UNITED STATES
SECURITIES AND EXCHANGE COMMISSION
Washington, D.C. 20549
FORM N-CSR
CERTIFIED SHAREHOLDER REPORT OF REGISTERED
MANAGEMENT INVESTMENT COMPANIES
Investment Company Act file number 811-6397
Fidelity California Municipal Trust II
(Exact name of registrant as specified in charter)
82 Devonshire St., Boston, Massachusetts 02109
(Address of principal executive offices) (Zip code)
Scott C. Goebel, Secretary
82 Devonshire St.
Boston, Massachusetts 02109
(Name and address of agent for service)
Registrant's telephone number, including area code: 617-563-7000
Date of fiscal year end: | February 28 |
| |
Date of reporting period: | February 28, 2010 |
Item 1. Reports to Stockholders
Fidelity®
California AMT Tax-Free
Money Market Fund -
California AMT Tax-Free
Money Market
Institutional Class
Service Class
Annual Report
February 28, 2010
(2_fidelity_logos) (Registered_Trademark)
Contents
Chairman's Message | <Click Here> | The Chairman's message to shareholders. |
Shareholder Expense Example | <Click Here> | An example of shareholder expenses. |
Investment Changes/
Performance | <Click Here> | A summary of major shifts in the fund's investments over the past year. |
Investments | <Click Here> | A complete list of the fund's investments. |
Financial Statements | <Click Here> | Statements of assets and liabilities, operations, and changes in net assets,
as well as financial highlights. |
Notes | <Click Here> | Notes to the financial statements. |
Report of Independent Registered Public Accounting Firm | <Click Here> | |
Trustees and Officers | <Click Here> | |
Distributions | <Click Here> | |
Proxy Voting Results | <Click Here> | |
Board Approval of Investment Advisory Contracts and Management Fees | <Click Here> | |
To view a fund's proxy voting guidelines and proxy voting record for the 12-month period ended June 30, visit http://www.fidelity.com/proxyvotingresults or visit the Securities and Exchange Commission's (SEC) web site at http://www.sec.gov. You may also call 1-800-544-8544 to request a free copy of the proxy voting guidelines.
Standard & Poor's, S&P and S&P 500 are registered service marks of The McGraw-Hill Companies, Inc. and have been licensed for use by Fidelity Distributors Corporation.
Other third party marks appearing herein are the property of their respective owners.
All other marks appearing herein are registered or unregistered trademarks or service marks of FMR LLC or an affiliated company.
Annual Report
This report and the financial statements contained herein are submitted for the general information of the shareholders of the fund. This report is not authorized for distribution to prospective investors in the fund unless preceded or accompanied by an effective prospectus.
A fund files its complete schedule of portfolio holdings with the SEC for the first and third quarters of each fiscal year on Form N-Q. Forms N-Q are available on the SEC's web site at http://www.sec.gov. A fund's Forms N-Q may be reviewed and copied at the SEC's Public Reference Room in Washington, DC. Information regarding the operation of the SEC's Public Reference Room may be obtained by calling 1-800-SEC-0330. For a complete list of a fund's portfolio holdings, view the most recent holdings listing, semiannual report, or annual report on Fidelity's web site at http://www.fidelity.com/holdings or http://www.advisor.fidelity.com, as applicable.
NOT FDIC INSURED · MAY LOSE VALUE · NO BANK GUARANTEE
Neither the funds nor Fidelity Distributors Corporation is a bank.
Annual Report
(photo_of_Abigail_P_Johnson)
Dear Shareholder:
The turnaround in global capital markets that marked most of 2009 slowed in early 2010, as investors considered the risks to a sustained recovery, including increased political uncertainty, high unemployment, weak consumer spending and potential inflation on the horizon. Financial markets are always unpredictable, of course, but there also are several time-tested investment principles that can help put the odds in your favor.
One of the basic tenets is to invest for the long term. Over time, riding out the markets' inevitable ups and downs has proven much more effective than selling into panic or chasing the hottest trend. Even missing only a few of the markets' best days can significantly diminish investor returns. Patience also affords the benefits of compounding - of earning interest on additional income or reinvested dividends and capital gains. There can be tax advantages and cost benefits to consider as well. While staying the course doesn't eliminate risk, it can considerably lessen the effect of short-term declines.
You can further manage your investing risk through diversification. And today, more than ever, geographic diversification should be taken into account. Studies indicate that asset allocation is the single most important determinant of a portfolio's long-term success. The right mix of stocks, bonds and cash - aligned to your particular risk tolerance and investment objective - is very important. Age-appropriate rebalancing is also an essential aspect of asset allocation. For younger investors, an emphasis on equities - which historically have been the best-performing asset class over time - is encouraged. As investors near their specific goal, such as retirement or sending a child to college, consideration may be given to replacing volatile assets (e.g. common stocks) with more-stable fixed investments (bonds or savings plans).
A third principle - investing regularly - can help lower the average cost of your purchases. Investing a certain amount of money each month or quarter helps ensure you won't pay for all your shares at market highs. This strategy - known as dollar cost averaging - also reduces "emotion" from investing, helping shareholders avoid selling weak performers just prior to an upswing, or chasing a hot performer just before a correction.
We invite you to contact us via the Internet, through our Investor Centers or by phone. It is our privilege to provide you the information you need to make the investments that are right for you.
Sincerely,
(The chairman's signature appears here.)
Abigail P. Johnson
Annual Report
Shareholder Expense Example
As a shareholder of the Fund, you incur two types of costs: (1) transaction costs, and (2) ongoing costs, including management fees, distribution and/or service (12b-1) fees and other Fund expenses. This Example is intended to help you understand your ongoing costs (in dollars) of investing in the Fund and to compare these costs with the ongoing costs of investing in other mutual funds.
The Example is based on an investment of $1,000 invested at the beginning of the period and held for the entire period (September 1, 2009 to February 28, 2010).
Actual Expenses
The first line of the accompanying table for each class of the Fund provides information about actual account values and actual expenses. You may use the information in this line, together with the amount you invested, to estimate the expenses that you paid over the period. Simply divide your account value by $1,000.00 (for example, an $8,600 account value divided by $1,000.00 = 8.6), then multiply the result by the number in the first line for a class of the Fund under the heading entitled "Expenses Paid During Period" to estimate the expenses you paid on your account during this period. A small balance maintenance fee of $12.00 that is charged once a year may apply for certain accounts with a value of less than $2,000. This fee is not included in the table below. If it was, the estimate of expenses you paid during the period would be higher, and your ending account value lower, by this amount. In addition, the Fund, as a shareholder in the underlying Fidelity Central Funds, will indirectly bear its pro-rata share of the fees and expenses incurred by the underlying Fidelity Central Funds. These fees and expenses are not included in the Fund's annualized expense ratio used to calculate the expense estimate in the table below.
Hypothetical Example for Comparison Purposes
The second line of the accompanying table for each class of the Fund provides information about hypothetical account values and hypothetical expenses based on a Class' actual expense ratio and an assumed rate of return of 5% per year before expenses, which is not the Class' actual return. The hypothetical account values and expenses may not be used to estimate the actual ending account balance or expenses you paid for the period. You may use this information to compare the ongoing costs of investing in the Fund and other funds. To do so, compare this 5% hypothetical example with the 5% hypothetical examples that appear in the shareholder reports of the other funds. A small balance maintenance fee of $12.00 that is charged once a year may apply for certain accounts with a value of less than $2,000. This fee is not included in the table below. If it was, the estimate of expenses you paid during the period would be higher, and your ending account value lower, by this amount. In addition, the Fund, as a shareholder in the underlying Fidelity Central Funds, will indirectly bear its pro-rata share of the fees and expenses incurred by the underlying Fidelity Central Funds. These fees and expenses are not included in the Fund's annualized expense ratio used to calculate the expense estimate in the table below.
Please note that the expenses shown in the table are meant to highlight your ongoing costs only and do not reflect any transaction costs. Therefore, the second line of the table is useful in comparing ongoing costs only, and will not help you determine the relative total costs of owning different funds.
Annual Report
| Annualized Expense Ratio | Beginning
Account Value
September 1, 2009 | Ending
Account Value
February 28, 2010 | Expenses Paid
During Period*
September 1, 2009
to February 28, 2010 |
California AMT Tax-Free Money Market | .28% | | | |
Actual | | $ 1,000.00 | $ 1,000.10 | $ 1.39 |
HypotheticalA | | $ 1,000.00 | $ 1,023.41 | $ 1.40 |
Institutional Class | .21% | | | |
Actual | | $ 1,000.00 | $ 1,000.50 | $ 1.04 |
HypotheticalA | | $ 1,000.00 | $ 1,023.75 | $ 1.05 |
Service Class | .29% | | | |
Actual | | $ 1,000.00 | $ 1,000.05 | $ 1.44 ** |
HypotheticalA | | $ 1,000.00 | $ 1,023.36 | $ 1.45** |
A 5% return per year before expenses
* Expenses are equal to each Class' annualized expense ratio, multiplied by the average account value over the period, multiplied by 181/365 (to reflect the one-half year period).
** If certain fees were not voluntarily waived by FMR or its affiliates during the period, the annualized expense ratio and the expenses paid in the actual and hypothetical examples above would have been as follows:
| Annualized Expense Ratio | Expenses Paid |
Service Class | .46% | |
Actual | | $ 2.28 |
HypotheticalA | | $ 2.31 |
Annual Report
Investment Changes/Performance (Unaudited)
Maturity Diversification |
Days | % of fund's investments 2/28/10 | % of fund's investments 8/31/09 | % of fund's investments 2/28/09 |
0 - 30 | 85.0 | 81.0 | 81.3 |
31 - 90 | 2.3 | 3.5 | 3.2 |
91 - 180 | 11.9 | 4.4 | 10.8 |
181 - 397 | 0.8 | 11.1 | 4.7 |
Weighted Average Maturity |
| 2/28/10 | 8/31/09 | 2/28/09 |
Fidelity California AMT Tax-Free Money Market Fund | 26 Days | 46 Days | 34 Days |
California Tax-Free Money Market Funds Average * | 25 Days | 34 Days | 25 Days |
Asset Allocation (% of fund's net assets) |
As of February 28, 2010 | As of August 31, 2009 |
 | Variable Rate
Demand Notes
(VRDNs) 76.1% | | | Variable Rate
Demand Notes
(VRDNs) 77.0% | |
 | Commercial Paper (including CP Mode) 6.4% | | | Commercial Paper (including CP Mode) 4.1% | |
 | Municipal Notes 12.9% | | | Municipal Notes 16.4% | |
 | Fidelity Tax-Free
Cash Central Fund 2.3% | | | Fidelity Tax-Free
Cash Central Fund 0.6% | |
 | Other Investments 2.4% | | | Other Investments 2.5% | |
 | Net Other Assets ** (0.1)% | | | Net Other Assets ** (0.6)% | |

* Source: iMoneyNet,Inc
** Net Other Assets are not included in pie chart.
Annual Report
Current and Historical Seven-Day Yields
| 3/1/10 | 11/30/09 | 8/31/09 | 6/1/09 | 3/2/09 |
Fidelity California AMT Tax-Free Money Market Fund | 0.01% | 0.01% | 0.02% | 0.31% | 0.33% |
Fidelity California AMT Tax-Free Money Market Fund - - Institutional Class | 0.06% | 0.12% | 0.11% | 0.41% | 0.45% |
Fidelity California AMT Tax-Free Money Market Fund - - Service Class | 0.01% | 0.01% | 0.01% | 0.16% | 0.21% |
Yield refers to the income paid by the fund over a given period. Yields for money market funds are usually for seven-day periods, as they are here, though they are expressed as annual percentage rates. Past performance is no guarantee of future results. Yield will vary and it is possible to lose money by investing in the fund. A portion of the Fund's expenses were reimbursed and/or waived. Absent such reimbursements and/or waivers the Fund would have had a net investment loss and therefore its performance would have been lower.
Annual Report
Investments February 28, 2010
Showing Percentage of Net Assets
Municipal Securities - 100.1% |
| Principal Amount (000s) | | Value (000s) |
California - 94.5% |
ABAG Fin. Auth. for Nonprofit Corps. Rev. (Schools of the Sacred Heart - San Francisco Proj.) Series 2008 A, 0.17%, LOC Bank of America NA, VRDN (b) | $ 7,200 | | $ 7,200 |
Bay Area Toll Auth. San Francisco Bay Toll Bridge Rev. Participating VRDN: | | | |
Series Putters 3293, 0.18% (Liquidity Facility JPMorgan Chase Bank) (b)(f) | 5,000 | | 5,000 |
Series Putters 3434, 0.18% (Liquidity Facility JPMorgan Chase Bank) (b)(f) | 11,675 | | 11,675 |
California Cmnty. College Fing. Auth. Rev. TRAN: | | | |
Series 2009 A, 2% 6/30/10 | 12,760 | | 12,804 |
Series 2009 D, 2.25% 6/30/10 | 4,200 | | 4,214 |
California Cmntys. Note Prog. TRAN Series 2009 A3, 2% 6/30/10 | 6,300 | | 6,333 |
California Dept. of Wtr. Resources Pwr. Supply Rev.: | | | |
Bonds Series 2002 A, 5.25% 5/1/10 | 4,100 | | 4,132 |
Series 2002 C1, 0.19%, LOC Dexia Cr. Local de France, VRDN (b) | 22,340 | | 22,340 |
Series 2002 C10, 0.18%, LOC Landesbank Hessen-Thuringen, VRDN (b) | 22,315 | | 22,315 |
Series 2002 C11, 0.16%, LOC KBC Bank NV, LOC Bank of Nova Scotia New York Branch, VRDN (b) | 9,300 | | 9,300 |
Series 2002 C12, 0.17%, LOC Landesbank Hessen-Thuringen, VRDN (b) | 21,000 | | 21,000 |
Series 2002 C4, 0.19%, LOC JPMorgan Chase Bank, LOC California Teachers Retirement Sys., VRDN (b) | 65,200 | | 65,200 |
California Dept. of Wtr. Resources Wtr. Rev. Participating VRDN Series MS 3071, 0.2% (Liquidity Facility Morgan Stanley) (b)(f) | 5,150 | | 5,150 |
California Econ. Recovery: | | | |
Series 2004 C1, 0.14%, LOC Bank of America NA, VRDN (b) | 2,800 | | 2,800 |
Series 2004 C3, 0.13%, LOC Bank of America NA, VRDN (b) | 5,100 | | 5,100 |
California Ed. Notes Prog. TRAN Series 2009 A, 2% 7/30/10 | 15,200 | | 15,291 |
California Edl. Facilities Auth. Rev.: | | | |
Participating VRDN: | | | |
Series BBT 2014, 0.18% (Liquidity Facility Branch Banking & Trust Co.) (b)(f) | 4,485 | | 4,485 |
Series DB 373, 0.19% (Liquidity Facility Deutsche Bank AG) (b)(f) | 4,937 | | 4,937 |
Series Putters 3508, 0.18% (Liquidity Facility JPMorgan Chase Bank) (b)(f) | 10,225 | | 10,225 |
Municipal Securities - continued |
| Principal Amount (000s) | | Value (000s) |
California - continued |
California Edl. Facilities Auth. Rev.: - continued | | | |
Participating VRDN: | | | |
Series Putters 3526, 0.14% (Liquidity Facility JPMorgan Chase Bank) (b)(f) | $ 12,980 | | $ 12,980 |
Series ROC II R 11790PB, 0.22% (Liquidity Facility Deutsche Postbank AG) (b)(f) | 6,100 | | 6,100 |
Series SGB 45, 0.18% (Liquidity Facility Societe Generale) (b)(f) | 5,000 | | 5,000 |
Participating VRDN Series Floaters 08 38C, 0.16% (Liquidity Facility Wells Fargo & Co.) (b)(f) | 34,220 | | 34,220 |
California Gen. Oblig.: | | | |
Bonds 5.75% 3/1/19 (Pre-Refunded to 3/1/10 @ 101) (e) | 5,700 | | 5,757 |
Participating VRDN Series Solar 06 11, 0.2% (Liquidity Facility U.S. Bank NA, Minnesota) (b)(f) | 22,720 | | 22,720 |
Series 2003 A1, 0.14%, LOC JPMorgan Chase Bank, VRDN (b) | 4,000 | | 4,000 |
Series 2003 B1, 0.15%, LOC BNP Paribas New York Branch, LOC California Pub. Employees' Retirement Sys., VRDN (b) | 9,000 | | 9,000 |
Series 2003 B3, 0.18%, LOC BNP Paribas New York Branch, LOC California Pub. Employees' Retirement Sys., VRDN (b) | 45,000 | | 45,000 |
Series 2003 B4, 0.18%, LOC BNP Paribas New York Branch, LOC California Pub. Employees' Retirement Sys., VRDN (b) | 16,550 | | 16,550 |
Series 2003 C1, 0.18%, LOC Bank of America NA, VRDN (b) | 3,000 | | 3,000 |
Series 2003 C2, 0.18%, LOC Bank of Nova Scotia New York Branch, VRDN (b) | 27,150 | | 27,150 |
Series 2004 A1, 0.12%, LOC Citibank NA, LOC California Teachers Retirement Sys., VRDN (b) | 900 | | 900 |
Series 2004 A3, 0.14%, LOC State Street Bank & Trust Co., Boston, LOC California Teachers Retirement Sys., VRDN (b) | 2,900 | | 2,900 |
Series 2004 A4, 0.14%, LOC Citibank NA, LOC California Teachers Retirement Sys., VRDN (b) | 3,000 | | 3,000 |
Series 2004 A7, 0.17%, LOC Citibank NA, LOC California Teachers Retirement Sys., VRDN (b) | 6,590 | | 6,590 |
Series 2004 A8, 0.17%, LOC Citibank NA, LOC California Teachers Retirement Sys., VRDN (b) | 7,600 | | 7,600 |
Series 2004 A9, 0.17%, LOC State Street Bank & Trust Co., Boston, LOC California Teachers Retirement Sys., VRDN (b) | 10,000 | | 10,000 |
Series 2004 B3, 0.12%, LOC Citibank NA, VRDN (b) | 4,700 | | 4,700 |
Series 2005 A1, 0.18%, LOC Fortis Banque SA, VRDN (b) | 22,195 | | 22,195 |
Municipal Securities - continued |
| Principal Amount (000s) | | Value (000s) |
California - continued |
California Gen. Oblig.: - continued | | | |
Series 2005 A2, 0.2%, LOC Calyon SA, VRDN (b) | $ 6,865 | | $ 6,865 |
Series 2005 B1, 0.2%, LOC Bank of America NA, VRDN (b) | 22,700 | | 22,700 |
Series 2005 B2, 0.17%, LOC Societe Generale, VRDN (b) | 53,955 | | 53,955 |
Series 2005 B6, 0.14%, LOC KBC Bank NV, VRDN (b) | 36,695 | | 36,695 |
0.32% 3/5/10, LOC Dexia Cr. Local de France, LOC Royal Bank of Canada, CP | 1,300 | | 1,300 |
0.33% 3/1/10, LOC Dexia Cr. Local de France, LOC Royal Bank of Canada, CP | 9,600 | | 9,600 |
0.33% 3/4/10, LOC Dexia Cr. Local de France, LOC Royal Bank of Canada, CP | 6,445 | | 6,445 |
0.33% 3/4/10, LOC Dexia Cr. Local de France, LOC Royal Bank of Canada, CP | 17,000 | | 17,000 |
0.35% 3/2/10, LOC Dexia Cr. Local de France, LOC Royal Bank of Canada, CP | 22,700 | | 22,700 |
0.35% 3/2/10, LOC Dexia Cr. Local de France, LOC Royal Bank of Canada, CP | 2,000 | | 2,000 |
0.35% 3/3/10, LOC Dexia Cr. Local de France, LOC Royal Bank of Canada, CP | 4,200 | | 4,200 |
California Health Facilities Fing. Auth. Rev.: | | | |
Bonds (Cedars-Sinai Med. Ctr. Proj.) Series 2009, 3% 8/15/10 | 6,100 | | 6,156 |
(Catholic Healthcare West Proj.) Series 2005 I, 0.15%, LOC Bank of America NA, VRDN (b) | 12,000 | | 12,000 |
(Scripps Health Proj.): | | | |
Series 2008 E, 0.2%, LOC Bank of America NA, VRDN (b) | 6,325 | | 6,325 |
Series 2010 B, 0.15%, LOC JPMorgan Chase Bank, VRDN (b) | 16,000 | | 16,000 |
(Scripps Memorial Hosp. Proj.) Series 2008 G, 0.2%, LOC Bank of America NA, VRDN (b) | 5,600 | | 5,600 |
(Stanford Hosp. and Clinics Proj.) Series 2008 A2, 0.2%, LOC Bank of America NA, VRDN (b) | 25,100 | | 25,100 |
California Hsg. Fin. Agcy. Rev. (Multifamily Hsg. Prog.): | | | |
Series 2000 D, 0.21% (Liquidity Facility Fannie Mae) (Liquidity Facility Freddie Mac), VRDN (b) | 4,445 | | 4,445 |
Series 2002 B, 0.21% (Liquidity Facility Fannie Mae) (Liquidity Facility Freddie Mac), VRDN (b) | 2,600 | | 2,600 |
California Infrastructure & Econ. Dev. Bank Rev.: | | | |
Bonds (J. Paul Getty Trust Co. Proj.) Series B, 0.3% tender 4/6/10, CP mode | 3,000 | | 3,000 |
(India Cmnty. Ctr., Inc. Proj.) Series 2007 A, 0.15%, LOC Bank of America NA, VRDN (b) | 5,550 | | 5,550 |
Municipal Securities - continued |
| Principal Amount (000s) | | Value (000s) |
California - continued |
California Infrastructure & Econ. Dev. Bank Rev.: - continued | | | |
(Orange County Performing Arts Ctr. Proj.) Series 2008 A, 0.14%, LOC Bank of America NA, VRDN (b) | $ 2,125 | | $ 2,125 |
(RAND Corp. Proj.): | | | |
Series 2008 A, 0.17%, LOC Bank of America NA, VRDN (b) | 8,525 | | 8,525 |
Series 2008 B, 0.14%, LOC Bank of America NA, VRDN (b) | 3,300 | | 3,300 |
(The American Nat'l. Red Cross Proj.) Series 2008, 0.17%, LOC U.S. Bank NA, Minnesota, VRDN (b) | 6,500 | | 6,500 |
California Muni. Fin. Auth. Rev.: | | | |
(La Sierra Univ. Proj.) Series 2008 A, 0.14%, LOC Wells Fargo Bank NA, VRDN (b) | 3,000 | | 3,000 |
(Turning Point School Proj.) Series 2009, 0.18%, LOC U.S. Bank NA, Minnesota, VRDN (b) | 4,570 | | 4,570 |
California Poll. Cont. Fing. Auth. Ctfs. of Prtn. (Pacific Gas & Elec. Co. Proj.) Series 1996 C, 0.12%, LOC JPMorgan Chase Bank, VRDN (b) | 2,400 | | 2,400 |
California Pub. Works Board Lease Rev. Participating VRDN Series BA 08 1065, 0.18% (Liquidity Facility Bank of America NA) (b)(f) | 4,203 | | 4,203 |
California State Univ. Rev. Series 2001 A, 0.27% 3/3/10, LOC JPMorgan Chase Bank, LOC State Street Bank & Trust Co., Boston, CP | 8,000 | | 8,000 |
California Statewide Cmntys. Dev. Auth. Rev.: | | | |
(American Baptist Homes of the West Proj.) Series 2006, 0.21%, LOC Bank of America NA, VRDN (b) | 5,705 | | 5,705 |
(Motion Picture & Television Fund Proj.) Series 2001 A, 0.17%, LOC BNP Paribas SA, VRDN (b) | 7,700 | | 7,700 |
Carlsbad Multifamily Hsg. Rev. ( Costa Apts. Proj.) Series 1993 A, 0.18%, LOC Freddie Mac, VRDN (b) | 14,600 | | 14,600 |
Chino Basin Reg'l. Fing. Auth. Rev. (Inland Empire Util. Agcy. Proj.) Series B, 0.21%, LOC Dexia Cr. Local de France, VRDN (b) | 2,875 | | 2,875 |
Chula Vista Ind. Dev. Rev. (San Diego Gas & Elec. Co. Proj.) Series 2006 A, 0.18%, VRDN (b) | 48,220 | | 48,220 |
Contra Costa Wtr. District Wtr. Rev. Participating VRDN Series ROC II R 11410, 0.21% (Liquidity Facility Citibank NA) (b)(f) | 2,600 | | 2,600 |
Costa Mesa Redev. Agcy. Multi-family Hsg. (Family Village Apts. Proj.) Series 1994 A, 0.5%, LOC Bank of America NA, VRDN (b) | 1,455 | | 1,455 |
Davis Joint Unified School District TRAN 1.5% 6/30/10 | 11,000 | | 11,022 |
Municipal Securities - continued |
| Principal Amount (000s) | | Value (000s) |
California - continued |
Dublin San Ramon Svcs. District and East Bay Muni. Util. District Series 2004 A, 0.2% 3/10/10, LOC JPMorgan Chase Bank, CP | $ 9,000 | | $ 9,000 |
East Bay Muni. Util. District Wastewtr. Sys. Rev. Series 2008 B1, 0.17% (Liquidity Facility Dexia Cr. Local de France), VRDN (b) | 2,550 | | 2,550 |
East Bay Muni. Util. District Wtr. Sys. Rev.: | | | |
Participating VRDN Series ROC II R 10397, 0.2% (Liquidity Facility Citibank NA) (b)(f) | 6,675 | | 6,675 |
Series 2008 A3, 0.2% (Liquidity Facility Dexia Cr. Local de France), VRDN (b) | 7,780 | | 7,780 |
Series 2008 A4, 0.17% (Liquidity Facility Dexia Cr. Local de France), VRDN (b) | 3,500 | | 3,500 |
Series 2008 B3, 0.21% (Liquidity Facility Landesbank Baden-Wuert), VRDN (b) | 1,800 | | 1,800 |
Eastern Muni. Wtr. District Wtr. and Swr. Rev. Ctfs. of Prtn. Participating VRDN Series Putters 3220, 0.18% (Liquidity Facility JPMorgan Chase Bank) (b)(f) | 1,585 | | 1,585 |
El Dorado Irrigation District Rev. Ctfs. of Prtn. Series 2008 A, 0.21%, LOC Dexia Cr. Local de France, VRDN (b) | 19,400 | | 19,400 |
Fresno Rev. (Trinity Health Cr. Proj.) Series 2000 C, 0.18% (Liquidity Facility Landesbank Hessen-Thuringen), VRDN (b) | 21,060 | | 21,060 |
Hayward Multi-family Hsg. Rev. (Sherwood Apts. Proj.) Series 1984 A, 0.17%, LOC Fannie Mae, VRDN (b) | 25,920 | | 25,920 |
Irvine Ranch Wtr. District Rev. (District #105 Impt. Proj.) Series 2008 B, 0.2%, LOC Landesbank Baden-Wuert, VRDN (b) | 20,165 | | 20,165 |
Kern County Board of Ed. TRAN 2% 6/30/10 | 6,300 | | 6,326 |
Loma Linda Hosp. Rev. (Loma Linda Univ. Med. Ctr. Proj.) Series 2008 B, 0.18%, LOC Bank of America NA, VRDN (b) | 9,000 | | 9,000 |
Los Angeles Cmnty. College District Participating VRDN: | | | |
Series MS 3096, 0.2% (Liquidity Facility Morgan Stanley) (b)(f) | 7,350 | | 7,350 |
Series Putters 2864, 0.2% (Liquidity Facility JPMorgan Chase Bank) (b)(f) | 4,785 | | 4,785 |
Series Putters 3287, 0.18% (Liquidity Facility JPMorgan Chase Bank) (b)(f) | 4,500 | | 4,500 |
Series WF 09 8C, 0.16% (Liquidity Facility Wells Fargo & Co.) (b)(f) | 11,200 | | 11,200 |
Los Angeles County Gen. Oblig. TRAN 2.5% 6/30/10 | 35,100 | | 35,296 |
Los Angeles County Metropolitan Trans. Auth. Sales Tax Rev.: | | | |
Series 2009 C3, 0.15%, LOC Sumitomo Mitsui Banking Corp., VRDN (b) | 7,300 | | 7,300 |
Series A, 0.23% 3/2/10, LOC BNP Paribas SA, LOC Dexia Cr. Local de France, CP | 9,200 | | 9,200 |
Municipal Securities - continued |
| Principal Amount (000s) | | Value (000s) |
California - continued |
Los Angeles County Schools Pooled Fing. Prog. Ctfs. of Prtn. TRAN Series A, 2.5% 6/30/10 | $ 8,300 | | $ 8,345 |
Los Angeles Dept. of Wtr. & Pwr. Rev.: | | | |
Participating VRDN: | | | |
Series BA 08 3040X, 0.21% (Liquidity Facility Bank of America NA) (b)(f) | 6,665 | | 6,665 |
Series Putters 1302Z, 0.2% (Liquidity Facility JPMorgan Chase Bank) (b)(f) | 7,995 | | 7,995 |
Series Putters 3327, 0.18% (Liquidity Facility JPMorgan Chase Bank) (b)(f) | 7,495 | | 7,495 |
Series ROC II R 500, 0.21% (Liquidity Facility Citibank NA) (b)(f) | 11,600 | | 11,600 |
Series 2002 A2, 0.18% (Liquidity Facility JPMorgan Chase Bank), VRDN (b) | 27,800 | | 27,800 |
Los Angeles Dept. of Wtr. & Pwr. Wtrwks. Rev. Participating VRDN: | | | |
Series Putters 3309, 0.18% (Liquidity Facility JPMorgan Chase Bank) (b)(f) | 6,660 | | 6,660 |
Series Putters 3310, 0.18% (Liquidity Facility JPMorgan Chase Bank) (b)(f) | 4,000 | | 4,000 |
Los Angeles Gen. Oblig. TRAN Series 2009, 2.5% 4/28/10 | 28,500 | | 28,592 |
Los Angeles Habor Dept. Rev. Participating VRDN Series Putters 3520, 0.18% (Liquidity Facility JPMorgan Chase Bank) (b)(f) | 6,095 | | 6,095 |
Los Angeles Unified School District: | | | |
Bonds Series 2010 KRY, 1.5% 7/1/10 (a) | 5,700 | | 5,723 |
Participating VRDN Series BA 08 1049, 0.21% (Liquidity Facility Bank of America NA) (b)(f) | 22,800 | | 22,800 |
TRAN Series A, 2% 8/12/10 | 34,400 | | 34,612 |
Los Angeles Wastewtr. Sys. Rev. Participating VRDN Series Putters 2254, 0.2% (Liquidity Facility JPMorgan Chase Bank) (b)(f) | 5,780 | | 5,780 |
Metropolitan Wtr. District of Southern California Wtr. Rev. Participating VRDN Series 3655 Z, 0.18% (Liquidity Facility JPMorgan Chase Bank) (b)(f) | 1,670 | | 1,670 |
Metropolitan Wtr. District of Southern California Wtrwks. Rev.: | | | |
Participating VRDN: | | | |
Series BA 08 1087, 0.18% (Liquidity Facility Bank of America NA) (b)(f) | 4,375 | | 4,375 |
Series Putters 3289, 0.18% (Liquidity Facility JPMorgan Chase Bank) (b)(f) | 2,210 | | 2,210 |
Series ROC II R 11301, 0.2% (Liquidity Facility Citibank NA) (b)(f) | 4,275 | | 4,275 |
Municipal Securities - continued |
| Principal Amount (000s) | | Value (000s) |
California - continued |
Metropolitan Wtr. District of Southern California Wtrwks. Rev.: - continued | | | |
Series 2001 C2, 0.12% (Liquidity Facility Lloyds TSB Bank PLC), VRDN (b) | $ 6,800 | | $ 6,800 |
Series 2008 A1, 0.17% (Liquidity Facility Bank of America NA), VRDN (b) | 48,300 | | 48,300 |
Series 2008 A2, 0.23% (Liquidity Facility Landesbank Baden-Wuert), VRDN (b) | 78,985 | | 78,983 |
Orange County Hsg. Auth. Apt. Dev. Rev. (Lanteen Pines/Frost Group Proj.) 0.21%, LOC Fannie Mae, VRDN (b) | 9,860 | | 9,860 |
Orange County Sanitation District Ctfs. of Prtn. Participating VRDN: | | | |
Series MS 06 2222, 0.2% (Liquidity Facility Wells Fargo & Co.) (b)(f) | 7,764 | | 7,764 |
Series ROC II R 11304, 0.21% (Liquidity Facility Citibank NA) (b)(f) | 7,405 | | 7,405 |
Orange County Sanitation District Rev. BAN Series 2009 B, 2% 12/1/10 | 6,400 | | 6,475 |
Orange County Wtr. District Rev. Ctfs. of Prtn. Participating VRDN Series Floaters 3117, 0.13% (Liquidity Facility Morgan Stanley) (b)(f) | 4,500 | | 4,500 |
Peralta Cmnty. College District Gen. Oblig. Participating VRDN: | | | |
Series BA 08 3032X, 0.21% (Liquidity Facility Bank of America NA) (b)(f) | 3,490 | | 3,490 |
Series Putters 3499Z, 0.2% (Liquidity Facility JPMorgan Chase Bank) (b)(f) | 1,740 | | 1,740 |
Rancho Wtr. District Fing. Auth. Rev.: | | | |
Participating VRDN Series BA 08 3024X, 0.21% (Liquidity Facility Bank of America NA) (b)(f) | 7,140 | | 7,140 |
Series 2008 B, 0.17%, LOC UBS AG, VRDN (b) | 16,050 | | 16,050 |
Richmond Wastewtr. Rev. Series 2008 A, 0.18%, LOC Union Bank of California, VRDN (b) | 3,000 | | 3,000 |
Riverside County Asset Leasing Corp. Leasehold Rev. (Southwest Justice Ctr. Proj.) Series 2008 A, 0.18%, LOC Union Bank of California, VRDN (b) | 7,800 | | 7,800 |
Riverside County Gen. Oblig. Series B: | | | |
0.26% 3/10/10, LOC Bank of Nova Scotia New York Branch, CP | 10,712 | | 10,712 |
0.3% 3/1/10, LOC Bank of Nova Scotia New York Branch, CP | 20,593 | | 20,593 |
Riverside Ctfs. of Prtn. (Riverside Renaissance Proj.) Series 2008, 0.18%, LOC Bank of America NA, VRDN (b) | 18,500 | | 18,500 |
Municipal Securities - continued |
| Principal Amount (000s) | | Value (000s) |
California - continued |
Roseville Elec. Sys. Rev. Ctfs. of Prtn. Series 2008 A, 0.19%, LOC Dexia Cr. Local de France, VRDN (b) | $ 1,950 | | $ 1,950 |
Sacramento County Sanitation District Fing. Auth. Rev.: | | | |
Participating VRDN Series Putters 2821, 0.2% (Liquidity Facility JPMorgan Chase & Co.) (b)(f) | 6,620 | | 6,620 |
(Sacramento Reg'l. County Sanitation District Proj.) Series 2008 A, 0.15%, LOC Bank of America NA, VRDN (b) | 5,500 | | 5,500 |
Series 2008 E, 0.2%, LOC U.S. Bank NA, Minnesota, VRDN (b) | 2,000 | | 2,000 |
Sacramento Muni. Util. District Elec. Rev. Series 2007 J, 0.23% 3/12/10, LOC Bank of New York, New York, LOC California Teachers Retirement Sys., CP | 11,300 | | 11,300 |
Sacramento Suburban Wtr. District Ctfs. of Prtn. Series 2009 A, 0.19%, LOC Sumitomo Mitsui Banking Corp., VRDN (b) | 6,000 | | 6,000 |
San Bernardino County Gen. Oblig. TRAN 2% 6/30/10 | 9,000 | | 9,048 |
San Bernardino County Multi-family Rev. (Quail Point Apts. Proj.) Series 1990 A, 0.2%, LOC Fannie Mae, VRDN (b) | 4,025 | | 4,025 |
San Diego County & School District TRAN: | | | |
Series 2009 A, 2% 6/30/10 | 9,000 | | 9,042 |
Series 2009 B1, 2% 6/30/10 | 10,800 | | 10,843 |
San Diego Pub. Facilities Fing. Auth. Swr. Rev. Bonds Series 2009 B, 3% 5/15/10 | 13,010 | | 13,079 |
San Diego Pub. Facilities Fing. Auth. Wtr. Rev. Participating VRDN Series Putters 3504, 0.18% (Liquidity Facility JPMorgan Chase Bank) (b)(f) | 7,000 | | 7,000 |
San Diego Unified School District: | | | |
Participating VRDN Series SGA 01 120, 0.2% (Liquidity Facility Societe Generale) (b)(f) | 22,565 | | 22,565 |
TRAN Series A, 2% 7/8/10 | 17,900 | | 17,993 |
San Francisco Bay Area Rapid Transit Fing. Auth. Participating VRDN Series Putters 3161, 0.18% (Liquidity Facility JPMorgan Chase Bank) (b)(f) | 16,660 | | 16,660 |
San Francisco City & County Arpts. Commission Int'l. Arpt. Rev. Second Series 36B, 0.17%, LOC Union Bank of California, VRDN (b) | 17,800 | | 17,800 |
San Francisco City & County Gen. Oblig.: | | | |
Bonds: | | | |
(Laguna Honda Hosp. Proj.) Series 2005 A, 5% 6/15/10 | 6,520 | | 6,604 |
Series 2008 R1, 5% 6/15/10 | 8,500 | | 8,613 |
Participating VRDN Series BA 08 3318, 0.18% (Liquidity Facility Bank of America NA) (b)(f) | 2,500 | | 2,500 |
San Francisco City and County Fin. Corp. Lease Rev. (Moscone Ctr. Expansion Proj.) Series 2008 2, 0.17%, LOC State Street Bank & Trust Co., Boston, VRDN (b) | 5,510 | | 5,510 |
Municipal Securities - continued |
| Principal Amount (000s) | | Value (000s) |
California - continued |
San Francisco Redev. Agcy. Multi-family Hsg. Rev. (Fillmore Ctr. Proj.) Series 1992 A1, 0.2%, LOC Freddie Mac, VRDN (b) | $ 11,900 | | $ 11,900 |
San Francisco Student Finl. Auth. Participating VRDN Series Solar 06 97, 0.18% (Liquidity Facility U.S. Bank NA, Minnesota) (b)(f) | 7,655 | | 7,655 |
San Jose Fing. Auth. Lease Rev. (Civic Ctr. Garage Proj.) Series 2008 B, 0.17%, LOC Bank of America NA, LOC California Teachers Retirement Sys., VRDN (b) | 6,400 | | 6,400 |
San Juan Capistrano Gen. Oblig. Participating VRDN Series Putters 3646, 0.18% (Liquidity Facility JPMorgan Chase Bank) (b)(f) | 10,050 | | 10,050 |
San Mateo Unified School District BAN 2% 2/28/11 | 10,000 | | 10,141 |
San Mateo-Foster City School District BAN Series 2009, 1.75% 3/1/10 | 6,300 | | 6,300 |
San Pablo Redev. Agcy. 0.13%, LOC Union Bank of California, VRDN (b) | 12,645 | | 12,645 |
Santa Cruz County Redev. Agcy. Participating VRDN Series Solar 06 31, 0.18% (Liquidity Facility U.S. Bank NA, Minnesota) (b)(f) | 7,400 | | 7,400 |
Santa Monica-Malibu Unified School District BAN Series 2009, 2% 7/30/10 | 10,000 | | 10,062 |
Sequoia Union High School District TRAN 2.5% 7/1/10 | 6,500 | | 6,543 |
South Placer Wastewtr. Auth. Rev. Series 2008 B, 0.16%, LOC State Street Bank & Trust Co., Boston, LOC California Teachers Retirement Sys., VRDN (b) | 48,200 | | 48,200 |
Southern California Pub. Pwr. Auth. Rev.: | | | |
(Magnolia Pwr. Proj.): | | | |
Series 2009-1, 0.18%, LOC KBC Bank NV, VRDN (b) | 22,600 | | 22,600 |
Series 2009-2, 0.2%, LOC Bank of America NA, VRDN (b) | 2,000 | | 2,000 |
(Palo Verde Proj.) Series 2008 B, 0.21%, LOC Dexia Cr. Local de France, VRDN (b) | 6,600 | | 6,600 |
State Ctr. Cmnty. College District Participating VRDN Series Putters 1972, 0.2% (Liquidity Facility JPMorgan Chase Bank) (b)(f) | 4,575 | | 4,575 |
Torrance Gen. Oblig. TRAN 2.5% 7/1/10 | 7,200 | | 7,250 |
Univ. of California Revs. Participating VRDN: | | | |
Series Putters 2475, 0.18% (Liquidity Facility JPMorgan Chase Bank) (b)(f) | 1,690 | | 1,690 |
Series Putters 3368, 0.18% (Liquidity Facility JPMorgan Chase Bank) (b)(f) | 6,275 | | 6,275 |
Series Solar 06 39, 0.18% (Liquidity Facility U.S. Bank NA, Minnesota) (b)(f) | 10,040 | | 10,040 |
Municipal Securities - continued |
| Principal Amount (000s) | | Value (000s) |
California - continued |
Ventura County Gen. Oblig. TRAN 2.5% 7/1/10 | $ 16,500 | | $ 16,616 |
Western Muni. Wtr. District Facilities Auth. Wtr. Rev. Series 2009 A, 0.16%, LOC U.S. Bank NA, Minnesota, VRDN (b) | 11,635 | | 11,635 |
Whittier Health Facilities Rev. (Presbyterian Intercommunity Hosp. Proj.) Series 2009 C, 0.17%, LOC U.S. Bank NA, Minnesota, VRDN (b) | 5,700 | | 5,700 |
| | 1,983,024 |
Florida - 0.1% |
Florida Hsg. Fin. Corp. Multi-family Mtg. Rev. (Victoria Park Apts. Proj.) Series 2002 J, 0.19%, LOC Fannie Mae, VRDN (b) | 1,390 | | 1,390 |
Georgia - 0.1% |
DeKalb County Hsg. Auth. Multi-family Hsg. Rev. (Winterscreek Apt. Proj.) 0.22%, LOC Fannie Mae, VRDN (b) | 2,300 | | 2,300 |
Indiana - 0.1% |
Indiana Dev. Fin. Auth. Envir. Rev. Series 2005, 0.18%, LOC Royal Bank of Scotland PLC, VRDN (b) | 2,000 | | 2,000 |
Maine - 0.2% |
Maine Health & Higher Ed. Facilities Auth. Rev. Series 2008 A, 0.21%, LOC KBC Bank NV, VRDN (b) | 4,800 | | 4,800 |
Massachusetts - 0.7% |
Massachusetts Bay Trans. Auth. Sales Tax Rev. Participating VRDN Series DCL 08 26, 0.3% (Liquidity Facility Dexia Cr. Local de France) (b)(f) | 10,420 | | 10,420 |
Massachusetts Wtr. Resources Auth. Wtr. & Swr. Rev.: | | | |
Series 2008 C, 0.28% (Liquidity Facility Bayerische Landesbank), VRDN (b) | 1,700 | | 1,700 |
Series 2008 D, 0.28% (Liquidity Facility Bayerische Landesbank), VRDN (b) | 1,900 | | 1,900 |
| | 14,020 |
North Carolina - 0.2% |
Charlotte Wtr. & Swr. Sys. Rev. Series 2006 B, 0.18% (Liquidity Facility Wachovia Bank NA), VRDN (b) | 5,400 | | 5,400 |
Pennsylvania - 1.0% |
Bucks County Indl. Dev. Auth. Hosp. Rev. (Grand View Hosp. Proj.) Series 2008 A, 0.17%, LOC PNC Bank NA, Pittsburgh, VRDN (b) | 8,650 | | 8,650 |
Delaware County Indl. Dev. Auth. Rev. (Academy of Notre Dame de Namur Proj.) Series 2007, 0.38%, LOC Citizens Bank of Pennsylvania, VRDN (b) | 4,120 | | 4,120 |
Municipal Securities - continued |
| Principal Amount (000s) | | Value (000s) |
Pennsylvania - continued |
Pennsylvania Higher Edl. Facilities Auth. Rev. (St. Joseph's Univ. Proj.) Series 2008 B, 0.2%, LOC Citizens Bank of Pennsylvania, VRDN (b) | $ 4,000 | | $ 4,000 |
Philadelphia Auth. for Indl. Dev. Rev. (William Penn Charter School Proj.) Series 2008, 0.19%, LOC PNC Bank NA, Pittsburgh, VRDN (b) | 3,400 | | 3,400 |
| | 20,170 |
Puerto Rico - 0.5% |
Puerto Rico Commonwealth Pub. Impt. Gen. Oblig. Series 2007 A7, 0.22%, LOC UBS AG, VRDN (b) | 9,600 | | 9,600 |
South Carolina - 0.2% |
Greenville Hosp. Sys. Facilities Rev. Series 2008 E, 0.18%, LOC Wachovia Bank NA, VRDN (b) | 4,830 | | 4,830 |
Texas - 0.2% |
Weslaco Health Facilities Dev. Corp. Rev. (Knapp Med. Ctr. Proj.) Series 2008 B, 0.43%, LOC Compass Bank, VRDN (b) | 4,730 | | 4,730 |
| Shares | | |
Other - 2.3% |
Fidelity Tax-Free Cash Central Fund, 0.16% (c)(d) | 48,018 | | 48,018 |
TOTAL INVESTMENT PORTFOLIO - 100.1% (Cost $2,100,282) | | 2,100,282 |
NET OTHER ASSETS - (0.1)% | | (1,083) |
NET ASSETS - 100% | $ 2,099,199 |
Security Type Abbreviations |
BAN - BOND ANTICIPATION NOTE |
CP - COMMERCIAL PAPER |
TRAN - TAX AND REVENUE
ANTICIPATION NOTE |
VRDN - VARIABLE RATE DEMAND NOTE |
Legend |
(a) Security or a portion of the security purchased on a delayed delivery or when-issued basis. |
(b) The coupon rate shown on floating or adjustable rate securities represents the rate at period end. |
(c) Information in this report regarding holdings by state and security types does not reflect the holdings of the Fidelity Tax-Free Cash Central Fund. |
(d) Affiliated fund that is available only to investment companies and other accounts managed by Fidelity Investments. The rate quoted is the annualized seven-day yield of the fund at period end. A complete unaudited listing of the fund's holdings as of its most recent quarter end is available upon request. |
(e) Security collateralized by an amount sufficient to pay interest and principal. |
(f) Provides evidence of ownership in one or more underlying municipal bonds. |
Affiliated Central Funds |
Information regarding fiscal year to date income earned by the Fund from investments in Fidelity Central Funds is as follows: |
Fund | Income earned
(Amounts in thousands) |
Fidelity Tax-Free Cash Central Fund | $ 92 |
Other Information |
All investments are categorized as Level 2 under the Fair Value Hierarchy. The inputs or methodology used for valuing securities may not be an indication of the risk associated with investing in those securities. For more information on valuation inputs, please refer to the Security Valuation section in the accompanying Notes to Financial Statements. |
See accompanying notes which are an integral part of the financial statements.
Annual Report
Statement of Assets and Liabilities
Amounts in thousands (except per-share amounts) | February 28, 2010 |
| | |
Assets | | |
Investment in securities, at value - See accompanying schedule: Unaffiliated issuers (cost $2,052,264) | $ 2,052,264 | |
Fidelity Central Funds (cost $48,018) | 48,018 | |
Total Investments (cost $2,100,282) | | $ 2,100,282 |
Cash | | 981 |
Receivable for investments sold | | 1,501 |
Receivable for fund shares sold | | 1,156 |
Interest receivable | | 4,440 |
Distributions receivable from Fidelity Central Funds | | 4 |
Receivable from investment adviser for expense reductions | | 72 |
Total assets | | 2,108,436 |
| | |
Liabilities | | |
Payable for investments purchased on a delayed delivery basis | $ 5,723 | |
Payable for fund shares redeemed | 3,076 | |
Distributions payable | 9 | |
Accrued management fee | 353 | |
Other affiliated payables | 76 | |
Total liabilities | | 9,237 |
| | |
Net Assets | | $ 2,099,199 |
Net Assets consist of: | | |
Paid in capital | | $ 2,099,076 |
Accumulated undistributed net realized gain (loss) on investments | | 123 |
Net Assets | | $ 2,099,199 |
California AMT Tax-Free Money Market: | | |
Net Asset Value, offering price and redemption price per share ($807,652 ÷ 807,267 shares) | | $ 1.00 |
| | |
Institutional Class: | | |
Net Asset Value, offering price and redemption price per share ($1,290,879 ÷ 1,290,467 shares) | | $ 1.00 |
| | |
Service Class: | | |
Net Asset Value, offering price and redemption price per share ($668 ÷ 668 shares) | | $ 1.00 |
See accompanying notes which are an integral part of the financial statements.
Annual Report
Statement of Operations
Amounts in thousands | Year ended February 28, 2010 |
| | |
Investment Income | | |
Interest | | $ 12,047 |
Income from Fidelity Central Funds | | 92 |
Total income | | 12,139 |
| | |
Expenses | | |
Management fee | $ 5,363 | |
Transfer agent fees | 1,854 | |
Distribution fees | 10 | |
Independent trustees' compensation | 10 | |
Money Market Guarantee Program fee | 1,128 | |
Total expenses before reductions | 8,365 | |
Expense reductions | (953) | 7,412 |
Net investment income | | 4,727 |
Realized and Unrealized Gain (Loss) Net realized gain (loss) on: | | |
Investment securities: | | |
Unaffiliated issuers | | 47 |
Net increase in net assets resulting from operations | | $ 4,774 |
See accompanying notes which are an integral part of the financial statements.
Annual Report
Financial Statements - continued
Statement of Changes in Net Assets
Amounts in thousands | Year ended February 28,
2010 | Year ended February 28,
2009 |
Increase (Decrease) in Net Assets | | |
Operations | | |
Net investment income | $ 4,727 | $ 77,468 |
Net realized gain (loss) | 47 | 451 |
Net increase in net assets resulting
from operations | 4,774 | 77,919 |
Distributions to shareholders from net investment income | (4,727) | (77,467) |
Distributions to shareholders from net realized gain | - | (1,136) |
Total distributions | (4,727) | (78,603) |
Share transactions - net increase (decrease) | (1,291,813) | (1,762,354) |
Total increase (decrease) in net assets | (1,291,766) | (1,763,038) |
| | |
Net Assets | | |
Beginning of period | 3,390,965 | 5,154,003 |
End of period | $ 2,099,199 | $ 3,390,965 |
See accompanying notes which are an integral part of the financial statements.
Annual Report
Financial Highlights - California AMT Tax-Free Money Market
Years ended February 28, | 2010 | 2009 | 2008 D | 2007 | 2006 |
Selected Per-Share Data | | | | | |
Net asset value, beginning of period | $ 1.00 | $ 1.00 | $ 1.00 | $ 1.00 | $ 1.00 |
Income from Investment Operations | | | | | |
Net investment income | .001 | .015 | .032 | .032 | .023 |
Net realized and unrealized gain (loss) E | - | - | - | - | - |
Total from investment operations | .001 | .015 | .032 | .032 | .023 |
Distributions from net investment income | (.001) | (.015) | (.032) | (.032) | (.023) |
Distributions from net realized gain | - | - E | - E | - E | - |
Total distributions | (.001) | (.015) | (.032) | (.032) | (.023) |
Net asset value, end of period | $ 1.00 | $ 1.00 | $ 1.00 | $ 1.00 | $ 1.00 |
Total Return A | .11% | 1.50% | 3.27% | 3.24% | 2.34% |
Ratios to Average Net Assets B, C | | | | | |
Expenses before reductions | .34% | .32% | .32% | .43% | .43% |
Expenses net of fee waivers,
if any | .33% | .32% | .31% | .35% | .35% |
Expenses net of all reductions | .33% | .29% | .24% | .27% | .27% |
Net investment income | .12% | 1.55% | 3.21% | 3.19% | 2.34% |
Supplemental Data | | | | | |
Net assets, end of period
(in millions) | $ 808 | $ 1,306 | $ 2,022 | $ 3,212 | $ 2,206 |
A Total returns would have been lower had certain expenses not been reduced during the periods shown.
B Fees and expenses of the underlying Fidelity Central Funds are not included in the Fund's expense ratio. The Fund indirectly bears its proportionate share of the expenses of any underlying Fidelity Central Funds.
C Expense ratios reflect operating expenses of the class. Expenses before reductions do not reflect amounts reimbursed or waived or reductions from expense offset arrangements and do not represent the amount paid by the class during periods when reimbursements, waivers or reductions occur. Expenses net of fee waivers reflect expenses after reimbursement and waivers but prior to reductions from expense offset arrangements. Expenses net of all reductions represent the net expenses paid by the class.
D For the year ended February 29.
E Amount represents less than $.001 per share.
See accompanying notes which are an integral part of the financial statements.
Annual Report
Financial Highlights - Institutional Class
Years ended February 28, | 2010 | 2009 | 2008 E |
Selected Per-Share Data | | | |
Net asset value, beginning of period | $ 1.00 | $ 1.00 | $ 1.00 |
Income from Investment Operations | | | |
Net investment income | .002 | .016 | .029 |
Net realized and unrealized gain (loss) G | - | - | - |
Total from investment operations | .002 | .016 | .029 |
Distributions from net investment income | (.002) | (.016) | (.029) |
Distributions from net realized gain | - | - G | - G |
Total distributions | (.002) | (.016) | (.029) |
Net asset value, end of period | $ 1.00 | $ 1.00 | $ 1.00 |
Total Return B, C | .19% | 1.60% | 2.90% |
Ratios to Average Net Assets D, F | | | |
Expenses before reductions | .29% | .27% | .25% A |
Expenses net of fee waivers, if any | .24% | .22% | .20% A |
Expenses net of all reductions | .24% | .19% | .13% A |
Net investment income | .21% | 1.65% | 3.22% A |
Supplemental Data | | | |
Net assets, end of period (in millions) | $ 1,291 | $ 2,076 | $ 3,116 |
A Annualized
B Total returns for periods of less than one year are not annualized.
C Total returns would have been lower had certain expenses not been reduced during the periods shown.
D Fees and expenses of the underlying Fidelity Central Funds are not included in the Fund's expense ratio. The Fund indirectly bears its proportionate share of the expenses of any underlying Fidelity Central Funds.
E For the period April 18, 2007 (commencement of sale of shares) to February 29, 2008.
F Expense ratios reflect operating expenses of the class. Expenses before reductions do not reflect amounts reimbursed or waived or reductions from expense offset arrangements and do not represent the amount paid by the class during periods when reimbursements, waivers or reductions occur. Expense ratios before reductions for start-up periods may not be representative of longer-term operating periods. Expenses net of fee waivers reflect expenses after reimbursement and waivers but prior to reductions from expense offset arrangements. Expenses net of all reductions represent the net expenses paid by the class.
G Amount represents less than $.001 per share.
See accompanying notes which are an integral part of the financial statements.
Annual Report
Financial Highlights - Service Class
Years ended February 28, | 2010 | 2009 | 2008 E |
Selected Per-Share Data | | | |
Net asset value, beginning of period | $ 1.00 | $ 1.00 | $ 1.00 |
Income from Investment Operations | | | |
Net investment income | - G | .013 | .026 |
Net realized and unrealized gain (loss) G | - | - | - |
Total from investment operations | - G | .013 | .026 |
Distributions from net investment income | - G | (.013) | (.026) |
Distributions from net realized gain | - | - G | - G |
Total distributions | - G | (.013) | (.026) |
Net asset value, end of period | $ 1.00 | $ 1.00 | $ 1.00 |
Total Return B, C | .05% | 1.35% | 2.67% |
Ratios to Average Net Assets D, F | | | |
Expenses before reductions | .54% | .52% | .50% A |
Expenses net of fee waivers, if any | .43% | .47% | .45% A |
Expenses net of all reductions | .43% | .44% | .38% A |
Net investment income | .02% | 1.40% | 2.84% A |
Supplemental Data | | | |
Net assets, end of period (in millions) | $ 1 | $ 9 | $ 16 |
A Annualized
B Total returns for periods of less than one year are not annualized.
C Total returns would have been lower had certain expenses not been reduced during the periods shown.
D Fees and expenses of the underlying Fidelity Central Funds are not included in the Fund's expense ratio. The Fund indirectly bears its proportionate share of the expenses of any underlying Fidelity Central Funds.
E For the period April 18, 2007 (commencement of sale of shares) to February 29, 2008.
F Expense ratios reflect operating expenses of the class. Expenses before reductions do not reflect amounts reimbursed or waived or reductions from expense offset arrangements and do not represent the amount paid by the class during periods when reimbursements, waivers or reductions occur. Expense ratios before reductions for start-up periods may not be representative of longer-term operating periods. Expenses net of fee waivers reflect expenses after reimbursement and waivers but prior to reductions from expense offset arrangements. Expenses net of all reductions represent the net expenses paid by the class.
G Amount represents less than $.001 per share.
See accompanying notes which are an integral part of the financial statements.
Annual Report
Notes to Financial Statements
For the period ended February 28, 2010
(Amounts in thousands except ratios)
1. Organization.
Fidelity California AMT Tax-Free Money Market Fund (the Fund) is a fund of Fidelity California Municipal Trust II (the trust) and is authorized to issue an unlimited number of shares. The trust is registered under the Investment Company Act of 1940, as amended (the 1940 Act), as an open-end management investment company organized as a Delaware statutory trust. The Fund offers California AMT Tax-Free Money Market, Institutional Class and Service Class shares, each of which has equal rights as to assets and voting privileges. Each class has exclusive voting rights with respect to matters that affect that class. Investment income, realized and unrealized capital gains and losses, the common expenses of the Fund, and certain fund-level expense reductions, if any, are allocated on a pro-rata basis to each class based on the relative net assets of each class to the total net assets of the Fund. Each class differs with respect to transfer agent and distribution and service plan fees incurred. Certain expense reductions also differ by class.
2. Investments in Fidelity Central Funds.
The Fund may invest in Fidelity Central Funds, which are open-end investment companies available only to other investment companies and accounts managed by Fidelity Management & Research Company (FMR) and its affiliates. The Fund's Schedule of Investments lists each of the Fidelity Central Funds held as of period end, if any, as an investment of the Fund, but does not include the underlying holdings of each Fidelity Central Fund. As an Investing Fund, the Fund indirectly bears its proportionate share of the expenses of the underlying Fidelity Central Funds.
The Money Market Central Funds seek preservation of capital and current income and are managed by Fidelity Investments Money Management, Inc. (FIMM), an affiliate of FMR.
A complete unaudited list of holdings for each Fidelity Central Fund is available upon request or at the Securities and Exchange Commission (the SEC) web site at www.sec.gov. In addition, the financial statements of the Fidelity Central Funds which are not covered by the Fund's Report of Independent Registered Public Accounting Firm, are available on the SEC web site or upon request.
3. Significant Accounting Policies.
The financial statements have been prepared in conformity with accounting principles generally accepted in the United States of America, which require management to make certain estimates and assumptions at the date of the financial statements. Actual results could differ from those estimates. The following summarizes the significant accounting policies of the Fund:
Annual Report
3. Significant Accounting Policies - continued
Security Valuation. The Fund categorizes the inputs to valuation techniques used to value its investments into a disclosure hierarchy consisting of three levels as shown below.
Level 1 - quoted prices in active markets for identical investments
Level 2 - other significant observable inputs (including quoted prices for similar investments, interest rates, prepayment speeds, etc.)
Level 3 - unobservable inputs (including the fund's own assumptions based on the best information available)
As permitted by compliance with certain conditions under Rule 2a-7 of the 1940 Act, securities are valued at amortized cost, which approximates value and are categorized as Level 2 in the hierarchy.
Investment Transactions and Income. The net asset value per share for processing shareholder transactions is calculated as of the close of business of the New York Stock Exchange (NYSE), normally 4:00 p.m. Eastern time. Security transactions, including the Fund's investment activity in the Fidelity Central Funds, are accounted for as of trade date. Gains and losses on securities sold are determined on the basis of identified cost. Interest income and distributions from the Fidelity Central Funds are accrued as earned. Interest income includes coupon interest and amortization of premium and accretion of discount on debt securities.
Expenses. Most expenses of the trust can be directly attributed to a fund. Expenses which cannot be directly attributed are apportioned among each Fund in the trust. Expense estimates are accrued in the period to which they relate and adjustments are made when actual amounts are known.
The Fund participated in the U.S. Treasury Department's Temporary Guarantee Program for Money Market Funds (the "Program") through September 18, 2009. The Fund paid the U.S. Treasury Department fees equal to 0.04% based on the number of shares outstanding as of September 19, 2008 to participate in the Program through September 18, 2009. The expense was borne by the Fund without regard to any expense limitation in effect for the Fund.
Income Tax Information and Distributions to Shareholders. Each year, the Fund intends to qualify as a regulated investment company by distributing substantially all of its taxable income and realized gains under Subchapter M of the Internal Revenue Code and filing its U.S. federal tax return. As a result, no provision for income taxes is required. As of February 28, 2010, the Fund did not have any unrecognized tax benefits in the accompanying financial statements. A Fund's federal tax return is subject to examination by the Internal Revenue Service (IRS) for a period of three years.
Annual Report
Notes to Financial Statements - continued
(Amounts in thousands except ratios)
3. Significant Accounting Policies - continued
Income Tax Information and Distributions to Shareholders - continued
Dividends are declared daily and paid monthly from net investment income. Distributions from realized gains, if any, are recorded on the ex-dividend date. Income dividends and capital gain distributions are declared separately for each class. Income and capital gain distributions are determined in accordance with income tax regulations, which may differ from generally accepted accounting principles. In addition, the Fund claimed a portion of the payment made to redeeming shareholders as a distribution for income tax purposes.
Capital accounts within the financial statements are adjusted for permanent book-tax differences. These adjustments have no impact on net assets or the results of operations. Temporary book-tax differences will reverse in a subsequent period.
Book-tax differences are primarily due to deferred trustees compensation and losses deferred due to excise tax regulations.
The Funds purchase municipal securities whose interest, in the opinion of the issuer, is free from federal income tax. There is no assurance that the IRS will agree with this opinion. In the event the IRS determines that the issuer does not comply with relevant tax requirements, interest payments from a security could become federally taxable, possibly retroactively to the date the security was issued.
The federal tax cost of investment securities and unrealized appreciation (depreciation) as of period end were as follows:
Gross unrealized appreciation | $ - |
Gross unrealized depreciation | - |
Net unrealized appreciation (depreciation) | $ - |
| |
Tax Cost | $ 2,100,282 |
The tax-based components of distributable earnings as of period end were as follows:
Undistributed tax-exempt income | $ 124 |
Net unrealized appreciation (depreciation) | $ - |
Annual Report
3. Significant Accounting Policies - continued
Income Tax Information and Distributions to Shareholders - continued
The tax character of distributions paid was as follows:
| February 28, 2010 | February 28, 2009 |
Tax-exempt Income | $ 4,727 | $ 77,467 |
Ordinary Income | - | 610 |
Long-term Capital Gains | - | 526 |
Total | $ 4,727 | $ 78,603 |
4. Operating Policies.
Delayed Delivery Transactions and When-Issued Securities. The Fund may purchase or sell securities on a delayed delivery or when-issued basis. Payment and delivery may take place after the customary settlement period for that security. The price of the underlying securities and the date when the securities will be delivered and paid for are fixed at the time the transaction is negotiated. During the time a delayed delivery sell is outstanding, equivalent deliverable securities are held for the transaction. The securities purchased on a delayed delivery or when-issued basis are identified as such in the Fund's Schedule of Investments. The Fund may receive compensation for interest forgone in the purchase of a delayed delivery or when-issued security. With respect to purchase commitments, the Fund identifies securities as segregated in its records with a value at least equal to the amount of the commitment. Losses may arise due to changes in the value of the underlying securities or if the counterparty does not perform under the contract's terms, or if the issuer does not issue the securities due to political, economic, or other factors.
5. Fees and Other Transactions with Affiliates.
Management Fee and Expense Contract. FMR and its affiliates provide the Fund with investment management related services for which the Fund pays a monthly management fee that is based on an annual rate of .20% of the Fund's average net assets. FMR pays all other fund-level expenses, except the compensation of the independent Trustees and certain exceptions such as interest expense.
In addition, under the expense contract, FMR pays class level expenses for California AMT Tax-Free Money Market so that the total expenses do not exceed .35%, expressed as a percentage of class average net assets, with certain exceptions such as interest expense.
Annual Report
Notes to Financial Statements - continued
(Amounts in thousands except ratios)
5. Fees and Other Transactions with Affiliates - continued
Distribution and Service Plan. In accordance with Rule 12b-1 of the 1940 Act, the Fund has adopted separate Distribution and Service Plans for each class of shares. Service Class pays Fidelity Distributors Corporation (FDC), an affiliate of FMR, a Service Fee based on an annual percentage of Service Class' average net assets. In addition, FDC may pay financial intermediaries for selling shares of the Fund and providing shareholder support services. For the period, the Service Fee rate, total service fees and amounts retained by FDC were as follows:
| Service
Fee | Total Fees* | Retained
by FDC |
Service Class | .25% | $ 10 | $ - |
* During the period, FMR or its affiliates waived a portion of these fees.
Transfer Agent and Accounting Fees. Citibank, N.A. (Citibank) is the custodian, transfer agent, and shareholder servicing agent for the Fund. Citibank has entered into a sub-arrangement with Fidelity Investments Institutional Operations Company, Inc. (FIIOC), an affiliate of FMR, under which FIIOC performs the activities associated with the Fund's transfer, dividend disbursing and shareholder servicing agent functions. FIIOC pays for typesetting, printing and mailing of shareholder reports, except proxy statements. For the period, transfer agent fees for each class were as follows:
| Amount** | % of
Average
Net Assets |
California AMT Tax-Free Money Market | $ 1,021 | .10 |
Institutional Class | 831 | .05 |
Service Class | 2 | .05 |
| $ 1,854 | |
Citibank also has a sub-arrangement with Fidelity Service Company, Inc. (FSC), an affiliate of FMR, under which FSC maintains the Fund's accounting records. The fee is based on the level of average net assets for the month.
** During the period, FMR or its affiliates waived a portion of these fees.
Annual Report
6. Expense Reductions.
FMR contractually agreed to reimburse Institutional Class and Service Class to the extent annual operating expenses, expressed as a percentage of each class' average net assets, exceed .20% and .45%, respectively. Some expenses, for example interest expense and the fee for participating in the U.S. Treasury Department's Temporary Guarantee Program, are excluded from this reimbursement. During the period, this reimbursement reduced Institutional Class and Service Class expenses by $826 and $2, respectively.
FMR or its affiliates voluntarily agreed to waive certain fees during the period. The amount of the waiver for each class is as follows:
California AMT Tax-Free Money Market | $ 117 |
Institutional Class | 1 |
Service Class | 2 |
| $ 120 |
Through arrangements with the Fund's custodian, credits realized as a result of uninvested cash balances were used to reduce the Fund's expenses. During the period, these credits reduced the Fund's expenses by $5.
7. Distributions to Shareholders.
Distributions to shareholders of each class were as follows:
Years ended February 28, | 2010 | 2009 |
From net investment income | | |
California AMT Tax-Free Money Market | $ 1,256 | $ 28,242 |
Institutional Class | 3,468 | 49,005 |
Service Class | 3 | 220 |
Total | $ 4,727 | $ 77,467 |
From net realized gain | | |
California AMT Tax-Free Money Market | $ - | $ 443 |
Institutional Class | - | 688 |
Service Class | - | 5 |
Total | $ - | $ 1,136 |
Annual Report
Notes to Financial Statements - continued
(Amounts in thousands except ratios)
8. Share Transactions.
Transactions for each class of shares at a $1.00 per share were as follows:
Years ended February 28, | 2010 | 2009 |
California AMT Tax-Free Money Market
Shares sold | 303,247 | 1,482,875 |
Reinvestment of distributions | 1,147 | 26,208 |
Shares redeemed | (802,735) | (2,225,022) |
Net increase (decrease) | (498,341) | (715,939) |
Institutional Class
Shares sold | 603,343 | 2,607,136 |
Reinvestment of distributions | 3,073 | 44,418 |
Shares redeemed | (1,391,618) | (3,690,874) |
Net increase (decrease) | (785,202) | (1,039,320) |
Service Class
Shares sold | 151 | 24,433 |
Reinvestment of distributions | 3 | 219 |
Shares redeemed | (8,424) | (31,747) |
Net increase (decrease) | (8,270) | (7,095) |
9. Other.
The Fund's organizational documents provide former and current trustees and officers with a limited indemnification against liabilities arising in connection with the performance of their duties to the Fund. In the normal course of business, the Fund may also enter into contracts that provide general indemnifications. The Fund's maximum exposure under these arrangements is unknown as this would be dependent on future claims that may be made against the Fund. The risk of material loss from such claims is considered remote.
The supply of municipal money market securities has fluctuated significantly due to market volatility. As a result, the Fund's cash position may be significant during the period.
Annual Report
To the Trustees of Fidelity California Municipal Trust II and the Shareholders of Fidelity California AMT Tax-Free Money Market Fund:
In our opinion, the accompanying statement of assets and liabilities, including the schedule of investments, and the related statements of operations and of changes in net assets and the financial highlights present fairly, in all material respects, the financial position of Fidelity California AMT Tax-Free Money Market Fund (a fund of Fidelity California Municipal Trust II) at February 28, 2010, the results of its operations for the year then ended, the changes in its net assets for each of the two years in the period then ended and the financial highlights for each of the periods indicated, in conformity with accounting principles generally accepted in the United States of America. These financial statements and financial highlights (hereafter referred to as "financial statements") are the responsibility of the Fidelity California AMT Tax-Free Money Market Fund's management. Our responsibility is to express an opinion on these financial statements based on our audits. We conducted our audits of these financial statements in accordance with the standards of the Public Company Accounting Oversight Board (United States). Those standards require that we plan and perform the audit to obtain reasonable assurance about whether the financial statements are free of material misstatement. An audit includes examining, on a test basis, evidence supporting the amounts and disclosures in the financial statements, assessing the accounting principles used and significant estimates made by management, and evaluating the overall financial statement presentation. We believe that our audits, which included confirmation of securities at February 28, 2010 by correspondence with the custodian and brokers, provide a reasonable basis for our opinion.
/s/ PricewaterhouseCoopers LLP
PricewaterhouseCoopers LLP
Boston, Massachusetts
April 15, 2010
Annual Report
The Trustees and executive officers of the trust and fund, as applicable, are listed below. The Board of Trustees governs the fund and is responsible for protecting the interests of shareholders. The Trustees are experienced executives who meet periodically throughout the year to oversee the fund's activities, review contractual arrangements with companies that provide services to the fund, oversee management of the risks associated with such activities and contractual arrangements, and review the fund's performance. Except for James C. Curvey, each of the Trustees oversees 188 funds advised by FMR or an affiliate. Mr. Curvey oversees 410 funds advised by FMR or an affiliate.
The Trustees hold office without limit in time except that (a) any Trustee may resign; (b) any Trustee may be removed by written instrument, signed by at least two-thirds of the number of Trustees prior to such removal; (c) any Trustee who requests to be retired or who has become incapacitated by illness or injury may be retired by written instrument signed by a majority of the other Trustees; and (d) any Trustee may be removed at any special meeting of shareholders by a two-thirds vote of the outstanding voting securities of the trust. Each Trustee who is not an interested person (as defined in the 1940 Act) (Independent Trustee), shall retire not later than the last day of the calendar year in which his or her 72nd birthday occurs. The Independent Trustees may waive this mandatory retirement age policy with respect to individual Trustees. The executive officers hold office without limit in time, except that any officer may resign or may be removed by a vote of a majority of the Trustees at any regular meeting or any special meeting of the Trustees. Except as indicated, each individual has held the office shown or other offices in the same company for the past five years.
Experience, Skills, Attributes, and Qualifications of the Fund's Trustees. The Governance and Nominating Committee has adopted a statement of policy that describes the experience, qualifications, attributes, and skills that are necessary and desirable for potential Independent Trustee candidates ("Statement of Policy"). The Board believes that each Trustee satisfied at the time he or she was initially elected or appointed a Trustee, and continues to satisfy, the standards contemplated by the Statement of Policy. The Governance and Nominating Committee also engages professional search firms to help identify potential Independent Trustee candidates who have the experience, qualifications, attributes, and skills consistent with the Statement of Policy. From time to time, additional criteria based on the composition and skills of the current Independent Trustees, as well as experience or skills that may be appropriate in light of future changes to board composition, business conditions, and regulatory or other developments, have also been considered by the professional search firms and the Governance and Nominating Committee. In addition, the Board takes into account the Trustees' commitment and participation in Board and committee meetings, as well as their leadership of standing and ad hoc committees throughout their tenure.
In determining that a particular Trustee was and continues to be qualified to serve as a Trustee, the Board has considered a variety of criteria, none of which, in isolation, was controlling. The Board believes that, collectively, the Trustees have balanced and diverse experience, qualifications, attributes, and skills, which allow the Board to operate effectively in governing the fund and protecting the interests of shareholders. Information about the specific experience, skills, attributes, and qualifications of each Trustee, which in each case led to the Board's conclusion that the Trustee should serve (or continue to serve) as a trustee of the fund, is provided below.
Annual Report
Trustees and Officers - continued
Board Structure and Oversight Function. Abigail P. Johnson is an interested person (as defined in the 1940 Act) and currently serves as Chairman. The Trustees have determined that an interested Chairman is appropriate and benefits shareholders because an interested Chairman has a personal and professional stake in the quality and continuity of services provided to the fund. Independent Trustees exercise their informed business judgment to appoint an individual of their choosing to serve as Chairman, regardless of whether the Trustee happens to be independent or a member of management. The Independent Trustees have determined that they can act independently and effectively without having an Independent Trustee serve as Chairman and that a key structural component for assuring that they are in a position to do so is for the Independent Trustees to constitute a substantial majority for the Board. The Independent Trustees also regularly meet in executive session. Kenneth L. Wolfe serves as Chairman of the Independent Trustees and as such (i) acts as a liaison between the Independent Trustees and management with respect to matters important to the Independent Trustees and (ii) with management prepares agendas for Board meetings.
Fidelity funds are overseen by different Boards of Trustees. The fund's Board oversees Fidelity's investment-grade bond, money market, and asset allocation funds and another Board oversees Fidelity's equity and high income funds. The asset allocation funds may invest in Fidelity funds that are overseen by such other Board. The use of separate Boards, each with its own committee structure, allows the Trustees of each group of Fidelity funds to focus on the unique issues of the funds they oversee, including common research, investment, and operational issues. On occasion, the separate Boards establish joint committees to address issues of overlapping consequences for the Fidelity funds overseen by each Board.
The Trustees operate using a system of committees to facilitate the timely and efficient consideration of all matters of importance to the Trustees, the fund, and fund shareholders and to facilitate compliance with legal and regulatory requirements and oversight of the fund's activities and associated risks. The Board, acting through its committees, has charged FMR and its affiliates with (i) identifying events or circumstances the occurrence of which could have demonstrably adverse effects on the fund's business and/or reputation; (ii) implementing processes and controls to lessen the possibility that such events or circumstances occur or to mitigate the effects of such events or circumstances if they do occur; and (iii) creating and maintaining a system designed to evaluate continuously business and market conditions in order to facilitate the identification and implementation processes described in (i) and (ii) above. Because the day-to-day operations and activities of the fund are carried out by or through FMR, its affiliates and other service providers, the fund's exposure to risks is mitigated but not eliminated by the processes overseen by the Trustees. While each of the Board's committees has responsibility for overseeing different aspects of the fund's activities, oversight is exercised primarily through the Operations and Audit Committees. Appropriate personnel, including but not limited to the fund's Chief Compliance Officer ("CCO"), FMR's internal auditor, the independent accountants, the fund's Treasurer and portfolio management personnel, make periodic reports to the Board's committees, as appropriate. The responsibilities of each committee, including their oversight responsibilities, are described further under "Standing Committees of the Fund's Trustees."
Annual Report
The fund's Statement of Additional Information (SAI) includes more information about the Trustees. To request a free copy, call Fidelity at 1-800-544-8544.
Interested Trustees*:
Correspondence intended for each Trustee who is an interested person may be sent to Fidelity Investments, 82 Devonshire Street, Boston, Massachusetts 02109.
Name, Age; Principal Occupations and Other Relevant Experience+ |
Abigail P. Johnson (48) |
| Year of Election or Appointment: 2009 Ms. Johnson is Trustee and Chairman of the Board of Trustees of certain Trusts. Ms. Johnson serves as President of Personal and Workplace Investing (2005-present). Ms. Johnson is a Director of FMR LLC. Previously, Ms. Johnson served as President and a Director of FMR (2001-2005), a Trustee of other investment companies advised by FMR, Fidelity Investments Money Management, Inc., and FMR Co., Inc. (2001-2005), Senior Vice President of the Fidelity funds (2001-2005), and managed a number of Fidelity funds. Ms. Abigail P. Johnson and Mr. Arthur E. Johnson are not related. |
James C. Curvey (74) |
| Year of Election or Appointment: 2007 Mr. Curvey also serves as Trustee (2007-present) of other investment companies advised by FMR. Mr. Curvey is a Director of FMR and FMR Co., Inc. (2007-present). Mr. Curvey is also Vice Chairman (2006-
present) and Director of FMR LLC. In addition, Mr. Curvey serves as an Overseer for the Boston Symphony Orchestra and a member of the Trustees of Villanova University. |
* Trustees have been determined to be "Interested Trustees" by virtue of, among other things, their affiliation with the trust or various entities under common control with FMR.
+ The information above includes each Trustee's principal occupation during the last five years and other information relating to the experience, attributes, and skills relevant to each Trustee's qualifications to serve as a Trustee, which led to the conclusion that each Trustee should serve as a Trustee for the fund.
Annual Report
Trustees and Officers - continued
Independent Trustees:
Correspondence intended for each Independent Trustee (that is, the Trustees other than the Interested Trustees) may be sent to Fidelity Investments, P.O. Box 55235, Boston, Massachusetts 02205-5235.
Name, Age; Principal Occupations and Other Relevant Experience+ |
Albert R. Gamper, Jr. (67) |
| Year of Election or Appointment: 2006 Prior to his retirement in December 2004, Mr. Gamper served as Chairman of the Board of CIT Group Inc. (commercial finance). During his tenure with CIT Group Inc. Mr. Gamper served in numerous senior management positions, including Chairman (1987-1989; 1999-2001; 2002-2004), Chief Executive Officer (1987-2004), and President (2002-2003). He also served as President and Chief Executive Officer of Tyco Capital Corporation (2001-2002). Mr. Gamper currently serves as a member of the Board of Directors of Public Service Enterprise Group (utilities, 2000-present), a member of the Board of Trustees, Rutgers University (2004-present), and Chairman of the Board of Saint Barnabas Health Care System. Previously, Mr. Gamper served as Chairman of the Board of Governors, Rutgers University (2004-2007). |
Robert F. Gartland (58) |
| Year of Election or Appointment: 2010 Mr. Gartland is a partner and investor of Vietnam Partners LLC (investments and consulting, 2008-present) and is Chairman and an investor in Gartland and Mellina Group Corp. (consulting, 2009-present). Prior to his retirement, Mr. Gartland held a variety of positions at Morgan Stanley (financial services, 1979-2007) including Managing Director (1987-2007). |
Arthur E. Johnson (63) |
| Year of Election or Appointment: 2008 Mr. Johnson serves as a member of the Board of Directors of Eaton Corporation (diversified power management, 2009-present) and AGL Resources, Inc. (holding company). Prior to his retirement, Mr. Johnson served as Senior Vice President of Corporate Strategic Development of Lockheed Martin Corporation (defense contractor, 1999-2009). He previously served on the Board of Directors of IKON Office Solutions, Inc. (1999-2008) and Delta Airlines (2005-2007). Mr. Arthur E. Johnson and Ms. Abigail P. Johnson are not related. |
Michael E. Kenneally (55) |
| Year of Election or Appointment: 2009 Prior to his retirement, Mr. Kenneally served as a Member of the Advisory Board for certain Fidelity Fixed Income and Asset Allocation Funds (2008-2009). Mr. Kenneally served as Chairman and Global Chief Executive Officer of Credit Suisse Asset Management (2003-2005). Mr. Kenneally was a Director of the Credit Suisse Funds (U.S. mutual funds, 2004-2008) and certain other closed-end funds (2004-2005) and was awarded the Chartered Financial Analyst (CFA) designation in 1991. |
James H. Keyes (69) |
| Year of Election or Appointment: 2007 Mr. Keyes serves as a member of the Boards of Navistar International Corporation (manufacture and sale of trucks, buses, and diesel engines, since 2002) and Pitney Bowes, Inc. (integrated mail, messaging, and document management solutions, since 1998). Prior to his retirement, Mr. Keyes served as Chairman and Chief Executive Officer of Johnson Controls (automotive, building, and energy, 1998-2002) and as a member of the Board of LSI Logic Corporation (semiconductor technologies, 1984-2008). |
Marie L. Knowles (63) |
| Year of Election or Appointment: 2001 Prior to Ms. Knowles' retirement in June 2000, she served as Executive Vice President and Chief Financial Officer of Atlantic Richfield Company (ARCO) (diversified energy, 1996-2000). From 1993 to 1996, she was a Senior Vice President of ARCO and President of ARCO Transportation Company. She served as a Director of ARCO from 1996 to 1998. Ms. Knowles currently serves as a Director of McKesson Corporation (healthcare service, since 2002). Ms. Knowles is an Honorary Trustee of the Brookings Institution and a member of the Board of the Catalina Island Conservancy and of the Santa Catalina Island Company (2009-present). She also serves as a member of the Advisory Board for the School of Engineering of the University of Southern California and the Foundation Board of the School of Architecture at the University of Virginia (2007- present). Previously, Ms. Knowles served as a Director of Phelps Dodge Corporation (copper mining and manufacturing, 1994-2007). |
Kenneth L. Wolfe (71) |
| Year of Election or Appointment: 2005 Mr. Wolfe is Chairman of the Independent Trustees of the Fixed Income and Asset Allocation Funds (2008-present). Prior to his retirement, Mr. Wolfe served as Chairman and a Director (2007-2009) and Chairman and Chief Executive Officer of Hershey Foods Corporation. He also served as a member of the Boards of Adelphia Communications Corporation (telecommunications, 2003-2006), Bausch & Lomb, Inc. (medical/pharmaceutical, 1993-2007), and Revlon, Inc. (personal care products, 2004-2009). |
+ The information above includes each Trustee's principal occupation during the last five years and other information relating to the experience, attributes, and skills relevant to each Trustee's qualifications to serve as a Trustee, which led to the conclusion that each Trustee should serve as a Trustee for the fund.
Executive Officers:
Correspondence intended for each executive officer may be sent to Fidelity Investments, 82 Devonshire Street, Boston, Massachusetts 02109.
Name, Age; Principal Occupation |
John R. Hebble (51) |
| Year of Election or Appointment: 2008 President and Treasurer of Fidelity's Fixed Income and Asset Allocation Funds. Mr. Hebble also serves as Treasurer and Chief Financial Officer of The North Carolina Capital Management Trust: Cash and Term Portfolio (2008-present), Assistant Treasurer of other Fidelity funds (2009-present) and is an employee of Fidelity Investments. |
Boyce I. Greer (54) |
| Year of Election or Appointment: 2005 or 2006 Vice President of Fidelity's Fixed Income Funds (2006) and Asset Allocation Funds (2005). Mr. Greer is also a Trustee of other investment companies advised by FMR. Mr. Greer is President of the Asset Allocation Division (2008-present), President and a Director of Strategic Advisers, Inc. (2008-present), President and a Director of Fidelity Investments Money Management, Inc. (2007-present), and an Executive Vice President of FMR (2005-present). Previously, Mr. Greer served as Executive Vice President of FMR Co., Inc. (2005-2009), and as a Director and Managing Director of Strategic Advisers, Inc. (2002-2005). |
Robert P. Brown (46) |
| Year of Election or Appointment: 2010 Vice President of Fidelity's Money Market Funds. Mr. Brown also serves as President, Money Market Group of FMR (2010-present) and is an employee of Fidelity Investments. |
Scott C. Goebel (42) |
| Year of Election or Appointment: 2008 Secretary and Chief Legal Officer (CLO) of the Fidelity funds. Mr. Goebel also serves as General Counsel, Secretary, and Senior Vice President of FMR (2008-present) and FMR Co., Inc. (2008-present); Deputy General Counsel of FMR LLC; Chief Legal Officer of Fidelity Management & Research (Hong Kong) Limited (2008-present) and Assistant Secretary of Fidelity Management & Research (Japan) Inc. (2008-present), Fidelity Investments Money Management, Inc. (2008-present), Fidelity Management & Research (U.K.) Inc. (2008-present), and Fidelity Research and Analysis Company (2008-present). Previously, Mr. Goebel served as Assistant Secretary of the Funds (2007-2008) and as Vice President and Secretary of Fidelity Distributors Corporation (FDC) (2005-2007). |
Holly C. Laurent (55) |
| Year of Election or Appointment: 2008 Anti-Money Laundering (AML) Officer of the Fidelity funds. Ms. Laurent is an employee of Fidelity Investments. Previously, Ms. Laurent was Senior Vice President and Head of Legal for Fidelity Business Services India Pvt. Ltd. (2006-2008), and Senior Vice President, Deputy General Counsel and Group Head for FMR LLC (2005-2006). |
Christine Reynolds (51) |
| Year of Election or Appointment: 2008 Chief Financial Officer of the Fidelity funds. Ms. Reynolds became President of Fidelity Pricing and Cash Management Services (FPCMS) in August 2008. Ms. Reynolds served as Chief Operating Officer of FPCMS (2007-2008). Previously, Ms. Reynolds served as President, Treasurer, and Anti-Money Laundering officer of the Fidelity funds (2004-2007). |
Michael H. Whitaker (42) |
| Year of Election or Appointment: 2008 Chief Compliance Officer of Fidelity's Fixed Income and Asset Allocation Funds. Mr. Whitaker is an employee of Fidelity Investments (2007-
present). Prior to joining Fidelity Investments, Mr. Whitaker worked at MFS Investment Management where he served as Senior Vice President and Chief Compliance Officer (2004-2006), and Assistant General Counsel. |
Jeffrey S. Christian (48) |
| Year of Election or Appointment: 2009 Deputy Treasurer of the Fidelity funds. Mr. Christian is an employee of Fidelity Investments. Previously, Mr. Christian served as Chief Financial Officer (2008-2009) of certain Fidelity funds and Senior Vice President of Fidelity Pricing and Cash Management Services (FPCMS) (2004-2009). |
Bryan A. Mehrmann (48) |
| Year of Election or Appointment: 2005 Deputy Treasurer of the Fidelity funds. Mr. Mehrmann is an employee of Fidelity Investments. |
Stephanie J. Dorsey (40) |
| Year of Election or Appointment: 2008 Deputy Treasurer of Fidelity's Fixed Income and Asset Allocation Funds. Ms. Dorsey is an employee of Fidelity Investments (2008-present). Previously, Ms. Dorsey served as Treasurer (2004-2008) of the JPMorgan Mutual Funds and Vice President (2004-2008) of JPMorgan Chase Bank. |
Paul M. Murphy (62) |
| Year of Election or Appointment: 2007 Assistant Treasurer of the Fidelity funds. Mr. Murphy is an employee of Fidelity Investments. Previously, Mr. Murphy served as Chief Financial Officer of the Fidelity funds (2005-2006), Vice President and Associate General Counsel of FMR (2007), and Senior Vice President of Fidelity Pricing and Cash Management Services (FPCMS) (1994-2007). |
Kenneth B. Robins (40) |
| Year of Election or Appointment: 2009 Assistant Treasurer of the Fidelity Fixed Income and Asset Allocation Funds. Mr. Robins also serves as President and Treasurer of other Fidelity funds (2008-present; 2010-present) and is an employee of Fidelity Investments (2004-present). Previously, Mr. Robins served as Deputy Treasurer of the Fidelity funds (2005-2008) and Treasurer and Chief Financial Officer of The North Carolina Capital Management Trust: Cash and Term Portfolios (2006-2008). |
Gary W. Ryan (51) |
| Year of Election or Appointment: 2005 Assistant Treasurer of the Fidelity funds. Mr. Ryan is an employee of Fidelity Investments. Previously, Mr. Ryan served as Vice President of Fund Reporting in Fidelity Pricing and Cash Management Services (FPCMS) (1999-2005). |
Annual Report
The fund hereby designates as a capital gain dividend with respect to the taxable year ended February 28, 2010, $2,773, or, if subsequently determined to be different, the net capital gain of such year.
During fiscal year ended 2010, 100% of the fund's income dividends was free from federal income tax, and 0% of the fund's income dividends was subject to the federal alternative minimum tax.
The fund will notify shareholders in January 2011 of amounts for use in preparing 2010 income tax returns.
Annual Report
A special meeting of the fund's shareholders was held on July 15, 2009. The results of votes taken among shareholders on the proposal before them are reported below. Each vote reported represents one dollar of net asset value held on the record date for the meeting.
PROPOSAL 1 |
To elect a Board of Trustees.A |
| # of
Votes | % of
Votes |
James C. Curvey |
Affirmative | 2,788,043,164.54 | 94.768 |
Withheld | 153,920,307.77 | 5.232 |
TOTAL | 2,941,963,472.31 | 100.000 |
Albert R. Gamper, Jr. |
Affirmative | 2,790,500,747.28 | 94.852 |
Withheld | 151,462,725.03 | 5.148 |
TOTAL | 2,941,963,472.31 | 100.000 |
Abigail P. Johnson |
Affirmative | 2,779,034,879.71 | 94.462 |
Withheld | 162,928,592.60 | 5.538 |
TOTAL | 2,941,963,472.31 | 100.000 |
Arthur E. Johnson |
Affirmative | 2,785,063,048.69 | 94.667 |
Withheld | 156,900,423.62 | 5.333 |
TOTAL | 2,941,963,472.31 | 100.000 |
Michael E. Kenneally |
Affirmative | 2,788,276,098.94 | 94.776 |
Withheld | 153,687,373.37 | 5.224 |
TOTAL | 2,941,963,472.31 | 100.000 |
James H. Keyes |
Affirmative | 2,791,083,278.78 | 94.871 |
Withheld | 150,880,193.53 | 5.129 |
TOTAL | 2,941,963,472.31 | 100.000 |
Marie L. Knowles |
Affirmative | 2,787,624,959.03 | 94.754 |
Withheld | 154,338,513.28 | 5.246 |
TOTAL | 2,941,963,472.31 | 100.000 |
Kenneth L. Wolfe |
Affirmative | 2,784,214,157.42 | 94.638 |
Withheld | 157,749,314.89 | 5.362 |
TOTAL | 2,941,963,472.31 | 100.000 |
A Denotes trust-wide proposal and voting results. |
Annual Report
Board Approval of Investment Advisory Contracts and Management Fees
Fidelity California AMT Tax-Free Money Market Fund
Each year, the Board of Trustees, including the Independent Trustees (together, the Board), votes on the renewal of the management contract and sub-advisory agreements (together, the Advisory Contracts) for the fund. The Board, assisted by the advice of fund counsel and Independent Trustees' counsel, requests and considers a broad range of information throughout the year.
The Board meets regularly and considers at each of its meetings factors that are relevant to its annual consideration of the renewal of the fund's Advisory Contracts, including the services and support provided to the fund and its shareholders. The Board has established three standing committees, each composed of Independent Trustees with varying backgrounds, to which the Board has assigned specific subject matter responsibilities in order to enhance effective decision-making by the Board. The Operations Committee meets regularly throughout the year and, among other matters, considers matters specifically related to the annual consideration of the renewal of the fund's Advisory Contracts. The Board, acting directly and through its Committees, requests and receives information concerning the annual consideration of the renewal of the fund's Advisory Contracts. The Board also meets as needed to consider matters specifically related to the Board's annual consideration of the renewal of Advisory Contracts.
At its September 2009 meeting, the Board of Trustees, including the Independent Trustees, unanimously determined to renew the fund's Advisory Contracts. In reaching its determination, the Board considered all factors it believed relevant, including (i) the nature, extent, and quality of the services to be provided to the fund and its shareholders (including the investment performance of the fund); (ii) the competitiveness of the fund's management fee and total expenses; (iii) the total costs of the services to be provided by and the profits to be realized by Fidelity from its relationship with the fund; (iv) the extent to which economies of scale would be realized as the fund grows; and (v) whether fee levels reflect these economies of scale, if any, for the benefit of fund shareholders.
In considering whether to renew the Advisory Contracts for the fund, the Board ultimately reached a determination, with the assistance of fund counsel and Independent Trustees' counsel and through the exercise of its business judgment, that the renewal of the Advisory Contracts and the compensation to be received by Fidelity under the management contract is consistent with Fidelity's fiduciary duty under applicable law. The Board's decision to renew the Advisory Contracts was not based on any single factor noted above, but rather was based on a comprehensive consideration of all the information provided to the Board at its meetings throughout the year. The Board, in reaching its determination to renew the Advisory Contracts, is aware that shareholders in the fund have a broad range of investment choices available to them, including a wide choice among mutual funds offered by competitors to Fidelity, and that the fund's shareholders, with the opportunity to review and weigh the disclosure provided by the fund in its prospectus and other public disclosures, have chosen to invest in this fund, managed by Fidelity.
Annual Report
Board Approval of Investment Advisory Contracts and
Management Fees - continued
Nature, Extent, and Quality of Services Provided. The Board considered staffing within the investment adviser, FMR, and the sub-advisers (together, the Investment Advisers), including the backgrounds of the fund's investment personnel and the fund's investment objective and discipline. The Independent Trustees also had discussions with senior management of Fidelity's investment operations and investment groups. The Board considered the structure of the portfolio manager compensation program and whether this structure provides appropriate incentives.
Resources Dedicated to Investment Management and Support Services. The Board reviewed the size, education, and experience of the Investment Advisers' investment staff, their use of technology, and the Investment Advisers' approach to recruiting, training, and retaining portfolio managers and other research, advisory, and management personnel. In response to the recent financial crisis, Fidelity took a number of actions intended to cut costs and improve efficiency without weakening the investment teams or resources. The Board specifically noted Fidelity's response to the 2008 credit market crisis. The Board noted that Fidelity's analysts have access to a variety of technological tools and market and securities data that enable them to perform both fundamental and quantitative analysis and to specialize in various disciplines. The Board considered Fidelity's extensive global research capabilities that enable the Investment Advisers to aggregate data from various sources in an effort to produce positive investment results. The Board also considered that Fidelity's portfolio managers and analysts have access to daily portfolio attribution that allows for monitoring of a fund's portfolio, as well as an electronic communication system that provides immediate real-time access to research concerning issuers and credit enhancers. In addition, the Board considered the trading resources that are an integral part of the fixed-income portfolio management investment process.
Shareholder and Administrative Services. The Board considered (i) the nature, extent, quality, and cost of advisory, administrative, distribution, and shareholder services performed by the Investment Advisers and their affiliates under the Advisory Contracts and under separate agreements covering transfer agency and pricing and bookkeeping services for the fund; (ii) the nature and extent of the Investment Advisers' supervision of third party service providers, principally custodians and subcustodians; and (iii) the resources devoted to, and the record of compliance with, the fund's compliance policies and procedures.
The Board noted that the growth of fund assets over time across the complex allows Fidelity to reinvest in the development of services designed to enhance the value or convenience of the Fidelity funds as investment vehicles. These services include 24-hour access to account information and market information through phone representatives and over the Internet, and investor education materials and asset allocation tools.
Annual Report
Investment in a Large Fund Family. The Board considered the benefits to shareholders of investing in a Fidelity fund, including the benefits of investing in a fund that is part of a large family of funds offering a variety of investment disciplines and providing a large variety of mutual fund investor services. The Board noted that Fidelity had taken a number of actions over the previous year that benefited particular funds, including (i) dedicating additional resources to investment research and to restructure and broaden the focus of the investment research teams; (ii) bolstering the senior management team that oversees asset management; (iii) contractually agreeing to reduce the management fee on Fidelity U.S. Bond Index Fund; and (iv) expanding Class A and Class T load waiver categories to increase rollover retention opportunities and create consistent policies across the classes.
Investment Performance. The Board considered whether the fund has operated in accordance with its investment objective, as well as its record of compliance with its investment restrictions. It also reviewed the fund's absolute investment performance for each class, as well as the fund's relative investment performance for each class measured against a peer group of mutual funds deemed appropriate by the Board over multiple periods. The following charts considered by the Board show, over the one-, three-, and five-year periods ended December 31, 2008, as available, the cumulative total returns of Fidelity California AMT Tax-Free Money Market (retail class) and Service Class of the fund and a range of cumulative total returns of a peer group of mutual funds identified by Lipper Inc. as having an investment objective similar to that of the fund. The returns of Fidelity California AMT Tax-Free Money Market (retail class) and Service Class show the performance of the highest performing class (based on five-year performance) and the lowest performing class (based on one-year performance), respectively. The box within each chart shows the 25th percentile return (bottom of box) and the 75th percentile return (top of box) of the peer group. Returns shown above the box are in the first quartile and returns shown below the box are in the fourth quartile. The percentage beaten numbers noted below each chart correspond to the percentile box and represent the percentage of funds in the peer group whose performance was equal to or lower than that of the class indicated.
Annual Report
Board Approval of Investment Advisory Contracts and
Management Fees - continued
Fidelity California AMT Tax-Free Money Market Fund
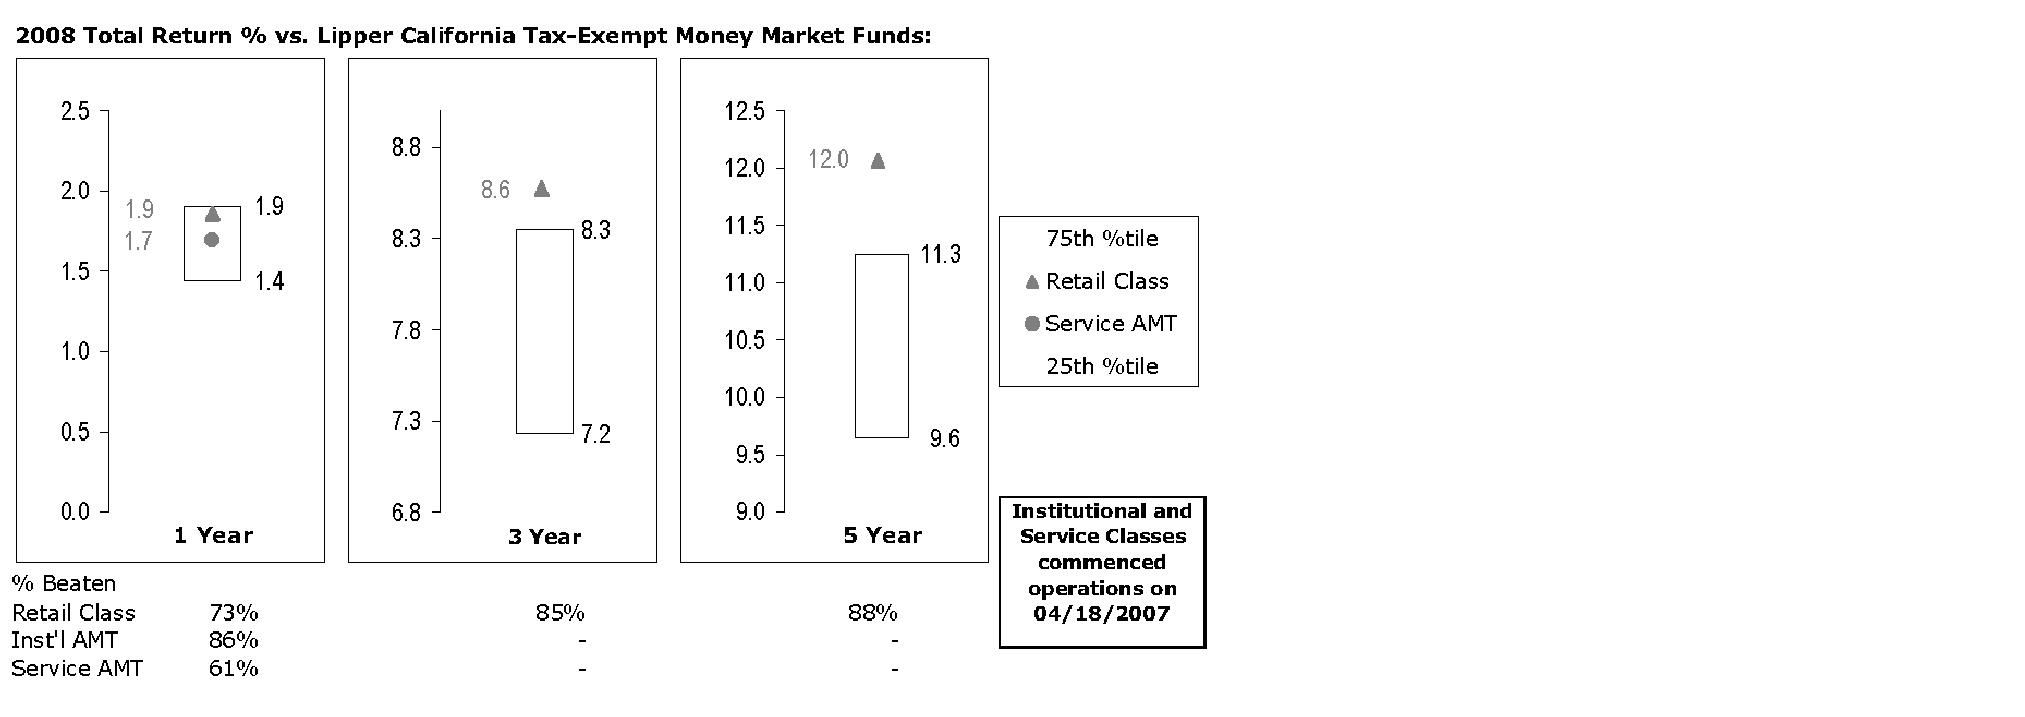
The Board reviewed the fund's relative investment performance against its peer group and stated that the performance of Fidelity California AMT Tax-Free Money Market (retail class) of the fund was in the second quartile for the one-year period and the first quartile for the three- and five-year periods. The Board considered that the variations in performance among the fund's classes reflect the variations in class expenses, which result in lower performance for higher expense classes. The Board also reviewed the fund's performance during 2009.
Based on its review, and giving particular weight to the nature and quality of the resources dedicated by the Investment Advisers to maintain and improve relative performance and factoring in the unprecedented recent market events, the Board concluded that the nature, extent, and quality of the services provided to the fund will benefit the fund's shareholders, particularly in light of the Board's view that the fund's shareholders benefit from investing in a fund that is part of a large family of funds offering a variety of investment disciplines and services.
Competitiveness of Management Fee and Total Fund Expenses. The Board considered the fund's management fee and total expenses compared to "mapped groups" of competitive funds and classes. Fidelity creates "mapped groups" by combining similar Lipper investment objective categories that have comparable management fee characteristics. Combining Lipper investment objective categories aids the Board's management fee and total expense comparisons by broadening the competitive group used for comparison and by reducing the number of universes to which various Fidelity funds are compared.
Annual Report
The Board considered two proprietary management fee comparisons for the 12-month periods shown in the chart below. The group of Lipper funds used by the Board for management fee comparisons is referred to below as the "Total Mapped Group" and, for the reasons explained above, is broader than the Lipper peer group used by the Board for performance comparisons. The Total Mapped Group comparison focuses on a fund's standing relative to the total universe of comparable funds available to investors, in terms of gross management fees before expense reimbursements or caps. "TMG %" represents the percentage of funds in the Total Mapped Group that had management fees that were lower than the fund's. For example, a TMG % of 10% means that 90% of the funds in the Total Mapped Group had higher management fees than the fund. The "Asset-Size Peer Group" (ASPG) comparison focuses on a fund's standing relative to non-Fidelity funds similar in size to the fund within the Total Mapped Group. The ASPG represents at least 15% of the funds in the Total Mapped Group with comparable asset size and management fee characteristics, subject to a minimum of 50 funds (or all funds in the Total Mapped Group if fewer than 50). Additional information, such as the ASPG quartile in which the fund's management fee ranked, is also included in the chart and considered by the Board. For a more meaningful comparison of management fees, the fund is compared on the basis of a hypothetical "net management fee," which is derived by subtracting payments made by FMR for "fund-level" non-management expenses (including pricing and bookkeeping fees and custody fees) from the fund's management fee. In this regard, the Board realizes that net management fees can vary from year to year because of differences in "fund-level" non-management expenses. The Board noted, however, that FMR does not pay transfer agent fees or other "class-level" expenses (including 12b-1 fees, if applicable) under the fund's management contract.
Annual Report
Board Approval of Investment Advisory Contracts and
Management Fees - continued
Fidelity California AMT Tax-Free Money Market Fund
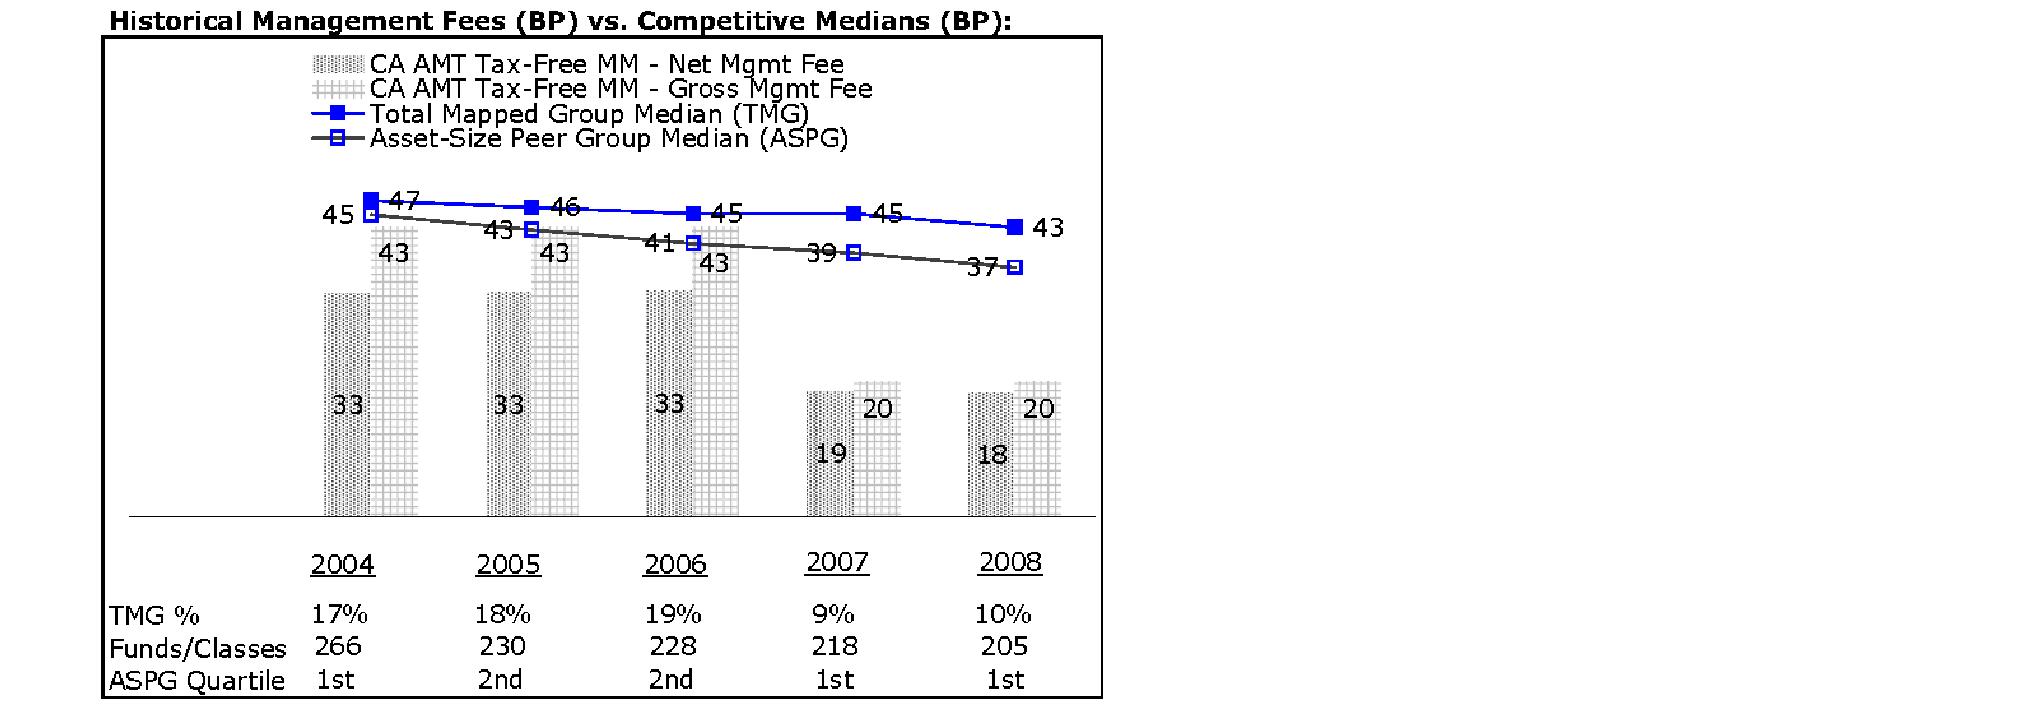
The Board noted that the fund's hypothetical net management fee ranked below the median of its Total Mapped Group and below the median of its ASPG for 2008.
Furthermore, the Board considered that it had approved an amended and restated management contract for the fund (effective April 1, 2007) that (i) lowered the fund's management fee from 43 basis points to 20 basis points, and (ii) provides that FMR will pay all "fund-level" expenses out of the management fee, with certain limited exceptions. (Transfer agent fees and 12b-1 fees, if applicable, currently are the only "class-level" expenses.) The Board considered that the chart reflects the fund's lower management fee for 2007 as if the lower fee were in effect for the entire year.
Based on its review, the Board concluded that the fund's management fee was fair and reasonable in light of the services that the fund receives and the other factors considered.
In its review of each class's total expenses, the Board considered the fund's hypothetical net management fee as well as the fund's all-inclusive fee. The Board also considered other "fund-level" expenses, such as pricing and bookkeeping fees and custodial, legal, and audit fees. The Board also considered other "class-level" expenses, such as transfer agent fees and fund-paid 12b-1 fees. The Board also noted the effects of any waivers and reimbursements on fees and expenses. As part of its review, the Board also considered current and historical total expenses of each class of the fund compared to competitive fund median expenses. Each class of the fund is compared to those funds and classes in the Total Mapped Group (used by the Board for management fee comparisons) that have a similar sales load structure.
Annual Report
The Board noted that the total expenses of each of Fidelity California AMT Tax-Free Money Market (retail class) and Institutional Class ranked below its competitive median for 2008 and the total expenses of Service Class ranked above its competitive median for 2008. The Board noted that the fund offers multiple classes, each of which has a different 12b-1 fee structure, and that the multiple structures are intended to offer a range of pricing options for the intermediary market. The Board also noted that the total expenses of the classes vary primarily by the level of their 12b-1 fees, although differences in transfer agent fees may also cause expenses to vary from class to class.
The Board also considered that the current contractual arrangements for the fund (i) have the effect of setting the total "fund-level" expenses (including, among certain other expenses, the management fee) for each class at 20 basis points, (ii) set the "class-level" transfer agent fee for Fidelity California AMT Tax-Free Money Market (retail class) at a fixed rate of 10 basis points, and (iii) limit the total expenses of Fidelity California AMT Tax-Free Money Market (retail class) to 35 basis points. The fees and expenses payable under these contractual arrangements may not be increased without the approval of the Board and, in the case of (i) and (iii), the shareholders of the applicable class. Institutional Class and Service Class (which commenced operations on April 17, 2007) are subject to different "class-level" expenses (transfer agent fees and 12b-1 fees). In addition, the Board considered that, effective April 18, 2007, FMR contractually agreed to limit the total expenses of Institutional Class and Service Class to 20 basis points and 45 basis points, respectively. The fees and expenses payable under these contractual arrangements may not be increased without Board approval.
In its review, the Board also considered Fidelity fee structures and other information on clients that FMR and its affiliates service in other competitive markets, such as other mutual funds advised or subadvised by FMR or its affiliates, pension plan clients, and other institutional clients.
Based on its review, the Board concluded that the total expenses of each class of the fund were reasonable, although in one case above the median of the universe presented for comparison, in light of the services that the fund and its shareholders receive and the other factors considered.
Costs of the Services and Profitability. The Board considered the revenues earned and the expenses incurred by Fidelity in conducting the business of developing, marketing, distributing, managing, administering and servicing the fund and its shareholders. The Board also considered the level of Fidelity's profits in respect of all the Fidelity funds.
On an annual basis, FMR presents to the Board Fidelity's profitability for the fund. Fidelity calculates the profitability for each fund, as well as aggregate profitability for groups of Fidelity funds and all Fidelity funds, using a series of detailed revenue and cost allocation methodologies which originate with the audited books and records of Fidelity. The Audit Committee of the Board reviews any significant changes from the prior year's methodologies.
Annual Report
Board Approval of Investment Advisory Contracts and
Management Fees - continued
PricewaterhouseCoopers LLP (PwC), independent registered public accounting firm and auditor to Fidelity and certain Fidelity funds, has been engaged annually by the Board as part of the Board's assessment of Fidelity's profitability analysis. PwC's engagement includes the review and assessment of Fidelity's methodologies used in determining the revenues and expenses attributable to Fidelity's mutual fund business, and completion of agreed-upon procedures surrounding the mathematical accuracy of fund profitability and its conformity to allocation methodologies. After considering PwC's reports issued under the engagement and information provided by Fidelity, the Board believes that while other allocation methods may also be reasonable, Fidelity's profitability methodologies are reasonable in all material respects.
The Board has also reviewed Fidelity's non-fund businesses and any fall-out benefits related to the mutual fund business as well as cases where Fidelity's affiliates may benefit from or be related to the fund's business.
The Board considered the costs of the services provided by and the profits realized by Fidelity in connection with the operation of the fund and determined that the amount of profit is a fair entrepreneurial profit for the management of the fund.
Economies of Scale. The Board considered whether there have been economies of scale in respect of the management of the Fidelity funds, whether the Fidelity funds (including the fund) have appropriately benefited from any such economies of scale, and whether there is potential for realization of any further economies of scale. The Board considered the extent to which the fund will benefit from economies of scale through increased services to the fund, through waivers or reimbursements, or through fee or expense reductions.
In February 2009, the Board created an Ad Hoc Committee (the "Committee") to analyze economies of scale. The Committee was formed to consider whether FMR attains economies of scale in respect of the management and servicing of the Fidelity funds, whether the Fidelity funds have appropriately benefited from such economies of scale, and whether there is potential for realization of any further economies of scale.
The Board concluded, considering the findings of the Committee, that any potential economies of scale are being shared between fund shareholders and Fidelity in an appropriate manner.
Additional Information Requested by the Board. In order to develop fully the factual basis for consideration of the Fidelity funds' Advisory Contracts, the Board requested and received additional information on certain topics, including (i) fund performance trends, actions to be taken by FMR to improve certain funds' overall performance and Fidelity's long-term strategies for certain funds; (ii) portfolio manager changes that have occurred during the past year; (iii) Fidelity's fund profitability methodology, the profitability of certain fund service providers, and profitability trends for certain funds; (iv) Fidelity's compensation structure for portfolio managers and key personnel, including its effects on fund profitability, and the extent to which current market conditions have affected retention and recruitment; (v) the selection of and compensation paid by FMR to fund sub-advisers; (vi) Fidelity's fee structures and rationale for recommending different fees among categories of funds; (vii) the rationale for any differences between fund fee structures and fee structures in place for other Fidelity clients; and (viii) explanations for the relative total expenses borne by certain funds and classes, total expense competitive trends, and actions that might be taken by FMR to reduce total expenses for certain funds and classes.
Annual Report
Based on its evaluation of all of the conclusions noted above, and after considering all material factors, the Board ultimately concluded that the advisory fee structures are fair and reasonable, and that the fund's Advisory Contracts should be renewed.
Annual Report
Investment Adviser
Fidelity Management & Research
Company
Boston, MA
Investment Sub-Adviser
Fidelity Investments Money
Management, Inc.
FIL Investment Advisors
FIL Investment Advisors
(U.K.) Ltd.
Fidelity Research & Analysis Company
Fidelity Management & Research
(U.K.) Inc.
Fidelity Management & Research
(Hong Kong) Limited
Fidelity Management & Research
(Japan), Inc.
General Distributor
Fidelity Distributors Corporation
Boston, MA
Transfer and Service Agents
Citibank, N.A.
New York, NY
Fidelity Service Company, Inc.
Boston, MA
Fidelity Investments Institutional
Operations Company, Inc.
Boston, MA
Custodian
Citibank, N.A.
New York, NY
The Fidelity Telephone Connection
Mutual Fund 24-Hour Service
Exchanges/Redemptions
and Account Assistance 1-800-544-6666
Product Information 1-800-544-6666
Retirement Accounts 1-800-544-4774 (8 a.m. - 9 p.m.)
TDD Service 1-800-544-0118
for the deaf and hearing impaired
(9 a.m. - 9 p.m. Eastern time)
Fidelity Automated Service
Telephone (FAST®) 1-800-544-5555
Automated line for quickest service
SCM-UANN-0410
1.855628.102

Fidelity® California
Municipal Money Market
Fund
Annual Report
February 28, 2010
(2_fidelity_logos) (Registered_Trademark)
Contents
Chairman's Message | <Click Here> | The Chairman's message to shareholders. |
Shareholder Expense Example | <Click Here> | An example of shareholder expenses. |
Investment Changes/
Performance | <Click Here> | A summary of major shifts in the fund's investments over the past year. |
Investments | <Click Here> | A complete list of the fund's investments with their market values. |
Financial Statements | <Click Here> | Statements of assets and liabilities, operations, and changes in net assets,
as well as financial highlights. |
Notes | <Click Here> | Notes to the financial statements. |
Report of Independent Registered Public Accounting Firm | <Click Here> | |
Trustees and Officers | <Click Here> | |
Distributions | <Click Here> | |
Proxy Voting Results | <Click Here> | |
Board Approval of Investment Advisory Contracts and Management Fees | <Click Here> | |
To view a fund's proxy voting guidelines and proxy voting record for the 12-month period ended June 30, visit http://www.fidelity.com/proxyvotingresults or visit the Securities and Exchange Commission's (SEC) web site at http://www.sec.gov. You may also call 1-800-544-8544 to request a free copy of the proxy voting guidelines.
Standard & Poor's, S&P and S&P 500 are registered service marks of The McGraw-Hill Companies, Inc. and have been licensed for use by Fidelity Distributors Corporation.
Other third party marks appearing herein are the property of their respective owners.
All other marks appearing herein are registered or unregistered trademarks or service marks of FMR LLC or an affiliated company.
Annual Report
This report and the financial statements contained herein are submitted for the general information of the shareholders of the fund. This report is not authorized for distribution to prospective investors in the fund unless preceded or accompanied by an effective prospectus.
A fund files its complete schedule of portfolio holdings with the SEC for the first and third quarters of each fiscal year on Form N-Q. Forms N-Q are available on the SEC's web site at http://www.sec.gov. A fund's Forms N-Q may be reviewed and copied at the SEC's Public Reference Room in Washington, DC. Information regarding the operation of the SEC's Public Reference Room may be obtained by calling 1-800-SEC-0330. For a complete list of a fund's portfolio holdings, view the most recent holdings listing, semiannual report, or annual report on Fidelity's web site at http://www.fidelity.com or http://www.advisor.fidelity.com, as applicable.
NOT FDIC INSURED · MAY LOSE VALUE · NO BANK GUARANTEE
Neither the funds nor Fidelity Distributors Corporation is a bank.
Annual Report
(photo_of_Abigail_P_Johnson)
Dear Shareholder:
The turnaround in global capital markets that marked most of 2009 slowed in early 2010, as investors considered the risks to a sustained recovery, including increased political uncertainty, high unemployment, weak consumer spending and potential inflation on the horizon. Financial markets are always unpredictable, of course, but there also are several time-tested investment principles that can help put the odds in your favor.
One of the basic tenets is to invest for the long term. Over time, riding out the markets' inevitable ups and downs has proven much more effective than selling into panic or chasing the hottest trend. Even missing only a few of the markets' best days can significantly diminish investor returns. Patience also affords the benefits of compounding - of earning interest on additional income or reinvested dividends and capital gains. There can be tax advantages and cost benefits to consider as well. While staying the course doesn't eliminate risk, it can considerably lessen the effect of short-term declines.
You can further manage your investing risk through diversification. And today, more than ever, geographic diversification should be taken into account. Studies indicate that asset allocation is the single most important determinant of a portfolio's long-term success. The right mix of stocks, bonds and cash - aligned to your particular risk tolerance and investment objective - is very important. Age-appropriate rebalancing is also an essential aspect of asset allocation. For younger investors, an emphasis on equities - which historically have been the best-performing asset class over time - is encouraged. As investors near their specific goal, such as retirement or sending a child to college, consideration may be given to replacing volatile assets (e.g. common stocks) with more-stable fixed investments (bonds or savings plans).
A third principle - investing regularly - can help lower the average cost of your purchases. Investing a certain amount of money each month or quarter helps ensure you won't pay for all your shares at market highs. This strategy - known as dollar cost averaging - also reduces "emotion" from investing, helping shareholders avoid selling weak performers just prior to an upswing, or chasing a hot performer just before a correction.
We invite you to contact us via the Internet, through our Investor Centers or by phone. It is our privilege to provide you the information you need to make the investments that are right for you.
Sincerely,
(The chairman's signature appears here.)
Abigail P. Johnson
Annual Report
Shareholder Expense Example
As a shareholder of the Fund, you incur two types of costs: (1) transaction costs, and (2) ongoing costs, including management fees and other Fund expenses. This Example is intended to help you understand your ongoing costs (in dollars) of investing in the Fund and to compare these costs with the ongoing costs of investing in other mutual funds.
The Example is based on an investment of $1,000 invested at the beginning of the period and held for the entire period (September 1, 2009 to February 28, 2010).
Actual Expenses
The first line of the accompanying table provides information about actual account values and actual expenses. You may use the information in this line, together with the amount you invested, to estimate the expenses that you paid over the period. Simply divide your account value by $1,000.00 (for example, an $8,600 account value divided by $1,000.00 = 8.6), then multiply the result by the number in the first line under the heading entitled "Expenses Paid During Period" to estimate the expenses you paid on your account during this period. A small balance maintenance fee of $12.00 that is charged once a year may apply for certain accounts with a value of less than $2,000. This fee is not included in the table below. If it was, the estimate of expenses you paid during the period would be higher, and your ending account value lower, by this amount. In addition, the Fund, as a shareholder in the underlying Fidelity Central Funds, will indirectly bear its pro-rata share of the fees and expenses incurred by the underlying Fidelity Central Funds. These fees and expenses are not included in the Fund's annualized expense ratio used to calculate the expense estimate in the table below.
Hypothetical Example for Comparison Purposes
The second line of the accompanying table provides information about hypothetical account values and hypothetical expenses based on the Fund's actual expense ratio and an assumed rate of return of 5% per year before expenses, which is not the Fund's actual return. The hypothetical account values and expenses may not be used to estimate the actual ending account balance or expenses you paid for the period. You may use this information to compare the ongoing costs of investing in the Fund and other funds. To do so, compare this 5% hypothetical example with the 5% hypothetical examples that appear in the shareholder reports of the other funds. A small balance maintenance fee of $12.00 that is charged once a year may apply for certain accounts with a value of less than $2,000. This fee is not included in the table below. If it was, the estimate of expenses you paid during the period would be higher, and your ending account value lower, by this amount. In addition, the Fund, as a shareholder in the underlying Fidelity Central Funds, will indirectly bear its pro-rata share of the fees and expenses incurred by the underlying Fidelity Central Funds. These fees and expenses are not included in the Fund's annualized expense ratio used to calculate the expense estimate in the table below.
Please note that the expenses shown in the table are meant to highlight your ongoing costs only and do not reflect any transaction costs. Therefore, the second line of the table is useful in comparing ongoing costs only, and will not help you determine the relative total costs of owning different funds.
Annual Report
| Annualized Expense Ratio | Beginning
Account Value
September 1, 2009 | Ending
Account Value
February 28, 2010 | Expenses Paid
During Period*
September 1, 2009
to February 28, 2010 |
Actual | .33% | $ 1,000.00 | $ 1,000.05 | $ 1.64 ** |
Hypothetical (5% return per year before expenses) | | $ 1,000.00 | $ 1,023.16 | $ 1.66 ** |
* Expenses are equal to the Fund's annualized expense ratio, multiplied by the average account value over the period, multiplied by 181/365 (to reflect the one-half year period).
** If certain fees were not voluntarily waived by FMR or its affiliates during the period, the annualized expense ratio would have been .52% and the expenses paid in the actual and hypothetical examples above would have been $2.58 and $2.61, respectively.
Annual Report
Investment Changes/Performance (Unaudited)
Maturity Diversification |
Days | % of fund's investments 2/28/10 | % of fund's investments 8/31/09 | % of fund's investments 2/28/09 |
0 - 30 | 88.3 | 83.5 | 85.0 |
31 - 90 | 2.3 | 2.3 | 2.6 |
91 - 180 | 9.1 | 3.5 | 8.2 |
181 - 397 | 0.3 | 10.7 | 4.2 |
Weighted Average Maturity |
| 2/28/10 | 8/31/09 | 2/28/09 |
Fidelity California Municipal Money Market | 21 Days | 44 Days | 28 Days |
California Tax-Free Money Market
Funds Average* | 25 Days | 34 Days | 25 Days |
Asset Allocation (% of fund's net assets) |
As of February 28, 2010 | As of August 31, 2009 |
| Variable Rate Demand Notes (VRDNs) 73.1% | | | Variable Rate Demand Notes (VRDNs) 74.6% | |
 | Commercial Paper (including CP Mode) 4.8% | | | Commercial Paper (including CP Mode) 4.8% | |
 | Tender Bonds 0.5% | | | Tender Bonds 0.5% | |
 | Municipal Notes 9.3% | | | Municipal Notes 13.7% | |
 | Fidelity Municipal
Cash Central Fund 10.1% | | | Fidelity Municipal
Cash Central Fund 3.7% | |
 | Other Investments 2.1% | | | Other Investments 2.3% | |
 | Net Other Assets 0.1% | | | Net Other Assets 0.4% | |

Current and Historical Seven-Day Yields |
| 3/1/10 | 11/30/09 | 8/31/09 | 6/1/09 | 3/2/09 |
Fidelity California Municipal Money Market Fund | 0.01% | 0.01% | 0.01% | 0.15% | 0.12% |
Yield refers to the income paid by the fund over a given period. Yields for money market funds are usually for seven-day periods, as they are here, though they are expressed as annual percentage rates. Past performance is no guarantee of future results. Yield will vary and it is possible to lose money by investing in the fund. A portion of the Fund's expenses were reimbursed and/or waived. Absent such reimbursements and/or waivers the Fund would have had a net investment loss and therefore its performance would have been lower.
* Source: iMoneyNet,Inc
Annual Report
Investments February 28, 2010
Showing Percentage of Net Assets
Municipal Securities - 99.9% |
| Principal Amount (000s) | | Value (000s) |
Arizona - 0.1% |
Arizona Health Facilities Auth. Rev. (Banner Health Sys. Proj.) Series 2008 E, 0.23%, LOC Landesbank Baden-Wuert, VRDN (b) | $ 5,100 | | $ 5,100 |
California - 85.5% |
ABAG Fin. Auth. for Nonprofit Corps. Multi-family Hsg. Rev. (Vintage Chateau Proj.) Series A, 0.22%, LOC Union Bank of California, VRDN (b)(e) | 11,300 | | 11,300 |
ABAG Fin. Auth. for Nonprofit Corps. Rev.: | | | |
(Eskaton Properties, Inc. Proj.) Series 2008 B, 0.2%, LOC Bank of America NA, VRDN (b) | 15,600 | | 15,600 |
(Valley Christian Schools Proj.) Series 2003, 0.15%, LOC Bank of America NA, VRDN (b) | 7,580 | | 7,580 |
Acalanes Union High School District BAN Series 2009 A, 3.25% 4/1/10 | 4,500 | | 4,509 |
Alameda County Indl. Dev. Auth. Rev. (Edward L. Shimmon, Inc. Proj.) Series 1996 A, 0.3%, LOC BNP Paribas SA, VRDN (b)(e) | 4,900 | | 4,900 |
Anaheim Hsg. Auth. Multi-family Hsg. Rev. (Park Vista Apt. Proj.) Series 2000 D, 0.18%, LOC Freddie Mac, VRDN (b)(e) | 14,580 | | 14,580 |
Anaheim Pub. Fing. Auth. Rev. Participating VRDN: | | | |
Series BA 08 3035X, 0.21% (Liquidity Facility Bank of America NA) (b)(g) | 6,385 | | 6,385 |
Series ROC II R 781PB, 0.23% (Liquidity Facility Deutsche Postbank AG) (b)(g) | 18,970 | | 18,970 |
Series ROC II R 861, 0.21% (Liquidity Facility Citibank NA) (b)(g) | 4,175 | | 4,175 |
Bay Area Toll Auth. San Francisco Bay Toll Bridge Rev. Participating VRDN: | | | |
Series EGL 07 0053, 0.2% (Liquidity Facility Citibank NA) (b)(g) | 10,395 | | 10,395 |
Series Putters 3211, 0.18% (Liquidity Facility JPMorgan Chase Bank) (b)(g) | 19,485 | | 19,485 |
Series Putters 3293, 0.18% (Liquidity Facility JPMorgan Chase Bank) (b)(g) | 2,495 | | 2,495 |
Series Putters 3434, 0.18% (Liquidity Facility JPMorgan Chase Bank) (b)(g) | 1,500 | | 1,500 |
Bueno Park Multi-family Hsg. Rev. (Walden Glen Apts. Proj.) Series 2000 A, 0.19%, LOC Fannie Mae, VRDN (b)(e) | 14,288 | | 14,288 |
California Cmnty. College Fing. Auth. Rev. TRAN: | | | |
Series 2009 A, 2% 6/30/10 | 23,300 | | 23,380 |
Series 2009 D, 2.25% 6/30/10 | 7,800 | | 7,826 |
California Cmntys. Note Prog. TRAN Series 2009 A3, 2% 6/30/10 | 11,200 | | 11,258 |
Municipal Securities - continued |
| Principal Amount (000s) | | Value (000s) |
California - continued |
California Dept. of Wtr. Resources Pwr. Supply Rev.: | | | |
Bonds Series 2002 A, 5.25% 5/1/10 | $ 11,355 | | $ 11,445 |
Series 2002 C1, 0.19%, LOC Dexia Cr. Local de France, VRDN (b) | 3,000 | | 3,000 |
Series 2002 C10, 0.18%, LOC Landesbank Hessen-Thuringen, VRDN (b) | 36,375 | | 36,375 |
Series 2002 C11, 0.16%, LOC KBC Bank NV, LOC Bank of Nova Scotia New York Branch, VRDN (b) | 20,700 | | 20,700 |
Series 2002 C12, 0.17%, LOC Landesbank Hessen-Thuringen, VRDN (b) | 4,000 | | 4,000 |
Series 2002 C4, 0.19%, LOC JPMorgan Chase Bank, LOC California Teachers Retirement Sys., VRDN (b) | 13,800 | | 13,800 |
Series 2002 C5, 0.24%, LOC Dexia Cr. Local de France, VRDN (b) | 23,500 | | 23,500 |
Series 2002 C8, 0.16%, LOC Bayerische Landesbank Girozentrale, VRDN (b) | 5,200 | | 5,200 |
Series 2002 C9, 0.16%, LOC Citibank NA, VRDN (b) | 1,550 | | 1,550 |
Series 2005 F2, 0.11%, LOC JPMorgan Chase Bank, LOC Societe Generale, VRDN (b) | 7,600 | | 7,600 |
California Dept. of Wtr. Resources Wtr. Rev. Participating VRDN: | | | |
Series BBT 08 28, 0.18% (Liquidity Facility Branch Banking & Trust Co.) (b)(g) | 7,245 | | 7,245 |
Series Putters 3019, 0.18% (Liquidity Facility JPMorgan Chase Bank) (b)(g) | 9,785 | | 9,785 |
Series Putters 3361, 0.2% (Liquidity Facility JPMorgan Chase Bank) (b)(g) | 2,570 | | 2,570 |
California Econ. Recovery Series 2004 C4, 0.11%, LOC JPMorgan Chase Bank, VRDN (b) | 3,200 | | 3,200 |
California Ed. Notes Prog. TRAN Series 2009 A, 2% 7/30/10 | 27,865 | | 28,031 |
California Edl. Facilities Auth. Rev.: | | | |
Participating VRDN: | | | |
Series MS 3067, 0.2% (Liquidity Facility Morgan Stanley) (b)(g) | 13,000 | | 13,000 |
Series MS 3141, 0.2% (Liquidity Facility Morgan Stanley) (b)(g) | 7,750 | | 7,750 |
Series MS 3144, 0.13% (Liquidity Facility Morgan Stanley) (b)(g) | 3,750 | | 3,750 |
Series Putters 3506, 0.18% (Liquidity Facility JPMorgan Chase Bank) (b)(g) | 10,225 | | 10,225 |
Series ROC II R 11790PB, 0.22% (Liquidity Facility Deutsche Postbank AG) (b)(g) | 11,990 | | 11,990 |
0.28% 5/5/10, CP | 10,000 | | 10,000 |
Municipal Securities - continued |
| Principal Amount (000s) | | Value (000s) |
California - continued |
California Gen. Oblig.: | | | |
Bonds: | | | |
5.75% 3/1/19 (Pre-Refunded to 3/1/10 @ 101) (f) | $ 10,290 | | $ 10,393 |
5.75% 3/1/27 (Pre-Refunded to 3/1/10 @ 101) (f) | 7,000 | | 7,070 |
Series 2003 B2, 0.17%, LOC BNP Paribas New York Branch, LOC California Pub. Employees' Retirement Sys., VRDN (b) | 11,100 | | 11,100 |
Series 2003 B4, 0.18%, LOC BNP Paribas New York Branch, LOC California Pub. Employees' Retirement Sys., VRDN (b) | 6,050 | | 6,050 |
Series 2003 C2, 0.18%, LOC Bank of Nova Scotia New York Branch, VRDN (b) | 36,300 | | 36,300 |
Series 2003 C4, 0.17%, LOC Citibank NA, VRDN (b) | 7,500 | | 7,500 |
Series 2004 A1, 0.12%, LOC Citibank NA, LOC California Teachers Retirement Sys., VRDN (b) | 13,440 | | 13,440 |
Series 2004 A4, 0.14%, LOC Citibank NA, LOC California Teachers Retirement Sys., VRDN (b) | 2,000 | | 2,000 |
Series 2004 A8, 0.17%, LOC Citibank NA, LOC California Teachers Retirement Sys., VRDN (b) | 16,800 | | 16,800 |
Series 2004 A9, 0.17%, LOC State Street Bank & Trust Co., Boston, LOC California Teachers Retirement Sys., VRDN (b) | 33,000 | | 33,000 |
Series 2004 B1, 0.12%, LOC Citibank NA, VRDN (b) | 6,500 | | 6,500 |
Series 2004 B5, 0.16%, LOC Citibank NA, VRDN (b) | 2,400 | | 2,400 |
Series 2005 A2, 0.2%, LOC Calyon SA, VRDN (b) | 31,575 | | 31,575 |
Series 2005 B1, 0.2%, LOC Bank of America NA, VRDN (b) | 27,000 | | 27,000 |
Series 2005 B2, 0.17%, LOC Societe Generale, VRDN (b) | 23,075 | | 23,075 |
Series 2005 B3, 0.17%, LOC JPMorgan Chase Bank, VRDN (b) | 23,500 | | 23,500 |
0.31% 3/5/10, LOC Dexia Cr. Local de France, LOC Royal Bank of Canada, CP | 3,000 | | 3,000 |
0.33% 3/1/10, LOC Dexia Cr. Local de France, LOC Royal Bank of Canada, CP | 20,400 | | 20,400 |
0.33% 3/4/10, LOC Dexia Cr. Local de France, LOC Royal Bank of Canada, CP | 26,250 | | 26,250 |
0.33% 3/4/10, LOC Dexia Cr. Local de France, LOC Royal Bank of Canada, CP | 34,056 | | 34,056 |
0.35% 3/2/10, LOC Dexia Cr. Local de France, LOC Royal Bank of Canada, CP | 30,569 | | 30,569 |
0.35% 3/2/10, LOC Dexia Cr. Local de France, LOC Royal Bank of Canada, CP | 13,938 | | 13,938 |
0.35% 3/3/10, LOC Dexia Cr. Local de France, LOC Royal Bank of Canada, CP | 9,800 | | 9,800 |
Municipal Securities - continued |
| Principal Amount (000s) | | Value (000s) |
California - continued |
California Health Facilities Fing. Auth. Rev.: | | | |
Bonds: | | | |
(Cedars-Sinai Med. Ctr. Proj.) Series 2009, 3% 8/15/10 | $ 12,350 | | $ 12,463 |
(Stanford Hosp. and Clinics Proj.) Series 2008 A1, 0.55%, tender 6/16/10 (b) | 14,000 | | 14,000 |
Participating VRDN Series Putters 3630, 0.18% (Liquidity Facility JPMorgan Chase Bank) (b)(g) | 3,500 | | 3,500 |
(Catholic Healthcare West Proj.): | | | |
Series 2005 H, 0.2%, LOC Bank of America NA, VRDN (b) | 11,550 | | 11,550 |
Series 2005 I, 0.15%, LOC Bank of America NA, VRDN (b) | 18,970 | | 18,970 |
Series 2009 H, 0.18%, LOC Citibank NA, VRDN (b) | 2,800 | | 2,800 |
(Children's Hosp. of Orange County Proj.) Series 2009 D, 0.2%, LOC U.S. Bank NA, Minnesota, VRDN (b) | 19,200 | | 19,200 |
(Scripps Health Proj.): | | | |
Series 2008 E, 0.2%, LOC Bank of America NA, VRDN (b) | 4,675 | | 4,675 |
Series 2010 B, 0.15%, LOC JPMorgan Chase Bank, VRDN (b) | 22,000 | | 22,000 |
(Scripps Memorial Hosp. Proj.) Series 2008 G, 0.2%, LOC Bank of America NA, VRDN (b) | 30,475 | | 30,475 |
(Stanford Hosp. and Clinics Proj.) Series 2008 A2, 0.2%, LOC Bank of America NA, VRDN (b) | 42,800 | | 42,800 |
California Hsg. Fin. Agcy. Multifamily Hsg. Rev.: | | | |
Series 2006 A, 0.26% (Liquidity Facility Fannie Mae) (Liquidity Facility Freddie Mac), VRDN (b)(e) | 20,980 | | 20,980 |
Series 2008 B, 0.18% (Liquidity Facility Fannie Mae) (Liquidity Facility Freddie Mac), VRDN (b)(e) | 28,060 | | 28,060 |
Series 2008 C, 0.18% (Liquidity Facility Fannie Mae) (Liquidity Facility Freddie Mac), VRDN (b)(e) | 14,320 | | 14,320 |
California Hsg. Fin. Agcy. Rev.: | | | |
(Home Mtg. Prog.): | | | |
Series 2002 J, 0.17% (Liquidity Facility Fannie Mae) (Liquidity Facility Freddie Mac), VRDN (b)(e) | 18,820 | | 18,820 |
Series 2003 H, 0.17% (Liquidity Facility Fannie Mae) (Liquidity Facility Freddie Mac), VRDN (b)(e) | 30,000 | | 30,000 |
Series 2003 M, 0.17% (Liquidity Facility Fannie Mae) (Liquidity Facility Freddie Mac), VRDN (b)(e) | 25,000 | | 25,000 |
Series 2005 F: | | | |
0.19% (Liquidity Facility Fannie Mae) (Liquidity Facility Freddie Mac), VRDN (b)(e) | 20,000 | | 20,000 |
0.19% (Liquidity Facility Fannie Mae) (Liquidity Facility Freddie Mac), VRDN (b)(e) | 30,465 | | 30,465 |
Municipal Securities - continued |
| Principal Amount (000s) | | Value (000s) |
California - continued |
California Hsg. Fin. Agcy. Rev.: - continued | | | |
(Home Mtg. Prog.): | | | |
Series 2006 C, 0.18% (Liquidity Facility Fannie Mae) (Liquidity Facility Freddie Mac), VRDN (b)(e) | $ 87,120 | | $ 87,120 |
Series 2006 F1, 0.15% (Liquidity Facility Fannie Mae) (Liquidity Facility Freddie Mac), VRDN (b)(e) | 21,130 | | 21,130 |
Series 2007 H, 0.15% (Liquidity Facility Fannie Mae) (Liquidity Facility Freddie Mac), VRDN (b)(e) | 25,000 | | 25,000 |
Series 2007 K, 0.15% (Liquidity Facility Fannie Mae) (Liquidity Facility Freddie Mac), VRDN (b)(e) | 25,000 | | 25,000 |
(Multifamily Hsg. Prog.): | | | |
Series 2000 C, 0.26% (Liquidity Facility Fannie Mae) (Liquidity Facility Freddie Mac), VRDN (b)(e) | 35,400 | | 35,400 |
Series 2002 E, 0.18% (Liquidity Facility Fannie Mae) (Liquidity Facility Freddie Mac), VRDN (b)(e) | 15,925 | | 15,925 |
Series 2005 B, 0.18% (Liquidity Facility Fannie Mae) (Liquidity Facility Freddie Mac), VRDN (b)(e) | 31,500 | | 31,500 |
California Infrastructure & Econ. Dev. Bank Rev.: | | | |
Bonds (The J. Paul Getty Trust Proj.) Series 2007 A2, 0.5%, tender 4/1/10 (b) | 9,000 | | 9,000 |
(Betts Spring Co. Proj.) Series 2008, 0.25%, LOC Bank of America NA, VRDN (b)(e) | 9,460 | | 9,460 |
(Olam West Coast, Inc. Proj.) Series 2009, 0.18%, LOC Harris NA, VRDN (b) | 10,000 | | 10,000 |
(The American Nat'l. Red Cross Proj.) Series 2008, 0.17%, LOC U.S. Bank NA, Minnesota, VRDN (b) | 8,075 | | 8,075 |
California Muni. Fin. Auth. Solid Waste Rev. (Allied Waste North America, Inc. Proj.) Series 2008 B, 0.23%, LOC Bank of America NA, VRDN (b)(e) | 51,750 | | 51,750 |
California Poll. Cont. Fing. Auth. Envir. Impt. Rev.: | | | |
(Air Products & Chemicals Proj.) Series 1997 B, 0.35%, VRDN (b)(e) | 32,000 | | 32,000 |
(Browning Ferris Ind. Proj.) Series 1997 B, 0.19%, LOC Bank of America NA, VRDN (b)(e) | 10,000 | | 10,000 |
California Poll. Cont. Fing. Auth. Resource Recovery Rev.: | | | |
(Atlantic Richfield Co. Proj.) Series 1994 A, 0.13% (BP PLC Guaranteed), VRDN (b)(e) | 7,300 | | 7,300 |
(Burney Forest Prod. Proj.) 0.17%, LOC Union Bank of California, VRDN (b)(e) | 7,800 | | 7,800 |
California Pub. Works Board Lease Rev. Participating VRDN Series BA 08 1065, 0.18% (Liquidity Facility Bank of America NA) (b)(g) | 13,690 | | 13,690 |
Municipal Securities - continued |
| Principal Amount (000s) | | Value (000s) |
California - continued |
California Statewide Cmntys. Dev. Auth. Indl. Dev. Rev. (Arthurmade Plastics, Inc. Proj.) Series 2000 A, 0.5%, LOC Bank of America NA, VRDN (b)(e) | $ 2,600 | | $ 2,600 |
California Statewide Cmntys. Dev. Auth. Multi-family Hsg. Rev.: | | | |
(Aegis of Aptos Proj.) Series 1998-Y 0.2%, LOC Fannie Mae, VRDN (b)(e) | 7,350 | | 7,350 |
(Bristol Apts. Proj.) Series Z, 0.2%, LOC Freddie Mac, VRDN (b)(e) | 9,500 | | 9,500 |
(Crocker Oaks Apts. Proj.) Series 2001 H, 0.2%, LOC Fannie Mae, VRDN (b)(e) | 6,750 | | 6,750 |
(Crystal View Apt. Proj.) Series A, 0.17%, LOC Fannie Mae, VRDN (b)(e) | 20,000 | | 20,000 |
(Grove Apts. Proj.) Series X, 0.2%, LOC Fannie Mae, VRDN (b)(e) | 6,150 | | 6,150 |
(Heritage Park Apts. Proj.) Series 2008 C, 0.17%, LOC Freddie Mac, VRDN (b)(e) | 11,000 | | 11,000 |
(Irvine Apt. Cmntys. LP Proj.): | | | |
Series 2001 W1, 0.2%, LOC Wells Fargo Bank NA, VRDN (b)(e) | 17,900 | | 17,900 |
Series 2001 W2, 0.2%, LOC Wells Fargo Bank NA, VRDN (b)(e) | 31,538 | | 31,538 |
Series 2001 W3, 0.2%, LOC Wells Fargo Bank NA, VRDN (b)(e) | 18,000 | | 18,000 |
(Maple Square Apt. Proj.) Series AA, 0.22%, LOC Citibank NA, VRDN (b)(e) | 9,800 | | 9,800 |
(Marlin Cove Apts. Proj.) Series V, 0.17%, LOC Fannie Mae, VRDN (b)(e) | 34,000 | | 34,000 |
(Northwest Gateway Apts. Proj.) Series 2004 C, 0.17%, LOC Fannie Mae, VRDN (b)(e) | 30,045 | | 30,045 |
(Northwood Apts. Proj.) Series N, 0.2%, LOC Freddie Mac, VRDN (b)(e) | 5,000 | | 5,000 |
(Parkside Terrace Apts. Proj.) Series 2008 E, 0.21%, LOC Freddie Mac, VRDN (b)(e) | 10,000 | | 10,000 |
(River Run Sr. Apts. Proj.) Series LL, 0.19%, LOC Fannie Mae, VRDN (b)(e) | 13,505 | | 13,505 |
(Salvation Army S.F. Proj.) 0.25%, LOC Fannie Mae, VRDN (b)(e) | 17,245 | | 17,245 |
(Sunrise Fresno Proj.) Series B, 0.2%, LOC Fannie Mae, VRDN (b)(e) | 5,500 | | 5,500 |
(Terraces at Park Marino Proj.) Series I, 0.2%, LOC California Teachers Retirement Sys., VRDN (b)(e) | 6,530 | | 6,530 |
(Vineyard Creek Apts. Proj.) Series O, 0.19%, LOC Fannie Mae, VRDN (b)(e) | 12,452 | | 12,452 |
Municipal Securities - continued |
| Principal Amount (000s) | | Value (000s) |
California - continued |
California Statewide Cmntys. Dev. Auth. Multi-family Hsg. Rev.: - continued | | | |
(Vizcaya Apts. Proj.) Series B, 0.18%, LOC Freddie Mac, VRDN (b)(e) | $ 22,200 | | $ 22,200 |
(Wilshire Court Proj.) Series M, 0.17%, LOC Fannie Mae, VRDN (b)(e) | 32,500 | | 32,495 |
California Statewide Cmntys. Dev. Auth. Rev.: | | | |
(American Baptist Homes of the West Proj.) Series 2006, 0.21%, LOC Bank of America NA, VRDN (b) | 10,000 | | 10,000 |
(Childrens Hosp. Los Angeles Proj.) Series 2008 A, 0.17%, LOC Bank of America NA, VRDN (b) | 13,810 | | 13,810 |
(JTF Enterprises LLC Proj.) Series 1996 A, 0.35%, LOC Bank of America NA, VRDN (b)(e) | 3,000 | | 3,000 |
(Motion Picture & Television Fund Proj.) Series 2001 A, 0.17%, LOC BNP Paribas SA, VRDN (b) | 2,300 | | 2,300 |
(Oakmont Stockton Proj.) Series 1997 C, 0.2%, LOC Fed. Home Ln. Bank, San Francisco, VRDN (b)(e) | 5,960 | | 5,960 |
California Statewide Cmntys. Dev. Corp. Rev.: | | | |
(Merrill Packaging Proj.) 0.3%, LOC Wells Fargo Bank NA, VRDN (b)(e) | 600 | | 600 |
(Rix Industries Proj.) Series 1996 I, 0.3%, LOC Wells Fargo Bank NA, VRDN (b)(e) | 960 | | 960 |
(Supreme Truck Bodies of California Proj.) 0.3%, LOC JPMorgan Chase Bank, VRDN (b)(e) | 375 | | 375 |
Camarillo City Multi-Family Hsg. Rev. (Hacienda de Camarillo Proj.) Series 1996, 0.18%, LOC Fannie Mae, VRDN (b)(e) | 600 | | 600 |
Carlsbad Unified School District Participating VRDN Series WF 09 22Z, 0.16% (Liquidity Facility Wells Fargo & Co.) (b)(g) | 9,870 | | 9,870 |
Chula Vista Ind. Dev. Rev. (San Diego Gas & Elec. Co. Proj.): | | | |
Series 2004 F, 0.2%, VRDN (b)(e) | 55,000 | | 55,000 |
Series 2006 A, 0.18%, VRDN (b) | 77,020 | | 77,020 |
Dublin Hsg. Auth. Multi-Family Hsg. Rev. (Park Sierra Iron Horse Trail Proj.) Series 1998-A, 0.18%, LOC Freddie Mac, VRDN (b)(e) | 28,700 | | 28,700 |
East Bay Muni. Util. District Wastewtr. Sys. Rev.: | | | |
Series 2008 B2, 0.19% (Liquidity Facility Dexia Cr. Local de France), VRDN (b) | 2,275 | | 2,275 |
Series 2008 C, 0.17% (Liquidity Facility Dexia Cr. Local de France), VRDN (b) | 16,600 | | 16,600 |
East Bay Muni. Util. District Wtr. Sys. Rev.: | | | |
Participating VRDN: | | | |
Series EGL 7 05 0045, 0.2% (Liquidity Facility Citibank NA) (b)(g) | 39,600 | | 39,600 |
Municipal Securities - continued |
| Principal Amount (000s) | | Value (000s) |
California - continued |
East Bay Muni. Util. District Wtr. Sys. Rev.: - continued | | | |
Participating VRDN: | | | |
Series ROC II R 10397, 0.2% (Liquidity Facility Citibank NA) (b)(g) | $ 6,500 | | $ 6,500 |
Series ROC II R 11826, 0.2% (Liquidity Facility Citibank NA) (b)(g) | 14,995 | | 14,995 |
Series 2008 A1, 0.17% (Liquidity Facility Dexia Cr. Local de France), VRDN (b) | 20,450 | | 20,450 |
Series 2008 A2, 0.2% (Liquidity Facility Dexia Cr. Local de France), VRDN (b) | 7,575 | | 7,575 |
Series 2008 A4, 0.17% (Liquidity Facility Dexia Cr. Local de France), VRDN (b) | 35,895 | | 35,895 |
Series 2008 B3, 0.21% (Liquidity Facility Landesbank Baden-Wuert), VRDN (b) | 17,210 | | 17,210 |
El Dorado Irrigation District Rev. Ctfs. of Prtn. Series 2008 A, 0.21%, LOC Dexia Cr. Local de France, VRDN (b) | 41,195 | | 41,195 |
Fresno Rev. (Trinity Health Cr. Proj.) Series 2000 C, 0.18% (Liquidity Facility Landesbank Hessen-Thuringen), VRDN (b) | 76,200 | | 76,200 |
Irvine Ranch Wtr. District Rev. (District #105 Impt. Proj.) Series 2008 B, 0.2%, LOC Landesbank Baden-Wuert, VRDN (b) | 48,200 | | 48,200 |
Kern County Board of Ed. TRAN 2% 6/30/10 | 12,000 | | 12,050 |
Livermore Multi-family Mtg. Rev. (Portola Meadows Apts. Proj.) 0.25%, LOC Freddie Mac, VRDN (b)(e) | 10,725 | | 10,725 |
Loma Linda Hosp. Rev. (Loma Linda Univ. Med. Ctr. Proj.) Series 2008 B, 0.18%, LOC Bank of America NA, VRDN (b) | 6,100 | | 6,100 |
Long Beach Hbr. Rev. Participating VRDN Series SG 147, 0.23% (Liquidity Facility Societe Generale) (b)(e)(g) | 9,890 | | 9,890 |
Los Angeles Cmnty. College District Participating VRDN: | | | |
Series EGL 08 57, 0.2% (Liquidity Facility Citibank NA) (b)(g) | 17,400 | | 17,400 |
Series WF 09 8C, 0.16% (Liquidity Facility Wells Fargo & Co.) (b)(g) | 19,775 | | 19,775 |
Los Angeles Cmnty. Redev. Agcy. Multi-family Hsg. Rev. (Hollywood & Vine Apts. Proj.) Series A, 0.17%, LOC Fannie Mae, VRDN (b)(e) | 89,600 | | 89,600 |
Los Angeles County Gen. Oblig. TRAN 2.5% 6/30/10 | 62,100 | | 62,447 |
Los Angeles County Hsg. Auth. Multi-family Hsg. Rev. (Park Sierra Apts. Proj.) Series 1986 A, 0.27%, LOC Freddie Mac, VRDN (b)(e) | 19,000 | | 19,000 |
Los Angeles County Metropolitan Trans. Auth. Sales Tax Rev.: | | | |
Bonds (Proposition C-2nd Tier Proj.) Series 2009 D, 2% 7/1/10 | 10,140 | | 10,190 |
Series A, 0.23% 3/2/10, LOC BNP Paribas SA, LOC Dexia Cr. Local de France, CP | 5,535 | | 5,535 |
Municipal Securities - continued |
| Principal Amount (000s) | | Value (000s) |
California - continued |
Los Angeles County Schools Pooled Fing. Prog. Ctfs. of Prtn. TRAN Series A, 2.5% 6/30/10 | $ 14,700 | | $ 14,780 |
Los Angeles Dept. of Wtr. & Pwr. Rev.: | | | |
Participating VRDN: | | | |
Series Putters 3332, 0.18% (Liquidity Facility JPMorgan Chase Bank) (b)(g) | 6,660 | | 6,660 |
Series ROC II R 500, 0.21% (Liquidity Facility Citibank NA) (b)(g) | 20,900 | | 20,900 |
Series 2002 A7, 0.16% (Liquidity Facility Landesbank Hessen-Thuringen), VRDN (b) | 7,000 | | 7,000 |
Los Angeles Dept. of Wtr. & Pwr. Wtrwks. Rev. Participating VRDN: | | | |
Series Putters 3310, 0.18% (Liquidity Facility JPMorgan Chase Bank) (b)(g) | 7,245 | | 7,245 |
Series Solar 06 48, 0.17% (Liquidity Facility U.S. Bank NA, Minnesota) (b)(g) | 15,470 | | 15,470 |
Los Angeles Gen. Oblig. TRAN Series 2009, 2.5% 4/28/10 | 51,000 | | 51,165 |
Los Angeles Habor Dept. Rev. Participating VRDN Series Putters 3520, 0.18% (Liquidity Facility JPMorgan Chase Bank) (b)(g) | 6,095 | | 6,095 |
Los Angeles Hbr. Dept. Rev. Participating VRDN Series DB 634, 0.23% (Liquidity Facility Deutsche Bank AG) (b)(e)(g) | 14,780 | | 14,780 |
Los Angeles Multi-family Hsg. Rev. (Channel Gateway Apts. Proj.) Series 1989 B, 0.27%, LOC Freddie Mac, VRDN (b)(e) | 67,700 | | 67,700 |
Los Angeles Unified School District: | | | |
Bonds Series 2010 KRY, 1.5% 7/1/10 (a) | 13,270 | | 13,323 |
Participating VRDN Series BA 08 1049, 0.21% (Liquidity Facility Bank of America NA) (b)(g) | 16,200 | | 16,200 |
TRAN Series A, 2% 8/12/10 | 65,600 | | 66,004 |
Los Angeles Wastewtr. Sys. Rev. Participating VRDN: | | | |
Series EGL 7 05 3003, 0.21% (Liquidity Facility Citibank NA) (b)(g) | 34,000 | | 34,000 |
Series Putters 3371, 0.18% (Liquidity Facility JPMorgan Chase Bank) (b)(g) | 22,495 | | 22,495 |
Metropolitan Wtr. District of Southern California Wtr. Rev. Participating VRDN Series Putters 3547, 0.18% (Liquidity Facility JPMorgan Chase Bank) (b)(g) | 3,500 | | 3,500 |
Metropolitan Wtr. District of Southern California Wtrwks. Rev.: | | | |
Participating VRDN: | | | |
Series BA 08 1062, 0.18% (Liquidity Facility Bank of America NA) (b)(g) | 6,525 | | 6,525 |
Series EGL 07 0044, 0.2% (Liquidity Facility Citibank NA) (b)(g) | 7,000 | | 7,000 |
Municipal Securities - continued |
| Principal Amount (000s) | | Value (000s) |
California - continued |
Metropolitan Wtr. District of Southern California Wtrwks. Rev.: - continued | | | |
Participating VRDN: | | | |
Series Putters 3653 Z, 0.2% (Liquidity Facility JPMorgan Chase Bank) (b)(g) | $ 2,495 | | $ 2,495 |
Series 2008 A1, 0.17% (Liquidity Facility Bank of America NA), VRDN (b) | 77,010 | | 77,010 |
Series 2008 A2, 0.23% (Liquidity Facility Landesbank Baden-Wuert), VRDN (b) | 78,650 | | 78,650 |
Milpitas Multiple-family Rev. (Crossing at Montague Proj.) Series A, 0.17%, LOC Fannie Mae, VRDN (b)(e) | 25,000 | | 25,000 |
Newport Beach Rev. (Hoag Memorial Hosp. Presbyterian Proj.) Series 2008 F, 0.19%, LOC Bank of America NA, VRDN (b) | 13,600 | | 13,600 |
Norwalk-Mirada Unified School District Participating VRDN Series SG 169, 0.2% (Liquidity Facility Societe Generale) (b)(g) | 20,000 | | 20,000 |
Olcese Wtr. District Bonds (Rio Bravo Wtr. Delivery Sys. Proj.) Series 1986 A, 0.28% tender 4/6/10, LOC Sumitomo Mitsui Banking Corp., CP mode (e) | 4,900 | | 4,900 |
Orange County Apt. Dev. Rev.: | | | |
(Ladera Apts. Proj.) Series 2001 II B, 0.18%, LOC Fannie Mae, VRDN (b)(e) | 23,500 | | 23,500 |
(Park Place Apts. Proj.) Series 1989 A, 0.18%, LOC Freddie Mac, VRDN (b)(e) | 500 | | 500 |
(Wood Canyon Villas Proj.) Series 2001 E, 0.18%, LOC Fannie Mae, VRDN (b)(e) | 16,000 | | 16,000 |
Orange County Sanitation District Ctfs. of Prtn. Participating VRDN Series MS 06 2222, 0.2% (Liquidity Facility Wells Fargo & Co.) (b)(g) | 15,537 | | 15,537 |
Orange County Sanitation District Rev. BAN Series 2009 B, 2% 12/1/10 | 13,600 | | 13,760 |
Paramount Hsg. Auth. Multi-family Rev. (Century Place Apts. Proj.) Series 1999 A, 0.19%, LOC Fannie Mae, VRDN (b)(e) | 21,000 | | 21,000 |
Peralta Cmnty. College District Gen. Oblig. Participating VRDN: | | | |
Series BA 08 3027X, 0.21% (Liquidity Facility Bank of America NA) (b)(g) | 8,080 | | 8,080 |
Series Putters 2682, 0.2% (Liquidity Facility JPMorgan Chase Bank) (b)(g) | 2,225 | | 2,225 |
Pleasant Hill Redev. Agcy. Multi-family Hsg. Rev. (Chateau III Proj.) Series 2001, 0.22%, LOC Fannie Mae, VRDN (b)(e) | 10,355 | | 10,355 |
Pleasanton Multi-family Rev. (Bernal Apts. Proj.) Series A, 0.19%, LOC Fannie Mae, VRDN (b)(e) | 13,750 | | 13,750 |
Rancho Wtr. District Fing. Auth. Rev. Series 2008 B, 0.17%, LOC UBS AG, VRDN (b) | 1,500 | | 1,500 |
Municipal Securities - continued |
| Principal Amount (000s) | | Value (000s) |
California - continued |
Richmond Wastewtr. Rev. Series 2008 A, 0.18%, LOC Union Bank of California, VRDN (b) | $ 4,000 | | $ 4,000 |
Riverside County Ctfs. of Prtn. (Woodcrest Library Proj.) 0.18%, LOC Bank of America NA, VRDN (b) | 10,000 | | 10,000 |
Riverside County Gen. Oblig. Series B: | | | |
0.26% 3/10/10, LOC Bank of Nova Scotia New York Branch, CP | 12,900 | | 12,900 |
0.3% 3/1/10, LOC Bank of Nova Scotia New York Branch, CP | 25,000 | | 25,000 |
Riverside County Ind. Dev. Auth. Ind. Dev. Rev. (Merrick Engineering, Inc. Proj.) 0.3%, LOC Wells Fargo Bank NA, VRDN (b)(e) | 935 | | 935 |
Riverside Indl. Dev. Auth. Indl. Dev. Rev. (Sabert Corp. Proj.) 0.26%, LOC PNC Bank NA, Pittsburgh, VRDN (b)(e) | 2,920 | | 2,920 |
Roseville Elec. Sys. Rev. Ctfs. of Prtn. Series 2008 A, 0.19%, LOC Dexia Cr. Local de France, VRDN (b) | 1,350 | | 1,350 |
Sacramento County Hsg. Auth. Multi-family Hsg. Rev.: | | | |
(California Place Apts. Proj.) Series B, 0.21%, LOC Fannie Mae, VRDN (b)(e) | 4,500 | | 4,500 |
(Deer Park Apts. Proj.) Issue A, 0.19%, LOC Fannie Mae, VRDN (b)(e) | 13,200 | | 13,200 |
(Sun Valley Proj.) Series 2001 F, 0.21%, LOC Fannie Mae, VRDN (b)(e) | 3,750 | | 3,750 |
Sacramento Hsg. Auth. Multi-family: | | | |
(Countrywood Village Apts. Proj.) Series F, 0.2%, LOC Fannie Mae, VRDN (b)(e) | 8,225 | | 8,225 |
(Valencia Point Apts. Proj.) 0.19%, LOC Fannie Mae, VRDN (b)(e) | 4,900 | | 4,900 |
Sacramento Muni. Util. District Elec. Rev. Series 2007 J, 0.23% 3/12/10, LOC Bank of New York, New York, LOC California Teachers Retirement Sys., CP | 25,200 | | 25,200 |
Sacramento Redev. Agcy. Multi-family (18th & L Apts. Proj.) 0.18%, LOC Fannie Mae, VRDN (b)(e) | 21,075 | | 21,075 |
Sacramento Suburban Wtr. District Ctfs. of Prtn. Series 2009 A, 0.19%, LOC Sumitomo Mitsui Banking Corp., VRDN (b) | 6,000 | | 6,000 |
San Bernardino County Flood Cont. District Judgement Oblig. Series 2008, 0.18%, LOC UBS AG, VRDN (b) | 5,500 | | 5,500 |
San Bernardino County Gen. Oblig. TRAN 2% 6/30/10 | 16,000 | | 16,085 |
San Diego Cmnty. College District Participating VRDN Series Floaters 09 16Z, 0.16% (Liquidity Facility Wells Fargo & Co.) (b)(g) | 10,925 | | 10,925 |
San Diego County & School District TRAN: | | | |
Series 2009 A, 2% 6/30/10 | 30,975 | | 31,126 |
Series 2009 B1, 2% 6/30/10 | 19,200 | | 19,276 |
Municipal Securities - continued |
| Principal Amount (000s) | | Value (000s) |
California - continued |
San Diego County Wtr. Auth. Wtr. Rev. Participating VRDN: | | | |
Series Putters 2903Z, 0.2% (Liquidity Facility JPMorgan Chase Bank) (b)(g) | $ 6,840 | | $ 6,840 |
Series Putters 3028, 0.2% (Liquidity Facility JPMorgan Chase Bank) (b)(g) | 8,715 | | 8,715 |
Series WF 08 29C, 0.16% (Liquidity Facility Wells Fargo & Co.) (b)(g) | 16,870 | | 16,870 |
San Diego Hsg. Auth. Multi-family Hsg.: | | | |
(Bay Vista Apts. Proj.) Series A, 0.18%, LOC Fannie Mae, VRDN (b)(e) | 9,700 | | 9,700 |
(Delta Village Apts. Proj.) Series A, 0.36%, LOC Citibank NA, VRDN (b)(e) | 6,700 | | 6,700 |
(Stratton Apts. Proj.) Series 2000 A, 0.18%, LOC Fannie Mae, VRDN (b)(e) | 5,000 | | 5,000 |
San Diego Pub. Facilities Fing. Auth. Swr. Rev. Bonds Series 2009 B, 3% 5/15/10 | 23,500 | | 23,624 |
San Diego Pub. Facilities Fing. Auth. Wtr. Rev. Participating VRDN Series Putters 3505, 0.18% (Liquidity Facility JPMorgan Chase Bank) (b)(g) | 11,245 | | 11,245 |
San Diego Unified School District TRAN Series A, 2% 7/8/10 | 32,100 | | 32,267 |
San Francisco Bay Area Rapid Trans. District Sales Tax Rev. Participating VRDN Series BA 08 3041X, 0.21% (Liquidity Facility Bank of America NA) (b)(g) | 6,665 | | 6,665 |
San Francisco City & County Arpts. Commission Int'l. Arpt. Rev.: | | | |
Second Series 36B, 0.17%, LOC Union Bank of California, VRDN (b) | 22,820 | | 22,820 |
Series 2010 A1, 0.22%, LOC JPMorgan Chase Bank, VRDN (b)(e) | 25,000 | | 25,000 |
Series 2010 A2, 0.2%, LOC JPMorgan Chase Bank, VRDN (b)(e) | 14,000 | | 14,000 |
Series 2010 A3, 0.2%, LOC JPMorgan Chase Bank, VRDN (b)(e) | 16,000 | | 16,000 |
San Francisco City & County Gen. Oblig. Bonds Series 2008 R1, 5% 6/15/10 | 15,200 | | 15,403 |
San Francisco City and County Fin. Corp. Lease Rev. (Moscone Ctr. Expansion Proj.) Series 2008 2, 0.17%, LOC State Street Bank & Trust Co., Boston, VRDN (b) | 31,390 | | 31,390 |
San Francisco Redev. Agcy. Multi-family Hsg. Rev. 0.23%, LOC Freddie Mac, VRDN (b)(e) | 3,000 | | 3,000 |
San Jose Multi-family Hsg. Rev.: | | | |
(Alamaden Family Apts. Proj.) Series 2003 D, 0.18%, LOC Fannie Mae, VRDN (b)(e) | 20,615 | | 20,615 |
Municipal Securities - continued |
| Principal Amount (000s) | | Value (000s) |
California - continued |
San Jose Multi-family Hsg. Rev.: - continued | | | |
(Betty Ann Garens Apts. Proj.) Series 2002 A, 0.36%, LOC Citibank NA, VRDN (b)(e) | $ 7,005 | | $ 7,005 |
(El Paseo Apts. Proj.) Series 2002 B, 0.36%, LOC Citibank NA, VRDN (b)(e) | 4,845 | | 4,845 |
(Kennedy Apt. Homes Proj.) Series 2002 K, 0.2%, LOC Fannie Mae, VRDN (b)(e) | 9,375 | | 9,375 |
(Las Ventanas Apts. Proj.) Series 2008 B, 0.18%, LOC Freddie Mac, VRDN (b) | 12,950 | | 12,950 |
(Siena at Renaissance Square Proj.) Series 1996 A, 0.17%, LOC Key Bank NA, VRDN (b)(e) | 49,500 | | 49,500 |
San Mateo-Foster City School District BAN Series 2009, 1.75% 3/1/10 | 10,175 | | 10,175 |
Santa Ana Hsg. Auth. 0.2%, LOC Fannie Mae, VRDN (b)(e) | 8,140 | | 8,140 |
Santa Barbara County Schools Fing. Auth. TRAN 2% 6/30/10 | 12,000 | | 12,057 |
Santa Clara County Fing. Auth. Lease Rev. Participating VRDN Series MS 3104, 0.22% (Liquidity Facility Morgan Stanley) (b)(g) | 9,000 | | 9,000 |
Santa Clara County Hsg. Auth. Multi-family Hsg. Rev. (Timberwood Apts. Proj.) Series B, 0.35%, LOC Union Bank of California, VRDN (b)(e) | 11,745 | | 11,745 |
Santa Cruz Redev. Agcy. Multi-family Rev. (Shaffer Road Apts. Proj.) Series A, 0.17%, LOC Fannie Mae, VRDN (b)(e) | 29,925 | | 29,925 |
Santa Monica-Malibu Unified School District Bonds Series 2006 B, 1.5% 8/1/10 | 3,000 | | 3,013 |
Santa Rosa Multi-family Hsg. Rev. (Quail Run Apts./Santa Rosa Hsg. Partners Proj.) Series 1997 A, 0.35%, LOC U.S. Bank NA, Minnesota, VRDN (b)(e) | 2,630 | | 2,630 |
Sequoia Union High School District TRAN 2.5% 7/1/10 | 11,500 | | 11,577 |
South Placer Wastewtr. Auth. Rev. Series 2008 A, 0.2%, LOC State Street Bank & Trust Co., Boston, LOC California Teachers Retirement Sys., VRDN (b) | 31,704 | | 31,704 |
Southern California Pub. Pwr. Auth. RAN (Tieton Hydropower Proj.) Series 2009 A, 2% 8/16/10 | 11,000 | | 11,080 |
Southern California Pub. Pwr. Auth. Rev.: | | | |
(Magnolia Pwr. Proj.) Series 2009-2, 0.2%, LOC Bank of America NA, VRDN (b) | 9,795 | | 9,795 |
(Palo Verde Proj.) Series 2008 B, 0.21%, LOC Dexia Cr. Local de France, VRDN (b) | 28,035 | | 28,035 |
State Ctr. Cmnty. College District Participating VRDN Series Putters 1972, 0.2% (Liquidity Facility JPMorgan Chase Bank) (b)(g) | 8,265 | | 8,265 |
Torrance Gen. Oblig. TRAN 2.5% 7/1/10 | 12,800 | | 12,889 |
Municipal Securities - continued |
| Principal Amount (000s) | | Value (000s) |
California - continued |
Univ. of California Revs. Participating VRDN: | | | |
Series MS 3066, 0.2% (Liquidity Facility Morgan Stanley) (b)(g) | $ 10,900 | | $ 10,900 |
Series Putters 2475, 0.18% (Liquidity Facility JPMorgan Chase Bank) (b)(g) | 1,035 | | 1,035 |
Series Putters 3365, 0.18% (Liquidity Facility JPMorgan Chase Bank) (b)(g) | 6,210 | | 6,210 |
Series Putters 3368, 0.18% (Liquidity Facility JPMorgan Chase Bank) (b)(g) | 9,500 | | 9,500 |
Series Putters 3370, 0.18% (Liquidity Facility JPMorgan Chase Bank) (b)(g) | 6,000 | | 6,000 |
Series Solar 06 39, 0.18% (Liquidity Facility U.S. Bank NA, Minnesota) (b)(g) | 10,300 | | 10,300 |
Ventura County Gen. Oblig. TRAN 2.5% 7/1/10 | 20,500 | | 20,646 |
Western Muni. Wtr. District Facilities Auth. Wtr. Rev. Series 2009 A, 0.16%, LOC U.S. Bank NA, Minnesota, VRDN (b) | 1,355 | | 1,355 |
Whittier Health Facilities Rev. (Presbyterian Intercommunity Hosp. Proj.) Series 2009 C, 0.17%, LOC U.S. Bank NA, Minnesota, VRDN (b) | 26,500 | | 26,500 |
| | 4,314,024 |
Florida - 0.3% |
Sunshine State Govt. Fing. Commission Rev. Series L, 0.27% 3/3/10, LOC Dexia Cr. Local de France, CP (e) | 15,000 | | 15,000 |
Georgia - 0.1% |
Putnam Dev. Auth. Swr. Facility Rev. (Oconee Crossings Wharf Proj.) 0.4%, LOC Wachovia Bank NA, VRDN (b)(e) | 3,505 | | 3,505 |
Louisiana - 0.1% |
Louisiana Gas & Fuel Tax Rev. Participating VRDN Series Solar 06 133, 0.17% (Liquidity Facility U.S. Bank NA, Minnesota) (b)(g) | 6,920 | | 6,920 |
Maryland - 0.2% |
Chestertown Econ. Dev. Rev. (Washington College Proj.) Series 2008 A, 0.55%, LOC RBS Citizens NA, VRDN (b) | 3,265 | | 3,265 |
Maryland Health & Higher Edl. Facilities Auth. Rev. (Univ. of Maryland Med. Sys. Proj.) Series 2008 A, 0.4%, LOC Citizens Bank of Pennsylvania, VRDN (b) | 7,000 | | 7,000 |
| | 10,265 |
Massachusetts - 0.3% |
Massachusetts Wtr. Resources Auth. Wtr. & Swr. Rev. Series 2008 C, 0.28% (Liquidity Facility Bayerische Landesbank), VRDN (b) | 13,625 | | 13,625 |
Municipal Securities - continued |
| Principal Amount (000s) | | Value (000s) |
Mississippi - 0.0% |
Mississippi Bus. Fin. Corp. Indl. Dev. Rev. (Omega Motion LLC Proj.) Series 1996, 0.35%, LOC Wachovia Bank NA, VRDN (b)(e) | $ 1,500 | | $ 1,500 |
Nevada - 0.2% |
Clark County Arpt. Rev.: | | | |
Series 2008 D2, 0.24%, LOC Landesbank Baden-Wuert, VRDN (b) | 5,600 | | 5,600 |
Series 2008 D3, 0.26%, LOC Bayerische Landesbank, VRDN (b) | 1,600 | | 1,600 |
Clark County Passenger Facility Charge Rev. McCarran Int'l. Arpt. Series 2005 A2, 0.26%, LOC Bayerische Landesbank, VRDN (b)(e) | 3,600 | | 3,600 |
| | 10,800 |
Ohio - 1.0% |
Dayton Montgomery County Port Auth. Spl. Arpt. Facilities Rev. (Wilmington Air Park, Inc. Proj.): | | | |
Series 2007 B, 4% (Deutsche Post AG Guaranteed), VRDN (b)(e) | 21,200 | | 21,200 |
Series 2007 C, 4% (Deutsche Post AG Guaranteed), VRDN (b)(e) | 16,000 | | 16,000 |
Ohio Hsg. Fin. Agcy. Multi-family Hsg. Rev. (Club at Spring Valley Apts. Proj.) Series 1996 A, 0.8%, LOC RBS Citizens NA, VRDN (b)(e) | 5,000 | | 5,000 |
Westlake Health Facilities Rev. (Lutheran Home Proj.) Series 2005, 0.55%, LOC RBS Citizens NA, VRDN (b) | 7,600 | | 7,600 |
| | 49,800 |
Pennsylvania - 0.3% |
Delaware County Indl. Dev. Auth. Rev. (Academy of Notre Dame de Namur Proj.) Series 2007, 0.38%, LOC Citizens Bank of Pennsylvania, VRDN (b) | 4,245 | | 4,245 |
Pennsylvania Higher Edl. Facilities Auth. Rev. (St. Joseph's Univ. Proj.) Series 2008 B, 0.2%, LOC Citizens Bank of Pennsylvania, VRDN (b) | 12,000 | | 12,000 |
| | 16,245 |
Puerto Rico - 0.9% |
Puerto Rico Commonwealth Hwy. & Trans. Auth. Trans. Rev. Series 1998 A, 0.2%, LOC Bank of Nova Scotia New York Branch, VRDN (b) | 47,800 | | 47,800 |
Rhode Island - 0.1% |
Rhode Island Indl. Facilities Corp. Indl. Dev. Rev. (Calise & Sons Bakery Proj.) Series 1999, 0.4%, LOC RBS Citizens NA, VRDN (b)(e) | 2,925 | | 2,925 |
Municipal Securities - continued |
| Principal Amount (000s) | | Value (000s) |
Texas - 0.4% |
Weslaco Health Facilities Dev. Corp. Rev. (Knapp Med. Ctr. Proj.): | | | |
Series 2008 A, 0.43%, LOC Compass Bank, VRDN (b) | $ 4,675 | | $ 4,675 |
Series 2008 B, 0.43%, LOC Compass Bank, VRDN (b) | 4,730 | | 4,730 |
West Harris County Reg'l. Wtr. Auth. Wtr. Sys. Rev. Participating VRDN Series Solar 07 103, 0.17% (Liquidity Facility U.S. Bank NA, Minnesota) (b)(g) | 10,305 | | 10,305 |
| | 19,710 |
Virginia - 0.2% |
Hanover County Econ. Dev. Auth. Rev. (Bon Secours Health Sys. Proj.) Series 2008 D1, 0.24%, LOC Landesbank Baden-Wuert, VRDN (b) | 4,500 | | 4,500 |
Norfolk Econ. Dev. Auth. Rev. (Bon Secours Health Sys. Proj.) Series 2008 D1, 0.24%, LOC Landesbank Baden-Wuert, VRDN (b) | 5,905 | | 5,905 |
| | 10,405 |
Washington - 0.1% |
Port of Seattle Rev. Series 2005, 0.28%, LOC Fortis Banque SA, VRDN (b)(e) | 4,600 | | 4,600 |
| Shares | | |
Other - 10.1% |
Fidelity Municipal Cash Central Fund, 0.19% (c)(d) | 507,960 | | 507,960 |
TOTAL INVESTMENT PORTFOLIO - 99.9% (Cost $5,040,184) | | 5,040,184 |
NET OTHER ASSETS - 0.1% | | 4,021 |
NET ASSETS - 100% | $ 5,044,205 |
Security Type Abbreviations |
BAN - BOND ANTICIPATION NOTE |
CP - COMMERCIAL PAPER |
RAN - REVENUE ANTICIPATION NOTE |
TRAN - TAX AND REVENUE
ANTICIPATION NOTE |
VRDN - VARIABLE RATE DEMAND NOTE |
Legend |
(a) Security or a portion of the security purchased on a delayed delivery or when-issued basis. |
(b) The coupon rate shown on floating or adjustable rate securities represents the rate at period end. |
(c) Information in this report regarding holdings by state and security types does not reflect the holdings of the Fidelity Municipal Cash Central Fund. |
(d) Affiliated fund that is available only to investment companies and other accounts managed by Fidelity Investments. The rate quoted is the annualized seven-day yield of the fund at period end. A complete unaudited listing of the fund's holdings as of its most recent quarter end is available upon request. |
(e) Private activity obligations whose interest is subject to the federal alternative minimum tax for individuals. |
(f) Security collateralized by an amount sufficient to pay interest and principal. |
(g) Provides evidence of ownership in one or more underlying municipal bonds. |
Affiliated Central Funds |
Information regarding fiscal year to date income earned by the Fund from investments in Fidelity Central Funds is as follows: |
Fund | Income earned
(Amounts in thousands) |
Fidelity Municipal Cash Central Fund | $ 739 |
Other Information |
All investments are categorized as Level 2 under the Fair Value Hierarchy. The inputs or methodology used for valuing securities may not be an indication of the risk associated with investing in those securities. For more information on valuation inputs, please refer to the Security Valuation section in the accompanying Notes to Financial Statements. |
See accompanying notes which are an integral part of the financial statements.
Annual Report
Statement of Assets and Liabilities
Amounts in thousands (except per-share amount) | February 28, 2010 |
| | |
Assets | | |
Investment in securities, at value - See accompanying schedule: Unaffiliated issuers (cost $4,532,224) | $ 4,532,224 | |
Fidelity Central Funds (cost $507,960) | 507,960 | |
Total Investments (cost $5,040,184) | | $ 5,040,184 |
Cash | | 1,206 |
Receivable for investments sold | | 3,101 |
Receivable for fund shares sold | | 74,521 |
Interest receivable | | 8,463 |
Distributions receivable from Fidelity Central Funds | | 69 |
Prepaid expenses | | 12 |
Total assets | | 5,127,556 |
| | |
Liabilities | | |
Payable for investments purchased
Regular delivery | $ 4,901 | |
Delayed delivery | 13,323 | |
Payable for fund shares redeemed | 63,468 | |
Accrued management fee | 989 | |
Other affiliated payables | 627 | |
Other payables and accrued expenses | 43 | |
Total liabilities | | 83,351 |
| | |
Net Assets | | $ 5,044,205 |
Net Assets consist of: | | |
Paid in capital | | $ 5,044,194 |
Accumulated undistributed net realized gain (loss) on investments | | 11 |
Net Assets, for 5,042,570 shares outstanding | | $ 5,044,205 |
Net Asset Value, offering price and redemption price per share ($5,044,205 ÷ 5,042,570 shares) | | $ 1.00 |
See accompanying notes which are an integral part of the financial statements.
Annual Report
Statement of Operations
Amounts in thousands | Year ended February 28, 2010 |
| | |
Investment Income | | |
Interest | | $ 24,445 |
Income from Fidelity Central Funds | | 739 |
Total income | | 25,184 |
| | |
Expenses | | |
Management fee | $ 19,318 | |
Transfer agent fees | 6,806 | |
Accounting fees and expenses | 448 | |
Custodian fees and expenses | 85 | |
Independent trustees' compensation | 18 | |
Registration fees | 50 | |
Audit | 50 | |
Legal | 33 | |
Money Market Guarantee Program fee | 1,405 | |
Miscellaneous | 667 | |
Total expenses before reductions | 28,880 | |
Expense reductions | (5,904) | 22,976 |
Net investment income | | 2,208 |
Realized and Unrealized Gain (Loss) Net realized gain (loss) on: | | |
Investment securities: | | |
Unaffiliated issuers | | 111 |
Net increase in net assets resulting from operations | | $ 2,319 |
See accompanying notes which are an integral part of the financial statements.
Annual Report
Financial Statements - continued
Statement of Changes in Net Assets
Amounts in thousands | Year ended February 28,
2010 | Year ended February 28,
2009 |
Increase (Decrease) in Net Assets | | |
Operations | | |
Net investment income | $ 2,208 | $ 81,590 |
Net realized gain (loss) | 111 | 142 |
Net increase in net assets resulting
from operations | 2,319 | 81,732 |
Distributions to shareholders from net investment income | (2,207) | (81,592) |
Distributions to shareholders from net realized gain | - | (1,249) |
Total distributions | (2,207) | (82,841) |
Share transactions at net asset value of $1.00 per share
Proceeds from sales of shares | 20,539,823 | 27,544,557 |
Reinvestment of distributions | 2,168 | 81,419 |
Cost of shares redeemed | (21,259,309) | (27,914,159) |
Net increase (decrease) in net assets and shares resulting from share transactions | (717,318) | (288,183) |
Total increase (decrease) in net assets | (717,206) | (289,292) |
| | |
Net Assets | | |
Beginning of period | 5,761,411 | 6,050,703 |
End of period | $ 5,044,205 | $ 5,761,411 |
See accompanying notes which are an integral part of the financial statements.
Annual Report
Financial Highlights
Years ended February 28, | 2010 | 2009 | 2008D | 2007 | 2006 |
Selected Per-Share Data | | | | | |
Net asset value, beginning of period | $ 1.00 | $ 1.00 | $ 1.00 | $ 1.00 | $ 1.00 |
Income from Investment Operations | | | | | |
Net investment income | - E | .013 | .030 | .030 | .022 |
Net realized and unrealized gain (loss) E | - | - | - | - | - |
Total from investment operations | - E | .013 | .030 | .030 | .022 |
Distributions from net investment income | - E | (.013) | (.030) | (.030) | (.022) |
Distributions from net realized gain | - | - E | - E | - | - |
Total distributions | - E | (.013) | (.030) | (.030) | (.022) |
Net asset value, end of period | $ 1.00 | $ 1.00 | $ 1.00 | $ 1.00 | $ 1.00 |
Total Return A | .04% | 1.32% | 3.06% | 3.09% | 2.19% |
Ratios to Average Net Assets B, C | | | | | |
Expenses before reductions | .55% | .53% | .51% | .52% | .52% |
Expenses net of fee waivers,
if any | .44% | .53% | .51% | .52% | .52% |
Expenses net of all reductions | .44% | .50% | .41% | .38% | .41% |
Net investment income | .04% | 1.30% | 2.98% | 3.05% | 2.18% |
Supplemental Data | | | | | |
Net assets, end of period
(in millions) | $ 5,044 | $ 5,761 | $ 6,051 | $ 4,762 | $ 4,096 |
A Total returns would have been lower had certain expenses not been reduced during the periods shown.
B Fees and expenses of the underlying Fidelity Central Funds are not included in the Fund's expense ratio. The Fund indirectly bears its proportionate share of the expenses of any underlying Fidelity Central Funds.
C Expense ratios reflect operating expenses of the Fund. Expenses before reductions do not reflect amounts reimbursed or waived or reductions from expense offset arrangements and do not represent the amount paid by the Fund during periods when reimbursements, waivers or reductions occur. Expenses net of fee waivers reflect expenses after reimbursement and waivers but prior to reductions from expense offset arrangements. Expenses net of all reductions represent the net expenses paid by the Fund.
D For the year ended February 29.
E Amount represents less than $.001 per share.
See accompanying notes which are an integral part of the financial statements.
Annual Report
Notes to Financial Statements
For the period ended February 28, 2010
(Amounts in thousands except ratios)
1. Organization.
Fidelity California Municipal Money Market Fund (the Fund) is a fund of Fidelity California Municipal Trust II (the trust) and is authorized to issue an unlimited number of shares. The trust is registered under the Investment Company Act of 1940, as amended (the 1940 Act), as an open-end management investment company organized as a Delaware statutory trust. The Fund may be affected by economic and political developments in the state of California.
2. Investments in Fidelity Central Funds.
The Fund may invest in Fidelity Central Funds, which are open-end investment companies available only to other investment companies and accounts managed by Fidelity Management & Research Company (FMR) and its affiliates. The Fund's Schedule of Investments lists each of the Fidelity Central Funds held as of period end, if any, as an investment of the Fund, but does not include the underlying holdings of each Fidelity Central Fund. As an Investing Fund, the Fund indirectly bears its proportionate share of the expenses of the underlying Fidelity Central Funds.
The Money Market Central Funds seek preservation of capital and current income and are managed by Fidelity Investments Money Management, Inc. (FIMM), an affiliate of FMR.
A complete unaudited list of holdings for each Fidelity Central Fund is available upon request or at the Securities and Exchange Commission (the SEC) web site at www.sec.gov. In addition, the financial statements of the Fidelity Central Funds which are not covered by the Fund's Report of Independent Registered Public Accounting Firm, are available on the SEC web site or upon request.
3. Significant Accounting Policies.
The financial statements have been prepared in conformity with accounting principles generally accepted in the United States of America, which require management to make certain estimates and assumptions at the date of the financial statements. Actual results could differ from those estimates. The following summarizes the significant accounting policies of the Fund:
Annual Report
3. Significant Accounting Policies - continued
Security Valuation. The Fund categorizes the inputs to valuation techniques used to value its investments into a disclosure hierarchy consisting of three levels as shown below.
Level 1 - quoted prices in active markets for identical investments
Level 2 - other significant observable inputs (including quoted prices for similar investments, interest rates, prepayment speeds, etc.)
Level 3 - unobservable inputs (including the fund's own assumptions based on the best information available)
As permitted by compliance with certain conditions under Rule 2a-7 of the 1940 Act, securities are valued at amortized cost, which approximates value and are categorized as Level 2 in the hierarchy.
Investment Transactions and Income. The net asset value per share for processing shareholder transactions is calculated as of the close of business of the New York Stock Exchange (NYSE), normally 4:00 p.m. Eastern time. Security transactions, including the Fund's investment activity in the Fidelity Central Funds, are accounted for as of trade date. Gains and losses on securities sold are determined on the basis of identified cost. Interest income and distributions from the Fidelity Central Funds are accrued as earned. Interest income includes coupon interest and amortization of premium and accretion of discount on debt securities.
Expenses. Most expenses of the trust can be directly attributed to a fund. Expenses which cannot be directly attributed are apportioned among each Fund in the trust. Expense estimates are accrued in the period to which they relate and adjustments are made when actual amounts are known.
The Fund participated in the U.S. Treasury Department's Temporary Guarantee Program for Money Market Funds (the "Program") through September 18, 2009. The Fund paid the U.S. Treasury Department fees equal to 0.04% based on the number of shares outstanding as of September 19, 2008 to participate in the Program through September 18, 2009. The expense was borne by the Fund without regard to any expense limitation in effect for the Fund.
Income Tax Information and Distributions to Shareholders. Each year, the Fund intends to qualify as a regulated investment company by distributing substantially all of its taxable income and realized gains under Subchapter M of the Internal Revenue Code and filing its U.S. federal tax return. As a result, no provision for income taxes is required. As of February 28, 2010, the Fund did not have any unrecognized tax benefits in the accompanying financial statements. A Fund's federal tax return is subject to examination by the Internal Revenue Service (IRS) for a period of three years.
Annual Report
Notes to Financial Statements - continued
(Amounts in thousands except ratios)
3. Significant Accounting Policies - continued
Income Tax Information and Distributions to Shareholders - continued
Dividends are declared daily and paid monthly from net investment income. Distributions from realized gains, if any, are recorded on the ex-dividend date. Income and capital gain distributions are determined in accordance with income tax regulations, which may differ from generally accepted accounting principles. In addition, the Fund claimed a portion of the payment made to redeeming shareholders as a distribution for income tax purposes.
Capital accounts within the financial statements are adjusted for permanent book-tax differences. These adjustments have no impact on net assets or the results of operations. Temporary book-tax differences will reverse in a subsequent period.
Book-tax differences are primarily due to deferred trustees compensation and losses deferred due to excise tax regulations.
The Funds purchase municipal securities whose interest, in the opinion of the issuer, is free from federal income tax. There is no assurance that the IRS will agree with this opinion. In the event the IRS determines that the issuer does not comply with relevant tax requirements, interest payments from a security could become federally taxable, possibly retroactively to the date the security was issued.
The federal tax cost of investment securities and unrealized appreciation (depreciation) as of period end were as follows:
Gross unrealized appreciation | $ - |
Gross unrealized depreciation | - |
Net unrealized appreciation (depreciation) | $ - |
| |
Tax Cost | $ 5,040,184 |
The tax-based components of distributable earnings as of period end were as follows:
Undistributed tax-exempt income | $ 2 |
Undistributed ordinary income | $ 4 |
Undistributed long-term capital gain | $ 5 |
Net unrealized appreciation (depreciation) | $ - |
The tax character of distributions paid was as follows:
| February 28, 2010 | February 28, 2009 |
Tax-exempt Income | $ 2,207 | $ 81,592 |
Ordinary Income | - | 624 |
Long-term Capital Gains | - | 625 |
Total | $ 2,207 | $ 82,841 |
Annual Report
4. Operating Policies.
Delayed Delivery Transactions and When-Issued Securities. The Fund may purchase or sell securities on a delayed delivery or when-issued basis. Payment and delivery may take place after the customary settlement period for that security. The price of the underlying securities and the date when the securities will be delivered and paid for are fixed at the time the transaction is negotiated. During the time a delayed delivery sell is outstanding, equivalent deliverable securities are held for the transaction. The securities purchased on a delayed delivery or when-issued basis are identified as such in the Fund's Schedule of Investments. The Fund may receive compensation for interest forgone in the purchase of a delayed delivery or when-issued security. With respect to purchase commitments, the Fund identifies securities as segregated in its records with a value at least equal to the amount of the commitment. Losses may arise due to changes in the value of the underlying securities or if the counterparty does not perform under the contract's terms, or if the issuer does not issue the securities due to political, economic, or other factors.
5. Fees and Other Transactions with Affiliates.
Management Fee. FMR and its affiliates provide the Fund with investment management related services for which the Fund pays a monthly management fee. The management fee is the sum of an individual fund fee rate that is based on an annual rate of .25% of the Fund's average net assets and a group fee rate that averaged .12% during the period. The group fee rate is based upon the average net assets of all the mutual funds advised by FMR. The group fee rate decreases as assets under management increase and increases as assets under management decrease. For the period, the total annual management fee rate was .37% of the Fund's average net assets.
Transfer Agent and Accounting Fees. Citibank, N.A. (Citibank) is the custodian, transfer agent and shareholder servicing agent for the Fund. Citibank has entered into a sub-arrangement with Fidelity Investments Institutional Operations Company, Inc. (FIIOC), an affiliate of FMR, under which FIIOC performs the activities associated with the Fund's transfer, dividend disbursing and shareholder servicing agent functions. The Fund pays account fees and asset-based fees that vary according to account size and type of account. FIIOC pays for typesetting, printing and mailing of shareholder reports, except proxy statements. For the period, the transfer agent fees were equivalent to an annual rate of .13% of average net assets.
Citibank also has a sub-arrangement with Fidelity Service Company, Inc. (FSC), an affiliate of FMR, under which FSC maintains the Fund's accounting records. The fee is based on the level of average net assets for the month.
Annual Report
Notes to Financial Statements - continued
(Amounts in thousands except ratios)
6. Expense Reductions.
FMR or its affiliates voluntarily agreed to waive certain fees during the period. The amount of the waiver is $5,901.
Through arrangements with the Fund's custodian, credits realized as a result of uninvested cash balances were used to reduce the Fund's expenses. During the period, these credits reduced the Fund's custody expenses by $3.
7. Other.
The Fund's organizational documents provide former and current trustees and officers with a limited indemnification against liabilities arising in connection with the performance of their duties to the Fund. In the normal course of business, the Fund may also enter into contracts that provide general indemnifications. The Fund's maximum exposure under these arrangements is unknown as this would be dependent on future claims that may be made against the Fund. The risk of material loss from such claims is considered remote.
The supply of municipal money market securities has fluctuated significantly due to market volatility. As a result, the Fund's cash position may be significant during the period.
Annual Report
To the Trustees of Fidelity California Municipal Trust II and the Shareholders of Fidelity California Municipal Money Market Fund:
In our opinion, the accompanying statement of assets and liabilities, including the schedule of investments, and the related statements of operations and of changes in net assets and the financial highlights present fairly, in all material respects, the financial position of Fidelity California Municipal Money Market Fund (a fund of Fidelity California Municipal Trust II) at February 28, 2010, the results of its operations for the year then ended, the changes in its net assets for each of the two years in the period then ended and the financial highlights for each of the five years in the period then ended, in conformity with accounting principles generally accepted in the United States of America. These financial statements and financial highlights (hereafter referred to as "financial statements") are the responsibility of the Fidelity California Municipal Money Market Fund's management. Our responsibility is to express an opinion on these financial statements based on our audits. We conducted our audits of these financial statements in accordance with the standards of the Public Company Accounting Oversight Board (United States). Those standards require that we plan and perform the audit to obtain reasonable assurance about whether the financial statements are free of material misstatement. An audit includes examining, on a test basis, evidence supporting the amounts and disclosures in the financial statements, assessing the accounting principles used and significant estimates made by management, and evaluating the overall financial statement presentation. We believe that our audits, which included confirmation of securities at February 28, 2010 by correspondence with the custodian and brokers, provide a reasonable basis for our opinion.
/s/ PricewaterhouseCoopers LLP
PricewaterhouseCoopers LLP
Boston, Massachusetts
April 15, 2010
Annual Report
The Trustees and executive officers of the trust and fund, as applicable, are listed below. The Board of Trustees governs the fund and is responsible for protecting the interests of shareholders. The Trustees are experienced executives who meet periodically throughout the year to oversee the fund's activities, review contractual arrangements with companies that provide services to the fund, oversee management of the risks associated with such activities and contractual arrangements, and review the fund's performance. Except for James C. Curvey, each of the Trustees oversees 188 funds advised by FMR or an affiliate. Mr. Curvey oversees 410 funds advised by FMR or an affiliate.
The Trustees hold office without limit in time except that (a) any Trustee may resign; (b) any Trustee may be removed by written instrument, signed by at least two-thirds of the number of Trustees prior to such removal; (c) any Trustee who requests to be retired or who has become incapacitated by illness or injury may be retired by written instrument signed by a majority of the other Trustees; and (d) any Trustee may be removed at any special meeting of shareholders by a two-thirds vote of the outstanding voting securities of the trust. Each Trustee who is not an interested person (as defined in the 1940 Act) (Independent Trustee), shall retire not later than the last day of the calendar year in which his or her 72nd birthday occurs. The Independent Trustees may waive this mandatory retirement age policy with respect to individual Trustees. The executive officers hold office without limit in time, except that any officer may resign or may be removed by a vote of a majority of the Trustees at any regular meeting or any special meeting of the Trustees. Except as indicated, each individual has held the office shown or other offices in the same company for the past five years.
Experience, Skills, Attributes, and Qualifications of the Fund's Trustees. The Governance and Nominating Committee has adopted a statement of policy that describes the experience, qualifications, attributes, and skills that are necessary and desirable for potential Independent Trustee candidates ("Statement of Policy"). The Board believes that each Trustee satisfied at the time he or she was initially elected or appointed a Trustee, and continues to satisfy, the standards contemplated by the Statement of Policy. The Governance and Nominating Committee also engages professional search firms to help identify potential Independent Trustee candidates who have the experience, qualifications, attributes, and skills consistent with the Statement of Policy. From time to time, additional criteria based on the composition and skills of the current Independent Trustees, as well as experience or skills that may be appropriate in light of future changes to board composition, business conditions, and regulatory or other developments, have also been considered by the professional search firms and the Governance and Nominating Committee. In addition, the Board takes into account the Trustees' commitment and participation in Board and committee meetings, as well as their leadership of standing and ad hoc committees throughout their tenure.
In determining that a particular Trustee was and continues to be qualified to serve as a Trustee, the Board has considered a variety of criteria, none of which, in isolation, was controlling. The Board believes that, collectively, the Trustees have balanced and diverse experience, qualifications, attributes, and skills, which allow the Board to operate effectively in governing the fund and protecting the interests of shareholders. Information about the specific experience, skills, attributes, and qualifications of each Trustee, which in each case led to the Board's conclusion that the Trustee should serve (or continue to serve) as a trustee of the fund, is provided below.
Annual Report
Board Structure and Oversight Function. Abigail P. Johnson is an interested person (as defined in the 1940 Act) and currently serves as Chairman. The Trustees have determined that an interested Chairman is appropriate and benefits shareholders because an interested Chairman has a personal and professional stake in the quality and continuity of services provided to the fund. Independent Trustees exercise their informed business judgment to appoint an individual of their choosing to serve as Chairman, regardless of whether the Trustee happens to be independent or a member of management. The Independent Trustees have determined that they can act independently and effectively without having an Independent Trustee serve as Chairman and that a key structural component for assuring that they are in a position to do so is for the Independent Trustees to constitute a substantial majority for the Board. The Independent Trustees also regularly meet in executive session. Kenneth L. Wolfe serves as Chairman of the Independent Trustees and as such (i) acts as a liaison between the Independent Trustees and management with respect to matters important to the Independent Trustees and (ii) with management prepares agendas for Board meetings.
Fidelity funds are overseen by different Boards of Trustees. The fund's Board oversees Fidelity's investment-grade bond, money market, and asset allocation funds and another Board oversees Fidelity's equity and high income funds. The asset allocation funds may invest in Fidelity funds that are overseen by such other Board. The use of separate Boards, each with its own committee structure, allows the Trustees of each group of Fidelity funds to focus on the unique issues of the funds they oversee, including common research, investment, and operational issues. On occasion, the separate Boards establish joint committees to address issues of overlapping consequences for the Fidelity funds overseen by each Board.
The Trustees operate using a system of committees to facilitate the timely and efficient consideration of all matters of importance to the Trustees, the fund, and fund shareholders and to facilitate compliance with legal and regulatory requirements and oversight of the fund's activities and associated risks. The Board, acting through its committees, has charged FMR and its affiliates with (i) identifying events or circumstances the occurrence of which could have demonstrably adverse effects on the fund's business and/or reputation; (ii) implementing processes and controls to lessen the possibility that such events or circumstances occur or to mitigate the effects of such events or circumstances if they do occur; and (iii) creating and maintaining a system designed to evaluate continuously business and market conditions in order to facilitate the identification and implementation processes described in (i) and (ii) above. Because the day-to-day operations and activities of the fund are carried out by or through FMR, its affiliates and other service providers, the fund's exposure to risks is mitigated but not eliminated by the processes overseen by the Trustees. While each of the Board's committees has responsibility for overseeing different aspects of the fund's activities, oversight is exercised primarily through the Operations and Audit Committees. Appropriate personnel, including but not limited to the fund's Chief Compliance Officer ("CCO"), FMR's internal auditor, the independent accountants, the fund's Treasurer and portfolio management personnel, make periodic reports to the Board's committees, as appropriate. The responsibilities of each committee, including their oversight responsibilities, are described further under "Standing Committees of the Fund's Trustees."
Annual Report
Trustees and Officers - continued
The fund's Statement of Additional Information (SAI) includes more information about the Trustees. To request a free copy, call Fidelity at 1-800-544-8544.
Interested Trustees*:
Correspondence intended for each Trustee who is an interested person may be sent to Fidelity Investments, 82 Devonshire Street, Boston, Massachusetts 02109.
Name, Age; Principal Occupations and Other Relevant Experience+ |
Abigail P. Johnson (48) |
| Year of Election or Appointment: 2009 Ms. Johnson is Trustee and Chairman of the Board of Trustees of certain Trusts. Ms. Johnson serves as President of Personal and Workplace Investing (2005-present). Ms. Johnson is a Director of FMR LLC. Previously, Ms. Johnson served as President and a Director of FMR (2001- 2005), a Trustee of other investment companies advised by FMR, Fidelity Investments Money Management, Inc., and FMR Co., Inc. (2001-2005), Senior Vice President of the Fidelity funds (2001-2005), and managed a number of Fidelity funds. Ms. Abigail P. Johnson and Mr. Arthur E. Johnson are not related. |
James C. Curvey (74) |
| Year of Election or Appointment: 2007 Mr. Curvey also serves as Trustee (2007-present) of other investment companies advised by FMR. Mr. Curvey is a Director of FMR and FMR Co., Inc. (2007-present). Mr. Curvey is also Vice Chairman (2006-
present) and Director of FMR LLC. In addition, Mr. Curvey serves as an Overseer for the Boston Symphony Orchestra and a member of the Trustees of Villanova University. |
* Trustees have been determined to be "Interested Trustees" by virtue of, among other things, their affiliation with the trust or various entities under common control with FMR.
+ The information above includes each Trustee's principal occupation during the last five years and other information relating to the experience, attributes, and skills relevant to each Trustee's qualifications to serve as a Trustee, which led to the conclusion that each Trustee should serve as a Trustee for the fund.
Annual Report
Independent Trustees:
Correspondence intended for each Independent Trustee (that is, the Trustees other than the Interested Trustees) may be sent to Fidelity Investments, P.O. Box 55235, Boston, Massachusetts 02205-5235.
Name, Age; Principal Occupations and Other Relevant Experience+ |
Albert R. Gamper, Jr. (67) |
| Year of Election or Appointment: 2006 Prior to his retirement in December 2004, Mr. Gamper served as Chairman of the Board of CIT Group Inc. (commercial finance). During his tenure with CIT Group Inc. Mr. Gamper served in numerous senior management positions, including Chairman (1987-1989; 1999-2001; 2002-2004), Chief Executive Officer (1987-2004), and President (2002-2003). He also served as President and Chief Executive Officer of Tyco Capital Corporation (2001-2002). Mr. Gamper currently serves as a member of the Board of Directors of Public Service Enterprise Group (utilities, 2000-present), a member of the Board of Trustees, Rutgers University (2004-present), and Chairman of the Board of Saint Barnabas Health Care System. Previously, Mr. Gamper served as Chairman of the Board of Governors, Rutgers University (2004-2007). |
Robert F. Gartland (58) |
| Year of Election or Appointment: 2010 Mr. Gartland is a partner and investor of Vietnam Partners LLC (investments and consulting, 2008-present) and is Chairman and an investor in Gartland and Mellina Group Corp. (consulting, 2009-present). Prior to his retirement, Mr. Gartland held a variety of positions at Morgan Stanley (financial services, 1979-2007) including Managing Director (1987-2007). |
Arthur E. Johnson (63) |
| Year of Election or Appointment: 2008 Mr. Johnson serves as a member of the Board of Directors of Eaton Corporation (diversified power management, 2009-present) and AGL Resources, Inc. (holding company). Prior to his retirement, Mr. Johnson served as Senior Vice President of Corporate Strategic Development of Lockheed Martin Corporation (defense contractor, 1999-2009). He previously served on the Board of Directors of IKON Office Solutions, Inc. (1999-2008) and Delta Airlines (2005-2007). Mr. Arthur E. Johnson and Ms. Abigail P. Johnson are not related. |
Michael E. Kenneally (55) |
| Year of Election or Appointment: 2009 Prior to his retirement, Mr. Kenneally served as a Member of the Advisory Board for certain Fidelity Fixed Income and Asset Allocation Funds (2008-2009). Mr. Kenneally served as Chairman and Global Chief Executive Officer of Credit Suisse Asset Management (2003-2005). Mr. Kenneally was a Director of the Credit Suisse Funds (U.S. mutual funds, 2004-2008) and certain other closed-end funds (2004-2005) and was awarded the Chartered Financial Analyst (CFA) designation in 1991. |
James H. Keyes (69) |
| Year of Election or Appointment: 2007 Mr. Keyes serves as a member of the Boards of Navistar International Corporation (manufacture and sale of trucks, buses, and diesel engines, since 2002) and Pitney Bowes, Inc. (integrated mail, messaging, and document management solutions, since 1998). Prior to his retirement, Mr. Keyes served as Chairman and Chief Executive Officer of Johnson Controls (automotive, building, and energy, 1998-2002) and as a member of the Board of LSI Logic Corporation (semiconductor technologies, 1984-2008). |
Marie L. Knowles (63) |
| Year of Election or Appointment: 2001 Prior to Ms. Knowles' retirement in June 2000, she served as Executive Vice President and Chief Financial Officer of Atlantic Richfield Company (ARCO) (diversified energy, 1996-2000). From 1993 to 1996, she was a Senior Vice President of ARCO and President of ARCO Transportation Company. She served as a Director of ARCO from 1996 to 1998. Ms. Knowles currently serves as a Director of McKesson Corporation (healthcare service, since 2002). Ms. Knowles is an Honorary Trustee of the Brookings Institution and a member of the Board of the Catalina Island Conservancy and of the Santa Catalina Island Company (2009-present). She also serves as a member of the Advisory Board for the School of Engineering of the University of Southern California and the Foundation Board of the School of Architecture at the University of Virginia (2007- present). Previously, Ms. Knowles served as a Director of Phelps Dodge Corporation (copper mining and manufacturing, 1994-2007). |
Kenneth L. Wolfe (71) |
| Year of Election or Appointment: 2005 Mr. Wolfe is Chairman of the Independent Trustees of the Fixed Income and Asset Allocation Funds (2008-present). Prior to his retirement, Mr. Wolfe served as Chairman and a Director (2007-2009) and Chairman and Chief Executive Officer of Hershey Foods Corporation. He also served as a member of the Boards of Adelphia Communications Corporation (telecommunications, 2003-2006), Bausch & Lomb, Inc. (medical/pharmaceutical, 1993-2007), and Revlon, Inc. (personal care products, 2004-2009). |
+ The information above includes each Trustee's principal occupation during the last five years and other information relating to the experience, attributes, and skills relevant to each Trustee's qualifications to serve as a Trustee, which led to the conclusion that each Trustee should serve as a Trustee for the fund.
Executive Officers:
Correspondence intended for each executive officer may be sent to Fidelity Investments, 82 Devonshire Street, Boston, Massachusetts 02109.
Name, Age; Principal Occupation |
John R. Hebble (51) |
| Year of Election or Appointment: 2008 President and Treasurer of Fidelity's Fixed Income and Asset Allocation Funds. Mr. Hebble also serves as Treasurer and Chief Financial Officer of the North Carolina Capital Management Trust: Cash and Term Portfolio (2008-present), Assistant Treasurer of other Fidelity funds (2009-
present) and is an employee of Fidelity Investments. |
Boyce I. Greer (54) |
| Year of Election or Appointment: 2005 or 2006 Vice President of Fidelity's Fixed Income Funds (2006) and Asset Allocation Funds (2005). Mr. Greer is also a Trustee of other investment companies advised by FMR. Mr. Greer is President of the Asset Allocation Division (2008-present), President and a Director of Strategic Advisers, Inc. (2008-present), President and a Director of Fidelity Investments Money Management, Inc. (2007-present), and an Executive Vice President of FMR (2005-present). Previously, Mr. Greer served as Executive Vice President of FMR Co., Inc. (2005-2009), and as a Director and Managing Director of Strategic Advisers, Inc. (2002-2005). |
Robert P. Brown (46) |
| Year of Election or Appointment: 2010 Vice President of Fidelity's Money Market Funds. Mr. Brown also serves as President, Money Market Group of FMR (2010-present) and is an employee of Fidelity Investments. |
Scott C. Goebel (42) |
| Year of Election or Appointment: 2008 Secretary and Chief Legal Officer (CLO) of the Fidelity funds. Mr. Goebel also serves as General Counsel, Secretary, and Senior Vice President of FMR (2008-present) and FMR Co., Inc. (2008-present); Deputy General Counsel of FMR LLC; Chief Legal Officer of Fidelity Management & Research (Hong Kong) Limited (2008-present) and Assistant Secretary of Fidelity Management & Research (Japan) Inc. (2008-present), Fidelity Investments Money Management, Inc. (2008-present), Fidelity Management & Research (U.K.) Inc. (2008-present), and Fidelity Research and Analysis Company (2008-present). Previously, Mr. Goebel served as Assistant Secretary of the Funds (2007-2008) and as Vice President and Secretary of Fidelity Distributors Corporation (FDC) (2005-2007). |
Holly C. Laurent (55) |
| Year of Election or Appointment: 2008 Anti-Money Laundering (AML) Officer of the Fidelity funds. Ms. Laurent is an employee of Fidelity Investments. Previously, Ms. Laurent was Senior Vice President and Head of Legal for Fidelity Business Services India Pvt. Ltd. (2006-2008), and Senior Vice President, Deputy General Counsel and Group Head for FMR LLC (2005-2006). |
Christine Reynolds (51) |
| Year of Election or Appointment: 2008 Chief Financial Officer of the Fidelity funds. Ms. Reynolds became President of Fidelity Pricing and Cash Management Services (FPCMS) in August 2008. Ms. Reynolds served as Chief Operating Officer of FPCMS (2007-2008). Previously, Ms. Reynolds served as President, Treasurer, and Anti-Money Laundering officer of the Fidelity funds (2004-2007). |
Michael H. Whitaker (42) |
| Year of Election or Appointment: 2008 Chief Compliance Officer of Fidelity's Fixed Income and Asset Allocation Funds. Mr. Whitaker is an employee of Fidelity Investments (2007-
present). Prior to joining Fidelity Investments, Mr. Whitaker worked at MFS Investment Management where he served as Senior Vice President and Chief Compliance Officer (2004-2006), and Assistant General Counsel. |
Jeffrey S. Christian (48) |
| Year of Election or Appointment: 2009 Deputy Treasurer of the Fidelity funds. Mr. Christian is an employee of Fidelity Investments. Previously, Mr. Christian served as Chief Financial Officer (2008-2009) of certain Fidelity funds and Senior Vice President of Fidelity Pricing and Cash Management Services (FPCMS) (2004-2009). |
Bryan A. Mehrmann (48) |
| Year of Election or Appointment: 2005 Deputy Treasurer of the Fidelity funds. Mr. Mehrmann is an employee of Fidelity Investments. |
Stephanie J. Dorsey (40) |
| Year of Election or Appointment: 2008 Deputy Treasurer of Fidelity's Fixed Income and Asset Allocation Funds. Ms. Dorsey is an employee of Fidelity Investments (2008-present). Previously, Ms. Dorsey served as Treasurer (2004-2008) of the JPMorgan Mutual Funds and Vice President (2004-2008) of JPMorgan Chase Bank. |
Paul M. Murphy (62) |
| Year of Election or Appointment: 2007 Assistant Treasurer of the Fidelity funds. Mr. Murphy is an employee of Fidelity Investments. Previously, Mr. Murphy served as Chief Financial Officer of the Fidelity funds (2005-2006), Vice President and Associate General Counsel of FMR (2007), and Senior Vice President of Fidelity Pricing and Cash Management Services (FPCMS) (1994-2007). |
Kenneth B. Robins (40) |
| Year of Election or Appointment: 2009 Assistant Treasurer of the Fidelity Fixed Income and Asset Allocation Funds. Mr. Robins also serves as President and Treasurer of other Fidelity funds (2008-present; 2010-present) and is an employee of Fidelity Investments (2004-present). Previously, Mr. Robins served as Deputy Treasurer of the Fidelity funds (2005-2008) and Treasurer and Chief Financial Officer of The North Carolina Capital Management Trust: Cash and Term Portfolios (2006-2008). |
Gary W. Ryan (51) |
| Year of Election or Appointment: 2005 Assistant Treasurer of the Fidelity funds. Mr. Ryan is an employee of Fidelity Investments. Previously, Mr. Ryan served as Vice President of Fund Reporting in Fidelity Pricing and Cash Management Services (FPCMS) (1999-2005). |
Annual Report
The fund hereby designates as a capital gain dividend with respect to the taxable year ended February 28, 2010, $5,093, or, if subsequently determined to be different, the net capital gain of such year.
During the fiscal year ended 2010, 100% of the fund's income dividends was free from federal income tax, and 31.73% of the fund's income dividends was subject to the federal alternative minimum tax.
The fund will notify shareholders in January 2011 of amounts for use in preparing 2010 income tax returns.
Annual Report
A special meeting of the fund's shareholders was held on July 15, 2009. The results of votes taken among shareholders on the proposal before them are reported below. Each vote reported represents one dollar of net asset value held on the record date for the meeting.
PROPOSAL 1 |
To elect a Board of Trustees.A |
| # of
Votes | % of
Votes |
James C. Curvey |
Affirmative | 2,788,043,164.54 | 94.768 |
Withheld | 153,920,307.77 | 5.232 |
TOTAL | 2,941,963,472.31 | 100.000 |
Albert R. Gamper, Jr. |
Affirmative | 2,790,500,747.28 | 94.852 |
Withheld | 151,462,725.03 | 5.148 |
TOTAL | 2,941,963,472.31 | 100.000 |
Abigail P. Johnson |
Affirmative | 2,779,034,879.71 | 94.462 |
Withheld | 162,928,592.60 | 5.538 |
TOTAL | 2,941,963,472.31 | 100.000 |
Arthur E. Johnson |
Affirmative | 2,785,063,048.69 | 94.667 |
Withheld | 156,900,423.62 | 5.333 |
TOTAL | 2,941,963,472.31 | 100.000 |
Michael E. Kenneally |
Affirmative | 2,788,276,098.94 | 94.776 |
Withheld | 153,687,373.37 | 5.224 |
TOTAL | 2,941,963,472.31 | 100.000 |
James H. Keyes |
Affirmative | 2,791,083,278.78 | 94.871 |
Withheld | 150,880,193.53 | 5.129 |
TOTAL | 2,941,963,472.31 | 100.000 |
Marie L. Knowles |
Affirmative | 2,787,624,959.03 | 94.754 |
Withheld | 154,338,513.28 | 5.246 |
TOTAL | 2,941,963,472.31 | 100.000 |
Kenneth L. Wolfe |
Affirmative | 2,784,214,157.42 | 94.638 |
Withheld | 157,749,314.89 | 5.362 |
TOTAL | 2,941,963,472.31 | 100.000 |
A Denotes trust-wide proposal and voting results. |
Annual Report
Board Approval of Investment Advisory Contracts and Management Fees
Fidelity California Municipal Money Market Fund
Each year, the Board of Trustees, including the Independent Trustees (together, the Board), votes on the renewal of the management contract and sub-advisory agreements (together, the Advisory Contracts) for the fund. The Board, assisted by the advice of fund counsel and Independent Trustees' counsel, requests and considers a broad range of information throughout the year.
The Board meets regularly and considers at each of its meetings factors that are relevant to its annual consideration of the renewal of the fund's Advisory Contracts, including the services and support provided to the fund and its shareholders. The Board has established three standing committees, each composed of Independent Trustees with varying backgrounds, to which the Board has assigned specific subject matter responsibilities in order to enhance effective decision-making by the Board. The Operations Committee meets regularly throughout the year and, among other matters, considers matters specifically related to the annual consideration of the renewal of the fund's Advisory Contracts. The Board, acting directly and through its Committees, requests and receives information concerning the annual consideration of the renewal of the fund's Advisory Contracts. The Board also meets as needed to consider matters specifically related to the Board's annual consideration of the renewal of Advisory Contracts.
At its September 2009 meeting, the Board of Trustees, including the Independent Trustees, unanimously determined to renew the fund's Advisory Contracts. In reaching its determination, the Board considered all factors it believed relevant, including (i) the nature, extent, and quality of the services to be provided to the fund and its shareholders (including the investment performance of the fund); (ii) the competitiveness of the fund's management fee and total expenses; (iii) the total costs of the services to be provided by and the profits to be realized by Fidelity from its relationship with the fund; (iv) the extent to which economies of scale would be realized as the fund grows; and (v) whether fee levels reflect these economies of scale, if any, for the benefit of fund shareholders.
In considering whether to renew the Advisory Contracts for the fund, the Board ultimately reached a determination, with the assistance of fund counsel and Independent Trustees' counsel and through the exercise of its business judgment, that the renewal of the Advisory Contracts and the compensation to be received by Fidelity under the management contract is consistent with Fidelity's fiduciary duty under applicable law. The Board's decision to renew the Advisory Contracts was not based on any single factor noted above, but rather was based on a comprehensive consideration of all the information provided to the Board at its meetings throughout the year. The Board, in reaching its determination to renew the Advisory Contracts, is aware that shareholders in the fund have a broad range of investment choices available to them, including a wide choice among mutual funds offered by competitors to Fidelity, and that the fund's shareholders, with the opportunity to review and weigh the disclosure provided by the fund in its prospectus and other public disclosures, have chosen to invest in this fund, managed by Fidelity.
Annual Report
Nature, Extent, and Quality of Services Provided. The Board considered staffing within the investment adviser, FMR, and the sub-advisers (together, the Investment Advisers), including the backgrounds of the fund's investment personnel and the fund's investment objective and discipline. The Independent Trustees also had discussions with senior management of Fidelity's investment operations and investment groups. The Board considered the structure of the portfolio manager compensation program and whether this structure provides appropriate incentives.
Resources Dedicated to Investment Management and Support Services. The Board reviewed the size, education, and experience of the Investment Advisers' investment staff, their use of technology, and the Investment Advisers' approach to recruiting, training, and retaining portfolio managers and other research, advisory, and management personnel. In response to the recent financial crisis, Fidelity took a number of actions intended to cut costs and improve efficiency without weakening the investment teams or resources. The Board specifically noted Fidelity's response to the 2008 credit market crisis. The Board noted that Fidelity's analysts have access to a variety of technological tools and market and securities data that enable them to perform both fundamental and quantitative analysis and to specialize in various disciplines. The Board considered Fidelity's extensive global research capabilities that enable the Investment Advisers to aggregate data from various sources in an effort to produce positive investment results. The Board also considered that Fidelity's portfolio managers and analysts have access to daily portfolio attribution that allows for monitoring of a fund's portfolio, as well as an electronic communication system that provides immediate real-time access to research concerning issuers and credit enhancers. In addition, the Board considered the trading resources that are an integral part of the fixed-income portfolio management investment process.
Shareholder and Administrative Services. The Board considered (i) the nature, extent, quality, and cost of advisory, administrative, distribution, and shareholder services performed by the Investment Advisers and their affiliates under the Advisory Contracts and under separate agreements covering transfer agency and pricing and bookkeeping services for the fund; (ii) the nature and extent of the Investment Advisers' supervision of third party service providers, principally custodians and subcustodians; and (iii) the resources devoted to, and the record of compliance with, the fund's compliance policies and procedures.
The Board noted that the growth of fund assets over time across the complex allows Fidelity to reinvest in the development of services designed to enhance the value or convenience of the Fidelity funds as investment vehicles. These services include 24-hour access to account information and market information through phone representatives and over the Internet, and investor education materials and asset allocation tools.
Annual Report
Board Approval of Investment Advisory Contracts and
Management Fees - continued
Investment in a Large Fund Family. The Board considered the benefits to shareholders of investing in a Fidelity fund, including the benefits of investing in a fund that is part of a large family of funds offering a variety of investment disciplines and providing a large variety of mutual fund investor services. The Board noted that Fidelity had taken a number of actions over the previous year that benefited particular funds, including (i) dedicating additional resources to investment research and to restructure and broaden the focus of the investment research teams; (ii) bolstering the senior management team that oversees asset management; (iii) contractually agreeing to reduce the management fee on Fidelity U.S. Bond Index Fund; and (iv) expanding Class A and Class T load waiver categories to increase rollover retention opportunities and create consistent policies across the classes.
Investment Performance. The Board considered whether the fund has operated in accordance with its investment objective, as well as its record of compliance with its investment restrictions. It also reviewed the fund's absolute investment performance, as well as the fund's relative investment performance measured against a peer group of mutual funds deemed appropriate by the Board over multiple periods. The following charts considered by the Board show, over the one-, three-, and five-year periods ended December 31, 2008, the fund's cumulative total returns and a range of cumulative total returns of a peer group of mutual funds identified by Lipper Inc. as having an investment objective similar to that of the fund. The box within each chart shows the 25th percentile return (bottom of box) and the 75th percentile return (top of box) of the peer group. Returns shown above the box are in the first quartile and returns shown below the box are in the fourth quartile. The percentage beaten number noted below each chart corresponds to the percentile box and represents the percentage of funds in the peer group whose performance was equal to or lower than that of the fund.
Annual Report
Fidelity California Municipal Money Market Fund
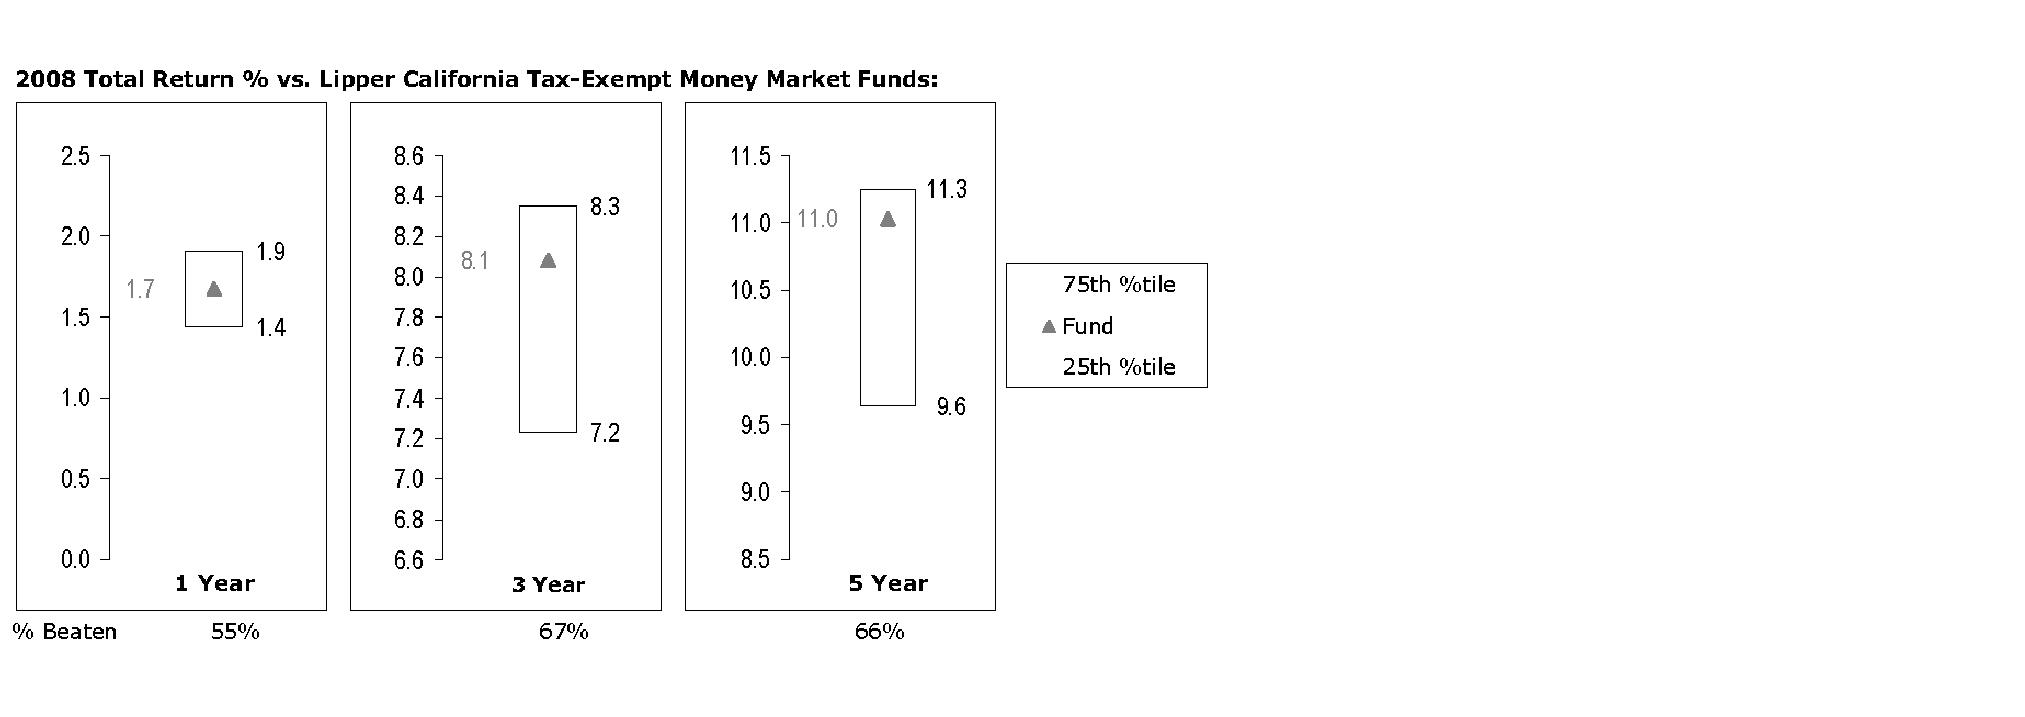
The Board reviewed the fund's relative investment performance against its peer group and stated that the performance of the fund was in the second quartile for all the periods shown. The Board also reviewed the fund's performance during 2009.
Based on its review, and giving particular weight to the nature and quality of the resources dedicated by the Investment Advisers to maintain and improve relative performance and factoring in the unprecedented recent market events, the Board concluded that the nature, extent, and quality of the services provided to the fund will benefit the fund's shareholders, particularly in light of the Board's view that the fund's shareholders benefit from investing in a fund that is part of a large family of funds offering a variety of investment disciplines and services.
Competitiveness of Management Fee and Total Fund Expenses. The Board considered the fund's management fee and total expenses compared to "mapped groups" of competitive funds and classes. Fidelity creates "mapped groups" by combining similar Lipper investment objective categories that have comparable management fee characteristics. Combining Lipper investment objective categories aids the Board's management fee and total expense comparisons by broadening the competitive group used for comparison and by reducing the number of universes to which various Fidelity funds are compared.
The Board considered two proprietary management fee comparisons for the 12-month periods shown in the chart below. The group of Lipper funds used by the Board for management fee comparisons is referred to below as the "Total Mapped Group" and, for the reasons explained above, is broader than the Lipper peer group used by the Board for performance comparisons. The Total Mapped Group comparison focuses on a fund's standing relative to the total universe of comparable funds available to investors, in terms of gross management fees before expense reimbursements or caps. "TMG %" represents the percentage of funds in the Total Mapped Group that had management fees that were lower than the fund's. For example, a TMG % of 32% means that 68% of the funds in the Total Mapped Group had higher management fees than the fund. The "Asset-Size Peer Group" (ASPG) comparison focuses on a fund's standing relative to non-Fidelity funds similar in size to the fund within the Total Mapped Group. The ASPG represents at least 15% of the funds in the Total Mapped Group with comparable asset size and management fee characteristics, subject to a minimum of 50 funds (or all funds in the Total Mapped Group if fewer than 50). Additional information, such as the ASPG quartile in which the fund's management fee ranked, is also included in the chart and considered by the Board.
Annual Report
Board Approval of Investment Advisory Contracts and
Management Fees - continued
Fidelity California Municipal Money Market Fund
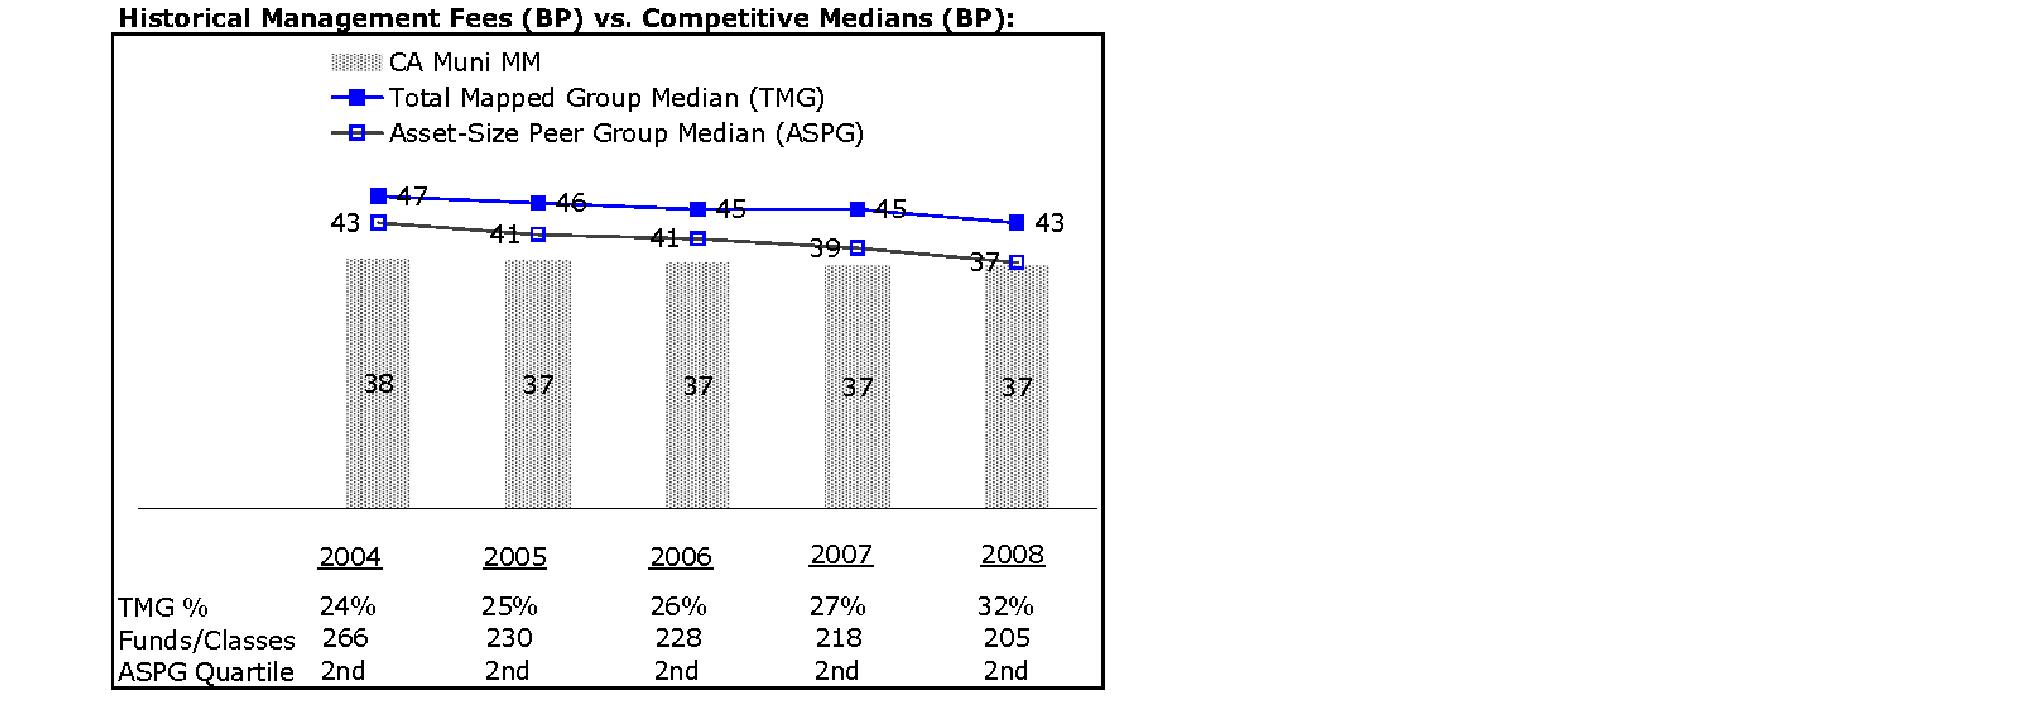
The Board noted that the fund's management fee ranked below the median of its Total Mapped Group and equal to the median of its ASPG for 2008.
Based on its review, the Board concluded that the fund's management fee was fair and reasonable in light of the services that the fund receives and the other factors considered.
In its review of the fund's total expenses, the Board considered the fund's management fee as well as other fund expenses, such as transfer agent fees, pricing and bookkeeping fees, and custodial, legal, and audit fees. The Board also noted the effects of any waivers and reimbursements on fees and expenses. As part of its review, the Board also considered current and historical total expenses of the fund compared to competitive fund median expenses. The fund is compared to those funds and classes in the Total Mapped Group (used by the Board for management fee comparisons) that have a similar sales load structure.
Annual Report
The Board noted that the fund's total expenses ranked below its competitive median for 2008. The Board considered that Fidelity has been voluntarily waiving part or all of the transfer agent fees and management fees to maintain a minimum yield for the fund.
In its review, the Board also considered Fidelity fee structures and other information on clients that FMR and its affiliates service in other competitive markets, such as other mutual funds advised or subadvised by FMR or its affiliates, pension plan clients, and other institutional clients.
Based on its review, the Board concluded that the fund's total expenses were reasonable in light of the services that the fund and its shareholders receive and the other factors considered.
Costs of the Services and Profitability. The Board considered the revenues earned and the expenses incurred by Fidelity in conducting the business of developing, marketing, distributing, managing, administering and servicing the fund and its shareholders. The Board also considered the level of Fidelity's profits in respect of all the Fidelity funds.
On an annual basis, FMR presents to the Board Fidelity's profitability for the fund. Fidelity calculates the profitability for each fund, as well as aggregate profitability for groups of Fidelity funds and all Fidelity funds, using a series of detailed revenue and cost allocation methodologies which originate with the audited books and records of Fidelity. The Audit Committee of the Board reviews any significant changes from the prior year's methodologies.
PricewaterhouseCoopers LLP (PwC), independent registered public accounting firm and auditor to Fidelity and certain Fidelity funds, has been engaged annually by the Board as part of the Board's assessment of Fidelity's profitability analysis. PwC's engagement includes the review and assessment of Fidelity's methodologies used in determining the revenues and expenses attributable to Fidelity's mutual fund business, and completion of agreed-upon procedures surrounding the mathematical accuracy of fund profitability and its conformity to allocation methodologies. After considering PwC's reports issued under the engagement and information provided by Fidelity, the Board believes that while other allocation methods may also be reasonable, Fidelity's profitability methodologies are reasonable in all material respects.
The Board has also reviewed Fidelity's non-fund businesses and any fall-out benefits related to the mutual fund business as well as cases where Fidelity's affiliates may benefit from or be related to the fund's business.
Annual Report
Board Approval of Investment Advisory Contracts and
Management Fees - continued
The Board considered the costs of the services provided by and the profits realized by Fidelity in connection with the operation of the fund and determined that the amount of profit is a fair entrepreneurial profit for the management of the fund.
Economies of Scale. The Board considered whether there have been economies of scale in respect of the management of the Fidelity funds, whether the Fidelity funds (including the fund) have appropriately benefited from any such economies of scale, and whether there is potential for realization of any further economies of scale. The Board considered the extent to which the fund will benefit from economies of scale through increased services to the fund, through waivers or reimbursements, or through fee or expense reductions.
In February 2009, the Board created an Ad Hoc Committee (the "Committee") to analyze economies of scale. The Committee was formed to consider whether FMR attains economies of scale in respect of the management and servicing of the Fidelity funds, whether the Fidelity funds have appropriately benefited from such economies of scale, and whether there is potential for realization of any further economies of scale.
The Board recognized that the fund's management contract incorporates a "group fee" structure, which provides for lower group fee rates as total fund assets under FMR's management increase, and for higher group fee rates as total fund assets under FMR's management decrease. FMR determines the group fee rates based on a tiered asset "breakpoint" schedule that varies based on asset class. The Board considered that the group fee is designed to deliver the benefits of economies of scale to fund shareholders when total fund assets increase, even if assets of any particular fund are unchanged or have declined, because some portion of Fidelity's costs are attributable to services provided to all Fidelity funds, and all funds benefit if those costs can be allocated among more assets. The Board concluded that, given the group fee structure, fund shareholders will achieve a certain level of economies of scale as assets under FMR's management increase at the fund complex level, regardless of whether Fidelity achieves any such economies of scale.
The Board concluded, considering the findings of the Committee, that any potential economies of scale are being shared between fund shareholders and Fidelity in an appropriate manner.
Additional Information Requested by the Board. In order to develop fully the factual basis for consideration of the Fidelity funds' Advisory Contracts, the Board requested and received additional information on certain topics, including (i) fund performance trends, actions to be taken by FMR to improve certain funds' overall performance and Fidelity's long-term strategies for certain funds; (ii) portfolio manager changes that have occurred during the past year; (iii) Fidelity's fund profitability methodology, the profitability of certain fund service providers, and profitability trends for certain funds; (iv) Fidelity's compensation structure for portfolio managers and key personnel, including its effects on fund profitability, and the extent to which current market conditions have affected retention and recruitment; (v) the selection of and compensation paid by FMR to fund sub-advisers; (vi) Fidelity's fee structures and rationale for recommending different fees among categories of funds; (vii) the rationale for any differences between fund fee structures and fee structures in place for other Fidelity clients; and (viii) explanations for the relative total expenses borne by certain funds and classes, total expense competitive trends, and actions that might be taken by FMR to reduce total expenses for certain funds and classes.
Annual Report
Based on its evaluation of all of the conclusions noted above, and after considering all material factors, the Board ultimately concluded that the advisory fee structures are fair and reasonable, and that the fund's Advisory Contracts should be renewed.
Annual Report
Managing Your Investments
Fidelity offers several ways to conveniently manage your personal investments via your telephone or PC. You can access your account information, conduct trades and research your investments 24 hours a day.
By Phone
Fidelity Automated Service Telephone provides a single toll-free number to access account balances, positions, quotes and trading. It's easy to navigate the service, and on your first call, the system will help you create a personal identification number (PIN) for security.
(phone_graphic)
Fidelity Automated
Service Telephone (FAST®)
1-800-544-5555
Press
 For mutual fund and brokerage trading.
 For quotes.*
 For account balances and holdings.
 To review orders and mutual
fund activity.
 To change your PIN.

 To speak to a Fidelity representative.
By PC
Fidelity's web site on the Internet provides a wide range of information, including daily financial news, fund performance, interactive planning tools and news about Fidelity products and services.
(computer_graphic)
Fidelity's Web Site
www.fidelity.com
* When you call the quotes line, please remember that a fund's yield and return will vary and, except for money market funds, share price will also vary. This means that you may have a gain or loss when you sell your shares. There is no assurance that money market funds will be able to maintain a stable $1 share price; an investment in a money market fund is not insured or guaranteed by the U.S. government. Total returns are historical and include changes in share price, reinvestment of dividends and capital gains, and the effects of any sales charges.
Annual Report
To Visit Fidelity
For directions and hours,
please call 1-800-544-9797.
Arizona
7001 West Ray Road
Chandler, AZ
15445 N. Scottsdale Road
Scottsdale, AZ
17550 North 75th Avenue
Glendale, AZ
5330 E. Broadway Blvd
Tucson, AZ
California
815 East Birch Street
Brea, CA
1411 Chapin Avenue
Burlingame, CA
851 East Hamilton Avenue
Campbell, CA
601 Larkspur Landing Circle
Larkspur, CA
2000 Avenue of the Stars
Los Angeles, CA
27101 Puerta Real
Mission Viejo, CA
73575 El Paseo
Palm Desert, CA
251 University Avenue
Palo Alto, CA
123 South Lake Avenue
Pasadena, CA
16656 Bernardo Ctr. Drive
Rancho Bernardo, CA
1220 Roseville Parkway
Roseville, CA
1740 Arden Way
Sacramento, CA
7676 Hazard Center Drive
San Diego, CA
11943 El Camino Real
San Diego, CA
8 Montgomery Street
San Francisco, CA
3793 State Street
Santa Barbara, CA
1200 Wilshire Boulevard
Santa Monica, CA
398 West El Camino Real
Sunnyvale, CA
111 South Westlake Blvd
Thousand Oaks, CA
21701 Hawthorne Boulevard
Torrance, CA
2001 North Main Street
Walnut Creek, CA
6326 Canoga Avenue
Woodland Hills, CA
2211 Michelson Drive
Irvine, CA
Colorado
281 East Flatiron Circle
Broomfield, CO
1625 Broadway
Denver, CO
9185 Westview Road
Lone Tree, CO
Connecticut
48 West Putnam Avenue
Greenwich, CT
265 Church Street
New Haven, CT
300 Atlantic Street
Stamford, CT
29 South Main Street
West Hartford, CT
1261 Post Road
Fairfield, CT
Delaware
400 Delaware Avenue
Wilmington, DE
Florida
175 East Altamonte Drive
Altamonte Springs, FL
1400 Glades Road
Boca Raton, FL
121 Alhambra Plaza
Coral Gables, FL
2948 N. Federal Highway
Ft. Lauderdale, FL
4671 Town Center Parkway
Jacksonville, FL
8880 Tamiami Trail, North
Naples, FL
230 Royal Palm Way
Palm Beach, FL
3501 PGA Boulevard
Palm Beach Gardens, FL
3550 Tamiami Trail, South
Sarasota, FL
1502 N. Westshore Blvd.
Tampa, FL
2465 State Road 7
Wellington, FL
Georgia
3242 Peachtree Road
Atlanta, GA
1000 Abernathy Road
Atlanta, GA
Illinois
One North LaSalle Street
Chicago, IL
401 North Michigan Avenue
Chicago, IL
One Skokie Valley Road
Highland Park, IL
1415 West 22nd Street
Oak Brook, IL
15105 S LaGrange Road
Orland Park, IL
1572 East Golf Road
Schaumburg, IL
1823 Freedom Drive
Naperville, IL
Indiana
8480 Keystone Crossing
Indianapolis, IN
Kansas
5400 College Boulevard
Overland Park, KS
Maine
Three Canal Plaza
Portland, ME
Maryland
7315 Wisconsin Avenue
Bethesda, MD
610 York Road
Towson, MD
Massachusetts
801 Boylston Street
Boston, MA
155 Congress Street
Boston, MA
300 Granite Street
Braintree, MA
44 Mall Road
Burlington, MA
238 Main Street
Cambridge, MA
200 Endicott Street
Danvers, MA
Annual Report
405 Cochituate Road
Framingham, MA
551 Boston Turnpike
Shrewsbury, MA
Michigan
500 E. Eisenhower Pkwy.
Ann Arbor, MI
280 N. Old Woodward Ave.
Birmingham, MI
30200 Northwestern Hwy.
Farmington Hills, MI
43420 Grand River Avenue
Novi, MI
3480 28th Street
Grand Rapids, MI
2425 S. Linden Road STE E
Flint, MI
Minnesota
7740 France Avenue South
Edina, MN
8342 3rd Street North
Oakdale, MN
Missouri
1524 South Lindbergh Blvd.
St. Louis, MO
Nevada
2225 Village Walk Drive
Henderson, NV
New Jersey
501 Route 73 South
Marlton, NJ
150 Essex Street
Millburn, NJ
35 Morris Street
Morristown, NJ
396 Route 17, North
Paramus, NJ
3518 Route 1 North
Princeton, NJ
530 Broad Street
Shrewsbury, NJ
New Mexico
2261 Q Street NE
Albuquerque, NM
New York
1130 Franklin Avenue
Garden City, NY
37 West Jericho Turnpike
Huntington Station, NY
1271 Avenue of the Americas
New York, NY
980 Madison Avenue
New York, NY
61 Broadway
New York, NY
350 Park Avenue
New York, NY
200 Fifth Avenue
New York, NY
733 Third Avenue
New York, NY
2070 Broadway
New York, NY
1075 Northern Blvd.
Roslyn, NY
799 Central Park Avenue
Scarsdale, NY
3349 Monroe Avenue
Rochester, NY
North Carolina
4611 Sharon Road
Charlotte, NC
7011 Fayetteville Road
Durham, NC
Ohio
3805 Edwards Road
Cincinnati, OH
1324 Polaris Parkway
Columbus, OH
1800 Crocker Road
Westlake, OH
28699 Chagrin Boulevard
Woodmere Village, OH
Oregon
7493 SW Bridgeport Road
Tigard, OR
Pennsylvania
600 West DeKalb Pike
King of Prussia, PA
1735 Market Street
Philadelphia, PA
12001 Perry Highway
Wexford, PA
Rhode Island
10 Memorial Boulevard
Providence, RI
Tennessee
3018 Peoples Street
Johnson City, TN
7628 West Farmington Blvd.
Germantown, TN
2035 Mallory Lane
Franklin, TN
Texas
10000 Research Boulevard
Austin, TX
4001 Northwest Parkway
Dallas, TX
12532 Memorial Drive
Houston, TX
2701 Drexel Drive
Houston, TX
6560 Fannin Street
Houston, TX
1701 Lake Robbins Drive
The Woodlands, TX
6500 N. MacArthur Blvd.
Irving, TX
6005 West Park Boulevard
Plano, TX
1576 East Southlake Blvd.
Southlake, TX
15600 Southwest Freeway
Sugar Land, TX
139 N. Loop 1604 East
San Antonio, TX
Utah
279 West South Temple
Salt Lake City, UT
Virginia
1861 International Drive
McLean, VA
11957 Democracy Drive
Reston, VA
Washington
10500 NE 8th Street
Bellevue, WA
1518 6th Avenue
Seattle, WA
304 Strander Blvd
Tukwila, WA
Washington, DC
1900 K Street, N.W.
Washington, DC
Wisconsin
16020 West Bluemound Road
Brookfield, WI
Fidelity Brokerage Services, Inc., 100 Summer St., Boston, MA 02110 Member NYSE/SIPC
Annual Report
Investment Adviser
Fidelity Management & Research
Company
Boston, MA
Investment Sub-Advisers
Fidelity Investments Money
Management, Inc.
FIL Investment Advisors
FIL Investment Advisors
(U.K.) Ltd.
Fidelity Management &
Research (Japan) Inc.
Fidelity Management &
Research (Hong Kong) Limited
Fidelity Management &
Research Company (U.K.) Inc.
Fidelity Research & Analysis Company
General Distributor
Fidelity Distributors Corporation
Boston, MA
Transfer and Service Agents
Citibank, N.A.
New York, NY
Fidelity Investments Institutional Operations Company, Inc.
Boston, MA
Fidelity Service Company, Inc.
Boston, MA
Custodian
Citibank, N.A.
New York, NY
The Fidelity Telephone Connection
Mutual Fund 24-Hour Service
Exchanges/Redemptions
and Account Assistance 1-800-544-6666
Product Information 1-800-544-6666
Retirement Accounts 1-800-544-4774 (8 a.m. - 9 p.m.)
TDD Service 1-800-544-0118
for the deaf and hearing impaired
(9 a.m. - 9 p.m. Eastern time)
Fidelity Automated Service
Telephone (FAST®) 1-800-544-5555
Automated line for quickest service
CFS-UANN-0410
1.855630.102
Item 2. Code of Ethics
As of the end of the period, February 28, 2010, Fidelity California Municipal Trust II (the trust) has adopted a code of ethics, as defined in Item 2 of Form N-CSR, that applies to its President and Treasurer and its Chief Financial Officer. A copy of the code of ethics is filed as an exhibit to this Form N-CSR.
Item 3. Audit Committee Financial Expert
The Board of Trustees of the trust has determined that Marie L. Knowles is an audit committee financial expert, as defined in Item 3 of Form N-CSR. Ms. Knowles is independent for purposes of Item 3 of Form N-CSR.
Item 4. Principal Accountant Fees and Services
Fees and Services
The following table presents fees billed by PricewaterhouseCoopers LLP ("PwC") in each of the last two fiscal years for services rendered to Fidelity California AMT Tax-Free Money Market Fund and Fidelity California Municipal Money Market Fund (the "Funds"):
Services Billed by PwC
February 28, 2010 FeesA
| Audit Fees | Audit-Related Fees | Tax Fees | All Other Fees |
Fidelity California AMT Tax-Free Money Market Fund | $46,000 | $- | $2,000 | $3,300 |
Fidelity California Municipal Money Market Fund | $46,000 | $- | $2,000 | $5,000 |
February 28, 2009 FeesA
| Audit Fees | Audit-Related Fees | Tax Fees | All Other Fees |
Fidelity California AMT Tax-Free Money Market Fund | $52,000 | $- | $2,000 | $4,800 |
Fidelity California Municipal Money Market Fund | $50,000 | $- | $2,000 | $5,600 |
A Amounts may reflect rounding.
The following table presents fees billed by PwC that were required to be approved by the Audit Committee for services that relate directly to the operations and financial reporting of the Funds and that are rendered on behalf of Fidelity Management & Research Company ("FMR") and entities controlling, controlled by, or under common control with FMR (not including any sub-adviser whose role is primarily portfolio management and is subcontracted with or overseen by another investment adviser) that provide ongoing services to the Funds ("Fund Service Providers"):
Services Billed by PwC
| February 28, 2010A | February 28, 2009A |
Audit-Related Fees | $2,250,000 | $2,985,000 |
Tax Fees | $- | $2,000 |
All Other Fees | $- | $- |
A Amounts may reflect rounding.
"Audit-Related Fees" represent fees billed for assurance and related services that are reasonably related to the performance of the fund audit or the review of the fund's financial statements and that are not reported under Audit Fees.
"Tax Fees" represent fees billed for tax compliance, tax advice or tax planning that relate directly to the operations and financial reporting of the fund.
"All Other Fees" represent fees billed for assurance services provided to the fund or Fund Service Provider that relate directly to the operations and financial reporting of the fund, excluding those services that are reported under Audit Fees, Audit-Related Fees or Tax Fees.
Assurance services must be performed by an independent public accountant.
* * *
The aggregate non-audit fees billed by PwC for services rendered to the Funds, FMR (not including any sub-adviser whose role is primarily portfolio management and is subcontracted with or overseen by another investment adviser), and any Fund Service Provider for each of the last two fiscal years of the Funds are as follows:
Billed By | February 28, 2010 A | February 28, 2009 A,B |
PwC | $4,295,000 | $3,625,000 |
A Amounts may reflect rounding.
B Reflects current period presentation.
The trust's Audit Committee has considered non-audit services that were not pre-approved that were provided by PwC to Fund Service Providers to be compatible with maintaining the independence of PwC in its audit of the Funds, taking into account representations from PwC, in accordance with Public Company Accounting Oversight Board rules, regarding its independence from the Funds and their related entities and FMR's review of the appropriateness and permissibility under applicable law of such non-audit services prior to their provision to the Fund Service Providers.
Audit Committee Pre-Approval Policies and Procedures
The trust's Audit Committee must pre-approve all audit and non-audit services provided by a fund's independent registered public accounting firm relating to the operations or financial reporting of the fund. Prior to the commencement of any audit or non-audit services to a fund, the Audit Committee reviews the services to determine whether they are appropriate and permissible under applicable law.
The Audit Committee has adopted policies and procedures to, among other purposes, provide a framework for the Committee's consideration of non-audit services by the audit firms that audit the Fidelity funds. The policies and procedures require that any non-audit service provided by a fund audit firm to a Fidelity fund and any non-audit service provided by a fund auditor to a Fund Service Provider that relates directly to the operations and financial reporting of a Fidelity fund ("Covered Service") are subject to approval by the Audit Committee before such service is provided.
All Covered Services must be approved in advance of provision of the service either: (i) by formal resolution of the Audit Committee, or (ii) by oral or written approval of the service by the Chair of the Audit Committee (or if the Chair is unavailable, such other member of the Audit Committee as may be designated by the Chair to act in the Chair's absence). The approval contemplated by (ii) above is permitted where the Treasurer determines that action on such an engagement is necessary before the next meeting of the Audit Committee.
Non-audit services provided by a fund audit firm to a Fund Service Provider that do not relate directly to the operations and financial reporting of a Fidelity fund are reported to the Audit Committee on a periodic basis.
Non-Audit Services Approved Pursuant to Rule 2-01(c)(7)(i)(C) and (ii) of Regulation S-X ("De Minimis Exception")
There were no non-audit services approved or required to be approved by the Audit Committee pursuant to the De Minimis Exception during the Funds' last two fiscal years relating to services provided to (i) the Funds or (ii) any Fund Service Provider that relate directly to the operations and financial reporting of the Funds.
Item 5. Audit Committee of Listed Registrants
Not applicable.
Item 6. Investments
(a) Not applicable.
(b) Not applicable
Item 7. Disclosure of Proxy Voting Policies and Procedures for Closed-End Management Investment Companies
Not applicable.
Item 8. Portfolio Managers of Closed-End Management Investment Companies
Not applicable.
Item 9. Purchase of Equity Securities by Closed-End Management Investment Company and Affiliated Purchasers
Not applicable.
Item 10. Submission of Matters to a Vote of Security Holders
There were no material changes to the procedures by which shareholders may recommend nominees to the trust's Board of Trustees.
Item 11. Controls and Procedures
(a)(i) The President and Treasurer and the Chief Financial Officer have concluded that the trust's disclosure controls and procedures (as defined in Rule 30a-3(c) under the Investment Company Act) provide reasonable assurances that material information relating to the trust is made known to them by the appropriate persons, based on their evaluation of these controls and procedures as of a date within 90 days of the filing date of this report.
(a)(ii) There was no change in the trust's internal control over financial reporting (as defined in Rule 30a-3(d) under the Investment Company Act) that occurred during the second fiscal quarter of the period covered by this report that has materially affected, or is reasonably likely to materially affect, the trust's internal control over financial reporting.
Item 12. Exhibits
(a) | (1) | Code of Ethics pursuant to Item 2 of Form N-CSR is filed and attached hereto as EX-99.CODE ETH. |
(a) | (2) | Certification pursuant to Rule 30a-2(a) under the Investment Company Act of 1940 (17 CFR 270.30a-2(a)) is filed and attached hereto as Exhibit 99.CERT. |
(a) | (3) | Not applicable. |
(b) | | Certification pursuant to Rule 30a-2(b) under the Investment Company Act of 1940 (17 CFR 270.30a-2(b)) is furnished and attached hereto as Exhibit 99.906CERT. |
SIGNATURES
Pursuant to the requirements of the Securities Exchange Act of 1934 and the Investment Company Act of 1940, the registrant has duly caused this report to be signed on its behalf by the undersigned, thereunto duly authorized.
Fidelity California Municipal Trust II
By: | /s/John R. Hebble |
| John R. Hebble |
| President and Treasurer |
| |
Date: | April 27, 2010 |
Pursuant to the requirements of the Securities Exchange Act of 1934 and the Investment Company Act of 1940, this report has been signed below by the following persons on behalf of the registrant and in the capacities and on the dates indicated.
By: | /s/John R. Hebble |
| John R. Hebble |
| President and Treasurer |
| |
Date: | April 27, 2010 |
By: | /s/Christine Reynolds |
| Christine Reynolds |
| Chief Financial Officer |
| |
Date: | April 27, 2010 |