UNITED STATES
SECURITIES AND EXCHANGE COMMISSION
Washington, D.C. 20549
FORM N-CSR
CERTIFIED SHAREHOLDER REPORT OF REGISTERED
MANAGEMENT INVESTMENT COMPANIES
Investment Company Act file number 811-6397
Fidelity California Municipal Trust II
(Exact name of registrant as specified in charter)
82 Devonshire St., Boston, Massachusetts 02109
(Address of principal executive offices) (Zip code)
Scott C. Goebel, Secretary
82 Devonshire St.
Boston, Massachusetts 02109
(Name and address of agent for service)
Registrant's telephone number, including area code: 617-563-7000
Date of fiscal year end: | February 29 |
| |
Date of reporting period: | February 29, 2012 |
Item 1. Reports to Stockholders
Fidelity® California
Municipal Money Market
Fund
Annual Report
February 29, 2012
(Fidelity Cover Art)
Contents
Shareholder Expense Example | (Click Here) | An example of shareholder expenses. |
Investment Changes/
Performance | (Click Here) | A summary of major shifts in the fund's investments over the past six months. |
Investments | (Click Here) | A complete list of the fund's investments with their market values. |
Financial Statements | (Click Here) | Statements of assets and liabilities, operations, and changes in net assets,
as well as financial highlights. |
Notes | (Click Here) | Notes to the financial statements. |
Report of Independent Registered Public Accounting Firm | (Click Here) | |
Trustees and Officers | (Click Here) | |
Distributions | (Click Here) | |
Board Approval of Investment Advisory Contracts and Management Fees | (Click Here) | |
To view a fund's proxy voting guidelines and proxy voting record for the 12-month period ended June 30, visit http://www.fidelity.com/proxyvotingresults or visit the Securities and Exchange Commission's (SEC) web site at http://www.sec.gov. You may also call 1-800-544-8544 to request a free copy of the proxy voting guidelines.
Standard & Poor's, S&P and S&P 500 are registered service marks of The McGraw-Hill Companies, Inc. and have been licensed for use by Fidelity Distributors Corporation.
Other third party marks appearing herein are the property of their respective owners.
All other marks appearing herein are registered or unregistered trademarks or service marks of FMR LLC or an affiliated company.
Annual Report
This report and the financial statements contained herein are submitted for the general information of the shareholders of the fund. This report is not authorized for distribution to prospective investors in the fund unless preceded or accompanied by an effective prospectus.
A fund files its complete schedule of portfolio holdings with the SEC for the first and third quarters of each fiscal year on Form N-Q. Forms N-Q are available on the SEC's web site at http://www.sec.gov. A fund's Forms N-Q may be reviewed and copied at the SEC's Public Reference Room in Washington, DC. Information regarding the operation of the SEC's Public Reference Room may be obtained by calling 1-800-SEC-0330. For a complete list of a fund's portfolio holdings, view the most recent holdings listing, semiannual report, or annual report on Fidelity's web site at http://www.fidelity.com, http://www.advisor.fidelity.com, or http://www.401k.com, as applicable.
NOT FDIC INSURED • MAY LOSE VALUE • NO BANK GUARANTEE
Neither the fund nor Fidelity Distributors Corporation is a bank.
Annual Report
Shareholder Expense Example
As a shareholder of the Fund, you incur two types of costs: (1) transaction costs, and (2) ongoing costs, including management fees and other Fund expenses. This Example is intended to help you understand your ongoing costs (in dollars) of investing in the Fund and to compare these costs with the ongoing costs of investing in other mutual funds.
The Example is based on an investment of $1,000 invested at the beginning of the period and held for the entire period (September 1, 2011 to February 29, 2012).
Actual Expenses
The first line of the accompanying table provides information about actual account values and actual expenses. You may use the information in this line, together with the amount you invested, to estimate the expenses that you paid over the period. Simply divide your account value by $1,000.00 (for example, an $8,600 account value divided by $1,000.00 = 8.6), then multiply the result by the number in the first line under the heading entitled "Expenses Paid During Period" to estimate the expenses you paid on your account during this period. A small balance maintenance fee of $12.00 that is charged once a year may apply for certain accounts with a value of less than $2,000. This fee is not included in the table below. If it was, the estimate of expenses you paid during the period would be higher, and your ending account value lower, by this amount. In addition, the Fund, as a shareholder in the underlying Fidelity Central Funds, will indirectly bear its pro-rata share of the fees and expenses incurred by the underlying Fidelity Central Funds. These fees and expenses are not included in the Fund's annualized expense ratio used to calculate the expense estimate in the table below.
Hypothetical Example for Comparison Purposes
The second line of the accompanying table provides information about hypothetical account values and hypothetical expenses based on the Fund's actual expense ratio and an assumed rate of return of 5% per year before expenses, which is not the Fund's actual return. The hypothetical account values and expenses may not be used to estimate the actual ending account balance or expenses you paid for the period. You may use this information to compare the ongoing costs of investing in the Fund and other funds. To do so, compare this 5% hypothetical example with the 5% hypothetical examples that appear in the shareholder reports of the other funds. A small balance maintenance fee of $12.00 that is charged once a year may apply for certain accounts with a value of less than $2,000. This fee is not included in the table below. If it was, the estimate of expenses you paid during the period would be higher, and your ending account value lower, by this amount. In addition, the Fund, as a shareholder in the underlying Fidelity Central Funds, will indirectly bear its pro-rata share of the fees and expenses incurred by the underlying Fidelity Central Funds. These fees and expenses are not included in the Fund's annualized expense ratio used to calculate the expense estimate in the table below.
Please note that the expenses shown in the table are meant to highlight your ongoing costs only and do not reflect any transaction costs. Therefore, the second line of the table is useful in comparing ongoing costs only, and will not help you determine the relative total costs of owning different funds.
Annual Report
| Annualized Expense Ratio | Beginning
Account Value
September 1, 2011 | Ending
Account Value
February 29, 2012 | Expenses Paid
During Period*
September 1, 2011 to
February 29, 2012 |
Actual | .17% | $ 1,000.00 | $ 1,000.05 | $ .85** |
Hypothetical (5% return per year before expenses) | | $ 1,000.00 | $ 1,024.02 | $ .86** |
* Expenses are equal to the Fund's annualized expense ratio, multiplied by the average account value over the period, multiplied by 182/366 (to reflect the one-half year period).
** If certain fees were not voluntarily waived by FMR or its affiliates during the period, the annualized expense ratio for the Fund would have been .51% and the expenses paid in the actual and hypothetical examples above would have been $2.53 and $2.56, respectively.
Annual Report
Investment Changes/Performance (Unaudited)
Effective Maturity Diversification |
Days | % of fund's investments 2/29/12 | % of fund's investments 8/31/11 | % of fund's
investments 2/28/11 |
1 - 7 | 68.5 | 67.3 | 73.9 |
8 - 30 | 8.7 | 4.4 | 4.5 |
31 - 60 | 4.1 | 6.3 | 5.6 |
61 - 90 | 3.1 | 4.5 | 3.5 |
91 - 180 | 11.2 | 4.4 | 11.3 |
> 180 | 4.4 | 13.1 | 1.2 |
Effective maturity is determined in accordance with the requirements of Rule 2a-7 under the Investment Company Act of 1940. |
Weighted Average Maturity |
| 2/29/12 | 8/31/11 | 2/28/11 |
Fidelity California Municipal Money Market | 36 Days | 48 Days | 28 Days |
California Tax-Free Money Market
Funds Average* | 30 Days | 36 Days | 26 Days |
This is a weighted average of all the maturities of the securities held in a fund. Weighted Average Maturity (WAM) can be used as a measure of sensitivity to interest rate changes and market changes. Generally, the longer the maturity, the greater the sensitivity to such changes. WAM is based on the dollar-weighted average length of time until principal payments must be paid. Depending on the types of securities held in a fund, certain maturity shortening devices (e.g., demand features, interest rate resets, and call options) may be taken into account when calculating the WAM. |
Weighted Average Life |
| 2/29/12 | 8/31/11 | 2/28/11 |
Fidelity California Municipal Money Market | 36 Days | 48 Days | 28 Days |
Weighted Average Life (WAL) is the weighted average of the life of the securities held in a fund or portfolio and can be used as a measure of sensitivity to changes in liquidity and/or credit risk. Generally, the higher the value, the greater the sensitivity. WAL is based on the dollar-weighted average length of time until principal payments must be paid, taking into account any call options exercised by the issuer and any permissible maturity shortening features other than interest rate resets. The difference between WAM and WAL is that WAM takes into account interest rate resets and WAL does not. WAL for money market funds is not the same as WAL of a mortgage- or asset-backed security. |
Asset Allocation (% of fund's net assets) |
As of February 29, 2012 | As of August 31, 2011 |
 | Variable Rate Demand Notes (VRDNs) 60.3% | | | Variable Rate Demand Notes (VRDNs) 62.5% | |
 | Commercial Paper
(including CP Mode) 14.5% | | | Commercial Paper
(including CP Mode) 16.6% | |
 | Tender Bonds 3.2% | | | Tender Bonds 2.9% | |
 | Municipal Notes 15.3% | | | Municipal Notes 14.2% | |
 | Fidelity Municipal
Cash Central Fund 5.8% | | | Fidelity Municipal
Cash Central Fund 2.8% | |
 | Other Investments 3.9% | | | Other Investments 1.3% | |
 | Net Other Assets** (3.0)% | |  | Net Other Assets** (0.3)% | |

* Source: iMoneyNet, Inc.
** Net Other Assets are not included in the pie chart.
Annual Report
Current and Historical Seven-Day Yields |
| 2/29/12 | 11/28/11 | 8/29/11 | 5/30/11 | 2/28/11 |
California Municipal Money Market Fund | 0.01% | 0.01% | 0.01% | 0.01% | 0.01% |
Yield refers to the income paid by the fund over a given period. Yields for money market funds are usually for seven-day periods, as they are here, though they are expressed as annual percentage rates. Past performance is no guarantee of future results. Yield will vary and it's possible to lose money investing in the Fund. A portion of the Fund's expenses was reimbursed and/or waived. Absent such reimbursements and/or waivers the yield for the period ending February 29, 2012, the most recent period shown in the table, would have been -0.35%.
Annual Report
Investments February 29, 2012
Showing Percentage of Net Assets
Municipal Securities - 103.0% |
| Principal Amount (000s) | | Value (000s) |
California - 93.0% |
ABAG Fin. Auth. for Nonprofit Corps. Multi-family Hsg. Rev.: | | | |
(Acton Courtyard Apts. Proj.) Series 2010 A, 0.16% 3/7/12, LOC Freddie Mac, VRDN (c)(f) | $ 8,620 | | $ 8,620 |
(La Terrazza Apts. Proj.) Series 2002 A, 0.15% 3/7/12, LOC Fannie Mae Guaranteed Mtg. pass-thru certificates, VRDN (c)(f) | 8,585 | | 8,585 |
(Miramar Apts. Proj.) Series 2000 A, 0.13% 3/7/12, LOC Fannie Mae Guaranteed Mtg. pass-thru certificates, VRDN (c)(f) | 8,400 | | 8,400 |
(The Artech Bldg. Proj.) Series 2010 B, 0.16% 3/7/12, LOC Freddie Mac, VRDN (c)(f) | 3,200 | | 3,200 |
(Vintage Chateau Proj.) Series A, 0.16% 3/7/12, LOC Union Bank of California, VRDN (c)(f) | 10,700 | | 10,700 |
ABAG Fin. Auth. for Nonprofit Corps. Rev.: | | | |
(Eskaton Properties, Inc. Proj.) Series 2008 B, 0.16% 3/7/12, LOC U.S. Bank NA, Cincinnati, VRDN (c) | 14,900 | | 14,900 |
(Schools of the Sacred Heart - San Francisco Proj.): | | | |
Series 2008 A, 0.28% 3/7/12, LOC Bank of America NA, VRDN (c) | 7,105 | | 7,105 |
Series 2008 B, 0.28% 3/7/12, LOC Bank of America NA, VRDN (c) | 5,315 | | 5,315 |
Acalanes Union High School District Bonds Series WF11 85Z, 0.2%, tender 7/25/12 (Liquidity Facility Wells Fargo Bank NA) (c)(g)(h) | 10,525 | | 10,525 |
Alameda County Joint Powers Auth. Lease Rev. Series 2010 A, 0.17% 4/13/12, LOC Fed. Home Ln. Bank, San Francisco, CP | 5,700 | | 5,700 |
Bay Area Toll Auth. San Francisco Bay Toll Bridge Rev. Participating VRDN: | | | |
Series BA 08 1058, 0.26% 3/7/12 (Liquidity Facility Bank of America NA) (c)(g) | 2,250 | | 2,250 |
Series EGL 07 0053, 0.16% 3/7/12 (Liquidity Facility Citibank NA) (c)(g) | 10,395 | | 10,395 |
Series II R 11901, 0.16% 3/7/12 (Liquidity Facility Citibank NA) (c)(g) | 1,300 | | 1,300 |
Series Putters 3211, 0.16% 3/7/12 (Liquidity Facility JPMorgan Chase Bank) (c)(g) | 13,320 | | 13,320 |
Series Putters 3293, 0.16% 3/7/12 (Liquidity Facility JPMorgan Chase Bank) (c)(g) | 4,995 | | 4,995 |
Series Putters 3434, 0.16% 3/7/12 (Liquidity Facility JPMorgan Chase Bank) (c)(g) | 4,195 | | 4,195 |
Series ROC II R 11453, 0.16% 3/7/12 (Liquidity Facility Citibank NA) (c)(g) | 5,000 | | 5,000 |
Municipal Securities - continued |
| Principal Amount (000s) | | Value (000s) |
California - continued |
Belmont-Redwood Shores School District Bonds Series WF 11 10, 0.2%, tender 7/25/12 (Liquidity Facility Wells Fargo Bank NA) (c)(g)(h) | $ 10,350 | | $ 10,350 |
Bueno Park Multi-family Hsg. Rev. (Walden Glen Apts. Proj.) Series 2000 A, 0.14% 3/7/12, LOC Fannie Mae Guaranteed Mtg. pass-thru certificates, VRDN (c)(f) | 14,288 | | 14,288 |
California Cmnty. College Fin. Auth. Trans. TRAN Series A, 2% 6/29/12 | 52,200 | | 52,473 |
California Dept. of Wtr. Resources Bonds (Central Valley Proj.) Series AF, 5% 12/1/12 | 1,000 | | 1,036 |
California Dept. of Wtr. Resources Pwr. Supply Rev. Bonds: | | | |
Series 2002 A, 5.5% 5/1/12 | 1,750 | | 1,765 |
Series 2010 L, 2% 5/1/12 | 1,000 | | 1,003 |
Series A, 5.5% 5/1/12 | 1,000 | | 1,009 |
Series L, 5% 5/1/12 | 18,700 | | 18,845 |
California Dept. of Wtr. Resources Wtr. Rev. Participating VRDN: | | | |
Series BA 08 3031X, 0.26% 3/7/12 (Liquidity Facility Bank of America NA) (c)(g) | 3,500 | | 3,500 |
Series BBT 08 28, 0.15% 3/7/12 (Liquidity Facility Branch Banking & Trust Co.) (c)(g) | 7,190 | | 7,190 |
Series Putters 3019, 0.16% 3/7/12 (Liquidity Facility JPMorgan Chase Bank) (c)(g) | 9,785 | | 9,785 |
Series Putters 3361, 0.16% 3/7/12 (Liquidity Facility JPMorgan Chase Bank) (c)(g) | 4,570 | | 4,570 |
California Econ. Dev. Fing. Auth. Rev. (KQED, Inc. Proj.) Series 1996, 0.25% 3/7/12, LOC Wells Fargo Bank NA, VRDN (c) | 1,665 | | 1,665 |
California Econ. Recovery Bonds: | | | |
Series 2004 A, 5.25% 7/1/12 | 13,535 | | 13,759 |
Series 2009 A: | | | |
2.5% 7/1/12 | 2,000 | | 2,015 |
5% 7/1/12 | 4,790 | | 4,865 |
California Ed. Notes Prog. TRAN Series B, 2% 4/30/12 | 7,700 | | 7,721 |
California Edl. Facilities Auth. Rev.: | | | |
(Univ. of San Francisco Proj.): | | | |
Series 2000, 0.12% 3/7/12, LOC JPMorgan Chase Bank, VRDN (c) | 9,000 | | 9,000 |
Series 2005 B, 0.1% 3/7/12, LOC JPMorgan Chase Bank, VRDN (c) | 1,690 | | 1,690 |
Participating VRDN: | | | |
Series BA 08 1207, 0.22% 3/7/12 (Liquidity Facility Bank of America NA) (c)(g) | 6,670 | | 6,670 |
Municipal Securities - continued |
| Principal Amount (000s) | | Value (000s) |
California - continued |
California Edl. Facilities Auth. Rev.: - continued | | | |
Participating VRDN: | | | |
Series Floaters 08 38C, 0.16% 3/7/12 (Liquidity Facility Wells Fargo & Co.) (c)(g) | $ 8,820 | | $ 8,820 |
Series Putters 3960, 0.16% 3/7/12 (Liquidity Facility JPMorgan Chase Bank) (c)(g) | 7,330 | | 7,330 |
Series Putters 3962, 0.16% 3/7/12 (Liquidity Facility JPMorgan Chase Bank) (c)(g) | 4,345 | | 4,345 |
Series Putters 3969, 0.16% 3/7/12 (Liquidity Facility JPMorgan Chase Bank) (c)(g) | 6,665 | | 6,665 |
Series ROC II R 11974, 0.16% 3/7/12 (Liquidity Facility Citibank NA) (c)(g) | 3,500 | | 3,500 |
Series WF 10 54C, 0.16% 3/7/12 (Liquidity Facility Wells Fargo Bank NA) (c)(g) | 7,145 | | 7,145 |
Series WF11 59 C, 0.16% 3/7/12 (Liquidity Facility Wells Fargo Bank NA) (c)(g) | 4,735 | | 4,735 |
Series 2003: | | | |
0.08% 3/16/12, CP | 21,600 | | 21,600 |
0.14% 4/20/12, CP | 12,400 | | 12,400 |
Series 2008 S3, 0.23% 7/26/12, CP | 35,300 | | 35,300 |
Series 2010 S4, 0.22% 3/22/12, CP | 42,800 | | 42,800 |
California Enterprise Dev. Auth. (Frank-Lin Distillers Products, Ltd. Proj.) Series 2010, 0.17% 3/7/12, LOC Wells Fargo Bank NA, VRDN (c) | 9,835 | | 9,835 |
California Gen. Oblig.: | | | |
Bonds: | | | |
2% 3/1/12 | 51,900 | | 51,900 |
2% 9/1/12 | 35,800 | | 36,086 |
4% 4/1/12 | 1,000 | | 1,003 |
4.5% 6/1/12 | 11,000 | | 11,115 |
5% 3/1/12 | 1,000 | | 1,000 |
5.25% 4/1/12 (Pre-Refunded to 4/1/12 @ 100) | 1,830 | | 1,838 |
5.5% 4/1/12 | 6,000 | | 6,026 |
Series 2003 B1, 0.11% 3/7/12, LOC JPMorgan Chase Bank, LOC California Pub. Employees Retirement Sys., VRDN (c) | 54,000 | | 54,000 |
Series 2003 C1, 0.14% 3/7/12, LOC Bank of America NA, VRDN (c) | 4,400 | | 4,400 |
Series 2003 C4, 0.15% 3/7/12, LOC Citibank NA, VRDN (c) | 5,000 | | 5,000 |
Series 2004 A4, 0.15% 3/1/12, LOC Citibank NA, LOC California Teachers Retirement Sys., VRDN (c) | 5,000 | | 5,000 |
Series 2004 A7, 0.19% 3/7/12, LOC Citibank NA, LOC California Teachers Retirement Sys., VRDN (c) | 64,960 | | 64,960 |
Municipal Securities - continued |
| Principal Amount (000s) | | Value (000s) |
California - continued |
California Gen. Oblig.: - continued | | | |
Series 2004 A9, 0.14% 3/7/12, LOC State Street Bank & Trust Co., Boston, LOC California Teachers Retirement Sys., VRDN (c) | $ 16,500 | | $ 16,500 |
Series 2004 B5, 0.13% 3/7/12, LOC Citibank NA, VRDN (c) | 1,900 | | 1,900 |
Series 2005 A3, 0.14% 3/7/12, LOC Bank of America NA, VRDN (c) | 15,000 | | 15,000 |
California Health Facilities Fing. Auth. Rev.: | | | |
(Catholic Healthcare West Proj.) Series 2004 K, 0.16% 3/7/12, LOC Bank of America NA, VRDN (c) | 10,000 | | 10,000 |
(Children's Hosp. Los Angeles Proj.) Series 2010 B, 0.2% 3/1/12, LOC Bank of America NA, VRDN (c) | 23,275 | | 23,275 |
(Scripps Health Proj.): | | | |
Series 2008 C, 0.12% 3/7/12, LOC Union Bank of California, VRDN (c) | 13,100 | | 13,100 |
Series 2008 D, 0.13% 3/7/12, LOC Bank of America NA, VRDN (c) | 13,125 | | 13,125 |
(Scripps Memorial Hosp. Proj.) Series 2008 G, 0.13% 3/7/12, LOC Bank of America NA, VRDN (c) | 3,700 | | 3,700 |
Bonds: | | | |
(Stanford Hosp. & Clinics Proj.): | | | |
Series 2008 B2, 0.13%, tender 7/18/12 (c) | 14,050 | | 14,050 |
Series 2008 B2-2, 0.23%, tender 6/7/12 (c) | 4,000 | | 4,000 |
Series 2011, 1.5% 8/15/12 | 7,700 | | 7,737 |
Participating VRDN: | | | |
Series MS 3248, 0.26% 3/7/12 (Liquidity Facility Morgan Stanley Bank, West Valley City Utah) (c)(g) | 23,000 | | 23,000 |
Series MS 3267, 0.26% 3/7/12 (Liquidity Facility Morgan Stanley Bank, West Valley City Utah) (c)(g) | 33,375 | | 33,375 |
Series Putters 3630, 0.16% 3/7/12 (Liquidity Facility JPMorgan Chase Bank) (c)(g) | 4,665 | | 4,665 |
Series Putters 3878 Q, 0.16% 3/7/12 (Liquidity Facility JPMorgan Chase Bank) (c)(g) | 2,000 | | 2,000 |
Series Putters 4039, 0.16% 3/7/12 (Liquidity Facility JPMorgan Chase Bank) (c)(g) | 3,000 | | 3,000 |
Series ROC II R 11952, 0.16% 3/7/12 (Liquidity Facility Citibank NA) (c)(g) | 4,980 | | 4,980 |
California Hsg. Fin. Agcy. Multifamily Hsg. Rev.: | | | |
Series 2006 A, 0.15% 3/7/12 (Liquidity Facility Fannie Mae Guaranteed Mtg. pass-thru certificates) (Liquidity Facility Freddie Mac), VRDN (c)(f) | 12,685 | | 12,685 |
Municipal Securities - continued |
| Principal Amount (000s) | | Value (000s) |
California - continued |
California Hsg. Fin. Agcy. Multifamily Hsg. Rev.: - continued | | | |
Series 2008 C: | | | |
0.12% 3/7/12 (Liquidity Facility Fannie Mae Guaranteed Mtg. pass-thru certificates) (Liquidity Facility Freddie Mac), VRDN (c)(f) | $ 5,800 | | $ 5,800 |
0.12% 3/7/12 (Liquidity Facility Fannie Mae Guaranteed Mtg. pass-thru certificates) (Liquidity Facility Freddie Mac), VRDN (c)(f) | 2,505 | | 2,505 |
California Hsg. Fin. Agcy. Rev.: | | | |
(Home Mtg. Prog.): | | | |
Series 2000 N, 0.1% 3/7/12 (Liquidity Facility Fannie Mae Guaranteed Mtg. pass-thru certificates) (Liquidity Facility Freddie Mac), VRDN (c)(f) | 21,035 | | 21,035 |
Series 2000 X2, 0.1% 3/7/12 (Liquidity Facility Fannie Mae Guaranteed Mtg. pass-thru certificates) (Liquidity Facility Freddie Mac), VRDN (c)(f) | 8,050 | | 8,050 |
Series 2001 U, 0.1% 3/7/12 (Liquidity Facility Fannie Mae Guaranteed Mtg. pass-thru certificates) (Liquidity Facility Freddie Mac), VRDN (c)(f) | 3,145 | | 3,145 |
Series 2002 M, 0.13% 3/7/12 (Liquidity Facility Fannie Mae Guaranteed Mtg. pass-thru certificates) (Liquidity Facility Freddie Mac), VRDN (c)(f) | 800 | | 800 |
Series 2003 F, 0.1% 3/7/12 (Liquidity Facility Fannie Mae Guaranteed Mtg. pass-thru certificates) (Liquidity Facility Freddie Mac), VRDN (c)(f) | 14,565 | | 14,565 |
Series 2003 M, 0.1% 3/7/12 (Liquidity Facility Fannie Mae Guaranteed Mtg. pass-thru certificates) (Liquidity Facility Freddie Mac), VRDN (c)(f) | 3,300 | | 3,300 |
Series 2005 A, 0.13% 3/7/12 (Liquidity Facility Fannie Mae Guaranteed Mtg. pass-thru certificates) (Liquidity Facility Freddie Mac), VRDN (c)(f) | 7,240 | | 7,240 |
Series 2005 D, 0.1% 3/7/12 (Liquidity Facility Fannie Mae Guaranteed Mtg. pass-thru certificates) (Liquidity Facility Freddie Mac), VRDN (c)(f) | 31,625 | | 31,625 |
Series 2005 H, 0.13% 3/7/12 (Liquidity Facility Fannie Mae Guaranteed Mtg. pass-thru certificates) (Liquidity Facility Freddie Mac), VRDN (c)(f) | 8,700 | | 8,700 |
Series 2006 C, 0.13% 3/7/12 (Liquidity Facility Fannie Mae Guaranteed Mtg. pass-thru certificates) (Liquidity Facility Freddie Mac), VRDN (c)(f) | 1,360 | | 1,360 |
Series 2008 E, 0.13% 3/7/12 (Liquidity Facility Fannie Mae Guaranteed Mtg. pass-thru certificates) (Liquidity Facility Freddie Mac), VRDN (c)(f) | 7,325 | | 7,325 |
Municipal Securities - continued |
| Principal Amount (000s) | | Value (000s) |
California - continued |
California Hsg. Fin. Agcy. Rev.: - continued | | | |
(Multifamily Hsg. Prog.): | | | |
Series 2000 A, 0.15% 3/7/12 (Liquidity Facility Fannie Mae Guaranteed Mtg. pass-thru certificates) (Liquidity Facility Freddie Mac), VRDN (c)(f) | $ 29,275 | | $ 29,275 |
Series 2000 C, 0.15% 3/7/12 (Liquidity Facility Fannie Mae Guaranteed Mtg. pass-thru certificates) (Liquidity Facility Freddie Mac), VRDN (c)(f) | 13,000 | | 13,000 |
Series 2000 D, 0.13% 3/7/12 (Liquidity Facility Fannie Mae Guaranteed Mtg. pass-thru certificates) (Liquidity Facility Freddie Mac), VRDN (c) | 3,865 | | 3,865 |
Series 2001 G, 0.12% 3/7/12 (Liquidity Facility Fannie Mae Guaranteed Mtg. pass-thru certificates) (Liquidity Facility Freddie Mac), VRDN (c)(f) | 17,100 | | 17,100 |
Series 2002 C, 0.15% 3/7/12 (Liquidity Facility Fannie Mae Guaranteed Mtg. pass-thru certificates) (Liquidity Facility Freddie Mac), VRDN (c)(f) | 15,125 | | 15,125 |
Series 2002 E, 0.12% 3/7/12 (Liquidity Facility Fannie Mae Guaranteed Mtg. pass-thru certificates) (Liquidity Facility Freddie Mac), VRDN (c)(f) | 6,055 | | 6,055 |
Series 2005 B, 0.12% 3/7/12 (Liquidity Facility Fannie Mae Guaranteed Mtg. pass-thru certificates) (Liquidity Facility Freddie Mac), VRDN (c)(f) | 8,185 | | 8,185 |
Series 2005 D, 0.15% 3/7/12 (Liquidity Facility Fannie Mae Guaranteed Mtg. pass-thru certificates) (Liquidity Facility Freddie Mac), VRDN (c)(f) | 16,610 | | 16,610 |
Series 2002 U, 0.13% 3/7/12 (Liquidity Facility Fannie Mae Guaranteed Mtg. pass-thru certificates) (Liquidity Facility Freddie Mac), VRDN (c)(f) | 15,200 | | 15,200 |
Series 2003 D, 0.13% 3/7/12 (Liquidity Facility Fannie Mae Guaranteed Mtg. pass-thru certificates) (Liquidity Facility Freddie Mac), VRDN (c)(f) | 32,105 | | 32,105 |
California Infrastructure & Econ. Dev. Bank Rev.: | | | |
(Betts Spring Co. Proj.) Series 2008, 0.38% 3/7/12, LOC Bank of America NA, VRDN (c)(f) | 8,895 | | 8,895 |
(JSerra Catholic High School Proj.) Series 2009 A, 0.15% 3/7/12, LOC Wells Fargo Bank NA, VRDN (c) | 4,000 | | 4,000 |
California Muni. Fin. Auth. Indl. Dev. Rev. (Edelbrock Permanent Mold, LLC Proj.) Series 2007, 0.23% 3/7/12, LOC PNC Bank NA, VRDN (c)(f) | 5,095 | | 5,095 |
California Poll. Cont. Fing. Auth. Solid Waste Disp. Rev.: | | | |
(Recology, Inc. Proj.) Series 2010 A, 0.22% 3/7/12, LOC Bank of America NA, VRDN (c) | 48,000 | | 48,000 |
Series 2011 A, 0.2% 3/7/12, LOC Comerica Bank, VRDN (c)(f) | 2,810 | | 2,810 |
Municipal Securities - continued |
| Principal Amount (000s) | | Value (000s) |
California - continued |
California Pub. Works Board Lease Rev. Participating VRDN: | | | |
Series BA 08 1065, 0.22% 3/7/12 (Liquidity Facility Bank of America NA) (c)(g) | $ 21,090 | | $ 21,090 |
Series MT 772, 0.22% 3/7/12 (Liquidity Facility Bank of America NA) (c)(g) | 9,160 | | 9,160 |
California School Cash Reserve Prog. Auth. TRAN: | | | |
Series 2011 A, 2% 3/1/12 | 6,900 | | 6,900 |
Series 2011 C, 2% 3/1/12 | 51,400 | | 51,400 |
Series 2011 D, 2% 3/1/12 | 28,530 | | 28,530 |
Series 2011 E, 2% 6/1/12 | 20,600 | | 20,685 |
Series 2011 G, 2% 6/1/12 | 38,155 | | 38,298 |
Series 2012 P: | | | |
2% 10/31/12 | 11,380 | | 11,513 |
2% 12/31/12 | 10,000 | | 10,142 |
Series 2012 S, 2% 12/31/12 | 18,000 | | 18,255 |
California State Univ. Rev. Series 2001 A: | | | |
0.1% 4/3/12, LOC JPMorgan Chase Bank, LOC State Street Bank & Trust Co., Boston, CP | 3,000 | | 3,000 |
0.16% 3/1/12, LOC JPMorgan Chase Bank, LOC State Street Bank & Trust Co., Boston, CP | 10,600 | | 10,600 |
0.17% 3/1/12, LOC JPMorgan Chase Bank, LOC State Street Bank & Trust Co., Boston, CP | 2,700 | | 2,700 |
California Statewide Cmntys. Dev. Auth. Gas Supply Rev. Series 2010, 0.15% 3/7/12 (Liquidity Facility Royal Bank of Canada), VRDN (c) | 72,205 | | 72,205 |
California Statewide Cmntys. Dev. Auth. Indl. Dev. Rev. (Arthur Made Plastics, Inc. Proj.) Series 2000 A, 0.53% 3/7/12, LOC Bank of America NA, VRDN (c)(f) | 2,300 | | 2,300 |
California Statewide Cmntys. Dev. Auth. Multi-family Hsg. Rev.: | | | |
(Aegis of Aptos Proj.) Series 1998-Y 0.14% 3/7/12, LOC Fannie Mae Guaranteed Mtg. pass-thru certificates, VRDN (c)(f) | 7,350 | | 7,350 |
(Bristol Apts. Proj.) Series Z, 0.14% 3/7/12, LOC Freddie Mac, VRDN (c)(f) | 9,500 | | 9,500 |
(Crocker Oaks Apts. Proj.) Series 2001 H, 0.14% 3/7/12, LOC Fannie Mae Guaranteed Mtg. pass-thru certificates, VRDN (c)(f) | 6,750 | | 6,750 |
(Crystal View Apt. Proj.) Series A, 0.13% 3/7/12, LOC Fannie Mae Guaranteed Mtg. pass-thru certificates, VRDN (c)(f) | 27,075 | | 27,075 |
(Grove Apts. Proj.) Series X, 0.14% 3/7/12, LOC Fannie Mae Guaranteed Mtg. pass-thru certificates, VRDN (c)(f) | 6,150 | | 6,150 |
Municipal Securities - continued |
| Principal Amount (000s) | | Value (000s) |
California - continued |
California Statewide Cmntys. Dev. Auth. Multi-family Hsg. Rev.: - continued | | | |
(Heritage Park Apts. Proj.) Series 2008 C, 0.13% 3/7/12, LOC Freddie Mac, VRDN (c)(f) | $ 19,000 | | $ 19,000 |
(Maple Square Apt. Proj.) Series AA, 0.15% 3/7/12, LOC Citibank NA, VRDN (c)(f) | 5,955 | | 5,955 |
(Marlin Cove Apts. Proj.) Series V, 0.13% 3/7/12, LOC Fannie Mae Guaranteed Mtg. pass-thru certificates, VRDN (c)(f) | 40,000 | | 40,000 |
(Northwest Gateway Apts. Proj.) Series 2004 C, 0.14% 3/7/12, LOC Fannie Mae Guaranteed Mtg. pass-thru certificates, VRDN (c)(f) | 23,000 | | 23,000 |
(Northwood Apts. Proj.) Series N, 0.14% 3/7/12, LOC Freddie Mac, VRDN (c)(f) | 4,800 | | 4,800 |
(Parkside Terrace Apts. Proj.) Series 2008 E, 0.15% 3/7/12, LOC Freddie Mac, VRDN (c)(f) | 17,009 | | 17,009 |
(River Run Sr. Apts. Proj.) Series LL, 0.13% 3/7/12, LOC Fannie Mae Guaranteed Mtg. pass-thru certificates, VRDN (c)(f) | 13,505 | | 13,505 |
(Salvation Army S.F. Proj.) 0.16% 3/7/12, LOC Fannie Mae Guaranteed Mtg. pass-thru certificates, VRDN (c)(f) | 16,645 | | 16,645 |
(Sunrise Fresno Proj.) Series B, 0.14% 3/7/12, LOC Fannie Mae Guaranteed Mtg. pass-thru certificates, VRDN (c)(f) | 5,500 | | 5,500 |
(Terraces at Park Marino Proj.) Series I, 0.16% 3/7/12, LOC California Teachers Retirement Sys., VRDN (c)(f) | 6,105 | | 6,105 |
(The Crossings Sr. Apts./ Phase II Proj.) Series J, 0.14% 3/7/12, LOC Fannie Mae Guaranteed Mtg. pass-thru certificates, VRDN (c)(f) | 11,100 | | 11,100 |
(Valley Palms Apts. Proj.) Series 2002 C, 0.13% 3/7/12, LOC Fannie Mae Guaranteed Mtg. pass-thru certificates, VRDN (c)(f) | 25,500 | | 25,500 |
(Villas at Hamilton Apts. Proj.) Series 2001 HH, 0.13% 3/7/12, LOC Fannie Mae Guaranteed Mtg. pass-thru certificates, VRDN (c)(f) | 11,300 | | 11,300 |
(Vineyard Creek Apts. Proj.): | | | |
Series 2003 W, 0.18% 3/7/12, LOC Fannie Mae Guaranteed Mtg. pass-thru certificates, VRDN (c)(f) | 23,500 | | 23,500 |
Series O, 0.18% 3/7/12, LOC Fannie Mae Guaranteed Mtg. pass-thru certificates, VRDN (c)(f) | 12,452 | | 12,452 |
(Vista Del Monte Proj.) Series QQ, 0.14% 3/7/12, LOC Fannie Mae Guaranteed Mtg. pass-thru certificates, VRDN (c)(f) | 13,350 | | 13,350 |
(Vizcaya Apts. Proj.) Series B, 0.13% 3/7/12, LOC Freddie Mac, VRDN (c)(f) | 22,200 | | 22,200 |
Municipal Securities - continued |
| Principal Amount (000s) | | Value (000s) |
California - continued |
California Statewide Cmntys. Dev. Auth. Multi-family Hsg. Rev.: - continued | | | |
(Wilshire Court Proj.) Series M, 0.13% 3/7/12, LOC Fannie Mae Guaranteed Mtg. pass-thru certificates, VRDN (c)(f) | $ 20,290 | | $ 20,285 |
California Statewide Cmntys. Dev. Auth. Rev.: | | | |
(American Baptist Homes of the West Proj.) Series 2006, 0.2% 3/7/12, LOC Bank of America NA, VRDN (c) | 36,815 | | 36,815 |
(Oakmont Stockton Proj.) Series 1997 C, 0.14% 3/7/12, LOC Fed. Home Ln. Bank, San Francisco, VRDN (c)(f) | 5,960 | | 5,960 |
(Park Century School Proj.) Series 2007, 0.36% 3/7/12, LOC Bank of America NA, VRDN (c) | 7,875 | | 7,875 |
(The Archer School for Girls, Inc. Proj.) Series 2005, 0.17% 3/7/12, LOC Wells Fargo Bank NA, VRDN (c) | 310 | | 310 |
Participating VRDN: | | | |
Series Putters 3891, 0.16% 3/7/12 (Liquidity Facility JPMorgan Chase Bank) (c)(g) | 4,465 | | 4,465 |
Series ROC II R 14001, 0.16% 3/7/12 (Liquidity Facility Citibank NA) (c)(g) | 2,375 | | 2,375 |
TRAN Series 2011 A, 2% 5/15/12 | 11,000 | | 11,040 |
California Statewide Cmntys. Dev. Corp. Rev.: | | | |
(Merrill Packaging Proj.) 0.18% 3/7/12, LOC Wells Fargo Bank NA, VRDN (c)(f) | 290 | | 290 |
(Rix Industries Proj.) Series 1996 I, 0.18% 3/7/12, LOC Wells Fargo Bank NA, VRDN (c)(f) | 800 | | 800 |
Camarillo City Multi-Family Hsg. Rev. (Hacienda de Camarillo Proj.) Series 1996, 0.15% 3/7/12, LOC Fannie Mae Guaranteed Mtg. pass-thru certificates, VRDN (c)(f) | 600 | | 600 |
Chabot-Las Positas Cmnty. College District Participating VRDN Series WF 11 46C, 0.16% 3/7/12 (Liquidity Facility Wells Fargo Bank NA) (c)(g) | 17,025 | | 17,025 |
Chula Vista Ind. Dev. Rev. (San Diego Gas & Elec. Co. Proj.) Series 2004 F, 0.11% 3/7/12, VRDN (c)(f) | 75,000 | | 75,000 |
Contra Costa Wtr. District Wtr. Rev. Participating VRDN Series MT 749, 0.22% 3/7/12 (Liquidity Facility Bank of America NA) (c)(g) | 15,350 | | 15,350 |
Desert Sands Unified School District TRAN 1.5% 1/31/13 (b) | 21,800 | | 22,039 |
East Bay Muni. Util. District Wastewtr. Sys. Rev. Participating VRDN Series Putters 3772 Z, 0.16% 3/7/12 (Liquidity Facility JPMorgan Chase Bank) (c)(g) | 11,250 | | 11,250 |
East Bay Muni. Util. District Wtr. Sys. Rev. Participating VRDN: | | | |
Series EGL 07 0069, 0.16% 3/7/12 (Liquidity Facility Citibank NA) (c)(g) | 48,800 | | 48,800 |
Series EGL 7 05 0045, 0.16% 3/7/12 (Liquidity Facility Citibank NA) (c)(g) | 39,600 | | 39,600 |
Municipal Securities - continued |
| Principal Amount (000s) | | Value (000s) |
California - continued |
East Bay Muni. Util. District Wtr. Sys. Rev. Participating VRDN: - continued | | | |
Series MS 3250, 0.26% 3/7/12 (Liquidity Facility Morgan Stanley Bank, West Valley City Utah) (c)(g) | $ 7,500 | | $ 7,500 |
Series Putters 3759 Z, 0.16% 3/7/12 (Liquidity Facility JPMorgan Chase Bank) (c)(g) | 6,035 | | 6,035 |
Series ROC II R 10397, 0.16% 3/7/12 (Liquidity Facility Citibank NA) (c)(g) | 6,500 | | 6,500 |
Eastern Muni. Wtr. District Wtr. and Swr. Rev. Ctfs. of Prtn. Participating VRDN Series Putters 3220, 0.16% 3/7/12 (Liquidity Facility JPMorgan Chase Bank) (c)(g) | 1,585 | | 1,585 |
El Camino Cmnty. College District Participating VRDN Series MT 722, 0.22% 3/7/12 (Liquidity Facility Bank of America NA) (c)(g) | 9,490 | | 9,490 |
Elk Grove Unified School District Spl. Tax Participating VRDN Series Solar 06-80, 0.15% 3/7/12 (Liquidity Facility U.S. Bank NA, Cincinnati) (c)(g) | 7,300 | | 7,300 |
Elsinore Valley Muni. Wtr. District Ctfs. of Prtn. Series 2011 A, 0.13% 3/7/12, LOC Union Bank of California, VRDN (c) | 1,000 | | 1,000 |
Foothill-De Anza Cmnty. College District Participating VRDN: | | | |
Series MS 3268 X, 0.26% 3/7/12 (Liquidity Facility Morgan Stanley Bank, West Valley City Utah) (c)(g) | 5,000 | | 5,000 |
Series MS 3288, 0.26% 3/7/12 (Liquidity Facility Morgan Stanley Bank, West Valley City Utah) (c)(g) | 7,000 | | 7,000 |
Series WF 11 68C, 0.16% 3/7/12 (Liquidity Facility Wells Fargo Bank NA) (c)(g) | 8,495 | | 8,495 |
Fremont Union High School District, Santa Clara Bonds Series WF 11 34C, 0.2%, tender 7/25/12 (Liquidity Facility Wells Fargo Bank NA) (c)(g)(h) | 17,940 | | 17,940 |
Garden Grove Multi-family Hsg. Rev. (Cal-Malabar Apts. Proj.) Series 1997 A, 0.18% 3/7/12, LOC Fannie Mae Guaranteed Mtg. pass-thru certificates, VRDN (c)(f) | 3,200 | | 3,200 |
Grossmont Healthcare District Participating VRDN: | | | |
Series MS 3253, 0.26% 3/7/12 (Liquidity Facility Morgan Stanley Bank, West Valley City Utah) (c)(g) | 14,375 | | 14,375 |
Series WF 11 30C, 0.16% 3/7/12 (Liquidity Facility Wells Fargo Bank NA) (c)(g) | 10,175 | | 10,175 |
Grossmont Union High School District Participating VRDN: | | | |
Series Putters 3797Z, 0.16% 3/7/12 (Liquidity Facility JPMorgan Chase Bank) (c)(g) | 3,270 | | 3,270 |
Series ROC RR II R 11929, 0.16% 3/7/12 (Liquidity Facility Citibank NA) (c)(g) | 4,000 | | 4,000 |
Kern County Board of Ed. TRAN Series A, 1% 10/1/12 (b) | 14,930 | | 14,983 |
Municipal Securities - continued |
| Principal Amount (000s) | | Value (000s) |
California - continued |
Livermore Multi-family Mtg. Rev. (Portola Meadows Apts. Proj.) 0.16% 3/7/12, LOC Freddie Mac, VRDN (c)(f) | $ 11,025 | | $ 11,025 |
Los Angeles Cmnty. College District: | | | |
Bonds Series WF 09 8C, 0.2%, tender 7/25/12 (Liquidity Facility Wells Fargo & Co.) (c)(g)(h) | 19,610 | | 19,610 |
Participating VRDN: | | | |
Series EGL 08 57, 0.16% 3/7/12 (Liquidity Facility Citibank NA) (c)(g) | 17,400 | | 17,400 |
Series MT 752, 0.22% 3/7/12 (Liquidity Facility Bank of America NA) (c)(g) | 9,575 | | 9,575 |
Series Putters 2864, 0.16% 3/7/12 (Liquidity Facility JPMorgan Chase Bank) (c)(g) | 5,780 | | 5,780 |
Series Putters 3609Z, 0.16% 3/7/12 (Liquidity Facility JPMorgan Chase Bank) (c)(g) | 4,995 | | 4,995 |
Series Putters 3770 Z, 0.16% 3/7/12 (Liquidity Facility JPMorgan Chase Bank) (c)(g) | 3,270 | | 3,270 |
Series Putters 3776Z, 0.16% 3/7/12 (Liquidity Facility JPMorgan Chase Bank) (c)(g) | 7,425 | | 7,425 |
Series Putters 4004 Z, 0.16% 3/7/12 (Liquidity Facility JPMorgan Chase Bank) (c)(g) | 5,885 | | 5,885 |
Series ROC II R 11728, 0.16% 3/7/12 (Liquidity Facility Citibank NA) (c)(g) | 10,960 | | 10,960 |
Series ROC II R 11773, 0.16% 3/7/12 (Liquidity Facility Citibank NA) (c)(g) | 2,835 | | 2,835 |
Los Angeles Cmnty. Redev. Agcy. Multi-family Hsg. Rev. (Hollywood & Vine Apts. Proj.) Series A, 0.13% 3/7/12, LOC Fannie Mae Guaranteed Mtg. pass-thru certificates, VRDN (c)(f) | 89,000 | | 89,000 |
Los Angeles County Cap. Asset Leasing Corp. Lease Rev. Bonds Series 2011 A, 1.5% 12/1/12 | 8,025 | | 8,082 |
Los Angeles County Gen. Oblig.: | | | |
Series 2010 A: | | | |
0.1% 4/5/12, LOC JPMorgan Chase Bank, CP | 41,270 | | 41,270 |
0.13% 4/5/12, LOC JPMorgan Chase Bank, CP | 6,655 | | 6,655 |
Series 2010 B, 0.24% 3/6/12, LOC Bank of America NA, CP | 7,500 | | 7,500 |
Series 2010 C, 0.16% 3/5/12, LOC Wells Fargo Bank NA, CP | 7,000 | | 7,000 |
TRAN Series 2012 B, 2.5% 3/30/12 | 49,100 | | 49,185 |
Los Angeles County Hsg. Auth. Multi-family Hsg. Rev. (Park Sierra Apts. Proj.) Series 1986 A, 0.17% 3/7/12, LOC Freddie Mac, VRDN (c)(f) | 50,900 | | 50,900 |
Municipal Securities - continued |
| Principal Amount (000s) | | Value (000s) |
California - continued |
Los Angeles County Schools Pooled Fing. Prog. Ctfs. of Prtn. TRAN: | | | |
Series 2012 B1, 2% 11/30/12 | $ 16,200 | | $ 16,411 |
Series 2012 B2, 2% 12/31/12 | 54,800 | | 55,551 |
Series 2012 B3, 2% 1/31/13 | 29,900 | | 30,323 |
Los Angeles Dept. Arpt. Rev.: | | | |
Participating VRDN: | | | |
Series Putters 3838, 0.16% 3/7/12 (Liquidity Facility JPMorgan Chase Bank) (c)(g) | 5,000 | | 5,000 |
Series ROC II R 11842, 0.16% 3/7/12 (Liquidity Facility Citibank NA) (c)(g) | 6,750 | | 6,750 |
Series WF 10 44C, 0.16% 3/7/12 (Liquidity Facility Wells Fargo Bank NA) (c)(g) | 7,440 | | 7,440 |
Series A: | | | |
0.17% 3/8/12, LOC Citibank NA, LOC State Street Bank & Trust Co., Boston, CP | 17,500 | | 17,500 |
0.17% 3/8/12, LOC Citibank NA, LOC State Street Bank & Trust Co., Boston, CP | 14,100 | | 14,100 |
0.17% 3/8/12, LOC Citibank NA, LOC State Street Bank & Trust Co., Boston, CP | 32,300 | | 32,300 |
Los Angeles Dept. of Wtr. & Pwr. Rev.: | | | |
Bonds: | | | |
Series 2003 A1, 5% 7/1/12 | 1,000 | | 1,016 |
Series 2011A, 2% 7/1/12 | 6,000 | | 6,035 |
Participating VRDN: | | | |
Series MS 3289, 0.26% 3/7/12 (c)(g) | 7,335 | | 7,335 |
Series MT 782, 0.22% 3/7/12 (Liquidity Facility Bank of America NA) (c)(g) | 15,910 | | 15,910 |
Series Putters 3718 Z, 0.18% 3/7/12 (Liquidity Facility JPMorgan Chase Bank) (c)(g) | 12,060 | | 12,060 |
Series ROC II R 500, 0.16% 3/7/12 (Liquidity Facility Citibank NA) (c)(g) | 20,900 | | 20,900 |
Series Solar 06 48, 0.14% 3/7/12 (Liquidity Facility U.S. Bank NA, Cincinnati) (c)(g) | 15,340 | | 15,340 |
0.16% 4/5/12 (Liquidity Facility Wells Fargo Bank NA), CP | 46,300 | | 46,300 |
0.2% 3/8/12 (Liquidity Facility Wells Fargo Bank NA), CP | 15,500 | | 15,500 |
Los Angeles Dept. of Wtr. & Pwr. Wtrwks. Rev.: | | | |
Bonds Series WF 10 43C, 0.2%, tender 7/25/12 (Liquidity Facility Wells Fargo Bank NA) (c)(g)(h) | 25,005 | | 25,005 |
Participating VRDN: | | | |
Series MT 734, 0.22% 3/7/12 (Liquidity Facility Bank of America NA) (c)(g) | 5,450 | | 5,450 |
Municipal Securities - continued |
| Principal Amount (000s) | | Value (000s) |
California - continued |
Los Angeles Dept. of Wtr. & Pwr. Wtrwks. Rev.: - continued | | | |
Participating VRDN: | | | |
Series Putters 3310, 0.16% 3/7/12 (Liquidity Facility JPMorgan Chase Bank) (c)(g) | $ 7,245 | | $ 7,245 |
Series Putters 3750 Z, 0.16% 3/7/12 (Liquidity Facility JPMorgan Chase Bank) (c)(g) | 4,000 | | 4,000 |
Los Angeles Gen. Oblig.: | | | |
Participating VRDN: | | | |
Series Putters 3930, 0.13% 3/1/12 (Liquidity Facility JPMorgan Chase & Co.) (c)(g) | 2,000 | | 2,000 |
Series Putters 3931, 0.13% 3/1/12 (Liquidity Facility JPMorgan Chase & Co.) (c)(g) | 2,000 | | 2,000 |
TRAN: | | | |
2.5% 3/30/12 | 9,600 | | 9,617 |
2.5% 4/30/12 | 27,800 | | 27,899 |
Los Angeles Hbr. Dept. Rev. Participating VRDN Series WF 10 40C, 0.16% 3/7/12 (Liquidity Facility Wells Fargo Bank NA) (c)(g) | 5,400 | | 5,400 |
Los Angeles Multi-family Hsg. Rev. (Channel Gateway Apts. Proj.) Series 1989 B, 0.16% 3/7/12, LOC Freddie Mac, VRDN (c)(f) | 67,700 | | 67,700 |
Los Angeles Muni. Impt. Corp. Lease Rev.: | | | |
Series 2004 A1: | | | |
0.09% 3/21/12, LOC Wells Fargo Bank NA, CP | 13,503 | | 13,503 |
0.12% 3/15/12, LOC Wells Fargo Bank NA, CP | 35,352 | | 35,352 |
0.17% 3/5/12, LOC Wells Fargo Bank NA, CP | 5,000 | | 5,000 |
Series 2004 A2: | | | |
0.12% 3/15/12, LOC JPMorgan Chase Bank, CP | 10,000 | | 10,000 |
0.13% 4/4/12, LOC JPMorgan Chase Bank, CP | 5,000 | | 5,000 |
0.17% 3/5/12, LOC JPMorgan Chase Bank, CP | 22,958 | | 22,958 |
Los Angeles Unified School District: | | | |
Bonds: | | | |
Series 1997 A, 6% 7/1/12 | 2,780 | | 2,833 |
Series 2002 B, 5% 7/1/12 | 635 | | 645 |
Series 2005 E, 4.5% 7/1/12 | 5,515 | | 5,592 |
Series 2009 A, 5% 7/1/12 | 8,190 | | 8,319 |
Series 2010, 4% 7/1/12 | 3,000 | | 3,037 |
Series A2, 2% 7/1/12 | 3,435 | | 3,455 |
TRAN Series A, 2% 8/1/12 | 11,305 | | 11,389 |
Los Angeles Wastewtr. Sys. Rev.: | | | |
Participating VRDN: | | | |
Series EGL 7 05 3003, 0.16% 3/7/12 (Liquidity Facility Citibank NA) (c)(g) | 34,000 | | 34,000 |
Municipal Securities - continued |
| Principal Amount (000s) | | Value (000s) |
California - continued |
Los Angeles Wastewtr. Sys. Rev.: - continued | | | |
Participating VRDN: | | | |
Series Putters 3371, 0.16% 3/7/12 (Liquidity Facility JPMorgan Chase Bank) (c)(g) | $ 22,495 | | $ 22,495 |
Series Putters 3751, 0.16% 3/7/12 (Liquidity Facility JPMorgan Chase Bank) (c)(g) | 4,935 | | 4,935 |
Series 2008 F1, 0.17% 3/7/12, LOC Bank of America NA, VRDN (c) | 10,000 | | 10,000 |
Series 2008 G, 0.17% 3/7/12, LOC Bank of America NA, VRDN (c) | 28,000 | | 28,000 |
Los Rios Cmnty. College District Participating VRDN Series ROC II R 11953 X, 0.16% 3/7/12 (Liquidity Facility Citibank NA) (c)(g) | 6,400 | | 6,400 |
Metropolitan Wtr. District of Southern California Wtr. Rev. Participating VRDN Series Putters 3547, 0.16% 3/7/12 (Liquidity Facility JPMorgan Chase Bank) (c)(g) | 10,935 | | 10,935 |
Metropolitan Wtr. District of Southern California Wtrwks. Rev. Participating VRDN: | | | |
Series BA 08 1062, 0.22% 3/7/12 (Liquidity Facility Bank of America NA) (c)(g) | 16,800 | | 16,800 |
Series BA 08 1087, 0.22% 3/7/12 (Liquidity Facility Bank of America NA) (c)(g) | 5,750 | | 5,750 |
Series EGL 07 0044, 0.16% 3/7/12 (Liquidity Facility Citibank NA) (c)(g) | 16,430 | | 16,430 |
Series EGL 07 71, 0.16% 3/7/12 (Liquidity Facility Citibank NA) (c)(g) | 43,000 | | 43,000 |
Series Putters 3289, 0.16% 3/7/12 (Liquidity Facility JPMorgan Chase Bank) (c)(g) | 2,225 | | 2,225 |
Series Putters 3653 Z, 0.16% 3/7/12 (Liquidity Facility JPMorgan Chase Bank) (c)(g) | 2,495 | | 2,495 |
Series Putters 3752 Z, 0.16% 3/7/12 (Liquidity Facility JPMorgan Chase Bank) (c)(g) | 3,570 | | 3,570 |
Modesto Pub. Fing. Auth. Lease Rev. Series 2008 B, 0.22% 3/7/12, LOC Bank of America NA, VRDN (c) | 45,815 | | 45,815 |
Newport Mesa Unified School District Participating VRDN Series WF 11 70Z, 0.16% 3/7/12 (Liquidity Facility Wells Fargo Bank NA) (c)(g) | 12,845 | | 12,845 |
Oakland Gen. Oblig. TRAN 2% 3/30/12 | 9,000 | | 9,012 |
Ohlone Cmnty. College District Participating VRDN: | | | |
Series Putters 3782 Z, 0.16% 3/7/12 (Liquidity Facility JPMorgan Chase Bank) (c)(g) | 12,250 | | 12,250 |
Series WF 11 113C, 0.16% 3/7/12 (Liquidity Facility Wells Fargo Bank NA) (c)(g) | 12,300 | | 12,300 |
Municipal Securities - continued |
| Principal Amount (000s) | | Value (000s) |
California - continued |
Olcese Wtr. District Bonds (Sumitomo Mitsui Banking Corp. Proj.) Series 1986 A, 0.11% tender 3/1/12, LOC Sumitomo Mitsui Banking Corp., CP mode (f) | $ 3,300 | | $ 3,300 |
Orange County Apt. Dev. Rev.: | | | |
(Ladera Apts. Proj.) Series 2001 II B, 0.13% 3/7/12, LOC Fannie Mae Guaranteed Mtg. pass-thru certificates, VRDN (c)(f) | 23,500 | | 23,500 |
(Park Place Apts. Proj.) Series 1989 A, 0.13% 3/7/12, LOC Freddie Mac, VRDN (c)(f) | 15,400 | | 15,400 |
(Wood Canyon Villas Proj.) Series 2001 E, 0.13% 3/7/12, LOC Fannie Mae Guaranteed Mtg. pass-thru certificates, VRDN (c)(f) | 16,000 | | 16,000 |
Orange County Rfdg. Recovery TRAN: | | | |
2% 3/15/12 | 15,300 | | 15,310 |
2% 5/15/12 | 14,960 | | 15,013 |
2% 6/29/12 | 41,715 | | 41,951 |
Orange County Sanitation District Ctfs. of Prtn. Participating VRDN: | | | |
Series MS 06 2222, 0.19% 3/7/12 (Liquidity Facility Wells Fargo & Co.) (c)(g) | 15,454 | | 15,454 |
Series MS 3030, 0.26% 3/7/12 (Liquidity Facility Morgan Stanley Bank, West Valley City Utah) (c)(g) | 10,515 | | 10,515 |
Orange County Spl. Fing. Auth. Teeter Plan Rev. Series L: | | | |
0.15% 3/7/12, LOC Wells Fargo Bank NA, CP | 18,464 | | 18,464 |
0.15% 3/8/12, LOC Wells Fargo Bank NA, CP | 30,900 | | 30,900 |
Orange County Wtr. District Rev. Ctfs. of Prtn.: | | | |
Participating VRDN Series Putters 3686Z, 0.16% 3/7/12 (Liquidity Facility JPMorgan Chase Bank) (c)(g) | 4,100 | | 4,100 |
Series 2003 A, 0.13% 3/7/12, LOC Citibank NA, VRDN (c) | 5,800 | | 5,800 |
Pleasant Hill Redev. Agcy. Multi-family Hsg. Rev. (Chateau III Proj.) Series 2001, 0.18% 3/7/12, LOC Fannie Mae Guaranteed Mtg. pass-thru certificates, VRDN (c)(f) | 10,355 | | 10,355 |
Pleasanton Multi-family Rev. (Bernal Apts. Proj.) Series A, 0.14% 3/7/12, LOC Fannie Mae Guaranteed Mtg. pass-thru certificates, VRDN (c)(f) | 13,750 | | 13,750 |
Port of Oakland Port Rev. Series 2010 A, 0.12% 3/16/12, LOC Wells Fargo Bank NA, CP | 43,065 | | 43,065 |
Poway Unified School District Participating VRDN Series WF 11 91 Z, 0.16% 3/7/12 (Liquidity Facility Wells Fargo Bank NA) (c)(g) | 13,885 | | 13,885 |
RBC Muni. Products, Inc. Trust Bonds: | | | |
Series RBC E 21, 0.2%, tender 5/3/12 (Liquidity Facility Royal Bank of Canada) (c)(g)(h) | 26,925 | | 26,925 |
Municipal Securities - continued |
| Principal Amount (000s) | | Value (000s) |
California - continued |
RBC Muni. Products, Inc. Trust Bonds: - continued | | | |
Series RBC E 24, 0.2%, tender 4/2/12 (Liquidity Facility Royal Bank of Canada) (c)(g)(h) | $ 15,500 | | $ 15,500 |
Richmond Wastewtr. Rev. Series 2008 A, 0.16% 3/7/12, LOC Union Bank of California, VRDN (c) | 12,500 | | 12,500 |
Rio Hondo Cmnty. College District Bonds Series WF 10 51Z, 0.2%, tender 7/25/12 (Liquidity Facility Wells Fargo Bank NA) (c)(g)(h) | 21,540 | | 21,540 |
Riverside County Gen. Oblig.: | | | |
Series B: | | | |
0.12% 6/15/12, LOC Bank of Nova Scotia New York Branch, CP | 44,887 | | 44,887 |
0.17% 4/13/12, LOC Bank of Nova Scotia New York Branch, CP | 33,800 | | 33,800 |
TRAN 2% 3/30/12 | 44,100 | | 44,161 |
Riverside County Ind. Dev. Auth. Ind. Dev. Rev. (Merrick Engineering, Inc. Proj.) 0.24% 3/7/12, LOC Wells Fargo Bank NA, VRDN (c)(f) | 1,940 | | 1,940 |
Riverside Ctfs. of Prtn. (Riverside Renaissance Proj.) Series 2008, 0.19% 3/7/12, LOC Bank of America NA, VRDN (c) | 200 | | 200 |
Riverside Indl. Dev. Auth. Indl. Dev. Rev. (Sabert Corp. Proj.) 0.19% 3/7/12, LOC PNC Bank NA, VRDN (c)(f) | 2,230 | | 2,230 |
Roseville Joint Union High School District TRAN 2% 10/4/12 | 8,000 | | 8,066 |
Sacramento County Hsg. Auth. Multi-family Hsg. Rev.: | | | |
(California Place Apts. Proj.) Series B, 0.15% 3/7/12, LOC Fannie Mae Guaranteed Mtg. pass-thru certificates, VRDN (c)(f) | 4,500 | | 4,500 |
(Deer Park Apts. Proj.) Issue A, 0.14% 3/7/12, LOC Fannie Mae Guaranteed Mtg. pass-thru certificates, VRDN (c)(f) | 13,200 | | 13,200 |
(Sun Valley Proj.) Series 2001 F, 0.15% 3/7/12, LOC Fannie Mae Guaranteed Mtg. pass-thru certificates, VRDN (c)(f) | 3,750 | | 3,750 |
Sacramento Gen. Oblig. TRAN 2% 6/29/12 | 21,875 | | 21,999 |
Sacramento Hsg. Auth. Multi-family: | | | |
(Countrywood Village Apts. Proj.) Series F, 0.14% 3/7/12, LOC Fannie Mae Guaranteed Mtg. pass-thru certificates, VRDN (c)(f) | 8,225 | | 8,225 |
(Valencia Point Apts. Proj.) 0.14% 3/7/12, LOC Fannie Mae Guaranteed Mtg. pass-thru certificates, VRDN (c)(f) | 4,900 | | 4,900 |
Sacramento Muni. Util. District Elec. Rev. Bonds Series 2011 X, 1.5% 8/15/12 | 2,200 | | 2,211 |
Sacramento Redev. Agcy. Multi-family (18th & L Apts. Proj.) 0.13% 3/7/12, LOC Fannie Mae Guaranteed Mtg. pass-thru certificates, VRDN (c)(f) | 21,075 | | 21,075 |
Municipal Securities - continued |
| Principal Amount (000s) | | Value (000s) |
California - continued |
San Bernardino County Gen. Oblig. TRAN Series A, 2% 6/29/12 | $ 49,700 | | $ 49,979 |
San Diego Cmnty. College District: | | | |
Bonds Series 2011, 1.5% 8/1/12 | 5,000 | | 5,026 |
Participating VRDN: | | | |
Series Putters 3741Z, 0.16% 3/7/12 (Liquidity Facility JPMorgan Chase Bank) (c)(g) | 5,000 | | 5,000 |
Series Putters 3963, 0.16% 3/7/12 (Liquidity Facility JPMorgan Chase Bank) (c)(g) | 2,000 | | 2,000 |
San Diego County & School District TRAN Series 2011 A, 2% 6/29/12 | 11,500 | | 11,565 |
San Diego County Wtr. Auth. Wtr. Rev. Participating VRDN: | | | |
Series Putters 2903Z, 0.16% 3/7/12 (Liquidity Facility JPMorgan Chase Bank) (c)(g) | 7,380 | | 7,380 |
Series Putters 3028, 0.16% 3/7/12 (Liquidity Facility JPMorgan Chase Bank) (c)(g) | 8,715 | | 8,715 |
Series Putters 3736Z, 0.16% 3/7/12 (Liquidity Facility JPMorgan Chase Bank) (c)(g) | 2,000 | | 2,000 |
San Diego Hsg. Auth. Multi-family Hsg. Rev.: | | | |
(Bay Vista Apts. Proj.) Series A, 0.13% 3/7/12, LOC Fannie Mae Guaranteed Mtg. pass-thru certificates, VRDN (c)(f) | 14,500 | | 14,500 |
(Delta Village Apts. Proj.) Series A, 0.19% 3/7/12, LOC Citibank NA, VRDN (c)(f) | 6,500 | | 6,500 |
(Stratton Apts. Proj.) Series 2000 A, 0.13% 3/7/12, LOC Fannie Mae Guaranteed Mtg. pass-thru certificates, VRDN (c)(f) | 5,000 | | 5,000 |
San Diego Pub. Facilities Fing. Auth. Wtr. Rev. Participating VRDN Series MS 3229X, 0.26% 3/7/12 (Liquidity Facility Morgan Stanley Bank, West Valley City Utah) (c)(g) | 7,500 | | 7,500 |
San Diego Unified School District Participating VRDN Series WF 11 97C, 0.16% 3/7/12 (Liquidity Facility Wells Fargo Bank NA) (c)(g) | 19,505 | | 19,505 |
San Francisco Bay Area Rapid Transit District Sales Tax Rev. Participating VRDN Series BA 08 3041X, 0.26% 3/7/12 (Liquidity Facility Bank of America NA) (c)(g) | 6,665 | | 6,665 |
San Francisco Bay Area Rapid Transit Fing. Auth. Participating VRDN Series ROC II R 12318, 0.19% 3/7/12 (Liquidity Facility Citibank NA) (c)(g) | 22,725 | | 22,725 |
San Francisco City & County Gen. Oblig.: | | | |
Participating VRDN: | | | |
Series BA 08 3318, 0.26% 3/7/12 (Liquidity Facility Bank of America NA) (c)(g) | 2,000 | | 2,000 |
Series MT 764, 0.22% 3/7/12 (Liquidity Facility Bank of America NA) (c)(g) | 6,700 | | 6,700 |
Municipal Securities - continued |
| Principal Amount (000s) | | Value (000s) |
California - continued |
San Francisco City & County Gen. Oblig.: - continued | | | |
Participating VRDN: | | | |
Series WF 10 48C, 0.16% 3/7/12 (Liquidity Facility Wells Fargo Bank NA) (c)(g) | $ 20,140 | | $ 20,140 |
Series 1, 0.1% 4/3/12, LOC JPMorgan Chase Bank, CP | 12,031 | | 12,031 |
Series 2, 0.17% 3/8/12, LOC U.S. Bank NA, Cincinnati, CP | 17,744 | | 17,744 |
San Francisco City & County Multi-family (8th & Howard Family Apts. Proj.) Series 2000 B, 0.15% 3/7/12, LOC Citibank NA, VRDN (c)(f) | 4,105 | | 4,105 |
San Francisco City & County Redev. Agcy. Multi-family Hsg. Rev.: | | | |
(Mission Creek Cmnty. Proj.) Series B, 0.15% 3/7/12, LOC Citibank NA, VRDN (c)(f) | 6,825 | | 6,825 |
(Ocean Beach Apts. Proj.) Series B, 0.15% 3/7/12, LOC Citibank NA, VRDN (c)(f) | 6,735 | | 6,735 |
San Francisco City & County Unified School District TRAN 2% 6/29/12 | 15,300 | | 15,385 |
San Francisco Redev. Agcy. Multi-family Hsg. Rev. 0.15% 3/7/12, LOC Freddie Mac, VRDN (c)(f) | 3,000 | | 3,000 |
San Joaquin County Trans. Auth. Sales Tax Rev. Participating VRDN Series Putters 4715, 0.22% 3/7/12 (Liquidity Facility Bank of America NA) (c)(g) | 14,500 | | 14,500 |
San Jose Evergreen Cmnty. College District Bonds Series 2012 A, 2% 8/1/12 | 7,950 | | 8,012 |
San Jose Multi-family Hsg. Rev.: | | | |
(Alamaden Family Apts. Proj.) Series 2003 D, 0.13% 3/7/12, LOC Fannie Mae Guaranteed Mtg. pass-thru certificates, VRDN (c)(f) | 24,615 | | 24,615 |
(Betty Ann Gardens Apts. Proj.) Series 2002 A, 0.2% 3/7/12, LOC Citibank NA, VRDN (c)(f) | 6,800 | | 6,800 |
(El Paseo Apts. Proj.) Series 2002 B, 0.2% 3/7/12, LOC Citibank NA, VRDN (c)(f) | 4,645 | | 4,645 |
(Kennedy Apt. Homes Proj.) Series 2002 K, 0.14% 3/7/12, LOC Fannie Mae Guaranteed Mtg. pass-thru certificates, VRDN (c)(f) | 9,075 | | 9,075 |
(Las Ventanas Apts. Proj.) Series 2008 B, 0.14% 3/7/12, LOC Freddie Mac, VRDN (c) | 13,300 | | 13,300 |
(Siena at Renaissance Square Proj.) Series 1996 A, 0.13% 3/7/12, LOC Key Bank NA, VRDN (c)(f) | 46,000 | | 46,000 |
(Trestles Apts. Proj.) Series 2004 A, 0.18% 3/7/12, LOC Freddie Mac, VRDN (c)(f) | 7,325 | | 7,325 |
(Turnleaf Apts. Proj.) Series 2003 A, 0.18% 3/7/12, LOC Freddie Mac, VRDN (c)(f) | 10,860 | | 10,860 |
Municipal Securities - continued |
| Principal Amount (000s) | | Value (000s) |
California - continued |
San Marcos Unified School District Participating VRDN: | | | |
Series Putters 3927 Z, 0.16% 3/7/12 (Liquidity Facility JPMorgan Chase Bank) (c)(g) | $ 5,340 | | $ 5,340 |
Series ROC II R 11998X, 0.17% 3/7/12 (Liquidity Facility Citibank NA) (c)(g) | 7,760 | | 7,760 |
San Mateo County Cmnty. College District Participating VRDN Series WF 11 64C, 0.16% 3/7/12 (Liquidity Facility Wells Fargo Bank NA) (a)(c)(g) | 8,365 | | 8,365 |
San Mateo County Trans. District Sales Tax Rev. Participating VRDN Series MT 778, 0.22% 3/7/12 (Liquidity Facility Bank of America NA) (c)(g) | 10,280 | | 10,280 |
San Ramon Valley Union School District Participating VRDN Series MT 743, 0.22% 3/7/12 (Liquidity Facility Bank of America NA) (c)(g) | 4,120 | | 4,120 |
Santa Ana Hsg. Auth. (City Gardens Apts. Proj.) Series 2006 B, 0.15% 3/7/12, LOC Fannie Mae Guaranteed Mtg. pass-thru certificates, VRDN (c)(f) | 8,140 | | 8,140 |
Santa Clara County Fing. Auth. Lease Rev. (Multiple Facilities Proj.) Series 2008 M, 0.23% 3/7/12, LOC Bank of America NA, VRDN (c) | 35,335 | | 35,335 |
Santa Clara County Gen. Oblig. TRAN 2% 6/29/12 | 50,000 | | 50,298 |
Santa Clara County Hsg. Auth. Multi-family Hsg. Rev. (Timberwood Apts. Proj.) Series B, 0.24% 3/7/12, LOC Union Bank of California, VRDN (c)(f) | 11,445 | | 11,445 |
Santa Clara Elec. Rev. Series 2008 B. 0.13% 3/7/12, LOC Bank of America NA, VRDN (c) | 11,800 | | 11,800 |
Santa Clara Valley Trans. Auth. Participating VRDN Series ROC R 11967, 0.16% 3/7/12 (Liquidity Facility Citibank NA) (c)(g) | 4,850 | | 4,850 |
Santa Clara Valley Wtr. District Wtr. Util. Rev.: | | | |
Series 2010 A1, 0.16% 5/3/12, LOC JPMorgan Chase Bank, CP | 28,310 | | 28,310 |
Series 2010 A2: | | | |
0.14% 5/4/12, LOC JPMorgan Chase Bank, CP | 14,700 | | 14,700 |
0.15% 3/8/12, LOC JPMorgan Chase Bank, CP | 29,955 | | 29,955 |
Santa Cruz County TRAN: | | | |
2% 3/1/12 | 7,000 | | 7,000 |
2% 7/5/12 | 25,300 | | 25,448 |
Santa Cruz Redev. Agcy. Multi-family Rev.: | | | |
(1010 Pacific Ave. Apts. Proj.) Series B, 0.15% 3/7/12, LOC Fannie Mae Guaranteed Mtg. pass-thru certificates, VRDN (c)(f) | 16,000 | | 16,000 |
Municipal Securities - continued |
| Principal Amount (000s) | | Value (000s) |
California - continued |
Santa Cruz Redev. Agcy. Multi-family Rev.: - continued | | | |
(Shaffer Road Apts. Proj.) Series A, 0.13% 3/7/12, LOC Fannie Mae Guaranteed Mtg. pass-thru certificates, VRDN (c)(f) | $ 6,000 | | $ 6,000 |
Sierra Joint Cmnty. College District TRAN 2% 10/4/12 | 7,200 | | 7,260 |
South Coast Local Ed. Agcy. TRAN: | | | |
Series 2011 A, 2% 6/29/12 | 4,000 | | 4,022 |
Series 2011 C, 2% 8/31/12 | 10,000 | | 10,075 |
Southern California Pub. Pwr. Auth. Participating VRDN Series Putters 3947, 0.16% 3/7/12 (Liquidity Facility JPMorgan Chase Bank) (c)(g) | 5,500 | | 5,500 |
Southern California Pub. Pwr. Auth. Rev.: | | | |
(Magnolia Pwr. Proj.) Series 2009-1, 0.11% 3/7/12, LOC U.S. Bank NA, Cincinnati, VRDN (c) | 28,400 | | 28,400 |
(Palo Verde Proj.) Series 2008 A, 0.15% 3/7/12, LOC Citibank NA, VRDN (c) | 1,450 | | 1,450 |
State Ctr. Cmnty. College District Participating VRDN Series Putters 1972, 0.16% 3/7/12 (Liquidity Facility JPMorgan Chase Bank) (c)(g) | 12,755 | | 12,755 |
Torrance Gen. Oblig. Rev. (Torrance Memorial Med. Ctr. Proj.) Series 2010 B, 0.14% 3/7/12, LOC Citibank NA, VRDN (c) | 5,000 | | 5,000 |
Univ. of California Revs.: | | | |
Participating VRDN: | | | |
Series Floaters 09 7C, 0.16% 3/7/12 (Liquidity Facility Wells Fargo & Co.) (c)(g) | 4,000 | | 4,000 |
Series MS 1274, 0.26% 3/7/12 (Liquidity Facility Morgan Stanley Bank, West Valley City Utah) (c)(g) | 8,060 | | 8,060 |
Series MT 738, 0.22% 3/7/12 (Liquidity Facility Bank of America NA) (c)(g) | 6,660 | | 6,660 |
Series Putters 3365, 0.16% 3/7/12 (Liquidity Facility JPMorgan Chase Bank) (c)(g) | 4,885 | | 4,885 |
Series Putters 3367, 0.16% 3/7/12 (Liquidity Facility JPMorgan Chase Bank) (c)(g) | 1,500 | | 1,500 |
Series Putters 3368, 0.16% 3/7/12 (Liquidity Facility JPMorgan Chase Bank) (c)(g) | 9,500 | | 9,500 |
Series Putters 3754 Z, 0.16% 3/7/12 (Liquidity Facility JPMorgan Chase Bank) (c)(g) | 4,250 | | 4,250 |
Series Putters 3961, 0.16% 3/7/12 (Liquidity Facility JPMorgan Chase Bank) (c)(g) | 2,000 | | 2,000 |
Series ROC II R 11886X, 0.16% 3/7/12 (Liquidity Facility Citibank NA) (c)(g) | 6,845 | | 6,845 |
Series A: | | | |
0.09% 4/5/12, CP | 40,485 | | 40,485 |
Municipal Securities - continued |
| Principal Amount (000s) | | Value (000s) |
California - continued |
Univ. of California Revs.: - continued | | | |
Series A: | | | |
0.16% 5/3/12, CP | $ 17,300 | | $ 17,300 |
Walnut Energy Ctr. Auth. Series 2005 B, 0.17% 3/8/12, LOC State Street Bank & Trust Co., Boston, CP | 10,000 | | 10,000 |
| | 5,077,720 |
Colorado - 0.2% |
RBC Muni. Products, Inc. Trust Participating VRDN Series RBC E 25, 0.19% 3/7/12 (Liquidity Facility Royal Bank of Canada) (c)(f)(g) | 12,500 | | 12,500 |
Delaware - 0.1% |
Delaware Econ. Dev. Auth. Rev. (Delmarva Pwr. & Lt. Co. Proj.) Series 1999 A, 0.43% 3/7/12, VRDN (c) | 4,630 | | 4,630 |
Indiana - 0.2% |
Rockport Indl. Dev. Rev. (AK Steel Corp. Proj.) Series 1998 A, 0.16% 3/7/12, LOC PNC Bank NA, VRDN (c)(f) | 10,000 | | 10,000 |
Iowa - 0.3% |
Iowa Fin. Auth. Poll. Cont. Facility Rev. (MidAmerican Energy Proj.) Series 2008 B, 0.14% 3/7/12, VRDN (c) | 15,725 | | 15,725 |
Kentucky - 0.3% |
Carroll County Envir. Facilities Rev. (Kentucky Utils. Co. Proj.) Series 2006 B, 0.17% 3/7/12, LOC Sumitomo Mitsui Banking Corp., VRDN (c)(f) | 5,000 | | 5,000 |
Jefferson County Poll. Cont. Rev. Bonds (Louisville Gas & Elec. Co. Proj.) Series 2001 A, 0.31% tender 3/1/12, CP mode | 2,200 | | 2,200 |
Trimble County Poll. Cont. Rev. Bonds (Louisville Gas & Elec. Co. Proj.) Series 2001 B, 0.4% tender 3/22/12, CP mode (f) | 8,100 | | 8,100 |
| | 15,300 |
Maryland - 0.1% |
Maryland Health & Higher Edl. Facilities Auth. Rev. (Univ. of Maryland Med. Sys. Proj.) Series 2008 A, 0.26% 3/7/12, LOC Citizens Bank of Pennsylvania, VRDN (c) | 7,000 | | 7,000 |
Massachusetts - 0.2% |
Massachusetts Indl. Fin. Agcy. Poll. Cont. Rev. Bonds (New England Pwr. Co. Proj.) Series 1992, 0.4% tender 3/13/12, CP mode | 6,000 | | 6,000 |
Massachusetts State Dev. Fing. Agcy. Poll. Cont. Rev. Bonds (Massachusetts Elec. Co. Proj.) Series 2004 M, 0.9% tender 3/1/12, CP mode | 7,500 | | 7,500 |
| | 13,500 |
Municipal Securities - continued |
| Principal Amount (000s) | | Value (000s) |
Michigan - 1.0% |
Michigan Fin. Auth. Rev. Series 2011 L, 0.16% 3/7/12, LOC Citibank NA, VRDN (c) | $ 54,000 | | $ 54,000 |
Nevada - 0.2% |
Nevada Dept. of Bus. & Industry (LVE Energy Partners LLC Proj.) 0.17% 3/7/12, LOC Sumitomo Mitsui Banking Corp., VRDN (c)(f) | 9,550 | | 9,550 |
New Hampshire - 0.2% |
New Hampshire Bus. Fin. Auth. Poll. Cont. Rev. Bonds (New England Pwr. Co. Proj.): | | | |
Series 1990 A, 0.45% tender 3/13/12, CP mode (f) | 3,300 | | 3,300 |
Series 1990 B, 0.55% tender 3/20/12, CP mode | 8,600 | | 8,600 |
| | 11,900 |
North Carolina - 0.2% |
Gaston County Indl. Facilities & Poll. Cont. Fing. Auth. Rev. (Duke Energy Corp. Proj.) Series 1999, 0.2% 3/1/12, VRDN (c)(f) | 12,000 | | 12,000 |
Ohio - 0.3% |
Cleveland Wtrwks. Rev. Series 2008 Q, 0.21% 3/7/12, LOC Bank of America NA, VRDN (c) | 3,000 | | 3,000 |
Ohio Hsg. Fin. Agcy. Residential Mtg. Rev. Series 2006 I, 0.18% 3/7/12 (Liquidity Facility Citibank NA), VRDN (c)(f) | 5,600 | | 5,600 |
Westlake Health Facilities Rev. (Lutheran Home Proj.) Series 2005, 0.32% 3/7/12, LOC RBS Citizens NA, VRDN (c) | 7,200 | | 7,200 |
| | 15,800 |
Oregon - 0.1% |
Port of Portland Arpt. Rev. Series Eighteen B, 0.12% 3/7/12, LOC Wells Fargo Bank NA, VRDN (c)(f) | 7,680 | | 7,680 |
South Carolina - 0.0% |
Oconee County Poll. Cont. Rev. (Duke Energy Corp. Proj.) Series 1999 A, 0.18% 3/1/12, VRDN (c) | 3,100 | | 3,100 |
Texas - 0.6% |
Pasadena Independent School District Participating VRDN Series BC 11 110B, 0.18% 3/7/12 (Liquidity Facility Barclays Bank PLC) (c)(g) | 3,000 | | 3,000 |
Southeast Texas Hsg. Fin. Corp. Multi-family Hsg. Rev. (Oaks of Hitchcock Apt. Proj.) Series 2000 A, 0.19% 3/7/12, LOC Gen. Elec. Cap. Corp., VRDN (c)(f) | 5,150 | | 5,150 |
Municipal Securities - continued |
| Principal Amount (000s) | | Value (000s) |
Texas - continued |
Texas Dept. of Hsg. & Cmnty. Affairs Single Family Mtg. Rev. Participating VRDN Series ROC II R 11215 WF, 0.22% 3/7/12 (Liquidity Facility Wells Fargo & Co.) (c)(f)(g) | $ 12,120 | | $ 12,120 |
West Harris County Reg'l. Wtr. Auth. Wtr. Sys. Rev. Participating VRDN Series Solar 07 103, 0.14% 3/7/12 (Liquidity Facility U.S. Bank NA, Cincinnati) (c)(g) | 10,235 | | 10,235 |
| | 30,505 |
Virginia - 0.2% |
Arlington County Indl. Dev. Auth. Multi-family Hsg. Rev. Series A, 0.2% 3/7/12, LOC Freddie Mac, VRDN (c)(f) | 4,000 | | 4,000 |
Virginia Hsg. Dev. Auth. Commonwealth Mtg. Rev. Participating VRDN Series BA 1046, 0.29% 3/7/12 (Liquidity Facility Bank of America NA) (c)(f)(g) | 6,200 | | 6,200 |
| | 10,200 |
| Shares | | |
Other - 5.8% |
Fidelity Municipal Cash Central Fund, 0.15% (d)(e) | 315,859,000 | | 315,859 |
TOTAL INVESTMENT PORTFOLIO - 103.0% (Cost $5,626,969) | | 5,626,969 |
NET OTHER ASSETS (LIABILITIES) - (3.0)% | | (166,422) |
NET ASSETS - 100% | $ 5,460,547 |
Security Type Abbreviations |
CP | - | COMMERCIAL PAPER |
TRAN | - | TAX AND REVENUE ANTICIPATION NOTE |
VRDN | - | VARIABLE RATE DEMAND NOTE (A debt instrument that is payable upon demand, either daily, weekly or monthly) |
Legend |
(a) Security exempt from registration under Rule 144A of the Securities Act of 1933. These securities may be resold in transactions exempt from registration, normally to qualified institutional buyers. At the end of the period, the value of these securities amounted to $8,365,000 or 0.2% of net assets. |
(b) Security or a portion of the security purchased on a delayed delivery or when-issued basis. |
(c) Coupon rates for floating and adjustable rate securities reflect the rates in effect at period end. |
(d) Information in this report regarding holdings by state and security types does not reflect the holdings of the Fidelity Municipal Cash Central Fund. |
(e) Affiliated fund that is available only to investment companies and other accounts managed by Fidelity Investments. The rate quoted is the annualized seven-day yield of the fund at period end. A complete unaudited listing of the fund's holdings as of its most recent quarter end is available upon request. In addition, each Fidelity Central Fund's financial statements, which are not covered by the Fund's Report of Independent Registered Public Accounting Firm, are available on the SEC's website or upon request. |
(f) Private activity obligations whose interest is subject to the federal alternative minimum tax for individuals. |
(g) Provides evidence of ownership in one or more underlying municipal bonds. |
(h) Restricted securities - Investment in securities not registered under the Securities Act of 1933 (excluding 144A issues). At the end of the period, the value of restricted securities (excluding 144A issues) amounted to $147,395,000 or 2.7% of net assets. |
Additional information on each restricted holding is as follows: |
Security | Acquisition Date | Cost
(000s) |
Acalanes Union High School District Bonds Series WF11 85Z, 0.2%, tender 7/25/12 (Liquidity Facility Wells Fargo Bank NA) | 1/25/12 - 2/1/12 | $ 10,525 |
Security | Acquisition Date | Cost
(000s) |
Belmont-Redwood Shores School District Bonds Series WF 11 10, 0.2%, tender 7/25/12 (Liquidity Facility Wells Fargo Bank NA) | 1/25/12 | $ 10,350 |
Fremont Union High School District, Santa Clara Bonds Series WF 11 34C, 0.2%, tender 7/25/12 (Liquidity Facility Wells Fargo Bank NA) | 3/24/11 | $ 17,940 |
Los Angeles Cmnty. College District Bonds Series WF 09 8C, 0.2%, tender 7/25/12 (Liquidity Facility Wells Fargo & Co.) | 8/18/11 | $ 19,610 |
Los Angeles Dept. of Wtr. & Pwr. Wtrwks. Rev. Bonds Series WF 10 43C, 0.2%, tender 7/25/12 (Liquidity Facility Wells Fargo Bank NA) | 11/24/10 - 9/1/11 | $ 25,005 |
RBC Muni. Products, Inc. Trust Bonds: Series RBC E 21, 0.2%, tender 5/3/12 (Liquidity Facility Royal Bank of Canada) | 8/30/11 | $ 26,925 |
Security | Acquisition Date | Cost
(000s) |
Series RBC E 24, 0.2%, tender 4/2/12 (Liquidity Facility Royal Bank of Canada) | 11/9/11 | $ 15,500 |
Rio Hondo Cmnty. College District Bonds Series WF 10 51Z, 0.2%, tender 7/25/12 (Liquidity Facility Wells Fargo Bank NA) | 12/23/10 - 2/1/12 | $ 21,540 |
Affiliated Central Funds |
Information regarding fiscal year to date income earned by the Fund from investments in Fidelity Central Funds is as follows: |
Fund | Income earned
(Amounts in thousands) |
Fidelity Municipal Cash Central Fund | $ 288 |
Other Information |
The date shown for securities represents the date when principal payments must be paid, taking into account any call options exercised by the issuer and any permissible maturity shortening features other than interest rate resets. |
All investments are categorized as Level 2 under the Fair Value Hierarchy. The inputs or methodology used for valuing securities may not be an indication of the risk associated with investing in those securities. For more information on valuation inputs, please refer to the Security Valuation section in the accompanying Notes to Financial Statements. |
See accompanying notes which are an integral part of the financial statements.
Annual Report
Statement of Assets and Liabilities
Amounts in thousands (except per-share amount) | February 29, 2012 |
Assets | | |
Investment in securities, at value - See accompanying schedule: Unaffiliated issuers (cost $5,311,110) | $ 5,311,110 | |
Fidelity Central Funds (cost $315,859) | 315,859 | |
Total Investments (cost $5,626,969) | | $ 5,626,969 |
Cash | | 106 |
Receivable for investments sold | | 12,903 |
Receivable for fund shares sold | | 51,445 |
Interest receivable | | 10,983 |
Distributions receivable from Fidelity Central Funds | | 36 |
Prepaid expenses | | 9 |
Total assets | | 5,702,451 |
| | |
Liabilities | | |
Payable for investments purchased
Regular delivery | $ 151,966 | |
Delayed delivery | 37,022 | |
Payable for fund shares redeemed | 51,507 | |
Distributions payable | 1 | |
Accrued management fee | 685 | |
Other affiliated payables | 681 | |
Other payables and accrued expenses | 42 | |
Total liabilities | | 241,904 |
| | |
Net Assets | | $ 5,460,547 |
Net Assets consist of: | | |
Paid in capital | | $ 5,462,163 |
Accumulated undistributed net realized gain (loss) on investments | | (1,616) |
Net Assets, for 5,460,539 shares outstanding | | $ 5,460,547 |
Net Asset Value, offering price and redemption price per share ($5,460,547 ÷ 5,460,539 shares) | | $ 1.00 |
See accompanying notes which are an integral part of the financial statements.
Annual Report
Statement of Operations
Amounts in thousands | Year ended February 29, 2012 |
Investment Income | | |
Interest | | $ 10,452 |
Income from Fidelity Central Funds | | 288 |
Total income | | 10,740 |
| | |
Expenses | | |
Management fee | $ 19,215 | |
Transfer agent fees | 6,883 | |
Accounting fees and expenses | 449 | |
Custodian fees and expenses | 65 | |
Independent trustees' compensation | 19 | |
Registration fees | 53 | |
Audit | 46 | |
Legal | 32 | |
Miscellaneous | 38 | |
Total expenses before reductions | 26,800 | |
Expense reductions | (16,586) | 10,214 |
Net investment income (loss) | | 526 |
Realized and Unrealized Gain (Loss) Net realized gain (loss) on: | | |
Investment securities: | | |
Unaffiliated issuers | | 64 |
Net increase in net assets resulting from operations | | $ 590 |
See accompanying notes which are an integral part of the financial statements.
Annual Report
Financial Statements - continued
Statement of Changes in Net Assets
Amounts in thousands | Year ended
February 29,
2012 | Year ended
February 28,
2011 |
Increase (Decrease) in Net Assets | | |
Operations | | |
Net investment income (loss) | $ 526 | $ 501 |
Net realized gain (loss) | 64 | (1,691) |
Net increase in net assets resulting
from operations | 590 | (1,190) |
Distributions to shareholders from net investment income | (526) | (501) |
Share transactions at net asset value of $1.00 per share
Proceeds from sales of shares | 17,435,875 | 19,668,465 |
Reinvestment of distributions | 519 | 495 |
Cost of shares redeemed | (17,089,120) | (19,598,265) |
Net increase (decrease) in net assets and shares resulting from share transactions | 347,274 | 70,695 |
Total increase (decrease) in net assets | 347,338 | 69,004 |
| | |
Net Assets | | |
Beginning of period | 5,113,209 | 5,044,205 |
End of period | $ 5,460,547 | $ 5,113,209 |
See accompanying notes which are an integral part of the financial statements.
Annual Report
Financial Highlights
Years ended February 28, | 2012 D | 2011 | 2010 | 2009 | 2008 D |
Selected Per-Share Data | | | | | |
Net asset value, beginning of period | $ 1.00 | $ 1.00 | $ 1.00 | $ 1.00 | $ 1.00 |
Income from Investment Operations | | | | | |
Net investment income (loss) | - E | - E | - E | .013 | .030 |
Net realized and unrealized gain (loss) E | - | - | - | - | - |
Total from investment operations | - E | - E | - E | .013 | .030 |
Distributions from net investment income | - E | - E | - E | (.013) | (.030) |
Distributions from net realized gain | - | - | - | - E | - E |
Total distributions | - E | - E | - E | (.013) | (.030) |
Net asset value, end of period | $ 1.00 | $ 1.00 | $ 1.00 | $ 1.00 | $ 1.00 |
Total Return A | .01% | .01% | .04% | 1.32% | 3.06% |
Ratios to Average Net Assets B,C | | | | | |
Expenses before reductions | .51% | .51% | .55% | .53% | .51% |
Expenses net of fee waivers, if any | .19% | .32% | .44% | .53% | .51% |
Expenses net of all reductions | .19% | .32% | .44% | .50% | .41% |
Net investment income (loss) | .01% | .01% | .04% | 1.30% | 2.98% |
Supplemental Data | | | | | |
Net assets, end of period
(in millions) | $ 5,461 | $ 5,113 | $ 5,044 | $ 5,761 | $ 6,051 |
A Total returns would have been lower if certain expenses had not been reduced during the applicable periods shown.
B Fees and expenses of any underlying Fidelity Central Funds are not included in the Fund's expense ratio. The Fund indirectly bears its proportionate share of the expenses of any underlying Fidelity Central Funds.
C Expense ratios reflect operating expenses of the Fund. Expenses before reductions do not reflect amounts reimbursed or waived or reductions from expense offset arrangements and do not represent the amount paid by the Fund during periods when reimbursements, waivers or reductions occur. Expenses net of fee waivers reflect expenses after reimbursement and waivers but prior to reductions from expense offset arrangements. Expenses net of all reductions represent the net expenses paid by the Fund.
D For the year ended February 29.
E Amount represents less than $.001 per share.
See accompanying notes which are an integral part of the financial statements.
Annual Report
Notes to Financial Statements
For the period ended February 29, 2012
(Amounts in thousands except percentages)
1. Organization.
Fidelity California Municipal Money Market Fund (the Fund) is a fund of Fidelity California Municipal Trust II (the Trust) and is authorized to issue an unlimited number of shares. The Trust is registered under the Investment Company Act of 1940, as amended (the 1940 Act), as an open-end management investment company organized as a Delaware statutory trust. The Fund may be affected by economic and political developments in the state of California.
2. Investments in Fidelity Central Funds.
The Fund invests in Fidelity Central Funds, which are open-end investment companies available only to other investment companies and accounts managed by Fidelity Management & Research Company (FMR) and its affiliates. The Fund's Schedule of Investments lists each of the Fidelity Central Funds held as of period end, if any, as an investment of the Fund, but does not include the underlying holdings of each Fidelity Central Fund. As an Investing Fund, the Fund indirectly bears its proportionate share of the expenses of the underlying Fidelity Central Funds.
The Money Market Central Funds seek preservation of capital and current income and are managed by Fidelity Investments Money Management, Inc. (FIMM), an affiliate of FMR.
A complete unaudited list of holdings for each Fidelity Central Fund is available upon request or at the Securities and Exchange Commission (the SEC) web site at www.sec.gov. In addition, the financial statements of the Fidelity Central Funds, which are not covered by the Fund's Report of Independent Registered Public Accounting Firm, are available on the SEC web site or upon request.
3. Significant Accounting Policies.
The financial statements have been prepared in conformity with accounting principles generally accepted in the United States of America (GAAP), which require management to make certain estimates and assumptions at the date of the financial statements. Actual results could differ from those estimates. Subsequent events, if any, through the date that the financial statements were issued have been evaluated in the preparation of the financial statements. The following summarizes the significant accounting policies of the Fund:
Security Valuation. The Fund categorizes the inputs to valuation techniques used to value its investments into a disclosure hierarchy consisting of three levels as shown below:
Level 1 - quoted prices in active markets for identical investments
Level 2 - other significant observable inputs (including quoted prices for similar investments, interest rates, prepayment speeds, etc.)
Level 3 - unobservable inputs (including the Fund's own assumptions based on the best information available)
Annual Report
Notes to Financial Statements - continued
(Amounts in thousands except percentages)
3. Significant Accounting Policies - continued
Security Valuation - continued
As permitted by compliance with certain conditions under Rule 2a-7 of the 1940 Act, securities are valued at amortized cost, which approximates fair value. The amortized cost of an instrument is determined by valuing it at its original cost and thereafter amortizing any discount or premium from its face value at a constant rate until maturity. Securities held by a money market fund are generally high quality and liquid; however, they are reflected as Level 2 because the inputs used to determine fair value are not quoted prices in an active market.
Investment Transactions and Income. The net asset value per share for processing shareholder transactions is calculated as of the close of business of the New York Stock Exchange (NYSE), normally 4:00 p.m. Eastern time. Security transactions, including the Fund's investment activity in the Fidelity Central Funds, are accounted for as of trade date. Gains and losses on securities sold are determined on the basis of identified cost. Interest income and distributions from the Fidelity Central Funds are accrued as earned. Interest income includes coupon interest and amortization of premium and accretion of discount on debt securities.
Expenses. Expenses directly attributable to a fund are charged to that fund. Expenses attributable to more than one fund are allocated among the respective funds on the basis of relative net assets or other appropriate methods. Expense estimates are accrued in the period to which they relate and adjustments are made when actual amounts are known.
Income Tax Information and Distributions to Shareholders. Each year, the Fund intends to qualify as a regulated investment company under Subchapter M of the Internal Revenue Code, including distributing substantially all of its taxable income and realized gains. As a result, no provision for income taxes is required. As of February 29, 2012, the Fund did not have any unrecognized tax benefits in the financial statements; nor is the Fund aware of any tax positions for which it is reasonably possible that the total amounts of unrecognized tax benefits will significantly change in the next twelve months. The Fund files a U.S. federal tax return, in addition to state and local tax returns as required. A fund's federal income tax returns are subject to examination by the Internal Revenue Service (IRS) for a period of three fiscal years after they are filed. State and local tax returns may be subject to examination for an additional fiscal year depending on the jurisdiction.
Dividends are declared and recorded daily and paid monthly from net investment income. Distributions from realized gains, if any, are declared and recorded on the ex-dividend date. Income and capital gain distributions are determined in accordance with income tax regulations, which may differ from GAAP.
Annual Report
3. Significant Accounting Policies - continued
Income Tax Information and Distributions to Shareholders - continued
Capital accounts within the financial statements are adjusted for permanent book-tax differences. These adjustments have no impact on net assets or the results of operations. Temporary book-tax differences will reverse in a subsequent period.
Book-tax differences are primarily due to deferred trustees compensation and capital loss carryforwards.
The Funds purchase municipal securities whose interest, in the opinion of the issuer, is free from federal income tax. There is no assurance that the IRS will agree with this opinion. In the event the IRS determines that the issuer does not comply with relevant tax requirements, interest payments from a security could become federally taxable, possibly retroactively to the date the security was issued.
The federal tax cost of investment securities and unrealized appreciation (depreciation) as of period end were as follows:
Gross unrealized appreciation | $ - |
Gross unrealized depreciation | - |
Net unrealized appreciation (depreciation) on securities and other investments | $ - |
| |
Tax cost | $ 5,626,969 |
The tax-based components of distributable earnings as of period end were as follows:
Undistributed tax-exempt income | $ 11 |
Capital loss carryforward | $ (1,627) |
Capital loss carryforwards are only available to offset future capital gains of the Fund to the extent provided by regulations and may be limited. Under the Regulated Investment Company Modernization Act of 2010 (the Act), the Fund is permitted to carry forward capital losses incurred in taxable years beginning after December 22, 2010 for an unlimited period and such capital losses are required to be used prior to any losses that expire. At February 29, 2012 capital loss carryforwards were as follows:
Fiscal year of expiration | |
2019 | $ (1,627) |
Annual Report
Notes to Financial Statements - continued
(Amounts in thousands except percentages)
3. Significant Accounting Policies - continued
Income Tax Information and Distributions to Shareholders - continued
The tax character of distributions paid was as follows:
| February 29, 2012 | February 28, 2011 |
Tax-exempt Income | $ 526 | $ 501 |
4. Operating Policies.
Delayed Delivery Transactions and When-Issued Securities. During the period, the Fund transacted in securities on a delayed delivery or when-issued basis. Payment and delivery may take place after the customary settlement period for that security. The price of the underlying securities and the date when the securities will be delivered and paid for are fixed at the time the transaction is negotiated. During the time a delayed delivery sell is outstanding, equivalent deliverable securities are held for the transaction. The securities purchased on a delayed delivery or when-issued basis are identified as such in the Fund's Schedule of Investments. The Fund may receive compensation for interest forgone in the purchase of a delayed delivery or when-issued security. With respect to purchase commitments, the Fund identifies securities as segregated in its records with a value at least equal to the amount of the commitment. Losses may arise due to changes in the value of the underlying securities or if the counterparty does not perform under the contract's terms, or if the issuer does not issue the securities due to political, economic, or other factors.
Restricted Securities. The Fund may invest in securities that are subject to legal or contractual restrictions on resale. These securities generally may be resold in transactions exempt from registration or to the public if the securities are registered. Disposal of these securities may involve time-consuming negotiations and expense, and prompt sale at an acceptable price may be difficult. Information regarding restricted securities is included at the end of the Fund's Schedule of Investments.
5. Fees and Other Transactions with Affiliates.
Management Fee. FMR and its affiliates provide the Fund with investment management related services for which the Fund pays a monthly management fee. The management fee is the sum of an individual fund fee rate that is based on an annual rate of .25% of the Fund's average net assets and an annualized group fee rate that averaged .12% during the period. The group fee rate is based upon the average net assets of all the mutual funds advised by FMR. The group fee rate decreases as assets under management increase and increases as assets under management decrease. For the period, the total annual management fee rate was .37% of the Fund's average net assets.
Annual Report
5. Fees and Other Transactions with Affiliates - continued
Transfer Agent and Accounting Fees. Citibank, N.A. (Citibank) is the custodian, transfer agent and servicing agent for the Fund. Citibank has entered into a sub-arrangement with Fidelity Investments Institutional Operations Company, Inc. (FIIOC), an affiliate of FMR, under which FIIOC performs the activities associated with the Fund's transfer agency, dividend disbursing and shareholder servicing functions. The Fund pays account fees and asset-based fees that vary according to account size and type of account. FIIOC pays for typesetting, printing and mailing of shareholder reports, except proxy statements. For the period, transfer agent fees were equivalent to an annual rate of .13% of average net assets.
During the period, FMR or its affiliates waived a portion of these fees.
Citibank also has a sub-arrangement with Fidelity Service Company, Inc. (FSC), an affiliate of FMR, under which FSC maintains the Fund's accounting records. The fee is based on the level of average net assets for the month.
6. Expense Reductions.
FMR or its affiliates voluntarily agreed to waive certain fees in order to maintain a minimum annualized yield of .01%. Such arrangements may be discontinued by FMR at any time. For the period, the amount of the waiver was $16,583.
In addition, through arrangements with the Fund's custodian, credits realized as a result of uninvested cash balances were used to reduce the Fund's expenses. During the period, these credits reduced the Fund's custody expenses by $3.
7. Other.
The Fund's organizational documents provide former and current trustees and officers with a limited indemnification against liabilities arising in connection with the performance of their duties to the Fund. In the normal course of business, the Fund may also enter into contracts that provide general indemnifications. The Fund's maximum exposure under these arrangements is unknown as this would be dependent on future claims that may be made against the Fund. The risk of material loss from such claims is considered remote.
Annual Report
To the Trustees of Fidelity California Municipal Trust II and the Shareholders of Fidelity California Municipal Money Market Fund:
In our opinion, the accompanying statement of assets and liabilities, including the schedule of investments, and the related statements of operations and of changes in net assets and the financial highlights present fairly, in all material respects, the financial position of Fidelity California Municipal Money Market Fund (a fund of Fidelity California Municipal Trust II) at February 29, 2012, the results of its operations for the year then ended, the changes in its net assets for each of the two years in the period then ended and the financial highlights for each of the five years in the period then ended, in conformity with accounting principles generally accepted in the United States of America. These financial statements and financial highlights (hereafter referred to as "financial statements") are the responsibility of the Fidelity California Municipal Money Market Fund's management. Our responsibility is to express an opinion on these financial statements based on our audits. We conducted our audits of these financial statements in accordance with the standards of the Public Company Accounting Oversight Board (United States). Those standards require that we plan and perform the audit to obtain reasonable assurance about whether the financial statements are free of material misstatement. An audit includes examining, on a test basis, evidence supporting the amounts and disclosures in the financial statements, assessing the accounting principles used and significant estimates made by management, and evaluating the overall financial statement presentation. We believe that our audits, which included confirmation of securities at February 29, 2012 by correspondence with the custodian and brokers, provide a reasonable basis for our opinion.
/s/ PricewaterhouseCoopers LLP
PricewaterhouseCoopers LLP
Boston, Massachusetts
April 11, 2012
Annual Report
The Trustees and executive officers of the trust and fund, as applicable, are listed below. The Board of Trustees governs the fund and is responsible for protecting the interests of shareholders. The Trustees are experienced executives who meet periodically throughout the year to oversee the fund's activities, review contractual arrangements with companies that provide services to the fund, oversee management of the risks associated with such activities and contractual arrangements, and review the fund's performance. Except for James C. Curvey, each of the Trustees oversees 204 funds advised by FMR or an affiliate. Mr. Curvey oversees 430 funds advised by FMR or an affiliate.
The Trustees hold office without limit in time except that (a) any Trustee may resign; (b) any Trustee may be removed by written instrument, signed by at least two-thirds of the number of Trustees prior to such removal; (c) any Trustee who requests to be retired or who has become incapacitated by illness or injury may be retired by written instrument signed by a majority of the other Trustees; and (d) any Trustee may be removed at any special meeting of shareholders by a two-thirds vote of the outstanding voting securities of the trust. Each Trustee who is not an interested person (as defined in the 1940 Act) (Independent Trustee), shall retire not later than the last day of the calendar year in which his or her 75th birthday occurs. The Independent Trustees may waive this mandatory retirement age policy with respect to individual Trustees. The executive officers hold office without limit in time, except that any officer may resign or may be removed by a vote of a majority of the Trustees at any regular meeting or any special meeting of the Trustees. Except as indicated, each individual has held the office shown or other offices in the same company for the past five years.
Experience, Skills, Attributes, and Qualifications of the Fund's Trustees. The Governance and Nominating Committee has adopted a statement of policy that describes the experience, qualifications, attributes, and skills that are necessary and desirable for potential Independent Trustee candidates (Statement of Policy). The Board believes that each Trustee satisfied at the time he or she was initially elected or appointed a Trustee, and continues to satisfy, the standards contemplated by the Statement of Policy. The Governance and Nominating Committee also engages professional search firms to help identify potential Independent Trustee candidates who have the experience, qualifications, attributes, and skills consistent with the Statement of Policy. From time to time, additional criteria based on the composition and skills of the current Independent Trustees, as well as experience or skills that may be appropriate in light of future changes to board composition, business conditions, and regulatory or other developments, have also been considered by the professional search firms and the Governance and Nominating Committee. In addition, the Board takes into account the Trustees' commitment and participation in Board and committee meetings, as well as their leadership of standing and ad hoc committees throughout their tenure.
In determining that a particular Trustee was and continues to be qualified to serve as a Trustee, the Board has considered a variety of criteria, none of which, in isolation, was controlling. The Board believes that, collectively, the Trustees have balanced and diverse experience, qualifications, attributes, and skills, which allow the Board to operate effectively in governing the fund and protecting the interests of shareholders. Information about the specific experience, skills, attributes, and qualifications of each Trustee, which in each case led to the Board's conclusion that the Trustee should serve (or continue to serve) as a trustee of the fund, is provided below.
Annual Report
Board Structure and Oversight Function. Abigail P. Johnson is an interested person (as defined in the 1940 Act) and currently serves as Chairman. The Trustees have determined that an interested Chairman is appropriate and benefits shareholders because an interested Chairman has a personal and professional stake in the quality and continuity of services provided to the fund. Independent Trustees exercise their informed business judgment to appoint an individual of their choosing to serve as Chairman, regardless of whether the Trustee happens to be independent or a member of management. The Independent Trustees have determined that they can act independently and effectively without having an Independent Trustee serve as Chairman and that a key structural component for assuring that they are in a position to do so is for the Independent Trustees to constitute a substantial majority for the Board. The Independent Trustees also regularly meet in executive session. Kenneth L. Wolfe serves as Chairman of the Independent Trustees and as such (i) acts as a liaison between the Independent Trustees and management with respect to matters important to the Independent Trustees and (ii) with management prepares agendas for Board meetings.
Fidelity funds are overseen by different Boards of Trustees. The fund's Board oversees Fidelity's investment-grade bond, money market, and asset allocation funds and another Board oversees Fidelity's equity and high income funds. The asset allocation funds may invest in Fidelity funds that are overseen by such other Board. The use of separate Boards, each with its own committee structure, allows the Trustees of each group of Fidelity funds to focus on the unique issues of the funds they oversee, including common research, investment, and operational issues. On occasion, the separate Boards establish joint committees to address issues of overlapping consequences for the Fidelity funds overseen by each Board.
The Trustees operate using a system of committees to facilitate the timely and efficient consideration of all matters of importance to the Trustees, the fund, and fund shareholders and to facilitate compliance with legal and regulatory requirements and oversight of the fund's activities and associated risks. The Board, acting through its committees, has charged FMR and its affiliates with (i) identifying events or circumstances the occurrence of which could have demonstrably adverse effects on the fund's business and/or reputation; (ii) implementing processes and controls to lessen the possibility that such events or circumstances occur or to mitigate the effects of such events or circumstances if they do occur; and (iii) creating and maintaining a system designed to evaluate continuously business and market conditions in order to facilitate the identification and implementation processes described in (i) and (ii) above. Because the day-to-day operations and activities of the fund are carried out by or through FMR, its affiliates and other service providers, the fund's exposure to risks is mitigated but not eliminated by the processes overseen by the Trustees. While each of the Board's committees has responsibility for overseeing different aspects of the fund's activities, oversight is exercised primarily through the Operations and Audit Committees. In addition, an ad hoc Board committee of Independent Trustees has worked with FMR to enhance the Board's oversight of investment and financial risks, legal and regulatory risks, technology risks, and operational risks, including the development of additional risk reporting to the Board. The Operations Committee also worked and continues to work with FMR to enhance the stress tests required under SEC regulations for money market funds. Appropriate personnel, including but not limited to the fund's Chief Compliance Officer (CCO), FMR's internal auditor, the independent accountants, the fund's Treasurer and portfolio management personnel, make periodic reports to the Board's committees, as appropriate, including an annual review of FMR's risk management program for the Fidelity funds. The responsibilities of each standing committee, including their oversight responsibilities, are described further under "Standing Committees of the Fund's Trustees."
Annual Report
Trustees and Officers - continued
The fund's Statement of Additional Information (SAI) includes more information about the Trustees. To request a free copy, call Fidelity at 1-800-544-8544.
Interested Trustees*:
Correspondence intended for each Trustee who is an interested person may be sent to Fidelity Investments, 82 Devonshire Street, Boston, Massachusetts 02109.
Name, Age; Principal Occupations and Other Relevant Experience+ |
Abigail P. Johnson (50) |
| Year of Election or Appointment: 2009 Ms. Johnson is Trustee and Chairman of the Board of Trustees of certain Trusts. Ms. Johnson serves as President of Personal, Workplace and Institutional Services (2005-present). Ms. Johnson is Chairman and Director of FMR Co., Inc. (2011-present), Chairman and Director of FMR (2011-present), and the Vice Chairman and Director (2007-present) of FMR LLC. Previously, Ms. Johnson served as President and a Director of FMR (2001-2005), a Trustee of other investment companies advised by FMR, Fidelity Investments Money Management, Inc., and FMR Co., Inc. (2001-2005), Senior Vice President of the Fidelity funds (2001-2005), and managed a number of Fidelity funds. Ms. Abigail P. Johnson and Mr. Arthur E. Johnson are not related. |
James C. Curvey (76) |
| Year of Election or Appointment: 2007 Mr. Curvey also serves as Trustee (2007-present) of other investment companies advised by FMR. Mr. Curvey is a Director of Fidelity Investments Money Management, Inc. (2009-present), Director of Fidelity Research & Analysis Co. (2009-present) and Director of FMR and FMR Co., Inc. (2007-present). Mr. Curvey is also Vice Chairman (2007-present) and Director of FMR LLC. In addition, Mr. Curvey serves as an Overseer for the Boston Symphony Orchestra and a member of the Trustees of Villanova University. Previously, Mr. Curvey was the Vice Chairman (2006-2007) and Director (2000-2007) of FMR Corp. |
* Trustees have been determined to be "Interested Trustees" by virtue of, among other things, their affiliation with the trust or various entities under common control with FMR.
+ The information above includes each Trustee's principal occupation during the last five years and other information relating to the experience, attributes, and skills relevant to each Trustee's qualifications to serve as a Trustee, which led to the conclusion that each Trustee should serve as a Trustee for the fund.
Independent Trustees:
Correspondence intended for each Independent Trustee (that is, the Trustees other than the Interested Trustees) may be sent to Fidelity Investments, P.O. Box 55235, Boston, Massachusetts 02205-5235.
Name, Age; Principal Occupations and Other Relevant Experience+ |
Albert R. Gamper, Jr. (69) |
| Year of Election or Appointment: 2006 Mr. Gamper is Vice Chairman of the Independent Trustees of the Fixed Income and Asset Allocation Funds (2011-present). Prior to his retirement in December 2004, Mr. Gamper served as Chairman of the Board of CIT Group Inc. (commercial finance). During his tenure with CIT Group Inc. Mr. Gamper served in numerous senior management positions, including Chairman (1987-1989; 1999-2001; 2002-2004), Chief Executive Officer (1987-2004), and President (2002-2003). Mr. Gamper currently serves as a member of the Board of Directors of Public Service Enterprise Group (utilities, 2000-present), a member of the Board of Trustees, Rutgers University (2004-present), and Chairman of the Board of Saint Barnabas Health Care System. Previously, Mr. Gamper served as Chairman of the Board of Governors, Rutgers University (2004-2007). |
Robert F. Gartland (60) |
| Year of Election or Appointment: 2010 Mr. Gartland is Chairman and an investor in Gartland and Mellina Group Corp. (consulting, 2009-present). Previously, Mr. Gartland served as a partner and investor of Vietnam Partners LLC (investments and consulting, 2008-2011). Prior to his retirement, Mr. Gartland held a variety of positions at Morgan Stanley (financial services, 1979-2007) including Managing Director (1987-2007). |
Arthur E. Johnson (65) |
| Year of Election or Appointment: 2008 Mr. Johnson serves as a member of the Board of Directors of Eaton Corporation (diversified power management, 2009-present), AGL Resources, Inc. (holding company, 2002-present) and Booz Allen Hamilton (management consulting, 2011-present). Prior to his retirement, Mr. Johnson served as Senior Vice President of Corporate Strategic Development of Lockheed Martin Corporation (defense contractor, 1999-2009). He previously served on the Board of Directors of IKON Office Solutions, Inc. (1999-2008) and Delta Airlines (2005-2007). Mr. Arthur E. Johnson is not related to Mr. Edward C. Johnson 3d or Ms. Abigail P. Johnson. |
Michael E. Kenneally (57) |
| Year of Election or Appointment: 2009 Previously, Mr. Kenneally served as a Member of the Advisory Board for certain Fidelity Fixed Income and Asset Allocation Funds (2008-2009). Prior to his retirement, Mr. Kenneally served as Chairman and Global Chief Executive Officer of Credit Suisse Asset Management (2003-2005). Mr. Kenneally was a Director of the Credit Suisse Funds (U.S. mutual funds, 2004-2008) and certain other closed-end funds (2004-2005) and was awarded the Chartered Financial Analyst (CFA) designation in 1991. |
James H. Keyes (71) |
| Year of Election or Appointment: 2007 Mr. Keyes serves as a member of the Boards of Navistar International Corporation (manufacture and sale of trucks, buses, and diesel engines, since 2002) and Pitney Bowes, Inc. (integrated mail, messaging, and document management solutions, since 1998). Prior to his retirement, Mr. Keyes served as Chairman and Chief Executive Officer of Johnson Controls (automotive, building, and energy, 1998-2002) and as a member of the Board of LSI Logic Corporation (semiconductor technologies, 1984-2008). |
Marie L. Knowles (65) |
| Year of Election or Appointment: 2001 Prior to Ms. Knowles' retirement in June 2000, she served as Executive Vice President and Chief Financial Officer of Atlantic Richfield Company (ARCO) (diversified energy, 1996-2000). From 1993 to 1996, she was a Senior Vice President of ARCO and President of ARCO Transportation Company. She served as a Director of ARCO from 1996 to 1998. Ms. Knowles currently serves as a Director and Chairman of the Audit Committee of McKesson Corporation (healthcare service, since 2002). Ms. Knowles is an Honorary Trustee of the Brookings Institution and a member of the Board of the Catalina Island Conservancy and of the Santa Catalina Island Company (2009-present). She also serves as a member of the Advisory Board for the School of Engineering of the University of Southern California and the Foundation Board of the School of Architecture at the University of Virginia (2007-present). Previously, Ms. Knowles served as a Director of Phelps Dodge Corporation (copper mining and manufacturing, 1994-2007). |
Kenneth L. Wolfe (73) |
| Year of Election or Appointment: 2005 Mr. Wolfe is Chairman of the Independent Trustees of the Fixed Income and Asset Allocation Funds (2008-present). Prior to his retirement, Mr. Wolfe served as Chairman and a Director (2007-2009) and Chairman and Chief Executive Officer (1994-2001) of Hershey Foods Corporation. He also served as a member of the Boards of Adelphia Communications Corporation (telecommunications, 2003-2006), Bausch & Lomb, Inc. (medical/pharmaceutical, 1993-2007), and Revlon, Inc. (personal care products, 2004-2009). |
+ The information above includes each Trustee's principal occupation during the last five years and other information relating to the experience, attributes, and skills relevant to each Trustee's qualifications to serve as a Trustee, which led to the conclusion that each Trustee should serve as a Trustee for the fund.
Annual Report
Trustees and Officers - continued
Executive Officers:
Correspondence intended for each executive officer may be sent to Fidelity Investments, 82 Devonshire Street, Boston, Massachusetts 02109.
Name, Age; Principal Occupation |
John R. Hebble (53) |
| Year of Election or Appointment: 2008 President and Treasurer of Fidelity's Fixed Income and Asset Allocation Funds. Mr. Hebble also serves as President (2011-present), Treasurer, and Chief Financial Officer of The North Carolina Capital Management Trust: Cash and Term Portfolios (2008-present), Assistant Treasurer of other Fidelity funds (2009-present) and is an employee of Fidelity Investments. |
Robert P. Brown (48) |
| Year of Election or Appointment: 2010 Vice President of Fidelity's Money Market Funds and Executive Vice President of Fidelity Investments Money Management, Inc. (2010-present). Mr. Brown also serves as President, Money Market Group of FMR (2010-present), Managing Director of Research, Director of Fidelity Management & Research (U.K.) Inc. (2008-present) and is an employee of Fidelity Investments. |
Scott C. Goebel (44) |
| Year of Election or Appointment: 2008 Secretary and Chief Legal Officer (CLO) of the Fidelity funds. Mr. Goebel also serves as Secretary of Fidelity Investments Money Management, Inc. (FIMM) (2010-present) and Fidelity Research and Analysis Company (FRAC) (2010-present); Secretary and CLO of The North Carolina Capital Management Trust: Cash and Term Portfolios (2008-present); General Counsel, Secretary, and Senior Vice President of FMR (2008-present) and FMR Co., Inc. (2008-present); employed by FMR LLC or an affiliate (2001-present); Chief Legal Officer of Fidelity Management & Research (Hong Kong) Limited (2008-present) and Assistant Secretary of Fidelity Management & Research (Japan) Inc. (2008-present), and Fidelity Management & Research (U.K.) Inc. (2008-present). Previously, Mr. Goebel served as Assistant Secretary of FIMM (2008-2010), FRAC (2008-2010), and the Funds (2007-2008) and as Vice President and Secretary of Fidelity Distributors Corporation (FDC) (2005-2007). |
David J. Carter (38) |
| Year of Election or Appointment: 2010 Assistant Secretary of Fidelity's Fixed Income and Asset Allocation Funds. Mr. Carter also serves as Vice President, Associate General Counsel (2010-present) and is an employee of Fidelity Investments (2005-present). |
Holly C. Laurent (57) |
| Year of Election or Appointment: 2008 Anti-Money Laundering (AML) Officer of the Fidelity funds. Ms. Laurent also serves as AML Officer of The North Carolina Capital Management Trust: Cash and Term Portfolios (2008-present) and is an employee of Fidelity Investments. Previously, Ms. Laurent was Senior Vice President and Head of Legal for Fidelity Business Services India Pvt. Ltd. (2006-2008), and Senior Vice President, Deputy General Counsel and Group Head for FMR LLC (2005-2006). |
Christine Reynolds (53) |
| Year of Election or Appointment: 2008 Chief Financial Officer of the Fidelity funds. Ms. Reynolds became President of Fidelity Pricing and Cash Management Services (FPCMS) in August 2008. Ms. Reynolds served as Chief Operating Officer of FPCMS (2007-2008). Previously, Ms. Reynolds served as President, Treasurer, and Anti-Money Laundering officer of the Fidelity funds (2004-2007). |
Michael H. Whitaker (44) |
| Year of Election or Appointment: 2008 Chief Compliance Officer of Fidelity's Fixed Income and Asset Allocation Funds. Mr. Whitaker also serves as Chief Compliance Officer of The North Carolina Capital Management Trust: Cash and Term Portfolios (2008-present). Mr. Whitaker is an employee of Fidelity Investments (2007-present). Prior to joining Fidelity Investments, Mr. Whitaker worked at MFS Investment Management where he served as Senior Vice President and Chief Compliance Officer (2004-2006), and Assistant General Counsel. |
Joseph F. Zambello (54) |
| Year of Election or Appointment: 2011 Deputy Treasurer of the Fidelity funds. Mr. Zambello is an employee of Fidelity Investments. Previously, Mr. Zambello served as Vice President of FMR's Program Management Group (2009-2011) and Vice President of the Transfer Agent Oversight Group (2005-2009). |
Stephanie J. Dorsey (42) |
| Year of Election or Appointment: 2008 Deputy Treasurer of Fidelity's Fixed Income and Asset Allocation Funds. Ms. Dorsey also serves as Assistant Treasurer of other Fidelity funds (2010-present) and is an employee of Fidelity Investments (2008-present). Previously, Ms. Dorsey served as Treasurer (2004-2008) of the JPMorgan Mutual Funds and Vice President (2004-2008) of JPMorgan Chase Bank. |
Adrien E. Deberghes (44) |
| Year of Election or Appointment: 2010 Assistant Treasurer of Fidelity's Fixed Income and Asset Allocation Funds. Mr. Deberghes also serves as Vice President and Assistant Treasurer (2011-present) and Deputy Treasurer (2008-present) of other Fidelity funds, and is an employee of Fidelity Investments (2008-present). Previously, Mr. Deberghes served as Senior Vice President of Mutual Fund Administration at State Street Corporation (2007-2008), Senior Director of Mutual Fund Administration at Investors Bank & Trust (2005-2007), and Director of Finance for Dunkin' Brands (2000-2005). |
Kenneth B. Robins (42) |
| Year of Election or Appointment: 2009 Assistant Treasurer of the Fidelity Fixed Income and Asset Allocation Funds. Mr. Robins also serves as President and Treasurer of other Fidelity funds (2008-present; 2010-present) and is an employee of Fidelity Investments (2004-present). Previously, Mr. Robins served as Deputy Treasurer of the Fidelity funds (2005-2008) and Treasurer and Chief Financial Officer of The North Carolina Capital Management Trust: Cash and Term Portfolios (2006-2008). |
Gary W. Ryan (53) |
| Year of Election or Appointment: 2005 Assistant Treasurer of the Fidelity funds. Mr. Ryan is an employee of Fidelity Investments. Previously, Mr. Ryan served as Vice President of Fund Reporting in Fidelity Pricing and Cash Management Services (FPCMS) (1999-2005). |
Jonathan Davis (43) |
| Year of Election or Appointment: 2010 Assistant Treasurer of the Fidelity funds. Mr. Davis is also Assistant Treasurer of Fidelity Rutland Square Trust II and Fidelity Commonwealth Trust II. Mr. Davis is an employee of Fidelity Investments. Previously, Mr. Davis served as Vice President and Associate General Counsel of FMR LLC (2003-2010). |
Annual Report
During fiscal year ended 2012, 100% of the fund's income dividends was free from federal income tax, and 22.65% of the fund's income dividends was subject to the federal alternative minimum tax.
The fund will notify shareholders in January 2013 of amounts for use in preparing 2012 income tax returns.
Annual Report
Board Approval of Investment Advisory Contracts and Management Fees
Fidelity California Municipal Money Market Fund
Each year, the Board of Trustees, including the Independent Trustees (together, the Board), votes on the renewal of the management contract and sub-advisory agreements (together, the Advisory Contracts) for the fund. The Board, assisted by the advice of fund counsel and Independent Trustees' counsel, requests and considers a broad range of information relevant to the renewal of the Advisory Contracts throughout the year.
The Board meets regularly and considers at each of its meetings factors that are relevant to its annual consideration of the renewal of the fund's Advisory Contracts, including the services and support provided to the fund and its shareholders. The Board has established three standing committees, Operations, Audit, and Nominating and Governance, each composed of Independent Trustees with varying backgrounds, to which the Board has assigned specific subject matter responsibilities in order to enhance effective decision-making by the Board. The Operations Committee, of which all of the Independent Trustees are members, meets regularly throughout the year and, among other matters, considers matters specifically related to the annual consideration of the renewal of the fund's Advisory Contracts. The Board, acting directly and through its Committees, requests and receives information concerning the annual consideration of the renewal of the fund's Advisory Contracts. The Board also meets as needed to consider matters specifically related to the Board's annual consideration of the renewal of Advisory Contracts. Members of the Board may also meet with trustees of other Fidelity funds through ad hoc joint committees to discuss certain matters relevant to the Fidelity funds.
At its September 2011 meeting, the Board of Trustees, including the Independent Trustees, unanimously determined to renew the fund's Advisory Contracts. In reaching its determination, the Board considered all factors it believed relevant, including (i) the nature, extent, and quality of the services to be provided to the fund and its shareholders (including the investment performance of the fund); (ii) the competitiveness of the fund's management fee and total expense ratio; (iii) the total costs of the services to be provided by and the profits to be realized by Fidelity from its relationship with the fund; (iv) the extent to which economies of scale would be realized as the fund grows; and (v) whether fee levels reflect these economies of scale, if any, for the benefit of fund shareholders.
In considering whether to renew the Advisory Contracts for the fund, the Board reached a determination, with the assistance of fund counsel and Independent Trustees' counsel and through the exercise of its business judgment, that the renewal of the Advisory Contracts is in the best interests of the fund and its shareholders and that the compensation payable under the Advisory Contracts is fair and reasonable. The Board's decision to renew the Advisory Contracts was not based on any single factor, but rather was based on a comprehensive consideration of all the information provided to the Board at its meetings throughout the year. The Board, in reaching its determination to renew the Advisory Contracts, is aware that shareholders in the fund have a broad range of investment choices available to them, including a wide choice among mutual funds offered by Fidelity's competitors, and that the fund's shareholders, who have the opportunity to review and weigh the disclosure provided by the fund in its prospectus and other public disclosures, have chosen to invest in this fund, managed by Fidelity.
Annual Report
Nature, Extent, and Quality of Services Provided. The Board considered the staffing within the investment adviser, FMR, and the sub-advisers (together, the Investment Advisers), including the backgrounds of the fund's investment personnel and the fund's investment objective and discipline. The Independent Trustees also had discussions with senior management of Fidelity's investment operations and investment groups. The Board considered the structure of the portfolio manager compensation program and whether this structure provides appropriate incentives to act in the best interests of the fund.
Resources Dedicated to Investment Management and Support Services. The Board reviewed the general qualifications and capabilities of the Investment Advisers' investment staff, including its size, education, experience, and resources, as well as the Investment Advisers' approach to recruiting, managing, and compensating investment personnel. The Board also noted that FMR has devoted increased resources to non-U.S. offices. The Board noted that Fidelity's analysts have extensive resources, tools and capabilities which allow them to conduct sophisticated quantitative and fundamental analysis, as well as credit analysis of issuers, counterparties and enhancers. The Board also believes that Fidelity's investment professionals have sufficient access to global information and data so as to provide competitive investment results over time, and that those professionals also have access to sophisticated tools which permit them to assess portfolio construction and risk and performance attribution characteristics continuously, as well as to transmit new information and research conclusions rapidly around the world. Additionally, in its deliberations, the Board considered the Investment Advisers' trading capabilities and resources which are an integral part of the investment management process.
Shareholder and Administrative Services. The Board considered (i) the nature, extent, quality, and cost of advisory, administrative, and shareholder services performed by the Investment Advisers and their affiliates under the Advisory Contracts and under separate agreements covering transfer agency and pricing and bookkeeping services for the fund; (ii) the nature and extent of the investment adviser's supervision of third party service providers, principally custodians and subcustodians; and (iii) the resources devoted to, and the record of compliance with, the fund's compliance policies and procedures.
The Board noted that the growth of fund assets over time across the complex allows Fidelity to reinvest in the development of services designed to enhance the value or convenience of the Fidelity funds as investment vehicles. These services include 24-hour access to account information and market information through telephone representatives and over the Internet, investor education materials and asset allocation tools, and the expanded availability of Fidelity Investor Centers, with 35 new branches opening since 2010.
Annual Report
Board Approval of Investment Advisory Contracts and
Management Fees - continued
Investment in a Large Fund Family. The Board considered the benefits to shareholders of investing in a Fidelity fund, including the benefits of investing in a fund that is part of a large family of funds offering a variety of investment disciplines and providing a large variety of mutual fund investor services. The Board noted that Fidelity had taken, or had made recommendations that resulted in the Fidelity funds taking, a number of actions over the previous year that benefited particular funds, including (i) continuing to dedicate additional resources to investment research and support of the senior management team that oversees asset management; (ii) rationalizing product lines through the mergers of six funds into other funds; (iii) continuing to migrate the Freedom Funds to dedicated lower cost underlying funds; (iv) obtaining shareholder approval to broaden the investment strategies for Fidelity Consumer Finance Portfolio, Fidelity Emerging Asia Fund, and Fidelity Environment and Alternative Energy Portfolio; (v) contractually agreeing to reduce the management fees and impose other expense limitations on Spartan 500 Index Fund and U.S. Bond Index Fund in connection with launching new institutional classes of these funds; (vi) changing the name, primary and supplemental benchmarks, and investment policies of Fidelity Global Strategies Fund to support the fund's flexible investment mandate and global orientation; and (vii) reducing the transfer agency account fee rates on certain accounts.
Investment Performance. The Board considered whether the fund has operated in accordance with its investment objective, as well as its record of compliance with its investment restrictions. It also reviewed the fund's absolute investment performance, as well as the fund's relative investment performance measured over multiple periods against a peer group of mutual funds deemed appropriate by Fidelity and reviewed by the Board. The following charts considered by the Board show, over the one-, three-, and five-year periods ended December 31, 2010, the fund's cumulative total returns and a range of cumulative total returns of a peer group of mutual funds identified by Lipper Inc. as having an investment objective similar to that of the fund. The box within each chart shows the 25th percentile return (bottom of box) and the 75th percentile return (top of box) of the peer group. Returns shown above the box are in the first quartile and returns shown below the box are in the fourth quartile. The percentage beaten number noted below each chart corresponds to the percentile box and represents the percentage of funds in the peer group whose performance was equal to or lower than that of the fund.
Annual Report
Fidelity California Municipal Money Market Fund
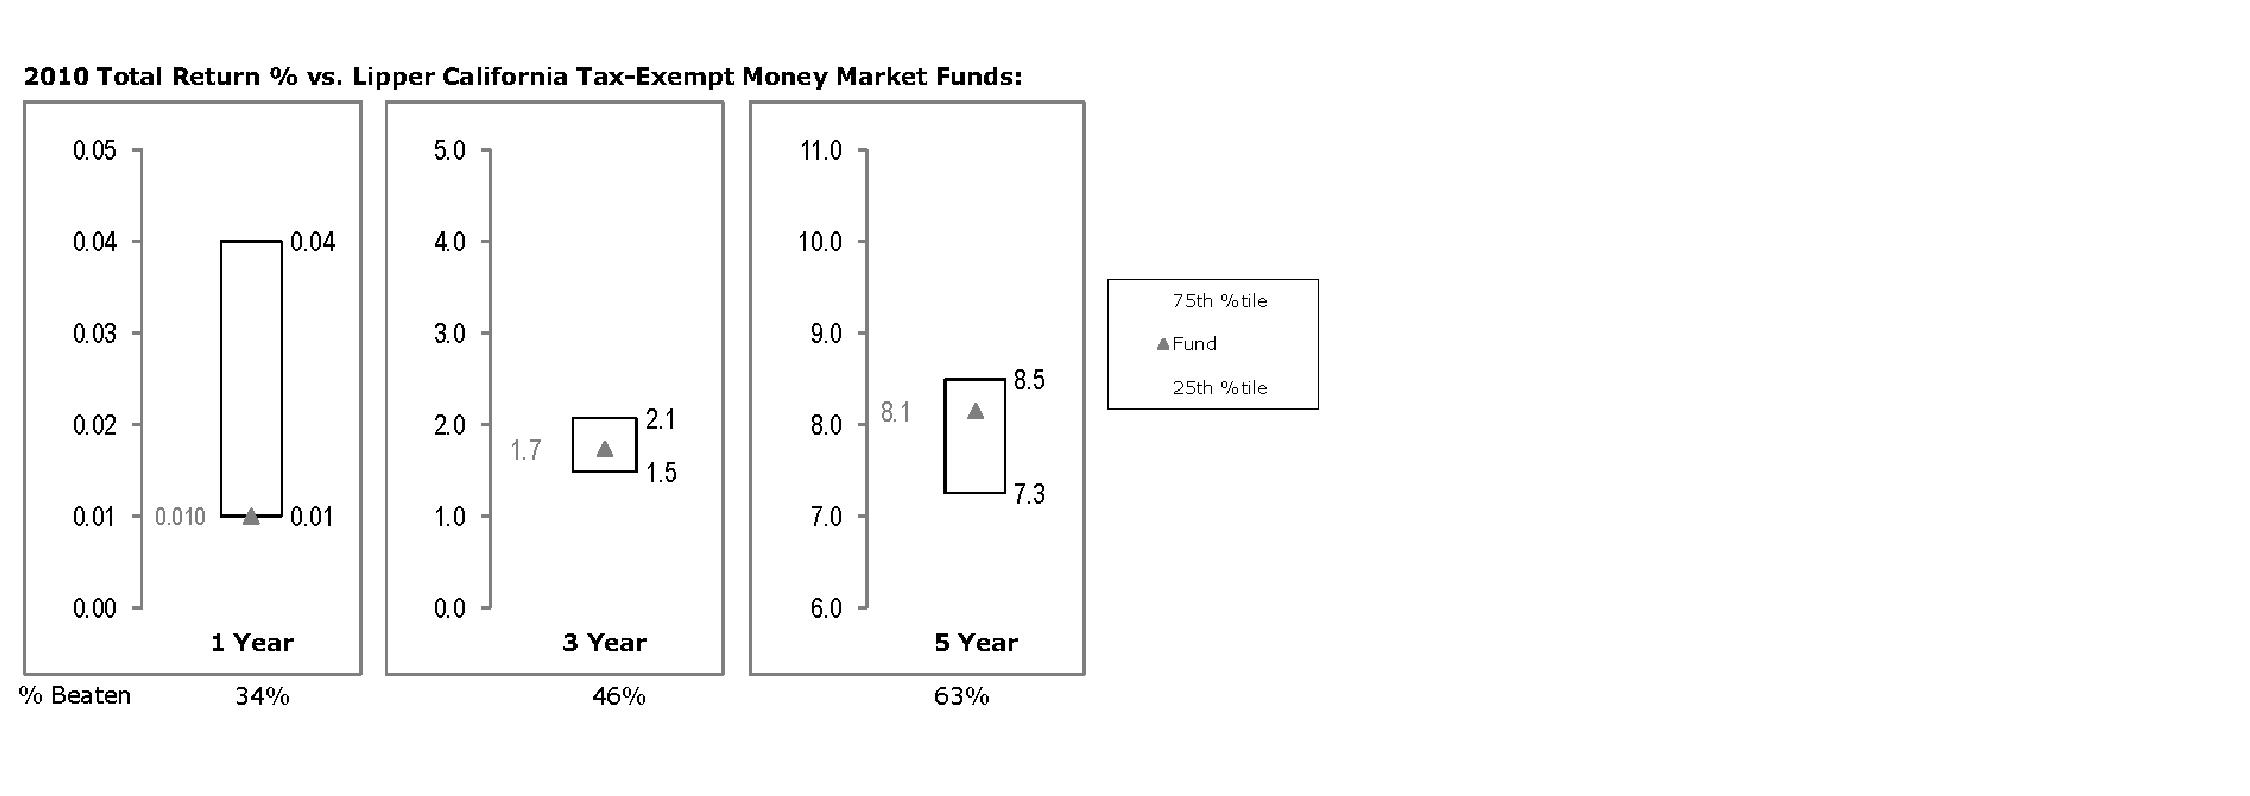
The Board reviewed the fund's relative investment performance against its peer group and noted that the performance of the fund was in the third quartile for the one- and three-year periods and the second quartile for the five-year period. The Board considered that FMR had taken steps to provide shareholders with stability of principal and to enhance safety and liquidity, which contributed to the fund's weakened performance relative to its peer group. The Board also reviewed the fund's performance since inception as well as performance in the current year.
Based on its review, the Board concluded that the nature, extent, and quality of services provided to the fund under the Advisory Contracts should benefit the fund's shareholders.
Competitiveness of Management Fee and Total Expense Ratio. The Board considered the fund's management fee and total expense ratio compared to "mapped groups" of competitive funds and classes. Fidelity creates "mapped groups" by combining similar Lipper investment objective categories that have comparable management fee characteristics. Combining Lipper investment objective categories aids the Board's management fee and total expense ratio comparisons by broadening the competitive group used for comparison and by reducing the number of universes to which various Fidelity funds are compared.
Management Fee. The Board considered two proprietary management fee comparisons for the 12-month periods shown in the chart below. The group of Lipper funds used by the Board for management fee comparisons is referred to below as the "Total Mapped Group" and, for the reasons explained above, is broader than the Lipper peer group used by the Board for performance comparisons. The Total Mapped Group comparison focuses on a fund's standing relative to the total universe of comparable funds available to investors in terms of gross management fees before expense reimbursements or caps. "TMG %" represents the percentage of funds in the Total Mapped Group that had management fees that were lower than the fund's. For example, a TMG % of 36% means that 64% of the funds in the Total Mapped Group had higher management fees than the fund. The "Asset-Size Peer Group" (ASPG) comparison focuses on a fund's standing relative to non-Fidelity funds similar in size to the fund within the Total Mapped Group. The ASPG represents at least 15% of the funds in the Total Mapped Group with comparable asset size and management fee characteristics, subject to a minimum of 50 funds (or all funds in the Total Mapped Group if fewer than 50). Additional information, such as the ASPG quartile in which the fund's management fee ranked, is also included in the chart and considered by the Board.
Annual Report
Board Approval of Investment Advisory Contracts and
Management Fees - continued
Fidelity California Municipal Money Market Fund
The Board noted that the fund's management fee ranked below the median of its Total Mapped Group and above the median of its ASPG for 2010.
Based on its review, the Board concluded that the fund's management fee is fair and reasonable in light of the services that the fund receives and the other factors considered.
Total Expense Ratio. In its review of the fund's total expense ratio, the Board considered the fund's management fee as well as other fund expenses, such as transfer agent fees, pricing and bookkeeping fees, and custodial, legal, and audit fees. The Board also noted the effects of any waivers and reimbursements on fees and expenses. As part of its review, the Board also considered the current and historical total expense ratios of the fund compared to competitive fund median expenses. The fund is compared to those funds and classes in the Total Mapped Group (used by the Board for management fee comparisons) that have a similar sales load structure.
Annual Report
The Board noted that the fund's total expense ratio ranked below its competitive median for 2010. The Board considered that Fidelity has been voluntarily waiving part or all of the transfer agent fees and/or management fees to maintain a minimum yield, and also noted that Fidelity retains the ability to be repaid in certain circumstances.
Fees Charged to Other Fidelity Clients. The Board also considered Fidelity fee structures and other information with respect to clients of FMR and its affiliates, such as other mutual funds advised or subadvised by FMR or its affiliates, pension plan clients, and other institutional clients. In March 2010, the Board created an ad hoc joint committee with the board of other Fidelity funds (the Committee) to review and compare Fidelity's institutional investment advisory business with its business of providing services to the Fidelity funds, including the differences in services provided, fees charged, and costs incurred, as well as competition in their respective marketplaces.
Based on its review of total expense ratios and fees charged to other Fidelity clients, the Board concluded that the fund's total expense ratio was reasonable in light of the services that the fund and its shareholders receive and the other factors considered, including the findings of the Committee.
Costs of the Services and Profitability. The Board considered the revenues earned and the expenses incurred by Fidelity in conducting the business of developing, marketing, distributing, managing, administering and servicing the fund and its shareholders. The Board also considered the level of Fidelity's profits in respect of all the Fidelity funds.
On an annual basis, FMR presents to the Board Fidelity's profitability for the fund. Fidelity calculates the profitability for each fund, as well as aggregate profitability for groups of Fidelity funds and all Fidelity funds, using a series of detailed revenue and cost allocation methodologies which originate with the books and records of Fidelity on which Fidelity's audited financial statements are based. The Audit Committee of the Board reviews any significant changes from the prior year's methodologies.
PricewaterhouseCoopers LLP (PwC), independent registered public accounting firm and auditor to Fidelity and certain Fidelity funds, has been engaged annually by the Board as part of the Board's assessment of Fidelity's profitability analysis. PwC's engagement includes the review and assessment of Fidelity's methodologies used in determining the revenues and expenses attributable to Fidelity's mutual fund business, and completion of agreed-upon procedures surrounding the mathematical accuracy of fund profitability and its conformity to allocation methodologies. After considering PwC's reports issued under the engagement and information provided by Fidelity, the Board concluded that while other allocation methods may also be reasonable, Fidelity's profitability methodologies are reasonable in all material respects.
Annual Report
Board Approval of Investment Advisory Contracts and
Management Fees - continued
The Board also reviewed Fidelity's non-fund businesses and fall-out benefits related to the mutual fund business as well as cases where Fidelity's affiliates may benefit from or be related to the fund's business.
The Board considered the costs of the services provided by and the profits realized by Fidelity in connection with the operation of the fund and was satisfied that the profitability was not excessive in the circumstances.
Economies of Scale. The Board considered whether there have been economies of scale in respect of the management of the Fidelity funds, whether the Fidelity funds (including the fund) have appropriately benefited from any such economies of scale, and whether there is potential for realization of any further economies of scale. The Board considered the extent to which the fund will benefit from economies of scale through increased services to the fund, through waivers or reimbursements, or through fee or expense reductions. The Board also noted that in 2009, it and the board of other Fidelity funds created an ad hoc committee (the Economies of Scale Committee) to analyze whether FMR attains economies of scale in respect of the management and servicing of the Fidelity funds, whether the Fidelity funds have appropriately benefited from such economies of scale, and whether there is potential for realization of any further economies of scale.
The Board recognized that the fund's management contract incorporates a "group fee" structure, which provides for lower group fee rates as total fund assets under FMR's management increase, and for higher group fee rates as total fund assets under FMR's management decrease. FMR calculates the group fee rates based on a tiered asset "breakpoint" schedule that varies based on asset class. The Board considered that the group fee is designed to deliver the benefits of economies of scale to fund shareholders when total Fidelity fund assets increase, even if assets of any particular fund are unchanged or have declined, because some portion of Fidelity's costs are attributable to services provided to all Fidelity funds, and all funds benefit if those costs can be allocated among more assets. The Board concluded that, given the group fee structure, fund shareholders will benefit from lower management fees as assets under FMR's management increase at the fund complex level, regardless of whether Fidelity achieves any such economies of scale.
The Board concluded, taking into account the analysis of the Economies of Scale Committee, that any potential economies of scale are being appropriately shared between fund shareholders and Fidelity.
Additional Information Requested by the Board. In order to develop fully the factual basis for consideration of the Fidelity funds' Advisory Contracts, the Board requested and received additional information on certain topics, including: (i) Fidelity's fund profitability methodology, profitability trends for certain funds, and the impact of certain factors on fund profitability results; (ii) portfolio manager changes that have occurred during the past year and the amount of the investment that each portfolio manager has made in the Fidelity fund(s) that he or she manages; (iii) Fidelity's compensation structure for portfolio managers, research analysts, and other key personnel, including its effects on fund profitability, the rationale for the compensation structure, and the extent to which current market conditions have affected retention and recruitment; (iv) the compensation paid to fund sub-advisers on behalf of the Fidelity funds; (v) Fidelity's fee structures and rationale for recommending different fees among different categories of funds and classes, as well as Fidelity's voluntary waiver of its fees to maintain minimum yields for certain money market funds and classes; (vi) the reasons why certain expenses affect various funds and classes differently; (vii) Fidelity's transfer agent fees, expenses, and services and how the benefits of decreased costs and new efficiencies can be shared across all of the Fidelity funds; (viii) the reasons for and consequences of changes to certain product lines compared to competitors; (ix) the allocation of and historical trends in Fidelity's realization of fall-out benefits; and (x) explanations regarding the relative total expense ratios of certain funds and classes, total expense competitive trends, and actions that might be taken by FMR to reduce total expense ratios for certain funds and classes or to achieve further economies of scale.
Annual Report
Based on its evaluation of all of the conclusions noted above, and after considering all factors it believed relevant, the Board ultimately concluded that the advisory fee structures are fair and reasonable, and that the fund's Advisory Contracts should be renewed.
Annual Report
Managing Your Investments
Fidelity offers several ways to conveniently manage your personal investments via your telephone or PC. You can access your account information, conduct trades and research your investments 24 hours a day.
By Phone
Fidelity Automated Service Telephone provides a single toll-free number to access account balances, positions, quotes and trading. It's easy to navigate the service, and on your first call, the system will help you create a personal identification number (PIN) for security.
(phone graphic)Fidelity Automated
Service Telephone (FAST®)
1-800-544-5555
Press
1 For mutual fund and brokerage trading.
2 For quotes.*
3 For account balances and holdings.
4 To review orders and mutual
fund activity.
5 To change your PIN.
*0 To speak to a Fidelity representative.
By PC
Fidelity's web site on the Internet provides a wide range of information, including daily financial news, fund performance, interactive planning tools and news about Fidelity products and services.
(computer graphic)Fidelity's Web Site
www.fidelity.com
* When you call the quotes line, please remember that a fund's yield and return will vary and, except for money market funds, share price will also vary. This means that you may have a gain or loss when you sell your shares. There is no assurance that money market funds will be able to maintain a stable $1 share price; an investment in a money market fund is not insured or guaranteed by the U.S. government. Total returns are historical and include changes in share price, reinvestment of dividends and capital gains distributions, and the effects of any sales charges.
Annual Report
Investment Adviser
Fidelity Management & Research
Company
Boston, MA
Investment Sub-Advisers
Fidelity Investments Money
Management, Inc.
Fidelity Management &
Research (Japan) Inc.
Fidelity Management &
Research (Hong Kong) Limited
Fidelity Management &
Research Company (U.K.) Inc.
General Distributor
Fidelity Distributors Corporation
Boston, MA
Transfer and Service Agents
Citibank, N.A.
New York, NY
Fidelity Investments Institutional Operations Company, Inc.
Boston, MA
Fidelity Service Company, Inc.
Boston, MA
Custodian
Citibank, N.A.
New York, NY
The Fidelity Telephone Connection
Mutual Fund 24-Hour Service
Exchanges/Redemptions
and Account Assistance 1-800-544-6666
Product Information 1-800-544-6666
Retirement Accounts 1-800-544-4774 (8 a.m. - 9 p.m.)
TDD Service 1-800-544-0118
for the deaf and hearing impaired
(9 a.m. - 9 p.m. Eastern time)
Fidelity Automated Service
Telephone (FAST®) 1-800-544-5555
Automated line for quickest service
CFS-UANN-0412
1.855630.104
(Fidelity Investment logo)(registered trademark)
Corporate Headquarters
82 Devonshire St., Boston, MA 02109
www.fidelity.com
Fidelity®
California AMT Tax-Free
Money Market Fund -
Fidelity California AMT Tax-Free
Money Market Fund
Institutional Class
Service Class
Annual Report
February 29, 2012
(Fidelity Cover Art)
Contents
Shareholder Expense Example | (Click Here) | An example of shareholder expenses. |
Investment Changes/
Performance | (Click Here) | A summary of major shifts in the fund's investments over the past six months. |
Investments | (Click Here) | A complete list of the fund's investments. |
Financial Statements | (Click Here) | Statements of assets and liabilities, operations, and changes in net assets,
as well as financial highlights. |
Notes | (Click Here) | Notes to the financial statements. |
Report of Independent Registered Public Accounting Firm | (Click Here) | |
Trustees and Officers | (Click Here) | |
Distributions | (Click Here) | |
Board Approval of Investment Advisory Contracts and Management Fees | (Click Here) | |
To view a fund's proxy voting guidelines and proxy voting record for the 12-month period ended June 30, visit http://www.fidelity.com/proxyvotingresults or visit the Securities and Exchange Commission's (SEC) web site at http://www.sec.gov. You may also call 1-800-544-8544 for Fidelity California AMT Tax-Free Money Market Fund or 1-877-208-0098 for Institutional Class and Service Class of the fund to request a free copy of the proxy voting guidelines.
Standard & Poor's, S&P and S&P 500 are registered service marks of The McGraw-Hill Companies, Inc. and have been licensed for use by Fidelity Distributors Corporation.
Other third party marks appearing herein are the property of their respective owners.
All other marks appearing herein are registered or unregistered trademarks or service marks of FMR LLC or an affiliated company.
This report and the financial statements contained herein are submitted for the general information of the shareholders of the fund. This report is not authorized for distribution to prospective investors in the fund unless preceded or accompanied by an effective prospectus.
A fund files its complete schedule of portfolio holdings with the SEC for the first and third quarters of each fiscal year on Form N-Q. Forms N-Q are available on the SEC's web site at http://www.sec.gov. A fund's Forms N-Q may be reviewed and copied at the SEC's Public Reference Room in Washington, DC. Information regarding the operation of the SEC's Public Reference Room may be obtained by calling 1-800-SEC-0330. For a complete list of a fund's portfolio holdings, view the most recent holdings listing, semiannual report, or annual report on Fidelity's web site at http://www.fidelity.com/holdings, http://www.advisor.fidelity.com, or http://www.401k.com, as applicable.
NOT FDIC INSURED • MAY LOSE VALUE • NO BANK GUARANTEE
Neither the fund nor Fidelity Distributors Corporation is a bank.
Annual Report
Shareholder Expense Example
As a shareholder of the Fund, you incur two types of costs: (1) transaction costs, and (2) ongoing costs, including management fees, distribution and/or service (12b-1) fees and other Fund expenses. This Example is intended to help you understand your ongoing costs (in dollars) of investing in the Fund and to compare these costs with the ongoing costs of investing in other mutual funds.
The Example is based on an investment of $1,000 invested at the beginning of the period and held for the entire period (September 1, 2011 to February 29, 2012).
Actual Expenses
The first line of the accompanying table for each class of the Fund provides information about actual account values and actual expenses. You may use the information in this line, together with the amount you invested, to estimate the expenses that you paid over the period. Simply divide your account value by $1,000.00 (for example, an $8,600 account value divided by $1,000.00 = 8.6), then multiply the result by the number in the first line for a class of the Fund under the heading entitled "Expenses Paid During Period" to estimate the expenses you paid on your account during this period. A small balance maintenance fee of $12.00 that is charged once a year may apply for certain accounts with a value of less than $2,000. This fee is not included in the table below. If it was, the estimate of expenses you paid during the period would be higher, and your ending account value lower, by this amount. In addition, the Fund, as a shareholder in the underlying Fidelity Central Funds, will indirectly bear its pro-rata share of the fees and expenses incurred by the underlying Fidelity Central Funds. These fees and expenses are not included in the Fund's annualized expense ratio used to calculate the expense estimate in the table below.
Hypothetical Example for Comparison Purposes
The second line of the accompanying table for each class of the Fund provides information about hypothetical account values and hypothetical expenses based on a Class' actual expense ratio and an assumed rate of return of 5% per year before expenses, which is not the Class' actual return. The hypothetical account values and expenses may not be used to estimate the actual ending account balance or expenses you paid for the period. You may use this information to compare the ongoing costs of investing in the Fund and other funds. To do so, compare this 5% hypothetical example with the 5% hypothetical examples that appear in the shareholder reports of the other funds. A small balance maintenance fee of $12.00 that is charged once a year may apply for certain accounts with a value of less than $2,000. This fee is not included in the table below. If it was, the estimate of expenses you paid during the period would be higher, and your ending account value lower, by this amount. In addition, the Fund, as a shareholder in the underlying Fidelity Central Funds, will indirectly bear its pro-rata share of the fees and expenses incurred by the underlying Fidelity Central Funds. These fees and expenses are not included in the Fund's annualized expense ratio used to calculate the expense estimate in the table below.
Please note that the expenses shown in the table are meant to highlight your ongoing costs only and do not reflect any transaction costs. Therefore, the second line of the table is useful in comparing ongoing costs only, and will not help you determine the relative total costs of owning different funds.
Annual Report
| Annualized Expense Ratio | Beginning
Account Value
September 1, 2011 | Ending
Account Value
February 29, 2012 | Expenses Paid
During Period*
September 1, 2011 to
February 29, 2012 |
California AMT Tax-Free Money Market | .17% | | | |
Actual | | $ 1,000.00 | $ 1,000.05 | $ .85** |
HypotheticalA | | $ 1,000.00 | $ 1,024.02 | $ .86** |
Institutional Class | .17% | | | |
Actual | | $ 1,000.00 | $ 1,000.05 | $ .85** |
HypotheticalA | | $ 1,000.00 | $ 1,024.02 | $ .86** |
Service Class | .17% | | | |
Actual | | $ 1,000.00 | $ 1,000.05 | $ .85** |
HypotheticalA | | $ 1,000.00 | $ 1,024.02 | $ .86** |
A 5% return per year before expenses
* Expenses are equal to each Class' annualized expense ratio, multiplied by the average account value over the period, multiplied by 182/366 (to reflect the one-half year period).
** If certain fees were not voluntarily waived by FMR or its affiliates during the period, the annualized expense ratio and the expenses paid in the actual and hypothetical examples above would have been as follows:
| Annualized
Expense Ratio
| Expenses Paid
|
California AMT Tax-Free Money Market | .30% | |
Actual | | $ 1.49 |
HypotheticalA | | $ 1.51 |
Institutional Class | .20% | |
Actual | | $ .99 |
HypotheticalA | | $ 1.01 |
Service Class | .45% | |
Actual | | $ 2.24 |
HypotheticalA | | $ 2.26 |
Annual Report
Investment Changes/Performance (Unaudited)
Effective Maturity Diversification |
Days | % of fund's investments 2/29/12 | % of fund's investments 8/31/11 | % of fund's investments 2/28/11 |
1 - 7 | 63.9 | 61.9 | 70.5 |
8 - 30 | 7.4 | 8.4 | 3.3 |
31 - 60 | 5.0 | 5.5 | 6.0 |
61 - 90 | 5.0 | 7.0 | 5.1 |
91 - 180 | 14.6 | 4.9 | 13.8 |
> 180 | 4.1 | 12.3 | 1.3 |
Effective maturity is determined in accordance with the requirements of Rule 2a-7 under the Investment Company Act of 1940. |
Weighted Average Maturity |
| 2/29/12 | 8/31/11 | 2/28/11 |
Fidelity California AMT Tax-Free Money Market Fund | 39 Days | 49 Days | 33 Days |
California Tax-Free Money Market Funds Average * | 30 Days | 36 Days | 26 Days |
This is a weighted average of all the maturities of the securities held in a fund. Weighted Average Maturity (WAM) can be used as a measure of sensitivity to interest rate changes and market changes. Generally, the longer the maturity, the greater the sensitivity to such changes. WAM is based on the dollar-weighted average length of time until principal payments must be paid. Depending on the types of securities held in a fund, certain maturity shortening devices (e.g., demand features, interest rate resets, and call options) may be taken into account when calculating the WAM. |
Weighted Average Life |
| 2/29/12 | 8/31/11 | 2/28/11 |
Fidelity California AMT Tax-Free Money Market Fund | 39 Days | 49 Days | 33 Days |
Weighted Average Life (WAL) is the weighted average of the life of the securities held in a fund or portfolio and can be used as a measure of sensitivity to changes in liquidity and/or credit risk. Generally, the higher the value, the greater the sensitivity. WAL is based on the dollar-weighted average length of time until principal payments must be paid, taking into account any call options exercised by the issuer and any permissible maturity shortening features other than interest rate resets. The difference between WAM and WAL is that WAM takes into account interest rate resets and WAL does not. WAL for money market funds is not the same as WAL of a mortgage- or asset-backed security. |
Asset Allocation (% of fund's net assets) |
As of February 29, 2012 | As of August 31, 2011 |
| Variable Rate
Demand Notes
(VRDNs) 47.8% | | | Variable Rate
Demand Notes
(VRDNs) 55.5% | |
 | Commercial Paper (including CP Mode) 18.3% | | | Commercial Paper (including CP Mode) 21.5% | |
 | Tender Bonds 3.7% | | | Tender Bonds 3.0% | |
| Municipal Notes 15.7% | | | Municipal Notes 14.8% | |
| Fidelity Tax-Free
Cash Central Fund 11.1% | | | Fidelity Tax-Free
Cash Central Fund 2.8% | |
| Other Investments 5.2% | | | Other Investments 1.4% | |
 | Net Other Assets† (1.8)% | |  | Net Other Assets 1.0% | |

* Source: iMoneyNet, Inc.
† Net Other Assets are not included in the pie chart.
Current and Historical Seven-Day Yields |
| 2/29/12 | 11/28/11 | 8/29/11 | 5/30/11 | 2/28/11 |
| | | | | |
California AMT Tax-Free Money Market | 0.01% | 0.01% | 0.01% | 0.01% | 0.01% |
| | | | | |
Institutional Class | 0.01% | 0.01% | 0.01% | 0.05% | 0.12% |
| | | | | |
Service Class | 0.01% | 0.01% | 0.01% | 0.01% | 0.01% |
Yield refers to the income paid by the fund over a given period. Yields for money market funds are usually for seven-day periods, as they are here, though they are expressed as annual percentage rates. Past performance is no guarantee of future results. Yield will vary and it's possible to lose money investing in the Fund. A portion of the Fund's expenses was reimbursed and/or waived. Absent such reimbursements and/or waivers the yield for the period ending February 29, 2012, the most recent period shown in the table, would have been (0.12)% for California AMT Tax-Free Money Market Class, (0.07)% for the Institutional Class and (0.32)% for the Service Class.sfgdsgdsiurren
Annual Report
Investments February 29, 2012
Showing Percentage of Net Assets
Municipal Securities - 101.8% |
| Principal Amount (000s) | | Value (000s) |
California - 88.1% |
ABAG Fin. Auth. for Nonprofit Corps. Rev. (Schools of the Sacred Heart - San Francisco Proj.) Series 2008 B, 0.28% 3/7/12, LOC Bank of America NA, VRDN (c) | $ 1,400 | | $ 1,400 |
Alameda County Joint Powers Auth. Lease Rev. Series 2010 A, 0.17% 4/13/12, LOC Fed. Home Ln. Bank, San Francisco, CP | 5,800 | | 5,800 |
Bay Area Toll Auth. San Francisco Bay Toll Bridge Rev. Participating VRDN: | | | |
Series EGL 07 0053, 0.16% 3/7/12 (Liquidity Facility Citibank NA) (c)(f) | 3,465 | | 3,465 |
Series Putters 3293, 0.16% 3/7/12 (Liquidity Facility JPMorgan Chase Bank) (c)(f) | 5,000 | | 5,000 |
Series Putters 3434, 0.16% 3/7/12 (Liquidity Facility JPMorgan Chase Bank) (c)(f) | 8,300 | | 8,300 |
Series Putters 3694, 0.16% 3/7/12 (Liquidity Facility JPMorgan Chase Bank) (c)(f) | 2,500 | | 2,500 |
California Cmnty. College Fin. Auth. Trans. TRAN Series A, 2% 6/29/12 | 9,030 | | 9,077 |
California Dept. of Wtr. Resources Participating VRDN: | | | |
Series MS 3276, 0.26% 3/7/12 (Liquidity Facility Morgan Stanley Bank, West Valley City Utah) (c)(f) | 5,000 | | 5,000 |
Series ROC II R 11970-1, 0.16% 3/7/12 (Liquidity Facility Citibank NA) (c)(f) | 4,200 | | 4,200 |
California Dept. of Wtr. Resources Pwr. Supply Rev. Bonds: | | | |
Series 2002 A, 5.25% 5/1/12 | 2,000 | | 2,016 |
Series L, 5% 5/1/12 | 8,500 | | 8,568 |
California Dept. of Wtr. Resources Wtr. Rev. Participating VRDN Series Putters 3361, 0.16% 3/7/12 (Liquidity Facility JPMorgan Chase Bank) (c)(f) | 5,695 | | 5,695 |
California Econ. Recovery Bonds Series 2004 A: | | | |
5.25% 7/1/12 | 3,310 | | 3,364 |
5.25% 7/1/12 | 1,000 | | 1,017 |
California Ed. Notes Prog. TRAN Series B, 2% 4/30/12 | 2,300 | | 2,306 |
California Edl. Facilities Auth. Rev.: | | | |
Bonds (Loyola Marymount Univ. Proj.) Series 2011, 2.5% 10/1/12 | 750 | | 758 |
Participating VRDN: | | | |
Series BBT 2014, 0.15% 3/7/12 (Liquidity Facility Branch Banking & Trust Co.) (c)(f) | 4,755 | | 4,755 |
Series EGL 07 0066, 0.16% 3/7/12 (Liquidity Facility Citibank NA) (c)(f) | 11,050 | | 11,050 |
Series ROC II R 11974, 0.16% 3/7/12 (Liquidity Facility Citibank NA) (c)(f) | 1,500 | | 1,500 |
Series 2003, 0.08% 3/16/12, CP | 3,200 | | 3,200 |
Municipal Securities - continued |
| Principal Amount (000s) | | Value (000s) |
California - continued |
California Edl. Facilities Auth. Rev.: - continued | | | |
Series 2008 S3, 0.23% 7/26/12, CP | $ 14,700 | | $ 14,700 |
California Gen. Oblig.: | | | |
Bonds: | | | |
2% 3/1/12 | 14,400 | | 14,400 |
2% 9/1/12 | 9,690 | | 9,768 |
4% 6/1/12 | 1,000 | | 1,009 |
5% 6/1/12 | 2,000 | | 2,023 |
5% 9/1/12 | 1,080 | | 1,104 |
Series 2003 B1, 0.11% 3/7/12, LOC JPMorgan Chase Bank, LOC California Pub. Employees Retirement Sys., VRDN (c) | 8,000 | | 8,000 |
California Health Facilities Fing. Auth. Rev.: | | | |
(Scripps Health Proj.) Series 2008 D, 0.13% 3/7/12, LOC Bank of America NA, VRDN (c) | 1,200 | | 1,200 |
Bonds (Stanford Hosp. & Clinics Proj.) Series 2008 B2-2, 0.23%, tender 6/7/12 (c) | 14,550 | | 14,550 |
California Infrastructure & Econ. Dev. Bank Rev. (JSerra Catholic High School Proj.) Series 2009 A, 0.15% 3/7/12, LOC Wells Fargo Bank NA, VRDN (c) | 9,410 | | 9,410 |
California Poll. Cont. Fing. Auth. Solid Waste Disp. Rev. (Recology, Inc. Proj.) Series 2010 A, 0.22% 3/7/12, LOC Bank of America NA, VRDN (c) | 32,000 | | 32,000 |
California Pub. Works Board Lease Rev. Participating VRDN Series BA 08 1065, 0.22% 3/7/12 (Liquidity Facility Bank of America NA) (c)(f) | 4,203 | | 4,203 |
California School Cash Reserve Prog. Auth. TRAN: | | | |
Series 2011 A, 2% 3/1/12 | 2,100 | | 2,100 |
Series 2011 C, 2% 3/1/12 | 18,775 | | 18,775 |
Series 2011 D, 2% 3/1/12 | 7,900 | | 7,900 |
Series 2011 E, 2% 6/1/12 | 5,400 | | 5,422 |
Series 2011 G, 2% 6/1/12 | 11,600 | | 11,643 |
Series 2012 R, 2% 10/31/12 | 2,500 | | 2,526 |
Series 2012 S, 2% 12/31/12 | 2,000 | | 2,028 |
Series 2012 T, 2% 12/31/12 | 5,500 | | 5,579 |
California State Univ. Rev. Series 2001 A, 0.16% 3/1/12, LOC JPMorgan Chase Bank, LOC State Street Bank & Trust Co., Boston, CP | 14,400 | | 14,400 |
California Statewide Cmntys. Dev. Auth. Rev.: | | | |
(American Baptist Homes of the West Proj.) Series 2006, 0.2% 3/7/12, LOC Bank of America NA, VRDN (c) | 8,800 | | 8,800 |
(Park Century School Proj.) Series 2007, 0.36% 3/7/12, LOC Bank of America NA, VRDN (c) | 1,350 | | 1,350 |
Municipal Securities - continued |
| Principal Amount (000s) | | Value (000s) |
California - continued |
Calleguas-Las Virgenes Pub. Fing. Auth. Rev. Participating VRDN Series ROC II R 11852, 0.16% 3/7/12 (Liquidity Facility Citibank NA) (c)(f) | $ 6,300 | | $ 6,300 |
Campbell Union High School District Bonds Series WF 10 52C, 0.2%, tender 7/25/12 (Liquidity Facility Wells Fargo Bank NA) (c)(f)(g) | 10,305 | | 10,305 |
Chula Vista Ind. Dev. Rev. (San Diego Gas & Elec. Co. Proj.) Series 2006 A, 0.11% 3/7/12, VRDN (c) | 71,690 | | 71,690 |
Contra Costa Wtr. District Wtr. Rev. Participating VRDN Series ROC II R 11410, 0.16% 3/7/12 (Liquidity Facility Citibank NA) (c)(f) | 5,325 | | 5,325 |
Costa Mesa Redev. Agcy. Multi-family Hsg. (Family Village Apts. Proj.) Series 1994 A, 0.32% 3/7/12, LOC Bank of America NA, VRDN (c) | 2,600 | | 2,600 |
Desert Sands Unified School District TRAN 1.5% 1/31/13 (b) | 5,200 | | 5,257 |
East Bay Muni. Util. District Wtr. Sys. Rev. Participating VRDN: | | | |
Series EGL 07 0069, 0.16% 3/7/12 (Liquidity Facility Citibank NA) (c)(f) | 17,200 | | 17,200 |
Series ROC II R 10397, 0.16% 3/7/12 (Liquidity Facility Citibank NA) (c)(f) | 14,455 | | 14,455 |
Series ROC II R 11950, 0.16% 3/7/12 (Liquidity Facility Citibank NA) (c)(f) | 6,090 | | 6,090 |
Elsinore Valley Muni. Wtr. District Ctfs. of Prtn. Series 2011 A, 0.13% 3/7/12, LOC Union Bank of California, VRDN (c) | 5,250 | | 5,250 |
Foothill-De Anza Cmnty. College District Participating VRDN: | | | |
Series MS 3282, 0.26% 3/7/12 (Liquidity Facility Morgan Stanley Bank, West Valley City Utah) (c)(f) | 2,500 | | 2,500 |
Series WF 11 68C, 0.16% 3/7/12 (Liquidity Facility Wells Fargo Bank NA) (c)(f) | 9,225 | | 9,225 |
Kern County Board of Ed. TRAN Series A, 1% 10/1/12 (b) | 3,500 | | 3,512 |
Long Beach Gas & Util. Rev. Series A. 0.17% 3/15/12, LOC JPMorgan Chase Bank, CP | 2,000 | | 2,000 |
Los Angeles Cmnty. College District: | | | |
Bonds Series WF 09 8C, 0.2%, tender 7/25/12 (Liquidity Facility Wells Fargo & Co.) (c)(f)(g) | 11,200 | | 11,200 |
Participating VRDN: | | | |
Series Floaters 56 C, 0.16% 3/7/12 (Liquidity Facility Wells Fargo & Co.) (c)(f) | 5,300 | | 5,300 |
Series MS 3237, 0.26% 3/7/12 (Liquidity Facility Morgan Stanley Bank, West Valley City Utah) (c)(f) | 7,790 | | 7,790 |
Series Putters 2864, 0.16% 3/7/12 (Liquidity Facility JPMorgan Chase Bank) (c)(f) | 3,785 | | 3,785 |
Series WF 11 36C, 0.16% 3/7/12 (Liquidity Facility Wells Fargo Bank NA) (a)(c)(f) | 5,240 | | 5,240 |
Municipal Securities - continued |
| Principal Amount (000s) | | Value (000s) |
California - continued |
Los Angeles County Cap. Asset Leasing Corp. Lease Rev. Bonds Series 2011 A, 1.5% 6/1/12 | $ 8,245 | | $ 8,267 |
Los Angeles County Gen. Oblig.: | | | |
Series 2010 A, 0.1% 4/5/12, LOC JPMorgan Chase Bank, CP | 11,280 | | 11,280 |
TRAN Series 2012 B, 2.5% 3/30/12 | 12,800 | | 12,822 |
Los Angeles County Schools Pooled Fing. Prog. Ctfs. of Prtn. TRAN: | | | |
Series 2012 B1, 2% 11/30/12 | 3,800 | | 3,850 |
Series 2012 B2, 2% 12/31/12 | 13,000 | | 13,178 |
Series 2012 B3, 2% 1/31/13 | 7,100 | | 7,200 |
Los Angeles Dept. Arpt. Rev.: | | | |
Participating VRDN: | | | |
Series BC 10 27B, 0.15% 3/7/12 (Liquidity Facility Barclays Bank PLC) (c)(f) | 1,400 | | 1,400 |
Series Putters 3838, 0.16% 3/7/12 (Liquidity Facility JPMorgan Chase Bank) (c)(f) | 2,500 | | 2,500 |
Series Putters 3847, 0.16% 3/7/12 (Liquidity Facility JPMorgan Chase Bank) (c)(f) | 5,000 | | 5,000 |
Series A: | | | |
0.17% 3/8/12, LOC Citibank NA, LOC State Street Bank & Trust Co., Boston, CP | 3,400 | | 3,400 |
0.17% 3/8/12, LOC Citibank NA, LOC State Street Bank & Trust Co., Boston, CP | 7,700 | | 7,700 |
Los Angeles Dept. of Wtr. & Pwr. Rev.: | | | |
Bonds Series 2003 A1, 5% 7/1/12 | 1,335 | | 1,356 |
Participating VRDN: | | | |
Series BA 08 3040X, 0.26% 3/7/12 (Liquidity Facility Bank of America NA) (c)(f) | 6,665 | | 6,665 |
Series MT 753, 0.22% 3/7/12 (Liquidity Facility Bank of America NA) (c)(f) | 7,035 | | 7,035 |
Series MT 771, 0.26% 3/7/12 (Liquidity Facility Bank of America NA) (c)(f) | 3,685 | | 3,685 |
Series Putters 3327, 0.16% 3/7/12 (Liquidity Facility JPMorgan Chase Bank) (c)(f) | 3,745 | | 3,745 |
Series Putters 3837Z, 0.16% 3/7/12 (Liquidity Facility JPMorgan Chase Bank) (c)(f) | 6,875 | | 6,875 |
Series Putters 3902 Z, 0.16% 3/7/12 (Liquidity Facility JPMorgan Chase Bank) (c)(f) | 3,380 | | 3,380 |
Series ROC II R 500, 0.16% 3/7/12 (Liquidity Facility Citibank NA) (c)(f) | 11,600 | | 11,600 |
0.16% 4/5/12 (Liquidity Facility Wells Fargo Bank NA), CP | 13,200 | | 13,200 |
Municipal Securities - continued |
| Principal Amount (000s) | | Value (000s) |
California - continued |
Los Angeles Dept. of Wtr. & Pwr. Wtrwks. Rev. Participating VRDN: | | | |
Series Putters 3309, 0.16% 3/7/12 (Liquidity Facility JPMorgan Chase Bank) (c)(f) | $ 6,660 | | $ 6,660 |
Series Putters 3310, 0.16% 3/7/12 (Liquidity Facility JPMorgan Chase Bank) (c)(f) | 4,000 | | 4,000 |
Los Angeles Gen. Oblig.: | | | |
Participating VRDN Series Putters 3931, 0.13% 3/1/12 (Liquidity Facility JPMorgan Chase & Co.) (c)(f) | 3,000 | | 3,000 |
TRAN: | | | |
2.5% 3/30/12 | 3,400 | | 3,406 |
2.5% 4/30/12 | 8,200 | | 8,229 |
Los Angeles Hbr. Dept. Rev. Participating VRDN Series WF 10 40C, 0.16% 3/7/12 (Liquidity Facility Wells Fargo Bank NA) (c)(f) | 1,400 | | 1,400 |
Los Angeles Muni. Impt. Corp. Lease Rev.: | | | |
Series 2004 A1: | | | |
0.12% 3/15/12, LOC Wells Fargo Bank NA, CP | 8,500 | | 8,500 |
0.17% 3/5/12, LOC Wells Fargo Bank NA, CP | 10,000 | | 10,000 |
Series 2004 A2: | | | |
0.11% 3/20/12, LOC JPMorgan Chase Bank, CP | 2,000 | | 2,000 |
0.15% 4/4/12, LOC JPMorgan Chase Bank, CP | 5,000 | | 5,000 |
Los Angeles Unified School District Bonds Series A1, 2% 7/1/12 | 3,585 | | 3,606 |
Los Angeles Wastewtr. Sys. Rev. Participating VRDN Series Putters 2254, 0.16% 3/7/12 (Liquidity Facility JPMorgan Chase Bank) (c)(f) | 5,260 | | 5,260 |
Metropolitan Wtr. District of Southern California Wtr. Rev. Participating VRDN Series 3655 Z, 0.16% 3/7/12 (Liquidity Facility JPMorgan Chase Bank) (c)(f) | 6,685 | | 6,685 |
Metropolitan Wtr. District of Southern California Wtrwks. Rev. Participating VRDN: | | | |
Series EGL 07 71, 0.16% 3/7/12 (Liquidity Facility Citibank NA) (c)(f) | 16,150 | | 16,150 |
Series MT 774, 0.26% 3/7/12 (Liquidity Facility Bank of America NA) (c)(f) | 2,495 | | 2,495 |
Series Putters 3289, 0.16% 3/7/12 (Liquidity Facility JPMorgan Chase Bank) (c)(f) | 2,210 | | 2,210 |
Series Putters 3653 Z, 0.16% 3/7/12 (Liquidity Facility JPMorgan Chase Bank) (c)(f) | 2,500 | | 2,500 |
Modesto Pub. Fing. Auth. Lease Rev. Series 2008 B, 0.22% 3/7/12, LOC Bank of America NA, VRDN (c) | 15,430 | | 15,430 |
Municipal Securities - continued |
| Principal Amount (000s) | | Value (000s) |
California - continued |
Orange County Hsg. Auth. Apt. Dev. Rev. (Lanteen Pines/Frost Group Proj.) 0.13% 3/7/12, LOC Fannie Mae Guaranteed Mtg. pass-thru certificates, VRDN (c) | $ 9,860 | | $ 9,860 |
Orange County Rfdg. Recovery TRAN: | | | |
2% 3/15/12 | 4,715 | | 4,718 |
2% 5/15/12 | 4,600 | | 4,616 |
2% 6/29/12 | 12,900 | | 12,973 |
Orange County Sanitation District Ctfs. of Prtn. Participating VRDN Series MS 06 2222, 0.19% 3/7/12 (Liquidity Facility Wells Fargo & Co.) (c)(f) | 7,711 | | 7,711 |
Orange County Spl. Fing. Auth. Teeter Plan Rev. Series L: | | | |
0.15% 3/7/12, LOC Wells Fargo Bank NA, CP | 4,800 | | 4,800 |
0.15% 3/8/12, LOC Wells Fargo Bank NA, CP | 9,100 | | 9,100 |
Port of Oakland Port Rev. Series 2010 A, 0.12% 3/16/12, LOC Wells Fargo Bank NA, CP | 11,100 | | 11,100 |
Rancho Wtr. District Fing. Auth. Rev. Participating VRDN Series BA 08 3024X, 0.26% 3/7/12 (Liquidity Facility Bank of America NA) (c)(f) | 7,140 | | 7,140 |
RBC Muni. Products, Inc. Trust Bonds: | | | |
Series RBC E 21, 0.2%, tender 5/3/12 (Liquidity Facility Royal Bank of Canada) (c)(f)(g) | 7,600 | | 7,600 |
Series RBC E 24, 0.2%, tender 4/2/12 (Liquidity Facility Royal Bank of Canada) (c)(f)(g) | 4,500 | | 4,500 |
Richmond Wastewtr. Rev. Series 2008 A, 0.16% 3/7/12, LOC Union Bank of California, VRDN (c) | 17,760 | | 17,760 |
Riverside County Gen. Oblig.: | | | |
Series B: | | | |
0.12% 6/15/12, LOC Bank of Nova Scotia New York Branch, CP | 35,875 | | 35,875 |
0.17% 4/13/12, LOC Bank of Nova Scotia New York Branch, CP | 18,955 | | 18,955 |
TRAN 2% 3/30/12 | 13,400 | | 13,418 |
Riverside Ctfs. of Prtn. (Riverside Renaissance Proj.) Series 2008, 0.19% 3/7/12, LOC Bank of America NA, VRDN (c) | 14,600 | | 14,600 |
Riverside Elec. Rev. Series 2008 A, 0.19% 3/7/12, LOC Bank of America NA, VRDN (c) | 2,500 | | 2,500 |
Sacramento Gen. Oblig. TRAN 2% 6/29/12 | 6,400 | | 6,436 |
Sacramento Muni. Util. District Elec. Rev. Series K1, 0.1% 4/5/12, LOC JPMorgan Chase Bank, CP | 3,600 | | 3,600 |
Sacramento Suburban Wtr. District Ctfs. of Prtn. Series 2009 A, 0.12% 3/7/12, LOC Sumitomo Mitsui Banking Corp., VRDN (c) | 10,000 | | 10,000 |
San Bernardino County Gen. Oblig. TRAN Series A, 2% 6/29/12 | 15,300 | | 15,386 |
Municipal Securities - continued |
| Principal Amount (000s) | | Value (000s) |
California - continued |
San Bernardino County Multi-family Rev. (Quail Point Apts. Proj.) Series 1990 A, 0.13% 3/7/12, LOC Fannie Mae Guaranteed Mtg. pass-thru certificates, VRDN (c) | $ 4,150 | | $ 4,150 |
San Diego Cmnty. College District Participating VRDN: | | | |
Putters 3676Z, 0.16% 3/7/12 (Liquidity Facility JPMorgan Chase Bank) (c)(f) | 3,335 | | 3,335 |
Series MS 3261, 0.26% 3/7/12 (Liquidity Facility Morgan Stanley Bank, West Valley City Utah) (c)(f) | 3,065 | | 3,065 |
Series ROC II R 11774, 0.16% 3/7/12 (Liquidity Facility Citibank NA) (c)(f) | 9,360 | | 9,360 |
San Diego County & School District TRAN Series 2011 A, 2% 6/29/12 | 3,500 | | 3,520 |
San Diego County Wtr. Auth. Wtr. Rev. Participating VRDN Series Putters 3736Z, 0.16% 3/7/12 (Liquidity Facility JPMorgan Chase Bank) (c)(f) | 2,825 | | 2,825 |
San Diego Pub. Facilities Fing. Auth. Wtr. Rev. Participating VRDN Series Putters 3504, 0.16% 3/7/12 (Liquidity Facility JPMorgan Chase Bank) (c)(f) | 7,000 | | 7,000 |
San Francisco Bay Area Rapid Transit District Sales Tax Rev. Participating VRDN Series Putters 3753 Z, 0.16% 3/7/12 (Liquidity Facility JPMorgan Chase Bank) (c)(f) | 4,215 | | 4,215 |
San Francisco Bay Area Rapid Transit Fing. Auth. Participating VRDN Series Putters 3161, 0.16% 3/7/12 (Liquidity Facility JPMorgan Chase Bank) (c)(f) | 16,660 | | 16,660 |
San Francisco City & County Gen. Oblig.: | | | |
Participating VRDN Series BA 08 3318, 0.26% 3/7/12 (Liquidity Facility Bank of America NA) (c)(f) | 5,000 | | 5,000 |
Series 2, 0.17% 3/8/12, LOC U.S. Bank NA, Cincinnati, CP | 4,700 | | 4,700 |
San Francisco City & County Unified School District TRAN 2% 6/29/12 | 4,700 | | 4,726 |
San Francisco Redev. Agcy. Multi-family Hsg. Rev. (Fillmore Ctr. Proj.) Series 1992 A1, 0.13% 3/7/12, LOC Freddie Mac, VRDN (c) | 11,900 | | 11,900 |
San Jose Multi-family Hsg. Rev. (Las Ventanas Apts. Proj.) Series 2008 B, 0.14% 3/7/12, LOC Freddie Mac, VRDN (c) | 4,200 | | 4,200 |
San Juan Capistrano Gen. Oblig. Participating VRDN Series Putters 3646, 0.16% 3/7/12 (Liquidity Facility JPMorgan Chase Bank) (c)(f) | 10,050 | | 10,050 |
San Marcos Unified School District Participating VRDN Series MS 3269, 0.26% 3/7/12 (Liquidity Facility Morgan Stanley Bank, West Valley City Utah) (c)(f) | 5,000 | | 5,000 |
San Ramon Valley Union School District Participating VRDN Series MT 743, 0.22% 3/7/12 (Liquidity Facility Bank of America NA) (c)(f) | 5,725 | | 5,725 |
Municipal Securities - continued |
| Principal Amount (000s) | | Value (000s) |
California - continued |
Santa Barbara County Gen. Oblig. TRAN Series 2011 A, 2% 6/29/12 | $ 2,000 | | $ 2,011 |
Santa Clara Valley Wtr. District Wtr. Util. Rev.: | | | |
Series 2010 A1, 0.16% 5/3/12, LOC JPMorgan Chase Bank, CP | 8,600 | | 8,600 |
Series 2010 A2, 0.14% 5/4/12, LOC JPMorgan Chase Bank, CP | 15,255 | | 15,255 |
Santa Cruz County TRAN 2% 7/5/12 | 7,700 | | 7,749 |
Santa Cruz Redev. Agcy. Multi-family Rev. Participating VRDN Series Solar 06 31, 0.15% 3/7/12 (Liquidity Facility U.S. Bank NA, Cincinnati) (c)(f) | 7,400 | | 7,400 |
Sonoma County Gen. Oblig. Participating VRDN Series Putters 4000, 0.13% 3/1/12 (Liquidity Facility JPMorgan Chase & Co.) (c)(f) | 4,500 | | 4,500 |
Southern California Pub. Pwr. Auth. Bonds Series 2011-1 2% 7/1/12 | 4,235 | | 4,259 |
Univ. of California Revs.: | | | |
Bonds Series 2009 O, 5% 5/15/12 | 1,500 | | 1,515 |
Participating VRDN: | | | |
Series Floaters 09 7C, 0.16% 3/7/12 (Liquidity Facility Wells Fargo & Co.) (c)(f) | 13,460 | | 13,460 |
Series MS 1274, 0.26% 3/7/12 (Liquidity Facility Morgan Stanley Bank, West Valley City Utah) (c)(f) | 2,200 | | 2,200 |
Series Putters 3365, 0.16% 3/7/12 (Liquidity Facility JPMorgan Chase Bank) (c)(f) | 4,055 | | 4,055 |
Series Putters 3368, 0.16% 3/7/12 (Liquidity Facility JPMorgan Chase Bank) (c)(f) | 6,275 | | 6,275 |
Series A: | | | |
0.09% 4/5/12, CP | 3,145 | | 3,145 |
0.16% 5/3/12, CP | 6,700 | | 6,700 |
Walnut Energy Ctr. Auth. Series 2005 B, 0.17% 3/8/12, LOC State Street Bank & Trust Co., Boston, CP | 5,000 | | 5,000 |
West Contra Costa Unified School District Bonds Series 2010 A, 3% 8/1/12 | 1,200 | | 1,212 |
| | 1,138,969 |
Kentucky - 0.1% |
Jefferson County Poll. Cont. Rev. Bonds (Louisville Gas & Elec. Co. Proj.) Series 2001 A, 0.31% tender 3/1/12, CP mode | 700 | | 700 |
Massachusetts - 0.2% |
Massachusetts Indl. Fin. Agcy. Poll. Cont. Rev. Bonds (New England Pwr. Co. Proj.) Series 1992, 0.4% tender 3/13/12, CP mode | 3,100 | | 3,100 |
Municipal Securities - continued |
| Principal Amount (000s) | | Value (000s) |
Michigan - 1.0% |
Michigan Fin. Auth. Rev. Series 2011 L, 0.16% 3/7/12, LOC Citibank NA, VRDN (c) | $ 13,000 | | $ 13,000 |
New Hampshire - 0.3% |
New Hampshire Bus. Fin. Auth. Poll. Cont. Rev. Bonds (New England Pwr. Co. Proj.) Series 1990 B, 0.55% tender 3/20/12, CP mode | 3,300 | | 3,300 |
Ohio - 0.5% |
Ohio Air Quality Dev. Auth. Rev. (Cincinnati Gas & Elec. Co. Proj.) Series A, 0.37% 3/7/12, VRDN (c) | 6,000 | | 6,000 |
Pennsylvania - 0.3% |
Bucks County Indl. Dev. Auth. Rev. (Lutheran Cmnty. at Telford Healthcare Ctr., Inc. Proj.) Series 2007 B, 0.19% 3/7/12, LOC Citizens Bank of Pennsylvania, VRDN (c) | 3,650 | | 3,650 |
Rhode Island - 0.2% |
Rhode Island Health and Edl. Bldg. Corp. Higher Ed. Facility Rev. (Roger Williams Univ. Proj.) Series 2008 B, 0.24% 3/7/12, LOC Bank of America NA, VRDN (c) | 2,870 | | 2,870 |
| Shares | | |
Other - 11.1% |
Fidelity Tax-Free Cash Central Fund, 0.13% (d)(e) | 143,374,000 | | 143,374 |
TOTAL INVESTMENT PORTFOLIO - 101.8% (Cost $1,314,963) | 1,314,963 |
NET OTHER ASSETS (LIABILITIES) - (1.8)% | (22,874) |
NET ASSETS - 100% | $ 1,292,089 |
Security Type Abbreviations |
CP | - | COMMERCIAL PAPER |
TRAN | - | TAX AND REVENUE ANTICIPATION NOTE |
VRDN | - | VARIABLE RATE DEMAND NOTE (A debt instrument that is payable upon demand, either daily, weekly or monthly) |
Legend |
(a) Security exempt from registration under Rule 144A of the Securities Act of 1933. These securities may be resold in transactions exempt from registration, normally to qualified institutional buyers. At the end of the period, the value of these securities amounted to $5,240,000 or 0.4% of net assets. |
(b) Security or a portion of the security purchased on a delayed delivery or when-issued basis. |
(c) Coupon rates for floating and adjustable rate securities reflect the rates in effect at period end. |
(d) Information in this report regarding holdings by state and security types does not reflect the holdings of the Fidelity Tax-Free Cash Central Fund. |
(e) Affiliated fund that is available only to investment companies and other accounts managed by Fidelity Investments. The rate quoted is the annualized seven-day yield of the fund at period end. A complete unaudited listing of the fund's holdings as of its most recent quarter end is available upon request. In addition, each Fidelity Central Fund's financial statements, which are not covered by the Fund's Report of Independent Registered Public Accounting Firm, are available on the SEC's website or upon request. |
(f) Provides evidence of ownership in one or more underlying municipal bonds. |
(g) Restricted securities - Investment in securities not registered under the Securities Act of 1933 (excluding 144A issues). At the end of the period, the value of restricted securities (excluding 144A issues) amounted to $33,605,000 or 2.6% of net assets. |
Additional information on each restricted holding is as follows: |
Security | Acquisition Date | Cost
(000s) |
Campbell Union High School District Bonds Series WF 10 52C, 0.2%, tender 7/25/12 (Liquidity Facility Wells Fargo Bank NA) | 12/23/10 | $ 10,305 |
Los Angeles Cmnty. College District Bonds Series WF 09 8C, 0.2%, tender 7/25/12 (Liquidity Facility Wells Fargo & Co.) | 8/18/11 | $ 11,200 |
RBC Muni. Products, Inc. Trust Bonds Series RBC E 21, 0.2%, tender 5/3/12 (Liquidity Facility Royal Bank of Canada) | 8/30/11 | $ 7,600 |
RBC Muni. Products, Inc. Trust Bonds Series RBC E 24, 0.2%, tender 4/2/12 (Liquidity Facility Royal Bank of Canada) | 11/9/11 | $ 4,500 |
Affiliated Central Funds |
Information regarding fiscal year to date income earned by the Fund from investments in Fidelity Central Funds is as follows: |
Fund | Income earned
(Amounts in thousands) |
Fidelity Tax-Free Cash Central Fund | $ 111 |
Other Information |
The date shown for securities represents the date when principal payments must be paid, taking into account any call options exercised by the issuer and any permissible maturity shortening features other than interest rate resets. |
All investments are categorized as Level 2 under the Fair Value Hierarchy. The inputs or methodology used for valuing securities may not be an indication of the risk associated with investing in those securities. For more information on valuation inputs, please refer to the Security Valuation section in the accompanying Notes to Financial Statements. |
See accompanying notes which are an integral part of the financial statements.
Annual Report
Statement of Assets and Liabilities
Amounts in thousands (except per-share amounts) | February 29, 2012 |
Assets | | |
Investment in securities, at value - See accompanying schedule: Unaffiliated issuers (cost $1,171,589) | $ 1,171,589 | |
Fidelity Central Funds (cost $143,374) | 143,374 | |
Total Investments (cost $1,314,963) | | $ 1,314,963 |
Cash | | 1,610 |
Receivable for investments sold | | 16,753 |
Receivable for fund shares sold | | 1,016 |
Interest receivable | | 2,905 |
Distributions receivable from Fidelity Central Funds | | 15 |
Receivable from investment adviser for expense reductions | | 41 |
Total assets | | 1,337,303 |
| | |
Liabilities | | |
Payable for investments purchased
Regular delivery | $ 35,519 | |
Delayed delivery | 8,769 | |
Payable for fund shares redeemed | 571 | |
Distributions payable | 1 | |
Accrued management fee | 205 | |
Other affiliated payables | 149 | |
Total liabilities | | 45,214 |
| | |
Net Assets | | $ 1,292,089 |
Net Assets consist of: | | |
Paid in capital | | $ 1,292,519 |
Accumulated undistributed net realized gain (loss) on investments | | (430) |
Net Assets | | $ 1,292,089 |
See accompanying notes which are an integral part of the financial statements.
Annual Report
Financial Statements - continued
Statement of Assets and Liabilities - continued
Amounts in thousands (except per-share amounts) | February 29, 2012 |
California AMT Tax-Free Money Market:
Net Asset Value, offering price and redemption price per share ($475,641 ÷ 475,487 shares) | | $ 1.00 |
| | |
Institutional Class:
Net Asset Value, offering price and redemption price per share ($816,068 ÷ 815,905 shares) | | $ 1.00 |
| | |
Service Class:
Net Asset Value, offering price and redemption price per share ($380 ÷ 379 shares) | | $ 1.00 |
See accompanying notes which are an integral part of the financial statements.
Annual Report
Statement of Operations
Amounts in thousands | Year ended February 29, 2012 |
Investment Income | | |
Interest | | $ 3,044 |
Income from Fidelity Central Funds | | 111 |
Total income | | 3,155 |
| | |
Expenses | | |
Management fee | $ 2,952 | |
Transfer agent fees | 1,001 | |
Distribution and service plan fees | 10 | |
Independent trustees' compensation | 6 | |
Total expenses before reductions | 3,969 | |
Expense reductions | (1,174) | 2,795 |
Net investment income (loss) | | 360 |
Realized and Unrealized Gain (Loss) Net realized gain (loss) on: | | |
Investment securities: | | |
Unaffiliated issuers | | 166 |
Net increase in net assets resulting from operations | | $ 526 |
See accompanying notes which are an integral part of the financial statements.
Annual Report
Financial Statements - continued
Statement of Changes in Net Assets
Amounts in thousands | Year ended
February 29,
2012 | Year ended
February 28,
2011 |
Increase (Decrease) in Net Assets | | |
Operations | | |
Net investment income (loss) | $ 360 | $ 1,476 |
Net realized gain (loss) | 166 | (645) |
Net increase in net assets resulting
from operations | 526 | 831 |
Distributions to shareholders from net investment income | (360) | (1,476) |
Share transactions - net increase (decrease) | (366,643) | (439,988) |
Total increase (decrease) in net assets | (366,477) | (440,633) |
| | |
Net Assets | | |
Beginning of period | 1,658,566 | 2,099,199 |
End of period | $ 1,292,089 | $ 1,658,566 |
See accompanying notes which are an integral part of the financial statements.
Annual Report
Financial Highlights - California AMT Tax-Free Money Market
Years ended February 28, | 2012 D | 2011 | 2010 | 2009 | 2008 D |
Selected Per-Share Data | | | | | |
Net asset value, beginning of period | $ 1.00 | $ 1.00 | $ 1.00 | $ 1.00 | $ 1.00 |
Income from Investment Operations | | | | | |
Net investment income (loss) | - E | - E | .001 | .015 | .032 |
Net realized and unrealized gain (loss) E | - | - | - | - | - |
Total from investment operations | - E | - E | .001 | .015 | .032 |
Distributions from net investment income | - E | - E | (.001) | (.015) | (.032) |
Distributions from net realized gain | - | - | - | - E | - E |
Total distributions | - E | - E | (.001) | (.015) | (.032) |
Net asset value, end of period | $ 1.00 | $ 1.00 | $ 1.00 | $ 1.00 | $ 1.00 |
Total Return A | .01% | .02% | .11% | 1.50% | 3.27% |
Ratios to Average Net Assets B,C | | | | | |
Expenses before reductions | .30% | .30% | .34% | .32% | .32% |
Expenses net of fee waivers, if any | .20% | .30% | .33% | .32% | .31% |
Expenses net of all reductions | .20% | .30% | .33% | .29% | .24% |
Net investment income (loss) | .01% | .02% | .12% | 1.55% | 3.21% |
Supplemental Data | | | | | |
Net assets, end of period (in millions) | $ 476 | $ 587 | $ 808 | $ 1,306 | $ 2,022 |
A Total returns would have been lower if certain expenses had not been reduced during the applicable periods shown.
B Fees and expenses of any underlying Fidelity Central Funds are not included in the Fund's expense ratio. The Fund indirectly bears its proportionate share of the expenses of any underlying Fidelity Central Funds.
C Expense ratios reflect operating expenses of the class. Expenses before reductions do not reflect amounts reimbursed or waived or reductions from expense offset arrangements and do not represent the amount paid by the class during periods when reimbursements, waivers or reductions occur. Expenses net of fee waivers reflect expenses after reimbursement and waivers but prior to reductions from expense offset arrangements. Expenses net of all reductions represent the net expenses paid by the class.
D For the year ended February 29.
E Amount represents less than $.001 per share.
See accompanying notes which are an integral part of the financial statements.
Annual Report
Financial Highlights - Institutional Class
Years ended February 28, | 2012 G | 2011 | 2010 | 2009 | 2008 E |
Selected Per-Share Data | | | | | |
Net asset value, beginning of period | $ 1.00 | $ 1.00 | $ 1.00 | $ 1.00 | $ 1.00 |
Income from Investment Operations | | | | | |
Net investment income (loss) | - H | .001 | .002 | .016 | .029 |
Net realized and unrealized gain (loss) H | - | - | - | - | - |
Total from investment operations | - H | .001 | .002 | .016 | .029 |
Distributions from net investment income | - H | (.001) | (.002) | (.016) | (.029) |
Distributions from net realized gain | - | - | - | - H | - H |
Total distributions | - H | (.001) | (.002) | (.016) | (.029) |
Net asset value, end of period | $ 1.00 | $ 1.00 | $ 1.00 | $ 1.00 | $ 1.00 |
Total Return B,C | .03% | .12% | .19% | 1.60% | 2.90% |
Ratios to Average Net Assets D,F | | | | | |
Expenses before reductions | .25% | .25% | .29% | .27% | .25% A |
Expenses net of fee waivers, if any | .18% | .20% | .24% | .22% | .20% A |
Expenses net of all reductions | .18% | .20% | .24% | .19% | .13% A |
Net investment income (loss) | .03% | .12% | .21% | 1.65% | 3.22% A |
Supplemental Data | | | | | |
Net assets, end of period (in millions) | $ 816 | $ 1,065 | $ 1,291 | $ 2,076 | $ 3,116 |
A Annualized
B Total returns for periods of less than one year are not annualized.
C Total returns would have been lower if certain expenses had not been reduced during the applicable periods shown.
D Fees and expenses of any underlying Fidelity Central Funds are not included in the Fund's expense ratio. The Fund indirectly bears its proportionate share of the expenses of any underlying Fidelity Central Funds.
E For the period April 18, 2007 (commencement of sale of shares) to February 29, 2008.
F Expense ratios reflect operating expenses of the class. Expenses before reductions do not reflect amounts reimbursed or waived or reductions from expense offset arrangements and do not represent the amount paid by the class during periods when reimbursements, waivers or reductions occur. Expense ratios before reductions for start-up periods may not be representative of longer-term operating periods. Expenses net of fee waivers reflect expenses after reimbursement and waivers but prior to reductions from expense offset arrangements. Expenses net of all reductions represent the net expenses paid by the class.
G For the year ended February 29.
H Amount represents less than $.001 per share.
See accompanying notes which are an integral part of the financial statements.
Annual Report
Financial Highlights - Service Class
Years ended February 28, | 2012 G | 2011 | 2010 | 2009 | 2008 E |
Selected Per-Share Data | | | | | |
Net asset value, beginning of period | $ 1.00 | $ 1.00 | $ 1.00 | $ 1.00 | $ 1.00 |
Income from Investment Operations | | | | | |
Net investment income (loss) | - H | - H | - H | .013 | .026 |
Net realized and unrealized gain (loss) H | - | - | - | - | - |
Total from investment operations | - H | - H | - H | .013 | .026 |
Distributions from net investment income | - H | - H | - H | (.013) | (.026) |
Distributions from net realized gain | - | - | - | - H | - H |
Total distributions | - H | - H | - H | (.013) | (.026) |
Net asset value, end of period | $ 1.00 | $ 1.00 | $ 1.00 | $ 1.00 | $ 1.00 |
Total Return B,C | .01% | .01% | .05% | 1.35% | 2.67% |
Ratios to Average Net Assets D,F | | | | | |
Expenses before reductions | .50% | .50% | .54% | .52% | .50% A |
Expenses net of fee waivers, if any | .22% | .31% | .43% | .47% | .45% A |
Expenses net of all reductions | .22% | .31% | .43% | .44% | .38% A |
Net investment income (loss) | .01% | .01% | .02% | 1.40% | 2.84% A |
Supplemental Data | | | | | |
Net assets, end of period (000 omitted) | $ 380 | $ 6,536 | $ 668 | $ 8,939 | $ 16,036 |
A Annualized
B Total returns for periods of less than one year are not annualized.
C Total returns would have been lower if certain expenses had not been reduced during the applicable periods shown.
D Fees and expenses of any underlying Fidelity Central Funds are not included in the Fund's expense ratio. The Fund indirectly bears its proportionate share of the expenses of any underlying Fidelity Central Funds.
E For the period April 18, 2007 (commencement of sale of shares) to February 29, 2008.
F Expense ratios reflect operating expenses of the class. Expenses before reductions do not reflect amounts reimbursed or waived or reductions from expense offset arrangements and do not represent the amount paid by the class during periods when reimbursements, waivers or reductions occur. Expense ratios before reductions for start-up periods may not be representative of longer-term operating periods. Expenses net of fee waivers reflect expenses after reimbursement and waivers but prior to reductions from expense offset arrangements. Expenses net of all reductions represent the net expenses paid by the class.
G For the year ended February 29.
H Amount represents less than $.001 per share.
See accompanying notes which are an integral part of the financial statements.
Annual Report
Notes to Financial Statements
For the period ended February 29, 2012
(Amounts in thousands except percentages)
1. Organization.
Fidelity California AMT Tax-Free Money Market Fund (the Fund) is a fund of Fidelity California Municipal Trust II (the Trust) and is authorized to issue an unlimited number of shares. The Trust is registered under the Investment Company Act of 1940, as amended (the 1940 Act), as an open-end management investment company organized as a Delaware statutory trust. The Fund offers California AMT Tax-Free Money Market, Institutional Class and Service Class shares, each of which has equal rights as to assets and voting privileges. Each class has exclusive voting rights with respect to matters that affect that class. Investment income, realized and unrealized capital gains and losses, the common expenses of the Fund, and certain fund-level expense reductions, if any, are allocated on a pro-rata basis to each class based on the relative net assets of each class to the total net assets of the Fund. Each class differs with respect to transfer agent and distribution and service plan fees incurred. Certain expense reductions may also differ by class. The Fund may be affected by economic and political developments in the state of California.
2. Investments in Fidelity Central Funds.
The Fund invests in Fidelity Central Funds, which are open-end investment companies available only to other investment companies and accounts managed by Fidelity Management & Research Company (FMR) and its affiliates. The Fund's Schedule of Investments lists each of the Fidelity Central Funds held as of period end, if any, as an investment of the Fund, but does not include the underlying holdings of each Fidelity Central Fund. As an Investing Fund, the Fund indirectly bears its proportionate share of the expenses of the underlying Fidelity Central Funds.
The Money Market Central Funds seek preservation of capital and current income and are managed by Fidelity Investments Money Management, Inc. (FIMM), an affiliate of FMR.
A complete unaudited list of holdings for each Fidelity Central Fund is available upon request or at the Securities and Exchange Commission (the SEC) web site at www.sec.gov. In addition, the financial statements of the Fidelity Central Funds, which are not covered by the Fund's Report of Independent Registered Public Accounting Firm, are available on the SEC web site or upon request.
3. Significant Accounting Policies.
The financial statements have been prepared in conformity with accounting principles generally accepted in the United States of America (GAAP), which require management to make certain estimates and assumptions at the date of the financial statements. Actual results could differ from those estimates. Subsequent events, if any, through the date that the financial statements were issued have been evaluated in the preparation of the financial statements. The following summarizes the significant accounting policies of the Fund:
Annual Report
3. Significant Accounting Policies - continued
Security Valuation. The Fund categorizes the inputs to valuation techniques used to value its investments into a disclosure hierarchy consisting of three levels as shown below:
Level 1 - quoted prices in active markets for identical investments
Level 2 - other significant observable inputs (including quoted prices for similar investments, interest rates, prepayment speeds, etc.)
Level 3 - unobservable inputs (including the Fund's own assumptions based on the best information available)
As permitted by compliance with certain conditions under Rule 2a-7 of the 1940 Act, securities are valued at amortized cost, which approximates fair value. The amortized cost of an instrument is determined by valuing it at its original cost and thereafter amortizing any discount or premium from its face value at a constant rate until maturity. Securities held by a money market fund are generally high quality and liquid; however, they are reflected as Level 2 because the inputs used to determine fair value are not quoted prices in an active market.
Investment Transactions and Income. The net asset value per share for processing shareholder transactions is calculated as of the close of business of the New York Stock Exchange (NYSE), normally 4:00 p.m. Eastern time. Security transactions, including the Fund's investment activity in the Fidelity Central Funds, are accounted for as of trade date. Gains and losses on securities sold are determined on the basis of identified cost. Interest income and distributions from the Fidelity Central Funds are accrued as earned. Interest income includes coupon interest and amortization of premium and accretion of discount on debt securities.
Expenses. Expenses directly attributable to a fund are charged to that fund. Expenses attributable to more than one fund are allocated among the respective funds on the basis of relative net assets or other appropriate methods. Expense estimates are accrued in the period to which they relate and adjustments are made when actual amounts are known.
Income Tax Information and Distributions to Shareholders. Each year, the Fund intends to qualify as a regulated investment company under Subchapter M of the Internal Revenue Code, including distributing substantially all of its taxable income and realized gains. As a result, no provision for income taxes is required. As of February 29, 2012, the Fund did not have any unrecognized tax benefits in the financial statements; nor is the Fund aware of any tax positions for which it is reasonably possible that the total amounts of unrecognized tax benefits will significantly change in the next twelve months. The Fund files a U.S. federal tax return, in addition to state and local tax returns as required. A fund's federal income tax returns are subject to examination by the
Annual Report
Notes to Financial Statements - continued
(Amounts in thousands except percentages)
3. Significant Accounting Policies - continued
Income Tax Information and Distributions to Shareholders - continued
Internal Revenue Service (IRS) for a period of three fiscal years after they are filed. State and local tax returns may be subject to examination for an additional fiscal year depending on the jurisdiction.
Dividends are declared and recorded daily and paid monthly from net investment income. Distributions from realized gains, if any, are declared and recorded on the ex-dividend date. Income dividends and capital gain distributions are declared separately for each class. Income and capital gain distributions are determined in accordance with income tax regulations, which may differ from GAAP. In addition, the Fund claimed a portion of the payment made to redeeming shareholders as a distribution for income tax purposes.
Capital accounts within the financial statements are adjusted for permanent book-tax differences. These adjustments have no impact on net assets or the results of operations. Temporary book-tax differences will reverse in a subsequent period.
Book-tax differences are primarily due to deferred trustees compensation and capital loss carryforwards.
The Funds purchase municipal securities whose interest, in the opinion of the issuer, is free from federal income tax. There is no assurance that the IRS will agree with this opinion. In the event the IRS determines that the issuer does not comply with relevant tax requirements, interest payments from a security could become federally taxable, possibly retroactively to the date the security was issued.
The federal tax cost of investment securities and unrealized appreciation (depreciation) as of period end were as follows:
Gross unrealized appreciation | $ - |
Gross unrealized depreciation | - |
Net unrealized appreciation (depreciation) on securities and other investments | $ - |
| |
Tax Cost | $ 1,314,963 |
The tax-based components of distributable earnings as of period end were as follows:
Undistributed tax-exempt income | $ 50 |
Capital loss carryforward | $ (480) |
Annual Report
3. Significant Accounting Policies - continued
Income Tax Information and Distributions to Shareholders - continued
Capital loss carryforwards are only available to offset future capital gains of the Fund to the extent provided by regulations and may be limited. Under the Regulated Investment Company Modernization Act of 2010 (the Act), the Fund is permitted to carry forward capital losses incurred in taxable years beginning after December 22, 2010 for an unlimited period and such capital losses are required to be used prior to any losses that expire. Capital loss carryforwards were as follows:
Fiscal year of expiration | |
2019 | $ (480) |
The tax character of distributions paid was as follows:
| February 29, 2012 | February 28, 2011 |
Tax-exempt Income | $ 360 | $ 1,476 |
4. Operating Policies.
Delayed Delivery Transactions and When-Issued Securities. During the period, the Fund transacted in securities on a delayed delivery or when-issued basis. Payment and delivery may take place after the customary settlement period for that security. The price of the underlying securities and the date when the securities will be delivered and paid for are fixed at the time the transaction is negotiated. During the time a delayed delivery sell is outstanding, equivalent deliverable securities are held for the transaction. The securities purchased on a delayed delivery or when-issued basis are identified as such in the Fund's Schedule of Investments. The Fund may receive compensation for interest forgone in the purchase of a delayed delivery or when-issued security. With respect to purchase commitments, the Fund identifies securities as segregated in its records with a value at least equal to the amount of the commitment. Losses may arise due to changes in the value of the underlying securities or if the counterparty does not perform under the contract's terms, or if the issuer does not issue the securities due to political, economic, or other factors.
Restricted Securities. The Fund may invest in securities that are subject to legal or contractual restrictions on resale. These securities generally may be resold in transactions exempt from registration or to the public if the securities are registered. Disposal of these securities may involve time-consuming negotiations and expense, and prompt sale at an acceptable price may be difficult. Information regarding restricted securities is included at the end of the Fund's Schedule of Investments.
Annual Report
Notes to Financial Statements - continued
(Amounts in thousands except percentages)
5. Fees and Other Transactions with Affiliates.
Management Fee and Expense Contract. FMR and its affiliates provide the Fund with investment management related services for which the Fund pays a monthly management fee that is based on an annual rate of .20% of the Fund's average net assets. FMR pays all other fund-level expenses, except the compensation of the independent Trustees and certain exceptions such as interest expense. The management fee paid to FMR by the Fund is reduced by an amount equal to the fees and expenses paid by the Fund to the independent Trustees.
In addition, under the expense contract, FMR pays class level expenses for California AMT Tax-Free Money Market so that the total expenses do not exceed .35%, expressed as a percentage of class average net assets, with certain exceptions such as interest expense.
Distribution and Service Plan Fees. In accordance with Rule 12b-1 of the 1940 Act, the Fund has adopted separate Distribution and Service Plans for each class of shares. Service Class pays Fidelity Distributors Corporation (FDC), an affiliate of FMR, a Service Fee based on an annual percentage of Service Class' average net assets. In addition, FDC may pay financial intermediaries for selling shares of the Fund and providing shareholder support services. For the period, the Service Fee rate, total service fees and amounts retained by FDC were as follows:
| Service
Fee | Total Fees* | Retained
by FDC |
Service Class | .25% | $ 10 | $ -** |
* During the period, FMR or its affiliates waived a portion of these fees.
** Amount represents ninety four dollars.
Transfer Agent and Accounting Fees. Citibank, N.A. (Citibank) is the custodian, transfer agent, and servicing agent for the Fund. Citibank has entered into a sub-arrangement with Fidelity Investments Institutional Operations Company, Inc. (FIIOC), an affiliate of FMR, under which FIIOC performs the activities associated with the Fund's transfer agency, dividend disbursing and shareholder servicing functions. FIIOC pays for typesetting, printing and mailing of shareholder reports, except proxy statements. For the period, transfer agent fees for each class were as follows:
| Amount* | % of
Average
Net Assets |
California AMT Tax-Free Money Market | $ 523 | .10 |
Institutional Class | 476 | .05 |
Service Class | 2 | .05 |
| $ 1,001 | |
* During the period, FMR or its affiliates waived a portion of these fees.
Annual Report
5. Fees and Other Transactions with Affiliates - continued
Transfer Agent and Accounting Fees - continued
Citibank also has a sub-arrangement with Fidelity Service Company, Inc. (FSC), an affiliate of FMR, under which FSC maintains the Fund's accounting records. The fee is based on the level of average net assets for the month.
6. Expense Reductions.
FMR contractually agreed to reimburse Institutional Class and Service Class to the extent annual operating expenses, expressed as a percentage of each class' average net assets, exceed .20% and .45%, respectively. Some expenses, for example interest expense, are excluded from this reimbursement. During the period, this reimbursement reduced Institutional Class and Service Class expenses by $475 and $2, respectively.
Additionally, FMR or its affiliates voluntarily agreed to waive certain fees in order to maintain a minimum annualized yield of .01%. Such arrangements may be discontinued by FMR at any time. For the period, the amount of the waiver for each class was as follows:
California AMT Tax-Free Money Market | $ 507 |
Institutional Class | 180 |
Service Class | 9 |
In addition, through arrangements with the Fund's custodian, credits realized as a result of uninvested cash balances were used to reduce the Fund's expenses. During the period, these credits reduced the Fund's expenses by $1.
7. Distributions to Shareholders.
Distributions to shareholders of each class were as follows:
| Year ended
February 29,
2012 | Year ended
February 28,
2011 |
From net investment income | | |
California AMT Tax-Free Money Market | $ 53 | $ 125 |
Institutional Class | 307 | 1,350 |
Service Class | -* | 1 |
Total | $ 360 | $ 1,476 |
* Amount represents three hundred and ninety six dollars.
Annual Report
Notes to Financial Statements - continued
(Amounts in thousands except percentages)
8. Share Transactions.
Transactions for each class of shares at a $1.00 per share were as follows:
| Year ended
February 29,
2012 | Year ended
February 28,
2011 |
California AMT Tax-Free Money Market Shares sold | 107,331 | 169,593 |
Reinvestment of distributions | 49 | 114 |
Shares redeemed | (218,695) | (390,172) |
Net increase (decrease) | (111,315) | (220,465) |
Institutional Class Shares sold | 308,304 | 502,475 |
Reinvestment of distributions | 275 | 1,180 |
Shares redeemed | (557,750) | (729,046) |
Net increase (decrease) | (249,171) | (225,391) |
Service Class Shares sold | - | 7,999 |
Reinvestment of distributions | -* | 1 |
Shares redeemed | (6,157) | (2,132) |
Net increase (decrease) | (6,157) | 5,868 |
* Amount represents three hundred and ninety six dollars.
9. Other.
The Fund's organizational documents provide former and current trustees and officers with a limited indemnification against liabilities arising in connection with the performance of their duties to the Fund. In the normal course of business, the Fund may also enter into contracts that provide general indemnifications. The Fund's maximum exposure under these arrangements is unknown as this would be dependent on future claims that may be made against the Fund. The risk of material loss from such claims is considered remote.
Annual Report
To the Trustees of Fidelity California Municipal Trust II and the Shareholders of Fidelity California AMT Tax-Free Money Market Fund:
In our opinion, the accompanying statement of assets and liabilities, including the schedule of investments, and the related statements of operations and of changes in net assets and the financial highlights present fairly, in all material respects, the financial position of Fidelity California AMT Tax-Free Money Market Fund (a fund of Fidelity California Municipal Trust II) at February 29, 2012, the results of its operations for the year then ended, the changes in its net assets for each of the two years in the period then ended and the financial highlights for each of the periods indicated, in conformity with accounting principles generally accepted in the United States of America. These financial statements and financial highlights (hereafter referred to as "financial statements") are the responsibility of the Fidelity California AMT Tax-Free Money Market Fund's management. Our responsibility is to express an opinion on these financial statements based on our audits. We conducted our audits of these financial statements in accordance with the standards of the Public Company Accounting Oversight Board (United States). Those standards require that we plan and perform the audit to obtain reasonable assurance about whether the financial statements are free of material misstatement. An audit includes examining, on a test basis, evidence supporting the amounts and disclosures in the financial statements, assessing the accounting principles used and significant estimates made by management, and evaluating the overall financial statement presentation. We believe that our audits, which included confirmation of securities at February 29, 2012 by correspondence with the custodian and brokers, provide a reasonable basis for our opinion.
/s/ PricewaterhouseCoopers LLP
PricewaterhouseCoopers LLP
Boston, Massachusetts
April 12, 2012
Annual Report
The Trustees and executive officers of the trust and fund, as applicable, are listed below. The Board of Trustees governs the fund and is responsible for protecting the interests of shareholders. The Trustees are experienced executives who meet periodically throughout the year to oversee the fund's activities, review contractual arrangements with companies that provide services to the fund, oversee management of the risks associated with such activities and contractual arrangements, and review the fund's performance. Except for James C. Curvey, each of the Trustees oversees 204 funds advised by FMR or an affiliate. Mr. Curvey oversees 430 funds advised by FMR or an affiliate.
The Trustees hold office without limit in time except that (a) any Trustee may resign; (b) any Trustee may be removed by written instrument, signed by at least two-thirds of the number of Trustees prior to such removal; (c) any Trustee who requests to be retired or who has become incapacitated by illness or injury may be retired by written instrument signed by a majority of the other Trustees; and (d) any Trustee may be removed at any special meeting of shareholders by a two-thirds vote of the outstanding voting securities of the trust. Each Trustee who is not an interested person (as defined in the 1940 Act) (Independent Trustee), shall retire not later than the last day of the calendar year in which his or her 75th birthday occurs. The Independent Trustees may waive this mandatory retirement age policy with respect to individual Trustees. The executive officers hold office without limit in time, except that any officer may resign or may be removed by a vote of a majority of the Trustees at any regular meeting or any special meeting of the Trustees. Except as indicated, each individual has held the office shown or other offices in the same company for the past five years.
Experience, Skills, Attributes, and Qualifications of the Fund's Trustees. The Governance and Nominating Committee has adopted a statement of policy that describes the experience, qualifications, attributes, and skills that are necessary and desirable for potential Independent Trustee candidates (Statement of Policy). The Board believes that each Trustee satisfied at the time he or she was initially elected or appointed a Trustee, and continues to satisfy, the standards contemplated by the Statement of Policy. The Governance and Nominating Committee also engages professional search firms to help identify potential Independent Trustee candidates who have the experience, qualifications, attributes, and skills consistent with the Statement of Policy. From time to time, additional criteria based on the composition and skills of the current Independent Trustees, as well as experience or skills that may be appropriate in light of future changes to board composition, business conditions, and regulatory or other developments, have also been considered by the professional search firms and the Governance and Nominating Committee. In addition, the Board takes into account the Trustees' commitment and participation in Board and committee meetings, as well as their leadership of standing and ad hoc committees throughout their tenure.
In determining that a particular Trustee was and continues to be qualified to serve as a Trustee, the Board has considered a variety of criteria, none of which, in isolation, was controlling. The Board believes that, collectively, the Trustees have balanced and diverse experience, qualifications, attributes, and skills, which allow the Board to operate effectively in governing the fund and protecting the interests of shareholders. Information about the specific experience, skills, attributes, and qualifications of each Trustee, which in each case led to the Board's conclusion that the Trustee should serve (or continue to serve) as a trustee of the fund, is provided below.
Annual Report
Trustees and Officers - continued
Board Structure and Oversight Function. Abigail P. Johnson is an interested person (as defined in the 1940 Act) and currently serves as Chairman. The Trustees have determined that an interested Chairman is appropriate and benefits shareholders because an interested Chairman has a personal and professional stake in the quality and continuity of services provided to the fund. Independent Trustees exercise their informed business judgment to appoint an individual of their choosing to serve as Chairman, regardless of whether the Trustee happens to be independent or a member of management. The Independent Trustees have determined that they can act independently and effectively without having an Independent Trustee serve as Chairman and that a key structural component for assuring that they are in a position to do so is for the Independent Trustees to constitute a substantial majority for the Board. The Independent Trustees also regularly meet in executive session. Kenneth L. Wolfe serves as Chairman of the Independent Trustees and as such (i) acts as a liaison between the Independent Trustees and management with respect to matters important to the Independent Trustees and (ii) with management prepares agendas for Board meetings.
Fidelity funds are overseen by different Boards of Trustees. The fund's Board oversees Fidelity's investment-grade bond, money market, and asset allocation funds and another Board oversees Fidelity's equity and high income funds. The asset allocation funds may invest in Fidelity funds that are overseen by such other Board. The use of separate Boards, each with its own committee structure, allows the Trustees of each group of Fidelity funds to focus on the unique issues of the funds they oversee, including common research, investment, and operational issues. On occasion, the separate Boards establish joint committees to address issues of overlapping consequences for the Fidelity funds overseen by each Board.
The Trustees operate using a system of committees to facilitate the timely and efficient consideration of all matters of importance to the Trustees, the fund, and fund shareholders and to facilitate compliance with legal and regulatory requirements and oversight of the fund's activities and associated risks. The Board, acting through its committees, has charged FMR and its affiliates with (i) identifying events or circumstances the occurrence of which could have demonstrably adverse effects on the fund's business and/or reputation; (ii) implementing processes and controls to lessen the possibility that such events or circumstances occur or to mitigate the effects of such events or circumstances if they do occur; and (iii) creating and maintaining a system designed to evaluate continuously business and market conditions in order to facilitate the identification and implementation processes described in (i) and (ii) above. Because the day-to-day operations and activities of the fund are carried out by or through FMR, its affiliates and other service providers, the fund's exposure to risks is mitigated but not eliminated by the processes overseen by the Trustees. While each of the Board's committees has responsibility for overseeing different aspects of the fund's activities, oversight is exercised primarily through the Operations and Audit Committees. In addition, an ad hoc Board committee of Independent Trustees has worked with FMR to enhance the Board's oversight of investment and financial risks, legal and regulatory risks, technology risks, and operational risks, including the development of additional risk reporting to the Board. The Operations Committee also worked and continues to work with FMR to enhance the stress tests required under SEC regulations for money market funds. Appropriate personnel, including but not limited to the fund's Chief Compliance Officer (CCO), FMR's internal auditor, the independent accountants, the fund's Treasurer and portfolio management personnel, make periodic reports to the Board's committees, as appropriate, including an annual review of FMR's risk management program for the Fidelity funds. The responsibilities of each standing committee, including their oversight responsibilities, are described further under "Standing Committees of the Fund's Trustees."
Annual Report
The fund's Statement of Additional Information (SAI) includes more information about the Trustees. To request a free copy, call Fidelity at 1-877-208-0098 for Institutional Class and Service Class or 1-800-544-8544 for Fidelity California AMT Tax-Free Money Market Fund.
Interested Trustees*:
Correspondence intended for each Trustee who is an interested person may be sent to Fidelity Investments, 82 Devonshire Street, Boston, Massachusetts 02109.
Name, Age; Principal Occupations and Other Relevant Experience+ |
Abigail P. Johnson (50) |
| Year of Election or Appointment: 2009 Ms. Johnson is Trustee and Chairman of the Board of Trustees of certain Trusts. Ms. Johnson serves as President of Personal, Workplace and Institutional Services (2005-present). Ms. Johnson is Chairman and Director of FMR Co., Inc. (2011-present), Chairman and Director of FMR (2011-present), and the Vice Chairman and Director (2007-present) of FMR LLC. Previously, Ms. Johnson served as President and a Director of FMR (2001-2005), a Trustee of other investment companies advised by FMR, Fidelity Investments Money Management, Inc., and FMR Co., Inc. (2001-2005), Senior Vice President of the Fidelity funds (2001-2005), and managed a number of Fidelity funds. Ms. Abigail P. Johnson and Mr. Arthur E. Johnson are not related. |
James C. Curvey (76) |
| Year of Election or Appointment: 2007 Mr. Curvey also serves as Trustee (2007-present) of other investment companies advised by FMR. Mr. Curvey is a Director of Fidelity Investments Money Management, Inc. (2009-present), Director of Fidelity Research & Analysis Co. (2009-present) and Director of FMR and FMR Co., Inc. (2007-present). Mr. Curvey is also Vice Chairman (2007-present) and Director of FMR LLC. In addition, Mr. Curvey serves as an Overseer for the Boston Symphony Orchestra and a member of the Trustees of Villanova University. Previously, Mr. Curvey was the Vice Chairman (2006-2007) and Director (2000-2007) of FMR Corp. |
* Trustees have been determined to be "Interested Trustees" by virtue of, among other things, their affiliation with the trust or various entities under common control with FMR.
+ The information above includes each Trustee's principal occupation during the last five years and other information relating to the experience, attributes, and skills relevant to each Trustee's qualifications to serve as a Trustee, which led to the conclusion that each Trustee should serve as a Trustee for the fund.
Independent Trustees:
Correspondence intended for each Independent Trustee (that is, the Trustees other than the Interested Trustees) may be sent to Fidelity Investments, P.O. Box 55235, Boston, Massachusetts 02205-5235.
Name, Age; Principal Occupations and Other Relevant Experience+ |
Albert R. Gamper, Jr. (69) |
| Year of Election or Appointment: 2006 Mr. Gamper is Vice Chairman of the Independent Trustees of the Fixed Income and Asset Allocation Funds (2011-present). Prior to his retirement in December 2004, Mr. Gamper served as Chairman of the Board of CIT Group Inc. (commercial finance). During his tenure with CIT Group Inc. Mr. Gamper served in numerous senior management positions, including Chairman (1987-1989; 1999-2001; 2002-2004), Chief Executive Officer (1987-2004), and President (2002-2003). Mr. Gamper currently serves as a member of the Board of Directors of Public Service Enterprise Group (utilities, 2000-present), a member of the Board of Trustees, Rutgers University (2004-present), and Chairman of the Board of Saint Barnabas Health Care System. Previously, Mr. Gamper served as Chairman of the Board of Governors, Rutgers University (2004-2007). |
Robert F. Gartland (60) |
| Year of Election or Appointment: 2010 Mr. Gartland is Chairman and an investor in Gartland and Mellina Group Corp. (consulting, 2009-present). Previously, Mr. Gartland served as a partner and investor of Vietnam Partners LLC (investments and consulting, 2008-2011). Prior to his retirement, Mr. Gartland held a variety of positions at Morgan Stanley (financial services, 1979-2007) including Managing Director (1987-2007). |
Arthur E. Johnson (65) |
| Year of Election or Appointment: 2008 Mr. Johnson serves as a member of the Board of Directors of Eaton Corporation (diversified power management, 2009-present), AGL Resources, Inc. (holding company, 2002-present) and Booz Allen Hamilton (management consulting, 2011-present). Prior to his retirement, Mr. Johnson served as Senior Vice President of Corporate Strategic Development of Lockheed Martin Corporation (defense contractor, 1999-2009). He previously served on the Board of Directors of IKON Office Solutions, Inc. (1999-2008) and Delta Airlines (2005-2007). Mr. Arthur E. Johnson is not related to Mr. Edward C. Johnson 3d or Ms. Abigail P. Johnson. |
Michael E. Kenneally (57) |
| Year of Election or Appointment: 2009 Previously, Mr. Kenneally served as a Member of the Advisory Board for certain Fidelity Fixed Income and Asset Allocation Funds (2008-2009). Prior to his retirement, Mr. Kenneally served as Chairman and Global Chief Executive Officer of Credit Suisse Asset Management (2003-2005). Mr. Kenneally was a Director of the Credit Suisse Funds (U.S. mutual funds, 2004-2008) and certain other closed-end funds (2004-2005) and was awarded the Chartered Financial Analyst (CFA) designation in 1991. |
James H. Keyes (71) |
| Year of Election or Appointment: 2007 Mr. Keyes serves as a member of the Boards of Navistar International Corporation (manufacture and sale of trucks, buses, and diesel engines, since 2002) and Pitney Bowes, Inc. (integrated mail, messaging, and document management solutions, since 1998). Prior to his retirement, Mr. Keyes served as Chairman and Chief Executive Officer of Johnson Controls (automotive, building, and energy, 1998-2002) and as a member of the Board of LSI Logic Corporation (semiconductor technologies, 1984-2008). |
Marie L. Knowles (65) |
| Year of Election or Appointment: 2001 Prior to Ms. Knowles' retirement in June 2000, she served as Executive Vice President and Chief Financial Officer of Atlantic Richfield Company (ARCO) (diversified energy, 1996-2000). From 1993 to 1996, she was a Senior Vice President of ARCO and President of ARCO Transportation Company. She served as a Director of ARCO from 1996 to 1998. Ms. Knowles currently serves as a Director and Chairman of the Audit Committee of McKesson Corporation (healthcare service, since 2002). Ms. Knowles is an Honorary Trustee of the Brookings Institution and a member of the Board of the Catalina Island Conservancy and of the Santa Catalina Island Company (2009-present). She also serves as a member of the Advisory Board for the School of Engineering of the University of Southern California and the Foundation Board of the School of Architecture at the University of Virginia (2007-present). Previously, Ms. Knowles served as a Director of Phelps Dodge Corporation (copper mining and manufacturing, 1994-2007). |
Kenneth L. Wolfe (73) |
| Year of Election or Appointment: 2005 Mr. Wolfe is Chairman of the Independent Trustees of the Fixed Income and Asset Allocation Funds (2008-present). Prior to his retirement, Mr. Wolfe served as Chairman and a Director (2007-2009) and Chairman and Chief Executive Officer (1994-2001) of Hershey Foods Corporation. He also served as a member of the Boards of Adelphia Communications Corporation (telecommunications, 2003-2006), Bausch & Lomb, Inc. (medical/pharmaceutical, 1993-2007), and Revlon, Inc. (personal care products, 2004-2009). |
+ The information above includes each Trustee's principal occupation during the last five years and other information relating to the experience, attributes, and skills relevant to each Trustee's qualifications to serve as a Trustee, which led to the conclusion that each Trustee should serve as a Trustee for the fund.
Annual Report
Executive Officers:
Correspondence intended for each executive officer may be sent to Fidelity Investments, 82 Devonshire Street, Boston, Massachusetts 02109.
Name, Age; Principal Occupation |
John R. Hebble (53) |
| Year of Election or Appointment: 2008 President and Treasurer of Fidelity's Fixed Income and Asset Allocation Funds. Mr. Hebble also serves as President (2011-present), Treasurer, and Chief Financial Officer of The North Carolina Capital Management Trust: Cash and Term Portfolios (2008-present), Assistant Treasurer of other Fidelity funds (2009-present) and is an employee of Fidelity Investments. |
Robert P. Brown (48) |
| Year of Election or Appointment: 2010 Vice President of Fidelity's Money Market Funds and Executive Vice President of Fidelity Investments Money Management, Inc. (2010-present). Mr. Brown also serves as President, Money Market Group of FMR (2010-present), Managing Director of Research, Director of Fidelity Management & Research (U.K.) Inc. (2008-present) and is an employee of Fidelity Investments. |
Scott C. Goebel (44) |
| Year of Election or Appointment: 2008 Secretary and Chief Legal Officer (CLO) of the Fidelity funds. Mr. Goebel also serves as Secretary of Fidelity Investments Money Management, Inc. (FIMM) (2010-present) and Fidelity Research and Analysis Company (FRAC) (2010-present); Secretary and CLO of The North Carolina Capital Management Trust: Cash and Term Portfolios (2008-present); General Counsel, Secretary, and Senior Vice President of FMR (2008-present) and FMR Co., Inc. (2008-present); employed by FMR LLC or an affiliate (2001-present); Chief Legal Officer of Fidelity Management & Research (Hong Kong) Limited (2008-present) and Assistant Secretary of Fidelity Management & Research (Japan) Inc. (2008-present), and Fidelity Management & Research (U.K.) Inc. (2008-present). Previously, Mr. Goebel served as Assistant Secretary of FIMM (2008-2010), FRAC (2008-2010), and the Funds (2007-2008) and as Vice President and Secretary of Fidelity Distributors Corporation (FDC) (2005-2007). |
David J. Carter (38) |
| Year of Election or Appointment: 2010 Assistant Secretary of Fidelity's Fixed Income and Asset Allocation Funds. Mr. Carter also serves as Vice President, Associate General Counsel (2010-present) and is an employee of Fidelity Investments (2005-present). |
Holly C. Laurent (57) |
| Year of Election or Appointment: 2008 Anti-Money Laundering (AML) Officer of the Fidelity funds. Ms. Laurent also serves as AML Officer of The North Carolina Capital Management Trust: Cash and Term Portfolios (2008-present) and is an employee of Fidelity Investments. Previously, Ms. Laurent was Senior Vice President and Head of Legal for Fidelity Business Services India Pvt. Ltd. (2006-2008), and Senior Vice President, Deputy General Counsel and Group Head for FMR LLC (2005-2006). |
Christine Reynolds (53) |
| Year of Election or Appointment: 2008 Chief Financial Officer of the Fidelity funds. Ms. Reynolds became President of Fidelity Pricing and Cash Management Services (FPCMS) in August 2008. Ms. Reynolds served as Chief Operating Officer of FPCMS (2007-2008). Previously, Ms. Reynolds served as President, Treasurer, and Anti-Money Laundering officer of the Fidelity funds (2004-2007). |
Michael H. Whitaker (44) |
| Year of Election or Appointment: 2008 Chief Compliance Officer of Fidelity's Fixed Income and Asset Allocation Funds. Mr. Whitaker also serves as Chief Compliance Officer of The North Carolina Capital Management Trust: Cash and Term Portfolios (2008-present). Mr. Whitaker is an employee of Fidelity Investments (2007-present). Prior to joining Fidelity Investments, Mr. Whitaker worked at MFS Investment Management where he served as Senior Vice President and Chief Compliance Officer (2004-2006), and Assistant General Counsel. |
Joseph F. Zambello (54) |
| Year of Election or Appointment: 2011 Deputy Treasurer of the Fidelity funds. Mr. Zambello is an employee of Fidelity Investments. Previously, Mr. Zambello served as Vice President of FMR's Program Management Group (2009-2011) and Vice President of the Transfer Agent Oversight Group (2005-2009). |
Stephanie J. Dorsey (42) |
| Year of Election or Appointment: 2008 Deputy Treasurer of Fidelity's Fixed Income and Asset Allocation Funds. Ms. Dorsey also serves as Assistant Treasurer of other Fidelity funds (2010-present) and is an employee of Fidelity Investments (2008-present). Previously, Ms. Dorsey served as Treasurer (2004-2008) of the JPMorgan Mutual Funds and Vice President (2004-2008) of JPMorgan Chase Bank. |
Adrien E. Deberghes (44) |
| Year of Election or Appointment: 2010 Assistant Treasurer of Fidelity's Fixed Income and Asset Allocation Funds. Mr. Deberghes also serves as Vice President and Assistant Treasurer and Deputy Treasurer (2008-present) of other Fidelity funds, and is an employee of Fidelity Investments (2008-present). Previously, Mr. Deberghes served as Senior Vice President of Mutual Fund Administration at State Street Corporation (2007-2008), Senior Director of Mutual Fund Administration at Investors Bank & Trust (2005-2007), and Director of Finance for Dunkin' Brands (2000-2005). |
Kenneth B. Robins (42) |
| Year of Election or Appointment: 2009 Assistant Treasurer of the Fidelity Fixed Income and Asset Allocation Funds. Mr. Robins also serves as President and Treasurer of other Fidelity funds (2008-present; 2010-present) and is an employee of Fidelity Investments (2004-present). Previously, Mr. Robins served as Deputy Treasurer of the Fidelity funds (2005-2008) and Treasurer and Chief Financial Officer of The North Carolina Capital Management Trust: Cash and Term Portfolios (2006-2008). |
Gary W. Ryan (53) |
| Year of Election or Appointment: 2005 Assistant Treasurer of the Fidelity funds. Mr. Ryan is an employee of Fidelity Investments. Previously, Mr. Ryan served as Vice President of Fund Reporting in Fidelity Pricing and Cash Management Services (FPCMS) (1999-2005). |
Jonathan Davis (43) |
| Year of Election or Appointment: 2010 Assistant Treasurer of the Fidelity funds. Mr. Davis is also Assistant Treasurer of Fidelity Rutland Square Trust II and Fidelity Commonwealth Trust II. Mr. Davis is an employee of Fidelity Investments. Previously, Mr. Davis served as Vice President and Associate General Counsel of FMR LLC (2003-2010). |
Annual Report
During fiscal year ended 2012, 100% of the fund's income dividends was free from federal income tax, and 0% of the fund's income dividends was subject to the federal alternative minimum tax.
The fund will notify shareholders in January 2013 of amounts for use in preparing 2012 income tax returns.
Annual Report
Board Approval of Investment Advisory Contracts and Management Fees
Fidelity California AMT Tax-Free Money Market Fund
Each year, the Board of Trustees, including the Independent Trustees (together, the Board), votes on the renewal of the management contract and sub-advisory agreements (together, the Advisory Contracts) for the fund. The Board, assisted by the advice of fund counsel and Independent Trustees' counsel, requests and considers a broad range of information relevant to the renewal of the Advisory Contracts throughout the year.
The Board meets regularly and considers at each of its meetings factors that are relevant to its annual consideration of the renewal of the fund's Advisory Contracts, including the services and support provided to the fund and its shareholders. The Board has established three standing committees, Operations, Audit, and Nominating and Governance, each composed of Independent Trustees with varying backgrounds, to which the Board has assigned specific subject matter responsibilities in order to enhance effective decision-making by the Board. The Operations Committee, of which all of the Independent Trustees are members, meets regularly throughout the year and, among other matters, considers matters specifically related to the annual consideration of the renewal of the fund's Advisory Contracts. The Board, acting directly and through its Committees, requests and receives information concerning the annual consideration of the renewal of the fund's Advisory Contracts. The Board also meets as needed to consider matters specifically related to the Board's annual consideration of the renewal of Advisory Contracts. Members of the Board may also meet with trustees of other Fidelity funds through ad hoc joint committees to discuss certain matters relevant to the Fidelity funds.
At its September 2011 meeting, the Board of Trustees, including the Independent Trustees, unanimously determined to renew the fund's Advisory Contracts. In reaching its determination, the Board considered all factors it believed relevant, including (i) the nature, extent, and quality of the services to be provided to the fund and its shareholders (including the investment performance of the fund); (ii) the competitiveness of the fund's management fee and total expense ratio; (iii) the total costs of the services to be provided by and the profits to be realized by Fidelity from its relationship with the fund; (iv) the extent to which economies of scale would be realized as the fund grows; and (v) whether fee levels reflect these economies of scale, if any, for the benefit of fund shareholders.
In considering whether to renew the Advisory Contracts for the fund, the Board reached a determination, with the assistance of fund counsel and Independent Trustees' counsel and through the exercise of its business judgment, that the renewal of the Advisory Contracts is in the best interests of the fund and its shareholders and that the compensation payable under the Advisory Contracts is fair and reasonable. The Board's decision to renew the Advisory Contracts was not based on any single factor, but rather was based on a comprehensive consideration of all the information provided to the Board at its meetings throughout the year. The Board, in reaching its determination to renew the Advisory Contracts, is aware that shareholders in the fund have a broad range of investment choices available to them, including a wide choice among mutual funds offered by Fidelity's competitors, and that the fund's shareholders, who have the opportunity to review and weigh the disclosure provided by the fund in its prospectus and other public disclosures, have chosen to invest in this fund, managed by Fidelity.
Annual Report
Board Approval of Investment Advisory Contracts and
Management Fees - continued
Nature, Extent, and Quality of Services Provided. The Board considered the staffing within the investment adviser, FMR, and the sub-advisers (together, the Investment Advisers), including the backgrounds of the fund's investment personnel and the fund's investment objective and discipline. The Independent Trustees also had discussions with senior management of Fidelity's investment operations and investment groups. The Board considered the structure of the portfolio manager compensation program and whether this structure provides appropriate incentives to act in the best interests of the fund.
Resources Dedicated to Investment Management and Support Services. The Board reviewed the general qualifications and capabilities of the Investment Advisers' investment staff, including its size, education, experience, and resources, as well as the Investment Advisers' approach to recruiting, managing, and compensating investment personnel. The Board also noted that FMR has devoted increased resources to non-U.S. offices. The Board noted that Fidelity's analysts have extensive resources, tools and capabilities which allow them to conduct sophisticated quantitative and fundamental analysis, as well as credit analysis of issuers, counterparties and enhancers. The Board also believes that Fidelity's investment professionals have sufficient access to global information and data so as to provide competitive investment results over time, and that those professionals also have access to sophisticated tools which permit them to assess portfolio construction and risk and performance attribution characteristics continuously, as well as to transmit new information and research conclusions rapidly around the world. Additionally, in its deliberations, the Board considered the Investment Advisers' trading capabilities and resources which are an integral part of the investment management process.
Shareholder and Administrative Services. The Board considered (i) the nature, extent, quality, and cost of advisory, administrative, and shareholder services performed by the Investment Advisers and their affiliates under the Advisory Contracts and under separate agreements covering transfer agency and pricing and bookkeeping services for the fund; (ii) the nature and extent of the investment adviser's supervision of third party service providers, principally custodians and subcustodians; and (iii) the resources devoted to, and the record of compliance with, the fund's compliance policies and procedures.
The Board noted that the growth of fund assets over time across the complex allows Fidelity to reinvest in the development of services designed to enhance the value or convenience of the Fidelity funds as investment vehicles. These services include 24-hour access to account information and market information through telephone representatives and over the Internet, investor education materials and asset allocation tools, and the expanded availability of Fidelity Investor Centers, with 35 new branches opening since 2010.
Annual Report
Investment in a Large Fund Family. The Board considered the benefits to shareholders of investing in a Fidelity fund, including the benefits of investing in a fund that is part of a large family of funds offering a variety of investment disciplines and providing a large variety of mutual fund investor services. The Board noted that Fidelity had taken, or had made recommendations that resulted in the Fidelity funds taking, a number of actions over the previous year that benefited particular funds, including (i) continuing to dedicate additional resources to investment research and support of the senior management team that oversees asset management; (ii) rationalizing product lines through the mergers of six funds into other funds; (iii) continuing to migrate the Freedom Funds to dedicated lower cost underlying funds; (iv) obtaining shareholder approval to broaden the investment strategies for Fidelity Consumer Finance Portfolio, Fidelity Emerging Asia Fund, and Fidelity Environment and Alternative Energy Portfolio; (v) contractually agreeing to reduce the management fees and impose other expense limitations on Spartan 500 Index Fund and U.S. Bond Index Fund in connection with launching new institutional classes of these funds; (vi) changing the name, primary and supplemental benchmarks, and investment policies of Fidelity Global Strategies Fund to support the fund's flexible investment mandate and global orientation; and (vii) reducing the transfer agency account fee rates on certain accounts.
Investment Performance. The Board considered whether the fund has operated in accordance with its investment objective, as well as its record of compliance with its investment restrictions. It also reviewed the fund's absolute investment performance for each class, as well as the fund's relative investment performance for each class measured over multiple periods against a peer group of mutual funds deemed appropriate by Fidelity and reviewed by the Board. The following charts considered by the Board show, over the one-, three-, and five-year periods ended December 31, 2010, as available, the cumulative total returns of Institutional Class and the retail class of the fund and a range of cumulative total returns of a peer group of mutual funds identified by Lipper Inc. as having an investment objective similar to that of the fund. The returns of Institutional Class and the retail class show the performance of the highest performing class (based on three-year performance) and the lowest performing class (based on five-year performance), respectively. The box within each chart shows the 25th percentile return (bottom of box) and the 75th percentile return (top of box) of the peer group. Returns shown above the box are in the first quartile and returns shown below the box are in the fourth quartile. The percentage beaten numbers noted below each chart correspond to the percentile box and represent the percentage of funds in the peer group whose performance was equal to or lower than that of the class indicated.
Annual Report
Board Approval of Investment Advisory Contracts and
Management Fees - continued
Fidelity California AMT Tax-Free Money Market Fund
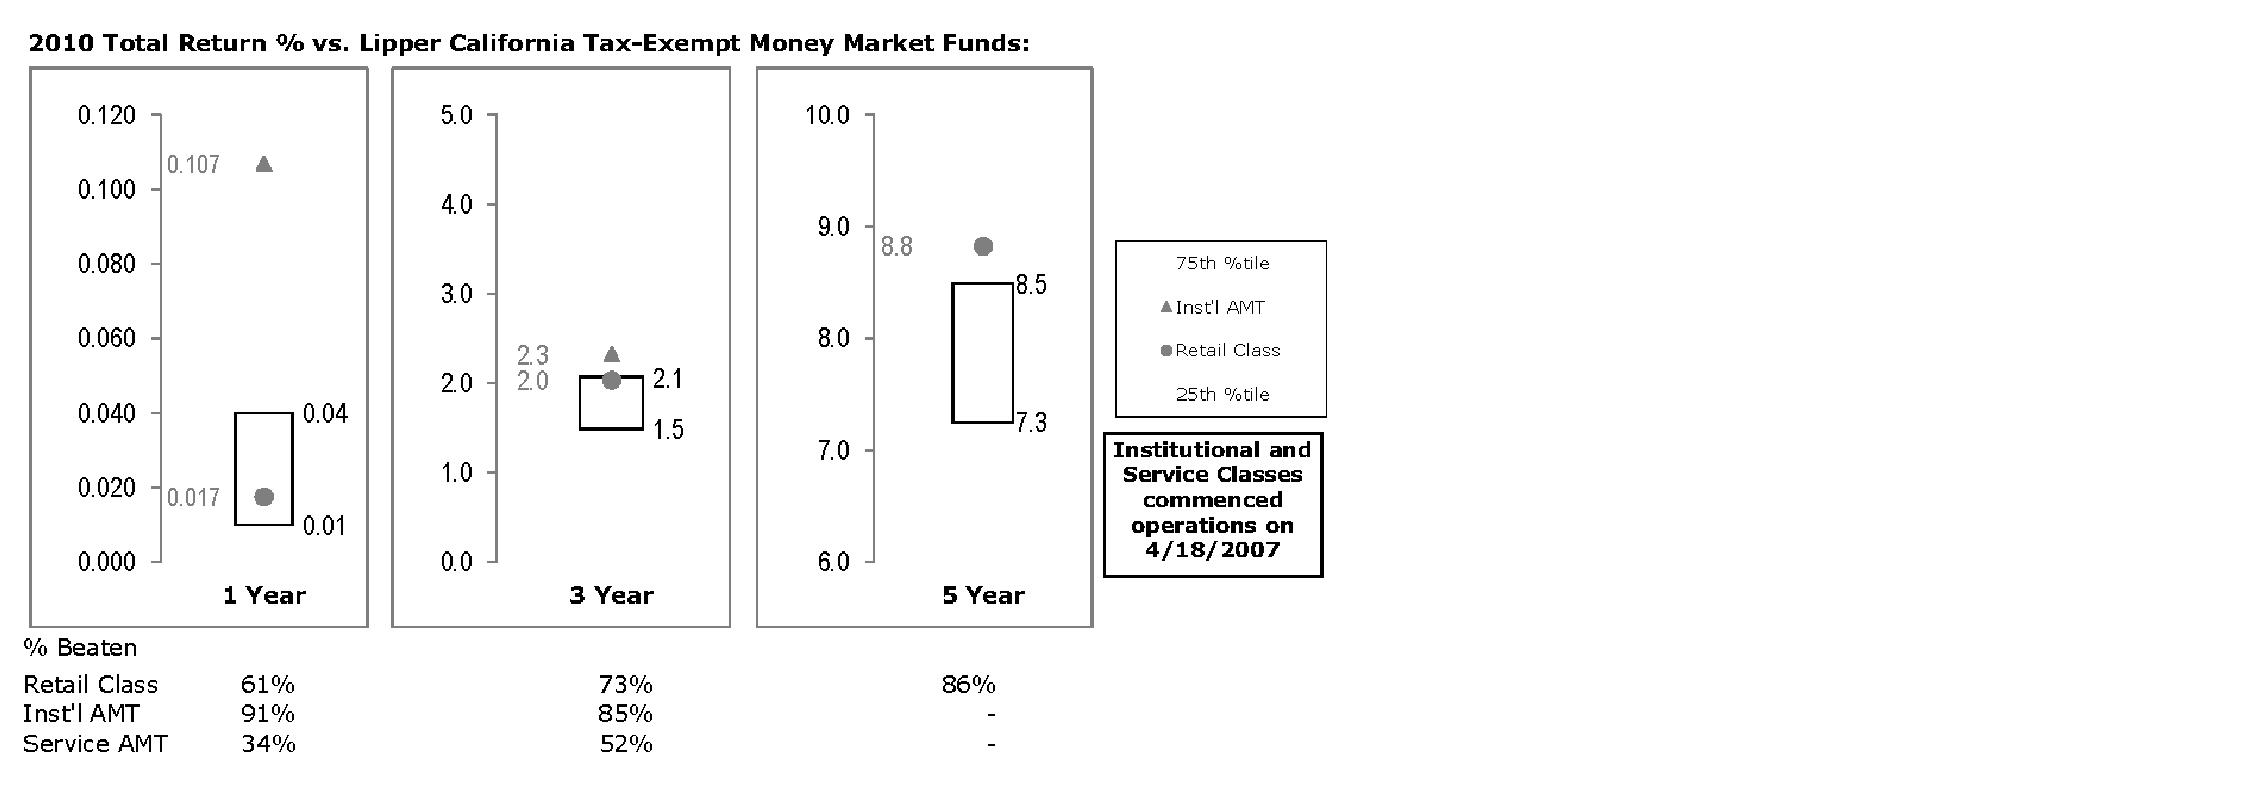
The Board reviewed the fund's relative investment performance against its peer group and noted that the performance of the retail class of the fund (the class with the longest performance record) was in the second quartile for the one- and three-year periods and the first quartile for the five-year period. The Board considered that FMR had taken steps to provide shareholders with stability of principal and to enhance safety and liquidity. The Board considered that the variations in performance among the fund's classes reflect the variations in class expenses, which result in lower performance for higher expense classes. The Board also reviewed the fund's performance since inception as well as performance in the current year.
Based on its review, the Board concluded that the nature, extent, and quality of services provided to the fund under the Advisory Contracts should benefit the fund's shareholders.
Competitiveness of Management Fee and Total Expense Ratio. The Board considered the fund's management fee and total expense ratio compared to "mapped groups" of competitive funds and classes. Fidelity creates "mapped groups" by combining similar Lipper investment objective categories that have comparable management fee characteristics. Combining Lipper investment objective categories aids the Board's management fee and total expense ratio comparisons by broadening the competitive group used for comparison and by reducing the number of universes to which various Fidelity funds are compared.
Annual Report
Management Fee. The Board considered two proprietary management fee comparisons for the 12-month periods shown in the chart below. The group of Lipper funds used by the Board for management fee comparisons is referred to below as the "Total Mapped Group" and, for the reasons explained above, is broader than the Lipper peer group used by the Board for performance comparisons. The Total Mapped Group comparison focuses on a fund's standing relative to the total universe of comparable funds available to investors in terms of gross management fees before expense reimbursements or caps. "TMG %" represents the percentage of funds in the Total Mapped Group that had management fees that were lower than the fund's. For example, a TMG % of 11% means that 89% of the funds in the Total Mapped Group had higher management fees than the fund. The "Asset-Size Peer Group" (ASPG) comparison focuses on a fund's standing relative to non-Fidelity funds similar in size to the fund within the Total Mapped Group. The ASPG represents at least 15% of the funds in the Total Mapped Group with comparable asset size and management fee characteristics, subject to a minimum of 50 funds (or all funds in the Total Mapped Group if fewer than 50). Additional information, such as the ASPG quartile in which the fund's management fee ranked, is also included in the chart and considered by the Board. Because the vast majority of competitor funds' management fees do not cover non-management expenses, for a more meaningful comparison of management fees, the fund is compared on the basis of a hypothetical "net management fee," which is derived by subtracting payments made by FMR for "fund-level" non-management expenses (including pricing and bookkeeping fees and fees paid to non-affiliated custodians) from the fund's management fee. In this regard, the Board realized that net management fees can vary from year to year because of differences in "fund-level" non-management expenses. The Board noted, however, that FMR does not pay transfer agent fees or other "class-level" expenses (including 12b-1 fees, if applicable) under the fund's management contract.
Annual Report
Board Approval of Investment Advisory Contracts and
Management Fees - continued
Fidelity California AMT Tax-Free Money Market Fund
The Board noted that the fund's hypothetical net management fee ranked below the median of its Total Mapped Group and below the median of its ASPG for 2010.
Furthermore, the Board considered that it had approved an amended and restated management contract for the fund (effective April 1, 2007) that (i) lowered the fund's management fee from 43 basis points to 20 basis points, and (ii) provides that FMR will pay all "fund-level" expenses out of the management fee, with certain limited exceptions. (Transfer agent fees and 12b-1 fees, if applicable, currently are the only "class-level" expenses.) The Board considered that the chart reflects the fund's lower management fee for 2007 as if the lower fee were in effect for the entire year.
Based on its review, the Board concluded that the fund's management fee is fair and reasonable in light of the services that the fund receives and the other factors considered.
Total Expense Ratio. In its review of each class's total expense ratio, the Board considered the fund's hypothetical net management fee as well as the fund's gross management fee. The Board also considered other "fund-level" expenses, such as pricing and bookkeeping fees and custodial, legal, and audit fees. The Board also considered other "class-level" expenses, such as transfer agent fees and fund-paid 12b-1 fees. The Board also noted the effects of any waivers and reimbursements on fees and expenses. As part of its review, the Board also considered the current and historical total expense ratios of each class of the fund compared to competitive fund median expenses. Each class of the fund is compared to those funds and classes in the Total Mapped Group (used by the Board for management fee comparisons) that have a similar sales load structure.
Annual Report
The Board noted that the total expense ratio of each class ranked below its competitive median for 2010.
The Board also considered that the current contractual arrangements for the fund (i) have the effect of setting the total "fund-level" expenses (including, among certain other expenses, the management fee) for each class at 20 basis points, (ii) set the "class-level" transfer agent fee for the retail class at a fixed rate of 10 basis points, and (iii) limit the total expenses of the retail class to 35 basis points. The fees and expenses payable under these contractual arrangements may not be increased without the approval of the Board and, in the case of (i) and (iii), the shareholders of the applicable class. Institutional Class and Service Class (which commenced operations on April 18, 2007) are subject to different "class-level" expenses (transfer agent fees and 12b-1 fees). In addition, the Board considered that, effective April 17, 2007, FMR contractually agreed to limit the total expenses of Institutional Class and Service Class to 20 basis points and 45 basis points, respectively. The fees and expenses payable under these contractual arrangements may not be increased without Board approval.
The Board considered that Fidelity has been voluntarily waiving part or all of the 12b-1 fees, transfer agent fees, and/or management fees to maintain a minimum yield, and also noted that Fidelity retains the ability to be repaid in certain circumstances.
Fees Charged to Other Fidelity Clients. The Board also considered Fidelity fee structures and other information with respect to clients of FMR and its affiliates, such as other mutual funds advised or subadvised by FMR or its affiliates, pension plan clients, and other institutional clients. In March 2010, the Board created an ad hoc joint committee with the board of other Fidelity funds (the Committee) to review and compare Fidelity's institutional investment advisory business with its business of providing services to the Fidelity funds, including the differences in services provided, fees charged, and costs incurred, as well as competition in their respective marketplaces.
Based on its review of total expense ratios and fees charged to other Fidelity clients, the Board concluded that the total expense ratio of each class of the fund was reasonable in light of the services that the fund and its shareholders receive and the other factors considered, including the findings of the Committee.
Costs of the Services and Profitability. The Board considered the revenues earned and the expenses incurred by Fidelity in conducting the business of developing, marketing, distributing, managing, administering and servicing the fund and its shareholders. The Board also considered the level of Fidelity's profits in respect of all the Fidelity funds.
On an annual basis, FMR presents to the Board Fidelity's profitability for the fund. Fidelity calculates the profitability for each fund, as well as aggregate profitability for groups of Fidelity funds and all Fidelity funds, using a series of detailed revenue and cost allocation methodologies which originate with the books and records of Fidelity on which Fidelity's audited financial statements are based. The Audit Committee of the Board reviews any significant changes from the prior year's methodologies.
Annual Report
Board Approval of Investment Advisory Contracts and
Management Fees - continued
PricewaterhouseCoopers LLP (PwC), independent registered public accounting firm and auditor to Fidelity and certain Fidelity funds, has been engaged annually by the Board as part of the Board's assessment of Fidelity's profitability analysis. PwC's engagement includes the review and assessment of Fidelity's methodologies used in determining the revenues and expenses attributable to Fidelity's mutual fund business, and completion of agreed-upon procedures surrounding the mathematical accuracy of fund profitability and its conformity to allocation methodologies. After considering PwC's reports issued under the engagement and information provided by Fidelity, the Board concluded that while other allocation methods may also be reasonable, Fidelity's profitability methodologies are reasonable in all material respects.
The Board also reviewed Fidelity's non-fund businesses and fall-out benefits related to the mutual fund business as well as cases where Fidelity's affiliates may benefit from or be related to the fund's business.
The Board considered the costs of the services provided by and the profits realized by Fidelity in connection with the operation of the fund and was satisfied that the profitability was not excessive in the circumstances.
Economies of Scale. The Board considered whether there have been economies of scale in respect of the management of the Fidelity funds, whether the Fidelity funds (including the fund) have appropriately benefited from any such economies of scale, and whether there is potential for realization of any further economies of scale. The Board considered the extent to which the fund will benefit from economies of scale through increased services to the fund, through waivers or reimbursements, or through fee or expense reductions. The Board also noted that in 2009, it and the board of other Fidelity funds created an ad hoc committee (the Economies of Scale Committee) to analyze whether FMR attains economies of scale in respect of the management and servicing of the Fidelity funds, whether the Fidelity funds have appropriately benefited from such economies of scale, and whether there is potential for realization of any further economies of scale.
The Board concluded, taking into account the analysis of the Economies of Scale Committee, that any potential economies of scale are being appropriately shared between fund shareholders and Fidelity.
Additional Information Requested by the Board. In order to develop fully the factual basis for consideration of the Fidelity funds' Advisory Contracts, the Board requested and received additional information on certain topics, including: (i) Fidelity's fund profitability methodology, profitability trends for certain funds, and the impact of certain factors on fund profitability results; (ii) portfolio manager changes that have occurred during the past year and the amount of the investment that each portfolio manager has made in the Fidelity fund(s) that he or she manages; (iii) Fidelity's compensation structure for portfolio managers, research analysts, and other key personnel, including its effects on fund profitability, the rationale for the compensation structure, and the extent to which current market conditions have affected retention and recruitment; (iv) the compensation paid to fund sub-advisers on behalf of the Fidelity funds; (v) Fidelity's fee structures and rationale for recommending different fees among different categories of funds and classes, as well as Fidelity's voluntary waiver of its fees to maintain minimum yields for certain money market funds and classes; (vi) the reasons why certain expenses affect various funds and classes differently; (vii) Fidelity's transfer agent fees, expenses, and services and how the benefits of decreased costs and new efficiencies can be shared across all of the Fidelity funds; (viii) the reasons for and consequences of changes to certain product lines compared to competitors; (ix) the allocation of and historical trends in Fidelity's realization of fall-out benefits; and (x) explanations regarding the relative total expense ratios of certain funds and classes, total expense competitive trends, and actions that might be taken by FMR to reduce total expense ratios for certain funds and classes or to achieve further economies of scale.
Annual Report
Based on its evaluation of all of the conclusions noted above, and after considering all factors it believed relevant, the Board ultimately concluded that the advisory fee structures are fair and reasonable, and that the fund's Advisory Contracts should be renewed.
Annual Report
Investment Adviser
Fidelity Management & Research
Company
Boston, MA
Investment Sub-Advisers
Fidelity Investments Money
Management, Inc.
Fidelity Management & Research
(U.K.) Inc.
Fidelity Management & Research
(Hong Kong) Limited
Fidelity Management & Research
(Japan), Inc.
General Distributor
Fidelity Distributors Corporation
Boston, MA
Transfer and Service Agents
Citibank, N.A.
New York, NY
Fidelity Service Company, Inc.
Boston, MA
Fidelity Investments Institutional
Operations Company, Inc.
Boston, MA
Custodian
Citibank, N.A.
New York, NY
The Fidelity Telephone Connection
Mutual Fund 24-Hour Service
Exchanges/Redemptions
and Account Assistance 1-800-544-6666
Product Information 1-800-544-6666
Retirement Accounts 1-800-544-4774 (8 a.m. - 9 p.m.)
TDD Service 1-800-544-0118
for the deaf and hearing impaired
(9 a.m. - 9 p.m. Eastern time)
Fidelity Automated Service
Telephone (FAST®) 1-800-544-5555
Automated line for quickest service
SCM-UANN-0412
1.855628.104
(Fidelity Investment logo)(registered trademark)
Corporate Headquarters
82 Devonshire St., Boston, MA 02109
www.fidelity.com
Item 2. Code of Ethics
As of the end of the period, February 29, 2012, Fidelity California Municipal Trust II (the trust) has adopted a code of ethics, as defined in Item 2 of Form N-CSR, that applies to its President and Treasurer and its Chief Financial Officer. A copy of the code of ethics is filed as an exhibit to this Form N-CSR.
Item 3. Audit Committee Financial Expert
The Board of Trustees of the trust has determined that Marie L. Knowles is an audit committee financial expert, as defined in Item 3 of Form N-CSR. Ms. Knowles is independent for purposes of Item 3 of Form N-CSR.
Item 4. Principal Accountant Fees and Services
Fees and Services
The following table presents fees billed by PricewaterhouseCoopers LLP ("PwC") in each of the last two fiscal years for services rendered to Fidelity California AMT Tax-Free Money Market Fund and Fidelity California Municipal Money Market Fund (the "Funds"):
Services Billed by PwC
February 29, 2012 FeesA
| Audit Fees | Audit-Related Fees | Tax Fees | All Other Fees |
Fidelity California AMT Tax-Free Money Market Fund | $39,000 | $- | $2,000 | $2,200 |
Fidelity California Municipal Money Market Fund | $39,000 | $- | $2,000 | $3,800 |
February 28, 2011 FeesA
| Audit Fees | Audit-Related Fees | Tax Fees | All Other Fees |
Fidelity California AMT Tax-Free Money Market Fund | $43,000 | $- | $2,000 | $2,800 |
Fidelity California Municipal Money Market Fund | $43,000 | $- | $2,000 | $4,500 |
A Amounts may reflect rounding.
The following table presents fees billed by PwC that were required to be approved by the Audit Committee for services that relate directly to the operations and financial reporting of the Funds and that are rendered on behalf of Fidelity Management & Research Company ("FMR") and entities controlling, controlled by, or under common control with FMR (not including any sub-adviser whose role is primarily portfolio management and is subcontracted with or overseen by another investment adviser) that provide ongoing services to the Funds ("Fund Service Providers"):
Services Billed by PwC
| February 29, 2012A | February 28, 2011A |
Audit-Related Fees | $3,795,000 | $2,550,000 |
Tax Fees | $- | $- |
All Other Fees | $- | $510,000 |
A Amounts may reflect rounding.
"Audit-Related Fees" represent fees billed for assurance and related services that are reasonably related to the performance of the fund audit or the review of the fund's financial statements and that are not reported under Audit Fees.
"Tax Fees" represent fees billed for tax compliance, tax advice or tax planning that relate directly to the operations and financial reporting of the fund.
"All Other Fees" represent fees billed for services provided to the fund or Fund Service Provider, a significant portion of which are assurance related, that relate directly to the operations and financial reporting of the fund, excluding those services that are reported under Audit Fees, Audit-Related Fees or Tax Fees.
Assurance services must be performed by an independent public accountant.
* * *
The aggregate non-audit fees billed by PwC for services rendered to the Funds, FMR (not including any sub-adviser whose role is primarily portfolio management and is subcontracted with or overseen by another investment adviser), and any Fund Service Provider for each of the last two fiscal years of the Funds are as follows:
Billed By | February 29, 2012 A | February 28, 2011 A |
PwC | $5,130,000 | $4,960,000 |
A Amounts may reflect rounding.
The trust's Audit Committee has considered non-audit services that were not pre-approved that were provided by PwC to Fund Service Providers to be compatible with maintaining the independence of PwC in its audit of the Funds, taking into account representations from PwC, in accordance with Public Company Accounting Oversight Board rules, regarding its independence from the Funds and their related entities and FMR's review of the appropriateness and permissibility under applicable law of such non-audit services prior to their provision to the Fund Service Providers.
Audit Committee Pre-Approval Policies and Procedures
The trust's Audit Committee must pre-approve all audit and non-audit services provided by a fund's independent registered public accounting firm relating to the operations or financial reporting of the fund. Prior to the commencement of any audit or non-audit services to a fund, the Audit Committee reviews the services to determine whether they are appropriate and permissible under applicable law.
The Audit Committee has adopted policies and procedures to, among other purposes, provide a framework for the Committee's consideration of non-audit services by the audit firms that audit the Fidelity funds. The policies and procedures require that any non-audit service provided by a fund audit firm to a Fidelity fund and any non-audit service provided by a fund auditor to a Fund Service Provider that relates directly to the operations and financial reporting of a Fidelity fund ("Covered Service") are subject to approval by the Audit Committee before such service is provided.
All Covered Services must be approved in advance of provision of the service either: (i) by formal resolution of the Audit Committee, or (ii) by oral or written approval of the service by the Chair of the Audit Committee (or if the Chair is unavailable, such other member of the Audit Committee as may be designated by the Chair to act in the Chair's absence). The approval contemplated by (ii) above is permitted where the Treasurer determines that action on such an engagement is necessary before the next meeting of the Audit Committee.
Non-audit services provided by a fund audit firm to a Fund Service Provider that do not relate directly to the operations and financial reporting of a Fidelity fund are reported to the Audit Committee on a periodic basis.
Non-Audit Services Approved Pursuant to Rule 2-01(c)(7)(i)(C) and (ii) of Regulation S-X ("De Minimis Exception")
There were no non-audit services approved or required to be approved by the Audit Committee pursuant to the De Minimis Exception during the Funds' last two fiscal years relating to services provided to (i) the Funds or (ii) any Fund Service Provider that relate directly to the operations and financial reporting of the Funds.
Item 5. Audit Committee of Listed Registrants
Not applicable.
Item 6. Investments
(a) Not applicable.
(b) Not applicable
Item 7. Disclosure of Proxy Voting Policies and Procedures for Closed-End Management Investment Companies
Not applicable.
Item 8. Portfolio Managers of Closed-End Management Investment Companies
Not applicable.
Item 9. Purchase of Equity Securities by Closed-End Management Investment Company and Affiliated Purchasers
Not applicable.
Item 10. Submission of Matters to a Vote of Security Holders
There were no material changes to the procedures by which shareholders may recommend nominees to the trust's Board of Trustees.
Item 11. Controls and Procedures
(a)(i) The President and Treasurer and the Chief Financial Officer have concluded that the trust's disclosure controls and procedures (as defined in Rule 30a-3(c) under the Investment Company Act) provide reasonable assurances that material information relating to the trust is made known to them by the appropriate persons, based on their evaluation of these controls and procedures as of a date within 90 days of the filing date of this report.
(a)(ii) There was no change in the trust's internal control over financial reporting (as defined in Rule 30a-3(d) under the Investment Company Act) that occurred during the second fiscal quarter of the period covered by this report that has materially affected, or is reasonably likely to materially affect, the trust's internal control over financial reporting.
Item 12. Exhibits
(a) | (1) | Code of Ethics pursuant to Item 2 of Form N-CSR is filed and attached hereto as EX-99.CODE ETH. |
(a) | (2) | Certification pursuant to Rule 30a-2(a) under the Investment Company Act of 1940 (17 CFR 270.30a-2(a)) is filed and attached hereto as Exhibit 99.CERT. |
(a) | (3) | Not applicable. |
(b) | | Certification pursuant to Rule 30a-2(b) under the Investment Company Act of 1940 (17 CFR 270.30a-2(b)) is furnished and attached hereto as Exhibit 99.906CERT. |
SIGNATURES
Pursuant to the requirements of the Securities Exchange Act of 1934 and the Investment Company Act of 1940, the registrant has duly caused this report to be signed on its behalf by the undersigned, thereunto duly authorized.
Fidelity California Municipal Trust II
By: | /s/John R. Hebble |
| John R. Hebble |
| President and Treasurer |
| |
Date: | April 25, 2012 |
Pursuant to the requirements of the Securities Exchange Act of 1934 and the Investment Company Act of 1940, this report has been signed below by the following persons on behalf of the registrant and in the capacities and on the dates indicated.
By: | /s/John R. Hebble |
| John R. Hebble |
| President and Treasurer |
| |
Date: | April 25, 2012 |
By: | /s/Christine Reynolds |
| Christine Reynolds |
| Chief Financial Officer |
| |
Date: | April 25, 2012 |