UNITED STATES
SECURITIES AND EXCHANGE COMMISSION
Washington, D.C. 20549
FORM N-CSR
CERTIFIED SHAREHOLDER REPORT OF REGISTERED
MANAGEMENT INVESTMENT COMPANIES
Investment Company Act file number 811-06397
Fidelity California Municipal Trust II
(Exact name of registrant as specified in charter)
245 Summer St., Boston, MA 02210
(Address of principal executive offices) (Zip code)
Cynthia Lo Bessette, Secretary
245 Summer St.
Boston, Massachusetts 02210
(Name and address of agent for service)
Registrant's telephone number, including area code:
617-563-7000
| |
Date of fiscal year end: | February 28 |
|
|
Date of reporting period: | August 31, 2022 |
Item 1.
Reports to Stockholders
Fidelity® California Municipal Money Market Fund
Semi-Annual Report
August 31, 2022
Contents
To view a fund's proxy voting guidelines and proxy voting record for the 12-month period ended June 30, visit http://www.fidelity.com/proxyvotingresults or visit the Securities and Exchange Commission's (SEC) web site at http://www.sec.gov.
You may also call 1-800-544-8544 to request a free copy of the proxy voting guidelines.
Standard & Poor's, S&P and S&P 500 are registered service marks of The McGraw-Hill Companies, Inc. and have been licensed for use by Fidelity Distributors Corporation.
Other third-party marks appearing herein are the property of their respective owners.
All other marks appearing herein are registered or unregistered trademarks or service marks of FMR LLC or an affiliated company. © 2022 FMR LLC. All rights reserved.
This report and the financial statements contained herein are submitted for the general information of the shareholders of the Fund. This report is not authorized for distribution to prospective investors in the Fund unless preceded or accompanied by an effective prospectus.
A fund files its complete schedule of portfolio holdings with the SEC for the first and third quarters of each fiscal year on Form N-PORT. Forms N-PORT are available on the SEC's web site at http://www.sec.gov. A fund's Forms N-PORT may be reviewed and copied at the SEC's Public Reference Room in Washington, DC. Information regarding the operation of the SEC's Public Reference Room may be obtained by calling 1-800-SEC-0330.
For a complete list of a fund's portfolio holdings, view the most recent holdings listing, semiannual report, or annual report on Fidelity's web site at http://www.fidelity.com, http://www.institutional.fidelity.com, or http://www.401k.com, as applicable.
NOT FDIC INSURED •MAY LOSE VALUE •NO BANK GUARANTEE
Neither the Fund nor Fidelity Distributors Corporation is a bank.
| Current 7-Day Yields |
| | | |
| Fidelity® California Municipal Money Market Fund | 1.21% | |
| | | |
Yield refers to the income paid by the Fund over a given period. Yield for money market funds is usually for seven-day periods, as it is here, though it is expressed as an annual percentage rate. Past performance is no guarantee of future results. Yield will vary and it's possible to lose money investing in the Fund. A portion of the Fund's expenses was reimbursed and/or waived. Absent such reimbursements and/or waivers the yield for the period ending August 31, 2022, the most recent period shown in the table, would have been 1.18% for Fidelity® California Municipal Money Market Fund. | |
| Effective Maturity Diversification (% of Fund's Investments) |
| Days |
| 1 - 7 | 84.1 | |
| 8 - 30 | 1.4 | |
| 31 - 60 | 10.7 | |
| 61 - 90 | 1.5 | |
| 91 - 180 | 0.4 | |
| > 180 | 1.9 | |
| Effective maturity is determined in accordance with the requirements of Rule 2a-7 under the Investment Company Act of 1940. |
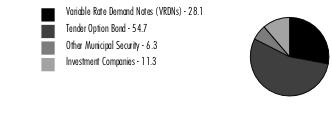
Asset Allocation (% of Fund's net assets) |
|
Net Other Assets (Liabilities) - (0.4)%* |
*Net Other Assets (Liabilities) are not available in the pie chart. |
|
Showing Percentage of Net Assets
| Variable Rate Demand Note - 28.1% |
| | | Principal Amount (a) (000s) | Value ($) (000s) |
| Alabama - 0.7% | | | |
| Decatur Indl. Dev. Board Exempt Facilities Rev. (Nucor Steel Decatur LLC Proj.) Series 2003 A, 1.85% 9/7/22, VRDN (b)(c) | | 7,161 | 7,161 |
| West Jefferson Indl. Dev. Series 2008, 1.79% 9/7/22, VRDN (b) | | 1,400 | 1,400 |
TOTAL ALABAMA | | | 8,561 |
| Arkansas - 0.9% | | | |
| Blytheville Indl. Dev. Rev. (Nucor Corp. Proj.): | | | |
| Series 1998, 1.85% 9/7/22, VRDN (b)(c) | | 3,000 | 3,000 |
| Series 2002, 1.95% 9/7/22, VRDN (b)(c) | | 6,800 | 6,800 |
TOTAL ARKANSAS | | | 9,800 |
| California - 24.9% | | | |
| Alameda County Indl. Dev. Auth. Rev. (Edward L. Shimmon, Inc. Proj.) Series 1996 A, 1.71% 9/7/22, LOC BNP Paribas SA, VRDN (b)(c) | | 3,375 | 3,375 |
| Bay Area Toll Auth. San Francisco Bay Toll Bridge Rev. Series 2007 D2, 1.44% 9/7/22, LOC Bank of America NA, VRDN (b) | | 20,000 | 20,000 |
| California Poll. Cont. Fing. Auth. Exempt Facilities Rev. (ExxonMobil Proj.) Series 2001, 0.88% 9/1/22 (Exxon Mobil Corp. Guaranteed), VRDN (b)(c) | | 9,845 | 9,845 |
| California Poll. Cont. Fing. Auth. Solid Waste Disp. Rev. (Recology, Inc. Proj.) Series 2018 A, 1.69% 9/7/22, LOC Wells Fargo Bank NA, VRDN (b)(c)(d) | | 35,715 | 35,708 |
| California Statewide Cmntys. Dev. Auth. Multi-family Hsg. Rev.: | | | |
| (Irvine Apt. Cmntys. LP Proj.) Series 2001 W2, 0.95% 9/1/22, LOC Wells Fargo Bank NA, VRDN (b)(c) | | 1,200 | 1,200 |
| (Maple Square Apt. Proj.) Series AA, 1.75% 9/7/22, LOC Citibank NA, VRDN (b)(c) | | 4,455 | 4,455 |
| (Terraces at Park Marino Proj.) Series I, 1.76% 9/7/22, LOC Bank of The West San Francisco, VRDN (b)(c) | | 4,470 | 4,470 |
| (The Crossings at Elk Grove Apts.) Series H, 1.65% 9/7/22, LOC Citibank NA, VRDN (b)(c) | | 5,930 | 5,930 |
| Los Angeles Multi-family Hsg. Rev. (Colonia Corona Apts. Proj.) Series 2004 D, 1.65% 9/7/22, LOC Citibank NA, VRDN (b)(c) | | 2,100 | 2,100 |
| Riverside Ctfs. of Prtn. (Riverside Renaissance Proj.) Series 2008, 1.47% 9/7/22, LOC Bank of America NA, VRDN (b)(e) | | 21,500 | 21,500 |
| Sacramento Hsg. Auth. Multi-family Rev. (Phoenix Park II Apts. Proj.) Series 2004 F, 1.65% (b)(c) | | 5,056 | 5,056 |
| San Diego Hsg. Auth. Multi-family Hsg. Rev.: | | | |
| (Delta Village Apts. Proj.) Series A, 1.75% 9/7/22, LOC Citibank NA, VRDN (b)(c) | | 4,700 | 4,700 |
| Series 2017 A, 1.7% 9/7/22, LOC Bank of America NA, VRDN (b) | | 2,400 | 2,400 |
| San Francisco City & County Arpts. Commission Int'l. Arpt. Rev. Series 2010 A1, 1.25% 9/7/22, LOC Bank of America NA, VRDN (b)(c) | | 10,300 | 10,300 |
| San Francisco City & County Redev. Agcy. Multi-family Hsg. Rev.: | | | |
| (Antonia Manor Apts. Proj.) Series 2000 E, 1.65% 9/7/22, LOC Citibank NA, VRDN (b)(c) | | 300 | 300 |
| (Mission Creek Cmnty. Proj.) Series B, 1.65% 9/7/22, LOC Citibank NA, VRDN (b)(c) | | 3,155 | 3,155 |
| (Ocean Beach Apts. Proj.) Series B, 1.47% 9/7/22, LOC Citibank NA, VRDN (b)(c) | | 3,730 | 3,730 |
| Series 2000 G, 1.47% 9/7/22, LOC Citibank NA, VRDN (b)(c) | | 840 | 840 |
| FHLMC California Statewide Cmntys. Dev. Auth. Multi-family Hsg. Rev. (Heritage Park Apts. Proj.) Series 2008 C, 1.6% 9/7/22, LOC Freddie Mac, VRDN (b)(c) | | 20,000 | 20,000 |
| FNMA: | | | |
| ABAG Fin. Auth. for Nonprofit Corps. Multi-family Hsg. Rev. ( Terrazza Apts. Proj.) Series 2002 A, 1.68% 9/7/22, LOC Fannie Mae, VRDN (b)(c) | | 15,000 | 15,000 |
| California Statewide Cmntys. Dev. Auth. Multi-family Hsg. Rev. (Salvation Army S.F. Proj.) Series 2003 EEE, 1.64% 9/7/22, LOC Fannie Mae, VRDN (b)(c) | | 8,805 | 8,805 |
| Emeryville Redev. Agcy. Multi-family Hsg. Rev. Series 2002 A, 1.82% 9/7/22, LOC Fannie Mae, VRDN (b)(c) | | 30,000 | 30,000 |
| Orange County Apt. Dev. Rev.: | | | |
(Ladera Apts. Proj.) Series 2001 II B, 1.61% 9/7/22, LOC Fannie Mae, VRDN (b)(c) | | 18,600 | 18,600 |
(Wood Canyon Villas Proj.) Series 2001 E, 1.61% 9/7/22, LOC Fannie Mae, VRDN (b)(c) | | 13,800 | 13,800 |
| San Jose Multi-family Hsg. Rev. (Almaden Lake Village Apt. Assoc. Proj.) Series 1997 A, 1.82% 9/7/22, LOC Fannie Mae, VRDN (b)(c) | | 16,500 | 16,500 |
| Santa Cruz Redev. Agcy. Multi-family Rev.: | | | |
(1010 Pacific Ave. Apts. Proj.) Series B, 1.73% 9/7/22, LOC Fannie Mae, VRDN (b)(c) | | 14,545 | 14,545 |
(Shaffer Road Apts. Proj.) Series A, 1.73% 9/7/22, LOC Fannie Mae, VRDN (b)(c) | | 4,900 | 4,900 |
TOTAL CALIFORNIA | | | 281,214 |
| Kansas - 0.6% | | | |
| Cygne Poll. Cont. Rev. (Kansas Gas and Elec. Co. Proj.) Series 1994 B, 1.65% 9/7/22, VRDN (b)(f) | | 3,040 | 3,040 |
| Burlington Envir. Impt. Rev. (Kansas City Pwr. and Lt. Co. Proj.): | | | |
| Series 2007 A, 1.69% 9/7/22, VRDN (b) | | 2,300 | 2,300 |
| Series 2007 B, 1.69% 9/7/22, VRDN (b) | | 1,100 | 1,100 |
| Wamego Kansas Poll. Cont. Rfdg. Rev. (Western Resources, Inc. Proj.) Series 1994, 1.65% 9/7/22, VRDN (b) | | 700 | 700 |
TOTAL KANSAS | | | 7,140 |
| Louisiana - 0.1% | | | |
| Saint James Parish Gen. Oblig. (Nucor Steel Louisiana LLC Proj.) Series 2010 B1, 1.95% 9/7/22, VRDN (b) | | 700 | 700 |
| Nebraska - 0.0% | | | |
| Stanton County Indl. Dev. Rev. Series 1998, 1.85% 9/7/22, VRDN (b)(c) | | 300 | 300 |
| Texas - 0.3% | | | |
| Jewett Econ. Dev. Corp. Indl. Dev. Rev. (Nucor Corp. Proj.) Series 2003, 1.85% 9/7/22, VRDN (b)(c) | | 3,450 | 3,450 |
| West Virginia - 0.6% | | | |
| West Virginia Econ. Dev. Auth. Solid Waste Disp. Facilities Rev. (Appalachian Pwr. Co. Amos Proj.) Series 2008 B, 1.75% 9/7/22, VRDN (b)(c) | | 6,800 | 6,800 |
| TOTAL VARIABLE RATE DEMAND NOTE (Cost $317,965) | | | 317,965 |
| | | | |
| Tender Option Bond - 54.7% |
| | | Principal Amount (a) (000s) | Value ($) (000s) |
| California - 53.0% | | | |
| Alameda Corridor Trans. Auth. Rev. Participating VRDN Series XF 11 48, 1.76% 9/7/22 (Liquidity Facility Deutsche Bank AG New York Branch) (b)(g)(h) | | 4,000 | 4,000 |
| Allan-Hancock Joint Cmnty. College District Participating VRDN Series XF 07 69, 1.7% 9/7/22 (Liquidity Facility JPMorgan Chase Bank) (b)(g)(h) | | 1,290 | 1,290 |
| Bay Area Toll Auth. San Francisco Bay Toll Bridge Rev. Participating VRDN Series XF 10 44, 1.73% 9/7/22 (Liquidity Facility Deutsche Bank AG New York Branch) (b)(g)(h) | | 5,700 | 5,700 |
| California Edl. Facilities Auth. Rev. Participating VRDN Series 2022 XM 09 66, 1.7% 9/7/22 (Liquidity Facility JPMorgan Chase Bank) (b)(g)(h) | | 7,000 | 7,000 |
| California Gen. Oblig. Participating VRDN: | | | |
| Series XF 13 30, 1.7% 9/7/22 (Liquidity Facility JPMorgan Chase Bank) (b)(g)(h) | | 1,300 | 1,300 |
| Series XF 13 51, 1.7% 9/7/22 (Liquidity Facility JPMorgan Chase Bank) (b)(g)(h) | | 2,100 | 2,100 |
| Series XF 29 82, 1.69% 9/7/22 (Liquidity Facility Citibank NA) (b)(g)(h) | | 1,825 | 1,825 |
| California Health Facilities Fing. Auth. Rev.: | | | |
| Bonds Series MS 00 07, 1.67%, tender 11/9/22 (Liquidity Facility Morgan Stanley Bank, West Valley City Utah) (b)(g)(h) | | 5,035 | 5,035 |
| Participating VRDN: | | | |
Series 15 XF0120, 1.73% 9/7/22 (Liquidity Facility JPMorgan Chase Bank) (b)(g)(h) | | 11,700 | 11,700 |
Series 15 XF2119, 1.7% 9/7/22 (Liquidity Facility Morgan Stanley Bank, West Valley City Utah) (b)(g)(h) | | 7,995 | 7,995 |
Series 17 04, 1.82% 10/12/22 (Liquidity Facility Barclays Bank PLC) (b)(g)(h) | | 54,130 | 54,130 |
Series 2017 XF 2048, 1.72% 9/7/22 (Liquidity Facility Citibank NA) (b)(g)(h) | | 2,400 | 2,400 |
Series 2017 XF 2417, 1.72% 9/7/22 (Liquidity Facility Morgan Stanley Bank, West Valley City Utah) (b)(g)(h) | | 3,800 | 3,800 |
Series 2017, 1.72% 9/7/22 (Liquidity Facility Morgan Stanley Bank, West Valley City Utah) (b)(g)(h) | | 4,800 | 4,800 |
Series BC 22 013, 1.82% 10/12/22 (Liquidity Facility Barclays Bank PLC) (b)(g)(h) | | 3,900 | 3,900 |
Series BC 22 015, 1.82% 10/12/22 (Liquidity Facility Barclays Bank PLC) (b)(g)(h) | | 2,800 | 2,800 |
Series DB 15 XF 0234, 1.75% 9/7/22 (Liquidity Facility Citibank NA) (b)(g)(h) | | 6,600 | 6,600 |
Series DBE 80 11, 1.81% 9/7/22 (Liquidity Facility Deutsche Bank AG New York Branch) (b)(g)(h) | | 18,090 | 18,090 |
Series Floaters 013, 1.82% 10/12/22 (Liquidity Facility Barclays Bank PLC) (b)(g)(h) | | 27,485 | 27,485 |
Series Floaters XF 06 08, 1.7% 9/7/22 (Liquidity Facility Toronto-Dominion Bank) (b)(g)(h) | | 7,825 | 7,825 |
Series Floaters XF 06 22, 1.72% 9/7/22 (Liquidity Facility Toronto-Dominion Bank) (b)(g)(h) | | 2,490 | 2,490 |
Series Floaters XF 06 33, 1.7% 9/7/22 (Liquidity Facility Toronto-Dominion Bank) (b)(g)(h) | | 1,500 | 1,500 |
Series Floaters XF 07 62, 1.75% 9/7/22 (Liquidity Facility JPMorgan Chase Bank) (b)(g)(h) | | 2,300 | 2,300 |
Series Floaters XF 24 67, 1.7% 9/7/22 (Liquidity Facility Morgan Stanley Bank, West Valley City Utah) (b)(g)(h) | | 1,900 | 1,900 |
Series Floaters XF 25 95, 1.75% 9/7/22 (Liquidity Facility Toronto-Dominion Bank) (b)(g)(h) | | 4,900 | 4,900 |
Series Floaters XG 01 04, 1.72% 9/7/22 (Liquidity Facility Morgan Stanley Bank, West Valley City Utah) (b)(g)(h) | | 1,100 | 1,100 |
Series Floaters XG 01 41, 1.73% 9/7/22 (Liquidity Facility Morgan Stanley Bank, West Valley City Utah) (b)(g)(h) | | 6,000 | 6,000 |
Series Floaters ZM 05 02, 1.7% 9/7/22 (Liquidity Facility Morgan Stanley Bank, West Valley City Utah) (b)(g)(h) | | 1,500 | 1,500 |
Series MIZ 91 02, 1.1% 9/1/22 (Liquidity Facility Mizuho Cap. Markets LLC) (b)(g)(h) | | 8,400 | 8,400 |
| California Muni. Fin. Auth. Participating VRDN Series XF 28 63, 1.7% 9/7/22 (Liquidity Facility Morgan Stanley Bank, West Valley City Utah) (b)(g)(h) | | 4,600 | 4,600 |
| California Muni. Fin. Auth. Rev. Participating VRDN Series Floaters XG 02 30, 1.75% 9/7/22 (Liquidity Facility Bank of America NA) (b)(c)(g)(h) | | 3,740 | 3,740 |
| California State Univ. Rev. Participating VRDN Series XM 10 00, 1.7% 9/7/22 (Liquidity Facility JPMorgan Chase Bank) (b)(g)(h) | | 1,500 | 1,500 |
| California Statewide Cmntys. Dev. Auth. Rev. Participating VRDN: | | | |
| Series 2017, 1.73% 9/7/22 (Liquidity Facility Deutsche Bank AG New York Branch) (b)(g)(h) | | 8,650 | 8,650 |
| Series 2021 XF 11 28, 1.74% 9/7/22 (Liquidity Facility Deutsche Bank AG New York Branch) (b)(g)(h) | | 2,800 | 2,800 |
| Central Union High School District Participating VRDN Series Floaters XF 07 59, 1.71% 9/7/22 (Liquidity Facility Toronto-Dominion Bank) (b)(g)(h) | | 2,320 | 2,320 |
| Chaffey Unified High School District Participating VRDN: | | | |
| Series Floaters ZM 05 85, 1.7% 9/7/22 (Liquidity Facility Wells Fargo Bank NA) (b)(g)(h) | | 2,000 | 2,000 |
| Series XF 13 44, 1.7% 9/7/22 (Liquidity Facility Bank of America NA) (b)(g)(h) | | 1,460 | 1,460 |
| Chino Valley Unified School District Participating VRDN: | | | |
| Series XF 09 22, 1.7% 9/7/22 (Liquidity Facility JPMorgan Chase Bank) (b)(g)(h) | | 2,000 | 2,000 |
| Series XF 13 03, 1.7% 9/7/22 (Liquidity Facility JPMorgan Chase Bank) (b)(g)(h) | | 1,400 | 1,400 |
| Del Mar Union School District Spl. Tax Participating VRDN Series XG 02 59, 1.72% 9/7/22 (Liquidity Facility Bank of America NA) (b)(g)(h) | | 760 | 760 |
| Downey Unified School District Participating VRDN Series 2021 XF 12 24, 1.7% 9/7/22 (Liquidity Facility Royal Bank of Canada) (b)(g)(h) | | 1,265 | 1,265 |
| Escondido Gen. Oblig. Participating VRDN Series Floaters G 77, 1.7% 9/7/22 (Liquidity Facility Royal Bank of Canada) (b)(g)(h) | | 2,000 | 2,000 |
| Foothill/Eastern Trans. Corridor Agcy. Toll Road Rev. Participating VRDN Series Floaters XG 02 43, 1.72% 9/7/22 (Liquidity Facility Bank of America NA) (b)(g)(h) | | 4,390 | 4,390 |
| Grossmont-Cuyamaca Cmnty. College District Participating VRDN Series ZL 02 91, 1.7% 9/7/22 (Liquidity Facility Royal Bank of Canada) (b)(g)(h) | | 800 | 800 |
| Lodi Unified School District Participating VRDN Series 2021 XG 03 22, 1.7% 9/7/22 (Liquidity Facility Royal Bank of Canada) (b)(g)(h) | | 235 | 235 |
| Long Beach Unified School District Participating VRDN Series 2021 XF 12 52, 1.7% 9/7/22 (Liquidity Facility JPMorgan Chase Bank) (b)(g)(h) | | 4,095 | 4,095 |
| Los Angeles County Gen. Oblig. Participating VRDN Series XF 30 05, 1.7% 9/7/22 (Liquidity Facility Morgan Stanley Bank, West Valley City Utah) (b)(g)(h) | | 2,300 | 2,300 |
| Los Angeles County Metropolitan Trans. Auth. Sales Tax Rev. Participating VRDN Series ZL 02 92, 1.7% 9/7/22 (Liquidity Facility JPMorgan Chase Bank) (b)(g)(h) | | 1,300 | 1,300 |
| Los Angeles Dept. Arpt. Rev. Participating VRDN: | | | |
| Series 2018 XF 06 75, 1.73% 9/7/22 (Liquidity Facility Royal Bank of Canada) (b)(c)(g)(h) | | 8,490 | 8,490 |
| Series 2021 XF 12 49, 1.73% 9/7/22 (Liquidity Facility Royal Bank of Canada) (b)(c)(g)(h) | | 2,100 | 2,100 |
| Series 2022, 1.75% 9/7/22 (Liquidity Facility Toronto-Dominion Bank) (b)(c)(g)(h) | | 5,600 | 5,600 |
| Series Floaters XF 27 24, 1.72% 9/7/22 (Liquidity Facility Morgan Stanley Bank, West Valley City Utah) (b)(c)(g)(h) | | 12,275 | 12,275 |
| Series Floaters ZM 01 17, 1.73% 9/7/22 (Liquidity Facility Morgan Stanley Bank, West Valley City Utah) (b)(c)(g)(h) | | 7,645 | 7,645 |
| Series Floaters ZM 05 95, 1.73% 9/7/22 (Liquidity Facility Morgan Stanley Bank, West Valley City Utah) (b)(c)(g)(h) | | 2,500 | 2,500 |
| Series XF 13 68, 1.72% 9/7/22 (Liquidity Facility JPMorgan Chase Bank) (b)(c)(g)(h) | | 2,250 | 2,250 |
| Series XF 30 11, 1.72% 9/7/22 (Liquidity Facility Morgan Stanley Bank, West Valley City Utah) (b)(c)(g)(h) | | 2,800 | 2,800 |
| Series XL 01 61, 1.71% 9/7/22 (Liquidity Facility Morgan Stanley Bank, West Valley City Utah) (b)(c)(g)(h) | | 300 | 300 |
| Series ZL 02 47, 1.72% 9/7/22 (Liquidity Facility JPMorgan Chase Bank) (b)(c)(g)(h) | | 1,940 | 1,940 |
| Series ZL 03 10, 1.72% 9/7/22 (Liquidity Facility JPMorgan Chase Bank) (b)(c)(g)(h) | | 2,705 | 2,705 |
| Series ZM 04 73, 1.73% 9/7/22 (Liquidity Facility Royal Bank of Canada) (b)(c)(g)(h) | | 305 | 305 |
| Series ZM 04 87, 1.73% 9/7/22 (Liquidity Facility Royal Bank of Canada) (b)(c)(g)(h) | | 1,465 | 1,465 |
| Los Angeles Dept. of Wtr. & Pwr. Rev. Participating VRDN: | | | |
| Series MS 3345, 1.7% 9/7/22 (Liquidity Facility Morgan Stanley Bank, West Valley City Utah) (b)(g)(h) | | 4,585 | 4,585 |
| Series XF 13 47, 1.7% 9/7/22 (Liquidity Facility JPMorgan Chase Bank) (b)(g)(h) | | 1,200 | 1,200 |
| Series XM 09 84, 1.7% 9/7/22 (Liquidity Facility Morgan Stanley Bank, West Valley City Utah) (b)(g)(h) | | 2,000 | 2,000 |
| Los Angeles Dept. of Wtr. & Pwr. Wtrwks. Rev. Participating VRDN Series MS 3403, 1.7% 9/7/22 (Liquidity Facility Morgan Stanley Bank, West Valley City Utah) (b)(g)(h) | | 6,975 | 6,975 |
| Los Angeles Unified School District Participating VRDN Series XM 09 98, 1.7% 9/7/22 (Liquidity Facility JPMorgan Chase Bank) (b)(g)(h) | | 2,400 | 2,400 |
| Los Angeles Wastewtr. Sys. Rev.: | | | |
| Bonds Series Floaters G 26, 1.82%, tender 12/1/22 (Liquidity Facility Royal Bank of Canada) (b)(g)(h) | | 1,900 | 1,900 |
| Participating VRDN Series ZL 02 24, 1.7% 9/7/22 (Liquidity Facility Royal Bank of Canada) (b)(g)(h) | | 2,000 | 2,000 |
| Oakland Unified School District Alameda County Participating VRDN Series ZL 02 42, 1.7% 9/7/22 (Liquidity Facility Royal Bank of Canada) (b)(g)(h) | | 800 | 800 |
| Riverside County Trans. Commission Sales Tax Rev. Participating VRDN Series Floaters XF 22 97, 1.72% 9/7/22 (Liquidity Facility Citibank NA) (b)(g)(h) | | 1,200 | 1,200 |
| Riverside County Trans. Commission Toll Rev. Participating VRDN: | | | |
| Series 2021 XG 03 40, 1.72% 9/7/22 (Liquidity Facility Bank of America NA) (b)(g)(h) | | 3,015 | 3,015 |
| Series 2021 XG 03 41, 1.72% 9/7/22 (Liquidity Facility Bank of America NA) (b)(g)(h) | | 965 | 965 |
| Sacramento Area Flood Cont. Agcy.: | | | |
| Bonds Series G 118, 1.82%, tender 4/3/23 (Liquidity Facility Royal Bank of Canada) (b)(g)(h)(i) | | 800 | 800 |
| Participating VRDN Series Floaters XM 04 55, 1.7% 9/7/22 (Liquidity Facility Morgan Stanley Bank, West Valley City Utah) (b)(g)(h) | | 3,900 | 3,900 |
| Sacramento City Fing. Auth. Rev. Participating VRDN Series Floaters XG 01 00, 1.73% 9/7/22 (Liquidity Facility Deutsche Bank AG New York Branch) (b)(g)(h) | | 8,300 | 8,300 |
| Sacramento Gen. Oblig. Participating VRDN Series XG 00 67, 1.73% 9/7/22 (Liquidity Facility Deutsche Bank AG New York Branch) (b)(g)(h) | | 5,255 | 5,255 |
| San Diego County Reg'l. Arpt. Auth. Arpt. Rev. Participating VRDN Series XX 12 15, 1.71% 9/7/22 (Liquidity Facility Barclays Bank PLC) (b)(c)(g)(h) | | 4,000 | 4,000 |
| San Diego Unified School District Participating VRDN: | | | |
| Series Floaters XF 07 55, 1.7% 9/7/22 (Liquidity Facility JPMorgan Chase Bank) (b)(g)(h) | | 10,210 | 10,210 |
| Series MS 3330, 1.7% 9/7/22 (Liquidity Facility Morgan Stanley Bank, West Valley City Utah) (b)(g)(h) | | 5,940 | 5,940 |
| San Francisco Bay Area Rapid Transit Fing. Auth. Participating VRDN Series XF 13 31, 1.7% 9/7/22 (Liquidity Facility Toronto-Dominion Bank) (b)(g)(h) | | 1,875 | 1,875 |
| San Francisco City & County Arpts. Commission Int'l. Arpt. Rev. Participating VRDN: | | | |
| Series Floaters XF 07 12, 1.8% 9/7/22 (Liquidity Facility Deutsche Bank AG New York Branch) (b)(c)(g)(h) | | 103,005 | 103,005 |
| Series Floaters XF 07 54, 1.72% 9/7/22 (Liquidity Facility JPMorgan Chase Bank) (b)(c)(g)(h) | | 7,880 | 7,880 |
| Series Floaters XL 01 01, 1.72% 9/7/22 (Liquidity Facility JPMorgan Chase Bank) (b)(c)(g)(h) | | 36,285 | 36,285 |
| Series Floaters XM 07 26, 1.74% 9/7/22 (Liquidity Facility Bank of America NA) (b)(c)(g)(h) | | 10,575 | 10,575 |
| Series XG 03 63, 1.75% 9/7/22 (Liquidity Facility Bank of America NA) (b)(c)(g)(h) | | 4,685 | 4,685 |
| San Francisco City & County Ctfs. of Prtn. Participating VRDN Series XG 03 72, 1.7% 9/7/22 (Liquidity Facility Wells Fargo Bank NA) (b)(g)(h) | | 1,000 | 1,000 |
| San Francisco Pub. Utils. Commission Wtr. Rev. Participating VRDN Series XF 29 93, 1.7% 9/7/22 (Liquidity Facility Morgan Stanley Bank, West Valley City Utah) (b)(g)(h) | | 1,500 | 1,500 |
| San Jose Int. Arpt. Rev. Participating VRDN Series 2017, 1.71% 9/7/22 (Liquidity Facility Barclays Bank PLC) (b)(c)(g)(h) | | 11,700 | 11,700 |
| Sweetwater Union High School District Participating VRDN Series XM 10 14, 1.7% 9/7/22 (Liquidity Facility Royal Bank of Canada) (b)(g)(h) | | 2,000 | 2,000 |
| Trustees of the California State Univ. Participating VRDN Series ZM 00 90, 1.7% 9/7/22 (Liquidity Facility JPMorgan Chase Bank) (b)(g)(h) | | 2,360 | 2,360 |
| Univ. of California Regents Med. Ctr. Pool Rev. Participating VRDN: | | | |
| Series XF 13 06, 1.7% 9/7/22 (Liquidity Facility JPMorgan Chase Bank) (b)(g)(h) | | 2,665 | 2,665 |
| Series XF 13 35, 1.7% 9/7/22 (Liquidity Facility JPMorgan Chase Bank) (b)(g)(h) | | 700 | 700 |
| Series XF 13 40, 1.7% 9/7/22 (Liquidity Facility Toronto-Dominion Bank) (b)(g)(h) | | 800 | 800 |
| Series XG 03 66, 1.7% 9/7/22 (Liquidity Facility Wells Fargo Bank NA) (b)(g)(h) | | 4,340 | 4,340 |
| Univ. of California Revs. Participating VRDN: | | | |
| Series Floaters XF 06 32, 1.7% 9/7/22 (Liquidity Facility Toronto-Dominion Bank) (b)(g)(h) | | 4,650 | 4,650 |
| Series Floaters XG 00 61, 1.73% 9/7/22 (Liquidity Facility Deutsche Bank AG New York Branch) (b)(g)(h) | | 2,750 | 2,750 |
| Series Floaters ZF 06 28, 1.7% 9/7/22 (Liquidity Facility Toronto-Dominion Bank) (b)(g)(h) | | 2,500 | 2,500 |
| Series Floaters ZF 06 29, 1.7% 9/7/22 (Liquidity Facility Toronto-Dominion Bank) (b)(g)(h) | | 5,000 | 5,000 |
| Series Floaters ZF 26 70, 1.7% 9/7/22 (Liquidity Facility Morgan Stanley Bank, West Valley City Utah) (b)(g)(h) | | 1,600 | 1,600 |
| Series MS 3396, 1.7% 9/7/22 (Liquidity Facility Morgan Stanley Bank, West Valley City Utah) (b)(g)(h) | | 8,805 | 8,805 |
| Series XF 09 21, 1.7% 9/7/22 (Liquidity Facility Toronto-Dominion Bank) (b)(g)(h) | | 2,225 | 2,225 |
| Series XF 29 89, 1.7% 9/7/22 (Liquidity Facility Morgan Stanley Bank, West Valley City Utah) (b)(g)(h) | | 1,900 | 1,900 |
| Series ZL 02 33, 1.7% 9/7/22 (Liquidity Facility Royal Bank of Canada) (b)(g)(h) | | 1,000 | 1,000 |
| Series ZL 02 84, 1.7% 9/7/22 (Liquidity Facility Royal Bank of Canada) (b)(g)(h) | | 3,100 | 3,100 |
TOTAL CALIFORNIA | | | 598,200 |
| Colorado - 0.0% | | | |
| Denver City & County Arpt. Rev. Bonds Series G-114, 1.92%, tender 12/1/22 (Liquidity Facility Royal Bank of Canada) (b)(c)(g)(h)(i) | | 400 | 400 |
| Connecticut - 0.3% | | | |
| Connecticut Gen. Oblig. Participating VRDN Series Floaters 016, 1.82% 10/12/22 (Liquidity Facility Barclays Bank PLC) (b)(g)(h) | | 2,200 | 2,200 |
| Connecticut Spl. Tax Oblig. Trans. Infrastructure Rev. Bonds Series Floaters G 110, 1.85%, tender 4/3/23 (Liquidity Facility Royal Bank of Canada) (b)(g)(h)(i) | | 1,500 | 1,500 |
TOTAL CONNECTICUT | | | 3,700 |
| Florida - 0.1% | | | |
| Greater Orlando Aviation Auth. Arpt. Facilities Rev. Bonds Series Floaters G 25, 1.92%, tender 4/3/23 (Liquidity Facility Royal Bank of Canada) (b)(c)(g)(h)(i) | | 600 | 600 |
| Tampa-Hillsborough County Expressway Auth. Rev. Bonds Series G-113, 1.87%, tender 1/3/23 (Liquidity Facility Royal Bank of Canada) (b)(g)(h)(i) | | 800 | 800 |
TOTAL FLORIDA | | | 1,400 |
| Illinois - 0.1% | | | |
| Chicago Gen. Oblig. Participating VRDN Series XM 10 05, 1.82% 9/7/22 (Liquidity Facility Deutsche Bank AG New York Branch) (b)(g)(h) | | 300 | 300 |
| Illinois Fin. Auth. Rev. Participating VRDN Series Floaters 017, 1.82% 10/12/22 (Liquidity Facility Barclays Bank PLC) (b)(g)(h) | | 280 | 280 |
TOTAL ILLINOIS | | | 580 |
| Kentucky - 0.1% | | | |
| CommonSpirit Health Participating VRDN Series MIZ 90 21, 1.77% 9/7/22 (Liquidity Facility Mizuho Cap. Markets LLC) (b)(g)(h) | | 400 | 400 |
| Kentucky State Property & Buildings Commission Rev. Bonds Series G 116, 1.87%, tender 11/1/22 (Liquidity Facility Royal Bank of Canada) (b)(g)(h)(i) | | 400 | 400 |
TOTAL KENTUCKY | | | 800 |
| Missouri - 0.2% | | | |
| Kansas City Indl. Dev. Auth. Participating VRDN Series XG 03 96, 1.89% 9/7/22 (Liquidity Facility Deutsche Bank AG New York Branch) (b)(c)(g)(h) | | 1,800 | 1,800 |
| New York - 0.0% | | | |
| New York City Gen. Oblig. Participating VRDN Series 2020 003, 1.82% 10/12/22 (Liquidity Facility Wells Fargo Bank NA) (b)(g)(h) | | 300 | 300 |
| Ohio - 0.2% | | | |
| Ohio Hosp. Rev. Participating VRDN Series 002, 1.82% 10/12/22 (Liquidity Facility Barclays Bank PLC) (b)(g)(h) | | 1,100 | 1,100 |
| Ohio Univ. Gen. Receipts Athens Bonds Series Floaters G 27, 1.87%, tender 12/1/22 (Liquidity Facility Royal Bank of Canada) (b)(g)(h)(i) | | 700 | 700 |
TOTAL OHIO | | | 1,800 |
| South Carolina - 0.0% | | | |
| South Carolina Trans. Infrastructure Bank Rev. Bonds Series Floaters G 109, 1.87%, tender 4/3/23 (Liquidity Facility Royal Bank of Canada) (b)(g)(h)(i) | | 400 | 400 |
| Texas - 0.4% | | | |
| Harris County Cultural Ed. Facilities Fin. Corp. Med. Facilities Rev. Participating VRDN Series 2022 006, 1.82% 10/12/22 (Liquidity Facility Barclays Bank PLC) (b)(g)(h) | | 4,900 | 4,900 |
| Virginia - 0.0% | | | |
| Virginia Pub. Bldg. Auth. Pub. Facilities Rev. Bonds Series Floaters G 40, 1.87%, tender 2/1/23 (Liquidity Facility Royal Bank of Canada) (b)(g)(h)(i) | | 400 | 400 |
| Washington - 0.3% | | | |
| Port of Seattle Rev. Participating VRDN Series XM 10 27, 1.8% 9/7/22 (Liquidity Facility JPMorgan Chase Bank) (b)(c)(g)(h) | | 3,000 | 3,000 |
| TOTAL TENDER OPTION BOND (Cost $617,680) | | | 617,680 |
| | | | |
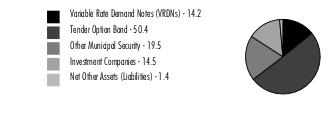
| Other Municipal Security - 6.3% |
| | | Principal Amount (a) (000s) | Value ($) (000s) |
| California - 6.3% | | | |
| California Gen. Oblig.: | | | |
| Series 2022 A1: | | | |
1.88% 10/4/22, LOC Wells Fargo Bank NA, CP | | 2,500 | 2,500 |
1.97% 10/27/22, LOC Wells Fargo Bank NA, CP | | 5,800 | 5,800 |
| Series 2022 A4: | | | |
1.8% 9/22/22, LOC Toronto-Dominion Bank, CP | | 2,000 | 2,000 |
1.99% 11/3/22, LOC Toronto-Dominion Bank, CP | | 6,100 | 6,100 |
| Series 2022 A5, 1.87% 10/18/22, LOC U.S. Bank NA, Cincinnati, CP | | 7,414 | 7,414 |
| Series 2022 A7, 1.87% 10/18/22, LOC State Street Bank & Trust Co., Boston, CP | | 1,400 | 1,400 |
| California Health Facilities Fing. Auth. Rev. Bonds: | | | |
| Series 2009 C, 5%, tender 10/18/22 (b) | | 675 | 678 |
| Series 2017 A: | | | |
5%, tender 11/1/22 (b) | | 990 | 995 |
5%, tender 11/1/22 (b) | | 500 | 502 |
| Series 2017 C, 5%, tender 11/1/22 (b) | | 4,215 | 4,239 |
| Long Beach Hbr. Rev. Bonds Series 2020 B, 5% 5/15/23 (c) | | 800 | 814 |
| Los Angeles County Cap. Asset Leasing Corp. Lease Rev. Series 2022 B: | | | |
| 1.82% 10/20/22, LOC U.S. Bank NA, Cincinnati, CP | | 4,000 | 4,000 |
| 1.87% 10/19/22, LOC U.S. Bank NA, Cincinnati, CP | | 2,800 | 2,800 |
| Los Angeles Dept. Arpt. Rev. Bonds: | | | |
| Series 2015 D, 5% 5/15/23 (c) | | 1,390 | 1,414 |
| Series 2017 B, 5% 5/15/23 (c) | | 1,000 | 1,017 |
| Los Angeles Gen. Oblig. TRAN Series 2022, 4% 6/29/23 | | 11,400 | 11,549 |
| Los Angeles Muni. Impt. Corp. Lease Rev. Series 2022 A2, 1.85% 9/8/22, LOC Bank of America NA, CP | | 3,300 | 3,300 |
| Riverside County Gen. Oblig. TRAN Series 2022, 5% 6/30/23 | | 4,000 | 4,092 |
| San Francisco City & County Pub. Util. Commission Wastewtr. Rev. Series 2022 A1, 1.3% 9/13/22, LOC Sumitomo Mitsui Banking Corp., CP | | 7,900 | 7,900 |
| Santa Clara Valley Wtr. District Wtr. Util. Rev. Series 2022 A, 1.43% 9/8/22, LOC MUFG Bank Ltd., CP | | 2,200 | 2,200 |
| | | | |
| TOTAL OTHER MUNICIPAL SECURITY (Cost $70,714) | | | 70,714 |
| | | | |
| Investment Company - 11.3% |
| | | Shares | Value ($) (000s) |
Fidelity Municipal Cash Central Fund 1.45% (j)(k) (Cost $127,601) | | 127,579 | 127,601 |
| | | | |
| TOTAL INVESTMENT IN SECURITIES - 100.4% (Cost $1,133,960) | 1,133,960 |
NET OTHER ASSETS (LIABILITIES) - (0.4)% | (4,564) |
| NET ASSETS - 100.0% | 1,129,396 |
| | |
Security Type Abbreviations
| CP | - | COMMERCIAL PAPER |
| TRAN | - | TAX AND REVENUE ANTICIPATION NOTE |
| VRDN | - | VARIABLE RATE DEMAND NOTE (A debt instrument that is payable upon demand, either daily, weekly or monthly) |
The date shown for securities represents the date when principal payments must be paid, taking into account any call options exercised by the issuer and any permissible maturity shortening features other than interest rate resets
Any values shown as $0 in the Schedule of Investments may reflect amounts less than $500.
Legend
| (a) | Amount is stated in United States dollars unless otherwise noted. |
| (b) | Coupon rates for floating and adjustable rate securities reflect the rates in effect at period end. |
| (c) | Private activity obligations whose interest is subject to the federal alternative minimum tax for individuals. |
| (d) | Security exempt from registration under Rule 144A of the Securities Act of 1933. These securities may be resold in transactions exempt from registration, normally to qualified institutional buyers. At the end of the period, the value of these securities amounted to $35,708,000 or 3.2% of net assets. |
| (e) | Security or a portion of the security purchased on a delayed delivery or when-issued basis. |
| (f) | A portion of the security sold on a delayed delivery basis. |
| (g) | Provides evidence of ownership in one or more underlying municipal bonds. |
| (h) | Coupon rates are determined by re-marketing agents based on current market conditions. |
| (i) | Restricted securities (including private placements) - Investment in securities not registered under the Securities Act of 1933 (excluding 144A issues). At the end of the period, the value of restricted securities (excluding 144A issues) amounted to $6,000,000 or 0.5% of net assets. |
| (j) | Information in this report regarding holdings by state and security types does not reflect the holdings of the Fidelity Municipal Cash Central Fund. |
| (k) | Affiliated fund that is generally available only to investment companies and other accounts managed by Fidelity Investments. The rate quoted is the annualized seven-day yield of the fund at period end. A complete unaudited listing of the fund's holdings as of its most recent quarter end is available upon request. In addition, each Fidelity Central Fund's financial statements are available on the SEC's website or upon request. |
| Additional information on each restricted holding is as follows: |
| Security | Acquisition Date | Cost ($) (000s) |
| Connecticut Spl. Tax Oblig. Trans. Infrastructure Rev. Bonds Series Floaters G 110, 1.85%, tender 4/3/23 (Liquidity Facility Royal Bank of Canada) | 4/01/21 | 1,500 |
| Denver City & County Arpt. Rev. Bonds Series G-114, 1.92%, tender 12/1/22 (Liquidity Facility Royal Bank of Canada) | 6/01/21 | 400 |
| Greater Orlando Aviation Auth. Arpt. Facilities Rev. Bonds Series Floaters G 25, 1.92%, tender 4/3/23 (Liquidity Facility Royal Bank of Canada) | 4/01/21 | 600 |
| Kentucky State Property & Buildings Commission Rev. Bonds Series G 116, 1.87%, tender 11/1/22 (Liquidity Facility Royal Bank of Canada) | 5/03/21 | 400 |
| Ohio Univ. Gen. Receipts Athens Bonds Series Floaters G 27, 1.87%, tender 12/1/22 (Liquidity Facility Royal Bank of Canada) | 6/01/21 | 700 |
| Sacramento Area Flood Cont. Agcy. Bonds Series G 118, 1.82%, tender 4/3/23 (Liquidity Facility Royal Bank of Canada) | 4/01/21 | 800 |
| South Carolina Trans. Infrastructure Bank Rev. Bonds Series Floaters G 109, 1.87%, tender 4/3/23 (Liquidity Facility Royal Bank of Canada) | 4/01/21 | 400 |
| Tampa-Hillsborough County Expressway Auth. Rev. Bonds Series G-113, 1.87%, tender 1/3/23 (Liquidity Facility Royal Bank of Canada) | 7/01/21 | 800 |
| Virginia Pub. Bldg. Auth. Pub. Facilities Rev. Bonds Series Floaters G 40, 1.87%, tender 2/1/23 (Liquidity Facility Royal Bank of Canada) | 2/01/21 | 400 |
Affiliated Central Funds
Fiscal year to date information regarding the Fund's investments in Fidelity Central Funds, including the ownership percentage, is presented below.
| Affiliate (Amounts in thousands) | Value, beginning of period ($) | Purchases ($) | Sales Proceeds ($) | Dividend Income ($) | Realized Gain (loss) ($) | Change in Unrealized appreciation (depreciation) ($) | Value, end of period ($) | %ownership, end of period |
| Fidelity Municipal Cash Central Fund 1.45% | 116,408 | 358,934 | 347,741 | 397 | - | - | 127,601 | 7.7% |
| Total | 116,408 | 358,934 | 347,741 | 397 | - | - | 127,601 | |
| | | | | | | | | |
Amounts in the income column in the above table include any capital gain distributions from underlying funds, which are presented in the corresponding line item in the Statement of Operations, if applicable.
Investment Valuation
All investments are categorized as Level 2 under the Fair Value Hierarchy. The inputs or methodology used for valuing securities may not be an indication of the risk associated with investing in these securities. For more information on valuation inputs, refer to the Investment Valuation section in the accompanying Notes to Financial Statements.
| Statement of Assets and Liabilities |
| Amounts in thousands (except per-share amount) | | | | August 31, 2022 (Unaudited) |
| | | | | |
| Assets | | | | |
| Investment in securities, at value - See accompanying schedule: | | $1,006,359 | | |
Unaffiliated issuers (cost $1,006,359) | | | |
Fidelity Central Funds (cost $127,601) | | 127,601 | | |
| | | | | |
| Total Investment in Securities (cost $1,133,960) | | | $ | 1,133,960 |
| Receivable for investments sold | | | | |
Regular delivery | | | | 10,000 |
Delayed delivery | | | | 400 |
| Receivable for fund shares sold | | | | 262 |
| Interest receivable | | | | 2,647 |
| Distributions receivable from Fidelity Central Funds | | | | 187 |
| Prepaid expenses | | | | 2 |
Total assets | | | | 1,147,458 |
| Liabilities | | | | |
| Payable to custodian bank | | $210 | | |
| Payable for investments purchased on a delayed delivery basis | | 17,000 | | |
| Payable for fund shares redeemed | | 306 | | |
| Distributions payable | | 62 | | |
| Accrued management fee | | 327 | | |
| Other affiliated payables | | 134 | | |
| Other payables and accrued expenses | | 23 | | |
| Total Liabilities | | | | 18,062 |
| Net Assets | | | $ | 1,129,396 |
| Net Assets consist of: | | | | |
| Paid in capital | | | $ | 1,129,633 |
| Total accumulated earnings (loss) | | | | (237) |
| Net Assets | | | $ | 1,129,396 |
Net Asset Value , offering price and redemption price per share ($1,129,396 ÷ 1,127,477 shares) | | | $ | 1.00 |
| | | | | |
| Statement of Operations |
| Amounts in thousands | | | | Six months ended August 31, 2022 (Unaudited) |
| Investment Income | | | | |
| Interest | | | $ | 4,690 |
| Income from Fidelity Central Funds | | | | 397 |
| Total Income | | | | 5,087 |
| Expenses | | | | |
| Management fee | $ | 2,024 | | |
| Transfer agent fees | | 762 | | |
| Accounting fees and expenses | | 65 | | |
| Custodian fees and expenses | | 6 | | |
| Independent trustees' fees and expenses | | 2 | | |
| Registration fees | | 17 | | |
| Audit | | 18 | | |
| Legal | | 2 | | |
| Miscellaneous | | 5 | | |
| Total expenses before reductions | | 2,901 | | |
| Expense reductions | | (138) | | |
| Total expenses after reductions | | | | 2,763 |
| Net Investment income (loss) | | | | 2,324 |
| Realized and Unrealized Gain (Loss) | | | | |
| Net realized gain (loss) on: | | | | |
| Investment Securities: | | | | |
| Unaffiliated issuers | | (8) | | |
| Total net realized gain (loss) | | | | (8) |
| Net increase in net assets resulting from operations | | | $ | 2,316 |
| Statement of Changes in Net Assets |
| |
| Amount in thousands | | Six months ended August 31, 2022 (Unaudited) | | Year ended February 28, 2022 |
| Increase (Decrease) in Net Assets | | | | |
| Operations | | | | |
| Net investment income (loss) | $ | 2,324 | $ | 283 |
| Net realized gain (loss) | | (8) | | (103) |
Net increase in net assets resulting from operations | | 2,316 | | 180 |
| Distributions to shareholders | | (2,654) | | (195) |
| Share transactions | | | | |
| Proceeds from sales of shares | | 83,013 | | 144,669 |
| Reinvestment of distributions | | 2,517 | | 186 |
| Cost of shares redeemed | | (164,047) | | (315,818) |
Net increase (decrease) in net assets and shares resulting from share transactions | | (78,517) | | (170,963) |
| Total increase (decrease) in net assets | | (78,855) | | (170,978) |
| | | | | |
| Net Assets | | | | |
| Beginning of period | | 1,208,251 | | 1,379,229 |
| End of period | $ | 1,129,396 | $ | 1,208,251 |
| | | | | |
| Other Information | | | | |
| Shares | | | | |
| Sold | | 83,013 | | 144,669 |
| Issued in reinvestment of distributions | | 2,517 | | 186 |
| Redeemed | | (164,047) | | (315,818) |
| Net increase (decrease) | | (78,517) | | (170,963) |
| | | | | |
| Fidelity® California Municipal Money Market Fund |
| |
| | Six months ended (Unaudited) August 31, 2022 | | Years ended February 28, 2022 | | 2021 | | 2020 A | | 2019 | | 2018 |
Selected Per-Share Data | | | | | | | | | | | | |
| Net asset value, beginning of period | $ | 1.00 | $ | 1.00 | $ | 1.00 | $ | 1.00 | $ | 1.00 | $ | 1.00 |
| Income from Investment Operations | | | | | | | | | | | | |
Net investment income (loss) B | | .002 | | - C | | .002 | | .009 | | .010 | | .005 |
| Net realized and unrealized gain (loss) | | - C | | - C | | .001 | | .001 | | - C | | - C |
| Total from investment operations | | .002 | | - C | | .003 | | .010 | | .010 | | .005 |
| Distributions from net investment income | | (.002) | | - C | | (.002) | | (.009) | | (.010) | | (.005) |
| Distributions from net realized gain | | - C | | - C | | - C | | (.001) | | - | | - C |
| Total distributions | | (.002) | | - C | | (.003) D | | (.010) | | (.010) | | (.005) |
| Net asset value, end of period | $ | 1.00 | $ | 1.00 | $ | 1.00 | $ | 1.00 | $ | 1.00 | $ | 1.00 |
Total Return E,F | | .23% | | .02% | | .26% | | 1.01% | | 1.03% | | .51% |
Ratios to Average Net Assets B,G,H | | | | | | | | | | | | |
| Expenses before reductions | | .49% I | | .50% | | .50% | | .50% | | .50% | | .49% |
| Expenses net of fee waivers, if any | | .47% I | | .10% | | .25% | | .50% | | .50% | | .49% |
| Expenses net of all reductions | | .47% I | | .10% | | .25% | | .50% | | .50% | | .49% |
| Net investment income (loss) | | .40% I | | .02% | | .27% C | | .95% | | 1.02% | | .48% |
| Supplemental Data | | | | | | | | | | | | |
| Net assets, end of period (in millions) | $ | 1,129 | $ | 1,208 | $ | 1,379 | $ | 1,663 | $ | 1,994 | $ | 2,557 |
A For the year ended February 29.
B Net investment income (loss) is affected by the timing of the declaration of dividends by any underlying mutual funds or exchange-traded funds (ETFs). Net investment income (loss) of any such underlying funds is not included in the Fund's net investment income (loss) ratio.
C Amount represents less than $.0005 per share.
D Total distributions per share do not sum due to rounding.
E Total returns for periods of less than one year are not annualized.
F Total returns would have been lower if certain expenses had not been reduced during the applicable periods shown.
G Fees and expenses of any underlying mutual funds or exchange-traded funds (ETFs) are not included in the Fund's expense ratio. The Fund indirectly bears its proportionate share of these expenses. For additional expense information related to investments in Fidelity Central Funds, please refer to the "Investments in Fidelity Central Funds" note found in the Notes to Financial Statements section of the most recent Annual or Semi-Annual report.
H Expense ratios reflect operating expenses of the class. Expenses before reductions do not reflect amounts reimbursed, waived, or reduced through arrangements with the investment adviser, brokerage services, or other offset arrangements, if applicable, and do not represent the amount paid by the class during periods when reimbursements, waivers or reductions occur.
I Annualized
For the period ended August 31, 2022
( Amounts in thousands except percentages)
1. Organization.
Fidelity California Municipal Money Market Fund (the Fund) is a fund of Fidelity California Municipal Trust II (the Trust) and is authorized to issue an unlimited number of shares. Share transactions on the Statement of Changes in Net Assets may contain exchanges between affiliated funds. The Trust is registered under the Investment Company Act of 1940, as amended (the 1940 Act), as an open-end management investment company organized as a Delaware statutory trust. Shares of the Fund are only available for purchase by retail shareholders The Fund may be affected by economic and political developments in the state of California.
Effective after the close of business on September 9, 2022, the Fund was closed to new accounts with certain exceptions.
2. Investments in Fidelity Central Funds.
Funds may invest in Fidelity Central Funds, which are open-end investment companies generally available only to other investment companies and accounts managed by the investment adviser and its affiliates. The Schedule of Investments lists any Fidelity Central Funds held as an investment as of period end, but does not include the underlying holdings of each Fidelity Central Fund. An investing fund indirectly bears its proportionate share of the expenses of the underlying Fidelity Central Funds.
Based on its investment objective, each Fidelity Central Fund may invest or participate in various investment vehicles or strategies that are similar to those of the investing fund. These strategies are consistent with the investment objectives of the investing fund and may involve certain economic risks which may cause a decline in value of each of the Fidelity Central Funds and thus a decline in the value of the investing fund.
| Fidelity Central Fund | Investment Manager | Investment Objective | Investment Practices | Expense Ratio A |
| Fidelity Money Market Central Funds | Fidelity Management & Research Company LLC (FMR) | Each fund seeks to obtain a high level of current income consistent with the preservation of capital and liquidity. | Short-term Investments | Less than .005% |
A Expenses expressed as a percentage of average net assets and are as of each underlying Central Fund's most recent annual or semi-annual shareholder report.
A complete unaudited list of holdings for each Fidelity Central Fund is available upon request or at the Securities and Exchange Commission website at www.sec.gov. In addition, the financial statements of the Fidelity Central Funds which contain the significant accounting policies (including investment valuation policies) of those funds, and are not covered by the Report of Independent Registered Public Accounting Firm, are available on the Securities and Exchange Commission website or upon request.
3. Significant Accounting Policies.
The Fund is an investment company and applies the accounting and reporting guidance of the Financial Accounting Standards Board (FASB) Accounting Standards Codification Topic 946 Financial Services - Investment Companies . The financial statements have been prepared in conformity with accounting principles generally accepted in the United States of America (GAAP), which require management to make certain estimates and assumptions at the date of the financial statements. Actual results could differ from those estimates. Subsequent events, if any, through the date that the financial statements were issued have been evaluated in the preparation of the financial statements. The Fund's Schedule of Investments lists any underlying mutual funds or exchange-traded funds (ETFs) but does not include the underlying holdings of these funds. The following summarizes the significant accounting policies of the Fund:
Investment Valuation. The Fund categorizes the inputs to valuation techniques used to value its investments into a disclosure hierarchy consisting of three levels as shown below:
Level 1 - unadjusted quoted prices in active markets for identical investments
Level 2 - other significant observable inputs (including quoted prices for similar investments, interest rates, prepayment speeds, etc.)
Level 3 - unobservable inputs (including the Fund's own assumptions based on the best information available)
As permitted by compliance with certain conditions under Rule 2a-7 of the 1940 Act, securities are valued at amortized cost, which approximates fair value. The amortized cost of an instrument is determined by valuing it at its original cost and thereafter amortizing any discount or premium from its face value at a constant rate until maturity. Securities held by a money market fund are generally high quality and liquid; however, they are reflected as Level 2 because the inputs used to determine fair value are not quoted prices in an active market.
Investment Transactions and Income. The net asset value per share for processing shareholder transactions is calculated as of the close of business of the New York Stock Exchange (NYSE), normally 4:00 p.m. Eastern time. Security transactions are accounted for as of trade date, including the Fund's investment activity in the Fidelity Central Fund. Gains and losses on securities sold are determined on the basis of identified cost. Interest income is accrued as earned and includes coupon interest and amortization of premium and accretion of discount on debt securities as applicable. Income and capital gains distributions from Fidelity Central Funds, if any, are recorded on the ex-dividend date.
Expenses. Expenses directly attributable to a fund are charged to that fund. Expenses attributable to more than one fund are allocated among the respective funds on the basis of relative net assets or other appropriate methods. Expenses included in the accompanying financial statements reflect the expenses of that fund and do not include any expenses associated with any underlying mutual funds or exchange-traded funds. Although not included in a fund's expenses, a fund indirectly bears its proportionate share of these expenses through the net asset value of each underlying mutual fund or exchange-traded fund. Expense estimates are accrued in the period to which they relate and adjustments are made when actual amounts are known.
Income Tax Information and Distributions to Shareholders. Each year, the Fund intends to qualify as a regulated investment company under Subchapter M of the Internal Revenue Code, including distributing substantially all of its taxable income and realized gains. As a result, no provision for U.S. Federal income taxes is required. The Fund files a U.S. federal tax return, in addition to state and local tax returns as required. The Fund's federal income tax returns are subject to examination by the Internal Revenue Service (IRS) for a period of three fiscal years after they are filed. State and local tax returns may be subject to examination for an additional fiscal year depending on the jurisdiction.
Distributions are declared and recorded daily and paid monthly from net investment income. Distributions from realized gains, if any, are declared and recorded on the ex-dividend date. Income and capital gain distributions are determined in accordance with income tax regulations, which may differ from GAAP.
Capital accounts within the financial statements are adjusted for permanent book-tax differences. These adjustments have no impact on net assets or the results of operations. Capital accounts are not adjusted for temporary book-tax differences which will reverse in a subsequent period.
The Fund purchases municipal securities whose interest, in the opinion of the issuer, is free from federal income tax. There is no assurance that the IRS will agree with this opinion. In the event the IRS determines that the issuer does not comply with relevant tax requirements, interest payments from a security could become federally taxable, possibly retroactively to the date the security was issued.
As of period end, the cost and unrealized appreciation (depreciation) in securities for federal income tax purposes were as follows:
| Gross unrealized appreciation | $ - |
| Gross unrealized depreciation | - |
| Net unrealized appreciation (depreciation) | $ - |
| Tax cost | $ 1,133,960 |
Delayed Delivery Transactions and When-Issued Securities. During the period, certain Funds transacted in securities on a delayed delivery or when-issued basis. Payment and delivery may take place after the customary settlement period for that security. The price of the underlying securities and the date when the securities will be delivered and paid for are fixed at the time the transaction is negotiated. Securities purchased on a delayed delivery or when-issued basis are identified as such in the Schedule of Investments. Compensation for interest forgone in the purchase of a delayed delivery or when-issued debt security may be received. With respect to purchase commitments, each applicable Fund identifies securities as segregated in its records with a value at least equal to the amount of the commitment. Payables and receivables associated with the purchases and sales of delayed delivery securities having the same coupon, settlement date and broker are offset. Delayed delivery or when-issued securities that have been purchased from and sold to different brokers are reflected as both payables and receivables in the Statement of Assets and Liabilities under the caption "Delayed delivery", as applicable. Losses may arise due to changes in the value of the underlying securities or if the counterparty does not perform under the contract's terms, or if the issuer does not issue the securities due to political, economic, or other factors.
Restricted Securities (including Private Placements). Funds may invest in securities that are subject to legal or contractual restrictions on resale. These securities generally may be resold in transactions exempt from registration or to the public if the securities are registered. Disposal of these securities may involve time-consuming negotiations and expense, and prompt sale at an acceptable price may be difficult. Information regarding restricted securities held at period end is included at the end of the Schedule of Investments, if applicable.
5. Fees and Other Transactions with Affiliates.
Management Fee. Fidelity Management & Research Company LLC (the investment adviser) and its affiliates provide the Fund with investment management related services for which the Fund pays a monthly management fee. The management fee is the sum of an individual fund fee rate that is based on an annual rate of .25% of the Fund's average net assets and an annualized group fee rate that averaged .10% during the period. The group fee rate is based upon the monthly average net assets of a group of registered investment companies with which the investment adviser has management contracts. The group fee rate decreases as assets under management increase and increases as assets under management decrease. For the reporting period, the total annualized management fee rate was .35% of the Fund's average net assets.
Transfer Agent Fees. Fidelity Investments Institutional Operations Company LLC (FIIOC), an affiliate of the investment adviser, is the transfer, dividend disbursing and shareholder servicing agent for the Fund. FIIOC receives account fees and asset-based fees that vary according to account size and type of account. FIIOC pays for typesetting, printing and mailing of shareholder reports, except proxy statements. For the period, transfer agent fees were equivalent to an annualized rate of .13% of average net assets.
During the period, the investment adviser or its affiliates waived a portion of these fees.
Accounting Fees. Fidelity Service Company, Inc. (FSC), an affiliate of the investment adviser, maintains the Fund's accounting records. The accounting fee is based on the level of average net assets for each month. For the period, the fees were equivalent to the following annualized rates:
| | % of Average Net Assets |
| Fidelity California Municipal Money Market Fund | .01 |
Interfund Trades. Funds may purchase from or sell securities to other Fidelity Funds under procedures adopted by the Board. The procedures have been designed to ensure these interfund trades are executed in accordance with Rule 17a-7 of the 1940 Act. Interfund trades during the period are noted in the table below.
| | Purchases ($) | Sales ($) | Realized Gain (Loss) ($) |
| Fidelity California Municipal Money Market Fund | 40,645 | 46,000 | - |
6. Expense Reductions.
The investment adviser or its affiliates voluntarily agreed to waive certain fees in order to avoid a negative yield. Such arrangements may be discontinued by the investment adviser at any time. For the period, the amount of the waiver was $128.
In addition, during the period the investment adviser or an affiliate reimbursed and/or waived a portion of operating expenses in the amount of $10.
7. Other.
A fund's organizational documents provide former and current trustees and officers with a limited indemnification against liabilities arising in connection with the performance of their duties to the fund. In the normal course of business, a fund may also enter into contracts that provide general indemnifications. A fund's maximum exposure under these arrangements is unknown as this would be dependent on future claims that may be made against a fund. The risk of material loss from such claims is considered remote.
8. Risk and Uncertainties.
Many factors affect a fund's performance. Developments that disrupt global economies and financial markets, such as pandemics, epidemics, outbreaks of infectious diseases, war, terrorism, and environmental disasters, may significantly affect a fund's investment performance. The effects of these developments to a fund will be impacted by the types of securities in which a fund invests, the financial condition, industry, economic sector, and geographic location of an issuer, and a fund's level of investment in the securities of that issuer.
9. Reorganization.
Subsequent to period end, on September 16, 2022, Fidelity California Municipal Money Market Fund (formerly Fidelity California AMT Tax-Free Money Market Fund) acquired all of the assets and assumed all of the liabilities of Fidelity California Municipal Money Market Fund ("Target Fund") pursuant to an Agreement and Plan of Reorganization ("Agreements") approved by the Board of Trustees ("The Board"). The securities held by the Target Fund were the primary assets acquired by Fidelity California Municipal Money Market Fund. The acquisition was accomplished by an exchange of Premium Class (formerly Fidelity California AMT Tax-Free Money Market Fund Class) of Fidelity California Municipal Money Market Fund for shares outstanding of the Target Fund at its respective net asset value on the acquisition date. The reorganization provides shareholders of the Target Fund access to a larger portfolio with a similar investment objective and lower projected expenses. For financial reporting purposes, the assets and liabilities of the Target Fund and shares issued by Fidelity California Municipal Money Market Fund were recorded at fair value; however, the cost basis of the investments received from the Target Fund were carried forward and will be utilized for purposes of the Fidelity California Municipal Money Market Fund ongoing reporting of realized and unrealized gains and losses to more closely align subsequent reporting of realized gains with amounts distributable to shareholders for tax purposes. The reorganization qualified as a tax-free reorganization for federal income tax purposes with no gain or loss recognized to the funds or their shareholders.
| Target Fund | Investments ($) | Unrealized appreciation (depreciation) ($) | Net Assets ($) | Shares Exchanged | Shares Exchanged Ratio |
| Fidelity California Municipal Money Market Fund | 1,117,559 | 0 | 1,127,846 | 1,125,928 | 1.0000 |
| Surviving Fund | Net Assets ($) | Total net assets after the acquisition ($) |
| Fidelity California Municipal Money Market Fund (formerly Fidelity California AMT Tax-Free Money Market Fund) | 2,657,669 | 3,785,515 |
As a shareholder, you incur two types of costs: (1) transaction costs, which may include sales charges (loads) on purchase payments or redemption proceeds, as applicable and (2) ongoing costs, which generally include management fees, distribution and/or service (12b-1) fees and other Fund expenses. This Example is intended to help you understand your ongoing costs (in dollars) of investing in a fund and to compare these costs with the ongoing costs of investing in other mutual funds.
| The Example is based on an investment of $1,000 invested at the beginning of the period and held for the entire period (March 1, 2022 to August 31, 2022). |
Actual Expenses
The first line of the accompanying table provides information about actual account values and actual expenses. You may use the information in this line, together with the amount you invested, to estimate the expenses that you paid over the period. Simply divide your account value by $1,000.00 (for example, an $8,600 account value divided by $1,000.00 = 8.6), then multiply the result by the number in the first line for a class/Fund under the heading entitled "Expenses Paid During Period" to estimate the expenses you paid on your account during this period. If any fund is a shareholder of any underlying mutual funds or exchange-traded funds (ETFs) (the Underlying Funds), such fund indirectly bears its proportional share of the expenses of the Underlying Funds in addition to the direct expenses incurred presented in the table. These fees and expenses are not included in the annualized expense ratio used to calculate the expense estimate in the table below.
Hypothetical Example for Comparison Purposes
The second line of the accompanying table provides information about hypothetical account values and hypothetical expenses based on the actual expense ratio and an assumed rate of return of 5% per year before expenses, which is not the actual return. The hypothetical account values and expenses may not be used to estimate the actual ending account balance or expenses you paid for the period. You may use this information to compare the ongoing costs of investing in the Fund and other funds. To do so, compare this 5% hypothetical example with the 5% hypothetical examples that appear in the shareholder reports of the other funds. If any fund is a shareholder of any Underlying Funds, such fund indirectly bears its proportional share of the expenses of the Underlying Funds in addition to the direct expenses as presented in the table. These fees and expenses are not included in the annualized expense ratio used to calculate the expense estimate in the table below.
Please note that the expenses shown in the table are meant to highlight your ongoing costs only and do not reflect any transaction costs. Therefore, the second line of the table is useful in comparing ongoing costs only, and will not help you determine the relative total costs of owning different funds. In addition, if these transactional costs were included, your costs would have been higher.
| | | | | Annualized Expense Ratio- A | | Beginning Account Value March 1, 2022 | | Ending Account Value August 31, 2022 | | Expenses Paid During Period- C March 1, 2022 to August 31, 2022 |
| | | | | | | | | | |
| Fidelity® California Municipal Money Market Fund | | | | .47% | | | | | | |
| Actual | | | | | | $ 1,000 | | $ 1,002.30 | | $ 2.37 |
Hypothetical- B | | | | | | $ 1,000 | | $ 1,022.84 | | $ 2.40 |
| |
A Annualized expense ratio reflects expenses net of applicable fee waivers.
B 5% return per year before expenses
C Expenses are equal to the annualized expense ratio, multiplied by the average account value over the period, multiplied by 184/ 365 (to reflect the one-half year period). The fees and expenses of any Underlying Funds are not included in each annualized expense ratio.
1.855639.115
CFS-SANN-1022
Fidelity® California AMT Tax-Free Money Market Fund
(Renamed Fidelity® California Municipal Money Market Fund effective September 16, 2022)
Semi-Annual Report
August 31, 2022
Contents
To view a fund's proxy voting guidelines and proxy voting record for the 12-month period ended June 30, visit http://www.fidelity.com/proxyvotingresults or visit the Securities and Exchange Commission's (SEC) web site at http://www.sec.gov.
You may also call 1-800-544-8544, or for Institutional and Service Class, call 1-877-208-0098, to request a free copy of the proxy voting guidelines.
Standard & Poor's, S&P and S&P 500 are registered service marks of The McGraw-Hill Companies, Inc. and have been licensed for use by Fidelity Distributors Corporation.
Other third-party marks appearing herein are the property of their respective owners.
All other marks appearing herein are registered or unregistered trademarks or service marks of FMR LLC or an affiliated company. © 2022 FMR LLC. All rights reserved.
This report and the financial statements contained herein are submitted for the general information of the shareholders of the Fund. This report is not authorized for distribution to prospective investors in the Fund unless preceded or accompanied by an effective prospectus.
A fund files its complete schedule of portfolio holdings with the SEC for the first and third quarters of each fiscal year on Form N-PORT. Forms N-PORT are available on the SEC's web site at http://www.sec.gov. A fund's Forms N-PORT may be reviewed and copied at the SEC's Public Reference Room in Washington, DC. Information regarding the operation of the SEC's Public Reference Room may be obtained by calling 1-800-SEC-0330.
For a complete list of a fund's portfolio holdings, view the most recent holdings listing, semiannual report, or annual report on Fidelity's web site at http://www.fidelity.com, http://www.institutional.fidelity.com, or http://www.401k.com, as applicable.
NOT FDIC INSURED •MAY LOSE VALUE •NO BANK GUARANTEE
Neither the Fund nor Fidelity Distributors Corporation is a bank.
| Current 7-Day Yields |
| | | |
| Fidelity® California AMT Tax-Free Money Market Fund | 1.26% | |
| Institutional Class | 1.36% | |
| | | |
Yield refers to the income paid by the Fund over a given period. Yield for money market funds is usually for seven-day periods, as it is here, though it is expressed as an annual percentage rate. Past performance is no guarantee of future results. Yield will vary and it's possible to lose money investing in the Fund. A portion of the Fund's expenses was reimbursed and/or waived. Absent such reimbursements and/or waivers the yield for the period ending August 31, 2022, the most recent period shown in the table, would have been 1.31% for Institutional Class. | |
| Effective Maturity Diversification (% of Fund's Investments) |
| Days |
| 1 - 7 | 75.2 | |
| 8 - 30 | 5.7 | |
| 31 - 60 | 13.1 | |
| 61 - 90 | 3.5 | |
| 91 - 180 | 0.3 | |
| > 180 | 2.2 | |
| Effective maturity is determined in accordance with the requirements of Rule 2a-7 under the Investment Company Act of 1940. |
Asset Allocation (% of Fund's net assets) |
|
|
Showing Percentage of Net Assets
| Variable Rate Demand Note - 14.2% |
| | | Principal Amount (a) (000s) | Value ($) (000s) |
| Alabama - 0.3% | | | |
| Mobile Indl. Dev. Board Poll. Cont. Rev. (Alabama Pwr. Co. Barry Plant Proj.) Series 2007 C, 1.79% 9/7/22, VRDN (b) | | 2,600 | 2,600 |
| West Jefferson Indl. Dev. Series 2008, 1.79% 9/7/22, VRDN (b) | | 6,190 | 6,190 |
TOTAL ALABAMA | | | 8,790 |
| Alaska - 0.4% | | | |
| Valdez Marine Term. Rev. (ConocoPhillips Proj.) Series 1994 A, 1.55% 9/7/22 (ConocoPhillips Co. Guaranteed), VRDN (b) | | 9,200 | 9,200 |
| Arizona - 0.0% | | | |
| Maricopa County Poll. Cont. Rev. (Arizona Pub. Svc. Co. Palo Verde Proj.) Series 2009 A, 1.77% 9/7/22, VRDN (b) | | 1,150 | 1,150 |
| California - 12.7% | | | |
| Bay Area Toll Auth. San Francisco Bay Toll Bridge Rev.: | | | |
| Series 2007 C2, 1.4% 9/7/22, LOC MUFG Bank Ltd., VRDN (b) | | 200 | 200 |
| Series 2007 D2, 1.44% 9/7/22, LOC Bank of America NA, VRDN (b) | | 2,100 | 2,100 |
| Series 2008 C1, 1.42% 9/7/22, LOC Sumitomo Mitsui Banking Corp., VRDN (b) | | 8,310 | 8,310 |
| Series G1, 1.35% 9/7/22, LOC Bank of America NA, VRDN (b) | | 2,000 | 2,000 |
| California Edl. Facilities Auth. Rev. (Stanford Univ. Proj.) Series L, 1.2% 9/7/22, VRDN (b) | | 500 | 500 |
| California Gen. Oblig.: | | | |
| Series 2004 A2, 0.85% 9/1/22, LOC State Street Bank & Trust Co., Boston, VRDN (b) | | 2,100 | 2,100 |
| Series 2005 A2-1, 1.1% 9/7/22, LOC Sumitomo Mitsui Banking Corp., VRDN (b) | | 34,515 | 34,515 |
| Series 2005 B1, 1.18% 9/7/22, LOC Wells Fargo Bank NA, VRDN (b) | | 11,035 | 11,035 |
| Series 2020 A, 1.49% 9/7/22, LOC State Street Bank & Trust Co., Boston, VRDN (b) | | 40,000 | 40,000 |
| California Health Facilities Fing. Auth. Rev.: | | | |
| (Adventist Health Sys. West Proj.) Series 2009 B, 0.95% 9/1/22, LOC U.S. Bank NA, Cincinnati, VRDN (b) | | 7,250 | 7,250 |
| (Dignity Health Proj.) Series 2011 C, 1.24% 9/7/22, LOC Bank of Montreal, VRDN (b) | | 11,305 | 11,305 |
| Series 2011 B, 1.35% 9/7/22, LOC Bank of Montreal, VRDN (b) | | 300 | 300 |
| California Statewide Cmntys. Dev. Auth. Poll. Cont. Rev. (Chevron U.S.A., Inc. Proj.) Series 2002, 0.85% 9/1/22 (Chevron Corp. Guaranteed), VRDN (b) | | 15,250 | 15,250 |
| Irvine Impt. Bond Act of 1915: | | | |
| (Assessment District #97-17 Proj.) Series 1998, 0.95% 9/1/22, LOC State Street Bank & Trust Co., Boston, VRDN (b) | | 1,639 | 1,639 |
| Series 2006 B, 0.95% 9/1/22, LOC U.S. Bank NA, Cincinnati, VRDN (b) | | 900 | 900 |
| Irvine Reassessment District 12-1 Ltd. Oblig. Series 2005 21A, 0.95% 9/1/22, LOC U.S. Bank NA, Cincinnati, VRDN (b) | | 1,400 | 1,400 |
| Los Angeles Dept. of Wtr. & Pwr. Rev.: | | | |
| Series 2001 B1, 1.34% 9/7/22 (Liquidity Facility Barclays Bank PLC), VRDN (b) | | 3,000 | 3,000 |
| Series 2001 B7, 1.34% 9/7/22 (Liquidity Facility Barclays Bank PLC), VRDN (b) | | 550 | 550 |
| Series 2001 B8, 1.32% 9/7/22 (Liquidity Facility Barclays Bank PLC), VRDN (b)(c) | | 800 | 800 |
| Series 2002 A1, 0.79% 9/1/22 (Liquidity Facility Bank of America NA), VRDN (b) | | 3,000 | 3,000 |
| Series 2002 A3, 0.9% 9/1/22 (Liquidity Facility Bank of America NA), VRDN (b) | | 5,440 | 5,440 |
| Series 2021 A1, 0.85% 9/1/22 (Liquidity Facility Royal Bank of Canada), VRDN (b) | | 16,900 | 16,900 |
| Series 2021 A2, 0.85% 9/1/22 (Liquidity Facility Royal Bank of Canada), VRDN (b) | | 3,030 | 3,030 |
| Los Angeles Dept. of Wtr. & Pwr. Wtrwks. Rev.: | | | |
| Series 2001 B4, 0.85% 9/1/22 (Liquidity Facility Barclays Bank PLC), VRDN (b) | | 4,000 | 4,000 |
| Series 2019 A, 0.85% 9/1/22 (Liquidity Facility Barclays Bank PLC), VRDN (b) | | 3,100 | 3,100 |
| Series 2020 A, 0.8% 9/1/22 (Liquidity Facility TD Banknorth, NA), VRDN (b) | | 1,600 | 1,600 |
| Series A1, 0.8% 9/1/22 (Liquidity Facility TD Banknorth, NA), VRDN (b) | | 14,325 | 14,325 |
| Modesto Pub. Fing. Auth. Lease Rev. Series 2008 B, 1.6% 9/7/22, LOC Bank of The West San Francisco, VRDN (b) | | 5,950 | 5,950 |
| Modesto Wtr. Rev. Ctfs. of Prtn. Series 2008 A, 1.4% 9/7/22, LOC JPMorgan Chase Bank, VRDN (b) | | 4,285 | 4,285 |
| Riverside Ctfs. of Prtn. (Riverside Renaissance Proj.) Series 2008, 1.47% 9/7/22, LOC Bank of America NA, VRDN (b)(d) | | 29,465 | 29,465 |
| San Bernardino County Flood Cont. District Judgment Oblig. Series 2008, 1.55% 9/7/22, LOC Bank of America NA, VRDN (b) | | 10,375 | 10,375 |
| San Diego Hsg. Auth. Multi-family Hsg. Rev. Series 2017 A, 1.7% 9/7/22, LOC Bank of America NA, VRDN (b) | | 45,060 | 45,060 |
| San Francisco City & County Arpts. Commission Int'l. Arpt. Rev. Series 2018 C, 1.26% 9/7/22, LOC Sumitomo Mitsui Banking Corp., VRDN (b) | | 6,330 | 6,330 |
| San Francisco City & County Fin. Corp. Lease Rev. (Moscone Ctr. Expansion Proj.): | | | |
| Series 2008 1, 1.4% 9/7/22, LOC TD Banknorth, NA, VRDN (b) | | 14,550 | 14,550 |
| Series 2008 2, 1.45% 9/7/22, LOC TD Banknorth, NA, VRDN (b) | | 14,000 | 14,000 |
| Santa Clara County Fing. Auth. Rev. (El Camino Hosp. Proj.) Series 2009 A, 1.24% 9/7/22, LOC Wells Fargo Bank NA, VRDN (b) | | 1,465 | 1,465 |
| Southern California Pub. Pwr. Auth. Rev. Series 2020 3, 0.95% 9/1/22, LOC U.S. Bank NA, Cincinnati, VRDN (b) | | 2,500 | 2,500 |
| Stanislaus County Cap. Impts. Fing. Auth. Rev. Series 2004, 1.68% 9/7/22, LOC Bank of America NA, VRDN (b) | | 525 | 525 |
| Western Muni. Wtr. District Facilities Auth. Wtr. Rev. Series 2012 A, 1.38% 9/7/22, LOC Toronto-Dominion Bank, VRDN (b) | | 500 | 500 |
| FHLMC Los Angeles Cmnty. Redev. Agcy. Multi-family Hsg. Rev. (Promenade Towers Proj.) Series 2000, 1.52% 9/7/22, LOC Freddie Mac, VRDN (b) | | 2,800 | 2,800 |
TOTAL CALIFORNIA | | | 332,354 |
| Delaware - 0.0% | | | |
| Delaware Econ. Dev. Auth. Rev. (Delmarva Pwr. & Lt. Co. Proj.) Series 1993 C, 1.55% 9/7/22, VRDN (b) | | 600 | 600 |
| Kansas - 0.2% | | | |
| Burlington Envir. Impt. Rev. (Kansas City Pwr. and Lt. Co. Proj.): | | | |
| Series 2007 A, 1.69% 9/7/22, VRDN (b) | | 200 | 200 |
| Series 2007 B, 1.69% 9/7/22, VRDN (b) | | 900 | 900 |
| St. Mary's Kansas Poll. Cont. Rev. (Kansas Gas and Elec. Co. Proj.) Series 1994, 1.65% 9/7/22, VRDN (b) | | 2,000 | 2,000 |
| Wamego Kansas Poll. Cont. Rfdg. Rev. (Western Resources, Inc. Proj.) Series 1994, 1.65% 9/7/22, VRDN (b) | | 2,800 | 2,800 |
TOTAL KANSAS | | | 5,900 |
| Louisiana - 0.6% | | | |
| Saint James Parish Gen. Oblig. (Nucor Steel Louisiana LLC Proj.): | | | |
| Series 2010 A1, 1.83% 9/7/22, VRDN (b) | | 8,735 | 8,735 |
| Series 2010 B1, 1.95% 9/7/22, VRDN (b) | | 6,565 | 6,565 |
TOTAL LOUISIANA | | | 15,300 |
| Pennsylvania - 0.0% | | | |
| Beaver County Indl. Dev. Auth. Series 2018 A, 1.74% 9/7/22, LOC Truist Bank, VRDN (b) | | 300 | 300 |
| TOTAL VARIABLE RATE DEMAND NOTE (Cost $373,594) | | | 373,594 |
| | | | |
| Tender Option Bond - 50.4% |
| | | Principal Amount (a) (000s) | Value ($) (000s) |
| Arizona - 0.0% | | | |
| Arizona Indl. Dev. Auth. Hosp. Rev. Participating VRDN Series XM 10 13, 1.79% 9/7/22 (Liquidity Facility JPMorgan Chase Bank) (b)(e)(f) | | 500 | 500 |
| California - 48.5% | | | |
| Canada Unified School District Participating VRDN Series Floaters XF 26 42, 1.71% 9/7/22 (Liquidity Facility Bank of America NA) (b)(e)(f) | | 8,100 | 8,100 |
| Academy of Motion Picture Arts Participating VRDN Series 2017, 1.71% 9/7/22 (Liquidity Facility Barclays Bank PLC) (b)(e)(f) | | 4,865 | 4,865 |
| Alameda Corridor Trans. Auth. Rev. Participating VRDN Series XF 11 48, 1.76% 9/7/22 (Liquidity Facility Deutsche Bank AG New York Branch) (b)(e)(f) | | 8,619 | 8,619 |
| Bay Area Toll Auth. San Francisco Bay Toll Bridge Rev. Participating VRDN: | | | |
| Series 17 XX 1045, 1.7% 9/7/22 (Liquidity Facility Barclays Bank PLC) (b)(e)(f) | | 16,000 | 16,000 |
| Series XF 10 44, 1.73% 9/7/22 (Liquidity Facility Deutsche Bank AG New York Branch) (b)(e)(f) | | 4,350 | 4,350 |
| Buck Institute Age Research Participating VRDN Series Floaters XF 10 35, 1.73% 9/7/22 (Liquidity Facility Deutsche Bank AG New York Branch) (b)(e)(f) | | 5,760 | 5,760 |
| Cabrillo Unified School District Participating VRDN Series 2017 XF 2434, 1.7% 9/7/22 (Liquidity Facility Morgan Stanley Bank, West Valley City Utah) (b)(e)(f) | | 5,760 | 5,760 |
| California Gen. Oblig. Participating VRDN: | | | |
| Series 15 XF 1039, 1.7% 9/7/22 (Liquidity Facility Morgan Stanley Bank, West Valley City Utah) (b)(e)(f) | | 9,880 | 9,880 |
| Series 15 XF0129, 1.7% 9/7/22 (Liquidity Facility Citibank NA) (b)(e)(f) | | 5,900 | 5,900 |
| Series 15 XF2161, 1.7% 9/7/22 (Liquidity Facility Morgan Stanley Bank, West Valley City Utah) (b)(e)(f) | | 2,440 | 2,440 |
| Series 15 XF2171, 1.69% 9/7/22 (Liquidity Facility Citibank NA) (b)(e)(f) | | 10,400 | 10,400 |
| Series 2017 XF 2414, 1.7% 9/7/22 (Liquidity Facility JPMorgan Chase Bank) (b)(e)(f) | | 3,000 | 3,000 |
| Series Floaters G 80, 1.7% 9/7/22 (Liquidity Facility Royal Bank of Canada) (b)(e)(f) | | 3,000 | 3,000 |
| Series Floaters G68, 1.7% 9/7/22 (Liquidity Facility Royal Bank of Canada) (b)(e)(f) | | 12,825 | 12,825 |
| Series Floaters XM 06 93, 1.7% 9/7/22 (Liquidity Facility JPMorgan Chase Bank) (b)(e)(f) | | 2,225 | 2,225 |
| Series Floaters YX 10 84, 1.7% 9/7/22 (Liquidity Facility Barclays Bank PLC) (b)(e)(f) | | 3,500 | 3,500 |
| Series Floaters YX 10 90, 1.7% 9/7/22 (Liquidity Facility Barclays Bank PLC) (b)(e)(f) | | 8,845 | 8,845 |
| Series Floaters ZM 06 04, 1.7% 9/7/22 (Liquidity Facility Morgan Stanley Bank, West Valley City Utah) (b)(e)(f) | | 2,500 | 2,500 |
| Series Floaters ZM 06 05, 1.7% 9/7/22 (Liquidity Facility Morgan Stanley Bank, West Valley City Utah) (b)(e)(f) | | 2,000 | 2,000 |
| Series Floaters ZM 06 08, 1.7% 9/7/22 (Liquidity Facility Morgan Stanley Bank, West Valley City Utah) (b)(e)(f) | | 4,575 | 4,575 |
| Series RBC G 52, 1.7% 9/7/22 (Liquidity Facility Royal Bank of Canada) (b)(e)(f) | | 3,000 | 3,000 |
| Series XF 13 30, 1.7% 9/7/22 (Liquidity Facility JPMorgan Chase Bank) (b)(e)(f) | | 2,855 | 2,855 |
| Series XF 13 51, 1.7% 9/7/22 (Liquidity Facility JPMorgan Chase Bank) (b)(e)(f) | | 4,655 | 4,655 |
| Series XF 29 82, 1.69% 9/7/22 (Liquidity Facility Citibank NA) (b)(e)(f) | | 1,825 | 1,825 |
| Series XG 03 68, 1.7% 9/7/22 (Liquidity Facility Wells Fargo Bank NA) (b)(e)(f) | | 1,315 | 1,315 |
| Series ZL 02 22, 1.7% 9/7/22 (Liquidity Facility JPMorgan Chase Bank) (b)(e)(f) | | 2,395 | 2,395 |
| California Health Facilities Fing. Auth. Rev.: | | | |
| Bonds Series MS 00 07, 1.67%, tender 11/9/22 (Liquidity Facility Morgan Stanley Bank, West Valley City Utah) (b)(e)(f) | | 11,000 | 11,000 |
| Participating VRDN: | | | |
Series 15 XF0120, 1.73% 9/7/22 (Liquidity Facility JPMorgan Chase Bank) (b)(e)(f) | | 22,410 | 22,410 |
Series 16 ZF0212, 1.75% 9/7/22 (Liquidity Facility JPMorgan Chase Bank) (b)(e)(f) | | 2,935 | 2,935 |
Series 17 04, 1.82% 10/12/22 (Liquidity Facility Barclays Bank PLC) (b)(e)(f) | | 84,580 | 84,580 |
Series 2017 XF 2048, 1.72% 9/7/22 (Liquidity Facility Citibank NA) (b)(e)(f) | | 8,100 | 8,100 |
Series 2017 XF 2417, 1.72% 9/7/22 (Liquidity Facility Morgan Stanley Bank, West Valley City Utah) (b)(e)(f) | | 31,450 | 31,450 |
Series 2017, 1.72% 9/7/22 (Liquidity Facility Morgan Stanley Bank, West Valley City Utah) (b)(e)(f) | | 26,535 | 26,535 |
Series BC 22 013, 1.82% 10/12/22 (Liquidity Facility Barclays Bank PLC) (b)(e)(f) | | 8,445 | 8,445 |
Series BC 22 015, 1.82% 10/12/22 (Liquidity Facility Barclays Bank PLC) (b)(e)(f) | | 6,110 | 6,110 |
Series DB 15 XF 0234, 1.75% 9/7/22 (Liquidity Facility Citibank NA) (b)(e)(f) | | 10,965 | 10,965 |
Series DBE 80 11, 1.81% 9/7/22 (Liquidity Facility Deutsche Bank AG New York Branch) (b)(e)(f) | | 48,025 | 48,025 |
Series Floaters 013, 1.82% 10/12/22 (Liquidity Facility Barclays Bank PLC) (b)(e)(f) | | 22,080 | 22,080 |
Series Floaters XF 06 08, 1.7% 9/7/22 (Liquidity Facility Toronto-Dominion Bank) (b)(e)(f) | | 25,830 | 25,830 |
Series Floaters XF 06 22, 1.72% 9/7/22 (Liquidity Facility Toronto-Dominion Bank) (b)(e)(f) | | 9,405 | 9,405 |
Series Floaters XF 06 33, 1.7% 9/7/22 (Liquidity Facility Toronto-Dominion Bank) (b)(e)(f) | | 38,580 | 38,580 |
Series Floaters XF 07 62, 1.75% 9/7/22 (Liquidity Facility JPMorgan Chase Bank) (b)(e)(f) | | 4,600 | 4,600 |
Series Floaters XF 24 67, 1.7% 9/7/22 (Liquidity Facility Morgan Stanley Bank, West Valley City Utah) (b)(e)(f) | | 4,100 | 4,100 |
Series Floaters XF 25 95, 1.75% 9/7/22 (Liquidity Facility Toronto-Dominion Bank) (b)(e)(f) | | 2,300 | 2,300 |
Series Floaters XF 26 98, 1.7% 9/7/22 (Liquidity Facility Barclays Bank PLC) (b)(e)(f) | | 4,800 | 4,800 |
Series Floaters XG 01 04, 1.72% 9/7/22 (Liquidity Facility Morgan Stanley Bank, West Valley City Utah) (b)(e)(f) | | 500 | 500 |
Series Floaters XG 01 25, 1.71% 9/7/22 (Liquidity Facility Barclays Bank PLC) (b)(e)(f) | | 20,455 | 20,455 |
Series Floaters XG 01 41, 1.73% 9/7/22 (Liquidity Facility Morgan Stanley Bank, West Valley City Utah) (b)(e)(f) | | 14,925 | 14,925 |
Series Floaters XL 00 45, 1.7% 9/7/22 (Liquidity Facility JPMorgan Chase Bank) (b)(e)(f) | | 5,270 | 5,270 |
Series Floaters XM 06 96, 1.7% 9/7/22 (Liquidity Facility Bank of America NA) (b)(e)(f) | | 6,885 | 6,885 |
Series Floaters ZM 05 02, 1.7% 9/7/22 (Liquidity Facility Morgan Stanley Bank, West Valley City Utah) (b)(e)(f) | | 14,000 | 14,000 |
Series Floaters ZM 05 43, 1.7% 9/7/22 (Liquidity Facility Morgan Stanley Bank, West Valley City Utah) (b)(e)(f) | | 4,000 | 4,000 |
Series MIZ 91 02, 1.1% 9/1/22 (Liquidity Facility Mizuho Cap. Markets LLC) (b)(e)(f) | | 19,590 | 19,590 |
Series MS 3389, 1.7% 9/7/22 (Liquidity Facility Toronto-Dominion Bank) (b)(e)(f) | | 4,000 | 4,000 |
Series YX 11 53, 1.71% 9/7/22 (Liquidity Facility Barclays Bank PLC) (b)(e)(f) | | 7,100 | 7,100 |
Series ZM 06 17, 1.73% 9/7/22 (Liquidity Facility Morgan Stanley Bank, West Valley City Utah) (b)(e)(f) | | 5,000 | 5,000 |
| California Infrastructure and Econ. Dev. Bank Rev. Participating VRDN Series XF 29 04, 1.71% (b)(e)(f) | | 8,600 | 8,600 |
| California Muni. Fin. Auth. Rev. Participating VRDN Series Floaters XL 00 59, 1.71% 9/7/22 (Liquidity Facility Barclays Bank PLC) (b)(e)(f) | | 5,570 | 5,570 |
| California Pub. Works Board Lease Rev. Participating VRDN Series YX 11 91, 1.7% 9/7/22 (Liquidity Facility Barclays Bank PLC) (b)(e)(f) | | 14,260 | 14,260 |
| California State Univ. Rev. Participating VRDN: | | | |
| Series Floaters XF 24 41, 1.7% 9/7/22 (Liquidity Facility JPMorgan Chase Bank) (b)(e)(f) | | 23,060 | 23,060 |
| Series Floaters ZF 25 72, 1.7% 9/7/22 (Liquidity Facility Morgan Stanley Bank, West Valley City Utah) (b)(e)(f) | | 4,890 | 4,890 |
| Series XM 10 00, 1.7% 9/7/22 (Liquidity Facility JPMorgan Chase Bank) (b)(e)(f) | | 3,265 | 3,265 |
| Series ZL 02 31, 1.7% 9/7/22 (Liquidity Facility Royal Bank of Canada) (b)(e)(f) | | 1,330 | 1,330 |
| Series ZL 02 88, 1.7% 9/7/22 (Liquidity Facility Barclays Bank PLC) (b)(e)(f) | | 6,745 | 6,745 |
| California Statewide Cmntys. Dev. Auth. Rev. Participating VRDN: | | | |
| Series 2017: | | | |
1.71% 9/7/22 (Liquidity Facility Barclays Bank PLC) (b)(e)(f) | | 6,330 | 6,330 |
1.73% 9/7/22 (Liquidity Facility Deutsche Bank AG New York Branch) (b)(e)(f) | | 10,100 | 10,100 |
| Series 2021 XF 11 28, 1.74% 9/7/22 (Liquidity Facility Deutsche Bank AG New York Branch) (b)(e)(f) | | 4,625 | 4,625 |
| Central Union High School District Participating VRDN Series Floaters XF 07 59, 1.71% 9/7/22 (Liquidity Facility Toronto-Dominion Bank) (b)(e)(f) | | 4,300 | 4,300 |
| Chaffey Unified High School District Participating VRDN: | | | |
| Series Floaters XF 05 48, 1.7% 9/7/22 (Liquidity Facility Royal Bank of Canada) (b)(e)(f) | | 7,500 | 7,500 |
| Series Floaters ZM 05 85, 1.7% 9/7/22 (Liquidity Facility Wells Fargo Bank NA) (b)(e)(f) | | 1,750 | 1,750 |
| Series XF 13 44, 1.7% 9/7/22 (Liquidity Facility Bank of America NA) (b)(e)(f) | | 3,300 | 3,300 |
| Chino Valley Unified School District Participating VRDN Series XF 13 03, 1.7% 9/7/22 (Liquidity Facility JPMorgan Chase Bank) (b)(e)(f) | | 2,720 | 2,720 |
| Coast Cmnty. College District Participating VRDN Series Floaters XM 06 89, 1.7% 9/7/22 (Liquidity Facility Royal Bank of Canada) (b)(e)(f) | | 4,820 | 4,820 |
| Del Mar Union School District Spl. Tax Participating VRDN Series XG 02 59, 1.72% 9/7/22 (Liquidity Facility Bank of America NA) (b)(e)(f) | | 1,900 | 1,900 |
| Downey Unified School District Participating VRDN Series 2021 XF 12 24, 1.7% 9/7/22 (Liquidity Facility Royal Bank of Canada) (b)(e)(f) | | 3,050 | 3,050 |
| Eastern Muni. Wtr. District Fing. Auth. Participating VRDN Series Floaters XF 24 48, 1.7% 9/7/22 (Liquidity Facility Toronto-Dominion Bank) (b)(e)(f) | | 2,400 | 2,400 |
| El Camino Hosp. Participating VRDN Series 2017 XF 2415, 1.71% 9/7/22 (Liquidity Facility Barclays Bank PLC) (b)(e)(f) | | 9,150 | 9,150 |
| Elk Grove Unified School District Participating VRDN Series Floaters XG 01 27, 1.71% 9/7/22 (Liquidity Facility Bank of America NA) (b)(e)(f) | | 2,100 | 2,100 |
| Escondido Gen. Oblig. Participating VRDN Series Floaters G 77, 1.7% 9/7/22 (Liquidity Facility Royal Bank of Canada) (b)(e)(f) | | 5,375 | 5,375 |
| Fillmore Calif Wastewtr. Rev. Participating VRDN Series Floaters XF 24 70, 1.71% 9/7/22 (Liquidity Facility Barclays Bank PLC) (b)(e)(f) | | 5,535 | 5,535 |
| Foothill/Eastern Trans. Corridor Agcy. Toll Road Rev. Participating VRDN Series Floaters XG 02 43, 1.72% 9/7/22 (Liquidity Facility Bank of America NA) (b)(e)(f) | | 7,935 | 7,935 |
| Fresno Unified School District Participating VRDN: | | | |
| Series Floaters 05 75, 1.7% 9/7/22 (Liquidity Facility JPMorgan Chase Bank) (b)(e)(f) | | 2,150 | 2,150 |
| Series Floaters XF 07 70, 1.7% 9/7/22 (Liquidity Facility Royal Bank of Canada) (b)(e)(f) | | 10,000 | 10,000 |
| Garvey School District Participating VRDN Series Floaters XF 26 60, 1.75% 9/7/22 (Liquidity Facility Morgan Stanley Bank, West Valley City Utah) (b)(e)(f) | | 4,270 | 4,270 |
| Grossmont-Cuyamaca Cmnty. College District Participating VRDN: | | | |
| Series Floaters XG 01 88, 1.7% 9/7/22 (Liquidity Facility Royal Bank of Canada) (b)(e)(f) | | 4,000 | 4,000 |
| Series ZL 02 91, 1.7% 9/7/22 (Liquidity Facility Royal Bank of Canada) (b)(e)(f) | | 1,900 | 1,900 |
| Hartnell Cmnty. College District Gen. Oblig. Participating VRDN Series Floaters XF 05 87, 1.7% 9/7/22 (Liquidity Facility Toronto-Dominion Bank) (b)(e)(f) | | 500 | 500 |
| Hayward Area Recreation and Park District Participating VRDN Series Floaters XF 24 68, 1.7% 9/7/22 (Liquidity Facility Morgan Stanley Bank, West Valley City Utah) (b)(e)(f) | | 5,000 | 5,000 |
| Independent Cities Calif Fin. A Participating VRDN Series XL 01 12, 1.71% 9/7/22 (Liquidity Facility Barclays Bank PLC) (b)(e)(f) | | 2,100 | 2,100 |
| Irvine Ranch Wtr. District Ctfs. of Prtn. Participating VRDN Series Floaters ZM 06 35, 1.7% 9/7/22 (Liquidity Facility JPMorgan Chase Bank) (b)(e)(f) | | 3,225 | 3,225 |
| Long Beach Unified School District Participating VRDN Series 2021 XF 12 52, 1.7% 9/7/22 (Liquidity Facility JPMorgan Chase Bank) (b)(e)(f) | | 6,690 | 6,690 |
| Los Angeles Cmnty. College District Participating VRDN Series Floaters XF 27 74, 1.7% 9/7/22 (Liquidity Facility Morgan Stanley Bank, West Valley City Utah) (b)(e)(f) | | 3,750 | 3,750 |
| Los Angeles County Facilities, Inc. Participating VRDN Series XM 07 50, 1.71% 9/7/22 (Liquidity Facility Bank of America NA) (b)(e)(f) | | 6,000 | 6,000 |
| Los Angeles County Gen. Oblig. Participating VRDN Series XF 30 05, 1.7% 9/7/22 (Liquidity Facility Morgan Stanley Bank, West Valley City Utah) (b)(e)(f) | | 5,200 | 5,200 |
| Los Angeles County Metropolitan Trans. Auth. Sales Tax Rev. Participating VRDN: | | | |
| Series 2021 XF 12 38, 1.7% 9/7/22 (Liquidity Facility Royal Bank of Canada) (b)(e)(f) | | 1,130 | 1,130 |
| Series ZL 02 92, 1.7% 9/7/22 (Liquidity Facility JPMorgan Chase Bank) (b)(e)(f) | | 3,020 | 3,020 |
| Los Angeles County Pub. Works Fing. Auth. Lease Rev. Participating VRDN: | | | |
| Series XL 02 30, 1.7% 9/7/22 (Liquidity Facility Wells Fargo Bank NA) (b)(e)(f) | | 2,080 | 2,080 |
| Series YX 11 55, 1.7% 9/7/22 (Liquidity Facility Barclays Bank PLC) (b)(e)(f) | | 9,960 | 9,960 |
| Los Angeles Dept. of Wtr. & Pwr. Rev. Participating VRDN: | | | |
| Series Floaters XF 07 32, 1.7% 9/7/22 (Liquidity Facility Toronto-Dominion Bank) (b)(e)(f) | | 4,600 | 4,600 |
| Series Floaters XF 25 62, 1.69% 9/7/22 (Liquidity Facility Citibank NA) (b)(e)(f) | | 3,665 | 3,665 |
| Series Floaters XL 00 96, 1.7% 9/7/22 (Liquidity Facility Royal Bank of Canada) (b)(e)(f) | | 3,000 | 3,000 |
| Series MS 3345, 1.7% 9/7/22 (Liquidity Facility Morgan Stanley Bank, West Valley City Utah) (b)(e)(f) | | 2,540 | 2,540 |
| Series XF 13 47, 1.7% 9/7/22 (Liquidity Facility JPMorgan Chase Bank) (b)(e)(f) | | 2,680 | 2,680 |
| Series XM 09 84, 1.7% 9/7/22 (Liquidity Facility Morgan Stanley Bank, West Valley City Utah) (b)(e)(f) | | 7,330 | 7,330 |
| Series YX 11 43, 1.7% 9/7/22 (Liquidity Facility Barclays Bank PLC) (b)(e)(f) | | 1,200 | 1,200 |
| Series ZL 02 85, 1.7% 9/7/22 (Liquidity Facility Barclays Bank PLC) (b)(e)(f) | | 5,890 | 5,890 |
| Los Angeles Dept. of Wtr. & Pwr. Wtrwks. Rev. Participating VRDN: | | | |
| Series Floaters XG 01 21, 1.7% 9/7/22 (Liquidity Facility Bank of America NA) (b)(e)(f) | | 6,500 | 6,500 |
| Series Floaters ZM 04 68, 1.7% 9/7/22 (Liquidity Facility Royal Bank of Canada) (b)(e)(f) | | 7,415 | 7,415 |
| Los Angeles Unified School District Participating VRDN: | | | |
| Series Floaters XM 07 03, 1.7% 9/7/22 (Liquidity Facility JPMorgan Chase Bank) (b)(e)(f) | | 8,000 | 8,000 |
| Series Floaters YX 10 87, 1.7% 9/7/22 (Liquidity Facility Barclays Bank PLC) (b)(e)(f) | | 3,750 | 3,750 |
| Series Floaters ZM 05 91, 1.7% 9/7/22 (Liquidity Facility Bank of America NA) (b)(e)(f) | | 8,440 | 8,440 |
| Series Floaters ZM 05 92, 1.7% 9/7/22 (Liquidity Facility Bank of America NA) (b)(e)(f) | | 3,725 | 3,725 |
| Series XM 09 98, 1.7% 9/7/22 (Liquidity Facility JPMorgan Chase Bank) (b)(e)(f) | | 5,100 | 5,100 |
| Los Angeles Wastewtr. Sys. Rev.: | | | |
| Bonds Series Floaters G 26, 1.82%, tender 12/1/22 (Liquidity Facility Royal Bank of Canada) (b)(e)(f) | | 3,100 | 3,100 |
| Participating VRDN: | | | |
Series 15 ZF0243, 1.7% 9/7/22 (Liquidity Facility JPMorgan Chase Bank) (b)(e)(f) | | 5,430 | 5,430 |
Series 2015 ZF 0242, 1.7% 9/7/22 (Liquidity Facility JPMorgan Chase Bank) (b)(e)(f) | | 2,100 | 2,100 |
Series ROC II R 14059, 1.69% 9/7/22 (Liquidity Facility Citibank NA) (b)(e)(f) | | 6,000 | 6,000 |
Series XG 03 67, 1.7% 9/7/22 (Liquidity Facility Wells Fargo Bank NA) (b)(e)(f) | | 1,335 | 1,335 |
Series ZL 02 24, 1.7% 9/7/22 (Liquidity Facility Royal Bank of Canada) (b)(e)(f) | | 4,000 | 4,000 |
| Lucia Mar Unified School District Participating VRDN Series 2017, 1.71% 9/7/22 (Liquidity Facility Barclays Bank PLC) (b)(e)(f) | | 6,400 | 6,400 |
| Marin Pub. Fing. Auth. Rev. Sausalito-Marin San. District Participating VRDN Series 2017 XF 2436, 1.7% 9/7/22 (Liquidity Facility Morgan Stanley Bank, West Valley City Utah) (b)(e)(f) | | 6,315 | 6,315 |
| Mount San Antonio Cmnty. College Participating VRDN Series Floaters XF 07 53, 1.7% 9/7/22 (Liquidity Facility Royal Bank of Canada) (b)(e)(f) | | 4,000 | 4,000 |
| Norwalk-Mirada Unified School District Participating VRDN Series XM 08 10, 1.7% 9/7/22 (Liquidity Facility Royal Bank of Canada) (b)(e)(f) | | 4,990 | 4,990 |
| Oakland Gen. Oblig. Participating VRDN Series RBC G 61, 1.7% 9/7/22 (Liquidity Facility Royal Bank of Canada) (b)(e)(f) | | 6,650 | 6,650 |
| Oakland Unified School District Alameda County Participating VRDN Series ZL 02 42, 1.7% 9/7/22 (Liquidity Facility Royal Bank of Canada) (b)(e)(f) | | 1,600 | 1,600 |
| Palomar Cmnty. College District Participating VRDN Series Floaters XF 25 65, 1.69% 9/7/22 (Liquidity Facility Citibank NA) (b)(e)(f) | | 8,645 | 8,645 |
| Pub. Utils. Commission San Francisco City & County Wastewtr. Rev. Participating VRDN Series Floaters ZF 27 44, 1.7% 9/7/22 (Liquidity Facility Morgan Stanley Bank, West Valley City Utah) (b)(e)(f) | | 6,905 | 6,905 |
| Rancho Wtr. District Fing. Auth. Rev. Participating VRDN Series Floaters XF 27 52, 1.7% 9/7/22 (Liquidity Facility JPMorgan Chase Bank) (b)(e)(f) | | 6,200 | 6,200 |
| Riverside County Trans. Commission Sales Tax Rev. Participating VRDN Series Floaters XF 22 97, 1.72% 9/7/22 (Liquidity Facility Citibank NA) (b)(e)(f) | | 3,825 | 3,825 |
| Riverside County Trans. Commission Toll Rev. Participating VRDN: | | | |
| Series 2021 XG 03 40, 1.72% 9/7/22 (Liquidity Facility Bank of America NA) (b)(e)(f) | | 2,400 | 2,400 |
| Series 2021 XG 03 41, 1.72% 9/7/22 (Liquidity Facility Bank of America NA) (b)(e)(f) | | 7,245 | 7,245 |
| Sacramento Area Flood Cont. Agcy.: | | | |
| Bonds Series G 118, 1.82%, tender 4/3/23 (Liquidity Facility Royal Bank of Canada) (b)(e)(f)(g) | | 1,490 | 1,490 |
| Participating VRDN: | | | |
Series Floaters XM 04 55, 1.7% 9/7/22 (Liquidity Facility Morgan Stanley Bank, West Valley City Utah) (b)(e)(f) | | 1,100 | 1,100 |
Series Floaters ZM 04 57, 1.7% 9/7/22 (Liquidity Facility JPMorgan Chase Bank) (b)(e)(f) | | 6,330 | 6,330 |
| Sacramento City Fing. Auth. Rev. Participating VRDN Series Floaters XG 01 00, 1.73% 9/7/22 (Liquidity Facility Deutsche Bank AG New York Branch) (b)(e)(f) | | 18,365 | 18,365 |
| Sacramento City Unified School District Participating VRDN Series XG 03 93, 1.7% 9/7/22 (Liquidity Facility Barclays Bank PLC) (b)(e)(f) | | 2,400 | 2,400 |
| Sacramento Gen. Oblig. Participating VRDN Series XG 00 67, 1.73% 9/7/22 (Liquidity Facility Deutsche Bank AG New York Branch) (b)(e)(f) | | 100 | 100 |
| San Diego Unified School District Participating VRDN: | | | |
| Series Floaters XF 07 00, 1.7% 9/7/22 (Liquidity Facility Toronto-Dominion Bank) (b)(e)(f) | | 4,000 | 4,000 |
| Series Floaters XF 07 55, 1.7% 9/7/22 (Liquidity Facility JPMorgan Chase Bank) (b)(e)(f) | | 20,065 | 20,065 |
| Series RBC G 51, 1.7% 9/7/22 (Liquidity Facility Royal Bank of Canada) (b)(e)(f) | | 2,000 | 2,000 |
| San Francisco Bay Area Rapid Transit Fing. Auth. Participating VRDN: | | | |
| Series Floaters XF 24 49, 1.69% 9/7/22 (Liquidity Facility Citibank NA) (b)(e)(f) | | 2,500 | 2,500 |
| Series floaters XX 10 51, 1.7% 9/7/22 (Liquidity Facility Barclays Bank PLC) (b)(e)(f) | | 3,330 | 3,330 |
| Series XG 03 81, 1.7% 9/7/22 (Liquidity Facility JPMorgan Chase Bank) (b)(e)(f) | | 2,150 | 2,150 |
| Series XL 02 15, 1.7% 9/7/22 (Liquidity Facility Morgan Stanley Bank, West Valley City Utah) (b)(e)(f) | | 4,580 | 4,580 |
| Series ZM 06 43, 1.7% 9/7/22 (Liquidity Facility JPMorgan Chase Bank) (b)(e)(f) | | 2,655 | 2,655 |
| San Francisco City & County Arpts. Commission Int'l. Arpt. Rev. Participating VRDN Series XF 10 32, 1.73% 9/7/22 (Liquidity Facility Deutsche Bank AG New York Branch) (b)(e)(f) | | 3,865 | 3,865 |
| San Francisco City & County Ctfs. of Prtn. Participating VRDN Series XG 03 72, 1.7% 9/7/22 (Liquidity Facility Wells Fargo Bank NA) (b)(e)(f) | | 2,135 | 2,135 |
| San Francisco Pub. Utils. Commission Wtr. Rev. Participating VRDN: | | | |
| Series Floaters XF 06 07, 1.7% 9/7/22 (Liquidity Facility Toronto-Dominion Bank) (b)(e)(f) | | 4,330 | 4,330 |
| Series XF 29 93, 1.7% 9/7/22 (Liquidity Facility Morgan Stanley Bank, West Valley City Utah) (b)(e)(f) | | 3,180 | 3,180 |
| Santa Clara County Fing. Auth. Lease Rev. Participating VRDN Series ZF 28 20, 1.7% 9/7/22 (Liquidity Facility Citibank NA) (b)(e)(f) | | 8,575 | 8,575 |
| Santa Monica Cmnty. College District Gen. Oblig. Participating VRDN: | | | |
| Series 15 XF2169, 1.69% 9/7/22 (Liquidity Facility Citibank NA) (b)(e)(f) | | 4,800 | 4,800 |
| Series Floaters ZF 06 30, 1.7% 9/7/22 (Liquidity Facility Toronto-Dominion Bank) (b)(e)(f) | | 5,000 | 5,000 |
| Selma Calif Unified School District Participating VRDN Series XG 02 80, 1.71% 9/7/22 (Liquidity Facility Bank of America NA) (b)(e)(f) | | 3,960 | 3,960 |
| Southwestern Cmnty. College District Gen. Oblig. Participating VRDN Series Floaters XF 27 26, 1.7% 9/7/22 (Liquidity Facility Morgan Stanley Bank, West Valley City Utah) (b)(e)(f) | | 3,250 | 3,250 |
| Sweetwater Union High School District Participating VRDN Series XM 10 14, 1.7% 9/7/22 (Liquidity Facility Royal Bank of Canada) (b)(e)(f) | | 4,325 | 4,325 |
| The Regents of the Univ. of California Gen. Rev. Participating VRDN Series Floaters XM 03 90, 1.7% 9/7/22 (Liquidity Facility JPMorgan Chase Bank) (b)(e)(f) | | 7,500 | 7,500 |
| Trustees of the California State Univ. Participating VRDN Series ZM 00 90, 1.7% 9/7/22 (Liquidity Facility JPMorgan Chase Bank) (b)(e)(f) | | 8,380 | 8,380 |
| Univ. of California Regents Med. Ctr. Pool Rev. Participating VRDN: | | | |
| Series 2018 Floaters XX 10 92, 1.7% 9/7/22 (Liquidity Facility Barclays Bank PLC) (b)(e)(f) | | 2,225 | 2,225 |
| Series Floaters YX 10 97, 1.7% 9/7/22 (Liquidity Facility Barclays Bank PLC) (b)(e)(f) | | 6,030 | 6,030 |
| Series XF 13 35, 1.7% 9/7/22 (Liquidity Facility JPMorgan Chase Bank) (b)(e)(f) | | 1,550 | 1,550 |
| Series XF 13 40, 1.7% 9/7/22 (Liquidity Facility Toronto-Dominion Bank) (b)(e)(f) | | 1,700 | 1,700 |
| Series XG 03 66, 1.7% 9/7/22 (Liquidity Facility Wells Fargo Bank NA) (b)(e)(f) | | 6,240 | 6,240 |
| Series XX 12 01, 1.7% 9/7/22 (Liquidity Facility Barclays Bank PLC) (b)(e)(f) | | 7,500 | 7,500 |
| Series YX 12 05, 1.7% 9/7/22 (Liquidity Facility Barclays Bank PLC) (b)(e)(f) | | 7,020 | 7,020 |
| Univ. of California Revs. Participating VRDN: | | | |
| Series 15 ZF0177, 1.7% 9/7/22 (Liquidity Facility JPMorgan Chase Bank) (b)(e)(f) | | 7,110 | 7,110 |
| Series 2015 ZF0186, 1.7% 9/7/22 (Liquidity Facility JPMorgan Chase Bank) (b)(e)(f) | | 2,500 | 2,500 |
| Series Floaters XF 05 24, 1.7% 9/7/22 (Liquidity Facility Toronto-Dominion Bank) (b)(e)(f) | | 9,075 | 9,075 |
| Series Floaters XF 06 32, 1.7% 9/7/22 (Liquidity Facility Toronto-Dominion Bank) (b)(e)(f) | | 5,985 | 5,985 |
| Series Floaters XG 00 61, 1.73% 9/7/22 (Liquidity Facility Deutsche Bank AG New York Branch) (b)(e)(f) | | 2,600 | 2,600 |
| Series Floaters XM 04 34, 1.7% 9/7/22 (Liquidity Facility Barclays Bank PLC) (b)(e)(f) | | 7,500 | 7,500 |
| Series Floaters XM 07 04, 1.69% 9/7/22 (Liquidity Facility Citibank NA) (b)(e)(f) | | 26,930 | 26,930 |
| Series Floaters YX 10 98, 1.7% 9/7/22 (Liquidity Facility Barclays Bank PLC) (b)(e)(f) | | 1,100 | 1,100 |
| Series Floaters ZF 06 27, 1.7% 9/7/22 (Liquidity Facility Toronto-Dominion Bank) (b)(e)(f) | | 2,500 | 2,500 |
| Series XF 13 07, 1.7% 9/7/22 (Liquidity Facility JPMorgan Chase Bank) (b)(e)(f) | | 2,840 | 2,840 |
| Series XF 27 45, 1.7% 9/7/22 (Liquidity Facility JPMorgan Chase Bank) (b)(e)(f) | | 9,900 | 9,900 |
| Series XF 29 89, 1.7% 9/7/22 (Liquidity Facility Morgan Stanley Bank, West Valley City Utah) (b)(e)(f) | | 3,800 | 3,800 |
| Series XX 12 13, 1.7% 9/7/22 (Liquidity Facility Barclays Bank PLC) (b)(e)(f) | | 6,000 | 6,000 |
| Series ZL 02 84, 1.7% 9/7/22 (Liquidity Facility Royal Bank of Canada) (b)(e)(f) | | 6,900 | 6,900 |
| Whittier Health Facilities Rev. Participating VRDN Series Floaters CTFS 030, 1.82% 10/12/22 (Liquidity Facility Barclays Bank PLC) (b)(e)(f) | | 18,865 | 18,865 |
TOTAL CALIFORNIA | | | 1,273,359 |
| Colorado - 0.4% | | | |
| Colorado Health Facilities Auth. Rev. Bonds Participating VRDN Series 2022 004, 1.82% 10/12/22 (Liquidity Facility Barclays Bank PLC) (b)(e)(f) | | 11,000 | 11,000 |
| Connecticut - 0.4% | | | |
| Connecticut Gen. Oblig. Participating VRDN: | | | |
| Series Floaters 014, 1.82% 10/12/22 (Liquidity Facility Barclays Bank PLC) (b)(e)(f) | | 2,355 | 2,355 |
| Series Floaters 016, 1.82% 10/12/22 (Liquidity Facility Barclays Bank PLC) (b)(e)(f) | | 4,900 | 4,900 |
| Connecticut Spl. Tax Oblig. Trans. Infrastructure Rev.: | | | |
| Bonds Series Floaters G 110, 1.85%, tender 4/3/23 (Liquidity Facility Royal Bank of Canada) (b)(e)(f)(g) | | 2,650 | 2,650 |
| Participating VRDN Series ROC II R 14073, 1.73% 9/7/22 (Liquidity Facility Citibank NA) (b)(e)(f) | | 700 | 700 |
TOTAL CONNECTICUT | | | 10,605 |
| Florida - 0.2% | | | |
| Escambia County Health Facilities Auth. Health Facilities Rev. Participating VRDN Series XG 02 81, 1.71% 9/7/22 (Liquidity Facility Bank of America NA) (b)(e)(f) | | 900 | 900 |
| Fort Myers Util. Sys. Rev. Participating VRDN Series XF 08 13, 1.79% 9/7/22 (Liquidity Facility JPMorgan Chase Bank) (b)(e)(f) | | 700 | 700 |
| Palm Beach County Health Facilities Auth. Hosp. Rev. Participating VRDN: | | | |
| Series XG 03 70, 1.77% 9/7/22 (Liquidity Facility Bank of America NA) (b)(e)(f) | | 1,860 | 1,860 |
| Series XM 07 82, 1.74% 9/7/22 (Liquidity Facility Barclays Bank PLC) (b)(e)(f) | | 800 | 800 |
| South Miami Health Facilities Auth. Hosp. Rev. Participating VRDN: | | | |
| Series XF 25 23, 1.74% 9/7/22 (Liquidity Facility Barclays Bank PLC) (b)(e)(f) | | 800 | 800 |
| Series XM 08 68, 1.82% 9/7/22 (Liquidity Facility JPMorgan Chase Bank) (b)(e)(f) | | 500 | 500 |
TOTAL FLORIDA | | | 5,560 |
| Georgia - 0.0% | | | |
| Fulton County Dev. Auth. Rev. Participating VRDN Series XL 02 68, 1.77% 9/7/22 (Liquidity Facility Bank of America NA) (b)(e)(f) | | 700 | 700 |
| Illinois - 0.2% | | | |
| Chicago Gen. Oblig. Participating VRDN Series XM 10 05, 1.82% 9/7/22 (Liquidity Facility Deutsche Bank AG New York Branch) (b)(e)(f) | | 700 | 700 |
| Illinois Fin. Auth. Rev. Participating VRDN Series Floaters 017, 1.82% 10/12/22 (Liquidity Facility Barclays Bank PLC) (b)(e)(f) | | 4,470 | 4,470 |
| Portofino Landings Cmnty. Dev. D Participating VRDN Series XM 09 38, 1.72% 9/7/22 (Liquidity Facility Bank of America NA) (b)(e)(f) | | 300 | 300 |
TOTAL ILLINOIS | | | 5,470 |
| Kentucky - 0.1% | | | |
| CommonSpirit Health Participating VRDN Series MIZ 90 21, 1.77% 9/7/22 (Liquidity Facility Mizuho Cap. Markets LLC) (b)(e)(f) | | 1,700 | 1,700 |
| Kentucky State Property & Buildings Commission Rev. Bonds Series G 116, 1.87%, tender 11/1/22 (Liquidity Facility Royal Bank of Canada) (b)(e)(f)(g) | | 500 | 500 |
TOTAL KENTUCKY | | | 2,200 |
| Maryland - 0.1% | | | |
| Baltimore Proj. Rev. Bonds Series Floaters G 28, 1.87%, tender 1/3/23 (Liquidity Facility Royal Bank of Canada) (b)(e)(f)(g) | | 1,300 | 1,300 |
| Michigan - 0.0% | | | |
| Mclaren Health Care Corp. Participating VRDN Series XL 02 71, 1.77% 9/7/22 (Liquidity Facility Bank of America NA) (b)(e)(f) | | 400 | 400 |
| New York - 0.0% | | | |
| New York City Gen. Oblig. Participating VRDN Series 2020 003, 1.82% 10/12/22 (Liquidity Facility Wells Fargo Bank NA) (b)(e)(f) | | 700 | 700 |
| Ohio - 0.2% | | | |
| Cuyahoga County Ctfs. of Prtn. Participating VRDN Series Floaters XG 02 06, 1.77% 9/7/22 (Liquidity Facility Bank of America NA) (b)(e)(f) | | 400 | 400 |
| Middletown Hosp. Facilities Rev. Participating VRDN Series Floaters 003, 1.82% 10/12/22 (Liquidity Facility Barclays Bank PLC) (b)(e)(f) | | 1,090 | 1,090 |
| Ohio Hosp. Rev. Participating VRDN Series 002, 1.82% 10/12/22 (Liquidity Facility Barclays Bank PLC) (b)(e)(f) | | 2,700 | 2,700 |
| Ohio Univ. Gen. Receipts Athens Bonds Series Floaters G 27, 1.87%, tender 12/1/22 (Liquidity Facility Royal Bank of Canada) (b)(e)(f)(g) | | 1,100 | 1,100 |
TOTAL OHIO | | | 5,290 |
| Pennsylvania - 0.1% | | | |
| Geisinger Auth. Health Sys. Rev. Participating VRDN Series Floaters YX 10 49, 1.75% 9/7/22 (Liquidity Facility Barclays Bank PLC) (b)(e)(f) | | 1,595 | 1,595 |
| South Carolina - 0.1% | | | |
| South Carolina Trans. Infrastructure Bank Rev. Bonds Series Floaters G 109, 1.87%, tender 4/3/23 (Liquidity Facility Royal Bank of Canada) (b)(e)(f)(g) | | 800 | 800 |
| Texas - 0.1% | | | |
| North Ft. Bend Wtr. Auth. Participating VRDN Series XF 08 16, 1.77% 9/7/22 (Liquidity Facility JPMorgan Chase Bank) (b)(e)(f) | | 1,925 | 1,925 |
| Virginia - 0.0% | | | |
| Virginia Pub. Bldg. Auth. Pub. Facilities Rev. Bonds Series Floaters G 40, 1.87%, tender 2/1/23 (Liquidity Facility Royal Bank of Canada) (b)(e)(f)(g) | | 700 | 700 |
| TOTAL TENDER OPTION BOND (Cost $1,322,104) | | | 1,322,104 |
| | | | |
| Other Municipal Security - 19.5% |
| | | Principal Amount (a) (000s) | Value ($) (000s) |
| California - 19.5% | | | |
| California Edl. Facilities Auth. Rev. Bonds Series 2022 S3: | | | |
| 1.35% tender 9/22/22, CP mode | | 38,600 | 38,600 |
| 1.35% tender 9/22/22, CP mode | | 1,700 | 1,700 |
| California Gen. Oblig.: | | | |
| Bonds: | | | |
Series 2011, 5% 10/1/22 | | 1,000 | 1,002 |
Series 2019, 5% 10/1/22 | | 12,400 | 12,436 |
Series 2020, 5% 10/1/22 | | 1,885 | 1,890 |
| Series 2002 A3, 1.4% 9/13/22, LOC UBS AG, CP | | 17,500 | 17,500 |
| Series 2022 A1: | | | |
1.88% 10/4/22, LOC Wells Fargo Bank NA, CP | | 5,635 | 5,635 |
1.97% 10/27/22, LOC Wells Fargo Bank NA, CP | | 13,200 | 13,200 |
| Series 2022 A2, 1.13% 9/15/22, LOC Royal Bank of Canada, CP | | 10,000 | 10,000 |
| Series 2022 A4: | | | |
1.8% 9/22/22, LOC Toronto-Dominion Bank, CP | | 8,000 | 8,000 |
1.99% 11/3/22, LOC Toronto-Dominion Bank, CP | | 13,900 | 13,900 |
| Series 2022 A7, 1.87% 10/18/22, LOC State Street Bank & Trust Co., Boston, CP | | 19,600 | 19,600 |
| California Health Facilities Fing. Auth. Rev. Bonds: | | | |
| (Stanford Hosp. & Clinics Proj.) Series 2008 B2, 1.35%, tender 9/8/22 (b) | | 14,000 | 14,000 |
| Series 2009 C, 5%, tender 10/18/22 (b) | | 610 | 613 |
| Series 2009 D, 1.7%, tender 10/18/22 (b) | | 1,305 | 1,305 |
| Series 2017 A: | | | |
5%, tender 11/1/22 (b) | | 2,000 | 2,010 |
5%, tender 11/1/22 (b) | | 1,285 | 1,291 |
| Series 2017 C, 5%, tender 11/1/22 (b) | | 10,830 | 10,894 |
| California Pub. Works Board Lease Rev. Bonds Series 2014 A, 5% 9/1/22 | | 1,000 | 1,000 |
| East Bay Muni. Util. District Wastewtr. Sys. Rev.: | | | |
| Series 2022 A1: | | | |
1.12% 9/1/22 (Liquidity Facility Sumitomo Mitsui Banking Corp.), CP | | 19,000 | 19,000 |
1.4% 10/5/22 (Liquidity Facility Sumitomo Mitsui Banking Corp.), CP | | 2,000 | 2,000 |
| Series 2022 A2: | | | |
1.78% 10/5/22 (Liquidity Facility Bank of America NA), CP | | 14,300 | 14,300 |
1.85% 11/8/22 (Liquidity Facility Bank of America NA), CP | | 8,000 | 8,000 |
1.9% 11/8/22 (Liquidity Facility Bank of America NA), CP | | 4,000 | 4,000 |
| Los Angeles County Cap. Asset Leasing Corp. Lease Rev. Series 2022 B: | | | |
| 1.82% 10/20/22, LOC U.S. Bank NA, Cincinnati, CP | | 9,000 | 9,000 |
| 1.87% 10/19/22, LOC U.S. Bank NA, Cincinnati, CP | | 6,200 | 6,200 |
| Los Angeles County Gen. Oblig. Series 2022 D, 1.58% 9/7/22, LOC State Street Bank & Trust Co., Boston, CP | | 26,650 | 26,650 |
| Los Angeles County Metropolitan Trans. Auth. Sales Tax Rev. Series 2022 ATE, 1.95% 11/15/22, LOC Bank of America NA, CP | | 3,000 | 3,000 |
| Los Angeles County Pub. Works Fing. Auth. Lease Rev. Bonds Series 2022 G, 5% 12/1/22 | | 1,000 | 1,007 |
| Los Angeles Gen. Oblig. TRAN Series 2022, 4% 6/29/23 | | 25,500 | 25,834 |
| Los Angeles Muni. Impt. Corp. Lease Rev.: | | | |
| Series 2022 A1, 1.88% 10/13/22, LOC BMO Harris Bank NA, CP | | 14,500 | 14,500 |
| Series 2022 A2: | | | |
1.85% 9/8/22, LOC Bank of America NA, CP | | 7,200 | 7,200 |
1.86% 10/13/22, LOC Bank of America NA, CP | | 2,200 | 2,200 |
| Series 2022 A3: | | | |
1.87% 10/13/22, LOC U.S. Bank NA, Cincinnati, CP | | 6,000 | 6,000 |
1.89% 10/13/22, LOC U.S. Bank NA, Cincinnati, CP | | 11,000 | 11,000 |
| Los Angeles Unified School District Bonds Series A, 5% 7/1/23 | | 6,000 | 6,138 |
| Riverside County Gen. Oblig. TRAN Series 2022, 5% 6/30/23 | | 9,000 | 9,208 |
| Sacramento Muni. Util. District Elec. Rev. Series 2022 M1, 1.95% 11/3/22, LOC Bank of America NA, CP | | 17,000 | 17,000 |
| San Diego County Reg'l. Trans. Commission Sales Tax Rev. Series 2022 B, 1.25% 9/1/22, LOC Bank of America NA, CP | | 3,550 | 3,550 |
| San Francisco City & County Arpts. Commission Int'l. Arpt. Rev. Series 2022 B4, 1.25% 10/4/22, LOC U.S. Bank NA, Cincinnati, CP | | 4,080 | 4,080 |
| San Francisco City & County Pub. Util. Commission Wastewtr. Rev.: | | | |
| Series 2022 A1: | | | |
1.3% 9/13/22, LOC Sumitomo Mitsui Banking Corp., CP | | 18,119 | 18,119 |
1.58% 9/7/22, LOC Sumitomo Mitsui Banking Corp., CP | | 10,080 | 10,080 |
| Series 2022 A2: | | | |
1.67% 10/5/22, LOC Bank of America NA, CP | | 26,500 | 26,500 |
1.82% 10/4/22, LOC Sumitomo Mitsui Banking Corp., CP | | 20,000 | 20,000 |
| Santa Clara Valley Wtr. District Wtr. Util. Rev. Series 2022 A: | | | |
| 1.18% 9/8/22, LOC MUFG Bank Ltd., CP | | 17,530 | 17,530 |
| 1.43% 9/8/22, LOC MUFG Bank Ltd., CP | | 5,000 | 5,000 |
| 1.57% 9/8/22, LOC MUFG Bank Ltd., CP | | 11,400 | 11,400 |
| Univ. of California Revs. Bonds Series 2013 AK, 5%, tender 5/15/23 (b) | | 10,000 | 10,191 |
| Walnut Energy Ctr. Auth. Rev. Series 2022 B, 1.65% 11/3/22, LOC Wells Fargo Bank NA, CP | | 19,331 | 19,331 |
TOTAL CALIFORNIA | | | 512,594 |
| Michigan - 0.0% | | | |
| Kent Hosp. Fin. Auth. Hosp. Facilities Rev. Bonds (Spectrum Health Sys. Proj.) Series 2015 A, SIFMA Municipal Swap Index + 0.250% 1.92%, tender 3/29/23 (b)(h) | | 200 | 200 |
| TOTAL OTHER MUNICIPAL SECURITY (Cost $512,794) | | | 512,794 |
| | | | |
| Investment Company - 14.5% |
| | | Shares | Value ($) (000s) |
Fidelity Tax-Free Cash Central Fund 1.35% (i)(j) (Cost $380,647) | | 380,542 | 380,647 |
| | | | |
| TOTAL INVESTMENT IN SECURITIES - 98.6% (Cost $2,589,139) | 2,589,139 |
NET OTHER ASSETS (LIABILITIES) - 1.4% | 37,398 |
| NET ASSETS - 100.0% | 2,626,537 |
| | |
Security Type Abbreviations
| CP | - | COMMERCIAL PAPER |
| TRAN | - | TAX AND REVENUE ANTICIPATION NOTE |
| VRDN | - | VARIABLE RATE DEMAND NOTE (A debt instrument that is payable upon demand, either daily, weekly or monthly) |
The date shown for securities represents the date when principal payments must be paid, taking into account any call options exercised by the issuer and any permissible maturity shortening features other than interest rate resets
Any values shown as $0 in the Schedule of Investments may reflect amounts less than $500.
Legend
| (a) | Amount is stated in United States dollars unless otherwise noted. |
| (b) | Coupon rates for floating and adjustable rate securities reflect the rates in effect at period end. |
| (c) | Security or a portion of the security purchased on a delayed delivery or when-issued basis. |
| (d) | A portion of the security sold on a delayed delivery basis. |
| (e) | Provides evidence of ownership in one or more underlying municipal bonds. |
| (f) | Coupon rates are determined by re-marketing agents based on current market conditions. |
| (g) | Restricted securities (including private placements) - Investment in securities not registered under the Securities Act of 1933 (excluding 144A issues). At the end of the period, the value of restricted securities (excluding 144A issues) amounted to $8,540,000 or 0.3% of net assets. |
| (h) | Coupon is indexed to a floating interest rate which may be multiplied by a specified factor and/or subject to caps or floors. |
| (i) | Information in this report regarding holdings by state and security types does not reflect the holdings of the Fidelity Tax-Free Cash Central Fund. |
| (j) | Affiliated fund that is generally available only to investment companies and other accounts managed by Fidelity Investments. The rate quoted is the annualized seven-day yield of the fund at period end. A complete unaudited listing of the fund's holdings as of its most recent quarter end is available upon request. In addition, each Fidelity Central Fund's financial statements are available on the SEC's website or upon request. |
| Additional information on each restricted holding is as follows: |
| Security | Acquisition Date | Cost ($) (000s) |
| Baltimore Proj. Rev. Bonds Series Floaters G 28, 1.87%, tender 1/3/23 (Liquidity Facility Royal Bank of Canada) | 7/01/21 | 1,300 |
| Connecticut Spl. Tax Oblig. Trans. Infrastructure Rev. Bonds Series Floaters G 110, 1.85%, tender 4/3/23 (Liquidity Facility Royal Bank of Canada) | 4/01/21 | 2,650 |
| Kentucky State Property & Buildings Commission Rev. Bonds Series G 116, 1.87%, tender 11/1/22 (Liquidity Facility Royal Bank of Canada) | 5/03/21 | 500 |
| Ohio Univ. Gen. Receipts Athens Bonds Series Floaters G 27, 1.87%, tender 12/1/22 (Liquidity Facility Royal Bank of Canada) | 6/01/21 | 1,100 |
| Sacramento Area Flood Cont. Agcy. Bonds Series G 118, 1.82%, tender 4/3/23 (Liquidity Facility Royal Bank of Canada) | 4/01/21 | 1,490 |
| South Carolina Trans. Infrastructure Bank Rev. Bonds Series Floaters G 109, 1.87%, tender 4/3/23 (Liquidity Facility Royal Bank of Canada) | 4/01/21 | 800 |
| Virginia Pub. Bldg. Auth. Pub. Facilities Rev. Bonds Series Floaters G 40, 1.87%, tender 2/1/23 (Liquidity Facility Royal Bank of Canada) | 2/01/21 | 700 |
Affiliated Central Funds
Fiscal year to date information regarding the Fund's investments in Fidelity Central Funds, including the ownership percentage, is presented below.
| Affiliate (Amounts in thousands) | Value, beginning of period ($) | Purchases ($) | Sales Proceeds ($) | Dividend Income ($) | Realized Gain (loss) ($) | Change in Unrealized appreciation (depreciation) ($) | Value, end of period ($) | %ownership, end of period |
| Fidelity Tax-Free Cash Central Fund 1.35% | 126,140 | 946,351 | 691,844 | 1,131 | - | - | 380,647 | 15.3% |
| Total | 126,140 | 946,351 | 691,844 | 1,131 | - | - | 380,647 | |
| | | | | | | | | |
Amounts in the income column in the above table include any capital gain distributions from underlying funds, which are presented in the corresponding line item in the Statement of Operations, if applicable.
Investment Valuation
All investments are categorized as Level 2 under the Fair Value Hierarchy. The inputs or methodology used for valuing securities may not be an indication of the risk associated with investing in these securities. For more information on valuation inputs, refer to the Investment Valuation section in the accompanying Notes to Financial Statements.
| Statement of Assets and Liabilities |
| Amounts in thousands (except per-share amounts) | | | | August 31, 2022 (Unaudited) |
| | | | | |
| Assets | | | | |
| Investment in securities, at value - See accompanying schedule: | | $2,208,492 | | |
Unaffiliated issuers (cost $2,208,492) | | | |
Fidelity Central Funds (cost $380,647) | | 380,647 | | |
| | | | | |
| Total Investment in Securities (cost $2,589,139) | | | $ | 2,589,139 |
| Cash | | | | 476 |
| Receivable for investments sold | | | | |
Regular delivery | | | | 10,000 |
Delayed delivery | | | | 17,000 |
| Receivable for fund shares sold | | | | 21,997 |
| Interest receivable | | | | 6,086 |
| Distributions receivable from Fidelity Central Funds | | | | 476 |
| Receivable from investment adviser for expense reductions | | | | 78 |
| Other receivables | | | | 3 |
Total assets | | | | 2,645,255 |
| Liabilities | | | | |
| Payable for investments purchased | | | | |
Regular delivery | | $1,301 | | |
Delayed delivery | | 800 | | |
| Payable for fund shares redeemed | | 15,722 | | |
| Distributions payable | | 349 | | |
| Accrued management fee | | 421 | | |
| Other affiliated payables | | 125 | | |
| Total Liabilities | | | | 18,718 |
| Net Assets | | | $ | 2,626,537 |
| Net Assets consist of: | | | | |
| Paid in capital | | | $ | 2,626,341 |
| Total accumulated earnings (loss) | | | | 196 |
| Net Assets | | | $ | 2,626,537 |
| | | | | |
| Net Asset Value and Maximum Offering Price | | | | |
| Fidelity California AMT Tax-Free Money Market Fund : | | | | |
Net Asset Value , offering price and redemption price per share ($499,860 ÷ 499,472 shares) | | | $ | 1.00 |
| Institutional Class : | | | | |
Net Asset Value , offering price and redemption price per share ($2,126,677 ÷ 2,124,977 shares) | | | $ | 1.00 |
| Statement of Operations |
| Amounts in thousands | | | | Six months ended August 31, 2022 (Unaudited) |
| Investment Income | | | | |
| Interest | | | $ | 9,244 |
| Income from Fidelity Central Funds | | | | 1,131 |
| Total Income | | | | 10,375 |
| Expenses | | | | |
| Management fee | $ | 2,400 | | |
| Transfer agent fees | | 719 | | |
| Independent trustees' fees and expenses | | 3 | | |
| Total expenses before reductions | | 3,122 | | |
| Expense reductions | | (477) | | |
| Total expenses after reductions | | | | 2,645 |
| Net Investment income (loss) | | | | 7,730 |
| Realized and Unrealized Gain (Loss) | | | | |
| Net realized gain (loss) on: | | | | |
| Investment Securities: | | | | |
| Unaffiliated issuers | | 39 | | |
| Total net realized gain (loss) | | | | 39 |
| Net increase in net assets resulting from operations | | | $ | 7,769 |
| Statement of Changes in Net Assets |
| |
| Amount in thousands | | Six months ended August 31, 2022 (Unaudited) | | Year ended February 28, 2022 |
| Increase (Decrease) in Net Assets | | | | |
| Operations | | | | |
| Net investment income (loss) | $ | 7,730 | $ | 229 |
| Net realized gain (loss) | | 39 | | 582 |
Net increase in net assets resulting from operations | | 7,769 | | 811 |
| Distributions to shareholders | | (7,730) | | (229) |
| Share transactions - net increase (decrease) | | 657,495 | | (509,898) |
| Total increase (decrease) in net assets | | 657,534 | | (509,316) |
| | | | | |
| Net Assets | | | | |
| Beginning of period | | 1,969,003 | | 2,478,319 |
| End of period | $ | 2,626,537 | $ | 1,969,003 |
| | | | | |
| | | | | |
| Fidelity® California AMT Tax-Free Money Market Fund |
| |
| | Six months ended (Unaudited) August 31, 2022 | | Years ended February 28, 2022 | | 2021 | | 2020 A | | 2019 | | 2018 |
Selected Per-Share Data | | | | | | | | | | | | |
| Net asset value, beginning of period | $ | 1.00 | $ | 1.00 | $ | 1.00 | $ | 1.00 | $ | 1.00 | $ | 1.00 |
| Income from Investment Operations | | | | | | | | | | | | |
Net investment income (loss) B | | .003 | | - C | | .002 | | .011 | | .012 | | .006 |
Net realized and unrealized gain (loss) C | | - | | - | | - | | - | | - | | - |
| Total from investment operations | | .003 | | - C | | .002 | | .011 | | .012 | | .006 |
| Distributions from net investment income | | (.003) | | - C | | (.002) | | (.011) | | (.012) | | (.006) |
| Distributions from net realized gain | | - | | - | | - C | | - C | | - C | | - C |
| Total distributions | | (.003) | | - C | | (.002) | | (.011) | | (.012) | | (.006) |
| Net asset value, end of period | $ | 1.00 | $ | 1.00 | $ | 1.00 | $ | 1.00 | $ | 1.00 | $ | 1.00 |
Total Return D,E | | .27% | | .01% | | .22% | | 1.06% | | 1.19% | | .65% |
Ratios to Average Net Assets B,F,G | | | | | | | | | | | | |
| Expenses before reductions | | .30% H | | .30% | | .30% | | .30% | | .30% | | .30% |
| Expenses net of fee waivers, if any | | .30% H | | .09% | | .22% | | .30% | | .30% | | .30% |
| Expenses net of all reductions | | .30% H | | .09% | | .22% | | .30% | | .30% | | .30% |
| Net investment income (loss) | | .56% H | | .01% | | .25% | | 1.04% | | 1.19% | | .66% |
| Supplemental Data | | | | | | | | | | | | |
| Net assets, end of period (in millions) | $ | 500 | $ | 446 | $ | 513 | $ | 675 | $ | 686 | $ | 465 |
A For the year ended February 29.
B Net investment income (loss) is affected by the timing of the declaration of dividends by any underlying mutual funds or exchange-traded funds (ETFs). Net investment income (loss) of any such underlying funds is not included in the Fund's net investment income (loss) ratio.
C Amount represents less than $.0005 per share.
D Total returns for periods of less than one year are not annualized.
E Total returns would have been lower if certain expenses had not been reduced during the applicable periods shown.
F Fees and expenses of any underlying mutual funds or exchange-traded funds (ETFs) are not included in the Fund's expense ratio. The Fund indirectly bears its proportionate share of these expenses. For additional expense information related to investments in Fidelity Central Funds, please refer to the "Investments in Fidelity Central Funds" note found in the Notes to Financial Statements section of the most recent Annual or Semi-Annual report.
G Expense ratios reflect operating expenses of the class. Expenses before reductions do not reflect amounts reimbursed, waived, or reduced through arrangements with the investment adviser, brokerage services, or other offset arrangements, if applicable, and do not represent the amount paid by the class during periods when reimbursements, waivers or reductions occur.
H Annualized
| Fidelity® California AMT Tax-Free Money Market Fund Institutional Class |
| |
| | Six months ended (Unaudited) August 31, 2022 | | Years ended February 28, 2022 | | 2021 | | 2020 A | | 2019 | | 2018 |
Selected Per-Share Data | | | | | | | | | | | | |
| Net asset value, beginning of period | $ | 1.00 | $ | 1.00 | $ | 1.00 | $ | 1.00 | $ | 1.00 | $ | 1.00 |
| Income from Investment Operations | | | | | | | | | | | | |
Net investment income (loss) B | | .003 | | - C | | .003 | | .012 | | .013 | | .007 |
Net realized and unrealized gain (loss) C | | - | | - | | - | | - | | - | | - |
| Total from investment operations | | .003 | | - C | | .003 | | .012 | | .013 | | .007 |
| Distributions from net investment income | | (.003) | | - C | | (.003) | | (.012) | | (.013) | | (.007) |
| Distributions from net realized gain | | - | | - | | - C | | - C | | - C | | - C |
| Total distributions | | (.003) | | - C | | (.003) | | (.012) | | (.013) | | (.007) |
| Net asset value, end of period | $ | 1.00 | $ | 1.00 | $ | 1.00 | $ | 1.00 | $ | 1.00 | $ | 1.00 |
Total Return D,E | | .32% | | .01% | | .26% | | 1.16% | | 1.29% | | .75% |
Ratios to Average Net Assets B,F,G | | | | | | | | | | | | |
| Expenses before reductions | | .25% H | | .25% | | .25% | | .25% | | .25% | | .25% |
| Expenses net of fee waivers, if any | | .20% H | | .09% | | .18% | | .20% | | .20% | | .20% |
| Expenses net of all reductions | | .20% H | | .09% | | .18% | | .20% | | .20% | | .20% |
| Net investment income (loss) | | .66% H | | .01% | | .29% | | 1.14% | | 1.29% | | .76% |
| Supplemental Data | | | | | | | | | | | | |
| Net assets, end of period (in millions) | $ | 2,127 | $ | 1,523 | $ | 1,963 | $ | 3,527 | $ | 2,775 | $ | 1,719 |
A For the year ended February 29.
B Net investment income (loss) is affected by the timing of the declaration of dividends by any underlying mutual funds or exchange-traded funds (ETFs). Net investment income (loss) of any such underlying funds is not included in the Fund's net investment income (loss) ratio.
C Amount represents less than $.0005 per share.
D Total returns for periods of less than one year are not annualized.
E Total returns would have been lower if certain expenses had not been reduced during the applicable periods shown.
F Fees and expenses of any underlying mutual funds or exchange-traded funds (ETFs) are not included in the Fund's expense ratio. The Fund indirectly bears its proportionate share of these expenses. For additional expense information related to investments in Fidelity Central Funds, please refer to the "Investments in Fidelity Central Funds" note found in the Notes to Financial Statements section of the most recent Annual or Semi-Annual report.
G Expense ratios reflect operating expenses of the class. Expenses before reductions do not reflect amounts reimbursed, waived, or reduced through arrangements with the investment adviser, brokerage services, or other offset arrangements, if applicable, and do not represent the amount paid by the class during periods when reimbursements, waivers or reductions occur.
H Annualized
For the period ended August 31, 2022
( Amounts in thousands except percentages)
1. Organization.
Fidelity California AMT Tax-Free Money Market Fund (the Fund) is a fund of Fidelity California Municipal Trust II (the Trust) and is authorized to issue an unlimited number of shares. The Trust is registered under the Investment Company Act of 1940, as amended (the 1940 Act), as an open-end management investment company organized as a Delaware statutory trust. The Fund offers California AMT Tax-Free Money Market and Institutional Class shares, each of which has equal rights as to assets and voting privileges. In July 2022, the Board of Trustees approved a plan of liquidation for Service Class of the Fund; and Service Class was liquidated on August 12, 2022. Each class has exclusive voting rights with respect to matters that affect that class. Shares of the Fund are only available for purchase by retail shareholders. The Fund may be affected by economic and political developments in the state of California.
In July 2022, the Board of Trustees approved a change in the name of Fidelity California AMT Tax-Free Money Market Fund to Fidelity California Municipal Money Market Fund. In addition, the California AMT Tax-Free Money Market class of shares were renamed Premium Class. These changes were effective September 16, 2022.
2. Investments in Fidelity Central Funds.
Funds may invest in Fidelity Central Funds, which are open-end investment companies generally available only to other investment companies and accounts managed by the investment adviser and its affiliates. The Schedule of Investments lists any Fidelity Central Funds held as an investment as of period end, but does not include the underlying holdings of each Fidelity Central Fund. An investing fund indirectly bears its proportionate share of the expenses of the underlying Fidelity Central Funds.
Based on its investment objective, each Fidelity Central Fund may invest or participate in various investment vehicles or strategies that are similar to those of the investing fund. These strategies are consistent with the investment objectives of the investing fund and may involve certain economic risks which may cause a decline in value of each of the Fidelity Central Funds and thus a decline in the value of the investing fund.
| Fidelity Central Fund+ | Investment Manager | Investment Objective | Investment Practices | Expense Ratio A |
| Fidelity Money Market Central Funds | Fidelity Management & Research Company LLC (FMR) | Each fund seeks to obtain a high level of current income consistent with the preservation of capital and liquidity. | Short-term Investments | Less than .005% |
A Expenses expressed as a percentage of average net assets and are as of each underlying Central Fund's most recent annual or semi-annual shareholder report.
A complete unaudited list of holdings for each Fidelity Central Fund is available upon request or at the Securities and Exchange Commission website at www.sec.gov. In addition, the financial statements of the Fidelity Central Funds which contain the significant accounting policies (including investment valuation policies) of those funds, and are not covered by the Report of Independent Registered Public Accounting Firm, are available on the Securities and Exchange Commission website or upon request.
3. Significant Accounting Policies.
The Fund is an investment company and applies the accounting and reporting guidance of the Financial Accounting Standards Board (FASB) Accounting Standards Codification Topic 946 Financial Services - Investment Companies . The financial statements have been prepared in conformity with accounting principles generally accepted in the United States of America (GAAP), which require management to make certain estimates and assumptions at the date of the financial statements. Actual results could differ from those estimates. Subsequent events, if any, through the date that the financial statements were issued have been evaluated in the preparation of the financial statements. The Fund's Schedule of Investments lists any underlying mutual funds or exchange-traded funds (ETFs) but does not include the underlying holdings of these funds. The following summarizes the significant accounting policies of the Fund:
Investment Valuation. The Fund categorizes the inputs to valuation techniques used to value its investments into a disclosure hierarchy consisting of three levels as shown below:
Level 1 - unadjusted quoted prices in active markets for identical investments
Level 2 - other significant observable inputs (including quoted prices for similar investments, interest rates, prepayment speeds, etc.)
Level 3 - unobservable inputs (including the Fund's own assumptions based on the best information available)
As permitted by compliance with certain conditions under Rule 2a-7 of the 1940 Act, securities are valued at amortized cost, which approximates fair value. The amortized cost of an instrument is determined by valuing it at its original cost and thereafter amortizing any discount or premium from its face value at a constant rate until maturity. Securities held by a money market fund are generally high quality and liquid; however, they are reflected as Level 2 because the inputs used to determine fair value are not quoted prices in an active market.
Investment Transactions and Income. The net asset value per share for processing shareholder transactions is calculated as of the close of business of the New York Stock Exchange (NYSE), normally 4:00 p.m. Eastern time. Security transactions, including the Fund's investment activity in the Fidelity Central Funds, are accounted for as of trade date. Gains and losses on securities sold are determined on the basis of identified cost. Income and capital gain distributions from Fidelity Central Funds, if any, are recorded on the ex-dividend date. Interest income is accrued as earned and includes coupon interest and amortization of premium and accretion of discount on debt securities as applicable.
Class Allocations and Expenses. Investment income, realized and unrealized capital gains and losses, common expenses of a fund, and certain fund-level expense reductions, if any, are allocated daily on a pro-rata basis to each class based on the relative net assets of each class to the total net assets of a fund. Each class differs with respect to transfer agent and distribution and service plan fees incurred, as applicable. Certain expense reductions may also differ by class, if applicable. For the reporting period, the allocated portion of income and expenses to each class as a percent of its average net assets may vary due to the timing of recording these transactions in relation to fluctuating net assets of the classes. Expenses directly attributable to a fund are charged to that fund. Expenses attributable to more than one fund are allocated among the respective funds on the basis of relative net assets or other appropriate methods. Expenses included in the accompanying financial statements reflect the expenses of that fund and do not include any expenses associated with any underlying mutual funds or exchange-traded funds. Although not included in a fund's expenses, a fund indirectly bears its proportionate share of these expenses through the net asset value of each underlying mutual fund or exchange-traded fund. Expense estimates are accrued in the period to which they relate and adjustments are made when actual amounts are known.
Income Tax Information and Distributions to Shareholders. Each year, the Fund intends to qualify as a regulated investment company under Subchapter M of the Internal Revenue Code, including distributing substantially all of its taxable income and realized gains. As a result, no provision for U.S. Federal income taxes is required. The Fund files a U.S. federal tax return, in addition to state and local tax returns as required. The Fund's federal income tax returns are subject to examination by the Internal Revenue Service (IRS) for a period of three fiscal years after they are filed. State and local tax returns may be subject to examination for an additional fiscal year depending on the jurisdiction.
Distributions are declared and recorded daily and paid monthly from net investment income. Distributions from realized gains, if any, are declared and recorded on the ex-dividend date. Income and capital gain distributions are declared separately for each class. Income and capital gain distributions are determined in accordance with income tax regulations, which may differ from GAAP.
Capital accounts within the financial statements are adjusted for permanent book-tax differences. These adjustments have no impact on net assets or the results of operations. Capital accounts are not adjusted for temporary book-tax differences which will reverse in a subsequent period.
The Fund purchases municipal securities whose interest, in the opinion of the issuer, is free from federal income tax. There is no assurance that the IRS will agree with this opinion. In the event the IRS determines that the issuer does not comply with relevant tax requirements, interest payments from a security could become federally taxable, possibly retroactively to the date the security was issued.
As of period end, the cost and unrealized appreciation (depreciation) in securities for federal income tax purposes were as follows:
| Gross unrealized appreciation | $ - |
| Gross unrealized depreciation | - |
| Net unrealized appreciation (depreciation) | $ - |
| Tax cost | $ 2,589,139 |
Delayed Delivery Transactions and When-Issued Securities. During the period, certain Funds transacted in securities on a delayed delivery or when-issued basis. Payment and delivery may take place after the customary settlement period for that security. The price of the underlying securities and the date when the securities will be delivered and paid for are fixed at the time the transaction is negotiated. Securities purchased on a delayed delivery or when-issued basis are identified as such in the Schedule of Investments. Compensation for interest forgone in the purchase of a delayed delivery or when-issued debt security may be received. With respect to purchase commitments, each applicable Fund identifies securities as segregated in its records with a value at least equal to the amount of the commitment. Payables and receivables associated with the purchases and sales of delayed delivery securities having the same coupon, settlement date and broker are offset. Delayed delivery or when-issued securities that have been purchased from and sold to different brokers are reflected as both payables and receivables in the Statement of Assets and Liabilities under the caption "Delayed delivery", as applicable. Losses may arise due to changes in the value of the underlying securities or if the counterparty does not perform under the contract's terms, or if the issuer does not issue the securities due to political, economic, or other factors.
Restricted Securities (including Private Placements). Funds may invest in securities that are subject to legal or contractual restrictions on resale. These securities generally may be resold in transactions exempt from registration or to the public if the securities are registered. Disposal of these securities may involve time-consuming negotiations and expense, and prompt sale at an acceptable price may be difficult. Information regarding restricted securities held at period end is included at the end of the Schedule of Investments, if applicable.
4. Fees and Other Transactions with Affiliates.
Management Fee and Expense Contract. Fidelity Management & Research Company LLC (the investment adviser) and its affiliates provide the Fund with investment management related services for which the Fund pays a monthly management fee that is based on an annual rate of .20% of the Fund's average net assets. Under the management contract, the investment adviser pays all other fund-level expenses, except the compensation of the independent Trustees and certain other expenses such as interest expense. The management fee is reduced by an amount equal to the fees and expenses paid by the Fund to the independent Trustees.
In addition, under the expense contract, the investment adviser pays class-level expenses for Fidelity California AMT Tax-Free Money Market Fund so that the total expenses do not exceed .35%, expressed as a percentage of class average net assets, with certain exceptions such as interest expense.
Distribution and Service Plan Fees. In accordance with Rule 12b-1 of the 1940 Act, the Fund has adopted separate Distribution and Service Plans for each class of shares. Service Class pays Fidelity Distributors Company LLC (FDC), an affiliate of the investment adviser, a Service Fee based on an annual percentage of Service Class' average net assets. In addition, FDC may pay financial intermediaries for selling shares of the Fund and providing shareholder support services. For the period, the Service Fee rate, total service fees and amounts retained by FDC were as follows:
| | Service Fee | Total Fees | Retained by FDC |
| Service Class | .25% | $- A | $- A |
A Amount represents less than five hundred dollars.
During the period, the investment adviser or its affiliates waived a portion of these fees.
Transfer Agent Fees. Fidelity Investments Institutional Operations Company LLC (FIIOC), an affiliate of the investment adviser, is the transfer, dividend disbursing and shareholder servicing agent for the Fund. FIIOC receives asset-based fees with respect to each account. FIIOC pays for typesetting, printing and mailing of shareholder reports, except proxy statements. Each class, with the exception of California AMT Tax-Free Money Market, pays a transfer agent fee equal to an annual rate of .05% of class-level average net assets. California AMT Tax-Free Money Market pays a transfer agent fee equal to an annual rate of .10% of class-level average net assets. For the period, transfer agent fees for each class were as follows:
| | Amount |
| Fidelity California AMT Tax-Free Money Market Fund | $ 236 |
| Institutional Class | 483 |
| | $ 719 |
During the period, the investment adviser or its affiliates waived a portion of these fees.
Interfund Trades. Funds may purchase from or sell securities to other Fidelity Funds under procedures adopted by the Board. The procedures have been designed to ensure these interfund trades are executed in accordance with Rule 17a-7 of the 1940 Act. Interfund trades during the period are noted in the table below.
| | Purchases ($) | Sales ($) | Realized Gain (Loss) ($) |
| Fidelity California AMT Tax-Free Money Market Fund | 106,420 | 22,440 | - |
5. Expense Reductions.
The investment adviser contractually agreed to reimburse Institutional Class and Service Class to the extent annual operating expenses, expressed as a percentage of each class' average net assets, exceed .20% and .45%, respectively. Some expenses, for example the compensation of the independent Trustees and certain other expenses such as interest expense, are excluded from this reimbursement. During the period, this reimbursement reduced Institutional Class and Service Class expenses by $468 and an amount of less than five hundred dollars, respectively.
Additionally, the investment adviser or its affiliates voluntarily agreed to waive certain fees in order to avoid a negative yield. Such arrangements may be discontinued by the investment adviser at any time. For the period, the amount of the waiver for each class was as follows:
| Fidelity California AMT Tax-Free Money Market Fund | $5 |
| Service Class | $- A |
A Amount represents less than five hundred dollars.
Through arrangements with the Fund's custodian and each class' transfer agent, credits realized as a result of certain uninvested cash balances were used to reduce the Fund's expenses. During the period, custodian credits reduced the Fund's expenses by $4.
6. Distributions to Shareholders.
Distributions to shareholders of each class were as follows:
| | Six months ended August 31, 2022 | Year ended February 28, 2022 |
| Fidelity California AMT Tax-Free Money Market Fund | | |
| Distributions to shareholders | | |
| Fidelity California AMT Tax-Free Money Market Fund | $ 1,303 | $47 |
| Institutional Class | 6,427 | 182 |
| Service Class | - A | - A |
Total | $ 7,730 | $ 229 |
A Amount represents less than five hundred dollars.
7. Share Transactions.
Share transactions for each class of shares at a $1.00 per share were as follows and may contain in-kind transactions, automatic conversions between classes or exchanges between affiliated funds:
| | Shares | Shares | Dollars | Dollars |
| | Six months ended August 31, 2022 | Year ended February 28, 2022 | Six months ended August 31, 2022 | Year ended February 28, 2022 |
| Fidelity California AMT Tax-Free Money Market Fund | | | | |
| Shares sold | 187,345 | 161,634 | $ 187,345 | $ 161,634 |
| Reinvestment of distributions | 1,145 | 41 | 1,145 | 41 |
| Shares redeemed | (134,424) | (229,403) | (134,424) | (229,403) |
| Net increase (decrease) | 54,066 | (67,728) | $ 54,066 | $ (67,728) |
| Institutional Class | | | | |
| Shares sold | 1,906,421 | 736,844 | $ 1,906,421 | $ 736,844 |
| Reinvestment of distributions | 5,682 | 164 | 5,682 | 164 |
| Shares redeemed | (1,308,652) | (1,177,686) | (1,308,652) | (1,177,686) |
| Net increase (decrease) | 603,451 | (440,678) | $ 603,451 | $ (440,678) |
| Service Class | | | | |
| Shares sold | 6 | - A | $ 6 | $ - B |
| Shares redeemed | (28) | (1,492) | (28) | (1,492) |
| Net increase (decrease) | (22) | (1,492) | $ (22) | $ (1,492) |
A Amount represents less than five hundred shares.
B Amount represents less than five hundred dollars.
8. Other.
A fund's organizational documents provide former and current trustees and officers with a limited indemnification against liabilities arising in connection with the performance of their duties to the fund. In the normal course of business, a fund may also enter into contracts that provide general indemnifications. A fund's maximum exposure under these arrangements is unknown as this would be dependent on future claims that may be made against a fund. The risk of material loss from such claims is considered remote.
9. Risk and Uncertainties.
Many factors affect a fund's performance. Developments that disrupt global economies and financial markets, such as pandemics, epidemics, outbreaks of infectious diseases, war, terrorism, and environmental disasters, may significantly affect a fund's investment performance. The effects of these developments to a fund will be impacted by the types of securities in which a fund invests, the financial condition, industry, economic sector, and geographic location of an issuer, and a fund's level of investment in the securities of that issuer.
10. Reorganization.
Subsequent to period end, on September 16, 2022, the Fund acquired all of the assets and assumed all of the liabilities of Fidelity California Municipal Money Market Fund ("Target Fund") pursuant to an Agreement and Plan of Reorganization ("Agreements") approved by the Board of Trustees ("The Board"). The securities held by the Target Fund were the primary assets acquired by the Fund. The acquisition was accomplished by an exchange of Premium Class (formerly Fidelity California AMT Tax-Free Money Market Fund Class) of the Fund for shares then outstanding of the Target Fund at its respective net asset value on the acquisition date. The reorganization provides shareholders of the Target Fund access to a larger portfolio with a similar investment objective and lower projected expenses. For financial reporting purposes, the assets and liabilities of the Target Fund and shares issued by the Fund were recorded at fair value; however, the cost basis of the investments received from the Target Fund were carried forward and will be utilized for purposes of the Fund's ongoing reporting of realized and unrealized gains and losses to more closely align subsequent reporting of realized gains with amounts distributable to shareholders for tax purposes. The reorganization qualified as a tax-free reorganization for federal income tax purposes with no gain or loss recognized to the funds or their shareholders.
| Target Fund | Investments $ | Unrealized appreciation (depreciation) $ | Net Assets $ | Shares Exchanged | Shares Exchanged Ratio |
| Fidelity California Municipal Money Market Fund | 1,117,559 | 0 | 1,127,846 | 1,125,928 | 1.0000 |
| Surviving Fund | Net Assets $ | Total net assets after the acquisition $ | | | |
| Fidelity California Municipal Money Market Fund (formerly Fidelity California AMT Tax-Free Money Market Fund) | 2,657,669 | 3,785,515 | | | |
As a shareholder, you incur two types of costs: (1) transaction costs, which may include sales charges (loads) on purchase payments or redemption proceeds, as applicable and (2) ongoing costs, which generally include management fees, distribution and/or service (12b-1) fees and other Fund expenses. This Example is intended to help you understand your ongoing costs (in dollars) of investing in a fund and to compare these costs with the ongoing costs of investing in other mutual funds.
| The Example is based on an investment of $1,000 invested at the beginning of the period and held for the entire period (March 1, 2022 to August 31, 2022). |
Actual Expenses
The first line of the accompanying table provides information about actual account values and actual expenses. You may use the information in this line, together with the amount you invested, to estimate the expenses that you paid over the period. Simply divide your account value by $1,000.00 (for example, an $8,600 account value divided by $1,000.00 = 8.6), then multiply the result by the number in the first line for a class/Fund under the heading entitled "Expenses Paid During Period" to estimate the expenses you paid on your account during this period. If any fund is a shareholder of any underlying mutual funds or exchange-traded funds (ETFs) (the Underlying Funds), such fund indirectly bears its proportional share of the expenses of the Underlying Funds in addition to the direct expenses incurred presented in the table. These fees and expenses are not included in the annualized expense ratio used to calculate the expense estimate in the table below.
Hypothetical Example for Comparison Purposes
The second line of the accompanying table provides information about hypothetical account values and hypothetical expenses based on the actual expense ratio and an assumed rate of return of 5% per year before expenses, which is not the actual return. The hypothetical account values and expenses may not be used to estimate the actual ending account balance or expenses you paid for the period. You may use this information to compare the ongoing costs of investing in the Fund and other funds. To do so, compare this 5% hypothetical example with the 5% hypothetical examples that appear in the shareholder reports of the other funds. If any fund is a shareholder of any Underlying Funds, such fund indirectly bears its proportional share of the expenses of the Underlying Funds in addition to the direct expenses as presented in the table. These fees and expenses are not included in the annualized expense ratio used to calculate the expense estimate in the table below.
Please note that the expenses shown in the table are meant to highlight your ongoing costs only and do not reflect any transaction costs. Therefore, the second line of the table is useful in comparing ongoing costs only, and will not help you determine the relative total costs of owning different funds. In addition, if these transactional costs were included, your costs would have been higher.
| | | | | Annualized Expense Ratio- A | | Beginning Account Value March 1, 2022 | | Ending Account Value August 31, 2022 | | Expenses Paid During Period- C March 1, 2022 to August 31, 2022 |
| Fidelity® California AMT Tax-Free Money Market Fund | | | | | | | | | | |
| Fidelity® California AMT Tax-Free Money Market Fund | | | | .30% | | | | | | |
| Actual | | | | | | $ 1,000 | | $ 1,002.70 | | $ 1.51 |
Hypothetical- B | | | | | | $ 1,000 | | $ 1,023.69 | | $ 1.53 |
| Institutional Class | | | | .20% | | | | | | |
| Actual | | | | | | $ 1,000 | | $ 1,003.20 | | $ 1.01 |
Hypothetical- B | | | | | | $ 1,000 | | $ 1,024.20 | | $ 1.02 |
| |
A Annualized expense ratio reflects expenses net of applicable fee waivers.
B 5% return per year before expenses
C Expenses are equal to the annualized expense ratio, multiplied by the average account value over the period, multiplied by 184/ 365 (to reflect the one-half year period). The fees and expenses of any Underlying Funds are not included in each annualized expense ratio.
1.855636.115
SCM-SANN-1022
Item 2.
Code of Ethics
Not applicable.
Item 3.
Audit Committee Financial Expert
Not applicable.
Item 4.
Principal Accountant Fees and Services
Not applicable.
Item 5.
Audit Committee of Listed Registrants
Not applicable.
Item 6.
Investments
(a)
Not applicable.
(b)
Not applicable
Item 7.
Disclosure of Proxy Voting Policies and Procedures for Closed-End Management Investment Companies
Not applicable.
Item 8.
Portfolio Managers of Closed-End Management Investment Companies
Not applicable.
Item 9.
Purchase of Equity Securities by Closed-End Management Investment Company and Affiliated Purchasers
Not applicable.
Item 10.
Submission of Matters to a Vote of Security Holders
There were no material changes to the procedures by which shareholders may recommend nominees to the Fidelity California Municipal Trust II’s Board of Trustees.
Item 11.
Controls and Procedures
(a)(i) The President and Treasurer and the Chief Financial Officer have concluded that the Fidelity California Municipal Trust II’s (the “Trust”) disclosure controls and
procedures (as defined in Rule 30a-3(c) under the Investment Company Act) provide reasonable assurances that material information relating to the Trust is made known to them by the appropriate persons, based on their evaluation of these controls and procedures as of a date within 90 days of the filing date of this report.
(a)(ii) There was no change in the Trust’s internal control over financial reporting (as defined in Rule 30a-3(d) under the Investment Company Act) that occurred during the period covered by this report that has materially affected, or is reasonably likely to materially affect, the Trust’s internal control over financial reporting.
Item 12.
Disclosure of Securities Lending Activities for Closed-End Management
Investment Companies
Not applicable.
Item 13.
Exhibits
SIGNATURES
Pursuant to the requirements of the Securities Exchange Act of 1934 and the Investment Company Act of 1940, the registrant has duly caused this report to be signed on its behalf by the undersigned, thereunto duly authorized.
Fidelity California Municipal Trust II
| |
By: | /s/Laura M. Del Prato |
| Laura M. Del Prato |
| President and Treasurer |
|
|
Date: | October 20, 2022 |
Pursuant to the requirements of the Securities Exchange Act of 1934 and the Investment Company Act of 1940, this report has been signed below by the following persons on behalf of the registrant and in the capacities and on the dates indicated.
| |
By: | /s/Laura M. Del Prato |
| Laura M. Del Prato |
| President and Treasurer |
|
|
Date: | October 20, 2022 |
| |
By: | /s/John J. Burke III |
| John J. Burke III |
| Chief Financial Officer |
|
|
Date: | October 20, 2022 |