UNITED STATES
SECURITIES AND EXCHANGE COMMISSION
Washington, D.C. 20549
FORM N-CSR
CERTIFIED SHAREHOLDER REPORT OF REGISTERED
MANAGEMENT INVESTMENT COMPANIES
Investment Company Act file number 811-06397
Fidelity California Municipal Trust II
(Exact name of registrant as specified in charter)
245 Summer St., Boston, MA 02210
(Address of principal executive offices) (Zip code)
Nicole Macarchuk, Secretary
245 Summer St.
Boston, Massachusetts 02210
(Name and address of agent for service)
Registrant's telephone number, including area code:
617-563-7000
| |
Date of fiscal year end: | February 29 |
|
|
Date of reporting period: | August 31, 2024 |
Item 1.
Reports to Stockholders
| |
| | SEMI-ANNUAL SHAREHOLDER REPORT | AS OF AUGUST 31, 2024 | |
| | Fidelity® California Municipal Money Market Fund Fidelity® California Municipal Money Market Fund Premium Class : FSPXX |
| | | |
This semi-annual shareholder report contains information about Fidelity® California Municipal Money Market Fund for the period March 1, 2024 to August 31, 2024. You can find additional information about the Fund at fundresearch.fidelity.com/prospectus/sec. You can also request this information by contacting us at 1-800-544-8544 or by sending an e-mail to fidfunddocuments@fidelity.com.
What were your Fund costs for the last six months?(based on hypothetical $10,000 investment)
| | Costs of a $10,000 investment | Costs paid as a percentage of a $10,000 investment | |
| Premium Class | $ 15 | 0.30% | |
Key Fund Statistics (as of August 31, 2024)
KEY FACTS | | |
| Fund Size | $5,189,118,446 | |
| Number of Holdings | 458 | |
What did the Fund invest in?
(as of August 31, 2024)
EFFECTIVE MATURITY DIVERSIFICATION (% of Fund's net assets) |
| Days |
| 1-7 | 71.8 | |
| 8-30 | 1.4 | |
| 31-60 | 11.3 | |
| 61-90 | 7.5 | |
| 91-180 | 2.3 | |
| >180 | 6.1 | |
| |
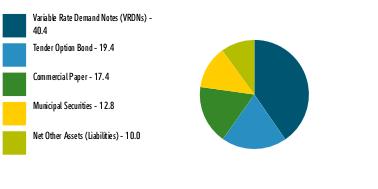
| Variable Rate Demand Notes (VRDNs) | 40.4 |
| Tender Option Bond | 19.4 |
| Commercial Paper | 17.4 |
| Municipal Securities | 12.8 |
| Net Other Assets (Liabilities) | 10.0 |
ASSET ALLOCATION (% of Fund's net assets) |
|
|
| Fidelity, the Fidelity Investments Logo and all other Fidelity trademarks or service marks used herein are trademarks or service marks of FMR LLC. Any third-party marks that are used herein are trademarks or service marks of their respective owners. © 2024 FMR LLC. All rights reserved. |
| | For additional information about the Fund; including its prospectus, financial information, holdings and proxy information, scan the QR code or visit fundresearch.fidelity.com/prospectus/sec 1.9914536.100 457-TSRS-1024 |
| |
| | SEMI-ANNUAL SHAREHOLDER REPORT | AS OF AUGUST 31, 2024 | |
| | Fidelity® California Municipal Money Market Fund Fidelity® California Municipal Money Market Fund : FABXX |
| | | |
This semi-annual shareholder report contains information about Fidelity® California Municipal Money Market Fund for the period March 1, 2024 to August 31, 2024. You can find additional information about the Fund at fundresearch.fidelity.com/prospectus/sec. You can also request this information by contacting us at 1-800-544-8544 or by sending an e-mail to fidfunddocuments@fidelity.com.
What were your Fund costs for the last six months?(based on hypothetical $10,000 investment)
| | Costs of a $10,000 investment | Costs paid as a percentage of a $10,000 investment | |
| Fidelity® California Municipal Money Market Fund | $ 21 | 0.42% | |
Key Fund Statistics (as of August 31, 2024)
KEY FACTS | | |
| Fund Size | $5,189,118,446 | |
| Number of Holdings | 458 | |
What did the Fund invest in?
(as of August 31, 2024)
EFFECTIVE MATURITY DIVERSIFICATION (% of Fund's net assets) |
| Days |
| 1-7 | 71.8 | |
| 8-30 | 1.4 | |
| 31-60 | 11.3 | |
| 61-90 | 7.5 | |
| 91-180 | 2.3 | |
| >180 | 6.1 | |
| |
| Variable Rate Demand Notes (VRDNs) | 40.4 |
| Tender Option Bond | 19.4 |
| Commercial Paper | 17.4 |
| Municipal Securities | 12.8 |
| Net Other Assets (Liabilities) | 10.0 |
ASSET ALLOCATION (% of Fund's net assets) |
|
|
| Fidelity, the Fidelity Investments Logo and all other Fidelity trademarks or service marks used herein are trademarks or service marks of FMR LLC. Any third-party marks that are used herein are trademarks or service marks of their respective owners. © 2024 FMR LLC. All rights reserved. |
| | For additional information about the Fund; including its prospectus, financial information, holdings and proxy information, scan the QR code or visit fundresearch.fidelity.com/prospectus/sec 1.9914537.100 6958-TSRS-1024 |
| |
| | SEMI-ANNUAL SHAREHOLDER REPORT | AS OF AUGUST 31, 2024 | |
| | Fidelity® California Municipal Money Market Fund Fidelity® California Municipal Money Market Fund Institutional Class : FSBXX |
| | | |
This semi-annual shareholder report contains information about Fidelity® California Municipal Money Market Fund for the period March 1, 2024 to August 31, 2024. You can find additional information about the Fund at fundresearch.fidelity.com/prospectus/sec. You can also request this information by contacting us at 1-877-208-0098 or by sending an e-mail to fidfunddocuments@fidelity.com.
What were your Fund costs for the last six months?(based on hypothetical $10,000 investment)
| | Costs of a $10,000 investment | Costs paid as a percentage of a $10,000 investment | |
| Institutional Class | $ 10 | 0.20% | |
Key Fund Statistics (as of August 31, 2024)
KEY FACTS | | |
| Fund Size | $5,189,118,446 | |
| Number of Holdings | 458 | |
What did the Fund invest in?
(as of August 31, 2024)
EFFECTIVE MATURITY DIVERSIFICATION (% of Fund's net assets) |
| Days |
| 1-7 | 71.8 | |
| 8-30 | 1.4 | |
| 31-60 | 11.3 | |
| 61-90 | 7.5 | |
| 91-180 | 2.3 | |
| >180 | 6.1 | |
| |
| Variable Rate Demand Notes (VRDNs) | 40.4 |
| Tender Option Bond | 19.4 |
| Commercial Paper | 17.4 |
| Municipal Securities | 12.8 |
| Net Other Assets (Liabilities) | 10.0 |
ASSET ALLOCATION (% of Fund's net assets) |
|
|
| Fidelity, the Fidelity Investments Logo and all other Fidelity trademarks or service marks used herein are trademarks or service marks of FMR LLC. Any third-party marks that are used herein are trademarks or service marks of their respective owners. © 2024 FMR LLC. All rights reserved. |
| | For additional information about the Fund; including its prospectus, financial information, holdings and proxy information, scan the QR code or visit fundresearch.fidelity.com/prospectus/sec 1.9914535.100 1868-TSRS-1024 |
Item 2.
Code of Ethics
Not applicable.
Item 3.
Audit Committee Financial Expert
Not applicable.
Item 4.
Principal Accountant Fees and Services
Not applicable.
Item 5.
Audit Committee of Listed Registrants
Not applicable.
Item 6.
Investments
(a)
Not applicable.
(b)
Not applicable
Item 7.
Financial Statements and Financial Highlights for Open-End Management Investment Companies
Fidelity® California Municipal Money Market Fund
Semi-Annual Report
August 31, 2024
Contents
To view a fund's proxy voting guidelines and proxy voting record for the 12-month period ended June 30, visit http://www.fidelity.com/proxyvotingresults or visit the Securities and Exchange Commission's (SEC) web site at http://www.sec.gov.
You may also call 1-800-544-8544, or for Institutional, call 1-877-208-0098, to request a free copy of the proxy voting guidelines.
Standard & Poor's, S&P and S&P 500 are registered service marks of The McGraw-Hill Companies, Inc. and have been licensed for use by Fidelity Distributors Corporation.
Other third-party marks appearing herein are the property of their respective owners.
All other marks appearing herein are registered or unregistered trademarks or service marks of FMR LLC or an affiliated company. © 2024 FMR LLC. All rights reserved.
This report and the financial statements contained herein are submitted for the general information of the shareholders of the Fund. This report is not authorized for distribution to prospective investors in the Fund unless preceded or accompanied by an effective prospectus.
A fund files its complete schedule of portfolio holdings with the SEC for the first and third quarters of each fiscal year on Form N-PORT. Forms N-PORT are available on the SEC's web site at http://www.sec.gov. A fund's Forms N-PORT may be reviewed and copied at the SEC's Public Reference Room in Washington, DC. Information regarding the operation of the SEC's Public Reference Room may be obtained by calling 1-800-SEC-0330.
For a complete list of a fund's portfolio holdings, view the most recent holdings listing, semiannual report, or annual report on Fidelity's web site at http://www.fidelity.com, http://www.institutional.fidelity.com, or http://www.401k.com, as applicable.
NOT FDIC INSURED •MAY LOSE VALUE •NO BANK GUARANTEE
Neither the Fund nor Fidelity Distributors Corporation is a bank.
Item 7: Financial Statements and Financial Highlights for Open-End Management Investment Companies (Semi-Annual Report)
Fidelity® California Municipal Money Market Fund
Schedule of Investments August 31, 2024 (Unaudited)
Showing Percentage of Net Assets
| Variable Rate Demand Note - 40.4% |
| | | Principal Amount (a) (000s) | Value ($) (000s) |
| Alabama - 0.4% | | | |
| Decatur Indl. Dev. Board Exempt Facilities Rev. (Nucor Steel Decatur LLC Proj.) Series 2003 A, 3.2% 9/6/24, VRDN (b)(c) | | 7,161 | 7,161 |
| West Jefferson Indl. Dev. Board Solid Waste Disp. Rev. (Alabama Pwr. Co. Plant Miller Proj.) Series 2023, 3.45% 9/6/24, VRDN (b)(c) | | 14,600 | 14,600 |
TOTAL ALABAMA | | | 21,761 |
| Arizona - 0.2% | | | |
| Maricopa County Poll. Cont. Rev.: | | | |
| (Arizona Pub. Svc. Co. Palo Verde Proj.) Series 2009 A, 3.13% 9/6/24, VRDN (b) | | 1,150 | 1,150 |
| Series 2009 B, 3.13% 9/6/24, VRDN (b) | | 6,400 | 6,400 |
| Series 2009 C, 3.2% 9/6/24, VRDN (b) | | 2,500 | 2,500 |
TOTAL ARIZONA | | | 10,050 |
| Arkansas - 0.1% | | | |
| Blytheville Indl. Dev. Rev. (Nucor Corp. Proj.) Series 1998, 3.2% 9/6/24, VRDN (b)(c) | | 3,000 | 3,000 |
| California - 35.9% | | | |
| Alameda County Indl. Dev. Auth. Rev. (Edward L. Shimmon, Inc. Proj.) Series 1996 A, 2.9% 9/6/24, LOC BNP Paribas SA, VRDN (b)(c) | | 3,200 | 3,200 |
| Bay Area Toll Auth. San Francisco Bay Toll Bridge Rev.: | | | |
| Series 2007 A2, 2.15% 9/6/24, LOC MUFG Bank Ltd., VRDN (b) | | 300 | 300 |
| Series 2007 C2, 2.18% 9/6/24, LOC MUFG Bank Ltd., VRDN (b) | | 1,500 | 1,500 |
| Series 2007 D2, 2.14% 9/6/24, LOC Bank of America NA, VRDN (b) | | 3,400 | 3,400 |
| Series 2008 C1, 2.18% 9/6/24, LOC Sumitomo Mitsui Banking Corp., VRDN (b) | | 3,400 | 3,400 |
| Series 2008 F1, 2.18% 9/6/24, LOC Sumitomo Mitsui Banking Corp., VRDN (b) | | 7,000 | 7,000 |
| Series 2024 B, 2.2% 9/6/24, LOC Sumitomo Mitsui Banking Corp., VRDN (b) | | 36,750 | 36,750 |
| Series 2024 D, 2.9% 9/3/24, LOC Toronto-Dominion Bank, VRDN (b) | | 21,200 | 21,200 |
| Series 2024 E, 2.9% 9/3/24, LOC Bank of America NA, VRDN (b) | | 15,000 | 15,000 |
| Series 2024 G, 2.14% 9/6/24, LOC Bank of America NA, VRDN (b)(d) | | 10,000 | 10,000 |
| Series 2024 H, 3.85% 9/3/24, LOC Bank of America NA, VRDN (b) | | 44,850 | 44,850 |
| Series 2024 I, 3.75% 9/3/24, LOC TD Banknorth, NA, VRDN (b) | | 20,200 | 20,200 |
| Series 2024, 2.14% 9/6/24, LOC Sumitomo Mitsui Banking Corp., VRDN (b) | | 78,555 | 78,555 |
| California Fin. Auth. Exempt Facilities Rev. (ExxonMobil Proj.) Series 2007, 2.97% 9/3/24 (Exxon Mobil Corp. Guaranteed), VRDN (b)(c) | | 3,470 | 3,470 |
| California Gen. Oblig.: | | | |
| Series 2003 A1, 2.75% 9/3/24, LOC Barclays Bank PLC, VRDN (b) | | 280 | 280 |
| Series 2003 C3, 2% 9/6/24, LOC U.S. Bank NA, Cincinnati, VRDN (b) | | 17,600 | 17,600 |
| Series 2004 A2, 2.75% 9/3/24, LOC State Street Bank & Trust Co., Boston, VRDN (b) | | 500 | 500 |
| Series 2004 A3, 2.75% 9/3/24, LOC State Street Bank & Trust Co., Boston, VRDN (b) | | 925 | 925 |
| Series 2004 A9, 1.9% 9/6/24, LOC State Street Bank & Trust Co., Boston, VRDN (b) | | 130 | 130 |
| Series 2005 A2-1, 1.82% 9/6/24, LOC Sumitomo Mitsui Banking Corp., VRDN (b) | | 39,900 | 39,900 |
| Series 2005 B3, 1.91% 9/6/24, LOC Sumitomo Mitsui Banking Corp., VRDN (b) | | 33,850 | 33,850 |
| Series 2005 B5, 2.75% 9/3/24, LOC U.S. Bank NA, Cincinnati, VRDN (b) | | 2,450 | 2,450 |
| California Health Facilities Fing. Auth. Rev.: | | | |
| (Adventist Health Sys. West Proj.) Series 2009 B, 2.7% 9/3/24, LOC U.S. Bank NA, Cincinnati, VRDN (b) | | 5,000 | 5,000 |
| (Dignity Health Proj.) Series 2011 C, 2% 9/6/24, LOC Bank of Montreal, VRDN (b) | | 6,400 | 6,400 |
| Series 2023 B, 2.8% 9/3/24, LOC Barclays Bank PLC, VRDN (b) | | 26,800 | 26,800 |
| Series 2024 C1, 1.95% 9/6/24, VRDN (b) | | 4,500 | 4,500 |
| Series 2024 C2, 2.45% 9/6/24, VRDN (b) | | 5,000 | 5,000 |
| California Poll. Cont. Fing. Auth. Envir. Impt. Rev. (Air Products & Chemicals Proj.) Series 2008 B, 2.9% 9/3/24, VRDN (b) | | 25,000 | 25,000 |
| California Poll. Cont. Fing. Auth. Exempt Facilities Rev. (ExxonMobil Proj.) Series 2001, 2.97% 9/3/24 (Exxon Mobil Corp. Guaranteed), VRDN (b)(c) | | 13,995 | 13,995 |
| California Poll. Cont. Fing. Auth. Solid Waste Disp. Rev. (Recology, Inc. Proj.) Series 2018 A, 2.57% 9/6/24, LOC Wells Fargo Bank NA, VRDN (b)(c)(e) | | 36,715 | 36,709 |
| California Pub. Fin. Auth. Rev.: | | | |
| Series 2024 C, 3.55% 9/3/24, LOC Royal Bank of Canada, VRDN (b) | | 4,900 | 4,900 |
| Series 2024 E, 3.65% 9/3/24, LOC TD Banknorth, NA, VRDN (b) | | 125 | 125 |
| California Statewide Cmntys. Dev. Auth. Multi-family Hsg. Rev.: | | | |
| (Irvine Apt. Cmntys. LP Proj.): | | | |
Series 2001 W1, 3% 9/3/24, LOC Wells Fargo Bank NA, VRDN (b)(c) | | 18,800 | 18,800 |
Series 2001 W2, 3% 9/3/24, LOC Wells Fargo Bank NA, VRDN (b)(c) | | 32,000 | 32,000 |
| (Maple Square Apt. Proj.) Series AA, 3.05% 9/6/24, LOC Citibank NA, VRDN (b)(c) | | 4,155 | 4,155 |
| (Terraces at Park Marino Proj.) Series I, 3.06% 9/6/24, LOC BMO Harris Bank NA, VRDN (b)(c) | | 4,470 | 4,470 |
| (The Crossings at Elk Grove Apts.) Series H, 2.69% 9/6/24, LOC Citibank NA, VRDN (b)(c) | | 5,430 | 5,430 |
| Calleguas-Las Virgenes Pub. Fing. Auth. Rev. (Calleguas Muni. Wtr. District Proj.) Series 2008 A, 2.6% 9/6/24, LOC Wells Fargo Bank NA, VRDN (b) | | 7,240 | 7,240 |
| Irvine Impt. Bond Act of 1915: | | | |
| (Assessment District #03-19 Proj.) Series 2004 A, 2.7% 9/3/24, LOC U.S. Bank NA, Cincinnati, VRDN (b) | | 10,801 | 10,801 |
| Series 2006 B, 2.7% 9/3/24, LOC U.S. Bank NA, Cincinnati, VRDN (b) | | 21,566 | 21,566 |
| Irvine Ranch Wtr. District Rev.: | | | |
| (District #105, 113, 135, 161, 182, 213, 235, 250, 261 Impt. Proj.) Series 2008 A, 2.19% 9/6/24, LOC Sumitomo Mitsui Banking Corp., VRDN (b) | | 350 | 350 |
| Series 2009 A, 2.7% 9/3/24, LOC U.S. Bank NA, Cincinnati, VRDN (b) | | 19,580 | 19,580 |
| Series 2009 B, 2.85% 9/3/24, LOC Bank of America NA, VRDN (b) | | 2,225 | 2,225 |
| Irvine Reassessment District 12-1 Ltd. Oblig.: | | | |
| Series 2005 21A, 2.7% 9/3/24, LOC U.S. Bank NA, Cincinnati, VRDN (b) | | 1,755 | 1,755 |
| Series A, 2.7% 9/3/24, LOC Sumitomo Mitsui Banking Corp., VRDN (b) | | 20,397 | 20,397 |
| Los Angeles Dept. of Wtr. & Pwr. Rev.: | | | |
| Series 2001 B6, 2.85% 9/3/24 (Liquidity Facility Barclays Bank PLC), VRDN (b) | | 1,000 | 1,000 |
| Series 2021 A1, 2.85% 9/3/24 (Liquidity Facility Royal Bank of Canada), VRDN (b) | | 44,130 | 44,130 |
| Series 2023 C1, 2.85% 9/3/24 (Liquidity Facility TD Banknorth, NA), VRDN (b) | | 50,130 | 50,130 |
| Series 2023 F1, 2.85% 9/3/24 (Liquidity Facility JPMorgan Chase Bank), VRDN (b) | | 59,490 | 59,490 |
| Series A3, 2.86% 9/3/24 (Liquidity Facility Royal Bank of Canada), VRDN (b) | | 61,650 | 61,650 |
| Los Angeles Dept. of Wtr. & Pwr. Wtrwks. Rev.: | | | |
| Series 2001 B4, 2.85% 9/3/24 (Liquidity Facility Barclays Bank PLC), VRDN (b) | | 500 | 500 |
| Series 2019 A, 2.85% 9/3/24 (Liquidity Facility Barclays Bank PLC), VRDN (b) | | 4,070 | 4,070 |
| Series 2019 A1, 2.88% 9/3/24 (Liquidity Facility Barclays Bank PLC), VRDN (b) | | 99,700 | 99,700 |
| Series 2020 A, 2.9% 9/3/24 (Liquidity Facility TD Banknorth, NA), VRDN (b) | | 19,515 | 19,515 |
| Series A1, 2.9% 9/3/24 (Liquidity Facility TD Banknorth, NA), VRDN (b) | | 200 | 200 |
| Los Angeles Multi-family Hsg. Rev. (Colonia Corona Apts. Proj.) Series 2004 D, 2.69% 9/6/24, LOC Citibank NA, VRDN (b)(c) | | 2,100 | 2,100 |
| Orange County Wtr. District Rev. Ctfs. of Prtn. Series 2003 A, 2.05% 9/6/24, LOC Bank of America NA, VRDN (b) | | 85,670 | 85,670 |
| Riverside County Ctfs. of Prtn. (Woodcrest Library Proj.) Series 2009, 2.13% 9/6/24, LOC Bank of America NA, VRDN (b) | | 2,885 | 2,885 |
| Riverside Ctfs. of Prtn. (Riverside Renaissance Proj.) Series 2008, 2.2% 9/6/24, LOC Bank of America NA, VRDN (b) | | 68,640 | 68,640 |
| San Bernardino County Flood Cont. District Judgment Oblig. Series 2008, 2.2% 9/3/24, LOC Bank of America NA, VRDN (b) | | 24,625 | 24,625 |
| San Diego Hsg. Auth. Multi-family Hsg. Rev.: | | | |
| Series 2017 A, 2.5% 9/6/24, LOC Bank of America NA, VRDN (b) | | 142,885 | 142,885 |
| Series 2020 F, 2.5% 9/6/24, LOC Mizuho Corporate Bank Ltd., VRDN (b) | | 2,250 | 2,250 |
| San Francisco City & County Arpts. Commission Int'l. Arpt. Rev. Series 2018 B, 2% 9/6/24, LOC Barclays Bank PLC, VRDN (b) | | 225 | 225 |
| San Francisco City & County Redev. Agcy. Multi-family Hsg. Rev.: | | | |
| (Antonia Manor Apts. Proj.) Series 2000 E, 2.59% 9/6/24, LOC Citibank NA, VRDN (b)(c) | | 550 | 550 |
| (Mission Creek Cmnty. Proj.) Series B, 2.69% 9/6/24, LOC Citibank NA, VRDN (b)(c) | | 1,810 | 1,810 |
| (Ocean Beach Apts. Proj.) Series B, 2.9% 9/6/24, LOC Citibank NA, VRDN (b)(c) | | 3,080 | 3,080 |
| Series 2000 G, 2.55% 9/6/24, LOC Citibank NA, VRDN (b)(c) | | 5,840 | 5,840 |
| Santa Clara County Fing. Auth. Lease Rev. (Multiple Facilities Proj.) Series 2008 M, 2.19% 9/6/24, LOC Bank of America NA, VRDN (b) | | 61,780 | 61,780 |
| Santa Clara County Fing. Auth. Rev. (El Camino Hosp. Proj.) Series 2009 A, 2.03% 9/6/24, LOC Wells Fargo Bank NA, VRDN (b) | | 10,410 | 10,410 |
| Univ. of California Revs.: | | | |
| Series 2013 AL 2, 2.9% 9/3/24, VRDN (b) | | 28,700 | 28,700 |
| Series 2013 AL 4, 2.85% 9/3/24, VRDN (b) | | 68,665 | 68,665 |
| Series 2013 AL3, 2.9% 9/3/24, VRDN (b) | | 22,735 | 22,735 |
| Series 2023 BP: | | | |
2.8% 9/3/24, VRDN (b) | | 46,185 | 46,185 |
3.45% 9/3/24, VRDN (b) | | 34,450 | 34,450 |
| Series 2024 BY1, 2.05% 9/6/24, VRDN (b) | | 70,150 | 70,150 |
| Series 2024 BY2, 2.05% 9/6/24, VRDN (b) | | 77,800 | 77,800 |
| Series AL1, 2.9% 9/3/24, VRDN (b) | | 15,850 | 15,850 |
| FHLMC California Statewide Cmntys. Dev. Auth. Multi-family Hsg. Rev. (Heritage Park Apts. Proj.) Series 2008 C, 2.55% 9/6/24, LOC Freddie Mac, VRDN (b)(c) | | 15,000 | 15,000 |
| FNMA: | | | |
| California Statewide Cmntys. Dev. Auth. Multi-family Hsg. Rev.: | | | |
(Salvation Army S.F. Proj.) Series 2003 EEE, 2.23% 9/6/24, LOC Fannie Mae, VRDN (b)(c) | | 11,405 | 11,405 |
(The Crossings Sr. Apts./Phase II Proj.) Series J, 2.62% 9/6/24, LOC Fannie Mae, VRDN (b)(c) | | 3,000 | 3,000 |
(Wilshire Court Proj.) Series AAA, 2.4% 9/6/24, LOC Fannie Mae, VRDN (b)(c) | | 3,000 | 3,000 |
| Emeryville Redev. Agcy. Multi-family Hsg. Rev. Series 2002 A, 2.93% 9/6/24, LOC Fannie Mae, VRDN (b)(c) | | 30,000 | 30,000 |
| Orange County Apt. Dev. Rev.: | | | |
(Ladera Apts. Proj.) Series 2001 II B, 2.71% 9/6/24, LOC Fannie Mae, VRDN (b)(c) | | 13,300 | 13,300 |
(Wood Canyon Villas Proj.) Series 2001 E, 2.62% 9/6/24, LOC Fannie Mae, VRDN (b)(c) | | 8,810 | 8,810 |
| San Jose Multi-family Hsg. Rev.: | | | |
(Almaden Lake Village Apt. Assoc. Proj.) Series 1997 A, 2.93% 9/6/24, LOC Fannie Mae, VRDN (b)(c) | | 16,500 | 16,500 |
(Kennedy Apt. Homes Proj.) Series 2002 K, 2.71% 9/6/24, LOC Fannie Mae, VRDN (b)(c) | | 3,975 | 3,975 |
| Santa Cruz Redev. Agcy. Multi-family Rev.: | | | |
(1010 Pacific Ave. Apts. Proj.) Series B, 2.81% 9/6/24, LOC Fannie Mae, VRDN (b)(c) | | 16,295 | 16,295 |
(Shaffer Road Apts. Proj.) Series A, 2.81% 9/6/24, LOC Fannie Mae, VRDN (b)(c) | | 3,900 | 3,900 |
TOTAL CALIFORNIA | | | 1,864,513 |
| Delaware - 0.0% | | | |
| Delaware Econ. Dev. Auth. Rev. (Delmarva Pwr. & Lt. Co. Proj.) Series 1993 C, 3% 9/6/24, VRDN (b) | | 1,200 | 1,200 |
| Florida - 1.5% | | | |
| Bay County Indl. Rev. Dev. (Gulf Pwr. Co. Proj.) Series 2020, 3.2% 9/6/24, VRDN (b)(c) | | 900 | 900 |
| Broward County Indl. Dev. Rev. (Florida Pwr. & Lt. Co. Proj.) Series 2018 B, 3.2% 9/6/24, VRDN (b)(c) | | 5,300 | 5,300 |
| Lee County Indl. Dev. Auth. Rev. (Florida Pwr. & Lt. Co. Proj.) Series 2016 A, 3.05% 9/6/24, VRDN (b)(c) | | 9,500 | 9,500 |
| Miami-Dade County Indl. Dev. Auth. Rev.: | | | |
| (Florida Pwr. & Lt. Co. Proj.) Series 2021, 3.15% 9/6/24, VRDN (b)(c) | | 2,300 | 2,300 |
| Series 2024 A, 3.15% 9/6/24, VRDN (b)(c) | | 29,200 | 29,200 |
| Series 2024 B, 3.15% 9/6/24, VRDN (b)(c) | | 31,400 | 31,400 |
TOTAL FLORIDA | | | 78,600 |
| Georgia - 0.2% | | | |
| Monroe County Dev. Auth. Rev. (Florida Pwr. & Lt. Co. Proj.): | | | |
| Series 2017, 3.2% 9/6/24, VRDN (b)(c) | | 7,600 | 7,600 |
| Series 2019, 3.15% 9/6/24, VRDN (b)(c) | | 400 | 400 |
TOTAL GEORGIA | | | 8,000 |
| Indiana - 0.0% | | | |
| Indiana Dev. Fin. Auth. Envir. Rev. (PSI Energy Proj.) Series 2003 A, 3.25% 9/6/24, VRDN (b)(c) | | 900 | 900 |
| Iowa - 0.7% | | | |
| Iowa Fin. Auth. Solid Disp. Waste Rev. (MidAmerican Energy Co. Proj.) Series 2008 A, 3.13% 9/6/24, VRDN (b)(c) | | 14,500 | 14,500 |
| Iowa Fin. Auth. Solid Waste Facilities (MidAmerican Energy Co. Proj.) Series 2017, 3.1% 9/6/24, VRDN (b)(c) | | 22,445 | 22,445 |
TOTAL IOWA | | | 36,945 |
| Kansas - 0.0% | | | |
| Burlington Envir. Impt. Rev. (Kansas City Pwr. and Lt. Co. Proj.): | | | |
| Series 2007 A, 3.33% 9/6/24, VRDN (b) | | 200 | 200 |
| Series 2007 B, 3.33% 9/6/24, VRDN (b) | | 900 | 900 |
TOTAL KANSAS | | | 1,100 |
| Kentucky - 0.4% | | | |
| Meade County Indl. Bldg. Rev. (Nucor Steel Brandenburg Proj.): | | | |
| Series 2020 B1, 3.75% 9/3/24, VRDN (b)(c) | | 2,300 | 2,300 |
| Series 2021 A1, 4.55% 9/3/24, VRDN (b)(c) | | 8,350 | 8,350 |
| Series 2021 B1, 3.75% 9/3/24, VRDN (b)(c) | | 6,950 | 6,950 |
TOTAL KENTUCKY | | | 17,600 |
| Louisiana - 0.1% | | | |
| Saint James Parish Gen. Oblig. (Nucor Steel Louisiana LLC Proj.): | | | |
| Series 2010 A1, 3.1% 9/6/24, VRDN (b) | | 2,375 | 2,375 |
| Series 2010 B1, 3.25% 9/6/24, VRDN (b) | | 200 | 200 |
TOTAL LOUISIANA | | | 2,575 |
| Nebraska - 0.0% | | | |
| Stanton County Indl. Dev. Rev.: | | | |
| (Nucor Corp. Proj.) Series 1996, 3.2% 9/6/24, VRDN (b)(c) | | 700 | 700 |
| Series 1998, 3.2% 9/6/24, VRDN (b)(c) | | 500 | 500 |
TOTAL NEBRASKA | | | 1,200 |
| North Carolina - 0.1% | | | |
| Hertford County Indl. Facilities Poll. Cont. Fing. Auth. (Nucor Corp. Proj.) Series 2000 A, 3.4% 9/6/24, VRDN (b)(c) | | 6,800 | 6,800 |
| South Carolina - 0.1% | | | |
| Berkeley County Indl. Dev. Rev.: | | | |
| Series 1998, 3.35% 9/6/24, VRDN (b)(c) | | 3,275 | 3,275 |
| Series A, 3.35% 9/6/24, VRDN (b)(c) | | 2,350 | 2,350 |
| Darlington County Indl. Dev. Rev. (Nucor Corp. Proj.) Series 2003 A, 3.35% 9/6/24, VRDN (b)(c) | | 700 | 700 |
TOTAL SOUTH CAROLINA | | | 6,325 |
| Tennessee - 0.1% | | | |
| Loudon County Indl. Dev. Board Exempt Facilities Rev. (Kimberly-Clark Corp. Proj.) Series 1999, 3.2% 9/6/24, VRDN (b)(c) | | 3,500 | 3,500 |
| Texas - 0.1% | | | |
| Jewett Econ. Dev. Corp. Indl. Dev. Rev. (Nucor Corp. Proj.) Series 2003, 3.2% 9/6/24, VRDN (b)(c) | | 3,450 | 3,450 |
| Utah - 0.3% | | | |
| Emery County Poll. Cont. Rev. (PacifiCorp Proj.) Series 1994, 3.6% 9/6/24, VRDN (b) | | 17,000 | 17,000 |
| Wyoming - 0.2% | | | |
| Converse County Envir. Impt. Rev. Series 1995, 3.45% 9/6/24, VRDN (b)(c) | | 2,000 | 2,000 |
| Lincoln County Poll. Cont. Rev. (PacifiCorp Proj.) Series 1994, 3.45% 9/6/24, VRDN (b) | | 1,600 | 1,600 |
| Sweetwater County Env Imp Rev. (Pacificorp Proj.) Series 1995, 3.5% 9/3/24, VRDN (b)(c) | | 6,000 | 6,000 |
TOTAL WYOMING | | | 9,600 |
| TOTAL VARIABLE RATE DEMAND NOTE (Cost $2,094,119) | | | 2,094,119 |
| | | | |
| Tender Option Bond - 19.4% |
| | | Principal Amount (a) (000s) | Value ($) (000s) |
| Arizona - 0.1% | | | |
| Arizona St Indl. Dev. Auth. Multi Participating VRDN Series MIZ 91 80, 3.24% 10/4/24 (Liquidity Facility Mizuho Cap. Markets LLC) (b)(f)(g)(h) | | 1,170 | 1,170 |
| Mizuho Floater / Residual Trust V Participating VRDN Series Floater MIZ 91 87, 3.24% 10/4/24 (Liquidity Facility Mizuho Cap. Markets LLC) (b)(f)(g)(h) | | 2,600 | 2,600 |
TOTAL ARIZONA | | | 3,770 |
| California - 18.9% | | | |
| Burbank Glendale Pasadena Arpt. Auth. Rev. Participating VRDN Series XF 17 08, 2.97% 9/6/24 (Liquidity Facility Royal Bank of Canada) (b)(c)(f)(h) | | 1,785 | 1,785 |
| California Cmnty. Choice Fing. Auth. Clean Energy Proj. Rev. Participating VRDN: | | | |
| Series XF 16 35, 2.95% 9/6/24 (Liquidity Facility Royal Bank of Canada) (b)(f)(h) | | 6,750 | 6,750 |
| Series XF 16 81, 3.05% 9/3/24 (Liquidity Facility JPMorgan Chase Bank) (b)(f)(h) | | 14,000 | 14,000 |
| Series XF 16 90, 2.94% 9/6/24 (Liquidity Facility Royal Bank of Canada) (b)(f)(h) | | 22,375 | 22,375 |
| Series XG 05 74, 2.95% 9/6/24 (Liquidity Facility Royal Bank of Canada) (b)(f)(h) | | 9,910 | 9,910 |
| Series XG 05 84, 2.95% 9/6/24 (Liquidity Facility Royal Bank of Canada) (b)(f)(h) | | 2,585 | 2,585 |
| Series XM 11 11, 3.05% 9/3/24 (Liquidity Facility JPMorgan Chase Bank) (b)(f)(h) | | 7,500 | 7,500 |
| Series XM 11 38, 2.95% 9/6/24 (Liquidity Facility Royal Bank of Canada) (b)(f)(h) | | 4,000 | 4,000 |
| California Edl. Facilities Auth. Rev. Participating VRDN Series 2022 XF 30 46, 2.93% 9/6/24 (Liquidity Facility Morgan Stanley Bank, West Valley City Utah) (b)(f)(h) | | 8,000 | 8,000 |
| California Gen. Oblig. Participating VRDN: | | | |
| Series 2022 XF 14 15, 2.95% 9/6/24 (Liquidity Facility Toronto-Dominion Bank) (b)(f)(h) | | 1,705 | 1,705 |
| Series 2022 ZF 30 55, 2.92% 9/6/24 (Liquidity Facility Morgan Stanley Bank, West Valley City Utah) (b)(f)(h) | | 2,625 | 2,625 |
| Series Floaters XF 10 38, 2.95% 9/6/24 (Liquidity Facility Toronto-Dominion Bank) (b)(f)(h) | | 10,480 | 10,480 |
| Series Floaters YX 10 84, 2.92% 9/6/24 (Liquidity Facility Barclays Bank PLC) (b)(f)(h) | | 3,500 | 3,500 |
| Series XF 13 87, 2.95% 9/6/24 (Liquidity Facility Toronto-Dominion Bank) (b)(f)(h) | | 2,665 | 2,665 |
| Series XF 16 27, 2.95% 9/3/24 (Liquidity Facility JPMorgan Chase Bank) (b)(f)(h) | | 2,800 | 2,800 |
| Series XF 16 32, 2.95% 9/3/24 (Liquidity Facility JPMorgan Chase Bank) (b)(f)(h) | | 5,825 | 5,825 |
| Series XF 30 20, 2.92% 9/6/24 (Liquidity Facility Barclays Bank PLC) (b)(f)(h) | | 1,000 | 1,000 |
| Series XF 31 49, 2.93% 9/6/24 (Liquidity Facility JPMorgan Chase Bank) (b)(f)(h) | | 12,340 | 12,340 |
| Series XL 05 01, 2.95% 9/6/24 (Liquidity Facility Wells Fargo Bank NA) (b)(f)(h) | | 2,375 | 2,375 |
| California Health Facilities Fing. Auth. Rev. Participating VRDN: | | | |
| Series 15 XF2119, 2.93% 9/6/24 (Liquidity Facility Morgan Stanley Bank, West Valley City Utah) (b)(f)(h) | | 2,665 | 2,665 |
| Series BC 22 015, 3.17% 10/4/24 (Liquidity Facility Barclays Bank PLC) (b)(f)(h) | | 8,800 | 8,800 |
| Series Floater BC 23 007, 3.17% 10/4/24 (Liquidity Facility Barclays Bank PLC) (b)(f)(h) | | 105,680 | 105,680 |
| Series Floater BC 23 015, 3.17% 10/4/24 (Liquidity Facility Barclays Bank PLC) (b)(f)(h) | | 5,670 | 5,670 |
| Series Floaters 013, 3.17% 10/4/24 (Liquidity Facility Barclays Bank PLC) (b)(f)(h) | | 42,800 | 42,800 |
| Series Floaters XF 07 62, 3% 9/6/24 (Liquidity Facility JPMorgan Chase Bank) (b)(f)(h) | | 7,365 | 7,365 |
| Series Floaters XF 24 67, 2.95% 9/6/24 (Liquidity Facility Morgan Stanley Bank, West Valley City Utah) (b)(f)(h) | | 10,000 | 10,000 |
| Series Floaters XF 26 98, 2.94% 9/6/24 (Liquidity Facility Barclays Bank PLC) (b)(f)(h) | | 4,800 | 4,800 |
| Series Floaters XL 00 45, 3.9% 9/3/24 (Liquidity Facility JPMorgan Chase Bank) (b)(f)(h) | | 5,270 | 5,270 |
| Series MIZ 91 02, 3.12% 9/6/24 (Liquidity Facility Mizuho Cap. Markets LLC) (b)(f)(h) | | 22,919 | 22,919 |
| Series XF 14 32, 2.95% 9/6/24 (Liquidity Facility Toronto-Dominion Bank) (b)(f)(h) | | 1,000 | 1,000 |
| Series XF 15 18, 2.95% 9/3/24 (Liquidity Facility JPMorgan Chase Bank) (b)(f)(h) | | 3,930 | 3,930 |
| Series XF 15 27, 2.96% 9/6/24 (Liquidity Facility Bank of America NA) (b)(f)(h) | | 2,670 | 2,670 |
| Series XF 30 92, 2.94% 9/6/24 (Liquidity Facility Barclays Bank PLC) (b)(f)(h) | | 5,325 | 5,325 |
| Series YX 13 12, 2.94% 9/6/24 (Liquidity Facility Barclays Bank PLC) (b)(f)(h) | | 10,695 | 10,695 |
| California Muni. Fin. Auth. Participating VRDN Series ZL 04 77, 2.93% 9/6/24 (Liquidity Facility Morgan Stanley Bank, West Valley City Utah) (b)(f)(h) | | 7,500 | 7,500 |
| California Pub. Works Board Lease Rev. Participating VRDN: | | | |
| Series XF 16 50, 2.97% 9/6/24 (Liquidity Facility JPMorgan Chase Bank) (b)(f)(h) | | 4,130 | 4,130 |
| Series YX 11 91, 2.94% 9/6/24 (Liquidity Facility Barclays Bank PLC) (b)(f)(h) | | 14,260 | 14,260 |
| California State Univ. Rev. Participating VRDN: | | | |
| Series XG 05 87, 2.95% 9/6/24 (Liquidity Facility Bank of America NA) (b)(f)(h) | | 1,800 | 1,800 |
| Series XM 10 00, 2.95% 9/3/24 (Liquidity Facility JPMorgan Chase Bank) (b)(f)(h) | | 9,525 | 9,525 |
| Series ZL 02 88, 2.94% 9/6/24 (Liquidity Facility Barclays Bank PLC) (b)(f)(h) | | 13,490 | 13,490 |
| California Statewide Cmntys. Dev. Auth. Multi-family Hsg. Rev. Participating VRDN Series Floater MIZ 91 84, 3.17% 10/4/24 (Liquidity Facility Mizuho Cap. Markets LLC) (b)(f)(g)(h) | | 20,380 | 20,380 |
| California Statewide Cmntys. Dev. Auth. Rev. Participating VRDN Series XF 17 31, 2.94% 9/6/24 (Liquidity Facility Royal Bank of Canada) (b)(f)(h) | | 3,045 | 3,045 |
| Chaffey Unified High School District Participating VRDN Series XF 13 44, 2.95% 9/6/24 (Liquidity Facility Bank of America NA) (b)(f)(h) | | 4,760 | 4,760 |
| Chino Valley Unified School District Participating VRDN Series XF 16 61, 2.93% 9/6/24 (Liquidity Facility JPMorgan Chase Bank) (b)(f)(h) | | 3,175 | 3,175 |
| East Bay Muni. Util. District Wastewtr. Sys. Rev. Participating VRDN Series XF 16 97, 2.93% 9/6/24 (Liquidity Facility JPMorgan Chase Bank) (b)(f)(h) | | 4,800 | 4,800 |
| Folsom-Cordova Unified School District Participating VRDN Series 2022 037, 3.15% 9/3/24 (Liquidity Facility Barclays Bank PLC) (b)(f)(h) | | 4,065 | 4,065 |
| Foothill/Eastern Trans. Corridor Agcy. Toll Road Rev. Participating VRDN Series Floaters XG 02 43, 2.97% 9/6/24 (Liquidity Facility Bank of America NA) (b)(f)(h) | | 5,285 | 5,285 |
| Long Beach Unified School District Participating VRDN: | | | |
| Series XG 04 78, 2.98% 9/6/24 (Liquidity Facility Wells Fargo Bank NA) (b)(f)(h) | | 6,465 | 6,465 |
| Series XG 05 01, 2.95% 9/6/24 (Liquidity Facility Wells Fargo Bank NA) (b)(f)(h) | | 1,920 | 1,920 |
| Los Angeles County Facilities, Inc. Participating VRDN: | | | |
| Series 2022 XF 13 76, 2.97% 9/6/24 (Liquidity Facility Bank of America NA) (b)(f)(h) | | 5,000 | 5,000 |
| Series ZF 31 62, 2.95% 9/6/24 (Liquidity Facility Wells Fargo Bank NA) (b)(f)(h) | | 1,670 | 1,670 |
| Los Angeles County Gen. Oblig. Participating VRDN Series XF 30 05, 2.95% 9/6/24 (Liquidity Facility Morgan Stanley Bank, West Valley City Utah) (b)(f)(h) | | 7,500 | 7,500 |
| Los Angeles County Metropolitan Trans. Auth. Sales Tax Rev. Participating VRDN Series ZL 03 27, 2.93% 9/6/24 (Liquidity Facility JPMorgan Chase Bank) (b)(f)(h) | | 2,800 | 2,800 |
| Los Angeles County Pub. Works Fing. Auth. Lease Rev. Participating VRDN: | | | |
| Series XM 10 94, 2.93% 9/6/24 (Liquidity Facility Morgan Stanley Bank, West Valley City Utah) (b)(f)(h) | | 3,970 | 3,970 |
| Series YX 12 93, 2.94% 9/6/24 (Liquidity Facility Barclays Bank PLC) (b)(f)(h) | | 5,250 | 5,250 |
| Los Angeles Dept. Arpt. Rev. Participating VRDN: | | | |
| Series 2018 XF 06 75, 2.97% 9/6/24 (Liquidity Facility JPMorgan Chase Bank) (b)(c)(f)(h) | | 6,145 | 6,145 |
| Series 2021 XF 12 49, 2.97% 9/6/24 (Liquidity Facility JPMorgan Chase Bank) (b)(c)(f)(h) | | 3,195 | 3,195 |
| Series 2022 XF 13 84, 2.98% 9/6/24 (Liquidity Facility Toronto-Dominion Bank) (b)(c)(f)(h) | | 1,500 | 1,500 |
| Series 2022 XG 04 15, 2.95% 9/6/24 (Liquidity Facility Morgan Stanley Bank, West Valley City Utah) (b)(c)(f)(h) | | 4,800 | 4,800 |
| Series 2022 XM 10 37, 2.98% 9/6/24 (Liquidity Facility Royal Bank of Canada) (b)(c)(f)(h) | | 4,000 | 4,000 |
| Series 2022: | | | |
2.97% 9/6/24 (Liquidity Facility Bank of America NA) (b)(c)(f)(h) | | 5,510 | 5,510 |
3% 9/6/24 (Liquidity Facility Toronto-Dominion Bank) (b)(c)(f)(h) | | 5,600 | 5,600 |
| Series Floaters XG 02 32, 2.96% 9/6/24 (Liquidity Facility Morgan Stanley Bank, West Valley City Utah) (b)(c)(f)(h) | | 17,700 | 17,700 |
| Series Floaters XX 10 28, 2.95% 9/6/24 (Liquidity Facility Barclays Bank PLC) (b)(c)(f)(h) | | 980 | 980 |
| Series XF 13 68, 2.97% 9/6/24 (Liquidity Facility JPMorgan Chase Bank) (b)(c)(f)(h) | | 2,250 | 2,250 |
| Series XF 13 73, 2.97% 9/6/24 (Liquidity Facility JPMorgan Chase Bank) (b)(c)(f)(h) | | 865 | 865 |
| Series XF 15 84, 2.97% 9/6/24 (Liquidity Facility JPMorgan Chase Bank) (b)(c)(f)(h) | | 4,000 | 4,000 |
| Series XF 30 11, 2.97% 9/6/24 (Liquidity Facility Morgan Stanley Bank, West Valley City Utah) (b)(c)(f)(h) | | 2,800 | 2,800 |
| Series XF 30 39, 2.97% 9/6/24 (Liquidity Facility Morgan Stanley Bank, West Valley City Utah) (b)(c)(f)(h) | | 15,000 | 15,000 |
| Series XG 04 76, 3.05% 9/3/24 (Liquidity Facility JPMorgan Chase Bank) (b)(c)(f)(h) | | 9,440 | 9,440 |
| Series XL 04 61, 2.94% 9/6/24 (Liquidity Facility Morgan Stanley Bank, West Valley City Utah) (b)(c)(f)(h) | | 8,780 | 8,780 |
| Series XL 04 99, 2.93% 9/6/24 (Liquidity Facility Morgan Stanley Bank, West Valley City Utah) (b)(f)(h) | | 3,000 | 3,000 |
| Series XX 13 08, 2.95% 9/6/24 (Liquidity Facility Barclays Bank PLC) (b)(c)(f)(h) | | 7,500 | 7,500 |
| Series YX 12 29, 2.95% 9/6/24 (Liquidity Facility Barclays Bank PLC) (b)(c)(f)(h) | | 13,960 | 13,960 |
| Series ZF 16 73, 2.97% 9/6/24 (Liquidity Facility JPMorgan Chase Bank) (b)(c)(f)(h) | | 2,200 | 2,200 |
| Series ZF 32 40, 2.94% 9/6/24 (Liquidity Facility Morgan Stanley Bank, West Valley City Utah) (b)(c)(f)(h) | | 1,500 | 1,500 |
| Series ZF 32 41, 2.94% 9/6/24 (Liquidity Facility Morgan Stanley Bank, West Valley City Utah) (b)(c)(f)(h) | | 1,495 | 1,495 |
| Series ZL 05 19, 2.95% 9/6/24 (Liquidity Facility Morgan Stanley Bank, West Valley City Utah) (b)(c)(f)(h) | | 2,850 | 2,850 |
| Los Angeles Dept. of Wtr. & Pwr. Rev. Participating VRDN: | | | |
| Series XF 14 41, 3.9% 9/3/24 (Liquidity Facility JPMorgan Chase Bank) (b)(f)(h) | | 3,500 | 3,500 |
| Series XF 14 49, 2.93% 9/6/24 (Liquidity Facility JPMorgan Chase Bank) (b)(f)(h) | | 1,835 | 1,835 |
| Series XF 30 25, 2.95% 9/6/24 (Liquidity Facility Morgan Stanley Bank, West Valley City Utah) (b)(f)(h) | | 8,000 | 8,000 |
| Series XL 04 04, 2.94% 9/6/24 (Liquidity Facility Morgan Stanley Bank, West Valley City Utah) (b)(f)(h) | | 4,665 | 4,665 |
| Series XX 12 40, 2.94% 9/6/24 (Liquidity Facility Barclays Bank PLC) (b)(f)(h) | | 4,125 | 4,125 |
| Series ZL 02 85, 2.94% 9/6/24 (Liquidity Facility Barclays Bank PLC) (b)(f)(h) | | 11,775 | 11,775 |
| Series ZL 03 26, 2.93% 9/6/24 (Liquidity Facility JPMorgan Chase Bank) (b)(f)(h) | | 1,335 | 1,335 |
| Los Angeles Dept. of Wtr. & Pwr. Wtrwks. Rev. Participating VRDN: | | | |
| Series XL 03 99, 2.94% 9/6/24 (Liquidity Facility Wells Fargo Bank NA) (b)(f)(h) | | 6,250 | 6,250 |
| Series XM 11 53, 2.94% 9/6/24 (Liquidity Facility UBS AG) (b)(f)(h) | | 5,965 | 5,965 |
| Los Angeles Hbr. Dept. Rev. Participating VRDN Series Floaters XF 07 61, 2.93% 9/6/24 (Liquidity Facility JPMorgan Chase Bank) (b)(f)(h) | | 1,500 | 1,500 |
| Los Angeles Unified School District Participating VRDN: | | | |
| Series 2022 ZL 03 61, 2.92% 9/6/24 (Liquidity Facility Morgan Stanley Bank, West Valley City Utah) (b)(f)(h) | | 4,950 | 4,950 |
| Series 2023, 2.93% 9/6/24 (Liquidity Facility Citibank NA) (b)(f)(h) | | 19,250 | 19,250 |
| Series ZF 31 87, 2.93% 9/6/24 (Liquidity Facility Morgan Stanley Bank, West Valley City Utah) (b)(f)(h) | | 4,150 | 4,150 |
| Los Angeles Wastewtr. Sys. Rev. Participating VRDN Series ROC II R 14059, 2.94% 9/6/24 (Liquidity Facility JPMorgan Chase Bank) (b)(f)(h) | | 6,000 | 6,000 |
| Lucile Salter Packard Children's Hosp. Participating VRDN Series Floaters XG 01 48, 2.95% 9/6/24 (Liquidity Facility Morgan Stanley Bank, West Valley City Utah) (b)(f)(h) | | 2,524 | 2,524 |
| North Orange County Cmnty. College District Rev. Participating VRDN Series XX 12 39, 2.94% 9/6/24 (Liquidity Facility Barclays Bank PLC) (b)(f)(h) | | 10,000 | 10,000 |
| Palmdale School District Participating VRDN Series 2022 045, 3.15% 9/3/24 (Liquidity Facility Barclays Bank PLC) (b)(f)(h) | | 3,905 | 3,905 |
| Pub. Utils. Commission San Francisco City & County Wastewtr. Rev. Participating VRDN Series ZF 14 35, 2.93% 9/6/24 (Liquidity Facility JPMorgan Chase Bank) (b)(f)(h) | | 2,130 | 2,130 |
| RBC Muni. Products, Inc. Trust Participating VRDN Series 2023, 2.92% 9/6/24 (Liquidity Facility Royal Bank of Canada) (b)(f)(h) | | 30,000 | 30,000 |
| Riverside County Trans. Commission Toll Rev. Participating VRDN Series 2021 XG 03 41, 2.97% 9/6/24 (Liquidity Facility Bank of America NA) (b)(f)(h) | | 15,000 | 15,000 |
| Sacramento City Unified School District Participating VRDN Series XG 03 93, 2.95% 9/6/24 (Liquidity Facility Barclays Bank PLC) (b)(f)(h) | | 4,800 | 4,800 |
| San Diego County Reg'l. Arpt. Auth. Arpt. Rev. Participating VRDN: | | | |
| Series XF 15 15, 2.98% 9/6/24 (Liquidity Facility Toronto-Dominion Bank) (b)(c)(f)(h) | | 11,800 | 11,800 |
| Series XF 15 22, 2.98% 9/6/24 (Liquidity Facility Toronto-Dominion Bank) (b)(c)(f)(h) | | 7,235 | 7,235 |
| Series XF 16 20, 2.97% 9/6/24 (Liquidity Facility Royal Bank of Canada) (b)(c)(f)(h) | | 3,160 | 3,160 |
| Series XF 31 80, 2.95% 9/6/24 (Liquidity Facility Barclays Bank PLC) (b)(c)(f)(h) | | 8,000 | 8,000 |
| Series XL 05 46, 2.97% 9/6/24 (Liquidity Facility JPMorgan Chase Bank) (b)(c)(f)(h) | | 8,000 | 8,000 |
| Series XX 12 15, 2.95% 9/6/24 (Liquidity Facility Barclays Bank PLC) (b)(c)(f)(h) | | 7,500 | 7,500 |
| Series ZF 16 72, 3.02% 9/6/24 (Liquidity Facility JPMorgan Chase Bank) (b)(c)(f)(h) | | 7,250 | 7,250 |
| Series ZL 05 10, 2.97% 9/6/24 (Liquidity Facility Morgan Stanley Bank, West Valley City Utah) (b)(c)(f)(h) | | 10,400 | 10,400 |
| San Diego Unified School District Participating VRDN: | | | |
| Series XF 13 86, 2.95% 9/6/24 (Liquidity Facility Bank of America NA) (b)(f)(h) | | 2,915 | 2,915 |
| Series XF 14 27, 2.93% 9/6/24 (Liquidity Facility JPMorgan Chase Bank) (b)(f)(h) | | 2,000 | 2,000 |
| Series XF 31 50, 2.93% 9/6/24 (Liquidity Facility JPMorgan Chase Bank) (b)(f)(h) | | 5,400 | 5,400 |
| San Francisco Bay Area Rapid Transit Fing. Auth. Participating VRDN: | | | |
| Series XF 13 31, 2.95% 9/6/24 (Liquidity Facility Toronto-Dominion Bank) (b)(f)(h) | | 1,875 | 1,875 |
| Series XF 15 01, 2.95% 9/3/24 (Liquidity Facility JPMorgan Chase Bank) (b)(f)(h) | | 3,055 | 3,055 |
| Series XG 03 81, 2.93% 9/6/24 (Liquidity Facility JPMorgan Chase Bank) (b)(f)(h) | | 3,640 | 3,640 |
| San Francisco City & County Arpts. Commission Int'l. Arpt. Rev. Participating VRDN: | | | |
| Series 2023, 2.95% 9/6/24 (Liquidity Facility Barclays Bank PLC) (b)(f)(h) | | 1,975 | 1,975 |
| Series Floaters XL 01 01, 2.97% 9/6/24 (Liquidity Facility JPMorgan Chase Bank) (b)(c)(f)(h) | | 4,185 | 4,185 |
| Series XG 03 63, 3% 9/6/24 (Liquidity Facility Bank of America NA) (b)(c)(f)(h) | | 4,160 | 4,160 |
| San Francisco City & County Ctfs. of Prtn. Participating VRDN Series XG 03 72, 2.95% 9/6/24 (Liquidity Facility Wells Fargo Bank NA) (b)(f)(h) | | 3,135 | 3,135 |
| Southern California Pub. Pwr. Auth. Participating VRDN Series XF 17 06, 2.95% 9/6/24 (Liquidity Facility Royal Bank of Canada) (b)(f)(h) | | 1,535 | 1,535 |
| Univ. of California Regents Med. Ctr. Pool Rev. Participating VRDN: | | | |
| Series 2022 XX 12 62, 2.94% 9/6/24 (Liquidity Facility Barclays Bank PLC) (b)(f)(h) | | 3,750 | 3,750 |
| Series Floaters YX 10 97, 2.95% 9/6/24 (Liquidity Facility Barclays Bank PLC) (b)(f)(h) | | 3,750 | 3,750 |
| Series XF 16 24, 3.9% 9/3/24 (Liquidity Facility JPMorgan Chase Bank) (b)(f)(h) | | 7,570 | 7,570 |
| Series XG 03 66, 2.95% 9/6/24 (Liquidity Facility Wells Fargo Bank NA) (b)(f)(h) | | 8,765 | 8,765 |
| Series XX 12 01, 2.94% 9/6/24 (Liquidity Facility Barclays Bank PLC) (b)(f)(h) | | 7,500 | 7,500 |
| Series XX 12 06, 2.94% 9/6/24 (Liquidity Facility Barclays Bank PLC) (b)(f)(h) | | 21,670 | 21,670 |
| Series XX 12 75, 2.94% 9/6/24 (Liquidity Facility Barclays Bank PLC) (b)(f)(h) | | 2,685 | 2,685 |
| Series YX 12 00, 2.94% 9/6/24 (Liquidity Facility Barclays Bank PLC) (b)(f)(h) | | 19,870 | 19,870 |
| Series YX 12 05, 2.95% 9/6/24 (Liquidity Facility Barclays Bank PLC) (b)(f)(h) | | 7,020 | 7,020 |
| Series YX 12 94, 2.95% 9/6/24 (Liquidity Facility Barclays Bank PLC) (b)(f)(h) | | 1,875 | 1,875 |
| Univ. of California Revs. Participating VRDN: | | | |
| Series 2022 XF 14 12, 2.95% 9/6/24 (Liquidity Facility Toronto-Dominion Bank) (b)(f)(h) | | 5,000 | 5,000 |
| Series 2022 XF 30 48, 2.93% 9/6/24 (Liquidity Facility Morgan Stanley Bank, West Valley City Utah) (b)(f)(h) | | 5,625 | 5,625 |
| Series 2022 ZL 03 48, 2.93% 9/6/24 (Liquidity Facility JPMorgan Chase Bank) (b)(f)(h) | | 4,000 | 4,000 |
| Series XM 11 06, 2.92% 9/6/24 (Liquidity Facility Morgan Stanley Bank, West Valley City Utah) (b)(f)(h) | | 5,685 | 5,685 |
| Series XX 13 25, 2.94% 9/6/24 (Liquidity Facility Barclays Bank PLC) (b)(f)(h) | | 7,500 | 7,500 |
TOTAL CALIFORNIA | | | 978,813 |
| Colorado - 0.1% | | | |
| Colorado Health Facilities Auth. Rev. Bonds Participating VRDN Series 2023, 3.22% 10/4/24 (Liquidity Facility Barclays Bank PLC) (b)(f)(h) | | 7,200 | 7,200 |
| Delaware - 0.1% | | | |
| Mizuho Floater / Residual Trust V Participating VRDN Floater MIZ 91 75, 3.24% 10/4/24 (Liquidity Facility Mizuho Cap. Markets LLC) (b)(f)(g)(h) | | 2,800 | 2,800 |
| Illinois - 0.0% | | | |
| Illinois Fin. Auth. Rev. Participating VRDN Series Floaters 017, 3.22% 10/4/24 (Liquidity Facility Barclays Bank PLC) (b)(f)(h) | | 1,360 | 1,360 |
| Minnesota - 0.1% | | | |
| Mizuho Floater / Residual Trust V Participating VRDN Series Floater MIZ 91 86, 3.24% 10/4/24 (Liquidity Facility Mizuho Cap. Markets LLC) (b)(f)(g)(h) | | 2,700 | 2,700 |
| Missouri - 0.0% | | | |
| Missouri Health & Edl. Facilities Rev. Bonds Series 2023 G 121, 3.12%, tender 12/2/24 (Liquidity Facility Royal Bank of Canada) (b)(f)(h) | | 1,320 | 1,320 |
| Tennessee - 0.0% | | | |
| Metropolitan Govt. Nashville & Davidson County Health & Edl. Facilities Board Participating VRDN Series MIZ 91 81, 3.24% 10/4/24 (Liquidity Facility Mizuho Cap. Markets LLC) (b)(f)(g)(h) | | 530 | 530 |
| Texas - 0.1% | | | |
| El Paso Wtr. & Swr. Rev. Bonds Series G 124, 3.12%, tender 9/3/24 (Liquidity Facility Royal Bank of Canada) (b)(f)(g)(h)(i) | | 1,400 | 1,400 |
| Mizuho Floater / Residual Trust V Participating VRDN Series Floater MIZ 91 85, 3.24% 10/4/24 (Liquidity Facility Mizuho Cap. Markets LLC) (b)(f)(g)(h) | | 2,600 | 2,600 |
| Texas Wtr. Dev. Board Rev. Bonds Series MS 00 17, 3.07%, tender 10/17/24 (Liquidity Facility Morgan Stanley Bank, West Valley City Utah) (b)(f)(g)(h) | | 2,300 | 2,300 |
TOTAL TEXAS | | | 6,300 |
| Washington - 0.0% | | | |
| Central Puget Sound Reg'l. Trans. Auth. Sales & Use Tax Rev. Bonds Series G 123, 3.12%, tender 11/1/24 (Liquidity Facility Royal Bank of Canada) (b)(f)(g)(h) | | 1,000 | 1,000 |
| TOTAL TENDER OPTION BOND (Cost $1,005,793) | | | 1,005,793 |
| | | | |
| Other Municipal Security - 30.2% |
| | | Principal Amount (a) (000s) | Value ($) (000s) |
| California - 30.2% | | | |
| Antelope Valley Cmnty. College District Bonds Series 2015: | | | |
| 0% 2/15/25 (Pre-Refunded to 2/15/25 @ 73.5) | | 200 | 145 |
| 5% 2/15/25 (Pre-Refunded to 2/15/25 @ 100) | | 140 | 141 |
| Bay Area Toll Auth. San Francisco Bay Toll Bridge Rev. Bonds Series 2014 S6, 5% 10/1/24 (Pre-Refunded to 10/1/24 @ 100) | | 26,445 | 26,476 |
| California Edl. Facilities Auth. Rev. Bonds: | | | |
| Series 2009 C, 5.25% 10/1/24 (Escrowed to Maturity) | | 120 | 120 |
| Series 2024 S3, 3.45% tender 11/18/24, CP mode | | 12,000 | 12,000 |
| California Gen. Oblig.: | | | |
| Bonds: | | | |
Series 2003: | | | |
5.5% 2/1/25 | | 140 | 141 |
5.5% 2/1/25 | | 220 | 222 |
Series 2014: | | | |
4% 10/1/24 | | 100 | 100 |
5% 10/1/24 | | 765 | 766 |
5% 10/1/24 | | 890 | 891 |
5% 11/1/24 | | 3,725 | 3,734 |
Series 2015 B, 5% 9/1/24 | | 625 | 625 |
Series 2015: | | | |
4% 3/1/25 | | 125 | 125 |
5% 3/1/25 | | 175 | 176 |
Series 2016: | | | |
5% 9/1/24 | | 165 | 165 |
5% 9/1/24 | | 505 | 505 |
5% 9/1/24 | | 1,050 | 1,050 |
5% 9/1/24 | | 325 | 325 |
Series 2017, 5% 11/1/24 | | 385 | 386 |
Series 2018: | | | |
4% 10/1/24 | | 130 | 130 |
5% 10/1/24 | | 1,200 | 1,202 |
5% 10/1/24 | | 15,675 | 15,694 |
Series 2019: | | | |
4% 10/1/24 | | 21,985 | 21,994 |
5% 4/1/25 | | 250 | 252 |
5% 4/1/25 | | 150 | 151 |
Series 2020: | | | |
4% 11/1/24 | | 290 | 290 |
4% 3/1/25 | | 835 | 838 |
5% 11/1/24 | | 1,125 | 1,128 |
5% 3/1/25 | | 210 | 212 |
Series 2021: | | | |
4% 12/1/24 | | 325 | 325 |
5% 9/1/24 | | 270 | 270 |
5% 10/1/24 | | 640 | 641 |
5% 10/1/24 | | 10,245 | 10,260 |
Series 2022: | | | |
5% 9/1/24 | | 10,550 | 10,550 |
5% 9/1/24 | | 300 | 300 |
5% 4/1/25 | | 345 | 348 |
Series 2023: | | | |
5% 9/1/24 | | 54,590 | 54,590 |
5% 9/1/24 | | 40,420 | 40,420 |
5% 10/1/24 | | 7,815 | 7,823 |
Series 2024: | | | |
4% 8/1/25 (j) | | 5,000 | 5,060 |
5% 9/1/24 | | 25,735 | 25,735 |
5% 2/1/25 (j) | | 33,285 | 33,600 |
5% 8/1/25 (j) | | 47,290 | 48,293 |
| Series 2024 A1: | | | |
3.05% 11/4/24, LOC Wells Fargo Bank NA, CP | | 28,460 | 28,460 |
3.4% 9/26/24, LOC Wells Fargo Bank NA, CP | | 10,000 | 10,000 |
| Series 2024 A2: | | | |
3.15% 11/21/24, LOC Royal Bank of Canada, CP | | 41,495 | 41,495 |
3.38% 10/7/24, LOC Royal Bank of Canada, CP | | 30,140 | 30,140 |
| Series 2024 A3, 3.2% 10/10/24, LOC UBS AG, CP | | 36,275 | 36,275 |
| Series 2024 A4: | | | |
3.15% 10/9/24, LOC Toronto-Dominion Bank, CP | | 16,965 | 16,965 |
3.2% 11/14/24, LOC Toronto-Dominion Bank, CP | | 38,900 | 38,900 |
| Series 2024 A6, 3.5% 9/3/24, LOC Bank of America NA, CP | | 17,000 | 17,000 |
| Series 2024 A7: | | | |
3.55% 10/8/24, LOC State Street Bank & Trust Co., Boston, CP | | 17,260 | 17,260 |
3.55% 10/10/24, LOC State Street Bank & Trust Co., Boston, CP | | 20,260 | 20,260 |
| Series 2024 A8, 3.1% 10/8/24, LOC Bank of Montreal, CP | | 11,755 | 11,755 |
| California Health Facilities Fing. Auth. Rev. Bonds: | | | |
| Series 2014 A, 5% 10/1/24 (Pre-Refunded to 10/1/24 @ 100) | | 645 | 646 |
| Series 2015, 5% 11/15/24 | | 200 | 201 |
| Series 2016 A, 5% 11/15/24 (Escrowed to Maturity) | | 300 | 301 |
| Series 2016 B, 5% 11/15/24 | | 130 | 130 |
| Series 2017 A, 5% 11/15/24 | | 375 | 376 |
| Series 2018 A, 5% 11/15/24 | | 7,480 | 7,506 |
| Series 2021 A, 3%, tender 8/15/25 (b) | | 1,175 | 1,175 |
| California Infrastructure and Econ. Dev. Bank Rev. Bonds: | | | |
| Series 2017, 5% 10/1/24 | | 330 | 330 |
| Series 2018, 5% 10/1/24 | | 600 | 601 |
| California Muni. Fin. Auth. Rev. Bonds Series 2015 A: | | | |
| 4.25% 2/1/25 (Pre-Refunded to 2/1/25 @ 100) | | 100 | 100 |
| 5% 2/1/25 (Pre-Refunded to 2/1/25 @ 100) | | 100 | 101 |
| California Pub. Works Board Lease Rev. Bonds: | | | |
| (Riverside Campus Projs.) Series 2017 H, 5% 4/1/25 | | 250 | 252 |
| (Various Cap. Projs.): | | | |
Series 2014 H, 5% 12/1/24 | | 160 | 161 |
Series 2016 C, 5% 11/1/24 | | 1,370 | 1,373 |
Series 2017 G, 4% 10/1/24 | | 400 | 400 |
Series 2020 D, 5% 11/1/24 | | 615 | 617 |
Series 2021 A, 5% 2/1/25 | | 180 | 181 |
Series 2023 C, 5% 9/1/24 | | 14,700 | 14,700 |
Series 2023 D, 5% 11/1/24 | | 455 | 456 |
| Series 2014 A, 5% 9/1/24 | | 360 | 360 |
| Series 2014 B, 5% 10/1/24 | | 725 | 726 |
| Series 2014 C, 5% 10/1/24 | | 2,350 | 2,353 |
| Series 2014 D, 5% 9/1/24 | | 115 | 115 |
| Series 2014 E, 5% 9/1/24 | | 500 | 500 |
| Series 2015 G, 5% 5/1/25 | | 410 | 415 |
| Series 2015 H, 5% 12/1/24 | | 375 | 376 |
| Series 2016 E, 5% 10/1/24 | | 1,300 | 1,302 |
| Series 2017 D, 5% 9/1/24 | | 375 | 375 |
| Series 2017 E, 5% 9/1/24 | | 820 | 820 |
| Series 2017, 5% 10/1/24 | | 575 | 576 |
| Series 2018 C, 5% 11/1/24 | | 255 | 256 |
| Series 2022 D, 5% 5/1/25 | | 135 | 136 |
| Series 2023 B, 5% 12/1/24 | | 650 | 653 |
| California State Univ. Rev.: | | | |
| Bonds: | | | |
Series 2015 A: | | | |
4% 11/1/24 | | 200 | 200 |
5% 11/1/24 | | 425 | 426 |
Series 2017 A, 5% 11/1/24 | | 1,175 | 1,178 |
Series 2021 A, 5% 11/1/24 | | 375 | 376 |
| Series 2024 A: | | | |
3.3% 11/4/24, LOC State Street Bank & Trust Co., Boston, LOC Wells Fargo Bank NA, CP | | 6,786 | 6,786 |
3.5% 9/5/24, LOC State Street Bank & Trust Co., Boston, LOC Wells Fargo Bank NA, CP | | 6,535 | 6,535 |
| California Statewide Cmntys. Dev. Auth. Rev. Bonds Series 2014: | | | |
| 5% 11/15/24 (Pre-Refunded to 11/15/24 @ 100) | | 1,000 | 1,003 |
| 5% 11/15/24 (Pre-Refunded to 11/15/24 @ 100) | | 160 | 161 |
| 5% 11/15/24 (Pre-Refunded to 11/15/24 @ 100) | | 2,200 | 2,206 |
| 5.25% 10/1/24 (Pre-Refunded to 10/1/24 @ 100) | | 985 | 986 |
| East Bay Muni. Util. District Wastewtr. Sys. Rev.: | | | |
| Series 2024 A1: | | | |
3.23% 10/9/24 (Liquidity Facility Sumitomo Mitsui Banking Corp.), CP | | 23,000 | 23,000 |
3.53% 9/5/24 (Liquidity Facility Sumitomo Mitsui Banking Corp.), CP | | 39,210 | 39,210 |
| Series 2024 A2: | | | |
3.2% 11/5/24 (Liquidity Facility Bank of America NA), CP | | 31,200 | 31,200 |
3.6% 10/2/24 (Liquidity Facility Bank of America NA), CP | | 33,800 | 33,800 |
| Foothill-De Anza Commission Clctfs Bonds Series 2016: | | | |
| 4% 10/1/24 (Pre-Refunded to 10/1/24 @ 100) | | 505 | 505 |
| 5% 10/1/24 (Pre-Refunded to 10/1/24 @ 100) | | 290 | 290 |
| Golden Gate Bridge & Hwy. District Series 2024 B: | | | |
| 3.8% 1/16/25, CP | | 16,800 | 16,800 |
| 3.85% 11/14/24, CP | | 3,750 | 3,750 |
| 3.85% 11/14/24, CP | | 5,000 | 5,000 |
| 3.85% 11/14/24, CP | | 875 | 875 |
| Golden State Tobacco Securitization Corp. Tobacco Settlement Rev. Bonds: | | | |
| Series 2015 A: | | | |
4% 6/1/25 (Pre-Refunded to 6/1/25 @ 100) | | 150 | 151 |
5% 6/1/25 (Pre-Refunded to 6/1/25 @ 100) | | 340 | 344 |
5% 6/1/25 (Pre-Refunded to 6/1/25 @ 100) | | 740 | 749 |
5% 6/1/25 (Pre-Refunded to 6/1/25 @ 100) | | 545 | 552 |
5% 6/1/25 (Pre-Refunded to 6/1/25 @ 100) | | 2,025 | 2,051 |
| Series 2017 A1, 5% 6/1/25 (Escrowed to Maturity) | | 210 | 212 |
| Jefferson School Di Sm County Bonds Series 2014 B: | | | |
| 4% 9/1/24 (Pre-Refunded to 9/1/24 @ 100) | | 120 | 120 |
| 5% 9/1/24 (Pre-Refunded to 9/1/24 @ 100) | | 265 | 265 |
| Los Angeles County Cap. Asset Leasing Corp. Lease Rev.: | | | |
| Series 2024 A, 3.5% 11/5/24, LOC Bank of Montreal, CP | | 45,136 | 45,136 |
| Series 2024 C: | | | |
3.2% 11/20/24, LOC Bank of America NA, CP | | 61,039 | 61,039 |
3.35% 9/6/24, LOC Bank of America NA, CP | | 65,000 | 65,000 |
| Series 2024 D: | | | |
3.5% 11/5/24, LOC Sumitomo Mitsui Banking Corp., CP | | 11,670 | 11,670 |
3.55% 10/2/24, LOC Sumitomo Mitsui Banking Corp., CP | | 4,200 | 4,200 |
| Los Angeles County Gen. Oblig. TRAN Series 2024, 5% 6/30/25 | | 61,320 | 62,180 |
| Los Angeles County Pub. Works Fing. Auth. Lease Rev. Bonds: | | | |
| (LACMA Bldg. for the Permanent Collection Proj.) Series 2020 A, 5% 12/1/24 | | 100 | 100 |
| Series 2016 D, 5% 12/1/24 | | 110 | 110 |
| Series 2021 F, 5% 12/1/24 | | 225 | 226 |
| Los Angeles County Schools Pooled Fing. Prog. Ctfs. of Prtn. TRAN Series 2024, 4% 6/2/25 (j) | | 10,000 | 10,089 |
| Los Angeles Dept. Arpt. Rev. Bonds: | | | |
| Series 2015 A, 5% 5/15/25 (c) | | 115 | 116 |
| Series 2016 A, 5% 5/15/25 (c) | | 910 | 918 |
| Series 2017 B, 5% 5/15/25 (c) | | 100 | 101 |
| Series 2018 A, 5% 5/15/25 (c) | | 130 | 131 |
| Series 2018 B, 5% 5/15/25 (c) | | 1,075 | 1,085 |
| Series 2018 C, 5% 5/15/25 (c) | | 100 | 101 |
| Series 2019 A, 5% 5/15/25 (c) | | 1,350 | 1,363 |
| Series 2019 E, 5% 5/15/25 | | 160 | 162 |
| Series 2020 C, 5% 5/15/25 (c) | | 605 | 612 |
| Series 2021 B, 5% 5/15/25 | | 250 | 253 |
| Series 2022 C, 5% 5/15/25 (c) | | 330 | 334 |
| Series 2022 G, 5% 5/15/25 (c) | | 1,420 | 1,437 |
| Series 2023 A, 5% 5/15/25 (c) | | 695 | 702 |
| Los Angeles Gen. Oblig.: | | | |
| Bonds Series 2021 B, 4% 9/1/24 | | 375 | 375 |
| TRAN Series 2024, 5% 6/26/25 | | 98,220 | 99,447 |
| Los Angeles Muni. Impt. Corp. Lease Rev.: | | | |
| Bonds: | | | |
Series 2016 A: | | | |
4% 11/1/24 | | 110 | 110 |
5% 11/1/24 | | 960 | 963 |
Series 2016 B, 5% 11/1/24 | | 370 | 371 |
Series 2020 A, 5% 11/1/24 | | 405 | 406 |
| Series 2024 A1: | | | |
3.1% 10/10/24, LOC BMO Harris Bank NA, CP | | 5,000 | 5,000 |
3.2% 10/22/24, LOC BMO Harris Bank NA, CP | | 9,000 | 9,000 |
| Series 2024 A2, 3.2% 11/18/24, LOC Bank of America NA, CP | | 14,300 | 14,300 |
| Los Angeles Unified School District Ctfs. of Prtn. Bonds: | | | |
| Series 2020 A, 5% 10/1/24 | | 975 | 976 |
| Series 2023 A, 5% 10/1/24 | | 1,165 | 1,167 |
| Los Angeles Wastewtr. Sys. Rev. Series 2024 A2, 3.55% 9/10/24, LOC Toronto-Dominion Bank, CP | | 33,624 | 33,624 |
| Orange County Trans. Auth. Bonds (I-405 Impt. Proj.) Series 2021: | | | |
| 4% 10/15/24 (Escrowed to Maturity) | | 2,030 | 2,032 |
| 5% 10/15/24 (Escrowed to Maturity) | | 26,615 | 26,665 |
| Port of Oakland Port Rev.: | | | |
| Series 2024 A, 3.45% 9/26/24, LOC Bank of America NA, CP (c) | | 2,342 | 2,342 |
| Series 2024 D, 3.45% 9/26/24, LOC Bank of America NA, CP (c) | | 20,193 | 20,193 |
| Pub. Utils. Commission San Francisco City & County Wastewtr. Rev. Bonds Series 2018 B, 5% 10/1/24 | | 360 | 361 |
| Riverside County Gen. Oblig. TRAN Series 2024, 5% 6/30/25 | | 48,830 | 49,515 |
| San Bernardino County Trans. Auth. Sales Tax Rev. Series 2024 A, 3.15% 10/3/24, LOC Barclays Bank PLC, CP | | 2,248 | 2,248 |
| San Diego Unified School District TRAN Series 2024 A, 5% 6/30/25 | | 15,310 | 15,539 |
| San Francisco City & County Ctfs. of Prtn. Bonds Series 2020 R1, 5% 10/1/24 | | 350 | 351 |
| San Francisco City & County Pub. Util. Commission Wastewtr. Rev.: | | | |
| Series 2024 A1, 3.6% 9/12/24, LOC Sumitomo Mitsui Banking Corp., CP | | 12,500 | 12,500 |
| Series 2024 A2, 3.1% 10/22/24, LOC Sumitomo Mitsui Banking Corp., CP | | 32,135 | 32,135 |
| San Francisco Pub. Utils. Commission Wtr. Rev. Bonds: | | | |
| Series 2015 A, 5% 11/1/24 | | 125 | 125 |
| Series 2016 B, 3% 11/1/24 | | 100 | 100 |
| Series 2016, 5% 11/1/24 | | 155 | 155 |
| San Joaquin Hills Trans. Corridor Agcy. Toll Road Rev. Bonds Series 2014 A: | | | |
| 5% 1/15/25 (Pre-Refunded to 1/15/25 @ 100) | | 110 | 111 |
| 5% 1/15/25 (Pre-Refunded to 1/15/25 @ 100) | | 305 | 307 |
| 5% 1/15/25 (Pre-Refunded to 1/15/25 @ 100) | | 1,905 | 1,916 |
| San Jose Evergreen Cmnty. College District Bonds: | | | |
| Series 2014 A, 5% 9/1/24 (Pre-Refunded to 9/1/24 @ 100) | | 1,440 | 1,440 |
| Series 2014 C: | | | |
4.125% 9/1/24 (Pre-Refunded to 9/1/24 @ 100) | | 345 | 345 |
5% 9/1/24 (Pre-Refunded to 9/1/24 @ 100) | | 300 | 300 |
| San Jose Int. Arpt. Rev. Series 2024 A1, 3.55% 10/9/24, LOC Bank of America NA, CP | | 21,614 | 21,614 |
| San Mateo County Cmnty. College District Bonds Series 2014: | | | |
| 5% 9/1/24 (Pre-Refunded to 9/1/24 @ 100) | | 250 | 250 |
| 5% 9/1/24 (Pre-Refunded to 9/1/24 @ 100) | | 375 | 375 |
| 5% 9/1/24 (Pre-Refunded to 9/1/24 @ 100) | | 275 | 275 |
| 5% 9/1/24 (Pre-Refunded to 9/1/24 @ 100) | | 250 | 250 |
| San Mateo Unified School District Bonds Series 2014: | | | |
| 4.5% 9/1/24 (Pre-Refunded to 9/1/24 @ 100) | | 170 | 170 |
| 5% 9/1/24 (Pre-Refunded to 9/1/24 @ 100) | | 1,000 | 1,000 |
| 5% 9/1/24 (Pre-Refunded to 9/1/24 @ 100) | | 150 | 150 |
| Univ. of California Revs. Series 2024: | | | |
| 3.1% 11/13/24, CP | | 22,100 | 22,100 |
| 3.1% 11/13/24, CP | | 6,360 | 6,360 |
| 3.5% 10/10/24, CP | | 2,150 | 2,150 |
| 3.5% 11/20/24, CP | | 15,000 | 15,000 |
| 3.75% 11/13/24, CP | | 7,470 | 7,470 |
| 3.75% 12/19/24, CP | | 46,800 | 46,800 |
| 3.85% 11/14/24, CP | | 10,000 | 10,000 |
| Walnut Energy Ctr. Auth. Rev. Series 2024 B, 3% 12/10/24, LOC Wells Fargo Bank NA, CP | | 18,331 | 18,331 |
TOTAL CALIFORNIA | | | 1,567,789 |
| Michigan - 0.0% | | | |
| Kent Hosp. Fin. Auth. Hosp. Facilities Rev. Bonds (Spectrum Health Sys. Proj.) Series 2015 A, SIFMA Municipal Swap Index + 0.250% 3.17%, tender 3/28/25 (b)(i) | | 1,800 | 1,800 |
| TOTAL OTHER MUNICIPAL SECURITY (Cost $1,569,589) | | | 1,569,589 |
| | | | |
| Investment Company - 10.4% |
| | | Shares | Value ($) (000s) |
Fidelity Municipal Cash Central Fund 3.22% (k)(l) (Cost $539,112) | | 539,009 | 539,112 |
| | | | |
| TOTAL INVESTMENT IN SECURITIES - 100.4% (Cost $5,208,613) | 5,208,613 |
NET OTHER ASSETS (LIABILITIES) - (0.4)% | (19,495) |
| NET ASSETS - 100.0% | 5,189,118 |
| | |
Security Type Abbreviations
| CP | - | COMMERCIAL PAPER |
| TRAN | - | TAX AND REVENUE ANTICIPATION NOTE |
| VRDN | - | VARIABLE RATE DEMAND NOTE (A debt instrument that is payable upon demand, either daily, weekly or monthly) |
The date shown for securities represents the date when principal payments must be paid, taking into account any call options exercised by the issuer and any permissible maturity shortening features other than interest rate resets.
Any values shown as $0 in the Schedule of Investments may reflect amounts less than $500.
Legend
| (a) | Amount is stated in United States dollars unless otherwise noted. |
| (b) | Coupon rates for floating and adjustable rate securities reflect the rates in effect at period end. |
| (c) | Private activity obligations whose interest is subject to the federal alternative minimum tax for individuals. |
| (d) | A portion of the security sold on a delayed delivery basis. |
| (e) | Security exempt from registration under Rule 144A of the Securities Act of 1933. These securities may be resold in transactions exempt from registration, normally to qualified institutional buyers. At the end of the period, the value of these securities amounted to $36,709,000 or 0.7% of net assets. |
| (f) | Provides evidence of ownership in one or more underlying municipal bonds. |
| (g) | Restricted securities (including private placements) - Investment in securities not registered under the Securities Act of 1933 (excluding 144A issues). At the end of the period, the value of restricted securities (excluding 144A issues) amounted to $37,480,000 or 0.7% of net assets. |
| (h) | Coupon rates are determined by re-marketing agents based on current market conditions. |
| (i) | Coupon is indexed to a floating interest rate which may be multiplied by a specified factor and/or subject to caps or floors. |
| (j) | Security or a portion of the security purchased on a delayed delivery or when-issued basis. |
| (k) | Information in this report regarding holdings by state and security types does not reflect the holdings of the Fidelity Municipal Cash Central Fund. |
| (l) | Affiliated fund that is generally available only to investment companies and other accounts managed by Fidelity Investments. The rate quoted is the annualized seven-day yield of the fund at period end. A complete unaudited listing of the fund's holdings as of its most recent quarter end is available upon request. In addition, each Fidelity Central Fund's financial statements are available on the SEC's website or upon request. |
| Additional information on each restricted holding is as follows: |
| Security | Acquisition Date | Cost ($) (000s) |
| Arizona St Indl. Dev. Auth. Multi Participating VRDN Series MIZ 91 80, 3.24% 10/4/24 (Liquidity Facility Mizuho Cap. Markets LLC) | 7/11/24 | 1,170 |
| | | |
| California Statewide Cmntys. Dev. Auth. Multi-family Hsg. Rev. Participating VRDN Series Floater MIZ 91 84, 3.17% 10/4/24 (Liquidity Facility Mizuho Cap. Markets LLC) | 8/06/24 | 20,380 |
| | | |
| Central Puget Sound Reg'l. Trans. Auth. Sales & Use Tax Rev. Bonds Series G 123, 3.12%, tender 11/1/24 (Liquidity Facility Royal Bank of Canada) | 5/01/24 | 1,000 |
| | | |
| El Paso Wtr. & Swr. Rev. Bonds Series G 124, 3.12%, tender 9/5/24 (Liquidity Facility Royal Bank of Canada) | 3/01/24 | 1,400 |
| | | |
| Metropolitan Govt. Nashville & Davidson County Health & Edl. Facilities Board Participating VRDN Series MIZ 91 81, 3.24% 10/4/24 (Liquidity Facility Mizuho Cap. Markets LLC) | 7/11/24 | 530 |
| | | |
| Mizuho Floater / Residual Trust V Participating VRDN Floater MIZ 91 75, 3.24% 10/4/24 (Liquidity Facility Mizuho Cap. Markets LLC) | 6/20/24 | 2,800 |
| | | |
| Mizuho Floater / Residual Trust V Participating VRDN Series Floater MIZ 91 85, 3.24% 10/4/24 (Liquidity Facility Mizuho Cap. Markets LLC) | 8/21/24 | 2,600 |
| | | |
| Mizuho Floater / Residual Trust V Participating VRDN Series Floater MIZ 91 86, 3.24% 10/4/24 (Liquidity Facility Mizuho Cap. Markets LLC) | 8/21/24 | 2,700 |
| | | |
| Mizuho Floater / Residual Trust V Participating VRDN Series Floater MIZ 91 87, 3.24% 10/4/24 (Liquidity Facility Mizuho Cap. Markets LLC) | 8/21/24 | 2,600 |
| | | |
| Texas Wtr. Dev. Board Rev. Bonds Series MS 00 17, 3.07%, tender 10/17/24 (Liquidity Facility Morgan Stanley Bank, West Valley City Utah) | 10/12/23 | 2,300 |
| | | |
Affiliated Central Funds
Fiscal year to date information regarding the Fund's investments in Fidelity Central Funds, including the ownership percentage, is presented below.
| Affiliate (Amounts in thousands) | Value, beginning of period ($) | Purchases ($) | Sales Proceeds ($) | Dividend Income ($) | Realized Gain (loss) ($) | Change in Unrealized appreciation (depreciation) ($) | Value, end of period ($) | % ownership, end of period |
| Fidelity Municipal Cash Central Fund 3.22% | 327,929 | 1,077,632 | 866,439 | 8,062 | (10) | - | 539,112 | 22.6% |
| Total | 327,929 | 1,077,632 | 866,439 | 8,062 | (10) | - | 539,112 | |
| | | | | | | | | |
Amounts in the dividend income column in the above table include any capital gain distributions from underlying funds, which are presented in the corresponding line item in the Statement of Operations, if applicable.
Amounts included in the purchases and sales proceeds columns may include in-kind transactions, if applicable.
Investment Valuation
All investments are categorized as Level 2 under the Fair Value Hierarchy. The inputs or methodology used for valuing securities may not be an indication of the risk associated with investing in these securities. For more information on valuation inputs, refer to the Investment Valuation section in the accompanying Notes to Financial Statements.
Financial Statements (Unaudited)
| Statement of Assets and Liabilities |
| As of August 31, 2024 (Unaudited) Amounts in thousands (except per-share amounts) |
| Assets | | | | |
| Investment in securities, at value - See accompanying schedule: | | | | |
Unaffiliated issuers (cost $4,669,501) | $ | 4,669,501 | | |
Fidelity Central Funds (cost $539,112) | | 539,112 | | |
| | | | | |
| | | | | |
| Total Investment in Securities (cost $5,208,613) | | | $ | 5,208,613 |
| Cash | | | | 1 |
| Receivable for investments sold | | | | |
Regular delivery | | | | 27,400 |
Delayed delivery | | | | 15,000 |
| Receivable for fund shares sold | | | | 25,905 |
| Interest receivable | | | | 27,367 |
| Distributions receivable from Fidelity Central Funds | | | | 1,865 |
| Receivable from investment adviser for expense reductions | | | | 133 |
| Other receivables | | | | 3 |
Total assets | | | | 5,306,287 |
| Liabilities | | | | |
| Payable for investments purchased | | | | |
Regular delivery | $ | 23,013 | | |
Delayed delivery | | 74,280 | | |
| Payable for fund shares redeemed | | 17,295 | | |
| Distributions payable | | 1,421 | | |
| Accrued management fee | | 867 | | |
| Other affiliated payables | | 293 | | |
| Total liabilities | | | | 117,169 |
| Net Assets | | | $ | 5,189,118 |
| Net Assets consist of: | | | | |
| Paid in capital | | | $ | 5,188,967 |
| Total accumulated earnings (loss) | | | | 151 |
| Net Assets | | | $ | 5,189,118 |
| | | | | |
| Net Asset Value and Maximum Offering Price | | | | |
| Fidelity California Municipal Money Market Fund : | | | | |
Net Asset Value, offering price and redemption price per share ($37,975 ÷ 37,984 shares) | | | $ | 1.00 |
| Institutional Class : | | | | |
Net Asset Value, offering price and redemption price per share ($3,430,430 ÷ 3,427,672 shares) | | | $ | 1.00 |
| Premium Class : | | | | |
Net Asset Value, offering price and redemption price per share ($1,720,713 ÷ 1,719,335 shares) | | | $ | 1.00 |
| Statement of Operations |
Six months ended August 31, 2024 (Unaudited) Amounts in thousands |
| Investment Income | | | | |
| Interest | | | $ | 71,890 |
| Income from Fidelity Central Funds | | | | 8,062 |
| Total income | | | | 79,952 |
| Expenses | | | | |
| Management fee | $ | 4,760 | | |
| Transfer agent fees | | 1,629 | | |
| Independent trustees' fees and expenses | | 6 | | |
| Total expenses before reductions | | 6,395 | | |
| Expense reductions | | (750) | | |
| Total expenses after reductions | | | | 5,645 |
| Net Investment income (loss) | | | | 74,307 |
| Realized and Unrealized Gain (Loss) | | | | |
| Net realized gain (loss) on: | | | | |
| Investment Securities: | | | | |
| Unaffiliated issuers | | (36) | | |
| Fidelity Central Funds | | (10) | | |
| Total net realized gain (loss) | | | | (46) |
| Net increase in net assets resulting from operations | | | $ | 74,261 |
| Statement of Changes in Net Assets |
| |
| Amount in thousands | | Six months ended August 31, 2024 (Unaudited) | | Year ended February 29, 2024 |
| Increase (Decrease) in Net Assets | | | | |
| Operations | | | | |
| Net investment income (loss) | $ | 74,307 | $ | 120,827 |
| Net realized gain (loss) | | (46) | | (28) |
Net increase in net assets resulting from operations | | 74,261 | | 120,799 |
| Distributions to shareholders | | (74,284) | | (120,738) |
| | | | | |
| Share transactions - net increase (decrease) | | 945,068 | | 266,351 |
| Total increase (decrease) in net assets | | 945,045 | | 266,412 |
| | | | | |
| Net Assets | | | | |
| Beginning of period | | 4,244,073 | | 3,977,661 |
| End of period | $ | 5,189,118 | $ | 4,244,073 |
| | | | | |
| | | | | |
Financial Highlights
Fidelity® California Municipal Money Market Fund |
| |
| | Six months ended (Unaudited) August 31, 2024 | | Years ended February 28, 2024 A | | 2023 B |
Selected Per-Share Data | | | | | | |
| Net asset value, beginning of period | $ | 1.00 | $ | 1.00 | $ | 1.00 |
| Income from Investment Operations | | | | | | |
Net investment income (loss) C | | .015 | | .026 | | .009 |
Net realized and unrealized gain (loss) D | | - | | - | | - |
| Total from investment operations | | .015 | | .026 | | .009 |
| Distributions from net investment income | | (.015) | | (.026) | | (.009) |
| Distributions from net realized gain | | - | | - | | - D |
| Total distributions | | (.015) | | (.026) | | (.009) |
| Net asset value, end of period | $ | 1.00 | $ | 1.00 | $ | 1.00 |
Total Return E,F | | | | 2.66% | | .89% |
Ratios to Average Net Assets C,G,H | | | | | | |
| Expenses before reductions | | .42% I | | .42% | | .42% I |
| Expenses net of fee waivers, if any | | | | .42% | | .42% I |
| Expenses net of all reductions | | .42% I | | .42% | | .42% I |
| Net investment income (loss) | | 2.91% I | | 2.63% | | 2.12% I |
| Supplemental Data | | | | | | |
| Net assets, end of period (in millions) | $ | 38 | $ | 25 | $ | 11 |
AFor the year ended February 29.
BFor the period September 22, 2022 (commencement of sale of shares) through February 28, 2023.
CNet investment income (loss) is affected by the timing of the declaration of dividends by any underlying mutual funds or exchange-traded funds (ETFs). Net investment income (loss) of any mutual funds or ETFs is not included in the Fund's net investment income (loss) ratio.
DAmount represents less than $.0005 per share.
ETotal returns would have been lower if certain expenses had not been reduced during the applicable periods shown.
FTotal returns for periods of less than one year are not annualized.
GFees and expenses of any underlying mutual funds or exchange-traded funds (ETFs) are not included in the Fund's expense ratio. The Fund indirectly bears its proportionate share of these expenses. For additional expense information related to investments in Fidelity Central Funds, please refer to the "Investments in Fidelity Central Funds" note found in the Notes to Financial Statements section of the most recent Annual or Semi-Annual report.
HExpense ratios reflect operating expenses of the class. Expenses before reductions do not reflect amounts reimbursed, waived, or reduced through arrangements with the investment adviser, brokerage services, or other offset arrangements, if applicable, and do not represent the amount paid by the class during periods when reimbursements, waivers or reductions occur.
IAnnualized.
Fidelity® California Municipal Money Market Fund Institutional Class |
| |
| | Six months ended (Unaudited) August 31, 2024 | | Years ended February 28, 2024 A | | 2023 | | 2022 | | 2021 | | 2020 A |
Selected Per-Share Data | | | | | | | | | | | | |
| Net asset value, beginning of period | $ | 1.00 | $ | 1.00 | $ | 1.00 | $ | 1.00 | $ | 1.00 | $ | 1.00 |
| Income from Investment Operations | | | | | | | | | | | | |
Net investment income (loss) B | | .016 | | .029 | | .014 | | - C | | .003 | | .012 |
Net realized and unrealized gain (loss) C | | - | | - | | - | | - | | - | | - |
| Total from investment operations | | .016 | | .029 | | .014 | | - C | | .003 | | .012 |
| Distributions from net investment income | | (.016) | | (.029) | | (.014) | | - C | | (.003) | | (.012) |
| Distributions from net realized gain | | - | | - | | - C | | - | | - C | | - C |
| Total distributions | | (.016) | | (.029) | | (.014) | | - C | | (.003) | | (.012) |
| Net asset value, end of period | $ | 1.00 | $ | 1.00 | $ | 1.00 | $ | 1.00 | $ | 1.00 | $ | 1.00 |
Total Return D,E | | | | 2.89% | | 1.38% | | .01% | | .26% | | 1.16% |
Ratios to Average Net Assets B,F,G | | | | | | | | | | | | |
| Expenses before reductions | | .25% H | | .25% | | .25% | | .25% | | .25% | | .25% |
| Expenses net of fee waivers, if any | | | | .20% | | .20% | | .09% | | .18% | | .20% |
| Expenses net of all reductions | | .20% H | | .20% | | .20% | | .09% | | .18% | | .20% |
| Net investment income (loss) | | 3.13% H | | 2.85% | | 1.57% | | .01% | | .29% | | 1.14% |
| Supplemental Data | | | | | | | | | | | | |
| Net assets, end of period (in millions) | $ | 3,430 | $ | 2,670 | $ | 2,340 | $ | 1,523 | $ | 1,963 | $ | 3,527 |
AFor the year ended February 29.
BNet investment income (loss) is affected by the timing of the declaration of dividends by any underlying mutual funds or exchange-traded funds (ETFs). Net investment income (loss) of any mutual funds or ETFs is not included in the Fund's net investment income (loss) ratio.
CAmount represents less than $.0005 per share.
DTotal returns for periods of less than one year are not annualized.
ETotal returns would have been lower if certain expenses had not been reduced during the applicable periods shown.
FFees and expenses of any underlying mutual funds or exchange-traded funds (ETFs) are not included in the Fund's expense ratio. The Fund indirectly bears its proportionate share of these expenses. For additional expense information related to investments in Fidelity Central Funds, please refer to the "Investments in Fidelity Central Funds" note found in the Notes to Financial Statements section of the most recent Annual or Semi-Annual report.
GExpense ratios reflect operating expenses of the class. Expenses before reductions do not reflect amounts reimbursed, waived, or reduced through arrangements with the investment adviser, brokerage services, or other offset arrangements, if applicable, and do not represent the amount paid by the class during periods when reimbursements, waivers or reductions occur.
HAnnualized.
Fidelity® California Municipal Money Market Fund Premium Class |
| |
| | Six months ended (Unaudited) August 31, 2024 | | Years ended February 28, 2024 A | | 2023 | | 2022 | | 2021 | | 2020 A |
Selected Per-Share Data | | | | | | | | | | | | |
| Net asset value, beginning of period | $ | 1.00 | $ | 1.00 | $ | 1.00 | $ | 1.00 | $ | 1.00 | $ | 1.00 |
| Income from Investment Operations | | | | | | | | | | | | |
Net investment income (loss) B | | .015 | | .028 | | .013 | | - C | | .002 | | .011 |
Net realized and unrealized gain (loss) C | | - | | - | | - | | - | | - | | - |
| Total from investment operations | | .015 | | .028 | | .013 | | - C | | .002 | | .011 |
| Distributions from net investment income | | (.015) | | (.028) | | (.013) | | - C | | (.002) | | (.011) |
| Distributions from net realized gain | | - | | - | | - C | | - | | - C | | - C |
| Total distributions | | (.015) | | (.028) | | (.013) | | - C | | (.002) | | (.011) |
| Net asset value, end of period | $ | 1.00 | $ | 1.00 | $ | 1.00 | $ | 1.00 | $ | 1.00 | $ | 1.00 |
Total Return D,E | | | | 2.79% | | 1.28% | | .01% | | .22% | | 1.06% |
Ratios to Average Net Assets B,F,G | | | | | | | | | | | | |
| Expenses before reductions | | .30% H | | .30% | | .30% | | .30% | | .30% | | .30% |
| Expenses net of fee waivers, if any | | | | .30% | | .30% | | .09% | | .22% | | .30% |
| Expenses net of all reductions | | .30% H | | .30% | | .30% | | .09% | | .22% | | .30% |
| Net investment income (loss) | | 3.03% H | | 2.75% | | 1.47% | | .01% | | .25% | | 1.04% |
| Supplemental Data | | | | | | | | | | | | |
| Net assets, end of period (in millions) | $ | 1,721 | $ | 1,549 | $ | 1,626 | $ | 446 | $ | 513 | $ | 675 |
AFor the year ended February 29.
BNet investment income (loss) is affected by the timing of the declaration of dividends by any underlying mutual funds or exchange-traded funds (ETFs). Net investment income (loss) of any mutual funds or ETFs is not included in the Fund's net investment income (loss) ratio.
CAmount represents less than $.0005 per share.
DTotal returns for periods of less than one year are not annualized.
ETotal returns would have been lower if certain expenses had not been reduced during the applicable periods shown.
FFees and expenses of any underlying mutual funds or exchange-traded funds (ETFs) are not included in the Fund's expense ratio. The Fund indirectly bears its proportionate share of these expenses. For additional expense information related to investments in Fidelity Central Funds, please refer to the "Investments in Fidelity Central Funds" note found in the Notes to Financial Statements section of the most recent Annual or Semi-Annual report.
GExpense ratios reflect operating expenses of the class. Expenses before reductions do not reflect amounts reimbursed, waived, or reduced through arrangements with the investment adviser, brokerage services, or other offset arrangements, if applicable, and do not represent the amount paid by the class during periods when reimbursements, waivers or reductions occur.
HAnnualized.
Notes to Financial Statements
(Unaudited)For the period ended August 31, 2024
(Amounts in thousands except percentages)
1. Organization.
Fidelity California Municipal Money Market Fund (the Fund) is a fund of Fidelity California Municipal Trust II (the Trust) and is authorized to issue an unlimited number of shares. The Trust is registered under the Investment Company Act of 1940, as amended (the 1940 Act), as an open-end management investment company organized as a Delaware statutory trust. The Fund offers Fidelity California Municipal Money Market Fund, Institutional Class and Premium Class shares, each of which has equal rights as to assets and voting privileges. Each class has exclusive voting rights with respect to matters that affect that class. Shares of the Fund are only available for purchase by retail shareholders. The Fund may be affected by economic and political developments in the state of California.
2. Investments in Fidelity Central Funds.
Funds may invest in Fidelity Central Funds, which are open-end investment companies generally available only to other investment companies and accounts managed by the investment adviser and its affiliates. The Schedule of Investments lists any Fidelity Central Funds held as an investment as of period end, but does not include the underlying holdings of each Fidelity Central Fund. An investing fund indirectly bears its proportionate share of the expenses of the underlying Fidelity Central Funds.
Based on its investment objective, each Fidelity Central Fund may invest or participate in various investment vehicles or strategies that are similar to those of the investing fund. These strategies are consistent with the investment objectives of the investing fund and may involve certain economic risks which may cause a decline in value of each of the Fidelity Central Funds and thus a decline in the value of the investing fund.
| Fidelity Central Fund | Investment Manager | Investment Objective | Investment Practices | Expense RatioA |
| Fidelity Money Market Central Funds | Fidelity Management & Research Company LLC (FMR) | Each fund seeks to obtain a high level of current income consistent with the preservation of capital and liquidity. | Short-term Investments | Less than .005% |
A Expenses expressed as a percentage of average net assets and are as of each underlying Central Fund's most recent annual or semi-annual shareholder report.
A complete unaudited list of holdings for each Fidelity Central Fund is available upon request or at the Securities and Exchange Commission website at www.sec.gov. In addition, the financial statements of the Fidelity Central Funds which contain the significant accounting policies (including investment valuation policies) of those funds, and are not covered by the Report of Independent Registered Public Accounting Firm, are available on the Securities and Exchange Commission website or upon request.
3. Significant Accounting Policies.
The Fund is an investment company and applies the accounting and reporting guidance of the Financial Accounting Standards Board (FASB) Accounting Standards Codification Topic 946 Financial Services - Investment Companies. The financial statements have been prepared in conformity with accounting principles generally accepted in the United States of America (GAAP), which require management to make certain estimates and assumptions at the date of the financial statements. Actual results could differ from those estimates. Subsequent events, if any, through the date that the financial statements were issued have been evaluated in the preparation of the financial statements. The Fund's Schedule of Investments lists any underlying mutual funds or exchange-traded funds (ETFs) but does not include the underlying holdings of these funds. The following summarizes the significant accounting policies of the Fund:
Investment Valuation. The Fund categorizes the inputs to valuation techniques used to value its investments into a disclosure hierarchy consisting of three levels as shown below:
Level 1 - unadjusted quoted prices in active markets for identical investments
Level 2 - other significant observable inputs (including quoted prices for similar investments, interest rates, prepayment speeds, etc.)
Level 3 - unobservable inputs (including the Fund's own assumptions based on the best information available)
As permitted by compliance with certain conditions under Rule 2a-7 of the 1940 Act, securities are valued at amortized cost, which approximates fair value. The amortized cost of an instrument is determined by valuing it at its original cost and thereafter amortizing any discount or premium from its face value at a constant rate until maturity. Securities held by a money market fund are generally high quality and liquid; however, they are reflected as Level 2 because the inputs used to determine fair value are not quoted prices in an active market.
Investments in the Fidelity Central Funds are valued at their closing net asset value (NAV) each business day and are categorized as Level 1 in the hierarchy.
Investment Transactions and Income. The net asset value per share for processing shareholder transactions is calculated as of the close of business of the New York Stock Exchange (NYSE), normally 4:00 p.m. Eastern time. Security transactions, including the Fund's investment activity in the Fidelity Central Funds, are accounted for as of trade date. Gains and losses on securities sold are determined on the basis of identified cost. Income and capital gain distributions from Fidelity Central Funds, if any, are recorded on the ex-dividend date. Interest income is accrued as earned and includes coupon interest and amortization of premium and accretion of discount on debt securities as applicable.
Class Allocations and Expenses. Investment income, realized and unrealized capital gains and losses, common expenses of a fund, and certain fund-level expense reductions, if any, are allocated daily on a pro-rata basis to each class based on the relative net assets of each class to the total net assets of a fund. Each class differs with respect to transfer agent and distribution and service plan fees incurred, as applicable. Certain expense reductions may also differ by class, if applicable. For the reporting period, the allocated portion of income and expenses to each class as a percent of its average net assets may vary due to the timing of recording these transactions in relation to fluctuating net assets of the classes. Expenses directly attributable to a fund are charged to that fund. Expenses attributable to more than one fund are allocated among the respective funds on the basis of relative net assets or other appropriate methods. Expenses included in the accompanying financial statements reflect the expenses of that fund and do not include any expenses associated with any underlying mutual funds or exchange-traded funds (ETFs). Although not included in a fund's expenses, a fund indirectly bears its proportionate share of these expenses through the net asset value of each underlying mutual fund or exchange-traded fund (ETF). Expense estimates are accrued in the period to which they relate and adjustments are made when actual amounts are known.
Income Tax Information and Distributions to Shareholders. Each year, the Fund intends to qualify as a regulated investment company under Subchapter M of the Internal Revenue Code, including distributing substantially all of its taxable income and realized gains. As a result, no provision for U.S. Federal income taxes is required. The Fund files a U.S. federal tax return, in addition to state and local tax returns as required. The Fund's federal income tax returns are subject to examination by the Internal Revenue Service (IRS) for a period of three fiscal years after they are filed. State and local tax returns may be subject to examination for an additional fiscal year depending on the jurisdiction.
Distributions are declared and recorded daily and paid monthly from net investment income. Distributions from realized gains, if any, are declared and recorded on the ex-dividend date. Income and capital gain distributions are declared separately for each class. Income and capital gain distributions are determined in accordance with income tax regulations, which may differ from GAAP.
Capital accounts within the financial statements are adjusted for permanent book-tax differences. These adjustments have no impact on net assets or the results of operations. Capital accounts are not adjusted for temporary book-tax differences which will reverse in a subsequent period.
Book-tax differences are primarily due to market discount, capital loss carryforwards and losses deferred due to wash sales.
The Fund purchases municipal securities whose interest, in the opinion of the issuer, is free from federal income tax. There is no assurance that the IRS will agree with this opinion. In the event the IRS determines that the issuer does not comply with relevant tax requirements, interest payments from a security could become federally taxable, possibly retroactively to the date the security was issued.
As of period end, the cost and unrealized appreciation (depreciation) in securities for federal income tax purposes were as follows:
| Gross unrealized appreciation | $25 |
| Gross unrealized depreciation | (25) |
| Net unrealized appreciation (depreciation) | $- |
| Tax cost | $5,208,613 |
Capital loss carryforwards are only available to offset future capital gains of the Fund to the extent provided by regulations and may be limited. The capital loss carryforward information presented below, including any applicable limitation, is estimated as of prior fiscal period end and is subject to adjustment.
Delayed Delivery Transactions and When-Issued Securities. During the period, certain Funds transacted in securities on a delayed delivery or when-issued basis. Payment and delivery may take place after the customary settlement period for that security. The price of the underlying securities and the date when the securities will be delivered and paid for are fixed at the time the transaction is negotiated. Securities purchased on a delayed delivery or when-issued basis are identified as such in the Schedule of Investments. Compensation for interest forgone in the purchase of a delayed delivery or when-issued debt security may be received. With respect to purchase commitments, each applicable Fund identifies securities as segregated in its records with a value at least equal to the amount of the commitment. Payables and receivables associated with the purchases and sales of delayed delivery securities having the same coupon, settlement date and broker are offset. Delayed delivery or when-issued securities that have been purchased from and sold to different brokers are reflected as both payables and receivables in the Statement of Assets and Liabilities under the caption "Delayed delivery", as applicable. Losses may arise due to changes in the value of the underlying securities or if the counterparty does not perform under the contract's terms, or if the issuer does not issue the securities due to political, economic, or other factors.
Restricted Securities (including Private Placements). Funds may invest in securities that are subject to legal or contractual restrictions on resale. These securities generally may be resold in transactions exempt from registration or to the public if the securities are registered. Disposal of these securities may involve time-consuming negotiations and expense, and prompt sale at an acceptable price may be difficult. Information regarding restricted securities held at period end is included at the end of the Schedule of Investments, if applicable.
New Rule Issuance. In July 2023, the Securities and Exchange Commission issued a Final Rule relative to Money Market Reform. Among other things, the Final Rule includes amendments for: (1) Removal of redemption gates except for liquidations; (2) Required liquidity fees for institutional prime and institutional tax-exempt money market funds; (3) Discretionary liquidity fees for non-government money market funds; (4) Higher liquidity requirements; and (5) Changes to reporting requirements for Form N-MFP and Form N-CR. The Final Rule imposes different implementation dates for the amendments through October 2, 2024. The amendments have been implemented to date, and management has concluded that there are no material impacts to the Fund's financial statements and related disclosures.
4. Fees and Other Transactions with Affiliates.
Management Fee and Expense Contract. Fidelity Management & Research Company LLC (the investment adviser) and its affiliates provide the Fund with investment management related services for which the Fund pays a monthly management fee that is based on an annual rate of .20% of the Fund's average net assets. Under the management contract, the investment adviser pays all other fund-level expenses, except the compensation of the independent Trustees and certain other expenses such as interest expense. The management fee is reduced by an amount equal to the fees and expenses paid by the Fund to the independent Trustees.
In addition, under the expense contract, the investment adviser pays class-level expenses for Premium Class so that the total expenses do not exceed .35%, expressed as a percentage of class average net assets, with certain exceptions such as interest expense.
Transfer Agent Fees. Fidelity Investments Institutional Operations Company LLC (FIIOC), an affiliate of the investment adviser, is the transfer, dividend disbursing and shareholder servicing agent for the Fund. FIIOC receives asset-based fees with respect to each account. FIIOC pays for typesetting, printing and mailing of shareholder reports, except proxy statements. For the period, transfer agent fees for each class were as follows:
| | Amount ($) | % of Class-Level Average Net AssetsA |
| Fidelity California Municipal Money Market Fund | 35 | .22 |
| Institutional Class | 773 | .05 |
| Premium Class | 821 | .10 |
| | 1,629 | |
A Annualized
Interfund Trades. Funds may purchase from or sell securities to other Fidelity Funds under procedures adopted by the Board. The procedures have been designed to ensure these interfund trades are executed in accordance with Rule 17a-7 of the 1940 Act. Interfund trades during the period are noted in the table below.
| | Purchases ($) | Sales ($) | Realized Gain (Loss)($) |
| Fidelity California Municipal Money Market Fund | 46,760 | 57,550 | - |
Sub-Advisory Arrangements. Effective March 1, 2024, the Fund's sub-advisory agreements with FMR Investment Management (UK) Limited, Fidelity Management & Research (Hong Kong) Limited, and Fidelity Management & Research (Japan) Limited were amended to provide that the investment adviser pays each sub-adviser monthly fees equal to 110% of the sub-adviser's costs for providing sub-advisory services.
5. Expense Reductions.
The investment adviser contractually agreed to reimburse Institutional Class to the extent annual operating expenses, expressed as a percentage of average net assets, exceed .20%. Some expenses, for example the compensation of the independent Trustees, and certain other expenses such as interest expense, are excluded from this reimbursement. During the period, this reimbursement reduced Institutional Class expenses by $748.
Through arrangements with the Fund's custodian, credits realized as a result of certain uninvested cash balances were used to reduce the Fund's expenses. During the period, custodian credits reduced the Fund's expenses by $2.
6. Distributions to Shareholders.
Distributions to shareholders of each class were as follows:
| | Six months ended August 31, 2024 | Year ended February 29, 2024 |
| Fidelity California Municipal Money Market Fund | | |
| Distributions to shareholders | | |
| Fidelity California Municipal Money Market Fund | $460 | $559 |
| Institutional Class | 48,745 | 75,855 |
| Premium Class | 25,079 | 44,324 |
Total | $74,284 | $120,738 |
7. Share Transactions.
Share transactions for each class of shares at a $1.00 per share were as follows and may contain in-kind transactions, automatic conversions between classes or exchanges between affiliated funds:
| | Shares | Shares | Dollars | Dollars |
| | Six months ended August 31, 2024 | Year ended February 29, 2024 | Six months ended August 31, 2024 | Year ended February 29, 2024 |
| Fidelity California Municipal Money Market Fund | | | | |
| Fidelity California Municipal Money Market Fund | | | | |
| Shares sold | 35,886 | 48,897 | $35,886 | $48,897 |
| Reinvestment of distributions | 411 | 471 | 411 | 471 |
| Shares redeemed | (23,140) | (35,957) | (23,140) | (35,957) |
| Net increase (decrease) | 13,157 | 13,411 | $13,157 | $13,411 |
| Institutional Class | | | | |
| Shares sold | 2,848,785 | 4,143,961 | $2,848,784 | $4,143,960 |
| Reinvestment of distributions | 43,112 | 66,428 | 43,112 | 66,428 |
| Shares redeemed | (2,131,450) | (3,881,096) | (2,131,450) | (3,881,096) |
| Net increase (decrease) | 760,447 | 329,293 | $760,446 | $329,292 |
| Premium Class | | | | |
| Shares sold | 651,804 | 1,018,144 | $651,804 | $1,018,144 |
| Reinvestment of distributions | 22,487 | 40,095 | 22,487 | 40,095 |
| Shares redeemed | (502,826) | (1,134,591) | (502,826) | (1,134,591) |
| Net increase (decrease) | 171,465 | (76,352) | $171,465 | $(76,352) |
8. Other.
A fund's organizational documents provide former and current trustees and officers with a limited indemnification against liabilities arising in connection with the performance of their duties to the fund. In the normal course of business, a fund may also enter into contracts that provide general indemnifications. A fund's maximum exposure under these arrangements is unknown as this would be dependent on future claims that may be made against a fund. The risk of material loss from such claims is considered remote.
9. Risk and Uncertainties.
Many factors affect a fund's performance. Developments that disrupt global economies and financial markets, such as pandemics, epidemics, outbreaks of infectious diseases, war, terrorism, and environmental disasters, may significantly affect a fund's investment performance. The effects of these developments to a fund will be impacted by the types of securities in which a fund invests, the financial condition, industry, economic sector, and geographic location of an issuer, and a fund's level of investment in the securities of that issuer. Significant concentrations in security types, issuers, industries, sectors, and geographic locations may magnify the factors that affect a fund's performance.
Item 8: Changes in and Disagreements with Accountants for Open-End Management Investment Companies
(Unaudited)
Note: This is not applicable for any fund included in this document.
Item 9: Proxy Disclosures for Open-End Management Investment Companies
(Unaudited)
Note: This is not applicable for any fund included in this document.
Item 10: Remuneration Paid to Directors, Officers, and others of Open-End Management Investment Companies
(Unaudited)
Note: This information is disclosed as part of the financial statements for each Fund as part of Item 7: Financial Statements and Financial Highlights for Open-End Management Investment companies.
Item 11: Statement Regarding Basis for Approval of Investment Advisory Contract
(Unaudited)
Note: This is not applicable for any fund included in this document.
1.855636.117
SCM-SANN-1024
Item 8.
Changes in and Disagreements with Accountants for Open-End Management Investment Companies
See Item 7.
Item 9.
Proxy Disclosures for Open-End Management Investment Companies
See Item 7.
Item 10.
Remuneration Paid to Directors, Officers, and Others of Open-End Management Investment Companies
See Item 7.
Item 11.
Statement Regarding Basis for Approval of Investment Advisory Contract
See Item 7.
Item 12.
Disclosure of Proxy Voting Policies and Procedures for Closed-End Management Investment Companies
Not applicable.
Item 13.
Portfolio Managers of Closed-End Management Investment Companies
Not applicable.
Item 14.
Purchases of Equity Securities by Closed-End Management Investment Company and Affiliated Purchasers
Not applicable.
Item 15.
Submission of Matters to a Vote of Security Holders
There were no material changes to the procedures by which shareholders may recommend nominees to the Fidelity California Municipal Trust II’s Board of Trustees.
Item 16.
Controls and Procedures
(a)(i) The President and Treasurer and the Chief Financial Officer have concluded that the Fidelity California Municipal Trust II’s (the “Trust”) disclosure controls and procedures (as defined in Rule 30a-3(c) under the Investment Company Act) provide reasonable assurances that material information relating to the Trust is made known to them by the appropriate persons, based on their evaluation of these controls and procedures as of a date within 90 days of the filing date of this report.
(a)(ii) There was no change in the Trust’s internal control over financial reporting (as defined in Rule 30a-3(d) under the Investment Company Act) that occurred during the period covered by this report that has materially affected, or is reasonably likely to materially affect, the Trust’s internal control over financial reporting.
Item 17.
Disclosure of Securities Lending Activities for Closed-End Management Investment Companies
Not applicable.
Item 18.
Recovery of Erroneously Awarded Compensation
(a)
Not applicable.
(b)
Not applicable.
Item 19.
Exhibits
SIGNATURES
Pursuant to the requirements of the Securities Exchange Act of 1934 and the Investment Company Act of 1940, the registrant has duly caused this report to be signed on its behalf by the undersigned, thereunto duly authorized.
Fidelity California Municipal Trust II
|
By: | /s/Laura M. Del Prato |
| Laura M. Del Prato |
| President and Treasurer (Principal Executive Officer) |
|
|
Date: | October 23, 2024 |
Pursuant to the requirements of the Securities Exchange Act of 1934 and the Investment Company Act of 1940, this report has been signed below by the following persons on behalf of the registrant and in the capacities and on the dates indicated.
|
By: | /s/Laura M. Del Prato |
| Laura M. Del Prato |
| President and Treasurer (Principal Executive Officer) |
|
|
Date: | October 23, 2024 |
|
By: | /s/John J. Burke III |
| John J. Burke III |
| Chief Financial Officer (Principal Financial Officer) |
|
|
Date: | October 23, 2024 |