UNITED STATES
SECURITIES AND EXCHANGE COMMISSION
Washington, D.C. 20549
FORM N-CSR
CERTIFIED SHAREHOLDER REPORT OF REGISTERED MANAGEMENT
INVESTMENT COMPANIES
Investment Company Act file number 811-06400
The Advisors’ Inner Circle Fund
(Exact name of registrant as specified in charter)
SEI Investments
One Freedom Valley Drive
Oaks, PA 19456
(Address of principal executive offices) (Zip code)
SEI Investments
One Freedom Valley Drive
Oaks, PA 19456
(Name and address of agent for service)
Registrant’s telephone number, including area code: (877) 446-3863
Date of fiscal year end: October 31, 2022
Date of reporting period: October 31, 2022
| Item 1. | Reports to Stockholders. |
A copy of the report transmitted to stockholders pursuant to Rule 30e-1 under the Investment Company Act of 1940, as amended (the “Act”) (17 CFR § 270.30e-1), is attached hereto.
THE ADVISORS’ INNER CIRCLE FUND

Emerging Markets Equity Fund
ANNUAL REPORT TO SHAREHOLDERS
October 31, 2022
This information must be preceded or accompanied by a current prospectus. Investors should read the prospectus carefully before investing.

MANAGER’S DISCUSSION AND ANALYSIS OF FUND PERFORMANCE
(Unaudited)
The total net of fees return of the LSV Emerging Markets Equity Fund, the benchmark MSCI Emerging Markets Index and the MSCI Emerging Markets Value Index for the trailing periods ending October 31, 2022 were as follows:
| One Year | Three Year | Since Inception | ||||
| LSV Emerging Markets Equity Fund, Institutional Class Shares* | -21.97% | -0.95% | -0.02% | |||
Benchmark: | ||||||
| MSCI Emerging Markets | -31.03% | -4.42% | -2.12% | |||
Value Benchmark: | ||||||
| MSCI Emerging Markets Value | -25.21% | -4.23% | -3.11% |
* Year Ended October 31, 2022.
Institutional Class Shares performance as of 9/30/22: -23.74% (1-year), -0.07% (3 Year) and -0.24% (Since Inception). The performance data quoted represents past performance. Past performance does not guarantee future results. The investment return and principal value of an investment will fluctuate so that an investor’s shares when redeemed, may be worth more or less than their original cost and current performance may be lower or higher than the performance quoted. For performance data current to the most recent month end, please call 888-FUND-LSV (888-386-3578). Inception date 1/18/2019.
Global equity markets fell sharply over the past twelve months as record high inflation, a slowing economy and increasingly hawkish global central banks took a dent out of consumer confidence, stoking fears that a recession may be unavoidable. The MSCI Emerging Markets Index was down 31.03% (in USD). From a style perspective, emerging markets value stocks (as measured by the MSCI Indices) outperformed growth amidst the market volatility—the MSCI Emerging Markets Value Index was down 25.21% while the MSCI Emerging Markets Growth Index was down 36.11% (both in USD). The LSV Emerging Markets Equity Fund, Institutional Class Shares, was down 21.97% for the period. From a sector perspective, Utilities, Financials and Industrials stocks outperformed while the Consumer Discretionary, Communication Services and Real Estate sectors lagged.
While the broad equity market sold off during the period, value stocks and the Fund held up much better than the overall market. The Fund’s deeper value bias added value over the period as cheaper stocks on an earnings and cash flow basis held up relatively well. Performance attribution further indicates that both stock and sector selection contributed positively to portfolio relative returns for the period. Stock selection relative gains were primarily the result of the outperformance of deep value names within the Information Technology, Consumer Discretionary and Financials sectors—holdings within the Semiconductors, Automobile Manufacturers and Diversified Banks industries performed particularly well. Within Consumer Discretionary, not owning expensive names in the Internet & Direct Marketing Retail industry also added value. From a sector perspective, relative gains were more modest and largely the result of our underweight positions in the Communication Services and Consumer Discretionary sectors. Top contributors included our overweight positions in Banco do Brasil, EDP Energias do Brasil, Sisecam, Hindustan Aeronautics and Shougang Fushan Resources. Our underweight to Alibaba as well as not owning Tencent, Taiwan Semiconductor, Sberbank, Meituan and NIO also added value. The main individual detractors included not owning Petrobras, Reliance Industries, ICICI Bank and Itaú Unibanco. Overweight positions in Lukoil,
1
MANAGER’S DISCUSSION AND ANALYSIS OF FUND PERFORMANCE
(Unaudited)
MTS, China Yongda Automobile, Nornickel, SITC International, Country Garden Holdings, Powerlong Real Estate and Agile Group.
The Fund continues to trade at a significant discount to the overall market as well as to the value benchmark. The Fund is trading at 6.3x forward earnings compared to 11.4x for the MSCI Emerging Markets Index, 0.8x book value compared to 1.5x for the MSCI Emerging Markets Index and 4.1x cash flow compared to 7.9x for the MSCI Emerging Markets Index. Sector weightings are a result of our bottom-up stock selection process, subject to constraints at the sector and industry levels. The Fund is currently overweight Industrials, Energy and Utilities while underweight the Consumer Discretionary, Communication Services and Materials sectors.
Our organization remains stable and our research team continues to pursue an active research agenda in which we are looking for better ways to measure value and identify signs of positive change. As always, we are focused on delivering the long-term results that our investors have come to expect from LSV and that we have delivered for clients since 1994.
This material represents the manager’s assessment of the portfolio and market environment at a specific point in time and should not be relied upon by the reader as research or investment advice. Investing involves risk including loss of principal. The information provided herein represents the opinion of the manager and is not intended to be a forecast of future events, a guarantee of future results or investment advice.
Forward earnings is not a forecast of the Fund’s future performance. Investing involves risk, including possible loss of principal. Investments in smaller companies typically exhibit higher volatility.
The MSCI Emerging Markets Index is a market capitalization weighted index designed to provide a broad measure of equity-market performance throughout the emerging markets.
The MSCI Emerging Markets Value Index captures large and mid-cap securities exhibiting overall value style characteristics across the emerging markets.
The MSCI Emerging Markets Growth Index captures large and mid-cap securities exhibiting overall growth style characteristics across the emerging markets.
The MSCI Emerging Markets Small Cap Index is an index designed to provide a broad measure of performance throughout the emerging markets of companies with small market capitalization.
Index Returns are for illustrative purposes only and do not represent actual fund performance. Index performance returns do not reflect any manage fees, transaction costs or expenses. Indexes are unmanaged and one cannot invest directly in an index. Past performance does not guarantee future results.
2
Comparison of Change in the Value of a $100,000 Investment in the
LSV Emerging Markets Equity Fund, Institutional Class Shares, versus the MSCI Emerging Markets Index
Average Annual Total Return for the period ended October 31, 2022 | ||||||||||||
| One Year Return | Three Year Return | Annualized Inception to Date(1) | ||||||||||
LSV Emerging Markets Equity Fund, Institutional Class Shares | -21.97 | % | -0.95 | -0.02 | % | |||||||
LSV Emerging Markets Equity Fund, Investor Class Shares(2) | -22.18 | % | -1.20 | -0.20 | % | |||||||
MSCI Emerging Markets Index | -31.03 | % | -4.42 | -2.12 | % | |||||||
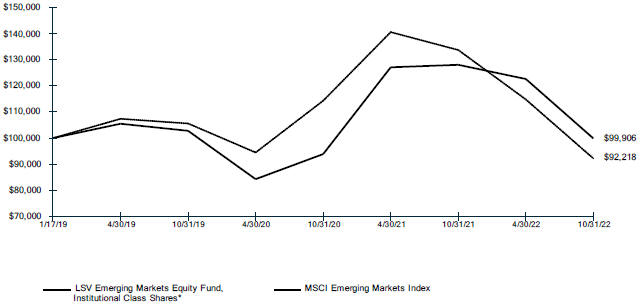
| * | The graph is based on only the Institutional Class Shares; performance for Investor Class Shares would be different due to differences in fee structures. |
| (1) | The LSV Emerging Markets Equity Fund Commenced operations on January 17, 2019. |
| (2) | Investor Class Shares commenced operations on January 17, 2019. Institutional Class Shares’ performance was adjusted to reflect the 12b-1 fees applicable to the Investor Class Shares. |
The performance data quoted herein represents past performance and the return and value of an investment in the Fund will fluctuate so that, when redeemed, may be worth less than its original cost. Past performance does not guarantee future results. The Fund’s performance assumes the reinvestment of all dividends and all capital gains. Index returns assume reinvestment of dividends and, unlike a fund’s returns, do not reflect any fees or expenses. If such fees and expenses were included in the Index returns, the performance would have been lower. Please note that one cannot invest directly in an unmanaged index. Fee waivers were in effect previously, if they had not been in effect, performance would have been lower.
Returns shown do not reflect the deduction of taxes that a shareholder would pay on Fund distributions or the redemption of Fund shares.
See definition of comparative indices on page 2.
3
October 31, 2022
Sector Weightings (Unaudited)†:
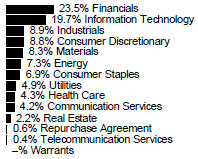
| † | Percentages are based on total investments. |
Schedule of Investments
LSV Emerging Markets Equity Fund | ||||||||
| Shares | Value (000) | |||||||
Foreign Common Stock (94.4%) |
| |||||||
Brazil (5.3%) |
| |||||||
Banco do Brasil | 24,300 | $ | 174 | |||||
Camil Alimentos | 44,100 | 87 | ||||||
EDP - Energias do Brasil | 22,900 | 102 | ||||||
JBS | 35,400 | 171 | ||||||
Qualicorp Consultoria e Corretora de Seguros | 3,000 | 5 | ||||||
Telefonica Brasil | 9,200 | 74 | ||||||
Vale | 16,500 | 214 | ||||||
Vibra Energia | 15,100 | 53 | ||||||
|
| |||||||
| 880 | ||||||||
|
| |||||||
Chile (1.3%) |
| |||||||
Cencosud | 83,100 | 112 | ||||||
Cia Cervecerias Unidas | 10,300 | 56 | ||||||
Vina Concha y Toro | 44,300 | 50 | ||||||
|
| |||||||
| 218 | ||||||||
|
| |||||||
China (2.4%) |
| |||||||
China CITIC Bank, Cl H | 263,000 | 98 | ||||||
Haier Smart Home, Cl H | 15,800 | 40 | ||||||
Kunlun Energy | 92,000 | 55 | ||||||
Powerlong Real Estate Holdings | 92,000 | 8 | ||||||
Shanghai Pharmaceuticals Holding, Cl H | 36,000 | 49 | ||||||
Shenzhen Expressway, Cl H | 64,000 | 46 | ||||||
Sinotrans, Cl H | 215,000 | 52 | ||||||
Vipshop Holdings ADR* | 7,300 | 51 | ||||||
|
| |||||||
| 399 | ||||||||
|
| |||||||
Czech Republic (0.2%) |
| |||||||
Philip Morris CR | 40 | 27 | ||||||
|
| |||||||
| LSV Emerging Markets Equity Fund | ||||||||
| Shares | Value (000) | |||||||
Egypt (0.4%) |
| |||||||
Eastern SAE | 62,000 | $ | 30 | |||||
ElSewedy Electric | 121,500 | 43 | ||||||
|
| |||||||
| 73 | ||||||||
|
| |||||||
Greece (0.3%) |
| |||||||
Motor Oil Hellas Corinth Refineries |
| 2,700 |
|
| 46 |
| ||
|
| |||||||
Hong Kong (23.3%) |
| |||||||
3SBio | 89,000 | 63 | ||||||
Agile Group Holdings | 82,000 | 16 | ||||||
Alibaba Group Holding* | 13,400 | 105 | ||||||
Anhui Conch Cement, Cl H | 12,500 | 32 | ||||||
Asia Cement China Holdings | 85,000 | 30 | ||||||
BAIC Motor, Cl H | 305,500 | 68 | ||||||
Baidu, Cl A* | 6,240 | 60 | ||||||
Bank of China, Cl H | 762,000 | 245 | ||||||
Bank of Communications, Cl H | 208,000 | 101 | ||||||
Beijing Enterprises Holdings | 22,500 | 57 | ||||||
China BlueChemical | 214,000 | 41 | ||||||
China Coal Energy, Cl H | 84,000 | 62 | ||||||
China Everbright | 64,000 | 34 | ||||||
China Everbright Bank, Cl H | 265,000 | 69 | ||||||
China Hongqiao Group | 58,000 | 41 | ||||||
China Lesso Group Holdings | 85,000 | 69 | ||||||
China Medical System Holdings | 44,000 | 48 | ||||||
China Merchants Port Holdings | 52,000 | 61 | ||||||
China Minsheng Banking, Cl H | 254,000 | 74 | ||||||
China Pacific Insurance Group, Cl H | 39,000 | 63 | ||||||
China Petroleum & Chemical, Cl H | 268,000 | 106 | ||||||
China Railway Group, Cl H | 143,000 | 62 | ||||||
China Reinsurance Group, Cl H | 740,000 | 39 | ||||||
China Resources Medical Holdings | 121,000 | 58 | ||||||
China Suntien Green Energy, Cl H | 88,000 | 33 | ||||||
China Tower, Cl H | 554,000 | 50 | ||||||
China Traditional Chinese Medicine Holdings | 144,000 | 62 | ||||||
China XLX Fertiliser | 128,000 | 49 | ||||||
China Yongda Automobiles Services Holdings | 98,000 | 44 | ||||||
Country Garden Holdings | 93,000 | 12 | ||||||
Dali Foods Group | 101,500 | 42 | ||||||
Dongfeng Motor Group, Cl H | 150,000 | 68 | ||||||
The accompanying notes are an integral part of the financial statements
4
Schedule of Investments
October 31, 2022
| LSV Emerging Markets Equity Fund | ||||||||
| Shares | Value (000) | |||||||
Hong Kong (continued) |
| |||||||
Far East Horizon | 75,000 | $ | 58 | |||||
Grand Pharmaceutical Group | 103,500 | 44 | ||||||
Guangzhou Baiyunshan Pharmaceutical Holdings, Cl H | 22,000 | 49 | ||||||
Hengan International Group | 11,000 | 43 | ||||||
Kingboard Laminates Holdings | 66,000 | 53 | ||||||
Lenovo Group | 224,000 | 178 | ||||||
Lonking Holdings | 152,000 | 21 | ||||||
Maanshan Iron & Steel, Cl H | 134,000 | 22 | ||||||
NetDragon Websoft Holdings | 32,000 | 54 | ||||||
New China Life Insurance, Cl H | 34,700 | 55 | ||||||
Nine Dragons Paper Holdings | 66,000 | 39 | ||||||
Orient Overseas International | 6,000 | 88 | ||||||
People’s Insurance Group of China, Cl H | 310,000 | 86 | ||||||
PetroChina, Cl H | 454,000 | 174 | ||||||
PICC Property & Casualty, Cl H | 164,000 | 151 | ||||||
Ping An Insurance Group of China, Cl H | 12,000 | 48 | ||||||
Postal Savings Bank of China, Cl H | 146,000 | 68 | ||||||
Shougang Fushan Resources Group | 116,000 | 31 | ||||||
Sinopec Engineering Group, Cl H | 124,000 | 44 | ||||||
Sinopharm Group, Cl H | 48,000 | 91 | ||||||
Sinotruk Hong Kong | 37,500 | 33 | ||||||
SITC International Holdings | 38,000 | 62 | ||||||
SSY Group | 224,000 | 93 | ||||||
TCL Electronics Holdings | 229,000 | 88 | ||||||
Vinda International Holdings | 13,000 | 24 | ||||||
Want Want China Holdings | 123,000 | 81 | ||||||
Yuexiu Transport Infrastructure | 98,000 | 38 | ||||||
Zhejiang Expressway, Cl H | 68,000 | 42 | ||||||
Zhengzhou Coal Mining Machinery Group, Cl H | 63,400 | 54 | ||||||
|
| |||||||
| 3,876 | ||||||||
|
| |||||||
Hungary (0.5%) |
| |||||||
Magyar Telekom | ||||||||
Telecommunications | 26,200 | 19 | ||||||
MOL Hungarian Oil & Gas | 10,900 | 65 | ||||||
|
| |||||||
| 84 | ||||||||
|
| |||||||
India (13.5%) |
| |||||||
Aurobindo Pharma | 4,600 | 30 | ||||||
| LSV Emerging Markets Equity Fund | ||||||||
| Shares | Value (000) | |||||||
India (continued) |
| |||||||
Chambal Fertilisers and Chemicals | 16,600 | $ | 65 | |||||
Coal India | 28,200 | 84 | ||||||
Cyient | 6,000 | 54 | ||||||
GAIL India | 124,500 | 137 | ||||||
Gujarat State Fertilizers & Chemicals | 50,600 | 75 | ||||||
HCL Technologies | 8,700 | 109 | ||||||
Hindustan Aeronautics | 3,200 | 98 | ||||||
Hindustan Petroleum | 21,300 | 55 | ||||||
Indiabulls Housing Finance* | 3,100 | 5 | ||||||
Indian Bank | 29,300 | 90 | ||||||
Jubilant Life Sciences, Cl A | 4,400 | 20 | ||||||
Kalpataru Power Transmission | 17,800 | 102 | ||||||
KRBL | 20,200 | 97 | ||||||
National Aluminium | 67,900 | 58 | ||||||
NMDC | 44,900 | 54 | ||||||
NTPC | 51,900 | 109 | ||||||
Oil & Natural Gas | 67,600 | 109 | ||||||
Oil India | 31,200 | 73 | ||||||
Oracle Financial Services Software | 2,200 | 77 | ||||||
Petronet LNG | 42,400 | 105 | ||||||
Power Finance | 54,800 | 76 | ||||||
Power Grid Corp of India | 28,600 | 79 | ||||||
REC | 60,600 | 75 | ||||||
Redington India | 64,800 | 107 | ||||||
Tata Steel | 114,000 | 141 | ||||||
UPL | 8,200 | 72 | ||||||
Vedanta | 24,400 | 83 | ||||||
|
| |||||||
| 2,239 | ||||||||
|
| |||||||
Indonesia (2.8%) |
| |||||||
Astra International | 304,900 | 130 | ||||||
Bank Negara Indonesia Persero | 147,700 | 89 | ||||||
Bukit Asam | 177,000 | 44 | ||||||
Matahari Department Store | 249,400 | 75 | ||||||
United Tractors | 58,800 | 122 | ||||||
|
| |||||||
| 460 | ||||||||
|
| |||||||
Malaysia (2.1%) |
| |||||||
AMMB Holdings | 88,000 | 76 | ||||||
CIMB Group Holdings | 61,600 | 72 | ||||||
RHB Bank | 62,800 | 76 | ||||||
Scientex | 64,200 | 44 | ||||||
Tenaga Nasional | 41,600 | 74 | ||||||
|
| |||||||
| 342 | ||||||||
|
| |||||||
Mexico (2.6%) |
| |||||||
Cemex* | 208,200 | 81 | ||||||
Fibra Uno Administracion | 55,800 | 65 | ||||||
The accompanying notes are an integral part of the financial statements
5
Schedule of Investments
October 31, 2022
| LSV Emerging Markets Equity Fund | ||||||||
| Shares | Value (000) | |||||||
Mexico (continued) |
| |||||||
Grupo Financiero Banorte, Cl O | 16,600 | $ | 136 | |||||
Grupo Mexico | 22,000 | 79 | ||||||
Megacable Holdings | 32,700 | 68 | ||||||
|
| |||||||
| 429 | ||||||||
|
| |||||||
Philippines (0.8%) |
| |||||||
DMCI Holdings | 460,100 | 76 | ||||||
Metro Pacific Investments | 808,200 | 51 | ||||||
|
| |||||||
| 127 | ||||||||
|
| |||||||
Poland (1.6%) |
| |||||||
Asseco Poland | 5,300 | 76 | ||||||
Cyfrowy Polsat | 13,800 | 52 | ||||||
Polskie Gornictwo Naftowe i Gazownictwo | 56,500 | 61 | ||||||
Powszechny Zaklad Ubezpieczen | 14,000 | 79 | ||||||
|
| |||||||
| 268 | ||||||||
|
| |||||||
Russia (–%) |
| |||||||
Gazprom PJSC(A)(B) | 11,300 | — | ||||||
LUKOIL PJSC(A)(B) | 2,300 | — | ||||||
Magnit PJSC(A)(B) | 1,000 | — | ||||||
MMC Norilsk Nickel PJSC(A)(B) | 370 | — | ||||||
Mobile TeleSystems PJSC(A)(B) | 13,800 | — | ||||||
|
| |||||||
| — | ||||||||
|
| |||||||
Singapore (0.4%) |
| |||||||
Yangzijiang Shipbuilding Holdings | 81,400 | 69 | ||||||
|
| |||||||
South Africa (4.1%) |
| |||||||
Absa Group | 15,100 | 163 | ||||||
African Rainbow Minerals | 4,300 | 61 | ||||||
Astral Foods | 3,800 | 36 | ||||||
Exxaro Resources | 4,000 | 45 | ||||||
Foschini Group | 8,300 | 52 | ||||||
Impala Platinum Holdings | 7,400 | 76 | ||||||
MTN Group | 6,600 | 47 | ||||||
Nedbank Group | 5,600 | 66 | ||||||
Oceana Group | 16,600 | 50 | ||||||
Telkom SOC | 7,500 | 15 | ||||||
Vodacom Group | 10,200 | 70 | ||||||
|
| |||||||
| 681 | ||||||||
|
| |||||||
South Korea (12.7%) |
| |||||||
DB HiTek | 1,400 | 43 | ||||||
| LSV Emerging Markets Equity Fund | ||||||||
| Shares | Value (000) | |||||||
South Korea (continued) |
| |||||||
DB Insurance | 1,100 | $ | 43 | |||||
DL E&C | 332 | 8 | ||||||
DL Holdings | 133 | 6 | ||||||
Hana Financial Group | 2,900 | 84 | ||||||
Hankook & Co | 5,100 | 46 | ||||||
Hyundai Glovis | 600 | 73 | ||||||
Hyundai Greenfood | 7,000 | 32 | ||||||
Hyundai Home Shopping Network | 1,000 | 31 | ||||||
Hyundai Marine & Fire Insurance | 2,800 | 65 | ||||||
Kginicis | 1,700 | 15 | ||||||
Kia Motors | 2,800 | 131 | ||||||
KT | 4,800 | 124 | ||||||
KT&G | 1,300 | 87 | ||||||
LG | 1,400 | 78 | ||||||
LX INTERNATIONAL CORP | 2,700 | 77 | ||||||
LX Semicon | 1,000 | 58 | ||||||
Maeil Dairies | 1,000 | 33 | ||||||
S&T Motiv | 900 | 28 | ||||||
Samsung Electronics | 17,000 | 710 | ||||||
SFA Engineering | 700 | 19 | ||||||
Shinhan Financial Group | 3,700 | 94 | ||||||
Shinsegae | 300 | 45 | ||||||
SK Square* | 785 | 20 | ||||||
SK Telecom | 2,100 | 74 | ||||||
Value Added Technology | 1,400 | 30 | ||||||
Vieworks | 2,300 | 56 | ||||||
|
| |||||||
| 2,110 | ||||||||
|
| |||||||
Taiwan (14.4%) |
| |||||||
ASE Technology Holding | 51,000 | 127 | ||||||
Asia Vital Components | 15,000 | 47 | ||||||
Asustek Computer | 6,000 | 44 | ||||||
Cathay Financial Holding | 122,859 | 144 | ||||||
China Development Financial Holding | 185,000 | 67 | ||||||
China Development Financial Holding | 68,375 | 16 | ||||||
Chipbond Technology | 22,000 | 37 | ||||||
ChipMOS Technologies | 58,000 | 57 | ||||||
Compeq Manufacturing | 58,000 | 79 | ||||||
Elan Microelectronics | 19,000 | 48 | ||||||
Fubon Financial Holding | 57,541 | 91 | ||||||
Global Mixed Mode Technology | 8,000 | 32 | ||||||
Hon Hai Precision Industry | 62,000 | 198 | ||||||
International Games System | 4,000 | 44 | ||||||
King Yuan Electronics | 65,000 | 66 | ||||||
MediaTek | 10,000 | 184 | ||||||
Micro-Star International | 21,000 | 71 | ||||||
Novatek Microelectronics | 8,000 | 60 | ||||||
Pou Chen | 98,000 | 83 | ||||||
Powertech Technology | 34,000 | 79 | ||||||
The accompanying notes are an integral part of the financial statements
6
Schedule of Investments
October 31, 2022
LSV Emerging Markets Equity Fund |
| |||||||
| Shares | Value (000) | |||||||
Taiwan (continued) |
| |||||||
Primax Electronics | 25,000 | $ | 42 | |||||
Radiant Opto-Electronics | 15,000 | 46 | ||||||
Shin Kong Financial Holding | 278,000 | 69 | ||||||
Sigurd Microelectronics | 26,000 | 38 | ||||||
Simplo Technology | 9,000 | 72 | ||||||
Sino-American Silicon Products | 10,000 | 38 | ||||||
SinoPac Financial Holdings | 143,910 | 72 | ||||||
Synnex Technology International | 27,000 | 44 | ||||||
Topco Scientific | 10,000 | 46 | ||||||
Tripod Technology | 11,000 | 30 | ||||||
United Microelectronics | 83,000 | 101 | ||||||
Wan Hai Lines | 13,800 | 29 | ||||||
Yuanta Financial Holding | 151,204 | 92 | ||||||
Zhen Ding Technology Holding | 28,000 | 92 | ||||||
|
| |||||||
| 2,385 | ||||||||
|
| |||||||
Thailand (3.2%) |
| |||||||
Bangkok Bank | 17,700 | 68 | ||||||
Kasikornbank | 24,000 | 92 | ||||||
Kiatnakin Bank | 43,700 | 84 | ||||||
Krung Thai Bank | 286,900 | 132 | ||||||
Origin Property | 273,000 | 73 | ||||||
Quality Houses | 593,800 | 34 | ||||||
Supalai | 96,600 | 53 | ||||||
|
| |||||||
| 536 | ||||||||
|
| |||||||
Turkey (1.6%) |
| |||||||
Coca-Cola Icecek | 6,400 | 59 | ||||||
Haci Omer Sabanci Holding | 52,200 | 94 | ||||||
Turkiye Sise ve Cam Fabrikalari | 59,600 | 107 | ||||||
|
| |||||||
| 260 | ||||||||
|
| |||||||
United Arab Emirates (0.9%) |
| |||||||
Abu Dhabi Commercial | ||||||||
Bank PJSC | 20,000 | 51 | ||||||
Emaar Properties PJSC | 59,100 | 98 | ||||||
|
| |||||||
| 149 | ||||||||
|
| |||||||
TOTAL FOREIGN COMMON STOCK |
| 15,658 | ||||||
|
| |||||||
Foreign Preferred Stock (2.7%) |
| |||||||
Brazil** (2.5%) | ||||||||
Banco do Estado do Rio Grande do Sul | 36,000 | 81 | ||||||
LSV Emerging Markets Equity Fund |
| |||||||
| Shares | Value (000) | |||||||
Brazil** (continued) |
| |||||||
Cia Energetica de Minas Gerais | 43,700 | $ | 96 | |||||
Cia Paranaense de Energia | 58,400 | 84 | ||||||
Itausa | 79,400 | 165 | ||||||
|
| |||||||
| 426 | ||||||||
|
| |||||||
Colombia** (0.1%) |
| |||||||
Banco Davivienda | 1,700 | 9 | ||||||
|
| |||||||
India** (0.1%) |
| |||||||
NMDC Steel Ltd * | 44,900 | 20 | ||||||
|
| |||||||
TOTAL FOREIGN PREFERRED STOCK |
| 455 | ||||||
|
| |||||||
Warrants (0.0%)* | ||||||||
Thailand (0.0%*) | ||||||||
Thaifoods Group 05/14/2024* | 41,710 | 1 | ||||||
|
| |||||||
TOTAL WARRANTS | 1 | |||||||
|
| |||||||
| Face Amount (000) | ||||||||
Repurchase Agreement (0.6%) |
| |||||||
South Street Securities 2.730%, dated 10/31/2022, to be repurchased on 11/01/2022, repurchase price $92 (collateralized by various U.S. Treasury obligations, ranging in par value $0 - $59, 0.750% - 4.026%, 12/31/2023 – 11/30/2028; total market value $94) | $ | 92 | 92 | |||||
|
| |||||||
TOTAL REPURCHASE AGREEMENT |
| 92 | ||||||
|
| |||||||
Total Investments – 97.7% |
| $ | 16,206 | |||||
|
| |||||||
|
| |||||||
Percentages are based on Net Assets of $16,592 (000).
| (A) | Level 3 security in accordance with fair value hierarchy. |
| (B) | Security is considered illiquid. The total value of such securities as of October 31, 2022 was $– and represented –% of Net Assets. |
| * | Non-income producing security. |
| ** | No rate available. |
ADR — American Depositary Receipt
Cl — Class
PJSC — Public Joint Stock Company
The accompanying notes are an integral part of the financial statements
7
Schedule of Investments
October 31, 2022
The following is a summary of the inputs used as of October 31, 2022, in valuing the Fund’s investments carried at value ($000):
Investments in Securities | Level 1 | Level 2 | Level 3(1) | Total | ||||||||||||
Foreign Common Stock |
| |||||||||||||||
Brazil | $ | 880 | $ | – | $ | – | $ | 880 | ||||||||
Chile | 218 | – | – | 218 | ||||||||||||
China | 399 | – | – | 399 | ||||||||||||
Czech Republic | 27 | – | – | 27 | ||||||||||||
Egypt | 73 | – | – | 73 | ||||||||||||
Greece | 46 | – | – | 46 | ||||||||||||
Hong Kong | 3,876 | – | – | 3,876 | ||||||||||||
Hungary | – | 84 | – | 84 | ||||||||||||
India | 2,239 | – | – | 2,239 | ||||||||||||
Indonesia | 460 | – | – | 460 | ||||||||||||
Malaysia | 342 | – | – | 342 | ||||||||||||
Mexico | 429 | – | – | 429 | ||||||||||||
Philippines | – | 127 | – | 127 | ||||||||||||
Poland | 207 | 61 | – | 268 | ||||||||||||
Russia‡ | – | – | –^ | – | ||||||||||||
Singapore | 69 | – | – | 69 | ||||||||||||
South Africa | 681 | – | – | 681 | ||||||||||||
South Korea | 2,110 | – | – | 2,110 | ||||||||||||
Taiwan | 2,385 | – | – | 2,385 | ||||||||||||
Thailand | 536 | – | – | 536 | ||||||||||||
Turkey | 260 | – | – | 260 | ||||||||||||
United Arab Emirates | 149 | – | – | 149 | ||||||||||||
|
|
|
|
|
|
|
|
| ||||||||
Total Foreign Common Stock | 15,386 | 272 | – | 15,658 | ||||||||||||
|
|
|
|
|
|
|
|
| ||||||||
Foreign Preferred Stock |
| |||||||||||||||
Brazil | 426 | – | – | 426 | ||||||||||||
Colombia | 9 | – | – | 9 | ||||||||||||
India | – | 20 | – | 20 | ||||||||||||
|
|
|
|
|
|
|
|
| ||||||||
Total Foreign Preferred Stock | 435 | 20 | – | 455 | ||||||||||||
|
|
|
|
|
|
|
|
| ||||||||
Total Repurchase Agreement | – | 92 | – | 92 | ||||||||||||
|
|
|
|
|
|
|
|
| ||||||||
Total Warrants | 1 | – | – | 1 | ||||||||||||
|
|
|
|
|
|
|
|
| ||||||||
Total Investments in Securities | $ | 15,822 | $ | 384 | $ | – | $ | 16,206 | ||||||||
|
|
|
|
|
|
|
|
| ||||||||
| (1) | A reconciliation of Level 3 investments and disclosures of significant unobservable inputs are presented when the Fund has a significant amount of Level 3 investments at the beginning and/or end of the period in relation to Net Assets. Management has concluded that Level 3 investments are not material in relation to Net Assets. |
| ‡ | For the year ended October 31, 2022, there were no significant changes into/out of Level 3. The transfer into Level 3 investments for the Fund were immaterial, although the unrealized appreciation/(depreciation) on these investments was $(473)($ Thousands). These securities were impacted by the invasion of Ukraine and sanctions on market conditions in Russia. From the start of the conflict in Ukraine until October 31, 2022, Russian-held investments were deemed to be worthless due to sanctions and inaccessibility of the market. |
| ^ | Includes Securities in which the fair value is $0 or has been rounded to $0. |
Amounts designated as “—“ are $0 or have been rounded to $0.
For more information on valuation inputs, see Note 2 —Significant Accounting Policies in the Notes to Financial Statements.
The accompanying notes are an integral part of the financial statements
8
Statement of Assets and Liabilities (000)
October 31, 2022
| LSV Emerging Markets Equity Fund | ||||
Assets: | ||||
Investments, at Value (Cost $20,254) | $ | 16,206 | ||
Foreign Currency, at Value (Cost $382) | 378 | |||
Receivable due from Investment Adviser | 45 | |||
Dividends and Interest Receivable | 24 | |||
Reclaims Receivable | 2 | |||
Prepaid Expenses | 8 | |||
Total Assets | 16,663 | |||
Liabilities: | ||||
Payable to Custodian | 44 | |||
Accrued Foreign Capital Gains Tax | 12 | |||
Payable due to Transfer Agent | 6 | |||
Payable for Printing Fees | 4 | |||
Payable for Pricing Fees | 2 | |||
Payable for Professional Fees | 2 | |||
Payable due to Administrator | 1 | |||
Total Liabilities | 71 | |||
Net Assets | $ | 16,592 | ||
| ||||
Net Assets Consist of: |
| |||
Paid-in Capital | $ | 20,225 | ||
Total Accumulated Losses | (3,633) | |||
| ||||
Net Assets | $ | 16,592 | ||
| ||||
Net Asset Value, Offering and Redemption Price Per Share — |
$ |
8.67 |
| |
| ||||
Net Asset Value, Offering and Redemption Price Per Share — | $ | 8.65 | ||
| ||||
| (1) | Shares have not been rounded. |
The accompanying notes are an integral part of the financial statements
9
Statement of Operations (000)
For the year ended October 31, 2022
| LSV Emerging Markets Equity Fund | ||||
Investment Income: | ||||
Dividend Income | $ | 1,015 | ||
Interest Income | 1 | |||
Foreign Taxes Withheld | (116) | |||
Total Investment Income | 900 | |||
Expenses: | ||||
Investment Advisory Fees | 163 | |||
Administration Fees | 9 | |||
Distribution Fees - Investor Class | 3 | |||
Chief Compliance Officer Fees | 2 | |||
Trustees’ Fees | 1 | |||
Custodian Fees | 119 | |||
Transfer Agent Fees | 36 | |||
Registration and Filing Fees | 36 | |||
Printing Fees | 8 | |||
Professional Fees | 2 | |||
Insurance and Other Fees | 21 | |||
Total Expenses | 400 | |||
Less: Waiver of Investment Advisory Fees | (163) | |||
Less: Reimbursement of Expenses from Investment Adviser | (40) | |||
Net Expenses | 197 | |||
Net Investment Income | 703 | |||
Net Realized Gain on Investments | 42 | |||
Net Realized Loss on Foreign Currency Transactions | (61) | |||
Net Realized Gain on Foreign Forward Currency Contracts | 5 | |||
Net Realized Loss on Foreign Capital Gains Tax | (21) | |||
Net Change in Unrealized Appreciation (Depreciation) on Investments | (4,700) | |||
Net Change in Unrealized Appreciation (Depreciation) on Foreign Capital Gains Tax on Appreciated Securities | 51 | |||
Net Change in Unrealized Appreciation (Depreciation) on Foreign Currency Translation | (5) | |||
Net Realized and Unrealized Loss on Investments | (4,689) | |||
Net Decrease in Net Assets Resulting from Operations | $ | (3,986) | ||
| ||||
The accompanying notes are an integral part of the financial statements
10
Statements of Changes in Net Assets (000)
For the year ended October 31,
| LSV Emerging Markets Equity Fund | ||||||||
| 2022 | 2021 | |||||||
Operations: | ||||||||
Net Investment Income | $ | 703 | $ | 366 | ||||
Net Realized Gain (Loss) | (35 | ) | 800 | |||||
Net Change in Unrealized Appreciation (Depreciation) | (4,654 | ) | 1,442 | |||||
Net Increase (Decrease) in Net Assets Resulting from Operations | (3,986 | ) | 2,608 | |||||
Distributions | ||||||||
Institutional Class Shares | (1,265 | ) | (243 | ) | ||||
Investor Class Shares | (85 | ) | (10 | ) | ||||
Total Distributions | (1,350 | ) | (253 | ) | ||||
Capital Share Transactions: | ||||||||
Institutional Class Shares: | ||||||||
Issued | 11,227 | 4,923 | ||||||
Reinvestment of Dividends and Distributions | 1,265 | 243 | ||||||
Redeemed | (5,151 | ) | (324 | ) | ||||
Net Increase from Institutional Class Shares Transactions | 7,341 | 4,842 | ||||||
Investor Class Shares: | ||||||||
Issued | 499 | 564 | ||||||
Reinvestment of Dividends and Distributions | 85 | 10 | ||||||
Redeemed | (479 | ) | (23 | ) | ||||
Net Increase from Investor Class Shares Transactions | 105 | 551 | ||||||
Net Increase in Net Assets Derived from Capital Share Transactions | 7,446 | 5,393 | ||||||
Total Increase in Net Assets | 2,110 | 7,748 | ||||||
Net Assets: | ||||||||
Beginning of Year | 14,482 | 6,734 | ||||||
End of Year | $ | 16,592 | $ | 14,482 | ||||
Shares Transactions: | ||||||||
Institutional Class: | ||||||||
Issued | 1,113 | 418 | ||||||
Reinvestment of Dividends and Distributions | 111 | 23 | ||||||
Redeemed | (517 | ) | (29 | ) | ||||
Total Institutional Class Share Transactions | 707 | 412 | ||||||
Investor Class: | ||||||||
Issued | 46 | 48 | ||||||
Reinvestment of Dividends and Distributions | 7 | 1 | ||||||
Redeemed | (44 | ) | (2 | ) | ||||
Total Investor Class Share Transactions | 9 | 47 | ||||||
Net Increase in Shares Outstanding | 716 | 459 | ||||||
The accompanying notes are an integral part of the financial statements
11
Financial Highlights
For a share outstanding throughout each period or year ended October 31,
| Net Asset Value Beginning of Year | Net Investments Income (1) | Realized and Unrealized Gains (Losses) on Investment | Total from Operations | Dividends from Net Investment Income | Distributions from Realized Gains | Total Dividends and Distributions | Net Asset Value End of Year | Total Return† | Net Assets End of Year (000) | Ratio of Expenses to Average Net Assets | Ratio of Expenses to Average Net Assets (Excluding Waivers, Reimbursements and Fees Paid Indirectly) | Ratio of Net Investment Income to Average Net Assets | Portfolio Turnover Rate | |||||||||||||||||||||||||||||||||||||||||||
LSV Emerging Markets Equity Fund |
| |||||||||||||||||||||||||||||||||||||||||||||||||||||||
Institutional Class Shares |
| |||||||||||||||||||||||||||||||||||||||||||||||||||||||
2022 | $ | 12.09 | $ | 0.45 | $ | (2.88 | ) | $ | (2.43 | ) | $ | (0.36 | ) | $ | (0.63 | ) | $ | (0.99 | ) | $ | 8.67 | (21.97 | )% | $ | 15,780 | 1.19 | % | 2.45 | % | 4.33 | % | 38 | % | |||||||||||||||||||||||
2021 | 9.11 | 0.37 | 2.91 | 3.28 | (0.21 | ) | (0.09 | ) | (0.30 | ) | 12.09 | 36.38 | 13,451 | 1.19 | 2.68 | 3.18 | 19 | |||||||||||||||||||||||||||||||||||||||
2020 | 10.28 | 0.26 | (1.11 | ) | (0.85 | ) | (0.31 | ) | (0.01 | ) | (0.32 | ) | 9.11 | (8.67 | ) | 6,384 | 1.19 | 3.20 | 2.85 | 19 | ||||||||||||||||||||||||||||||||||||
2019** | 10.00 | 0.27 | 0.01 | 0.28 | – | – | – | 10.28 | 2.80 | 6,416 | 1.20 | 4.20 | 3.38 | 5 | ‡ | |||||||||||||||||||||||||||||||||||||||||
Investor Class Shares |
| |||||||||||||||||||||||||||||||||||||||||||||||||||||||
2022 | $ | 12.07 | | $ | 0.43 | $ | (2.89 | ) | $ | (2.46 | ) | $ | (0.33 | ) | $ | (0.63 | ) | $ | (0.96 | ) | $ | 8.65 | (22.18 | )% | $ | 812 | 1.45 | % | 2.63 | % | 4.04 | % | 38 | % | ||||||||||||||||||||||
2021 | 9.10 | 0.37 | 2.88 | 3.25 | (0.19 | ) | (0.09 | ) | (0.28 | ) | 12.07 | 36.06 | 1,031 | 1.45 | 2.95 | 3.15 | 19 | |||||||||||||||||||||||||||||||||||||||
2020 | 10.28 | 0.25 | (1.12 | ) | (0.87 | ) | (0.30) | (0.01) | (0.31) | 9.10 | (8.83) | 350 | 1.45 | 3.50 | 2.79 | 19 | ||||||||||||||||||||||||||||||||||||||||
2019** | 10.00 | 0.15 | 0.13 | 0.28 | – | – | – | 10.28 | 2.80 | 184 | 1.48 | (2) | 3.89 | 1.92 | 5 | ‡ | ||||||||||||||||||||||||||||||||||||||||
| ** | Commenced operations on January 17, 2019. All ratios for the period have been annualized |
| † | Total return is for the period indicated and has not been annualized. Total return would have been lower had the Adviser not waived a portion of its fee. Total returns shown do not reflect the deduction of taxes that a shareholder would pay on Fund distributions or the redemption of Capital shares. |
| ‡ | Portfolio turnover rate is for the period indicated and has not been annualized. |
| (1) | Per share calculations were performed using average shares for the period. |
| (2) | Ratio reflects the impact of the low level of average Net Assets. Under normal asset levels, the ratio of expenses to Average Net Assets would have been 1.45%. |
Amounts designated as “—” are $0 or have been rounded to $0.
The accompanying notes are an integral part of the financial statements
12
Notes to Financial Statements
October 31, 2022
1. Organization:
The Advisors’ Inner Circle Fund (the “Trust”) is organized as a Massachusetts business trust under an Amended and Restated Agreement and Declaration of Trust dated February 18, 1997. The Trust is registered under the Investment Company Act of 1940, as amended, as an open-end management investment company with 28 funds. The financial statements herein are those of the LSV Emerging Markets Equity Fund, a diversified Fund (the “Fund”). The Fund seeks long-term growth of capital by investing in undervalued stocks which are out of favor in the market. The Fund commenced operations on January 17, 2019, offering Institutional Class Shares and Investor Class Shares. The financial statements of the remaining funds of the Trust are not presented herein, but are presented separately. The assets of each fund are segregated, and a shareholder’s interest is limited to the fund in which shares are held.
2. Significant Accounting Policies:
The following are significant accounting policies, which are consistently followed in the preparation of the financial statements of the Fund. The Fund is an investment company that applies the accounting and reporting guidance issued in Topic 946 by the U.S. Financial Accounting Standards Board (“FASB”).
Use of Estimates — The preparation of financial statements in conformity with U.S. generally accepted accounting principles (“U.S. GAAP”) requires management to make estimates and assumptions that affect the fair value of assets and liabilities and disclosure of contingent assets and liabilities at the date of the financial statements and the reported amounts of increases and decreases in net assets from operations during the reporting period. Actual results could differ from those estimates and such differences could be material.
Security Valuation — Securities listed on a securities exchange, market or automated quotation system for which quotations are readily available (except for securities traded on NASDAQ), including securities traded over the counter, are valued at the last quoted sale price on an exchange or market (foreign or domestic) on which they are traded on the valuation date (or at approximately 4:00 pm ET if a security’s primary exchange is normally open at that time), or, if there is no such reported sale on the valuation date, at the most recent quoted bid price. For securities traded on NASDAQ, the NASDAQ Official Closing Price will be used. The prices for foreign securities are reported in local currency and converted to U.S. dollars using currency exchange rates.
Securities for which market prices are not “readily available” are required to be fair valued under the 1940 Act.
In December 2020, the SEC adopted Rule 2a-5 under the 1940 Act, establishing requirements to determine fair value in good faith for purposes of the 1940 Act. The rule permits fund boards to designate a fund’s investment adviser to perform fair-value determinations, subject to board oversight and certain other conditions. The rule also defines when market quotations are “readily available” for purposes of the 1940 Act and requires a fund to fair value a portfolio investment when a market quotation is not readily available. The SEC also adopted new Rule 31a-4 under the 1940 Act, which sets forth recordkeeping requirements associated with fair-value determinations. The compliance date for Rule 2a-5 and Rule 31a-4 was September 8, 2022.
Effective September 8, 2022, and pursuant to the requirements of Rule 2a-5, the Trust’s Board of Trustees (the “Board”) designated the Adviser as the Board’s valuation designee to perform fair-value determinations for the Fund through a Fair Value Committee (the “Committee”) established by the Adviser and approved new Adviser Fair Value Procedures for the Fund. Prior to September 8, 2022, fair-value determinations were performed in accordance with the Trust’s Fair Value Procedures established by the Board and were implemented through a Fair Value Committee designated by the Board.
Some of the more common reasons that may necessitate that a security be valued using Fair Value Procedures include: the security’s trading has been halted or suspended; the security has been de-listed from a national exchange; the security’s primary trading market is temporarily closed at a time when under normal conditions it would be open; the security has not been traded for an extended period of time; the security’s primary pricing source is not able or willing to provide a price; or trading of the security is subject to local government-imposed restrictions. When a security is valued in accordance with the Fair Value Procedures, the Committee will determine the value after taking into consideration relevant information reasonably available to the Committee. As of October 31, 2022, the total market value of securities that were fair valued by the Committee were $0 (000) or 0.0% of Net Assets.
For securities that principally trade on a foreign market or exchange, a significant gap in time can exist between the time of a particular security’s last trade and the time at which the Fund calculates its net asset value. The closing prices of such securities may no longer reflect their market value at the time the Fund calculates net asset value if an event that could materially affect the value of those securities (a “Significant Event”) has occurred between the
13
Notes to Financial Statements
October 31, 2022
time of the security’s last close and the time that the Fund calculates net asset value. A Significant Event may relate to a single issuer or to an entire market sector. If the adviser of the Fund becomes aware of a Significant Event that has occurred with respect to a security or group of securities after the closing of the exchange or market on which the security or securities principally trade, but before the time at which the Fund calculates net asset value, it may request that a Committee meeting be called. In addition, the Fund’s administrator monitors price movements among certain selected indices, securities and/or baskets of securities that may be an indicator that the closing prices received earlier from foreign exchanges or markets may not reflect market value at the time the Fund calculates net asset value. If price movements in a monitored index or security exceed levels established by the administrator, the administrator notifies the adviser that such limits have been exceeded. In such event, the adviser makes the determination whether a Committee meeting should be called based on the information provided.
The Fund uses Intercontinental Exchange Data Pricing & Reference Data, LLC (“ICE”) as a third party fair valuation vendor when the fair value trigger is met. ICE provides a fair value for foreign securities in the Fund based on certain factors and methodologies (involving, generally, tracking valuation correlations between the U.S. market and each non-U.S. security) applied by ICE in the event that there is a movement in the U.S. market that exceeds a specific threshold established by the Committee. The Committee establishes a “confidence interval” which is used to determine the level of correlation between the value of a foreign security and movements in the U.S. market before a particular security is fair valued when the threshold is exceeded. In the event that the threshold established by the Committee is exceeded on a specific day, the Fund values its non-U.S. securities that exceed the applicable “confidence interval” based upon the fair values provided by ICE. In such event, it is not necessary to hold a Committee meeting. In the event that the Adviser believes that the fair values provided by ICE are not reliable, the Adviser contacts SEI Investments Global Fund Services (the “Administrator”) and may request that a meeting of the Committee be held. As of October 31, 2022, the total market value of securities valued in accordance with Fair Value Procedures were $211 (000) or 1.3% of Net Assets. If a local market in which the Fund owns securities is closed for one or more days, the Fund shall value all securities held in that corresponding currency based on the fair value prices provided by ICE using the predetermined confidence interval discussed above.
In accordance with the authoritative guidance on
fair value measurements and disclosure under U.S. GAAP, the Fund discloses fair value of its investments in a hierarchy that prioritizes the inputs to valuation techniques used to measure the fair value. The objective of a fair value measurement is to determine the price that would be received to sell an asset or paid to transfer a liability in an orderly transaction between market participants at the measurement date (an exit price). Accordingly, the fair value hierarchy gives the highest priority to quoted prices (unadjusted) in active markets for identical assets or liabilities (Level 1) and the lowest priority to unobservable inputs (Level 3). The three levels of the fair value hierarchy are described below:
Level 1 — Unadjusted quoted prices in active markets for identical, unrestricted assets or liabilities that the Fund has the ability to access at the measurement date;
Level 2 — Other significant observable inputs (includes quoted prices for similar securities, interest rates, prepayment speeds, credit risk, referenced indices, quoted prices in inactive markets, adjusted quoted prices in active markets, adjusted quoted prices on foreign equity securities that were adjusted in accordance with The Adviser’s pricing proce-dures,etc.); and
Level 3 — Prices, inputs or proprietary modeling techniques which are both significant to the fair value measurement and unobservable (supported by little or no market activity).
Investments are classified within the level of the lowest significant input considered in determining fair value. Investments classified within Level 3 whose fair value measurement considers several inputs may include Level 1 or Level 2 inputs as components of the overall fair value measurement.
Federal Income Taxes — It is the Fund’s intention to continue to qualify as a regulated investment company for Federal income tax purposes by complying with the appropriate provisions of Subchapter M of the Internal Revenue Code of 1986, as amended and to distribute substantially all of its income to shareholders. Accordingly, no provision for Federal income taxes has been made in the financial statements.
The Fund evaluates tax positions taken or expected to be taken in the course of preparing the Fund’s tax returns to determine whether it is “more-likely-than-not” (i.e., greater than 50-percent) that each tax position will be sustained upon examination by a taxing authority based on the technical merits of the position. Tax positions not deemed to meet the more-likely-than-not threshold are recorded as a tax benefit or expense in the current year. The Fund did not record any tax provision in the current period.
14
Notes to Financial Statements
October 31, 2022
However, management’s conclusions regarding tax positions taken may be subject to review and adjustment at a later date based on factors including, but not limited to, examination by tax authorities on open tax years (i.e. the last three open tax year ends, as applicable), on-going analysis of and changes to tax laws, regulations and interpretations thereof.
As of and during the year ended October 31, 2022, the Fund did not have a liability for any unrecognized tax benefits. The Fund recognizes interest and penalties, if any, related to unrecognized tax benefits as income tax expense in the Statement of Operations. During the year ended October 31, 2022, the Fund did not incur any interest or penalties.
Security Transactions and Investment Income— Security transactions are accounted for on trade date for financial reporting purposes. Costs used in determining realized gains or losses on the sale of investment securities are based on the specific identification method. Dividend income is recorded on the ex-dividend date. Interest income is recognized on the accrual basis from settlement date.
Investments in Real Estate Investment Trusts (REITs) — With respect to the Fund, dividend income is recorded based on the income included in distributions received from the REIT investments using published REIT reclassifications including some management estimates when actual amounts are not available. Distributions received in excess of this estimated amount are recorded as a reduction of the cost of investments or reclassified to capital gains. The actual amounts of income, return of capital, and capital gains are only determined by each REIT after its fiscal year-end, and may differ from the estimated amounts.
Repurchase Agreements — In connection with transactions involving repurchase agreements, a third party custodian bank takes possession of the underlying securities (“collateral”), the value of which exceeds the principal amount of the repurchase transaction, including accrued interest. Such collateral will be cash, debt securities issued or guaranteed by the U.S. Government, securities that at the time the repurchase agreement is entered into are rated in the highest category by a nationally recognized statistical rating organization (“NRSRO”), as determined by the Adviser.
Provisions of the repurchase agreements and procedures adopted by the Board require that the market value of the collateral, including accrued interest thereon, is sufficient in the event of default by the counterparty. In the event of default or
bankruptcy by the counterparty to the agreement, realization and/or retention of the collateral or proceeds may be subject to legal proceedings.
Repurchase agreements are entered into by the Fund under Master Repurchase Agreements (“MRA”) which permit the Fund, under certain circumstances including an event of default (such as bankruptcy or insolvency), to offset payables and/or receivables under the MRA with collateral held and/ or posted to the counterparty and create one single net payment due to or from the Fund.
At October 31, 2022, the open repurchase agreement by counterparty which is subject to a MRA on a net payment basis is as follows (000):
| Counterparty | Repurchase Agreement | Fair Value of | Cash Collateral Received(1) | Net Amount(2) | ||||||||||||
South Street Securities | $ | 92 | $ | 92 | $ | - | $ | - | ||||||||
(1) The amount of collateral reflected in the table does not include any over-collateralization received by the Fund.
(2) Net amount represents the net amount receivable due from the counterparty in the event of default.
Foreign Currency Translation— The books and records of the Fund are maintained in U.S. dollars. Investment securities and other assets and liabilities denominated in a foreign currency are translated into U.S. dollars on the date of valuation. The Fund does not isolate that portion of realized or unrealized gains and losses resulting from changes in the foreign exchange rate from fluctuations arising from changes in the market prices of the securities. These gains and losses are included in net realized and unrealized gains and losses on investments on the Statement of Operations. Net realized and unrealized gains and losses on foreign currency transactions represent net foreign exchange gains or losses from foreign currency exchange contracts, disposition of foreign currencies, currency gains or losses realized between trade and settlement dates on securities transactions and the difference between the amount of the investment income and foreign withholding taxes recorded on the Fund’s books and the U.S. dollar equivalent amounts actually received or paid.
Expenses— Expenses that are directly related to the Fund are charged to the Fund. Other operating expenses of the Trust are prorated to the Fund based on the number of funds and/or average daily net assets
Classes— Class specific expenses are borne by that class of shares. Income, realized and
15
Notes to Financial Statements
October 31, 2022
unrealized gains and losses and non-class specific expenses are allocated to the respective class on the basis of average daily net assets.
Dividends and Distributions to Shareholders— Dividends from net investment income, if any, are declared and paid to shareholders annually. Any net realized capital gains are distributed to shareholders at least annually.
3. Transactions with Affiliates:
Certain officers of the Trust are also employees of SEI Investments Global Funds Services (the “Administrator”), a wholly owned subsidiary of SEI Investments Company and/or SEI Investments Distribution Co. (the “Distributor”). Such officers are paid no fees by the Trust for serving as officers of the Trust other than the Chief Compliance Officer (“CCO”) as described below.
A portion of the services provided by the CCO and his staff, whom are employees of the Administrator, are paid for by the Trust as incurred. The services include regulatory oversight of the Trust’s Advisors and service providers as required by SEC regulations. The CCO’s services have been approved by and reviewed by the Board.
| 4. | Administration, Distribution, Transfer Agency and Custodian Agreements: |
The Fund, along with other series of the Trust advised by LSV Asset Management (the “Adviser”), and the Administrator are parties to an Administration Agreement, under which the Administrator provides administrative services to the Fund. For these services, the Administrator is paid an asset based fee, subject to certain minimums, which will vary depending on the number of share classes and the average daily net assets of the Fund. For the year ended October 31, 2022, the Fund incurred $9,063 for these services.
The Trust and Distributor are parties to a Distribution Agreement dated November 14, 1991, as Amended and Restated November 14, 2005. The Distributor receives no fees for its distribution services under this agreement.
The Fund has adopted a distribution plan under the Rule 12b-1 under the 1940 Act for Investor Class Shares that allows the Fund to pay distribution and service fees for the sale and distribution of its shares, and for services provided to shareholders. The maximum annual distribution fee for Investor Class Shares of the Fund is 0.25% annually of the average daily net assets. For the year ended October 31, 2022, the Fund incurred $2,540 of distribution fees.
DST Systems, Inc. serves as the transfer agent and dividend disbursing agent for the Fund under a transfer
agency agreement with the Trust. During the year ended October 31, 2022, the Fund earned $97 in cash management credits which were used to offset transfer agent expenses.
U.S. Bank, N.A. acts as custodian (the “Custodian”) for the Fund. The Custodian plays no role in determining the investment policies of the Fund or which securities are to be purchased and sold by the Fund.
5. Investment Advisory Agreement:
The Trust and the Adviser are parties to an Investment Advisory Agreement, under which the Adviser receives an annual fee equal to 1.00% of the Fund’s average daily net assets. The Adviser has contractually agreed to waive its fee (excluding interest, taxes, brokerage commissions, acquired fund fees and expenses, and extraordinary expenses) in order to limit the Fund’s total operating expenses after fee waivers and/or expense reimbursements to a maximum of 1.20% and 1.45% of the Fund’s Institutional Class and Investor Class Shares’ average daily net assets, respectively, through February 28, 2023. Refer to waiver of investment advisory fees on the Statement of Operations for fees waived for the year ended October 31, 2022.
| 6. | Investment Transactions: |
The cost of security purchases and the proceeds from security sales, other than short-term investments, for the year ended October 31, 2022, were as follows (000):
Purchases | $ | 12,408 | ||
Sales | $ | 6,000 |
| 7. | Federal Tax Information: |
The amount and character of income and capital gain distributions to be paid, if any, are determined in accordance with Federal income tax regulations, which may differ from U.S. GAAP. As a result, net investment income (loss) and net realized gain (loss) on investment transactions for a reporting period may differ significantly from distributions during such period. These book/tax differences may be temporary or permanent.
The permanent differences primarily consist of foreign currency translations and reclassification of long term capital gain distribution on REITs, investments in passive foreign investment companies (PFICs) and foreign capital gains tax. There are no permanent differences that are credited or charged to Paid-in Capital and Distributable Earnings as of October 31, 2022.
The tax character of dividends and distributions paid during the years ended October 31, 2022 and 2021 was as follows (000):
16
Notes to Financial Statements
October 31, 2022
| Ordinary Income | Long-Term Capital Gain | Total | ||||||||||
2022 | $ | 718 | $ | 632 | $ | 1,350 | ||||||
2021 | 225 | 28 | 253 | |||||||||
As of October 31, 2022, the components of distributable earnings (accumulated losses) on a tax basis were as follows (000):
Undistributed Ordinary Income | $ | 520 | ||
Capital Loss Carryforward | (12 | ) | ||
Other Temporary Differences | 1 | |||
Unrealized Depreciation | (4,142 | ) | ||
|
| |||
Total Accumulated Losses | $ | (3,633 | ) | |
|
|
As of October 31, 2022, the Fund has short-term and long-term capital loss carryforwards of $12 (000) and $0 (000), respectively.
During the year ended October 31, 2022, no capital loss carryforwards were utilized to offset capital gains.
The total cost of securities for Federal income tax purposes and the aggregate gross unrealized appreciation and depreciation on investments held by the Fund at October 31, 2022, were as follows (000):
| Federal Tax Cost | Aggregated Gross Unrealized Appreciation | Aggregated Gross Unrealized Depreciation | Net Unrealized Depreciation | |||
| $ 20,332 | $ 685 | $ (4,815) | $ (4,130) |
| 8. | Concentration of Risks: |
Equity Risk — Since the Fund purchases equity securities, the Fund is subject to the risk that stock prices will fall over short or extended periods of time. Historically, the equity markets have moved in cycles, and the value of the Fund’s equity securities may fluctuate drastically from day-to-day. Individual companies may report poor results or be negatively affected by industry and/or economic trends and developments. The prices of securities issued by such companies may suffer a decline in response. These factors contribute to price volatility, which is the principal risk of investing in the Fund.
Foreign Company Risk — Investing in foreign companies, including direct investments and through Depositary Receipts, poses additional risks since political and economic events unique to a country or region will affect those markets and their issuers. These risks will not necessarily affect the U.S. economy or similar issuers located in the United States. In addition, investments in foreign companies are generally denominated in a foreign currency, the value of which may be influenced by currency exchange rates and exchange control regulations. Changes in the value
of a currency compared to the U.S. dollar may affect (positively or negatively) the value of the Fund’s investments. These currency movements may occur separately from, and in response to, events that do not otherwise affect the value of the security in the issuer’s home country. Securities of foreign companies may not be registered with the U.S. Securities and Exchange Commission (the “SEC”) and foreign companies are generally not subject to the regulatory controls imposed on U.S. issuers and, as a consequence, there is generally less publicly available information about foreign securities than is available about domestic securities. Income from foreign securities owned by the Fund may be reduced by a withholding tax at the source, which tax would reduce income received from the securities comprising the portfolio. Foreign securities may also be more difficult to value than securities of U.S. issuers. While Depositary Receipts provide an alternative to directly purchasing the underlying foreign securities in their respective national markets and currencies, investments in Depositary Receipts continue to be subject to many of the risks associated with investing directly in foreign securities.
Emerging Market Risk — Investments in emerging markets securities are considered speculative and subject to heightened risks in addition to the general risks of investing in foreign securities. Unlike more established markets, emerging markets may have governments that are less stable, markets that are less liquid and economies that are less developed. In addition, the securities markets of emerging market countries may consist of companies with smaller market capitalizations and may suffer periods of relative illiquidity; significant price volatility; restrictions on foreign investment; and possible restrictions on repatriation of investment income and capital. Furthermore, foreign investors may be required to register the proceeds of sales, and future economic or political crises could lead to price controls, forced mergers, expropriation or confiscatory taxation, seizure, nationalization or creation of government monopolies.
Risk of Investing in Russia — Russia’s military invasion of Ukraine in February 2022, the resulting responses by the United States and other countries, and the potential for wider conflict have had, and could continue to have, severe adverse effects on regional and global economies and could further increase volatility and uncertainty in the financial markets. The United States and other countries have imposed broad-ranging economic sanctions on Russia and certain Russian individuals, banking entities and corporations as a response to its invasion of Ukraine. The United States and other countries have also imposed economic sanctions on Belarus and may impose sanctions
17
Notes to Financial Statements
October 31, 2022
on other countries that provide military or economic support to Russia. These sanctions, as well as any other economic consequences related to the invasion, such as additional sanctions, boycotts or changes in consumer or purchaser preferences or cyberattacks on governments, companies or individuals, may further decrease the value and liquidity of certain Russian securities and securities of issuers in other countries that are subject to economic sanctions related to the invasion. To the extent that a Fund has exposure to Russian investments or investments in countries affected by the invasion, the Fund’s ability to price, buy, sell, receive or deliver such investments may be impaired. In addition, any exposure that a Fund may have to counterparties in Russia or in countries affected by the invasion could negatively impact the Fund’s investments. The extent and duration of military actions and the repercussions of such actions (including any retaliatory actions or countermeasures that may be taken by those subject to sanctions) are impossible to predict. These events have resulted in, and could continue to result in, significant market disruptions, including in certain industries or sectors such as the oil and natural gas markets, and may further strain global supply chains and negatively affect inflation and global growth. These and any related events could significantly impact a Fund’s performance and the value of an investment in a Fund beyond any direct exposure a Fund may have to Russian issuers or issuers in other countries affected by the invasion.
Currency Risk — As a result of the Fund’s investments in securities or other investments denominated in, and/ or receiving revenues in, foreign currencies, the Fund will be subject to currency risk. Currency risk is the risk that foreign currencies will decline in value relative to the U.S. dollar, in which case, the dollar value of an investment in the Fund would be adversely affected.
Market Risk — The risk that the market value of an investment may move up and down, sometimes rapidly and unpredictably. Markets for securities in which the Fund invests may decline significantly in response to adverse issuer, political, regulatory, market, economic or other developments that may cause broad changes in market value, public perceptions concerning these developments, and adverse investor sentiment or publicity. Similarly, the impact of any epidemic, pandemic or natural disaster, or widespread fear that such events may occur, could negatively affect the global economy, as well as the economies of individual countries, the financial performance of individual companies and sectors, and the markets in general in significant and unforeseen ways. Any such impact could adversely affect the prices and liquidity of the securities and other instruments in which the Fund invests, which in turn
could negatively impact the Fund’s performance and cause losses on your investment in the Fund.
Medium and Smaller Capitalization Risk — The medium- and smaller-capitalization companies in which the Fund may invest may be more vulnerable to adverse business or economic events than larger, more established companies. In particular, investments in these medium- and small-sized companies may pose additional risks, including liquidity risk, because these companies tend to have limited product lines, markets and financial resources, and may depend upon a relatively small management group. Therefore, medium- and small-capitalization stocks may be more volatile than those of larger companies. These securities may be traded over-the-counter or listed on an exchange.
Preferred Stock Risk — Preferred stocks in which the Fund may invest are sensitive to interest rate changes, and are also subject to equity risk, which is the risk that stock prices will fall over short or extended periods of time. The rights of preferred stocks on the distribution of a company’s assets in the event of a liquidation are generally subordinate to the rights associated with a company’s debt securities.
| 9. | Other: |
At October 31, 2022, 80% of total shares outstanding for the Institutional Class Shares were held by four record shareholders each owning 10% or greater of the aggregate total shares outstanding. At October 31, 2022, 86% of total shares outstanding for the Investor Class Shares were held by two record shareholders owning 10% or greater of the aggregate total shares outstanding. These were comprised mostly of omnibus accounts which were held on behalf of various individual shareholders.
10. Indemnifications:
In the normal course of business, the Fund enters into contracts that provide general indemnifications. The Fund’s maximum exposure under these arrangements is dependent on future claims that may be made against the Fund and, therefore, cannot be estimated; however, based on experience, the risk of loss from such claims is considered remote.
11. Subsequent Events:
The Fund has evaluated the need for additional disclosures and/or adjustments resulting from subsequent events through the date the financial statements were issued. Based on this evaluation, no additional disclosures or adjustments were required to the financial statements.
18
Report of Independent Registered Public Accounting Firm
To the Board of Trustees of The Advisors’ Inner Circle Fund and the Shareholders of LSV Emerging Markets Equity Fund
Opinion on the Financial Statements
We have audited the accompanying statement of assets and liabilities of LSV Emerging Markets Equity Fund (the “Fund”) (one of the series constituting The Advisors’ Inner Circle Fund (the “Trust”)), including the schedule of investments, as of October 31, 2022, and the related statement of operations for the year then ended, the statements of changes in net assets for each of the two years in the period then ended, the financial highlights for each of the three years in the period then ended and the period from January 17, 2019 (commencement of operations) to October 31, 2019 and the related notes (collectively referred to as the “financial statements”). In our opinion, the financial statements present fairly, in all material respects, the financial position of the Fund (one of the series constituting The Advisors’ Inner Circle Fund) at October 31, 2022, the results of its operations for the year then ended, the changes in its net assets for each of the two years in the period then ended and its financial highlights for each of the three years in the period then ended and the period from January 17, 2019 (commencement of operations) to October 31, 2019, in conformity with U.S. generally accepted accounting principles.
Basis for Opinion
These financial statements are the responsibility of the Trust’s management. Our responsibility is to express an opinion on the Fund’s financial statements based on our audits. We are a public accounting firm registered with the Public Company Accounting Oversight Board (United States) (“PCAOB”) and are required to be independent with respect to the Trust in accordance with the U.S. federal securities laws and the applicable rules and regulations of the Securities and Exchange Commission and the PCAOB.
We conducted our audits in accordance with the standards of the PCAOB. Those standards require that we plan and perform the audit to obtain reasonable assurance about whether the financial statements are free of material misstatement, whether due to error or fraud. The Trust is not required to have, nor were we engaged to perform, an audit of the Trust’s internal control over financial reporting. As part of our audits, we are required to obtain an understanding of internal control over financial reporting but not for the purpose of expressing an opinion on the effectiveness of the Trust’s internal control over financial reporting. Accordingly, we express no such opinion.
Our audits included performing procedures to assess the risks of material misstatement of the financial statements, whether due to error or fraud, and performing procedures that respond to those risks. Such procedures included examining, on a test basis, evidence regarding the amounts and disclosures in the financial statements. Our procedures included confirmation of securities owned as of October 31, 2022, by correspondence with the custodian and brokers; when replies were not received from brokers, we performed other auditing procedures. Our audits also included evaluating the accounting principles used and significant estimates made by management, as well as evaluating the overall presentation of the financial statements. We believe that our audits provide a reasonable basis for our opinion.

We have served as the auditor of one or more LSV Asset Management investment companies since 2005.
Philadelphia, Pennsylvania
December 23, 2022
19
Disclosure of Fund Expenses (Unaudited)
All mutual funds have operating expenses. As a shareholder of a mutual fund, your investment is affected by these ongoing costs, which include (among others) costs for portfolio management, administrative services, and shareholder reports like this one. It is important for you to understand the impact of these costs on your investment returns.
Operating expenses such as these are deducted from the mutual fund’s gross income and directly reduce your final investment return. These expenses are expressed as a percentage of the mutual fund’s average net assets; this percentage is known as the mutual fund’s expense ratio.
The following examples use the expense ratio and are intended to help you understand the ongoing costs (in dollars) of investing in your Fund and to compare these costs with those of other mutual funds. The examples are based on an investment of $1,000 made at the beginning of the period and held for the entire period from May 1, 2021 to October 31, 2022.
The table below illustrates your Fund’s costs in two ways:
• Actual fund return. This section helps you to estimate the actual expenses after fee waivers that your Fund incurred over the period. The “Expenses Paid During Period” column shows the actual dollar expense incurred by a $1,000 investment in the Fund, and the “Ending Account Value” number is derived from deducting that expense from the Fund’s gross investment return.
You can use this information, together with the actual amount you invested in the Fund, to estimate the expenses you paid over that period. Simply divide your account value by $1,000 to arrive at a ratio (for example, an $8,600 account value divided by $1,000 = $8.6), then multiply that ratio by the number shown for your Fund under “Expenses Paid During Period.”
• Hypothetical 5% return. This section helps you compare your Fund’s costs with those of other mutual funds. It assumes that the Fund had an annual 5% return before expenses during the period, but that the expense ratio (Column 3) is unchanged. This example is useful in making comparisons because the Securities and Exchange Commission requires all mutual funds to make this 5% calculation. You can assess your Fund’s comparative cost by comparing the hypothetical result for your Fund in the “Expense Paid During Period” column with those that appear in the same charts in the shareholder reports for other mutual funds.
NOTE: Because the hypothetical return is set at 5% for comparison purposes — NOT your Fund’s actual return —the account values shown do not apply to your specific investment.
| Beginning Account Value 05/01/22 | Ending Account Value 10/31/22 | Annualized Expense Ratios | Expenses Paid During Period* | |||||||||||||
LSV Emerging Markets Equity Fund | ||||||||||||||||
Actual Fund Return | ||||||||||||||||
Institutional Class Shares | $ | 1,000.00 | $ | 814.80 | 1.20% | $5.49 | ||||||||||
Investor Class Shares | 1,000.00 | 813.70 | 1.46 | 6.67 | ||||||||||||
Hypothetical 5% Return | ||||||||||||||||
Institutional Class Shares | $ | 1,000.00 | $ | 1,019.16 | 1.20% | $6.11 | ||||||||||
Investor Class Shares | 1,000.00 | 1,017.85 | 1.46 | 7.43 | ||||||||||||
| * | Expenses are equal to the Fund’s annualized expense ratio multiplied by the average account value over the period, multiplied by 184/365 (to reflect the one half year period). |
20
Review of Liquidity Risk Management Program (Unaudited)
Pursuant to Rule 22e-4 under the 1940 Act, the Funds’ investment adviser has adopted, and the Board has approved, a liquidity risk management program (the “Program”) to govern the Funds’ approach to managing liquidity risk. The Program is overseen by the Funds’ Liquidity Risk Management Program Administrator (the “Program Administrator”), and the Program’s principal objectives include assessing, managing and periodically reviewing each Fund’s liquidity risk, based on factors specific to the circumstances of the Funds.
At a meeting of the Board held on May 24, 2022, the Trustees received a report from the Program Administrator addressing the operations of the Program and assessing its adequacy and effectiveness of implementation for the period from January 1, 2021 through December 31, 2021. The Program Administrator’s report included an assessment of how market conditions caused by the COVID-19 pandemic impacted the Funds’ liquidity risk during the period covered by the report. The Program Administrator’s report noted that the Program Administrator had determined that the Program is reasonably designed to assess and manage each Fund’s liquidity risk and has operated adequately and effectively to manage each Fund’s liquidity risk during the period covered by the report. The Program Administrator’s report noted that during the period covered by the report, there were no liquidity events that impacted the Funds or their ability to timely meet redemptions without dilution to existing shareholders. The Program Administrator’s report further noted that no material changes have been made to the Program during the period covered by the report.
There can be no assurance that the Program will achieve its objectives in the future. Please refer to the prospectus for more information regarding a Fund’s exposure to liquidity risk and other principal risks to which an investment in the Funds may be subject.
21
Trustees And Officers Of The Advisors’ Inner Circle Fund (Unaudited)
Set forth below are the names, ages, position with the Trust, term of office, length of time served and the principal occupations for the last five years of each of the persons currently serving as Trustees and Officers of the Trust. Trustees who are deemed not to be “interested persons” of the Trust are referred to as “Independent Board Members.” Messrs. Nesher and Klauder are Trustees who may be deemed to be “interested” persons of the Fund as that term is defined in the 1940 Act by virtue of their affiliation with the Trust’s Distributor. The Trust’s Statement of Additional Information (“SAI”) includes additional information about the Trustees and Officers. The SAI may be obtained without charge by calling 888-Fund-LSV. The following chart lists Trustees and Officers as of October 31, 2022.
| Name and Year of Birth | Position with Trust and Length of Time Served1 | Principal Occupation in the Past Five Years | Other Directorships Held in the Past Five Years2 | |||
INTERESTED TRUSTEES3,4 | ||||||
| Robert Nesher (Born: 1946) | Chairman of the Board of Trustees (since 1991) | SEI employee 1974 to present; currently performs various services on behalf of SEI Investments for which Mr. Nesher is compensated. President, Chief Executive Officer and Trustee of SEI Daily Income Trust, SEI Tax Exempt Trust, SEI Institutional Managed Trust, SEI Institutional International Trust, SEI Institutional Investments Trust, SEI Asset Allocation Trust, Adviser Managed Trust, New Covenant Funds, SEI Insurance Products Trust and SEI Catholic Values Trust. President and Director of SEI Structured Credit Fund, LP. Vice Chairman of O’Connor EQUUS (closed-end investment company) to 2016. President, Chief Executive Officer and Trustee of SEI Liquid Asset Trust to 2016. Vice Chairman of Winton Series Trust to 2017. Vice Chairman of Winton Diversified Opportunities Fund (closed-end investment company), The Advisors’ Inner Circle Fund III, Gallery Trust, Schroder Series Trust and Schroder Global Series Trust to 2018.
| Current Directorships: Trustee of The Advisors’ Inner Circle Fund II, Bishop Street Funds, Frost Family of Funds, Catholic Responsible Investments Funds, SEI Daily Income Trust, SEI Institutional International Trust, SEI Institutional Investments Trust, SEI Institutional Managed Trust, SEI Asset Allocation Trust, SEI Tax Exempt Trust, Adviser Managed Trust, New Covenant Funds, SEI Insurance Products Trust and SEI Catholic Values Trust. Director of SEI Structured Credit Fund, LP, SEI Global Master Fund plc, SEI Global Assets Fund plc, SEI Global Investments Fund plc, SEI Investments—Global Funds Services, Limited, SEI Investments Global, Limited, SEI Investments (Europe) Ltd., SEI Investments—Unit Trust Management (UK) Limited, SEI Multi-Strategy Funds PLC and SEI Global Nominee Ltd.
Former Directorships: Trustee of The KP Funds to 2021. Trustee of SEI Liquid Asset Trust to 2016. | |||
| N. Jeffrey Klauder (Born: 1952) | Trustee (since 2018) | Senior Advisor of SEI Investments since 2018. Executive Vice President and General Counsel of SEI Investments, 2004 to 2018. | Current Directorships: Trustee of The Advisors’ Inner Circle Fund II, Bishop Street Funds and Catholic Responsible Investments Funds. Director of SEI Private Trust Company, SEI Global Fund Services Ltd., SEI Investments Global Limited, SEI Global Master Fund, SEI Global Investments Fund, SEI Global Assets Fund and SEI Investments - Guernsey Limited.
Former Directorships: Trustee of The KP Funds to 2021. Trustee of SEI Investments Management Corporation, SEI Trust Company, SEI Investments (South Africa), Limited and SEI Investments (Canada) Company to 2018. | |||
| 1 | Each Trustee shall hold office during the lifetime of this Trust until the election and qualification of his or her successor, or until he or she sooner dies, resigns, or is removed in accordance with the Trust’s Declaration of Trust. |
| 2 | Directorships of Companies required to report to the Securities and Exchange Commission under the Securities Exchange Act of 1934 (i.e., “public companies”) or other investment companies under the 1940 Act. |
| 3 | Denotes Trustees who may be deemed to be “interested” persons of the Fund as that term is defined in the 1940 Act by virtue of their affiliation with the Distributor and/or its affiliates. |
| 4 | Trustees oversee 28 funds in The Advisors’ Inner Circle Fund. |
22
Trustees And Officers Of The Advisors’ Inner Circle Fund (Unaudited)
| Name and Year of Birth | Position with Trust and Length of Time Served1 | Principal Occupation in the Past Five Years | Other Directorships Held in the Past Five Years2 | |||
INDEPENDENT TRUSTEES3 | ||||||
| Joseph T. Grause, Jr. (Born: 1952) | Trustee (Since 2011) Lead Independent Trustee (since 2018) | Self-Employed Consultant since 2012. Director of Endowments and Foundations, Morningstar Investment Management, Morningstar, Inc., 2010 to 2011. Director of International Consulting and Chief Executive Officer of Morningstar Associates Europe Limited, Morningstar, Inc., 2007 to 2010. Country Manager – Morningstar UK Limited, Morningstar, Inc., 2005 to 2007.
| Current Directorships: Trustee of The Advisors’ Inner Circle Fund II, Bishop Street Funds, Frost Family of Funds, and Catholic Responsible Investments Funds. Director of RQSI GAA Systematic Global Macro Fund, Ltd.
Former Directorships: Trustee of The KP Funds to 2021. Director of The Korea Fund, Inc. to 2019. | |||
| Mitchell A. Johnson (Born: 1942) | Trustee (since 2005) | Retired. Private investor since 1994. | Current Directorships: Trustee of The Advisors’ Inner Circle Fund II, Bishop Street Funds, Catholic Responsible Investments Funds, SEI Asset Allocation Trust, SEI Daily Income Trust, SEI Institutional International Trust, SEI Institutional Managed Trust, SEI Institutional Investments Trust, SEI Tax Exempt Trust, Adviser Managed Trust, New Covenant Funds, SEI Insurance Products Trust and SEI Catholic Values Trust. Director of Federal Agricultural Mortgage Corporation (Farmer Mac) since 1997 and RQSI GAA Systematic Global Macro Fund, Ltd.
Former Directorships: Trustee of The KP Funds to 2021. Trustee of SEI Liquid Asset Trust to 2016. | |||
| Betty L. Krikorian (Born: 1943) | Trustee (since 2005) | Vice President, Compliance, AARP Financial Inc., from 2008 to 2010. Self- Employed Legal and Financial Services Consultant since 2003. Counsel (in- house) for State Street Bank from 1995 to 2003.
| Current Directorships: Trustee of The Advisors’ Inner Circle Fund II, Bishop Street Funds, and Catholic Responsible Investments Funds. Director of RQSI GAA Systematic Global Macro Fund, Ltd.
Former Directorships: Trustee of The KP Funds to 2021. | |||
| Robert Mulhall (Born: 1958) | Trustee (since 2019) | Partner, Ernst & Young LLP, from 1998 to 2018. | Current Directorships: Trustee of The Advisors’ Inner Circle Fund II, Bishop Street Funds, Frost Family of Funds and Catholic Responsible Investments Funds. Director of RQSI GAA Systematic Global Macro Fund, Ltd.
Former Directorships: Trustee of The KP Funds to 2021. Trustee of Villanova University Alumni Board of Directors to 2018. | |||
| Bruce R. Speca (Born: 1956) | Trustee (since 2011) | Global Head of Asset Allocation, Manulife Asset Management (subsidiary of Manulife Financial), 2010 to 2011. Executive Vice President – Investment Management Services, John Hancock Financial Services (subsidiary of Manulife Financial), 2003 to 2010.
| Current Directorships: Trustee of The Advisors’ Inner Circle Fund II, Bishop Street Funds, Frost Family of Funds and Catholic Responsible Investments Funds. Director of Stone Harbor Investments Funds (8 Portfolios), Stone Harbor Emerging Markets Income Fund (closed-end fund) and Stone Harbor Emerging Markets Total Income Fund (closed-end fund). Director of RQSI GAA Systematic Global Macro Fund, Ltd.
Former Directorships: Trustee of The KP Funds to 2021. | |||
| 1 | Each Trustee shall hold office during the lifetime of this Trust until the election and qualification of his or her successor, or until he or she sooner dies, resigns, or is removed in accordance with the Trust’s Declaration of Trust. |
| 2 | Directorships of Companies required to report to the Securities and Exchange Commission under the Securities Exchange Act of 1934 (i.e., “public companies”) or other investment companies under the 1940 Act. |
| 3 | Trustees oversee 28 funds in The Advisors’ Inner Circle Fund. |
23
Trustees And Officers Of The Advisors’ Inner Circle Fund (Unaudited)
| Name and Year of Birth | Position with Trust and Length of Time Served | Principal Occupation in the Past Five Years | Other Directorships Held in the Past Five Years | |||
OFFICERS | ||||||
| Michael Beattie (Born: 1965) | President (since 2011) | Director of Client Service, SEI Investments, since 2004. | None. | |||
| James Bernstein (Born: 1962) | Vice President and Assistant Secretary (since 2017) | Attorney, SEI Investments, since 2017.
Prior Positions: Self-employed consultant, 2017. Associate General Counsel & Vice President, Nationwide Funds Group and Nationwide Mutual Insurance Company, from 2002 to 2016. Assistant General Counsel & Vice President, Market Street Funds and Provident Mutual Insurance Company, from 1999 to 2002.
| None. | |||
John Bourgeois (Born: 1973) | Assistant Treasurer (since 2017) | Fund Accounting Manager, SEI Investments, since 2000. | None. | |||
| Russell Emery (Born: 1962) | Chief Compliance Officer (since 2006) | Chief Compliance Officer of SEI Structured Credit Fund, LP since 2007. Chief Compliance Officer of The Advisors’ Inner Circle Fund II, Bishop Street Funds, Frost Family of Funds, Catholic Responsible Investments Funds, The Advisors’ Inner Circle Fund III, Gallery Trust, Schroder Series Trust, Schroder Global Series Trust, Delaware Wilshire Private Markets Master Fund, Delaware Wilshire Private Markets Fund, Delaware Wilshire Private Markets Tender Fund, SEI Institutional Managed Trust, SEI Asset Allocation Trust, SEI Institutional International Trust, SEI Institutional Investments Trust, SEI Daily Income Trust, SEI Tax Exempt Trust, Adviser Managed Trust, New Covenant Funds, SEI Insurance Products Trust and SEI Catholic Values Trust. Chief Compliance Officer of O’Connor EQUUS (closed- end investment company) to 2016. Chief Compliance Officer of SEI Liquid Asset Trust to 2016. Chief Compliance Officer of Winton Series Trust to 2017. Chief Compliance Officer of Winton Diversified Opportunities Fund (closed- end investment company) to 2018. Chief Compliance Officer of The KP Funds to 2021. | None. | |||
24
Trustees And Officers Of The Advisors’ Inner Circle Fund (Unaudited)
Name and Year of Birth | Position with and Length of | Principal Occupation in the Past Five Years | Other Directorships Held in the Past Five Years | |||
OFFICERS (continued) | ||||||
Eric C. Griffith (Born: 1969) | Vice President and Assistant Secretary (since 2019) | Counsel at SEI Investments since 2019. Vice President and Assistant General Counsel, JPMorgan Chase & Co., from 2012 to 2018. | None. | |||
| Matthew M. Maher (Born: 1975) | Vice President (since 2018)
Secretary (since 2020) | Counsel at SEI Investments since 2018. Attorney, Blank Rome LLP, from 2015 to 2018. Assistant Counsel & Vice President, Bank of New York Mellon, from 2013 to 2014. Attorney, Dilworth Paxson LLP, from 2006 to 2013.
| None. | |||
| Andrew Metzger (Born: 1980) | Treasurer, Controller and Chief Financial Officer (since 2021) | Director of Fund Accounting, SEI Investments, since 2020. Senior Director, Embark, from 2019 to 2020. Senior Manager, PricewaterhouseCoopers LLP, from 2002 to 2019.
| None. | |||
Robert Morrow (Born: 1968) | Vice President (since 2017) | Account Manager, SEI Investments, since 2007.
| None. | |||
| Alexander F. Smith (Born: 1977) | Vice President and Assistant Secretary (since 2020) | Counsel at SEI Investments since 2020. Associate Counsel & Manager, Vanguard, 2012 to 2020. Attorney, Stradley Ronon Stevens & Young, LLP, 2008 to 2012.
| None. | |||
| Bridget E. Sudall (Born: 1980) | Anti-Money Laundering Compliance Officer and Privacy Officer (since 2015) | Senior Associate and AML Officer, Morgan Stanley Alternative Investment Partners, from 2011 to 2015. Investor Services Team Lead, Morgan Stanley Alternative Investment Partners, from 2007 to 2011.
| None. | |||
25
NOTICE TO SHAREHOLDERS
OF
LSV EMERGING MARKETS EQUITY FUND
(Unaudited)
For shareholders that do not have an October 31, 2022 tax year end, this notice is for informational purposes only. For shareholders with an October 31, 2022 tax year end, please consult your tax advisor as to the pertinence of this notice. For the fiscal year ended October 31, 2022, the Fund is designating the following items with regard to distributions paid during the year.
Long-Term Capital Gain Distribution | Ordinary Income Distributions | Total Distributions | Qualifying for Corporate Dividends Receivable Deductions (1) | Qualifying Dividend Income (2) | U.S. Government Interest (3) | Interest Related Dividends(4) | Short-Term Capital Gain Dividends(5) | Qualifying Dividend Income(6) | Foreign Tax Credit | |||||||||
| 42.54% | 57.46% | 100.00% | 0.00% | 58.11% | 0.00% | 0.00% | 100.00% | 0.00% | 9.21% |
| (1) | Qualifying dividends represent dividends which qualify for the corporate dividends received deduction and is reflected as a percentage of ordinary income distributions (the total of short-term capital gain and net investment income distributions). |
| (2) | The percentage in this column represents the amount of “Qualifying Dividend Income” as created by the Jobs and Growth Tax Relief Reconciliation Act of 2003 and is reflected as a percentage of ordinary income distributions (the total of short-term capital gain and net investment income distributions). It is the intention of the aforementioned Fund to designate the maximum amount permitted by the law. |
| (3) | “U.S. Government Interest” represents the amount of interest that was derived from direct U.S. Government obligations and distributed during the fiscal year. This amount is reflected as a percentage of ordinary income distributions. Generally, interest from direct U.S. Government obligations is exempt from state income tax. However, for shareholders of the Advisors’ Inner Circle Fund-LSV Value Equity Fund who are residents of California, Connecticut and New York, the statutory threshold requirements were not satisfied to permit exemption of these amounts from state income. |
| (4) | The percentage in this column represents the amount of “Interest Related Dividend” is reflected as a percentage of ordinary income distribution. Interest related dividends is exempted from U.S. withholding tax when paid to foreign investors. |
| (5) | The percentage in this column represents the amount of “Short-Term Capital Gain Dividends” is reflected as a percentage of short-term capital gain distribution that is exempted from U.S. withholding tax when paid to foreign investors. |
| (6) | The percentage of this column represents that amount of ordinary dividend income that qualified for 20% Business Income Deduction. |
The Fund intends to pass through a foreign tax credit to shareholders. For the fiscal year ended 2022 the total amount of foreign source income is $808,326. The total Amount of Foreign tax paid is $136,978. Your allocable share of the foreign tax credit will be reported on Form 1099 DIV. |
The information reported herein may differ from the information and distributions taxable to the shareholders for the calendar year ending December 31, 2022. Complete information will be computed and reported in conjunction with your 2022 Form 1099-DIV. |
26
Notes
Notes
Notes
Trust: The Advisors’ Inner Circle Fund
Fund: LSV Emerging Markets Equity Fund
Adviser: LSV Asset Management
Distributor: SEI Investments Distribution Co.
Administrator: SEI Investments Global Fund Services
Legal Counsel: Morgan, Lewis & Bockius LLP
The Fund files their complete schedule of investments with the Securities and Exchange Commission (“SEC”) for the first and third quarters of each fiscal year as an exhibit to its report on Form N-PORT (Form N-Q for filings prior to March 31, 2020). The Funds’ Forms N-Q and N-PORT are available on the SEC’s website at http://www.sec.gov, and may be reviewed and copied at the SEC’s Public Reference Room in Washington, DC. Information on the operation of the Public Reference Room may be obtained by calling 1-800-SEC-0330.
A description of the policies and procedures that the Fund uses to determine how to vote proxies relating to Fund securities, as well as information relating to how a Fund voted proxies relating to fund securities during the most recent 12-month period ended June 30, is available (i) without charge, upon request, by calling 1-888-386-3578; and (ii) on the SEC’s website at http://www.sec.gov.
LSV-AR-011-0400
| ||||||||||
| Item 2. | Code of Ethics. |
The Registrant (also referred to as the “Trust”) has adopted a code of ethics that applies to the Registrant’s principal executive officer, principal financial officer, controller or principal accounting officer, and any person who performs a similar function. There have been no amendments to or waivers granted to this code of ethics during the period covered by this report.
| Item 3. | Audit Committee Financial Expert. |
(a)(1) The Registrant’s board of trustees has determined that the Registrant has at least one audit committee financial expert serving on the audit committee.
(a)(2) The audit committee financial expert is Robert Mulhall. Mr. Mulhall is considered to be “independent,” as that term is defined in Form N-CSR Item 3(a)(2).
| Item 4. | Principal Accountant Fees and Services. |
Fees billed by PricewaterhouseCoopers LLP (“PwC”) relate to The Advisors’ Inner Circle Fund (the “Trust”).
PwC billed the Trust aggregate fees for services rendered to the Trust for the last two fiscal years as follows:
| 2022 | 2021 | |||||||||||||||||||||||||
| All fees and services to the Trust that were pre-approved | All fees and services to service affiliates that were pre-approved | All other fees and services to service affiliates that did not require pre-approval | All fees and services to the Trust that were pre-approved | All fees and services to service affiliates that were pre-approved | All other fees and services to service affiliates that did not require pre-approval | |||||||||||||||||||||
| (a) | Audit Fees(1) | $ | 72,710 | None | None | $ | 104,400 | None | None | |||||||||||||||||
| (b) | Audit-Related Fees | None | None | None | None | None | None | |||||||||||||||||||
| (c) | Tax Fees | $ | 10,000 | (2) | None | $ | 256,295 | (4) | $ | 10,000 | (2) | None | $ | 150,670 | (4) | |||||||||||
| (d) | All Other Fees | None | None | $ | 86,500 | (5) | None | None | $ | 385,179 | (5) | |||||||||||||||
Fees billed by Ernst & Young LLP (“E&Y”) related to the Trust
E&Y billed the Trust aggregate fees for services rendered to the Trust for the last two fiscal years as follows:
| 2022 | 2021 | |||||||||||||||||||||||||
| All fees and services to the Trust that were pre-approved | All fees and services to service affiliates that were pre-approved | All other fees and services to service affiliates that did not require pre-approval | All fees and services to the Trust that were pre-approved | All fees and services to service affiliates that were pre-approved | All other fees and services to service affiliates that did not require pre-approval | |||||||||||||||||||||
| (a) | Audit Fees(1) | $ | 529,590 | None | None | $ | 719,590 | None | None | |||||||||||||||||
| (b) | Audit-Related Fees | $ | 10,000 | (6) | None | None | None | None | None | |||||||||||||||||
| (c) | Tax Fees | $ | 2,000 | (3) | None | None | None | None | None | |||||||||||||||||
| (d) | All Other Fees | None | None | None | None | None | None | |||||||||||||||||||
Fees billed by BBD, LLP (“BBD”) related to the Trust
BBD billed the Trust aggregate fees for services rendered to the Trust for the last two fiscal years as follows:
| 2022 | 2021 | |||||||||||||||||||||||||
| All fees and services to the Trust that were pre-approved | All fees and services to service affiliates that were pre-approved | All other fees and services to service affiliates that did not require pre-approval | All fees and services to the Trust that were pre-approved | All fees and services to service affiliates that were pre-approved | All other fees and services to service affiliates that did not require pre-approval | |||||||||||||||||||||
| (a) | Audit Fees(1) | $ | 61,000 | None | None | $ | 77,300 | None | None | |||||||||||||||||
| (b) | Audit-Related Fees | None | None | None | None | None | None | |||||||||||||||||||
| (c) | Tax Fees | None | None | None | None | None | None | |||||||||||||||||||
| (d) | All Other Fees | None | None | None | None | None | None | |||||||||||||||||||
Notes:
| (1) | Audit fees include amounts related to the audit of the Trust’s annual financial statements and services normally provided by the accountant in connection with statutory and regulatory filings. |
| (2) | Final tax compliance services provided to McKee International Equity Portfolio. |
| (3) | Common Reporting Standard (“CRS”) tax services for the Sands Capital Global Growth Fund. |
| (4) | Tax compliance services provided to service affiliates of the funds. |
| (5) | Non-audit assurance engagements for service affiliates of the funds. |
| (6) | Fees related to consents for Cambiar N-14 filings. |
(e)(1) The Trust’s Audit Committee has adopted and the Board of Trustees has ratified an Audit and Non-Audit Services Pre-Approval Policy (the “Policy”), which sets forth the procedures and the conditions pursuant to which services proposed to be performed by the independent auditor of the Funds may be pre-approved.
The Policy provides that all requests or applications for proposed services to be provided by the independent auditor must be submitted to the Registrant’s Chief Financial Officer (“CFO”) and must include a detailed description of the services proposed to be rendered. The CFO will determine whether such services:
| 1. | require specific pre-approval; |
| 2. | are included within the list of services that have received the general pre-approval of the Audit Committee pursuant to the Policy; or |
| 3. | have been previously pre-approved in connection with the independent auditor’s annual engagement letter for the applicable year or otherwise. In any instance where services require pre-approval, the Audit Committee will consider whether such services are consistent with SEC’s rules and whether the provision of such services would impair the auditor’s independence. |
Requests or applications to provide services that require specific pre-approval by the Audit Committee will be submitted to the Audit Committee by the CFO. The Audit Committee will be informed by the CFO on a quarterly basis of all services rendered by the independent auditor. The Audit Committee has delegated specific pre-approval authority to either the Audit Committee Chair or financial expert, provided that the estimated fee for any such proposed pre-approved service does not exceed $100,000 and any pre-approval decisions are reported to the Audit Committee at its next regularly-scheduled meeting.
Services that have received the general pre-approval of the Audit Committee are identified and described in the Policy. In addition, the Policy sets forth a maximum fee per engagement with respect to each identified service that has received general pre-approval.
All services to be provided by the independent auditor shall be provided pursuant to a signed written engagement letter with the Registrant, the investment adviser, or applicable control affiliate (except that matters as to which an engagement letter would be impractical because of timing issues or because the matter is small may not be the subject of an engagement letter) that sets forth both the services to be provided by the independent auditor and the total fees to be paid to the independent auditor for those services.
In addition, the Audit Committee has determined to take additional measures on an annual basis to meet the Audit Committee’s responsibility to oversee the work of the independent auditor and to assure the auditor’s independence from the Registrant, such as (a) reviewing a formal written statement from the independent auditor delineating all relationships between the independent auditor and the Registrant, and (b) discussing with the independent auditor the independent auditor’s methods and procedures for ensuring independence.
(e)(2) Percentage of fees billed applicable to non-audit services pursuant to waiver of pre-approval requirement were as follows (PwC):
| 2022 | 2021 | |||||||
Audit-Related Fees | None | None | ||||||
Tax Fees | None | None | ||||||
All Other Fees | None | None | ||||||
(e)(2) Percentage of fees billed applicable to non-audit services pursuant to waiver of pre-approval requirement were as follows (E&Y):
| 2022 | 2021 | |||||||
Audit-Related Fees | None | None | ||||||
Tax Fees | None | None | ||||||
All Other Fees | None | None | ||||||
(e)(2) Percentage of fees billed applicable to non-audit services pursuant to waiver of pre-approval requirement were as follows (BBD):
| 2022 | 2021 | |||||||
Audit-Related Fees | None | None | ||||||
Tax Fees | None | None | ||||||
All Other Fees | None | None | ||||||
(f) Not applicable.
(g) The aggregate non-audit fees and services billed by PwC for services rendered to the Registrant, and rendered to the Registrant’s investment adviser (not including any sub-adviser whose role is primarily portfolio management and is subcontracted with or overseen by another investment adviser), and any entity controlling, controlled by, or under common control with the adviser that provides ongoing services to the Registrant for the last two fiscal-years-ended October 31st were $342,795 and $535,849 for 2022 and 2021, respectively.
(g) The aggregate non-audit fees and services billed by E&Y for services rendered to the Registrant, and rendered to the Registrant’s investment adviser (not including any sub-adviser whose role is primarily portfolio management and is subcontracted with or overseen by another investment adviser), and any entity controlling, controlled by, or under common control with the
adviser that provides ongoing services to the Registrant for the last two fiscal-years-ended October 31st were $2,000 and $0 for 2022 and 2021, respectively.
(g) The aggregate non-audit fees and services billed by BBD for services rendered to the Registrant, and rendered to the Registrant’s investment adviser (not including any sub-adviser whose role is primarily portfolio management and is subcontracted with or overseen by another investment adviser), and any entity controlling, controlled by, or under common control with the adviser that provides ongoing services to the Registrant for the last two fiscal-years-ended October 31st were $0 and $0 for 2022 and 2021, respectively.
(h) During the past fiscal year, all non-audit services provided by the Registrant’s principal accountant to either the Registrant’s investment adviser or to any entity controlling, controlled by, or under common control with the Registrant’s investment adviser that provides ongoing services to the Registrant were pre-approved by the Audit Committee of Registrant’s Board of Trustees. Included in the Audit Committee’s pre-approval of these non-audit service were the review and consideration as to whether the provision of these non-audit services is compatible with maintaining the principal accountant’s independence.
(i) Not applicable. The Registrant has not retained, for the preparation of the audit report on the financial statements included in the Form N-CSR, a registered public accounting firm that has a branch or office that is located in a foreign jurisdiction and that the Public Company Accounting Oversight Board (the “PCAOB”) has determined that the PCAOB is unable to inspect or investigate completely because of a position taken by an authority in the foreign jurisdiction.
(j) Not applicable. The Registrant is not a “foreign issuer,” as defined in 17 CFR 240.3b-4.
| Item 5. | Audit Committee of Listed Registrants. |
Not applicable to open-end management investment companies.
| Item 6. | Schedule of Investments. |
Schedule of Investments is included as part of the Report to Shareholders filed under Item 1 of this form.
| Item 7. | Disclosure of Proxy Voting Policies and Procedures for Closed-End Management Investment Companies. |
Not applicable to open-end management investment companies.
| Item 8. | Portfolio Managers of Closed-End Management Investment Companies |
Not applicable to open-end management investment companies.
| Item 9. | Purchases of Equity Securities by Closed-End Management Company and Affiliated Purchasers. |
Not applicable to open-end management investment companies.
| Item 10. | Submission of Matters to a Vote of Security Holders. |
There have been no changes to the procedures by which shareholders may recommend nominees to the Registrant’s Board of Trustees during the period covered by this report.
| Item 11. | Controls and Procedures. |
(a) The Registrant’s principal executive and principal financial officers, or persons performing similar functions, have concluded that the Registrant’s disclosure controls and procedures, as defined in Rule 30a-3(c) under the Act (17 CFR § 270.30a-3(c)), as of a date within 90 days of the filing date of the report, are effective based on the evaluation of these controls and procedures required by Rule 30a-3(b) under the Act (17 CFR § 270.30a-3(b)) and Rule 13a-15(b) or Rule 15d-15(b) under the Exchange Act, as amended (17 CFR § 240.13a-15(b) or § 240.15d-15(b)).
(b) There has been no change in the Registrant’s internal control over financial reporting (as defined in Rule 30a-3(d) under the Act (17 CFR § 270.3a-3(d)) that occurred during the period covered by this report that has materially affected, or is reasonably likely to materially affect, the Registrant’s internal control over financial reporting.
| Item 12. | Disclosure of Securities Lending Activities for Closed-End Management Investment Companies. |
Not applicable to open-end management investment companies.
| Item 13. | Exhibits. |
SIGNATURES
Pursuant to the requirements of the Securities Exchange Act of 1934 and the Investment Company Act of 1940, the Registrant has duly caused this report to be signed on its behalf by the undersigned, thereunto duly authorized.
| (Registrant) | The Advisors’ Inner Circle Fund | |||||
| By (Signature and Title) | /s/ Michael Beattie | |||||
Michael Beattie, President | ||||||
| Date: January 6, 2023 | ||||||
Pursuant to the requirements of the Securities Exchange Act of 1934 and the Investment Company Act of 1940, this report has been signed below by the following persons on behalf of the Registrant and in the capacities and on the dates indicated.
| By (Signature and Title) | /s/ Michael Beattie | |||||
Michael Beattie, President | ||||||
| Date: January 6, 2023 | ||||||
| By (Signature and Title) | /s/ Andrew Metzger | |||||
| Andrew Metzger, | ||||||
| Treasurer, Controller, and CFO | ||||||
| Date: January 6, 2023 | ||||||