UNITED STATES
SECURITIES AND EXCHANGE COMMISSION
Washington, D.C. 20549
FORM N-CSR
CERTIFIED SHAREHOLDER REPORT OF REGISTERED MANAGEMENT
INVESTMENT COMPANIES
Investment Company Act File Number 811-06400
The Advisors’ Inner Circle Fund
(Exact name of registrant as specified in charter)
SEI Investments
One Freedom Valley Drive
Oaks, PA 19456
(Address of principal executive offices) (Zip code)
SEI Investments
One Freedom Valley Drive
Oaks, PA 19456
(Name and address of agent for service)
Registrant’s telephone number, including area code: (877) 446-3863
Date of fiscal year end: October 31, 2023
Date of reporting period: October 31, 2023
| Item 1. | Reports to Stockholders. |
(a) A copy of the report transmitted to stockholders pursuant to Rule 30e-1 under the Investment Company Act of 1940, as amended (the “Act”) (17 CFR § 270.30e-1), is attached hereto.
The Advisors’ Inner Circle Fund

Acadian Emerging Markets Portfolio
| Annual Report | October 31, 2023 | |
| ||
| Investment Adviser: | ||
| Acadian Asset Management LLC | ||
| ||
| THE ADVISORS’ INNER CIRCLE FUND | ACADIAN EMERGING | |
| MARKETS PORTFOLIO | ||
| OCTOBER 31, 2023 |
| TABLE OF CONTENTS |
| |||
| 1 | ||||
| 5 | ||||
| 24 | ||||
| 25 | ||||
| 26 | ||||
| 27 | ||||
| 30 | ||||
| 43 | ||||
| 45 | ||||
| 46 | ||||
| 48 | ||||
| 56 | ||||
| 59 | ||||
| 60 | ||||
The Portfolio files its complete schedule of investments with the Securities and Exchange Commission (“SEC”) for the first and third quarters of each fiscal year as an exhibit to its report on Form N-PORT. The Portfolio’s N-PORT is available on the SEC’s website at https://www.sec.gov, and may be reviewed and copied at the SEC’s Public Reference Room in Washington, DC. Information on the operation of the Public Reference Room may be obtained by calling 1-800-SEC-0330.
A description of the policies and procedures that the Portfolio uses to determine how to vote proxies relating to portfolio securities, as well as information relating to how a portfolio voted proxies relating to portfolio securities during the most recent 12-month period ended June 30, is available (i) without charge, upon request, by calling 1-866-AAM-6161; and (ii) on the SEC’s website at https://www.sec.gov.
| THE ADVISORS’ INNER CIRCLE FUND | ACADIAN EMERGING MARKETS PORTFOLIO OCTOBER 31, 2023 (Unaudited) |
We are pleased to present the annual report for the Acadian Emerging Markets Portfolio (the “Portfolio”). This commentary covers the twelve months from November 1, 2022 to October 31, 2023, focusing on the portfolio’s performance and some of the conditions and decisions that impacted returns.
Portfolio Performance Review
For the twelve months ended October 31, 2023, the Acadian Emerging Markets Portfolio Investor Class returned 24.6% (on a NAV basis), versus 11.3% for the MSCI Emerging Markets Index, a widely followed emerging markets benchmark.
Market Review
High inflation remained a focal point during the period. Geopolitical tensions persisted, with no end in sight to the Russia-Ukraine war and an escalating war of words between the United States, China, and Russia. The reopening of the Chinese economy boosted markets in the beginning of the period, but performance stalled when cracks in their economy developed amid a struggling real estate market and government interventions. Despite China’s macroeconomic weaknesses, investors observed that several emerging market economies performed better than anticipated, and the decline in inflation has placed emerging market central banks in a relatively advantageous position compared to their counterparts in developed markets. Eastern Europe, in particular Greece, Poland, and Hungary, performed particularly well.
For the full period, the MSCI Emerging Markets Index collectively returned 11.3%. Poland, Hungary, and Egypt were the best performing markets, while Qatar, UAE, and Saudi Arabia were the worst. All sectors performed well during this period apart from Utilities and Materials down only slightly over the period. IT, Communication Services and Consumer Discretionary were the top sector performers.
Portfolio Structure
The portfolio was invested in a broad range of emerging companies and markets over the period. The investment process considered both bottom-up company attractiveness and top-down country and industry ratings, combined with benchmark-relative risk controls, to determine individual stock positions. Significant country overweight positions during the period were China, Saudi Arabia, and Hungary. The portfolio was generally underweighted relative to the benchmark in India, Mexico, and Malaysia. At the sector level, the portfolio was focused on Energy, Communication Services, and Information Technology, while Financials, Consumer Discretionary, and Health Care were the greatest underweights.
1
| THE ADVISORS’ INNER CIRCLE FUND | ACADIAN EMERGING MARKETS PORTFOLIO OCTOBER 31, 2023 (Unaudited) |
Portfolio Performance
The portfolio outperformed the benchmark for the period by 13.8%, largely driven by stock selection in both countries and sectors.
Stock selection in both Taiwan IT and Chinese Energy stocks, respectively led by positions in Wistron Corp and PetroChina Co LTD. An overweight position to Saudi Arabian IT sector also yielded strong results, namely due to a position in Elm Co.
Conversely, an overweight to Saudi Arabian Utilities and Indonesian Energy detracted most from relative return, due in part to over exposure to Saudi Electric Co and Adaro Energy, both of which underperformed during the period.
The portfolio’s exposure to Value and Technical signals were rewarded the most over the period, followed less so by our Growth and Quality signals. Our Top-Down model was a minor detractor.
We continue to view the asset class positively and believe it forms an essential part of global portfolio diversification. Please let us know if we can provide any additional information.
Sincerely,
Brendan O. Bradley, Ph.D. | Ryan D. Taliaferro, Ph.D. | |
| Chief Investment Officer | Director, Equity Strategies |
Index Source: MSCI. Copyright MSCI 2023. All Rights Reserved. Without prior written permission of MSCI this information and any other MSCI intellectual property may only be used for your internal use, may not be reproduced or re-disseminated in any form and may not be used to create financial instruments or products or any indices. This information is provided on an “as is” basis, and the user of this information assumes the entire risk of any use of this information. Neither MSCI nor any third party involved in or related to the computing or compiling of the data makes any express or implied warranties, representations or guarantees concerning the MSCI index-related data, and in no event shall MSCI or any third party have any liability for any direct, indirect, special, punitive, consequential or any other damages (including lost profits) relating to any use of this information
The specific countries, sectors, and individual stocks discussed herein are non-exclusive and are provided as representative of the portfolio’s performance during the period. For a complete list of markets, sectors, and stocks in which the portfolio was invested during the period and the performance of each, please contact Acadian. Please note that Acadian’s system of portfolio attribution uses certain estimates and assumptions and the calculations provided herein are based upon Acadian’s internal records and not those maintained by the Custodian. Additional details about our method of calculation will be furnished upon request. Reference to the benchmark is for comparative purposes only and is not intended to indicate that the portfolio will or did contain the same investments as the benchmark. This review contains
2
| THE ADVISORS’ INNER CIRCLE FUND | ACADIAN EMERGING MARKETS PORTFOLIO OCTOBER 31, 2023 (Unaudited) |
confidential information of Acadian Asset Management LLC. Market conditions are subject to change. Past performance is no guarantee of future returns.
The information provided has been prepared by Acadian from our internal records. It is not intended to replace the official records of your account that you receive directly from the custodian. You are encouraged to compare the information provided to you by Acadian to that provided by the custodian and to contact us with any questions.
Performance data quoted represents past performance. Past performance does not guarantee future results. The investment return and principal value of an investment will fluctuate so that an investor’s shares, when redeemed, may be worth more or less than their original cost and current performance may be lower or higher than the performance quoted. Total expense ratio for the fund is 1.46%. Shareholders may pay a redemption fee of 2% when they redeem shares held for less than 30 days. For performance data current to the most recent month end, please call 1-866-AAM-6161. The fund’s benchmark was changed March 1, 2012 to the MSCI Emerging Markets Index. Prior to that, the benchmark had been the IFC Investable Index.
Past performance is no guarantee of future performance and may differ significantly from future performance due to market volatility.
The MSCI Emerging Markets Index is a free float-adjusted market capitalization index that is designed to measure equity market performance of emerging markets.
Mutual fund investing involves risk including loss of principal. In addition to the normal risks associated with investing, international investments may involve risk of capital loss from unfavorable fluctuation in currency values, from differences in generally accepted accounting principles or from economic or political instability in other nations. Emerging markets involve heightened risks related to the same factors, in addition to those associated with their relatively small size and lesser liquidity. The fund is diversified.
To determine if this fund is an appropriate investment for you, carefully consider the fund’s objectives, risk factors, charges, and expenses before investing. This and other information can be found in the fund’s full and summary prospectuses, which can be obtained by calling 1-866-AAM-6161. Please read the prospectus carefully before investing.
The Acadian Emerging Markets Portfolio is distributed by SEI Investments Distribution Co, which is not affiliated with Acadian Asset Management LLC.
Registered representatives associated with Funds Distributor, LLC (“FD”), member FINRA. FD is not affiliated with Acadian Asset Management LLC.
3
| THE ADVISORS’ INNER CIRCLE FUND | ACADIAN EMERGING MARKETS PORTFOLIO OCTOBER 31, 2023 (Unaudited) |
Growth of a $10,000 Investment
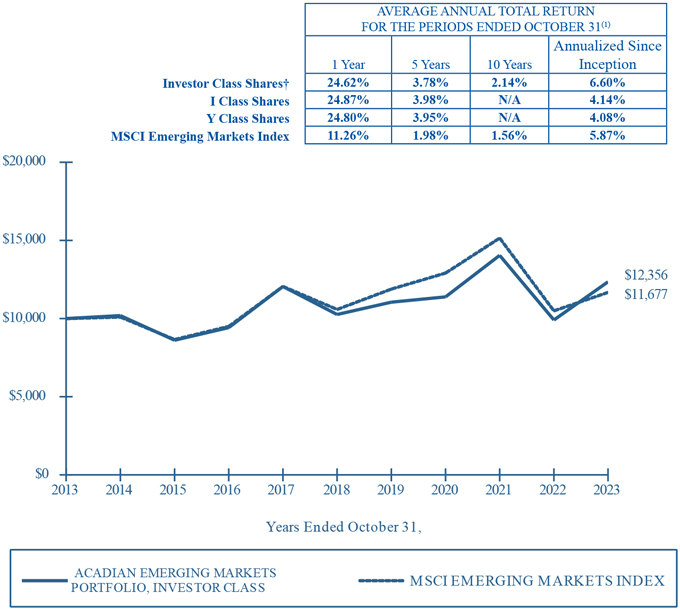
(1) Past performance is not an indication of future performance. Investor Class Shares were offered beginning 6/17/93. I Class Shares and Y Class Shares were offered beginning 10/31/16. Returns shown do not reflect the deduction of taxes that a shareholder would pay on portfolio distributions or the redemption of portfolio shares. The returns for certain periods reflect fee waivers and/or reimbursements in effect for that period; absent fee waivers and/or reimbursements, performance would have been lower.
† The graph is based on Investor Class Shares only. Returns for I Class Shares and Y Class Shares would be different due to differences in fee structures.
N/A — Not available.
(See definition of comparative index on page 3.)
4
| THE ADVISORS’ INNER CIRCLE FUND | ACADIAN EMERGING MARKETS PORTFOLIO OCTOBER 31, 2023
|
SECTOR WEIGHTINGS (Unaudited)† |
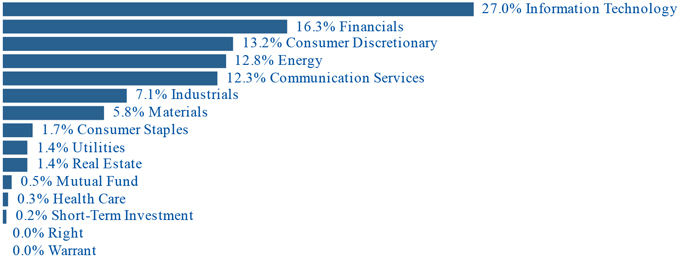
† Percentages based on total investments.
SCHEDULE OF INVESTMENTS |
| |||||||
COMMON STOCK — 95.2% |
| |||||||
| Shares | Value | |||||||
Brazil — 0.3% | ||||||||
Caixa Seguridade Participacoes S | 113,000 | $ | 242,731 | |||||
CSN Mineracao | 902,700 | 923,872 | ||||||
Fras-Le * | 46,100 | 136,332 | ||||||
Mahle Metal Leve | 16,800 | 121,124 | ||||||
Nova Embrapar Participacoes * (A) | 854 | — | ||||||
Seara Alimentos * (A) | 911 | — | ||||||
SYN prop e tech * | 35,300 | 26,256 | ||||||
Ultrapar Participacoes | 36,800 | 148,828 | ||||||
|
|
| ||||||
| 1,599,143 | ||||||||
|
|
| ||||||
China — 23.2% | ||||||||
37 Interactive Entertainment Network Technology Group, Cl A | 1,296,200 | 3,666,390 | ||||||
Agricultural Bank of China, Cl H | 9,307,000 | 3,437,602 | ||||||
Anhui Hengyuan Coal Industry and Electricity Power, Cl A | 828,200 | 1,061,014 | ||||||
Autohome ADR | 101,724 | 2,721,117 | ||||||
Avary Holding Shenzhen, Cl A | 266,100 | 779,751 | ||||||
Bank of China, Cl H | 7,440,926 | 2,599,379 | ||||||
Bank of Communications, Cl H | 859,236 | 508,243 | ||||||
Baoxiniao Holding, Cl A * | 1,138,366 | 950,398 | ||||||
Beijing Caishikou Department Store, Cl A | 96,300 | 182,322 | ||||||
Beijing Seeyon Internet Software, Cl A | 16,637 | 84,260 | ||||||
BYD Electronic International | 230,500 | 962,226 | ||||||
Changjiang Publishing & Media, Cl A | 639,958 | 663,237 | ||||||
Cheetah Mobile ADR * | 3,235 | 5,499 | ||||||
The accompanying notes are an integral part of the financial statements.
5
| THE ADVISORS’ INNER CIRCLE FUND | ACADIAN EMERGING MARKETS PORTFOLIO OCTOBER 31, 2023
|
COMMON STOCK — continued | ||||||||
| Shares | Value | |||||||
China — (continued) | ||||||||
Cheng De Lolo, Cl A | 191,200 | $ | 220,384 | |||||
Chengdu Hongqi Chain, Cl A | 82,300 | 58,046 | ||||||
China Citic Bank, Cl H | 830,342 | 370,422 | ||||||
China Construction Bank, Cl H | 26,603,715 | 15,045,945 | ||||||
China Petroleum & Chemical, Cl H | 1,290,000 | 659,755 | ||||||
Chinese Universe Publishing and Media Group, Cl A | 2,334,199 | 3,692,755 | ||||||
Chongqing Rural Commercial Bank, Cl H | 198,622 | 75,195 | ||||||
Edan Instruments, Cl A | 163,400 | 239,053 | ||||||
Era, Cl A | 764,400 | 554,751 | ||||||
Focus Technology, Cl A | 229,700 | 856,831 | ||||||
G-bits Network Technology Xiamen, Cl A | 69,789 | 2,536,707 | ||||||
Giant Network Group, Cl A | 198,400 | 320,341 | ||||||
Guangdong Homa Group, Cl A * | 281,600 | 275,533 | ||||||
Hangzhou Binjiang Real Estate Group, Cl A | 302,100 | 345,760 | ||||||
Hangzhou Robam Appliances, Cl A | 86,600 | 273,211 | ||||||
Harbin Power Equipment, Cl H | 35,135 | 10,106 | ||||||
Hello Group ADR * | 93,940 | 665,095 | ||||||
Hisense Visual Technology, Cl A | 241,700 | 769,178 | ||||||
Hitevision, Cl A | 181,050 | 622,554 | ||||||
HLA Group, Cl A | 302,000 | 307,122 | ||||||
Industrial & Commercial Bank of China, Cl H | 6,415,000 | 3,074,355 | ||||||
Inner Mongolia Xinhua Distribution Group, Cl A | 69,000 | 112,887 | ||||||
Jiangsu Rainbow Heavy Industries, Cl A | 232,800 | 168,822 | ||||||
Jointown Pharmaceutical Group, Cl A | 104,818 | 102,000 | ||||||
JOYY ADR | 32,859 | 1,278,872 | ||||||
Kanzhun ADR * | 20,617 | 305,132 | ||||||
Kingnet Network, Cl A | 1,776,600 | 2,597,617 | ||||||
Kunlun Energy | 4,810,000 | 4,007,230 | ||||||
Loncin Motor, Cl A | 1,012,750 | 768,572 | ||||||
Lonking Holdings | 53,354 | 8,242 | ||||||
Metallurgical Corp of China, Cl H | 2,345,849 | 465,173 | ||||||
MINISO Group Holding ADR | 36,396 | 921,183 | ||||||
MLS, Cl A | 253,500 | 321,584 | ||||||
New China Life Insurance, Cl H | 641,200 | 1,406,575 | ||||||
Opple Lighting, Cl A | 298,600 | 796,841 | ||||||
PDD Holdings ADR * | 51,999 | 5,273,739 | ||||||
Perfect World, Cl A | 1,636,582 | 2,686,158 | ||||||
PetroChina, Cl H | 16,274,000 | 10,622,294 | ||||||
PICC Property & Casualty, Cl H | 648,000 | 739,987 | ||||||
Ping An Insurance Group of China, Cl H | 266,000 | 1,349,279 | ||||||
Qifu Technology ADR | 10,566 | 156,271 | ||||||
Qudian ADR * | 249,049 | 418,402 | ||||||
Rongan Property, Cl A | 867,900 | 329,735 | ||||||
The accompanying notes are an integral part of the financial statements.
6
| THE ADVISORS’ INNER CIRCLE FUND | ACADIAN EMERGING MARKETS PORTFOLIO OCTOBER 31, 2023
|
COMMON STOCK — continued | ||||||||
| Shares | Value | |||||||
China — (continued) | ||||||||
SAIC Motor, Cl A | 785,300 | $ | 1,559,171 | |||||
Shanghai Pudong Construction, Cl A | 1,658,580 | 1,472,210 | ||||||
Shenzhen Laibao Hi-tech, Cl A | 840,200 | 1,209,232 | ||||||
Shui On Land | 643,500 | 56,726 | ||||||
Sinotrans, Cl H | 497,000 | 163,345 | ||||||
Sinotruk Hong Kong | 2,792,148 | 5,259,020 | ||||||
Suzhou Gold Mantis Construction Decoration, Cl A | 901,346 | 510,046 | ||||||
TAL Education Group ADR * | 85,188 | 747,099 | ||||||
TCL Electronics Holdings * | 949,000 | 330,084 | ||||||
Tencent Holdings | 631,000 | 23,352,525 | ||||||
Tian Di Science & Technology, Cl A | 932,100 | 657,334 | ||||||
Tianneng Power International | 297,484 | 268,622 | ||||||
Time Publishing and Media, Cl A | 65,191 | 92,645 | ||||||
Triangle Tyre, Cl A | 206,800 | 421,946 | ||||||
Trip.com Group ADR * | 123,047 | 4,183,598 | ||||||
Universal Scientific Industrial Shanghai, Cl A | 461,000 | 915,624 | ||||||
Vatti, Cl A | 467,000 | 375,951 | ||||||
Vipshop Holdings ADR * | 305,745 | 4,359,924 | ||||||
Wasu Media Holding, Cl A | 25,200 | 25,015 | ||||||
Weaver Network Technology, Cl A | 25,500 | 174,063 | ||||||
Weibo ADR * | 37,785 | 446,996 | ||||||
Weichai Power, Cl H | 179,000 | 267,931 | ||||||
Weiqiao Textile, Cl H * | 545,295 | 111,494 | ||||||
Xiamen Comfort Science & Technology Group, Cl A | 337,300 | 339,110 | ||||||
Xiangpiaopiao Food, Cl A | 50,800 | 114,399 | ||||||
Xiangyu Medical, Cl A | 48,986 | 335,770 | ||||||
Yutong Bus, Cl A | 253,800 | 473,182 | ||||||
Zhejiang Publishing & Media, Cl A | 162,500 | 166,761 | ||||||
Zhejiang Semir Garment, Cl A | 4,687,896 | 3,911,087 | ||||||
|
|
| ||||||
| 135,732,042 | ||||||||
|
|
| ||||||
Colombia — 0.0% | ||||||||
Cementos Argos | 77,006 | 88,606 | ||||||
|
|
| ||||||
Egypt — 0.0% | ||||||||
Ezz Steel SAE * | 25,763 | 62,400 | ||||||
|
|
| ||||||
Greece — 0.2% | ||||||||
Aegean Airlines * | 3,894 | 42,603 | ||||||
Cairo Mezz * | 11,041 | 1,221 | ||||||
Fourlis Holdings | 25,163 | 107,964 | ||||||
National Bank of Greece * | 144,184 | 825,793 | ||||||
|
|
| ||||||
| 977,581 | ||||||||
|
|
| ||||||
The accompanying notes are an integral part of the financial statements.
7
| THE ADVISORS’ INNER CIRCLE FUND | ACADIAN EMERGING MARKETS PORTFOLIO OCTOBER 31, 2023
|
COMMON STOCK — continued | ||||||||
| Shares | Value | |||||||
Hong Kong — 9.9% | ||||||||
AAC Technologies Holdings | 72,000 | $ | 129,603 | |||||
Alibaba Group Holding * | 1,556,868 | 16,028,079 | ||||||
Asia Cement China Holdings | 1,079,140 | 334,521 | ||||||
Baidu, Cl A * | 272,300 | 3,574,975 | ||||||
Brilliance China Automotive Holdings * | 1,552,000 | 713,508 | ||||||
Cabbeen Fashion | 107,928 | 6,896 | ||||||
China BlueChemical | 994,491 | 232,730 | ||||||
China Coal Energy, Cl H | 2,310,645 | 1,814,935 | ||||||
China Foods | 421,556 | 145,983 | ||||||
China Harmony Auto Holding | 895,780 | 77,890 | ||||||
China High Speed Transmission Equipment Group * | 448,314 | 104,858 | ||||||
China International Marine Containers Group, Cl H | 202,346 | 106,706 | ||||||
China Minsheng Banking, Cl H | 1,628,500 | 541,412 | ||||||
China Oriental Group * | 442,545 | 68,023 | ||||||
China Pacific Insurance Group, Cl H | 2,355,631 | 5,802,791 | ||||||
China Taiping Insurance Holdings | 633,800 | 585,489 | ||||||
Chongqing Machinery & Electric, Cl H | 466,000 | 32,809 | ||||||
CITIC Resources Holdings | 690,000 | 28,677 | ||||||
Consun Pharmaceutical Group | 118,000 | 69,405 | ||||||
COSCO SHIPPING Ports | 107 | 65 | ||||||
CPMC Holdings | 208,609 | 160,025 | ||||||
Dawnrays Pharmaceutical Holdings | 79,485 | 11,303 | ||||||
Edvantage Group Holdings | 102,310 | 32,148 | ||||||
FriendTimes * | 592,219 | 99,141 | ||||||
Fufeng Group | 350,742 | 182,166 | ||||||
Goodbaby International Holdings * | 572,280 | 28,944 | ||||||
Grand Baoxin Auto Group * | 379,968 | 9,368 | ||||||
Hisense Home Appliances Group, Cl H | 71,000 | 195,433 | ||||||
Inkeverse Group * | 748,000 | 67,106 | ||||||
JD.com, Cl A | 178,250 | 2,266,121 | ||||||
JNBY Design | 471,314 | 574,155 | ||||||
Joy City Property | 780,000 | 24,623 | ||||||
Kingboard Holdings | 85,000 | 206,998 | ||||||
Kingsoft | 182,400 | 636,481 | ||||||
Kuaishou Technology, Cl B * | 308,200 | 1,984,761 | ||||||
Launch Tech, Cl H | 46,542 | 12,224 | ||||||
Lenovo Group | 6,244,000 | 7,266,344 | ||||||
Maoye International Holdings | 286,000 | 6,213 | ||||||
MOG Digitech Holdings * | 340,000 | 95,731 | ||||||
NetDragon Websoft Holdings | 247,000 | 438,874 | ||||||
NetEase | 261,500 | 5,596,506 | ||||||
New Oriental Education & Technology Group * | 199,700 | 1,302,051 | ||||||
Orient Overseas International | 12,500 | 157,622 | ||||||
The accompanying notes are an integral part of the financial statements.
8
| THE ADVISORS’ INNER CIRCLE FUND | ACADIAN EMERGING MARKETS PORTFOLIO OCTOBER 31, 2023
|
COMMON STOCK — continued | ||||||||
| Shares | Value | |||||||
Hong Kong — (continued) | ||||||||
Pou Sheng International Holdings | 1,878,142 | $ | 160,703 | |||||
Renrui Human Resources Technology Holdings * | 1,804 | 820 | ||||||
Sinopec Engineering Group, Cl H | 1,555,500 | 777,382 | ||||||
Skyworth Group | 5,139,486 | 1,857,131 | ||||||
Tongcheng Travel Holdings * | 99,200 | 189,517 | ||||||
Uni-President China Holdings | 123,000 | 83,713 | ||||||
Wasion Holdings | 188,000 | 69,517 | ||||||
XD * | 11,984 | 18,159 | ||||||
Xiaomi, Cl B * | 1,444,400 | 2,589,844 | ||||||
Zoomlion Heavy Industry Science and Technology | 100 | 52 | ||||||
ZTE, Cl H | 125,800 | 279,560 | ||||||
|
|
| ||||||
| 57,780,091 | ||||||||
|
|
| ||||||
Hungary — 2.0% | ||||||||
MOL Hungarian Oil & Gas | 344,269 | 2,740,426 | ||||||
OTP Bank Nyrt | 241,161 | 8,976,019 | ||||||
|
|
| ||||||
| 11,716,445 | ||||||||
|
|
| ||||||
India — 13.9% | ||||||||
Action Construction Equipment | 4,865 | 48,721 | ||||||
Andhra Paper | 5,846 | 38,591 | ||||||
Andhra Sugars | 40,305 | 51,413 | ||||||
Angel One | 15,461 | 479,853 | ||||||
Apar Industries | 34,366 | 2,138,423 | ||||||
Arvind | 222,899 | 524,299 | ||||||
AurionPro Solutions | 13,962 | 268,691 | ||||||
Bajaj Consumer Care | 13,858 | 38,667 | ||||||
Birlasoft | 35,233 | 231,956 | ||||||
Castrol India | 127,544 | 208,591 | ||||||
CE Info Systems | 3,157 | 79,027 | ||||||
CESC | 343,429 | 349,729 | ||||||
Chennai Petroleum | 105,361 | 728,539 | ||||||
Cigniti Technologies | 12,994 | 160,800 | ||||||
Coal India | 2,834,887 | 10,700,947 | ||||||
Cyient | 63,035 | 1,202,519 | ||||||
Datamatics Global Services | 22,513 | 182,981 | ||||||
DCM Shriram Industries | 36,391 | 54,818 | ||||||
Dhampur Sugar Mills | 21,205 | 67,555 | ||||||
Dhunseri Ventures | 11,142 | 37,707 | ||||||
Elecon Engineering | 96,672 | 980,683 | ||||||
Emami | 68,908 | 422,132 | ||||||
ESAB India | 690 | 47,991 | ||||||
Finolex Cables | 4,512 | 48,625 | ||||||
Force Motors | 1,976 | 81,449 | ||||||
The accompanying notes are an integral part of the financial statements.
9
| THE ADVISORS’ INNER CIRCLE FUND | ACADIAN EMERGING MARKETS PORTFOLIO OCTOBER 31, 2023
|
COMMON STOCK — continued | ||||||||
| Shares | Value | |||||||
India — (continued) | ||||||||
Foseco India | 724 | $ | 29,030 | |||||
GHCL | 47,629 | 332,708 | ||||||
GHCL Textiles * | 47,629 | 42,757 | ||||||
Gillette India | 317 | 23,320 | ||||||
Godawari Power and Ispat | 70,623 | 522,788 | ||||||
Godfrey Phillips India | 5,127 | 139,510 | ||||||
Gokaldas Exports | 9,415 | 94,445 | ||||||
Great Eastern Shipping | 30,644 | 292,400 | ||||||
Gujarat Industries Power | 46,596 | 86,779 | ||||||
Gujarat Narmada Valley Fertilizers & Chemicals | 40,046 | 332,712 | ||||||
Gujarat Pipavav Port | 28,643 | 41,913 | ||||||
Gujarat State Fertilizers & Chemicals | 30,351 | 72,998 | ||||||
HCL Technologies | 965,628 | 14,811,217 | ||||||
Hindustan Aeronautics | 244,067 | 5,341,346 | ||||||
Indiabulls Housing Finance | 237,041 | 461,296 | ||||||
Indian Oil | 1,593,973 | 1,717,088 | ||||||
Intellect Design Arena | 19,717 | 160,876 | ||||||
ISGEC Heavy Engineering | 5,417 | 43,843 | ||||||
ITC | 630,149 | 3,243,717 | ||||||
ITD Cementation India | 38,041 | 91,235 | ||||||
J Kumar Infraprojects | 56,858 | 275,012 | ||||||
Jagran Prakashan * | 140,311 | 168,137 | ||||||
Jindal Saw | 150,278 | 799,588 | ||||||
Kalyani Steels | 2,129 | 11,746 | ||||||
Karnataka Bank | 729,817 | 2,014,120 | ||||||
KDDL | 1,543 | 41,988 | ||||||
Kewal Kiran Clothing | 27,438 | 250,792 | ||||||
Kirloskar Brothers | 30,179 | 328,224 | ||||||
Kirloskar Industries | 1,818 | 67,470 | ||||||
Kokuyo Camlin | 7,933 | 13,820 | ||||||
Kolte-Patil Developers | 10,994 | 63,338 | ||||||
KPIT Technologies | 363,171 | 5,313,879 | ||||||
KSB | 13,074 | 480,438 | ||||||
LG Balakrishnan & Bros | 26,722 | 341,842 | ||||||
Mahanagar Gas | 22,868 | 283,544 | ||||||
Maharashtra Scooters | 798 | 72,174 | ||||||
Maharashtra Seamless | 59,388 | 511,867 | ||||||
MakeMyTrip * | 2,059 | 79,745 | ||||||
Man Infraconstruction | 56,947 | 102,546 | ||||||
Manappuram Finance | 164,062 | 270,987 | ||||||
Mangalore Chemicals & Fertilizers | 33,585 | 44,919 | ||||||
Mangalore Refinery & Petrochemicals * | 1,049,719 | 1,308,364 | ||||||
Mazagon Dock Shipbuilders | 54,712 | 1,293,195 | ||||||
The accompanying notes are an integral part of the financial statements.
10
| THE ADVISORS’ INNER CIRCLE FUND | ACADIAN EMERGING MARKETS PORTFOLIO OCTOBER 31, 2023
|
COMMON STOCK — continued | ||||||||
| Shares | Value | |||||||
India — (continued) | ||||||||
MOIL | 34,378 | $ | 95,793 | |||||
Mrs Bectors Food Specialities | 22,178 | 298,629 | ||||||
MSTC | 23,107 | 122,674 | ||||||
National Aluminium | 677,213 | 749,843 | ||||||
Nava | 279,542 | 1,386,662 | ||||||
NCC | 107,339 | 186,354 | ||||||
Neuland Laboratories | 1,448 | 67,316 | ||||||
NIIT | 30,311 | 46,545 | ||||||
NIIT Learning Systems | 59,181 | 277,109 | ||||||
NMDC | 15,794 | 29,271 | ||||||
NRB Bearings | 89,057 | 278,378 | ||||||
Nucleus Software Exports | 6,979 | 127,751 | ||||||
Oil & Natural Gas | 1,776,996 | 3,976,181 | ||||||
Oil India | 202,404 | 727,366 | ||||||
Oracle Financial Services Software | 21,547 | 1,004,045 | ||||||
Orient Cement | 162,820 | 386,938 | ||||||
Pennar Industries * | 81,342 | 99,242 | ||||||
Power Finance | 508,827 | 1,506,888 | ||||||
Prakash Industries * | 184,655 | 351,487 | ||||||
Prudent Corporate Advisory Services | 2,724 | 39,252 | ||||||
PTC India | 321,599 | 542,026 | ||||||
PTC India Financial Services | 137,078 | 47,035 | ||||||
Punjab National Bank | 468,422 | 410,863 | ||||||
Repco Home Finance | 25,178 | 124,530 | ||||||
Rural Electrification | 517,586 | 1,789,039 | ||||||
Savita Oil Technologies | 3,290 | 14,380 | ||||||
Seshasayee Paper & Boards | 25,001 | 104,196 | ||||||
Siyaram Silk Mills | 37,411 | 238,196 | ||||||
SKM EGG Products Export | 2,327 | 12,032 | ||||||
SMC Global Securities | 1,350 | 1,408 | ||||||
Sonata Software | 32,021 | 443,667 | ||||||
SP Apparels | 13,232 | 90,259 | ||||||
Star Cement * | 21,237 | 40,038 | ||||||
Stylam Industries | 1,460 | 29,312 | ||||||
Styrenix Performance Materials | 4,846 | 80,237 | ||||||
Sutlej Textiles and Industries | 30,377 | 19,264 | ||||||
Tamil Nadu Newsprint & Papers | 47,442 | 158,281 | ||||||
Tamilnadu Petroproducts | 92,741 | 101,861 | ||||||
Time Technoplast | 122,412 | 235,255 | ||||||
TransIndia Real Estate * | 17,795 | 8,368 | ||||||
Transport Corp of India | 16,142 | 158,807 | ||||||
Triveni Turbine * | 170,857 | 737,142 | ||||||
Ugar Sugar Works | 75,362 | 86,139 | ||||||
The accompanying notes are an integral part of the financial statements.
11
| THE ADVISORS’ INNER CIRCLE FUND | ACADIAN EMERGING MARKETS PORTFOLIO OCTOBER 31, 2023
|
COMMON STOCK — continued | ||||||||
| Shares | Value | |||||||
India — (continued) | ||||||||
Ujjivan Financial Services | 70,867 | $ | 455,538 | |||||
Uniparts India | 4,018 | 26,854 | ||||||
Vardhman Textiles | 30,623 | 135,773 | ||||||
Voltamp Transformers | 1,209 | 69,786 | ||||||
VST Tillers Tractors | 1,352 | 57,468 | ||||||
West Coast Paper Mills | 42,557 | 376,309 | ||||||
WNS Holdings ADR * | 30,355 | 1,648,884 | ||||||
Zensar Technologies | 32,696 | 192,517 | ||||||
|
|
| ||||||
| 81,387,608 | ||||||||
|
|
| ||||||
Indonesia — 2.3% | ||||||||
ABM Investama | 68,965 | 16,571 | ||||||
Adaro Energy Indonesia | 30,027,555 | 4,844,924 | ||||||
AKR Corporindo | 3,281,400 | 303,089 | ||||||
Astra International | 5,471,600 | 1,990,456 | ||||||
Bank CIMB Niaga | 896,267 | 97,654 | ||||||
Bank Mandiri Persero | 5,743,500 | 2,051,878 | ||||||
Bank OCBC Nisp | 239,061 | 16,709 | ||||||
Bank Pembangunan Daerah Jawa Barat Dan Banten | 402,740 | 28,776 | ||||||
Bukit Asam | 6,058,175 | 945,669 | ||||||
Gajah Tunggal * | 1,469,077 | 81,384 | ||||||
Hanjaya Mandala Sampoerna | 4,121,600 | 235,957 | ||||||
Indika Energy | 279,534 | 31,939 | ||||||
Indo Tambangraya Megah | 234,549 | 391,753 | ||||||
Map Aktif Adiperkasa | 2,356,000 | 110,495 | ||||||
Mayora Indah | 329,782 | 59,205 | ||||||
Medco Energi Internasional | 4,698,800 | 377,761 | ||||||
Mitra Adiperkasa | 1,992,700 | 217,712 | ||||||
Panin Financial * | 3,262,500 | 55,862 | ||||||
Perusahaan Gas Negara | 5,744,806 | 454,204 | ||||||
Perusahaan Perkebunan London Sumatra Indonesia | 1,310,277 | 75,476 | ||||||
Puradelta Lestari | 3,587,100 | 38,593 | ||||||
Temas | 2,699,542 | 26,341 | ||||||
Trans Power Marine | 904,900 | 37,028 | ||||||
Triputra Agro Persada | 817,217 | 28,299 | ||||||
United Tractors | 483,200 | 764,668 | ||||||
|
|
| ||||||
| 13,282,403 | ||||||||
|
|
| ||||||
Luxembourg — 0.9% | ||||||||
Ternium ADR | 143,355 | 5,374,379 | ||||||
|
|
| ||||||
Malaysia — 0.1% | ||||||||
AirAsia X * | 31,800 | 13,154 | ||||||
Bermaz Auto | 74,700 | 39,184 | ||||||
Dayang Enterprise Holdings | 271,500 | 106,139 | ||||||
The accompanying notes are an integral part of the financial statements.
12
| THE ADVISORS’ INNER CIRCLE FUND | ACADIAN EMERGING MARKETS PORTFOLIO OCTOBER 31, 2023
|
COMMON STOCK — continued | ||||||||
| Shares | Value | |||||||
Malaysia — (continued) | ||||||||
Fraser & Neave Holdings | 8,000 | $ | 43,824 | |||||
Hong Leong Financial Group | 7,900 | 29,116 | ||||||
IGB Real Estate Investment Trust ‡ | 44,400 | 15,839 | ||||||
Jaya Tiasa Holdings | 233,300 | 42,117 | ||||||
Kim Loong Resources | 25,400 | 10,031 | ||||||
KSL Holdings * | 228,383 | 51,862 | ||||||
Magni-Tech Industries | 13,700 | 5,665 | ||||||
Mah Sing Group | 181,900 | 31,339 | ||||||
Padini Holdings | 133,600 | 110,761 | ||||||
Pelikan International * | 195,300 | 34,665 | ||||||
Sports Toto | 107,000 | 32,564 | ||||||
YTL Power International | 665,200 | 294,806 | ||||||
|
|
| ||||||
| 861,066 | ||||||||
|
|
| ||||||
Mexico — 1.0% | ||||||||
Cemex ADR * | 756,323 | 4,515,248 | ||||||
Fomento Economico Mexicano ADR | 9,722 | 1,102,572 | ||||||
|
|
| ||||||
| 5,617,820 | ||||||||
|
|
| ||||||
Philippines — 0.0% | ||||||||
Semirara Mining & Power, Cl A | 518,700 | 265,416 | ||||||
SSI Group | 150,472 | 6,953 | ||||||
|
|
| ||||||
| 272,369 | ||||||||
|
|
| ||||||
Poland — 1.3% | ||||||||
Asseco Poland | 529 | 9,686 | ||||||
Budimex | 19 | 2,127 | ||||||
Grenevia * | 141,382 | 100,700 | ||||||
LiveChat Software | 6,691 | 180,270 | ||||||
PGE Polska Grupa Energetyczna * | 200,568 | 348,330 | ||||||
Powszechny Zaklad Ubezpieczen | 621,531 | 7,033,169 | ||||||
Unimot | 337 | 8,028 | ||||||
|
|
| ||||||
| 7,682,310 | ||||||||
|
|
| ||||||
Qatar — 0.0% | ||||||||
Ooredoo QPSC | 59,971 | 162,898 | ||||||
|
|
| ||||||
Russia — 0.0% | ||||||||
Globaltrans Investment GDR * (A) | 114,181 | — | ||||||
HeadHunter Group ADR * (A) | 3,279 | — | ||||||
Novolipetsk Steel PJSC GDR * (A) | 189,918 | — | ||||||
Sberbank of Russia PJSC ADR * (A) | 447,493 | — | ||||||
Tatneft PJSC ADR * (A) | 153,163 | — | ||||||
|
|
| ||||||
| — | ||||||||
|
|
| ||||||
Saudi Arabia — 5.8% | ||||||||
Al Babtain Power & Telecommunication | 58,381 | 289,932 | ||||||
The accompanying notes are an integral part of the financial statements.
13
| THE ADVISORS’ INNER CIRCLE FUND | ACADIAN EMERGING MARKETS PORTFOLIO OCTOBER 31, 2023
|
COMMON STOCK — continued | ||||||||
| Shares | Value | |||||||
Saudi Arabia — (continued) | ||||||||
Al-Dawaa Medical Services | 54,790 | $ | 1,384,299 | |||||
Alwasail Industrial | 1,994 | 10,616 | ||||||
Americana Restaurants International | 6,423,732 | 6,490,188 | ||||||
Arabian Centres | 165,764 | 886,328 | ||||||
Arabian Contracting Services | 19,300 | 1,038,154 | ||||||
Arabian Internet & Communications Services | 45,733 | 3,817,218 | ||||||
Arabian Pipes * | 16,433 | 421,775 | ||||||
Astra Industrial Group | 15,882 | 385,475 | ||||||
Dar Al Arkan Real Estate Development * | 323,953 | 1,304,606 | ||||||
Electrical Industries | 729,940 | 409,379 | ||||||
Elm | 41,962 | 7,845,704 | ||||||
Etihad Etisalat | 70,687 | 868,608 | ||||||
Fawaz Abdulaziz Al Hokair * | 47,233 | 244,529 | ||||||
Gulf Insurance Group | 45,558 | 356,415 | ||||||
Leejam Sports JSC | 43,637 | 1,786,609 | ||||||
Middle East Healthcare * | 31,265 | 575,258 | ||||||
Middle East Specialized Cables * | 64,677 | 275,838 | ||||||
Naba Alsaha Medical Services | 247 | 5,925 | ||||||
National Agriculture Development * | 79,415 | 969,613 | ||||||
Saudi Arabian Amiantit * | 15,186 | 151,704 | ||||||
Saudi Electricity | 801,557 | 3,805,586 | ||||||
Saudi Marketing | 49,360 | 263,141 | ||||||
Zamil Industrial Investment * | 85,854 | 458,476 | ||||||
|
|
| ||||||
| 34,045,376 | ||||||||
|
|
| ||||||
Singapore — 0.0% | ||||||||
Riverstone Holdings | 512,200 | 220,927 | ||||||
|
|
| ||||||
South Africa — 1.6% | ||||||||
Exxaro Resources | 77,726 | 780,129 | ||||||
Hudaco Industries | 688 | 5,700 | ||||||
Investec | 266,871 | 1,460,112 | ||||||
Kumba Iron Ore | 205,890 | 5,454,056 | ||||||
Lewis Group | 14,392 | 29,962 | ||||||
Murray & Roberts Holdings * | 58,238 | 2,181 | ||||||
Omnia Holdings | 10,425 | 32,370 | ||||||
Sanlam | 33,889 | 118,893 | ||||||
Sappi | 216,323 | 455,105 | ||||||
Standard Bank Group | 106,234 | 1,042,645 | ||||||
Sun International | 12,734 | 25,626 | ||||||
Zeda * | 32,760 | 18,899 | ||||||
|
|
| ||||||
| 9,425,678 | ||||||||
|
|
| ||||||
South Korea — 10.1% | ||||||||
Ace Bed | 567 | 10,454 | ||||||
The accompanying notes are an integral part of the financial statements.
14
| THE ADVISORS’ INNER CIRCLE FUND | ACADIAN EMERGING MARKETS PORTFOLIO OCTOBER 31, 2023
|
COMMON STOCK — continued | ||||||||
| Shares | Value | |||||||
South Korea — (continued) | ||||||||
Advanced Process Systems | 3,673 | $ | 44,464 | |||||
AfreecaTV | 6,179 | 307,674 | ||||||
Ahnlab | 7,852 | 373,565 | ||||||
AK Holdings | 1,437 | 18,584 | ||||||
Binggrae | 737 | 29,905 | ||||||
BNK Financial Group | 95,862 | 482,489 | ||||||
Cheil Worldwide | 37,434 | 551,191 | ||||||
China Crystal New Material Holdings * | 101,819 | 128,052 | ||||||
CJ | 24,599 | 1,534,396 | ||||||
Creas F&C | 168 | 1,104 | ||||||
Daewon San Up | 781 | 3,138 | ||||||
Daishin Securities | 203 | 2,107 | ||||||
DB * | 45,418 | 53,235 | ||||||
DB HiTek | 51,947 | 1,875,361 | ||||||
DGB Financial Group | 44,754 | 260,658 | ||||||
DL Construction | 375 | 3,435 | ||||||
DMS | 9,421 | 38,268 | ||||||
Dongwon F&B | 3,100 | 66,884 | ||||||
DoubleUGames | 844 | 25,897 | ||||||
DRB Holding | 528 | 2,019 | ||||||
DY POWER | 2,434 | 21,125 | ||||||
Echo Marketing | 14,098 | 104,741 | ||||||
Eugene Technology | 17,747 | 503,344 | ||||||
Global Standard Technology | 3,878 | 58,382 | ||||||
GS Holdings | 8,603 | 251,224 | ||||||
Hana Financial Group | 285,984 | 8,315,495 | ||||||
Hancom * | 31,166 | 270,671 | ||||||
Handsome | 2,901 | 40,109 | ||||||
Hankook Tire & Technology | 6,567 | 186,316 | ||||||
Hansol Technics | 15,410 | 68,647 | ||||||
Hanwha | 116,122 | 1,912,777 | ||||||
Hanwha Aerospace | 3,748 | 281,778 | ||||||
Hanwha Life Insurance * | 137,009 | 281,548 | ||||||
Hanyang Securities | 3,054 | 21,003 | ||||||
HD Hyundai Construction Equipment | 2,041 | 67,366 | ||||||
Hyundai Glovis | 2,555 | 324,257 | ||||||
iMarketKorea | 6,925 | 40,129 | ||||||
Infinitt Healthcare * | 4,997 | 17,977 | ||||||
JB Financial Group | 35,597 | 266,267 | ||||||
KB Financial Group | 133,181 | 5,076,629 | ||||||
KC Tech | 5,815 | 82,071 | ||||||
Kolon | 7,102 | 83,645 | ||||||
Korea Business News | 15,443 | 61,225 | ||||||
The accompanying notes are an integral part of the financial statements.
15
| THE ADVISORS’ INNER CIRCLE FUND | ACADIAN EMERGING MARKETS PORTFOLIO OCTOBER 31, 2023
|
COMMON STOCK — continued | ||||||||
| Shares | Value | |||||||
South Korea — (continued) | ||||||||
Korea Cast Iron Pipe Industries | 7,156 | $ | 33,239 | |||||
Korean Reinsurance | 9,536 | 62,723 | ||||||
KT | 147,201 | 3,561,112 | ||||||
Kyung Dong Navien | 1,527 | 54,292 | ||||||
LG Electronics | 106,239 | 7,881,128 | ||||||
LG Uplus | 443,837 | 3,326,431 | ||||||
Lock&Lock | 6,971 | 35,648 | ||||||
LOT Vacuum | 4,221 | 63,796 | ||||||
Lotte Data Communication | 2,414 | 50,054 | ||||||
LX Hausys | 9,289 | 263,557 | ||||||
Multicampus | 1,070 | 24,594 | ||||||
NHN * | 38,488 | 610,522 | ||||||
NOROO Paint & Coatings | 6,264 | 42,278 | ||||||
PHA | 2,685 | 17,910 | ||||||
Piolink | 2,947 | 26,353 | ||||||
Rayence | 15,821 | 105,856 | ||||||
Sajodaerim | 7,208 | 149,053 | ||||||
Samsung Electronics | 266,762 | 13,278,046 | ||||||
Sangsangin * | 1,817 | 5,693 | ||||||
Saramin | 6,553 | 92,666 | ||||||
SAVEZONE I&C CORP | 11,048 | 19,694 | ||||||
Sebang | 6,363 | 50,077 | ||||||
Sejong Industrial | 26,717 | 103,844 | ||||||
Seoul Semiconductor | 7,050 | 52,754 | ||||||
Seoyon | 8,880 | 43,662 | ||||||
Seoyon E-Hwa | 5,699 | 60,479 | ||||||
SGC e Tec E&C | 939 | 12,786 | ||||||
Shinsegae Engineering & Construction | 1,067 | 10,048 | ||||||
Shinsung Tongsang | 76,333 | 117,137 | ||||||
SK D&D | 3,015 | 61,377 | ||||||
SK Discovery | 1,351 | 37,041 | ||||||
Sungshin Cement | 7,062 | 43,407 | ||||||
Suprema * | 2,025 | 29,016 | ||||||
TK | 5,267 | 59,391 | ||||||
Tongyang Life Insurance * | 14,899 | 48,468 | ||||||
Value Added Technology | 8,376 | 180,279 | ||||||
WiSoL | 13,595 | 60,898 | ||||||
Woongjin Thinkbig | 18,433 | 33,287 | ||||||
Woori Financial Group | 398,023 | 3,515,640 | ||||||
YES24 | 471 | 1,514 | ||||||
Youngone | 20,652 | 830,200 | ||||||
|
|
| ||||||
| 59,205,556 | ||||||||
|
|
| ||||||
The accompanying notes are an integral part of the financial statements.
16
| THE ADVISORS’ INNER CIRCLE FUND | ACADIAN EMERGING MARKETS PORTFOLIO OCTOBER 31, 2023
|
COMMON STOCK — continued | ||||||||
| Shares | Value | |||||||
Taiwan — 17.5% | ||||||||
Acer | 1,437,000 | $ | 1,518,745 | |||||
Alpha Networks | 215,000 | 235,838 | ||||||
Apacer Technology | 18,000 | 30,583 | ||||||
Arcadyan Technology | 187,000 | 892,938 | ||||||
Asustek Computer | 455,000 | 4,770,736 | ||||||
Axiomtek | 123,124 | 302,362 | ||||||
Champion Microelectronic | 21,000 | 43,811 | ||||||
Channel Well Technology | 242,000 | 611,907 | ||||||
Chicony Electronics | 160,000 | 615,959 | ||||||
China Ecotek | 37,000 | 58,869 | ||||||
Chin-Poon Industrial | 195,000 | 209,783 | ||||||
ChipMOS Technologies | 479,000 | 607,114 | ||||||
ChipMOS Technologies ADR | 2,816 | 70,400 | ||||||
Compal Electronics | 2,778,000 | 2,416,402 | ||||||
Compucase Enterprise | 23,000 | 46,053 | ||||||
D-Link | 375,000 | 212,855 | ||||||
Dynamic Holding | 390,685 | 943,229 | ||||||
Elan Microelectronics | 99,000 | 441,322 | ||||||
Elitegroup Computer Systems | 160,000 | 126,654 | ||||||
Emerging Display Technologies | 249,000 | 213,519 | ||||||
Ennoconn | 78,000 | 602,076 | ||||||
Eva Airways | 935,000 | 792,893 | ||||||
Evergreen Marine Taiwan | 2,103,200 | 6,998,983 | ||||||
First Insurance | 95,000 | 49,418 | ||||||
Fitipower Integrated Technology | 112,450 | 930,833 | ||||||
Gemtek Technology | 550,000 | 555,413 | ||||||
General Plastic Industrial | 30,000 | 31,309 | ||||||
Getac Holdings | 294,000 | 659,270 | ||||||
Giantplus Technology | 328,000 | 122,955 | ||||||
Global Brands Manufacture | 453,000 | 864,079 | ||||||
Global Mixed Mode Technology | 79,000 | 608,020 | ||||||
Gourmet Master | 91,000 | 273,419 | ||||||
Hannstar Board | 281,000 | 485,106 | ||||||
Hon Hai Precision Industry | 817,648 | 2,440,446 | ||||||
International Games System | 181,000 | 3,488,761 | ||||||
Inventec | 771,000 | 965,882 | ||||||
ITE Technology | 73,000 | 368,043 | ||||||
Jarllytec | 83,000 | 381,901 | ||||||
Jess-Link Products | 40,000 | 103,237 | ||||||
Kindom Development | 20,000 | 21,079 | ||||||
King Yuan Electronics | 57,000 | 135,044 | ||||||
L&K Engineering | 84,000 | 330,987 | ||||||
La Kaffa International * | 80,000 | 253,234 | ||||||
The accompanying notes are an integral part of the financial statements.
17
| THE ADVISORS’ INNER CIRCLE FUND | ACADIAN EMERGING MARKETS PORTFOLIO OCTOBER 31, 2023
|
COMMON STOCK — continued | ||||||||
| Shares | Value | |||||||
Taiwan — (continued) | ||||||||
Lite-On Technology | 612,061 | $ | 1,905,659 | |||||
Machvision | 12,000 | 66,598 | ||||||
Macroblock | 200,000 | 618,799 | ||||||
MediaTek | 91,000 | 2,375,042 | ||||||
Micro-Star International | 428,000 | 2,191,074 | ||||||
MPI | 39,000 | 228,582 | ||||||
Nexcom International | 115,000 | 144,042 | ||||||
Novatek Microelectronics | 452,000 | 6,365,549 | ||||||
Phison Electronics | 20,000 | 288,664 | ||||||
Pou Chen | 1,860,000 | 1,657,935 | ||||||
Powertech Technology | 196,000 | 636,772 | ||||||
Promate Solutions | 14,000 | 42,100 | ||||||
Qisda | 19,000 | 24,941 | ||||||
Quanta Computer | 1,055,000 | 6,229,043 | ||||||
Raydium Semiconductor | 127,000 | 1,410,616 | ||||||
Realtek Semiconductor | 834,000 | 10,394,036 | ||||||
Sea Sonic Electronics | 71,000 | 199,259 | ||||||
Senao International | 61,000 | 67,729 | ||||||
Sercomm | 34,000 | 118,627 | ||||||
Silicon Motion Technology ADR | 2,313 | 123,931 | ||||||
Simplo Technology | 63,000 | 649,069 | ||||||
Sitronix Technology | 43,000 | 380,104 | ||||||
Solteam | 34,000 | 43,747 | ||||||
Star Comgistic Capital | 147,723 | 123,323 | ||||||
Sunplus Innovation Technology | 32,000 | 117,034 | ||||||
Sunrex Technology | 40,000 | 61,127 | ||||||
Taiwan PCB Techvest | 42,000 | 55,011 | ||||||
Taiwan Semiconductor Manufacturing | 1,526,000 | 24,923,425 | ||||||
TTFB | 7,600 | 55,545 | ||||||
Ubright Optronics | 7,000 | 11,165 | ||||||
Ventec International Group * | 49,000 | 127,858 | ||||||
Wah Hong Industrial | 35,000 | 41,822 | ||||||
Winbond Electronics | 806,000 | 624,587 | ||||||
Wistron | 704,000 | 1,963,105 | ||||||
Wistron NeWeb | 179,000 | 707,140 | ||||||
Wowprime | 180,320 | 1,332,104 | ||||||
X-Legend Entertainment | 10,200 | 19,232 | ||||||
Zyxel Group | 220,000 | 372,170 | ||||||
|
|
| ||||||
| 102,528,033 | ||||||||
|
|
| ||||||
Thailand — 3.2% | ||||||||
AP Thailand NVDR | 144,800 | 43,525 | ||||||
Bangchak NVDR | 851,200 | 977,588 | ||||||
Bangkok Bank NVDR | 2,127,800 | 9,324,238 | ||||||
The accompanying notes are an integral part of the financial statements.
18
| THE ADVISORS’ INNER CIRCLE FUND | ACADIAN EMERGING MARKETS PORTFOLIO OCTOBER 31, 2023
|
COMMON STOCK — continued | ||||||||
| Shares | Value | |||||||
Thailand — (continued) | ||||||||
Banpu NVDR | 5,742,400 | $ | 1,213,845 | |||||
BTS Rail Mass Transit Growth Infrastructure Fund | 267,600 | 24,867 | ||||||
Index Livingmall NVDR | 529,700 | 333,258 | ||||||
Krung Thai Bank NVDR | 1,069,800 | 559,360 | ||||||
Lanna Resources NVDR | 271,500 | 111,040 | ||||||
Minor International NVDR | 538,700 | 419,799 | ||||||
MK Restaurants Group NVDR | 143,300 | 161,438 | ||||||
Polyplex Thailand NVDR | 9,500 | 2,620 | ||||||
Pruksa Holding NVDR | 47,600 | 16,563 | ||||||
PTT NVDR | 2,833,000 | 2,622,209 | ||||||
PTT Exploration & Production NVDR | 443,700 | 2,026,303 | ||||||
Regional Container Lines NVDR | 414,800 | 226,207 | ||||||
Silicon Craft Technology NVDR | 189,120 | 37,146 | ||||||
Star Petroleum Refining NVDR * | 369,900 | 76,262 | ||||||
Supalai NVDR | 156,100 | 79,965 | ||||||
Thai Oil NVDR | 263,600 | 345,132 | ||||||
|
|
| ||||||
| 18,601,365 | ||||||||
|
|
| ||||||
Turkey — 0.7% | ||||||||
Agesa Hayat ve Emeklilik | 263,164 | 547,310 | ||||||
Anadolu Grubu Holding, Cl A | 4,624 | 33,538 | ||||||
CarrefourSA Carrefour Sabanci Ticaret Merkezi * | 7,974 | 31,311 | ||||||
Turkiye Petrol Rafinerileri | 735,335 | 3,689,203 | ||||||
|
|
| ||||||
| 4,301,362 | ||||||||
|
|
| ||||||
United Arab Emirates — 1.0% | ||||||||
Emaar Properties PJSC | 2,558,282 | 4,660,637 | ||||||
Emirates NBD Bank PJSC | 195,951 | 904,563 | ||||||
Sharjah Islamic Bank | 117,456 | 74,829 | ||||||
Yalla Group ADR * | 15,307 | 82,199 | ||||||
|
|
| ||||||
| 5,722,228 | ||||||||
|
|
| ||||||
United Kingdom — 0.2% | ||||||||
Thungela Resources | 121,723 | 1,078,779 | ||||||
|
|
| ||||||
TOTAL COMMON STOCK | 557,726,465 | |||||||
|
|
| ||||||
PREFERRED STOCK(B) — 4.3% | ||||||||
Brazil — 4.3% | ||||||||
Cia de Ferro Ligas da Bahia FERBASA | 48,058 | 466,115 | ||||||
Cia Energetica de Minas Gerais | 981,179 | 2,278,892 | ||||||
Gerdau | 1,642,779 | 7,129,272 | ||||||
The accompanying notes are an integral part of the financial statements.
19
| THE ADVISORS’ INNER CIRCLE FUND | ACADIAN EMERGING MARKETS PORTFOLIO OCTOBER 31, 2023
|
PREFERRED STOCK(B) — continued | ||||||||
| Shares | Value | |||||||
Brazil — (continued) | ||||||||
Marcopolo | 145,500 | $ | 150,067 | |||||
Metalurgica Gerdau, Cl A | 535,200 | 1,097,628 | ||||||
Noxville Investimentos * (A) | 455 | — | ||||||
Petroleo Brasileiro | 2,034,694 | 14,015,951 | ||||||
|
|
| ||||||
| 25,137,925 | ||||||||
|
|
| ||||||
South Korea — 0.0% | ||||||||
CJ | 9,029 | 462,660 | ||||||
|
|
| ||||||
TOTAL PREFERRED STOCK | 25,600,585 | |||||||
|
|
| ||||||
| ||||||||
MUTUAL FUND — 0.5% | ||||||||
United States — 0.5% | ||||||||
iShares MSCI Emerging Markets ETF | 81,181 | 2,979,343 | ||||||
|
|
| ||||||
TOTAL MUTUAL FUND | 2,979,343 | |||||||
|
|
| ||||||
| ||||||||
WARRANT — 0.0% | ||||||||
| Number of Warrants | ||||||||
Thailand — 0.0% | ||||||||
Successmore Being PCL, Expires 05/28/25 * (A) | 400 | 16 | ||||||
|
|
| ||||||
TOTAL WARRANT | 16 | |||||||
|
|
| ||||||
| ||||||||
RIGHT — 0.0% | ||||||||
| Number of Rights | ||||||||
Taiwan — 0.0% | ||||||||
Winbond Electronics, Expires 11/07/23 | 32,402 | 2,947 | ||||||
|
|
| ||||||
TOTAL RIGHT | 2,947 | |||||||
|
|
| ||||||
The accompanying notes are an integral part of the financial statements.
20
| THE ADVISORS’ INNER CIRCLE FUND | ACADIAN EMERGING MARKETS PORTFOLIO OCTOBER 31, 2023
|
SHORT-TERM INVESTMENT — 0.2% | ||||||||
| Shares | Value | |||||||
FIRST AMERICAN TREASURY OBLIGATIONS FUND, Cl X, 5.27% (C) | 1,054,936 | $ | 1,054,936 | |||||
|
|
| ||||||
TOTAL INVESTMENTS— 100.2% | $ | 587,364,292 | ||||||
|
|
| ||||||
Percentages are based on Net Assets of $585,983,370.
| * | Non-income producing security. |
| ‡ | Real Estate Investment Trust |
| (A) | Level 3 security in accordance with fair value hierarchy. |
| (B) | There is currently no rate available. |
| (C) | The rate shown is the 7 day effective yield as of October 31, 2023. |
ADR — American Depositary Receipt
Cl — Class
ETF — Exchange Traded Fund
GDR — Global Depositary Receipt
NVDR — Non-Voting Depositary Receipt
PJSC — Public Joint Stock Company
QPSC — Qatari Public Shareholding Company
The accompanying notes are an integral part of the financial statements.
21
| THE ADVISORS’ INNER CIRCLE FUND | ACADIAN EMERGING MARKETS PORTFOLIO OCTOBER 31, 2023
|
The summary of input levels used to value the Portfolio’s net assets as of October 31, 2023 was as follows:
| Investments in Securities | Level 1 | Level 2 | Level 3† | Total | ||||||||||||
Common Stock | ||||||||||||||||
Brazil | $ | 1,599,143 | $ | — | $ | —^ | $ | 1,599,143 | ||||||||
China | 27,102,550 | 108,629,492 | — | 135,732,042 | ||||||||||||
Colombia | 88,606 | — | — | 88,606 | ||||||||||||
Egypt | — | 62,400 | — | 62,400 | ||||||||||||
Greece | 43,824 | 933,757 | — | 977,581 | ||||||||||||
Hong Kong | 551,124 | 57,228,967 | — | 57,780,091 | ||||||||||||
Hungary | — | 11,716,445 | — | 11,716,445 | ||||||||||||
India | 2,252,412 | 79,135,196 | — | 81,387,608 | ||||||||||||
Indonesia | 619,052 | 12,663,351 | — | 13,282,403 | ||||||||||||
Luxembourg | 5,374,379 | — | — | 5,374,379 | ||||||||||||
Malaysia | 193,945 | 667,121 | — | 861,066 | ||||||||||||
Mexico | 5,617,820 | — | — | 5,617,820 | ||||||||||||
Philippines | — | 272,369 | — | 272,369 | ||||||||||||
Poland | — | 7,682,310 | — | 7,682,310 | ||||||||||||
Qatar | 162,898 | — | — | 162,898 | ||||||||||||
Russia | — | — | —^ | —^ | ||||||||||||
Saudi Arabia | 4,594,690 | 29,450,686 | — | 34,045,376 | ||||||||||||
Singapore | — | 220,927 | — | 220,927 | ||||||||||||
South Africa | 1,983,249 | 7,442,429 | — | 9,425,678 | ||||||||||||
South Korea | 191,741 | 59,013,815 | — | 59,205,556 | ||||||||||||
Taiwan | 194,331 | 102,333,702 | — | 102,528,033 | ||||||||||||
Thailand | 135,907 | 18,465,458 | — | 18,601,365 | ||||||||||||
Turkey | 64,849 | 4,236,513 | — | 4,301,362 | ||||||||||||
United Arab Emirates | 157,028 | 5,565,200 | — | 5,722,228 | ||||||||||||
United Kingdom | — | 1,078,779 | — | 1,078,779 | ||||||||||||
|
|
|
|
|
|
|
| |||||||||
Total Common Stock | 50,927,548 | 506,798,917 | — | 557,726,465 | ||||||||||||
|
|
|
|
|
|
|
| |||||||||
Preferred Stock | ||||||||||||||||
Brazil | 25,137,925 | — | —^ | 25,137,925 | ||||||||||||
South Korea | — | 462,660 | — | 462,660 | ||||||||||||
|
|
|
|
|
|
|
| |||||||||
Total Preferred Stock | 25,137,925 | 462,660 | —^ | 25,600,585 | ||||||||||||
|
|
|
|
|
|
|
| |||||||||
Mutual Fund | 2,979,343 | — | — | 2,979,343 | ||||||||||||
Warrant | — | — | 16 | 16 | ||||||||||||
Right | — | 2,947 | — | 2,947 | ||||||||||||
Short-Term Investment | — | 1,054,936 | — | 1,054,936 | ||||||||||||
|
|
|
|
|
|
|
| |||||||||
Total Investments in Securities | $ | 79,044,816 | $ | 508,319,460 | $ | 16 | $ | 587,364,292 | ||||||||
|
|
|
|
|
|
|
| |||||||||
† A reconciliation of Level 3 investments and disclosures of significant unobservable inputs are presented when the Portfolio has a significant amount of Level 3 investments at the end of the period in relation to net assets. Management has concluded that Level 3 investments are not material in relation to net assets.
^ Includes securities in which the fair value is $0 or has been rounded to $0.
The accompanying notes are an integral part of the financial statements.
22
| THE ADVISORS’ INNER CIRCLE FUND | ACADIAN EMERGING MARKETS PORTFOLIO OCTOBER 31, 2023
|
For more information on valuation inputs, see Note 2 — Significant Accounting Policies in the Notes to Financial Statements.
The accompanying notes are an integral part of the financial statements.
23
| THE ADVISORS’ INNER CIRCLE FUND | ACADIAN EMERGING MARKETS PORTFOLIO OCTOBER 31, 2023
|
| STATEMENT OF ASSETS AND LIABILITIES | ||||
Assets | ||||
Investments, at Value (Cost $547,928,437) | $ | 587,364,292 | ||
Foreign Currency, at Value (Cost $2,083,895) | 2,081,240 | |||
Receivable for Investment Securities Sold | 15,306,295 | |||
Dividends and Interest Receivable | 1,334,309 | |||
Receivable for Capital Shares Sold | 446,855 | |||
Reclaim Receivable | 90,923 | |||
Prepaid Expenses | 27,155 | |||
|
| |||
Total Assets | 606,651,069 | |||
|
| |||
Liabilities | ||||
Payable for Investment Securities Purchased | 15,799,118 | |||
Accrued Foreign Capital Gains Tax on Appreciated Securities | 3,395,079 | |||
Payable to Adviser | 458,253 | |||
Payable for Capital Shares Redeemed | 354,350 | |||
Payable to Custodian | 292,237 | |||
Shareholder Servicing Fees Payable - Investor Class | 88,664 | |||
Shareholder Servicing Fees Payable - Y Class | 106 | |||
Payable to Administrator | 53,474 | |||
Payable to Trustees | 6,488 | |||
Chief Compliance Officer Fees Payable | 3,673 | |||
Unrealized Loss on Spot Contracts | 55 | |||
Accrued Expenses | 216,202 | |||
|
| |||
Total Liabilities | 20,667,699 | |||
|
| |||
Net Assets | $ | 585,983,370 | ||
|
| |||
Net Assets Consist of: | ||||
Paid-in Capital | $ | 554,272,853 | ||
Total Distributable Earnings | 31,710,517 | |||
|
| |||
Net Assets | $ | 585,983,370 | ||
|
| |||
Investor Class Shares: | ||||
Net Assets | $ | 283,457,035 | ||
Outstanding Shares of Beneficial Interest (unlimited authorization - no par value) | 14,904,155 | |||
|
| |||
Net Asset Value, Redemption and Offering Price Per Share * | $ | 19.02 | ||
|
| |||
I Class Shares: | ||||
Net Assets | $ | 299,395,188 | ||
Outstanding Shares of Beneficial Interest (unlimited authorization - no par value) | 15,743,243 | |||
|
| |||
Net Asset Value, Redemption and Offering Price Per Share * | $ | 19.02 | ||
|
| |||
Y Class Shares: | ||||
Net Assets | $ | 3,131,147 | ||
Outstanding Shares of Beneficial Interest (unlimited authorization - no par value) | 165,028 | |||
|
| |||
Net Asset Value, Redemption and Offering Price Per Share * | $ | 18.97 | ||
|
| |||
| * | Redemption price per share may vary depending upon the length of time shares are held. |
The accompanying notes are an integral part of the financial statements.
24
| THE ADVISORS’ INNER CIRCLE FUND | ACADIAN EMERGING MARKETS PORTFOLIO FOR THE YEAR ENDED OCTOBER 31, 2023
|
STATEMENT OF OPERATIONS | ||||
Investment Income: | ||||
Dividends | $ | 36,883,531 | ||
Less: Foreign Taxes Withheld | (4,280,449 | ) | ||
|
|
| ||
Total Investment Income | 32,603,082 | |||
|
|
| ||
Expenses: | ||||
Investment Advisory Fees | 5,682,504 | |||
Shareholder Servicing Fees - Investor Class | 693,916 | |||
Shareholder Servicing Fees - Y Class | 2,016 | |||
Administration Fees | 655,117 | |||
Trustees’ Fees | 26,051 | |||
Chief Compliance Officer Fees | 6,843 | |||
Custodian Fees | 767,874 | |||
Transfer Agent Fees | 159,364 | |||
Printing Fees | 144,322 | |||
Interest Expense | 93,822 | |||
Filing and Registration Fees | 67,865 | |||
Legal Fees | 65,105 | |||
Audit Fees | 38,877 | |||
Other Expenses | 113,970 | |||
|
|
| ||
Total Expenses | 8,517,646 | |||
|
|
| ||
Less: | ||||
Fees Paid Indirectly (Note 4) | (20,486 | ) | ||
|
|
| ||
Net Expenses | 8,497,160 | |||
|
|
| ||
Net Investment Income | 24,105,922 | |||
|
|
| ||
Net Realized Loss on: | ||||
Investments | (18,270,643 | ) | ||
Foreign Capital Gains Tax | (789,424 | ) | ||
Foreign Currency Transactions | (599,784 | ) | ||
|
|
| ||
Net Realized Loss | (19,659,851 | ) | ||
|
|
| ||
Net Change in Unrealized Appreciation (Depreciation) on: | ||||
Investments | 137,045,384 | |||
Foreign Capital Gains Tax on Depreciated Securities | (2,158,993 | ) | ||
Foreign Currencies and Translation of other Assets and Liabilities Denominated in Foreign Currencies | 28,279 | |||
|
|
| ||
Net Change in Unrealized Appreciation | 134,914,670 | |||
|
|
| ||
Net Realized and Unrealized Gain | 115,254,819 | |||
|
|
| ||
Net Increase in Net Assets Resulting from Operations | $ | 139,360,741 | ||
|
|
| ||
The accompanying notes are an integral part of the financial statements.
25
| THE ADVISORS’ INNER CIRCLE FUND | ACADIAN EMERGING MARKETS PORTFOLIO
|
STATEMENTS OF CHANGES IN NET ASSETS |
| Year Ended October 31, 2023 | Year Ended October 31, 2022 | |||||||
Operations: | ||||||||
Net Investment Income | $ | 24,105,922 | $ | 40,563,803 | ||||
Net Realized Gain (Loss) | (19,659,851 | ) | 1,758,572 | |||||
Net Change in Unrealized Appreciation (Depreciation) | 134,914,670 | (325,249,551 | ) | |||||
|
|
|
| |||||
Net Increase (Decrease) in Net Assets Resulting from Operations | 139,360,741 | (282,927,176 | ) | |||||
|
|
|
| |||||
Distributions: | ||||||||
Investor Class Shares | (22,785,848 | ) | (17,800,931 | ) | ||||
I Class Shares | (21,338,558 | ) | (13,456,457 | ) | ||||
Y Class Shares | (440,711 | ) | (216,931 | ) | ||||
|
|
|
| |||||
Total Distributions | (44,565,117 | ) | (31,474,319 | ) | ||||
|
|
|
| |||||
Capital Share Transactions:(1) | ||||||||
Investor Class Shares: | ||||||||
Issued | 14,428,787 | 82,547,939 | ||||||
Reinvestment of Distributions | 22,252,987 | 17,518,818 | ||||||
Redemption Fees — (See Note 2) | 3,261 | 534 | ||||||
Redeemed | (126,089,006 | ) | (172,389,796 | ) | ||||
|
|
|
| |||||
Decrease in Net Assets derived from Investor Class Transactions | (89,403,971 | ) | (72,322,505 | ) | ||||
|
|
|
| |||||
I Class Shares: | ||||||||
Issued | 76,035,895 | 117,160,815 | ||||||
Reinvestment of Distributions | 18,279,007 | 11,719,825 | ||||||
Redemption Fees — (See Note 2) | 2,545 | 14,793 | ||||||
Redeemed | (96,712,771 | ) | (141,322,663 | ) | ||||
|
|
|
| |||||
Decrease in Net Assets derived from I Class Transactions | (2,395,324 | ) | (12,427,230 | ) | ||||
|
|
|
| |||||
Y Class Shares: | ||||||||
Issued | 67,027 | 2,414,547 | ||||||
Reinvestment of Distributions | 407,053 | 181,073 | ||||||
Redeemed | (4,049,086 | ) | (1,289,528 | ) | ||||
|
|
|
| |||||
Increase (Decrease) in Net Assets derived from Y Class Transactions | (3,575,006 | ) | 1,306,092 | |||||
|
|
|
| |||||
Net Decrease in Net Assets from Capital Share Transactions | (95,374,301 | ) | (83,443,643 | ) | ||||
|
|
|
| |||||
Total Decrease in Net Assets | (578,677 | ) | (397,845,138 | ) | ||||
|
|
|
| |||||
Net Assets: | ||||||||
Beginning of Year | 586,562,047 | 984,407,185 | ||||||
|
|
|
| |||||
End of Year | $ | 585,983,370 | $ | 586,562,047 | ||||
|
|
|
| |||||
| (1) | See Note 7 in Notes to Financial Statements. |
The accompanying notes are an integral part of the financial statements.
26
| THE ADVISORS’ INNER CIRCLE FUND | ACADIAN EMERGING MARKETS PORTFOLIO |
FINANCIAL HIGHLIGHTS |
| Selected Per Share Data & Ratios |
| For a Share Outstanding Throughout Each Year |
| Years Ended October 31, | ||||||||||||||||||||
Investor Class Shares | 2023 | 2022 | 2021 | 2020 | 2019 | |||||||||||||||
Net Asset Value, | $ | 16.37 | $ | 23.93 | $ | 19.65 | $ | 19.41 | $ | 18.35 | ||||||||||
|
|
|
|
|
|
|
|
|
| |||||||||||
Income from Operations: | ||||||||||||||||||||
Net Investment Income* | 0.70 | 0.96 | 0.47 | 0.29 | 0.39 | |||||||||||||||
Net Realized and Unrealized Gain (Loss) | 3.21 | (7.78 | ) | 4.10 | 0.32 | 1.00 | ||||||||||||||
|
|
|
|
|
|
|
|
|
| |||||||||||
Total from Operations | 3.91 | (6.82 | ) | 4.57 | 0.61 | 1.39 | ||||||||||||||
|
|
|
|
|
|
|
|
|
| |||||||||||
Redemption Fees* | 0.00 | ^ | 0.00 | ^ | — | 0.00 | ^ | 0.00 | ^ | |||||||||||
|
|
|
|
|
|
|
|
|
| |||||||||||
Dividends and Distributions from: | ||||||||||||||||||||
Net Investment Income | (1.07 | ) | (0.70 | ) | (0.29 | ) | (0.37 | ) | (0.33 | ) | ||||||||||
Net Realized Gains | (0.19 | ) | (0.04 | ) | — | — | — | |||||||||||||
|
|
|
|
|
|
|
|
|
| |||||||||||
Total Dividends and Distributions | (1.26 | ) | (0.74 | ) | (0.29 | ) | (0.37 | ) | (0.33 | ) | ||||||||||
|
|
|
|
|
|
|
|
|
| |||||||||||
Net Asset Value, End of Year | $ | 19.02 | $ | 16.37 | $ | 23.93 | $ | 19.65 | $ | 19.41 | ||||||||||
|
|
|
|
|
|
|
|
|
| |||||||||||
Total Return † | 24.62% | (29.43)% | 23.35% | 3.04% | 7.72% | |||||||||||||||
|
|
|
|
|
|
|
|
|
| |||||||||||
Ratios and Supplemental Data | ||||||||||||||||||||
| Net Assets, End of Year (Thousands) | $ 283,457 | $ 322,684 | $ 580,640 | $ 674,360 | $ 625,488 | |||||||||||||||
Ratio of Expenses to Average Net Assets(1) | 1.46% | 1.49% | 1.43% | 1.40% | 1.40% | |||||||||||||||
Ratio of Net Investment Income to Average Net Assets | 3.69% | 4.52% | 1.97% | 1.56% | 2.07% | |||||||||||||||
Portfolio Turnover Rate | 68% | 66% | 70% | 55% | 48% | |||||||||||||||
| * | Per share amounts for the period are based on average outstanding shares. |
| ^ | Amount was less than $0.005 per share. |
| † | Returns shown do not reflect the deduction of taxes that a shareholder would pay on Portfolio distributions or the redemption of Portfolio shares. |
| (1) | The Ratio of Expenses to Average Net Assets excludes the effect of fees paid indirectly. If these expense offsets were included, the ratio would have been the same as the ratio reported. |
The accompanying notes are an integral part of the financial statements.
27
| THE ADVISORS’ INNER CIRCLE FUND | ACADIAN EMERGING MARKETS PORTFOLIO
|
FINANCIAL HIGHLIGHTS |
| Selected Per Share Data & Ratios |
| For a Share Outstanding Throughout Each Year |
Years Ended October 31, | ||||||||||||||||||||
I Class Shares | 2023 | 2022 | 2021 | 2020 | 2019 | |||||||||||||||
Net Asset Value, | $ | 16.39 | $ | 23.97 | $ | 19.67 | $ | 19.43 | $ | 18.38 | ||||||||||
|
|
|
|
|
|
|
|
|
| |||||||||||
Income from Operations: | ||||||||||||||||||||
Net Investment Income* | 0.75 | 1.00 | 0.53 | 0.29 | 0.41 | |||||||||||||||
Net Realized and Unrealized Gain (Loss) | 3.20 | (7.77 | ) | 4.09 | 0.35 | 1.00 | ||||||||||||||
|
|
|
|
|
|
|
|
|
| |||||||||||
Total from Operations | 3.95 | (6.77 | ) | 4.62 | 0.64 | 1.41 | ||||||||||||||
|
|
|
|
|
|
|
|
|
| |||||||||||
Redemption Fees* | 0.00 | ^ | 0.00 | ^ | — | 0.00 | ^ | 0.00 | ^ | |||||||||||
|
|
|
|
|
|
|
|
|
| |||||||||||
Dividends and Distributions from: | ||||||||||||||||||||
Net Investment Income | (1.13 | ) | (0.77 | ) | (0.32 | ) | (0.40 | ) | (0.36 | ) | ||||||||||
Net Realized Gains | (0.19 | ) | (0.04 | ) | — | — | — | |||||||||||||
|
|
|
|
|
|
|
|
|
| |||||||||||
Total Dividends and Distributions | (1.32 | ) | (0.81 | ) | (0.32 | ) | (0.40 | ) | (0.36 | ) | ||||||||||
|
|
|
|
|
|
|
|
|
| |||||||||||
Net Asset Value, End of Year | $ | 19.02 | $ | 16.39 | $ | 23.97 | $ | 19.67 | $ | 19.43 | ||||||||||
|
|
|
|
|
|
|
|
|
| |||||||||||
Total Return † | 24.87% | (29.26)% | 23.61% | 3.20% | 7.86% | |||||||||||||||
|
|
|
|
|
|
|
|
|
| |||||||||||
Ratios and Supplemental Data | ||||||||||||||||||||
| Net Assets, End of Year (Thousands) | $ 299,395 | $ 258,008 | $ 396,786 | $ 330,942 | $ 496,662 | |||||||||||||||
Ratio of Expenses to Average Net Assets(1) | 1.24% | 1.27% | 1.22% | 1.24% | 1.25% | |||||||||||||||
Ratio of Net Investment Income to Average Net Assets | 3.95% | 4.70% | 2.21% | 1.53% | 2.13% | |||||||||||||||
Portfolio Turnover Rate | 68% | 66% | 70% | 55% | 48% | |||||||||||||||
| * | Per share amounts for the period are based on average outstanding shares. |
| ^ | Amount was less than $0.005 per share. |
| † | Returns shown do not reflect the deduction of taxes that a shareholder would pay on Portfolio distributions or the redemption of Portfolio shares. |
| (1) | The Ratio of Expenses to Average Net Assets excludes the effect of fees paid indirectly. If these expense offsets were included, the ratio would have been the same as the ratio reported. |
The accompanying notes are an integral part of the financial statements.
28
| THE ADVISORS’ INNER CIRCLE FUND | ACADIAN EMERGING MARKETS PORTFOLIO
|
FINANCIAL HIGHLIGHTS |
| Selected Per Share Data & Ratios |
| For a Share Outstanding Throughout Each Year |
| Years Ended October 31, | ||||||||||||||||||||
Y Class Shares | 2023 | 2022 | 2021 | 2020 | 2019 | |||||||||||||||
Net Asset Value, | $ | 16.35 | $ | 23.92 | $ | 19.63 | $ | 19.40 | $ | 18.34 | ||||||||||
|
|
|
|
|
|
|
|
|
| |||||||||||
Income from Operations: | ||||||||||||||||||||
Net Investment Income* | 0.74 | 0.99 | 0.50 | 0.25 | 0.43 | |||||||||||||||
Net Realized and Unrealized Gain (Loss) | 3.19 | (7.76 | ) | 4.11 | 0.38 | 0.98 | ||||||||||||||
|
|
|
|
|
|
|
|
|
| |||||||||||
Total from Operations | 3.93 | (6.77 | ) | 4.61 | 0.63 | 1.41 | ||||||||||||||
|
|
|
|
|
|
|
|
|
| |||||||||||
Redemption Fees* | — | — | — | 0.00 | ^ | — | ||||||||||||||
|
|
|
|
|
|
|
|
|
| |||||||||||
Dividends and Distributions from: | ||||||||||||||||||||
Net Investment Income | (1.12 | ) | (0.76 | ) | (0.32 | ) | (0.40 | ) | (0.35 | ) | ||||||||||
Net Realized Gains | (0.19 | ) | (0.04 | ) | — | — | — | |||||||||||||
|
|
|
|
|
|
|
|
|
| |||||||||||
Total Dividends and Distributions | (1.31 | ) | (0.80 | ) | (0.32 | ) | (0.40 | ) | (0.35 | ) | ||||||||||
|
|
|
|
|
|
|
|
|
| |||||||||||
Net Asset Value, End of Year | $ | 18.97 | $ | 16.35 | $ | 23.92 | $ | 19.63 | $ | 19.40 | ||||||||||
|
|
|
|
|
|
|
|
|
| |||||||||||
Total Return † | 24.80% | (29.31)% | 23.61% | 3.15% | 7.89% | |||||||||||||||
|
|
|
|
|
|
|
|
|
| |||||||||||
Ratios and Supplemental Data | ||||||||||||||||||||
| Net Assets, End of Year (Thousands) | $ 3,131 | $ 5,870 | $ 6,982 | $ 8,334 | $ 20,363 | |||||||||||||||
Ratio of Expenses to Average Net Assets(1) | 1.29% | 1.32% | 1.24% | 1.24% | 1.25% | |||||||||||||||
Ratio of Net Investment Income to Average Net Assets | 3.95% | 4.71% | 2.10% | 1.34% | 2.26% | |||||||||||||||
Portfolio Turnover Rate | 68% | 66% | 70% | 55% | 48% | |||||||||||||||
| * | Per share amounts for the period are based on average outstanding shares. |
| ^ | Amount was less than $0.005 per share. |
| † | Returns shown do not reflect the deduction of taxes that a shareholder would pay on Portfolio distributions or the redemption of Portfolio shares. |
| (1) | The Ratio of Expenses to Average Net Assets excludes the effect of fees paid indirectly. If these expense offsets were included, the ratio would have been the same as the ratio reported. |
The accompanying notes are an integral part of the financial statements.
29
| THE ADVISORS’ INNER CIRCLE FUND | ACADIAN EMERGING MARKETS PORTFOLIO OCTOBER 31, 2023
|
NOTES TO FINANCIAL STATEMENTS |
1. Organization:
The Advisors’ Inner Circle Fund (the “Trust”) is organized as a Massachusetts business trust under an Amended and Restated Agreement and Declaration of Trust dated February 18, 1997. The Trust is registered under the Investment Company Act of 1940, as amended (the “1940 Act”), as an open-end management investment company with 28 funds. The financial statements herein are those of the Acadian Emerging Markets Portfolio (“Portfolio”), a diversified portfolio. The investment objective of the Portfolio is to seek long-term capital appreciation by investing primarily in common stocks of emerging market country issuers. The financial statements of the remaining portfolios are presented separately. The assets of each portfolio are segregated, and a shareholder’s interest is limited to the portfolio in which shares are held.
2. Significant Accounting Policies:
The following are significant accounting policies, which are consistently followed in the preparation of the financial statements of the Portfolio. The Portfolio is an investment company that applies the accounting and reporting guidance issued in Topic 946 by the U.S. Financial Accounting Standards Board (“FASB”).
Use of Estimates — The preparation of financial statements in conformity with U.S. GAAP requires management to make estimates and assumptions that affect the fair value of investments, reported amounts of assets and liabilities and disclosure of contingent assets and liabilities at the date of the financial statements and the reported amounts of increases and decreases in net assets from operations during the reported period. Actual results could differ from those estimates and such differences could be material.
Security Valuation — Securities listed on a securities exchange, market or automated quotation system for which quotations are readily available (except for securities traded on NASDAQ), including securities traded over the counter, are valued at the last quoted sale price on an exchange or market (foreign or domestic) on which they are traded on valuation date (or at approximately 4:00 pm ET if a security’s primary exchange is normally open at that time), or, if there is no such reported sale on the valuation date, at the most recent quoted bid price. For securities traded on NASDAQ, the NASDAQ Official Closing Price will be used. The prices for foreign securities are reported in local currency and converted to U.S. dollars using currency exchange rates.
Securities for which market prices are not “readily available” are valued in accordance with fair value procedures (the “Fair Value Procedures”) established by the Adviser and approved by the Trust’s Board of Trustees (the “Board”). Pursuant to Rule 2a-5 under the 1940 Act, the Board has designated the Adviser as the “valuation designee”
30
| THE ADVISORS’ INNER CIRCLE FUND | ACADIAN EMERGING MARKETS PORTFOLIO OCTOBER 31, 2023
|
to determine the fair value of securities and other instruments for which no readily available market quotations are available. The Fair Value Procedures are implemented through a Fair Value Committee (the “Committee”) of the Adviser.
Some of the more common reasons that may necessitate that a security be valued using Fair Value Procedures include: the security’s trading has been halted or suspended; the security has been de-listed from a national exchange; the security’s primary trading market is temporarily closed at a time when under normal conditions it would be open; the security has not been traded for an extended period of time; the security’s primary pricing source is not able or willing to provide a price; or trading of the security is subject to local government-imposed restrictions. When a security is valued in accordance with the Fair Value Procedures, the Committee will determine the value after taking into consideration relevant information reasonably available to the Committee.
For securities that principally trade on a foreign market or exchange, a significant gap in time can exist between the time of a particular security’s last trade and the time at which the Portfolio calculates its net asset values. The closing prices of such securities may no longer reflect their market value at the time the Portfolio calculates its net asset value if an event that could materially affect the value of those securities (a “Significant Event”) has occurred between the time of the security’s last close and the time that the Acadian Emerging Markets Portfolio calculates its net asset value. A Significant Event may relate to a single issuer or to an entire market sector. If Acadian Asset Management LLC (the “Adviser”) of the Portfolio becomes aware of a Significant Event that has occurred with respect to a security or group of securities after the closing of the exchange or market on which the security or securities principally trade, but before the time at which the Portfolio calculates its net asset value, it may request that a Committee meeting be called. As of October 31, 2023, the total market value of securities in the Portfolio, valued in accordance with fair value procedures, was $507,261,577 or 87% of Net Assets.
The Portfolio uses Intercontinental Exchange Data Pricing & Reference Data, LLC. (“ICE”) as a third party fair valuation vendor. ICE provides a fair value for foreign securities in the Portfolio based on certain factors and methodologies (involving, generally, tracking valuation correlations between the U.S. market and each non-U.S. security) applied by ICE in the event that there is a movement in the U.S. markets that exceeds a specific threshold established by the Committee. The Committee establishes a “confidence interval” which is used to determine the level of correlation between the value of a foreign security and movements in the U.S. market before a particular security is fair valued when the threshold is exceeded. In the event that the threshold established by the Committee is exceeded on a specific day, the Portfolio values its non-U.S. securities that exceed the applicable “confidence interval” based upon the fair values provided by ICE. In such event, it is not necessary to hold a Committee
31
| THE ADVISORS’ INNER CIRCLE FUND | ACADIAN EMERGING MARKETS PORTFOLIO OCTOBER 31, 2023
|
meeting. In the event that the Adviser believes that the fair values provided by ICE are not reliable, the Adviser contacts SEI Investments Global Fund Services (the “Administrator”) and may request that a meeting of the Committee be held.
If a local market in which the Portfolio own securities is closed for one or more days, the Portfolio shall value all securities held in that corresponding currency based on the fair value prices provided by ICE using the predetermined confidence interval discussed above.
In accordance with the authoritative guidance on fair value measurements and disclosure under U.S. GAAP, the Portfolio discloses fair value of their investments in a hierarchy that prioritizes the inputs to valuation techniques used to measure the fair value. The objective of a fair value measurement is to determine the price that would be received to sell an asset or paid to transfer a liability in an orderly transaction between market participants at the measurement date (an exit price). Accordingly, the fair value hierarchy gives the highest priority to quoted prices (unadjusted) in active markets for identical assets or liabilities (Level 1) and the lowest priority to unobservable inputs (Level 3). The three levels of the fair value hierarchy are described below:
| • | Level 1 — Unadjusted quoted prices in active markets for identical, unrestricted assets or liabilities that the Portfolio has the ability to access at the measurement date; |
| • | Level 2 — Other significant observable inputs (including quoted prices for similar securities, interest rates, prepayment speeds, credit risk, referenced indices, quoted prices in inactive markets, adjusted quoted prices in active markets, adjusted quoted prices on foreign equity securities that were adjusted in accordance with the Adviser’s pricing procedures, etc.); and |
| • | Level 3 — Prices, inputs or exotic modeling techniques which are both significant to the fair value measurement and unobservable (supported by little or no market activity). |
Investments are classified within the level of the lowest significant input considered in determining fair value. Investments classified within Level 3 whose fair value measurement considers several inputs may include Level 1 or Level 2 inputs as components of the overall fair value measurement.
The inputs or methodology used for valuing securities are not necessarily an indication of risk associated with investing in those securities.
For details of the investment classification, refer to the Schedule of Investments.
32
| THE ADVISORS’ INNER CIRCLE FUND | ACADIAN EMERGING MARKETS PORTFOLIO OCTOBER 31, 2023
|
Federal Income Taxes — It is the Portfolio’s intention to continue to qualify as a regulated investment company for Federal income tax purposes by complying with the appropriate provisions of Subchapter M of the Internal Revenue Code of 1986, as amended and by distributing to shareholders all of their net investment income and realized gains. Accordingly, no provisions for Federal income taxes have been made in the financial statements.
The Portfolio evaluates tax positions taken or expected to be taken in the course of preparing the Portfolio’s tax returns to determine whether it is “more-likely-than-not” (i.e., greater than 50-percent) that each tax position will be sustained upon examination by a taxing authority based on the technical merits of the position. Tax positions not deemed to meet the more-likely-than-not threshold are recorded as a tax benefit or expense in the current year. The Portfolio did not record any tax provision in the current period. However, management’s conclusions regarding tax positions taken may be subject to review and adjustment at a later date based on factors including, but not limited to, examination by tax authorities (i.e., the last 3 open tax year ends and current tax year, as applicable), on-going analysis of and changes to tax laws, regulations and interpretations thereof.
As of and during the year ended October 31, 2023, the Portfolio did not have a liability for any unrecognized tax benefits. The Portfolio recognizes interest and penalties, if any, related to unrecognized tax benefits as income tax expense in the Statement of Operations. During the year ended October 31, 2023, the Portfolio did not incur any interest or penalties.
Security Transactions and Investment Income — Security transactions are accounted for on trade date. Costs used in determining realized gains or losses on the sale of investment securities are based on the specific identification method. Dividend income is recorded on the ex-dividend date. Certain dividends from foreign securities will be recorded as soon as the Portfolio is informed of the dividend if such information is obtained subsequent to the ex-dividend date. Interest income is recognized on an accrual basis from settlement date. Discounts and premiums on securities purchased are accreted and amortized using the scientific interest method, which approximates the effective interest method.
Foreign Taxes — The Fund may be subject to taxes imposed by countries in which it invests. Such taxes are generally based on either income or gains earned or repatriated. The Fund accrues and applies such taxes to net investment income, net realized gains and net unrealized gains as income and/or capital gains earned.
Foreign Currency Translation — The books and records of the Portfolio are maintained in U.S. dollars. Investment securities and other assets and liabilities denominated in a foreign currency are translated into U.S. dollars on the date of
33
| THE ADVISORS’ INNER CIRCLE FUND | ACADIAN EMERGING MARKETS PORTFOLIO OCTOBER 31, 2023
|
valuation. The Portfolio does not isolate that portion of realized or unrealized gains and losses resulting from changes in foreign exchange rates from fluctuations arising from changes in the market prices of securities. These gains and losses are included in net realized and unrealized gains and losses on investments on the Statement of Operations. Net realized and unrealized gains and losses on foreign currency transactions represent net foreign exchange gains or losses from foreign currency exchange contracts, disposition of foreign currencies, currency gains or losses realized between trade and settlement dates on securities transactions and the difference between the amount of investment income and foreign withholding taxes recorded on the Portfolio’s books and the U.S. dollar equivalent amounts actually received or paid.
Forward Foreign Currency Exchange Contracts — The Portfolio may enter into forward foreign currency exchange contracts to protect the value of securities held and related receivables and payables against changes in future foreign exchange rates. A forward currency contract is an agreement between two parties to buy and sell currency at a set price on a future date. The market value of the contract will fluctuate with changes in currency exchange rates. The contract is marked-to-market daily using the current forward rate and the change in market value is recorded by the Portfolio as unrealized gain or loss. The Portfolio recognizes realized gains or losses when the contract is closed, equal to the difference between the value of the contract at the time it was opened and the value at the time it was closed. Any realized or unrealized gains (loss) during the period are presented on the Statement of Operations. Risks may arise from unanticipated movements in the value of a foreign currency relative to the U.S. dollar. Risks may also arise upon entering into these contracts from the potential inability of counterparties to meet the terms of their contracts and are generally limited to the amount of unrealized gain on the contracts at the date of default.
Expenses — Most expenses of the Trust can be directly attributed to a particular fund. Expenses that cannot be directly attributed to a particular fund are apportioned among the funds of the Trust based on the number of funds and/or relative net assets.
Classes — Class specific expenses are borne by that class of shares. Income, realized and unrealized gains (losses) and non-class specific expenses are allocated to the respective class on the basis of relative net assets.
Dividends and Distributions to Shareholders — The Portfolio distributes substantially all of its net investment income, if any, annually. Any net realized capital gains will be distributed at least annually. All distributions are recorded on ex-dividend date.
Redemption Fees — The Portfolio retains a redemption fee of 2.00% on redemptions of capital shares if redeemed within 30 days of purchase. The redemption fee is
34
| THE ADVISORS’ INNER CIRCLE FUND | ACADIAN EMERGING MARKETS PORTFOLIO OCTOBER 31, 2023
|
recorded as an increase to paid-in capital. The redemption fees retained by the Portfolio are reported on the Statements of Changes in Net Assets.
3. Transactions with Affiliates:
Certain officers of the Trust are also officers of the Administrator and/or SEI Investments Distribution Co. (the “Distributor”). Such officers are paid no fees by the Trust, other than the Chief Compliance Officer (“CCO”) as described below, for serving as officers of the Trust.
A portion of the services provided by the CCO and his staff, who are employees of the Administrator, are paid for by the Trust as incurred. The services include regulatory oversight of the Trust’s Advisors and service providers as required by SEC regulations. The CCO’s services and fees have been approved by and are reviewed by the Board.
4. Administration, Distribution, Shareholder Servicing, Transfer Agent and Custodian Agreements:
The Portfolio and the Administrator are parties to an Administration Agreement, under which the Administrator provides administrative services to the Portfolio. For these services, the Administrator is paid an asset based fee, which will vary depending on the number of share classes and the average daily net assets of the Portfolio. For the year ended October 31, 2023, the Portfolio paid $655,117 for these services.
The Trust and the Distributor are parties to a Distribution Agreement. The Distributor receives no fees under the agreement.
The Portfolio has adopted a shareholder servicing plan under which a shareholder servicing fee of up to 0.25% of average daily net assets of the Investor Class Shares up to 0.10% of average daily net assets of the Y Class Shares will be paid to financial intermediaries. Certain brokers, dealers, banks, trust companies and other financial representatives may receive compensation from the Portfolio for providing a variety of services, including record keeping and transaction processing. Such fees are paid by the Portfolio to the extent that the number of accounts serviced by the financial representative multiplied by the account fee charged by the Portfolio’s transfer agent would not exceed the amount that would have been charged had the accounts serviced by the financial representative been registered directly through the transfer agent. All fees in excess of this amount are paid by the Adviser, an affiliate of Old Mutual (US) Holdings, Inc. These fees are disclosed on the Statement of Operations as Shareholder Servicing Fees.
DST Systems, Inc. (the “Transfer Agent”) serves as the transfer agent and dividend disbursing agent for the Portfolio under a transfer agency agreement.
For the year ended October 31, 2023, the Portfolio earned cash management credits of $20,486, which were used to offset transfer agent expenses. This amount is labeled as “Fees Paid Indirectly” on the Statement of Operations.
35
| THE ADVISORS’ INNER CIRCLE FUND | ACADIAN EMERGING MARKETS PORTFOLIO OCTOBER 31, 2023
|
U.S. Bank, N.A. serves as custodian (the “Custodian”) for the Portfolio. The Custodian plays no role in determining the investment policies of the Portfolio or which securities are to be purchased or sold by the Portfolio.
5. Investment Advisory Agreement:
Under the terms of the investment advisory agreement the Adviser provides investment advisory services to the Portfolio at a fee calculated at an annual rate of 0.90% of the Portfolio’s average daily net assets.
The Adviser has voluntarily agreed to reduce fees and reimburse expenses to the extent necessary to keep total annual fund operating expenses from exceeding 2.50% of the Portfolio’s average daily net assets. The Adviser intends to continue these voluntary fee reductions and expense limitations until further notice, but may discontinue all or part of these fee reductions or expense reimbursements at any time.
6. Investment Transactions:
For the year ended October 31, 2023, the Portfolio made purchases of $424,828,926 and sales of $543,622,746 of investment securities other than long-term U.S. Government and short-term securities. There were no purchases or sales of long-term U.S. Government securities.
36
| THE ADVISORS’ INNER CIRCLE FUND | ACADIAN EMERGING MARKETS PORTFOLIO OCTOBER 31, 2023
|
7. Share Transactions:
| Year Ended October 31, 2023 | Year Ended October 31, 2022 | |||||||
Investor Class Shares: | ||||||||
Issued | 764,689 | 3,668,811 | ||||||
Reinvestment of Distributions | 1,263,009 | 750,522 | ||||||
Redeemed | (6,831,732 | ) | (8,980,192 | ) | ||||
Net Decrease in Shares Outstanding from Investor Class Share Transactions | (4,804,034 | ) | (4,560,859 | ) | ||||
I Class Shares: | ||||||||
Issued | 4,078,460 | 5,507,041 | ||||||
Reinvestment of Distributions | 1,039,191 | 502,288 | ||||||
Redeemed | (5,114,817 | ) | (6,824,908 | ) | ||||
Net Increase (Decrease) in Shares Outstanding from I Class Share Transactions | 2,834 | (815,579 | ) | |||||
Y Class Shares: | ||||||||
Issued | 3,587 | 118,395 | ||||||
Reinvestment of Distributions | 23,190 | 7,777 | ||||||
Redeemed | (220,659 | ) | (59,187 | ) | ||||
Net Increase (Decrease) in Shares Outstanding from Y Class Share Transactions | (193,882 | ) | 66,985 | |||||
Net Decrease in Shares Outstanding from Share Transactions | (4,995,082 | ) | (5,309,453 | ) | ||||
8. Line of Credit:
The Portfolio entered into an agreement which enables it to participate in a $50 million unsecured committed revolving line of credit with MUFG Union Bank N.A., which is set to expire July 29, 2024. The proceeds from the borrowings shall be used to finance the Portfolio’s short term general working capital requirements, including the funding of shareholder redemptions. Interest is charged to the Portfolio based on their borrowings at the current reference rate. For the year ended October 31, 2023, the Portfolio had average borrowings of $2,522,230 and a maximum amount borrowed of $35,554,000 over a period of 169 days at a weighted average interest rate of 7.84%. Interest accrued on the borrowings during the period was $93,822. As of October 31, 2023, the Portfolio did not have any borrowings outstanding.
9. Federal Tax Information:
The amount and character of income and capital gain distributions to be paid, if any, are determined in accordance with Federal income tax regulations, which may differ from U.S. GAAP. As a result, net investment income (loss) and net realized gain (loss) on investment transactions for a reporting period may differ significantly from distributions during such period. These book/tax differences may be temporary or permanent in nature.
37
| THE ADVISORS’ INNER CIRCLE FUND | ACADIAN EMERGING MARKETS PORTFOLIO OCTOBER 31, 2023
|
There were no permanent differences credited or charged to Paid-in Capital and Distributable Earnings as of October 31, 2023.
The tax character of dividends and distributions declared during the last two fiscal years were as follows:
| Ordinary Income | Long-Term Capital Gain | Total | ||||||||||||
2023 | $ | 37,952,435 | $ | 6,612,682 | $ | 44,565,117 | ||||||||
| 2022 | 29,888,278 | 1,586,041 | 31,474,319 | ||||||||||
As of October 31, 2023, the components of Distributable Earnings on a tax basis were as follows:
Undistributed Ordinary Income | $ | 25,261,630 | ||
Capital Loss Carryforwards | (16,782,020 | ) | ||
Net Unrealized Appreciation | 23,230,926 | |||
Other Temporary Differences | (19 | ) | ||
Total Distributable Earnings | $ | 31,710,517 |
For Federal income tax purposes, capital losses incurred may be carried forward and applied against future capital gains. Under the Regulated Investment Company Modernization Act of 2010, the Portfolio is permitted to carry forward capital losses incurred in taxable years beginning after December 22, 2010 for an unlimited period. Post-enactment capital losses that are carried forward will retain their character as either short-term or long-term capital losses rather than being considered all short-term as under previous law. The capital loss carryforwards with no expiration are noted below:
| Short-Term | Long-Term | Total Capital Loss | ||||||||
| Loss | Loss | Carryforwards | ||||||||
| $ | 10,139,546 | $ | 6,642,474 | $ | 16,782,020 | |||||
For Federal income tax purposes, the difference between Federal tax cost and book cost primarily relates to PFICs and wash sales, which cannot be used for Federal income tax purposes in the current year and have been deferred for use in future years. The Federal tax cost and aggregate gross unrealized appreciation and depreciation on investments, held by the Portfolio at October 31, 2023, were as follows:
Federal Tax Cost | Aggregated Gross Unrealized Appreciation | Aggregated Gross Unrealized Depreciation | Net Unrealized Appreciation | |||||||||||
| $ | 560,727,145 | $ | 91,389,558 | $ | (64,763,553 | ) | $ | 26,626,005 | ||||||
38
| THE ADVISORS’ INNER CIRCLE FUND | ACADIAN EMERGING MARKETS PORTFOLIO OCTOBER 31, 2023
|
The difference in unrealized appreciation is attributable to Foreign Capital Gains Tax Payable.
10. Concentration of Risk:
As with all management investment companies, a shareholder of the Portfolio is subject to the risk that his or her investment could lose money. The Portfolio is subject to the principal risks noted below, any of which may adversely affect the Portfolio’s net asset value (“NAV”) and ability to meet its investment objective.
Active Management Risk – The Portfolio is subject to the risk that the Adviser’s judgments about the attractiveness, value, or potential appreciation of the Portfolio’s investments may prove to be incorrect. If the investments selected and strategies employed by the Portfolio fail to produce the intended results, the Portfolio could underperform in comparison to other funds with similar objectives and investment strategies.
Equity Risk – Since it purchases equity securities, the Portfolio is subject to the risk that stock prices may fall over short or extended periods of time. Historically, equity markets have moved in cycles, and the value of the Portfolio’s equity securities may fluctuate drastically from day-to-day. Individual companies may report poor results or be negatively affected by industry and/ or economic trends and developments. The prices of securities issued by such companies may suffer a decline in response. These factors contribute to price volatility, which is the principal risk of investing in the Portfolio. This risk is greater for small and medium-sized companies, which tend to be more vulnerable to adverse developments than larger companies.
Small Capitalization Company Risk – The smaller capitalization companies that the Fund invests in may be more vulnerable to adverse business or economic events than larger, more established companies. In particular, investments in these small companies may pose additional risks, including liquidity risk, because these companies tend to have limited product lines, markets, financial resources, and may depend upon a relatively small management group. Therefore, small capitalization stocks may be more volatile than those of larger companies. These securities may be traded over-the-counter or listed on an exchange. The Fund is also subject to the risk that the Adviser’s particular investment style, which focuses on small capitalization stocks, may underperform other segments of the equity market or the equity market as a whole.
Foreign Company Risk – Investing in foreign companies, whether through investments made in foreign markets or made through the purchase of ADRs and GDRs, which are traded on exchanges and represent an ownership in a foreign security, pose additional risks since political and economic events unique to a country or region will affect those markets and their issuers. Political events (civil unrest, national elections, changes in political conditions and foreign relations, imposition of exchange controls and repatriation restrictions), social and economic events (labor strikes, rising inflation) and natural disasters occurring in a country where the Portfolio invests could cause the Portfolio’s investments in that country to experience gains or losses. These risks will not necessarily affect the U.S. economy or similar issuers located in the United States. In addition, investments in foreign companies are generally denominated
39
| THE ADVISORS’ INNER CIRCLE FUND | ACADIAN EMERGING MARKETS PORTFOLIO OCTOBER 31, 2023
|
in a foreign currency. As a result, changes in the value of those currencies compared to the U.S. dollar may affect (positively or negatively) the value of the Portfolio’s investments. These currency movements may occur separately from, and in response to, events that do not otherwise affect the value of the security in the issuer’s home country. While ADRs and GDRs provide an alternative to directly purchasing the underlying foreign securities in their respective national markets and currencies, investments in ADRs and GDRs continue to be subject to many of the risks associated with investing directly in foreign securities.
Emerging Markets Securities Risk – Investments in emerging markets securities are considered speculative and subject to heightened risks in addition to the general risks of investing in non-U.S. securities. Unlike more established markets, emerging markets may have governments that are less stable, markets that are less liquid, and economies that are less developed. Securities of foreign companies may not be registered with the U.S. Securities and Exchange Commission (the “SEC”) and foreign companies are generally not subject to the regulatory controls imposed on U.S. issuers and, as a consequence, there is generally less publicly available information about foreign securities than is available about domestic securities. Income from foreign securities owned by the Portfolio may be reduced by a withholding tax at the source, which tax would reduce income received from the securities comprising the portfolio. In addition, emerging markets securities may be issued by companies with smaller market capitalizations and may suffer periods of relative illiquidity, significant price volatility, restrictions on foreign investment, and possible restrictions on repatriation of investment income and capital. Furthermore, emerging market governments may have limited ability to raise taxes or authorize appropriations for debt repayment. In addition, foreign investors may be required to register the proceeds of sales, and future economic or political crises could lead to price controls, forced mergers, expropriation or confiscatory taxation, seizure, nationalization or creation of government monopolies.
Foreign Currency Risk – Because non-U.S. securities are usually denominated in currencies other than the dollar, the value of the Portfolio’s portfolio may be influenced by currency exchange rates and exchange control regulations. The currencies of emerging market countries may experience significant declines against the U.S. dollar, and devaluation may occur subsequent to investments in these currencies by the Portfolio. Inflation and rapid fluctuations in inflation rates have had, and may continue to have, negative effects on the economies and securities markets of certain emerging market countries.
Geographic Focus Risk – To the extent that it focuses its investments in a particular country or region, the Fund may be more susceptible to economic, political, regulatory or other events or conditions affecting issuers and countries within that country or region. As a result, the Fund may be subject to greater price volatility and risk of loss than a fund holding more geographically diverse investments.
Market Risk – The risk that the market value of an investment may fluctuate. Markets for securities in which the Fund invests may decline significantly in response to adverse issuer, political, regulatory, market, economic or other developments. Similarly, the impact of any epidemic, pandemic or natural disaster, or widespread fear that such events may occur,
40
| THE ADVISORS’ INNER CIRCLE FUND | ACADIAN EMERGING MARKETS PORTFOLIO OCTOBER 31, 2023
|
could negatively affect the global economy, as well as the economies of individual countries, the financial performance of individual companies and sectors, and the markets in general in significant and unforeseen ways. Any such impact could adversely affect the prices and liquidity of the securities and other instruments in which the Fund invests, which in turn could negatively impact the Fund’s performance and cause losses on your investment in the Fund.
The foregoing is not intended to be a complete discussion of all risks associated with the investment strategies of the Fund. Please refer to the Fund’s current prospectus for a discussion of the risks associated with investing in the Fund.
11. Other:
As of October 31, 2023, 78% of the Portfolio’s Investor Class Shares outstanding were held by two record shareholders, 70% of the Portfolio’s I Class Shares were held by four record shareholders, and 82% of the Portfolio’s Y Class Shares outstanding were held by two record shareholders. These shareholders were comprised of omnibus accounts that were held on behalf of various shareholders.
In the normal course of business, the Portfolio enters into contracts that provide general indemnifications. The Portfolio’s maximum exposure under these arrangements is dependent on future claims that may be made against the Portfolio and, therefore, cannot be established; however, based on experience, the risk of loss from such potential claims is considered remote.
12. Loans of Fund Securities:
The Portfolio may lend fund securities having a market value up to one-third of the Portfolio’s total assets. Such loans are secured by collateral equal the market value of the loaned securities. Such collateral will be cash or debt securities issued or guaranteed by the U.S. Government or any agencies. Cash collateral received in connection with these loans is invested in short-term money market instruments. It is the Portfolio’s policy to obtain additional collateral from or return excess collateral to the borrower by the end of the next business day following the valuation date of the securities loaned. Therefore, the value of the collateral held may be temporarily less than the value of the securities on loan. Securities Lending entails a risk of loss to the Portfolio if the market value of the loans were to increase and the borrower did not increase the collateral accordingly. An additional risk is that the borrower fails to return the securities when recalled. The Portfolio could also experience delays and costs in gaining access to the collateral. The Portfolio bears the risk of any deficiency in the amount of the collateral available for return to the borrower due to any loss on the collateral invested.
During the year and as of October 31, 2023, there were no securities on loan for the Portfolio.
41
| THE ADVISORS’ INNER CIRCLE FUND | ACADIAN EMERGING MARKETS PORTFOLIO OCTOBER 31, 2023
|
13. Subsequent Events:
The Portfolio has evaluated the need for additional disclosures and/or adjustments resulting from subsequent events through the date the financial statements were issued. Based on this evaluation, no additional adjustments were required to the financial statements.
42
| THE ADVISORS’ INNER CIRCLE FUND | ACADIAN EMERGING MARKETS PORTFOLIO OCTOBER 31, 2023
|
REPORT OF INDEPENDENT REGISTERED PUBLIC ACCOUNTING FIRM
To the Board of Trustees of The Advisors’ Inner Circle Portfolio
and Shareholders of Acadian Emerging Markets Portfolio
Opinion on the Financial Statements
We have audited the accompanying statement of assets and liabilities, including the schedule of investments, of Acadian Emerging Markets Portfolio (the “Fund”), a series of The Advisors’ Inner Circle Fund as of October 31, 2023, the related statements of operations, changes in net assets, and the financial highlights for the year then ended, and the related notes (collectively referred to as the “financial statements”). In our opinion, the financial statements present fairly, in all material respects, the financial position of the Fund as of October 31, 2023, the results of its operations, the changes in net assets, and the financial highlights for the year then ended, in conformity with accounting principles generally accepted in the United States of America.
The Fund’s financial statement and financial highlights for the year ended October 31, 2022, and prior, were audited by other auditors whose report dated December 29, 2022, expressed an unqualified opinion on those financial statements and financial highlights.
Basis for Opinion
These financial statements are the responsibility of the Fund’s management. Our responsibility is to express an opinion on the Fund’s financial statements based on our audit. We are a public accounting firm registered with the Public Company Accounting Oversight Board (United States) (“PCAOB”) and are required to be independent with respect to the Fund in accordance with the U.S. federal securities laws and the applicable rules and regulations of the Securities and Exchange Commission and the PCAOB.
We conducted our audit in accordance with the standards of the PCAOB. Those standards require that we plan and perform the audit to obtain reasonable assurance about whether the financial statements are free of material misstatement whether due to error or fraud.
Our audit included performing procedures to assess the risks of material misstatement of the financial statements, whether due to error or fraud, and performing procedures that respond to those risks. Such procedures included examining, on a test basis, evidence regarding the amounts and disclosures in the financial statements. Our procedures included confirmation of securities owned as of October 31, 2023, by correspondence with the custodian and brokers; when replies were not received from brokers, we performed other auditing procedures. Our audit also included evaluating the accounting principles used and significant estimates made by management, as well as evaluating the overall presentation of the financial statements. We believe that our audit provides a reasonable basis for our opinion.
We have served as the Fund’s auditor since 2023.
43
| THE ADVISORS’ INNER CIRCLE FUND | ACADIAN EMERGING MARKETS PORTFOLIO OCTOBER 31, 2023
|

Philadelphia, Pennsylvania
December 29, 2023
44
| THE ADVISORS’ INNER CIRCLE FUND | ACADIAN EMERGING MARKETS PORTFOLIO OCTOBER 31, 2023
|
ADDITIONAL INFORMATION (Unaudited) |
Effective March 6, 2023, BBD LLP (“BBD”) ceased to serve as the independent registered public accounting firm of the Acadian Emerging Markets Portfolio (“Portfolio”), a series of The Advisors’ Inner Circle Fund. The Audit Committee of the Board of Trustees approved the replacement of BBD as a result of Cohen & Company, Ltd.’s (“Cohen”) acquisition of BBD’s investment management group.
The report of BBD on the financial statements of the Portfolio as of and for the fiscal years ended October 31, 2022 and October 31, 2021 did not contain an adverse opinion or a disclaimer of opinion, and were not qualified or modified as to uncertainties, audit scope or accounting principles. During the fiscal years ended October 31, 2022 and October 31, 2021, and during the subsequent interim period through March 6, 2023: (i) there were no disagreements between the registrant and BBD on any matter of accounting principles or practices, financial statement disclosure, or auditing scope or procedure, which disagreements, if not resolved to the satisfaction of BBD, would have caused it to make reference to the subject matter of the disagreements in its report on the financial statements of the Portfolio for such years or interim period; and (ii) there were no “reportable events,” as defined in Item 304(a)(1)(v) of Regulation S-K under the Securities Exchange Act of 1934, as amended.
At a meeting on May 23, 2023, the Audit Committee of the Board of Trustees also recommended and approved the appointment of Cohen as the Portfolio’s independent registered public accounting firm for the fiscal year ending October 31, 2023.
During the fiscal years ended October 31, 2022 and October 31, 2021, and during the subsequent interim period through May 23, 2023, neither the registrant, nor anyone acting on its behalf, consulted with Cohen on behalf of the Portfolio regarding the application of accounting principles to a specified transaction (either completed or proposed), the type of audit opinion that might be rendered on the Portfolio’s financial statements, or any matter that was either: (i) the subject of a “disagreement,” as defined in Item 304(a)(1)(iv) of Regulation S-K and the instructions thereto; or (ii) “reportable events,” as defined in Item 304(a)(1)(v) of Regulation S-K.
45
| THE ADVISORS’ INNER CIRCLE FUND | ACADIAN EMERGING MARKETS PORTFOLIO OCTOBER 31, 2023
|
DISCLOSURE OF FUND EXPENSES (Unaudited) |
All mutual funds have operating expenses. As a shareholder of a mutual fund, your investment is affected by these ongoing costs, which include (among others) costs for Portfolio management, administrative services, and shareholder reports like this one. It is important for you to understand the impact of these costs on your investment returns. Operating expenses such as these are deducted from a mutual fund’s gross income and directly reduce your final investment return. These expenses are expressed as a percentage of a mutual fund’s average net assets; this percentage is known as a mutual fund’s expense ratio. The following examples use the expense ratio and are intended to help you understand the ongoing costs (in dollars) of investing in your Portfolio/Fund and to compare these costs with those of other mutual funds. The examples are based on an investment of $1,000 made at the beginning of the period shown and held for the entire period (May 1, 2023 to October 31, 2023).
The table below illustrates your Portfolio’s costs in two ways:
Actual Fund Return. This section helps you to estimate the actual expenses that your Portfolio incurred over the period. The “Expenses Paid During Period” column shows the actual dollar expense cost incurred by a $1,000 investment in the Portfolio, and the “Ending Account Value” number is derived from deducting that expense cost from the Portfolio’s gross investment return.
You can use this information, together with the actual amount you invested in the Portfolio, to estimate the expenses you paid over that period. Simply divide your actual account value by $1,000 to arrive at a ratio (for example, an $8,600 account value divided by $1,000 = 8.6), then multiply that ratio by the number shown under “Expenses Paid During Period.”
Hypothetical 5% Return. This section helps you compare your Portfolio’s costs with those of other mutual funds. It assumes that the Portfolio had an annual 5% return before expenses during the period and that the expense ratio (Column 3) remained unchanged. This example is useful in making comparisons because the Securities and Exchange Commission requires all mutual funds to make this 5% calculation. You can assess your Portfolio’s comparative cost by comparing the hypothetical result for your Portfolio in the “Expenses Paid During Period” column with those that appear in the same charts in the shareholder reports for other mutual funds.
46
| THE ADVISORS’ INNER CIRCLE FUND | ACADIAN EMERGING MARKETS PORTFOLIO OCTOBER 31, 2023
|
DISCLOSURE OF FUND EXPENSES (Unaudited) |
NOTE: Because the return is set at 5% for comparison purposes — NOT your Portfolio’s actual return — the account values shown do not apply to your specific investment.
| Beginning | Ending | Expenses | ||||||||||||||
| Account | Account | Annualized | Paid | |||||||||||||
| Value | Value | Expense | During | |||||||||||||
| 05/01/23 | 10/31/23 | Ratios | Period* | |||||||||||||
Investor Class Shares | ||||||||||||||||
Actual Fund Return | $1,000.00 | $1,009.00 | 1.43% | $7.24 | ||||||||||||
Hypothetical 5% Return | $1,000.00 | $1,018.00 | 1.43% | $7.27 | ||||||||||||
I Class Shares | ||||||||||||||||
Actual Fund Return | $1,000.00 | $1,010.60 | 1.22% | $6.18 | ||||||||||||
Hypothetical 5% Return | $1,000.00 | $1,019.06 | 1.22% | $6.21 | ||||||||||||
Y Class Shares | ||||||||||||||||
Actual Fund Return | $1,000.00 | $1,010.10 | 1.27% | $6.43 | ||||||||||||
Hypothetical 5% Return | $1,000.00 | $1,018.80 | 1.27% | $6.46 | ||||||||||||
| * | Expenses are equal to the Portfolio’s annualized expense ratio multiplied by the average account value over the period, multiplied by 184/365. |
47
| THE ADVISORS’ INNER CIRCLE FUND | ACADIAN EMERGING MARKETS PORTFOLIO OCTOBER 31, 2023
|
TRUSTEES AND OFFICERS OF THE ADVISORS’ INNER CIRCLE FUND (Unaudited) |
Set forth below are the names, years of birth, positions with the Trust, length of term of office, and the principal occupations for the last five years of each of the persons currently serving as Trustees and Officers of the Trust. Unless otherwise noted, the business address of each Trustee is SEI Investments Company, 1 Freedom Valley Drive, Oaks, Pennsylvania 19456. Trustees who are deemed not to be “interested persons” of the Trust are referred to as “Independent Trustees.” Messrs. Nesher and Klauder
Name and Year of Birth | Position with Trust Served1 | Principal Occupations in the Past Five Years | ||
| INTERESTED TRUSTEES 3,4 | ||||
| Robert Nesher (Born: 1946) | Chairman of the Board of Trustees (since 1991) | SEI employee 1974 to present; currently performs various services on behalf of SEI Investments for which Mr. Nesher is compensated. President, Chief Executive Officer and Trustee of SEI Daily Income Trust, SEI Tax Exempt Trust, SEI Institutional Managed Trust, SEI Institutional International Trust, SEI Institutional Investments Trust, SEI Asset Allocation Trust, Adviser Managed Trust, New Covenant Funds, SEI Insurance Products Trust and SEI Catholic Values Trust. President and Director of SEI Structured Credit Fund, LP. Vice Chairman of Winton Series Trust to 2017. Vice Chairman of Winton Diversified Opportunities Fund (closed-end investment company), The Advisors’ Inner Circle Fund III, Gallery Trust, Schroder Series Trust and Schroder Global Series Trust to 2018. | ||
N. Jeffrey Klauder (Born: 1952) | Trustee (since 2018) | Senior Advisor of SEI Investments since 2018. Executive Vice President and General Counsel of SEI Investments, 2004 to 2018.
| ||
| 1 | Each Trustee shall hold office during the lifetime of this Trust until the election and qualification of his or her successor, or until he or she sooner dies, resigns, or is removed in accordance with the Trust’s Declaration of Trust. |
| 2 | Directorships of Companies required to report to the Securities and Exchange Commission under the Securities Exchange Act of 1934 (i.e., “public companies”) or other investment companies under the 1940 Act. |
| 3 | Denotes Trustees who may be deemed to be “interested” persons of the Fund as that term is defined in the 1940 Act by virtue of their affiliation with the Distributor and/or its affiliates. |
| 4 | Trustees oversee 28 funds in The Advisors’ Inner Circle Fund. |
48
| THE ADVISORS’ INNER CIRCLE FUND | ACADIAN EMERGING MARKETS PORTFOLIO OCTOBER 31, 2023
|
are Trustees who may be deemed to be “interested” persons of the Trust as that term is defined in the 1940 Act by virtue of their affiliation with the Trust’s Distributor. The Trust’s Statement of Additional Information (“SAI”) includes additional information about the Trustees and Officers. The SAI may be obtained without charge by calling 1-866-226-6161. The following chart lists Trustees and Officers as of October 31, 2023.
Other Directorships
Held in the Past Five Years2
Current Directorships: Trustee of The Advisors’ Inner Circle Fund II, Bishop Street Funds, Frost Family of Funds, Catholic Responsible Investments Funds, SEI Daily Income Trust, SEI Institutional International Trust, SEI Institutional Investments Trust, SEI Institutional Managed Trust, SEI Asset Allocation Trust, SEI Tax Exempt Trust, Adviser Managed Trust, New Covenant Funds, SEI Insurance Products Trust and SEI Catholic Values Trust. Director of SEI Structured Credit Fund, LP, SEI Global Master Fund plc, SEI Global Assets Fund plc, SEI Global Investments Fund plc, SEI Investments—Global Funds Services, Limited, SEI Investments Global, Limited, SEI Investments (Europe) Ltd., SEI Investments—Unit Trust Management (UK) Limited, SEI Multi-Strategy Funds PLC and SEI Global Nominee Ltd.
Former Directorships: Trustee of The KP Funds to 2022.
Current Directorships: Trustee of The Advisors’ Inner Circle Fund II, Bishop Street Funds and Catholic Responsible Investments Funds. Director of SEI Private Trust Company, SEI Global Fund Services Ltd., SEI Investments Global Limited, SEI Global Master Fund, SEI Global Investments Fund, SEI Global Assets Fund and SEI Investments - Guernsey Limited.
Former Directorships: Trustee of SEI Investments Management Corporation, SEI Trust Company, SEI Investments (South Africa), Limited and SEI Investments (Canada) Company to 2018. Trustee of The KP Funds to 2022.
49
| THE ADVISORS’ INNER CIRCLE FUND | ACADIAN EMERGING MARKETS PORTFOLIO OCTOBER 31, 2023
|
TRUSTEES AND OFFICERS OF THE ADVISORS’ INNER CIRCLE FUND (Unaudited) |
Name and Year of Birth | Position with Trust and Length of Time Served1 | Principal Occupations in the Past Five Years | ||
| INDEPENDENT TRUSTEES3 | ||||
| Kathleen Gaffney (Born: 1961) | Trustee (since 2022) | Retired since 2019. Vice President and Portfolio Manager, Eaton Vance Management from 2012 to 2019. | ||
| Joseph T. Grause, Jr. (Born: 1952) | Trustee (since 2011) Lead Independent Trustee (since 2018) | Self-Employed Consultant since 2012. Director of Endowments and Foundations, Morningstar Investment Management, Morningstar, Inc., 2010 to 2011. Director of International Consulting and Chief Executive Officer of Morningstar Associates Europe Limited, Morningstar, Inc., 2007 to 2010. Country Manager – Morningstar UK Limited, Morningstar, Inc., 2005 to 2007. | ||
| Betty L. Krikorian (Born: 1943) | Trustee (since 2005) | Vice President, Compliance, AARP Financial Inc., from 2008 to 2010. Self-Employed Legal and Financial Services Consultant since 2003. Counsel (in-house) for State Street Bank from 1995 to 2003. | ||
| Robert Mulhall (Born: 1958) | Trustee (since 2019) | Partner, Ernst & Young LLP, from 1998 to 2018. | ||
| Bruce Speca (Born: 1956) | Trustee (since 2011) | Global Head of Asset Allocation, Manulife Asset Management (subsidiary of Manulife Financial), 2010 to 2011. Executive Vice President – Investment Management Services, John Hancock Financial Services (subsidiary of Manulife Financial), 2003 to 2010. | ||
| Monica Walker (Born: 1958) | Trustee (since 2022) | Retired. Private Investor since 2017. Co-Founder (1991-2017), Chairman and Chief Executive Officer (2009 to 2017) and Chief Investment Officer - Equity (2007 to 2017) of Holland Capital Management, LLC (Chicago). | ||
| OFFICERS | ||||
| Michael Beattie (Born: 1965) | President (since 2011) | Director of Client Service, SEI Investments, since 2004. | ||
| 1 | Each Trustee shall hold office during the lifetime of this Trust until the election and qualification of his or her successor, or until he or she sooner dies, resigns, or is removed in accordance with the Trust’s Declaration of Trust. |
| 2 | Directorships of Companies required to report to the Securities and Exchange Commission under the Securities Exchange Act of 1934 (i.e., “public companies”) or other investment companies under the 1940 Act. |
| 3 | Trustees oversee 28 funds in The Advisors’ Inner Circle Fund. |
50
| THE ADVISORS’ INNER CIRCLE FUND | ACADIAN EMERGING MARKETS PORTFOLIO OCTOBER 31, 2023
|
Other Directorships
Held in the Past Five Years2
Current Directorships: Trustee of The Advisors’ Inner Circle Fund II, Bishop Street Funds and Catholic Responsible Investments Funds.
Current Directorships: Trustee of The Advisors’ Inner Circle Fund II, Bishop Street Funds, Frost Family of Funds, and Catholic Responsible Investments Funds.
Former Directorships: Director of The Korea Fund, Inc. to 2019. Trustee of The KP Funds to 2022.
Current Directorships: Trustee of The Advisors’ Inner Circle Fund II, Bishop Street Funds, and Catholic Responsible Investments Funds.
Former Directorships: Trustee of The KP Funds to 2022.
Current Directorships: Trustee of The Advisors’ Inner Circle Fund II, Bishop Street Funds, Frost Family of Funds and Catholic Responsible Investments Funds.
Former Directorships: Trustee of Villanova University Alumni Board of Directors to 2018. Trustee of The KP Funds to 2022.
Current Directorships: Trustee of The Advisors’ Inner Circle Fund II, Bishop Street Funds, Frost Family of Funds and Catholic Responsible Investments Funds. Former Directorships: Trustee of The KP Funds to 2022. Director of Stone Harbor Investments Funds (8 Portfolios), Stone Harbor Emerging Markets Income Fund (closed-end fund) and Stone Harbor Emerging Markets Total Income Fund (closed-end fund) to 2022.
Former Directorships: Trustee of The KP Funds to 2022.
Current Directorships: Trustee of The Advisors’ Inner Circle Fund II, Bishop Street Funds and Catholic Responsible Investments Funds.
None.
51
| THE ADVISORS’ INNER CIRCLE FUND | ACADIAN EMERGING MARKETS PORTFOLIO OCTOBER 31, 2023
|
TRUSTEES AND OFFICERS OF THE ADVISORS’ INNER CIRCLE FUND (Unaudited) |
Name and Year of Birth | Position with Trust and Length of Time Served | Principal Occupations in the Past Five Years | ||
| OFFICERS (continued) | ||||
| James Bernstein (Born: 1962) | Vice President and Assistant Secretary (since 2017) | Attorney, SEI Investments, since 2017.
Prior Positions: Self-employed consultant, 2017. Associate General Counsel & Vice President, Nationwide Funds Group and Nationwide Mutual Insurance Company, from 2002 to 2016. Assistant General Counsel & Vice President, Market Street Funds and Provident Mutual Insurance Company, from 1999 to 2002. | ||
| John Bourgeois (Born: 1973) | Assistant Treasurer (since 2017) | Fund Accounting Manager, SEI Investments, since 2000. | ||
| Donald Duncan (Born: 1964) | Anti-Money Laundering Compliance Officer and Privacy Coordinator (since 2023) | Chief Compliance Officer and Global Head of Anti-Money Laundering Strategy of SEI Investments Company since January 2023. Head of Global Anti-Money Laundering Program for Hamilton Lane Advisors, LLC from August 2021 until December 2022. Senior VP and Supervising Principal of Hamilton Lane Securities, LLC from June 2016 to August 2021. Senior Director at AXA-Equitable from June 2011 until May 2016. Senior Director at PRUCO Securities, a subsidiary of Prudential Financial, Inc. from October 2005 until December 2009. | ||
| Eric C. Griffith (Born: 1969) | Vice President and Assistant Secretary (since 2019) | Counsel at SEI Investments since 2019. Vice President and Assistant General Counsel, JPMorgan Chase & Co., from 2012 to 2018. | ||
| Matthew M. Maher (Born: 1975) | Vice President (since 2018) Secretary (since 2020) | Counsel at SEI Investments since 2018. Attorney, Blank Rome LLP, from 2015 to 2018. Assistant Counsel & Vice President, Bank of New York Mellon, from 2013 to 2014. Attorney, Dilworth Paxson LLP, from 2006 to 2013. | ||
| Andrew Metzger (Born: 1980) | Treasurer, Controller and Chief Financial Officer (since 2021) | Director of Fund Accounting, SEI Investments, since 2020. Senior Director, Embark, from 2019 to 2020. Senior Manager, PricewaterhouseCoopers LLP, from 2002 to 2019. | ||
52
| THE ADVISORS’ INNER CIRCLE FUND | ACADIAN EMERGING MARKETS PORTFOLIO OCTOBER 31, 2023
|
Other Directorships
Held in the Past Five Years
None.
None.
None.
None.
None.
None.
53
| THE ADVISORS’ INNER CIRCLE FUND | ACADIAN EMERGING MARKETS PORTFOLIO OCTOBER 31, 2023
|
TRUSTEES AND OFFICERS OF THE ADVISORS’ INNER CIRCLE FUND (Unaudited) |
Name and Year of Birth | Position with Trust and Length of Time Served | Principal Occupation in the Past Five Years | ||
| OFFICERS (continued) | ||||
| Robert Morrow (Born: 1968) | Vice President (since 2017) | Account Manager, SEI Investments, since 2007. | ||
| Stephen F. Panner (Born: 1970) | Chief Compliance Officer (since 2022) | Chief Compliance Officer of SEI Asset Allocation Trust, SEI Daily Income Trust, SEI Institutional Investments Trust, SEI Institutional International Trust, SEI Institutional Managed Trust, SEI Tax Exempt Trust, Adviser Managed Trust, New Covenant Funds, SEI Catholic Values Trust, SEI Exchange Traded Funds, SEI Structured Credit Fund LP, The Advisors’ Inner Circle Fund, The Advisors’ Inner Circle Fund II, The Advisors’ Inner Circle Fund III, Bishop Street Funds, Frost Family of Funds, Gallery Trust, Delaware Wilshire Private Markets Fund, Delaware Wilshire Private Markets Master Fund, Delaware Wilshire Private Markets Tender Fund and Catholic Responsible Investments Funds since September 2022. Fund Compliance Officer of SEI Investments Company from February 2011 to September 2022. Fund Accounting Director and CFO and Controller for the SEI Funds from July 2005 to February 2011. | ||
| Alexander F. Smith (Born: 1977) | Vice President and Assistant Secretary (since 2020) | Counsel at SEI Investments since 2020. Associate Counsel & Manager, Vanguard, 2012 to 2020. Attorney, Stradley Ronon Stevens & Young, LLP, 2008 to 2012. | ||
54
| THE ADVISORS’ INNER CIRCLE FUND | ACADIAN EMERGING MARKETS PORTFOLIO OCTOBER 31, 2023
|
Other Directorships
Held in the Past Five Years
None.
None.
None.
55
| THE ADVISORS’ INNER CIRCLE FUND | ACADIAN EMERGING MARKETS PORTFOLIO
|
APPROVAL OF INVESTMENT ADVISORY AGREEMENT (Unaudited) |
Pursuant to Section 15 of the Investment Company Act of 1940 (the “1940 Act”), the Fund’s advisory agreement (the “Agreement”) must be renewed at least annually after its initial two-year term: (i) by the vote of the Board of Trustees (the “Board” or the “Trustees”) of The Advisors’ Inner Circle Fund (the “Trust”) or by a vote of a majority of the shareholders of the Fund; and (ii) by the vote of a majority of the Trustees who are not parties to the Agreement or “interested persons” of any party thereto, as defined in the 1940 Act (the “Independent Trustees”), cast in person at a meeting called for the purpose of voting on such renewal.
A Board meeting was held on May 23-24, 2023 to decide whether to renew the Agreement for an additional one-year term. In preparation for the meeting, the Trustees requested that the Adviser furnish information necessary to evaluate the terms of the Agreement. Prior to the meeting, the Independent Trustees of the Fund met to review and discuss the information provided and submitted a request for additional information to the Adviser, and information was provided in response to this request. The Trustees used this information, as well as other information that the Adviser and other service providers of the Fund presented or submitted to the Board at the meeting and other meetings held during the prior year, to help them decide whether to renew the Agreement for an additional year.
Specifically, the Board requested and received written materials from the Adviser and other service providers of the Fund regarding: (i) the nature, extent and quality of the Adviser’s services; (ii) the Adviser’s investment management personnel; (iii) the Adviser’s operations and financial condition; (iv) the Adviser’s brokerage practices (including any soft dollar arrangements) and investment strategies; (v) the Fund’s advisory fee paid to the Adviser and overall fees and operating expenses compared with a peer group of mutual funds; (vi) the level of the Adviser’s profitability from its relationship with the Fund, including both direct and indirect benefits accruing to the Adviser and its affiliates; (vii) the Adviser’s potential economies of scale; (viii) the Adviser’s compliance program, including a description of material compliance matters and material compliance violations; (ix) the Adviser’s policies on and compliance procedures for personal securities transactions; and (x) the Fund’s performance compared with a peer group of mutual funds and the Fund’s benchmark index.
Representatives from the Adviser, along with other Fund service providers, presented additional information and participated in question and answer sessions at the Board meeting to help the Trustees evaluate the Adviser’s services, fee and other aspects of the Agreement. The Independent Trustees received advice from independent counsel and met in executive sessions outside the presence of Fund management and the Adviser.
At the Board meeting, the Trustees, including all of the Independent Trustees, based on their evaluation of the information provided by the Adviser and other service providers of the Fund, renewed the Agreement. In considering the renewal of the Agreement, the Board considered various factors that they determined were relevant, including: (i) the nature, extent and quality of the services provided by the Adviser; (ii) the investment performance of the Fund and the Adviser; (iii) the costs of the services provided and profits realized by the Ad-
56
| THE ADVISORS’ INNER CIRCLE FUND | ACADIAN EMERGING MARKETS PORTFOLIO
|
viser from its relationship with the Fund, including both direct and indirect benefits accruing to the Adviser and its affiliates; (iv) the extent to which economies of scale are being realized by the Adviser; and (v) whether fee levels reflect such economies of scale for the benefit of Fund investors, as discussed in further detail below.
Nature, Extent and Quality of Services Provided by the Adviser
In considering the nature, extent and quality of the services provided by the Adviser, the Board reviewed the portfolio management services provided by the Adviser to the Fund, including the quality and continuity of the Adviser’s portfolio management personnel, the resources of the Adviser, and the Adviser’s compliance history and compliance program.
The Trustees reviewed the terms of the Agreement. The Trustees also reviewed the Adviser’s investment and risk management approaches for the Fund. The most recent investment adviser registration form (“Form ADV”) for the Adviser was available to the Board, as was the response of the Adviser to a detailed series of questions which included, among other things, information about the investment advisory services provided by the Adviser to the Fund. The Trustees also considered other services provided to the Fund by the Adviser such as selecting broker-dealers for executing portfolio transactions, monitoring adherence to the Fund’s investment restrictions, and monitoring compliance with various Fund policies and procedures and with applicable securities laws and regulations. Based on the factors above, as well as those discussed below, the Board concluded, within the context of its full deliberations, that the nature, extent and quality of the services provided to the Fund by the Adviser were sufficient to support renewal of the Agreement.
Investment Performance of the Fund and the Adviser
The Board was provided with regular reports regarding the Fund’s performance over various time periods. The Trustees also reviewed reports prepared by the Fund’s administrator comparing the Fund’s performance to its benchmark index and a peer group of mutual funds as classified by Lipper, an independent provider of investment company data, over various periods of time. Representatives from the Adviser provided information regarding and led discussions of factors impacting the performance of the Fund, outlining current market conditions and explaining their expectations and strategies for the future. The Trustees determined that the Fund’s performance was satisfactory, or, where the Fund’s performance was materially below its benchmark and/or peer group, the Trustees were satisfied by the reasons for the underperformance and/or the steps taken by the Adviser in an effort to improve the performance of the Fund. Based on this information, the Board concluded, within the context of its full deliberations, that the investment results that the Adviser had been able to achieve for the Fund were sufficient to support renewal of the Agreement.
Costs of Advisory Services, Profitability and Economies of Scale
In considering the advisory fee payable by the Fund to the Adviser, the Trustees reviewed, among other things, a report of the advisory fee paid to the Adviser. The Trustees also
57
| THE ADVISORS’ INNER CIRCLE FUND | ACADIAN EMERGING MARKETS PORTFOLIO
|
reviewed reports prepared by the Fund’s administrator comparing the Fund’s net and gross expense ratios and advisory fee to those paid by a peer group of mutual funds as classified by Lipper. The Trustees reviewed the management fees charged by the Adviser to other clients with comparable mandates. The Trustees considered any differences in management fees and took into account the respective demands, resources and complexity associated with the Fund and other client accounts as well as the extensive regulatory, compliance and tax regimes to which the Fund is subject. The Board concluded, within the context of its full deliberations, that the advisory fee was reasonable in light of the nature and quality of the services rendered by the Adviser.
The Trustees reviewed the costs of services provided by and the profits realized by the Adviser from its relationship with the Fund, including both direct benefits and indirect benefits, such as research and brokerage services received under soft dollar arrangements, accruing to the Adviser and its affiliates. The Trustees considered how the Adviser’s profitability was affected by factors such as its organizational structure and method for allocating expenses. The Trustees concluded that the profit margins of the Adviser with respect to the management of the Fund were not unreasonable.
The Trustees considered the Adviser’s views relating to economies of scale in connection with the Fund as Fund assets grow and the extent to which the benefits of any such economies of scale are shared with the Fund and Fund shareholders. The Board considered the existence of any economies of scale and whether those were passed along to the Fund’s shareholders through a graduated advisory fee schedule or other means, including fee waivers. The Trustees recognized that economies of scale are difficult to identify and quantify and are rarely identifiable on a fund-by-fund basis. Based on this evaluation, the Board concluded that the advisory fee was reasonable in light of the information that was provided to the Trustees by the Adviser with respect to economies of scale.
Renewal of the Agreement
Based on the Board’s deliberations and its evaluation of the information described above and other factors and information it believed relevant in the exercise of its reasonable business judgment, the Board, including all of the Independent Trustees, with the assistance of Fund counsel and Independent Trustees’ counsel, unanimously concluded that the terms of the Agreement, including the fees payable thereunder, were fair and reasonable and agreed to renew the Agreement for another year. In its deliberations, the Board did not identify any absence of information as material to its decision, or any particular factor (or conclusion with respect thereto) or single piece of information that was all-important, controlling or determinative of its decision, but considered all of the factors together, and each Trustee may have attributed different weights to the various factors (and conclusions with respect thereto) and information.
58
| THE ADVISORS’ INNER CIRCLE FUND | ACADIAN EMERGING MARKETS PORTFOLIO OCTOBER 31, 2023
|
REVIEW OF LIQUIDITY RISK MANAGEMENT PROGRAM (Unaudited) |
Pursuant to Rule 22e-4 under the 1940 Act, the Fund’s investment adviser has adopted, and the Board has approved, a liquidity risk management program (the “Program”) to govern the Fund’s approach to managing liquidity risk. The Program is overseen by the Fund’s Liquidity Risk Management Program Administrator (the “Program Administrator”), and the Program’s principal objectives include assessing, managing and periodically reviewing the Fund’s liquidity risk, based on factors specific to the circumstances of the Fund.
At a meeting of the Board held on May 23, 2023, the Trustees received a report from the Program Administrator addressing the operations of the Program and assessing its adequacy and effectiveness of implementation for the period from January 1, 2022 through December 31, 2022. Among other things, the Program Administrator’s report noted that:
• The Program Administrator had determined that the Program is reasonably designed to assess and manage the Fund’s liquidity risk and has operated adequately and effectively to manage the Fund’s liquidity risk during the period covered by the report.
• During the period covered by the report, there were no liquidity events that impacted the Fund or its ability to timely meet redemptions without dilution to existing shareholders.
• No material changes have been made to the Program during the period covered by the report.
There can be no assurance that the Program will achieve its objectives in the future. Please refer to the prospectus for more information regarding the Fund’s exposure to liquidity risk and other principal risks to which an investment in the Fund may be subject.
59
| THE ADVISORS’ INNER CIRCLE FUND | ACADIAN EMERGING MARKETS PORTFOLIO OCTOBER 31, 2023
|
NOTICE TO SHAREHOLDERS (Unaudited) |
| Qualifying | ||||||||||||||||||||||||||||||||||||||
| Long-Term | Ordinary | For Corporate | Qualifying | U.S. | Interest | Short Term | Foreign | |||||||||||||||||||||||||||||||
| Return Of | Capital Gain | Income | Total | Dividends Rec. | Dividend | Government | Related | Capital Gain | Tax | |||||||||||||||||||||||||||||
| Capital | Distribution | Distributions | Distributions | Deduction(1) | Income(2) | Interest(3) | Dividend(4) | Dividends(5) | Credit(6) | |||||||||||||||||||||||||||||
| 0.00% | 13.32% | 86.68% | 100.00% | 0.20% | 65.11% | 0.00% | 0.00% | 0.00% | 10.21% | |||||||||||||||||||||||||||||
| (1) | Qualifying dividends represent dividends which qualify for the corporate dividend received deduction and are reflected as a percentage of ordinary income distributions (the total of short term capital gain and net investment income distributions). |
| (2) | The percentage in this column represents the amount of “Qualifying Dividend Income” as created by the Jobs and Growth Tax Relief Reconciliation Act of 2003 and is reflected as a percentage of ordinary income distributions (the total of short term capital gain and net investment income distributions). It is the intention of each of the aforementioned Portfolios to designate the maximum amount permitted by law. |
| (3) | “U.S. Government Interest” represents the amount of interest that was derived from direct U.S. Government obligations and distributed during the fiscal year. This amount is reflected as a percentage of ordinary income. Generally, interest from direct U.S. Government obligations is exempt from state income tax. However, for shareholders of the Portfolio who are residents of California, Connecticut and New York, the statutory threshold requirements were not satisfied to permit exemption of these amounts from state income. |
| (4) | The percentage in this column represents the amount of “Interest Related Dividend” as created by the American Jobs Creation Act of 2004 and is reflected as a percentage of net investment income distributions that is exempt from U.S. withholding tax when paid to foreign investors. |
| (5) | The percentage in this column represents the amount of “Short-Term Capital Gain Dividends” as created by the American Jobs Creation Act of 2004 and is reflected as a percentage of short-term capital gain distributions that is exempt from U.S. withholding tax when paid to foreign investors. |
| (6) | The percentage in this column represents the amount of “Qualifying Foreign Taxes” as a percentage of ordinary distributions during the fiscal year ended October 31, 2023 amounting to $5,069,361 are expected to be passed through to the shareholders as foreign tax credits on Form 1099-DIV for the year ending December 31, 2023, which shareholders of this Portfolio will receive in late January, 2024. In addition, for the fiscal year ended October 31, 2023, gross foreign source income amounted to $29,451,192 for the Portfolio. |
The information reported herein may differ from the information and distributions taxable to the shareholders for the calendar year ending December 31, 2023. Complete information will be computed and reported in conjunction with your 2023 Form 1099-DIV.
60
This page intentionally left blank.
Acadian Funds
P.O. Box 219009
Kansas City, MO 64121
1-866-AAM-6161
Adviser:
Acadian Asset Management LLC
260 Franklin Street
Boston, MA 02110
Distributor:
SEI Investments Distribution Co.
1 Freedom Valley Drive
Oaks, PA 19456
Administrator:
SEI Investments Global Funds Services
1 Freedom Valley Drive
Oaks, PA 19456
Legal Counsel:
Morgan, Lewis & Bockius LLP
2222 Market Street
Philadelphia, PA 19103
This information must be preceded or accompanied by a current prospectus for the Portfolio described.
ACA-AR-001-2200
(b) Not applicable.
| Item 2. | Code of Ethics. |
The Registrant (also referred to as the “Trust”) has adopted a code of ethics that applies to the Registrant’s principal executive officer, principal financial officer, controller or principal accounting officer, and any person who performs a similar function. There have been no amendments to or waivers granted to this code of ethics during the period covered by this report.
| Item 3. | Audit Committee Financial Expert. |
(a)(1) The Registrant’s board of trustees has determined that the Registrant has at least one audit committee financial expert serving on the audit committee.
(a)(2) The Registrant’s audit committee financial expert is Robert Mulhall. Mr Mulhall is considered to be “independent”, as that term is defined in Form N-CSR Item 3(a)(2).
| Item 4. | Principal Accountant Fees and Services. |
Fees billed by PricewaterhouseCoopers LLP (“PwC”) related to the Trust.
PwC billed the Trust aggregate fees for services rendered to the Trust for the last two fiscal years as follows:
| FYE October 31, 2023 | FYE October 31, 2022 | |||||||||||||
All fees and services to the Trust that were pre- approved | All fees and services to service affiliates that were pre- approved | All other fees and services to service affiliates that did not require pre- approval | All fees and services to the Trust that were pre- approved | All fees and services to service affiliates that were pre- approved | All other fees and services to service affiliates that did not require pre- approval | |||||||||
(a) | Audit Fees(1) | $72,710 | None | None | $72,710 | None | None | |||||||
(b) | Audit-Related Fees | None | None | None | None | None | None | |||||||
(c) | Tax Fees | None | None | $115,395(4) | $10,000(2) | None | $256,295(4) | |||||||
(d) | All Other Fees | None | None | $47,411(5) | None | None | $86,500(5) | |||||||
Fees billed by Ernst & Young LLP (“E&Y”) related to the Trust.
E&Y billed the Trust aggregate fees for services rendered to the Trust for the last two fiscal years as follows:
2
| 2023 | 2022 | |||||||||||||
All fees and services to the Trust that were pre- approved | All fees and services to service affiliates that were pre- approved | All other fees and services to service affiliates that did not require pre- approval | All fees and services to the Trust that were pre- approved | All fees and services to service affiliates that were pre- approved | All other fees and services to service affiliates that did not require pre- approval | |||||||||
(a) | Audit Fees(1) | $550,800 | None | None | $529,590 | None | None | |||||||
(b) | Audit-Related Fees | None | None | None | $10,000(6) | None | None | |||||||
(c) | Tax Fees | None | None | None | $2,000(3) | None | None | |||||||
(d) | All Other Fees | None | None | None | None | None | None | |||||||
Fees billed by Cohen & Co. (“Cohen”) related to the Trust.
Cohen billed the Trust aggregate fees for services rendered to the Trust for the last two fiscal years as follows:
| 2023 | 2022 | |||||||||||||
All fees and services to the Trust that were pre- approved | All fees and services to service affiliates that were pre- approved | All other fees and services to service affiliates that did not require pre- approval | All fees and services to the Trust that were pre- approved | All fees and services to service affiliates that were pre- approved | All other fees and services to service affiliates that did not require pre- approval | |||||||||
(a) | Audit Fees(1) | $61,000 | None | None | $61,000 | None | None | |||||||
(b) | Audit-Related Fees | None | None | None | None | None | None | |||||||
(c) | Tax Fees | None | None | None | None | None | None | |||||||
(d) | All Other Fees | None | None | None | None | None | None | |||||||
Notes:
| (1) | Audit fees include amounts related to the audit of the Trust’s annual financial statements and services normally provided by the accountant in connection with statutory and regulatory filings. |
3
| (2) | Final tax compliance services provided to McKee International Equity Portfolio. |
| (3) | Common Reporting Standard (“CRS”) tax services for the Sands Capital Global Growth Fund. |
| (4) | Tax compliance services provided to service affiliates of the funds. |
| (5) | Non-audit assurance engagements for service affiliates of the funds. |
| (6) | Fees related to consents for Cambiar N-14 filings. |
(e)(1) The Trust’s Audit Committee has adopted and the Board of Trustees has ratified an Audit and Non-Audit Services Pre-Approval Policy (the “Policy”), which sets forth the procedures and the conditions pursuant to which services proposed to be performed by the independent auditor of the Funds may be pre-approved.
The Policy provides that all requests or applications for proposed services to be provided by the independent auditor must be submitted to the Registrant’s Chief Financial Officer (“CFO”) and must include a detailed description of the services proposed to be rendered. The CFO will determine whether such services:
(1) require specific pre-approval; (2) are included within the list of services that have received the general pre-approval of the Audit Committee pursuant to the Policy; or (3) have been previously pre-approved in connection with the independent auditor’s annual engagement letter for the applicable year or otherwise. In any instance where services require pre-approval, the Audit Committee will consider whether such services are consistent with SEC’s rules and whether the provision of such services would impair the auditor’s independence.
Requests or applications to provide services that require specific pre-approval by the Audit Committee will be submitted to the Audit Committee by the CFO. The Audit Committee will be informed by the CFO on a quarterly basis of all services rendered by the independent auditor. The Audit Committee has delegated specific pre-approval authority to either the Audit Committee Chair or financial expert, provided that the estimated fee for any such proposed pre-approved service does not exceed $100,000 and any pre-approval decisions are reported to the Audit Committee at its next regularly-scheduled meeting.
Services that have received the general pre-approval of the Audit Committee are identified and described in the Policy. In addition, the Policy sets forth a maximum fee per engagement with respect to each identified service that has received general pre-approval.
All services to be provided by the independent auditor shall be provided pursuant to a signed written engagement letter with the Registrant, the investment adviser, or applicable control affiliate (except that matters as to which an engagement letter would be impractical because of timing issues or because the matter is small may not be the subject of an engagement letter) that sets forth both the services to be provided by the independent auditor and the total fees to be paid to the independent auditor for those services.
In addition, the Audit Committee has determined to take additional measures on an annual basis to meet the Audit Committee’s responsibility to oversee the work of the independent auditor and to assure the auditor’s independence from the Registrant, such as (a) reviewing a formal written statement from the independent auditor delineating all relationships between the independent auditor and the Registrant, and (b) discussing with the independent auditor the independent auditor’s methods and procedures for ensuring independence.
(e)(2) Percentage of fees billed applicable to non-audit services pursuant to waiver of pre-approval requirement were as follows (PwC):
| 2023 | 2022 | |||
Audit-Related Fees
| None
| None
|
4
Tax Fees | None | None | ||
All Other Fees
| None
| None
|
(e)(2) Percentage of fees billed applicable to non-audit services pursuant to waiver of pre-approval requirement were as follows (E&Y):
| 2023 | 2022 | |||
Audit-Related Fees | None | None | ||
Tax Fees | None | None | ||
All Other Fees
| None
| None
|
(e)(2) Percentage of fees billed applicable to non-audit services pursuant to waiver of pre-approval requirement were as follows (Cohen):
| 2023 | 2022 | |||
Audit-Related Fees | None | None | ||
Tax Fees | None | None | ||
All Other Fees
| None
| None
|
(f) Not applicable.
(g) The aggregate non-audit fees and services billed by PwC for services rendered to the Registrant, and rendered to the Registrant’s investment adviser (not including any sub-adviser whose role is primarily portfolio management and is subcontracted with or overseen by another investment adviser), and any entity controlling, controlled by, or under common control with the adviser that provides ongoing services to the Registrant for the last two fiscal years ended October 31st were $162,806 and $342,795 for 2023 and 2022, respectively.
(g) The aggregate non-audit fees and services billed by E&Y for services rendered to the Registrant, and rendered to the Registrant’s investment adviser (not including any sub-adviser whose role is primarily portfolio management and is subcontracted with or overseen by another investment adviser), and any entity controlling, controlled by, or under common control with the adviser that provides ongoing services to the Registrant for the last two fiscal years ended October 31st were $0 and $2,000 for 2023 and 2022, respectively.
(g) The aggregate non-audit fees and services billed by Cohen for services rendered to the Registrant, and rendered to the Registrant’s investment adviser (not including any sub-adviser whose role is primarily portfolio management and is subcontracted with or overseen by another investment adviser), and any entity controlling, controlled by, or under common control with the adviser that provides ongoing services to the Registrant for the last two fiscal-years-ended October 31st were $0 and $0 for 2023 and 2022, respectively.
(h) During the past fiscal year, all non-audit services provided by the Registrant’s principal accountant to either the Registrant’s investment adviser or to any entity controlling, controlled by, or under common control with the Registrant’s investment adviser that provides ongoing services to the Registrant were pre-approved by the Audit Committee of Registrant’s Board of Trustees. Included in the Audit Committee’s pre-approval of these non-audit service were the review and consideration as to whether the provision of these non-audit services is compatible with maintaining the principal accountant’s independence.
5
(i) Not Applicable. The Registrant has not retained, for the preparation of the audit report on the financial statements included in the Form N-CSR, a registered public accounting firm that has a branch or office that is located in a foreign jurisdiction and that the Public Company Accounting Oversight Board (the “PCAOB”) has determined that the PCAOB is unable to inspect or investigate completely because of a position taken by an authority in the foreign jurisdiction.
(j) Not applicable. The Registrant is not a “foreign issuer,” as defined in 17 CFR § 240.3b-4.
| Item 5. | Audit Committee of Listed Registrants. |
Not applicable to open-end management investment companies.
| Item 6. | Schedule of Investments. |
Schedule of Investments is included as part of the Report to Shareholders filed under Item 1 of this form.
Item 7. Disclosure of Proxy Voting Policies and Procedures for Closed-End Management Investment Companies.
Not applicable to open-end management investment companies.
| Item 8. | Portfolio Managers of Closed-End Management Investment Companies. |
Not applicable to open-end management investment companies.
| Item 9. | Purchases of Equity Securities by Closed-End Management Company and Affiliated Purchasers. |
Not applicable to open-end management investment companies.
| Item 10. | Submission of Matters to a Vote of Security Holders. |
There have been no changes to the procedures by which shareholders may recommend nominees to the Registrant’s Board of Trustees during the period covered by this report.
| Item 11. | Controls and Procedures. |
(a) The Registrant’s principal executive and principal financial officers, or persons performing similar functions, have concluded that the Registrant’s disclosure controls and procedures, as defined in Rule 30a-3(c) under the Act (17 CFR § 270.30a-3(c)), as of a date within 90 days of the filing date of the report, are effective based on the evaluation of these controls and procedures required by Rule 30a-3(b) under the Act (17 CFR § 270.30a-3(b)) and Rule 13a-15(b) or Rule 15d-15(b) under the Securities Exchange Act of 1934 (17 CFR § 240.13a-15(b) or § 240.15d-15(b)).
(b) There has been no change in the Registrant’s internal control over financial reporting (as defined in Rule 30a-3(d) under the Act (17 CFR § 270.3a-3(d)) that occurred during the period covered by this report that has materially affected, or is reasonably likely to materially affect, the Registrant’s internal control over financial reporting.
| Item 12. | Disclosure of Securities Lending Activities for Closed-End Management Investment Companies. |
Not applicable to open-end management investment companies.
| Item 13. | Exhibits. |
6
7
SIGNATURES
Pursuant to the requirements of the Securities Exchange Act of 1934 and the Investment Company Act of 1940, the Registrant has duly caused this report to be signed on its behalf by the undersigned, thereunto duly authorized.
(Registrant) | The Advisors’ Inner Circle Fund | |
By (Signature and Title) | /s/ Michael Beattie | |
Michael Beattie, President | ||
Date: January 9, 2024 | ||
Pursuant to the requirements of the Securities Exchange Act of 1934 and the Investment Company Act of 1940, this report has been signed below by the following persons on behalf of the Registrant and in the capacities and on the dates indicated.
By (Signature and Title) | /s/ Michael Beattie | |
Michael Beattie, President | ||
Date: January 9, 2024 | ||
By (Signature and Title) | /s/ Andrew Metzger | |
Andrew Metzger | ||
Treasurer, Controller, and CFO | ||
Date: January 9, 2024 | ||
8