UNITED STATES
SECURITIES AND EXCHANGE COMMISSION
Washington, D.C. 20549
________
FORM N-CSR
________
CERTIFIED SHAREHOLDER REPORT OF REGISTERED MANAGEMENT
INVESTMENT COMPANIES
Investment Company Act File Number 811-06400
The Advisors’ Inner Circle Fund
(Exact name of registrant as specified in charter)
________
SEI Investments
One Freedom Valley Drive
Oaks, PA 19456
(Address of principal executive offices) (Zip code)
SEI Investments
One Freedom Valley Drive
Oaks, PA 19456
(Name and address of agent for service)
Registrant’s telephone number, including area code: (877) 446-3863
Date of fiscal year end: September 30, 2024
Date of reporting period: September 30, 2024
Item 1. Reports to Stockholders.
(a) A copy of the report transmitted to stockholders pursuant to Rule 30e-1 under the Investment Company Act of 1940, as amended (the “Act”) (17 CFR § 270.30e-1), is attached hereto.
The Advisors' Inner Circle Fund/Institutional Shares - EGFIX
Annual Shareholder Report - September 30, 2024
This annual shareholder report contains important information about Institutional Shares of the Edgewood Growth Fund (the "Fund") for the period from October 1, 2023 to September 30, 2024. You can find additional information about the Fund at http://edgewoodfunds.com/document-library. You can also request this information by contacting us at 1-800-791-4226.
What were the Fund costs for the last year?
(based on a hypothetical $10,000 investment)
| Fund Name | Costs of a $10,000 investment | Costs paid as a percentage of a $10,000 investment |
|---|
| Edgewood Growth Fund, Institutional Shares | $118 | 1.00% |
How did the Fund perform in the last year?
The Edgewood Growth Fund was up +35.27% (Institutional shares) and up +34.74% (Retail shares) for the trailing twelve-month period ending September 30, 2024. The S&P 500 Growth Index was up +41.10% and the S&P 500 Total Return Index was up +36.35% in the same period. For the six-month period ending September 30, 2024, the Fund was up +3.28% (Institutional shares) and up +3.09% (Retail shares). In the same six-month period, the S&P 500 Growth Index was up +13.67% and the S&P 500 Total Return Index was up +10.42%.
Over the last twelve months, the three largest contributors were NVIDIA Corporation, Netflix Inc., and ServiceNow Inc. Nvidia's business continues to benefit from growing enterprise investment in artificial intelligence (“AI”) infrastructure. Nvidia’s decades of investment in hardware and software helped to accelerate the adoption of AI technologies and by extension Nvidia products. We expect Nvidia to continue to grow as they innovate to serve their customers' AI buildout. Netflix is also executing at a high level, reporting strong results being driven by balanced growth across geographies and product tiers. The company’s membership growth and pricing increases has not only driven revenue growth, but also allowed Netflix to leverage its content costs, expanding operating margins over the last year. The 2025 content slate is expected to be one of the strongest in recent history which should drive continued growth. ServiceNow has paired excellent sales execution with an increasingly strategic product suite. ServiceNow has become one of the go-to software providers to bring AI into large organizations. We believe ServiceNow's market opportunity is expanding as they find additional ways to deliver efficiency and cost savings to their customer base.
Over the last twelve months, the three largest detractors were Estée Lauder Companies Inc., Align Technology, Inc. and Lululemon Athletica Inc. We exited the position in Estee Lauder during the third quarter after continued disappointment in financial results and several management missteps. Exposure to China continues to weigh on revenue growth while indie brands are taking share from the US business. We believe in the power of Estee Lauder’s brands long-term and view the margin opportunity from here as attractive but expect the turnaround will be a multi-year process with a high degree of uncertainty. Align reported weak results in October 2023 with management citing lower-than-expected demand due to a more challenging macroeconomic environment. This manifested in decreased patient visits, lower willingness to spend on adult braces, and fewer orthodontic case starts overall. Align has a good consumer brand and a large total market opportunity but our confidence in the pace and consistency of management’s execution declined and we exited the position during the fourth quarter of 2023. Lululemon is seeing signs of a more selective US consumer and potentially heightened competition from newer, smaller brands entering the athletic apparel space which has caused investors to become bearish on the company’s future growth prospects. Lululemon’s management team believes the recent challenges are due to internal issues in assortment planning and product development. We believe, while something to monitor closely, competitive fears could be overblown, and Lululemon is primarily suffering from lapping outsized growth rates in 2022-2023. As the team works into 2025, new product launches should help bolster sales in the US, while the international business continues to grow nicely, especially in China.
Edgewood’s investment team aims to identify the highest quality companies that can compound growth over the long term by studying the industry, business model, competitive advantages, and management team to determine the growth potential of the company. The investment process is designed to identify and own future market leaders and we believe in our differentiated portfolio construction.
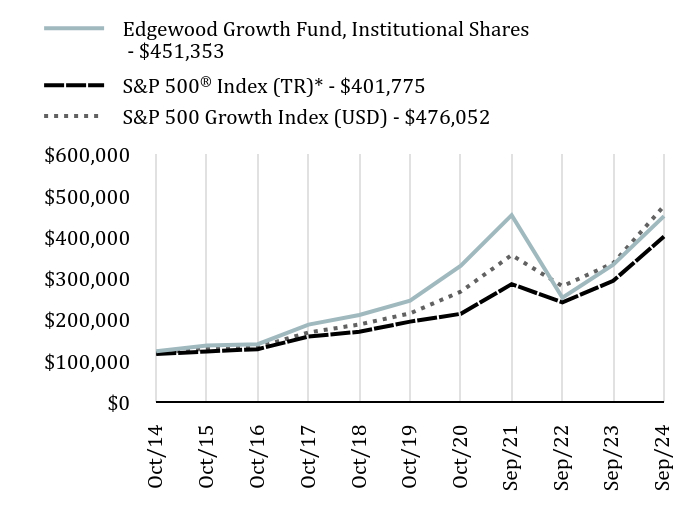
Total Return Based on $100,000 Investment
Average Annual Total Returns as of September 30, 2024
| Fund/Index Name | 1 Year | 5 Years | 10 Years |
|---|
| Edgewood Growth Fund, Institutional Shares | 35.27% | 13.36% | 14.34% |
S&P 500® Index (TR)* | 36.35% | 15.98% | 13.38% |
| S&P 500 Growth Index (USD) | 41.10% | 17.56% | 15.17% |
| Edgewood Growth Fund, Institutional Shares - $451353 | S&P 500® Index (TR)* - $401775 | S&P 500 Growth Index (USD) - $476052 |
|---|
| Oct/14 | $123892 | $117268 | $119385 |
| Oct/15 | $137976 | $123366 | $130405 |
| Oct/16 | $140937 | $128928 | $133879 |
| Oct/17 | $188505 | $159397 | $169374 |
| Oct/18 | $211831 | $171107 | $188758 |
| Oct/19 | $246645 | $195620 | $215713 |
| Oct/20 | $331237 | $214616 | $268453 |
| Sep/21 | $453750 | $286634 | $356925 |
| Sep/22 | $253515 | $242286 | $281586 |
| Sep/23 | $333739 | $294661 | $337391 |
| Sep/24 | $451353 | $401775 | $476052 |
The line graph represents historical performance of a hypothetical investment of $100,000 in the Fund during the last 10 years. Returns shown are total returns, which assume the reinvestment of dividends and capital gains. The table and graph presented above do not reflect the deduction of taxes a shareholder would pay on Fund distributions or the redemption of Fund Shares. Past performance is not indicative of future performance.Call 1-800-791-4226 or visit http://edgewoodfunds.com/document-library for current month-end performance.
Footnote Reference*As of September 2024, pursuant to the new regulatory requirements, this index has been added to represent the broad-based securities market index.
Key Fund Statistics as of September 30, 2024
| Total Net Assets | Number of Holdings | Total Advisory Fees Paid | Portfolio Turnover Rate |
|---|
| $20,226,881,256 | 23 | $185,466,858 | 33% |
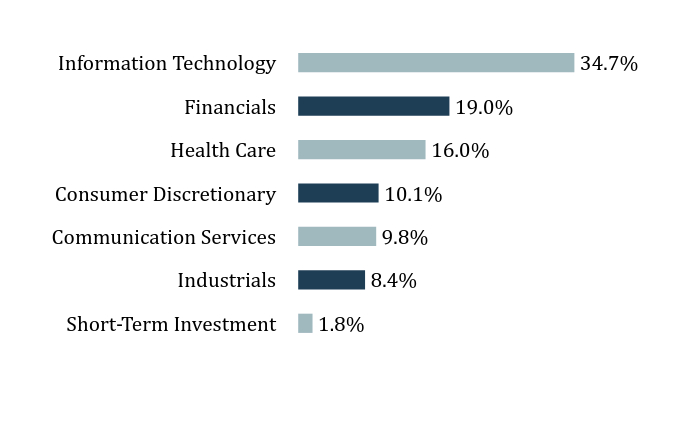
What did the Fund invest in?
Sector WeightingsFootnote Reference*
| Value | Value |
|---|
| Short-Term Investment | 1.8% |
| Industrials | 8.4% |
| Communication Services | 9.8% |
| Consumer Discretionary | 10.1% |
| Health Care | 16.0% |
| Financials | 19.0% |
| Information Technology | 34.7% |
| Footnote | Description |
Footnote* | Percentages are calculated based on total net assets. |
| Holding Name | | | Percentage of Total Net AssetsFootnote Reference(A) |
|---|
| Netflix Inc. | | | 6.9% |
| Microsoft Corp. | | | 5.7% |
| ServiceNow Inc. | | | 5.7% |
| Uber Technologies Inc. | | | 5.5% |
| S&P Global Inc. | | | 5.4% |
| Eli Lilly & Co. | | | 5.3% |
| Visa Inc., Cl A | | | 5.3% |
| NVIDIA Corp. | | | 5.3% |
| ASML Holding NV | | | 4.9% |
| Blackstone Inc. | | | 4.8% |
| Footnote | Description |
Footnote(A) | Short-Term Investments are not shown in the top ten chart. |
There were no material changes during the reporting period.
Changes in and Disagreements with Accountants
There were no changes in or disagreements with accountants during the reporting period.
For additional information about the Fund, including its prospectus, financial information, holdings, and proxy voting information, call or visit:
Rule 30e-1 of the Investment Company Act of 1940 permits funds to transmit only one copy of a proxy statement, annual report or semi-annual report to shareholders (who need not be related) with the same residential, commercial or electronic address, provided that the shareholders have consented in writing and the reports are addressed either to each shareholder individually or to the shareholders as a group. This process is known as “householding” and is designed to reduce the duplicate copies of materials that shareholders receive and to lower printing and mailing costs for funds. Once implemented, if you would like to discontinue householding for your accounts, please call toll-free at 1-800-791-4226 to request individual copies of these documents. Once the Fund receives notice to stop householding, we will begin sending individual copies 30 days after receiving your request.
The Advisors' Inner Circle Fund/Retail Shares - EGFFX
Annual Shareholder Report - September 30, 2024
This annual shareholder report contains important information about Retail Shares of the Edgewood Growth Fund (the "Fund") for the period from October 1, 2023 to September 30, 2024. You can find additional information about the Fund at http://edgewoodfunds.com/document-library. You can also request this information by contacting us at 1-800-791-4226.
What were the Fund costs for the last year?
(based on a hypothetical $10,000 investment)
| Fund Name | Costs of a $10,000 investment | Costs paid as a percentage of a $10,000 investment |
|---|
| Edgewood Growth Fund, Retail Shares | $164 | 1.40% |
How did the Fund perform in the last year?
The Edgewood Growth Fund was up +35.27% (Institutional shares) and up +34.74% (Retail shares) for the trailing twelve-month period ending September 30, 2024. The S&P 500 Growth Index was up +41.10% and the S&P 500 Total Return Index was up +36.35% in the same period. For the six-month period ending September 30, 2024, the Fund was up +3.28% (Institutional shares) and up +3.09% (Retail shares). In the same six-month period, the S&P 500 Growth Index was up +13.67% and the S&P 500 Total Return Index was up +10.42%.
Over the last twelve months, the three largest contributors were NVIDIA Corporation, Netflix Inc., and ServiceNow Inc. Nvidia's business continues to benefit from growing enterprise investment in artificial intelligence (“AI”) infrastructure. Nvidia’s decades of investment in hardware and software helped to accelerate the adoption of AI technologies and by extension Nvidia products. We expect Nvidia to continue to grow as they innovate to serve their customers' AI buildout. Netflix is also executing at a high level, reporting strong results being driven by balanced growth across geographies and product tiers. The company’s membership growth and pricing increases has not only driven revenue growth, but also allowed Netflix to leverage its content costs, expanding operating margins over the last year. The 2025 content slate is expected to be one of the strongest in recent history which should drive continued growth. ServiceNow has paired excellent sales execution with an increasingly strategic product suite. ServiceNow has become one of the go-to software providers to bring AI into large organizations. We believe ServiceNow's market opportunity is expanding as they find additional ways to deliver efficiency and cost savings to their customer base.
Over the last twelve months, the three largest detractors were Estée Lauder Companies Inc., Align Technology, Inc. and Lululemon Athletica Inc. We exited the position in Estee Lauder during the third quarter after continued disappointment in financial results and several management missteps. Exposure to China continues to weigh on revenue growth while indie brands are taking share from the US business. We believe in the power of Estee Lauder’s brands long-term and view the margin opportunity from here as attractive but expect the turnaround will be a multi-year process with a high degree of uncertainty. Align reported weak results in October 2023 with management citing lower-than-expected demand due to a more challenging macroeconomic environment. This manifested in decreased patient visits, lower willingness to spend on adult braces, and fewer orthodontic case starts overall. Align has a good consumer brand and a large total market opportunity but our confidence in the pace and consistency of management’s execution declined and we exited the position during the fourth quarter of 2023. Lululemon is seeing signs of a more selective US consumer and potentially heightened competition from newer, smaller brands entering the athletic apparel space which has caused investors to become bearish on the company’s future growth prospects. Lululemon’s management team believes the recent challenges are due to internal issues in assortment planning and product development. We believe, while something to monitor closely, competitive fears could be overblown, and Lululemon is primarily suffering from lapping outsized growth rates in 2022-2023. As the team works into 2025, new product launches should help bolster sales in the US, while the international business continues to grow nicely, especially in China.
Edgewood’s investment team aims to identify the highest quality companies that can compound growth over the long term by studying the industry, business model, competitive advantages, and management team to determine the growth potential of the company. The investment process is designed to identify and own future market leaders and we believe in our differentiated portfolio construction.
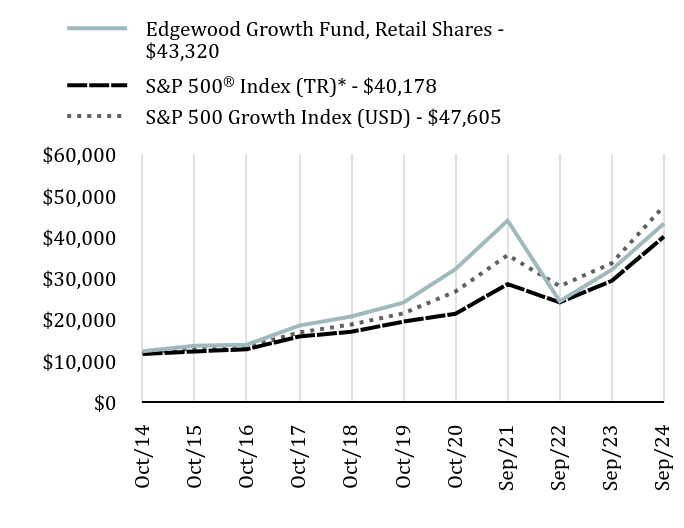
Total Return Based on $10,000 Investment
Average Annual Total Returns as of September 30, 2024
| Fund/Index Name | 1 Year | 5 Years | 10 Years |
|---|
| Edgewood Growth Fund, Retail Shares | 34.74% | 12.91% | 13.89% |
S&P 500® Index (TR)* | 36.35% | 15.98% | 13.38% |
| S&P 500 Growth Index (USD) | 41.10% | 17.56% | 15.17% |
| Edgewood Growth Fund, Retail Shares - $43320 | S&P 500® Index (TR)* - $40178 | S&P 500 Growth Index (USD) - $47605 |
|---|
| Oct/14 | $12371 | $11727 | $11939 |
| Oct/15 | $13722 | $12337 | $13040 |
| Oct/16 | $13964 | $12893 | $13388 |
| Oct/17 | $18596 | $15940 | $16937 |
| Oct/18 | $20821 | $17111 | $18876 |
| Oct/19 | $24144 | $19562 | $21571 |
| Oct/20 | $32293 | $21462 | $26845 |
| Sep/21 | $44074 | $28663 | $35693 |
| Sep/22 | $24525 | $24229 | $28159 |
| Sep/23 | $32152 | $29466 | $33739 |
| Sep/24 | $43320 | $40178 | $47605 |
The line graph represents historical performance of a hypothetical investment of $10,000 in the Fund during the last 10 years. Returns shown are total returns, which assume the reinvestment of dividends and capital gains. The table and graph presented above do not reflect the deduction of taxes a shareholder would pay on Fund distributions or the redemption of Fund Shares. Past performance is not indicative of future performance.Call 1-800-791-4226 or visit http://edgewoodfunds.com/document-library for current month-end performance.
Footnote Reference*As of September 2024, pursuant to the new regulatory requirements, this index has been added to represent the broad-based securities market index.
Key Fund Statistics as of September 30, 2024
| Total Net Assets | Number of Holdings | Total Advisory Fees Paid | Portfolio Turnover Rate |
|---|
| $20,226,881,256 | 23 | $185,466,858 | 33% |
What did the Fund invest in?
Sector WeightingsFootnote Reference*
| Value | Value |
|---|
| Short-Term Investment | 1.8% |
| Industrials | 8.4% |
| Communication Services | 9.8% |
| Consumer Discretionary | 10.1% |
| Health Care | 16.0% |
| Financials | 19.0% |
| Information Technology | 34.7% |
| Footnote | Description |
Footnote* | Percentages are calculated based on total net assets. |
| Holding Name | | | Percentage of Total Net AssetsFootnote Reference(A) |
|---|
| Netflix Inc. | | | 6.9% |
| Microsoft Corp. | | | 5.7% |
| ServiceNow Inc. | | | 5.7% |
| Uber Technologies Inc. | | | 5.5% |
| S&P Global Inc. | | | 5.4% |
| Eli Lilly & Co. | | | 5.3% |
| Visa Inc., Cl A | | | 5.3% |
| NVIDIA Corp. | | | 5.3% |
| ASML Holding NV | | | 4.9% |
| Blackstone Inc. | | | 4.8% |
| Footnote | Description |
Footnote(A) | Short-Term Investments are not shown in the top ten chart. |
There were no material changes during the reporting period.
Changes in and Disagreements with Accountants
There were no changes in or disagreements with accountants during the reporting period.
For additional information about the Fund, including its prospectus, financial information, holdings, and proxy voting information, call or visit:
Rule 30e-1 of the Investment Company Act of 1940 permits funds to transmit only one copy of a proxy statement, annual report or semi-annual report to shareholders (who need not be related) with the same residential, commercial or electronic address, provided that the shareholders have consented in writing and the reports are addressed either to each shareholder individually or to the shareholders as a group. This process is known as “householding” and is designed to reduce the duplicate copies of materials that shareholders receive and to lower printing and mailing costs for funds. Once implemented, if you would like to discontinue householding for your accounts, please call toll-free at 1-800-791-4226 to request individual copies of these documents. Once the Fund receives notice to stop householding, we will begin sending individual copies 30 days after receiving your request.
(b) Not applicable
Item 2. Code of Ethics.
The Registrant (also referred to as the “Trust”) has adopted a code of ethics that applies to the Registrant’s principal executive officer, principal financial officer, controller or principal accounting officer, and any person who performs a similar function. There have been no amendments to or waivers granted to this code of ethics during the period covered by this report.
Item 3. Audit Committee Financial Expert.
(a)(1) The Registrant’s board of trustees has determined that the Registrant has at least one audit committee financial expert serving on the audit committee.
(a)(2) The Registrant’s audit committee financial expert is Robert Mulhall. Mr. Mulhall is considered to be “independent,” as that term is defined in Form N-CSR Item 3(a)(2).
Item 4. Principal Accountant Fees and Services.
Fees billed by Ernst & Young LLP (“E&Y”) related to the Trust.
E&Y billed the Trust aggregate fees for services rendered to the Trust for the last two fiscal years as follows:
| | FYE September 30, 2024 | FYE September 30, 2023 |
| | | All fees and services to the Trust that were pre-approved | All fees and services to service affiliates that were pre-approved | All other fees and services to service affiliates that did not require pre-approval | All fees and services to the Trust that were pre-approved | All fees and services to service affiliates that were pre-approved | All other fees and services to service affiliates that did not require pre-approval |
| (a) | Audit Fees(1) | $25,740 | None | None | $24,990 | None | None |
| (b) | Audit-Related Fees | None | None | None | None | None | None |
| (c) | Tax Fees | None | None | None | None | None | None |
| (d) | All Other Fees | None | None | None | None | None | None |
Notes:
| (1) | Audit fees include amounts related to the audit of the Trust’s annual financial statements and services normally provided by the accountant in connection with statutory and regulatory filings. |
(e)(1) The Trust’s Audit Committee has adopted and the Board of Trustees has ratified an Audit and Non-Audit Services Pre-Approval Policy (the “Policy”), which sets forth the procedures and the conditions pursuant to which services proposed to be performed by the independent auditor of the Funds may be pre-approved.
The Policy provides that all requests or applications for proposed services to be provided by the independent auditor must be submitted to the Registrant’s Chief Financial Officer (“CFO”) and must include a detailed description of the services proposed to be rendered. The CFO will determine whether such services:
1. require specific pre-approval;
2. are included within the list of services that have received the general pre-approval of the Audit Committee pursuant to the Policy; or
3. have been previously pre-approved in connection with the independent auditor’s annual engagement letter for the applicable year or otherwise. In any instance where services require pre-approval, the Audit Committee will consider whether such services are consistent with SEC’s rules and whether the provision of such services would impair the auditor’s independence.
Requests or applications to provide services that require specific pre-approval by the Audit Committee will be submitted to the Audit Committee by the CFO. The Audit Committee will be informed by the CFO on a quarterly basis of all services rendered by the independent auditor. The Audit Committee has delegated specific pre-approval authority to either the Audit Committee Chair or financial expert, provided that the estimated fee for any such proposed pre-approved service does not exceed $100,000 and any pre-approval decisions are reported to the Audit Committee at its next regularly-scheduled meeting.
Services that have received the general pre-approval of the Audit Committee are identified and described in the Policy. In addition, the Policy sets forth a maximum fee per engagement with respect to each identified service that has received general pre-approval.
All services to be provided by the independent auditor shall be provided pursuant to a signed written engagement letter with the Registrant, the investment adviser, or applicable control affiliate (except that matters as to which an engagement letter would be impractical because of timing issues or because the matter is small may not be the subject of an engagement letter) that sets forth both the services to be provided by the independent auditor and the total fees to be paid to the independent auditor for those services.
In addition, the Audit Committee has determined to take additional measures on an annual basis to meet the Audit Committee’s responsibility to oversee the work of the independent auditor and to assure the auditor's independence from the Registrant, such as (a) reviewing a formal written statement from the independent auditor delineating all relationships between the independent auditor and the Registrant, and (b) discussing with the independent auditor the independent auditor’s methods and procedures for ensuring independence.
(e)(2) Percentage of fees billed by E&Y applicable to non-audit services pursuant to the “de minimis” exception of Rule 2-01(c)(7)(i)(C) were as follows:
| | FYE September 30, 2024 | FYE September 30, 2023 |
Audit-Related Fees | None | None |
| Tax Fees | None | None |
All Other Fees | None | None |
(f) Not applicable.
(g) The aggregate non-audit fees and services billed by E&Y for services rendered to the Registrant, and rendered to the Registrant’s investment adviser (not including any sub-adviser whose role is primarily portfolio management and is subcontracted with or overseen by another investment adviser), and any entity controlling, controlled by, or under common control with the adviser that provides ongoing services to the Registrant for the last two fiscal-years-ended September 30th were $0 and $0 for 2024 and 2023, respectively.
(h) During the past fiscal year, all non-audit services provided by the Registrant’s principal accountant to either the Registrant’s investment adviser or to any entity controlling, controlled by, or under common control with the Registrant’s investment adviser that provides ongoing services to the Registrant were pre-approved by the Audit Committee of Registrant’s Board of Trustees. Included in the Audit Committee’s pre-approval of these non-audit service were the review and consideration as to whether the provision of these non-audit services is compatible with maintaining the principal accountant’s independence.
(i) Not Applicable. The Registrant has not retained, for the preparation of the audit report on the financial statements included in the Form N-CSR, a registered public accounting firm that has a branch or office that is located in a foreign jurisdiction and that the Public Company Accounting Oversight Board (the “PCAOB”) has determined that the PCAOB is unable to inspect or investigate completely because of a position taken by an authority in the foreign jurisdiction.
(j) Not Applicable. The Registrant is not a “foreign issuer,” as defined in 17 CFR 240.3b-4.
Item 5. Audit Committee of Listed Registrants.
Not applicable to open-end management investment companies.
Item 6. Schedule of Investments.
(a) The Schedule of Investments is included as part of the Financial Statements and Other Information filed under Item 7 of this form.
(b) Not applicable.
Item 7. Financial Statements and Financial Highlights for Open-End Management Investment Companies.
Financial Statements and Financial Highlights are filed herein.
The Advisors’ Inner Circle Fund
Annual Financials and Other Information
THE ADVISORS’ INNER CIRCLE FUND
EDGEWOOD GROWTH FUND
SEPTEMBER 30, 2024
Table of Contents
Financial Statements (Form N-CSR Item 7) | |
Schedule of Investments | 1 |
Statement of Assets and Liabilities | 3 |
Statement of Operations | 4 |
Statements of Changes in Net Assets | 5 |
Financial Highlights | 6 |
Notes to Financial Statements | 8 |
Report of Independent Registered Public Accounting Firm | 21 |
Notice to Shareholders | 23 |
THE ADVISORS’ INNER CIRCLE FUND
EDGEWOOD GROWTH FUND
SEPTEMBER 30, 2024
SCHEDULE OF INVESTMENTS |
COMMON STOCK†† — 98.0% |
| | | Shares | | | Value | |
COMMUNICATION SERVICES — 9.8% | | | | |
Netflix Inc.* | | | 1,956,226 | | | $ | 1,387,492,414 | |
Trade Desk, Cl A* | | | 5,412,106 | | | | 593,437,423 | |
| | | | | | | | 1,980,929,837 | |
| | | | | | | | | |
CONSUMER DISCRETIONARY — 10.1% | | | | |
Airbnb Inc., Cl A* | | | 7,363,949 | | | | 933,822,373 | |
Chipotle Mexican Grill Inc., Cl A* | | | 11,389,415 | | | | 656,258,092 | |
Lululemon Athletica Inc.* | | | 1,705,694 | | | | 462,840,067 | |
| | | | | | | | 2,052,920,532 | |
| | | | | | | | | |
FINANCIALS — 19.0% | | | | |
Blackstone Inc. | | | 6,367,028 | | | | 974,982,998 | |
MSCI Inc., Cl A | | | 1,183,217 | | | | 689,732,686 | |
S&P Global Inc. | | | 2,112,613 | | | | 1,091,418,128 | |
Visa Inc., Cl A | | | 3,925,689 | | | | 1,079,368,190 | |
| | | | | | | | 3,835,502,002 | |
| | | | | | | | | |
HEALTH CARE — 16.0% | | | | |
Danaher Corp | | | 3,455,596 | | | | 960,724,800 | |
Eli Lilly & Co. | | | 1,219,612 | | | | 1,080,503,055 | |
Intuitive Surgical Inc.* | | | 1,628,980 | | | | 800,269,005 | |
Vertex Pharmaceuticals Inc.* | | | 833,904 | | | | 387,832,072 | |
| | | | | | | | 3,229,328,932 | |
| | | | | | | | | |
INDUSTRIALS — 8.4% | | | | |
Copart Inc.* | | | 11,143,771 | | | | 583,933,601 | |
Uber Technologies Inc.* | | | 14,920,102 | | | | 1,121,394,866 | |
| | | | | | | | 1,705,328,467 | |
| | | | | | | | | |
INFORMATION TECHNOLOGY — 34.7% | | | | |
Adobe Inc.* | | | 1,843,909 | | | | 954,739,202 | |
ASML Holding NV | | | 1,184,058 | | | | 986,616,329 | |
Intuit Inc. | | | 1,370,007 | | | | 850,774,347 | |
Microsoft Corp. | | | 2,678,317 | | | | 1,152,479,805 | |
NVIDIA Corp. | | | 8,881,455 | | | | 1,078,563,895 | |
ServiceNow Inc.* | | | 1,285,336 | | | | 1,149,591,665 | |
The accompanying notes are an integral part of the financial statements.
1
THE ADVISORS’ INNER CIRCLE FUND
EDGEWOOD GROWTH FUND
SEPTEMBER 30, 2024
COMMON STOCK†† — continued |
| | Shares | | | Value | |
INFORMATION TECHNOLOGY — continued | | | | |
Synopsys Inc.* | | | 1,664,287 | | | $ | 842,778,294 | |
| | | | | | | | 7,015,543,537 | |
| | | | | | | | | |
TOTAL COMMON STOCK | | | | | | | | |
(Cost $10,785,881,470) | | | | | | | 19,819,553,307 | |
| | | | | | | | | |
SHORT-TERM INVESTMENT — 1.8% |
| | | | | | | | | |
Fidelity Institutional Money Market Funds - Government Portfolio, Cl I, 4.830% (A) | | | | | | | | |
(Cost $357,878,881) | | | 357,878,881 | | | | 357,878,881 | |
| | | | | | | | | |
TOTAL INVESTMENTS — 99.8% | | | | | | | | |
(Cost $11,143,760,351) | | | | | | $ | 20,177,432,188 | |
| Percentages are based on Net Assets of $20,226,881,256. |
* | Non-income producing security. |
†† | More narrow industries are utilized for compliance purposes, whereas broad sectors are utilized for reporting purposes. |
(A) | The rate reported is the 7-day effective yield as of September 30, 2024. |
As of September 30, 2024, all of the Fund’s investments in securities were considered Level 1, in accordance with the authoritative guidance on fair value measurements and disclosure under U.S. GAAP.
For more information on valuation inputs, see Note 2 in Notes to Financial Statements.
The accompanying notes are an integral part of the financial statements.
2
THE ADVISORS’ INNER CIRCLE FUND
EDGEWOOD GROWTH FUND
SEPTEMBER 30, 2024
| Statement of Assets and Liabilities | | | |
| Assets: | | | |
| Investments, at Value (Cost $11,143,760,351) | | $ | 20,177,432,188 | |
| Receivable for Investment Securities Sold | | | 47,615,418 | |
| Receivable for Capital Shares Sold | | | 19,761,338 | |
| Dividends Receivable | | | 2,581,112 | |
| Prepaid Expenses | | | 120,679 | |
| Total Assets | | | 20,247,510,735 | |
| | | | | |
| Liabilities: | | | | |
| Payable for Capital Shares Redeemed | | | 11,716,314 | |
| Payable due to Adviser | | | 6,626,402 | |
| Payable due to Shareholder Servicing Agent (Retail Shares) | | | 664,966 | |
| Distribution Fees Payable (Retail Shares) | | | 444,648 | |
| Payable due to Administrator | | | 209,703 | |
| Due to Custodian | | | 24,098 | |
| Payable due to Trustees | | | 5,756 | |
| Chief Compliance Officer Fees Payable | | | 4,852 | |
| Other Accrued Expenses | | | 932,740 | |
| Total Liabilities | | | 20,629,479 | |
Commitments and Contingencies† | | | | |
| Net Assets | | $ | 20,226,881,256 | |
| | | | | |
| Net Assets Consist of: | | | | |
| Paid-in Capital | | $ | 8,589,302,185 | |
| Total Distributable Earnings | | | 11,637,579,071 | |
| | | $ | 20,226,881,256 | |
| | | | | |
| Net Asset Value, Offering and Redemption Price Per Share- | | | | |
| Institutional Shares ($19,771,585,414 ÷ 387,330,301 shares) | | $ | 51.05 | |
| | | | | |
| Net Asset Value, Offering and Redemption Price Per Share- | | | | |
| Retail Shares ($455,295,842 ÷ 9,685,712 shares) | | $ | 47.01 | |
| | | | | |
† | See Note 5 in Notes to Financial Statements. |
The accompanying notes are an integral part of the financial statements.
3
THE ADVISORS’ INNER CIRCLE FUND
EDGEWOOD GROWTH FUND
For the YEar ENDED SEPTEMBER 30, 2024
| | | | |
| Statement of Operations | | | |
| Investment Income | | | |
| Dividend Income | | $ | 103,270,884 | |
| Income from Securities Lending | | | 1,010,979 | |
| Less: Foreign Taxes Withheld | | | (1,204,614 | ) |
| Total Investment Income | | | 103,077,249 | |
| | | | | |
| Expenses | | | | |
| Investment Advisory Fees | | | 189,741,531 | |
| Administration Fees | | | 2,484,760 | |
| Distribution Fees (Retail Shares) | | | 1,108,267 | |
| Shareholder Servicing Fees (Retail Shares) | | | 664,966 | |
| Trustees' Fees | | | 23,783 | |
| Chief Compliance Officer Fees | | | 7,732 | |
| Printing Fees | | | 1,001,040 | |
| Transfer Agent Fees | | | 974,115 | |
| Custodian Fees | | | 357,753 | |
| Registration Fees | | | 102,797 | |
| Professional Fees | | | 71,707 | |
| Insurance and Other Expenses | | | 136,105 | |
| | | | | |
| Total Expenses | | | 196,674,556 | |
| Less: | | | | |
| Waiver of Investment Advisory Fees* | | | (4,274,673 | ) |
| Fees Paid Indirectly** | | | (658,975 | ) |
| | | | | |
| Net Expenses | | | 191,740,908 | |
| | | | | |
| Net Investment Loss | | | (88,663,659 | ) |
| Net Realized Gain on Investments | | | 3,284,715,548 | |
| Net Change in Unrealized Appreciation (Depreciation) on Investments | | | 2,398,198,849 | |
| Net Realized and Unrealized Gain on Investments | | | 5,682,914,397 | |
| Net Increase in Net Assets Resulting from Operations | | $ | 5,594,250,738 | |
| * | See Note 5 in Notes to Financial Statements. |
| ** | See Note 4 in Notes to Financial Statements. |
The accompanying notes are an integral part of the financial statements.
4
THE ADVISORS’ INNER CIRCLE FUND
| Statements of Changes in net assets | | | | | | |
| | | | | | | |
| | | Year Ended
September 30, 2024 | | | Year Ended
September 30, 2023 | |
Operations: | | | | | | | | |
Net Investment Loss | | $ | (88,663,659 | ) | | $ | (34,678,004 | ) |
Net Realized Gain | | | 3,284,715,548 | | | | 1,160,006,445 | |
Net Change in Unrealized Appreciation (Depreciation) | | | 2,398,198,849 | | | | 3,371,412,693 | |
Net Increase in Net Assets Resulting from Operations | | | 5,594,250,738 | | | | 4,496,741,134 | |
| | | | | | | | | |
Distributions: | | | | | | | | |
Institutional Shares | | | — | | | | (1,982,733,860 | ) |
Retail Shares | | | — | | | | (51,282,071 | ) |
Total Distributions | | | — | | | | (2,034,015,931 | ) |
| | | | | | | | | |
Capital Share Transactions:(1) | | | | | | | | |
Institutional Shares | | | | | | | | |
Issued | | | 3,030,901,003 | | | | 2,873,273,077 | |
Reinvestment of Distributions | | | — | | | | 1,558,591,245 | |
Redeemed | | | (4,448,732,987 | ) | | | (6,699,513,196 | ) |
Net Institutional Shares Transactions | | | (1,417,831,984 | ) | | | (2,267,648,874 | ) |
Retail Shares | | | | | | | | |
Issued | | | 101,662,652 | | | | 116,028,046 | |
Reinvestment of Distributions | | | — | | | | 36,077,780 | |
Redeemed | | | (157,498,316 | ) | | | (202,665,845 | ) |
Net Retail Shares Transactions | | | (55,835,664 | ) | | | (50,560,019 | ) |
Net Decrease in Net Assets from Share Transactions | | | (1,473,667,648 | ) | | | (2,318,208,893 | ) |
Total Increase in Net Assets | | | 4,120,583,090 | | | | 144,516,310 | |
| | | | | | | | | |
Net Assets: | | | | | | | | |
Beginning of Year | | | 16,106,298,166 | | | | 15,961,781,856 | |
End of Year | | $ | 20,226,881,256 | | | $ | 16,106,298,166 | |
(1) | For share transactions, see Note 6 in the Notes to Financial Statements. |
Amounts designated as " —" are $0 or have been rounded to $0.
The accompanying notes are an integral part of the financial statements.
5
THE ADVISORS’ INNER CIRCLE FUND
Financial HIghlights
Selected Per Share Data & Ratios
For a Share Outstanding Throughout Each Period or Year
| | | Institutional Shares | |
| | | Year
Ended
September 30, 2024 | | | Year
Ended
September 30, 2023 | | | Year
Ended
September 30, 2022 | | | Period
Ended
September 30, 2021^ | | | Year
Ended
October 31, 2020 | | | Year
Ended
October 31, 2019 | |
| | | | | | | | | | | | | | | | | | | | | | | | | |
Net Asset Value, Beginning of Year | | $ | 37.74 | | | $ | 33.04 | | | $ | 62.57 | | | $ | 48.33 | | | $ | 36.09 | | | $ | 32.56 | |
Income (Loss) from Operations: | | | | | | | | | | | | | | | | | | | | | | | | |
Net Investment Income (Loss)(1) | | | (0.21 | ) | | | (0.07 | ) | | | (0.23 | ) | | | (0.27 | ) | | | (0.17 | ) | | | (0.10 | ) |
Net Realized and Unrealized Gain (Loss) | | | 13.52 | | | | 9.52 | | | | (25.81 | ) | | | 17.51 | | | | 12.52 | | | | 5.06 | |
Total from Operations | | | 13.31 | | | | 9.45 | | | | (26.04 | ) | | | 17.24 | | | | 12.35 | | | | 4.96 | |
Dividends and Distributions: | | | | | | | | | | | | | | | | | | | | | | | | |
Net Realized Gain | | | — | | | | (4.75 | ) | | | (3.49 | ) | | | (3.00 | ) | | | (0.11 | ) | | | (1.43 | ) |
Total Dividends and Distributions | | | — | | | | (4.75 | ) | | | (3.49 | ) | | | (3.00 | ) | | | (0.11 | ) | | | (1.43 | ) |
Net Asset Value, End of Year | | $ | 51.05 | | | $ | 37.74 | | | $ | 33.04 | | | $ | 62.57 | | | $ | 48.33 | | | $ | 36.09 | |
Total Return† | | | 35.27 | % | | | 31.64 | % | | | (44.13 | %) | | | 36.99 | % | | | 34.30 | % | | | 16.43 | % |
Ratios and Supplemental Data | | | | | | | | | | | | | | | | | | | | | | | | |
Net Assets, End of Year (Thousands) | | $ | 19,771,585 | | | $ | 15,723,492 | | | $ | 15,581,513 | | | $ | 31,517,529 | | | $ | 23,508,881 | | | $ | 15,393,594 | |
Ratio of Expenses to Average Net Assets | | | 1.00 | % | | | 1.00 | % | | | 1.00 | % | | | 1.00 | %* | | | 1.00 | % | | | 1.00 | % |
Ratio of Expenses to Average Net Assets (Excluding Waivers and Fees Paid Indirectly) | | | 1.02 | % | | | 1.03 | % | | | 1.03 | % | | | 1.04 | %* | | | 1.04 | % | | | 1.05 | % |
Ratio of Net Investment Loss to Average Net Assets | | | (0.46 | )% | | | (0.20 | )% | | | (0.46 | )% | | | (0.51 | )%* | | | (0.41 | )% | | | (0.30 | )% |
Portfolio Turnover Rate | | | 33 | % | | | 23 | % | | | 32 | % | | | 14 | %** | | | 24 | % | | | 25 | % |
^ | For the period November 1, 2020 to September 30, 2021. Effective February 24, 2021, the Edgewood Growth Fund changed its fiscal year end to September 30. |
(1) | Calculated using average shares. |
† | Return is for the period indicated and has not been annualized. Total return would have been lower had certain expenses not been waived and assumed by the Adviser during the period. Returns shown do not reflect the deduction of taxes that a shareholder would pay on Fund distributions or the redemption of Fund shares. |
* | Annualized |
** | Not Annualized |
| Amounts designated as "—" are $0 or have been rounded to $0. |
The accompanying notes are an integral part of the financial statements.
6
THE ADVISORS’ INNER CIRCLE FUND
Financial Highlights
Selected Per Share Data & Ratios
For a Share Outstanding Throughout Each Period or Year
| | | Retail Shares | |
| | | Year
Ended
September 30, 2024 | | | Year
Ended
September 30, 2023 | | | Year
Ended
September 30, 2022 | | | Period
Ended
September 30, 2021^ | | | Year
Ended
October 31, 2020 | | | Year
Ended
October 31, 2019 | |
| | | | | | | | | | | | | | | | | | | | | | | | | |
Net Asset Value, Beginning of Year | | $ | 34.89 | | | $ | 30.99 | | | $ | 59.13 | | | $ | 45.98 | | | $ | 34.48 | | | $ | 31.30 | |
Income (Loss) from Operations: | | | | | | | | | | | | | | | | | | | | | | | | |
Net Investment Income (Loss)(1) | | | (0.37 | ) | | | (0.20 | ) | | | (0.40 | ) | | | (0.45 | ) | | | (0.32 | ) | | | (0.22 | ) |
Net Realized and Unrealized Gain (Loss) | | | 12.49 | | | | 8.85 | | | | (24.25 | ) | | | 16.60 | | | | 11.93 | | | | 4.83 | |
Total from Operations | | | 12.12 | | | | 8.65 | | | | (24.65 | ) | | | 16.15 | | | | 11.61 | | | | 4.61 | |
Dividends and Distributions: | | | | | | | | | | | | | | | | | | | | | | | | |
Net Realized Gain | | | — | | | | (4.75 | ) | | | (3.49 | ) | | | (3.00 | ) | | | (0.11 | ) | | | (1.43 | ) |
Total Dividends and Distributions | | | — | | | | (4.75 | ) | | | (3.49 | ) | | | (3.00 | ) | | | (0.11 | ) | | | (1.43 | ) |
Net Asset Value, End of Year | | $ | 47.01 | | | $ | 34.89 | | | $ | 30.99 | | | $ | 59.13 | | | $ | 45.98 | | | $ | 34.48 | |
Total Return† | | | 34.74 | % | | | 31.10 | % | | | (44.36 | %) | | | 36.48 | % | | | 33.75 | % | | | 15.96 | % |
Ratios and Supplemental Data | | | | | | | | | | | | | | | | | | | | | | | | |
Net Assets, End of Year (Thousands) | | $ | 455,296 | | | $ | 382,806 | | | $ | 380,269 | | | $ | 938,366 | | | $ | 597,046 | | | $ | 410,371 | |
Ratio of Expenses to Average Net Assets | | | 1.40 | % | | | 1.40 | % | | | 1.40 | % | | | 1.40 | %* | | | 1.40 | % | | | 1.40 | % |
Ratio of Expenses to Average Net Assets (Excluding Waivers and Fees Paid Indirectly) | | | 1.42 | % | | | 1.43 | % | | | 1.43 | % | | | 1.44 | %* | | | 1.44 | % | | | 1.45 | % |
Ratio of Net Investment Loss to Average Net Assets | | | (0.86 | )% | | | (0.60 | )% | | | (0.87 | )% | | | (0.91 | )%* | | | (0.80 | )% | | | (0.68 | )% |
Portfolio Turnover Rate | | | 33 | % | | | 23 | % | | | 32 | % | | | 14 | %** | | | 24 | % | | | 25 | % |
^ | For the period November 1, 2020 to September 30, 2021. Effective February 24, 2021, the Edgewood Growth Fund changed its fiscal year end to September 30. |
(1) | Calculated using average shares. |
† | Return is for the period indicated and has not been annualized. Total return would have been lower had certain expenses not been waived and assumed by the Adviser during the period. Returns shown do not reflect the deduction of taxes that a shareholder would pay on Fund distributions or the redemption of Fund shares. |
* | Annualized |
** | Not Annualized |
| Amounts designated as "—" are $0 or have been rounded to $0. |
The accompanying notes are an integral part of the financial statements.
7
THE ADVISORS’ INNER CIRCLE FUND
EDGEWOOD GROWTH FUND
SEPTEMBER 30, 2024
Notes to Financial Statements
The Advisors’ Inner Circle Fund (the “Trust”) is organized as a Massachusetts business trust under an Amended and Restated Agreement and Declaration of Trust dated February 18, 1997. The Trust is registered under the Investment Company Act of 1940, as amended, as an open-end management investment company with 26 funds. The financial statements herein are those of the Edgewood Growth Fund (the “Fund”) which offers two classes of shares: Institutional Shares and Retail Shares. The Fund is non-diversified and its investment objective is to provide long-term growth of capital. The financial statements of the remaining funds of the Trust are presented separately. The assets of each fund of the Trust are segregated, and a shareholder’s interest is limited to the fund of the Trust in which shares are held.
2. | Significant Accounting Policies: |
The accompanying financial statements have been prepared in conformity with U.S. generally accepted accounting principles (“U.S. GAAP”) and are presented in U.S. dollars which is the functional currency of the Fund. The Fund is an investment company and therefore applies the accounting and reporting guidance issued by the U.S. Financial Accounting Standards Board (“FASB”) in Accounting Standards Codification (“ASC”) Topic 946, Financial Services — Investment Companies. The following are significant accounting policies which are consistently followed in the preparation of the financial statements.
Use of Estimates — The preparation of financial statements requires management to make estimates and assumptions that affect the fair value of assets, the reported amount of assets and liabilities and disclosure of contingent assets and liabilities at the date of the financial statements and the reported amounts of increases and decreases in net assets from operations during the reporting period. Actual results could differ from those estimates and such differences could be material.
Security Valuation — Securities listed on a securities exchange, market or automated quotation system for which quotations are readily available (except for securities traded on NASDAQ), including securities traded over the counter, are valued at the last quoted sale price on an exchange or market (foreign or domestic) on which they are traded on the valuation date (or at approximately 4:00 pm ET if a security’s primary exchange
THE ADVISORS’ INNER CIRCLE FUND
EDGEWOOD GROWTH FUND
SEPTEMBER 30, 2024
is normally open at that time), or, if there is no such reported sale, at the most recent quoted bid price. For securities traded on NASDAQ, the NASDAQ Official Closing Price will be used. If available, debt securities are priced based upon valuations provided by independent, third-party pricing agents. Such values generally reflect the last reported sales price if the security is actively traded. The third-party pricing agents may also value debt securities at an evaluated bid price by employing methodologies that utilize actual market transactions, broker-supplied valuations, or other methodologies designed to identify the market value for such securities. Such methodologies generally consider such factors as security prices, yields, maturities, call features, ratings and developments relating to specific securities in arriving at valuations. On the first day a new debt security purchase is recorded, if a price is not available on the automated pricing feeds from our primary and secondary pricing vendors nor is it available from an independent broker, the security may be valued at its purchase price. Each day thereafter, the debt security will be valued according to the Fund’s Fair Value Procedures until an independent source can be secured.
All investment companies held in the Fund’s portfolio are valued at the published net asset value.
Securities for which market prices are not “readily available” are valued in accordance with fair value procedures (the "Fair Value Procedures") established by the Adviser and approved by the Trust's Board of Trustees (the “Board”). Pursuant to Rule 2a-5 under the 1940 Act, the Board has designated the Adviser as the "valuation designee" to determine the fair value of securities and other instruments for which no readily available market quotations are available. The Fair Value Procedures are implemented through a Fair Value Committee (the “Committee”) of the Adviser.
Some of the more common reasons that may necessitate that a security be valued using Fair Value Procedures include: the security's trading has been halted or suspended; the security has been de-listed from a national exchange; the security's primary trading market is temporarily closed at a time when under normal conditions it would be open; the security has not been traded for an extended period of time; the security's primary pricing source is not able or willing to provide a price; or trading of the security is subject to local government-imposed restrictions. When a security is valued in accordance with the Fair Value Procedures, the Committee will
THE ADVISORS’ INNER CIRCLE FUND
EDGEWOOD GROWTH FUND
SEPTEMBER 30, 2024
determine the value after taking into consideration relevant information reasonably available to the Committee. As of September 30, 2024, there were no securities valued in accordance with the Fair Value Procedures.
In accordance with the authoritative guidance on fair value measurements and disclosure under U.S. GAAP, the Fund discloses fair value of its investments in a hierarchy that prioritizes the inputs to valuation techniques used to measure the fair value. The objective of a fair value measurement is to determine the price that would be received to sell an asset or paid to transfer a liability in an orderly transaction between market participants at the measurement date (an exit price). Accordingly, the fair value hierarchy gives the highest priority to quoted prices (unadjusted) in active markets for identical assets or liabilities (Level 1) and the lowest priority to unobservable inputs (Level 3). The three levels of the fair value hierarchy are described below:
| | ● | Level 1 — Unadjusted quoted prices in active markets for identical, unrestricted assets or liabilities that the Fund has the ability to access at the measurement date; |
| | ● | Level 2 — Other significant observable inputs (includes quoted prices for similar securities, interest rates, prepayment speed, credit risk, referenced indices, quoted prices in inactive markets, adjusted quoted prices in active markets, etc.); and |
| | ● | Level 3 — Prices, inputs or proprietary modeling techniques which are both significant to the fair value measurement and unobservable (supported by little or no market activity). |
Investments are classified within the level of the lowest significant input considered in determining fair value. Investments classified within Level 3 whose fair value measurement considers several inputs may include Level 1 or Level 2 inputs as components of the overall fair value measurement.
For details of investment classifications, reference the Schedule of Investments.
For the year ended September 30, 2024, there have been no significant changes to the Fund’s fair valuation methodology.
Security Transactions and Investment Income — Security transactions are accounted for on trade date for financial reporting purposes. Costs used in
THE ADVISORS’ INNER CIRCLE FUND
EDGEWOOD GROWTH FUND
SEPTEMBER 30, 2024
determining realized gains and losses on the sale of investment securities are based on the specific identification method. Dividend income is recorded on the ex-dividend date. Interest income is recognized on the accrual basis.
Investments in REITs — With respect to the Fund, dividend income is recorded based on the income included in distributions received from the REIT investments using published REIT reclassifications including some management estimates when actual amounts are not available. Distributions received in excess of this estimated amount are recorded as a reduction of the cost of investments or reclassified to capital gains. The actual amounts of income, return of capital, and capital gains are only determined by each REIT after its fiscal year-end, and may differ from the estimated amounts.
Repurchase Agreements — The Fund may invest in tri-party repurchase agreements. Securities held as collateral for tri-party repurchase agreements are maintained in a segregated account by the broker’s custodian bank. Provisions of the repurchase agreements require that the market value of the collateral, including accrued interest thereon, is sufficient in the event of default of the counterparty. Such collateral will be cash, debt securities issued or guaranteed by the U.S. Government, securities that at the time of the repurchase agreement is entered into are rated in the highest category by a nationally recognized statistical rating organization (“NRSRO”) or unrated securities that are of comparable quality to securities that are rated in the highest category by an NRSRO, as determined by the Adviser. If the counterparty defaults and the value of the collateral declines or if the counterparty enters into an insolvency proceeding, realization and/or retention of the collateral by the Fund may be delayed or limited. As of September 30, 2024, the Fund did not have any open repurchase agreements.
Federal Income Taxes — It is the Fund’s intention to continue to qualify as a regulated investment company for Federal income tax purposes by complying with the appropriate provisions of Subchapter M of the Internal Revenue Code of 1986, as amended, and to distribute substantially all of its income to its shareholders. Accordingly, no provision for Federal income taxes has been made in the financial statements.
The Fund evaluates tax positions taken or expected to be taken in the course of preparing the Fund’s tax returns to determine whether it is
THE ADVISORS’ INNER CIRCLE FUND
EDGEWOOD GROWTH FUND
SEPTEMBER 30, 2024
“more-likely-than-not” (i.e., greater than 50-percent) that each tax position will be sustained upon examination by a taxing authority based on the technical merits of the position. Tax positions not deemed to meet the more-likely-than-not threshold are recorded as a tax benefit or expense in the current year. The Fund did not record any tax provision in the current period. However, management’s conclusions regarding tax positions taken may be subject to review and adjustment at a later date based on factors including, but not limited to, examination by tax authorities (i.e., the last 3 open tax year ends, as applicable), on-going analysis of and changes to tax laws, regulations and interpretations thereof.
As of and during the year ended September 30, 2024, the Fund did not have a liability for any interest or penalties related to unrecognized tax benefits. The Fund recognizes interest and penalties, if any, related to unrecognized tax benefits as income tax expense in the Statement of Operations. During the year ended September 30, 2024, the Fund did not incur any interest or penalties.
Expenses — Expenses that are directly related to the Fund are charged to the Fund. Other operating expenses of the Trust are prorated to the funds based on the number of funds and/or relative daily net assets.
Classes — Class specific expenses are borne by that class of shares. Income, realized and unrealized gains/losses, and non-class specific expenses are allocated to the respective class on the basis of relative daily net assets.
Dividends and Distributions to Shareholders — Dividends from net investment income and distributions from net realized capital gains, if any, are declared and paid annually by the Fund.
3. | Transactions with Affiliates: |
Certain officers of the Trust are also employees of SEI Investments Global Funds Services (the “Administrator”), a wholly owned subsidiary of SEI Investments Company, and/or SEI Investments Distribution Co. (the “Distributor”). Such officers are paid no fees by the Trust, other than the Chief Compliance Officer (“CCO”) as described below, for serving as officers of the Trust.
A portion of the services provided by the CCO and his staff, whom are employees of the Administrator, are paid for by the Trust as incurred. The services include regulatory oversight of the Trust’s Advisors and service providers as required
THE ADVISORS’ INNER CIRCLE FUND
EDGEWOOD GROWTH FUND
SEPTEMBER 30, 2024
by SEC regulations. The CCO’s services and fees have been approved by and are reviewed by the Board.
4. | Administration, Distribution, Shareholder Servicing, Transfer Agent and Custodian Agreements: |
The Fund and the Administrator are parties to an Administration Agreement under which the Administrator provides administrative services to the Fund. For these services, the Administrator is paid an asset-based fee, which will vary depending on the number of share classes and the average daily net assets of the Fund. For the year ended September 30, 2024, the Fund incurred $2,484,760 for these services.
The Fund has adopted the Distribution Plan (the “Plan”) for the Retail Shares. Under the Plan, the Distributor, or third parties that enter into agreements with the Distributor, may receive up to 0.25% of the Fund’s average daily net assets attributable to Retail Shares as compensation for distribution services. The Distributor will not receive any compensation for the distribution of Institutional Shares of the Fund.
The Fund has entered into shareholder servicing agreements with third-party service providers pursuant to which the service providers provide certain shareholder services to Fund shareholders (the “Service Plan”) for the Retail Shares. Under the Service Plan, the Fund may pay service providers a fee at a rate of up to 0.25% annually of the average daily net assets attributable to Retail Shares, subject to the arrangement for provision of shareholder and administrative services. For the year ended September 30, 2024, the Fund’s Retail Shares incurred $664,966 of shareholder servicing fees, an effective rate of 0.15%.
SS&C Global Investor & Distribution Solutions, Inc. serves as transfer agent and dividend disbursing agent for the Fund under the transfer agency agreement with the Trust. During the year ended September 30, 2024, the Fund earned cash management credits of $658,975, which were used to offset transfer agent expenses. This amount is labeled “Fees Paid Indirectly” on the Statement of Operations.
U.S. Bank, N.A. acts as custodian (the “Custodian”) for the Fund. The Custodian plays no role in determining the investment policies of the Fund or which securities are to be purchased or sold by the Fund.
THE ADVISORS’ INNER CIRCLE FUND
EDGEWOOD GROWTH FUND
SEPTEMBER 30, 2024
5. | Investment Advisory Agreement: |
Under the terms of an investment advisory agreement, Edgewood Management LLC (the “Adviser”) provides investment advisory services to the Fund at a fee, which is calculated daily and paid twice per month at an annual rate of 1.00% of the Fund’s average daily net assets. The Adviser has contractually agreed to waive fees and reimburse expenses to the extent necessary to keep the Institutional Shares’ total annual operating expenses (excluding interest, taxes, brokerage commissions, acquired fund fees and expenses, and extraordinary expenses) from exceeding an amount equal to the management fees payable to the Adviser through January 31, 2025. The Adviser has contractually agreed to waive fees and reimburse expenses to the extent necessary to keep the Retail Shares’ total annual operating expenses (excluding interest, taxes, brokerage commissions, acquired fund fees and expenses, and extraordinary expenses) to an amount equal to the sum of the management fees, and, to the extent incurred, distribution (12b-1) fees and shareholder servicing fees, until January 31, 2025. Refer to “Waiver of Investment Advisory Fees” on the Statement of Operations for fees waived for the year ended September 30, 2024. In addition, the Adviser may receive from the Fund the difference between the Total Annual Fund Operating Expenses (not including excluded expenses) and the contractual expense limit to recoup all or a portion of its prior fee waivers or expense reimbursements made during the three-year period preceding the recoupment if at any point Total Annual Fund Operating Expenses (not including excluded expenses) are below the contractual expense limit (i) at the time of the fee waiver and/or expense reimbursement and (ii) at the time of the recoupment. During the year ended September 30, 2024, the Fund did not recoup any previously waived fees.
For the year ended September 30, 2024, the Adviser waived fees for the Fund in the amount of $4,274,673. The amounts subject to recapture which expire in 2025, 2026 and 2027 are $8,824,437, $4,888,727, and $4,274,673 respectively.
THE ADVISORS’ INNER CIRCLE FUND
EDGEWOOD GROWTH FUND
SEPTEMBER 30, 2024
| | | Year Ended
September 30, 2024 | | | Year Ended
September 30, 2023 | |
Share Transactions: | | | | | | | | |
Institutional Shares | | | | | | | | |
Issued | | | 66,760,846 | | | | 81,316,988 | |
Reinvested | | | — | | | | 50,083,266 | |
Redeemed | | | (96,086,189 | ) | | | (186,356,272 | ) |
Net Institutional Shares Transactions | | | (29,325,343 | ) | | | (54,956,018 | ) |
| | | Year Ended
September 30, 2024 | | | Year Ended
September 30, 2023 | |
Share Transactions: | | | | | | | | |
Retail Shares | | | | | | | | |
Issued | | | 2,398,452 | | | | 3,495,052 | |
Reinvested | | | — | | | | 1,250,096 | |
Redeemed | | | (3,684,233 | ) | | | (6,045,543 | ) |
Net Retail Shares Transactions | | | (1,285,781 | ) | | | (1,300,395 | ) |
Total Net Decrease in Share Transactions | | | (30,611,124 | ) | | | (56,256,413 | ) |
7. | Investment Transactions: |
For the year ended September 30, 2024, the Fund made purchases of $6,177,954,896 and sales of $7,782,607,469 of investment securities other than long-term U.S. Government and short-term securities. The Fund had no purchases or sales of long-term U.S. Government securities.
8. | Federal Tax Information: |
The amount and character of income and capital gain distributions to be paid, if any, are determined in accordance with Federal income tax regulations, which may differ from U.S. GAAP. As a result, net investment income (loss) and net realized gain (loss) on investment transactions for a reporting period may differ significantly from distributions during such period. These book/tax differences may be temporary or permanent. The permanent differences primarily consist of reclassification of long term capital gain distribution on REITs, net operating loss, investment in partnerships and deemed distributions
THE ADVISORS’ INNER CIRCLE FUND
EDGEWOOD GROWTH FUND
SEPTEMBER 30, 2024
due to shareholder redemptions. The permanent difference that is credited or charged to Paid-in Capital and Distributable Earnings (Accumulated Losses) as of September 30, 2024 is primarily related to net operating loss and deemed distributions due to shareholder redemptions that have been reclassified to (from) the following accounts:
Paid-in Capital | | Accumulated Losses | |
$154,882,436 | | | $(154,882,436) | |
The tax character of dividends and distributions declared during the period/fiscal years ended September 30, 2024 and September 30, 2023 were as follows:
| | | Ordinary
Income | | | Long-Term
Capital Gain | | | Total | |
2024 | | $ | — | | | $ | — | | | $ | — | |
2023 | | $ | — | | | $ | 2,034,015,931 | | | $ | 2,034,015,931 | |
As of September 30, 2024, the components of Distributable Earnings on a tax basis were as follows:
Undistributed Long-Term Capital Gain | | $ | 2,813,793,132 | |
Late-Year Loss Deferral | | | (101,791,609 | ) |
Other Temporary Differences | | | 2 | |
Unrealized Appreciation | | | 8,925,577,546 | |
Total Net Distributable Earnings | | $ | 11,637,579,071 | |
Qualified late year ordinary Loss Deferral represent losses realized from January 1, 2024 through September 30, 2024, that in accordance with federal income tax regulations, the Fund has elected to defer and treat as having arisen in the following fiscal year.
During the year ended September 30, 2024, the fund utilized $200,617,030 of prior year capital loss carryforwards to offset capital gains.
The difference between book-basis and tax-basis unrealized appreciation (depreciation) is due to differences in the timing of recognition of gains and losses on investments for tax and book purposes. The Funds' net unrealized appreciation difference is attributable primarily to wash sales, investment in Partnerships and ROC securities.
THE ADVISORS’ INNER CIRCLE FUND
EDGEWOOD GROWTH FUND
SEPTEMBER 30, 2024
The Federal tax cost and aggregate gross unrealized appreciation and depreciation on investments held by the Fund at September 30, 2024 were as follows:
| | Federal
Tax Cost | | | Aggregate Gross
Unrealized
Appreciation | | | Aggregate Gross
Unrealized
Depreciation | | | Net Unrealized
Appreciation | |
| | $ | 11,251,854,644 | | | $ | 9,169,020,870 | | | $ | (243,443,326 | ) | | $ | 8,925,577,544 | |
9. | Concentration of Risks: |
The Fund’s investment strategy often results in a core group of stocks of companies that it believes hold the most growth potential. As a result, poor performance or adverse economic events affecting one or more of these companies could have a greater impact on the Fund than it would on another mutual fund with a broader range of investments.
Equity Risk – Since it purchases equity securities, the Fund is subject to the risk that stock prices will fall over short or extended periods of time. Historically, the equity markets have moved in cycles, and the value of the Fund’s equity securities may fluctuate drastically from day-to-day. Individual companies may report poor results or be negatively affected by industry and/or economic trends and developments. The prices of securities issued by such companies may suffer a decline in response. These factors contribute to price volatility, which is the principal risk of investing in the Fund.
Non-Diversification Risk – The Fund is non-diversified and its investment strategy often results in a core group of stocks of companies that it believes hold the most growth potential. As a result, poor performance or adverse economic events affecting one or more of these companies could have a greater impact on the Fund than it would on another mutual fund with a broader range of investments. However, the Fund intends to satisfy the asset diversification requirements for qualifying as a regulated investment Company under Subchapter M of the Internal Revenue Code of 1986, as amended.
Small- and Medium-Capitalization Company Risk – To the extent that the Fund invests in small- and medium-capitalization companies, the Fund may be subject to additional risk. The small- and medium-capitalization companies in which the Fund may invest may be more vulnerable to adverse business or economic events than larger, more established companies. In particular, investments in these small and mid-sized companies may pose additional risks, including liquidity risk, because these companies tend to have limited product
THE ADVISORS’ INNER CIRCLE FUND
EDGEWOOD GROWTH FUND
SEPTEMBER 30, 2024
lines, markets and financial resources, and may depend upon a relatively small management group. Therefore, small and mid-cap stocks may be more volatile than those of larger companies. These securities may be traded over-the-counter or listed on an exchange.
Foreign Company Risk – When the Fund invests in foreign securities, it will be subject to risks not typically associated with domestic securities. Although American Depositary Receipts (“ADRs”) are an alternative to directly purchasing the underlying foreign securities in their national markets and currencies, they are also subject to many of the risks associated with investing directly in foreign securities. Foreign investments can be riskier and more volatile than investments in the United States. Adverse political and economic developments or changes in the value of foreign currency can make it difficult for the Fund to sell its securities and could reduce the value of your shares. Securities of foreign companies may not be registered with the SEC and foreign companies are generally not subject to the regulatory controls imposed on U.S. issuers and, as a consequence, there is generally less publicly available information about foreign securities than is available about domestic securities. Income from foreign securities owned by the Fund may be reduced by a withholding tax at the source, which tax would reduce income received from the securities comprising the portfolio. Foreign securities may also be more difficult to value than securities of U.S. issuers. In addition, periodic U.S. Government restrictions on investments in issuers from certain foreign countries may require the Fund to sell such investments at inopportune times, which could result in losses to the Fund.
Investment Style Risk – The Fund pursues a “growth style” of investing, meaning that the Fund invests in equity securities of companies that the Adviser believes will have above-average rates of earnings growth and which, therefore, may experience above-average increases in stock prices. Over time, a growth investing style may go in and out of favor, causing the Fund to sometimes underperform other equity funds that use differing investing styles.
Market Risk – The risk that the market value of an investment may move up and down, sometimes rapidly and unpredictably. Markets for securities in which the Fund invests may decline significantly in response to adverse issuer, political, regulatory, market, economic or other developments that may cause broad changes in market value, public perceptions concerning these developments, and adverse investor sentiment or publicity. Similarly, the impact of any epidemic, pandemic or natural disaster, or widespread fear
THE ADVISORS’ INNER CIRCLE FUND
EDGEWOOD GROWTH FUND
SEPTEMBER 30, 2024
that such events may occur, could negatively affect the global economy, as well as the economies of individual countries, the financial performance of individual companies and sectors, and the markets in general in significant and unforeseen ways. Any such impact could adversely affect the prices and liquidity of the securities and other instruments in which the Fund invests, which in turn could negatively impact the Fund’s performance and cause losses on your investment in the Fund.
Cyber Security Risk – The Fund and its service providers may be susceptible to operational and information security risks resulting from a breach in cyber security, including cyber-attacks. Cyber-attacks may interfere with the processing of shareholder transactions, impact the Fund’s ability to calculate its net asset value, cause the release of private shareholder information or confidential company information, impede redemptions, subject the Fund to regulatory fines or financial losses, and cause reputational damage. Similar types of cyber security risks are also present for issuers of securities in which the Fund invests.
10. | Loans of Portfolio Securities: |
The Fund may lend portfolio securities having a market value up to one-third of the Fund’s total assets. Such loans are secured by collateral equal to no less than the market value of the loaned securities determined daily. Such collateral will be (i) cash collateral, which may be converted into collateral investments upon the direction of the Fund, and any proceeds derived therefrom, (ii) securities issued or guaranteed by the United States Government or its agencies, or (iii) irrevocable bank letters of credit issued by a person other than the borrower or an affiliate thereof, or equivalent obligation denominated in United States dollars. It is the Fund’s policy to obtain additional collateral from or return excess collateral to the borrower by the end of the next business day, following the valuation date of the securities loaned. Therefore, the value of the collateral held may be temporarily less than the value of the securities on loan. The securities lending agent (U.S. Bank National Association) and the Fund may pay a part of the interest earned from the investment of collateral in the form of a premium. The Fund records securities lending income net of such allocations. Lending securities entails a risk of loss to the Fund if and to the extent that the market value of the securities loans were to increase and the borrower did not increase the collateral accordingly, and the borrower fails to return the securities. The Fund could also experience delays and costs in gaining access to the collateral. The Fund bears the risk of any deficiency in the
THE ADVISORS’ INNER CIRCLE FUND
EDGEWOOD GROWTH FUND
SEPTEMBER 30, 2024
amount of the collateral available for return to the borrower due to any loss on the collateral invested. In the event of default, the Fund may use the collateral received to offset the position on the loan not returned by the borrower. As of September 30, 2024, the Fund had no securities on loan.
11. | Concentration of Shareholders: |
At September 30, 2024, 40% of Institutional and 76% of Retail total shares outstanding were held by 2 and 3 record shareholders, respectively, each owning 10% or greater of the aggregate total shares outstanding. These shareholders were comprised of omnibus accounts that were held on behalf of various individual shareholders.
In the normal course of business, the Fund enters into contracts that provide general indemnifications. The Fund’s maximum exposure under these arrangements is dependent on future claims that may be made against the Fund and, therefore, cannot be established; however, based on experience, the risk of loss from such claim is considered remote.
The Fund has evaluated the need for additional disclosures and/or adjustments resulting from subsequent events through the date the financial statements were issued. Based on this evaluation, no additional disclosures and/or adjustments were required to the financial statements.
THE ADVISORS’ INNER CIRCLE FUND
EDGEWOOD GROWTH FUND
SEPTEMBER 30, 2024
REPORT OF INDEPENDENT REGISTERED PUBLIC ACCOUNTING FIRM
To the Board of Trustees of The Advisors’ Inner Circle Fund and the Shareholders of Edgewood Growth Fund
Opinion on the Financial Statements
We have audited the accompanying statement of assets and liabilities of Edgewood Growth Fund (the “Fund”) (one of the funds constituting The Advisors’ Inner Circle Fund (the “Trust”)), including the schedule of investments, as of September 30, 2024, and the related statement of operations for the year then ended, the statements of changes in net assets for each of the two years in the period then ended, the financial highlights for each of the three years in the period ended September 30, 2024, the period from November 1, 2020 through September 30, 2021, and each of the two years in the period ended October 31, 2020 and the related notes (collectively referred to as the “financial statements”). In our opinion, the financial statements present fairly, in all material respects, the financial position of the Fund (one of the funds constituting The Advisors’ Inner Circle Fund) at September 30, 2024, the results of its operations for the year then ended, the changes in its net assets for each of the two years in the period then ended, and its financial highlights for each of the three years in the period ended September 30, 2024, the period from November 1, 2020 through September 30, 2021, and each of the two years in the period ended October 31, 2020, in conformity with U.S. generally accepted accounting principles.
Basis for Opinion
These financial statements are the responsibility of the Trust’s management. Our responsibility is to express an opinion on the Fund’s financial statements based on our audits. We are a public accounting firm registered with the Public Company Accounting Oversight Board (United States) ("PCAOB") and are required to be independent with respect to the Trust in accordance with the U.S. federal securities laws and the applicable rules and regulations of the Securities and Exchange Commission and the PCAOB.
We conducted our audits in accordance with the standards of the PCAOB. Those standards require that we plan and perform the audit to obtain reasonable assurance about whether the financial statements are free of material misstatement, whether due to error or fraud. The Trust is not required to
THE ADVISORS’ INNER CIRCLE FUND
EDGEWOOD GROWTH FUND
SEPTEMBER 30, 2024
have, nor were we engaged to perform, an audit of the Trust’s internal control over financial reporting. As part of our audits, we are required to obtain an understanding of internal control over financial reporting but not for the purpose of expressing an opinion on the effectiveness of the Trust’s internal control over financial reporting. Accordingly, we express no such opinion.
Our audits included performing procedures to assess the risks of material misstatement of the financial statements, whether due to error or fraud, and performing procedures that respond to those risks. Such procedures included examining, on a test basis, evidence regarding the amounts and disclosures in the financial statements. Our procedures included confirmation of securities owned as of September 30, 2024, by correspondence with the custodian. Our audits also included evaluating the accounting principles used and significant estimates made by management, as well as evaluating the overall presentation of the financial statements. We believe that our audits provide a reasonable basis for our opinion.
We have served as the auditor of one or more Edgewood Management LLC investment companies since 2006.
Philadelphia, Pennsylvania
November 26, 2024
THE ADVISORS’ INNER CIRCLE FUND
EDGEWOOD GROWTH FUND
SEPTEMBER 30, 2024
NOTICE TO SHAREHOLDERS (Unaudited)
For shareholders that do not have a September 30, 2024, tax year end, this notice is for informational purposes only. For shareholders with a September 30, 2024, tax year end, please consult your tax advisor as to the pertinence of this notice. For the fiscal year ended September 30 2024, the Fund is designating the following items with regard to distributions paid during the year.
Long-Term Capital Gain Distributions | | Ordinary Income Distributions | | | Total Distributions | | | Qualifying for Corporate Dividends Received Deduction (1) | | | Qualifying Dividend Income (2) | | | U.S. Government Interest (3) | | | Interest Related Dividends (4) | | | Short-Term Capital Gain Dividends (5) | | | Qualifying Business Income (6) | |
100.00% | | | 0.00 | % | | | 100.00 | % | | | 0.00 | % | | | 0.00 | % | | | 0.00 | % | | | 0.00 | % | | | 0.00 | % | | | 0.00 | % |
| (1) | Qualifying dividends represent dividends which qualify for the corporate dividends received deduction and is reflected as a percentage of ordinary Income distributions (the total of short-term capital gain and net investment income distributions). |
| (2) | The percentage in this column represents the amount of “Qualifying Dividend Income” as created by the Jobs and Growth Tax Relief Reconciliation Act of 2003 and is reflected as a percentage of ordinary income distributions (the total of short-term capital gain and net investment income distributions). It is the intention of each of the aforementioned funds to designate the maximum amount permitted by law. |
| (3) | “U.S. Government Interest” represents the amount of interest that was derived from direct U.S. Government obligations and distributed during the fiscal year. This amount is reflected as a percentage of ordinary income. Generally, interest from direct U.S. Government obligations is exempt from state income tax. However, for shareholders of the Advisors’ Inner Circle Fund — Edgewood Growth Fund who are residents of California, Connecticut and New York, the statutory threshold requirements were not satisfied to permit exemption of these amounts from state income. |
| (4) | The percentage in this column represents the amount of “Interest Related Dividends” as created by the American Jobs Creation Act of 2004 and is reflected as a percentage of net investment income distributions that is exempt from U.S withholding tax when paid to foreign investors. |
| (5) | The percentage in this column represents the amount of “Short-Term Capital Gain Dividends” as created by the American Jobs Creation Act of 2004 and is reflected as a percentage of short-term capital gain distributions that is exempt from U.S withholding tax when paid to foreign investors. |
| (6) | The percentage of this column represents that amount of ordinary dividend income that qualified for 20% Business Income Deduction. |
The information reported herein may differ from the information and distributions taxable to the shareholder for the calendar year ending December 31, 2024. Complete information will be computed and reported with your 2024 Form 1099-DIV.
Edgewood Growth Fund
P.O. Box 219009
Kansas City, MO 64121-9009
1-800-791-4226
Investment Adviser:
Edgewood Management LLC
600 Steamboat Road, Suite 103
Greenwich, Connecticut 06830-7181
Distributor:
SEI Investments Distribution Co.
One Freedom Valley Drive
Oaks, PA 19456
Legal Counsel:
Morgan, Lewis & Bockius LLP
2222 Market Street
Philadelphia, PA 19103
Independent Registered Public Accounting Firm:
Ernst & Young LLP
One Commerce Square
2005 Market Street, Suite 700
Philadelphia, PA 19103
This information must be preceded or accompanied by a current prospectus
for the Fund.
Item 8. Changes in and Disagreements with Accountants for Open-End Management Investment Companies.
There were no changes in or disagreements with accountants on accounting and financial disclosure during the period covered by the report.
Item 9. Proxy Disclosures for Open-End Management Investment Companies.
There were no matters submitted to a vote of shareholders during the period covered by this report.
Item 10. Remuneration Paid to Directors, Officers, and Others of Open-End Management Investment Companies.
No remuneration was paid by the company during the period covered by the report to any Officers of the Trust, other than as disclosed as part of the financial statements included above in Item 7.
Item 11. Statement Regarding Basis for Approval of Investment Advisory Contract.
The disclosure regarding the Approval of Advisory Agreement, if applicable, is included as part of the financial statements included above in Item 7.
Item 12. Disclosure of Proxy Voting Policies and Procedures for Closed-End Management Investment Companies.
Not applicable to open-end management investment companies.
Item 13. Portfolio Managers of Closed-End Management Investment Companies
Not applicable to open-end management investment companies.
Item 14. Purchases of Equity Securities by Closed-End Management Company and Affiliated Purchasers.
Not applicable to open-end management investment companies.
Item 15. Submission of Matters to a Vote of Security Holders.
There have been no changes to the procedures by which shareholders may recommend nominees to the Registrant’s Board of Trustees during the period covered by this report.
Item 16. Controls and Procedures.
(a) The Registrant's principal executive and principal financial officers, or persons performing similar functions, have concluded that the Registrant's disclosure controls and procedures, as defined in Rule 30a-3(c) under the Act (17 CFR § 270.30a-3(c)), as of a date within 90 days of the filing date of the report, are effective based on the evaluation of these controls and procedures required by Rule 30a-3(b) under the Act (17 CFR § 270.30a-3(b)) and Rule 13a-15(b) or Rule 15d-15(b) under the Securities Exchange Act of 1934, as amended (17 CFR § 240.13a-15(b) or § 240.15d-15(b)).
(b) There has been no change in the Registrant's internal control over financial reporting (as defined in Rule 30a-3(d) under the Act (17 CFR § 270.3a-3(d)) that occurred during the period covered by this report that has materially affected, or is reasonably likely to materially affect, the Registrant's internal control over financial reporting.
Item 17. Disclosure of Securities Lending Activities for Closed-End Management Investment Companies.
Not applicable to open-end management investment companies.
Item 18. Recovery of Erroneously Awarded Compensation.
(a) Not applicable.
(b) Not applicable.
Item 19. Exhibits.
(a)(1) Code of Ethics attached hereto.
(a)(2) Not applicable.
(a)(3) A separate certification for the principal executive officer and the principal financial officer of the Registrant, as required by Rule 30a-2(a) under the Act (17 CFR § 270.30a-2(a)), are filed herewith.
(a)(4) Not applicable.
(b) Officer certifications, as required by Rule 30a-2(b) under the Act (17 CFR § 270.30a-2(b)), also accompany this filing as exhibits.
SIGNATURES
Pursuant to the requirements of the Securities Exchange Act of 1934 and the Investment Company Act of 1940, the Registrant has duly caused this report to be signed on its behalf by the undersigned, thereunto duly authorized.
| (Registrant) | The Advisors’ Inner Circle Fund | |
| | | |
| By (Signature and Title) | /s/ Michael Beattie | |
| | Michael Beattie, Principal Executive | |
| Date: December 6, 2024 | | |
Pursuant to the requirements of the Securities Exchange Act of 1934 and the Investment Company Act of 1940, this report has been signed below by the following persons on behalf of the Registrant and in the capacities and on the dates indicated.
| By (Signature and Title) | /s/ Michael Beattie | |
| | Michael Beattie, Principal Executive | |
| Date: December 6, 2024 | | |
| | | |
| By (Signature and Title) | /s/ Andrew Metzger | |
| | Andrew Metzger, | |
| Principal Financial Officer | |
| Date: December 6, 2024 | | |