Technical Report
Kupol Project
Preliminary Assessment Summary
Chukotka, A.O.
Russian Federation
By
Tom Garagan, P.Geo.
Bema Gold Corporation
May 19, 2004
Table of Contents
| Technical Report - Kupol Project Preliminary Assessment Summary | i |
| Bema Gold Corporation | |
| Technical Report - Kupol Project Preliminary Assessment Summary | ii |
| Bema Gold Corporation | |
| Technical Report - Kupol Project Preliminary Assessment Summary | iii |
| Bema Gold Corporation | |
List of Tables
| Technical Report - Kupol Project Preliminary Assessment Summary | iv |
| Bema Gold Corporation | |
List of Figures
| Technical Report - Kupol Project Preliminary Assessment Summary | v |
| Bema Gold Corporation | |
| Technical Report - Kupol Project Preliminary Assessment Summary | vi |
| Bema Gold Corporation | |
| Technical Report - Kupol Project Preliminary Assessment Summary | vii |
| Bema Gold Corporation | |
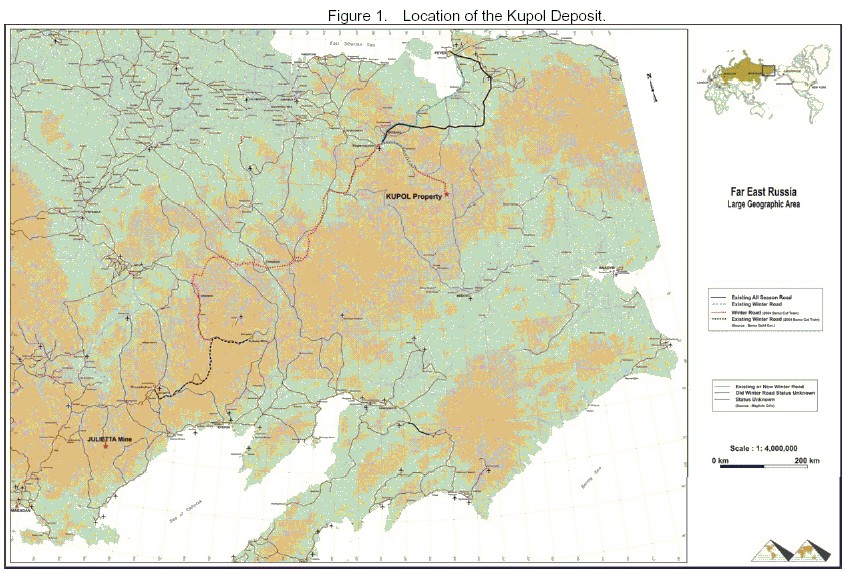
| | 1.0 Summary On December 18, 2002, Bema Gold announced that it had completed the terms of a definitive agreement with the Government of Chukotka, an autonomous Okrug (region) in northeast Russia, to acquire up to a 75% interest in the Kupol gold and silver. Bema Gold can acquire a 75% interest on the following basis: (i) an initial 20% interest by paying $8 million cash (paid in December, 2002) and expending a minimum of $5 million (expended) on exploration on the Kupol property by December, 2003; (ii) a further 10% interest by paying $12.5 million in cash by December 31, 2003 (paid); (iii) an additional 10% interest by paying $10 million in cash and expending an additional $5 million on exploration by December, 2004; and (iv) the final 35% interest by completing a bankable feasibility study and by paying $5.00 per ounce for 75% of the gold identified in the proven and probable reserve categories in the feasibility study (within 90 days of the completion of the feasibility study). Upon commencement of mine construction, the Company must pay a further $5.00 per ounce of gold for 75% of the ounces identified in the proven and probable reserves contained in the feasibility study. To date Bema Gold has earned a 30% interest in the Kupol project and is operator of the project. The Kupol Deposit is located in the Northwest part of the Anadyr foothills on the boundary between the Anadyr and Bilibino Regions in the Chukotka Autonomous Okrug, and is approximately 430 km northwest of Anadyr, 200 km southeast of Bilibino / Keperveyem, 320 km south of Pevek and 1250 km northeast of Magadan. Kupol can be accessed by winter road and by helicopter; an airstrip is being constructed at site this year that will accept fixed wing aircraft. The geographical coordinates for the site are 66°47’northing and 169°33’ easting. The location of the deposit is shown in Figure 1 – Location of the Kupol Deposit. Quartz veins at the Kupol site were located in 1966 by a Soviet Government Exploration Expedition and the main vein was discovered in 1996 by the Bilibino based, State funded Anyusk Geological Expedition. Gold and silver mineralization at Kupol is hosted by polyphase brecciated quartz-adularia veins. The extent of brecciation is highly variable but generally the higher-grade zones are more strongly brecciated. The Kupol deposit can be classified as a low sulphidation epithermal fissure vein type deposit. The silver to gold ratio is typically 12 to 1. Between 1996 and 2002 a limited amount of exploration work was conducted. In 2003 Bema mobilized drills and supplies and completed 22,000 metres of diamond drilling in 166 holes in addition to 2.5 kilometres of trenching in 15 trenches. Sufficient sample was collected from the drilling to conduct a thorough metallurgical testing program. From the work completed in 2003, on February 23, 2004, Bema published an indicated resource estimate of 2.5 million tonnes grading 22.3 grams of gold per tonne and 232 grams of silver per tonne (1.8 million ounces of gold and 19 million ounces of silver) in addition to an inferred resource of 7.1 million tonnes grading 18.4 grams of gold per tonne and 242 grams of silver per tonne (4.2 million ounces of gold and 55 million ounces of silver). The |
| Technical Report - Kupol Project Preliminary Assessment Summary | 1 |
| Bema Gold Corporation | |
| | published resource estimate used a 6 grams of gold per tonne cut off grade and is considered very preliminary in nature because the limits of the deposit have not been tested along strike or at depth. The Kupol epithermal vein system has been delineated along 4 kilometres of strike length, of which 3.4 kilometres has been tested by surface trenches and diamond drilling. Bema’s estimate of the ultimate size for the Kupol deposit is in excess of 10 million ounces of gold and 100 million ounces of silver. This Technical Report, summarizing a report known as a Preliminary Economic Assessment (PEA), is the beginning of the planning process for conducting mining and milling operations. While some parts of the study (Metallurgical Design, Logistics, Plant and Infrastructure) are advanced well beyond what is required for a PEA, the study has been based on the indicated plus the inferred resources, which therefore reverts it to a PEA by definition. The Preliminary Assessment that is being developed from the conclusions drawn from this Technical Report, is that the Preliminary Assessment includes the use of inferred resources that are considered too speculative geologically to have economic considerations applied to them that would enable them to be categorized as mineral reserves. Thus, there is no certainty that the results predicted by the Preliminary Assessment will be realized. The current timeline for the project includes construction beginning in 2005 (foundations and earthworks), continuing in 2006 through the 2nd quarter of 2007. Start-up is anticipated in 4th quarter 2007 with full production beginning in 2008. The total identified diluted mineral resource outlined by the open pit and underground plans is 11.57 million tonnes at a grade of 14.72 grams / tonne gold and 181.8 grams / tonne silver at a gold cutoff grade of 6.0 g/t. The distribution of the mineral resource by the production source and by the mineral resource classification category is stated in Table 1. |
Table 1. Production Source and Mineral Resource Classification
| Production Source | | %
Indicated | %
Inferred |
Open Pit:
Tonnages (millions)
Au (g/t)
Ag (g/t)
| | | |
| 4.98 | 62.8% | 37.2% |
| 16.07 | | |
| 172.9 | | |
Underground
Tonnages (millions)
Au (g/t)
Ag (g/t)
| | | |
| 6.59 | 1% | 99% |
| 13.70 | | |
| 188.6 | | |
Total
Tonnages (millions)
Au (g/t)
Ag (g/t) | | | |
| 11.57 | 28% | 72% |
| 14.72 | | |
| 181.8 | | |
| | The identified open pit resource (tonnes and grade) is based on the final diluted Block Model. The final diluted Block Model for the open pit includes approximately 20% dilution. The |
| Technical Report - Kupol Project Preliminary Assessment Summary | 2 |
| Bema Gold Corporation | |
| | grade of the dilution material is based on the actual grades of the dilution material with in the Block Model. All production stated for the open pit includes the 20% dilution. The identified underground resource (tonnes and grade) is based on the final undiluted Block Model. The production stated for the underground includes approximately 19% dilution with a gold grade of 2 grams per tonne and a silver grade of 20 grams per tonne. Open Pit methods during the first 5 years of the project will be used to mine the ore on a two shift per day , 340 days per year schedule (25 days per year are not scheduled to allow for weather delays), at a rate of approximately 4,500 tonnes per day of ore, (approximately 3000 tonnes per day of high grade ore greater than or equal to 10 grams per tonne of gold and 1500 tonnes per day or low grade ore), and 65,000 tonnes per day of waste. Low Grade ore will be stockpiled and delivered to the mill in the later years of the project’s life. The waste to ore strip ratio is 20 to 1. The average dilution in the final pit model is 20%. The production schedule for the Open Pit is stated in Table 2. |
| Technical Report - Kupol Project Preliminary Assessment Summary | 3 |
| Bema Gold Corporation | |
| Technical Report - Kupol Project Preliminary Assessment Summary | 4 |
| Bema Gold Corporation | |
Table 2. Open Pit Production Schedule by Year
| OPEN PIT PRODUCTION | Preproduction | YR 1 | YR 2 | YR 3 | YR 4 |
| | | | | | |
| High Grade Ore Pit | | | | | |
| Production | 366,500 t | 956,100 t | 1,095,200 t | 435,300 t | 101,700 t |
| Au Grade | 24.88 g /t | 26.11 g /t | 22.18 g /t | 15.45 g /t | 15.48 g /t |
| Ag Grade | 232.1g /t | 258.1 g /t | 250.2 g /t | 155.6 g /t | 227.2 g /t |
| % Indicated | 91% | 70% | 62% | 86% | 20% |
| % Inferred | 9 % | 30% | 38% | 32% | 80% |
| | | | | | |
| Low Grade Ore Pit | | | | | |
| Production | 86,600 t | 448,700 t | 467,900 t | 535,400 t | 484,600 t |
| Au Grade | 6.98 g /t | 6.23 g /t | 6.51 g /t | 6.51 g /t | 6.97 g /t |
| Ag Grade | 62.4 g /t | 58.5 g /t | 74.5 g /t | 77.0 g /t | 116.4 g /t |
| % Indicated | 78% | 61% | 53% | 75% | 29% |
| % Inferred | 22% | 39% | 47% | 25% | 71% |
| | | | | | |
| Total Ore Pit Production | 453,100 t | 1,404,800 t | 1,563,100 t | 970,700 t | 586,300 t |
| Au Grade | 21.46 g /t | 19.76 g /t | 17.49 g /t | 10.52 g /t | 8.45 g /t |
| Ag Grade | 199.6 g /t | 194.4 g /t | 197.6 g /t | 112.2 g /t | 135.6 g /t |
| | | | | | |
| Waste Pit Production | | | | | |
| Acid Generating | 970,000 t | 4,333,000 t | 6,832,000 t | 2,517,000 t | 3,717,000 t |
| Potentially Acid Generating | 10,534,000 t | 13,665,000 t | 12,507,000 t | 14,930,000 t | 9,913,000 t |
| Non-Acid Generating | 4,278,000 t | 3,783,000 t | 2,421,000 t | 4,983,000 t | 1,450,000 t |
| Unclassified | 514,000 t | 213,000 t | 277,000 t | 339,000 t | 20,000 t |
| Overburden | 404,000 t | 451,000 t | 400,000 t | 130,000 t | 1,000 t |
| Total Waste | 16,700,000 t | 22,445,000 t | 22,437,000 t | 22,899,000 t | 15,101,00 t |
| | | | | | |
| High Grade Ore per Day | 1,078 t /d | 2,812 t /d | 3,221 t /d | 1,280 t /d | 299 t /d |
| Low Grade Ore (Stockpiled) | | | | | |
| per Day | 255 t /d | 1,320 t /d | 1,376 t /d | 1,575 t /d | 1,425 t /d |
| Waste Tonnes per Day | 49,118 t /d | 66,015 t /d | 65,991 t /d | 67,350 t /d | 44,415 t /d |
| Total Rock Tonnes per Day | 50,450 t /d | 70,146 t /d | 70,589 t /d | 70,205 t /d | 46,139 t /d |
| | Underground mechanized mining methods during the third through twelfth year of the project will be used to mine the ore on a two shift per day, 365 days per year schedule at a rate of approximately 2,200 tonnes per day of ore. The average dilution in the final underground model is 19%. The production schedule for the Underground Mine is stated in Table 3. |
| Technical Report - Kupol Project Preliminary Assessment Summary | 5 |
| Bema Gold Corporation | |
Table 3. Underground Production by Year
Underground
Production | Tonnes | Gold
Grade | Silver
Grade | Tonnes
per Day |
| | | | | |
| YR 2 | 1,500 t | 19.51 g/t | 265.8 g/t | 4 t /d |
| YR 3 | 497,300 t | 12.73 g/t | 168.5 g/t | 1,362 t /d |
| YR 4 | 743,816 t | 13.16 g/t | 177.6 g/t | 2,038 t /d |
| YR 5 | 800,480 t | 14.28 g/t | 180.8 g/t | 2,193 t /d |
| YR 6 | 803,402 t | 14.28 g/t | 187.5 g/t | 2,201 t /d |
| YR 7 | 777,369 t | 14.01 g/t | 185.5 g/t | 2,130 t /d |
| YR 8 | 728,892 t | 13.96 g/t | 182.0 g/t | 1,997 t /d |
| YR 9 | 717,440 t | 13.58 g/t | 193.9 g/t | 1,966 t /d |
| YR 10 | 725,800 t | 13.41 g/t | 200.1 g/t | 1,988 t /d |
| YR 11 | 674,700 t | 13.42 g/t | 211.1 g/t | 1,848 t /d |
| YR 12 | 122,487 t | 13.91 g/t | 229.6 g/t | 336 t /d |
| | | | | |
| TOTAL | 6,593,185 t | 13.70 g/t | 188.6 g/t | |
| | The Mill will process the ore on a two shift per day, 365 days per year schedule at a rate of approximately 3,200 tonnes per day of ore during the operation of the open pit and the mill process rate will decrease down to approximately 2,200 tonnes per day once the low grade stockpile from the open pit is consumed . The gold recovery will be 93.5% and the silver recovery will be 83%. The mill availability will be 94%. The milling process will consist of a primary crushing and grinding circuit and will include conventional gravity technology followed by whole ore leaching. Merrill Crowe precipitation will be used to produce doré bars. Doré will be sent to a refinery located near Magadan or shipped by air to a refinery in central Russia. The production schedule for the mill is stated in Table 4. |
| Technical Report - Kupol Project Preliminary Assessment Summary | 6 |
| Bema Gold Corporation | |
Table 4. Mill Production Schedule
| Mill Production | Tonnes per
Day | Tonnes per
Year | Gold Grade | Silver Grade | Gold Produced
[troy ounces] | Silver Produced
[troy ounces] | Gold
Recovery | Silver
Recovery |
| YR 1 | 3,048 t/d | 1,112,507 t | 24.64 g/t | 239.24 g/t | 779,718 t-oz | 6,652,796 t-oz | 91.0% | 77.0% |
| YR 2 | 3,205 t/d | 1,169,697 t | 22.04 g/t | 239.34 g/t | 770,167 t-oz | 7,385,201 t-oz | 93.5% | 83.0% |
| YR 3 | 3,205 t/d | 1,169,697 t | 14.65 g/t | 167.62 g/t | 530,171 t-oz | 5,360,891 t-oz | 93.5% | 83.0% |
| YR 4 | 3,205 t/d | 1,169,697 t | 11.78 g/t | 153.05 g/t | 420,007 t-oz | 4,803,483 t-oz | 93.5% | 83.0% |
| YR 5 | 3,205 t/d | 1,169,697 t | 11.78 g/t | 151.81 g/t | 414,237 t-oz | 4,740,723 t-oz | 93.5% | 83.0% |
| YR 6 | 3,205 t/d | 1,169,697 t | 11.87 g/t | 153.98 g/t | 417,317 t-oz | 4,802,410 t-oz | 93.5% | 83.0% |
| YR 7 | 3,205 t/d | 1,169,697 t | 11.62 g/t | 152.48 g/t | 408,939 t-oz | 4,762,194 t-oz | 93.5% | 83.0% |
| YR 8 | 2,666 t/d | 973,160 t | 12.22 g/t | 159.39 g/t | 360,369 t-oz | 4,174,909 t-oz | 93.5% | 83.0% |
| YR 9 | 2,096 t/d | 764,992 t | 13.27 g/t | 184.63 g/t | 308,078 t-oz | 3,790,246 t-oz | 93.5% | 83.0% |
| YR 10 | 1,983 t/d | 723,710 t | 13.45 g/t | 198.53 g/t | 293,429 t-oz | 3,830,298 t-oz | 93.5% | 83.0% |
| YR 11 | 1,883 t/d | 687,475 t | 13.42 g/t | 208.19 g/t | 278,190 t-oz | 3,820,113 t-oz | 93.5% | 83.0% |
| YR 12 | 798 t/d | 291,162 t | 13.63 g/t | 218.87 g/t | 135,210 t-oz | 1,920,251 t-oz | 93.5% | 83.0% |
| TOTAL | | 11,571,185 t | 14.72 g/t | 181.8 g/t | 5,115,832 t-oz | 56,043,517 t-oz | | |
| | A cyanide destruction system will be used to reduce cyanide concentrations to an acceptable level for disposal. These tails will either be filtered and report to a dry stack area, or thickened and pumped to a conventional tailings impoundment. To date, no decision has been made on the preferred option. This will not be decided until filter tests are completed later this year. Due to the remote location of the project, a mancamp and complete infrastructure will be constructed to support the mine. The mancamp will be designed to accomodate 500 persons. The project will be designed to meet Russian and North American industry and environmental standards. Operating permits will be obtained from local, regional and federal authorities. Various studies have been conducted throughout the PEA period, reviewing different cases with variations in production rates, process alternatives, logistical issues and economic factors. From these studies a project case (Base Case) was selected and sensitivities were evaluated with changes in capital costs, operating costs and metal prices. The total pre-production capital cost to construct the plant facilities including the tailing pond and owners costs is estimated at USD $186.3 million. In addition, due to the remote location of the project, it is expected that all consumables and supplies required for a 12-month period will be purchased and shipped to site prior to start up and total approximately $58.8 million. Open pit mine equipment as well as an initial underground mining fleet is assumed to be purchased by way of a capital lease at a total cost of $58.7 million. All pre-production capital, mobile fleet, owners costs and inventory amounts are inclusive of estimated importation duties. Value added taxes are refundable and have therefore been excluded from the presented totals. Refer to the economic model for supporting detail. |
| Technical Report - Kupol Project Preliminary Assessment Summary | 7 |
| Bema Gold Corporation | |
Table 5. Preproduction Capital Costs
| Preproduction Capital Cost Estimate | (USD $ millions) |
| | |
| Preproduction Plant & Equipment Capital Costs | |
| Processing Plant & Infrastructure | $150.6 |
| Site General | $1.3 |
| Processing CN Recovery | $5.4 |
| Owners Site Construction | $29.0 |
| Subtotal – Preproduction Plant & Equipment Capital | $186.3 |
| | |
| Owners Preproduction Capital Costs | |
| Surface Mining Costs (Pre-Stripping) | $20.8 |
| Underground Mine | $1.9 |
| Processing Costs | $1.4 |
| Site Services | $3.0 |
| General & Administrative | $7.9 |
| Subtotal – Owners Preproduction Capital | $35.0 |
| | |
| Inventory Costs | |
| Working Capital (supplies inventory) | $58.8 |
| | |
| Taxes(Property) | |
| Tax (Property, Environmental) | $13.4 |
| | |
| TOTAL preproduction capital | $293.5 |
| | |
| Mine equipment – capital lease | |
| | |
| Underground Mine Equipment | $18.9 |
| Surface Mine Equipment | $39.8 |
| Total Capital Lease – Mine Equipment | $58.7 |
| | The current timeline for the project includes construction beginning in 2005 (foundations and earthworks), continuing in 2006 through the 2nd quarter of 2007. Start-up is anticipated in 4th quarter 2007 with full production beginning in 2008. The present study (Base Case) shows a technically feasible project. The preliminary economic assessment is based on USD $350 per ounce gold and USD $ 5.50 per ounce silver and an exchange rate of 30 roubles to the US Dollar. The life of project average Open Pit mining cost is estimated to be $23.73 per surface ore tonne mined and $1.12 per rock tonne mined. The life of project average Underground Mining cost is estimated to be $31.66 per underground ore tonne mined. The life of project average Milling cost is estimated to be $25.77 per ore tonne milled. The life of project average Site Services cost is estimated to be $2.17 per ore tonne milled. The life of project average General & Adminstrative Cost is estimated to be $ 3.05 per ore tonne milled. |
| Technical Report - Kupol Project Preliminary Assessment Summary | 8 |
| Bema Gold Corporation | |
| | The preliminary economic analysis indicates the Kupol project has a payback period for the preproduction capital investment and operating costs within approximately 18 months before Net Profit Tax and within approximately 25 months after Net Profit Tax. The Net Present Value before Net Profit Tax, using a per ounce gold price of $350 and a silver price of $5.50, at a 0% discount rate is $845 million, at 5% discount rate is $552 million and at 8% discount rate is $429 million. The Net Present Value after Net Profit Tax, using a per ounce gold price of $350 and a silver price of $5.50, at a 0% discount rate is $645 million, at 5% discount rate is $405 million and at 8% discount rate is $304 million. The Discounted Cash Flow Return on Investment is approximately 23.5% before taxes and 19.4% after taxes. The cash cost per gold ounce produced (less silver credits) averages $39 per ounce for the first two years of operation, $70 per ounce for the first five years of operation and the life of mine averages $76 per ounce. The full cost per ounce produced, which includes production royalty taxes of 6% for gold and 6.5% for silver, (less silver credits) averages $72 per ounce for the first two years of operation, $104 per ounce for the first five years of operation and the life of mine averages $112 per ounce. The Base Case preliminary economics are stated in Table 6. |
| Technical Report - Kupol Project Preliminary Assessment Summary | 9 |
| Bema Gold Corporation | |
DOES NOT INCLUDE ROYALTY OR TRANCHE PAYMENTS
17-May-04 | Table 6. Base Case Preliminary Economics
KUPOL PROJECT
CJSC-CMGC - Chukotka Mining and Geological Company
PRELIMINARY ECONOMIC ASSESSMENT - {P.E.A.}
COMPARISON STATEMENT OF OPERATIONS - 100%
[separation of preproduction capital and operating costs by full operating years] |
| Technical Report - Kupol Project Preliminary Assessment Summary | 10 |
| Bema Gold Corporation | |
| | The focus of the Feasibility study will be to upgrade and expand the resource estimate with 55,000 metres of diamond drilling to be conducted in the summer of 2004, and better define the ultimate size of the Kupol Deposit. Mine plans will be completed with alternative contribution levels from the underground and open pit to with the focus on reducing preproduction capital. production levels and operating costs. With the additional drilling Feasibility mine planning will target underground production capability to maintain a rate of 3,000 tonnes per day for the Life of Mine. Metallurgical work conducted during the Feasibility will focus on optimizing the current process flow sheet and confirming any assumptions included in the PEA. Evaluations will be conducted to determine interactions of reagents to further improve recoveries and reduce consumption. In addition, tests will be carried out to determine if dry stack tailings are feasible, which would reduce Capital costs. |
| | |
| 1.1 | Exploration Potential |
| | |
| | The limit of the boiling level of the system has not been identified and as such the system remains open at depth along the full strike extent of the structure. Magnetic surveying at the northern end of the deposit indicates that a strong magnetic low continues to the northern limits of the survey coverage. Drilling in 2003 indicated that the magnetic low corresponds with hydrothermal alteration associated to the Kupol structure. The magnetic anomaly will be drilled in 2004 as stepouts north from the 2003 drilling. The magnetic survey coverage will be extended for 2.2 kilometres to the north. To the south the jarositic alteration zone associated with the Kupol structure continues down into the Kayeremveem River valley. Vein outcrop and float, along with associated silver, arsenic and minor gold soil geochemistry anomalies, are associated with portions of this alteration zone. While the alteration zone continues, there are rhyolitic dykes and dome structures emplaced along parts of the main structure that partially limit the vein. Exploration in 2003 indicated the potential to identify additional ore shoots along this portion of the structure. Drilling in 2003 intersected a deep vein splay off of the Main Kupol structure on section 2675 N from which one sample assayed 102.94 g/t gold over 1.0 metres. Further definition of this vein will be undertaken in 2004 in conjunction with drilling of the main vein. To the west of the Kupol structure a series of north-south trending alteration zones with minor quartz veining have been identified. These zones are believed to represent the upper levels of the Kupol hydrothermal system based on their anomalous antimony and arsenic geochemistry, presence of silicified algal tubes and probable kaolinitic argillic alteration assemblage. Anomalous gold (to 1.2 g/t) was found associated with these structures. The alteration zones have been mapped for up to 600 metres strike length and can be traced south through magnetic lows and/or resistivity highs for an additional kilometre. |
| Technical Report - Kupol Project Preliminary Assessment Summary | 11 |
| Bema Gold Corporation | |
| 1.2 | Environment |
| | | |
| | 1.2.1 Baseline Information |
| | | |
| | The Kupol Property is located within the watershed of the Anui and Anadyr upland regions, in the east foothills of the Anui mountain ridge. This area is characterized by prevailing low, rounded hills with occasional flat, midland areas. The watersheds are flat-shaped or convex-plane, with rounded hilltops elevated from 100 to 200 meters above the riverbeds. The tops are divided by wide (200 to 300 m) but shallow (20 to 30 m) saddles. The absolute elevations of the hills surrounding the property do not exceed 700-1050 m (1034.2 m for Malakhai Mountain and 815.0 m for Kupol Mountain). Permafrost is distributed throughout the Kupol Property area. Depending on geomorphology, thickness of permafrost layer goes down from surface to 200 to 320 meters and reaches its maximum deep under riverbeds. Thickness of seasonal melting varies from 0.02 -1.5 meters in river valley terrains to 12.4 meters on watersheds. In accordance with the closest weather stations, the average annual air temperature at the Kupol site, with only minor variances, is near -13°C. The total amount of precipitation does not exceed 277 mm. The absolute minimum average monthly temperatures occur in January and February (-58 °C). During the warmest months (June-August), the average air temperatures are 8.3; 11.3; and 10 °C; respectively. The territory around the Kupol site belongs to the Watersheds of the Srednyi Kayemraveem and Malyi Anyui Rivers. The Srednyi Kayemraveem drains into the Mechkereva River. The Mechkereva River is a right tributary of the Anadyr River. The Anadyr River is one of the largest waterways on the Chukotka peninsula and the waters flow from the West to the East thru the middle part of Chukotka and drains into the Bering Sea in the Pacific Ocean. The Malyi Anyui River is a right tributary of the Kolyma River. The Kolyma is one of the largest waterways of the Far Northeastern part of Russia and flows form the South to the North to the Eastern Siberian Sea in the Arctic Ocean. The Srednyi Kayemraveem River runs north to south and is situated just east of the deposit. It has an average bed width of 5-10 meters and an average depth of 0.3 meters. The river is primarily fed from surface water runoff (90%) that includes rain, snowmelt, and seasonal thawing of the active permafrost layer. Based on analogous rivers, the maximum amount of flow occurs in June and July. During the spring and summer, the river will experience 97% of its annual flow (3% occurs in the fall months). Based on geobotanical classification, the Kupol deposit is located in the Anyusk geobotanical district of the sparsely forested area of the western part of the Anyusk-Chukotka foothills. The forest composition of the Kupol deposit is represented by 73 species that are typical for the Omolon and Anyusk geobotanical regions. The area is not populated with any rare or protected species. The area around the Kupol deposit is populated by wildlife that is typical for the cold-weather, topography, and mountainous terrain that surrounds the deposit. Among rare and endangered species that can be located within the area include: |
| Technical Report - Kupol Project Preliminary Assessment Summary | 12 |
| Bema Gold Corporation | |
| | 1. | mammals protected under the Russian Red Book for Far Eastern Russia: |
| | | a. | Yakutian snow sheep; and, |
| | | b. | Wild northern reindeer. |
| | | | |
| | 2. | birds protected under the Russian Red Book for Far Eastern Russia: |
| | | a. | Peregrine Falcon; and, |
| | | b. | Gyrfalcon. |
| | The site was surveyed during the 2003 field season by an archeologist. This included walking the site and surrounding areas to look for any identifying artifacts or areas that may have archeological significance. There were 4 areas that were identified for further investigation. None of these areas were located within the construction footprint. There are no nature preserves or protected environmentally sensitive areas in the vicinity of the Kupol site. |
| | | |
| | 1.2.2 Impacts |
| | | |
| | Impacts describe the potential effect that a risk source may have on one or more environmental receptors. Receptors can include affected humans (mine personnel, local communities) as well as natural ecosystems. Potential environmental impacts have been assessed by characterizing the natural receiving environment, mine employees and local communities affected by the mine and combining this with theoretical knowledge of typical effects of exposure to the identified risk sources. Impacts are shown in Table 7 and include: |
Table 7. Project Imapcts
| Component | Impact Description | Mitigation Measures | Risk |
| Air quality | Short term, episodic, and localized impacts | Baghouses for dust, regular maintenance, catalytic converters where feasible, watering of fugitive dust sources, minimizing land disturbance | HIGH for stationary sources, MEDIUM for mobile sources, and HIGH for fugitive sources |
| Topography and land disturbance | Changes in topography, removal of vegetation, reduction in surface water quality, and changes in hydrobiological characteristics | Minimizing land disturbance, interim reclamation, and stockpiling of topsoil | INTERMEDIATE for topography and land disturbance |
| Soil | Compaction, soil structure loss, potential chemical changes due to chemical composition | Minimize land disturbance, interim reclamation, extensive testing of potential ARD and implementation of wasterock management plan. | Potential impacts from ARD, if not properly managed are HIGH |
| Technical Report - Kupol Project Preliminary Assessment Summary | 13 |
| Bema Gold Corporation | |
| Component | Impact Description | Mitigation Measures | Risk |
| Surface water quality | Changes in river productivity, increased sedimentation, no long term impacts | Proper erosion control measures, minimization of land disturbances, treatment of domestic wastewater, minimize potential of filtration from tailings impoundment | Potential impacts from erosion and run-off are LOW. Potential impacts, if tailings facility leaks, are HIGH. None of the impacts are considered long term. |
| Vegetation | Reduction in ground cover, loss of habitat and feeding area for wildlife | Minimize land disturbance, interim reclamation | Potential impacts from vegetation loss are LOW. Impacts are considered to be short term. |
| Wildlife impacts | Loss of wildlife through poaching and disturbance of natural habitat | Minimize land disturbance and implement strong anti- poaching policies at the mine. | Potential impacts for wildlife loss are LOW. Impacts are considered to be SHORT term. |
| Aesthetics and visual resources | Loss of aesthetics and visual resource through land disturbance and creation of new land formations | Minimize land disturbance and conduct interim reclamation | Potential impacts are LOW. Impacts for land formation are considered LONG term. |
| Socioeconomics | Increase revenue for the region through taxation and job creation. Overall positive impacts for the region. | Maximize opportunities for IP and women. Maximize number of employees hired from the region. Maximize potential for local purchases and potential development of small to medium enterprises to support the operations. | Potential positive socioeconomic impacts are considered HIGH and LONG term. |
| Archeology | Loss of cultural monuments during land disturbance | Conducted survey of area. Create an cultural monument response plan | Potential impacts are LOW. Impacts are considered to be LONG term. |
| 1.3 | Russian Feasibility Study Requirements |
| | | |
| | Bema Gold is currently developing a Preliminary Assessment of the property. The results of this assessment indicate that the project should advance to the feasibility level. The proposed completion date for development of a full feasibility study is May 2005. In addition to the development of the feasibility study, Bema Gold will develop several documents required under Russian guidelines to include: |
| | |
| | • | Declaration of Intent and Basis for Act of Site Selection- these documents are provided to the local regulatory agency (in Bilibino and Anadyr) to provide the regulators with an idea of the direction that the project is going and helps avoid costly |
| Technical Report - Kupol Project Preliminary Assessment Summary | 14 |
| Bema Gold Corporation | |
| | | delays in project design. It is anticipated that these documents will be submitted in June 2004. |
| | | |
| | • | An Investment-Level Feasibility Study (TEO-I)- In Russia, the feasibility process (and accompanying environmental impact assessment) is divided into two separate categories: Investment and Construction. In the event of a foreign investor or joint- venture project, both documents are required and must be submitted to the federal government for review and differ only in their level of detail. Bema anticipates completing the TEO-I as an extension of the Preliminary Assessment prior to the end of 2004. |
| | | |
| | • | Construction-level Feasibility Study (TEO-C)– In Russia, the TEO-C (and accompanying environmental impact assessment) is required to commence construction. This document will be based on the feasibility study and include the necessary information to receive approvals to construct a project in Russia. Bema anticipates completing the TEO-C during the same period at the Western Feasibility Study (2ndquarter 2005). |
| | | |
| | The requirements and timeline for submittal of these documents is detailed in Section 3 – Permitting Requirements. It is anticipated that a Western consultant will be hired to complete the feasibility study and that Russian specialists will be hired to satisfy the Russian permitting requirements. To date, these qualified persons have not been chosen. |
| | | |
| 1.4 | Conclusions & Recommendations |
| | | |
| | The following conclusions may be drawn from this Technical Report and the Preliminary Assessment that is being developed: |
| | | |
| | • | The Preliminary Assessment confirms that the Kupol Project and property contains a substantial resource that, with additional exploration and concept development, may be developed into a major gold producer. |
| | • | The drilling completed by Bema Gold and the reinterpretation of the geology of the deposits has improved the value of the project from previous assessments. |
| | • | The study demonstrated the positive impact of near surface, high grade deposits, such as that outlined in this report. |
| | • | The Preliminary Assessment is based on a series of assumptions and as a result incorporates a number of risks: |
| | • | The Preliminary Assessment also speculates on the impact of exploration success on the project economics. This speculation is intended to provide direction for future exploration. Bema Gold has developed a geological model for the property upon which it is reasonable to anticipate exploration success, but this report is not intended to endorse the certainty of that success. |
| | • | Many of the project concepts, including project operational logistics, the tailings impoundment facility, mine dewatering, water supply and water treatment, were based on preliminary evaluations and Bema Gold’s experience on similar projects. Additional site-specific data will be required to confirm these concepts. |
| | • | A number of the project concepts may become focus issues during permitting. |
| Technical Report - Kupol Project Preliminary Assessment Summary | 15 |
| Bema Gold Corporation | |
| | • | These include tailings disposal and mine water discharge. Bema is in the process of quantifying these impacts at this time. |
| | • | The financial analysis conducted for this Preliminary Assessment was valued at the date of a production decision and does not incorporate sunk costs. These costs include additional exploration to add to and increase the confidence in the mineral resource, geotechnical and water management data collection, metallurgical testwork to confirm and optimize the existing flowsheet, negotiations with others to construct the access road and provide power, permitting, and project financing. |
| | • | Bema recommends the following be completed during the next phase of the project development: |
| | • | Drilling in 2004 should be biased toward providing sufficient drill information for completion of a feasibility study on the deposit. However, given that this is only the second season of a major drill campaign on the property, a secondary goal of the program should be to continue to assess the potential of the property. |
| | • | It is considered essential to undertake a detailed structural evaluation prior to the completion of a final feasibility study. This may require the drilling of suite of holes oblique(north-west dipping) to the current east to west section lines. |
| | • | The drilling of east-plunging holes, parallel to the proposed footwall slope is required to define both the geological structures and the rock mass conditions within the footwall. |
| | • | Site investigation activities should be undertaken in summer 2004 to finalize the tailings disposal option selection and to provide data for feasibility design. |
| | • | Site investigation activities should be undertaken in summer 2004 to finalize the groundwater intake option selection and to provide data for water sourcing for feasibility design |
| | • | Further investigation of the potential for developing Mud Lake as a potable water source should also be investigated. The lake should be sounded while ice is still present for access. |
| | • | Additional environmental studies must be completed to ensure that conditions are characterized during the feasibility study. |
| | • | Additional metallurgical testing will be completed to confirm the process design. |
| | • | Additional ABA testing will be conducted to ensure that all material is adequately characterized. |
| Technical Report - Kupol Project Preliminary Assessment Summary | 16 |
| Bema Gold Corporation | |
| | 2.0 Introduction and Terms of Reference This report documents the results of the Preliminary Assessment and constitutes an internal Qualified Person’s Review and Technical Report. Tom Garagan, Vice President, Exploration of Bema Gold, served as the Qualified Person responsible for the preparation of this Technical Report as defined in National Instrument 43-101 (NI 43-101), Standards of Disclosure for Mineral Projects and in compliance with Form 43-101F1 (the “Technical Report”). Information and data for the review and report were obtained from the Preliminary Assessment under development for the property. The work entailed a summary and review of existing resource, metallurgical and cost data, analysis of alternate project development strategies, determination of preliminary open pit limits, and estimating capital and operating costs. The work associated with the Preliminary Assessment although still in progress, was completed in sufficient detail to prepare this Technical Report. The Preliminary Assessment was not included as part of this Technical Report due to the large volume of information contained therein. |
| | | |
| 2.1 | Terms of Reference The analysis herein is based on the extensive investigation and exploration conducted both by the Russian government and by Bema Gold. This Technical Report provides pertinent information contained within Bema Gold’s Preliminary Assessment. The intent of this Technical Report is to provide substantive discussion regarding the Kupol Project, for use by public and private shareholders. |
| | | |
| | | |
| | 2.1.1 Report Format – Units |
| | | |
| | All dollar figures ($) are quoted in United States dollars. This project is in the Chukotka Autonomous Okrug, Russian Federation, and all work on the project was completed using the SI system. This was continued in this report unless explicitly noted in the text, although equivalent U.S. customary measurements (e.g. miles) are occasionally included with the SI units. |
| Technical Report - Kupol Project Preliminary Assessment Summary | 17 |
| Bema Gold Corporation | |
| | 3.0 Disclaimer This Technical Report and the Preliminary Assessment it summarizes includes the use of inferred resources that are considered too speculative geologically to have economic considerations applied to them that would enable them to be categorized as mineral reserves, and there is no certainty that the results predicted by this Technical Report, and the Preliminary Assessment (in development) will be realized. This Technical Report and the Preliminary Assessment also speculates on the impact of exploration success on the project economics. This speculation is intended to provide direction for future exploration. Bema Gold has developed a geological model for the property upon which it is reasonable to anticipate exploration success, but this report is not intended to endorse the certainty of that success. This Technical Report and the Preliminary Assessment documents the qualifications and assumptions made by the qualified person. |
| Technical Report - Kupol Project Preliminary Assessment Summary | 18 |
| Bema Gold Corporation | |
| | 4.0 Property Description The Kupol Deposit is located in the Northwest part of the Anadyr foothills on the boundary between the Anadyr and Bilibino Regions in the Chukotka Autonomous Okrug. The geographical coordinates for the site are 66°47’northing and 169°33’ easting. The location of the deposit is shown in Figure 1, Location of the Kupol Deposit. The property is situated near the border of the Bilibinski-Anadyrski Districts, and comprised of a 3.3 km by 5.3 km (1766.73 hectare) north-south oriented license area. The detailed location (latitude and longitude) of the Kupol License is: |
| | Southwest Corner | 169 ° 31 ’ 21 ”E, 66 ° 45 ’ 48 ”N |
| | Nothwest Corner | 169 ° 31 ’ 21 ”E, 66 ° 48 ’ 39 ”N |
| | Northeast Corner | 169 ° 35 ’ 49 ”E, 66 ° 48 ’ 39 ”N |
| | Southeast Corner | 169 ° 35 ’ 52 ”E, 66 ° 45 ’ 48 ”N |
| | The detailed location map is shown in the November, 2003 Kupol Technical Report by Tom Garagan and Hugh MacKinnon. |
| | |
| 4.1 | Title and Ownership |
| | |
| | On December 18, 2002, Bema Gold announced that it had completed the terms of a definitive agreement with the Government of Chukotka, an autonomous Okrug (region) in northeast Russia, to acquire up to a 75% interest in the Kupol gold and silver project (the “Kupol Deposit”). The Exploration and Production License (АНД 11305 БЕ, and former License АНД 00746), along with other relevant licenses and documentation for the Kupol deposit were issued by Ministry on Natural Resources and the Administration of the Chukotka Autonomous Okrug to the Closed Joint Stock Company Chukotka Mining and Geological Company (CMGC) on October 4, 2002. CMGC was set up as a wholly owned subsidiary of Chukotka Unitary Enterprise (CUE). Pursuant to the Framework Agreement (dated December 5, 2002 and amended August 7, 2003), Bema has the right to acquire (through a wholly owned Bema subsidiary, Kupol Ventures Limited) up to 75% in the Kupol Deposit.
|
| Technical Report - Kupol Project Preliminary Assessment Summary | 19 |
| Bema Gold Corporation | |
| | 5.0 Accessibility, Climate, Local Resources, Physiography |
| | |
| 5.1 | Accessibility |
| | |
| | The Kupol deposit is located in the Northwest part of the Anadyr foothills on the boundary between the Anadyr and Bilibino Regions in the Chukotka Autonomous Okrug. The geographical coordinates for the site are 66°47’northing and 169°33’ easting. The area is accessible only be helicopter during the summer months and over a winter road from December until early May. It is located 298 kilometers southeast of the town of Bilibino. The main access road from port facilities are from Pevek, through Bilibino to the Kupol site. The towns of Pevek and Bilibino are connected with a winter road (~325 kilometers) and an all-season road (~575 kilometers). The winter road follows the contour of Chaunskii Bay and then travels in a more or less straight line southwest to Bilibino. It is passable (in most years) between the middle of December and the middle of April. The summer road is a gravel road that, in theory, can be used all year long. The road does not have any bridges, despite having to cross several rivers. The total distance between Bilibino and site is 298 kilometers. The site is connected to Bilibino via a winter road that is passable (in most years) between the middle of December and the middle of April. The road travels from Bilibino south to Keperveyeem (approximately 35 kilometers of all-seasons road). From Keperveyeem, the road travels along the Maly Anyui River to Ilernyi (approximately 140 kilometers of winter road that is maintained by the government). From Ilernyi, the winter road travels southeast to the site (approximately 160 kilometers) to site. Due to the remote location of the project, a mancamp and complete infrastructure will be constructed to support the mine. This camp will be located immediately northwest of the mill and be attached to the mill via an arctic corridor. The mancamp will be designed to house 500 persons. |
| | |
| 5.2 | Topography |
| | |
| | The Kupol Property is located within the watershed of the Anui and Anadyr upland regions, in the east foothills of the Anui mountain ridge. This area is characterized by prevailing low, rounded hills with occasional flat, midland areas. The geomorphological features within its boundaries include erosion-tectonic, erosion-glacial, accumulative water-glacial, accumulative fluvial and relict types and sub-types of the topography, showing different distribution and hierarchy. |
| Technical Report - Kupol Project Preliminary Assessment Summary | 20 |
| Bema Gold Corporation | |
| | The erosion-tectonic and erosion-glacial types of the terrain feature spatial interrelation and sometimes are juxtaposed onto each other. These displacements occurred in different ways, and are fixed by distribution areas of the Miocene-Pliocene flatland (peneplain), volcanic plateau, quaternary plains and upland terraces. The watersheds are flat-shaped or convex-plane, with rounded hilltops elevated from 100 to 200 meters above the riverbeds. The tops are divided by wide (200 to 300 m) but shallow (20 to 30 m) saddles. The watershed slopes are not likely to exceed 15-20 degrees; their foothills and riverbeds are overlain with young talus-solifluction and solifluction sediments. The absolute elevations of the hills surrounding the property do not exceed 700-1050 m (1034.2 m for Malakhai Mountain and 815.0 m for Kupol Mountain). |
| | | |
| 5.3 | Permafrost |
| | |
| | Permafrost is distributed throughout the Kupol Property area. Depending on geomorphology, thickness of permafrost layer goes down from surface to 200 to 320 meters and reaches its maximum depth under riverbeds (based on literature reviews). Thickness of seasonal melting varies from 0.02 -1.5 meters in river valley terrains to 12.4 meters on watersheds. The annual temperature range line never goes beyond 20 – 30 meters under surface. Rock temperature within this range can vary from -14.0°C at the bottom to -5.8°C at the 2 meter depth. Temperature gradient within permafrost rock has been measured at 0.023°C/m. Seasonal thaw in the deposit area begins in early June through September. In the bald peak areas, its depth largely depends on slope exposure and is 0.8 -2.0 m; in talus patches, the thaw depth is limited by thickness of talus. In Arctic tundra patches, the thaw depth depends on mechanical structure of sediments and varies between 0.8 and 1.8 m. The seasonal thaw is 0.3 -0.4 m in typical hummocky and hillocky (mound) tundra areas and 2.5 m in local well-drained areas. |
| | |
| 5.4 | Climate |
| | |
| | The climate at the Kupol minesite is defined by the site’s geographical location at the northeastern extremity of Eurasia because of the influence of two oceans and the vast continental mass of Yakutia. Atmospheric conditions include complex circulation patterns that vary considerably over both the warm and cold times of the year. The climate of the region around the Kupol site belongs to the continental climatic region of the subarctic climate belt with extremely severe weather consisting of long and cold winters (8-8.5 months), overcast weather, and short summer periods (2.5 months). In order to characterize the climatic conditions around the Kupol territory, data was used from the closest multi-year weather stations that are located in the Malyi Anyui river basin: |
| | |
| | • | Weather station “Ileryny” – is situated in a lake depression that has a diameter of 10- 30 kilometers. It is built adjacent to Ileryny Lake in the upper reaches of the Malyi Anyui watershed. The absolute elevation of the station is 425 meters above sea level (masl). The station is located 2-4 kilometers from a mountain ridge that belongs to the |
| Technical Report - Kupol Project Preliminary Assessment Summary | 21 |
| Bema Gold Corporation | |
| | | northeastern portion of the Anyui foothills that have an absolute elevation of 500-900 masl. |
| | | |
| | • | Weather station “Ostrovnoye” – is located along an old terrace of the Mayi Anyui River approximately 60-90 meters from the village. The absolute elevation of the weather station is 98 masl. The valley has a width of up to 10 kilometers in the vicinity of the weather station. The closest mountain structures with an elevation of 300-800 masl and steep slopes of up to 20-45° are 5-6 kilometers to the north, 8-9 kilometers to the east, and 1.5-3 kilometers to the south and east of the weather station. |
| | | |
| | In accordance with the closest weather stations, the average annual air temperature at the Kupol site, with only minor variances, is near -13 °C. The total amount of precipitation does not exceed 277 mm. The total number of days with an average daily temperature above zero does not exceed 50 days. Positive average daily temperatures are first noted in the first 10 days of June. The transition from positive average daily temperatures to negative average daily temperatures typically occurs in the middle 10 days of September. The absolute minimum average monthly temperatures occur in January and February (-58 °C). During the warmest months (June-August), the average air temperatures are 8.3; 11.3; and 10 °C; respectively. The relative humidity at the Kupol site is not high and, on an annual average, reaches 71% and is an indicator of the high continental climate of the region. The approximate amount of evaporation from surface water sources is 280 mm during warm periods. This also bears witness to the continental climate of the region. Snow cover appears in the mountainous regions in the middle of September and achieves a maximum depth in March. The average depth of snow cover is 38-45 cm. The duration of a stable snow cover is approximately 237 days. As a result of the wind blowing, the valleys are filled with snowdrifts and the tops of the mountains and steeps slows are blown bare. The average snow density reaches 160 kg/m3 with a water content of 107 mm. During the winter months, approximately 116 mm of precipitation falls. This is approximately 46% of the annual amounts. Wind patterns for the region around the Kupol site are defined primarily by the trade winds that are characterized by atmospheric circulation. The average annual wind speed is 2.1 -2.6 m/s with a maximum wind speed of 20 m/s. The maximum wind speed recorded at the weather stations is 24 m/s. The maximum wind speed recorded by the weather station installed at site (2003) is 30 m/s. Seasonally, the weather at the site follows the following patterns: Winter (September-May) – The average air temperature in January and February reaches -33.1 °C. The average absolute minimum temperature observed in January-February is -58 °C with an average monthly temperature of -32.9 and -33.3 °C, respectively. Strong winds, frequent whiteouts, the most number of foggy days, and days without any sun are |
| Technical Report - Kupol Project Preliminary Assessment Summary | 22 |
| Bema Gold Corporation | |
| | observed during the winter period. This period also has approximately 96-133 mm of precipitation. The average snow cover is 0.5 mm. This snow cover is unevenly distributed and is very compacted. Spring (May-June) – The Spring is cold with average temperatures near 0 °C with frequent whiteouts, snowstorms, and frosts. Summer (July-August) – The average monthly temperature of the warmest period (July-August) is near 10.1 °C, with the average absolute maximum temperature (In July) reaching 30-33 °C. Anytime during summer, the temperature can drop and snow can fall. The amount of precipitation to fall during the summertime is between 94 and 131 mm. During summer, daylight hours are approximately 23 hours per day. Fall (August-September) – The transition to winter is extremely short. Falls are cold, cloudy, and humid. The development of snow cover typically occurs during the second 10 days of September. |
| | |
| 5.5 | Local Resources |
| | |
| | The land surrounding the Kupol site currently is within the land used by the Lamutskoye agricultural community for reindeer herding and supporting traditional indigenous activities for hunting and gathering. The land is owned and administered by the municipality of Anadyr, region of the Chukotka Autonomous Okrug. Indigenous groups that use the surrounding land include: Chukchi, Lamut, and Chuvanyets. All of these indigenous persons belong to the Anadyr Regional Association for Indigenous Persons of Chukotka. The Chukotka Autonomous Okrug is located in the farthest northeast region of Russia on the Chukotka peninsula and adjoining mainland. It was originally part of the Magadan Oblast but was separated in 1992. It is located 3671 miles from Moscow and has an area of 737,000 m2 (making it the 6th largest area in Russia). The Chukotka Autonomous Okrug is bordered by the Magadan and Koryak Regions. It is divided into eight administrative districts: Chukotskii, Providenskii, Shmidtovskii, Iul’tinskii, Bilibinskii, Chaunskii, Anadyrskii, and Beringovskii. The capital of Chukotka, the town of Anadyr, is independent of the eight administrative districts. The overall region is sparsely populated. The entire region has approximately 65,000 inhabitants. Of this population, approximately 1/2 of the people live in the two districts (plus the capital) where the Kupol deposit is located (Bilibinskii and Anadyrskii). The overall population of the region has suffered a severe decline of more than 50% in the last 15 years. Overall, the Chukotka Autonomous Okrug ranks near the bottom in Russia for total industrial output. The economy is focused on mining and is rich in natural resources represented by deposits of tin, mercury, gold, coal, natural gas, and building materials. Other major industries within the region include a nuclear power plant, animal husbandry (reindeer herding), and transportation/shipping. |
| Technical Report - Kupol Project Preliminary Assessment Summary | 23 |
| Bema Gold Corporation | |
| | There are no railways or highways in Chukotka. Major seaports include Anadyr and Pevek. Airports can be found in Anadyr, Bilibino, and Pevek. |
| | | |
| | 5.5.1 Anadyrskii District |
| | | |
| | The Anadyrskii District is the largest municipal district in the Chukotka Autonomous Okrug and occupies an area of 250,000 km2. It is connected to the rest of Russia by a sea port and an airport (that has in recent years been approved for international flights). Additionally, several areas can be reached from Anadyr in the winter via a network of winter roads. The Anadyrskii District (including the capital city of Anadyr) is one of the most populated municipalities in Chukotka. Approximately 23,500 persons live within this district/capital. The population of the Anadarskii District, plus the capital, is centered in 3 towns that are located on the fareastern shore of the Anadarskii District: Anadyr, Ugol’ny Kopi, and Shakterskii. These three cities account for more than 19,000 inhabitants (80% of the district, almost 30% of the entire region). The other small villages account for a total of 4300 persons. The largest village is Markovo with approximately 1500 persons. |
| | |
| | 5.5.2 Bilibinskii District |
| | | |
| | The Bilibinskii District is the 2nd largest municipal district in the Chukotka Autonomous Okrug with an area of 175,000 m2. It is made up of the administrative center (Bilibino), two villages (Aliskerovo and Vstrechy), and 5 settlements. The population is primarily concentrated along the Mal and Anyui Rivers. It is connected to the rest of Russia by a sea port and an airport (located in Keperveem). Additionally, it can be accessed by winter road from approximately December through April. The Bilibinskii District is the 2nd most populous municipal district in Chukotka. There are approximately 12,000 inhabitants living in this municipality. More than 60% (7400 persons) of this population is centered in Bilibino. The other three population centers include the villages of Omolon (1000 persons) Anyusk (600 persons) and Keperveem (600 persons). More than 70% of the population is Russian or Ukraine. The primary industries of the Bilibino Regions are gold, energy, retail, and construction. Agriculture within the region is very weak due to the remoteness and natural conditions. In 2002 approximately 6.6 million rubles were earned by agricultural enterprises (4.2 million for vegetables and 2.4 million in animal products). The average wage earned within the region was 11,048.2 rubles per month (as of 1/1/03). The highest paying jobs were at the nuclear power plant, the airport, and communications organizations. |
| Technical Report - Kupol Project Preliminary Assessment Summary | 24 |
| Bema Gold Corporation | |
| | 5.5.3 Chaunskii District |
| | | |
| | The Chaunskii District is located on the north shore of the Chukotka Autonomous Okrug and has an area of 58,100 m2. It has a total population of 7030 persons with more than 70% of the population living in the administrative center (Pevek). In addition to the administrative center, there are 7 villages and 3 native settlements. The largest village, other than Pevek, is Komsomol’skii (population ~1,000 persons). Migration of population within the region has been severely negative with the population declining more than 30% in the last five years. This is primarily due to people moving out of the area to look for better living conditions. The entire region has approximately 985 indigenous persons. More than 98% of the indigenous persons (975) are Chukchi. More than 85% of the indigenous persons live in 3 settlements (Aion, Yanranai, and Rykuchi). Of the people living in the settlements, more than 1/3 of the working population (557 persons) is unemployed. Most of the employment is centered around traditional enterprises such as reindeer herding and fishing. |
| | |
| 5.6 | Vegetation |
| | | |
| | Based on geobotanical classification, the Kupol deposit is located in the Anyusk geobotanical district of the sparsely forested area of the western part of the Anyusk-Chukotka foothills. The forest composition of the Kupol deposit is represented by 73 species that are typical for the Omolon and Anyusk geobotanical regions. The area is not populated with any rare or protected species. Structurally, the area is similar to all other areas that are found within the Anyusk-Chukotsk foothill region and can be divided into 3 elevation belts: |
| | |
| | • | Mountain-arctic deserts and arctic tundra. These occur at the top of watersheds, ridges, and crests and along slopes with no vegetation/ fragmented vegetation. The elevation is 600-1000 meters. |
| | • | Tundra with typical subarctic mottling and tussocky features that are featured within the rolling, hilly areas between 500-600 meters; and, |
| | • | Tundra that is found within the river valleys and draw areas that consists of marshes and fields. |
| | | |
| | The vegetative association of the mountain-arctic deserts and arctic tundra is made up of sparsely populated groves of arctic and subarctic dwarf shrubs and lichen mixed with arctic sedge and grasses. The ground cover can be estimated at being between 10% and 30% of the total surface area for this belt. Species typically found in this belt include: The vegetative association for the subarctic tundra has a much more consistent grouping then the mountain tops. However, the vegetative ground cover in these areas does not exceed 70%. The vegetative associations found within the river valleys are, typically, more |
| Technical Report - Kupol Project Preliminary Assessment Summary | 25 |
| Bema Gold Corporation | |
| | complex than those found within the subarctic tundra areas. The density of the ground covering can be lower due to the relatively short-term development of the alluvial substrate. There is no commercially valuable vegetation located within the site boundaries. The existing vegetation can be used as reindeer pastures. The value as a reindeer pasture is no higher than the multitude of other areas surrounding the site with similar plant densities and speciation. The area is not within the limits of any reindeer winter foraging areas (the closest location is more than 20 kilometers from the site) but does come close to the summer route used by the reindeer herding group station in the village of Lamutskoye. Their route includes Starichnaya River, Kayemraveyeem Creek and Kopytochnaya Creek. Their route brings them no closer than 10 kilometers from the site. |
| | |
| 5.7 | Surface and Mining Rights |
| | |
| | On December 18, 2002, Bema Gold announced that it had completed the terms of a definitive agreement with the Government of Chukotka, an autonomous Okrug (region) in northeast Russia, to acquire up to a 75% interest in the Kupol gold and silver project (the “Kupol Deposit”). Bema Gold can acquire a 75% interest on the following basis: (i) an initial 20% interest by paying $8 million cash (paid in December, 2002) and expending a minimum of $5 million (expended) on exploration on the Kupol property by December, 2003; (ii) a further 10% interest by paying $12.5 million in cash by December 31, 2003 (paid); (iii) an additional 10% interest by paying $10 million in cash and expending an additional $5 million on exploration by December, 2004; and (iv) the final 35% interest by completing a bankable feasibility study and by paying $5.00 per ounce for 75% of the gold identified in the proven and probable reserve categories in the feasibility study (within 90 days of the completion of the feasibility study). Upon commencement of mine construction, the Company must pay a further $5.00 per ounce of gold for 75% of the ounces identified in the proven and probable reserves contained in the feasibility study. To date Bema Gold has earned a 30% interest in the Kupol project and is operator of the project. The Exploration and Production License (АНД 11305 БЕ, and former License АНД 00746), along with other relevant licenses and documentation for the Kupol deposit were issued by Ministry on Natural Resources and the Administration of the Chukotka Autonomous Okrug to the Closed Joint Stock Company Chukotka Mining and Geological Company (CMGC) on October 4, 2002. CMGC was set up as a wholly owned subsidiary of Chukotka Unitary Enterprise (CUE). Pursuant to the Framework Agreement (dated December 5, 2002 and amended August 7, 2003), Bema has the right to acquire (through a wholly-owned Bema subsidiary, Kupol Ventures Limited) up to a 75% in the Kupol Deposit License for Subsoil Use. The License for Subsoil Use (АНД 11305 БЕ) is owned by CMGC. It was registered October 4, 2002 and expires on March 16, 2024. The validity term of the license may be |
| Technical Report - Kupol Project Preliminary Assessment Summary | 26 |
| Bema Gold Corporation | |
| | extended by the government of Chukotka if the license holders provide a substantiated application for an extension of the license terms 6 months before the expiry date. |
| | | |
| 5.8 | Tailings Site |
| | |
| | The preliminary assessment for the tailings disposal facility was completed by AMEC Earth & Environmental (AMEC). Figure 2, Site General Arrangement, shows the site plan and potential location of the tailings facilities. Two options for tailings disposal will be brought forth to the feasibility stage, filtered dry stack tailings disposal, and conventional tailings system. The conventional tailings system was included in the cost estimates for the preliminary assessment. |
| | |
| | 5.8.1 Filtered, dry stack tailings disposal |
| | |
| | A dry stack would be placed at the head of a moderately sloping drainage about 3 km west of the mill site. Filtered tailings would be delivered via a road of about 3 km length, dumped on the dry stack surface and spread with a bulldozer. No water management system would be required other than diversion of any surface runoff away from the dry stack and capture of contact runoff in the summer months. The potential clay content of the ore may prohibit filtering tailings using traditional mineral processing technologies (cycloning and disc filters), so that up to 20% of the material may report to a slurry fines stream and need to be separately disposed. Bema is currently planning to provide samples of the ore to vendors of pressure filter equipment to assess the feasibility of thickening 100% of the ore. On that basis, it is assumed that filtering can be made a viable option for Kupol tailings disposal. |
| Technical Report - Kupol Project Preliminary Assessment Summary | 27 |
| Bema Gold Corporation | |

| Technical Report - Kupol Project Preliminary Assessment Summary | 28 |
| Bema Gold Corporation | |
| | 5.8.2 Conventional tailings dam |
| | |
| | AMEC also looked at a conventional tailings location and preliminary design. A potential site was identified during 2003. The site has good topographic characteristics. The gradient of the stream in the valley bottom is gentle, estimated with a hand clinometer at about 2.5% slope. There is a favorable dam site location, controlled by bedrock abutments, where the valley narrows, and upstream the valley widens to provide storage. The tailings impoundment site would be developed by construction of a dual geomembrane-lined rockfill dam. Tailings and reclaim water lines would have lengths of about 3.5 km. Operation of the impoundment in winter would require storing enough water to allow formation of an ice cap over the pond in the order of 2 m thick, and all tailings to be disposed beneath the ice cap. |
| | |
| 5.9 | Power |
| | |
| | Electricity will be generated on site using a combination of 900 RPM and 1200 RPM generator sets. Four medium speed diesel engines rated at 4.4 MW (operating at 900 RPM) will be the primary units. Three of these engines will be operational and the fourth unit will serve as a back-up/stand-by. Additionally, three generator sets rated at 1.45 MW (each) operating at 1200 RPM will provide emergency back-up. These units will serve as emergency back-up in case of a major engine failure or scheduled overhaul of one of the larger units. One or two of the 1.45 MW generator sets will also provide peak power backup while starting the SAG and/or Ball Mill. A 1.45 MW unit can also operate in parallel with the 4.4 MW units to allow a (desirable) 90% plus engine loading. All seven units will be equipped for waste heat recovery. |
| | |
| 5.10 | Water Supply Fresh water supply is from well(s) located on Kaiemveem creek - about 9 km downstream of the mine. Water will be pumped in an insulated 8” steel and HDPE pipeline to a tank at the mill site that will also serve as a firewater tank. If required fresh water can be pumped into the tailings impoundment area. Potable water supply will be supplied from a different source (to be determined) or produced from the Fresh water supply by a small (15 usgpm) treatment plant. |
| Technical Report - Kupol Project Preliminary Assessment Summary | 29 |
| Bema Gold Corporation | |
| | 6.0 History |
| | | |
| | Quartz veins were originally located in the Kupol area in 1966 during a Soviet government 1:200,000 regional mapping program. Almost 30 years later, the main deposit was discovered by the Bilibino-based, State funded Anyusk Geological Expedition in 1995. Gold, silver, arsenic and antimony anomalies were identified with a 1:200,000 stream sediment geochemical sampling program. Over the next two years (1996 and 1997) the expedition completed the following work: |
| | |
| | • | mapping; |
| | • | prospecting; |
| | • | magnetic and resistivity surveys; and, |
| | • | lithogeochemical and soil surveys (1:2000). |
| | | |
| | During 1998, a limited amount of work was completed that included four trenches and two drill holes. In 1999 a local Chukotka-based, Russian mining cartel (Metall) acquired the rights to the deposit and contracted Anyusk Geological Expedition to conduct the exploration work. From 1999 to the end of 2001, an additional 31 trenches and 24 drill holes were completed. In 2000 and 2001, 450 metres of the vein system were stripped, exposed and channel sampled in detail. Work on the project was stopped at the end of 2001 by which time 3,004 metres of drilling and 8,143.7 linear metres of trenching, including the detailed channel sampling, had been completed. Additionally, the majority of the license area (8.3 km2) was surveyed and a frame for a small mill was constructed. Based on this work, a Russian C1+C2 Reserve of 780,000 tonnes containing 835,000 ounces of gold and 9,350,000 ounces of silver at an average grade of 33.3 g/t gold and 372.8 g/t silver was reported by Anysuk Geological Expedition. This 'reserve' was prepared in accordance with Russian requirements (not in compliance with Canadian National Instrument 43-101 standards), and only covered 450 metres strike length within the central portion of the deposit to a maximum depth of 140 metres. In 2001, two metallurgical samples (145 kg and 1.7 tonnes) were collected and preliminary petrographic and metallurgical testing was conducted by the IRGIRIDMET laboratory in Irkutsk, Russia (Panchenko and Kogan, 2000). Preliminary testing results indicated recoveries of 97.45% for Au and 90.7% for Ag based on a 24-hour cyanide leach of gravity concentrate. In 2002 Metall’s license was revoked for nonpayment of contractors and incompletion of the reporting required under the license. Because of this, there was no exploration activity in 2002. In December 2003, Bema Gold Corporation entered into an agreement to acquire up to 75% of the property. |
| Technical Report - Kupol Project Preliminary Assessment Summary | 30 |
| Bema Gold Corporation | |
| | In 2003, exploration activities included: |
| | | |
| | • | trenching; |
| | • | diamond drilling; |
| | • | reconnaissance mapping; |
| | • | prospecting; and, |
| | • | condemnation drilling. |
| | | |
| | The exploration activities are further detailed in Section 10 of this report. |
| Technical Report - Kupol Project Preliminary Assessment Summary | 31 |
| Bema Gold Corporation | |
| | 7.0 Geological Setting |
| | |
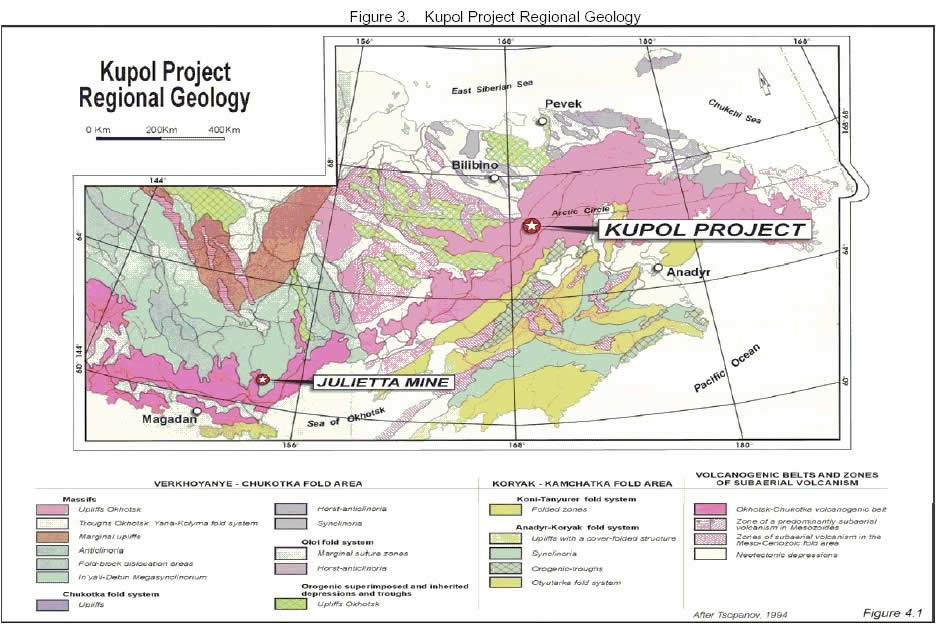
| 7.1 | Regional Geology The Kupol deposit is located in the 3000-km long Cretaceous Okhotsk-Chukotka volcanogenic belt (see Figure 3, Kupol Project Regional Geology). This belt is interpreted to be an Andean volcanic arc type tectonic setting, with the Mesozoic Anyui sedimentary fold belt in a back-arc setting to the northwest of the Kupol region. Russian 1:200,000 scale mapping indicates that the Kupol deposit area is centered within a 10-kilometre wide caldera, along the western margins of the 100-kilometre wide Mechkerevskaya volcano-tectonic 'depression', an Upper Cretaceous bimodal nested volcanic complex. The volcanic succession in the area is 1300 metres thick and comprised of a lower sequence of felsic tuffs and ignimbrites, a middle sequence of andesitic to basaltic-andesite flows and fragmentals capped by felsic tuffs and flows. These sequences are cut and discordantly overlain by basalts of reported Paleogenic age. Mineralization is associated with a north-south trending splay (the Kupol structure1) off of a regional fault (Kayemraveem fault) of similar orientation. The Kayemraveem structure terminates 25 kilometres to the north at the Maly Anyui River fault. The Maly Anyui is a major east-west trending strike slip structure. |
| | | |
| | 1 | It should be noted that this text refers to the north-south trending splay as the Kupol Structure. Russian text
often refers to this splay as the Middle Kayemraveem Fault. These two terms are interchangeable. |
| Technical Report - Kupol Project Preliminary Assessment Summary | 32 |
| Bema Gold Corporation | |
| Technical Report - Kupol Project Preliminary Assessment Summary | 33 |
| Bema Gold Corporation | |
| | The magnitude of displacement along the Kupol structure is unknown but the direction is inferred to be normal-right lateral due to fault geometry. Russian interpretation suggests that the Kayemraveem fault intersects a volcanic subsidence ring structure (Kovalevsky caldera) within the Kupol deposit area. The Kayemraveem fault and Kupol structure are the locus for felsic dome and dyke intrusions. |
| | |
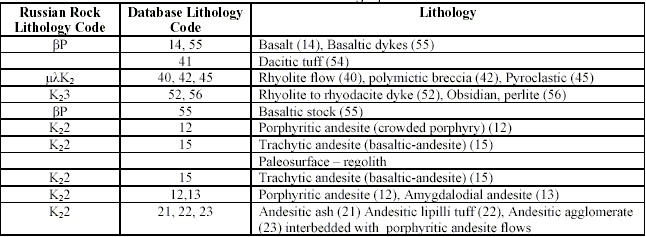
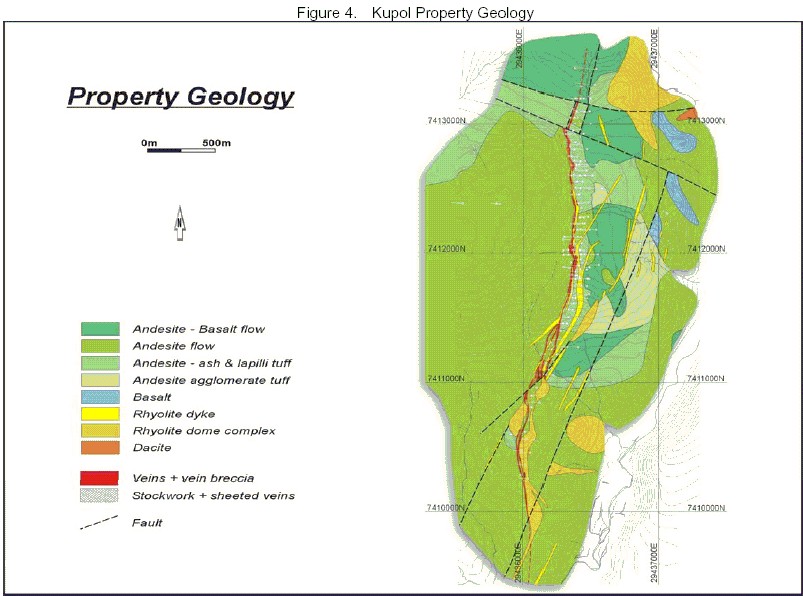
| 7.2 | Property Geology The property is underlain by a bimodal suite of andesite fragmentals, feldspar-hornblende porphyritic andesite, and basaltic-andesite (trachytic andesite) flows that include minor basalts that dip shallowly eastward (see Figure 4, Kupol Property Geology). The andesitic volcanics have been intruded by massive to weakly banded rhyolite dykes, rhyolite and dacitic flow dome complexes, and dykes of basaltic composition. Late intrusions of andesitic and basaltic compositions cut the earlier units and form prominent topographic features in the area, including the porphyritic andesite Kupol Dome structure for which the property derives its name. A generalized stratigraphic section for the area is presented in Table 8, Generalized Stratigraphic Section illustrating the Russian lithology codes and corresponding database codes used in the Resource Model. |
Table 8. Generalized Stratigraphic Section
| Technical Report - Kupol Project Preliminary Assessment Summary | 34 |
| Bema Gold Corporation | |
| Technical Report - Kupol Project Preliminary Assessment Summary | 35 |
| Bema Gold Corporation | |
| | 7.2.1 Lithology |
| | | |
| | 7.2.1.1 Intermediate and Mafic Volcanic Units (Units 10 and 20) Rocks of andesitic composition have been divided into two principal groups on the basis of textures: flows (Unit 10) and fragmentals/pyroclastics (Unit 20). Each group is further subdivided based on composition and or texture. Each of these subdivisions is described below. Porphyritic Andesite Flows (Unit 12): There are two principal types of porphyritic andesite flows present on the property: a feldspar phyric (crowded porphyry) unit and a porphyritic andesite unit. The feldspar phyric unit outcrops predominantly to the west of the Kupol vein and was originally mapped by the Russians as an intrusive porphyritic diorite. It is believed that it represents a thick flow unit or sub-volcanic sill. It is distinguished from the porphyritic andesite units by: |
| | |
| | • | a higher percentage (40-60%) of 1-4 mm euhedral feldspar phenocrysts; |
| | • | the presence of clinopyroxenes and biotite; and, |
| | • | weak magnetism. |
| | | |
| | The units are laterally fairly continuous and massive. Minor flow breccias lead to some misinterpretation of the flows as pyroclastic units. It should be noted that the two porphyritic andesites were not broken out as separate units in the logging. Additionally, dykes of andesitic composition are likely present but have not been broken out in the logging. Amygdaloidal Andesite Flows (Unit 13): Amygdaloidal andesite flows occur as units of approximately 1 to 15 metres thickness within the Big Bend zone and Central zone portions of the deposit. They have similar character as the andesite described above, but are weakly porphyritic and contain 10-20% of 1 to 4 mm amygdules that are commonly filled with calcite or chlorite. They were only mapped in eight holes and are likely either discontinuous or not easily distinguished from the main andesite flow units. They were partially mislabeled originally as volcano-sedimentary units but petrography confirmed that the units are amygdaloidal andesite flows. Basalt and Basaltic Dykes (Units 14 and 55): Basalts exposed on the property are fine-grained, black to dark grey, massive and moderately to strongly magnetic. Two generations of basaltic units appear to be present in the deposit area. The older unit occurs as a small buried stock encountered in drilling in the Big Bend zone. This weakly carbonate altered unit cuts the veins and is cut by the rhyolite dykes and faults. The younger unit occurs as flows, stocks and dykes that are exposed on the western valley slope above the Kayemraveem Valley, and as several narrow (<2 m) dykes identified by |
| Technical Report - Kupol Project Preliminary Assessment Summary | 36 |
| Bema Gold Corporation | |
| | drilling in the northern portion of the deposit. The younger units are not carbonate-altered and commonly contain 5-7% olivine. Trachytic Andesites [Andesite-Basalt (Unit 15)]: Trachytic andesites (Andesite-Basalt) have a darker colour index (depending on level of alteration) than the andesites, are weakly to strongly magnetic, and are composed of 40 to 50% plagioclase, 5 to 15% K-feldspar, 7 to 15% biotite and 2-4% orthopyroxene or hornblende and 5-10% clinopyroxene. The trachytic andesites are most prevalent in the northern portion of the deposit and are underlain in the Big Bend zone by a one- to fifteen-metre thick limonitic, clay-rich horizon, inferred to be a paleoregolith. The trachytic andesites to the north are intercalated with andesite fragmental units. Petrography indicates that some of these units are amygdaloidal. The andesitic pyroclastic or fragmental units have been sub-divided into the following units based on the dominant textural character within a horizon: |
| | | |
| | • | Unit 21: Ash tuff (grain/fragment size <2 mm) |
| | • | Unit 22: Lapilli tuff (grain/fragment size 2-64 mm) |
| | • | Unit 23: Agglomerate tuff (grain/fragment size >64 mm) |
| | | |
| | These units occur as intercalated, continuous to discontinuous layers or horizons. Locally there are hematite bearing horizons (North zone or domain) and tuffaceous argillite (Central zone) that may be used as marker horizons for correlation purposes. The lapilli and agglomerate tuffs are commonly comprised of fragments of porphyritic andesite. No large bombs were identified to suggest that the drill area is directly adjacent to a vent. However, the prevalence of lapilli and agglomerate tuffs in the drill area suggest that the deposit is close to a volcanic center. 7.2.1.2 FelsicVolcanic Units (Units 40 and 50) The felsic volcanics have been subdivided into two principal groups: |
| | |
| | 1. | dome complex related lithologies (Units 40, 41 and 42); and, |
| | 2. | dykes and related contact lithologies (Units 52 and 56). |
| | | |
| | These units are described in the following sections. Rhyolite flows and pyroclastic (Unit 40): Larger rhyolitic to rhyodacitic bodies occur within the Kupol structure. These bodies are distinguished from the dykes by their size, heterogenic character and apparent layering with fragmental beds. The composition of these units appears similar to the dykes. Mapping and drill intersections of these units suggest that the contacts are steep. These units are believed to be flow dome complexes and small eruptive centers. It should be noted that Ignimbritic units were not logged in the rhyolite package within the deposit area. |
| Technical Report - Kupol Project Preliminary Assessment Summary | 37 |
| Bema Gold Corporation | |
| | Dacite [Undifferentiated dykes and pyroclastics (Unit 41)]: Dacitic rocks are exposed as a single mass in the northeastern portion of the property, to the west of the Kayemraveem River valley. Fragments of carbonized trees found in this unit indicate it is a flow or pyroclastic unit. Polymictic Breccias (Unit 42): Polymictic breccias occur intimately associated with the rhyolite dykes throughout the deposit area. The breccia zones most commonly occur in the footwall of the dykes, transitional to host rocks. They are comprised of a mix of angular rhyolite, obsidian, quartz vein and andesite fragments in a dark, clay-rich felsic matrix. The breccias are irregular in outline (in some cases pipe-like and/or conformable with contacts) and are believed to represent explosive breccia bodies or breccia. Rhyolite to Rhyodacite Dykes (Unit 52): North-south and northeast trending rhyolite to rhyodacitic dykes transect and bisect the vein zones. The most common felsic dyke is aphanitic, weakly to strongly flow banded texture. The secondary type of felsic dyke is weakly porphyritic. The dykes range in colour from buff, pastel, orange, and grey, to purple, depending on the oxidation state, and commonly are weakly clay, sericite and/or pyrite altered. Petrography indicates that the dykes contain minor biotite and may be alkalic in composition. Obsidian and Perlite (Unit 56): The margins of the dykes are commonly quenched with a 0.3 - to 1.2 -metre rind of black obsidian (Unit 56). The implication is that the dykes were emplaced into a cool volcanic pile. The obsidian rich zone commonly grades outward to spherulitic perlite (Unit 56) and/or a green, smectite rich contact zone adjacent to the andesitic host. These zones likely represent areas of devitrified glass but also locally contain fault gouge and fault breccias that indicate tectonic activity (strain uptake) along these contacts. |
| | | |
| | 7.2.2 Structure |
| | | |
| | The main vein system (Kupol structure) strikes north-south and dips steeply to the east at 75° to 90° (Figure 4, Kupol Property Geology). It is a linear fissure structure that contains local dilational jogs, sinusoidal sways, and sigmoidal loop structures. The jogs often correspond to primary and second order dilational zones with resultant thickening of the veins and development of higher-grade shoots. For example, from 950 N to 2000 N (Big Bend and South zones), there is a change in the strike of the vein system from 0 to 020. Additionally, there is a sway at 2600 N that hosts one of the Central zone high-grade shoots. Localization of the jogs may be a function of intersection of the vein structure with northeast structures. In the area from 1800 N to 2400 N there is a jog in the vein system at an elevation of 600 to 475 metres. Geometry of this jog suggests a reverse sense to this dilatant zone. |
| Technical Report - Kupol Project Preliminary Assessment Summary | 38 |
| Bema Gold Corporation | |
| | There are discontinuous zones of fault gouge and fault brecciation along the length of the vein structure. These zones are up to one-metre wide internal to the vein and 0.1 to 0.5 -metres wide along the margins of portions of the vein. Current interpretation has the majority of faults in the hanging wall parallel to sub-parallel to the vein system. Offset of lithologies across the vein structure indicates there has been dip and/or strike-slip displacement along the north-south structures. This is confirmed in the north portion of the zone where one of these north trending structures, 100 metres east of the main zone, displaces a marker horizon by 30-40 metres in an east-side down normal direction. One shallow (50°) easterly dipping vein was intersected in several holes in the central zone. This vein splays off of the main structure at about the 475 level. The vein geometry is similar to the rhyolite dykes noted within this area. There is a set of syn- to post-mineralization steep northeast faults (015 to 030) that do not appear to offset the vein structure. As with the main zone structure these faults are commonly “occupied” by rhyolite dykes. Several of these faults can be traced on satellite imagery for upwards of 20 kilometres, including one that intersects the Big Bend zone. Two late, northwest faults at 300 cut the northern portion of the zone. The first, The Premola Fault, offsets the zone 25 to 35 metres in a dextral normal orientation. The second, the Northern Fault, down drops the vein system by approximately 150 metres. This normal fault is inferred based on the relative location of the vein, the occurrence of the clay alteration zone above the zone, the clay mineralogy (kaolinite vs illite-montmorillonite), and the geochemical signature (end of geochemical anomaly across fault). Another explanation for these changes may simply be a moderate dipping contact to the hydrothermal system. The Kayemraveem valley, to the east of Kupol, strikes northeast. It is possible that this is also a major structure and that the junction with the main north-south trend may have been the locus for development of the Kupol structure. The main Kupol structure is inferred to be a splay off of a regional structure with a similar orientation. Geometry of the main deposit resembles a dextral-normal strike-slip fault structure with the Big Bend at a major dilatant jog in this structure. It is inferred that the hydrothermal system was long-lived based on the tremendous size (up to 25 metres true width), polyphase breccia history, and the continuity of the vein systems. This interpretation is compatible with the regional tectonic framework with paleo-reconstruction indicating an oblique arc subduction zone to the west of the area during the Cretaceous-early Eocene. However, the orientation of the main rhyolite dykes is not necessarily compatible with this orientation, based on the absence of a prominent northeast trending extensional regime rather than north-northeast. Secondly, the significant width of the vein structure, displacement or offset of the stratigraphy across the Kupol structure, and the presence of dykes within the fault zone suggest that the fault zone may be extensional rather than compressional. There appears to be a weakly preferred northwest orientation to some of the sulphosalt mineralization. This orientation is compatible with a conjugate set of |
| Technical Report - Kupol Project Preliminary Assessment Summary | 39 |
| Bema Gold Corporation | |
| | fractures associated with the north-northeast trending structures. Likely there is a component of both extension and compression leading to the development of the structures. Detailed structural studies will need to be conducted in 2004. |
| | | |
| | 7.2.3 Alteration |
| | |
| | Alteration associated with the Kupol structure shows up as a broad (up to 400-metre wide) zone of magnetite destruction ( 3500 nt anomaly) on the magnetic intensity map (see Figure 5, Magnetic Intensity Summary Map). Based on this map the bulk of the alteration appears to be associated with the structural hanging wall of the zone. Argillic alteration extends 40 to 150 metres into the structural hanging wall with the extent of alteration largely dependent on the porosity and/or fracturing of the various host units. Due to the low density of drilling in the footwall, the extent of clay alteration in the footwall has not been determined. However, alteration locally occurs 10-15 metres out from the vein. Strongly altered lithological units were assigned the lithology code ending in 9 (e.g., the strongly altered mafic-intermediate fragmentals are coded 19). In general the code *9 was only assigned to units with alteration so intense that original textures were nearly obliterated, making determination of the original lithology and textures very difficult. |
| Technical Report - Kupol Project Preliminary Assessment Summary | 40 |
| Bema Gold Corporation | |
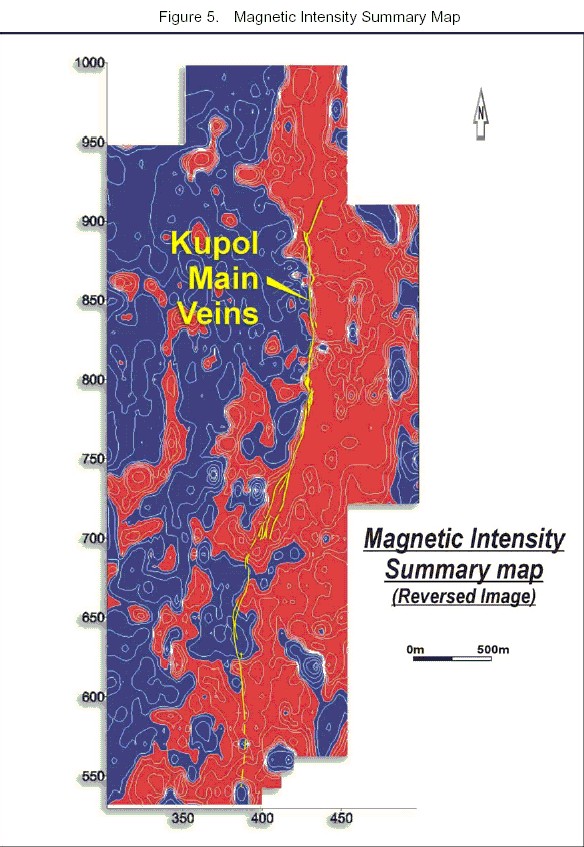
| Technical Report - Kupol Project Preliminary Assessment Summary | 41 |
| Bema Gold Corporation | |
| | Clay alteration is often accompanied by pervasive and fracture filling calcium carbonate+ disseminated pyrite. The pyroclastic units are typically more strongly altered than the flow units. To the north the clay alteration is particularly intense with 109 metres of strong to very strong clay alteration encountered in hole KP03-119. This area of clay alteration is interpreted to be an advanced argillic zone at the top of the Kupol hydrothermal system. Drilling below this clay alteration, in holes KP03-128, 134 and 144, confirmed the existence of 'ore' grade epithermal vein mineralization. The clay-jarosite alteration zone continues into the Kayemraveem River to the south. This is indicated by a broad zone of intense, sulphate-rich, pyritic, clay alteration along the riverbanks and exposed in trenches K-49, K-52 and K-24. Clay type varies by location with kaolinite dominant to the north and at shallower levels, and illite-montmorillonite-smectite more prevalent in the Big Bend hanging wall. The rhyolite dykes are commonly weakly to moderately clay altered. Infrared spectroscopy (PIMA) testing indicates a complex paragenetic sequence of clay mineralogy, likely reflecting overprinting of multiple hydrothermal events. Therefore, the clay alteration likely is associated with syn- and post-ore processes and with the post-ore event reflecting an acidic solution overprint on the upper levels of the deposit. Within 400 metres of the Kupol structure, particularly in the hanging wall of the vein, the rocks are weakly to moderately propylitically altered (chlorite-calcite+pyrite+epidote). Epidote occurrence is rare, while calcite (carbonate alteration) is common. Petrography indicates that iron carbonate (siderite) is present in limited amounts. Alteration adjacent to the veins consists of silica, adularia and pervasive sericite-illite in the hanging wall and footwall volcanic units. In selected areas, the silicification extends up to 40 metres from the vein (e.g., Trench K-42). Near the surface, the silicification- adularization - sericitization is commonly accompanied by a strong late supergene, sulphate-rich jarositic (yellow) colour anomaly. There is a broad chloritic alteration zone at depth within the Central zone and northern Big Bend zone areas of the deposit. Within this zone chlorite - pyrite+ magnetite replaces original sulphosalt bands and sulphidic breccia matrices and the fine colloform and crustiform quartz bands have been partially re-crystallized. This suggests that this alteration represents a prograde, metasomatic thermal overprint associated with the intrusion of the late Kupol dome or similar plug. Hematitic zones are present as a function of pre-, syn-, and post-ore events within the deposit area. At the present time the hematite occurrence has not been tied to any particular alteration assemblage(s). The agglomerate units to the east of the deposit area contain hematitic clasts suggesting a syn-volcanic, pre-ore hematitic alteration system. 7.2.3.1 Oxidation Weak to moderate oxidation occurs near surface within and adjacent to the mineralized zones. Oxidation is transitional with limonite, goethite, hematite and hydrous oxides present along fractures, as breccia infill or as rinds and weathered rims to sulphides and iron rich |
| Technical Report - Kupol Project Preliminary Assessment Summary | 42 |
| Bema Gold Corporation | |
| | minerals. The oxidation level outside the ore zone varies from 25- to 40-metres deep with local fracture controlled oxidation to 300 metres depth. The fracture-controlled oxidation within the ore zone extends to a maximum depth of 175 metres below the surface. No studies have been done in regards to any effects of near surface oxidation. However, as the oxidation is transitional type and there is good correlation between surface trenching and undercut drill hole values, there is no surface (supergene) enrichment evident. |
| Technical Report - Kupol Project Preliminary Assessment Summary | 43 |
| Bema Gold Corporation | |
| | 8.0 Deposit Type On the basis of geological setting, vein textures, mineralogy and alteration assemblages, the Kupol deposit can be classified as a low sulphidation epithermal fissure vein type deposit (Hedenquist, Arribas and Gonzalez-Urien Classification, 2000), or quartz-adularia-sericite type (Sillitoe Classification, 1993). The high level, low temperature, epithermal nature of the Kupol deposit is confirmed by Russian fluid inclusion studies that show homogenization temperatures for vein samples that range from 160° - 260°C (Vartanyan et al., 2001). A limited study of the silver-gold ratios and mineralogy in the few holes that have gone to depth has revealed that there is no noticeable transition to base metal and or silver rich phases with depth. Nor is there an increase in calcium or iron carbonate in the vein system. Similarly, vein textures such as cyclic colloform and crustiform banding and open space filling exist at depth, suggesting that the deeper intersections are still above the boiling zone for the vein system. The results of a quick silver-gold ratio study are presented in Table 9. Review of Ag:Au ratios indicate relatively constant Ag:Au ratios over 190 to 300m of vertical extent and supports the view that the bottom of the system has not yet been reached. |
Table 9. Review of Ag:Au Ratios
| Location | Vertical Range | Comment |
| 600N S. Extension | 570-380RL (190m) | No change in Ag:Au ratio with depth. |
| 1275N South | 575-290 RL (285m) | Marked increase in Ag:Au from 5:1 @530 RL to 14:1 @290 RL. Three holes (10,45,46) dominantly 93, colloform banded quartz- adularia vein fragments healed by silica, weak to sparse drusy, fracture controlled hematite. |
| 1750N Big Bend | 600-400RL (200m) | No change in Ag:Au ratio with depth. Higher Ag:Au ratios at hanging wall of vein followed by gradual decline. |
| 2000N Big Bend | 660-3609RL (300m) | No change in overall Ag:Au ratio with depth. Below 500RL, higher Ag:Au ratios at hanging wall of vein followed by gradual decline. |
| 2500N Central | 625-360RL (265m) | No change in Ag:Au ratio with depth. |
| 2600N Central | 640-430RL (210m) | No change in Ag:Au ratio with depth. Below 500 RL, higher Ag:Au ratios at hanging wall of vein followed by gradual decline. |
| 3100N North | 575-325RL (250m) | No change in Ag:Au ratio with depth. |
| | A literature review indicates that the Kupol deposit has similarities to many large, low sulphidation epithermal deposits including: Hishikari (Japan), Comstock Lode (Nevada, USA), Martha Hill Mine (Waihi District, New Zealand), Kubaka (Russia); El Penon (Chile), and Ken Snyder (Nevada, USA). The Comstock Lode and Martha Hill deposits were mined to a depth extent of approximately 800 metres and 600 metres, respectively. The Hishikari and Ken Snyder deposit are partially stratigraphically controlled. This limits the vertical extent of ore grade mineralization in those systems to approximately 200 metres. Hishikari, Martha Hill and Kubaka have silver:gold ratios of close to 1:1, while Ken Snyder is 10:1, |
| Technical Report - Kupol Project Preliminary Assessment Summary | 44 |
| Bema Gold Corporation | |
| | Kupol 12:1, El Penon 19:1, and Comstock Lode 23:1. The majority of the mineralization discovered so far at Kupol is contained within one main fissure vein system, similar to the Comstock Lode and Ken Snyder deposits. The following facts suggest a late acid sulphate overprint of the system either as a late 'gasp' of mineralizing fluids or a draw down of the system during the waning stages of the hydrothermal system: |
| | | |
| | • | the occurrence of a large clay alteration zone, predominantly in the hanging wall and above the northern portion of the deposit; and, |
| | • | jarosite, alunite, and gypsum over the length of the vein system. |
| Technical Report - Kupol Project Preliminary Assessment Summary | 45 |
| Bema Gold Corporation | |
| | 9.0 Mineralization Gold and silver mineralization at Kupol is hosted by polyphase brecciated quartz-adularia veins. The extent of brecciation is highly variable but generally the higher-grade zones are more strongly brecciated. For ease of logging the vein, mineralization was broken down on the basis of texture into the following units: |
| | | |
| | • | Massive vein (Unit 90) is comprised of massive to sugary textured, very fine to fine- grained quartz veins. This coding was also used for smaller, more massive veins in the footwall or hanging wall host rocks. |
| | • | Banded colloform and crustiform veins (Unit 91) have well developed cyclic banding of quartz+sulphides with quartz cryptocrystalline quartz (chalcedonic) to fine grained quartz. |
| | • | Vein Breccia (Unit 92) is comprised of brecciated quartz vein, where the matrix is composed of rock flour, sulphides and/or vein fragments. |
| | • | Quartz breccia (Unit 93) is brecciated quartz vein with the matrix comprised of one or more phases of re-healing by a quartz dominant phase. |
| | • | Stockwork (Unit 94) is stockwork style vein mineralization contained either within the main vein or in the hanging wall or footwall of the system. Stockwork refers to areas with crosscutting multiple generations of veining with the veins commonly <10 cm wide. |
| | • | Veinlet and stringer mineralization (Unit 95) is similar to Unit 94, but with sheeted, generally non-crosscutting vein mineralization. This unit forms haloes of vein mineralization up to 55-metres wide within and/or adjacent to the main vein system. This unit may contain veinlets or veins of colloform, crustiform and breccia character. Both Units 94 and 95 generally require greater than 10% veining present in order for either of these codes to be used as a primary lithology designator. |
| | • | Wall rock breccia mineralization (Unit 96) is wall rock breccia in which veins contain >25% wall rock fragments and/or puzzle breccias of wall rock healed by quartz veins. |
| | • | Yellow siliceous breccia (Unit 97) is a brecciated vein and/or banded vein with fractures and rock flour infilled with jarosite+quartz that give the rock a distinctive yellow hue. Jarosite commonly makes up 3 to 10% of the matrix. The unit was differentiated because it is fairly common in the Big Bend zone and Central zones. Unit 97 occurs down to a maximum depth of approximately 250 metres below surface. |
| | | |
| | A multitude of different vein lithologies and different degrees of brecciation are present within vein intersections. However, for logging purposes, only the dominant lithology in a vein or portion of the vein was coded and described. Polyphase brecciation within the vein system is believed to be principally hydrothermal and phreatic, with only minor, later, tectonic brecciation. Tectonic breccia occurs as rock flour and minor gouge zones within or along the margins of the veins. As a generalization there are low sulphide (<2% sulphides) and high sulphide (2-7% sulphides) veins and brecciated |
| Technical Report - Kupol Project Preliminary Assessment Summary | 46 |
| Bema Gold Corporation | |
| | veins present in the system. The high sulphide veins carry the highest 'bonanza'. Later cycles of quartz, including amethyst, commonly occur as open space filling and often have cockscomb, cockade to dogstooth textures. Quartz pseudomorphing of bladed calcite is present primarily near surface in the northern portions of the vein system. The predominant gold and silver minerals are electrum, native gold, silver-rich tetrahedrite (freibergite), acanthite and a variety of sulphosalts. Arsenic and antimony rich end members of a variety of mineral groups are present reflecting different solution chemistry in the evolution of the deposit and/or zonation in the deposit. Minor selenium- bearing sulphosalts are present. A list of minerals present in the Kupol deposit is provided in Table 10, List of Kupol Minerals. |
Table 10. List of Kupol Minerals
| Prevailing | Less Common | Rare |
| Ore Minerals |
| Pyrite | Arsenopyrite | Naumannite |
| Marcasite | Galena | Se-Polybasite |
| Chalcopyrite | Tennantite (Cu12As4S13) | Se-Miargyrite |
| Sphalerite | Aguilarite (Ag4SeS) | Se-Proustite |
| Electrum | Native Gold | Kustellite |
| Perceite(Ag, Cu)16As2S11 | Se-Stephanite (Ag5SbS4) | Berthierite |
| Freibergite(Ag,Cu,Fe)12(Sb,As)4S13 | Se-Pyrargyrite | Stibnite |
| Stephanite(Ag5SbS4) | Se-Acanthite | Utenbogardtite |
| Pyrargyrite(Aerosite) (Ag3SbS3) | Leucoxene | Fishesserite |
| TetrahedriteCu12Sb4S13 | Proustite Ag3AsS3 | Chlorargyrite (Cerargyrite) AgCl |
| | | Liujiynite (Ag3Au4)S2 |
| AcanthiteAg2S | | Mckinstreyite (AgCu)2S |
| Vein Minerals |
| Quartz | Hydromica | Kaolinite |
| Adularia | Sericite | Gypsum |
| | Chlorite | Albite |
| | Hematite | Natrolite |
| | | Pyrophyllite |
| | | Anhydrite |
| Supergene Minerals |
| Fehydroxides (hydro-goethite, limonite) | Chalcanthite CuSO4- 5H2O | Anglesite |
| Covellite CuS | Brochantite Cu4SO4(OH)6 | Bornite |
| Acanthite Ag2S | Chalcocite, incl. Jarlite | Scorodite |
| Hematite | Irregular Covellite (Jarrowite, Spionkopite) | Fe, CuAntimonite Group |
| | Polybasite | |
| Technical Report - Kupol Project Preliminary Assessment Summary | 47 |
| Bema Gold Corporation | |
| 9.1 | Mineral Paragenesis |
| | |
| | Russian studies indicate a varied sequence of mineral associations. The initial phase of mineralization was quartz-adularia with a pyritic and minor base metal component. The second phase is quartz-adularia-gold-silver sulphosalts (As and Sb rich phases). The third phase is quartz-antimony-rich phases. The fourth phase is acid-sulphate and fifth phase is oxidation. There is a metasomatic overprint at depth on the central portion of the deposit with a re-crystallization of the vein mineralogy to chlorite, pyrite+ magnetite, and hematite. As a generalization, gold occurs within or is rimmed by sulphosalts and free within the quartz. Given the two principal locations for the gold, there maybe another generation of gold present - late, post-sulphosalt cycles. The acid-sulphate phase is marked by jarosite, alunite, gypsum+ acanthite and covellite. Jarosite abundance in this phase partially reflects the growth of new minerals from the breakdown of adularia and sericite by late acidic solutions in the waning stages of the hydrothermal processes. Several generations of hematite are inferred to be present in the south zone on the basis of cross-cutting relationships. The initial phase of hematite occurs with early (pre-precious metal) low sulphosalt quartz and the late (post precious metal) hematite as fracture and breccia infill of sulphosalt bearing quartz. Kupol complexes and associations are presented in Table 11, Kupol Mineral Complexes and Associations. |
Table 11. Kupol Mineral Complexes and Associations
| Complex | Association |
| Hypogene |
| Pyrite-Adularia-Quartz (pre-productive) | Pyrite-Adularia-Quartz |
Arsenopyrite-Pyrite-Adularia-Quartz (low
productive) 260-185° C | 1. Arsenopyrite-Pyrite |
| 2. Tennantite (Cu12As4S13)-Pyrite |
| Amethyst-Quartz |
Gold-Stephanite-Pyrargyrite-Adularia-Quartz
(basic productive)
265-240° C , 220-200° C, 180-160° C | 1. Gold-Pearceite (Ag, Cu)16As2S11-Chalcopyrite |
2. Gold-Freibergite ((Ag,Cu,Fe)12(Sb,As)4S13)
3. Stephanite (Ag5SbS4) - Pyrargyrite (Ag3SbS3) |
| Gold-Aquilarite (Ag4SeS) -Se Pyrargyrite |
Stibnite-Marcasite-Quartz
(post-productive)
240-220° C | 1. Pyrite-Marcasite |
| 2. Berthierite (FeSb2S4) – Stibnite |
| 3. Gypsum-Anhydrite-Chlorite |
| Acid Sulphate & Supergene |
| Acanthite-Jarosite | 1. Acanthite (Ag2S)-Covellite (CuS) |
| 2. Acanthite-Jarosite (KFe3(SO4)2(OH)6) |
| 3. Alunite (KAl3(SO4)2(OH)6) |
| 4. Gypsum |
| 5. Iron Hydroxides |
| Technical Report - Kupol Project Preliminary Assessment Summary | 48 |
| Bema Gold Corporation | |
| | 10.0 Exploration Exploration conducted before 2003 is discussed in Section 6, History. In summary, the vein system was defined by 35 trenches over a strike length of 3.0 kilometres and by geophysics, geochemistry, and mapping over 4 kilometres of strike length. Trench spacing ranged from 200 metres along strike to the south, to 50 metres in the Big Bend. The central portion of the vein system (1800 N to 2250 N) was stripped, mapped and channel sampled in detail (4 metres between channels). Geochemical surveying at 1:10,000 covering 7.8 km2 completed over the area defined the deposit as a gold, silver, arsenic anomaly with local anomalous areas of mercury, lead, zinc and antimony. Magnetic and resistivity surveys were also completed over a similar area with initial 100 x 20-metre grids followed by detailed 25-metre x 5-metre and 20-metre x 5-metre grids, respectively. This work defined the deposit as an area of magnetic low response and higher apparent resistivity. Twenty-six holes totaling 3,004 metres were drilled over a strike length of 450 metres to a maximum depth of 140 metres. |
| | | |
| 10.1 | 2003 Exploration Exploration in 2003 favored the diamond drilling program. Additional exploration included: |
| | |
| | • | 22,256 metres diamond drilling in 166 holes |
| | • | trenching: 2.5 kilometres in 15 trenches; |
| | • | detailed magnetic surveying: 18.15 line kilometres at 25 m x 5 m spacing; |
| | • | reconnaissance mapping, prospecting and sampling in areas of proposed mine infrastructure; and, |
| | • | prospecting and general 1:4,000 scale mapping of selected areas of the property. |
| | | |
| | Each of the items listed above is described in more detail in the following sections. |
| | |
| | 10.1.1 Trenching |
| | | |
| | Due to permafrost conditions, excessive water and the poor state of the bulldozer equipment, only five of the 15 trenches excavated this year were partially mapped and sampled. The remaining trenches were mapped in a cursory fashion in an attempt to obtain some information from them prior to the closure of the trenching season. Trenches were placed along the Kupol structure as infill and step-out trenches to help define the grade and width of the vein(s) and to define and locate the alteration zone associated with the structure. The location of each new trench is shown in Figure 6, 2003 Trench Locations. Results of the sampling program from the new trenches are provided in Table 12, Summary of 2003 Trenching Results. |
| Technical Report - Kupol Project Preliminary Assessment Summary | 49 |
| Bema Gold Corporation | |
Table 12. Summary of 2003 Trenching Results
| Trench Number | Section | Zone | Metres | Au (g/t) | Ag (g/t) |
| K-42 | 1570N | HW | 3.2 | 71.04 | 756.57 |
| K-43 | 1150N |
FW | 12.5 | 3.08 | 38.61 |
| 2.3 | 9.71 | 71.02 |
| K-44 | 1025N | FW | 1.0 | 3.58 | 71.43 |
| K-47 | 625N | HW | 3.4 | 34.44 | 775.49 |
| K-48 | 200N | FW | 1.0 | 47.86 | 154.78 |
| HW | 3.0 | 4.51 | 21.18 |
| HW | 5.0 | 3.0 | 152.96 |
| Technical Report - Kupol Project Preliminary Assessment Summary | 50 |
| Bema Gold Corporation | |
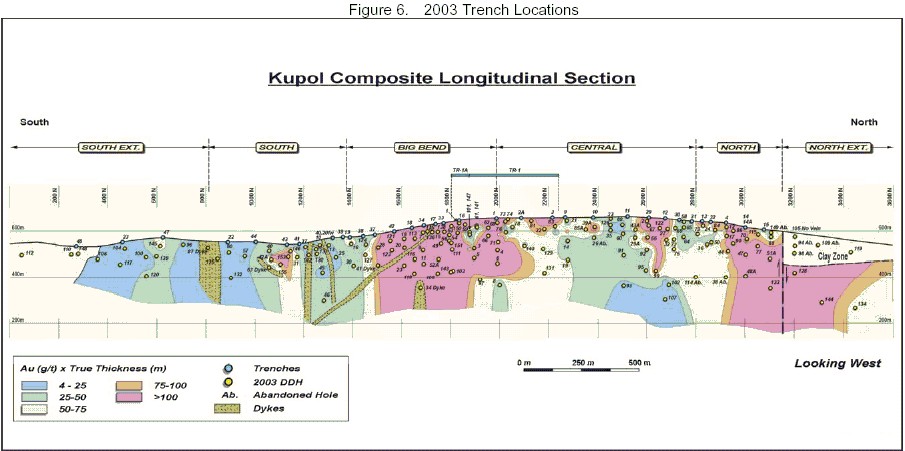
| Technical Report - Kupol Project Preliminary Assessment Summary | 51 |
| Bema Gold Corporation | |
| | 10.1.2 Magnetic Surveying |
| | | |
| | There is a high contrast between unaltered andesites and the mineralized zones due to the strong alteration and related magnetite destruction. A detailed magnetic survey was completed in the northern and southern portions of the property to better define the alteration and the vein system. The survey to the north (See Figure 7, Kupol Project Northern Magnetic Grid Survey) provided good definition of the main alteration trend and was used for spotting drill holes. The southern survey examined the area east of the main Kupol structural corridor to attempt to define alteration trends associated with geochemical anomalies. The southern magnetic survey (See Figure 8, Kupol Project Southern Magnetic Survey) was not as successful in defining a distinct trend due to the larger areas of alteration and lower contrast between the altered rhyolite dykes, domes, and flows. No distinct anomalies coincident with the geochemical anomalies were located east of the main veins. |
| | |
| | 10.1.3 Mapping and Prospecting |
| | |
| | Several smaller high-grade (>10 g/t Au) veins were identified through drilling and mapping in 2003 (See Figure 9, Other Property Targets). These veins and float trains occur outside of, but parallel and sub-parallel to the main vein structure. Selected results from these veins are provided in Table 13, Selected 2003 Prospecting Sampling Results. |
Table 13. Selected 2003 Prospecting Sampling Results
| Sample # | Type | Au (g/t) | Ag (g/t) |
| Zone K-2B |
| P1101 | float | 41.16 | 320.6 |
| P1102 | float | 23.54 | 90.10 |
| P1105 | float | 93.30 | 949.80 |
| P1202 | float | 85.88 | 563.08 |
| P1203 | float | 18.34 | 40.8 |
| Zone K-2B-N |
| P1106 | float | 205.90 | 1812.9 |
| P1109 | float | 17.16 | 119.80 |
| P1110 | float | 13.16 | 366.90 |
| Zone K-2B-NE |
| P1114 | grab | 12.0 | 101.04 |
| P1119 | grab | 13.74 | 176.22 |
| P1125 | grab | 15.86 | 156.98 |
| Kupol South |
| P1191 | float | 6.78 | 3.24 |
| P1192 | float | 3.24 | 87.16 |
| Technical Report - Kupol Project Preliminary Assessment Summary | 52 |
| Bema Gold Corporation | |
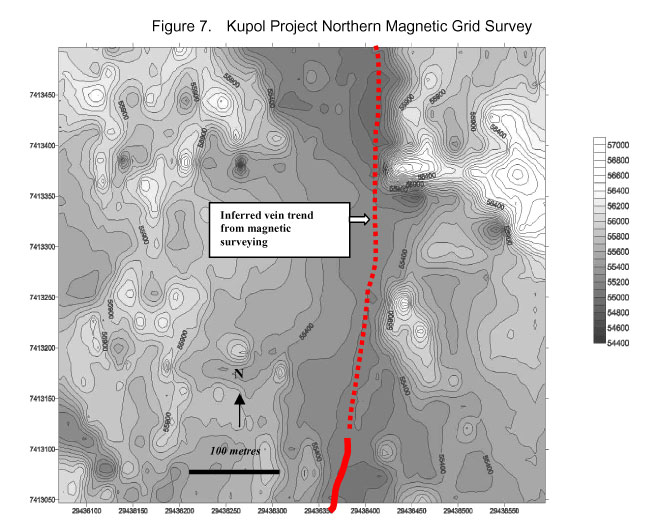
| Technical Report - Kupol Project Preliminary Assessment Summary | 53 |
| Bema Gold Corporation | |
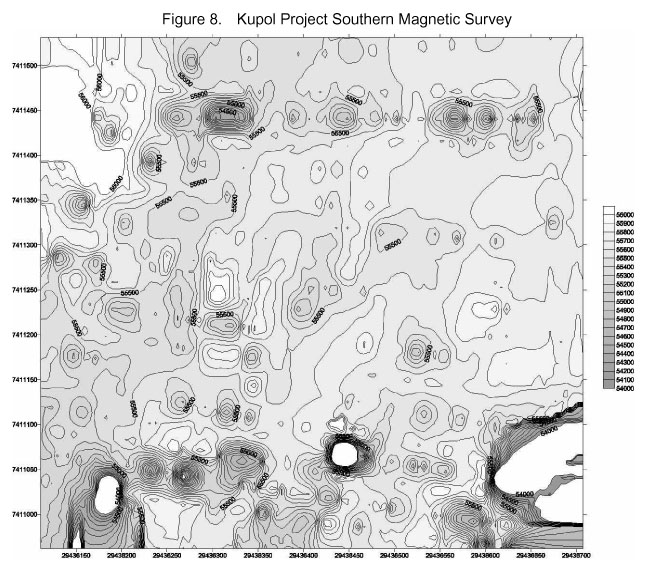
| Technical Report - Kupol Project Preliminary Assessment Summary | 54 |
| Bema Gold Corporation | |

| | 10.1.4 Drilling |
| | | |
| | The Kupol Project 2003 drilling is discussed in Section 11. |
| Technical Report - Kupol Project Preliminary Assessment Summary | 55 |
| Bema Gold Corporation | |
| | 11.0 Drilling In 2003 there were 166 holes drilled (22,256 metres). Diamond drilling was completed using two Longyear 38 drills (HQ and NQ core size) and two Russian CKB-4 drills (NQ core size). Drill hole locations are shown in Figure 10, Drill Hole Location and Results Summary. Drill results are summarized by each zone. Core recoveries vary by location and have recoveries in the mineralized zones ranging from 35% to 100% (average ~85%). Drilling muds and polymers were used extensively to enhance recoveries. Holes with poor zone recoveries were re-drilled (KP03-48A and 90A), with the exception of holes KP03-77 and 144, which will have to be re-drilled in 2004. The drill grid is based on a Gauss Kruger (Pulkovo 42) (GK) datum. For simplicity only the last five digits of the GK coordinate are used. Grid lines are oriented east-west (090), perpendicular to the average strike of the deposit. The Kupol deposit has been divided into 6 zones: |
| | | |
| | 1. | South Extension Zone (Sections 50N to 800N); |
| | 2. | South Zone (800N to 1450N); |
| | 3. | Big Bend Zone (1450N to 2025N); |
| | 4. | Central Zone (2025N to 2800N); |
| | 5. | North Zone (2800N to 3150N); and, |
| | 6. | North Extension Zone (3150N to 3425N ’ north). |
| | |
| | Drilling within each of these zones is described in more detail in the following sections. |
| | |
| 11.1 | South Extension Zone (Sections 50N to 800N) The South Extension zone extends from the Kayemraveem River at section 850 S to 800 N and was tested by 12 holes in 2003 from 50 N to 800 N. These holes included: KP03-087, -096, -100, -104, - 106, -110, -112, -117, -120, -139, -145, and -148. The coordinates of these holes are provided in A.2. The zone has been drilled at a drill spacing of 75 metres to greater than 200 metres to a maximum vertical depth of 175 metres. In areas of tighter drill spacing, several higher-grade zones were intersected as with the following significant assay intervals: |
| | |
| | • | KP03-145 average 103.71 g/t Au and 1011.08 g/t Ag over 1.15 metres |
| | • | KP03-145 average 34.00 g/t Au and 229.37 g/t Ag over 3.00 metres |
| | • | KP03-104average 9.13 g/t Au and 96.78 g/t Ag over 1.80 metres |
| Technical Report - Kupol Project Preliminary Assessment Summary | 56 |
| Bema Gold Corporation | |
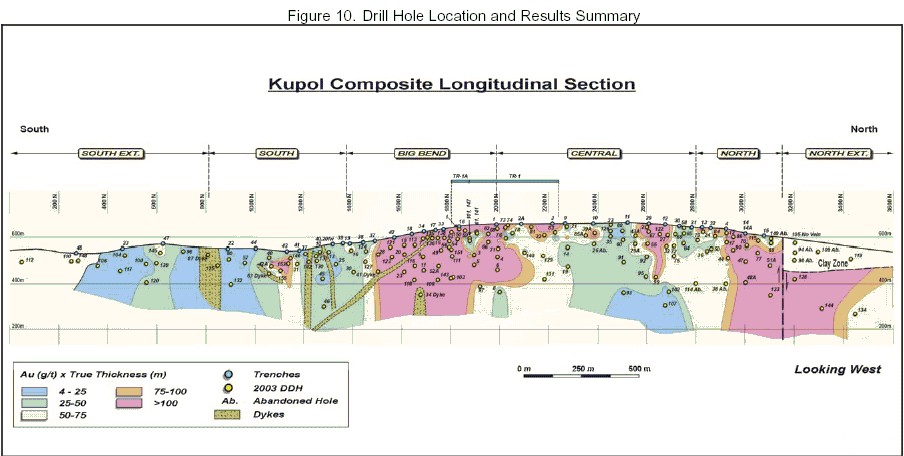
| Technical Report - Kupol Project Preliminary Assessment Summary | 57 |
| Bema Gold Corporation | |
| | Drilling, trenching, and mapping suggest that there are three or more main veins with variable widths and grades in this area. Drilling in 2003 focused on the central vein due to its continuity of exposure in trenches. However, significant grades have been intersected in each of the other two veins, including the multiple intersections indicated above in hole KP03-145, and narrower intersections such as 64 g/t Au and 115.5 g/t Ag in hole KP03-148. The deepest hole in the South Extension zone, KP03-120, intersected 1.90 metres of 27.51 g/t Au and 201.98 g/t Ag at a vertical depth of 170 metres (RL 400). The south extension is characterized by quartz vein material with distinct olive-green quartz and a hematite overprint. Vein textures are similar to those seen north of this zone but the quartz tends to be more sucrosic and/or massive. The sulphosalts are a bit finer-grained than in the Big Bend and, in general, there is more gypsum than in the vein systems observed to the north. There is no obvious zonation pattern or strong base metal signature to suggest the South Extension zone is distal to the main mineralization pathways. Silver to gold ratios vary from 7:1 to 30:1 with an average of approximately 12:1, similar to the rest of the Kupol deposit. Significant drill intercepts, vein float, strong alteration, magnetic and resistivity anomalies and soil geochemical anomalies along strike to the south suggests the zone is still open to the south and at depth. |
| | | |
| 11.2 | South Zone (800N to 1450N) |
| | |
| | The South zone is contiguous with the South Extension and Big Bend zones and comprises 650 metres of strike length with four main veins. There is a separation of up to 75 metres between the eastern (hanging wall) and western (footwall) veins. Twenty-one holes, with a drill spacing of 50 to greater than 100 metres, were tested in the South zone. These include: KP03-010, -013, -025, -031, -037, -040, -042, -042A, -045, -046, -057, -063, -080, -125, -130, -132, -137, -142, -146, -153, and -155. The coordinates of these holes are provided in Appendix A.2. Drilling in 2003 concentrated on testing the eastern vein (hanging wall - main Kupol vein), and the central western (footwall) vein splay off of the main vein. Significant intersections from the eastern (hanging wall) vein include: |
| | |
| | • | KP03-130 - average 27.88 g/t Au and 306.60 g/t Ag over 5.30 metres |
| | • | KP03-016 (at the junction with Big Bend)- average 18.54 g/t Au with 68.31 g/t Ag over 8.00 metres |
| | | |
| | Significant intersections from the footwall vein include: |
| | | |
| | • | KP03-42A - average 33.26 g/t Au and 356.74 g/t Ag over 7.60 metres |
| | • | KP03-146 - average 55.49 g/t Au with 117.58 g/t Ag over 3.25 metres |
| Technical Report - Kupol Project Preliminary Assessment Summary | 58 |
| Bema Gold Corporation | |
| | The drill density is higher in the hanging wall vein and lower in the westernmost footwall vein. The South zone was drill tested to a maximum depth of 150 metres. Significant drill results that support the strength of the mineralized system at depth in the South zone include: |
| | | |
| | • | KP03-46 - average 8.25 g/t Au and 115.39 g/t Ag over 6.30 metres |
| | | |
| | Vein textures and mineralization in hole KP03-46 are similar to those seen throughout the Kupol vein mineralized structure. Previous trenching by Russian Expedition work prior to 2003 and Bema in 2003 evaluated the South zone on 100-metre centers up to 1250 N and then on 50- to 75-metre centers to up 1450 N. Significant trenching results include: |
| | | |
| | • | K-19 HW vein - average 17.87 g/t Au and 118.25 g/t Ag over 10.70 metres |
| | • | K-19 FW vein - average 48.0 g/t Au with 1120.4 g/t Ag over 0.80 metres |
| | • | K-20 HW vein - average 27.40 g/t Au with 221.92 g/t Ag over 5.0 metres |
| | | |
| | A large rhyolite dyke-flow dome complex cuts off the hanging wall veins at 800 N. Rhyolite dykes and rhyolite flows locally disrupt the other veins. Based on the drilling and trenching to date, continuity of the mineralization and grade is well defined in the hanging wall vein but needs better definition in the footwall veins. Up to 55 metres (true width 45 metres) of veining and sheeted veining was intersected in this zone, in which shorter intervals of higher grade [e.g., KP03-42A (4.0 metres of 4.21 g/t Au, 7.50 metres of 33.26 g/t Au and 5.30 metres of 18.05 g/t Au)] have been intersected. Drilling covering this zone is still widely spaced, so infill drilling is required along the complete length of the zone to define the higher-grade ore shoots. As with the South Extension zone, the South zone is characterized by an abundance of olive green quartz and two phases of hematite. Preliminary petrographic and infrared spectroscopy (PIMA) studies of the area indicate a mixed alteration assemblage similar to other areas of the deposit. The presence of kaolinite and boiling textures in the vein and at depth in holes KP03-46 and 42 suggest a relatively high stratigraphic position in the epithermal system and good potential for mineralization at depth. Petrographic work to date indicates that acanthite is the dominant silver sulphide mineral in this area. |
| | |
| 11.3 | Big Bend Zone (1450N to 2025N) The Big Bend zone has a continuous strike length of 575 metres and is contiguous with the South and Central zones. The Big Bend is interpreted to occur at a right-lateral dilatant flexure in the vein system. This flexure is evident as a change in strike of the Kupol structure from 000 to 020 Az. The northern end of the Big Bend zone is defined by the location of a large rhyolite dyke that bisects the zone at Section 2025 N. A southwest trending splay off of the main vein structure at Section 1450 N defines the start of the South zone. The Big Bend zone has been drill |
| Technical Report - Kupol Project Preliminary Assessment Summary | 59 |
| Bema Gold Corporation | |
| | tested by 60 drill holes. Forty-eight holes were drilled by Bema in 2003 and 12 holes were drilled by Anyusk Geological Expedition (Russian) from 1998 to 2001. These holes include: CKB-01 to -05, -28, 29, 33, 34, 341, KP-001, -003 to 009, -011, -015, -016, -018, -020, -023, -028, -030, -034, -041, -049, -052, -052A, -053, -054, -056, -059, -061, -062, -066, -068, -071, -097, -101, -103, -108, -111, -113, -116, -118, -121, -123, -124, -127, -135, -136, -138, -141, -143, -147, -150, and -151. The Big Bend zone is drilled on 50- to 100-metre centers to a depth of 150 to 250 metres vertically below surface. There has been tighter drilling near surface in the area of the geostatistical-cross centered on 1800 N from 1675 N to 2000 N. Two holes (KP03-97 and KP03-08) tested the northern 100 metres of the zone to a maximum depth of 280 metres below surface. Significant intersections from the Big Bend zone include: |
| | | |
| | • | KP03-04 - average 27.97 g/t Au and 27.97 g/t Ag over 18.0 metres true width |
| | • | KP03-09 - average 65.05 g/t Au and 1021.27 g/t Ag over 11.0 metres true width |
| | • | KP03-49 - average 43.40 g/t Au and 499.18 g/t Ag over 11.50 metres true width |
| | • | KP03-113 - average 77.05 g/t Au and 949.87 g/t Ag over 6.20 metres true width |
| | • | KP03-138 - average 88.56 g/t Au and 480.91 g/t Ag over 6.75 metres true width |
| | | |
| | Big Bend zone has been trenched on 50-to 75-metre centers from 1450 N to 1800 N. From 1800 N to 2025 N the zone has been stripped, mapped and channel sampled in detail at four-metre centers. The Big Bend zone is comprised of a single, large polyphase breccia fissure vein with associated sheeted veining. This vein is divided into footwall and hanging wall segments by two, 3- to10-metre wide rhyolite dykes that bisect the zone. There is no apparent difference in grade of intersections across the dykes. The Big Bend zone vein width varies from one to 18 metres and is associated with a lower-grade stockwork/sheeted vein that is up to 30 metres wide. Clay gouge, sheeted and stockwork veins, and small islands of wall rock occur locally within the main vein envelope. Gold and silver mineralization exhibits remarkable continuity within individual vein intercepts and between sections in the central portion of the Big Bend zone. The continuity of mineralization within the vein is evident in the examples of drill hole intersections from separate drill sections provided in Table 14, Big Bend Zone Examples of Continuity. |
Table 14. Big Bend Zone Examples of Continuity
| Hole KP03-09 | Hole KP03-111 |
| From | To | Metres | Au (g/t) | Ag (g/t) | From | To | Metres | Au (g/t) | Ag (g/t) |
| 102.50 | 103.50 | 1.00 | 82.34 | 1313.16 | 116.00 | 116.50 | 0.50 | 15.96 | 252.56 |
| 103.50 | 104.40 | 0.90 | 43.82 | 615.86 | 116.50 | 117.10 | 0.60 | 13.94 | 202.60 |
| 104.40 | 105.00 | 0.60 | 52.52 | 903.14 | 117.10 | 117.80 | 0.70 | 14.36 | 223.76 |
| 105.00 | 106.00 | 1.00 | 34.74 | 727.56 | 117.80 | 118.40 | 0.60 | 32.20 | 272.18 |
| 106.00 | 107.00 | 1.00 | 92.64 | 2083.16 | 118.40 | 119.00 | 0.60 | 72.14 | 235.80 |
| 107.00 | 107.60 | 0.60 | 108.36 | 3174.38 | 119.00 | 119.80 | 0.80 | 50.96 | 145.10 |
| 107.60 | 108.10 | 0.50 | 7.10 | 170.82 | 119.80 | 120.70 | 0.90 | 13.56 | 150.90 |
| 108.10 | 109.00 | 0.90 | 19.48 | 275.56 | 120.70 | 121.30 | 0.60 | 23.48 | 251.64 |
| 109.00 | 110.00 | 1.00 | 67.60 | 1471.86 | 121.30 | 122.30 | 1.00 | 36.64 | 387.78 |
| Technical Report - Kupol Project Preliminary Assessment Summary | 60 |
| Bema Gold Corporation | |
| Hole KP03-09 | Hole KP03-111 |
| From | To | Metres | Au (g/t) | Ag (g/t) | From | To | Metres | Au (g/t) | Ag (g/t) |
| 110.00 | 111.00 | 1.00 | 13.48 | 385.54 | 122.30 | 123.30 | 1.00 | 43.62 | 577.36 |
| 111.00 | 112.00 | 1.00 | 50.64 | 645.46 | 123.30 | 124.20 | 0.90 | 25.34 | 182.12 |
| 112.00 | 113.00 | 1.00 | 36.90 | 386.82 | 124.20 | 125.20 | 1.00 | 14.68 | 319.48 |
| 113.00 | 114.00 | 1.00 | 217.06 | 3025.78 | 125.20 | 125.70 | 0.50 | 3.02 | 55.24 |
| 114.00 | 115.00 | 1.00 | 120.04 | 1918.68 | 125.70 | 126.50 | 0.80 | 3.26 | 70.44 |
| 115.00 | 116.00 | 1.00 | 158.36 | 1955.90 | 126.50 | 127.50 | 1.00 | 83.62 | 1820.20 |
| 116.00 | 117.00 | 1.00 | 51.20 | 631.00 | 127.50 | 128.10 | 0.60 | 8.82 | 188.58 |
| 117.00 | 117.40 | 0.40 | 14.10 | 90.18 | 128.10 | 128.70 | 0.60 | 1.26 | 24.10 |
| 117.40 | 118.40 | 1.00 | 23.24 | 152.90 | 128.70 | 129.40 | 0.70 | 48.00 | 1381.26 |
| 118.40 | 119.40 | 1.00 | 21.46 | 108.72 | 129.40 | 130.10 | 0.70 | 32.82 | 167.72 |
| 119.40 | 120.40 | 1.00 | 14.78 | 48.40 | 130.10 | 130.80 | 0.70 | 83.06 | 308.32 |
| 120.40 | 120.80 | 0.40 | 42.82 | 60.80 | 130.80 | 131.70 | 0.90 | 143.46 | 379.34 |
| | | | | | 131.70 | 132.70 | 1.00 | 27.50 | 276.76 |
| | | | | | 132.70 | 133.30 | 0.60 | 46.14 | 220.86 |
| | | | | | 133.30 | 133.90 | 0.60 | 5.00 | 14.32 |
| | The Big Bend zone vein is interpreted to be open at depth based on the following holes: |
| | | |
| | • | KP03-108 - average 32.67 g/t Au over 10.0 metres (RL 410) |
| | • | KP03-118 - average 10.11 g/t Au over 3.5 metres (RL 415) |
| | • | KP03-143 - average 20.68 g/t Au over 7.60 metres (RL 448) |
| | • | KP03-143 - average 35.36 g/t Au over 9.60 metres (RL400) |
| | • | KPO3-097 - average 8.96 g/t Au over 11.85 metres (RL 395) |
| | | |
| | A metasomatic chlorite-pyrite overprint is observed at depths of greater than 225 metres at the north end of the Big Bend zone adjacent to the Central zone. This overprint is believed to be due to the effect of the intrusion of the 'Kupol' andesite plug or another intrusion. Textures such as cyclic banding, open space filling, re-healed hydrothermal brecciation, re-crystallized cryptocrystalline quartz and partially replaced (by chlorite and pyrite) sulphosalt banding are present to indicate that this area is within the boiling level of the hydrothermal system. Grades are lower in the two holes that tested this area (KP03-97 grading 8.96 g/t Au with 96.60 g/t Ag over 11.85 metres and hole KP03-08 grading 8.85 g/t Au with 109.94 g/t Ag over 4.50 metres). Overall, the styles of mineralization are similar throughout the Big Bend zone, but within each vein intersection there are a variety of textural and mineralogical types reflecting local variability in the hydrothermal brecciation/boiling events. In general, the highest grades reflect either better preservation of original, early stage sulphosalt rich cyclic colloform – crustiform banding, and/or a cycle of sulphosalt and gold-rich healing of breccias. |
| | |
| 11.4 | Central Zone (2025N to 2800N) The Central zone covers a 775-metre strike of the Kupol vein structure contiguous with the Big Bend and North zones. Sixteen holes were drilled by the Anyusk Geological Expedition |
| Technical Report - Kupol Project Preliminary Assessment Summary | 61 |
| Bema Gold Corporation | |
| | (1998 to 2001) and 43 holes tested the zone in 2003. These include: CKB-07, -07.1, -08, -08A, -09, -10, -12, -13, -13A, -14 to -17, -17.1, -19, -20, KP03-002, -014, -019, -021, -022, -026, -027, -029, -029A, -032, -033, -035, -039, -039A, -043, -043A, -055, -058, -070, -064, -065, -067, -069, -072, -073 to -076, -078, -079, -081 to -083, -085, -085A, -089, -091 to -093, -095, -099, -102, -107, -114, -122, -126, -129, -131, -140, -152, -154, -156, and -157. Drill spacing on the upper levels of the zone range from 25 metres to 100 metres but hole spacing in the deeper levels (>75 metres depth) is greater than 100 metres. The zone was drilled to a maximum depth of 430 metres below surface on a single section (2675 N). Significant intersections include: |
| | | |
| | • | KP03-02 - average 27.04 g/t Au and 580.54 g/t Ag over 7.70 metres (6.20 metres true width) |
| | • | KP03-67 - average 39.34 g/t Au and 313.67 g/t Ag over 8.55 metres (6.50 metres true width) |
| | • | KP03-73 - average 14.25 g/t Au and 113.40 g/t Ag over 29.30 metres (24.50 metres true width) |
| | • | KP03-122 - average 48.87 g/t Au and 526.36 g/t Ag over 10.45 metres (7.75 metres true width) |
| | | |
| | The Central zone has been exposed and channel-sampled at four-metre centers from 2025 N to 2225 N. Within the stripped area the vein zone ranges in width from five to 30 metres and is limited to the east by a four- to seven-metre wide rhyolite dyke. There is good continuity of grades within and along strike in this exposed vein area, with the highest grades encountered at the south end of the vein. From 2225 N to 2800 N eight trenches spaced at 50- to 100-metre centers have tested the zone. Up to 2700 N the grades average greater than 15 g/t Au over two to 11 metres for the vein on the eastern side of the dyke and greater than 9 g/t over one to six metres on the western side of the dyke. Mineralization in the Central zone is hosted within two narrower veins, as opposed to a single vein in Big Bend zone. These veins occur within a wider, lower grade, sheeted and stockwork zone. Shoot development in this zone appears to be related to dilational zones in the vein structure and is possibly related to junctions with northeast and/or northwest trending structures. Sheeted veins are common in these dilational zones as shown by the following holes: |
| | |
| | • | KP03-73 - average 14.25 g/t Au and 113.40 g/t over 24.50 metres (true width) |
| | • | KP03-32 - average 8.40 g/t Au and 204.53 g/t Ag over 10.50 metres (true width) within a 45 metre sheeted vein zone |
| | • | KP03-27 - average 6.48 g/t Au and 58.01 g/t Ag over 15.20 metres (true width) |
| | | |
| | The upper levels of the Central zone are characterized by a bifurcation and partial paucity in the vein structure that is similar to that seen in the northern portion of the Big Bend zone. The Central zone appears to have distinct high-grade, steeply plunging shoots (based on drilling completed to date). The geometry of the main shoots has not been well defined. It is |
| Technical Report - Kupol Project Preliminary Assessment Summary | 62 |
| Bema Gold Corporation | |
| | believed that the spatial distribution of known ore shoots is a function of drill density rather than lack of shoots based on: |
| | | |
| | • | the presence of high-grade surface mineralization; and, |
| | • | similarity in vein mineralogy and textures along strike. |
| | | |
| | Based on drilling in 2003, the continuity of mineralization within the higher-grade zones extends to greater than 250 metres below surface. Local pinching and or stockwork development is believed to reflect a reduction in constraining pressure as a function of proximity to surface and interaction with the meteoric water table. Sulphosalt concentrations are generally lower in this zone and there is a higher percentage of pyrite, especially north of 2475 N. There appears to be more constrained precious metal rich fluid pathways in the central and northern portion of the Central zone, with lower-grade crustiform and chalcedonic veining present adjacent to higher-grade sulphidic colloform-banded brecciated vein material. The deepest intersection, in hole KP03-107, is partially faulted off and does not appear to constrain the system at depth. The presence of cyclic banding and chalcedonic quartz in the main veins in this hole indicates the presence of boiling at 430 metres below surface within this area of the Central zone. Holes KP03-82 and KP03-58 were collared in front of the vein. The zone has a chlorite-pyrite metasomatic overprint at depth in the southern and central portions of the Central zone (similar to the northern deep part of the Big Bend). This overprint starts at a depth of approximately 560 m RL (KP03-14) and extends to depth in a convex form. Petrography of samples from near surface in the Central zone indicates similar mineralogy to the Big Bend zone. One sample from 225 m depth (KP03-99) indicates a complex paragenesis as follows: |
| | |
| | 1. | quartz-adularia vein; |
| | 2. | breccia infill by a sulphidic (pyritic) iron-carbonate phase; |
| | 3. | base metal (chalcopyrite, sphalerite), arsenic (arsenopyrite) and gold-silver (electrum, acanthite, freibergite) bearing phase; |
| | 4. | at least one other phase of quartz+adularia; and, |
| | 5. | partial recrystallization by the thermal aureole. |
| | | |
| 11.5 | North Zone (Section 2800N to 3150N) TheNorth zone has a strike length of 350 metres and is contiguous with the Central and North Extension zones. Twenty holes and five trenches tested the area in 2003 at 50-metre drill spacing near surface and greater than 100 metre at depth. These include: KP03-012, - |
| Technical Report - Kupol Project Preliminary Assessment Summary | 63 |
| Bema Gold Corporation | |
| | 017, -024, -036, -038, -044, -047, -048, -048A, -050, -051, -051A, -070, -077, -084, -086, -088, -090, -090A, -115, -133, and -149. Trenches are spaced at approximately 40- to 50-metre centers. The zone has been drilled to a depth of 275 metres. Significant results include: |
| | | |
| | • | KP03-133 - average 70.54 g/t Au and 709.15 g/t Ag over 11.95 metres |
| | • | KP03-86 - average 66.44 g/t Au with 359.61 g/t Ag over 15.60 metres |
| | • | KP03-47 - average 22.10 g/t Au with 474.32 g/t Ag over 6.13 metres |
| | • | KP03-47 - average 43.40 g/t Au with 330.60 g/t Ag over 16.80 metres |
| | | |
| | The North zone is made up of two veins with the east (hanging wall) vein commonly wider than the west (footwall) vein. Silver to gold ratios range from 5 to 15:1 in the east and 6 to 35:1 in the west. Grades are generally higher in the west (footwall) vein than the east (hanging wall) vein. The northern boundary is defined by a west-northwest trending, high angle fault that down drops the stratigraphy 100 to 150 metres to the north. This fault is inferred based on stratigraphy, alteration zonation, and vein location across the fault. Additionally, a west-northwest trending dextral-normal fault bisects the zone at 2975N. Offset on this fault is of the order of 25-35 metres strike and dip slip. The textures and the character of the quartz and clay mineralogy, even at depth, suggest the intersection of the upper levels of a bonanza epithermal system. No consistent changes in silver-gold ratios are present to suggest a progressive change toward the roots of the boiling zone. Examples of high-level style boiling textures present at depth and at surface include quartz pseudomorphing of bladed calcite, opaline quartz infilling of voids, crustiform chalcedony and multiple re-healed breccia phases. In general, there are less sulphosalts within this area than in Big Bend zone. Difficult drilling conditions were encountered in the North zone with five holes abandoned and two holes re-drilled (KP03-48A and KP03-51A). Poor core recoveries were encountered in several holes resulting in the washing of the sulphosalt mineralization in more intensely brecciated intervals. Hole KP03-90 was re-drilled as hole KP03-90A. The re-drilled hole almost doubled the old gold grade (19.22 g/t Au and 262.18 g/t Ag over 70 metres) as a result of the near 100% core recovery. Hole KP03-38 was abandoned at the start of the zone and hole KP03-114 was abandoned before the zone. |
| | |
| 11.6 | North Extension Zone (3150N to 3425N —> north) Eight holes tested the North Extension zone in 2003. These included: KP03-094, -098, -105, -109, -119, -128, -134, and, -144. Five holes tested the upper levels of the zone for veining and to determine the extent, character, and location of the alteration zone. Four of the five holes were abandoned due to squeezing clays and fractured zones at depth. Three holes, KP03-128, 144 and 134, penetrated below the upper alteration zone and intersected the main vein system. Drilling density is low with 125 metres or more between the significant holes at depth. Results from these holes include: |
| Technical Report - Kupol Project Preliminary Assessment Summary | 64 |
| Bema Gold Corporation | |
| | • | KP03-128 - average 12.33 g/t Au and 101.83 g/t Ag over 18.25 metres (true width) |
| | • | KP03-134 - 20.47 g/t Au and 55.37 g/t Ag over 2.77 metres (true width) |
| | • | KP03-144 - 11.83 g/t Au and 109.42 g/t Ag over 6.10 metres (true width) |
| | | |
| | The main vein system is covered by a 100- to 150-metre thick cap of intense kaolinite+ illite altered andesites. This alteration zone manifests itself as a broad magnetic low that extends to the limit of the survey 350 metres north of the last drill hole completed on the Kupol mineralized structure. Minor stringer veins, with low gold and silver values occur in vuggy siliceous pyrite-rich veins within the lower levels of the alteration blanket and demarcate the start of the transition into the precious metal zone. Petrography indicates the presence of amorphous silica colloform banding, kaolinite and open space filling indicative of high levels in an epithermal system. On the basis of the alteration zonation, vein textures, mineralogy and mineralization, the North Extension is believed to be the down dropped extension of the North zone, and as such represents the top of the Kupol epithermal vein system. The zone is open to the north and at depth. Two holes, KP03-03 and KP03-04, scissor twinned the Russian holes CKB-34A and CKB-5 respectively. A comparison of the results is provided in Table 15, Comparison of scissor twin hole results. |
Table 15. Comparison of scissor twin hole results
| Parameter | KP-03-03 | CKB-34A | KP-03-04 | CKB-05 |
| Au (g/t) | 14.73 | 16.00 | 27.97 | 51.60 |
| Ag (g/t) | 180.44 | 340.10 | 220.90 | 530.90 |
| Intersection length (m) | 15.10 | 29.20 | 29.90 | 41.30 |
| True width (m) | 14.00 | 14.00 | 18.00 | 27.50 |
| Au * True Width | 206.22 | 224.00 | 503.46 | 1419.00 |
| % Difference (Au * m) | -8.6 | -181.8 |
| | Both confirmation test holes encountered lower grades over similar true widths. Hole CKB-05 was drilled down dip of a high-grade zone in the hanging wall of the vein, while hole KP03-04 encountered high grades in the footwall of the same zone. Further drilling within this area suggests that the grades are somewhat more variable in this small section of the deposit. The Russian drill holes assays were excluded from the resource modeling but they were used to assist in geological interpretation on sections and levels during solids modeling. The Russian grades were not used due to Canadian National Instrument, NC 43-101 compliance issues that included: |
| | | |
| | 1. | Questions about accuracy of hole collar and down-hole surveying. Down-hole surveying was not performed on all holes due to difficult ground conditions. |
| | 2. | There was no geological QA/QC program to check the results. |
| Technical Report - Kupol Project Preliminary Assessment Summary | 65 |
| Bema Gold Corporation | |
| | 3. | There was an internal laboratory control program but the control results have not been provided. |
| | 4. | The whole core was sampled, so representative core does not remain to verify results. |
| | 5. | The drill program was not supervised by a qualified person. |
| Technical Report - Kupol Project Preliminary Assessment Summary | 66 |
| Bema Gold Corporation | |
| | 12.0 Sampling Method & Approach |
| | |
| 12.1 | Sampling Protocols Drill core was delivered from the drills in covered wooden or waxed cardboard boxes and 'quick' logged (see 12.3.2) by Canadian geologists. Each hole was geotechnically logged and then logged in detail by the Russian geologists. Sampling intervals were determined, marked up, and tagged by the Russian geologists. The intervals were based on geology (lithology, mineralogy, texture and structure). Sampling across contacts was only completed if the vein width was less than the minimum sample width. The core was oriented to ensure that an even split of the veins was taken and that there was no sample bias. The Canadian geologists checked the sample intervals prior to the core being split. The minimum sample length was 0.25 m for HQ-size core and 0.30 m for NQ-size core. Generally, the maximum sample length was 1 metre. Mineralized zones were bracketed by a minimum of one to three metres of sampling into the footwall and hanging wall. All vein zones and alteration types of interest were sampled and each major zone was continuously sampled. Samples containing visible gold or abundant sulphosalt mineralization were indicated by a white sample bag at the start of the sample interval, so sampling technicians would employ contamination minimization protocols during cutting and laboratory preparation. Field duplicate samples were marked with flagging tape. Core to be sampled was delivered to the splitting shack and then photographed. Core was 2/3 split using a diamond saw with the remaining third returned to the core box as a record. The core saw core jig was calibrated to ensure an even 2/3 split was taken of the core for both HQ- and NQ-sized samples. For samples of strongly broken core, care was taken to ensure a 2/3 split of the sample. This commonly involved the use of a metal divider and a spoon. The core was split in consecutive sampling order, from top of hole to the bottom. Field duplicate samples were cut into 1/3 sections with two 1/3 portions sent for assay. The saw blade was cleaned on a regular basis using a dressing stone, and was cleaned after every sample that was well mineralized or contained visible gold. Fresh water was used at all times to protect against re-circulation contamination. Samples were bagged and field blanks/reference standards were inserted by the geologists into the sample stream. The samples were then assembled into batches of 20 samples, in the order they were sampled, and submitted to the laboratory two to three times per day. Well-mineralized or visible gold-bearing samples were indicated on the submission form to ensure that contamination reduction protocols were followed by the laboratory. Core samples for all 2003 mineralized intersections are stored in racks in a locked core storage tent. The remaining (unmineralized) 2003 core is stored in racks in locked |
| Technical Report - Kupol Project Preliminary Assessment Summary | 67 |
| Bema Gold Corporation | |
| | containers. No mineralized intersections remain from the Pre-2003 (Anuysk) Russian drilling due to whole core sampling. The remaining unmineralized core from the Pre-2003 drilling has been organized and stacked at the old Russian camp site adjacent to the Central trench. Core recovery was recorded for all core runs. Within the zone, core recovery averaged greater than 85%. However, in several cases core recoveries over short intervals were low. Hole KP03-90 was re-drilled as hole KP03-90A to improve core recoveries in the zone in this area. As a result of this, hole KP03-90 will be excluded from any resource calculations. Holes KP03-77 and KP03-144 had lower than ideal core recoveries within the zone, with intervals in hole KP03-144 particularly low (<40%). Due to low drill hole density in these areas, these holes will be included in current resource studies; however they will be re-drilled and the original hole will be excluded from any future Feasibility Study. |
| | | | |
| | 12.1.1 Trench Sampling Protocols |
| | | |
| | Trench sampling followed the same sampling protocols as the cores. Samples were collected using a chisel and hammer to cut an even channel across each zone. Care was taken to collect equal volumes of rock across each channel to ensure there was no sampling bias based on rock softness or fracture density. Sample intervals were marked with metal tags at the start and end points surveyed. |
| | |
| 12.2 | Logging Protocols This section includes detailed information on the logging protocols for the Kupol project in 2003, including: |
| | |
| | • | geological logging; and, |
| | • | geotechnical logging. |
| | | |
| | Quick logs of each hole were completed by the Canadian geological staff as an instrument to continuously monitor the drill program and as a check on the detailed core logging. Detailed logging was conducted by university trained, professional Russian geologists. Both log styles were handwritten and then entered into Excel© spreadsheets that were compiled and loaded into a relational (Access©) database. In addition to the detailed logging of the lithologies, colour(s), grain size, structures, core axes angles and the intensity of occurrence or non-occurrence of the following geological characteristics were noted on the detailed logs: |
| | |
| | 1. | Oxidation type, mineralogy, and intensity; |
| | 2. | Mineralization |
| | | a. | Pyrite |
| | | b. | Galena |
| | | c. | Chalcopyrite |
| Technical Report - Kupol Project Preliminary Assessment Summary | 68 |
| Bema Gold Corporation | |
| | | d. | Sulphosalts |
| | | e. | Acanthite |
| | | f. | Arsenopyrite |
| | | g. | Visible gold |
| | 3. | Alteration |
| | | a. | Silicification |
| | | b. | Carbonate |
| | | c. | Propylitic |
| | | d. | Argillic |
| | | e. | Sericite-adularia |
| | | f. | Gypsum |
| | 4. | Vein texture and intensity |
| | 5. | Magnetism |
| | 6. | Structure and bedding |
| | | |
| | For most of the parameters an intensity code from 0 (absence) to 3 (strong) was assigned with the numeric percentage varying by field. Vein intervals in the first 40 drill holes for 2003 were re-logged to ensure conformity of early logging with later logging. |
| | |
| | 12.2.1 Geotechnical logging |
| | | |
| | Core recoveries and rock quality designation (RQD) for all core runs were routinely recorded through the course of the program by the geological technicians. These measurements were recorded on separate logs and in a separate data file from the detailed logs. Predominate fracture orientations, fault attitudes, and fault gouge zones were recorded by the geologists in the detailed logs. Qualitative information on properties such as rock hardness, fracture density, jointing/degree of weathering, and alteration, were recorded as part of the quick log and detailed logging. Core photography for the remainder of the core was limited to only those intervals that were sampled. |
| | |
| 12.3 | Survey Data |
| | |
| | 12.3.1 Topographical surveys |
| | | |
| | The Kupol area is covered by Russian State “non-classified” topographic maps at 1:200,000 and 1:100,000 scale and by “classified” 1:25,000 scale maps. An 8 km2 area around the Kupol deposit has been surveyed in detail at 1:2,000 scale with two-metre contour spacing. To facilitate the detailed surveying, a survey net was set up over the deposit area. This net was tied to the regional survey control points. Russian detailed survey control was set out in a Russian Local Grid (LG) coordinate system (with a classified origin). Additional local control was set out in the Gauss Kruger (Pulkov 42) geodetic system in order to facilitate drill hole layout and collar surveying. In 2003, a surveying audit was completed in the LG coordinate system to establish site control for engineering studies and created topographic |
| Technical Report - Kupol Project Preliminary Assessment Summary | 69 |
| Bema Gold Corporation | |
| | maps for the proposed facilities. This new site control was tied to the regional survey control points. |
| | | |
| | 12.3.2 Drill hole collar surveys |
| | | |
| | All 2003 drill holes were marked with a location marker immediately after the drill was pulled off of the setup. Location markers were comprised of four-inch PVC pipe marked with the drill hole number. Surveyors surveyed every hole and trench soon after completion using conventional theodolite and survey rod instrumentation. The collar locations were hand-calculated and were reported with coordinates represented in the local grid datum and in the Gauss-Kruger (Pulkov 42) geodetic system. In 2003 the Gauss-Kruger system was considered the official datum. All preserved collars (~90%) were surveyed using a total station survey instrument and reported in local grid coordinates. These coordinates were compared to the existing coordinates with variably oriented differences from less than one metre to seven metres. Generally, the surveys correlated well. Where significant differences between the two surveys existed, the original Russian and audit calculations were checked and where possible the hole resurveyed. Remaining discrepancies of greater than one metre will be checked, wherever possible, in 2004. |
| | |
| | 12.3.3 Down-hole surveys |
| | | |
| | Down-hole surveys were measured using a Reflex EZ-SHOT electronic solid-state single shot (magnetic) instrument. The measurements were read directly from the display on the instrument and transferred by hand onto paper forms. There is no direct permanent record of this reading. The inclination and azimuth at collar were hand-entered into a spreadsheet and the two-degree correction from magnetic north to true north was made. Measurements that were obviously erroneous were discarded. Less than 10% of the holes lack down-hole surveys due to bad ground conditions or unavailability of the survey tool. The drill was aligned with the bearing pickets that were set by the surveyors. The head angle was set using a Brunton compass and was rechecked after the casing was set. These setup measurements were used as the initial record in the down-hole survey. Initially down-hole measurements were collected at 30-metre spacing. These measurements indicated that there were no major deviations and the measurement spacing was increased to 50 metres. On the Western rigs the down-hole tests were performed by the driller as the hole was being drilled. On the Anyusk rigs the tests were performed by a Russian geologist after the hole was completed. At the very end of the 2003 program when the EZ-SHOT tool was no longer available, the measurement for the down-hole survey was derived from a survey of the drill ram and rods. The following holes were affected by the lack of instrumentation: KP03-146, KP03-148 and KP03-152 to - 155. In order to preserve a more accurate initial survey it is recommended that the setup be surveyed for all holes drilled in the future. |
| Technical Report - Kupol Project Preliminary Assessment Summary | 70 |
| Bema Gold Corporation | |
| | 12.3.4 Trenches |
| | | |
| | Trenches are treated as drillholes. The down-hole survey for each trench was calculated from the individual trench survey points. |
| Technical Report - Kupol Project Preliminary Assessment Summary | 71 |
| Bema Gold Corporation | |
| | 13.0 Sample Preparation, Analyses & Security |
| | | |
| 13.1 | Preparation & Analysis Due to the remote location of the Kupol Project and the difficulties with shipments of samples within and from Russia, a containerized field laboratory was set up at the Kupol site. The laboratory was set up and run as an independent 'arms length' laboratory. No Bema or contractor personnel were allowed in the laboratory or laboratory area unless accompanied by an independent laboratory manager. Laboratory management was overseen by qualified North American laboratory managers that supervised Russian-certified assayers and set up QA/QC protocols. Laboratory procedures and QA/QC protocols were audited in 2003 by an internationally recognized, independent consultant (Barry Smee and Associates, 2003). The results of this audit are provided in the Preliminary Assessment. Samples were received at the laboratory as follows: |
| | |
| | • | Each shipment was checked to ensure accuracy of paperwork. |
| | • | Samples were logged into the laboratory system and the laboratory signed off on delivery of each submission. |
| | • | Shipments were then placed in a secure container to await processing. |
| | | |
| | All samples were dried in a locked, heated container, either within the sample bag or on a steel tray, and then transferred to the sample preparation lab. Each sample was first crushed in a jaw crusher to 95% passing minus 10 mesh (<2 mm) then divided by a Jones riffle splitter into two - 1 kg samples. The first sample was preserved as a geological coarse reject duplicate that was kept in a locked container until the geology staff retrieved it. The second sample went to the LM2 bowl and puck pulverizer where it was pulverized until 90% passed -150 mesh. The 1 kg pulverized sample was then split into four 250g samples, each in a sample envelope. One pulp sample went for fire assay, one kept as a lab reject, and two were retained as geology duplicates. All pulp duplicates are stored in locked containers. One in 20 samples was screened from both crusher and pulverizer splits to ensure compliance with specifications. All equipment was air washed between samples and a silica blank sample was run as a cleaning medium every 20 samples, and after visible gold-bearing or well-mineralized samples. A 50 g split was taken off of the 250 g pulp sample and was analyzed for gold and silver using standard fire assay techniques with a gravimetric finish. The detection limit for gold was 0.2 g/t and for silver 1 g/t. |
| Technical Report - Kupol Project Preliminary Assessment Summary | 72 |
| Bema Gold Corporation | |
| 13.2 | Quality Assurance / Quality Control Programs A strict protocol for sample quality control and quality assurance was followed throughout the full program and was independently audited (Barry Smee, Smee and Associates, 2003). The QA/QC program involved the regular insertion of field blanks and standard reference material into the sample stream, the collection of field duplicate samples, and external checks using a pulp duplicate. The Preliminary Assessment includes complete detailed findings of the independent audit. Due to equipment start up problems with the Kupol laboratory, the initial sets of samples from the project were analyzed at Bema Gold’s Julietta Mine laboratory. The Russian assayers responsible for assaying at the Kupol laboratory were sent to Julietta to ensure the same protocols were followed for sample preparation and analyses as in the laboratory at Kupol. Pulps from all samples originally analyzed at the Julietta laboratory were returned to Kupol and re-analyzed at the Kupol laboratory. The database used in the resource calculation only contains data from the Kupol laboratory. The Julietta laboratory and Assayers Canada laboratory, of North Vancouver, British Columbia, Canada, are external check laboratories. All laboratory submissions included a full set of QC samples. |
| | | |
| | 13.2.1 Standard reference material |
| | | |
| | In order to monitor the accuracy of the laboratories, three gold reference standards covering a range of grades were purchased from CDN Resource Laboratories of Delta, BC. These samples were inserted into the sample stream at a ratio of 1:20. The standards came in individual 60 or 75 gram Kraft paper wrapped packets. Each standard is certificated with an accepted mean as obtained through a round robin assay program. Standard failure limit was set at plus or minus three standard deviations (SD). A description of the standards is provided in Table 16, Reference Standards Used at the Kupol Project. |
Table 16. Geological Reference Standards Used at the Kupol Project
| Standard Name | Accepted Mean (g/t Au) | Standard Deviation (g/t Au) |
| GS-4 (STD 1) | 3.45 | +/- 0.105 |
| GS-6 (STD 2) | 9.99 | +/- 0.25 |
| GS-8 (STD 3) | 33.50 | +/- 0.85 |
| | Results for the reference standards are presented in Figures 11 - 16, Reference Standards, Internal QA/QC. As indicated by the charts the Kupol laboratory experienced startup problems but once the procedures and protocols were established it proceeded to provide accurate analyses. In early summer (2003) some batches were re-run up to three times before they were passed and deemed as acceptable for inclusion in the database. Standard GS-8 assay results form a tight cluster below the mean, the results for GS-6 are scattered about the mean with a slight bias on the high side, and GS-4 assay results are generally fall on the lower side of the mean. Therefore, the Kupol laboratory biases low for samples in the 30 g/t range, a bit high for samples in the 10 g/t range, and low for samples in the 3.5 g/t range. Julietta assay results tend to be a bit higher for the same Kupol sample and the reference |
| Technical Report - Kupol Project Preliminary Assessment Summary | 73 |
| Bema Gold Corporation | |
| | standards suggest that the Julietta laboratory assays high for the GS-4 and GS-8 standards, and assays well for the GS-6 standard. Sample batches that included a failed standard were automatically re-analyzed unless the failure was clearly due to a sample number mix up. Sample results were not loaded into the database unless a batch passed the QA/QC. In some cases, this required a batch to be re-run several times before a reference standard passed, indicating the batch accuracy was okay. |
Figure 11. Reference Standard QA/QC Results for Standard GS-4
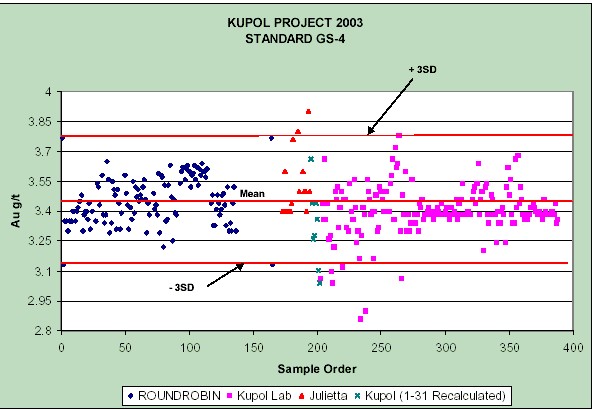
| Technical Report - Kupol Project Preliminary Assessment Summary | 74 |
| Bema Gold Corporation | |
Figure 12. Reference Standard QA/QC Results for Standard GS-6
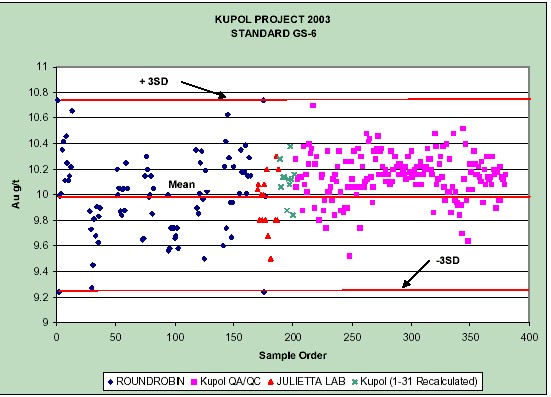
Figure 13. Reference Standard QA/QC Results for Standard GS-8
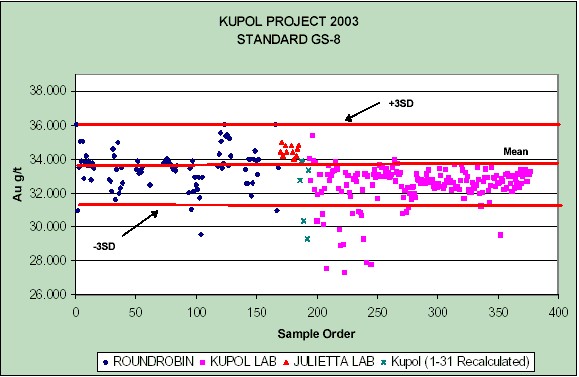
| Technical Report - Kupol Project Preliminary Assessment Summary | 75 |
| Bema Gold Corporation | |
Figure 14. Reference Standard QA/QC Results for Standard A
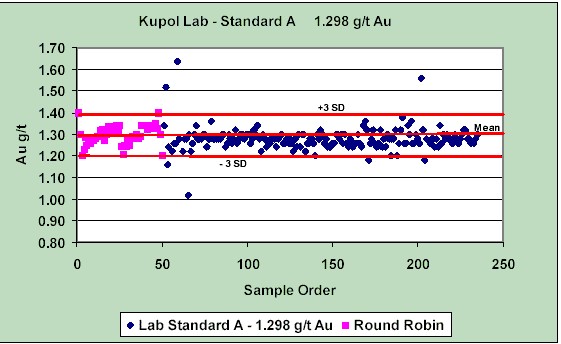
Figure 15. Reference Standard QA/QC Results for Standard B
| Technical Report - Kupol Project Preliminary Assessment Summary | 76 |
| Bema Gold Corporation | |
Figure 16. Reference Standard QA/QC Results for Standard C
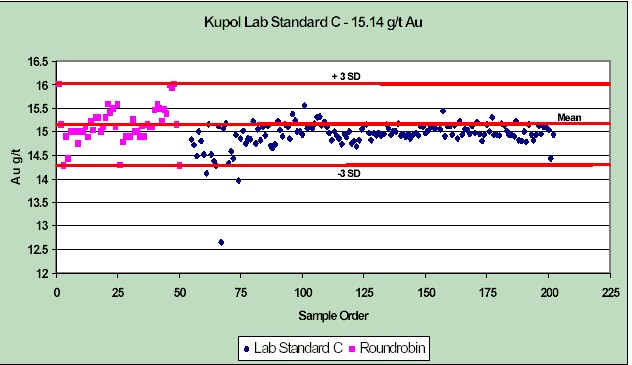
| | 13.2.2 Blank Sample Assays |
| | | |
| | A coarse field blank was used to check for contamination and sample order mix-ups. Rhyolitic flow material from the north end of the property was selected as a field blank, as it contained no gold and had characteristics similar to the mineralized zones. Field blanks were inserted every 20 samples and also after well-mineralized samples or samples containing visible gold. Failure threshold was set at 0.5 g/t Au, 2.5 times the detection limit. Figure 17, Kupol Field Blank, shows the blank results for the Kupol and Julietta laboratories. There is very little contamination associated with the preparation work in the Kupol laboratory. The majority of samples above the threshold at both Kupol and Julietta followed very high-grade samples, and thus did not require a re-run of a batch. The laboratories were informed of the instances of contamination and the lab manager adjusted procedures where appropriate. |
| | |
| | 13.2.3 Duplicate Assays |
| | | |
| | In order to check on the precision of the laboratory, field duplicates were collected as a 1/3 split of the drill core. Duplicates were taken of every twentieth sample. To ensure an adequate statistical dataset, additional duplicates were taken within mineralized samples containing visible gold. Results for the field duplicates are presented as scatter plots (Figures 18 – 20) and as a Thompson- Howarth LC plot (Figure 21). Field duplicate scatter plots are presented in three |
| Technical Report - Kupol Project Preliminary Assessment Summary | 77 |
| Bema Gold Corporation | |
| | ranges: 0-650 g/t Au, 0-30 g/t Au, and 30 to 100 g/t Au. One preparation (prep) and one pulp duplicate samples were collected by the laboratory within each batch of 20 samples. The prep duplicates a split taken off of the sample after crushing. The pulp duplicate is a 50-gram sample from the same 250-gram laboratory split used for original assay. Scatter plots of the field duplicate samples show a wide scatter about the 1:1 reference line. This wide scatter of results is confirmed by the Thompson-Howarth LC plot of the same data set and indicates there is poor precision of the field duplicate results. |
Figure 17. QA/QC Result for Field Blank
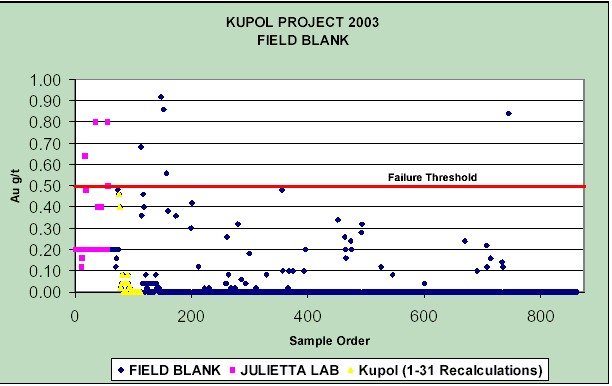
| Technical Report - Kupol Project Preliminary Assessment Summary | 78 |
| Bema Gold Corporation | |
Figure 18. Field Duplicate Scatter Plot – 0 to 650 g/t Au
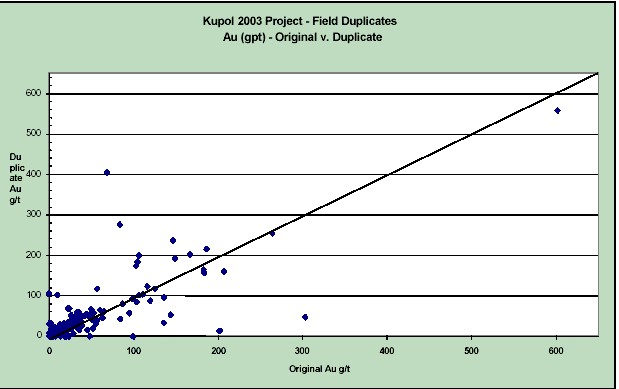
Figure 19. Field Duplicates Scatter Plot – 0 to 30 g/t Au
| Technical Report - Kupol Project Preliminary Assessment Summary | 79 |
| Bema Gold Corporation | |
Figure 20. Field Duplicate Scatter Plots – 30 to 100 g/t Au
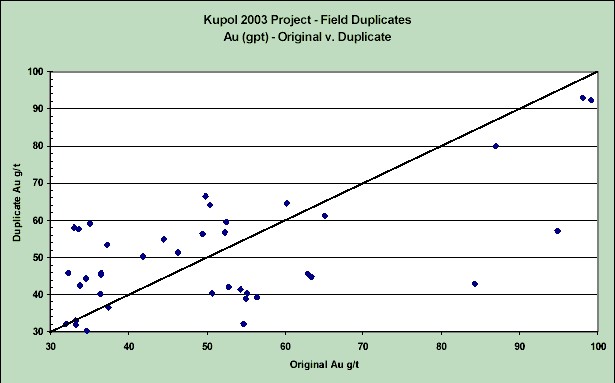
Figure 21. Thompson- Howarth LC plot
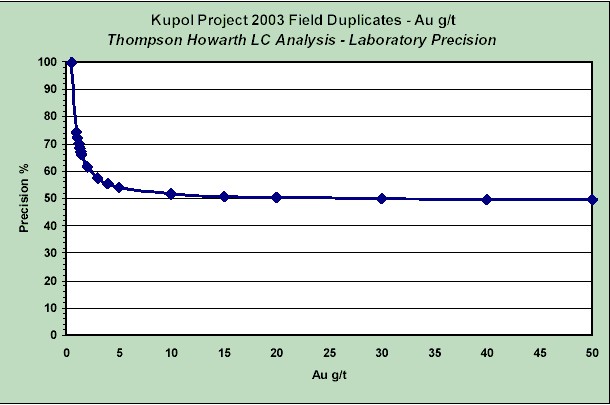
| Technical Report - Kupol Project Preliminary Assessment Summary | 80 |
| Bema Gold Corporation | |
| | Plots of the prep and pulp duplicate (Figures 22 and 23) are very similar and show very good precision once the samples have been homogenized. The reason for the magnitude of difference between the field, pulp, and prep duplicates is uncertain. The good correlation of the pulp and prep duplicates indicates there is no problem with the analyses and the internal laboratory splitting. Poor precision in the field duplicates indicates there may be a problem in sampling methodology or inherent variability in the mineralization. There was no significant change in the results from early season (low sample population) to late season (large sample population). Auditing of the sampling methodology indicates there are neither inherent biases nor errors in sampling technique, so the distribution of mineralization within the samples is believed to be responsible for the lower reproducibility of the field duplicates The abundance of visible gold in the deposit indicates that there appears to be a nugget effect with respect to gold distribution. As the vein system is a polyphase breccia, it is this brecciation and multiple re-healing events that may account for the irregular gold distribution and grade variability. Petrographic and metallurgical studies indicate a bimodal gold distribution, both free and sulphosalt associated, with 10-15% of the gold reporting in a gravity concentrate. The laboratory flow sheet will be modified in 2004 to include a coarse metallics screen assay procedure for well-mineralized samples. This should help reduce the scatter in the field duplicates. |
Figure 22. Thompson Howarth LC Analyses for Preparation Duplicates
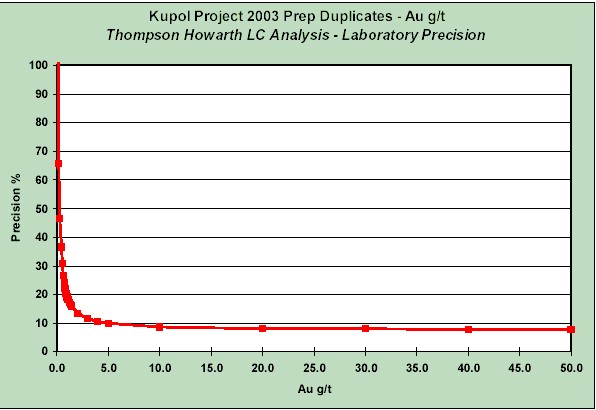
| Technical Report - Kupol Project Preliminary Assessment Summary | 81 |
| Bema Gold Corporation | |
Figure 23. Thompson Howarth LC Analyses for Pulp Duplicates
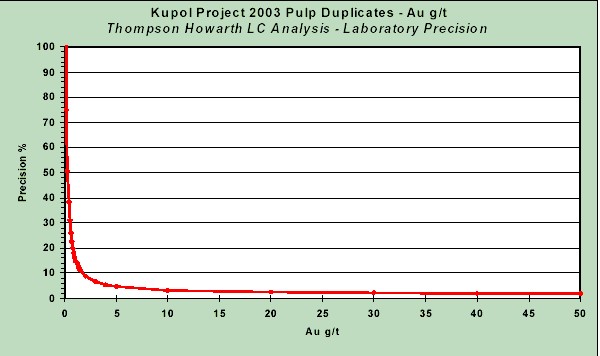
| | 13.2.4 External Check Samples |
| | | |
| | An external, Canadian laboratory was used as the main external check laboratory (Assayers Canada). Bema Gold’s Julietta Mine Laboratory was also used as a check laboratory for the initial startup of the Kupol laboratory due to the short turn around time for sample results. All principal intersections for the first 69 holes were assayed in full at either the Julietta or Assayers Canada laboratories. Assays for the remaining holes were checked with a routine 10% of samples and portions of key intersections were sent for external checks. As shown in Figures 24 through 29, there is a good correlation between Kupol and the independent laboratory, with the independent laboratory assaying slightly lower than the Kupol laboratory. Reference standards submitted to the independent laboratory indicate that the independent analyses are within acceptable limits, with results a bit high for higher-grade samples. The latter contrasts with the Kupol sample results (samples results assay lower but standards a bit higher at the independent laboratory). Figures 30 and 31 show the comparison results of the Julietta and Kupol laboratories. There is a good correlation of the Kupol and Julietta laboratories with the Julietta laboratory assaying slightly higher than the Kupol laboratory. |
| Technical Report - Kupol Project Preliminary Assessment Summary | 82 |
| Bema Gold Corporation | |
Figure 24. Kupol and Independent Laboratory External Check Sample Results

Figure 25. Kupol and Independent Laboratory External Check Sample Results
| Technical Report - Kupol Project Preliminary Assessment Summary | 83 |
| Bema Gold Corporation | |
Figure 26. Kupol and Independent Laboratory External Check Sample Results

Figure 27. Kupol and Independent Laboratory External Check Sample Results
| Technical Report - Kupol Project Preliminary Assessment Summary | 84 |
| Bema Gold Corporation | |
Figure 28. Kupol and Independent Laboratory External Check Sample Results
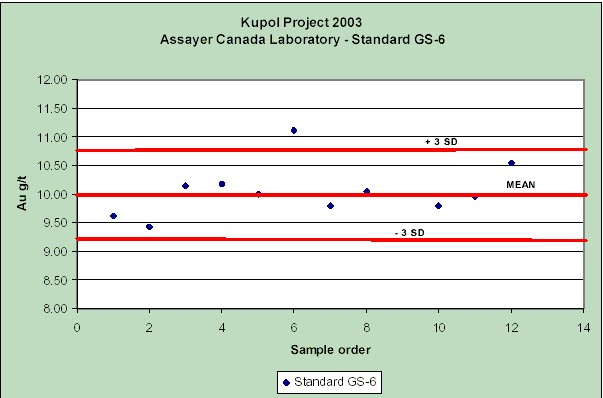
Figure 29. Kupol and Independent Laboratory External Check Sample Results
| Technical Report - Kupol Project Preliminary Assessment Summary | 85 |
| Bema Gold Corporation | |
Figure 30. Comparison results of the Julietta and Kupol laboratories
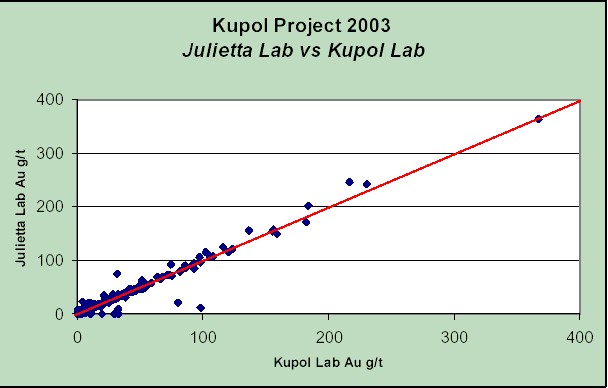
Figure 31. Comparison results of the Julietta and Kupol laboratories
| Technical Report - Kupol Project Preliminary Assessment Summary | 86 |
| Bema Gold Corporation | |
| 13.3 | Bulk Density Measurements A program to determine the in-situ bulk density of Kupol ore and major lithological waste units was set up at site and conducted between August 28 and October 21, 2003. Samples were systematically collected from holes KP03-118 through KP03-157. Representative samples of the major ore and waste lithological units and alteration assemblages were selected from each drill hole for testing. Spot bulk density measurements were conducted on 65 samples from 22 holes drilled prior to KP03-118. In total, 488 specific gravity (SG) determinations (164 ore and 324 waste) were carried out in the field. Additionally, 26 samples were sent to laboratories in Canada for independent checks using the industry standard ASTM C914-95 (Reapproved, 1999) wax-coated immersion method. |
| | | |
| | 13.3.1 Methodology |
| | | |
| | Samples for specific gravity testing were selected by the Russian geologists based on the following parameters: |
| | | |
| | • | One sample from each major lithological unit and/or major alteration assemblage from waste rock within each drill hole. |
| | • | Approximately one sample per three metres of vein width (ore). Samples were representative of the vein texture and composition for each interval. |
| | • | One sample in footwall and hanging wall lithological unit adjacent to vein contact |
| | | |
| | The size of the specific gravity core samples were as follows: |
| | | |
| | • | HQ core – 100-200 mm length of whole core |
| | • | NQ core – 200-300 mm length of whole core |
| | | |
| | Testing was performed by Russian geological technicians using the Plastic Wrap/Immersion method. The program was monitored by Canadian geological staff. Plastic Wrap/Immersion (Onsite) Determination Method: |
| | | |
| | 1. | A representative core sample was selected by the geologist. |
| | 2. | The down-hole direction was marked on the core with a blue grease pencil. The core was placed in a clean, plastic-lined wooden corebox along with a tag showing: hole number, from, to, and a lithology code. A similar tag was placed in the original corebox. |
| | 3. | When the specific gravity samples were ready for drying a lid was screwed on to the top of the corebox and it was brought to the preparation lab personnel for storage in their drying container. |
| | 4. | After 24 hours of drying at 50-60°C the core was retrieved and brought to the specific gravity station. |
| Technical Report - Kupol Project Preliminary Assessment Summary | 87 |
| Bema Gold Corporation | |
| | 5. | Calibration of the balance was checked with a 1000 mL volumetric flask check weight. |
| | 6. | The dry weight of each sample was recorded. |
| | 7. | Each core sample was sealed with plastic wrap and the wrap taped in place. A knife was used to remove the plastic wrap from the ends of the core as the irregular surfaces tended to trap air beneath the plastic wrap. If the sample was highly water absorbent, as in the case of a strongly clay altered unit, the end of the core was lightly sprayed with polyurethane to seal out water. |
| | 8. | A 2000 mL graduated cylinder was filled with water to the 1000 mL level |
| | 9. | The core sample was completely immersed within the water in the 2000 mL graduated cylinder. |
| | 10. | The resultant water level in the graduated cylinder was quickly read and recorded. |
| | 11. | The core sample was removed from the graduated cylinder and the water was drained. |
| | 12. | The plastic wrap was removed and the sample was cloth dried. |
| | 13. | The wet core sample weight was weighed and recorded. If the wet core sample weight was less than original dry weight, due to sample washing (disintegration or desegregation) during testing, then the original dry sample weight was recorded. |
| | 14. | The core was returned to the original corebox. |
| | 15. | The empty, used SG corebox was cleaned with compressed air and washed with water when necessary. This box was reused daily. |
| | 16. | The data was entered into a spreadsheet by the geological technician; a separate file was created for each day. |
| | | |
| | 13.3.2 Results |
| | | |
| | Table 17 presents a summary of the specific gravity (SG) testing results using the plastic wrap immersion method and statistical analyses. Results are presented by lithology and alteration code. Test results indicate that there is a wide variation in SG within the different waste rock units but overall a limited difference between the individual units. The variability within the major lithological units can partially be explained by varying intensities of alteration. Argillic alteration results in a reduction of the average density for non-altered waste lithology (2.45) by: |
| | |
| | • | (0.82%) weakly argillic |
| | • | (5.31%) moderately argillic |
| | • | (10.61%) strongly argillic |
| Technical Report - Kupol Project Preliminary Assessment Summary | 88 |
| Bema Gold Corporation | |
Table 17. Summary Statistics for Onsite Plastic Wrap Density Measurements
| Density (done on-site) byRock TypeGroups (1) |
| Lith | Description | Count | Minimum | Maximum | Length-Wted(2)Mean |
| 10-19 | Mafic-Interm Volc | 61 | 2.18 | 2.68 | 2.52 |
| 20-29 | Mafic-Interm Frags | 161 | 1.63 | 2.99 | 2.42 |
| 30-39 | Sediments | 12 | 2.35 | 2.59 | 2.45 |
| 40-49 | Felsic-Interm Volc & Frags | 10 | 1.94 | 2.99 | 2.41 |
| 50-59 | Dykes | 49 | 2.05 | 2.53 | 2.30 |
| 60-69 | Intrusives | None | None | None | None |
| 70-79 | Tectonic Structures | 26 | 2.04 | 3.09 | 2.35 |
| 80-89 | Surficial Deposits | None | None | None | None |
| 90-97 | Vein/Stockwork | 164 | 2.05 | 3.03 | 2.45 |
| 90-93,96-97 | Vein | 122 | 2.05 | 3.03 | 2.44 |
| 94-95 | Stockwork | 42 | 2.19 | 2.66 | 2.47 |
| Density (done on-site) by 90-series Lithology Codes (1) |
| Lith | Description | Count | Minimum | Maximum | Length-Wted Mean |
| 90 | Vein | 13 | 2.20 | 2.72 | 2.42 |
| 91 | Banded Vein | 50 | 2.25 | 3.03 | 2.46 |
| 92 | Breccia | 17 | 2.05 | 2.05 | 2.41 |
| 93 | Quartz Breccia | 18 | 2.16 | 2.55 | 2.44 |
| 94 | Stockwork | 25 | 2.19 | 2.62 | 2.48 |
| 95 | Veinlets, Stringers | 17 | 2.24 | 2.66 | 2.45 |
| 96 | Wall Rock Breccia | 12 | 2.21 | 2.57 | 2.45 |
| 97 | Yellow Siliceous Breccia | 12 | 2.23 | 2.57 | 2.42 |
| Density (done on-site) by Argillic Alteration Intensity (1) |
| AARG | Description | Count | Minimum | Maximum | Length-Wted Mean |
| 0 | not present | 296 | 2.04 | 3.09 | 2.45 |
| 1 | Weak | 135 | 2.13 | 2.81 | 2.43 |
| 2 | Moderate | 25 | 1.92 | 2.59 | 2.32 |
| 3 | Strong | 27 | 1.63 | 2.48 | 2.19 |
| Density (done on-site) by Argillic Alteration Groups (1) |
| AARG | Description | Count | Minimum | Maximum | Length-Wted Mean |
| 0+1 | not present & weak | 431 | 2.04 | 3.09 | 2.45 |
| 2+3 | moderate & strong | 52 | 1.63 | 2.59 | 2.25 |
| Density (done on-site) byAltered Rock Types (1) |
| Lith | Description | Count | Minimum | Maximum | Length-Wted Mean |
| 19 | Strongly Altered Lava | 10 | 2.29 | 2.61 | 2.47 |
| 29 | Strongly Altered Frags | 41 | 1.63 | 2.6 | 2.39 |
| 59 | Strongly Altered Dyke | 1 | 2.35 | 2.35 | 2.35 |
Note (1): 5 outlier values removed ; (2) Weighted
| | Overall there is a slight decrease in mean SG due to argillic alteration but a higher decrease due to strong carbonate, sericite-adularia and/or argillic alteration. Tectonic structures have a lower bulk density as a function of significant void spaces and/or clay gouge content. The mean bulk density for the veins by the plastic immersion method is 2.44. The eight different vein types show less than 3% variation in mean bulk density (2.41 – 2.48) . If the stockwork category is excluded then the density variation is only 2% (2.41 – 2.46) . The higher density (SG 2.46) of the banded quartz vein (unit 91) versus the unbanded vein (unit 90) (SG 2.42) is due to the higher sulphosalt and adularia content. Lower mean (SG |
| Technical Report - Kupol Project Preliminary Assessment Summary | 89 |
| Bema Gold Corporation | |
| | 2.41) density of the vein breccia (unit 92) is due to the higher fracture intensity, and presence of clay, rock flour and/or fault gouge. The stockwork (unit 94), stringer (unit 95) and wallrock breccia (unit 96) categories are all at the high end of the density range (2.45 – 2.48) due to the presence of higher density wallrock. |
| | | |
| | 13.3.3 Check measurements by wax coating measurements |
| | | |
| | A total of 26 samples (11 vein or stockwork and 15 host rock), for which SG determinations were already derived on-site, were sent to ALS Chemex Laboratories for measurement using the wax-coated method. This external testing was conducted at the end of the drill program so whole core samples of vein rock were not available; instead, the 1/3 split of the vein samples was used. 13.3.3.1 Methodology Samples were tested at using ALS Chemex’s Specialty Assay Procedure – OA-GRA08a that is identical to or slightly modified from theindustry standard ASTM C914-95 (Reapproved 1999) procedure. This procedure is summarized below: |
| | |
| | 1. | The rock or core section is covered in a paraffin wax coat and is weighed on a balance. |
| | 2. | The sample is then weighed while it is suspended in water. |
| | 3. | From the data, the specific gravity is calculated as follows: |
| | Specific Gravity = | Weight of sample (g) | |
| | Weight in air (g) - Weight in water (g) | |
| | 13.3.4 On-site versus external measurements |
| | | |
| | The summary statistics for the 26 samples with measurements done at site and at ALS Chemex are summarized in Table 18. For the 26 individual samples, the difference between the wax-coated method and the on-site method ranges from –0.03 to 0.17 with the average difference equal to 0.08. The percent difference ranges from –1.28 to 6.84 percent with the average difference equal to about 3.2 percent. For vein samples only (90-series lithologies) the average difference between the wax-coated and on-site method is also about 3.2 percent The individual sample results are compared graphically on Figure 32. The figure shows that most of the density measurements using the wax-coated method are higher compared to the on-site method. Two samples had the same value and one sample had a lower value. |
| Technical Report - Kupol Project Preliminary Assessment Summary | 90 |
| Bema Gold Corporation | |
Table 18. Summary Statistics for Wax Coated Checks and On-site Densities
| | Number | Minimum | Maximum | Mean |
All Checks –
On-site measurements
| 26 | 2.05 | 2.76 | 2.43 |
All Checks –
Wax-coated Measurements
| 26 | 2.13 | 2.85 | 2.51 |
Vein Checks –
On-site Measurements
| 11 | 2.34 | 2.76 | 2.47 |
Vein Checks –
Wax-coated Measurements
| 11 | 2.43 | 2.85 | 2.55 |
Non-vein Checks –
On-site Measurements
| 15 | 2.05 | 2.60 | 2.41 |
Non-vein Checks –
Wax-coated Measurements | 15 | 2.13 | 2.68 | 2.49 |
Figure 32. Original On-site Density versus Chemex Wax-coated Density
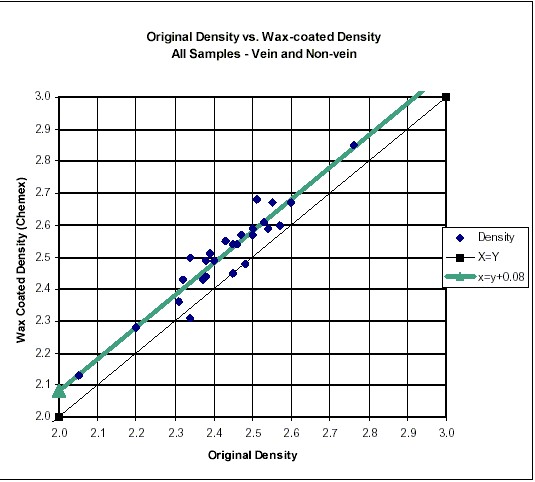
| Technical Report - Kupol Project Preliminary Assessment Summary | 91 |
| Bema Gold Corporation | |
| | 13.3.5 Comparison of Three Methods of Bulk Density Measurements |
| | | |
| | Three different methods of bulk density measurements were carried out on five core samples: Kupol plastic wrap/water immersion method (WRAP), Chemex wax immersion (ASTM designation C914-95 Reapproved 1999, Chemex designation OA-GRA08a) (WAX) and the caliper method (CALIPER). Three other core samples were submitted for this comparison test but were removed from the data set due to badly pitted surfaces or fractured seams which failed during the sawing process. Samples 1 and 2 (see Table 19) comprised cylinders of lab quality soda glass. They were not perfectly cylindrical and in fact tapered slightly over their long axis. In order to caliper test these samples the diameter of the samples was measured with a dial caliper in five evenly spaced locations over the length of the core and an average diameter was calculated. |
Table 19. Density Method test – core measurements
| SAMPLE ID | DIAM 1 mm | DIAM 2 mm | DIAM 3 mm | DIAM 4 mm | DIAM 5 mm | AVG. D mm | LENGTH 1 mm | LENGTH 2 mm | LENGTH 3 mm | LENGTH 4 mm | AVG. L mm |
| HQ GLASS | 57.96 | 57.33 | 56.90 | 56.41 | 55.40 | 56.80 | 187.00 | 187.00 | 187.00 | 187.00 | 187.03 |
| PQ GLASS | 67.11 | 66.98 | 66.50 | 66.04 | 65.51 | 66.43 | 76.71 | 76.73 | 76.76 | 76.81 | 76.75 |
| SG-22 | 47.45 | 47.47 | 47.45 | 47.47 | 47.50 | 47.47 | 175.90 | 176.20 | 177.10 | 176.00 | 176.30 |
| SG-19 | 63.17 | 63.09 | 63.20 | 63.09 | 63.09 | 63.13 | 56.36 | 55.83 | 55.85 | 55.63 | 55.92 |
| SG-21 | 63.04 | 62.99 | 63.02 | 63.02 | 63.07 | 63.03 | 105.44 | 105.31 | 105.77 | 105.69 | 105.55 |
| | Samples 3 to 5 comprised 2 PQ and one HQ whole core sample with sawn ends, which allowed for caliper measurements. The lengths of the glass and core samples were more consistent than the diameters. Four length measurements were made and an average was calculated. The HQ sample tapered steadily from 57.96mm to 55.40mm, a total of 2.56mm over 187.03mm of core length. The PQ core exhibited more taper varying from 67.11mm to 65.51mm, 1.60mm over a 76.75mm length of core. Diameter 3 on each core was measured at the middle of the core and generally agrees well with the averaged diameters. The greater taper on the PQ glass sample may have resulted in a less accurate caliper method determination (see Figure 32). The results of this comparison test are listed in Table 20 and are plotted in Figure 32. With the exception of the PQ glass sample the wax immersion and caliper methods produce similar results while the Kupol Immersion Method is consistently biased low with respect to the other two methods. The low specific gravity of the PQ glass sample (#3) tested by caliper method may be due to the significant taper in the cylinder which makes a volumetric calculation based on caliper methods less accurate. |
| Technical Report - Kupol Project Preliminary Assessment Summary | 92 |
| Bema Gold Corporation | |
Table 20. Density method test - results
| # | SAMPLE ID | AVG. D mm | AVG. L mm | VOL cc | DRY WEIGHT | DRY WRAPPED WEIGHT | KUPOL IMMERSION METHOD | CHEMEX WAX IMMERSION | CALIPER DENSITY |
| 1 | HQ GLASS | 56.80 | 187.03 | 473.89 | 1194.60 | 1195.30 | 2.48 | 2.51 | 2.52 |
| 2 | PQ GLASS | 66.43 | 76.75 | 265.99 | 661.90 | 662.20 | 2.51 | 2.51 | 2.49 |
| 3 | SG-22 | 47.47 | 176.30 | 311.99 | 797.40 | 798.10 | 2.49 | 2.54 | 2.56 |
| 4 | SG-19 | 63.13 | 55.92 | 175.02 | 399.30 | 399.60 | 2.22 | 2.30 | 2.28 |
| 5 | SG-21 | 63.03 | 105.55 | 329.32 | 872.80 | 873.30 | 2.61 | 2.66 | 2.65 |
Figure 33. Comparison of bulk density determination method results
| | The difference between the dry wrapped weight and the dry weight is due to the plastic wrap and tape used in the plastic wrap/water immersion method. While the weight of this wrap is compensated for in the density calculation, the volume of the wrap and tape is not accounted for. This unaccounted volume of plastic along with any small, trapped air bubbles accounts for the low bias of the plastic wrap/water immersion method. Table 21 shows the bias of the plastic wrap method versus the averaged values for the wax immersion and caliper tests. The PQ glass measurement (#3) has been removed from the data set due to its uncertain caliper determination. |
| Technical Report - Kupol Project Preliminary Assessment Summary | 93 |
| Bema Gold Corporation | |
| | Based on this set of data the plastic wrap immersion method is biased 2% low with respect to the wax immersion and caliper methods. |
Table 21. Density method test - comparison
| # | SAMPLE ID | KUPOL WRAP IMMERSION | CHEMEX WAX IMMERSION | CALIPER | AVG
WAX & CALIPER | BIAS |
| 1 | HQ GLASS | 2.48 | 2.51 | 2.52 | 2.52 | -1.43 |
| 3 | SG-22 | 2.49 | 2.54 | 2.56 | 2.55 | -2.35 |
| 4 | SG-19 | 2.22 | 2.30 | 2.28 | 2.29 | -3.09 |
| 5 | SG-21 | 2.61 | 2.66 | 2.65 | 2.66 | -1.79 |
| | 13.3.6 Densities used for resource reporting |
| | | |
| | The ALS Chemex check density measurements show that the results of the tests done at site with the plastic wrap/immersion method are low with respect to the wax immersion method. This is probably due to the unaccounted for volume of the plastic wrap and tape used to seal the sample. Air trapped by the wrap also serves to lower the specific gravity determined by the plastic wrap/water displacement method but it is probably minor compared to the effect of the plastic wrap. There is as a slight bias toward higher SG values for the vein samples because of the need to use the 1/3 split where more competent, less fractured or less porous samples were in preference to vein 'rubble'. Due to the measurement bias in the plastic wrap/immersion method, the density measurements completed at ALS Chemex using the wax-coated method were used for reporting resources at Kupol. The density used for vein and stockwork material is 2.55 tonnes/cubic metre. |
| | |
| | 13.3.7 Recommendations |
| | | |
| | It is recommended that in 2004: |
| | |
| | 1. | Testing methodology be change to the ASTM C914-95 (Reapproved 1999) wax coated immersion method. |
| | 2. | Random measurements should be taken in order to reduce sample selection bias. |
| | | |
| 13.4 | Security No unauthorized personnel were allowed in the core storage, logging, or cutting facilities during the core logging and sampling process. Core for sampling was delivered directly to |
| Technical Report - Kupol Project Preliminary Assessment Summary | 94 |
| Bema Gold Corporation | |
| | the core-cutting tent or to a secure storage container before cutting. Lids were kept on boxes during transfer. Once cut, the samples were assembled into batch shipments within the core-cutting tent. These batches were stored in sealed rice bags pending submittal to the laboratory. The batches were delivered, along with a sample submission form, to the laboratory several times a day. At the laboratory, each sample submission was checked for accuracy. The laboratory signed off on the receipt of the shipment and took custody of the samples. Bema staff was not allowed access to the samples after this point. Prior to processing, the samples were stored in a locked container. External check sample shipments were assembled by the laboratory staff in accordance with a submission list prepared by the Bema geologists. Samples for each submission were placed and sealed intoSecur-Pak secure sample bags and the laboratory signed off on each submission. TheSecur-Pak bags were sealed in either a box or a rice bag for shipping. The secured bags were shipped to Canada along with a chain of custody document and a checklist. The independent laboratory received these secure bags and signed off on the custody document. |
| Technical Report - Kupol Project Preliminary Assessment Summary | 95 |
| Bema Gold Corporation | |
| | 14.0 Data Verification The Kupol database (GD_Kupol2003.mdb) is a Microsoft Access file that contains information for all holes drilled on the property. This database was built and is maintained using Gemcom® geological software as a front-end application and modified using Access© as a back-end application. The initial data was provided in a collection of spreadsheets that originated in Russia and Canada and in the Gemcom 4.11 project GCDBKU. A new Gemcom 4.11 project, GCDBKP was created by combining the data from all sources. On site, dozens of Excel© format files containing 2003 drilling information were provided. All files were standardized, compiled and loaded into the database. Data validation was incorporated into the database to exclude invalid data from being loaded. However, this validation cannot prevent valid, yet erroneous, data from being loaded. |
| | | |
| 14.1 | Database management in the field The database was kept absolutely current with drilling. Information that was compiled in the field included: |
| | | |
| | • | Header Table:The collar survey data loaded from a file maintained by the site surveyors. The final hole lengths were obtained from the lithology log. All other information was added as it became available. |
| | • | Survey Table:The down-hole survey data was hand entered from paper slips into a spreadsheet and then imported or merged into the database. |
| | • | Detail Log Table:The data for this table was provided in a series of spreadsheet files, one for each hole. This information was manipulated and compiled prior to being loaded into the database. |
| | • | Assay Table:The data for these tables was initially provided in a spreadsheet maintained by the Project Manager. Current assay results were loaded from the data file provided by the laboratory; the format of this file was manipulated but the results were untouched. The assay results from external labs that were reported as less-than- detection were stripped of the symbol and the value halved. |
| | • | RQD Table:The data for this table was provided in a series of spreadsheet files, one for each hole. This information was compiled and the recovery and RQD was recalculated prior to being loaded into the database. |
| | • | SG Table:The data for this table was provided in a series of spreadsheet files, each with data from several holes. The SG was recalculated and then loaded into the database. |
| | | |
| | All other tables were built, modified and loaded as time permitted using original data collected directly from the paper files or from digital files that were initially provided. |
| Technical Report - Kupol Project Preliminary Assessment Summary | 96 |
| Bema Gold Corporation | |
| | In November 2003 the Gemcom project was switched from GEMS 4.11to a differently managed GEMS 5.2 The drillhole database as of 29 December 2003 was used for modeling. |
| | | |
| | 14.1.1 Hardcopy Storage |
| | | |
| | Original data, such as handwritten logs and assay certificates, are considered to be the ultimate resource for information. Each hole drilled has its own file folder and all documents pertaining to that hole is stored within that folder. All originals of the documents, except the Russian documents, are located at the Bema office in Vancouver, BC. Russian documents have been copied and a photocopy sent to Vancouver. |
| | |
| 14.2 | Data Checking |
| | |
| | Data validation was built into the database to ensure that the data falls within acceptable limits. However, this validation does not protect against valid but erroneous data. Errors are usually generated during data entry but, in rare instances, can exist in the original data itself. Only the most pertinent fields in the Header, Survey, Assay, Detail Log, RQD and SG tables were rigorously checked. The other fields and tables containing data that was not used in modeling were less rigorously checked and found to be in adequate shape. The database is subjected to a validation routine provided by Gemcom that checks for obvious errors such as inconsistent hole lengths, zero length intervals, out of sequence intervals and missing intervals. These types of errors, when detected and are found to be truly erroneous, are corrected and re-validated. Overall, this database is deemed to be in good shape, especially for that data that were used for the model. It is recommended that additional on-going checking and cleaning be performed in order to attain an error-free dataset. The following sections highlight measures that were taken to verify the data. |
| | |
| | 14.2.1 Header table |
| | | |
| | 2003: Collar surveys were loaded into the database and checked visually on-screen for obvious errors such as extra digits and transposed northings and eastings. Suspect survey results were re-submitted to the surveyors who checked and corrected the errors. Once, plotted, this data was also checked visually. These checks were on-going through the field season. In all cases the errors were due to data entry errors. |
| Technical Report - Kupol Project Preliminary Assessment Summary | 97 |
| Bema Gold Corporation | |
| | For a final check, the coordinates and hole lengths were extracted from the database and printed. The collar coordinates were compared against a print out of the file maintained by the surveyors and the hole lengths were checked against the geologists’ logs. Checks of this information yielded occasional errors that in most cases was found to be data entry errors. All errors were corrected. Additionally, the collar information was subjected to a direct digital check against the surveyors’ final file. This check yielded rare decimal place differences that were corrected. Erroneous data were corrected and reloaded. The corrected data were subjected to two additional independent checks and no errors were reported. Pre-2003: The pre-2003 data were not checked prior to creating the model for the following reasons: |
| | | |
| | • | time constraints; |
| | • | a lack of official documents; and, |
| | • | the decision to exclude the pre-2003 drilling from the economic model. |
| | | |
| | The original database was assumed to be correct. Hole lengths were compared against the original drill logs and a few errors were identified and corrected. |
| | |
| | 14.2.2 Survey table |
| | | |
| | 2003: Down-hole surveys were checked against the original slips of paper where the information was recorded. Several on-going checks during the field season yielded occasional errors that were corrected. In most cases, the errors were data entry errors due to an incorrect conversion from the measured azimuth to a true azimuth. For a final check, 100% of the down-hole survey data was extracted, printed and compared against the original data. This check yielded data entry/conversion errors as before. Two independent checks of this data detected no errors. Visual inspections of the plotted hole traces also yielded no errors. Pre-2003: The down-hole, pre-2003 data was not checked prior to creating the model for the following reasons: |
| | |
| | • | time constraints; |
| | • | a lack of official documents; and, |
| | • | the decision to exclude the pre-2003 drilling from the economic model. |
| Technical Report - Kupol Project Preliminary Assessment Summary | 98 |
| Bema Gold Corporation | |
| | The original database was assumed to be correct. Trenches all plot correctly based on the original site drawings. 14.2.3 Detail Log Survey 2003: Near the end of the field season the original digital files from which the data was extracted were compared against the original paper drill logs. This comparison was conducted by the data entry clerk who entered the majority of the data. This preliminary check yielded an unacceptable amount of errors - up to 3% in some files. Errors were corrected and reloaded into the database. For a final check 100% of the data from this table was extracted from the database, printed and compared to the original logs. This comparison was performed by geological personnel in the Vancouver office by highlighting errors on the paper printouts. This check yielded a high proportion of errors, (up to 3% but usually less than 1%), with many of the errors occurring due to input mistakes and ambiguities in the log. Very few errors were detected in the LITHCODE column. All of the identified errors were checked against the original logs and the database was corrected. A subsequent 10% check of the database yielded occasional errors, mostly in fields that were not used for the geological or economic modeling. The translated lithological descriptions were never checked except for interval gaps and overlaps. The original error-laden digital logs from which the database was originally loaded were discarded. Pre-2003: Due to time constraints and the decision to exclude the pre-2003 drilling from the economic model the log data was not checked prior to creating the model. The original database was assumed to be correct. 14.2.4 Assay table 2003: Data stored in this table was continuously under review and errors were corrected as they were encountered. Interval errors and mis-assigned QA/QC labels were the most common, albeit rare errors. As a final check 10% of the data from this table was extracted, printed and compared against the assay certificates. This data was error-free for all certificates except for the occurrences described below. |
| Technical Report - Kupol Project Preliminary Assessment Summary | 99 |
| Bema Gold Corporation | |
| | The results for the first 26 assay certificates differed slightly from those stored in the database. Those certificates were found to be misprints and the results from the database were compared against the newly printed certificates and the silver results were still found to be in error. The difference was the result of a difference between the Bema-calculated silver loss correction formula and that used by the lab for all assay results. The formula used by the lab was checked and deemed to be correct. The raw analytical data were re-entered by the chief assayer and the calculated results were exactly identical to those reported previously; therefore these data were deemed correct and merged into the database. Pre-2003: Due to time constraints and the decision to exclude the pre-2003 drilling from the economic model the drill data was not checked prior to creating the model. The original database was assumed to be correct. The trench assay results were checked in the following manner: |
| | | |
| | • | The results were extracted from the database and every sample ending with '0' or '5' (10.6% of the database) |
| | • | These values were compared to a copy of the original assay certificate. |
| | | |
| | It was discovered that certificates are missing for many samples and that we have results for samples that are not in the database. This check revealed that many differences between the database values and those in the certificate were in those samples with gold values less than detection. In several occurrences there were 1-2 gpt differences in gold values yet the silver values were correct; this indicated that there might have been subsequent determinations for gold. As an additional check, 800 assay results were re-keyed from the original assay certificates and compared against those results stored in the database. This comparison indicated that the database contains a combination of results from different analytical techniques (spectral analyses and gravimetric finishes) and different labs (Anyusk and Dukat). It appears that for lower grade samples the spectral result was used, and for the higher results the gravimetric result was used. When the gravimetric results from the database are compared against the certificates, the error level is insignificant. However, because there is not a complete suite of certificates, it is impossible to completely check the database. Additionally, there are several duplicated sample numbers. Nonetheless, the unmodified Russian data files were used in the model. In 2004, the pre-2003 trench data will be re-checked using a sampling program to test 10% of the data set. |
| Technical Report - Kupol Project Preliminary Assessment Summary | 100 |
| Bema Gold Corporation | |
| | 14.2.5 RQD data 2003: All of the RQD data (100%) were extracted from the database, printed, and compared against the original paper logs. The rare errors that were discovered were corrected and the recovery and RQD values were recalculated/reloaded into the database. The errors encountered were mostly data entry errors. However, there were some ambiguities in several of the original hand-written logs. Pre-2003: RQD was not recorded prior to 2003. 14.2.6 Specific gravity tables 2003: All of the specific gravity data (100%) was extracted from the database, printed, and compared against the original paper logs. The rare errors that were discovered were corrected and the SG values were recalculated and reloaded into the database. Pre-2003: SG was not recorded prior to 2003. |
| Technical Report - Kupol Project Preliminary Assessment Summary | 101 |
| Bema Gold Corporation | |
| | 15.0 Adjacent Properties Adjacent properties are not relevant to the evaluation of the Kupol Project. |
| Technical Report - Kupol Project Preliminary Assessment Summary | 102 |
| Bema Gold Corporation | |
| | 16.0 Metallurgical Testwork / Mineral Processing |
| | |
| 16.1 | Introduction Mineral Processing and Metallurgical testing for Kupol flowsheet development focused on two process options: 1) whole ore leaching and 2) flotation/leaching. These options were selected as the most promising flowsheet alternatives because of their potential for achieving good precious metals recoveries with reasonable capital and operating costs. Lakefield Research and McClelland Laboratories performed the Kupol metallurgical testing. Lakefield performed testing on whole ore leach and flotation/leach recovery and McClelland Laboratories conducted testing on whole ore leaching. The Lakefield work also included assessment of gravity recovery for both flowsheet options, and characterization of the chemical, physical and mineralogical properties of the zone composite test samples. Other gravity testing was also performed by Knelson and Falcon. In addition to the testwork focusing on the gold/silver recovery aspect, other planned testing included assessment of ore grindability, solid/liquid separation properties, cyanide destruction process requirements and characterization of the geotechnical/environmental parameters of metallurgical tailings. Lakefield/MacPherson conducted the grind test program. The objectives of the overall scope of the metallurgical process development included: |
| | 1) | Characterize all key metallurgical, chemical and physical properties of all major Kupol ore zones for required plant design data. |
| | 2) | Evaluate the two flowsheet alternatives. |
| | 3) | Select the best flowsheet alternative based on metallurgical recoveries, capital costs, operating costs, simplicity of design and application of established technology. |
| | | |
| 16.2 | Metallurgical Testwork Metallurgical and grinding tests were undertaken to characterize all key metallurgical, chemical and physical properties of the Kupol ore zones. Testing began by dividing the Kupol vein structure into 10 metallurgical zones on the basis of vein texture, form, and mineralogy (see Figure 33). Based on this classification, 10 composite samples were prepared for metallurgical testing which represented the major ore zones over the strike length of the Kupol deposit that were made up using the assay reject samples from the diamond drill core samples. Sampling included 93 composite hole and interval core samples totaling 1036 kg. A full listing of |
| Technical Report - Kupol Project Preliminary Assessment Summary | 103 |
| Bema Gold Corporation | |
| | samples used in the composites is provided in the Preliminary Assessment summary report included in Section 18. Representative weights of reject samples were split on the basis of their sample length versus the total composite drilled length. Each zone composite contained about 1.5 meters of dilution from the hanging wall and 1 meter of dilution from the foot wall. Occasionally it was not possible to complete the composites as designed due to a lack of sample reject. This was a more of a problem with the earlier holes as there had been more repeat analyses during the start up phase of the Kupol assay laboratory that used up much of the reject material. Once the composites were prepared, they were analyzed for: |
| | | |
| | 1. | head grades; |
| | 2. | metals composition; and, |
| | 3. | whole rock analyses. |
| | | |
| | Gold and silver head grades analyses, along with assays for other elements typically associated with precious metals deposits, were completed using metallic assays for the Kupol zone composites. Results are provided in Table 22, Head Grade Analyses for Kupol Zones. |
Table 22. Head Grade Analyses for Kupol Zones
| | Au (g/t) | Ag (g/t) | S (%) | Fe (%) | As (%) | C(t) (%) | Hg (g/t) |
| SZ | 7.17 | 91.5 | 0.79 | 1.36 | 0.05 | 0.02 | 1.1 |
| BBT1Z | 36.7 | 403 | 0.51 | 1.08 | 0.16 | 0.02 | 2.0 |
| BBT2Z | 18.4 | 192 | 0.58 | 1.31 | 0.13 | <0.01 | 1.3 |
| BBCTZ | 22.1 | 169 | 0.86 | 1.61 | 0.15 | <0.01 | 1.3 |
| CZ | 7.64 | 125 | 0.48 | 1.85 | 0.17 | 0.01 | 2.0 |
| CPYZ | 21.3 | 256 | 1.07 | 1.99 | 0.37 | <0.01 | 2.3 |
| NSVZ | 8.12 | 87.4 | 0.31 | 2.18 | 0.05 | 0.04 | 0.5 |
| NHWZ | 29.9 | 349 | 0.41 | 1.62 | 0.08 | 0.04 | 1.3 |
| NFWZ | 51.6 | 451 | 0.52 | 2.08 | 0.14 | 0.64 | 1.4 |
| NEXZ | 11.6 | 99.2 | 1.70 | 2.20 | 0.66 | 0.07 | 2.8 |
| CCHLOR | 17.4 | 227 | - | - | - | - | - |
| NCHLOR | 29.8 | 75.5 | - | - | - | - | - |
| | Gold assays ranged from 7.17 grams/tonne (g/t) for the South Zone (SZ) composite to 51.6 g/t for the North Foot Wall Zone (NFWZ). Silver assays ranged from 75.5 g/t for the North Chloritic Zone (NCHLOR) to 451 g/t for the North Foot Wall Zone. The CCHLOR Au and Ag grades are the average of 4 individual hole composites tested. Additional gold/silver head assays on the ten zone composites were completed by another laboratory (Mclelland Labs). These results were similar to the results listed in Table 21. The full results are provided in the Preliminary Assessment which is in development. Zone composites were analyzed to determine the modes of gold and silver occurrence in the samples. The Preliminary Assessment only includes data on Big Bend Type One Zone (BBT1Z) and North Hanging Wall Zone (NHWZ) due to time constraints. The rest of the |
| Technical Report - Kupol Project Preliminary Assessment Summary | 104 |
| Bema Gold Corporation | |
| | material will be included in the Feasibility Study. BBT1Z and NHWZ were given higher priority for completion as they represent the most important ore zones (based on geological information provided to date) in the Kupol deposit. All samples were analyzed using heavy liquid separation and deportment. Ore characterization focused on the following testing: |
| | | |
| | • | JKTech drop weight test or SMC test; |
| | • | MacPherson autogenous mill grindability; |
| | • | Density; |
| | • | Bond rod mill grindability; |
| | • | Bond ball mill grindability; |
| | • | Bond abrasion index; and, |
| | • | Bond impact test. |
| | | |
| | Two independent gravity separation studies were completed. These included: |
| | | |
| | • | Gravity separation on BBT1Z to determine gravity recoverable gold; and, |
| | • | recovery of gold and silver from each zone composite by gravity separation. |
| | | |
| 16.3 | Metallurgical test results The ore samples were all found to be very hard in ball mill hardness, and relatively softer in SAG mill hardness. Overall, Bond ball mill work indices ranged from a low of 18.6 kWh/t for KP03-GC6 (rhyolite dyke) to a high of 22.2 kWh/t for KP03-GC12 (Central Zone). The throughput to the MacPherson mill for the trench sample (GC-03) was 8.2 kg/h, which placed the ore in the moderately hard category. The results of the drop-weight test were somewhat different, as the ore measured 'soft' with respect to both impact and abrasion breakage. The discrepancy between the two tests was caused by the low specific gravity of the ore (which reduces throughput rate), as well as the natural variation of hardness by size, which was found to be fairly large on the trench sample. Other results generated from the grind study include a crushing work index and abrasion indices. KP03-GC3 was evaluated in a low energy impact test and produced a crushing work index of 7.8 kWh/t. Bond abrasion indices for samples KP03-GC1 through KP03-GC6 ranged from a low of 0.111 g for GC6 (rhyolite material) to a high of 0.928 g for GC1 At 2500 and 2000 t/d, the SAG mill ball charge will need to be reduced to 4% and 2%, respectively, assuming a 70% critical speed. Alternatively, the mill may possibly be operated nearly fully-autogenously at higher speed. Since the mill is designed for SAG milling, some balls can always be added to the mill when necessary. On the ball mill side, the lower throughputs should allow the ball mill to achieve very fine grinds, which may result in superior metallurgy. A 40-micron product could be obtained at 2500 t/d and possibly 30 microns at 2000 t/d. Alternatively, the grind could be maintained at |
| Technical Report - Kupol Project Preliminary Assessment Summary | 105 |
| Bema Gold Corporation | |
| | 45 microns, by using a low ball charge in the ball mill, i.e. 23% and 17%, respectively. This may result in slight power inefficiencies, though. A pebble crusher will be installed for safety, as the ore is relatively hard. The system design will allow for the crusher to be by-passed. The simulated effect of pebble crusher was fairly small in the simulations, except for a significant reduction in circulating load to the SAG mill. Results gravity separation tests show that gravity gold recovery ranged from a low of 8.0% for Central Zone (CZ) to a high of 47.7% for the North Chloritic Zone (NCHLOR). All of the North Zone composites as well as the South Zone composite had gravity gold recoveries above 25%. Silver gravity recoveries varied from 0.8% for Central Zone to 13.4% for North Chloritic Zone. Silver did not respond well to gravity recovery because of its predominant occurrence as sulfosalts in the Kupol zone composites. Because of the significant gravity gold recovery achieved in the majority of the Kupol zone composites, combined with the verification of significant free gold in the process mineralogy and petrographic studies, gravity separation was included for both process options. |
| | |
| 16.4 | Recoveries The comparison for whole ore leach recoveries on BBT1Z between Lakefield and McClelland Labs indicated that gold recoveries were similar (94.7% - Lakefield vs 95.2% - McClelland), but silver recoveries differed significantly (73.9% - Lakefield vs 82.0% - McClelland). Conditions for the comparative tests were identical. The cause of the difference is not clear at this time. A full listing of the Metallurgical results is provided in the detailed Preliminary Assessment. Overall gold recoveries achieved for the flotatation/leach testing varied from 93.1% for the North Extension Zone to 96.8% for North Hanging Wall Zone. Overall silver recoveries ranged from 75.7% for Central Zone to 92.1% for North Sheeted Vein Zone. Based upon these results, whole ore leaching was selected as the preferred metallurgical process. Again, based on the preliminary testwork, it is assumed that the whole ore leach option can obtain plant gold and silver recoveries of 93.5% and 83.1%, respectively. The whole ore leach option is lower in capital cost by $14.3 million and operating costs are estimated to be lower by $4.07/tonne. |
| Technical Report - Kupol Project Preliminary Assessment Summary | 106 |
| Bema Gold Corporation | |
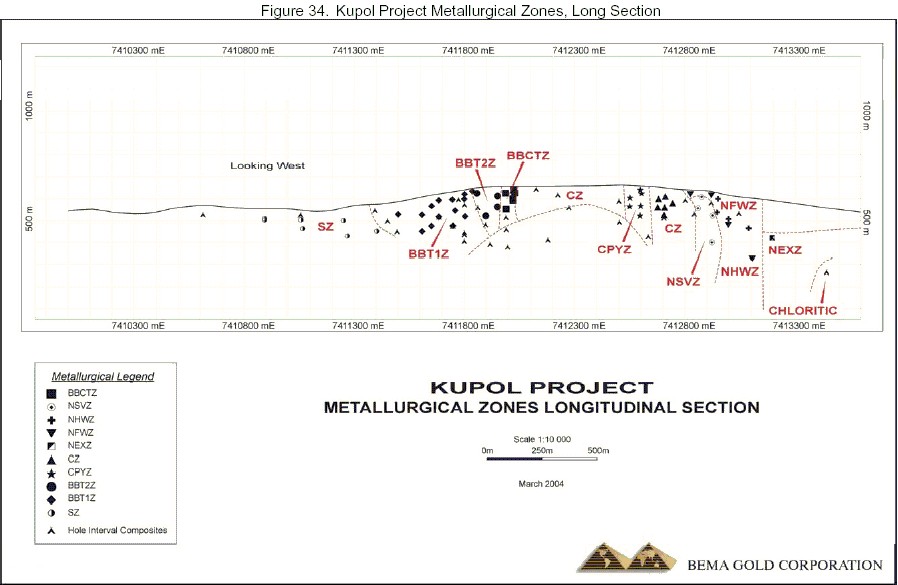
| Technical Report - Kupol Project Preliminary Assessment Summary | 118 |
| Bema Gold Corporation | |
| | 17.0 Mineral Resource and Mineral Reserve Estimates The three-dimensional computer model used as the basis for Mineral Resource estimates was built by a team of experienced geoscientists and geostatisticians from Bema Gold Corporation (Bema), AMEC Americas (AMEC) and several Independent Contractors. The Qualified Person for this work was Tom Garagan, P.Geo., Vice President Exploration, Bema. Additionally, Dr. Harry Parker, Technical Director Geology and Geostatistics, AMEC reviewed the methodology used to build the resource model and provided detailed input on the declustered distributions, SMU analysis, risk-adjusted metal reduction, and resource classification. The team involved with building the model include Susan Meister (with over 20 years experience in building resource models) who managed the building of the model; Ken Brisebois, P.Eng. Principal Geological Engineer, AMEC, did the Geostatistical analysis; Steve Blower, P.Geo., Senior Geologist for AMEC, built the Gemcom block model; Vivian Park, P.Geo., was the database manager and coordinated the solids modeling work; and Hugh MacKinnon, P.Geo., Project Manager for Geology was responsible for the overall review of the interpretations. The logged geology and assay data are maintained in Access database files. Gemcom software was used for digitizing, solids modeling and grade estimation work. Most of the computer work was completed in Bema’s Vancouver office. |
| | |
| 17.1 | Methodology The bulk of the mineralization at Kupol occurs within the vein zone with small amounts of mineralization occurring within the stockwork zone. Vein, stockwork, dykes (those cross cutting the vein) and major faults within the vein/stockwork area were interpreted on east-west trending cross sections spaced 12.5 to 100 meters apart depending upon local drill hole spacing. The interpretation was based on the logged geology, not on assay grade. The sectional interpretation was digitized and reconciled on levels spaced 25 to 50 meters apart, and solid models were built from the reconciled sectional interpretations. Special attention was given to the area with detailed trench data. One block model, oriented orthogonally to the Gauss-Kruger coordinate system, was used for this study. Assay intervals, composites and blocks were coded from either the digitized sectional interpretation or the solids model comprising vein, stockwork, dyke and fault solids. A detailed review of the gold and silver distributions within the interpreted vein and stockwork zones guided the approach used for block grade estimation. To control gold and silver grade estimation within the vein, an indicator was selected based on logged sulfosalts and gold grade. The gold indicator was also used for silver grade |
| Technical Report - Kupol Project Preliminary Assessment Summary | 119 |
| Bema Gold Corporation | |
| | estimation. The indicator variable, high-grade gold and silver populations and low-grade gold and silver populations were estimated into the blocks using Ordinary Kriging. The estimated whole block grade was calculated using the indicator as a weighting factor when the indicator was between 0.2 and 0.8. If the indicator was greater then 0.8 then the estimated high grade was used for the whole block grade, and if the indicator was less than 0.2, the estimated low grade was used for the whole block grade. The kriging results were checked in a number of ways including detailed visual checks on screen and on plotted cross sections, comparison of kriged estimates and declustered composite distributions, block model statistics, analysis of the change of support statistics, analysis of grade profiles by northing, easting and elevation and global confidence limit checks. The final model was risk adjusted by lowering the grades of the highest grade blocks until a requisite amount of metal was removed. This amount was determined through Monte Carlo simulation. Mineral Resources have been categorized using the classification of the Canadian Institute of Mining, Metallurgy and Petroleum (2000). At Kupol, Indicated Mineral Resources are estimated where drill holes or trenches intersect the vein(s) at an approximate 50-meter spacing on a vertical longitudinal projection. Inferred Mineral Resources are estimated down-dip and along strike from Indicated Resources in areas that have been drilled on approximately a 100-meter spacing (locally 150-meter spacing) on a vertical longitudinal projection. |
| | | |
| | 17.1.1 Block Model Parameters One block model covering the Kupol vein area was built in the Gauss Krueger coordinate system, the coordinate system used to survey the 2003 drill holes. Table 23 summarizes the block model specifications. |
Table 23. Block Model Specifications
| Direction | Model Origin | Block Size (m) | Number of Blocks |
| East-West (columns) | 29435600 | 3 | 470 |
| North-South (rows) | 7410012 | 25 | 148 |
| Elevation (levels) | 724(1) | 12 | 48 |
| (1)Top elevation of upper block |
| 17.2 | Interpretation, Solids Modeling and Block Coding Introduction Because of the size of the Kupol Deposit and the time-line to complete the resource model, interpretations and solids modeling were done by zone: North, Central, Big Bend and South. A team consisting of an interpreting geologist (“geologist”) and a modeling geologist |
| Technical Report - Kupol Project Preliminary Assessment Summary | 120 |
| Bema Gold Corporation | |
| | (“modeler”) was assigned to each zone, with the four zones worked on concurrently. See Table 24. |
Table 24. Modeling Teams
| Zone | Interpreted By | Modeled By |
| North and North Extension | P. Fischl, P. Geo | V. Park, P. Geo |
| Central | V. Shein | T. McKinnon |
| Big Bend | H. MacKinnon, P. Geo | A. Shahkar |
| South and South Extension | L. Lewis, P. Geo | A. Shahkar, T. McKinnon |
South Extension = South of 800N
South: 800N to 1450N
Big Bend = 1450N to 2025N
Central = 2025N to 2800N
North =2800N to 3150N
North Extension: North of 3200N |
| | The geologist most familiar with a zone because of time spent in the field was assigned to interpret that zone. Interpretations were based on a combination of familiarity with the geology, quick log data, detailed Russian logs, existing surface plans, and field correlations. Digitizing and other graphical support were provided by Bema staff members S. Mallory, P. McPhail and S. Tremblay. 17.2.1 Topographic Surface The method used for obtaining the data used for generating the topographic surface is described below. The data were collated and manipulated into a useable format, and numerous checks were completed to ensure the integrity of the data (done by P. McPhail, Bema). |
| | | |
| | • | Topographic lines were digitized (P. McPhail, Bema) from a photocopy of a 1999 1:10000 Russian surface plan (UTM Zone 59N WGS 84, truncated Gauss-Krueger (GK)) of the Kupol area. Surface trench locations were digitized from a photocopy of a 1:15000 Russian gold geochemistry plan and inserted into the drawing. The resultant drawing was used as a base into which other surveys were spliced and compared. |
| | • | Bema was provided with a hand-drawn 1:2000 map (Anuysk) that showed the contoured results of a physical topographic survey (Anyusk Expedition) of the Kupol area conducted from 1995 to 1999. The survey was conducted using a local Russian grid (LG) and showed the same trenches that were digitized from the GK plans. This Anuysk map was digitized in Magadan into AutoCAD 3D format and used as the main topographic base. Feature lines were 'pressed' to the topographic features, and any other obvious irregularities were corrected. |
| | • | Using the trenches and drill holes as a guide, the 1:2000 detailed survey results were converted into Gauss-Krueger coordinates and the conversion from GK to LG was calculated. This conversion was checked graphically against the point survey information. The Anyusk survey information was spliced into an AutoCAD drawing |
| Technical Report - Kupol Project Preliminary Assessment Summary | 121 |
| Bema Gold Corporation | |
| | | containing all topographic information in both grid systems. The merge between the two datasets is not seamless; however, the slight difference in elevation does not affect the model area. |
| | • | The topographic lines in GK grid were exported to ASCII as feature and contour lines for use in external software packages. The file provided to V. Park in July 2003 was named CleanContours2.asc. This file was imported into Gemcom software and was deemed the “official” topographic surface. |
| | | |
| | The methodology used to generate the topographic surface is as follows: |
| | | |
| | • | The data from CleanContours.asc was loaded into the Gemcom 3-D workspace. |
| | • | The original ground (OG) surface was created from the loaded data using the Laplace gridding method. This method was chosen to smooth edge effects and to extend the limits of the surface well beyond the anticipated model limits. The parameters used were: Row Height = Column Height = 5m, no rotation, Interpolation level = 100, smoothing factor = 20 and grid initialization based on nearest assigned neighbour value. |
| | • | The Laplace OG surface (Kupol\OG\Laplace.bt2) was provided to S. Blower (AMEC) who trimmed the surface to better fit the model geometry, copied and moved the surface to +300 meters and created a solid from the two surfaces. The resultant solid (Topo\ExtendUp\Air.bt2) was used to code the blocks in the model. |
| | | |
| | 17.2.2 Overburden Surface The overburden surface was created from three main datasets: 1) selected overburden/bedrock contacts in drillholes, 2) surveyed trench “collars”, and 3) topography surface displacement. Drill hole and trench information were used to create the overburden surface, if available, otherwise the topographic surface was adjusted based on the recommendations made by the geologists. The following section briefly documents the methods employed: |
| | | |
| | • | The first occurrence of a bedrock lithology code on each drillhole was captured using the drillhole intersection selection tool in Gemcom. In many cases, the first lithology code indicated the depth of casing, which may have been below the depth of actual overburden; therefore, the selections were reviewed by section to see that the data were consistent with the actual depth of overburden. In the cases where an automatic selection was inappropriate, it was deleted from the selection. The retained selection points were saved as point data in an extraction file. |
| | • | In the cases where the start point of a trench was below the existing topographic surface, especially in the central trench area (1800N to 2230N), these points were captured and stored as point data in an extraction file. |
| | • | In the areas without trench or drillhole data, the elevation of the existing topographic surface was reduced by two to seven meters based on recommendations from the Bema geologists. North of 3100N, the elevation was decreased seven meters, south of 1375N, the elevation was decreased six meters, and in all other places the elevation |
| Technical Report - Kupol Project Preliminary Assessment Summary | 122 |
| Bema Gold Corporation | |
| | | was decreased two meters. These modified contour lines were saved as polylines in ASCII format. |
| | • | The ASCII format polylines and the point data from the extraction files were loaded into the Gemcom 3-D environment. A surface was created from the loaded data using the Laplace gridding method. |
| | | |
| | The resultant surface was clipped to match the topographic surface limits and was manipulated in Gemcom to ensure that the overburden surface was always beneath the topographic surface. The final surface was saved as OVB\MinTopo.bt2. 17.2.3 Lithology Model Vein, stockwork, dyke, faults and basalt were interpreted as the major units controlling mineralization. Statistical analysis of grades by lithologies in addition to observations made in the field, were used to determine which lithologies to combine for interpretation (refer to Section 17.4) . Once this was determined, the logged geology, not gold grade, was used to guide the interpretation of vein and stockwork zones. Contact dilution and minimum mining widths were not applied; therefore, locally the vein width may be less than one meter. Conversely, if a core or trench sample was logged as one of the vein lithologies (lith=90, 91, 92, 93, 96, and 97, refer to Section 17.4.1) and the gold grade was very low, it was included in the interpretation of the vein. 17.2.3.1 Interpretation Solids were created for the following lithological units: veins, stockwork and stringer zones, rhyolite dykes, faults and basaltic dykes. Solids based on these lithologies have been labeled in the model as VEIN, STOCK, DYKE, FAULTS and BASALT respectively and were created and used to code the blocks for the RockType and Percent variables. Due to complexity within the Big Bend zone, the dykes and faults were modeled as a single entity FLTDYK (fault-dyke) for the sole purpose of removing volume from the VEIN and STOCK solids. Geological interpretations were based on a combination of the quick log and detailed log information, utilizing the field plots and Russian geologist’s October 2003 interpretations as a base. All interpreted contacts are lithological (geologic) contacts, as defined through the core or trench logging, and based on measured contact attitudes (from core or trench mapping) wherever possible. Only the “major” vein zones, with the exception of one splay in the Central zone and a narrow vein in the South Extension, were modeled. Vein outlines were defined using one or more of the vein codes; 90 (massive to sugary quartz), 91 (colloform banded and/or crustiform), 92 (breccia), 93 (quartz healed breccia), 96 (wall rock breccia) and 97 (yellow siliceous/ jarositic breccia). For ease of modeling and on the basis of statistics (refer to Section 5.4), these units were grouped together to form one or more major vein solids. 'Stockwork' zones were defined from the codes 95 (veinlet-stringer) and 94 (stockwork), where there was> 10% veining present within the logged interval. To simplify modeling, encapsulated stockwork or host rock within the main vein were modeled only if they exceeded three meters width; the width of the smallest mining unit. Similarly, smaller |
| Technical Report - Kupol Project Preliminary Assessment Summary | 123 |
| Bema Gold Corporation | |
| | discrete veins within the stockwork or stringer zones were lumped in with the stockwork to create a single solid. With limited exceptions, that made geological sense, gold and silver grades were not used as a guide in defining the vein outline. Within the Central trench area, where very detailed sampling and geological information was available, an effort was to made model the smaller individual veins within the broader vein system in order to help in preserving grade of the veins. Only rhyolite or basalt dykes that directly cut the vein zone were modeled. Additional dykes, footwall and hanging wall faults were digitized into polygons on section but not specifically modeled into 3D solids. From the geological understanding of the deposit thus far, no stratigraphic control is apparent in the localizing the higher grade gold and silver mineralization at Kupol. Consequently, the volcanic stratigraphy was interpreted on section and digitized into polygons but not modeled into solids. Surficial geological information from pre-2003 was updated by the Russian and Canadian geologists based on the new trench information and by projection of the drill hole information to surface. This update was done on a copy of the1:200 Russian trench plans and then simplified onto a 1:5000 summary plan. The down dip potential of the system was accounted for by projection to 150 m ASL, the lower limit of the model. Projections to depth were based on information on measured core axis contacts, deep holes on adjacent sections and general geological understanding of the deposit. Geological contacts representing veins, stockwork, dykes and faults in the immediate area of drilling were drawn on only those sections with drilling. 17.2.3.2 Construction of Solids Models The procedure used to build the solids was iterative, with each subsequent pass replacing its predecessor. The process was staged with each zone processed in succession; the general order for completing the interpretation and development was Big Bend, North, Central and South. All paper interpretations have been preserved in Bema’s Vancouver office. |
| | | |
| | • | The initial interpretation was completed by the geologists on a set of 1:500 paper cross sections (oriented 090, looking north, 25 meter thickness) showing lithology codes, Au (gpt) and Ag (gpt). |
| | • | The initial interpretation was digitized into attributed polygons with Gemcom. The polygons were exported as 3-D polylines (3DRs) and transferred to V. Park. |
| | • | The 3DRs were imported back into a polygon workspace saved within Kupol2003.mdb. Using a plane interpolation technique, the resultant polygon-level section intersection lines were saved into a traverse workspace within the Kupol2003.mdb database. |
| | • | The 3DRs were loaded into the Gemcom 3-D environment. The drillholes were loaded and the contacts were “snapped” to the lithology code interval. The snapped polylines were then “wobbled”, an interpolation technique that better places the line |
| Technical Report - Kupol Project Preliminary Assessment Summary | 124 |
| Bema Gold Corporation | |
| | | in 3D and smoothes the difference between the points that were digitized to a plane and those that were snapped to drillhole intercepts. The resultant wobbled polylines were saved to an ASCII file. |
| | • | The wobbled polylines were extruded into one-meter thick solids and these solids were sliced into a set of 25 meter spaced level section annotated graphics files. A set of level-section graphics files was created from the polygon-level section intersection lines stored in the traverse workspace. |
| | • | A set of 1:500 paper level sections (looking down, 25-meter thickness) was plotted. Drillholes with lithology codes and assays, the sliced solids and the sliced polygons were plotted on the levels. The level sections were interpreted by the geologists at 25- to 50-meter spacing and these interpretations were digitized into attributed polygons. |
| | • | The level section 3DRs were imported back into a polygon workspace saved within the Kupol2003.mdb. Using a plane interpolation technique, the resultant polygon- vertical section intersection lines were saved into a traverse workspace within the Kupol2003.mdb database. |
| | • | A set of 1:1000 paper cross sections (oriented 090, looking north, 25-meter thickness) that showed lithology codes, Au (gm/t) and Ag (gm/t), the original interpretation polygons and the sliced level section interpretation were plotted and distributed to the geologists for checking and modification. |
| | • | The cross and level section polylines were distributed amongst the modelers. Working with the last set of cross section interpretations, the level sections and the polylines, the modeler created a set of overlapping outlines from which the solids could be constructed. In all cases, contacts were snapped to the drillholes. The interpretation was extended down to 150 meters ASL on all cross sections. |
| | • | The modeler made changes, as necessary, to make it possible to create solids. If the changes were significant, then the modifications were discussed with and approved by the geologist. Intermediate and partial sections were interpreted by the modelers. |
| | • | The solids were created by using tie lines to link the final 3DRs and any other necessary lines created by the modeler to best represent the solid shape. In the central trench area (mini-trenches, 1800N to 2230N), numerous partial sections were created by the modeler to tie the cross section interpretation into the detailed surface trench interpretation. In the South, zone solids were created by extrusion. |
| | | |
| | 17.2.3.3 Block Coding A set of solids representing STOCK, VEIN, DYKE, FLTDYK, FAULTS and BASALT were created for each zone. Codes were assigned based on solid precedence and ore/waste material toggles. A needling integration level of 10 (100 needles per block) was used, with the needles oriented horizontally and parallel to the direction of the model rows (across the strike of the veins). Blocks were eligible for rock type coding if the block volumes within the appropriate solids were greater than zero. The process for transferring the ore codes (vein and stockwork) from the solids to the blocks involved the following basic steps: |
| Technical Report - Kupol Project Preliminary Assessment Summary | 125 |
| Bema Gold Corporation | |
| | • | Load the list of solids, excluding the stockwork and air solids |
| | • | Set the vein rock code to “Ore”, and all others to “Waste” |
| | • | Update the vein rock type codes and volume percentages, using only the “Ore” materials, |
| | • | Load the stockwork solids, |
| | • | Set the vein rock code to “Waste”, and the stockwork rock code to “Ore”, |
| | • | Update the stockwork rock type codes and volume percentages, using only the “Ore” materials. |
| | | |
| | The solids loaded for vein and stockwork rock code and volume percent assignments are shown on a cross section in Figure 35. |
Figure 35. Solids Used for Vein and Stockwork Rock Code Assignment, Section 1700N
.

| Technical Report - Kupol Project Preliminary Assessment Summary | 126 |
| Bema Gold Corporation | |
| | Waste codes were assigned as follows: |
| | | |
| | • | Load the complete list of solids, |
| | • | Set the air, stockwork and vein rock codes to “Ore”, and all others to “Waste” |
| | • | Update the waste rock codes in the standard folder. |
| | • | Load the air solid |
| | • | Update the air volume percentage to a temporary variable, |
| | • | Assign the waste volume percentage by subtracting the combined vein, stockwork and air percentages from 100. |
| | | |
| | The solids that were loaded for waste rock code assignments are shown on a cross section in Figure 36. |
Figure 36. Solids Used for Waste Rock Code Assignment on Section 1700N.

| Technical Report - Kupol Project Preliminary Assessment Summary | 127 |
| Bema Gold Corporation | |
| | The block model lithology coding was checked as follows: |
| | | |
| | • | S. Blower (AMEC) performed a visual onscreen check to ensure that the block coding honoured the solid precedence established. Each rock type modeled (VEIN, STOCK and STANDARD = all waste types)) was assigned a percentage of the block. VEIN and STOCK were assigned a percentage based on the solids; the STANDARD rock type was assigned using a mathematical manipulation. |
| | • | The coded blocks were passed back to Bema. The rock type coding was compared visually onscreen against the solids and found to be good. |
| | • | A block manipulation to sum the percentages revealed that all rock type percentages totaled equal 100 percent. This was checked mathematically as well as visually onscreen by cross and level section. |
| | • | Conditional block manipulation was used to create a variable that stores the majority rock type code. The resultant code was compared visually onscreen and with a selection of plotted paper sections and plans. The coding was compared against the solids used for coding and was found to be good. |
| | | |
| | 17.2.4 Clay Argillic (clay) alteration was interpreted onto the original set (used for lithology) of 1:500 cross sections. As with the lithology model the outlines defined reflect the geological understanding for each area based on the both the quick log and detailed log information. In certain areas of the deposit, such as the North and North Extension zones, there is a strong stratigraphic (porosity driven) control to the alteration. With the exception of these relatively sharp stratigraphic boundaries the alteration contacts were smoothed to ease modeling. These outlines were digitized to polygons. Contacts were not snapped to drillholes. The polygons were exported to 3D polylines and modified slightly by the modeler to better develop continuity between sections. However, due to a general lack of data and continuity, solids were created by polygon extrusion, and the block model was coded by Bema using those solids. 17.2.5 Carbonate, Pyrite and Acid Rock Drainage Classification Carbonate was interpreted on a set of 1:500 paper sections showing carbonate code only (except in the North area where carbonate was interpreted on the original lithology sections). To the north, the interpretations were based on the quick logging, and for all other areas the detailed logging codes were used. As with the argillic alteration, some areas were modeled as having a stratigraphic control to the carbonate alteration. Pyrite was interpreted on a set of 1:500 paper sections that showed pyrite code only. These outlines were based on the detailed logging codes with minor modifications according to the quick log information. Pyrite distribution reflects both phyllic (to potassic), (sericite-adularia) and propylitic alteration shells. The sericite-adularia alteration envelope around the veins and stockwork zones was interpreted on section and digitized but not required as a component to the mine planning at this stage. |
| Technical Report - Kupol Project Preliminary Assessment Summary | 128 |
| Bema Gold Corporation | |
| | Both pyrite and carbonate were logged using a scale of zero to three; however, for both attributes the interpretation consisted of presence (codes 1, 2 or 3) or absence only. For each alteration type, outlines were digitized to polygons. Contacts were not snapped to drillholes. The polygons were exported to 3D polylines and modified slightly by the modeller to better develop continuity between sections. However, due to a general lack of data and continuity, the solids were created by extruding the polygons; the block model was coded by Bema using those solids. Acid rock drainage (ARD) potential of the mine area was determined by combining the pyrite and carbonate models. The four combinations (presence of carbonate with absence of pyrite, absence of carbonate with presence of pyrite, presence of both and absence of both) were tabulated from the block model. Solids representing the four possible combinations were also created from coded blocks. 17.2.6 Structures Major faults were interpreted in two stages. The major faults and dykes were modeled with the lithological interpretation and in many cases were modeled at the same time. The hanging wall faults and dykes were added to the original interpretation after the creation of the lithological solids model. In the North zone the entire structural interpretation was completed at the same time as the lithological interpretation. The structural interpretation in the South and Central zones was modeled into solids when possible; however, due to a lack of sectional continuity no new structures were modeled. Numerous additional faults and dykes were added to the Big Bend zone after the initial major lithological interpretation. An attempt was made with this second round of interpretation to separate the faults from the dyke in the main vein area and to add hanging wall structures. After several attempts it was determined that the due to a lack of continuity the faults could not be modeled into 3D shapes. 17.2.7 Metallurgical Zones Metallurgical zones were interpreted by V. Shein (Bema) and drawn onto a vertical summary longitudinal section. These outlines were digitized into polygons. The polylines were exported and used to create, by extrusion, a series of extruded solids that were used by Bema to code the block model. The metallurgical zones are summarized below: Table 25. Metallurgical zones |
| Met String | Met Integer | Met Code |
| SZ | 1 | 101 |
| BBT1Z | 2 | 102 |
| BBT2Z | 3 | 103 |
| BBCTZ | 4 | 104 |
| CZ | 5 | 105 |
| Technical Report - Kupol Project Preliminary Assessment Summary | 129 |
| Bema Gold Corporation | |
| Met String | Met Integer | Met Code |
| CPYZ | 6 | 106 |
| NZ = FWZ+NHWZ | 7 | 107 |
| NSVZ | 8 | 108 |
| NEXZ | 9 | 109 |
| CCHLOR | 10 | 110 |
| NCHLOR | 11 | 111 |
| | Other Alteration Types and Volcanic Stratigraphy Additional geological characteristics that were interpreted on cross section but not modeled include sericite-adularia, jarosite and oxidation types (hematite and limonite). At present these interpretations lack sectional continuity and may only be modeled using polyline extrusion methods. The volcanic stratigraphy was drawn-in after all the other interpretations. Additional drilling and significantly more time to complete a three-dimensional interpretation are needed to build three-dimensional solids models of volcanic stratigraphy. 17.3 Grade Distribution Studies for Gold and Silver 17.3.1 Exploratory Data Analysis Exploratory data analysis consists of univariate statistics and geostatistics used in support of block grade estimation plans and resource estimates. One of the principal goals of the work is to provide guidance for domaining or separating the deposit into divisions suitable for grade estimation. The studies are undertaken on assays and composites. Initial results from analysis on assays at Kupol are discussed in this section. 17.3.1.1 Choice of Data For the purposes of this discussion, the analyses presented use the Bema diamond drilling and all of the available trench data. This dataset was used in the final compositing and grade estimation. Although not included specifically in this discussion, each of the analyses referred to below were carried out on datasets having only diamond drill holes and having only trench data. This was done in order to observe any significant differences in the results from the two types of samples, which might impact the conclusion to use the combined dataset. There were no findings in this work that impact the conclusions drawn (see discussion below). 17.3.1.2 Logged Lithology Analysis of assays by logged lithologies shows that the dominant mineralization occurs within the assays logged as Vein. There is scattered mineralization in the other lithologies, but it is relatively insignificant from the viewpoint of economically recoverable resources. |
| Technical Report - Kupol Project Preliminary Assessment Summary | 130 |
| Bema Gold Corporation | |
| | Figures 37 and 38 show boxplots2for Au and Ag divided by the logged lithologies. There are recognizable economic grades in the vein lithology. The stockwork lithology (included in the Vein boxplot) has some high-grade material within a significant number of assays. Study on section, however, shows that the economic grades in the Stockwork lithology are generally isolated in the largely sub-economic background material. |
Figure 37. Boxplots for Au and Ag divided by the logged lithologies

Figure 38. Boxplots for Au and Ag divided by the logged lithologies
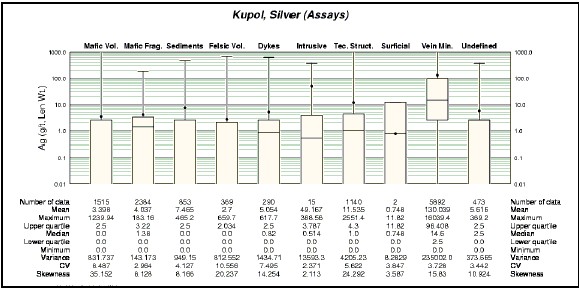
| ______________________________________ |
| | 2A boxplot is a histogram of the data in a less traditional format, which facilitates side-by-side comparison of populations. The box itself illustrates the 25th and 75th percentile and median, and the mean of the distribution is plotted as a dot. The minimum and maximum of the data are plotted at the end of the lines extending vertically above and below the box. |
| Technical Report - Kupol Project Preliminary Assessment Summary | 131 |
| Bema Gold Corporation | |
| | The coefficient of variation3is very high (3.3 and 3.7 respectively, for Au and Ag) within the vein material. Study on section supports this result, where correlated areas of high and low grade are evident. Based on this result, further domaining within the vein material was necessary to support the successful estimation of grade to block-size support. 17.3.1.3 Study within the Logged Vein Lithology If the logged Vein lithology is further divided into its logged textural groupings some definite trends become evident. Figures 39, 40, 41 and 42 show Au and Ag results. The 90 series vein textures are Vein (90), Banded/Colliform (91), Breccia (92), Quartz Breccia (93), Stockwork (94), Veinlet/Stringers (95), Wall Rock Breccia (96), Yellow Siliceous Breccia (97 ). |
Figure 39. Gold Assays Statistics Within Logged Lithologies

| ______________________________________ |
| | 3The coefficient of variation is the standard deviation divided by the mean of the population. It provides a useful statistic for comparing different distributions. It is most effective when the distributions are, or are assumed to be, normal. |
| Technical Report - Kupol Project Preliminary Assessment Summary | 132 |
| Bema Gold Corporation | |
Figure 40. Silver Assays Statistics Within Logged Lithologies
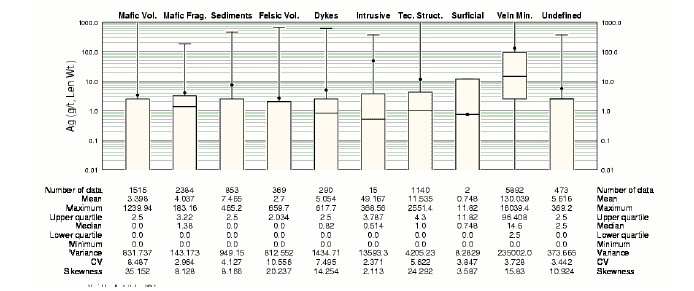
Figure 41. Gold Assays Statistics Within Logged Vein Textures
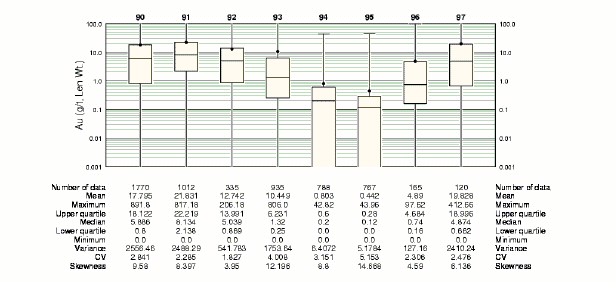
| Technical Report - Kupol Project Preliminary Assessment Summary | 133 |
| Bema Gold Corporation | |
Figure 42. Silver Assays Statistics Within Logged Vein Textures
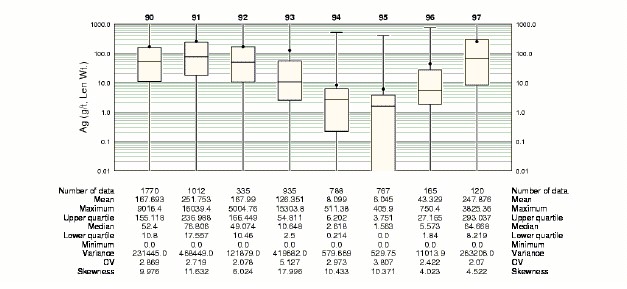
| | The average grades for both Au and Ag in Stockwork (Lithology 94) and Veinlet/Stringers (95) are definitely lower than the other vein lithologies. Quartz Breccia (93) and the Wall Rock Breccias (96) show slightly depressed average grades. These results supported the choice to model the Vein package separately from Stockwork (94,95) material.
Figures 43 and 44 show the boxplot results when the Vein textures are regrouped in order to combine the lower grade Stockwork and Veinlet textures. Note the improved differentiation in mean grade between the two groupings. The coefficients of variation, however, are still too high to regard these groupings as adequate for block grade estimation. |
Figure 43. Gold Assays Statistics Within Logged Vein Textural Groupings

| Technical Report - Kupol Project Preliminary Assessment Summary | 134 |
| Bema Gold Corporation | |
Figure 44. Silver Assays Statistics Within Logged Vein Textural Groupings

| | Further work was completed to investigate other logged geological information, which might assist in the domaining within the vein package. The following sections discuss each effort. 17.3.1.4 Investigation of Au/Ag Ratios An initial analysis of the Au/Ag ratios was undertaken in order to investigate the possibility of using the ratios as a way to domain the mineralization. The results showed that on average the Au/Ag ratio is quite consistent throughout the deposit, both geographically, as well as within different sample types, such as trenches versus diamond drilling. The use of Au/Ag ratios was not explored any further. 17.3.1.5 Visible Gold Logging Visible gold is logged by occurrence and it was thought to be a possible candidate for domaining the deposit. Further investigations show that logging of visible gold definitely highlights the higher grade gold occurrences. It is evident, however, that the logging of a 'single', '2-5Speck' or '>5Speck' is not differentiating the amount of gold in a given sample. This is illustrated in the boxplots by the generally same mean within these categories as well as the other population statistics. This information is not suitable for assisting in domaining the vein material for grade estimation. 17.3.1.6 Pyrite Occurrence Pyrite occurrence was logged on a 0-3 scale (0-not present, 3-strong). The results of a statistical analysis show that pyrite is not an indicator for gold or silver content when looking |
| Technical Report - Kupol Project Preliminary Assessment Summary | 135 |
| Bema Gold Corporation | |
| | at the Vein package in its entirety. It may be that pyrite content helps to domain the Vein material on a local basis but it cannot be used for assisting the overall block grade estimation. 17.3.1.7 Sulphosalt Occurrence Sulphosalt mineral occurrence (predominantly Stephanite Ag5SbS4 and argentiferous tetrahedrite (Cu,Ag)10(Fe,Zn)2(As,Sb)4S13) was logged on a 0-3 scale in the Bema diamond drill core. Figures 45 and 46 show boxplot results within the Vein package assays. The results show a relatively good domaining in the Au and Ag grades with the mean grades rising consistently with increased sulphosalt presence. In addition, the coefficients of variation are lower than seen with splitting the Au and Ag populations based on other logged variables. These distributions indicate that the presence of sulfosalts could be used to at least partially domain the Au and Ag populations. The data used to produce these results are the same set of vein package assays that has been discussed in other areas of this section. A logical next step was to analyze sulphosalt domains within the Vein textural groupings discussed previously. This more detailed analysis was done after the lithology modeling (Vein and Stockwork packages were modeled deterministically, see Section 17.3.4 for discussion). |
Figure 45. Gold Assays Statistics Within Logged Vein by Sulphosalt Content

| Technical Report - Kupol Project Preliminary Assessment Summary | 136 |
| Bema Gold Corporation | |
Figure 46. Silver Assays Statistics Within Logged Vein by Sulphosalt Content
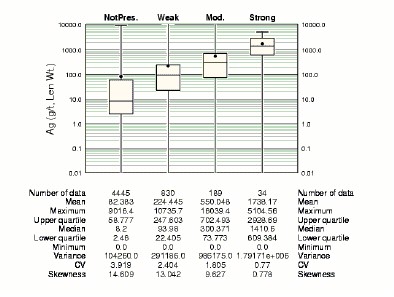
| | 17.3.2 Outlier Capping At Kupol, as with many precious metals deposits, a relatively small number of assays represent a large amount of metal within the overall gold grade distribution. Capping (or high-grade cutting) of outlier grades was implemented to reduce the influence of these high grades in the block grade estimates and to lower the variability such that linear estimation techniques (e.g. ordinary kriging and inverse distance), could be used for block grade estimation. Further metal reduction was applied to the block estimates before reporting of the final resource. This high-risk metal is addressed in Sections 17.4.5 and 17.5.4. The outlier capping levels were selected from lognormal probability plots of gold and silver assays within interpreted vein and stockwork assays. Decile analysis4 was also run. The decile analysis results suggest capping at levels different than the levels selected from the lognormal probability plots. Additional metal was removed before reporting resources; therefore, it was not a great concern. Table 25 shows the summary of the amount of metal removed from the assay distribution using the capping levels suggested by the probability plots and the decile work. These distributions are highly clustered (trench data and locally closer spaced drilling); therefore, the amount of metal removed is misleading. |
| | ____________________________ |
| | 4 Decile analysis consists of dividing a given population into 10 equal parts then examining the amount of metal contributed to the overall deposit by decile. The upper decile is also divided into percentiles and the metal content is examined. The method and guidelines for selecting a cap grade are described in the following paper: “Geologist’s Gordian Knot: To cut or not to cut”, I.Parrish,Mining Engineering, 1997. |
| Technical Report - Kupol Project Preliminary Assessment Summary | 137 |
| Bema Gold Corporation | |
| | 17.3.3 Composites 17.3.3.1 Introduction The analysis of compositing is discussed within this section. The creation of the composites within Gemcom is discussed initially followed by analysis of composite length and its effect. A discussion is included on the distribution of Au and Ag in the trench sampling versus the diamond drill sampling as well as within geographic sector. Statistical analyses are presented using the tagged composites from the final lithology models generated in three dimensions using the GEMCOM software. |
Table 26. Decile Analysis Results on Assays
| Comparison of Various Cap Levels |
| | Cap
Threshold | Percent Metal
Removed(1) | Number of
Assays Capped | Percent of Assays
Capped(2) |
Interpreted Vein – Au Based
on Decile Analysis
| Cap @ 200
gm/t | 12.3 | 42 | 1.1 |
Interpreted Vein – Au
Based on Log. Prob. Plot
| Cap @ 300
gm/t | 7.5 | 24 | 0.6 |
Interpreted Vein – Ag Based
on Decile Analysis
| Cap @ 2400
gm/t | 12.2 | 36 | 0.9 |
Interpreted Vein – Ag Based
on Log. Prob. Plot
| Cap @ 3200
gm/t | 8.4 | 26 | 0.7 |
Interpreted Stockwork – Au
Based on Decile Analysis
| Cap @ 11
gm/t | 16.0 | 27 | 0.9 |
Interpreted Stockwork – Au
Based on Log. Prob. Plot
| Cap @ 20
gm/t | 8.8 | 12 | 0.4 |
Interpreted Stockwork – Ag
Based on Decile Analysis
| Cap @ 170
gm/t | 8.8 | 22 | 0.7 |
Interpreted Stockwork – Ag
Based on Log. Prob. Plot
| Cap @ 300
gm/t | 3.7 | 9 | 0.3 |
(1) Percent Metal Removed = metal removed from the raw (clustered) length-weighted assays.
(2) Percent of Assays Capped within the material type such as vein or stockwork |
| | Six-meter and 1.5 -meter composites were used in the work but only 1.5 -meter composites are discussed in detail here. The 1.5 -meter composites were used to estimate grade for the final block model. Some discussion of the 6-meter composites may be found in the discussion of nearest neighbour block estimation in Section 17.5.3.1. 17.3.3.2 Mechanics of Composite Building The methodology used to create composites was as follows: |
| | | |
| | • | The 3D polylines of the sectional lithology interpretation used to create the final solids were imported into a polygon workspace in the Kupol2003.mdb database. The polygons used to create the lithology solids were used to tag the assay intervals from which composites were subsequently calculated. The decision to use the polygons rather than solids was partly due to timing issues and the assumption that the |
| Technical Report - Kupol Project Preliminary Assessment Summary | 138 |
| Bema Gold Corporation | |
| | | drillhole/ polyline intercepts are the same as the drillhole/solid intercepts (with the exception of minor differences in the Central trench area). |
| | • | The polygons and the drillholes were loaded into the Gemcom 3D environment. A very large polygon that encompassed the entire model area was created to represent a background value. In the area of the Central trenches (1800N to 2230N) a set of surface polygons was created to represent the rock type areas. |
| | • | The Detail Log table in the database was updated with a code representing the polygons, using the precedence of BASALT>FAULTS>FLTDYK>DYKE>VEIN> STOCK>BACKGROUND. The cross section polygons were used to code ALL of the drillholes and those trenches that are not in the central trench area. The surface (in plan) polygons were used to code all the trenches in the central trench area. These codes were composited into the broader intervals (the full intercept for each lithology modeled) into a new table POLYCOMPS. Each rock type is represented by a string value and an integer value. |
Table 27. POLYCOMPS table
| Rock Type String | Rock Type Integer |
| VEIN | 100 |
| STOCK | 200 |
| FAULTS | 300 |
| FLTDYK | 400 |
| DYKE | 500 |
| BASALT | 600 |
| BACKGROUND | 700 |
| | • | The POLYCOMP intervals were checked onscreen by loading the POLYCOMP codes and comparing them visually with the polygons. Rare coding changes, most often encountered in the South zone, were made manually and directly into the POLYCOMPS table. |
| | • | The grade composite intervals were created in the COMP_15 table. Fixed length 1.5- meter composites were created, from collar to toe, with a new composite starting at each POLYCOMP code change. Gold and silver composites, using both capped and uncapped values, were created. These composites were manipulated (outside Gemcom) such that composite intervals less than 0.6 meters were re-composited into the composite above it. These intervals were saved back into the Kupol2003.mdb database as the KB_COMPS table; these intervals were used for grade interpolation (see Section 17.4.2). |
| | • | Note: The solid/drillhole intercepts were saved into the table SOLIDCOMP. Composites for these intercepts were generated in the same manner as for the polygons; however, these composites werenotused in modeling |
| | | |
| | 17.3.3.3 Analysis of Short Length Composites Composites were initially created in GEMCOM (as described above) using down-the-hole compositing at 1.5 -meter lengths. The composites were started and stopped on the boundary of modeled solids for Vein, Stockwork and so on. Inspection of these composites on section |
| Technical Report - Kupol Project Preliminary Assessment Summary | 139 |
| Bema Gold Corporation | |
| | highlights the issue of short composites at the ends of runs within the modeled Vein package. Study on section indicated that there is often a trend in grade across the Vein. The trend, whether it be grading high or low, is often correlated up or down the footwall/hanging wall planar orientation of the vein. To investigate this trend, a program was written which identified the hanging wall and footwall side of each run within the Vein. A location index was then calculated for each composite with Index=0 being the hanging wall and Index=1 being the footwall. Figure 47 shows the results with each composite plotted as a point on a scatterplot. The blue line is the conditional expectation line or the moving average of the data by its location index. The conditional expectation trend line shows that, on average, the composites are lower grade as one moves towards the footwall. In the style of compositing initially employed, most drill holes end up with shorter than 1.5m composites at the footwall. This means that there would likely be a bias towards the lower grade (on average) footwall composites. This effect would be exacerbated by GEMCOM’s inability to do length weighting in its kriging routines. The relationship of grade versus length was then investigated to confirm the grade levels of the small composites at the end of runs. The results for Au in the Vein (High Grade portion) are shown in Figure 48. This graph shows a definite trend towards lower than average grade (approximately 32g/t for this data). A program was written to add the smaller composites back onto the last full size composite where possible. In some cases, there is only a single less than 1.5m composite defining a vein splay intercept. For these cases, no 're-stitching' was done. Figure 49 illustrates the same data contained in Figure 46 after the 're-stitching' has taken place. The program only added back those composites less than 0.6m. The conditional expectation line for lengths greater than 0.6 meters now shows no real trend or bias. The portion of the conditional expectation below 0.6 meters can be ignored since it is controlled by only a few data. |
| Technical Report - Kupol Project Preliminary Assessment Summary | 140 |
| Bema Gold Corporation | |
Figure 47. Au in 1.5m Composites by Hanging Wall and Foot Wall Position
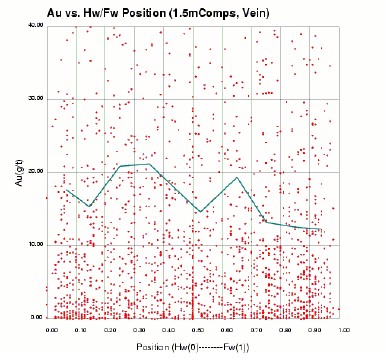
| | The global distribution statistics were thoroughly checked before and after the 're-stitching' and there was no change in characteristics such as mean, variance and so on. |
Figure 48. Au Versus Length in Original 1.5-meter Composites
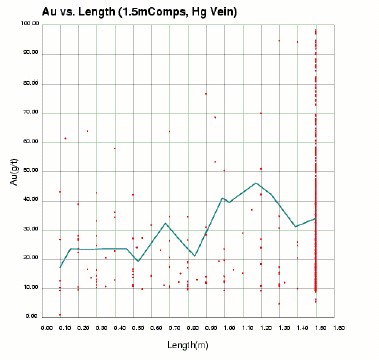
| Technical Report - Kupol Project Preliminary Assessment Summary | 141 |
| Bema Gold Corporation | |
Figure 49. Au Versus Length in 1.5-meter Composites After Elimination of Shorter Composites
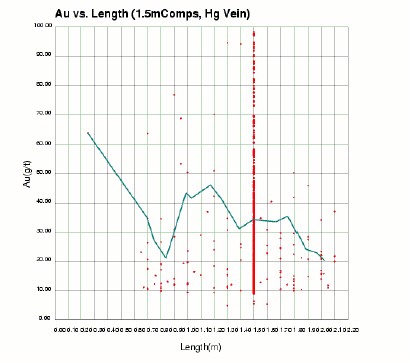
| | 17.3.3.4 Analysis by Modeled Lithologies After the completion of the geological solids modeling, most of the analyses completed on assays were re-done for the newly tagged composites. Figures 50 and 51 summarize the Au and Ag distributions based on the modeled lithologies. The Vein distribution now maps more closely to the logged sub-lithology range of 90-93,96-97 shown in Figure 49. It still, however, contains a substantial amount of the lower grade material from the Stockwork (94) and Veinlet (95) logged vein textures. The coefficients of variation, while lowered substantially as compared to assay levels, are still relatively high at 1.68 and 1.78 respectively for Au and Ag. The Stockwork zone now shows a mean Au grade of 0.83 g/t compared to 0.62 g/t in the assay distribution for the Vein Textures 93,94 assay logging codes. This reflects a slight increase of higher grade material from adjacent higher grade Vein textures. The remainder of the modeled lithologies are quite low grade and volumetrically smaller. The Faults, FLTDYK (Fault-Dyke), Dyke and other areas were not estimated in the block model. |
| Technical Report - Kupol Project Preliminary Assessment Summary | 142 |
| Bema Gold Corporation | |
Figure 50. Au in 1.5 -meter Composites by Modeled Lithologies
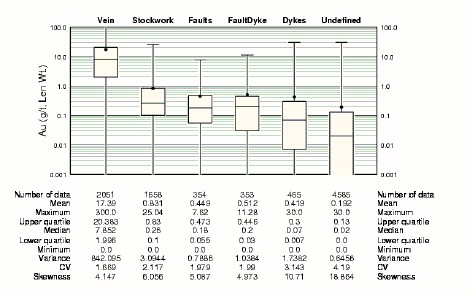
Figure 51. Ag in 1.5 -meter Composites by Modeled Lithologies
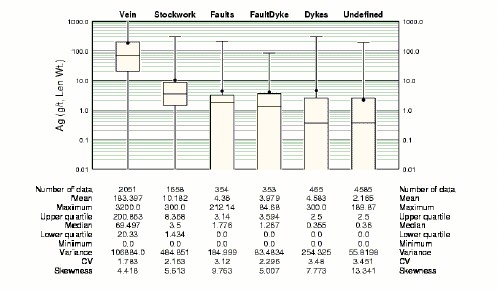
| | Figures 52 and 53 show the distributions for Au and Ag in Vein in histograms and probability plots. Refer to Section 17.4.2 for a discussion on outlier capping. |
| Technical Report - Kupol Project Preliminary Assessment Summary | 143 |
| Bema Gold Corporation | |
Figure 52. Au in 1.5 -meter Composites – Vein
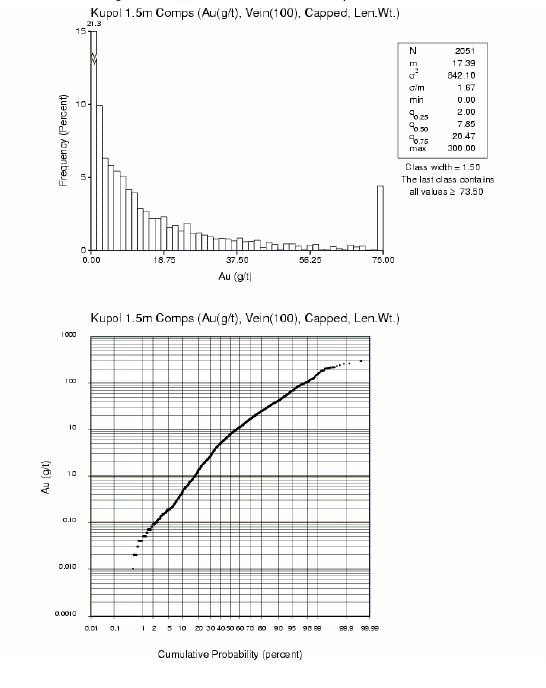
| Technical Report - Kupol Project Preliminary Assessment Summary | 144 |
| Bema Gold Corporation | |
Figure 53. Ag in 1.5 -meter Composites – Vein
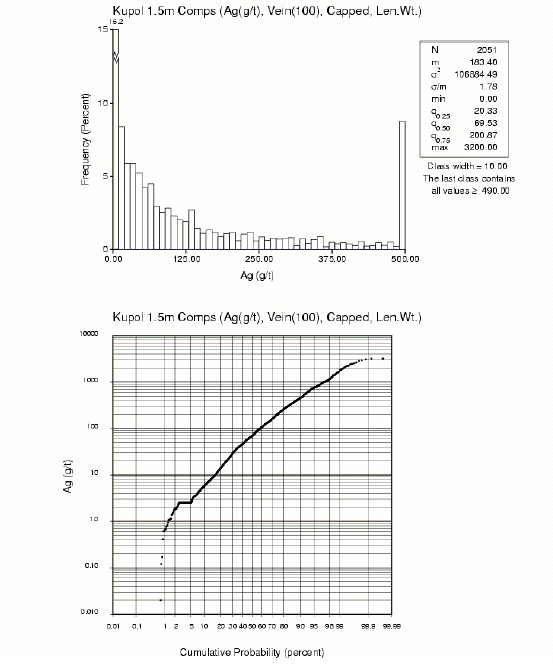
| | 17.3.3.5 Analysis by Sulphosalt Content Sulphosalt content was coded to the 1.5 -meter composites (by predominant code) since it showed the best possibilities for use as a domaining characteristic for the Au and Ag grade estimations. A considerable effort was applied in analysing the difference between the logging of Sulphosalt by the original methodology (MSS in the logging vernacular) and the more recent re-logging methods (QLSS). It was concluded that the newer re-logging of Sulphosalts (QLSS) was slightly more reliable. The sub-populations defined within the QLSS logging had slight lower coefficients of variation than those by MSS, indicating that |
| Technical Report - Kupol Project Preliminary Assessment Summary | 145 |
| Bema Gold Corporation | |
| | the logging was perhaps more consistent within QLSS or perhaps the understanding of the deposit had increased by this time and confidence in logging Sulphosalt had also improved. Using QLSS, Figure 54 shows the distributions of Au for the logged categories. The plots show that QLSS is very good at differentiating grade for successively higher grade material with increased Sulphosalt content |
Figure 54. Au in 1.5 -meter Composites – by Vein and QLSS
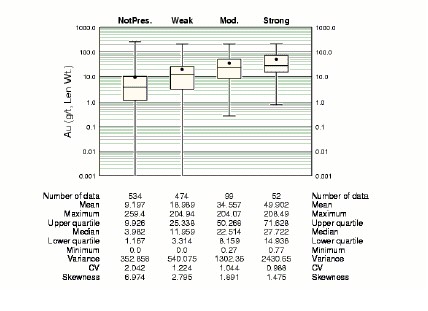
| | In the data with Sulphosalt content (i.e., weak through to strong), it was noted that the coefficients of variation were significantly lower than that of the overall distribution. This result further supports the use of presence versus absence of sulphosalts for domaining the Vein zone in advance of grade estimation. 17.3.3.6 Development of Indicators Study of drill hole and trench sampling on section as well as exploratory data analysis illustrates that the Vein (100) zone should be further domained to facilitate more representative and correct block grade estimation. To do this, a single indicator was developed in order to define the proportion of high and low grade material in each block. To develop the indicator, the distribution of capped 1.5 -meter composites was used (Figure 55). Initially, the distribution was divided by setting an indicator using the Sulphosalt (QLSS) field. This logic gave an indicator equal to zero for composites where QLSS equaled zero and an indicator of one where QLSS was greater than zero. Most likely due to logging variability, use of this indicator criterion resulted in a few very high grade composites with an indicator of zero. An additional criterion was applied whereby if the composite Au grade was greater than 9 g/t, then the indicator was set to one as well. The level for this additional threshold was set by studying the probability plots as well as checking the resulting coefficients of variation in the two data sets for various potential thresholds. Figure 54 shows the final division of the Au Vein (100) 1.5 -meter composites. |
| Technical Report - Kupol Project Preliminary Assessment Summary | 146 |
| Bema Gold Corporation | |
Figure 55. Au in 1.5 -meter Vein (100) Composites by High and Low Grade Indicator
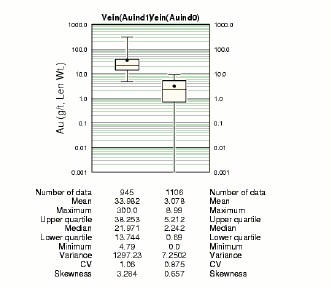
| | The coefficients of variation, 1.06 and 0.87 for Au and Ag respectively, are quite reasonable for this style of mineralization. Figure 56 shows a contact analysis5 plot comparing the high grade (HG) and low grade (LG) composites. There is a very sharp break between these samples when comparing HG and LG sampling occurring close to each other. This contact plot shows such a sharp break that for future models, consideration should be given to deterministically modeling hard boundaries for some of the more obvious low grade areas which correlate section to section. |
| | 5 | This analysis plots the average grade of composites within bins of three-dimensional separation distances between composites identified as being on opposite sides of a given contact. The samples are identified based on the criteria posted at the top of each side of the contact plot. In each distance bin on the graph, the number of composites found within that distance from the contact is posted as a small number. The number of samples found in each group and their overall mean grade is also posted. |
| Technical Report - Kupol Project Preliminary Assessment Summary | 147 |
| Bema Gold Corporation | |
| Figure 56. Au in 1.5-meter Vein (100) Composites – Contact Plot Between High and Low Grade |
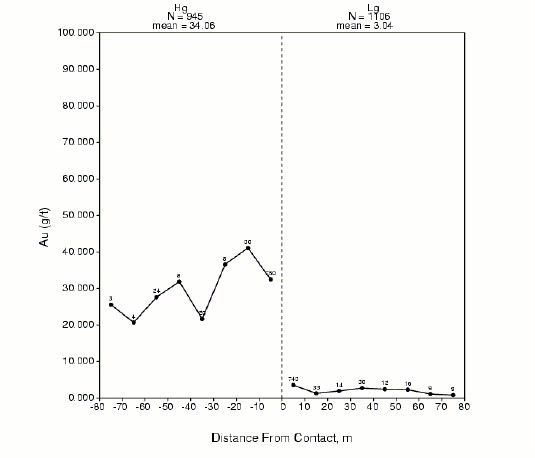
| | Although this analysis was carried out on the full Vein (100) data set, the same work was performed on just the Big Bend data set. Although anticipated, this result helps to confirm the belief that the complete Vein Au distribution is representative of the important local area in Big Bend. Correlation plots between Au and Ag for the complete Vein (100) population as well as two for the populations divided by the Au indicator criteria show that the correlation coefficients are quite high (i.e., 0.81 for the overall distribution). It was concluded that because of the relatively high correlation coefficients, the Au indicator criteria could be used for the Ag distribution as well. For future models, the validity of this assumption should be re-checked. It is likely that Ag will require its own indicator as more sampling is added to the project and models become more refined. 17.3.3.7 Comparison of Trench Data to Diamond Drill Data by Sector For the purposes of resource estimation, the trench sampling has been combined with the diamond drill sampling. A series of analyses were undertaken to assess the effect of the |
| Technical Report - Kupol Project Preliminary Assessment Summary | 148 |
| Bema Gold Corporation | |
| | trench versus the diamond drilling in various sectors of the deposit. The purpose of these analyses was to assess the potential effect on the kriging plans. The results of this work are summarized on Table 28. Au statistics by trench data only, diamond drill sampling only and the combined results are presented in the sub-tables. The results are divided by sector reading across the table. In addition, the results are split by the High Grade (HG) and Low Grade (LG) divisions defined by the indicator discussed earlier. The third sub-table shows the combined HG and LG results. The second set of three sub-tables give the same result for Ag. The data used is the 1.5 -meter capped composites. From these results, it is noted that the coefficients of variation are generally similar between the drill sampling and the trench sampling in the various sub-populations. There are some differences between means in the group, specifically in the Big Bend HG Au sub-population. In general, these comparisons support the combined use of these data in the estimation plan. Some effort must be made to ensure that the trench data is not projected too far down-dip, especially in the Big Bend. |
| Technical Report - Kupol Project Preliminary Assessment Summary | 149 |
| Bema Gold Corporation | |
| Technical Report - Kupol Project Preliminary Assessment Summary | 150 |
| Bema Gold Corporation | |
| | 17.3.4 Variography 17.3.4.1 Introduction For most mineral deposits, the measure of spatial variability for a given metal depends on both the separation distance between points of measurement and the direction from position to position. Variability increases and correlation decreases with the separation distance. When the rate of change in variability is dependant on the direction, the measure of spatial variability is termed anisotropic. Usually this anisotropy can be described in terms of an ellipsoid, which has axes of anisotropy. There are several functions that measure variability, the most frequently used is the semi-variogram. The nugget effect of a variogram model indicates short-range variability, which is often difficult to separate from the variability introduced in sample collection, preparation and assaying. The spatial variability for the various elements was defined using correlograms6 as this can often provide a more robust measure of spatial variability than the traditional variogram method (Srivastava and Parker, 1989)7. The correlogram was probably the first measure of spatial continuity (the converse of variability) developed. It measures the correlation coefficient between two sets of data, comprising values at the heads and values at the tails of vectors with similar direction and magnitude. The correlogram is most applicable where the variance is defined and directionally stationary. For ease of modeling, the correlogram value is subtracted from one and is presented in a similar graphical form as the variogram. The work was done in variogram software written by AMEC and field tested over many years. The correlograms presented in this report are referred to as variograms. Variograms were calculated and modeled for the Au indicator, Au and Ag. For Au and Ag, a separate variogram was modeled for the High Grade (HG) and Low Grade (LG) portion. Variograms were modeled separately within the Vein (100) and Stockwork (200) material. 17.3.4.2 Vein Material Table 29 shows the Au variogram model parameters. In each case, the directions of the ellipse defining the variogram ranges have been specified in azimuth and dip (positive downward from horizontal) convention. For each metal, the HG and LG variogram is listed |
| ______________________________ |
| | 6 Variogram and correlogram are both functions of vector-oriented distances measuring the spatial correlation or continuity of the RF (random function) Z under study. One minus the correlogram gives an estimate of the variogram with a unit sill. Definitions and notations: |

with E [ f(Z(x)) ] meaning the mathematical expectation of a function f applied on RF Z for all locations x over the study domain D, ox stands for the standard deviation of Z on the domain Dx of points which can be used as first points(.x) in pairs (.x ,.x+h) at a distance h.
| | 72Robust Measures of Spatial Continuity, Srivastava and Parker, Geostatistics, 1989, Kluwoer Academic Publishers. |
| Technical Report - Kupol Project Preliminary Assessment Summary | 151 |
| Bema Gold Corporation | |
| | as well as an “average” variogram. All variograms were calculated on 1.5 -meter capped composites. |
Table 29. Variogram Models for Vein Material
| Indicator in Vein(100) | Azimuth | Dip (+ve Down) | Range1 | Range2 |
| X | 180 | 0 | 20 | 155 |
| Y | 90 | 80 | 45 | 200 |
| Z | 90 | -10 | 5 | 25 |
| | C0, C1, C2 | 0.25 | 0.35 | 0.4 |
| Au Hg Vein(100) | Azimuth | Dip (+ve Down) | Range1 | Range2 |
| X | 175 | 0 | 11 | 55 |
| Y | 85 | 80 | 25 | 60 |
| Z | 85 | -10 | 3 | 11 |
| | C0, C1, C2 | 0.3 | 0.35 | 0.35 |
| Au Lg Vein(100) | Azimuth | Dip (+ve Down) | Range1 | Range2 |
| X | 180 | 0 | 18 | 95 |
| Y | 90 | 75 | 35 | 135 |
| Z | 90 | -15 | 4 | 15 |
| | C0, C1, C2 | 0.3 | 0.35 | 0.35 |
| Au Vein(100) | Azimuth | Dip (+ve Down) | Range1 | Range2 |
| X | 175 | 0 | 20 | 65 |
| Y | 85 | 80 | 25 | 115 |
| Z | 85 | -5 | 4 | 13 |
| | C0, C1, C2 | 0.3 | 0.3 | 0.4 |
| Ag Hg Vein(100) | Azimuth | Dip (+ve Down) | Range1 | Range2 |
| X | 175 | 0 | 20 | 75 |
| Y | 85 | 90 | 30 | 85 |
| Z | 85 | 0 | 5 | 15 |
| | C0, C1, C2 | 0.35 | 0.25 | 0.4 |
| Ag Lg Vein(100) | Azimuth | Dip (+ve Down) | Range1 | Range2 |
| X | 180 | 0 | 12 | 40 |
| Y | 90 | 80 | 50 | 135 |
| Z | 90 | -10 | 4 | 16 |
| | C0, C1, C2 | 0.35 | 0.3 | 0.35 |
| Ag Vein(100) | Azimuth | Dip (+ve Down) | Range1 | Range2 |
| X | 175 | 0 | 20 | 75 |
| Y | 85 | 85 | 25 | 110 |
| Z | 85 | -5 | 4 | 14 |
| | C0,C1, C2 | 0.35 | 0.25 | 0.4 |
| Note: All models are spherical, ranges are in meters | |
| | The variograms are generally modeled with the maximum ranges in the down-dip direction of the vein structure. The models have been rotated so that the Y-axis is pointed in the direction of maximum correlation. The ranges in the strike direction of the vein structure (essentially northerly) are shorter than the down-dip direction while the ranges of the variogram across the vein structure are extremely short. These general characteristics are confirmed on section where it can be observed that “bands” of high and low grade material can be correlated quite readily up and down the section (essentially parallel to the Hanging Wall/Footwall orientation). |
| Technical Report - Kupol Project Preliminary Assessment Summary | 152 |
| Bema Gold Corporation | |
| | The indicator variograms are quite good, having longer ranges than the grade variograms. Often seen in this style of mineralization, the ranges on the variograms for LG portions are generally longer than their HG counterparts. The modeled nugget values are on the order of 25 to 35 percent of the total variance of the data. At the first range distance, 60 to 70 percent of the sill is reached. The distance on the first range varies from 25 to 45 meters in the down-dip direction to 12 to 18 meters in the strike direction. Ag variograms are similar to Au variograms. 17.3.4.3 Stockwork Material Variograms were developed, although they were eventually only used in guiding an inverse distance block grade estimation. |
| | | |
| 17.4 | Additional Grade Studies 17.4.1 Introduction The following additional studies were carried out in support of various aspects of the resource estimation. The reporting of the work is collected here to provide comprehensive documentation. 17.4.2 Definition of the Validation Area For the purposes of detailed validation and analysis of the block modeling results, a validation area was defined. This area was defined by the following criteria: |
| | | |
| | • | Two holes within 50 meters of the block centroid, and |
| | • | 1 hole within 35 meters of the block centroid. |
| | • | No blocks north of 2975N and south of 1400N |
| | • | No blocks from pass #4 of the estimation plan. |
| | | |
| | This group of blocks contain more tonnage than the eventual Measured plus Indicated resource, but less than the total of Inferred and Measured plus Indicated. Much of the tuning and validation of the block grade and indicator estimations was completed using analyses on these blocks. 17.4.3 Analysis of Declustered Distributions A common global validation check on any estimation technique is to compare the means at a zero cutoff of the declustered distribution to the estimation distribution. In most mineral deposits, the exploration data are somewhat clustered. Very often more data are available for high-grade areas, both because these are of most economic interest and because the |
| Technical Report - Kupol Project Preliminary Assessment Summary | 153 |
| Bema Gold Corporation | |
| | variability in grade as measured by the standard deviation is proportional to the mean grade itself. To obtain a spatially representative frequency distribution of grade, some form of declustering is required. There are two main methods of doing this: |
| | | |
| | • | Nearest Neighbour Models |
| | • | Cell Declustered Models |
| | | |
| | 17.4.3.1 Nearest Neighbour Models A nearest neighbour (or block polygon) estimate was built using the 1.5 -meter composites (trenches and Bema drill holes) coded as Vein (100) and the blocks coded as Vein. A single large spherical search (750 meters) was used for the nearest neighbour estimations. The orientations and searches used for kriging were not used because Gemcom uses the anisotropic distance to assign the value to the block. This approach was used and caused extreme irregularities in the block values relative to the composites. Visual inspection on screen of cross sections and plans indicated a problem with this model. Many composites were not represented in the block distribution and others were over represented. The exact scenario depended on the orientation of the vein in both strike and down-dip directions relative to the blocks and the search orientation. A combination of the small composite length and the large block size, made the discrepancy even more pronounced. The 1.5 -meter nearest neighbour model was not a reliable check for bias. It was believed that much of the problem introduced in the 1.5 -meter nearest neighbour model was related to the small composite length relative to the block size; therefore, 6-meter composites were generated from the assay data and a nearest neighbour model was generated from them. Visual inspection showed that this model better represented the composites but the issue of the clustered trench data was not resolved. The trenches were grossly under-represented in the block distribution To be effective, the block-size should be small enough such that all composites are assigned to some blocks. At Kupol, the main nominal composite length is 1.5 meters. But there are a significant number of composites with different lengths; there are 423 out of 2051 composites with lengths that are different from 1.5 meters, or 20.6 percent. The nearest neighbour model ignores this, i.e., assumes that all composites have the same length. If there is any relationship between length and grade, the nearest neighbour model and frequency distribution of grade may be biased. A secondary issue is the block size and data spacing. The block size is 25 X 3 X 12 m in the north-south, east-west and vertical directions. Given that the composites are 1.5 meters in length and spaced as close as 4 meters laterally in trenches, not all composites will be assigned to blocks. The sheer size of the Kupol deposit and lack of subcelling available in the GEMCOM software used makes use of smaller blocks impractical. |
| Technical Report - Kupol Project Preliminary Assessment Summary | 154 |
| Bema Gold Corporation | |
| | An attempt was made to use 6 m composites, to ensure all composites are “used” in constructing a declustered distribution, but the composite lengths are even more variable, and the trenches are still much more closely spaced than the block size. For these reasons, the nearest-neighbor model method of declustering was rejected. 17.4.3.2 Cell Declustering Cell declustering is a very commonly used method. As normally implemented, the deposit is divided into large cells that contain multiple data points. The data captured in each cell are weighted by 1/n, where n is the number of data in a cell. The origin is often shifted and the weights over all cases are averaged to give a final weight to a datum. In a refined technique, the data are weighted by their length as well. This method works well in massive deposits that do not have boundaries, or have large distances between their extremes. Where this is not the case, the effect of a cell that straddles a boundary, either lithological or topographic can be disproportionate, as 1) the data density near the boundary is often sparse, and 2) the volume of the cell is much higher than the volume of mineralisation within it. AMEC has seen the mean thrown off by as much as 20 percent because of this; failure to length-weight can throw the mean off by 5 percent. As a result, AMEC developed a cell-declustering program that avoids these problems. The program has the following steps: |
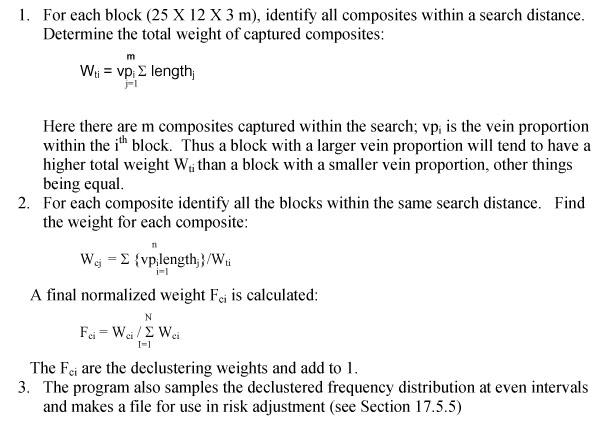
| Technical Report - Kupol Project Preliminary Assessment Summary | 155 |
| Bema Gold Corporation | |
| | The declustering program was run over a number of datasets. Of concern was the search distance to be used. If a small search distance is used, many blocks in sparsely drilled areas will not capture a composite. The blocks in densely drilled areas will receive most of the weight. If the densely drilled areas are higher grade, the mean of declustered composites will be higher than if a larger search radius were used. On the other hand, if a very large search radius is used, within a block, the more numerous composites will obtain more weight. Again, if these are higher grade, the mean of declustered composites will be higher than if a smaller search radius were used. Usually, by experimentation, the search radius is chosen which minimizes the declustered mean. Table 30 shows the results of such an experiment. |
Table 30. Variation in Declustered Mean (g/t) According to Change in Search Radius(1)
| Type | 20 m Radius | 25 m Radius | 30 m Radius | 35 m Radius | 50 m Radius |
| | Mean | % | Mean | % | Mean | % | Mean | % | Mean | % |
| DH | 20.70 | 92.9 | 20.58 | 92.4 | 19.99 | 93.5 | 19.35 | 93.5 | 19.47 | 91.6 |
| Trench | 15.40 | 7.1 | 16.11 | 7.6 | 15.83 | 6.5 | 15.77 | 6.5 | 16.13 | 8.3 |
| All | 20.35 | 100.0 | 20.25 | 100.0 | 19.72 | 100.0 | 19.12 | 100.0 | 19.19 | 100.0 |
| | Slightly different block dataset used to decluster than final. On an unweighted basis, the trench data represent 44.2 percent of the data. Declustering reduces this markedly to between 6.5 an 8.3 percent. The trench data have a lower average grade than drill holes. Their weight increases slightly as the radius is increased (i.e., trench data are projected further). The drill holes have a higher average grade where the radius is lowest; more weight is given to blocks in the more densely drilled portion of the Big Bend area that has higher grade. The minimum declustered grade is found using a 35-meter radius, and this was used for subsequent runs. Table 31 provides a summary of statistics for the validation area. |
Table 31. Comparison of Means (g/t) for Validation Area*
| Variable Name | Arithmetic
Mean (g/t) | Length-Weighted
Mean (g/t) | Declustered and Length-
Weighted (g/t) |
| Au Uncapped | 20.00 | 20.09 | 19.80 |
| Au Capped | 18.56 | 18.62 | 19.14 |
| Ag Uncapped | 210.07 | 210.95 | 240.58 |
| Ag Capped | 192.81 | 193.52 | 229.91 |
*(refer to Section 5.5.2 for a description of the Validation Area)
| | There is very little difference between arithmetic and length-weighted averages. Except for the Au capped case, the declustered means are higher than arithmetic or length-weighted means, reflecting downgrading the influence of trench data. Figures 57 and 58 show histograms and probability plots for capped Au and Ag. These show a spike of barren material, followed by a skewed distribution that shows a flattening slope on the lognormal probability plot with increasing grade. The patterns for gold and silver are similar, with coefficients of variation about 1.4. This is a lower amount of relative |
| Technical Report - Kupol Project Preliminary Assessment Summary | 156 |
| Bema Gold Corporation | |
| | variability than is usually seen for bonanza-type epithermal gold deposits, particularly considering the composite support is only 1.5 m. The coefficients of variation are also lower than those shown in Figures 55 and 56 because the validation area is slightly more homogeneous than the whole deposit. The challenge for resource estimation at Kupol will lie more with defining the location and volume of vein material and to a lesser extent the interpolation of grade. |
Figure 57. Histogram and Lognormal Probability Plot of Cell Declustered Gold Grade
Distribution – Validation Area
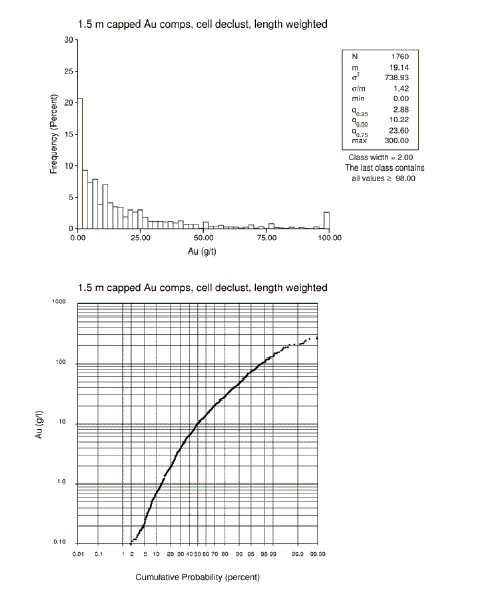
| Technical Report - Kupol Project Preliminary Assessment Summary | 157 |
| Bema Gold Corporation | |
Figure 58. Histogram and Lognormal Probability Plot of Cell Declustered Silver
Grade Distribution – Validation Area
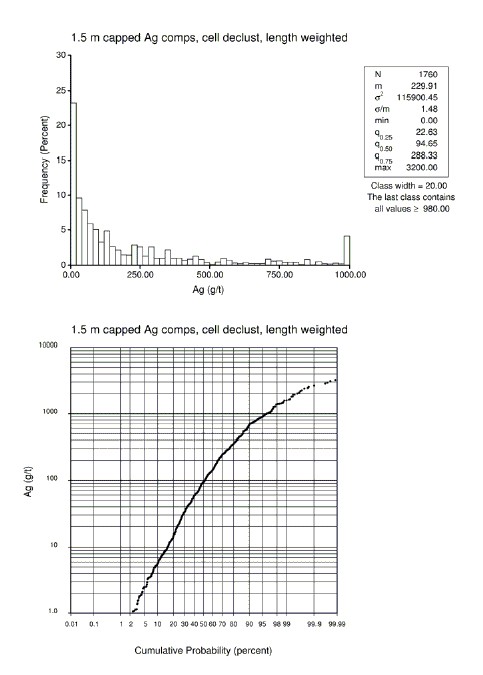
| Technical Report - Kupol Project Preliminary Assessment Summary | 158 |
| Bema Gold Corporation | |
| | 17.4.4 Comparison of Selective Mining Unit Sizes An analysis of selective mining unit (SMU)8 size was completed. The impetus for the study was discussions with the mine planning group who were interested in the possibility of being very selective with small SMU’s. For the comparative study, the estimated blocks from the validation area were used for tabulations. The declustered distribution for Au was manipulated using HERCO to produce theoretical grade tonnage curves for the various SMU’s in question. Table 32 summarizes the descriptions of the SMU’s used in the study. Case 1a is the base case and the SMU used to tune the final kriged block estimations. |
Table 32. Description of SMU Sizes Analyzed
| Case | SMU Size | Description |
| 1a | 10x5x3m | Assume 6 blastholes on a 5x3m grid |
| 1b | 10x5x3m | Assume blastholes on a 5x3m grid
Assume holes drilled at 50 degree angle
Sampling at 1.5m intervals |
| 2a | 5x2.5x1.5m | Assume blastholes on a 5x3m grid |
| 2b | 5x2.5x1.5m | Assume blastholes on a 2.5x1.5m grid
Assume holes drilled at 50 degree angle
Sampling at 1.5m intervals |
| 3a | 1.5x1.5x1.5m | Assume blastholes on a 5x3m grid |
| 3b | 1.5x1.5x1.5m | Assume blastholes on a 1.5x1.5m grid
Assume holes drilled at 50 degree angle
Sampling at 1.5m intervals |
| | Table 33 shows the grade tonnage relationships developed for the various SMU’s in the Validation Area. In each case, a variance reduction factor was derived and used to transform the distributions. The grade, tonnage and metal recovered for each case are tabulated for the various cutoffs. |
Table 33. Theoretical Grade Tonnage Relationships forSMU sizes – Validation Area
| Cutoff | % Tonnage
Recov. | Recov.
Au(g/t)
Case 1a: | Ton.Recov. | Metal
Recov. | Cutoff | %Ton.
Recov. | Recov.
Au(g/t)
Case 1b: | Ton.
Recov. | Metal
Recov. |
| 0.0 | 1.00 | 19.07 | 4660.1 | 2858.1 | 0.0 | 1.00 | 19.08 | 4660.1 | 2858.2 |
| 1.0 | 0.98 | 19.41 | 4566.9 | 2850.0 | 1.0 | 0.98 | 19.44 | 4566.9 | 2854.1 |
| 2.0 | 0.95 | 20.06 | 4427.1 | 2856.0 | 2.0 | 0.94 | 20.12 | 4380.5 | 2834.2 |
| 3.0 | 0.91 | 20.85 | 4240.7 | 2842.8 | 3.0 | 0.90 | 20.89 | 4194.1 | 2817.6 |
| 4.0 | 0.86 | 21.70 | 4007.7 | 2795.8 | 4.0 | 0.86 | 21.82 | 4007.7 | 2811.2 |
| 5.0 | 0.82 | 22.64 | 3821.3 | 2781.7 | 5.0 | 0.82 | 22.73 | 3821.3 | 2793.2 |
| 6.0 | 0.78 | 23.59 | 3634.9 | 2756.7 | 6.0 | 0.77 | 23.74 | 3588.3 | 2738.9 |
| 7.0 | 0.73 | 24.58 | 3401.9 | 2688.1 | 7.0 | 0.73 | 24.73 | 3401.9 | 2705.4 |
| 8.0 | 0.69 | 25.58 | 3215.5 | 2645.2 | 8.0 | 0.69 | 25.76 | 3215.5 | 2662.8 |
| 9.0 | 0.65 | 26.60 | 3029.1 | 2590.8 | 9.0 | 0.65 | 26.82 | 3029.1 | 2612.0 |
| 10.0 | 0.61 | 27.70 | 2842.7 | 2532.0 | 10.0 | 0.61 | 27.87 | 2842.7 | 2547.2 |
| 11.0 | 0.58 | 28.77 | 2702.9 | 2500.6 | 11.0 | 0.58 | 28.94 | 2702.9 | 2515.2 |
| 12.0 | 0.55 | 29.84 | 2563.1 | 2459.2 | 12.0 | 0.54 | 30.04 | 2516.5 | 2430.9 |
| ____________________________ |
| | |
| | 8 The selective mining unit (SMU) is assumed to be the smallest volume that would be designated as ore by ore-control procedures at the time of mining. It is often equal in area to two times the blast hole spacing. |
| Technical Report - Kupol Project Preliminary Assessment Summary | 159 |
| Bema Gold Corporation | |
| Cutoff | %Tonnage
Recov. | Recov.
Au(g/t) | Ton.Recov. | Metal
Recov. | Cutoff | % Ton.
Recov. | Recov.
Au(g/t) | Ton.
Recov. | Metal
Recov. |
| 13.0 | 0.51 | 30.90 | 2376.7 | 2361.7 | 13.0 | 0.51 | 31.11 | 2376.7 | 2377.0 |
| 14.0 | 0.48 | 31.99 | 2236.8 | 2301.1 | 14.0 | 0.48 | 32.22 | 2236.8 | 2317.5 |
| 15.0 | 0.46 | 33.07 | 2143.6 | 2279.6 | 15.0 | 0.45 | 33.26 | 2097.0 | 2242.8 |
| Case 2a: | Case 2b: |
| Cutoff | %Tonnage
Recov. | Recov.
Au(g/t) | Ton.Recov. | Metal
Recov. | Cutoff | % Ton.
Recov. | Recov.
Au(g/t) | Ton.
Recov. | Metal
Recov. |
| 0.0 | 1.00 | 19.08 | 4660.1 | 2859.0 | 0.0 | 1.00 | 19.08 | 4660.1 | 2859.4 |
| 1.0 | 0.98 | 19.52 | 4566.9 | 2865.8 | 1.0 | 0.97 | 19.66 | 4520.3 | 2857.8 |
| 2.0 | 0.93 | 20.37 | 4333.9 | 2837.9 | 2.0 | 0.92 | 20.54 | 4287.3 | 2831.3 |
| 3.0 | 0.89 | 21.28 | 4147.5 | 2837.9 | 3.0 | 0.88 | 21.49 | 4100.9 | 2834.1 |
| 4.0 | 0.84 | 22.23 | 3914.5 | 2798.5 | 4.0 | 0.83 | 22.49 | 3867.9 | 2797.2 |
| 5.0 | 0.80 | 23.23 | 3728.1 | 2784.8 | 5.0 | 0.79 | 23.52 | 3681.5 | 2783.7 |
| 6.0 | 0.75 | 24.27 | 3495.1 | 2726.9 | 6.0 | 0.74 | 24.61 | 3448.5 | 2728.3 |
| 7.0 | 0.71 | 25.32 | 3308.7 | 2693.3 | 7.0 | 0.70 | 25.70 | 3262.1 | 2695.2 |
| 8.0 | 0.67 | 26.41 | 3122.3 | 2651.8 | 8.0 | 0.66 | 26.78 | 3075.7 | 2648.0 |
| 9.0 | 0.63 | 27.46 | 2935.9 | 2592.4 | 9.0 | 0.62 | 27.89 | 2889.3 | 2590.7 |
| 10.0 | 0.60 | 28.56 | 2796.1 | 2568.0 | 10.0 | 0.59 | 29.02 | 2749.5 | 2565.7 |
| 11.0 | 0.56 | 29.72 | 2609.7 | 2493.6 | 11.0 | 0.55 | 30.17 | 2563.1 | 2486.7 |
| 12.0 | 0.53 | 30.82 | 2469.9 | 2447.9 | 12.0 | 0.52 | 31.30 | 2423.3 | 2439.1 |
| 13.0 | 0.50 | 31.95 | 2330.1 | 2393.8 | 13.0 | 0.49 | 32.43 | 2283.4 | 2381.2 |
| 14.0 | 0.47 | 33.07 | 2190.2 | 2329.3 | 14.0 | 0.46 | 33.55 | 2143.6 | 2312.5 |
| 15.0 | 0.44 | 34.22 | 2050.4 | 2256.3 | 15.0 | 0.44 | 34.75 | 2050.4 | 2291.1 |
| Case 3a: | Case 3b: |
| Cutoff | %Tonnage
Recov. | Recov.
Au(g/t) | Ton.Recov. | Metal
Recov. | Cutoff | % Ton.
Recov. | Recov.
Au(g/t) | Ton.
Recov. | Metal
Recov. |
| 0.0 | 1.00 | 19.08 | 4660.1 | 2859.0 | 0.0 | 1.00 | 19.09 | 4660.1 | 2859.7 |
| 1.0 | 0.98 | 19.52 | 4566.9 | 2865.8 | 1.0 | 0.97 | 19.75 | 4520.3 | 2870.3 |
| 2.0 | 0.93 | 20.37 | 4333.9 | 2837.9 | 2.0 | 0.92 | 20.71 | 4287.3 | 2854.6 |
| 3.0 | 0.89 | 21.28 | 4147.5 | 2837.9 | 3.0 | 0.87 | 21.71 | 4054.3 | 2829.5 |
| 4.0 | 0.84 | 22.23 | 3914.5 | 2798.5 | 4.0 | 0.82 | 22.77 | 3821.3 | 2798.3 |
| 5.0 | 0.80 | 23.23 | 3728.1 | 2784.8 | 5.0 | 0.78 | 23.86 | 3634.9 | 2788.2 |
| 6.0 | 0.75 | 24.27 | 3495.1 | 2726.9 | 6.0 | 0.73 | 24.95 | 3401.9 | 2729.4 |
| 7.0 | 0.71 | 25.32 | 3308.7 | 2693.3 | 7.0 | 0.69 | 26.06 | 3215.5 | 2693.9 |
| 8.0 | 0.67 | 26.41 | 3122.3 | 2651.8 | 8.0 | 0.65 | 27.20 | 3029.1 | 2648.7 |
| 9.0 | 0.63 | 27.46 | 2935.9 | 2592.4 | 9.0 | 0.61 | 28.33 | 2842.7 | 2589.4 |
| 10.0 | 0.60 | 28.56 | 2796.1 | 2568.0 | 10.0 | 0.58 | 29.46 | 2702.9 | 2560.2 |
| 11.0 | 0.56 | 29.72 | 2609.7 | 2493.6 | 11.0 | 0.55 | 30.62 | 2563.1 | 2523.5 |
| 12.0 | 0.53 | 30.82 | 2469.9 | 2447.9 | 12.0 | 0.52 | 31.74 | 2423.3 | 2472.9 |
| 13.0 | 0.50 | 31.95 | 2330.1 | 2393.8 | 13.0 | 0.49 | 32.88 | 2283.4 | 2414.4 |
| 14.0 | 0.47 | 33.07 | 2190.2 | 2329.3 | 14.0 | 0.46 | 34.06 | 2143.6 | 2347.6 |
| 15.0 | 0.44 | 34.22 | 2050.4 | 2256.3 | 15.0 | 0.43 | 35.23 | 2003.8 | 2269.9 |
| | Table 34 shows three matrices comparing the metal, grade and tonnage results from the various SMU sizes. In each case, the comparison is expressed as a relative percent difference. For example, to compare the change in recovered metal when moving from Case 1a SMU to Case 3b SMU, use the first sub-table and follow along the top row to the column labeled 3b and read there is a drop of 1% in recovered metal. |
| Technical Report - Kupol Project Preliminary Assessment Summary | 160 |
| Bema Gold Corporation | |
Table 34. Comparison Matrices for SMU sizes – Validation Area
| Comparison at a 6g/t Cutoff - Recovered Metal | | | |
| | 1a | 1b | 2a | 2b | 3a | 3b |
| 1a | 0.00% | -0.65% | -1.08% | -1.03% | -1.08% | -0.99% |
| 1b | | 0.00% | -0.43% | -0.39% | -0.43% | -0.35% |
| 2a | | | 0.00% | 0.05% | 0.00% | 0.09% |
| 2b | | | | 0.00% | -0.05% | 0.04% |
| 3a | | | | | 0.00% | 0.09% |
| 3b | | | | | | 0.00% |
| | | | | | | |
| Comparison at a 6g/t Cutoff - Recovered Grade | | | |
| | 1a | 1b | 2a | 2b | 3a | 3b |
| 1a | 0.00% | 0.64% | 2.88% | 4.32% | 2.88% | 5.79% |
| 1b | | 0.00% | 2.22% | 3.65% | 2.22% | 5.11% |
| 2a | | | 0.00% | 1.38% | 0.00% | 2.83% |
| 2b | | | | 0.00% | -1.38% | 1.41% |
| 3a | | | | | 0.00% | 2.83% |
| 3b | | | | | | 0.00% |
| | | | | | | |
| Comparison at a 6g/t Cutoff - Recovered Tonnage | | | |
| | 1a | 1b | 2a | 2b | 3a | 3b |
| 1a | 0.00% | -1.28% | -3.85% | -5.13% | -3.85% | -6.41% |
| 1b | | 0.00% | -2.60% | -3.90% | -2.60% | -5.19% |
| 2a | | | 0.00% | -1.33% | 0.00% | -2.67% |
| 2b | | | | 0.00% | 1.35% | -1.35% |
| 3a | | | | | 0.00% | -2.67% |
| 3b | | | | | | 0.00% |
| | 17.4.4.1 Discussion There is little change in metal recovered when going from Case 1a SMU size of 10x5x3m to the most selective scenario of Case 3b. As expected, there is a relative increase in recovered material grade (5.8%) and an associated drop in recovered tonnage (6.4%) . This level of improvement in the recovered grade may be significant if the grade-recovery relationship is sensitive or variable in the area around the cutoff grade. Past experience with this style of mineralization has shown that taking a little extra dilution (a little more tonnage) is usually advantageous since economic mineralization often occurs in nearby fractures and openings not modeled by the (necessarily) smoothed boundary outlines of the geologic models. The high-grade levels (relative to other open-pit gold deposits) of mineralization at Kupol would make this scenario even more attractive. 17.4.5 Capping by Risk Adjustment Method Precious metals deposits have skewed grade distributions. Skewed grade distributions have the property that a small proportion of samples can represent a disproportionately large amount of metal. The limited number of these samples can introduce significant uncertainty into a resource estimate. It is a common practice to cut the grades of very high-grade |
| Technical Report - Kupol Project Preliminary Assessment Summary | 161 |
| Bema Gold Corporation | |
| | samples, restrict their projection distance or to adjust resource models to mitigate downside risk. In many precious metals deposits, Kupol included, the highest grade samples are scattered and discontinuous at the exploration drill-hole spacing. The number of high-grade samples intersected can vary according to the positioning of the drill holes, and it is impossible to know in advance which positions would give the most accurate estimate of the amount of high-grade metal actually present. The uncertainty related to the amount of high-grade metal can be evaluated using a Monte Carlo simulation technique developed by Mineral Resources Development/AMEC that has been applied over a 13-year period. This method essentially redrills the deposit 1000 times and notes the variation in the amount of high-grade metal present in annual or global production increments. The 20th percentile of the simulated metal contents is added to the metal content represented by the remaining samples to give a risk-adjusted metal content. The difference between total metal content and risk-adjusted metal content is termed metal at risk. Theoretically, in four periods out of five, the mine should do better than the estimate; however there is additional and largely unquantifiable uncertainty related to representivity of the sample-grade frequency distribution input to the simulation. The appropriate time-period for Indicated Resources is annual, as Indicated Resources will be used to prepare annual production schedules as part of preliminary assessment, scoping and feasibility studies. For Inferred Resources, there is inadequate information to support annual planning; a global time-period is used. The method has advantages over other top-cutting methods in that it takes into account 1) the data density, and 2) the volume increments used for production scheduling. As the data density is increased, the amount of metal at risk is reduced; longer production increments have less risk than shorter ones. At Kupol, frequency distributions of 1.5 -meter composite grades were inspected and classified into three groups (higher-grade Indicated, located in the Big Bend Sector; lower-grade Indicated, and Inferred). The composites were declustered and Monte Carlo Simulations run. Table 35 below shows the results of these simulations for gold: |
Table 35. Metal at Risk
| Area | Production
Increment | No. Currently
Available
Composites
Mined in
period | High-
grade
Threshold
(g/t Au) | Expected High-
grade
Composites in
Period | Metal
Represented | Metal
at Risk |
| Number | % |
High-grade
Indicated | Annual | 113 | 110 | 7 | 5.8 | 28.5% | 11.2% |
Low-grade
Indicated | Annual | 113 | 50 | 5 | 4.8 | 27.1% | 13.0% |
| Inferred | Global | 571 | 60 | 37 | 6.5 | 28.8% | 3.6% |
| | The metal at risk is typical of preliminary assessment or prefeasibility stage projects. Typically with infill drilling (feasibility stage), the metal at risk for Indicated Resources is approximately five percent. |
| Technical Report - Kupol Project Preliminary Assessment Summary | 162 |
| Bema Gold Corporation | |
| | Metal at risk was removed by top-cutting the grades of the resource model constructed from 1.5 -meter composites based on assays capped at 300 g/t Au and 2400 g/t Ag. The summary resource has been declared on a risk-adjusted basis. The risk-adjustment also tends to ameliorate the overprojection of high-grade intercepts. The tables below show a comparison of tonnages and grades based on a model that is totally uncut and the risk-adjusted model. Tables 36 and 37 show the resource summary at 6 g/t cutoff for uncapped and capped grades respectively. |
Table 36. Mineral Resource using Uncut Grades (uncapped)
| | Tonnes
(000’s) | Gold (g/t) | Silver (g/t) | Gold Ounces
(000’s) | Silver Ounces
(000’s) |
| Indicated Mineral Resource, 6 g/t gold cutoff, Uncut Grades |
| Big Bend zones | 1,257 | 32.8 | 337 | 1,326 | 13,600 |
| Kupol Vein, all zones | 2,551 | 25.2 | 259 | 2,063 | 21,200 |
| Inferred Mineral Resource, 6 g/t gold cutoff, Uncut Grades |
| Big Bend zone | 2,629 | 23.1 | 355.0 | 1,954 | 30,000 |
| Kupol Vein, all zones | 7,160 | 19.1 | 250.0 | 4,387 | 57,600 |
Table 37. Mineral Resource using Uncut Grades (capped)
| | Tonnes
(000’s) | Gold (g/t) | Silver (g/t) | Gold Ounces
(000’s) | Silver Ounces
(000’s) |
| Indicated Mineral Resource, 6 g/t gold cutoff |
| Big Bend zone | 1,257 | 29.6 | 308 | 1,196 | 12,400 |
| Kupol Vein, all zones | 2,551 | 22.3 | 232 | 1,826 | 19,100 |
| | Tonnes
(000’s) | Gold (g/t) | Silver (g/t) | Gold Ounces
(000’s) | Silver Ounces
(000’s) |
| Inferred Mineral Resource, 6 g/t gold cutoff |
| Big Bend zone | 2,629 | 22.4 | 337 | 1,895 | 28,500 |
| Kupol Vein, all zones | 7,166 | 18.4 | 243 | 4,231 | 55,900 |
| 17.5 | Grade Estimation |
| | |
| | 17.5.1 Introduction The indicator variable, high grade gold and silver, and low grade gold and silver were estimated for blocks coded as Vein using ordinary kriging. The grades for the vein portion of the block were calculated by weighting the low and high grades by the indicator variable. For blocks coded as Stockwork, the gold and silver grades were estimated directly into the blocks using inverse distance to the power of eight. The strike-length of the Kupol deposit as modeled is approximately 3.5 km long. The overall orientation of the vein is striking N-S and dipping steeply to the east at 80-85 degrees. Locally there are variations; therefore, eight estimation domains were set up to allow |
| Technical Report - Kupol Project Preliminary Assessment Summary | 163 |
| Bema Gold Corporation | |
| | different search orientations. The domains were used for all ordinary kriging and inverse distance estimation runs (Figure 59). |
Figure 59. Search Domains used for Block Estimation

| | The final estimation plans were the result of running numerous test runs. The runs were checked by viewing the block values compared to nearby composites on the computer screen and on paper cross sections. Other checks that were done to help guide the estimation plan included statistically comparing the kriged results to the declustered composite distribution and running profile plots comparing the 1.5 -meter composite distribution to the kriged distribution by northing, easting and elevation. Some of the changes implemented for the various runs include adding the fourth pass, reducing the size of pass four, restricting the number of composites allowed to estimate a block particularly in wide spaced areas, using Russian trenches in the first pass only to limit their impact on block grades. The estimation was run in four passes, each subsequent pass estimates only blocks that have not been estimated in an earlier pass. Four passes were needed to handle the close spaced trench data and to allow estimation of blocks long distances from the composites. The main purpose for each pass is as follows: |
| Technical Report - Kupol Project Preliminary Assessment Summary | 164 |
| Bema Gold Corporation | |
| | • | Pass #1 – Estimate blocks with trench data within the block |
| | • | Pass#2 – Estimate most Indicated Resource blocks |
| | • | Pass#3 – Estimate most Inferred Resource blocks |
| | • | Pass#4 – Estimate some Inferred Resource blocks |
| | | |
| | The variograms used for kriging indicators and grades are summarized in Section 17.4.4. 17.5.2 Indicator Estimation Plan The final search distances, minimum and maximum number of composites used to estimate a block, maximum number of composites used from one hole and the input data selection (Russian trenches and Bema diamond drill holes for kriging the indicators are summarized on Table 38. |
Table 38. Parameters used for Kriging Indicators
Indicator - Domain 1000 (most of Big Bend)
| | Search Distance
Strike x Across x Dip | Min
Comps | Max
Comps | Max
Per Hole | Data Selection |
| Pass #1 | 12.5 x 1.5 x 12 m | 10 | 50 | -- | All Trenches & Bema DH |
| Pass #2 | 60 x 15 x 100 m | 4 | 12 | 3 | K Trenches & Bema DH |
| Pass #3 | 110 x 15 x 150 m | 3 | 12 | 3 | K Trenches & Bema DH |
| Pass #4 | 200 x 30 x 250 m | 1 | 12 | 3 | K Trenches & Bema DH |
Indicator - Domain 2000 (most of Central) | Pass #1 | 12.5 x 1.5 x 12 m | 10 | 50 | -- | All Trenches & Bema DH |
| Pass #2 | 60 x 15 x 100 m | 3 | 12 | 2 | K Trenches & Bema DH |
| Pass #3 | 110 x 15 x 150 m | 2 | 12 | 2 | K Trenches & Bema DH |
| Pass #4 | 200 x 30 x 250 m | 1 | 12 | 3 | K Trenches & Bema DH |
Indicator - Domain 3000 (North), 4000 (North), 5000 (Central & North), 7000 (Central) | Pass #1 | 40 x 12 x 70 m | 3 | 12 | 2 | All Trenches & Bema DH |
| Pass #2 | 60 x 15 x 100 m | 2 | 12 | 2 | K Trenches & Bema DH |
| Pass #3 | 110 x 15 x 150 m | 2 | 12 | 2 | K Trenches & Bema DH |
| Pass #4 | 200 x 30 x 250 m | 1 | 8 | 3 | K Trenches & Bema DH |
Indicator - Domain 6000 (South) | Pass #1 | 20 x 12 x 70 m | 1 | 4 | 2 | All Trenches & Bema DH |
| Pass #2 | 60 x 15 x 70 m | 1 | 4 | 3 | K Trenches & Bema DH |
| Pass #3 | 110 x 15 x 150 m | 1 | 4 | 3 | K Trenches & Bema DH |
| Pass #4 | 200 x 30 x 250 m | 1 | 4 | 3 | K Trenches & Bema DH |
Indicator - Domain 8000 (South) - 600N to 1000N | Pass #1 | 20 x 12 x 70 m | 1 | 4 | 2 | All Trenches & Bema DH |
| Pass #2 | 60 x 15 x 70 m | 1 | 4 | 3 | K Trenches & Bema DH |
| Pass #3 | 110 x 15 x 150 m | 1 | 4 | 3 | K Trenches & Bema DH |
| Pass #4 | 200 x 30 x 250 m | 1 | 4 | 3 | K Trenches & Bema DH |
| Technical Report - Kupol Project Preliminary Assessment Summary | 165 |
| Bema Gold Corporation | |
17.5.3 Grade Estimation Plan
The kriging plan used to estimate high grade gold and silver (HGAu) and low grade gold and silver (LGAu) are summarized on Table 39.
Table 39. Parameters used for Kriging High Grade Gold and Silver and Low Grade Gold and Silver
HGAu & LGAu - Domain 1000 (most of Big Bend)
| | Search Distance
Strike x Across x Dip | Min
Comps | Max
Comps | Max
Per Hole | Data Selection |
| Pass #1 | 12.5 x 1.5 x 12 m | 3 | 50 | -- | All Trenches & Bema DH |
| Pass #2 | 60 x 10 x 100 m | 4 | 12 | 3 | K Trenches & Bema DH |
| Pass #3 | 110 x 15 x 150 m | 3 | 12 | 2 | K Trenches & Bema DH |
| Pass #4 | 700 x 50 x 700 m | 1 | 8 | -- | K Trenches & Bema DH |
HGAu & LGAu -- Domain 2000 (most of Central) | Pass #1 | 12.5 x 1.5 x 12 m | 3 | 50 | -- | All Trenches & Bema DH |
| Pass #2 | 60 x 15 x 100 m | 3 | 12 | 2 | K Trenches & Bema DH |
| Pass #3 | 110 x 15 x 150 m | 1 | 12 | 2 | K Trenches & Bema DH |
| Pass #4 | 700 x 50 x 700 m | 1 | 8 | -- | K Trenches & Bema DH |
HGAu & LGAu - Domain 5000 (North & Central), 7000 (Central) | Pass #1 | 40 x 12 x 70 m | 3 | 12 | 2 | All Trenches & Bema DH |
| Pass #2 | 60 x 15 x 100 m | 1 | 12 | 2 | K Trenches & Bema DH |
| Pass #3 | 110 x 15 x 150 m | 1 | 12 | 2 | K Trenches & Bema DH |
| Pass #4 | 700 x 50 x 700 m | 1 | 12 | 2 | K Trenches & Bema DH |
HGAu & LGAu - Domain 3000 (North) and Domain 4000 (North) | Pass #1 | 40 x 12 x 70 m | 3 | 12 | 2 | All Trenches & Bema DH |
| Pass #2 | 60 x 15 x 100 m | 1 | 12 | 3 | K Trenches & Bema DH |
| Pass #3 | 110 x 15 x 150 m | 1 | 8 | 3 | K Trenches & Bema DH |
| Pass #4 | 700 x 50 x 700 m | 1 | 8 | 4 | K Trenches & Bema DH |
HGAu & LGAu - Domain 6000 (South) | Pass #1 | 20 x 12 x 70 m | 1 | 8 | 3 | All Trenches & Bema DH |
| Pass #2 | 60 x 15 x 70m | 1 | 8 | 3 | K Trenches & Bema DH |
| Pass #3 | 110 x 15 x 150 m | 1 | 8 | 3 | K Trenches & Bema DH |
| Pass #4 | 700 x 50 x 700 m | 1 | 8 | 3 | K Trenches & Bema DH |
HGAu & LGAu -- Domain 8000 (South) - 600N to 1000N| Pass #1 | 20 x 12 x 70 m | 1 | 8 | 3 | All Trenches & Bema DH |
| Pass #2 | 60 x 15 x 70m | 1 | 8 | 3 | K Trenches & Bema DH |
| Pass #3 | 110 x 15 x 150 m | 1 | 8 | 3 | K Trenches & Bema DH |
| Pass #4 | 700 x 50 x 700 m | 1 | 8 | 3 | K Trenches & Bema DH |
| | 17.5.4 Final Block Grades 17.5.4.1 Whole Block Grade Calculation – Vein The block grade calculation, that is combining the low grade, high grade and indicator estimates into a whole block grade (for the portion of the block coded as vein), was done by reviewing several items. The distributions of whole block grades were calculated using different weighting factors for the indicators, a detailed review of the cross sections was done |
| Technical Report - Kupol Project Preliminary Assessment Summary | 166 |
| Bema Gold Corporation | |
| | to assess what indicator threshold would reasonably represent the grades expected in the blocks and kriged estimates were compared to the predicted SMU distribution. Distributions of whole block grades were calculated by using different indicator weighting schemes. Histograms, lognormal probability plots and summary statistics were generated on each of the distributions for comparison. The block grades in the first distribution were all weighted on the indicator. The second distribution had a 10-90 split. The 10-90 split calculation was done as follows, if the indicator value was greater than or equal to 10 and less than or equal to 90, the whole block grade was weighted, however, if the indicator was less than 10 the low grade estimate was used and if the indicator was greater than 90, the high grade estimate was used. Distributions were created for the 20-80, 30-70, 40-60 and 50-50 split on the indicator weighting. The 30-70, 40-60 and 50-50 split distributions show an unacceptable flattening of the grade distribution between 5 and 9 gm/t Au. Since the operational cutoff may be within this range of grades, it was decided that the “split” for the whole block calculation should be between 20-80 and 0-100. The distribution for the 20-80 created block grades that better represent the drill hole composites in addition to providing a closer comparison to the predicted SMU distribution. The gold and silver grades for the Vein portion of the block were estimated as follows: |
| | | |
| | • | If the indicator variable was greater than or equal to 0.2 and less than or equal to 0.8, the block grade for vein was calculated by weighting the kriged high and low grades by the indicator. The indicator weighting was treated as if it were the percentage of high grade, the following equation used: (Indicator*high grade)+((1-indicator)*low grade) |
| | • | If the indicator variable was less than 0.2, the low grade estimate was used as the whole block vein grade. |
| | • | If the indicator variable was greater than 0.8, the high grade estimate was used as the whole block vein grade. |
| | | |
| | 17.5.4.2 Whole Block Grade Calculation – Stockwork Gold and silver grades were estimated directly into the stockwork blocks by inverse distance; therefore, weighting by the indicator was not required. Implementation of Risk Adjusted Metal Reduction on Vein Blocks The initial kriging runs for gold and silver grades were run with the outlier capped distributions (refer to Section 17.3.2 Capping Analysis) as input. It was determined by way of the risk-adjustment method that additional metal should be removed from the resource (refer to Section 17.5.5 Capping by Risk Adjustment Method). To arrive at the final block grades, the outlier capped block grades were capped (or cut) to remove the requisite amount of metal. This risk-adjusted model is also referred to as MOD4. |
| Technical Report - Kupol Project Preliminary Assessment Summary | 167 |
| Bema Gold Corporation | |
| | 17.5.5 Model Validation 17.5.5.1 Introduction For this resource model, a number of checks were carried out to validate the block estimates. These included: |
| | | |
| | • | Visual inspection of estimation results on sections and plans, |
| | • | Comparison of kriged estimates and declustered composite distributions, |
| | • | Analysis of block model statistics, |
| | • | Analysis of grade profiles by northing, easting and elevation, and |
| | • | An analysis of change of support statistics. |
| | | |
| | 17.5.5.2 Visual Inspection of Models Several full sets of east-west trending cross sections plotted on paper showing the kriged indicators and gold grades, the calculated whole block grade and the 1.5 meter composites were reviewed. The cross sections were reviewed in conjunction with the block grade versus drill hole data profiles (in north-south, east-west, and vertical directions) and global statistics to help define the final estimation plan. The kriged block values relative to the 1.5 -meter composites were compared, with modifications made to the kriging plan after each set was checked. The block model reasonably represents the areas with good drill hole coverage (drill holes spaced 50 meters or less). In areas with wider spaced drilling, it was more difficult to represent the local variability within the vein. Time was taken to modify the kriging plan to improve the look of the model in these areas. A set of paper cross sections are stored in Bema’s Vancouver office and they are also available on the enclosed CD. Similar checks were done for silver grades in Vein and silver and gold grades in Stockwork by viewing the cross sections on the computer screen. 17.5.5.3 Comparison of Kriged Estimates and Declustered Composite Distributions Means for kriged blocks and declustered 1.5 m composites were compared in three areas: |
| | | |
| | • | Higher-grade Indicated: between 1500 N and 1840 N, between 1940 and 2030 N |
| | • | Lower-grade Indicated: south of 1500 N, between 1840 N and 1940 N, north of 2030 N |
| | • | Inferred |
| | | |
| | The Indicated blocks are a subset of the validation area. The means compare reasonably well (Table 40). |
| Technical Report - Kupol Project Preliminary Assessment Summary | 168 |
| Bema Gold Corporation | |
Table 40. Comparison of Means Based on Cut Data
| Group | Mean Declustered
1.5 m Composites
Au (g/t) | Mean Kriged
Au (g/t) | Mean Declustered
1.5m Composites Ag
(g/t) | Mean
Kriged
Ag (g/t) |
Higher Grade
Indicated | 33.60 | 33.21 | 361.98 | 340.19 |
Lower Grade
Indicated | 10.34 | 10.97 | 120.74 | 119.19 |
| Inferred | 12.76 | 11.76 | 165.03 | 156.76 |
| | 17.5.5.4 Analysis of Block Model Statistics Analyses of various block model results were carried out during the validation of the estimation plan. The capped results shown in the plots use only the outlier cap grades. 17.5.5.5 Analysis of Grade Profiles by Northing, Easting and Elevation For the purposes of validating resource model estimates, the 6-meter composite nearest neighbour estimate was compared to the kriged block estimates. Grade profiles were calculated for Au and Ag, for Indicated Resources and Inferred Resources, separately, through the deposit in elevation, northing and easting directions by averaging the block results using ore tonnage weighting. In addition to these, there are profiles for the results grouped by geographic sector over the strike length of the deposit area. In general, the agreement is good and confirmatory. This is especially true in the Indicated blocks. The peaks in the profiles (either low or high) are less pronounced in the kriged estimates as is expected. This is due to the effect of the averaging calculation inherent in any weighted averaging technique such as kriging or inverse distance. More importantly, there are generally no obvious biases in the profiles. An exception is present between 300 and 400 Elevation at Big Bend, where the kriged grades model grades are higher than those for nearest neighbour. This is in an area of Inferred Resources, with limited data occurring between these elevations; kriging has probably been influenced by higher grade composites from above. Elsewhere, where there is a departure, it is usually associated with a low tonnage. This is common because the nearest neighbour estimate loses its unbiased tendency at low block counts. 17.5.5.6 Change of Support Analysis An independent check was made for the blocks contained within the validation area (see discussion in Section 17.4.2) of the resource estimate for Au using the discrete Gaussian change of support method described by Journel and Huijbregts9. One of the objectives of the kriging plan is to tune the variability of individual kriged block grades such that they have a similar grade tonnage distribution to the SMU on which final selection will be made. |
| _________________________ |
| | 9 Journel, A.G., and Huijbregts, Ch. J., 1978, Mining Geostatistics: London, Academic Press, 600 p. |
| Technical Report - Kupol Project Preliminary Assessment Summary | 169 |
| Bema Gold Corporation | |
Table 41 shows the comparison of the kriged Au block estimates against the predicted grade tonnage curve. The comparison is very good, especially at the cutoff range of interest (2 to 6 g/t).
Table 41. Comparison Matrices for SMU sizes Analyzed
| | Change of Support
Prediction | Kriged Result | Case 1a SMU |
| Cutoff | Tonnes
(1000's) | Au (g/t) | Tonnes
(1000's) | Au (g/t) | dTonnage | dAu |
0.0
1.0
2.0
3.0
4.0
5.0
6.0
7.0
8.0
9.0
10.0
11.0
12.0 | 4660.1
4566.9
4427.1
4240.7
4007.7
3821.3
3634.9
3401.9
3215.5
3029.1
2842.7
2702.9
2563.1 | 19.07
19.41
20.06
20.85
21.70
22.64
23.59
24.58
25.58
26.60
27.70
28.77
29.84 | 4660.1
4595.3
4423.5
4193.4
4048.8
3923.5
3773.5
3645.2
3489.9
3302.5
3111.1
2935.1
2758.4 | 19.12
19.38
20.07
21.03
21.66
22.21
22.87
23.44
24.15
25.04
26.00
26.93
27.92 | 0.00%
0.62%
-0.08%
-1.12%
1.03%
2.67%
3.81%
7.15%
8.53%
9.03%
9.44%
8.59%
7.62% | 0.24%
-0.14%
0.03%
0.87%
-0.17%
-1.89%
-3.04%
-4.62%
-5.61%
-5.86%
-6.14%
-6.41%
-6.43% |
Note : The difference in grade(dAu) and tonnage(dTonnage) is expressed as a percent
relative difference to the Herco Prediction
| 17.6 | Resource Classification |
| | |
| | 17.6.1 Mineral Resource Definitions Mineral Resources have been categorized using the classification put forth by the Canadian Institute of Mining, Metallurgy and Petroleum (CIM 2000). This classification is the basis for Technical Reports by Qualified Persons in Canada, and the classification is virtually the same as that of the JORC code (Australia), SME guidelines (USA), SAMREC (South Africa) and that of the European Union. The definitions listed below are quoted from the Appendix to Companion Policy 43-101CP, Canadian Institute of Mining, Metallurgy and Petroleum – Definitions Adopted by CIM Council August 20, 2000. 17.6.1.1 Indicated Resource (CIM 2000) The definition of an Indicated Resource “An 'Indicated Mineral Resource' is that part of a Mineral Resource for which quantity, grade or quality, densities, shape and physical characteristics, can be estimated with a level of confidence sufficient to allow the appropriate application of technical and economic parameters, to support mine planning and evaluation of the economic viability of the deposit. The estimate is based on detailed and reliable exploration and testing information gathered through appropriate techniques from locations |
| Technical Report - Kupol Project Preliminary Assessment Summary | 170 |
| Bema Gold Corporation | |
| | such as outcrops, trenches, pits, workings and drill holes that are spaced closely enough for geological and grade continuity to be reasonably assumed. Mineralization may be classified as an Indicated Mineral Resource by the Qualified Person when the nature, quality, quantity and distribution of data are such as to allow confident interpretation of the geological framework and to reasonably assume the continuity of mineralization. The Qualified Person must recognize the importance of the Indicated Mineral Resource category to the advancement of the feasibility of the project. An Indicated Mineral Resource estimate is of sufficient quality to support a Preliminary Feasibility Study which can serve as the basis for major development decisions.” 17.6.1.2 Inferred Resource (CIM 2000) “An 'Inferred Mineral Resource' is that part of a Mineral Resource for which quantity and grade or quality can be estimated on the basis of geological evidence and limited sampling and reasonably assumed, but not verified, geological and grade continuity. The estimate is based on limited information and sampling gathered through appropriate techniques from locations such as outcrops, trenches, pits, workings and drill holes. Due to the uncertainty that may attach to Inferred Mineral Resources, it cannot be assumed that all or any part of an Inferred Mineral Resource will be upgraded to an Indicated or Measured Mineral Resource as a result of continued exploration. Confidence in the estimate is insufficient to allow the meaningful application of technical and economic parameters or to enable an evaluation of economic viability worthy of public disclosure. Inferred Mineral Resources must be excluded from estimates forming the basis of feasibility or other economic studies.” 17.6.2 Definition of Resource Categories at Kupol 17.6.2.1 Introduction Indicated and Inferred resources were defined by reviewing grade and mineralized vein width on east/west trending cross sections and a vertical longitudinal projection. Additionally in depth discussions were held with the project geologists about the genetic model for Kupol and the style of mineralization, both globally and locally. Figure 60 shows the drill hole “interval composites” and the outline of Indicated Resources and Inferred Resources. |
| Technical Report - Kupol Project Preliminary Assessment Summary | 171 |
| Bema Gold Corporation | |
Figure 60. Limits of Indicated and Inferred Resources on a Summary Vertical Longitudinal Section
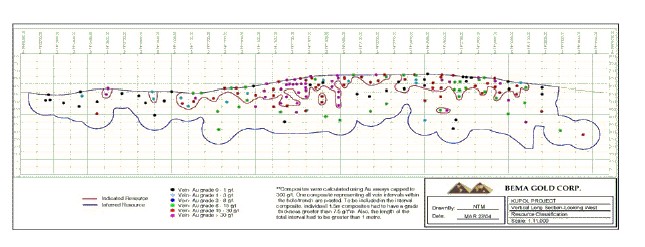
| | 17.6.2.2 Indicated Resource At Kupol, Indicated Mineral Resources are estimated where drill holes or trenches intersect the vein(s) at approximately a 50-metre spacing, with some of it drilled to 25-meter spacing on a vertical longitudinal projection (refer to Section 17.7.3 for a description of the composites used to define the vein for this exercise). Indicated Resources are limited to 25-meters down-dip in the vein and 12.5 to 25 meters along strike. The Indicated Resources are generally located within 100 meters of the surface, and the majority are located in the Big Bend and Central Sectors. With this spacing, the vein structure is continuous, although the vein thickness may be locally affected by faulting and removal by dykes. The grade appears continuous from hole to hole, and this continuity has been confirmed by approximately 104 trenches spaced at four-meter intervals across the outcrop of the vein in the Big Bend and Central Sectors. Trenches show that the veins are often braided with low-grade or barren stockwork and gouge-filled shears. Infill drilling will be required to support feasibility studies and mining operations. 17.6.2.3 Inferred Resources Inferred Mineral Resources are estimated down-dip and along strike from Indicated Resources in areas that have been drilled on approximately a 100-meter spacing (locally 150-meter spacing) on a vertical longitudinal projection. Preliminary geostatistical studies and inspection of sections show that continuity of grade is greatest in the down-dip direction. |
| Technical Report - Kupol Project Preliminary Assessment Summary | 172 |
| Bema Gold Corporation | |
| | Projection distances have been limited to within 100 meters of a drill hole, locally 150 meters (vertically), with the depth of Inferred Resources extending to approximately 350 meters from surface. There are four holes at this depth (KP02-046, KP03-107, KP03-134, KP03-144), which show the continued existence of the vein structure and mineralization. The current drill hole spacing is too wide to enable grade continuity to be demonstrated. 17.6.3 Assessment of Confidence in Grade and Tonnage Estimation Another method was used to assess the continuity of grade in the deposit and to assist in the validation of the current resource classification. For base and precious metals deposits, drilling sufficient to estimate the tonnage, grade and metal content on annual production increments ± 15 percent at 90 percent confidence is typically adequate to define an Indicated Resource. That is, when the stated confidence limits are met, cross-sectional and level plan interpretations show continuity with respect to orebody outlines and grade. Additionally the annual cash flow projections can usually accommodate a 15 percent drop in tonnage, grade or metal content without severely affecting project viability. Many projects are designed and operated in such a way that a 15 percent shortfall can be made-up by rescheduling production. More severe shortfalls are difficult to overcome. Finally, the planning horizon for feasibility studies is generally annual increments, and a ± 15 percent error level is often applied to capital and operating costs when conducting a feasibility study. Hence, a balanced approach requires a similar degree of confidence in the resources/reserves. 17.6.3.1 Choice of Data to Create the Interval Composites For the analysis a set of composites were calculated such that one composite was generated for the total vein intersection in each hole/trench. These 'Interval Composites' are meant to represent a set of composites, which is a best estimation of their mineable potential. The process allows clearly un-mineable areas to not be included so that the assessment of confidence more clearly reflects the eventual mining scenario. The Interval Composites were calculated from the final 1.5 -meter composites used for grade estimation. Additional criteria were applied including: |
| | | |
| | • | To be used in the calculation within a hole, the individual 1.5-meter composites must have a grade thickness (length x Au (g/t)) greater than 7.5. |
| | • | If, after application of the previous criteria, the total length of the interval composite is less than one meter, then the composite is not included in the final data set. |
| | | |
| | Various additional hand edits were applied to deal with the following issues: |
| | | |
| | • | Some drill holes clearly were not drilled through all mineable mineralization in their respective areas. These drill holes were not included since they would have improperly small lengths. In some cases, these holes were already superseded by other holes which penetrated all vein material. |
| | • | Some drill holes were combined with others by hand editing if for instance, one hole penetrated one part of the vein and a second hole penetrated the remainder of the vein |
| Technical Report - Kupol Project Preliminary Assessment Summary | 173 |
| Bema Gold Corporation | |
| | | material in the area. This occurred occasionally where drilling was steeply dipping in relation to the vein orientation. |
| | | |
| | This approach allows multiple vein splays to be represented as one mineable Interval Composite. This approach is justified because of the detailed criteria applied to individual 1.5 -meter composites discussed above. In the few cases where the vein splays are appreciably separated, the distance is still close enough that cost of development could be potentially supported by the vein grade thickness available. 17.6.3.2 Calculation of True Thickness Calculation of true thickness was performed by draping10a set of points surrounding the drill hole location onto the modeled three-dimensional surface of the vein. The equation for the plane defined by these points is derived and represents the average orientation of the vein in the vicinity of the drill hole. This approach is successful because the orientation of a given surface is often changing near drill hole penetration points, especially at the wider drill sample spacings common in early stage project work. The use of the three points surrounding the drill hole pierce point accommodates most radical changes in vein orientation close by and gives the best approximation of the vein orientation. This procedure above is carried out on the hanging wall and footwall for the vein separately for each hole. The results are then averaged to derive a final vein orientation. In the case of Kupol, the orientation of the vein derived from the hanging wall and footwall separately show little deviation. This is an anticipated result based on the deposit characteristics evident in sectional views. The Interval Composite is then projected to the best-fit local plane and the true thickness is then calculated. 17.6.3.3 Interval Composite Statistics The appendices (5.7.3) to the full resource report contains some statistics for the Interval Composites. There are statistics for grade, true thickness and grade thickness. In addition, results are included for vein orientation and drillhole orientation 17.6.3.4 Variography Variography was completed for grade thickness and true thickness. In each case, variography was completed with and without trench data included. In addition there are variograms for horizontal thickness (horizontal projection of the drill hole intercept to the plane of the vein) and horizontal thickness times grade. Table 42 contains a summary of the variogram models derived for the Interval Composites when trench data is not included. |
| _____________________ |
| | 10 Draping refers to taking a point in space and dropping it until it lies, or registers, on the modeled vein hanging wall. This step is performed in the mine modeling software. |
| Technical Report - Kupol Project Preliminary Assessment Summary | 174 |
| Bema Gold Corporation | |
Table 42. Variogram Models for Interval Composites
| True Thickness (m) | Azimuth | Dip (+ve Down) | Range1 | Range2 |
| X | 90 | 0 | 1 | 2 |
| Y | 0 | 0 | 20 | 55 |
| Z | 0 | -90 | 80 | 245 |
| | C0, C1,C2 | 0 | 0.5 | 0.5 |
| | | | | |
| Grade Thickness | Azimuth | Dip (+ve Down) | Range1 | Range2 |
| X | 90 | 0 | 1 | 2 |
| Y | 0 | 0 | 15 | 50 |
| Z | 0 | -90 | 210 | 300 |
| | C0, C1,C2 | 0 | 0.45 | 0.55 |
| Note: All Models are Exponential, Ranges are in Meters | |
| | 17.6.3.5 Confidence Limits Discussion To assess the confidence in resource estimation confidence intervals were calculated for grade based on yearly production increments. The method used for calculating the 90 percent confidence limits for tonnage, grade and metal uses relative estimation variances derived from theoretical kriging of large blocks using the derived variogram models. The relative estimation variance for grade is derived by quotient11 as: |

| | When we look at 50-meter spacing within the vein, estimation variances can be calculated using the derived variograms and blocks of ground representing a production increment. In this case, one-month production blocks (127,755 tonnes) were used as the basis. The coefficients of variation for the composites were adjusted by removing the interval composites without mineable thicknesses and top cutting two outliers in grade thickness. Using the methodology summarized, a confidence interval of +/- 14.5% at 90% confidence was calculated for grade on a yearly production increment. This result falls within the desired +/- 15% at 90% confidence on yearly production increments. |
| ___________________________ |
| | 11 Journel, A.G., and Huijbregts, Ch. J., 1978, Mining Geostatistics: London, Academic Press, 600 p. |
| Technical Report - Kupol Project Preliminary Assessment Summary | 175 |
| Bema Gold Corporation | |
| | The analysis is deemed to be a reasonable validation of the chosen nominal sample spacing found within the Indicated Resource category. Comment The elimination of composites without mineable thicknesses supposes that these areas, predominately dikes and faults that cut out the vein, cluster and their boundaries are accurately defined. At this stage, this is not entirely true; clustering of non-mineable intercepts is noted, but the boundaries of such horses of waste can not be accurately interpreted. Assessment of associated risk must more properly be done using conditional simulation (in progress – April 2004). It may be necessary to locally drill additional holes to define more accurately the boundaries of non-mineable zones on the vertical longitudinal projection. |
| | |
| 17.7 | Mineral Resource Statement Indicated Mineral Resources are tabulated by gold cutoff grades on Table 43, and the grade-tonnage graph is shown on Figure 61. Inferred Mineral Resources are shown on Table 44, with the grade-tonnage graph on Figure 62. Resource tabulations and grade-tonnage curves by area (South, Big Bend, Central and North) are located in the appendices (5.8.1) to the full mineral resources report. The geological resource has sufficient continuity to be classified as indicated and inferred as per NI 43-101 regulations. |
Table 43. Kupol Deposit, Indicated Mineral Resource *
| Tonnes | Au | Ag | Metal(1000's) | |
| Cutoff | (x1000) | (g/t) | (g/t) | Au (oz) | Ag (oz) |
| 0.0 | 3,589.3 | 16.6 | 176.3 | 1,921.0 | 20,347.9 |
| 0.5 | 3,568.5 | 16.7 | 177.3 | 1,920.8 | 20,342.7 |
| 1.0 | 3,479.7 | 17.2 | 181.5 | 1,918.6 | 20,307.7 |
| 1.5 | 3,356.4 | 17.7 | 187.5 | 1,913.6 | 20,230.0 |
| 2.0 | 3,222.9 | 18.4 | 194.1 | 1,906.2 | 20,117.5 |
| 2.5 | 3,111.7 | 19.0 | 200.1 | 1,898.1 | 20,021.7 |
| 3.0 | 3,000.1 | 19.6 | 205.8 | 1,888.2 | 19,855.8 |
| 3.5 | 2,890.8 | 20.2 | 212.0 | 1,876.8 | 19,705.0 |
| 4.0 | 2,801.9 | 20.7 | 217.1 | 1,866.1 | 19,554.9 |
| 4.5 | 2,728.6 | 21.2 | 221.6 | 1,856.1 | 19,437.8 |
| 5.0 | 2,662.5 | 21.6 | 226.0 | 1,846.0 | 19,344.8 |
| 5.5 | 2,613.7 | 21.9 | 228.6 | 1,837.8 | 19,210.6 |
| 6.0* | 2,551.3 | 22.3 | 232.4 | 1,826.3 | 19,066.0 |
| 6.5 | 2,502.6 | 22.6 | 235.4 | 1,816.5 | 18,941.7 |
| 7.0 | 2,425.6 | 23.1 | 240.3 | 1,799.8 | 18,739.8 |
| 7.5 | 2,363.5 | 23.5 | 244.2 | 1,785.4 | 18,561.7 |
| 8.0 | 2,305.6 | 23.9 | 247.5 | 1,770.9 | 18,351.2 |
| 8.5 | 2,250.0 | 24.3 | 251.0 | 1,756.1 | 18,158.0 |
| 9.0 | 2,198.6 | 24.6 | 254.4 | 1,741.6 | 17,984.3 |
| 9.5 | 2,138.0 | 25.1 | 258.5 | 1,723.7 | 17,772.4 |
| 10.0 | 2,087.2 | 25.5 | 261.8 | 1,707.8 | 17,571.5 |
| | | | | | |
| 10.5 | 2,040.6 | 25.8 | 265.3 | 1,692.5 | 17,405.5 |
| Technical Report - Kupol Project Preliminary Assessment Summary | 176 |
| Bema Gold Corporation | |
| | Tonnes | Au | Ag | Metal(1000's) | |
| Cutoff | (x1000) | (g/t) | (g/t) | Au (oz) | Ag (oz) |
| 11.0 | 1,993.9 | 26.2 | 268.4 | 1,676.3 | 17,206.7 |
| 11.5 | 1,936.0 | 26.6 | 272.8 | 1,655.4 | 16,983.2 |
| 12.0 | 1,900.1 | 26.9 | 275.8 | 1,641.8 | 16,849.8 |
| 12.5 | 1,845.3 | 27.3 | 280.3 | 1,620.2 | 16,628.4 |
| * The 6 grams per tonne of gold cut off grade resource was released on February 3, 2004 |
Figure 61. Gold Grade and Tonnage above Gold Grade Cutoffs, Indicated Resource

| Technical Report - Kupol Project Preliminary Assessment Summary | 177 |
| Bema Gold Corporation | |
Table 44. Kupol Deposit, Inferred Resource, Vein and Stockwork Mineralization *
| Tonnes | Au | Ag | Metal(1000's) | |
| Cutoff | (x1000) | (g/t) | (g/t) | Au (oz) | Ag (oz) |
| 0.0 | 26,230.9 | 5.8 | 77.4 | 4,893.9 | 65,256.1 |
| 0.5 | 16,044.8 | 9.4 | 124.9 | 4,840.6 | 64,446.8 |
| 1.0 | 13,559.1 | 11.0 | 146.2 | 4,783.1 | 63,738.9 |
| 1.5 | 11,911.4 | 12.3 | 163.6 | 4,717.2 | 62,642.8 |
| 2.0 | 10,890.2 | 13.3 | 176.9 | 4,660.9 | 61,931.8 |
| 2.5 | 10,195.5 | 14.1 | 186.6 | 4,610.6 | 61,158.9 |
| 3.0 | 9,402.2 | 15.0 | 199.0 | 4,540.3 | 60,160.8 |
| 3.5 | 8,835.0 | 15.8 | 208.7 | 4,481.2 | 59,280.2 |
| 4.0 | 8,419.6 | 16.4 | 216.4 | 4,431.7 | 58,597.0 |
| 4.5 | 8,144.8 | 16.8 | 221.9 | 4,394.2 | 58,109.4 |
| 5.0 | 7,698.1 | 17.5 | 230.9 | 4,325.2 | 57,147.6 |
| 5.5 | 7,447.7 | 17.9 | 236.4 | 4,282.8 | 56,600.0 |
| 6.0* | 7,165.7 | 18.4 | 242.5 | 4,231.2 | 55,873.8 |
| 6.5 | 6,886.0 | 18.9 | 248.2 | 4,175.4 | 54,945.4 |
| 7.0 | 6,748.3 | 19.1 | 251.3 | 4,145.6 | 54,535.6 |
| 7.5 | 6,443.4 | 19.7 | 258.7 | 4,073.7 | 53,598.0 |
| 8.0 | 6,246.2 | 20.0 | 263.6 | 4,024.4 | 52,933.4 |
| 8.5 | 6,066.6 | 20.4 | 267.7 | 3,976.9 | 52,222.9 |
| 9.0 | 5,859.9 | 20.8 | 273.0 | 3,918.7 | 51,430.3 |
| 9.5 | 5,600.3 | 21.3 | 279.2 | 3,841.3 | 50,268.6 |
| 10.0 | 5,319.4 | 21.9 | 287.4 | 3,752.9 | 49,162.5 |
| 10.5 | 5,170.2 | 22.3 | 291.9 | 3,703.7 | 48,523.5 |
| 11.0 | 5,035.8 | 22.6 | 296.0 | 3,657.2 | 47,926.6 |
| 11.5 | 4,859.2 | 23.0 | 301.8 | 3,593.4 | 47,156.0 |
| 12.0 | 4,680.6 | 23.4 | 307.9 | 3,526.0 | 46,338.0 |
| 12.5 | 4,515.5 | 23.8 | 313.7 | 3,460.8 | 45,554.1 |
* The 6 grams per tonne of gold cut off grade resource was released on February 3, 2004.
| Technical Report - Kupol Project Preliminary Assessment Summary | 178 |
| Bema Gold Corporation | |
Figure 62. Gold Grade and Tonnage above Gold Grade Cutoffs, Inferred Resource

| Technical Report - Kupol Project Preliminary Assessment Summary | 179 |
| Bema Gold Corporation | |
| | 17.8 Recommendations The following items should be considered when building the next computer model for reporting resources at Kupol: |
| | | |
| | • | The areas where there are only Russian drill holes should be re-drilled to fill in this gap in data. |
| | • | A systematic approach to re-sampling some of the Russian trenches should be completed. |
| | • | For resource estimation a single model should suit both underground and open-pit purposes; however to support mine planning, allowances for dilution and ore loss should be separately applied for blocks to be taken by open-pit and underground. If feasible, the block width should be reduced to 1.5 m. |
| | • | A lower cutoff grade within the Vein should be used to define the mineralized zone to reduce the over-influence of the low grade material during block estimation. This should be done only if close-spaced drilling and trenching demonstrates strongly that segregatable low-grade zones within the vein exist. |
| | • | Stratigraphic coding and coding of different vein splays for composites and blocks would improve the appearance of block model estimates. The vein splay coding is particularly important for controlling the projection of grades within a splay. |
| | • | Fault and dyke material may have different geotechnical characteristics; they should be modelled separately. |
| | • | The composite length and block size should be more compatible. |
| | • | Trench data should be handled separately from the diamond drill hole data in future models. One approach would be to build separate models and then combine them for the upper 4-8 benches but otherwise the trench model is unused. |
| | • | Based on the complexity and size of the Kupol model(s) and the need to re-estimate resources in a short time frame, serious consideration should be given to using a different software package such as Datamine, MineSight or Vulcan for future Kupol models. |
| | • | Additional drilling should be completed to bring the Inferred Resource within the open pit into the Indicated category as well as targeting some of the material in the preliminary underground mine plan. The specific drill hole spacing needed to bring these areas into reportable resource categories or into a higher confidence level of resource will be better known at the completion of the Drill Hole Spacing Study underway by AMEC. |
| | | |
| | Two or three areas should be selected for placement of close spaced drill holes on an approximate 5 (across strike) x 10 to 12 (along strike) meter spacing. The areas should represent different configurations of the vein (in areas with wide vein widths and narrow widths) relative to the faults, dykes, stockwork, etc. This drilling should extend about 90 |
| Technical Report - Kupol Project Preliminary Assessment Summary | 180 |
| Bema Gold Corporation | |
| | meters along strike and extend to about 50 meters at depth. This detailed information can be used to assess the dilution and ore loss for inclusion in the Feasibility Study model. |
| Technical Report - Kupol Project Preliminary Assessment Summary | 181 |
| Bema Gold Corporation | |
| | 18.0 Other Relevant Data and Interpretation The following section provides a summary of the Preliminary Assessment of the Kupol Project, recently completed. Sheer volume has precluded inclusion of the entire Preliminary Assessment. This summary presents the main points of the Preliminary Assessment. The Geology, Resource Model and Metallurgy sections of the Preliminary Assessment report are omitted from the summary as they are presented in detail in sections 7 through 17 of this Technical report. |
| | | |
| 18.1 | Introduction On December 18, 2002, Bema Gold announced that it had completed the terms of a definitive agreement with the Government of Chukotka, an autonomous Okrug (region) in northeast Russia, to acquire up to a 75% interest in the Kupol gold and silver project (the “Kupol Deposit”). The Kupol Deposit is located in the Northwest part of the Anadyr foothills on the boundary between the Anadyr and Bilibino Regions in the Chukotka Autonomous Okrug. The geographical coordinates for the site are 66°47’northing and 169°33’ easting. The location of the deposit is shown in Figure 1 – Location of the Kupol Deposit. Bema Gold is currently developing a Preliminary Assessment of the property. The results of this assessment indicate that the project should advance to the feasibility level. The proposed completion date for development of a full feasibility study is May 2005. In addition to the development of the feasibility study, Bema Gold will develop several documents required under Russian guidelines to include: |
| | | |
| | • | Declaration of Intent and Basis for Act of Site Selection- these documents are provided to the local regulatory agency (in Bilibino and Anadyr) to provide the regulators with an idea of the direction that the project is going and helps avoid costly delays in project design. It is anticipated that these documents will be submitted in June 2004. |
| | • | An Investment-Level Feasibility Study (TEO-I)- In Russia, the feasibility process (and accompanying environmental impact assessment) is divided into two separate categories: Investment and Construction. In the event of a foreign investor or joint-venture project, both documents are required and must be submitted to the federal government for review and differ only in their level of detail. Bema anticipates completing the TEO-I as an extension of the Preliminary Assessment prior to the end of 2004. |
| | • | Construction-level Feasibility Study (TEO-C)– In Russia, the TEO-C (and accompanying environmental impact assessment) is required to commence construction. This document will be based on the feasibility study and include the necessary information to receive approvals to construct a project in Russia. Bema anticipates completing the TEO-C during the same period at the Western Feasibility Study (2ndquarter 2005). |
| Technical Report - Kupol Project Preliminary Assessment Summary | 182 |
| Bema Gold Corporation | |
| | The requirements and timeline for submittal of these documents is detailed in Section 3 – Permitting Requirements. It is anticipated that a Western consultant will be hired to complete the feasibility study and that Russian specialists will be hired to satisfy the Russian permitting requirements. To date, these qualified persons have not been chosen. The current timeline for the project includes construction beginning in 2005 (foundations and earthworks), continuing in 2006 through the 2nd quarter of 2007. Start-up is anticipated in 4th quarter 2007 with full production beginning in 2008. |
| | |
| 18.2 | Mining The mining sections were completed by SRK Consulting with support from Bema Gold Corporation and the resource model completed by AMEC Consultants. A detailed description of the entire mining report is provided in Section 6 of the Preliminary Assessment. The mining plan calls for both open pit and underground mining methods. The total identified mineable (indicated and inferred) resource outlined by the open pit and underground plans is 11.57 million tonnes of ore at a grade of 14.72 g/tonne gold and 181.8 g/tonne silver over a 12 year mine life. This includes 4.98 million tonnes from the open pit at a grade of 16.07 g/tonne gold and 172.9 g/tonne silver, this includes the 20% dilution at the actual gold and silver grades reported in the Block Model. Also, 6.59 million tonnes from the underground at a grade of 13.70 g/tonne gold and 188.6 g/tonne of silver, this includes the 19% dilution at a gold grade of 2 grams per tonne and a silver grade of 20 grams per tonne. 18.2.1 Open Pit The ultimate pit depth was calculated at 180 metres. This assumes that the entire pit is within permafrost and therefore, does not include any groundwater influences in the pit slope design. It was assumed that a final bench geometry of 24 metre bench height (70º bench face angle) with a minimum bench width of 10 metres can be successfully and safely mined. The average overall slope angle of the pit will varies depending on geotechnical parameters but averages 50 degrees. The selectivity for the open pit is constrained by the minimum mining width of 3 metres. The cut off used to outline potential open pit mineable blocks for this exercise is 6 grams per tonne of gold. The Kupol open pit will be mined as a standard truck/shovel operation, with the crusher located at the processing plant, and the mid-point of the waste dump is located approximately 2 km to the south of the processing plant. Given the overall strip ratio of 20:1, and bench by bench strip ratios of up to 43:1 in the upper benches, the focus will be on keeping ahead on the waste in order to ensure adequate and timely ore exposure. |
| Technical Report - Kupol Project Preliminary Assessment Summary | 183 |
| Bema Gold Corporation | |
| | Three hydraulic shovels (11 m3) have been selected as the main loading units in waste as they provide superior break out force when digging tight or frozen muck as compared to wheel loaders. These shovels will be matched with 90 tonne mining trucks that will be used for both waste and ore haulage. Based on cycle times for average haul distances to the crusher and waste dump, and on 340 scheduled days per year, this will require a fleet of 12 trucks. Drilling requirements in waste would be handled by tracked, diesel powered rigs equipped with DHD drills capable of single-pass drilling of 8m benches with an additional 1 m for sub-grade, with a hole size of 152mm – 229mm (6” – 9”). The production schedule for the open pit assumes pre-stripping and stockpiling commences in Year 0. Ore from the open pit will be mined during the 1st four years of operation. Table 46, Open Pit Production Schedule shows the amount of material mined and the average grades per year from the open pit. The production schedule assumes that the pit operators work 340 days per year on two – 11 hour shifts. Table 45. Open Pit Production Schedule |
| OPEN PIT PRODUCTION | Preproduction | YR 1 | YR 2 | YR 3 | YR 4 |
| | | | | | |
| High Grade Ore Pit | | | | | |
| Production | 366,500 t | 956,100 t | 1,095,200 t | 435,300 t | 101,700 t |
| Au Grade | 24.88 g /t | 26.11 g /t | 22.18 g /t | 15.45 g /t | 15.48 g /t |
| Ag Grade | 232.1 g /t | 258.1 g /t | 250.2 g /t | 155.6 g /t | 227.2 g /t |
| % Indicated | 91% | 70% | 62% | 86% | 20% |
| % Inferred | 9% | 30% | 38% | 32% | 80% |
| | | | | | |
| Low Grade Ore Pit | | | | | |
| Production | 86,600 t | 448,700 t | 467,900 t | 535,400 t | 484,600 t |
| Au Grade | 6.98 g /t | 6.23 g /t | 6.51 g /t | 6.51 g /t | 6.97 g /t |
| Ag Grade | 62.4 g /t | 58.5 g /t | 74.5 g /t | 77.0 g /t | 116.4 g /t |
| % Indicated | 78% | 61% | 53% | 75% | 29% |
| % Inferred | 22% | 39% | 47% | 25% | 71% |
| | | | | | |
| Total Ore Pit Production | 453,100 t | 1,404,800 t | 1,563,100 t | 970,700 t | 586,300 t |
| Au Grade | 21.46 g /t | 19.76 g /t | 17.49 g /t | 10.52 g /t | 8.45 g /t |
| Ag Grade | 199.6 g /t | 194.4 g /t | 197.6 g /t | 112.2 g /t | 135.6 g /t |
| | | | | | |
| Waste Pit Production | | | | | |
| Acid Generating | 970,000 t | 4,333,000 t | 6,832,000 t | 2,517,000 t | 3,717,000 t |
| Potentially Acid Generating | 10,534,000 t | 13,665,000 t | 12,507,000 t | 14,930,000 t | 9,913,000 t |
| Non-Acid Generating | 4,278,000 t | 3,783,000 t | 2,421,000 t | 4,983,000 t | 1,450,000 t |
| Unclassified | 514,000 t | 213,000 t | 277,000 t | 339,000 t | 20,000 t |
| Overburden | 404,000 t | 451,000 t | 400,000 t | 130,000 t | 1,000 t |
| Total Waste | 16,700,000 t | 22,445,000 t | 22,437,000 t | 22,899,000 t | 15,101,000 t |
| | | | | | |
| High Grade Ore per Day | 1,078 t /d | 2,812 t /d | 3,221 t /d | 1,280 t /d | 299 t /d |
| Low Grade Ore (Stockpiled) | 255 t /d | 1,320 t /d | 1,376 t /d | 1,575 t /d | 1,425 t /d |
| Technical Report - Kupol Project Preliminary Assessment Summary | 184 |
| Bema Gold Corporation | |
| per Day | | | | | |
| Waste Tonnes per Day | 49,118 t /d | 66,015 t /d | 65,991 t /d | 67,350 t /d | 44,415 t /d |
| Total Rock Tonnes per Day | 50,450 t /d | 70,146 t /d | 70,589 t /d | 70,205 t /d | 46,139 t /d |
| | 18.2.2 Underground |
| | | |
| | All of the underground deposit falls within the inferred category at this time. The Kupol mineralization is typical of a high grade vein hosted deposit: single and multiple veins; globally continuous mineralized vein with localized discontinuous segments and variable thickness. Veins on surface were exposed with trenches that crossed the orebody and were excavated at 4 metre intervals providing detailed information on the orebody at that elevation. In contrast, the drill hole information at depth in the underground mine area is typically in excess of 100 metre spacing and provides a less clear picture of what might be encountered. As the density of diamond drilling for underground increases, the boundaries of the mining blocks will be refined and will likely change. The cut-off used to outline potential underground mineable blocks for this exercise is 7g/tonne gold. |
| | | |
| | The underground mining plan excludes indicated and inferred mining blocks (600 metres long x 60 metres high) that have an overall block value of less than 7 g/tonne gold equivalent. The underground mining plan assumes that the entire underground mine is located in permafrost but this assumption is only based on speculation and more studies are needed. Based on the geometry of the mineralization and the assumption that the underground mine rock mechanics are strengthened by permafrost, the following two underground mining methods are proposed: |
| | |
| | • | Long-hole with rock fill where the geometry is reasonably consistent and sufficiently wide |
| | • | Cut-and-fill where the geometry is more variable or much narrower |
| | | |
| | If the assumption that permafrost significantly strengthens the rock mass is correct, then it has further been assumed that there will be no constraints on size of openings within the typical range of mineralized thicknesses in the model. Dilution has been calculated at approximately 19%. The underground mine plan assumes that two declines can average approximately 1100 tonnes per day ore and waste over 13 years. Development of both declines begins in Year 1 and ore haulage in Year 3. Table 47, Underground Production Schedule shows the amount of material mined and the average grades per year from the open pit. The production schedule assumes that the pit operators work 365 days per year on two – 10 hour shifts. |
| Technical Report - Kupol Project Preliminary Assessment Summary | 185 |
| Bema Gold Corporation | |
Table 46. Underground Production Schedule
Underground
Production | Tonnes | Gold
Grade | Silver
Grade | Tonnes
per Day |
| | | | | |
| YR 2 | 1,500 t | 19.51 g/t | 265.8 g/t | 4 t /d |
| YR 3 | 497,300 t | 12.73 g/t | 168.5 g/t | 1,362 t /d |
| YR 4 | 743,816 t | 13.16 g/t | 177.6 g/t | 2,038 t /d |
| YR 5 | 800,480 t | 14.28 g/t | 180.8 g/t | 2,193 t /d |
| YR 6 | 803,402 t | 14.28 g/t | 187.5 g/t | 2,201 t /d |
| YR 7 | 777,369 t | 14.01 g/t | 185.5 g/t | 2,130 t /d |
| YR 8 | 728,892 t | 13.96 g/t | 182.0 g/t | 1,997 t /d |
| YR 9 | 717,440 t | 13.58 g/t | 193.9 g/t | 1,966 t /d |
| YR 10 | 725,800 t | 13.41 g/t | 200.1 g/t | 1,988 t /d |
| YR 11 | 674,700 t | 13.42 g/t | 211.1 g/t | 1,848 t /d |
| YR 12 | 122,487 t | 13.91 g/t | 229.6 g/t | 336 t /d |
| | | | | |
| TOTAL | 6,593,185 t | 13.70 g/t | 188.6 g/t | |
| | The waste cross-cut access off the main decline will be 5m by 5m until the re-handle bays are reached; beyond the remuck bays it will be 4m by 5m with the height needed for 2 x 1.1m diameter ventilation tubing. Development in ore will be 4m to 5m high and the full width of the ore (except where it is wider than 8m when it will be limited to that width or two parallel headings used placed on the hanging wall and footwall contacts); the width is very seldom greater than 8m. All development will use 2 boom jumbos. It is planned to use dry drilling rather than brine to maintain frozen conditions; this may require a variance. The backfill cycle is an integral part of the production cycle and on an annual basis approximately 1400 tonnes per day of backfill is required to be placed to maintain 2000 tonnes per day of ore production. It is assumed that sill mats can be constructed of waste rock, sprayed with water and frozen in place. Backfill will be a combination of run-of-mine waste either directly from underground development, with open pit waste or waste from a borrow source located on surface. The waste for backfill that is obtained from the surface sources may need to be sized to below 0.3m. Waste from the surface sources would probably be trucked with the open pit mine trucks (CAT 777) to a stockpile area near the portal, then reloaded onto the underground mine trucks (Elphinstone AE40 or AD40) and back-hauled to the stopes requiring backfill. Ore and waste haulage will be accomplished using 40 tonne articulated trucks. Development of declines and access ramps will be completed using 6.3 yd3 and 7.6 yd3 LHDs. |
| Technical Report - Kupol Project Preliminary Assessment Summary | 186 |
| Bema Gold Corporation | |
| | 18.2.3 Wasterock The total amount of waste produced is approximately 100 million tonnes. Mine waste rock will be generated primarily by the open pit (~99%). For purposes of this preliminary assessment, only the open pit waste materials have been taken into account. This figure includes about 1.5 million tonnes of overburden that will be stockpiled for dump reclamation. An ideal waste dump site exists immediately to the west of the open pit, proving a short, level or slightly downhill haul. The dump foundation conditions are generally good, and the dump surface is gently sloping so there will be no significant geotechnical stability concerns. In order to characterize the wastes, a geochemist (Dr. Steve Atkins) prepared a program for geochemical characterization of the wastes. Approximately 234 samples were selected for acid generation potential and other geochemical testing. The results of the geochemical characterization indicated that approximately 19% of the material may be acid generating, approximately 17% of the material may be non-acid generating, and the remaining portion (~64%) is potentially acid generating and must be classified in the field. The non-classified material has been assumed to be non-acid generating for this study. A site has been selected for the waste dumps, immediately to the southwest of the open pit. The waste dump site has ideal characteristics. It is on a moderately sloping knoll formed by shallow bedrock. The top of the waste dump site is near the pit exit of one of the main haulage ramps, so waste haulage distances will be very short. The dump area has a relatively small catchment area upslope, so that there will be modest runoff onto the dump site. The objectives of waste management strategy will be to develop a dumping plan that will isolate acid generating (AG) and potentially acid generating (PAG) materials, and minimize infiltration and enhance freezing, for control of acid generation and metal leaching. It is expected that freezing of the entire mass of potentially reactive waste materials should be achievable. Waste materials will be sorted during mining into AG, NAG and PAG categories so that each material can be placed in designated waste dump zones. ARD classification of the wastes will be accomplished by sampling and assaying blasthole cuttings in the mine. The assay will be done by relatively fast index sulphur testing such as the Leco S test. Following testing, blasted waste materials will be flagged to identify their ARD classification, and haul trucks directed to the appropriate dump location. |
| | |
| 18.3 | Process Description A detailed process description is presented in Section 8. The mill is designed to have an average throughput of 3,205 tonnes per day at 94% availability at a grind size of 80% passing 325 mesh (maximum 3,409 tonnes per day at 100% availability) with an annual availability of 94%. This equates to an annual throughput of 1,169,997 tonnes per year. Cyanide testing is just beginning. Technologies that are under consideration at this time include peroxygen and SO2/air. The current mill design allows for two tanks, each with a 1- |
| Technical Report - Kupol Project Preliminary Assessment Summary | 187 |
| Bema Gold Corporation | |
| | hour retention time, and inclusion of sodium meta-bisulphite and copper sulphate mixing systems. The estimated reagent consumption for the mill is provided in Table 48 Estimated Mill Reagent Consumption. |
Table 47. Estimated Mill Reagent Consumption
| Reagent | Consumption (kg/tonne milled) | ConsumptionA(tonne/year) |
| Sodium cyanide | 2.70B | 3158 |
| Lime | 2.20 | 2573 |
| Flocculant (AF-305) | 0.30 | 351 |
| Lead nitrate | 0.26 | 304 |
| Zinc Dust | 0.10 | 117 |
| Antiscalant | 0.05 | 58 |
| Hydrochloric acid | 0.01 | 12 |
| Copper sulphate | 0.27C | 316 |
| Sodium metabisulfite | 3.77C | 4410 |
| Diatomite | 0.05 | 59 |
| | kg/kg doré produced | tonne/yearD |
| Borax | 0.75 | 191 |
| Sodium Nitrate | 0.25 | 55 |
| | ABased on an average daily throughput of 3205 tonnes/day
BAssumes a cyanide recovery circuit adds 0.5 kg/tonne of NaCN
CAssumes a cyanide recovery circuit reduces consumption of reagents
DBased on an annual production of 225 tonnes of dore. |
| | |
| | The maximum fresh water make-up for the mill processing needs is approximately 169.3 m3/hour. This is based on a maximum dry feed rate of 3409 tonnes per day. Assumptions in the water balance include: |
| | • | Ore feed contains 3% moisture; |
| | • | Solids specific gravity is 2.6; |
| | • | Water retained by the tailings is 30%; |
| | • | CCD wash ratio is 3:1; and, |
| | • | The percent solids to the dam is 45%. |
| | | |
| | Process water for the mill water balance can either be sourced from the tailings dam or from process water wells located downstream of the tailings facility. |
| | |
| 18.4 | Tailings Facilities The preliminary assessment for the tailings disposal facility was completed by AMEC Earth & Environmental (AMEC). The preliminary assessment design is based on a total tailings volume – 10,000,000 tonnes, with potential for expansion to 20,000,000 in future. It includes a daily tailings storage requirement of: |
| | | |
| | • | Years 1 through 4 - 3000 tonnes per day (peak 3409 tpd) |
| Technical Report - Kupol Project Preliminary Assessment Summary | 188 |
| Bema Gold Corporation | |
| | • | Year 5 onward – 2000 tonnes per day (with potentially a portion of tailings to underground backfill) |
| | | | |
| | The preliminary assessment focused on two (2) options: |
| | |
| | | |
| | • | Dry stack tailings (100%); or, |
| | • | Conventional tailings system. |
| | | |
| | While both options will be brought forth to the feasibility stage, the conventional tailings system was included in the cost estimates for the prefeasibility. This is due to the lack of data for tailings filtration during this stage of the design and the consideration that the conventional system will provide the more conservative cost estimate for the study. The conventional tailings impoundment site would be developed by construction of a dual geomembrane-lined rockfill dam. Tailings and reclaim water lines would have lengths of about 3.5 km. Operation of the impoundment in winter would require storing enough water to allow formation of an ice cap over the pond in the order of 2 m thick, and all tailings to be disposed beneath the ice cap. Assuming all catchment runoff water is stored in the impoundment, and subsequently used as process water, the water balance shows that there would be essentially a net balance in the tailings impoundment. However, this balance is based on average precipitation data and assumed runoff coefficients. In the event of a higher-than average annual precipitation, there could be a significant excess of water. Diversion ditches will need to be constructed to allow discharge of excess water. It is proposed that the ditches would have discharge controls that would allow spilling into the impoundment or diverting, depending on water storage needs. The tailings starter dam is designed to store 5 years of tailings (~5.1 M t or 3.9 Mm3) with a crest elevation of 534 m for an embankment height of 26 m. The starter dam will have a crest width of 10 m. The upstream slope is 2.5H:1V and a downstream slope is 1.75H:1V. The dam embankment will be constructed of locally quarried bedrock, or suitable mine waste rock, that will be spread and compacted in 1 m lifts. A composite liner system (geosynthetic clay liner (GCL) and high density polyethylene (HDPE) or Arctic liner (LLDPE)) will be placed on the upstream face of the dam. Construction scheduling at Kupol is critical, both because of the need to bring all major equipment, materials and supplies in over a winter road, and because of the very short summer season. The slurry tailings impoundment would require two construction seasons to complete the lined rockfill dam, and hence would require mobilization of equipment in the winter of 2005-2006, to allow construction in 2006 and 2007. The following site investigation activities should be undertaken in summer 2004 to finalize the tailings disposal option selection and to provide data for feasibility design: |
| | |
| | a) | Survey. The following ground surveys should be completed as a minimum: |
| | | • | Dry stack area |
| Technical Report - Kupol Project Preliminary Assessment Summary | 189 |
| Bema Gold Corporation | |
| | | • | Road corridor to dry stack area |
| | | • | Tailings impoundment area. In 2003 the dam site was surveyed. However, as the dam survey was not tied in to the impoundment topography, this survey was of limited use. The entire impoundment area should be surveyed up to above elevation 600 m to allow accurate calculation of the impoundment elevation- storage relationship and also to allow for layout and design of diversions. |
| | | • | Tailings access road and tailings pipeline corridor |
| | | |
| | b) | Geological mapping. AMEC proposes that a senior geological engineer map the surficial geology of the tailings dam site and dry stack areas. The objectives of the mapping at the tailings dam site will be to optimize the dam location with respect to both topography (optimum site for dam fill volume) and abutment and valley bottom foundation conditions. At the dry stack area, the mapping will be to develop a general appreciation of the geology and geotechnical conditions. Based on the mapping, geophysical and geotechnical drilling programs will be laid out. |
| | | |
| | c) | Geophysical surveys. Geophysical surveys should be undertaken to assist in identifying depths of overburden overlying bedrock and also to identify any significant ice lensing that may be present in the foundations. At Julietta Mine, ground penetrating radar (GPR) was used effectively to locate ice lensing in the tailings area. |
| | | |
| | d) | Geotechnical drilling. Geotechnical drilling will be required to develop a thorough understanding of the tailings dam foundation conditions. High quality drilling must be done to allow quantification of ice content and to identify ice lensing in the foundations. A number of drillholes should also be completed to characterize the dry stack foundation area. |
| | | |
| | e) | Thermistor installations. Thermistors should be installed in drill holes in the tailings dam foundation area. The temperature data from these thermistors will be of vital importance for thermal modeling for feasibility design. |
| | | |
| | f) | Hydrologic monitoring. The hydrology of the tailings basin needs to be better understood to assess whether there will be an excess flow in the tailings valley catchment requiring diversions and also for design of the diversions. Stream gauging should be carried out to assess the total runoff from this basin and the peak flow characteristics of the main stream in the tailings basin. |
| | | |
| 18.5 | Water Supply The preliminary assessment for the water supply was completed by AMEC Earth & Environmental (AMEC) and is presented in Section 10 of the Preliminary Assessment. This report assumes that the estimated water requirements at the Kupol facilities will be approximately 400,000 to 600,000m3/yr (1,100 to 1,600 m3/day) for process water, and |
| Technical Report - Kupol Project Preliminary Assessment Summary | 190 |
| Bema Gold Corporation | |
| | 35,000 to 50,000m3/yr(100 to 140m3/day) for the potable water. There were several options investigated during this study to include: |
| | | |
| | • | Option 1: Alluvial deposits in Kaiyemraveyeem Creek downstream (south) of the deposit; |
| | • | Option 2: Alluvial deposits in Sarichnaya River (north) of the deposit; |
| | • | Option 3: Surface water storage in the tailings basin; |
| | • | Option 4: Water from the shallow lake located north of the mine; and, |
| | • | Option 5: Water supply dam on Kaiyemraveyeem Creek. |
| | | |
| | Option 1: Alluvial Deposits in Kaiyemraveyeem Creek Downstream (South) of the Mine Downstream of the site, at a distance of approximately 4 km (and farther south) the Kaiyemraveem Creek flows in a wide valley with relatively steep slopes and a flat bottom. In the valley bottom the creek terraces are very well developed and consist of sand and gravel. In the summer and fall streamflow is present at the ground surface. In places the riverbed is dry, but in these locations the water flows below ground, within the sand and gravel deposits. At a distance of approximately 17 km south of the mine site groundwater discharge has been observed, resulting in extensive naled formation in winter (persona communication from local workers). This naled indicates that groundwater flows in the alluvial deposits all year round, which in turn confirms the existence of talik conditions under the stream bed. At a distance of approximately 5 km from the mine and campsite the gravel deposits are over 10 m thick. The positive features of this process water option are: 1) proven conditions of groundwater existence in the alluvial deposits, and 2) high extraction rates available due to the permeable nature of alluvial strata. Also, a relative proximity and easy access to the mine site make this option attractive. Downstream (south) of the test location groundwater resources are even more abundant, as the drainage network recharging the aquifer becomes more extensive. The downside of moving the water intake (wells) southward would be a greater distance from site, and therefore an increased length of the water pipeline. The main disadvantage of this option is the location of groundwater intakes (wells) downstream of the mine site, tailings facility and camp(s), which could potentially contribute to surface and groundwater contamination. There is no confining, low-permeability layer, which would naturally protect the shallow alluvial aquifer; therefore it has to be assumed that groundwater could be process-affected in the future and these wells should not be used for potable water supply. The preliminary assessment assumed that water would be sourced from a well south of the facility for process water and that a suitable potable water source would be found north of the facilities. The following site investigation activities should be undertaken in summer 2004 to finalize the groundwater intake option selection and to provide data for feasibility design: |
| Technical Report - Kupol Project Preliminary Assessment Summary | 191 |
| Bema Gold Corporation | |
| | • | Complete additional, shallow production well(s) in Kaiyemraveem Valley near the VES-3 site, based on confirmation by the aquifer test in April 2004 that there is a year-round aquifer at this location. Further long-term aquifer testing may be required. |
| | | |
| | • | Drill an exploration hole, and possibly completion of production well to the base of talik at VES-3, i.e., to the depth of approximately 100m deep, pending the results of earlier investigations. |
| | | |
| | • | Continuously pump the wells at the VES-3 location for a period of up to 2 months during the winter of 2004-2005 to assess whether there is sufficient water in storage for long-term extraction. If this long term pump test should indicate that the aquifer at VES-3 location may become depleted with long term pumping, then the next target for process water is still in the Kaiyemraveem Creek valley but further south, downstream of the confluence of the “tailings” creek (south of N 7,406,000), or even further south. In such a case geophysical examination of the valley cross-section (vertical electric resistivity, VES) should be completed prior to the exploration hole drilling and completion of the production wells. It may be prudent to carry out electrical resistivity surveys at the downstream locations as a contingency to identify potential well sites. |
| | | |
| | • | At the selected location in Starichnaya River valley (N 7,418,000) geophysical examination of the valley cross-section (vertical electric resistivity, VES) should be completed. Interpretation of the results should be carried out on-site in order to select a location for exploratory drilling and production wells. The geophysical investigations should be verified and possibly re-interpreted with borehole logs. Drill exploratory hole(s) to the top of bedrock and establish the exact site stratigraphy. Install thermistors and measure ground temperatures to evaluate the depth of talik. Depending on the established site conditions, complete water wells and carry out aquifer test in order to establish the potential production rates and groundwater quality. |
| | | |
| | • | Further investigation of the potential for developing Mud Lake as a potable water source should also be investigated. The lake should be sounded while ice is still present for access. Note that at the present time it is considered that deep groundwater exploration (over 200 m) through the permafrost into the underlying bedrock is not promising, as the bedrock aquifers would unlikely offer high production rates, and in addition, may produce saline water. Therefore, such an option is not recommended. |
| | | |
| 18.6 | Ancillary Facilities Due to its remote location, the Kupol project must include all ancillary support facilities to include access roads, airport facilities, mancamp, power generation, fuel storage and distribution, wastewater treatment plant and other necessary facilities. |
| Technical Report - Kupol Project Preliminary Assessment Summary | 192 |
| Bema Gold Corporation | |
| | 18.6.1 Access Roads The main access road is from the Pevek port facilities to Bilibino and then to the Kupol site. The towns of Pevek and Bilibino are connected with a winter road (~325 kilometers) and an all seasons road (~575 kilometers). The winter road follows the contour of Chaunskii Bay and then travels in a more or less straight line southwest to Bilibino. It is passable (in most years) between the middle of December and the middle of April. The summer road is a gravel road that, in theory, can be used all year long. The road does not have any bridges, despite having to cross several rivers. The total distance between Bilibino and site is approximately 300 kilometers. The site is connected to Bilibino via a winter road that is passable (in most years) between the middle of December and the middle of April. The road travels from Bilibino south to Keperveyeem (approximately 35 kilometers of all-seasons road). From Keperveyeem, the road travels along the Maly Anyui River to Ilernyi (approximately 140 kilometers of winter road that is maintained by the government). From Ilernyi, the winter road travels southeast to the site (approximately 160 kilometers) to site. 18.6.2 Airport facilities The airstrip has been designed and will be constructed in the summer of 2004. It will be constructed approximately 10 kilometers north of the mine site along a plateau in Starichnaya valley. The airstrip will initially be 1500 meters long (including approaches) by 150 meters wide and is expected to be expanded to accommodate larger planes (AN26, AN12). The airstrip will also have a 1000 m3 fuel tank for aviation fuel and 50 m3 fuel tank for surface vehicles. There will also be a small building for shift change inspection and airstrip support. 18.6.3 Mancamp There are currently 2 options for location of the mancamp. Option 1 is 200 meters northwest of the powerhouse section of the mill located near the fuel farm. Option 2 is 200 meters northeast of the warehouse and administration complex portion of the mill. Both cases require that the mancamp be connected to the mill via a heated arctic corridor. The living facilities of the man camp will provide a comfortable living environment for 500 people. It will include 8 modules connected by a six-meter wide arctic corridor. The distance between each of the modules will be 40 feet (12.2 meters). Each module will be separated from the arctic corridor by a fire wall and have 2 exits (1 at each end). Additionally, there will be a cafeteria and lounge centrally located along the arctic corridor between the sleeping units. 18.6.4 Power Generation The power requirement for the Kupol Project is ~12 MWatt with heat recovery from the generators (without heat recovery it will be approximately 18 to 20 MWatts). This includes a 2.5 MWatt allowance for the mine. The anticipated site power demand of 12 MWatt equates |
| Technical Report - Kupol Project Preliminary Assessment Summary | 193 |
| Bema Gold Corporation | |
| | to an average 91% engine loading factor. Four medium speed diesel engines rated at 4.4 MW (operating at 900 RPM) will act as the primary generators. Three of these engines will be operational and the fourth unit will serve as a back-up/stand-by. Additionally, three generator sets rated at 1.45 MW (each) operating at 1200 RPM will provide emergency backup and will be used to balance the power load. These units will serve as emergency back-up in case of a major engine failure or scheduled overhaul of one of the larger units. One or two of the 1.45 MW generator sets will also provide peak power back-up while starting the SAG and/or Ball Mill. Additionally, a 1400 KW rated generator will be installed in a used, heated cargo container adjacent to the camp. The generator will have its own 24-hour fuel supply and will supply emergency power to the camp, communications system and selected mill equipment in case of a catastrophic event in the powerhouse. The generating sets will operate on No. 2 fuel oil, either winter or arctic grade. All generator sets will be equipped with a cooling water and exhaust waste heat recovery system designed to provide heat to the mill, tank area and the truck shop, the cake building, warehouse and offices / mine dry and the camp complex. Note that any building located more than 500 meters from the mill complex will have to be heated using either small boilers or electrical heaters. This includes: the mine portal building, explosives storage/ANFO facilities, security checkpoint, the well pumphouses, and the airport facilities. 18.6.5 Fuel Storage and distribution It is estimated 40,000m3 (33,000 tonnes) of diesel fuel will be required to operate the powerhouse, camp, mill, and mobile equipment at Kupol for 12 months. Note that since fuel is transported for 3 months during the winter, that the site fuel storage requirements do need to contain the full, annual amount. Grade No.2, winter and arctic grade diesel fuel, will be stored in a lined and contained fuel farm about 300 meters from the mill building and fed to the powerhouse by gravity. The volume of containment will be 110% of the largest tank within the containment area. The fuel farm is designed to accept up to nine 3000 m3 fuel storage tanks. All of the fuel tanks will be fabricated in Russia and will be suitable for the arctic conditions. All tanks will be certified to meet Russian safety and environmental standards. All fuel for the site will be trucked from Pevek over the winter road. Fuel will be unloaded on a concrete slab with a center sump to control spillage. Two fuel trucks (the maximum fuel load per truck 16 m3) may unload at the same time. 18.6.6 Wastewater treatment plant The wastewater treatment plant will be a series of treatments designed to treat both sewage and kitchen wastes. It consists of a grease trap, an aerobic section, a biological contacting unit, a settling tank, and disinfection by UV light. The unit will be capable of handling up to 125 m3/day. The unit will be located near the mancamp and discharge into the tailings facility. If a dry stack is chosen, the unit will discharge into Kayemraveyeem Creek below the waste dump. |
| Technical Report - Kupol Project Preliminary Assessment Summary | 194 |
| Bema Gold Corporation | |
| 18.7 | Project Schedule The construction period is approximately three and a half years. The construction schedule is attached as Figure 63. Activities in Construction Year 1 are: |
| | | |
| | • | Erect Construction Camp for 250 man capacity, |
| | • | Construct site airstrip, |
| | • | Construct temporary site access roads, |
| | • | Earthworks for preparing building foundations, |
| | • | Crush and screen aggregate for Year 2 concrete, |
| | • | Conduct geotechnical investigations at the tailings impoundment site, dry stack site and waste rock site, |
| | • | Identify and improve winter road route from Pevek to site, |
| | • | Identify permanent process and potable water sources. |
| | | |
| | Activities in Construction Year 2 are: |
| | | |
| | • | Pour the concrete foundations for the majority of the surface facilities, |
| | • | Crush and screen aggregate for concrete, |
| | • | Erect six each 3,000 cubic meter fuel tanks, |
| | • | Expand site airstrip, |
| | • | Improve site access roads, |
| | • | Establish Pevek logistic facility. |
| | | |
| | Activities in Construction Year 3 are: |
| | | |
| | • | Install major process equipment, |
| | • | Erect all major buildings, |
| | • | Permanent Mancamp facility commissioned, |
| | • | Erect remaining fuel tanks, |
| | • | Commence earthworks for tailings facility, |
| | • | Improve site access roads. |
| | | |
| | Activities in Construction Year 4 are: |
| | | |
| | • | Install remaining process equipment, |
| | • | Erect remaining ancillary buildings, |
| | • | Complete electrical, piping and ancillary services, |
| | • | Pit pre-stripping commences and stockpiles ore, |
| | • | Complete site access roads and surface mine haul roads, |
| | • | Complete earthworks for tailings facility, |
| | • | Complete earthworks for waste rock dump, |
| | • | Commission Process and Plant facility. |
| | | |
| | Activities in Production Year 1 are: |
| | | |
| | • | Process plant fully commissioned, |
| Technical Report - Kupol Project Preliminary Assessment Summary | 195 |
| Bema Gold Corporation | |
| | • | Surface mine producing in excess of 3,000 tonnes of high grade ore per day and stockpiling the lowgrade ore for future milling, |
| | • | Underground mines commence development. |
| Technical Report - Kupol Project Preliminary Assessment Summary | 196 |
| Bema Gold Corporation | |
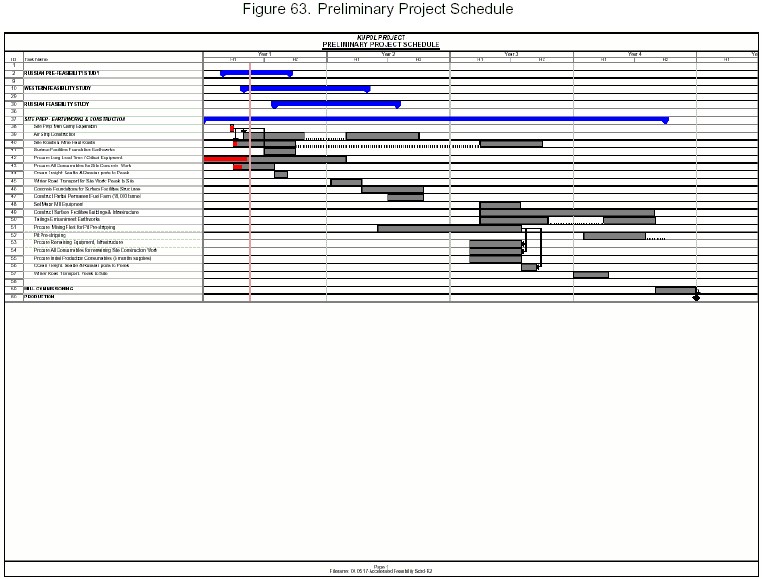
| Technical Report - Kupol Project Preliminary Assessment Summary | 197 |
| Bema Gold Corporation | |
| 18.8 | Preliminary Economic Evaluations 18.8.1 Metal Prices The metal prices used in the economic model were USD $350 per ounce of gold and USD $5.50 per ounce of silver. 18.8.2 Marketing and Refinery Agreement The milling facility located at the Kupol site will produce approximately 250 tonnes per year (650 kg per day) of dore (gold and silver product in bar form). These dore bars will be transported weekly by security personnel on an AN12 aircraft from the site to Magadan. The dore bars will then be transported by security in an armored vehicle from the Magadan Airport to the Kolyma Refinery located near Magadan. The refinery then refines the dore into gold and silver bullion bars meeting international standards. Per Russian regulations, the Central Bank of Russia has the first right of refusal to purchase the gold bullion and silver bullion, if they elect not to then the bullion can be exported for sale. The Preliminary Economic Assessment Model uses the current refinery agreement between Kolyma Refinery and Bema’s Julietta Mine as the basis for calculating the Net Production Value. The current agreement is the Refinery Contract No. 90/2001, dated August 7th, 2001 with Amendment No. 1, dated November 25th, 2002. The Kolyma Refinery has the capacity to refine the gold from Kupol but will need to expand their silver refinery in order to process the large amount of silver (7 million ounces per year) from Kupol. This is not expected to be an issue since previously they expanded their silver refinery to be able to refine the silver in the dore from the Julietta Mine. The Kolyma Refinery has several years to engineer and construct the silver refinery expansion prior to receiving dore from Kupol. 18.8.3 Currency Exchange Rates The recent historical exchange rate of 30 Roubles (RUR) to 1 United States Dollar (USD) is used in the Preliminary Economic Assessment evaluation. The Bank of Canada states the average annual exchange rate to USD $1.00 for 2000 was RUR 28.16, 2001 was RUR 29.20, 2002 was RUR 31.38, 2003 was RUR 30.68 and for the first four months of 2004 was RUR 28.65. 18.8.4 Manpower, Labor Rates, Rotation Schedule, Payroll Overhead The Preliminary Economic Assessment model shows the detailed staffing levels with job functions by year for each activity area (Surface Mining, Underground Mining, Processing, |
| Technical Report - Kupol Project Preliminary Assessment Summary | 198 |
| Bema Gold Corporation | |
| | Site General, General & Administrative) for the Kupol site. The staffing levels are based on similar operations and take into account the additional staffing requirements required by Russian regulations gained by Bema’s experience at Julietta. For further staffing detail refer to the economic model. Below is a summary of the staffing levels for each activity area. |
TOTAL
EMPLOYEES | YR
-3 | YR
-2 | YR
-1 | YR
0 | YR
1 | YR
2 | YR
3 | YR
4 | YR
5 | YR
6 | YR
7 | YR
8 | YR
9 | YR
10 | YR
11 | YR
12 |
Surface
Mine
| 1 | 3 | 50 | 307 | 286 | 280 | 280 | 256 | 4 | 4 | 4 | 4 | 4 | 4 | 4 | 1 |
Underground
Mine
| 1 | 1 | 1 | 15 | 176 | 195 | 296 | 334 | 330 | 282 | 296 | 290 | 286 | 268 | 252 | 73 |
Processing
| 0 | 1 | 2 | 64 | 172 | 149 | 145 | 144 | 142 | 142 | 142 | 142 | 142 | 142 | 142 | 36 |
Site General
| 1 | 58 | 92 | 155 | 221 | 220 | 234 | 228 | 195 | 190 | 192 | 179 | 170 | 169 | 165 | 74 |
General &
Administrative
| 14 | 14 | 14 | 20 | 28 | 27 | 27 | 27 | 27 | 27 | 27 | 27 | 27 | 27 | 27 | 8 |
Total
Employees
| 17 | 77 | 158 | 561 | 883 | 871 | 982 | 989 | 698 | 646 | 661 | 643 | 630 | 610 | 590 | 192 |
| | | | | | | | | | | | | | | | | |
Total
Employees at
Site per Day | 9 | 38 | 78 | 263 | 399 | 393 | 446 | 454 | 319 | 292 | 300 | 297 | 294 | 284 | 276 | 86 |
| | The labor rates for expatriates is based on existing rates from Bema’s Julietta operation located in Far East Russia. The labor rates for the local labor is based on existing base rates and salaries presently paid at Julietta and at Kupol. These labor rates are stated in the economic model next to each job position. The expatriates will be on a 6 week on site and 4 week off site rotation schedule, a similar schedule is in place at Julietta. The local labor will be on a 3 week on site and 3 week off site rotation schedule. The surface mine is scheduled to work 11 hour shifts, this includes their unpaid 1 hour lunch break, thus their effective paid time is 10 hours per day. The underground mine is scheduled to work 10 hour shifts, this includes their unpaid 1 hour lunch break, thus their effective paid time is 9 hours per day. The processing plant is scheduled to work 12 hour shifts, this does not include their 1 hour staggered lunch break, thus their effective paid time is 11 hours per day. The site general (consists of Power Generation, Admininstration, Logistics, Transportation personnel) is scheduled to work between 10 hours to 12 hours per day depending on the job position, this includes their 1 hour lunch break. The payroll overhead for expatriates is based on actual rates from Julietta. There is a total of 32.6% expatriate payroll overhead comprised of 14% for medical benefits, 6% for tax offset and 12.6% for workman compensation benefits. The local labor payroll overhead is based on actual rates at Julietta and at Kupol. Basically the employer’s payroll overhead is 400% of the employees base rate (for example if the employees base rate is 50 roubles per hour, the employer’s total cost is 250 roubles per hour). This 400% overhead is comprised of a 35% Unified Social Tax, 100% Chukotka Coefficient, a 100% Regional Coefficient, 40% night shift coefficient, 17% for offshift / additional pay rates, 33% for vacations, 7% for worked holidays, show up pay of 100 roubles per day, 7% for travel pay and annually calculated and based overtime rates of 50% and 100% for hours worked in excess of the straight time hours |
| Technical Report - Kupol Project Preliminary Assessment Summary | 199 |
| Bema Gold Corporation | |
| | for the year. The specific payroll overhead rates and their application is depicted in the economic model. 18.8.5 Economic Model Basis The economic model for the Preliminary Economic Assessment is an Activity Based Costing model. This model identifies the detail activities required for each work process. The resources and appropriate resource drivers were identified for each activity. The resources and resource driver requirements were calculated and actual supply, labor and logistic costs were used or estimated. This modeling method is appropriate for determining operating costs for the Kupol Project due to its uniqueness within the mining industry. Specific activity costs and equipment costs were modeled and then compared to actual operating costs at similar mining operations, such as Kinross Gold’s Kubaka Surface Mine located in Far East Russia, Cameco Corporation’s Kumtor Surface Mine located in Kyrgyzstan, Kennecott Corporation’s Greens Creek Mine located in Alaska, Bema Gold’s Julietta Mine located in Far East Russia, and other mines located in Nevada and United States. Equipment operating costs were also obtained from Caterpillar, Hitachi and Ingersoll Rand to provide a comparison and check with reported actual costs. Actual supply costs, processing reagent costs, grinding media, fuel, ocean and land freight costs where obtained from potential or existing suppliers and used in the economic model. 18.8.6 Preproduction Capital Cost Estimate The Preproduction Capital Cost Estimate for the Kupol Project’s processing plant and infrastructure was prepared by Orocon Incorporated. Orocon performed the engineering, procurement, construction and management for the process plant and facility at Bema Gold’s Julietta operation located in Far East Russia. The grinding mills and crushing equipment have already been secured and partial payment made, their total cost is included below. The Preproduction Capital Cost Estimate for Kupol Project’s surface mining equipment, underground mine equipment and infrastructure was prepared jointly between SRK Consulting and Bema Gold. The capital costs are for new equipment and based on quotes from the equipment manufacturer and equipment quotes from other mines that have recently purchased equipment. The total pre-production capital cost to construct the plant facilities including the tailing pond and owners costs is estimated at USD $186.3 million. In addition, due to the remote location of the project, it is expected that all consumables and supplies required for a 12-month period will be purchased and shipped to site prior to start up and total approximately $58.8 million. Open pit mine equipment as well as an initial underground mining fleet is assumed to be purchased by way of a capital lease at a total cost of $58.7 million. All pre-production capital, mobile fleet, owners costs and inventory amounts are inclusive of estimated importation duties. Value added taxes are refundable and have therefore been excluded from the presented totals. Refer to the economic model for supporting detail. |
| Technical Report - Kupol Project Preliminary Assessment Summary | 200 |
| Bema Gold Corporation | |
Table 48. Preproduction Capital Costs
| Preproduction Capital Cost Estimate | (USD $ millions) |
| | |
| Preproduction Plant & Equipment Capital Costs | |
| Processing Plant & Infrastructure | $150.6 |
| Site General | $1.3 |
| Processing CN Recovery | $5.4 |
| Owners Site Construction | $29.0 |
| Subtotal – Preproduction Plant & Equipment Capital | $186.3 |
| | |
| Owners Preproduction Capital Costs | |
| Surface Mining Costs (Pre-Stripping) | $20.8 |
| Underground Mine | $.9 |
| Processing Costs | $1.4 |
| Site Services | $.0 |
| General & Administrative | $7.9 |
| Subtotal – Owners Preproduction Capital | $35.0 |
| | |
| Inventory Costs | |
| Working Capital (supplies inventory) | $58.8 |
| | |
| Taxes(Property) | |
| Tax (Property, Environmental) | $13.4 |
| | |
| TOTAL preproduction capital | $293.5 |
| | |
| Mine equipment – capital lease | |
| | |
| Underground Mine Equipment | $18.9 |
| Surface Mine Equipment | $39.8 |
| Total Capital Lease - Mine Equipment | $58.7 |
| | 18.8.7 Operating Cost Estimate The operating cost estimate was prepared by Bema Gold and is based on actual or estimated supply costs, actual and estimated logistic costs, engineered productivity / production rates and equipment operating and maintenance costs from other operating mines and equipment vendors. Refer to the economic model for supporting detail. The total average Surface Mining cost per ore tonne mined is $23.73. The surface mining cost per rock tonne mined is $1.12. The total average Underground Mining cost per ore tonne mined is $31.66. |
| Technical Report - Kupol Project Preliminary Assessment Summary | 201 |
| Bema Gold Corporation | |
| | The total average Processing cost per ore tonne milled is $25.77. The total average Site Services cost per ore tonne milled is $1.91. The total average General & Administrative cost per ore tonne milled is $2.37. 18.8.8 Preliminary Economic Analysis The preliminary economic analysis indicates the Kupol project has a payback period for the preproduction capital investment and operating costs within approximately 18 months before Net Profit Tax and within approximately 25 months after Net Profit Tax. The Net Present Value before Net Profit Tax, using a per ounce gold price of $350 and a silver price of $5.50, at a 0% discount rate is $845 million, at 5% discount rate is $552 million and at 8% discount rate is $429 million. The Net Present Value after Net Profit Tax, using a per ounce gold price of $350 and a silver price of $5.50, at a 0% discount rate is $645 million, at 5% discount rate is $405 million and at 8% discount rate is $304 million. The Discounted Cash Flow Return on Investment is approximately 23.5% before taxes and 19.4% after taxes. This Preliminary Assessment includes the use of inferred resources that are considered too speculative geologically to have economic considerations applied to them that would enable them to be categorized as mineral reserves. Thus, there is no certainty that the results predicted by the Preliminary Assessment will be realized. The cash cost per gold ounce produced (less silver credits) averages $39 per ounce for the first two years of operation, $70 per ounce for the first five years of operation and the life of mine averages $76 per ounce. The full cost per ounce produced, which includes production royalty taxes of 6% for gold and 6.5% for silver, (less silver credits) averages $72 per ounce for the first two years of operation, $104 per ounce for the first five years of operation and the life of mine averages $112 per ounce. See Table 49 below for a summary of the economics by period. |
| Technical Report - Kupol Project Preliminary Assessment Summary | 202 |
| Bema Gold Corporation | |
Table 49. Economic Model Summary
| Technical Report - Kupol Project Preliminary Assessment Summary | 203 |
| Bema Gold Corporation | |
| | 19.0 Conclusions The following conclusions may be drawn from this Technical Report and the Preliminary Assessment which is being developed: |
| | | |
| | • | The Preliminary Assessment confirms that the Kupol Project and property contains a substantial resource that, with additional exploration and concept development, may be developed into a major gold producer. |
| | • | The drilling and trenching completed by Bema Gold and the reinterpretation of the geology of the deposits has improved the value of the project from previous assessments. |
| | • | The study demonstrated the positive impact of near surface, high grade deposits, such as that outlined in this report. |
| | • | The Preliminary Assessment is based on a series of assumptions and as a result incorporates a number of risks: |
| | • | The Preliminary Assessment also speculates on the impact of exploration success on the project economics. This speculation is intended to provide direction for future exploration. Bema Gold has developed a geological model for the property upon which it is reasonable to anticipate exploration success, but this report is not intended to endorse the certainty of that success. |
| | • | Many of the project concepts, including project operational logistics, the tailings impoundment facility, water supply and water treatment, were based on preliminary evaluations and Bema Gold’s experience on similar projects. Additional site-specific data will be required to confirm these concepts. |
| | • | A number of the project concepts may become focus issues during permitting. These include tailings disposal and mine water discharge. Bema is in the process of quantifying these impacts at this time. |
| | • | The financial analysis conducted for this Preliminary Assessment was valued at the date of a production decision and does not incorporate sunk costs. These costs include additional exploration to add to and increase the confidence in the mineral resource, geotechnical and water management data collection, metallurgical testwork to confirm and optimize the existing flowsheet, negotiations with others to construct the access road and provide power, permitting, and project financing. |
| | | |
| | Bema recommends the following be completed during the next phase of the project development: |
| | |
| | • | Drilling in 2004 should be biased toward providing sufficient drill information for completion of a feasibility study on the deposit. However, given that this is only the second season of a major drill campaign on the property, a secondary goal of the program should be to continue to assess the potential of the property. |
| | • | It is considered essential to undertake a detailed structural evaluation prior to the completion of a final feasibility study. This may require the drilling of suite of holes oblique(north-west dipping) to the current east to west section lines. The drilling of |
| Technical Report - Kupol Project Preliminary Assessment Summary | 204 |
| Bema Gold Corporation | |
| | | east-plunging holes, parallel to the proposed footwall slope is required to define both the geological structures and the rock mass conditions within the footwall. |
| | • | Site investigation activities should be undertaken in summer 2004 to finalize the tailings disposal option selection and to provide data for feasibility design. |
| | • | Site investigation activities should be undertaken in summer 2004 to finalize the groundwater intake option selection and to provide data for water sourcing for feasibility design |
| | • | Further investigation of the potential for developing Mud Lake as a potable water source should also be investigated. The lake should be sounded while ice is still present for access. |
| | • | Additional metallurgical testing to finalize processing design. |
| | • | Additional ABA testing to ensure that all waste material is adequately characterized. |
| | • | Additional environmental baseline studies to ensure that the site is adequately characterized. |
| Technical Report - Kupol Project Preliminary Assessment Summary | 205 |
| Bema Gold Corporation | |
| | 20.0 Recommendations |
| | | |
| 20.1 | Geology It is recommended that in 2004: |
| | |
| | 3. | Testing methodology for specific gravity measurement be changed to the ASTM C914-95 (Re-approved 1999) wax coated immersion method. |
| | 4. | Random specific gravity measurements should be taken in order to reduce sample selection bias. |
| | | |
| 20.2 | Drilling program 2004 Drilling in 2004 will be biased toward providing sufficient drill information for completion of a feasibility study on the deposit. However, given that this is only the second season of a major drill campaign on the property, a secondary goal of the program will be to continue to assess the potential of the property. Towards these ends the following program is recommended: |
| | | |
| | • | Upgrade resource in area of proposed open pit(s) to measured and indicated. |
| | • | Increase drill density throughout deposit area to advance sections of deposit to Russian C1, C2, P1 and P2 classifications in accordance with 2004 Proyekt submittal to Geolkom. |
| | • | Exploration drilling to attempt to determine limits of main Kupol structure including drilling to depth to determine boiling level of system, and drilling along strike to determine extent of mineralization and vein system. |
| | • | Initial exploratory drilling of additional exploration targets on the property. |
| | • | Condemnation (sterilization) drilling of infrastructure and airstrip areas. |
| | • | Metallurgical drilling (PQ and HQ). |
| | • | Geotechnical (slope stability test) drilling. |
| | |
| | Fifty seven thousand metres of drilling have been allocated toward this program. Drilling will be conducted utilizing two CKB-4 Russian drills, three Longyear 44 drills and two Longyear 38 drills. A drill hole spacing study by AMEC Americas will determine the drilling density required to upgrade the recourse classification in each of the main areas of the deposit. |
| | |
| 20.3 | Mining It is considered essential to undertake a detailed structural evaluation prior to the completion of a final feasibility study. This may require the drilling of suite of holes oblique(north-west dipping) to the current east to west section lines. |
| Technical Report - Kupol Project Preliminary Assessment Summary | 206 |
| Bema Gold Corporation | |
| | The drilling of east-plunging holes, parallel to the proposed footwall slope is required to define both the geological structures and the rock mass conditions within the footwall. |
| | | |
| 20.4 | Resource and Reserve Modeling The following items should be considered when building the next computer model for reporting resources at Kupol: |
| | | |
| | • | The areas where there are only Russian drill holes should be re-drilled to fill in this gap in data. |
| | • | A systematic approach to re-sampling some of the Russian trenches should be completed. |
| | • | For resource estimation a single model should suit both underground and open-pit purposes; however to support mine planning, allowances for dilution and ore loss should be separately applied for blocks to be taken by open-pit and underground. If feasible, the block width should be reduced to 1.5 m. |
| | • | A lower cutoff grade within the Vein should be used to define the mineralized zone to reduce the over-influence of the low grade material during block estimation. This should be done only if close-spaced drilling and trenching demonstrates strongly that segregatable low-grade zones within the vein exist. |
| | • | Stratigraphic coding and coding of different vein splays for composites and blocks would improve the appearance of block model estimates. The vein splay coding is particularly important for controlling the projection of grades within a splay. |
| | • | Fault and dyke material may have different geotechnical characteristics; they should be modelled separately. |
| | • | The composite length and block size should be more compatible. |
| | • | Trench data should be handled separately from the diamond drill hole data in future models. One approach would be to build separate models and then combine them for the upper 4-8 benches but otherwise the trench model is unused. |
| | • | Based on the complexity and size of the Kupol model(s) and the need to re-estimate resources in a short time frame, serious consideration should be given to using a different software package such as Datamine, MineSight or Vulcan for future Kupol models. |
| | • | Additional drilling should be completed to bring the Inferred Resource within the open pit into the Indicated category as well as targeting some of the material in the preliminary underground mine plan. The specific drill hole spacing needed to bring these areas into reportable resource categories or into a higher confidence level of resource will be better known at the completion of the Drill Hole Spacing Study underway by AMEC. |
| | | |
| | Two or three areas should be selected for placement of close spaced drill holes on an approximate 5 (across strike) x 10 to 12 (along strike) meter spacing. The areas should represent different configurations of the vein (in areas with wide vein widths and narrow widths) relative to the faults, dykes, stockwork, etc. This drilling should extend about 90 |
| Technical Report - Kupol Project Preliminary Assessment Summary | 207 |
| Bema Gold Corporation | |
| | meters along strike and extend to about 50 meters at depth. This detailed information can be used to assess the dilution and ore loss for inclusion in the Feasibility Study model. |
| | | | |
| 20.5 | Tailings Facilities The following site investigation activities should be undertaken in summer 2004 to finalize the tailings disposal option selection and to provide data for feasibility design: |
| | a) | Survey. The follow ground surveys should be completed as a minimum: |
| | | • | Dry stack area |
| | | • | Road corridor to dry stack area |
| | | • | Tailings impoundment area. In 2003 the dam site was surveyed. However, as the dam survey was not tied in to the impoundment topography, this survey was of limited use. The entire impoundment area should be surveyed up to above elevation 600 m to allow accurate calculation of the impoundment elevation- storage relationship and also to allow for layout and design of diversions. |
| | | • | Tailings access road and tailings pipeline corridor |
| |
| | b) | Geological mapping. AMEC proposes that a senior geological engineer map the surficial geology of the tailings dam site and dry stack areas. The objectives of the mapping at the tailings dam site will be to optimize the dam location with respect to both topography (optimum site for dam fill volume) and abutment and valley bottom foundation conditions. At the dry stack area, the mapping will be to develop a general appreciation of the geology and geotechnical conditions. Based on the mapping, geophysical and geotechnical drilling programs will be laid out. |
| |
| | c) | Geophysical surveys. Geophysical surveys should be undertaken to assist in identifying depths of overburden overlying bedrock and also to identify any significant ice lensing that may be present in the foundations. At Julietta Mine, ground penetrating radar (GPR) was used effectively to locate ice lensing in the tailings area. |
| |
| | d) | Geotechnical drilling. Geotechnical drilling will be required to develop a thorough understanding of the tailings dam foundation conditions. High quality drilling must be done to allow quantification of ice content and to identify ice lensing in the foundations. A number of drillholes should also be completed to characterize the dry stack foundation area. |
| |
| | e) | Thermistor installations. Thermistors should be installed in drill holes in the tailings dam foundation area. The temperature data from these thermistors will be of vital importance for thermal modeling for feasibility design. |
| |
| | f) | Hydrologic monitoring. The hydrology of the tailings basin needs to be better understood to assess whether there will be an excess flow in the tailings valley catchment requiring diversions and also for design of the diversions. Stream gauging |
| Technical Report - Kupol Project Preliminary Assessment Summary | 208 |
| Bema Gold Corporation | |
| | | should be carried out to assess the total runoff from this basin and the peak flow characteristics of the main stream in the tailings basin. |
| | | |
| 20.6 | Water Supply The following site investigation activities should be undertaken in summer 2004 to finalize the groundwater intake option selection and to provide data for feasibility design: |
| | |
| | • | Complete additional, shallow production well(s) in Kaiyemraveem Valley near the VES-3 site, based on confirmation by the aquifer test in April 2004 that there is a year-round aquifer at this location. Further long-term aquifer testing may be required. |
| | | |
| | • | Drill an exploration hole, and possibly completion of production well to the base of talik at VES-3, i.e., to the depth of approximately 100m deep, pending the results of earlier investigations. |
| | | |
| | • | Continuously pump the wells at the VES-3 location for a period of up to 2 months during the winter of 2004-2005 to assess whether there is sufficient water in storage for long-term extraction. If this long term pump test should indicate that the aquifer at VES-3 location may become depleted with long term pumping, then the next target for process water is still in the Kaiyemraveem Creek valley but further south, downstream of the confluence of the “tailings” creek (south of N 7,406,000), or even further south. In such a case geophysical examination of the valley cross-section (vertical electric resistivity, VES) should be completed prior to the exploration hole drilling and completion of the production wells. It may be prudent to carry out electrical resistivity surveys at the downstream locations as a contingency to identify potential well sites. |
| | | |
| | 20.6.1 Potable Water Well (Option 1): |
| | | |
| | • | At the selected location in Starichnaya River valley (N 7,418,000) geophysical examination of the valley cross-section (vertical electric resistivity, VES) should be completed. Interpretation of the results should be carried out on-site in order to select a location for exploratory drilling and production wells. The geophysical investigations should be verified and possibly re-interpreted with borehole logs. |
| | | |
| | • | Drill exploratory hole(s) to the top of bedrock and establish the exact site stratigraphy. Install thermistors and measure ground temperatures to evaluate the depth of talik. |
| | | |
| | • | Depending on the established site conditions, complete water wells and carry out aquifer test in order to establish the potential production rates and groundwater quality. |
| Technical Report - Kupol Project Preliminary Assessment Summary | 209 |
| Bema Gold Corporation | |
| | 20.6.2 Potable Water Well (Option 4): Further investigation of the potential for developing Mud Lake as a potable water source should also be investigated. The lake should be sounded while ice is still present for access. Note: at the present time it is considered that deep groundwater exploration (over 200 m) through the permafrost into the underlying bedrock is not promising, as the bedrock aquifers would unlikely offer high production rates, and in addition, may produce saline water. Therefore, such an option is not recommended. |
| Technical Report - Kupol Project Preliminary Assessment Summary | 210 |
| Bema Gold Corporation | |
| | 21.0 References Anyusk Geological Expedition, 2000, Summary Report on the Exploration of the Kupol Deposit, Internal Report Brathwaite, R.L., Cargill, H.J., Christie, A.B., Swain, A., 2001, Lithological and spatial controls on the distribution of quartz veins in andesite and rhyolite hosted epithermal Au-Ag deposits of the Hauraki Goldfield, New Zealand: Mineralium Deposita, Vol 36, p 1-12 Garagan, T. and MacKinnon, H., 2003, Kupol Project Technical Report: Bema Gold Corporation, filed on SEDAR 11/28/2003. Hedenquist, J.W., Arribas, A., and Gonzalez-Urien, E., 2000, Exploration for Epithermal gold deposits: Reviews in Economic Geology, v.13. p. 245-277 Hudson, D.M., 2003, Epithermal alteration and mineralization in the Comstock Lode, Virginia City, Nevada: Economic Geology, v 98, No 2, p 367-386 Izawa, E., Urashima, Y., Ibaraki, K., Suzuki, R., Yokoyama, T., Kawasaki, K., Koga, A., Taguchi, S., 1990. The Hishikari gold deposit: high grade epithermal veins in Quaternary volcanics of southern Kyushu, Japan: Journal of Geochemical Exploration, v. 35, p 1-56. Panchenko, A.F., Kogan, D.J., 2000, Laboratory test work on the technological properties of the ore from the Kupol deposit. Irgiredmet Report, Irkutsk, Sillitoe, R.H., 1993, Epithermal Models, Genetic Types, geometrical controls and shallow features: Geological Association of Canada Special Paper 40, p. 403-417. Thompson, M. and Howarth, R.J., 1978: A new approach to the estimation of analytical precision. Journal Geochemical Exploration, 9:22-30. Vartanyan, S.S., Schepotiev, Y.M., Bochek, L.I., Lorents, D.A., Nickolaeva, L.A., Sergievsky, A.P., 2001, Study of the mineralogy and geochemical features of gold mineralization of Kupol ore occurrence, Internal Paper, Moscow. |
| Technical Report - Kupol Project Preliminary Assessment Summary | 211 |
| Bema Gold Corporation | |
22.0 Certificate and Consent by Tom Garagan

CERTIFICATE OF AUTHOR
Tom Garagan, P. Geo, Vice President, Exploration
Bema Gold Corporation
Suite 3100, Three Bentall Centre, 595 Burrard Street, P.O. Box 49143
Vancouver, British Columbia, Canada
Telephone: (604) 681-8371
Fax: (604) 681-1242
Email:tgaragan@bemagold.com
| 1. | I, Tom Garagan, P. Geo, do hereby certify that I am Vice President of Exploration for Bema Gold Corporation, Suite 3100, Three Bentall Centre, 595 Burrard Street, P.O. Box 49143 Vancouver, British Columbia, Canada. |
| | |
| 2. | I graduated with a bachelor of Science (Honours) degree in Geological Sciences from the University of Ottawa in 1980. |
| | |
| 3. | I am a member of the Association of Professional Geoscientists and Engineers of British Columbia, Association of Professional Engineers, Geologists and Geophyseists of Alberta and a fellow of the Geological Association of Canada. |
| | |
| 4. | I have worked as a geologist for a total of 23 years since by graduation from the university. I have been involved in gold exploration and mining in Canada, USA, Russia, South Africa, Ethiopia, Chile, Argentina, Venezuela and Mexico. |
| | |
| 5. | I have read the definition of “qualified person” set out in National Instrument 43-101 (“NI 43-101) and certify that by reason of my education, affiliation with a professional association (as defined in NI 43-101) and past relevant work experience, I fulfill the requirements to be a “qualified person” for the purposes of NI-43-101. |
| Technical Report - Kupol Project Preliminary Assessment Summary | 212 |
| Bema Gold Corporation | |
| 6. | I am responsible for supervising the writing of the technical report titled Technical Report, Kupol Project ,Preliminary Assessment Summary dated May 19, 2004 (the “Technical Report”) relating to the Kupol Property. I visited the property twice in 2001 and for a total of 25 days during the course of active exploration in 2003. |
| |
| 7. | I have read NI 43-101 and certify that the Technical Report has been prepared in compliance with NI-43-101 and Form 43-101F1. |
| |
| 8. | I have not had prior involvement with the property that is the subject of the Technical Report. |
| |
| 9. | I am not aware of any material fact or material change with respect to the subject matter of the Technical Report that is not reflected in the Technical Report, the omission to disclose which makes the Technical Report misleading. |
| |
| 10. | I am not independent of the issuer. Per section 5.3.2 of National Instrument 43-101 an independent qualified person was not required for the writing of the Technical Report on the Kupol Property. |
Dated at Vancouver, this 19th day of May, 2004.
BEMA GOLD CORPORATION
Per:
(Signed, sealed and delivered by:
“Tom Garagan, VP Exploration”)
| Technical Report - Kupol Project Preliminary Assessment Summary | 213 |
| Bema Gold Corporation | |
CONSENT OF QUALIFIED PERSON
British Columbia Securities Commission
Alberta Securities Commission
Saskatchewan Securities Commission
Manitoba Securities Commission
Ontario Securities Commission
Autorité des marchés financiers
New Brunswick Office of the Administrator
Office of the Attorney General
Registrar of Securities, Prince Edward Island
Nova Scotia Securities Commission
Securities Commission of Newfoundland
The undersigned hereby:
| | 1. | states that the undersigned is one of the authors of the report entitled “Technical Report, Kupol Project, Preliminary Assessment Summary” dated May 19, 2004 (the “Report”) prepared on behalf of Bema Gold Corporation (the “Issuer”), portions of which are summarized in the press release dated May 26, 2004 (the “Press Release”), and the material change report dated June 1, 2004 (the “Material Change Report”), of the Issuer; |
| |
| | 2. | consents to the references to and summary of the Report in the Press Release and Material Change Report; |
| |
| | 3. | certifies that the undersigned has read the disclosure in the Press Release and Material Change Report and has no reason to |
| Technical Report - Kupol Project Preliminary Assessment Summary | 214 |
| Bema Gold Corporation | |
| | | believe that there are any misrepresentations in the information contained therein that are derived from the Report or that the disclosure in the Press Release or Material Change Report contains any misrepresentation of the information contained in the Report; and |
| | | |
| | 4. | consents to the filing of the Report in the public files of the securities commissions in each of the provinces of Canada. |
Dated: June 1, 2004
(Signed, Sealed and delivered by :
« TOM GARAGAN, VP Exploration »)
| Technical Report - Kupol Project Preliminary Assessment Summary | 215 |
| Bema Gold Corporation | |