UNITED STATES
SECURITIES AND EXCHANGE COMMISSION
Washington, D.C. 20549
FORM N-CSR
CERTIFIED SHAREHOLDER REPORT OF REGISTERED
MANAGEMENT INVESTMENT COMPANIES
Investment Company Act file number 811-6440
Fidelity Aberdeen Street Trust
(Exact name of registrant as specified in charter)
245 Summer St., Boston, Massachusetts 02210
(Address of principal executive offices) (Zip code)
Scott C. Goebel, Secretary
245 Summer St.
Boston, Massachusetts 02210
(Name and address of agent for service)
Registrant's telephone number, including area code: 617-563-7000
Date of fiscal year end: | March 31 |
| |
Date of reporting period: | March 31, 2013 |
Item 1. Reports to Stockholders
Fidelity Freedom® Funds -
Income, 2000, 2005, 2010, 2015, 2020, 2025, 2030, 2035, 2040, 2045, 2050, 2055
Annual Report
March 31, 2013
(Fidelity Cover Art)
Contents
Annual Report
To view a fund's proxy voting guidelines and proxy voting record for the 12-month period ended June 30, visit http://www.fidelity.com/proxyvotingresults or visit the Securities and Exchange Commission's (SEC) web site at http://www.sec.gov. You may also call 1-800-544-8544 to request a free copy of the proxy voting guidelines.
Standard & Poor's, S&P and S&P 500 are registered service marks of The McGraw-Hill Companies, Inc. and have been licensed for use by Fidelity Distributors Corporation.
Other third-party marks appearing herein are the property of their respective owners.
All other marks appearing herein are registered or unregistered trademarks or service marks of FMR LLC or an affiliated company. © 2013 FMR LLC. All rights reserved.
This report and the financial statements contained herein are submitted for the general information of the shareholders of the funds. This report is not authorized for distribution to prospective investors in the funds unless preceded or accompanied by an effective prospectus.
A fund files its complete schedule of portfolio holdings with the SEC for the first and third quarters of each fiscal year on Form N-Q. Forms N-Q are available on the SEC's web site at http://www.sec.gov. A fund's Forms N-Q may be reviewed and copied at the SEC's Public Reference Room in Washington, DC. Information regarding the operation of the SEC's Public Reference Room may be obtained by calling 1-800-SEC-0330. For a complete list of a fund's portfolio holdings, view the most recent holdings listing, semiannual report, or annual report on Fidelity's web site at http://www.fidelity.com, http://www.advisor.fidelity.com, or http://www.401k.com, as applicable.
NOT FDIC INSURED • MAY LOSE VALUE • NO BANK GUARANTEE
Neither the funds nor Fidelity Distributors Corporation is a bank.
Annual Report
Fidelity Freedom Income Fund
Performance: The Bottom Line
Average annual total return reflects the change in the value of an investment, assuming reinvestment of the fund's distributions from dividend income and capital gains (the profits earned upon the sale of securities that have grown in value, if any) and assuming a constant rate of performance each year. The $10,000 table and the fund's returns do not reflect the deduction of taxes that a shareholder would pay on fund distributions or the redemption of fund shares. During periods of reimbursement by Fidelity, a fund's total return will be greater than it would be had the reimbursement not occurred. How a fund did yesterday is no guarantee of how it will do tomorrow.
Average Annual Total Returns
Periods ended March 31, 2013 | Past 1
year | Past 5
years | Past 10
years |
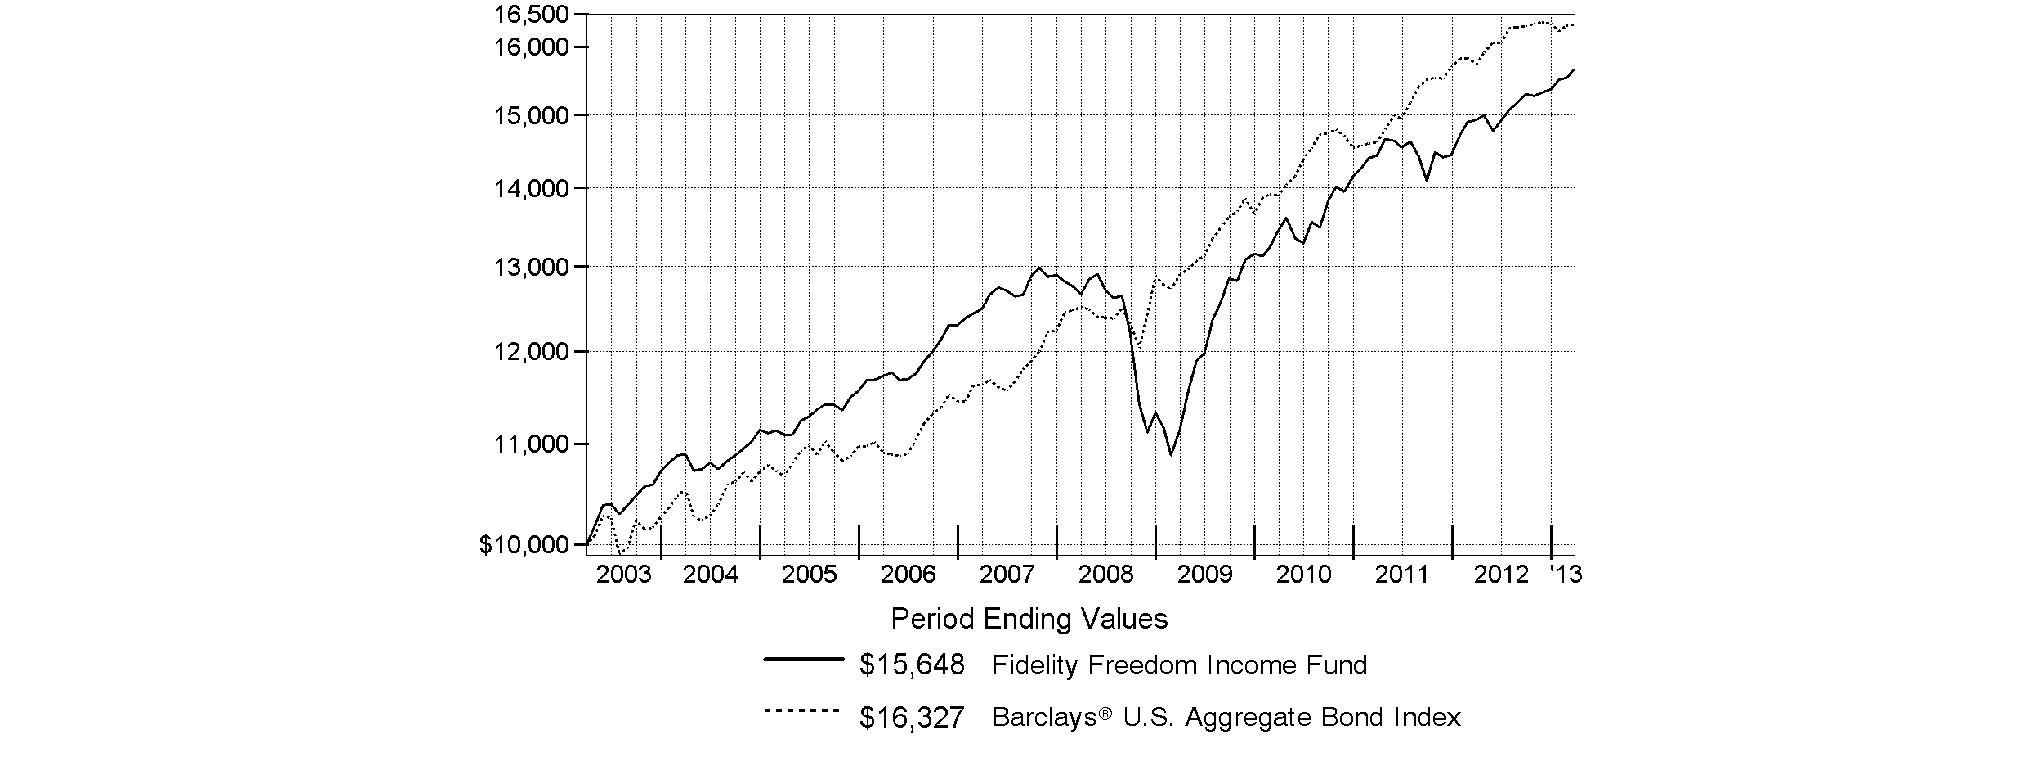
Fidelity Freedom Income Fund | 4.79% | 4.32% | 4.58% |
$10,000 Over 10 Years
Let's say hypothetically that $10,000 was invested in Fidelity Freedom Income Fund on March 31, 2003. The chart shows how the value of your investment would have changed, and also shows how the Barclays® U.S. Aggregate Bond Index performed over the same period.
Annual Report
Fidelity Freedom 2000 Fund
Performance: The Bottom Line
Average annual total return reflects the change in the value of an investment, assuming reinvestment of the fund's distributions from dividend income and capital gains (the profits earned upon the sale of securities that have grown in value, if any) and assuming a constant rate of performance each year. The $10,000 table and the fund's returns do not reflect the deduction of taxes that a shareholder would pay on fund distributions or the redemption of fund shares. During periods of reimbursement by Fidelity, a fund's total return will be greater than it would be had the reimbursement not occurred. How a fund did yesterday is no guarantee of how it will do tomorrow.
Average Annual Total Returns
Periods ended March 31, 2013 | Past 1
year | Past 5
years | Past 10
years |
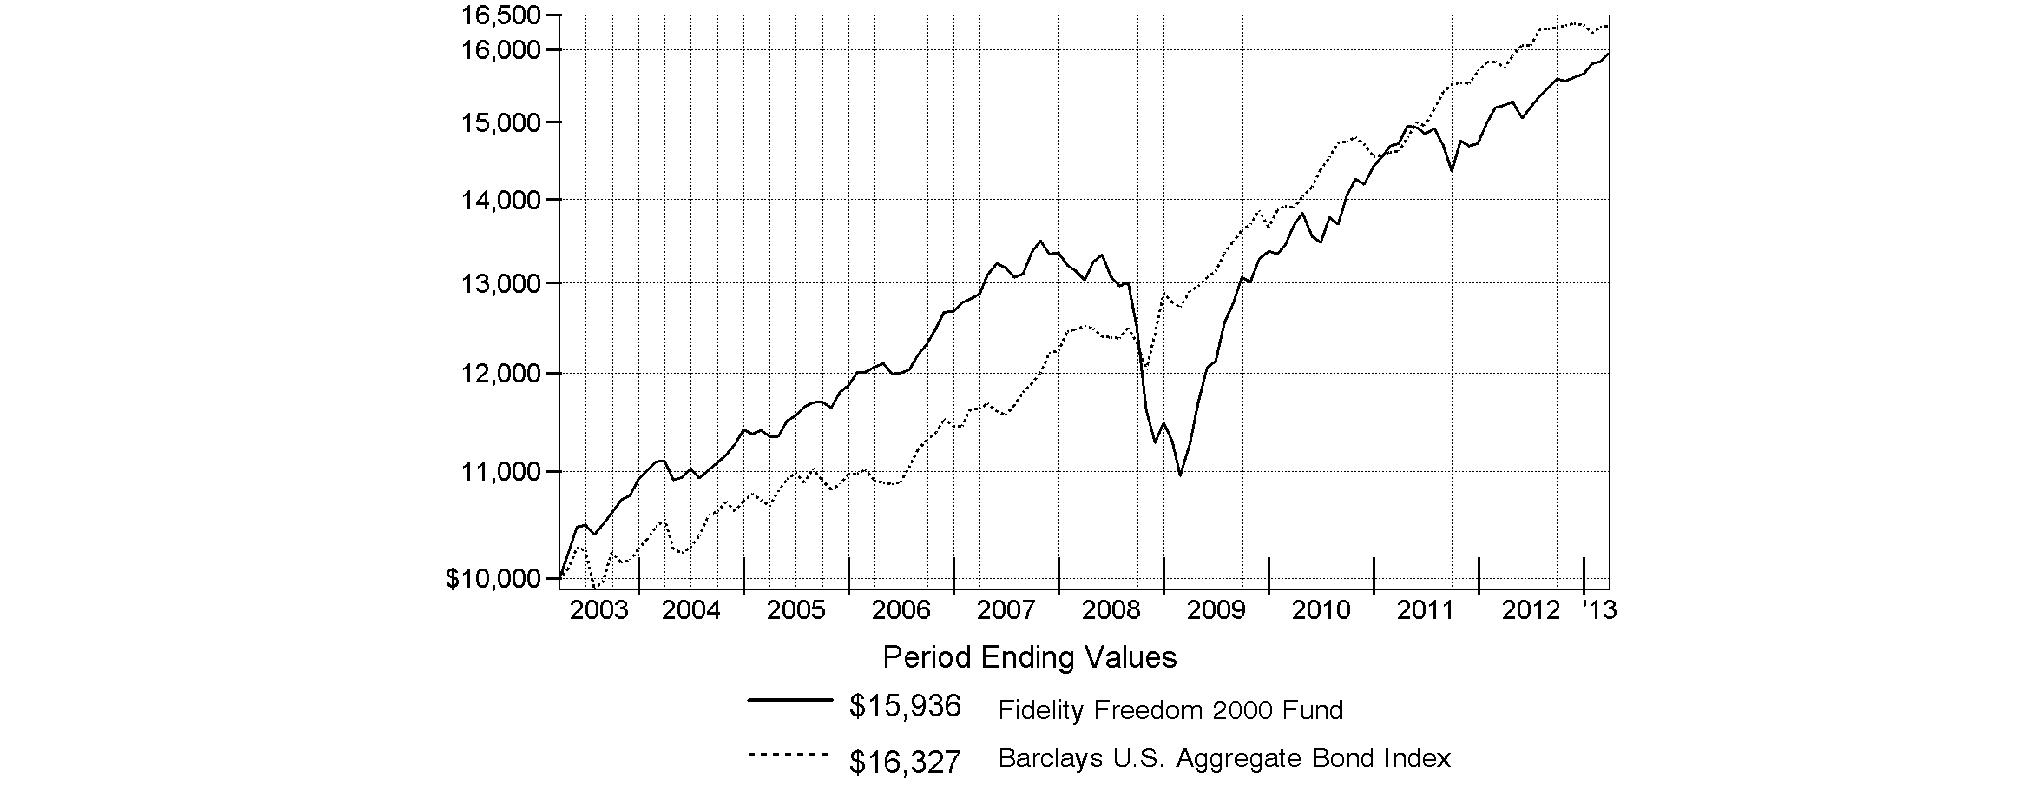
Fidelity Freedom 2000 Fund | 4.70% | 4.10% | 4.77% |
$10,000 Over 10 Years
Let's say hypothetically that $10,000 was invested in Fidelity Freedom 2000 Fund on March 31, 2003. The chart shows how the value of your investment would have changed, and also shows how the Barclays U.S. Aggregate Bond Index performed over the same period.
Annual Report
Fidelity Freedom 2005 Fund
Performance: The Bottom Line
Average annual total return reflects the change in the value of an investment, assuming reinvestment of the fund's distributions from dividend income and capital gains (the profits earned upon the sale of securities that have grown in value, if any) and assuming a constant rate of performance each year. The $10,000 table and the fund's returns do not reflect the deduction of taxes that a shareholder would pay on fund distributions or the redemption of fund shares. During periods of reimbursement by Fidelity, a fund's total return will be greater than it would be had the reimbursement not occurred. How a fund did yesterday is no guarantee of how it will do tomorrow.
Average Annual Total Returns
Periods ended March 31, 2013 | | Past 1
year | Past 5
years | Life of
fundA |
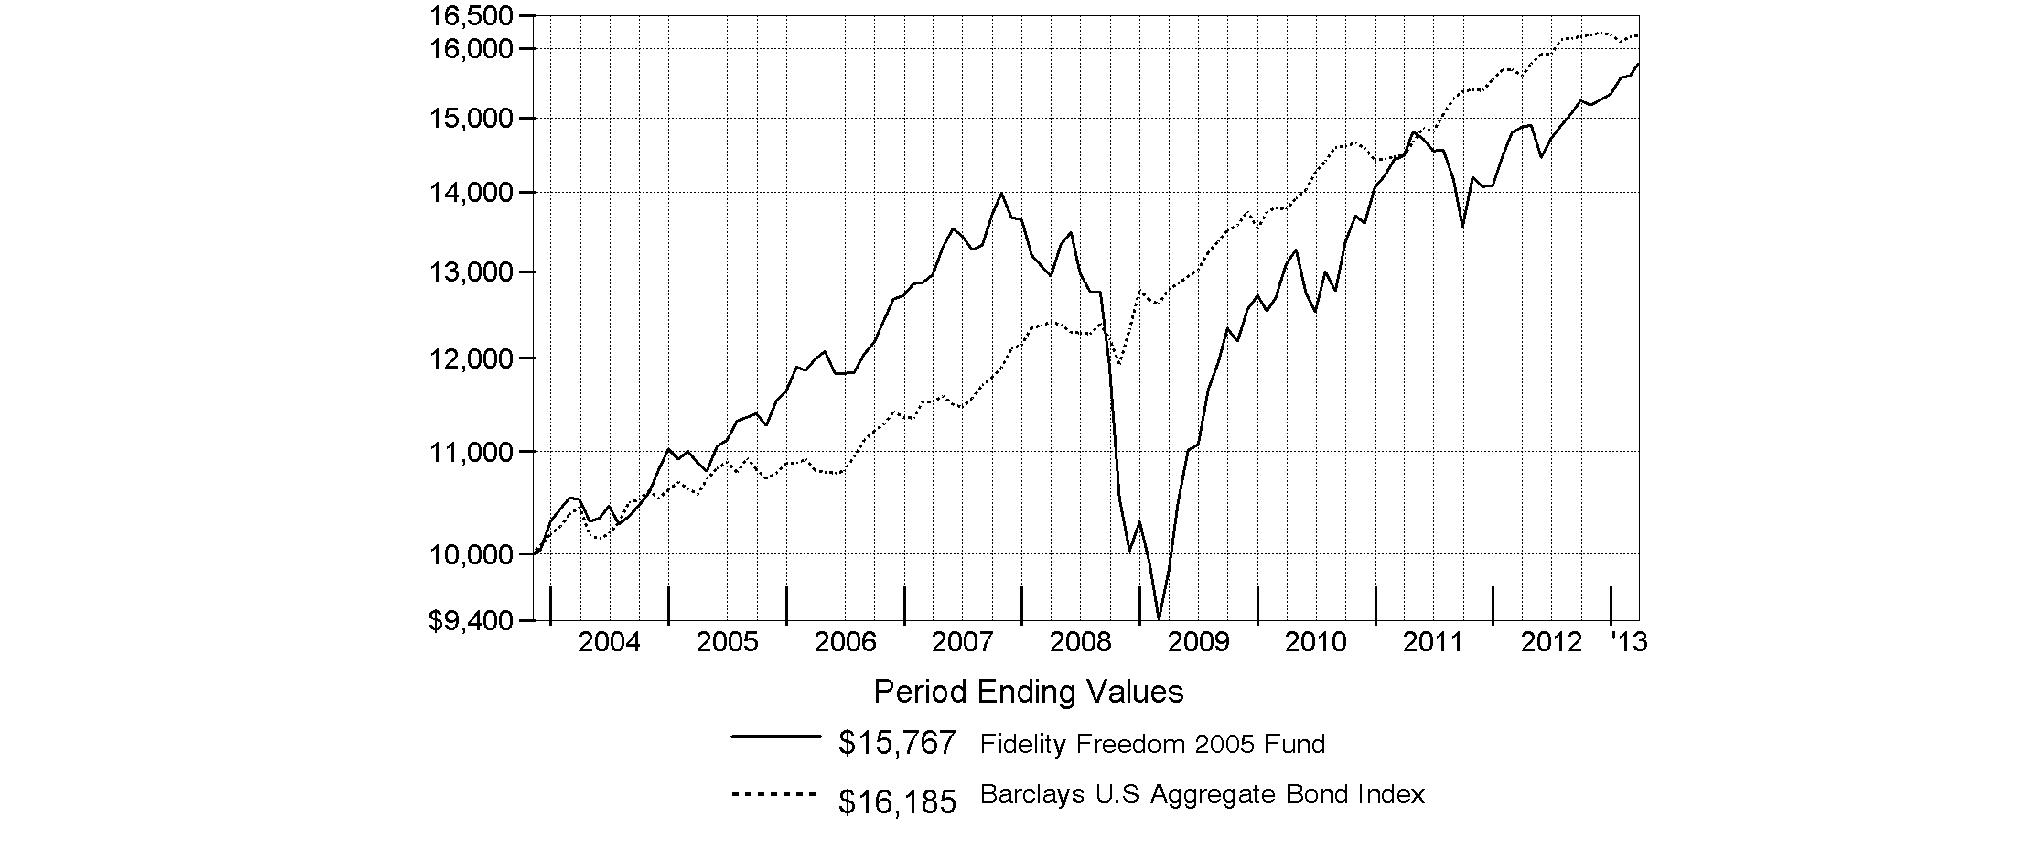
Fidelity Freedom 2005 Fund | | 5.99% | 4.02% | 4.96% |
A From November 6, 2003.
$10,000 Over Life of Fund
Let's say hypothetically that $10,000 was invested in Fidelity Freedom 2005 Fund on November 6, 2003, when the fund started. The chart shows how the value of your investment would have changed, and also shows how the Barclays U.S. Aggregate Bond Index performed over the same period.
Annual Report
Fidelity Freedom 2010 Fund
Performance: The Bottom Line
Average annual total return reflects the change in the value of an investment, assuming reinvestment of the fund's distributions from dividend income and capital gains (the profits earned upon the sale of securities that have grown in value, if any) and assuming a constant rate of performance each year. The $10,000 table and the fund's returns do not reflect the deduction of taxes that a shareholder would pay on fund distributions or the redemption of fund shares. During periods of reimbursement by Fidelity, a fund's total return will be greater than it would be had the reimbursement not occurred. How a fund did yesterday is no guarantee of how it will do tomorrow.
Average Annual Total Returns
Periods ended March 31, 2013 | Past 1
year | Past 5
years | Past 10
years |
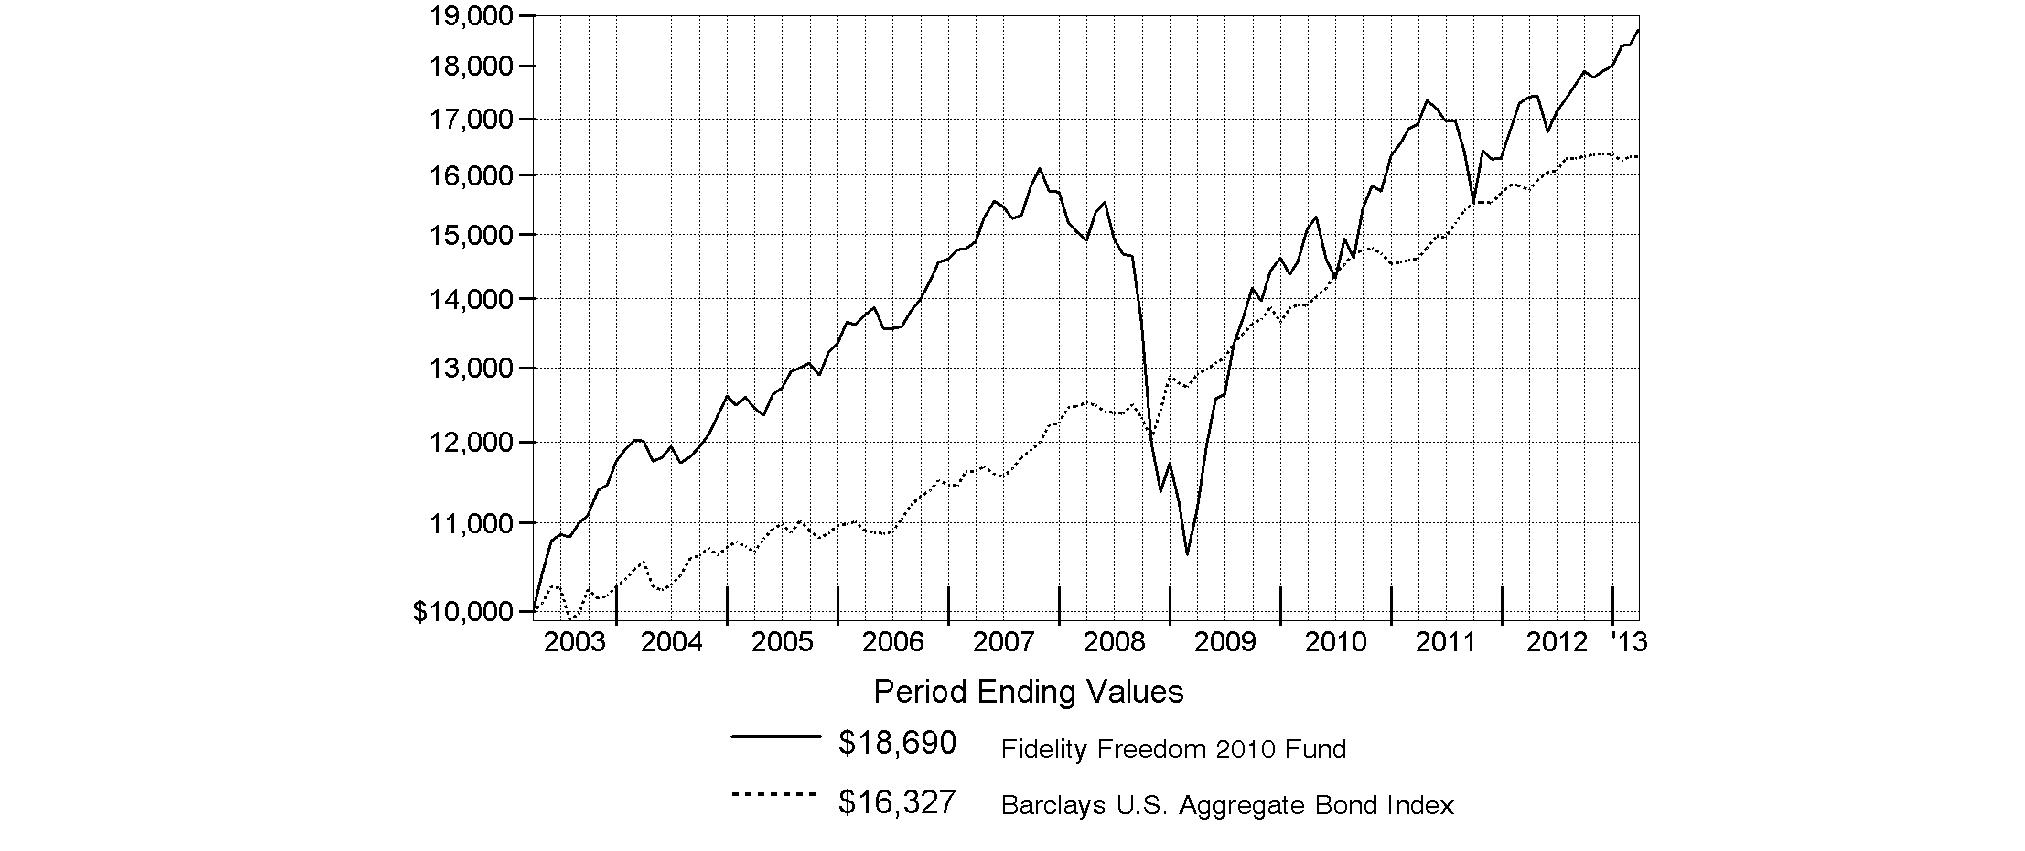
Fidelity Freedom 2010 Fund | 7.43% | 4.63% | 6.45% |
$10,000 Over 10 Years
Let's say hypothetically that $10,000 was invested in Fidelity Freedom 2010 Fund on March 31, 2003. The chart shows how the value of your investment would have changed, and also shows how the Barclays U.S. Aggregate Bond Index performed over the same period.
Annual Report
Fidelity Freedom 2015 Fund
Performance: The Bottom Line
Average annual total return reflects the change in the value of an investment, assuming reinvestment of the fund's distributions from dividend income and capital gains (the profits earned upon the sale of securities that have grown in value, if any) and assuming a constant rate of performance each year. The $10,000 table and the fund's returns do not reflect the deduction of taxes that a shareholder would pay on fund distributions or the redemption of fund shares. During periods of reimbursement by Fidelity, a fund's total return will be greater than it would be had the reimbursement not occurred. How a fund did yesterday is no guarantee of how it will do tomorrow.
Average Annual Total Returns
Periods ended March 31, 2013 | | Past 1
year | Past 5
years | Life of
fundA |
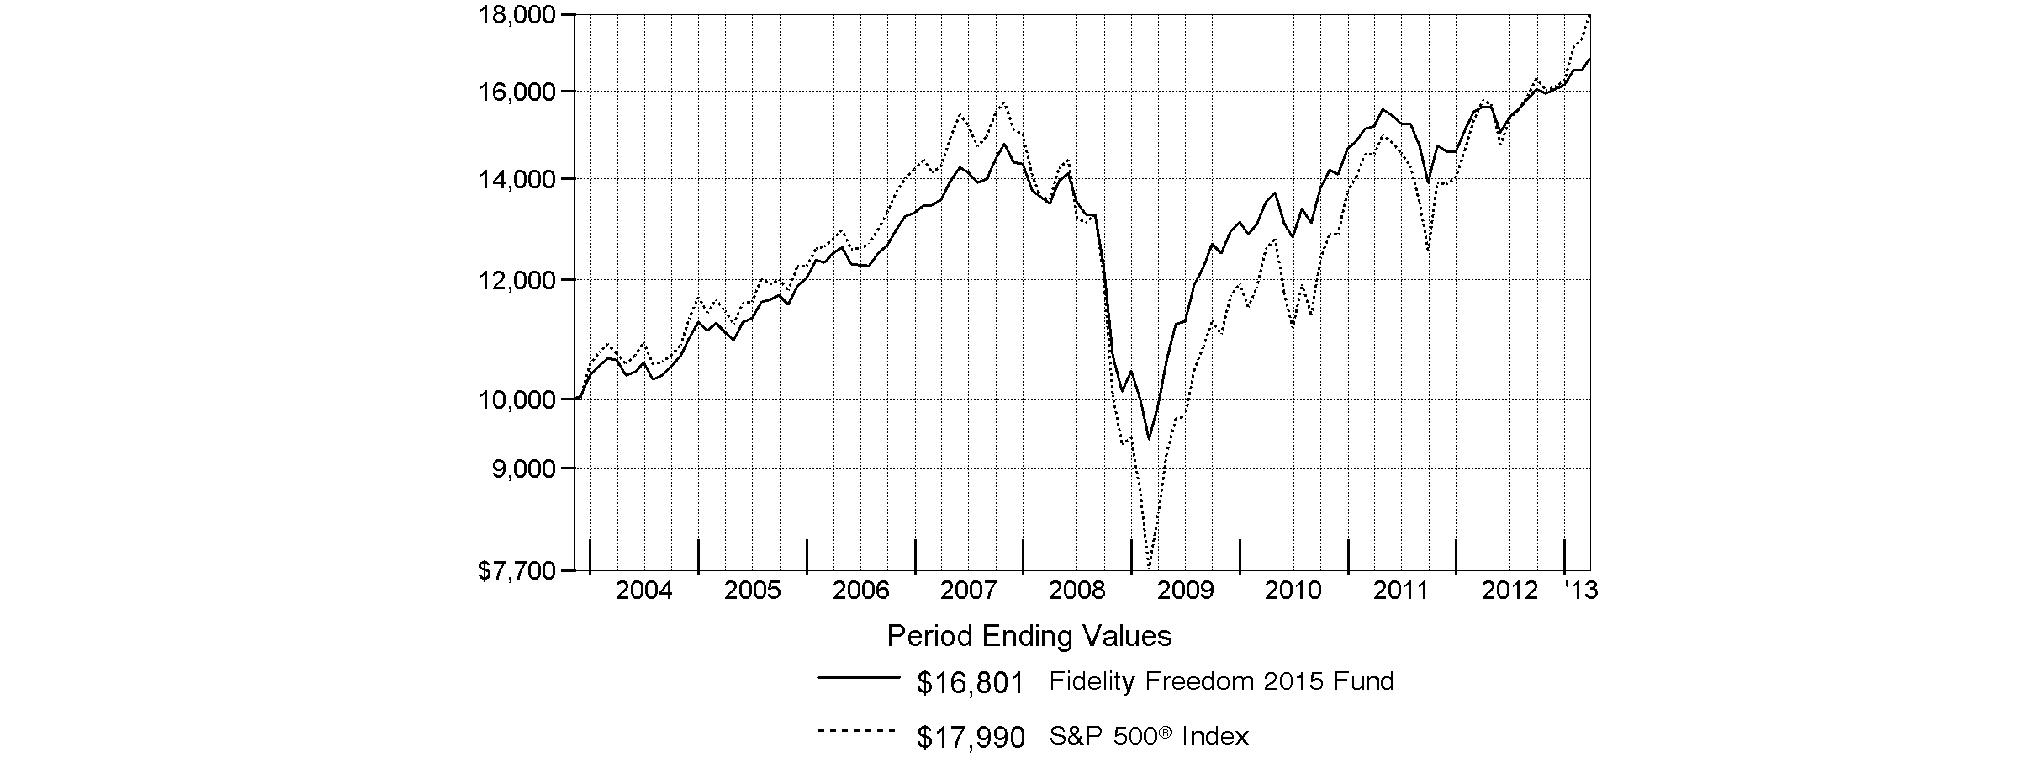
Fidelity Freedom 2015 Fund | | 7.60% | 4.51% | 5.67% |
A From November 6, 2003.
$10,000 Over Life of Fund
Let's say hypothetically that $10,000 was invested in Fidelity Freedom 2015 Fund on November 6, 2003, when the fund started. The chart shows how the value of your investment would have changed, and also shows how the S&P 500® Index performed over the same period.
Annual Report
Fidelity Freedom 2020 Fund
Performance: The Bottom Line
Average annual total return reflects the change in the value of an investment, assuming reinvestment of the fund's distributions from dividend income and capital gains (the profits earned upon the sale of securities that have grown in value, if any) and assuming a constant rate of performance each year. The $10,000 table and the fund's returns do not reflect the deduction of taxes that a shareholder would pay on fund distributions or the redemption of fund shares. During periods of reimbursement by Fidelity, a fund's total return will be greater than it would be had the reimbursement not occurred. How a fund did yesterday is no guarantee of how it will do tomorrow.
Average Annual Total Returns
Periods ended March 31, 2013 | Past 1
year | Past 5
years | Past 10
years |
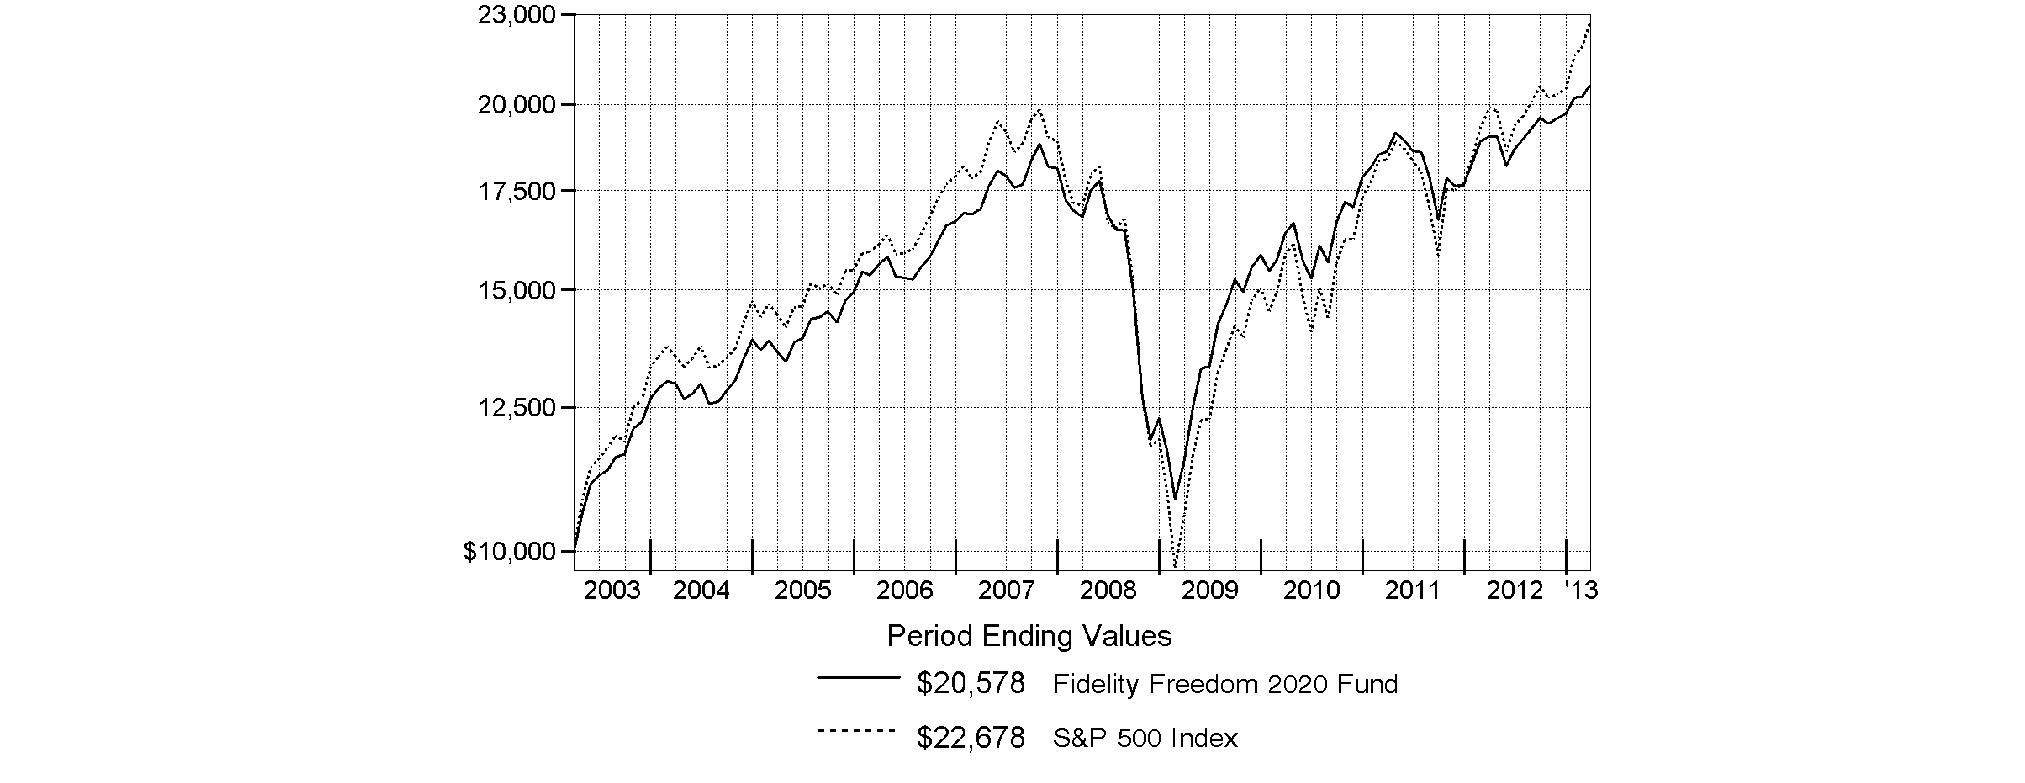
Fidelity Freedom 2020 Fund | 8.12% | 4.16% | 7.48% |
$10,000 Over 10 Years
Let's say hypothetically that $10,000 was invested in Fidelity Freedom 2020 Fund on March 31, 2003. The chart shows how the value of your investment would have changed, and also shows how the S&P 500 Index performed over the same period.
Annual Report
Fidelity Freedom 2025 Fund
Performance: The Bottom Line
Average annual total return reflects the change in the value of an investment, assuming reinvestment of the fund's distributions from dividend income and capital gains (the profits earned upon the sale of securities that have grown in value, if any) and assuming a constant rate of performance each year. The $10,000 table and the fund's returns do not reflect the deduction of taxes that a shareholder would pay on fund distributions or the redemption of fund shares. During periods of reimbursement by Fidelity, a fund's total return will be greater than it would be had the reimbursement not occurred. How a fund did yesterday is no guarantee of how it will do tomorrow.
Average Annual Total Returns
Periods ended March 31, 2013 | | Past 1
year | Past 5
years | Life of
fundA |
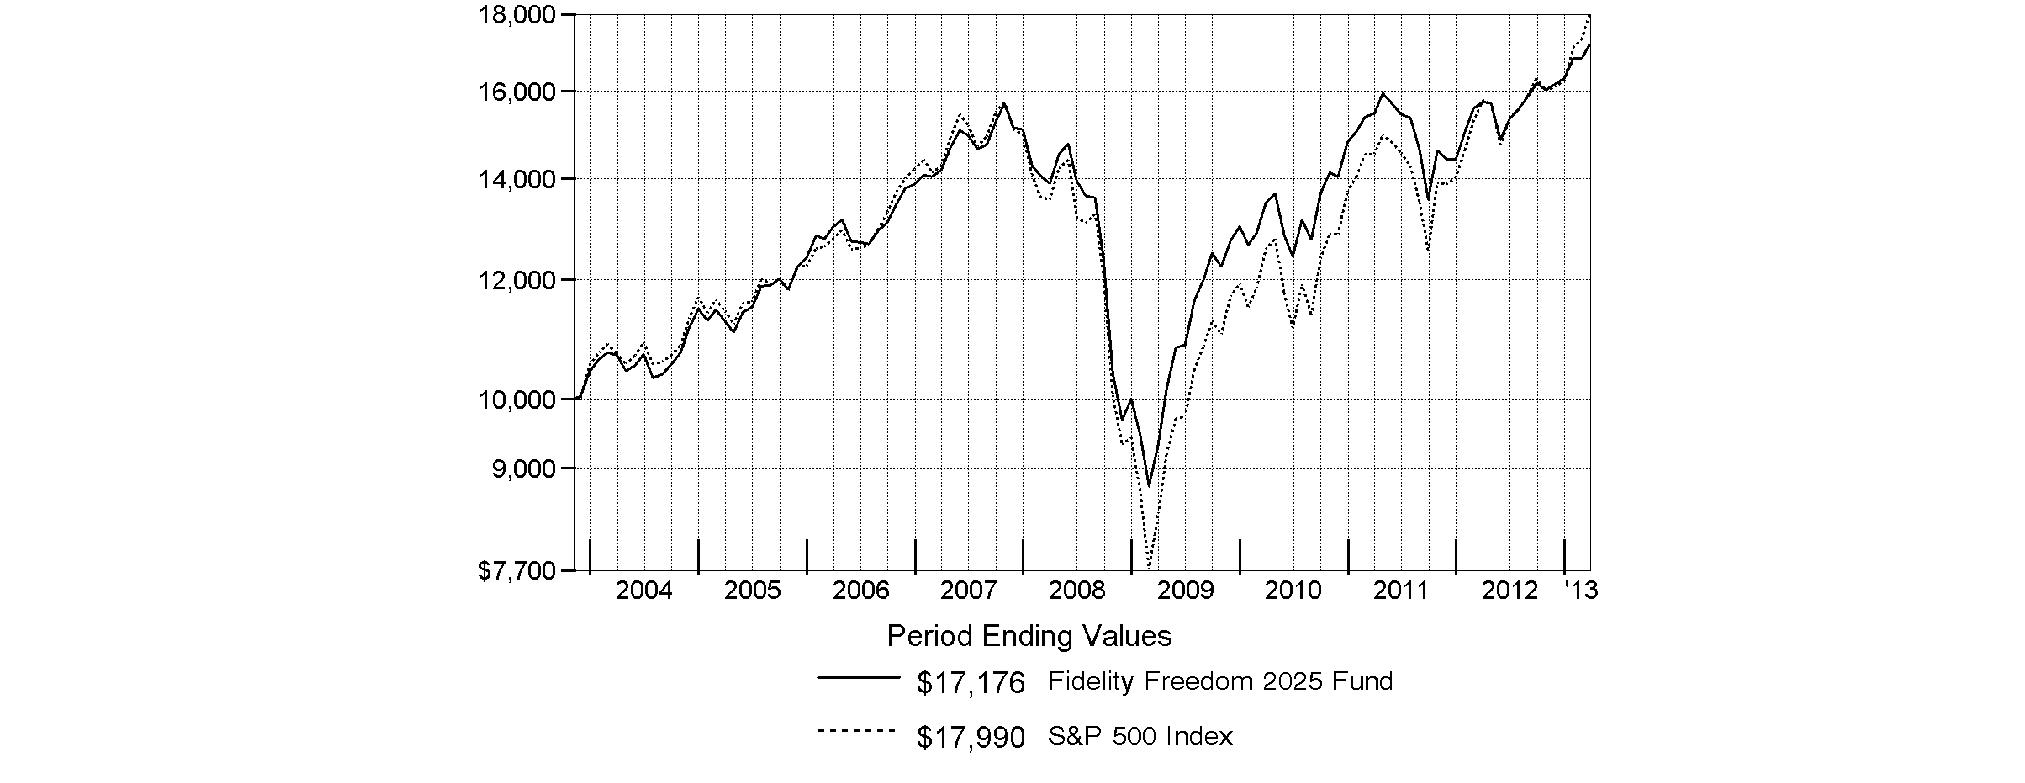
Fidelity Freedom 2025 Fund | | 9.03% | 4.31% | 5.92% |
A From November 6, 2003.
$10,000 Over Life of Fund
Let's say hypothetically that $10,000 was invested in Fidelity Freedom 2025 Fund on November 6, 2003, when the fund started. The chart shows how the value of your investment would have changed, and also shows how the S&P 500 Index performed over the same period.
Annual Report
Fidelity Freedom 2030 Fund
Performance: The Bottom Line
Average annual total return reflects the change in the value of an investment, assuming reinvestment of the fund's distributions from dividend income and capital gains (the profits earned upon the sale of securities that have grown in value, if any) and assuming a constant rate of performance each year. The $10,000 table and the fund's returns do not reflect the deduction of taxes that a shareholder would pay on fund distributions or the redemption of fund shares. During periods of reimbursement by Fidelity, a fund's total return will be greater than it would be had the reimbursement not occurred. How a fund did yesterday is no guarantee of how it will do tomorrow.
Average Annual Total Returns
Periods ended March 31, 2013 | Past 1
year | Past 5
years | Past 10
years |
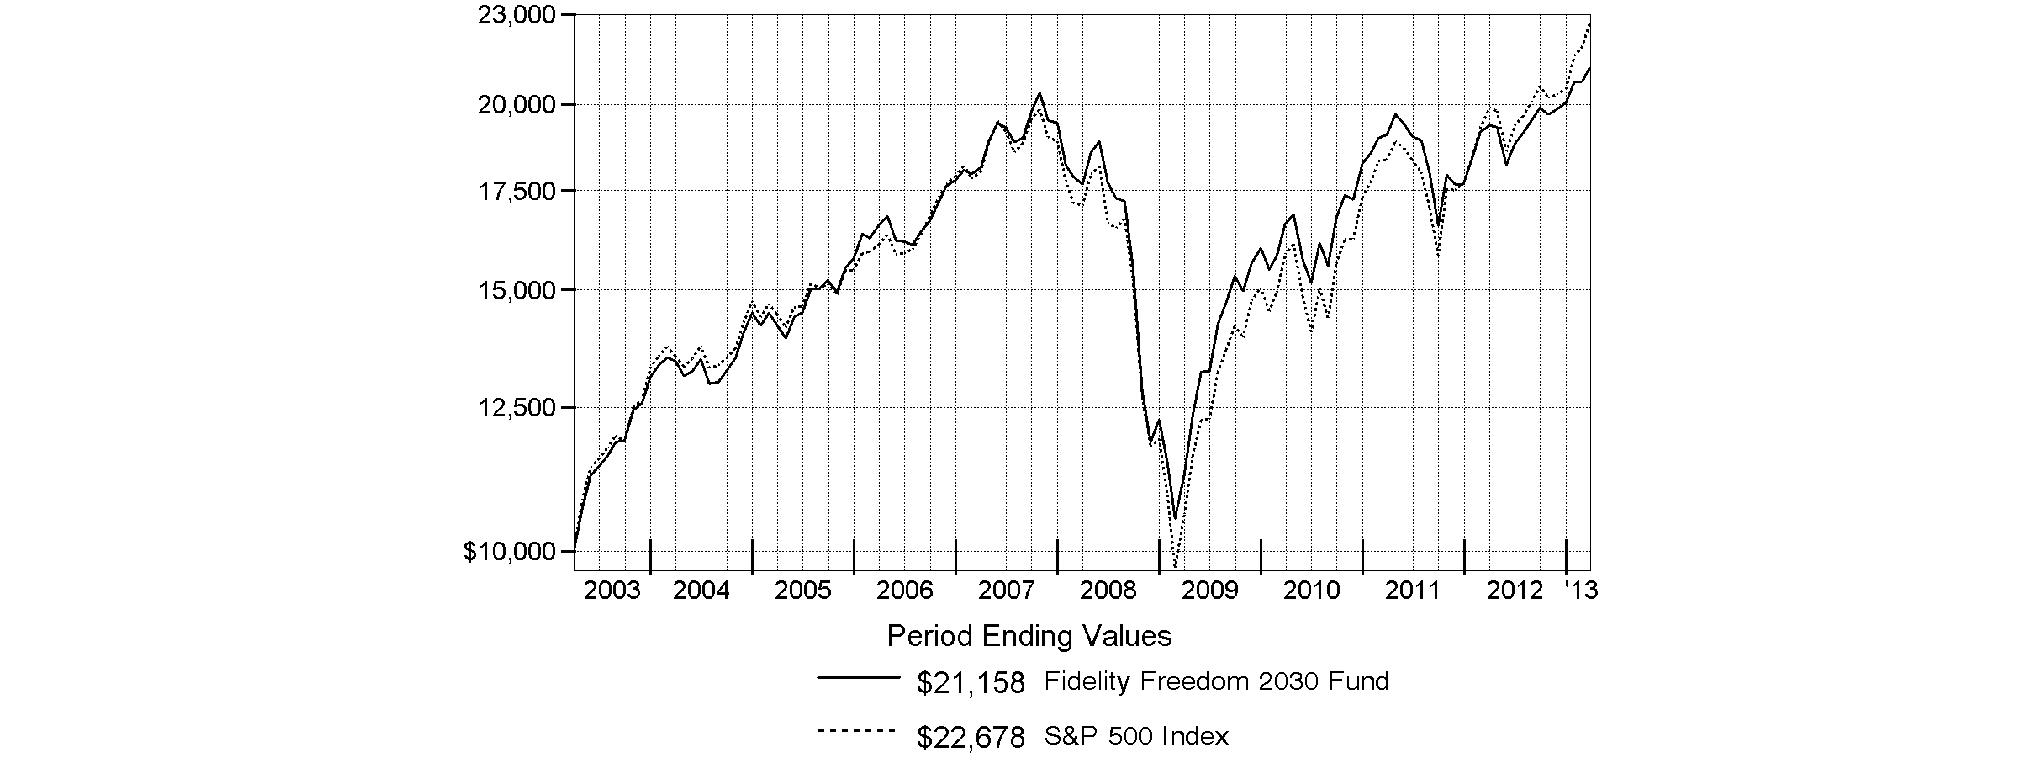
Fidelity Freedom 2030 Fund | 9.30% | 3.68% | 7.78% |
$10,000 Over 10 Years
Let's say hypothetically that $10,000 was invested in Fidelity Freedom 2030 Fund on March 31, 2003. The chart shows how the value of your investment would have changed, and also shows how the S&P 500 Index performed over the same period.
Annual Report
Fidelity Freedom 2035 Fund
Performance: The Bottom Line
Average annual total return reflects the change in the value of an investment, assuming reinvestment of the fund's distributions from dividend income and capital gains (the profits earned upon the sale of securities that have grown in value, if any) and assuming a constant rate of performance each year. The $10,000 table and the fund's returns do not reflect the deduction of taxes that a shareholder would pay on fund distributions or the redemption of fund shares. During periods of reimbursement by Fidelity, a fund's total return will be greater than it would be had the reimbursement not occurred. How a fund did yesterday is no guarantee of how it will do tomorrow.
Average Annual Total Returns
Periods ended March 31, 2013 | Past 1
year | Past 5
years | Life of
fundA |
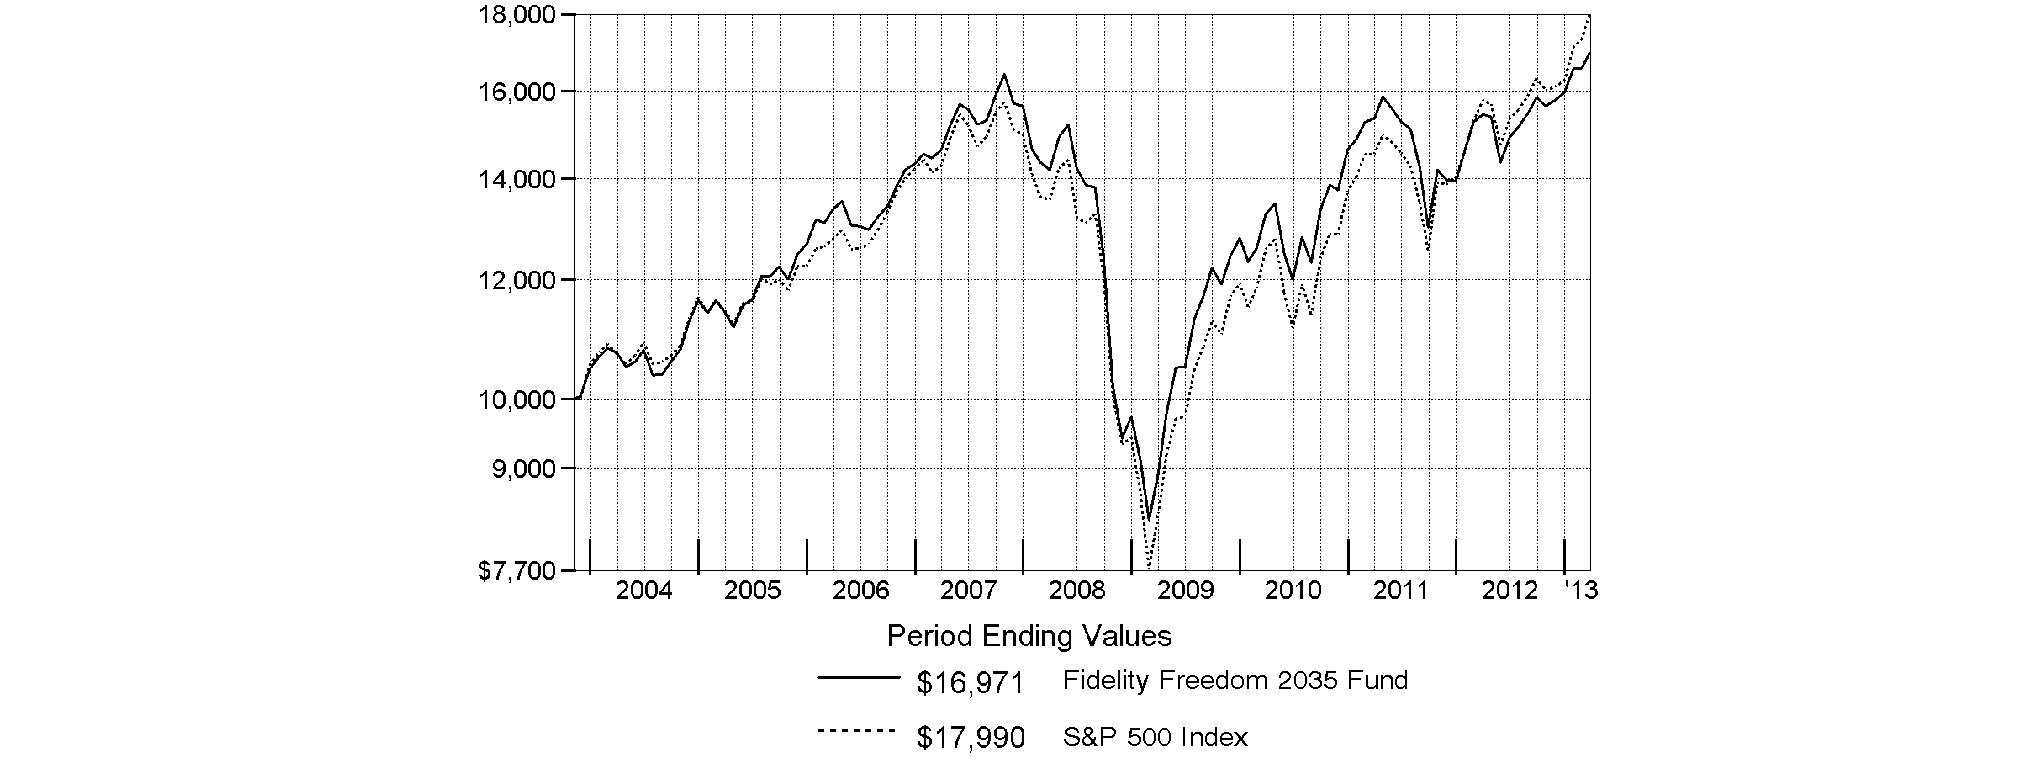
Fidelity Freedom 2035 Fund | 9.85% | 3.65% | 5.78% |
A From November 6, 2003.
$10,000 Over Life of Fund
Let's say hypothetically that $10,000 was invested in Fidelity Freedom 2035 Fund on November 6, 2003, when the fund started. The chart shows how the value of your investment would have changed, and also shows how the S&P 500 Index performed over the same period.
Annual Report
Fidelity Freedom 2040 Fund
Performance: The Bottom Line
Average annual total return reflects the change in the value of an investment, assuming reinvestment of the fund's distributions from dividend income and capital gains (the profits earned upon the sale of securities that have grown in value, if any) and assuming a constant rate of performance each year. The $10,000 table and the fund's returns do not reflect the deduction of taxes that a shareholder would pay on fund distributions or the redemption of fund shares. During periods of reimbursement by Fidelity, a fund's total return will be greater than it would be had the reimbursement not occurred. How a fund did yesterday is no guarantee of how it will do tomorrow.
Average Annual Total Returns
Periods ended March 31, 2013 | Past 1
year | Past 5
years | Past 10
years |
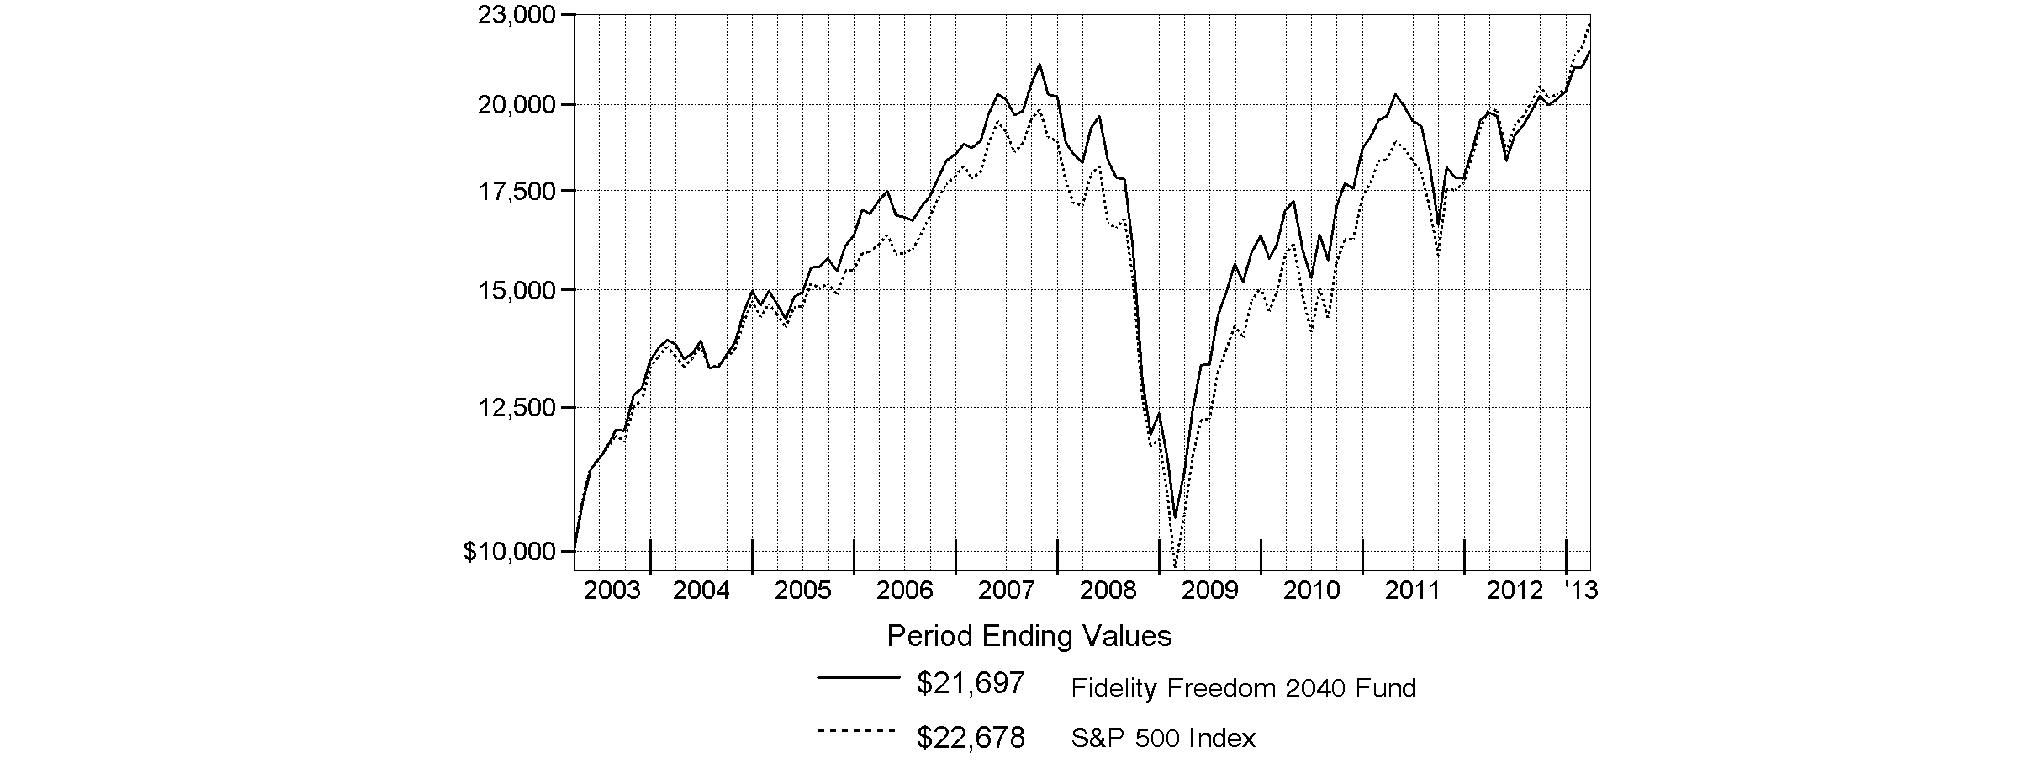
Fidelity Freedom 2040 Fund | 9.94% | 3.48% | 8.05% |
$10,000 Over 10 Years
Let's say hypothetically that $10,000 was invested in Fidelity Freedom 2040 Fund on March 31, 2003. The chart shows how the value of your investment would have changed, and also shows how the S&P 500 Index performed over the same period.
Annual Report
Fidelity Freedom 2045 Fund
Performance: The Bottom Line
Average annual total return reflects the change in the value of an investment, assuming reinvestment of the fund's distributions from dividend income and capital gains (the profits earned upon the sale of securities that have grown in value, if any) and assuming a constant rate of performance each year. The $10,000 table and the fund's returns do not reflect the deduction of taxes that a shareholder would pay on fund distributions or the redemption of fund shares. During periods of reimbursement by Fidelity, a fund's total return will be greater than it would be had the reimbursement not occurred. How a fund did yesterday is no guarantee of how it will do tomorrow.
Average Annual Total Returns
Periods ended March 31, 2013 | Past 1
year | Past 5
years | Life of
fundA |
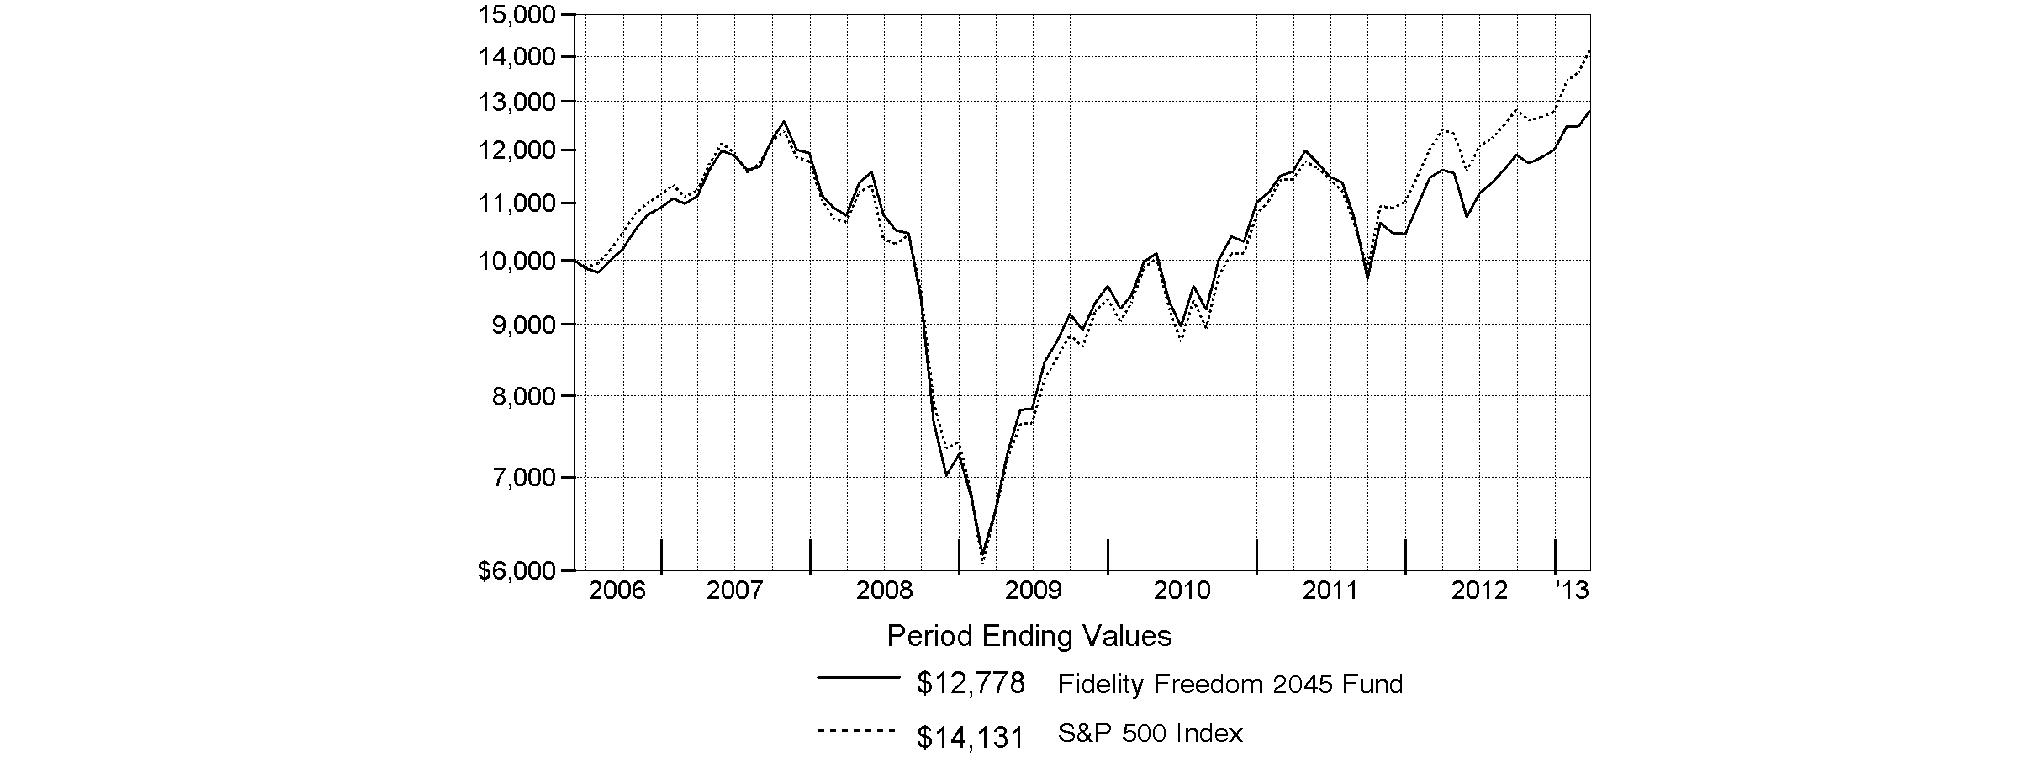
Fidelity Freedom 2045 Fund | 10.14% | 3.48% | 3.65% |
A From June 1, 2006.
$10,000 Over Life of Fund
Let's say hypothetically that $10,000 was invested in Fidelity Freedom 2045 Fund on June 1, 2006, when the fund started. The chart shows how the value of your investment would have changed, and also shows how the S&P 500 Index performed over the same period.
Annual Report
Fidelity Freedom 2050 Fund
Performance: The Bottom Line
Average annual total return reflects the change in the value of an investment, assuming reinvestment of the fund's distributions from dividend income and capital gains (the profits earned upon the sale of securities that have grown in value, if any) and assuming a constant rate of performance each year. The $10,000 table and the fund's returns do not reflect the deduction of taxes that a shareholder would pay on fund distributions or the redemption of fund shares. During periods of reimbursement by Fidelity, a fund's total return will be greater than it would be had the reimbursement not occurred. How a fund did yesterday is no guarantee of how it will do tomorrow.
Average Annual Total Returns
Periods ended March 31, 2013 | Past 1
year | Past 5
years | Life of
fundA |
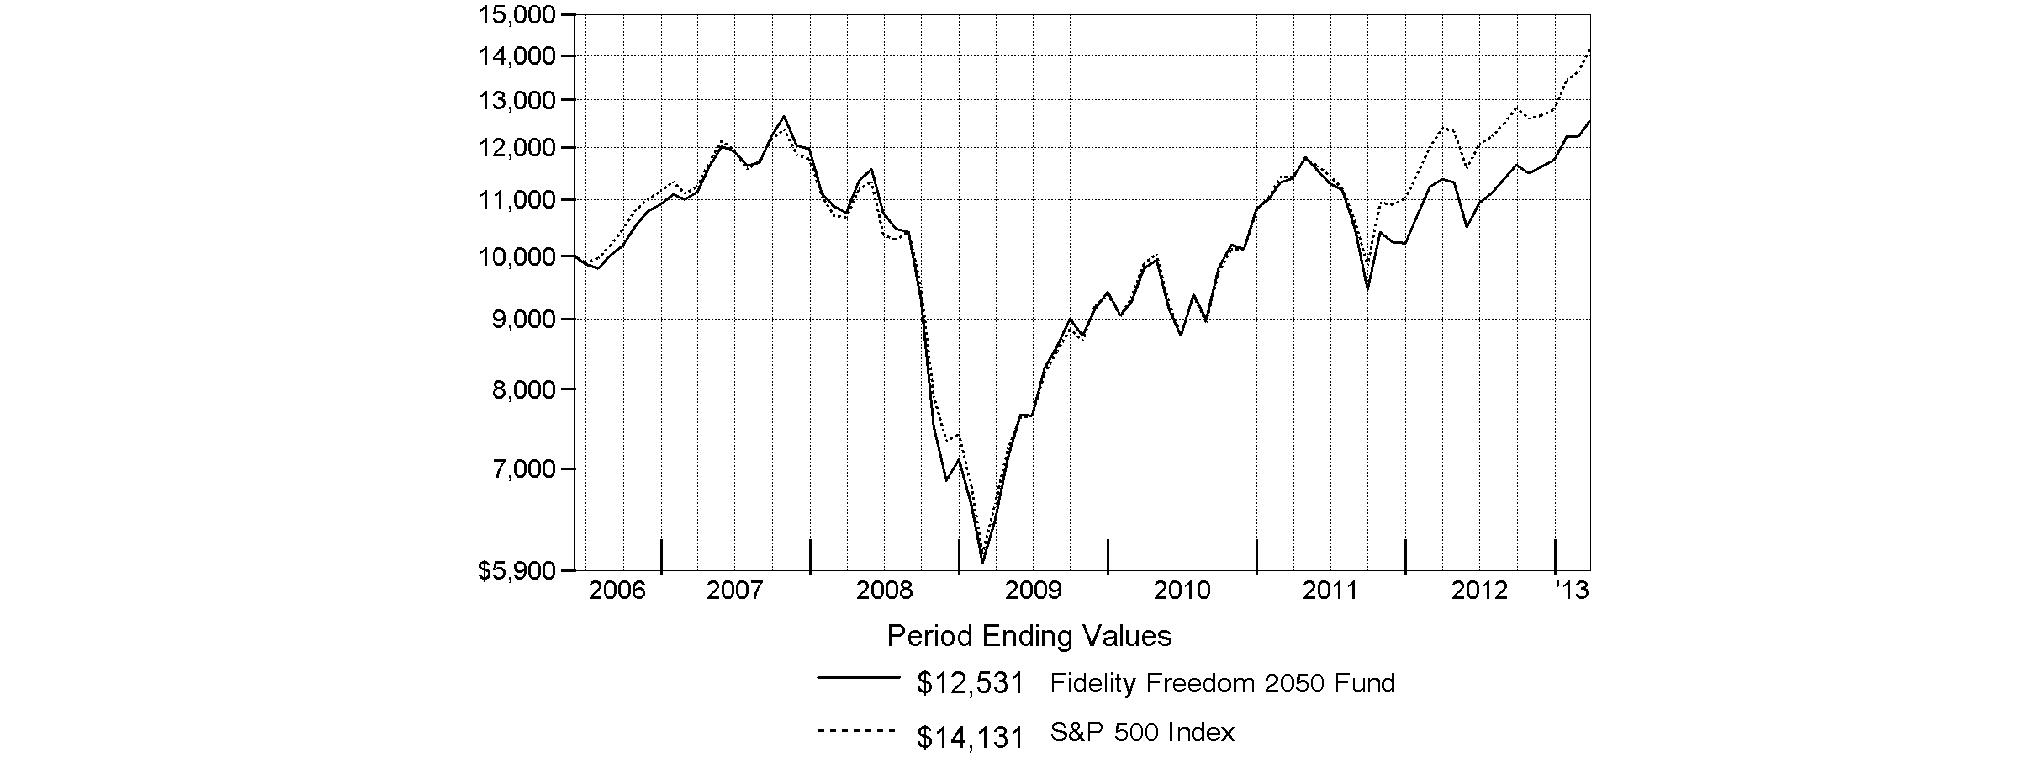
Fidelity Freedom 2050 Fund | 10.18% | 3.13% | 3.36% |
A From June 1, 2006.
$10,000 Over Life of Fund
Let's say hypothetically that $10,000 was invested in Fidelity Freedom 2050 Fund on June 1, 2006, when the fund started. The chart shows how the value of your investment would have changed, and also shows how the S&P 500 Index performed over the same period.
Annual Report
Fidelity Freedom 2055 Fund
Performance: The Bottom Line
Average annual total return reflects the change in the value of an investment, assuming reinvestment of the fund's distributions from dividend income and capital gains (the profits earned upon the sale of securities that have grown in value, if any) and assuming a constant rate of performance each year. The $10,000 table and the fund's returns do not reflect the deduction of taxes that a shareholder would pay on fund distributions or the redemption of fund shares. During periods of reimbursement by Fidelity, a fund's total return will be greater than it would be had the reimbursement not occurred. How a fund did yesterday is no guarantee of how it will do tomorrow.
Average Annual Total Returns
Periods ended March 31, 2013 | Past 1
year | Life of
fundA |
Fidelity Freedom 2055 Fund | 10.39% | 5.73% |
A From June 1, 2011.
$10,000 Over Life of Fund
Let's say hypothetically that $10,000 was invested in Fidelity Freedom 2055 Fund on June 1, 2011, when the fund started. The chart shows how the value of your investment would have changed, and also shows how the S&P 500 Index performed over the same period.

-
Annual Report
Market Recap: U.S. stock markets extended a four-year bull run and two major equity benchmarks reached record territory during the year ending March 31, 2013, as gains in the global economy and more monetary stimulus from the U.S. Federal Reserve kept markets on the upswing for much of the period. Optimism over the nation's jobs picture and housing market teamed up with solid corporate earnings to make stocks a favorite with investors during the 12-month period. The broad-based S&P 500® Index finished the year up 13.96%, closing at an all-time high at the end of the period, while the blue-chip-laden Dow Jones Industrial AverageSM - which broke its own record in early March - gained 13.37% for the full 12 months. The technology-heavy Nasdaq Composite Index® advanced a more modest 7.14%, curtailed by the weak performance of consumer electronics giant Apple, a large index component. During the year, markets shrugged off an early decline brought on by debt woes in Europe, and another dip later in the period amid pre-election jitters and Congressional gridlock over the federal budget. The year's gains were broad-based, with eight of the 10 sectors in the S&P 500® posting a double-digit increase, led by telecommunication services and health care, while technology fell 1%. Despite the headwind of a stronger U.S. dollar, foreign developed-markets stocks rose strongly, with the MSCI® EAFE® Index adding 11.40%. In the fixed-income arena, U.S. high-yield bonds benefited from investors' overall willingness to take on more risk, with The BofA Merrill LynchSM US High Yield Constrained Index adding 13.06% for the period. The shift away from perceived safety left U.S. investment-grade debt with a relatively modest 3.77% gain for the year, as measured by the Barclays® U.S. Aggregate Bond Index.
Comments from Christopher Sharpe and Andrew Dierdorf, Co-Portfolio Managers of Fidelity Freedom® Funds: For the year, each of the Freedom Funds delivered a positive absolute return. Funds with the longest time horizons until retirement - which have greater allocations to underlying equity and higher-yielding debt funds - posted the best results, each rising into low double-digit territory. These results were consistent with what we would expect in an environment where investors preferred higher-risk asset classes in search of the potential for outsized returns. In relative terms, each of the Freedom Funds - except Freedom Income Fund and Freedom 2000 Fund - trailed its respective Composite index, hampered by underperformance among the underlying funds in the U.S. equity asset class. (For specific Fund results, please refer to the performance section of this report.) Although equities provided a nice lift during the period, the Funds' investments in U.S. stocks struggled to keep pace with the market, as represented by the Dow Jones U.S. Total Stock Market IndexSM, which returned 14.48%. The majority of the underlying U.S. equity funds trailed the Dow Jones index, which hindered the relative performance of Funds with greater allocations to this asset class. Fidelity® Series All-Sector Equity Fund, Fidelity® Blue Chip Growth Fund and Fidelity Growth Company Fund were among the most significant detractors. The Funds' investments in commodities - represented by Fidelity Series Commodity Strategy Fund - also finished behind the Dow Jones index and dragged on relative performance. Commodities faced an uphill battle and lost ground as investors chose to take profits in the precious metals segment during the second half of the period, while severe weather for most of the year weighed on the agricultural subsector. Shifting to the non-U.S. equity asset class, each of the three underlying funds focused on developed markets outperformed the 11.40% return of the MSCI® EAFE® Index. On the downside, Fidelity Series Emerging Markets Fund hurt relative performance because it struggled amid lackluster prospects for economic growth within developing countries. Turning to the Funds' fixed-income asset classes, high-quality bonds largely produced positive absolute returns throughout the past year. In an effort to buoy the economy, the Federal Reserve kept interest rates low. However, Treasury yields still fell below the current inflation rate, which created a challenging environment for fixed-income investors. As such, the most conservative investment-grade bonds - U.S. government securities - delivered the most modest result, while the riskiest segment of the overall bond market, high-yield debt, experienced the strongest return. Thanks to the Funds' highly diversified portfolio of debt instruments, the aggregate performance of the bond asset class handily outpaced the 3.77% result of the Barclays® U.S. Aggregate Bond Index. Five of the six underlying funds beat the Barclays index. Core holding Fidelity Series Investment Grade Bond Fund solidly outpaced the benchmark, while Fidelity Series High Income Fund and Fidelity Series Real Estate Income Fund also provided a powerful boost. In the short-term debt asset class, Fidelity Short-Term Bond Fund propelled the Funds' aggregate performance here, topping the 0.13% return of Barclays® U.S. 3 Month Treasury Bellwether Index.
The views expressed above reflect those of the portfolio manager(s) only through the end of the period as stated on the cover of this report and do not necessarily represent the views of Fidelity or any other person in the Fidelity organization. Any such views are subject to change at any time based upon market or other conditions and Fidelity disclaims any responsibility to update such views. These views may not be relied on as investment advice and, because investment decisions for a Fidelity fund are based on numerous factors, may not be relied on as an indication of trading intent on behalf of any Fidelity fund.
Annual Report
As a shareholder of a Fund, you incur two types of costs: (1) transaction costs, and (2) ongoing costs, including other Fund expenses. This Example is intended to help you understand your ongoing costs (in dollars) of investing in the Funds and to compare these costs with the ongoing costs of investing in other mutual funds.
The Example is based on an investment of $1,000 invested at the beginning of the period and held for the entire period (October 1, 2012 to March 31, 2013).
Actual Expenses
The first line of the accompanying table for each fund provides information about actual account values and actual expenses. You may use the information in this line, together with the amount you invested, to estimate the expenses that you paid over the period. Simply divide your account value by $1,000.00 (for example, an $8,600 account value divided by $1,000.00 = 8.6), then multiply the result by the number in the first line for a fund under the heading entitled "Expenses Paid During Period" to estimate the expenses you paid on your account during this period. A small balance maintenance fee of $12.00 that is charged once a year may apply for certain accounts with a value of less than $2,000. This fee is not included in the table below. If it was, the estimate of expenses you paid during the period would be higher, and your ending account value lower, by this amount. In addition, each Fund, as a shareholder in underlying Fidelity Funds, will indirectly bear its pro-rata share of the fees and expenses incurred by the underlying Fidelity Funds. These fees and expenses are not included in each Fund's annualized expense ratio used to calculate the expense estimates in the table below.
Hypothetical Example for Comparison Purposes
The second line of the accompanying table for each fund provides information about hypothetical account values and hypothetical expenses based on a fund's actual expense ratio and an assumed rate of return of 5% per year before expenses, which is not the Fund's actual return. The hypothetical account values and expenses may not be used to estimate the actual ending account balance or expenses you paid for the period. You may use this information to compare the ongoing costs of investing in the Fund and other funds. To do so, compare this 5% hypothetical example with the 5% hypothetical examples that appear in the shareholder reports of the other funds. A small balance maintenance fee of $12.00 that is charged once a year may apply for certain accounts with a value of less than $2,000. This fee is not included in the table below. If it was, the estimate of expenses you paid during the period would be higher, and your ending account value lower, by this amount. In addition, each Fund, as a shareholder in underlying Fidelity Funds, will indirectly bear its pro-rata share of the fees and expenses incurred by the underlying Fidelity Funds. These fees and expenses are not included in each Fund's annualized expense ratio used to calculate the expense estimates in the table below.
Please note that the expenses shown in the table are meant to highlight your ongoing costs only and do not reflect any transaction costs. Therefore, the second line of the table is useful in comparing ongoing costs only, and will not help you determine the relative total costs of owning different funds.
| Annualized
Expense Ratio B | Beginning
Account Value
October 1, 2012 | Ending
Account Value
March 31, 2013 | Expenses Paid
During Period*
October 1, 2012
to March 31, 2013 |
Freedom Income | 0.0% | | | |
Actual | | $ 1,000.00 | $ 1,023.20 | $ - |
HypotheticalA | | $ 1,000.00 | $ 1,024.93 | $ - |
Freedom 2000 | 0.0% | | | |
Actual | | $ 1,000.00 | $ 1,022.80 | $ - |
Hypothetical A | | $ 1,000.00 | $ 1,024.93 | $ - |
Freedom 2005 | 0.0% | | | |
Actual | | $ 1,000.00 | $ 1,034.60 | $ - |
Hypothetical A | | $ 1,000.00 | $ 1,024.93 | $ - |
Freedom 2010 | 0.0% | | | |
Actual | | $ 1,000.00 | $ 1,045.10 | $ - |
Hypothetical A | | $ 1,000.00 | $ 1,024.93 | $ - |
Freedom 2015 | 0.0% | | | |
Actual | | $ 1,000.00 | $ 1,046.20 | $ - |
Hypothetical A | | $ 1,000.00 | $ 1,024.93 | $ - |
Freedom 2020 | 0.0% | | | |
Actual | | $ 1,000.00 | $ 1,050.70 | $ - |
Hypothetical A | | $ 1,000.00 | $ 1,024.93 | $ - |
Freedom 2025 | 0.0% | | | |
Actual | | $ 1,000.00 | $ 1,060.70 | $ - |
Hypothetical A | | $ 1,000.00 | $ 1,024.93 | $ - |
Freedom 2030 | 0.0% | | | |
Actual | | $ 1,000.00 | $ 1,063.00 | $ - |
Hypothetical A | | $ 1,000.00 | $ 1,024.93 | $ - |
| Annualized
Expense Ratio B | Beginning
Account Value
October 1, 2012 | Ending
Account Value
March 31, 2013 | Expenses Paid
During Period*
October 1, 2012
to March 31, 2013 |
Freedom 2035 | 0.0% | | | |
Actual | | $ 1,000.00 | $ 1,070.80 | $ - |
Hypothetical A | | $ 1,000.00 | $ 1,024.93 | $ - |
Freedom 2040 | 0.0% | | | |
Actual | | $ 1,000.00 | $ 1,071.20 | $ - |
Hypothetical A | | $ 1,000.00 | $ 1,024.93 | $ - |
Freedom 2045 | 0.0% | | | |
Actual | | $ 1,000.00 | $ 1,073.70 | $ - |
Hypothetical A | | $ 1,000.00 | $ 1,024.93 | $ - |
Freedom 2050 | 0.0% | | | |
Actual | | $ 1,000.00 | $ 1,075.20 | $ - |
Hypothetical A | | $ 1,000.00 | $ 1,024.93 | $ - |
Freedom 2055 | 0.0% | | | |
Actual | | $ 1,000.00 | $ 1,078.20 | $ - |
Hypothetical A | | $ 1,000.00 | $ 1,024.93 | $ - |
A 5% return per year before expenses
B Annualized expense ratio reflects expenses net of applicable fee waivers.
* Expenses are equal to each Fund's annualized expense ratio, multiplied by the average account value over the period, multiplied by 182/365 (to reflect the one-half year period). The fees and expenses of the underlying Fidelity Funds in which the Funds invest are not included in the Fund's annualized expense ratio.
Annual Report
Fidelity Freedom Income Fund
Investment Changes (Unaudited)
The information in the following tables is based on the direct investments of the Fund. |
Fund Holdings as of March 31, 2013 |
| % of fund's
net assets | % of fund's net assets
6 months ago |
Commodity Funds | | |
Fidelity Series Commodity Strategy Fund | 1.9 | 2.1 |
Domestic Equity Funds | | |
Fidelity Blue Chip Growth Fund | 1.3 | 1.0 |
Fidelity Disciplined Equity Fund | 0.3 | 1.3 |
Fidelity Growth Company Fund | 1.8 | 2.0 |
Fidelity Series 100 Index Fund | 0.5 | 1.8 |
Fidelity Series All-Sector Equity Fund | 2.0 | 3.0 |
Fidelity Series Equity-Income Fund | 1.3 | 0.0 |
Fidelity Series Intrinsic Opportunities Fund | 0.8 | 0.0 |
Fidelity Series Large Cap Value Fund | 1.1 | 2.5 |
Fidelity Series Mega Cap Fund | 0.5 | 0.0 |
Fidelity Series Opportunistic Insights Fund | 0.9 | 0.0 |
Fidelity Series Real Estate Equity Fund | 0.2 | 0.2 |
Fidelity Series Small Cap Opportunities Fund | 0.5 | 0.5 |
Fidelity Series Stock Selector Large Cap Value Fund | 1.3 | 0.0 |
Fidelity Small Cap Growth Fund | 0.3 | 0.3 |
Fidelity Small Cap Value Fund | 0.3 | 0.3 |
| 13.1 | 12.9 |
Developed International Equity Funds | | |
Fidelity Series International Growth Fund | 2.0 | 2.0 |
Fidelity Series International Small Cap Fund | 0.4 | 0.4 |
Fidelity Series International Value Fund | 2.0 | 1.9 |
| 4.4 | 4.3 |
Emerging Markets Equity Funds | | |
Fidelity Series Emerging Markets Fund | 1.2 | 1.2 |
High Yield Bond Funds | | |
Fidelity Series Emerging Markets Debt Fund | 0.5 | 0.6 |
Fidelity Series Floating Rate High Income Fund | 1.2 | 1.3 |
Fidelity Series High Income Fund | 4.9 | 4.8 |
Fidelity Series Real Estate Income Fund | 0.4 | 0.7 |
| 7.0 | 7.4 |
Inflation-Protected Bond Funds | | |
Fidelity Series Inflation-Protected Bond Index Fund | 11.4 | 12.0 |
Investment Grade Bond Funds | | |
Fidelity Series Investment Grade Bond Fund | 21.5 | 21.1 |
Short-Term Funds | | |
Fidelity Institutional Money Market Portfolio Institutional Class | 21.7 | 21.2 |
Fidelity Short-Term Bond Fund | 17.8 | 17.8 |
| 39.5 | 39.0 |
Net Other Assets (Liabilities)* | 0.0 | 0.0 |
| 100.0 | 100.0 |
Asset Allocation (% of fund's net assets) |
Period end |
 | Commodity Funds | 1.9% | |
 | Domestic Equity Funds | 13.1% | |
 | Developed International Equity Funds | 4.4% | |
 | Emerging Markets Equity Funds | 1.2% | |
 | High Yield Bond Funds | 7.0% | |
 | Inflation-Protected Bond Funds | 11.4% | |
 | Investment Grade Bond Funds | 21.5% | |
 | Short-Term Funds | 39.5% | |

Six months ago |
| Commodity Funds | 2.1% | |
| Domestic Equity Funds | 12.9% | |
| Developed International Equity Funds | 4.3% | |
| Emerging Markets Equity Funds | 1.2% | |
| High Yield Bond Funds | 7.4% | |
| Inflation-Protected Bond Funds | 12.0% | |
| Investment Grade Bond Funds | 21.1% | |
| Short-Term Funds | 39.0% | |

Expected |
| Commodity Funds | 2.0% | |
| Domestic Equity Funds | 12.6% | |
| Developed International Equity Funds | 4.2% | |
| Emerging Markets Equity Funds | 1.2% | |
| High Yield Bond Funds | 5.0% | |
| Inflation-Protected Bond Funds | 12.0% | |
| Investment Grade Bond Funds | 23.0% | |
| Short-Term Funds | 40.0% | |

The six months ago allocation is based on the fund's holdings as of September 30, 2012. The current allocation is based on the fund's holdings as of March 31, 2013. The expected allocation represents the fund's anticipated allocation at September 30, 2013. |
* Amount represents less than 0.1% |
Annual Report
Fidelity Freedom Income Fund
Investments March 31, 2013
Showing Percentage of Net Assets
Domestic Equity Funds - 15.0% |
| Shares | | Value |
Commodity Funds - 1.9% |
Fidelity Series Commodity Strategy Fund (a) | 4,821,452 | | $ 41,898,415 |
Domestic Equity Funds - 13.1% |
Fidelity Blue Chip Growth Fund | 552,449 | | 29,550,512 |
Fidelity Disciplined Equity Fund | 237,747 | | 6,471,462 |
Fidelity Growth Company Fund | 390,874 | | 39,532,972 |
Fidelity Series 100 Index Fund | 974,696 | | 10,058,863 |
Fidelity Series All-Sector Equity Fund | 3,380,842 | | 43,443,824 |
Fidelity Series Equity-Income Fund | 2,482,462 | | 27,580,149 |
Fidelity Series Intrinsic Opportunities Fund | 1,624,344 | | 18,436,302 |
Fidelity Series Large Cap Value Fund | 2,163,007 | | 25,177,407 |
Fidelity Series Mega Cap Fund | 915,130 | | 10,075,586 |
Fidelity Series Opportunistic Insights Fund | 1,830,561 | | 20,136,167 |
Fidelity Series Real Estate Equity Fund | 323,977 | | 4,218,184 |
Fidelity Series Small Cap Opportunities Fund | 919,185 | | 11,333,546 |
Fidelity Series Stock Selector Large Cap Value Fund | 2,471,149 | | 27,676,866 |
Fidelity Small Cap Growth Fund | 335,495 | | 6,072,452 |
Fidelity Small Cap Value Fund | 345,497 | | 6,512,618 |
TOTAL DOMESTIC EQUITY FUNDS | | 286,276,910 |
TOTAL DOMESTIC EQUITY FUNDS (Cost $265,512,538) |
328,175,325
|
International Equity Funds - 5.6% |
| | | |
Developed International Equity Funds - 4.4% |
Fidelity Series International Growth Fund | 3,464,239 | | 43,822,625 |
Fidelity Series International Small Cap Fund | 653,937 | | 8,972,020 |
Fidelity Series International Value Fund | 4,443,073 | | 43,630,979 |
TOTAL DEVELOPED INTERNATIONAL EQUITY FUNDS | | 96,425,624 |
Emerging Markets Equity Funds - 1.2% |
Fidelity Series Emerging Markets Fund | 1,581,177 | | 26,453,092 |
TOTAL INTERNATIONAL EQUITY FUNDS (Cost $108,413,443) |
122,878,716
|
Bond Funds - 39.9% |
| Shares | | Value |
High Yield Bond Funds - 7.0% |
Fidelity Series Emerging Markets Debt Fund | 1,071,517 | | $ 11,658,104 |
Fidelity Series Floating Rate High Income Fund | 2,375,318 | | 25,249,630 |
Fidelity Series High Income Fund | 10,311,120 | | 108,369,867 |
Fidelity Series Real Estate Income Fund | 690,768 | | 8,061,268 |
TOTAL HIGH YIELD BOND FUNDS | | 153,338,869 |
Inflation-Protected Bond Funds - 11.4% |
Fidelity Series Inflation-Protected Bond Index Fund | 21,939,407 | | 249,889,843 |
Investment Grade Bond Funds - 21.5% |
Fidelity Series Investment Grade Bond Fund | 40,896,487 | | 471,536,497 |
TOTAL BOND FUNDS (Cost $805,940,315) |
874,765,209
|
Short-Term Funds - 39.5% |
| | | |
Fidelity Institutional Money Market Portfolio Institutional Class | 475,076,345 | | 475,076,345 |
Fidelity Short-Term Bond Fund | 45,443,228 | | 390,811,762 |
TOTAL SHORT-TERM FUNDS (Cost $869,633,276) |
865,888,107
|
TOTAL INVESTMENT PORTFOLIO - 100.0% (Cost $2,049,499,572) | | 2,191,707,357 |
NET OTHER ASSETS (LIABILITIES) - 0.0% | | (41,587) |
NET ASSETS - 100% | $ 2,191,665,770 |
Legend |
(a) Non-income producing |
Other Information |
All investments are categorized as Level 1 under the Fair Value Hierarchy. The inputs or methodology used for valuing securities may not be an indication of the risk associated with investing in those securities. For more information on valuation inputs, please refer to the Security Valuation section in the accompanying Notes to Financial Statements. |
See accompanying notes which are an integral part of the financial statements.
Annual Report
Fidelity Freedom Income Fund
Statement of Assets and Liabilities
| March 31, 2013 |
| | |
Assets | | |
Investment in securities, at value (cost $2,049,499,572) - See accompanying schedule | | $ 2,191,707,357 |
Cash | | 13 |
Receivable for investments sold | | 2,567,495 |
Receivable for fund shares sold | | 2,452,769 |
Total assets | | 2,196,727,634 |
| | |
Liabilities | | |
Payable for investments purchased | $ 500,530 | |
Payable for fund shares redeemed | 4,561,334 | |
Total liabilities | | 5,061,864 |
| | |
Net Assets | | $ 2,191,665,770 |
Net Assets consist of: | | |
Paid in capital | | $ 2,017,646,445 |
Undistributed net investment income | | 2,058,651 |
Accumulated undistributed net realized gain (loss) on investments | | 29,752,889 |
Net unrealized appreciation (depreciation) on investments | | 142,207,785 |
Net Assets, for 184,069,765 shares outstanding | | $ 2,191,665,770 |
Net Asset Value, offering price and redemption price per share ($2,191,665,770 ÷ 184,069,765 shares) | | $ 11.91 |
Statement of Operations
| Year ended March 31, 2013 |
| | |
Investment Income | | |
Income distributions from underlying funds | | $ 30,039,521 |
| | |
Expenses | | |
Independent trustees' compensation | $ 8,345 | |
Total expenses before reductions | 8,345 | |
Expense reductions | (8,345) | - |
Net investment income (loss) | | 30,039,521 |
Realized and Unrealized Gain (Loss) Realized gain (loss) on sale of underlying fund shares | 45,407,286 | |
Capital gain distributions from underlying funds | 34,755,779 | |
Total net realized gain (loss) | | 80,163,065 |
Change in net unrealized appreciation (depreciation) on underlying funds | | (5,809,253) |
Net gain (loss) | | 74,353,812 |
Net increase (decrease) in net assets resulting from operations | | $ 104,393,333 |
See accompanying notes which are an integral part of the financial statements.
Annual Report
Fidelity Freedom Income Fund
Financial Statements - continued
Statement of Changes in Net Assets
| Year ended
March 31,
2013 | Year ended
March 31,
2012 |
Increase (Decrease) in Net Assets | | |
Operations | | |
Net investment income (loss) | $ 30,039,521 | $ 41,397,654 |
Net realized gain (loss) | 80,163,065 | 61,728,198 |
Change in net unrealized appreciation (depreciation) | (5,809,253) | (22,188,979) |
Net increase (decrease) in net assets resulting from operations | 104,393,333 | 80,936,873 |
Distributions to shareholders from net investment income | (30,676,109) | (42,298,956) |
Distributions to shareholders from net realized gain | (15,315,416) | (17,888,732) |
Total distributions | (45,991,525) | (60,187,688) |
Share transactions
Proceeds from sales of shares | 576,179,291 | 849,715,344 |
Reinvestment of distributions | 45,296,041 | 59,298,592 |
Cost of shares redeemed | (871,916,280) | (1,405,719,831) |
Net increase (decrease) in net assets resulting from share transactions | (250,440,948) | (496,705,895) |
Total increase (decrease) in net assets | (192,039,140) | (475,956,710) |
| | |
Net Assets | | |
Beginning of period | 2,383,704,910 | 2,859,661,620 |
End of period (including undistributed net investment income of $2,058,651 and undistributed net investment income of $2,695,240, respectively) | $ 2,191,665,770 | $ 2,383,704,910 |
Other Information Shares | | |
Sold | 49,200,613 | 74,273,185 |
Issued in reinvestment of distributions | 3,877,974 | 5,222,417 |
Redeemed | (74,491,637) | (123,177,428) |
Net increase (decrease) | (21,413,050) | (43,681,826) |
Financial Highlights
Years ended March 31, | 2013 | 2012 | 2011 | 2010 | 2009 |
Selected Per-Share Data | | | | | |
Net asset value, beginning of period | $ 11.60 | $ 11.48 | $ 10.96 | $ 9.37 | $ 11.19 |
Income from Investment Operations | | | | | |
Net investment income (loss)B | .15 | .18 | .19 | .26 | .36 |
Net realized and unrealized gain (loss) | .40 | .21 | .60 | 1.65 | (1.66) |
Total from investment operations | .55 | .39 | .79 | 1.91 | (1.30) |
Distributions from net investment income | (.16) | (.19) | (.20) | (.26) | (.37) |
Distributions from net realized gain | (.08) | (.08) | (.07) | (.06) | (.15) |
Total distributions | (.24) | (.27) | (.27) | (.32) F | (.52) |
Net asset value, end of period | $ 11.91 | $ 11.60 | $ 11.48 | $ 10.96 | $ 9.37 |
Total Return A | 4.79% | 3.47% | 7.33% | 20.60% | (11.97)% |
Ratios to Average Net Assets C,E | | | | | |
Expenses before reductions D | .00% | .00% | .00% | .00% | .00% |
Expenses net of fee waivers, if any | .00% | .00% | .00% | .00% | .00% |
Expenses net of all reductions | .00% | .00% | .00% | .00% | .00% |
Net investment income (loss) | 1.32% | 1.58% | 1.71% | 2.54% | 3.46% |
Supplemental Data | | | | | |
Net assets, end of period (000 omitted) | $ 2,191,666 | $ 2,383,705 | $ 2,859,662 | $ 2,734,398 | $ 2,179,906 |
Portfolio turnover rate | 14% | 20% | 38% | 29% | 35% |
A Total returns would have been lower if certain expenses had not been reduced during the applicable periods shown.
B Calculated based on average shares outstanding during the period.
C Amounts do not include the activity of the Underlying Funds.
D Amount represents less than .01%.
E Expense ratios reflect operating expenses of the Fund. Expenses before reductions do not reflect amounts reimbursed by the investment adviser or reductions from expense offset arrangements and do not represent the amount paid by the Fund during periods when reimbursements or reductions occur. Expenses net of fee waivers reflect expenses after reimbursement by the investment adviser but prior to reductions from expense offset arrangements. Expenses net of all reductions represent the net expenses paid by the Fund but do not include expenses of the investment companies in which the Fund invests.
F Total distributions of $.32 per share is comprised of distributions from net investment income of $.260 and distributions from net realized gain of $.060 per share.
See accompanying notes which are an integral part of the financial statements.
Annual Report
Fidelity Freedom 2000 Fund
Investment Changes (Unaudited)
The information in the following tables is based on the direct investments of the Fund. |
Fund Holdings as of March 31, 2013 |
| % of fund's
net assets | % of fund's net assets
6 months ago |
Commodity Funds | | |
Fidelity Series Commodity Strategy Fund | 1.9 | 2.0 |
Domestic Equity Funds | | |
Fidelity Blue Chip Growth Fund | 1.3 | 1.0 |
Fidelity Disciplined Equity Fund | 0.3 | 1.3 |
Fidelity Growth Company Fund | 1.8 | 2.1 |
Fidelity Series 100 Index Fund | 0.4 | 1.8 |
Fidelity Series All-Sector Equity Fund | 2.0 | 2.9 |
Fidelity Series Equity-Income Fund | 1.3 | 0.0 |
Fidelity Series Intrinsic Opportunities Fund | 0.9 | 0.0 |
Fidelity Series Large Cap Value Fund | 1.1 | 2.5 |
Fidelity Series Mega Cap Fund | 0.5 | 0.0 |
Fidelity Series Opportunistic Insights Fund | 0.9 | 0.0 |
Fidelity Series Real Estate Equity Fund | 0.2 | 0.2 |
Fidelity Series Small Cap Opportunities Fund | 0.5 | 0.5 |
Fidelity Series Stock Selector Large Cap Value Fund | 1.3 | 0.0 |
Fidelity Small Cap Growth Fund | 0.3 | 0.3 |
Fidelity Small Cap Value Fund | 0.3 | 0.3 |
| 13.1 | 12.9 |
Developed International Equity Funds | | |
Fidelity Series International Growth Fund | 2.0 | 2.0 |
Fidelity Series International Small Cap Fund | 0.4 | 0.4 |
Fidelity Series International Value Fund | 2.0 | 1.9 |
| 4.4 | 4.3 |
Emerging Markets Equity Funds | | |
Fidelity Series Emerging Markets Fund | 1.2 | 1.2 |
High Yield Bond Funds | | |
Fidelity Series Emerging Markets Debt Fund | 0.5 | 0.6 |
Fidelity Series Floating Rate High Income Fund | 1.1 | 1.4 |
Fidelity Series High Income Fund | 5.0 | 4.8 |
Fidelity Series Real Estate Income Fund | 0.4 | 0.8 |
| 7.0 | 7.6 |
Inflation-Protected Bond Funds | | |
Fidelity Series Inflation-Protected Bond Index Fund | 11.4 | 11.9 |
Investment Grade Bond Funds | | |
Fidelity Series Investment Grade Bond Fund | 21.5 | 21.1 |
Short-Term Funds | | |
Fidelity Institutional Money Market Portfolio Institutional Class | 21.7 | 21.3 |
Fidelity Short-Term Bond Fund | 17.8 | 17.7 |
| 39.5 | 39.0 |
Net Other Assets (Liabilities)* | 0.0 | 0.0 |
| 100.0 | 100.0 |
Asset Allocation (% of fund's net assets) |
Period end |
| Commodity Funds | 1.9% | |
| Domestic Equity Funds | 13.1% | |
| Developed International Equity Funds | 4.4% | |
| Emerging Markets Equity Funds | 1.2% | |
| High Yield Bond Funds | 7.0% | |
| Inflation-Protected Bond Funds | 11.4% | |
| Investment Grade Bond Funds | 21.5% | |
| Short-Term Funds | 39.5% | |

Six months ago |
| Commodity Funds | 2.0% | |
| Domestic Equity Funds | 12.9% | |
| Developed International Equity Funds | 4.3% | |
| Emerging Markets Equity Funds | 1.2% | |
| High Yield Bond Funds | 7.6% | |
| Inflation-Protected Bond Funds | 11.9% | |
| Investment Grade Bond Funds | 21.1% | |
| Short-Term Funds | 39.0% | |

Expected |
| Commodity Funds | 2.0% | |
| Domestic Equity Funds | 12.6% | |
| Developed International Equity Funds | 4.2% | |
| Emerging Markets Equity Funds | 1.2% | |
| High Yield Bond Funds | 5.0% | |
| Inflation-Protected Bond Funds | 12.0% | |
| Investment Grade Bond Funds | 23.0% | |
| Short-Term Funds | 40.0% | |

The fund invests according to an asset allocation strategy that becomes increasingly conservative over time. The six months ago allocation is based on the fund's holdings as of September 30, 2012. The current allocation is based on the fund's holdings as of March 31, 2013. The expected allocation represents the fund's anticipated allocation at September 30, 2013. |
* Amount represents less than 0.1% |
Annual Report
Fidelity Freedom 2000 Fund
Investments March 31, 2013
Showing Percentage of Net Assets
Domestic Equity Funds - 15.0% |
| Shares | | Value |
Commodity Funds - 1.9% |
Fidelity Series Commodity Strategy Fund (a) | 2,170,886 | | $ 18,865,003 |
Domestic Equity Funds - 13.1% |
Fidelity Blue Chip Growth Fund | 251,624 | | 13,459,390 |
Fidelity Disciplined Equity Fund | 108,076 | | 2,941,841 |
Fidelity Growth Company Fund | 178,985 | | 18,102,567 |
Fidelity Series 100 Index Fund | 440,507 | | 4,546,028 |
Fidelity Series All-Sector Equity Fund | 1,537,182 | | 19,752,787 |
Fidelity Series Equity-Income Fund | 1,140,935 | | 12,675,789 |
Fidelity Series Intrinsic Opportunities Fund | 761,253 | | 8,640,223 |
Fidelity Series Large Cap Value Fund | 986,092 | | 11,478,106 |
Fidelity Series Mega Cap Fund | 420,622 | | 4,631,043 |
Fidelity Series Opportunistic Insights Fund | 841,603 | | 9,257,628 |
Fidelity Series Real Estate Equity Fund | 152,122 | | 1,980,634 |
Fidelity Series Small Cap Opportunities Fund | 419,382 | | 5,170,986 |
Fidelity Series Stock Selector Large Cap Value Fund | 1,136,252 | | 12,726,026 |
Fidelity Small Cap Growth Fund | 154,039 | | 2,788,099 |
Fidelity Small Cap Value Fund | 158,845 | | 2,994,231 |
TOTAL DOMESTIC EQUITY FUNDS | | 131,145,378 |
TOTAL DOMESTIC EQUITY FUNDS (Cost $120,826,949) |
150,010,381
|
International Equity Funds - 5.6% |
| | | |
Developed International Equity Funds - 4.4% |
Fidelity Series International Growth Fund | 1,591,456 | | 20,131,920 |
Fidelity Series International Small Cap Fund | 300,729 | | 4,126,007 |
Fidelity Series International Value Fund | 2,041,201 | | 20,044,595 |
TOTAL DEVELOPED INTERNATIONAL EQUITY FUNDS | | 44,302,522 |
Emerging Markets Equity Funds - 1.2% |
Fidelity Series Emerging Markets Fund | 727,358 | | 12,168,692 |
TOTAL INTERNATIONAL EQUITY FUNDS (Cost $49,304,546) |
56,471,214
|
Bond Funds - 39.9% |
| Shares | | Value |
High Yield Bond Funds - 7.0% |
Fidelity Series Emerging Markets Debt Fund | 495,477 | | $ 5,390,785 |
Fidelity Series Floating Rate High Income Fund | 1,098,974 | | 11,682,093 |
Fidelity Series High Income Fund | 4,747,895 | | 49,900,379 |
Fidelity Series Real Estate Income Fund | 319,431 | | 3,727,756 |
TOTAL HIGH YIELD BOND FUNDS | | 70,701,013 |
Inflation-Protected Bond Funds - 11.4% |
Fidelity Series Inflation-Protected Bond Index Fund | 10,073,874 | | 114,741,430 |
Investment Grade Bond Funds - 21.5% |
Fidelity Series Investment Grade Bond Fund | 18,682,570 | | 215,410,032 |
TOTAL BOND FUNDS (Cost $368,776,866) |
400,852,475
|
Short-Term Funds - 39.5% |
| | | |
Fidelity Institutional Money Market Portfolio Institutional Class | 217,485,045 | | 217,485,045 |
Fidelity Short-Term Bond Fund | 20,783,574 | | 178,738,729 |
TOTAL SHORT-TERM FUNDS (Cost $399,259,969) |
396,223,774
|
TOTAL INVESTMENT PORTFOLIO - 100.0% (Cost $938,168,330) | | 1,003,557,844 |
NET OTHER ASSETS (LIABILITIES) - 0.0% | | (7,946) |
NET ASSETS - 100% | $ 1,003,549,898 |
Legend |
(a) Non-income producing |
Other Information |
All investments are categorized as Level 1 under the Fair Value Hierarchy. The inputs or methodology used for valuing securities may not be an indication of the risk associated with investing in those securities. For more information on valuation inputs, please refer to the Security Valuation section in the accompanying Notes to Financial Statements. |
See accompanying notes which are an integral part of the financial statements.
Annual Report
Fidelity Freedom 2000 Fund
Statement of Assets and Liabilities
| March 31, 2013 |
| | |
Assets | | |
Investment in securities, at value (cost $938,168,330) - See accompanying schedule | | $ 1,003,557,844 |
Receivable for investments sold | | 1,514,643 |
Receivable for fund shares sold | | 559,532 |
Total assets | | 1,005,632,019 |
| | |
Liabilities | | |
Payable for investments purchased | $ 227,325 | |
Payable for fund shares redeemed | 1,854,796 | |
Total liabilities | | 2,082,121 |
| | |
Net Assets | | $ 1,003,549,898 |
Net Assets consist of: | | |
Paid in capital | | $ 927,691,882 |
Undistributed net investment income | | 2,361,608 |
Accumulated undistributed net realized gain (loss) on investments | | 8,106,894 |
Net unrealized appreciation (depreciation) on investments | | 65,389,514 |
Net Assets, for 79,699,999 shares outstanding | | $ 1,003,549,898 |
Net Asset Value, offering price and redemption price per share ($1,003,549,898 ÷ 79,699,999 shares) | | $ 12.59 |
Statement of Operations
| Year ended March 31, 2013 |
| | |
Investment Income | | |
Income distributions from underlying funds | | $ 14,543,943 |
| | |
Expenses | | |
Independent trustees' compensation | $ 4,079 | |
Total expenses before reductions | 4,079 | |
Expense reductions | (4,079) | - |
Net investment income (loss) | | 14,543,943 |
Realized and Unrealized Gain (Loss) Realized gain (loss) on sale of underlying fund shares | 31,305,807 | |
Capital gain distributions from underlying funds | 16,584,709 | |
Total net realized gain (loss) | | 47,890,516 |
Change in net unrealized appreciation (depreciation) on underlying funds | | (12,705,167) |
Net gain (loss) | | 35,185,349 |
Net increase (decrease) in net assets resulting from operations | | $ 49,729,292 |
See accompanying notes which are an integral part of the financial statements.
Annual Report
Statement of Changes in Net Assets
| Year ended
March 31,
2013 | Year ended
March 31,
2012 |
Increase (Decrease) in Net Assets | | |
Operations | | |
Net investment income (loss) | $ 14,543,943 | $ 21,265,544 |
Net realized gain (loss) | 47,890,516 | 36,174,564 |
Change in net unrealized appreciation (depreciation) | (12,705,167) | (16,570,580) |
Net increase (decrease) in net assets resulting from operations | 49,729,292 | 40,869,528 |
Distributions to shareholders from net investment income | (15,922,623) | (21,732,556) |
Distributions to shareholders from net realized gain | (7,401,419) | (10,057,268) |
Total distributions | (23,324,042) | (31,789,824) |
Share transactions
Proceeds from sales of shares | 211,998,303 | 367,699,508 |
Reinvestment of distributions | 23,138,995 | 31,577,916 |
Cost of shares redeemed | (473,996,472) | (674,322,091) |
Net increase (decrease) in net assets resulting from share transactions | (238,859,174) | (275,044,667) |
Total increase (decrease) in net assets | (212,453,924) | (265,964,963) |
| | |
Net Assets | | |
Beginning of period | 1,216,003,822 | 1,481,968,785 |
End of period (including undistributed net investment income of $2,361,608 and undistributed net investment income of $3,740,287, respectively) | $ 1,003,549,898 | $ 1,216,003,822 |
Other Information Shares | | |
Sold | 17,091,972 | 30,270,221 |
Issued in reinvestment of distributions | 1,877,679 | 2,645,308 |
Redeemed | (38,251,373) | (55,588,770) |
Net increase (decrease) | (19,281,722) | (22,673,241) |
Financial Highlights
Years ended March 31, | 2013 | 2012 | 2011 | 2010 | 2009 |
Selected Per-Share Data | | | | | |
Net asset value, beginning of period | $ 12.29 | $ 12.18 | $ 11.61 | $ 9.86 | $ 12.08 |
Income from Investment Operations | | | | | |
Net investment income (loss) B | .16 | .19 | .20 | .27 | .37 |
Net realized and unrealized gain (loss) | .41 | .22 | .67 | 1.83 | (1.97) |
Total from investment operations | .57 | .41 | .87 | 2.10 | (1.60) |
Distributions from net investment income | (.18) | (.20) | (.22) | (.29) | (.41) |
Distributions from net realized gain | (.09) | (.10) | (.08) | (.06) | (.21) |
Total distributions | (.27) | (.30) | (.30) | (.35) F | (.62) |
Net asset value, end of period | $ 12.59 | $ 12.29 | $ 12.18 | $ 11.61 | $ 9.86 |
Total Return A | 4.70% | 3.45% | 7.56% | 21.46% | (13.60)% |
Ratios to Average Net Assets C,E | | | | | |
Expenses before reductions D | .00% | .00% | .00% | .00% | .00% |
Expenses net of fee waivers, if any | .00% | .00% | .00% | .00% | .00% |
Expenses net of all reductions | .00% | .00% | .00% | .00% | .00% |
Net investment income (loss) | 1.32% | 1.58% | 1.67% | 2.47% | 3.33% |
Supplemental Data | | | | | |
Net assets, end of period (000 omitted) | $ 1,003,550 | $ 1,216,004 | $ 1,481,969 | $ 1,708,818 | $ 1,443,544 |
Portfolio turnover rate | 12% | 19% | 32% | 31% | 33% |
A Total returns would have been lower if certain expenses had not been reduced during the applicable periods shown.
B Calculated based on average shares outstanding during the period.
C Amounts do not include the activity of the Underlying Funds.
D Amount represents less than .01%.
E Expense ratios reflect operating expenses of the Fund. Expenses before reductions do not reflect amounts reimbursed by the investment adviser or reductions from expense offset arrangements and do not represent the amount paid by the Fund during periods when reimbursements or reductions occur. Expenses net of fee waivers reflect expenses after reimbursement by the investment adviser but prior to reductions from expense offset arrangements. Expenses net of all reductions represent the net expenses paid by the Fund but do not include expenses of the investment companies in which the Fund invests.
F Total distributions of $.35 per share is comprised of distributions from net investment income of $.290 and distributions from net realized gain of $.060 per share.
See accompanying notes which are an integral part of the financial statements.
Annual Report
Fidelity Freedom 2005 Fund
Investment Changes (Unaudited)
The information in the following tables is based on the direct investments of the Fund. |
Fund Holdings as of March 31, 2013 |
| % of fund's
net assets | % of fund's net assets
6 months ago |
Commodity Funds | | |
Fidelity Series Commodity Strategy Fund | 3.8 | 4.2 |
Domestic Equity Funds | | |
Fidelity Blue Chip Growth Fund | 2.3 | 1.8 |
Fidelity Disciplined Equity Fund | 0.5 | 2.4 |
Fidelity Growth Company Fund | 3.1 | 3.6 |
Fidelity Series 100 Index Fund | 0.8 | 3.2 |
Fidelity Series All-Sector Equity Fund | 3.4 | 5.2 |
Fidelity Series Equity-Income Fund | 2.2 | 0.0 |
Fidelity Series Intrinsic Opportunities Fund | 1.2 | 0.0 |
Fidelity Series Large Cap Value Fund | 2.0 | 4.5 |
Fidelity Series Mega Cap Fund | 0.8 | 0.0 |
Fidelity Series Opportunistic Insights Fund | 1.6 | 0.0 |
Fidelity Series Real Estate Equity Fund | 0.3 | 0.3 |
Fidelity Series Small Cap Opportunities Fund | 0.9 | 0.9 |
Fidelity Series Stock Selector Large Cap Value Fund | 2.2 | 0.0 |
Fidelity Small Cap Growth Fund | 0.5 | 0.5 |
Fidelity Small Cap Value Fund | 0.5 | 0.5 |
| 22.3 | 22.9 |
Developed International Equity Funds | | |
Fidelity Series International Growth Fund | 3.4 | 3.4 |
Fidelity Series International Small Cap Fund | 0.7 | 0.7 |
Fidelity Series International Value Fund | 3.3 | 3.4 |
| 7.4 | 7.5 |
Emerging Markets Equity Funds | | |
Fidelity Series Emerging Markets Fund | 2.1 | 2.3 |
High Yield Bond Funds | | |
Fidelity Series Emerging Markets Debt Fund | 0.7 | 0.7 |
Fidelity Series Floating Rate High Income Fund | 1.1 | 1.2 |
Fidelity Series High Income Fund | 4.8 | 4.7 |
Fidelity Series Real Estate Income Fund | 0.5 | 0.6 |
| 7.1 | 7.2 |
Inflation-Protected Bond Funds | | |
Fidelity Series Inflation-Protected Bond Index Fund | 9.1 | 9.8 |
Investment Grade Bond Funds | | |
Fidelity Series Investment Grade Bond Fund | 18.0 | 18.3 |
Short-Term Funds | | |
Fidelity Institutional Money Market Portfolio Institutional Class | 16.6 | 15.4 |
Fidelity Short-Term Bond Fund | 13.6 | 12.4 |
| 30.2 | 27.8 |
Net Other Assets (Liabilities)* | 0.0 | 0.0 |
| 100.0 | 100.0 |
Asset Allocation (% of fund's net assets) |
Period end |
| Commodity Funds | 3.8% | |
| Domestic Equity Funds | 22.3% | |
| Developed International Equity Funds | 7.4% | |
| Emerging Markets Equity Funds | 2.1% | |
| High Yield Bond Funds | 7.1% | |
| Inflation-Protected Bond Funds | 9.1% | |
| Investment Grade Bond Funds | 18.0% | |
| Short-Term Funds | 30.2% | |

Six months ago |
| Commodity Funds | 4.2% | |
| Domestic Equity Funds | 22.9% | |
| Developed International Equity Funds | 7.5% | |
| Emerging Markets Equity Funds | 2.3% | |
| High Yield Bond Funds | 7.2% | |
| Inflation-Protected Bond Funds | 9.8% | |
| Investment Grade Bond Funds | 18.3% | |
| Short-Term Funds | 27.8% | |

Expected |
| Commodity Funds | 3.6% | |
| Domestic Equity Funds | 20.4% | |
| Developed International Equity Funds | 6.8% | |
| Emerging Markets Equity Funds | 2.0% | |
| High Yield Bond Funds | 5.0% | |
| Inflation-Protected Bond Funds | 9.7% | |
| Investment Grade Bond Funds | 19.6% | |
| Short-Term Funds | 32.9% | |

The fund invests according to an asset allocation strategy that becomes increasingly conservative over time. The six months ago allocation is based on the fund's holdings as of September 30, 2012. The current allocation is based on the fund's holdings as of March 31, 2013. The expected allocation represents the fund's anticipated allocation at September 30, 2013. |
* Amount represents less than 0.1% |
Annual Report
Fidelity Freedom 2005 Fund
Investments March 31, 2013
Showing Percentage of Net Assets
Domestic Equity Funds - 26.1% |
| Shares | | Value |
Commodity Funds - 3.8% |
Fidelity Series Commodity Strategy Fund (a) | 3,046,059 | | $ 26,470,248 |
Domestic Equity Funds - 22.3% |
Fidelity Blue Chip Growth Fund | 309,781 | | 16,570,159 |
Fidelity Disciplined Equity Fund | 132,716 | | 3,612,518 |
Fidelity Growth Company Fund | 213,797 | | 21,623,451 |
Fidelity Series 100 Index Fund | 536,628 | | 5,538,000 |
Fidelity Series All-Sector Equity Fund | 1,864,763 | | 23,962,206 |
Fidelity Series Equity-Income Fund | 1,382,583 | | 15,360,498 |
Fidelity Series Intrinsic Opportunities Fund | 761,047 | | 8,637,881 |
Fidelity Series Large Cap Value Fund | 1,205,471 | | 14,031,678 |
Fidelity Series Mega Cap Fund | 508,729 | | 5,601,103 |
Fidelity Series Opportunistic Insights Fund | 1,017,576 | | 11,193,340 |
Fidelity Series Real Estate Equity Fund | 189,030 | | 2,461,176 |
Fidelity Series Small Cap Opportunities Fund | 516,109 | | 6,363,627 |
Fidelity Series Stock Selector Large Cap Value Fund | 1,377,789 | | 15,431,236 |
Fidelity Small Cap Growth Fund | 187,471 | | 3,393,222 |
Fidelity Small Cap Value Fund | 192,855 | | 3,635,319 |
TOTAL DOMESTIC EQUITY FUNDS | | 157,415,414 |
TOTAL DOMESTIC EQUITY FUNDS (Cost $174,010,031) |
183,885,662
|
International Equity Funds - 9.5% |
| | | |
Developed International Equity Funds - 7.4% |
Fidelity Series International Growth Fund | 1,879,835 | | 23,779,915 |
Fidelity Series International Small Cap Fund | 355,283 | | 4,874,479 |
Fidelity Series International Value Fund | 2,392,107 | | 23,490,490 |
TOTAL DEVELOPED INTERNATIONAL EQUITY FUNDS | | 52,144,884 |
Emerging Markets Equity Funds - 2.1% |
Fidelity Series Emerging Markets Fund | 872,345 | | 14,594,326 |
TOTAL INTERNATIONAL EQUITY FUNDS (Cost $63,137,140) |
66,739,210
|
Bond Funds - 34.2% |
| Shares | | Value |
High Yield Bond Funds - 7.1% |
Fidelity Series Emerging Markets Debt Fund | 432,170 | | $ 4,702,012 |
Fidelity Series Floating Rate High Income Fund | 768,314 | | 8,167,175 |
Fidelity Series High Income Fund | 3,240,174 | | 34,054,224 |
Fidelity Series Real Estate Income Fund | 287,956 | | 3,360,451 |
TOTAL HIGH YIELD BOND FUNDS | | 50,283,862 |
Inflation-Protected Bond Funds - 9.1% |
Fidelity Series Inflation-Protected Bond Index Fund | 5,637,373 | | 64,209,676 |
Investment Grade Bond Funds - 18.0% |
Fidelity Series Investment Grade Bond Fund | 10,970,104 | | 126,485,301 |
TOTAL BOND FUNDS (Cost $236,285,091) |
240,978,839
|
Short-Term Funds - 30.2% |
| | | |
Fidelity Institutional Money Market Portfolio Institutional Class | 116,878,761 | | 116,878,761 |
Fidelity Short-Term Bond Fund | 11,128,004 | | 95,700,835 |
TOTAL SHORT-TERM FUNDS (Cost $213,660,360) |
212,579,596
|
TOTAL INVESTMENT PORTFOLIO - 100.0% (Cost $687,092,622) | | 704,183,307 |
NET OTHER ASSETS (LIABILITIES) - 0.0% | | (24) |
NET ASSETS - 100% | $ 704,183,283 |
Legend |
(a) Non-income producing |
Other Information |
All investments are categorized as Level 1 under the Fair Value Hierarchy. The inputs or methodology used for valuing securities may not be an indication of the risk associated with investing in those securities. For more information on valuation inputs, please refer to the Security Valuation section in the accompanying Notes to Financial Statements. |
See accompanying notes which are an integral part of the financial statements.
Annual Report
Fidelity Freedom 2005 Fund
Statement of Assets and Liabilities
| March 31, 2013 |
| | |
Assets | | |
Investment in securities, at value (cost $687,092,622) - See accompanying schedule | | $ 704,183,307 |
Receivable for investments sold | | 375,368 |
Receivable for fund shares sold | | 498,627 |
Total assets | | 705,057,302 |
| | |
Liabilities | | |
Payable for investments purchased | $ 25 | |
Payable for fund shares redeemed | 873,994 | |
Total liabilities | | 874,019 |
| | |
Net Assets | | $ 704,183,283 |
Net Assets consist of: | | |
Paid in capital | | $ 710,800,439 |
Undistributed net investment income | | 1,446,777 |
Accumulated undistributed net realized gain (loss) on investments | | (25,154,618) |
Net unrealized appreciation (depreciation) on investments | | 17,090,685 |
Net Assets, for 61,077,982 shares outstanding | | $ 704,183,283 |
Net Asset Value, offering price and redemption price per share ($704,183,283 ÷ 61,077,982 shares) | | $ 11.53 |
Statement of Operations
| Year ended March 31, 2013 |
| | |
Investment Income | | |
Income distributions from underlying funds | | $ 10,136,653 |
| | |
Expenses | | |
Independent trustees' compensation | $ 2,705 | |
Total expenses before reductions | 2,705 | |
Expense reductions | (2,705) | - |
Net investment income (loss) | | 10,136,653 |
Realized and Unrealized Gain (Loss) Realized gain (loss) on sale of underlying fund shares | 10,342,250 | |
Capital gain distributions from underlying funds | 12,210,203 | |
Total net realized gain (loss) | | 22,552,453 |
Change in net unrealized appreciation (depreciation) on underlying funds | | 8,411,298 |
Net gain (loss) | | 30,963,751 |
Net increase (decrease) in net assets resulting from operations | | $ 41,100,404 |
See accompanying notes which are an integral part of the financial statements.
Annual Report
Fidelity Freedom 2005 Fund
Financial Statements - continued
Statement of Changes in Net Assets
| Year ended
March 31,
2013 | Year ended
March 31,
2012 |
Increase (Decrease) in Net Assets | | |
Operations | | |
Net investment income (loss) | $ 10,136,653 | $ 13,483,753 |
Net realized gain (loss) | 22,552,453 | 22,827,059 |
Change in net unrealized appreciation (depreciation) | 8,411,298 | (17,764,598) |
Net increase (decrease) in net assets resulting from operations | 41,100,404 | 18,546,214 |
Distributions to shareholders from net investment income | (10,742,526) | (13,768,494) |
Distributions to shareholders from net realized gain | (4,341,485) | (9,568,884) |
Total distributions | (15,084,011) | (23,337,378) |
Share transactions
Proceeds from sales of shares | 171,676,253 | 262,175,970 |
Reinvestment of distributions | 14,972,075 | 23,180,949 |
Cost of shares redeemed | (306,330,103) | (415,117,192) |
Net increase (decrease) in net assets resulting from share transactions | (119,681,775) | (129,760,273) |
Total increase (decrease) in net assets | (93,665,382) | (134,551,437) |
| | |
Net Assets | | |
Beginning of period | 797,848,665 | 932,400,102 |
End of period (including undistributed net investment income of $1,446,777 and undistributed net investment income of $2,052,650, respectively) | $ 704,183,283 | $ 797,848,665 |
Other Information Shares | | |
Sold | 15,303,988 | 24,006,753 |
Issued in reinvestment of distributions | 1,345,365 | 2,184,224 |
Redeemed | (27,376,874) | (38,147,213) |
Net increase (decrease) | (10,727,521) | (11,956,236) |
Financial Highlights
Years ended March 31, | 2013 | 2012 | 2011 | 2010 | 2009 |
Selected Per-Share Data | | | | | |
Net asset value, beginning of period | $ 11.11 | $ 11.13 | $ 10.32 | $ 8.02 | $ 11.19 |
Income from Investment Operations | | | | | |
Net investment income (loss) B | .15 | .17 | .17 | .23 | .29 |
Net realized and unrealized gain (loss) | .51 | .12 | .91 | 2.39 | (2.88) |
Total from investment operations | .66 | .29 | 1.08 | 2.62 | (2.59) |
Distributions from net investment income | (.17) | (.18) | (.19) | (.24) | (.32) |
Distributions from net realized gain | (.07) | (.13) | (.09) | (.08) | (.26) |
Total distributions | (.24) | (.31) | (.27) G | (.32) F | (.58) |
Net asset value, end of period | $ 11.53 | $ 11.11 | $ 11.13 | $ 10.32 | $ 8.02 |
Total Return A | 5.99% | 2.76% | 10.64% | 32.83% | (23.91)% |
Ratios to Average Net Assets C,E | | | | | |
Expenses before reductions D | .00% | .00% | .00% | .00% | .00% |
Expenses net of fee waivers, if any | .00% | .00% | .00% | .00% | .00% |
Expenses net of all reductions | .00% | .00% | .00% | .00% | .00% |
Net investment income (loss) | 1.38% | 1.58% | 1.60% | 2.37% | 3.03% |
Supplemental Data | | | | | |
Net assets, end of period (000 omitted) | $ 704,183 | $ 797,849 | $ 932,400 | $ 1,013,924 | $ 770,642 |
Portfolio turnover rate | 22% | 29% | 38% | 34% | 43% |
A Total returns would have been lower if certain expenses had not been reduced during the applicable periods shown.
B Calculated based on average shares outstanding during the period.
C Amounts do not include the activity of the Underlying Funds.
D Amount represents less than .01%.
E Expense ratios reflect operating expenses of the Fund. Expenses before reductions do not reflect amounts reimbursed by the investment adviser or reductions from expense offset arrangements and do not represent the amount paid by the Fund during periods when reimbursements or reductions occur. Expenses net of fee waivers reflect expenses after reimbursement by the investment adviser but prior to reductions from expense offset arrangements. Expenses net of all reductions represent the net expenses paid by the Fund but do not include expenses of the investment companies in which the Fund invests.
F Total distributions of $.32 per share is comprised of distributions from net investment income of $.235 and distributions from net realized gain of $.080 per share.
G Total distributions of $.27 per share is comprised of distributions from net investment income of $.188 and distributions from net realized gain of $.085 per share.
See accompanying notes which are an integral part of the financial statements.
Annual Report
Fidelity Freedom 2010 Fund
Investment Changes (Unaudited)
The information in the following tables is based on the direct investments of the Fund. |
Fund Holdings as of March 31, 2013 |
| % of fund's
net assets | % of fund's net assets
6 months ago |
Commodity Funds | | |
Fidelity Series Commodity Strategy Fund | 5.0 | 5.2 |
Domestic Equity Funds | | |
Fidelity Blue Chip Growth Fund | 3.2 | 2.3 |
Fidelity Disciplined Equity Fund | 0.7 | 3.2 |
Fidelity Growth Company Fund | 4.3 | 5.0 |
Fidelity Series 100 Index Fund | 1.1 | 4.3 |
Fidelity Series All-Sector Equity Fund | 4.7 | 7.1 |
Fidelity Series Equity-Income Fund | 3.0 | 0.0 |
Fidelity Series Intrinsic Opportunities Fund | 1.7 | 0.0 |
Fidelity Series Large Cap Value Fund | 2.8 | 6.1 |
Fidelity Series Mega Cap Fund | 1.1 | 0.0 |
Fidelity Series Opportunistic Insights Fund | 2.2 | 0.0 |
Fidelity Series Real Estate Equity Fund | 0.4 | 0.4 |
Fidelity Series Small Cap Opportunities Fund | 1.2 | 1.2 |
Fidelity Series Stock Selector Large Cap Value Fund | 3.0 | 0.0 |
Fidelity Small Cap Growth Fund | 0.6 | 0.7 |
Fidelity Small Cap Value Fund | 0.7 | 0.7 |
| 30.7 | 31.0 |
Developed International Equity Funds | | |
Fidelity Series International Growth Fund | 4.7 | 4.6 |
Fidelity Series International Small Cap Fund | 0.9 | 0.9 |
Fidelity Series International Value Fund | 4.6 | 4.5 |
| 10.2 | 10.0 |
Emerging Markets Equity Funds | | |
Fidelity Series Emerging Markets Fund | 2.8 | 2.9 |
High Yield Bond Funds | | |
Fidelity Series Emerging Markets Debt Fund | 0.7 | 0.7 |
Fidelity Series Floating Rate High Income Fund | 1.1 | 1.5 |
Fidelity Series High Income Fund | 4.8 | 4.7 |
Fidelity Series Real Estate Income Fund | 0.5 | 0.8 |
| 7.1 | 7.7 |
Inflation-Protected Bond Funds | | |
Fidelity Series Inflation-Protected Bond Index Fund | 10.2 | 10.6 |
Investment Grade Bond Funds | | |
Fidelity Series Investment Grade Bond Fund | 21.5 | 21.6 |
Short-Term Funds | | |
Fidelity Institutional Money Market Portfolio Institutional Class | 6.9 | 6.0 |
Fidelity Short-Term Bond Fund | 5.6 | 5.0 |
| 12.5 | 11.0 |
Net Other Assets (Liabilities)* | 0.0 | 0.0 |
| 100.0 | 100.0 |
Asset Allocation (% of fund's net assets) |
Period end |
| Commodity Funds | 5.0% | |
| Domestic Equity Funds | 30.7% | |
| Developed International Equity Funds | 10.2% | |
| Emerging Markets Equity Funds | 2.8% | |
| High Yield Bond Funds | 7.1% | |
| Inflation-Protected Bond Funds | 10.2% | |
| Investment Grade Bond Funds | 21.5% | |
| Short-Term Funds | 12.5% | |

Six months ago |
| Commodity Funds | 5.2% | |
| Domestic Equity Funds | 31.0% | |
| Developed International Equity Funds | 10.0% | |
| Emerging Markets Equity Funds | 2.9% | |
| High Yield Bond Funds | 7.7% | |
| Inflation-Protected Bond Funds | 10.6% | |
| Investment Grade Bond Funds | 21.6% | |
| Short-Term Funds | 11.0% | |

Expected |
| Commodity Funds | 5.2% | |
| Domestic Equity Funds | 29.4% | |
| Developed International Equity Funds | 9.7% | |
| Emerging Markets Equity Funds | 2.9% | |
| High Yield Bond Funds | 5.0% | |
| Inflation-Protected Bond Funds | 10.5% | |
| Investment Grade Bond Funds | 23.1% | |
| Short-Term Funds | 14.2% | |

The fund invests according to an asset allocation strategy that becomes increasingly conservative over time. The six months ago allocation is based on the fund's holdings as of September 30, 2012. The current allocation is based on the fund's holdings as of March 31, 2013. The expected allocation represents the fund's anticipated allocation at September 30, 2013. |
* Amount represents less than 0.1% |
Annual Report
Fidelity Freedom 2010 Fund
Investments March 31, 2013
Showing Percentage of Net Assets
Domestic Equity Funds - 35.7% |
| Shares | | Value |
Commodity Funds - 5.0% |
Fidelity Series Commodity Strategy Fund (a) | 33,491,087 | | $ 291,037,550 |
Domestic Equity Funds - 30.7% |
Fidelity Blue Chip Growth Fund | 3,479,435 | | 186,114,976 |
Fidelity Disciplined Equity Fund | 1,501,257 | | 40,864,204 |
Fidelity Growth Company Fund | 2,491,910 | | 252,031,793 |
Fidelity Series 100 Index Fund | 6,121,116 | | 63,169,918 |
Fidelity Series All-Sector Equity Fund | 21,391,805 | | 274,884,699 |
Fidelity Series Equity-Income Fund | 15,862,181 | | 176,228,827 |
Fidelity Series Intrinsic Opportunities Fund | 9,010,778 | | 102,272,330 |
Fidelity Series Large Cap Value Fund | 13,942,829 | | 162,294,534 |
Fidelity Series Mega Cap Fund | 5,838,385 | | 64,280,620 |
Fidelity Series Opportunistic Insights Fund | 11,670,526 | | 128,375,786 |
Fidelity Series Real Estate Equity Fund | 2,064,303 | | 26,877,220 |
Fidelity Series Small Cap Opportunities Fund | 5,764,685 | | 71,078,566 |
Fidelity Series Stock Selector Large Cap Value Fund | 15,834,352 | | 177,344,742 |
Fidelity Small Cap Growth Fund | 2,126,105 | | 38,482,496 |
Fidelity Small Cap Value Fund | 2,192,610 | | 41,330,695 |
TOTAL DOMESTIC EQUITY FUNDS | | 1,805,631,406 |
TOTAL DOMESTIC EQUITY FUNDS (Cost $1,957,850,571) |
2,096,668,956
|
International Equity Funds - 13.0% |
| | | |
Developed International Equity Funds - 10.2% |
Fidelity Series International Growth Fund | 21,646,939 | | 273,833,776 |
Fidelity Series International Small Cap Fund | 4,066,309 | | 55,789,764 |
Fidelity Series International Value Fund | 27,665,104 | | 271,671,324 |
TOTAL DEVELOPED INTERNATIONAL EQUITY FUNDS | | 601,294,864 |
Emerging Markets Equity Funds - 2.8% |
Fidelity Series Emerging Markets Fund | 9,868,656 | | 165,102,623 |
TOTAL INTERNATIONAL EQUITY FUNDS (Cost $723,223,744) |
766,397,487
|
Bond Funds - 38.8% |
| Shares | | Value |
High Yield Bond Funds - 7.1% |
Fidelity Series Emerging Markets Debt Fund | 3,573,460 | | $ 38,879,246 |
Fidelity Series Floating Rate High Income Fund | 6,342,974 | | 67,425,812 |
Fidelity Series High Income Fund | 26,814,283 | | 281,818,109 |
Fidelity Series Real Estate Income Fund | 2,589,150 | | 30,215,379 |
TOTAL HIGH YIELD BOND FUNDS | | 418,338,546 |
Inflation-Protected Bond Funds - 10.2% |
Fidelity Series Inflation-Protected Bond Index Fund | 52,340,631 | | 596,159,790 |
Investment Grade Bond Funds - 21.5% |
Fidelity Series Investment Grade Bond Fund | 109,755,351 | | 1,265,479,190 |
TOTAL BOND FUNDS (Cost $2,225,399,128) |
2,279,977,526
|
Short-Term Funds - 12.5% |
| | | |
Fidelity Institutional Money Market Portfolio Institutional Class | 404,251,789 | | 404,251,789 |
Fidelity Short-Term Bond Fund | 38,607,035 | | 332,020,499 |
TOTAL SHORT-TERM FUNDS (Cost $744,669,747) |
736,272,288
|
TOTAL INVESTMENT PORTFOLIO - 100.0% (Cost $5,651,143,190) | | 5,879,316,257 |
NET OTHER ASSETS (LIABILITIES) - 0.0% | | (24,688) |
NET ASSETS - 100% | $ 5,879,291,569 |
Legend |
(a) Non-income producing |
Other Information |
All investments are categorized as Level 1 under the Fair Value Hierarchy. The inputs or methodology used for valuing securities may not be an indication of the risk associated with investing in those securities. For more information on valuation inputs, please refer to the Security Valuation section in the accompanying Notes to Financial Statements. |
See accompanying notes which are an integral part of the financial statements.
Annual Report
Fidelity Freedom 2010 Fund
Statement of Assets and Liabilities
| March 31, 2013 |
| | |
Assets | | |
Investment in securities, at value (cost $5,651,143,190) - See accompanying schedule | | $ 5,879,316,257 |
Receivable for investments sold | | 9,889,834 |
Receivable for fund shares sold | | 3,819,193 |
Other receivables | | 56,650 |
Total assets | | 5,893,081,934 |
| | |
Liabilities | | |
Payable for investments purchased | $ 3,129,672 | |
Payable for fund shares redeemed | 10,604,043 | |
Other payables and accrued expenses | 56,650 | |
Total liabilities | | 13,790,365 |
| | |
Net Assets | | $ 5,879,291,569 |
Net Assets consist of: | | |
Paid in capital | | $ 5,818,553,548 |
Undistributed net investment income | | 12,027,472 |
Accumulated undistributed net realized gain (loss) on investments | | (179,462,518) |
Net unrealized appreciation (depreciation) on investments | | 228,173,067 |
Net Assets, for 400,857,447 shares outstanding | | $ 5,879,291,569 |
Net Asset Value, offering price and redemption price per share ($5,879,291,569 ÷ 400,857,447 shares) | | $ 14.67 |
Statement of Operations
| Year ended March 31, 2013 |
| | |
Investment Income | | |
Income distributions from underlying funds | | $ 97,566,494 |
| | |
Expenses | | |
Independent trustees' compensation | $ 23,408 | |
Total expenses before reductions | 23,408 | |
Expense reductions | (23,408) | - |
Net investment income (loss) | | 97,566,494 |
Realized and Unrealized Gain (Loss) Realized gain (loss) on sale of underlying fund shares | 141,963,921 | |
Capital gain distributions from underlying funds | 129,243,530 | |
Total net realized gain (loss) | | 271,207,451 |
Change in net unrealized appreciation (depreciation) on underlying funds | | 59,475,421 |
Net gain (loss) | | 330,682,872 |
Net increase (decrease) in net assets resulting from operations | | $ 428,249,366 |
See accompanying notes which are an integral part of the financial statements.
Annual Report
Statement of Changes in Net Assets
| Year ended
March 31,
2013 | Year ended
March 31,
2012 |
Increase (Decrease) in Net Assets | | |
Operations | | |
Net investment income (loss) | $ 97,566,494 | $ 137,057,347 |
Net realized gain (loss) | 271,207,451 | 292,480,286 |
Change in net unrealized appreciation (depreciation) | 59,475,421 | (290,060,057) |
Net increase (decrease) in net assets resulting from operations | 428,249,366 | 139,477,576 |
Distributions to shareholders from net investment income | (104,287,093) | (140,843,917) |
Distributions to shareholders from net realized gain | (42,473,324) | (108,792,143) |
Total distributions | (146,760,417) | (249,636,060) |
Share transactions
Proceeds from sales of shares | 1,055,233,571 | 1,448,243,890 |
Reinvestment of distributions | 145,632,188 | 247,426,763 |
Cost of shares redeemed | (2,663,149,142) | (4,226,677,321) |
Net increase (decrease) in net assets resulting from share transactions | (1,462,283,383) | (2,531,006,668) |
Total increase (decrease) in net assets | (1,180,794,434) | (2,641,165,152) |
| | |
Net Assets | | |
Beginning of period | 7,060,086,003 | 9,701,251,155 |
End of period (including undistributed net investment income of $12,027,472 and undistributed net investment income of $18,748,071, respectively) | $ 5,879,291,569 | $ 7,060,086,003 |
Other Information Shares | | |
Sold | 74,675,351 | 105,551,960 |
Issued in reinvestment of distributions | 10,401,803 | 18,684,890 |
Redeemed | (188,864,045) | (309,880,969) |
Net increase (decrease) | (103,786,891) | (185,644,119) |
Financial Highlights
Years ended March 31, | 2013 | 2012 | 2011 | 2010 | 2009 |
Selected Per-Share Data | | | | | |
Net asset value, beginning of period | $ 13.99 | $ 14.05 | $ 12.89 | $ 9.87 | $ 14.07 |
Income from Investment Operations | | | | | |
Net investment income (loss)B | .22 | .23 | .22 | .29 | .37 |
Net realized and unrealized gain (loss) | .80 | .17 | 1.31 | 3.14 | (3.77) |
Total from investment operations | 1.02 | .40 | 1.53 | 3.43 | (3.40) |
Distributions from net investment income | (.24) | (.26) | (.25) | (.31) | (.40) |
Distributions from net realized gain | (.10) | (.20) | (.12) | (.11) | (.40) |
Total distributions | (.34) | (.46) | (.37) | (.41) F | (.80) |
Net asset value, end of period | $ 14.67 | $ 13.99 | $ 14.05 | $ 12.89 | $ 9.87 |
Total Return A | 7.43% | 3.01% | 12.02% | 34.99% | (25.06)% |
Ratios to Average Net Assets C,E | | | | | |
Expenses before reductions D | .00% | .00% | .00% | .00% | .00% |
Expenses net of fee waivers, if any | .00% | .00% | .00% | .00% | .00% |
Expenses net of all reductions | .00% | .00% | .00% | .00% | .00% |
Net investment income (loss) | 1.54% | 1.67% | 1.64% | 2.40% | 3.03% |
Supplemental Data | | | | | |
Net assets, end of period (000 omitted) | $ 5,879,292 | $ 7,060,086 | $ 9,701,251 | $ 11,088,228 | $ 9,130,697 |
Portfolio turnover rate | 19% | 18% | 34% | 25% | 39% |
A Total returns would have been lower if certain expenses had not been reduced during the applicable periods shown.
B Calculated based on average shares outstanding during the period.
C Amounts do not include the activity of the Underlying Funds.
D Amount represents less than .01%.
E Expense ratios reflect operating expenses of the Fund. Expenses before reductions do not reflect amounts reimbursed by the investment adviser or reductions from expense offset arrangements and do not represent the amount paid by the Fund during periods when reimbursements or reductions occur. Expenses net of fee waivers reflect expenses after reimbursement by the investment adviser but prior to reductions from expense offset arrangements. Expenses net of all reductions represent the net expenses paid by the Fund but do not include expenses of the investment companies in which the Fund invests.
F Total distributions of $.41 per share is comprised of distributions from net investment income of $.305 and distributions from net realized gain of $.105 per share.
See accompanying notes which are an integral part of the financial statements.
Annual Report
Fidelity Freedom 2015 Fund
Investment Changes (Unaudited)
The information in the following tables is based on the direct investments of the Fund. |
Fund Holdings as of March 31, 2013 |
| % of fund's
net assets | % of fund's net assets
6 months ago |
Commodity Funds | | |
Fidelity Series Commodity Strategy Fund | 5.3 | 5.5 |
Domestic Equity Funds | | |
Fidelity Blue Chip Growth Fund | 3.3 | 2.3 |
Fidelity Disciplined Equity Fund | 0.7 | 3.3 |
Fidelity Growth Company Fund | 4.5 | 5.1 |
Fidelity Series 100 Index Fund | 1.1 | 4.5 |
Fidelity Series All-Sector Equity Fund | 4.9 | 7.3 |
Fidelity Series Equity-Income Fund | 3.1 | 0.0 |
Fidelity Series Intrinsic Opportunities Fund | 1.8 | 0.0 |
Fidelity Series Large Cap Value Fund | 2.9 | 6.2 |
Fidelity Series Mega Cap Fund | 1.1 | 0.0 |
Fidelity Series Opportunistic Insights Fund | 2.3 | 0.0 |
Fidelity Series Real Estate Equity Fund | 0.5 | 0.4 |
Fidelity Series Small Cap Opportunities Fund | 1.3 | 1.2 |
Fidelity Series Stock Selector Large Cap Value Fund | 3.1 | 0.0 |
Fidelity Small Cap Growth Fund | 0.7 | 0.7 |
Fidelity Small Cap Value Fund | 0.7 | 0.7 |
| 32.0 | 31.7 |
Developed International Equity Funds | | |
Fidelity Series International Growth Fund | 4.8 | 4.8 |
Fidelity Series International Small Cap Fund | 1.0 | 1.0 |
Fidelity Series International Value Fund | 4.8 | 4.7 |
| 10.6 | 10.5 |
Emerging Markets Equity Funds | | |
Fidelity Series Emerging Markets Fund | 2.9 | 3.0 |
High Yield Bond Funds | | |
Fidelity Series Emerging Markets Debt Fund | 0.6 | 0.7 |
Fidelity Series Floating Rate High Income Fund | 1.1 | 1.4 |
Fidelity Series High Income Fund | 4.7 | 4.7 |
Fidelity Series Real Estate Income Fund | 0.6 | 0.8 |
| 7.0 | 7.6 |
Inflation-Protected Bond Funds | | |
Fidelity Series Inflation-Protected Bond Index Fund | 9.9 | 10.1 |
Investment Grade Bond Funds | | |
Fidelity Series Investment Grade Bond Fund | 22.6 | 22.1 |
Short-Term Funds | | |
Fidelity Institutional Money Market Portfolio Institutional Class | 5.3 | 5.2 |
Fidelity Short-Term Bond Fund | 4.4 | 4.3 |
| 9.7 | 9.5 |
Net Other Assets (Liabilities)* | 0.0 | 0.0 |
| 100.0 | 100.0 |
Asset Allocation (% of fund's net assets) |
Period end |
| Commodity Funds | 5.3% | |
| Domestic Equity Funds | 32.0% | |
| Developed International Equity Funds | 10.6% | |
| Emerging Markets Equity Funds | 2.9% | |
| High Yield Bond Funds | 7.0% | |
| Inflation-Protected Bond Funds | 9.9% | |
| Investment Grade Bond Funds | 22.6% | |
| Short-Term Funds | 9.7% | |

Six months ago |
| Commodity Funds | 5.5% | |
| Domestic Equity Funds | 31.7% | |
| Developed International Equity Funds | 10.5% | |
| Emerging Markets Equity Funds | 3.0% | |
| High Yield Bond Funds | 7.6% | |
| Inflation-Protected Bond Funds | 10.1% | |
| Investment Grade Bond Funds | 22.1% | |
| Short-Term Funds | 9.5% | |

Expected |
| Commodity Funds | 5.5% | |
| Domestic Equity Funds | 31.1% | |
| Developed International Equity Funds | 10.3% | |
| Emerging Markets Equity Funds | 3.0% | |
| High Yield Bond Funds | 5.0% | |
| Inflation-Protected Bond Funds | 10.6% | |
| Investment Grade Bond Funds | 24.4% | |
| Short-Term Funds | 10.1% | |

The fund invests according to an asset allocation strategy that becomes increasingly conservative over time. The six months ago allocation is based on the fund's holdings as of September 30, 2012. The current allocation is based on the fund's holdings as of March 31, 2013. The expected allocation represents the fund's anticipated allocation at September 30, 2013. |
* Amount represents less than 0.1% |
Annual Report
Fidelity Freedom 2015 Fund
Investments March 31, 2013
Showing Percentage of Net Assets
Domestic Equity Funds - 37.3% |
| Shares | | Value |
Commodity Funds - 5.3% |
Fidelity Series Commodity Strategy Fund (a) | 39,861,859 | | $ 346,399,555 |
Domestic Equity Funds - 32.0% |
Fidelity Blue Chip Growth Fund | 3,996,255 | | 213,759,696 |
Fidelity Disciplined Equity Fund | 1,728,202 | | 47,041,667 |
Fidelity Growth Company Fund | 2,899,096 | | 293,214,576 |
Fidelity Series 100 Index Fund | 7,095,188 | | 73,222,342 |
Fidelity Series All-Sector Equity Fund | 24,620,405 | | 316,372,211 |
Fidelity Series Equity-Income Fund | 18,032,150 | | 200,337,181 |
Fidelity Series Intrinsic Opportunities Fund | 10,438,110 | | 118,472,548 |
Fidelity Series Large Cap Value Fund | 16,379,007 | | 190,651,645 |
Fidelity Series Mega Cap Fund | 6,645,121 | | 73,162,778 |
Fidelity Series Opportunistic Insights Fund | 13,285,864 | | 146,144,507 |
Fidelity Series Real Estate Equity Fund | 2,332,001 | | 30,362,650 |
Fidelity Series Small Cap Opportunities Fund | 6,640,737 | | 81,880,283 |
Fidelity Series Stock Selector Large Cap Value Fund | 18,009,498 | | 201,706,380 |
Fidelity Small Cap Growth Fund | 2,486,964 | | 45,014,044 |
Fidelity Small Cap Value Fund | 2,567,835 | | 48,403,699 |
TOTAL DOMESTIC EQUITY FUNDS | | 2,079,746,207 |
TOTAL DOMESTIC EQUITY FUNDS (Cost $2,209,140,024) |
2,426,145,762
|
International Equity Funds - 13.5% |
| | | |
Developed International Equity Funds - 10.6% |
Fidelity Series International Growth Fund | 24,756,367 | | 313,168,036 |
Fidelity Series International Small Cap Fund | 4,659,055 | | 63,922,233 |
Fidelity Series International Value Fund | 31,665,330 | | 310,953,542 |
TOTAL DEVELOPED INTERNATIONAL EQUITY FUNDS | | 688,043,811 |
Emerging Markets Equity Funds - 2.9% |
Fidelity Series Emerging Markets Fund | 11,299,911 | | 189,047,511 |
TOTAL INTERNATIONAL EQUITY FUNDS (Cost $813,560,805) |
877,091,322
|
Bond Funds - 39.5% |
| Shares | | Value |
High Yield Bond Funds - 7.0% |
Fidelity Series Emerging Markets Debt Fund | 3,924,159 | | $ 42,694,851 |
Fidelity Series Floating Rate High Income Fund | 6,954,709 | | 73,928,556 |
Fidelity Series High Income Fund | 29,032,113 | | 305,127,509 |
Fidelity Series Real Estate Income Fund | 3,136,064 | | 36,597,869 |
TOTAL HIGH YIELD BOND FUNDS | | 458,348,785 |
Inflation-Protected Bond Funds - 9.9% |
Fidelity Series Inflation-Protected Bond Index Fund | 56,490,220 | | 643,423,611 |
Investment Grade Bond Funds - 22.6% |
Fidelity Series Investment Grade Bond Fund | 127,328,675 | | 1,468,099,626 |
TOTAL BOND FUNDS (Cost $2,475,139,772) |
2,569,872,022
|
Short-Term Funds - 9.7% |
| | | |
Fidelity Institutional Money Market Portfolio Institutional Class | 347,754,811 | | 347,754,811 |
Fidelity Short-Term Bond Fund | 33,293,044 | | 286,320,176 |
TOTAL SHORT-TERM FUNDS (Cost $636,170,620) |
634,074,987
|
TOTAL INVESTMENT PORTFOLIO - 100.0% (Cost $6,134,011,221) | | 6,507,184,093 |
NET OTHER ASSETS (LIABILITIES) - 0.0% | | (14,924) |
NET ASSETS - 100% | $ 6,507,169,169 |
Legend |
(a) Non-income producing |
Other Information |
All investments are categorized as Level 1 under the Fair Value Hierarchy. The inputs or methodology used for valuing securities may not be an indication of the risk associated with investing in those securities. For more information on valuation inputs, please refer to the Security Valuation section in the accompanying Notes to Financial Statements. |
See accompanying notes which are an integral part of the financial statements.
Annual Report
Fidelity Freedom 2015 Fund
Statement of Assets and Liabilities
| March 31, 2013 |
| | |
Assets | | |
Investment in securities, at value (cost $6,134,011,221) - See accompanying schedule | | $ 6,507,184,093 |
Receivable for investments sold | | 7,592,252 |
Receivable for fund shares sold | | 6,467,359 |
Total assets | | 6,521,243,704 |
| | |
Liabilities | | |
Payable for investments purchased | $ 3,614,479 | |
Payable for fund shares redeemed | 10,460,056 | |
Total liabilities | | 14,074,535 |
| | |
Net Assets | | $ 6,507,169,169 |
Net Assets consist of: | | |
Paid in capital | | $ 6,095,661,999 |
Undistributed net investment income | | 13,159,621 |
Accumulated undistributed net realized gain (loss) on investments | | 25,174,677 |
Net unrealized appreciation (depreciation) on investments | | 373,172,872 |
Net Assets, for 529,864,651 shares outstanding | | $ 6,507,169,169 |
Net Asset Value, offering price and redemption price per share ($6,507,169,169 ÷ 529,864,651 shares) | | $ 12.28 |
Statement of Operations
| Year ended March 31, 2013 |
| | |
Investment Income | | |
Income distributions from underlying funds | | $ 104,883,570 |
| | |
Expenses | | |
Independent trustees' compensation | $ 24,593 | |
Total expenses before reductions | 24,593 | |
Expense reductions | (24,593) | - |
Net investment income (loss) | | 104,883,570 |
Realized and Unrealized Gain (Loss) Realized gain (loss) on sale of underlying fund shares | 241,278,883 | |
Capital gain distributions from underlying funds | 141,568,957 | |
Total net realized gain (loss) | | 382,847,840 |
Change in net unrealized appreciation (depreciation) on underlying funds | | (18,263,602) |
Net gain (loss) | | 364,584,238 |
Net increase (decrease) in net assets resulting from operations | | $ 469,467,808 |
See accompanying notes which are an integral part of the financial statements.
Annual Report
Fidelity Freedom 2015 Fund
Financial Statements - continued
Statement of Changes in Net Assets
| Year ended
March 31,
2013 | Year ended
March 31,
2012 |
Increase (Decrease) in Net Assets | | |
Operations | | |
Net investment income (loss) | $ 104,883,570 | $ 135,913,221 |
Net realized gain (loss) | 382,847,840 | 661,549,310 |
Change in net unrealized appreciation (depreciation) | (18,263,602) | (639,151,542) |
Net increase (decrease) in net assets resulting from operations | 469,467,808 | 158,310,989 |
Distributions to shareholders from net investment income | (110,329,490) | (137,866,230) |
Distributions to shareholders from net realized gain | (45,506,416) | (106,366,861) |
Total distributions | (155,835,906) | (244,233,091) |
Share transactions
Proceeds from sales of shares | 1,800,318,470 | 2,362,612,585 |
Reinvestment of distributions | 155,091,386 | 242,953,703 |
Cost of shares redeemed | (3,017,087,231) | (4,115,744,958) |
Net increase (decrease) in net assets resulting from share transactions | (1,061,677,375) | (1,510,178,670) |
Total increase (decrease) in net assets | (748,045,473) | (1,596,100,772) |
| | |
Net Assets | | |
Beginning of period | 7,255,214,642 | 8,851,315,414 |
End of period (including undistributed net investment income of $13,159,621 and undistributed net investment income of $18,605,542, respectively) | $ 6,507,169,169 | $ 7,255,214,642 |
Other Information Shares | | |
Sold | 152,357,073 | 206,404,025 |
Issued in reinvestment of distributions | 13,251,938 | 22,000,679 |
Redeemed | (256,121,423) | (361,888,007) |
Net increase (decrease) | (90,512,412) | (133,483,303) |
Financial Highlights
Years ended March 31, | 2013 | 2012 | 2011 | 2010 | 2009 |
Selected Per-Share Data | | | | | |
Net asset value, beginning of period | $ 11.69 | $ 11.74 | $ 10.74 | $ 8.13 | $ 11.73 |
Income from Investment Operations | | | | | |
Net investment income (loss) B | .18 | .20 | .18 | .24 | .29 |
Net realized and unrealized gain (loss) | .69 | .12 | 1.12 | 2.70 | (3.29) |
Total from investment operations | .87 | .32 | 1.30 | 2.94 | (3.00) |
Distributions from net investment income | (.20) | (.21) | (.20) | (.24) | (.30) |
Distributions from net realized gain | (.08) | (.16) | (.10) | (.09) | (.30) |
Total distributions | (.28) | (.37) | (.30) | (.33) F | (.60) |
Net asset value, end of period | $ 12.28 | $ 11.69 | $ 11.74 | $ 10.74 | $ 8.13 |
Total Return A | 7.60% | 2.95% | 12.24% | 36.33% | (26.45)% |
Ratios to Average Net Assets C,E | | | | | |
Expenses before reductions D | .00% | .00% | .00% | .00% | .00% |
Expenses net of fee waivers, if any | .00% | .00% | .00% | .00% | .00% |
Expenses net of all reductions | .00% | .00% | .00% | .00% | .00% |
Net investment income (loss) | 1.57% | 1.71% | 1.66% | 2.38% | 2.97% |
Supplemental Data | | | | | |
Net assets, end of period (000 omitted) | $ 6,507,169 | $ 7,255,215 | $ 8,851,315 | $ 8,848,519 | $ 6,089,406 |
Portfolio turnover rate | 23% | 24% | 43% | 30% | 36% |
A Total returns would have been lower if certain expenses had not been reduced during the applicable periods shown.
B Calculated based on average shares outstanding during the period.
C Amounts do not include the activity of the Underlying Funds.
D Amount represents less than .01%.
E Expense ratios reflect operating expenses of the Fund. Expenses before reductions do not reflect amounts reimbursed by the investment adviser or reductions from expense offset arrangements and do not represent the amount paid by the Fund during periods when reimbursements or reductions occur. Expenses net of fee waivers reflect expenses after reimbursement by the investment adviser but prior to reductions from expense offset arrangements. Expenses net of all reductions represent the net expenses paid by the Fund but do not include expenses of the investment companies in which the Fund invests.
F Total distributions of $.33 per share is comprised of distributions from net investment income of $.235 and distributions from net realized gain of $.091 per share.
See accompanying notes which are an integral part of the financial statements.
Annual Report
Fidelity Freedom 2020 Fund
Investment Changes (Unaudited)
The information in the following tables is based on the direct investments of the Fund. |
Fund Holdings as of March 31, 2013 |
| % of fund's
net assets | % of fund's net assets
6 months ago |
Commodity Funds | | |
Fidelity Series Commodity Strategy Fund | 5.8 | 6.2 |
Domestic Equity Funds | | |
Fidelity Blue Chip Growth Fund | 3.6 | 2.6 |
Fidelity Disciplined Equity Fund | 0.8 | 3.8 |
Fidelity Growth Company Fund | 4.9 | 5.7 |
Fidelity Series 100 Index Fund | 1.2 | 5.0 |
Fidelity Series All-Sector Equity Fund | 5.4 | 8.2 |
Fidelity Series Equity-Income Fund | 3.4 | 0.0 |
Fidelity Series Intrinsic Opportunities Fund | 1.9 | 0.0 |
Fidelity Series Large Cap Value Fund | 3.2 | 7.0 |
Fidelity Series Mega Cap Fund | 1.2 | 0.0 |
Fidelity Series Opportunistic Insights Fund | 2.5 | 0.0 |
Fidelity Series Real Estate Equity Fund | 0.5 | 0.5 |
Fidelity Series Small Cap Opportunities Fund | 1.4 | 1.4 |
Fidelity Series Stock Selector Large Cap Value Fund | 3.4 | 0.0 |
Fidelity Small Cap Growth Fund | 0.8 | 0.8 |
Fidelity Small Cap Value Fund | 0.8 | 0.8 |
| 35.0 | 35.8 |
Developed International Equity Funds | | |
Fidelity Series International Growth Fund | 5.2 | 5.4 |
Fidelity Series International Small Cap Fund | 1.1 | 1.1 |
Fidelity Series International Value Fund | 5.2 | 5.3 |
| 11.5 | 11.8 |
Emerging Markets Equity Funds | | |
Fidelity Series Emerging Markets Fund | 3.2 | 3.4 |
High Yield Bond Funds | | |
Fidelity Series Emerging Markets Debt Fund | 0.8 | 0.8 |
Fidelity Series Floating Rate High Income Fund | 1.1 | 1.3 |
Fidelity Series High Income Fund | 5.4 | 5.7 |
Fidelity Series Real Estate Income Fund | 0.6 | 0.7 |
| 7.9 | 8.5 |
Inflation-Protected Bond Funds | | |
Fidelity Series Inflation-Protected Bond Index Fund | 8.2 | 8.1 |
Investment Grade Bond Funds | | |
Fidelity Series Investment Grade Bond Fund | 21.7 | 20.8 |
Short-Term Funds | | |
Fidelity Institutional Money Market Portfolio Institutional Class | 3.7 | 2.9 |
Fidelity Short-Term Bond Fund | 3.0 | 2.5 |
| 6.7 | 5.4 |
Net Other Assets (Liabilities)* | 0.0 | 0.0 |
| 100.0 | 100.0 |
Asset Allocation (% of fund's net assets) |
Period end |
| Commodity Funds | 5.8% | |
| Domestic Equity Funds | 35.0% | |
| Developed International Equity Funds | 11.5% | |
| Emerging Markets Equity Funds | 3.2% | |
| High Yield Bond Funds | 7.9% | |
| Inflation-Protected Bond Funds | 8.2% | |
| Investment Grade Bond Funds | 21.7% | |
| Short-Term Funds | 6.7% | |

Six months ago |
| Commodity Funds | 6.2% | |
| Domestic Equity Funds | 35.8% | |
| Developed International Equity Funds | 11.8% | |
| Emerging Markets Equity Funds | 3.4% | |
| High Yield Bond Funds | 8.5% | |
| Inflation-Protected Bond Funds | 8.1% | |
| Investment Grade Bond Funds | 20.8% | |
| Short-Term Funds | 5.4% | |

Expected |
| Commodity Funds | 5.9% | |
| Domestic Equity Funds | 33.4% | |
| Developed International Equity Funds | 11.0% | |
| Emerging Markets Equity Funds | 3.3% | |
| High Yield Bond Funds | 5.5% | |
| Inflation-Protected Bond Funds | 9.0% | |
| Investment Grade Bond Funds | 24.2% | |
| Short-Term Funds | 7.7% | |

The fund invests according to an asset allocation strategy that becomes increasingly conservative over time. The six months ago allocation is based on the fund's holdings as of September 30, 2012. The current allocation is based on the fund's holdings as of March 31, 2013. The expected allocation represents the fund's anticipated allocation at September 30, 2013. |
* Amount represents less than 0.1% |
Annual Report
Fidelity Freedom 2020 Fund
Investments March 31, 2013
Showing Percentage of Net Assets
Domestic Equity Funds - 40.8% |
| Shares | | Value |
Commodity Funds - 5.8% |
Fidelity Series Commodity Strategy Fund (a) | 91,279,801 | | $ 793,221,467 |
Domestic Equity Funds - 35.0% |
Fidelity Blue Chip Growth Fund | 9,199,155 | | 492,062,782 |
Fidelity Disciplined Equity Fund | 3,977,667 | | 108,272,106 |
Fidelity Growth Company Fund | 6,557,058 | | 663,180,853 |
Fidelity Series 100 Index Fund | 16,238,268 | | 167,578,924 |
Fidelity Series All-Sector Equity Fund | 56,478,384 | | 725,747,232 |
Fidelity Series Equity-Income Fund | 41,473,864 | | 460,774,634 |
Fidelity Series Intrinsic Opportunities Fund | 23,075,637 | | 261,908,477 |
Fidelity Series Large Cap Value Fund | 36,932,559 | | 429,894,987 |
Fidelity Series Mega Cap Fund | 15,262,790 | | 168,043,313 |
Fidelity Series Opportunistic Insights Fund | 30,510,093 | | 335,611,023 |
Fidelity Series Real Estate Equity Fund | 5,544,753 | | 72,192,684 |
Fidelity Series Small Cap Opportunities Fund | 15,254,246 | | 188,084,857 |
Fidelity Series Stock Selector Large Cap Value Fund | 41,409,372 | | 463,784,970 |
Fidelity Small Cap Growth Fund | 5,587,095 | | 101,126,412 |
Fidelity Small Cap Value Fund | 5,755,756 | | 108,495,992 |
TOTAL DOMESTIC EQUITY FUNDS | | 4,746,759,246 |
TOTAL DOMESTIC EQUITY FUNDS (Cost $4,976,991,673) |
5,539,980,713
|
International Equity Funds - 14.7% |
| | | |
Developed International Equity Funds - 11.5% |
Fidelity Series International Growth Fund | 56,519,042 | | 714,965,886 |
Fidelity Series International Small Cap Fund | 10,595,147 | | 145,365,421 |
Fidelity Series International Value Fund | 72,067,510 | | 707,702,951 |
TOTAL DEVELOPED INTERNATIONAL EQUITY FUNDS | | 1,568,034,258 |
Emerging Markets Equity Funds - 3.2% |
Fidelity Series Emerging Markets Fund | 25,855,858 | | 432,568,504 |
TOTAL INTERNATIONAL EQUITY FUNDS (Cost $1,861,047,099) |
2,000,602,762
|
Bond Funds - 37.8% |
| Shares | | Value |
High Yield Bond Funds - 7.9% |
Fidelity Series Emerging Markets Debt Fund | 9,802,674 | | $ 106,653,094 |
Fidelity Series Floating Rate High Income Fund | 14,509,934 | | 154,240,602 |
Fidelity Series High Income Fund | 69,553,488 | | 731,007,157 |
Fidelity Series Real Estate Income Fund | 7,017,735 | | 81,896,972 |
TOTAL HIGH YIELD BOND FUNDS | | 1,073,797,825 |
Inflation-Protected Bond Funds - 8.2% |
Fidelity Series Inflation-Protected Bond Index Fund | 97,439,181 | | 1,109,832,266 |
Investment Grade Bond Funds - 21.7% |
Fidelity Series Investment Grade Bond Fund | 255,378,047 | | 2,944,508,889 |
TOTAL BOND FUNDS (Cost $4,972,514,685) |
5,128,138,980
|
Short-Term Funds - 6.7% |
| | | |
Fidelity Institutional Money Market Portfolio Institutional Class | 500,577,942 | | 500,577,942 |
Fidelity Short-Term Bond Fund | 47,752,667 | | 410,672,936 |
TOTAL SHORT-TERM FUNDS (Cost $909,317,864) |
911,250,878
|
TOTAL INVESTMENT
PORTFOLIO - 100.0% (Cost $12,719,871,321) | | 13,579,973,333 |
NET OTHER ASSETS (LIABILITIES) - 0.0% | | (22,876) |
NET ASSETS - 100% | $ 13,579,950,457 |
Legend |
(a) Non-income producing |
Other Information |
All investments are categorized as Level 1 under the Fair Value Hierarchy. The inputs or methodology used for valuing securities may not be an indication of the risk associated with investing in those securities. For more information on valuation inputs, please refer to the Security Valuation section in the accompanying Notes to Financial Statements. |
See accompanying notes which are an integral part of the financial statements.
Annual Report
Fidelity Freedom 2020 Fund
Statement of Assets and Liabilities
| March 31, 2013 |
| | |
Assets | | |
Investment in securities, at value (cost $12,719,871,321) - See accompanying schedule | | $ 13,579,973,333 |
Cash | | 5 |
Receivable for investments sold | | 20,053,447 |
Receivable for fund shares sold | | 13,994,697 |
Other receivables | | 96,191 |
Total assets | | 13,614,117,673 |
| | |
Liabilities | | |
Payable for investments purchased | $ 8,254,399 | |
Payable for fund shares redeemed | 25,816,629 | |
Other payables and accrued expenses | 96,188 | |
Total liabilities | | 34,167,216 |
| | |
Net Assets | | $ 13,579,950,457 |
Net Assets consist of: | | |
Paid in capital | | $ 12,659,043,140 |
Undistributed net investment income | | 29,295,135 |
Accumulated undistributed net realized gain (loss) on investments | | 31,510,170 |
Net unrealized appreciation (depreciation) on investments | | 860,102,012 |
Net Assets, for 909,081,376 shares outstanding | | $ 13,579,950,457 |
Net Asset Value, offering price and redemption price per share ($13,579,950,457 ÷ 909,081,376 shares) | | $ 14.94 |
Statement of Operations
| Year ended March 31, 2013 |
| | |
Investment Income | | |
Income distributions from underlying funds | | $ 232,843,698 |
| | |
Expenses | | |
Independent trustees' compensation | $ 52,044 | |
Total expenses before reductions | 52,044 | |
Expense reductions | (52,044) | - |
Net investment income (loss) | | 232,843,698 |
Realized and Unrealized Gain (Loss) Realized gain (loss) on sale of underlying fund shares | 666,027,626 | |
Capital gain distributions from underlying funds | 300,189,583 | |
Total net realized gain (loss) | | 966,217,209 |
Change in net unrealized appreciation (depreciation) on underlying funds | | (145,899,197) |
Net gain (loss) | | 820,318,012 |
Net increase (decrease) in net assets resulting from operations | | $ 1,053,161,710 |
See accompanying notes which are an integral part of the financial statements.
Annual Report
Statement of Changes in Net Assets
| Year ended
March 31,
2013 | Year ended
March 31,
2012 |
Increase (Decrease) in Net Assets | | |
Operations | | |
Net investment income (loss) | $ 232,843,698 | $ 300,423,343 |
Net realized gain (loss) | 966,217,209 | 1,692,371,659 |
Change in net unrealized appreciation (depreciation) | (145,899,197) | (1,822,697,842) |
Net increase (decrease) in net assets resulting from operations | 1,053,161,710 | 170,097,160 |
Distributions to shareholders from net investment income | (243,387,454) | (305,833,965) |
Distributions to shareholders from net realized gain | (89,218,598) | (255,195,490) |
Total distributions | (332,606,052) | (561,029,455) |
Share transactions
Proceeds from sales of shares | 3,011,958,439 | 3,897,423,920 |
Reinvestment of distributions | 331,286,060 | 557,517,048 |
Cost of shares redeemed | (5,907,826,193) | (8,563,423,133) |
Net increase (decrease) in net assets resulting from share transactions | (2,564,581,694) | (4,108,482,165) |
Total increase (decrease) in net assets | (1,844,026,036) | (4,499,414,460) |
| | |
Net Assets | | |
Beginning of period | 15,423,976,493 | 19,923,390,953 |
End of period (including undistributed net investment income of $29,295,135 and undistributed net investment income of $39,838,891, respectively) | $ 13,579,950,457 | $ 15,423,976,493 |
Other Information Shares | | |
Sold | 210,663,326 | 281,444,802 |
Issued in reinvestment of distributions | 23,411,907 | 41,972,559 |
Redeemed | (414,285,789) | (624,065,257) |
Net increase (decrease) | (180,210,556) | (300,647,896) |
Financial Highlights
Years ended March 31, | 2013 | 2012 | 2011 | 2010 | 2009 |
Selected Per-Share Data | | | | | |
Net asset value, beginning of period | $ 14.16 | $ 14.33 | $ 12.98 | $ 9.42 | $ 14.66 |
Income from Investment Operations | | | | | |
Net investment income (loss) B | .24 | .24 | .22 | .27 | .33 |
Net realized and unrealized gain (loss) | .89 | .08 E | 1.50 | 3.68 | (4.74) |
Total from investment operations | 1.13 | .32 | 1.72 | 3.95 | (4.41) |
Distributions from net investment income | (.25) | (.26) | (.24) | (.29) | (.31) |
Distributions from net realized gain | (.10) | (.22) | (.14) | (.11) | (.52) |
Total distributions | (.35) | (.49) I | (.37) H | (.39) G | (.83) |
Net asset value, end of period | $ 14.94 | $ 14.16 | $ 14.33 | $ 12.98 | $ 9.42 |
Total Return A | 8.12% | 2.45% | 13.47% | 42.19% | (31.39)% |
Ratios to Average Net Assets C,F | | | | | |
Expenses before reductions D | .00% | .00% | .00% | .00% | .00% |
Expenses net of fee waivers, if any | .00% | .00% | .00% | .00% | .00% |
Expenses net of all reductions | .00% | .00% | .00% | .00% | .00% |
Net investment income (loss) | 1.65% | 1.74% | 1.69% | 2.30% | 2.73% |
Supplemental Data | | | | | |
Net assets, end of period (000 omitted) | $ 13,579,950 | $ 15,423,976 | $ 19,923,391 | $ 20,563,040 | $ 14,316,696 |
Portfolio turnover rate | 25% | 24% | 42% | 29% | 35% |
A Total returns would have been lower if certain expenses had not been reduced during the applicable periods shown.
B Calculated based on average shares outstanding during the period.
C Amounts do not include the activity of the Underlying Funds.
D Amount represents less than .01%.
E The amount shown for a share outstanding does not correspond with the aggregate net gain (loss) on investments for the period due to the timing of sales and repurchases of shares in relation to fluctuating market values of the investments of the Fund.
F Expense ratios reflect operating expenses of the Fund. Expenses before reductions do not reflect amounts reimbursed by the investment adviser or reductions from expense offset arrangements and do not represent the amount paid by the Fund during periods when reimbursements or reductions occur. Expenses net of fee waivers reflect expenses after reimbursement by the investment adviser but prior to reductions from expense offset arrangements. Expenses net of all reductions represent the net expenses paid by the Fund but do not include expenses of the investment companies in which the Fund invests.
G Total distributions of $.39 per share is comprised of distributions from net investment income of $.285 and distributions from net realized gain of $.105 per share.
H Total distributions of $.37 per share is comprised of distributions from net investment income of $,236 and distributions from net realized gain of $.135 per share.
I Total distributions of $.49 per share is comprised of distributions from net investment income of $.264 and distributions from net realized gain of $.222 per share.
See accompanying notes which are an integral part of the financial statements.
Annual Report
Fidelity Freedom 2025 Fund
Investment Changes (Unaudited)
The information in the following tables is based on the direct investments of the Fund. |
Fund Holdings as of March 31, 2013 |
| % of fund's
net assets | % of fund's net assets
6 months ago |
Commodity Funds | | |
Fidelity Series Commodity Strategy Fund | 7.2 | 7.5 |
Domestic Equity Funds | | |
Fidelity Blue Chip Growth Fund | 4.4 | 3.1 |
Fidelity Disciplined Equity Fund | 1.0 | 4.5 |
Fidelity Growth Company Fund | 6.0 | 6.8 |
Fidelity Series 100 Index Fund | 1.5 | 5.9 |
Fidelity Series All-Sector Equity Fund | 6.5 | 9.7 |
Fidelity Series Equity-Income Fund | 4.0 | 0.0 |
Fidelity Series Intrinsic Opportunities Fund | 2.5 | 0.0 |
Fidelity Series Large Cap Value Fund | 3.9 | 8.3 |
Fidelity Series Mega Cap Fund | 1.5 | 0.0 |
Fidelity Series Opportunistic Insights Fund | 2.9 | 0.0 |
Fidelity Series Real Estate Equity Fund | 0.6 | 0.6 |
Fidelity Series Small Cap Opportunities Fund | 1.7 | 1.6 |
Fidelity Series Stock Selector Large Cap Value Fund | 4.1 | 0.0 |
Fidelity Small Cap Growth Fund | 0.9 | 0.9 |
Fidelity Small Cap Value Fund | 1.0 | 0.9 |
| 42.5 | 42.3 |
Developed International Equity Funds | | |
Fidelity Series International Growth Fund | 6.3 | 6.5 |
Fidelity Series International Small Cap Fund | 1.3 | 1.3 |
Fidelity Series International Value Fund | 6.3 | 6.4 |
| 13.9 | 14.2 |
Emerging Markets Equity Funds | | |
Fidelity Series Emerging Markets Fund | 3.9 | 4.1 |
High Yield Bond Funds | | |
Fidelity Series Emerging Markets Debt Fund | 0.8 | 0.8 |
Fidelity Series Floating Rate High Income Fund | 1.0 | 1.1 |
Fidelity Series High Income Fund | 6.9 | 6.8 |
Fidelity Series Real Estate Income Fund | 0.5 | 0.6 |
| 9.2 | 9.3 |
Inflation-Protected Bond Funds | | |
Fidelity Series Inflation-Protected Bond Index Fund | 5.4 | 5.2 |
Investment Grade Bond Funds | | |
Fidelity Series Investment Grade Bond Fund | 17.2 | 17.0 |
Short-Term Funds | | |
Fidelity Institutional Money Market Portfolio Institutional Class | 0.4 | 0.2 |
Fidelity Short-Term Bond Fund | 0.3 | 0.2 |
| 0.7 | 0.4 |
Net Other Assets (Liabilities)* | 0.0 | 0.0 |
| 100.0 | 100.0 |
Asset Allocation (% of fund's net assets) |
Period end |
| Commodity Funds | 7.2% | |
| Domestic Equity Funds | 42.5% | |
| Developed International Equity Funds | 13.9% | |
| Emerging Markets
Equity Funds | 3.9% | |
| High Yield Bond Funds | 9.2% | |
| Inflation-Protected
Bond Funds | 5.4% | |
| Investment Grade
Bond Funds | 17.2% | |
| Short-Term Funds | 0.7% | |

Six months ago |
| Commodity Funds | 7.5% | |
| Domestic Equity Funds | 42.3% | |
| Developed International Equity Funds | 14.2% | |
| Emerging Markets
Equity Funds | 4.1% | |
| High Yield Bond Funds | 9.3% | |
| Inflation-Protected
Bond Funds | 5.2% | |
| Investment Grade
Bond Funds | 17.0% | |
| Short-Term Funds | 0.4% | |

Expected |
| Commodity Funds | 7.3% | |
| Domestic Equity Funds | 41.1% | |
| Developed International Equity Funds | 13.6% | |
| Emerging Markets
Equity Funds | 4.0% | |
| High Yield Bond Funds | 7.3% | |
| Inflation-Protected
Bond Funds | 6.1% | |
| Investment Grade
Bond Funds | 19.5% | |
| Short-Term Funds | 1.1% | |

The fund invests according to an asset allocation strategy that becomes increasingly conservative over time. The six months ago allocation is based on the fund's holdings as of September 30, 2012. The current allocation is based on the fund's holdings as of March 31, 2013. The expected allocation represents the fund's anticipated allocation at September 30, 2013. |
* Amount represents less than 0.1% |
Annual Report
Fidelity Freedom 2025 Fund
Investments March 31, 2013
Showing Percentage of Net Assets
Domestic Equity Funds - 49.7% |
| Shares | | Value |
Commodity Funds - 7.2% |
Fidelity Series Commodity Strategy Fund (a) | 68,019,945 | | $ 591,093,320 |
Domestic Equity Funds - 42.5% |
Fidelity Blue Chip Growth Fund | 6,751,851 | | 361,156,496 |
Fidelity Disciplined Equity Fund | 2,934,801 | | 79,885,277 |
Fidelity Growth Company Fund | 4,927,843 | | 498,402,031 |
Fidelity Series 100 Index Fund | 12,038,903 | | 124,241,484 |
Fidelity Series All-Sector Equity Fund | 41,578,686 | | 534,286,119 |
Fidelity Series Equity-Income Fund | 29,925,499 | | 332,472,297 |
Fidelity Series Intrinsic Opportunities Fund | 17,835,987 | | 202,438,452 |
Fidelity Series Large Cap Value Fund | 27,588,712 | | 321,132,608 |
Fidelity Series Mega Cap Fund | 11,032,635 | | 121,469,306 |
Fidelity Series Opportunistic Insights Fund | 22,063,258 | | 242,695,836 |
Fidelity Series Real Estate Equity Fund | 3,899,421 | | 50,770,463 |
Fidelity Series Small Cap Opportunities Fund | 11,258,907 | | 138,822,327 |
Fidelity Series Stock Selector Large Cap Value Fund | 29,928,227 | | 335,196,146 |
Fidelity Small Cap Growth Fund | 4,243,142 | | 76,800,863 |
Fidelity Small Cap Value Fund | 4,383,269 | | 82,624,629 |
TOTAL DOMESTIC EQUITY FUNDS | | 3,502,394,334 |
TOTAL DOMESTIC EQUITY FUNDS (Cost $3,733,211,428) |
4,093,487,654
|
International Equity Funds - 17.8% |
| | | |
Developed International Equity Funds - 13.9% |
Fidelity Series International Growth Fund | 41,305,340 | | 522,512,545 |
Fidelity Series International Small Cap Fund | 7,746,227 | | 106,278,239 |
Fidelity Series International Value Fund | 52,734,686 | | 517,854,612 |
TOTAL DEVELOPED INTERNATIONAL EQUITY FUNDS | | 1,146,645,396 |
Emerging Markets Equity Funds - 3.9% |
Fidelity Series Emerging Markets Fund | 18,898,486 | | 316,171,663 |
TOTAL INTERNATIONAL EQUITY FUNDS (Cost $1,336,057,963) |
1,462,817,059
|
Bond Funds - 31.8% |
| Shares | | Value |
High Yield Bond Funds - 9.2% |
Fidelity Series Emerging Markets Debt Fund | 5,868,092 | | $ 63,844,839 |
Fidelity Series Floating Rate High Income Fund | 7,540,143 | | 80,151,717 |
Fidelity Series High Income Fund | 54,217,908 | | 569,830,215 |
Fidelity Series Real Estate Income Fund | 3,933,891 | | 45,908,504 |
TOTAL HIGH YIELD BOND FUNDS | | 759,735,275 |
Inflation-Protected Bond Funds - 5.4% |
Fidelity Series Inflation-Protected Bond Index Fund | 38,798,921 | | 441,919,712 |
Investment Grade Bond Funds - 17.2% |
Fidelity Series Investment Grade Bond Fund | 122,483,026 | | 1,412,229,289 |
TOTAL BOND FUNDS (Cost $2,518,232,547) |
2,613,884,276
|
Short-Term Funds - 0.7% |
| | | |
Fidelity Institutional Money Market Portfolio Institutional Class | 32,776,776 | | 32,776,776 |
Fidelity Short-Term Bond Fund | 3,130,162 | | 26,919,395 |
TOTAL SHORT-TERM FUNDS (Cost $59,562,689) |
59,696,171
|
TOTAL INVESTMENT PORTFOLIO - 100.0% (Cost $7,647,064,627) | | 8,229,885,160 |
NET OTHER ASSETS (LIABILITIES) - 0.0% | | (434) |
NET ASSETS - 100% | $ 8,229,884,726 |
Legend |
(a) Non-income producing |
Other Information |
All investments are categorized as Level 1 under the Fair Value Hierarchy. The inputs or methodology used for valuing securities may not be an indication of the risk associated with investing in those securities. For more information on valuation inputs, please refer to the Security Valuation section in the accompanying Notes to Financial Statements. |
See accompanying notes which are an integral part of the financial statements.
Annual Report
Fidelity Freedom 2025 Fund
Statement of Assets and Liabilities
| March 31, 2013 |
| | |
Assets | | |
Investment in securities, at value (cost $7,647,064,627) - See accompanying schedule | | $ 8,229,885,160 |
Receivable for investments sold | | 6,125,850 |
Receivable for fund shares sold | | 10,069,908 |
Total assets | | 8,246,080,918 |
| | |
Liabilities | | |
Payable for investments purchased | $ 6,942,560 | |
Payable for fund shares redeemed | 9,253,632 | |
Total liabilities | | 16,196,192 |
| | |
Net Assets | | $ 8,229,884,726 |
Net Assets consist of: | | |
Paid in capital | | $ 7,553,811,912 |
Undistributed net investment income | | 16,405,156 |
Accumulated undistributed net realized gain (loss) on investments | | 76,847,125 |
Net unrealized appreciation (depreciation) on investments | | 582,820,533 |
Net Assets, for 654,254,722 shares outstanding | | $ 8,229,884,726 |
Net Asset Value, offering price and redemption price per share ($8,229,884,726 ÷ 654,254,722 shares) | | $ 12.58 |
Statement of Operations
| Year ended March 31, 2013 |
| | |
Investment Income | | |
Income distributions from underlying funds | | $ 140,023,295 |
| | |
Expenses | | |
Independent trustees' compensation | $ 29,616 | |
Total expenses before reductions | 29,616 | |
Expense reductions | (29,616) | - |
Net investment income (loss) | | 140,023,295 |
Realized and Unrealized Gain (Loss) Realized gain (loss) on sale of underlying fund shares | 124,637,022 | |
Capital gain distributions from underlying funds | 175,839,813 | |
Total net realized gain (loss) | | 300,476,835 |
Change in net unrealized appreciation (depreciation) on underlying funds | | 245,402,402 |
Net gain (loss) | | 545,879,237 |
Net increase (decrease) in net assets resulting from operations | | $ 685,902,532 |
See accompanying notes which are an integral part of the financial statements.
Annual Report
Fidelity Freedom 2025 Fund
Financial Statements - continued
Statement of Changes in Net Assets
| Year ended
March 31,
2013 | Year ended
March 31,
2012 |
Increase (Decrease) in Net Assets | | |
Operations | | |
Net investment income (loss) | $ 140,023,295 | $ 159,820,643 |
Net realized gain (loss) | 300,476,835 | 26,267,400 |
Change in net unrealized appreciation (depreciation) | 245,402,402 | (133,838,722) |
Net increase (decrease) in net assets resulting from operations | 685,902,532 | 52,249,321 |
Distributions to shareholders from net investment income | (143,208,455) | (161,271,864) |
Distributions to shareholders from net realized gain | (41,403,773) | (144,613,448) |
Total distributions | (184,612,228) | (305,885,312) |
Share transactions
Proceeds from sales of shares | 2,165,051,657 | 2,683,363,305 |
Reinvestment of distributions | 184,222,369 | 305,282,160 |
Cost of shares redeemed | (3,219,615,558) | (4,296,064,888) |
Net increase (decrease) in net assets resulting from share transactions | (870,341,532) | (1,307,419,423) |
Total increase (decrease) in net assets | (369,051,228) | (1,561,055,414) |
| | |
Net Assets | | |
Beginning of period | 8,598,935,954 | 10,159,991,368 |
End of period (including undistributed net investment income of $16,405,156 and undistributed net investment income of $19,590,316, respectively) | $ 8,229,884,726 | $ 8,598,935,954 |
Other Information Shares | | |
Sold | 181,648,013 | 233,329,832 |
Issued in reinvestment of distributions | 15,600,566 | 27,842,491 |
Redeemed | (271,318,538) | (377,937,733) |
Net increase (decrease) | (74,069,959) | (116,765,410) |
Financial Highlights
Years ended March 31, | 2013 | 2012 | 2011 | 2010 | 2009 |
Selected Per-Share Data | | | | | |
Net asset value, beginning of period | $ 11.81 | $ 12.02 | $ 10.77 | $ 7.68 | $ 12.15 |
Income from Investment Operations | | | | | |
Net investment income (loss) B | .21 | .20 | .18 | .22 | .26 |
Net realized and unrealized gain (loss) | .84 | - E | 1.37 | 3.18 | (4.10) |
Total from investment operations | 1.05 | .20 | 1.55 | 3.40 | (3.84) |
Distributions from net investment income | (.22) | (.22) | (.19) | (.21) | (.26) |
Distributions from net realized gain | (.06) | (.19) | (.11) | (.10) | (.37) |
Total distributions | (.28) | (.41) | (.30) | (.31) G | (.63) |
Net asset value, end of period | $ 12.58 | $ 11.81 | $ 12.02 | $ 10.77 | $ 7.68 |
Total Return A | 9.03% | 1.93% | 14.57% | 44.43% | (32.84)% |
Ratios to Average Net Assets C,F | | | | | |
Expenses before reductions D | .00% | .00% | .00% | .00% | .00% |
Expenses net of fee waivers, if any | .00% | .00% | .00% | .00% | .00% |
Expenses net of all reductions | .00% | .00% | .00% | .00% | .00% |
Net investment income (loss) | 1.73% | 1.75% | 1.67% | 2.21% | 2.64% |
Supplemental Data | | | | | |
Net assets, end of period (000 omitted) | $ 8,229,885 | $ 8,598,936 | $ 10,159,991 | $ 9,301,452 | $ 5,798,688 |
Portfolio turnover rate | 31% | 28% | 49% | 26% | 29% |
A Total returns would have been lower if certain expenses had not been reduced during the applicable periods shown.
B Calculated based on average shares outstanding during the period.
C Amounts do not include the activity of the Underlying Funds.
D Amount represents less than .01%.
E The amount shown for a share outstanding does not correspond with the aggregate net gain (loss) on investments for the period due to the timing of sales and repurchases of shares in relation to fluctuating market values of the investments of the Fund.
F Expense ratios reflect operating expenses of the Fund. Expenses before reductions do not reflect amounts reimbursed by the investment adviser or reductions from expense offset arrangements and do not represent the amount paid by the Fund during periods when reimbursements or reductions occur. Expenses net of fee waivers reflect expenses after reimbursement by the investment adviser but prior to reductions from expense offset arrangements. Expenses net of all reductions represent the net expenses paid by the Fund but do not include expenses of the investment companies in which the Fund invests.
G Total distributions of $.31 per share is comprised of distributions from net investment income of $.210 and distributions from net realized gain of $.095 per share.
See accompanying notes which are an integral part of the financial statements.
Annual Report
Fidelity Freedom 2030 Fund
Investment Changes (Unaudited)
The information in the following tables is based on the direct investments of the Fund. |
Fund Holdings as of March 31, 2013 |
| % of fund's
net assets | % of fund's net assets
6 months ago |
Commodity Funds | | |
Fidelity Series Commodity Strategy Fund | 7.5 | 7.8 |
Domestic Equity Funds | | |
Fidelity Blue Chip Growth Fund | 4.6 | 3.3 |
Fidelity Disciplined Equity Fund | 1.0 | 4.7 |
Fidelity Growth Company Fund | 6.3 | 7.1 |
Fidelity Series 100 Index Fund | 1.6 | 6.2 |
Fidelity Series All-Sector Equity Fund | 6.8 | 10.2 |
Fidelity Series Equity-Income Fund | 4.3 | 0.0 |
Fidelity Series Intrinsic Opportunities Fund | 2.6 | 0.0 |
Fidelity Series Large Cap Value Fund | 4.1 | 8.7 |
Fidelity Series Mega Cap Fund | 1.6 | 0.0 |
Fidelity Series Opportunistic Insights Fund | 3.1 | 0.0 |
Fidelity Series Real Estate Equity Fund | 0.6 | 0.6 |
Fidelity Series Small Cap Opportunities Fund | 1.8 | 1.7 |
Fidelity Series Stock Selector Large Cap Value Fund | 4.3 | 0.0 |
Fidelity Small Cap Growth Fund | 1.0 | 1.0 |
Fidelity Small Cap Value Fund | 1.0 | 0.9 |
| 44.7 | 44.4 |
Developed International Equity Funds | | |
Fidelity Series International Growth Fund | 6.7 | 6.7 |
Fidelity Series International Small Cap Fund | 1.4 | 1.4 |
Fidelity Series International Value Fund | 6.6 | 6.7 |
| 14.7 | 14.8 |
Emerging Markets Equity Funds | | |
Fidelity Series Emerging Markets Fund | 4.0 | 4.2 |
High Yield Bond Funds | | |
Fidelity Series Emerging Markets Debt Fund | 0.8 | 0.9 |
Fidelity Series Floating Rate High Income Fund | 0.9 | 1.0 |
Fidelity Series High Income Fund | 7.0 | 6.9 |
Fidelity Series Real Estate Income Fund | 0.5 | 0.6 |
| 9.2 | 9.4 |
Inflation-Protected Bond Funds | | |
Fidelity Series Inflation-Protected Bond Index Fund | 2.5 | 2.1 |
Investment Grade Bond Funds | | |
Fidelity Series Investment Grade Bond Fund | 17.4 | 17.3 |
Net Other Assets (Liabilities)* | 0.0 | 0.0 |
| 100.0 | 100.0 |
Asset Allocation (% of fund's net assets) |
Period end |
| Commodity Funds | 7.5% | |
| Domestic Equity Funds | 44.7% | |
| Developed International Equity Funds | 14.7% | |
| Emerging Markets
Equity Funds | 4.0% | |
| High Yield Bond Funds | 9.2% | |
 | Inflation-Protected
Bond Funds | 2.5% | |
| Investment Grade Bond Funds | 17.4% | |

Six months ago |
| Commodity Funds | 7.8% | |
| Domestic Equity Funds | 44.4% | |
| Developed International Equity Funds | 14.8% | |
| Emerging Markets
Equity Funds | 4.2% | |
| High Yield Bond Funds | 9.4% | |
| Inflation-Protected
Bond Funds | 2.1% | |
| Investment Grade Bond Funds | 17.3% | |

Expected |
| Commodity Funds | 7.7% | |
| Domestic Equity Funds | 43.8% | |
| Developed International Equity Funds | 14.4% | |
| Emerging Markets
Equity Funds | 4.3% | |
| High Yield Bond Funds | 7.5% | |
| Inflation-Protected
Bond Funds | 3.1% | |
| Investment Grade Bond Funds | 19.2% | |

The fund invests according to an asset allocation strategy that becomes increasingly conservative over time. The six months ago allocation is based on the fund's holdings as of September 30, 2012. The current allocation is based on the fund's holdings as of March 31, 2013. The expected allocation represents the fund's anticipated allocation at September 30, 2013. |
* Amount represents less than 0.1% |
Annual Report
Fidelity Freedom 2030 Fund
Investments March 31, 2013
Showing Percentage of Net Assets
Domestic Equity Funds - 52.2% |
| Shares | | Value |
Commodity Funds - 7.5% |
Fidelity Series Commodity Strategy Fund (a) | 92,338,534 | | $ 802,421,860 |
Domestic Equity Funds - 44.7% |
Fidelity Blue Chip Growth Fund | 9,116,175 | | 487,624,225 |
Fidelity Disciplined Equity Fund | 3,934,451 | | 107,095,744 |
Fidelity Growth Company Fund | 6,673,241 | | 674,931,574 |
Fidelity Series 100 Index Fund | 16,131,934 | | 166,481,556 |
Fidelity Series All-Sector Equity Fund | 56,069,763 | | 720,496,458 |
Fidelity Series Equity-Income Fund | 41,097,249 | | 456,590,441 |
Fidelity Series Intrinsic Opportunities Fund | 24,145,264 | | 274,048,747 |
Fidelity Series Large Cap Value Fund | 37,442,069 | | 435,825,680 |
Fidelity Series Mega Cap Fund | 15,147,858 | | 166,777,913 |
Fidelity Series Opportunistic Insights Fund | 30,293,620 | | 333,229,823 |
Fidelity Series Real Estate Equity Fund | 5,243,130 | | 68,265,551 |
Fidelity Series Small Cap Opportunities Fund | 15,191,185 | | 187,307,306 |
Fidelity Series Stock Selector Large Cap Value Fund | 41,102,269 | | 460,345,409 |
Fidelity Small Cap Growth Fund | 5,749,257 | | 104,061,555 |
Fidelity Small Cap Value Fund | 5,945,267 | | 112,068,277 |
TOTAL DOMESTIC EQUITY FUNDS | | 4,755,150,259 |
TOTAL DOMESTIC EQUITY FUNDS (Cost $5,045,386,448) |
5,557,572,119
|
International Equity Funds - 18.7% |
| | | |
Developed International Equity Funds - 14.7% |
Fidelity Series International Growth Fund | 56,085,737 | | 709,484,571 |
Fidelity Series International Small Cap Fund | 10,493,810 | | 143,975,076 |
Fidelity Series International Value Fund | 71,654,379 | | 703,646,006 |
TOTAL DEVELOPED INTERNATIONAL EQUITY FUNDS | | 1,557,105,653 |
|
| Shares | | Value |
Emerging Markets Equity Funds - 4.0% |
Fidelity Series Emerging Markets Fund | 25,619,624 | | $ 428,616,306 |
TOTAL INTERNATIONAL EQUITY FUNDS (Cost $1,847,349,899) |
1,985,721,959
|
Bond Funds - 29.1% |
| | | |
High Yield Bond Funds - 9.2% |
Fidelity Series Emerging Markets Debt Fund | 7,629,419 | | 83,008,083 |
Fidelity Series Floating Rate High Income Fund | 9,044,120 | | 96,138,999 |
Fidelity Series High Income Fund | 70,746,851 | | 743,549,405 |
Fidelity Series Real Estate Income Fund | 4,628,241 | | 54,011,577 |
TOTAL HIGH YIELD BOND FUNDS | | 976,708,064 |
Inflation-Protected Bond Funds - 2.5% |
Fidelity Series Inflation-Protected Bond Index Fund | 23,635,964 | | 269,213,630 |
Investment Grade Bond Funds - 17.4% |
Fidelity Series Investment Grade Bond Fund | 160,206,568 | | 1,847,181,730 |
TOTAL BOND FUNDS (Cost $3,047,714,965) |
3,093,103,424
|
TOTAL INVESTMENT PORTFOLIO - 100.0% (Cost $9,940,451,312) | 10,636,397,502 |
NET OTHER ASSETS (LIABILITIES) - 0.0% | | (194) |
NET ASSETS - 100% | $ 10,636,397,308 |
Legend |
(a) Non-income producing |
Other Information |
All investments are categorized as Level 1 under the Fair Value Hierarchy. The inputs or methodology used for valuing securities may not be an indication of the risk associated with investing in those securities. For more information on valuation inputs, please refer to the Security Valuation section in the accompanying Notes to Financial Statements. |
See accompanying notes which are an integral part of the financial statements.
Annual Report
Fidelity Freedom 2030 Fund
Statement of Assets and Liabilities
| March 31, 2013 |
| | |
Assets | | |
Investment in securities, at value (cost $9,940,451,312) - See accompanying schedule | | $ 10,636,397,502 |
Receivable for investments sold | | 17,295,768 |
Receivable for fund shares sold | | 12,249,364 |
Other receivables | | 67,154 |
Total assets | | 10,666,009,788 |
| | |
Liabilities | | |
Payable for investments purchased | $ 8,291,334 | |
Payable for fund shares redeemed | 21,253,990 | |
Other payables and accrued expenses | 67,156 | |
Total liabilities | | 29,612,480 |
| | |
Net Assets | | $ 10,636,397,308 |
Net Assets consist of: | | |
Paid in capital | | $ 10,054,709,078 |
Undistributed net investment income | | 21,075,017 |
Accumulated undistributed net realized gain (loss) on investments | | (135,332,977) |
Net unrealized appreciation (depreciation) on investments | | 695,946,190 |
Net Assets, for 708,233,626 shares outstanding | | $ 10,636,397,308 |
Net Asset Value, offering price and redemption price per share ($10,636,397,308 ÷ 708,233,626 shares) | | $ 15.02 |
Statement of Operations
| Year ended March 31, 2013 |
| | |
Investment Income | | |
Income distributions from underlying funds | | $ 191,240,952 |
| | |
Expenses | | |
Independent trustees' compensation | $ 39,666 | |
Total expenses before reductions | 39,666 | |
Expense reductions | (39,666) | - |
Net investment income (loss) | | 191,240,952 |
Realized and Unrealized Gain (Loss) Realized gain (loss) on sale of underlying fund shares | 460,083,756 | |
Capital gain distributions from underlying funds | 232,849,089 | |
Total net realized gain (loss) | | 692,932,845 |
Change in net unrealized appreciation (depreciation) on underlying funds | | 41,418,078 |
Net gain (loss) | | 734,350,923 |
Net increase (decrease) in net assets resulting from operations | | $ 925,591,875 |
See accompanying notes which are an integral part of the financial statements.
Annual Report
Statement of Changes in Net Assets
| Year ended
March 31,
2013 | Year ended
March 31,
2012 |
Increase (Decrease) in Net Assets | | |
Operations | | |
Net investment income (loss) | $ 191,240,952 | $ 222,844,916 |
Net realized gain (loss) | 692,932,845 | 1,319,147,336 |
Change in net unrealized appreciation (depreciation) | 41,418,078 | (1,564,861,118) |
Net increase (decrease) in net assets resulting from operations | 925,591,875 | (22,868,866) |
Distributions to shareholders from net investment income | (197,568,570) | (223,391,088) |
Distributions to shareholders from net realized gain | (49,492,170) | (211,206,217) |
Total distributions | (247,060,740) | (434,597,305) |
Share transactions
Proceeds from sales of shares | 2,435,501,325 | 3,079,728,395 |
Reinvestment of distributions | 246,356,389 | 431,982,453 |
Cost of shares redeemed | (4,378,903,589) | (6,144,385,509) |
Net increase (decrease) in net assets resulting from share transactions | (1,697,045,875) | (2,632,674,661) |
Total increase (decrease) in net assets | (1,018,514,740) | (3,090,140,832) |
| | |
Net Assets | | |
Beginning of period | 11,654,912,048 | 14,745,052,880 |
End of period (including undistributed net investment income of $21,075,017 and undistributed net investment income of $27,402,635, respectively) | $ 10,636,397,308 | $ 11,654,912,048 |
Other Information Shares | | |
Sold | 171,683,612 | 224,798,338 |
Issued in reinvestment of distributions | 17,520,585 | 33,126,599 |
Redeemed | (309,491,711) | (453,556,083) |
Net increase (decrease) | (120,287,514) | (195,631,146) |
Financial Highlights
Years ended March 31, | 2013 | 2012 | 2011 | 2010 | 2009 |
Selected Per-Share Data | | | | | |
Net asset value, beginning of period | $ 14.07 | $ 14.40 | $ 12.87 | $ 8.97 | $ 15.02 |
Income from Investment Operations | | | | | |
Net investment income (loss) B | .25 | .24 | .21 | .23 | .27 |
Net realized and unrealized gain (loss) | 1.04 | (.07) | 1.67 | 4.02 | (5.46) |
Total from investment operations | 1.29 | .17 | 1.88 | 4.25 | (5.19) |
Distributions from net investment income | (.27) | (.26) | (.22) | (.24) | (.27) |
Distributions from net realized gain | (.07) | (.24) | (.13) | (.11) | (.59) |
Total distributions | (.34) | (.50) | (.35) | (.35) F | (.86) |
Net asset value, end of period | $ 15.02 | $ 14.07 | $ 14.40 | $ 12.87 | $ 8.97 |
Total Return A | 9.30% | 1.48% | 14.81% | 47.57% | (36.25)% |
Ratios to Average Net Assets C,E | | | | | |
Expenses before reductions D | .00% | .00% | .00% | .00% | .00% |
Expenses net of fee waivers, if any | .00% | .00% | .00% | .00% | .00% |
Expenses net of all reductions | .00% | .00% | .00% | .00% | .00% |
Net investment income (loss) | 1.77% | 1.75% | 1.62% | 2.01% | 2.29% |
Supplemental Data | | | | | |
Net assets, end of period (000 omitted) | $ 10,636,397 | $ 11,654,912 | $ 14,745,053 | $ 14,595,428 | $ 9,685,340 |
Portfolio turnover rate | 29% | 26% | 44% | 29% | 23% |
A Total returns would have been lower if certain expenses had not been reduced during the applicable periods shown.
B Calculated based on average shares outstanding during the period.
C Amounts do not include the activity of the Underlying Funds.
D Amount represents less than .01%.
E Expense ratios reflect operating expenses of the Fund. Expenses before reductions do not reflect amounts reimbursed by the investment adviser or reductions from expense offset arrangements and do not represent the amount paid by the Fund during periods when reimbursements or reductions occur. Expenses net of fee waivers reflect expenses after reimbursement by the investment adviser but prior to reductions from expense offset arrangements. Expenses net of all reductions represent the net expenses paid by the Fund but do not include expenses of the investment companies in which the Fund invests.
F Total distributions of $.35 per share is comprised of distributions from net investment income of $.240 and distributions from net realized gain of $.105 per share.
See accompanying notes which are an integral part of the financial statements.
Annual Report
Fidelity Freedom 2035 Fund
Investment Changes (Unaudited)
The information in the following tables is based on the direct investments of the Fund. |
Fund Holdings as of March 31, 2013 |
| % of fund's
net assets | % of fund's net assets
6 months ago |
Commodity Funds | | |
Fidelity Series Commodity Strategy Fund | 8.7 | 9.2 |
Domestic Equity Funds | | |
Fidelity Blue Chip Growth Fund | 5.3 | 3.7 |
Fidelity Disciplined Equity Fund | 1.2 | 5.4 |
Fidelity Growth Company Fund | 7.3 | 8.1 |
Fidelity Series 100 Index Fund | 1.8 | 7.1 |
Fidelity Series All-Sector Equity Fund | 7.8 | 11.7 |
Fidelity Series Equity-Income Fund | 4.9 | 0.0 |
Fidelity Series Intrinsic Opportunities Fund | 2.9 | 0.0 |
Fidelity Series Large Cap Value Fund | 4.8 | 9.9 |
Fidelity Series Mega Cap Fund | 1.8 | 0.0 |
Fidelity Series Opportunistic Insights Fund | 3.6 | 0.0 |
Fidelity Series Real Estate Equity Fund | 0.7 | 0.7 |
Fidelity Series Small Cap Opportunities Fund | 2.0 | 2.0 |
Fidelity Series Stock Selector Large Cap Value Fund | 4.9 | 0.0 |
Fidelity Small Cap Growth Fund | 1.1 | 1.1 |
Fidelity Small Cap Value Fund | 1.2 | 1.1 |
| 51.3 | 50.8 |
Developed International Equity Funds | | |
Fidelity Series International Growth Fund | 7.7 | 7.7 |
Fidelity Series International Small Cap Fund | 1.5 | 1.6 |
Fidelity Series International Value Fund | 7.6 | 7.7 |
| 16.8 | 17.0 |
Emerging Markets Equity Funds | | |
Fidelity Series Emerging Markets Fund | 4.7 | 4.9 |
High Yield Bond Funds | | |
Fidelity Series Emerging Markets Debt Fund | 0.8 | 0.9 |
Fidelity Series Floating Rate High Income Fund | 0.8 | 0.5 |
Fidelity Series High Income Fund | 6.9 | 6.8 |
Fidelity Series Real Estate Income Fund | 0.4 | 0.3 |
| 8.9 | 8.5 |
Investment Grade Bond Funds | | |
Fidelity Series Investment Grade Bond Fund | 9.6 | 9.6 |
Net Other Assets (Liabilities)* | 0.0 | 0.0 |
| 100.0 | 100.0 |
Asset Allocation (% of fund's net assets) |
Period end |
| Commodity Funds | 8.7% | |
| Domestic Equity Funds | 51.3% | |
| Developed International Equity Funds | 16.8% | |
| Emerging Markets
Equity Funds | 4.7% | |
| High Yield Bond Funds | 8.9% | |
| Investment Grade
Bond Funds | 9.6% | |

Six months ago |
| Commodity Funds | 9.2% | |
| Domestic Equity Funds | 50.8% | |
| Developed International Equity Funds | 17.0% | |
| Emerging Markets
Equity Funds | 4.9% | |
| High Yield Bond Funds | 8.5% | |
| Investment Grade
Bond Funds | 9.6% | |

Expected |
| Commodity Funds | 8.8% | |
| Domestic Equity Funds | 50.0% | |
| Developed International Equity Funds | 16.5% | |
| Emerging Markets
Equity Funds | 4.9% | |
| High Yield Bond Funds | 7.5% | |
| Inflation-Protected Bond Funds | 0.1% | |
| Investment Grade
Bond Funds | 12.2% | |

The fund invests according to an asset allocation strategy that becomes increasingly conservative over time. The six months ago allocation is based on the fund's holdings as of September 30, 2012. The current allocation is based on the fund's holdings as of March 31, 2013. The expected allocation represents the fund's anticipated allocation at September 30, 2013. |
* Amount represents less than 0.1% |
Annual Report
Fidelity Freedom 2035 Fund
Investments March 31, 2013
Showing Percentage of Net Assets
Domestic Equity Funds - 60.0% |
| Shares | | Value |
Commodity Funds - 8.7% |
Fidelity Series Commodity Strategy Fund (a) | 56,630,426 | | $ 492,118,400 |
Domestic Equity Funds - 51.3% |
Fidelity Blue Chip Growth Fund | 5,589,810 | | 298,998,948 |
Fidelity Disciplined Equity Fund | 2,432,501 | | 66,212,676 |
Fidelity Growth Company Fund | 4,099,772 | | 414,650,988 |
Fidelity Series 100 Index Fund | 9,961,157 | | 102,799,140 |
Fidelity Series All-Sector Equity Fund | 34,419,765 | | 442,293,979 |
Fidelity Series Equity-Income Fund | 24,681,019 | | 274,206,122 |
Fidelity Series Intrinsic Opportunities Fund | 14,468,423 | | 164,216,602 |
Fidelity Series Large Cap Value Fund | 23,025,228 | | 268,013,652 |
Fidelity Series Mega Cap Fund | 9,098,267 | | 100,171,919 |
Fidelity Series Opportunistic Insights Fund | 18,199,555 | | 200,195,104 |
Fidelity Series Real Estate Equity Fund | 3,210,529 | | 41,801,081 |
Fidelity Series Small Cap Opportunities Fund | 9,336,310 | | 115,116,706 |
Fidelity Series Stock Selector Large Cap Value Fund | 24,697,495 | | 276,611,948 |
Fidelity Small Cap Growth Fund | 3,539,906 | | 64,072,307 |
Fidelity Small Cap Value Fund | 3,659,103 | | 68,974,089 |
TOTAL DOMESTIC EQUITY FUNDS | | 2,898,335,261 |
TOTAL DOMESTIC EQUITY FUNDS (Cost $3,100,257,585) |
3,390,453,661
|
International Equity Funds - 21.5% |
| | | |
Developed International Equity Funds - 16.8% |
Fidelity Series International Growth Fund | 34,193,863 | | 432,552,372 |
Fidelity Series International Small Cap Fund | 6,396,368 | | 87,758,173 |
Fidelity Series International Value Fund | 43,645,389 | | 428,597,716 |
TOTAL DEVELOPED INTERNATIONAL EQUITY FUNDS | | 948,908,261 |
|
| Shares | | Value |
Emerging Markets Equity Funds - 4.7% |
Fidelity Series Emerging Markets Fund | 15,672,163 | | $ 262,195,289 |
TOTAL INTERNATIONAL EQUITY FUNDS (Cost $1,111,463,619) |
1,211,103,550
|
Bond Funds - 18.5% |
| | | |
High Yield Bond Funds - 8.9% |
Fidelity Series Emerging Markets Debt Fund | 3,989,874 | | 43,409,832 |
Fidelity Series Floating Rate High Income Fund | 4,341,194 | | 46,146,895 |
Fidelity Series High Income Fund | 37,076,948 | | 389,678,722 |
Fidelity Series Real Estate Income Fund | 2,232,143 | | 26,049,104 |
TOTAL HIGH YIELD BOND FUNDS | | 505,284,553 |
Investment Grade Bond Funds - 9.6% |
Fidelity Series Investment Grade Bond Fund | 46,980,838 | | 541,689,061 |
TOTAL BOND FUNDS (Cost $1,018,249,930) |
1,046,973,614
|
TOTAL INVESTMENT PORTFOLIO - 100.0% (Cost $5,229,971,134) | | 5,648,530,825 |
NET OTHER ASSETS (LIABILITIES) - 0.0% | | (73) |
NET ASSETS - 100% | $ 5,648,530,752 |
Legend |
(a) Non-income producing |
Other Information |
All investments are categorized as Level 1 under the Fair Value Hierarchy. The inputs or methodology used for valuing securities may not be an indication of the risk associated with investing in those securities. For more information on valuation inputs, please refer to the Security Valuation section in the accompanying Notes to Financial Statements. |
See accompanying notes which are an integral part of the financial statements.
Annual Report
Fidelity Freedom 2035 Fund
Statement of Assets and Liabilities
| March 31, 2013 |
| | |
Assets | | |
Investment in securities, at value (cost $5,229,971,134) - See accompanying schedule | | $ 5,648,530,825 |
Receivable for investments sold | | 5,290,770 |
Receivable for fund shares sold | | 7,869,872 |
Total assets | | 5,661,691,467 |
| | |
Liabilities | | |
Payable for investments purchased | $ 5,720,052 | |
Payable for fund shares redeemed | 7,440,663 | |
Total liabilities | | 13,160,715 |
| | |
Net Assets | | $ 5,648,530,752 |
Net Assets consist of: | | |
Paid in capital | | $ 5,104,786,730 |
Undistributed net investment income | | 8,938,586 |
Accumulated undistributed net realized gain (loss) on investments | | 116,245,745 |
Net unrealized appreciation (depreciation) on investments | | 418,559,691 |
Net Assets, for 449,354,565 shares outstanding | | $ 5,648,530,752 |
Net Asset Value, offering price and redemption price per share ($5,648,530,752 ÷ 449,354,565 shares) | | $ 12.57 |
Statement of Operations
| Year ended March 31, 2013 |
| | |
Investment Income | | |
Income distributions from underlying funds | | $ 94,134,924 |
| | |
Expenses | | |
Independent trustees' compensation | $ 20,197 | |
Total expenses before reductions | 20,197 | |
Expense reductions | (20,197) | - |
Net investment income (loss) | | 94,134,924 |
Realized and Unrealized Gain (Loss) Realized gain (loss) on sale of underlying fund shares | 111,042,555 | |
Capital gain distributions from underlying funds | 112,878,487 | |
Total net realized gain (loss) | | 223,921,042 |
Change in net unrealized appreciation (depreciation) on underlying funds | | 189,781,598 |
Net gain (loss) | | 413,702,640 |
Net increase (decrease) in net assets resulting from operations | | $ 507,837,564 |
See accompanying notes which are an integral part of the financial statements.
Annual Report
Statement of Changes in Net Assets
| Year ended
March 31,
2013 | Year ended
March 31,
2012 |
Increase (Decrease) in Net Assets | | |
Operations | | |
Net investment income (loss) | $ 94,134,924 | $ 96,072,402 |
Net realized gain (loss) | 223,921,042 | 32,328,558 |
Change in net unrealized appreciation (depreciation) | 189,781,598 | (179,779,375) |
Net increase (decrease) in net assets resulting from operations | 507,837,564 | (51,378,415) |
Distributions to shareholders from net investment income | (94,950,080) | (95,667,245) |
Distributions to shareholders from net realized gain | (15,457,683) | (108,498,683) |
Total distributions | (110,407,763) | (204,165,928) |
Share transactions
Proceeds from sales of shares | 1,600,255,935 | 1,977,975,085 |
Reinvestment of distributions | 110,279,193 | 203,895,877 |
Cost of shares redeemed | (2,316,826,416) | (2,978,199,641) |
Net increase (decrease) in net assets resulting from share transactions | (606,291,288) | (796,328,679) |
Total increase (decrease) in net assets | (208,861,487) | (1,051,873,022) |
| | |
Net Assets | | |
Beginning of period | 5,857,392,239 | 6,909,265,261 |
End of period (including undistributed net investment income of $8,938,586 and undistributed net investment income of $9,753,742, respectively) | $ 5,648,530,752 | $ 5,857,392,239 |
Other Information Shares | | |
Sold | 136,178,047 | 174,487,156 |
Issued in reinvestment of distributions | 9,462,687 | 18,994,591 |
Redeemed | (197,756,468) | (266,004,062) |
Net increase (decrease) | (52,115,734) | (72,522,315) |
Financial Highlights
Years ended March 31, | 2013 | 2012 | 2011 | 2010 | 2009 |
Selected Per-Share Data | | | | | |
Net asset value, beginning of period | $ 11.68 | $ 12.04 | $ 10.66 | $ 7.36 | $ 12.41 |
Income from Investment Operations | | | | | |
Net investment income (loss) B | .20 | .18 | .16 | .18 | .22 |
Net realized and unrealized gain (loss) | .93 | (.14) | 1.48 | 3.40 | (4.63) |
Total from investment operations | 1.13 | .04 | 1.64 | 3.58 | (4.41) |
Distributions from net investment income | (.21) | (.19) | (.17) | (.18) | (.20) |
Distributions from net realized gain | (.03) | (.21) | (.10) | (.10) | (.44) |
Total distributions | (.24) | (.40) | (.26) G | (.28) F | (.64) |
Net asset value, end of period | $ 12.57 | $ 11.68 | $ 12.04 | $ 10.66 | $ 7.36 |
Total Return A | 9.85% | .63% | 15.63% | 48.79% | (37.11)% |
Ratios to Average Net Assets C,E | | | | | |
Expenses before reductions D | .00% | .00% | .00% | .00% | .00% |
Expenses net of fee waivers, if any | .00% | .00% | .00% | .00% | .00% |
Expenses net of all reductions | .00% | .00% | .00% | .00% | .00% |
Net investment income (loss) | 1.70% | 1.57% | 1.49% | 1.91% | 2.24% |
Supplemental Data | | | | | |
Net assets, end of period (000 omitted) | $ 5,648,531 | $ 5,857,392 | $ 6,909,265 | $ 6,082,003 | $ 3,576,031 |
Portfolio turnover rate | 36% | 30% | 47% | 25% | 20% |
A Total returns would have been lower if certain expenses had not been reduced during the applicable periods shown.
B Calculated based on average shares outstanding during the period.
C Amounts do not include the activity of the Underlying Funds.
D Amount represents less than .01%.
E Expense ratios reflect operating expenses of the Fund. Expenses before reductions do not reflect amounts reimbursed by the investment adviser or reductions from expense offset arrangements and do not represent the amount paid by the Fund during periods when reimbursements or reductions occur. Expenses net of fee waivers reflect expenses after reimbursement by the investment adviser but prior to reductions from expense offset arrangements. Expenses net of all reductions represent the net expenses paid by the Fund but do not include expenses of the investment companies in which the Fund invests.
F Total distributions of $.28 per share is comprised of distributions from net investment income of $.180 and distributions from net realized gain of $.095 per share.
G Total distributions of $.26 per share is comprised of distributions from net investment income of $.168 and distributions from net realized gain of $.095 per share.
See accompanying notes which are an integral part of the financial statements.
Annual Report
Fidelity Freedom 2040 Fund
Investment Changes (Unaudited)
The information in the following tables is based on the direct investments of the Fund. |
Fund Holdings as of March 31, 2013 |
| % of fund's
net assets | % of fund's net assets
6 months ago |
Commodity Funds | | |
Fidelity Series Commodity Strategy Fund | 8.9 | 9.3 |
Domestic Equity Funds | | |
Fidelity Blue Chip Growth Fund | 5.3 | 3.8 |
Fidelity Disciplined Equity Fund | 1.2 | 5.4 |
Fidelity Growth Company Fund | 7.4 | 8.2 |
Fidelity Series 100 Index Fund | 1.8 | 7.2 |
Fidelity Series All-Sector Equity Fund | 7.9 | 11.8 |
Fidelity Series Equity-Income Fund | 5.0 | 0.0 |
Fidelity Series Intrinsic Opportunities Fund | 3.0 | 0.0 |
Fidelity Series Large Cap Value Fund | 4.8 | 10.1 |
Fidelity Series Mega Cap Fund | 1.8 | 0.0 |
Fidelity Series Opportunistic Insights Fund | 3.7 | 0.0 |
Fidelity Series Real Estate Equity Fund | 0.7 | 0.7 |
Fidelity Series Small Cap Opportunities Fund | 2.1 | 2.0 |
Fidelity Series Stock Selector Large Cap Value Fund | 5.0 | 0.0 |
Fidelity Small Cap Growth Fund | 1.2 | 1.1 |
Fidelity Small Cap Value Fund | 1.2 | 1.1 |
| 52.1 | 51.4 |
Developed International Equity Funds | | |
Fidelity Series International Growth Fund | 7.8 | 7.8 |
Fidelity Series International Small Cap Fund | 1.6 | 1.6 |
Fidelity Series International Value Fund | 7.7 | 7.8 |
| 17.1 | 17.2 |
Emerging Markets Equity Funds | | |
Fidelity Series Emerging Markets Fund | 4.7 | 4.9 |
High Yield Bond Funds | | |
Fidelity Series Emerging Markets Debt Fund | 0.8 | 0.9 |
Fidelity Series Floating Rate High Income Fund | 0.8 | 0.5 |
Fidelity Series High Income Fund | 7.0 | 7.2 |
Fidelity Series Real Estate Income Fund | 0.4 | 0.3 |
| 9.0 | 8.9 |
Investment Grade Bond Funds | | |
Fidelity Series Investment Grade Bond Fund | 8.2 | 8.3 |
Net Other Assets (Liabilities)* | 0.0 | 0.0 |
| 100.0 | 100.0 |
Asset Allocation (% of fund's net assets) |
Period end |
| Commodity Funds | 8.9% | |
| Domestic Equity Funds | 52.1% | |
| Developed International Equity Funds | 17.1% | |
| Emerging Markets Equity Funds | 4.7% | |
| High Yield Bond Funds | 9.0% | |
| Investment Grade Bond Funds | 8.2% | |

Six months ago |
| Commodity Funds | 9.3% | |
| Domestic Equity Funds | 51.4% | |
| Developed International Equity Funds | 17.2% | |
| Emerging Markets Equity Funds | 4.9% | |
| High Yield Bond Funds | 8.9% | |
| Investment Grade Bond Funds | 8.3% | |

Expected |
| Commodity Funds | 9.1% | |
| Domestic Equity Funds | 51.5% | |
| Developed International Equity Funds | 17.0% | |
| Emerging Markets Equity Funds | 5.0% | |
| High Yield Bond Funds | 7.5% | |
| Investment Grade Bond Funds | 9.9% | |

The fund invests according to an asset allocation strategy that becomes increasingly conservative over time. The six months ago allocation is based on the fund's holdings as of September 30, 2012. The current allocation is based on the fund's holdings as of March 31, 2013. The expected allocation represents the fund's anticipated allocation at September 30, 2013. |
* Amount represents less than 0.1%. |
Annual Report
Fidelity Freedom 2040 Fund
Investments March 31, 2013
Showing Percentage of Net Assets
Domestic Equity Funds - 61.0% |
| Shares | | Value |
Commodity Funds - 8.9% |
Fidelity Series Commodity Strategy Fund (a) | 69,237,941 | | $ 601,677,707 |
Domestic Equity Funds - 52.1% |
Fidelity Blue Chip Growth Fund | 6,760,403 | | 361,613,965 |
Fidelity Disciplined Equity Fund | 2,916,384 | | 79,383,963 |
Fidelity Growth Company Fund | 4,954,602 | | 501,108,462 |
Fidelity Series 100 Index Fund | 11,945,781 | | 123,280,464 |
Fidelity Series All-Sector Equity Fund | 41,422,327 | | 532,276,904 |
Fidelity Series Equity-Income Fund | 30,426,815 | | 338,041,915 |
Fidelity Series Intrinsic Opportunities Fund | 17,737,777 | | 201,323,772 |
Fidelity Series Large Cap Value Fund | 27,806,690 | | 323,669,869 |
Fidelity Series Mega Cap Fund | 11,217,912 | | 123,509,214 |
Fidelity Series Opportunistic Insights Fund | 22,433,560 | | 246,769,163 |
Fidelity Series Real Estate Equity Fund | 3,791,388 | | 49,363,878 |
Fidelity Series Small Cap Opportunities Fund | 11,244,578 | | 138,645,643 |
Fidelity Series Stock Selector Large Cap Value Fund | 30,453,548 | | 341,079,737 |
Fidelity Small Cap Growth Fund | 4,318,173 | | 78,158,932 |
Fidelity Small Cap Value Fund | 4,473,977 | | 84,334,462 |
TOTAL DOMESTIC EQUITY FUNDS | | 3,522,560,343 |
TOTAL DOMESTIC EQUITY FUNDS (Cost $3,811,439,694) |
4,124,238,050
|
International Equity Funds - 21.8% |
| | | |
Developed International Equity Funds - 17.1% |
Fidelity Series International Growth Fund | 41,561,566 | | 525,753,805 |
Fidelity Series International Small Cap Fund | 7,749,726 | | 106,326,246 |
Fidelity Series International Value Fund | 53,151,206 | | 521,944,842 |
TOTAL DEVELOPED INTERNATIONAL EQUITY FUNDS | | 1,154,024,893 |
|
| Shares | | Value |
Emerging Markets Equity Funds - 4.7% |
Fidelity Series Emerging Markets Fund | 19,008,498 | | $ 318,012,165 |
TOTAL INTERNATIONAL EQUITY FUNDS (Cost $1,379,505,658) |
1,472,037,058
|
Bond Funds - 17.2% |
| | | |
High Yield Bond Funds - 9.0% |
Fidelity Series Emerging Markets Debt Fund | 4,836,954 | | 52,626,055 |
Fidelity Series Floating Rate High Income Fund | 4,787,044 | | 50,886,280 |
Fidelity Series High Income Fund | 44,989,756 | | 472,842,334 |
Fidelity Series Real Estate Income Fund | 2,474,725 | | 28,880,044 |
TOTAL HIGH YIELD BOND FUNDS | | 605,234,713 |
Investment Grade Bond Funds - 8.2% |
Fidelity Series Investment Grade Bond Fund | 48,313,950 | | 557,059,848 |
TOTAL BOND FUNDS (Cost $1,138,135,241) |
1,162,294,561
|
TOTAL INVESTMENT PORTFOLIO - 100.0% (Cost $6,329,080,593) | | 6,758,569,669 |
NET OTHER ASSETS (LIABILITIES) - 0.0% | | (81) |
NET ASSETS - 100% | $ 6,758,569,588 |
Legend |
(a) Non-income producing |
Other Information |
All investments are categorized as Level 1 under the Fair Value Hierarchy. The inputs or methodology used for valuing securities may not be an indication of the risk associated with investing in those securities. For more information on valuation inputs, please refer to the Security Valuation section in the accompanying Notes to Financial Statements. |
See accompanying notes which are an integral part of the financial statements.
Annual Report
Fidelity Freedom 2040 Fund
Statement of Assets and Liabilities
| March 31, 2013 |
| | |
Assets | | |
Investment in securities, at value (cost $6,329,080,593) - See accompanying schedule | | $ 6,758,569,669 |
Receivable for investments sold | | 10,461,729 |
Receivable for fund shares sold | | 7,676,758 |
Total assets | | 6,776,708,156 |
| | |
Liabilities | | |
Payable for investments purchased | $ 6,150,236 | |
Payable for fund shares redeemed | 11,988,332 | |
Total liabilities | | 18,138,568 |
| | |
Net Assets | | $ 6,758,569,588 |
Net Assets consist of: | | |
Paid in capital | | $ 6,225,965,619 |
Undistributed net investment income | | 10,590,141 |
Accumulated undistributed net realized gain (loss) on investments | | 92,524,752 |
Net unrealized appreciation (depreciation) on investments | | 429,489,076 |
Net Assets, for 769,727,515 shares outstanding | | $ 6,758,569,588 |
Net Asset Value, offering price and redemption price per share ($6,758,569,588 ÷ 769,727,515 shares) | | $ 8.78 |
Statement of Operations
| Year ended March 31, 2013 |
| | |
Investment Income | | |
Income distributions from underlying funds | | $ 115,806,882 |
| | |
Expenses | | |
Independent trustees' compensation | $ 24,969 | |
Total expenses before reductions | 24,969 | |
Expense reductions | (24,969) | - |
Net investment income (loss) | | 115,806,882 |
Realized and Unrealized Gain (Loss) Realized gain (loss) on sale of underlying fund shares | 299,536,052 | |
Capital gain distributions from underlying funds | 135,452,672 | |
Total net realized gain (loss) | | 434,988,724 |
Change in net unrealized appreciation (depreciation) on underlying funds | | 72,440,995 |
Net gain (loss) | | 507,429,719 |
Net increase (decrease) in net assets resulting from operations | | $ 623,236,601 |
See accompanying notes which are an integral part of the financial statements.
Annual Report
Fidelity Freedom 2040 Fund
Financial Statements - continued
Statement of Changes in Net Assets
| Year ended
March 31,
2013 | Year ended
March 31,
2012 |
Increase (Decrease) in Net Assets | | |
Operations | | |
Net investment income (loss) | $ 115,806,882 | $ 120,982,921 |
Net realized gain (loss) | 434,988,724 | 833,188,648 |
Change in net unrealized appreciation (depreciation) | 72,440,995 | (1,049,271,891) |
Net increase (decrease) in net assets resulting from operations | 623,236,601 | (95,100,322) |
Distributions to shareholders from net investment income | (116,763,462) | (122,139,578) |
Distributions to shareholders from net realized gain | (17,513,053) | (138,786,891) |
Total distributions | (134,276,515) | (260,926,469) |
Share transactions
Proceeds from sales of shares | 1,752,526,704 | 2,209,757,962 |
Reinvestment of distributions | 133,868,825 | 259,278,646 |
Cost of shares redeemed | (2,909,851,337) | (3,893,308,072) |
Net increase (decrease) in net assets resulting from share transactions | (1,023,455,808) | (1,424,271,464) |
Total increase (decrease) in net assets | (534,495,722) | (1,780,298,255) |
| | |
Net Assets | | |
Beginning of period | 7,293,065,310 | 9,073,363,565 |
End of period (including undistributed net investment income of $10,590,141 and undistributed net investment income of $11,546,721, respectively) | $ 6,758,569,588 | $ 7,293,065,310 |
Other Information Shares | | |
Sold | 213,801,336 | 279,471,713 |
Issued in reinvestment of distributions | 16,447,611 | 34,637,769 |
Redeemed | (355,303,340) | (497,604,670) |
Net increase (decrease) | (125,054,393) | (183,495,188) |
Financial Highlights
Years ended March 31, | 2013 | 2012 | 2011 | 2010 | 2009 |
Selected Per-Share Data | | | | | |
Net asset value, beginning of period | $ 8.15 | $ 8.41 | $ 7.45 | $ 5.10 | $ 8.79 |
Income from Investment Operations | | | | | |
Net investment income (loss) B | .14 | .12 | .12 | .13 | .15 |
Net realized and unrealized gain (loss) | .66 | (.10) | 1.03 | 2.42 | (3.35) |
Total from investment operations | .80 | .02 | 1.15 | 2.55 | (3.20) |
Distributions from net investment income | (.15) | (.13) | (.12) | (.13) | (.15) |
Distributions from net realized gain | (.02) | (.15) | (.07) | (.07) | (.34) |
Total distributions | (.17) | (.28) | (.19) | (.20) F | (.49) |
Net asset value, end of period | $ 8.78 | $ 8.15 | $ 8.41 | $ 7.45 | $ 5.10 |
Total Return A | 9.94% | .58% | 15.66% | 50.14% | (38.20)% |
Ratios to Average Net Assets C,E | | | | | |
Expenses before reductions D | .00% | .00% | .00% | .00% | .00% |
Expenses net of fee waivers, if any | .00% | .00% | .00% | .00% | .00% |
Expenses net of all reductions | .00% | .00% | .00% | .00% | .00% |
Net investment income (loss) | 1.70% | 1.55% | 1.52% | 1.94% | 2.22% |
Supplemental Data | | | | | |
Net assets, end of period (000 omitted) | $ 6,758,570 | $ 7,293,065 | $ 9,073,364 | $ 8,622,511 | $ 5,336,303 |
Portfolio turnover rate | 33% | 27% | 46% | 27% | 17% |
A Total returns would have been lower if certain expenses had not been reduced during the applicable periods shown.
B Calculated based on average shares outstanding during the period.
C Amounts do not include the activity of the Underlying Funds.
D Amount represents less than .01%.
E Expense ratios reflect operating expenses of the Fund. Expenses before reductions do not reflect amounts reimbursed by the investment adviser or reductions from expense offset arrangements and do not represent the amount paid by the Fund during periods when reimbursements or reductions occur. Expenses net of fee waivers reflect expenses after reimbursement by the investment adviser but prior to reductions from expense offset arrangements. Expenses net of all reductions represent the net expenses paid by the Fund but do not include expenses of the investment companies in which the Fund invests.
F Total distributions of $.20 per share is comprised of distributions from net investment income of $.125 and distributions from net realized gain of $.070 per share.
See accompanying notes which are an integral part of the financial statements.
Annual Report
Fidelity Freedom 2045 Fund
Investment Changes (Unaudited)
The information in the following tables is based on the direct investments of the Fund. |
Fund Holdings as of March 31, 2013 |
| % of fund's
net assets | % of fund's net assets
6 months ago |
Commodity Funds | | |
Fidelity Series Commodity Strategy Fund | 9.2 | 9.5 |
Domestic Equity Funds | | |
Fidelity Blue Chip Growth Fund | 5.5 | 3.9 |
Fidelity Disciplined Equity Fund | 1.2 | 5.5 |
Fidelity Growth Company Fund | 7.7 | 8.4 |
Fidelity Series 100 Index Fund | 1.9 | 7.3 |
Fidelity Series All-Sector Equity Fund | 8.1 | 12.0 |
Fidelity Series Equity-Income Fund | 5.0 | 0.0 |
Fidelity Series Intrinsic Opportunities Fund | 3.0 | 0.0 |
Fidelity Series Large Cap Value Fund | 4.9 | 10.3 |
Fidelity Series Mega Cap Fund | 1.8 | 0.0 |
Fidelity Series Opportunistic Insights Fund | 3.7 | 0.0 |
Fidelity Series Real Estate Equity Fund | 0.8 | 0.7 |
Fidelity Series Small Cap Opportunities Fund | 2.1 | 2.0 |
Fidelity Series Stock Selector Large Cap Value Fund | 5.0 | 0.0 |
Fidelity Small Cap Growth Fund | 1.2 | 1.2 |
Fidelity Small Cap Value Fund | 1.3 | 1.2 |
| 53.2 | 52.5 |
Developed International Equity Funds | | |
Fidelity Series International Growth Fund | 8.0 | 8.0 |
Fidelity Series International Small Cap Fund | 1.6 | 1.6 |
Fidelity Series International Value Fund | 8.0 | 8.1 |
| 17.6 | 17.7 |
Emerging Markets Equity Funds | | |
Fidelity Series Emerging Markets Fund | 4.9 | 5.0 |
High Yield Bond Funds | | |
Fidelity Series Emerging Markets Debt Fund | 0.7 | 0.9 |
Fidelity Series Floating Rate High Income Fund | 0.4 | 0.3 |
Fidelity Series High Income Fund | 9.1 | 9.1 |
Fidelity Series Real Estate Income Fund | 0.4 | 0.1 |
| 10.6 | 10.4 |
Investment Grade Bond Funds | | |
Fidelity Series Investment Grade Bond Fund | 4.5 | 4.9 |
Net Other Assets (Liabilities)* | 0.0 | 0.0 |
| 100.0 | 100.0 |
Asset Allocation (% of fund's net assets) |
Period end |
| Commodity Funds | 9.2% | |
| Domestic Equity Funds | 53.2% | |
| Developed International Equity Funds | 17.6% | |
| Emerging Markets Equity Funds | 4.9% | |
| High Yield Bond Funds | 10.6% | |
| Investment Grade Bond Funds | 4.5% | |

Six months ago |
| Commodity Funds | 9.5% | |
| Domestic Equity Funds | 52.5% | |
| Developed International Equity Funds | 17.7% | |
| Emerging Markets Equity Funds | 5.0% | |
| High Yield Bond Funds | 10.4% | |
| Investment Grade Bond Funds | 4.9% | |

Expected |
| Commodity Funds | 9.3% | |
| Domestic Equity Funds | 52.7% | |
| Developed International Equity Funds | 17.4% | |
| Emerging Markets Equity Funds | 5.2% | |
| High Yield Bond Funds | 9.6% | |
| Investment Grade Bond Funds | 5.8% | |

The fund invests according to an asset allocation strategy that becomes increasingly conservative over time. The six months ago allocation is based on the fund's holdings as of September 30, 2012. The current allocation is based on the fund's holdings as of March 31, 2013. The expected allocation represents the fund's anticipated allocation at September 30, 2013. |
* Amount represents less than 0.1%. |
Annual Report
Fidelity Freedom 2045 Fund
Investments March 31, 2013
Showing Percentage of Net Assets
Domestic Equity Funds - 62.4% |
| Shares | | Value |
Commodity Funds - 9.2% |
Fidelity Series Commodity Strategy Fund (a) | 26,353,649 | | $ 229,013,206 |
Domestic Equity Funds - 53.2% |
Fidelity Blue Chip Growth Fund | 2,544,825 | | 136,122,664 |
Fidelity Disciplined Equity Fund | 1,115,054 | | 30,351,780 |
Fidelity Growth Company Fund | 1,884,066 | | 190,554,402 |
Fidelity Series 100 Index Fund | 4,542,137 | | 46,874,857 |
Fidelity Series All-Sector Equity Fund | 15,605,626 | | 200,532,299 |
Fidelity Series Equity-Income Fund | 11,149,068 | | 123,866,150 |
Fidelity Series Intrinsic Opportunities Fund | 6,590,128 | | 74,797,958 |
Fidelity Series Large Cap Value Fund | 10,504,497 | | 122,272,345 |
Fidelity Series Mega Cap Fund | 4,109,764 | | 45,248,499 |
Fidelity Series Opportunistic Insights Fund | 8,223,909 | | 90,463,001 |
Fidelity Series Real Estate Equity Fund | 1,446,185 | | 18,829,328 |
Fidelity Series Small Cap Opportunities Fund | 4,237,062 | | 52,242,976 |
Fidelity Series Stock Selector Large Cap Value Fund | 11,169,195 | | 125,094,985 |
Fidelity Small Cap Growth Fund | 1,649,897 | | 29,863,139 |
Fidelity Small Cap Value Fund | 1,710,634 | | 32,245,448 |
TOTAL DOMESTIC EQUITY FUNDS | | 1,319,359,831 |
TOTAL DOMESTIC EQUITY FUNDS (Cost $1,281,897,988) |
1,548,373,037
|
International Equity Funds - 22.5% |
| | | |
Developed International Equity Funds - 17.6% |
Fidelity Series International Growth Fund | 15,712,741 | | 198,766,174 |
Fidelity Series International Small Cap Fund | 2,952,368 | | 40,506,495 |
Fidelity Series International Value Fund | 20,157,631 | | 197,947,938 |
TOTAL DEVELOPED INTERNATIONAL EQUITY FUNDS | | 437,220,607 |
|
| Shares | | Value |
Emerging Markets Equity Funds - 4.9% |
Fidelity Series Emerging Markets Fund | 7,157,895 | | $ 119,751,578 |
TOTAL INTERNATIONAL EQUITY FUNDS (Cost $492,319,472) |
556,972,185
|
Bond Funds - 15.1% |
| | | |
High Yield Bond Funds - 10.6% |
Fidelity Series Emerging Markets Debt Fund | 1,742,165 | | 18,954,756 |
Fidelity Series Floating Rate High Income Fund | 889,948 | | 9,460,149 |
Fidelity Series High Income Fund | 21,450,752 | | 225,447,407 |
Fidelity Series Real Estate Income Fund | 781,167 | | 9,116,218 |
TOTAL HIGH YIELD BOND FUNDS | | 262,978,530 |
Investment Grade Bond Funds - 4.5% |
Fidelity Series Investment Grade Bond Fund | 9,726,081 | | 112,141,719 |
TOTAL BOND FUNDS (Cost $359,377,493) |
375,120,249
|
TOTAL INVESTMENT PORTFOLIO - 100.0% (Cost $2,133,594,953) | | 2,480,465,471 |
NET OTHER ASSETS (LIABILITIES) - 0.0% | | (18) |
NET ASSETS - 100% | $ 2,480,465,453 |
Legend |
(a) Non-income producing |
Other Information |
All investments are categorized as Level 1 under the Fair Value Hierarchy. The inputs or methodology used for valuing securities may not be an indication of the risk associated with investing in those securities. For more information on valuation inputs, please refer to the Security Valuation section in the accompanying Notes to Financial Statements. |
See accompanying notes which are an integral part of the financial statements.
Annual Report
Fidelity Freedom 2045 Fund
Statement of Assets and Liabilities
| March 31, 2013 |
| | |
Assets | | |
Investment in securities, at value (cost $2,133,594,953) - See accompanying schedule | | $ 2,480,465,471 |
Cash | | 3 |
Receivable for investments sold | | 2,151,292 |
Receivable for fund shares sold | | 4,648,471 |
Total assets | | 2,487,265,237 |
| | |
Liabilities | | |
Payable for investments purchased | $ 4,197,690 | |
Payable for fund shares redeemed | 2,602,094 | |
Total liabilities | | 6,799,784 |
| | |
Net Assets | | $ 2,480,465,453 |
Net Assets consist of: | | |
Paid in capital | | $ 2,031,471,750 |
Undistributed net investment income | | 3,813,101 |
Accumulated undistributed net realized gain (loss) on investments | | 98,310,084 |
Net unrealized appreciation (depreciation) on investments | | 346,870,518 |
Net Assets, for 238,022,989 shares outstanding | | $ 2,480,465,453 |
Net Asset Value, offering price and redemption price per share ($2,480,465,453 ÷ 238,022,989 shares) | | $ 10.42 |
Statement of Operations
| Year ended March 31, 2013 |
| | |
Investment Income | | |
Income distributions from underlying funds | | $ 41,368,476 |
| | |
Expenses | | |
Independent trustees' compensation | $ 8,618 | |
Total expenses before reductions | 8,618 | |
Expense reductions | (8,618) | - |
Net investment income (loss) | | 41,368,476 |
Realized and Unrealized Gain (Loss) Realized gain (loss) on sale of underlying fund shares | 87,271,744 | |
Capital gain distributions from underlying funds | 46,085,093 | |
Total net realized gain (loss) | | 133,356,837 |
Change in net unrealized appreciation (depreciation) on underlying funds | | 54,006,409 |
Net gain (loss) | | 187,363,246 |
Net increase (decrease) in net assets resulting from operations | | $ 228,731,722 |
See accompanying notes which are an integral part of the financial statements.
Annual Report
Fidelity Freedom 2045 Fund
Financial Statements - continued
Statement of Changes in Net Assets
| Year ended
March 31,
2013 | Year ended
March 31,
2012 |
Increase (Decrease) in Net Assets | | |
Operations | | |
Net investment income (loss) | $ 41,368,476 | $ 38,215,967 |
Net realized gain (loss) | 133,356,837 | 83,768,771 |
Change in net unrealized appreciation (depreciation) | 54,006,409 | (143,372,598) |
Net increase (decrease) in net assets resulting from operations | 228,731,722 | (21,387,860) |
Distributions to shareholders from net investment income | (41,465,860) | (37,996,762) |
Distributions to shareholders from net realized gain | (4,528,192) | (43,334,145) |
Total distributions | (45,994,052) | (81,330,907) |
Share transactions
Proceeds from sales of shares | 987,985,006 | 1,129,907,629 |
Reinvestment of distributions | 45,960,325 | 81,272,235 |
Cost of shares redeemed | (1,169,045,115) | (1,336,056,773) |
Net increase (decrease) in net assets resulting from share transactions | (135,099,784) | (124,876,909) |
Total increase (decrease) in net assets | 47,637,886 | (227,595,676) |
| | |
Net Assets | | |
Beginning of period | 2,432,827,567 | 2,660,423,243 |
End of period (including undistributed net investment income of $3,813,101 and undistributed net investment income of $3,910,486, respectively) | $ 2,480,465,453 | $ 2,432,827,567 |
Other Information Shares | | |
Sold | 101,844,132 | 120,995,689 |
Issued in reinvestment of distributions | 4,772,492 | 9,201,517 |
Redeemed | (120,670,005) | (144,738,699) |
Net increase (decrease) | (14,053,381) | (14,541,493) |
Financial Highlights
Years ended March 31, | 2013 | 2012 | 2011 | 2010 | 2009 |
Selected Per-Share Data | | | | | |
Net asset value, beginning of period | $ 9.65 | $ 9.98 | $ 8.81 | $ 5.99 | $ 10.24 |
Income from Investment Operations | | | | | |
Net investment income (loss) B | .17 | .15 | .14 | .16 | .18 |
Net realized and unrealized gain (loss) | .79 | (.15) | 1.25 | 2.88 | (4.00) |
Total from investment operations | .96 | - | 1.39 | 3.04 | (3.82) |
Distributions from net investment income | (.17) | (.15) | (.14) | (.15) | (.15) |
Distributions from net realized gain | (.02) | (.17) | (.08) | (.07) | (.28) |
Total distributions | (.19) | (.33) G | (.22) | (.22) F | (.43) |
Net asset value, end of period | $ 10.42 | $ 9.65 | $ 9.98 | $ 8.81 | $ 5.99 |
Total Return A | 10.14% | .29% | 15.99% | 50.86% | (38.60)% |
Ratios to Average Net Assets C,E | | | | | |
Expenses before reductions D | .00% | .00% | .00% | .00% | .00% |
Expenses net of fee waivers, if any | .00% | .00% | .00% | .00% | .00% |
Expenses net of all reductions | .00% | .00% | .00% | .00% | .00% |
Net investment income (loss) | 1.75% | 1.57% | 1.55% | 1.97% | 2.29% |
Supplemental Data | | | | | |
Net assets, end of period (000 omitted) | $ 2,480,465 | $ 2,432,828 | $ 2,660,423 | $ 2,071,143 | $ 946,939 |
Portfolio turnover rate | 45% | 40% | 50% | 24% | 17% |
A Total returns would have been lower if certain expenses had not been reduced during the applicable periods shown.
B Calculated based on average shares outstanding during the period.
C Amounts do not include the activity of the Underlying Funds.
D Amount represents less than .01%.
E Expense ratios reflect operating expenses of the Fund. Expenses before reductions do not reflect amounts reimbursed by the investment adviser or reductions from expense offset arrangements and do not represent the amount paid by the Fund during periods when reimbursements or reductions occur. Expenses net of fee waivers reflect expenses after reimbursement by the investment adviser but prior to reductions from expense offset arrangements. Expenses net of all reductions represent the net expenses paid by the Fund but do not include expenses of the investment companies in which the Fund invests.
F Total distributions of $.22 per share is comprised of distributions from net investment income of $.145 and distributions from net realized gain of $.070 per share.
G Total distributions of $.33 per share is comprised of distributions from net investment income of $.153 and distributions from net realized gain of $.174 per share.
See accompanying notes which are an integral part of the financial statements.
Annual Report
Fidelity Freedom 2050 Fund
Investment Changes (Unaudited)
The information in the following tables is based on the direct investments of the Fund. |
Fund Holdings as of March 31, 2013 |
| % of fund's
net assets | % of fund's net assets
6 months ago |
Commodity Funds | | |
Fidelity Series Commodity Strategy Fund | 9.4 | 9.8 |
Domestic Equity Funds | | |
Fidelity Blue Chip Growth Fund | 5.6 | 4.0 |
Fidelity Disciplined Equity Fund | 1.2 | 5.6 |
Fidelity Growth Company Fund | 7.8 | 8.6 |
Fidelity Series 100 Index Fund | 1.9 | 7.5 |
Fidelity Series All-Sector Equity Fund | 8.2 | 12.3 |
Fidelity Series Equity-Income Fund | 5.1 | 0.0 |
Fidelity Series Intrinsic Opportunities Fund | 3.0 | 0.0 |
Fidelity Series Large Cap Value Fund | 5.0 | 10.5 |
Fidelity Series Mega Cap Fund | 1.9 | 0.0 |
Fidelity Series Opportunistic Insights Fund | 3.7 | 0.0 |
Fidelity Series Real Estate Equity Fund | 0.8 | 0.7 |
Fidelity Series Small Cap Opportunities Fund | 2.1 | 2.1 |
Fidelity Series Stock Selector Large Cap Value Fund | 5.2 | 0.0 |
Fidelity Small Cap Growth Fund | 1.2 | 1.2 |
Fidelity Small Cap Value Fund | 1.3 | 1.2 |
| 54.0 | 53.7 |
Developed International Equity Funds | | |
Fidelity Series International Growth Fund | 8.0 | 8.2 |
Fidelity Series International Small Cap Fund | 1.6 | 1.6 |
Fidelity Series International Value Fund | 8.1 | 8.3 |
| 17.7 | 18.1 |
Emerging Markets Equity Funds | | |
Fidelity Series Emerging Markets Fund | 4.9 | 5.1 |
High Yield Bond Funds | | |
Fidelity Series Emerging Markets Debt Fund | 0.8 | 0.9 |
Fidelity Series Floating Rate High Income Fund | 0.1 | 0.1 |
Fidelity Series High Income Fund | 9.3 | 9.2 |
Fidelity Series Real Estate Income Fund | 0.3 | 0.1 |
| 10.5 | 10.3 |
Investment Grade Bond Funds | | |
Fidelity Series Investment Grade Bond Fund | 3.5 | 3.0 |
Net Other Assets (Liabilities)* | 0.0 | 0.0 |
| 100.0 | 100.0 |
Asset Allocation (% of fund's net assets) |
Period end |
| Commodity Funds | 9.4% | |
| Domestic Equity Funds | 54.0% | |
| Developed International Equity Funds | 17.7% | |
| Emerging Markets Equity Funds | 4.9% | |
| High Yield Bond Funds | 10.5% | |
| Investment Grade Bond Funds | 3.5% | |

Six months ago |
| Commodity Funds | 9.8% | |
| Domestic Equity Funds | 53.7% | |
| Developed International Equity Funds | 18.1% | |
| Emerging Markets Equity Funds | 5.1% | |
| High Yield Bond Funds | 10.3% | |
| Investment Grade Bond Funds | 3.0% | |

Expected |
| Commodity Funds | 9.4% | |
| Domestic Equity Funds | 53.1% | |
| Developed International Equity Funds | 17.6% | |
| Emerging Markets Equity Funds | 5.2% | |
| High Yield Bond Funds | 10.0% | |
| Investment Grade Bond Funds | 4.7% | |

The fund invests according to an asset allocation strategy that becomes increasingly conservative over time. The six months ago allocation is based on the fund's holdings as of September 30, 2012. The current allocation is based on the fund's holdings as of March 31, 2013. The expected allocation represents the fund's anticipated allocation at September 30, 2013. |
* Amount represents less than 0.1%. |
Annual Report
Fidelity Freedom 2050 Fund
Investments March 31, 2013
Showing Percentage of Net Assets
Domestic Equity Funds - 63.4% |
| Shares | | Value |
Commodity Funds - 9.4% |
Fidelity Series Commodity Strategy Fund (a) | 22,336,036 | | $ 194,100,158 |
Domestic Equity Funds - 54.0% |
Fidelity Blue Chip Growth Fund | 2,160,242 | | 115,551,329 |
Fidelity Disciplined Equity Fund | 937,958 | | 25,531,228 |
Fidelity Growth Company Fund | 1,593,404 | | 161,156,910 |
Fidelity Series 100 Index Fund | 3,833,310 | | 39,559,755 |
Fidelity Series All-Sector Equity Fund | 13,217,864 | | 169,849,558 |
Fidelity Series Equity-Income Fund | 9,494,004 | | 105,478,389 |
Fidelity Series Intrinsic Opportunities Fund | 5,537,229 | | 62,847,546 |
Fidelity Series Large Cap Value Fund | 8,925,308 | | 103,890,585 |
Fidelity Series Mega Cap Fund | 3,500,480 | | 38,540,289 |
Fidelity Series Opportunistic Insights Fund | 7,003,584 | | 77,039,422 |
Fidelity Series Real Estate Equity Fund | 1,198,629 | | 15,606,153 |
Fidelity Series Small Cap Opportunities Fund | 3,598,838 | | 44,373,673 |
Fidelity Series Stock Selector Large Cap Value Fund | 9,510,013 | | 106,512,148 |
Fidelity Small Cap Growth Fund | 1,392,235 | | 25,199,447 |
Fidelity Small Cap Value Fund | 1,443,974 | | 27,218,917 |
TOTAL DOMESTIC EQUITY FUNDS | | 1,118,355,349 |
TOTAL DOMESTIC EQUITY FUNDS (Cost $1,099,777,960) |
1,312,455,507
|
International Equity Funds - 22.6% |
| | | |
Developed International Equity Funds - 17.7% |
Fidelity Series International Growth Fund | 13,176,178 | | 166,678,653 |
Fidelity Series International Small Cap Fund | 2,476,034 | | 33,971,182 |
Fidelity Series International Value Fund | 16,979,090 | | 166,734,667 |
TOTAL DEVELOPED INTERNATIONAL EQUITY FUNDS | | 367,384,502 |
|
| Shares | | Value |
Emerging Markets Equity Funds - 4.9% |
Fidelity Series Emerging Markets Fund | 6,006,739 | | $ 100,492,737 |
TOTAL INTERNATIONAL EQUITY FUNDS (Cost $414,647,297) |
467,877,239
|
Bond Funds - 14.0% |
| | | |
High Yield Bond Funds - 10.5% |
Fidelity Series Emerging Markets Debt Fund | 1,447,953 | | 15,753,724 |
Fidelity Series Floating Rate High Income Fund | 233,753 | | 2,484,791 |
Fidelity Series High Income Fund | 18,212,690 | | 191,415,370 |
Fidelity Series Real Estate Income Fund | 579,133 | | 6,758,487 |
TOTAL HIGH YIELD BOND FUNDS | | 216,412,372 |
Investment Grade Bond Funds - 3.5% |
Fidelity Series Investment Grade Bond Fund | 6,331,272 | | 72,999,572 |
TOTAL BOND FUNDS (Cost $280,129,590) |
289,411,944
|
TOTAL INVESTMENT PORTFOLIO - 100.0% (Cost $1,794,554,847) | | 2,069,744,690 |
NET OTHER ASSETS (LIABILITIES) - 0.0% | | (7) |
NET ASSETS - 100% | $ 2,069,744,683 |
Legend |
(a) Non-income producing |
Other Information |
All investments are categorized as Level 1 under the Fair Value Hierarchy. The inputs or methodology used for valuing securities may not be an indication of the risk associated with investing in those securities. For more information on valuation inputs, please refer to the Security Valuation section in the accompanying Notes to Financial Statements. |
See accompanying notes which are an integral part of the financial statements.
Annual Report
Fidelity Freedom 2050 Fund
Statement of Assets and Liabilities
| March 31, 2013 |
| | |
Assets | | |
Investment in securities, at value (cost $1,794,554,847) - See accompanying schedule | | $ 2,069,744,690 |
Cash | | 1 |
Receivable for investments sold | | 2,499,983 |
Receivable for fund shares sold | | 4,736,342 |
Total assets | | 2,076,981,016 |
| | |
Liabilities | | |
Payable for investments purchased | $ 2,047,761 | |
Payable for fund shares redeemed | 5,188,572 | |
Total liabilities | | 7,236,333 |
| | |
Net Assets | | $ 2,069,744,683 |
Net Assets consist of: | | |
Paid in capital | | $ 1,746,817,777 |
Undistributed net investment income | | 3,149,213 |
Accumulated undistributed net realized gain (loss) on investments | | 44,587,850 |
Net unrealized appreciation (depreciation) on investments | | 275,189,843 |
Net Assets, for 201,330,314 shares outstanding | | $ 2,069,744,683 |
Net Asset Value, offering price and redemption price per share ($2,069,744,683 ÷ 201,330,314 shares) | | $ 10.28 |
Statement of Operations
| Year ended March 31, 2013 |
| | |
Investment Income | | |
Income distributions from underlying funds | | $ 34,449,705 |
| | |
Expenses | | |
Independent trustees' compensation | $ 7,315 | |
Total expenses before reductions | 7,315 | |
Expense reductions | (7,315) | - |
Net investment income (loss) | | 34,449,705 |
Realized and Unrealized Gain (Loss) Realized gain (loss) on sale of underlying fund shares | 75,198,875 | |
Capital gain distributions from underlying funds | 37,999,022 | |
Total net realized gain (loss) | | 113,197,897 |
Change in net unrealized appreciation (depreciation) on underlying funds | | 46,471,895 |
Net gain (loss) | | 159,669,792 |
Net increase (decrease) in net assets resulting from operations | | $ 194,119,497 |
See accompanying notes which are an integral part of the financial statements.
Annual Report
Fidelity Freedom 2050 Fund
Financial Statements - continued
Statement of Changes in Net Assets
| Year ended
March 31,
2013 | Year ended
March 31,
2012 |
Increase (Decrease) in Net Assets | | |
Operations | | |
Net investment income (loss) | $ 34,449,705 | $ 29,999,810 |
Net realized gain (loss) | 113,197,897 | 65,496,216 |
Change in net unrealized appreciation (depreciation) | 46,471,895 | (118,193,738) |
Net increase (decrease) in net assets resulting from operations | 194,119,497 | (22,697,712) |
Distributions to shareholders from net investment income | (34,165,519) | (29,642,403) |
Distributions to shareholders from net realized gain | (3,253,611) | (37,922,950) |
Total distributions | (37,419,130) | (67,565,353) |
Share transactions
Proceeds from sales of shares | 854,887,344 | 1,070,131,795 |
Reinvestment of distributions | 37,337,537 | 67,201,744 |
Cost of shares redeemed | (1,045,485,840) | (1,146,994,203) |
Net increase (decrease) in net assets resulting from share transactions | (153,260,959) | (9,660,664) |
Total increase (decrease) in net assets | 3,439,408 | (99,923,729) |
| | |
Net Assets | | |
Beginning of period | 2,066,305,275 | 2,166,229,004 |
End of period (including undistributed net investment income of $3,149,213 and undistributed net investment income of $2,865,027, respectively) | $ 2,069,744,683 | $ 2,066,305,275 |
Other Information Shares | | |
Sold | 89,442,709 | 116,303,992 |
Issued in reinvestment of distributions | 3,933,171 | 7,744,377 |
Redeemed | (109,263,719) | (126,179,123) |
Net increase (decrease) | (15,887,839) | (2,130,754) |
Financial Highlights
Years ended March 31, | 2013 | 2012 | 2011 | 2010 | 2009 |
Selected Per-Share Data | | | | | |
Net asset value, beginning of period | $ 9.51 | $ 9.88 | $ 8.69 | $ 5.84 | $ 10.26 |
Income from Investment Operations | | | | | |
Net investment income (loss) B | .16 | .14 | .13 | .14 | .17 |
Net realized and unrealized gain (loss) | .79 | (.19) | 1.27 | 2.92 | (4.15) |
Total from investment operations | .95 | (.05) | 1.40 | 3.06 | (3.98) |
Distributions from net investment income | (.17) | (.14) | (.13) | (.13) | (.15) |
Distributions from net realized gain | (.02) | (.18) | (.08) | (.08) | (.29) |
Total distributions | (.18) G | (.32) | (.21) | (.21) F | (.44) |
Net asset value, end of period | $ 10.28 | $ 9.51 | $ 9.88 | $ 8.69 | $ 5.84 |
Total Return A | 10.18% | (.17)% | 16.29% | 52.51% | (40.19)% |
Ratios to Average Net Assets C,E | | | | | |
Expenses before reductions D | .00% | .00% | .00% | .00% | .00% |
Expenses net of fee waivers, if any | .00% | .00% | .00% | .00% | .00% |
Expenses net of all reductions | .00% | .00% | .00% | .00% | .00% |
Net investment income (loss) | 1.71% | 1.49% | 1.47% | 1.85% | 2.13% |
Supplemental Data | | | | | |
Net assets, end of period (000 omitted) | $ 2,069,745 | $ 2,066,305 | $ 2,166,229 | $ 1,665,296 | $ 767,949 |
Portfolio turnover rate | 44% | 41% | 51% | 23% | 20% |
A Total returns would have been lower if certain expenses had not been reduced during the applicable periods shown.
B Calculated based on average shares outstanding during the period.
C Amounts do not include the activity of the Underlying Funds.
D Amount represents less than .01%.
E Expense ratios reflect operating expenses of the Fund. Expenses before reductions do not reflect amounts reimbursed by the investment adviser or reductions from expense offset arrangements and do not represent the amount paid by the Fund during periods when reimbursements or reductions occur. Expenses net of fee waivers reflect expenses after reimbursement by the investment adviser but prior to reductions from expense offset arrangements. Expenses net of all reductions represent the net expenses paid by the Fund but do not include expenses of the investment companies in which the Fund invests.
F Total distributions of $.21 per share is comprised of distributions from net investment income of $.130 and distributions from net realized gain of $.075 per share.
G Total distributions of $.18 per share is comprised of distributions from net investment income of $.167 and distributions from net realized gain of $.016 per share.
See accompanying notes which are an integral part of the financial statements.
Annual Report
Fidelity Freedom 2055 Fund
Investment Changes (Unaudited)
The information in the following tables is based on the direct investments of the Fund. |
Fund Holdings as of March 31, 2013 |
| % of fund's
net assets | % of fund's net assets
6 months ago |
Commodity Funds | | |
Fidelity Series Commodity Strategy Fund | 9.8 | 10.1 |
Domestic Equity Funds | | |
Fidelity Blue Chip Growth Fund | 6.4 | 4.2 |
Fidelity Disciplined Equity Fund | 1.4 | 5.8 |
Fidelity Growth Company Fund | 8.4 | 8.6 |
Fidelity Series 100 Index Fund | 2.2 | 7.8 |
Fidelity Series All-Sector Equity Fund | 9.4 | 12.8 |
Fidelity Series Equity-Income Fund | 4.5 | 0.0 |
Fidelity Series Intrinsic Opportunities Fund | 2.9 | 0.0 |
Fidelity Series Large Cap Value Fund | 5.4 | 10.9 |
Fidelity Series Mega Cap Fund | 1.6 | 0.0 |
Fidelity Series Opportunistic Insights Fund | 3.3 | 0.0 |
Fidelity Series Real Estate Equity Fund | 1.1 | 0.8 |
Fidelity Series Small Cap Opportunities Fund | 2.5 | 2.2 |
Fidelity Series Stock Selector Large Cap Value Fund | 4.5 | 0.0 |
Fidelity Small Cap Growth Fund | 1.3 | 1.3 |
Fidelity Small Cap Value Fund | 1.4 | 1.3 |
| 56.3 | 55.7 |
Developed International Equity Funds | | |
Fidelity Series International Growth Fund | 8.5 | 8.4 |
Fidelity Series International Small Cap Fund | 1.7 | 1.7 |
Fidelity Series International Value Fund | 8.3 | 8.3 |
| 18.5 | 18.4 |
Emerging Markets Equity Funds | | |
Fidelity Series Emerging Markets Fund | 5.3 | 5.5 |
High Yield Bond Funds | | |
Fidelity Series Emerging Markets Debt Fund | 0.6 | 0.8 |
Fidelity Series Floating Rate High Income Fund | 0.0* | 0.0* |
Fidelity Series High Income Fund | 9.2 | 9.2 |
Fidelity Series Real Estate Income Fund | 0.2 | 0.0* |
| 10.0 | 10.0 |
Investment Grade Bond Funds | | |
Fidelity Series Investment Grade Bond Fund | 0.1 | 0.3 |
Net Other Assets (Liabilities)* | 0.0 | 0.0 |
| 100.0 | 100.0 |
Asset Allocation (% of fund's net assets) |
Period end |
| Commodity Funds | 9.8% | |
| Domestic Equity Funds | 56.3% | |
| Developed International Equity Funds | 18.5% | |
| Emerging Markets Equity Funds | 5.3% | |
| High Yield Bond Funds | 10.0% | |
| Investment Grade Bond Funds | 0.1% | |

Six months ago |
| Commodity Funds | 10.1% | |
| Domestic Equity Funds | 55.7% | |
| Developed International Equity Funds | 18.4% | |
| Emerging Markets Equity Funds | 5.5% | |
| High Yield Bond Funds | 10.0% | |
| Investment Grade Bond Funds | 0.3% | |

Expected |
| Commodity Funds | 9.8% | |
| Domestic Equity Funds | 55.8% | |
| Developed International Equity Funds | 18.4% | |
| Emerging Markets Equity Funds | 5.5% | |
| High Yield Bond Funds | 10.0% | |
| Investment Grade Bond Funds | 0.5% | |

The fund invests according to an asset allocation strategy that becomes increasingly conservative over time. The six months ago allocation is based on the fund's holdings as of September 30, 2012. The current allocation is based on the fund's holdings as of March 31, 2013. The expected allocation represents the fund's anticipated allocation at September 30, 2013. |
* Amount represents less than 0.1%. |
Annual Report
Fidelity Freedom 2055 Fund
Investments March 31, 2013
Showing Percentage of Net Assets
Domestic Equity Funds - 66.1% |
| Shares | | Value |
Commodity Funds - 9.8% |
Fidelity Series Commodity Strategy Fund (a) | 1,753,855 | | $ 15,240,996 |
Domestic Equity Funds - 56.3% |
Fidelity Blue Chip Growth Fund | 184,694 | | 9,879,288 |
Fidelity Disciplined Equity Fund | 78,076 | | 2,125,234 |
Fidelity Growth Company Fund | 129,298 | | 13,077,158 |
Fidelity Series 100 Index Fund | 336,875 | | 3,476,555 |
Fidelity Series All-Sector Equity Fund | 1,129,747 | | 14,517,243 |
Fidelity Series Equity-Income Fund | 632,733 | | 7,029,662 |
Fidelity Series Intrinsic Opportunities Fund | 394,504 | | 4,477,624 |
Fidelity Series Large Cap Value Fund | 715,111 | | 8,323,887 |
Fidelity Series Mega Cap Fund | 233,178 | | 2,567,293 |
Fidelity Series Opportunistic Insights Fund | 469,000 | | 5,158,995 |
Fidelity Series Real Estate Equity Fund | 127,471 | | 1,659,671 |
Fidelity Series Small Cap Opportunities Fund | 309,682 | | 3,818,377 |
Fidelity Series Stock Selector Large Cap Value Fund | 630,352 | | 7,059,938 |
Fidelity Small Cap Growth Fund | 110,724 | | 2,004,111 |
Fidelity Small Cap Value Fund | 112,280 | | 2,116,481 |
TOTAL DOMESTIC EQUITY FUNDS | | 87,291,517 |
TOTAL DOMESTIC EQUITY FUNDS (Cost $96,616,608) |
102,532,513
|
International Equity Funds - 23.8% |
| | | |
Developed International Equity Funds - 18.5% |
Fidelity Series International Growth Fund | 1,035,060 | | 13,093,510 |
Fidelity Series International Small Cap Fund | 192,684 | | 2,643,631 |
Fidelity Series International Value Fund | 1,316,946 | | 12,932,413 |
TOTAL DEVELOPED INTERNATIONAL EQUITY FUNDS | | 28,669,554 |
|
| Shares | | Value |
Emerging Markets Equity Funds - 5.3% |
Fidelity Series Emerging Markets Fund | 489,583 | | $ 8,190,722 |
TOTAL INTERNATIONAL EQUITY FUNDS (Cost $34,072,097) |
36,860,276
|
Bond Funds - 10.1% |
| | | |
High Yield Bond Funds - 10.0% |
Fidelity Series Emerging Markets Debt Fund | 87,929 | | 956,671 |
Fidelity Series Floating Rate High Income Fund | 474 | | 5,037 |
Fidelity Series High Income Fund | 1,360,549 | | 14,299,373 |
Fidelity Series Real Estate Income Fund | 30,839 | | 359,892 |
TOTAL HIGH YIELD BOND FUNDS | | 15,620,973 |
Investment Grade Bond Funds - 0.1% |
Fidelity Series Investment Grade Bond Fund | 11,116 | | 128,171 |
TOTAL BOND FUNDS (Cost $15,241,057) |
15,749,144
|
TOTAL INVESTMENT PORTFOLIO - 100.0% (Cost $145,929,762) | | 155,141,933 |
NET OTHER ASSETS (LIABILITIES) - 0.0% | | 0 |
NET ASSETS - 100% | $ 155,141,933 |
Legend |
(a) Non-income producing |
Other Information |
All investments are categorized as Level 1 under the Fair Value Hierarchy. The inputs or methodology used for valuing securities may not be an indication of the risk associated with investing in those securities. For more information on valuation inputs, please refer to the Security Valuation section in the accompanying Notes to Financial Statements. |
See accompanying notes which are an integral part of the financial statements.
Annual Report
Fidelity Freedom 2055 Fund
Statement of Assets and Liabilities
| March 31, 2013 |
| | |
Assets | | |
Investment in securities, at value (cost $145,929,762) - See accompanying schedule | | $ 155,141,933 |
Receivable for investments sold | | 47,932 |
Receivable for fund shares sold | | 1,302,459 |
Total assets | | 156,492,324 |
| | |
Liabilities | | |
Payable for investments purchased | $ 1,194,524 | |
Payable for fund shares redeemed | 155,867 | |
Total liabilities | | 1,350,391 |
| | |
Net Assets | | $ 155,141,933 |
Net Assets consist of: | | |
Paid in capital | | $ 143,851,735 |
Undistributed net investment income | | 189,135 |
Accumulated undistributed net realized gain (loss) on investments | | 1,888,892 |
Net unrealized appreciation (depreciation) on investments | | 9,212,171 |
Net Assets, for 14,694,111 shares outstanding | | $ 155,141,933 |
Net Asset Value, offering price and redemption price per share ($155,141,933 ÷ 14,694,111 shares) | | $ 10.56 |
Statement of Operations
| Year ended March 31, 2013 |
| | |
Investment Income | | |
Income distributions from underlying funds | | $ 1,545,566 |
| | |
Expenses | | |
Independent trustees' compensation | $ 246 | |
Total expenses before reductions | 246 | |
Expense reductions | (246) | - |
Net investment income | | 1,545,566 |
Realized and Unrealized Gain (Loss) Realized gain (loss) on sale of underlying fund shares | 10,990 | |
Capital gain distributions from underlying funds | 2,110,572 | |
Total net realized gain (loss) | | 2,121,562 |
Change in net unrealized appreciation (depreciation) on underlying funds | | 8,820,646 |
Net gain (loss) | | 10,942,208 |
Net increase (decrease) in net assets resulting from operations | | $ 12,487,774 |
See accompanying notes which are an integral part of the financial statements.
Annual Report
Fidelity Freedom 2055 Fund
Financial Statements - continued
Statement of Changes in Net Assets
| Year ended
March 31,
2013 | For the period
June 1, 2011
(commencement of operations) to
March 31, 2012 |
Increase (Decrease) in Net Assets | | |
Operations | | |
Net investment income | $ 1,545,566 | $ 132,068 |
Net realized gain (loss) | 2,121,562 | 258,119 |
Change in net unrealized appreciation (depreciation) | 8,820,646 | 391,525 |
Net increase (decrease) in net assets resulting from operations | 12,487,774 | 781,712 |
Distributions to shareholders from net investment income | (1,376,832) | (111,654) |
Distributions to shareholders from net realized gain | (357,234) | (133,568) |
Total distributions | (1,734,066) | (245,222) |
Share transactions
Proceeds from sales of shares | 175,712,102 | 23,292,628 |
Reinvestment of distributions | 1,733,331 | 245,212 |
Cost of shares redeemed | (54,035,538) | (3,096,000) |
Net increase (decrease) in net assets resulting from share transactions | 123,409,895 | 20,441,840 |
Total increase (decrease) in net assets | 134,163,603 | 20,978,330 |
| | |
Net Assets | | |
Beginning of period | 20,978,330 | - |
End of period (including undistributed net investment income of $189,135 and undistributed net investment income of $20,401, respectively) | $ 155,141,933 | $ 20,978,330 |
Other Information Shares | | |
Sold | 17,794,776 | 2,441,454 |
Issued in reinvestment of distributions | 178,383 | 28,024 |
Redeemed | (5,425,829) | (322,697) |
Net increase (decrease) | 12,547,330 | 2,146,781 |
Financial Highlights
|
| Period ended
March 31, |
Periods ended March 31, | 2013 | 2012 H |
Selected Per-Share Data | | |
Net asset value, beginning of period | $ 9.77 | $ 10.00 |
Income from Investment Operations | | |
Net investment income D | .20 | .13 |
Net realized and unrealized gain (loss) | .80 | (.12) G |
Total from investment operations | 1.00 | .01 |
Distributions from net investment income | (.14) | (.11) |
Distributions from net realized gain | (.06) | (.13) |
Total distributions | (.21) J | (.24) |
Net asset value, end of period | $ 10.56 | $ 9.77 |
Total Return B,C | 10.39% | .32% |
Ratios to Average Net Assets E,I | | |
Expenses before reductions F | .00% | .00% A |
Expenses net of fee waivers, if any | .00% | .00% A |
Expenses net of all reductions | .00% | .00% A |
Net investment income | 1.99% | 1.69% A |
Supplemental Data | | |
Net assets, end of period (000 omitted) | $ 155,142 | $ 20,978 |
Portfolio turnover rate | 45% | 8% A |
A Annualized
B Total returns for periods of less than one year are not annualized.
C Total returns would have been lower if certain expenses had not been reduced during the applicable periods shown.
D Calculated based on average shares outstanding during the period.
E Amounts do not include the activity of the Underlying Funds.
F Amount represents less than .01%.
G The amount shown for a share outstanding does not correspond with the aggregate net gain (loss) on investments for the period due to the timing of sales and repurchases of shares in relation to fluctuating market values of the investments of the Fund.
H For the period June 1, 2011 (commencement of operations) to March 31, 2012.
I Expense ratios reflect operating expenses of the Fund. Expenses before reductions do not reflect amounts reimbursed by the investment adviser or reductions from expense offset arrangements and do not represent the amount paid by the Fund during periods when reimbursements or reductions occur. Expenses net of fee waivers reflect expenses after reimbursement by the investment adviser but prior to reductions from expense offset arrangements. Expenses net of all reductions represent the net expenses paid by the Fund but do not include expenses of the investment companies in which the Fund invests.
J Total distributions of $.21 per share is comprised of distributions from net investment income of $.141 and distributions from net realized gain of $.064 per share.
See accompanying notes which are an integral part of the financial statements.
Annual Report
Notes to Financial Statements
For the period ended March 31, 2013
1. Organization.
Freedom Income Fund, Freedom 2000 Fund, Freedom 2005 Fund, Freedom 2010 Fund, Freedom 2015 Fund, Freedom 2020 Fund, Freedom 2025 Fund, Freedom 2030 Fund, Freedom 2035 Fund, Freedom 2040 Fund, Freedom 2045 Fund, Freedom 2050 Fund and Freedom 2055 Fund(the Funds) are funds of Fidelity Aberdeen Street Trust (the Trust). The Trust is registered under the Investment Company Act of 1940, as amended (the 1940 Act), as an open-end management investment company organized as a Delaware statutory trust. Each Fund is authorized to issue an unlimited number of shares. The Funds invest primarily in a combination of other Fidelity equity, bond, and short-term funds (the Underlying Funds) managed by Fidelity Management & Research Company (FMR).
2. Significant Accounting Policies.
The financial statements have been prepared in conformity with accounting principles generally accepted in the United States of America (GAAP), which require management to make certain estimates and assumptions at the date of the financial statements. Actual results could differ from those estimates. Subsequent events, if any, through the date that the financial statements were issued have been evaluated in the preparation of the financial statements. The following summarizes the significant accounting policies of the Funds:
Security Valuation. Investments are valued as of 4:00 p.m. Eastern time on the last calendar day of the period. Each Fund categorizes the inputs to valuation techniques used to value its investments into a disclosure hierarchy consisting of three levels as shown below:
Level 1 - quoted prices in active markets for identical investments
Level 2 - other significant observable inputs (including quoted prices for similar investments, interest rates, prepayment speeds, etc.)
Level 3 - unobservable inputs (including the Fund's own assumptions based on the best information available)
Valuation techniques used to value each Fund's investments by major category are as follows. Investments in the Underlying Funds are valued at their closing net asset value (NAV) each business day and are categorized as Level 1 in the hierarchy.
Investment Transactions and Income. For financial reporting purposes, the Funds' investment holdings and NAV include trades executed through the end of the last business day of the period. The NAV per share for processing shareholder transactions is calculated as of the close of business of the New York Stock Exchange (NYSE), normally 4:00 p.m. Eastern time and includes trades executed through the end of the prior business day. Gains and losses on securities sold are determined on the basis of identified cost. Income and capital gain distributions from the Underlying Funds, if any, are recorded on the ex-dividend date.
Expenses. Expenses directly attributable to a fund are charged to that fund. Expenses attributable to more than one fund are allocated among the respective funds on the basis of relative net assets or other appropriate methods. Expenses included in the accompanying financial statements reflect the expenses of each Fund and do not include any expenses associated with the Underlying Funds. Expense estimates are accrued in the period to which they relate and adjustments are made when actual amounts are known.
Deferred Trustee Compensation. Under a Deferred Compensation Plan (the Plan) for Freedom 2010 Fund, Freedom 2020 Fund and Freedom 2030 Fund, independent Trustees may elect to defer receipt of a portion of their annual compensation. Deferred amounts are invested in a cross-section of Fidelity funds, are marked-to-market and remain in the Funds until distributed in accordance with the Plan. The investment of deferred amounts and the offsetting payable to the Trustees are included in the accompanying Statement of Assets and Liabilities.
Income Tax Information and Distributions to Shareholders. Each year, each Fund intends to qualify as a regulated investment company under Subchapter M of the Internal Revenue Code, including distributing substantially all of its taxable income and realized gains. As a result, no provision for income taxes is required. As of March 31, 2013, each Fund did not have any unrecognized tax benefits in the financial statements; nor is each Fund aware of any tax positions for which it is reasonably possible that the total amounts of unrecognized tax benefits will significantly change in the next twelve months. Each Fund files a U.S. federal tax return, in addition to state and local tax returns as required. A fund's federal income tax returns are subject to examination by the Internal Revenue Service (IRS) for a period of three fiscal years after they are filed. State and local tax returns may be subject to examination for an additional fiscal year depending on the jurisdiction.
Distributions are declared and recorded on the ex-dividend date. Income and capital gain distributions are determined in accordance with income tax regulations, which may differ from GAAP.
Capital accounts within the financial statements are adjusted for permanent book-tax differences. These adjustments have no impact on net assets or the results of operations. Temporary book-tax differences will reverse in a subsequent period.
Annual Report
2. Significant Accounting Policies - continued
Income Tax Information and Distributions to Shareholders - continued
Book-tax differences are primarily due to the short-term gain distributions from the Underlying Funds, deferred trustees compensation, capital loss carryforwards, losses deferred due to wash sales, and excise tax regulations.
The federal tax cost of investment securities and unrealized appreciation (depreciation) as of period end were as follows for each Fund:
| Tax cost | Gross unrealized
appreciation | Gross unrealized
depreciation | Net unrealized
appreciation
(depreciation) on
securities and
other investments |
Freedom Income | $ 2,050,895,984 | $ 154,276,239 | $ (13,464,866) | $ 140,811,373 |
Freedom 2000 | 938,905,169 | 71,017,577 | (6,364,902) | 64,652,675 |
Freedom 2005 | 688,917,832 | 26,523,858 | (11,258,383) | 15,265,475 |
Freedom 2010 | 5,669,291,185 | 320,034,134 | (110,009,062) | 210,025,072 |
Freedom 2015 | 6,146,444,472 | 462,590,264 | (101,850,643) | 360,739,621 |
Freedom 2020 | 12,747,118,632 | 1,070,046,039 | (237,191,338) | 832,854,701 |
Freedom 2025 | 7,660,872,555 | 713,954,746 | (144,942,141) | 569,012,605 |
Freedom 2030 | 9,969,952,105 | 908,720,120 | (242,274,723) | 666,445,397 |
Freedom 2035 | 5,242,237,222 | 532,387,524 | (126,093,921) | 406,293,603 |
Freedom 2040 | 6,350,310,419 | 595,936,866 | (187,677,616) | 408,259,250 |
Freedom 2045 | 2,142,564,681 | 386,669,700 | (48,768,910) | 337,900,790 |
Freedom 2050 | 1,801,936,367 | 312,068,280 | (44,259,957) | 267,808,323 |
Freedom 2055 | 146,205,072 | 9,781,215 | (844,354) | 8,936,861 |
The tax-based components of distributable earnings as of period end were as follows for each Fund:
| Undistributed
ordinary income | Undistributed
long-term
capital gain | Capital loss
carryforward | Net unrealized
appreciation
(depreciation) |
Freedom Income | $ 2,244,322 | $ 30,963,629 | $ - | $ 140,811,373 |
Freedom 2000 | 2,392,487 | 8,812,854 | - | 64,652,675 |
Freedom 2005 | 1,517,687 | - | (23,400,318) | 15,265,475 |
Freedom 2010 | 13,379,790 | - | (162,610,190) | 210,025,072 |
Freedom 2015 | 14,748,104 | 36,019,447 | - | 360,739,621 |
Freedom 2020 | 31,518,283 | 56,630,524 | - | 832,854,701 |
Freedom 2025 | 18,844,529 | 88,215,680 | - | 569,012,605 |
Freedom 2030 | 24,417,531 | - | (109,107,545) | 666,445,397 |
Freedom 2035 | 10,768,404 | 126,682,015 | - | 406,293,603 |
Freedom 2040 | 12,747,035 | 111,597,683 | - | 408,259,250 |
Freedom 2045 | 4,707,946 | 106,384,967 | - | 337,900,790 |
Freedom 2050 | 3,828,282 | 51,290,300 | - | 267,808,323 |
Freedom 2055 | 423,516 | 1,929,822 | - | 8,936,861 |
Capital loss carryforwards are only available to offset future capital gains of the Funds to the extent provided by regulations and may be limited. Under the Regulated Investment Company Modernization Act of 2010 (the Act), the Funds are permitted to carry forward capital losses incurred in taxable years beginning after December 22, 2010 for an unlimited period and such capital losses are required to be used prior to any losses that expire. Capital loss carryforwards were as follows:
| Fiscal year of expiration | |
| 2018 | 2019 | Total with expiration |
Freedom 2005 | $ (23,400,318) | $ - | $ (23,400,318) |
Freedom 2010 | (162,610,190) | - | (162,610,190) |
Freedom 2030 | - | (109,107,545) | (109,107,545) |
Annual Report
Notes to Financial Statements - continued
2. Significant Accounting Policies - continued
Income Tax Information and Distributions to Shareholders - continued
The tax character of distributions paid was as follows:
March 31, 2013 | | | |
| Ordinary
Income | Long-term
Capital Gains | Total |
Freedom Income | $ 45,991,525 | $ - | $ 45,991,525 |
Freedom 2000 | 23,324,042 | - | 23,324,042 |
Freedom 2005 | 15,084,011 | - | 15,084,011 |
Freedom 2010 | 146,760,417 | - | 146,760,417 |
Freedom 2015 | 155,835,906 | - | 155,835,906 |
Freedom 2020 | 332,606,052 | - | 332,606,052 |
Freedom 2025 | 184,612,228 | - | 184,612,228 |
Freedom 2030 | 247,060,740 | - | 247,060,740 |
Freedom 2035 | 110,407,763 | - | 110,407,763 |
Freedom 2040 | 134,276,515 | - | 134,276,515 |
Freedom 2045 | 45,994,052 | - | 45,994,052 |
Freedom 2050 | 37,419,130 | - | 37,419,130 |
Freedom 2055 | 1,478,430 | 255,636 | 1,734,066 |
March 31, 2012 | | | |
| Ordinary
Income | Long-term
Capital Gains | Total |
Freedom Income | $ 60,187,688 | $ - | $ 60,187,688 |
Freedom 2000 | 31,789,824 | - | 31,789,824 |
Freedom 2005 | 23,337,378 | - | 23,337,378 |
Freedom 2010 | 249,636,060 | - | 249,636,060 |
Freedom 2015 | 244,233,091 | - | 244,233,091 |
Freedom 2020 | 561,029,455 | - | 561,029,455 |
Freedom 2025 | 305,885,312 | - | 305,885,312 |
Freedom 2030 | 434,597,305 | - | 434,597,305 |
Freedom 2035 | 204,165,928 | - | 204,165,928 |
Freedom 2040 | 260,926,469 | - | 260,926,469 |
Freedom 2045 | 81,330,907 | - | 81,330,907 |
Freedom 2050 | 67,565,353 | - | 67,565,353 |
Freedom 2055 | 232,700 | 12,522 | 245,222 |
3. Purchases and Sales of Investments.
Purchases and redemptions of the Underlying Fund shares are noted in the table below.
| Purchases ($) | Redemptions ($) |
Freedom Income | 312,472,172 | 544,070,013 |
Freedom 2000 | 131,854,386 | 362,905,420 |
Freedom 2005 | 162,077,330 | 274,497,861 |
Freedom 2010 | 1,216,311,030 | 2,598,532,485 |
Freedom 2015 | 1,531,274,463 | 2,502,335,125 |
Freedom 2020 | 3,611,394,270 | 5,975,545,721 |
Freedom 2025 | 2,555,950,405 | 3,295,041,145 |
Freedom 2030 | 3,191,981,211 | 4,711,997,749 |
Freedom 2035 | 2,005,479,997 | 2,515,165,592 |
Freedom 2040 | 2,255,057,837 | 3,161,530,542 |
Freedom 2045 | 1,068,611,391 | 1,162,251,650 |
Freedom 2050 | 884,086,574 | 1,002,317,935 |
Freedom 2055 | 160,945,796 | 35,613,814 |
Annual Report
4. Fees and Other Transactions with Affiliates.
Management Fee. Strategic Advisers, Inc. (Strategic Advisers), an affiliate of FMR, provides the Funds with investment management related services. The Funds do not pay any fees for these services.
Other Transactions. Strategic Advisers has entered into an administration agreement with FMR under which FMR provides management and administrative services (other than investment advisory services) necessary for the operation of each Fund. Pursuant to this agreement, FMR pays all expenses of each Fund, excluding the compensation of the independent Trustees and certain other expenses such as interest expense. FMR also contracts with other Fidelity companies to perform the services necessary for the operation of each Fund. The Funds do not pay any fees for these services.
Reallocation of Underlying Fund Investments. During the period, Strategic Advisers reallocated investments of the Funds. This involved taxable redemptions of the Funds' interest in Fidelity Disciplined Equity Fund, Fidelity Series 100 Index Fund, Fidelity Series All-Sector Equity Fund and Fidelity Series Large Cap Value Fund ("selected Underlying Funds") for cash and securities and non-taxable exchanges of those securities for shares of Fidelity Series Stock Selector Large Cap Value Fund, Fidelity Series Equity-Income Fund, Fidelity Series Opportunistic Insights Fund, Fidelity Series Mega Cap Fund and Fidelity Blue Chip Growth Fund, all of which are affiliated investment companies managed by FMR. Realized gains and losses on the redemptions of the selected Underlying Funds in connection with the reallocation are included in the accompanying Statements of Operations as "Realized gain (loss) on sale of underlying fund shares."
Details of these transactions with the related gain (loss) for the Funds are presented in the accompanying table:
| Value of Cash
and Securities
reallocated | Realized Gain (Loss) on
redemptions of selected
Underlying Funds |
Freedom Income | $ 91,859,264 | $ 17,930,747 |
Freedom 2000 | 43,320,765 | 8,459,067 |
Freedom 2005 | 52,355,137 | (1,336,091) |
Freedom 2010 | 605,338,321 | (4,093,957) |
Freedom 2015 | 664,101,841 | 32,888,987 |
Freedom 2020 | 1,574,843,927 | 97,296,851 |
Freedom 2025 | 1,081,005,266 | 65,850,587 |
Freedom 2030 | 1,509,522,562 | 69,406,945 |
Freedom 2035 | 891,478,073 | 71,425,525 |
Freedom 2040 | 1,110,848,671 | 45,049,901 |
Freedom 2045 | 401,319,261 | 55,144,109 |
Freedom 2050 | 344,781,710 | 37,107,863 |
Freedom 2055 | 16,862,419 | 219,568 |
5. Expense Reductions.
FMR voluntarily agreed to reimburse each Fund's operating expenses. Some expenses, for example interest expense, are excluded from this reimbursement.
The following Funds were in reimbursement during the period:
| Reimbursement
from adviser |
Freedom Income | $ 8,345 |
Freedom 2000 | 4,079 |
Freedom 2005 | 2,705 |
Freedom 2010 | 23,408 |
Freedom 2015 | 24,593 |
Freedom 2020 | 52,044 |
Freedom 2025 | 29,616 |
Freedom 2030 | 39,666 |
Freedom 2035 | 20,197 |
Freedom 2040 | 24,969 |
Freedom 2045 | 8,618 |
Freedom 2050 | 7,315 |
Freedom 2055 | 246 |
Annual Report
Notes to Financial Statements - continued
6. Other.
The Funds' organizational documents provide former and current trustees and officers with a limited indemnification against liabilities arising in connection with the performance of their duties to the Funds. In the normal course of business, the Funds may also enter into contracts that provide general indemnifications. The Funds' maximum exposure under these arrangements is unknown as this would be dependent on future claims that may be made against the Funds. The risk of material loss from such claims is considered remote.
The Funds do not invest in the Underlying Funds for the purpose of exercising management or control; however, investments by the Funds within their principal investment strategies may represent a significant portion of the Underlying Fund's net assets. At the end of the period, the following Freedom Funds were the owners of record of 10% or more of the total outstanding shares of the Underlying Funds.
Fund | Freedom 2020 |
Fidelity Series Floating Rate High Income Fund | 11% |
Fidelity Series Inflation-Protected Bond Index Fund | 13% |
Fidelity Series Investment Grade Bond Fund | 11% |
Fidelity Series Real Estate Income Fund | 10% |
The Funds, in aggregate, were the owners of record of more than 20% of the total outstanding shares of the following Underlying Funds.
Fund | % of shares held |
Fidelity Disciplined Equity Fund | 22% |
Fidelity Series 100 Index Fund | 42% |
Fidelity Series All-Sector Equity Fund | 39% |
Fidelity Series Commodity Strategy Fund | 38% |
Fidelity Series Emerging Markets Debt Fund | 42% |
Fidelity Series Emerging Markets Fund | 40% |
Fidelity Series Equity-Income Fund | 46% |
Fidelity Series Floating Rate High Income Fund | 43% |
Fidelity Series High Income Fund | 40% |
Fidelity Series Inflation-Protected Bond Index Fund | 42% |
Fidelity Series International Growth Fund | 40% |
Fidelity Series International Small Cap Fund | 40% |
Fidelity Series International Value Fund | 40% |
Fidelity Series Intrinsic Opportunities Fund | 46% |
Fidelity Series Investment Grade Bond Fund | 42% |
Fidelity Series Large Cap Value Fund | 39% |
Fidelity Series Mega Cap Fund | 46% |
Fidelity Series Opportunistic Insights Fund | 46% |
Fidelity Series Real Estate Equity Fund | 42% |
Fidelity Series Real Estate Income Fund | 42% |
Fidelity Series Small Cap Opportunities Fund | 37% |
Fidelity Series Stock Selector Large Cap Value Fund | 46% |
Fidelity Small Cap Growth Fund | 28% |
Annual Report
Report of Independent Registered Public Accounting Firm
To the Trustees of Fidelity Aberdeen Street Trust and the Shareholders of Fidelity Freedom Income Fund, Fidelity Freedom 2000 Fund, Fidelity Freedom 2005 Fund, Fidelity Freedom 2010 Fund, Fidelity Freedom 2015 Fund, Fidelity Freedom 2020 Fund, Fidelity Freedom 2025 Fund, Fidelity Freedom 2030 Fund, Fidelity Freedom 2035 Fund, Fidelity Freedom 2040 Fund, Fidelity Freedom 2045 Fund, Fidelity Freedom 2050 Fund and Fidelity Freedom 2055 Fund:
In our opinion, the accompanying statements of assets and liabilities, including the schedules of investments, and the related statements of operations and of changes in net assets and the financial highlights present fairly, in all material respects, the financial position of Fidelity Freedom Income Fund, Fidelity Freedom 2000 Fund, Fidelity Freedom 2005 Fund, Fidelity Freedom 2010 Fund, Fidelity Freedom 2015 Fund, Fidelity Freedom 2020 Fund, Fidelity Freedom 2025 Fund, Fidelity Freedom 2030 Fund, Fidelity Freedom 2035 Fund, Fidelity Freedom 2040 Fund, Fidelity Freedom 2045 Fund, Fidelity Freedom 2050 Fund and Fidelity Freedom 2055 Fund (funds of Fidelity Aberdeen Street Trust) at March 31, 2013, the results of each of their operations for the year then ended, the changes in each of their net assets for each of the periods indicated and the financial highlights for each of the periods indicated, in conformity with accounting principles generally accepted in the United States of America. These financial statements and financial highlights (hereafter referred to as "financial statements") are the responsibility of the Fidelity Aberdeen Street Trust's management. Our responsibility is to express an opinion on these financial statements based on our audits. We conducted our audits of these financial statements in accordance with the standards of the Public Company Accounting Oversight Board (United States). Those standards require that we plan and perform the audit to obtain reasonable assurance about whether the financial statements are free of material misstatement. An audit includes examining, on a test basis, evidence supporting the amounts and disclosures in the financial statements, assessing the accounting principles used and significant estimates made by management, and evaluating the overall financial statement presentation. We believe that our audits, which included confirmation of securities at March 31, 2013 by correspondence with the custodian, provide a reasonable basis for our opinion.
PricewaterhouseCoopers LLP
Boston, Massachusetts
May 17, 2013
Annual Report
The Trustees and executive officers of the trust and funds, as applicable, are listed below. The Board of Trustees governs each Fidelity Freedom Fund and is responsible for protecting the interests of shareholders. The Trustees are experienced executives who meet periodically throughout the year to oversee each Fidelity Freedom Fund's activities, review contractual arrangements with companies that provide services to each Fidelity Freedom Fund, oversee management of the risks associated with such activities and contractual arrangements, and review each Fidelity Freedom Fund's performance. If the interests of a Fidelity Freedom Fund and an underlying Fidelity fund were to diverge, a conflict of interest could arise and affect how the Trustees fulfill their fiduciary duties to the affected funds. Strategic Advisers has structured the Fidelity Freedom Funds to avoid these potential conflicts, although there may be situations where a conflict of interest is unavoidable. In such instances, Strategic Advisers and the Trustees would take reasonable steps to minimize and, if possible, eliminate the conflict. Except for Elizabeth S. Acton and James C. Curvey, each of the Trustees oversees 219 Fidelity funds. Ms. Acton oversees 201 Fidelity funds. Mr. Curvey oversees 453 Fidelity funds.
The Trustees hold office without limit in time except that (a) any Trustee may resign; (b) any Trustee may be removed by written instrument, signed by at least two-thirds of the number of Trustees prior to such removal; (c) any Trustee who requests to be retired or who has become incapacitated by illness or injury may be retired by written instrument signed by a majority of the other Trustees; and (d) any Trustee may be removed at any special meeting of shareholders by a two-thirds vote of the outstanding voting securities of the trust. Each Trustee who is not an interested person of the trust and the funds (as defined in the 1940 Act) (Independent Trustee), shall retire not later than the last day of the month in which his or her 75th birthday occurs. The Independent Trustees may waive this mandatory retirement age policy with respect to individual Trustees. The executive officers hold office without limit in time, except that any officer may resign or may be removed by a vote of a majority of the Trustees at any regular meeting or any special meeting of the Trustees. Except as indicated, each individual has held the office shown or other offices in the same company for the past five years.
Experience, Skills, Attributes, and Qualifications of the Funds' Trustees. The Governance and Nominating Committee has adopted a statement of policy that describes the experience, qualifications, attributes, and skills that are necessary and desirable for potential Independent Trustee candidates (Statement of Policy). The Board believes that each Trustee satisfied at the time he or she was initially elected or appointed a Trustee, and continues to satisfy, the standards contemplated by the Statement of Policy. The Governance and Nominating Committee also engages professional search firms to help identify potential Independent Trustee candidates who have the experience, qualifications, attributes, and skills consistent with the Statement of Policy. From time to time, additional criteria based on the composition and skills of the current Independent Trustees, as well as experience or skills that may be appropriate in light of future changes to board composition, business conditions, and regulatory or other developments, have also been considered by the professional search firms and the Governance and Nominating Committee. In addition, the Board takes into account the Trustees' commitment and participation in Board and committee meetings, as well as their leadership of standing and ad hoc committees throughout their tenure.
In determining that a particular Trustee was and continues to be qualified to serve as a Trustee, the Board has considered a variety of criteria, none of which, in isolation, was controlling. The Board believes that, collectively, the Trustees have balanced and diverse experience, qualifications, attributes, and skills, which allow the Board to operate effectively in governing each fund and protecting the interests of shareholders. Information about the specific experience, skills, attributes, and qualifications of each Trustee, which in each case led to the Board's conclusion that the Trustee should serve (or continue to serve) as a trustee of the funds, is provided below.
Board Structure and Oversight Function. Abigail P. Johnson is an interested person (as defined in the 1940 Act) and currently serves as Chairman. The Trustees have determined that an interested Chairman is appropriate and benefits shareholders because an interested Chairman has a personal and professional stake in the quality and continuity of services provided to the funds. Independent Trustees exercise their informed business judgment to appoint an individual of their choosing to serve as Chairman, regardless of whether the Trustee happens to be independent or a member of management. The Independent Trustees have determined that they can act independently and effectively without having an Independent Trustee serve as Chairman and that a key structural component for assuring that they are in a position to do so is for the Independent Trustees to constitute a substantial majority for the Board. The Independent Trustees also regularly meet in executive session. Albert R. Gamper, Jr. serves as Chairman of the Independent Trustees and as such (i) acts as a liaison between the Independent Trustees and management with respect to matters important to the Independent Trustees and (ii) with management prepares agendas for Board meetings.
Fidelity funds are overseen by different Boards of Trustees. The funds' Board oversees Fidelity's investment-grade bond, money market, and asset allocation funds and another Board oversees Fidelity's equity and high income funds. The asset allocation funds may invest in Fidelity funds that are overseen by such other Board. The use of separate Boards, each with its own committee structure, allows the Trustees of each group of Fidelity funds to focus on the unique issues of the funds they oversee, including common research, investment, and operational issues. On occasion, the separate Boards establish joint committees to address issues of overlapping consequences for the Fidelity funds overseen by each Board.
The Trustees operate using a system of committees to facilitate the timely and efficient consideration of all matters of importance to the Trustees, each fund, and fund shareholders and to facilitate compliance with legal and regulatory requirements and oversight of the funds' activities and associated risks. The Board, acting through its committees, has charged FMR and its affiliates with (i) identifying events or circumstances the occurrence of which could have demonstrably adverse effects on the funds' business and/or reputation; (ii) implementing processes and controls to lessen the possibility that such events or circumstances occur or to mitigate the effects of such events or circumstances if they do occur; and (iii) creating and maintaining a system designed to evaluate continuously business and market conditions in order to facilitate the identification and implementation processes described in (i) and (ii) above. Because the day-to-day operations and activities of the funds are carried out by or through FMR, its affiliates, and other service providers, the funds' exposure to risks is mitigated but not eliminated by the processes overseen by the Trustees. While each of the Board's committees has responsibility for overseeing different aspects of the funds' activities, oversight is exercised primarily through the Operations and Audit Committees. In addition, an ad hoc Board committee of Independent Trustees has worked with FMR to enhance the Board's oversight of investment and financial risks, legal and regulatory risks, technology risks, and operational risks, including the development of additional risk reporting to the Board. Appropriate personnel, including but not limited to the funds' Chief Compliance Officer (CCO), FMR's internal auditor, the independent accountants, the funds' Treasurer and portfolio management personnel, make periodic reports to the Board's committees, as appropriate, including an annual review of FMR's risk management program for the Fidelity funds. The responsibilities of each standing committee, including their oversight responsibilities, are described further under "Standing Committees of the Funds' Trustees."
Annual Report
Trustees and Officers - continued
The funds' Statement of Additional Information (SAI) includes more information about the Trustees. To request a free copy, call Fidelity at 1-800-544-8544.
Interested Trustees*:
Correspondence intended for each Trustee who is an interested person may be sent to Fidelity Investments, 245 Summer Street, Boston, Massachusetts 02210.
Name, Year of Birth; Principal Occupations and Other Relevant Experience+ |
Abigail P. Johnson (1961) |
| Year of Election or Appointment: 2009 Ms. Johnson is Trustee and Chairman of the Board of Trustees of certain Trusts. Ms. Johnson serves as President of Fidelity Financial Services (2012-present) and President of Personal, Workplace and Institutional Services (2005-present). Ms. Johnson is Chairman and Director of FMR Co., Inc. (2011-present), Chairman and Director of FMR (2011-present), and the Vice Chairman and Director (2007-present) of FMR LLC. Previously, Ms. Johnson served as President and a Director of FMR (2001-2005), a Trustee of other investment companies advised by FMR, Fidelity Investments Money Management, Inc., and FMR Co., Inc. (2001-2005), Senior Vice President of the Fidelity funds (2001-2005), and managed a number of Fidelity funds. Ms. Abigail P. Johnson and Mr. Arthur E. Johnson are not related. |
James C. Curvey (1935) |
| Year of Election or Appointment: 2007 Mr. Curvey also serves as Trustee (2007-present) of other investment companies advised by FMR. Mr. Curvey is a Director of Fidelity Investments Money Management, Inc. (2009-present), Director of Fidelity Research & Analysis Co. (2009-present) and Director of FMR and FMR Co., Inc. (2007-present). Mr. Curvey is also Vice Chairman (2007-present) and Director of FMR LLC. In addition, Mr. Curvey serves as an Overseer for the Boston Symphony Orchestra and a member of the Trustees of Villanova University. Previously, Mr. Curvey was the Vice Chairman (2006-2007) and Director (2000-2007) of FMR Corp. |
* Trustees have been determined to be "Interested Trustees" by virtue of, among other things, their affiliation with the trust or various entities under common control with FMR.
+ The information above includes each Trustee's principal occupation during the last five years and other information relating to the experience, attributes, and skills relevant to each Trustee's qualifications to serve as a Trustee, which led to the conclusion that each Trustee should serve as a Trustee for each fund.
Independent Trustees:
Correspondence intended for each Independent Trustee (that is, the Trustees other than the Interested Trustees) may be sent to Fidelity Investments, P.O. Box 55235, Boston, Massachusetts 02205-5235.
Name, Year of Birth; Principal Occupations and Other Relevant Experience+ |
Elizabeth S. Acton (1951) |
| Year of Election or Appointment: 2013 Ms. Acton is Trustee of certain Trusts. Prior to her retirement in April 2012, Ms. Acton was Executive Vice President, Finance (November 2011-April 2012), Executive Vice President, Chief Financial Officer (April 2002-November 2011), and Treasurer (May 2004-May 2005) of Comerica Incorporated (financial services). Prior to joining Comerica, Ms. Acton held a variety of positions at Ford Motor Company (1983-2002), including Vice President and Treasurer (2000-2002) and Executive Vice President and Chief Financial Officer of Ford Motor Credit Company (1998-2000). Ms. Acton currently serves as a member of the Board of Directors and Audit and Finance Committees of Beazer Homes USA, Inc. (homebuilding, 2012-present). |
Albert R. Gamper, Jr. (1942) |
| Year of Election or Appointment: 2006 Mr. Gamper is Chairman of the Independent Trustees of the Fixed Income and Asset Allocation Funds (2012-present). Prior to his retirement in December 2004, Mr. Gamper served as Chairman of the Board of CIT Group Inc. (commercial finance). During his tenure with CIT Group Inc. Mr. Gamper served in numerous senior management positions, including Chairman (1987-1989; 1999-2001; 2002-2004), Chief Executive Officer (1987-2004), and President (2002-2003). Mr. Gamper currently serves as a member of the Board of Directors of Public Service Enterprise Group (utilities, 2000-present), a member of the Board of Trustees, Rutgers University (2004-present), and Chairman of the Board of Barnabas Health Care System. Previously, Mr. Gamper served as Vice Chairman of the Independent Trustees of the Fixed Income and Asset Allocation Funds (2011-2012) and as Chairman of the Board of Governors, Rutgers University (2004-2007). |
Robert F. Gartland (1951) |
| Year of Election or Appointment: 2010 Mr. Gartland is Chairman and an investor in Gartland and Mellina Group Corp. (consulting, 2009-present). Previously, Mr. Gartland served as a partner and investor of Vietnam Partners LLC (investments and consulting, 2008-2011). Prior to his retirement, Mr. Gartland held a variety of positions at Morgan Stanley (financial services, 1979-2007) including Managing Director (1987-2007). |
Arthur E. Johnson (1947) |
| Year of Election or Appointment: 2008 Mr. Johnson serves as a member of the Board of Directors of Eaton Corporation (diversified power management, 2009-present), AGL Resources, Inc. (holding company, 2002-present) and Booz Allen Hamilton (management consulting, 2011-present). Prior to his retirement, Mr. Johnson served as Senior Vice President of Corporate Strategic Development of Lockheed Martin Corporation (defense contractor, 1999-2009). He previously served on the Board of Directors of IKON Office Solutions, Inc. (1999-2008) and Delta Airlines (2005-2007). Mr. Arthur E. Johnson is not related to Ms. Abigail P. Johnson. |
Michael E. Kenneally (1954) |
| Year of Election or Appointment: 2009
Previously, Mr. Kenneally served as a Member of the Advisory Board for certain Fidelity Fixed Income and Asset Allocation Funds (2008-2009). Prior to his retirement, Mr. Kenneally served as Chairman and Global Chief Executive Officer of Credit Suisse Asset Management (2003-2005). Mr. Kenneally was a Director of the Credit Suisse Funds (U.S. mutual funds, 2004-2008) and certain other closed-end funds (2004-2005) and was awarded the Chartered Financial Analyst (CFA) designation in 1991. |
James H. Keyes (1940) |
| Year of Election or Appointment: 2007 Mr. Keyes serves as a member of the Boards of Navistar International Corporation (manufacture and sale of trucks, buses, and diesel engines, since 2002) and Pitney Bowes, Inc. (integrated mail, messaging, and document management solutions, since 1998). Prior to his retirement, Mr. Keyes served as Chairman and Chief Executive Officer of Johnson Controls (automotive, building, and energy, 1998-2002) and as a member of the Board of LSI Logic Corporation (semiconductor technologies, 1984-2008). |
Marie L. Knowles (1946) |
| Year of Election or Appointment: 2001 Ms. Knowles is Vice Chairman of the Independent Trustees of the Fixed Income and Asset Allocation Funds (2012-present). Prior to Ms. Knowles' retirement in June 2000, she served as Executive Vice President and Chief Financial Officer of Atlantic Richfield Company (ARCO) (diversified energy, 1996-2000). From 1993 to 1996, she was a Senior Vice President of ARCO and President of ARCO Transportation Company. She served as a Director of ARCO from 1996 to 1998. Ms. Knowles currently serves as a Director and Chairman of the Audit Committee of McKesson Corporation (healthcare service, since 2002). Ms. Knowles is an Honorary Trustee of the Brookings Institution and a member of the Board of the Catalina Island Conservancy and of the Santa Catalina Island Company (2009-present). She also serves as a member of the Advisory Board for the School of Engineering of the University of Southern California and the Foundation Board of the School of Architecture at the University of Virginia (2007-present). Previously, Ms. Knowles served as a Director of Phelps Dodge Corporation (copper mining and manufacturing, 1994-2007). |
Kenneth L. Wolfe (1939) |
| Year of Election or Appointment: 2005 Prior to his retirement, Mr. Wolfe served as Chairman and a Director (2007-2009) and Chairman and Chief Executive Officer (1994-2001) of Hershey Foods Corporation. He also served as a member of the Boards of Adelphia Communications Corporation (telecommunications, 2003-2006), Bausch & Lomb, Inc. (medical/pharmaceutical, 1993-2007), and Revlon, Inc. (personal care products, 2004-2009). Mr. Wolfe previously served as Chairman of the Independent Trustees of the Fixed Income and Asset Allocation Funds (2008-2012). |
Annual Report
Trustees and Officers - continued
+ The information above includes each Trustee's principal occupation during the last five years and other information relating to the experience, attributes, and skills relevant to each Trustee's qualifications to serve as a Trustee, which led to the conclusion that each Trustee should serve as a Trustee for each fund.
Executive Officers:
Correspondence intended for each executive officer may be sent to Fidelity Investments, 245 Summer Street, Boston, Massachusetts 02210.
Name, Year of Birth; Principal Occupation |
Stephanie J. Dorsey (1969) |
| Year of Election or Appointment: 2013 President and Treasurer of Fidelity's Fixed Income and Asset Allocation Funds. Ms. Dorsey also serves as Assistant Treasurer of other Fidelity funds (2010-present) and is an employee of Fidelity Investments (2008-present). Previously, Ms. Dorsey served as Deputy Treasurer of Fidelity's Fixed Income and Asset Allocation Funds (2008-2013), Treasurer (2004-2008) of the JPMorgan Mutual Funds and Vice President (2004-2008) of JPMorgan Chase Bank. |
Charles S. Morrison (1960) |
| Year of Election or Appointment: 2012 Vice President of Fidelity's Fixed Income and Asset Allocation Funds. Mr. Morrison also serves as President, Fixed Income and is an employee of Fidelity Investments. Previously, Mr. Morrison served as Vice President of Fidelity's Money Market Funds (2005-2009), President, Money Market Group Leader of FMR (2009), and Senior Vice President, Money Market Group of FMR (2004-2009). Mr. Morrison also served as Vice President of Fidelity's Bond Funds (2002-2005), certain Balanced Funds (2002-2005), and certain Asset Allocation Funds (2002-2007), and as Senior Vice President (2002-2005) of Fidelity's Fixed Income Division. |
Derek L. Young (1964) |
| Year of Election or Appointment: 2009 Vice President of Fidelity's Asset Allocation Funds. Mr. Young is also a Trustee of other investment companies advised by Strategic Advisers, Inc. (Strategic Advisers) (2012-present), President and a Director of Strategic Advisers (2011-present), President of Fidelity Global Asset Allocation (GAA) (2011-present), and Vice Chairman of Pyramis Global Advisors LLC (2011-present). Previously, Mr. Young served as Chief Investment Officer of GAA (2009-2011) and as a portfolio manager. |
Andrew Windmueller (1960) |
| Year of Election or Appointment: 2012 Vice President of Fidelity's Asset Allocation Funds. Mr. Windmueller also serves as Chief Investment Officer of Strategic Advisers, Inc. (2011-present), Chief Investment Officer for Global Asset Allocation Multi-Asset Class Strategies (2011-present), and is an employee of Fidelity Investments (2000-present). |
Scott C. Goebel (1968) |
| Year of Election or Appointment: 2008 Secretary and Chief Legal Officer (CLO) of the Fidelity funds. Mr. Goebel also serves as Secretary of Fidelity Investments Money Management, Inc. (FIMM) (2010-present) and Fidelity Research and Analysis Company (FRAC) (2010-present); Secretary and CLO of The North Carolina Capital Management Trust: Cash and Term Portfolios (2008-present); General Counsel, Secretary, and Senior Vice President of FMR (2008-present) and FMR Co., Inc. (2008-present); employed by FMR LLC or an affiliate (2001-present); Chief Legal Officer of Fidelity Management & Research (Hong Kong) Limited (2008-present) and Assistant Secretary of Fidelity Management & Research (Japan) Inc. (2008-present), and Fidelity Management & Research (U.K.) Inc. (2008-present). Previously, Mr. Goebel served as Assistant Secretary of FIMM (2008-2010), FRAC (2008-2010), and the Funds (2007-2008) and as Vice President and Secretary of Fidelity Distributors Corporation (FDC) (2005-2007). |
Ramon Herrera (1974) |
| Year of Election or Appointment: 2012 Assistant Secretary of Fidelity's Fixed Income and Asset Allocation Funds. Mr. Herrera also serves as Vice President, Associate General Counsel (2010-present) and is an employee of Fidelity Investments (2004-present). |
Elizabeth Paige Baumann (1968) |
| Year of Election or Appointment: 2012 Anti-Money Laundering (AML) Officer of the Fidelity funds. Ms. Baumann also serves as AML Officer of The North Carolina Capital Management Trust: Cash and Term Portfolios (2012-present), Chief AML Officer of FMR LLC (2012-present), and is an employee of Fidelity Investments. Previously, Ms. Baumann served as Vice President and Deputy Anti-Money Laundering Officer (2007-2012). |
Christine Reynolds (1958) |
| Year of Election or Appointment: 2008 Chief Financial Officer of the Fidelity funds. Ms. Reynolds became President of Fidelity Pricing and Cash Management Services (FPCMS) in August 2008. Ms. Reynolds served as Chief Operating Officer of FPCMS (2007-2008). Previously, Ms. Reynolds served as President, Treasurer, and Anti-Money Laundering officer of the Fidelity funds (2004-2007). |
Michael H. Whitaker (1967) |
| Year of Election or Appointment: 2008 Chief Compliance Officer of Fidelity's Fixed Income and Asset Allocation Funds. Mr. Whitaker also serves as Chief Compliance Officer of The North Carolina Capital Management Trust: Cash and Term Portfolios (2008-present). Mr. Whitaker is an employee of Fidelity Investments (2007-present). Prior to joining Fidelity Investments, Mr. Whitaker worked at MFS Investment Management where he served as Senior Vice President and Chief Compliance Officer (2004-2006), and Assistant General Counsel. |
Joseph F. Zambello (1957) |
| Year of Election or Appointment: 2011 Deputy Treasurer of the Fidelity funds. Mr. Zambello is an employee of Fidelity Investments. Previously, Mr. Zambello served as Vice President of FMR's Program Management Group (2009-2011) and Vice President of the Transfer Agent Oversight Group (2005-2009). |
Stephen Sadoski (1971) |
| Year of Election or Appointment: 2013 Deputy Treasurer of Fidelity's Fixed Income and Asset Allocation Funds. Mr. Sadoski also serves as Deputy Treasurer of other Fidelity funds (2012-present) and is an employee of Fidelity Investments (2012-present). Previously, Mr. Sadoski served as Assistant Treasurer of Fidelity's Fixed Income and Asset Allocation Funds (2012-2013), an assistant chief accountant in the Division of Investment Management of the Securities and Exchange Commission (SEC) (2009-2012) and as a senior manager at Deloitte & Touche (1997-2009). |
Adrien E. Deberghes (1967) |
| Year of Election or Appointment: 2010 Assistant Treasurer of Fidelity's Fixed Income and Asset Allocation Funds. Mr. Deberghes also serves as Vice President and Assistant Treasurer (2011-present) and Deputy Treasurer (2008-present) of other Fidelity funds, and is an employee of Fidelity Investments (2008-present). Previously, Mr. Deberghes served as Senior Vice President of Mutual Fund Administration at State Street Corporation (2007-2008), Senior Director of Mutual Fund Administration at Investors Bank & Trust (2005-2007), and Director of Finance for Dunkin' Brands (2000-2005). |
Kenneth B. Robins (1969) |
| Year of Election or Appointment: 2009 Assistant Treasurer of the Fidelity Fixed Income and Asset Allocation Funds. Mr. Robins also serves as President and Treasurer of other Fidelity funds (2008-present; 2010-present) and is an employee of Fidelity Investments (2004-present). Previously, Mr. Robins served as Deputy Treasurer of the Fidelity funds (2005-2008) and Treasurer and Chief Financial Officer of The North Carolina Capital Management Trust: Cash and Term Portfolios (2006-2008). |
Gary W. Ryan (1958) |
| Year of Election or Appointment: 2005 Assistant Treasurer of the Fidelity funds. Mr. Ryan is an employee of Fidelity Investments. Previously, Mr. Ryan served as Vice President of Fund Reporting in Fidelity Pricing and Cash Management Services (FPCMS) (1999-2005). |
Jonathan Davis (1968) |
| Year of Election or Appointment: 2010 Assistant Treasurer of the Fidelity funds. Mr. Davis is also Assistant Treasurer of Fidelity Rutland Square Trust II and Fidelity Commonwealth Trust II. Mr. Davis is an employee of Fidelity Investments. Previously, Mr. Davis served as Vice President and Associate General Counsel of FMR LLC (2003-2010). |
Annual Report
The Board of Trustees of each fund voted to pay to shareholders of record at the opening of business on record date, the following distributions per share derived from capital gains realized from sales of portfolio securities and dividends derived from net investment income:
| Pay Date | Record Date | Dividends | Capital Gains |
Fidelity Freedom Income Fund | 5/6/2013 | 5/3/2013 | $0.010 | $0.173 |
Fidelity Freedom 2000 Fund | 5/6/2013 | 5/3/2013 | $0.031 | $0.113 |
Fidelity Freedom 2005 Fund | 5/6/2013 | 5/3/2013 | $0.025 | $0.002 |
Fidelity Freedom 2010 Fund | 5/6/2013 | 5/3/2013 | $0.031 | $0.004 |
Fidelity Freedom 2015 Fund | 5/13/2013 | 5/10/2013 | $0.026 | $0.072 |
Fidelity Freedom 2020 Fund | 5/13/2013 | 5/10/2013 | $0.033 | $0.066 |
Fidelity Freedom 2025 Fund | 5/6/2013 | 5/3/2013 | $0.026 | $0.139 |
Fidelity Freedom 2030 Fund | 5/6/2013 | 5/3/2013 | $0.031 | $0.005 |
Fidelity Freedom 2035 Fund | 5/13/2013 | 5/10/2013 | $0.020 | $0.288 |
Fidelity Freedom 2040 Fund | 5/6/2013 | 5/3/2013 | $0.014 | $0.150 |
Fidelity Freedom 2045 Fund | 5/13/2013 | 5/10/2013 | $0.016 | $0.447 |
Fidelity Freedom 2050 Fund | 5/13/2013 | 5/10/2013 | $0.016 | $0.258 |
Fidelity Freedom 2055 Fund | 5/13/2013 | 5/10/2013 | $0.012 | $0.130 |
The funds hereby designate as capital gain dividend the amounts noted below for the taxable year ended March 31, 2013, or, if subsequently determined to be different, the net capital gain of such year.
Fidelity Freedom Income Fund | $30,963,629 |
Fidelity Freedom 2000 Fund | $8,812,854 |
Fidelity Freedom 2015 Fund | $36,019,447 |
Fidelity Freedom 2020 Fund | $56,630,524 |
Fidelity Freedom 2025 Fund | $88,215,680 |
Fidelity Freedom 2035 Fund | $126,682,015 |
Fidelity Freedom 2040 Fund | $111,597,683 |
Fidelity Freedom 2045 Fund | $106,384,967 |
Fidelity Freedom 2050 Fund | $51,290,300 |
Fidelity Freedom 2055 Fund | $2,052,818 |
A percentage of the dividends distributed during the fiscal year for the following funds were derived from interest on U.S. Government securities which is generally exempt from state income tax:
Fidelity Freedom Income Fund | 18.43% |
Fidelity Freedom 2000 Fund | 18.35% |
Fidelity Freedom 2005 Fund | 14.29% |
Fidelity Freedom 2010 Fund | 13.28% |
Fidelity Freedom 2015 Fund | 12.97% |
Fidelity Freedom 2020 Fund | 10.96% |
Fidelity Freedom 2025 Fund | 7.88% |
Fidelity Freedom 2030 Fund | 6.01% |
Fidelity Freedom 2035 Fund | 2.73% |
Fidelity Freedom 2040 Fund | 2.41% |
Fidelity Freedom 2045 Fund | 1.40% |
Fidelity Freedom 2050 Fund | 0.92% |
Fidelity Freedom 2055 Fund | 0.09% |
Annual Report
A percentage of the dividends distributed during the fiscal year for the following funds qualify for the dividends-received deduction for corporate shareholders:
Fidelity Freedom Income Fund | |
May 2012 June 2012 July 2012 August 2012 September 2012 October 2012 November 2012 December 2012 | 7% 8% 8% 8% 8% 8% 8% 8% |
| |
Fidelity Freedom 2000 Fund | |
December 2012 | 8% |
Fidelity Freedom 2005 Fund | |
December 2012 | 15% |
Fidelity Freedom 2010 Fund | |
December 2012 | 17% |
Fidelity Freedom 2015 Fund | |
May 2012 December 2012 | 1% 18% |
Fidelity Freedom 2020 Fund | |
May 2012 December 2012 | 1% 20% |
Fidelity Freedom 2025 Fund | |
May 2012 December 2012 | 2% 24% |
Fidelity Freedom 2030 Fund | |
May 2012 December 2012 | 1% 25% |
Fidelity Freedom 2035 Fund | |
May 2012 December 2012 | 2% 32% |
Fidelity Freedom 2040 Fund | |
May 2012 December 2012 | 3% 34% |
Fidelity Freedom 2045 Fund | |
May 2012 December 2012 | 3% 35% |
Fidelity Freedom 2050 Fund | |
May 2012 December 2012 | 4% 36% |
Fidelity Freedom 2055 Fund | |
May 2012 December 2012 | 9% 44% |
Annual Report
Distributions (Unaudited) - continued
A percentage of the dividends distributed during the fiscal year for the following funds may be taken into account as a dividend for purposes of the maximum rate under section 1(h)(11) of the Internal Revenue Code.
Fidelity Freedom Income Fund | |
May 2012 June 2012 July 2012 August 2012 September 2012 October 2012 November 2012 December 2012 February 2013 March 2013 | 11% 14% 14% 14% 14% 14% 14% 14% 4% 4% |
| |
Fidelity Freedom 2000 Fund | |
May 2012 December 2012 | 1% 14% |
Fidelity Freedom 2005 Fund | |
May 2012 December 2012 | 1% 24% |
Fidelity Freedom 2010 Fund | |
May 2012 December 2012 | 1% 28% |
Fidelity Freedom 2015 Fund | |
May 2012 December 2012 | 2% 29% |
Fidelity Freedom 2020 Fund | |
May 2012 December 2012 | 2% 33% |
Fidelity Freedom 2025 Fund | |
May 2012 December 2012 | 3% 40% |
Fidelity Freedom 2030 Fund | |
May 2012 December 2012 | 2% 42% |
Fidelity Freedom 2035 Fund | |
May 2012 December 2012 | 4% 54% |
Fidelity Freedom 2040 Fund | |
May 2012 December 2012 | 5% 55% |
Fidelity Freedom 2045 Fund | |
May 2012 December 2012 | 5% 57% |
Fidelity Freedom 2050 Fund | |
May 2012 December 2012 | 8% 60% |
Fidelity Freedom 2055 Fund | |
May 2012 December 2012 | 15% 72% |
The funds will notify shareholders in January 2014 of amounts for use in preparing 2013 income tax returns.
Annual Report
Investment Adviser
Strategic Advisers, Inc.
Boston, MA
Administrator
Fidelity Management & Research
Company
Boston, MA
General Distributor
Fidelity Distributors Corporation
Smithfield, RI
Transfer and Service Agents
Fidelity Investments Institutional
Operations Company, Inc.
Boston, MA
Fidelity Service Company, Inc.
Boston, MA
Custodian
The Bank of New York Mellon
New York, NY
FF-UANNPRO-0513
1.814503.108
Fidelity Freedom K® Funds -
Income, 2000, 2005, 2010, 2015, 2020, 2025, 2030, 2035, 2040, 2045, 2050, 2055
Annual Report
March 31, 2013
(Fidelity Cover Art)
Contents
Annual Report
To view a fund's proxy voting guidelines and proxy voting record for the 12-month period ended June 30, visit http://www.fidelity.com/proxyvotingresults or visit the Securities and Exchange Commission's (SEC) web site at http://www.sec.gov. You may also call 1-800-835-5092 to request a free copy of the proxy voting guidelines.
Standard & Poor's, S&P and S&P 500 are registered service marks of The McGraw-Hill Companies, Inc. and have been licensed for use by Fidelity Distributors Corporation.
Other third-party marks appearing herein are the property of their respective owners.
All other marks appearing herein are registered or unregistered trademarks or service marks of FMR LLC or an affiliated company. © 2013 FMR LLC. All rights reserved.
This report and the financial statements contained herein are submitted for the general information of the shareholders of the funds. This report is not authorized for distribution to prospective investors in the funds unless preceded or accompanied by an effective prospectus.
A fund files its complete schedule of portfolio holdings with the SEC for the first and third quarters of each fiscal year on Form N-Q. Forms N-Q are available on the SEC's web site at http://www.sec.gov. A fund's Forms N-Q may be reviewed and copied at the SEC's Public Reference Room in Washington, DC. Information regarding the operation of the SEC's Public Reference Room may be obtained by calling 1-800-SEC-0330. For a complete list of a fund's portfolio holdings, view the most recent holdings listing, semiannual report, or annual report on Fidelity's web site at http://www.fidelity.com, http://www.advisor.fidelity.com, or http://www.401k.com, as applicable.
NOT FDIC INSURED • MAY LOSE VALUE • NO BANK GUARANTEE
Neither the funds nor Fidelity Distributors Corporation is a bank.
Annual Report
Fidelity Freedom K® Income Fund
Average annual total return reflects the change in the value of an investment, assuming reinvestment of the fund's distributions from dividend income and capital gains (the profits earned upon the sale of securities that have grown in value, if any) and assuming a constant rate of performance each year. The $10,000 table and the fund's returns do not reflect the deduction of taxes that a shareholder would pay on fund distributions or the redemption of fund shares. During periods of reimbursement by Fidelity, a fund's total return will be greater than it would be had the reimbursement not occurred. How a fund did yesterday is no guarantee of how it will do tomorrow.
Average Annual Total Returns
Periods ended March 31, 2013 | Past 1
year | Life of
fund A |
Fidelity Freedom K® Income Fund | 4.77% | 7.51% |
A From July 2, 2009.
$10,000 Over Life of Fund
Let's say hypothetically that $10,000 was invested in Fidelity Freedom K® Income Fund on July 2, 2009, when the fund started. The chart shows how the value of your investment would have changed, and also shows how the Barclays® U.S. Aggregate Bond Index performed over the same period.
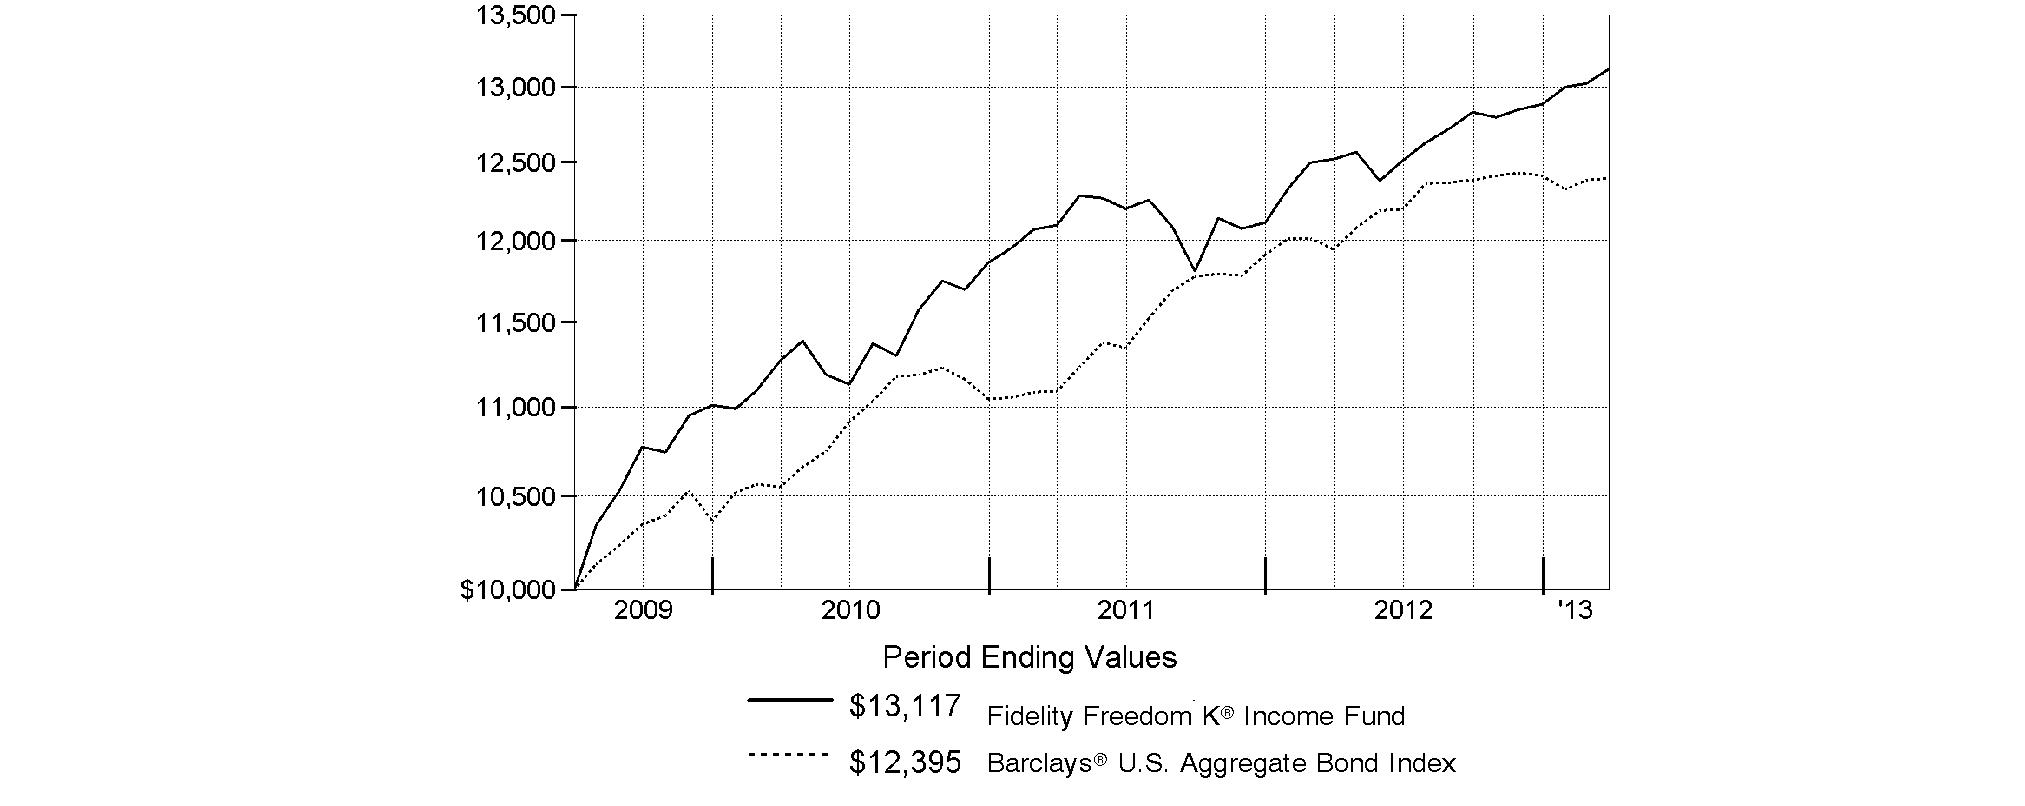
Annual Report
Fidelity Freedom K® 2000 Fund
Performance: The Bottom Line
Average annual total return reflects the change in the value of an investment, assuming reinvestment of the fund's distributions from dividend income and capital gains (the profits earned upon the sale of securities that have grown in value, if any) and assuming a constant rate of performance each year. The $10,000 table and the fund's returns do not reflect the deduction of taxes that a shareholder would pay on fund distributions or the redemption of fund shares. During periods of reimbursement by Fidelity, a fund's total return will be greater than it would be had the reimbursement not occurred. How a fund did yesterday is no guarantee of how it will do tomorrow.
Average Annual Total Returns
Periods ended March 31, 2013 | Past 1
year | Life of
fund A |
Fidelity Freedom K® 2000 Fund | 4.84% | 7.70% |
A From July 2, 2009.
$10,000 Over Life of Fund
Let's say hypothetically that $10,000 was invested in Fidelity Freedom K® 2000 Fund on July 2, 2009, when the fund started. The chart shows how the value of your investment would have changed, and also shows how the Barclays U.S. Aggregate Bond Index performed over the same period.
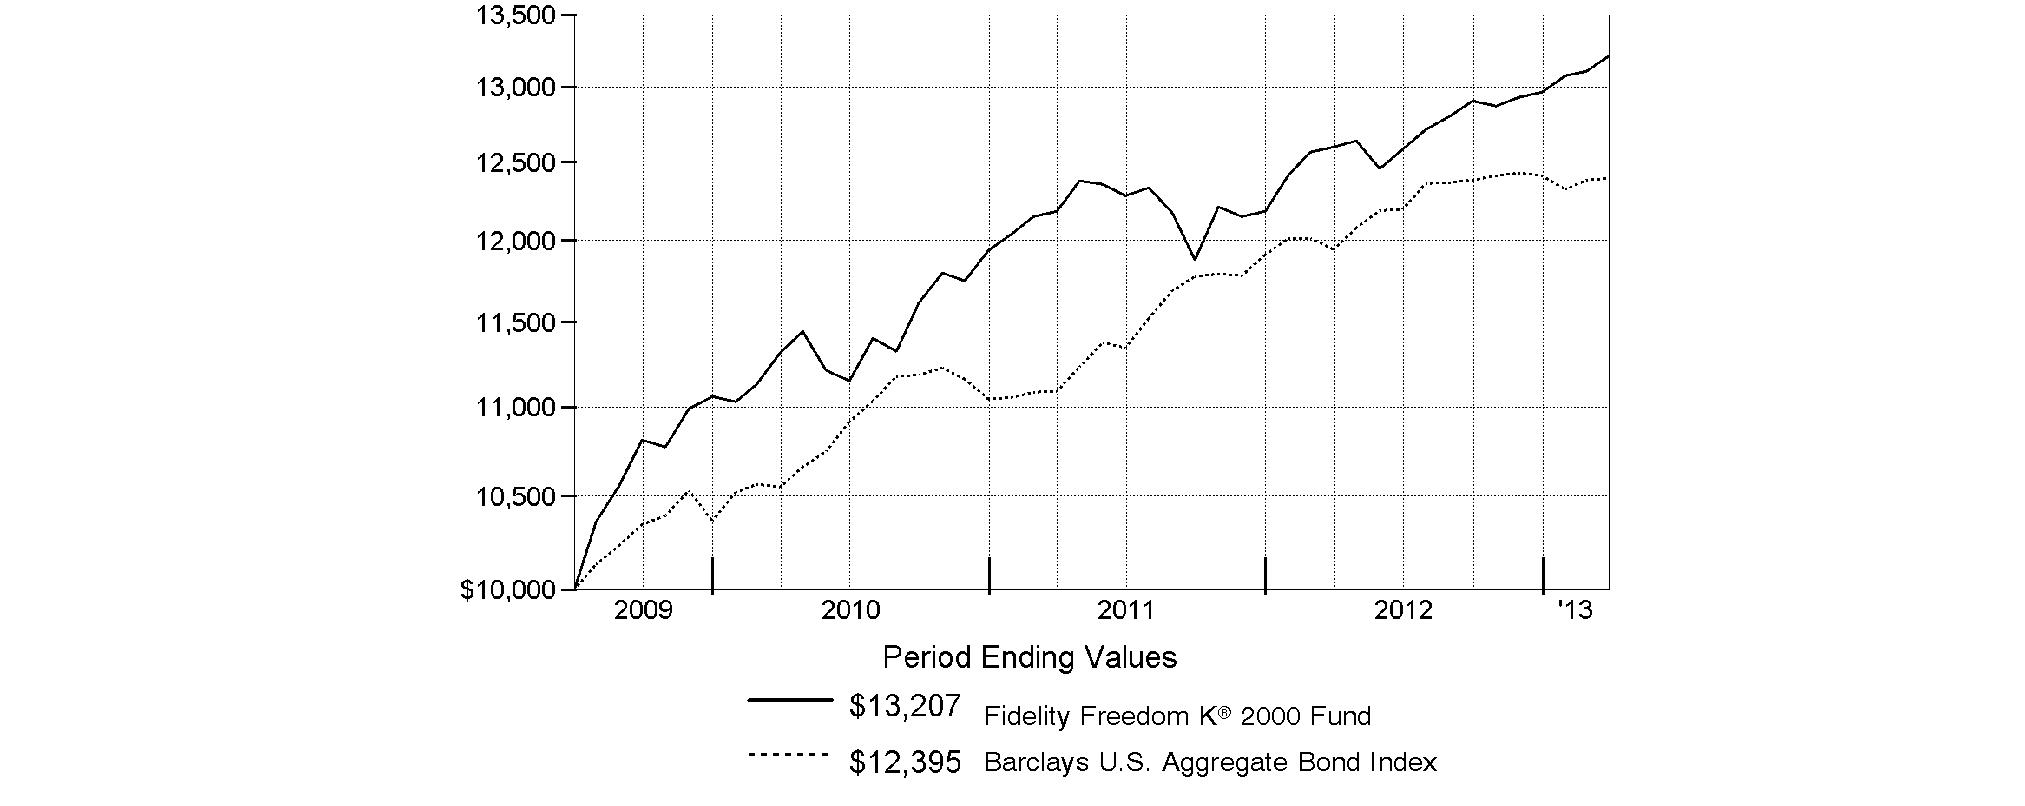
Annual Report
Fidelity Freedom K® 2005 Fund
Performance: The Bottom Line
Average annual total return reflects the change in the value of an investment, assuming reinvestment of the fund's distributions from dividend income and capital gains (the profits earned upon the sale of securities that have grown in value, if any) and assuming a constant rate of performance each year. The $10,000 table and the fund's returns do not reflect the deduction of taxes that a shareholder would pay on fund distributions or the redemption of fund shares. During periods of reimbursement by Fidelity, a fund's total return will be greater than it would be had the reimbursement not occurred. How a fund did yesterday is no guarantee of how it will do tomorrow.
Average Annual Total Returns
Periods ended March 31, 2013 | Past 1
year | Life of
fund A |
Fidelity Freedom K® 2005 Fund | 6.03% | 10.26% |
A From July 2, 2009.
$10,000 Over Life of Fund
Let's say hypothetically that $10,000 was invested in Fidelity Freedom K® 2005 Fund on July 2, 2009, when the fund started. The chart shows how the value of your investment would have changed, and also shows how the Barclays U.S. Aggregate Bond Index performed over the same period.

Annual Report
Fidelity Freedom K® 2010 Fund
Performance: The Bottom Line
Average annual total return reflects the change in the value of an investment, assuming reinvestment of the fund's distributions from dividend income and capital gains (the profits earned upon the sale of securities that have grown in value, if any) and assuming a constant rate of performance each year. The $10,000 table and the fund's returns do not reflect the deduction of taxes that a shareholder would pay on fund distributions or the redemption of fund shares. During periods of reimbursement by Fidelity, a fund's total return will be greater than it would be had the reimbursement not occurred. How a fund did yesterday is no guarantee of how it will do tomorrow.
Average Annual Total Returns
Periods ended March 31, 2013 | Past 1
year | Life of
fund A |
Fidelity Freedom K® 2010 Fund | 7.53% | 11.42% |
A From July 2, 2009.
$10,000 Over Life of Fund
Let's say hypothetically that $10,000 was invested in Fidelity Freedom K® 2010 Fund on July 2, 2009, when the fund started. The chart shows how the value of your investment would have changed, and also shows how the Barclays U.S. Aggregate Bond Index performed over the same period.
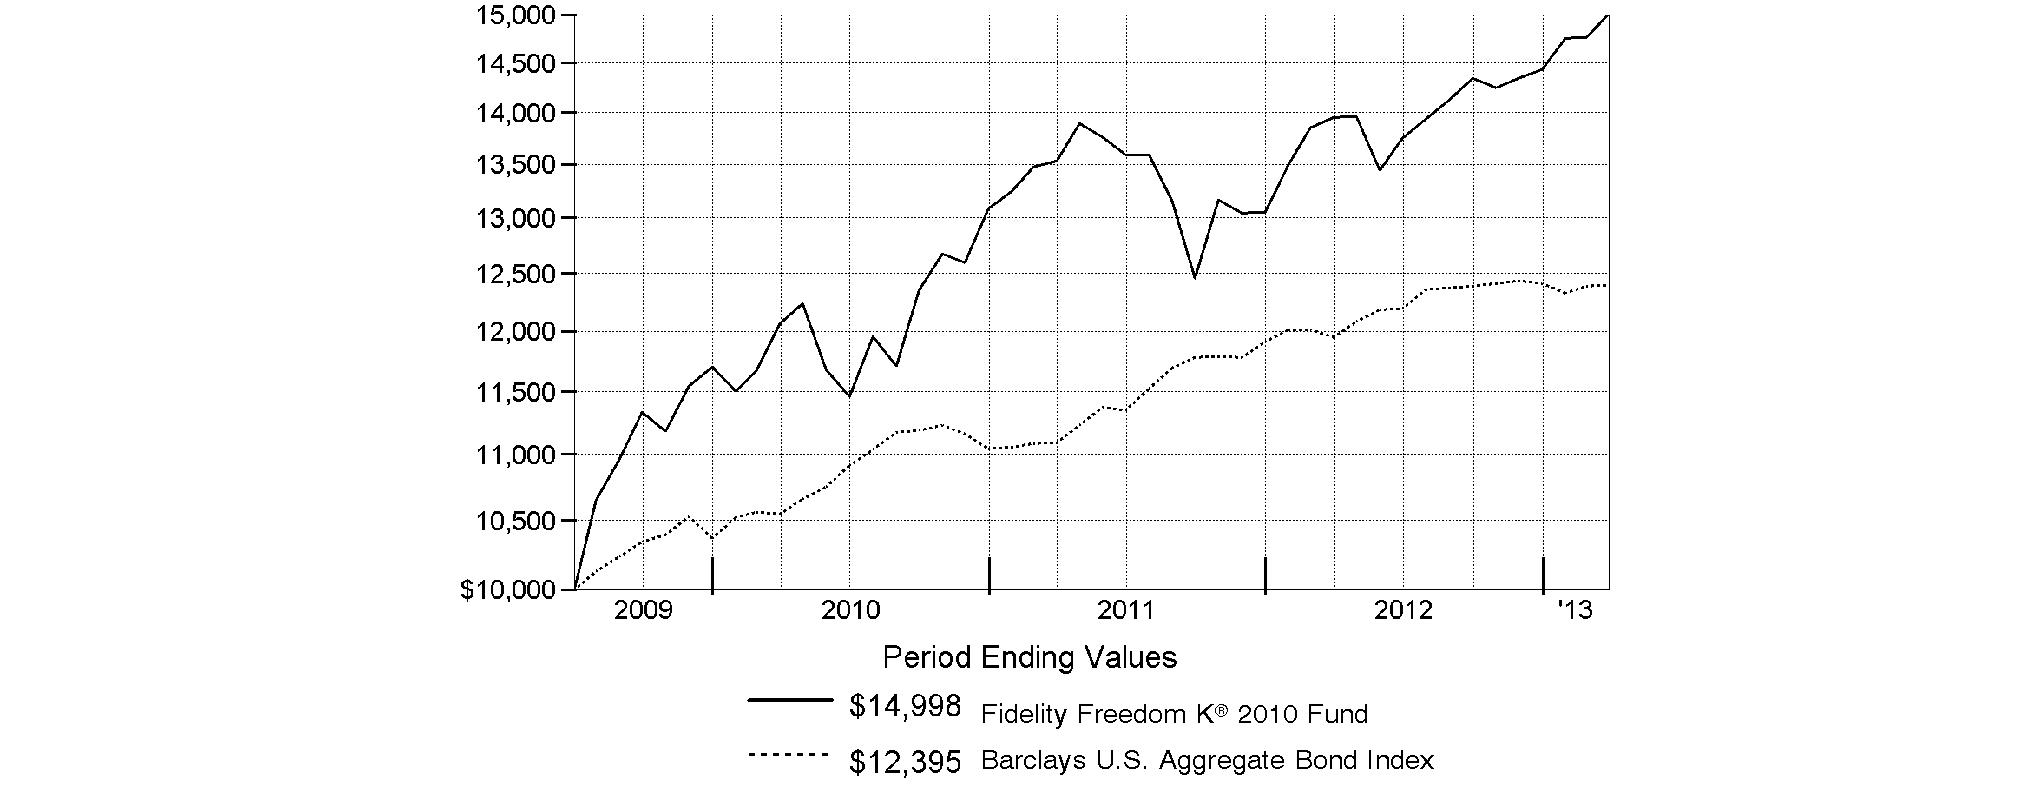
Annual Report
Fidelity Freedom K® 2015 Fund
Performance: The Bottom Line
Average annual total return reflects the change in the value of an investment, assuming reinvestment of the fund's distributions from dividend income and capital gains (the profits earned upon the sale of securities that have grown in value, if any) and assuming a constant rate of performance each year. The $10,000 table and the fund's returns do not reflect the deduction of taxes that a shareholder would pay on fund distributions or the redemption of fund shares. During periods of reimbursement by Fidelity, a fund's total return will be greater than it would be had the reimbursement not occurred. How a fund did yesterday is no guarantee of how it will do tomorrow.
Average Annual Total Returns
Periods ended March 31, 2013 | Past 1
year | Life of
fund A |
Fidelity Freedom K® 2015 Fund | 7.70% | 11.70% |
A From July 2, 2009.
$10,000 Over Life of Fund
Let's say hypothetically that $10,000 was invested in Fidelity Freedom K® 2015 Fund on July 2, 2009, when the fund started. The chart shows how the value of your investment would have changed, and also shows how the S&P 500® Index performed over the same period.
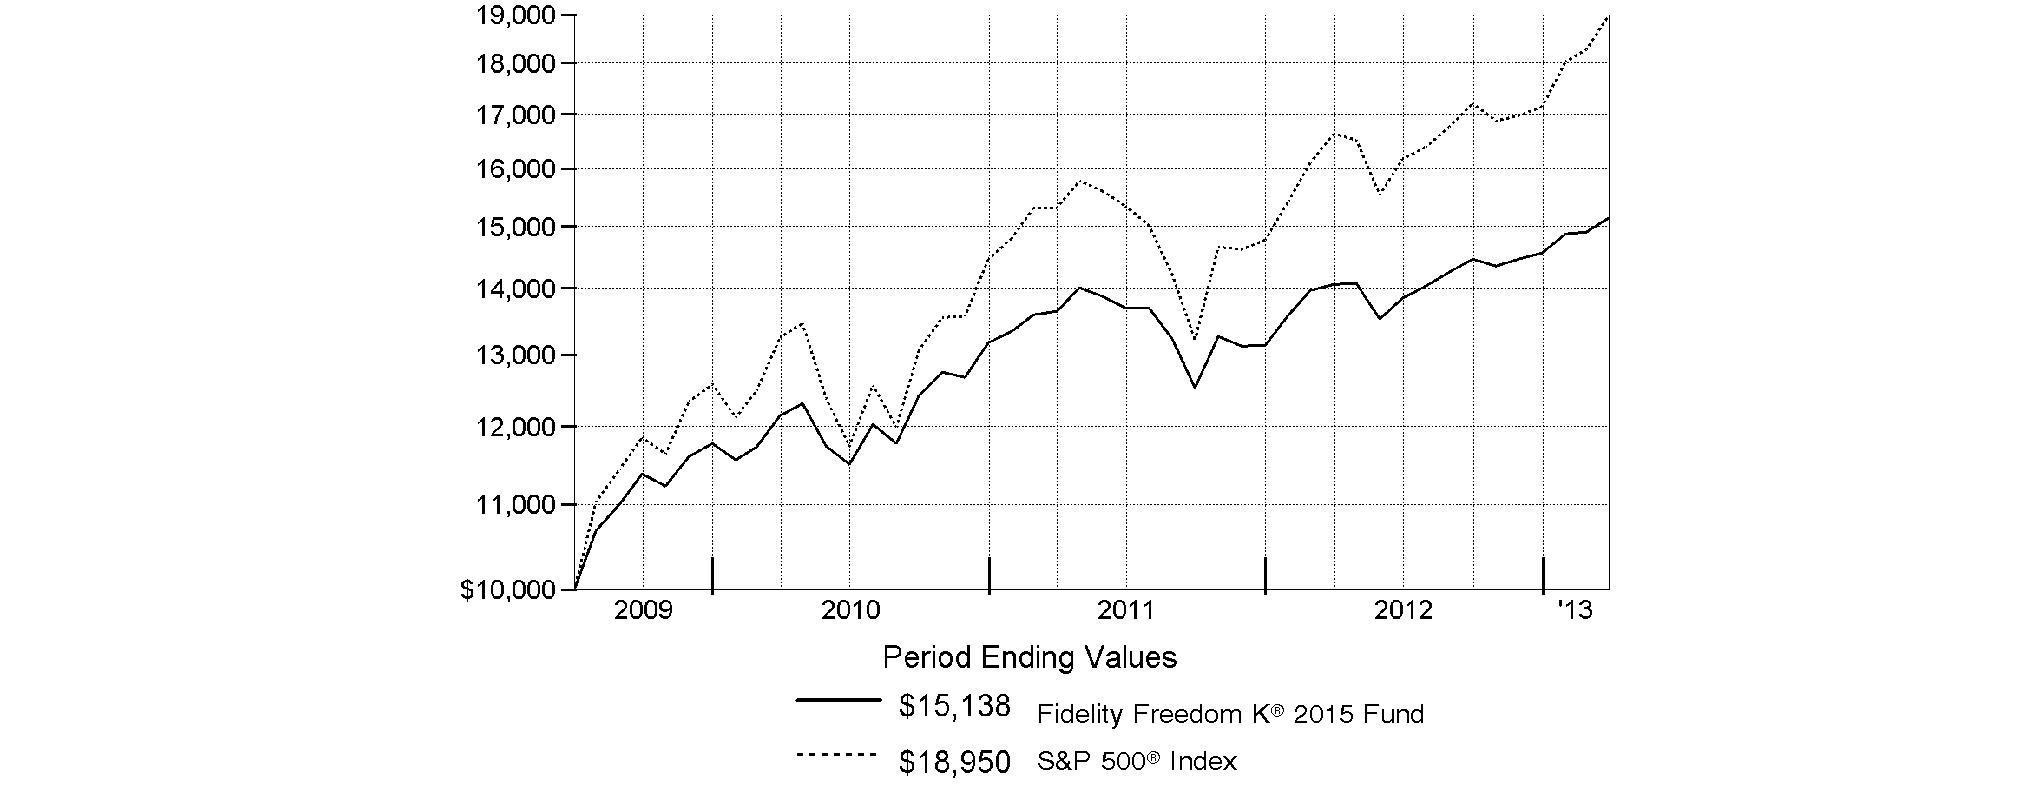
Annual Report
Fidelity Freedom K® 2020 Fund
Performance: The Bottom Line
Average annual total return reflects the change in the value of an investment, assuming reinvestment of the fund's distributions from dividend income and capital gains (the profits earned upon the sale of securities that have grown in value, if any) and assuming a constant rate of performance each year. The $10,000 table and the fund's returns do not reflect the deduction of taxes that a shareholder would pay on fund distributions or the redemption of fund shares. During periods of reimbursement by Fidelity, a fund's total return will be greater than it would be had the reimbursement not occurred. How a fund did yesterday is no guarantee of how it will do tomorrow.
Average Annual Total Returns
Periods ended March 31, 2013 | Past 1
year | Life of
fund A |
Fidelity Freedom K® 2020 Fund | 8.17% | 12.83% |
A From July 2, 2009.
$10,000 Over Life of Fund
Let's say hypothetically that $10,000 was invested in Fidelity Freedom K® 2020 Fund on July 2, 2009, when the fund started. The chart shows how the value of your investment would have changed, and also shows how the S&P 500 Index performed over the same period.
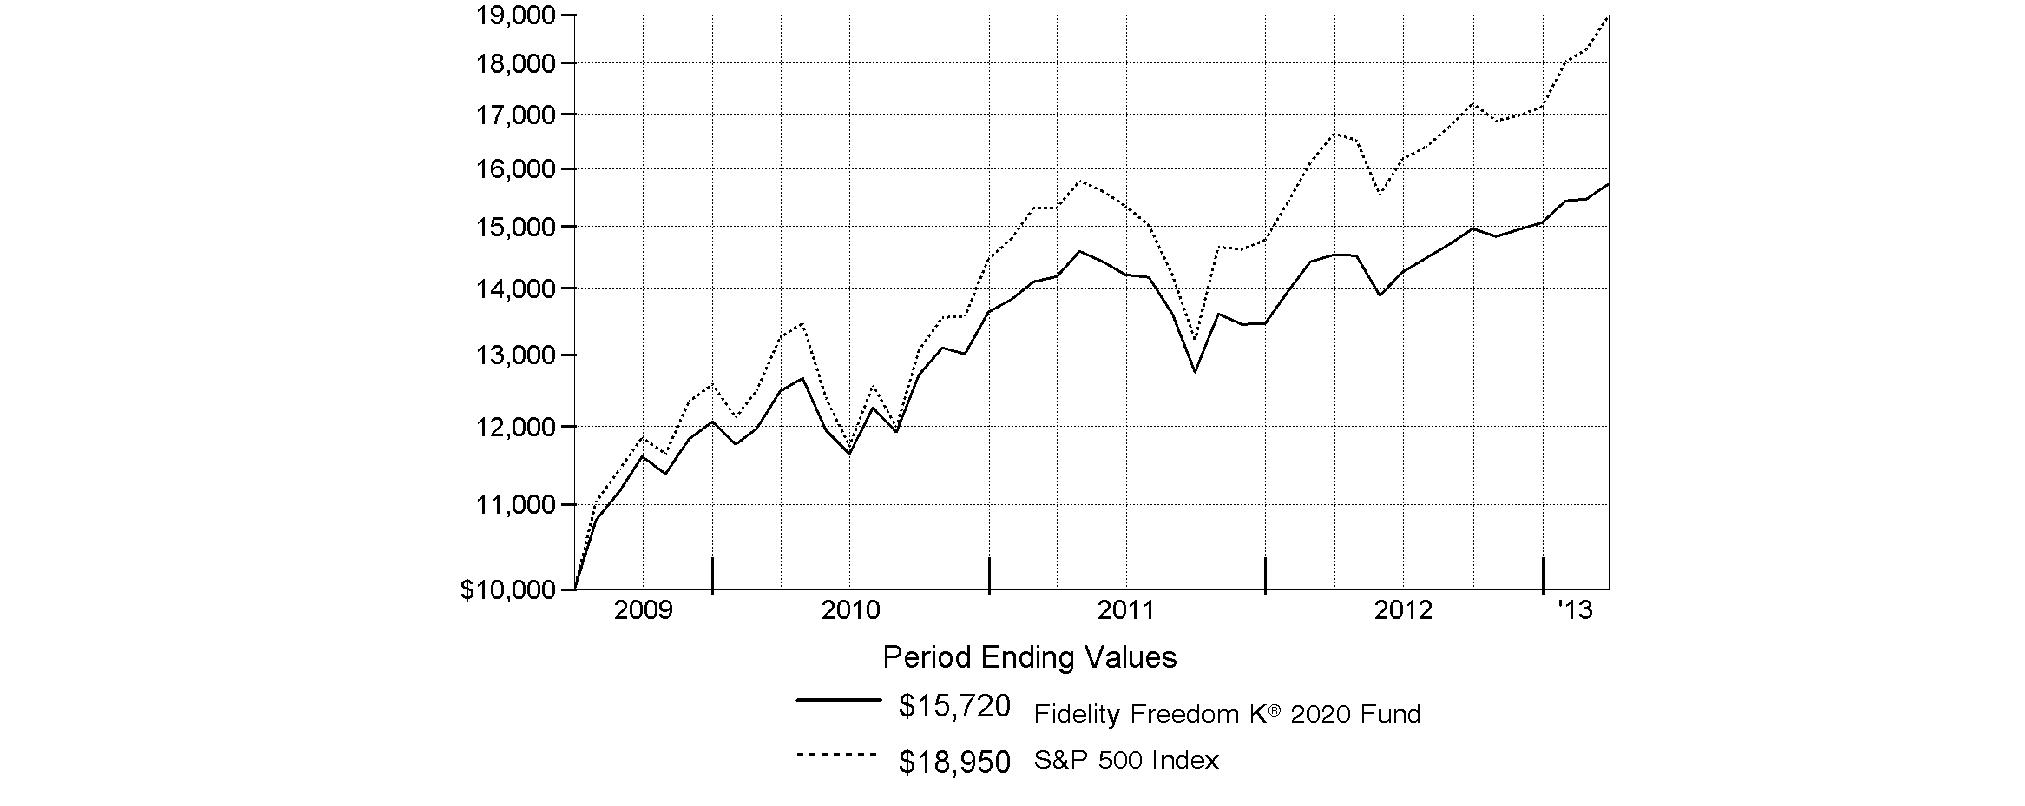
Annual Report
Fidelity Freedom K® 2025 Fund
Performance: The Bottom Line
Average annual total return reflects the change in the value of an investment, assuming reinvestment of the fund's distributions from dividend income and capital gains (the profits earned upon the sale of securities that have grown in value, if any) and assuming a constant rate of performance each year. The $10,000 table and the fund's returns do not reflect the deduction of taxes that a shareholder would pay on fund distributions or the redemption of fund shares. During periods of reimbursement by Fidelity, a fund's total return will be greater than it would be had the reimbursement not occurred. How a fund did yesterday is no guarantee of how it will do tomorrow.
Average Annual Total Returns
Periods ended March 31, 2013 | Past 1
year | Life of
fund A |
Fidelity Freedom K® 2025 Fund | 9.17% | 13.60% |
A From July 2, 2009.
$10,000 Over Life of Fund
Let's say hypothetically that $10,000 was invested in Fidelity Freedom K® 2025 Fund on July 2, 2009, when the fund started. The chart shows how the value of your investment would have changed, and also shows how the S&P 500 Index performed over the same period.
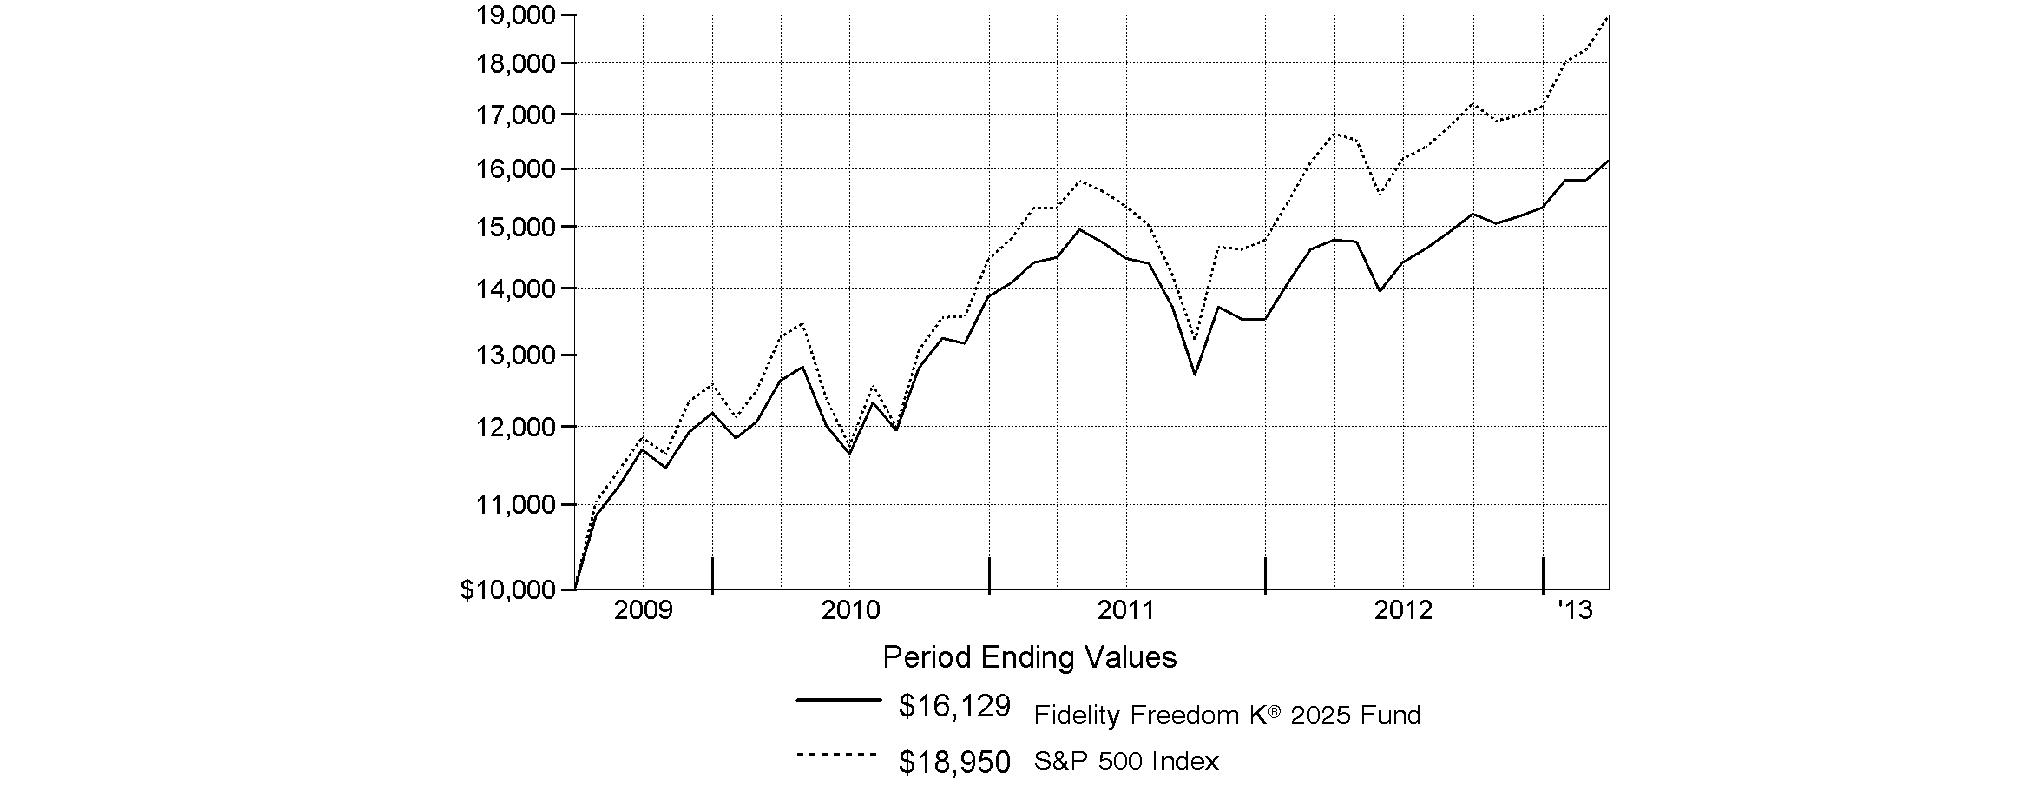
Annual Report
Fidelity Freedom K® 2030 Fund
Performance: The Bottom Line
Average annual total return reflects the change in the value of an investment, assuming reinvestment of the fund's distributions from dividend income and capital gains (the profits earned upon the sale of securities that have grown in value, if any) and assuming a constant rate of performance each year. The $10,000 table and the fund's returns do not reflect the deduction of taxes that a shareholder would pay on fund distributions or the redemption of fund shares. During periods of reimbursement by Fidelity, a fund's total return will be greater than it would be had the reimbursement not occurred. How a fund did yesterday is no guarantee of how it will do tomorrow.
Average Annual Total Returns
Periods ended March 31, 2013 | Past 1
year | Life of
fund A |
Fidelity Freedom K® 2030 Fund | 9.46% | 14.04% |
A From July 2, 2009.
$10,000 Over Life of Fund
Let's say hypothetically that $10,000 was invested in Fidelity Freedom K® 2030 Fund on July 2, 2009, when the fund started. The chart shows how the value of your investment would have changed, and also shows how the S&P 500 Index performed over the same period.
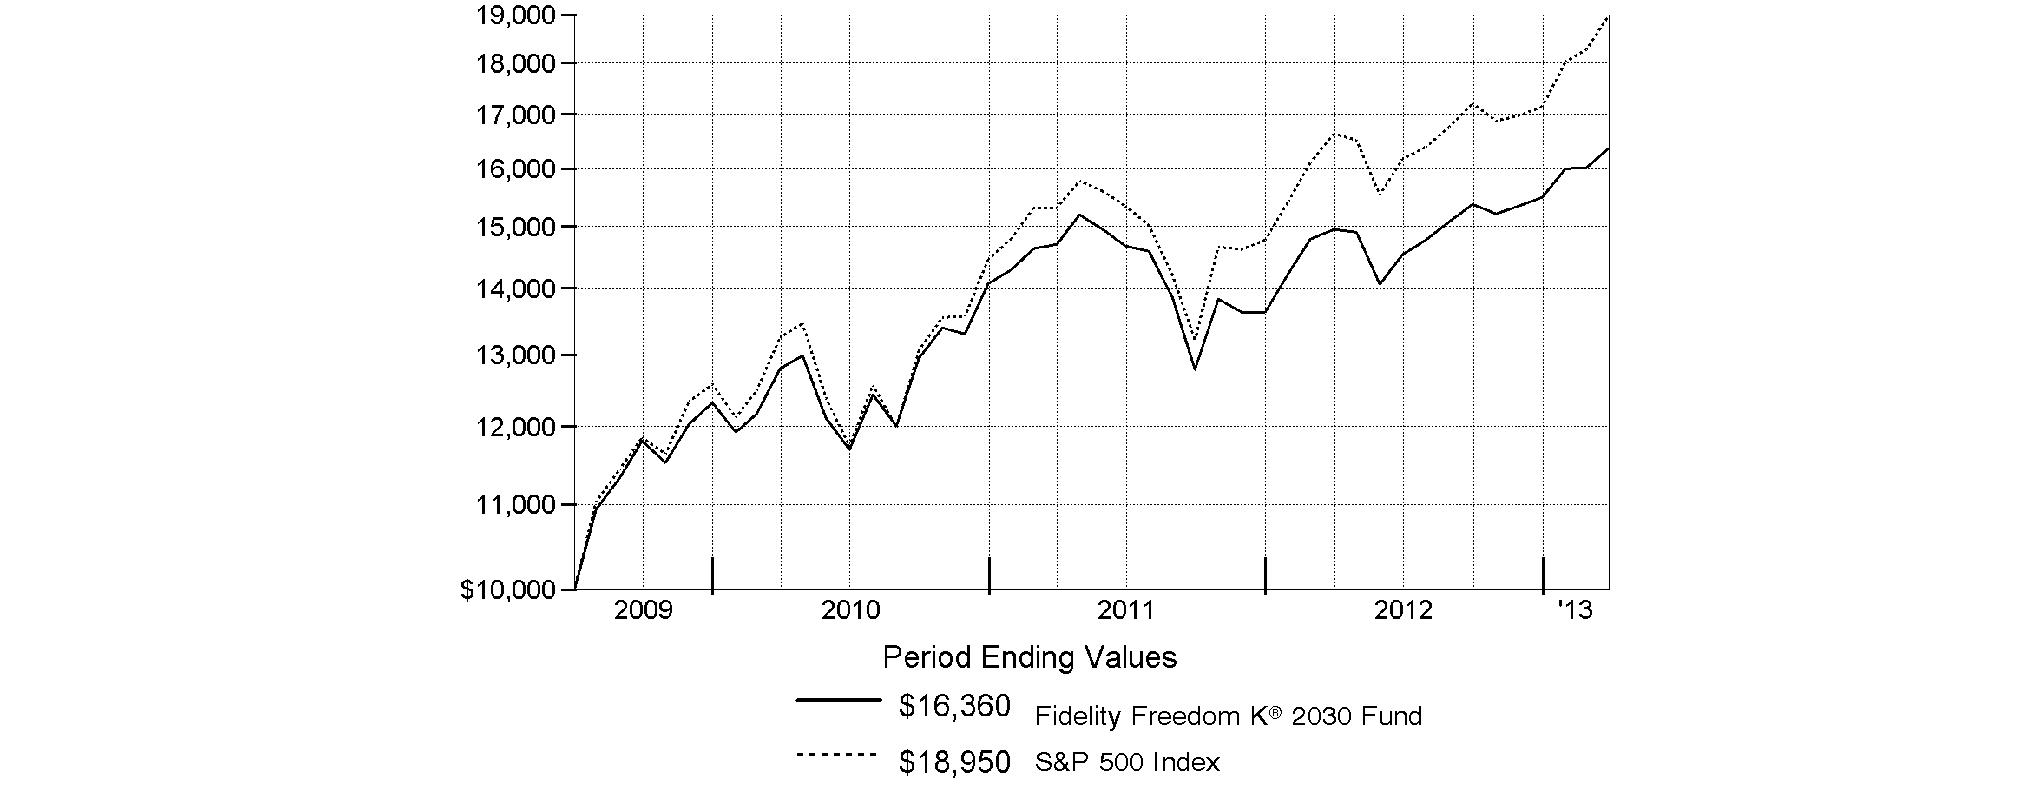
Annual Report
Fidelity Freedom K® 2035 Fund
Performance: The Bottom Line
Average annual total return reflects the change in the value of an investment, assuming reinvestment of the fund's distributions from dividend income and capital gains (the profits earned upon the sale of securities that have grown in value, if any) and assuming a constant rate of performance each year. The $10,000 table and the fund's returns do not reflect the deduction of taxes that a shareholder would pay on fund distributions or the redemption of fund shares. During periods of reimbursement by Fidelity, a fund's total return will be greater than it would be had the reimbursement not occurred. How a fund did yesterday is no guarantee of how it will do tomorrow.
Average Annual Total Returns
Periods ended March 31, 2013 | Past 1
year | Life of
fund A |
Fidelity Freedom K® 2035 Fund | 10.01% | 14.39% |
A From July 2, 2009.
$10,000 Over Life of Fund
Let's say hypothetically that $10,000 was invested in Fidelity Freedom K® 2035 Fund on July 2, 2009, when the fund started. The chart shows how the value of your investment would have changed, and also shows how the S&P 500 Index performed over the same period.

Annual Report
Fidelity Freedom K® 2040 Fund
Performance: The Bottom Line
Average annual total return reflects the change in the value of an investment, assuming reinvestment of the fund's distributions from dividend income and capital gains (the profits earned upon the sale of securities that have grown in value, if any) and assuming a constant rate of performance each year. The $10,000 table and the fund's returns do not reflect the deduction of taxes that a shareholder would pay on fund distributions or the redemption of fund shares. During periods of reimbursement by Fidelity, a fund's total return will be greater than it would be had the reimbursement not occurred. How a fund did yesterday is no guarantee of how it will do tomorrow.
Average Annual Total Returns
Periods ended March 31, 2013 | Past 1
year | Life of
fund A |
Fidelity Freedom K® 2040 Fund | 10.04% | 14.54% |
A From July 2, 2009.
$10,000 Over Life of Fund
Let's say hypothetically that $10,000 was invested in Fidelity Freedom K® 2040 Fund on July 2, 2009, when the fund started. The chart shows how the value of your investment would have changed, and also shows how the S&P 500 Index performed over the same period.
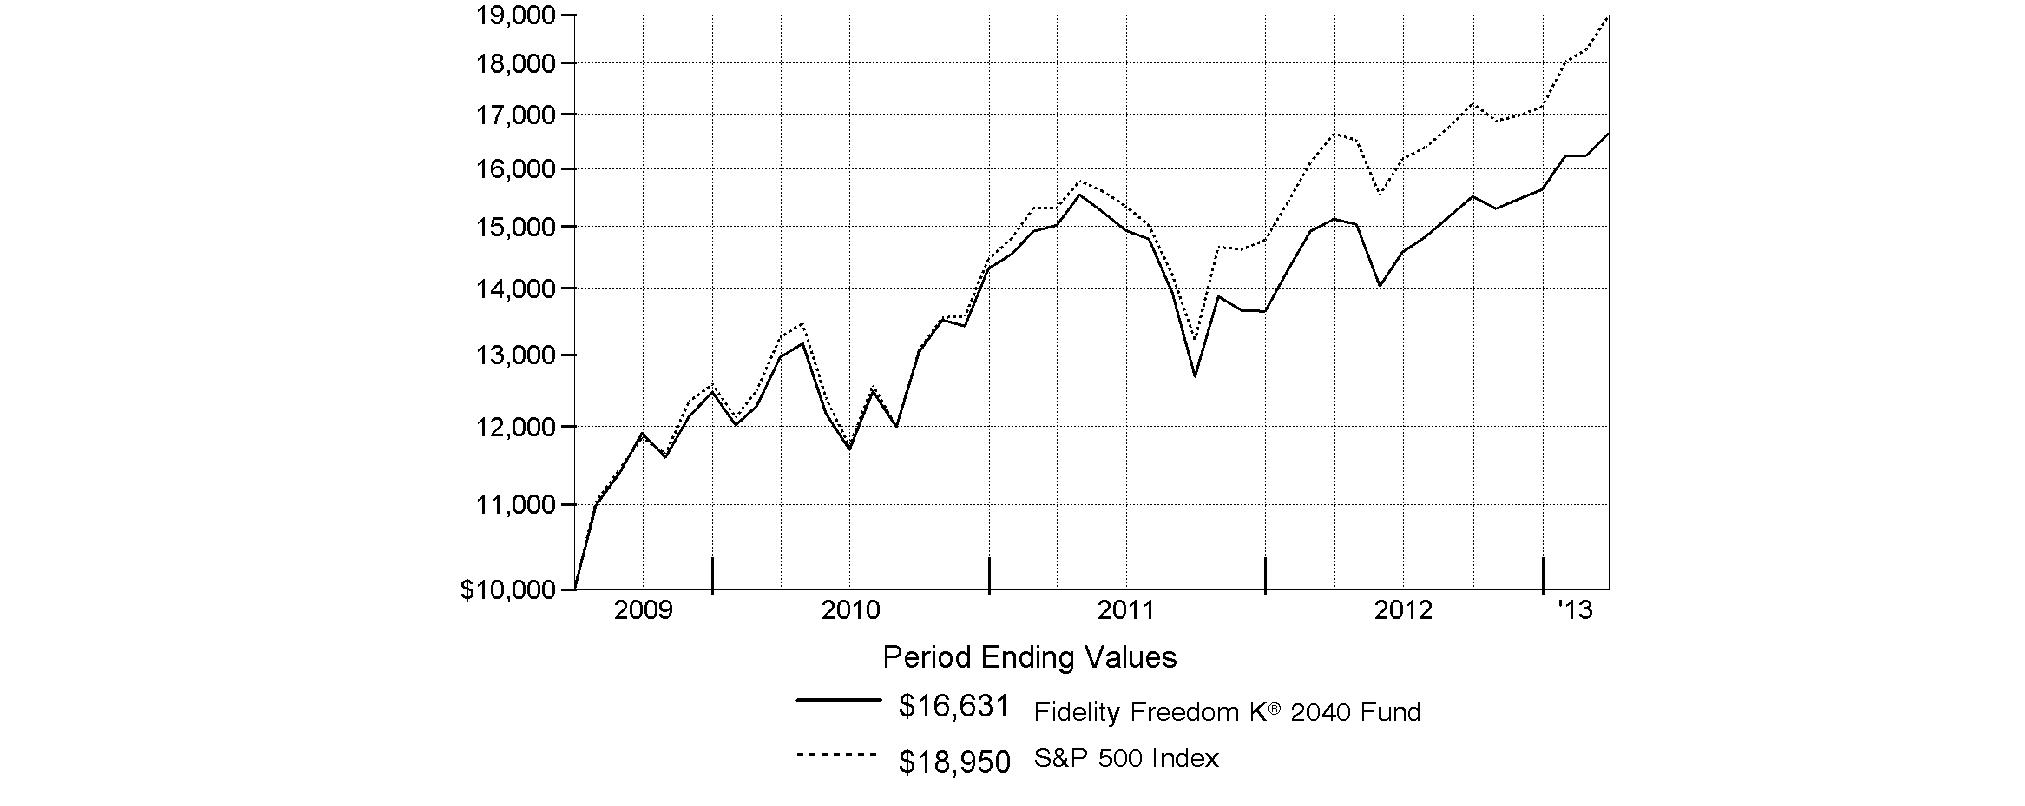
Annual Report
Fidelity Freedom K® 2045 Fund
Performance: The Bottom Line
Average annual total return reflects the change in the value of an investment, assuming reinvestment of the fund's distributions from dividend income and capital gains (the profits earned upon the sale of securities that have grown in value, if any) and assuming a constant rate of performance each year. The $10,000 table and the fund's returns do not reflect the deduction of taxes that a shareholder would pay on fund distributions or the redemption of fund shares. During periods of reimbursement by Fidelity, a fund's total return will be greater than it would be had the reimbursement not occurred. How a fund did yesterday is no guarantee of how it will do tomorrow.
Average Annual Total Returns
Periods ended March 31, 2013 | Past 1
year | Life of
fund A |
Fidelity Freedom K® 2045 Fund | 10.27% | 14.71% |
A From July 2, 2009.
$10,000 Over Life of Fund
Let's say hypothetically that $10,000 was invested in Fidelity Freedom K® 2045 Fund on July 2, 2009, when the fund started. The chart shows how the value of your investment would have changed, and also shows how the S&P 500 Index performed over the same period.

Annual Report
Fidelity Freedom K® 2050 Fund
Performance: The Bottom Line
Average annual total return reflects the change in the value of an investment, assuming reinvestment of the fund's distributions from dividend income and capital gains (the profits earned upon the sale of securities that have grown in value, if any) and assuming a constant rate of performance each year. The $10,000 table and the fund's returns do not reflect the deduction of taxes that a shareholder would pay on fund distributions or the redemption of fund shares. During periods of reimbursement by Fidelity, a fund's total return will be greater than it would be had the reimbursement not occurred. How a fund did yesterday is no guarantee of how it will do tomorrow.
Average Annual Total Returns
Periods ended March 31, 2013 | Past 1
year | Life of
fund A |
Fidelity Freedom K® 2050 Fund | 10.26% | 14.80% |
A From July 2, 2009.
$10,000 Over Life of Fund
Let's say hypothetically that $10,000 was invested in Fidelity Freedom K® 2050 Fund on July 2, 2009, when the fund started. The chart shows how the value of your investment would have changed, and also shows how the S&P 500 Index performed over the same period.

Annual Report
Fidelity Freedom K® 2055 Fund
Performance: The Bottom Line
Average annual total return reflects the change in the value of an investment, assuming reinvestment of the fund's distributions from dividend income and capital gains (the profits earned upon the sale of securities that have grown in value, if any) and assuming a constant rate of performance each year. The $10,000 table and the fund's returns do not reflect the deduction of taxes that a shareholder would pay on fund distributions or the redemption of fund shares. During periods of reimbursement by Fidelity, a fund's total return will be greater than it would be had the reimbursement not occurred. How a fund did yesterday is no guarantee of how it will do tomorrow.
Average Annual Total Returns
Periods ended March 31, 2013 | Past 1
year | Life of
fund A |
Fidelity Freedom K® 2055 Fund | 10.48% | 5.85% |
A From June 1, 2011
$10,000 Over Life of Fund
Let's say hypothetically that $10,000 was invested in Fidelity Freedom K® 2055 Fund on June 1, 2011, when the fund started. The chart shows how the value of your investment would have changed, and also shows how the S&P 500 Index performed over the same period.
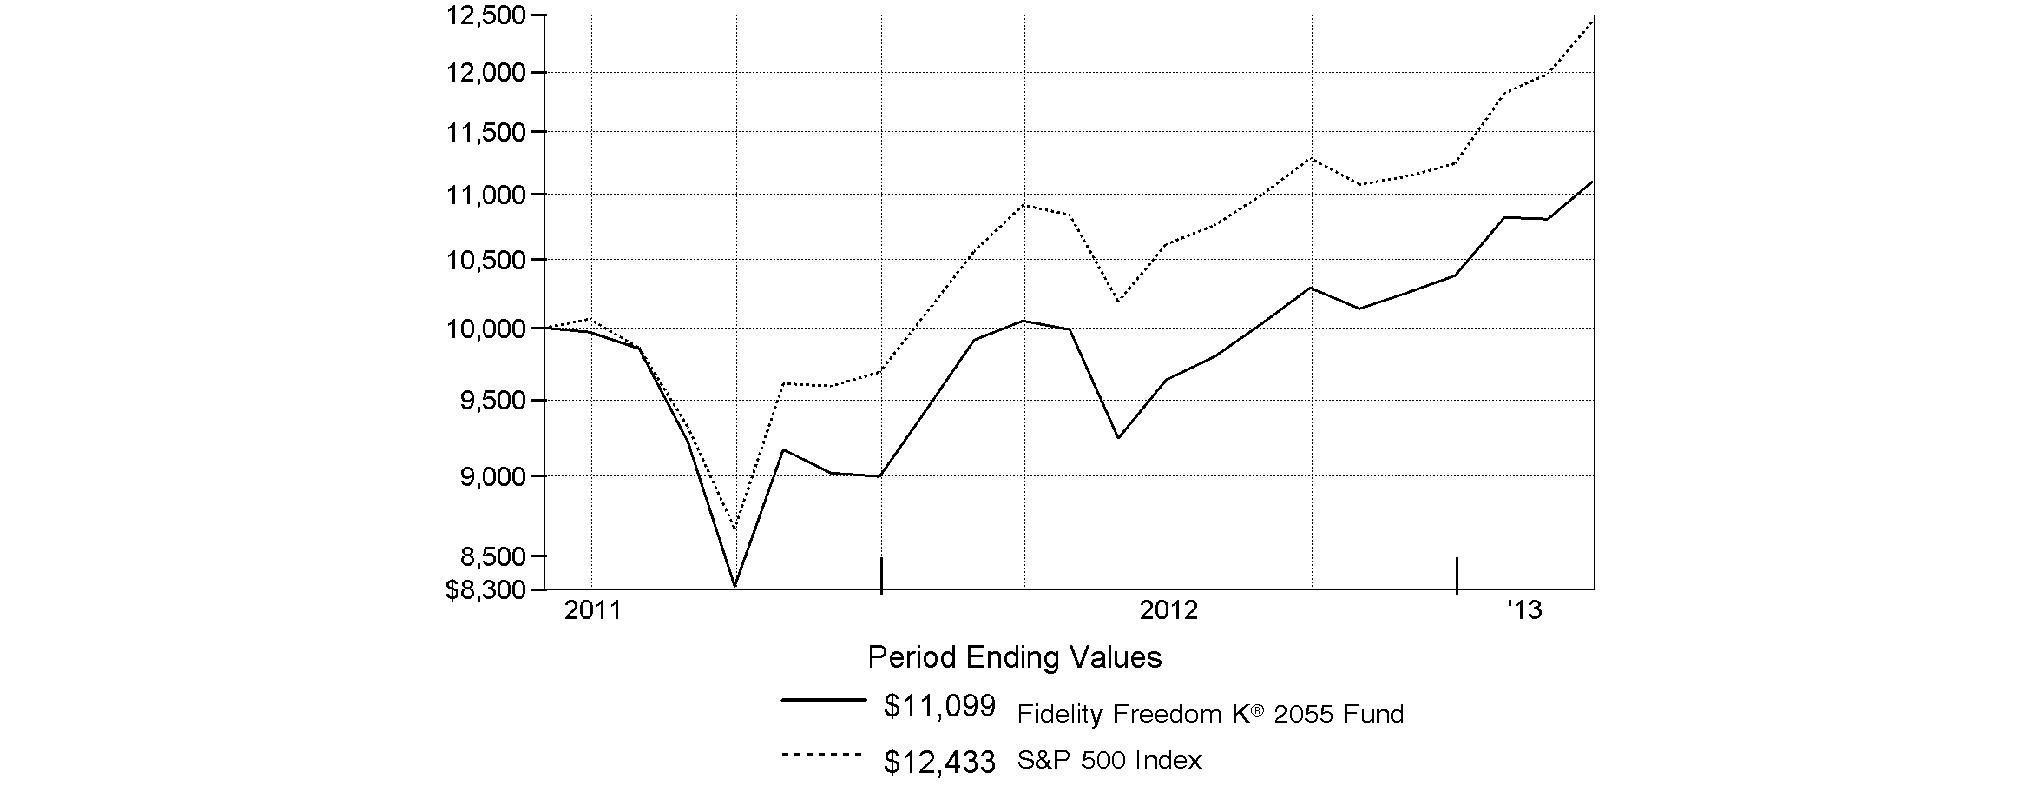
-
Annual Report
Market Recap: U.S. stock markets extended a four-year bull run and two major equity benchmarks reached record territory during the year ending March 31, 2013, as gains in the global economy and more monetary stimulus from the U.S. Federal Reserve kept markets on the upswing for much of the period. Optimism over the nation's jobs picture and housing market teamed up with solid corporate earnings to make stocks a favorite with investors during the 12-month period. The broad-based S&P 500® Index finished the year up 13.96%, closing at an all-time high at the end of the period, while the blue-chip-laden Dow Jones Industrial AverageSM - which broke its own record in early March - gained 13.37% for the full 12 months. The technology-heavy Nasdaq Composite Index® advanced a more modest 7.14%, curtailed by the weak performance of consumer electronics giant Apple, a large index component. During the year, markets shrugged off an early decline brought on by debt woes in Europe, and another dip later in the period amid pre-election jitters and Congressional gridlock over the federal budget. The year's gains were broad-based, with eight of the 10 sectors in the S&P 500® posting a double-digit increase, led by telecommunication services and health care, while technology fell 1%. Despite the headwind of a stronger U.S. dollar, foreign developed-markets stocks rose strongly, with the MSCI® EAFE® Index adding 11.40%. In the fixed-income arena, U.S. high-yield bonds benefited from investors' overall willingness to take on more risk, with The BofA Merrill LynchSM US High Yield Constrained Index adding 13.06% for the period. The shift away from perceived safety left U.S. investment-grade debt with a relatively modest 3.77% gain for the year, as measured by the Barclays® U.S. Aggregate Bond Index.
Comments from Christopher Sharpe and Andrew Dierdorf, Co-Portfolio Managers of Fidelity Freedom K® Funds: For the year, each of the Freedom K Funds delivered a positive absolute return. Funds with the longest time horizons until retirement - which have greater allocations to underlying equity and higher-yielding debt funds - posted the best results, each rising into low double-digit territory. These results were consistent with what we would expect in an environment where investors preferred higher-risk asset classes in search of the potential for outsized returns. In relative terms, each of the Freedom K Funds - except Fidelity Freedom K® Income Fund and Fidelity Freedom K® 2000 Fund - trailed its respective Composite index, hampered by underperformance among the underlying funds in the U.S. equity asset class. (For specific Fund results, please refer to the performance section of this report.) Although equities provided a nice lift during the period, the Funds' investments in U.S. stocks struggled to keep pace with the market, as represented by the Dow Jones U.S. Total Stock Market IndexSM, which returned 14.48%. The majority of the underlying U.S. equity funds trailed the Dow Jones index, which hindered the relative performance of Funds with greater allocations to this asset class. Fidelity® Series All-Sector Equity Fund Class F, Fidelity® Blue Chip Growth Fund Class F and Fidelity Growth Company Fund Class F were among the most significant detractors. The Funds' investments in commodities - represented by Fidelity Series Commodity Strategy Fund Class F - also finished behind the Dow Jones index and dragged on relative performance. Commodities faced an uphill battle and lost ground, as investors chose to take profits in the precious metals segment during the second half of the period, while severe weather for most of the year weighed on the agricultural subsector. Shifting to the non-U.S. equity asset class, each of the three underlying funds focused on developed markets outperformed the 11.40% return of the MSCI® EAFE® Index. On the downside, Fidelity Series Emerging Markets Fund Class F hurt relative performance because it struggled amid lackluster prospects for economic growth within developing countries. Turning to the Funds' fixed-income asset classes, high-quality bonds largely produced positive absolute returns throughout the past year. In an effort to buoy the economy, the Federal Reserve kept interest rates low. However, Treasury yields still fell below the current inflation rate, which created a challenging environment for fixed-income investors. As such, the most conservative investment-grade bonds - U.S. government securities - delivered the most modest result, while the riskiest segment of the overall bond market, high-yield debt, experienced the strongest return. Thanks to the Funds' highly diversified portfolio of debt instruments, the aggregate performance of the bond asset class handily outpaced the 3.77% result of the Barclays® U.S. Aggregate Bond Index. Core holding Fidelity Series Investment Grade Bond Fund Class F solidly outpaced the benchmark, while Fidelity Series High Income Fund Class F and Fidelity Series Real Estate Income Fund Class F also provided a powerful boost. In the short-term debt asset class, Fidelity Short-Term Bond Fund Class F propelled the Funds' aggregate performance here, topping the 0.13% return of Barclays® U.S. 3 Month Treasury Bellwether Index.
The views expressed above reflect those of the portfolio manager(s) only through the end of the period as stated on the cover of this report and do not necessarily represent the views of Fidelity or any other person in the Fidelity organization. Any such views are subject to change at any time based upon market or other conditions and Fidelity disclaims any responsibility to update such views. These views may not be relied on as investment advice and, because investment decisions for a Fidelity fund are based on numerous factors, may not be relied on as an indication of trading intent on behalf of any Fidelity fund.
Annual Report
As a shareholder of a Fund, you incur two types of costs: (1) transaction costs and (2) ongoing costs, including other Fund expenses. This Example is intended to help you understand your ongoing costs (in dollars) of investing in the Funds and to compare these costs with the ongoing costs of investing in other mutual funds.
The Example is based on an investment of $1,000 invested at the beginning of the period and held for the entire period (October 1, 2012 to March 31, 2013).
Actual Expenses
The first line of the accompanying table for each fund provides information about actual account values and actual expenses. You may use the information in this line, together with the amount you invested, to estimate the expenses that you paid over the period. Simply divide your account value by $1,000.00 (for example, an $8,600 account value divided by $1,000.00 = 8.6), then multiply the result by the number in the first line for a fund under the heading entitled "Expenses Paid During Period" to estimate the expenses you paid on your account during this period. In addition, each Fund, as a shareholder in underlying Fidelity Funds, will indirectly bear its pro-rata share of the fees and expenses incurred by the underlying Fidelity Funds. These fees and expenses are not included in each Fund's annualized expense ratio used to calculate the expense estimates in the table below.
Hypothetical Example for Comparison Purposes
The second line of the accompanying table for each fund provides information about hypothetical account values and hypothetical expenses based on a fund's actual expense ratio and an assumed rate of return of 5% per year before expenses, which is not the Fund's actual return. The hypothetical account values and expenses may not be used to estimate the actual ending account balance or expenses you paid for the period. You may use this information to compare the ongoing costs of investing in the Fund and other funds. To do so, compare this 5% hypothetical example with the 5% hypothetical examples that appear in the shareholder reports of the other funds. In addition, each Fund, as a shareholder in underlying Fidelity Funds, will indirectly bear its pro-rata share of the fees and expenses incurred by the underlying Fidelity Funds. These fees and expenses are not included in each Fund's annualized expense ratio used to calculate the expense estimates in the table below.
Please note that the expenses shown in the table are meant to highlight your ongoing costs only and do not reflect any transaction costs. Therefore, the second line of the table is useful in comparing ongoing costs only, and will not help you determine the relative total costs of owning different funds.
| Annualized
Expense RatioB | Beginning
Account Value
October 1, 2012 | Ending
Account Value
March 31, 2013 | Expenses Paid
During Period*
October 1, 2012
to March 31, 2013 |
Fidelity Freedom K® Income Fund | .05% | | | |
Actual | | $ 1,000.00 | $ 1,022.50 | $ .25 |
HypotheticalA | | $ 1,000.00 | $ 1,024.68 | $ .25 |
Fidelity Freedom K® 2000 Fund | .05% | | | |
Actual | | $ 1,000.00 | $ 1,023.40 | $ .25 |
HypotheticalA | | $ 1,000.00 | $ 1,024.68 | $ .25 |
Fidelity Freedom K® 2005 Fund | .05% | | | |
Actual | | $ 1,000.00 | $ 1,034.50 | $ .25 |
HypotheticalA | | $ 1,000.00 | $ 1,024.68 | $ .25 |
Fidelity Freedom K® 2010 Fund | .05% | | | |
Actual | | $ 1,000.00 | $ 1,045.50 | $ .25 |
HypotheticalA | | $ 1,000.00 | $ 1,024.68 | $ .25 |
Fidelity Freedom K® 2015 Fund | .05% | | | |
Actual | | $ 1,000.00 | $ 1,046.60 | $ .26 |
HypotheticalA | | $ 1,000.00 | $ 1,024.68 | $ .25 |
Fidelity Freedom K® 2020 Fund | .05% | | | |
Actual | | $ 1,000.00 | $ 1,051.30 | $ .26 |
HypotheticalA | | $ 1,000.00 | $ 1,024.68 | $ .25 |
Fidelity Freedom K® 2025 Fund | .05% | | | |
Actual | | $ 1,000.00 | $ 1,060.90 | $ .26 |
HypotheticalA | | $ 1,000.00 | $ 1,024.68 | $ .25 |
Fidelity Freedom K® 2030 Fund | .05% | | | |
Actual | | $ 1,000.00 | $ 1,063.80 | $ .26 |
HypotheticalA | | $ 1,000.00 | $ 1,024.68 | $ .25 |
Fidelity Freedom K® 2035 Fund | .05% | | | |
Actual | | $ 1,000.00 | $ 1,071.60 | $ .26 |
HypotheticalA | | $ 1,000.00 | $ 1,024.68 | $ .25 |
| Annualized
Expense RatioB | Beginning
Account Value
October 1, 2012 | Ending
Account Value
March 31, 2013 | Expenses Paid
During Period*
October 1, 2012
to March 31, 2013 |
Fidelity Freedom K® 2040 Fund | .05% | | | |
Actual | | $ 1,000.00 | $ 1,072.10 | $ .26 |
HypotheticalA | | $ 1,000.00 | $ 1,024.68 | $ .25 |
Fidelity Freedom K® 2045 Fund | .05% | | | |
Actual | | $ 1,000.00 | $ 1,074.90 | $ .26 |
HypotheticalA | | $ 1,000.00 | $ 1,024.68 | $ .25 |
Fidelity Freedom K® 2050 Fund | .05% | | | |
Actual | | $ 1,000.00 | $ 1,075.60 | $ .26 |
HypotheticalA | | $ 1,000.00 | $ 1,024.68 | $ .25 |
Fidelity Freedom K® 2055 Fund | .05% | | | |
Actual | | $ 1,000.00 | $ 1,078.50 | $ .26 |
HypotheticalA | | $ 1,000.00 | $ 1,024.68 | $ .25 |
A 5% return per year before expenses
B Annualized expense ratio reflects expenses net of applicable fee waivers.
* Expenses are equal to each Fund's annualized expense ratio, multiplied by the average account value over the period, multiplied by 182/365 (to reflect the one-half year period). The fees and expenses of the underlying Fidelity Funds in which the Funds invest are not included in the Fund's annualized expense ratio.
Annual Report
Fidelity Freedom K® Income Fund
Investment Changes (Unaudited)
The information in the following tables is based on the direct investments of the Fund. |
Fund Holdings as of March 31, 2013 |
| % of fund's
net assets | % of fund's net assets
6 months ago |
Commodity Funds | | |
Fidelity Series Commodity Strategy Fund Class F | 1.9 | 2.0 |
Domestic Equity Funds | | |
Fidelity Blue Chip Growth Fund Class F | 1.4 | 1.0 |
Fidelity Disciplined Equity Fund Class F | 0.3 | 1.3 |
Fidelity Growth Company Fund Class F | 1.8 | 2.0 |
Fidelity Series 100 Index Fund | 0.5 | 1.8 |
Fidelity Series All-Sector Equity Fund Class F | 2.0 | 3.0 |
Fidelity Series Equity Income Fund Class F | 1.2 | 0.0 |
Fidelity Series Intrinsic Opportunities Fund Class F | 0.8 | 0.0 |
Fidelity Series Large Cap Value Fund Class F | 1.2 | 2.5 |
Fidelity Series Mega Cap Fund Class F | 0.5 | 0.0 |
Fidelity Series Opportunistic Insights Fund Class F | 0.9 | 0.0 |
Fidelity Series Real Estate Equity Fund Class F | 0.2 | 0.2 |
Fidelity Series Small Cap Opportunities Fund Class F | 0.5 | 0.5 |
Fidelity Series Stock Selector Large Cap Value Fund Class F | 1.2 | 0.0 |
Fidelity Small Cap Growth Fund Class F | 0.3 | 0.3 |
Fidelity Small Cap Value Fund Class F | 0.3 | 0.3 |
| 13.1 | 12.9 |
Developed International Equity Funds | | |
Fidelity Series International Growth Fund Class F | 2.0 | 2.0 |
Fidelity Series International Small Cap Fund Class F | 0.4 | 0.4 |
Fidelity Series International Value Fund Class F | 2.0 | 1.9 |
| 4.4 | 4.3 |
Emerging Markets Equity Funds | | |
Fidelity Series Emerging Markets Fund Class F | 1.2 | 1.2 |
High Yield Bond Funds | | |
Fidelity Series Emerging Markets Debt Fund Class F | 0.5 | 0.5 |
Fidelity Series Floating Rate High Income Fund Class F | 1.1 | 1.2 |
Fidelity Series High Income Fund Class F | 5.0 | 4.8 |
Fidelity Series Real Estate Income Fund Class F | 0.4 | 0.7 |
| 7.0 | 7.2 |
Inflation-Protected Bond Funds | | |
Fidelity Series Inflation-Protected Bond Index Fund Class F | 11.4 | 12.0 |
Investment Grade Bond Funds | | |
Fidelity Series Investment Grade Bond Fund Class F | 21.5 | 21.2 |
Short-Term Funds | | |
Fidelity Institutional Money Market Portfolio Class F | 21.7 | 21.3 |
Fidelity Short-Term Bond Fund Class F | 17.8 | 17.9 |
| 39.5 | 39.2 |
Net Other Assets (Liabilities)* | 0.0 | 0.0 |
| 100.0 | 100.0 |
* Amount represents less than 0.1%
Asset Allocation (% of fund's net assets) |
Period end |
 | Commodity Funds | 1.9% | |
 | Domestic Equity Funds | 13.1% | |
 | Developed International Equity Funds | 4.4% | |
 | Emerging Markets Equity Funds | 1.2% | |
 | High Yield Bond Funds | 7.0% | |
 | Inflation-Protected Bond Funds | 11.4% | |
 | Investment Grade Bond Funds | 21.5% | |
 | Short-Term Funds | 39.5% | |

Six months ago |
| Commodity Funds | 2.0% | |
| Domestic Equity Funds | 12.9% | |
| Developed International Equity Funds | 4.3% | |
| Emerging Markets Equity Funds | 1.2% | |
| High Yield Bond Funds | 7.2% | |
| Inflation-Protected Bond Funds | 12.0% | |
| Investment Grade Bond Funds | 21.2% | |
| Short-Term Funds | 39.2% | |

Expected |
| Commodity Funds | 2.0% | |
| Domestic Equity Funds | 12.6% | |
| Developed International Equity Funds | 4.2% | |
| Emerging Markets Equity Funds | 1.2% | |
| High Yield Bond Funds | 5.0% | |
| Inflation-Protected Bond Funds | 12.0% | |
| Investment Grade Bond Funds | 23.0% | |
| Short-Term Funds | 40.0% | |

The six months ago allocation is based on the fund's holdings as of September 30, 2012. The current allocation is based on the fund's holdings as of March 31, 2013. The expected allocation represents the fund's anticipated allocation at September 30, 2013. |
Annual Report
Fidelity Freedom K® Income Fund
Investments March 31, 2013
Showing Percentage of Net Assets
Domestic Equity Funds - 15.0% |
| Shares | | Value |
Commodity Funds - 1.9% |
Fidelity Series Commodity Strategy Fund Class F (a) | 3,427,306 | | $ 29,920,383 |
Domestic Equity Funds - 13.1% |
Fidelity Blue Chip Growth Fund Class F | 399,241 | | 21,399,323 |
Fidelity Disciplined Equity Fund Class F | 171,257 | | 4,651,346 |
Fidelity Growth Company Fund Class F | 281,270 | | 28,422,283 |
Fidelity Series 100 Index Fund | 701,747 | | 7,242,026 |
Fidelity Series All-Sector Equity Fund Class F | 2,443,500 | | 31,398,973 |
Fidelity Series Equity Income Fund Class F | 1,750,389 | | 19,446,821 |
Fidelity Series Intrinsic Opportunities Fund Class F | 1,159,198 | | 13,156,895 |
Fidelity Series Large Cap Value Fund Class F | 1,561,036 | | 18,154,852 |
Fidelity Series Mega Cap Fund Class F | 645,590 | | 7,114,397 |
Fidelity Series Opportunistic Insights Fund Class F | 1,292,761 | | 14,233,295 |
Fidelity Series Real Estate Equity Fund Class F | 219,631 | | 2,859,599 |
Fidelity Series Small Cap Opportunities Fund Class F | 660,800 | | 8,187,311 |
Fidelity Series Stock Selector Large Cap Value Fund Class F | 1,742,874 | | 19,520,184 |
Fidelity Small Cap Growth Fund Class F | 235,483 | | 4,297,566 |
Fidelity Small Cap Value Fund Class F | 242,766 | | 4,588,276 |
TOTAL DOMESTIC EQUITY FUNDS | | 204,673,147 |
TOTAL DOMESTIC EQUITY FUNDS (Cost $208,801,668) |
234,593,530
|
International Equity Funds - 5.6% |
| | | |
Developed International Equity Funds - 4.4% |
Fidelity Series International Growth Fund Class F | 2,468,873 | | 31,280,623 |
Fidelity Series International Small Cap Fund Class F | 466,206 | | 6,410,334 |
Fidelity Series International Value Fund Class F | 3,167,972 | | 31,172,842 |
TOTAL DEVELOPED INTERNATIONAL EQUITY FUNDS | | 68,863,799 |
|
| Shares | | Value |
Emerging Markets Equity Funds - 1.2% |
Fidelity Series Emerging Markets Fund Class F | 1,132,726 | | $ 18,984,480 |
TOTAL INTERNATIONAL EQUITY FUNDS (Cost $77,869,353) |
87,848,279
|
Bond Funds - 39.9% |
| | | |
High Yield Bond Funds - 7.0% |
Fidelity Series Emerging Markets Debt Fund Class F | 734,907 | | 7,995,783 |
Fidelity Series Floating Rate High Income Fund Class F | 1,686,207 | | 17,924,383 |
Fidelity Series High Income Fund Class F | 7,397,442 | | 77,747,119 |
Fidelity Series Real Estate Income Fund Class F | 491,734 | | 5,738,540 |
TOTAL HIGH YIELD BOND FUNDS | | 109,405,825 |
Inflation-Protected Bond Funds - 11.4% |
Fidelity Series Inflation-Protected Bond Index Fund Class F | 15,683,926 | | 178,639,922 |
Investment Grade Bond Funds - 21.5% |
Fidelity Series Investment Grade Bond Fund Class F | 29,184,506 | | 336,789,194 |
TOTAL BOND FUNDS (Cost $614,620,072) |
624,834,941
|
Short-Term Funds - 39.5% |
| | | |
Fidelity Institutional Money Market Portfolio Class F | 339,166,529 | | 339,166,529 |
Fidelity Short-Term Bond Fund Class F | 32,481,922 | | 279,344,535 |
TOTAL SHORT-TERM FUNDS (Cost $614,730,167) |
618,511,064
|
TOTAL INVESTMENT PORTFOLIO - 100.0% (Cost $1,516,021,260) | | 1,565,787,814 |
NET OTHER ASSETS (LIABILITIES) - 0.0% | | (64,871) |
NET ASSETS - 100% | $ 1,565,722,943 |
Legend |
(a) Non-income producing |
Other Information |
All investments are categorized as Level 1 under the Fair Value Hierarchy. The inputs or methodology used for valuing securities may not be an indication of the risk associated with investing in those securities. For more information on valuation inputs, please refer to the Security Valuation section in the accompanying Notes to Financial Statements. |
See accompanying notes which are an integral part of the financial statements.
Annual Report
Fidelity Freedom K® Income Fund
Statement of Assets and Liabilities
| March 31, 2013 |
| | |
Assets | | |
Investment in securities, at value (cost $1,516,021,260) - See accompanying schedule | | $ 1,565,787,814 |
Receivable for investments sold | | 2,274,089 |
Receivable for fund shares sold | | 2,753,648 |
Total assets | | 1,570,815,551 |
| | |
Liabilities | | |
Payable for investments purchased | $ 353,304 | |
Payable for fund shares redeemed | 4,674,424 | |
Transfer agent fees payable | 64,880 | |
Total liabilities | | 5,092,608 |
| | |
Net Assets | | $ 1,565,722,943 |
Net Assets consist of: | | |
Paid in capital | | $ 1,502,671,229 |
Undistributed net investment income | | 1,597,923 |
Accumulated undistributed net realized gain (loss) on investments | | 11,687,237 |
Net unrealized appreciation (depreciation) on investments | | 49,766,554 |
Net Assets, for 131,745,025 shares outstanding | | $ 1,565,722,943 |
Net Asset Value, offering price and redemption price per share ($1,565,722,943 ÷ 131,745,025 shares) | | $ 11.88 |
Statement of Operations
| Year ended March 31, 2013 |
| | |
Investment Income | | |
Income distributions from underlying funds | | $ 20,215,127 |
| | |
Expenses | | |
Transfer agent fees | $ 703,897 | |
Independent trustees' compensation | 5,085 | |
Total expenses | | 708,982 |
Net investment income (loss) | | 19,506,145 |
Realized and Unrealized Gain (Loss) Realized gain (loss) on sale of underlying fund shares | 6,054,553 | |
Capital gain distributions from underlying funds | 22,952,907 | |
Total net realized gain (loss) | | 29,007,460 |
Change in net unrealized appreciation (depreciation) on underlying funds | | 19,854,338 |
Net gain (loss) | | 48,861,798 |
Net increase (decrease) in net assets resulting from operations | | $ 68,367,943 |
See accompanying notes which are an integral part of the financial statements.
Annual Report
Fidelity Freedom K® Income Fund
Financial Statements - continued
Statement of Changes in Net Assets
| Year ended
March 31,
2013 | Year ended
March 31,
2012 |
Increase (Decrease) in Net Assets | | |
Operations | | |
Net investment income (loss) | $ 19,506,145 | $ 14,949,419 |
Net realized gain (loss) | 29,007,460 | 14,295,894 |
Change in net unrealized appreciation (depreciation) | 19,854,338 | 10,607,304 |
Net increase (decrease) in net assets resulting from operations | 68,367,943 | 39,852,617 |
Distributions to shareholders from net investment income | (19,271,276) | (14,314,692) |
Distributions to shareholders from net realized gain | (20,877,308) | (15,065,060) |
Total distributions | (40,148,584) | (29,379,752) |
Share transactions
Proceeds from sales of shares | 753,193,034 | 941,766,818 |
Reinvestment of distributions | 40,148,584 | 29,379,752 |
Cost of shares redeemed | (537,169,540) | (336,343,461) |
Net increase (decrease) in net assets resulting from share transactions | 256,172,078 | 634,803,109 |
Total increase (decrease) in net assets | 284,391,437 | 645,275,974 |
| | |
Net Assets | | |
Beginning of period | 1,281,331,506 | 636,055,532 |
End of period (including undistributed net investment income of $1,597,923 and undistributed net investment income of $1,363,054, respectively) | $ 1,565,722,943 | $ 1,281,331,506 |
Other Information Shares | | |
Sold | 64,260,405 | 81,922,597 |
Issued in reinvestment of distributions | 3,441,371 | 2,570,739 |
Redeemed | (45,842,631) | (29,269,759) |
Net increase (decrease) | 21,859,145 | 55,223,577 |
Financial Highlights
Years ended March 31, | 2013 | 2012 | 2011 | 2010 E |
Selected Per-Share Data | | | | |
Net asset value, beginning of period | $ 11.66 | $ 11.64 | $ 11.10 | $ 10.00 |
Income from Investment Operations | | | | |
Net investment income (loss) C | .16 | .19 | .20 | .17 |
Net realized and unrealized gain (loss) | .39 | .21 | .61 | 1.09 |
Total from investment operations | .55 | .40 | .81 | 1.26 |
Distributions from net investment income | (.16) | (.18) | (.18) | (.13) |
Distributions from net realized gain | (.17) | (.19) | (.09) | (.03) |
Total distributions | (.33) | (.38) G | (.27) | (.16) |
Net asset value, end of period | $ 11.88 | $ 11.66 | $ 11.64 | $ 11.10 |
Total Return B | 4.77% | 3.50% | 7.37% | 12.66% |
Ratios to Average Net Assets D, F | | | | |
Expenses before reductions | .05% | .05% | .05% | .05% A |
Expenses net of fee waivers, if any | .05% | .05% | .05% | .05% A |
Expenses net of all reductions | .05% | .05% | .05% | .05% A |
Net investment income (loss) | 1.37% | 1.67% | 1.77% | 2.18% A |
Supplemental Data | | | | |
Net assets, end of period (000 omitted) | $ 1,565,723 | $ 1,281,332 | $ 636,056 | $ 123,777 |
Portfolio turnover rate | 17% | 20% | 32% | 32% A |
A Annualized
B Total returns for periods of less than one year are not annualized.
C Calculated based on average shares outstanding during the period.
D Amounts do not include the activity of the Underlying Funds.
E For the period July 2, 2009 (commencement of operations) to March 31, 2010.
F Expense ratios reflect operating expenses of the Fund. Expenses before reductions do not reflect amounts reimbursed by the investment adviser or reductions from expense offset arrangements and do not represent the amount paid by the Fund during periods when reimbursements or reductions occur. Expenses net of fee waivers reflect expenses after reimbursement by the investment adviser but prior to reductions from expense offset arrangements. Expenses net of all reductions represent the net expenses paid by the Fund but do not include expenses of the investment companies in which the Fund invests.
G Total distributions of $.38 per share is comprised of distributions from net investment income of $.182 and distributions from net realized gain of $.194 per share.
See accompanying notes which are an integral part of the financial statements.
Annual Report
Fidelity Freedom K® 2000 Fund
Investment Changes (Unaudited)
The information in the following tables is based on the direct investments of the Fund. |
Fund Holdings as of March 31, 2013 |
| % of fund's
net assets | % of fund's net assets
6 months ago |
Commodity Funds | | |
Fidelity Series Commodity Strategy Fund Class F | 1.9 | 2.1 |
Domestic Equity Funds | | |
Fidelity Blue Chip Growth Fund Class F | 1.3 | 1.0 |
Fidelity Disciplined Equity Fund Class F | 0.3 | 1.3 |
Fidelity Growth Company Fund Class F | 1.8 | 2.0 |
Fidelity Series 100 Index Fund | 0.4 | 1.8 |
Fidelity Series All-Sector Equity Fund Class F | 2.0 | 3.0 |
Fidelity Series Equity Income Fund Class F | 1.3 | 0.0 |
Fidelity Series Intrinsic Opportunities Fund Class F | 0.8 | 0.0 |
Fidelity Series Large Cap Value Fund Class F | 1.2 | 2.5 |
Fidelity Series Mega Cap Fund Class F | 0.5 | 0.0 |
Fidelity Series Opportunistic Insights Fund Class F | 0.9 | 0.0 |
Fidelity Series Real Estate Equity Fund Class F | 0.2 | 0.2 |
Fidelity Series Small Cap Opportunities Fund Class F | 0.5 | 0.5 |
Fidelity Series Stock Selector Large Cap Value Fund Class F | 1.3 | 0.0 |
Fidelity Small Cap Growth Fund Class F | 0.3 | 0.3 |
Fidelity Small Cap Value Fund Class F | 0.3 | 0.3 |
| 13.1 | 12.9 |
Developed International Equity Funds | | |
Fidelity Series International Growth Fund Class F | 2.0 | 2.0 |
Fidelity Series International Small Cap Fund Class F | 0.4 | 0.4 |
Fidelity Series International Value Fund Class F | 2.0 | 1.9 |
| 4.4 | 4.3 |
Emerging Markets Equity Funds | | |
Fidelity Series Emerging Markets Fund Class F | 1.2 | 1.2 |
High Yield Bond Funds | | |
Fidelity Series Emerging Markets Debt Fund Class F | 0.5 | 0.5 |
Fidelity Series Floating Rate High Income Fund Class F | 1.2 | 1.2 |
Fidelity Series High Income Fund Class F | 5.0 | 4.9 |
Fidelity Series Real Estate Income Fund Class F | 0.4 | 0.7 |
| 7.1 | 7.3 |
Inflation-Protected Bond Funds | | |
Fidelity Series Inflation-Protected Bond Index Fund Class F | 11.4 | 12.0 |
Investment Grade Bond Funds | | |
Fidelity Series Investment Grade Bond Fund Class F | 21.4 | 21.1 |
Short-Term Funds | | |
Fidelity Institutional Money Market Portfolio Class F | 21.7 | 21.3 |
Fidelity Short-Term Bond Fund Class F | 17.8 | 17.8 |
| 39.5 | 39.1 |
Net Other Assets (Liabilities)* | 0.0 | 0.0 |
| 100.0 | 100.0 |
* Amount represents less than 0.1%
Asset Allocation (% of fund's net assets) |
Period end |
| Commodity Funds | 1.9% | |
| Domestic Equity Funds | 13.1% | |
| Developed International Equity Funds | 4.4% | |
| Emerging Markets Equity Funds | 1.2% | |
| High Yield Bond Funds | 7.1% | |
| Inflation-Protected Bond Funds | 11.4% | |
| Investment Grade Bond Funds | 21.4% | |
| Short-Term Funds | 39.5% | |

Six months ago |
| Commodity Funds | 2.1% | |
| Domestic Equity Funds | 12.9% | |
| Developed International Equity Funds | 4.3% | |
| Emerging Markets Equity Funds | 1.2% | |
| High Yield Bond Funds | 7.3% | |
| Inflation-Protected Bond Funds | 12.0% | |
| Investment Grade Bond Funds | 21.1% | |
| Short-Term Funds | 39.1% | |

Expected |
| Commodity Funds | 2.0% | |
| Domestic Equity Funds | 12.6% | |
| Developed International Equity Funds | 4.2% | |
| Emerging Markets Equity Funds | 1.2% | |
| High Yield Bond Funds | 5.0% | |
| Inflation-Protected Bond Funds | 12.0% | |
| Investment Grade Bond Funds | 23.0% | |
| Short-Term Funds | 40.0% | |

The fund invests according to an asset allocation strategy that becomes increasingly conservative over time. The six months ago allocation is based on the fund's holdings as of September 30, 2012. The current allocation is based on the fund's holdings as of March 31, 2013. The expected allocation represents the fund's anticipated allocation at September 30, 2013. |
Annual Report
Fidelity Freedom K® 2000 Fund
Investments March 31, 2013
Showing Percentage of Net Assets
Domestic Equity Funds - 15.0% |
| Shares | | Value |
Commodity Funds - 1.9% |
Fidelity Series Commodity Strategy Fund Class F (a) | 1,678,933 | | $ 14,657,088 |
Domestic Equity Funds - 13.1% |
Fidelity Blue Chip Growth Fund Class F | 193,421 | | 10,367,354 |
Fidelity Disciplined Equity Fund Class F | 83,658 | | 2,272,153 |
Fidelity Growth Company Fund Class F | 136,973 | | 13,841,156 |
Fidelity Series 100 Index Fund | 339,533 | | 3,503,980 |
Fidelity Series All-Sector Equity Fund Class F | 1,182,688 | | 15,197,543 |
Fidelity Series Equity Income Fund Class F | 873,203 | | 9,701,289 |
Fidelity Series Intrinsic Opportunities Fund Class F | 564,095 | | 6,402,479 |
Fidelity Series Large Cap Value Fund Class F | 763,317 | | 8,877,379 |
Fidelity Series Mega Cap Fund Class F | 321,864 | | 3,546,946 |
Fidelity Series Opportunistic Insights Fund Class F | 644,502 | | 7,095,962 |
Fidelity Series Real Estate Equity Fund Class F | 101,050 | | 1,315,668 |
Fidelity Series Small Cap Opportunities Fund Class F | 320,636 | | 3,972,675 |
Fidelity Series Stock Selector Large Cap Value Fund Class F | 869,755 | | 9,741,259 |
Fidelity Small Cap Growth Fund Class F | 114,830 | | 2,095,648 |
Fidelity Small Cap Value Fund Class F | 118,667 | | 2,242,805 |
TOTAL DOMESTIC EQUITY FUNDS | | 100,174,296 |
TOTAL DOMESTIC EQUITY FUNDS (Cost $101,375,681) |
114,831,384
|
International Equity Funds - 5.6% |
| | | |
Developed International Equity Funds - 4.4% |
Fidelity Series International Growth Fund Class F | 1,207,363 | | 15,297,286 |
Fidelity Series International Small Cap Fund Class F | 227,340 | | 3,125,927 |
Fidelity Series International Value Fund Class F | 1,544,222 | | 15,195,142 |
TOTAL DEVELOPED INTERNATIONAL EQUITY FUNDS | | 33,618,355 |
|
| Shares | | Value |
Emerging Markets Equity Funds - 1.2% |
Fidelity Series Emerging Markets Fund Class F | 551,764 | | $ 9,247,573 |
TOTAL INTERNATIONAL EQUITY FUNDS (Cost $37,924,607) |
42,865,928
|
Bond Funds - 39.9% |
| | | |
High Yield Bond Funds - 7.1% |
Fidelity Series Emerging Markets Debt Fund Class F | 379,493 | | 4,128,883 |
Fidelity Series Floating Rate High Income Fund Class F | 842,095 | | 8,951,472 |
Fidelity Series High Income Fund Class F | 3,651,077 | | 38,372,819 |
Fidelity Series Real Estate Income Fund Class F | 245,503 | | 2,865,016 |
TOTAL HIGH YIELD BOND FUNDS | | 54,318,190 |
Inflation-Protected Bond Funds - 11.4% |
Fidelity Series Inflation-Protected Bond Index Fund Class F | 7,660,441 | | 87,252,419 |
Investment Grade Bond Funds - 21.4% |
Fidelity Series Investment Grade Bond Fund Class F | 14,261,100 | | 164,573,090 |
TOTAL BOND FUNDS (Cost $299,656,420) |
306,143,699
|
Short-Term Funds - 39.5% |
| | | |
Fidelity Institutional Money Market Portfolio Class F | 165,948,123 | | 165,948,123 |
Fidelity Short-Term Bond Fund Class F | 15,871,113 | | 136,491,569 |
TOTAL SHORT-TERM FUNDS (Cost $300,236,745) |
302,439,692
|
TOTAL INVESTMENT PORTFOLIO - 100.0% (Cost $739,193,453) | | 766,280,703 |
NET OTHER ASSETS (LIABILITIES) - 0.0% | | (31,804) |
NET ASSETS - 100% | $ 766,248,899 |
Legend |
(a) Non-income producing |
Other Information |
All investments are categorized as Level 1 under the Fair Value Hierarchy. The inputs or methodology used for valuing securities may not be an indication of the risk associated with investing in those securities. For more information on valuation inputs, please refer to the Security Valuation section in the accompanying Notes to Financial Statements. |
See accompanying notes which are an integral part of the financial statements.
Annual Report
Fidelity Freedom K® 2000 Fund
Statement of Assets and Liabilities
| March 31, 2013 |
| | |
Assets | | |
Investment in securities, at value (cost $739,193,453) - See accompanying schedule | | $ 766,280,703 |
Receivable for investments sold | | 1,061,965 |
Receivable for fund shares sold | | 704,263 |
Total assets | | 768,046,931 |
| | |
Liabilities | | |
Payable for investments purchased | $ 172,793 | |
Payable for fund shares redeemed | 1,593,428 | |
Transfer agent fees payable | 31,811 | |
Total liabilities | | 1,798,032 |
| | |
Net Assets | | $ 766,248,899 |
Net Assets consist of: | | |
Paid in capital | | $ 731,551,279 |
Undistributed net investment income | | 1,745,849 |
Accumulated undistributed net realized gain (loss) on investments | | 5,864,521 |
Net unrealized appreciation (depreciation) on investments | | 27,087,250 |
Net Assets, for 63,663,256 shares outstanding | | $ 766,248,899 |
Net Asset Value, offering price and redemption price per share ($766,248,899 ÷ 63,663,256 shares) | | $ 12.04 |
Statement of Operations
| Year ended March 31, 2013 |
| | |
Investment Income | | |
Income distributions from underlying funds | | $ 10,349,402 |
| | |
Expenses | | |
Transfer agent fees | $ 360,292 | |
Independent trustees' compensation | 2,617 | |
Total expenses | | 362,909 |
Net investment income (loss) | | 9,986,493 |
Realized and Unrealized Gain (Loss) Realized gain (loss) on sale of underlying fund shares | 3,143,100 | |
Capital gain distributions from underlying funds | 11,658,069 | |
Total net realized gain (loss) | | 14,801,169 |
Change in net unrealized appreciation (depreciation) on underlying funds | | 10,236,408 |
Net gain (loss) | | 25,037,577 |
Net increase (decrease) in net assets resulting from operations | | $ 35,024,070 |
See accompanying notes which are an integral part of the financial statements.
Annual Report
Fidelity Freedom K 2000 Fund
Financial Statements - continued
Statement of Changes in Net Assets
| Year ended
March 31,
2013 | Year ended
March 31,
2012 |
Increase (Decrease) in Net Assets | | |
Operations | | |
Net investment income (loss) | $ 9,986,493 | $ 8,587,023 |
Net realized gain (loss) | 14,801,169 | 8,771,350 |
Change in net unrealized appreciation (depreciation) | 10,236,408 | 3,383,207 |
Net increase (decrease) in net assets resulting from operations | 35,024,070 | 20,741,580 |
Distributions to shareholders from net investment income | (10,127,602) | (7,832,451) |
Distributions to shareholders from net realized gain | (10,962,080) | (10,260,599) |
Total distributions | (21,089,682) | (18,093,050) |
Share transactions
Proceeds from sales of shares | 317,129,847 | 396,400,982 |
Reinvestment of distributions | 21,089,682 | 18,093,050 |
Cost of shares redeemed | (248,577,057) | (169,656,839) |
Net increase (decrease) in net assets resulting from share transactions | 89,642,472 | 244,837,193 |
Total increase (decrease) in net assets | 103,576,860 | 247,485,723 |
| | |
Net Assets | | |
Beginning of period | 662,672,039 | 415,186,316 |
End of period (including undistributed net investment income of $1,745,849 and undistributed net investment income of $1,886,958, respectively) | $ 766,248,899 | $ 662,672,039 |
Other Information Shares | | |
Sold | 26,708,564 | 33,920,155 |
Issued in reinvestment of distributions | 1,790,935 | 1,569,080 |
Redeemed | (20,902,745) | (14,530,318) |
Net increase (decrease) | 7,596,754 | 20,958,917 |
Financial Highlights
Years ended March 31, | 2013 | 2012 | 2011 | 2010 E |
Selected Per-Share Data | | | | |
Net asset value, beginning of period | $ 11.82 | $ 11.83 | $ 11.20 | $ 10.00 |
Income from Investment Operations | | | | |
Net investment income (loss) C | .16 | .19 | .20 | .19 |
Net realized and unrealized gain (loss) | .40 | .20 | .65 | 1.12 |
Total from investment operations | .56 | .39 | .85 | 1.31 |
Distributions from net investment income | (.16) | (.17) | (.14) | (.06) |
Distributions from net realized gain | (.18) | (.24) | (.08) | (.05) |
Total distributions | (.34) | (.40) G | (.22) | (.11) |
Net asset value, end of period | $ 12.04 | $ 11.82 | $ 11.83 | $ 11.20 |
Total Return B | 4.84% | 3.41% | 7.68% | 13.12% |
Ratios to Average Net Assets D, F | | | | |
Expenses before reductions | .05% | .05% | .05% | .05% A |
Expenses net of fee waivers, if any | .05% | .05% | .05% | .05% A |
Expenses net of all reductions | .05% | .05% | .05% | .05% A |
Net investment income (loss) | 1.37% | 1.65% | 1.74% | 2.40% A |
Supplemental Data | | | | |
Net assets, end of period (000 omitted) | $ 766,249 | $ 662,672 | $ 415,186 | $ 87,474 |
Portfolio turnover rate | 20% | 22% | 36% | 35% A |
A Annualized
B Total returns for periods of less than one year are not annualized.
C Calculated based on average shares outstanding during the period.
D Amounts do not include the activity of the Underlying Funds.
E For the period July 2, 2009 (commencement of operations) to March 31, 2010.
F Expense ratios reflect operating expenses of the Fund. Expenses before reductions do not reflect amounts reimbursed by the investment adviser or reductions from expense offset arrangements and do not represent the amount paid by the Fund during periods when reimbursements or reductions occur. Expenses net of fee waivers reflect expenses after reimbursement by the investment adviser but prior to reductions from expense offset arrangements. Expenses net of all reductions represent the net expenses paid by the Fund but do not include expenses of the investment companies in which the Fund invests.
G Total distributions of $.40 per share is comprised of distributions from net investment income of $.166 and distributions from net realized gain of $.235 per share.
See accompanying notes which are an integral part of the financial statements.
Annual Report
Fidelity Freedom K® 2005 Fund
Investment Changes (Unaudited)
The information in the following tables is based on the direct investments of the Fund. |
Fund Holdings as of March 31, 2013 |
| % of fund's
net assets | % of fund's net assets
6 months ago |
Commodity Funds | | |
Fidelity Series Commodity Strategy Fund Class F | 3.8 | 4.2 |
Domestic Equity Funds | | |
Fidelity Blue Chip Growth Fund Class F | 2.4 | 1.8 |
Fidelity Disciplined Equity Fund Class F | 0.5 | 2.4 |
Fidelity Growth Company Fund Class F | 3.1 | 3.6 |
Fidelity Series 100 Index Fund | 0.8 | 3.2 |
Fidelity Series All-Sector Equity Fund Class F | 3.4 | 5.2 |
Fidelity Series Equity Income Fund Class F | 2.2 | 0.0 |
Fidelity Series Intrinsic Opportunities Fund Class F | 1.2 | 0.0 |
Fidelity Series Large Cap Value Fund Class F | 2.0 | 4.5 |
Fidelity Series Mega Cap Fund Class F | 0.8 | 0.0 |
Fidelity Series Opportunistic Insights Fund Class F | 1.6 | 0.0 |
Fidelity Series Real Estate Equity Fund Class F | 0.3 | 0.3 |
Fidelity Series Small Cap Opportunities Fund Class F | 0.9 | 0.9 |
Fidelity Series Stock Selector Large Cap Value Fund Class F | 2.2 | 0.0 |
Fidelity Small Cap Growth Fund Class F | 0.5 | 0.5 |
Fidelity Small Cap Value Fund Class F | 0.5 | 0.5 |
| 22.4 | 22.9 |
Developed International Equity Funds | | |
Fidelity Series International Growth Fund Class F | 3.4 | 3.4 |
Fidelity Series International Small Cap Fund Class F | 0.7 | 0.7 |
Fidelity Series International Value Fund Class F | 3.3 | 3.4 |
| 7.4 | 7.5 |
Emerging Markets Equity Funds | | |
Fidelity Series Emerging Markets Fund Class F | 2.0 | 2.3 |
High Yield Bond Funds | | |
Fidelity Series Emerging Markets Debt Fund Class F | 0.6 | 0.6 |
Fidelity Series Floating Rate High Income Fund Class F | 1.1 | 1.0 |
Fidelity Series High Income Fund Class F | 4.8 | 4.7 |
Fidelity Series Real Estate Income Fund Class F | 0.5 | 0.5 |
| 7.0 | 6.8 |
Inflation-Protected Bond Funds | | |
Fidelity Series Inflation-Protected Bond Index Fund Class F | 9.1 | 9.8 |
Investment Grade Bond Funds | | |
Fidelity Series Investment Grade Bond Fund Class F | 18.1 | 18.5 |
Short-Term Funds | | |
Fidelity Institutional Money Market Portfolio Class F | 16.6 | 15.5 |
Fidelity Short-Term Bond Fund Class F | 13.6 | 12.5 |
| 30.2 | 28.0 |
Net Other Assets (Liabilities)* | 0.0 | 0.0 |
| 100.0 | 100.0 |
* Amount represents less than 0.1% |
Asset Allocation (% of fund's net assets) |
Period end |
| Commodity Funds | 3.8% | |
| Domestic Equity Funds | 22.4% | |
| Developed International Equity Funds | 7.4% | |
| Emerging Markets Equity Funds | 2.0% | |
| High Yield Bond Funds | 7.0% | |
| Inflation-Protected Bond Funds | 9.1% | |
| Investment Grade Bond Funds | 18.1% | |
| Short-Term Funds | 30.2% | |

Six months ago |
| Commodity Funds | 4.2% | |
| Domestic Equity Funds | 22.9% | |
| Developed International Equity Funds | 7.5% | |
| Emerging Markets Equity Funds | 2.3% | |
| High Yield Bond Funds | 6.8% | |
| Inflation-Protected Bond Funds | 9.8% | |
| Investment Grade Bond Funds | 18.5% | |
| Short-Term Funds | 28.0% | |

Expected |
 | Commodity Funds | 3.6% | |
| Domestic Equity Funds | 20.4% | |
| Developed International Equity Funds | 6.8% | |
| Emerging Markets Equity Funds | 2.0% | |
| High Yield Bond Funds | 5.0% | |
| Inflation-Protected Bond Funds | 9.7% | |
| Investment Grade Bond Funds | 19.6% | |
| Short-Term Funds | 32.9% | |

The fund invests according to an asset allocation strategy that becomes increasingly conservative over time. The six months ago allocation is based on the fund's holdings as of September 30, 2012. The current allocation is based on the fund's holdings as of March 31, 2013. The expected allocation represents the fund's anticipated allocation at September 30, 2013. |
Annual Report
Fidelity Freedom K® 2005 Fund
Investments March 31, 2013
Showing Percentage of Net Assets
Domestic Equity Funds - 26.2% |
| Shares | | Value |
Commodity Funds - 3.8% |
Fidelity Series Commodity Strategy Fund Class F (a) | 2,143,499 | | $ 18,712,743 |
Domestic Equity Funds - 22.4% |
Fidelity Blue Chip Growth Fund Class F | 220,443 | | 11,815,761 |
Fidelity Disciplined Equity Fund Class F | 94,947 | | 2,578,747 |
Fidelity Growth Company Fund Class F | 151,141 | | 15,272,824 |
Fidelity Series 100 Index Fund | 383,434 | | 3,957,039 |
Fidelity Series All-Sector Equity Fund Class F | 1,327,813 | | 17,062,392 |
Fidelity Series Equity Income Fund Class F | 968,276 | | 10,757,552 |
Fidelity Series Intrinsic Opportunities Fund Class F | 540,132 | | 6,130,497 |
Fidelity Series Large Cap Value Fund Class F | 859,578 | | 9,996,897 |
Fidelity Series Mega Cap Fund Class F | 356,387 | | 3,927,382 |
Fidelity Series Opportunistic Insights Fund Class F | 713,176 | | 7,852,073 |
Fidelity Series Real Estate Equity Fund Class F | 116,788 | | 1,520,576 |
Fidelity Series Small Cap Opportunities Fund Class F | 365,807 | | 4,532,355 |
Fidelity Series Stock Selector Large Cap Value Fund Class F | 964,964 | | 10,807,598 |
Fidelity Small Cap Growth Fund Class F | 130,661 | | 2,384,563 |
Fidelity Small Cap Value Fund Class F | 134,836 | | 2,548,398 |
TOTAL DOMESTIC EQUITY FUNDS | | 111,144,654 |
TOTAL DOMESTIC EQUITY FUNDS (Cost $115,251,736) |
129,857,397
|
International Equity Funds - 9.4% |
| | | |
Developed International Equity Funds - 7.4% |
Fidelity Series International Growth Fund Class F | 1,320,380 | | 16,729,213 |
Fidelity Series International Small Cap Fund Class F | 249,176 | | 3,426,173 |
Fidelity Series International Value Fund Class F | 1,680,252 | | 16,533,675 |
TOTAL DEVELOPED INTERNATIONAL EQUITY FUNDS | | 36,689,061 |
Emerging Markets Equity Funds - 2.0% |
Fidelity Series Emerging Markets Fund Class F | 611,538 | | 10,249,384 |
TOTAL INTERNATIONAL EQUITY FUNDS (Cost $41,076,549) |
46,938,445
|
Bond Funds - 34.2% |
| Shares | | Value |
High Yield Bond Funds - 7.0% |
Fidelity Series Emerging Markets Debt Fund Class F | 283,188 | | $ 3,081,086 |
Fidelity Series Floating Rate High Income Fund Class F | 510,896 | | 5,430,822 |
Fidelity Series High Income Fund Class F | 2,280,121 | | 23,964,069 |
Fidelity Series Real Estate Income Fund Class F | 199,950 | | 2,333,416 |
TOTAL HIGH YIELD BOND FUNDS | | 34,809,393 |
Inflation-Protected Bond Funds - 9.1% |
Fidelity Series Inflation-Protected Bond Index Fund Class F | 3,964,838 | | 45,159,502 |
Investment Grade Bond Funds - 18.1% |
Fidelity Series Investment Grade Bond Fund Class F | 7,759,582 | | 89,545,578 |
TOTAL BOND FUNDS (Cost $165,991,521) |
169,514,473
|
Short-Term Funds - 30.2% |
| | | |
Fidelity Institutional Money Market Portfolio Class F | 82,320,523 | | 82,320,523 |
Fidelity Short-Term Bond Fund Class F | 7,843,444 | | 67,453,619 |
TOTAL SHORT-TERM FUNDS (Cost $148,973,932) |
149,774,142
|
TOTAL INVESTMENT PORTFOLIO - 100.0% (Cost $471,293,738) | | 496,084,457 |
NET OTHER ASSETS (LIABILITIES) - 0.0% | | (20,561) |
NET ASSETS - 100% | $ 496,063,896 |
Legend |
(a) Non-income producing |
Other Information |
All investments are categorized as Level 1 under the Fair Value Hierarchy. The inputs or methodology used for valuing securities may not be an indication of the risk associated with investing in those securities. For more information on valuation inputs, please refer to the Security Valuation section in the accompanying Notes to Financial Statements. |
See accompanying notes which are an integral part of the financial statements.
Annual Report
Fidelity Freedom K® 2005 Fund
Statement of Assets and Liabilities
| March 31, 2013 |
| | |
Assets | | |
Investment in securities, at value (cost $471,293,738) - See accompanying schedule | | $ 496,084,457 |
Receivable for investments sold | | 95,488 |
Receivable for fund shares sold | | 1,372,676 |
Total assets | | 497,552,621 |
| | |
Liabilities | | |
Payable for investments purchased | $ 1,100,075 | |
Payable for fund shares redeemed | 368,086 | |
Transfer agent fees payable | 20,564 | |
Total liabilities | | 1,488,725 |
| | |
Net Assets | | $ 496,063,896 |
Net Assets consist of: | | |
Paid in capital | | $ 464,324,800 |
Undistributed net investment income | | 998,079 |
Accumulated undistributed net realized gain (loss) on investments | | 5,950,298 |
Net unrealized appreciation (depreciation) on investments | | 24,790,719 |
Net Assets, for 38,163,444 shares outstanding | | $ 496,063,896 |
Net Asset Value, offering price and redemption price per share ($496,063,896 ÷ 38,163,444 shares) | | $ 13.00 |
Statement of Operations
| Year ended March 31, 2013 |
| | |
Investment Income | | |
Income distributions from underlying funds | | $ 6,827,124 |
| | |
Expenses | | |
Transfer agent fees | $ 223,222 | |
Independent trustees' compensation | 1,608 | |
Total expenses | | 224,830 |
Net investment income (loss) | | 6,602,294 |
Realized and Unrealized Gain (Loss) Realized gain (loss) on sale of underlying fund shares | 3,810,255 | |
Capital gain distributions from underlying funds | 8,100,894 | |
Total net realized gain (loss) | | 11,911,149 |
Change in net unrealized appreciation (depreciation) on underlying funds | | 9,551,556 |
Net gain (loss) | | 21,462,705 |
Net increase (decrease) in net assets resulting from operations | | $ 28,064,999 |
See accompanying notes which are an integral part of the financial statements.
Annual Report
Fidelity Freedom K® 2005 Fund
Financial Statements - continued
Statement of Changes in Net Assets
| Year ended
March 31,
2013 | Year ended
March 31,
2012 |
Increase (Decrease) in Net Assets | | |
Operations | | |
Net investment income (loss) | $ 6,602,294 | $ 5,095,456 |
Net realized gain (loss) | 11,911,149 | 6,719,958 |
Change in net unrealized appreciation (depreciation) | 9,551,556 | (238,126) |
Net increase (decrease) in net assets resulting from operations | 28,064,999 | 11,577,288 |
Distributions to shareholders from net investment income | (6,563,931) | (4,709,146) |
Distributions to shareholders from net realized gain | (7,399,766) | (7,947,894) |
Total distributions | (13,963,697) | (12,657,040) |
Share transactions
Proceeds from sales of shares | 255,064,764 | 261,370,551 |
Reinvestment of distributions | 13,963,697 | 12,657,040 |
Cost of shares redeemed | (175,074,534) | (142,755,897) |
Net increase (decrease) in net assets resulting from share transactions | 93,953,927 | 131,271,694 |
Total increase (decrease) in net assets | 108,055,229 | 130,191,942 |
| | |
Net Assets | | |
Beginning of period | 388,008,667 | 257,816,725 |
End of period (including undistributed net investment income of $998,079 and undistributed net investment income of $959,716, respectively) | $ 496,063,896 | $ 388,008,667 |
Other Information Shares | | |
Sold | 20,164,317 | 21,093,693 |
Issued in reinvestment of distributions | 1,114,064 | 1,039,078 |
Redeemed | (13,795,032) | (11,566,245) |
Net increase (decrease) | 7,483,349 | 10,566,526 |
Financial Highlights
Years ended March 31, | 2013 | 2012 | 2011 | 2010 E |
Selected Per-Share Data | | | | |
Net asset value, beginning of period | $ 12.65 | $ 12.82 | $ 11.85 | $ 10.00 |
Income from Investment Operations | | | | |
Net investment income (loss) C | .19 | .21 | .21 | .18 |
Net realized and unrealized gain (loss) | .56 | .13 | 1.05 | 1.76 |
Total from investment operations | .75 | .34 | 1.26 | 1.94 |
Distributions from net investment income | (.18) | (.18) | (.17) | (.05) |
Distributions from net realized gain | (.21) | (.33) | (.12) | (.04) |
Total distributions | (.40) G | (.51) | (.29) | (.09) |
Net asset value, end of period | $ 13.00 | $ 12.65 | $ 12.82 | $ 11.85 |
Total Return B | 6.03% | 2.83% | 10.75% | 19.42% |
Ratios to Average Net Assets D, F | | | | |
Expenses before reductions | .05% | .05% | .05% | .06% A |
Expenses net of fee waivers, if any | .05% | .05% | .05% | .06% A |
Expenses net of all reductions | .05% | .05% | .05% | .06% A |
Net investment income (loss) | 1.46% | 1.66% | 1.73% | 2.11% A |
Supplemental Data | | | | |
Net assets, end of period (000 omitted) | $ 496,064 | $ 388,009 | $ 257,817 | $ 65,083 |
Portfolio turnover rate | 29% | 37% | 47% | 40% A |
A Annualized
B Total returns for periods of less than one year are not annualized.
C Calculated based on average shares outstanding during the period.
D Amounts do not include the activity of the Underlying Funds.
E For the period July 2, 2009 (commencement of operations) to March 31, 2010.
F Expense ratios reflect operating expenses of the Fund. Expenses before reductions do not reflect amounts reimbursed by the investment adviser or reductions from expense offset arrangements and do not represent the amount paid by the Fund during periods when reimbursements or reductions occur. Expenses net of fee waivers reflect expenses after reimbursement by the investment adviser but prior to reductions from expense offset arrangements. Expenses net of all reductions represent the net expenses paid by the Fund but do not include expenses of the investment companies in which the Fund invests.
G Total distributions of $.40 per share is comprised of distributions from net investment income of $.182 and distributions from net realized gain of $.213 per share.
See accompanying notes which are an integral part of the financial statements.
Annual Report
Fidelity Freedom K® 2010 Fund
Investment Changes (Unaudited)
The information in the following tables is based on the direct investments of the Fund. |
Fund Holdings as of March 31, 2013 |
| % of fund's
net assets | % of fund's net assets
6 months ago |
Commodity Funds | | |
Fidelity Series Commodity Strategy Fund Class F | 5.0 | 5.3 |
Domestic Equity Funds | | |
Fidelity Blue Chip Growth Fund Class F | 3.2 | 2.3 |
Fidelity Disciplined Equity Fund Class F | 0.7 | 3.2 |
Fidelity Growth Company Fund Class F | 4.3 | 5.0 |
Fidelity Series 100 Index Fund | 1.1 | 4.3 |
Fidelity Series All-Sector Equity Fund Class F | 4.7 | 7.1 |
Fidelity Series Equity Income Fund Class F | 3.0 | 0.0 |
Fidelity Series Intrinsic Opportunities Fund Class F | 1.7 | 0.0 |
Fidelity Series Large Cap Value Fund Class F | 2.8 | 6.1 |
Fidelity Series Mega Cap Fund Class F | 1.1 | 0.0 |
Fidelity Series Opportunistic Insights Fund Class F | 2.2 | 0.0 |
Fidelity Series Real Estate Equity Fund Class F | 0.4 | 0.4 |
Fidelity Series Small Cap Opportunities Fund Class F | 1.2 | 1.2 |
Fidelity Series Stock Selector Large Cap Value Fund Class F | 3.0 | 0.0 |
Fidelity Small Cap Growth Fund Class F | 0.6 | 0.7 |
Fidelity Small Cap Value Fund Class F | 0.7 | 0.7 |
| 30.7 | 31.0 |
Developed International Equity Funds | | |
Fidelity Series International Growth Fund Class F | 4.6 | 4.6 |
Fidelity Series International Small Cap Fund Class F | 1.0 | 0.9 |
Fidelity Series International Value Fund Class F | 4.6 | 4.6 |
| 10.2 | 10.1 |
Emerging Markets Equity Funds | | |
Fidelity Series Emerging Markets Fund Class F | 2.8 | 2.9 |
High Yield Bond Funds | | |
Fidelity Series Emerging Markets Debt Fund Class F | 0.7 | 0.7 |
Fidelity Series Floating Rate High Income Fund Class F | 1.1 | 1.4 |
Fidelity Series High Income Fund Class F | 4.8 | 4.7 |
Fidelity Series Real Estate Income Fund Class F | 0.5 | 0.7 |
| 7.1 | 7.5 |
Inflation-Protected Bond Funds | | |
Fidelity Series Inflation-Protected Bond Index Fund Class F | 10.1 | 10.6 |
Investment Grade Bond Funds | | |
Fidelity Series Investment Grade Bond Fund Class F | 21.5 | 21.6 |
Short-Term Funds | | |
Fidelity Institutional Money Market Portfolio Class F | 6.9 | 6.0 |
Fidelity Short-Term Bond Fund Class F | 5.7 | 5.0 |
| 12.6 | 11.0 |
Net Other Assets (Liabilities)* | 0.0 | 0.0 |
| 100.0 | 100.0 |
* Amount represents less than 0.1% |
Asset Allocation (% of fund's net assets) |
Period end |
| Commodity Funds | 5.0% | |
| Domestic Equity Funds | 30.7% | |
| Developed International Equity Funds | 10.2% | |
| Emerging Markets Equity Funds | 2.8% | |
| High Yield Bond Funds | 7.1% | |
| Inflation-Protected Bond Funds | 10.1% | |
| Investment Grade Bond Funds | 21.5% | |
| Short-Term Funds | 12.6% | |

Six months ago |
| Commodity Funds | 5.3% | |
| Domestic Equity Funds | 31.0% | |
| Developed International Equity Funds | 10.1% | |
| Emerging Markets Equity Funds | 2.9% | |
| High Yield Bond Funds | 7.5% | |
| Inflation-Protected Bond Funds | 10.6% | |
| Investment Grade Bond Funds | 21.6% | |
| Short-Term Funds | 11.0% | |

Expected |
| Commodity Funds | 5.2% | |
| Domestic Equity Funds | 29.4% | |
| Developed International Equity Funds | 9.7% | |
| Emerging Markets Equity Funds | 2.9% | |
| High Yield Bond Funds | 5.0% | |
| Inflation-Protected Bond Funds | 10.5% | |
| Investment Grade Bond Funds | 23.1% | |
| Short-Term Funds | 14.2% | |

The fund invests according to an asset allocation strategy that becomes increasingly conservative over time. The six months ago allocation is based on the fund's holdings as of September 30, 2012. The current allocation is based on the fund's holdings as of March 31, 2013. The expected allocation represents the fund's anticipated allocation at September 30, 2013. |
Annual Report
Fidelity Freedom K® 2010 Fund
Investments March 31, 2013
Showing Percentage of Net Assets
Domestic Equity Funds - 35.7% |
| Shares | | Value |
Commodity Funds - 5.0% |
Fidelity Series Commodity Strategy Fund Class F (a) | 27,077,329 | | $ 236,385,079 |
Domestic Equity Funds - 30.7% |
Fidelity Blue Chip Growth Fund Class F | 2,794,821 | | 149,802,430 |
Fidelity Disciplined Equity Fund Class F | 1,211,041 | | 32,891,866 |
Fidelity Growth Company Fund Class F | 1,995,331 | | 201,628,203 |
Fidelity Series 100 Index Fund | 4,910,773 | | 50,679,176 |
Fidelity Series All-Sector Equity Fund Class F | 17,152,485 | | 220,409,431 |
Fidelity Series Equity Income Fund Class F | 12,686,890 | | 140,951,352 |
Fidelity Series Intrinsic Opportunities Fund Class F | 7,070,711 | | 80,252,568 |
Fidelity Series Large Cap Value Fund Class F | 11,329,082 | | 131,757,219 |
Fidelity Series Mega Cap Fund Class F | 4,672,655 | | 51,492,653 |
Fidelity Series Opportunistic Insights Fund Class F | 9,351,555 | | 102,960,623 |
Fidelity Series Real Estate Equity Fund Class F | 1,443,240 | | 18,790,991 |
Fidelity Series Small Cap Opportunities Fund Class F | 4,608,689 | | 57,101,662 |
Fidelity Series Stock Selector Large Cap Value Fund Class F | 12,661,998 | | 141,814,376 |
Fidelity Small Cap Growth Fund Class F | 1,652,699 | | 30,161,753 |
Fidelity Small Cap Value Fund Class F | 1,706,063 | | 32,244,593 |
TOTAL DOMESTIC EQUITY FUNDS | | 1,442,938,896 |
TOTAL DOMESTIC EQUITY FUNDS (Cost $1,497,128,160) |
1,679,323,975
|
International Equity Funds - 13.0% |
| | | |
Developed International Equity Funds - 10.2% |
Fidelity Series International Growth Fund Class F | 17,180,043 | | 217,671,150 |
Fidelity Series International Small Cap Fund Class F | 3,225,614 | | 44,352,190 |
Fidelity Series International Value Fund Class F | 21,932,995 | | 215,820,670 |
TOTAL DEVELOPED INTERNATIONAL EQUITY FUNDS | | 477,844,010 |
|
| Shares | | Value |
Emerging Markets Equity Funds - 2.8% |
Fidelity Series Emerging Markets Fund Class F | 7,842,583 | | $ 131,441,689 |
TOTAL INTERNATIONAL EQUITY FUNDS (Cost $540,888,527) |
609,285,699
|
Bond Funds - 38.7% |
| | | |
High Yield Bond Funds - 7.1% |
Fidelity Series Emerging Markets Debt Fund Class F | 2,873,754 | | 31,266,438 |
Fidelity Series Floating Rate High Income Fund Class F | 5,102,826 | | 54,243,040 |
Fidelity Series High Income Fund Class F | 21,488,567 | | 225,844,840 |
Fidelity Series Real Estate Income Fund Class F | 2,085,324 | | 24,335,736 |
TOTAL HIGH YIELD BOND FUNDS | | 335,690,054 |
Inflation-Protected Bond Funds - 10.1% |
Fidelity Series Inflation-Protected Bond Index Fund Class F | 41,635,491 | | 474,228,237 |
Investment Grade Bond Funds - 21.5% |
Fidelity Series Investment Grade Bond Fund Class F | 87,634,502 | | 1,011,302,155 |
TOTAL BOND FUNDS (Cost $1,781,302,287) |
1,821,220,446
|
Short-Term Funds - 12.6% |
| | | |
Fidelity Institutional Money Market Portfolio Class F | 324,006,396 | | 324,006,396 |
Fidelity Short-Term Bond Fund Class F | 30,946,756 | | 266,142,105 |
TOTAL SHORT-TERM FUNDS (Cost $586,477,001) |
590,148,501
|
TOTAL INVESTMENT PORTFOLIO - 100.0% (Cost $4,405,795,975) | | 4,699,978,621 |
NET OTHER ASSETS (LIABILITIES) - 0.0% | | (194,917) |
NET ASSETS - 100% | $ 4,699,783,704 |
Legend |
(a) Non-income producing |
Other Information |
All investments are categorized as Level 1 under the Fair Value Hierarchy. The inputs or methodology used for valuing securities may not be an indication of the risk associated with investing in those securities. For more information on valuation inputs, please refer to the Security Valuation section in the accompanying Notes to Financial Statements. |
See accompanying notes which are an integral part of the financial statements.
Annual Report
Fidelity Freedom K® 2010 Fund
Statement of Assets and Liabilities
| March 31, 2013 |
| | |
Assets | | |
Investment in securities, at value (cost $4,405,795,975) - See accompanying schedule | | $ 4,699,978,621 |
Receivable for investments sold | | 9,479,073 |
Receivable for fund shares sold | | 7,518,298 |
Total assets | | 4,716,975,992 |
| | |
Liabilities | | |
Payable for investments purchased | $ 2,488,290 | |
Payable for fund shares redeemed | 14,509,053 | |
Transfer agent fees payable | 194,945 | |
Total liabilities | | 17,192,288 |
| | |
Net Assets | | $ 4,699,783,704 |
Net Assets consist of: | | |
Paid in capital | | $ 4,317,765,588 |
Undistributed net investment income | | 9,553,951 |
Accumulated undistributed net realized gain (loss) on investments | | 78,281,519 |
Net unrealized appreciation (depreciation) on investments | | 294,182,646 |
Net Assets, for 351,075,199 shares outstanding | | $ 4,699,783,704 |
Net Asset Value, offering price and redemption price per share ($4,699,783,704 ÷ 351,075,199 shares) | | $ 13.39 |
Statement of Operations
| Year ended March 31, 2013 |
| | |
Investment Income | | |
Income distributions from underlying funds | | $ 74,805,706 |
| | |
Expenses | | |
Transfer agent fees | $ 2,175,358 | |
Independent trustees' compensation | 15,810 | |
Total expenses | | 2,191,168 |
Net investment income (loss) | | 72,614,538 |
Realized and Unrealized Gain (Loss) Realized gain (loss) on sale of underlying fund shares | 41,200,023 | |
Capital gain distributions from underlying funds | 96,061,209 | |
Total net realized gain (loss) | | 137,261,232 |
Change in net unrealized appreciation (depreciation) on underlying funds | | 117,239,921 |
Net gain (loss) | | 254,501,153 |
Net increase (decrease) in net assets resulting from operations | | $ 327,115,691 |
See accompanying notes which are an integral part of the financial statements.
Annual Report
Fidelity Freedom K 2010 Fund
Financial Statements - continued
Statement of Changes in Net Assets
| Year ended
March 31,
2013 | Year ended
March 31,
2012 |
Increase (Decrease) in Net Assets | | |
Operations | | |
Net investment income (loss) | $ 72,614,538 | $ 59,249,816 |
Net realized gain (loss) | 137,261,232 | 92,078,454 |
Change in net unrealized appreciation (depreciation) | 117,239,921 | 549,097 |
Net increase (decrease) in net assets resulting from operations | 327,115,691 | 151,877,367 |
Distributions to shareholders from net investment income | (73,332,890) | (55,252,209) |
Distributions to shareholders from net realized gain | (90,164,143) | (91,139,646) |
Total distributions | (163,497,033) | (146,391,855) |
Share transactions
Proceeds from sales of shares | 1,635,790,352 | 2,385,432,286 |
Reinvestment of distributions | 163,497,033 | 146,391,855 |
Cost of shares redeemed | (1,393,908,281) | (1,071,760,225) |
Net increase (decrease) in net assets resulting from share transactions | 405,379,104 | 1,460,063,916 |
Total increase (decrease) in net assets | 568,997,762 | 1,465,549,428 |
| | |
Net Assets | | |
Beginning of period | 4,130,785,942 | 2,665,236,514 |
End of period (including undistributed net investment income of $9,553,951 and undistributed net investment income of $10,272,303, respectively) | $ 4,699,783,704 | $ 4,130,785,942 |
Other Information Shares | | |
Sold | 126,668,267 | 189,462,446 |
Issued in reinvestment of distributions | 12,812,082 | 11,862,119 |
Redeemed | (107,862,174) | (84,968,631) |
Net increase (decrease) | 31,618,175 | 116,355,934 |
Financial Highlights
Years ended March 31, | 2013 | 2012 | 2011 | 2010 E |
Selected Per-Share Data | | | | |
Net asset value, beginning of period | $ 12.93 | $ 13.12 | $ 11.97 | $ 10.00 |
Income from Investment Operations | | | | |
Net investment income (loss) C | .21 | .23 | .23 | .17 |
Net realized and unrealized gain (loss) | .74 | .14 | 1.21 | 1.89 |
Total from investment operations | .95 | .37 | 1.44 | 2.06 |
Distributions from net investment income | (.22) | (.20) | (.17) | (.05) |
Distributions from net realized gain | (.27) | (.36) | (.12) | (.04) |
Total distributions | (.49) | (.56) | (.29) | (.09) |
Net asset value, end of period | $ 13.39 | $ 12.93 | $ 13.12 | $ 11.97 |
Total Return B | 7.53% | 3.08% | 12.17% | 20.62% |
Ratios to Average Net Assets D, F | | | | |
Expenses before reductions | .05% | .05% | .05% | .05% A |
Expenses net of fee waivers, if any | .05% | .05% | .05% | .05% A |
Expenses net of all reductions | .05% | .05% | .05% | .05% A |
Net investment income (loss) | 1.65% | 1.85% | 1.82% | 2.04% A |
Supplemental Data | | | | |
Net assets, end of period (000 omitted) | $ 4,699,784 | $ 4,130,786 | $ 2,665,237 | $ 675,704 |
Portfolio turnover rate | 30% | 28% | 42% | 29% A |
A Annualized
B Total returns for periods of less than one year are not annualized.
C Calculated based on average shares outstanding during the period.
D Amounts do not include the activity of the Underlying Funds.
E For the period July 2, 2009 (commencement of operations) to March 31, 2010.
F Expense ratios reflect operating expenses of the Fund. Expenses before reductions do not reflect amounts reimbursed by the investment adviser or reductions from expense offset arrangements and do not represent the amount paid by the Fund during periods when reimbursements or reductions occur. Expenses net of fee waivers reflect expenses after reimbursement by the investment adviser but prior to reductions from expense offset arrangements. Expenses net of all reductions represent the net expenses paid by the Fund but do not include expenses of the investment companies in which the Fund invests.
See accompanying notes which are an integral part of the financial statements.
Annual Report
Fidelity Freedom K® 2015 Fund
Investment Changes (Unaudited)
The information in the following tables is based on the direct investments of the Fund. |
Fund Holdings as of March 31, 2013 |
| % of fund's
net assets | % of fund's net assets
6 months ago |
Commodity Funds | | |
Fidelity Series Commodity Strategy Fund Class F | 5.3 | 5.5 |
Domestic Equity Funds | | |
Fidelity Blue Chip Growth Fund Class F | 3.3 | 2.4 |
Fidelity Disciplined Equity Fund Class F | 0.7 | 3.3 |
Fidelity Growth Company Fund Class F | 4.5 | 5.1 |
Fidelity Series 100 Index Fund | 1.2 | 4.5 |
Fidelity Series All-Sector Equity Fund Class F | 4.9 | 7.3 |
Fidelity Series Equity Income Fund Class F | 3.1 | 0.0 |
Fidelity Series Intrinsic Opportunities Fund Class F | 1.8 | 0.0 |
Fidelity Series Large Cap Value Fund Class F | 2.9 | 6.2 |
Fidelity Series Mega Cap Fund Class F | 1.1 | 0.0 |
Fidelity Series Opportunistic Insights Fund Class F | 2.3 | 0.0 |
Fidelity Series Real Estate Equity Fund Class F | 0.4 | 0.4 |
Fidelity Series Small Cap Opportunities Fund Class F | 1.3 | 1.2 |
Fidelity Series Stock Selector Large Cap Value Fund Class F | 3.1 | 0.0 |
Fidelity Small Cap Growth Fund Class F | 0.7 | 0.7 |
Fidelity Small Cap Value Fund Class F | 0.7 | 0.7 |
| 32.0 | 31.8 |
Developed International Equity Funds | | |
Fidelity Series International Growth Fund Class F | 4.8 | 4.8 |
Fidelity Series International Small Cap Fund Class F | 1.0 | 1.0 |
Fidelity Series International Value Fund Class F | 4.8 | 4.7 |
| 10.6 | 10.5 |
Emerging Markets Equity Funds | | |
Fidelity Series Emerging Markets Fund Class F | 2.9 | 3.0 |
High Yield Bond Funds | | |
Fidelity Series Emerging Markets Debt Fund Class F | 0.6 | 0.6 |
Fidelity Series Floating Rate High Income Fund Class F | 1.1 | 1.3 |
Fidelity Series High Income Fund Class F | 4.7 | 4.7 |
Fidelity Series Real Estate Income Fund Class F | 0.6 | 0.7 |
| 7.0 | 7.3 |
Inflation-Protected Bond Funds | | |
Fidelity Series Inflation-Protected Bond Index Fund Class F | 9.9 | 10.1 |
Investment Grade Bond Funds | | |
Fidelity Series Investment Grade Bond Fund Class F | 22.6 | 22.3 |
Short-Term Funds | | |
Fidelity Institutional Money Market Portfolio Class F | 5.3 | 5.2 |
Fidelity Short-Term Bond Fund Class F | 4.4 | 4.3 |
| 9.7 | 9.5 |
Net Other Assets (Liabilities)* | 0.0 | 0.0 |
| 100.0 | 100.0 |
* Amount represents less than 0.1% |
Asset Allocation (% of fund's net assets) |
Period end |
| Commodity Funds | 5.3% | |
| Domestic Equity Funds | 32.0% | |
| Developed International Equity Funds | 10.6% | |
| Emerging Markets Equity Funds | 2.9% | |
| High Yield Bond Funds | 7.0% | |
| Inflation-Protected Bond Funds | 9.9% | |
| Investment Grade Bond Funds | 22.6% | |
| Short-Term Funds | 9.7% | |

Six months ago |
| Commodity Funds | 5.5% | |
| Domestic Equity Funds | 31.8% | |
| Developed International Equity Funds | 10.5% | |
| Emerging Markets Equity Funds | 3.0% | |
| High Yield Bond Funds | 7.3% | |
| Inflation-Protected Bond Funds | 10.1% | |
| Investment Grade Bond Funds | 22.3% | |
| Short-Term Funds | 9.5% | |

Expected |
| Commodity Funds | 5.5% | |
| Domestic Equity Funds | 31.1% | |
| Developed International Equity Funds | 10.3% | |
| Emerging Markets Equity Funds | 3.0% | |
| High Yield Bond Funds | 5.0% | |
| Inflation-Protected Bond Funds | 10.6% | |
| Investment Grade Bond Funds | 24.4% | |
| Short-Term Funds | 10.1% | |

The fund invests according to an asset allocation strategy that becomes increasingly conservative over time. The six months ago allocation is based on the fund's holdings as of September 30, 2012. The current allocation is based on the fund's holdings as of March 31, 2013. The expected allocation represents the fund's anticipated allocation at September 30, 2013. |
Annual Report
Fidelity Freedom K® 2015 Fund
Investments March 31, 2013
Showing Percentage of Net Assets
Domestic Equity Funds - 37.3% |
| Shares | | Value |
Commodity Funds - 5.3% |
Fidelity Series Commodity Strategy Fund Class F (a) | 43,641,105 | | $ 380,986,843 |
Domestic Equity Funds - 32.0% |
Fidelity Blue Chip Growth Fund Class F | 4,437,290 | | 237,838,735 |
Fidelity Disciplined Equity Fund Class F | 1,927,798 | | 52,358,996 |
Fidelity Growth Company Fund Class F | 3,192,484 | | 322,600,509 |
Fidelity Series 100 Index Fund | 7,881,513 | | 81,337,216 |
Fidelity Series All-Sector Equity Fund Class F | 27,315,964 | | 351,010,140 |
Fidelity Series Equity Income Fund Class F | 19,641,513 | | 218,217,212 |
Fidelity Series Intrinsic Opportunities Fund Class F | 11,390,352 | | 129,280,499 |
Fidelity Series Large Cap Value Fund Class F | 17,995,986 | | 209,293,319 |
Fidelity Series Mega Cap Fund Class F | 7,240,950 | | 79,795,267 |
Fidelity Series Opportunistic Insights Fund Class F | 14,492,716 | | 159,564,808 |
Fidelity Series Real Estate Equity Fund Class F | 2,291,265 | | 29,832,276 |
Fidelity Series Small Cap Opportunities Fund Class F | 7,337,010 | | 90,905,560 |
Fidelity Series Stock Selector Large Cap Value Fund Class F | 19,611,371 | | 219,647,351 |
Fidelity Small Cap Growth Fund Class F | 2,662,864 | | 48,597,274 |
Fidelity Small Cap Value Fund Class F | 2,751,793 | | 52,008,882 |
TOTAL DOMESTIC EQUITY FUNDS | | 2,282,288,044 |
TOTAL DOMESTIC EQUITY FUNDS (Cost $2,397,884,383) |
2,663,274,887
|
International Equity Funds - 13.5% |
| | | |
Developed International Equity Funds - 10.6% |
Fidelity Series International Growth Fund Class F | 27,117,905 | | 343,583,858 |
Fidelity Series International Small Cap Fund Class F | 5,103,677 | | 70,175,563 |
Fidelity Series International Value Fund Class F | 34,677,018 | | 341,221,853 |
TOTAL DEVELOPED INTERNATIONAL EQUITY FUNDS | | 754,981,274 |
|
| Shares | | Value |
Emerging Markets Equity Funds - 2.9% |
Fidelity Series Emerging Markets Fund Class F | 12,398,814 | | $ 207,804,129 |
TOTAL INTERNATIONAL EQUITY FUNDS (Cost $857,775,787) |
962,785,403
|
Bond Funds - 39.5% |
| | | |
High Yield Bond Funds - 7.0% |
Fidelity Series Emerging Markets Debt Fund Class F | 4,080,253 | | 44,393,155 |
Fidelity Series Floating Rate High Income Fund Class F | 7,552,771 | | 80,285,954 |
Fidelity Series High Income Fund Class F | 32,108,333 | | 337,458,576 |
Fidelity Series Real Estate Income Fund Class F | 3,409,368 | | 39,787,328 |
TOTAL HIGH YIELD BOND FUNDS | | 501,925,013 |
Inflation-Protected Bond Funds - 9.9% |
Fidelity Series Inflation-Protected Bond Index Fund Class F | 62,102,650 | | 707,349,178 |
Investment Grade Bond Funds - 22.6% |
Fidelity Series Investment Grade Bond Fund Class F | 139,414,956 | | 1,608,848,595 |
TOTAL BOND FUNDS (Cost $2,772,085,061) |
2,818,122,786
|
Short-Term Funds - 9.7% |
| | | |
Fidelity Institutional Money Market Portfolio Class F | 381,045,557 | | 381,045,557 |
Fidelity Short-Term Bond Fund Class F | 36,477,919 | | 313,710,106 |
TOTAL SHORT-TERM FUNDS (Cost $690,601,112) |
694,755,663
|
TOTAL INVESTMENT PORTFOLIO - 100.0% (Cost $6,718,346,343) | | 7,138,938,739 |
NET OTHER ASSETS (LIABILITIES) - 0.0% | | (293,971) |
NET ASSETS - 100% | $ 7,138,644,768 |
Legend |
(a) Non-income producing |
Other Information |
All investments are categorized as Level 1 under the Fair Value Hierarchy. The inputs or methodology used for valuing securities may not be an indication of the risk associated with investing in those securities. For more information on valuation inputs, please refer to the Security Valuation section in the accompanying Notes to Financial Statements. |
See accompanying notes which are an integral part of the financial statements.
Annual Report
Fidelity Freedom K® 2015 Fund
Statement of Assets and Liabilities
| March 31, 2013 |
| | |
Assets | | |
Investment in securities, at value (cost $6,718,346,343) - See accompanying schedule | | $ 7,138,938,739 |
Receivable for investments sold | | 9,834,892 |
Receivable for fund shares sold | | 21,891,530 |
Total assets | | 7,170,665,161 |
| | |
Liabilities | | |
Payable for investments purchased | $ 3,932,640 | |
Payable for fund shares redeemed | 27,793,741 | |
Transfer agent fees payable | 294,012 | |
Total liabilities | | 32,020,393 |
| | |
Net Assets | | $ 7,138,644,768 |
Net Assets consist of: | | |
Paid in capital | | $ 6,595,575,137 |
Undistributed net investment income | | 14,130,444 |
Accumulated undistributed net realized gain (loss) on investments | | 108,346,791 |
Net unrealized appreciation (depreciation) on investments | | 420,592,396 |
Net Assets, for 529,655,771 shares outstanding | | $ 7,138,644,768 |
Net Asset Value, offering price and redemption price per share ($7,138,644,768 ÷ 529,655,771 shares) | | $ 13.48 |
Statement of Operations
| Year ended March 31, 2013 |
| | |
Investment Income | | |
Income distributions from underlying funds | | $ 108,083,999 |
| | |
Expenses | | |
Transfer agent fees | $ 3,088,640 | |
Independent trustees' compensation | 22,203 | |
Total expenses | | 3,110,843 |
Net investment income (loss) | | 104,973,156 |
Realized and Unrealized Gain (Loss) Realized gain (loss) on sale of underlying fund shares | 51,603,846 | |
Capital gain distributions from underlying funds | 142,266,857 | |
Total net realized gain (loss) | | 193,870,703 |
Change in net unrealized appreciation (depreciation) on underlying funds | | 191,632,000 |
Net gain (loss) | | 385,502,703 |
Net increase (decrease) in net assets resulting from operations | | $ 490,475,859 |
See accompanying notes which are an integral part of the financial statements.
Annual Report
Fidelity Freedom K 2015 Fund
Financial Statements - continued
Statement of Changes in Net Assets
| Year ended
March 31,
2013 | Year ended
March 31,
2012 |
Increase (Decrease) in Net Assets | | |
Operations | | |
Net investment income (loss) | $ 104,973,156 | $ 75,366,197 |
Net realized gain (loss) | 193,870,703 | 112,050,956 |
Change in net unrealized appreciation (depreciation) | 191,632,000 | 15,624,223 |
Net increase (decrease) in net assets resulting from operations | 490,475,859 | 203,041,376 |
Distributions to shareholders from net investment income | (104,060,774) | (69,048,549) |
Distributions to shareholders from net realized gain | (121,907,706) | (110,875,285) |
Total distributions | (225,968,480) | (179,923,834) |
Share transactions
Proceeds from sales of shares | 2,897,817,791 | 3,367,532,187 |
Reinvestment of distributions | 225,968,480 | 179,923,834 |
Cost of shares redeemed | (1,715,829,396) | (1,253,246,618) |
Net increase (decrease) in net assets resulting from share transactions | 1,407,956,875 | 2,294,209,403 |
Total increase (decrease) in net assets | 1,672,464,254 | 2,317,326,945 |
| | |
Net Assets | | |
Beginning of period | 5,466,180,514 | 3,148,853,569 |
End of period (including undistributed net investment income of $14,130,444 and undistributed net investment income of $13,218,064, respectively) | $ 7,138,644,768 | $ 5,466,180,514 |
Other Information Shares | | |
Sold | 222,954,292 | 266,725,796 |
Issued in reinvestment of distributions | 17,651,115 | 14,546,763 |
Redeemed | (131,962,603) | (99,415,824) |
Net increase (decrease) | 108,642,804 | 181,856,735 |
Financial Highlights
Years ended March 31, | 2013 | 2012 | 2011 | 2010 E |
Selected Per-Share Data | | | | |
Net asset value, beginning of period | $ 12.98 | $ 13.17 | $ 12.01 | $ 10.00 |
Income from Investment Operations | | | | |
Net investment income (loss) C | .22 | .24 | .23 | .19 |
Net realized and unrealized gain (loss) | .75 | .13 | 1.24 | 1.95 |
Total from investment operations | .97 | .37 | 1.47 | 2.14 |
Distributions from net investment income | (.21) | (.20) | (.18) | (.07) |
Distributions from net realized gain | (.26) | (.36) | (.14) | (.06) |
Total distributions | (.47) | (.56) | (.31) G | (.13) |
Net asset value, end of period | $ 13.48 | $ 12.98 | $ 13.17 | $ 12.01 |
Total Return B | 7.70% | 3.00% | 12.42% | 21.38% |
Ratios to Average Net Assets D, F | | | | |
Expenses before reductions | .05% | .05% | .05% | .05% A |
Expenses net of fee waivers, if any | .05% | .05% | .05% | .05% A |
Expenses net of all reductions | .05% | .05% | .05% | .05% A |
Net investment income (loss) | 1.68% | 1.86% | 1.83% | 2.26% A |
Supplemental Data | | | | |
Net assets, end of period (000 omitted) | $ 7,138,645 | $ 5,466,181 | $ 3,148,854 | $ 870,342 |
Portfolio turnover rate | 21% | 23% | 35% | 23% A |
A Annualized
B Total returns for periods of less than one year are not annualized.
C Calculated based on average shares outstanding during the period.
D Amounts do not include the activity of the Underlying Funds.
E For the period July 2, 2009 (commencement of operations) to March 31, 2010.
F Expense ratios reflect operating expenses of the Fund. Expenses before reductions do not reflect amounts reimbursed by the investment adviser or reductions from expense offset arrangements and do not represent the amount paid by the Fund during periods when reimbursements or reductions occur. Expenses net of fee waivers reflect expenses after reimbursement by the investment adviser but prior to reductions from expense offset arrangements. Expenses net of all reductions represent the net expenses paid by the Fund but do not include expenses of the investment companies in which the Fund invests.
G Total distributions of $.31 per share is comprised of distributions from net investment income of $.176 and distributions from net realized gain of $.137 per share.
See accompanying notes which are an integral part of the financial statements.
Annual Report
Fidelity Freedom K® 2020 Fund
Investment Changes (Unaudited)
The information in the following tables is based on the direct investments of the Fund. |
Fund Holdings as of March 31, 2013 |
| % of fund's
net assets | % of fund's net assets
6 months ago |
Commodity Funds | | |
Fidelity Series Commodity Strategy Fund Class F | 5.9 | 6.2 |
Domestic Equity Funds | | |
Fidelity Blue Chip Growth Fund Class F | 3.7 | 2.7 |
Fidelity Disciplined Equity Fund Class F | 0.8 | 3.8 |
Fidelity Growth Company Fund Class F | 4.9 | 5.7 |
Fidelity Series 100 Index Fund | 1.2 | 5.0 |
Fidelity Series All-Sector Equity Fund Class F | 5.4 | 8.3 |
Fidelity Series Equity Income Fund Class F | 3.4 | 0.0 |
Fidelity Series Intrinsic Opportunities Fund Class F | 1.9 | 0.0 |
Fidelity Series Large Cap Value Fund Class F | 3.2 | 7.0 |
Fidelity Series Mega Cap Fund Class F | 1.2 | 0.0 |
Fidelity Series Opportunistic Insights Fund Class F | 2.5 | 0.0 |
Fidelity Series Real Estate Equity Fund Class F | 0.5 | 0.5 |
Fidelity Series Small Cap Opportunities Fund Class F | 1.4 | 1.4 |
Fidelity Series Stock Selector Large Cap Value Fund Class F | 3.4 | 0.0 |
Fidelity Small Cap Growth Fund Class F | 0.7 | 0.8 |
Fidelity Small Cap Value Fund Class F | 0.8 | 0.8 |
| 35.0 | 36.0 |
Developed International Equity Funds | | |
Fidelity Series International Growth Fund Class F | 5.2 | 5.4 |
Fidelity Series International Small Cap Fund Class F | 1.1 | 1.1 |
Fidelity Series International Value Fund Class F | 5.2 | 5.3 |
| 11.5 | 11.8 |
Emerging Markets Equity Funds | | |
Fidelity Series Emerging Markets Fund Class F | 3.2 | 3.4 |
High Yield Bond Funds | | |
Fidelity Series Emerging Markets Debt Fund Class F | 0.7 | 0.7 |
Fidelity Series Floating Rate High Income Fund Class F | 1.1 | 1.2 |
Fidelity Series High Income Fund Class F | 5.4 | 5.7 |
Fidelity Series Real Estate Income Fund Class F | 0.6 | 0.6 |
| 7.8 | 8.2 |
Inflation-Protected Bond Funds | | |
Fidelity Series Inflation-Protected Bond Index Fund Class F | 8.2 | 8.1 |
Investment Grade Bond Funds | | |
Fidelity Series Investment Grade Bond Fund Class F | 21.7 | 20.9 |
Short-Term Funds | | |
Fidelity Institutional Money Market Portfolio Class F | 3.7 | 2.9 |
Fidelity Short-Term Bond Fund Class F | 3.0 | 2.5 |
| 6.7 | 5.4 |
Net Other Assets (Liabilities)* | 0.0 | 0.0 |
| 100.0 | 100.0 |
* Amount represents less than 0.1% |
Asset Allocation (% of fund's net assets) |
Period end |
| Commodity Funds | 5.9% | |
| Domestic Equity Funds | 35.0% | |
| Developed International Equity Funds | 11.5% | |
| Emerging Markets Equity Funds | 3.2% | |
| High Yield Bond Funds | 7.8% | |
| Inflation-Protected Bond Funds | 8.2% | |
| Investment Grade Bond Funds | 21.7% | |
| Short-Term Funds | 6.7% | |

Six months ago |
| Commodity Funds | 6.2% | |
| Domestic Equity Funds | 36.0% | |
| Developed International Equity Funds | 11.8% | |
| Emerging Markets Equity Funds | 3.4% | |
| High Yield Bond Funds | 8.2% | |
| Inflation-Protected Bond Funds | 8.1% | |
| Investment Grade Bond Funds | 20.9% | |
| Short-Term Funds | 5.4% | |

Expected |
| Commodity Funds | 5.9% | |
| Domestic Equity Funds | 33.4% | |
| Developed International Equity Funds | 11.0% | |
| Emerging Markets Equity Funds | 3.3% | |
| High Yield Bond Funds | 5.5% | |
| Inflation-Protected Bond Funds | 9.0% | |
| Investment Grade Bond Funds | 24.2% | |
| Short-Term Funds | 7.7% | |

The fund invests according to an asset allocation strategy that becomes increasingly conservative over time. The six months ago allocation is based on the fund's holdings as of September 30, 2012. The current allocation is based on the fund's holdings as of March 31, 2013. The expected allocation represents the fund's anticipated allocation at September 30, 2013. |
Annual Report
Fidelity Freedom K® 2020 Fund
Investments March 31, 2013
Showing Percentage of Net Assets
Domestic Equity Funds - 40.9% |
| Shares | | Value |
Commodity Funds - 5.9% |
Fidelity Series Commodity Strategy Fund Class F (a) | 107,982,250 | | $ 942,685,044 |
Domestic Equity Funds - 35.0% |
Fidelity Blue Chip Growth Fund Class F | 10,979,451 | | 588,498,575 |
Fidelity Disciplined Equity Fund Class F | 4,755,459 | | 129,158,280 |
Fidelity Growth Company Fund Class F | 7,811,636 | | 789,365,850 |
Fidelity Series 100 Index Fund | 19,377,203 | | 199,972,738 |
Fidelity Series All-Sector Equity Fund Class F | 67,378,977 | | 865,819,849 |
Fidelity Series Equity Income Fund Class F | 48,729,204 | | 541,381,458 |
Fidelity Series Intrinsic Opportunities Fund Class F | 26,629,929 | | 302,249,698 |
Fidelity Series Large Cap Value Fund Class F | 44,280,730 | | 514,984,893 |
Fidelity Series Mega Cap Fund Class F | 17,940,869 | | 197,708,377 |
Fidelity Series Opportunistic Insights Fund Class F | 35,895,991 | | 395,214,863 |
Fidelity Series Real Estate Equity Fund Class F | 5,815,082 | | 75,712,362 |
Fidelity Series Small Cap Opportunities Fund Class F | 18,131,197 | | 224,645,527 |
Fidelity Series Stock Selector Large Cap Value Fund Class F | 48,645,325 | | 544,827,638 |
Fidelity Small Cap Growth Fund Class F | 6,498,428 | | 118,596,302 |
Fidelity Small Cap Value Fund Class F | 6,710,235 | | 126,823,443 |
TOTAL DOMESTIC EQUITY FUNDS | | 5,614,959,853 |
TOTAL DOMESTIC EQUITY FUNDS (Cost $5,919,558,053) |
6,557,644,897
|
International Equity Funds - 14.7% |
| | | |
Developed International Equity Funds - 11.5% |
Fidelity Series International Growth Fund Class F | 66,568,317 | | 843,420,577 |
Fidelity Series International Small Cap Fund Class F | 12,480,184 | | 171,602,530 |
Fidelity Series International Value Fund Class F | 84,887,207 | | 835,290,115 |
TOTAL DEVELOPED INTERNATIONAL EQUITY FUNDS | | 1,850,313,222 |
|
| Shares | | Value |
Emerging Markets Equity Funds - 3.2% |
Fidelity Series Emerging Markets Fund Class F | 30,493,651 | | $ 511,073,597 |
TOTAL INTERNATIONAL EQUITY FUNDS (Cost $2,102,738,804) |
2,361,386,819
|
Bond Funds - 37.7% |
| | | |
High Yield Bond Funds - 7.8% |
Fidelity Series Emerging Markets Debt Fund Class F | 10,931,998 | | 118,940,141 |
Fidelity Series Floating Rate High Income Fund Class F | 16,973,173 | | 180,424,834 |
Fidelity Series High Income Fund Class F | 82,047,863 | | 862,323,043 |
Fidelity Series Real Estate Income Fund Class F | 8,216,483 | | 95,886,354 |
TOTAL HIGH YIELD BOND FUNDS | | 1,257,574,372 |
Inflation-Protected Bond Funds - 8.2% |
Fidelity Series Inflation-Protected Bond Index Fund Class F | 115,288,436 | | 1,313,135,289 |
Investment Grade Bond Funds - 21.7% |
Fidelity Series Investment Grade Bond Fund Class F | 301,820,437 | | 3,483,007,844 |
TOTAL BOND FUNDS (Cost $5,961,212,123) |
6,053,717,505
|
Short-Term Funds - 6.7% |
| | | |
Fidelity Institutional Money Market Portfolio Class F | 593,164,107 | | 593,164,107 |
Fidelity Short-Term Bond Fund Class F | 56,591,547 | | 486,687,301 |
TOTAL SHORT-TERM FUNDS (Cost $1,075,543,579) |
1,079,851,408
|
TOTAL INVESTMENT PORTFOLIO - 100.0% (Cost $15,059,052,559) | 16,052,600,629 |
NET OTHER ASSETS (LIABILITIES) - 0.0% | | (659,726) |
NET ASSETS - 100% | $ 16,051,940,903 |
Legend |
(a) Non-income producing |
Other Information |
All investments are categorized as Level 1 under the Fair Value Hierarchy. The inputs or methodology used for valuing securities may not be an indication of the risk associated with investing in those securities. For more information on valuation inputs, please refer to the Security Valuation section in the accompanying Notes to Financial Statements. |
See accompanying notes which are an integral part of the financial statements.
Annual Report
Fidelity Freedom K® 2020 Fund
Statement of Assets and Liabilities
| March 31, 2013 |
| | |
Assets | | |
Investment in securities, at value (cost $15,059,052,559) - See accompanying schedule | | $ 16,052,600,629 |
Receivable for investments sold | | 16,564,467 |
Receivable for fund shares sold | | 46,614,131 |
Total assets | | 16,115,779,227 |
| | |
Liabilities | | |
Payable for investments purchased | $ 9,675,740 | |
Payable for fund shares redeemed | 53,502,766 | |
Transfer agent fees payable | 659,818 | |
Total liabilities | | 63,838,324 |
| | |
Net Assets | | $ 16,051,940,903 |
Net Assets consist of: | | |
Paid in capital | | $ 14,758,197,359 |
Undistributed net investment income | | 31,790,272 |
Accumulated undistributed net realized gain (loss) on investments | | 268,405,202 |
Net unrealized appreciation (depreciation) on investments | | 993,548,070 |
Net Assets, for 1,147,901,633 shares outstanding | | $ 16,051,940,903 |
Net Asset Value, offering price and redemption price per share ($16,051,940,903 ÷ 1,147,901,633 shares) | | $ 13.98 |
Statement of Operations
| Year ended March 31, 2013 |
| | |
Investment Income | | |
Income distributions from underlying funds | | $ 252,237,970 |
| | |
Expenses | | |
Transfer agent fees | $ 6,818,312 | |
Independent trustees' compensation | 48,932 | |
Total expenses | | 6,867,244 |
Net investment income (loss) | | 245,370,726 |
Realized and Unrealized Gain (Loss) Realized gain (loss) on sale of underlying fund shares | 130,123,176 | |
Capital gain distributions from underlying funds | 318,580,928 | |
Total net realized gain (loss) | | 448,704,104 |
Change in net unrealized appreciation (depreciation) on underlying funds | | 471,599,307 |
Net gain (loss) | | 920,303,411 |
Net increase (decrease) in net assets resulting from operations | | $ 1,165,674,137 |
See accompanying notes which are an integral part of the financial statements.
Annual Report
Fidelity Freedom K® 2020 Fund
Financial Statements - continued
Statement of Changes in Net Assets
| Year ended
March 31,
2013 | Year ended
March 31,
2012 |
Increase (Decrease) in Net Assets | | |
Operations | | |
Net investment income (loss) | $ 245,370,726 | $ 168,300,771 |
Net realized gain (loss) | 448,704,104 | 259,628,612 |
Change in net unrealized appreciation (depreciation) | 471,599,307 | 22,331,370 |
Net increase (decrease) in net assets resulting from operations | 1,165,674,137 | 450,260,753 |
Distributions to shareholders from net investment income | (242,055,622) | (153,614,168) |
Distributions to shareholders from net realized gain | (272,202,329) | (255,510,896) |
Total distributions | (514,257,951) | (409,125,064) |
Share transactions
Proceeds from sales of shares | 5,706,482,439 | 6,940,773,309 |
Reinvestment of distributions | 514,257,951 | 409,125,064 |
Cost of shares redeemed | (2,874,667,076) | (1,969,151,512) |
Net increase (decrease) in net assets resulting from share transactions | 3,346,073,314 | 5,380,746,861 |
Total increase (decrease) in net assets | 3,997,489,500 | 5,421,882,550 |
| | |
Net Assets | | |
Beginning of period | 12,054,451,403 | 6,632,568,853 |
End of period (including undistributed net investment income of $31,790,272 and undistributed net investment income of $28,475,167, respectively) | $ 16,051,940,903 | $ 12,054,451,403 |
Other Information Shares | | |
Sold | 425,101,001 | 534,520,638 |
Issued in reinvestment of distributions | 38,982,612 | 32,134,331 |
Redeemed | (214,551,170) | (151,744,911) |
Net increase (decrease) | 249,532,443 | 414,910,058 |
Financial Highlights
Years ended March 31, | 2013 | 2012 | 2011 | 2010 E |
Selected Per-Share Data | | | | |
Net asset value, beginning of period | $ 13.42 | $ 13.72 | $ 12.37 | $ 10.00 |
Income from Investment Operations | | | | |
Net investment income (loss) C | .24 | .25 | .24 | .18 |
Net realized and unrealized gain (loss) | .82 | .06 | 1.42 | 2.30 |
Total from investment operations | 1.06 | .31 | 1.66 | 2.48 |
Distributions from net investment income | (.23) | (.21) | (.18) | (.06) |
Distributions from net realized gain | (.27) | (.40) | (.13) | (.05) |
Total distributions | (.50) | (.61) | (.31) | (.11) |
Net asset value, end of period | $ 13.98 | $ 13.42 | $ 13.72 | $ 12.37 |
Total Return B | 8.17% | 2.50% | 13.62% | 24.78% |
Ratios to Average Net Assets D, F | | | | |
Expenses before reductions | .05% | .05% | .05% | .05% A |
Expenses net of fee waivers, if any | .05% | .05% | .05% | .05% A |
Expenses net of all reductions | .05% | .05% | .05% | .05% A |
Net investment income (loss) | 1.78% | 1.94% | 1.89% | 2.01% A |
Supplemental Data | | | | |
Net assets, end of period (000 omitted) | $ 16,051,941 | $ 12,054,451 | $ 6,632,569 | $ 1,585,350 |
Portfolio turnover rate | 23% | 21% | 37% | 20% A |
A Annualized
B Total returns would have been lower if certain expenses had not been reduced during the applicable periods shown.
C Calculated based on average shares outstanding during the period.
D Amounts do not include the activity of the Underlying Funds.
E For the period July 2, 2009 (commencement of operations) to March 31, 2010.
F Expense ratios reflect operating expenses of the Fund. Expenses before reductions do not reflect amounts reimbursed by the investment adviser or reductions from expense offset arrangements and do not represent the amount paid by the Fund during periods when reimbursements or reductions occur. Expenses net of fee waivers reflect expenses after reimbursement by the investment adviser but prior to reductions from expense offset arrangements. Expenses net of all reductions represent the net expenses paid by the Fund but do not include expenses of the investment companies in which the Fund invests.
See accompanying notes which are an integral part of the financial statements.
Annual Report
Fidelity Freedom K® 2025 Fund
Investment Changes (Unaudited)
The information in the following tables is based on the direct investments of the Fund. |
Fund Holdings as of March 31, 2013 |
| % of fund's
net assets | % of fund's net assets
6 months ago |
Commodity Funds | | |
Fidelity Series Commodity Strategy Fund Class F | 7.2 | 7.5 |
Domestic Equity Funds | | |
Fidelity Blue Chip Growth Fund Class F | 4.5 | 3.1 |
Fidelity Disciplined Equity Fund Class F | 1.0 | 4.5 |
Fidelity Growth Company Fund Class F | 6.1 | 6.8 |
Fidelity Series 100 Index Fund | 1.5 | 6.0 |
Fidelity Series All-Sector Equity Fund Class F | 6.6 | 9.8 |
Fidelity Series Equity Income Fund Class F | 4.0 | 0.0 |
Fidelity Series Intrinsic Opportunities Fund Class F | 2.4 | 0.0 |
Fidelity Series Large Cap Value Fund Class F | 3.9 | 8.3 |
Fidelity Series Mega Cap Fund Class F | 1.5 | 0.0 |
Fidelity Series Opportunistic Insights Fund Class F | 2.9 | 0.0 |
Fidelity Series Real Estate Equity Fund Class F | 0.6 | 0.5 |
Fidelity Series Small Cap Opportunities Fund Class F | 1.7 | 1.7 |
Fidelity Series Stock Selector Large Cap Value Fund Class F | 4.0 | 0.0 |
Fidelity Small Cap Growth Fund Class F | 0.9 | 1.0 |
Fidelity Small Cap Value Fund Class F | 1.0 | 0.9 |
| 42.6 | 42.6 |
Developed International Equity Funds | | |
Fidelity Series International Growth Fund Class F | 6.4 | 6.5 |
Fidelity Series International Small Cap Fund Class F | 1.3 | 1.3 |
Fidelity Series International Value Fund Class F | 6.3 | 6.4 |
| 14.0 | 14.2 |
Emerging Markets Equity Funds | | |
Fidelity Series Emerging Markets Fund Class F | 3.9 | 4.1 |
High Yield Bond Funds | | |
Fidelity Series Emerging Markets Debt Fund Class F | 0.7 | 0.7 |
Fidelity Series Floating Rate High Income Fund Class F | 0.9 | 0.9 |
Fidelity Series High Income Fund Class F | 6.9 | 6.9 |
Fidelity Series Real Estate Income Fund Class F | 0.6 | 0.5 |
| 9.1 | 9.0 |
Inflation-Protected Bond Funds | | |
Fidelity Series Inflation-Protected Bond Index Fund Class F | 5.3 | 5.2 |
Investment Grade Bond Funds | | |
Fidelity Series Investment Grade Bond Fund Class F | 17.2 | 17.0 |
Short-Term Funds | | |
Fidelity Institutional Money Market Portfolio Class F | 0.4 | 0.2 |
Fidelity Short-Term Bond Fund Class F | 0.3 | 0.2 |
| 0.7 | 0.4 |
Net Other Assets (Liabilities)* | 0.0 | 0.0 |
| 100.0 | 100.0 |
* Amount represents less than 0.1% |
Asset Allocation (% of fund's net assets) |
Period end |
| Commodity Funds | 7.2% | |
| Domestic Equity Funds | 42.6% | |
| Developed International Equity Funds | 14.0% | |
| Emerging Markets Equity Funds | 3.9% | |
| High Yield Bond Funds | 9.1% | |
| Inflation-Protected Bond Funds | 5.3% | |
| Investment Grade Bond Funds | 17.2% | |
| Short-Term Funds | 0.7% | |

Six months ago |
| Commodity Funds | 7.5% | |
| Domestic Equity Funds | 42.6% | |
| Developed International Equity Funds | 14.2% | |
| Emerging Markets Equity Funds | 4.1% | |
| High Yield Bond Funds | 9.0% | |
| Inflation-Protected Bond Funds | 5.2% | |
| Investment Grade Bond Funds | 17.0% | |
| Short-Term Funds | 0.4% | |

Expected |
| Commodity Funds | 7.3% | |
| Domestic Equity Funds | 41.1% | |
| Developed International Equity Funds | 13.6% | |
| Emerging Markets Equity Funds | 4.0% | |
| High Yield Bond Funds | 7.3% | |
| Inflation-Protected Bond Funds | 6.1% | |
| Investment Grade Bond Funds | 19.5% | |
| Short-Term Funds | 1.1% | |

The fund invests according to an asset allocation strategy that becomes increasingly conservative over time. The six months ago allocation is based on the fund's holdings as of September 30, 2012. The current allocation is based on the fund's holdings as of March 31, 2013. The expected allocation represents the fund's anticipated allocation at September 30, 2013. |
Annual Report
Fidelity Freedom K® 2025 Fund
Investments March 31, 2013
Showing Percentage of Net Assets
Domestic Equity Funds - 49.8% |
| Shares | | Value |
Commodity Funds - 7.2% |
Fidelity Series Commodity Strategy Fund Class F (a) | 81,819,177 | | $ 714,281,419 |
Domestic Equity Funds - 42.6% |
Fidelity Blue Chip Growth Fund Class F | 8,241,141 | | 441,725,132 |
Fidelity Disciplined Equity Fund Class F | 3,571,452 | | 97,000,644 |
Fidelity Growth Company Fund Class F | 5,953,386 | | 601,589,634 |
Fidelity Series 100 Index Fund | 14,637,508 | | 151,059,084 |
Fidelity Series All-Sector Equity Fund Class F | 50,681,006 | | 651,250,933 |
Fidelity Series Equity Income Fund Class F | 35,710,816 | | 396,747,170 |
Fidelity Series Intrinsic Opportunities Fund Class F | 20,878,973 | | 236,976,345 |
Fidelity Series Large Cap Value Fund Class F | 33,214,640 | | 386,286,269 |
Fidelity Series Mega Cap Fund Class F | 13,168,494 | | 145,116,806 |
Fidelity Series Opportunistic Insights Fund Class F | 26,338,272 | | 289,984,373 |
Fidelity Series Real Estate Equity Fund Class F | 4,262,517 | | 55,497,972 |
Fidelity Series Small Cap Opportunities Fund Class F | 13,659,963 | | 169,246,938 |
Fidelity Series Stock Selector Large Cap Value Fund Class F | 35,712,142 | | 399,975,994 |
Fidelity Small Cap Growth Fund Class F | 4,987,876 | | 91,028,733 |
Fidelity Small Cap Value Fund Class F | 5,159,552 | | 97,515,534 |
TOTAL DOMESTIC EQUITY FUNDS | | 4,211,001,561 |
TOTAL DOMESTIC EQUITY FUNDS (Cost $4,479,918,375) |
4,925,282,980
|
International Equity Funds - 17.9% |
| | | |
Developed International Equity Funds - 14.0% |
Fidelity Series International Growth Fund Class F | 49,700,334 | | 629,703,229 |
Fidelity Series International Small Cap Fund Class F | 9,319,380 | | 128,141,475 |
Fidelity Series International Value Fund Class F | 63,447,496 | | 624,323,358 |
TOTAL DEVELOPED INTERNATIONAL EQUITY FUNDS | | 1,382,168,062 |
|
| Shares | | Value |
Emerging Markets Equity Funds - 3.9% |
Fidelity Series Emerging Markets Fund Class F | 22,755,752 | | $ 381,386,399 |
TOTAL INTERNATIONAL EQUITY FUNDS (Cost $1,579,421,989) |
1,763,554,461
|
Bond Funds - 31.6% |
| | | |
High Yield Bond Funds - 9.1% |
Fidelity Series Emerging Markets Debt Fund Class F | 6,613,732 | | 71,957,407 |
Fidelity Series Floating Rate High Income Fund Class F | 8,483,646 | | 90,181,158 |
Fidelity Series High Income Fund Class F | 65,104,833 | | 684,251,795 |
Fidelity Series Real Estate Income Fund Class F | 4,550,482 | | 53,104,120 |
TOTAL HIGH YIELD BOND FUNDS | | 899,494,480 |
Inflation-Protected Bond Funds - 5.3% |
Fidelity Series Inflation-Protected Bond Index Fund Class F | 46,506,402 | | 529,707,916 |
Investment Grade Bond Funds - 17.2% |
Fidelity Series Investment Grade Bond Fund Class F | 147,114,156 | | 1,697,697,363 |
TOTAL BOND FUNDS (Cost $3,078,596,094) |
3,126,899,759
|
Short-Term Funds - 0.7% |
| | | |
Fidelity Institutional Money Market Portfolio Class F | 39,758,924 | | 39,758,924 |
Fidelity Short-Term Bond Fund Class F | 3,792,079 | | 32,611,876 |
TOTAL SHORT-TERM FUNDS (Cost $72,232,756) |
72,370,800
|
TOTAL INVESTMENT PORTFOLIO - 100.0% (Cost $9,210,169,214) | | 9,888,108,000 |
NET OTHER ASSETS (LIABILITIES) - 0.0% | | (404,862) |
NET ASSETS - 100% | $ 9,887,703,138 |
Legend |
(a) Non-income producing |
Other Information |
All investments are categorized as Level 1 under the Fair Value Hierarchy. The inputs or methodology used for valuing securities may not be an indication of the risk associated with investing in those securities. For more information on valuation inputs, please refer to the Security Valuation section in the accompanying Notes to Financial Statements. |
See accompanying notes which are an integral part of the financial statements.
Annual Report
Fidelity Freedom K® 2025 Fund
Statement of Assets and Liabilities
| March 31, 2013 |
| | |
Assets | | |
Investment in securities, at value (cost $9,210,169,214) - See accompanying schedule | | $ 9,888,108,000 |
Receivable for investments sold | | 7,987,728 |
Receivable for fund shares sold | | 37,846,010 |
Total assets | | 9,933,941,738 |
| | |
Liabilities | | |
Payable for investments purchased | $ 7,254,536 | |
Payable for fund shares redeemed | 38,579,146 | |
Transfer agent fees payable | 404,918 | |
Total liabilities | | 46,238,600 |
| | |
Net Assets | | $ 9,887,703,138 |
Net Assets consist of: | | |
Paid in capital | | $ 9,010,274,717 |
Undistributed net investment income | | 18,861,488 |
Accumulated undistributed net realized gain (loss) on investments | | 180,628,147 |
Net unrealized appreciation (depreciation) on investments | | 677,938,786 |
Net Assets, for 691,513,443 shares outstanding | | $ 9,887,703,138 |
Net Asset Value, offering price and redemption price per share ($9,887,703,138 ÷ 691,513,443 shares) | | $ 14.30 |
Statement of Operations
| Year ended March 31, 2013 |
| | |
Investment Income | | |
Income distributions from underlying funds | | $ 156,617,657 |
| | |
Expenses | | |
Transfer agent fees | $ 3,995,894 | |
Independent trustees' compensation | 28,435 | |
Total expenses | | 4,024,329 |
Net investment income (loss) | | 152,593,328 |
Realized and Unrealized Gain (Loss) Realized gain (loss) on sale of underlying fund shares | 79,672,974 | |
Capital gain distributions from underlying funds | 191,715,615 | |
Total net realized gain (loss) | | 271,388,589 |
Change in net unrealized appreciation (depreciation) on underlying funds | | 368,201,225 |
Net gain (loss) | | 639,589,814 |
Net increase (decrease) in net assets resulting from operations | | $ 792,183,142 |
See accompanying notes which are an integral part of the financial statements.
Annual Report
Fidelity Freedom K® 2025 Fund
Financial Statements - continued
Statement of Changes in Net Assets
| Year ended
March 31,
2013 | Year ended
March 31,
2012 |
Increase (Decrease) in Net Assets | | |
Operations | | |
Net investment income (loss) | $ 152,593,328 | $ 90,622,031 |
Net realized gain (loss) | 271,388,589 | 146,109,032 |
Change in net unrealized appreciation (depreciation) | 368,201,225 | 13,197,853 |
Net increase (decrease) in net assets resulting from operations | 792,183,142 | 249,928,916 |
Distributions to shareholders from net investment income | (147,879,817) | (83,068,687) |
Distributions to shareholders from net realized gain | (145,666,744) | (143,569,525) |
Total distributions | (293,546,561) | (226,638,212) |
Share transactions
Proceeds from sales of shares | 3,914,024,849 | 4,077,077,016 |
Reinvestment of distributions | 293,546,561 | 226,638,212 |
Cost of shares redeemed | (1,497,471,333) | (1,102,185,884) |
Net increase (decrease) in net assets resulting from share transactions | 2,710,100,077 | 3,201,529,344 |
Total increase (decrease) in net assets | 3,208,736,658 | 3,224,820,048 |
| | |
Net Assets | | |
Beginning of period | 6,678,966,480 | 3,454,146,432 |
End of period (including undistributed net investment income of $18,861,488 and undistributed net investment income of $14,147,978, respectively) | $ 9,887,703,138 | $ 6,678,966,480 |
Other Information Shares | | |
Sold | 288,192,126 | 311,729,581 |
Issued in reinvestment of distributions | 22,013,209 | 17,696,143 |
Redeemed | (110,265,804) | (84,704,164) |
Net increase (decrease) | 199,939,531 | 244,721,560 |
Financial Highlights
Years ended March 31, | 2013 | 2012 | 2011 | 2010 F |
Selected Per-Share Data | | | | |
Net asset value, beginning of period | $ 13.59 | $ 13.99 | $ 12.50 | $ 10.00 |
Income from Investment Operations | | | | |
Net investment income (loss) C | .26 | .26 | .25 | .18 |
Net realized and unrealized gain (loss) | .95 | (.02) E | 1.57 | 2.44 |
Total from investment operations | 1.21 | .24 | 1.82 | 2.62 |
Distributions from net investment income | (.24) | (.21) | (.19) | (.07) |
Distributions from net realized gain | (.26) | (.43) | (.14) | (.05) |
Total distributions | (.50) | (.64) | (.33) | (.12) |
Net asset value, end of period | $ 14.30 | $ 13.59 | $ 13.99 | $ 12.50 |
Total Return B | 9.17% | 2.02% | 14.72% | 26.24% |
Ratios to Average Net Assets D, G | | | | |
Expenses before reductions | .05% | .05% | .05% | .05% A |
Expenses net of fee waivers, if any | .05% | .05% | .05% | .05% A |
Expenses net of all reductions | .05% | .05% | .05% | .05% A |
Net investment income (loss) | 1.89% | 1.95% | 1.90% | 2.02% A |
Supplemental Data | | | | |
Net assets, end of period (000 omitted) | $ 9,887,703 | $ 6,678,966 | $ 3,454,146 | $ 930,417 |
Portfolio turnover rate | 23% | 20% | 38% | 19% A |
A Annualized
B Total returns for periods of less than one year are not annualized.
C Calculated based on average shares outstanding during the period.
D Amounts do not include the activity of the Underlying Funds.
E The amount shown for a share outstanding does not correspond with the aggregate net gain (loss) on investments for the period due to the timing of sales and repurchases of shares in relation to fluctuating market values of the investments of the Fund.
F For the period July 2, 2009 (commencement of operations) to March 31, 2010.
G Expense ratios reflect operating expenses of the Fund. Expenses before reductions do not reflect amounts reimbursed by the investment adviser or reductions from expense offset arrangements and do not represent the amount paid by the Fund during periods when reimbursements or reductions occur. Expenses net of fee waivers reflect expenses after reimbursement by the investment adviser but prior to reductions from expense offset arrangements. Expenses net of all reductions represent the net expenses paid by the Fund but do not include expenses of the investment companies in which the Fund invests.
See accompanying notes which are an integral part of the financial statements.
Annual Report
Fidelity Freedom K® 2030 Fund
Investment Changes (Unaudited)
The information in the following tables is based on the direct investments of the Fund. |
Fund Holdings as of March 31, 2013 |
| % of fund's
net assets | % of fund's net assets
6 months ago |
Commodity Funds | | |
Fidelity Series Commodity Strategy Fund Class F | 7.6 | 7.8 |
Domestic Equity Funds | | |
Fidelity Blue Chip Growth Fund Class F | 4.7 | 3.3 |
Fidelity Disciplined Equity Fund Class F | 1.0 | 4.7 |
Fidelity Growth Company Fund Class F | 6.4 | 7.2 |
Fidelity Series 100 Index Fund | 1.6 | 6.3 |
Fidelity Series All-Sector Equity Fund Class F | 6.9 | 10.3 |
Fidelity Series Equity Income Fund Class F | 4.2 | 0.0 |
Fidelity Series Intrinsic Opportunities Fund Class F | 2.5 | 0.0 |
Fidelity Series Large Cap Value Fund Class F | 4.1 | 8.7 |
Fidelity Series Mega Cap Fund Class F | 1.5 | 0.0 |
Fidelity Series Opportunistic Insights Fund Class F | 3.1 | 0.0 |
Fidelity Series Real Estate Equity Fund Class F | 0.6 | 0.5 |
Fidelity Series Small Cap Opportunities Fund Class F | 1.8 | 1.7 |
Fidelity Series Stock Selector Large Cap Value Fund Class F | 4.3 | 0.0 |
Fidelity Small Cap Growth Fund Class F | 1.0 | 1.0 |
Fidelity Small Cap Value Fund Class F | 1.0 | 1.0 |
| 44.7 | 44.7 |
Developed International Equity Funds | | |
Fidelity Series International Growth Fund Class F | 6.7 | 6.7 |
Fidelity Series International Small Cap Fund Class F | 1.4 | 1.4 |
Fidelity Series International Value Fund Class F | 6.6 | 6.7 |
| 14.7 | 14.8 |
Emerging Markets Equity Funds | | |
Fidelity Series Emerging Markets Fund Class F | 4.0 | 4.3 |
High Yield Bond Funds | | |
Fidelity Series Emerging Markets Debt Fund Class F | 0.7 | 0.7 |
Fidelity Series Floating Rate High Income Fund Class F | 0.9 | 0.9 |
Fidelity Series High Income Fund Class F | 7.0 | 7.0 |
Fidelity Series Real Estate Income Fund Class F | 0.5 | 0.5 |
| 9.1 | 9.1 |
Inflation-Protected Bond Funds | | |
Fidelity Series Inflation-Protected Bond Index Fund Class F | 2.5 | 2.1 |
Investment Grade Bond Funds | | |
Fidelity Series Investment Grade Bond Fund Class F | 17.4 | 17.2 |
Net Other Assets (Liabilities)* | 0.0 | 0.0 |
| 100.0 | 100.0 |
* Amount represents less than 0.1% |
Asset Allocation (% of fund's net assets) |
Period end |
| Commodity Funds | 7.6% | |
| Domestic Equity Funds | 44.7% | |
| Developed International Equity Funds | 14.7% | |
| Emerging Markets Equity Funds | 4.0% | |
| High Yield Bond Funds | 9.1% | |
 | Inflation-Protected Bond Funds | 2.5% | |
| Investment Grade Bond Funds | 17.4% | |

Six months ago |
| Commodity Funds | 7.8% | |
| Domestic Equity Funds | 44.7% | |
| Developed International Equity Funds | 14.8% | |
| Emerging Markets Equity Funds | 4.3% | |
| High Yield Bond Funds | 9.1% | |
| Inflation-Protected Bond Funds | 2.1% | |
| Investment Grade Bond Funds | 17.2% | |

Expected |
| Commodity Funds | 7.7% | |
| Domestic Equity Funds | 43.8% | |
| Developed International Equity Funds | 14.4% | |
| Emerging Markets Equity Funds | 4.3% | |
| High Yield Bond Funds | 7.5% | |
| Inflation-Protected Bond Funds | 3.1% | |
| Investment Grade Bond Funds | 19.2% | |

The fund invests according to an asset allocation strategy that becomes increasingly conservative over time. The six months ago allocation is based on the fund's holdings as of September 30, 2012. The current allocation is based on the fund's holdings as of March 31, 2013. The expected allocation represents the fund's anticipated allocation at September 30, 2013. |
Annual Report
Fidelity Freedom K® 2030 Fund
Investments March 31, 2013
Showing Percentage of Net Assets
Domestic Equity Funds - 52.3% |
| Shares | | Value |
Commodity Funds - 7.6% |
Fidelity Series Commodity Strategy Fund Class F (a) | 112,351,632 | | $ 980,829,744 |
Domestic Equity Funds - 44.7% |
Fidelity Blue Chip Growth Fund Class F | 11,233,423 | | 602,111,489 |
Fidelity Disciplined Equity Fund Class F | 4,873,352 | | 132,360,247 |
Fidelity Growth Company Fund Class F | 8,200,981 | | 828,709,110 |
Fidelity Series 100 Index Fund | 19,943,813 | | 205,820,148 |
Fidelity Series All-Sector Equity Fund Class F | 69,151,589 | | 888,597,916 |
Fidelity Series Equity Income Fund Class F | 49,432,641 | | 549,196,646 |
Fidelity Series Intrinsic Opportunities Fund Class F | 28,776,310 | | 326,611,115 |
Fidelity Series Large Cap Value Fund Class F | 45,758,651 | | 532,173,112 |
Fidelity Series Mega Cap Fund Class F | 18,225,200 | | 200,841,703 |
Fidelity Series Opportunistic Insights Fund Class F | 36,457,680 | | 401,399,062 |
Fidelity Series Real Estate Equity Fund Class F | 5,757,321 | | 74,960,322 |
Fidelity Series Small Cap Opportunities Fund Class F | 18,651,325 | | 231,089,918 |
Fidelity Series Stock Selector Large Cap Value Fund Class F | 49,449,110 | | 553,830,035 |
Fidelity Small Cap Growth Fund Class F | 6,933,480 | | 126,536,017 |
Fidelity Small Cap Value Fund Class F | 7,198,005 | | 136,042,302 |
TOTAL DOMESTIC EQUITY FUNDS | | 5,790,279,142 |
TOTAL DOMESTIC EQUITY FUNDS (Cost $6,151,811,274) |
6,771,108,886
|
International Equity Funds - 18.7% |
| | | |
Developed International Equity Funds - 14.7% |
Fidelity Series International Growth Fund Class F | 68,113,477 | | 862,997,755 |
Fidelity Series International Small Cap Fund Class F | 12,743,806 | | 175,227,326 |
Fidelity Series International Value Fund Class F | 86,978,852 | | 855,871,899 |
TOTAL DEVELOPED INTERNATIONAL EQUITY FUNDS | | 1,894,096,980 |
|
| Shares | | Value |
Emerging Markets Equity Funds - 4.0% |
Fidelity Series Emerging Markets Fund Class F | 31,184,442 | | $ 522,651,248 |
TOTAL INTERNATIONAL EQUITY FUNDS (Cost $2,165,121,870) |
2,416,748,228
|
Bond Funds - 29.0% |
| | | |
High Yield Bond Funds - 9.1% |
Fidelity Series Emerging Markets Debt Fund Class F | 8,697,894 | | 94,633,090 |
Fidelity Series Floating Rate High Income Fund Class F | 10,491,030 | | 111,519,649 |
Fidelity Series High Income Fund Class F | 85,944,595 | | 903,277,695 |
Fidelity Series Real Estate Income Fund Class F | 5,404,104 | | 63,065,894 |
TOTAL HIGH YIELD BOND FUNDS | | 1,172,496,328 |
Inflation-Protected Bond Funds - 2.5% |
Fidelity Series Inflation-Protected Bond Index Fund Class F | 28,864,376 | | 328,765,237 |
Investment Grade Bond Funds - 17.4% |
Fidelity Series Investment Grade Bond Fund Class F | 194,893,674 | | 2,249,073,002 |
TOTAL BOND FUNDS (Cost $3,696,794,130) |
3,750,334,567
|
TOTAL INVESTMENT
PORTFOLIO - 100.0% (Cost $12,013,727,274) | 12,938,191,681 |
NET OTHER ASSETS (LIABILITIES) - 0.0% | (529,778) |
NET ASSETS - 100% | $ 12,937,661,903 |
Legend |
(a) Non-income producing |
Other Information |
All investments are categorized as Level 1 under the Fair Value Hierarchy. The inputs or methodology used for valuing securities may not be an indication of the risk associated with investing in those securities. For more information on valuation inputs, please refer to the Security Valuation section in the accompanying Notes to Financial Statements. |
See accompanying notes which are an integral part of the financial statements.
Annual Report
Fidelity Freedom K® 2030 Fund
Statement of Assets and Liabilities
| March 31, 2013 |
| | |
Assets | | |
Investment in securities, at value (cost $12,013,727,274) - See accompanying schedule | | $ 12,938,191,681 |
Receivable for investments sold | | 15,029,161 |
Receivable for fund shares sold | | 42,885,042 |
Total assets | | 12,996,105,884 |
| | |
Liabilities | | |
Payable for investments purchased | $ 9,978,627 | |
Payable for fund shares redeemed | 47,935,500 | |
Transfer agent fees payable | 529,854 | |
Total liabilities | | 58,443,981 |
| | |
Net Assets | | $ 12,937,661,903 |
Net Assets consist of: | | |
Paid in capital | | $ 11,739,444,360 |
Undistributed net investment income | | 24,287,420 |
Accumulated undistributed net realized gain (loss) on investments | | 249,465,716 |
Net unrealized appreciation (depreciation) on investments | | 924,464,407 |
Net Assets, for 893,157,146 shares outstanding | | $ 12,937,661,903 |
Net Asset Value, offering price and redemption price per share ($12,937,661,903 ÷ 893,157,146 shares) | | $ 14.49 |
Statement of Operations
| Year ended March 31, 2013 |
| | |
Investment Income | | |
Income distributions from underlying funds | | $ 212,983,183 |
| | |
Expenses | | |
Transfer agent fees | $ 5,309,328 | |
Independent trustees' compensation | 37,932 | |
Total expenses | | 5,347,260 |
Net investment income (loss) | | 207,635,923 |
Realized and Unrealized Gain (Loss) Realized gain (loss) on sale of underlying fund shares | 112,246,751 | |
Capital gain distributions from underlying funds | 252,901,819 | |
Total net realized gain (loss) | | 365,148,570 |
Change in net unrealized appreciation (depreciation) on underlying funds | | 493,923,180 |
Net gain (loss) | | 859,071,750 |
Net increase (decrease) in net assets resulting from operations | | $ 1,066,707,673 |
See accompanying notes which are an integral part of the financial statements.
Annual Report
Fidelity Freedom K® 2030 Fund
Financial Statements - continued
Statement of Changes in Net Assets
| Year ended
March 31,
2013 | Year ended
March 31,
2012 |
Increase (Decrease) in Net Assets | | |
Operations | | |
Net investment income (loss) | $ 207,635,923 | $ 128,584,165 |
Net realized gain (loss) | 365,148,570 | 208,813,939 |
Change in net unrealized appreciation (depreciation) | 493,923,180 | (517,775) |
Net increase (decrease) in net assets resulting from operations | 1,066,707,673 | 336,880,329 |
Distributions to shareholders from net investment income | (202,803,148) | (118,012,992) |
Distributions to shareholders from net realized gain | (198,489,086) | (201,795,152) |
Total distributions | (401,292,234) | (319,808,144) |
Share transactions
Proceeds from sales of shares | 4,684,029,188 | 5,285,420,441 |
Reinvestment of distributions | 401,292,234 | 319,808,144 |
Cost of shares redeemed | (2,019,839,253) | (1,305,941,645) |
Net increase (decrease) in net assets resulting from share transactions | 3,065,482,169 | 4,299,286,940 |
Total increase (decrease) in net assets | 3,730,897,608 | 4,316,359,125 |
| | |
Net Assets | | |
Beginning of period | 9,206,764,295 | 4,890,405,170 |
End of period (including undistributed net investment income of $24,287,420 and undistributed net investment income of $19,454,645, respectively) | $ 12,937,661,903 | $ 9,206,764,295 |
Other Information Shares | | |
Sold | 341,169,501 | 400,113,001 |
Issued in reinvestment of distributions | 29,813,341 | 24,694,584 |
Redeemed | (147,480,227) | (98,949,169) |
Net increase (decrease) | 223,502,615 | 325,858,416 |
Financial Highlights
Years ended March 31, | 2013 | 2012 | 2011 | 2010 F |
Selected Per-Share Data | | | | |
Net asset value, beginning of period | $ 13.75 | $ 14.22 | $ 12.67 | $ 10.00 |
Income from Investment Operations | | | | |
Net investment income (loss) C | .27 | .26 | .25 | .17 |
Net realized and unrealized gain (loss) | .99 | (.07) E | 1.62 | 2.62 |
Total from investment operations | 1.26 | .19 | 1.87 | 2.79 |
Distributions from net investment income | (.25) | (.22) | (.18) | (.07) |
Distributions from net realized gain | (.26) | (.44) | (.14) | (.05) |
Total distributions | (.52) H | (.66) | (.32) | (.12) |
Net asset value, end of period | $ 14.49 | $ 13.75 | $ 14.22 | $ 12.67 |
Total Return B | 9.46% | 1.62% | 14.95% | 27.94% |
Ratios to Average Net Assets D, G | | | | |
Expenses before reductions | .05% | .05% | .05% | .05% A |
Expenses net of fee waivers, if any | .05% | .05% | .05% | .05% A |
Expenses net of all reductions | .05% | .05% | .05% | .05% A |
Net investment income (loss) | 1.94% | 1.99% | 1.88% | 1.93% A |
Supplemental Data | | | | |
Net assets, end of period (000 omitted) | $ 12,937,662 | $ 9,206,764 | $ 4,890,405 | $ 1,280,910 |
Portfolio turnover rate | 25% | 19% | 37% | 23% A |
A Annualized
B Total returns for periods of less than one year are not annualized.
C Calculated based on average shares outstanding during the period.
D Amounts do not include the activity of the Underlying Funds.
E The amount shown for a share outstanding does not correspond with the aggregate net gain (loss) on investments for the period due to the timing of sales and repurchases of shares in relation to fluctuating market values of the investments of the Fund.
F For the period July 2, 2009 (commencement of operations) to March 31, 2010.
G Expense ratios reflect operating expenses of the Fund. Expenses before reductions do not reflect amounts reimbursed by the investment adviser or reductions from expense offset arrangements and do not represent the amount paid by the Fund during periods when reimbursements or reductions occur. Expenses net of fee waivers reflect expenses after reimbursement by the investment adviser but prior to reductions from expense offset arrangements. Expenses net of all reductions represent the net expenses paid by the Fund but do not include expenses of the investment companies in which the Fund invests.
H Total distributions of $.52 per share is comprised of distributions from net investment income of $.252 and distributions from net realized gain of $.264 per share.
See accompanying notes which are an integral part of the financial statements.
Annual Report
Fidelity Freedom K 2035 Fund
Investment Changes (Unaudited)
The information in the following tables is based on the direct investments of the Fund. |
Fund Holdings as of March 31, 2013 |
| % of fund's
net assets | % of fund's net assets
6 months ago |
Commodity Funds | | |
Fidelity Series Commodity Strategy Fund Class F | 8.8 | 9.3 |
Domestic Equity Funds | | |
Fidelity Blue Chip Growth Fund Class F | 5.4 | 3.8 |
Fidelity Disciplined Equity Fund Class F | 1.2 | 5.4 |
Fidelity Growth Company Fund Class F | 7.4 | 8.2 |
Fidelity Series 100 Index Fund | 1.8 | 7.1 |
Fidelity Series All-Sector Equity Fund Class F | 7.9 | 11.7 |
Fidelity Series Equity Income Fund Class F | 4.8 | 0.0 |
Fidelity Series Intrinsic Opportunities Fund Class F | 2.8 | 0.0 |
Fidelity Series Large Cap Value Fund Class F | 4.8 | 10.0 |
Fidelity Series Mega Cap Fund Class F | 1.8 | 0.0 |
Fidelity Series Opportunistic Insights Fund Class F | 3.5 | 0.0 |
Fidelity Series Real Estate Equity Fund Class F | 0.7 | 0.6 |
Fidelity Series Small Cap Opportunities Fund Class F | 2.1 | 2.0 |
Fidelity Series Stock Selector Large Cap Value Fund Class F | 4.8 | 0.0 |
Fidelity Small Cap Growth Fund Class F | 1.1 | 1.1 |
Fidelity Small Cap Value Fund Class F | 1.2 | 1.1 |
| 51.3 | 51.0 |
Developed International Equity Funds | | |
Fidelity Series International Growth Fund Class F | 7.7 | 7.8 |
Fidelity Series International Small Cap Fund Class F | 1.5 | 1.5 |
Fidelity Series International Value Fund Class F | 7.6 | 7.8 |
| 16.8 | 17.1 |
Emerging Markets Equity Funds | | |
Fidelity Series Emerging Markets Fund Class F | 4.7 | 4.9 |
High Yield Bond Funds | | |
Fidelity Series Emerging Markets Debt Fund Class F | 0.7 | 0.7 |
Fidelity Series Floating Rate High Income Fund Class F | 0.8 | 0.5 |
Fidelity Series High Income Fund Class F | 6.9 | 6.9 |
Fidelity Series Real Estate Income Fund Class F | 0.4 | 0.3 |
| 8.8 | 8.4 |
Investment Grade Bond Funds | | |
Fidelity Series Investment Grade Bond Fund Class F | 9.6 | 9.3 |
Net Other Assets (Liabilities)* | 0.0 | 0.0 |
| 100.0 | 100.0 |
* Amount represents less than 0.1% |
Asset Allocation (% of fund's net assets) |
Period end |
| Commodity Funds | 8.8% | |
| Domestic Equity Funds | 51.3% | |
| Developed International Equity Funds | 16.8% | |
| Emerging Markets Equity Funds | 4.7% | |
| High Yield Bond Funds | 8.8% | |
| Investment Grade Bond Funds | 9.6% | |

Six months ago |
| Commodity Funds | 9.3% | |
| Domestic Equity Funds | 51.0% | |
| Developed International Equity Funds | 17.1% | |
| Emerging Markets Equity Funds | 4.9% | |
| High Yield Bond Funds | 8.4% | |
| Investment Grade Bond Funds | 9.3% | |

Expected |
| Commodity Funds | 8.8% | |
| Domestic Equity Funds | 50.0% | |
| Developed International Equity Funds | 16.5% | |
| Emerging Markets Equity Funds | 4.9% | |
| High Yield Bond Funds | 7.5% | |
| Investment Grade Bond Funds | 12.2% | |
 | Inflation-Protected Bond Funds | 0.1% | |

The fund invests according to an asset allocation strategy that becomes increasingly conservative over time. The six months ago allocation is based on the fund's holdings as of September 30, 2012. The current allocation is based on the fund's holdings as of March 31, 2013. The expected allocation represents the fund's anticipated allocation at September 30, 2013. |
Annual Report
Fidelity Freedom K® 2035 Fund
Investments March 31, 2013
Showing Percentage of Net Assets
Domestic Equity Funds - 60.1% |
| Shares | | Value |
Commodity Funds - 8.8% |
Fidelity Series Commodity Strategy Fund Class F (a) | 73,699,030 | | $ 643,392,529 |
Domestic Equity Funds - 51.3% |
Fidelity Blue Chip Growth Fund Class F | 7,370,516 | | 395,059,637 |
Fidelity Disciplined Equity Fund Class F | 3,183,521 | | 86,464,431 |
Fidelity Growth Company Fund Class F | 5,367,146 | | 542,350,097 |
Fidelity Series 100 Index Fund | 13,064,725 | | 134,827,963 |
Fidelity Series All-Sector Equity Fund Class F | 45,309,906 | | 582,232,287 |
Fidelity Series Equity Income Fund Class F | 31,663,838 | | 351,785,243 |
Fidelity Series Intrinsic Opportunities Fund Class F | 18,202,147 | | 206,594,366 |
Fidelity Series Large Cap Value Fund Class F | 30,376,384 | | 353,277,341 |
Fidelity Series Mega Cap Fund Class F | 11,676,576 | | 128,675,865 |
Fidelity Series Opportunistic Insights Fund Class F | 23,354,639 | | 257,134,571 |
Fidelity Series Real Estate Equity Fund Class F | 3,794,596 | | 49,405,638 |
Fidelity Series Small Cap Opportunities Fund Class F | 12,247,982 | | 151,752,500 |
Fidelity Series Stock Selector Large Cap Value Fund Class F | 31,709,733 | | 355,149,012 |
Fidelity Small Cap Growth Fund Class F | 4,517,881 | | 82,451,331 |
Fidelity Small Cap Value Fund Class F | 4,679,098 | | 88,434,960 |
TOTAL DOMESTIC EQUITY FUNDS | | 3,765,595,242 |
TOTAL DOMESTIC EQUITY FUNDS (Cost $4,030,109,799) |
4,408,987,771
|
International Equity Funds - 21.5% |
| | | |
Developed International Equity Funds - 16.8% |
Fidelity Series International Growth Fund Class F | 44,339,185 | | 561,777,471 |
Fidelity Series International Small Cap Fund Class F | 8,296,651 | | 114,078,949 |
Fidelity Series International Value Fund Class F | 56,597,219 | | 556,916,636 |
TOTAL DEVELOPED INTERNATIONAL EQUITY FUNDS | | 1,232,773,056 |
|
| Shares | | Value |
Emerging Markets Equity Funds - 4.7% |
Fidelity Series Emerging Markets Fund Class F | 20,347,632 | | $ 341,026,305 |
TOTAL INTERNATIONAL EQUITY FUNDS (Cost $1,414,522,813) |
1,573,799,361
|
Bond Funds - 18.4% |
| | | |
High Yield Bond Funds - 8.8% |
Fidelity Series Emerging Markets Debt Fund Class F | 4,854,915 | | 52,821,472 |
Fidelity Series Floating Rate High Income Fund Class F | 5,215,061 | | 55,436,095 |
Fidelity Series High Income Fund Class F | 48,049,197 | | 504,997,060 |
Fidelity Series Real Estate Income Fund Class F | 2,768,990 | | 32,314,117 |
TOTAL HIGH YIELD BOND FUNDS | | 645,568,744 |
Investment Grade Bond Funds - 9.6% |
Fidelity Series Investment Grade Bond Fund Class F | 60,761,485 | | 701,187,533 |
TOTAL BOND FUNDS (Cost $1,319,041,891) |
1,346,756,277
|
TOTAL INVESTMENT PORTFOLIO - 100.0% (Cost $6,763,674,503) | | 7,329,543,409 |
NET OTHER ASSETS (LIABILITIES) - 0.0% | | (299,385) |
NET ASSETS - 100% | $ 7,329,244,024 |
Legend |
(a) Non-income producing |
Other Information |
All investments are categorized as Level 1 under the Fair Value Hierarchy. The inputs or methodology used for valuing securities may not be an indication of the risk associated with investing in those securities. For more information on valuation inputs, please refer to the Security Valuation section in the accompanying Notes to Financial Statements. |
See accompanying notes which are an integral part of the financial statements.
Annual Report
Fidelity Freedom K® 2035 Fund
Statement of Assets and Liabilities
| March 31, 2013 |
| | |
Assets | | |
Investment in securities, at value (cost $6,763,674,503) - See accompanying schedule | | $ 7,329,543,409 |
Receivable for investments sold | | 6,153,079 |
Receivable for fund shares sold | | 32,679,588 |
Total assets | | 7,368,376,076 |
| | |
Liabilities | | |
Payable for investments purchased | $ 10,389,833 | |
Payable for fund shares redeemed | 28,442,791 | |
Transfer agent fees payable | 299,428 | |
Total liabilities | | 39,132,052 |
| | |
Net Assets | | $ 7,329,244,024 |
Net Assets consist of: | | |
Paid in capital | | $ 6,601,130,596 |
Undistributed net investment income | | 11,026,396 |
Accumulated undistributed net realized gain (loss) on investments | | 151,218,126 |
Net unrealized appreciation (depreciation) on investments | | 565,868,906 |
Net Assets, for 496,992,276 shares outstanding | | $ 7,329,244,024 |
Net Asset Value, offering price and redemption price per share ($7,329,244,024 ÷ 496,992,276 shares) | | $ 14.75 |
Statement of Operations
| Year ended March 31, 2013 |
| | |
Investment Income | | |
Income distributions from underlying funds | | $ 113,564,436 |
| | |
Expenses | | |
Transfer agent fees | $ 2,882,218 | |
Independent trustees' compensation | 20,441 | |
Total expenses | | 2,902,659 |
Net investment income (loss) | | 110,661,777 |
Realized and Unrealized Gain (Loss) Realized gain (loss) on sale of underlying fund shares | 63,376,470 | |
Capital gain distributions from underlying funds | 132,109,580 | |
Total net realized gain (loss) | | 195,486,050 |
Change in net unrealized appreciation (depreciation) on underlying funds | | 332,298,561 |
Net gain (loss) | | 527,784,611 |
Net increase (decrease) in net assets resulting from operations | | $ 638,446,388 |
See accompanying notes which are an integral part of the financial statements.
Annual Report
Statement of Changes in Net Assets
| Year ended
March 31,
2013 | Year ended
March 31,
2012 |
Increase (Decrease) in Net Assets | | |
Operations | | |
Net investment income (loss) | $ 110,661,777 | $ 58,625,284 |
Net realized gain (loss) | 195,486,050 | 107,988,759 |
Change in net unrealized appreciation (depreciation) | 332,298,561 | 8,217,455 |
Net increase (decrease) in net assets resulting from operations | 638,446,388 | 174,831,498 |
Distributions to shareholders from net investment income | (107,158,832) | (54,398,837) |
Distributions to shareholders from net realized gain | (89,768,174) | (100,788,269) |
Total distributions | (196,927,006) | (155,187,106) |
Share transactions
Proceeds from sales of shares | 2,960,649,419 | 2,957,844,108 |
Reinvestment of distributions | 196,927,006 | 155,187,106 |
Cost of shares redeemed | (1,052,885,544) | (671,545,016) |
Net increase (decrease) in net assets resulting from share transactions | 2,104,690,881 | 2,441,486,198 |
Total increase (decrease) in net assets | 2,546,210,263 | 2,461,130,590 |
| | |
Net Assets | | |
Beginning of period | 4,783,033,761 | 2,321,903,171 |
End of period (including undistributed net investment income of $11,026,396 and undistributed net investment income of $7,523,451, respectively) | $ 7,329,244,024 | $ 4,783,033,761 |
Other Information Shares | | |
Sold | 213,995,655 | 222,865,783 |
Issued in reinvestment of distributions | 14,476,142 | 11,944,014 |
Redeemed | (76,102,506) | (50,751,229) |
Net increase (decrease) | 152,369,291 | 184,058,568 |
Financial Highlights
Years ended March 31, | 2013 | 2012 | 2011 | 2010 F |
Selected Per-Share Data | | | | |
Net asset value, beginning of period | $ 13.88 | $ 14.46 | $ 12.78 | $ 10.00 |
Income from Investment Operations | | | | |
Net investment income (loss) C | .26 | .24 | .23 | .15 |
Net realized and unrealized gain (loss) | 1.09 | (.17) E | 1.76 | 2.74 |
Total from investment operations | 1.35 | .07 | 1.99 | 2.89 |
Distributions from net investment income | (.24) | (.20) | (.18) | (.06) |
Distributions from net realized gain | (.23) | (.45) | (.13) | (.05) |
Total distributions | (.48) H | (.65) | (.31) | (.11) |
Net asset value, end of period | $ 14.75 | $ 13.88 | $ 14.46 | $ 12.78 |
Total Return B | 10.01% | .78% | 15.76% | 28.94% |
Ratios to Average Net Assets D, G | | | | |
Expenses before reductions | .05% | .05% | .05% | .05% A |
Expenses net of fee waivers, if any | .05% | .05% | .05% | .05% A |
Expenses net of all reductions | .05% | .05% | .05% | .05% A |
Net investment income (loss) | 1.90% | 1.81% | 1.75% | 1.72% A |
Supplemental Data | | | | |
Net assets, end of period (000 omitted) | $ 7,329,244 | $ 4,783,034 | $ 2,321,903 | $ 632,052 |
Portfolio turnover rate | 26% | 17% | 37% | 19% A |
A Annualized
B Total returns for periods of less than one year are not annualized.
C Calculated based on average shares outstanding during the period.
D Amounts do not include the activity of the Underlying Funds.
E The amount shown for a share outstanding does not correspond with the aggregate net gain (loss) on investments for the period due to the timing of sales and repurchases of shares in relation to fluctuating market values of the investments of the Fund.
F For the period July 2, 2009 (commencement of operations) to March 31, 2010.
G Expense ratios reflect operating expenses of the Fund. Expenses before reductions do not reflect amounts reimbursed by the investment adviser or reductions from expense offset arrangements and do not represent the amount paid by the Fund during periods when reimbursements or reductions occur. Expenses net of fee waivers reflect expenses after reimbursement by the investment adviser but prior to reductions from expense offset arrangements. Expenses net of all reductions represent the net expenses paid by the Fund but do not include expenses of the investment companies in which the Fund invests.
H Total distributions of $.48 per share is comprised of distributions from net investment income of $.243 and distributions from net realized gain of $.232 per share.
See accompanying notes which are an integral part of the financial statements.
Annual Report
Fidelity Freedom K® 2040 Fund
Investment Changes (Unaudited)
The information in the following tables is based on the direct investments of the Fund. |
Fund Holdings as of March 31, 2013 |
| % of fund's
net assets | % of fund's net assets
6 months ago |
Commodity Funds | | |
Fidelity Series Commodity Strategy Fund Class F | 8.9 | 9.3 |
Domestic Equity Funds | | |
Fidelity Blue Chip Growth Fund Class F | 5.5 | 3.9 |
Fidelity Disciplined Equity Fund Class F | 1.2 | 5.4 |
Fidelity Growth Company Fund Class F | 7.5 | 8.2 |
Fidelity Series 100 Index Fund | 1.9 | 7.2 |
Fidelity Series All-Sector Equity Fund Class F | 8.0 | 11.8 |
Fidelity Series Equity Income Fund Class F | 4.9 | 0.0 |
Fidelity Series Intrinsic Opportunities Fund Class F | 2.9 | 0.0 |
Fidelity Series Large Cap Value Fund Class F | 4.9 | 10.1 |
Fidelity Series Mega Cap Fund Class F | 1.8 | 0.0 |
Fidelity Series Opportunistic Insights Fund Class F | 3.6 | 0.0 |
Fidelity Series Real Estate Equity Fund Class F | 0.7 | 0.6 |
Fidelity Series Small Cap Opportunities Fund Class F | 2.1 | 2.0 |
Fidelity Series Stock Selector Large Cap Value Fund Class F | 4.9 | 0.0 |
Fidelity Small Cap Growth Fund Class F | 1.1 | 1.2 |
Fidelity Small Cap Value Fund Class F | 1.2 | 1.1 |
| 52.2 | 51.5 |
Developed International Equity Funds | | |
Fidelity Series International Growth Fund Class F | 7.8 | 7.9 |
Fidelity Series International Small Cap Fund Class F | 1.6 | 1.6 |
Fidelity Series International Value Fund Class F | 7.7 | 7.8 |
| 17.1 | 17.3 |
Emerging Markets Equity Funds | | |
Fidelity Series Emerging Markets Fund Class F | 4.7 | 4.9 |
High Yield Bond Funds | | |
Fidelity Series Emerging Markets Debt Fund Class F | 0.7 | 0.8 |
Fidelity Series Floating Rate High Income Fund Class F | 0.7 | 0.4 |
Fidelity Series High Income Fund Class F | 7.0 | 7.3 |
Fidelity Series Real Estate Income Fund Class F | 0.4 | 0.2 |
| 8.8 | 8.7 |
Investment Grade Bond Funds | | |
Fidelity Series Investment Grade Bond Fund Class F | 8.3 | 8.3 |
Net Other Assets (Liabilities)* | 0.0 | 0.0 |
| 100.0 | 100.0 |
* Amount represents less than 0.1% |
Asset Allocation (% of fund's net assets) |
Period end |
| Commodity Funds | 8.9% | |
| Domestic Equity Funds | 52.2% | |
| Developed International Equity Funds | 17.1% | |
| Emerging Markets Equity Funds | 4.7% | |
| High Yield Bond Funds | 8.8% | |
| Investment Grade Bond Funds | 8.3% | |

Six months ago |
| Commodity Funds | 9.3% | |
| Domestic Equity Funds | 51.5% | |
| Developed International Equity Funds | 17.3% | |
| Emerging Markets Equity Funds | 4.9% | |
| High Yield Bond Funds | 8.7% | |
| Investment Grade Bond Funds | 8.3% | |

Expected |
| Commodity Funds | 9.1% | |
| Domestic Equity Funds | 51.5% | |
| Developed International Equity Funds | 17.0% | |
| Emerging Markets Equity Funds | 5.0% | |
| High Yield Bond Funds | 7.5% | |
| Investment Grade Bond Funds | 9.9% | |

The fund invests according to an asset allocation strategy that becomes increasingly conservative over time. The six months ago allocation is based on the fund's holdings as of September 30, 2012. The current allocation is based on the fund's holdings as of March 31, 2013. The expected allocation represents the fund's anticipated allocation at September 30, 2013. |
Annual Report
Fidelity Freedom K® 2040 Fund
Investments March 31, 2013
Showing Percentage of Net Assets
Domestic Equity Funds - 61.1% |
| Shares | | Value |
Commodity Funds - 8.9% |
Fidelity Series Commodity Strategy Fund Class F (a) | 84,290,071 | | $ 735,852,317 |
Domestic Equity Funds - 52.2% |
Fidelity Blue Chip Growth Fund Class F | 8,365,742 | | 448,403,754 |
Fidelity Disciplined Equity Fund Class F | 3,607,181 | | 97,971,049 |
Fidelity Growth Company Fund Class F | 6,117,376 | | 618,160,833 |
Fidelity Series 100 Index Fund | 14,797,538 | | 152,710,597 |
Fidelity Series All-Sector Equity Fund Class F | 51,270,207 | | 658,822,164 |
Fidelity Series Equity Income Fund Class F | 36,099,800 | | 401,068,775 |
Fidelity Series Intrinsic Opportunities Fund Class F | 20,728,907 | | 235,273,091 |
Fidelity Series Large Cap Value Fund Class F | 34,555,531 | | 401,880,827 |
Fidelity Series Mega Cap Fund Class F | 13,313,101 | | 146,710,372 |
Fidelity Series Opportunistic Insights Fund Class F | 26,626,690 | | 293,159,852 |
Fidelity Series Real Estate Equity Fund Class F | 4,241,068 | | 55,218,701 |
Fidelity Series Small Cap Opportunities Fund Class F | 13,863,727 | | 171,771,572 |
Fidelity Series Stock Selector Large Cap Value Fund Class F | 36,149,204 | | 404,871,081 |
Fidelity Small Cap Growth Fund Class F | 5,214,373 | | 95,162,312 |
Fidelity Small Cap Value Fund Class F | 5,420,527 | | 102,447,957 |
TOTAL DOMESTIC EQUITY FUNDS | | 4,283,632,937 |
TOTAL DOMESTIC EQUITY FUNDS (Cost $4,585,466,764) |
5,019,485,254
|
International Equity Funds - 21.8% |
| | | |
Developed International Equity Funds - 17.1% |
Fidelity Series International Growth Fund Class F | 50,405,495 | | 638,637,618 |
Fidelity Series International Small Cap Fund Class F | 9,405,433 | | 129,324,708 |
Fidelity Series International Value Fund Class F | 64,403,387 | | 633,729,325 |
TOTAL DEVELOPED INTERNATIONAL EQUITY FUNDS | | 1,401,691,651 |
|
| Shares | | Value |
Emerging Markets Equity Funds - 4.7% |
Fidelity Series Emerging Markets Fund Class F | 23,123,922 | | $ 387,556,934 |
TOTAL INTERNATIONAL EQUITY FUNDS (Cost $1,610,447,537) |
1,789,248,585
|
Bond Funds - 17.1% |
| | | |
High Yield Bond Funds - 8.8% |
Fidelity Series Emerging Markets Debt Fund Class F | 5,469,022 | | 59,502,957 |
Fidelity Series Floating Rate High Income Fund Class F | 5,310,282 | | 56,448,298 |
Fidelity Series High Income Fund Class F | 54,671,108 | | 574,593,348 |
Fidelity Series Real Estate Income Fund Class F | 2,845,688 | | 33,209,173 |
TOTAL HIGH YIELD BOND FUNDS | | 723,753,776 |
Investment Grade Bond Funds - 8.3% |
Fidelity Series Investment Grade Bond Fund Class F | 58,755,938 | | 678,043,519 |
TOTAL BOND FUNDS (Cost $1,367,853,132) |
1,401,797,295
|
TOTAL INVESTMENT PORTFOLIO - 100.0% (Cost $7,563,767,433) | | 8,210,531,134 |
NET OTHER ASSETS (LIABILITIES) - 0.0% | | (335,630) |
NET ASSETS - 100% | $ 8,210,195,504 |
Legend |
(a) Non-income producing |
Other Information |
All investments are categorized as Level 1 under the Fair Value Hierarchy. The inputs or methodology used for valuing securities may not be an indication of the risk associated with investing in those securities. For more information on valuation inputs, please refer to the Security Valuation section in the accompanying Notes to Financial Statements. |
See accompanying notes which are an integral part of the financial statements.
Annual Report
Fidelity Freedom K® 2040 Fund
Statement of Assets and Liabilities
| March 31, 2013 |
| | |
Assets | | |
Investment in securities, at value (cost $7,563,767,433) - See accompanying schedule | | $ 8,210,531,134 |
Receivable for investments sold | | 8,724,467 |
Receivable for fund shares sold | | 31,237,418 |
Total assets | | 8,250,493,019 |
| | |
Liabilities | | |
Payable for investments purchased | $ 7,378,094 | |
Payable for fund shares redeemed | 32,583,744 | |
Transfer agent fees payable | 335,677 | |
Total liabilities | | 40,297,515 |
| | |
Net Assets | | $ 8,210,195,504 |
Net Assets consist of: | | |
Paid in capital | | $ 7,380,885,936 |
Undistributed net investment income | | 12,238,357 |
Accumulated undistributed net realized gain (loss) on investments | | 170,307,510 |
Net unrealized appreciation (depreciation) on investments | | 646,763,701 |
Net Assets, for 554,637,464 shares outstanding | | $ 8,210,195,504 |
Net Asset Value, offering price and redemption price per share ($8,210,195,504 ÷ 554,637,464 shares) | | $ 14.80 |
Statement of Operations
| Year ended March 31, 2013 |
| | |
Investment Income | | |
Income distributions from underlying funds | | $ 128,807,039 |
| | |
Expenses | | |
Transfer agent fees | $ 3,278,295 | |
Independent trustees' compensation | 23,335 | |
Total expenses | | 3,301,630 |
Net investment income (loss) | | 125,505,409 |
Realized and Unrealized Gain (Loss) Realized gain (loss) on sale of underlying fund shares | 75,656,667 | |
Capital gain distributions from underlying funds | 147,304,375 | |
Total net realized gain (loss) | | 222,961,042 |
Change in net unrealized appreciation (depreciation) on underlying funds | | 370,796,035 |
Net gain (loss) | | 593,757,077 |
Net increase (decrease) in net assets resulting from operations | | $ 719,262,486 |
See accompanying notes which are an integral part of the financial statements.
Annual Report
Fidelity Freedom K® 2040 Fund
Financial Statements - continued
Statement of Changes in Net Assets
| Year ended
March 31,
2013 | Year ended
March 31,
2012 |
Increase (Decrease) in Net Assets | | |
Operations | | |
Net investment income (loss) | $ 125,505,409 | $ 70,344,470 |
Net realized gain (loss) | 222,961,042 | 127,919,318 |
Change in net unrealized appreciation (depreciation) | 370,796,035 | (5,885,900) |
Net increase (decrease) in net assets resulting from operations | 719,262,486 | 192,377,888 |
Distributions to shareholders from net investment income | (121,755,541) | (65,753,841) |
Distributions to shareholders from net realized gain | (104,692,158) | (125,534,083) |
Total distributions | (226,447,699) | (191,287,924) |
Share transactions
Proceeds from sales of shares | 3,194,396,979 | 3,409,717,548 |
Reinvestment of distributions | 226,447,699 | 191,287,924 |
Cost of shares redeemed | (1,313,097,134) | (874,290,765) |
Net increase (decrease) in net assets resulting from share transactions | 2,107,747,544 | 2,726,714,707 |
Total increase (decrease) in net assets | 2,600,562,331 | 2,727,804,671 |
| | |
Net Assets | | |
Beginning of period | 5,609,633,173 | 2,881,828,502 |
End of period (including undistributed net investment income of $12,238,357 and undistributed net investment income of $8,488,490, respectively) | $ 8,210,195,504 | $ 5,609,633,173 |
Other Information Shares | | |
Sold | 230,116,813 | 255,817,488 |
Issued in reinvestment of distributions | 16,605,081 | 14,652,524 |
Redeemed | (94,807,866) | (65,765,499) |
Net increase (decrease) | 151,914,028 | 204,704,513 |
Financial Highlights
Years ended March 31, | 2013 | 2012 | 2011 | 2010 F |
Selected Per-Share Data | | | | |
Net asset value, beginning of period | $ 13.93 | $ 14.55 | $ 12.85 | $ 10.00 |
Income from Investment Operations | | | | |
Net investment income (loss) C | .26 | .24 | .24 | .15 |
Net realized and unrealized gain (loss) | 1.09 | (.19) E | 1.77 | 2.81 |
Total from investment operations | 1.35 | .05 | 2.01 | 2.96 |
Distributions from net investment income | (.25) | (.20) | (.18) | (.07) |
Distributions from net realized gain | (.24) | (.47) | (.13) | (.05) |
Total distributions | (.48) I | (.67) | (.31) | (.11) H |
Net asset value, end of period | $ 14.80 | $ 13.93 | $ 14.55 | $ 12.85 |
Total Return B | 10.04% | .67% | 15.81% | 29.64% |
Ratios to Average Net Assets D, G | | | | |
Expenses before reductions | .05% | .05% | .05% | .05% A |
Expenses net of fee waivers, if any | .05% | .05% | .05% | .05% A |
Expenses net of all reductions | .05% | .05% | .05% | .05% A |
Net investment income (loss) | 1.90% | 1.82% | 1.79% | 1.70% A |
Supplemental Data | | | | |
Net assets, end of period (000 omitted) | $ 8,210,196 | $ 5,609,633 | $ 2,881,829 | $ 749,360 |
Portfolio turnover rate | 27% | 18% | 38% | 19% A |
A Annualized
B Total returns for periods of less than one year are not annualized.
C Calculated based on average shares outstanding during the period.
D Amounts do not include the activity of the Underlying Funds.
E The amount shown for a share outstanding does not correspond with the aggregate net gain (loss) on investments for the period due to the timing of sales and repurchases of shares in relation to fluctuating market values of the investments of the Fund.
F For the period July 2, 2009 (commencement of operations) to March 31, 2010.
G Expense ratios reflect operating expenses of the Fund. Expenses before reductions do not reflect amounts reimbursed by the investment adviser or reductions from expense offset arrangements and do not represent the amount paid by the Fund during periods when reimbursements or reductions occur. Expenses net of fee waivers reflect expenses after reimbursement by the investment adviser but prior to reductions from expense offset arrangements. Expenses net of all reductions represent the net expenses paid by the Fund but do not include expenses of the investment companies in which the Fund invests.
H Total distributions of $.11 per share is comprised of distributions from net investment income of $.065 and distributions from net realized gain of $.045 per share.
I Total distributions of $.48 per share is comprised of distributions from net investment income of $.245 and distributions from net realized gain of $.237 per share.
See accompanying notes which are an integral part of the financial statements.
Annual Report
Fidelity Freedom K® 2045 Fund
Investment Changes (Unaudited)
The information in the following tables is based on the direct investments of the Fund. |
Fund Holdings as of March 31, 2013 |
| % of fund's
net assets | % of fund's net assets
6 months ago |
Commodity Funds | | |
Fidelity Series Commodity Strategy Fund Class F | 9.2 | 9.6 |
Domestic Equity Funds | | |
Fidelity Blue Chip Growth Fund Class F | 5.6 | 3.9 |
Fidelity Disciplined Equity Fund Class F | 1.2 | 5.6 |
Fidelity Growth Company Fund Class F | 7.8 | 8.5 |
Fidelity Series 100 Index Fund | 1.9 | 7.4 |
Fidelity Series All-Sector Equity Fund Class F | 8.3 | 12.1 |
Fidelity Series Equity Income Fund Class F | 4.9 | 0.0 |
Fidelity Series Intrinsic Opportunities Fund Class F | 2.9 | 0.0 |
Fidelity Series Large Cap Value Fund Class F | 5.0 | 10.4 |
Fidelity Series Mega Cap Fund Class F | 1.8 | 0.0 |
Fidelity Series Opportunistic Insights Fund Class F | 3.6 | 0.0 |
Fidelity Series Real Estate Equity Fund Class F | 0.7 | 0.6 |
Fidelity Series Small Cap Opportunities Fund Class F | 2.2 | 2.1 |
Fidelity Series Stock Selector Large Cap Value Fund Class F | 5.0 | 0.0 |
Fidelity Small Cap Growth Fund Class F | 1.2 | 1.2 |
Fidelity Small Cap Value Fund Class F | 1.3 | 1.1 |
| 53.4 | 52.9 |
Developed International Equity Funds | | |
Fidelity Series International Growth Fund Class F | 8.0 | 8.0 |
Fidelity Series International Small Cap Fund Class F | 1.6 | 1.6 |
Fidelity Series International Value Fund Class F | 8.0 | 8.1 |
| 17.6 | 17.7 |
Emerging Markets Equity Funds | | |
Fidelity Series Emerging Markets Fund Class F | 4.9 | 5.1 |
High Yield Bond Funds | | |
Fidelity Series Emerging Markets Debt Fund Class F | 0.7 | 0.8 |
Fidelity Series Floating Rate High Income Fund Class F | 0.3 | 0.2 |
Fidelity Series High Income Fund Class F | 9.1 | 9.1 |
Fidelity Series Real Estate Income Fund Class F | 0.3 | 0.1 |
| 10.4 | 10.2 |
Investment Grade Bond Funds | | |
Fidelity Series Investment Grade Bond Fund Class F | 4.5 | 4.5 |
Net Other Assets (Liabilities)* | 0.0 | 0.0 |
| 100.0 | 100.0 |
* Amount represents less than 0.1% |
Asset Allocation (% of fund's net assets) |
Period end |
| Commodity Funds | 9.2% | |
| Domestic Equity Funds | 53.4% | |
| Developed International Equity Funds | 17.6% | |
| Emerging Markets Equity Funds | 4.9% | |
| High Yield Bond Funds | 10.4% | |
| Investment Grade Bond Funds | 4.5% | |

Six months ago |
| Commodity Funds | 9.6% | |
| Domestic Equity Funds | 52.9% | |
| Developed International Equity Funds | 17.7% | |
| Emerging Markets Equity Funds | 5.1% | |
| High Yield Bond Funds | 10.2% | |
| Investment Grade Bond Funds | 4.5% | |

Expected |
| Commodity Funds | 9.3% | |
| Domestic Equity Funds | 52.7% | |
| Developed International Equity Funds | 17.4% | |
| Emerging Markets Equity Funds | 5.2% | |
| High Yield Bond Funds | 9.6% | |
| Investment Grade Bond Funds | 5.8% | |

The fund invests according to an asset allocation strategy that becomes increasingly conservative over time. The six months ago allocation is based on the fund's holdings as of September 30, 2012. The current allocation is based on the fund's holdings as of March 31, 2013. The expected allocation represents the fund's anticipated allocation at September 30, 2013. |
Annual Report
Fidelity Freedom K® 2045 Fund
Investments March 31, 2013
Showing Percentage of Net Assets
Domestic Equity Funds - 62.6% |
| Shares | | Value |
Commodity Funds - 9.2% |
Fidelity Series Commodity Strategy Fund Class F (a) | 40,207,708 | | $ 351,013,285 |
Domestic Equity Funds - 53.4% |
Fidelity Blue Chip Growth Fund Class F | 4,017,480 | | 215,336,932 |
Fidelity Disciplined Equity Fund Class F | 1,730,347 | | 46,996,225 |
Fidelity Growth Company Fund Class F | 2,932,333 | | 296,312,250 |
Fidelity Series 100 Index Fund | 7,082,645 | | 73,092,900 |
Fidelity Series All-Sector Equity Fund Class F | 24,566,756 | | 315,682,810 |
Fidelity Series Equity Income Fund Class F | 16,900,586 | | 187,765,506 |
Fidelity Series Intrinsic Opportunities Fund Class F | 9,716,171 | | 110,278,545 |
Fidelity Series Large Cap Value Fund Class F | 16,457,613 | | 191,402,042 |
Fidelity Series Mega Cap Fund Class F | 6,230,292 | | 68,657,819 |
Fidelity Series Opportunistic Insights Fund Class F | 12,469,884 | | 137,293,423 |
Fidelity Series Real Estate Equity Fund Class F | 2,053,226 | | 26,732,998 |
Fidelity Series Small Cap Opportunities Fund Class F | 6,644,252 | | 82,322,283 |
Fidelity Series Stock Selector Large Cap Value Fund Class F | 16,930,276 | | 189,619,093 |
Fidelity Small Cap Growth Fund Class F | 2,482,802 | | 45,311,128 |
Fidelity Small Cap Value Fund Class F | 2,574,630 | | 48,660,513 |
TOTAL DOMESTIC EQUITY FUNDS | | 2,035,464,467 |
TOTAL DOMESTIC EQUITY FUNDS (Cost $2,199,244,970) |
2,386,477,752
|
International Equity Funds - 22.5% |
| | | |
Developed International Equity Funds - 17.6% |
Fidelity Series International Growth Fund Class F | 24,128,633 | | 305,709,775 |
Fidelity Series International Small Cap Fund Class F | 4,530,648 | | 62,296,415 |
Fidelity Series International Value Fund Class F | 30,929,388 | | 304,345,181 |
TOTAL DEVELOPED INTERNATIONAL EQUITY FUNDS | | 672,351,371 |
|
| Shares | | Value |
Emerging Markets Equity Funds - 4.9% |
Fidelity Series Emerging Markets Fund Class F | 11,126,489 | | $ 186,479,953 |
TOTAL INTERNATIONAL EQUITY FUNDS (Cost $777,598,835) |
858,831,324
|
Bond Funds - 14.9% |
| | | |
High Yield Bond Funds - 10.4% |
Fidelity Series Emerging Markets Debt Fund Class F | 2,504,509 | | 27,249,057 |
Fidelity Series Floating Rate High Income Fund Class F | 1,178,739 | | 12,529,991 |
Fidelity Series High Income Fund Class F | 32,879,558 | | 345,564,155 |
Fidelity Series Real Estate Income Fund Class F | 1,136,092 | | 13,258,198 |
TOTAL HIGH YIELD BOND FUNDS | | 398,601,401 |
Investment Grade Bond Funds - 4.5% |
Fidelity Series Investment Grade Bond Fund Class F | 14,772,934 | | 170,479,657 |
TOTAL BOND FUNDS (Cost $549,631,635) |
569,081,058
|
TOTAL INVESTMENT PORTFOLIO - 100.0% (Cost $3,526,475,440) | | 3,814,390,134 |
NET OTHER ASSETS (LIABILITIES) - 0.0% | | (154,560) |
NET ASSETS - 100% | $ 3,814,235,574 |
Legend |
(a) Non-income producing |
Other Information |
All investments are categorized as Level 1 under the Fair Value Hierarchy. The inputs or methodology used for valuing securities may not be an indication of the risk associated with investing in those securities. For more information on valuation inputs, please refer to the Security Valuation section in the accompanying Notes to Financial Statements. |
See accompanying notes which are an integral part of the financial statements.
Annual Report
Fidelity Freedom K® 2045 Fund
Statement of Assets and Liabilities
| March 31, 2013 |
| | |
Assets | | |
Investment in securities, at value (cost $3,526,475,440) - See accompanying schedule | | $ 3,814,390,134 |
Receivable for investments sold | | 2,297,506 |
Receivable for fund shares sold | | 22,321,940 |
Total assets | | 3,839,009,580 |
| | |
Liabilities | | |
Payable for investments purchased | $ 16,961,298 | |
Payable for fund shares redeemed | 7,658,127 | |
Transfer agent fees payable | 154,581 | |
Total liabilities | | 24,774,006 |
| | |
Net Assets | | $ 3,814,235,574 |
Net Assets consist of: | | |
Paid in capital | | $ 3,445,838,924 |
Undistributed net investment income | | 5,681,298 |
Accumulated undistributed net realized gain (loss) on investments | | 74,800,658 |
Net unrealized appreciation (depreciation) on investments | | 287,914,694 |
Net Assets, for 253,893,261 shares outstanding | | $ 3,814,235,574 |
Net Asset Value, offering price and redemption price per share ($3,814,235,574 ÷ 253,893,261 shares) | | $ 15.02 |
Statement of Operations
| Year ended March 31, 2013 |
| | |
Investment Income | | |
Income distributions from underlying funds | | $ 57,901,105 |
| | |
Expenses | | |
Transfer agent fees | $ 1,426,295 | |
Independent trustees' compensation | 10,034 | |
Total expenses | | 1,436,329 |
Net investment income (loss) | | 56,464,776 |
Realized and Unrealized Gain (Loss) Realized gain (loss) on sale of underlying fund shares | 26,909,416 | |
Capital gain distributions from underlying funds | 63,208,232 | |
Total net realized gain (loss) | | 90,117,648 |
Change in net unrealized appreciation (depreciation) on underlying funds | | 188,323,806 |
Net gain (loss) | | 278,441,454 |
Net increase (decrease) in net assets resulting from operations | | $ 334,906,230 |
See accompanying notes which are an integral part of the financial statements.
Annual Report
Statement of Changes in Net Assets
| Year ended
March 31,
2013 | Year ended
March 31,
2012 |
Increase (Decrease) in Net Assets | | |
Operations | | |
Net investment income (loss) | $ 56,464,776 | $ 26,470,160 |
Net realized gain (loss) | 90,117,648 | 47,683,926 |
Change in net unrealized appreciation (depreciation) | 188,323,806 | 16,891,627 |
Net increase (decrease) in net assets resulting from operations | 334,906,230 | 91,045,713 |
Distributions to shareholders from net investment income | (54,226,677) | (24,252,667) |
Distributions to shareholders from net realized gain | (36,755,954) | (41,511,318) |
Total distributions | (90,982,631) | (65,763,985) |
Share transactions
Proceeds from sales of shares | 1,784,217,328 | 1,524,802,536 |
Reinvestment of distributions | 90,982,631 | 65,763,985 |
Cost of shares redeemed | (559,701,128) | (288,452,836) |
Net increase (decrease) in net assets resulting from share transactions | 1,315,498,831 | 1,302,113,685 |
Total increase (decrease) in net assets | 1,559,422,430 | 1,327,395,413 |
| | |
Net Assets | | |
Beginning of period | 2,254,813,144 | 927,417,731 |
End of period (including undistributed net investment income of $5,681,298 and undistributed net investment income of $3,443,198, respectively) | $ 3,814,235,574 | $ 2,254,813,144 |
Other Information Shares | | |
Sold | 126,875,232 | 113,614,190 |
Issued in reinvestment of distributions | 6,590,465 | 5,018,200 |
Redeemed | (39,824,450) | (21,558,421) |
Net increase (decrease) | 93,641,247 | 97,073,969 |
Financial Highlights
Years ended March 31, | 2013 | 2012 | 2011 | 2010 F |
Selected Per-Share Data | | | | |
Net asset value, beginning of period | $ 14.07 | $ 14.68 | $ 12.91 | $ 10.00 |
Income from Investment Operations | | | | |
Net investment income (loss) C | .28 | .25 | .25 | .14 |
Net realized and unrealized gain (loss) | 1.12 | (.22) E | 1.81 | 2.86 |
Total from investment operations | 1.40 | .03 | 2.06 | 3.00 |
Distributions from net investment income | (.25) | (.20) | (.18) | (.06) |
Distributions from net realized gain | (.20) | (.44) | (.11) | (.04) |
Total distributions | (.45) | (.64) | (.29) | (.09) H |
Net asset value, end of period | $ 15.02 | $ 14.07 | $ 14.68 | $ 12.91 |
Total Return B | 10.27% | .45% | 16.12% | 30.03% |
Ratios to Average Net Assets D, G | | | | |
Expenses before reductions | .05% | .05% | .05% | .05% A |
Expenses net of fee waivers, if any | .05% | .05% | .05% | .05% A |
Expenses net of all reductions | .05% | .05% | .05% | .05% A |
Net investment income (loss) | 1.96% | 1.85% | 1.83% | 1.55% A |
Supplemental Data | | | | |
Net assets, end of period (000 omitted) | $ 3,814,236 | $ 2,254,813 | $ 927,418 | $ 175,992 |
Portfolio turnover rate | 27% | 14% | 39% | 20% A |
A Annualized
B Total returns for periods of less than one year are not annualized.
C Calculated based on average shares outstanding during the period.
D Amounts do not include the activity of the Underlying Funds.
E The amount shown for a share outstanding does not correspond with the aggregate net gain (loss) on investments for the period due to the timing of sales and repurchases of shares in relation to fluctuating market values of the investments of the Fund.
F For the period July 2, 2009 (commencement of operations) to March 31, 2010.
G Expense ratios reflect operating expenses of the Fund. Expenses before reductions do not reflect amounts reimbursed by the investment adviser or reductions from expense offset arrangements and do not represent the amount paid by the Fund during periods when reimbursements or reductions occur. Expenses net of fee waivers reflect expenses after reimbursement by the investment adviser but prior to reductions from expense offset arrangements. Expenses net of all reductions represent the net expenses paid by the Fund but do not include expenses of the investment companies in which the Fund invests.
H Total distributions of $.09 per share is comprised of distributions from net investment income of $.055 and distributions from net realized gain of $.035 per share.
See accompanying notes which are an integral part of the financial statements.
Annual Report
Fidelity Freedom K® 2050 Fund
Investment Changes (Unaudited)
The information in the following tables is based on the direct investments of the Fund. |
Fund Holdings as of March 31, 2013 |
| % of fund's
net assets | % of fund's net assets
6 months ago |
Commodity Funds | | |
Fidelity Series Commodity Strategy Fund Class F | 9.4 | 9.7 |
Domestic Equity Funds | | |
Fidelity Blue Chip Growth Fund Class F | 5.7 | 4.0 |
Fidelity Disciplined Equity Fund Class F | 1.2 | 5.7 |
Fidelity Growth Company Fund Class F | 7.8 | 8.6 |
Fidelity Series 100 Index Fund | 1.9 | 7.5 |
Fidelity Series All-Sector Equity Fund Class F | 8.4 | 12.4 |
Fidelity Series Equity Income Fund Class F | 5.0 | 0.0 |
Fidelity Series Intrinsic Opportunities Fund Class F | 2.9 | 0.0 |
Fidelity Series Large Cap Value Fund Class F | 5.1 | 10.5 |
Fidelity Series Mega Cap Fund Class F | 1.8 | 0.0 |
Fidelity Series Opportunistic Insights Fund Class F | 3.7 | 0.0 |
Fidelity Series Real Estate Equity Fund Class F | 0.7 | 0.7 |
Fidelity Series Small Cap Opportunities Fund Class F | 2.2 | 2.1 |
Fidelity Series Stock Selector Large Cap Value Fund Class F | 5.1 | 0.0 |
Fidelity Small Cap Growth Fund Class F | 1.2 | 1.2 |
Fidelity Small Cap Value Fund Class F | 1.3 | 1.2 |
| 54.0 | 53.9 |
Developed International Equity Funds | | |
Fidelity Series International Growth Fund Class F | 8.1 | 8.2 |
Fidelity Series International Small Cap Fund Class F | 1.6 | 1.7 |
Fidelity Series International Value Fund Class F | 8.0 | 8.3 |
| 17.7 | 18.2 |
Emerging Markets Equity Funds | | |
Fidelity Series Emerging Markets Fund Class F | 5.0 | 5.2 |
High Yield Bond Funds | | |
Fidelity Series Emerging Markets Debt Fund Class F | 0.7 | 0.8 |
Fidelity Series Floating Rate High Income Fund Class F | 0.1 | 0.1 |
Fidelity Series High Income Fund Class F | 9.3 | 9.1 |
Fidelity Series Real Estate Income Fund Class F | 0.3 | 0.1 |
| 10.4 | 10.1 |
Investment Grade Bond Funds | | |
Fidelity Series Investment Grade Bond Fund Class F | 3.5 | 2.9 |
Net Other Assets (Liabilities)* | 0.0 | 0.0 |
| 100.0 | 100.0 |
* Amount represents less than 0.1% |
Asset Allocation (% of fund's net assets) |
Period end |
| Commodity Funds | 9.4% | |
| Domestic Equity Funds | 54.0% | |
| Developed International Equity Funds | 17.7% | |
| Emerging Markets Equity Funds | 5.0% | |
| High Yield Bond Funds | 10.4% | |
| Investment Grade Bond Funds | 3.5% | |

Six months ago |
 | Commodity Funds | 9.7% | |
| Domestic Equity Funds | 53.9% | |
| Developed International Equity Funds | 18.2% | |
| Emerging Markets Equity Funds | 5.2% | |
| High Yield Bond Funds | 10.1% | |
| Investment Grade Bond Funds | 2.9% | |

Expected |
| Commodity Funds | 9.4% | |
| Domestic Equity Funds | 53.1% | |
| Developed International Equity Funds | 17.6% | |
| Emerging Markets Equity Funds | 5.2% | |
| High Yield Bond Funds | 10.0% | |
| Investment Grade Bond Funds | 4.7% | |

The fund invests according to an asset allocation strategy that becomes increasingly conservative over time. The six months ago allocation is based on the fund's holdings as of September 30, 2012. The current allocation is based on the fund's holdings as of March 31, 2013. The expected allocation represents the fund's anticipated allocation at September 30, 2013. |
Annual Report
Fidelity Freedom K® 2050 Fund
Investments March 31, 2013
Showing Percentage of Net Assets
Domestic Equity Funds - 63.4% |
| Shares | | Value |
Commodity Funds - 9.4% |
Fidelity Series Commodity Strategy Fund Class F (a) | 31,343,921 | | $ 273,632,432 |
Domestic Equity Funds - 54.0% |
Fidelity Blue Chip Growth Fund Class F | 3,118,841 | | 167,169,895 |
Fidelity Disciplined Equity Fund Class F | 1,342,676 | | 36,467,074 |
Fidelity Growth Company Fund Class F | 2,254,084 | | 227,775,172 |
Fidelity Series 100 Index Fund | 5,502,351 | | 56,784,261 |
Fidelity Series All-Sector Equity Fund Class F | 19,073,596 | | 245,095,711 |
Fidelity Series Equity Income Fund Class F | 13,158,850 | | 146,194,818 |
Fidelity Series Intrinsic Opportunities Fund Class F | 7,487,588 | | 84,984,122 |
Fidelity Series Large Cap Value Fund Class F | 12,711,106 | | 147,830,161 |
Fidelity Series Mega Cap Fund Class F | 4,851,800 | | 53,466,838 |
Fidelity Series Opportunistic Insights Fund Class F | 9,709,553 | | 106,902,174 |
Fidelity Series Real Estate Equity Fund Class F | 1,594,274 | | 20,757,443 |
Fidelity Series Small Cap Opportunities Fund Class F | 5,165,490 | | 64,000,427 |
Fidelity Series Stock Selector Large Cap Value Fund Class F | 13,178,477 | | 147,598,938 |
Fidelity Small Cap Growth Fund Class F | 1,900,657 | | 34,686,982 |
Fidelity Small Cap Value Fund Class F | 1,967,284 | | 37,181,666 |
TOTAL DOMESTIC EQUITY FUNDS | | 1,576,895,682 |
TOTAL DOMESTIC EQUITY FUNDS (Cost $1,708,892,774) |
1,850,528,114
|
International Equity Funds - 22.7% |
| | | |
Developed International Equity Funds - 17.7% |
Fidelity Series International Growth Fund Class F | 18,540,546 | | 234,908,722 |
Fidelity Series International Small Cap Fund Class F | 3,479,444 | | 47,842,353 |
Fidelity Series International Value Fund Class F | 23,826,887 | | 234,456,564 |
TOTAL DEVELOPED INTERNATIONAL EQUITY FUNDS | | 517,207,639 |
|
| Shares | | Value |
Emerging Markets Equity Funds - 5.0% |
Fidelity Series Emerging Markets Fund Class F | 8,624,460 | | $ 144,545,954 |
TOTAL INTERNATIONAL EQUITY FUNDS (Cost $599,209,809) |
661,753,593
|
Bond Funds - 13.9% |
| | | |
High Yield Bond Funds - 10.4% |
Fidelity Series Emerging Markets Debt Fund Class F | 1,902,287 | | 20,696,886 |
Fidelity Series Floating Rate High Income Fund Class F | 213,092 | | 2,265,171 |
Fidelity Series High Income Fund Class F | 25,715,751 | | 270,272,548 |
Fidelity Series Real Estate Income Fund Class F | 766,274 | | 8,942,416 |
TOTAL HIGH YIELD BOND FUNDS | | 302,177,021 |
Investment Grade Bond Funds - 3.5% |
Fidelity Series Investment Grade Bond Fund Class F | 8,986,434 | | 103,703,451 |
TOTAL BOND FUNDS (Cost $391,600,513) |
405,880,472
|
TOTAL INVESTMENT PORTFOLIO - 100.0% (Cost $2,699,703,096) | | 2,918,162,179 |
NET OTHER ASSETS (LIABILITIES) - 0.0% | | (117,651) |
NET ASSETS - 100% | $ 2,918,044,528 |
Legend |
(a) Non-income producing |
Other Information |
All investments are categorized as Level 1 under the Fair Value Hierarchy. The inputs or methodology used for valuing securities may not be an indication of the risk associated with investing in those securities. For more information on valuation inputs, please refer to the Security Valuation section in the accompanying Notes to Financial Statements. |
See accompanying notes which are an integral part of the financial statements.
Annual Report
Fidelity Freedom K® 2050 Fund
Statement of Assets and Liabilities
| March 31, 2013 |
| | |
Assets | | |
Investment in securities, at value (cost $2,699,703,096) - See accompanying schedule | | $ 2,918,162,179 |
Receivable for investments sold | | 1,689,158 |
Receivable for fund shares sold | | 18,931,797 |
Total assets | | 2,938,783,134 |
| | |
Liabilities | | |
Payable for investments purchased | $ 14,093,386 | |
Payable for fund shares redeemed | 6,527,552 | |
Transfer agent fees payable | 117,668 | |
Total liabilities | | 20,738,606 |
| | |
Net Assets | | $ 2,918,044,528 |
Net Assets consist of: | | |
Paid in capital | | $ 2,639,455,119 |
Undistributed net investment income | | 4,024,360 |
Accumulated undistributed net realized gain (loss) on investments | | 56,105,966 |
Net unrealized appreciation (depreciation) on investments | | 218,459,083 |
Net Assets, for 193,624,806 shares outstanding | | $ 2,918,044,528 |
Net Asset Value, offering price and redemption price per share ($2,918,044,528 ÷ 193,624,806 shares) | | $ 15.07 |
Statement of Operations
| Year ended March 31, 2013 |
| | |
Investment Income | | |
Income distributions from underlying funds | | $ 43,233,488 |
| | |
Expenses | | |
Transfer agent fees | $ 1,076,602 | |
Independent trustees' compensation | 7,567 | |
Total expenses | | 1,084,169 |
Net investment income (loss) | | 42,149,319 |
Realized and Unrealized Gain (Loss) Realized gain (loss) on sale of underlying fund shares | 19,365,725 | |
Capital gain distributions from underlying funds | 47,048,495 | |
Total net realized gain (loss) | | 66,414,220 |
Change in net unrealized appreciation (depreciation) on underlying funds | | 144,527,475 |
Net gain (loss) | | 210,941,695 |
Net increase (decrease) in net assets resulting from operations | | $ 253,091,014 |
See accompanying notes which are an integral part of the financial statements.
Annual Report
Fidelity Freedom K® 2050 Fund
Financial Statements - continued
Statement of Changes in Net Assets
| Year ended
March 31,
2013 | Year ended
March 31,
2012 |
Increase (Decrease) in Net Assets | | |
Operations | | |
Net investment income (loss) | $ 42,149,319 | $ 18,920,725 |
Net realized gain (loss) | 66,414,220 | 36,537,823 |
Change in net unrealized appreciation (depreciation) | 144,527,475 | 13,388,582 |
Net increase (decrease) in net assets resulting from operations | 253,091,014 | 68,847,130 |
Distributions to shareholders from net investment income | (40,396,292) | (17,366,248) |
Distributions to shareholders from net realized gain | (26,769,214) | (30,945,429) |
Total distributions | (67,165,506) | (48,311,677) |
Share transactions
Proceeds from sales of shares | 1,471,476,473 | 1,230,303,237 |
Reinvestment of distributions | 67,165,506 | 48,311,677 |
Cost of shares redeemed | (512,018,200) | (270,662,390) |
Net increase (decrease) in net assets resulting from share transactions | 1,026,623,779 | 1,007,952,524 |
Total increase (decrease) in net assets | 1,212,549,287 | 1,028,487,977 |
| | |
Net Assets | | |
Beginning of period | 1,705,495,241 | 677,007,264 |
End of period (including undistributed net investment income of $4,024,360 and undistributed net investment income of $2,271,333, respectively) | $ 2,918,044,528 | $ 1,705,495,241 |
Other Information Shares | | |
Sold | 104,262,767 | 91,524,400 |
Issued in reinvestment of distributions | 4,858,118 | 3,682,976 |
Redeemed | (36,404,612) | (20,139,961) |
Net increase (decrease) | 72,716,273 | 75,067,415 |
Financial Highlights
Years ended March 31, | 2013 | 2012 | 2011 | 2010 F |
Selected Per-Share Data | | | | |
Net asset value, beginning of period | $ 14.11 | $ 14.77 | $ 12.94 | $ 10.00 |
Income from Investment Operations | | | | |
Net investment income (loss) C | .27 | .24 | .24 | .15 |
Net realized and unrealized gain (loss) | 1.13 | (.27) E | 1.86 | 2.91 |
Total from investment operations | 1.40 | (.03) | 2.10 | 3.06 |
Distributions from net investment income | (.25) | (.19) | (.17) | (.07) |
Distributions from net realized gain | (.20) | (.44) | (.11) | (.05) |
Total distributions | (.44) I | (.63) | (.27) H | (.12) |
Net asset value, end of period | $ 15.07 | $ 14.11 | $ 14.77 | $ 12.94 |
Total Return B | 10.26% | .06% | 16.43% | 30.59% |
Ratios to Average Net Assets D, G | | | | |
Expenses before reductions | .05% | .05% | .05% | .05% A |
Expenses net of fee waivers, if any | .05% | .05% | .05% | .05% A |
Expenses net of all reductions | .05% | .05% | .05% | .05% A |
Net investment income (loss) | 1.94% | 1.78% | 1.77% | 1.62% A |
Supplemental Data | | | | |
Net assets, end of period (000 omitted) | $ 2,918,045 | $ 1,705,495 | $ 677,007 | $ 117,894 |
Portfolio turnover rate | 29% | 14% | 42% | 24% A |
A Annualized
B Total returns for periods of less than one year are not annualized.
C Calculated based on average shares outstanding during the period.
D Amounts do not include the activity of the Underlying Funds.
E The amount shown for a share outstanding does not correspond with the aggregate net gain (loss) on investments for the period due to the timing of sales and repurchases of shares in relation to fluctuating market values of the investments of the Fund.
F For the period July 2, 2009 (commencement of operations) to March 31, 2010.
G Expense ratios reflect operating expenses of the Fund. Expenses before reductions do not reflect amounts reimbursed by the investment adviser or reductions from expense offset arrangements and do not represent the amount paid by the Fund during periods when reimbursements or reductions occur. Expenses net of fee waivers reflect expenses after reimbursement by the investment adviser but prior to reductions from expense offset arrangements. Expenses net of all reductions represent the net expenses paid by the Fund but do not include expenses of the investment companies in which the Fund invests.
H Total distributions of $.27 per share is comprised of distributions from net investment income of $.167 and distributions from net realized gain of $.106 per share.
I Total distributions of $.44 per share is comprised of distributions from net investment income of $.245 and distributions from net realized gain of $.198 per share.
See accompanying notes which are an integral part of the financial statements.
Annual Report
Fidelity Freedom K® 2055 Fund
Investment Changes (Unaudited)
The information in the following tables is based on the direct investments of the Fund. |
Fund Holdings as of March 31, 2013 |
| % of fund's
net assets | % of fund's net assets
6 months ago |
Commodity Funds | | |
Fidelity Series Commodity Strategy Fund Class F | 9.8 | 10.3 |
Domestic Equity Funds | | |
Fidelity Blue Chip Growth Fund Class F | 6.4 | 4.2 |
Fidelity Disciplined Equity Fund Class F | 1.4 | 5.8 |
Fidelity Growth Company Fund Class F | 8.4 | 8.6 |
Fidelity Series 100 Index Fund | 2.2 | 7.8 |
Fidelity Series All-Sector Equity Fund Class F | 9.4 | 12.8 |
Fidelity Series Equity Income Fund Class F | 4.4 | 0.0 |
Fidelity Series Intrinsic Opportunities Fund Class F | 2.8 | 0.0 |
Fidelity Series Large Cap Value Fund Class F | 5.4 | 10.9 |
Fidelity Series Mega Cap Fund Class F | 1.6 | 0.0 |
Fidelity Series Opportunistic Insights Fund Class F | 3.3 | 0.0 |
Fidelity Series Real Estate Equity Fund Class F | 1.1 | 0.8 |
Fidelity Series Small Cap Opportunities Fund Class F | 2.5 | 2.2 |
Fidelity Series Stock Selector Large Cap Value Fund Class F | 4.5 | 0.0 |
Fidelity Small Cap Growth Fund Class F | 1.3 | 1.2 |
Fidelity Small Cap Value Fund Class F | 1.4 | 1.2 |
| 56.1 | 55.5 |
Developed International Equity Funds | | |
Fidelity Series International Growth Fund Class F | 8.5 | 8.3 |
Fidelity Series International Small Cap Fund Class F | 1.7 | 1.7 |
Fidelity Series International Value Fund Class F | 8.4 | 8.2 |
| 18.6 | 18.2 |
Emerging Markets Equity Funds | | |
Fidelity Series Emerging Markets Fund Class F | 5.3 | 5.5 |
High Yield Bond Funds | | |
Fidelity Series Emerging Markets Debt Fund Class F | 0.6 | 0.8 |
Fidelity Series Floating Rate High Income Fund Class F | 0.0* | 0.0* |
Fidelity Series High Income Fund Class F | 9.3 | 9.4 |
Fidelity Series Real Estate Income Fund Class F | 0.2 | 0.0* |
| 10.1 | 10.2 |
Investment Grade Bond Funds | | |
Fidelity Series Investment Grade Bond Fund Class F | 0.1 | 0.3 |
Net Other Assets (Liabilities)* | 0.0 | 0.0 |
| 100.0 | 100.0 |
* Amount represents less than 0.1%. |
Asset Allocation (% of fund's net assets) |
Period end |
| Commodity Funds | 9.8% | |
| Domestic Equity Funds | 56.1% | |
| Developed International Equity Funds | 18.6% | |
| Emerging Markets Equity Funds | 5.3% | |
| High Yield Bond Funds | 10.1% | |
| Investment Grade Bond Funds | 0.1% | |

Six months ago |
| Commodity Funds | 10.3% | |
| Domestic Equity Funds | 55.5% | |
| Developed International Equity Funds | 18.2% | |
| Emerging Markets Equity Funds | 5.5% | |
| High Yield Bond Funds | 10.2% | |
| Investment Grade Bond Funds | 0.3% | |

Expected |
| Commodity Funds | 9.8% | |
| Domestic Equity Funds | 55.8% | |
| Developed International Equity Funds | 18.4% | |
| Emerging Markets Equity Funds | 5.5% | |
| High Yield Bond Funds | 10.0% | |
| Investment Grade Bond Funds | 0.5% | |

The fund invests according to an asset allocation strategy that becomes increasingly conservative over time. The six months ago allocation is based on the fund's holdings as of September 30, 2012. The current allocation is based on the fund's holdings as of March 31, 2013. The expected allocation represents the fund's anticipated allocation at September 30, 2013. |
Annual Report
Fidelity Freedom K® 2055 Fund
Investments March 31, 2013
Showing Percentage of Net Assets
Domestic Equity Funds - 65.9% |
| Shares | | Value |
Commodity Funds - 9.8% |
Fidelity Series Commodity Strategy Fund Class F (a) | 2,342,762 | | $ 20,452,316 |
Domestic Equity Funds - 56.1% |
Fidelity Blue Chip Growth Fund Class F | 248,361 | | 13,312,170 |
Fidelity Disciplined Equity Fund Class F | 106,100 | | 2,881,689 |
Fidelity Growth Company Fund Class F | 174,041 | | 17,586,800 |
Fidelity Series 100 Index Fund | 454,058 | | 4,685,874 |
Fidelity Series All-Sector Equity Fund Class F | 1,525,834 | | 19,606,964 |
Fidelity Series Equity Income Fund Class F | 833,600 | | 9,261,291 |
Fidelity Series Intrinsic Opportunities Fund Class F | 518,047 | | 5,879,837 |
Fidelity Series Large Cap Value Fund Class F | 971,381 | | 11,297,163 |
Fidelity Series Mega Cap Fund Class F | 307,307 | | 3,386,524 |
Fidelity Series Opportunistic Insights Fund Class F | 616,643 | | 6,789,237 |
Fidelity Series Real Estate Equity Fund Class F | 170,185 | | 2,215,807 |
Fidelity Series Small Cap Opportunities Fund Class F | 415,288 | | 5,145,422 |
Fidelity Series Stock Selector Large Cap Value Fund Class F | 831,661 | | 9,314,599 |
Fidelity Small Cap Growth Fund Class F | 147,464 | | 2,691,226 |
Fidelity Small Cap Value Fund Class F | 150,915 | | 2,852,288 |
TOTAL DOMESTIC EQUITY FUNDS | | 116,906,891 |
TOTAL DOMESTIC EQUITY FUNDS (Cost $130,144,810) |
137,359,207
|
International Equity Funds - 23.9% |
| | | |
Developed International Equity Funds - 18.6% |
Fidelity Series International Growth Fund Class F | 1,399,762 | | 17,734,981 |
Fidelity Series International Small Cap Fund Class F | 260,550 | | 3,582,563 |
Fidelity Series International Value Fund Class F | 1,785,525 | | 17,569,569 |
TOTAL DEVELOPED INTERNATIONAL EQUITY FUNDS | | 38,887,113 |
|
| Shares | | Value |
Emerging Markets Equity Funds - 5.3% |
Fidelity Series Emerging Markets Fund Class F | 654,420 | | $ 10,968,071 |
TOTAL INTERNATIONAL EQUITY FUNDS (Cost $46,674,549) |
49,855,184
|
Bond Funds - 10.2% |
| | | |
High Yield Bond Funds - 10.1% |
Fidelity Series Emerging Markets Debt Fund Class F | 116,523 | | 1,267,774 |
Fidelity Series Floating Rate High Income Fund Class F | 613 | | 6,513 |
Fidelity Series High Income Fund Class F | 1,836,991 | | 19,306,774 |
Fidelity Series Real Estate Income Fund Class F | 40,948 | | 477,858 |
TOTAL HIGH YIELD BOND FUNDS | | 21,058,919 |
Investment Grade Bond Funds - 0.1% |
Fidelity Series Investment Grade Bond Fund Class F | 26,650 | | 307,537 |
TOTAL BOND FUNDS (Cost $20,788,466) |
21,366,456
|
TOTAL INVESTMENT PORTFOLIO - 100.0% (Cost $197,607,825) | | 208,580,847 |
NET OTHER ASSETS (LIABILITIES) - 0.0% | | (8,055) |
NET ASSETS - 100% | $ 208,572,792 |
Legend |
(a) Non-income producing |
Other Information |
All investments are categorized as Level 1 under the Fair Value Hierarchy. The inputs or methodology used for valuing securities may not be an indication of the risk associated with investing in those securities. For more information on valuation inputs, please refer to the Security Valuation section in the accompanying Notes to Financial Statements. |
See accompanying notes which are an integral part of the financial statements.
Annual Report
Fidelity Freedom K® 2055 Fund
Statement of Assets and Liabilities
| March 31, 2013 |
| | |
Assets | | |
Investment in securities, at value (cost $197,607,825) - See accompanying schedule | | $ 208,580,847 |
Receivable for investments sold | | 77,084 |
Receivable for fund shares sold | | 2,276,395 |
Total assets | | 210,934,326 |
| | |
Liabilities | | |
Payable for investments purchased | $ 1,458,199 | |
Payable for fund shares redeemed | 895,283 | |
Transfer agent fees payable | 8,052 | |
Total liabilities | | 2,361,534 |
| | |
Net Assets | | $ 208,572,792 |
Net Assets consist of: | | |
Paid in capital | | $ 194,973,557 |
Undistributed net investment income | | 228,934 |
Accumulated undistributed net realized gain (loss) on investments | | 2,397,279 |
Net unrealized appreciation (depreciation) on investments | | 10,973,022 |
Net Assets, for 19,607,978 shares outstanding | | $ 208,572,792 |
Net Asset Value, offering price and redemption price per share ($208,572,792 ÷ 19,607,978 shares) | | $ 10.64 |
Statement of Operations
| Year ended March 31, 2013 |
| | |
Investment Income | | |
Income distributions from underlying funds | | $ 1,993,308 |
| | |
Expenses | | |
Transfer agent fees | $ 44,808 | |
Independent trustees' compensation | 279 | |
Total expenses | | 45,087 |
Net investment income (loss) | | 1,948,221 |
Realized and Unrealized Gain (Loss) Realized gain (loss) on sale of underlying fund shares | 61,885 | |
Capital gain distributions from underlying funds | 2,594,232 | |
Total net realized gain (loss) | | 2,656,117 |
Change in net unrealized appreciation (depreciation) on underlying funds | | 10,191,458 |
Net gain (loss) | | 12,847,575 |
Net increase (decrease) in net assets resulting from operations | | $ 14,795,796 |
See accompanying notes which are an integral part of the financial statements.
Annual Report
Statement of Changes in Net Assets
| Year ended
March 31,
2013 | For the period
June 1, 2011
(commencement of
operations) to
March 31,
2012 |
Increase (Decrease) in Net Assets | | |
Operations | | |
Net investment income (loss) | $ 1,948,221 | $ 133,408 |
Net realized gain (loss) | 2,656,117 | 209,152 |
Change in net unrealized appreciation (depreciation) | 10,191,458 | 781,564 |
Net increase (decrease) in net assets resulting from operations | 14,795,796 | 1,124,124 |
Distributions to shareholders from net investment income | (1,740,051) | (112,202) |
Distributions to shareholders from net realized gain | (381,047) | (87,388) |
Total distributions | (2,121,098) | (199,590) |
Share transactions
Proceeds from sales of shares | 206,753,109 | 27,223,975 |
Reinvestment of distributions | 2,121,098 | 199,590 |
Cost of shares redeemed | (37,846,021) | (3,478,191) |
Net increase (decrease) in net assets resulting from share transactions | 171,028,186 | 23,945,374 |
Total increase (decrease) in net assets | 183,702,884 | 24,869,908 |
| | |
Net Assets | | |
Beginning of period | 24,869,908 | - |
End of period (including undistributed net investment income of $228,934 and undistributed net investment income of $20,763, respectively) | $ 208,572,792 | $ 24,869,908 |
Other Information Shares | | |
Sold | 20,650,775 | 2,863,934 |
Issued in reinvestment of distributions | 216,279 | 22,655 |
Redeemed | (3,787,133) | (358,532) |
Net increase (decrease) | 17,079,921 | 2,528,057 |
Financial Highlights
|
| Period ended
March 31, |
Years ended March 31, | 2013 | 2012 F |
Selected Per-Share Data | | |
Net asset value, beginning of period | $ 9.84 | $ 10.00 |
Income from Investment Operations | | |
Net investment income (loss) C | .22 | .14 |
Net realized and unrealized gain (loss) | .79 | (.11) E |
Total from investment operations | 1.01 | .03 |
Distributions from net investment income | (.15) | (.10) |
Distributions from net realized gain | (.06) | (.08) |
Total distributions | (.21) | (.19) H |
Net asset value, end of period | $ 10.64 | $ 9.84 |
Total Return B | 10.48% | .47% |
Ratios to Average Net Assets D, G | | |
Expenses before reductions | .05% | .05% A |
Expenses net of fee waivers, if any | .05% | .05% A |
Expenses net of all reductions | .05% | .05% A |
Net investment income (loss) | 2.17% | 1.78% A |
Supplemental Data | | |
Net assets, end of period (000 omitted) | $ 208,573 | $ 24,870 |
Portfolio turnover rate | 27% | 7% A |
A Annualized
B Total returns for periods of less than one year are not annualized.
C Calculated based on average shares outstanding during the period.
D Amounts do not include the activity of the Underlying Funds.
E The amount shown for a share outstanding does not correspond with the aggregate net gain (loss) on investments for the period due to the timing of sales and repurchases of shares in relation to fluctuating market values of the investments of the Fund.
F For the period June 1, 2011 (commencement of operations) to March 31, 2012.
G Expense ratios reflect operating expenses of the Fund. Expenses before reductions do not reflect amounts reimbursed by the investment adviser or reductions from expense offset arrangements and do not represent the amount paid by the Fund during periods when reimbursements or reductions occur. Expenses net of fee waivers reflect expenses after reimbursement by the investment adviser but prior to reductions from expense offset arrangements. Expenses net of all reductions represent the net expenses paid by the Fund but do not include expenses of the investment companies in which the Fund invests.
H Total distributions of $.19 per share is comprised of distributions from net investment income of $.104 and distributions from net realized gain of $.081 per share.
See accompanying notes which are an integral part of the financial statements.
Annual Report
Notes to Financial Statements
For the period ended March 31, 2013
1. Organization.
Fidelity Freedom K® Income Fund, Fidelity Freedom K® 2000 Fund, Fidelity Freedom K® 2005 Fund, Fidelity Freedom K® 2010 Fund, Fidelity Freedom K® 2015 Fund, Fidelity Freedom K® 2020 Fund, Fidelity Freedom K® 2025 Fund, Fidelity Freedom K® 2030 Fund, Fidelity Freedom K® 2035 Fund, Fidelity Freedom K® 2040 Fund, Fidelity Freedom K® 2045 Fund, Fidelity Freedom K® 2050 Fund and Fidelity Freedom K® 2055 Fund (the Funds) are funds of Fidelity Aberdeen Street Trust (the Trust). The Trust is registered under the Investment Company Act of 1940, as amended (the 1940 Act), as an open-end management investment company organized as a Delaware statutory trust. Each Fund is authorized to issue an unlimited number of shares. The Funds invest primarily in a combination of other Fidelity equity, bond and short-term funds (the Underlying Funds) managed by Fidelity Management & Research Company (FMR).
2. Significant Accounting Policies.
The financial statements have been prepared in conformity with accounting principles generally accepted in the United States of America (GAAP), which require management to make certain estimates and assumptions at the date of the financial statements. Actual results could differ from those estimates. Subsequent events, if any, through the date that the financial statements were issued have been evaluated in the preparation of the financial statements. The following summarizes the significant accounting policies of the Funds:
Security Valuation. Investments are valued as of 4:00 p.m. Eastern time on the last calendar day of the period. Each Fund categorizes the inputs to valuation techniques used to value its investments into a disclosure hierarchy consisting of three levels as shown below:
Level 1 - quoted prices in active markets for identical investments
Level 2 - other significant observable inputs (including quoted prices for similar investments, interest rates, prepayment speeds, etc.)
Level 3 - unobservable inputs (including the Fund's own assumptions based on the best information available)
Valuation techniques used to value each Fund's investments by major category are as follows. Investments in the Underlying Funds are valued at their closing net asset value (NAV) each business day and are categorized as Level 1 in the hierarchy.
Investment Transactions and Income. For financial reporting purposes, the Funds' investment holdings and NAV include trades executed through the end of the last business day of the period. The NAV per share for processing shareholder transactions is calculated as of the close of business of the New York Stock Exchange (NYSE), normally 4:00 p.m. Eastern time and includes trades executed through the end of the prior business day. Gains and losses on securities sold are determined on the basis of identified cost. Income and capital gain distributions from the Underlying Funds, if any, are recorded on the ex-dividend date.
Expenses. Expenses directly attributable to a fund are charged to that fund. Expenses attributable to more than one fund are allocated among the respective funds on the basis of relative net assets or other appropriate methods. Expenses included in the accompanying financial statements reflect the expenses of each Fund and do not include any expenses associated with the Underlying Funds. Expense estimates are accrued in the period to which they relate and adjustments are made when actual amounts are known.
Income Tax Information and Distributions to Shareholders. Each year, each Fund intends to qualify as a regulated investment company under Subchapter M of the Internal Revenue Code, including distributing substantially all of its taxable income and realized gains. As a result, no provision for income taxes is required. As of March 31, 2013, each Fund did not have any unrecognized tax benefits in the financial statements; nor is each Fund aware of any tax positions for which it is reasonably possible that the total amounts of unrecognized tax benefits will significantly change in the next twelve months. Each Fund files a U.S. federal tax return, in addition to state and local tax returns as required. A fund's federal income tax returns are subject to examination by the Internal Revenue Service (IRS) for a period of three fiscal years after they are filed. State and local tax returns may be subject to examination for an additional fiscal year depending on the jurisdiction.
Distributions are declared and recorded on the ex-dividend date. Income and capital gain distributions are determined in accordance with income tax regulations, which may differ from GAAP.
Capital accounts within the financial statements are adjusted for permanent book-tax differences. These adjustments have no impact on net assets or the results of operations. Temporary book-tax differences will reverse in a subsequent period.
Book-tax differences are primarily due to the short-term gain distributions from the Underlying Funds and losses deferred due to wash sales.
Annual Report
Notes to Financial Statements - continued
2. Significant Accounting Policies - continued
Income Tax Information and Distributions to Shareholders - continued
The federal tax cost of investment securities and unrealized appreciation (depreciation) as of period end were as follows for each Fund:
| Tax cost | Gross unrealized
appreciation | Gross unrealized
depreciation | Net unrealized
appreciation
(depreciation) on
securities and
other investments |
Fidelity Freedom K® Income Fund | $ 1,517,782,354 | $ 56,299,492 | $ (8,294,032) | $ 48,005,460 |
Fidelity Freedom K® 2000 Fund | 740,097,402 | 29,931,966 | (3,748,665) | 26,183,301 |
Fidelity Freedom K® 2005 Fund | 472,425,700 | 27,634,650 | (3,975,893) | 23,658,757 |
Fidelity Freedom K® 2010 Fund | 4,414,957,760 | 333,896,132 | (48,875,271) | 285,020,861 |
Fidelity Freedom K® 2015 Fund | 6,731,736,056 | 482,752,833 | (75,550,150) | 407,202,683 |
Fidelity Freedom K® 2020 Fund | 15,083,058,027 | 1,159,565,487 | (190,022,885) | 969,542,602 |
Fidelity Freedom K® 2025 Fund | 9,227,064,316 | 788,874,327 | (127,830,643) | 661,043,684 |
Fidelity Freedom K® 2030 Fund | 12,037,508,758 | 1,083,829,152 | (183,146,229) | 900,682,923 |
Fidelity Freedom K® 2035 Fund | 6,776,219,735 | 659,688,402 | (106,364,728) | 553,323,674 |
Fidelity Freedom K® 2040 Fund | 7,581,444,411 | 755,419,034 | (126,332,311) | 629,086,723 |
Fidelity Freedom K® 2045 Fund | 3,532,027,683 | 334,605,075 | (52,242,624) | 282,362,451 |
Fidelity Freedom K® 2050 Fund | 2,704,886,823 | 254,849,384 | (41,574,028) | 213,275,356 |
Fidelity Freedom K® 2055 Fund | 197,792,702 | 11,768,044 | (979,899) | 10,788,145 |
The tax-based components of distributable earnings as of period end were as follows for each Fund:
| Undistributed
ordinary income | Undistributed
long-term
capital gain | Net unrealized
appreciation
(depreciation) |
Fidelity Freedom K® Income Fund | $ 2,158,569 | $ 12,887,685 | $ 48,005,460 |
Fidelity Freedom K® 2000 Fund | 2,062,439 | 6,451,880 | 26,183,301 |
Fidelity Freedom K® 2005 Fund | 1,399,508 | 6,680,831 | 23,658,757 |
Fidelity Freedom K® 2010 Fund | 13,749,399 | 83,247,856 | 285,020,861 |
Fidelity Freedom K® 2015 Fund | 20,625,797 | 115,241,151 | 407,202,683 |
Fidelity Freedom K® 2020 Fund | 47,158,353 | 277,042,589 | 969,542,602 |
Fidelity Freedom K® 2025 Fund | 29,481,703 | 186,903,034 | 661,043,684 |
Fidelity Freedom K® 2030 Fund | 39,829,877 | 257,704,743 | 900,682,923 |
Fidelity Freedom K® 2035 Fund | 20,074,694 | 154,715,060 | 553,323,674 |
Fidelity Freedom K® 2040 Fund | 21,825,936 | 178,396,909 | 629,086,723 |
Fidelity Freedom K® 2045 Fund | 9,954,044 | 76,080,155 | 282,362,451 |
Fidelity Freedom K® 2050 Fund | 7,354,217 | 57,959,836 | 213,275,356 |
Fidelity Freedom K® 2055 Fund | 432,220 | 2,378,870 | 10,788,145 |
The tax character of distributions paid was as follows:
March 31, 2013 | | | |
| Ordinary Income | Long-term
Capital Gains | Total |
Fidelity Freedom K® Income Fund | $ 29,521,630 | $ 10,626,954 | $ 40,148,584 |
Fidelity Freedom K® 2000 Fund | 15,346,814 | 5,742,868 | 21,089,682 |
Fidelity Freedom K® 2005 Fund | 9,410,574 | 4,553,123 | 13,963,697 |
Fidelity Freedom K® 2010 Fund | 104,835,329 | 58,661,704 | 163,497,033 |
Fidelity Freedom K® 2015 Fund | 148,778,147 | 77,190,333 | 225,968,480 |
Fidelity Freedom K® 2020 Fund | 333,637,341 | 180,620,610 | 514,257,951 |
Fidelity Freedom K® 2025 Fund | 191,261,365 | 102,285,196 | 293,546,561 |
Fidelity Freedom K® 2030 Fund | 253,539,696 | 147,752,538 | 401,292,234 |
Fidelity Freedom K® 2035 Fund | 123,782,283 | 73,144,723 | 196,927,006 |
Fidelity Freedom K® 2040 Fund | 139,416,755 | 87,030,944 | 226,447,699 |
Fidelity Freedom K® 2045 Fund | 59,811,042 | 31,171,589 | 90,982,631 |
Fidelity Freedom K® 2050 Fund | 43,922,576 | 23,242,930 | 67,165,506 |
Fidelity Freedom K® 2055 Fund | 1,860,148 | 260,950 | 2,121,098 |
Annual Report
2. Significant Accounting Policies - continued
Income Tax Information and Distributions to Shareholders - continued
March 31, 2012 | | | |
| Ordinary Income | Long-term
Capital Gains | Total |
Fidelity Freedom K® Income Fund | $ 23,009,420 | $ 6,370,332 | $ 29,379,752 |
Fidelity Freedom K® 2000 Fund | 13,568,622 | 4,524,428 | 18,093,050 |
Fidelity Freedom K® 2005 Fund | 8,899,846 | 3,757,194 | 12,657,040 |
Fidelity Freedom K® 2010 Fund | 104,712,622 | 41,679,233 | 146,391,855 |
Fidelity Freedom K® 2015 Fund | 129,466,569 | 50,457,265 | 179,923,834 |
Fidelity Freedom K® 2020 Fund | 295,958,324 | 113,166,740 | 409,125,064 |
Fidelity Freedom K® 2025 Fund | 162,422,564 | 64,215,648 | 226,638,212 |
Fidelity Freedom K® 2030 Fund | 227,503,544 | 92,304,600 | 319,808,144 |
Fidelity Freedom K® 2035 Fund | 110,945,493 | 44,241,613 | 155,187,106 |
Fidelity Freedom K® 2040 Fund | 136,872,587 | 54,415,337 | 191,287,924 |
Fidelity Freedom K® 2045 Fund | 50,015,491 | 15,748,494 | 65,763,985 |
Fidelity Freedom K® 2050 Fund | 37,091,535 | 11,220,142 | 48,311,677 |
Fidelity Freedom K® 2055 Fund | 193,117 | 6,473 | 199,590 |
3. Purchases and Sales of Investments.
Purchases and redemptions of the Underlying Fund shares are noted in the table below.
| Purchases ($) | Redemptions ($) |
Fidelity Freedom K® Income Fund | 495,131,875 | 236,636,072 |
Fidelity Freedom K® 2000 Fund | 235,370,247 | 145,168,179 |
Fidelity Freedom K® 2005 Fund | 225,118,844 | 130,420,629 |
Fidelity Freedom K® 2010 Fund | 1,715,575,593 | 1,304,990,869 |
Fidelity Freedom K® 2015 Fund | 2,752,848,313 | 1,323,547,398 |
Fidelity Freedom K® 2020 Fund | 6,562,321,756 | 3,166,383,906 |
Fidelity Freedom K® 2025 Fund | 4,632,175,111 | 1,871,178,147 |
Fidelity Freedom K® 2030 Fund | 5,760,142,746 | 2,635,258,316 |
Fidelity Freedom K® 2035 Fund | 3,695,118,949 | 1,544,477,501 |
Fidelity Freedom K® 2040 Fund | 3,941,156,216 | 1,786,937,853 |
Fidelity Freedom K® 2045 Fund | 2,118,704,097 | 774,450,871 |
Fidelity Freedom K® 2050 Fund | 1,675,395,029 | 626,689,750 |
Fidelity Freedom K® 2055 Fund | 199,007,082 | 25,550,374 |
4. Fees and Other Transactions with Affiliates.
Management Fee. Strategic Advisers, Inc. (Strategic Advisers), an affiliate of FMR, provides the Funds with investment management related services. The Funds do not pay any fees for these services.
Other Transactions. Strategic Advisers has entered into an administration agreement with FMR under which FMR provides management and administrative services (other than investment advisory services) necessary for the operation of each Fund. Pursuant to this agreement, FMR pays all expenses of each Fund, excluding the transfer agent fees, the compensation of the independent Trustees and certain other expenses such as interest expense. FMR also contracts with other Fidelity companies to perform the services necessary for the operation of each Fund. The Funds do not pay any fees for these services.
Transfer Agent Fees. Fidelity Investments Institutional Operations Company, Inc. (FIIOC), an affiliate of FMR, is the Funds' transfer, dividend disbursing and shareholder servicing agent. FIIOC receives an asset-based fee of .05% based on each Fund's average net assets. FIIOC receives account fees and asset-based fees that vary according to account size and type of account. FIIOC pays for typesetting, printing and mailing of shareholder reports, except proxy statements.
Reallocation of Underlying Fund Investments. During the period, Strategic Advisers reallocated investments of the Funds. This involved taxable redemptions of the Funds' interest in Fidelity Disciplined Equity Fund Class F, Fidelity Series 100 Index Fund, Fidelity Series All-Sector Equity Fund Class F and Fidelity Series Large Cap Value Fund Class F ("selected Underlying Funds") for cash and securities and non-taxable exchanges of those securities for shares of Fidelity Series Stock Selector Large Cap Value Fund Class F, Fidelity Series Equity-Income Fund Class F, Fidelity Series
Annual Report
Notes to Financial Statements - continued
4. Fees and Other Transactions with Affiliates - continued
Reallocation of Underlying Fund Investments - continued
Opportunistic Insights Fund Class F, Fidelity Series Mega Cap Fund Class F and Fidelity Blue Chip Growth Fund Class F, all of which are affiliated investment companies managed by FMR. Realized gains and losses on the redemptions of the selected Underlying Funds in connection with the reallocation are included in the accompanying Statements of Operations as "Realized gain (loss) on sale of underlying fund shares."
Details of these transactions with the related gain (loss) for the Funds are presented in the accompanying table:
| Value of Cash
and Securities
reallocated | Realized Gain (Loss) on
redemptions of selected
Underlying Funds |
Fidelity Freedom K® Income | $ 61,693,869 | $ 5,101,282 |
Fidelity Freedom K® 2000 | 31,040,677 | 2,723,939 |
Fidelity Freedom K® 2005 | 34,827,607 | 3,139,597 |
Fidelity Freedom K® 2010 | 450,483,494 | 36,351,908 |
Fidelity Freedom K® 2015 | 664,633,862 | 50,461,057 |
Fidelity Freedom K® 2020 | 1,667,105,909 | 121,417,521 |
Fidelity Freedom K® 2025 | 1,172,735,747 | 77,865,058 |
Fidelity Freedom K® 2030 | 1,628,881,033 | 109,624,111 |
Fidelity Freedom K® 2035 | 1,023,545,667 | 62,717,618 |
Fidelity Freedom K® 2040 | 1,171,721,908 | 74,833,489 |
Fidelity Freedom K® 2045 | 534,842,092 | 26,824,221 |
Fidelity Freedom K® 2050 | 412,321,740 | 19,904,849 |
Fidelity Freedom K® 2055 | 19,785,476 | 118,414 |
5. Other.
The Funds' organizational documents provide former and current trustees and officers with a limited indemnification against liabilities arising in connection with the performance of their duties to the Funds. In the normal course of business, the Funds may also enter into contracts that provide general indemnifications. The Funds' maximum exposure under these arrangements is unknown as this would be dependent on future claims that may be made against the Funds. The risk of material loss from such claims is considered remote.
The Funds do not invest in the Underlying Funds for the purpose of exercising management or control; however, investments by the Funds within their principal investment strategies may represent a significant portion of the Underlying Fund's net assets. At the end of the period, the following Freedom K® Funds were the owners of record of 10% or more of the total outstanding shares of the Underlying Funds.
Fund | Fidelity Freedom K®
2020 Fund | Fidelity Freedom K®
2030 Fund |
Fidelity Series Emerging Markets Debt Fund | 10% | - |
Fidelity Series Floating Rate High Income Fund | 12% | - |
Fidelity Series Inflation-Protected Bond Index Fund | 16% | - |
Fidelity Series Intrinsic Opportunities Fund | - | 10% |
Fidelity Series Investment Grade Bond Fund | 13% | - |
Fidelity Series Real Estate Income Fund | 12% | - |
The Funds, in aggregate, were the owners of record of more than 20% of the total outstanding shares of the following Underlying Funds.
Fund | % of shares held |
Fidelity Disciplined Equity Fund | 27% |
Fidelity Series 100 Index Fund | 50% |
Fidelity Series All-Sector Equity Fund | 47% |
Fidelity Series Commodity Strategy Fund | 46% |
Fidelity Series Emerging Markets Debt Fund | 47% |
Fidelity Series Emerging Markets Fund | 48% |
Fidelity Series Equity-Income Fund | 54% |
Fidelity Series Floating Rate High Income Fund | 46% |
Fidelity Series High Income Fund | 48% |
Fidelity Series Inflation-Protected Bond Index Fund | 44% |
Fidelity Series International Growth Fund | 48% |
Fidelity Series International Small Cap Fund | 48% |
Annual Report
5. Other - continued
Fund | % of shares held |
Fidelity Series International Value Fund | 48% |
Fidelity Series Intrinsic Opportunities Fund | 54% |
Fidelity Series Investment Grade Bond Fund | 47% |
Fidelity Series Large Cap Value Fund | 48% |
Fidelity Series Mega Cap Fund | 54% |
Fidelity Series Opportunistic Insights Fund | 54% |
Fidelity Series Real Estate Equity Fund | 45% |
Fidelity Series Real Estate Income Fund | 47% |
Fidelity Series Small Cap Opportunities Fund | 45% |
Fidelity Series Stock Selector Large Cap Value Fund | 54% |
Fidelity Small Cap Growth Fund | 33% |
Annual Report
Report of Independent Registered Public Accounting Firm
To the Trustees of Fidelity Aberdeen Street Trust and the Shareholders of Fidelity Freedom K® Income Fund, Fidelity Freedom K® 2000 Fund, Fidelity Freedom K® 2005 Fund, Fidelity Freedom K® 2010 Fund, Fidelity Freedom K® 2015 Fund, Fidelity Freedom K® 2020 Fund, Fidelity Freedom K® 2025 Fund, Fidelity Freedom K® 2030 Fund, Fidelity Freedom K® 2035 Fund, Fidelity Freedom K® 2040 Fund, Fidelity Freedom K® 2045 Fund, Fidelity Freedom K® 2050 Fund and Fidelity Freedom K® 2055 Fund:
In our opinion, the accompanying statements of assets and liabilities, including the schedules of investments, and the related statements of operations and of changes in net assets and the financial highlights present fairly, in all material respects, the financial positions of Fidelity Freedom K® Income Fund, Fidelity Freedom K® 2000 Fund, Fidelity Freedom K® 2005 Fund, Fidelity Freedom K® 2010 Fund, Fidelity Freedom K® 2015 Fund, Fidelity Freedom K® 2020 Fund, Fidelity Freedom K® 2025 Fund, Fidelity Freedom K® 2030 Fund, Fidelity Freedom K® 2035 Fund, Fidelity Freedom K® 2040 Fund, Fidelity Freedom K® 2045 Fund, Fidelity Freedom K® 2050 Fund and Fidelity Freedom K® 2055 Fund (funds of Fidelity Aberdeen Street Trust) at March 31, 2013, and the results of each of their operations, the changes in each of their net assets and the financial highlights for each of the periods indicated, in conformity with accounting principles generally accepted in the United States of America. These financial statements and financial highlights (hereafter referred to as "financial statements") are the responsibility of the Fidelity Aberdeen Street Trust's management. Our responsibility is to express an opinion on these financial statements based on our audits. We conducted our audits of these financial statements in accordance with the standards of the Public Company Accounting Oversight Board (United States). Those standards require that we plan and perform the audit to obtain reasonable assurance about whether the financial statements are free of material misstatement. An audit includes examining, on a test basis, evidence supporting the amounts and disclosures in the financial statements, assessing the accounting principles used and significant estimates made by management, and evaluating the overall financial statement presentation. We believe that our audits, which included confirmation of securities at March 31, 2013 by correspondence with the custodian, provide a reasonable basis for our opinion.
PricewaterhouseCoopers LLP
Boston, Massachusetts
May 17, 2013
Annual Report
The Trustees and executive officers of the trust and funds, as applicable, are listed below. The Board of Trustees governs each Fidelity Freedom K® Fund and is responsible for protecting the interests of shareholders. The Trustees are experienced executives who meet periodically throughout the year to oversee each Fidelity Freedom K® Fund's activities, review contractual arrangements with companies that provide services to each Fidelity Freedom K® Fund, oversee management of the risks associated with such activities and contractual arrangements, and review each Fidelity Freedom K® Fund's performance. If the interests of a Fidelity Freedom K® Fund and an underlying Fidelity fund were to diverge, a conflict of interest could arise and affect how the Trustees fulfill their fiduciary duties to the affected funds. Strategic Advisers has structured the Fidelity Freedom K® Funds to avoid these potential conflicts, although there may be situations where a conflict of interest is unavoidable. In such instances, Strategic Advisers and the Trustees would take reasonable steps to minimize and, if possible, eliminate the conflict. Except for Elizabeth S. Acton and James C. Curvey, each of the Trustees oversees 219 Fidelity funds. Ms. Acton oversees 201 Fidelity funds. Mr. Curvey oversees 453 Fidelity funds.
The Trustees hold office without limit in time except that (a) any Trustee may resign; (b) any Trustee may be removed by written instrument, signed by at least two-thirds of the number of Trustees prior to such removal; (c) any Trustee who requests to be retired or who has become incapacitated by illness or injury may be retired by written instrument signed by a majority of the other Trustees; and (d) any Trustee may be removed at any special meeting of shareholders by a two-thirds vote of the outstanding voting securities of the trust. Each Trustee who is not an interested person of the trust and the funds (as defined in the 1940 Act) (Independent Trustee), shall retire not later than the last day of the month in which his or her 75th birthday occurs. The Independent Trustees may waive this mandatory retirement age policy with respect to individual Trustees. The executive officers hold office without limit in time, except that any officer may resign or may be removed by a vote of a majority of the Trustees at any regular meeting or any special meeting of the Trustees. Except as indicated, each individual has held the office shown or other offices in the same company for the past five years.
Experience, Skills, Attributes, and Qualifications of the Funds' Trustees. The Governance and Nominating Committee has adopted a statement of policy that describes the experience, qualifications, attributes, and skills that are necessary and desirable for potential Independent Trustee candidates (Statement of Policy). The Board believes that each Trustee satisfied at the time he or she was initially elected or appointed a Trustee, and continues to satisfy, the standards contemplated by the Statement of Policy. The Governance and Nominating Committee also engages professional search firms to help identify potential Independent Trustee candidates who have the experience, qualifications, attributes, and skills consistent with the Statement of Policy. From time to time, additional criteria based on the composition and skills of the current Independent Trustees, as well as experience or skills that may be appropriate in light of future changes to board composition, business conditions, and regulatory or other developments, have also been considered by the professional search firms and the Governance and Nominating Committee. In addition, the Board takes into account the Trustees' commitment and participation in Board and committee meetings, as well as their leadership of standing and ad hoc committees throughout their tenure.
In determining that a particular Trustee was and continues to be qualified to serve as a Trustee, the Board has considered a variety of criteria, none of which, in isolation, was controlling. The Board believes that, collectively, the Trustees have balanced and diverse experience, qualifications, attributes, and skills, which allow the Board to operate effectively in governing each fund and protecting the interests of shareholders. Information about the specific experience, skills, attributes, and qualifications of each Trustee, which in each case led to the Board's conclusion that the Trustee should serve (or continue to serve) as a trustee of the funds, is provided below.
Board Structure and Oversight Function. Abigail P. Johnson is an interested person (as defined in the 1940 Act) and currently serves as Chairman. The Trustees have determined that an interested Chairman is appropriate and benefits shareholders because an interested Chairman has a personal and professional stake in the quality and continuity of services provided to the funds. Independent Trustees exercise their informed business judgment to appoint an individual of their choosing to serve as Chairman, regardless of whether the Trustee happens to be independent or a member of management. The Independent Trustees have determined that they can act independently and effectively without having an Independent Trustee serve as Chairman and that a key structural component for assuring that they are in a position to do so is for the Independent Trustees to constitute a substantial majority for the Board. The Independent Trustees also regularly meet in executive session. Albert R. Gamper, Jr. serves as Chairman of the Independent Trustees and as such (i) acts as a liaison between the Independent Trustees and management with respect to matters important to the Independent Trustees and (ii) with management prepares agendas for Board meetings.
Fidelity funds are overseen by different Boards of Trustees. The funds' Board oversees Fidelity's investment-grade bond, money market, and asset allocation funds and another Board oversees Fidelity's equity and high income funds. The asset allocation funds may invest in Fidelity funds that are overseen by such other Board. The use of separate Boards, each with its own committee structure, allows the Trustees of each group of Fidelity funds to focus on the unique issues of the funds they oversee, including common research, investment, and operational issues. On occasion, the separate Boards establish joint committees to address issues of overlapping consequences for the Fidelity funds overseen by each Board.
The Trustees operate using a system of committees to facilitate the timely and efficient consideration of all matters of importance to the Trustees, each fund, and fund shareholders and to facilitate compliance with legal and regulatory requirements and oversight of the funds' activities and associated risks. The Board, acting through its committees, has charged FMR and its affiliates with (i) identifying events or circumstances the occurrence of which could have demonstrably adverse effects on the funds' business and/or reputation; (ii) implementing processes and controls to lessen the possibility that such events or circumstances occur or to mitigate the effects of such events or circumstances if they do occur; and (iii) creating and maintaining a system designed to evaluate continuously business and market conditions in order to facilitate the identification and implementation processes described in (i) and (ii) above. Because the day-to-day operations and activities of the funds are carried out by or through FMR, its affiliates, and other service providers, the funds' exposure to risks is mitigated but not eliminated by the processes overseen by the Trustees. While each of the Board's committees has responsibility for overseeing different aspects of the funds' activities, oversight is exercised primarily through the Operations and Audit Committees. In addition, an ad hoc Board committee of Independent Trustees has worked with FMR to enhance the Board's oversight of investment and financial risks, legal and regulatory risks, technology risks, and operational risks, including the development of additional risk reporting to the Board. Appropriate personnel, including but not limited to the funds' Chief Compliance Officer (CCO), FMR's internal auditor, the independent accountants, the funds' Treasurer and portfolio management personnel, make periodic reports to the Board's committees, as appropriate, including an annual review of FMR's risk management program for the Fidelity funds. The responsibilities of each standing committee, including their oversight responsibilities, are described further under "Standing Committees of the Funds' Trustees."
Annual Report
Trustees and Officers - continued
The funds' Statement of Additional Information (SAI) includes more information about the Trustees. To request a free copy, call Fidelity at 1-800-835-5092.
Interested Trustees*:
Correspondence intended for each Trustee who is an interested person may be sent to Fidelity Investments, 245 Summer Street, Boston, Massachusetts 02210.
Name, Year of Birth; Principal Occupations and Other Relevant Experience+ |
Abigail P. Johnson (1961) |
| Year of Election or Appointment: 2009 Ms. Johnson is Trustee and Chairman of the Board of Trustees of certain Trusts. Ms. Johnson serves as President of Fidelity Financial Services (2012-present) and President of Personal, Workplace and Institutional Services (2005-present). Ms. Johnson is Chairman and Director of FMR Co., Inc. (2011-present), Chairman and Director of FMR (2011-present), and the Vice Chairman and Director (2007-present) of FMR LLC. Previously, Ms. Johnson served as President and a Director of FMR (2001-2005), a Trustee of other investment companies advised by FMR, Fidelity Investments Money Management, Inc., and FMR Co., Inc. (2001-2005), Senior Vice President of the Fidelity funds (2001-2005), and managed a number of Fidelity funds. Ms. Abigail P. Johnson and Mr. Arthur E. Johnson are not related. |
James C. Curvey (1935) |
| Year of Election or Appointment: 2007 Mr. Curvey also serves as Trustee (2007-present) of other investment companies advised by FMR. Mr. Curvey is a Director of Fidelity Investments Money Management, Inc. (2009-present), Director of Fidelity Research & Analysis Co. (2009-present) and Director of FMR and FMR Co., Inc. (2007-present). Mr. Curvey is also Vice Chairman (2007-present) and Director of FMR LLC. In addition, Mr. Curvey serves as an Overseer for the Boston Symphony Orchestra and a member of the Trustees of Villanova University. Previously, Mr. Curvey was the Vice Chairman (2006-2007) and Director (2000-2007) of FMR Corp. |
* Trustees have been determined to be "Interested Trustees" by virtue of, among other things, their affiliation with the trust or various entities under common control with FMR.
+ The information above includes each Trustee's principal occupation during the last five years and other information relating to the experience, attributes, and skills relevant to each Trustee's qualifications to serve as a Trustee, which led to the conclusion that each Trustee should serve as a Trustee for each fund.
Independent Trustees:
Correspondence intended for each Independent Trustee (that is, the Trustees other than the Interested Trustees) may be sent to Fidelity Investments, P.O. Box 55235, Boston, Massachusetts 02205-5235.
Name, Year of Birth; Principal Occupations and Other Relevant Experience+ |
Elizabeth S. Acton (1951) |
| Year of Election or Appointment: 2013 Ms. Acton is Trustee of certain Trusts. Prior to her retirement in April 2012, Ms. Acton was Executive Vice President, Finance (November 2011-April 2012), Executive Vice President, Chief Financial Officer (April 2002-November 2011), and Treasurer (May 2004-May 2005) of Comerica Incorporated (financial services). Prior to joining Comerica, Ms. Acton held a variety of positions at Ford Motor Company (1983-2002), including Vice President and Treasurer (2000-2002) and Executive Vice President and Chief Financial Officer of Ford Motor Credit Company (1998-2000). Ms. Acton currently serves as a member of the Board of Directors and Audit and Finance Committees of Beazer Homes USA, Inc. (homebuilding, 2012-present). |
Albert R. Gamper, Jr. (1942) |
| Year of Election or Appointment: 2006 Mr. Gamper is Chairman of the Independent Trustees of the Fixed Income and Asset Allocation Funds (2012-present). Prior to his retirement in December 2004, Mr. Gamper served as Chairman of the Board of CIT Group Inc. (commercial finance). During his tenure with CIT Group Inc. Mr. Gamper served in numerous senior management positions, including Chairman (1987-1989; 1999-2001; 2002-2004), Chief Executive Officer (1987-2004), and President (2002-2003). Mr. Gamper currently serves as a member of the Board of Directors of Public Service Enterprise Group (utilities, 2000-present), a member of the Board of Trustees, Rutgers University (2004-present), and Chairman of the Board of Barnabas Health Care System. Previously, Mr. Gamper served as Vice Chairman of the Independent Trustees of the Fixed Income and Asset Allocation Funds (2011-2012) and as Chairman of the Board of Governors, Rutgers University (2004-2007). |
Robert F. Gartland (1951) |
| Year of Election or Appointment: 2010 Mr. Gartland is Chairman and an investor in Gartland and Mellina Group Corp. (consulting, 2009-present). Previously, Mr. Gartland served as a partner and investor of Vietnam Partners LLC (investments and consulting, 2008-2011). Prior to his retirement, Mr. Gartland held a variety of positions at Morgan Stanley (financial services, 1979-2007) including Managing Director (1987-2007). |
Arthur E. Johnson (1947) |
| Year of Election or Appointment: 2008 Mr. Johnson serves as a member of the Board of Directors of Eaton Corporation (diversified power management, 2009-present), AGL Resources, Inc. (holding company, 2002-present) and Booz Allen Hamilton (management consulting, 2011-present). Prior to his retirement, Mr. Johnson served as Senior Vice President of Corporate Strategic Development of Lockheed Martin Corporation (defense contractor, 1999-2009). He previously served on the Board of Directors of IKON Office Solutions, Inc. (1999-2008) and Delta Airlines (2005-2007). Mr. Arthur E. Johnson is not related to Ms. Abigail P. Johnson. |
Michael E. Kenneally (1954) |
| Year of Election or Appointment: 2009 Previously, Mr. Kenneally served as a Member of the Advisory Board for certain Fidelity Fixed Income and Asset Allocation Funds (2008-2009). Prior to his retirement, Mr. Kenneally served as Chairman and Global Chief Executive Officer of Credit Suisse Asset Management (2003-2005). Mr. Kenneally was a Director of the Credit Suisse Funds (U.S. mutual funds, 2004-2008) and certain other closed-end funds (2004-2005) and was awarded the Chartered Financial Analyst (CFA) designation in 1991. |
James H. Keyes (1940) |
| Year of Election or Appointment: 2007 Mr. Keyes serves as a member of the Boards of Navistar International Corporation (manufacture and sale of trucks, buses, and diesel engines, since 2002) and Pitney Bowes, Inc. (integrated mail, messaging, and document management solutions, since 1998). Prior to his retirement, Mr. Keyes served as Chairman and Chief Executive Officer of Johnson Controls (automotive, building, and energy, 1998-2002) and as a member of the Board of LSI Logic Corporation (semiconductor technologies, 1984-2008). |
Marie L. Knowles (1946) |
| Year of Election or Appointment: 2001 Ms. Knowles is Vice Chairman of the Independent Trustees of the Fixed Income and Asset Allocation Funds (2012-present). Prior to Ms. Knowles' retirement in June 2000, she served as Executive Vice President and Chief Financial Officer of Atlantic Richfield Company (ARCO) (diversified energy, 1996-2000). From 1993 to 1996, she was a Senior Vice President of ARCO and President of ARCO Transportation Company. She served as a Director of ARCO from 1996 to 1998. Ms. Knowles currently serves as a Director and Chairman of the Audit Committee of McKesson Corporation (healthcare service, since 2002). Ms. Knowles is an Honorary Trustee of the Brookings Institution and a member of the Board of the Catalina Island Conservancy and of the Santa Catalina Island Company (2009-present). She also serves as a member of the Advisory Board for the School of Engineering of the University of Southern California and the Foundation Board of the School of Architecture at the University of Virginia (2007-present). Previously, Ms. Knowles served as a Director of Phelps Dodge Corporation (copper mining and manufacturing, 1994-2007). |
Kenneth L. Wolfe (1939) |
| Year of Election or Appointment: 2005 Prior to his retirement, Mr. Wolfe served as Chairman and a Director (2007-2009) and Chairman and Chief Executive Officer (1994-2001) of Hershey Foods Corporation. He also served as a member of the Boards of Adelphia Communications Corporation (telecommunications, 2003-2006), Bausch & Lomb, Inc. (medical/pharmaceutical, 1993-2007), and Revlon, Inc. (personal care products, 2004-2009). Mr. Wolfe previously served as Chairman of the Independent Trustees of the Fixed Income and Asset Allocation Funds (2008-2012). |
+ The information above includes each Trustee's principal occupation during the last five years and other information relating to the experience, attributes, and skills relevant to each Trustee's qualifications to serve as a Trustee, which led to the conclusion that each Trustee should serve as a Trustee for each fund.
Annual Report
Trustees and Officers - continued
Executive Officers:
Correspondence intended for each executive officer may be sent to Fidelity Investments, 245 Summer Street, Boston, Massachusetts 02210.
Name, Year of Birth; Principal Occupation |
Stephanie J. Dorsey (1969) |
| Year of Election or Appointment: 2013 President and Treasurer of Fidelity's Fixed Income and Asset Allocation Funds. Ms. Dorsey also serves as Assistant Treasurer of other Fidelity funds (2010-present) and is an employee of Fidelity Investments (2008-present). Previously, Ms. Dorsey served as Deputy Treasurer of Fidelity's Fixed Income and Asset Allocation Funds (2008-2013), Treasurer (2004-2008) of the JPMorgan Mutual Funds and Vice President (2004-2008) of JPMorgan Chase Bank. |
Charles S. Morrison (1960) |
| Year of Election or Appointment: 2012 Vice President of Fidelity's Fixed Income and Asset Allocation Funds. Mr. Morrison also serves as President, Fixed Income and is an employee of Fidelity Investments. Previously, Mr. Morrison served as Vice President of Fidelity's Money Market Funds (2005-2009), President, Money Market Group Leader of FMR (2009), and Senior Vice President, Money Market Group of FMR (2004-2009). Mr. Morrison also served as Vice President of Fidelity's Bond Funds (2002-2005), certain Balanced Funds (2002-2005), and certain Asset Allocation Funds (2002-2007), and as Senior Vice President (2002-2005) of Fidelity's Fixed Income Division. |
Derek L. Young (1964) |
| Year of Election or Appointment: 2009 Vice President of Fidelity's Asset Allocation Funds. Mr. Young is also a Trustee of other investment companies advised by Strategic Advisers, Inc. (Strategic Advisers) (2012-present), President and a Director of Strategic Advisers (2011-present), President of Fidelity Global Asset Allocation (GAA) (2011-present), and Vice Chairman of Pyramis Global Advisors LLC (2011-present). Previously, Mr. Young served as Chief Investment Officer of GAA (2009-2011) and as a portfolio manager. |
Andrew Windmueller (1960) |
| Year of Election or Appointment: 2012 Vice President of Fidelity's Asset Allocation Funds. Mr. Windmueller also serves as Chief Investment Officer of Strategic Advisers, Inc. (2011-present), Chief Investment Officer for Global Asset Allocation Multi-Asset Class Strategies (2011-present), and is an employee of Fidelity Investments (2000-present). |
Scott C. Goebel (1968) |
| Year of Election or Appointment: 2008 Secretary and Chief Legal Officer (CLO) of the Fidelity funds. Mr. Goebel also serves as Secretary of Fidelity Investments Money Management, Inc. (FIMM) (2010-present) and Fidelity Research and Analysis Company (FRAC) (2010-present); Secretary and CLO of The North Carolina Capital Management Trust: Cash and Term Portfolios (2008-present); General Counsel, Secretary, and Senior Vice President of FMR (2008-present) and FMR Co., Inc. (2008-present); employed by FMR LLC or an affiliate (2001-present); Chief Legal Officer of Fidelity Management & Research (Hong Kong) Limited (2008-present) and Assistant Secretary of Fidelity Management & Research (Japan) Inc. (2008-present), and Fidelity Management & Research (U.K.) Inc. (2008-present). Previously, Mr. Goebel served as Assistant Secretary of FIMM (2008-2010), FRAC (2008-2010), and the Funds (2007-2008) and as Vice President and Secretary of Fidelity Distributors Corporation (FDC) (2005-2007). |
Ramon Herrera (1974) |
| Year of Election or Appointment: 2012 Assistant Secretary of Fidelity's Fixed Income and Asset Allocation Funds. Mr. Herrera also serves as Vice President, Associate General Counsel (2010-present) and is an employee of Fidelity Investments (2004-present). |
Elizabeth Paige Baumann (1968) |
| Year of Election or Appointment: 2012 Anti-Money Laundering (AML) Officer of the Fidelity funds. Ms. Baumann also serves as AML Officer of The North Carolina Capital Management Trust: Cash and Term Portfolios (2012-present), Chief AML Officer of FMR LLC (2012-present), and is an employee of Fidelity Investments. Previously, Ms. Baumann served as Vice President and Deputy Anti-Money Laundering Officer (2007-2012). |
Christine Reynolds (1958) |
| Year of Election or Appointment: 2008 Chief Financial Officer of the Fidelity funds. Ms. Reynolds became President of Fidelity Pricing and Cash Management Services (FPCMS) in August 2008. Ms. Reynolds served as Chief Operating Officer of FPCMS (2007-2008). Previously, Ms. Reynolds served as President, Treasurer, and Anti-Money Laundering officer of the Fidelity funds (2004-2007). |
Michael H. Whitaker (1967) |
| Year of Election or Appointment: 2008 Chief Compliance Officer of Fidelity's Fixed Income and Asset Allocation Funds. Mr. Whitaker also serves as Chief Compliance Officer of The North Carolina Capital Management Trust: Cash and Term Portfolios (2008-present). Mr. Whitaker is an employee of Fidelity Investments (2007-present). Prior to joining Fidelity Investments, Mr. Whitaker worked at MFS Investment Management where he served as Senior Vice President and Chief Compliance Officer (2004-2006), and Assistant General Counsel. |
Joseph F. Zambello (1957) |
| Year of Election or Appointment: 2011 Deputy Treasurer of the Fidelity funds. Mr. Zambello is an employee of Fidelity Investments. Previously, Mr. Zambello served as Vice President of FMR's Program Management Group (2009-2011) and Vice President of the Transfer Agent Oversight Group (2005-2009). |
Stephen Sadoski (1971) |
| Year of Election or Appointment: 2013 Deputy Treasurer of Fidelity's Fixed Income and Asset Allocation Funds. Mr. Sadoski also serves as Deputy Treasurer of other Fidelity funds (2012-present) and is an employee of Fidelity Investments (2012-present). Previously, Mr. Sadoski served as Assistant Treasurer of Fidelity's Fixed Income and Asset Allocation Funds (2012-2013), an assistant chief accountant in the Division of Investment Management of the Securities and Exchange Commission (SEC) (2009-2012) and as a senior manager at Deloitte & Touche (1997-2009). |
Adrien E. Deberghes (1967) |
| Year of Election or Appointment: 2010 Assistant Treasurer of Fidelity's Fixed Income and Asset Allocation Funds. Mr. Deberghes also serves as Vice President and Assistant Treasurer (2011-present) and Deputy Treasurer (2008-present) of other Fidelity funds, and is an employee of Fidelity Investments (2008-present). Previously, Mr. Deberghes served as Senior Vice President of Mutual Fund Administration at State Street Corporation (2007-2008), Senior Director of Mutual Fund Administration at Investors Bank & Trust (2005-2007), and Director of Finance for Dunkin' Brands (2000-2005). |
Kenneth B. Robins (1969) |
| Year of Election or Appointment: 2009 Assistant Treasurer of the Fidelity Fixed Income and Asset Allocation Funds. Mr. Robins also serves as President and Treasurer of other Fidelity funds (2008-present; 2010-present) and is an employee of Fidelity Investments (2004-present). Previously, Mr. Robins served as Deputy Treasurer of the Fidelity funds (2005-2008) and Treasurer and Chief Financial Officer of The North Carolina Capital Management Trust: Cash and Term Portfolios (2006-2008). |
Gary W. Ryan (1958) |
| Year of Election or Appointment: 2005 Assistant Treasurer of the Fidelity funds. Mr. Ryan is an employee of Fidelity Investments. Previously, Mr. Ryan served as Vice President of Fund Reporting in Fidelity Pricing and Cash Management Services (FPCMS) (1999-2005). |
Jonathan Davis (1968) |
| Year of Election or Appointment: 2010 Assistant Treasurer of the Fidelity funds. Mr. Davis is also Assistant Treasurer of Fidelity Rutland Square Trust II and Fidelity Commonwealth Trust II. Mr. Davis is an employee of Fidelity Investments. Previously, Mr. Davis served as Vice President and Associate General Counsel of FMR LLC (2003-2010). |
Annual Report
The Board of Trustees of each fund voted to pay to shareholders of record at the opening of business on record date, the following distributions per share derived from capital gains realized from sales of portfolio securities and dividends derived from net investment income:
| Pay Date | Record Date | Dividends | Capital Gains |
Fidelity Freedom K Income Fund | 05/06/13 | 05/03/13 | $0.010 | $0.102 |
Fidelity Freedom K 2000 Fund | 05/06/13 | 05/03/13 | $0.028 | $0.108 |
Fidelity Freedom K 2005 Fund | 05/06/13 | 05/03/13 | $0.026 | $0.185 |
Fidelity Freedom K 2010 Fund | 05/06/13 | 05/03/13 | $0.028 | $0.250 |
Fidelity Freedom K 2015 Fund | 05/13/13 | 05/10/13 | $0.027 | $0.229 |
Fidelity Freedom K 2020 Fund | 05/13/13 | 05/10/13 | $0.028 | $0.252 |
Fidelity Freedom K 2025 Fund | 05/13/13 | 05/10/13 | $0.027 | $0.280 |
Fidelity Freedom K 2030 Fund | 05/13/13 | 05/10/13 | $0.027 | $0.302 |
Fidelity Freedom K 2035 Fund | 05/06/13 | 05/03/13 | $0.022 | $0.323 |
Fidelity Freedom K 2040 Fund | 05/06/13 | 05/03/13 | $0.022 | $0.334 |
Fidelity Freedom K 2045 Fund | 05/06/13 | 05/03/13 | $0.022 | $0.308 |
Fidelity Freedom K 2050 Fund | 05/06/13 | 05/03/13 | $0.021 | $0.308 |
Fidelity Freedom K 2055 Fund | 05/06/13 | 05/03/13 | $0.011 | $0.120 |
The funds hereby designate as capital gain dividend the amounts noted below for the taxable year ended March 31, 2013, or, if subsequently determined to be different, the net capital gain of such year.
Fidelity Freedom K Income Fund | $18,333,885 |
Fidelity Freedom K 2000 Fund | $9,261,015 |
Fidelity Freedom K 2005 Fund | $8,402,130 |
Fidelity Freedom K 2010 Fund | $103,192,669 |
Fidelity Freedom K 2015 Fund | $144,241,791 |
Fidelity Freedom K 2020 Fund | $338,454,790 |
Fidelity Freedom K 2025 Fund | $218,927,384 |
Fidelity Freedom K 2030 Fund | $301,773,206 |
Fidelity Freedom K 2035 Fund | $171,483,697 |
Fidelity Freedom K 2040 Fund | $196,390,526 |
Fidelity Freedom K 2045 Fund | $81,555,484 |
Fidelity Freedom K 2050 Fund | $61,439,473 |
Fidelity Freedom K 2055 Fund | $2,512,917 |
A percentage of the dividends distributed during the fiscal year for the following funds were derived from interest on U.S. Government securities which is generally exempt from state income tax:
Fidelity Freedom K Income Fund | 18.92% |
Fidelity Freedom K 2000 Fund | 18.81% |
Fidelity Freedom K 2005 Fund | 14.46% |
Fidelity Freedom K 2010 Fund | 13.34% |
Fidelity Freedom K 2015 Fund | 13.03% |
Fidelity Freedom K 2020 Fund | 10.91% |
Fidelity Freedom K 2025 Fund | 7.68% |
Fidelity Freedom K 2030 Fund | 5.72% |
Fidelity Freedom K 2035 Fund | 2.45% |
Fidelity Freedom K 2040 Fund | 2.20% |
Fidelity Freedom K 2045 Fund | 1.19% |
Fidelity Freedom K 2050 Fund | 0.79% |
Fidelity Freedom K 2055 Fund | 0.07% |
Annual Report
A percentage of the dividends distributed during the fiscal year for the following funds qualify for the dividends-received deduction for corporate shareholders:
Fidelity Freedom K Income Fund | |
May 2012 | 8% |
June 2012 | 10% |
July 2012 | 10% |
August 2012 | 10% |
September 2012 | 10% |
October 2012 | 10% |
November 2012 | 10% |
December 2012 (Ex-Date 12/07/12) | 10% |
December 2012 (Ex-Date 12/28/12) | 10% |
Fidelity Freedom K 2000 Fund | |
May 2012 | 1% |
December 2012 | 10% |
Fidelity Freedom K 2005 Fund | |
May 2012 | 3% |
December 2012 | 17% |
Fidelity Freedom K 2010 Fund | |
May 2012 | 4% |
December 2012 | 20% |
Fidelity Freedom K 2015 Fund | |
May 2012 | 4% |
December 2012 | 20% |
Fidelity Freedom K 2020 Fund | |
May 2012 | 4% |
December 2012 | 23% |
Fidelity Freedom K 2025 Fund | |
May 2012 | 6% |
December 2012 | 28% |
Fidelity Freedom K 2030 Fund | |
May 2012 | 6% |
December 2012 | 29% |
Fidelity Freedom K 2035 Fund | |
May 2012 | 10% |
December 2012 | 37% |
Fidelity Freedom K 2040 Fund | |
May 2012 | 10% |
December 2012 | 37% |
Fidelity Freedom K 2045 Fund | |
May 2012 | 9% |
December 2012 | 40% |
Fidelity Freedom K 2050 Fund | |
May 2012 | 10% |
December 2012 | 41% |
Fidelity Freedom K 2055 Fund | |
May 2012 | 10% |
December 2012 | 48% |
Annual Report
Distributions (Unaudited) - continued
A percentage of the dividends distributed during the fiscal year for the following funds may be taken into account as a dividend for purposes of the maximum rate under section 1(h)(11) of the Internal Revenue Code.
Fidelity Freedom K Income Fund | |
May 2012 | 13% |
June 2012 | 16% |
July 2012 | 16% |
August 2012 | 16% |
September 2012 | 16% |
October 2012 | 16% |
November 2012 | 16% |
December 2012 (Ex-Date 12/07/12) | 16% |
December 2012 (Ex-Date 12/28/12) | 16% |
February 2013 | 4% |
March 2013 | 4% |
Fidelity Freedom K 2000 Fund | |
May 2012 | 1% |
December 2012 | 16% |
Fidelity Freedom K 2005 Fund | |
May 2012 | 1% |
December 2012 | 28% |
Fidelity Freedom K 2010 Fund | |
May 2012 | 2% |
December 2012 | 32% |
Fidelity Freedom K 2015 Fund | |
May 2012 | 2% |
December 2012 | 33% |
Fidelity Freedom K 2020 Fund | |
May 2012 | 1% |
December 2012 | 37% |
Fidelity Freedom K 2025 Fund | |
May 2012 | 2% |
December 2012 | 45% |
Fidelity Freedom K 2030 Fund | |
May 2012 | 3% |
December 2012 | 47% |
Fidelity Freedom K 2035 Fund | |
May 2012 | 4% |
December 2012 | 59% |
Fidelity Freedom K 2040 Fund | |
May 2012 | 4% |
December 2012 | 60% |
Fidelity Freedom K 2045 Fund | |
May 2012 | 3% |
December 2012 | 64% |
Fidelity Freedom K 2050 Fund | |
May 2012 | 2% |
December 2012 | 66% |
Fidelity Freedom K 2055 Fund | |
May 2012 | 7% |
December 2012 | 75% |
The funds will notify shareholders in January 2014 of amounts for use in preparing 2013 income tax returns.
Annual Report
Investment Adviser
Strategic Advisers, Inc.
Boston, MA
Administrator
Fidelity Management & Research Company
Boston, MA
General Distributor
Fidelity Distributors Corporation
Smithfield, RI
Transfer and Service Agents
Fidelity Investments Institutional
Operations Company, Inc.
Boston, MA
Fidelity Service Company, Inc.
Boston, MA
Custodians
JPMorgan Chase Bank
New York, NY
Income, 2000, 2005, 2010, 2015, 2020, 2025, 2030, 2035, 2040, 2045, 2050
The Bank of New York Mellon
New York, NY
2055

FF-K-UANNPRO-0513
1.927081.102
Fidelity Advisor Freedom Funds®-
Income, 2005, 2010, 2015, 2020, 2025, 2030, 2035, 2040, 2045, 2050 - Class A, Class T, Class B and Class C
Fidelity Advisor Freedom® 2055 Fund -
Class A, Class T, and Class C
Annual Report
March 31, 2013
(Fidelity Cover Art)
Contents
Annual Report
To view a fund's proxy voting guidelines and proxy voting record for the 12-month period ended June 30, visit http://www.fidelity.com/proxyvotingresults or visit the Securities and Exchange Commission's (SEC) web site at http://www.sec.gov. You may also call 1-877-208-0098 to request a free copy of the proxy voting guidelines.
Standard & Poor's, S&P and S&P 500 are registered service marks of The McGraw-Hill Companies, Inc. and have been licensed for use by Fidelity Distributors Corporation.
Other third-party marks appearing herein are the property of their respective owners.
All other marks appearing herein are registered or unregistered trademarks or service marks of FMR LLC or an affiliated company. © 2013 FMR LLC. All rights reserved.
This report and the financial statements contained herein are submitted for the general information of the shareholders of the funds. This report is not authorized for distribution to prospective investors in the funds unless preceded or accompanied by an effective prospectus.
A fund files its complete schedule of portfolio holdings with the SEC for the first and third quarters of each fiscal year on Form N-Q. Forms N-Q are available on the SEC's web site at http://www.sec.gov. A fund's Forms N-Q may be reviewed and copied at the SEC's Public Reference Room in Washington, DC. Information regarding the operation of the SEC's Public Reference Room may be obtained by calling 1-800-SEC-0330. For a complete list of a fund's portfolio holdings, view the most recent holdings listing, semiannual report, or annual report on Fidelity's web site at http://www.fidelity.com, http://www.advisor.fidelity.com, or http://www.401k.com, as applicable.
NOT FDIC INSURED • MAY LOSE VALUE • NO BANK GUARANTEE
Neither the funds nor Fidelity Distributors Corporation is a bank.
Annual Report
Fidelity Advisor Freedom Income Fund® - Class A, T, B, and C
Average annual total return reflects the change in the value of an investment, assuming reinvestment of the class' distributions from dividend income and capital gains (the profits earned upon the sale of securities that have grown in value, if any) and assuming a constant rate of performance each year. The $10,000 table and the fund's returns do not reflect the deduction of taxes that a shareholder would pay on fund distributions or the redemption of fund shares. During periods of reimbursement by Fidelity, a fund's total return will be greater than it would be had the reimbursement not occurred. How a fund did yesterday is no guarantee of how it will do tomorrow. Returns reflect the conversion of Class B shares to Class A shares after a maximum of seven years.
Average Annual Total Returns
Periods ended March 31, 2013 | Past 1
year | Past 5
years | Life of
fund A |
Class A (incl. 5.75% sales charge) | -1.48% | 2.98% | 3.50% |
Class T (incl. 3.50% sales charge) | 0.70% | 3.21% | 3.50% |
Class B (incl. contingent deferred sales charge)B | -1.20% | 3.07% | 3.57% |
Class C (incl. contingent deferred sales charge)C | 2.70% | 3.43% | 3.35% |
A From July 24, 2003.
B Class B shares' contingent deferred sales charges included in the past one year, past five years, and life of fund total return figures are 5%, 2%, and 0%, respectively.
C Class C shares' contingent deferred sales charges included in the past one year, past five years, and life of fund total return figures are 1%, 0%, and 0%, respectively.
$10,000 Over Life of Fund
Let's say hypothetically that $10,000 was invested in Fidelity Advisor Freedom Income Fund® - Class A on July 24, 2003, when the fund started, and the current 5.75% sales charge was paid. The chart shows how the value of your investment would have changed, and also shows how the Barclays® U.S. Aggregate Bond Index performed over the same period.
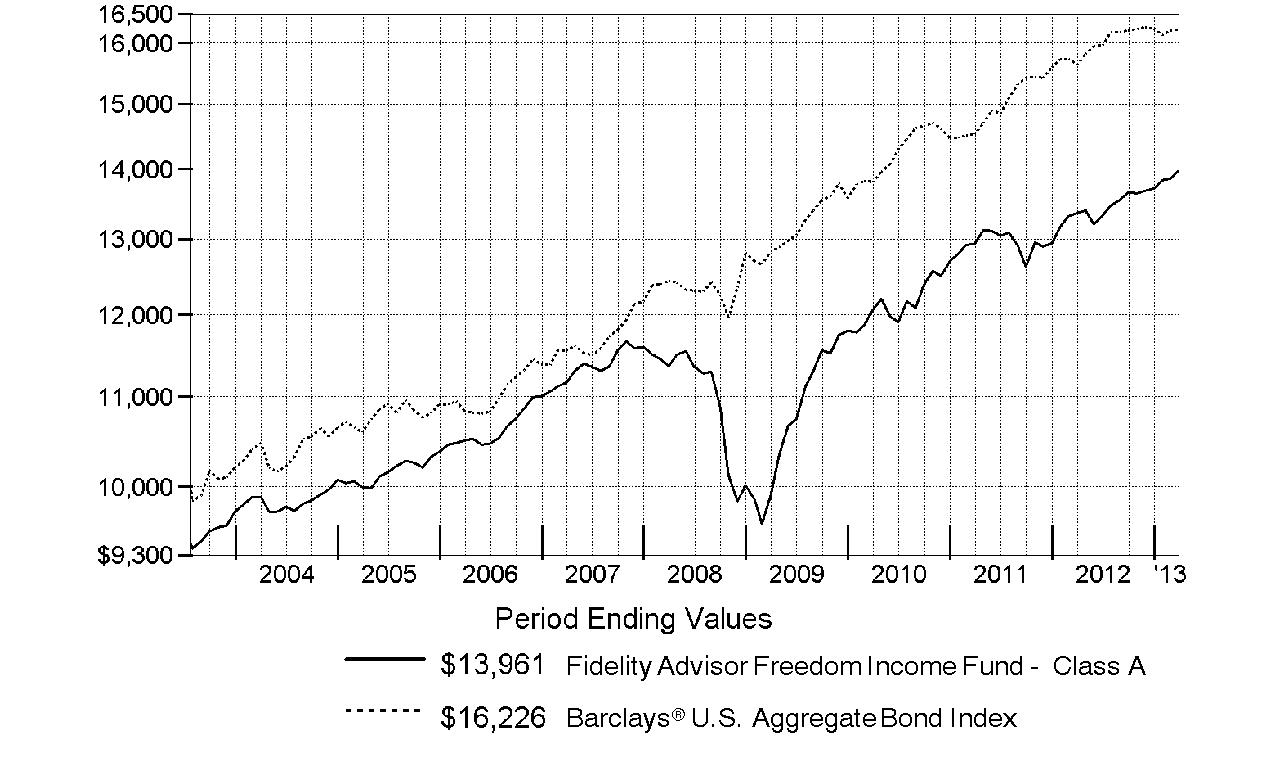
Annual Report
Fidelity Advisor Freedom 2005 Fund ® - Class A, T, B, and C
Performance: The Bottom Line
Average annual total return reflects the change in the value of an investment, assuming reinvestment of the class' distributions from dividend income and capital gains (the profits earned upon the sale of securities that have grown in value, if any) and assuming a constant rate of performance each year. The $10,000 table and the fund's returns do not reflect the deduction of taxes that a shareholder would pay on fund distributions or the redemption of fund shares. During periods of reimbursement by Fidelity, a fund's total return will be greater than it would be had the reimbursement not occurred. How a fund did yesterday is no guarantee of how it will do tomorrow. Returns reflect the conversion of Class B shares to Class A shares after a maximum of seven years.
Average Annual Total Returns
Periods ended March 31, 2013 | Past 1
year | Past 5
years | Life of
fund A |
Class A (incl. 5.75% sales charge) | -0.30% | 2.57% | 4.04% |
Class T (incl. 3.50% sales charge) | 1.86% | 2.80% | 4.05% |
Class B (incl. contingent deferred sales charge)B | 0.00% | 2.65% | 4.12% |
Class C (incl. contingent deferred sales charge)C | 4.01% | 3.01% | 3.92% |
A From November 6, 2003.
B Class B shares' contingent deferred sales charges included in the past one year, past five years, and life of fund total return figures are 5%, 2%, and 0%, respectively.
C Class C shares' contingent deferred sales charges included in the past one year, past five years, and life of fund total return figures are 1%, 0%, and 0%, respectively.
$10,000 Over Life of Fund
Let's say hypothetically that $10,000 was invested in Fidelity Advisor Freedom 2005 Fund® - Class A on November 6, 2003, when the fund started, and the current 5.75% sales charge was paid. The chart shows how the value of your investment would have changed, and also shows how the Barclays U.S. Aggregate Bond Index performed over the same period.
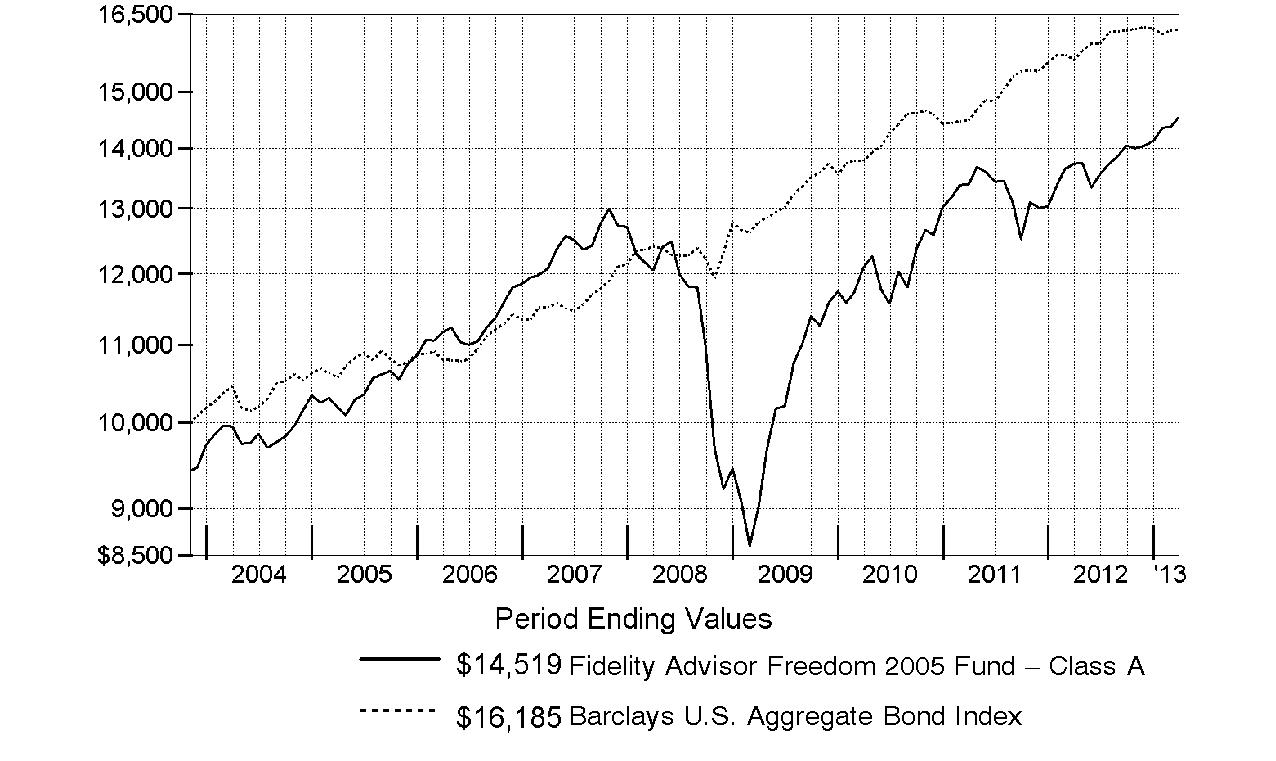
Annual Report
Fidelity Advisor Freedom 2010 Fund ® - Class A, T, B, and C
Performance: The Bottom Line
Average annual total return reflects the change in the value of an investment, assuming reinvestment of the class' distributions from dividend income and capital gains (the profits earned upon the sale of securities that have grown in value, if any) and assuming a constant rate of performance each year. The $10,000 table and the fund's returns do not reflect the deduction of taxes that a shareholder would pay on fund distributions or the redemption of fund shares. During periods of reimbursement by Fidelity, a fund's total return will be greater than it would be had the reimbursement not occurred. How a fund did yesterday is no guarantee of how it will do tomorrow. Returns reflect the conversion of Class B shares to Class A shares after a maximum of seven years.
Average Annual Total Returns
Periods ended March 31, 2013 | Past 1
year | Past 5
years | Life of
fund A |
Class A (incl. 5.75% sales charge) | 1.15% | 3.22% | 4.71% |
Class T (incl. 3.50% sales charge) | 3.24% | 3.43% | 4.70% |
Class B (incl. contingent deferred sales charge)B | 1.51% | 3.32% | 4.79% |
Class C (incl. contingent deferred sales charge)C | 5.49% | 3.65% | 4.56% |
A From July 24, 2003.
B Class B shares' contingent deferred sales charges included in the past one year, past five years, and life of fund total return figures are 5%, 2%, and 0%, respectively.
C Class C shares' contingent deferred sales charges included in the past one year, past five years, and life of fund total return figures are 1%, 0%, and 0%, respectively.
$10,000 Over Life of Fund
Let's say hypothetically that $10,000 was invested in Fidelity Advisor Freedom 2010 Fund® - Class A on July 24, 2003, when the fund started, and the current 5.75% sales charge was paid. The chart shows how the value of your investment would have changed, and also shows how the Barclays U.S. Aggregate Bond Index performed over the same period.
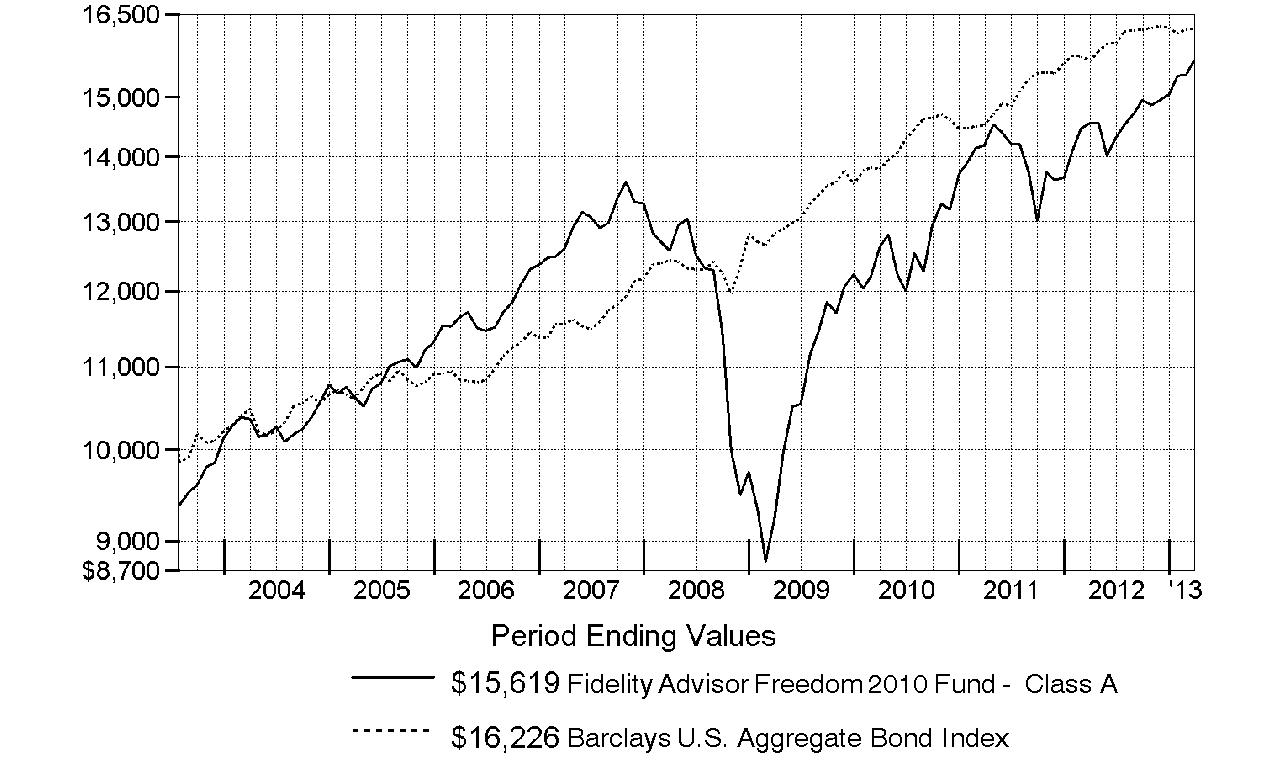
Annual Report
Fidelity Advisor Freedom 2015 Fund® - Class A, T, B, and C
Performance: The Bottom Line
Average annual total return reflects the change in the value of an investment, assuming reinvestment of the class' distributions from dividend income and capital gains (the profits earned upon the sale of securities that have grown in value, if any) and assuming a constant rate of performance each year. The $10,000 table and the fund's returns do not reflect the deduction of taxes that a shareholder would pay on fund distributions or the redemption of fund shares. During periods of reimbursement by Fidelity, a fund's total return will be greater than it would be had the reimbursement not occurred. How a fund did yesterday is no guarantee of how it will do tomorrow. Returns reflect the conversion of Class B shares to Class A shares after a maximum of seven years.
Average Annual Total Returns
Periods ended March 31, 2013 | Past 1
year | Past 5
years | Life of
fund A |
Class A (incl. 5.75% sales charge) | 1.27% | 3.02% | 4.71% |
Class T (incl. 3.50% sales charge) | 3.52% | 3.28% | 4.73% |
Class B (incl. contingent deferred sales charge) B | 1.65% | 3.13% | 4.81% |
Class C (incl. contingent deferred sales charge) C | 5.70% | 3.50% | 4.60% |
A From November 6, 2003.
B Class B shares' contingent deferred sales charges included in the past one year, past five years, and life of fund total return figures are 5%, 2%, and 0%, respectively.
C Class C shares' contingent deferred sales charges included in the past one year, past five years, and life of fund total return figures are 1%, 0%, and 0%, respectively.
$10,000 Over Life of Fund
Let's say hypothetically that $10,000 was invested in Fidelity Advisor Freedom 2015 Fund® - Class A on November 6, 2003, when the fund started, and the current 5.75% sales charge was paid. The chart shows how the value of your investment would have changed, and also shows how the S&P 500® Index performed over the same period.
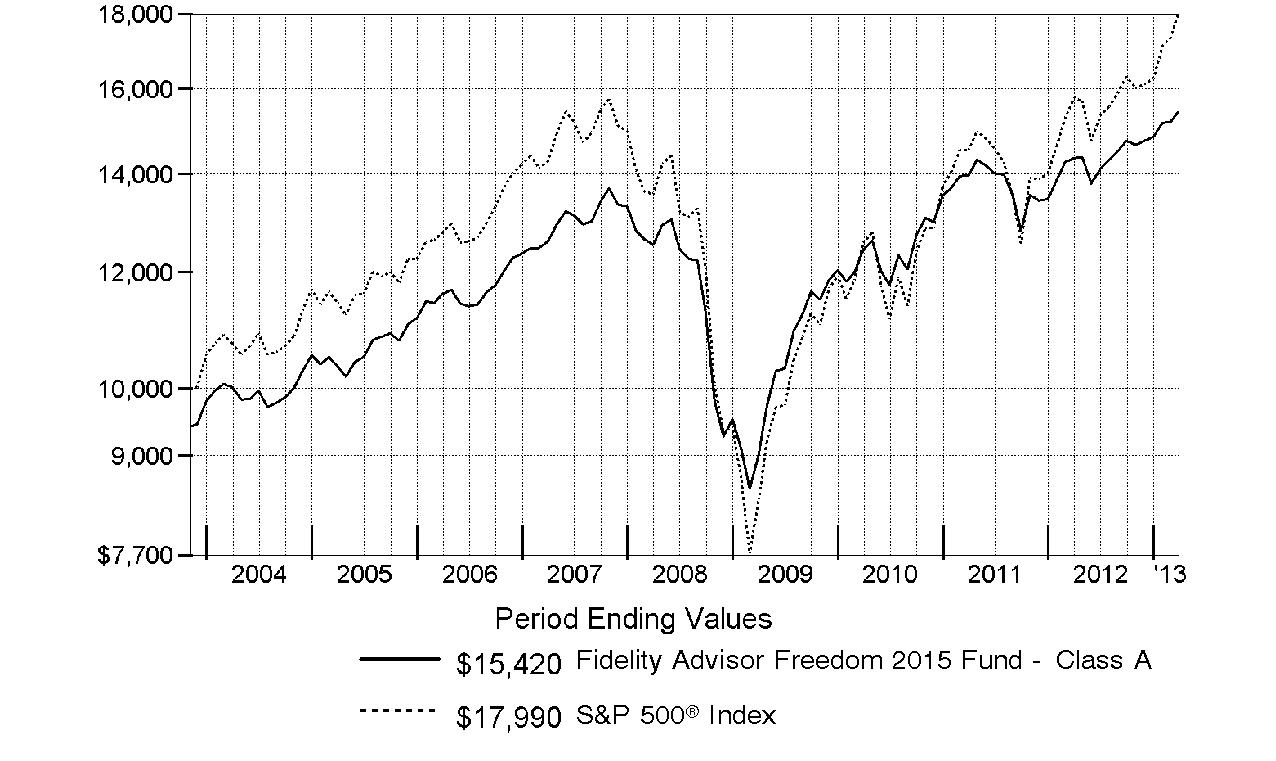
Annual Report
Fidelity Advisor Freedom 2020 Fund® - Class A, T, B, and C
Performance: The Bottom Line
Average annual total return reflects the change in the value of an investment, assuming reinvestment of the class' distributions from dividend income and capital gains (the profits earned upon the sale of securities that have grown in value, if any) and assuming a constant rate of performance each year. The $10,000 table and the fund's returns do not reflect the deduction of taxes that a shareholder would pay on fund distributions or the redemption of fund shares. During periods of reimbursement by Fidelity, a fund's total return will be greater than it would be had the reimbursement not occurred. How a fund did yesterday is no guarantee of how it will do tomorrow. Returns reflect the conversion of Class B shares to Class A shares after a maximum of seven years.
Average Annual Total Returns
Periods ended March 31, 2013 | Past 1
year | Past 5
years | Life of
fund A |
Class A (incl. 5.75% sales charge) | 1.70% | 2.61% | 5.21% |
Class T (incl. 3.50% sales charge) | 3.95% | 2.83% | 5.21% |
Class B (incl. contingent deferred sales charge) B | 2.19% | 2.71% | 5.29% |
Class C (incl. contingent deferred sales charge) C | 6.13% | 3.06% | 5.08% |
A From July 24, 2003.
B Class B shares' contingent deferred sales charges included in the past one year, past five years, and life of fund total return figures are 5%, 2%, and 0%, respectively.
C Class C shares' contingent deferred sales charges included in the past one year, past five years, and life of fund total return figures are 1%, 0%, and 0%, respectively.
$10,000 Over Life of Fund
Let's say hypothetically that $10,000 was invested in Fidelity Advisor Freedom 2020 Fund® - Class A on July 24, 2003, when the fund started, and the current 5.75% sales charge was paid. The chart shows how the value of your investment would have changed, and also shows how the S&P 500 Index performed over the same period.

Annual Report
Fidelity Advisor Freedom 2025 Fund® - Class A, T, B, and C
Performance: The Bottom Line
Average annual total return reflects the change in the value of an investment, assuming reinvestment of the class' distributions from dividend income and capital gains (the profits earned upon the sale of securities that have grown in value, if any) and assuming a constant rate of performance each year. The $10,000 table and the fund's returns do not reflect the deduction of taxes that a shareholder would pay on fund distributions or the redemption of fund shares. During periods of reimbursement by Fidelity, a fund's total return will be greater than it would be had the reimbursement not occurred. How a fund did yesterday is no guarantee of how it will do tomorrow. Returns reflect the conversion of Class B shares to Class A shares after a maximum of seven years.
Average Annual Total Returns
Periods ended March 31, 2013 | Past 1
year | Past 5
years | Life of
fund A |
Class A (incl. 5.75% sales charge) | 2.73% | 2.76% | 4.87% |
Class T (incl. 3.50% sales charge) | 4.94% | 2.98% | 4.91% |
Class B (incl. contingent deferred sales charge) B | 3.26% | 2.86% | 4.95% |
Class C (incl. contingent deferred sales charge) C | 7.23% | 3.22% | 4.75% |
A From November 6, 2003.
B Class B shares' contingent deferred sales charges included in the past one year, past five years, and life of fund total return figures are 5%, 2%, and 0%, respectively.
C Class C shares' contingent deferred sales charges included in the past one year, past five years, and life of fund total return figures are 1%, 0%, and 0%, respectively.
$10,000 Over Life of Fund
Let's say hypothetically that $10,000 was invested in Fidelity Advisor Freedom 2025 Fund® - Class A on November 6, 2003, when the fund started, and the current 5.75% sales charge was paid. The chart shows how the value of your investment would have changed, and also shows how the S&P 500 Index performed over the same period.
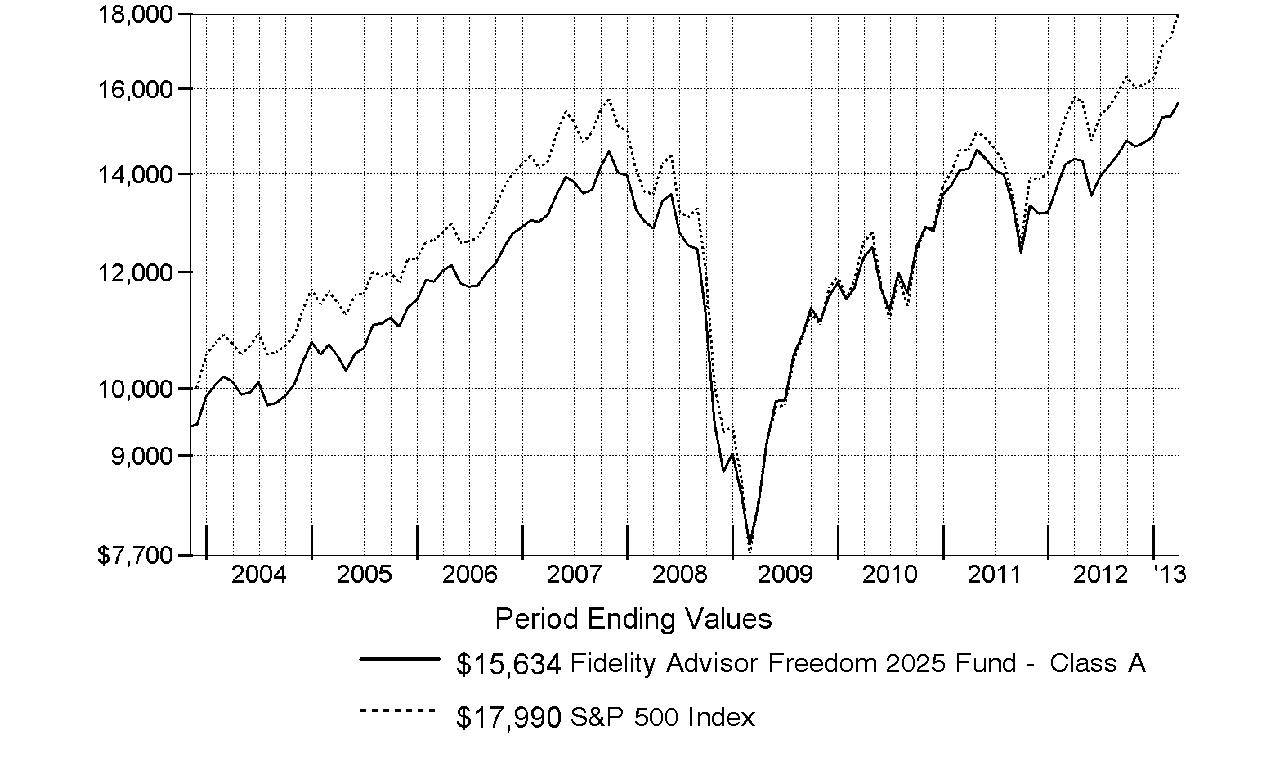
Annual Report
Fidelity Advisor Freedom 2030 Fund® - Class A, T, B, and C
Performance: The Bottom Line
Average annual total return reflects the change in the value of an investment, assuming reinvestment of the class' distributions from dividend income and capital gains (the profits earned upon the sale of securities that have grown in value, if any) and assuming a constant rate of performance each year. The $10,000 table and the fund's returns do not reflect the deduction of taxes that a shareholder would pay on fund distributions or the redemption of fund shares. During periods of reimbursement by Fidelity, a fund's total return will be greater than it would be had the reimbursement not occurred. How a fund did yesterday is no guarantee of how it will do tomorrow. Returns reflect the conversion of Class B shares to Class A shares after a maximum of seven years.
Average Annual Total Returns
Periods ended March 31, 2013 | Past 1
year | Past 5
years | Life of
fund A |
Class A (incl. 5.75% sales charge) | 2.97% | 2.11% | 5.29% |
Class T (incl. 3.50% sales charge) | 5.20% | 2.34% | 5.28% |
Class B (incl. contingent deferred sales charge) B | 3.44% | 2.20% | 5.36% |
Class C (incl. contingent deferred sales charge)C | 7.39% | 2.55% | 5.14% |
A From July 24, 2003.
B Class B shares' contingent deferred sales charges included in the past one year, past five years, and life of fund total return figures are 5%, 2%, and 0%, respectively.
C Class C shares' contingent deferred sales charges included in the past one year, past five years, and life of fund total return figures are 1%, 0%, and 0%, respectively.
$10,000 Over Life of Fund
Let's say hypothetically that $10,000 was invested in Fidelity Advisor Freedom 2030 Fund® - Class A on July 24, 2003, when the fund started, and the current 5.75% sales charge was paid. The chart shows how the value of your investment would have changed, and also shows how the S&P 500 Index performed over the same period.
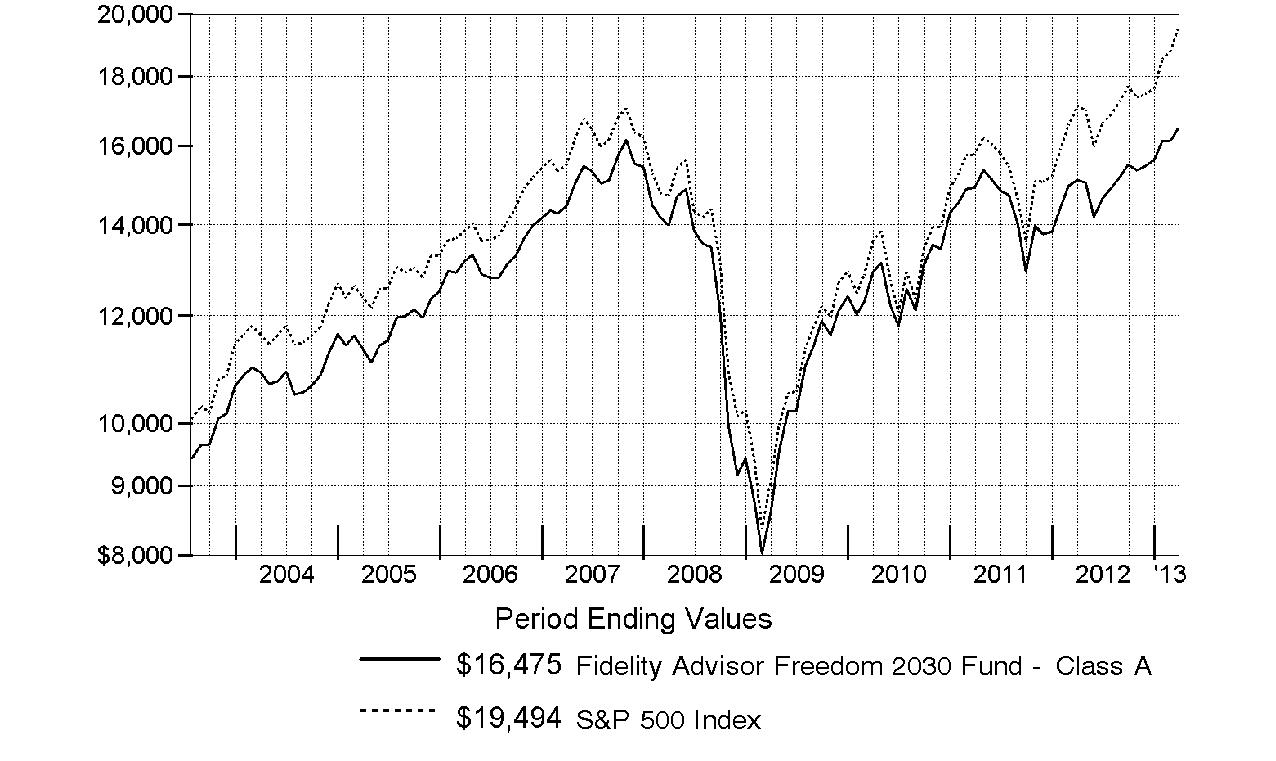
Annual Report
Fidelity Advisor Freedom 2035 Fund® - Class A, T, B, and C
Performance: The Bottom Line
Average annual total return reflects the change in the value of an investment, assuming reinvestment of the class' distributions from dividend income and capital gains (the profits earned upon the sale of securities that have grown in value, if any) and assuming a constant rate of performance each year. The $10,000 table and the fund's returns do not reflect the deduction of taxes that a shareholder would pay on fund distributions or the redemption of fund shares. During periods of reimbursement by Fidelity, a fund's total return will be greater than it would be had the reimbursement not occurred. How a fund did yesterday is no guarantee of how it will do tomorrow. Returns reflect the conversion of Class B shares to Class A shares after a maximum of seven years.
Average Annual Total Returns
Periods ended March 31, 2013 | Past 1
year | Past 5
years | Life of
fund A |
Class A (incl. 5.75% sales charge) | 3.57% | 2.15% | 4.75% |
Class T (incl. 3.50% sales charge) | 5.85% | 2.38% | 4.74% |
Class B (incl. contingent deferred sales charge) B | 4.02% | 2.22% | 4.80% |
Class C (incl. contingent deferred sales charge)C | 8.04% | 2.59% | 4.61% |
A From November 6, 2003.
B Class B shares' contingent deferred sales charges included in the past one year, past five years, and life of fund total return figures are 5%, 2%, and 0%, respectively.
C Class C shares' contingent deferred sales charges included in the past one year, past five years, and life of fund total return figures are 1%, 0%, and 0%, respectively.
$10,000 Over Life of Fund
Let's say hypothetically that $10,000 was invested in Fidelity Advisor Freedom 2035 Fund® - Class A on November 6, 2003, when the fund started, and the current 5.75% sales charge was paid. The chart shows how the value of your investment would have changed, and also shows how the S&P 500 Index performed over the same period.
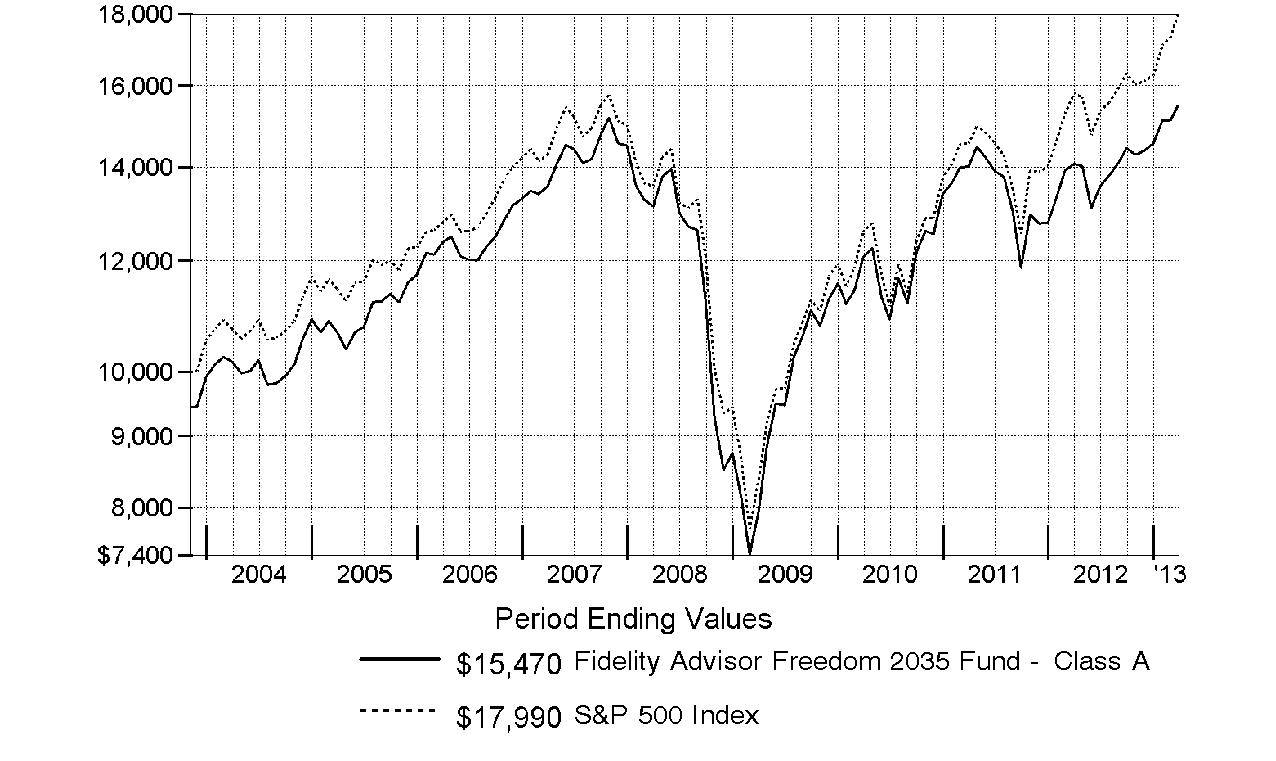
Annual Report
Fidelity Advisor Freedom 2040 Fund® - Class A, T, B, and C
Performance: The Bottom Line
Average annual total return reflects the change in the value of an investment, assuming reinvestment of the class' distributions from dividend income and capital gains (the profits earned upon the sale of securities that have grown in value, if any) and assuming a constant rate of performance each year. The $10,000 table and the fund's returns do not reflect the deduction of taxes that a shareholder would pay on fund distributions or the redemption of fund shares. During periods of reimbursement by Fidelity, a fund's total return will be greater than it would be had the reimbursement not occurred. How a fund did yesterday is no guarantee of how it will do tomorrow. Returns reflect the conversion of Class B shares to Class A shares after a maximum of seven years.
Average Annual Total Returns
Periods ended March 31, 2013 | Past 1
year | Past 5
years | Life of
fund A |
Class A (incl. 5.75% sales charge) | 3.62% | 2.01% | 5.47% |
Class T (incl. 3.50% sales charge) | 5.85% | 2.22% | 5.45% |
Class B (incl. contingent deferred sales charge) B | 4.14% | 2.09% | 5.54% |
Class C (incl. contingent deferred sales charge) C | 8.09% | 2.44% | 5.31% |
A From July 24, 2003.
B Class B shares' contingent deferred sales charges included in the past one year, past five years, and life of fund total return figures are 5%, 2%, and 0%, respectively.
C Class C shares' contingent deferred sales charges included in the past one year, past five years, and life of fund total return figures are 1%, 0%, and 0%, respectively.
$10,000 Over Life of Fund
Let's say hypothetically that $10,000 was invested in Fidelity Advisor Freedom 2040 Fund® - Class A on July 24, 2003, when the fund started, and the current 5.75% sales charge was paid. The chart shows how the value of your investment would have changed, and also shows how the S&P 500 Index performed over the same period.
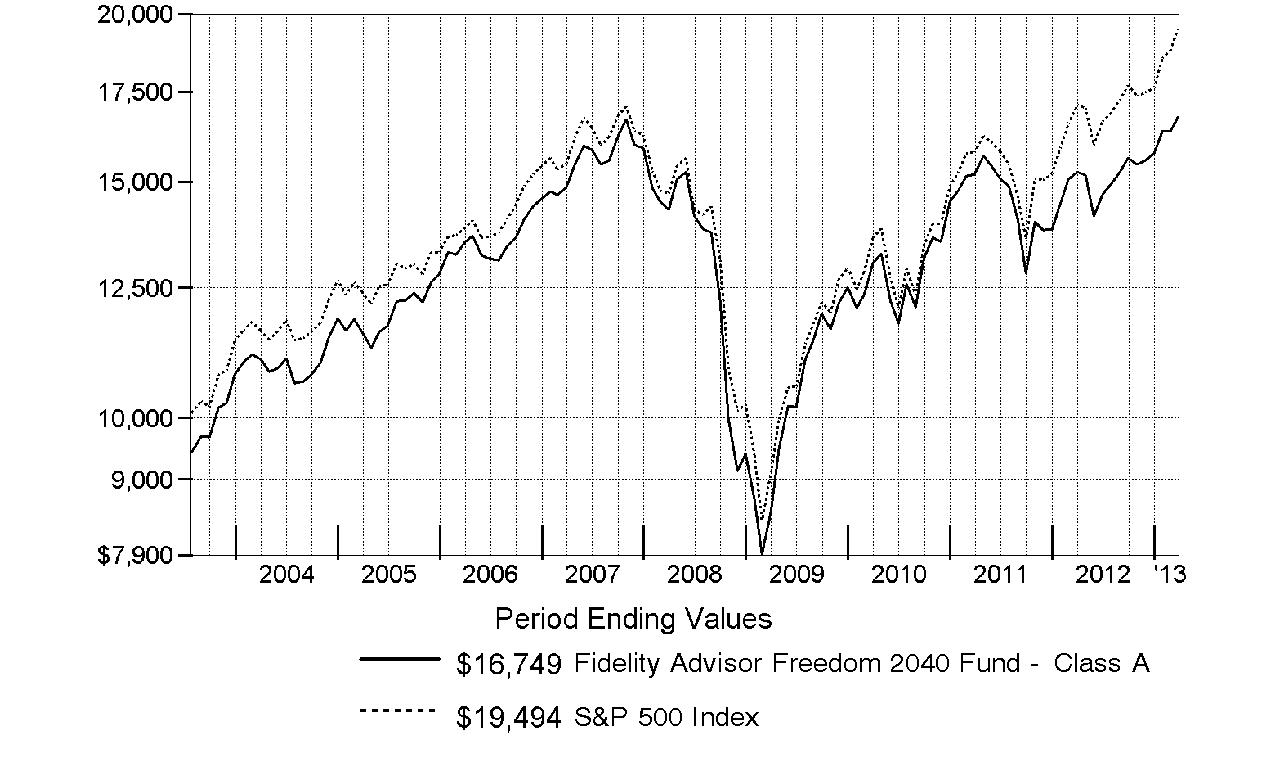
Annual Report
Fidelity Advisor Freedom 2045 Fund® - Class A, T, B, and C
Performance: The Bottom Line
Average annual total return reflects the change in the value of an investment, assuming reinvestment of the class' distributions from dividend income and capital gains (the profits earned upon the sale of securities that have grown in value, if any) and assuming a constant rate of performance each year. The $10,000 table and the fund's returns do not reflect the deduction of taxes that a shareholder would pay on fund distributions or the redemption of fund shares. During periods of reimbursement by Fidelity, a fund's total return will be greater than it would be had the reimbursement not occurred. How a fund did yesterday is no guarantee of how it will do tomorrow.
Average Annual Total Returns
Periods ended March 31, 2013 | Past 1
year | Past 5
years | Life of
fund A |
Class A (incl. 5.75% sales charge) | 3.88% | 1.97% | 2.49% |
Class T (incl. 3.50% sales charge) | 6.17% | 2.22% | 2.60% |
Class B (incl. contingent deferred sales charge) B | 4.40% | 2.04% | 2.61% |
Class C (incl. contingent deferred sales charge) C | 8.42% | 2.45% | 2.63% |
A From June 1, 2006.
B Class B shares' contingent deferred sales charges included in the past one year, past 5 years, and life of fund total return figures are 5%, 2%, and 0%, respectively.
C Class C shares' contingent deferred sales charges included in the past one year, past 5 years, and life of fund total return figures are 1%, 0%, and 0%, respectively.
$10,000 Over Life of Fund
Let's say hypothetically that $10,000 was invested in Fidelity Advisor Freedom 2045 Fund® - Class A on June 1, 2006, when the fund started, and the current 5.75% sales charge was paid. The chart shows how the value of your investment would have changed, and also shows how the S&P 500 Index performed over the same period.
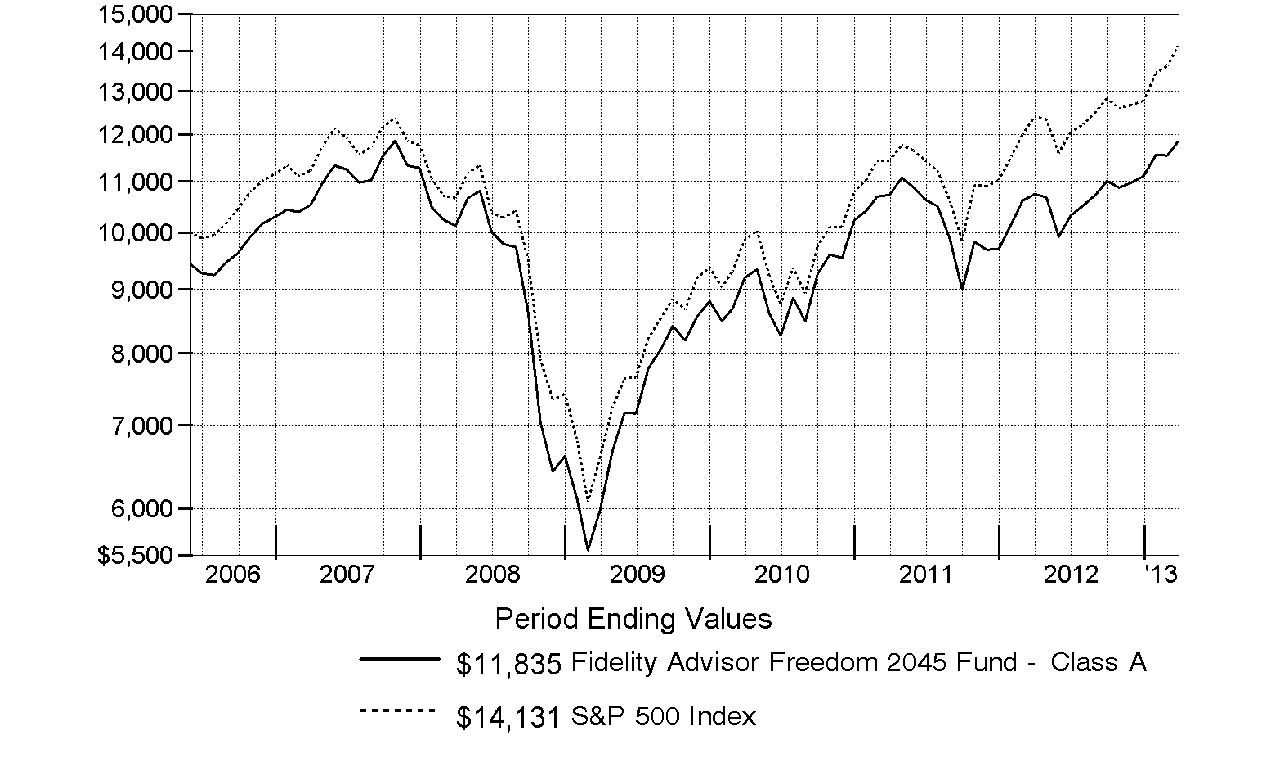
Annual Report
Fidelity Advisor Freedom 2050 Fund® - Class A, T, B, and C
Performance: The Bottom Line
Average annual total return reflects the change in the value of an investment, assuming reinvestment of the class' distributions from dividend income and capital gains (the profits earned upon the sale of securities that have grown in value, if any) and assuming a constant rate of performance each year. The $10,000 table and the fund's returns do not reflect the deduction of taxes that a shareholder would pay on fund distributions or the redemption of fund shares. During periods of reimbursement by Fidelity, a fund's total return will be greater than it would be had the reimbursement not occurred. How a fund did yesterday is no guarantee of how it will do tomorrow.
Average Annual Total Returns
Periods ended March 31, 2013 | | Past 1
year | Past 5
years | Life of
fund A |
Class A (incl. 5.75% sales charge) | | 3.90% | 1.76% | 2.31% |
Class T (incl. 3.50% sales charge) | | 6.14% | 2.00% | 2.42% |
Class B (incl. contingent deferred sales charge) B | | 4.47% | 1.84% | 2.45% |
Class C (incl. contingent deferred sales charge) C | | 8.53% | 2.26% | 2.48% |
A From June 1, 2006.
B Class B shares' contingent deferred sales charges included in the past one year, past 5 years, and life of fund total return figures are 5%, 2%, and 0%, respectively.
C Class C shares' contingent deferred sales charges included in the past one year, past 5 years, and life of fund total return figures are 1%, 0%, and 0%, respectively.
$10,000 Over Life of Fund
Let's say hypothetically that $10,000 was invested in Fidelity Advisor Freedom 2050 Fund® - Class A on June 1, 2006, when the fund started, and the current 5.75% sales charge was paid. The chart shows how the value of your investment would have changed, and also shows how the S&P 500 Index performed over the same period.
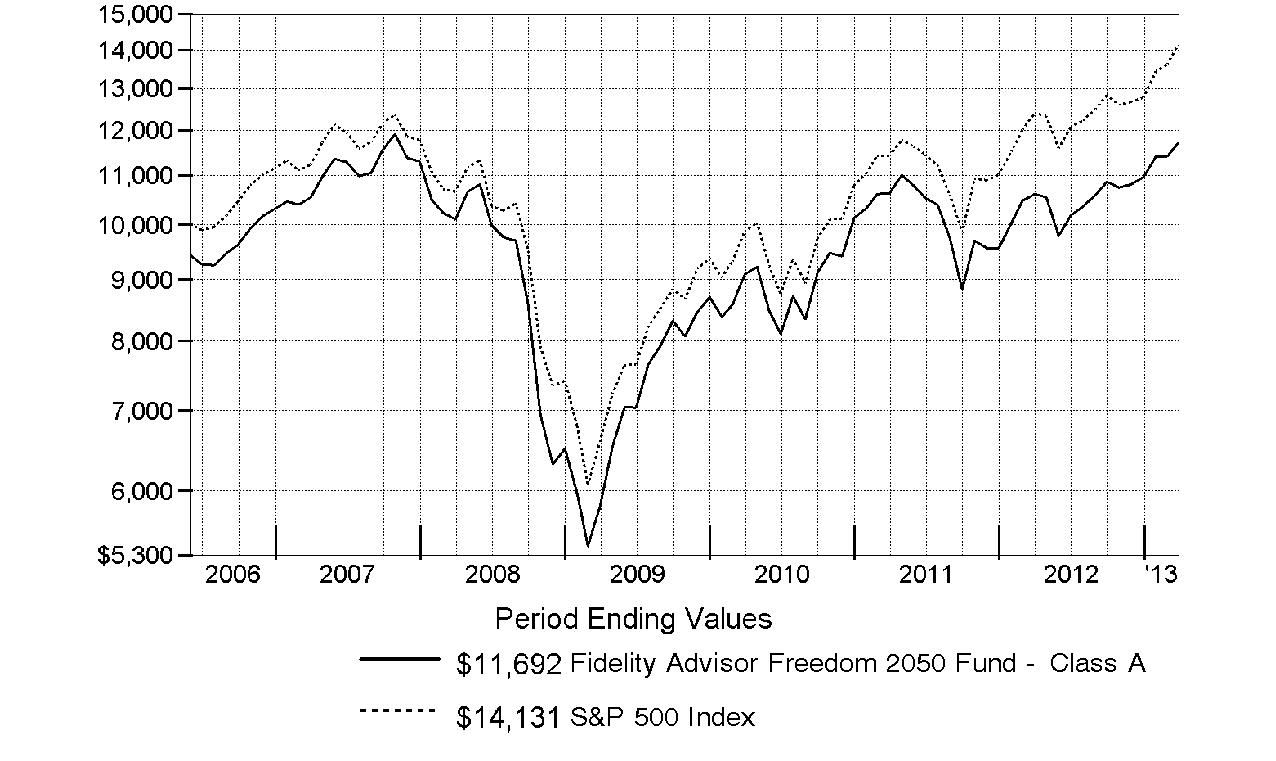
Annual Report
Fidelity Advisor Freedom® 2055 Fund - Class A, T, and C
Performance: The Bottom Line
Average annual total return reflects the change in the value of an investment, assuming reinvestment of the class' distributions from dividend income and capital gains (the profits earned upon the sale of securities that have grown in value, if any) and assuming a constant rate of performance each year. The $10,000 table and the fund's returns do not reflect the deduction of taxes that a shareholder would pay on fund distributions or the redemption of fund shares. During periods of reimbursement by Fidelity, a fund's total return will be greater than it would be had the reimbursement not occurred. How a fund did yesterday is no guarantee of how it will do tomorrow.
Average Annual Total Returns
Periods ended March 31, 2013 | Past 1
year | Life of
fund A |
Class A (incl. 5.75% sales charge) | 4.15% | 2.41% |
Class T (incl. 3.50% sales charge) | 6.38% | 3.50% |
Class C (incl. contingent deferred sales charge) B | 8.69% | 5.02% |
A From June 1, 2011.
B Class C shares' contingent deferred sales charges included in the past one year and life of fund total return figures are 1% and 0%, respectively.
$10,000 Over Life of Fund
Let's say hypothetically that $10,000 was invested in Fidelity Advisor Freedom 2055 Fund - Class A on June 1, 2011, when the fund started, and the current 5.75% sales charge was paid. The chart shows how the value of your investment would have changed, and also shows how the S&P 500 Index performed over the same period.
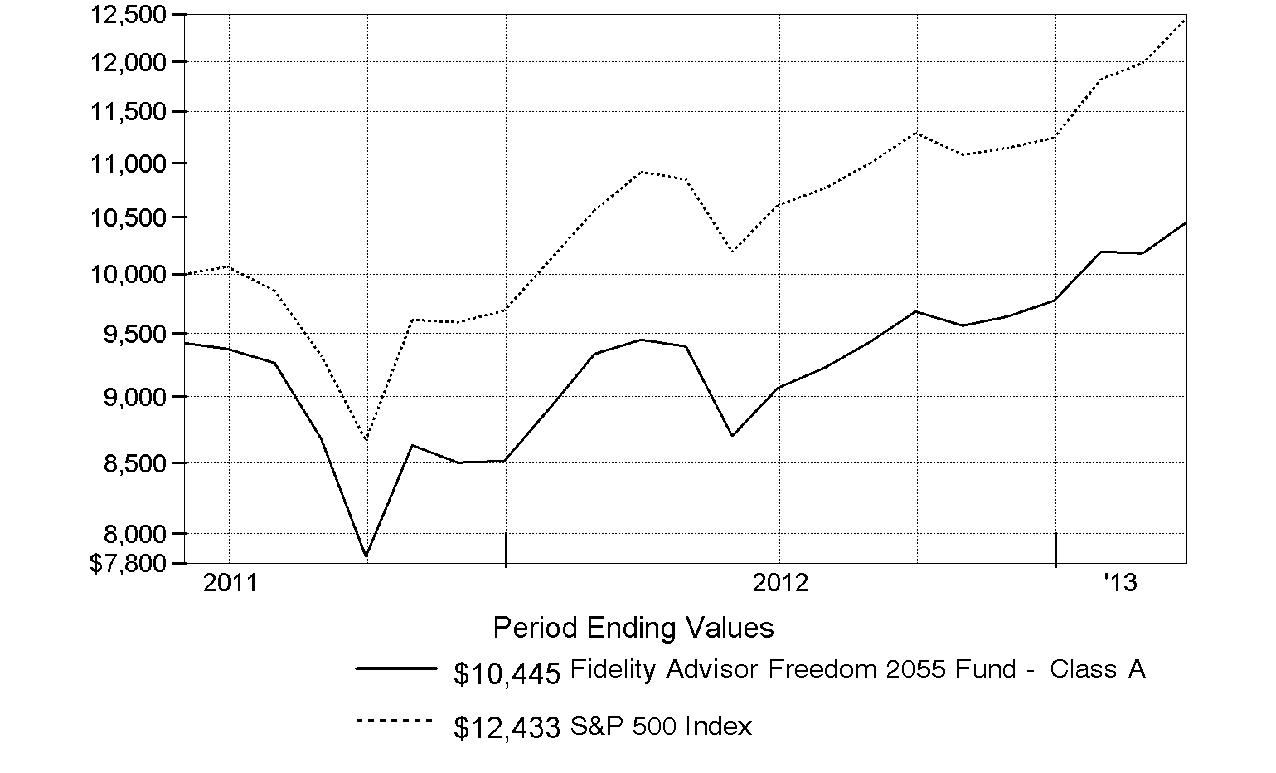
-
Annual Report
Market Recap: U.S. stock markets extended a four-year bull run and two major equity benchmarks reached record territory during the year ending March 31, 2013, as gains in the global economy and more monetary stimulus from the U.S. Federal Reserve kept markets on the upswing for much of the period. Optimism over the nation's jobs picture and housing market teamed up with solid corporate earnings to make stocks a favorite with investors during the 12-month period. The broad-based S&P 500® Index finished the year up 13.96%, closing at an all-time high at the end of the period, while the blue-chip-laden Dow Jones Industrial AverageSM - which broke its own record in early March - gained 13.37% for the full 12 months. The technology-heavy Nasdaq Composite Index® advanced a more modest 7.14%, curtailed by the weak performance of consumer electronics giant Apple, a large index component. During the year, markets shrugged off an early decline brought on by debt woes in Europe, and another dip later in the period amid pre-election jitters and Congressional gridlock over the federal budget. The year's gains were broad-based, with eight of the 10 sectors in the S&P 500® posting a double-digit increase, led by telecommunication services and health care, while technology fell 1%. Despite the headwind of a stronger U.S. dollar, foreign developed-markets stocks rose strongly, with the MSCI® EAFE® Index adding 11.40%. In the fixed-income arena, U.S. high-yield bonds benefited from investors' overall willingness to take on more risk, with The BofA Merrill LynchSM US High Yield Constrained Index adding 13.06% for the period. The shift away from perceived safety left U.S. investment-grade debt with a relatively modest 3.77% gain for the year, as measured by the Barclays® U.S. Aggregate Bond Index.
Comments from Christopher Sharpe and Andrew Dierdorf, Co-Portfolio Managers of Fidelity Advisor Freedom Funds®: For the year, the Class A, Class T, Class B and Class C shares of each of the Advisor Freedom Funds (excluding sales charges) delivered a positive absolute return. Funds with the longest time horizons until retirement - which have higher allocations to underlying equity and higher-yielding debt funds - posted the best results, each rising into low double-digit territory. These results were consistent with what we would expect in an environment where investors preferred higher-risk asset classes, especially equities, in search of the potential for outsized returns. In relative terms, the Class A, Class T, Class B and Class C shares of each of the Advisor Freedom Funds (excluding sales charges) - except Advisor Freedom Income Fund - trailed their respective Composite indexes, hampered by underperformance among the underlying funds in the U.S. equity asset class. (For specific Fund results, please refer to the performance section of this report.) Although equities provided a nice lift during the period, the Funds' investments in U.S. stocks struggled to keep pace with the market, as represented by the Dow Jones U.S. Total Stock Market IndexSM, which returned 14.48%. The majority of the underlying U.S. equity funds trailed the Dow Jones index, which hindered the relative performance of Funds with greater allocations to this asset class. Fidelity® Series All-Sector Equity Fund, Fidelity® Series Large Cap Value Fund and Fidelity Advisor® Equity Growth Fund were among the most significant detractors. The Funds' investments in commodities - represented by Fidelity Series Commodity Strategy Fund - also finished behind the Dow Jones index and dragged on relative performance. Commodities faced an uphill battle and lost ground, as investors chose to take profits in the precious metals segment during the second half of the period, while severe weather for most of the year weighed on the agricultural subsector. Shifting to the non-U.S. equity asset class, each of the three underlying funds focused on developed markets outperformed the 11.40% return of the MSCI® EAFE® Index. On the downside, Fidelity Series Emerging Markets Fund hurt relative performance because it struggled amid lackluster prospects for economic growth within developing countries. Turning to the Funds' fixed-income asset classes, high-quality bonds largely produced positive absolute returns throughout the past year. In an effort to buoy the economy, the Federal Reserve kept interest rates low. However, Treasury yields still fell below the current inflation rate, which created a challenging environment for fixed-income investors. As such, the most conservative investment-grade bonds - U.S. government securities - delivered the most modest result, while the riskiest segment of the overall bond market, high-yield debt, experienced the strongest return. Thanks to the Funds' highly diversified portfolio of debt instruments, the aggregate performance of the bond asset class handily outpaced the 3.77% result of the Barclays® U.S. Aggregate Bond Index. Five of the six underlying funds beat the Barclays index. Core holding Fidelity Series Investment Grade Bond Fund solidly outpaced the benchmark, while Fidelity Series High Income Fund and Fidelity Series Real Estate Income Fund also provided a powerful boost. In the short-term debt asset class, Fidelity Advisor® Short Fixed-Income Fund propelled the Funds' aggregate performance here, topping the 0.13% return of the Barclays® U.S. 3 Month Treasury Bellwether Index.
The views expressed above reflect those of the portfolio manager(s) only through the end of the period as stated on the cover of this report and do not necessarily represent the views of Fidelity or any other person in the Fidelity organization. Any such views are subject to change at any time based upon market or other conditions and Fidelity disclaims any responsibility to update such views. These views may not be relied on as investment advice and, because investment decisions for a Fidelity fund are based on numerous factors, may not be relied on as an indication of trading intent on behalf of any Fidelity fund.
Annual Report
As a shareholder of a Fund, you incur two types of costs: (1) transaction costs, including sales charges (loads) on purchase payments or redemption proceeds, and (2) ongoing costs, including distribution and/or service (12b-1) fees and other Fund expenses. This Example is intended to help you understand your ongoing costs (in dollars) of investing in the Funds and to compare these costs with the ongoing costs of investing in other mutual funds.
The Example is based on an investment of $1,000 invested at the beginning of the period and held for the entire period (October 1, 2012 to March 31, 2013).
Actual Expenses
The first line of the accompanying table for each class of each fund provides information about actual account values and actual expenses. You may use the information in this line, together with the amount you invested, to estimate the expenses that you paid over the period. Simply divide your account value by $1,000.00 (for example, an $8,600 account value divided by $1,000.00 = 8.6), then multiply the result by the number in the first line for a class of the fund under the heading entitled "Expenses Paid During Period" to estimate the expenses you paid on your account during this period. In addition, each Fund, as a shareholder in underlying Fidelity Funds, will indirectly bear its pro-rata share of the fees and expenses incurred by the underlying Fidelity Funds. These fees and expenses are not included in each Fund's annualized expense ratio used to calculate the expense estimates in the table below.
Hypothetical Example for Comparison Purposes
The second line of the accompanying table for each class of each fund provides information about hypothetical account values and hypothetical expenses based on a Class' actual expense ratio and an assumed rate of return of 5% per year before expenses, which is not the Class' actual return. The hypothetical account values and expenses may not be used to estimate the actual ending account balance or expenses you paid for the period. You may use this information to compare the ongoing costs of investing in the Fund and other funds. To do so, compare this 5% hypothetical example with the 5% hypothetical examples that appear in the shareholder reports of the other funds. In addition, each Fund, as a shareholder in underlying Fidelity Funds, will indirectly bear its pro-rata share of the fees and expenses incurred by the underlying Fidelity Funds. These fees and expenses are not included in each Fund's annualized expense ratio used to calculate the expense estimates in the table below.
Please note that the expenses shown in the table are meant to highlight your ongoing costs only and do not reflect any transaction costs. Therefore, the second line of the table is useful in comparing ongoing costs only, and will not help you determine the relative total costs of owning different funds. In addition, if these transactional costs were included, your costs would have been higher.
| Annualized
Expense Ratio B | Beginning
Account Value
October 1, 2012 | Ending
Account Value
March 31, 2013 | Expenses Paid
During Period*
October 1, 2012
to March 31, 2013 |
Advisor Freedom Income | | | | |
Class A | .25% | | | |
Actual | | $ 1,000.00 | $ 1,022.30 | $ 1.26 |
Hypothetical A | | $ 1,000.00 | $ 1,023.68 | $ 1.26 |
Class T | .50% | | | |
Actual | | $ 1,000.00 | $ 1,020.90 | $ 2.52 |
Hypothetical A | | $ 1,000.00 | $ 1,022.44 | $ 2.52 |
Class B | 1.00% | | | |
Actual | | $ 1,000.00 | $ 1,017.80 | $ 5.03 |
Hypothetical A | | $ 1,000.00 | $ 1,019.95 | $ 5.04 |
Class C | 1.00% | | | |
Actual | | $ 1,000.00 | $ 1,017.80 | $ 5.03 |
Hypothetical A | | $ 1,000.00 | $ 1,019.95 | $ 5.04 |
Institutional Class | .00% | | | |
Actual | | $ 1,000.00 | $ 1,023.40 | $ .00 |
Hypothetical A | | $ 1,000.00 | $ 1,024.93 | $ .00 |
| Annualized
Expense Ratio B | Beginning
Account Value
October 1, 2012 | Ending
Account Value
March 31, 2013 | Expenses Paid
During Period*
October 1, 2012
to March 31, 2013 |
Advisor Freedom 2005 | | | | |
Class A | .25% | | | |
Actual | | $ 1,000.00 | $ 1,034.00 | $ 1.27 |
Hypothetical A | | $ 1,000.00 | $ 1,023.68 | $ 1.26 |
Class T | .50% | | | |
Actual | | $ 1,000.00 | $ 1,032.50 | $ 2.53 |
Hypothetical A | | $ 1,000.00 | $ 1,022.44 | $ 2.52 |
Class B | 1.00% | | | |
Actual | | $ 1,000.00 | $ 1,030.20 | $ 5.06 |
Hypothetical A | | $ 1,000.00 | $ 1,019.95 | $ 5.04 |
Class C | 1.00% | | | |
Actual | | $ 1,000.00 | $ 1,029.30 | $ 5.06 |
HypotheticalA | | $ 1,000.00 | $ 1,019.95 | $ 5.04 |
Institutional Class | .00% | | | |
Actual | | $ 1,000.00 | $ 1,034.90 | $ .00 |
Hypothetical A | | $ 1,000.00 | $ 1,024.93 | $ .00 |
Advisor Freedom 2010 | | | | |
Class A | .25% | | | |
Actual | | $ 1,000.00 | $ 1,044.70 | $ 1.27 |
Hypothetical A | | $ 1,000.00 | $ 1,023.68 | $ 1.26 |
Class T | .50% | | | |
Actual | | $ 1,000.00 | $ 1,042.90 | $ 2.55 |
Hypothetical A | | $ 1,000.00 | $ 1,022.44 | $ 2.52 |
Class B | 1.00% | | | |
Actual | | $ 1,000.00 | $ 1,040.60 | $ 5.09 |
Hypothetical A | | $ 1,000.00 | $ 1,019.95 | $ 5.04 |
Class C | 1.00% | | | |
Actual | | $ 1,000.00 | $ 1,040.00 | $ 5.09 |
Hypothetical A | | $ 1,000.00 | $ 1,019.95 | $ 5.04 |
Institutional Class | .00% | | | |
Actual | | $ 1,000.00 | $ 1,045.60 | $ .00 |
Hypothetical A | | $ 1,000.00 | $ 1,024.93 | $ .00 |
Advisor Freedom 2015 | | | | |
Class A | .25% | | | |
Actual | | $ 1,000.00 | $ 1,045.90 | $ 1.28 |
Hypothetical A | | $ 1,000.00 | $ 1,023.68 | $ 1.26 |
Class T | .50% | | | |
Actual | | $ 1,000.00 | $ 1,044.80 | $ 2.55 |
Hypothetical A | | $ 1,000.00 | $ 1,022.44 | $ 2.52 |
Class B | 1.00% | | | |
Actual | | $ 1,000.00 | $ 1,041.80 | $ 5.09 |
Hypothetical A | | $ 1,000.00 | $ 1,019.95 | $ 5.04 |
Class C | 1.00% | | | |
Actual | | $ 1,000.00 | $ 1,042.20 | $ 5.09 |
Hypothetical A | | $ 1,000.00 | $ 1,019.95 | $ 5.04 |
Institutional Class | .00% | | | |
Actual | | $ 1,000.00 | $ 1,047.40 | $ .00 |
Hypothetical A | | $ 1,000.00 | $ 1,024.93 | $ .00 |
| Annualized
Expense Ratio B | Beginning
Account Value
October 1, 2012 | Ending
Account Value
March 31, 2013 | Expenses Paid
During Period*
October 1, 2012
to March 31, 2013 |
Advisor Freedom 2020 | | | | |
Class A | .25% | | | |
Actual | | $ 1,000.00 | $ 1,050.60 | $ 1.28 |
Hypothetical A | | $ 1,000.00 | $ 1,023.68 | $ 1.26 |
Class T | .50% | | | |
Actual | | $ 1,000.00 | $ 1,049.50 | $ 2.55 |
Hypothetical A | | $ 1,000.00 | $ 1,022.44 | $ 2.52 |
Class B | 1.00% | | | |
Actual | | $ 1,000.00 | $ 1,046.40 | $ 5.10 |
Hypothetical A | | $ 1,000.00 | $ 1,019.95 | $ 5.04 |
Class C | 1.00% | | | |
Actual | | $ 1,000.00 | $ 1,046.60 | $ 5.10 |
Hypothetical A | | $ 1,000.00 | $ 1,019.95 | $ 5.04 |
Institutional Class | .00% | | | |
Actual | | $ 1,000.00 | $ 1,052.10 | $ .00 |
Hypothetical A | | $ 1,000.00 | $ 1,024.93 | $ .00 |
Advisor Freedom 2025 | | | | |
Class A | .25% | | | |
Actual | | $ 1,000.00 | $ 1,060.60 | $ 1.28 |
Hypothetical A | | $ 1,000.00 | $ 1,023.68 | $ 1.26 |
Class T | .50% | | | |
Actual | | $ 1,000.00 | $ 1,058.70 | $ 2.57 |
Hypothetical A | | $ 1,000.00 | $ 1,022.44 | $ 2.52 |
Class B | 1.00% | | | |
Actual | | $ 1,000.00 | $ 1,056.70 | $ 5.13 |
Hypothetical A | | $ 1,000.00 | $ 1,019.95 | $ 5.04 |
Class C | 1.00% | | | |
Actual | | $ 1,000.00 | $ 1,057.30 | $ 5.13 |
Hypothetical A | | $ 1,000.00 | $ 1,019.95 | $ 5.04 |
Institutional Class | .00% | | | |
Actual | | $ 1,000.00 | $ 1,062.00 | $ .00 |
Hypothetical A | | $ 1,000.00 | $ 1,024.93 | $ .00 |
Advisor Freedom 2030 | | | | |
Class A | .25% | | | |
Actual | | $ 1,000.00 | $ 1,063.50 | $ 1.29 |
Hypothetical A | | $ 1,000.00 | $ 1,023.68 | $ 1.26 |
Class T | .50% | | | |
Actual | | $ 1,000.00 | $ 1,061.70 | $ 2.57 |
Hypothetical A | | $ 1,000.00 | $ 1,022.44 | $ 2.52 |
Class B | 1.00% | | | |
Actual | | $ 1,000.00 | $ 1,058.80 | $ 5.13 |
Hypothetical A | | $ 1,000.00 | $ 1,019.95 | $ 5.04 |
Class C | 1.00% | | | |
Actual | | $ 1,000.00 | $ 1,059.10 | $ 5.13 |
Hypothetical A | | $ 1,000.00 | $ 1,019.95 | $ 5.04 |
Institutional Class | .00% | | | |
Actual | | $ 1,000.00 | $ 1,064.20 | $ .00 |
Hypothetical A | | $ 1,000.00 | $ 1,024.93 | $ .00 |
| Annualized
Expense Ratio B | Beginning
Account Value
October 1, 2012 | Ending
Account Value
March 31, 2013 | Expenses Paid
During Period*
October 1, 2012
to March 31, 2013 |
Advisor Freedom 2035 | | | | |
Class A | .25% | | | |
Actual | | $ 1,000.00 | $ 1,072.20 | $ 1.29 |
Hypothetical A | | $ 1,000.00 | $ 1,023.68 | $ 1.26 |
Class T | .50% | | | |
Actual | | $ 1,000.00 | $ 1,070.80 | $ 2.58 |
Hypothetical A | | $ 1,000.00 | $ 1,022.44 | $ 2.52 |
Class B | 1.00% | | | |
Actual | | $ 1,000.00 | $ 1,067.40 | $ 5.15 |
Hypothetical A | | $ 1,000.00 | $ 1,019.95 | $ 5.04 |
Class C | 1.00% | | | |
Actual | | $ 1,000.00 | $ 1,067.50 | $ 5.15 |
Hypothetical A | | $ 1,000.00 | $ 1,019.95 | $ 5.04 |
Institutional Class | .00% | | | |
Actual | | $ 1,000.00 | $ 1,072.90 | $ .00 |
Hypothetical A | | $ 1,000.00 | $ 1,024.93 | $ .00 |
Advisor Freedom 2040 | | | | |
Class A | .25% | | | |
Actual | | $ 1,000.00 | $ 1,072.70 | $ 1.29 |
Hypothetical A | | $ 1,000.00 | $ 1,023.68 | $ 1.26 |
Class T | .50% | | | |
Actual | | $ 1,000.00 | $ 1,071.70 | $ 2.58 |
Hypothetical A | | $ 1,000.00 | $ 1,022.44 | $ 2.52 |
Class B | 1.00% | | | |
Actual | | $ 1,000.00 | $ 1,069.10 | $ 5.16 |
Hypothetical A | | $ 1,000.00 | $ 1,019.95 | $ 5.04 |
Class C | 1.00% | | | |
Actual | | $ 1,000.00 | $ 1,068.60 | $ 5.16 |
Hypothetical A | | $ 1,000.00 | $ 1,019.95 | $ 5.04 |
Institutional Class | .00% | | | |
Actual | | $ 1,000.00 | $ 1,073.50 | $ .00 |
Hypothetical A | | $ 1,000.00 | $ 1,024.93 | $ .00 |
Advisor Freedom 2045 | | | | |
Class A | .25% | | | |
Actual | | $ 1,000.00 | $ 1,075.10 | $ 1.29 |
Hypothetical A | | $ 1,000.00 | $ 1,023.68 | $ 1.26 |
Class T | .50% | | | |
Actual | | $ 1,000.00 | $ 1,074.80 | $ 2.59 |
Hypothetical A | | $ 1,000.00 | $ 1,022.44 | $ 2.52 |
Class B | 1.00% | | | |
Actual | | $ 1,000.00 | $ 1,071.40 | $ 5.16 |
Hypothetical A | | $ 1,000.00 | $ 1,019.95 | $ 5.04 |
Class C | 1.00% | | | |
Actual | | $ 1,000.00 | $ 1,071.50 | $ 5.16 |
Hypothetical A | | $ 1,000.00 | $ 1,019.95 | $ 5.04 |
Institutional Class | .00% | | | |
Actual | | $ 1,000.00 | $ 1,076.60 | $ .00 |
Hypothetical A | | $ 1,000.00 | $ 1,024.93 | $ .00 |
| Annualized
Expense Ratio B | Beginning
Account Value
October 1, 2012 | Ending
Account Value
March 31, 2013 | Expenses Paid
During Period*
October 1, 2012
to March 31, 2013 |
Advisor Freedom 2050 | | | | |
Class A | .25% | | | |
Actual | | $ 1,000.00 | $ 1,076.80 | $ 1.29 |
Hypothetical A | | $ 1,000.00 | $ 1,023.68 | $ 1.26 |
Class T | .50% | | | |
Actual | | $ 1,000.00 | $ 1,075.30 | $ 2.59 |
Hypothetical A | | $ 1,000.00 | $ 1,022.44 | $ 2.52 |
Class B | 1.00% | | | |
Actual | | $ 1,000.00 | $ 1,072.30 | $ 5.17 |
Hypothetical A | | $ 1,000.00 | $ 1,019.95 | $ 5.04 |
Class C | 1.00% | | | |
Actual | | $ 1,000.00 | $ 1,072.90 | $ 5.17 |
Hypothetical A | | $ 1,000.00 | $ 1,019.95 | $ 5.04 |
Institutional Class | .00% | | | |
Actual | | $ 1,000.00 | $ 1,078.30 | $ .00 |
Hypothetical A | | $ 1,000.00 | $ 1,024.93 | $ .00 |
Advisor Freedom 2055 | | | | |
Class A | .25% | | | |
Actual | | $ 1,000.00 | $ 1,079.00 | $ 1.30 |
Hypothetical A | | $ 1,000.00 | $ 1,023.68 | $ 1.26 |
Class T | .50% | | | |
Actual | | $ 1,000.00 | $ 1,077.80 | $ 2.59 |
Hypothetical A | | $ 1,000.00 | $ 1,022.44 | $ 2.52 |
Class C | 1.00% | | | |
Actual | | $ 1,000.00 | $ 1,075.60 | $ 5.17 |
Hypothetical A | | $ 1,000.00 | $ 1,019.95 | $ 5.04 |
Institutional Class | .00% | | | |
Actual | | $ 1,000.00 | $ 1,081.00 | $ .00 |
Hypothetical A | | $ 1,000.00 | $ 1,024.93 | $ .00 |
A 5% return per year before expenses
B Annualized expense ratio reflects expenses net of applicable fee waivers.
* Expenses are equal to each Class' annualized expense ratio, multiplied by the average account value over the period, multiplied by 182/ 365 (to reflect the one-half year period). The fees and expenses of the underlying Fidelity Funds in which the Funds invest are not included in each class' annualized expense ratio.
Annual Report
Fidelity Advisor Freedom Income Fund
Investment Changes (Unaudited)
The information in the following tables is based on the direct investments of the Fund. |
Fund Holdings as of March 31, 2013 |
| % of fund's
net assets | % of fund's net assets
6 months ago |
Commodity Funds | | |
Fidelity Series Commodity Strategy Fund | 1.9 | 2.1 |
Domestic Equity Funds | | |
Fidelity Advisor Equity Growth Fund Institutional Class | 1.8 | 1.5 |
Fidelity Advisor Growth & Income Fund Institutional Class | 0.9 | 1.9 |
Fidelity Advisor Large Cap Fund Institutional Class | 1.0 | 1.7 |
Fidelity Advisor Series Equity-Income Fund | 1.3 | 0.0 |
Fidelity Advisor Series Mega Cap Fund | 0.3 | 0.0 |
Fidelity Advisor Series Opportunistic Insights Fund | 0.9 | 0.0 |
Fidelity Advisor Series Stock Selector Large Cap Value Fund | 1.3 | 0.0 |
Fidelity Advisor Small Cap Fund Institutional Class | 0.7 | 0.6 |
Fidelity Series 100 Index Fund | 0.3 | 1.3 |
Fidelity Series All-Sector Equity Fund | 2.3 | 2.7 |
Fidelity Series Large Cap Value Fund | 1.3 | 2.5 |
Fidelity Series Real Estate Equity Fund | 0.2 | 0.2 |
Fidelity Series Small Cap Opportunities Fund | 0.8 | 0.6 |
| 13.1 | 13.0 |
Developed International Equity Funds | | |
Fidelity Series International Growth Fund | 2.0 | 2.0 |
Fidelity Series International Small Cap Fund | 0.4 | 0.4 |
Fidelity Series International Value Fund | 2.0 | 1.9 |
| 4.4 | 4.3 |
Emerging Markets Equity Funds | | |
Fidelity Series Emerging Markets Fund | 1.2 | 1.2 |
High Yield Bond Funds | | |
Fidelity Series Emerging Markets Debt Fund | 0.5 | 0.5 |
Fidelity Series Floating Rate High Income Fund | 1.1 | 1.1 |
Fidelity Series High Income Fund | 4.9 | 4.7 |
Fidelity Series Real Estate Income Fund | 0.4 | 0.6 |
| 6.9 | 6.9 |
Inflation-Protected Bond Funds | | |
Fidelity Series Inflation-Protected Bond Index Fund | 11.4 | 11.9 |
Investment Grade Bond Funds | | |
Fidelity Series Investment Grade Bond Fund | 21.5 | 21.3 |
Short-Term Funds | | |
Fidelity Advisor Short Fixed-Income Fund Institutional Class | 17.9 | 17.8 |
Fidelity Institutional Money Market Portfolio Institutional Class | 21.7 | 21.5 |
| 39.6 | 39.3 |
Net Other Assets (Liabilities)* | 0.0 | 0.0 |
| 100.0 | 100.0 |
* Amount represents less than 0.1% |
Asset Allocation (% of fund's net assets) |
Period end |
 | Commodity Funds | 1.9% | |
 | Domestic Equity Funds | 13.1% | |
 | Developed International Equity Funds | 4.4% | |
 | Emerging Markets
Equity Funds | 1.2% | |
 | High Yield Bond Funds | 6.9% | |
 | Inflation-Protected
Bond Funds | 11.4% | |
 | Investment Grade
Bond Funds | 21.5% | |
 | Short-Term Funds | 39.6% | |

Six months ago |
| Commodity Funds | 2.1% | |
| Domestic Equity Funds | 13.0% | |
| Developed International Equity Funds | 4.3% | |
| Emerging Markets
Equity Funds | 1.2% | |
| High Yield Bond Funds | 6.9% | |
| Inflation-Protected
Bond Funds | 11.9% | |
| Investment Grade
Bond Funds | 21.3% | |
| Short-Term Funds | 39.3% | |

Expected |
| Commodity Funds | 2.0% | |
| Domestic Equity Funds | 12.6% | |
| Developed International Equity Funds | 4.2% | |
| Emerging Markets
Equity Funds | 1.2% | |
| High Yield Bond Funds | 5.0% | |
| Inflation-Protected
Bond Funds | 12.0% | |
| Investment Grade
Bond Funds | 23.0% | |
| Short-Term Funds | 40.0% | |

The six months ago allocation is based on the fund's holdings as of September 30, 2012. The current allocation is based on the fund's holdings as of March 31, 2013. The expected allocation represents the fund's anticipated allocation at September 30, 2013. |
Annual Report
Fidelity Advisor Freedom Income Fund
Investments March 31, 2013
Showing Percentage of Net Assets
Domestic Equity Funds - 15.0% |
| Shares | | Value |
Commodity Funds - 1.9% |
Fidelity Series Commodity Strategy Fund (a) | 730,523 | | $ 6,348,249 |
Domestic Equity Funds - 13.1% |
Fidelity Advisor Equity Growth Fund Institutional Class | 80,594 | | 5,710,077 |
Fidelity Advisor Growth & Income Fund Institutional Class | 137,178 | | 3,030,254 |
Fidelity Advisor Large Cap Fund Institutional Class | 128,967 | | 3,065,549 |
Fidelity Advisor Series Equity-Income Fund | 378,976 | | 4,217,999 |
Fidelity Advisor Series Mega Cap Fund | 85,488 | | 944,641 |
Fidelity Advisor Series Opportunistic Insights Fund | 270,476 | | 2,977,939 |
Fidelity Advisor Series Stock Selector Large Cap Value Fund | 378,617 | | 4,236,726 |
Fidelity Advisor Small Cap Fund Institutional Class | 86,852 | | 2,340,665 |
Fidelity Series 100 Index Fund | 90,164 | | 930,494 |
Fidelity Series All-Sector Equity Fund | 593,285 | | 7,623,707 |
Fidelity Series Large Cap Value Fund | 375,096 | | 4,366,121 |
Fidelity Series Real Estate Equity Fund | 50,047 | | 651,607 |
Fidelity Series Small Cap Opportunities Fund | 220,678 | | 2,720,966 |
TOTAL DOMESTIC EQUITY FUNDS | | 42,816,745 |
TOTAL DOMESTIC EQUITY FUNDS (Cost $40,229,824) |
49,164,994
|
International Equity Funds - 5.6% |
| | | |
Developed International Equity Funds - 4.4% |
Fidelity Series International Growth Fund | 518,359 | | 6,557,246 |
Fidelity Series International Small Cap Fund | 97,940 | | 1,343,743 |
Fidelity Series International Value Fund | 665,561 | | 6,535,805 |
TOTAL DEVELOPED INTERNATIONAL EQUITY FUNDS | | 14,436,794 |
Emerging Markets Equity Funds - 1.2% |
Fidelity Series Emerging Markets Fund | 235,115 | | 3,933,471 |
TOTAL INTERNATIONAL EQUITY FUNDS (Cost $15,970,277) |
18,370,265
|
Bond Funds - 39.8% |
| Shares | | Value |
High Yield Bond Funds - 6.9% |
Fidelity Series Emerging Markets Debt Fund | 148,672 | | $ 1,617,547 |
Fidelity Series Floating Rate High Income Fund | 339,243 | | 3,606,153 |
Fidelity Series High Income Fund | 1,529,701 | | 16,077,152 |
Fidelity Series Real Estate Income Fund | 102,973 | | 1,201,698 |
TOTAL HIGH YIELD BOND FUNDS | | 22,502,550 |
Inflation-Protected Bond Funds - 11.4% |
Fidelity Series Inflation-Protected Bond Index Fund | 3,280,426 | | 37,364,057 |
Investment Grade Bond Funds - 21.5% |
Fidelity Series Investment Grade Bond Fund | 6,120,274 | | 70,566,759 |
TOTAL BOND FUNDS (Cost $123,255,421) |
130,433,366
|
Short-Term Funds - 39.6% |
| | | |
Fidelity Advisor Short Fixed-Income Fund Institutional Class | 6,246,764 | | 58,469,712 |
Fidelity Institutional Money Market Portfolio Institutional Class | 71,120,992 | | 71,120,992 |
TOTAL SHORT-TERM FUNDS (Cost $128,762,530) |
129,590,704
|
TOTAL INVESTMENT PORTFOLIO - 100.0% (Cost $308,218,052) | | 327,559,329 |
NET OTHER ASSETS (LIABILITIES) - 0.0% | | (73,808) |
NET ASSETS - 100% | $ 327,485,521 |
Legend |
(a) Non-income producing |
Other Information |
All investments are categorized as Level 1 under the Fair Value Hierarchy. The inputs or methodology used for valuing securities may not be an indication of the risk associated with investing in those securities. For more information on valuation inputs, please refer to the Security Valuation section in the accompanying Notes to Financial Statements. |
See accompanying notes which are an integral part of the financial statements.
Annual Report
Fidelity Advisor Freedom Income Fund
Statement of Assets and Liabilities
| March 31, 2013 |
| | |
Assets | | |
Investment in securities, at value (cost $308,218,052) - See accompanying schedule | | $ 327,559,329 |
Receivable for investments sold | | 573,754 |
Receivable for fund shares sold | | 275,056 |
Receivable from affiliate for expense reductions | | 63 |
Total assets | | 328,408,202 |
| | |
Liabilities | | |
Payable for investments purchased | $ 2,944 | |
Payable for fund shares redeemed | 844,640 | |
Distribution and service plan fees payable | 75,097 | |
Total liabilities | | 922,681 |
| | |
Net Assets | | $ 327,485,521 |
Net Assets consist of: | | |
Paid in capital | | $ 304,968,503 |
Undistributed net investment income | | 251,012 |
Accumulated undistributed net realized gain (loss) on investments | | 2,924,729 |
Net unrealized appreciation (depreciation) on investments | | 19,341,277 |
Net Assets | | $ 327,485,521 |
| | |
Calculation of Maximum Offering Price Class A:
Net Asset Value and redemption price per share ($176,876,416 ÷ 15,782,090 shares) | | $ 11.21 |
| | |
Maximum offering price per share (100/94.25 of $11.21) | | $ 11.89 |
Class T:
Net Asset Value and redemption price per share ($53,734,149 ÷ 4,798,915 shares) | | $ 11.20 |
| | |
Maximum offering price per share (100/96.50 of $11.20) | | $ 11.61 |
Class B:
Net Asset Value and offering price per share ($2,293,628 ÷ 204,985 shares)A | | $ 11.19 |
| | |
Class C:
Net Asset Value and offering price per share ($16,605,743 ÷ 1,484,974 shares)A | | $ 11.18 |
| | |
| | |
Institutional Class:
Net Asset Value, offering price and redemption price per share ($77,975,585 ÷ 6,941,093 shares) | | $ 11.23 |
A Redemption price per share is equal to net asset value less any applicable contingent deferred sales charge.
Statement of Operations
| Year ended March 31, 2013 |
| | |
Investment Income | | |
Income distributions from underlying funds | | $ 4,201,239 |
| | |
Expenses | | |
Distribution and service plan fees | $ 895,238 | |
Independent trustees' compensation | 1,142 | |
Total expenses before reductions | 896,380 | |
Expense reductions | (1,142) | 895,238 |
Net investment income (loss) | | 3,306,001 |
Realized and Unrealized Gain (Loss) Realized gain (loss) on sale of underlying fund shares | 1,989,110 | |
Capital gain distributions from underlying funds | 4,974,360 | |
Total net realized gain (loss) | | 6,963,470 |
Change in net unrealized appreciation (depreciation) on underlying funds | | 3,721,536 |
Net gain (loss) | | 10,685,006 |
Net increase (decrease) in net assets resulting from operations | | $ 13,991,007 |
See accompanying notes which are an integral part of the financial statements.
Annual Report
Statement of Changes in Net Assets
| Year ended
March 31,
2013 | Year ended
March 31,
2012 |
Increase (Decrease) in Net Assets | | |
Operations | | |
Net investment income (loss) | $ 3,306,001 | $ 3,691,556 |
Net realized gain (loss) | 6,963,470 | 4,714,552 |
Change in net unrealized appreciation (depreciation) | 3,721,536 | 871,075 |
Net increase (decrease) in net assets resulting from operations | 13,991,007 | 9,277,183 |
Distributions to shareholders from net investment income | (3,274,495) | (3,668,106) |
Distributions to shareholders from net realized gain | (4,055,113) | (2,101,589) |
Total distributions | (7,329,608) | (5,769,695) |
Share transactions - net increase (decrease) | 17,611,622 | 31,446,678 |
Total increase (decrease) in net assets | 24,273,021 | 34,954,166 |
| | |
Net Assets | | |
Beginning of period | 303,212,500 | 268,258,334 |
End of period (including undistributed net investment income of $251,012 and undistributed net investment income of $219,506, respectively) | $ 327,485,521 | $ 303,212,500 |
Financial Highlights - Class A
Years ended March 31, | 2013 | 2012 | 2011 | 2010 | 2009 |
Selected Per-Share Data | | | | | |
Net asset value, beginning of period | $ 10.98 | $ 10.85 | $ 10.35 | $ 8.74 | $ 10.46 |
Income from Investment Operations | | | | | |
Net investment income (loss) C | .12 | .15 | .16 | .22 | .29 |
Net realized and unrealized gain (loss) | .37 | .21 | .57 | 1.66 | (1.60) |
Total from investment operations | .49 | .36 | .73 | 1.88 | (1.31) |
Distributions from net investment income | (.12) | (.15) | (.16) | (.22) | (.30) |
Distributions from net realized gain | (.14) | (.08) | (.07) | (.06) | (.11) |
Total distributions | (.26) | (.23) | (.23) | (.27) F | (.41) |
Net asset value, end of period | $ 11.21 | $ 10.98 | $ 10.85 | $ 10.35 | $ 8.74 |
Total Return A, B | 4.53% | 3.34% | 7.11% | 21.74% | (12.78)% |
Ratios to Average Net Assets D, E | | | | | |
Expenses before reductions | .25% | .25% | .25% | .25% | .25% |
Expenses net of fee waivers, if any | .25% | .25% | .25% | .25% | .25% |
Expenses net of all reductions | .25% | .25% | .25% | .25% | .25% |
Net investment income (loss) | 1.08% | 1.37% | 1.48% | 2.19% | 3.03% |
Supplemental Data | | | | | |
Net assets, end of period (000 omitted) | $ 176,876 | $ 166,658 | $ 157,695 | $ 142,691 | $ 93,865 |
Portfolio turnover rate | 17% | 24% | 35% | 31% | 44% |
A Total returns would have been lower if certain expenses had not been reduced during the applicable periods shown.
B Total returns do not include the effect of the sales charges.
C Calculated based on average shares outstanding during the period.
D Amounts do not include the activity of the Underlying Funds.
E Expense ratios reflect operating expenses of the class. Expenses before reductions do not reflect amounts reimbursed by the investment adviser or reductions from expense offset arrangements and do not represent the amount paid by the class during periods when reimbursements or reductions occur. Expenses net of fee waivers reflect expenses after reimbursement by the investment adviser but prior to reductions from expense offset arrangements. Expenses net of all reductions represent the net expenses paid by the class but do not include expenses of the investment companies in which the Fund invests.
F Total distributions of $.27 per share is comprised of distributions from net investment income of $.217 and distributions from net realized gain of $.056 per share.
See accompanying notes which are an integral part of the financial statements.
Annual Report
Financial Highlights - Class T
Years ended March 31, | 2013 | 2012 | 2011 | 2010 | 2009 |
Selected Per-Share Data | | | | | |
Net asset value, beginning of period | $ 10.96 | $ 10.84 | $ 10.34 | $ 8.73 | $ 10.45 |
Income from Investment Operations | | | | | |
Net investment income (loss) C | .09 | .12 | .13 | .19 | .27 |
Net realized and unrealized gain (loss) | .38 | .20 | .57 | 1.67 | (1.61) |
Total from investment operations | .47 | .32 | .70 | 1.86 | (1.34) |
Distributions from net investment income | (.09) | (.12) | (.13) | (.19) | (.27) |
Distributions from net realized gain | (.14) | (.08) | (.07) | (.06) | (.11) |
Total distributions | (.23) | (.20) | (.20) | (.25) F | (.38) |
Net asset value, end of period | $ 11.20 | $ 10.96 | $ 10.84 | $ 10.34 | $ 8.73 |
Total Return A, B | 4.35% | 3.01% | 6.85% | 21.47% | (13.03)% |
Ratios to Average Net Assets D, E | | | | | |
Expenses before reductions | .50% | .50% | .50% | .50% | .50% |
Expenses net of fee waivers, if any | .50% | .50% | .50% | .50% | .50% |
Expenses net of all reductions | .50% | .50% | .50% | .50% | .50% |
Net investment income (loss) | .83% | 1.12% | 1.23% | 1.94% | 2.78% |
Supplemental Data | | | | | |
Net assets, end of period (000 omitted) | $ 53,734 | $ 56,246 | $ 57,404 | $ 52,047 | $ 42,675 |
Portfolio turnover rate | 17% | 24% | 35% | 31% | 44% |
A Total returns would have been lower if certain expenses had not been reduced during the applicable periods shown.
B Total returns do not include the effect of the sales charges.
C Calculated based on average shares outstanding during the period.
D Amounts do not include the activity of the Underlying Funds.
E Expense ratios reflect operating expenses of the class. Expenses before reductions do not reflect amounts reimbursed by the investment adviser or reductions from expense offset arrangements and do not represent the amount paid by the class during periods when reimbursements or reductions occur. Expenses net of fee waivers reflect expenses after reimbursement by the investment adviser but prior to reductions from expense offset arrangements. Expenses net of all reductions represent the net expenses paid by the class but do not include expenses of the investment companies in which the Fund invests.
F Total distributions of $.25 per share is comprised of distributions from net investment income of $.193 and distributions from net realized gain of $.056 per share.
Financial Highlights - Class B
Years ended March 31, | 2013 | 2012 | 2011 | 2010 | 2009 |
Selected Per-Share Data | | | | | |
Net asset value, beginning of period | $ 10.96 | $ 10.84 | $ 10.33 | $ 8.72 | $ 10.44 |
Income from Investment Operations | | | | | |
Net investment income (loss) C | .04 | .07 | .08 | .14 | .22 |
Net realized and unrealized gain (loss) | .37 | .19 | .58 | 1.67 | (1.60) |
Total from investment operations | .41 | .26 | .66 | 1.81 | (1.38) |
Distributions from net investment income | (.04) | (.07) | (.08) | (.14) | (.23) |
Distributions from net realized gain | (.14) | (.08) | (.07) | (.06) | (.11) |
Total distributions | (.18) | (.14) G | (.15) | (.20) F | (.34) |
Net asset value, end of period | $ 11.19 | $ 10.96 | $ 10.84 | $ 10.33 | $ 8.72 |
Total Return A, B | 3.80% | 2.47% | 6.39% | 20.86% | (13.48)% |
Ratios to Average Net Assets D, E | | | | | |
Expenses before reductions | 1.00% | 1.00% | 1.00% | 1.00% | 1.00% |
Expenses net of fee waivers, if any | 1.00% | 1.00% | 1.00% | 1.00% | 1.00% |
Expenses net of all reductions | 1.00% | 1.00% | 1.00% | 1.00% | 1.00% |
Net investment income (loss) | .33% | .62% | .73% | 1.44% | 2.28% |
Supplemental Data | | | | | |
Net assets, end of period (000 omitted) | $ 2,294 | $ 2,889 | $ 3,938 | $ 5,319 | $ 4,282 |
Portfolio turnover rate | 17% | 24% | 35% | 31% | 44% |
A Total returns would have been lower if certain expenses had not been reduced during the applicable periods shown.
B Total returns do not include the effect of the contingent deferred sales charge.
C Calculated based on average shares outstanding during the period.
D Amounts do not include the activity of the Underlying Funds.
E Expense ratios reflect operating expenses of the class. Expenses before reductions do not reflect amounts reimbursed by the investment adviser or reductions from expense offset arrangements and do not represent the amount paid by the class during periods when reimbursements or reductions occur. Expenses net of fee waivers reflect expenses after reimbursement by the investment adviser but prior to reductions from expense offset arrangements. Expenses net of all reductions represent the net expenses paid by the class but do not include expenses of the investment companies in which the Fund invests.
F Total distributions of $.20 per share is comprised of distributions from net investment income of $.142 and distributions from net realized gain of $.056 per share.
G Total distributions of $.14 per share is comprised of distributions from net investment income of $.065 and distributions from net realized gain of $.079 per share.
See accompanying notes which are an integral part of the financial statements.
Annual Report
Financial Highlights - Class C
Years ended March 31, | 2013 | 2012 | 2011 | 2010 | 2009 |
Selected Per-Share Data | | | | | |
Net asset value, beginning of period | $ 10.96 | $ 10.84 | $ 10.33 | $ 8.72 | $ 10.43 |
Income from Investment Operations | | | | | |
Net investment income (loss) C | .04 | .07 | .08 | .14 | .22 |
Net realized and unrealized gain (loss) | .36 | .20 | .58 | 1.67 | (1.60) |
Total from investment operations | .40 | .27 | .66 | 1.81 | (1.38) |
Distributions from net investment income | (.04) | (.07) | (.08) | (.14) | (.22) |
Distributions from net realized gain | (.14) | (.08) | (.07) | (.06) | (.11) |
Total distributions | (.18) | (.15) | (.15) | (.20) F | (.33) |
Net asset value, end of period | $ 11.18 | $ 10.96 | $ 10.84 | $ 10.33 | $ 8.72 |
Total Return A, B | 3.70% | 2.50% | 6.42% | 20.83% | (13.41)% |
Ratios to Average Net Assets D, E | | | | | |
Expenses before reductions | 1.00% | 1.00% | 1.00% | 1.00% | 1.00% |
Expenses net of fee waivers, if any | 1.00% | 1.00% | 1.00% | 1.00% | 1.00% |
Expenses net of all reductions | 1.00% | 1.00% | 1.00% | 1.00% | 1.00% |
Net investment income (loss) | .33% | .62% | .73% | 1.44% | 2.28% |
Supplemental Data | | | | | |
Net assets, end of period (000 omitted) | $ 16,606 | $ 17,170 | $ 16,581 | $ 14,697 | $ 11,362 |
Portfolio turnover rate | 17% | 24% | 35% | 31% | 44% |
A Total returns would have been lower if certain expenses had not been reduced during the applicable periods shown.
B Total returns do not include the effect of the contingent deferred sales charge.
C Calculated based on average shares outstanding during the period.
D Amounts do not include the activity of the Underlying Funds.
E Expense ratios reflect operating expenses of the class. Expenses before reductions do not reflect amounts reimbursed by the investment adviser or reductions from expense offset arrangements and do not represent the amount paid by the class during periods when reimbursements or reductions occur. Expenses net of fee waivers reflect expenses after reimbursement by the investment adviser but prior to reductions from expense offset arrangements. Expenses net of all reductions represent the net expenses paid by the class but do not include expenses of the investment companies in which the Fund invests.
F Total distributions of $.20 per share is comprised of distributions from net investment income of $.140 and distributions from net realized gain of $.056 per share.
Financial Highlights - Institutional Class
Years ended March 31, | 2013 | 2012 | 2011 | 2010 | 2009 |
Selected Per-Share Data | | | | | |
Net asset value, beginning of period | $ 11.00 | $ 10.87 | $ 10.37 | $ 8.75 | $ 10.48 |
Income from Investment Operations | | | | | |
Net investment income (loss) B | .15 | .18 | .18 | .24 | .31 |
Net realized and unrealized gain (loss) | .37 | .20 | .57 | 1.68 | (1.61) |
Total from investment operations | .52 | .38 | .75 | 1.92 | (1.30) |
Distributions from net investment income | (.14) | (.17) | (.19) | (.24) | (.32) |
Distributions from net realized gain | (.14) | (.08) | (.07) | (.06) | (.11) |
Total distributions | (.29) H | (.25) | (.25) G | (.30) F | (.43) |
Net asset value, end of period | $ 11.23 | $ 11.00 | $ 10.87 | $ 10.37 | $ 8.75 |
Total Return A | 4.75% | 3.58% | 7.36% | 22.16% | (12.63)% |
Ratios to Average Net Assets C, E | | | | | |
Expenses before reductions D | .00% | .00% | .00% | .00% | .00% |
Expenses net of fee waivers, if any | .00% | .00% | .00% | .00% | .00% |
Expense net of all reductions | .00% | .00% | .00% | .00% | .00% |
Net investment income (loss) | 1.33% | 1.62% | 1.73% | 2.44% | 3.28% |
Supplemental Data | | | | | |
Net assets, end of period (000 omitted) | $ 77,976 | $ 60,248 | $ 32,640 | $ 18,137 | $ 8,461 |
Portfolio turnover rate | 17% | 24% | 35% | 31% | 44% |
A Total returns would have been lower if certain expenses had not been reduced during the applicable periods shown.
B Calculated based on average shares outstanding during the period.
C Amounts do not include the activity of the Underlying Funds.
D Amount represents less than .01%.
E Expense ratios reflect operating expenses of the class. Expenses before reductions do not reflect amounts reimbursed by the investment adviser or reductions from expense offset arrangements and do not represent the amount paid by the class during periods when reimbursements or reductions occur. Expenses net of fee waivers reflect expenses after reimbursement by the investment adviser but prior to reductions from expense offset arrangements. Expenses net of all reductions represent the net expenses paid by the class but do not include expenses of the investment companies in which the Fund invests.
F Total distributions of $.30 per share is comprised of distributions from net investment income of $.243 and distributions from net realized gain of $.056 per share.
G Total distributions of $.25 per share is comprised of distributions from net investment income of $.186 and distributions from net realized gain of $.067 per share.
H Total distributions of $.29 per share is comprised of distributions from net investment income of $.144 and distributions from net realized gain of $.141 per share.
See accompanying notes which are an integral part of the financial statements.
Annual Report
Fidelity Advisor Freedom 2005 Fund
Investment Changes (Unaudited)
The information in the following tables is based on the direct investments of the Fund. |
Fund Holdings as of March 31, 2013 |
| % of fund's
net assets | % of fund's net assets
6 months ago |
Commodity Funds | | |
Fidelity Series Commodity Strategy Fund | 3.7 | 4.1 |
Domestic Equity Funds | | |
Fidelity Advisor Equity Growth Fund Institutional Class | 3.0 | 2.7 |
Fidelity Advisor Growth & Income Fund Institutional Class | 1.6 | 3.2 |
Fidelity Advisor Large Cap Fund Institutional Class | 1.6 | 3.0 |
Fidelity Advisor Series Equity-Income Fund | 2.1 | 0.0 |
Fidelity Advisor Series Mega Cap Fund | 0.5 | 0.0 |
Fidelity Advisor Series Opportunistic Insights Fund | 1.5 | 0.0 |
Fidelity Advisor Series Stock Selector Large Cap Value Fund | 2.2 | 0.0 |
Fidelity Advisor Small Cap Fund Institutional Class | 1.2 | 1.1 |
Fidelity Series 100 Index Fund | 0.5 | 2.2 |
Fidelity Series All-Sector Equity Fund | 4.0 | 4.7 |
Fidelity Series Large Cap Value Fund | 2.3 | 4.4 |
Fidelity Series Real Estate Equity Fund | 0.4 | 0.3 |
Fidelity Series Small Cap Opportunities Fund | 1.4 | 1.2 |
| 22.3 | 22.8 |
Developed International Equity Funds | | |
Fidelity Series International Growth Fund | 3.4 | 3.4 |
Fidelity Series International Small Cap Fund | 0.7 | 0.7 |
Fidelity Series International Value Fund | 3.3 | 3.4 |
| 7.4 | 7.5 |
Emerging Markets Equity Funds | | |
Fidelity Series Emerging Markets Fund | 2.0 | 2.2 |
High Yield Bond Funds | | |
Fidelity Series Emerging Markets Debt Fund | 0.6 | 0.6 |
Fidelity Series Floating Rate High Income Fund | 1.1 | 1.0 |
Fidelity Series High Income Fund | 4.8 | 4.7 |
Fidelity Series Real Estate Income Fund | 0.5 | 0.5 |
| 7.0 | 6.8 |
Inflation-Protected Bond Funds | | |
Fidelity Series Inflation-Protected Bond Index Fund | 9.1 | 9.6 |
Investment Grade Bond Funds | | |
Fidelity Series Investment Grade Bond Fund | 18.1 | 18.4 |
Short-Term Funds | | |
Fidelity Advisor Short Fixed-Income Fund Institutional Class | 13.7 | 12.8 |
Fidelity Institutional Money Market Portfolio Institutional Class | 16.7 | 15.8 |
| 30.4 | 28.6 |
Net Other Assets (Liabilities)* | 0.0 | 0.0 |
| 100.0 | 100.0 |
* Amount represents less than 0.1%
Asset Allocation (% of fund's net assets) |
Period end |
| Commodity Funds | 3.7% | |
| Domestic Equity Funds | 22.3% | |
| Developed International Equity Funds | 7.4% | |
| Emerging Markets
Equity Funds | 2.0% | |
| High Yield Bond Funds | 7.0% | |
| Inflation-Protected
Bond Funds | 9.1% | |
| Investment Grade
Bond Funds | 18.1% | |
| Short-Term Funds | 30.4% | |

Six months ago |
| Commodity Funds | 4.1% | |
| Domestic Equity Funds | 22.8% | |
| Developed International Equity Funds | 7.5% | |
| Emerging Markets
Equity Funds | 2.2% | |
| High Yield Bond Funds | 6.8% | |
| Inflation-Protected
Bond Funds | 9.6% | |
| Investment Grade
Bond Funds | 18.4% | |
| Short-Term Funds | 28.6% | |

Expected |
| Commodity Funds | 3.6% | |
| Domestic Equity Funds | 20.4% | |
| Developed International Equity Funds | 6.8% | |
| Emerging Markets
Equity Funds | 2.0% | |
| High Yield Bond Funds | 5.0% | |
| Inflation-Protected
Bond Funds | 9.7% | |
| Investment Grade
Bond Funds | 19.6% | |
| Short-Term Funds | 32.9% | |

The fund invests according to an asset allocation strategy that becomes increasingly conservative over time. The six months ago allocation is based on the fund's holdings as of September 30, 2012. The current allocation is based on the fund's holdings as of March 31, 2013. The expected allocation represents the fund's anticipated allocation at September 30, 2013. |
Annual Report
Fidelity Advisor Freedom 2005 Fund
Investments March 31, 2013
Showing Percentage of Net Assets
Domestic Equity Funds - 26.0% |
| Shares | | Value |
Commodity Funds - 3.7% |
Fidelity Series Commodity Strategy Fund (a) | 1,335,591 | | $ 11,606,286 |
Domestic Equity Funds - 22.3% |
Fidelity Advisor Equity Growth Fund Institutional Class | 130,696 | | 9,259,781 |
Fidelity Advisor Growth & Income Fund Institutional Class | 223,309 | | 4,932,891 |
Fidelity Advisor Large Cap Fund Institutional Class | 207,794 | | 4,939,271 |
Fidelity Advisor Series Equity-Income Fund | 600,019 | | 6,678,206 |
Fidelity Advisor Series Mega Cap Fund | 134,505 | | 1,486,283 |
Fidelity Advisor Series Opportunistic Insights Fund | 428,590 | | 4,718,776 |
Fidelity Advisor Series Stock Selector Large Cap Value Fund | 600,345 | | 6,717,864 |
Fidelity Advisor Small Cap Fund Institutional Class | 140,676 | | 3,791,219 |
Fidelity Series 100 Index Fund | 149,638 | | 1,544,268 |
Fidelity Series All-Sector Equity Fund | 960,764 | | 12,345,820 |
Fidelity Series Large Cap Value Fund | 617,627 | | 7,189,173 |
Fidelity Series Real Estate Equity Fund | 85,123 | | 1,108,307 |
Fidelity Series Small Cap Opportunities Fund | 357,958 | | 4,413,628 |
TOTAL DOMESTIC EQUITY FUNDS | | 69,125,487 |
TOTAL DOMESTIC EQUITY FUNDS (Cost $70,661,104) |
80,731,773
|
International Equity Funds - 9.4% |
| | | |
Developed International Equity Funds - 7.4% |
Fidelity Series International Growth Fund | 821,874 | | 10,396,703 |
Fidelity Series International Small Cap Fund | 156,326 | | 2,144,791 |
Fidelity Series International Value Fund | 1,047,420 | | 10,285,665 |
TOTAL DEVELOPED INTERNATIONAL EQUITY FUNDS | | 22,827,159 |
Emerging Markets Equity Funds - 2.0% |
Fidelity Series Emerging Markets Fund | 379,714 | | 6,352,622 |
TOTAL INTERNATIONAL EQUITY FUNDS (Cost $25,487,710) |
29,179,781
|
Bond Funds - 34.2% |
| Shares | | Value |
High Yield Bond Funds - 7.0% |
Fidelity Series Emerging Markets Debt Fund | 176,713 | | $ 1,922,638 |
Fidelity Series Floating Rate High Income Fund | 318,726 | | 3,388,054 |
Fidelity Series High Income Fund | 1,424,029 | | 14,966,543 |
Fidelity Series Real Estate Income Fund | 125,008 | | 1,458,849 |
TOTAL HIGH YIELD BOND FUNDS | | 21,736,084 |
Inflation-Protected Bond Funds - 9.1% |
Fidelity Series Inflation-Protected Bond Index Fund | 2,480,557 | | 28,253,550 |
Investment Grade Bond Funds - 18.1% |
Fidelity Series Investment Grade Bond Fund | 4,855,310 | | 55,981,719 |
TOTAL BOND FUNDS (Cost $100,813,222) |
105,971,353
|
Short-Term Funds - 30.4% |
| | | |
Fidelity Advisor Short Fixed-Income Fund Institutional Class | 4,542,785 | | 42,520,470 |
Fidelity Institutional Money Market Portfolio Institutional Class | 51,920,042 | | 51,920,042 |
TOTAL SHORT-TERM FUNDS (Cost $93,866,282) |
94,440,512
|
TOTAL INVESTMENT PORTFOLIO - 100.0% (Cost $290,828,318) | | 310,323,419 |
NET OTHER ASSETS (LIABILITIES) - 0.0% | | (60,283) |
NET ASSETS - 100% | $ 310,263,136 |
Legend |
(a) Non-income producing |
Other Information |
All investments are categorized as Level 1 under the Fair Value Hierarchy. The inputs or methodology used for valuing securities may not be an indication of the risk associated with investing in those securities. For more information on valuation inputs, please refer to the Security Valuation section in the accompanying Notes to Financial Statements. |
See accompanying notes which are an integral part of the financial statements.
Annual Report
Fidelity Advisor Freedom 2005 Fund
Statement of Assets and Liabilities
| March 31, 2013 |
| | |
Assets | | |
Investment in securities, at value (cost $290,828,318) - See accompanying schedule | | $ 310,323,419 |
Cash | | 9 |
Receivable for fund shares sold | | 591,594 |
Receivable from affiliate for expense reductions | | 124 |
Total assets | | 310,915,146 |
| | |
Liabilities | | |
Payable for investments purchased | $ 277,658 | |
Payable for fund shares redeemed | 313,597 | |
Distribution and service plan fees payable | 60,755 | |
Total liabilities | | 652,010 |
| | |
Net Assets | | $ 310,263,136 |
Net Assets consist of: | | |
Paid in capital | | $ 289,554,695 |
Undistributed net investment income | | 456,715 |
Accumulated undistributed net realized gain (loss) on investments | | 756,625 |
Net unrealized appreciation (depreciation) on investments | | 19,495,101 |
Net Assets | | $ 310,263,136 |
| | |
Calculation of Maximum Offering Price Class A:
Net Asset Value and redemption price per share ($204,417,698 ÷ 17,180,177 shares) | | $ 11.90 |
| | |
Maximum offering price per share (100/94.25 of $11.90) | | $ 12.63 |
Class T:
Net Asset Value and redemption price per share ($26,200,783 ÷ 2,202,327 shares) | | $ 11.90 |
| | |
Maximum offering price per share (100/96.50 of $11.90) | | $ 12.33 |
Class B:
Net Asset Value and offering price per share ($1,162,317 ÷ 97,454 shares)A | | $ 11.93 |
| | |
Class C:
Net Asset Value and offering price per share ($8,118,357 ÷ 683,764 shares)A | | $ 11.87 |
| | |
Institutional Class:
Net Asset Value, offering price and redemption price per share ($70,363,981 ÷ 5,878,961 shares) | | $ 11.97 |
A Redemption price per share is equal to net asset value less any applicable contingent deferred sales charge.
Statement of Operations
| Year ended March 31, 2013 |
| | |
Investment Income | | |
Income distributions from underlying funds | | $ 4,014,646 |
| | |
Expenses | | |
Distribution and service plan fees | $ 691,587 | |
Independent trustees' compensation | 1,027 | |
Total expenses before reductions | 692,614 | |
Expense reductions | (1,027) | 691,587 |
Net investment income | | 3,323,059 |
Realized and Unrealized Gain (Loss) Realized gain (loss) on sale of underlying fund shares | 7,776,161 | |
Capital gain distributions from underlying funds | 4,943,576 | |
Total net realized gain (loss) | | 12,719,737 |
Change in net unrealized appreciation (depreciation) on underlying funds | | 462,584 |
Net gain (loss) | | 13,182,321 |
Net increase (decrease) in net assets resulting from operations | | $ 16,505,380 |
See accompanying notes which are an integral part of the financial statements.
Annual Report
Statement of Changes in Net Assets
| Year ended
March 31,
2013 | Year ended
March 31,
2012 |
Increase (Decrease) in Net Assets | | |
Operations | | |
Net investment income | $ 3,323,059 | $ 3,460,669 |
Net realized gain (loss) | 12,719,737 | 5,192,572 |
Change in net unrealized appreciation (depreciation) | 462,584 | (1,891,328) |
Net increase (decrease) in net assets resulting from operations | 16,505,380 | 6,761,913 |
Distributions to shareholders from net investment income | (3,357,002) | (3,346,222) |
Distributions to shareholders from net realized gain | (1,779,655) | (2,914,928) |
Total distributions | (5,136,657) | (6,261,150) |
Share transactions - net increase (decrease) | 26,042,535 | 27,220,944 |
Total increase (decrease) in net assets | 37,411,258 | 27,721,707 |
| | |
Net Assets | | |
Beginning of period | 272,851,878 | 245,130,171 |
End of period (including undistributed net investment income of $456,715 and undistributed net investment income of $490,658, respectively) | $ 310,263,136 | $ 272,851,878 |
Financial Highlights - Class A
Years ended March 31, | 2013 | 2012 | 2011 | 2010 | 2009 |
Selected Per-Share Data | | | | | |
Net asset value, beginning of period | $ 11.45 | $ 11.45 | $ 10.57 | $ 8.10 | $ 11.40 |
Income from Investment Operations | | | | | |
Net investment income (loss) C | .13 | .15 | .15 | .20 | .27 |
Net realized and unrealized gain (loss) | .53 | .13 | .97 | 2.53 | (3.06) |
Total from investment operations | .66 | .28 | 1.12 | 2.73 | (2.79) |
Distributions from net investment income | (.13) | (.15) | (.15) | (.19) | (.28) |
Distributions from net realized gain | (.07) | (.13) | (.09) | (.07) | (.23) |
Total distributions | (.21) F | (.28) | (.24) | (.26) | (.51) |
Net asset value, end of period | $ 11.90 | $ 11.45 | $ 11.45 | $ 10.57 | $ 8.10 |
Total Return A,B | 5.79% | 2.53% | 10.72% | 33.91% | (25.09)% |
Ratios to Average Net Assets D,E | | | | | |
Expenses before reductions | .25% | .25% | .25% | .25% | .25% |
Expenses net of fee waivers, if any | .25% | .25% | .25% | .25% | .25% |
Expenses net of all reductions | .25% | .25% | .25% | .25% | .25% |
Net investment income (loss) | 1.16% | 1.37% | 1.37% | 2.01% | 2.75% |
Supplemental Data | | | | | |
Net assets, end of period (000 omitted) | $ 204,418 | $ 193,977 | $ 177,385 | $ 155,482 | $ 88,593 |
Portfolio turnover rate | 23% | 28% | 41% | 35% | 54% |
A Total returns would have been lower if certain expenses had not been reduced during the applicable periods shown.
B Total returns do not include the effect of the sales charges.
C Calculated based on average shares outstanding during the period.
D Amounts do not include the activity of the Underlying Funds.
E Expense ratios reflect operating expenses of the class. Expenses before reductions do not reflect amounts reimbursed by the investment adviser or reductions from expense offset arrangements and do not represent the amount paid by the class during periods when reimbursements or reductions occur. Expenses net of fee waivers reflect expenses after reimbursement by the investment adviser but prior to reductions from expense offset arrangements. Expenses net of all reductions represent the net expenses paid by the class but do not include expenses of the investment companies in which the Fund invests.
F Total distributions of $.21 per share is comprised of distributions from net investment income of $.134 and distributions from net realized gain of $.071 per share.
See accompanying notes which are an integral part of the financial statements.
Annual Report
Financial Highlights - Class T
Years ended March 31, | 2013 | 2012 | 2011 | 2010 | 2009 |
Selected Per-Share Data | | | | | |
Net asset value, beginning of period | $ 11.45 | $ 11.45 | $ 10.57 | $ 8.10 | $ 11.39 |
Income from Investment Operations | | | | | |
Net investment income (loss) C | .11 | .13 | .12 | .17 | .25 |
Net realized and unrealized gain (loss) | .52 | .12 | .97 | 2.54 | (3.06) |
Total from investment operations | .63 | .25 | 1.09 | 2.71 | (2.81) |
Distributions from net investment income | (.11) | (.12) | (.12) | (.17) | (.25) |
Distributions from net realized gain | (.07) | (.13) | (.09) | (.07) | (.23) |
Total distributions | (.18) | (.25) | (.21) | (.24) | (.48) |
Net asset value, end of period | $ 11.90 | $ 11.45 | $ 11.45 | $ 10.57 | $ 8.10 |
Total Return A,B | 5.56% | 2.25% | 10.42% | 33.61% | (25.27)% |
Ratios to Average Net Assets D,E | | | | | |
Expenses before reductions | .50% | .50% | .50% | .50% | .50% |
Expenses net of fee waivers, if any | .50% | .50% | .50% | .50% | .50% |
Expenses net of all reductions | .50% | .50% | .50% | .50% | .50% |
Net investment income (loss) | .91% | 1.12% | 1.12% | 1.76% | 2.50% |
Supplemental Data | | | | | |
Net assets, end of period (000 omitted) | $ 26,201 | $ 22,316 | $ 21,658 | $ 23,113 | $ 14,437 |
Portfolio turnover rate | 23% | 28% | 41% | 35% | 54% |
A Total returns would have been lower if certain expenses had not been reduced during the applicable periods shown.
B Total returns do not include the effect of the sales charges.
C Calculated based on average shares outstanding during the period.
D Amounts do not include the activity of the Underlying Funds.
E Expense ratios reflect operating expenses of the class. Expenses before reductions do not reflect amounts reimbursed by the investment adviser or reductions from expense offset arrangements and do not represent the amount paid by the class during periods when reimbursements or reductions occur. Expenses net of fee waivers reflect expenses after reimbursement by the investment adviser but prior to reductions from expense offset arrangements. Expenses net of all reductions represent the net expenses paid by the class but do not include expenses of the investment companies in which the Fund invests.
Financial Highlights - Class B
Years ended March 31, | 2013 | 2012 | 2011 | 2010 | 2009 |
Selected Per-Share Data | | | | | |
Net asset value, beginning of period | $ 11.47 | $ 11.45 | $ 10.56 | $ 8.09 | $ 11.37 |
Income from Investment Operations | | | | | |
Net investment income (loss) C | .05 | .07 | .07 | .12 | .20 |
Net realized and unrealized gain (loss) | .52 | .12 | .97 | 2.53 | (3.06) |
Total from investment operations | .57 | .19 | 1.04 | 2.65 | (2.86) |
Distributions from net investment income | (.04) | (.05) | (.07) | (.11) | (.19) |
Distributions from net realized gain | (.07) | (.12) | (.09) | (.07) | (.23) |
Total distributions | (.11) | (.17) | (.15) F | (.18) | (.42) |
Net asset value, end of period | $ 11.93 | $ 11.47 | $ 11.45 | $ 10.56 | $ 8.09 |
Total Return A,B | 5.00% | 1.73% | 9.94% | 32.90% | (25.69)% |
Ratios to Average Net Assets D,E | | | | | |
Expenses before reductions | 1.00% | 1.00% | 1.00% | 1.00% | 1.00% |
Expenses net of fee waivers, if any | 1.00% | 1.00% | 1.00% | 1.00% | 1.00% |
Expenses net of all reductions | 1.00% | 1.00% | 1.00% | 1.00% | 1.00% |
Net investment income (loss) | .41% | .62% | .62% | 1.26% | 2.00% |
Supplemental Data | | | | | |
Net assets, end of period (000 omitted) | $ 1,162 | $ 1,571 | $ 2,338 | $ 2,986 | $ 2,692 |
Portfolio turnover rate | 23% | 28% | 41% | 35% | 54% |
A Total returns would have been lower if certain expenses had not been reduced during the applicable periods shown.
B Total returns do not include the effect of the contingent deferred sales charge.
C Calculated based on average shares outstanding during the period.
D Amounts do not include the activity of the Underlying Funds.
E Expense ratios reflect operating expenses of the class. Expenses before reductions do not reflect amounts reimbursed by the investment adviser or reductions from expense offset arrangements and do not represent the amount paid by the class during periods when reimbursements or reductions occur. Expenses net of fee waivers reflect expenses after reimbursement by the investment adviser but prior to reductions from expense offset arrangements. Expenses net of all reductions represent the net expenses paid by the class but do not include expenses of the investment companies in which the Fund invests.
F Total distributions of $.15 per share is comprised of distributions from net investment income of $.065 and distributions from net realized gain of $.087 per share.
See accompanying notes which are an integral part of the financial statements.
Annual Report
Financial Highlights - Class C
Years ended March 31, | 2013 | 2012 | 2011 | 2010 | 2009 |
Selected Per-Share Data | | | | | |
Net asset value, beginning of period | $ 11.42 | $ 11.42 | $ 10.54 | $ 8.08 | $ 11.34 |
Income from Investment Operations | | | | | |
Net investment income (loss) C | .05 | .07 | .07 | .12 | .20 |
Net realized and unrealized gain (loss) | .52 | .11 | .97 | 2.53 | (3.04) |
Total from investment operations | .57 | .18 | 1.04 | 2.65 | (2.84) |
Distributions from net investment income | (.05) | (.07) | (.07) | (.12) | (.19) |
Distributions from net realized gain | (.07) | (.12) | (.09) | (.07) | (.23) |
Total distributions | (.12) | (.18) F | (.16) | (.19) | (.42) |
Net asset value, end of period | $ 11.87 | $ 11.42 | $ 11.42 | $ 10.54 | $ 8.08 |
Total Return A,B | 5.01% | 1.66% | 9.91% | 32.90% | (25.61)% |
Ratios to Average Net Assets D,E | | | | | |
Expenses before reductions | 1.00% | 1.00% | 1.00% | 1.00% | 1.00% |
Expenses net of fee waivers, if any | 1.00% | 1.00% | 1.00% | 1.00% | 1.00% |
Expenses net of all reductions | 1.00% | 1.00% | 1.00% | 1.00% | 1.00% |
Net investment income (loss) | .41% | .62% | .62% | 1.26% | 2.00% |
Supplemental Data | | | | | |
Net assets, end of period (000 omitted) | $ 8,118 | $ 8,053 | $ 8,679 | $ 9,377 | $ 6,761 |
Portfolio turnover rate | 23% | 28% | 41% | 35% | 54% |
A Total returns would have been lower if certain expenses had not been reduced during the applicable periods shown.
B Total returns do not include the effect of the contingent deferred sales charge.
C Calculated based on average shares outstanding during the period.
D Amounts do not include the activity of the Underlying Funds.
E Expense ratios reflect operating expenses of the class. Expenses before reductions do not reflect amounts reimbursed by the investment adviser or reductions from expense offset arrangements and do not represent the amount paid by the class during periods when reimbursements or reductions occur. Expenses net of fee waivers reflect expenses after reimbursement by the investment adviser but prior to reductions from expense offset arrangements. Expenses net of all reductions represent the net expenses paid by the class but do not include expenses of the investment companies in which the Fund invests.
F Total distributions of $.18 per share is comprised of distributions from net investment income of $.065 and distributions from net realized gain of $.115 per share.
Financial Highlights - Institutional Class
Years ended March 31, | 2013 | 2012 | 2011 | 2010 | 2009 |
Selected Per-Share Data | | | | | |
Net asset value, beginning of period | $ 11.51 | $ 11.52 | $ 10.63 | $ 8.14 | $ 11.46 |
Income from Investment Operations | | | | | |
Net investment income (loss) B | .16 | .18 | .18 | .22 | .29 |
Net realized and unrealized gain (loss) | .53 | .11 | .98 | 2.55 | (3.07) |
Total from investment operations | .69 | .29 | 1.16 | 2.77 | (2.78) |
Distributions from net investment income | (.16) | (.18) | (.18) | (.21) | (.31) |
Distributions from net realized gain | (.07) | (.13) | (.09) | (.07) | (.23) |
Total distributions | (.23) | (.30) F | (.27) | (.28) | (.54) |
Net asset value, end of period | $ 11.97 | $ 11.51 | $ 11.52 | $ 10.63 | $ 8.14 |
Total Return A | 6.11% | 2.67% | 11.02% | 34.28% | (24.93)% |
Ratios to Average Net Assets C,E | | | | | |
Expenses before reductions D | .00% | .00% | .00% | .00% | .00% |
Expenses net of fee waivers, if any | .00% | .00% | .00% | .00% | .00% |
Expenses net of all reductions | .00% | .00% | .00% | .00% | .00% |
Net investment income (loss) | 1.41% | 1.62% | 1.62% | 2.26% | 3.00% |
Supplemental Data | | | | | |
Net assets, end of period (000 omitted) | $ 70,364 | $ 46,935 | $ 35,069 | $ 18,775 | $ 9,313 |
Portfolio turnover rate | 23% | 28% | 41% | 35% | 54% |
A Total returns would have been lower if certain expenses had not been reduced during the applicable periods shown.
B Calculated based on average shares outstanding during the period.
C Amounts do not include the activity of the Underlying Funds.
D Amount represents less than .01%.
E Expense ratios reflect operating expenses of the class. Expenses before reductions do not reflect amounts reimbursed by the investment adviser or reductions from expense offset arrangements and do not represent the amount paid by the class during periods when reimbursements or reductions occur. Expenses net of fee waivers reflect expenses after reimbursement by the investment adviser but prior to reductions from expense offset arrangements. Expenses net of all reductions represent the net expenses paid by the class but do not include expenses of the investment companies in which the Fund invests.
F Total distributions of $.30 per share is comprised of distributions from net investment income of $.175 and distributions from net realized gain of $.128 per share.
See accompanying notes which are an integral part of the financial statements.
Annual Report
Fidelity Advisor Freedom 2010 Fund
Investment Changes (Unaudited)
The information in the following tables is based on the direct investments of the Fund. |
Fund Holdings as of March 31, 2013 |
| % of fund's
net assets | % of fund's net assets
6 months ago |
Commodity Funds | | |
Fidelity Series Commodity Strategy Fund | 5.1 | 5.4 |
Domestic Equity Funds | | |
Fidelity Advisor Equity Growth Fund Institutional Class | 4.1 | 3.6 |
Fidelity Advisor Growth & Income Fund Institutional Class | 2.2 | 4.4 |
Fidelity Advisor Large Cap Fund Institutional Class | 2.2 | 4.1 |
Fidelity Advisor Series Equity-Income Fund | 3.0 | 0.0 |
Fidelity Advisor Series Mega Cap Fund | 0.7 | 0.0 |
Fidelity Advisor Series Opportunistic Insights Fund | 2.1 | 0.0 |
Fidelity Advisor Series Stock Selector Large Cap Value Fund | 3.1 | 0.0 |
Fidelity Advisor Small Cap Fund Institutional Class | 1.7 | 1.5 |
Fidelity Series 100 Index Fund | 0.7 | 2.9 |
Fidelity Series All-Sector Equity Fund | 5.4 | 6.3 |
Fidelity Series Large Cap Value Fund | 3.1 | 6.0 |
Fidelity Series Real Estate Equity Fund | 0.5 | 0.4 |
Fidelity Series Small Cap Opportunities Fund | 1.9 | 1.5 |
| 30.7 | 30.7 |
Developed International Equity Funds | | |
Fidelity Series International Growth Fund | 4.6 | 4.6 |
Fidelity Series International Small Cap Fund | 0.9 | 0.9 |
Fidelity Series International Value Fund | 4.6 | 4.6 |
| 10.1 | 10.1 |
Emerging Markets Equity Funds | | |
Fidelity Series Emerging Markets Fund | 2.8 | 2.9 |
High Yield Bond Funds | | |
Fidelity Series Emerging Markets Debt Fund | 0.6 | 0.6 |
Fidelity Series Floating Rate High Income Fund | 1.2 | 1.2 |
Fidelity Series High Income Fund | 4.8 | 4.7 |
Fidelity Series Real Estate Income Fund | 0.5 | 0.6 |
| 7.1 | 7.1 |
Inflation-Protected Bond Funds | | |
Fidelity Series Inflation-Protected Bond Index Fund | 10.0 | 10.4 |
Investment Grade Bond Funds | | |
Fidelity Series Investment Grade Bond Fund | 21.6 | 22.0 |
Short-Term Funds | | |
Fidelity Advisor Short Fixed-Income Fund Institutional Class | 5.7 | 5.2 |
Fidelity Institutional Money Market Portfolio Institutional Class | 6.9 | 6.2 |
| 12.6 | 11.4 |
Net Other Assets (Liabilities)* | 0.0 | 0.0 |
| 100.0 | 100.0 |
* Amount represents less than 0.1% |
Asset Allocation (% of fund's net assets) |
Period end |
| Commodity Funds | 5.1% | |
| Domestic Equity Funds | 30.7% | |
| Developed International Equity Funds | 10.1% | |
| Emerging Markets
Equity Funds | 2.8% | |
| High Yield Bond Funds | 7.1% | |
| Inflation-Protected
Bond Funds | 10.0% | |
| Investment Grade
Bond Funds | 21.6% | |
| Short-Term Funds | 12.6% | |

Six months ago |
| Commodity Funds | 5.4% | |
| Domestic Equity Funds | 30.7% | |
| Developed International Equity Funds | 10.1% | |
| Emerging Markets
Equity Funds | 2.9% | |
| High Yield Bond Funds | 7.1% | |
| Inflation-Protected
Bond Funds | 10.4% | |
| Investment Grade
Bond Funds | 22.0% | |
| Short-Term Funds | 11.4% | |

Expected |
| Commodity Funds | 5.2% | |
| Domestic Equity Funds | 29.4% | |
| Developed International Equity Funds | 9.7% | |
| Emerging Markets
Equity Funds | 2.9% | |
| High Yield Bond Funds | 5.0% | |
| Inflation-Protected
Bond Funds | 10.5% | |
| Investment Grade
Bond Funds | 23.1% | |
| Short-Term Funds | 14.2% | |

The fund invests according to an asset allocation strategy that becomes increasingly conservative over time. The six months ago allocation is based on the fund's holdings as of September 30, 2012. The current allocation is based on the fund's holdings as of March 31, 2013. The expected allocation represents the fund's anticipated allocation at September 30, 2013. |
Annual Report
Fidelity Advisor Freedom 2010 Fund
Investments March 31, 2013
Showing Percentage of Net Assets
Domestic Equity Funds - 35.8% |
| Shares | | Value |
Commodity Funds - 5.1% |
Fidelity Series Commodity Strategy Fund (a) | 5,307,840 | | $ 46,125,134 |
Domestic Equity Funds - 30.7% |
Fidelity Advisor Equity Growth Fund Institutional Class | 525,848 | | 37,256,333 |
Fidelity Advisor Growth & Income Fund Institutional Class | 898,349 | | 19,844,540 |
Fidelity Advisor Large Cap Fund Institutional Class | 842,285 | | 20,021,126 |
Fidelity Advisor Series Equity-Income Fund | 2,497,487 | | 27,797,031 |
Fidelity Advisor Series Mega Cap Fund | 562,257 | | 6,212,935 |
Fidelity Advisor Series Opportunistic Insights Fund | 1,781,756 | | 19,617,134 |
Fidelity Advisor Series Stock Selector Large Cap Value Fund | 2,494,070 | | 27,908,639 |
Fidelity Advisor Small Cap Fund Institutional Class | 566,475 | | 15,266,503 |
Fidelity Series 100 Index Fund | 598,223 | | 6,173,658 |
Fidelity Series All-Sector Equity Fund | 3,861,521 | | 49,620,547 |
Fidelity Series Large Cap Value Fund | 2,423,182 | | 28,205,834 |
Fidelity Series Real Estate Equity Fund | 318,381 | | 4,145,322 |
Fidelity Series Small Cap Opportunities Fund | 1,441,398 | | 17,772,438 |
TOTAL DOMESTIC EQUITY FUNDS | | 279,842,040 |
TOTAL DOMESTIC EQUITY FUNDS (Cost $292,959,306) |
325,967,174
|
International Equity Funds - 12.9% |
| | | |
Developed International Equity Funds - 10.1% |
Fidelity Series International Growth Fund | 3,324,828 | | 42,059,080 |
Fidelity Series International Small Cap Fund | 627,031 | | 8,602,872 |
Fidelity Series International Value Fund | 4,255,871 | | 41,792,652 |
TOTAL DEVELOPED INTERNATIONAL EQUITY FUNDS | | 92,454,604 |
Emerging Markets Equity Funds - 2.8% |
Fidelity Series Emerging Markets Fund | 1,508,478 | | 25,236,844 |
TOTAL INTERNATIONAL EQUITY FUNDS (Cost $106,230,460) |
117,691,448
|
Bond Funds - 38.7% |
| Shares | | Value |
High Yield Bond Funds - 7.1% |
Fidelity Series Emerging Markets Debt Fund | 528,571 | | $ 5,750,850 |
Fidelity Series Floating Rate High Income Fund | 991,747 | | 10,542,272 |
Fidelity Series High Income Fund | 4,117,407 | | 43,273,952 |
Fidelity Series Real Estate Income Fund | 405,885 | | 4,736,681 |
TOTAL HIGH YIELD BOND FUNDS | | 64,303,755 |
Inflation-Protected Bond Funds - 10.0% |
Fidelity Series Inflation-Protected Bond Index Fund | 8,000,636 | | 91,127,240 |
Investment Grade Bond Funds - 21.6% |
Fidelity Series Investment Grade Bond Fund | 17,050,450 | | 196,591,693 |
TOTAL BOND FUNDS (Cost $337,333,331) |
352,022,688
|
Short-Term Funds - 12.6% |
| | | |
Fidelity Advisor Short Fixed-Income Fund Institutional Class | 5,541,785 | | 51,871,108 |
Fidelity Institutional Money Market Portfolio Institutional Class | 63,172,497 | | 63,172,497 |
TOTAL SHORT-TERM FUNDS (Cost $114,892,054) |
115,043,605
|
TOTAL INVESTMENT PORTFOLIO - 100.0% (Cost $851,415,151) | | 910,724,915 |
NET OTHER ASSETS (LIABILITIES) - 0.0% | | (204,375) |
NET ASSETS - 100% | $ 910,520,540 |
Legend |
(a) Non-income producing |
Other Information |
All investments are categorized as Level 1 under the Fair Value Hierarchy. The inputs or methodology used for valuing securities may not be an indication of the risk associated with investing in those securities. For more information on valuation inputs, please refer to the Security Valuation section in the accompanying Notes to Financial Statements. |
See accompanying notes which are an integral part of the financial statements.
Annual Report
Fidelity Advisor Freedom 2010 Fund
Statement of Assets and Liabilities
| March 31, 2013 |
| | |
Assets | | |
Investment in securities, at value (cost $851,415,151) - See accompanying schedule | | $ 910,724,915 |
Receivable for investments sold | | 606,911 |
Receivable for fund shares sold | | 551,982 |
Receivable from affiliate for expense reductions | | 67 |
Total assets | | 911,883,875 |
| | |
Liabilities | | |
Payable for investments purchased | $ 13,146 | |
Payable for fund shares redeemed | 1,147,043 | |
Distribution and service plan fees payable | 203,146 | |
Total liabilities | | 1,363,335 |
| | |
Net Assets | | $ 910,520,540 |
Net Assets consist of: | | |
Paid in capital | | $ 842,882,581 |
Undistributed net investment income | | 1,298,681 |
Accumulated undistributed net realized gain (loss) on investments | | 7,029,514 |
Net unrealized appreciation (depreciation) on investments | | 59,309,764 |
Net Assets | | $ 910,520,540 |
| | |
Calculation of Maximum Offering Price Class A:
Net Asset Value and redemption price per share ($540,979,627 ÷ 43,288,038 shares) | | $ 12.50 |
| | |
Maximum offering price per share (100/94.25 of $12.50) | | $ 13.26 |
Class T:
Net Asset Value and redemption price per share ($127,353,065 ÷ 10,219,403 shares) | | $ 12.46 |
| | |
Maximum offering price per share (100/96.50 of $12.46) | | $ 12.91 |
Class B:
Net Asset Value and offering price per share ($6,474,340 ÷ 518,448 shares)A | | $ 12.49 |
| | |
Class C:
Net Asset Value and offering price per share ($38,561,995 ÷ 3,111,743 shares)A | | $ 12.39 |
| | |
| | |
Institutional Class:
Net Asset Value, offering price and redemption price per share ($197,151,513 ÷ 15,710,835 shares) | | $ 12.55 |
A Redemption price per share is equal to net asset value less any applicable contingent deferred sales charge.
Statement of Operations
| Year ended March 31, 2013 |
| | |
Investment Income | | |
Income distributions from underlying funds | | $ 13,902,058 |
| | |
Expenses | | |
Distribution and service plan fees | $ 2,423,789 | |
Independent trustees' compensation | 3,206 | |
Total expenses before reductions | 2,426,995 | |
Expense reductions | (3,206) | 2,423,789 |
Net investment income | | 11,478,269 |
Realized and Unrealized Gain (Loss) Realized gain (loss) on sale of underlying fund shares | 35,773,452 | |
Capital gain distributions from underlying funds | 18,727,813 | |
Total net realized gain (loss) | | 54,501,265 |
Change in net unrealized appreciation (depreciation) on underlying funds | | (4,153,489) |
Net gain (loss) | | 50,347,776 |
Net increase (decrease) in net assets resulting from operations | | $ 61,826,045 |
See accompanying notes which are an integral part of the financial statements.
Annual Report
Statement of Changes in Net Assets
| Year ended
March 31,
2013 | Year ended
March 31,
2012 |
Increase (Decrease) in Net Assets | | |
Operations | | |
Net investment income (loss) | $ 11,478,269 | $ 12,180,618 |
Net realized gain (loss) | 54,501,265 | 36,518,657 |
Change in net unrealized appreciation (depreciation) | (4,153,489) | (26,218,587) |
Net increase (decrease) in net assets resulting from operations | 61,826,045 | 22,480,688 |
Distributions to shareholders from net investment income | (11,763,830) | (11,889,345) |
Distributions to shareholders from net realized gain | (6,303,241) | (11,297,317) |
Total distributions | (18,067,071) | (23,186,662) |
Share transactions - net increase (decrease) | (22,088,856) | 24,335,850 |
Total increase (decrease) in net assets | 21,670,118 | 23,629,876 |
| | |
Net Assets | | |
Beginning of period | 888,850,422 | 865,220,546 |
End of period (including undistributed net investment income of $1,298,681 and undistributed net investment income of $1,584,243, respectively) | $ 910,520,540 | $ 888,850,422 |
Financial Highlights - Class A
Years ended March 31, | 2013 | 2012 | 2011 | 2010 | 2009 |
Selected Per-Share Data | | | | | |
Net asset value, beginning of period | $ 11.89 | $ 11.92 | $ 10.87 | $ 8.19 | $ 11.78 |
Income from Investment Operations | | | | | |
Net investment income (loss) C | .16 | .17 | .15 | .21 | .27 |
Net realized and unrealized gain (loss) | .70 | .12 | 1.17 | 2.76 | (3.28) |
Total from investment operations | .86 | .29 | 1.32 | 2.97 | (3.01) |
Distributions from net investment income | (.16) | (.17) | (.17) | (.21) | (.28) |
Distributions from net realized gain | (.09) | (.16) | (.10) | (.08) | (.30) |
Total distributions | (.25) | (.32) G | (.27) | (.29) F | (.58) |
Net asset value, end of period | $ 12.50 | $ 11.89 | $ 11.92 | $ 10.87 | $ 8.19 |
Total Return A, B | 7.33% | 2.63% | 12.27% | 36.51% | (26.36)% |
Ratios to Average Net Assets D, E | | | | | |
Expenses before reductions | .25% | .25% | .25% | .25% | .25% |
Expenses net of fee waivers, if any | .25% | .25% | .25% | .25% | .25% |
Expenses net of all reductions | .25% | .25% | .25% | .25% | .25% |
Net investment income | 1.33% | 1.48% | 1.38% | 2.04% | 2.77% |
Supplemental Data | | | | | |
Net assets, end of period (000 omitted) | $ 540,980 | $ 552,770 | $ 536,999 | $ 478,025 | $ 339,203 |
Portfolio turnover rate | 26% | 25% | 41% | 42% | 44% |
A Total returns would have been lower if certain expenses had not been reduced during the applicable periods shown.
B Total returns do not include the effect of the sales charges.
C Calculated based on average shares outstanding during the period.
D Amounts do not include the activity of the Underlying Funds.
E Expense ratios reflect operating expenses of the class. Expenses before reductions do not reflect amounts reimbursed by the investment adviser or reductions from expense offset arrangements and do not represent the amount paid by the class during periods when reimbursements or reductions occur. Expenses net of fee waivers reflect expenses after reimbursement by the investment adviser but prior to reductions from expense offset arrangements. Expenses net of all reductions represent the net expenses paid by the class but do not include expenses of the investment companies in which the Fund invests.
F Total distributions of $.29 per share is comprised of distributions from net investment income of $.211 and distributions from net realized gain of $.083 per share.
G Total distributions of $.32 per share is comprised of distributions from net investment income of $.169 and distributions from net realized gain of $.155 per share.
See accompanying notes which are an integral part of the financial statements.
Annual Report
Financial Highlights - Class T
Years ended March 31, | 2013 | 2012 | 2011 | 2010 | 2009 |
Selected Per-Share Data | | | | | |
Net asset value, beginning of period | $ 11.86 | $ 11.88 | $ 10.83 | $ 8.16 | $ 11.74 |
Income from Investment Operations | | | | | |
Net investment income (loss) C | .13 | .14 | .13 | .18 | .25 |
Net realized and unrealized gain (loss) | .69 | .13 | 1.15 | 2.76 | (3.28) |
Total from investment operations | .82 | .27 | 1.28 | 2.94 | (3.03) |
Distributions from net investment income | (.13) | (.14) | (.13) | (.19) | (.25) |
Distributions from net realized gain | (.09) | (.16) | (.10) | (.08) | (.30) |
Total distributions | (.22) | (.29) G | (.23) | (.27) F | (.55) |
Net asset value, end of period | $ 12.46 | $ 11.86 | $ 11.88 | $ 10.83 | $ 8.16 |
Total Return A, B | 6.98% | 2.43% | 11.95% | 36.19% | (26.57)% |
Ratios to Average Net Assets D, E | | | | | |
Expenses before reductions | .50% | .50% | .50% | .50% | .50% |
Expenses net of fee waivers, if any | .50% | .50% | .50% | .50% | .50% |
Expenses net of all reductions | .50% | .50% | .50% | .50% | .50% |
Net investment income | 1.08% | 1.23% | 1.13% | 1.79% | 2.52% |
Supplemental Data | | | | | |
Net assets, end of period (000 omitted) | $ 127,353 | $ 132,044 | $ 152,126 | $ 204,059 | $ 163,842 |
Portfolio turnover rate | 26% | 25% | 41% | 42% | 44% |
A Total returns would have been lower if certain expenses had not been reduced during the applicable periods shown.
B Total returns do not include the effect of the sales charges.
C Calculated based on average shares outstanding during the period.
D Amounts do not include the activity of the Underlying Funds.
E Expense ratios reflect operating expenses of the class. Expenses before reductions do not reflect amounts reimbursed by the investment adviser or reductions from expense offset arrangements and do not represent the amount paid by the class during periods when reimbursements or reductions occur. Expenses net of fee waivers reflect expenses after reimbursement by the investment adviser but prior to reductions from expense offset arrangements. Expenses net of all reductions represent the net expenses paid by the class but do not include expenses of the investment companies in which the Fund invests.
F Total distributions of $.27 per share is comprised of distributions from net investment income of $.186 and distributions from net realized gain of $.083 per share.
G Total distributions of $.29 per share is comprised of distributions from net investment income of $.137 and distributions from net realized gain of $.155 per share.
Financial Highlights - Class B
Years ended March 31, | 2013 | 2012 | 2011 | 2010 | 2009 |
Selected Per-Share Data | | | | | |
Net asset value, beginning of period | $ 11.87 | $ 11.87 | $ 10.82 | $ 8.15 | $ 11.70 |
Income from Investment Operations | | | | | |
Net investment income (loss) C | .07 | .08 | .07 | .13 | .20 |
Net realized and unrealized gain (loss) | .70 | .13 | 1.15 | 2.76 | (3.26) |
Total from investment operations | .77 | .21 | 1.22 | 2.89 | (3.06) |
Distributions from net investment income | (.06) | (.07) | (.07) | (.13) | (.19) |
Distributions from net realized gain | (.09) | (.15) | (.10) | (.08) | (.30) |
Total distributions | (.15) | (.21) G | (.17) | (.22) F | (.49) |
Net asset value, end of period | $ 12.49 | $ 11.87 | $ 11.87 | $ 10.82 | $ 8.15 |
Total Return A, B | 6.51% | 1.90% | 11.37% | 35.54% | (26.92)% |
Ratios to Average Net Assets D, E | | | | | |
Expenses before reductions | 1.00% | 1.00% | 1.00% | 1.00% | 1.00% |
Expenses net of fee waivers, if any | 1.00% | 1.00% | 1.00% | 1.00% | 1.00% |
Expenses net of all reductions | 1.00% | 1.00% | 1.00% | 1.00% | 1.00% |
Net investment income | .58% | .73% | .63% | 1.29% | 2.03% |
Supplemental Data | | | | | |
Net assets, end of period (000 omitted) | $ 6,474 | $ 9,154 | $ 15,842 | $ 22,468 | $ 19,950 |
Portfolio turnover rate | 26% | 25% | 41% | 42% | 44% |
A Total returns would have been lower if certain expenses had not been reduced during the applicable periods shown.
B Total returns do not include the effect of the contingent deferred sales charge.
C Calculated based on average shares outstanding during the period.
D Amounts do not include the activity of the Underlying Funds.
E Expense ratios reflect operating expenses of the class. Expenses before reductions do not reflect amounts reimbursed by the investment adviser or reductions from expense offset arrangements and do not represent the amount paid by the class during periods when reimbursements or reductions occur. Expenses net of fee waivers reflect expenses after reimbursement by the investment adviser but prior to reductions from expense offset arrangements. Expenses net of all reductions represent the net expenses paid by the class but do not include expenses of the investment companies in which the Fund invests.
F Total distributions of $.22 per share is comprised of distributions from net investment income of $.134 and distributions from net realized gain of $.083 per share.
G Total distributions of $.21 per share is comprised of distributions from net investment income of $.065 and distributions from net realized gain of $.148 per share.
See accompanying notes which are an integral part of the financial statements.
Annual Report
Financial Highlights - Class C
Years ended March 31, | 2013 | 2012 | 2011 | 2010 | 2009 |
Selected Per-Share Data | | | | | |
Net asset value, beginning of period | $ 11.79 | $ 11.81 | $ 10.78 | $ 8.13 | $ 11.67 |
Income from Investment Operations | | | | | |
Net investment income (loss) C | .07 | .08 | .07 | .13 | .20 |
Net realized and unrealized gain (loss) | .69 | .13 | 1.14 | 2.74 | (3.25) |
Total from investment operations | .76 | .21 | 1.21 | 2.87 | (3.05) |
Distributions from net investment income | (.07) | (.08) | (.08) | (.14) | (.19) |
Distributions from net realized gain | (.09) | (.15) | (.10) | (.08) | (.30) |
Total distributions | (.16) | (.23) | (.18) | (.22) F | (.49) |
Net asset value, end of period | $ 12.39 | $ 11.79 | $ 11.81 | $ 10.78 | $ 8.13 |
Total Return A, B | 6.49% | 1.90% | 11.33% | 35.45% | (26.88)% |
Ratios to Average Net Assets D, E | | | | | |
Expenses before reductions | 1.00% | 1.00% | 1.00% | 1.00% | 1.00% |
Expenses net of fee waivers, if any | 1.00% | 1.00% | 1.00% | 1.00% | 1.00% |
Expenses net of all reductions | 1.00% | 1.00% | 1.00% | 1.00% | 1.00% |
Net investment income | .58% | .73% | .63% | 1.29% | 2.02% |
Supplemental Data | | | | | |
Net assets, end of period (000 omitted) | $ 38,562 | $ 38,423 | $ 44,764 | $ 47,178 | $ 37,524 |
Portfolio turnover rate | 26% | 25% | 41% | 42% | 44% |
A Total returns would have been lower if certain expenses had not been reduced during the applicable periods shown.
B Total returns do not include the effect of the contingent deferred sales charge.
C Calculated based on average shares outstanding during the period.
D Amounts do not include the activity of the Underlying Funds.
E Expense ratios reflect operating expenses of the class. Expenses before reductions do not reflect amounts reimbursed by the investment adviser or reductions from expense offset arrangements and do not represent the amount paid by the class during periods when reimbursements or reductions occur. Expenses net of fee waivers reflect expenses after reimbursement by the investment adviser but prior to reductions from expense offset arrangements. Expenses net of all reductions represent the net expenses paid by the class but do not include expenses of the investment companies in which the Fund invests.
F Total distributions of $.22 per share is comprised of distributions from net investment income of $.139 and distributions from net realized gain of $.083 per share.
Financial Highlights - Institutional Class
Years ended March 31, | 2013 | 2012 | 2011 | 2010 | 2009 |
Selected Per-Share Data | | | | | |
Net asset value, beginning of period | $ 11.94 | $ 11.96 | $ 10.91 | $ 8.22 | $ 11.82 |
Income from Investment Operations | | | | | |
Net investment income (loss) B | .19 | .20 | .18 | .23 | .30 |
Net realized and unrealized gain (loss) | .70 | .13 | 1.17 | 2.78 | (3.30) |
Total from investment operations | .89 | .33 | 1.35 | 3.01 | (3.00) |
Distributions from net investment income | (.19) | (.20) | (.20) | (.23) | (.30) |
Distributions from net realized gain | (.09) | (.16) | (.10) | (.08) | (.30) |
Total distributions | (.28) | (.35) G | (.30) | (.32) F | (.60) |
Net asset value, end of period | $ 12.55 | $ 11.94 | $ 11.96 | $ 10.91 | $ 8.22 |
Total Return A | 7.56% | 2.97% | 12.50% | 36.80% | (26.16)% |
Ratios to Average Net Assets C, D | | | | | |
Expenses before reductions E | .00% | .00% | .00% | .00% | .00% |
Expenses net of fee waivers, if any | .00% | .00% | .00% | .00% | .00% |
Expenses net of all reductions | .00% | .00% | .00% | .00% | .00% |
Net investment income (loss) | 1.58% | 1.73% | 1.63% | 2.29% | 3.02% |
Supplemental Data | | | | | |
Net assets, end of period (000 omitted) | $ 197,152 | $ 156,459 | $ 115,490 | $ 75,569 | $ 41,737 |
Portfolio turnover rate | 26% | 25% | 41% | 42% | 44% |
A Total returns would have been lower if certain expenses had not been reduced during the applicable periods shown.
B Calculated based on average shares outstanding during the period.
C Amounts do not include the activity of the Underlying Funds.
D Expense ratios reflect operating expenses of the class. Expenses before reductions do not reflect amounts reimbursed by the investment adviser or reductions from expense offset arrangements and do not represent the amount paid by the class during periods when reimbursements or reductions occur. Expenses net of fee waivers reflect expenses after reimbursement by the investment adviser but prior to reductions from expense offset arrangements. Expenses net of all reductions represent the net expenses paid by the class but do not include expenses of the investment companies in which the Fund invests.
E Amount represents less than .01%.
F Total distributions of $.32 per share is comprised of distributions from net investment income of $.234 and distributions from net realized gain of $.083 per share.
G Total distributions of $.35 per share is comprised of distributions from net investment income of $.199 and distributions from net realized gain of $.155 per share.
See accompanying notes which are an integral part of the financial statements.
Annual Report
Fidelity Advisor Freedom 2015 Fund
Investment Changes (Unaudited)
The information in the following tables is based on the direct investments of the Fund. |
Fund Holdings as of March 31, 2013 |
| % of fund's
net assets | % of fund's net assets
6 months ago |
Commodity Funds | | |
Fidelity Series Commodity Strategy Fund | 5.4 | 5.6 |
Domestic Equity Funds | | |
Fidelity Advisor Equity Growth Fund Institutional Class | 4.3 | 3.8 |
Fidelity Advisor Growth & Income Fund Institutional Class | 2.3 | 4.5 |
Fidelity Advisor Large Cap Fund Institutional Class | 2.3 | 4.2 |
Fidelity Advisor Series Equity-Income Fund | 3.1 | 0.0 |
Fidelity Advisor Series Mega Cap Fund | 0.7 | 0.0 |
Fidelity Advisor Series Opportunistic Insights Fund | 2.2 | 0.0 |
Fidelity Advisor Series Stock Selector Large Cap Value Fund | 3.1 | 0.0 |
Fidelity Advisor Small Cap Fund Institutional Class | 1.8 | 1.5 |
Fidelity Series 100 Index Fund | 0.7 | 3.0 |
Fidelity Series All-Sector Equity Fund | 5.7 | 6.5 |
Fidelity Series Large Cap Value Fund | 3.2 | 6.1 |
Fidelity Series Real Estate Equity Fund | 0.5 | 0.5 |
Fidelity Series Small Cap Opportunities Fund | 2.1 | 1.6 |
| 32.0 | 31.7 |
Developed International Equity Funds | | |
Fidelity Series International Growth Fund | 4.8 | 4.8 |
Fidelity Series International Small Cap Fund | 1.0 | 1.0 |
Fidelity Series International Value Fund | 4.7 | 4.7 |
| 10.5 | 10.5 |
Emerging Markets Equity Funds | | |
Fidelity Series Emerging Markets Fund | 2.9 | 3.0 |
High Yield Bond Funds | | |
Fidelity Series Emerging Markets Debt Fund | 0.6 | 0.6 |
Fidelity Series Floating Rate High Income Fund | 1.1 | 1.1 |
Fidelity Series High Income Fund | 4.7 | 4.7 |
Fidelity Series Real Estate Income Fund | 0.6 | 0.6 |
| 7.0 | 7.0 |
Inflation-Protected Bond Funds | | |
Fidelity Series Inflation-Protected Bond Index Fund | 9.9 | 10.1 |
Investment Grade Bond Funds | | |
Fidelity Series Investment Grade Bond Fund | 22.6 | 22.6 |
Short-Term Funds | | |
Fidelity Advisor Short Fixed-Income Fund Institutional Class | 4.4 | 4.3 |
Fidelity Institutional Money Market Portfolio Institutional Class | 5.3 | 5.2 |
| 9.7 | 9.5 |
Net Other Assets (Liabilities)* | 0.0 | 0.0 |
| 100.0 | 100.0 |
* Amount represents less than 0.1%
Asset Allocation (% of fund's net assets) |
Period end |
| Commodity Funds | 5.4% | |
| Domestic Equity Funds | 32.0% | |
| Developed International Equity Funds | 10.5% | |
| Emerging Markets
Equity Funds | 2.9% | |
| High Yield Bond Funds | 7.0% | |
| Inflation-Protected
Bond Funds | 9.9% | |
| Investment Grade
Bond Funds | 22.6% | |
| Short-Term Funds | 9.7% | |

Six months ago |
| Commodity Funds | 5.6% | |
| Domestic Equity Funds | 31.7% | |
| Developed International Equity Funds | 10.5% | |
| Emerging Markets
Equity Funds | 3.0% | |
| High Yield Bond Funds | 7.0% | |
| Inflation-Protected
Bond Funds | 10.1% | |
| Investment Grade
Bond Funds | 22.6% | |
| Short-Term Funds | 9.5% | |

Expected |
| Commodity Funds | 5.5% | |
| Domestic Equity Funds | 31.1% | |
| Developed International Equity Funds | 10.3% | |
| Emerging Markets
Equity Funds | 3.0% | |
| High Yield Bond Funds | 5.0% | |
| Inflation-Protected
Bond Funds | 10.6% | |
| Investment Grade
Bond Funds | 24.4% | |
| Short-Term Funds | 10.1% | |

The fund invests according to an asset allocation strategy that becomes increasingly conservative over time. The six months ago allocation is based on the fund's holdings as of September 30, 2012. The current allocation is based on the fund's holdings as of March 31, 2013. The expected allocation represents the fund's anticipated allocation at September 30, 2013. |
Annual Report
Fidelity Advisor Freedom 2015 Fund
Investments March 31, 2013
Showing Percentage of Net Assets
Domestic Equity Funds - 37.4% |
| Shares | | Value |
Commodity Funds - 5.4% |
Fidelity Series Commodity Strategy Fund (a) | 12,083,746 | | $ 105,007,756 |
Domestic Equity Funds - 32.0% |
Fidelity Advisor Equity Growth Fund Institutional Class | 1,194,883 | | 84,657,466 |
Fidelity Advisor Growth & Income Fund Institutional Class | 2,031,381 | | 44,873,207 |
Fidelity Advisor Large Cap Fund Institutional Class | 1,904,672 | | 45,274,051 |
Fidelity Advisor Series Equity-Income Fund | 5,518,080 | | 61,416,234 |
Fidelity Advisor Series Mega Cap Fund | 1,239,188 | | 13,693,032 |
Fidelity Advisor Series Opportunistic Insights Fund | 3,937,975 | | 43,357,108 |
Fidelity Advisor Series Stock Selector Large Cap Value Fund | 5,511,022 | | 61,668,338 |
Fidelity Advisor Small Cap Fund Institutional Class | 1,287,853 | | 34,707,632 |
Fidelity Series 100 Index Fund | 1,348,681 | | 13,918,390 |
Fidelity Series All-Sector Equity Fund | 8,743,322 | | 112,351,689 |
Fidelity Series Large Cap Value Fund | 5,441,171 | | 63,335,231 |
Fidelity Series Real Estate Equity Fund | 725,471 | | 9,445,628 |
Fidelity Series Small Cap Opportunities Fund | 3,276,025 | | 40,393,393 |
TOTAL DOMESTIC EQUITY FUNDS | | 629,091,399 |
TOTAL DOMESTIC EQUITY FUNDS (Cost $651,533,536) |
734,099,155
|
International Equity Funds - 13.4% |
| | | |
Developed International Equity Funds - 10.5% |
Fidelity Series International Growth Fund | 7,457,944 | | 94,342,991 |
Fidelity Series International Small Cap Fund | 1,404,121 | | 19,264,544 |
Fidelity Series International Value Fund | 9,543,567 | | 93,717,826 |
TOTAL DEVELOPED INTERNATIONAL EQUITY FUNDS | | 207,325,361 |
Emerging Markets Equity Funds - 2.9% |
Fidelity Series Emerging Markets Fund | 3,392,835 | | 56,762,125 |
TOTAL INTERNATIONAL EQUITY FUNDS (Cost $231,741,283) |
264,087,486
|
Bond Funds - 39.5% |
| Shares | | Value |
High Yield Bond Funds - 7.0% |
Fidelity Series Emerging Markets Debt Fund | 1,121,803 | | $ 12,205,213 |
Fidelity Series Floating Rate High Income Fund | 2,019,348 | | 21,465,667 |
Fidelity Series High Income Fund | 8,788,566 | | 92,367,830 |
Fidelity Series Real Estate Income Fund | 951,107 | | 11,099,419 |
TOTAL HIGH YIELD BOND FUNDS | | 137,138,129 |
Inflation-Protected Bond Funds - 9.9% |
Fidelity Series Inflation-Protected Bond Index Fund | 17,122,504 | | 195,025,325 |
Investment Grade Bond Funds - 22.6% |
Fidelity Series Investment Grade Bond Fund | 38,472,731 | | 443,590,585 |
TOTAL BOND FUNDS (Cost $742,298,756) |
775,754,039
|
Short-Term Funds - 9.7% |
| | | |
Fidelity Advisor Short Fixed-Income Fund Institutional Class | 9,238,724 | | 86,474,459 |
Fidelity Institutional Money Market Portfolio Institutional Class | 105,198,514 | | 105,198,514 |
TOTAL SHORT-TERM FUNDS (Cost $190,161,244) |
191,672,973
|
TOTAL INVESTMENT PORTFOLIO - 100.0% (Cost $1,815,734,819) | | 1,965,613,653 |
NET OTHER ASSETS (LIABILITIES) - 0.0% | | (441,328) |
NET ASSETS - 100% | $ 1,965,172,325 |
Legend |
(a) Non-income producing |
Other Information |
All investments are categorized as Level 1 under the Fair Value Hierarchy. The inputs or methodology used for valuing securities may not be an indication of the risk associated with investing in those securities. For more information on valuation inputs, please refer to the Security Valuation section in the accompanying Notes to Financial Statements. |
See accompanying notes which are an integral part of the financial statements.
Annual Report
Fidelity Advisor Freedom 2015 Fund
Statement of Assets and Liabilities
| March 31, 2013 |
| | |
Assets | | |
Investment in securities, at value (cost $1,815,734,819) - See accompanying schedule | | $ 1,965,613,653 |
Receivable for investments sold | | 2,881,426 |
Receivable for fund shares sold | | 1,563,337 |
Receivable from affiliate for expense reductions | | 699 |
Total assets | | 1,970,059,115 |
| | |
Liabilities | | |
Payable for investments purchased | $ 94 | |
Payable for fund shares redeemed | 4,472,776 | |
Distribution and service plan fees payable | 413,920 | |
Total liabilities | | 4,886,790 |
| | |
Net Assets | | $ 1,965,172,325 |
Net Assets consist of: | | |
Paid in capital | | $ 1,783,857,912 |
Undistributed net investment income | | 2,834,039 |
Accumulated undistributed net realized gain (loss) on investments | | 28,601,540 |
Net unrealized appreciation (depreciation) on investments | | 149,878,834 |
Net Assets | | $ 1,965,172,325 |
| | |
Calculation of Maximum Offering Price Class A:
Net Asset Value and redemption price per share ($1,181,020,177 ÷ 94,681,848 shares) | | $ 12.47 |
| | |
Maximum offering price per share (100/94.25 of $12.47) | | $ 13.23 |
Class T:
Net Asset Value and redemption price per share ($227,022,345 ÷ 18,225,924 shares) | | $ 12.46 |
| | |
Maximum offering price per share (100/96.50 of $12.46) | | $ 12.91 |
Class B:
Net Asset Value and offering price per share ($17,411,344 ÷ 1,399,205 shares)A | | $ 12.44 |
| | |
Class C:
Net Asset Value and offering price per share ($72,114,883 ÷ 5,822,033 shares)A | | $ 12.39 |
| | |
Institutional Class:
Net Asset Value, offering price and redemption price per share ($467,603,576 ÷ 37,232,745 shares) | | $ 12.56 |
A Redemption price per share is equal to net asset value less any applicable contingent deferred sales charge.
Statement of Operations
| Year ended March 31, 2013 |
| | |
Investment Income | | |
Income distributions from underlying funds | | $ 29,346,058 |
| | |
Expenses | | |
Distribution and service plan fees | $ 4,772,548 | |
Independent trustees' compensation | 6,594 | |
Total expenses before reductions | 4,779,142 | |
Expense reductions | (6,594) | 4,772,548 |
Net investment income (loss) | | 24,573,510 |
Realized and Unrealized Gain (Loss) Realized gain (loss) on sale of underlying fund shares | 52,407,457 | |
Capital gain distributions from underlying funds | 40,456,566 | |
Total net realized gain (loss) | | 92,864,023 |
Change in net unrealized appreciation (depreciation) on underlying funds | | 17,904,608 |
Net gain (loss) | | 110,768,631 |
Net increase (decrease) in net assets resulting from operations | | $ 135,342,141 |
See accompanying notes which are an integral part of the financial statements.
Annual Report
Statement of Changes in Net Assets
| Year ended
March 31,
2013 | Year ended
March 31,
2012 |
Increase (Decrease) in Net Assets | | |
Operations | | |
Net investment income (loss) | $ 24,573,510 | $ 23,538,138 |
Net realized gain (loss) | 92,864,023 | 42,817,853 |
Change in net unrealized appreciation (depreciation) | 17,904,608 | (18,849,124) |
Net increase (decrease) in net assets resulting from operations | 135,342,141 | 47,506,867 |
Distributions to shareholders from net investment income | (24,816,448) | (22,803,456) |
Distributions to shareholders from net realized gain | (13,437,037) | (21,487,940) |
Total distributions | (38,253,485) | (44,291,396) |
Share transactions - net increase (decrease) | 111,574,961 | 170,418,837 |
Total increase (decrease) in net assets | 208,663,617 | 173,634,308 |
| | |
Net Assets | | |
Beginning of period | 1,756,508,708 | 1,582,874,400 |
End of period (including undistributed net investment income of $2,834,039 and undistributed net investment income of $3,076,975, respectively) | $ 1,965,172,325 | $ 1,756,508,708 |
Financial Highlights - Class A
Years ended March 31, | 2013 | 2012 | 2011 | 2010 | 2009 |
Selected Per-Share Data | | | | | |
Net asset value, beginning of period | $ 11.85 | $ 11.87 | $ 10.81 | $ 8.05 | $ 11.85 |
Income from Investment Operations | | | | | |
Net investment income (loss) C | .16 | .17 | .16 | .20 | .26 |
Net realized and unrealized gain (loss) | .71 | .13 | 1.16 | 2.84 | (3.47) |
Total from investment operations | .87 | .30 | 1.32 | 3.04 | (3.21) |
Distributions from net investment income | (.16) | (.17) | (.16) | (.20) | (.26) |
Distributions from net realized gain | (.09) | (.15) | (.10) | (.08) | (.33) |
Total distributions | (.25) | (.32) | (.26) | (.28) G | (.59) F |
Net asset value, end of period | $ 12.47 | $ 11.85 | $ 11.87 | $ 10.81 | $ 8.05 |
Total Return A,B | 7.45% | 2.71% | 12.36% | 37.95% | (28.01)% |
Ratios to Average Net Assets D,E | | | | | |
Expenses before reductions | .25% | .25% | .25% | .25% | .25% |
Expenses net of fee waivers, if any | .25% | .25% | .25% | .25% | .25% |
Expenses net of all reductions | .25% | .25% | .25% | .25% | .25% |
Net investment income (loss) | 1.36% | 1.50% | 1.42% | 2.02% | 2.69% |
Supplemental Data | | | | | |
Net assets, end of period (000 omitted) | $ 1,181,020 | $ 1,101,302 | $ 1,004,955 | $ 830,024 | $ 477,641 |
Portfolio turnover rate | 20% | 19% | 33% | 29% | 36% |
A Total returns would have been lower if certain expenses had not been reduced during the applicable periods shown.
B Total returns do not include the effect of the sales charges.
C Calculated based on average shares outstanding during the period.
D Amounts do not include the activity of the Underlying Funds.
E Expense ratios reflect operating expenses of the class. Expenses before reductions do not reflect amounts reimbursed by the investment adviser or reductions from expense offset arrangements and do not represent the amount paid by the class during periods when reimbursements or reductions occur. Expenses net of fee waivers reflect expenses after reimbursement by the investment adviser but prior to reductions from expense offset arrangements. Expenses net of all reductions represent the net expenses paid by the class but do not include expenses of the investment companies in which the Fund invests.
F Total distributions of $.59 per share is comprised of distributions from net investment income of $.262 and distributions from net realized gain of $.325 per share.
G Total distributions of $.28 per share is comprised of distributions from net investment income of $.197 and distributions from net realized gain of $.082 per share.
See accompanying notes which are an integral part of the financial statements.
Annual Report
Financial Highlights - Class T
Years ended March 31, | 2013 | 2012 | 2011 | 2010 | 2009 |
Selected Per-Share Data | | | | | |
Net asset value, beginning of period | $ 11.83 | $ 11.85 | $ 10.79 | $ 8.04 | $ 11.82 |
Income from Investment Operations | | | | | |
Net investment income (loss) C | .13 | .14 | .13 | .18 | .24 |
Net realized and unrealized gain (loss) | .72 | .13 | 1.16 | 2.82 | (3.46) |
Total from investment operations | .85 | .27 | 1.29 | 3.00 | (3.22) |
Distributions from net investment income | (.13) | (.14) | (.13) | (.17) | (.23) |
Distributions from net realized gain | (.09) | (.15) | (.10) | (.08) | (.33) |
Total distributions | (.22) | (.29) | (.23) | (.25) G | (.56) F |
Net asset value, end of period | $ 12.46 | $ 11.83 | $ 11.85 | $ 10.79 | $ 8.04 |
Total Return A,B | 7.28% | 2.44% | 12.09% | 37.53% | (28.13)% |
Ratios to Average Net Assets D,E | | | | | |
Expenses before reductions | .50% | .50% | .50% | .50% | .50% |
Expenses net of fee waivers, if any | .50% | .50% | .50% | .50% | .50% |
Expenses net of all reductions | .50% | .50% | .50% | .50% | .50% |
Net investment income (loss) | 1.11% | 1.25% | 1.17% | 1.77% | 2.44% |
Supplemental Data | | | | | |
Net assets, end of period (000 omitted) | $ 227,022 | $ 213,366 | $ 236,106 | $ 225,384 | $ 162,439 |
Portfolio turnover rate | 20% | 19% | 33% | 29% | 36% |
A Total returns would have been lower if certain expenses had not been reduced during the applicable periods shown.
B Total returns do not include the effect of the sales charges.
C Calculated based on average shares outstanding during the period.
D Amounts do not include the activity of the Underlying Funds.
E Expense ratios reflect operating expenses of the class. Expenses before reductions do not reflect amounts reimbursed by the investment adviser or reductions from expense offset arrangements and do not represent the amount paid by the class during periods when reimbursements or reductions occur. Expenses net of fee waivers reflect expenses after reimbursement by the investment adviser but prior to reductions from expense offset arrangements. Expenses net of all reductions represent the net expenses paid by the class but do not include expenses of the investment companies in which the Fund invests.
F Total distributions of $.56 per share is comprised of distributions from net investment income of $.234 and distributions from net realized gain of $.325 per share.
G Total distributions of $.25 per share is comprised of distributions from net investment income of $.172 and distributions from net realized gain of $.082 per share.
Financial Highlights - Class B
Years ended March 31, | 2013 | 2012 | 2011 | 2010 | 2009 |
Selected Per-Share Data | | | | | |
Net asset value, beginning of period | $ 11.81 | $ 11.82 | $ 10.76 | $ 8.02 | $ 11.77 |
Income from Investment Operations | | | | | |
Net investment income (loss) C | .07 | .09 | .07 | .13 | .19 |
Net realized and unrealized gain (loss) | .71 | .13 | 1.16 | 2.82 | (3.44) |
Total from investment operations | .78 | .22 | 1.23 | 2.95 | (3.25) |
Distributions from net investment income | (.06) | (.07) | (.07) | (.12) | (.17) |
Distributions from net realized gain | (.09) | (.15) | (.10) | (.08) | (.33) |
Total distributions | (.15) | (.23) H | (.17) | (.21) G | (.50) F |
Net asset value, end of period | $ 12.44 | $ 11.81 | $ 11.82 | $ 10.76 | $ 8.02 |
Total Return A,B | 6.65% | 1.95% | 11.51% | 36.85% | (28.47)% |
Ratios to Average Net Assets D,E | | | | | |
Expenses before reductions | 1.00% | 1.00% | 1.00% | 1.00% | 1.00% |
Expenses net of fee waivers, if any | 1.00% | 1.00% | 1.00% | 1.00% | 1.00% |
Expenses net of all reductions | 1.00% | 1.00% | 1.00% | 1.00% | 1.00% |
Net investment income (loss) | .61% | .75% | .67% | 1.27% | 1.94% |
Supplemental Data | | | | | |
Net assets, end of period (000 omitted) | $ 17,411 | $ 23,552 | $ 32,762 | $ 35,932 | $ 27,727 |
Portfolio turnover rate | 20% | 19% | 33% | 29% | 36% |
A Total returns would have been lower if certain expenses had not been reduced during the applicable periods shown.
B Total returns do not include the effect of the contingent deferred sales charge.
C Calculated based on average shares outstanding during the period.
D Amounts do not include the activity of the Underlying Funds.
E Expense ratios reflect operating expenses of the class. Expenses before reductions do not reflect amounts reimbursed by the investment adviser or reductions from expense offset arrangements and do not represent the amount paid by the class during periods when reimbursements or reductions occur. Expenses net of fee waivers reflect expenses after reimbursement by the investment adviser but prior to reductions from expense offset arrangements. Expenses net of all reductions represent the net expenses paid by the class but do not include expenses of the investment companies in which the Fund invests.
F Total distributions of $.50 per share is comprised of distributions from net investment income of $.173 and distributions from net realized gain of $.325 per share.
G Total distributions of $.21 per share is comprised of distributions from net investment income of $.124 and distributions from net realized gain of $.082 per share.
H Total distributions of $.23 per share is comprised of distributions from net investment income of $.073 and distributions from net realized gain of $.154 per share.
See accompanying notes which are an integral part of the financial statements.
Annual Report
Financial Highlights - Class C
Years ended March 31, | 2013 | 2012 | 2011 | 2010 | 2009 |
Selected Per-Share Data | | | | | |
Net asset value, beginning of period | $ 11.77 | $ 11.79 | $ 10.74 | $ 8.00 | $ 11.76 |
Income from Investment Operations | | | | | |
Net investment income (loss) C | .07 | .09 | .07 | .13 | .19 |
Net realized and unrealized gain (loss) | .71 | .13 | 1.15 | 2.82 | (3.45) |
Total from investment operations | .78 | .22 | 1.22 | 2.95 | (3.26) |
Distributions from net investment income | (.07) | (.09) | (.07) | (.13) | (.18) |
Distributions from net realized gain | (.09) | (.15) | (.10) | (.08) | (.33) |
Total distributions | (.16) | (.24) | (.17) | (.21) G | (.50) F |
Net asset value, end of period | $ 12.39 | $ 11.77 | $ 11.79 | $ 10.74 | $ 8.00 |
Total Return A,B | 6.70% | 1.98% | 11.49% | 36.97% | (28.53)% |
Ratios to Average Net Assets D,E | | | | | |
Expenses before reductions | 1.00% | 1.00% | 1.00% | 1.00% | 1.00% |
Expenses net of fee waivers, if any | 1.00% | 1.00% | 1.00% | 1.00% | 1.00% |
Expenses net of all reductions | 1.00% | 1.00% | 1.00% | 1.00% | 1.00% |
Net investment income (loss) | .61% | .75% | .67% | 1.27% | 1.94% |
Supplemental Data | | | | | |
Net assets, end of period (000 omitted) | $ 72,115 | $ 70,220 | $ 70,396 | $ 64,801 | $ 46,942 |
Portfolio turnover rate | 20% | 19% | 33% | 29% | 36% |
A Total returns would have been lower if certain expenses had not been reduced during the applicable periods shown.
B Total returns do not include the effect of the contingent deferred sales charge.
C Calculated based on average shares outstanding during the period.
D Amounts do not include the activity of the Underlying Funds.
E Expense ratios reflect operating expenses of the class. Expenses before reductions do not reflect amounts reimbursed by the investment adviser or reductions from expense offset arrangements and do not represent the amount paid by the class during periods when reimbursements or reductions occur. Expenses net of fee waivers reflect expenses after reimbursement by the investment adviser but prior to reductions from expense offset arrangements. Expenses net of all reductions represent the net expenses paid by the class but do not include expenses of the investment companies in which the Fund invests.
F Total distributions of $.50 per share is comprised of distributions from net investment income of $.179 and distributions from net realized gain of $.325 per share.
G Total distributions of $.21 per share is comprised of distributions from net investment income of $.126 and distributions from net realized gain of $.082 per share.
Financial Highlights - Institutional Class
Years ended March 31, | 2013 | 2012 | 2011 | 2010 | 2009 |
Selected Per-Share Data | | | | | |
Net asset value, beginning of period | $ 11.93 | $ 11.94 | $ 10.87 | $ 8.09 | $ 11.91 |
Income from Investment Operations | | | | | |
Net investment income (loss) B | .19 | .20 | .19 | .23 | .29 |
Net realized and unrealized gain (loss) | .72 | .14 | 1.17 | 2.85 | (3.50) |
Total from investment operations | .91 | .34 | 1.36 | 3.08 | (3.21) |
Distributions from net investment income | (.19) | (.19) | (.19) | (.22) | (.29) |
Distributions from net realized gain | (.09) | (.15) | (.10) | (.08) | (.33) |
Total distributions | (.28) | (.35) H | (.29) | (.30) G | (.61) F |
Net asset value, end of period | $ 12.56 | $ 11.93 | $ 11.94 | $ 10.87 | $ 8.09 |
Total Return A | 7.74% | 3.01% | 12.67% | 38.30% | (27.85)% |
Ratios to Average Net Assets C,E | | | | | |
Expenses before reductions D | .00% | .00% | .00% | .00% | .00% |
Expenses net of fee waivers, if any | .00% | .00% | .00% | .00% | .00% |
Expenses net of all reductions | .00% | .00% | .00% | .00% | .00% |
Net investment income (loss) | 1.61% | 1.75% | 1.67% | 2.27% | 2.94% |
Supplemental Data | | | | | |
Net assets, end of period (000 omitted) | $ 467,604 | $ 348,068 | $ 238,655 | $ 137,487 | $ 77,998 |
Portfolio turnover rate | 20% | 19% | 33% | 29% | 36% |
A Total returns would have been lower if certain expenses had not been reduced during the applicable periods shown.
B Calculated based on average shares outstanding during the period.
C Amounts do not include the activity of the Underlying Funds.
D Amount represents less than .01%.
E Expense ratios reflect operating expenses of the class. Expenses before reductions do not reflect amounts reimbursed by the investment adviser or reductions from expense offset arrangements and do not represent the amount paid by the class during periods when reimbursements or reductions occur. Expenses net of fee waivers reflect expenses after reimbursement by the investment adviser but prior to reductions from expense offset arrangements. Expenses net of all reductions represent the net expenses paid by the class but do not include expenses of the investment companies in which the Fund invests.
F Total distributions of $.61 per share is comprised of distributions from net investment income of $.286 and distributions from net realized gain of $.325 per share.
G Total distributions of $.30 per share is comprised of distributions from net investment income of $.219 and distributions from net realized gain of $.082 per share.
H Total distributions of $.35 per share is comprised of distributions from net investment income of $.194 and distributions from net realized gain of $.154 per share.
See accompanying notes which are an integral part of the financial statements.
Annual Report
Fidelity Advisor Freedom 2020 Fund
Investment Changes (Unaudited)
The information in the following tables is based on the direct investments of the Fund. |
Fund Holdings as of March 31, 2013 |
| % of fund's
net assets | % of fund's net assets
6 months ago |
Commodity Funds | | |
Fidelity Series Commodity Strategy Fund | 5.9 | 6.3 |
Domestic Equity Funds | | |
Fidelity Advisor Equity Growth Fund Institutional Class | 4.7 | 4.2 |
Fidelity Advisor Growth & Income Fund Institutional Class | 2.5 | 5.1 |
Fidelity Advisor Large Cap Fund Institutional Class | 2.5 | 4.7 |
Fidelity Advisor Series Equity-Income Fund | 3.4 | 0.0 |
Fidelity Advisor Series Mega Cap Fund | 0.8 | 0.0 |
Fidelity Advisor Series Opportunistic Insights Fund | 2.4 | 0.0 |
Fidelity Advisor Series Stock Selector Large Cap Value Fund | 3.4 | 0.0 |
Fidelity Advisor Small Cap Fund Institutional Class | 1.9 | 1.7 |
Fidelity Series 100 Index Fund | 0.8 | 3.4 |
Fidelity Series All-Sector Equity Fund | 6.3 | 7.3 |
Fidelity Series Large Cap Value Fund | 3.6 | 6.9 |
Fidelity Series Real Estate Equity Fund | 0.5 | 0.5 |
Fidelity Series Small Cap Opportunities Fund | 2.2 | 1.8 |
| 35.0 | 35.6 |
Developed International Equity Funds | | |
Fidelity Series International Growth Fund | 5.2 | 5.4 |
Fidelity Series International Small Cap Fund | 1.1 | 1.1 |
Fidelity Series International Value Fund | 5.2 | 5.3 |
| 11.5 | 11.8 |
Emerging Markets Equity Funds | | |
Fidelity Series Emerging Markets Fund | 3.2 | 3.3 |
High Yield Bond Funds | | |
Fidelity Series Emerging Markets Debt Fund | 0.7 | 0.6 |
Fidelity Series Floating Rate High Income Fund | 1.1 | 1.0 |
Fidelity Series High Income Fund | 5.4 | 5.7 |
Fidelity Series Real Estate Income Fund | 0.6 | 0.5 |
| 7.8 | 7.8 |
Inflation-Protected Bond Funds | | |
Fidelity Series Inflation-Protected Bond Index Fund | 8.2 | 8.2 |
Investment Grade Bond Funds | | |
Fidelity Series Investment Grade Bond Fund | 21.7 | 21.3 |
Short-Term Funds | | |
Fidelity Advisor Short Fixed-Income Fund Institutional Class | 3.0 | 2.6 |
Fidelity Institutional Money Market Portfolio Institutional Class | 3.7 | 3.1 |
| 6.7 | 5.7 |
Net Other Assets (Liabilities)* | 0.0 | 0.0 |
| 100.0 | 100.0 |
* Amount represents less than 0.1%
Asset Allocation (% of fund's net assets) |
Period end |
| Commodity Funds | 5.9% | |
| Domestic Equity Funds | 35.0% | |
| Developed International Equity Funds | 11.5% | |
| Emerging Markets
Equity Funds | 3.2% | |
| High Yield Bond Funds | 7.8% | |
| Inflation-Protected
Bond Funds | 8.2% | |
| Investment Grade
Bond Funds | 21.7% | |
| Short-Term Funds | 6.7% | |

Six months ago |
| Commodity Funds | 6.3% | |
| Domestic Equity Funds | 35.6% | |
| Developed International Equity Funds | 11.8% | |
| Emerging Markets
Equity Funds | 3.3% | |
| High Yield Bond Funds | 7.8% | |
| Inflation-Protected
Bond Funds | 8.2% | |
| Investment Grade
Bond Funds | 21.3% | |
| Short-Term Funds | 5.7% | |

Expected |
| Commodity Funds | 5.9% | |
| Domestic Equity Funds | 33.4% | |
| Developed International Equity Funds | 11.0% | |
| Emerging Markets
Equity Funds | 3.3% | |
| High Yield Bond Funds | 5.5% | |
| Inflation-Protected
Bond Funds | 9.0% | |
| Investment Grade
Bond Funds | 24.2% | |
| Short-Term Funds | 7.7% | |

The fund invests according to an asset allocation strategy that becomes increasingly conservative over time. The six months ago allocation is based on the fund's holdings as of September 30, 2012. The current allocation is based on the fund's holdings as of March 31, 2013. The expected allocation represents the fund's anticipated allocation at September 30, 2013. |
Annual Report
Fidelity Advisor Freedom 2020 Fund
Investments March 31, 2013
Showing Percentage of Net Assets
Domestic Equity Funds - 40.9% |
| Shares | | Value |
Commodity Funds - 5.9% |
Fidelity Series Commodity Strategy Fund (a) | 22,205,638 | | $ 192,966,991 |
Domestic Equity Funds - 35.0% |
Fidelity Advisor Equity Growth Fund Institutional Class | 2,180,536 | | 154,490,981 |
Fidelity Advisor Growth & Income Fund Institutional Class | 3,723,526 | | 82,252,688 |
Fidelity Advisor Large Cap Fund Institutional Class | 3,487,502 | | 82,897,919 |
Fidelity Advisor Series Equity-Income Fund | 10,072,087 | | 112,102,324 |
Fidelity Advisor Series Mega Cap Fund | 2,267,571 | | 25,056,657 |
Fidelity Advisor Series Opportunistic Insights Fund | 7,185,655 | | 79,114,060 |
Fidelity Advisor Series Stock Selector Large Cap Value Fund | 10,052,969 | | 112,492,720 |
Fidelity Advisor Small Cap Fund Institutional Class | 2,345,768 | | 63,218,442 |
Fidelity Series 100 Index Fund | 2,472,874 | | 25,520,060 |
Fidelity Series All-Sector Equity Fund | 16,039,281 | | 206,104,762 |
Fidelity Series Large Cap Value Fund | 10,075,488 | | 117,278,679 |
Fidelity Series Real Estate Equity Fund | 1,349,681 | | 17,572,853 |
Fidelity Series Small Cap Opportunities Fund | 5,966,912 | | 73,572,021 |
TOTAL DOMESTIC EQUITY FUNDS | | 1,151,674,166 |
TOTAL DOMESTIC EQUITY FUNDS (Cost $1,203,914,650) |
1,344,641,157
|
International Equity Funds - 14.7% |
| | | |
Developed International Equity Funds - 11.5% |
Fidelity Series International Growth Fund | 13,634,875 | | 172,481,169 |
Fidelity Series International Small Cap Fund | 2,557,871 | | 35,093,991 |
Fidelity Series International Value Fund | 17,401,242 | | 170,880,200 |
TOTAL DEVELOPED INTERNATIONAL EQUITY FUNDS | | 378,455,360 |
Emerging Markets Equity Funds - 3.2% |
Fidelity Series Emerging Markets Fund | 6,226,379 | | 104,167,314 |
TOTAL INTERNATIONAL EQUITY FUNDS (Cost $426,783,330) |
482,622,674
|
Bond Funds - 37.7% |
| Shares | | Value |
High Yield Bond Funds - 7.8% |
Fidelity Series Emerging Markets Debt Fund | 2,235,611 | | $ 24,323,444 |
Fidelity Series Floating Rate High Income Fund | 3,331,878 | | 35,417,859 |
Fidelity Series High Income Fund | 16,774,387 | | 176,298,804 |
Fidelity Series Real Estate Income Fund | 1,650,206 | | 19,257,908 |
TOTAL HIGH YIELD BOND FUNDS | | 255,298,015 |
Inflation-Protected Bond Funds - 8.2% |
Fidelity Series Inflation-Protected Bond Index Fund | 23,738,799 | | 270,384,921 |
Investment Grade Bond Funds - 21.7% |
Fidelity Series Investment Grade Bond Fund | 61,935,384 | | 714,114,976 |
TOTAL BOND FUNDS (Cost $1,202,133,103) |
1,239,797,912
|
Short-Term Funds - 6.7% |
| | | |
Fidelity Advisor Short Fixed-Income Fund Institutional Class | 10,659,110 | | 99,769,271 |
Fidelity Institutional Money Market Portfolio Institutional Class | 121,613,151 | | 121,613,151 |
TOTAL SHORT-TERM FUNDS (Cost $220,217,039) |
221,382,422
|
TOTAL INVESTMENT PORTFOLIO - 100.0% (Cost $3,053,048,122) | | 3,288,444,165 |
NET OTHER ASSETS (LIABILITIES) - 0.0% | | (662,527) |
NET ASSETS - 100% | $ 3,287,781,638 |
Legend |
(a) Non-income producing |
Other Information |
All investments are categorized as Level 1 under the Fair Value Hierarchy. The inputs or methodology used for valuing securities may not be an indication of the risk associated with investing in those securities. For more information on valuation inputs, please refer to the Security Valuation section in the accompanying Notes to Financial Statements. |
See accompanying notes which are an integral part of the financial statements.
Annual Report
Fidelity Advisor Freedom 2020 Fund
Statement of Assets and Liabilities
| March 31, 2013 |
| | |
Assets | | |
Investment in securities, at value (cost $3,053,048,122) - See accompanying schedule | | $ 3,288,444,165 |
Receivable for investments sold | | 2,986,085 |
Receivable for fund shares sold | | 3,237,827 |
Receivable from affiliate for expense reductions | | 1,966 |
Total assets | | 3,294,670,043 |
| | |
Liabilities | | |
Payable for investments purchased | $ 174,600 | |
Payable for fund shares redeemed | 6,019,111 | |
Distribution and service plan fees payable | 694,694 | |
Total liabilities | | 6,888,405 |
| | |
Net Assets | | $ 3,287,781,638 |
Net Assets consist of: | | |
Paid in capital | | $ 2,989,884,201 |
Undistributed net investment income | | 4,825,219 |
Accumulated undistributed net realized gain (loss) on investments | | 57,676,175 |
Net unrealized appreciation (depreciation) on investments | | 235,396,043 |
Net Assets | | $ 3,287,781,638 |
| | |
Calculation of Maximum Offering Price Class A:
Net Asset Value and redemption price per share ($1,944,690,613 ÷ 148,981,246 shares) | | $ 13.05 |
| | |
Maximum offering price per share (100/94.25 of $13.05) | | $ 13.85 |
Class T:
Net Asset Value and redemption price per share ($430,153,411 ÷ 32,957,754 shares) | | $ 13.05 |
| | |
Maximum offering price per share (100/96.50 of $13.05) | | $ 13.52 |
Class B:
Net Asset Value and offering price per share ($33,074,388 ÷ 2,536,879 shares)A | | $ 13.04 |
| | |
Class C:
Net Asset Value and offering price per share ($102,575,578 ÷ 7,905,794 shares)A | | $ 12.97 |
| | |
Institutional Class:
Net Asset Value, offering price and redemption price per share ($777,287,648 ÷ 59,167,648 shares) | | $ 13.14 |
A Redemption price per share is equal to net asset value less any applicable contingent deferred sales charge.
Statement of Operations
| Year ended March 31, 2013 |
| | |
Investment Income | | |
Income distributions from underlying funds | | $ 50,395,124 |
| | |
Expenses | | |
Distribution and service plan fees | $ 7,854,830 | |
Independent trustees' compensation | 10,736 | |
Total expenses before reductions | 7,865,566 | |
Expense reductions | (10,736) | 7,854,830 |
Net investment income (loss) | | 42,540,294 |
Realized and Unrealized Gain (Loss) Realized gain (loss) on sale of underlying fund shares | 96,112,685 | |
Capital gain distributions from underlying funds | 67,046,834 | |
Total net realized gain (loss) | | 163,159,519 |
Change in net unrealized appreciation (depreciation) on underlying funds | | 31,602,843 |
Net gain (loss) | | 194,762,362 |
Net increase (decrease) in net assets resulting from operations | | $ 237,302,656 |
See accompanying notes which are an integral part of the financial statements.
Annual Report
Statement of Changes in Net Assets
| Year ended
March 31,
2013 | Year ended
March 31,
2012 |
Increase (Decrease) in Net Assets | | |
Operations | | |
Net investment income (loss) | $ 42,540,294 | $ 38,367,434 |
Net realized gain (loss) | 163,159,519 | 115,708,832 |
Change in net unrealized appreciation (depreciation) | 31,602,843 | (89,788,111) |
Net increase (decrease) in net assets resulting from operations | 237,302,656 | 64,288,155 |
Distributions to shareholders from net investment income | (42,626,632) | (36,847,353) |
Distributions to shareholders from net realized gain | (20,099,722) | (37,208,864) |
Total distributions | (62,726,354) | (74,056,217) |
Share transactions - net increase (decrease) | 290,138,617 | 322,693,501 |
Total increase (decrease) in net assets | 464,714,919 | 312,925,439 |
| | |
Net Assets | | |
Beginning of period | 2,823,066,719 | 2,510,141,280 |
End of period (including undistributed net investment income of $4,825,219 and undistributed net investment income of $4,911,557, respectively) | $ 3,287,781,638 | $ 2,823,066,719 |
Financial Highlights - Class A
Years ended March 31, | 2013 | 2012 | 2011 | 2010 | 2009 |
Selected Per-Share Data | | | | | |
Net asset value, beginning of period | $ 12.35 | $ 12.45 | $ 11.21 | $ 7.97 | $ 12.73 |
Income from Investment Operations | | | | | |
Net investment income (loss) C | .18 | .19 | .16 | .20 | .25 |
Net realized and unrealized gain (loss) | .78 | .06 | 1.36 | 3.32 | (4.33) |
Total from investment operations | .96 | .25 | 1.52 | 3.52 | (4.08) |
Distributions from net investment income | (.18) | (.18) | (.17) | (.19) | (.25) |
Distributions from net realized gain | (.08) | (.18) | (.11) | (.09) | (.43) |
Total distributions | (.26) | (.35) G | (.28) | (.28) F | (.68) |
Net asset value, end of period | $ 13.05 | $ 12.35 | $ 12.45 | $ 11.21 | $ 7.97 |
Total Return A,B | 7.91% | 2.23% | 13.73% | 44.32% | (33.34)% |
Ratios to Average Net Assets D,E | | | | | |
Expenses before reductions | .25% | .25% | .25% | .25% | .25% |
Expenses net of fee waivers, if any | .25% | .25% | .25% | .25% | .25% |
Expenses net of all reductions | .25% | .25% | .25% | .25% | .25% |
Net investment income (loss) | 1.44% | 1.55% | 1.43% | 1.92% | 2.49% |
Supplemental Data | | | | | |
Net assets, end of period (000 omitted) | $ 1,944,691 | $ 1,740,500 | $ 1,557,402 | $ 1,238,015 | $ 677,210 |
Portfolio turnover rate | 21% | 18% | 39% | 26% | 31% |
A Total returns would have been lower if certain expenses had not been reduced during the applicable periods shown.
B Total returns do not include the effect of the sales charges.
C Calculated based on average shares outstanding during the period.
D Amounts do not include the activity of the Underlying Funds.
E Expense ratios reflect operating expenses of the class. Expenses before reductions do not reflect amounts reimbursed by the investment adviser or reductions from expense offset arrangements and do not represent the amount paid by the class during periods when reimbursements or reductions occur. Expenses net of fee waivers reflect expenses after reimbursement by the investment adviser but prior to reductions from expense offset arrangements. Expenses net of all reductions represent the net expenses paid by the class but do not include expenses of the investment companies in which the Fund invests.
F Total distributions of $.28 per share is comprised of distributions from net investment income of $.189 and distributions from net realized gain of $.087 per share.
G Total distributions of $.35 per share is comprised of distributions from net investment income of $.178 and distributions from net realized gain of $.175 per share.
See accompanying notes which are an integral part of the financial statements.
Annual Report
Financial Highlights - Class T
Years ended March 31, | 2013 | 2012 | 2011 | 2010 | 2009 |
Selected Per-Share Data | | | | | |
Net asset value, beginning of period | $ 12.34 | $ 12.45 | $ 11.20 | $ 7.96 | $ 12.72 |
Income from Investment Operations | | | | | |
Net investment income (loss) C | .15 | .16 | .13 | .17 | .23 |
Net realized and unrealized gain (loss) | .79 | .05 | 1.37 | 3.32 | (4.34) |
Total from investment operations | .94 | .21 | 1.50 | 3.49 | (4.11) |
Distributions from net investment income | (.15) | (.15) | (.13) | (.16) | (.22) |
Distributions from net realized gain | (.08) | (.18) | (.11) | (.09) | (.43) |
Total distributions | (.23) | (.32) H | (.25) G | (.25) F | (.65) |
Net asset value, end of period | $ 13.05 | $ 12.34 | $ 12.45 | $ 11.20 | $ 7.96 |
Total Return A,B | 7.72% | 1.86% | 13.50% | 44.02% | (33.56)% |
Ratios to Average Net Assets D,E | | | | | |
Expenses before reductions | .50% | .50% | .50% | .50% | .50% |
Expenses net of fee waivers, if any | .50% | .50% | .50% | .50% | .50% |
Expenses net of all reductions | .50% | .50% | .50% | .50% | .50% |
Net investment income (loss) | 1.19% | 1.30% | 1.18% | 1.67% | 2.24% |
Supplemental Data | | | | | |
Net assets, end of period (000 omitted) | $ 430,153 | $ 386,416 | $ 424,707 | $ 488,097 | $ 343,919 |
Portfolio turnover rate | 21% | 18% | 39% | 26% | 31% |
A Total returns would have been lower if certain expenses had not been reduced during the applicable periods shown.
B Total returns do not include the effect of the sales charges.
C Calculated based on average shares outstanding during the period.
D Amounts do not include the activity of the Underlying Funds.
E Expense ratios reflect operating expenses of the class. Expenses before reductions do not reflect amounts reimbursed by the investment adviser or reductions from expense offset arrangements and do not represent the amount paid by the class during periods when reimbursements or reductions occur. Expenses net of fee waivers reflect expenses after reimbursement by the investment adviser but prior to reductions from expense offset arrangements. Expenses net of all reductions represent the net expenses paid by the class but do not include expenses of the investment companies in which the Fund invests.
F Total distributions of $.25 per share is comprised of distributions from net investment income of $.163 and distributions from net realized gain of $.087 per share.
G Total distributions of $.25 per share is comprised of distributions from net investment income of $.134 and distributions from net realized gain of $.111 per share.
H Total distributions of $.32 per share is comprised of distributions from net investment income of $.145 and distributions from net realized gain of $.175 per share.
Financial Highlights - Class B
Years ended March 31, | 2013 | 2012 | 2011 | 2010 | 2009 |
Selected Per-Share Data | | | | | |
Net asset value, beginning of period | $ 12.32 | $ 12.41 | $ 11.17 | $ 7.94 | $ 12.66 |
Income from Investment Operations | | | | | |
Net investment income (loss) C | .09 | .10 | .08 | .12 | .18 |
Net realized and unrealized gain (loss) | .79 | .06 | 1.35 | 3.31 | (4.31) |
Total from investment operations | .88 | .16 | 1.43 | 3.43 | (4.13) |
Distributions from net investment income | (.08) | (.08) | (.08) | (.12) | (.16) |
Distributions from net realized gain | (.08) | (.17) | (.11) | (.09) | (.43) |
Total distributions | (.16) | (.25) | (.19) | (.20) F | (.59) |
Net asset value, end of period | $ 13.04 | $ 12.32 | $ 12.41 | $ 11.17 | $ 7.94 |
Total Return A,B | 7.19% | 1.39% | 12.87% | 43.34% | (33.87)% |
Ratios to Average Net Assets D,E | | | | | |
Expenses before reductions | 1.00% | 1.00% | 1.00% | 1.00% | 1.00% |
Expenses net of fee waivers, if any | 1.00% | 1.00% | 1.00% | 1.00% | 1.00% |
Expenses net of all reductions | 1.00% | 1.00% | 1.00% | 1.00% | 1.00% |
Net investment income (loss) | .69% | .80% | .68% | 1.17% | 1.74% |
Supplemental Data | | | | | |
Net assets, end of period (000 omitted) | $ 33,074 | $ 43,138 | $ 61,856 | $ 71,888 | $ 52,871 |
Portfolio turnover rate | 21% | 18% | 39% | 26% | 31% |
A Total returns would have been lower if certain expenses had not been reduced during the applicable periods shown.
B Total returns do not include the effect of the contingent deferred sales charge.
C Calculated based on average shares outstanding during the period.
D Amounts do not include the activity of the Underlying Funds.
E Expense ratios reflect operating expenses of the class. Expenses before reductions do not reflect amounts reimbursed by the investment adviser or reductions from expense offset arrangements and do not represent the amount paid by the class during periods when reimbursements or reductions occur. Expenses net of fee waivers reflect expenses after reimbursement by the investment adviser but prior to reductions from expense offset arrangements. Expenses net of all reductions represent the net expenses paid by the class but do not include expenses of the investment companies in which the Fund invests.
F Total distributions of $.20 per share is comprised of distributions from net investment income of $.115 and distributions from net realized gain of $.087 per share.
See accompanying notes which are an integral part of the financial statements.
Annual Report
Financial Highlights - Class C
Years ended March 31, | 2013 | 2012 | 2011 | 2010 | 2009 |
Selected Per-Share Data | | | | | |
Net asset value, beginning of period | $ 12.27 | $ 12.37 | $ 11.14 | $ 7.92 | $ 12.64 |
Income from Investment Operations | | | | | |
Net investment income (loss) C | .09 | .10 | .08 | .12 | .18 |
Net realized and unrealized gain (loss) | .78 | .06 | 1.34 | 3.31 | (4.31) |
Total from investment operations | .87 | .16 | 1.42 | 3.43 | (4.13) |
Distributions from net investment income | (.08) | (.09) | (.08) | (.12) | (.16) |
Distributions from net realized gain | (.08) | (.17) | (.11) | (.09) | (.43) |
Total distributions | (.17) G | (.26) | (.19) | (.21) F | (.59) |
Net asset value, end of period | $ 12.97 | $ 12.27 | $ 12.37 | $ 11.14 | $ 7.92 |
Total Return A,B | 7.13% | 1.43% | 12.89% | 43.38% | (33.90)% |
Ratios to Average Net Assets D,E | | | | | |
Expenses before reductions | 1.00% | 1.00% | 1.00% | 1.00% | 1.00% |
Expenses net of fee waivers, if any | 1.00% | 1.00% | 1.00% | 1.00% | 1.00% |
Expenses net of all reductions | 1.00% | 1.00% | 1.00% | 1.00% | 1.00% |
Net investment income (loss) | .69% | .80% | .68% | 1.17% | 1.74% |
Supplemental Data | | | | | |
Net assets, end of period (000 omitted) | $ 102,576 | $ 97,550 | $ 101,019 | $ 93,237 | $ 62,702 |
Portfolio turnover rate | 21% | 18% | 39% | 26% | 31% |
A Total returns would have been lower if certain expenses had not been reduced during the applicable periods shown.
B Total returns do not include the effect of the contingent deferred sales charge.
C Calculated based on average shares outstanding during the period.
D Amounts do not include the activity of the Underlying Funds.
E Expense ratios reflect operating expenses of the class. Expenses before reductions do not reflect amounts reimbursed by the investment adviser or reductions from expense offset arrangements and do not represent the amount paid by the class during periods when reimbursements or reductions occur. Expenses net of fee waivers reflect expenses after reimbursement by the investment adviser but prior to reductions from expense offset arrangements. Expenses net of all reductions represent the net expenses paid by the class but do not include expenses of the investment companies in which the Fund invests.
F Total distributions of $.21 per share is comprised of distributions from net investment income of $.119 and distributions from net realized gain of $.087 per share.
G Total distributions of $.17 per share is comprised of distributions from net investment income of $.084 and distributions from net realized gain of $.083 per share.
Financial Highlights - Institutional Class
Years ended March 31, | 2013 | 2012 | 2011 | 2010 | 2009 |
Selected Per-Share Data | | | | | |
Net asset value, beginning of period | $ 12.42 | $ 12.53 | $ 11.27 | $ 8.01 | $ 12.79 |
Income from Investment Operations | | | | | |
Net investment income (loss) B | .21 | .22 | .19 | .22 | .28 |
Net realized and unrealized gain (loss) | .80 | .05 | 1.38 | 3.34 | (4.35) |
Total from investment operations | 1.01 | .27 | 1.57 | 3.56 | (4.07) |
Distributions from net investment income | (.21) | (.21) | (.20) | (.21) | (.28) |
Distributions from net realized gain | (.08) | (.18) | (.11) | (.09) | (.43) |
Total distributions | (.29) | (.38) G | (.31) | (.30) F | (.71) |
Net asset value, end of period | $ 13.14 | $ 12.42 | $ 12.53 | $ 11.27 | $ 8.01 |
Total Return A | 8.28% | 2.39% | 14.09% | 44.65% | (33.16)% |
Ratios to Average Net Assets C,E | | | | | |
Expenses before reductions D | .00% | .00% | .00% | .00% | .00% |
Expenses net of fee waivers, if any | .00% | .00% | .00% | .00% | .00% |
Expenses net of all reductions | .00% | .00% | .00% | .00% | .00% |
Net investment income (loss) | 1.69% | 1.80% | 1.68% | 2.17% | 2.74% |
Supplemental Data | | | | | |
Net assets, end of period (000 omitted) | $ 777,288 | $ 555,462 | $ 365,157 | $ 214,905 | $ 105,660 |
Portfolio turnover rate | 21% | 18% | 39% | 26% | 31% |
A Total returns would have been lower if certain expenses had not been reduced during the applicable periods shown.
B Calculated based on average shares outstanding during the period.
C Amounts do not include the activity of the Underlying Funds.
D Amount represents less than .01%.
E Expense ratios reflect operating expenses of the class. Expenses before reductions do not reflect amounts reimbursed by the investment adviser or reductions from expense offset arrangements and do not represent the amount paid by the class during periods when reimbursements or reductions occur. Expenses net of fee waivers reflect expenses after reimbursement by the investment adviser but prior to reductions from expense offset arrangements. Expenses net of all reductions represent the net expenses paid by the class but do not include expenses of the investment companies in which the Fund invests.
F Total distributions of $.30 per share is comprised of distributions from net investment income of $.211 and distributions from net realized gain of $.087 per share.
G Total distributions of $.38 per share is comprised of distributions from net investment income of $.208 and distributions from net realized gain of $.175 per share.
See accompanying notes which are an integral part of the financial statements.
Annual Report
Fidelity Advisor Freedom 2025 Fund
Investment Changes (Unaudited)
The information in the following tables is based on the direct investments of the Fund. |
Fund Holdings as of March 31, 2013 |
| % of fund's
net assets | % of fund's net assets
6 months ago |
Commodity Funds | | |
Fidelity Series Commodity Strategy Fund | 7.2 | 7.5 |
Domestic Equity Funds | | |
Fidelity Advisor Equity Growth Fund Institutional Class | 5.8 | 5.1 |
Fidelity Advisor Growth & Income Fund Institutional Class | 3.1 | 6.1 |
Fidelity Advisor Large Cap Fund Institutional Class | 3.1 | 5.6 |
Fidelity Advisor Series Equity-Income Fund | 4.1 | 0.0 |
Fidelity Advisor Series Mega Cap Fund | 0.9 | 0.0 |
Fidelity Advisor Series Opportunistic Insights Fund | 2.9 | 0.0 |
Fidelity Advisor Series Stock Selector Large Cap Value Fund | 4.1 | 0.0 |
Fidelity Advisor Small Cap Fund Institutional Class | 2.4 | 2.0 |
Fidelity Series 100 Index Fund | 0.9 | 4.1 |
Fidelity Series All-Sector Equity Fund | 7.6 | 8.7 |
Fidelity Series Large Cap Value Fund | 4.3 | 8.2 |
Fidelity Series Real Estate Equity Fund | 0.6 | 0.6 |
Fidelity Series Small Cap Opportunities Fund | 2.8 | 2.1 |
| 42.6 | 42.5 |
Developed International Equity Funds | | |
Fidelity Series International Growth Fund | 6.4 | 6.4 |
Fidelity Series International Small Cap Fund | 1.3 | 1.3 |
Fidelity Series International Value Fund | 6.3 | 6.4 |
| 14.0 | 14.1 |
Emerging Markets Equity Funds | | |
Fidelity Series Emerging Markets Fund | 3.8 | 4.0 |
High Yield Bond Funds | | |
Fidelity Series Emerging Markets Debt Fund | 0.7 | 0.6 |
Fidelity Series Floating Rate High Income Fund | 0.9 | 0.8 |
Fidelity Series High Income Fund | 6.9 | 6.9 |
Fidelity Series Real Estate Income Fund | 0.6 | 0.4 |
| 9.1 | 8.7 |
Inflation-Protected Bond Funds | | |
Fidelity Series Inflation-Protected Bond Index Fund | 5.4 | 5.3 |
Investment Grade Bond Funds | | |
Fidelity Series Investment Grade Bond Fund | 17.2 | 17.4 |
Short-Term Funds | | |
Fidelity Advisor Short Fixed-Income Fund Institutional Class | 0.3 | 0.2 |
Fidelity Institutional Money Market Portfolio Institutional Class | 0.4 | 0.3 |
| 0.7 | 0.5 |
Net Other Assets (Liabilities)* | 0.0 | 0.0 |
| 100.0 | 100.0 |
* Amount represents less than 0.1% |
Asset Allocation (% of fund's net assets) |
Period end |
| Commodity Funds | 7.2% | |
| Domestic Equity Funds | 42.6% | |
| Developed International Equity Funds | 14.0% | |
| Emerging Markets
Equity Funds | 3.8% | |
| High Yield Bond Funds | 9.1% | |
| Inflation-Protected
Bond Funds | 5.4% | |
| Investment Grade
Bond Funds | 17.2% | |
| Short-Term Funds | 0.7% | |

Six months ago |
| Commodity Funds | 7.5% | |
| Domestic Equity Funds | 42.5% | |
| Developed International Equity Funds | 14.1% | |
| Emerging Markets
Equity Funds | 4.0% | |
| High Yield Bond Funds | 8.7% | |
| Inflation-Protected
Bond Funds | 5.3% | |
| Investment Grade
Bond Funds | 17.4% | |
| Short-Term Funds | 0.5% | |

Expected |
| Commodity Funds | 7.3% | |
| Domestic Equity Funds | 41.1% | |
| Developed International Equity Funds | 13.6% | |
| Emerging Markets
Equity Funds | 4.0% | |
| High Yield Bond Funds | 7.3% | |
| Inflation-Protected
Bond Funds | 6.1% | |
| Investment Grade
Bond Funds | 19.5% | |
| Short-Term Funds | 1.1% | |

The fund invests according to an asset allocation strategy that becomes increasingly conservative over time. The six months ago allocation is based on the fund's holdings as of September 30, 2012. The current allocation is based on the fund's holdings as of March 31, 2013. The expected allocation represents the fund's anticipated allocation at September 30, 2013. |
Annual Report
Fidelity Advisor Freedom 2025 Fund
Investments March 31, 2013
Showing Percentage of Net Assets
Domestic Equity Funds - 49.8% |
| Shares | | Value |
Commodity Funds - 7.2% |
Fidelity Series Commodity Strategy Fund (a) | 24,163,564 | | $ 209,981,372 |
Domestic Equity Funds - 42.6% |
Fidelity Advisor Equity Growth Fund Institutional Class | 2,374,348 | | 168,222,574 |
Fidelity Advisor Growth & Income Fund Institutional Class | 4,043,660 | | 89,324,444 |
Fidelity Advisor Large Cap Fund Institutional Class | 3,792,063 | | 90,137,343 |
Fidelity Advisor Series Equity-Income Fund | 10,664,785 | | 118,699,060 |
Fidelity Advisor Series Mega Cap Fund | 2,378,662 | | 26,284,215 |
Fidelity Advisor Series Opportunistic Insights Fund | 7,619,323 | | 83,888,742 |
Fidelity Advisor Series Stock Selector Large Cap Value Fund | 10,684,739 | | 119,562,234 |
Fidelity Advisor Small Cap Fund Institutional Class | 2,557,499 | | 68,924,591 |
Fidelity Series 100 Index Fund | 2,693,240 | | 27,794,239 |
Fidelity Series All-Sector Equity Fund | 17,363,755 | | 223,124,251 |
Fidelity Series Large Cap Value Fund | 10,854,743 | | 126,349,210 |
Fidelity Series Real Estate Equity Fund | 1,431,424 | | 18,637,135 |
Fidelity Series Small Cap Opportunities Fund | 6,515,802 | | 80,339,838 |
TOTAL DOMESTIC EQUITY FUNDS | | 1,241,287,876 |
TOTAL DOMESTIC EQUITY FUNDS (Cost $1,314,003,581) |
1,451,269,248
|
International Equity Funds - 17.8% |
| | | |
Developed International Equity Funds - 14.0% |
Fidelity Series International Growth Fund | 14,614,189 | | 184,869,495 |
Fidelity Series International Small Cap Fund | 2,746,864 | | 37,686,968 |
Fidelity Series International Value Fund | 18,690,184 | | 183,537,602 |
TOTAL DEVELOPED INTERNATIONAL EQUITY FUNDS | | 406,094,065 |
Emerging Markets Equity Funds - 3.8% |
Fidelity Series Emerging Markets Fund | 6,666,796 | | 111,535,501 |
TOTAL INTERNATIONAL EQUITY FUNDS (Cost $459,184,814) |
517,629,566
|
Bond Funds - 31.7% |
| Shares | | Value |
High Yield Bond Funds - 9.1% |
Fidelity Series Emerging Markets Debt Fund | 1,957,971 | | $ 21,302,722 |
Fidelity Series Floating Rate High Income Fund | 2,511,371 | | 26,695,868 |
Fidelity Series High Income Fund | 19,231,692 | | 202,125,088 |
Fidelity Series Real Estate Income Fund | 1,345,736 | | 15,704,734 |
TOTAL HIGH YIELD BOND FUNDS | | 265,828,412 |
Inflation-Protected Bond Funds - 5.4% |
Fidelity Series Inflation-Protected Bond Index Fund | 13,823,933 | | 157,454,593 |
Investment Grade Bond Funds - 17.2% |
Fidelity Series Investment Grade Bond Fund | 43,482,970 | | 501,358,646 |
TOTAL BOND FUNDS (Cost $897,130,036) |
924,641,651
|
Short-Term Funds - 0.7% |
| | | |
Fidelity Advisor Short Fixed-Income Fund Institutional Class | 1,032,440 | | 9,663,635 |
Fidelity Institutional Money Market Portfolio Institutional Class | 11,776,143 | | 11,776,143 |
TOTAL SHORT-TERM FUNDS (Cost $21,396,651) |
21,439,778
|
TOTAL INVESTMENT PORTFOLIO - 100.0% (Cost $2,691,715,082) | | 2,914,980,243 |
NET OTHER ASSETS (LIABILITIES) - 0.0% | | (585,274) |
NET ASSETS - 100% | $ 2,914,394,969 |
Legend |
(a) Non-income producing |
Other Information |
All investments are categorized as Level 1 under the Fair Value Hierarchy. The inputs or methodology used for valuing securities may not be an indication of the risk associated with investing in those securities. For more information on valuation inputs, please refer to the Security Valuation section in the accompanying Notes to Financial Statements. |
See accompanying notes which are an integral part of the financial statements.
Annual Report
Fidelity Advisor Freedom 2025 Fund
Statement of Assets and Liabilities
| March 31, 2013 |
| | |
Assets | | |
Investment in securities, at value (cost $2,691,715,082) - See accompanying schedule | | $ 2,914,980,243 |
Cash | | 8 |
Receivable for investments sold | | 602,292 |
Receivable for fund shares sold | | 3,226,919 |
Receivable from affiliate for expense reductions | | 2,705 |
Total assets | | 2,918,812,167 |
| | |
Liabilities | | |
Payable for investments purchased | $ 11,846 | |
Payable for fund shares redeemed | 3,816,883 | |
Distribution and service plan fees payable | 588,469 | |
Total liabilities | | 4,417,198 |
| | |
Net Assets | | $ 2,914,394,969 |
Net Assets consist of: | | |
Paid in capital | | $ 2,606,476,849 |
Undistributed net investment income | | 4,044,954 |
Accumulated undistributed net realized gain (loss) on investments | | 80,608,005 |
Net unrealized appreciation (depreciation) on investments | | 223,265,161 |
Net Assets | | $ 2,914,394,969 |
| | |
Calculation of Maximum Offering Price Class A:
Net Asset Value and redemption price per share ($1,806,027,959 ÷ 142,014,836 shares) | | $ 12.72 |
| | |
Maximum offering price per share (100/94.25 of $12.72) | | $ 13.50 |
Class T:
Net Asset Value and redemption price per share ($324,351,528 ÷ 25,456,167 shares) | | $ 12.74 |
| | |
Maximum offering price per share (100/96.50 of $12.74) | | $ 13.20 |
Class B:
Net Asset Value and offering price per share ($23,060,838 ÷ 1,821,972 shares)A | | $ 12.66 |
| | |
Class C:
Net Asset Value and offering price per share ($74,414,909 ÷ 5,907,893 shares)A | | $ 12.60 |
| | |
Institutional Class:
Net Asset Value, offering price and redemption price per share ($686,539,735 ÷ 53,611,508 shares) | | $ 12.81 |
A Redemption price per share is equal to net asset value less any applicable contingent deferred sales charge.
Statement of Operations
| Year ended March 31, 2013 |
| | |
Investment Income | | |
Income distributions from underlying funds | | $ 45,634,334 |
| | |
Expenses | | |
Distribution and service plan fees | $ 6,390,546 | |
Independent trustees' compensation | 9,151 | |
Total expenses before reductions | 6,399,697 | |
Expense reductions | (9,151) | 6,390,546 |
Net investment income (loss) | | 39,243,788 |
Realized and Unrealized Gain (Loss) Realized gain (loss) on sale of underlying fund shares | 96,435,116 | |
Capital gain distributions from underlying funds | 58,750,408 | |
Total net realized gain (loss) | | 155,185,524 |
Change in net unrealized appreciation (depreciation) on underlying funds | | 39,571,192 |
Net gain (loss) | | 194,756,716 |
Net increase (decrease) in net assets resulting from operations | | $ 234,000,504 |
See accompanying notes which are an integral part of the financial statements.
Annual Report
Statement of Changes in Net Assets
| Year ended
March 31,
2013 | Year ended
March 31,
2012 |
Increase (Decrease) in Net Assets | | |
Operations | | |
Net investment income (loss) | $ 39,243,788 | $ 31,259,419 |
Net realized gain (loss) | 155,185,524 | 69,317,481 |
Change in net unrealized appreciation (depreciation) | 39,571,192 | (49,933,046) |
Net increase (decrease) in net assets resulting from operations | 234,000,504 | 50,643,854 |
Distributions to shareholders from net investment income | (38,848,941) | (29,784,172) |
Distributions to shareholders from net realized gain | (14,347,444) | (32,097,999) |
Total distributions | (53,196,385) | (61,882,171) |
Share transactions - net increase (decrease) | 370,631,756 | 440,882,254 |
Total increase (decrease) in net assets | 551,435,875 | 429,643,937 |
| | |
Net Assets | | |
Beginning of period | 2,362,959,094 | 1,933,315,157 |
End of period (including undistributed net investment income of $4,044,954 and undistributed net investment income of $3,650,108, respectively) | $ 2,914,394,969 | $ 2,362,959,094 |
Financial Highlights - Class A
Years ended March 31, | 2013 | 2012 | 2011 | 2010 | 2009 |
Selected Per-Share Data | | | | | |
Net asset value, beginning of period | $ 11.91 | $ 12.09 | $ 10.76 | $ 7.51 | $ 12.26 |
Income from Investment Operations | | | | | |
Net investment income (loss) C | .18 | .18 | .16 | .18 | .23 |
Net realized and unrealized gain (loss) | .88 | (.01) E | 1.43 | 3.32 | (4.36) |
Total from investment operations | 1.06 | .17 | 1.59 | 3.50 | (4.13) |
Distributions from net investment income | (.18) | (.17) | (.16) | (.17) | (.22) |
Distributions from net realized gain | (.07) | (.18) | (.11) | (.09) | (.40) |
Total distributions | (.25) | (.35) | (.26) H | (.25) G | (.62) |
Net asset value, end of period | $ 12.72 | $ 11.91 | $ 12.09 | $ 10.76 | $ 7.51 |
Total Return A, B | 9.00% | 1.61% | 14.97% | 46.86% | (34.98)% |
Ratios to Average Net Assets D, F | | | | | |
Expenses before reductions | .25% | .25% | .25% | .25% | .25% |
Expenses net of fee waivers, if any | .25% | .25% | .25% | .25% | .25% |
Expenses net of all reductions | .25% | .25% | .25% | .25% | .25% |
Net investment income (loss) | 1.54% | 1.56% | 1.42% | 1.82% | 2.41% |
Supplemental Data | | | | | |
Net assets, end of period (000 omitted) | $ 1,806,028 | $ 1,539,333 | $ 1,290,255 | $ 999,687 | $ 512,482 |
Portfolio turnover rate | 22% | 14% | 34% | 19% | 29% |
A Total returns would have been lower if certain expenses had not been reduced during the applicable periods shown.
B Total returns do not include the effect of the sales charges.
C Calculated based on average shares outstanding during the period.
D Amounts do not include the activity of the Underlying Funds.
E The amount shown for a share outstanding does not correspond with the aggregate net gain (loss) on investments for the period due to the timing of sales and repurchases of shares in relation to fluctuating market values of the investments of the Fund.
F Expense ratios reflect operating expenses of the class. Expenses before reductions do not reflect amounts reimbursed by the investment adviser or reductions from expense offset arrangements and do not represent the amount paid by the class during periods when reimbursements or reductions occur. Expenses net of fee waivers reflect expenses after reimbursement by the investment adviser but prior to reductions from expense offset arrangements. Expenses net of all reductions represent the net expenses paid by the class but do not include expenses of the investment companies in which the Fund invests.
G Total distributions of $.25 per share is comprised of distributions from net investment income of $.169 and distributions from net realized gain of $.085 per share.
H Total distributions of $.26 per share is comprised of distributions from net investment income of $.155 and distributions from net realized gain of $.106 per share.
See accompanying notes which are an integral part of the financial statements.
Annual Report
Financial Highlights - Class T
Years ended March 31, | 2013 | 2012 | 2011 | 2010 | 2009 |
Selected Per-Share Data | | | | | |
Net asset value, beginning of period | $ 11.93 | $ 12.11 | $ 10.78 | $ 7.52 | $ 12.28 |
Income from Investment Operations | | | | | |
Net investment income (loss) C | .15 | .15 | .13 | .15 | .21 |
Net realized and unrealized gain (loss) | .88 | (.01) E | 1.43 | 3.34 | (4.37) |
Total from investment operations | 1.03 | .14 | 1.56 | 3.49 | (4.16) |
Distributions from net investment income | (.15) | (.14) | (.13) | (.15) | (.20) |
Distributions from net realized gain | (.07) | (.18) | (.11) | (.09) | (.40) |
Total distributions | (.22) | (.32) | (.23) H | (.23) G | (.60) |
Net asset value, end of period | $ 12.74 | $ 11.93 | $ 12.11 | $ 10.78 | $ 7.52 |
Total Return A, B | 8.74% | 1.33% | 14.67% | 46.60% | (35.20)% |
Ratios to Average Net Assets D, F | | | | | |
Expenses before reductions | .50% | .50% | .50% | .50% | .50% |
Expenses net of fee waivers, if any | .50% | .50% | .50% | .50% | .50% |
Expenses net of all reductions | .50% | .50% | .50% | .50% | .50% |
Net investment income (loss) | 1.29% | 1.31% | 1.17% | 1.57% | 2.16% |
Supplemental Data | | | | | |
Net assets, end of period (000 omitted) | $ 324,352 | $ 257,594 | $ 258,166 | $ 230,003 | $ 139,330 |
Portfolio turnover rate | 22% | 14% | 34% | 19% | 29% |
A Total returns would have been lower if certain expenses had not been reduced during the applicable periods shown.
B Total returns do not include the effect of the sales charges.
C Calculated based on average shares outstanding during the period.
D Amounts do not include the activity of the Underlying Funds.
E The amount shown for a share outstanding does not correspond with the aggregate net gain (loss) on investments for the period due to the timing of sales and repurchases of shares in relation to fluctuating market values of the investments of the Fund.
F Expense ratios reflect operating expenses of the class. Expenses before reductions do not reflect amounts reimbursed by the investment adviser or reductions from expense offset arrangements and do not represent the amount paid by the class during periods when reimbursements or reductions occur. Expenses net of fee waivers reflect expenses after reimbursement by the investment adviser but prior to reductions from expense offset arrangements. Expenses net of all reductions represent the net expenses paid by the class but do not include expenses of the investment companies in which the Fund invests.
G Total distributions of $.23 per share is comprised of distributions from net investment income of $.146 and distributions from net realized gain of $.085 per share.
H Total distributions of $.23 per share is comprised of distributions from net investment income of $.128 and distributions from net realized gain of $.106 per share.
Financial Highlights - Class B
Years ended March 31, | 2013 | 2012 | 2011 | 2010 | 2009 |
Selected Per-Share Data | | | | | |
Net asset value, beginning of period | $ 11.84 | $ 12.01 | $ 10.70 | $ 7.47 | $ 12.17 |
Income from Investment Operations | | | | | |
Net investment income (loss) C | .09 | .09 | .07 | .10 | .16 |
Net realized and unrealized gain (loss) | .88 | (.01) E | 1.42 | 3.32 | (4.32) |
Total from investment operations | .97 | .08 | 1.49 | 3.42 | (4.16) |
Distributions from net investment income | (.08) | (.08) | (.07) | (.10) | (.14) |
Distributions from net realized gain | (.07) | (.17) | (.11) | (.09) | (.40) |
Total distributions | (.15) | (.25) | (.18) | (.19) G | (.54) |
Net asset value, end of period | $ 12.66 | $ 11.84 | $ 12.01 | $ 10.70 | $ 7.47 |
Total Return A, B | 8.26% | .82% | 14.02% | 45.83% | (35.45)% |
Ratios to Average Net Assets D, F | | | | | |
Expenses before reductions | 1.00% | 1.00% | 1.00% | 1.00% | 1.00% |
Expenses net of fee waivers, if any | 1.00% | 1.00% | 1.00% | 1.00% | 1.00% |
Expenses net of all reductions | 1.00% | 1.00% | 1.00% | 1.00% | 1.00% |
Net investment income (loss) | .79% | .81% | .67% | 1.07% | 1.66% |
Supplemental Data | | | | | |
Net assets, end of period (000 omitted) | $ 23,061 | $ 29,202 | $ 38,946 | $ 38,816 | $ 27,207 |
Portfolio turnover rate | 22% | 14% | 34% | 19% | 29% |
A Total returns would have been lower if certain expenses had not been reduced during the applicable periods shown.
B Total returns do not include the effect of the contingent deferred sales charge.
C Calculated based on average shares outstanding during the period.
D Amounts do not include the activity of the Underlying Funds.
E The amount shown for a share outstanding does not correspond with the aggregate net gain (loss) on investments for the period due to the timing of sales and repurchases of shares in relation to fluctuating market values of the investments of the Fund.
F Expense ratios reflect operating expenses of the class. Expenses before reductions do not reflect amounts reimbursed by the investment adviser or reductions from expense offset arrangements and do not represent the amount paid by the class during periods when reimbursements or reductions occur. Expenses net of fee waivers reflect expenses after reimbursement by the investment adviser but prior to reductions from expense offset arrangements. Expenses net of all reductions represent the net expenses paid by the class but do not include expenses of the investment companies in which the Fund invests.
G Total distributions of $.19 per share is comprised of distributions from net investment income of $.100 and distributions from net realized gain of $.085 per share.
See accompanying notes which are an integral part of the financial statements.
Annual Report
Financial Highlights - Class C
Years ended March 31, | 2013 | 2012 | 2011 | 2010 | 2009 |
Selected Per-Share Data | | | | | |
Net asset value, beginning of period | $ 11.80 | $ 11.98 | $ 10.68 | $ 7.46 | $ 12.16 |
Income from Investment Operations | | | | | |
Net investment income (loss) C | .09 | .09 | .07 | .10 | .16 |
Net realized and unrealized gain (loss) | .87 | (.01) E | 1.41 | 3.31 | (4.32) |
Total from investment operations | .96 | .08 | 1.48 | 3.41 | (4.16) |
Distributions from net investment income | (.10) | (.09) | (.08) | (.11) | (.14) |
Distributions from net realized gain | (.07) | (.17) | (.11) | (.09) | (.40) |
Total distributions | (.16) I | (.26) | (.18) H | (.19) G | (.54) |
Net asset value, end of period | $ 12.60 | $ 11.80 | $ 11.98 | $ 10.68 | $ 7.46 |
Total Return A, B | 8.23% | .86% | 14.01% | 45.83% | (35.44)% |
Ratios to Average Net Assets D, F | | | | | |
Expenses before reductions | 1.00% | 1.00% | 1.00% | 1.00% | 1.00% |
Expenses net of fee waivers, if any | 1.00% | 1.00% | 1.00% | 1.00% | 1.00% |
Expenses net of all reductions | 1.00% | 1.00% | 1.00% | 1.00% | 1.00% |
Net investment income (loss) | .79% | .81% | .67% | 1.07% | 1.66% |
Supplemental Data | | | | | |
Net assets, end of period (000 omitted) | $ 74,415 | $ 66,126 | $ 61,640 | $ 52,756 | $ 31,735 |
Portfolio turnover rate | 22% | 14% | 34% | 19% | 29% |
A Total returns would have been lower if certain expenses had not been reduced during the applicable periods shown.
B Total returns do not include the effect of the contingent deferred sales charge.
C Calculated based on average shares outstanding during the period.
D Amounts do not include the activity of the Underlying Funds.
E The amount shown for a share outstanding does not correspond with the aggregate net gain (loss) on investments for the period due to the timing of sales and repurchases of shares in relation to fluctuating market values of the investments of the Fund.
F Expense ratios reflect operating expenses of the class. Expenses before reductions do not reflect amounts reimbursed by the investment adviser or reductions from expense offset arrangements and do not represent the amount paid by the class during periods when reimbursements or reductions occur. Expenses net of fee waivers reflect expenses after reimbursement by the investment adviser but prior to reductions from expense offset arrangements. Expenses net of all reductions represent the net expenses paid by the class but do not include expenses of the investment companies in which the Fund invests.
G Total distributions of $.19 per share is comprised of distributions from net investment income of $.105 and distributions from net realized gain of $.085 per share.
H Total distributions of $.18 per share is comprised of distributions from net investment income of $.077 and distributions from net realized gain of $.106 per share.
I Total distributions of $.16 per share is comprised of distributions from net investment income of $.096 and distributions from net realized gain of $.066 per share.
Financial Highlights - Institutional Class
Years ended March 31, | 2013 | 2012 | 2011 | 2010 | 2009 |
Selected Per-Share Data | | | | | |
Net asset value, beginning of period | $ 11.99 | $ 12.17 | $ 10.83 | $ 7.55 | $ 12.33 |
Income from Investment Operations | | | | | |
Net investment income (loss) B | .22 | .21 | .19 | .20 | .26 |
Net realized and unrealized gain (loss) | .88 | (.02) E | 1.44 | 3.35 | (4.39) |
Total from investment operations | 1.10 | .19 | 1.63 | 3.55 | (4.13) |
Distributions from net investment income | (.21) | (.20) | (.18) | (.19) | (.25) |
Distributions from net realized gain | (.07) | (.18) | (.11) | (.09) | (.40) |
Total distributions | (.28) | (.37) G | (.29) | (.27) H | (.65) |
Net asset value, end of period | $ 12.81 | $ 11.99 | $ 12.17 | $ 10.83 | $ 7.55 |
Total Return A | 9.29% | 1.84% | 15.23% | 47.31% | (34.83)% |
Ratios to Average Net Assets C, F | | | | | |
Expenses before reductions D | .00% | .00% | .00% | .00% | .00% |
Expenses net of fee waivers, if any | .00% | .00% | .00% | .00% | .00% |
Expenses net of all reductions | .00% | .00% | .00% | .00% | .00% |
Net investment income (loss) | 1.79% | 1.81% | 1.67% | 2.07% | 2.66% |
Supplemental Data | | | | | |
Net assets, end of period (000 omitted) | $ 686,540 | $ 470,704 | $ 284,309 | $ 140,948 | $ 69,731 |
Portfolio turnover rate | 22% | 14% | 34% | 19% | 29% |
A Total returns would have been lower if certain expenses had not been reduced during the applicable periods shown.
B Calculated based on average shares outstanding during the period.
C Amounts do not include the activity of the Underlying Funds.
D Amount represents less than .01%.
E The amount shown for a share outstanding does not correspond with the aggregate net gain (loss) on investments for the period due to the timing of sales and repurchases of shares in relation to fluctuating market values of the investments of the Fund.
F Expense ratios reflect operating expenses of the class. Expenses before reductions do not reflect amounts reimbursed by the investment adviser or reductions from expense offset arrangements and do not represent the amount paid by the class during periods when reimbursements or reductions occur. Expenses net of fee waivers reflect expenses after reimbursement by the investment adviser but prior to reductions from expense offset arrangements. Expenses net of all reductions represent the net expenses paid by the class but do not include expenses of the investment companies in which the Fund invests.
G Total distributions of $.37 per share is comprised of distributions from net investment income of $.195 and distributions from net realized gain of $.179 per share.
H Total distributions of $.27 per share is comprised of distributions from net investment income of $.189 and distributions from net realized gain of $.085 per share.
See accompanying notes which are an integral part of the financial statements.
Annual Report
Fidelity Advisor Freedom 2030 Fund
Investment Changes (Unaudited)
The information in the following tables is based on the direct investments of the Fund. |
Fund Holdings as of March 31, 2013 |
| % of fund's
net assets | % of fund's net assets
6 months ago |
Commodity Funds | | |
Fidelity Series Commodity Strategy Fund | 7.6 | 7.9 |
Domestic Equity Funds | | |
Fidelity Advisor Equity Growth Fund Institutional Class | 6.1 | 5.3 |
Fidelity Advisor Growth & Income Fund Institutional Class | 3.2 | 6.4 |
Fidelity Advisor Large Cap Fund Institutional Class | 3.3 | 5.9 |
Fidelity Advisor Series Equity-Income Fund | 4.3 | 0.0 |
Fidelity Advisor Series Mega Cap Fund | 0.9 | 0.0 |
Fidelity Advisor Series Opportunistic Insights Fund | 3.0 | 0.0 |
Fidelity Advisor Series Stock Selector Large Cap Value Fund | 4.3 | 0.0 |
Fidelity Advisor Small Cap Fund Institutional Class | 2.5 | 2.1 |
Fidelity Series 100 Index Fund | 1.0 | 4.3 |
Fidelity Series All-Sector Equity Fund | 8.1 | 9.1 |
Fidelity Series Large Cap Value Fund | 4.5 | 8.6 |
Fidelity Series Real Estate Equity Fund | 0.7 | 0.6 |
Fidelity Series Small Cap Opportunities Fund | 2.9 | 2.2 |
| 44.8 | 44.5 |
Developed International Equity Funds | | |
Fidelity Series International Growth Fund | 6.7 | 6.7 |
Fidelity Series International Small Cap Fund | 1.4 | 1.4 |
Fidelity Series International Value Fund | 6.6 | 6.7 |
| 14.7 | 14.8 |
Emerging Markets Equity Funds | | |
Fidelity Series Emerging Markets Fund | 4.0 | 4.2 |
High Yield Bond Funds | | |
Fidelity Series Emerging Markets Debt Fund | 0.7 | 0.6 |
Fidelity Series Floating Rate High Income Fund | 0.8 | 0.8 |
Fidelity Series High Income Fund | 7.0 | 7.0 |
Fidelity Series Real Estate Income Fund | 0.5 | 0.4 |
| 9.0 | 8.8 |
Inflation-Protected Bond Funds | | |
Fidelity Series Inflation-Protected Bond Index Fund | 2.5 | 2.2 |
Investment Grade Bond Funds | | |
Fidelity Series Investment Grade Bond Fund | 17.4 | 17.6 |
Net Other Assets (Liabilities)* | 0.0 | 0.0 |
| 100.0 | 100.0 |
* Amount represents less than 0.1% |
Asset Allocation (% of fund's net assets) |
Period end |
| Commodity Funds | 7.6% | |
| Domestic Equity Funds | 44.8% | |
| Developed International Equity Funds | 14.7% | |
| Emerging Markets
Equity Funds | 4.0% | |
| High Yield Bond Funds | 9.0% | |
 | Inflation-Protected
Bond Funds | 2.5% | |
| Investment Grade
Bond Funds | 17.4% | |

Six months ago |
| Commodity Funds | 7.9% | |
| Domestic Equity Funds | 44.5% | |
| Developed International Equity Funds | 14.8% | |
| Emerging Markets
Equity Funds | 4.2% | |
| High Yield Bond Funds | 8.8% | |
| Inflation-Protected
Bond Funds | 2.2% | |
| Investment Grade
Bond Funds | 17.6% | |

Expected |
| Commodity Funds | 7.7% | |
| Domestic Equity Funds | 43.8% | |
| Developed International Equity Funds | 14.4% | |
| Emerging Markets
Equity Funds | 4.3% | |
| High Yield Bond Funds | 7.5% | |
| Inflation-Protected
Bond Funds | 3.1% | |
| Investment Grade
Bond Funds | 19.2% | |

The fund invests according to an asset allocation strategy that becomes increasingly conservative over time. The six months ago allocation is based on the fund's holdings as of September 30, 2012. The current allocation is based on the fund's holdings as of March 31, 2013. The expected allocation represents the fund's anticipated allocation at September 30, 2013. |
Annual Report
Fidelity Advisor Freedom 2030 Fund
Investments March 31, 2013
Showing Percentage of Net Assets
Domestic Equity Funds - 52.4% |
| Shares | | Value |
Commodity Funds - 7.6% |
Fidelity Series Commodity Strategy Fund (a) | 25,664,537 | | $ 223,024,825 |
Domestic Equity Funds - 44.8% |
Fidelity Advisor Equity Growth Fund Institutional Class | 2,536,195 | | 179,689,389 |
Fidelity Advisor Growth & Income Fund Institutional Class | 4,310,312 | | 95,214,795 |
Fidelity Advisor Large Cap Fund Institutional Class | 4,044,418 | | 96,135,812 |
Fidelity Advisor Series Equity-Income Fund | 11,377,808 | | 126,635,001 |
Fidelity Advisor Series Mega Cap Fund | 2,537,842 | | 28,043,155 |
Fidelity Advisor Series Opportunistic Insights Fund | 8,127,300 | | 89,481,574 |
Fidelity Advisor Series Stock Selector Large Cap Value Fund | 11,398,278 | | 127,546,729 |
Fidelity Advisor Small Cap Fund Institutional Class | 2,738,474 | | 73,801,869 |
Fidelity Series 100 Index Fund | 2,861,118 | | 29,526,733 |
Fidelity Series All-Sector Equity Fund | 18,519,121 | | 237,970,708 |
Fidelity Series Large Cap Value Fund | 11,531,744 | | 134,229,504 |
Fidelity Series Real Estate Equity Fund | 1,524,480 | | 19,848,733 |
Fidelity Series Small Cap Opportunities Fund | 6,964,137 | | 85,867,813 |
TOTAL DOMESTIC EQUITY FUNDS | | 1,323,991,815 |
TOTAL DOMESTIC EQUITY FUNDS (Cost $1,403,720,626) |
1,547,016,640
|
International Equity Funds - 18.7% |
| | | |
Developed International Equity Funds - 14.7% |
Fidelity Series International Growth Fund | 15,588,426 | | 197,193,583 |
Fidelity Series International Small Cap Fund | 2,926,867 | | 40,156,611 |
Fidelity Series International Value Fund | 19,915,996 | | 195,575,080 |
TOTAL DEVELOPED INTERNATIONAL EQUITY FUNDS | | 432,925,274 |
|
| Shares | | Value |
Emerging Markets Equity Funds - 4.0% |
Fidelity Series Emerging Markets Fund | 7,118,422 | | $ 119,091,201 |
TOTAL INTERNATIONAL EQUITY FUNDS (Cost $490,833,118) |
552,016,475
|
Bond Funds - 28.9% |
| | | |
High Yield Bond Funds - 9.0% |
Fidelity Series Emerging Markets Debt Fund | 1,982,274 | | 21,567,139 |
Fidelity Series Floating Rate High Income Fund | 2,338,389 | | 24,857,076 |
Fidelity Series High Income Fund | 19,636,999 | | 206,384,861 |
Fidelity Series Real Estate Income Fund | 1,230,314 | | 14,357,770 |
TOTAL HIGH YIELD BOND FUNDS | | 267,166,846 |
Inflation-Protected Bond Funds - 2.5% |
Fidelity Series Inflation-Protected Bond Index Fund | 6,591,072 | | 75,072,305 |
Investment Grade Bond Funds - 17.4% |
Fidelity Series Investment Grade Bond Fund | 44,516,226 | | 513,272,085 |
TOTAL BOND FUNDS (Cost $838,683,219) |
855,511,236
|
TOTAL INVESTMENT PORTFOLIO - 100.0% (Cost $2,733,236,963) | | 2,954,544,351 |
NET OTHER ASSETS (LIABILITIES) - 0.0% | | (603,837) |
NET ASSETS - 100% | $ 2,953,940,514 |
Legend |
(a) Non-income producing |
Other Information |
All investments are categorized as Level 1 under the Fair Value Hierarchy. The inputs or methodology used for valuing securities may not be an indication of the risk associated with investing in those securities. For more information on valuation inputs, please refer to the Security Valuation section in the accompanying Notes to Financial Statements. |
See accompanying notes which are an integral part of the financial statements.
Annual Report
Fidelity Advisor Freedom 2030 Fund
Statement of Assets and Liabilities
| March 31, 2013 |
| | |
Assets | | |
Investment in securities, at value (cost $2,733,236,963) - See accompanying schedule | | $ 2,954,544,351 |
Cash | | 16,515 |
Receivable for investments sold | | 961,656 |
Receivable for fund shares sold | | 3,376,401 |
Receivable from affiliate for expense reductions | | 2,543 |
Total assets | | 2,958,901,466 |
| | |
Liabilities | | |
Payable for investments purchased | $ 10,256 | |
Payable for fund shares redeemed | 4,344,383 | |
Distribution and service plan fees payable | 606,313 | |
Total liabilities | | 4,960,952 |
| | |
Net Assets | | $ 2,953,940,514 |
Net Assets consist of: | | |
Paid in capital | | $ 2,659,119,760 |
Undistributed net investment income | | 4,097,771 |
Accumulated undistributed net realized gain (loss) on investments | | 69,415,595 |
Net unrealized appreciation (depreciation) on investments | | 221,307,388 |
Net Assets | | $ 2,953,940,514 |
| | |
Calculation of Maximum Offering Price Class A:
Net Asset Value and redemption price per share ($1,747,548,664 ÷ 130,802,907 shares) | | $ 13.36 |
| | |
Maximum offering price per share (100/94.25 of $13.36) | | $ 14.18 |
Class T:
Net Asset Value and redemption price per share ($387,101,717 ÷ 29,058,407 shares) | | $ 13.32 |
| | |
Maximum offering price per share (100/96.50 of $13.32) | | $ 13.80 |
Class B:
Net Asset Value and offering price per share ($27,191,043 ÷ 2,045,740 shares)A | | $ 13.29 |
| | |
Class C:
Net Asset Value and offering price per share ($75,384,278 ÷ 5,697,106 shares)A | | $ 13.23 |
| | |
Institutional Class:
Net Asset Value, offering price and redemption price per share ($716,714,812 ÷ 53,391,541 shares) | | $ 13.42 |
A Redemption price per share is equal to net asset value less any applicable contingent deferred sales charge.
Statement of Operations
| Year ended March 31, 2013 |
| | |
Investment Income | | |
Income distributions from underlying funds | | $ 47,876,470 |
| | |
Expenses | | |
Distribution and service plan fees | $ 6,661,679 | |
Independent trustees' compensation | 9,385 | |
Total expenses before reductions | 6,671,064 | |
Expense reductions | (9,385) | 6,661,679 |
Net investment income (loss) | | 41,214,791 |
Realized and Unrealized Gain (Loss) Realized gain (loss) on sale of underlying fund shares | 106,179,779 | |
Capital gain distributions from underlying funds | 59,827,457 | |
Total net realized gain (loss) | | 166,007,236 |
Change in net unrealized appreciation (depreciation) on underlying funds | | 37,190,757 |
Net gain (loss) | | 203,197,993 |
Net increase (decrease) in net assets resulting from operations | | $ 244,412,784 |
See accompanying notes which are an integral part of the financial statements.
Annual Report
Statement of Changes in Net Assets
| Year ended
March 31,
2013 | Year ended
March 31,
2012 |
Increase (Decrease) in Net Assets | | |
Operations | | |
Net investment income (loss) | $ 41,214,791 | $ 33,350,591 |
Net realized gain (loss) | 166,007,236 | 105,028,851 |
Change in net unrealized appreciation (depreciation) | 37,190,757 | (97,033,979) |
Net increase (decrease) in net assets resulting from operations | 244,412,784 | 41,345,463 |
Distributions to shareholders from net investment income | (40,765,226) | (31,808,537) |
Distributions to shareholders from net realized gain | (13,074,704) | (34,249,192) |
Total distributions | (53,839,930) | (66,057,729) |
Share transactions - net increase (decrease) | 314,631,239 | 347,268,422 |
Total increase (decrease) in net assets | 505,204,093 | 322,556,156 |
| | |
Net Assets | | |
Beginning of period | 2,448,736,421 | 2,126,180,265 |
End of period (including undistributed net investment income of $4,097,771 and undistributed net investment income of $3,648,204, respectively) | $ 2,953,940,514 | $ 2,448,736,421 |
Financial Highlights - Class A
Years ended March 31, | 2013 | 2012 | 2011 | 2010 | 2009 |
Selected Per-Share Data | | | | | |
Net asset value, beginning of period | $ 12.48 | $ 12.72 | $ 11.29 | $ 7.69 | $ 13.29 |
Income from Investment Operations | | | | | |
Net investment income (loss) C | .20 | .19 | .16 | .16 | .21 |
Net realized and unrealized gain (loss) | .94 | (.06) E | 1.54 | 3.68 | (5.10) |
Total from investment operations | 1.14 | .13 | 1.70 | 3.84 | (4.89) |
Distributions from net investment income | (.20) | (.18) | (.16) | (.15) | (.21) |
Distributions from net realized gain | (.06) | (.19) | (.11) | (.09) | (.50) |
Total distributions | (.26) | (.37) | (.27) | (.24) G | (.71) |
Net asset value, end of period | $ 13.36 | $ 12.48 | $ 12.72 | $ 11.29 | $ 7.69 |
Total Return A, B | 9.25% | 1.25% | 15.27% | 50.17% | (38.49)% |
Ratios to Average Net Assets D, F | | | | | |
Expenses before reductions | .25% | .25% | .25% | .25% | .25% |
Expenses net of fee waivers, if any | .25% | .25% | .25% | .25% | .25% |
Expenses net of all reductions | .25% | .25% | .25% | .25% | .25% |
Net investment income (loss) | 1.58% | 1.57% | 1.38% | 1.61% | 2.08% |
Supplemental Data | | | | | |
Net assets, end of period (000 omitted) | $ 1,747,549 | $ 1,506,827 | $ 1,340,583 | $ 1,030,972 | $ 527,042 |
Portfolio turnover rate | 23% | 16% | 38% | 20% | 22% |
A Total returns would have been lower if certain expenses had not been reduced during the applicable periods shown.
B Total returns do not include the effect of the sales charges.
C Calculated based on average shares outstanding during the period.
D Amounts do not include the activity of the Underlying Funds.
E The amount shown for a share outstanding does not correspond with the aggregate net gain (loss) on investments for the period due to the timing of sales and repurchases of shares in relation to fluctuating market values of the investments of the Fund.
F Expense ratios reflect operating expenses of the class. Expenses before reductions do not reflect amounts reimbursed by the investment adviser or reductions from expense offset arrangements and do not represent the amount paid by the class during periods when reimbursements or reductions occur. Expenses net of fee waivers reflect expenses after reimbursement by the investment adviser but prior to reductions from expense offset arrangements. Expenses net of all reductions represent the net expenses paid by the class but do not include expenses of the investment companies in which the Fund invests.
G Total distributions of $.24 per share is comprised of distributions from net investment income of $.151 and distributions from net realized gain of $.093 per share.
See accompanying notes which are an integral part of the financial statements.
Annual Report
Financial Highlights - Class T
Years ended March 31, | 2013 | 2012 | 2011 | 2010 | 2009 |
Selected Per-Share Data | | | | | |
Net asset value, beginning of period | $ 12.44 | $ 12.68 | $ 11.25 | $ 7.67 | $ 13.25 |
Income from Investment Operations | | | | | |
Net investment income (loss) C | .17 | .16 | .13 | .14 | .19 |
Net realized and unrealized gain (loss) | .94 | (.06) E | 1.54 | 3.66 | (5.09) |
Total from investment operations | 1.11 | .10 | 1.67 | 3.80 | (4.90) |
Distributions from net investment income | (.17) | (.15) | (.13) | (.13) | (.18) |
Distributions from net realized gain | (.06) | (.19) | (.11) | (.09) | (.50) |
Total distributions | (.23) | (.34) | (.24) | (.22) G | (.68) |
Net asset value, end of period | $ 13.32 | $ 12.44 | $ 12.68 | $ 11.25 | $ 7.67 |
Total Return A, B | 9.02% | .98% | 14.98% | 49.72% | (38.62)% |
Ratios to Average Net Assets D, F | | | | | |
Expenses before reductions | .50% | .50% | .50% | .50% | .50% |
Expenses net of fee waivers, if any | .50% | .50% | .50% | .50% | .50% |
Expenses net of all reductions | .50% | .50% | .50% | .50% | .50% |
Net investment income (loss) | 1.33% | 1.32% | 1.12% | 1.36% | 1.83% |
Supplemental Data | | | | | |
Net assets, end of period (000 omitted) | $ 387,102 | $ 335,407 | $ 348,443 | $ 382,092 | $ 236,333 |
Portfolio turnover rate | 23% | 16% | 38% | 20% | 22% |
A Total returns would have been lower if certain expenses had not been reduced during the applicable periods shown.
B Total returns do not include the effect of the sales charges.
C Calculated based on average shares outstanding during the period.
D Amounts do not include the activity of the Underlying Funds.
E The amount shown for a share outstanding does not correspond with the aggregate net gain (loss) on investments for the period due to the timing of sales and repurchases of shares in relation to fluctuating market values of the investments of the Fund.
F Expense ratios reflect operating expenses of the class. Expenses before reductions do not reflect amounts reimbursed by the investment adviser or reductions from expense offset arrangements and do not represent the amount paid by the class during periods when reimbursements or reductions occur. Expenses net of fee waivers reflect expenses after reimbursement by the investment adviser but prior to reductions from expense offset arrangements. Expenses net of all reductions represent the net expenses paid by the class but do not include expenses of the investment companies in which the Fund invests.
G Total distributions of $.22 per share is comprised of distributions from net investment income of $.128 and distributions from net realized gain of $.093 per share.
Financial Highlights - Class B
Years ended March 31, | 2013 | 2012 | 2011 | 2010 | 2009 |
Selected Per-Share Data | | | | | |
Net asset value, beginning of period | $ 12.41 | $ 12.63 | $ 11.21 | $ 7.64 | $ 13.17 |
Income from Investment Operations | | | | | |
Net investment income (loss) C | .10 | .10 | .07 | .09 | .14 |
Net realized and unrealized gain (loss) | .94 | (.06) E | 1.53 | 3.65 | (5.06) |
Total from investment operations | 1.04 | .04 | 1.60 | 3.74 | (4.92) |
Distributions from net investment income | (.10) | (.08) | (.07) | (.08) | (.11) |
Distributions from net realized gain | (.06) | (.18) | (.11) | (.09) | (.50) |
Total distributions | (.16) | (.26) | (.18) | (.17) G | (.61) |
Net asset value, end of period | $ 13.29 | $ 12.41 | $ 12.63 | $ 11.21 | $ 7.64 |
Total Return A, B | 8.44% | .52% | 14.38% | 49.07% | (38.94)% |
Ratios to Average Net Assets D, F | | | | | |
Expenses before reductions | 1.00% | 1.00% | 1.00% | 1.00% | 1.00% |
Expenses net of fee waivers, if any | 1.00% | 1.00% | 1.00% | 1.00% | 1.00% |
Expenses net of all reductions | 1.00% | 1.00% | 1.00% | 1.00% | 1.00% |
Net investment income (loss) | .83% | .82% | .62% | .86% | 1.33% |
Supplemental Data | | | | | |
Net assets, end of period (000 omitted) | $ 27,191 | $ 34,324 | $ 47,275 | $ 51,360 | $ 35,701 |
Portfolio turnover rate | 23% | 16% | 38% | 20% | 22% |
A Total returns would have been lower if certain expenses had not been reduced during the applicable periods shown.
B Total returns do not include the effect of the contingent deferred sales charge.
C Calculated based on average shares outstanding during the period.
D Amounts do not include the activity of the Underlying Funds.
E The amount shown for a share outstanding does not correspond with the aggregate net gain (loss) on investments for the period due to the timing of sales and repurchases of shares in relation to fluctuating market values of the investments of the Fund.
F Expense ratios reflect operating expenses of the class. Expenses before reductions do not reflect amounts reimbursed by the investment adviser or reductions from expense offset arrangements and do not represent the amount paid by the class during periods when reimbursements or reductions occur. Expenses net of fee waivers reflect expenses after reimbursement by the investment adviser but prior to reductions from expense offset arrangements. Expenses net of all reductions represent the net expenses paid by the class but do not include expenses of the investment companies in which the Fund invests.
G Total distributions of $.17 per share is comprised of distributions from net investment income of $.080 and distributions from net realized gain of $.092 per share.
See accompanying notes which are an integral part of the financial statements.
Annual Report
Financial Highlights - Class C
Years ended March 31, | 2013 | 2012 | 2011 | 2010 | 2009 |
Selected Per-Share Data | | | | | |
Net asset value, beginning of period | $ 12.37 | $ 12.60 | $ 11.19 | $ 7.63 | $ 13.17 |
Income from Investment Operations | | | | | |
Net investment income (loss) C | .10 | .10 | .07 | .09 | .14 |
Net realized and unrealized gain (loss) | .93 | (.05) E | 1.53 | 3.65 | (5.06) |
Total from investment operations | 1.03 | .05 | 1.60 | 3.74 | (4.92) |
Distributions from net investment income | (.11) | (.09) | (.08) | (.08) | (.12) |
Distributions from net realized gain | (.06) | (.18) | (.11) | (.09) | (.50) |
Total distributions | (.17) | (.28) H | (.19) | (.18) G | (.62) |
Net asset value, end of period | $ 13.23 | $ 12.37 | $ 12.60 | $ 11.19 | $ 7.63 |
Total Return A, B | 8.39% | .55% | 14.38% | 49.06% | (38.96)% |
Ratios to Average Net Assets D, F | | | | | |
Expenses before reductions | 1.00% | 1.00% | 1.00% | 1.00% | 1.00% |
Expenses net of fee waivers, if any | 1.00% | 1.00% | 1.00% | 1.00% | 1.00% |
Expenses net of all reductions | 1.00% | 1.00% | 1.00% | 1.00% | 1.00% |
Net investment income (loss) | .83% | .82% | .63% | .86% | 1.33% |
Supplemental Data | | | | | |
Net assets, end of period (000 omitted) | $ 75,384 | $ 66,418 | $ 68,349 | $ 63,700 | $ 40,294 |
Portfolio turnover rate | 23% | 16% | 38% | 20% | 22% |
A Total returns would have been lower if certain expenses had not been reduced during the applicable periods shown.
B Total returns do not include the effect of the contingent deferred sales charge.
C Calculated based on average shares outstanding during the period.
D Amounts do not include the activity of the Underlying Funds.
E The amount shown for a share outstanding does not correspond with the aggregate net gain (loss) on investments for the period due to the timing of sales and repurchases of shares in relation to fluctuating market values of the investments of the Fund.
F Expense ratios reflect operating expenses of the class. Expenses before reductions do not reflect amounts reimbursed by the investment adviser or reductions from expense offset arrangements and do not represent the amount paid by the class during periods when reimbursements or reductions occur. Expenses net of fee waivers reflect expenses after reimbursement by the investment adviser but prior to reductions from expense offset arrangements. Expenses net of all reductions represent the net expenses paid by the class but do not include expenses of the investment companies in which the Fund invests.
G Total distributions of $.18 per share is comprised of distributions from net investment income of $.083 and distributions from net realized gain of $.093 per share.
H Total distributions of $.28 per share is comprised of distributions from net investment income of $.094 and distributions from net realized gain of $.182 per share.
Financial Highlights - Institutional Class
Years ended March 31, | 2013 | 2012 | 2011 | 2010 | 2009 |
Selected Per-Share Data | | | | | |
Net asset value, beginning of period | $ 12.54 | $ 12.77 | $ 11.33 | $ 7.72 | $ 13.34 |
Income from Investment Operations | | | | | |
Net investment income (loss) B | .23 | .22 | .19 | .19 | .23 |
Net realized and unrealized gain (loss) | .94 | (.05) E | 1.55 | 3.69 | (5.11) |
Total from investment operations | 1.17 | .17 | 1.74 | 3.88 | (4.88) |
Distributions from net investment income | (.23) | (.21) | (.19) | (.17) | (.24) |
Distributions from net realized gain | (.06) | (.19) | (.11) | (.09) | (.50) |
Total distributions | (.29) | (.40) | (.30) | (.27) G | (.74) |
Net asset value, end of period | $ 13.42 | $ 12.54 | $ 12.77 | $ 11.33 | $ 7.72 |
Total Return A | 9.47% | 1.57% | 15.56% | 50.42% | (38.31)% |
Ratios to Average Net Assets C, F | | | | | |
Expenses before reductions D | .00% | .00% | .00% | .00% | .00% |
Expenses net of fee waivers, if any | .00% | .00% | .00% | .00% | .00% |
Expenses net of all reductions | .00% | .00% | .00% | .00% | .00% |
Net investment income (loss) | 1.83% | 1.82% | 1.62% | 1.86% | 2.33% |
Supplemental Data | | | | | |
Net assets, end of period (000 omitted) | $ 716,715 | $ 505,761 | $ 321,529 | $ 178,232 | $ 82,534 |
Portfolio turnover rate | 23% | 16% | 38% | 20% | 22% |
A Total returns would have been lower if certain expenses had not been reduced during the applicable periods shown.
B Calculated based on average shares outstanding during the period.
C Amounts do not include the activity of the Underlying Funds.
D Amount represents less than .01%.
E The amount shown for a share outstanding does not correspond with the aggregate net gain (loss) on investments for the period due to the timing of sales and repurchases of shares in relation to fluctuating market values of the investments of the Fund.
F Expense ratios reflect operating expenses of the class. Expenses before reductions do not reflect amounts reimbursed by the investment adviser or reductions from expense offset arrangements and do not represent the amount paid by the class during periods when reimbursements or reductions occur. Expenses net of fee waivers reflect expenses after reimbursement by the investment adviser but prior to reductions from expense offset arrangements. Expenses net of all reductions represent the net expenses paid by the class but do not include expenses of the investment companies in which the Fund invests.
G Total distributions of $.27 per share is comprised of distributions from net investment income of $.173 and distributions from net realized gain of $.093 per share.
See accompanying notes which are an integral part of the financial statements.
Annual Report
Fidelity Advisor Freedom 2035 Fund
Investment Changes (Unaudited)
The information in the following tables is based on the direct investments of the Fund. |
Fund Holdings as of March 31, 2013 |
| % of fund's
net assets | % of fund's net assets
6 months ago |
Commodity Funds | | |
Fidelity Series Commodity Strategy Fund | 8.7 | 9.1 |
Domestic Equity Funds | | |
Fidelity Advisor Equity Growth Fund Institutional Class | 7.0 | 6.1 |
Fidelity Advisor Growth & Income Fund Institutional Class | 3.7 | 7.3 |
Fidelity Advisor Large Cap Fund Institutional Class | 3.8 | 6.8 |
Fidelity Advisor Series Equity-Income Fund | 4.9 | 0.0 |
Fidelity Advisor Series Mega Cap Fund | 1.1 | 0.0 |
Fidelity Advisor Series Opportunistic Insights Fund | 3.4 | 0.0 |
Fidelity Advisor Series Stock Selector Large Cap Value Fund | 4.9 | 0.0 |
Fidelity Advisor Small Cap Fund Institutional Class | 2.9 | 2.4 |
Fidelity Series 100 Index Fund | 1.1 | 4.9 |
Fidelity Series All-Sector Equity Fund | 9.3 | 10.5 |
Fidelity Series Large Cap Value Fund | 5.3 | 9.9 |
Fidelity Series Real Estate Equity Fund | 0.8 | 0.7 |
Fidelity Series Small Cap Opportunities Fund | 3.3 | 2.5 |
| 51.5 | 51.1 |
Developed International Equity Funds | | |
Fidelity Series International Growth Fund | 7.6 | 7.7 |
Fidelity Series International Small Cap Fund | 1.6 | 1.6 |
Fidelity Series International Value Fund | 7.6 | 7.7 |
| 16.8 | 17.0 |
Emerging Markets Equity Funds | | |
Fidelity Series Emerging Markets Fund | 4.6 | 4.9 |
High Yield Bond Funds | | |
Fidelity Series Emerging Markets Debt Fund | 0.7 | 0.7 |
Fidelity Series Floating Rate High Income Fund | 0.8 | 0.4 |
Fidelity Series High Income Fund | 6.9 | 6.9 |
Fidelity Series Real Estate Income Fund | 0.4 | 0.2 |
| 8.8 | 8.2 |
Investment Grade Bond Funds | | |
Fidelity Series Investment Grade Bond Fund | 9.6 | 9.7 |
Net Other Assets (Liabilities)* | 0.0 | 0.0 |
| 100.0 | 100.0 |
* Amount represents less than 0.1% |
Asset Allocation (% of fund's net assets) |
Period end |
| Commodity Funds | 8.7% | |
| Domestic Equity Funds | 51.5% | |
| Developed International Equity Funds | 16.8% | |
| Emerging Markets
Equity Funds | 4.6% | |
| High Yield Bond Funds | 8.8% | |
| Investment Grade
Bond Funds | 9.6% | |

Six months ago |
| Commodity Funds | 9.1% | |
| Domestic Equity Funds | 51.1% | |
| Developed International Equity Funds | 17.0% | |
| Emerging Markets
Equity Funds | 4.9% | |
| High Yield Bond Funds | 8.2% | |
| Investment Grade
Bond Funds | 9.7% | |

Expected |
| Commodity Funds | 8.8% | |
| Domestic Equity Funds | 50.0% | |
| Developed International Equity Funds | 16.5% | |
| Emerging Markets
Equity Funds | 4.9% | |
| High Yield Bond Funds | 7.5% | |
| Investment Grade
Bond Funds | 12.2% | |
| Inflation-Protected Bond Funds | 0.1% | |

The fund invests according to an asset allocation strategy that becomes increasingly conservative over time. The six months ago allocation is based on the fund's holdings as of September 30, 2012. The current allocation is based on the fund's holdings as of March 31, 2013. The expected allocation represents the fund's anticipated allocation at September 30, 2013. |
Annual Report
Fidelity Advisor Freedom 2035 Fund
Investments March 31, 2013
Showing Percentage of Net Assets
Domestic Equity Funds - 60.2% |
| Shares | | Value |
Commodity Funds - 8.7% |
Fidelity Series Commodity Strategy Fund (a) | 20,983,863 | | $ 182,349,768 |
Domestic Equity Funds - 51.5% |
Fidelity Advisor Equity Growth Fund Institutional Class | 2,061,223 | | 146,037,675 |
Fidelity Advisor Growth & Income Fund Institutional Class | 3,510,032 | | 77,536,597 |
Fidelity Advisor Large Cap Fund Institutional Class | 3,294,173 | | 78,302,498 |
Fidelity Advisor Series Equity-Income Fund | 9,097,363 | | 101,253,648 |
Fidelity Advisor Series Mega Cap Fund | 2,029,273 | | 22,423,472 |
Fidelity Advisor Series Opportunistic Insights Fund | 6,500,234 | | 71,567,575 |
Fidelity Advisor Series Stock Selector Large Cap Value Fund | 9,114,294 | | 101,988,948 |
Fidelity Advisor Small Cap Fund Institutional Class | 2,226,569 | | 60,006,024 |
Fidelity Series 100 Index Fund | 2,335,338 | | 24,100,686 |
Fidelity Series All-Sector Equity Fund | 15,053,128 | | 193,432,696 |
Fidelity Series Large Cap Value Fund | 9,424,558 | | 109,701,861 |
Fidelity Series Real Estate Equity Fund | 1,236,445 | | 16,098,520 |
Fidelity Series Small Cap Opportunities Fund | 5,662,580 | | 69,819,611 |
TOTAL DOMESTIC EQUITY FUNDS | | 1,072,269,811 |
TOTAL DOMESTIC EQUITY FUNDS (Cost $1,146,773,607) |
1,254,619,579
|
International Equity Funds - 21.4% |
| | | |
Developed International Equity Funds - 16.8% |
Fidelity Series International Growth Fund | 12,589,365 | | 159,255,463 |
Fidelity Series International Small Cap Fund | 2,357,445 | | 32,344,142 |
Fidelity Series International Value Fund | 16,053,146 | | 157,641,894 |
TOTAL DEVELOPED INTERNATIONAL EQUITY FUNDS | | 349,241,499 |
|
| Shares | | Value |
Emerging Markets Equity Funds - 4.6% |
Fidelity Series Emerging Markets Fund | 5,764,576 | | $ 96,441,362 |
TOTAL INTERNATIONAL EQUITY FUNDS (Cost $397,271,897) |
445,682,861
|
Bond Funds - 18.4% |
| | | |
High Yield Bond Funds - 8.8% |
Fidelity Series Emerging Markets Debt Fund | 1,384,314 | | 15,061,340 |
Fidelity Series Floating Rate High Income Fund | 1,488,336 | | 15,821,013 |
Fidelity Series High Income Fund | 13,674,466 | | 143,718,637 |
Fidelity Series Real Estate Income Fund | 789,397 | | 9,212,263 |
TOTAL HIGH YIELD BOND FUNDS | | 183,813,253 |
Investment Grade Bond Funds - 9.6% |
Fidelity Series Investment Grade Bond Fund | 17,359,957 | | 200,160,305 |
TOTAL BOND FUNDS (Cost $373,778,668) |
383,973,558
|
TOTAL INVESTMENT PORTFOLIO - 100.0% (Cost $1,917,824,172) | | 2,084,275,998 |
NET OTHER ASSETS (LIABILITIES) - 0.0% | | (397,977) |
NET ASSETS - 100% | $ 2,083,878,021 |
Legend |
(a) Non-income producing |
Other Information |
All investments are categorized as Level 1 under the Fair Value Hierarchy. The inputs or methodology used for valuing securities may not be an indication of the risk associated with investing in those securities. For more information on valuation inputs, please refer to the Security Valuation section in the accompanying Notes to Financial Statements. |
See accompanying notes which are an integral part of the financial statements.
Annual Report
Fidelity Advisor Freedom 2035 Fund
Statement of Assets and Liabilities
| March 31, 2013 |
| | |
Assets | | |
Investment in securities, at value (cost $1,917,824,172) - See accompanying schedule | | $ 2,084,275,998 |
Cash | | 10 |
Receivable for investments sold | | 45,016 |
Receivable for fund shares sold | | 2,306,411 |
Receivable from affiliate for expense reductions | | 2,025 |
Total assets | | 2,086,629,460 |
| | |
Liabilities | | |
Payable for investments purchased | $ 229,389 | |
Payable for fund shares redeemed | 2,122,074 | |
Distribution and service plan fees payable | 399,976 | |
Total liabilities | | 2,751,439 |
| | |
Net Assets | | $ 2,083,878,021 |
Net Assets consist of: | | |
Paid in capital | | $ 1,843,320,829 |
Undistributed net investment income | | 2,178,145 |
Accumulated undistributed net realized gain (loss) on investments | | 71,927,221 |
Net unrealized appreciation (depreciation) on investments | | 166,451,826 |
Net Assets | | $ 2,083,878,021 |
| | |
Calculation of Maximum Offering Price Class A:
Net Asset Value and redemption price per share ($1,258,796,597 ÷ 98,826,414 shares) | | $ 12.74 |
| | |
Maximum offering price per share (100/94.25 of $12.74) | | $ 13.52 |
Class T:
Net Asset Value and redemption price per share ($216,700,905 ÷ 17,095,750 shares) | | $ 12.68 |
| | |
Maximum offering price per share (100/96.50 of $12.68) | | $ 13.14 |
Class B:
Net Asset Value and offering price per share ($17,884,087 ÷ 1,420,457 shares)A | | $ 12.59 |
| | |
Class C:
Net Asset Value and offering price per share ($43,447,033 ÷ 3,459,011 shares)A | | $ 12.56 |
| | |
| | |
Institutional Class:
Net Asset Value, offering price and redemption price per share ($547,049,399 ÷ 42,732,015 shares) | | $ 12.80 |
A Redemption price per share is equal to net asset value less any applicable contingent deferred sales charge.
Statement of Operations
| Year ended March 31, 2013 |
| | |
Investment Income | | |
Income distributions from underlying funds | | $ 32,037,128 |
| | |
Expenses | | |
Distribution and service plan fees | $ 4,292,442 | |
Independent trustees' compensation | 6,390 | |
Total expenses before reductions | 4,298,832 | |
Expense reductions | (6,390) | 4,292,442 |
Net investment income | | 27,744,686 |
Realized and Unrealized Gain (Loss) Realized gain (loss) on sale of underlying fund shares | 77,307,662 | |
Capital gain distributions from underlying funds | 38,999,365 | |
Total net realized gain (loss) | | 116,307,027 |
Change in net unrealized appreciation (depreciation) on underlying funds | | 38,369,090 |
Net gain (loss) | | 154,676,117 |
Net increase (decrease) in net assets resulting from operations | | $ 182,420,803 |
See accompanying notes which are an integral part of the financial statements.
Annual Report
Statement of Changes in Net Assets
| Year ended
March 31,
2013 | Year ended
March 31,
2012 |
Increase (Decrease) in Net Assets | | |
Operations | | |
Net investment income | $ 27,744,686 | $ 19,358,537 |
Net realized gain (loss) | 116,307,027 | 51,989,047 |
Change in net unrealized appreciation (depreciation) | 38,369,090 | (49,807,030) |
Net increase (decrease) in net assets resulting from operations | 182,420,803 | 21,540,554 |
Distributions to shareholders from net investment income | (27,167,238) | (18,511,496) |
Distributions to shareholders from net realized gain | (5,583,432) | (23,728,615) |
Total distributions | (32,750,670) | (42,240,111) |
Share transactions - net increase (decrease) | 289,056,044 | 306,672,323 |
Total increase (decrease) in net assets | 438,726,177 | 285,972,766 |
| | |
Net Assets | | |
Beginning of period | 1,645,151,844 | 1,359,179,078 |
End of period (including undistributed net investment income of $2,178,145 and undistributed net investment income of $1,600,697, respectively) | $ 2,083,878,021 | $ 1,645,151,844 |
Financial Highlights - Class A
Years ended March 31, | 2013 | 2012 | 2011 | 2010 | 2009 |
Selected Per-Share Data | | | | | |
Net asset value, beginning of period | $ 11.80 | $ 12.11 | $ 10.65 | $ 7.18 | $ 12.53 |
Income from Investment Operations | | | | | |
Net investment income (loss) C | .18 | .16 | .14 | .14 | .20 |
Net realized and unrealized gain (loss) | .97 | (.13) E | 1.56 | 3.55 | (4.92) |
Total from investment operations | 1.15 | .03 | 1.70 | 3.69 | (4.72) |
Distributions from net investment income | (.18) | (.15) | (.13) | (.14) | (.18) |
Distributions from net realized gain | (.04) | (.19) | (.11) | (.08) | (.45) |
Total distributions | (.21) H | (.34) | (.24) | (.22) | (.63) G |
Net asset value, end of period | $ 12.74 | $ 11.80 | $ 12.11 | $ 10.65 | $ 7.18 |
Total Return A, B | 9.89% | .47% | 16.13% | 51.59% | (39.29)% |
Ratios to Average Net Assets D, F | | | | | |
Expenses before reductions | .25% | .25% | .25% | .25% | .25% |
Expenses net of fee waivers, if any | .25% | .25% | .25% | .25% | .25% |
Expenses net of all reductions | .25% | .25% | .25% | .25% | .25% |
Net investment income (loss) | 1.54% | 1.39% | 1.26% | 1.51% | 2.04% |
Supplemental Data | | | | | |
Net assets, end of period (000 omitted) | $ 1,258,797 | $ 1,057,102 | $ 906,896 | $ 669,450 | $ 314,996 |
Portfolio turnover rate | 25% | 13% | 30% | 16% | 21% |
A Total returns would have been lower if certain expenses had not been reduced during the applicable periods shown.
B Total returns do not include the effect of the sales charges.
C Calculated based on average shares outstanding during the period.
D Amounts do not include the activity of the Underlying Funds.
E The amount shown for a share outstanding does not correspond with the aggregate net gain (loss) on investments for the period due to the timing of sales and repurchases of shares in relation to fluctuating market values of the investments of the Fund.
F Expense ratios reflect operating expenses of the class. Expenses before reductions do not reflect amounts reimbursed by the investment adviser or reductions from expense offset arrangements and do not represent the amount paid by the class during periods when reimbursements or reductions occur. Expenses net of fee waivers reflect expenses after reimbursement by the investment adviser but prior to reductions from expense offset arrangements. Expenses net of all reductions represent the net expenses paid by the class but do not include expenses of the investment companies in which the Fund invests.
G Total distributions of $.63 per share is comprised of distributions from net investment income of $.182 and distributions from net realized gain of $.445 per share.
H Total distributions of $.21 per share is comprised of distributions from net investment income of $.175 and distributions from net realized gain of $.036 per share.
See accompanying notes which are an integral part of the financial statements.
Annual Report
Financial Highlights - Class T
Years ended March 31, | 2013 | 2012 | 2011 | 2010 | 2009 |
Selected Per-Share Data | | | | | |
Net asset value, beginning of period | $ 11.74 | $ 12.05 | $ 10.60 | $ 7.15 | $ 12.47 |
Income from Investment Operations | | | | | |
Net investment income (loss) C | .15 | .13 | .11 | .12 | .17 |
Net realized and unrealized gain (loss) | .97 | (.13) E | 1.55 | 3.53 | (4.89) |
Total from investment operations | 1.12 | - | 1.66 | 3.65 | (4.72) |
Distributions from net investment income | (.15) | (.12) | (.11) | (.12) | (.16) |
Distributions from net realized gain | (.04) | (.19) | (.11) | (.08) | (.45) |
Total distributions | (.18) I | (.31) | (.21) H | (.20) | (.60) G |
Net asset value, end of period | $ 12.68 | $ 11.74 | $ 12.05 | $ 10.60 | $ 7.15 |
Total Return A, B | 9.69% | .19% | 15.84% | 51.17% | (39.42)% |
Ratios to Average Net Assets D, F | | | | | |
Expenses before reductions | .50% | .50% | .50% | .50% | .50% |
Expenses net of fee waivers, if any | .50% | .50% | .50% | .50% | .50% |
Expenses net of all reductions | .50% | .50% | .50% | .50% | .50% |
Net investment income (loss) | 1.29% | 1.14% | 1.01% | 1.26% | 1.79% |
Supplemental Data | | | | | |
Net assets, end of period (000 omitted) | $ 216,701 | $ 166,843 | $ 169,442 | $ 143,106 | $ 81,463 |
Portfolio turnover rate | 25% | 13% | 30% | 16% | 21% |
A Total returns would have been lower if certain expenses had not been reduced during the applicable periods shown.
B Total returns do not include the effect of the sales charges.
C Calculated based on average shares outstanding during the period.
D Amounts do not include the activity of the Underlying Funds.
E The amount shown for a share outstanding does not correspond with the aggregate net gain (loss) on investments for the period due to the timing of sales and repurchases of shares in relation to fluctuating market values of the investments of the Fund.
F Expense ratios reflect operating expenses of the class. Expenses before reductions do not reflect amounts reimbursed by the investment adviser or reductions from expense offset arrangements and do not represent the amount paid by the class during periods when reimbursements or reductions occur. Expenses net of fee waivers reflect expenses after reimbursement by the investment adviser but prior to reductions from expense offset arrangements. Expenses net of all reductions represent the net expenses paid by the class but do not include expenses of the investment companies in which the Fund invests.
G Total distributions of $.60 per share is comprised of distributions from net investment income of $.156 and distributions from net realized gain of $.445 per share.
H Total distributions of $.21 per share is comprised of distributions from net investment income of $.106 and distributions from net realized gain of $.105 per share.
I Total distributions of $.18 per share is comprised of distributions from net investment income of $.148 and distributions from net realized gain of $.036 per share.
Financial Highlights - Class B
Years ended March 31, | 2013 | 2012 | 2011 | 2010 | 2009 |
Selected Per-Share Data | | | | | |
Net asset value, beginning of period | $ 11.67 | $ 11.96 | $ 10.52 | $ 7.10 | $ 12.38 |
Income from Investment Operations | | | | | |
Net investment income (loss) C | .09 | .07 | .05 | .07 | .13 |
Net realized and unrealized gain (loss) | .95 | (.12) E | 1.55 | 3.50 | (4.86) |
Total from investment operations | 1.04 | (.05) | 1.60 | 3.57 | (4.73) |
Distributions from net investment income | (.09) | (.07) | (.06) | (.07) | (.10) |
Distributions from net realized gain | (.04) | (.17) | (.10) | (.08) | (.45) |
Total distributions | (.12) H | (.24) | (.16) | (.15) | (.55) G |
Net asset value, end of period | $ 12.59 | $ 11.67 | $ 11.96 | $ 10.52 | $ 7.10 |
Total Return A, B | 9.02% | (.23)% | 15.28% | 50.43% | (39.76)% |
Ratios to Average Net Assets D, F | | | | | |
Expenses before reductions | 1.00% | 1.00% | 1.00% | 1.00% | 1.00% |
Expenses net of fee waivers, if any | 1.00% | 1.00% | 1.00% | 1.00% | 1.00% |
Expenses net of all reductions | 1.00% | 1.00% | 1.00% | 1.00% | 1.00% |
Net investment income (loss) | .79% | .64% | .51% | .76% | 1.30% |
Supplemental Data | | | | | |
Net assets, end of period (000 omitted) | $ 17,884 | $ 22,013 | $ 28,360 | $ 27,408 | $ 17,892 |
Portfolio turnover rate | 25% | 13% | 30% | 16% | 21% |
A Total returns would have been lower if certain expenses had not been reduced during the applicable periods shown.
B Total returns do not include the effect of the contingent deferred sales charge.
C Calculated based on average shares outstanding during the period.
D Amounts do not include the activity of the Underlying Funds.
E The amount shown for a share outstanding does not correspond with the aggregate net gain (loss) on investments for the period due to the timing of sales and repurchases of shares in relation to fluctuating market values of the investments of the Fund.
F Expense ratios reflect operating expenses of the class. Expenses before reductions do not reflect amounts reimbursed by the investment adviser or reductions from expense offset arrangements and do not represent the amount paid by the class during periods when reimbursements or reductions occur. Expenses net of fee waivers reflect expenses after reimbursement by the investment adviser but prior to reductions from expense offset arrangements. Expenses net of all reductions represent the net expenses paid by the class but do not include expenses of the investment companies in which the Fund invests.
G Total distributions of $.55 per share is comprised of distributions from net investment income of $.103 and distributions from net realized gain of $.445 per share.
H Total distributions of $.12 per share is comprised of distributions from net investment income of $.088 and distributions from net realized gain of $.036 per share.
See accompanying notes which are an integral part of the financial statements.
Annual Report
Financial Highlights - Class C
Years ended March 31, | 2013 | 2012 | 2011 | 2010 | 2009 |
Selected Per-Share Data | | | | | |
Net asset value, beginning of period | $ 11.65 | $ 11.96 | $ 10.52 | $ 7.11 | $ 12.39 |
Income from Investment Operations | | | | | |
Net investment income (loss) C | .09 | .07 | .06 | .07 | .12 |
Net realized and unrealized gain (loss) | .95 | (.13) E | 1.54 | 3.50 | (4.85) |
Total from investment operations | 1.04 | (.06) | 1.60 | 3.57 | (4.73) |
Distributions from net investment income | (.10) | (.08) | (.06) | (.08) | (.11) |
Distributions from net realized gain | (.04) | (.18) | (.10) | (.08) | (.45) |
Total distributions | (.13) I | (.25) H | (.16) | (.16) | (.55) G |
Net asset value, end of period | $ 12.56 | $ 11.65 | $ 11.96 | $ 10.52 | $ 7.11 |
Total Return A, B | 9.04% | (.29)% | 15.33% | 50.28% | (39.70)% |
Ratios to Average Net Assets D, F | | | | | |
Expenses before reductions | 1.00% | 1.00% | 1.00% | 1.00% | 1.00% |
Expenses net of fee waivers, if any | 1.00% | 1.00% | 1.00% | 1.00% | 1.00% |
Expenses net of all reductions | 1.00% | 1.00% | 1.00% | 1.00% | 1.00% |
Net investment income (loss) | .79% | .64% | .51% | .76% | 1.29% |
Supplemental Data | | | | | |
Net assets, end of period (000 omitted) | $ 43,447 | $ 38,614 | $ 36,389 | $ 30,994 | $ 17,821 |
Portfolio turnover rate | 25% | 13% | 30% | 16% | 21% |
A Total returns would have been lower if certain expenses had not been reduced during the applicable periods shown.
B Total returns do not include the effect of the contingent deferred sales charge.
C Calculated based on average shares outstanding during the period.
D Amounts do not include the activity of the Underlying Funds.
E The amount shown for a share outstanding does not correspond with the aggregate net gain (loss) on investments for the period due to the timing of sales and repurchases of shares in relation to fluctuating market values of the investments of the Fund.
F Expense ratios reflect operating expenses of the class. Expenses before reductions do not reflect amounts reimbursed by the investment adviser or reductions from expense offset arrangements and do not represent the amount paid by the class during periods when reimbursements or reductions occur. Expenses net of fee waivers reflect expenses after reimbursement by the investment adviser but prior to reductions from expense offset arrangements. Expenses net of all reductions represent the net expenses paid by the class but do not include expenses of the investment companies in which the Fund invests.
G Total distributions of $.55 per share is comprised of distributions from net investment income of $.107 and distributions from net realized gain of $.445 per share.
H Total distributions of $.25 per share is comprised of distributions from net investment income of $.076 and distributions from net realized gain of $.176 per share.
I Total distributions of $.13 per share is comprised of distributions from net investment income of $.098 and distributions from net realized gain of $.036 per share.
Financial Highlights - Institutional Class
Years ended March 31, | 2013 | 2012 | 2011 | 2010 | 2009 |
Selected Per-Share Data | | | | | |
Net asset value, beginning of period | $ 11.86 | $ 12.17 | $ 10.69 | $ 7.21 | $ 12.57 |
Income from Investment Operations | | | | | |
Net investment income (loss) B | .21 | .19 | .17 | .17 | .22 |
Net realized and unrealized gain (loss) | .97 | (.14) E | 1.57 | 3.55 | (4.93) |
Total from investment operations | 1.18 | .05 | 1.74 | 3.72 | (4.71) |
Distributions from net investment income | (.20) | (.17) | (.16) | (.16) | (.21) |
Distributions from net realized gain | (.04) | (.19) | (.11) | (.08) | (.45) |
Total distributions | (.24) | (.36) | (.26) H | (.24) | (.65) G |
Net asset value, end of period | $ 12.80 | $ 11.86 | $ 12.17 | $ 10.69 | $ 7.21 |
Total Return A | 10.10% | .71% | 16.51% | 51.81% | (39.08)% |
Ratios to Average Net Assets C, F | | | | | |
Expenses before reductions D | .00% | .00% | .00% | .00% | .00% |
Expenses net of fee waivers, if any | .00% | .00% | .00% | .00% | .00% |
Expenses net of all reductions | .00% | .00% | .00% | .00% | .00% |
Net investment income (loss) | 1.79% | 1.64% | 1.51% | 1.76% | 2.29% |
Supplemental Data | | | | | |
Net assets, end of period (000 omitted) | $ 547,049 | $ 360,580 | $ 218,092 | $ 97,629 | $ 43,667 |
Portfolio turnover rate | 25% | 13% | 30% | 16% | 21% |
A Total returns would have been lower if certain expenses had not been reduced during the applicable periods shown.
B Calculated based on average shares outstanding during the period.
C Amounts do not include the activity of the Underlying Funds.
D Amount represents less than .01%.
E The amount shown for a share outstanding does not correspond with the aggregate net gain (loss) on investments for the period due to the timing of sales and repurchases of shares in relation to fluctuating market values of the investments of the Fund.
F Expense ratios reflect operating expenses of the class. Expenses before reductions do not reflect amounts reimbursed by the investment adviser or reductions from expense offset arrangements and do not represent the amount paid by the class during periods when reimbursements or reductions occur. Expenses net of fee waivers reflect expenses after reimbursement by the investment adviser but prior to reductions from expense offset arrangements. Expenses net of all reductions represent the net expenses paid by the class but do not include expenses of the investment companies in which the Fund invests.
G Total distributions of $.65 per share is comprised of distributions from net investment income of $.206 and distributions from net realized gain of $.445 per share.
H Total distributions of $.26 per share is comprised of distributions from net investment income of $.157 and distributions from net realized gain of $.105 per share.
See accompanying notes which are an integral part of the financial statements.
Annual Report
Fidelity Advisor Freedom 2040 Fund
Investment Changes (Unaudited)
The information in the following tables is based on the direct investments of the Fund. |
Fund Holdings as of March 31, 2013 |
| % of fund's
net assets | % of fund's net assets
6 months ago |
Commodity Funds | | |
Fidelity Series Commodity Strategy Fund | 8.9 | 9.1 |
Domestic Equity Funds | | |
Fidelity Advisor Equity Growth Fund Institutional Class | 7.1 | 6.1 |
Fidelity Advisor Growth & Income Fund Institutional Class | 3.8 | 7.4 |
Fidelity Advisor Large Cap Fund Institutional Class | 3.8 | 6.8 |
Fidelity Advisor Series Equity-Income Fund | 5.0 | 0.0 |
Fidelity Advisor Series Mega Cap Fund | 1.1 | 0.0 |
Fidelity Advisor Series Opportunistic Insights Fund | 3.5 | 0.0 |
Fidelity Advisor Series Stock Selector Large Cap Value Fund | 5.0 | 0.0 |
Fidelity Advisor Small Cap Fund Institutional Class | 2.9 | 2.4 |
Fidelity Series 100 Index Fund | 1.2 | 5.0 |
Fidelity Series All-Sector Equity Fund | 9.4 | 10.6 |
Fidelity Series Large Cap Value Fund | 5.3 | 10.0 |
Fidelity Series Real Estate Equity Fund | 0.8 | 0.8 |
Fidelity Series Small Cap Opportunities Fund | 3.4 | 2.5 |
| 52.3 | 51.6 |
Developed International Equity Funds | | |
Fidelity Series International Growth Fund | 7.7 | 7.8 |
Fidelity Series International Small Cap Fund | 1.6 | 1.6 |
Fidelity Series International Value Fund | 7.7 | 7.7 |
| 17.0 | 17.1 |
Emerging Markets Equity Funds | | |
Fidelity Series Emerging Markets Fund | 4.7 | 4.9 |
High Yield Bond Funds | | |
Fidelity Series Emerging Markets Debt Fund | 0.7 | 0.7 |
Fidelity Series Floating Rate High Income Fund | 0.7 | 0.4 |
Fidelity Series High Income Fund | 7.0 | 7.3 |
Fidelity Series Real Estate Income Fund | 0.4 | 0.2 |
| 8.8 | 8.6 |
Investment Grade Bond Funds | | |
Fidelity Series Investment Grade Bond Fund | 8.3 | 8.7 |
Net Other Assets (Liabilities)* | 0.0 | 0.0 |
| 100.0 | 100.0 |
* Amount represents less than 0.1%
Asset Allocation (% of fund's net assets) |
Period end |
| Commodity Funds | 8.9% | |
| Domestic Equity Funds | 52.3% | |
| Developed International Equity Funds | 17.0% | |
| Emerging Markets
Equity Funds | 4.7% | |
| High Yield Bond Funds | 8.8% | |
| Investment Grade
Bond Funds | 8.3% | |

Six months ago |
| Commodity Funds | 9.1% | |
| Domestic Equity Funds | 51.6% | |
| Developed International Equity Funds | 17.1% | |
| Emerging Markets
Equity Funds | 4.9% | |
| High Yield Bond Funds | 8.6% | |
| Investment Grade
Bond Funds | 8.7% | |

Expected |
| Commodity Funds | 9.1% | |
| Domestic Equity Funds | 51.5% | |
| Developed International Equity Funds | 17.0% | |
| Emerging Markets
Equity Funds | 5.0% | |
| High Yield Bond Funds | 7.5% | |
| Investment Grade
Bond Funds | 9.9% | |

The fund invests according to an asset allocation strategy that becomes increasingly conservative over time. The six months ago allocation is based on the fund's holdings as of September 30, 2012. The current allocation is based on the fund's holdings as of March 31, 2013. The expected allocation represents the fund's anticipated allocation at September 30, 2013. |
Annual Report
Fidelity Advisor Freedom 2040 Fund
Investments March 31, 2013
Showing Percentage of Net Assets
Domestic Equity Funds - 61.2% |
| Shares | | Value |
Commodity Funds - 8.9% |
Fidelity Series Commodity Strategy Fund (a) | 20,726,811 | | $ 180,115,990 |
Domestic Equity Funds - 52.3% |
Fidelity Advisor Equity Growth Fund Institutional Class | 2,027,858 | | 143,673,712 |
Fidelity Advisor Growth & Income Fund Institutional Class | 3,439,345 | | 75,975,139 |
Fidelity Advisor Large Cap Fund Institutional Class | 3,231,495 | | 76,812,641 |
Fidelity Advisor Series Equity-Income Fund | 9,045,482 | | 100,676,220 |
Fidelity Advisor Series Mega Cap Fund | 2,017,634 | | 22,294,860 |
Fidelity Advisor Series Opportunistic Insights Fund | 6,463,092 | | 71,158,645 |
Fidelity Advisor Series Stock Selector Large Cap Value Fund | 9,061,912 | | 101,402,797 |
Fidelity Advisor Small Cap Fund Institutional Class | 2,192,656 | | 59,092,069 |
Fidelity Series 100 Index Fund | 2,282,948 | | 23,560,024 |
Fidelity Series All-Sector Equity Fund | 14,744,969 | | 189,472,856 |
Fidelity Series Large Cap Value Fund | 9,148,642 | | 106,490,192 |
Fidelity Series Real Estate Equity Fund | 1,200,424 | | 15,629,519 |
Fidelity Series Small Cap Opportunities Fund | 5,582,945 | | 68,837,714 |
TOTAL DOMESTIC EQUITY FUNDS | | 1,055,076,388 |
TOTAL DOMESTIC EQUITY FUNDS (Cost $1,145,191,225) |
1,235,192,378
|
International Equity Funds - 21.7% |
| | | |
Developed International Equity Funds - 17.0% |
Fidelity Series International Growth Fund | 12,375,205 | | 156,546,342 |
Fidelity Series International Small Cap Fund | 2,317,464 | | 31,795,611 |
Fidelity Series International Value Fund | 15,777,669 | | 154,936,713 |
TOTAL DEVELOPED INTERNATIONAL EQUITY FUNDS | | 343,278,666 |
|
| Shares | | Value |
Emerging Markets Equity Funds - 4.7% |
Fidelity Series Emerging Markets Fund | 5,664,300 | | $ 94,763,737 |
TOTAL INTERNATIONAL EQUITY FUNDS (Cost $389,167,780) |
438,042,403
|
Bond Funds - 17.1% |
| | | |
High Yield Bond Funds - 8.8% |
Fidelity Series Emerging Markets Debt Fund | 1,353,936 | | 14,730,822 |
Fidelity Series Floating Rate High Income Fund | 1,315,838 | | 13,987,354 |
Fidelity Series High Income Fund | 13,467,991 | | 141,548,587 |
Fidelity Series Real Estate Income Fund | 704,267 | | 8,218,795 |
TOTAL HIGH YIELD BOND FUNDS | | 178,485,558 |
Investment Grade Bond Funds - 8.3% |
Fidelity Series Investment Grade Bond Fund | 14,488,210 | | 167,049,065 |
TOTAL BOND FUNDS (Cost $337,466,745) |
345,534,623
|
TOTAL INVESTMENT PORTFOLIO - 100.0% (Cost $1,871,825,750) | | 2,018,769,404 |
NET OTHER ASSETS (LIABILITIES) - 0.0% | | (424,590) |
NET ASSETS - 100% | $ 2,018,344,814 |
Legend |
(a) Non-income producing |
Other Information |
All investments are categorized as Level 1 under the Fair Value Hierarchy. The inputs or methodology used for valuing securities may not be an indication of the risk associated with investing in those securities. For more information on valuation inputs, please refer to the Security Valuation section in the accompanying Notes to Financial Statements. |
See accompanying notes which are an integral part of the financial statements.
Annual Report
Fidelity Advisor Freedom 2040 Fund
Statement of Assets and Liabilities
| March 31, 2013 |
| | |
Assets | | |
Investment in securities, at value (cost $1,871,825,750) - See accompanying schedule | | $ 2,018,769,404 |
Cash | | 7 |
Receivable for investments sold | | 421,484 |
Receivable for fund shares sold | | 3,223,688 |
Receivable from affiliate for expense reductions | | 1,671 |
Total assets | | 2,022,416,254 |
| | |
Liabilities | | |
Payable for investments purchased | $ 584 | |
Payable for fund shares redeemed | 3,644,630 | |
Distribution and service plan fees payable | 426,226 | |
Total liabilities | | 4,071,440 |
| | |
Net Assets | | $ 2,018,344,814 |
Net Assets consist of: | | |
Paid in capital | | $ 1,800,153,501 |
Undistributed net investment income | | 1,945,539 |
Accumulated undistributed net realized gain (loss) on investments | | 69,302,120 |
Net unrealized appreciation (depreciation) on investments | | 146,943,654 |
Net Assets | | $ 2,018,344,814 |
| | |
Calculation of Maximum Offering Price Class A:
Net Asset Value and redemption price per share ($1,133,721,563 ÷ 83,309,638 shares) | | $ 13.61 |
| | |
Maximum offering price per share (100/94.25 of $13.61) | | $ 14.44 |
Class T:
Net Asset Value and redemption price per share ($288,886,043 ÷ 21,278,515 shares) | | $ 13.58 |
| | |
Maximum offering price per share (100/96.50 of $13.58) | | $ 14.07 |
Class B:
Net Asset Value and offering price per share ($24,480,984 ÷ 1,816,770 shares)A | | $ 13.48 |
| | |
Class C:
Net Asset Value and offering price per share ($62,893,114 ÷ 4,682,450 shares)A | | $ 13.43 |
| | |
Institutional Class:
Net Asset Value, offering price and redemption price per share ($508,363,110 ÷ 37,181,451 shares) | | $ 13.67 |
A Redemption price per share is equal to net asset value less any applicable contingent deferred sales charge.
Statement of Operations
| Year ended March 31, 2013 |
| | |
Investment Income | | |
Income distributions from underlying funds | | $ 31,708,261 |
| | |
Expenses | | |
Distribution and service plan fees | $ 4,715,294 | |
Independent trustees' compensation | 6,384 | |
Total expenses before reductions | 4,721,678 | |
Expense reductions | (6,384) | 4,715,294 |
Net investment income (loss) | | 26,992,967 |
Realized and Unrealized Gain (Loss) Realized gain (loss) on sale of underlying fund shares | 52,417,035 | |
Capital gain distributions from underlying funds | 37,762,695 | |
Total net realized gain (loss) | | 90,179,730 |
Change in net unrealized appreciation (depreciation) on underlying funds | | 62,667,913 |
Net gain (loss) | | 152,847,643 |
Net increase (decrease) in net assets resulting from operations | | $ 179,840,610 |
See accompanying notes which are an integral part of the financial statements.
Annual Report
Statement of Changes in Net Assets
| Year ended
March 31,
2013 | Year ended
March 31,
2012 |
Increase (Decrease) in Net Assets | | |
Operations | | |
Net investment income (loss) | $ 26,992,967 | $ 19,663,939 |
Net realized gain (loss) | 90,179,730 | 18,013,632 |
Change in net unrealized appreciation (depreciation) | 62,667,913 | (22,180,489) |
Net increase (decrease) in net assets resulting from operations | 179,840,610 | 15,497,082 |
Distributions to shareholders from net investment income | (26,501,610) | (18,881,497) |
Distributions to shareholders from net realized gain | (5,287,230) | (25,268,073) |
Total distributions | (31,788,840) | (44,149,570) |
Share transactions - net increase (decrease) | 198,765,979 | 229,257,376 |
Total increase (decrease) in net assets | 346,817,749 | 200,604,888 |
| | |
Net Assets | | |
Beginning of period | 1,671,527,065 | 1,470,922,177 |
End of period (including undistributed net investment income of $1,945,539 and undistributed net investment income of $1,454,182, respectively) | $ 2,018,344,814 | $ 1,671,527,065 |
Financial Highlights - Class A
Years ended March 31, | 2013 | 2012 | 2011 | 2010 | 2009 |
Selected Per-Share Data | | | | | |
Net asset value, beginning of period | $ 12.60 | $ 12.95 | $ 11.37 | $ 7.59 | $ 13.57 |
Income from Investment Operations | | | | | |
Net investment income (loss) C | .19 | .17 | .15 | .15 | .21 |
Net realized and unrealized gain (loss) | 1.05 | (.15) | 1.69 | 3.87 | (5.44) |
Total from investment operations | 1.24 | .02 | 1.84 | 4.02 | (5.23) |
Distributions from net investment income | (.19) | (.16) | (.15) | (.15) | (.20) |
Distributions from net realized gain | (.04) | (.21) | (.11) | (.09) | (.56) |
Total distributions | (.23) | (.37) | (.26) | (.24) | (.75)F |
Net asset value, end of period | $ 13.61 | $ 12.60 | $ 12.95 | $ 11.37 | $ 7.59 |
Total ReturnA,B | 9.94% | .38% | 16.38% | 53.15% | (40.42)% |
Ratios to Average Net AssetsD,E | | | | | |
Expenses before reductions | .25% | .25% | .25% | .25% | .25% |
Expenses net of fee waivers, if any | .25% | .25% | .25% | .25% | .25% |
Expenses net of all reductions | .25% | .25% | .25% | .25% | .25% |
Net investment income (loss) | 1.53% | 1.38% | 1.25% | 1.52% | 2.02% |
Supplemental Data | | | | | |
Net assets, end of period (000 omitted) | $ 1,133,722 | $ 967,348 | $ 865,008 | $ 670,673 | $ 342,357 |
Portfolio turnover rate | 26% | 14% | 38% | 18% | 18% |
A Total returns would have been lower if certain expenses had not been reduced during the applicable periods shown.
B Total returns do not include the effect of the sales charges.
C Calculated based on average shares outstanding during the period.
D Amounts do not include the activity of the Underlying Funds.
E Expense ratios reflect operating expenses of the class. Expenses before reductions do not reflect amounts reimbursed by the investment adviser or reductions from expense offset arrangements and do not represent the amount paid by the class during periods when reimbursements or reductions occur. Expenses net of fee waivers reflect expenses after reimbursement by the investment adviser but prior to reductions from expense offset arrangements. Expenses net of all reductions represent the net expenses paid by the class but do not include expenses of the investment companies in which the Fund invests.
F Total distributions of $.75 per share is comprised of distributions from net investment income of $.197 and distributions from net realized gain of $.555 per share.
See accompanying notes which are an integral part of the financial statements.
Annual Report
Financial Highlights - Class T
Years ended March 31, | 2013 | 2012 | 2011 | 2010 | 2009 |
Selected Per-Share Data | | | | | |
Net asset value, beginning of period | $ 12.57 | $ 12.92 | $ 11.34 | $ 7.57 | $ 13.54 |
Income from Investment Operations | | | | | |
Net investment income (loss) C | .16 | .14 | .12 | .13 | .18 |
Net realized and unrealized gain (loss) | 1.04 | (.16) | 1.68 | 3.86 | (5.43) |
Total from investment operations | 1.20 | (.02) | 1.80 | 3.99 | (5.25) |
Distributions from net investment income | (.16) | (.13) | (.11) | (.13) | (.17) |
Distributions from net realized gain | (.04) | (.21) | (.11) | (.09) | (.56) |
Total distributions | (.19) H | (.33) G | (.22) | (.22) | (.72) F |
Net asset value, end of period | $ 13.58 | $ 12.57 | $ 12.92 | $ 11.34 | $ 7.57 |
Total Return A,B | 9.69% | .12% | 16.06% | 52.83% | (40.61)% |
Ratios to Average Net Assets D,E | | | | | |
Expenses before reductions | .50% | .50% | .50% | .50% | .50% |
Expenses net of fee waivers, if any | .50% | .50% | .50% | .50% | .50% |
Expenses net of all reductions | .50% | .50% | .50% | .50% | .50% |
Net investment income (loss) | 1.28% | 1.13% | 1.00% | 1.27% | 1.77% |
Supplemental Data | | | | | |
Net assets, end of period (000 omitted) | $ 288,886 | $ 262,944 | $ 276,335 | $ 300,594 | $ 181,917 |
Portfolio turnover rate | 26% | 14% | 38% | 18% | 18% |
A Total returns would have been lower if certain expenses had not been reduced during the applicable periods shown.
B Total returns do not include the effect of the sales charges.
C Calculated based on average shares outstanding during the period.
D Amounts do not include the activity of the Underlying Funds.
E Expense ratios reflect operating expenses of the class. Expenses before reductions do not reflect amounts reimbursed by the investment adviser or reductions from expense offset arrangements and do not represent the amount paid by the class during periods when reimbursements or reductions occur. Expenses net of fee waivers reflect expenses after reimbursement by the investment adviser but prior to reductions from expense offset arrangements. Expenses net of all reductions represent the net expenses paid by the class but do not include expenses of the investment companies in which the Fund invests.
F Total distributions of $.72 per share is comprised of distributions from net investment income of $.168 and distributions from net realized gain of $.555 per share.
G Total distributions of $.33 per share is comprised of distributions from net investment income of $.127 and distributions from net realized gain of $.207 per share.
H Total distributions of $.19 per share is comprised of distributions from net investment income of $.156 and distributions from net realized gain of $.037 per share.
Financial Highlights - Class B
Years ended March 31, | 2013 | 2012 | 2011 | 2010 | 2009 |
Selected Per-Share Data | | | | | |
Net asset value, beginning of period | $ 12.48 | $ 12.82 | $ 11.26 | $ 7.52 | $ 13.42 |
Income from Investment Operations | | | | | |
Net investment income (loss) C | .10 | .08 | .06 | .08 | .13 |
Net realized and unrealized gain (loss) | 1.03 | (.15) | 1.66 | 3.83 | (5.37) |
Total from investment operations | 1.13 | (.07) | 1.72 | 3.91 | (5.24) |
Distributions from net investment income | (.09) | (.07) | (.06) | (.08) | (.11) |
Distributions from net realized gain | (.04) | (.20) | (.10) | (.09) | (.55) |
Total distributions | (.13) | (.27) | (.16) | (.17) | (.66) F |
Net asset value, end of period | $ 13.48 | $ 12.48 | $ 12.82 | $ 11.26 | $ 7.52 |
Total Return A,B | 9.14% | (.36)% | 15.43% | 52.08% | (40.85)% |
Ratios to Average Net Assets D,E | | | | | |
Expenses before reductions | 1.00% | 1.00% | 1.00% | 1.00% | 1.00% |
Expenses net of fee waivers, if any | 1.00% | 1.00% | 1.00% | 1.00% | 1.00% |
Expenses net of all reductions | 1.00% | 1.00% | 1.00% | 1.00% | 1.00% |
Net investment income (loss) | .78% | .63% | .50% | .77% | 1.28% |
Supplemental Data | | | | | |
Net assets, end of period (000 omitted) | $ 24,481 | $ 31,574 | $ 41,935 | $ 43,773 | $ 29,479 |
Portfolio turnover rate | 26% | 14% | 38% | 18% | 18% |
A Total returns would have been lower if certain expenses had not been reduced during the applicable periods shown.
B Total returns do not include the effect of the contingent deferred sales charge.
C Calculated based on average shares outstanding during the period.
D Amounts do not include the activity of the Underlying Funds.
E Expense ratios reflect operating expenses of the class. Expenses before reductions do not reflect amounts reimbursed by the investment adviser or reductions from expense offset arrangements and do not represent the amount paid by the class during periods when reimbursements or reductions occur. Expenses net of fee waivers reflect expenses after reimbursement by the investment adviser but prior to reductions from expense offset arrangements. Expenses net of all reductions represent the net expenses paid by the class but do not include expenses of the investment companies in which the Fund invests.
F Total distributions of $.66 per share is comprised of distributions from net investment income of $.112 and distributions from net realized gain of $.550 per share.
See accompanying notes which are an integral part of the financial statements.
Annual Report
Financial Highlights - Class C
Years ended March 31, | 2013 | 2012 | 2011 | 2010 | 2009 |
Selected Per-Share Data | | | | | |
Net asset value, beginning of period | $ 12.45 | $ 12.80 | $ 11.25 | $ 7.51 | $ 13.42 |
Income from Investment Operations | | | | | |
Net investment income (loss) C | .10 | .08 | .06 | .08 | .13 |
Net realized and unrealized gain (loss) | 1.02 | (.15) | 1.66 | 3.83 | (5.37) |
Total from investment operations | 1.12 | (.07) | 1.72 | 3.91 | (5.24) |
Distributions from net investment income | (.11) | (.08) | (.07) | (.08) | (.12) |
Distributions from net realized gain | (.04) | (.20) | (.10) | (.09) | (.55) |
Total distributions | (.14) G | (.28) | (.17) | (.17) | (.67) F |
Net asset value, end of period | $ 13.43 | $ 12.45 | $ 12.80 | $ 11.25 | $ 7.51 |
Total Return A,B | 9.09% | (.35)% | 15.39% | 52.18% | (40.91)% |
Ratios to Average Net Assets D,E | | | | | |
Expenses before reductions | 1.00% | 1.00% | 1.00% | 1.00% | 1.00% |
Expenses net of fee waivers, if any | 1.00% | 1.00% | 1.00% | 1.00% | 1.00% |
Expenses net of all reductions | 1.00% | 1.00% | 1.00% | 1.00% | 1.00% |
Net investment income (loss) | .78% | .63% | .50% | .77% | 1.28% |
Supplemental Data | | | | | |
Net assets, end of period (000 omitted) | $ 62,893 | $ 56,910 | $ 58,416 | $ 53,334 | $ 34,036 |
Portfolio turnover rate | 26% | 14% | 38% | 18% | 18% |
A Total returns would have been lower if certain expenses had not been reduced during the applicable periods shown.
B Total returns do not include the effect of the contingent deferred sales charge.
C Calculated based on average shares outstanding during the period.
D Amounts do not include the activity of the Underlying Funds.
E Expense ratios reflect operating expenses of the class. Expenses before reductions do not reflect amounts reimbursed by the investment adviser or reductions from expense offset arrangements and do not represent the amount paid by the class during periods when reimbursements or reductions occur. Expenses net of fee waivers reflect expenses after reimbursement by the investment adviser but prior to reductions from expense offset arrangements. Expenses net of all reductions represent the net expenses paid by the class but do not include expenses of the investment companies in which the Fund invests.
F Total distributions of $.67 per share is comprised of distributions from net investment income of $.115 and distributions from net realized gain of $.550 per share.
G Total distributions of $.14 per share is comprised of distributions from net investment income of $.105 and distributions from net realized gain of $.037 per share.
Financial Highlights - Institutional Class
Years ended March 31, | 2013 | 2012 | 2011 | 2010 | 2009 |
Selected Per-Share Data | | | | | |
Net asset value, beginning of period | $ 12.65 | $ 13.00 | $ 11.42 | $ 7.62 | $ 13.62 |
Income from Investment Operations | | | | | |
Net investment income (loss) B | .23 | .20 | .18 | .18 | .23 |
Net realized and unrealized gain (loss) | 1.05 | (.16) | 1.69 | 3.88 | (5.45) |
Total from investment operations | 1.28 | .04 | 1.87 | 4.06 | (5.22) |
Distributions from net investment income | (.22) | (.19) | (.18) | (.17) | (.22) |
Distributions from net realized gain | (.04) | (.21) | (.11) | (.09) | (.56) |
Total distributions | (.26) | (.39) G | (.29) | (.26) | (.78) F |
Net asset value, end of period | $ 13.67 | $ 12.65 | $ 13.00 | $ 11.42 | $ 7.62 |
Total Return A | 10.24% | .61% | 16.57% | 53.53% | (40.24)% |
Ratios to Average Net Assets C,E | | | | | |
Expenses before reductions D | .00% | .00% | .00% | .00% | .00% |
Expenses net of fee waivers, if any | .00% | .00% | .00% | .00% | .00% |
Expenses net of all reductions | .00% | .00% | .00% | .00% | .00% |
Net investment income (loss) | 1.78% | 1.63% | 1.50% | 1.77% | 2.27% |
Supplemental Data | | | | | |
Net assets, end of period (000 omitted) | $ 508,363 | $ 352,751 | $ 229,228 | $ 126,440 | $ 56,940 |
Portfolio turnover rate | 26% | 14% | 38% | 18% | 18% |
A Total returns would have been lower if certain expenses had not been reduced during the applicable periods shown.
B Calculated based on average shares outstanding during the period.
C Amounts do not include the activity of the Underlying Funds.
D Amount represents less than .01%.
E Expense ratios reflect operating expenses of the class. Expenses before reductions do not reflect amounts reimbursed by the investment adviser or reductions from expense offset arrangements and do not represent the amount paid by the class during periods when reimbursements or reductions occur. Expenses net of fee waivers reflect expenses after reimbursement by the investment adviser but prior to reductions from expense offset arrangements. Expenses net of all reductions represent the net expenses paid by the class but do not include expenses of the investment companies in which the Fund invests.
F Total distributions of $.78 per share is comprised of distributions from net investment income of $.224 and distributions from net realized gain of $.555 per share.
G Total distributions of $.39 per share is comprised of distributions from net investment income of $.186 and distributions from net realized gain of $.207 per share.
See accompanying notes which are an integral part of the financial statements.
Annual Report
Fidelity Advisor Freedom 2045 Fund
Investment Changes (Unaudited)
The information in the following tables is based on the direct investments of the Fund. |
Fund Holdings as of March 31, 2013 |
| % of fund's
net assets | % of fund's net assets
6 months ago |
Commodity Funds | | |
Fidelity Series Commodity Strategy Fund | 9.2 | 9.4 |
Domestic Equity Funds | | |
Fidelity Advisor Equity Growth Fund Institutional Class | 7.4 | 6.3 |
Fidelity Advisor Growth & Income Fund Institutional Class | 3.9 | 7.6 |
Fidelity Advisor Large Cap Fund Institutional Class | 4.0 | 7.0 |
Fidelity Advisor Series Equity-Income Fund | 4.9 | 0.0 |
Fidelity Advisor Series Mega Cap Fund | 1.1 | 0.0 |
Fidelity Advisor Series Opportunistic Insights Fund | 3.5 | 0.0 |
Fidelity Advisor Series Stock Selector Large Cap Value Fund | 5.0 | 0.0 |
Fidelity Advisor Small Cap Fund Institutional Class | 3.0 | 2.5 |
Fidelity Series 100 Index Fund | 1.2 | 5.1 |
Fidelity Series All-Sector Equity Fund | 9.7 | 10.8 |
Fidelity Series Large Cap Value Fund | 5.5 | 10.3 |
Fidelity Series Real Estate Equity Fund | 0.8 | 0.7 |
Fidelity Series Small Cap Opportunities Fund | 3.5 | 2.6 |
| 53.5 | 52.9 |
Developed International Equity Funds | | |
Fidelity Series International Growth Fund | 8.0 | 8.0 |
Fidelity Series International Small Cap Fund | 1.6 | 1.6 |
Fidelity Series International Value Fund | 7.9 | 8.0 |
| 17.5 | 17.6 |
Emerging Markets Equity Funds | | |
Fidelity Series Emerging Markets Fund | 4.9 | 5.1 |
High Yield Bond Funds | | |
Fidelity Series Emerging Markets Debt Fund | 0.7 | 0.7 |
Fidelity Series Floating Rate High Income Fund | 0.3 | 0.2 |
Fidelity Series High Income Fund | 9.1 | 9.1 |
Fidelity Series Real Estate Income Fund | 0.3 | 0.1 |
| 10.4 | 10.1 |
Investment Grade Bond Funds | | |
Fidelity Series Investment Grade Bond Fund | 4.5 | 4.9 |
Net Other Assets (Liabilities)* | 0.0 | 0.0 |
| 100.0 | 100.0 |
* Amount represents less than 0.1%
Asset Allocation (% of fund's net assets) |
Period end |
| Commodity Funds | 9.2% | |
| Domestic Equity Funds | 53.5% | |
| Developed International Equity Funds | 17.5% | |
| Emerging Markets
Equity Funds | 4.9% | |
| High Yield Bond Funds | 10.4% | |
| Investment Grade
Bond Funds | 4.5% | |

Six months ago |
| Commodity Funds | 9.4% | |
| Domestic Equity Funds | 52.9% | |
| Developed International Equity Funds | 17.6% | |
| Emerging Markets
Equity Funds | 5.1% | |
| High Yield Bond Funds | 10.1% | |
| Investment Grade
Bond Funds | 4.9% | |

Expected |
| Commodity Funds | 9.3% | |
| Domestic Equity Funds | 52.7% | |
| Developed International Equity Funds | 17.4% | |
| Emerging Markets
Equity Funds | 5.2% | |
| High Yield Bond Funds | 9.6% | |
| Investment Grade
Bond Funds | 5.8% | |

The fund invests according to an asset allocation strategy that becomes increasingly conservative over time. The six months ago allocation is based on the fund's holdings as of September 30, 2012. The current allocation is based on the fund's holdings as of March 31, 2013. The expected allocation represents the fund's anticipated allocation at September 30, 2013. |
Annual Report
Fidelity Advisor Freedom 2045 Fund
Investments March 31, 2013
Showing Percentage of Net Assets
Domestic Equity Funds - 62.7% |
| Shares | | Value |
Commodity Funds - 9.2% |
Fidelity Series Commodity Strategy Fund (a) | 9,609,068 | | $ 83,502,801 |
Domestic Equity Funds - 53.5% |
Fidelity Advisor Equity Growth Fund Institutional Class | 940,990 | | 66,669,108 |
Fidelity Advisor Growth & Income Fund Institutional Class | 1,606,216 | | 35,481,306 |
Fidelity Advisor Large Cap Fund Institutional Class | 1,508,004 | | 35,845,261 |
Fidelity Advisor Series Equity-Income Fund | 4,023,312 | | 44,779,464 |
Fidelity Advisor Series Mega Cap Fund | 897,890 | | 9,921,685 |
Fidelity Advisor Series Opportunistic Insights Fund | 2,875,266 | | 31,656,678 |
Fidelity Advisor Series Stock Selector Large Cap Value Fund | 4,030,535 | | 45,101,687 |
Fidelity Advisor Small Cap Fund Institutional Class | 1,017,999 | | 27,435,072 |
Fidelity Series 100 Index Fund | 1,075,497 | | 11,099,125 |
Fidelity Series All-Sector Equity Fund | 6,863,927 | | 88,201,459 |
Fidelity Series Large Cap Value Fund | 4,303,409 | | 50,091,676 |
Fidelity Series Real Estate Equity Fund | 563,433 | | 7,335,896 |
Fidelity Series Small Cap Opportunities Fund | 2,595,610 | | 32,003,872 |
TOTAL DOMESTIC EQUITY FUNDS | | 485,622,289 |
TOTAL DOMESTIC EQUITY FUNDS (Cost $498,828,771) |
569,125,090
|
International Equity Funds - 22.4% |
| | | |
Developed International Equity Funds - 17.5% |
Fidelity Series International Growth Fund | 5,718,366 | | 72,337,325 |
Fidelity Series International Small Cap Fund | 1,070,099 | | 14,681,753 |
Fidelity Series International Value Fund | 7,294,123 | | 71,628,283 |
TOTAL DEVELOPED INTERNATIONAL EQUITY FUNDS | | 158,647,361 |
|
| Shares | | Value |
Emerging Markets Equity Funds - 4.9% |
Fidelity Series Emerging Markets Fund | 2,634,535 | | $ 44,075,777 |
TOTAL INTERNATIONAL EQUITY FUNDS (Cost $181,195,488) |
202,723,138
|
Bond Funds - 14.9% |
| | | |
High Yield Bond Funds - 10.4% |
Fidelity Series Emerging Markets Debt Fund | 590,082 | | 6,420,091 |
Fidelity Series Floating Rate High Income Fund | 277,750 | | 2,952,479 |
Fidelity Series High Income Fund | 7,819,277 | | 82,180,603 |
Fidelity Series Real Estate Income Fund | 267,680 | | 3,123,821 |
TOTAL HIGH YIELD BOND FUNDS | | 94,676,994 |
Investment Grade Bond Funds - 4.5% |
Fidelity Series Investment Grade Bond Fund | 3,543,465 | | 40,856,148 |
TOTAL BOND FUNDS (Cost $130,703,009) |
135,533,142
|
TOTAL INVESTMENT PORTFOLIO - 100.0% (Cost $810,727,268) | | 907,381,370 |
NET OTHER ASSETS (LIABILITIES) - 0.0% | | (159,247) |
NET ASSETS - 100% | $ 907,222,123 |
Legend |
(a) Non-income producing |
Other Information |
All investments are categorized as Level 1 under the Fair Value Hierarchy. The inputs or methodology used for valuing securities may not be an indication of the risk associated with investing in those securities. For more information on valuation inputs, please refer to the Security Valuation section in the accompanying Notes to Financial Statements. |
See accompanying notes which are an integral part of the financial statements.
Annual Report
Fidelity Advisor Freedom 2045 Fund
Statement of Assets and Liabilities
| March 31, 2013 |
| | |
Assets | | |
Investment in securities, at value (cost $810,727,268) - See accompanying schedule | | $ 907,381,370 |
Cash | | 4 |
Receivable for investments sold | | 11,323 |
Receivable for fund shares sold | | 1,706,632 |
Receivable from affiliate for expense reductions | | 1,123 |
Total assets | | 909,100,452 |
| | |
Liabilities | | |
Payable for investments purchased | $ 744,234 | |
Payable for fund shares redeemed | 973,717 | |
Distribution and service plan fees payable | 160,378 | |
Total liabilities | | 1,878,329 |
| | |
Net Assets | | $ 907,222,123 |
Net Assets consist of: | | |
Paid in capital | | $ 792,973,363 |
Undistributed net investment income | | 966,423 |
Accumulated undistributed net realized gain (loss) on investments | | 16,628,235 |
Net unrealized appreciation (depreciation) on investments | | 96,654,102 |
Net Assets | | $ 907,222,123 |
| | |
Calculation of Maximum Offering Price Class A:
Net Asset Value and redemption price per share ($527,525,108 ÷ 50,445,707 shares) | | $ 10.46 |
| | |
Maximum offering price per share (100/94.25 of $10.46) | | $ 11.10 |
Class T:
Net Asset Value and redemption price per share ($92,997,571 ÷ 8,929,060 shares) | | $ 10.42 |
| | |
Maximum offering price per share (100/96.50 of $10.42) | | $ 10.80 |
Class B:
Net Asset Value and offering price per share ($3,651,362 ÷ 351,333 shares)A | | $ 10.39 |
| | |
Class C:
Net Asset Value and offering price per share ($13,415,230 ÷ 1,295,149 shares)A | | $ 10.36 |
| | |
Institutional Class:
Net Asset Value, offering price and redemption price per share ($269,632,852 ÷ 25,674,477 shares) | | $ 10.50 |
A Redemption price per share is equal to net asset value less any applicable contingent deferred sales charge.
Statement of Operations
| Year ended March 31, 2013 |
| | |
Investment Income | | |
Income distributions from underlying funds | | $ 13,689,653 |
| | |
Expenses | | |
Distribution and service plan fees | $ 1,642,770 | |
Independent trustees' compensation | 2,634 | |
Total expenses before reductions | 1,645,404 | |
Expense reductions | (2,634) | 1,642,770 |
Net investment income (loss) | | 12,046,883 |
Realized and Unrealized Gain (Loss) Realized gain (loss) on sale of underlying fund shares | 5,758,118 | |
Capital gain distributions from underlying funds | 15,627,374 | |
Total net realized gain (loss) | | 21,385,492 |
Change in net unrealized appreciation (depreciation) on underlying funds | | 48,075,115 |
Net gain (loss) | | 69,460,607 |
Net increase (decrease) in net assets resulting from operations | | $ 81,507,490 |
See accompanying notes which are an integral part of the financial statements.
Annual Report
Statement of Changes in Net Assets
| Year ended
March 31,
2013 | Year ended
March 31,
2012 |
Increase (Decrease) in Net Assets | | |
Operations | | |
Net investment income (loss) | $ 12,046,883 | $ 7,359,765 |
Net realized gain (loss) | 21,385,492 | 20,295,934 |
Change in net unrealized appreciation (depreciation) | 48,075,115 | (17,147,846) |
Net increase (decrease) in net assets resulting from operations | 81,507,490 | 10,507,853 |
Distributions to shareholders from net investment income | (11,684,331) | (7,058,225) |
Distributions to shareholders from net realized gain | (10,873,978) | (8,884,925) |
Total distributions | (22,558,309) | (15,943,150) |
Share transactions - net increase (decrease) | 205,501,582 | 170,603,885 |
Total increase (decrease) in net assets | 264,450,763 | 165,168,588 |
| | |
Net Assets | | |
Beginning of period | 642,771,360 | 477,602,772 |
End of period (including undistributed net investment income of $966,423 and undistributed net investment income of $603,871, respectively) | $ 907,222,123 | $ 642,771,360 |
Financial Highlights - Class A
Years ended March 31, | 2013 | 2012 | 2011 | 2010 | 2009 |
Selected Per-Share Data | | | | | |
Net asset value, beginning of period | $ 9.79 | $ 10.08 | $ 8.82 | $ 5.86 | $ 10.39 |
Income from Investment Operations | | | | | |
Net investment income (loss) C | .16 | .13 | .12 | .12 | .16 |
Net realized and unrealized gain (loss) | .81 | (.14) E | 1.33 | 3.02 | (4.29) |
Total from investment operations | .97 | (.01) | 1.45 | 3.14 | (4.13) |
Distributions from net investment income | (.15) | (.12) | (.11) | (.11) | (.14) |
Distributions from net realized gain | (.15) | (.16) | (.08) | (.07) | (.26) |
Total distributions | (.30) | (.28) | (.19) | (.18) | (.40) |
Net asset value, end of period | $ 10.46 | $ 9.79 | $ 10.08 | $ 8.82 | $ 5.86 |
Total Return A,B | 10.21% | .12% | 16.67% | 53.81% | (40.93)% |
Ratios to Average Net Assets D,F | | | | | |
Expenses before reductions | .25% | .25% | .25% | .25% | .25% |
Expenses net of fee waivers, if any | .25% | .25% | .25% | .25% | .25% |
Expenses net of all reductions | .25% | .25% | .25% | .25% | .25% |
Net investment income (loss) | 1.59% | 1.41% | 1.35% | 1.53% | 2.12% |
Supplemental Data | | | | | |
Net assets, end of period (000 omitted) | $ 527,525 | $ 403,850 | $ 320,731 | $ 205,405 | $ 81,985 |
Portfolio turnover rate | 25% | 11% | 32% | 14% | 18% |
A Total returns would have been lower if certain expenses had not been reduced during the applicable periods shown.
B Total returns do not include the effect of the sales charges.
C Calculated based on average shares outstanding during the period.
D Amounts do not include the activity of the Underlying Funds.
E The amount shown for a share outstanding does not correspond with the aggregate net gain (loss) on investments for the period due to the timing of sales and repurchases of shares in relation to fluctuating market values of the investments of the Fund.
F Expense ratios reflect operating expenses of the class. Expenses before reductions do not reflect amounts reimbursed by the investment adviser or reductions from expense offset arrangements and do not represent the amount paid by the class during periods when reimbursements or reductions occur. Expense ratios before reductions for start-up periods may not be representative of longer-term operating periods. Expenses net of fee waivers reflect expenses after reimbursement by the investment adviser but prior to reductions from expense offset arrangements. Expenses net of all reductions represent the net expenses paid by the class but do not include expenses of the investment companies in which the Fund invests.
See accompanying notes which are an integral part of the financial statements.
Annual Report
Financial Highlights - Class T
Years ended March 31, | 2013 | 2012 | 2011 | 2010 | 2009 |
Selected Per-Share Data | | | | | |
Net asset value, beginning of period | $ 9.75 | $ 10.04 | $ 8.79 | $ 5.84 | $ 10.36 |
Income from Investment Operations | | | | | |
Net investment income (loss) C | .13 | .11 | .10 | .10 | .14 |
Net realized and unrealized gain (loss) | .82 | (.15) E | 1.32 | 3.02 | (4.28) |
Total from investment operations | .95 | (.04) | 1.42 | 3.12 | (4.14) |
Distributions from net investment income | (.12) | (.10) | (.09) | (.10) | (.12) |
Distributions from net realized gain | (.15) | (.16) | (.08) | (.07) | (.26) |
Total distributions | (.28) H | (.25) G | (.17) | (.17) | (.38) |
Net asset value, end of period | $ 10.42 | $ 9.75 | $ 10.04 | $ 8.79 | $ 5.84 |
Total Return A,B | 10.02% | (.15)% | 16.36% | 53.52% | (41.08)% |
Ratios to Average Net Assets D,F | | | | | |
Expenses before reductions | .50% | .50% | .50% | .50% | .50% |
Expenses net of fee waivers, if any | .50% | .50% | .50% | .50% | .50% |
Expenses net of all reductions | .50% | .50% | .50% | .50% | .50% |
Net investment income (loss) | 1.34% | 1.16% | 1.10% | 1.28% | 1.87% |
Supplemental Data | | | | | |
Net assets, end of period (000 omitted) | $ 92,998 | $ 62,438 | $ 60,268 | $ 43,326 | $ 18,065 |
Portfolio turnover rate | 25% | 11% | 32% | 14% | 18% |
A Total returns would have been lower if certain expenses had not been reduced during the applicable periods shown.
B Total returns do not include the effect of the sales charges.
C Calculated based on average shares outstanding during the period.
D Amounts do not include the activity of the Underlying Funds.
E The amount shown for a share outstanding does not correspond with the aggregate net gain (loss) on investments for the period due to the timing of sales and repurchases of shares in relation to fluctuating market values of the investments of the Fund.
F Expense ratios reflect operating expenses of the class. Expenses before reductions do not reflect amounts reimbursed by the investment adviser or reductions from expense offset arrangements and do not represent the amount paid by the class during periods when reimbursements or reductions occur. Expense ratios before reductions for start-up periods may not be representative of longer-term operating periods. Expenses net of fee waivers reflect expenses after reimbursement by the investment adviser but prior to reductions from expense offset arrangements. Expenses net of all reductions represent the net expenses paid by the class but do not include expenses of the investment companies in which the Fund invests.
G Total distributions of $.25 per share is comprised of distributions from net investment income of $.096 and distributions from net realized gain of $.155 per share.
H Total distributions of $.28 per share is comprised of distributions from net investment income of $.124 and distributions from net realized gain of $.153 per share.
Financial Highlights - Class B
Years ended March 31, | 2013 | 2012 | 2011 | 2010 | 2009 |
Selected Per-Share Data | | | | | |
Net asset value, beginning of period | $ 9.73 | $ 10.01 | $ 8.77 | $ 5.83 | $ 10.33 |
Income from Investment Operations | | | | | |
Net investment income (loss) C | .08 | .06 | .05 | .06 | .11 |
Net realized and unrealized gain (loss) | .81 | (.14) E | 1.32 | 3.01 | (4.27) |
Total from investment operations | .89 | (.08) | 1.37 | 3.07 | (4.16) |
Distributions from net investment income | (.08) | (.05) | (.05) | (.06) | (.08) |
Distributions from net realized gain | (.15) | (.15) | (.08) | (.07) | (.26) |
Total distributions | (.23) | (.20) | (.13) | (.13) | (.34) |
Net asset value, end of period | $ 10.39 | $ 9.73 | $ 10.01 | $ 8.77 | $ 5.83 |
Total Return A,B | 9.40% | (.62)% | 15.71% | 52.74% | (41.39)% |
Ratios to Average Net Assets D,F | | | | | |
Expenses before reductions | 1.00% | 1.00% | 1.00% | 1.00% | 1.00% |
Expenses net of fee waivers, if any | 1.00% | 1.00% | 1.00% | 1.00% | 1.00% |
Expenses net of all reductions | 1.00% | 1.00% | 1.00% | 1.00% | 1.00% |
Net investment income (loss) | .84% | .66% | .60% | .78% | 1.37% |
Supplemental Data | | | | | |
Net assets, end of period (000 omitted) | $ 3,651 | $ 3,786 | $ 4,612 | $ 4,089 | $ 2,231 |
Portfolio turnover rate | 25% | 11% | 32% | 14% | 18% |
A Total returns would have been lower if certain expenses had not been reduced during the applicable periods shown.
B Total returns do not include the effect of the contingent deferred sales charge.
C Calculated based on average shares outstanding during the period.
D Amounts do not include the activity of the Underlying Funds.
E The amount shown for a share outstanding does not correspond with the aggregate net gain (loss) on investments for the period due to the timing of sales and repurchases of shares in relation to fluctuating market values of the investments of the Fund.
F Expense ratios reflect operating expenses of the class. Expenses before reductions do not reflect amounts reimbursed by the investment adviser or reductions from expense offset arrangements and do not represent the amount paid by the class during periods when reimbursements or reductions occur. Expense ratios before reductions for start-up periods may not be representative of longer-term operating periods. Expenses net of fee waivers reflect expenses after reimbursement by the investment adviser but prior to reductions from expense offset arrangements. Expenses net of all reductions represent the net expenses paid by the class but do not include expenses of the investment companies in which the Fund invests.
See accompanying notes which are an integral part of the financial statements.
Annual Report
Financial Highlights - Class C
Years ended March 31, | 2013 | 2012 | 2011 | 2010 | 2009 |
Selected Per-Share Data | | | | | |
Net asset value, beginning of period | $ 9.71 | $ 10.00 | $ 8.76 | $ 5.82 | $ 10.32 |
Income from Investment Operations | | | | | |
Net investment income (loss) C | .08 | .06 | .05 | .06 | .11 |
Net realized and unrealized gain (loss) | .81 | (.14) E | 1.32 | 3.01 | (4.27) |
Total from investment operations | .89 | (.08) | 1.37 | 3.07 | (4.16) |
Distributions from net investment income | (.09) | (.06) | (.06) | (.06) | (.08) |
Distributions from net realized gain | (.15) | (.15) | (.08) | (.07) | (.26) |
Total distributions | (.24) | (.21) | (.13) G | (.13) | (.34) |
Net asset value, end of period | $ 10.36 | $ 9.71 | $ 10.00 | $ 8.76 | $ 5.82 |
Total Return A,B | 9.42% | (.62)% | 15.80% | 52.90% | (41.39)% |
Ratios to Average Net Assets D,F | | | | | |
Expenses before reductions | 1.00% | 1.00% | 1.00% | 1.00% | 1.00% |
Expenses net of fee waivers, if any | 1.00% | 1.00% | 1.00% | 1.00% | 1.00% |
Expenses net of all reductions | 1.00% | 1.00% | 1.00% | 1.00% | 1.00% |
Net investment income (loss) | .84% | .66% | .60% | .78% | 1.37% |
Supplemental Data | | | | | |
Net assets, end of period (000 omitted) | $ 13,415 | $ 9,926 | $ 8,753 | $ 6,199 | $ 3,027 |
Portfolio turnover rate | 25% | 11% | 32% | 14% | 18% |
A Total returns would have been lower if certain expenses had not been reduced during the applicable periods shown.
B Total returns do not include the effect of the contingent deferred sales charge.
C Calculated based on average shares outstanding during the period.
D Amounts do not include the activity of the Underlying Funds.
E The amount shown for a share outstanding does not correspond with the aggregate net gain (loss) on investments for the period due to the timing of sales and repurchases of shares in relation to fluctuating market values of the investments of the Fund.
F Expense ratios reflect operating expenses of the class. Expenses before reductions do not reflect amounts reimbursed by the investment adviser or reductions from expense offset arrangements and do not represent the amount paid by the class during periods when reimbursements or reductions occur. Expense ratios before reductions for start-up periods may not be representative of longer-term operating periods. Expenses net of fee waivers reflect expenses after reimbursement by the investment adviser but prior to reductions from expense offset arrangements. Expenses net of all reductions represent the net expenses paid by the class but do not include expenses of the investment companies in which the Fund invests.
G Total distributions of $.13 per share is comprised of distributions from net investment income of $.057 and distributions from net realized gain of $.076 per share.
Financial Highlights - Institutional Class
Years ended March 31, | 2013 | 2012 | 2011 | 2010 | 2009 |
Selected Per-Share Data | | | | | |
Net asset value, beginning of period | $ 9.83 | $ 10.11 | $ 8.85 | $ 5.87 | $ 10.41 |
Income from Investment Operations | | | | | |
Net investment income (loss) B | .18 | .16 | .15 | .14 | .18 |
Net realized and unrealized gain (loss) | .81 | (.14) E | 1.32 | 3.04 | (4.30) |
Total from investment operations | .99 | .02 | 1.47 | 3.18 | (4.12) |
Distributions from net investment income | (.17) | (.14) | (.13) | (.13) | (.16) |
Distributions from net realized gain | (.15) | (.16) | (.08) | (.07) | (.26) |
Total distributions | (.32) | (.30) | (.21) | (.20) | (.42) |
Net asset value, end of period | $ 10.50 | $ 9.83 | $ 10.11 | $ 8.85 | $ 5.87 |
Total Return A | 10.43% | .45% | 16.86% | 54.35% | (40.81)% |
Ratios to Average Net Assets C,F | | | | | |
Expenses before reductions D | .00% | .00% | .00% | .00% | .00% |
Expenses net of fee waivers, if any | .00% | .00% | .00% | .00% | .00% |
Expenses net of all reductions | .00% | .00% | .00% | .00% | .00% |
Net investment income (loss) | 1.84% | 1.66% | 1.60% | 1.78% | 2.37% |
Supplemental Data | | | | | |
Net assets, end of period (000 omitted) | $ 269,633 | $ 162,772 | $ 83,240 | $ 32,842 | $ 12,078 |
Portfolio turnover rate | 25% | 11% | 32% | 14% | 18% |
A Total returns would have been lower if certain expenses had not been reduced during the applicable periods shown.
B Calculated based on average shares outstanding during the period.
C Amounts do not include the activity of the Underlying Funds.
D Amount represents less than .01%.
E The amount shown for a share outstanding does not correspond with the aggregate net gain (loss) on investments for the period due to the timing of sales and repurchases of shares in relation to fluctuating market values of the investments of the Fund.
F Expense ratios reflect operating expenses of the class. Expenses before reductions do not reflect amounts reimbursed by the investment adviser or reductions from expense offset arrangements and do not represent the amount paid by the class during periods when reimbursements or reductions occur. Expense ratios before reductions for start-up periods may not be representative of longer-term operating periods. Expenses net of fee waivers reflect expenses after reimbursement by the investment adviser but prior to reductions from expense offset arrangements. Expenses net of all reductions represent the net expenses paid by the class but do not include expenses of the investment companies in which the Fund invests.
See accompanying notes which are an integral part of the financial statements.
Annual Report
Fidelity Advisor Freedom 2050 Fund
Investment Changes (Unaudited)
The information in the following tables is based on the direct investments of the Fund. |
Fund Holdings as of March 31, 2013 |
| % of fund's
net assets | % of fund's net assets
6 months ago |
Commodity Funds | | |
Fidelity Series Commodity Strategy Fund | 9.3 | 9.6 |
Domestic Equity Funds | | |
Fidelity Advisor Equity Growth Fund Institutional Class | 7.4 | 6.4 |
Fidelity Advisor Growth & Income Fund Institutional Class | 4.0 | 7.7 |
Fidelity Advisor Large Cap Fund Institutional Class | 4.0 | 7.1 |
Fidelity Advisor Series Equity-Income Fund | 5.1 | 0.0 |
Fidelity Advisor Series Mega Cap Fund | 1.1 | 0.0 |
Fidelity Advisor Series Opportunistic Insights Fund | 3.6 | 0.0 |
Fidelity Advisor Series Stock Selector Large Cap Value Fund | 5.1 | 0.0 |
Fidelity Advisor Small Cap Fund Institutional Class | 3.0 | 2.6 |
Fidelity Series 100 Index Fund | 1.2 | 5.2 |
Fidelity Series All-Sector Equity Fund | 9.8 | 11.1 |
Fidelity Series Large Cap Value Fund | 5.6 | 10.5 |
Fidelity Series Real Estate Equity Fund | 0.8 | 0.8 |
Fidelity Series Small Cap Opportunities Fund | 3.5 | 2.6 |
| 54.2 | 54.0 |
Developed International Equity Funds | | |
Fidelity Series International Growth Fund | 8.1 | 8.2 |
Fidelity Series International Small Cap Fund | 1.7 | 1.6 |
Fidelity Series International Value Fund | 8.0 | 8.2 |
| 17.8 | 18.0 |
Emerging Markets Equity Funds | | |
Fidelity Series Emerging Markets Fund | 4.9 | 5.2 |
High Yield Bond Funds | | |
Fidelity Series Emerging Markets Debt Fund | 0.7 | 0.7 |
Fidelity Series Floating Rate High Income Fund | 0.1 | 0.1 |
Fidelity Series High Income Fund | 9.2 | 9.2 |
Fidelity Series Real Estate Income Fund | 0.3 | 0.1 |
| 10.3 | 10.1 |
Investment Grade Bond Funds | | |
Fidelity Series Investment Grade Bond Fund | 3.5 | 3.1 |
Net Other Assets (Liabilities)* | 0.0 | 0.0 |
| 100.0 | 100.0 |
* Amount represents less than 0.1% |
Asset Allocation (% of fund's net assets) |
Period end |
| Commodity Funds | 9.3% | |
| Domestic Equity Funds | 54.2% | |
| Developed International Equity Funds | 17.8% | |
| Emerging Markets
Equity Funds | 4.9% | |
| High Yield Bond Funds | 10.3% | |
| Investment Grade
Bond Funds | 3.5% | |

Six months ago |
| Commodity Funds | 9.6% | |
| Domestic Equity Funds | 54.0% | |
| Developed International Equity Funds | 18.0% | |
| Emerging Markets
Equity Funds | 5.2% | |
| High Yield Bond Funds | 10.1% | |
| Investment Grade
Bond Funds | 3.1% | |

Expected |
| Commodity Funds | 9.4% | |
| Domestic Equity Funds | 53.1% | |
| Developed International Equity Funds | 17.6% | |
| Emerging Markets
Equity Funds | 5.2% | |
| High Yield Bond Funds | 10.0% | |
| Investment Grade
Bond Funds | 4.7% | |

The fund invests according to an asset allocation strategy that becomes increasingly conservative over time. The six months ago allocation is based on the fund's holdings as of September 30, 2012. The current allocation is based on the fund's holdings as of March 31, 2013. The expected allocation represents the fund's anticipated allocation at September 30, 2013. |
Annual Report
Fidelity Advisor Freedom 2050 Fund
Investments March 31, 2013
Showing Percentage of Net Assets
Domestic Equity Funds - 63.5% |
| Shares | | Value |
Commodity Funds - 9.3% |
Fidelity Series Commodity Strategy Fund (a) | 7,141,032 | | $ 62,055,569 |
Domestic Equity Funds - 54.2% |
Fidelity Advisor Equity Growth Fund Institutional Class | 694,367 | | 49,195,874 |
Fidelity Advisor Growth & Income Fund Institutional Class | 1,187,233 | | 26,225,977 |
Fidelity Advisor Large Cap Fund Institutional Class | 1,114,205 | | 26,484,651 |
Fidelity Advisor Series Equity-Income Fund | 3,040,476 | | 33,840,493 |
Fidelity Advisor Series Mega Cap Fund | 678,605 | | 7,498,583 |
Fidelity Advisor Series Opportunistic Insights Fund | 2,173,001 | | 23,924,742 |
Fidelity Advisor Series Stock Selector Large Cap Value Fund | 3,045,702 | | 34,081,404 |
Fidelity Advisor Small Cap Fund Institutional Class | 750,716 | | 20,231,800 |
Fidelity Series 100 Index Fund | 794,846 | | 8,202,815 |
Fidelity Series All-Sector Equity Fund | 5,076,330 | | 65,230,846 |
Fidelity Series Large Cap Value Fund | 3,193,559 | | 37,173,024 |
Fidelity Series Real Estate Equity Fund | 416,650 | | 5,424,779 |
Fidelity Series Small Cap Opportunities Fund | 1,910,757 | | 23,559,633 |
TOTAL DOMESTIC EQUITY FUNDS | | 361,074,621 |
TOTAL DOMESTIC EQUITY FUNDS (Cost $368,697,399) |
423,130,190
|
International Equity Funds - 22.7% |
| | | |
Developed International Equity Funds - 17.8% |
Fidelity Series International Growth Fund | 4,252,154 | | 53,789,744 |
Fidelity Series International Small Cap Fund | 797,543 | | 10,942,294 |
Fidelity Series International Value Fund | 5,434,776 | | 53,369,497 |
TOTAL DEVELOPED INTERNATIONAL EQUITY FUNDS | | 118,101,535 |
|
| Shares | | Value |
Emerging Markets Equity Funds - 4.9% |
Fidelity Series Emerging Markets Fund | 1,952,601 | | $ 32,667,017 |
TOTAL INTERNATIONAL EQUITY FUNDS (Cost $134,063,958) |
150,768,552
|
Bond Funds - 13.8% |
| | | |
High Yield Bond Funds - 10.3% |
Fidelity Series Emerging Markets Debt Fund | 433,808 | | 4,719,827 |
Fidelity Series Floating Rate High Income Fund | 46,741 | | 496,860 |
Fidelity Series High Income Fund | 5,844,788 | | 61,428,717 |
Fidelity Series Real Estate Income Fund | 174,863 | | 2,040,650 |
TOTAL HIGH YIELD BOND FUNDS | | 68,686,054 |
Investment Grade Bond Funds - 3.5% |
Fidelity Series Investment Grade Bond Fund | 2,036,320 | | 23,478,771 |
TOTAL BOND FUNDS (Cost $89,078,371) |
92,164,825
|
TOTAL INVESTMENT PORTFOLIO - 100.0% (Cost $591,839,728) | | 666,063,567 |
NET OTHER ASSETS (LIABILITIES) - 0.0% | | (125,818) |
NET ASSETS - 100% | $ 665,937,749 |
Legend |
(a) Non-income producing |
Other Information |
All investments are categorized as Level 1 under the Fair Value Hierarchy. The inputs or methodology used for valuing securities may not be an indication of the risk associated with investing in those securities. For more information on valuation inputs, please refer to the Security Valuation section in the accompanying Notes to Financial Statements. |
See accompanying notes which are an integral part of the financial statements.
Annual Report
Fidelity Advisor Freedom 2050 Fund
Statement of Assets and Liabilities
| March 31, 2013 |
| | |
Assets | | |
Investment in securities, at value (cost $591,839,728) - See accompanying schedule | | $ 666,063,567 |
Receivable for fund shares sold | | 1,415,584 |
Receivable from affiliate for expense reductions | | 795 |
Total assets | | 667,479,946 |
| | |
Liabilities | | |
Payable to custodian bank | $ 1 | |
Payable for investments purchased | 496,062 | |
Payable for fund shares redeemed | 919,491 | |
Distribution and service plan fees payable | 126,643 | |
Total liabilities | | 1,542,197 |
| | |
Net Assets | | $ 665,937,749 |
Net Assets consist of: | | |
Paid in capital | | $ 579,190,994 |
Undistributed net investment income | | 657,613 |
Accumulated undistributed net realized gain (loss) on investments | | 11,865,303 |
Net unrealized appreciation (depreciation) on investments | | 74,223,839 |
Net Assets | | $ 665,937,749 |
| | |
Calculation of Maximum Offering Price Class A:
Net Asset Value and redemption price per share ($352,814,210 ÷ 33,954,803 shares) | | $ 10.39 |
| | |
Maximum offering price per share (100/94.25 of $10.39) | | $ 11.02 |
Class T:
Net Asset Value and redemption price per share ($89,196,337 ÷ 8,609,801 shares) | | $ 10.36 |
| | |
Maximum offering price per share (100/96.50 of $10.36) | | $ 10.74 |
Class B:
Net Asset Value and offering price per share ($5,531,512 ÷ 536,605 shares)A | | $ 10.31 |
| | |
Class C:
Net Asset Value and offering price per share ($16,188,095 ÷ 1,570,718 shares)A | | $ 10.31 |
| | |
Institutional Class:
Net Asset Value, offering price and redemption price per share ($202,207,595 ÷ 19,369,681 shares) | | $ 10.44 |
A Redemption price per share is equal to net asset value less any applicable contingent deferred sales charge.
Statement of Operations
| Year ended March 31, 2013 |
| | |
Investment Income | | |
Income distributions from underlying funds | | $ 10,034,385 |
| | |
Expenses | | |
Distribution and service plan fees | $ 1,328,558 | |
Independent trustees' compensation | 1,966 | |
Total expenses before reductions | 1,330,524 | |
Expense reductions | (1,966) | 1,328,558 |
Net investment income (loss) | | 8,705,827 |
Realized and Unrealized Gain (Loss) Realized gain (loss) on sale of underlying fund shares | 4,263,892 | |
Capital gain distributions from underlying funds | 11,322,183 | |
Total net realized gain (loss) | | 15,586,075 |
Change in net unrealized appreciation (depreciation) on underlying funds | | 35,894,143 |
Net gain (loss) | | 51,480,218 |
Net increase (decrease) in net assets resulting from operations | | $ 60,186,045 |
See accompanying notes which are an integral part of the financial statements.
Annual Report
Statement of Changes in Net Assets
| Year ended
March 31,
2013 | Year ended
March 31,
2012 |
Increase (Decrease) in Net Assets | | |
Operations | | |
Net investment income (loss) | $ 8,705,827 | $ 5,163,022 |
Net realized gain (loss) | 15,586,075 | 16,208,511 |
Change in net unrealized appreciation (depreciation) | 35,894,143 | (15,390,288) |
Net increase (decrease) in net assets resulting from operations | 60,186,045 | 5,981,245 |
Distributions to shareholders from net investment income | (8,370,984) | (4,903,717) |
Distributions to shareholders from net realized gain | (2,615,729) | (7,127,717) |
Total distributions | (10,986,713) | (12,031,434) |
Share transactions - net increase (decrease) | 126,263,908 | 133,278,402 |
Total increase (decrease) in net assets | 175,463,240 | 127,228,213 |
| | |
Net Assets | | |
Beginning of period | 490,474,509 | 363,246,296 |
End of period (including undistributed net investment income of $657,613 and undistributed net investment income of $322,770, respectively) | $ 665,937,749 | $ 490,474,509 |
Financial Highlights - Class A
Years ended March 31, | 2013 | 2012 | 2011 | 2010 | 2009 |
Selected Per-Share Data | | | | | |
Net asset value, beginning of period | $ 9.61 | $ 9.93 | $ 8.66 | $ 5.67 | $ 10.32 |
Income from Investment Operations | | | | | |
Net investment income (loss) C | .15 | .12 | .11 | .11 | .16 |
Net realized and unrealized gain (loss) | .82 | (.17) E | 1.34 | 3.05 | (4.39) |
Total from investment operations | .97 | (.05) | 1.45 | 3.16 | (4.23) |
Distributions from net investment income | (.14) | (.11) | (.11) | (.10) | (.13) |
Distributions from net realized gain | (.05) | (.16) | (.08) | (.07) | (.30) |
Total distributions | (.19) | (.27) | (.18) H | (.17) | (.42) G |
Net asset value, end of period | $ 10.39 | $ 9.61 | $ 9.93 | $ 8.66 | $ 5.67 |
Total Return A, B | 10.23% | (.22)% | 16.99% | 55.94% | (42.30)% |
Ratios to Average Net Assets D, F | | | | | |
Expenses before reductions | .25% | .25% | .25% | .25% | .25% |
Expenses net of fee waivers, if any | .25% | .25% | .25% | .25% | .25% |
Expenses net of all reductions | .25% | .25% | .25% | .25% | .25% |
Net investment income (loss) | 1.56% | 1.32% | 1.23% | 1.43% | 2.04% |
Supplemental Data | | | | | |
Net assets, end of period (000 omitted) | $ 352,814 | $ 280,478 | $ 220,549 | $ 137,716 | $ 57,591 |
Portfolio turnover rate | 28% | 12% | 36% | 15% | 16% |
A Total returns would have been lower if certain expenses had not been reduced during the applicable periods shown.
B Total returns do not include the effect of the sales charges.
C Calculated based on average shares outstanding during the period.
D Amounts do not include the activity of the Underlying Funds.
E The amount shown for a share outstanding does not correspond with the aggregate net gain (loss) on investments for the period due to the timing of sales and repurchases of shares in relation to fluctuating market values of the investments of the Fund.
F Expense ratios reflect operating expenses of the class. Expenses before reductions do not reflect amounts reimbursed by the investment adviser or reductions from expense offset arrangements and do not represent the amount paid by the class during periods when reimbursements or reductions occur. Expense ratios before reductions for start-up periods may not be representative of longer-term operating periods. Expenses net of fee waivers reflect expenses after reimbursement by the investment adviser but prior to reductions from expense offset arrangements. Expenses net of all reductions represent the net expenses paid by the class but do not include expenses of the investment companies in which the Fund invests.
G Total distributions of $.42 per share is comprised of distributions from net investment income of $.127 and distributions from net realized gain of $.295 per share.
H Total distributions of $.18 per share is comprised of distributions from net investment income of $.105 and distributions from net realized gain of $.079 per share.
See accompanying notes which are an integral part of the financial statements.
Annual Report
Financial Highlights - Class T
Years ended March 31, | 2013 | 2012 | 2011 | 2010 | 2009 |
Selected Per-Share Data | | | | | |
Net asset value, beginning of period | $ 9.58 | $ 9.90 | $ 8.64 | $ 5.66 | $ 10.30 |
Income from Investment Operations | | | | | |
Net investment income (loss) C | .13 | .10 | .09 | .09 | .14 |
Net realized and unrealized gain (loss) | .81 | (.17) E | 1.33 | 3.05 | (4.37) |
Total from investment operations | .94 | (.07) | 1.42 | 3.14 | (4.23) |
Distributions from net investment income | (.12) | (.09) | (.09) | (.09) | (.11) |
Distributions from net realized gain | (.05) | (.16) | (.08) | (.07) | (.30) |
Total distributions | (.16) I | (.25) | (.16) H | (.16) | (.41) G |
Net asset value, end of period | $ 10.36 | $ 9.58 | $ 9.90 | $ 8.64 | $ 5.66 |
Total Return A, B | 9.99% | (.48)% | 16.66% | 55.57% | (42.41)% |
Ratios to Average Net Assets D, F | | | | | |
Expenses before reductions | .50% | .50% | .50% | .50% | .50% |
Expenses net of fee waivers, if any | .50% | .50% | .50% | .50% | .50% |
Expenses net of all reductions | .50% | .50% | .50% | .50% | .50% |
Net investment income (loss) | 1.31% | 1.07% | .98% | 1.18% | 1.79% |
Supplemental Data | | | | | |
Net assets, end of period (000 omitted) | $ 89,196 | $ 64,512 | $ 61,195 | $ 46,449 | $ 21,186 |
Portfolio turnover rate | 28% | 12% | 36% | 15% | 16% |
A Total returns would have been lower if certain expenses had not been reduced during the applicable periods shown.
B Total returns do not include the effect of the sales charges.
C Calculated based on average shares outstanding during the period.
D Amounts do not include the activity of the Underlying Funds.
E The amount shown for a share outstanding does not correspond with the aggregate net gain (loss) on investments for the period due to the timing of sales and repurchases of shares in relation to fluctuating market values of the investments of the Fund.
F Expense ratios reflect operating expenses of the class. Expenses before reductions do not reflect amounts reimbursed by the investment adviser or reductions from expense offset arrangements and do not represent the amount paid by the class during periods when reimbursements or reductions occur. Expense ratios before reductions for start-up periods may not be representative of longer-term operating periods. Expenses net of fee waivers reflect expenses after reimbursement by the investment adviser but prior to reductions from expense offset arrangements. Expenses net of all reductions represent the net expenses paid by the class but do not include expenses of the investment companies in which the Fund invests.
G Total distributions of $.41 per share is comprised of distributions from net investment income of $.112 and distributions from net realized gain of $.295 per share.
H Total distributions of $.16 per share is comprised of distributions from net investment income of $.085 and distributions from net realized gain of $.079 per share.
I Total distributions of $.16 per share is comprised of distributions from net investment income of $.117 and distributions from net realized gain of $.046 per share.
Financial Highlights - Class B
Years ended March 31, | 2013 | 2012 | 2011 | 2010 | 2009 |
Selected Per-Share Data | | | | | |
Net asset value, beginning of period | $ 9.54 | $ 9.86 | $ 8.60 | $ 5.64 | $ 10.26 |
Income from Investment Operations | | | | | |
Net investment income (loss) C | .08 | .05 | .04 | .05 | .10 |
Net realized and unrealized gain (loss) | .81 | (.17) E | 1.34 | 3.03 | (4.35) |
Total from investment operations | .89 | (.12) | 1.38 | 3.08 | (4.25) |
Distributions from net investment income | (.08) | (.05) | (.05) | (.05) | (.08) |
Distributions from net realized gain | (.05) | (.15) | (.07) | (.07) | (.29) |
Total distributions | (.12) H | (.20) | (.12) | (.12) | (.37) G |
Net asset value, end of period | $ 10.31 | $ 9.54 | $ 9.86 | $ 8.60 | $ 5.64 |
Total Return A, B | 9.47% | (1.06)% | 16.16% | 54.72% | (42.71)% |
Ratios to Average Net Assets D, F | | | | | |
Expenses before reductions | 1.00% | 1.00% | 1.00% | 1.00% | 1.00% |
Expenses net of fee waivers, if any | 1.00% | 1.00% | 1.00% | 1.00% | 1.00% |
Expenses net of all reductions | 1.00% | 1.00% | 1.00% | 1.00% | 1.00% |
Net investment income (loss) | .81% | .57% | .48% | .68% | 1.29% |
Supplemental Data | | | | | |
Net assets, end of period (000 omitted) | $ 5,532 | $ 5,643 | $ 6,704 | $ 5,847 | $ 3,078 |
Portfolio turnover rate | 28% | 12% | 36% | 15% | 16% |
A Total returns would have been lower if certain expenses had not been reduced during the applicable periods shown.
B Total returns do not include the effect of the contingent deferred sales charge.
C Calculated based on average shares outstanding during the period.
D Amounts do not include the activity of the Underlying Funds.
E The amount shown for a share outstanding does not correspond with the aggregate net gain (loss) on investments for the period due to the timing of sales and repurchases of shares in relation to fluctuating market values of the investments of the Fund.
F Expense ratios reflect operating expenses of the class. Expenses before reductions do not reflect amounts reimbursed by the investment adviser or reductions from expense offset arrangements and do not represent the amount paid by the class during periods when reimbursements or reductions occur. Expense ratios before reductions for start-up periods may not be representative of longer-term operating periods. Expenses net of fee waivers reflect expenses after reimbursement by the investment adviser but prior to reductions from expense offset arrangements. Expenses net of all reductions represent the net expenses paid by the class but do not include expenses of the investment companies in which the Fund invests.
G Total distributions of $.37 per share is comprised of distributions from net investment income of $.078 and distributions from net realized gain of $.290 per share.
H Total distributions of $.12 per share is comprised of distributions from net investment income of $.077 and distributions from net realized gain of $.046 per share.
See accompanying notes which are an integral part of the financial statements.
Annual Report
Financial Highlights - Class C
Years ended March 31, | 2013 | 2012 | 2011 | 2010 | 2009 |
Selected Per-Share Data | | | | | |
Net asset value, beginning of period | $ 9.54 | $ 9.87 | $ 8.61 | $ 5.63 | $ 10.25 |
Income from Investment Operations | | | | | |
Net investment income (loss) C | .08 | .05 | .04 | .05 | .10 |
Net realized and unrealized gain (loss) | .82 | (.18) E | 1.34 | 3.05 | (4.35) |
Total from investment operations | .90 | (.13) | 1.38 | 3.10 | (4.25) |
Distributions from net investment income | (.08) | (.05) | (.05) | (.05) | (.08) |
Distributions from net realized gain | (.05) | (.15) | (.07) | (.07) | (.29) |
Total distributions | (.13) | (.20) | (.12) | (.12) | (.37) G |
Net asset value, end of period | $ 10.31 | $ 9.54 | $ 9.87 | $ 8.61 | $ 5.63 |
Total Return A, B | 9.53% | (1.08)% | 16.16% | 55.15% | (42.74)% |
Ratios to Average Net Assets D, F | | | | | |
Expenses before reductions | 1.00% | 1.00% | 1.00% | 1.00% | 1.00% |
Expenses net of fee waivers, if any | 1.00% | 1.00% | 1.00% | 1.00% | 1.00% |
Expenses net of all reductions | 1.00% | 1.00% | 1.00% | 1.00% | 1.00% |
Net investment income (loss) | .81% | .57% | .48% | .68% | 1.29% |
Supplemental Data | | | | | |
Net assets, end of period (000 omitted) | $ 16,188 | $ 13,344 | $ 12,014 | $ 9,646 | $ 5,436 |
Portfolio turnover rate | 28% | 12% | 36% | 15% | 16% |
A Total returns would have been lower if certain expenses had not been reduced during the applicable periods shown.
B Total returns do not include the effect of the contingent deferred sales charge.
C Calculated based on average shares outstanding during the period.
D Amounts do not include the activity of the Underlying Funds.
E The amount shown for a share outstanding does not correspond with the aggregate net gain (loss) on investments for the period due to the timing of sales and repurchases of shares in relation to fluctuating market values of the investments of the Fund.
F Expense ratios reflect operating expenses of the class. Expenses before reductions do not reflect amounts reimbursed by the investment adviser or reductions from expense offset arrangements and do not represent the amount paid by the class during periods when reimbursements or reductions occur. Expense ratios before reductions for start-up periods may not be representative of longer-term operating periods. Expenses net of fee waivers reflect expenses after reimbursement by the investment adviser but prior to reductions from expense offset arrangements. Expenses net of all reductions represent the net expenses paid by the class but do not include expenses of the investment companies in which the Fund invests.
G Total distributions of $.37 per share is comprised of distributions from net investment income of $.080 and distributions from net realized gain of $.290 per share.
Financial Highlights - Institutional Class
Years ended March 31, | 2013 | 2012 | 2011 | 2010 | 2009 |
Selected Per-Share Data | | | | | |
Net asset value, beginning of period | $ 9.65 | $ 9.97 | $ 8.70 | $ 5.68 | $ 10.35 |
Income from Investment Operations | | | | | |
Net investment income (loss) B | .18 | .15 | .13 | .13 | .17 |
Net realized and unrealized gain (loss) | .82 | (.18) E | 1.34 | 3.08 | (4.40) |
Total from investment operations | 1.00 | (.03) | 1.47 | 3.21 | (4.23) |
Distributions from net investment income | (.16) | (.13) | (.13) | (.12) | (.15) |
Distributions from net realized gain | (.05) | (.16) | (.08) | (.07) | (.30) |
Total distributions | (.21) | (.29) | (.20) H | (.19) | (.44) G |
Net asset value, end of period | $ 10.44 | $ 9.65 | $ 9.97 | $ 8.70 | $ 5.68 |
Total Return A | 10.55% | .02% | 17.17% | 56.66% | (42.22)% |
Ratios to Average Net Assets C, F | | | | | |
Expenses before reductions D | .00% | .00% | .00% | .00% | .00% |
Expenses net of fee waivers, if any | .00% | .00% | .00% | .00% | .00% |
Expenses net of all reductions | .00% | .00% | .00% | .00% | .00% |
Net investment income (loss) | 1.81% | 1.57% | 1.48% | 1.68% | 2.29% |
Supplemental Data | | | | | |
Net assets, end of period (000 omitted) | $ 202,208 | $ 126,497 | $ 62,785 | $ 40,214 | $ 15,010 |
Portfolio turnover rate | 28% | 12% | 36% | 15% | 16% |
A Total returns would have been lower if certain expenses had not been reduced during the applicable periods shown.
B Calculated based on average shares outstanding during the period.
C Amounts do not include the activity of the Underlying Funds.
D Amount represents less than .01%.
E The amount shown for a share outstanding does not correspond with the aggregate net gain (loss) on investments for the period due to the timing of sales and repurchases of shares in relation to fluctuating market values of the investments of the Fund.
F Expense ratios reflect operating expenses of the class. Expenses before reductions do not reflect amounts reimbursed by the investment adviser or reductions from expense offset arrangements and do not represent the amount paid by the class during periods when reimbursements or reductions occur. Expense ratios before reductions for start-up periods may not be representative of longer-term operating periods. Expenses net of fee waivers reflect expenses after reimbursement by the investment adviser but prior to reductions from expense offset arrangements. Expenses net of all reductions represent the net expenses paid by the class but do not include expenses of the investment companies in which the Fund invests.
G Total distributions of $.44 per share is comprised of distributions from net investment income of $.146 and distributions from net realized gain of $.295 per share.
H Total distributions of $.20 per share is comprised of distributions from net investment income of $.125 and distributions from net realized gain of $.078 per share.
See accompanying notes which are an integral part of the financial statements.
Annual Report
Fidelity Advisor Freedom 2055 Fund
Investment Changes (Unaudited)
The information in the following tables is based on the direct investments of the Fund. |
Fund Holdings as of March 31, 2013 |
| % of fund's
net assets | % of fund's net assets
6 months ago |
Commodity Funds | | |
Fidelity Series Commodity Strategy Fund | 9.7 | 9.9 |
Domestic Equity Funds | | |
Fidelity Advisor Equity Growth Fund Institutional Class | 8.0 | 6.7 |
Fidelity Advisor Growth & Income Fund Institutional Class | 4.4 | 8.0 |
Fidelity Advisor Large Cap Fund Institutional Class | 4.4 | 7.4 |
Fidelity Advisor Series Equity-Income Fund | 4.5 | 0.0 |
Fidelity Advisor Series Mega Cap Fund | 1.0 | 0.0 |
Fidelity Advisor Series Opportunistic Insights Fund | 3.2 | 0.0 |
Fidelity Advisor Series Stock Selector Large Cap Value Fund | 4.5 | 0.0 |
Fidelity Advisor Small Cap Fund Institutional Class | 3.3 | 2.7 |
Fidelity Series 100 Index Fund | 1.5 | 5.3 |
Fidelity Series All-Sector Equity Fund | 10.6 | 11.4 |
Fidelity Series Large Cap Value Fund | 6.2 | 10.8 |
Fidelity Series Real Estate Equity Fund | 0.9 | 0.8 |
Fidelity Series Small Cap Opportunities Fund | 3.8 | 2.8 |
| 56.3 | 55.9 |
Developed International Equity Funds | | |
Fidelity Series International Growth Fund | 8.4 | 8.4 |
Fidelity Series International Small Cap Fund | 1.7 | 1.7 |
Fidelity Series International Value Fund | 8.4 | 8.5 |
| 18.5 | 18.6 |
Emerging Markets Equity Funds | | |
Fidelity Series Emerging Markets Fund | 5.3 | 5.5 |
High Yield Bond Funds | | |
Fidelity Series Emerging Markets Debt Fund | 0.6 | 0.8 |
Fidelity Series Floating Rate High Income Fund | 0.0* | 0.0* |
Fidelity Series High Income Fund | 9.3 | 9.0 |
Fidelity Series Real Estate Income Fund | 0.2 | 0.0* |
| 10.1 | 9.8 |
Investment Grade Bond Funds | | |
Fidelity Series Investment Grade Bond Fund | 0.1 | 0.3 |
Net Other Assets (Liabilities)* | 0.0 | 0.0 |
| 100.0 | 100.0 |
* Amount represents less than 0.1% |
Asset Allocation (% of fund's net assets) |
Period end |
| Commodity Funds | 9.7% | |
| Domestic Equity Funds | 56.3% | |
| Developed International Equity Funds | 18.5% | |
| Emerging Markets
Equity Funds | 5.3% | |
| High Yield Bond Funds | 10.1% | |
| Investment Grade
Bond Funds | 0.1% | |

Six months ago |
| Commodity Funds | 9.9% | |
| Domestic Equity Funds | 55.9% | |
| Developed International Equity Funds | 18.6% | |
| Emerging Markets
Equity Funds | 5.5% | |
| High Yield Bond Funds | 9.8% | |
| Investment Grade
Bond Funds | 0.3% | |

Expected |
| Commodity Funds | 9.8% | |
| Domestic Equity Funds | 55.8% | |
| Developed International Equity Funds | 18.4% | |
| Emerging Markets
Equity Funds | 5.5% | |
| High Yield Bond Funds | 10.0% | |
| Investment Grade
Bond Funds | 0.5% | |

The fund invests according to an asset allocation strategy that becomes increasingly conservative over time. The six months ago allocation is based on the fund's holdings as of September 30, 2012. The current allocation is based on the fund's holdings as of March 31, 2013. The expected allocation represents the fund's anticipated allocation at September 30, 2013. |
Annual Report
Fidelity Advisor Freedom 2055 Fund
Investments March 31, 2013
Showing Percentage of Net Assets
Domestic Equity Funds - 66.0% |
| Shares | | Value |
Commodity Funds - 9.7% |
Fidelity Series Commodity Strategy Fund (a) | 665,614 | | $ 5,784,182 |
Domestic Equity Funds - 56.3% |
Fidelity Advisor Equity Growth Fund Institutional Class | 66,585 | | 4,717,573 |
Fidelity Advisor Growth & Income Fund Institutional Class | 117,482 | | 2,595,183 |
Fidelity Advisor Large Cap Fund Institutional Class | 109,269 | | 2,597,322 |
Fidelity Advisor Series Equity-Income Fund | 239,379 | | 2,664,286 |
Fidelity Advisor Series Mega Cap Fund | 54,116 | | 597,982 |
Fidelity Advisor Series Opportunistic Insights Fund | 172,163 | | 1,895,518 |
Fidelity Advisor Series Stock Selector Large Cap Value Fund | 239,270 | | 2,677,427 |
Fidelity Advisor Small Cap Fund Institutional Class | 71,980 | | 1,939,859 |
Fidelity Series 100 Index Fund | 84,682 | | 873,917 |
Fidelity Series All-Sector Equity Fund | 489,288 | | 6,287,353 |
Fidelity Series Large Cap Value Fund | 317,758 | | 3,698,707 |
Fidelity Series Real Estate Equity Fund | 41,844 | | 544,808 |
Fidelity Series Small Cap Opportunities Fund | 182,897 | | 2,255,121 |
TOTAL DOMESTIC EQUITY FUNDS | | 33,345,056 |
TOTAL DOMESTIC EQUITY FUNDS (Cost $37,000,276) |
39,129,238
|
International Equity Funds - 23.8% |
| | | |
Developed International Equity Funds - 18.5% |
Fidelity Series International Growth Fund | 395,886 | | 5,007,955 |
Fidelity Series International Small Cap Fund | 73,759 | | 1,011,976 |
Fidelity Series International Value Fund | 505,401 | | 4,963,040 |
TOTAL DEVELOPED INTERNATIONAL EQUITY FUNDS | | 10,982,971 |
|
| Shares | | Value |
Emerging Markets Equity Funds - 5.3% |
Fidelity Series Emerging Markets Fund | 186,093 | | $ 3,113,335 |
TOTAL INTERNATIONAL EQUITY FUNDS (Cost $13,200,537) |
14,096,306
|
Bond Funds - 10.2% |
| | | |
High Yield Bond Funds - 10.1% |
Fidelity Series Emerging Markets Debt Fund | 32,778 | | 356,627 |
Fidelity Series Floating Rate High Income Fund | 183 | | 1,943 |
Fidelity Series High Income Fund | 520,330 | | 5,468,666 |
Fidelity Series Real Estate Income Fund | 11,561 | | 134,922 |
TOTAL HIGH YIELD BOND FUNDS | | 5,962,158 |
Investment Grade Bond Funds - 0.1% |
Fidelity Series Investment Grade Bond Fund | 5,926 | | 68,328 |
TOTAL BOND FUNDS (Cost $5,861,857) |
6,030,486
|
TOTAL INVESTMENT PORTFOLIO - 100.0% (Cost $56,062,670) | | 59,256,030 |
NET OTHER ASSETS (LIABILITIES) - 0.0% | | (9,901) |
NET ASSETS - 100% | $ 59,246,129 |
Legend |
(a) Non-income producing |
Other Information |
All investments are categorized as Level 1 under the Fair Value Hierarchy. The inputs or methodology used for valuing securities may not be an indication of the risk associated with investing in those securities. For more information on valuation inputs, please refer to the Security Valuation section in the accompanying Notes to Financial Statements. |
See accompanying notes which are an integral part of the financial statements.
Annual Report
Fidelity Advisor Freedom 2055 Fund
Statement of Assets and Liabilities
| March 31, 2013 |
| | |
Assets | | |
Investment in securities, at value (cost $56,062,670) - See accompanying schedule | | $ 59,256,030 |
Receivable for fund shares sold | | 322,644 |
Receivable from affiliate for expense reductions | | 239 |
Total assets | | 59,578,913 |
| | |
Liabilities | | |
Payable for investments purchased | $ 193,630 | |
Payable for fund shares redeemed | 129,011 | |
Distribution and service plan fees payable | 10,143 | |
Total liabilities | | 332,784 |
| | |
Net Assets | | $ 59,246,129 |
Net Assets consist of: | | |
Paid in capital | | $ 55,335,797 |
Undistributed net investment income | | 45,086 |
Accumulated undistributed net realized gain (loss) on investments | | 671,886 |
Net unrealized appreciation (depreciation) on investments | | 3,193,360 |
Net Assets | | $ 59,246,129 |
| | |
Calculation of Maximum Offering Price Class A:
Net Asset Value and redemption price per share ($32,475,945 ÷ 3,074,354 shares) | | $ 10.56 |
| | |
Maximum offering price per share (100/94.25 of $10.56) | | $ 11.20 |
Class T:
Net Asset Value and redemption price per share ($7,238,789 ÷ 686,209 shares) | | $ 10.55 |
| | |
Maximum offering price per share (100/96.50 of $10.55) | | $ 10.93 |
Class C:
Net Asset Value and offering price per share ($1,093,620 ÷ 103,505 shares)A | | $ 10.57 |
| | |
Institutional Class:
Net Asset Value, offering price and redemption price per share ($18,437,775 ÷ 1,741,685 shares) | | $ 10.59 |
A Redemption price per share is equal to net asset value less any applicable contingent deferred sales charge.
Statement of Operations
| Year ended March 31, 2013 |
| | |
Investment Income | | |
Income distributions from underlying funds | | $ 580,158 |
| | |
Expenses | | |
Distribution and service plan fees | $ 64,121 | |
Independent trustees' compensation | 88 | |
Total expenses before reductions | 64,209 | |
Expense reductions | (88) | 64,121 |
Net investment income (loss) | | 516,037 |
Realized and Unrealized Gain (Loss) Realized gain (loss) on sale of underlying fund shares | (47,012) | |
Capital gain distributions from underlying funds | 802,719 | |
Total net realized gain (loss) | | 755,707 |
Change in net unrealized appreciation (depreciation) on underlying funds | | 3,283,912 |
Net gain (loss) | | 4,039,619 |
Net increase (decrease) in net assets resulting from operations | | $ 4,555,656 |
See accompanying notes which are an integral part of the financial statements.
Annual Report
Statement of Changes in Net Assets
| Year ended
March 31,
2013 | For the period
June 1, 2011
(commencement of
operations) to
March 31, 2012 |
Increase (Decrease) in Net Assets | | |
Operations | | |
Net investment income (loss) | $ 516,037 | $ 56,691 |
Net realized gain (loss) | 755,707 | 124,116 |
Change in net unrealized appreciation (depreciation) | 3,283,912 | (90,552) |
Net increase (decrease) in net assets resulting from operations | 4,555,656 | 90,255 |
Distributions to shareholders from net investment income | (473,172) | (53,298) |
Distributions to shareholders from net realized gain | (129,809) | (79,300) |
Total distributions | (602,981) | (132,598) |
Share transactions - net increase (decrease) | 47,565,310 | 7,770,487 |
Total increase (decrease) in net assets | 51,517,985 | 7,728,144 |
| | |
Net Assets | | |
Beginning of period | 7,728,144 | - |
End of period (including undistributed net investment income of $45,086 and undistributed net investment income of $2,221, respectively) | $ 59,246,129 | $ 7,728,144 |
Financial Highlights - Class A
Years ended March 31, | 2013 | 2012 H |
Selected Per-Share Data | | |
Net asset value, beginning of period | $ 9.75 | $ 10.00 |
Income from Investment Operations | | |
Net investment income (loss) E | .18 | .11 |
Net realized and unrealized gain (loss) | .83 | (.11) G |
Total from investment operations | 1.01 | - |
Distributions from net investment income | (.13) | (.11) |
Distributions from net realized gain | (.07) | (.15) |
Total distributions | (.20) | (.25) J |
Net asset value, end of period | $ 10.56 | $ 9.75 |
Total Return B, C, D | 10.51% | .29% |
Ratios to Average Net Assets F, I | | |
Expenses before reductions | .25% | .25% A |
Expenses net of fee waivers, if any | .25% | .25% A |
Expenses net of all reductions | .25% | .25% A |
Net investment income (loss) | 1.82% | 1.44% A |
Supplemental Data | | |
Net assets, end of period (000 omitted) | $ 32,476 | $ 2,655 |
Portfolio turnover rate | 29% | 18% A |
A Annualized
B Total returns for periods of less than one year are not annualized.
C Total returns would have been lower if certain expenses had not been reduced during the applicable periods shown.
D Total returns do not include the effect of the sales charges.
E Calculated based on average shares outstanding during the period.
F Amounts do not include the activity of the Underlying Funds.
G The amount shown for a share outstanding does not correspond with the aggregate net gain (loss) on investments for the period due to the timing of sales and repurchases of shares in relation to fluctuating market values of the investments of the Fund.
H For the period June 1, 2011 (commencement of operations) to March 31, 2012.
I Expense ratios reflect operating expenses of the class. Expenses before reductions do not reflect amounts reimbursed by the investment adviser or reductions from expense offset arrangements and do not represent the amount paid by the class during periods when reimbursements or reductions occur. Expenses net of fee waivers reflect expenses after reimbursement by the investment adviser but prior to reductions from expense offset arrangements. Expenses net of all reductions represent the net expenses paid by the class but do not include expenses of the investment companies in which the Fund invests.
J Total distributions of $.25 per share is comprised of distributions from net investment income of $.105 and distributions from net realized gain of $.146 per share.
See accompanying notes which are an integral part of the financial statements.
Annual Report
Financial Highlights - Class T
Years ended March 31, | 2013 | 2012 H |
Selected Per-Share Data | | |
Net asset value, beginning of period | $ 9.75 | $ 10.00 |
Income from Investment Operations | | |
Net investment income (loss) E | .16 | .09 |
Net realized and unrealized gain (loss) | .82 | (.10) G |
Total from investment operations | .98 | (.01) |
Distributions from net investment income | (.11) | (.09) |
Distributions from net realized gain | (.07) | (.15) |
Total distributions | (.18) | (.24) |
Net asset value, end of period | $ 10.55 | $ 9.75 |
Total Return B, C, D | 10.24% | .12% |
Ratios to Average Net Assets F, I | | |
Expenses before reductions | .50% | .50% A |
Expenses net of fee waivers, if any | .50% | .50% A |
Expenses net of all reductions | .50% | .50% A |
Net investment income (loss) | 1.57% | 1.19% A |
Supplemental Data | | |
Net assets, end of period (000 omitted) | $ 7,239 | $ 1,444 |
Portfolio turnover rate | 29% | 18% A |
A Annualized
B Total returns for periods of less than one year are not annualized.
C Total returns would have been lower if certain expenses had not been reduced during the applicable periods shown.
D Total returns do not include the effect of the sales charges.
E Calculated based on average shares outstanding during the period.
F Amounts do not include the activity of the Underlying Funds.
G The amount shown for a share outstanding does not correspond with the aggregate net gain (loss) on investments for the period due to the timing of sales and repurchases of shares in relation to fluctuating market values of the investments of the Fund.
H For the period June 1, 2011 (commencement of operations) to March 31, 2012.
I Expense ratios reflect operating expenses of the class. Expenses before reductions do not reflect amounts reimbursed by the investment adviser or reductions from expense offset arrangements and do not represent the amount paid by the class during periods when reimbursements or reductions occur. Expenses net of fee waivers reflect expenses after reimbursement by the investment adviser but prior to reductions from expense offset arrangements. Expenses net of all reductions represent the net expenses paid by the class but do not include expenses of the investment companies in which the Fund invests.
Financial Highlights - Class C
Years ended March 31, | 2013 | 2012 H |
Selected Per-Share Data | | |
Net asset value, beginning of period | $ 9.74 | $ 10.00 |
Income from Investment Operations | | |
Net investment income (loss) E | .10 | .05 |
Net realized and unrealized gain (loss) | .83 | (.10) G |
Total from investment operations | .93 | (.05) |
Distributions from net investment income | (.03) | (.06) |
Distributions from net realized gain | (.07) | (.15) |
Total distributions | (.10) | (.21) |
Net asset value, end of period | $ 10.57 | $ 9.74 |
Total Return B, C, D | 9.69% | (.27)% |
Ratios to Average Net Assets F, I | | |
Expenses before reductions | 1.00% | 1.00% A |
Expenses net of fee waivers, if any | 1.00% | 1.00% A |
Expenses net of all reductions | 1.00% | 1.00% A |
Net investment income (loss) | 1.07% | .69% A |
Supplemental Data | | |
Net assets, end of period (000 omitted) | $ 1,094 | $ 1,127 |
Portfolio turnover rate | 29% | 18% A |
A Annualized
B Total returns for periods of less than one year are not annualized.
C Total returns would have been lower if certain expenses had not been reduced during the applicable periods shown.
D Total returns do not include the effect of the contingent deferred sales charge.
E Calculated based on average shares outstanding during the period.
F Amounts do not include the activity of the Underlying Funds.
G The amount shown for a share outstanding does not correspond with the aggregate net gain (loss) on investments for the period due to the timing of sales and repurchases of shares in relation to fluctuating market values of the investments of the Fund.
H For the period June 1, 2011 (commencement of operations) to March 31, 2012.
I Expense ratios reflect operating expenses of the class. Expenses before reductions do not reflect amounts reimbursed by the investment adviser or reductions from expense offset arrangements and do not represent the amount paid by the class during periods when reimbursements or reductions occur. Expenses net of fee waivers reflect expenses after reimbursement by the investment adviser but prior to reductions from expense offset arrangements. Expenses net of all reductions represent the net expenses paid by the class but do not include expenses of the investment companies in which the Fund invests.
See accompanying notes which are an integral part of the financial statements.
Annual Report
Financial Highlights - Institutional Class
Years ended March 31, | 2013 | 2012 H |
Selected Per-Share Data | | |
Net asset value, beginning of period | $ 9.76 | $ 10.00 |
Income from Investment Operations | | |
Net investment income (loss) D | .21 | .13 |
Net realized and unrealized gain (loss) | .83 | (.11) G |
Total from investment operations | 1.04 | .02 |
Distributions from net investment income | (.14) | (.12) |
Distributions from net realized gain | (.07) | (.15) |
Total distributions | (.21) | (.26) J |
Net asset value, end of period | $ 10.59 | $ 9.76 |
Total Return B, C | 10.84% | .51% |
Ratios to Average Net Assets E, I | | |
Expenses before reductions F | .00% | .00% A |
Expenses net of fee waivers, if any | .00% | .00% A |
Expenses net of all reductions | .00% | .00% A |
Net investment income (loss) | 2.07% | 1.69% A |
Supplemental Data | | |
Net assets, end of period (000 omitted) | $ 18,438 | $ 2,503 |
Portfolio turnover rate | 29% | 18% A |
A Annualized
B Total returns for periods of less than one year are not annualized.
C Total returns would have been lower if certain expenses had not been reduced during the applicable periods shown.
D Calculated based on average shares outstanding during the period.
E Amounts do not include the activity of the Underlying Funds.
F Amount represents less than .01%.
G The amount shown for a share outstanding does not correspond with the aggregate net gain (loss) on investments for the period due to the timing of sales and repurchases of shares in relation to fluctuating market values of the investments of the Fund.
H For the period June 1, 2011 (commencement of operations) to March 31, 2012.
I Expense ratios reflect operating expenses of the class. Expenses before reductions do not reflect amounts reimbursed by the investment adviser or reductions from expense offset arrangements and do not represent the amount paid by the class during periods when reimbursements or reductions occur. Expenses net of fee waivers reflect expenses after reimbursement by the investment adviser but prior to reductions from expense offset arrangements. Expenses net of all reductions represent the net expenses paid by the class but do not include expenses of the investment companies in which the Fund invests.
J Total distributions of $.26 per share is comprised of distributions from net investment income of $.116 and distributions from net realized gain of $.146 per share.
See accompanying notes which are an integral part of the financial statements.
Annual Report
Notes to Financial Statements
For the period ended March 31, 2013
1. Organization.
Fidelity Advisor Freedom Income Fund, Fidelity Advisor Freedom 2005 Fund, Fidelity Advisor Freedom 2010 Fund, Fidelity Advisor Freedom 2015 Fund, Fidelity Advisor Freedom 2020 Fund, Fidelity Advisor Freedom 2025 Fund, Fidelity Advisor Freedom 2030 Fund, Fidelity Advisor Freedom 2035 Fund, Fidelity Advisor Freedom 2040 Fund, Fidelity Advisor Freedom 2045 Fund, Fidelity Advisor Freedom 2050 Fund and Fidelity Advisor Freedom 2055 Fund (the Funds) are funds of Fidelity Aberdeen Street Trust (the Trust). The Trust is registered under the Investment Company Act of 1940, as amended (the 1940 Act), as an open-end management investment company organized as a Delaware statutory trust. Each Fund is authorized to issue an unlimited number of shares. The Funds invest primarily in a combination of other Fidelity equity, bond and short-term funds (the Underlying Funds) managed by Fidelity Management & Research Company (FMR).
Each Fund offers Class A, Class T, Class C and Institutional Class shares, each of which, along with Class B shares, has equal rights as to assets and voting privileges. Effective after the close of business on September 1, 2010, Class B shares were closed to new accounts and additional purchases, except for exchanges and reinvestments. Each class has exclusive voting rights with respect to matters that affect that class. Class B shares will automatically convert to Class A shares after a holding period of seven years from the initial date of purchase. Investment income, realized and unrealized capital gains and losses, the common expenses of each Fund, and certain fund-level expense reductions, if any, are allocated on a pro-rata basis to each class based on the relative net assets of each class to the total net assets of each Fund. Each class differs with respect to distribution and service plan fees incurred. Certain expense reductions may also differ by class.
2. Significant Accounting Policies.
The financial statements have been prepared in conformity with accounting principles generally accepted in the United States of America (GAAP), which require management to make certain estimates and assumptions at the date of the financial statements. Actual results could differ from those estimates. Subsequent events, if any, through the date that the financial statements were issued have been evaluated in the preparation of the financial statements. The following summarizes the significant accounting policies of the Funds:
Security Valuation. Investments are valued as of 4:00 p.m. Eastern time on the last calendar day of the period. Each Fund categorizes the inputs to valuation techniques used to value its investments into a disclosure hierarchy consisting of three levels as shown below:
Level 1 - quoted prices in active markets for identical investments
Level 2 - other significant observable inputs (including quoted prices for similar investments, interest rates, prepayment speeds, etc.)
Level 3 - unobservable inputs (including the Fund's own assumptions based on the best information available)
Valuation techniques used to value each Fund's investments by major category are as follows. Investments in the Underlying Funds are valued at their closing net asset value (NAV) each business day and are categorized as Level 1 in the hierarchy.
Investment Transactions and Income. For financial reporting purposes, the Funds' investment holdings and NAV include trades executed through the end of the last business day of the period. The NAV per share for processing shareholder transactions is calculated as of the close of business of the New York Stock Exchange (NYSE), normally 4:00 p.m. Eastern time and includes trades executed through the end of the prior business day. Gains and losses on securities sold are determined on the basis of identified cost. Income and capital gain distributions from the Underlying Funds, if any, are recorded on the ex-dividend date.
Expenses. Expenses directly attributable to a fund are charged to that fund. Expenses attributable to more than one fund are allocated among the respective funds on the basis of relative net assets or other appropriate methods. Expenses included in the accompanying financial statements reflect the expenses of each Fund and do not include any expenses associated with the Underlying Funds. Expense estimates are accrued in the period to which they relate and adjustments are made when actual amounts are known.
Income Tax Information and Distributions to Shareholders. Each year, each Fund intends to qualify as a regulated investment company under Subchapter M of the Internal Revenue Code, including distributing substantially all of its taxable income and realized gains. As a result, no provision for income taxes is required. As of March 31, 2013, each Fund did not have any unrecognized tax benefits in the financial statements; nor is each Fund aware of any tax positions for which it is reasonably possible that the total amounts of unrecognized tax benefits will significantly change in the next twelve months. Each Fund files a U.S. federal tax return, in addition to state and local tax returns as required. A fund's federal income tax returns are subject to examination by the Internal Revenue Service (IRS) for a period of three fiscal years after they are filed. State and local tax returns may be subject to examination for an additional fiscal year depending on the jurisdiction.
Distributions are declared and recorded on the ex-dividend date. Income dividends and capital gain distributions are declared separately for each class. Income and capital gain distributions are determined in accordance with income tax regulations, which may differ from GAAP.
Capital accounts within the financial statements are adjusted for permanent book-tax differences. These adjustments have no impact on net assets or the results of operations. Temporary book-tax differences will reverse in a subsequent period.
Annual Report
2. Significant Accounting Policies - continued
Income Tax Information and Distributions to Shareholders - continued
Book-tax differences are primarily due to short-term gain distributions from the Underlying Funds, capital loss carryforwards and losses deferred due to wash sales and excise tax regulations.
The federal tax cost of investment securities and unrealized appreciation (depreciation) as of period end were as follows for each Fund:
| Tax cost | Gross unrealized
appreciation | Gross unrealized
depreciation | Net unrealized
appreciation
(depreciation) on
securities and
other investments |
Advisor Freedom Income | $ 308,887,922 | $ 20,071,621 | $ (1,400,214) | $ 18,671,407 |
Advisor Freedom 2005 | 291,930,308 | 20,619,209 | (2,226,098) | 18,393,111 |
Advisor Freedom 2010 | 853,289,878 | 67,346,266 | (9,911,229) | 57,435,037 |
Advisor Freedom 2015 | 1,818,763,337 | 165,753,270 | (18,902,954) | 146,850,316 |
Advisor Freedom 2020 | 3,058,091,525 | 269,088,437 | (38,735,797) | 230,352,640 |
Advisor Freedom 2025 | 2,696,525,255 | 259,281,521 | (40,826,533) | 218,454,988 |
Advisor Freedom 2030 | 2,738,067,079 | 261,014,164 | (44,536,892) | 216,477,272 |
Advisor Freedom 2035 | 1,922,312,493 | 197,065,552 | (35,102,047) | 161,963,505 |
Advisor Freedom 2040 | 1,875,980,639 | 178,130,610 | (35,341,845) | 142,788,765 |
Advisor Freedom 2045 | 812,974,198 | 108,848,673 | (14,441,501) | 94,407,172 |
Advisor Freedom 2050 | 593,912,303 | 83,256,852 | (11,105,588) | 72,151,264 |
Advisor Freedom 2055 | 56,156,186 | 3,547,789 | (447,945) | 3,099,844 |
The tax-based components of distributable earnings as of period end were as follows for each Fund:
| Undistributed
ordinary income | Undistributed
long-term
capital gain | Net unrealized
appreciation
(depreciation) |
Advisor Freedom Income | $ 462,115 | $ 3,383,496 | $ 18,671,407 |
Advisor Freedom 2005 | 476,621 | 1,838,709 | 18,393,111 |
Advisor Freedom 2010 | 1,474,668 | 8,728,254 | 57,435,037 |
Advisor Freedom 2015 | 3,141,367 | 31,322,730 | 146,850,316 |
Advisor Freedom 2020 | 5,631,670 | 61,913,127 | 230,352,640 |
Advisor Freedom 2025 | 4,880,880 | 84,582,252 | 218,454,988 |
Advisor Freedom 2030 | 5,115,477 | 73,228,005 | 216,477,272 |
Advisor Freedom 2035 | 3,011,843 | 75,581,844 | 161,963,505 |
Advisor Freedom 2040 | 2,694,214 | 72,708,334 | 142,788,765 |
Advisor Freedom 2045 | 1,362,498 | 18,479,090 | 94,407,172 |
Advisor Freedom 2050 | 1,187,067 | 13,408,424 | 72,151,264 |
Advisor Freedom 2055 | 95,591 | 714,897 | 3,099,844 |
The tax character of distributions paid was as follows:
March 31, 2013 | | | |
| Ordinary Income | Long-term
Capital Gains | Total |
Advisor Freedom Income | $ 5,414,666 | $ 1,914,942 | $ 7,329,608 |
Advisor Freedom 2005 | 5,136,657 | - | 5,136,657 |
Advisor Freedom 2010 | 18,067,071 | - | 18,067,071 |
Advisor Freedom 2015 | 38,253,485 | - | 38,253,485 |
Advisor Freedom 2020 | 62,726,354 | - | 62,726,354 |
Advisor Freedom 2025 | 53,196,385 | - | 53,196,385 |
Advisor Freedom 2030 | 53,839,930 | - | 53,839,930 |
Advisor Freedom 2035 | 32,750,670 | - | 32,750,670 |
Advisor Freedom 2040 | 31,788,840 | - | 31,788,840 |
Advisor Freedom 2045 | 13,679,345 | 8,878,964 | 22,558,309 |
Advisor Freedom 2050 | 9,440,533 | 1,546,180 | 10,986,713 |
Advisor Freedom 2055 | 507,335 | 95,646 | 602,981 |
Annual Report
Notes to Financial Statements - continued
2. Significant Accounting Policies - continued
Income Tax Information and Distributions to Shareholders - continued
March 31, 2012 | |
| Ordinary Income |
Advisor Freedom Income | $ 5,769,695 |
Advisor Freedom 2005 | 6,261,150 |
Advisor Freedom 2010 | 23,186,662 |
Advisor Freedom 2015 | 44,291,396 |
Advisor Freedom 2020 | 74,056,217 |
Advisor Freedom 2025 | 61,882,171 |
Advisor Freedom 2030 | 66,057,729 |
Advisor Freedom 2035 | 42,240,111 |
Advisor Freedom 2040 | 44,149,570 |
Advisor Freedom 2045 | 15,943,150 |
Advisor Freedom 2050 | 12,031,434 |
Advisor Freedom 2055 | 132,598 |
3. Purchases and Sales of Investments.
Purchases and redemptions of the Underlying Fund shares are noted in the table below.
| Purchases ($) | Redemptions ($) |
Advisor Freedom Income | 72,296,492 | 53,736,057 |
Advisor Freedom 2005 | 95,078,396 | 65,902,631 |
Advisor Freedom 2010 | 226,005,719 | 235,965,710 |
Advisor Freedom 2015 | 506,659,791 | 368,244,684 |
Advisor Freedom 2020 | 957,684,378 | 620,679,716 |
Advisor Freedom 2025 | 968,287,232 | 552,779,044 |
Advisor Freedom 2030 | 958,660,692 | 596,776,603 |
Advisor Freedom 2035 | 766,764,237 | 443,654,829 |
Advisor Freedom 2040 | 696,449,663 | 464,674,748 |
Advisor Freedom 2045 | 396,157,035 | 185,501,127 |
Advisor Freedom 2050 | 289,066,357 | 153,735,628 |
Advisor Freedom 2055 | 56,533,105 | 8,243,990 |
4. Fees and Other Transactions with Affiliates.
Management Fee. Strategic Advisers, Inc. (Strategic Advisers), an affiliate of FMR, provides the Funds with investment management related services. The Funds do not pay any fees for these services.
Other Transactions. Strategic Advisers has entered into an administration agreement with FMR under which FMR provides management and administrative services (other than investment advisory services) necessary for the operation of each Fund. Pursuant to this agreement, FMR pays all expenses of each Fund, excluding the distribution and service fees, the compensation of the independent Trustees and certain other expenses such as interest expense. FMR also contracts with other Fidelity companies to perform the services necessary for the operation of each Fund. The Funds do not pay any fees for these services.
Distribution and Service Plan Fees. In accordance with Rule 12b-1 of the 1940 Act, the Fund has adopted separate Distribution and Service Plans for each class of shares, except for the Institutional Class. Certain classes pay Fidelity Distributors Corporation (FDC), an affiliate of FMR, separate Distribution and Service Fees, each of which is based on an annual percentage of each class' average net assets. In addition, FDC may pay financial intermediaries for selling shares of the Fund and providing shareholder support services. For the period, the Distribution and Service Fee rates, total fees and amounts retained by FDC were as follows:
Advisor Freedom Income | Distribution
Fee | Service
Fee | Total Fees | Retained
by FDC |
Class A | 0% | .25% | $ 431,607 | $ 23,868 |
Class T | .25% | .25% | 268,168 | 562 |
Class B | .75% | .25% | 26,143 | 19,628 |
Class C | .75% | .25% | 169,320 | 19,250 |
| | | $ 895,238 | $ 63,308 |
Annual Report
4. Fees and Other Transactions with Affiliates - continued
Distribution and Service Plan Fees - continued
Advisor Freedom 2005 | Distribution
Fee | Service
Fee | Total Fees | Retained
by FDC |
Class A | 0% | .25% | $ 489,685 | $ 55,768 |
Class T | .25% | .25% | 111,669 | 181 |
Class B | .75% | .25% | 14,242 | 10,700 |
Class C | .75% | .25% | 75,991 | 6,173 |
| | | $ 691,587 | $ 72,822 |
Advisor Freedom 2010 | | | | |
Class A | 0% | .25% | $ 1,344,257 | $ 149,484 |
Class T | .25% | .25% | 627,612 | 3,522 |
Class B | .75% | .25% | 75,412 | 56,604 |
Class C | .75% | .25% | 376,508 | 24,230 |
| | | $ 2,423,789 | $ 233,840 |
Advisor Freedom 2015 | | | | |
Class A | 0% | .25% | $ 2,812,344 | $ 305,196 |
Class T | .25% | .25% | 1,064,512 | 2,092 |
Class B | .75% | .25% | 199,443 | 149,743 |
Class C | .75% | .25% | 696,249 | 62,213 |
| | | $ 4,772,548 | $ 519,244 |
Advisor Freedom 2020 | | | | |
Class A | 0% | .25% | $ 4,537,511 | $ 457,699 |
Class T | .25% | .25% | 1,973,821 | 3,223 |
Class B | .75% | .25% | 370,225 | 277,950 |
Class C | .75% | .25% | 973,273 | 101,323 |
| | | $ 7,854,830 | $ 840,195 |
Advisor Freedom 2025 | | | | |
Class A | 0% | .25% | $ 4,080,700 | $ 513,206 |
Class T | .25% | .25% | 1,374,990 | 2,672 |
Class B | .75% | .25% | 253,280 | 190,184 |
Class C | .75% | .25% | 681,576 | 77,081 |
| | | $ 6,390,546 | $ 783,143 |
Advisor Freedom 2030 | | | | |
Class A | 0% | .25% | $ 3,958,892 | $ 389,729 |
Class T | .25% | .25% | 1,720,461 | 2,675 |
Class B | .75% | .25% | 296,550 | 222,679 |
Class C | .75% | .25% | 685,776 | 84,605 |
| | | $ 6,661,679 | $ 699,688 |
Advisor Freedom 2035 | | | | |
Class A | 0% | .25% | $ 2,800,759 | $ 331,920 |
Class T | .25% | .25% | 907,405 | 1,426 |
Class B | .75% | .25% | 192,172 | 144,433 |
Class C | .75% | .25% | 392,106 | 50,256 |
| | | $ 4,292,442 | $ 528,035 |
Advisor Freedom 2040 | | | | |
Class A | 0% | .25% | $ 2,555,303 | $ 216,729 |
Class T | .25% | .25% | 1,319,604 | 5,286 |
Class B | .75% | .25% | 269,377 | 202,338 |
Class C | .75% | .25% | 571,010 | 66,961 |
| | | $ 4,715,294 | $ 491,314 |
Advisor Freedom 2045 | | | | |
Class A | 0% | .25% | $ 1,133,305 | $ 137,028 |
Class T | .25% | .25% | 364,438 | 765 |
Class B | .75% | .25% | 35,763 | 26,849 |
Class C | .75% | .25% | 109,264 | 23,157 |
| | | $ 1,642,770 | $ 187,799 |
Annual Report
Notes to Financial Statements - continued
4. Fees and Other Transactions with Affiliates - continued
Distribution and Service Plan Fees - continued
Advisor Freedom 2050 | Distribution
Fee | Service
Fee | Total Fees | Retained
by FDC |
Class A | 0% | .25% | $ 769,411 | $ 56,117 |
Class T | .25% | .25% | 364,127 | 625 |
Class B | .75% | .25% | 53,659 | 40,275 |
Class C | .75% | .25% | 141,361 | 25,425 |
| | | $ 1,328,558 | $ 122,442 |
Advisor Freedom 2055 | | | | |
Class A | 0% | .25% | $ 37,713 | $ 4,829 |
Class T | .25% | .25% | 18,139 | 1,731 |
Class C | .75% | .25% | 8,269 | 7,275 |
| | | $ 64,121 | $ 13,835 |
Sales Load. FDC may receive a front-end sales charge of up to 5.75% for selling Class A shares and 3.50% for selling Class T shares, some of which is paid to financial intermediaries for selling shares of the Fund. Depending on the holding period, FDC may receive contingent deferred sales charges levied on Class A, Class T, Class B, and Class C redemptions. The deferred sales charges range from 5.00% to 1.00% for Class B shares, 1.00% for Class C shares, 1.00% for certain purchases of Class A shares and .25% for certain purchases of Class T shares.
For the period, sales charge amounts retained by FDC were as follows:
Advisor Freedom Income | Retained
by FDC |
Class A | $ 11,181 |
Class T | 2,308 |
Class B* | 7,098 |
Class C* | 1,141 |
| $ 21,728 |
Advisor Freedom 2005 | |
Class A | $ 3,322 |
Class T | 818 |
Class B* | 954 |
Class C* | 297 |
| $ 5,391 |
Advisor Freedom 2010 | |
Class A | $ 11,116 |
Class T | 3,912 |
Class B* | 9,455 |
Class C* | 1,888 |
| $ 26,371 |
Advisor Freedom 2015 | |
Class A | $ 41,373 |
Class T | 15,978 |
Class B* | 20,372 |
Class C* | 6,055 |
| $ 83,778 |
Advisor Freedom 2020 | |
Class A | $ 92,210 |
Class T | 28,704 |
Class B* | 38,185 |
Class C* | 7,173 |
| $ 166,272 |
Advisor Freedom 2025 | |
Class A | $ 69,696 |
Class T | 34,021 |
Class B* | 24,961 |
Class C* | 5,172 |
| $ 133,850 |
Annual Report
4. Fees and Other Transactions with Affiliates - continued
Sales Load - continued
Advisor Freedom 2030 | Retained
by FDC |
Class A | $ 80,781 |
Class T | 32,758 |
Class B* | 29,957 |
Class C* | 7,626 |
| $ 151,122 |
Advisor Freedom 2035 | |
Class A | $ 55,539 |
Class T | 25,957 |
Class B* | 19,192 |
Class C* | 5,881 |
| $ 106,569 |
Advisor Freedom 2040 | |
Class A | $ 73,479 |
Class T | 30,710 |
Class B* | 38,202 |
Class C* | 8,308 |
| $ 150,699 |
Advisor Freedom 2045 | |
Class A | $ 28,665 |
Class T | 12,991 |
Class B* | 7,057 |
Class C* | 2,620 |
| $ 51,333 |
Advisor Freedom 2050 | |
Class A | $ 28,554 |
Class T | 9,656 |
Class B* | 6,915 |
Class C* | 1,975 |
| $ 47,100 |
Advisor Freedom 2055 | |
Class A | $ 4,450 |
Class T | 3,470 |
Class C* | 421 |
| $ 8,341 |
* When Class B and Class C shares are initially sold, FDC pays commissions from its own resources to financial intermediaries through which the sales are made.
Reallocation of Underlying Fund Investments. During the period, Strategic Advisers reallocated investments of the Funds. This involved taxable redemptions of the Funds' interest in Fidelity Advisor Growth & Income Fund Institutional Class, Fidelity Advisor Large Cap Fund Institutional Class, Fidelity Series 100 Index Fund, Fidelity Series All-Sector Equity Fund and Fidelity Series Large Cap Value Fund ("selected Underlying Funds") for cash and securities and non-taxable exchanges of those securities for shares of Fidelity Advisor Series Stock Selector Large Cap Value Fund, Fidelity Advisor Series Equity-Income Fund, Fidelity Advisor Series Opportunistic Insights Fund and Fidelity Advisor Series Mega Cap Fund, all of which are affiliated investment companies managed by FMR. Realized gains and losses on the redemptions of the selected Underlying Funds in connection with the reallocation are included in the accompanying Statements of Operations as "Realized gain (loss) on sale of underlying fund shares."
Annual Report
Notes to Financial Statements - continued
4. Fees and Other Transactions with Affiliates - continued
Reallocation of Underlying Fund Investments - continued
Details of these transactions with the related gain (loss) for the Funds are presented in the accompanying table:
| Value of Cash and Securities reallocated | Realized Gain
(Loss) on
redemption of
selected Underlying
Funds |
Advisor Freedom Income | $ 11,881,595 | $ 1,743,400 |
Advisor Freedom 2005 | 18,304,432 | 4,965,365 |
Advisor Freedom 2010 | 77,159,488 | 13,087,246 |
Advisor Freedom 2015 | 167,762,299 | 43,949,126 |
Advisor Freedom 2020 | 306,197,056 | 60,551,372 |
Advisor Freedom 2025 | 316,559,794 | 84,995,707 |
Advisor Freedom 2030 | 338,074,911 | 68,978,722 |
Advisor Freedom 2035 | 268,747,357 | 69,595,050 |
Advisor Freedom 2040 | 267,536,986 | 47,836,317 |
Advisor Freedom 2045 | 116,934,599 | 6,405,681 |
Advisor Freedom 2050 | 88,326,579 | 4,926,179 |
Advisor Freedom 2055 | 5,434,732 | (23,823) |
5. Expense Reductions.
FMR voluntarily agreed to reimburse funds to the extent annual operating expenses exceeded certain levels of average net assets as noted in the table below. Some expenses, for example interest expense, are excluded from this reimbursement.
The following classes of each applicable Fund were in reimbursement during the period:
| Expense
Limitations | Reimbursement
from affiliate |
| | |
Advisor Freedom Income | | |
Class A | .25% | $ 626 |
Class T | .50% | 194 |
Class B | 1.00% | 9 |
Class C | 1.00% | 61 |
Institutional Class | .00% | 252 |
Advisor Freedom 2005 | | |
Class A | .25% | 706 |
Class T | .50% | 81 |
Class B | 1.00% | 5 |
Class C | 1.00% | 27 |
Institutional Class | .00% | 208 |
Advisor Freedom 2010 | | |
Class A | .25% | 1,953 |
Class T | .50% | 456 |
Class B | 1.00% | 28 |
Class C | 1.00% | 137 |
Institutional Class | .00% | 632 |
Advisor Freedom 2015 | | |
Class A | .25% | 4,060 |
Class T | .50% | 768 |
Class B | 1.00% | 72 |
Class C | 1.00% | 251 |
Institutional Class | .00% | 1,443 |
Annual Report
5. Expense Reductions - continued
| Expense
Limitations | Reimbursement
from affiliate |
Advisor Freedom 2020 | | |
Class A | .25% | $ 6,531 |
Class T | .50% | 1,421 |
Class B | 1.00% | 133 |
Class C | 1.00% | 350 |
Institutional Class | .00% | 2,301 |
Advisor Freedom 2025 | | |
Class A | .25% | 5,846 |
Class T | .50% | 986 |
Class B | 1.00% | 91 |
Class C | 1.00% | 244 |
Institutional Class | .00% | 1,984 |
Advisor Freedom 2030 | | |
Class A | .25% | 5,684 |
Class T | .50% | 1,235 |
Class B | 1.00% | 106 |
Class C | 1.00% | 246 |
Institutional Class | .00% | 2,114 |
Advisor Freedom 2035 | | |
Class A | .25% | 4,005 |
Class T | .50% | 649 |
Class B | 1.00% | 68 |
Class C | 1.00% | 140 |
Institutional Class | .00% | 1,528 |
Advisor Freedom 2040 | | |
Class A | .25% | 3,667 |
Class T | .50% | 947 |
Class B | 1.00% | 97 |
Class C | 1.00% | 205 |
Institutional Class | .00% | 1,468 |
Advisor Freedom 2045 | | |
Class A | .25% | 1,607 |
Class T | .50% | 258 |
Class B | 1.00% | 13 |
Class C | 1.00% | 39 |
Institutional Class | .00% | 717 |
Advisor Freedom 2050 | | |
Class A | .25% | 1,094 |
Class T | .50% | 259 |
Class B | 1.00% | 19 |
Class C | 1.00% | 50 |
Institutional Class | .00% | 544 |
Advisor Freedom 2055 | | |
Class A | .25% | 48 |
Class T | .50% | 11 |
Class C | 1.00% | 3 |
Institutional Class | .00% | 26 |
Annual Report
Notes to Financial Statements - continued
6. Distributions to Shareholders.
Distributions to shareholders of each class were as follows:
Years ended March 31, | 2013 | 2012A |
Advisor Freedom Income | | |
From net investment income | | |
Class A | $ 1,869,112 | $ 2,187,187 |
Class T | 433,735 | 629,755 |
Class B | 9,453 | 19,380 |
Class C | 61,486 | 105,273 |
Institutional Class | 900,709 | 726,511 |
Total | $ 3,274,495 | $ 3,668,106 |
From net realized gain | | |
Class A | $ 2,240,481 | $ 1,181,735 |
Class T | 669,554 | 406,416 |
Class B | 32,437 | 22,819 |
Class C | 210,904 | 121,808 |
Institutional Class | 901,737 | 368,811 |
Total | $ 4,055,113 | $ 2,101,589 |
Advisor Freedom 2005 | | |
From net investment income | | |
Class A | $ 2,280,196 | $ 2,436,350 |
Class T | 219,973 | 208,571 |
Class B | 4,601 | 7,358 |
Class C | 31,434 | 47,660 |
Institutional Class | 820,798 | 646,283 |
Total | $ 3,357,002 | $ 3,346,222 |
From net realized gain | | |
Class A | $ 1,208,263 | $ 2,110,528 |
Class T | 146,502 | 226,243 |
Class B | 8,377 | 17,862 |
Class C | 47,485 | 84,322 |
Institutional Class | 369,028 | 475,973 |
Total | $ 1,779,655 | $ 2,914,928 |
Advisor Freedom 2010 | | |
From net investment income | | |
Class A | $ 7,248,480 | $ 7,710,919 |
Class T | 1,357,322 | 1,583,173 |
Class B | 35,114 | 58,993 |
Class C | 221,866 | 254,685 |
Institutional Class | 2,901,048 | 2,281,575 |
Total | $ 11,763,830 | $ 11,889,345 |
From net realized gain | | |
Class A | $ 3,797,581 | $ 7,072,545 |
Class T | 877,542 | 1,793,526 |
Class B | 49,505 | 137,428 |
Class C | 264,617 | 506,154 |
Institutional Class | 1,313,996 | 1,787,664 |
Total | $ 6,303,241 | $ 11,297,317 |
Advisor Freedom 2015 | | |
From net investment income | | |
Class A | $ 15,443,272 | $ 14,904,161 |
Class T | 2,370,199 | 2,481,473 |
Class B | 95,446 | 158,540 |
Class C | 437,291 | 504,952 |
Institutional Class | 6,470,240 | 4,754,330 |
Total | $ 24,816,448 | $ 22,803,456 |
Annual Report
6. Distributions to Shareholders - continued
Years ended March 31, | 2013 | 2012A |
Advisor Freedom 2015 | | |
From net realized gain | | |
Class A | $ 8,264,610 | $ 13,671,476 |
Class T | 1,548,591 | 2,769,769 |
Class B | 133,932 | 340,954 |
Class C | 514,113 | 915,393 |
Institutional Class | 2,975,791 | 3,790,348 |
Total | $ 13,437,037 | $ 21,487,940 |
Advisor Freedom 2020 | | |
From net investment income | | |
Class A | $ 26,237,034 | $ 23,576,228 |
Class T | 4,698,779 | 4,636,252 |
Class B | 207,668 | 297,637 |
Class C | 650,444 | 696,364 |
Institutional Class | 10,832,707 | 7,640,872 |
Total | $ 42,626,632 | $ 36,847,353 |
From net realized gain | | |
Class A | $ 12,221,481 | $ 23,169,017 |
Class T | 2,642,164 | 5,607,667 |
Class B | 229,820 | 648,689 |
Class C | 642,700 | 1,335,116 |
Institutional Class | 4,363,557 | 6,448,375 |
Total | $ 20,099,722 | $ 37,208,864 |
Advisor Freedom 2025 | | |
From net investment income | | |
Class A | $ 24,790,567 | $ 19,932,334 |
Class T | 3,595,303 | 2,880,883 |
Class B | 163,792 | 205,978 |
Class C | 561,745 | 468,001 |
Institutional Class | 9,737,534 | 6,296,976 |
Total | $ 38,848,941 | $ 29,784,172 |
From net realized gain | | |
Class A | $ 9,143,726 | $ 21,177,159 |
Class T | 1,563,144 | 3,767,040 |
Class B | 130,245 | 458,277 |
Class C | 386,200 | 923,057 |
Institutional Class | 3,124,129 | 5,772,466 |
Total | $ 14,347,444 | $ 32,097,999 |
Advisor Freedom 2030 | | |
From net investment income | | |
Class A | $ 24,782,410 | $ 20,115,725 |
Class T | 4,552,485 | 3,861,655 |
Class B | 210,414 | 250,086 |
Class C | 585,019 | 496,777 |
Institutional Class | 10,634,898 | 7,084,294 |
Total | $ 40,765,226 | $ 31,808,537 |
From net realized gain | | |
Class A | $ 7,915,192 | $ 21,297,759 |
Class T | 1,715,030 | 5,006,885 |
Class B | 137,323 | 541,636 |
Class C | 342,181 | 964,853 |
Institutional Class | 2,964,978 | 6,438,059 |
Total | $ 13,074,704 | $ 34,249,192 |
Annual Report
Notes to Financial Statements - continued
6. Distributions to Shareholders - continued
Years ended March 31, | 2013 | 2012A |
Advisor Freedom 2035 | | |
From net investment income | | |
Class A | $ 16,875,467 | $ 12,155,921 |
Class T | 2,349,822 | 1,567,804 |
Class B | 135,304 | 132,734 |
Class C | 332,280 | 239,769 |
Institutional Class | 7,474,365 | 4,415,268 |
Total | $ 27,167,238 | $ 18,511,496 |
From net realized gain | | |
Class A | $ 3,487,770 | $ 15,521,588 |
Class T | 574,019 | 2,563,657 |
Class B | 55,352 | 353,335 |
Class C | 122,062 | 553,791 |
Institutional Class | 1,344,229 | 4,736,244 |
Total | $ 5,583,432 | $ 23,728,615 |
Advisor Freedom 2040 | | |
From net investment income | | |
Class A | $ 15,416,805 | $ 11,304,090 |
Class T | 3,246,224 | 2,585,003 |
Class B | 187,384 | 196,144 |
Class C | 477,964 | 369,059 |
Institutional Class | 7,173,233 | 4,427,201 |
Total | $ 26,501,610 | $ 18,881,497 |
From net realized gain | | |
Class A | $ 3,045,286 | $ 14,726,886 |
Class T | 769,855 | 4,232,762 |
Class B | 73,757 | 545,075 |
Class C | 168,492 | 902,702 |
Institutional Class | 1,229,840 | 4,860,648 |
Total | $ 5,287,230 | $ 25,268,073 |
Advisor Freedom 2045 | | |
From net investment income | | |
Class A | $ 6,957,403 | $ 4,503,330 |
Class T | 988,121 | 586,545 |
Class B | 27,566 | 22,195 |
Class C | 101,775 | 61,259 |
Institutional Class | 3,609,466 | 1,884,896 |
Total | $ 11,684,331 | $ 7,058,225 |
From net realized gain | | |
Class A | $ 6,744,595 | $ 5,718,089 |
Class T | 1,044,959 | 942,329 |
Class B | 57,582 | 60,090 |
Class C | 162,607 | 143,108 |
Institutional Class | 2,864,235 | 2,021,309 |
Total | $ 10,873,978 | $ 8,884,925 |
Advisor Freedom 2050 | | |
From net investment income | | |
Class A | $ 4,634,192 | $ 2,879,907 |
Class T | 923,527 | 564,306 |
Class B | 42,092 | 29,299 |
Class C | 123,643 | 72,828 |
Institutional Class | 2,647,530 | 1,357,377 |
Total | $ 8,370,984 | $ 4,903,717 |
Annual Report
6. Distributions to Shareholders - continued
Years ended March 31, | 2013 | 2012A |
Advisor Freedom 2050 | | |
From net realized gain | | |
Class A | $ 1,465,892 | $ 4,184,946 |
Class T | 345,032 | 1,020,104 |
Class B | 25,867 | 90,871 |
Class C | 67,326 | 200,027 |
Institutional Class | 711,612 | 1,631,769 |
Total | $ 2,615,729 | $ 7,127,717 |
Advisor Freedom 2055 | | |
From net investment income | | |
Class A | $ 273,976 | $ 13,594 |
Class T | 55,233 | 9,780 |
Class C | 2,070 | 6,716 |
Institutional Class | 141,893 | 23,208 |
Total | $ 473,172 | $ 53,298 |
From net realized gain | | |
Class A | $ 68,154 | $ 18,902 |
Class T | 17,814 | 15,866 |
Class C | 6,257 | 15,322 |
Institutional Class | 37,584 | 29,210 |
Total | $ 129,809 | $ 79,300 |
A Distributions to shareholders for Advisor Freedom 2055 are for the period June 1, 2011 (commencement of sale of shares) to March 31, 2012.
7. Share Transactions.
Transactions for each class of shares were as follows:
| Shares | Dollars |
Years ended March 31, | 2013 | 2012A | 2013 | 2012A |
Advisor Freedom Income | | | | |
Class A | | | | |
Shares sold | 5,667,328 | 6,763,064 | $ 62,675,823 | $ 73,229,954 |
Reinvestment of distributions | 368,047 | 309,472 | 4,049,319 | 3,322,953 |
Shares redeemed | (5,438,505) | (6,417,079) | (60,152,423) | (69,457,016) |
Net increase (decrease) | 596,870 | 655,457 | $ 6,572,719 | $ 7,095,891 |
Class T | | | | |
Shares sold | 1,752,672 | 2,077,443 | $ 19,341,827 | $ 22,457,794 |
Reinvestment of distributions | 97,192 | 90,952 | 1,067,874 | 974,784 |
Shares redeemed | (2,181,141) | (2,331,629) | (24,078,105) | (25,241,205) |
Net increase (decrease) | (331,277) | (163,234) | $ (3,668,404) | $ (1,808,627) |
Class B | | | | |
Shares sold | 13,728 | 6,072 | $ 151,709 | $ 65,035 |
Reinvestment of distributions | 3,419 | 3,507 | 37,528 | 37,482 |
Shares redeemed | (75,727) | (109,320) | (836,079) | (1,183,454) |
Net increase (decrease) | (58,580) | (99,741) | $ (646,842) | $ (1,080,937) |
Class C | | | | |
Shares sold | 326,072 | 421,367 | $ 3,593,856 | $ 4,564,257 |
Reinvestment of distributions | 19,976 | 17,199 | 219,246 | 183,797 |
Shares redeemed | (428,327) | (401,421) | (4,730,145) | (4,324,783) |
Net increase (decrease) | (82,279) | 37,145 | $ (917,043) | $ 423,271 |
Institutional Class | | | | |
Shares sold | 3,768,736 | 3,628,852 | $ 41,751,702 | $ 39,319,829 |
Reinvestment of distributions | 161,577 | 99,130 | 1,781,582 | 1,066,090 |
Shares redeemed | (2,467,458) | (1,251,597) | (27,262,092) | (13,568,839) |
Net increase (decrease) | 1,462,855 | 2,476,385 | $ 16,271,192 | $ 26,817,080 |
Annual Report
Notes to Financial Statements - continued
7. Share Transactions - continued
| Shares | Dollars |
Years ended March 31, | 2013 | 2012A | 2013 | 2012A |
Advisor Freedom 2005 | | | | |
Class A | | | | |
Shares sold | 5,950,479 | 7,786,540 | $ 69,001,688 | $ 87,322,424 |
Reinvestment of distributions | 296,966 | 412,506 | 3,414,979 | 4,511,865 |
Shares redeemed | (6,013,562) | (6,738,587) | (69,615,909) | (75,603,513) |
Net increase (decrease) | 233,883 | 1,460,459 | $ 2,800,758 | $ 16,230,776 |
Class T | | | | |
Shares sold | 1,289,243 | 1,024,147 | $ 14,935,857 | $ 11,495,416 |
Reinvestment of distributions | 30,601 | 38,544 | 352,432 | 421,872 |
Shares redeemed | (1,066,736) | (1,004,234) | (12,303,077) | (11,236,630) |
Net increase (decrease) | 253,108 | 58,457 | $ 2,985,212 | $ 680,658 |
Class B | | | | |
Shares sold | 652 | 3,744 | $ 7,549 | $ 41,659 |
Reinvestment of distributions | 1,083 | 2,169 | 12,534 | 23,707 |
Shares redeemed | (41,276) | (73,115) | (481,200) | (821,480) |
Net increase (decrease) | (39,541) | (67,202) | $ (461,117) | $ (756,114) |
Class C | | | | |
Shares sold | 173,944 | 112,181 | $ 2,021,586 | $ 1,248,134 |
Reinvestment of distributions | 6,077 | 11,279 | 70,003 | 122,598 |
Shares redeemed | (201,333) | (178,517) | (2,316,273) | (1,995,084) |
Net increase (decrease) | (21,312) | (55,057) | $ (224,684) | $ (624,352) |
Institutional Class | | | | |
Shares sold | 3,014,914 | 2,429,586 | $ 35,073,813 | $ 27,506,243 |
Reinvestment of distributions | 102,306 | 101,406 | 1,182,672 | 1,115,392 |
Shares redeemed | (1,314,929) | (1,498,923) | (15,314,119) | (16,931,659) |
Net increase (decrease) | 1,802,291 | 1,032,069 | $ 20,942,366 | $ 11,689,976 |
Advisor Freedom 2010 | | | | |
Class A | | | | |
Shares sold | 12,708,869 | 17,608,014 | $ 153,017,064 | $ 204,386,415 |
Reinvestment of distributions | 915,288 | 1,298,075 | 10,935,441 | 14,610,159 |
Shares redeemed | (16,811,351) | (17,499,800) | (202,005,316) | (202,700,755) |
Net increase (decrease) | (3,187,194) | 1,406,289 | $ (38,052,811) | $ 16,295,819 |
Class T | | | | |
Shares sold | 3,712,396 | 3,132,138 | $ 44,524,286 | $ 36,364,131 |
Reinvestment of distributions | 183,018 | 294,000 | 2,182,056 | 3,301,119 |
Shares redeemed | (4,809,687) | (5,099,183) | (57,632,993) | (59,080,492) |
Net increase (decrease) | (914,273) | (1,673,045) | $ (10,926,651) | $ (19,415,242) |
Class B | | | | |
Shares sold | 9,563 | 30,105 | $ 115,968 | $ 347,386 |
Reinvestment of distributions | 6,587 | 16,202 | 78,910 | 181,659 |
Shares redeemed | (268,639) | (610,001) | (3,216,272) | (7,070,261) |
Net increase (decrease) | (252,489) | (563,694) | $ (3,021,394) | $ (6,541,216) |
Class C | | | | |
Shares sold | 499,095 | 353,574 | $ 5,991,309 | $ 4,060,801 |
Reinvestment of distributions | 36,663 | 61,010 | 435,812 | 680,336 |
Shares redeemed | (681,672) | (947,002) | (8,150,135) | (10,883,002) |
Net increase (decrease) | (145,914) | (532,418) | $ (1,723,014) | $ (6,141,865) |
Institutional Class | | | | |
Shares sold | 7,292,808 | 6,849,441 | $ 88,270,797 | $ 79,864,607 |
Reinvestment of distributions | 351,077 | 357,132 | 4,208,551 | 4,032,766 |
Shares redeemed | (5,034,949) | (3,758,825) | (60,844,334) | (43,759,019) |
Net increase (decrease) | 2,608,936 | 3,447,748 | $ 31,635,014 | $ 40,138,354 |
Annual Report
7. Share Transactions - continued
| Shares | Dollars |
Years ended March 31, | 2013 | 2012A | 2013 | 2012A |
Advisor Freedom 2015 | | | | |
Class A | | | | |
Shares sold | 28,506,295 | 34,624,687 | $ 342,099,746 | $ 399,860,256 |
Reinvestment of distributions | 1,974,621 | 2,528,175 | 23,498,680 | 28,303,874 |
Shares redeemed | (28,730,020) | (28,888,739) | (344,939,129) | (333,768,183) |
Net increase (decrease) | 1,750,896 | 8,264,123 | $ 20,659,297 | $ 94,395,947 |
Class T | | | | |
Shares sold | 7,048,273 | 5,394,979 | $ 84,377,992 | $ 62,336,809 |
Reinvestment of distributions | 321,618 | 453,320 | 3,825,959 | 5,071,415 |
Shares redeemed | (7,173,479) | (7,739,962) | (85,670,361) | (89,491,495) |
Net increase (decrease) | 196,412 | (1,891,663) | $ 2,533,590 | $ (22,083,271) |
Class B | | | | |
Shares sold | 18,918 | 57,144 | $ 230,299 | $ 659,696 |
Reinvestment of distributions | 17,784 | 41,296 | 211,983 | 461,175 |
Shares redeemed | (631,455) | (875,784) | (7,538,504) | (10,114,879) |
Net increase (decrease) | (594,753) | (777,344) | $ (7,096,222) | $ (8,994,008) |
Class C | | | | |
Shares sold | 1,112,764 | 1,085,862 | $ 13,243,553 | $ 12,546,495 |
Reinvestment of distributions | 73,853 | 116,272 | 876,636 | 1,293,137 |
Shares redeemed | (1,330,728) | (1,205,400) | (15,851,708) | (13,842,650) |
Net increase (decrease) | (144,111) | (3,266) | $ (1,731,519) | $ (3,018) |
Institutional Class | | | | |
Shares sold | 16,268,843 | 15,140,133 | $ 196,562,251 | $ 176,381,907 |
Reinvestment of distributions | 782,959 | 741,880 | 9,370,557 | 8,353,211 |
Shares redeemed | (8,997,016) | (6,686,950) | (108,722,993) | (77,631,931) |
Net increase (decrease) | 8,054,786 | 9,195,063 | $ 97,209,815 | $ 107,103,187 |
Advisor Freedom 2020 | | | | |
Class A | | | | |
Shares sold | 44,416,958 | 49,404,994 | $ 555,194,594 | $ 593,663,103 |
Reinvestment of distributions | 3,073,389 | 3,987,583 | 38,099,250 | 46,179,945 |
Shares redeemed | (39,485,922) | (37,475,426) | (494,297,897) | (450,426,886) |
Net increase (decrease) | 8,004,425 | 15,917,151 | $ 98,995,947 | $ 189,416,162 |
Class T | | | | |
Shares sold | 12,011,989 | 8,792,460 | $ 150,203,034 | $ 105,703,636 |
Reinvestment of distributions | 579,475 | 866,942 | 7,192,079 | 10,045,446 |
Shares redeemed | (10,936,020) | (12,474,056) | (136,699,168) | (149,794,855) |
Net increase (decrease) | 1,655,444 | (2,814,654) | $ 20,695,945 | $ (34,045,773) |
Class B | | | | |
Shares sold | 23,018 | 44,465 | $ 283,038 | $ 529,456 |
Reinvestment of distributions | 32,154 | 74,204 | 399,675 | 856,002 |
Shares redeemed | (1,019,496) | (1,602,205) | (12,664,560) | (19,227,315) |
Net increase (decrease) | (964,324) | (1,483,536) | $ (11,981,847) | $ (17,841,857) |
Class C | | | | |
Shares sold | 1,650,086 | 1,454,135 | $ 20,539,871 | $ 17,405,863 |
Reinvestment of distributions | 95,759 | 160,265 | 1,184,544 | 1,841,015 |
Shares redeemed | (1,789,596) | (1,828,349) | (22,192,952) | (21,813,476) |
Net increase (decrease) | (43,751) | (213,949) | $ (468,537) | $ (2,566,598) |
Institutional Class | | | | |
Shares sold | 25,904,119 | 23,399,673 | $ 326,561,698 | $ 282,767,751 |
Reinvestment of distributions | 1,214,162 | 1,189,695 | 15,144,940 | 13,857,103 |
Shares redeemed | (12,665,795) | (9,021,589) | (158,809,529) | (108,893,287) |
Net increase (decrease) | 14,452,486 | 15,567,779 | $ 182,897,109 | $ 187,731,567 |
Annual Report
Notes to Financial Statements - continued
7. Share Transactions - continued
| Shares | Dollars |
Years ended March 31, | 2013 | 2012A | 2013 | 2012A |
Advisor Freedom 2025 | | | | |
Class A | | | | |
Shares sold | 46,832,812 | 48,848,908 | $ 564,656,133 | $ 562,258,705 |
Reinvestment of distributions | 2,817,136 | 3,688,982 | 33,682,400 | 40,792,623 |
Shares redeemed | (36,915,729) | (29,982,380) | (445,620,144) | (345,037,796) |
Net increase (decrease) | 12,734,219 | 22,555,510 | $ 152,718,389 | $ 258,013,532 |
Class T | | | | |
Shares sold | 10,475,315 | 7,637,990 | $ 126,787,508 | $ 88,292,253 |
Reinvestment of distributions | 421,842 | 584,870 | 5,059,334 | 6,482,700 |
Shares redeemed | (7,029,069) | (7,949,975) | (84,713,362) | (91,910,477) |
Net increase (decrease) | 3,868,088 | 272,885 | $ 47,133,480 | $ 2,864,476 |
Class B | | | | |
Shares sold | 33,837 | 42,663 | $ 402,830 | $ 486,555 |
Reinvestment of distributions | 22,745 | 55,370 | 271,803 | 608,468 |
Shares redeemed | (700,042) | (874,149) | (8,354,336) | (10,083,099) |
Net increase (decrease) | (643,460) | (776,116) | $ (7,679,703) | $ (8,988,076) |
Class C | | | | |
Shares sold | 1,362,294 | 1,292,036 | $ 16,242,141 | $ 14,806,798 |
Reinvestment of distributions | 75,516 | 120,148 | 897,881 | 1,315,255 |
Shares redeemed | (1,133,462) | (951,921) | (13,531,664) | (10,872,825) |
Net increase (decrease) | 304,348 | 460,263 | $ 3,608,358 | $ 5,249,228 |
Institutional Class | | | | |
Shares sold | 24,213,764 | 21,538,187 | $ 294,374,445 | $ 249,495,381 |
Reinvestment of distributions | 1,063,922 | 1,059,523 | 12,801,944 | 11,781,405 |
Shares redeemed | (10,933,983) | (6,697,811) | (132,325,157) | (77,533,692) |
Net increase (decrease) | 14,343,703 | 15,899,899 | $ 174,851,232 | $ 183,743,094 |
Advisor Freedom 2030 | | | | |
Class A | | | | |
Shares sold | 41,613,890 | 42,835,455 | $ 525,837,935 | $ 516,945,396 |
Reinvestment of distributions | 2,585,181 | 3,546,218 | 32,378,742 | 41,015,516 |
Shares redeemed | (34,146,152) | (31,045,553) | (432,000,548) | (374,459,437) |
Net increase (decrease) | 10,052,919 | 15,336,120 | $ 126,216,129 | $ 183,501,475 |
Class T | | | | |
Shares sold | 11,109,856 | 8,388,334 | $ 139,954,510 | $ 101,146,779 |
Reinvestment of distributions | 492,157 | 756,879 | 6,152,559 | 8,734,784 |
Shares redeemed | (9,495,122) | (9,670,716) | (119,272,485) | (116,676,153) |
Net increase (decrease) | 2,106,891 | (525,503) | $ 26,834,584 | $ (6,794,590) |
Class B | | | | |
Shares sold | 20,379 | 36,631 | $ 253,313 | $ 434,470 |
Reinvestment of distributions | 25,911 | 63,872 | 324,148 | 732,818 |
Shares redeemed | (766,318) | (1,077,382) | (9,575,940) | (13,009,676) |
Net increase (decrease) | (720,028) | (976,879) | $ (8,998,479) | $ (11,842,388) |
Class C | | | | |
Shares sold | 1,523,134 | 1,073,369 | $ 19,092,460 | $ 12,925,305 |
Reinvestment of distributions | 69,617 | 118,601 | 867,428 | 1,356,119 |
Shares redeemed | (1,266,642) | (1,245,011) | (15,862,398) | (14,990,414) |
Net increase (decrease) | 326,109 | (53,041) | $ 4,097,490 | $ (708,990) |
Institutional Class | | | | |
Shares sold | 22,913,292 | 20,661,419 | $ 291,232,690 | $ 250,301,603 |
Reinvestment of distributions | 1,079,513 | 1,142,818 | 13,569,835 | 13,249,779 |
Shares redeemed | (10,947,359) | (6,631,955) | (138,321,010) | (80,438,467) |
Net increase (decrease) | 13,045,446 | 15,172,282 | $ 166,481,515 | $ 183,112,915 |
Annual Report
7. Share Transactions - continued
| Shares | Dollars |
Years ended March 31, | 2013 | 2012A | 2013 | 2012A |
Advisor Freedom 2035 | | | | |
Class A | | | | |
Shares sold | 34,835,056 | 34,768,661 | $ 415,484,819 | $ 395,110,554 |
Reinvestment of distributions | 1,706,155 | 2,535,573 | 20,199,297 | 27,466,248 |
Shares redeemed | (27,311,897) | (22,595,877) | (326,166,700) | (256,243,586) |
Net increase (decrease) | 9,229,314 | 14,708,357 | $ 109,517,416 | $ 166,333,216 |
Class T | | | | |
Shares sold | 8,091,085 | 5,610,062 | $ 96,019,491 | $ 63,400,892 |
Reinvestment of distributions | 243,254 | 373,246 | 2,870,268 | 4,025,458 |
Shares redeemed | (5,444,520) | (5,835,413) | (64,446,129) | (66,246,222) |
Net increase (decrease) | 2,889,819 | 147,895 | $ 34,443,630 | $ 1,180,128 |
Class B | | | | |
Shares sold | 11,260 | 16,340 | $ 131,688 | $ 193,121 |
Reinvestment of distributions | 15,412 | 42,889 | 181,095 | 457,833 |
Shares redeemed | (493,168) | (542,682) | (5,777,414) | (6,109,260) |
Net increase (decrease) | (466,496) | (483,453) | $ (5,464,631) | $ (5,458,306) |
Class C | | | | |
Shares sold | 873,123 | 842,694 | $ 10,285,137 | $ 9,496,396 |
Reinvestment of distributions | 36,956 | 70,870 | 433,119 | 755,598 |
Shares redeemed | (766,094) | (641,298) | (8,970,033) | (7,207,675) |
Net increase (decrease) | 143,985 | 272,266 | $ 1,748,223 | $ 3,044,319 |
Institutional Class | | | | |
Shares sold | 19,774,112 | 16,658,611 | $ 237,955,566 | $ 189,846,559 |
Reinvestment of distributions | 738,822 | 818,992 | 8,780,433 | 8,903,922 |
Shares redeemed | (8,196,096) | (4,989,829) | (97,924,593) | (57,177,515) |
Net increase (decrease) | 12,316,838 | 12,487,774 | $ 148,811,406 | $ 141,572,966 |
Advisor Freedom 2040 | | | | |
Class A | | | | |
Shares sold | 28,004,111 | 27,553,613 | $ 355,673,696 | $ 334,702,393 |
Reinvestment of distributions | 1,447,450 | 2,231,713 | 18,293,644 | 25,789,507 |
Shares redeemed | (22,935,436) | (19,786,758) | (292,260,264) | (240,137,054) |
Net increase (decrease) | 6,516,125 | 9,998,568 | $ 81,707,076 | $ 120,354,846 |
Class T | | | | |
Shares sold | 7,602,047 | 6,790,457 | $ 96,328,995 | $ 82,309,118 |
Reinvestment of distributions | 312,761 | 582,365 | 3,950,120 | 6,718,555 |
Shares redeemed | (7,559,551) | (7,839,034) | (95,678,684) | (95,324,860) |
Net increase (decrease) | 355,257 | (466,212) | $ 4,600,431 | $ (6,297,187) |
Class B | | | | |
Shares sold | 6,103 | 34,162 | $ 76,395 | $ 399,867 |
Reinvestment of distributions | 19,509 | 59,748 | 245,030 | 684,139 |
Shares redeemed | (739,626) | (833,809) | (9,293,767) | (10,085,732) |
Net increase (decrease) | (714,014) | (739,899) | $ (8,972,342) | $ (9,001,726) |
Class C | | | | |
Shares sold | 962,998 | 941,734 | $ 12,120,904 | $ 11,282,554 |
Reinvestment of distributions | 49,059 | 105,857 | 614,213 | 1,207,626 |
Shares redeemed | (901,869) | (1,037,963) | (11,261,526) | (12,466,739) |
Net increase (decrease) | 110,188 | 9,628 | $ 1,473,591 | $ 23,441 |
Institutional Class | | | | |
Shares sold | 16,906,391 | 14,522,651 | $ 216,610,718 | $ 176,901,050 |
Reinvestment of distributions | 660,482 | 769,888 | 8,377,157 | 8,925,684 |
Shares redeemed | (8,263,973) | (5,040,997) | (105,030,652) | (61,648,732) |
Net increase (decrease) | 9,302,900 | 10,251,542 | $ 119,957,223 | $ 124,178,002 |
Annual Report
Notes to Financial Statements - continued
7. Share Transactions - continued
| Shares | Dollars |
Years ended March 31, | 2013 | 2012A | 2013 | 2012A |
Advisor Freedom 2045 | | | | |
Class A | | | | |
Shares sold | 22,348,428 | 19,758,396 | $ 218,037,471 | $ 185,621,088 |
Reinvestment of distributions | 1,428,096 | 1,134,594 | 13,620,503 | 10,161,242 |
Shares redeemed | (14,594,828) | (11,463,161) | (143,000,136) | (107,406,601) |
Net increase (decrease) | 9,181,696 | 9,429,829 | $ 88,657,838 | $ 88,375,729 |
Class T | | | | |
Shares sold | 5,253,099 | 3,401,988 | $ 51,047,511 | $ 31,874,287 |
Reinvestment of distributions | 213,016 | 166,144 | 2,024,121 | 1,483,402 |
Shares redeemed | (2,939,816) | (3,169,427) | (28,557,658) | (30,052,164) |
Net increase (decrease) | 2,526,299 | 398,705 | $ 24,513,974 | $ 3,305,525 |
Class B | | | | |
Shares sold | 3,515 | 1,569 | $ 31,735 | $ 14,905 |
Reinvestment of distributions | 8,787 | 8,926 | 82,887 | 79,324 |
Shares redeemed | (49,903) | (82,138) | (482,094) | (781,057) |
Net increase (decrease) | (37,601) | (71,643) | $ (367,472) | $ (686,828) |
Class C | | | | |
Shares sold | 518,274 | 354,761 | $ 5,021,009 | $ 3,296,660 |
Reinvestment of distributions | 27,552 | 22,645 | 259,896 | 200,564 |
Shares redeemed | (272,934) | (230,539) | (2,637,588) | (2,135,319) |
Net increase (decrease) | 272,892 | 146,867 | $ 2,643,317 | $ 1,361,905 |
Institutional Class | | | | |
Shares sold | 13,436,841 | 10,643,520 | $ 132,476,916 | $ 100,329,191 |
Reinvestment of distributions | 671,239 | 428,124 | 6,432,276 | 3,841,804 |
Shares redeemed | (4,998,582) | (2,737,721) | (48,855,267) | (25,923,441) |
Net increase (decrease) | 9,109,498 | 8,333,923 | $ 90,053,925 | $ 78,247,554 |
Advisor Freedom 2050 | | | | |
Class A | | | | |
Shares sold | 15,759,974 | 15,354,022 | $ 152,322,278 | $ 142,028,423 |
Reinvestment of distributions | 630,390 | 796,372 | 6,034,537 | 6,986,139 |
Shares redeemed | (11,627,846) | (9,162,643) | (112,817,332) | (84,488,019) |
Net increase (decrease) | 4,762,518 | 6,987,751 | $ 45,539,483 | $ 64,526,543 |
Class T | | | | |
Shares sold | 4,570,956 | 3,433,527 | $ 44,088,375 | $ 31,583,600 |
Reinvestment of distributions | 131,758 | 179,974 | 1,260,447 | 1,573,378 |
Shares redeemed | (2,827,192) | (3,058,786) | (27,249,174) | (28,457,436) |
Net increase (decrease) | 1,875,522 | 554,715 | $ 18,099,648 | $ 4,699,542 |
Class B | | | | |
Shares sold | 330 | 8,292 | $ 3,096 | $ 76,015 |
Reinvestment of distributions | 6,911 | 13,247 | 65,663 | 114,938 |
Shares redeemed | (62,118) | (110,174) | (591,359) | (1,015,943) |
Net increase (decrease) | (54,877) | (88,635) | $ (522,600) | $ (824,990) |
Class C | | | | |
Shares sold | 469,493 | 463,409 | $ 4,511,086 | $ 4,275,978 |
Reinvestment of distributions | 19,364 | 30,263 | 184,167 | 262,422 |
Shares redeemed | (316,364) | (313,018) | (3,039,772) | (2,839,212) |
Net increase (decrease) | 172,493 | 180,654 | $ 1,655,481 | $ 1,699,188 |
Institutional Class | | | | |
Shares sold | 10,323,520 | 8,780,555 | $ 100,853,706 | $ 81,542,570 |
Reinvestment of distributions | 347,891 | 329,360 | 3,344,639 | 2,895,515 |
Shares redeemed | (4,410,206) | (2,296,393) | (42,706,449) | (21,259,966) |
Net increase (decrease) | 6,261,205 | 6,813,522 | $ 61,491,896 | $ 63,178,119 |
Annual Report
7. Share Transactions - continued
| Shares | Dollars |
Years ended March 31, | 2013 | 2012A | 2013 | 2012A |
Advisor Freedom 2055 | | | | |
Class A | | | | |
Shares sold | 3,664,304 | 311,914 | $ 36,168,205 | $ 3,010,798 |
Reinvestment of distributions | 35,066 | 3,701 | 341,179 | 32,496 |
Shares redeemed | (897,204) | (43,427) | (8,919,848) | (412,755) |
Net increase (decrease) | 2,802,166 | 272,188 | $ 27,589,536 | $ 2,630,539 |
Class T | | | | |
Shares sold | 865,233 | 145,637 | $ 8,537,245 | $ 1,433,545 |
Reinvestment of distributions | 7,527 | 2,921 | 73,047 | 25,646 |
Shares redeemed | (334,621) | (488) | (3,311,442) | (4,666) |
Net increase (decrease) | 538,139 | 148,070 | $ 5,298,850 | $ 1,454,525 |
Class C | | | | |
Shares sold | 90,384 | 114,214 | $ 903,238 | $ 1,133,007 |
Reinvestment of distributions | 877 | 2,506 | 8,307 | 22,001 |
Shares redeemed | (103,499) | (977) | (1,002,740) | (8,833) |
Net increase (decrease) | (12,238) | 115,743 | $ (91,195) | $ 1,146,175 |
Institutional Class | | | | |
Shares sold | 1,958,189 | 251,229 | $ 19,433,573 | $ 2,494,347 |
Reinvestment of distributions | 18,452 | 5,970 | 179,477 | 52,418 |
Shares redeemed | (491,376) | (779) | (4,844,931) | (7,517) |
Net increase (decrease) | 1,485,265 | 256,420 | $ 14,768,119 | $ 2,539,248 |
A Share transactions for Advisor Freedom 2055 are for the period June 1, 2011 (commencement of sale of shares) to March 31, 2012.
8. Other.
The Funds' organizational documents provide former and current trustees and officers with a limited indemnification against liabilities arising in connection with the performance of their duties to the Funds. In the normal course of business, the Funds may also enter into contracts that provide general indemnifications. The Funds' maximum exposure under these arrangements is unknown as this would be dependent on future claims that may be made against the Funds. The risk of material loss from such claims is considered remote.
The Funds do not invest in the Underlying Funds for the purpose of exercising management or control; however, investments by the Funds within their principal investment strategies may represent a significant portion of the Underlying Fund's net assets. At the end of the period, the following Advisor Freedom Funds were the owners of record of 10% or more of the total outstanding shares of the Underlying Funds.
Fund | Fidelity Advisor
Freedom 2020 | Fidelity Advisor
Freedom 2025 | Fidelity Advisor
Freedom 2030 | Fidelity Advisor
Freedom 2035 | Fidelity Advisor
Freedom 2040 |
Fidelity Advisor Series Equity-Income Fund | 15% | 16% | 17% | 14% | 14% |
Fidelity Advisor Series Mega Cap Fund | 15% | 16% | 17% | 14% | 14% |
Fidelity Advisor Series Opportunistic Insights Fund | 15% | 16% | 17% | 14% | 14% |
Fidelity Advisor Series Stock Selector Large Cap Value Fund | 15% | 16% | 17% | 14% | 14% |
The Funds, in aggregate, were the owners of record of more than 20% of the total outstanding shares of the following Underlying Funds.
Fund | % of shares held |
Fidelity Advisor Equity Growth Fund | 31% |
Fidelity Advisor Short Fixed-Income Fund | 32% |
Fidelity Advisor Growth & Income Fund | 54% |
Fidelity Advisor Large Cap Fund | 55% |
Fidelity Advisor Series Equity-Income Fund | 100% |
Fidelity Advisor Series Mega Cap Fund | 100% |
Fidelity Advisor Series Opportunistic Insights Fund | 100% |
Fidelity Advisor Series Stock Selector Large Cap Value Fund | 100% |
Annual Report
Report of Independent Registered Public Accounting Firm
To the Trustees of Fidelity Aberdeen Street Trust and the Shareholders of Fidelity Advisor Freedom Income Fund, Fidelity Advisor Freedom 2005 Fund, Fidelity Advisor Freedom 2010 Fund, Fidelity Advisor Freedom 2015 Fund, Fidelity Advisor Freedom 2020 Fund, Fidelity Advisor Freedom 2025 Fund, Fidelity Advisor Freedom 2030 Fund, Fidelity Advisor Freedom 2035 Fund, Fidelity Advisor Freedom 2040 Fund, Fidelity Advisor Freedom 2045 Fund, Fidelity Advisor Freedom 2050 Fund and Fidelity Advisor Freedom 2055 Fund:
We have audited the accompanying statements of assets and liabilities of Fidelity Advisor Freedom Income Fund, Fidelity Advisor Freedom 2005 Fund, Fidelity Advisor Freedom 2010 Fund, Fidelity Advisor Freedom 2015 Fund, Fidelity Advisor Freedom 2020 Fund, Fidelity Advisor Freedom 2025 Fund, Fidelity Advisor Freedom 2030 Fund, Fidelity Advisor Freedom 2035 Fund, Fidelity Advisor Freedom 2040 Fund, Fidelity Advisor Freedom 2045 Fund, Fidelity Advisor Freedom 2050 Fund and Fidelity Advisor Freedom 2055 Fund (the Funds) each a fund of Fidelity Aberdeen Street Trust, including the schedules of investments, as of March 31, 2013, and the related statements of operations, the statements of changes in net assets and the financial highlights for each of the periods presented. These financial statements and financial highlights are the responsibility of the Funds' management. Our responsibility is to express an opinion on these financial statements and financial highlights based on our audits.
We conducted our audits in accordance with the standards of the Public Company Accounting Oversight Board (United States). Those standards require that we plan and perform the audit to obtain reasonable assurance about whether the financial statements and financial highlights are free of material misstatement. The Funds are not required to have, nor were we engaged to perform, an audit of their internal control over financial reporting. Our audits included consideration of internal control over financial reporting as a basis for designing audit procedures that are appropriate in the circumstances, but not for the purpose of expressing an opinion on the effectiveness of the Funds' internal control over financial reporting. Accordingly, we express no such opinion. An audit also includes examining, on a test basis, evidence supporting the amounts and disclosures in the financial statements, assessing the accounting principles used and significant estimates made by management, as well as evaluating the overall financial statement presentation. Our procedures included confirmation of securities owned as of March 31, 2013, by correspondence with the custodians. We believe that our audits provide a reasonable basis for our opinion.
In our opinion, the financial statements and financial highlights referred to above present fairly, in all material respects, the financial position of Fidelity Advisor Freedom Income Fund, Fidelity Advisor Freedom 2005 Fund, Fidelity Advisor Freedom 2010 Fund, Fidelity Advisor Freedom 2015 Fund, Fidelity Advisor Freedom 2020 Fund, Fidelity Advisor Freedom 2025 Fund, Fidelity Advisor Freedom 2030 Fund, Fidelity Advisor Freedom 2035 Fund, Fidelity Advisor Freedom 2040 Fund, Fidelity Advisor Freedom 2045 Fund, Fidelity Advisor Freedom 2050 Fund and Fidelity Advisor Freedom 2055 Fund as of March 31, 2013, the results of their operations, the changes in their net assets and their financial highlights for each of the periods presented, in conformity with accounting principles generally accepted in the United States of America.
DELOITTE & TOUCHE LLP
Boston, Massachusetts
May 17, 2013
Annual Report
The Trustees and executive officers of the trust and funds, as applicable, are listed below. The Board of Trustees governs each Fidelity Advisor Freedom Fund and is responsible for protecting the interests of shareholders. The Trustees are experienced executives who meet periodically throughout the year to oversee each Fidelity Advisor Freedom Fund's activities, review contractual arrangements with companies that provide services to each Fidelity Advisor Freedom Fund, oversee management of the risks associated with such activities and contractual arrangements, and review each Fidelity Advisor Freedom Fund's performance. If the interests of a Fidelity Advisor Freedom Fund and an underlying Fidelity fund were to diverge, a conflict of interest could arise and affect how the Trustees fulfill their fiduciary duties to the affected funds. Strategic Advisers has structured the Fidelity Advisor Freedom Funds to avoid these potential conflicts, although there may be situations where a conflict of interest is unavoidable. In such instances, Strategic Advisers and the Trustees would take reasonable steps to minimize and, if possible, eliminate the conflict. Except for Elizabeth S. Acton and James C. Curvey, each of the Trustees oversees 219 Fidelity funds. Ms. Acton oversees 201 Fidelity funds. Mr. Curvey oversees 453 Fidelity funds.
The Trustees hold office without limit in time except that (a) any Trustee may resign; (b) any Trustee may be removed by written instrument, signed by at least two-thirds of the number of Trustees prior to such removal; (c) any Trustee who requests to be retired or who has become incapacitated by illness or injury may be retired by written instrument signed by a majority of the other Trustees; and (d) any Trustee may be removed at any special meeting of shareholders by a two-thirds vote of the outstanding voting securities of the trust. Each Trustee who is not an interested person of the trust and the funds (as defined in the 1940 Act) (Independent Trustee), shall retire not later than the last day of the month in which his or her 75th birthday occurs. The Independent Trustees may waive this mandatory retirement age policy with respect to individual Trustees. The executive officers hold office without limit in time, except that any officer may resign or may be removed by a vote of a majority of the Trustees at any regular meeting or any special meeting of the Trustees. Except as indicated, each individual has held the office shown or other offices in the same company for the past five years.
Experience, Skills, Attributes, and Qualifications of the Funds' Trustees. The Governance and Nominating Committee has adopted a statement of policy that describes the experience, qualifications, attributes, and skills that are necessary and desirable for potential Independent Trustee candidates (Statement of Policy). The Board believes that each Trustee satisfied at the time he or she was initially elected or appointed a Trustee, and continues to satisfy, the standards contemplated by the Statement of Policy. The Governance and Nominating Committee also engages professional search firms to help identify potential Independent Trustee candidates who have the experience, qualifications, attributes, and skills consistent with the Statement of Policy. From time to time, additional criteria based on the composition and skills of the current Independent Trustees, as well as experience or skills that may be appropriate in light of future changes to board composition, business conditions, and regulatory or other developments, have also been considered by the professional search firms and the Governance and Nominating Committee. In addition, the Board takes into account the Trustees' commitment and participation in Board and committee meetings, as well as their leadership of standing and ad hoc committees throughout their tenure.
In determining that a particular Trustee was and continues to be qualified to serve as a Trustee, the Board has considered a variety of criteria, none of which, in isolation, was controlling. The Board believes that, collectively, the Trustees have balanced and diverse experience, qualifications, attributes, and skills, which allow the Board to operate effectively in governing each fund and protecting the interests of shareholders. Information about the specific experience, skills, attributes, and qualifications of each Trustee, which in each case led to the Board's conclusion that the Trustee should serve (or continue to serve) as a trustee of the funds, is provided below.
Board Structure and Oversight Function. Abigail P. Johnson is an interested person (as defined in the 1940 Act) and currently serves as Chairman. The Trustees have determined that an interested Chairman is appropriate and benefits shareholders because an interested Chairman has a personal and professional stake in the quality and continuity of services provided to the funds. Independent Trustees exercise their informed business judgment to appoint an individual of their choosing to serve as Chairman, regardless of whether the Trustee happens to be independent or a member of management. The Independent Trustees have determined that they can act independently and effectively without having an Independent Trustee serve as Chairman and that a key structural component for assuring that they are in a position to do so is for the Independent Trustees to constitute a substantial majority for the Board. The Independent Trustees also regularly meet in executive session. Albert R. Gamper, Jr. serves as Chairman of the Independent Trustees and as such (i) acts as a liaison between the Independent Trustees and management with respect to matters important to the Independent Trustees and (ii) with management prepares agendas for Board meetings.
Fidelity funds are overseen by different Boards of Trustees. The funds' Board oversees Fidelity's investment-grade bond, money market, and asset allocation funds and another Board oversees Fidelity's equity and high income funds. The asset allocation funds may invest in Fidelity funds that are overseen by such other Board. The use of separate Boards, each with its own committee structure, allows the Trustees of each group of Fidelity funds to focus on the unique issues of the funds they oversee, including common research, investment, and operational issues. On occasion, the separate Boards establish joint committees to address issues of overlapping consequences for the Fidelity funds overseen by each Board.
The Trustees operate using a system of committees to facilitate the timely and efficient consideration of all matters of importance to the Trustees, each fund, and fund shareholders and to facilitate compliance with legal and regulatory requirements and oversight of the funds' activities and associated risks. The Board, acting through its committees, has charged FMR and its affiliates with (i) identifying events or circumstances the occurrence of which could have demonstrably adverse effects on the funds' business and/or reputation; (ii) implementing processes and controls to lessen the possibility that such events or circumstances occur or to mitigate the effects of such events or circumstances if they do occur; and (iii) creating and maintaining a system designed to evaluate continuously business and market conditions in order to facilitate the identification and implementation processes described in (i) and (ii) above. Because the day-to-day operations and activities of the funds are carried out by or through FMR, its affiliates, and other service providers, the funds' exposure to risks is mitigated but not eliminated by the processes overseen by the Trustees. While each of the Board's committees has responsibility for overseeing different aspects of the funds' activities, oversight is exercised primarily through the Operations and Audit Committees. In addition, an ad hoc Board committee of Independent Trustees has worked with FMR to enhance the Board's oversight of investment and financial risks, legal and regulatory risks, technology risks, and operational risks, including the development of additional risk reporting to the Board. Appropriate personnel, including but not limited to the funds' Chief Compliance Officer (CCO), FMR's internal auditor, the independent accountants, the funds' Treasurer and portfolio management personnel, make periodic reports to the Board's committees, as appropriate, including an annual review of FMR's risk management program for the Fidelity funds. The responsibilities of each standing committee, including their oversight responsibilities, are described further under "Standing Committees of the Funds' Trustees."
Annual Report
Trustees and Officers - continued
The funds' Statement of Additional Information (SAI) includes more information about the Trustees. To request a free copy, call Fidelity at 1-877-208-0098.
Interested Trustees*:
Correspondence intended for each Trustee who is an interested person may be sent to Fidelity Investments, 245 Summer Street, Boston, Massachusetts 02210.
Name, Year of Birth; Principal Occupations and Other Relevant Experience+ |
Abigail P. Johnson (1961) |
| Year of Election or Appointment: 2009 Ms. Johnson is Trustee and Chairman of the Board of Trustees of certain Trusts. Ms. Johnson serves as President of Fidelity Financial Services (2012-present) and President of Personal, Workplace and Institutional Services (2005-present). Ms. Johnson is Chairman and Director of FMR Co., Inc. (2011-present), Chairman and Director of FMR (2011-present), and the Vice Chairman and Director (2007-present) of FMR LLC. Previously, Ms. Johnson served as President and a Director of FMR (2001-2005), a Trustee of other investment companies advised by FMR, Fidelity Investments Money Management, Inc., and FMR Co., Inc. (2001-2005), Senior Vice President of the Fidelity funds (2001-2005), and managed a number of Fidelity funds. Ms. Abigail P. Johnson and Mr. Arthur E. Johnson are not related. |
James C. Curvey (1935) |
| Year of Election or Appointment: 2007 Mr. Curvey also serves as Trustee (2007-present) of other investment companies advised by FMR. Mr. Curvey is a Director of Fidelity Investments Money Management, Inc. (2009-present), Director of Fidelity Research & Analysis Co. (2009-present) and Director of FMR and FMR Co., Inc. (2007-present). Mr. Curvey is also Vice Chairman (2007-present) and Director of FMR LLC. In addition, Mr. Curvey serves as an Overseer for the Boston Symphony Orchestra and a member of the Trustees of Villanova University. Previously, Mr. Curvey was the Vice Chairman (2006-2007) and Director (2000-2007) of FMR Corp. |
* Trustees have been determined to be "Interested Trustees" by virtue of, among other things, their affiliation with the trust or various entities under common control with FMR.
+ The information above includes each Trustee's principal occupation during the last five years and other information relating to the experience, attributes, and skills relevant to each Trustee's qualifications to serve as a Trustee, which led to the conclusion that each Trustee should serve as a Trustee for each fund.
Independent Trustees:
Correspondence intended for each Independent Trustee (that is, the Trustees other than the Interested Trustees) may be sent to Fidelity Investments, P.O. Box 55235, Boston, Massachusetts 02205-5235.
Name, Year of Birth; Principal Occupations and Other Relevant Experience+ |
Elizabeth S. Acton (1951) |
| Year of Election or Appointment: 2013 Ms. Acton is Trustee of certain Trusts. Prior to her retirement in April 2012, Ms. Acton was Executive Vice President, Finance (November 2011-April 2012), Executive Vice President, Chief Financial Officer (April 2002-November 2011), and Treasurer (May 2004-May 2005) of Comerica Incorporated (financial services). Prior to joining Comerica, Ms. Acton held a variety of positions at Ford Motor Company (1983-2002), including Vice President and Treasurer (2000-2002) and Executive Vice President and Chief Financial Officer of Ford Motor Credit Company (1998-2000). Ms. Acton currently serves as a member of the Board of Directors and Audit and Finance Committees of Beazer Homes USA, Inc. (homebuilding, 2012-present). |
Albert R. Gamper, Jr. (1942) |
| Year of Election or Appointment: 2006 Mr. Gamper is Chairman of the Independent Trustees of the Fixed Income and Asset Allocation Funds (2012-present). Prior to his retirement in December 2004, Mr. Gamper served as Chairman of the Board of CIT Group Inc. (commercial finance). During his tenure with CIT Group Inc. Mr. Gamper served in numerous senior management positions, including Chairman (1987-1989; 1999-2001; 2002-2004), Chief Executive Officer (1987-2004), and President (2002-2003). Mr. Gamper currently serves as a member of the Board of Directors of Public Service Enterprise Group (utilities, 2000-present), a member of the Board of Trustees, Rutgers University (2004-present), and Chairman of the Board of Barnabas Health Care System. Previously, Mr. Gamper served as Vice Chairman of the Independent Trustees of the Fixed Income and Asset Allocation Funds (2011-2012) and as Chairman of the Board of Governors, Rutgers University (2004-2007). |
Robert F. Gartland (1951) |
| Year of Election or Appointment: 2010 Mr. Gartland is Chairman and an investor in Gartland and Mellina Group Corp. (consulting, 2009-present). Previously, Mr. Gartland served as a partner and investor of Vietnam Partners LLC (investments and consulting, 2008-2011). Prior to his retirement, Mr. Gartland held a variety of positions at Morgan Stanley (financial services, 1979-2007) including Managing Director (1987-2007). |
Arthur E. Johnson (1947) |
| Year of Election or Appointment: 2008 Mr. Johnson serves as a member of the Board of Directors of Eaton Corporation (diversified power management, 2009-present), AGL Resources, Inc. (holding company, 2002-present) and Booz Allen Hamilton (management consulting, 2011-present). Prior to his retirement, Mr. Johnson served as Senior Vice President of Corporate Strategic Development of Lockheed Martin Corporation (defense contractor, 1999-2009). He previously served on the Board of Directors of IKON Office Solutions, Inc. (1999-2008) and Delta Airlines (2005-2007). Mr. Arthur E. Johnson is not related to Ms. Abigail P. Johnson. |
Michael E. Kenneally (1954) |
| Year of Election or Appointment: 2009 Previously, Mr. Kenneally served as a Member of the Advisory Board for certain Fidelity Fixed Income and Asset Allocation Funds (2008-2009). Prior to his retirement, Mr. Kenneally served as Chairman and Global Chief Executive Officer of Credit Suisse Asset Management (2003-2005). Mr. Kenneally was a Director of the Credit Suisse Funds (U.S. mutual funds, 2004-2008) and certain other closed-end funds (2004-2005) and was awarded the Chartered Financial Analyst (CFA) designation in 1991. |
James H. Keyes (1940) |
| Year of Election or Appointment: 2007 Mr. Keyes serves as a member of the Boards of Navistar International Corporation (manufacture and sale of trucks, buses, and diesel engines, since 2002) and Pitney Bowes, Inc. (integrated mail, messaging, and document management solutions, since 1998). Prior to his retirement, Mr. Keyes served as Chairman and Chief Executive Officer of Johnson Controls (automotive, building, and energy, 1998-2002) and as a member of the Board of LSI Logic Corporation (semiconductor technologies, 1984-2008). |
Marie L. Knowles (1946) |
| Year of Election or Appointment: 2001 Ms. Knowles is Vice Chairman of the Independent Trustees of the Fixed Income and Asset Allocation Funds (2012-present). Prior to Ms. Knowles' retirement in June 2000, she served as Executive Vice President and Chief Financial Officer of Atlantic Richfield Company (ARCO) (diversified energy, 1996-2000). From 1993 to 1996, she was a Senior Vice President of ARCO and President of ARCO Transportation Company. She served as a Director of ARCO from 1996 to 1998. Ms. Knowles currently serves as a Director and Chairman of the Audit Committee of McKesson Corporation (healthcare service, since 2002). Ms. Knowles is an Honorary Trustee of the Brookings Institution and a member of the Board of the Catalina Island Conservancy and of the Santa Catalina Island Company (2009-present). She also serves as a member of the Advisory Board for the School of Engineering of the University of Southern California and the Foundation Board of the School of Architecture at the University of Virginia (2007-present). Previously, Ms. Knowles served as a Director of Phelps Dodge Corporation (copper mining and manufacturing, 1994-2007). |
Kenneth L. Wolfe (1939) |
| Year of Election or Appointment: 2005 Prior to his retirement, Mr. Wolfe served as Chairman and a Director (2007-2009) and Chairman and Chief Executive Officer (1994-2001) of Hershey Foods Corporation. He also served as a member of the Boards of Adelphia Communications Corporation (telecommunications, 2003-2006), Bausch & Lomb, Inc. (medical/pharmaceutical, 1993-2007), and Revlon, Inc. (personal care products, 2004-2009). Mr. Wolfe previously served as Chairman of the Independent Trustees of the Fixed Income and Asset Allocation Funds (2008-2012). |
Annual Report
Trustees and Officers - continued
+ The information above includes each Trustee's principal occupation during the last five years and other information relating to the experience, attributes, and skills relevant to each Trustee's qualifications to serve as a Trustee, which led to the conclusion that each Trustee should serve as a Trustee for each fund.
Executive Officers:
Correspondence intended for each executive officer may be sent to Fidelity Investments, 245 Summer Street, Boston, Massachusetts 02210.
Name, Year of Birth; Principal Occupation |
Stephanie J. Dorsey (1969) |
| Year of Election or Appointment: 2013 President and Treasurer of Fidelity's Fixed Income and Asset Allocation Funds. Ms. Dorsey also serves as Assistant Treasurer of other Fidelity funds (2010-present) and is an employee of Fidelity Investments (2008-present). Previously, Ms. Dorsey served as Deputy Treasurer of Fidelity's Fixed Income and Asset Allocation Funds (2008-2013), Treasurer (2004-2008) of the JPMorgan Mutual Funds and Vice President (2004-2008) of JPMorgan Chase Bank. |
Charles S. Morrison (1960) |
| Year of Election or Appointment: 2012 Vice President of Fidelity's Fixed Income and Asset Allocation Funds. Mr. Morrison also serves as President, Fixed Income and is an employee of Fidelity Investments. Previously, Mr. Morrison served as Vice President of Fidelity's Money Market Funds (2005-2009), President, Money Market Group Leader of FMR (2009), and Senior Vice President, Money Market Group of FMR (2004-2009). Mr. Morrison also served as Vice President of Fidelity's Bond Funds (2002-2005), certain Balanced Funds (2002-2005), and certain Asset Allocation Funds (2002-2007), and as Senior Vice President (2002-2005) of Fidelity's Fixed Income Division. |
Derek L. Young (1964) |
| Year of Election or Appointment: 2009 Vice President of Fidelity's Asset Allocation Funds. Mr. Young is also a Trustee of other investment companies advised by Strategic Advisers, Inc. (Strategic Advisers) (2012-present), President and a Director of Strategic Advisers (2011-present), President of Fidelity Global Asset Allocation (GAA) (2011-present), and Vice Chairman of Pyramis Global Advisors LLC (2011-present). Previously, Mr. Young served as Chief Investment Officer of GAA (2009-2011) and as a portfolio manager. |
Andrew Windmueller (1960) |
| Year of Election or Appointment: 2012 Vice President of Fidelity's Asset Allocation Funds. Mr. Windmueller also serves as Chief Investment Officer of Strategic Advisers, Inc. (2011-present), Chief Investment Officer for Global Asset Allocation Multi-Asset Class Strategies (2011-present), and is an employee of Fidelity Investments (2000-present). |
Scott C. Goebel (1968) |
| Year of Election or Appointment: 2008 Secretary and Chief Legal Officer (CLO) of the Fidelity funds. Mr. Goebel also serves as Secretary of Fidelity Investments Money Management, Inc. (FIMM) (2010-present) and Fidelity Research and Analysis Company (FRAC) (2010-present); Secretary and CLO of The North Carolina Capital Management Trust: Cash and Term Portfolios (2008-present); General Counsel, Secretary, and Senior Vice President of FMR (2008-present) and FMR Co., Inc. (2008-present); employed by FMR LLC or an affiliate (2001-present); Chief Legal Officer of Fidelity Management & Research (Hong Kong) Limited (2008-present) and Assistant Secretary of Fidelity Management & Research (Japan) Inc. (2008-present), and Fidelity Management & Research (U.K.) Inc. (2008-present). Previously, Mr. Goebel served as Assistant Secretary of FIMM (2008-2010), FRAC (2008-2010), and the Funds (2007-2008) and as Vice President and Secretary of Fidelity Distributors Corporation (FDC) (2005-2007). |
Ramon Herrera (1974) |
| Year of Election or Appointment: 2012 Assistant Secretary of Fidelity's Fixed Income and Asset Allocation Funds. Mr. Herrera also serves as Vice President, Associate General Counsel (2010-present) and is an employee of Fidelity Investments (2004-present). |
Elizabeth Paige Baumann (1968) |
| Year of Election or Appointment: 2012 Anti-Money Laundering (AML) Officer of the Fidelity funds. Ms. Baumann also serves as AML Officer of The North Carolina Capital Management Trust: Cash and Term Portfolios (2012-present), Chief AML Officer of FMR LLC (2012-present), and is an employee of Fidelity Investments. Previously, Ms. Baumann served as Vice President and Deputy Anti-Money Laundering Officer (2007-2012). |
Christine Reynolds (1958) |
| Year of Election or Appointment: 2008 Chief Financial Officer of the Fidelity funds. Ms. Reynolds became President of Fidelity Pricing and Cash Management Services (FPCMS) in August 2008. Ms. Reynolds served as Chief Operating Officer of FPCMS (2007-2008). Previously, Ms. Reynolds served as President, Treasurer, and Anti-Money Laundering officer of the Fidelity funds (2004-2007). |
Michael H. Whitaker (1967) |
| Year of Election or Appointment: 2008 Chief Compliance Officer of Fidelity's Fixed Income and Asset Allocation Funds. Mr. Whitaker also serves as Chief Compliance Officer of The North Carolina Capital Management Trust: Cash and Term Portfolios (2008-present). Mr. Whitaker is an employee of Fidelity Investments (2007-present). Prior to joining Fidelity Investments, Mr. Whitaker worked at MFS Investment Management where he served as Senior Vice President and Chief Compliance Officer (2004-2006), and Assistant General Counsel. |
Joseph F. Zambello (1957) |
| Year of Election or Appointment: 2011 Deputy Treasurer of the Fidelity funds. Mr. Zambello is an employee of Fidelity Investments. Previously, Mr. Zambello served as Vice President of FMR's Program Management Group (2009-2011) and Vice President of the Transfer Agent Oversight Group (2005-2009). |
Stephen Sadoski (1971) |
| Year of Election or Appointment: 2013 Deputy Treasurer of Fidelity's Fixed Income and Asset Allocation Funds. Mr. Sadoski also serves as Deputy Treasurer of other Fidelity funds (2012-present) and is an employee of Fidelity Investments (2012-present). Previously, Mr. Sadoski served as Assistant Treasurer of Fidelity's Fixed Income and Asset Allocation Funds (2012-2013), an assistant chief accountant in the Division of Investment Management of the Securities and Exchange Commission (SEC) (2009-2012) and as a senior manager at Deloitte & Touche (1997-2009). |
Adrien E. Deberghes (1967) |
| Year of Election or Appointment: 2010 Assistant Treasurer of Fidelity's Fixed Income and Asset Allocation Funds. Mr. Deberghes also serves as Vice President and Assistant Treasurer (2011-present) and Deputy Treasurer (2008-present) of other Fidelity funds, and is an employee of Fidelity Investments (2008-present). Previously, Mr. Deberghes served as Senior Vice President of Mutual Fund Administration at State Street Corporation (2007-2008), Senior Director of Mutual Fund Administration at Investors Bank & Trust (2005-2007), and Director of Finance for Dunkin' Brands (2000-2005). |
Kenneth B. Robins (1969) |
| Year of Election or Appointment: 2009 Assistant Treasurer of the Fidelity Fixed Income and Asset Allocation Funds. Mr. Robins also serves as President and Treasurer of other Fidelity funds (2008-present; 2010-present) and is an employee of Fidelity Investments (2004-present). Previously, Mr. Robins served as Deputy Treasurer of the Fidelity funds (2005-2008) and Treasurer and Chief Financial Officer of The North Carolina Capital Management Trust: Cash and Term Portfolios (2006-2008). |
Gary W. Ryan (1958) |
| Year of Election or Appointment: 2005 Assistant Treasurer of the Fidelity funds. Mr. Ryan is an employee of Fidelity Investments. Previously, Mr. Ryan served as Vice President of Fund Reporting in Fidelity Pricing and Cash Management Services (FPCMS) (1999-2005). |
Jonathan Davis (1968) |
| Year of Election or Appointment: 2010 Assistant Treasurer of the Fidelity funds. Mr. Davis is also Assistant Treasurer of Fidelity Rutland Square Trust II and Fidelity Commonwealth Trust II. Mr. Davis is an employee of Fidelity Investments. Previously, Mr. Davis served as Vice President and Associate General Counsel of FMR LLC (2003-2010). |
Annual Report
The Board of Trustees of each fund voted to pay to shareholders of record at the opening of business on record date, the following distributions per share derived from capital gains realized from sales of portfolio securities and dividends derived from net investment income:
| Pay Date | Record Date | Dividends | Capital Gains |
Fidelity Advisor Freedom Income Fund | | | | |
Class A | 05/06/13 | 05/03/13 | $0.006 | $0.125 |
Class T | 05/06/13 | 05/03/13 | $0.004 | $0.125 |
Class B | 05/06/13 | 05/03/13 | $0.000 | $0.125 |
Class C | 05/06/13 | 05/03/13 | $0.000 | $0.125 |
Fidelity Advisor Freedom 2005 Fund | | | | |
Class A | 05/06/13 | 05/03/13 | $0.017 | $0.073 |
Class T | 05/06/13 | 05/03/13 | $0.011 | $0.073 |
Class B | 05/06/13 | 05/03/13 | $0.000 | $0.071 |
Class C | 05/06/13 | 05/03/13 | $0.000 | $0.071 |
Fidelity Advisor Freedom 2010 Fund | | | | |
Class A | 05/06/13 | 05/03/13 | $0.018 | $0.124 |
Class T | 05/06/13 | 05/03/13 | $0.011 | $0.124 |
Class B | 05/06/13 | 05/03/13 | $0.000 | $0.120 |
Class C | 05/06/13 | 05/03/13 | $0.000 | $0.120 |
Fidelity Advisor Freedom 2015 Fund | | | | |
Class A | 05/13/13 | 05/10/13 | $0.018 | $0.204 |
Class T | 05/13/13 | 05/10/13 | $0.010 | $0.204 |
Class B | 05/13/13 | 05/10/13 | $0.000 | $0.200 |
Class C | 05/13/13 | 05/10/13 | $0.000 | $0.200 |
Fidelity Advisor Freedom 2020 Fund | | | | |
Class A | 05/06/13 | 05/03/13 | $0.019 | $0.250 |
Class T | 05/06/13 | 05/03/13 | $0.011 | $0.250 |
Class B | 05/06/13 | 05/03/13 | $0.000 | $0.245 |
Class C | 05/06/13 | 05/03/13 | $0.000 | $0.245 |
Fidelity Advisor Freedom 2025 Fund | | | | |
Class A | 05/06/13 | 05/03/13 | $0.017 | $0.374 |
Class T | 05/06/13 | 05/03/13 | $0.010 | $0.374 |
Class B | 05/06/13 | 05/03/13 | $0.000 | $0.368 |
Class C | 05/06/13 | 05/03/13 | $0.000 | $0.368 |
Fidelity Advisor Freedom 2030 Fund | | | | |
Class A | 05/06/13 | 05/03/13 | $0.018 | $0.338 |
Class T | 05/06/13 | 05/03/13 | $0.010 | $0.338 |
Class B | 05/06/13 | 05/03/13 | $0.000 | $0.331 |
Class C | 05/06/13 | 05/03/13 | $0.000 | $0.331 |
Fidelity Advisor Freedom 2035 Fund | | | | |
Class A | 05/06/13 | 05/03/13 | $0.012 | $0.466 |
Class T | 05/06/13 | 05/03/13 | $0.005 | $0.466 |
Class B | 05/06/13 | 05/03/13 | $0.000 | $0.459 |
Class C | 05/06/13 | 05/03/13 | $0.000 | $0.459 |
Fidelity Advisor Freedom 2040 Fund | | | | |
Class A | 05/06/13 | 05/03/13 | $0.013 | $0.492 |
Class T | 05/06/13 | 05/03/13 | $0.004 | $0.492 |
Class B | 05/06/13 | 05/03/13 | $0.000 | $0.485 |
Class C | 05/06/13 | 05/03/13 | $0.000 | $0.485 |
| Pay Date | Record Date | Dividends | Capital Gains |
Fidelity Advisor Freedom 2045 Fund | | | | |
Class A | 05/13/13 | 05/10/13 | $0.010 | $0.213 |
Class T | 05/13/13 | 05/10/13 | $0.004 | $0.213 |
Class B | 05/13/13 | 05/10/13 | $0.000 | $0.207 |
Class C | 05/13/13 | 05/10/13 | $0.000 | $0.207 |
Fidelity Advisor Freedom 2050 Fund | | | | |
Class A | 05/13/13 | 05/10/13 | $0.009 | $0.214 |
Class T | 05/13/13 | 05/10/13 | $0.004 | $0.214 |
Class B | 05/13/13 | 05/10/13 | $0.000 | $0.204 |
Class C | 05/13/13 | 05/10/13 | $0.000 | $0.204 |
Fidelity Advisor Freedom 2055 Fund | | | | |
Class A | 05/13/13 | 05/10/13 | $0.006 | $0.120 |
Class T | 05/13/13 | 05/10/13 | $0.001 | $0.120 |
Class C | 05/13/13 | 05/10/13 | $0.000 | $0.110 |
The funds hereby designate as capital gain dividend the amounts noted below for the taxable year ended March 31, 2013, or, if subsequently determined to be different, the net capital gain of such year.
Fidelity Advisor Freedom Income Fund | $4,545,642 |
Fidelity Advisor Freedom 2005 Fund | $1,838,709 |
Fidelity Advisor Freedom 2010 Fund | $8,728,254 |
Fidelity Advisor Freedom 2015 Fund | $31,322,730 |
Fidelity Advisor Freedom 2020 Fund | $61,913,127 |
Fidelity Advisor Freedom 2025 Fund | $84,582,251 |
Fidelity Advisor Freedom 2030 Fund | $73,228,005 |
Fidelity Advisor Freedom 2035 Fund | $75,581,843 |
Fidelity Advisor Freedom 2040 Fund | $72,708,334 |
Fidelity Advisor Freedom 2045 Fund | $19,259,685 |
Fidelity Advisor Freedom 2050 Fund | $13,997,836 |
Fidelity Advisor Freedom 2055 Fund | $753,517 |
A percentage of the dividends distributed during the fiscal year for the following funds were derived from interest on U.S. Government securities which is generally exempt from state income tax:
Fidelity Advisor Freedom Income Fund | |
Class A | 18.64% |
Class T | 18.64% |
Class B | 18.64% |
Class C | 18.64% |
Fidelity Advisor Freedom 2005 Fund | |
Class A | 14.31% |
Class T | 14.31% |
Class B | 14.31% |
Class C | 14.31% |
Fidelity Advisor Freedom 2010 Fund | |
Class A | 13.36% |
Class T | 13.36% |
Class B | 13.36% |
Class C | 13.36% |
Fidelity Advisor Freedom 2015 Fund | |
Class A | 13.10% |
Class T | 13.10% |
Class B | 13.10% |
Class C | 13.10% |
Fidelity Advisor Freedom 2020 Fund | |
Class A | 11.12% |
Class T | 11.12% |
Class B | 11.12% |
Class C | 11.12% |
Fidelity Advisor Freedom 2025 Fund | |
Class A | 7.94% |
Class T | 7.94% |
Class B | 7.94% |
Class C | 7.94% |
Fidelity Advisor Freedom 2030 Fund | |
Class A | 6.03% |
Class T | 6.03% |
Class B | 6.03% |
Class C | 6.03% |
Fidelity Advisor Freedom 2035 Fund | |
Class A | 2.65% |
Class T | 2.65% |
Class B | 2.65% |
Class C | 2.65% |
Fidelity Advisor Freedom 2040 Fund | |
Class A | 2.40% |
Class T | 2.40% |
Class B | 2.40% |
Class C | 2.40% |
Fidelity Advisor Freedom 2045 Fund | |
Class A | 1.35% |
Class T | 1.35% |
Class B | 1.35% |
Class C | 1.35% |
Fidelity Advisor Freedom 2050 Fund | |
Class A | 0.89% |
Class T | 0.89% |
Class B | 0.89% |
Class C | 0.89% |
Fidelity Advisor Freedom 2055 Fund | |
Class A | 0.08% |
Class T | 0.08% |
Class C | 0.08% |
Annual Report
A percentage of the dividends distributed during the fiscal year for the following funds qualify for the dividends-received deduction for corporate shareholders:
| Class A | Class T | Class B | Class C |
Fidelity Advisor Freedom Income Fund | | | | |
April 2012 | 2% | 2% | 6% | 6% |
May 2012 | 11% | 22% | 0% | 0% |
June 2012 | 10% | 15% | 73% | 73% |
July 2012 | 10% | 15% | 52% | 52% |
August 2012 | 10% | 15% | 46% | 46% |
September 2012 | 10% | 14% | 83% | 83% |
October 2012 | 10% | 14% | 84% | 84% |
November 2012 | 11% | 16% | 0% | 0% |
December 2012 (Ex-Date 12/07/12) | 11% | 18% | 0% | 0% |
December 2012 (Ex-Date 12/28/12) | 11% | 11% | 12% | 12% |
Fidelity Advisor Freedom 2005 Fund | | | | |
May 2012 | 2% | 3% | 0% | 0 |
December 2012 | 19% | 21% | 31% | 29% |
Fidelity Advisor Freedom 2010 Fund | | | | |
May 2012 | 2% | 2% | 0% | 19% |
December 2012 | 21% | 24% | 32% | 31% |
Fidelity Advisor Freedom 2015 Fund | | | | |
May 2012 | 2% | 3% | 0% | 0% |
December 2012 | 22% | 24% | 33% | 30% |
Fidelity Advisor Freedom 2020 Fund | | | | |
May 2012 | 2% | 3% | 0% | 0% |
December 2012 | 24% | 27% | 36% | 34% |
Fidelity Advisor Freedom 2025 Fund | | | | |
May 2012 | 3% | 4% | 0% | 0% |
December 2012 | 29% | 32% | 44% | 41% |
Fidelity Advisor Freedom 2030 Fund | | | | |
May 2012 | 3% | 4% | 0% | 0% |
December 2012 | 31% | 34% | 46% | 43% |
Fidelity Advisor Freedom 2035 Fund | | | | |
May 2012 | 7% | 15% | 0% | 0% |
December 2012 | 40% | 44% | 63% | 59% |
Fidelity Advisor Freedom 2040 Fund | | | | |
May 2012 | 6% | 16% | 0% | 0% |
December 2012 | 40% | 45% | 64% | 59% |
Fidelity Advisor Freedom 2045 Fund | | | | |
May 2012 | 8% | 20% | 0% | 0% |
December 2012 | 41% | 45% | 64% | 59% |
Fidelity Advisor Freedom 2050 Fund | | | | |
May 2012 | 12% | 0% | 0% | 0% |
December 2012 | 44% | 49% | 70% | 66% |
Fidelity Advisor Freedom 2055 Fund | | | | |
May 2012 | 23% | 0% | 0% | 0% |
December 2012 | 52% | 57% | 0% | 100% |
Annual Report
Distributions (Unaudited) - continued
A percentage of the dividends distributed during the fiscal year for the following funds may be taken into account as a dividend for purposes of the maximum rate under section 1(h)(11) of the Internal Revenue Code.
| Class A | Class T | Class B | Class C |
Fidelity Advisor Freedom Income Fund | | | | |
April 2012 | 3% | 4% | 10% | 10% |
May 2012 | 18% | 36% | 0% | 0% |
June 2012 | 17% | 24% | 100% | 100% |
July 2012 | 17% | 24% | 83% | 83% |
August 2012 | 17% | 25% | 73% | 73% |
September 2012 | 17% | 23% | 100% | 100% |
October 2012 | 17% | 23% | 100% | 100% |
November 2012 | 17% | 26% | 0% | 0% |
December 2012 (Ex-Date 12/07/12) | 18% | 29% | 0% | 0% |
December 2012 (Ex-Date 12/28/12) | 18% | 18% | 19% | 19% |
February 2013 | 6% | 12% | 0% | 0% |
March 2013 | 7% | 13% | 0% | 0% |
Fidelity Advisor Freedom 2005 Fund | | | | |
May 2012 | 4% | 5% | 0% | 0% |
December 2012 | 29% | 32% | 48% | 45% |
Fidelity Advisor Freedom 2010 Fund | | | | |
May 2012 | 3% | 4% | 0% | 30% |
December 2012 | 34% | 37% | 51% | 48% |
Fidelity Advisor Freedom 2015 Fund | | | | |
May 2012 | 3% | 5% | 0% | 0% |
December 2012 | 34% | 38% | 52% | 48% |
Fidelity Advisor Freedom 2020 Fund | | | | |
May 2012 | 4% | 6% | 0% | 0% |
December 2012 | 38% | 42% | 58% | 54% |
Fidelity Advisor Freedom 2025 Fund | | | | |
May 2012 | 5% | 7% | 0% | 0% |
December 2012 | 46% | 51% | 70% | 65% |
Fidelity Advisor Freedom 2030 Fund | | | | |
May 2012 | 5% | 7% | 0% | 0% |
December 2012 | 49% | 54% | 73% | 68% |
Fidelity Advisor Freedom 2035 Fund | | | | |
May 2012 | 11% | 24% | 0% | 0% |
December 2012 | 63% | 70% | 100% | 93% |
Fidelity Advisor Freedom 2040 Fund | | | | |
May 2012 | 10% | 26% | 0% | 0% |
December 2012 | 63% | 71% | 100% | 94% |
Fidelity Advisor Freedom 2045 Fund | | | | |
May 2012 | 13% | 32% | 0% | 0% |
December 2012 | 65% | 72% | 100% | 94% |
Fidelity Advisor Freedom 2050 Fund | | | | |
May 2012 | 20% | 0% | 0% | 0% |
December 2012 | 70% | 78% | 100% | 100% |
Fidelity Advisor Freedom 2055 Fund | | | | |
May 2012 | 35% | 0% | 0% | 0% |
December 2012 | 79% | 87% | 0% | 100% |
The funds will notify shareholders in January 2014 of amounts for use in preparing 2013 income tax returns.
Annual Report
Investment Adviser
Strategic Advisers, Inc.
Boston, MA
Administrator
Fidelity Management & Research Company
Boston, MA
General Distributor
Fidelity Distributors Corporation
Smithfield, RI
Transfer and Service Agents
Fidelity Investments Institutional Operations Company, Inc.
Boston, MA
Fidelity Service Company, Inc.
Boston, MA
Custodian
The Bank of New York Mellon
New York, NY
(Fidelity Investment logo)(registered trademark)
AFF-UANN-0513
1.792134.109
Fidelity Advisor Freedom Funds®-
Income, 2005, 2010, 2015, 2020, 2025, 2030, 2035, 2040, 2045, 2050, 2055 - Institutional Class
Annual Report
March 31, 2013
(Fidelity Cover Art)
Contents
Annual Report
To view a fund's proxy voting guidelines and proxy voting record for the 12-month period ended June 30, visit http://www.fidelity.com/proxyvotingresults or visit the Securities and Exchange Commission's (SEC) web site at http://www.sec.gov. You may also call 1-877-208-0098 to request a free copy of the proxy voting guidelines.
Standard & Poor's, S&P and S&P 500 are registered service marks of The McGraw-Hill Companies, Inc. and have been licensed for use by Fidelity Distributors Corporation.
Other third-party marks appearing herein are the property of their respective owners.
All other marks appearing herein are registered or unregistered trademarks or service marks of FMR LLC or an affiliated company. © 2013 FMR LLC. All rights reserved.
This report and the financial statements contained herein are submitted for the general information of the shareholders of the funds. This report is not authorized for distribution to prospective investors in the funds unless preceded or accompanied by an effective prospectus.
A fund files its complete schedule of portfolio holdings with the SEC for the first and third quarters of each fiscal year on Form N-Q. Forms N-Q are available on the SEC's web site at http://www.sec.gov. A fund's Forms N-Q may be reviewed and copied at the SEC's Public Reference Room in Washington, DC. Information regarding the operation of the SEC's Public Reference Room may be obtained by calling 1-800-SEC-0330. For a complete list of a fund's portfolio holdings, view the most recent holdings listing, semiannual report, or annual report on Fidelity's web site at http://www.fidelity.com, http://www.advisor.fidelity.com, or http://www.401k.com, as applicable.
NOT FDIC INSURED • MAY LOSE VALUE • NO BANK GUARANTEE
Neither the funds nor Fidelity Distributors Corporation is a bank.
Annual Report
Fidelity Advisor Freedom Income Fund® - Institutional Class
Performance: The Bottom Line
Average annual total return reflects the change in the value of an investment, assuming reinvestment of the class' distributions from dividend income and capital gains (the profits earned upon the sale of securities that have grown in value, if any) and assuming a constant rate of performance each year. The $10,000 table and the fund's returns do not reflect the deduction of taxes that a shareholder would pay on fund distributions or the redemption of fund shares. During periods of reimbursement by Fidelity, a fund's total return will be greater than it would be had the reimbursement not occurred. How a fund did yesterday is no guarantee of how it will do tomorrow.
Average Annual Total Returns
Periods ended March 31, 2013 | Past 1
year | Past 5
years | Life of
fund A |
Institutional Class | 4.75% | 4.45% | 4.40% |
A From July 24, 2003.
$10,000 Over Life of Fund
Let's say hypothetically that $10,000 was invested in Fidelity Advisor Freedom Income Fund® - Institutional Class on July 24, 2003, when the fund started. The chart shows how the value of your investment would have changed, and also shows how the Barclays® U.S. Aggregate Bond Index performed over the same period.
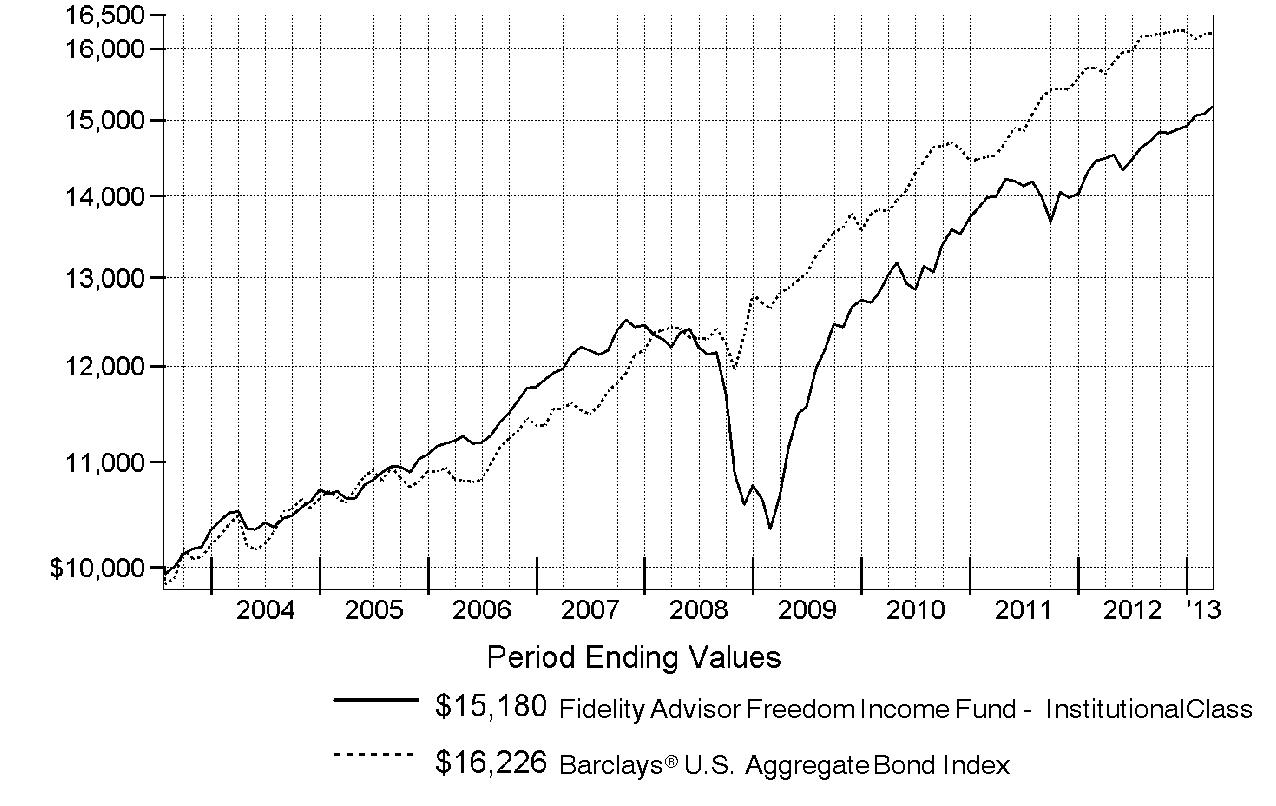
Annual Report
Fidelity Advisor Freedom 2005 Fund ® - Institutional Class
Performance: The Bottom Line
Average annual total return reflects the change in the value of an investment, assuming reinvestment of the class' distributions from dividend income and capital gains (the profits earned upon the sale of securities that have grown in value, if any) and assuming a constant rate of performance each year. The $10,000 table and the fund's returns do not reflect the deduction of taxes that a shareholder would pay on fund distributions or the redemption of fund shares. During periods of reimbursement by Fidelity, a fund's total return will be greater than it would be had the reimbursement not occurred. How a fund did yesterday is no guarantee of how it will do tomorrow.
Average Annual Total Returns
Periods ended March 31, 2013 | Past 1
year | Past 5
years | Life of
fund A |
Institutional Class | 6.11% | 4.04% | 4.96% |
A From November 6, 2003.
$10,000 Over Life of Fund
Let's say hypothetically that $10,000 was invested in Fidelity Advisor Freedom 2005 Fund® - Institutional Class on November 6, 2003, when the fund started. The chart shows how the value of your investment would have changed, and also shows how the Barclays U.S. Aggregate Bond Index performed over the same period.
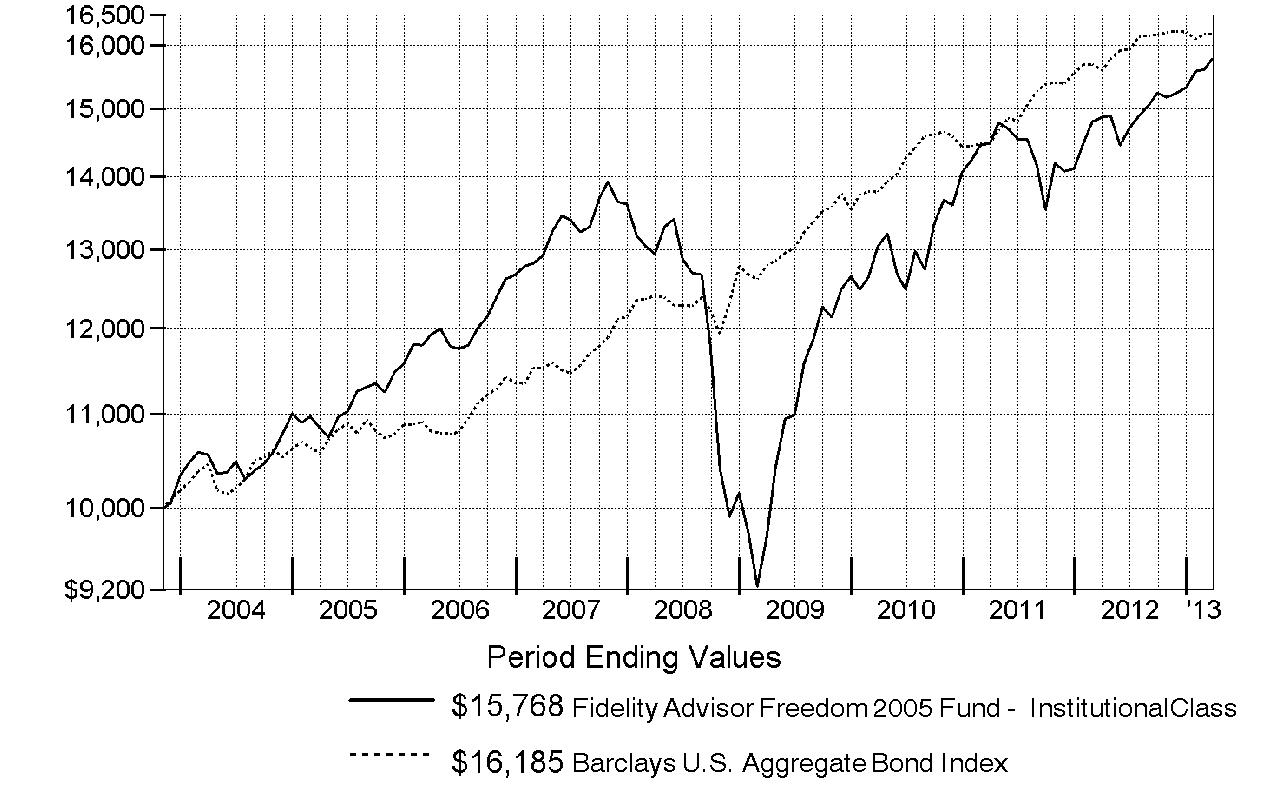
Annual Report
Fidelity Advisor Freedom 2010 Fund ® - Institutional Class
Performance: The Bottom Line
Average annual total return reflects the change in the value of an investment, assuming reinvestment of the class' distributions from dividend income and capital gains (the profits earned upon the sale of securities that have grown in value, if any) and assuming a constant rate of performance each year. The $10,000 table and the fund's returns do not reflect the deduction of taxes that a shareholder would pay on fund distributions or the redemption of fund shares. During periods of reimbursement by Fidelity, a fund's total return will be greater than it would be had the reimbursement not occurred. How a fund did yesterday is no guarantee of how it will do tomorrow.
Average Annual Total Returns
Periods ended March 31, 2013 | Past 1
year | Past 5
years | Life of
fund A |
Institutional Class | 7.56% | 4.71% | 5.61% |
A From July 24, 2003.
$10,000 Over Life of Fund
Let's say hypothetically that $10,000 was invested in Fidelity Advisor Freedom 2010 Fund® - Institutional Class on July 24, 2003, when the fund started. The chart shows how the value of your investment would have changed, and also shows how the Barclays U.S. Aggregate Bond Index performed over the same period.
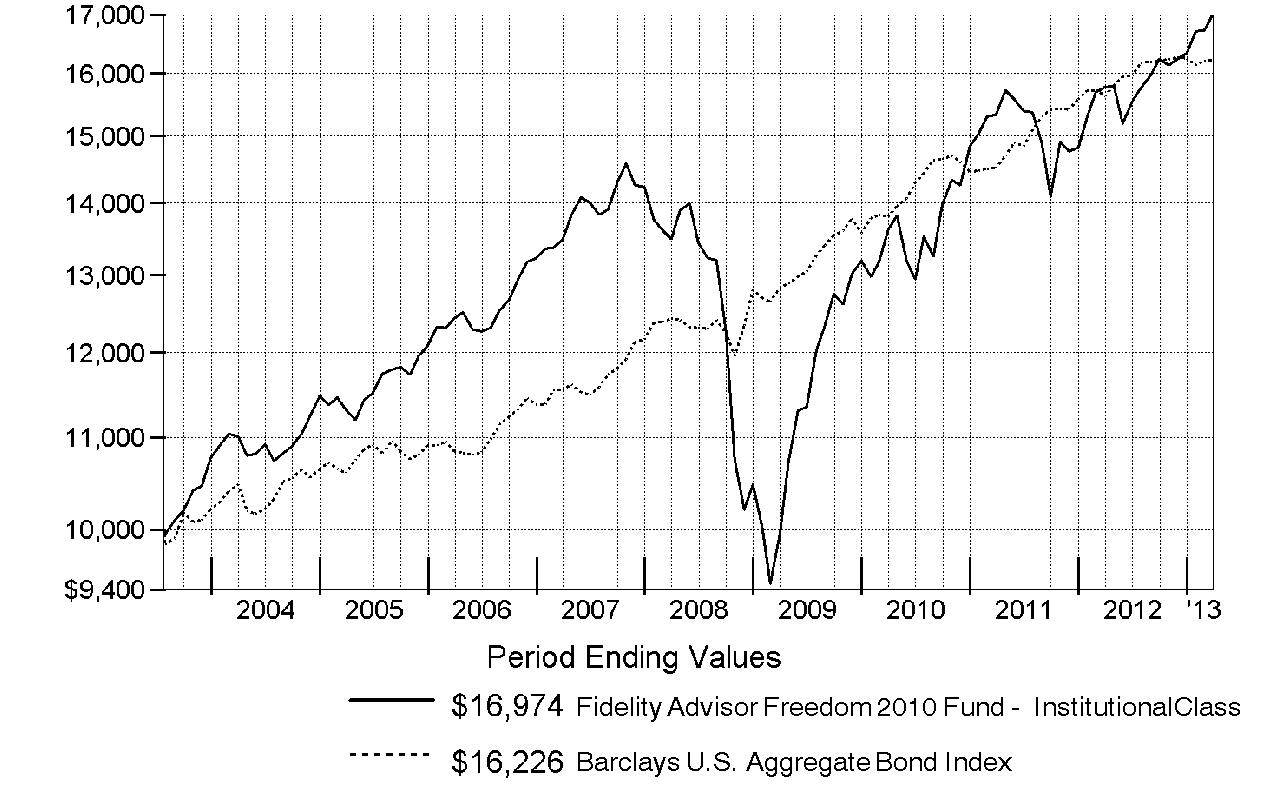
Annual Report
Fidelity Advisor Freedom 2015 Fund ® - Institutional Class
Performance: The Bottom Line
Average annual total return reflects the change in the value of an investment, assuming reinvestment of the class' distributions from dividend income and capital gains (the profits earned upon the sale of securities that have grown in value, if any) and assuming a constant rate of performance each year. The $10,000 table and the fund's returns do not reflect the deduction of taxes that a shareholder would pay on fund distributions or the redemption of fund shares. During periods of reimbursement by Fidelity, a fund's total return will be greater than it would be had the reimbursement not occurred. How a fund did yesterday is no guarantee of how it will do tomorrow.
Average Annual Total Returns
Periods ended March 31, 2013 | Past 1
year | Past 5
years | Life of
fund A |
Institutional Class | 7.74% | 4.53% | 5.65% |
A From November 6, 2003.
$10,000 Over Life of Fund
Let's say hypothetically that $10,000 was invested in Fidelity Advisor Freedom 2015 Fund® - Institutional Class on November 6, 2003, when the fund started. The chart shows how the value of your investment would have changed, and also shows how the S&P 500® Index performed over the same period.
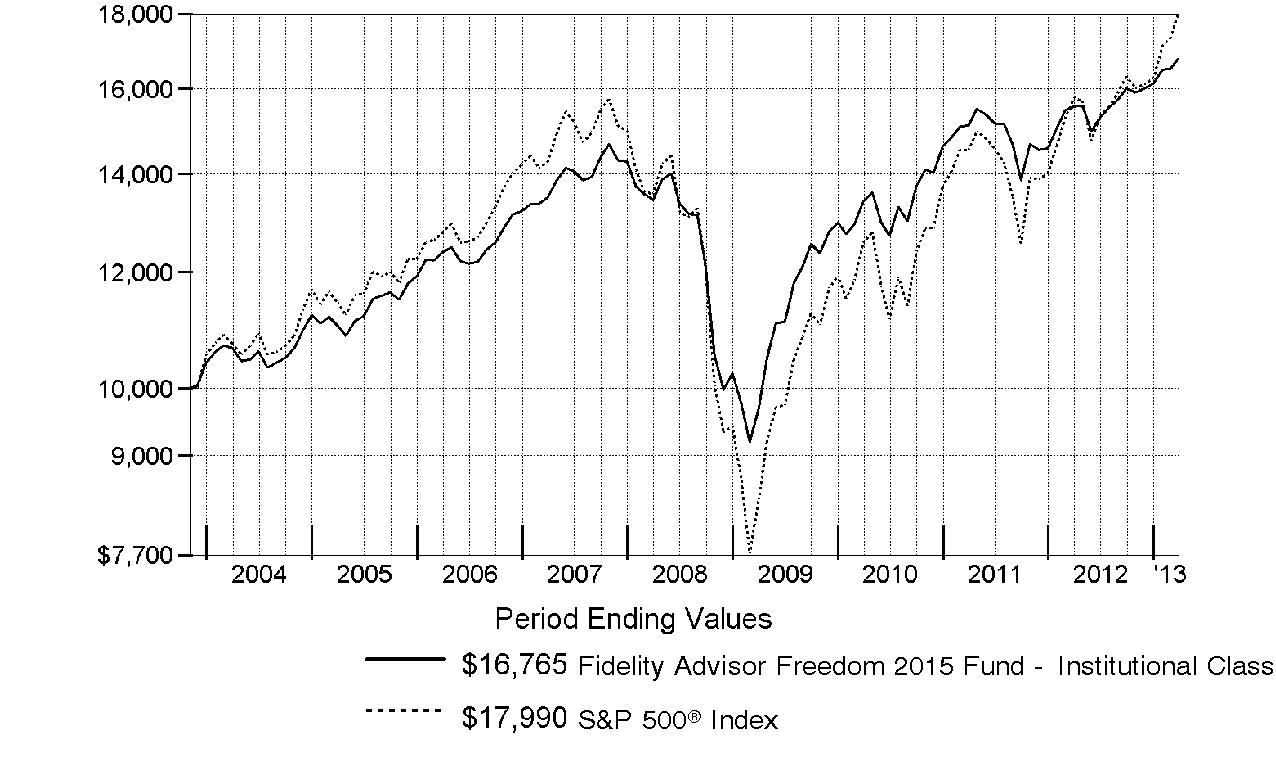
Annual Report
Fidelity Advisor Freedom 2020 Fund ® - Institutional Class
Performance: The Bottom Line
Average annual total return reflects the change in the value of an investment, assuming reinvestment of the class' distributions from dividend income and capital gains (the profits earned upon the sale of securities that have grown in value, if any) and assuming a constant rate of performance each year. The $10,000 table and the fund's returns do not reflect the deduction of taxes that a shareholder would pay on fund distributions or the redemption of fund shares. During periods of reimbursement by Fidelity, a fund's total return will be greater than it would be had the reimbursement not occurred. How a fund did yesterday is no guarantee of how it will do tomorrow.
Average Annual Total Returns
Periods ended March 31, 2013 | Past 1
year | Past 5
years | Life of
fund A |
Institutional Class | 8.28% | 4.11% | 6.13% |
A From July 24, 2003.
$10,000 Over Life of Fund
Let's say hypothetically that $10,000 was invested in Fidelity Advisor Freedom 2020 Fund® - Institutional Class on July 24, 2003, when the fund started. The chart shows how the value of your investment would have changed, and also shows how the S&P 500 Index performed over the same period.
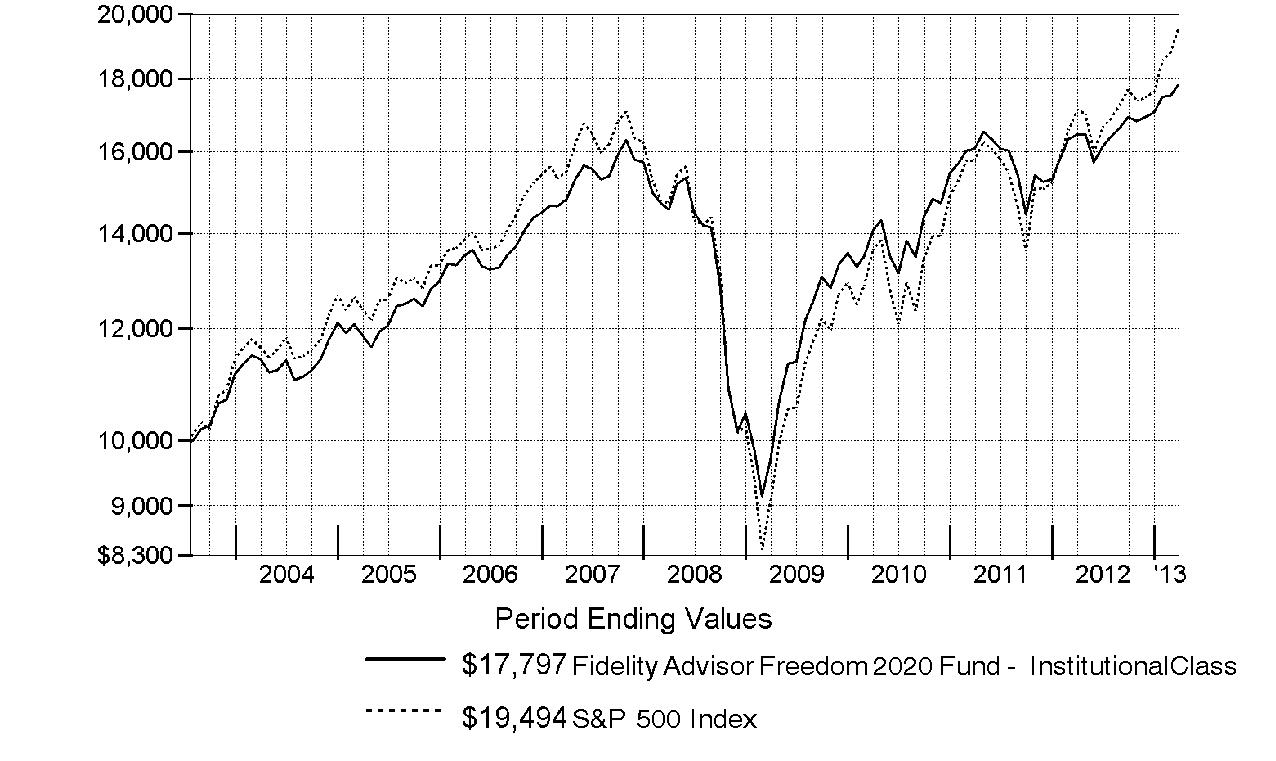
Annual Report
Fidelity Advisor Freedom 2025 Fund ® - Institutional Class
Performance: The Bottom Line
Average annual total return reflects the change in the value of an investment, assuming reinvestment of the class' distributions from dividend income and capital gains (the profits earned upon the sale of securities that have grown in value, if any) and assuming a constant rate of performance each year. The $10,000 table and the fund's returns do not reflect the deduction of taxes that a shareholder would pay on fund distributions or the redemption of fund shares. During periods of reimbursement by Fidelity, a fund's total return will be greater than it would be had the reimbursement not occurred. How a fund did yesterday is no guarantee of how it will do tomorrow.
Average Annual Total Returns
Periods ended March 31, 2013 | Past 1
year | Past 5
years | Life of
fund A |
Institutional Class | 9.29% | 4.24% | 5.80% |
A From November 6, 2003.
$10,000 Over Life of Fund
Let's say hypothetically that $10,000 was invested in Fidelity Advisor Freedom 2025 Fund® - Institutional Class on November 6, 2003, when the fund started. The chart shows how the value of your investment would have changed, and also shows how the S&P 500 Index performed over the same period.
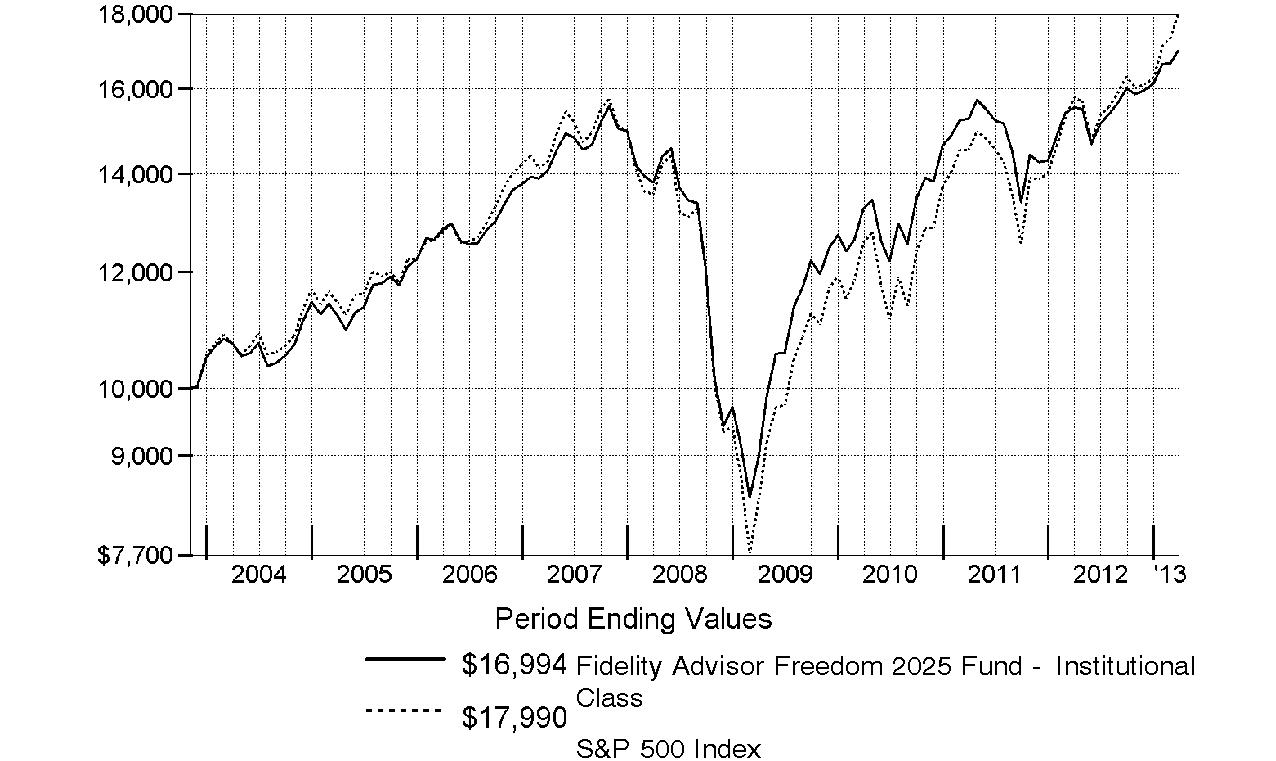
Annual Report
Fidelity Advisor Freedom 2030 Fund ® - Institutional Class
Performance: The Bottom Line
Average annual total return reflects the change in the value of an investment, assuming reinvestment of the class' distributions from dividend income and capital gains (the profits earned upon the sale of securities that have grown in value, if any) and assuming a constant rate of performance each year. The $10,000 table and the fund's returns do not reflect the deduction of taxes that a shareholder would pay on fund distributions or the redemption of fund shares. During periods of reimbursement by Fidelity, a fund's total return will be greater than it would be had the reimbursement not occurred. How a fund did yesterday is no guarantee of how it will do tomorrow.
Average Annual Total Returns
Periods ended March 31, 2013 | Past 1
year | Past 5
years | Life of
fund A |
Institutional Class | 9.47% | 3.58% | 6.18% |
A From July 24, 2003.
$10,000 Over Life of Fund
Let's say hypothetically that $10,000 was invested in Fidelity Advisor Freedom 2030 Fund® - Institutional Class on July 24, 2003, when the fund started. The chart shows how the value of your investment would have changed, and also shows how the S&P 500 Index performed over the same period.
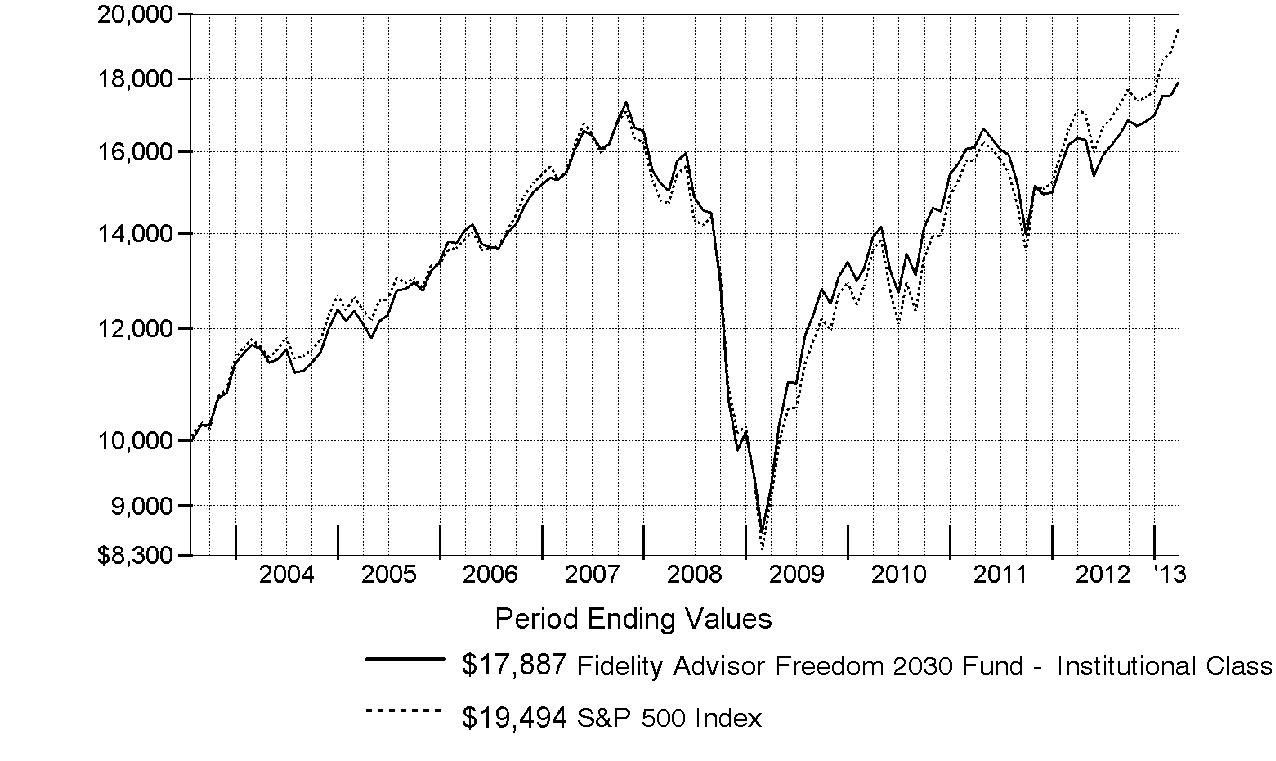
Annual Report
Fidelity Advisor Freedom 2035 Fund ® - Institutional Class
Performance: The Bottom Line
Average annual total return reflects the change in the value of an investment, assuming reinvestment of the class' distributions from dividend income and capital gains (the profits earned upon the sale of securities that have grown in value, if any) and assuming a constant rate of performance each year. The $10,000 table and the fund's returns do not reflect the deduction of taxes that a shareholder would pay on fund distributions or the redemption of fund shares. During periods of reimbursement by Fidelity, a fund's total return will be greater than it would be had the reimbursement not occurred. How a fund did yesterday is no guarantee of how it will do tomorrow.
Average Annual Total Returns
Periods ended March 31, 2013 | Past 1
year | Past 5
years | Life of
fund A |
Institutional Class | 10.10% | 3.62% | 5.65% |
A From November 6, 2003.
$10,000 Over Life of Fund
Let's say hypothetically that $10,000 was invested in Fidelity Advisor Freedom 2035 Fund® - Institutional Class on November 6, 2003, when the fund started. The chart shows how the value of your investment would have changed, and also shows how the S&P 500 Index performed over the same period.
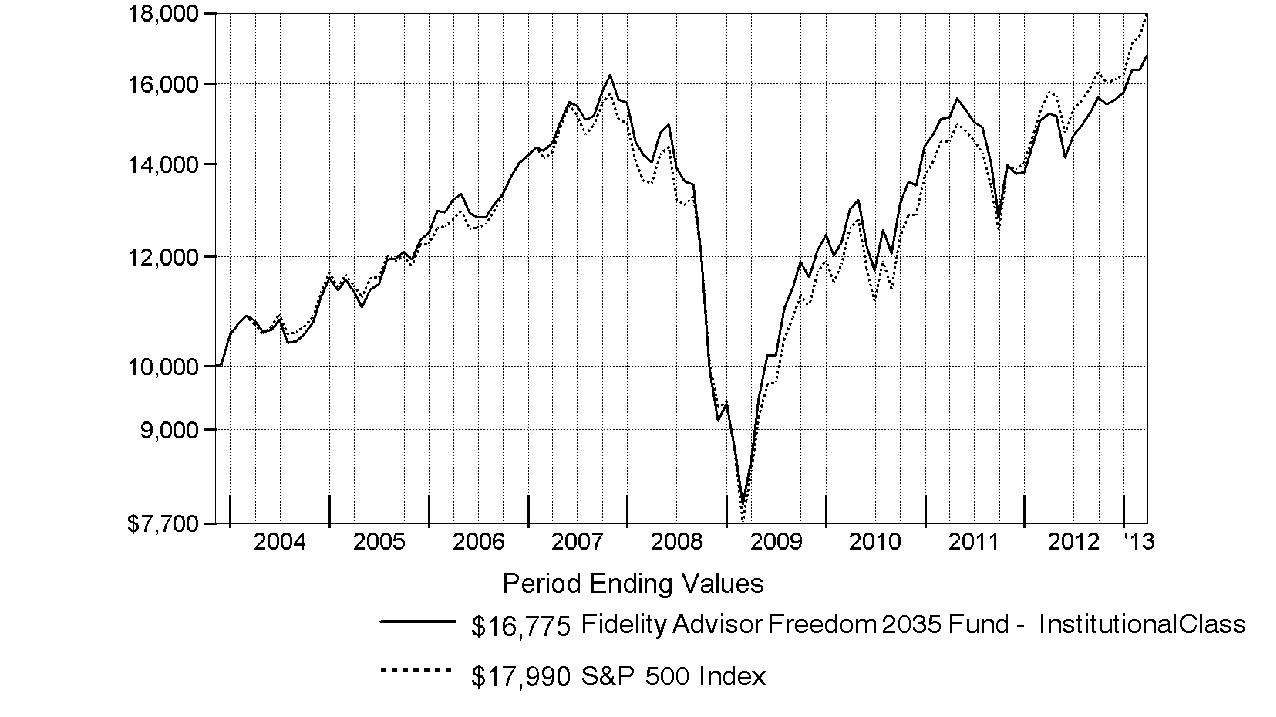
Annual Report
Fidelity Advisor Freedom 2040 Fund® - Institutional Class
Performance: The Bottom Line
Average annual total return reflects the change in the value of an investment, assuming reinvestment of the class' distributions from dividend income and capital gains (the profits earned upon the sale of securities that have grown in value, if any) and assuming a constant rate of performance each year. The $10,000 table and the fund's returns do not reflect the deduction of taxes that a shareholder would pay on fund distributions or the redemption of fund shares. During periods of reimbursement by Fidelity, a fund's total return will be greater than it would be had the reimbursement not occurred. How a fund did yesterday is no guarantee of how it will do tomorrow.
Average Annual Total Returns
Periods ended March 31, 2013 | Past 1
year | Past 5
years | Life of
fund A |
Institutional Class | 10.24% | 3.47% | 6.36% |
A From July 24, 2003.
$10,000 Over Life of Fund
Let's say hypothetically that $10,000 was invested in Fidelity Advisor Freedom 2040 Fund® - Institutional Class on July 24, 2003, when the fund started. The chart shows how the value of your investment would have changed, and also shows how the S&P 500 Index performed over the same period.
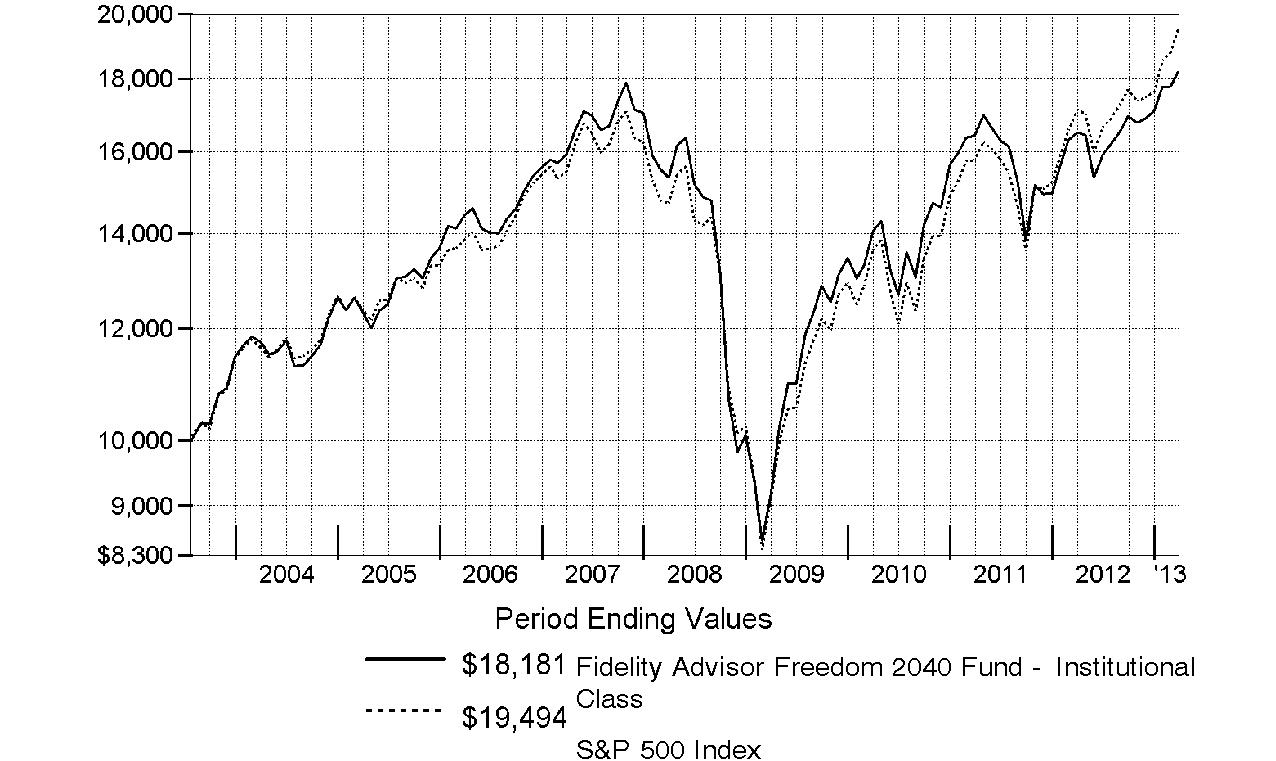
Annual Report
Fidelity Advisor Freedom 2045 Fund® - Institutional Class
Performance: The Bottom Line
Average annual total return reflects the change in the value of an investment, assuming reinvestment of the class' distributions from dividend income and capital gains (the profits earned upon the sale of securities that have grown in value, if any) and assuming a constant rate of performance each year. The $10,000 table and the fund's returns do not reflect the deduction of taxes that a shareholder would pay on fund distributions or the redemption of fund shares. During periods of reimbursement by Fidelity, a fund's total return will be greater than it would be had the reimbursement not occurred. How a fund did yesterday is no guarantee of how it will do tomorrow.
Average Annual Total Returns
Periods ended March 31, 2013 | | Past 1
year | Past 5
years | Life of
fund A |
Institutional Class | | 10.43% | 3.44% | 3.63% |
A From June 1, 2006.
$10,000 Over Life of Fund
Let's say hypothetically that $10,000 was invested in Fidelity Advisor Freedom 2045 Fund® - Institutional Class on June 1, 2006, when the fund started. The chart shows how the value of your investment would have changed, and also shows how the S&P 500 Index performed over the same period.
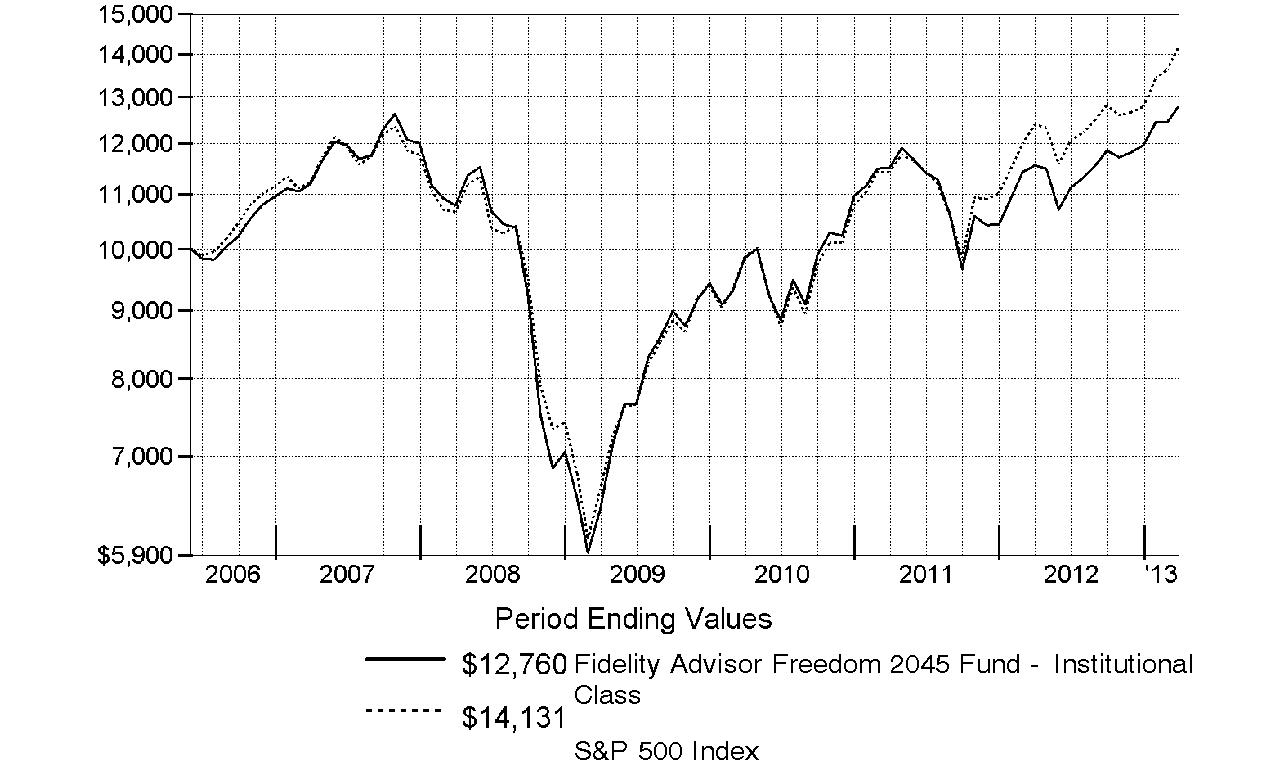
Annual Report
Fidelity Advisor Freedom 2050 Fund® - Institutional Class
Performance: The Bottom Line
Average annual total return reflects the change in the value of an investment, assuming reinvestment of the class' distributions from dividend income and capital gains (the profits earned upon the sale of securities that have grown in value, if any) and assuming a constant rate of performance each year. The $10,000 table and the fund's returns do not reflect the deduction of taxes that a shareholder would pay on fund distributions or the redemption of fund shares. During periods of reimbursement by Fidelity, a fund's total return will be greater than it would be had the reimbursement not occurred. How a fund did yesterday is no guarantee of how it will do tomorrow.
Average Annual Total Returns
Periods ended March 31, 2013 | Past 1
year | Past 5
years | Life of
fund A |
Institutional Class | 10.55% | 3.24% | 3.47% |
A From June 1, 2006.
$10,000 Over Life of Fund
Let's say hypothetically that $10,000 was invested in Fidelity Advisor Freedom 2050 Fund® - Institutional Class on June 1, 2006, when the fund started. The chart shows how the value of your investment would have changed, and also shows how the S&P 500 Index performed over the same period.
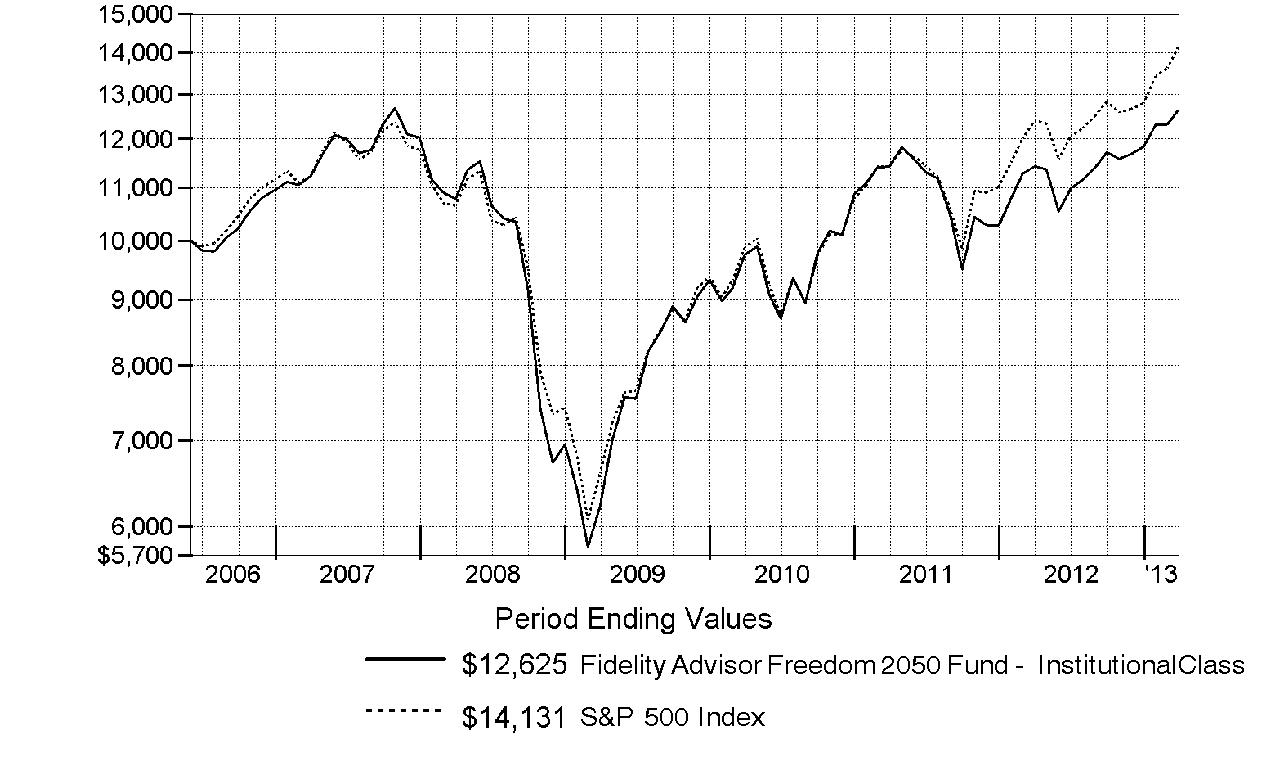
Annual Report
Fidelity Advisor Freedom® 2055 Fund - Institutional Class
Performance: The Bottom Line
Average annual total return reflects the change in the value of an investment, assuming reinvestment of the class' distributions from dividend income and capital gains (the profits earned upon the sale of securities that have grown in value, if any) and assuming a constant rate of performance each year. The $10,000 table and the fund's returns do not reflect the deduction of taxes that a shareholder would pay on fund distributions or the redemption of fund shares. During periods of reimbursement by Fidelity, a fund's total return will be greater than it would be had the reimbursement not occurred. How a fund did yesterday is no guarantee of how it will do tomorrow.
Average Annual Total Returns
Periods ended March 31, 2013 | Past 1
year | Life of
fund A |
Institutional Class | 10.84% | 6.07% |
A From June 1, 2011.
$10,000 Over Life of Fund
Let's say hypothetically that $10,000 was invested in Fidelity Advisor Freedom 2055 Fund - Institutional Class on June 1, 2011, when the fund started. The chart shows how the value of your investment would have changed, and also shows how the S&P 500 Index performed over the same period.
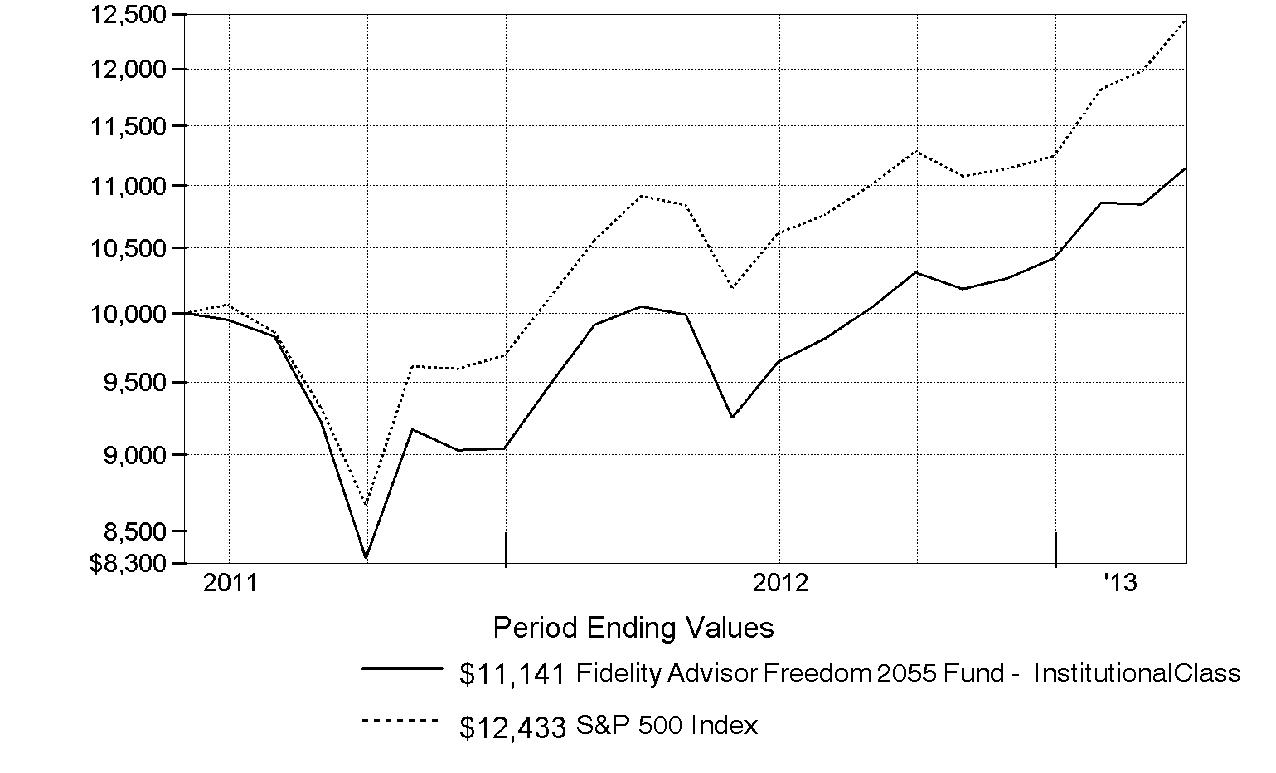
-
Annual Report
Market Recap: U.S. stock markets extended a four-year bull run and two major equity benchmarks reached record territory during the year ending March 31, 2013, as gains in the global economy and more monetary stimulus from the U.S. Federal Reserve kept markets on the upswing for much of the period. Optimism over the nation's jobs picture and housing market teamed up with solid corporate earnings to make stocks a favorite with investors during the 12-month period. The broad-based S&P 500® Index finished the year up 13.96%, closing at an all-time high at the end of the period, while the blue-chip-laden Dow Jones Industrial AverageSM - which broke its own record in early March - gained 13.37% for the full 12 months. The technology-heavy Nasdaq Composite Index® advanced a more modest 7.14%, curtailed by the weak performance of consumer electronics giant Apple, a large index component. During the year, markets shrugged off an early decline brought on by debt woes in Europe, and another dip later in the period amid pre-election jitters and Congressional gridlock over the federal budget. The year's gains were broad-based, with eight of the 10 sectors in the S&P 500® posting a double-digit increase, led by telecommunication services and health care, while technology fell 1%. Despite the headwind of a stronger U.S. dollar, foreign developed-markets stocks rose strongly, with the MSCI® EAFE® Index adding 11.40%. In the fixed-income arena, U.S. high-yield bonds benefited from investors' overall willingness to take on more risk, with The BofA Merrill LynchSM US High Yield Constrained Index adding 13.06% for the period. The shift away from perceived safety left U.S. investment-grade debt with a relatively modest 3.77% gain for the year, as measured by the Barclays® U.S. Aggregate Bond Index.
Comments from Christopher Sharpe and Andrew Dierdorf, Co-Portfolio Managers of Fidelity Advisor Freedom Funds®: For the year, the Institutional Class shares of each of the Advisor Freedom Funds delivered a positive absolute return. Funds with the longest time horizons until retirement - which have higher allocations to underlying equity and higher-yielding debt funds - posted the best results, rising into low double-digit territory. These results were consistent with what we would expect in an environment where investors preferred higher-risk asset classes, especially equities, in search of the potential for outsized returns. In relative terms, the Institutional Class shares of each of the Advisor Freedom Funds - except Advisor Freedom Income Fund - trailed its respective Composite index, hampered by underperformance among the underlying funds in the U.S. equity asset class. (For specific Fund results, please refer to the performance section of this report.) Although equities provided a nice lift during the period, the Funds' investments in U.S. stocks struggled to keep pace with the market, as represented by the Dow Jones U.S. Total Stock Market IndexSM, which returned 14.48%. The majority of the underlying U.S. equity funds trailed the Dow Jones index, which hindered the relative performance of Funds with greater allocations to this asset class. Fidelity® Series All-Sector Equity Fund, Fidelity® Series Large Cap Value Fund and Fidelity Advisor® Equity Growth Fund were among the most significant detractors. The Funds' investments in commodities - represented by Fidelity Series Commodity Strategy Fund - also finished behind the Dow Jones index and dragged on relative performance. Commodities faced an uphill battle and lost ground, as investors chose to take profits in the precious metals segment during the second half of the period, while severe weather for most of the year weighed on the agricultural subsector. Shifting to the non-U.S. equity asset class, each of the three underlying funds focused on developed markets outperformed the 11.40% return of the MSCI® EAFE® Index. On the downside, Fidelity Series Emerging Markets Fund hurt relative performance because it struggled amid lackluster prospects for economic growth within developing countries. Turning to the Funds' fixed-income asset classes, high-quality bonds largely produced positive absolute returns throughout the past year. In an effort to buoy the economy, the Federal Reserve kept interest rates low. However, Treasury yields still fell below the current inflation rate, which created a challenging environment for fixed-income investors. As such, the most conservative investment-grade bonds - U.S. government securities - delivered the most modest result, while the riskiest segment of the overall bond market, high-yield debt, experienced the strongest return. Thanks to the Funds' highly diversified portfolio of debt instruments, the aggregate performance of the bond asset class handily outpaced the 3.77% result of the Barclays® U.S. Aggregate Bond Index. Five of the six underlying funds beat the Barclays index. Core holding Fidelity Series Investment Grade Bond Fund solidly outpaced the benchmark, while Fidelity Series High Income Fund and Fidelity Series Real Estate Income Fund also provided a powerful boost. In the short-term debt asset class, Fidelity Advisor® Short Fixed-Income Fund propelled the Funds' aggregate performance here, topping the 0.13% return of the Barclays® U.S. 3 Month Treasury Bellwether Index.
The views expressed above reflect those of the portfolio manager(s) only through the end of the period as stated on the cover of this report and do not necessarily represent the views of Fidelity or any other person in the Fidelity organization. Any such views are subject to change at any time based upon market or other conditions and Fidelity disclaims any responsibility to update such views. These views may not be relied on as investment advice and, because investment decisions for a Fidelity fund are based on numerous factors, may not be relied on as an indication of trading intent on behalf of any Fidelity fund.
Annual Report
As a shareholder of a Fund, you incur two types of costs: (1) transaction costs, including sales charges (loads) on purchase payments or redemption proceeds, and (2) ongoing costs, including distribution and/or service (12b-1) fees and other Fund expenses. This Example is intended to help you understand your ongoing costs (in dollars) of investing in the Funds and to compare these costs with the ongoing costs of investing in other mutual funds.
The Example is based on an investment of $1,000 invested at the beginning of the period and held for the entire period (October 1, 2012 to March 31, 2013).
Actual Expenses
The first line of the accompanying table for each class of each fund provides information about actual account values and actual expenses. You may use the information in this line, together with the amount you invested, to estimate the expenses that you paid over the period. Simply divide your account value by $1,000.00 (for example, an $8,600 account value divided by $1,000.00 = 8.6), then multiply the result by the number in the first line for a class of the fund under the heading entitled "Expenses Paid During Period" to estimate the expenses you paid on your account during this period. In addition, each Fund, as a shareholder in underlying Fidelity Funds, will indirectly bear its pro-rata share of the fees and expenses incurred by the underlying Fidelity Funds. These fees and expenses are not included in each Fund's annualized expense ratio used to calculate the expense estimates in the table below.
Hypothetical Example for Comparison Purposes
The second line of the accompanying table for each class of each fund provides information about hypothetical account values and hypothetical expenses based on a Class' actual expense ratio and an assumed rate of return of 5% per year before expenses, which is not the Class' actual return. The hypothetical account values and expenses may not be used to estimate the actual ending account balance or expenses you paid for the period. You may use this information to compare the ongoing costs of investing in the Fund and other funds. To do so, compare this 5% hypothetical example with the 5% hypothetical examples that appear in the shareholder reports of the other funds. In addition, each Fund, as a shareholder in underlying Fidelity Funds, will indirectly bear its pro-rata share of the fees and expenses incurred by the underlying Fidelity Funds. These fees and expenses are not included in each Fund's annualized expense ratio used to calculate the expense estimates in the table below.
Please note that the expenses shown in the table are meant to highlight your ongoing costs only and do not reflect any transaction costs. Therefore, the second line of the table is useful in comparing ongoing costs only, and will not help you determine the relative total costs of owning different funds. In addition, if these transactional costs were included, your costs would have been higher.
| Annualized
Expense Ratio B | Beginning
Account Value
October 1, 2012 | Ending
Account Value
March 31, 2013 | Expenses Paid
During Period*
October 1, 2012
to March 31, 2013 |
Advisor Freedom Income | | | | |
Class A | .25% | | | |
Actual | | $ 1,000.00 | $ 1,022.30 | $ 1.26 |
Hypothetical A | | $ 1,000.00 | $ 1,023.68 | $ 1.26 |
Class T | .50% | | | |
Actual | | $ 1,000.00 | $ 1,020.90 | $ 2.52 |
Hypothetical A | | $ 1,000.00 | $ 1,022.44 | $ 2.52 |
Class B | 1.00% | | | |
Actual | | $ 1,000.00 | $ 1,017.80 | $ 5.03 |
Hypothetical A | | $ 1,000.00 | $ 1,019.95 | $ 5.04 |
Class C | 1.00% | | | |
Actual | | $ 1,000.00 | $ 1,017.80 | $ 5.03 |
Hypothetical A | | $ 1,000.00 | $ 1,019.95 | $ 5.04 |
Institutional Class | .00% | | | |
Actual | | $ 1,000.00 | $ 1,023.40 | $ .00 |
Hypothetical A | | $ 1,000.00 | $ 1,024.93 | $ .00 |
| Annualized
Expense Ratio B | Beginning
Account Value
October 1, 2012 | Ending
Account Value
March 31, 2013 | Expenses Paid
During Period*
October 1, 2012
to March 31, 2013 |
Advisor Freedom 2005 | | | | |
Class A | .25% | | | |
Actual | | $ 1,000.00 | $ 1,034.00 | $ 1.27 |
Hypothetical A | | $ 1,000.00 | $ 1,023.68 | $ 1.26 |
Class T | .50% | | | |
Actual | | $ 1,000.00 | $ 1,032.50 | $ 2.53 |
Hypothetical A | | $ 1,000.00 | $ 1,022.44 | $ 2.52 |
Class B | 1.00% | | | |
Actual | | $ 1,000.00 | $ 1,030.20 | $ 5.06 |
Hypothetical A | | $ 1,000.00 | $ 1,019.95 | $ 5.04 |
Class C | 1.00% | | | |
Actual | | $ 1,000.00 | $ 1,029.30 | $ 5.06 |
HypotheticalA | | $ 1,000.00 | $ 1,019.95 | $ 5.04 |
Institutional Class | .00% | | | |
Actual | | $ 1,000.00 | $ 1,034.90 | $ .00 |
Hypothetical A | | $ 1,000.00 | $ 1,024.93 | $ .00 |
Advisor Freedom 2010 | | | | |
Class A | .25% | | | |
Actual | | $ 1,000.00 | $ 1,044.70 | $ 1.27 |
Hypothetical A | | $ 1,000.00 | $ 1,023.68 | $ 1.26 |
Class T | .50% | | | |
Actual | | $ 1,000.00 | $ 1,042.90 | $ 2.55 |
Hypothetical A | | $ 1,000.00 | $ 1,022.44 | $ 2.52 |
Class B | 1.00% | | | |
Actual | | $ 1,000.00 | $ 1,040.60 | $ 5.09 |
Hypothetical A | | $ 1,000.00 | $ 1,019.95 | $ 5.04 |
Class C | 1.00% | | | |
Actual | | $ 1,000.00 | $ 1,040.00 | $ 5.09 |
Hypothetical A | | $ 1,000.00 | $ 1,019.95 | $ 5.04 |
Institutional Class | .00% | | | |
Actual | | $ 1,000.00 | $ 1,045.60 | $ .00 |
Hypothetical A | | $ 1,000.00 | $ 1,024.93 | $ .00 |
Advisor Freedom 2015 | | | | |
Class A | .25% | | | |
Actual | | $ 1,000.00 | $ 1,045.90 | $ 1.28 |
Hypothetical A | | $ 1,000.00 | $ 1,023.68 | $ 1.26 |
Class T | .50% | | | |
Actual | | $ 1,000.00 | $ 1,044.80 | $ 2.55 |
Hypothetical A | | $ 1,000.00 | $ 1,022.44 | $ 2.52 |
Class B | 1.00% | | | |
Actual | | $ 1,000.00 | $ 1,041.80 | $ 5.09 |
Hypothetical A | | $ 1,000.00 | $ 1,019.95 | $ 5.04 |
Class C | 1.00% | | | |
Actual | | $ 1,000.00 | $ 1,042.20 | $ 5.09 |
Hypothetical A | | $ 1,000.00 | $ 1,019.95 | $ 5.04 |
Institutional Class | .00% | | | |
Actual | | $ 1,000.00 | $ 1,047.40 | $ .00 |
Hypothetical A | | $ 1,000.00 | $ 1,024.93 | $ .00 |
| Annualized
Expense Ratio B | Beginning
Account Value
October 1, 2012 | Ending
Account Value
March 31, 2013 | Expenses Paid
During Period*
October 1, 2012
to March 31, 2013 |
Advisor Freedom 2020 | | | | |
Class A | .25% | | | |
Actual | | $ 1,000.00 | $ 1,050.60 | $ 1.28 |
Hypothetical A | | $ 1,000.00 | $ 1,023.68 | $ 1.26 |
Class T | .50% | | | |
Actual | | $ 1,000.00 | $ 1,049.50 | $ 2.55 |
Hypothetical A | | $ 1,000.00 | $ 1,022.44 | $ 2.52 |
Class B | 1.00% | | | |
Actual | | $ 1,000.00 | $ 1,046.40 | $ 5.10 |
Hypothetical A | | $ 1,000.00 | $ 1,019.95 | $ 5.04 |
Class C | 1.00% | | | |
Actual | | $ 1,000.00 | $ 1,046.60 | $ 5.10 |
Hypothetical A | | $ 1,000.00 | $ 1,019.95 | $ 5.04 |
Institutional Class | .00% | | | |
Actual | | $ 1,000.00 | $ 1,052.10 | $ .00 |
Hypothetical A | | $ 1,000.00 | $ 1,024.93 | $ .00 |
Advisor Freedom 2025 | | | | |
Class A | .25% | | | |
Actual | | $ 1,000.00 | $ 1,060.60 | $ 1.28 |
Hypothetical A | | $ 1,000.00 | $ 1,023.68 | $ 1.26 |
Class T | .50% | | | |
Actual | | $ 1,000.00 | $ 1,058.70 | $ 2.57 |
Hypothetical A | | $ 1,000.00 | $ 1,022.44 | $ 2.52 |
Class B | 1.00% | | | |
Actual | | $ 1,000.00 | $ 1,056.70 | $ 5.13 |
Hypothetical A | | $ 1,000.00 | $ 1,019.95 | $ 5.04 |
Class C | 1.00% | | | |
Actual | | $ 1,000.00 | $ 1,057.30 | $ 5.13 |
Hypothetical A | | $ 1,000.00 | $ 1,019.95 | $ 5.04 |
Institutional Class | .00% | | | |
Actual | | $ 1,000.00 | $ 1,062.00 | $ .00 |
Hypothetical A | | $ 1,000.00 | $ 1,024.93 | $ .00 |
Advisor Freedom 2030 | | | | |
Class A | .25% | | | |
Actual | | $ 1,000.00 | $ 1,063.50 | $ 1.29 |
Hypothetical A | | $ 1,000.00 | $ 1,023.68 | $ 1.26 |
Class T | .50% | | | |
Actual | | $ 1,000.00 | $ 1,061.70 | $ 2.57 |
Hypothetical A | | $ 1,000.00 | $ 1,022.44 | $ 2.52 |
Class B | 1.00% | | | |
Actual | | $ 1,000.00 | $ 1,058.80 | $ 5.13 |
Hypothetical A | | $ 1,000.00 | $ 1,019.95 | $ 5.04 |
Class C | 1.00% | | | |
Actual | | $ 1,000.00 | $ 1,059.10 | $ 5.13 |
Hypothetical A | | $ 1,000.00 | $ 1,019.95 | $ 5.04 |
Institutional Class | .00% | | | |
Actual | | $ 1,000.00 | $ 1,064.20 | $ .00 |
Hypothetical A | | $ 1,000.00 | $ 1,024.93 | $ .00 |
| Annualized
Expense Ratio B | Beginning
Account Value
October 1, 2012 | Ending
Account Value
March 31, 2013 | Expenses Paid
During Period*
October 1, 2012
to March 31, 2013 |
Advisor Freedom 2035 | | | | |
Class A | .25% | | | |
Actual | | $ 1,000.00 | $ 1,072.20 | $ 1.29 |
Hypothetical A | | $ 1,000.00 | $ 1,023.68 | $ 1.26 |
Class T | .50% | | | |
Actual | | $ 1,000.00 | $ 1,070.80 | $ 2.58 |
Hypothetical A | | $ 1,000.00 | $ 1,022.44 | $ 2.52 |
Class B | 1.00% | | | |
Actual | | $ 1,000.00 | $ 1,067.40 | $ 5.15 |
Hypothetical A | | $ 1,000.00 | $ 1,019.95 | $ 5.04 |
Class C | 1.00% | | | |
Actual | | $ 1,000.00 | $ 1,067.50 | $ 5.15 |
Hypothetical A | | $ 1,000.00 | $ 1,019.95 | $ 5.04 |
Institutional Class | .00% | | | |
Actual | | $ 1,000.00 | $ 1,072.90 | $ .00 |
Hypothetical A | | $ 1,000.00 | $ 1,024.93 | $ .00 |
Advisor Freedom 2040 | | | | |
Class A | .25% | | | |
Actual | | $ 1,000.00 | $ 1,072.70 | $ 1.29 |
Hypothetical A | | $ 1,000.00 | $ 1,023.68 | $ 1.26 |
Class T | .50% | | | |
Actual | | $ 1,000.00 | $ 1,071.70 | $ 2.58 |
Hypothetical A | | $ 1,000.00 | $ 1,022.44 | $ 2.52 |
Class B | 1.00% | | | |
Actual | | $ 1,000.00 | $ 1,069.10 | $ 5.16 |
Hypothetical A | | $ 1,000.00 | $ 1,019.95 | $ 5.04 |
Class C | 1.00% | | | |
Actual | | $ 1,000.00 | $ 1,068.60 | $ 5.16 |
Hypothetical A | | $ 1,000.00 | $ 1,019.95 | $ 5.04 |
Institutional Class | .00% | | | |
Actual | | $ 1,000.00 | $ 1,073.50 | $ .00 |
Hypothetical A | | $ 1,000.00 | $ 1,024.93 | $ .00 |
Advisor Freedom 2045 | | | | |
Class A | .25% | | | |
Actual | | $ 1,000.00 | $ 1,075.10 | $ 1.29 |
Hypothetical A | | $ 1,000.00 | $ 1,023.68 | $ 1.26 |
Class T | .50% | | | |
Actual | | $ 1,000.00 | $ 1,074.80 | $ 2.59 |
Hypothetical A | | $ 1,000.00 | $ 1,022.44 | $ 2.52 |
Class B | 1.00% | | | |
Actual | | $ 1,000.00 | $ 1,071.40 | $ 5.16 |
Hypothetical A | | $ 1,000.00 | $ 1,019.95 | $ 5.04 |
Class C | 1.00% | | | |
Actual | | $ 1,000.00 | $ 1,071.50 | $ 5.16 |
Hypothetical A | | $ 1,000.00 | $ 1,019.95 | $ 5.04 |
Institutional Class | .00% | | | |
Actual | | $ 1,000.00 | $ 1,076.60 | $ .00 |
Hypothetical A | | $ 1,000.00 | $ 1,024.93 | $ .00 |
| Annualized
Expense Ratio B | Beginning
Account Value
October 1, 2012 | Ending
Account Value
March 31, 2013 | Expenses Paid
During Period*
October 1, 2012
to March 31, 2013 |
Advisor Freedom 2050 | | | | |
Class A | .25% | | | |
Actual | | $ 1,000.00 | $ 1,076.80 | $ 1.29 |
Hypothetical A | | $ 1,000.00 | $ 1,023.68 | $ 1.26 |
Class T | .50% | | | |
Actual | | $ 1,000.00 | $ 1,075.30 | $ 2.59 |
Hypothetical A | | $ 1,000.00 | $ 1,022.44 | $ 2.52 |
Class B | 1.00% | | | |
Actual | | $ 1,000.00 | $ 1,072.30 | $ 5.17 |
Hypothetical A | | $ 1,000.00 | $ 1,019.95 | $ 5.04 |
Class C | 1.00% | | | |
Actual | | $ 1,000.00 | $ 1,072.90 | $ 5.17 |
Hypothetical A | | $ 1,000.00 | $ 1,019.95 | $ 5.04 |
Institutional Class | .00% | | | |
Actual | | $ 1,000.00 | $ 1,078.30 | $ .00 |
Hypothetical A | | $ 1,000.00 | $ 1,024.93 | $ .00 |
Advisor Freedom 2055 | | | | |
Class A | .25% | | | |
Actual | | $ 1,000.00 | $ 1,079.00 | $ 1.30 |
Hypothetical A | | $ 1,000.00 | $ 1,023.68 | $ 1.26 |
Class T | .50% | | | |
Actual | | $ 1,000.00 | $ 1,077.80 | $ 2.59 |
Hypothetical A | | $ 1,000.00 | $ 1,022.44 | $ 2.52 |
Class C | 1.00% | | | |
Actual | | $ 1,000.00 | $ 1,075.60 | $ 5.17 |
Hypothetical A | | $ 1,000.00 | $ 1,019.95 | $ 5.04 |
Institutional Class | .00% | | | |
Actual | | $ 1,000.00 | $ 1,081.00 | $ .00 |
Hypothetical A | | $ 1,000.00 | $ 1,024.93 | $ .00 |
A 5% return per year before expenses
B Annualized expense ratio reflects expenses net of applicable fee waivers.
* Expenses are equal to each Class' annualized expense ratio, multiplied by the average account value over the period, multiplied by 182/ 365 (to reflect the one-half year period). The fees and expenses of the underlying Fidelity Funds in which the Funds invest are not included in each class' annualized expense ratio.
Annual Report
Fidelity Advisor Freedom Income Fund
Investment Changes (Unaudited)
The information in the following tables is based on the direct investments of the Fund. |
Fund Holdings as of March 31, 2013 |
| % of fund's
net assets | % of fund's net assets
6 months ago |
Commodity Funds | | |
Fidelity Series Commodity Strategy Fund | 1.9 | 2.1 |
Domestic Equity Funds | | |
Fidelity Advisor Equity Growth Fund Institutional Class | 1.8 | 1.5 |
Fidelity Advisor Growth & Income Fund Institutional Class | 0.9 | 1.9 |
Fidelity Advisor Large Cap Fund Institutional Class | 1.0 | 1.7 |
Fidelity Advisor Series Equity-Income Fund | 1.3 | 0.0 |
Fidelity Advisor Series Mega Cap Fund | 0.3 | 0.0 |
Fidelity Advisor Series Opportunistic Insights Fund | 0.9 | 0.0 |
Fidelity Advisor Series Stock Selector Large Cap Value Fund | 1.3 | 0.0 |
Fidelity Advisor Small Cap Fund Institutional Class | 0.7 | 0.6 |
Fidelity Series 100 Index Fund | 0.3 | 1.3 |
Fidelity Series All-Sector Equity Fund | 2.3 | 2.7 |
Fidelity Series Large Cap Value Fund | 1.3 | 2.5 |
Fidelity Series Real Estate Equity Fund | 0.2 | 0.2 |
Fidelity Series Small Cap Opportunities Fund | 0.8 | 0.6 |
| 13.1 | 13.0 |
Developed International Equity Funds | | |
Fidelity Series International Growth Fund | 2.0 | 2.0 |
Fidelity Series International Small Cap Fund | 0.4 | 0.4 |
Fidelity Series International Value Fund | 2.0 | 1.9 |
| 4.4 | 4.3 |
Emerging Markets Equity Funds | | |
Fidelity Series Emerging Markets Fund | 1.2 | 1.2 |
High Yield Bond Funds | | |
Fidelity Series Emerging Markets Debt Fund | 0.5 | 0.5 |
Fidelity Series Floating Rate High Income Fund | 1.1 | 1.1 |
Fidelity Series High Income Fund | 4.9 | 4.7 |
Fidelity Series Real Estate Income Fund | 0.4 | 0.6 |
| 6.9 | 6.9 |
Inflation-Protected Bond Funds | | |
Fidelity Series Inflation-Protected Bond Index Fund | 11.4 | 11.9 |
Investment Grade Bond Funds | | |
Fidelity Series Investment Grade Bond Fund | 21.5 | 21.3 |
Short-Term Funds | | |
Fidelity Advisor Short Fixed-Income Fund Institutional Class | 17.9 | 17.8 |
Fidelity Institutional Money Market Portfolio Institutional Class | 21.7 | 21.5 |
| 39.6 | 39.3 |
Net Other Assets (Liabilities)* | 0.0 | 0.0 |
| 100.0 | 100.0 |
* Amount represents less than 0.1% |
Asset Allocation (% of fund's net assets) |
Period end |
 | Commodity Funds | 1.9% | |
 | Domestic Equity Funds | 13.1% | |
 | Developed International Equity Funds | 4.4% | |
 | Emerging Markets
Equity Funds | 1.2% | |
 | High Yield Bond Funds | 6.9% | |
 | Inflation-Protected
Bond Funds | 11.4% | |
 | Investment Grade
Bond Funds | 21.5% | |
 | Short-Term Funds | 39.6% | |

Six months ago |
| Commodity Funds | 2.1% | |
| Domestic Equity Funds | 13.0% | |
| Developed International Equity Funds | 4.3% | |
| Emerging Markets
Equity Funds | 1.2% | |
| High Yield Bond Funds | 6.9% | |
| Inflation-Protected
Bond Funds | 11.9% | |
| Investment Grade
Bond Funds | 21.3% | |
| Short-Term Funds | 39.3% | |

Expected |
| Commodity Funds | 2.0% | |
| Domestic Equity Funds | 12.6% | |
| Developed International Equity Funds | 4.2% | |
| Emerging Markets
Equity Funds | 1.2% | |
| High Yield Bond Funds | 5.0% | |
| Inflation-Protected
Bond Funds | 12.0% | |
| Investment Grade
Bond Funds | 23.0% | |
| Short-Term Funds | 40.0% | |

The six months ago allocation is based on the fund's holdings as of September 30, 2012. The current allocation is based on the fund's holdings as of March 31, 2013. The expected allocation represents the fund's anticipated allocation at September 30, 2013. |
Annual Report
Fidelity Advisor Freedom Income Fund
Investments March 31, 2013
Showing Percentage of Net Assets
Domestic Equity Funds - 15.0% |
| Shares | | Value |
Commodity Funds - 1.9% |
Fidelity Series Commodity Strategy Fund (a) | 730,523 | | $ 6,348,249 |
Domestic Equity Funds - 13.1% |
Fidelity Advisor Equity Growth Fund Institutional Class | 80,594 | | 5,710,077 |
Fidelity Advisor Growth & Income Fund Institutional Class | 137,178 | | 3,030,254 |
Fidelity Advisor Large Cap Fund Institutional Class | 128,967 | | 3,065,549 |
Fidelity Advisor Series Equity-Income Fund | 378,976 | | 4,217,999 |
Fidelity Advisor Series Mega Cap Fund | 85,488 | | 944,641 |
Fidelity Advisor Series Opportunistic Insights Fund | 270,476 | | 2,977,939 |
Fidelity Advisor Series Stock Selector Large Cap Value Fund | 378,617 | | 4,236,726 |
Fidelity Advisor Small Cap Fund Institutional Class | 86,852 | | 2,340,665 |
Fidelity Series 100 Index Fund | 90,164 | | 930,494 |
Fidelity Series All-Sector Equity Fund | 593,285 | | 7,623,707 |
Fidelity Series Large Cap Value Fund | 375,096 | | 4,366,121 |
Fidelity Series Real Estate Equity Fund | 50,047 | | 651,607 |
Fidelity Series Small Cap Opportunities Fund | 220,678 | | 2,720,966 |
TOTAL DOMESTIC EQUITY FUNDS | | 42,816,745 |
TOTAL DOMESTIC EQUITY FUNDS (Cost $40,229,824) |
49,164,994
|
International Equity Funds - 5.6% |
| | | |
Developed International Equity Funds - 4.4% |
Fidelity Series International Growth Fund | 518,359 | | 6,557,246 |
Fidelity Series International Small Cap Fund | 97,940 | | 1,343,743 |
Fidelity Series International Value Fund | 665,561 | | 6,535,805 |
TOTAL DEVELOPED INTERNATIONAL EQUITY FUNDS | | 14,436,794 |
Emerging Markets Equity Funds - 1.2% |
Fidelity Series Emerging Markets Fund | 235,115 | | 3,933,471 |
TOTAL INTERNATIONAL EQUITY FUNDS (Cost $15,970,277) |
18,370,265
|
Bond Funds - 39.8% |
| Shares | | Value |
High Yield Bond Funds - 6.9% |
Fidelity Series Emerging Markets Debt Fund | 148,672 | | $ 1,617,547 |
Fidelity Series Floating Rate High Income Fund | 339,243 | | 3,606,153 |
Fidelity Series High Income Fund | 1,529,701 | | 16,077,152 |
Fidelity Series Real Estate Income Fund | 102,973 | | 1,201,698 |
TOTAL HIGH YIELD BOND FUNDS | | 22,502,550 |
Inflation-Protected Bond Funds - 11.4% |
Fidelity Series Inflation-Protected Bond Index Fund | 3,280,426 | | 37,364,057 |
Investment Grade Bond Funds - 21.5% |
Fidelity Series Investment Grade Bond Fund | 6,120,274 | | 70,566,759 |
TOTAL BOND FUNDS (Cost $123,255,421) |
130,433,366
|
Short-Term Funds - 39.6% |
| | | |
Fidelity Advisor Short Fixed-Income Fund Institutional Class | 6,246,764 | | 58,469,712 |
Fidelity Institutional Money Market Portfolio Institutional Class | 71,120,992 | | 71,120,992 |
TOTAL SHORT-TERM FUNDS (Cost $128,762,530) |
129,590,704
|
TOTAL INVESTMENT PORTFOLIO - 100.0% (Cost $308,218,052) | | 327,559,329 |
NET OTHER ASSETS (LIABILITIES) - 0.0% | | (73,808) |
NET ASSETS - 100% | $ 327,485,521 |
Legend |
(a) Non-income producing |
Other Information |
All investments are categorized as Level 1 under the Fair Value Hierarchy. The inputs or methodology used for valuing securities may not be an indication of the risk associated with investing in those securities. For more information on valuation inputs, please refer to the Security Valuation section in the accompanying Notes to Financial Statements. |
See accompanying notes which are an integral part of the financial statements.
Annual Report
Fidelity Advisor Freedom Income Fund
Statement of Assets and Liabilities
| March 31, 2013 |
| | |
Assets | | |
Investment in securities, at value (cost $308,218,052) - See accompanying schedule | | $ 327,559,329 |
Receivable for investments sold | | 573,754 |
Receivable for fund shares sold | | 275,056 |
Receivable from affiliate for expense reductions | | 63 |
Total assets | | 328,408,202 |
| | |
Liabilities | | |
Payable for investments purchased | $ 2,944 | |
Payable for fund shares redeemed | 844,640 | |
Distribution and service plan fees payable | 75,097 | |
Total liabilities | | 922,681 |
| | |
Net Assets | | $ 327,485,521 |
Net Assets consist of: | | |
Paid in capital | | $ 304,968,503 |
Undistributed net investment income | | 251,012 |
Accumulated undistributed net realized gain (loss) on investments | | 2,924,729 |
Net unrealized appreciation (depreciation) on investments | | 19,341,277 |
Net Assets | | $ 327,485,521 |
| | |
Calculation of Maximum Offering Price Class A:
Net Asset Value and redemption price per share ($176,876,416 ÷ 15,782,090 shares) | | $ 11.21 |
| | |
Maximum offering price per share (100/94.25 of $11.21) | | $ 11.89 |
Class T:
Net Asset Value and redemption price per share ($53,734,149 ÷ 4,798,915 shares) | | $ 11.20 |
| | |
Maximum offering price per share (100/96.50 of $11.20) | | $ 11.61 |
Class B:
Net Asset Value and offering price per share ($2,293,628 ÷ 204,985 shares)A | | $ 11.19 |
| | |
Class C:
Net Asset Value and offering price per share ($16,605,743 ÷ 1,484,974 shares)A | | $ 11.18 |
| | |
| | |
Institutional Class:
Net Asset Value, offering price and redemption price per share ($77,975,585 ÷ 6,941,093 shares) | | $ 11.23 |
A Redemption price per share is equal to net asset value less any applicable contingent deferred sales charge.
Statement of Operations
| Year ended March 31, 2013 |
| | |
Investment Income | | |
Income distributions from underlying funds | | $ 4,201,239 |
| | |
Expenses | | |
Distribution and service plan fees | $ 895,238 | |
Independent trustees' compensation | 1,142 | |
Total expenses before reductions | 896,380 | |
Expense reductions | (1,142) | 895,238 |
Net investment income (loss) | | 3,306,001 |
Realized and Unrealized Gain (Loss) Realized gain (loss) on sale of underlying fund shares | 1,989,110 | |
Capital gain distributions from underlying funds | 4,974,360 | |
Total net realized gain (loss) | | 6,963,470 |
Change in net unrealized appreciation (depreciation) on underlying funds | | 3,721,536 |
Net gain (loss) | | 10,685,006 |
Net increase (decrease) in net assets resulting from operations | | $ 13,991,007 |
See accompanying notes which are an integral part of the financial statements.
Annual Report
Statement of Changes in Net Assets
| Year ended
March 31,
2013 | Year ended
March 31,
2012 |
Increase (Decrease) in Net Assets | | |
Operations | | |
Net investment income (loss) | $ 3,306,001 | $ 3,691,556 |
Net realized gain (loss) | 6,963,470 | 4,714,552 |
Change in net unrealized appreciation (depreciation) | 3,721,536 | 871,075 |
Net increase (decrease) in net assets resulting from operations | 13,991,007 | 9,277,183 |
Distributions to shareholders from net investment income | (3,274,495) | (3,668,106) |
Distributions to shareholders from net realized gain | (4,055,113) | (2,101,589) |
Total distributions | (7,329,608) | (5,769,695) |
Share transactions - net increase (decrease) | 17,611,622 | 31,446,678 |
Total increase (decrease) in net assets | 24,273,021 | 34,954,166 |
| | |
Net Assets | | |
Beginning of period | 303,212,500 | 268,258,334 |
End of period (including undistributed net investment income of $251,012 and undistributed net investment income of $219,506, respectively) | $ 327,485,521 | $ 303,212,500 |
Financial Highlights - Class A
Years ended March 31, | 2013 | 2012 | 2011 | 2010 | 2009 |
Selected Per-Share Data | | | | | |
Net asset value, beginning of period | $ 10.98 | $ 10.85 | $ 10.35 | $ 8.74 | $ 10.46 |
Income from Investment Operations | | | | | |
Net investment income (loss) C | .12 | .15 | .16 | .22 | .29 |
Net realized and unrealized gain (loss) | .37 | .21 | .57 | 1.66 | (1.60) |
Total from investment operations | .49 | .36 | .73 | 1.88 | (1.31) |
Distributions from net investment income | (.12) | (.15) | (.16) | (.22) | (.30) |
Distributions from net realized gain | (.14) | (.08) | (.07) | (.06) | (.11) |
Total distributions | (.26) | (.23) | (.23) | (.27) F | (.41) |
Net asset value, end of period | $ 11.21 | $ 10.98 | $ 10.85 | $ 10.35 | $ 8.74 |
Total Return A, B | 4.53% | 3.34% | 7.11% | 21.74% | (12.78)% |
Ratios to Average Net Assets D, E | | | | | |
Expenses before reductions | .25% | .25% | .25% | .25% | .25% |
Expenses net of fee waivers, if any | .25% | .25% | .25% | .25% | .25% |
Expenses net of all reductions | .25% | .25% | .25% | .25% | .25% |
Net investment income (loss) | 1.08% | 1.37% | 1.48% | 2.19% | 3.03% |
Supplemental Data | | | | | |
Net assets, end of period (000 omitted) | $ 176,876 | $ 166,658 | $ 157,695 | $ 142,691 | $ 93,865 |
Portfolio turnover rate | 17% | 24% | 35% | 31% | 44% |
A Total returns would have been lower if certain expenses had not been reduced during the applicable periods shown.
B Total returns do not include the effect of the sales charges.
C Calculated based on average shares outstanding during the period.
D Amounts do not include the activity of the Underlying Funds.
E Expense ratios reflect operating expenses of the class. Expenses before reductions do not reflect amounts reimbursed by the investment adviser or reductions from expense offset arrangements and do not represent the amount paid by the class during periods when reimbursements or reductions occur. Expenses net of fee waivers reflect expenses after reimbursement by the investment adviser but prior to reductions from expense offset arrangements. Expenses net of all reductions represent the net expenses paid by the class but do not include expenses of the investment companies in which the Fund invests.
F Total distributions of $.27 per share is comprised of distributions from net investment income of $.217 and distributions from net realized gain of $.056 per share.
See accompanying notes which are an integral part of the financial statements.
Annual Report
Financial Highlights - Class T
Years ended March 31, | 2013 | 2012 | 2011 | 2010 | 2009 |
Selected Per-Share Data | | | | | |
Net asset value, beginning of period | $ 10.96 | $ 10.84 | $ 10.34 | $ 8.73 | $ 10.45 |
Income from Investment Operations | | | | | |
Net investment income (loss) C | .09 | .12 | .13 | .19 | .27 |
Net realized and unrealized gain (loss) | .38 | .20 | .57 | 1.67 | (1.61) |
Total from investment operations | .47 | .32 | .70 | 1.86 | (1.34) |
Distributions from net investment income | (.09) | (.12) | (.13) | (.19) | (.27) |
Distributions from net realized gain | (.14) | (.08) | (.07) | (.06) | (.11) |
Total distributions | (.23) | (.20) | (.20) | (.25) F | (.38) |
Net asset value, end of period | $ 11.20 | $ 10.96 | $ 10.84 | $ 10.34 | $ 8.73 |
Total Return A, B | 4.35% | 3.01% | 6.85% | 21.47% | (13.03)% |
Ratios to Average Net Assets D, E | | | | | |
Expenses before reductions | .50% | .50% | .50% | .50% | .50% |
Expenses net of fee waivers, if any | .50% | .50% | .50% | .50% | .50% |
Expenses net of all reductions | .50% | .50% | .50% | .50% | .50% |
Net investment income (loss) | .83% | 1.12% | 1.23% | 1.94% | 2.78% |
Supplemental Data | | | | | |
Net assets, end of period (000 omitted) | $ 53,734 | $ 56,246 | $ 57,404 | $ 52,047 | $ 42,675 |
Portfolio turnover rate | 17% | 24% | 35% | 31% | 44% |
A Total returns would have been lower if certain expenses had not been reduced during the applicable periods shown.
B Total returns do not include the effect of the sales charges.
C Calculated based on average shares outstanding during the period.
D Amounts do not include the activity of the Underlying Funds.
E Expense ratios reflect operating expenses of the class. Expenses before reductions do not reflect amounts reimbursed by the investment adviser or reductions from expense offset arrangements and do not represent the amount paid by the class during periods when reimbursements or reductions occur. Expenses net of fee waivers reflect expenses after reimbursement by the investment adviser but prior to reductions from expense offset arrangements. Expenses net of all reductions represent the net expenses paid by the class but do not include expenses of the investment companies in which the Fund invests.
F Total distributions of $.25 per share is comprised of distributions from net investment income of $.193 and distributions from net realized gain of $.056 per share.
Financial Highlights - Class B
Years ended March 31, | 2013 | 2012 | 2011 | 2010 | 2009 |
Selected Per-Share Data | | | | | |
Net asset value, beginning of period | $ 10.96 | $ 10.84 | $ 10.33 | $ 8.72 | $ 10.44 |
Income from Investment Operations | | | | | |
Net investment income (loss) C | .04 | .07 | .08 | .14 | .22 |
Net realized and unrealized gain (loss) | .37 | .19 | .58 | 1.67 | (1.60) |
Total from investment operations | .41 | .26 | .66 | 1.81 | (1.38) |
Distributions from net investment income | (.04) | (.07) | (.08) | (.14) | (.23) |
Distributions from net realized gain | (.14) | (.08) | (.07) | (.06) | (.11) |
Total distributions | (.18) | (.14) G | (.15) | (.20) F | (.34) |
Net asset value, end of period | $ 11.19 | $ 10.96 | $ 10.84 | $ 10.33 | $ 8.72 |
Total Return A, B | 3.80% | 2.47% | 6.39% | 20.86% | (13.48)% |
Ratios to Average Net Assets D, E | | | | | |
Expenses before reductions | 1.00% | 1.00% | 1.00% | 1.00% | 1.00% |
Expenses net of fee waivers, if any | 1.00% | 1.00% | 1.00% | 1.00% | 1.00% |
Expenses net of all reductions | 1.00% | 1.00% | 1.00% | 1.00% | 1.00% |
Net investment income (loss) | .33% | .62% | .73% | 1.44% | 2.28% |
Supplemental Data | | | | | |
Net assets, end of period (000 omitted) | $ 2,294 | $ 2,889 | $ 3,938 | $ 5,319 | $ 4,282 |
Portfolio turnover rate | 17% | 24% | 35% | 31% | 44% |
A Total returns would have been lower if certain expenses had not been reduced during the applicable periods shown.
B Total returns do not include the effect of the contingent deferred sales charge.
C Calculated based on average shares outstanding during the period.
D Amounts do not include the activity of the Underlying Funds.
E Expense ratios reflect operating expenses of the class. Expenses before reductions do not reflect amounts reimbursed by the investment adviser or reductions from expense offset arrangements and do not represent the amount paid by the class during periods when reimbursements or reductions occur. Expenses net of fee waivers reflect expenses after reimbursement by the investment adviser but prior to reductions from expense offset arrangements. Expenses net of all reductions represent the net expenses paid by the class but do not include expenses of the investment companies in which the Fund invests.
F Total distributions of $.20 per share is comprised of distributions from net investment income of $.142 and distributions from net realized gain of $.056 per share.
G Total distributions of $.14 per share is comprised of distributions from net investment income of $.065 and distributions from net realized gain of $.079 per share.
See accompanying notes which are an integral part of the financial statements.
Annual Report
Financial Highlights - Class C
Years ended March 31, | 2013 | 2012 | 2011 | 2010 | 2009 |
Selected Per-Share Data | | | | | |
Net asset value, beginning of period | $ 10.96 | $ 10.84 | $ 10.33 | $ 8.72 | $ 10.43 |
Income from Investment Operations | | | | | |
Net investment income (loss) C | .04 | .07 | .08 | .14 | .22 |
Net realized and unrealized gain (loss) | .36 | .20 | .58 | 1.67 | (1.60) |
Total from investment operations | .40 | .27 | .66 | 1.81 | (1.38) |
Distributions from net investment income | (.04) | (.07) | (.08) | (.14) | (.22) |
Distributions from net realized gain | (.14) | (.08) | (.07) | (.06) | (.11) |
Total distributions | (.18) | (.15) | (.15) | (.20) F | (.33) |
Net asset value, end of period | $ 11.18 | $ 10.96 | $ 10.84 | $ 10.33 | $ 8.72 |
Total Return A, B | 3.70% | 2.50% | 6.42% | 20.83% | (13.41)% |
Ratios to Average Net Assets D, E | | | | | |
Expenses before reductions | 1.00% | 1.00% | 1.00% | 1.00% | 1.00% |
Expenses net of fee waivers, if any | 1.00% | 1.00% | 1.00% | 1.00% | 1.00% |
Expenses net of all reductions | 1.00% | 1.00% | 1.00% | 1.00% | 1.00% |
Net investment income (loss) | .33% | .62% | .73% | 1.44% | 2.28% |
Supplemental Data | | | | | |
Net assets, end of period (000 omitted) | $ 16,606 | $ 17,170 | $ 16,581 | $ 14,697 | $ 11,362 |
Portfolio turnover rate | 17% | 24% | 35% | 31% | 44% |
A Total returns would have been lower if certain expenses had not been reduced during the applicable periods shown.
B Total returns do not include the effect of the contingent deferred sales charge.
C Calculated based on average shares outstanding during the period.
D Amounts do not include the activity of the Underlying Funds.
E Expense ratios reflect operating expenses of the class. Expenses before reductions do not reflect amounts reimbursed by the investment adviser or reductions from expense offset arrangements and do not represent the amount paid by the class during periods when reimbursements or reductions occur. Expenses net of fee waivers reflect expenses after reimbursement by the investment adviser but prior to reductions from expense offset arrangements. Expenses net of all reductions represent the net expenses paid by the class but do not include expenses of the investment companies in which the Fund invests.
F Total distributions of $.20 per share is comprised of distributions from net investment income of $.140 and distributions from net realized gain of $.056 per share.
Financial Highlights - Institutional Class
Years ended March 31, | 2013 | 2012 | 2011 | 2010 | 2009 |
Selected Per-Share Data | | | | | |
Net asset value, beginning of period | $ 11.00 | $ 10.87 | $ 10.37 | $ 8.75 | $ 10.48 |
Income from Investment Operations | | | | | |
Net investment income (loss) B | .15 | .18 | .18 | .24 | .31 |
Net realized and unrealized gain (loss) | .37 | .20 | .57 | 1.68 | (1.61) |
Total from investment operations | .52 | .38 | .75 | 1.92 | (1.30) |
Distributions from net investment income | (.14) | (.17) | (.19) | (.24) | (.32) |
Distributions from net realized gain | (.14) | (.08) | (.07) | (.06) | (.11) |
Total distributions | (.29) H | (.25) | (.25) G | (.30) F | (.43) |
Net asset value, end of period | $ 11.23 | $ 11.00 | $ 10.87 | $ 10.37 | $ 8.75 |
Total Return A | 4.75% | 3.58% | 7.36% | 22.16% | (12.63)% |
Ratios to Average Net Assets C, E | | | | | |
Expenses before reductions D | .00% | .00% | .00% | .00% | .00% |
Expenses net of fee waivers, if any | .00% | .00% | .00% | .00% | .00% |
Expense net of all reductions | .00% | .00% | .00% | .00% | .00% |
Net investment income (loss) | 1.33% | 1.62% | 1.73% | 2.44% | 3.28% |
Supplemental Data | | | | | |
Net assets, end of period (000 omitted) | $ 77,976 | $ 60,248 | $ 32,640 | $ 18,137 | $ 8,461 |
Portfolio turnover rate | 17% | 24% | 35% | 31% | 44% |
A Total returns would have been lower if certain expenses had not been reduced during the applicable periods shown.
B Calculated based on average shares outstanding during the period.
C Amounts do not include the activity of the Underlying Funds.
D Amount represents less than .01%.
E Expense ratios reflect operating expenses of the class. Expenses before reductions do not reflect amounts reimbursed by the investment adviser or reductions from expense offset arrangements and do not represent the amount paid by the class during periods when reimbursements or reductions occur. Expenses net of fee waivers reflect expenses after reimbursement by the investment adviser but prior to reductions from expense offset arrangements. Expenses net of all reductions represent the net expenses paid by the class but do not include expenses of the investment companies in which the Fund invests.
F Total distributions of $.30 per share is comprised of distributions from net investment income of $.243 and distributions from net realized gain of $.056 per share.
G Total distributions of $.25 per share is comprised of distributions from net investment income of $.186 and distributions from net realized gain of $.067 per share.
H Total distributions of $.29 per share is comprised of distributions from net investment income of $.144 and distributions from net realized gain of $.141 per share.
See accompanying notes which are an integral part of the financial statements.
Annual Report
Fidelity Advisor Freedom 2005 Fund
Investment Changes (Unaudited)
The information in the following tables is based on the direct investments of the Fund. |
Fund Holdings as of March 31, 2013 |
| % of fund's
net assets | % of fund's net assets
6 months ago |
Commodity Funds | | |
Fidelity Series Commodity Strategy Fund | 3.7 | 4.1 |
Domestic Equity Funds | | |
Fidelity Advisor Equity Growth Fund Institutional Class | 3.0 | 2.7 |
Fidelity Advisor Growth & Income Fund Institutional Class | 1.6 | 3.2 |
Fidelity Advisor Large Cap Fund Institutional Class | 1.6 | 3.0 |
Fidelity Advisor Series Equity-Income Fund | 2.1 | 0.0 |
Fidelity Advisor Series Mega Cap Fund | 0.5 | 0.0 |
Fidelity Advisor Series Opportunistic Insights Fund | 1.5 | 0.0 |
Fidelity Advisor Series Stock Selector Large Cap Value Fund | 2.2 | 0.0 |
Fidelity Advisor Small Cap Fund Institutional Class | 1.2 | 1.1 |
Fidelity Series 100 Index Fund | 0.5 | 2.2 |
Fidelity Series All-Sector Equity Fund | 4.0 | 4.7 |
Fidelity Series Large Cap Value Fund | 2.3 | 4.4 |
Fidelity Series Real Estate Equity Fund | 0.4 | 0.3 |
Fidelity Series Small Cap Opportunities Fund | 1.4 | 1.2 |
| 22.3 | 22.8 |
Developed International Equity Funds | | |
Fidelity Series International Growth Fund | 3.4 | 3.4 |
Fidelity Series International Small Cap Fund | 0.7 | 0.7 |
Fidelity Series International Value Fund | 3.3 | 3.4 |
| 7.4 | 7.5 |
Emerging Markets Equity Funds | | |
Fidelity Series Emerging Markets Fund | 2.0 | 2.2 |
High Yield Bond Funds | | |
Fidelity Series Emerging Markets Debt Fund | 0.6 | 0.6 |
Fidelity Series Floating Rate High Income Fund | 1.1 | 1.0 |
Fidelity Series High Income Fund | 4.8 | 4.7 |
Fidelity Series Real Estate Income Fund | 0.5 | 0.5 |
| 7.0 | 6.8 |
Inflation-Protected Bond Funds | | |
Fidelity Series Inflation-Protected Bond Index Fund | 9.1 | 9.6 |
Investment Grade Bond Funds | | |
Fidelity Series Investment Grade Bond Fund | 18.1 | 18.4 |
Short-Term Funds | | |
Fidelity Advisor Short Fixed-Income Fund Institutional Class | 13.7 | 12.8 |
Fidelity Institutional Money Market Portfolio Institutional Class | 16.7 | 15.8 |
| 30.4 | 28.6 |
Net Other Assets (Liabilities)* | 0.0 | 0.0 |
| 100.0 | 100.0 |
* Amount represents less than 0.1%
Asset Allocation (% of fund's net assets) |
Period end |
| Commodity Funds | 3.7% | |
| Domestic Equity Funds | 22.3% | |
| Developed International Equity Funds | 7.4% | |
| Emerging Markets
Equity Funds | 2.0% | |
| High Yield Bond Funds | 7.0% | |
| Inflation-Protected
Bond Funds | 9.1% | |
| Investment Grade
Bond Funds | 18.1% | |
| Short-Term Funds | 30.4% | |

Six months ago |
| Commodity Funds | 4.1% | |
| Domestic Equity Funds | 22.8% | |
| Developed International Equity Funds | 7.5% | |
| Emerging Markets
Equity Funds | 2.2% | |
| High Yield Bond Funds | 6.8% | |
| Inflation-Protected
Bond Funds | 9.6% | |
| Investment Grade
Bond Funds | 18.4% | |
| Short-Term Funds | 28.6% | |

Expected |
| Commodity Funds | 3.6% | |
| Domestic Equity Funds | 20.4% | |
| Developed International Equity Funds | 6.8% | |
| Emerging Markets
Equity Funds | 2.0% | |
| High Yield Bond Funds | 5.0% | |
| Inflation-Protected
Bond Funds | 9.7% | |
| Investment Grade
Bond Funds | 19.6% | |
| Short-Term Funds | 32.9% | |

The fund invests according to an asset allocation strategy that becomes increasingly conservative over time. The six months ago allocation is based on the fund's holdings as of September 30, 2012. The current allocation is based on the fund's holdings as of March 31, 2013. The expected allocation represents the fund's anticipated allocation at September 30, 2013. |
Annual Report
Fidelity Advisor Freedom 2005 Fund
Investments March 31, 2013
Showing Percentage of Net Assets
Domestic Equity Funds - 26.0% |
| Shares | | Value |
Commodity Funds - 3.7% |
Fidelity Series Commodity Strategy Fund (a) | 1,335,591 | | $ 11,606,286 |
Domestic Equity Funds - 22.3% |
Fidelity Advisor Equity Growth Fund Institutional Class | 130,696 | | 9,259,781 |
Fidelity Advisor Growth & Income Fund Institutional Class | 223,309 | | 4,932,891 |
Fidelity Advisor Large Cap Fund Institutional Class | 207,794 | | 4,939,271 |
Fidelity Advisor Series Equity-Income Fund | 600,019 | | 6,678,206 |
Fidelity Advisor Series Mega Cap Fund | 134,505 | | 1,486,283 |
Fidelity Advisor Series Opportunistic Insights Fund | 428,590 | | 4,718,776 |
Fidelity Advisor Series Stock Selector Large Cap Value Fund | 600,345 | | 6,717,864 |
Fidelity Advisor Small Cap Fund Institutional Class | 140,676 | | 3,791,219 |
Fidelity Series 100 Index Fund | 149,638 | | 1,544,268 |
Fidelity Series All-Sector Equity Fund | 960,764 | | 12,345,820 |
Fidelity Series Large Cap Value Fund | 617,627 | | 7,189,173 |
Fidelity Series Real Estate Equity Fund | 85,123 | | 1,108,307 |
Fidelity Series Small Cap Opportunities Fund | 357,958 | | 4,413,628 |
TOTAL DOMESTIC EQUITY FUNDS | | 69,125,487 |
TOTAL DOMESTIC EQUITY FUNDS (Cost $70,661,104) |
80,731,773
|
International Equity Funds - 9.4% |
| | | |
Developed International Equity Funds - 7.4% |
Fidelity Series International Growth Fund | 821,874 | | 10,396,703 |
Fidelity Series International Small Cap Fund | 156,326 | | 2,144,791 |
Fidelity Series International Value Fund | 1,047,420 | | 10,285,665 |
TOTAL DEVELOPED INTERNATIONAL EQUITY FUNDS | | 22,827,159 |
Emerging Markets Equity Funds - 2.0% |
Fidelity Series Emerging Markets Fund | 379,714 | | 6,352,622 |
TOTAL INTERNATIONAL EQUITY FUNDS (Cost $25,487,710) |
29,179,781
|
Bond Funds - 34.2% |
| Shares | | Value |
High Yield Bond Funds - 7.0% |
Fidelity Series Emerging Markets Debt Fund | 176,713 | | $ 1,922,638 |
Fidelity Series Floating Rate High Income Fund | 318,726 | | 3,388,054 |
Fidelity Series High Income Fund | 1,424,029 | | 14,966,543 |
Fidelity Series Real Estate Income Fund | 125,008 | | 1,458,849 |
TOTAL HIGH YIELD BOND FUNDS | | 21,736,084 |
Inflation-Protected Bond Funds - 9.1% |
Fidelity Series Inflation-Protected Bond Index Fund | 2,480,557 | | 28,253,550 |
Investment Grade Bond Funds - 18.1% |
Fidelity Series Investment Grade Bond Fund | 4,855,310 | | 55,981,719 |
TOTAL BOND FUNDS (Cost $100,813,222) |
105,971,353
|
Short-Term Funds - 30.4% |
| | | |
Fidelity Advisor Short Fixed-Income Fund Institutional Class | 4,542,785 | | 42,520,470 |
Fidelity Institutional Money Market Portfolio Institutional Class | 51,920,042 | | 51,920,042 |
TOTAL SHORT-TERM FUNDS (Cost $93,866,282) |
94,440,512
|
TOTAL INVESTMENT PORTFOLIO - 100.0% (Cost $290,828,318) | | 310,323,419 |
NET OTHER ASSETS (LIABILITIES) - 0.0% | | (60,283) |
NET ASSETS - 100% | $ 310,263,136 |
Legend |
(a) Non-income producing |
Other Information |
All investments are categorized as Level 1 under the Fair Value Hierarchy. The inputs or methodology used for valuing securities may not be an indication of the risk associated with investing in those securities. For more information on valuation inputs, please refer to the Security Valuation section in the accompanying Notes to Financial Statements. |
See accompanying notes which are an integral part of the financial statements.
Annual Report
Fidelity Advisor Freedom 2005 Fund
Statement of Assets and Liabilities
| March 31, 2013 |
| | |
Assets | | |
Investment in securities, at value (cost $290,828,318) - See accompanying schedule | | $ 310,323,419 |
Cash | | 9 |
Receivable for fund shares sold | | 591,594 |
Receivable from affiliate for expense reductions | | 124 |
Total assets | | 310,915,146 |
| | |
Liabilities | | |
Payable for investments purchased | $ 277,658 | |
Payable for fund shares redeemed | 313,597 | |
Distribution and service plan fees payable | 60,755 | |
Total liabilities | | 652,010 |
| | |
Net Assets | | $ 310,263,136 |
Net Assets consist of: | | |
Paid in capital | | $ 289,554,695 |
Undistributed net investment income | | 456,715 |
Accumulated undistributed net realized gain (loss) on investments | | 756,625 |
Net unrealized appreciation (depreciation) on investments | | 19,495,101 |
Net Assets | | $ 310,263,136 |
| | |
Calculation of Maximum Offering Price Class A:
Net Asset Value and redemption price per share ($204,417,698 ÷ 17,180,177 shares) | | $ 11.90 |
| | |
Maximum offering price per share (100/94.25 of $11.90) | | $ 12.63 |
Class T:
Net Asset Value and redemption price per share ($26,200,783 ÷ 2,202,327 shares) | | $ 11.90 |
| | |
Maximum offering price per share (100/96.50 of $11.90) | | $ 12.33 |
Class B:
Net Asset Value and offering price per share ($1,162,317 ÷ 97,454 shares)A | | $ 11.93 |
| | |
Class C:
Net Asset Value and offering price per share ($8,118,357 ÷ 683,764 shares)A | | $ 11.87 |
| | |
Institutional Class:
Net Asset Value, offering price and redemption price per share ($70,363,981 ÷ 5,878,961 shares) | | $ 11.97 |
A Redemption price per share is equal to net asset value less any applicable contingent deferred sales charge.
Statement of Operations
| Year ended March 31, 2013 |
| | |
Investment Income | | |
Income distributions from underlying funds | | $ 4,014,646 |
| | |
Expenses | | |
Distribution and service plan fees | $ 691,587 | |
Independent trustees' compensation | 1,027 | |
Total expenses before reductions | 692,614 | |
Expense reductions | (1,027) | 691,587 |
Net investment income | | 3,323,059 |
Realized and Unrealized Gain (Loss) Realized gain (loss) on sale of underlying fund shares | 7,776,161 | |
Capital gain distributions from underlying funds | 4,943,576 | |
Total net realized gain (loss) | | 12,719,737 |
Change in net unrealized appreciation (depreciation) on underlying funds | | 462,584 |
Net gain (loss) | | 13,182,321 |
Net increase (decrease) in net assets resulting from operations | | $ 16,505,380 |
See accompanying notes which are an integral part of the financial statements.
Annual Report
Statement of Changes in Net Assets
| Year ended
March 31,
2013 | Year ended
March 31,
2012 |
Increase (Decrease) in Net Assets | | |
Operations | | |
Net investment income | $ 3,323,059 | $ 3,460,669 |
Net realized gain (loss) | 12,719,737 | 5,192,572 |
Change in net unrealized appreciation (depreciation) | 462,584 | (1,891,328) |
Net increase (decrease) in net assets resulting from operations | 16,505,380 | 6,761,913 |
Distributions to shareholders from net investment income | (3,357,002) | (3,346,222) |
Distributions to shareholders from net realized gain | (1,779,655) | (2,914,928) |
Total distributions | (5,136,657) | (6,261,150) |
Share transactions - net increase (decrease) | 26,042,535 | 27,220,944 |
Total increase (decrease) in net assets | 37,411,258 | 27,721,707 |
| | |
Net Assets | | |
Beginning of period | 272,851,878 | 245,130,171 |
End of period (including undistributed net investment income of $456,715 and undistributed net investment income of $490,658, respectively) | $ 310,263,136 | $ 272,851,878 |
Financial Highlights - Class A
Years ended March 31, | 2013 | 2012 | 2011 | 2010 | 2009 |
Selected Per-Share Data | | | | | |
Net asset value, beginning of period | $ 11.45 | $ 11.45 | $ 10.57 | $ 8.10 | $ 11.40 |
Income from Investment Operations | | | | | |
Net investment income (loss) C | .13 | .15 | .15 | .20 | .27 |
Net realized and unrealized gain (loss) | .53 | .13 | .97 | 2.53 | (3.06) |
Total from investment operations | .66 | .28 | 1.12 | 2.73 | (2.79) |
Distributions from net investment income | (.13) | (.15) | (.15) | (.19) | (.28) |
Distributions from net realized gain | (.07) | (.13) | (.09) | (.07) | (.23) |
Total distributions | (.21) F | (.28) | (.24) | (.26) | (.51) |
Net asset value, end of period | $ 11.90 | $ 11.45 | $ 11.45 | $ 10.57 | $ 8.10 |
Total Return A,B | 5.79% | 2.53% | 10.72% | 33.91% | (25.09)% |
Ratios to Average Net Assets D,E | | | | | |
Expenses before reductions | .25% | .25% | .25% | .25% | .25% |
Expenses net of fee waivers, if any | .25% | .25% | .25% | .25% | .25% |
Expenses net of all reductions | .25% | .25% | .25% | .25% | .25% |
Net investment income (loss) | 1.16% | 1.37% | 1.37% | 2.01% | 2.75% |
Supplemental Data | | | | | |
Net assets, end of period (000 omitted) | $ 204,418 | $ 193,977 | $ 177,385 | $ 155,482 | $ 88,593 |
Portfolio turnover rate | 23% | 28% | 41% | 35% | 54% |
A Total returns would have been lower if certain expenses had not been reduced during the applicable periods shown.
B Total returns do not include the effect of the sales charges.
C Calculated based on average shares outstanding during the period.
D Amounts do not include the activity of the Underlying Funds.
E Expense ratios reflect operating expenses of the class. Expenses before reductions do not reflect amounts reimbursed by the investment adviser or reductions from expense offset arrangements and do not represent the amount paid by the class during periods when reimbursements or reductions occur. Expenses net of fee waivers reflect expenses after reimbursement by the investment adviser but prior to reductions from expense offset arrangements. Expenses net of all reductions represent the net expenses paid by the class but do not include expenses of the investment companies in which the Fund invests.
F Total distributions of $.21 per share is comprised of distributions from net investment income of $.134 and distributions from net realized gain of $.071 per share.
See accompanying notes which are an integral part of the financial statements.
Annual Report
Financial Highlights - Class T
Years ended March 31, | 2013 | 2012 | 2011 | 2010 | 2009 |
Selected Per-Share Data | | | | | |
Net asset value, beginning of period | $ 11.45 | $ 11.45 | $ 10.57 | $ 8.10 | $ 11.39 |
Income from Investment Operations | | | | | |
Net investment income (loss) C | .11 | .13 | .12 | .17 | .25 |
Net realized and unrealized gain (loss) | .52 | .12 | .97 | 2.54 | (3.06) |
Total from investment operations | .63 | .25 | 1.09 | 2.71 | (2.81) |
Distributions from net investment income | (.11) | (.12) | (.12) | (.17) | (.25) |
Distributions from net realized gain | (.07) | (.13) | (.09) | (.07) | (.23) |
Total distributions | (.18) | (.25) | (.21) | (.24) | (.48) |
Net asset value, end of period | $ 11.90 | $ 11.45 | $ 11.45 | $ 10.57 | $ 8.10 |
Total Return A,B | 5.56% | 2.25% | 10.42% | 33.61% | (25.27)% |
Ratios to Average Net Assets D,E | | | | | |
Expenses before reductions | .50% | .50% | .50% | .50% | .50% |
Expenses net of fee waivers, if any | .50% | .50% | .50% | .50% | .50% |
Expenses net of all reductions | .50% | .50% | .50% | .50% | .50% |
Net investment income (loss) | .91% | 1.12% | 1.12% | 1.76% | 2.50% |
Supplemental Data | | | | | |
Net assets, end of period (000 omitted) | $ 26,201 | $ 22,316 | $ 21,658 | $ 23,113 | $ 14,437 |
Portfolio turnover rate | 23% | 28% | 41% | 35% | 54% |
A Total returns would have been lower if certain expenses had not been reduced during the applicable periods shown.
B Total returns do not include the effect of the sales charges.
C Calculated based on average shares outstanding during the period.
D Amounts do not include the activity of the Underlying Funds.
E Expense ratios reflect operating expenses of the class. Expenses before reductions do not reflect amounts reimbursed by the investment adviser or reductions from expense offset arrangements and do not represent the amount paid by the class during periods when reimbursements or reductions occur. Expenses net of fee waivers reflect expenses after reimbursement by the investment adviser but prior to reductions from expense offset arrangements. Expenses net of all reductions represent the net expenses paid by the class but do not include expenses of the investment companies in which the Fund invests.
Financial Highlights - Class B
Years ended March 31, | 2013 | 2012 | 2011 | 2010 | 2009 |
Selected Per-Share Data | | | | | |
Net asset value, beginning of period | $ 11.47 | $ 11.45 | $ 10.56 | $ 8.09 | $ 11.37 |
Income from Investment Operations | | | | | |
Net investment income (loss) C | .05 | .07 | .07 | .12 | .20 |
Net realized and unrealized gain (loss) | .52 | .12 | .97 | 2.53 | (3.06) |
Total from investment operations | .57 | .19 | 1.04 | 2.65 | (2.86) |
Distributions from net investment income | (.04) | (.05) | (.07) | (.11) | (.19) |
Distributions from net realized gain | (.07) | (.12) | (.09) | (.07) | (.23) |
Total distributions | (.11) | (.17) | (.15) F | (.18) | (.42) |
Net asset value, end of period | $ 11.93 | $ 11.47 | $ 11.45 | $ 10.56 | $ 8.09 |
Total Return A,B | 5.00% | 1.73% | 9.94% | 32.90% | (25.69)% |
Ratios to Average Net Assets D,E | | | | | |
Expenses before reductions | 1.00% | 1.00% | 1.00% | 1.00% | 1.00% |
Expenses net of fee waivers, if any | 1.00% | 1.00% | 1.00% | 1.00% | 1.00% |
Expenses net of all reductions | 1.00% | 1.00% | 1.00% | 1.00% | 1.00% |
Net investment income (loss) | .41% | .62% | .62% | 1.26% | 2.00% |
Supplemental Data | | | | | |
Net assets, end of period (000 omitted) | $ 1,162 | $ 1,571 | $ 2,338 | $ 2,986 | $ 2,692 |
Portfolio turnover rate | 23% | 28% | 41% | 35% | 54% |
A Total returns would have been lower if certain expenses had not been reduced during the applicable periods shown.
B Total returns do not include the effect of the contingent deferred sales charge.
C Calculated based on average shares outstanding during the period.
D Amounts do not include the activity of the Underlying Funds.
E Expense ratios reflect operating expenses of the class. Expenses before reductions do not reflect amounts reimbursed by the investment adviser or reductions from expense offset arrangements and do not represent the amount paid by the class during periods when reimbursements or reductions occur. Expenses net of fee waivers reflect expenses after reimbursement by the investment adviser but prior to reductions from expense offset arrangements. Expenses net of all reductions represent the net expenses paid by the class but do not include expenses of the investment companies in which the Fund invests.
F Total distributions of $.15 per share is comprised of distributions from net investment income of $.065 and distributions from net realized gain of $.087 per share.
See accompanying notes which are an integral part of the financial statements.
Annual Report
Financial Highlights - Class C
Years ended March 31, | 2013 | 2012 | 2011 | 2010 | 2009 |
Selected Per-Share Data | | | | | |
Net asset value, beginning of period | $ 11.42 | $ 11.42 | $ 10.54 | $ 8.08 | $ 11.34 |
Income from Investment Operations | | | | | |
Net investment income (loss) C | .05 | .07 | .07 | .12 | .20 |
Net realized and unrealized gain (loss) | .52 | .11 | .97 | 2.53 | (3.04) |
Total from investment operations | .57 | .18 | 1.04 | 2.65 | (2.84) |
Distributions from net investment income | (.05) | (.07) | (.07) | (.12) | (.19) |
Distributions from net realized gain | (.07) | (.12) | (.09) | (.07) | (.23) |
Total distributions | (.12) | (.18) F | (.16) | (.19) | (.42) |
Net asset value, end of period | $ 11.87 | $ 11.42 | $ 11.42 | $ 10.54 | $ 8.08 |
Total Return A,B | 5.01% | 1.66% | 9.91% | 32.90% | (25.61)% |
Ratios to Average Net Assets D,E | | | | | |
Expenses before reductions | 1.00% | 1.00% | 1.00% | 1.00% | 1.00% |
Expenses net of fee waivers, if any | 1.00% | 1.00% | 1.00% | 1.00% | 1.00% |
Expenses net of all reductions | 1.00% | 1.00% | 1.00% | 1.00% | 1.00% |
Net investment income (loss) | .41% | .62% | .62% | 1.26% | 2.00% |
Supplemental Data | | | | | |
Net assets, end of period (000 omitted) | $ 8,118 | $ 8,053 | $ 8,679 | $ 9,377 | $ 6,761 |
Portfolio turnover rate | 23% | 28% | 41% | 35% | 54% |
A Total returns would have been lower if certain expenses had not been reduced during the applicable periods shown.
B Total returns do not include the effect of the contingent deferred sales charge.
C Calculated based on average shares outstanding during the period.
D Amounts do not include the activity of the Underlying Funds.
E Expense ratios reflect operating expenses of the class. Expenses before reductions do not reflect amounts reimbursed by the investment adviser or reductions from expense offset arrangements and do not represent the amount paid by the class during periods when reimbursements or reductions occur. Expenses net of fee waivers reflect expenses after reimbursement by the investment adviser but prior to reductions from expense offset arrangements. Expenses net of all reductions represent the net expenses paid by the class but do not include expenses of the investment companies in which the Fund invests.
F Total distributions of $.18 per share is comprised of distributions from net investment income of $.065 and distributions from net realized gain of $.115 per share.
Financial Highlights - Institutional Class
Years ended March 31, | 2013 | 2012 | 2011 | 2010 | 2009 |
Selected Per-Share Data | | | | | |
Net asset value, beginning of period | $ 11.51 | $ 11.52 | $ 10.63 | $ 8.14 | $ 11.46 |
Income from Investment Operations | | | | | |
Net investment income (loss) B | .16 | .18 | .18 | .22 | .29 |
Net realized and unrealized gain (loss) | .53 | .11 | .98 | 2.55 | (3.07) |
Total from investment operations | .69 | .29 | 1.16 | 2.77 | (2.78) |
Distributions from net investment income | (.16) | (.18) | (.18) | (.21) | (.31) |
Distributions from net realized gain | (.07) | (.13) | (.09) | (.07) | (.23) |
Total distributions | (.23) | (.30) F | (.27) | (.28) | (.54) |
Net asset value, end of period | $ 11.97 | $ 11.51 | $ 11.52 | $ 10.63 | $ 8.14 |
Total Return A | 6.11% | 2.67% | 11.02% | 34.28% | (24.93)% |
Ratios to Average Net Assets C,E | | | | | |
Expenses before reductions D | .00% | .00% | .00% | .00% | .00% |
Expenses net of fee waivers, if any | .00% | .00% | .00% | .00% | .00% |
Expenses net of all reductions | .00% | .00% | .00% | .00% | .00% |
Net investment income (loss) | 1.41% | 1.62% | 1.62% | 2.26% | 3.00% |
Supplemental Data | | | | | |
Net assets, end of period (000 omitted) | $ 70,364 | $ 46,935 | $ 35,069 | $ 18,775 | $ 9,313 |
Portfolio turnover rate | 23% | 28% | 41% | 35% | 54% |
A Total returns would have been lower if certain expenses had not been reduced during the applicable periods shown.
B Calculated based on average shares outstanding during the period.
C Amounts do not include the activity of the Underlying Funds.
D Amount represents less than .01%.
E Expense ratios reflect operating expenses of the class. Expenses before reductions do not reflect amounts reimbursed by the investment adviser or reductions from expense offset arrangements and do not represent the amount paid by the class during periods when reimbursements or reductions occur. Expenses net of fee waivers reflect expenses after reimbursement by the investment adviser but prior to reductions from expense offset arrangements. Expenses net of all reductions represent the net expenses paid by the class but do not include expenses of the investment companies in which the Fund invests.
F Total distributions of $.30 per share is comprised of distributions from net investment income of $.175 and distributions from net realized gain of $.128 per share.
See accompanying notes which are an integral part of the financial statements.
Annual Report
Fidelity Advisor Freedom 2010 Fund
Investment Changes (Unaudited)
The information in the following tables is based on the direct investments of the Fund. |
Fund Holdings as of March 31, 2013 |
| % of fund's
net assets | % of fund's net assets
6 months ago |
Commodity Funds | | |
Fidelity Series Commodity Strategy Fund | 5.1 | 5.4 |
Domestic Equity Funds | | |
Fidelity Advisor Equity Growth Fund Institutional Class | 4.1 | 3.6 |
Fidelity Advisor Growth & Income Fund Institutional Class | 2.2 | 4.4 |
Fidelity Advisor Large Cap Fund Institutional Class | 2.2 | 4.1 |
Fidelity Advisor Series Equity-Income Fund | 3.0 | 0.0 |
Fidelity Advisor Series Mega Cap Fund | 0.7 | 0.0 |
Fidelity Advisor Series Opportunistic Insights Fund | 2.1 | 0.0 |
Fidelity Advisor Series Stock Selector Large Cap Value Fund | 3.1 | 0.0 |
Fidelity Advisor Small Cap Fund Institutional Class | 1.7 | 1.5 |
Fidelity Series 100 Index Fund | 0.7 | 2.9 |
Fidelity Series All-Sector Equity Fund | 5.4 | 6.3 |
Fidelity Series Large Cap Value Fund | 3.1 | 6.0 |
Fidelity Series Real Estate Equity Fund | 0.5 | 0.4 |
Fidelity Series Small Cap Opportunities Fund | 1.9 | 1.5 |
| 30.7 | 30.7 |
Developed International Equity Funds | | |
Fidelity Series International Growth Fund | 4.6 | 4.6 |
Fidelity Series International Small Cap Fund | 0.9 | 0.9 |
Fidelity Series International Value Fund | 4.6 | 4.6 |
| 10.1 | 10.1 |
Emerging Markets Equity Funds | | |
Fidelity Series Emerging Markets Fund | 2.8 | 2.9 |
High Yield Bond Funds | | |
Fidelity Series Emerging Markets Debt Fund | 0.6 | 0.6 |
Fidelity Series Floating Rate High Income Fund | 1.2 | 1.2 |
Fidelity Series High Income Fund | 4.8 | 4.7 |
Fidelity Series Real Estate Income Fund | 0.5 | 0.6 |
| 7.1 | 7.1 |
Inflation-Protected Bond Funds | | |
Fidelity Series Inflation-Protected Bond Index Fund | 10.0 | 10.4 |
Investment Grade Bond Funds | | |
Fidelity Series Investment Grade Bond Fund | 21.6 | 22.0 |
Short-Term Funds | | |
Fidelity Advisor Short Fixed-Income Fund Institutional Class | 5.7 | 5.2 |
Fidelity Institutional Money Market Portfolio Institutional Class | 6.9 | 6.2 |
| 12.6 | 11.4 |
Net Other Assets (Liabilities)* | 0.0 | 0.0 |
| 100.0 | 100.0 |
* Amount represents less than 0.1% |
Asset Allocation (% of fund's net assets) |
Period end |
| Commodity Funds | 5.1% | |
| Domestic Equity Funds | 30.7% | |
| Developed International Equity Funds | 10.1% | |
| Emerging Markets
Equity Funds | 2.8% | |
| High Yield Bond Funds | 7.1% | |
| Inflation-Protected
Bond Funds | 10.0% | |
| Investment Grade
Bond Funds | 21.6% | |
| Short-Term Funds | 12.6% | |

Six months ago |
| Commodity Funds | 5.4% | |
| Domestic Equity Funds | 30.7% | |
| Developed International Equity Funds | 10.1% | |
| Emerging Markets
Equity Funds | 2.9% | |
| High Yield Bond Funds | 7.1% | |
| Inflation-Protected
Bond Funds | 10.4% | |
| Investment Grade
Bond Funds | 22.0% | |
| Short-Term Funds | 11.4% | |

Expected |
| Commodity Funds | 5.2% | |
| Domestic Equity Funds | 29.4% | |
| Developed International Equity Funds | 9.7% | |
| Emerging Markets
Equity Funds | 2.9% | |
| High Yield Bond Funds | 5.0% | |
| Inflation-Protected
Bond Funds | 10.5% | |
| Investment Grade
Bond Funds | 23.1% | |
| Short-Term Funds | 14.2% | |

The fund invests according to an asset allocation strategy that becomes increasingly conservative over time. The six months ago allocation is based on the fund's holdings as of September 30, 2012. The current allocation is based on the fund's holdings as of March 31, 2013. The expected allocation represents the fund's anticipated allocation at September 30, 2013. |
Annual Report
Fidelity Advisor Freedom 2010 Fund
Investments March 31, 2013
Showing Percentage of Net Assets
Domestic Equity Funds - 35.8% |
| Shares | | Value |
Commodity Funds - 5.1% |
Fidelity Series Commodity Strategy Fund (a) | 5,307,840 | | $ 46,125,134 |
Domestic Equity Funds - 30.7% |
Fidelity Advisor Equity Growth Fund Institutional Class | 525,848 | | 37,256,333 |
Fidelity Advisor Growth & Income Fund Institutional Class | 898,349 | | 19,844,540 |
Fidelity Advisor Large Cap Fund Institutional Class | 842,285 | | 20,021,126 |
Fidelity Advisor Series Equity-Income Fund | 2,497,487 | | 27,797,031 |
Fidelity Advisor Series Mega Cap Fund | 562,257 | | 6,212,935 |
Fidelity Advisor Series Opportunistic Insights Fund | 1,781,756 | | 19,617,134 |
Fidelity Advisor Series Stock Selector Large Cap Value Fund | 2,494,070 | | 27,908,639 |
Fidelity Advisor Small Cap Fund Institutional Class | 566,475 | | 15,266,503 |
Fidelity Series 100 Index Fund | 598,223 | | 6,173,658 |
Fidelity Series All-Sector Equity Fund | 3,861,521 | | 49,620,547 |
Fidelity Series Large Cap Value Fund | 2,423,182 | | 28,205,834 |
Fidelity Series Real Estate Equity Fund | 318,381 | | 4,145,322 |
Fidelity Series Small Cap Opportunities Fund | 1,441,398 | | 17,772,438 |
TOTAL DOMESTIC EQUITY FUNDS | | 279,842,040 |
TOTAL DOMESTIC EQUITY FUNDS (Cost $292,959,306) |
325,967,174
|
International Equity Funds - 12.9% |
| | | |
Developed International Equity Funds - 10.1% |
Fidelity Series International Growth Fund | 3,324,828 | | 42,059,080 |
Fidelity Series International Small Cap Fund | 627,031 | | 8,602,872 |
Fidelity Series International Value Fund | 4,255,871 | | 41,792,652 |
TOTAL DEVELOPED INTERNATIONAL EQUITY FUNDS | | 92,454,604 |
Emerging Markets Equity Funds - 2.8% |
Fidelity Series Emerging Markets Fund | 1,508,478 | | 25,236,844 |
TOTAL INTERNATIONAL EQUITY FUNDS (Cost $106,230,460) |
117,691,448
|
Bond Funds - 38.7% |
| Shares | | Value |
High Yield Bond Funds - 7.1% |
Fidelity Series Emerging Markets Debt Fund | 528,571 | | $ 5,750,850 |
Fidelity Series Floating Rate High Income Fund | 991,747 | | 10,542,272 |
Fidelity Series High Income Fund | 4,117,407 | | 43,273,952 |
Fidelity Series Real Estate Income Fund | 405,885 | | 4,736,681 |
TOTAL HIGH YIELD BOND FUNDS | | 64,303,755 |
Inflation-Protected Bond Funds - 10.0% |
Fidelity Series Inflation-Protected Bond Index Fund | 8,000,636 | | 91,127,240 |
Investment Grade Bond Funds - 21.6% |
Fidelity Series Investment Grade Bond Fund | 17,050,450 | | 196,591,693 |
TOTAL BOND FUNDS (Cost $337,333,331) |
352,022,688
|
Short-Term Funds - 12.6% |
| | | |
Fidelity Advisor Short Fixed-Income Fund Institutional Class | 5,541,785 | | 51,871,108 |
Fidelity Institutional Money Market Portfolio Institutional Class | 63,172,497 | | 63,172,497 |
TOTAL SHORT-TERM FUNDS (Cost $114,892,054) |
115,043,605
|
TOTAL INVESTMENT PORTFOLIO - 100.0% (Cost $851,415,151) | | 910,724,915 |
NET OTHER ASSETS (LIABILITIES) - 0.0% | | (204,375) |
NET ASSETS - 100% | $ 910,520,540 |
Legend |
(a) Non-income producing |
Other Information |
All investments are categorized as Level 1 under the Fair Value Hierarchy. The inputs or methodology used for valuing securities may not be an indication of the risk associated with investing in those securities. For more information on valuation inputs, please refer to the Security Valuation section in the accompanying Notes to Financial Statements. |
See accompanying notes which are an integral part of the financial statements.
Annual Report
Fidelity Advisor Freedom 2010 Fund
Statement of Assets and Liabilities
| March 31, 2013 |
| | |
Assets | | |
Investment in securities, at value (cost $851,415,151) - See accompanying schedule | | $ 910,724,915 |
Receivable for investments sold | | 606,911 |
Receivable for fund shares sold | | 551,982 |
Receivable from affiliate for expense reductions | | 67 |
Total assets | | 911,883,875 |
| | |
Liabilities | | |
Payable for investments purchased | $ 13,146 | |
Payable for fund shares redeemed | 1,147,043 | |
Distribution and service plan fees payable | 203,146 | |
Total liabilities | | 1,363,335 |
| | |
Net Assets | | $ 910,520,540 |
Net Assets consist of: | | |
Paid in capital | | $ 842,882,581 |
Undistributed net investment income | | 1,298,681 |
Accumulated undistributed net realized gain (loss) on investments | | 7,029,514 |
Net unrealized appreciation (depreciation) on investments | | 59,309,764 |
Net Assets | | $ 910,520,540 |
| | |
Calculation of Maximum Offering Price Class A:
Net Asset Value and redemption price per share ($540,979,627 ÷ 43,288,038 shares) | | $ 12.50 |
| | |
Maximum offering price per share (100/94.25 of $12.50) | | $ 13.26 |
Class T:
Net Asset Value and redemption price per share ($127,353,065 ÷ 10,219,403 shares) | | $ 12.46 |
| | |
Maximum offering price per share (100/96.50 of $12.46) | | $ 12.91 |
Class B:
Net Asset Value and offering price per share ($6,474,340 ÷ 518,448 shares)A | | $ 12.49 |
| | |
Class C:
Net Asset Value and offering price per share ($38,561,995 ÷ 3,111,743 shares)A | | $ 12.39 |
| | |
| | |
Institutional Class:
Net Asset Value, offering price and redemption price per share ($197,151,513 ÷ 15,710,835 shares) | | $ 12.55 |
A Redemption price per share is equal to net asset value less any applicable contingent deferred sales charge.
Statement of Operations
| Year ended March 31, 2013 |
| | |
Investment Income | | |
Income distributions from underlying funds | | $ 13,902,058 |
| | |
Expenses | | |
Distribution and service plan fees | $ 2,423,789 | |
Independent trustees' compensation | 3,206 | |
Total expenses before reductions | 2,426,995 | |
Expense reductions | (3,206) | 2,423,789 |
Net investment income | | 11,478,269 |
Realized and Unrealized Gain (Loss) Realized gain (loss) on sale of underlying fund shares | 35,773,452 | |
Capital gain distributions from underlying funds | 18,727,813 | |
Total net realized gain (loss) | | 54,501,265 |
Change in net unrealized appreciation (depreciation) on underlying funds | | (4,153,489) |
Net gain (loss) | | 50,347,776 |
Net increase (decrease) in net assets resulting from operations | | $ 61,826,045 |
See accompanying notes which are an integral part of the financial statements.
Annual Report
Statement of Changes in Net Assets
| Year ended
March 31,
2013 | Year ended
March 31,
2012 |
Increase (Decrease) in Net Assets | | |
Operations | | |
Net investment income (loss) | $ 11,478,269 | $ 12,180,618 |
Net realized gain (loss) | 54,501,265 | 36,518,657 |
Change in net unrealized appreciation (depreciation) | (4,153,489) | (26,218,587) |
Net increase (decrease) in net assets resulting from operations | 61,826,045 | 22,480,688 |
Distributions to shareholders from net investment income | (11,763,830) | (11,889,345) |
Distributions to shareholders from net realized gain | (6,303,241) | (11,297,317) |
Total distributions | (18,067,071) | (23,186,662) |
Share transactions - net increase (decrease) | (22,088,856) | 24,335,850 |
Total increase (decrease) in net assets | 21,670,118 | 23,629,876 |
| | |
Net Assets | | |
Beginning of period | 888,850,422 | 865,220,546 |
End of period (including undistributed net investment income of $1,298,681 and undistributed net investment income of $1,584,243, respectively) | $ 910,520,540 | $ 888,850,422 |
Financial Highlights - Class A
Years ended March 31, | 2013 | 2012 | 2011 | 2010 | 2009 |
Selected Per-Share Data | | | | | |
Net asset value, beginning of period | $ 11.89 | $ 11.92 | $ 10.87 | $ 8.19 | $ 11.78 |
Income from Investment Operations | | | | | |
Net investment income (loss) C | .16 | .17 | .15 | .21 | .27 |
Net realized and unrealized gain (loss) | .70 | .12 | 1.17 | 2.76 | (3.28) |
Total from investment operations | .86 | .29 | 1.32 | 2.97 | (3.01) |
Distributions from net investment income | (.16) | (.17) | (.17) | (.21) | (.28) |
Distributions from net realized gain | (.09) | (.16) | (.10) | (.08) | (.30) |
Total distributions | (.25) | (.32) G | (.27) | (.29) F | (.58) |
Net asset value, end of period | $ 12.50 | $ 11.89 | $ 11.92 | $ 10.87 | $ 8.19 |
Total Return A, B | 7.33% | 2.63% | 12.27% | 36.51% | (26.36)% |
Ratios to Average Net Assets D, E | | | | | |
Expenses before reductions | .25% | .25% | .25% | .25% | .25% |
Expenses net of fee waivers, if any | .25% | .25% | .25% | .25% | .25% |
Expenses net of all reductions | .25% | .25% | .25% | .25% | .25% |
Net investment income | 1.33% | 1.48% | 1.38% | 2.04% | 2.77% |
Supplemental Data | | | | | |
Net assets, end of period (000 omitted) | $ 540,980 | $ 552,770 | $ 536,999 | $ 478,025 | $ 339,203 |
Portfolio turnover rate | 26% | 25% | 41% | 42% | 44% |
A Total returns would have been lower if certain expenses had not been reduced during the applicable periods shown.
B Total returns do not include the effect of the sales charges.
C Calculated based on average shares outstanding during the period.
D Amounts do not include the activity of the Underlying Funds.
E Expense ratios reflect operating expenses of the class. Expenses before reductions do not reflect amounts reimbursed by the investment adviser or reductions from expense offset arrangements and do not represent the amount paid by the class during periods when reimbursements or reductions occur. Expenses net of fee waivers reflect expenses after reimbursement by the investment adviser but prior to reductions from expense offset arrangements. Expenses net of all reductions represent the net expenses paid by the class but do not include expenses of the investment companies in which the Fund invests.
F Total distributions of $.29 per share is comprised of distributions from net investment income of $.211 and distributions from net realized gain of $.083 per share.
G Total distributions of $.32 per share is comprised of distributions from net investment income of $.169 and distributions from net realized gain of $.155 per share.
See accompanying notes which are an integral part of the financial statements.
Annual Report
Financial Highlights - Class T
Years ended March 31, | 2013 | 2012 | 2011 | 2010 | 2009 |
Selected Per-Share Data | | | | | |
Net asset value, beginning of period | $ 11.86 | $ 11.88 | $ 10.83 | $ 8.16 | $ 11.74 |
Income from Investment Operations | | | | | |
Net investment income (loss) C | .13 | .14 | .13 | .18 | .25 |
Net realized and unrealized gain (loss) | .69 | .13 | 1.15 | 2.76 | (3.28) |
Total from investment operations | .82 | .27 | 1.28 | 2.94 | (3.03) |
Distributions from net investment income | (.13) | (.14) | (.13) | (.19) | (.25) |
Distributions from net realized gain | (.09) | (.16) | (.10) | (.08) | (.30) |
Total distributions | (.22) | (.29) G | (.23) | (.27) F | (.55) |
Net asset value, end of period | $ 12.46 | $ 11.86 | $ 11.88 | $ 10.83 | $ 8.16 |
Total Return A, B | 6.98% | 2.43% | 11.95% | 36.19% | (26.57)% |
Ratios to Average Net Assets D, E | | | | | |
Expenses before reductions | .50% | .50% | .50% | .50% | .50% |
Expenses net of fee waivers, if any | .50% | .50% | .50% | .50% | .50% |
Expenses net of all reductions | .50% | .50% | .50% | .50% | .50% |
Net investment income | 1.08% | 1.23% | 1.13% | 1.79% | 2.52% |
Supplemental Data | | | | | |
Net assets, end of period (000 omitted) | $ 127,353 | $ 132,044 | $ 152,126 | $ 204,059 | $ 163,842 |
Portfolio turnover rate | 26% | 25% | 41% | 42% | 44% |
A Total returns would have been lower if certain expenses had not been reduced during the applicable periods shown.
B Total returns do not include the effect of the sales charges.
C Calculated based on average shares outstanding during the period.
D Amounts do not include the activity of the Underlying Funds.
E Expense ratios reflect operating expenses of the class. Expenses before reductions do not reflect amounts reimbursed by the investment adviser or reductions from expense offset arrangements and do not represent the amount paid by the class during periods when reimbursements or reductions occur. Expenses net of fee waivers reflect expenses after reimbursement by the investment adviser but prior to reductions from expense offset arrangements. Expenses net of all reductions represent the net expenses paid by the class but do not include expenses of the investment companies in which the Fund invests.
F Total distributions of $.27 per share is comprised of distributions from net investment income of $.186 and distributions from net realized gain of $.083 per share.
G Total distributions of $.29 per share is comprised of distributions from net investment income of $.137 and distributions from net realized gain of $.155 per share.
Financial Highlights - Class B
Years ended March 31, | 2013 | 2012 | 2011 | 2010 | 2009 |
Selected Per-Share Data | | | | | |
Net asset value, beginning of period | $ 11.87 | $ 11.87 | $ 10.82 | $ 8.15 | $ 11.70 |
Income from Investment Operations | | | | | |
Net investment income (loss) C | .07 | .08 | .07 | .13 | .20 |
Net realized and unrealized gain (loss) | .70 | .13 | 1.15 | 2.76 | (3.26) |
Total from investment operations | .77 | .21 | 1.22 | 2.89 | (3.06) |
Distributions from net investment income | (.06) | (.07) | (.07) | (.13) | (.19) |
Distributions from net realized gain | (.09) | (.15) | (.10) | (.08) | (.30) |
Total distributions | (.15) | (.21) G | (.17) | (.22) F | (.49) |
Net asset value, end of period | $ 12.49 | $ 11.87 | $ 11.87 | $ 10.82 | $ 8.15 |
Total Return A, B | 6.51% | 1.90% | 11.37% | 35.54% | (26.92)% |
Ratios to Average Net Assets D, E | | | | | |
Expenses before reductions | 1.00% | 1.00% | 1.00% | 1.00% | 1.00% |
Expenses net of fee waivers, if any | 1.00% | 1.00% | 1.00% | 1.00% | 1.00% |
Expenses net of all reductions | 1.00% | 1.00% | 1.00% | 1.00% | 1.00% |
Net investment income | .58% | .73% | .63% | 1.29% | 2.03% |
Supplemental Data | | | | | |
Net assets, end of period (000 omitted) | $ 6,474 | $ 9,154 | $ 15,842 | $ 22,468 | $ 19,950 |
Portfolio turnover rate | 26% | 25% | 41% | 42% | 44% |
A Total returns would have been lower if certain expenses had not been reduced during the applicable periods shown.
B Total returns do not include the effect of the contingent deferred sales charge.
C Calculated based on average shares outstanding during the period.
D Amounts do not include the activity of the Underlying Funds.
E Expense ratios reflect operating expenses of the class. Expenses before reductions do not reflect amounts reimbursed by the investment adviser or reductions from expense offset arrangements and do not represent the amount paid by the class during periods when reimbursements or reductions occur. Expenses net of fee waivers reflect expenses after reimbursement by the investment adviser but prior to reductions from expense offset arrangements. Expenses net of all reductions represent the net expenses paid by the class but do not include expenses of the investment companies in which the Fund invests.
F Total distributions of $.22 per share is comprised of distributions from net investment income of $.134 and distributions from net realized gain of $.083 per share.
G Total distributions of $.21 per share is comprised of distributions from net investment income of $.065 and distributions from net realized gain of $.148 per share.
See accompanying notes which are an integral part of the financial statements.
Annual Report
Financial Highlights - Class C
Years ended March 31, | 2013 | 2012 | 2011 | 2010 | 2009 |
Selected Per-Share Data | | | | | |
Net asset value, beginning of period | $ 11.79 | $ 11.81 | $ 10.78 | $ 8.13 | $ 11.67 |
Income from Investment Operations | | | | | |
Net investment income (loss) C | .07 | .08 | .07 | .13 | .20 |
Net realized and unrealized gain (loss) | .69 | .13 | 1.14 | 2.74 | (3.25) |
Total from investment operations | .76 | .21 | 1.21 | 2.87 | (3.05) |
Distributions from net investment income | (.07) | (.08) | (.08) | (.14) | (.19) |
Distributions from net realized gain | (.09) | (.15) | (.10) | (.08) | (.30) |
Total distributions | (.16) | (.23) | (.18) | (.22) F | (.49) |
Net asset value, end of period | $ 12.39 | $ 11.79 | $ 11.81 | $ 10.78 | $ 8.13 |
Total Return A, B | 6.49% | 1.90% | 11.33% | 35.45% | (26.88)% |
Ratios to Average Net Assets D, E | | | | | |
Expenses before reductions | 1.00% | 1.00% | 1.00% | 1.00% | 1.00% |
Expenses net of fee waivers, if any | 1.00% | 1.00% | 1.00% | 1.00% | 1.00% |
Expenses net of all reductions | 1.00% | 1.00% | 1.00% | 1.00% | 1.00% |
Net investment income | .58% | .73% | .63% | 1.29% | 2.02% |
Supplemental Data | | | | | |
Net assets, end of period (000 omitted) | $ 38,562 | $ 38,423 | $ 44,764 | $ 47,178 | $ 37,524 |
Portfolio turnover rate | 26% | 25% | 41% | 42% | 44% |
A Total returns would have been lower if certain expenses had not been reduced during the applicable periods shown.
B Total returns do not include the effect of the contingent deferred sales charge.
C Calculated based on average shares outstanding during the period.
D Amounts do not include the activity of the Underlying Funds.
E Expense ratios reflect operating expenses of the class. Expenses before reductions do not reflect amounts reimbursed by the investment adviser or reductions from expense offset arrangements and do not represent the amount paid by the class during periods when reimbursements or reductions occur. Expenses net of fee waivers reflect expenses after reimbursement by the investment adviser but prior to reductions from expense offset arrangements. Expenses net of all reductions represent the net expenses paid by the class but do not include expenses of the investment companies in which the Fund invests.
F Total distributions of $.22 per share is comprised of distributions from net investment income of $.139 and distributions from net realized gain of $.083 per share.
Financial Highlights - Institutional Class
Years ended March 31, | 2013 | 2012 | 2011 | 2010 | 2009 |
Selected Per-Share Data | | | | | |
Net asset value, beginning of period | $ 11.94 | $ 11.96 | $ 10.91 | $ 8.22 | $ 11.82 |
Income from Investment Operations | | | | | |
Net investment income (loss) B | .19 | .20 | .18 | .23 | .30 |
Net realized and unrealized gain (loss) | .70 | .13 | 1.17 | 2.78 | (3.30) |
Total from investment operations | .89 | .33 | 1.35 | 3.01 | (3.00) |
Distributions from net investment income | (.19) | (.20) | (.20) | (.23) | (.30) |
Distributions from net realized gain | (.09) | (.16) | (.10) | (.08) | (.30) |
Total distributions | (.28) | (.35) G | (.30) | (.32) F | (.60) |
Net asset value, end of period | $ 12.55 | $ 11.94 | $ 11.96 | $ 10.91 | $ 8.22 |
Total Return A | 7.56% | 2.97% | 12.50% | 36.80% | (26.16)% |
Ratios to Average Net Assets C, D | | | | | |
Expenses before reductions E | .00% | .00% | .00% | .00% | .00% |
Expenses net of fee waivers, if any | .00% | .00% | .00% | .00% | .00% |
Expenses net of all reductions | .00% | .00% | .00% | .00% | .00% |
Net investment income (loss) | 1.58% | 1.73% | 1.63% | 2.29% | 3.02% |
Supplemental Data | | | | | |
Net assets, end of period (000 omitted) | $ 197,152 | $ 156,459 | $ 115,490 | $ 75,569 | $ 41,737 |
Portfolio turnover rate | 26% | 25% | 41% | 42% | 44% |
A Total returns would have been lower if certain expenses had not been reduced during the applicable periods shown.
B Calculated based on average shares outstanding during the period.
C Amounts do not include the activity of the Underlying Funds.
D Expense ratios reflect operating expenses of the class. Expenses before reductions do not reflect amounts reimbursed by the investment adviser or reductions from expense offset arrangements and do not represent the amount paid by the class during periods when reimbursements or reductions occur. Expenses net of fee waivers reflect expenses after reimbursement by the investment adviser but prior to reductions from expense offset arrangements. Expenses net of all reductions represent the net expenses paid by the class but do not include expenses of the investment companies in which the Fund invests.
E Amount represents less than .01%.
F Total distributions of $.32 per share is comprised of distributions from net investment income of $.234 and distributions from net realized gain of $.083 per share.
G Total distributions of $.35 per share is comprised of distributions from net investment income of $.199 and distributions from net realized gain of $.155 per share.
See accompanying notes which are an integral part of the financial statements.
Annual Report
Fidelity Advisor Freedom 2015 Fund
Investment Changes (Unaudited)
The information in the following tables is based on the direct investments of the Fund. |
Fund Holdings as of March 31, 2013 |
| % of fund's
net assets | % of fund's net assets
6 months ago |
Commodity Funds | | |
Fidelity Series Commodity Strategy Fund | 5.4 | 5.6 |
Domestic Equity Funds | | |
Fidelity Advisor Equity Growth Fund Institutional Class | 4.3 | 3.8 |
Fidelity Advisor Growth & Income Fund Institutional Class | 2.3 | 4.5 |
Fidelity Advisor Large Cap Fund Institutional Class | 2.3 | 4.2 |
Fidelity Advisor Series Equity-Income Fund | 3.1 | 0.0 |
Fidelity Advisor Series Mega Cap Fund | 0.7 | 0.0 |
Fidelity Advisor Series Opportunistic Insights Fund | 2.2 | 0.0 |
Fidelity Advisor Series Stock Selector Large Cap Value Fund | 3.1 | 0.0 |
Fidelity Advisor Small Cap Fund Institutional Class | 1.8 | 1.5 |
Fidelity Series 100 Index Fund | 0.7 | 3.0 |
Fidelity Series All-Sector Equity Fund | 5.7 | 6.5 |
Fidelity Series Large Cap Value Fund | 3.2 | 6.1 |
Fidelity Series Real Estate Equity Fund | 0.5 | 0.5 |
Fidelity Series Small Cap Opportunities Fund | 2.1 | 1.6 |
| 32.0 | 31.7 |
Developed International Equity Funds | | |
Fidelity Series International Growth Fund | 4.8 | 4.8 |
Fidelity Series International Small Cap Fund | 1.0 | 1.0 |
Fidelity Series International Value Fund | 4.7 | 4.7 |
| 10.5 | 10.5 |
Emerging Markets Equity Funds | | |
Fidelity Series Emerging Markets Fund | 2.9 | 3.0 |
High Yield Bond Funds | | |
Fidelity Series Emerging Markets Debt Fund | 0.6 | 0.6 |
Fidelity Series Floating Rate High Income Fund | 1.1 | 1.1 |
Fidelity Series High Income Fund | 4.7 | 4.7 |
Fidelity Series Real Estate Income Fund | 0.6 | 0.6 |
| 7.0 | 7.0 |
Inflation-Protected Bond Funds | | |
Fidelity Series Inflation-Protected Bond Index Fund | 9.9 | 10.1 |
Investment Grade Bond Funds | | |
Fidelity Series Investment Grade Bond Fund | 22.6 | 22.6 |
Short-Term Funds | | |
Fidelity Advisor Short Fixed-Income Fund Institutional Class | 4.4 | 4.3 |
Fidelity Institutional Money Market Portfolio Institutional Class | 5.3 | 5.2 |
| 9.7 | 9.5 |
Net Other Assets (Liabilities)* | 0.0 | 0.0 |
| 100.0 | 100.0 |
* Amount represents less than 0.1%
Asset Allocation (% of fund's net assets) |
Period end |
| Commodity Funds | 5.4% | |
| Domestic Equity Funds | 32.0% | |
| Developed International Equity Funds | 10.5% | |
| Emerging Markets
Equity Funds | 2.9% | |
| High Yield Bond Funds | 7.0% | |
| Inflation-Protected
Bond Funds | 9.9% | |
| Investment Grade
Bond Funds | 22.6% | |
| Short-Term Funds | 9.7% | |

Six months ago |
| Commodity Funds | 5.6% | |
| Domestic Equity Funds | 31.7% | |
| Developed International Equity Funds | 10.5% | |
| Emerging Markets
Equity Funds | 3.0% | |
| High Yield Bond Funds | 7.0% | |
| Inflation-Protected
Bond Funds | 10.1% | |
| Investment Grade
Bond Funds | 22.6% | |
| Short-Term Funds | 9.5% | |

Expected |
| Commodity Funds | 5.5% | |
| Domestic Equity Funds | 31.1% | |
| Developed International Equity Funds | 10.3% | |
| Emerging Markets
Equity Funds | 3.0% | |
| High Yield Bond Funds | 5.0% | |
| Inflation-Protected
Bond Funds | 10.6% | |
| Investment Grade
Bond Funds | 24.4% | |
| Short-Term Funds | 10.1% | |

The fund invests according to an asset allocation strategy that becomes increasingly conservative over time. The six months ago allocation is based on the fund's holdings as of September 30, 2012. The current allocation is based on the fund's holdings as of March 31, 2013. The expected allocation represents the fund's anticipated allocation at September 30, 2013. |
Annual Report
Fidelity Advisor Freedom 2015 Fund
Investments March 31, 2013
Showing Percentage of Net Assets
Domestic Equity Funds - 37.4% |
| Shares | | Value |
Commodity Funds - 5.4% |
Fidelity Series Commodity Strategy Fund (a) | 12,083,746 | | $ 105,007,756 |
Domestic Equity Funds - 32.0% |
Fidelity Advisor Equity Growth Fund Institutional Class | 1,194,883 | | 84,657,466 |
Fidelity Advisor Growth & Income Fund Institutional Class | 2,031,381 | | 44,873,207 |
Fidelity Advisor Large Cap Fund Institutional Class | 1,904,672 | | 45,274,051 |
Fidelity Advisor Series Equity-Income Fund | 5,518,080 | | 61,416,234 |
Fidelity Advisor Series Mega Cap Fund | 1,239,188 | | 13,693,032 |
Fidelity Advisor Series Opportunistic Insights Fund | 3,937,975 | | 43,357,108 |
Fidelity Advisor Series Stock Selector Large Cap Value Fund | 5,511,022 | | 61,668,338 |
Fidelity Advisor Small Cap Fund Institutional Class | 1,287,853 | | 34,707,632 |
Fidelity Series 100 Index Fund | 1,348,681 | | 13,918,390 |
Fidelity Series All-Sector Equity Fund | 8,743,322 | | 112,351,689 |
Fidelity Series Large Cap Value Fund | 5,441,171 | | 63,335,231 |
Fidelity Series Real Estate Equity Fund | 725,471 | | 9,445,628 |
Fidelity Series Small Cap Opportunities Fund | 3,276,025 | | 40,393,393 |
TOTAL DOMESTIC EQUITY FUNDS | | 629,091,399 |
TOTAL DOMESTIC EQUITY FUNDS (Cost $651,533,536) |
734,099,155
|
International Equity Funds - 13.4% |
| | | |
Developed International Equity Funds - 10.5% |
Fidelity Series International Growth Fund | 7,457,944 | | 94,342,991 |
Fidelity Series International Small Cap Fund | 1,404,121 | | 19,264,544 |
Fidelity Series International Value Fund | 9,543,567 | | 93,717,826 |
TOTAL DEVELOPED INTERNATIONAL EQUITY FUNDS | | 207,325,361 |
Emerging Markets Equity Funds - 2.9% |
Fidelity Series Emerging Markets Fund | 3,392,835 | | 56,762,125 |
TOTAL INTERNATIONAL EQUITY FUNDS (Cost $231,741,283) |
264,087,486
|
Bond Funds - 39.5% |
| Shares | | Value |
High Yield Bond Funds - 7.0% |
Fidelity Series Emerging Markets Debt Fund | 1,121,803 | | $ 12,205,213 |
Fidelity Series Floating Rate High Income Fund | 2,019,348 | | 21,465,667 |
Fidelity Series High Income Fund | 8,788,566 | | 92,367,830 |
Fidelity Series Real Estate Income Fund | 951,107 | | 11,099,419 |
TOTAL HIGH YIELD BOND FUNDS | | 137,138,129 |
Inflation-Protected Bond Funds - 9.9% |
Fidelity Series Inflation-Protected Bond Index Fund | 17,122,504 | | 195,025,325 |
Investment Grade Bond Funds - 22.6% |
Fidelity Series Investment Grade Bond Fund | 38,472,731 | | 443,590,585 |
TOTAL BOND FUNDS (Cost $742,298,756) |
775,754,039
|
Short-Term Funds - 9.7% |
| | | |
Fidelity Advisor Short Fixed-Income Fund Institutional Class | 9,238,724 | | 86,474,459 |
Fidelity Institutional Money Market Portfolio Institutional Class | 105,198,514 | | 105,198,514 |
TOTAL SHORT-TERM FUNDS (Cost $190,161,244) |
191,672,973
|
TOTAL INVESTMENT PORTFOLIO - 100.0% (Cost $1,815,734,819) | | 1,965,613,653 |
NET OTHER ASSETS (LIABILITIES) - 0.0% | | (441,328) |
NET ASSETS - 100% | $ 1,965,172,325 |
Legend |
(a) Non-income producing |
Other Information |
All investments are categorized as Level 1 under the Fair Value Hierarchy. The inputs or methodology used for valuing securities may not be an indication of the risk associated with investing in those securities. For more information on valuation inputs, please refer to the Security Valuation section in the accompanying Notes to Financial Statements. |
See accompanying notes which are an integral part of the financial statements.
Annual Report
Fidelity Advisor Freedom 2015 Fund
Statement of Assets and Liabilities
| March 31, 2013 |
| | |
Assets | | |
Investment in securities, at value (cost $1,815,734,819) - See accompanying schedule | | $ 1,965,613,653 |
Receivable for investments sold | | 2,881,426 |
Receivable for fund shares sold | | 1,563,337 |
Receivable from affiliate for expense reductions | | 699 |
Total assets | | 1,970,059,115 |
| | |
Liabilities | | |
Payable for investments purchased | $ 94 | |
Payable for fund shares redeemed | 4,472,776 | |
Distribution and service plan fees payable | 413,920 | |
Total liabilities | | 4,886,790 |
| | |
Net Assets | | $ 1,965,172,325 |
Net Assets consist of: | | |
Paid in capital | | $ 1,783,857,912 |
Undistributed net investment income | | 2,834,039 |
Accumulated undistributed net realized gain (loss) on investments | | 28,601,540 |
Net unrealized appreciation (depreciation) on investments | | 149,878,834 |
Net Assets | | $ 1,965,172,325 |
| | |
Calculation of Maximum Offering Price Class A:
Net Asset Value and redemption price per share ($1,181,020,177 ÷ 94,681,848 shares) | | $ 12.47 |
| | |
Maximum offering price per share (100/94.25 of $12.47) | | $ 13.23 |
Class T:
Net Asset Value and redemption price per share ($227,022,345 ÷ 18,225,924 shares) | | $ 12.46 |
| | |
Maximum offering price per share (100/96.50 of $12.46) | | $ 12.91 |
Class B:
Net Asset Value and offering price per share ($17,411,344 ÷ 1,399,205 shares)A | | $ 12.44 |
| | |
Class C:
Net Asset Value and offering price per share ($72,114,883 ÷ 5,822,033 shares)A | | $ 12.39 |
| | |
Institutional Class:
Net Asset Value, offering price and redemption price per share ($467,603,576 ÷ 37,232,745 shares) | | $ 12.56 |
A Redemption price per share is equal to net asset value less any applicable contingent deferred sales charge.
Statement of Operations
| Year ended March 31, 2013 |
| | |
Investment Income | | |
Income distributions from underlying funds | | $ 29,346,058 |
| | |
Expenses | | |
Distribution and service plan fees | $ 4,772,548 | |
Independent trustees' compensation | 6,594 | |
Total expenses before reductions | 4,779,142 | |
Expense reductions | (6,594) | 4,772,548 |
Net investment income (loss) | | 24,573,510 |
Realized and Unrealized Gain (Loss) Realized gain (loss) on sale of underlying fund shares | 52,407,457 | |
Capital gain distributions from underlying funds | 40,456,566 | |
Total net realized gain (loss) | | 92,864,023 |
Change in net unrealized appreciation (depreciation) on underlying funds | | 17,904,608 |
Net gain (loss) | | 110,768,631 |
Net increase (decrease) in net assets resulting from operations | | $ 135,342,141 |
See accompanying notes which are an integral part of the financial statements.
Annual Report
Statement of Changes in Net Assets
| Year ended
March 31,
2013 | Year ended
March 31,
2012 |
Increase (Decrease) in Net Assets | | |
Operations | | |
Net investment income (loss) | $ 24,573,510 | $ 23,538,138 |
Net realized gain (loss) | 92,864,023 | 42,817,853 |
Change in net unrealized appreciation (depreciation) | 17,904,608 | (18,849,124) |
Net increase (decrease) in net assets resulting from operations | 135,342,141 | 47,506,867 |
Distributions to shareholders from net investment income | (24,816,448) | (22,803,456) |
Distributions to shareholders from net realized gain | (13,437,037) | (21,487,940) |
Total distributions | (38,253,485) | (44,291,396) |
Share transactions - net increase (decrease) | 111,574,961 | 170,418,837 |
Total increase (decrease) in net assets | 208,663,617 | 173,634,308 |
| | |
Net Assets | | |
Beginning of period | 1,756,508,708 | 1,582,874,400 |
End of period (including undistributed net investment income of $2,834,039 and undistributed net investment income of $3,076,975, respectively) | $ 1,965,172,325 | $ 1,756,508,708 |
Financial Highlights - Class A
Years ended March 31, | 2013 | 2012 | 2011 | 2010 | 2009 |
Selected Per-Share Data | | | | | |
Net asset value, beginning of period | $ 11.85 | $ 11.87 | $ 10.81 | $ 8.05 | $ 11.85 |
Income from Investment Operations | | | | | |
Net investment income (loss) C | .16 | .17 | .16 | .20 | .26 |
Net realized and unrealized gain (loss) | .71 | .13 | 1.16 | 2.84 | (3.47) |
Total from investment operations | .87 | .30 | 1.32 | 3.04 | (3.21) |
Distributions from net investment income | (.16) | (.17) | (.16) | (.20) | (.26) |
Distributions from net realized gain | (.09) | (.15) | (.10) | (.08) | (.33) |
Total distributions | (.25) | (.32) | (.26) | (.28) G | (.59) F |
Net asset value, end of period | $ 12.47 | $ 11.85 | $ 11.87 | $ 10.81 | $ 8.05 |
Total Return A,B | 7.45% | 2.71% | 12.36% | 37.95% | (28.01)% |
Ratios to Average Net Assets D,E | | | | | |
Expenses before reductions | .25% | .25% | .25% | .25% | .25% |
Expenses net of fee waivers, if any | .25% | .25% | .25% | .25% | .25% |
Expenses net of all reductions | .25% | .25% | .25% | .25% | .25% |
Net investment income (loss) | 1.36% | 1.50% | 1.42% | 2.02% | 2.69% |
Supplemental Data | | | | | |
Net assets, end of period (000 omitted) | $ 1,181,020 | $ 1,101,302 | $ 1,004,955 | $ 830,024 | $ 477,641 |
Portfolio turnover rate | 20% | 19% | 33% | 29% | 36% |
A Total returns would have been lower if certain expenses had not been reduced during the applicable periods shown.
B Total returns do not include the effect of the sales charges.
C Calculated based on average shares outstanding during the period.
D Amounts do not include the activity of the Underlying Funds.
E Expense ratios reflect operating expenses of the class. Expenses before reductions do not reflect amounts reimbursed by the investment adviser or reductions from expense offset arrangements and do not represent the amount paid by the class during periods when reimbursements or reductions occur. Expenses net of fee waivers reflect expenses after reimbursement by the investment adviser but prior to reductions from expense offset arrangements. Expenses net of all reductions represent the net expenses paid by the class but do not include expenses of the investment companies in which the Fund invests.
F Total distributions of $.59 per share is comprised of distributions from net investment income of $.262 and distributions from net realized gain of $.325 per share.
G Total distributions of $.28 per share is comprised of distributions from net investment income of $.197 and distributions from net realized gain of $.082 per share.
See accompanying notes which are an integral part of the financial statements.
Annual Report
Financial Highlights - Class T
Years ended March 31, | 2013 | 2012 | 2011 | 2010 | 2009 |
Selected Per-Share Data | | | | | |
Net asset value, beginning of period | $ 11.83 | $ 11.85 | $ 10.79 | $ 8.04 | $ 11.82 |
Income from Investment Operations | | | | | |
Net investment income (loss) C | .13 | .14 | .13 | .18 | .24 |
Net realized and unrealized gain (loss) | .72 | .13 | 1.16 | 2.82 | (3.46) |
Total from investment operations | .85 | .27 | 1.29 | 3.00 | (3.22) |
Distributions from net investment income | (.13) | (.14) | (.13) | (.17) | (.23) |
Distributions from net realized gain | (.09) | (.15) | (.10) | (.08) | (.33) |
Total distributions | (.22) | (.29) | (.23) | (.25) G | (.56) F |
Net asset value, end of period | $ 12.46 | $ 11.83 | $ 11.85 | $ 10.79 | $ 8.04 |
Total Return A,B | 7.28% | 2.44% | 12.09% | 37.53% | (28.13)% |
Ratios to Average Net Assets D,E | | | | | |
Expenses before reductions | .50% | .50% | .50% | .50% | .50% |
Expenses net of fee waivers, if any | .50% | .50% | .50% | .50% | .50% |
Expenses net of all reductions | .50% | .50% | .50% | .50% | .50% |
Net investment income (loss) | 1.11% | 1.25% | 1.17% | 1.77% | 2.44% |
Supplemental Data | | | | | |
Net assets, end of period (000 omitted) | $ 227,022 | $ 213,366 | $ 236,106 | $ 225,384 | $ 162,439 |
Portfolio turnover rate | 20% | 19% | 33% | 29% | 36% |
A Total returns would have been lower if certain expenses had not been reduced during the applicable periods shown.
B Total returns do not include the effect of the sales charges.
C Calculated based on average shares outstanding during the period.
D Amounts do not include the activity of the Underlying Funds.
E Expense ratios reflect operating expenses of the class. Expenses before reductions do not reflect amounts reimbursed by the investment adviser or reductions from expense offset arrangements and do not represent the amount paid by the class during periods when reimbursements or reductions occur. Expenses net of fee waivers reflect expenses after reimbursement by the investment adviser but prior to reductions from expense offset arrangements. Expenses net of all reductions represent the net expenses paid by the class but do not include expenses of the investment companies in which the Fund invests.
F Total distributions of $.56 per share is comprised of distributions from net investment income of $.234 and distributions from net realized gain of $.325 per share.
G Total distributions of $.25 per share is comprised of distributions from net investment income of $.172 and distributions from net realized gain of $.082 per share.
Financial Highlights - Class B
Years ended March 31, | 2013 | 2012 | 2011 | 2010 | 2009 |
Selected Per-Share Data | | | | | |
Net asset value, beginning of period | $ 11.81 | $ 11.82 | $ 10.76 | $ 8.02 | $ 11.77 |
Income from Investment Operations | | | | | |
Net investment income (loss) C | .07 | .09 | .07 | .13 | .19 |
Net realized and unrealized gain (loss) | .71 | .13 | 1.16 | 2.82 | (3.44) |
Total from investment operations | .78 | .22 | 1.23 | 2.95 | (3.25) |
Distributions from net investment income | (.06) | (.07) | (.07) | (.12) | (.17) |
Distributions from net realized gain | (.09) | (.15) | (.10) | (.08) | (.33) |
Total distributions | (.15) | (.23) H | (.17) | (.21) G | (.50) F |
Net asset value, end of period | $ 12.44 | $ 11.81 | $ 11.82 | $ 10.76 | $ 8.02 |
Total Return A,B | 6.65% | 1.95% | 11.51% | 36.85% | (28.47)% |
Ratios to Average Net Assets D,E | | | | | |
Expenses before reductions | 1.00% | 1.00% | 1.00% | 1.00% | 1.00% |
Expenses net of fee waivers, if any | 1.00% | 1.00% | 1.00% | 1.00% | 1.00% |
Expenses net of all reductions | 1.00% | 1.00% | 1.00% | 1.00% | 1.00% |
Net investment income (loss) | .61% | .75% | .67% | 1.27% | 1.94% |
Supplemental Data | | | | | |
Net assets, end of period (000 omitted) | $ 17,411 | $ 23,552 | $ 32,762 | $ 35,932 | $ 27,727 |
Portfolio turnover rate | 20% | 19% | 33% | 29% | 36% |
A Total returns would have been lower if certain expenses had not been reduced during the applicable periods shown.
B Total returns do not include the effect of the contingent deferred sales charge.
C Calculated based on average shares outstanding during the period.
D Amounts do not include the activity of the Underlying Funds.
E Expense ratios reflect operating expenses of the class. Expenses before reductions do not reflect amounts reimbursed by the investment adviser or reductions from expense offset arrangements and do not represent the amount paid by the class during periods when reimbursements or reductions occur. Expenses net of fee waivers reflect expenses after reimbursement by the investment adviser but prior to reductions from expense offset arrangements. Expenses net of all reductions represent the net expenses paid by the class but do not include expenses of the investment companies in which the Fund invests.
F Total distributions of $.50 per share is comprised of distributions from net investment income of $.173 and distributions from net realized gain of $.325 per share.
G Total distributions of $.21 per share is comprised of distributions from net investment income of $.124 and distributions from net realized gain of $.082 per share.
H Total distributions of $.23 per share is comprised of distributions from net investment income of $.073 and distributions from net realized gain of $.154 per share.
See accompanying notes which are an integral part of the financial statements.
Annual Report
Financial Highlights - Class C
Years ended March 31, | 2013 | 2012 | 2011 | 2010 | 2009 |
Selected Per-Share Data | | | | | |
Net asset value, beginning of period | $ 11.77 | $ 11.79 | $ 10.74 | $ 8.00 | $ 11.76 |
Income from Investment Operations | | | | | |
Net investment income (loss) C | .07 | .09 | .07 | .13 | .19 |
Net realized and unrealized gain (loss) | .71 | .13 | 1.15 | 2.82 | (3.45) |
Total from investment operations | .78 | .22 | 1.22 | 2.95 | (3.26) |
Distributions from net investment income | (.07) | (.09) | (.07) | (.13) | (.18) |
Distributions from net realized gain | (.09) | (.15) | (.10) | (.08) | (.33) |
Total distributions | (.16) | (.24) | (.17) | (.21) G | (.50) F |
Net asset value, end of period | $ 12.39 | $ 11.77 | $ 11.79 | $ 10.74 | $ 8.00 |
Total Return A,B | 6.70% | 1.98% | 11.49% | 36.97% | (28.53)% |
Ratios to Average Net Assets D,E | | | | | |
Expenses before reductions | 1.00% | 1.00% | 1.00% | 1.00% | 1.00% |
Expenses net of fee waivers, if any | 1.00% | 1.00% | 1.00% | 1.00% | 1.00% |
Expenses net of all reductions | 1.00% | 1.00% | 1.00% | 1.00% | 1.00% |
Net investment income (loss) | .61% | .75% | .67% | 1.27% | 1.94% |
Supplemental Data | | | | | |
Net assets, end of period (000 omitted) | $ 72,115 | $ 70,220 | $ 70,396 | $ 64,801 | $ 46,942 |
Portfolio turnover rate | 20% | 19% | 33% | 29% | 36% |
A Total returns would have been lower if certain expenses had not been reduced during the applicable periods shown.
B Total returns do not include the effect of the contingent deferred sales charge.
C Calculated based on average shares outstanding during the period.
D Amounts do not include the activity of the Underlying Funds.
E Expense ratios reflect operating expenses of the class. Expenses before reductions do not reflect amounts reimbursed by the investment adviser or reductions from expense offset arrangements and do not represent the amount paid by the class during periods when reimbursements or reductions occur. Expenses net of fee waivers reflect expenses after reimbursement by the investment adviser but prior to reductions from expense offset arrangements. Expenses net of all reductions represent the net expenses paid by the class but do not include expenses of the investment companies in which the Fund invests.
F Total distributions of $.50 per share is comprised of distributions from net investment income of $.179 and distributions from net realized gain of $.325 per share.
G Total distributions of $.21 per share is comprised of distributions from net investment income of $.126 and distributions from net realized gain of $.082 per share.
Financial Highlights - Institutional Class
Years ended March 31, | 2013 | 2012 | 2011 | 2010 | 2009 |
Selected Per-Share Data | | | | | |
Net asset value, beginning of period | $ 11.93 | $ 11.94 | $ 10.87 | $ 8.09 | $ 11.91 |
Income from Investment Operations | | | | | |
Net investment income (loss) B | .19 | .20 | .19 | .23 | .29 |
Net realized and unrealized gain (loss) | .72 | .14 | 1.17 | 2.85 | (3.50) |
Total from investment operations | .91 | .34 | 1.36 | 3.08 | (3.21) |
Distributions from net investment income | (.19) | (.19) | (.19) | (.22) | (.29) |
Distributions from net realized gain | (.09) | (.15) | (.10) | (.08) | (.33) |
Total distributions | (.28) | (.35) H | (.29) | (.30) G | (.61) F |
Net asset value, end of period | $ 12.56 | $ 11.93 | $ 11.94 | $ 10.87 | $ 8.09 |
Total Return A | 7.74% | 3.01% | 12.67% | 38.30% | (27.85)% |
Ratios to Average Net Assets C,E | | | | | |
Expenses before reductions D | .00% | .00% | .00% | .00% | .00% |
Expenses net of fee waivers, if any | .00% | .00% | .00% | .00% | .00% |
Expenses net of all reductions | .00% | .00% | .00% | .00% | .00% |
Net investment income (loss) | 1.61% | 1.75% | 1.67% | 2.27% | 2.94% |
Supplemental Data | | | | | |
Net assets, end of period (000 omitted) | $ 467,604 | $ 348,068 | $ 238,655 | $ 137,487 | $ 77,998 |
Portfolio turnover rate | 20% | 19% | 33% | 29% | 36% |
A Total returns would have been lower if certain expenses had not been reduced during the applicable periods shown.
B Calculated based on average shares outstanding during the period.
C Amounts do not include the activity of the Underlying Funds.
D Amount represents less than .01%.
E Expense ratios reflect operating expenses of the class. Expenses before reductions do not reflect amounts reimbursed by the investment adviser or reductions from expense offset arrangements and do not represent the amount paid by the class during periods when reimbursements or reductions occur. Expenses net of fee waivers reflect expenses after reimbursement by the investment adviser but prior to reductions from expense offset arrangements. Expenses net of all reductions represent the net expenses paid by the class but do not include expenses of the investment companies in which the Fund invests.
F Total distributions of $.61 per share is comprised of distributions from net investment income of $.286 and distributions from net realized gain of $.325 per share.
G Total distributions of $.30 per share is comprised of distributions from net investment income of $.219 and distributions from net realized gain of $.082 per share.
H Total distributions of $.35 per share is comprised of distributions from net investment income of $.194 and distributions from net realized gain of $.154 per share.
See accompanying notes which are an integral part of the financial statements.
Annual Report
Fidelity Advisor Freedom 2020 Fund
Investment Changes (Unaudited)
The information in the following tables is based on the direct investments of the Fund. |
Fund Holdings as of March 31, 2013 |
| % of fund's
net assets | % of fund's net assets
6 months ago |
Commodity Funds | | |
Fidelity Series Commodity Strategy Fund | 5.9 | 6.3 |
Domestic Equity Funds | | |
Fidelity Advisor Equity Growth Fund Institutional Class | 4.7 | 4.2 |
Fidelity Advisor Growth & Income Fund Institutional Class | 2.5 | 5.1 |
Fidelity Advisor Large Cap Fund Institutional Class | 2.5 | 4.7 |
Fidelity Advisor Series Equity-Income Fund | 3.4 | 0.0 |
Fidelity Advisor Series Mega Cap Fund | 0.8 | 0.0 |
Fidelity Advisor Series Opportunistic Insights Fund | 2.4 | 0.0 |
Fidelity Advisor Series Stock Selector Large Cap Value Fund | 3.4 | 0.0 |
Fidelity Advisor Small Cap Fund Institutional Class | 1.9 | 1.7 |
Fidelity Series 100 Index Fund | 0.8 | 3.4 |
Fidelity Series All-Sector Equity Fund | 6.3 | 7.3 |
Fidelity Series Large Cap Value Fund | 3.6 | 6.9 |
Fidelity Series Real Estate Equity Fund | 0.5 | 0.5 |
Fidelity Series Small Cap Opportunities Fund | 2.2 | 1.8 |
| 35.0 | 35.6 |
Developed International Equity Funds | | |
Fidelity Series International Growth Fund | 5.2 | 5.4 |
Fidelity Series International Small Cap Fund | 1.1 | 1.1 |
Fidelity Series International Value Fund | 5.2 | 5.3 |
| 11.5 | 11.8 |
Emerging Markets Equity Funds | | |
Fidelity Series Emerging Markets Fund | 3.2 | 3.3 |
High Yield Bond Funds | | |
Fidelity Series Emerging Markets Debt Fund | 0.7 | 0.6 |
Fidelity Series Floating Rate High Income Fund | 1.1 | 1.0 |
Fidelity Series High Income Fund | 5.4 | 5.7 |
Fidelity Series Real Estate Income Fund | 0.6 | 0.5 |
| 7.8 | 7.8 |
Inflation-Protected Bond Funds | | |
Fidelity Series Inflation-Protected Bond Index Fund | 8.2 | 8.2 |
Investment Grade Bond Funds | | |
Fidelity Series Investment Grade Bond Fund | 21.7 | 21.3 |
Short-Term Funds | | |
Fidelity Advisor Short Fixed-Income Fund Institutional Class | 3.0 | 2.6 |
Fidelity Institutional Money Market Portfolio Institutional Class | 3.7 | 3.1 |
| 6.7 | 5.7 |
Net Other Assets (Liabilities)* | 0.0 | 0.0 |
| 100.0 | 100.0 |
* Amount represents less than 0.1%
Asset Allocation (% of fund's net assets) |
Period end |
| Commodity Funds | 5.9% | |
| Domestic Equity Funds | 35.0% | |
| Developed International Equity Funds | 11.5% | |
| Emerging Markets
Equity Funds | 3.2% | |
| High Yield Bond Funds | 7.8% | |
| Inflation-Protected
Bond Funds | 8.2% | |
| Investment Grade
Bond Funds | 21.7% | |
| Short-Term Funds | 6.7% | |

Six months ago |
| Commodity Funds | 6.3% | |
| Domestic Equity Funds | 35.6% | |
| Developed International Equity Funds | 11.8% | |
| Emerging Markets
Equity Funds | 3.3% | |
| High Yield Bond Funds | 7.8% | |
| Inflation-Protected
Bond Funds | 8.2% | |
| Investment Grade
Bond Funds | 21.3% | |
| Short-Term Funds | 5.7% | |

Expected |
| Commodity Funds | 5.9% | |
| Domestic Equity Funds | 33.4% | |
| Developed International Equity Funds | 11.0% | |
| Emerging Markets
Equity Funds | 3.3% | |
| High Yield Bond Funds | 5.5% | |
| Inflation-Protected
Bond Funds | 9.0% | |
| Investment Grade
Bond Funds | 24.2% | |
| Short-Term Funds | 7.7% | |

The fund invests according to an asset allocation strategy that becomes increasingly conservative over time. The six months ago allocation is based on the fund's holdings as of September 30, 2012. The current allocation is based on the fund's holdings as of March 31, 2013. The expected allocation represents the fund's anticipated allocation at September 30, 2013. |
Annual Report
Fidelity Advisor Freedom 2020 Fund
Investments March 31, 2013
Showing Percentage of Net Assets
Domestic Equity Funds - 40.9% |
| Shares | | Value |
Commodity Funds - 5.9% |
Fidelity Series Commodity Strategy Fund (a) | 22,205,638 | | $ 192,966,991 |
Domestic Equity Funds - 35.0% |
Fidelity Advisor Equity Growth Fund Institutional Class | 2,180,536 | | 154,490,981 |
Fidelity Advisor Growth & Income Fund Institutional Class | 3,723,526 | | 82,252,688 |
Fidelity Advisor Large Cap Fund Institutional Class | 3,487,502 | | 82,897,919 |
Fidelity Advisor Series Equity-Income Fund | 10,072,087 | | 112,102,324 |
Fidelity Advisor Series Mega Cap Fund | 2,267,571 | | 25,056,657 |
Fidelity Advisor Series Opportunistic Insights Fund | 7,185,655 | | 79,114,060 |
Fidelity Advisor Series Stock Selector Large Cap Value Fund | 10,052,969 | | 112,492,720 |
Fidelity Advisor Small Cap Fund Institutional Class | 2,345,768 | | 63,218,442 |
Fidelity Series 100 Index Fund | 2,472,874 | | 25,520,060 |
Fidelity Series All-Sector Equity Fund | 16,039,281 | | 206,104,762 |
Fidelity Series Large Cap Value Fund | 10,075,488 | | 117,278,679 |
Fidelity Series Real Estate Equity Fund | 1,349,681 | | 17,572,853 |
Fidelity Series Small Cap Opportunities Fund | 5,966,912 | | 73,572,021 |
TOTAL DOMESTIC EQUITY FUNDS | | 1,151,674,166 |
TOTAL DOMESTIC EQUITY FUNDS (Cost $1,203,914,650) |
1,344,641,157
|
International Equity Funds - 14.7% |
| | | |
Developed International Equity Funds - 11.5% |
Fidelity Series International Growth Fund | 13,634,875 | | 172,481,169 |
Fidelity Series International Small Cap Fund | 2,557,871 | | 35,093,991 |
Fidelity Series International Value Fund | 17,401,242 | | 170,880,200 |
TOTAL DEVELOPED INTERNATIONAL EQUITY FUNDS | | 378,455,360 |
Emerging Markets Equity Funds - 3.2% |
Fidelity Series Emerging Markets Fund | 6,226,379 | | 104,167,314 |
TOTAL INTERNATIONAL EQUITY FUNDS (Cost $426,783,330) |
482,622,674
|
Bond Funds - 37.7% |
| Shares | | Value |
High Yield Bond Funds - 7.8% |
Fidelity Series Emerging Markets Debt Fund | 2,235,611 | | $ 24,323,444 |
Fidelity Series Floating Rate High Income Fund | 3,331,878 | | 35,417,859 |
Fidelity Series High Income Fund | 16,774,387 | | 176,298,804 |
Fidelity Series Real Estate Income Fund | 1,650,206 | | 19,257,908 |
TOTAL HIGH YIELD BOND FUNDS | | 255,298,015 |
Inflation-Protected Bond Funds - 8.2% |
Fidelity Series Inflation-Protected Bond Index Fund | 23,738,799 | | 270,384,921 |
Investment Grade Bond Funds - 21.7% |
Fidelity Series Investment Grade Bond Fund | 61,935,384 | | 714,114,976 |
TOTAL BOND FUNDS (Cost $1,202,133,103) |
1,239,797,912
|
Short-Term Funds - 6.7% |
| | | |
Fidelity Advisor Short Fixed-Income Fund Institutional Class | 10,659,110 | | 99,769,271 |
Fidelity Institutional Money Market Portfolio Institutional Class | 121,613,151 | | 121,613,151 |
TOTAL SHORT-TERM FUNDS (Cost $220,217,039) |
221,382,422
|
TOTAL INVESTMENT PORTFOLIO - 100.0% (Cost $3,053,048,122) | | 3,288,444,165 |
NET OTHER ASSETS (LIABILITIES) - 0.0% | | (662,527) |
NET ASSETS - 100% | $ 3,287,781,638 |
Legend |
(a) Non-income producing |
Other Information |
All investments are categorized as Level 1 under the Fair Value Hierarchy. The inputs or methodology used for valuing securities may not be an indication of the risk associated with investing in those securities. For more information on valuation inputs, please refer to the Security Valuation section in the accompanying Notes to Financial Statements. |
See accompanying notes which are an integral part of the financial statements.
Annual Report
Fidelity Advisor Freedom 2020 Fund
Statement of Assets and Liabilities
| March 31, 2013 |
| | |
Assets | | |
Investment in securities, at value (cost $3,053,048,122) - See accompanying schedule | | $ 3,288,444,165 |
Receivable for investments sold | | 2,986,085 |
Receivable for fund shares sold | | 3,237,827 |
Receivable from affiliate for expense reductions | | 1,966 |
Total assets | | 3,294,670,043 |
| | |
Liabilities | | |
Payable for investments purchased | $ 174,600 | |
Payable for fund shares redeemed | 6,019,111 | |
Distribution and service plan fees payable | 694,694 | |
Total liabilities | | 6,888,405 |
| | |
Net Assets | | $ 3,287,781,638 |
Net Assets consist of: | | |
Paid in capital | | $ 2,989,884,201 |
Undistributed net investment income | | 4,825,219 |
Accumulated undistributed net realized gain (loss) on investments | | 57,676,175 |
Net unrealized appreciation (depreciation) on investments | | 235,396,043 |
Net Assets | | $ 3,287,781,638 |
| | |
Calculation of Maximum Offering Price Class A:
Net Asset Value and redemption price per share ($1,944,690,613 ÷ 148,981,246 shares) | | $ 13.05 |
| | |
Maximum offering price per share (100/94.25 of $13.05) | | $ 13.85 |
Class T:
Net Asset Value and redemption price per share ($430,153,411 ÷ 32,957,754 shares) | | $ 13.05 |
| | |
Maximum offering price per share (100/96.50 of $13.05) | | $ 13.52 |
Class B:
Net Asset Value and offering price per share ($33,074,388 ÷ 2,536,879 shares)A | | $ 13.04 |
| | |
Class C:
Net Asset Value and offering price per share ($102,575,578 ÷ 7,905,794 shares)A | | $ 12.97 |
| | |
Institutional Class:
Net Asset Value, offering price and redemption price per share ($777,287,648 ÷ 59,167,648 shares) | | $ 13.14 |
A Redemption price per share is equal to net asset value less any applicable contingent deferred sales charge.
Statement of Operations
| Year ended March 31, 2013 |
| | |
Investment Income | | |
Income distributions from underlying funds | | $ 50,395,124 |
| | |
Expenses | | |
Distribution and service plan fees | $ 7,854,830 | |
Independent trustees' compensation | 10,736 | |
Total expenses before reductions | 7,865,566 | |
Expense reductions | (10,736) | 7,854,830 |
Net investment income (loss) | | 42,540,294 |
Realized and Unrealized Gain (Loss) Realized gain (loss) on sale of underlying fund shares | 96,112,685 | |
Capital gain distributions from underlying funds | 67,046,834 | |
Total net realized gain (loss) | | 163,159,519 |
Change in net unrealized appreciation (depreciation) on underlying funds | | 31,602,843 |
Net gain (loss) | | 194,762,362 |
Net increase (decrease) in net assets resulting from operations | | $ 237,302,656 |
See accompanying notes which are an integral part of the financial statements.
Annual Report
Statement of Changes in Net Assets
| Year ended
March 31,
2013 | Year ended
March 31,
2012 |
Increase (Decrease) in Net Assets | | |
Operations | | |
Net investment income (loss) | $ 42,540,294 | $ 38,367,434 |
Net realized gain (loss) | 163,159,519 | 115,708,832 |
Change in net unrealized appreciation (depreciation) | 31,602,843 | (89,788,111) |
Net increase (decrease) in net assets resulting from operations | 237,302,656 | 64,288,155 |
Distributions to shareholders from net investment income | (42,626,632) | (36,847,353) |
Distributions to shareholders from net realized gain | (20,099,722) | (37,208,864) |
Total distributions | (62,726,354) | (74,056,217) |
Share transactions - net increase (decrease) | 290,138,617 | 322,693,501 |
Total increase (decrease) in net assets | 464,714,919 | 312,925,439 |
| | |
Net Assets | | |
Beginning of period | 2,823,066,719 | 2,510,141,280 |
End of period (including undistributed net investment income of $4,825,219 and undistributed net investment income of $4,911,557, respectively) | $ 3,287,781,638 | $ 2,823,066,719 |
Financial Highlights - Class A
Years ended March 31, | 2013 | 2012 | 2011 | 2010 | 2009 |
Selected Per-Share Data | | | | | |
Net asset value, beginning of period | $ 12.35 | $ 12.45 | $ 11.21 | $ 7.97 | $ 12.73 |
Income from Investment Operations | | | | | |
Net investment income (loss) C | .18 | .19 | .16 | .20 | .25 |
Net realized and unrealized gain (loss) | .78 | .06 | 1.36 | 3.32 | (4.33) |
Total from investment operations | .96 | .25 | 1.52 | 3.52 | (4.08) |
Distributions from net investment income | (.18) | (.18) | (.17) | (.19) | (.25) |
Distributions from net realized gain | (.08) | (.18) | (.11) | (.09) | (.43) |
Total distributions | (.26) | (.35) G | (.28) | (.28) F | (.68) |
Net asset value, end of period | $ 13.05 | $ 12.35 | $ 12.45 | $ 11.21 | $ 7.97 |
Total Return A,B | 7.91% | 2.23% | 13.73% | 44.32% | (33.34)% |
Ratios to Average Net Assets D,E | | | | | |
Expenses before reductions | .25% | .25% | .25% | .25% | .25% |
Expenses net of fee waivers, if any | .25% | .25% | .25% | .25% | .25% |
Expenses net of all reductions | .25% | .25% | .25% | .25% | .25% |
Net investment income (loss) | 1.44% | 1.55% | 1.43% | 1.92% | 2.49% |
Supplemental Data | | | | | |
Net assets, end of period (000 omitted) | $ 1,944,691 | $ 1,740,500 | $ 1,557,402 | $ 1,238,015 | $ 677,210 |
Portfolio turnover rate | 21% | 18% | 39% | 26% | 31% |
A Total returns would have been lower if certain expenses had not been reduced during the applicable periods shown.
B Total returns do not include the effect of the sales charges.
C Calculated based on average shares outstanding during the period.
D Amounts do not include the activity of the Underlying Funds.
E Expense ratios reflect operating expenses of the class. Expenses before reductions do not reflect amounts reimbursed by the investment adviser or reductions from expense offset arrangements and do not represent the amount paid by the class during periods when reimbursements or reductions occur. Expenses net of fee waivers reflect expenses after reimbursement by the investment adviser but prior to reductions from expense offset arrangements. Expenses net of all reductions represent the net expenses paid by the class but do not include expenses of the investment companies in which the Fund invests.
F Total distributions of $.28 per share is comprised of distributions from net investment income of $.189 and distributions from net realized gain of $.087 per share.
G Total distributions of $.35 per share is comprised of distributions from net investment income of $.178 and distributions from net realized gain of $.175 per share.
See accompanying notes which are an integral part of the financial statements.
Annual Report
Financial Highlights - Class T
Years ended March 31, | 2013 | 2012 | 2011 | 2010 | 2009 |
Selected Per-Share Data | | | | | |
Net asset value, beginning of period | $ 12.34 | $ 12.45 | $ 11.20 | $ 7.96 | $ 12.72 |
Income from Investment Operations | | | | | |
Net investment income (loss) C | .15 | .16 | .13 | .17 | .23 |
Net realized and unrealized gain (loss) | .79 | .05 | 1.37 | 3.32 | (4.34) |
Total from investment operations | .94 | .21 | 1.50 | 3.49 | (4.11) |
Distributions from net investment income | (.15) | (.15) | (.13) | (.16) | (.22) |
Distributions from net realized gain | (.08) | (.18) | (.11) | (.09) | (.43) |
Total distributions | (.23) | (.32) H | (.25) G | (.25) F | (.65) |
Net asset value, end of period | $ 13.05 | $ 12.34 | $ 12.45 | $ 11.20 | $ 7.96 |
Total Return A,B | 7.72% | 1.86% | 13.50% | 44.02% | (33.56)% |
Ratios to Average Net Assets D,E | | | | | |
Expenses before reductions | .50% | .50% | .50% | .50% | .50% |
Expenses net of fee waivers, if any | .50% | .50% | .50% | .50% | .50% |
Expenses net of all reductions | .50% | .50% | .50% | .50% | .50% |
Net investment income (loss) | 1.19% | 1.30% | 1.18% | 1.67% | 2.24% |
Supplemental Data | | | | | |
Net assets, end of period (000 omitted) | $ 430,153 | $ 386,416 | $ 424,707 | $ 488,097 | $ 343,919 |
Portfolio turnover rate | 21% | 18% | 39% | 26% | 31% |
A Total returns would have been lower if certain expenses had not been reduced during the applicable periods shown.
B Total returns do not include the effect of the sales charges.
C Calculated based on average shares outstanding during the period.
D Amounts do not include the activity of the Underlying Funds.
E Expense ratios reflect operating expenses of the class. Expenses before reductions do not reflect amounts reimbursed by the investment adviser or reductions from expense offset arrangements and do not represent the amount paid by the class during periods when reimbursements or reductions occur. Expenses net of fee waivers reflect expenses after reimbursement by the investment adviser but prior to reductions from expense offset arrangements. Expenses net of all reductions represent the net expenses paid by the class but do not include expenses of the investment companies in which the Fund invests.
F Total distributions of $.25 per share is comprised of distributions from net investment income of $.163 and distributions from net realized gain of $.087 per share.
G Total distributions of $.25 per share is comprised of distributions from net investment income of $.134 and distributions from net realized gain of $.111 per share.
H Total distributions of $.32 per share is comprised of distributions from net investment income of $.145 and distributions from net realized gain of $.175 per share.
Financial Highlights - Class B
Years ended March 31, | 2013 | 2012 | 2011 | 2010 | 2009 |
Selected Per-Share Data | | | | | |
Net asset value, beginning of period | $ 12.32 | $ 12.41 | $ 11.17 | $ 7.94 | $ 12.66 |
Income from Investment Operations | | | | | |
Net investment income (loss) C | .09 | .10 | .08 | .12 | .18 |
Net realized and unrealized gain (loss) | .79 | .06 | 1.35 | 3.31 | (4.31) |
Total from investment operations | .88 | .16 | 1.43 | 3.43 | (4.13) |
Distributions from net investment income | (.08) | (.08) | (.08) | (.12) | (.16) |
Distributions from net realized gain | (.08) | (.17) | (.11) | (.09) | (.43) |
Total distributions | (.16) | (.25) | (.19) | (.20) F | (.59) |
Net asset value, end of period | $ 13.04 | $ 12.32 | $ 12.41 | $ 11.17 | $ 7.94 |
Total Return A,B | 7.19% | 1.39% | 12.87% | 43.34% | (33.87)% |
Ratios to Average Net Assets D,E | | | | | |
Expenses before reductions | 1.00% | 1.00% | 1.00% | 1.00% | 1.00% |
Expenses net of fee waivers, if any | 1.00% | 1.00% | 1.00% | 1.00% | 1.00% |
Expenses net of all reductions | 1.00% | 1.00% | 1.00% | 1.00% | 1.00% |
Net investment income (loss) | .69% | .80% | .68% | 1.17% | 1.74% |
Supplemental Data | | | | | |
Net assets, end of period (000 omitted) | $ 33,074 | $ 43,138 | $ 61,856 | $ 71,888 | $ 52,871 |
Portfolio turnover rate | 21% | 18% | 39% | 26% | 31% |
A Total returns would have been lower if certain expenses had not been reduced during the applicable periods shown.
B Total returns do not include the effect of the contingent deferred sales charge.
C Calculated based on average shares outstanding during the period.
D Amounts do not include the activity of the Underlying Funds.
E Expense ratios reflect operating expenses of the class. Expenses before reductions do not reflect amounts reimbursed by the investment adviser or reductions from expense offset arrangements and do not represent the amount paid by the class during periods when reimbursements or reductions occur. Expenses net of fee waivers reflect expenses after reimbursement by the investment adviser but prior to reductions from expense offset arrangements. Expenses net of all reductions represent the net expenses paid by the class but do not include expenses of the investment companies in which the Fund invests.
F Total distributions of $.20 per share is comprised of distributions from net investment income of $.115 and distributions from net realized gain of $.087 per share.
See accompanying notes which are an integral part of the financial statements.
Annual Report
Financial Highlights - Class C
Years ended March 31, | 2013 | 2012 | 2011 | 2010 | 2009 |
Selected Per-Share Data | | | | | |
Net asset value, beginning of period | $ 12.27 | $ 12.37 | $ 11.14 | $ 7.92 | $ 12.64 |
Income from Investment Operations | | | | | |
Net investment income (loss) C | .09 | .10 | .08 | .12 | .18 |
Net realized and unrealized gain (loss) | .78 | .06 | 1.34 | 3.31 | (4.31) |
Total from investment operations | .87 | .16 | 1.42 | 3.43 | (4.13) |
Distributions from net investment income | (.08) | (.09) | (.08) | (.12) | (.16) |
Distributions from net realized gain | (.08) | (.17) | (.11) | (.09) | (.43) |
Total distributions | (.17) G | (.26) | (.19) | (.21) F | (.59) |
Net asset value, end of period | $ 12.97 | $ 12.27 | $ 12.37 | $ 11.14 | $ 7.92 |
Total Return A,B | 7.13% | 1.43% | 12.89% | 43.38% | (33.90)% |
Ratios to Average Net Assets D,E | | | | | |
Expenses before reductions | 1.00% | 1.00% | 1.00% | 1.00% | 1.00% |
Expenses net of fee waivers, if any | 1.00% | 1.00% | 1.00% | 1.00% | 1.00% |
Expenses net of all reductions | 1.00% | 1.00% | 1.00% | 1.00% | 1.00% |
Net investment income (loss) | .69% | .80% | .68% | 1.17% | 1.74% |
Supplemental Data | | | | | |
Net assets, end of period (000 omitted) | $ 102,576 | $ 97,550 | $ 101,019 | $ 93,237 | $ 62,702 |
Portfolio turnover rate | 21% | 18% | 39% | 26% | 31% |
A Total returns would have been lower if certain expenses had not been reduced during the applicable periods shown.
B Total returns do not include the effect of the contingent deferred sales charge.
C Calculated based on average shares outstanding during the period.
D Amounts do not include the activity of the Underlying Funds.
E Expense ratios reflect operating expenses of the class. Expenses before reductions do not reflect amounts reimbursed by the investment adviser or reductions from expense offset arrangements and do not represent the amount paid by the class during periods when reimbursements or reductions occur. Expenses net of fee waivers reflect expenses after reimbursement by the investment adviser but prior to reductions from expense offset arrangements. Expenses net of all reductions represent the net expenses paid by the class but do not include expenses of the investment companies in which the Fund invests.
F Total distributions of $.21 per share is comprised of distributions from net investment income of $.119 and distributions from net realized gain of $.087 per share.
G Total distributions of $.17 per share is comprised of distributions from net investment income of $.084 and distributions from net realized gain of $.083 per share.
Financial Highlights - Institutional Class
Years ended March 31, | 2013 | 2012 | 2011 | 2010 | 2009 |
Selected Per-Share Data | | | | | |
Net asset value, beginning of period | $ 12.42 | $ 12.53 | $ 11.27 | $ 8.01 | $ 12.79 |
Income from Investment Operations | | | | | |
Net investment income (loss) B | .21 | .22 | .19 | .22 | .28 |
Net realized and unrealized gain (loss) | .80 | .05 | 1.38 | 3.34 | (4.35) |
Total from investment operations | 1.01 | .27 | 1.57 | 3.56 | (4.07) |
Distributions from net investment income | (.21) | (.21) | (.20) | (.21) | (.28) |
Distributions from net realized gain | (.08) | (.18) | (.11) | (.09) | (.43) |
Total distributions | (.29) | (.38) G | (.31) | (.30) F | (.71) |
Net asset value, end of period | $ 13.14 | $ 12.42 | $ 12.53 | $ 11.27 | $ 8.01 |
Total Return A | 8.28% | 2.39% | 14.09% | 44.65% | (33.16)% |
Ratios to Average Net Assets C,E | | | | | |
Expenses before reductions D | .00% | .00% | .00% | .00% | .00% |
Expenses net of fee waivers, if any | .00% | .00% | .00% | .00% | .00% |
Expenses net of all reductions | .00% | .00% | .00% | .00% | .00% |
Net investment income (loss) | 1.69% | 1.80% | 1.68% | 2.17% | 2.74% |
Supplemental Data | | | | | |
Net assets, end of period (000 omitted) | $ 777,288 | $ 555,462 | $ 365,157 | $ 214,905 | $ 105,660 |
Portfolio turnover rate | 21% | 18% | 39% | 26% | 31% |
A Total returns would have been lower if certain expenses had not been reduced during the applicable periods shown.
B Calculated based on average shares outstanding during the period.
C Amounts do not include the activity of the Underlying Funds.
D Amount represents less than .01%.
E Expense ratios reflect operating expenses of the class. Expenses before reductions do not reflect amounts reimbursed by the investment adviser or reductions from expense offset arrangements and do not represent the amount paid by the class during periods when reimbursements or reductions occur. Expenses net of fee waivers reflect expenses after reimbursement by the investment adviser but prior to reductions from expense offset arrangements. Expenses net of all reductions represent the net expenses paid by the class but do not include expenses of the investment companies in which the Fund invests.
F Total distributions of $.30 per share is comprised of distributions from net investment income of $.211 and distributions from net realized gain of $.087 per share.
G Total distributions of $.38 per share is comprised of distributions from net investment income of $.208 and distributions from net realized gain of $.175 per share.
See accompanying notes which are an integral part of the financial statements.
Annual Report
Fidelity Advisor Freedom 2025 Fund
Investment Changes (Unaudited)
The information in the following tables is based on the direct investments of the Fund. |
Fund Holdings as of March 31, 2013 |
| % of fund's
net assets | % of fund's net assets
6 months ago |
Commodity Funds | | |
Fidelity Series Commodity Strategy Fund | 7.2 | 7.5 |
Domestic Equity Funds | | |
Fidelity Advisor Equity Growth Fund Institutional Class | 5.8 | 5.1 |
Fidelity Advisor Growth & Income Fund Institutional Class | 3.1 | 6.1 |
Fidelity Advisor Large Cap Fund Institutional Class | 3.1 | 5.6 |
Fidelity Advisor Series Equity-Income Fund | 4.1 | 0.0 |
Fidelity Advisor Series Mega Cap Fund | 0.9 | 0.0 |
Fidelity Advisor Series Opportunistic Insights Fund | 2.9 | 0.0 |
Fidelity Advisor Series Stock Selector Large Cap Value Fund | 4.1 | 0.0 |
Fidelity Advisor Small Cap Fund Institutional Class | 2.4 | 2.0 |
Fidelity Series 100 Index Fund | 0.9 | 4.1 |
Fidelity Series All-Sector Equity Fund | 7.6 | 8.7 |
Fidelity Series Large Cap Value Fund | 4.3 | 8.2 |
Fidelity Series Real Estate Equity Fund | 0.6 | 0.6 |
Fidelity Series Small Cap Opportunities Fund | 2.8 | 2.1 |
| 42.6 | 42.5 |
Developed International Equity Funds | | |
Fidelity Series International Growth Fund | 6.4 | 6.4 |
Fidelity Series International Small Cap Fund | 1.3 | 1.3 |
Fidelity Series International Value Fund | 6.3 | 6.4 |
| 14.0 | 14.1 |
Emerging Markets Equity Funds | | |
Fidelity Series Emerging Markets Fund | 3.8 | 4.0 |
High Yield Bond Funds | | |
Fidelity Series Emerging Markets Debt Fund | 0.7 | 0.6 |
Fidelity Series Floating Rate High Income Fund | 0.9 | 0.8 |
Fidelity Series High Income Fund | 6.9 | 6.9 |
Fidelity Series Real Estate Income Fund | 0.6 | 0.4 |
| 9.1 | 8.7 |
Inflation-Protected Bond Funds | | |
Fidelity Series Inflation-Protected Bond Index Fund | 5.4 | 5.3 |
Investment Grade Bond Funds | | |
Fidelity Series Investment Grade Bond Fund | 17.2 | 17.4 |
Short-Term Funds | | |
Fidelity Advisor Short Fixed-Income Fund Institutional Class | 0.3 | 0.2 |
Fidelity Institutional Money Market Portfolio Institutional Class | 0.4 | 0.3 |
| 0.7 | 0.5 |
Net Other Assets (Liabilities)* | 0.0 | 0.0 |
| 100.0 | 100.0 |
* Amount represents less than 0.1% |
Asset Allocation (% of fund's net assets) |
Period end |
| Commodity Funds | 7.2% | |
| Domestic Equity Funds | 42.6% | |
| Developed International Equity Funds | 14.0% | |
| Emerging Markets
Equity Funds | 3.8% | |
| High Yield Bond Funds | 9.1% | |
| Inflation-Protected
Bond Funds | 5.4% | |
| Investment Grade
Bond Funds | 17.2% | |
| Short-Term Funds | 0.7% | |

Six months ago |
| Commodity Funds | 7.5% | |
| Domestic Equity Funds | 42.5% | |
| Developed International Equity Funds | 14.1% | |
| Emerging Markets
Equity Funds | 4.0% | |
| High Yield Bond Funds | 8.7% | |
| Inflation-Protected
Bond Funds | 5.3% | |
| Investment Grade
Bond Funds | 17.4% | |
| Short-Term Funds | 0.5% | |

Expected |
| Commodity Funds | 7.3% | |
| Domestic Equity Funds | 41.1% | |
| Developed International Equity Funds | 13.6% | |
| Emerging Markets
Equity Funds | 4.0% | |
| High Yield Bond Funds | 7.3% | |
| Inflation-Protected
Bond Funds | 6.1% | |
| Investment Grade
Bond Funds | 19.5% | |
| Short-Term Funds | 1.1% | |

The fund invests according to an asset allocation strategy that becomes increasingly conservative over time. The six months ago allocation is based on the fund's holdings as of September 30, 2012. The current allocation is based on the fund's holdings as of March 31, 2013. The expected allocation represents the fund's anticipated allocation at September 30, 2013. |
Annual Report
Fidelity Advisor Freedom 2025 Fund
Investments March 31, 2013
Showing Percentage of Net Assets
Domestic Equity Funds - 49.8% |
| Shares | | Value |
Commodity Funds - 7.2% |
Fidelity Series Commodity Strategy Fund (a) | 24,163,564 | | $ 209,981,372 |
Domestic Equity Funds - 42.6% |
Fidelity Advisor Equity Growth Fund Institutional Class | 2,374,348 | | 168,222,574 |
Fidelity Advisor Growth & Income Fund Institutional Class | 4,043,660 | | 89,324,444 |
Fidelity Advisor Large Cap Fund Institutional Class | 3,792,063 | | 90,137,343 |
Fidelity Advisor Series Equity-Income Fund | 10,664,785 | | 118,699,060 |
Fidelity Advisor Series Mega Cap Fund | 2,378,662 | | 26,284,215 |
Fidelity Advisor Series Opportunistic Insights Fund | 7,619,323 | | 83,888,742 |
Fidelity Advisor Series Stock Selector Large Cap Value Fund | 10,684,739 | | 119,562,234 |
Fidelity Advisor Small Cap Fund Institutional Class | 2,557,499 | | 68,924,591 |
Fidelity Series 100 Index Fund | 2,693,240 | | 27,794,239 |
Fidelity Series All-Sector Equity Fund | 17,363,755 | | 223,124,251 |
Fidelity Series Large Cap Value Fund | 10,854,743 | | 126,349,210 |
Fidelity Series Real Estate Equity Fund | 1,431,424 | | 18,637,135 |
Fidelity Series Small Cap Opportunities Fund | 6,515,802 | | 80,339,838 |
TOTAL DOMESTIC EQUITY FUNDS | | 1,241,287,876 |
TOTAL DOMESTIC EQUITY FUNDS (Cost $1,314,003,581) |
1,451,269,248
|
International Equity Funds - 17.8% |
| | | |
Developed International Equity Funds - 14.0% |
Fidelity Series International Growth Fund | 14,614,189 | | 184,869,495 |
Fidelity Series International Small Cap Fund | 2,746,864 | | 37,686,968 |
Fidelity Series International Value Fund | 18,690,184 | | 183,537,602 |
TOTAL DEVELOPED INTERNATIONAL EQUITY FUNDS | | 406,094,065 |
Emerging Markets Equity Funds - 3.8% |
Fidelity Series Emerging Markets Fund | 6,666,796 | | 111,535,501 |
TOTAL INTERNATIONAL EQUITY FUNDS (Cost $459,184,814) |
517,629,566
|
Bond Funds - 31.7% |
| Shares | | Value |
High Yield Bond Funds - 9.1% |
Fidelity Series Emerging Markets Debt Fund | 1,957,971 | | $ 21,302,722 |
Fidelity Series Floating Rate High Income Fund | 2,511,371 | | 26,695,868 |
Fidelity Series High Income Fund | 19,231,692 | | 202,125,088 |
Fidelity Series Real Estate Income Fund | 1,345,736 | | 15,704,734 |
TOTAL HIGH YIELD BOND FUNDS | | 265,828,412 |
Inflation-Protected Bond Funds - 5.4% |
Fidelity Series Inflation-Protected Bond Index Fund | 13,823,933 | | 157,454,593 |
Investment Grade Bond Funds - 17.2% |
Fidelity Series Investment Grade Bond Fund | 43,482,970 | | 501,358,646 |
TOTAL BOND FUNDS (Cost $897,130,036) |
924,641,651
|
Short-Term Funds - 0.7% |
| | | |
Fidelity Advisor Short Fixed-Income Fund Institutional Class | 1,032,440 | | 9,663,635 |
Fidelity Institutional Money Market Portfolio Institutional Class | 11,776,143 | | 11,776,143 |
TOTAL SHORT-TERM FUNDS (Cost $21,396,651) |
21,439,778
|
TOTAL INVESTMENT PORTFOLIO - 100.0% (Cost $2,691,715,082) | | 2,914,980,243 |
NET OTHER ASSETS (LIABILITIES) - 0.0% | | (585,274) |
NET ASSETS - 100% | $ 2,914,394,969 |
Legend |
(a) Non-income producing |
Other Information |
All investments are categorized as Level 1 under the Fair Value Hierarchy. The inputs or methodology used for valuing securities may not be an indication of the risk associated with investing in those securities. For more information on valuation inputs, please refer to the Security Valuation section in the accompanying Notes to Financial Statements. |
See accompanying notes which are an integral part of the financial statements.
Annual Report
Fidelity Advisor Freedom 2025 Fund
Statement of Assets and Liabilities
| March 31, 2013 |
| | |
Assets | | |
Investment in securities, at value (cost $2,691,715,082) - See accompanying schedule | | $ 2,914,980,243 |
Cash | | 8 |
Receivable for investments sold | | 602,292 |
Receivable for fund shares sold | | 3,226,919 |
Receivable from affiliate for expense reductions | | 2,705 |
Total assets | | 2,918,812,167 |
| | |
Liabilities | | |
Payable for investments purchased | $ 11,846 | |
Payable for fund shares redeemed | 3,816,883 | |
Distribution and service plan fees payable | 588,469 | |
Total liabilities | | 4,417,198 |
| | |
Net Assets | | $ 2,914,394,969 |
Net Assets consist of: | | |
Paid in capital | | $ 2,606,476,849 |
Undistributed net investment income | | 4,044,954 |
Accumulated undistributed net realized gain (loss) on investments | | 80,608,005 |
Net unrealized appreciation (depreciation) on investments | | 223,265,161 |
Net Assets | | $ 2,914,394,969 |
| | |
Calculation of Maximum Offering Price Class A:
Net Asset Value and redemption price per share ($1,806,027,959 ÷ 142,014,836 shares) | | $ 12.72 |
| | |
Maximum offering price per share (100/94.25 of $12.72) | | $ 13.50 |
Class T:
Net Asset Value and redemption price per share ($324,351,528 ÷ 25,456,167 shares) | | $ 12.74 |
| | |
Maximum offering price per share (100/96.50 of $12.74) | | $ 13.20 |
Class B:
Net Asset Value and offering price per share ($23,060,838 ÷ 1,821,972 shares)A | | $ 12.66 |
| | |
Class C:
Net Asset Value and offering price per share ($74,414,909 ÷ 5,907,893 shares)A | | $ 12.60 |
| | |
Institutional Class:
Net Asset Value, offering price and redemption price per share ($686,539,735 ÷ 53,611,508 shares) | | $ 12.81 |
A Redemption price per share is equal to net asset value less any applicable contingent deferred sales charge.
Statement of Operations
| Year ended March 31, 2013 |
| | |
Investment Income | | |
Income distributions from underlying funds | | $ 45,634,334 |
| | |
Expenses | | |
Distribution and service plan fees | $ 6,390,546 | |
Independent trustees' compensation | 9,151 | |
Total expenses before reductions | 6,399,697 | |
Expense reductions | (9,151) | 6,390,546 |
Net investment income (loss) | | 39,243,788 |
Realized and Unrealized Gain (Loss) Realized gain (loss) on sale of underlying fund shares | 96,435,116 | |
Capital gain distributions from underlying funds | 58,750,408 | |
Total net realized gain (loss) | | 155,185,524 |
Change in net unrealized appreciation (depreciation) on underlying funds | | 39,571,192 |
Net gain (loss) | | 194,756,716 |
Net increase (decrease) in net assets resulting from operations | | $ 234,000,504 |
See accompanying notes which are an integral part of the financial statements.
Annual Report
Statement of Changes in Net Assets
| Year ended
March 31,
2013 | Year ended
March 31,
2012 |
Increase (Decrease) in Net Assets | | |
Operations | | |
Net investment income (loss) | $ 39,243,788 | $ 31,259,419 |
Net realized gain (loss) | 155,185,524 | 69,317,481 |
Change in net unrealized appreciation (depreciation) | 39,571,192 | (49,933,046) |
Net increase (decrease) in net assets resulting from operations | 234,000,504 | 50,643,854 |
Distributions to shareholders from net investment income | (38,848,941) | (29,784,172) |
Distributions to shareholders from net realized gain | (14,347,444) | (32,097,999) |
Total distributions | (53,196,385) | (61,882,171) |
Share transactions - net increase (decrease) | 370,631,756 | 440,882,254 |
Total increase (decrease) in net assets | 551,435,875 | 429,643,937 |
| | |
Net Assets | | |
Beginning of period | 2,362,959,094 | 1,933,315,157 |
End of period (including undistributed net investment income of $4,044,954 and undistributed net investment income of $3,650,108, respectively) | $ 2,914,394,969 | $ 2,362,959,094 |
Financial Highlights - Class A
Years ended March 31, | 2013 | 2012 | 2011 | 2010 | 2009 |
Selected Per-Share Data | | | | | |
Net asset value, beginning of period | $ 11.91 | $ 12.09 | $ 10.76 | $ 7.51 | $ 12.26 |
Income from Investment Operations | | | | | |
Net investment income (loss) C | .18 | .18 | .16 | .18 | .23 |
Net realized and unrealized gain (loss) | .88 | (.01) E | 1.43 | 3.32 | (4.36) |
Total from investment operations | 1.06 | .17 | 1.59 | 3.50 | (4.13) |
Distributions from net investment income | (.18) | (.17) | (.16) | (.17) | (.22) |
Distributions from net realized gain | (.07) | (.18) | (.11) | (.09) | (.40) |
Total distributions | (.25) | (.35) | (.26) H | (.25) G | (.62) |
Net asset value, end of period | $ 12.72 | $ 11.91 | $ 12.09 | $ 10.76 | $ 7.51 |
Total Return A, B | 9.00% | 1.61% | 14.97% | 46.86% | (34.98)% |
Ratios to Average Net Assets D, F | | | | | |
Expenses before reductions | .25% | .25% | .25% | .25% | .25% |
Expenses net of fee waivers, if any | .25% | .25% | .25% | .25% | .25% |
Expenses net of all reductions | .25% | .25% | .25% | .25% | .25% |
Net investment income (loss) | 1.54% | 1.56% | 1.42% | 1.82% | 2.41% |
Supplemental Data | | | | | |
Net assets, end of period (000 omitted) | $ 1,806,028 | $ 1,539,333 | $ 1,290,255 | $ 999,687 | $ 512,482 |
Portfolio turnover rate | 22% | 14% | 34% | 19% | 29% |
A Total returns would have been lower if certain expenses had not been reduced during the applicable periods shown.
B Total returns do not include the effect of the sales charges.
C Calculated based on average shares outstanding during the period.
D Amounts do not include the activity of the Underlying Funds.
E The amount shown for a share outstanding does not correspond with the aggregate net gain (loss) on investments for the period due to the timing of sales and repurchases of shares in relation to fluctuating market values of the investments of the Fund.
F Expense ratios reflect operating expenses of the class. Expenses before reductions do not reflect amounts reimbursed by the investment adviser or reductions from expense offset arrangements and do not represent the amount paid by the class during periods when reimbursements or reductions occur. Expenses net of fee waivers reflect expenses after reimbursement by the investment adviser but prior to reductions from expense offset arrangements. Expenses net of all reductions represent the net expenses paid by the class but do not include expenses of the investment companies in which the Fund invests.
G Total distributions of $.25 per share is comprised of distributions from net investment income of $.169 and distributions from net realized gain of $.085 per share.
H Total distributions of $.26 per share is comprised of distributions from net investment income of $.155 and distributions from net realized gain of $.106 per share.
See accompanying notes which are an integral part of the financial statements.
Annual Report
Financial Highlights - Class T
Years ended March 31, | 2013 | 2012 | 2011 | 2010 | 2009 |
Selected Per-Share Data | | | | | |
Net asset value, beginning of period | $ 11.93 | $ 12.11 | $ 10.78 | $ 7.52 | $ 12.28 |
Income from Investment Operations | | | | | |
Net investment income (loss) C | .15 | .15 | .13 | .15 | .21 |
Net realized and unrealized gain (loss) | .88 | (.01) E | 1.43 | 3.34 | (4.37) |
Total from investment operations | 1.03 | .14 | 1.56 | 3.49 | (4.16) |
Distributions from net investment income | (.15) | (.14) | (.13) | (.15) | (.20) |
Distributions from net realized gain | (.07) | (.18) | (.11) | (.09) | (.40) |
Total distributions | (.22) | (.32) | (.23) H | (.23) G | (.60) |
Net asset value, end of period | $ 12.74 | $ 11.93 | $ 12.11 | $ 10.78 | $ 7.52 |
Total Return A, B | 8.74% | 1.33% | 14.67% | 46.60% | (35.20)% |
Ratios to Average Net Assets D, F | | | | | |
Expenses before reductions | .50% | .50% | .50% | .50% | .50% |
Expenses net of fee waivers, if any | .50% | .50% | .50% | .50% | .50% |
Expenses net of all reductions | .50% | .50% | .50% | .50% | .50% |
Net investment income (loss) | 1.29% | 1.31% | 1.17% | 1.57% | 2.16% |
Supplemental Data | | | | | |
Net assets, end of period (000 omitted) | $ 324,352 | $ 257,594 | $ 258,166 | $ 230,003 | $ 139,330 |
Portfolio turnover rate | 22% | 14% | 34% | 19% | 29% |
A Total returns would have been lower if certain expenses had not been reduced during the applicable periods shown.
B Total returns do not include the effect of the sales charges.
C Calculated based on average shares outstanding during the period.
D Amounts do not include the activity of the Underlying Funds.
E The amount shown for a share outstanding does not correspond with the aggregate net gain (loss) on investments for the period due to the timing of sales and repurchases of shares in relation to fluctuating market values of the investments of the Fund.
F Expense ratios reflect operating expenses of the class. Expenses before reductions do not reflect amounts reimbursed by the investment adviser or reductions from expense offset arrangements and do not represent the amount paid by the class during periods when reimbursements or reductions occur. Expenses net of fee waivers reflect expenses after reimbursement by the investment adviser but prior to reductions from expense offset arrangements. Expenses net of all reductions represent the net expenses paid by the class but do not include expenses of the investment companies in which the Fund invests.
G Total distributions of $.23 per share is comprised of distributions from net investment income of $.146 and distributions from net realized gain of $.085 per share.
H Total distributions of $.23 per share is comprised of distributions from net investment income of $.128 and distributions from net realized gain of $.106 per share.
Financial Highlights - Class B
Years ended March 31, | 2013 | 2012 | 2011 | 2010 | 2009 |
Selected Per-Share Data | | | | | |
Net asset value, beginning of period | $ 11.84 | $ 12.01 | $ 10.70 | $ 7.47 | $ 12.17 |
Income from Investment Operations | | | | | |
Net investment income (loss) C | .09 | .09 | .07 | .10 | .16 |
Net realized and unrealized gain (loss) | .88 | (.01) E | 1.42 | 3.32 | (4.32) |
Total from investment operations | .97 | .08 | 1.49 | 3.42 | (4.16) |
Distributions from net investment income | (.08) | (.08) | (.07) | (.10) | (.14) |
Distributions from net realized gain | (.07) | (.17) | (.11) | (.09) | (.40) |
Total distributions | (.15) | (.25) | (.18) | (.19) G | (.54) |
Net asset value, end of period | $ 12.66 | $ 11.84 | $ 12.01 | $ 10.70 | $ 7.47 |
Total Return A, B | 8.26% | .82% | 14.02% | 45.83% | (35.45)% |
Ratios to Average Net Assets D, F | | | | | |
Expenses before reductions | 1.00% | 1.00% | 1.00% | 1.00% | 1.00% |
Expenses net of fee waivers, if any | 1.00% | 1.00% | 1.00% | 1.00% | 1.00% |
Expenses net of all reductions | 1.00% | 1.00% | 1.00% | 1.00% | 1.00% |
Net investment income (loss) | .79% | .81% | .67% | 1.07% | 1.66% |
Supplemental Data | | | | | |
Net assets, end of period (000 omitted) | $ 23,061 | $ 29,202 | $ 38,946 | $ 38,816 | $ 27,207 |
Portfolio turnover rate | 22% | 14% | 34% | 19% | 29% |
A Total returns would have been lower if certain expenses had not been reduced during the applicable periods shown.
B Total returns do not include the effect of the contingent deferred sales charge.
C Calculated based on average shares outstanding during the period.
D Amounts do not include the activity of the Underlying Funds.
E The amount shown for a share outstanding does not correspond with the aggregate net gain (loss) on investments for the period due to the timing of sales and repurchases of shares in relation to fluctuating market values of the investments of the Fund.
F Expense ratios reflect operating expenses of the class. Expenses before reductions do not reflect amounts reimbursed by the investment adviser or reductions from expense offset arrangements and do not represent the amount paid by the class during periods when reimbursements or reductions occur. Expenses net of fee waivers reflect expenses after reimbursement by the investment adviser but prior to reductions from expense offset arrangements. Expenses net of all reductions represent the net expenses paid by the class but do not include expenses of the investment companies in which the Fund invests.
G Total distributions of $.19 per share is comprised of distributions from net investment income of $.100 and distributions from net realized gain of $.085 per share.
See accompanying notes which are an integral part of the financial statements.
Annual Report
Financial Highlights - Class C
Years ended March 31, | 2013 | 2012 | 2011 | 2010 | 2009 |
Selected Per-Share Data | | | | | |
Net asset value, beginning of period | $ 11.80 | $ 11.98 | $ 10.68 | $ 7.46 | $ 12.16 |
Income from Investment Operations | | | | | |
Net investment income (loss) C | .09 | .09 | .07 | .10 | .16 |
Net realized and unrealized gain (loss) | .87 | (.01) E | 1.41 | 3.31 | (4.32) |
Total from investment operations | .96 | .08 | 1.48 | 3.41 | (4.16) |
Distributions from net investment income | (.10) | (.09) | (.08) | (.11) | (.14) |
Distributions from net realized gain | (.07) | (.17) | (.11) | (.09) | (.40) |
Total distributions | (.16) I | (.26) | (.18) H | (.19) G | (.54) |
Net asset value, end of period | $ 12.60 | $ 11.80 | $ 11.98 | $ 10.68 | $ 7.46 |
Total Return A, B | 8.23% | .86% | 14.01% | 45.83% | (35.44)% |
Ratios to Average Net Assets D, F | | | | | |
Expenses before reductions | 1.00% | 1.00% | 1.00% | 1.00% | 1.00% |
Expenses net of fee waivers, if any | 1.00% | 1.00% | 1.00% | 1.00% | 1.00% |
Expenses net of all reductions | 1.00% | 1.00% | 1.00% | 1.00% | 1.00% |
Net investment income (loss) | .79% | .81% | .67% | 1.07% | 1.66% |
Supplemental Data | | | | | |
Net assets, end of period (000 omitted) | $ 74,415 | $ 66,126 | $ 61,640 | $ 52,756 | $ 31,735 |
Portfolio turnover rate | 22% | 14% | 34% | 19% | 29% |
A Total returns would have been lower if certain expenses had not been reduced during the applicable periods shown.
B Total returns do not include the effect of the contingent deferred sales charge.
C Calculated based on average shares outstanding during the period.
D Amounts do not include the activity of the Underlying Funds.
E The amount shown for a share outstanding does not correspond with the aggregate net gain (loss) on investments for the period due to the timing of sales and repurchases of shares in relation to fluctuating market values of the investments of the Fund.
F Expense ratios reflect operating expenses of the class. Expenses before reductions do not reflect amounts reimbursed by the investment adviser or reductions from expense offset arrangements and do not represent the amount paid by the class during periods when reimbursements or reductions occur. Expenses net of fee waivers reflect expenses after reimbursement by the investment adviser but prior to reductions from expense offset arrangements. Expenses net of all reductions represent the net expenses paid by the class but do not include expenses of the investment companies in which the Fund invests.
G Total distributions of $.19 per share is comprised of distributions from net investment income of $.105 and distributions from net realized gain of $.085 per share.
H Total distributions of $.18 per share is comprised of distributions from net investment income of $.077 and distributions from net realized gain of $.106 per share.
I Total distributions of $.16 per share is comprised of distributions from net investment income of $.096 and distributions from net realized gain of $.066 per share.
Financial Highlights - Institutional Class
Years ended March 31, | 2013 | 2012 | 2011 | 2010 | 2009 |
Selected Per-Share Data | | | | | |
Net asset value, beginning of period | $ 11.99 | $ 12.17 | $ 10.83 | $ 7.55 | $ 12.33 |
Income from Investment Operations | | | | | |
Net investment income (loss) B | .22 | .21 | .19 | .20 | .26 |
Net realized and unrealized gain (loss) | .88 | (.02) E | 1.44 | 3.35 | (4.39) |
Total from investment operations | 1.10 | .19 | 1.63 | 3.55 | (4.13) |
Distributions from net investment income | (.21) | (.20) | (.18) | (.19) | (.25) |
Distributions from net realized gain | (.07) | (.18) | (.11) | (.09) | (.40) |
Total distributions | (.28) | (.37) G | (.29) | (.27) H | (.65) |
Net asset value, end of period | $ 12.81 | $ 11.99 | $ 12.17 | $ 10.83 | $ 7.55 |
Total Return A | 9.29% | 1.84% | 15.23% | 47.31% | (34.83)% |
Ratios to Average Net Assets C, F | | | | | |
Expenses before reductions D | .00% | .00% | .00% | .00% | .00% |
Expenses net of fee waivers, if any | .00% | .00% | .00% | .00% | .00% |
Expenses net of all reductions | .00% | .00% | .00% | .00% | .00% |
Net investment income (loss) | 1.79% | 1.81% | 1.67% | 2.07% | 2.66% |
Supplemental Data | | | | | |
Net assets, end of period (000 omitted) | $ 686,540 | $ 470,704 | $ 284,309 | $ 140,948 | $ 69,731 |
Portfolio turnover rate | 22% | 14% | 34% | 19% | 29% |
A Total returns would have been lower if certain expenses had not been reduced during the applicable periods shown.
B Calculated based on average shares outstanding during the period.
C Amounts do not include the activity of the Underlying Funds.
D Amount represents less than .01%.
E The amount shown for a share outstanding does not correspond with the aggregate net gain (loss) on investments for the period due to the timing of sales and repurchases of shares in relation to fluctuating market values of the investments of the Fund.
F Expense ratios reflect operating expenses of the class. Expenses before reductions do not reflect amounts reimbursed by the investment adviser or reductions from expense offset arrangements and do not represent the amount paid by the class during periods when reimbursements or reductions occur. Expenses net of fee waivers reflect expenses after reimbursement by the investment adviser but prior to reductions from expense offset arrangements. Expenses net of all reductions represent the net expenses paid by the class but do not include expenses of the investment companies in which the Fund invests.
G Total distributions of $.37 per share is comprised of distributions from net investment income of $.195 and distributions from net realized gain of $.179 per share.
H Total distributions of $.27 per share is comprised of distributions from net investment income of $.189 and distributions from net realized gain of $.085 per share.
See accompanying notes which are an integral part of the financial statements.
Annual Report
Fidelity Advisor Freedom 2030 Fund
Investment Changes (Unaudited)
The information in the following tables is based on the direct investments of the Fund. |
Fund Holdings as of March 31, 2013 |
| % of fund's
net assets | % of fund's net assets
6 months ago |
Commodity Funds | | |
Fidelity Series Commodity Strategy Fund | 7.6 | 7.9 |
Domestic Equity Funds | | |
Fidelity Advisor Equity Growth Fund Institutional Class | 6.1 | 5.3 |
Fidelity Advisor Growth & Income Fund Institutional Class | 3.2 | 6.4 |
Fidelity Advisor Large Cap Fund Institutional Class | 3.3 | 5.9 |
Fidelity Advisor Series Equity-Income Fund | 4.3 | 0.0 |
Fidelity Advisor Series Mega Cap Fund | 0.9 | 0.0 |
Fidelity Advisor Series Opportunistic Insights Fund | 3.0 | 0.0 |
Fidelity Advisor Series Stock Selector Large Cap Value Fund | 4.3 | 0.0 |
Fidelity Advisor Small Cap Fund Institutional Class | 2.5 | 2.1 |
Fidelity Series 100 Index Fund | 1.0 | 4.3 |
Fidelity Series All-Sector Equity Fund | 8.1 | 9.1 |
Fidelity Series Large Cap Value Fund | 4.5 | 8.6 |
Fidelity Series Real Estate Equity Fund | 0.7 | 0.6 |
Fidelity Series Small Cap Opportunities Fund | 2.9 | 2.2 |
| 44.8 | 44.5 |
Developed International Equity Funds | | |
Fidelity Series International Growth Fund | 6.7 | 6.7 |
Fidelity Series International Small Cap Fund | 1.4 | 1.4 |
Fidelity Series International Value Fund | 6.6 | 6.7 |
| 14.7 | 14.8 |
Emerging Markets Equity Funds | | |
Fidelity Series Emerging Markets Fund | 4.0 | 4.2 |
High Yield Bond Funds | | |
Fidelity Series Emerging Markets Debt Fund | 0.7 | 0.6 |
Fidelity Series Floating Rate High Income Fund | 0.8 | 0.8 |
Fidelity Series High Income Fund | 7.0 | 7.0 |
Fidelity Series Real Estate Income Fund | 0.5 | 0.4 |
| 9.0 | 8.8 |
Inflation-Protected Bond Funds | | |
Fidelity Series Inflation-Protected Bond Index Fund | 2.5 | 2.2 |
Investment Grade Bond Funds | | |
Fidelity Series Investment Grade Bond Fund | 17.4 | 17.6 |
Net Other Assets (Liabilities)* | 0.0 | 0.0 |
| 100.0 | 100.0 |
* Amount represents less than 0.1% |
Asset Allocation (% of fund's net assets) |
Period end |
| Commodity Funds | 7.6% | |
| Domestic Equity Funds | 44.8% | |
| Developed International Equity Funds | 14.7% | |
| Emerging Markets
Equity Funds | 4.0% | |
| High Yield Bond Funds | 9.0% | |
 | Inflation-Protected
Bond Funds | 2.5% | |
| Investment Grade
Bond Funds | 17.4% | |

Six months ago |
| Commodity Funds | 7.9% | |
| Domestic Equity Funds | 44.5% | |
| Developed International Equity Funds | 14.8% | |
| Emerging Markets
Equity Funds | 4.2% | |
| High Yield Bond Funds | 8.8% | |
| Inflation-Protected
Bond Funds | 2.2% | |
| Investment Grade
Bond Funds | 17.6% | |

Expected |
| Commodity Funds | 7.7% | |
| Domestic Equity Funds | 43.8% | |
| Developed International Equity Funds | 14.4% | |
| Emerging Markets
Equity Funds | 4.3% | |
| High Yield Bond Funds | 7.5% | |
| Inflation-Protected
Bond Funds | 3.1% | |
| Investment Grade
Bond Funds | 19.2% | |

The fund invests according to an asset allocation strategy that becomes increasingly conservative over time. The six months ago allocation is based on the fund's holdings as of September 30, 2012. The current allocation is based on the fund's holdings as of March 31, 2013. The expected allocation represents the fund's anticipated allocation at September 30, 2013. |
Annual Report
Fidelity Advisor Freedom 2030 Fund
Investments March 31, 2013
Showing Percentage of Net Assets
Domestic Equity Funds - 52.4% |
| Shares | | Value |
Commodity Funds - 7.6% |
Fidelity Series Commodity Strategy Fund (a) | 25,664,537 | | $ 223,024,825 |
Domestic Equity Funds - 44.8% |
Fidelity Advisor Equity Growth Fund Institutional Class | 2,536,195 | | 179,689,389 |
Fidelity Advisor Growth & Income Fund Institutional Class | 4,310,312 | | 95,214,795 |
Fidelity Advisor Large Cap Fund Institutional Class | 4,044,418 | | 96,135,812 |
Fidelity Advisor Series Equity-Income Fund | 11,377,808 | | 126,635,001 |
Fidelity Advisor Series Mega Cap Fund | 2,537,842 | | 28,043,155 |
Fidelity Advisor Series Opportunistic Insights Fund | 8,127,300 | | 89,481,574 |
Fidelity Advisor Series Stock Selector Large Cap Value Fund | 11,398,278 | | 127,546,729 |
Fidelity Advisor Small Cap Fund Institutional Class | 2,738,474 | | 73,801,869 |
Fidelity Series 100 Index Fund | 2,861,118 | | 29,526,733 |
Fidelity Series All-Sector Equity Fund | 18,519,121 | | 237,970,708 |
Fidelity Series Large Cap Value Fund | 11,531,744 | | 134,229,504 |
Fidelity Series Real Estate Equity Fund | 1,524,480 | | 19,848,733 |
Fidelity Series Small Cap Opportunities Fund | 6,964,137 | | 85,867,813 |
TOTAL DOMESTIC EQUITY FUNDS | | 1,323,991,815 |
TOTAL DOMESTIC EQUITY FUNDS (Cost $1,403,720,626) |
1,547,016,640
|
International Equity Funds - 18.7% |
| | | |
Developed International Equity Funds - 14.7% |
Fidelity Series International Growth Fund | 15,588,426 | | 197,193,583 |
Fidelity Series International Small Cap Fund | 2,926,867 | | 40,156,611 |
Fidelity Series International Value Fund | 19,915,996 | | 195,575,080 |
TOTAL DEVELOPED INTERNATIONAL EQUITY FUNDS | | 432,925,274 |
|
| Shares | | Value |
Emerging Markets Equity Funds - 4.0% |
Fidelity Series Emerging Markets Fund | 7,118,422 | | $ 119,091,201 |
TOTAL INTERNATIONAL EQUITY FUNDS (Cost $490,833,118) |
552,016,475
|
Bond Funds - 28.9% |
| | | |
High Yield Bond Funds - 9.0% |
Fidelity Series Emerging Markets Debt Fund | 1,982,274 | | 21,567,139 |
Fidelity Series Floating Rate High Income Fund | 2,338,389 | | 24,857,076 |
Fidelity Series High Income Fund | 19,636,999 | | 206,384,861 |
Fidelity Series Real Estate Income Fund | 1,230,314 | | 14,357,770 |
TOTAL HIGH YIELD BOND FUNDS | | 267,166,846 |
Inflation-Protected Bond Funds - 2.5% |
Fidelity Series Inflation-Protected Bond Index Fund | 6,591,072 | | 75,072,305 |
Investment Grade Bond Funds - 17.4% |
Fidelity Series Investment Grade Bond Fund | 44,516,226 | | 513,272,085 |
TOTAL BOND FUNDS (Cost $838,683,219) |
855,511,236
|
TOTAL INVESTMENT PORTFOLIO - 100.0% (Cost $2,733,236,963) | | 2,954,544,351 |
NET OTHER ASSETS (LIABILITIES) - 0.0% | | (603,837) |
NET ASSETS - 100% | $ 2,953,940,514 |
Legend |
(a) Non-income producing |
Other Information |
All investments are categorized as Level 1 under the Fair Value Hierarchy. The inputs or methodology used for valuing securities may not be an indication of the risk associated with investing in those securities. For more information on valuation inputs, please refer to the Security Valuation section in the accompanying Notes to Financial Statements. |
See accompanying notes which are an integral part of the financial statements.
Annual Report
Fidelity Advisor Freedom 2030 Fund
Statement of Assets and Liabilities
| March 31, 2013 |
| | |
Assets | | |
Investment in securities, at value (cost $2,733,236,963) - See accompanying schedule | | $ 2,954,544,351 |
Cash | | 16,515 |
Receivable for investments sold | | 961,656 |
Receivable for fund shares sold | | 3,376,401 |
Receivable from affiliate for expense reductions | | 2,543 |
Total assets | | 2,958,901,466 |
| | |
Liabilities | | |
Payable for investments purchased | $ 10,256 | |
Payable for fund shares redeemed | 4,344,383 | |
Distribution and service plan fees payable | 606,313 | |
Total liabilities | | 4,960,952 |
| | |
Net Assets | | $ 2,953,940,514 |
Net Assets consist of: | | |
Paid in capital | | $ 2,659,119,760 |
Undistributed net investment income | | 4,097,771 |
Accumulated undistributed net realized gain (loss) on investments | | 69,415,595 |
Net unrealized appreciation (depreciation) on investments | | 221,307,388 |
Net Assets | | $ 2,953,940,514 |
| | |
Calculation of Maximum Offering Price Class A:
Net Asset Value and redemption price per share ($1,747,548,664 ÷ 130,802,907 shares) | | $ 13.36 |
| | |
Maximum offering price per share (100/94.25 of $13.36) | | $ 14.18 |
Class T:
Net Asset Value and redemption price per share ($387,101,717 ÷ 29,058,407 shares) | | $ 13.32 |
| | |
Maximum offering price per share (100/96.50 of $13.32) | | $ 13.80 |
Class B:
Net Asset Value and offering price per share ($27,191,043 ÷ 2,045,740 shares)A | | $ 13.29 |
| | |
Class C:
Net Asset Value and offering price per share ($75,384,278 ÷ 5,697,106 shares)A | | $ 13.23 |
| | |
Institutional Class:
Net Asset Value, offering price and redemption price per share ($716,714,812 ÷ 53,391,541 shares) | | $ 13.42 |
A Redemption price per share is equal to net asset value less any applicable contingent deferred sales charge.
Statement of Operations
| Year ended March 31, 2013 |
| | |
Investment Income | | |
Income distributions from underlying funds | | $ 47,876,470 |
| | |
Expenses | | |
Distribution and service plan fees | $ 6,661,679 | |
Independent trustees' compensation | 9,385 | |
Total expenses before reductions | 6,671,064 | |
Expense reductions | (9,385) | 6,661,679 |
Net investment income (loss) | | 41,214,791 |
Realized and Unrealized Gain (Loss) Realized gain (loss) on sale of underlying fund shares | 106,179,779 | |
Capital gain distributions from underlying funds | 59,827,457 | |
Total net realized gain (loss) | | 166,007,236 |
Change in net unrealized appreciation (depreciation) on underlying funds | | 37,190,757 |
Net gain (loss) | | 203,197,993 |
Net increase (decrease) in net assets resulting from operations | | $ 244,412,784 |
See accompanying notes which are an integral part of the financial statements.
Annual Report
Statement of Changes in Net Assets
| Year ended
March 31,
2013 | Year ended
March 31,
2012 |
Increase (Decrease) in Net Assets | | |
Operations | | |
Net investment income (loss) | $ 41,214,791 | $ 33,350,591 |
Net realized gain (loss) | 166,007,236 | 105,028,851 |
Change in net unrealized appreciation (depreciation) | 37,190,757 | (97,033,979) |
Net increase (decrease) in net assets resulting from operations | 244,412,784 | 41,345,463 |
Distributions to shareholders from net investment income | (40,765,226) | (31,808,537) |
Distributions to shareholders from net realized gain | (13,074,704) | (34,249,192) |
Total distributions | (53,839,930) | (66,057,729) |
Share transactions - net increase (decrease) | 314,631,239 | 347,268,422 |
Total increase (decrease) in net assets | 505,204,093 | 322,556,156 |
| | |
Net Assets | | |
Beginning of period | 2,448,736,421 | 2,126,180,265 |
End of period (including undistributed net investment income of $4,097,771 and undistributed net investment income of $3,648,204, respectively) | $ 2,953,940,514 | $ 2,448,736,421 |
Financial Highlights - Class A
Years ended March 31, | 2013 | 2012 | 2011 | 2010 | 2009 |
Selected Per-Share Data | | | | | |
Net asset value, beginning of period | $ 12.48 | $ 12.72 | $ 11.29 | $ 7.69 | $ 13.29 |
Income from Investment Operations | | | | | |
Net investment income (loss) C | .20 | .19 | .16 | .16 | .21 |
Net realized and unrealized gain (loss) | .94 | (.06) E | 1.54 | 3.68 | (5.10) |
Total from investment operations | 1.14 | .13 | 1.70 | 3.84 | (4.89) |
Distributions from net investment income | (.20) | (.18) | (.16) | (.15) | (.21) |
Distributions from net realized gain | (.06) | (.19) | (.11) | (.09) | (.50) |
Total distributions | (.26) | (.37) | (.27) | (.24) G | (.71) |
Net asset value, end of period | $ 13.36 | $ 12.48 | $ 12.72 | $ 11.29 | $ 7.69 |
Total Return A, B | 9.25% | 1.25% | 15.27% | 50.17% | (38.49)% |
Ratios to Average Net Assets D, F | | | | | |
Expenses before reductions | .25% | .25% | .25% | .25% | .25% |
Expenses net of fee waivers, if any | .25% | .25% | .25% | .25% | .25% |
Expenses net of all reductions | .25% | .25% | .25% | .25% | .25% |
Net investment income (loss) | 1.58% | 1.57% | 1.38% | 1.61% | 2.08% |
Supplemental Data | | | | | |
Net assets, end of period (000 omitted) | $ 1,747,549 | $ 1,506,827 | $ 1,340,583 | $ 1,030,972 | $ 527,042 |
Portfolio turnover rate | 23% | 16% | 38% | 20% | 22% |
A Total returns would have been lower if certain expenses had not been reduced during the applicable periods shown.
B Total returns do not include the effect of the sales charges.
C Calculated based on average shares outstanding during the period.
D Amounts do not include the activity of the Underlying Funds.
E The amount shown for a share outstanding does not correspond with the aggregate net gain (loss) on investments for the period due to the timing of sales and repurchases of shares in relation to fluctuating market values of the investments of the Fund.
F Expense ratios reflect operating expenses of the class. Expenses before reductions do not reflect amounts reimbursed by the investment adviser or reductions from expense offset arrangements and do not represent the amount paid by the class during periods when reimbursements or reductions occur. Expenses net of fee waivers reflect expenses after reimbursement by the investment adviser but prior to reductions from expense offset arrangements. Expenses net of all reductions represent the net expenses paid by the class but do not include expenses of the investment companies in which the Fund invests.
G Total distributions of $.24 per share is comprised of distributions from net investment income of $.151 and distributions from net realized gain of $.093 per share.
See accompanying notes which are an integral part of the financial statements.
Annual Report
Financial Highlights - Class T
Years ended March 31, | 2013 | 2012 | 2011 | 2010 | 2009 |
Selected Per-Share Data | | | | | |
Net asset value, beginning of period | $ 12.44 | $ 12.68 | $ 11.25 | $ 7.67 | $ 13.25 |
Income from Investment Operations | | | | | |
Net investment income (loss) C | .17 | .16 | .13 | .14 | .19 |
Net realized and unrealized gain (loss) | .94 | (.06) E | 1.54 | 3.66 | (5.09) |
Total from investment operations | 1.11 | .10 | 1.67 | 3.80 | (4.90) |
Distributions from net investment income | (.17) | (.15) | (.13) | (.13) | (.18) |
Distributions from net realized gain | (.06) | (.19) | (.11) | (.09) | (.50) |
Total distributions | (.23) | (.34) | (.24) | (.22) G | (.68) |
Net asset value, end of period | $ 13.32 | $ 12.44 | $ 12.68 | $ 11.25 | $ 7.67 |
Total Return A, B | 9.02% | .98% | 14.98% | 49.72% | (38.62)% |
Ratios to Average Net Assets D, F | | | | | |
Expenses before reductions | .50% | .50% | .50% | .50% | .50% |
Expenses net of fee waivers, if any | .50% | .50% | .50% | .50% | .50% |
Expenses net of all reductions | .50% | .50% | .50% | .50% | .50% |
Net investment income (loss) | 1.33% | 1.32% | 1.12% | 1.36% | 1.83% |
Supplemental Data | | | | | |
Net assets, end of period (000 omitted) | $ 387,102 | $ 335,407 | $ 348,443 | $ 382,092 | $ 236,333 |
Portfolio turnover rate | 23% | 16% | 38% | 20% | 22% |
A Total returns would have been lower if certain expenses had not been reduced during the applicable periods shown.
B Total returns do not include the effect of the sales charges.
C Calculated based on average shares outstanding during the period.
D Amounts do not include the activity of the Underlying Funds.
E The amount shown for a share outstanding does not correspond with the aggregate net gain (loss) on investments for the period due to the timing of sales and repurchases of shares in relation to fluctuating market values of the investments of the Fund.
F Expense ratios reflect operating expenses of the class. Expenses before reductions do not reflect amounts reimbursed by the investment adviser or reductions from expense offset arrangements and do not represent the amount paid by the class during periods when reimbursements or reductions occur. Expenses net of fee waivers reflect expenses after reimbursement by the investment adviser but prior to reductions from expense offset arrangements. Expenses net of all reductions represent the net expenses paid by the class but do not include expenses of the investment companies in which the Fund invests.
G Total distributions of $.22 per share is comprised of distributions from net investment income of $.128 and distributions from net realized gain of $.093 per share.
Financial Highlights - Class B
Years ended March 31, | 2013 | 2012 | 2011 | 2010 | 2009 |
Selected Per-Share Data | | | | | |
Net asset value, beginning of period | $ 12.41 | $ 12.63 | $ 11.21 | $ 7.64 | $ 13.17 |
Income from Investment Operations | | | | | |
Net investment income (loss) C | .10 | .10 | .07 | .09 | .14 |
Net realized and unrealized gain (loss) | .94 | (.06) E | 1.53 | 3.65 | (5.06) |
Total from investment operations | 1.04 | .04 | 1.60 | 3.74 | (4.92) |
Distributions from net investment income | (.10) | (.08) | (.07) | (.08) | (.11) |
Distributions from net realized gain | (.06) | (.18) | (.11) | (.09) | (.50) |
Total distributions | (.16) | (.26) | (.18) | (.17) G | (.61) |
Net asset value, end of period | $ 13.29 | $ 12.41 | $ 12.63 | $ 11.21 | $ 7.64 |
Total Return A, B | 8.44% | .52% | 14.38% | 49.07% | (38.94)% |
Ratios to Average Net Assets D, F | | | | | |
Expenses before reductions | 1.00% | 1.00% | 1.00% | 1.00% | 1.00% |
Expenses net of fee waivers, if any | 1.00% | 1.00% | 1.00% | 1.00% | 1.00% |
Expenses net of all reductions | 1.00% | 1.00% | 1.00% | 1.00% | 1.00% |
Net investment income (loss) | .83% | .82% | .62% | .86% | 1.33% |
Supplemental Data | | | | | |
Net assets, end of period (000 omitted) | $ 27,191 | $ 34,324 | $ 47,275 | $ 51,360 | $ 35,701 |
Portfolio turnover rate | 23% | 16% | 38% | 20% | 22% |
A Total returns would have been lower if certain expenses had not been reduced during the applicable periods shown.
B Total returns do not include the effect of the contingent deferred sales charge.
C Calculated based on average shares outstanding during the period.
D Amounts do not include the activity of the Underlying Funds.
E The amount shown for a share outstanding does not correspond with the aggregate net gain (loss) on investments for the period due to the timing of sales and repurchases of shares in relation to fluctuating market values of the investments of the Fund.
F Expense ratios reflect operating expenses of the class. Expenses before reductions do not reflect amounts reimbursed by the investment adviser or reductions from expense offset arrangements and do not represent the amount paid by the class during periods when reimbursements or reductions occur. Expenses net of fee waivers reflect expenses after reimbursement by the investment adviser but prior to reductions from expense offset arrangements. Expenses net of all reductions represent the net expenses paid by the class but do not include expenses of the investment companies in which the Fund invests.
G Total distributions of $.17 per share is comprised of distributions from net investment income of $.080 and distributions from net realized gain of $.092 per share.
See accompanying notes which are an integral part of the financial statements.
Annual Report
Financial Highlights - Class C
Years ended March 31, | 2013 | 2012 | 2011 | 2010 | 2009 |
Selected Per-Share Data | | | | | |
Net asset value, beginning of period | $ 12.37 | $ 12.60 | $ 11.19 | $ 7.63 | $ 13.17 |
Income from Investment Operations | | | | | |
Net investment income (loss) C | .10 | .10 | .07 | .09 | .14 |
Net realized and unrealized gain (loss) | .93 | (.05) E | 1.53 | 3.65 | (5.06) |
Total from investment operations | 1.03 | .05 | 1.60 | 3.74 | (4.92) |
Distributions from net investment income | (.11) | (.09) | (.08) | (.08) | (.12) |
Distributions from net realized gain | (.06) | (.18) | (.11) | (.09) | (.50) |
Total distributions | (.17) | (.28) H | (.19) | (.18) G | (.62) |
Net asset value, end of period | $ 13.23 | $ 12.37 | $ 12.60 | $ 11.19 | $ 7.63 |
Total Return A, B | 8.39% | .55% | 14.38% | 49.06% | (38.96)% |
Ratios to Average Net Assets D, F | | | | | |
Expenses before reductions | 1.00% | 1.00% | 1.00% | 1.00% | 1.00% |
Expenses net of fee waivers, if any | 1.00% | 1.00% | 1.00% | 1.00% | 1.00% |
Expenses net of all reductions | 1.00% | 1.00% | 1.00% | 1.00% | 1.00% |
Net investment income (loss) | .83% | .82% | .63% | .86% | 1.33% |
Supplemental Data | | | | | |
Net assets, end of period (000 omitted) | $ 75,384 | $ 66,418 | $ 68,349 | $ 63,700 | $ 40,294 |
Portfolio turnover rate | 23% | 16% | 38% | 20% | 22% |
A Total returns would have been lower if certain expenses had not been reduced during the applicable periods shown.
B Total returns do not include the effect of the contingent deferred sales charge.
C Calculated based on average shares outstanding during the period.
D Amounts do not include the activity of the Underlying Funds.
E The amount shown for a share outstanding does not correspond with the aggregate net gain (loss) on investments for the period due to the timing of sales and repurchases of shares in relation to fluctuating market values of the investments of the Fund.
F Expense ratios reflect operating expenses of the class. Expenses before reductions do not reflect amounts reimbursed by the investment adviser or reductions from expense offset arrangements and do not represent the amount paid by the class during periods when reimbursements or reductions occur. Expenses net of fee waivers reflect expenses after reimbursement by the investment adviser but prior to reductions from expense offset arrangements. Expenses net of all reductions represent the net expenses paid by the class but do not include expenses of the investment companies in which the Fund invests.
G Total distributions of $.18 per share is comprised of distributions from net investment income of $.083 and distributions from net realized gain of $.093 per share.
H Total distributions of $.28 per share is comprised of distributions from net investment income of $.094 and distributions from net realized gain of $.182 per share.
Financial Highlights - Institutional Class
Years ended March 31, | 2013 | 2012 | 2011 | 2010 | 2009 |
Selected Per-Share Data | | | | | |
Net asset value, beginning of period | $ 12.54 | $ 12.77 | $ 11.33 | $ 7.72 | $ 13.34 |
Income from Investment Operations | | | | | |
Net investment income (loss) B | .23 | .22 | .19 | .19 | .23 |
Net realized and unrealized gain (loss) | .94 | (.05) E | 1.55 | 3.69 | (5.11) |
Total from investment operations | 1.17 | .17 | 1.74 | 3.88 | (4.88) |
Distributions from net investment income | (.23) | (.21) | (.19) | (.17) | (.24) |
Distributions from net realized gain | (.06) | (.19) | (.11) | (.09) | (.50) |
Total distributions | (.29) | (.40) | (.30) | (.27) G | (.74) |
Net asset value, end of period | $ 13.42 | $ 12.54 | $ 12.77 | $ 11.33 | $ 7.72 |
Total Return A | 9.47% | 1.57% | 15.56% | 50.42% | (38.31)% |
Ratios to Average Net Assets C, F | | | | | |
Expenses before reductions D | .00% | .00% | .00% | .00% | .00% |
Expenses net of fee waivers, if any | .00% | .00% | .00% | .00% | .00% |
Expenses net of all reductions | .00% | .00% | .00% | .00% | .00% |
Net investment income (loss) | 1.83% | 1.82% | 1.62% | 1.86% | 2.33% |
Supplemental Data | | | | | |
Net assets, end of period (000 omitted) | $ 716,715 | $ 505,761 | $ 321,529 | $ 178,232 | $ 82,534 |
Portfolio turnover rate | 23% | 16% | 38% | 20% | 22% |
A Total returns would have been lower if certain expenses had not been reduced during the applicable periods shown.
B Calculated based on average shares outstanding during the period.
C Amounts do not include the activity of the Underlying Funds.
D Amount represents less than .01%.
E The amount shown for a share outstanding does not correspond with the aggregate net gain (loss) on investments for the period due to the timing of sales and repurchases of shares in relation to fluctuating market values of the investments of the Fund.
F Expense ratios reflect operating expenses of the class. Expenses before reductions do not reflect amounts reimbursed by the investment adviser or reductions from expense offset arrangements and do not represent the amount paid by the class during periods when reimbursements or reductions occur. Expenses net of fee waivers reflect expenses after reimbursement by the investment adviser but prior to reductions from expense offset arrangements. Expenses net of all reductions represent the net expenses paid by the class but do not include expenses of the investment companies in which the Fund invests.
G Total distributions of $.27 per share is comprised of distributions from net investment income of $.173 and distributions from net realized gain of $.093 per share.
See accompanying notes which are an integral part of the financial statements.
Annual Report
Fidelity Advisor Freedom 2035 Fund
Investment Changes (Unaudited)
The information in the following tables is based on the direct investments of the Fund. |
Fund Holdings as of March 31, 2013 |
| % of fund's
net assets | % of fund's net assets
6 months ago |
Commodity Funds | | |
Fidelity Series Commodity Strategy Fund | 8.7 | 9.1 |
Domestic Equity Funds | | |
Fidelity Advisor Equity Growth Fund Institutional Class | 7.0 | 6.1 |
Fidelity Advisor Growth & Income Fund Institutional Class | 3.7 | 7.3 |
Fidelity Advisor Large Cap Fund Institutional Class | 3.8 | 6.8 |
Fidelity Advisor Series Equity-Income Fund | 4.9 | 0.0 |
Fidelity Advisor Series Mega Cap Fund | 1.1 | 0.0 |
Fidelity Advisor Series Opportunistic Insights Fund | 3.4 | 0.0 |
Fidelity Advisor Series Stock Selector Large Cap Value Fund | 4.9 | 0.0 |
Fidelity Advisor Small Cap Fund Institutional Class | 2.9 | 2.4 |
Fidelity Series 100 Index Fund | 1.1 | 4.9 |
Fidelity Series All-Sector Equity Fund | 9.3 | 10.5 |
Fidelity Series Large Cap Value Fund | 5.3 | 9.9 |
Fidelity Series Real Estate Equity Fund | 0.8 | 0.7 |
Fidelity Series Small Cap Opportunities Fund | 3.3 | 2.5 |
| 51.5 | 51.1 |
Developed International Equity Funds | | |
Fidelity Series International Growth Fund | 7.6 | 7.7 |
Fidelity Series International Small Cap Fund | 1.6 | 1.6 |
Fidelity Series International Value Fund | 7.6 | 7.7 |
| 16.8 | 17.0 |
Emerging Markets Equity Funds | | |
Fidelity Series Emerging Markets Fund | 4.6 | 4.9 |
High Yield Bond Funds | | |
Fidelity Series Emerging Markets Debt Fund | 0.7 | 0.7 |
Fidelity Series Floating Rate High Income Fund | 0.8 | 0.4 |
Fidelity Series High Income Fund | 6.9 | 6.9 |
Fidelity Series Real Estate Income Fund | 0.4 | 0.2 |
| 8.8 | 8.2 |
Investment Grade Bond Funds | | |
Fidelity Series Investment Grade Bond Fund | 9.6 | 9.7 |
Net Other Assets (Liabilities)* | 0.0 | 0.0 |
| 100.0 | 100.0 |
* Amount represents less than 0.1% |
Asset Allocation (% of fund's net assets) |
Period end |
| Commodity Funds | 8.7% | |
| Domestic Equity Funds | 51.5% | |
| Developed International Equity Funds | 16.8% | |
| Emerging Markets
Equity Funds | 4.6% | |
| High Yield Bond Funds | 8.8% | |
| Investment Grade
Bond Funds | 9.6% | |

Six months ago |
| Commodity Funds | 9.1% | |
| Domestic Equity Funds | 51.1% | |
| Developed International Equity Funds | 17.0% | |
| Emerging Markets
Equity Funds | 4.9% | |
| High Yield Bond Funds | 8.2% | |
| Investment Grade
Bond Funds | 9.7% | |

Expected |
| Commodity Funds | 8.8% | |
| Domestic Equity Funds | 50.0% | |
| Developed International Equity Funds | 16.5% | |
| Emerging Markets
Equity Funds | 4.9% | |
| High Yield Bond Funds | 7.5% | |
| Investment Grade
Bond Funds | 12.2% | |
| Inflation-Protected Bond Funds | 0.1% | |

The fund invests according to an asset allocation strategy that becomes increasingly conservative over time. The six months ago allocation is based on the fund's holdings as of September 30, 2012. The current allocation is based on the fund's holdings as of March 31, 2013. The expected allocation represents the fund's anticipated allocation at September 30, 2013. |
Annual Report
Fidelity Advisor Freedom 2035 Fund
Investments March 31, 2013
Showing Percentage of Net Assets
Domestic Equity Funds - 60.2% |
| Shares | | Value |
Commodity Funds - 8.7% |
Fidelity Series Commodity Strategy Fund (a) | 20,983,863 | | $ 182,349,768 |
Domestic Equity Funds - 51.5% |
Fidelity Advisor Equity Growth Fund Institutional Class | 2,061,223 | | 146,037,675 |
Fidelity Advisor Growth & Income Fund Institutional Class | 3,510,032 | | 77,536,597 |
Fidelity Advisor Large Cap Fund Institutional Class | 3,294,173 | | 78,302,498 |
Fidelity Advisor Series Equity-Income Fund | 9,097,363 | | 101,253,648 |
Fidelity Advisor Series Mega Cap Fund | 2,029,273 | | 22,423,472 |
Fidelity Advisor Series Opportunistic Insights Fund | 6,500,234 | | 71,567,575 |
Fidelity Advisor Series Stock Selector Large Cap Value Fund | 9,114,294 | | 101,988,948 |
Fidelity Advisor Small Cap Fund Institutional Class | 2,226,569 | | 60,006,024 |
Fidelity Series 100 Index Fund | 2,335,338 | | 24,100,686 |
Fidelity Series All-Sector Equity Fund | 15,053,128 | | 193,432,696 |
Fidelity Series Large Cap Value Fund | 9,424,558 | | 109,701,861 |
Fidelity Series Real Estate Equity Fund | 1,236,445 | | 16,098,520 |
Fidelity Series Small Cap Opportunities Fund | 5,662,580 | | 69,819,611 |
TOTAL DOMESTIC EQUITY FUNDS | | 1,072,269,811 |
TOTAL DOMESTIC EQUITY FUNDS (Cost $1,146,773,607) |
1,254,619,579
|
International Equity Funds - 21.4% |
| | | |
Developed International Equity Funds - 16.8% |
Fidelity Series International Growth Fund | 12,589,365 | | 159,255,463 |
Fidelity Series International Small Cap Fund | 2,357,445 | | 32,344,142 |
Fidelity Series International Value Fund | 16,053,146 | | 157,641,894 |
TOTAL DEVELOPED INTERNATIONAL EQUITY FUNDS | | 349,241,499 |
|
| Shares | | Value |
Emerging Markets Equity Funds - 4.6% |
Fidelity Series Emerging Markets Fund | 5,764,576 | | $ 96,441,362 |
TOTAL INTERNATIONAL EQUITY FUNDS (Cost $397,271,897) |
445,682,861
|
Bond Funds - 18.4% |
| | | |
High Yield Bond Funds - 8.8% |
Fidelity Series Emerging Markets Debt Fund | 1,384,314 | | 15,061,340 |
Fidelity Series Floating Rate High Income Fund | 1,488,336 | | 15,821,013 |
Fidelity Series High Income Fund | 13,674,466 | | 143,718,637 |
Fidelity Series Real Estate Income Fund | 789,397 | | 9,212,263 |
TOTAL HIGH YIELD BOND FUNDS | | 183,813,253 |
Investment Grade Bond Funds - 9.6% |
Fidelity Series Investment Grade Bond Fund | 17,359,957 | | 200,160,305 |
TOTAL BOND FUNDS (Cost $373,778,668) |
383,973,558
|
TOTAL INVESTMENT PORTFOLIO - 100.0% (Cost $1,917,824,172) | | 2,084,275,998 |
NET OTHER ASSETS (LIABILITIES) - 0.0% | | (397,977) |
NET ASSETS - 100% | $ 2,083,878,021 |
Legend |
(a) Non-income producing |
Other Information |
All investments are categorized as Level 1 under the Fair Value Hierarchy. The inputs or methodology used for valuing securities may not be an indication of the risk associated with investing in those securities. For more information on valuation inputs, please refer to the Security Valuation section in the accompanying Notes to Financial Statements. |
See accompanying notes which are an integral part of the financial statements.
Annual Report
Fidelity Advisor Freedom 2035 Fund
Statement of Assets and Liabilities
| March 31, 2013 |
| | |
Assets | | |
Investment in securities, at value (cost $1,917,824,172) - See accompanying schedule | | $ 2,084,275,998 |
Cash | | 10 |
Receivable for investments sold | | 45,016 |
Receivable for fund shares sold | | 2,306,411 |
Receivable from affiliate for expense reductions | | 2,025 |
Total assets | | 2,086,629,460 |
| | |
Liabilities | | |
Payable for investments purchased | $ 229,389 | |
Payable for fund shares redeemed | 2,122,074 | |
Distribution and service plan fees payable | 399,976 | |
Total liabilities | | 2,751,439 |
| | |
Net Assets | | $ 2,083,878,021 |
Net Assets consist of: | | |
Paid in capital | | $ 1,843,320,829 |
Undistributed net investment income | | 2,178,145 |
Accumulated undistributed net realized gain (loss) on investments | | 71,927,221 |
Net unrealized appreciation (depreciation) on investments | | 166,451,826 |
Net Assets | | $ 2,083,878,021 |
| | |
Calculation of Maximum Offering Price Class A:
Net Asset Value and redemption price per share ($1,258,796,597 ÷ 98,826,414 shares) | | $ 12.74 |
| | |
Maximum offering price per share (100/94.25 of $12.74) | | $ 13.52 |
Class T:
Net Asset Value and redemption price per share ($216,700,905 ÷ 17,095,750 shares) | | $ 12.68 |
| | |
Maximum offering price per share (100/96.50 of $12.68) | | $ 13.14 |
Class B:
Net Asset Value and offering price per share ($17,884,087 ÷ 1,420,457 shares)A | | $ 12.59 |
| | |
Class C:
Net Asset Value and offering price per share ($43,447,033 ÷ 3,459,011 shares)A | | $ 12.56 |
| | |
| | |
Institutional Class:
Net Asset Value, offering price and redemption price per share ($547,049,399 ÷ 42,732,015 shares) | | $ 12.80 |
A Redemption price per share is equal to net asset value less any applicable contingent deferred sales charge.
Statement of Operations
| Year ended March 31, 2013 |
| | |
Investment Income | | |
Income distributions from underlying funds | | $ 32,037,128 |
| | |
Expenses | | |
Distribution and service plan fees | $ 4,292,442 | |
Independent trustees' compensation | 6,390 | |
Total expenses before reductions | 4,298,832 | |
Expense reductions | (6,390) | 4,292,442 |
Net investment income | | 27,744,686 |
Realized and Unrealized Gain (Loss) Realized gain (loss) on sale of underlying fund shares | 77,307,662 | |
Capital gain distributions from underlying funds | 38,999,365 | |
Total net realized gain (loss) | | 116,307,027 |
Change in net unrealized appreciation (depreciation) on underlying funds | | 38,369,090 |
Net gain (loss) | | 154,676,117 |
Net increase (decrease) in net assets resulting from operations | | $ 182,420,803 |
See accompanying notes which are an integral part of the financial statements.
Annual Report
Statement of Changes in Net Assets
| Year ended
March 31,
2013 | Year ended
March 31,
2012 |
Increase (Decrease) in Net Assets | | |
Operations | | |
Net investment income | $ 27,744,686 | $ 19,358,537 |
Net realized gain (loss) | 116,307,027 | 51,989,047 |
Change in net unrealized appreciation (depreciation) | 38,369,090 | (49,807,030) |
Net increase (decrease) in net assets resulting from operations | 182,420,803 | 21,540,554 |
Distributions to shareholders from net investment income | (27,167,238) | (18,511,496) |
Distributions to shareholders from net realized gain | (5,583,432) | (23,728,615) |
Total distributions | (32,750,670) | (42,240,111) |
Share transactions - net increase (decrease) | 289,056,044 | 306,672,323 |
Total increase (decrease) in net assets | 438,726,177 | 285,972,766 |
| | |
Net Assets | | |
Beginning of period | 1,645,151,844 | 1,359,179,078 |
End of period (including undistributed net investment income of $2,178,145 and undistributed net investment income of $1,600,697, respectively) | $ 2,083,878,021 | $ 1,645,151,844 |
Financial Highlights - Class A
Years ended March 31, | 2013 | 2012 | 2011 | 2010 | 2009 |
Selected Per-Share Data | | | | | |
Net asset value, beginning of period | $ 11.80 | $ 12.11 | $ 10.65 | $ 7.18 | $ 12.53 |
Income from Investment Operations | | | | | |
Net investment income (loss) C | .18 | .16 | .14 | .14 | .20 |
Net realized and unrealized gain (loss) | .97 | (.13) E | 1.56 | 3.55 | (4.92) |
Total from investment operations | 1.15 | .03 | 1.70 | 3.69 | (4.72) |
Distributions from net investment income | (.18) | (.15) | (.13) | (.14) | (.18) |
Distributions from net realized gain | (.04) | (.19) | (.11) | (.08) | (.45) |
Total distributions | (.21) H | (.34) | (.24) | (.22) | (.63) G |
Net asset value, end of period | $ 12.74 | $ 11.80 | $ 12.11 | $ 10.65 | $ 7.18 |
Total Return A, B | 9.89% | .47% | 16.13% | 51.59% | (39.29)% |
Ratios to Average Net Assets D, F | | | | | |
Expenses before reductions | .25% | .25% | .25% | .25% | .25% |
Expenses net of fee waivers, if any | .25% | .25% | .25% | .25% | .25% |
Expenses net of all reductions | .25% | .25% | .25% | .25% | .25% |
Net investment income (loss) | 1.54% | 1.39% | 1.26% | 1.51% | 2.04% |
Supplemental Data | | | | | |
Net assets, end of period (000 omitted) | $ 1,258,797 | $ 1,057,102 | $ 906,896 | $ 669,450 | $ 314,996 |
Portfolio turnover rate | 25% | 13% | 30% | 16% | 21% |
A Total returns would have been lower if certain expenses had not been reduced during the applicable periods shown.
B Total returns do not include the effect of the sales charges.
C Calculated based on average shares outstanding during the period.
D Amounts do not include the activity of the Underlying Funds.
E The amount shown for a share outstanding does not correspond with the aggregate net gain (loss) on investments for the period due to the timing of sales and repurchases of shares in relation to fluctuating market values of the investments of the Fund.
F Expense ratios reflect operating expenses of the class. Expenses before reductions do not reflect amounts reimbursed by the investment adviser or reductions from expense offset arrangements and do not represent the amount paid by the class during periods when reimbursements or reductions occur. Expenses net of fee waivers reflect expenses after reimbursement by the investment adviser but prior to reductions from expense offset arrangements. Expenses net of all reductions represent the net expenses paid by the class but do not include expenses of the investment companies in which the Fund invests.
G Total distributions of $.63 per share is comprised of distributions from net investment income of $.182 and distributions from net realized gain of $.445 per share.
H Total distributions of $.21 per share is comprised of distributions from net investment income of $.175 and distributions from net realized gain of $.036 per share.
See accompanying notes which are an integral part of the financial statements.
Annual Report
Financial Highlights - Class T
Years ended March 31, | 2013 | 2012 | 2011 | 2010 | 2009 |
Selected Per-Share Data | | | | | |
Net asset value, beginning of period | $ 11.74 | $ 12.05 | $ 10.60 | $ 7.15 | $ 12.47 |
Income from Investment Operations | | | | | |
Net investment income (loss) C | .15 | .13 | .11 | .12 | .17 |
Net realized and unrealized gain (loss) | .97 | (.13) E | 1.55 | 3.53 | (4.89) |
Total from investment operations | 1.12 | - | 1.66 | 3.65 | (4.72) |
Distributions from net investment income | (.15) | (.12) | (.11) | (.12) | (.16) |
Distributions from net realized gain | (.04) | (.19) | (.11) | (.08) | (.45) |
Total distributions | (.18) I | (.31) | (.21) H | (.20) | (.60) G |
Net asset value, end of period | $ 12.68 | $ 11.74 | $ 12.05 | $ 10.60 | $ 7.15 |
Total Return A, B | 9.69% | .19% | 15.84% | 51.17% | (39.42)% |
Ratios to Average Net Assets D, F | | | | | |
Expenses before reductions | .50% | .50% | .50% | .50% | .50% |
Expenses net of fee waivers, if any | .50% | .50% | .50% | .50% | .50% |
Expenses net of all reductions | .50% | .50% | .50% | .50% | .50% |
Net investment income (loss) | 1.29% | 1.14% | 1.01% | 1.26% | 1.79% |
Supplemental Data | | | | | |
Net assets, end of period (000 omitted) | $ 216,701 | $ 166,843 | $ 169,442 | $ 143,106 | $ 81,463 |
Portfolio turnover rate | 25% | 13% | 30% | 16% | 21% |
A Total returns would have been lower if certain expenses had not been reduced during the applicable periods shown.
B Total returns do not include the effect of the sales charges.
C Calculated based on average shares outstanding during the period.
D Amounts do not include the activity of the Underlying Funds.
E The amount shown for a share outstanding does not correspond with the aggregate net gain (loss) on investments for the period due to the timing of sales and repurchases of shares in relation to fluctuating market values of the investments of the Fund.
F Expense ratios reflect operating expenses of the class. Expenses before reductions do not reflect amounts reimbursed by the investment adviser or reductions from expense offset arrangements and do not represent the amount paid by the class during periods when reimbursements or reductions occur. Expenses net of fee waivers reflect expenses after reimbursement by the investment adviser but prior to reductions from expense offset arrangements. Expenses net of all reductions represent the net expenses paid by the class but do not include expenses of the investment companies in which the Fund invests.
G Total distributions of $.60 per share is comprised of distributions from net investment income of $.156 and distributions from net realized gain of $.445 per share.
H Total distributions of $.21 per share is comprised of distributions from net investment income of $.106 and distributions from net realized gain of $.105 per share.
I Total distributions of $.18 per share is comprised of distributions from net investment income of $.148 and distributions from net realized gain of $.036 per share.
Financial Highlights - Class B
Years ended March 31, | 2013 | 2012 | 2011 | 2010 | 2009 |
Selected Per-Share Data | | | | | |
Net asset value, beginning of period | $ 11.67 | $ 11.96 | $ 10.52 | $ 7.10 | $ 12.38 |
Income from Investment Operations | | | | | |
Net investment income (loss) C | .09 | .07 | .05 | .07 | .13 |
Net realized and unrealized gain (loss) | .95 | (.12) E | 1.55 | 3.50 | (4.86) |
Total from investment operations | 1.04 | (.05) | 1.60 | 3.57 | (4.73) |
Distributions from net investment income | (.09) | (.07) | (.06) | (.07) | (.10) |
Distributions from net realized gain | (.04) | (.17) | (.10) | (.08) | (.45) |
Total distributions | (.12) H | (.24) | (.16) | (.15) | (.55) G |
Net asset value, end of period | $ 12.59 | $ 11.67 | $ 11.96 | $ 10.52 | $ 7.10 |
Total Return A, B | 9.02% | (.23)% | 15.28% | 50.43% | (39.76)% |
Ratios to Average Net Assets D, F | | | | | |
Expenses before reductions | 1.00% | 1.00% | 1.00% | 1.00% | 1.00% |
Expenses net of fee waivers, if any | 1.00% | 1.00% | 1.00% | 1.00% | 1.00% |
Expenses net of all reductions | 1.00% | 1.00% | 1.00% | 1.00% | 1.00% |
Net investment income (loss) | .79% | .64% | .51% | .76% | 1.30% |
Supplemental Data | | | | | |
Net assets, end of period (000 omitted) | $ 17,884 | $ 22,013 | $ 28,360 | $ 27,408 | $ 17,892 |
Portfolio turnover rate | 25% | 13% | 30% | 16% | 21% |
A Total returns would have been lower if certain expenses had not been reduced during the applicable periods shown.
B Total returns do not include the effect of the contingent deferred sales charge.
C Calculated based on average shares outstanding during the period.
D Amounts do not include the activity of the Underlying Funds.
E The amount shown for a share outstanding does not correspond with the aggregate net gain (loss) on investments for the period due to the timing of sales and repurchases of shares in relation to fluctuating market values of the investments of the Fund.
F Expense ratios reflect operating expenses of the class. Expenses before reductions do not reflect amounts reimbursed by the investment adviser or reductions from expense offset arrangements and do not represent the amount paid by the class during periods when reimbursements or reductions occur. Expenses net of fee waivers reflect expenses after reimbursement by the investment adviser but prior to reductions from expense offset arrangements. Expenses net of all reductions represent the net expenses paid by the class but do not include expenses of the investment companies in which the Fund invests.
G Total distributions of $.55 per share is comprised of distributions from net investment income of $.103 and distributions from net realized gain of $.445 per share.
H Total distributions of $.12 per share is comprised of distributions from net investment income of $.088 and distributions from net realized gain of $.036 per share.
See accompanying notes which are an integral part of the financial statements.
Annual Report
Financial Highlights - Class C
Years ended March 31, | 2013 | 2012 | 2011 | 2010 | 2009 |
Selected Per-Share Data | | | | | |
Net asset value, beginning of period | $ 11.65 | $ 11.96 | $ 10.52 | $ 7.11 | $ 12.39 |
Income from Investment Operations | | | | | |
Net investment income (loss) C | .09 | .07 | .06 | .07 | .12 |
Net realized and unrealized gain (loss) | .95 | (.13) E | 1.54 | 3.50 | (4.85) |
Total from investment operations | 1.04 | (.06) | 1.60 | 3.57 | (4.73) |
Distributions from net investment income | (.10) | (.08) | (.06) | (.08) | (.11) |
Distributions from net realized gain | (.04) | (.18) | (.10) | (.08) | (.45) |
Total distributions | (.13) I | (.25) H | (.16) | (.16) | (.55) G |
Net asset value, end of period | $ 12.56 | $ 11.65 | $ 11.96 | $ 10.52 | $ 7.11 |
Total Return A, B | 9.04% | (.29)% | 15.33% | 50.28% | (39.70)% |
Ratios to Average Net Assets D, F | | | | | |
Expenses before reductions | 1.00% | 1.00% | 1.00% | 1.00% | 1.00% |
Expenses net of fee waivers, if any | 1.00% | 1.00% | 1.00% | 1.00% | 1.00% |
Expenses net of all reductions | 1.00% | 1.00% | 1.00% | 1.00% | 1.00% |
Net investment income (loss) | .79% | .64% | .51% | .76% | 1.29% |
Supplemental Data | | | | | |
Net assets, end of period (000 omitted) | $ 43,447 | $ 38,614 | $ 36,389 | $ 30,994 | $ 17,821 |
Portfolio turnover rate | 25% | 13% | 30% | 16% | 21% |
A Total returns would have been lower if certain expenses had not been reduced during the applicable periods shown.
B Total returns do not include the effect of the contingent deferred sales charge.
C Calculated based on average shares outstanding during the period.
D Amounts do not include the activity of the Underlying Funds.
E The amount shown for a share outstanding does not correspond with the aggregate net gain (loss) on investments for the period due to the timing of sales and repurchases of shares in relation to fluctuating market values of the investments of the Fund.
F Expense ratios reflect operating expenses of the class. Expenses before reductions do not reflect amounts reimbursed by the investment adviser or reductions from expense offset arrangements and do not represent the amount paid by the class during periods when reimbursements or reductions occur. Expenses net of fee waivers reflect expenses after reimbursement by the investment adviser but prior to reductions from expense offset arrangements. Expenses net of all reductions represent the net expenses paid by the class but do not include expenses of the investment companies in which the Fund invests.
G Total distributions of $.55 per share is comprised of distributions from net investment income of $.107 and distributions from net realized gain of $.445 per share.
H Total distributions of $.25 per share is comprised of distributions from net investment income of $.076 and distributions from net realized gain of $.176 per share.
I Total distributions of $.13 per share is comprised of distributions from net investment income of $.098 and distributions from net realized gain of $.036 per share.
Financial Highlights - Institutional Class
Years ended March 31, | 2013 | 2012 | 2011 | 2010 | 2009 |
Selected Per-Share Data | | | | | |
Net asset value, beginning of period | $ 11.86 | $ 12.17 | $ 10.69 | $ 7.21 | $ 12.57 |
Income from Investment Operations | | | | | |
Net investment income (loss) B | .21 | .19 | .17 | .17 | .22 |
Net realized and unrealized gain (loss) | .97 | (.14) E | 1.57 | 3.55 | (4.93) |
Total from investment operations | 1.18 | .05 | 1.74 | 3.72 | (4.71) |
Distributions from net investment income | (.20) | (.17) | (.16) | (.16) | (.21) |
Distributions from net realized gain | (.04) | (.19) | (.11) | (.08) | (.45) |
Total distributions | (.24) | (.36) | (.26) H | (.24) | (.65) G |
Net asset value, end of period | $ 12.80 | $ 11.86 | $ 12.17 | $ 10.69 | $ 7.21 |
Total Return A | 10.10% | .71% | 16.51% | 51.81% | (39.08)% |
Ratios to Average Net Assets C, F | | | | | |
Expenses before reductions D | .00% | .00% | .00% | .00% | .00% |
Expenses net of fee waivers, if any | .00% | .00% | .00% | .00% | .00% |
Expenses net of all reductions | .00% | .00% | .00% | .00% | .00% |
Net investment income (loss) | 1.79% | 1.64% | 1.51% | 1.76% | 2.29% |
Supplemental Data | | | | | |
Net assets, end of period (000 omitted) | $ 547,049 | $ 360,580 | $ 218,092 | $ 97,629 | $ 43,667 |
Portfolio turnover rate | 25% | 13% | 30% | 16% | 21% |
A Total returns would have been lower if certain expenses had not been reduced during the applicable periods shown.
B Calculated based on average shares outstanding during the period.
C Amounts do not include the activity of the Underlying Funds.
D Amount represents less than .01%.
E The amount shown for a share outstanding does not correspond with the aggregate net gain (loss) on investments for the period due to the timing of sales and repurchases of shares in relation to fluctuating market values of the investments of the Fund.
F Expense ratios reflect operating expenses of the class. Expenses before reductions do not reflect amounts reimbursed by the investment adviser or reductions from expense offset arrangements and do not represent the amount paid by the class during periods when reimbursements or reductions occur. Expenses net of fee waivers reflect expenses after reimbursement by the investment adviser but prior to reductions from expense offset arrangements. Expenses net of all reductions represent the net expenses paid by the class but do not include expenses of the investment companies in which the Fund invests.
G Total distributions of $.65 per share is comprised of distributions from net investment income of $.206 and distributions from net realized gain of $.445 per share.
H Total distributions of $.26 per share is comprised of distributions from net investment income of $.157 and distributions from net realized gain of $.105 per share.
See accompanying notes which are an integral part of the financial statements.
Annual Report
Fidelity Advisor Freedom 2040 Fund
Investment Changes (Unaudited)
The information in the following tables is based on the direct investments of the Fund. |
Fund Holdings as of March 31, 2013 |
| % of fund's
net assets | % of fund's net assets
6 months ago |
Commodity Funds | | |
Fidelity Series Commodity Strategy Fund | 8.9 | 9.1 |
Domestic Equity Funds | | |
Fidelity Advisor Equity Growth Fund Institutional Class | 7.1 | 6.1 |
Fidelity Advisor Growth & Income Fund Institutional Class | 3.8 | 7.4 |
Fidelity Advisor Large Cap Fund Institutional Class | 3.8 | 6.8 |
Fidelity Advisor Series Equity-Income Fund | 5.0 | 0.0 |
Fidelity Advisor Series Mega Cap Fund | 1.1 | 0.0 |
Fidelity Advisor Series Opportunistic Insights Fund | 3.5 | 0.0 |
Fidelity Advisor Series Stock Selector Large Cap Value Fund | 5.0 | 0.0 |
Fidelity Advisor Small Cap Fund Institutional Class | 2.9 | 2.4 |
Fidelity Series 100 Index Fund | 1.2 | 5.0 |
Fidelity Series All-Sector Equity Fund | 9.4 | 10.6 |
Fidelity Series Large Cap Value Fund | 5.3 | 10.0 |
Fidelity Series Real Estate Equity Fund | 0.8 | 0.8 |
Fidelity Series Small Cap Opportunities Fund | 3.4 | 2.5 |
| 52.3 | 51.6 |
Developed International Equity Funds | | |
Fidelity Series International Growth Fund | 7.7 | 7.8 |
Fidelity Series International Small Cap Fund | 1.6 | 1.6 |
Fidelity Series International Value Fund | 7.7 | 7.7 |
| 17.0 | 17.1 |
Emerging Markets Equity Funds | | |
Fidelity Series Emerging Markets Fund | 4.7 | 4.9 |
High Yield Bond Funds | | |
Fidelity Series Emerging Markets Debt Fund | 0.7 | 0.7 |
Fidelity Series Floating Rate High Income Fund | 0.7 | 0.4 |
Fidelity Series High Income Fund | 7.0 | 7.3 |
Fidelity Series Real Estate Income Fund | 0.4 | 0.2 |
| 8.8 | 8.6 |
Investment Grade Bond Funds | | |
Fidelity Series Investment Grade Bond Fund | 8.3 | 8.7 |
Net Other Assets (Liabilities)* | 0.0 | 0.0 |
| 100.0 | 100.0 |
* Amount represents less than 0.1%
Asset Allocation (% of fund's net assets) |
Period end |
| Commodity Funds | 8.9% | |
| Domestic Equity Funds | 52.3% | |
| Developed International Equity Funds | 17.0% | |
| Emerging Markets
Equity Funds | 4.7% | |
| High Yield Bond Funds | 8.8% | |
| Investment Grade
Bond Funds | 8.3% | |

Six months ago |
| Commodity Funds | 9.1% | |
| Domestic Equity Funds | 51.6% | |
| Developed International Equity Funds | 17.1% | |
| Emerging Markets
Equity Funds | 4.9% | |
| High Yield Bond Funds | 8.6% | |
| Investment Grade
Bond Funds | 8.7% | |

Expected |
| Commodity Funds | 9.1% | |
| Domestic Equity Funds | 51.5% | |
| Developed International Equity Funds | 17.0% | |
| Emerging Markets
Equity Funds | 5.0% | |
| High Yield Bond Funds | 7.5% | |
| Investment Grade
Bond Funds | 9.9% | |

The fund invests according to an asset allocation strategy that becomes increasingly conservative over time. The six months ago allocation is based on the fund's holdings as of September 30, 2012. The current allocation is based on the fund's holdings as of March 31, 2013. The expected allocation represents the fund's anticipated allocation at September 30, 2013. |
Annual Report
Fidelity Advisor Freedom 2040 Fund
Investments March 31, 2013
Showing Percentage of Net Assets
Domestic Equity Funds - 61.2% |
| Shares | | Value |
Commodity Funds - 8.9% |
Fidelity Series Commodity Strategy Fund (a) | 20,726,811 | | $ 180,115,990 |
Domestic Equity Funds - 52.3% |
Fidelity Advisor Equity Growth Fund Institutional Class | 2,027,858 | | 143,673,712 |
Fidelity Advisor Growth & Income Fund Institutional Class | 3,439,345 | | 75,975,139 |
Fidelity Advisor Large Cap Fund Institutional Class | 3,231,495 | | 76,812,641 |
Fidelity Advisor Series Equity-Income Fund | 9,045,482 | | 100,676,220 |
Fidelity Advisor Series Mega Cap Fund | 2,017,634 | | 22,294,860 |
Fidelity Advisor Series Opportunistic Insights Fund | 6,463,092 | | 71,158,645 |
Fidelity Advisor Series Stock Selector Large Cap Value Fund | 9,061,912 | | 101,402,797 |
Fidelity Advisor Small Cap Fund Institutional Class | 2,192,656 | | 59,092,069 |
Fidelity Series 100 Index Fund | 2,282,948 | | 23,560,024 |
Fidelity Series All-Sector Equity Fund | 14,744,969 | | 189,472,856 |
Fidelity Series Large Cap Value Fund | 9,148,642 | | 106,490,192 |
Fidelity Series Real Estate Equity Fund | 1,200,424 | | 15,629,519 |
Fidelity Series Small Cap Opportunities Fund | 5,582,945 | | 68,837,714 |
TOTAL DOMESTIC EQUITY FUNDS | | 1,055,076,388 |
TOTAL DOMESTIC EQUITY FUNDS (Cost $1,145,191,225) |
1,235,192,378
|
International Equity Funds - 21.7% |
| | | |
Developed International Equity Funds - 17.0% |
Fidelity Series International Growth Fund | 12,375,205 | | 156,546,342 |
Fidelity Series International Small Cap Fund | 2,317,464 | | 31,795,611 |
Fidelity Series International Value Fund | 15,777,669 | | 154,936,713 |
TOTAL DEVELOPED INTERNATIONAL EQUITY FUNDS | | 343,278,666 |
|
| Shares | | Value |
Emerging Markets Equity Funds - 4.7% |
Fidelity Series Emerging Markets Fund | 5,664,300 | | $ 94,763,737 |
TOTAL INTERNATIONAL EQUITY FUNDS (Cost $389,167,780) |
438,042,403
|
Bond Funds - 17.1% |
| | | |
High Yield Bond Funds - 8.8% |
Fidelity Series Emerging Markets Debt Fund | 1,353,936 | | 14,730,822 |
Fidelity Series Floating Rate High Income Fund | 1,315,838 | | 13,987,354 |
Fidelity Series High Income Fund | 13,467,991 | | 141,548,587 |
Fidelity Series Real Estate Income Fund | 704,267 | | 8,218,795 |
TOTAL HIGH YIELD BOND FUNDS | | 178,485,558 |
Investment Grade Bond Funds - 8.3% |
Fidelity Series Investment Grade Bond Fund | 14,488,210 | | 167,049,065 |
TOTAL BOND FUNDS (Cost $337,466,745) |
345,534,623
|
TOTAL INVESTMENT PORTFOLIO - 100.0% (Cost $1,871,825,750) | | 2,018,769,404 |
NET OTHER ASSETS (LIABILITIES) - 0.0% | | (424,590) |
NET ASSETS - 100% | $ 2,018,344,814 |
Legend |
(a) Non-income producing |
Other Information |
All investments are categorized as Level 1 under the Fair Value Hierarchy. The inputs or methodology used for valuing securities may not be an indication of the risk associated with investing in those securities. For more information on valuation inputs, please refer to the Security Valuation section in the accompanying Notes to Financial Statements. |
See accompanying notes which are an integral part of the financial statements.
Annual Report
Fidelity Advisor Freedom 2040 Fund
Statement of Assets and Liabilities
| March 31, 2013 |
| | |
Assets | | |
Investment in securities, at value (cost $1,871,825,750) - See accompanying schedule | | $ 2,018,769,404 |
Cash | | 7 |
Receivable for investments sold | | 421,484 |
Receivable for fund shares sold | | 3,223,688 |
Receivable from affiliate for expense reductions | | 1,671 |
Total assets | | 2,022,416,254 |
| | |
Liabilities | | |
Payable for investments purchased | $ 584 | |
Payable for fund shares redeemed | 3,644,630 | |
Distribution and service plan fees payable | 426,226 | |
Total liabilities | | 4,071,440 |
| | |
Net Assets | | $ 2,018,344,814 |
Net Assets consist of: | | |
Paid in capital | | $ 1,800,153,501 |
Undistributed net investment income | | 1,945,539 |
Accumulated undistributed net realized gain (loss) on investments | | 69,302,120 |
Net unrealized appreciation (depreciation) on investments | | 146,943,654 |
Net Assets | | $ 2,018,344,814 |
| | |
Calculation of Maximum Offering Price Class A:
Net Asset Value and redemption price per share ($1,133,721,563 ÷ 83,309,638 shares) | | $ 13.61 |
| | |
Maximum offering price per share (100/94.25 of $13.61) | | $ 14.44 |
Class T:
Net Asset Value and redemption price per share ($288,886,043 ÷ 21,278,515 shares) | | $ 13.58 |
| | |
Maximum offering price per share (100/96.50 of $13.58) | | $ 14.07 |
Class B:
Net Asset Value and offering price per share ($24,480,984 ÷ 1,816,770 shares)A | | $ 13.48 |
| | |
Class C:
Net Asset Value and offering price per share ($62,893,114 ÷ 4,682,450 shares)A | | $ 13.43 |
| | |
Institutional Class:
Net Asset Value, offering price and redemption price per share ($508,363,110 ÷ 37,181,451 shares) | | $ 13.67 |
A Redemption price per share is equal to net asset value less any applicable contingent deferred sales charge.
Statement of Operations
| Year ended March 31, 2013 |
| | |
Investment Income | | |
Income distributions from underlying funds | | $ 31,708,261 |
| | |
Expenses | | |
Distribution and service plan fees | $ 4,715,294 | |
Independent trustees' compensation | 6,384 | |
Total expenses before reductions | 4,721,678 | |
Expense reductions | (6,384) | 4,715,294 |
Net investment income (loss) | | 26,992,967 |
Realized and Unrealized Gain (Loss) Realized gain (loss) on sale of underlying fund shares | 52,417,035 | |
Capital gain distributions from underlying funds | 37,762,695 | |
Total net realized gain (loss) | | 90,179,730 |
Change in net unrealized appreciation (depreciation) on underlying funds | | 62,667,913 |
Net gain (loss) | | 152,847,643 |
Net increase (decrease) in net assets resulting from operations | | $ 179,840,610 |
See accompanying notes which are an integral part of the financial statements.
Annual Report
Statement of Changes in Net Assets
| Year ended
March 31,
2013 | Year ended
March 31,
2012 |
Increase (Decrease) in Net Assets | | |
Operations | | |
Net investment income (loss) | $ 26,992,967 | $ 19,663,939 |
Net realized gain (loss) | 90,179,730 | 18,013,632 |
Change in net unrealized appreciation (depreciation) | 62,667,913 | (22,180,489) |
Net increase (decrease) in net assets resulting from operations | 179,840,610 | 15,497,082 |
Distributions to shareholders from net investment income | (26,501,610) | (18,881,497) |
Distributions to shareholders from net realized gain | (5,287,230) | (25,268,073) |
Total distributions | (31,788,840) | (44,149,570) |
Share transactions - net increase (decrease) | 198,765,979 | 229,257,376 |
Total increase (decrease) in net assets | 346,817,749 | 200,604,888 |
| | |
Net Assets | | |
Beginning of period | 1,671,527,065 | 1,470,922,177 |
End of period (including undistributed net investment income of $1,945,539 and undistributed net investment income of $1,454,182, respectively) | $ 2,018,344,814 | $ 1,671,527,065 |
Financial Highlights - Class A
Years ended March 31, | 2013 | 2012 | 2011 | 2010 | 2009 |
Selected Per-Share Data | | | | | |
Net asset value, beginning of period | $ 12.60 | $ 12.95 | $ 11.37 | $ 7.59 | $ 13.57 |
Income from Investment Operations | | | | | |
Net investment income (loss) C | .19 | .17 | .15 | .15 | .21 |
Net realized and unrealized gain (loss) | 1.05 | (.15) | 1.69 | 3.87 | (5.44) |
Total from investment operations | 1.24 | .02 | 1.84 | 4.02 | (5.23) |
Distributions from net investment income | (.19) | (.16) | (.15) | (.15) | (.20) |
Distributions from net realized gain | (.04) | (.21) | (.11) | (.09) | (.56) |
Total distributions | (.23) | (.37) | (.26) | (.24) | (.75)F |
Net asset value, end of period | $ 13.61 | $ 12.60 | $ 12.95 | $ 11.37 | $ 7.59 |
Total ReturnA,B | 9.94% | .38% | 16.38% | 53.15% | (40.42)% |
Ratios to Average Net AssetsD,E | | | | | |
Expenses before reductions | .25% | .25% | .25% | .25% | .25% |
Expenses net of fee waivers, if any | .25% | .25% | .25% | .25% | .25% |
Expenses net of all reductions | .25% | .25% | .25% | .25% | .25% |
Net investment income (loss) | 1.53% | 1.38% | 1.25% | 1.52% | 2.02% |
Supplemental Data | | | | | |
Net assets, end of period (000 omitted) | $ 1,133,722 | $ 967,348 | $ 865,008 | $ 670,673 | $ 342,357 |
Portfolio turnover rate | 26% | 14% | 38% | 18% | 18% |
A Total returns would have been lower if certain expenses had not been reduced during the applicable periods shown.
B Total returns do not include the effect of the sales charges.
C Calculated based on average shares outstanding during the period.
D Amounts do not include the activity of the Underlying Funds.
E Expense ratios reflect operating expenses of the class. Expenses before reductions do not reflect amounts reimbursed by the investment adviser or reductions from expense offset arrangements and do not represent the amount paid by the class during periods when reimbursements or reductions occur. Expenses net of fee waivers reflect expenses after reimbursement by the investment adviser but prior to reductions from expense offset arrangements. Expenses net of all reductions represent the net expenses paid by the class but do not include expenses of the investment companies in which the Fund invests.
F Total distributions of $.75 per share is comprised of distributions from net investment income of $.197 and distributions from net realized gain of $.555 per share.
See accompanying notes which are an integral part of the financial statements.
Annual Report
Financial Highlights - Class T
Years ended March 31, | 2013 | 2012 | 2011 | 2010 | 2009 |
Selected Per-Share Data | | | | | |
Net asset value, beginning of period | $ 12.57 | $ 12.92 | $ 11.34 | $ 7.57 | $ 13.54 |
Income from Investment Operations | | | | | |
Net investment income (loss) C | .16 | .14 | .12 | .13 | .18 |
Net realized and unrealized gain (loss) | 1.04 | (.16) | 1.68 | 3.86 | (5.43) |
Total from investment operations | 1.20 | (.02) | 1.80 | 3.99 | (5.25) |
Distributions from net investment income | (.16) | (.13) | (.11) | (.13) | (.17) |
Distributions from net realized gain | (.04) | (.21) | (.11) | (.09) | (.56) |
Total distributions | (.19) H | (.33) G | (.22) | (.22) | (.72) F |
Net asset value, end of period | $ 13.58 | $ 12.57 | $ 12.92 | $ 11.34 | $ 7.57 |
Total Return A,B | 9.69% | .12% | 16.06% | 52.83% | (40.61)% |
Ratios to Average Net Assets D,E | | | | | |
Expenses before reductions | .50% | .50% | .50% | .50% | .50% |
Expenses net of fee waivers, if any | .50% | .50% | .50% | .50% | .50% |
Expenses net of all reductions | .50% | .50% | .50% | .50% | .50% |
Net investment income (loss) | 1.28% | 1.13% | 1.00% | 1.27% | 1.77% |
Supplemental Data | | | | | |
Net assets, end of period (000 omitted) | $ 288,886 | $ 262,944 | $ 276,335 | $ 300,594 | $ 181,917 |
Portfolio turnover rate | 26% | 14% | 38% | 18% | 18% |
A Total returns would have been lower if certain expenses had not been reduced during the applicable periods shown.
B Total returns do not include the effect of the sales charges.
C Calculated based on average shares outstanding during the period.
D Amounts do not include the activity of the Underlying Funds.
E Expense ratios reflect operating expenses of the class. Expenses before reductions do not reflect amounts reimbursed by the investment adviser or reductions from expense offset arrangements and do not represent the amount paid by the class during periods when reimbursements or reductions occur. Expenses net of fee waivers reflect expenses after reimbursement by the investment adviser but prior to reductions from expense offset arrangements. Expenses net of all reductions represent the net expenses paid by the class but do not include expenses of the investment companies in which the Fund invests.
F Total distributions of $.72 per share is comprised of distributions from net investment income of $.168 and distributions from net realized gain of $.555 per share.
G Total distributions of $.33 per share is comprised of distributions from net investment income of $.127 and distributions from net realized gain of $.207 per share.
H Total distributions of $.19 per share is comprised of distributions from net investment income of $.156 and distributions from net realized gain of $.037 per share.
Financial Highlights - Class B
Years ended March 31, | 2013 | 2012 | 2011 | 2010 | 2009 |
Selected Per-Share Data | | | | | |
Net asset value, beginning of period | $ 12.48 | $ 12.82 | $ 11.26 | $ 7.52 | $ 13.42 |
Income from Investment Operations | | | | | |
Net investment income (loss) C | .10 | .08 | .06 | .08 | .13 |
Net realized and unrealized gain (loss) | 1.03 | (.15) | 1.66 | 3.83 | (5.37) |
Total from investment operations | 1.13 | (.07) | 1.72 | 3.91 | (5.24) |
Distributions from net investment income | (.09) | (.07) | (.06) | (.08) | (.11) |
Distributions from net realized gain | (.04) | (.20) | (.10) | (.09) | (.55) |
Total distributions | (.13) | (.27) | (.16) | (.17) | (.66) F |
Net asset value, end of period | $ 13.48 | $ 12.48 | $ 12.82 | $ 11.26 | $ 7.52 |
Total Return A,B | 9.14% | (.36)% | 15.43% | 52.08% | (40.85)% |
Ratios to Average Net Assets D,E | | | | | |
Expenses before reductions | 1.00% | 1.00% | 1.00% | 1.00% | 1.00% |
Expenses net of fee waivers, if any | 1.00% | 1.00% | 1.00% | 1.00% | 1.00% |
Expenses net of all reductions | 1.00% | 1.00% | 1.00% | 1.00% | 1.00% |
Net investment income (loss) | .78% | .63% | .50% | .77% | 1.28% |
Supplemental Data | | | | | |
Net assets, end of period (000 omitted) | $ 24,481 | $ 31,574 | $ 41,935 | $ 43,773 | $ 29,479 |
Portfolio turnover rate | 26% | 14% | 38% | 18% | 18% |
A Total returns would have been lower if certain expenses had not been reduced during the applicable periods shown.
B Total returns do not include the effect of the contingent deferred sales charge.
C Calculated based on average shares outstanding during the period.
D Amounts do not include the activity of the Underlying Funds.
E Expense ratios reflect operating expenses of the class. Expenses before reductions do not reflect amounts reimbursed by the investment adviser or reductions from expense offset arrangements and do not represent the amount paid by the class during periods when reimbursements or reductions occur. Expenses net of fee waivers reflect expenses after reimbursement by the investment adviser but prior to reductions from expense offset arrangements. Expenses net of all reductions represent the net expenses paid by the class but do not include expenses of the investment companies in which the Fund invests.
F Total distributions of $.66 per share is comprised of distributions from net investment income of $.112 and distributions from net realized gain of $.550 per share.
See accompanying notes which are an integral part of the financial statements.
Annual Report
Financial Highlights - Class C
Years ended March 31, | 2013 | 2012 | 2011 | 2010 | 2009 |
Selected Per-Share Data | | | | | |
Net asset value, beginning of period | $ 12.45 | $ 12.80 | $ 11.25 | $ 7.51 | $ 13.42 |
Income from Investment Operations | | | | | |
Net investment income (loss) C | .10 | .08 | .06 | .08 | .13 |
Net realized and unrealized gain (loss) | 1.02 | (.15) | 1.66 | 3.83 | (5.37) |
Total from investment operations | 1.12 | (.07) | 1.72 | 3.91 | (5.24) |
Distributions from net investment income | (.11) | (.08) | (.07) | (.08) | (.12) |
Distributions from net realized gain | (.04) | (.20) | (.10) | (.09) | (.55) |
Total distributions | (.14) G | (.28) | (.17) | (.17) | (.67) F |
Net asset value, end of period | $ 13.43 | $ 12.45 | $ 12.80 | $ 11.25 | $ 7.51 |
Total Return A,B | 9.09% | (.35)% | 15.39% | 52.18% | (40.91)% |
Ratios to Average Net Assets D,E | | | | | |
Expenses before reductions | 1.00% | 1.00% | 1.00% | 1.00% | 1.00% |
Expenses net of fee waivers, if any | 1.00% | 1.00% | 1.00% | 1.00% | 1.00% |
Expenses net of all reductions | 1.00% | 1.00% | 1.00% | 1.00% | 1.00% |
Net investment income (loss) | .78% | .63% | .50% | .77% | 1.28% |
Supplemental Data | | | | | |
Net assets, end of period (000 omitted) | $ 62,893 | $ 56,910 | $ 58,416 | $ 53,334 | $ 34,036 |
Portfolio turnover rate | 26% | 14% | 38% | 18% | 18% |
A Total returns would have been lower if certain expenses had not been reduced during the applicable periods shown.
B Total returns do not include the effect of the contingent deferred sales charge.
C Calculated based on average shares outstanding during the period.
D Amounts do not include the activity of the Underlying Funds.
E Expense ratios reflect operating expenses of the class. Expenses before reductions do not reflect amounts reimbursed by the investment adviser or reductions from expense offset arrangements and do not represent the amount paid by the class during periods when reimbursements or reductions occur. Expenses net of fee waivers reflect expenses after reimbursement by the investment adviser but prior to reductions from expense offset arrangements. Expenses net of all reductions represent the net expenses paid by the class but do not include expenses of the investment companies in which the Fund invests.
F Total distributions of $.67 per share is comprised of distributions from net investment income of $.115 and distributions from net realized gain of $.550 per share.
G Total distributions of $.14 per share is comprised of distributions from net investment income of $.105 and distributions from net realized gain of $.037 per share.
Financial Highlights - Institutional Class
Years ended March 31, | 2013 | 2012 | 2011 | 2010 | 2009 |
Selected Per-Share Data | | | | | |
Net asset value, beginning of period | $ 12.65 | $ 13.00 | $ 11.42 | $ 7.62 | $ 13.62 |
Income from Investment Operations | | | | | |
Net investment income (loss) B | .23 | .20 | .18 | .18 | .23 |
Net realized and unrealized gain (loss) | 1.05 | (.16) | 1.69 | 3.88 | (5.45) |
Total from investment operations | 1.28 | .04 | 1.87 | 4.06 | (5.22) |
Distributions from net investment income | (.22) | (.19) | (.18) | (.17) | (.22) |
Distributions from net realized gain | (.04) | (.21) | (.11) | (.09) | (.56) |
Total distributions | (.26) | (.39) G | (.29) | (.26) | (.78) F |
Net asset value, end of period | $ 13.67 | $ 12.65 | $ 13.00 | $ 11.42 | $ 7.62 |
Total Return A | 10.24% | .61% | 16.57% | 53.53% | (40.24)% |
Ratios to Average Net Assets C,E | | | | | |
Expenses before reductions D | .00% | .00% | .00% | .00% | .00% |
Expenses net of fee waivers, if any | .00% | .00% | .00% | .00% | .00% |
Expenses net of all reductions | .00% | .00% | .00% | .00% | .00% |
Net investment income (loss) | 1.78% | 1.63% | 1.50% | 1.77% | 2.27% |
Supplemental Data | | | | | |
Net assets, end of period (000 omitted) | $ 508,363 | $ 352,751 | $ 229,228 | $ 126,440 | $ 56,940 |
Portfolio turnover rate | 26% | 14% | 38% | 18% | 18% |
A Total returns would have been lower if certain expenses had not been reduced during the applicable periods shown.
B Calculated based on average shares outstanding during the period.
C Amounts do not include the activity of the Underlying Funds.
D Amount represents less than .01%.
E Expense ratios reflect operating expenses of the class. Expenses before reductions do not reflect amounts reimbursed by the investment adviser or reductions from expense offset arrangements and do not represent the amount paid by the class during periods when reimbursements or reductions occur. Expenses net of fee waivers reflect expenses after reimbursement by the investment adviser but prior to reductions from expense offset arrangements. Expenses net of all reductions represent the net expenses paid by the class but do not include expenses of the investment companies in which the Fund invests.
F Total distributions of $.78 per share is comprised of distributions from net investment income of $.224 and distributions from net realized gain of $.555 per share.
G Total distributions of $.39 per share is comprised of distributions from net investment income of $.186 and distributions from net realized gain of $.207 per share.
See accompanying notes which are an integral part of the financial statements.
Annual Report
Fidelity Advisor Freedom 2045 Fund
Investment Changes (Unaudited)
The information in the following tables is based on the direct investments of the Fund. |
Fund Holdings as of March 31, 2013 |
| % of fund's
net assets | % of fund's net assets
6 months ago |
Commodity Funds | | |
Fidelity Series Commodity Strategy Fund | 9.2 | 9.4 |
Domestic Equity Funds | | |
Fidelity Advisor Equity Growth Fund Institutional Class | 7.4 | 6.3 |
Fidelity Advisor Growth & Income Fund Institutional Class | 3.9 | 7.6 |
Fidelity Advisor Large Cap Fund Institutional Class | 4.0 | 7.0 |
Fidelity Advisor Series Equity-Income Fund | 4.9 | 0.0 |
Fidelity Advisor Series Mega Cap Fund | 1.1 | 0.0 |
Fidelity Advisor Series Opportunistic Insights Fund | 3.5 | 0.0 |
Fidelity Advisor Series Stock Selector Large Cap Value Fund | 5.0 | 0.0 |
Fidelity Advisor Small Cap Fund Institutional Class | 3.0 | 2.5 |
Fidelity Series 100 Index Fund | 1.2 | 5.1 |
Fidelity Series All-Sector Equity Fund | 9.7 | 10.8 |
Fidelity Series Large Cap Value Fund | 5.5 | 10.3 |
Fidelity Series Real Estate Equity Fund | 0.8 | 0.7 |
Fidelity Series Small Cap Opportunities Fund | 3.5 | 2.6 |
| 53.5 | 52.9 |
Developed International Equity Funds | | |
Fidelity Series International Growth Fund | 8.0 | 8.0 |
Fidelity Series International Small Cap Fund | 1.6 | 1.6 |
Fidelity Series International Value Fund | 7.9 | 8.0 |
| 17.5 | 17.6 |
Emerging Markets Equity Funds | | |
Fidelity Series Emerging Markets Fund | 4.9 | 5.1 |
High Yield Bond Funds | | |
Fidelity Series Emerging Markets Debt Fund | 0.7 | 0.7 |
Fidelity Series Floating Rate High Income Fund | 0.3 | 0.2 |
Fidelity Series High Income Fund | 9.1 | 9.1 |
Fidelity Series Real Estate Income Fund | 0.3 | 0.1 |
| 10.4 | 10.1 |
Investment Grade Bond Funds | | |
Fidelity Series Investment Grade Bond Fund | 4.5 | 4.9 |
Net Other Assets (Liabilities)* | 0.0 | 0.0 |
| 100.0 | 100.0 |
* Amount represents less than 0.1%
Asset Allocation (% of fund's net assets) |
Period end |
| Commodity Funds | 9.2% | |
| Domestic Equity Funds | 53.5% | |
| Developed International Equity Funds | 17.5% | |
| Emerging Markets
Equity Funds | 4.9% | |
| High Yield Bond Funds | 10.4% | |
| Investment Grade
Bond Funds | 4.5% | |

Six months ago |
| Commodity Funds | 9.4% | |
| Domestic Equity Funds | 52.9% | |
| Developed International Equity Funds | 17.6% | |
| Emerging Markets
Equity Funds | 5.1% | |
| High Yield Bond Funds | 10.1% | |
| Investment Grade
Bond Funds | 4.9% | |

Expected |
| Commodity Funds | 9.3% | |
| Domestic Equity Funds | 52.7% | |
| Developed International Equity Funds | 17.4% | |
| Emerging Markets
Equity Funds | 5.2% | |
| High Yield Bond Funds | 9.6% | |
| Investment Grade
Bond Funds | 5.8% | |

The fund invests according to an asset allocation strategy that becomes increasingly conservative over time. The six months ago allocation is based on the fund's holdings as of September 30, 2012. The current allocation is based on the fund's holdings as of March 31, 2013. The expected allocation represents the fund's anticipated allocation at September 30, 2013. |
Annual Report
Fidelity Advisor Freedom 2045 Fund
Investments March 31, 2013
Showing Percentage of Net Assets
Domestic Equity Funds - 62.7% |
| Shares | | Value |
Commodity Funds - 9.2% |
Fidelity Series Commodity Strategy Fund (a) | 9,609,068 | | $ 83,502,801 |
Domestic Equity Funds - 53.5% |
Fidelity Advisor Equity Growth Fund Institutional Class | 940,990 | | 66,669,108 |
Fidelity Advisor Growth & Income Fund Institutional Class | 1,606,216 | | 35,481,306 |
Fidelity Advisor Large Cap Fund Institutional Class | 1,508,004 | | 35,845,261 |
Fidelity Advisor Series Equity-Income Fund | 4,023,312 | | 44,779,464 |
Fidelity Advisor Series Mega Cap Fund | 897,890 | | 9,921,685 |
Fidelity Advisor Series Opportunistic Insights Fund | 2,875,266 | | 31,656,678 |
Fidelity Advisor Series Stock Selector Large Cap Value Fund | 4,030,535 | | 45,101,687 |
Fidelity Advisor Small Cap Fund Institutional Class | 1,017,999 | | 27,435,072 |
Fidelity Series 100 Index Fund | 1,075,497 | | 11,099,125 |
Fidelity Series All-Sector Equity Fund | 6,863,927 | | 88,201,459 |
Fidelity Series Large Cap Value Fund | 4,303,409 | | 50,091,676 |
Fidelity Series Real Estate Equity Fund | 563,433 | | 7,335,896 |
Fidelity Series Small Cap Opportunities Fund | 2,595,610 | | 32,003,872 |
TOTAL DOMESTIC EQUITY FUNDS | | 485,622,289 |
TOTAL DOMESTIC EQUITY FUNDS (Cost $498,828,771) |
569,125,090
|
International Equity Funds - 22.4% |
| | | |
Developed International Equity Funds - 17.5% |
Fidelity Series International Growth Fund | 5,718,366 | | 72,337,325 |
Fidelity Series International Small Cap Fund | 1,070,099 | | 14,681,753 |
Fidelity Series International Value Fund | 7,294,123 | | 71,628,283 |
TOTAL DEVELOPED INTERNATIONAL EQUITY FUNDS | | 158,647,361 |
|
| Shares | | Value |
Emerging Markets Equity Funds - 4.9% |
Fidelity Series Emerging Markets Fund | 2,634,535 | | $ 44,075,777 |
TOTAL INTERNATIONAL EQUITY FUNDS (Cost $181,195,488) |
202,723,138
|
Bond Funds - 14.9% |
| | | |
High Yield Bond Funds - 10.4% |
Fidelity Series Emerging Markets Debt Fund | 590,082 | | 6,420,091 |
Fidelity Series Floating Rate High Income Fund | 277,750 | | 2,952,479 |
Fidelity Series High Income Fund | 7,819,277 | | 82,180,603 |
Fidelity Series Real Estate Income Fund | 267,680 | | 3,123,821 |
TOTAL HIGH YIELD BOND FUNDS | | 94,676,994 |
Investment Grade Bond Funds - 4.5% |
Fidelity Series Investment Grade Bond Fund | 3,543,465 | | 40,856,148 |
TOTAL BOND FUNDS (Cost $130,703,009) |
135,533,142
|
TOTAL INVESTMENT PORTFOLIO - 100.0% (Cost $810,727,268) | | 907,381,370 |
NET OTHER ASSETS (LIABILITIES) - 0.0% | | (159,247) |
NET ASSETS - 100% | $ 907,222,123 |
Legend |
(a) Non-income producing |
Other Information |
All investments are categorized as Level 1 under the Fair Value Hierarchy. The inputs or methodology used for valuing securities may not be an indication of the risk associated with investing in those securities. For more information on valuation inputs, please refer to the Security Valuation section in the accompanying Notes to Financial Statements. |
See accompanying notes which are an integral part of the financial statements.
Annual Report
Fidelity Advisor Freedom 2045 Fund
Statement of Assets and Liabilities
| March 31, 2013 |
| | |
Assets | | |
Investment in securities, at value (cost $810,727,268) - See accompanying schedule | | $ 907,381,370 |
Cash | | 4 |
Receivable for investments sold | | 11,323 |
Receivable for fund shares sold | | 1,706,632 |
Receivable from affiliate for expense reductions | | 1,123 |
Total assets | | 909,100,452 |
| | |
Liabilities | | |
Payable for investments purchased | $ 744,234 | |
Payable for fund shares redeemed | 973,717 | |
Distribution and service plan fees payable | 160,378 | |
Total liabilities | | 1,878,329 |
| | |
Net Assets | | $ 907,222,123 |
Net Assets consist of: | | |
Paid in capital | | $ 792,973,363 |
Undistributed net investment income | | 966,423 |
Accumulated undistributed net realized gain (loss) on investments | | 16,628,235 |
Net unrealized appreciation (depreciation) on investments | | 96,654,102 |
Net Assets | | $ 907,222,123 |
| | |
Calculation of Maximum Offering Price Class A:
Net Asset Value and redemption price per share ($527,525,108 ÷ 50,445,707 shares) | | $ 10.46 |
| | |
Maximum offering price per share (100/94.25 of $10.46) | | $ 11.10 |
Class T:
Net Asset Value and redemption price per share ($92,997,571 ÷ 8,929,060 shares) | | $ 10.42 |
| | |
Maximum offering price per share (100/96.50 of $10.42) | | $ 10.80 |
Class B:
Net Asset Value and offering price per share ($3,651,362 ÷ 351,333 shares)A | | $ 10.39 |
| | |
Class C:
Net Asset Value and offering price per share ($13,415,230 ÷ 1,295,149 shares)A | | $ 10.36 |
| | |
Institutional Class:
Net Asset Value, offering price and redemption price per share ($269,632,852 ÷ 25,674,477 shares) | | $ 10.50 |
A Redemption price per share is equal to net asset value less any applicable contingent deferred sales charge.
Statement of Operations
| Year ended March 31, 2013 |
| | |
Investment Income | | |
Income distributions from underlying funds | | $ 13,689,653 |
| | |
Expenses | | |
Distribution and service plan fees | $ 1,642,770 | |
Independent trustees' compensation | 2,634 | |
Total expenses before reductions | 1,645,404 | |
Expense reductions | (2,634) | 1,642,770 |
Net investment income (loss) | | 12,046,883 |
Realized and Unrealized Gain (Loss) Realized gain (loss) on sale of underlying fund shares | 5,758,118 | |
Capital gain distributions from underlying funds | 15,627,374 | |
Total net realized gain (loss) | | 21,385,492 |
Change in net unrealized appreciation (depreciation) on underlying funds | | 48,075,115 |
Net gain (loss) | | 69,460,607 |
Net increase (decrease) in net assets resulting from operations | | $ 81,507,490 |
See accompanying notes which are an integral part of the financial statements.
Annual Report
Statement of Changes in Net Assets
| Year ended
March 31,
2013 | Year ended
March 31,
2012 |
Increase (Decrease) in Net Assets | | |
Operations | | |
Net investment income (loss) | $ 12,046,883 | $ 7,359,765 |
Net realized gain (loss) | 21,385,492 | 20,295,934 |
Change in net unrealized appreciation (depreciation) | 48,075,115 | (17,147,846) |
Net increase (decrease) in net assets resulting from operations | 81,507,490 | 10,507,853 |
Distributions to shareholders from net investment income | (11,684,331) | (7,058,225) |
Distributions to shareholders from net realized gain | (10,873,978) | (8,884,925) |
Total distributions | (22,558,309) | (15,943,150) |
Share transactions - net increase (decrease) | 205,501,582 | 170,603,885 |
Total increase (decrease) in net assets | 264,450,763 | 165,168,588 |
| | |
Net Assets | | |
Beginning of period | 642,771,360 | 477,602,772 |
End of period (including undistributed net investment income of $966,423 and undistributed net investment income of $603,871, respectively) | $ 907,222,123 | $ 642,771,360 |
Financial Highlights - Class A
Years ended March 31, | 2013 | 2012 | 2011 | 2010 | 2009 |
Selected Per-Share Data | | | | | |
Net asset value, beginning of period | $ 9.79 | $ 10.08 | $ 8.82 | $ 5.86 | $ 10.39 |
Income from Investment Operations | | | | | |
Net investment income (loss) C | .16 | .13 | .12 | .12 | .16 |
Net realized and unrealized gain (loss) | .81 | (.14) E | 1.33 | 3.02 | (4.29) |
Total from investment operations | .97 | (.01) | 1.45 | 3.14 | (4.13) |
Distributions from net investment income | (.15) | (.12) | (.11) | (.11) | (.14) |
Distributions from net realized gain | (.15) | (.16) | (.08) | (.07) | (.26) |
Total distributions | (.30) | (.28) | (.19) | (.18) | (.40) |
Net asset value, end of period | $ 10.46 | $ 9.79 | $ 10.08 | $ 8.82 | $ 5.86 |
Total Return A,B | 10.21% | .12% | 16.67% | 53.81% | (40.93)% |
Ratios to Average Net Assets D,F | | | | | |
Expenses before reductions | .25% | .25% | .25% | .25% | .25% |
Expenses net of fee waivers, if any | .25% | .25% | .25% | .25% | .25% |
Expenses net of all reductions | .25% | .25% | .25% | .25% | .25% |
Net investment income (loss) | 1.59% | 1.41% | 1.35% | 1.53% | 2.12% |
Supplemental Data | | | | | |
Net assets, end of period (000 omitted) | $ 527,525 | $ 403,850 | $ 320,731 | $ 205,405 | $ 81,985 |
Portfolio turnover rate | 25% | 11% | 32% | 14% | 18% |
A Total returns would have been lower if certain expenses had not been reduced during the applicable periods shown.
B Total returns do not include the effect of the sales charges.
C Calculated based on average shares outstanding during the period.
D Amounts do not include the activity of the Underlying Funds.
E The amount shown for a share outstanding does not correspond with the aggregate net gain (loss) on investments for the period due to the timing of sales and repurchases of shares in relation to fluctuating market values of the investments of the Fund.
F Expense ratios reflect operating expenses of the class. Expenses before reductions do not reflect amounts reimbursed by the investment adviser or reductions from expense offset arrangements and do not represent the amount paid by the class during periods when reimbursements or reductions occur. Expense ratios before reductions for start-up periods may not be representative of longer-term operating periods. Expenses net of fee waivers reflect expenses after reimbursement by the investment adviser but prior to reductions from expense offset arrangements. Expenses net of all reductions represent the net expenses paid by the class but do not include expenses of the investment companies in which the Fund invests.
See accompanying notes which are an integral part of the financial statements.
Annual Report
Financial Highlights - Class T
Years ended March 31, | 2013 | 2012 | 2011 | 2010 | 2009 |
Selected Per-Share Data | | | | | |
Net asset value, beginning of period | $ 9.75 | $ 10.04 | $ 8.79 | $ 5.84 | $ 10.36 |
Income from Investment Operations | | | | | |
Net investment income (loss) C | .13 | .11 | .10 | .10 | .14 |
Net realized and unrealized gain (loss) | .82 | (.15) E | 1.32 | 3.02 | (4.28) |
Total from investment operations | .95 | (.04) | 1.42 | 3.12 | (4.14) |
Distributions from net investment income | (.12) | (.10) | (.09) | (.10) | (.12) |
Distributions from net realized gain | (.15) | (.16) | (.08) | (.07) | (.26) |
Total distributions | (.28) H | (.25) G | (.17) | (.17) | (.38) |
Net asset value, end of period | $ 10.42 | $ 9.75 | $ 10.04 | $ 8.79 | $ 5.84 |
Total Return A,B | 10.02% | (.15)% | 16.36% | 53.52% | (41.08)% |
Ratios to Average Net Assets D,F | | | | | |
Expenses before reductions | .50% | .50% | .50% | .50% | .50% |
Expenses net of fee waivers, if any | .50% | .50% | .50% | .50% | .50% |
Expenses net of all reductions | .50% | .50% | .50% | .50% | .50% |
Net investment income (loss) | 1.34% | 1.16% | 1.10% | 1.28% | 1.87% |
Supplemental Data | | | | | |
Net assets, end of period (000 omitted) | $ 92,998 | $ 62,438 | $ 60,268 | $ 43,326 | $ 18,065 |
Portfolio turnover rate | 25% | 11% | 32% | 14% | 18% |
A Total returns would have been lower if certain expenses had not been reduced during the applicable periods shown.
B Total returns do not include the effect of the sales charges.
C Calculated based on average shares outstanding during the period.
D Amounts do not include the activity of the Underlying Funds.
E The amount shown for a share outstanding does not correspond with the aggregate net gain (loss) on investments for the period due to the timing of sales and repurchases of shares in relation to fluctuating market values of the investments of the Fund.
F Expense ratios reflect operating expenses of the class. Expenses before reductions do not reflect amounts reimbursed by the investment adviser or reductions from expense offset arrangements and do not represent the amount paid by the class during periods when reimbursements or reductions occur. Expense ratios before reductions for start-up periods may not be representative of longer-term operating periods. Expenses net of fee waivers reflect expenses after reimbursement by the investment adviser but prior to reductions from expense offset arrangements. Expenses net of all reductions represent the net expenses paid by the class but do not include expenses of the investment companies in which the Fund invests.
G Total distributions of $.25 per share is comprised of distributions from net investment income of $.096 and distributions from net realized gain of $.155 per share.
H Total distributions of $.28 per share is comprised of distributions from net investment income of $.124 and distributions from net realized gain of $.153 per share.
Financial Highlights - Class B
Years ended March 31, | 2013 | 2012 | 2011 | 2010 | 2009 |
Selected Per-Share Data | | | | | |
Net asset value, beginning of period | $ 9.73 | $ 10.01 | $ 8.77 | $ 5.83 | $ 10.33 |
Income from Investment Operations | | | | | |
Net investment income (loss) C | .08 | .06 | .05 | .06 | .11 |
Net realized and unrealized gain (loss) | .81 | (.14) E | 1.32 | 3.01 | (4.27) |
Total from investment operations | .89 | (.08) | 1.37 | 3.07 | (4.16) |
Distributions from net investment income | (.08) | (.05) | (.05) | (.06) | (.08) |
Distributions from net realized gain | (.15) | (.15) | (.08) | (.07) | (.26) |
Total distributions | (.23) | (.20) | (.13) | (.13) | (.34) |
Net asset value, end of period | $ 10.39 | $ 9.73 | $ 10.01 | $ 8.77 | $ 5.83 |
Total Return A,B | 9.40% | (.62)% | 15.71% | 52.74% | (41.39)% |
Ratios to Average Net Assets D,F | | | | | |
Expenses before reductions | 1.00% | 1.00% | 1.00% | 1.00% | 1.00% |
Expenses net of fee waivers, if any | 1.00% | 1.00% | 1.00% | 1.00% | 1.00% |
Expenses net of all reductions | 1.00% | 1.00% | 1.00% | 1.00% | 1.00% |
Net investment income (loss) | .84% | .66% | .60% | .78% | 1.37% |
Supplemental Data | | | | | |
Net assets, end of period (000 omitted) | $ 3,651 | $ 3,786 | $ 4,612 | $ 4,089 | $ 2,231 |
Portfolio turnover rate | 25% | 11% | 32% | 14% | 18% |
A Total returns would have been lower if certain expenses had not been reduced during the applicable periods shown.
B Total returns do not include the effect of the contingent deferred sales charge.
C Calculated based on average shares outstanding during the period.
D Amounts do not include the activity of the Underlying Funds.
E The amount shown for a share outstanding does not correspond with the aggregate net gain (loss) on investments for the period due to the timing of sales and repurchases of shares in relation to fluctuating market values of the investments of the Fund.
F Expense ratios reflect operating expenses of the class. Expenses before reductions do not reflect amounts reimbursed by the investment adviser or reductions from expense offset arrangements and do not represent the amount paid by the class during periods when reimbursements or reductions occur. Expense ratios before reductions for start-up periods may not be representative of longer-term operating periods. Expenses net of fee waivers reflect expenses after reimbursement by the investment adviser but prior to reductions from expense offset arrangements. Expenses net of all reductions represent the net expenses paid by the class but do not include expenses of the investment companies in which the Fund invests.
See accompanying notes which are an integral part of the financial statements.
Annual Report
Financial Highlights - Class C
Years ended March 31, | 2013 | 2012 | 2011 | 2010 | 2009 |
Selected Per-Share Data | | | | | |
Net asset value, beginning of period | $ 9.71 | $ 10.00 | $ 8.76 | $ 5.82 | $ 10.32 |
Income from Investment Operations | | | | | |
Net investment income (loss) C | .08 | .06 | .05 | .06 | .11 |
Net realized and unrealized gain (loss) | .81 | (.14) E | 1.32 | 3.01 | (4.27) |
Total from investment operations | .89 | (.08) | 1.37 | 3.07 | (4.16) |
Distributions from net investment income | (.09) | (.06) | (.06) | (.06) | (.08) |
Distributions from net realized gain | (.15) | (.15) | (.08) | (.07) | (.26) |
Total distributions | (.24) | (.21) | (.13) G | (.13) | (.34) |
Net asset value, end of period | $ 10.36 | $ 9.71 | $ 10.00 | $ 8.76 | $ 5.82 |
Total Return A,B | 9.42% | (.62)% | 15.80% | 52.90% | (41.39)% |
Ratios to Average Net Assets D,F | | | | | |
Expenses before reductions | 1.00% | 1.00% | 1.00% | 1.00% | 1.00% |
Expenses net of fee waivers, if any | 1.00% | 1.00% | 1.00% | 1.00% | 1.00% |
Expenses net of all reductions | 1.00% | 1.00% | 1.00% | 1.00% | 1.00% |
Net investment income (loss) | .84% | .66% | .60% | .78% | 1.37% |
Supplemental Data | | | | | |
Net assets, end of period (000 omitted) | $ 13,415 | $ 9,926 | $ 8,753 | $ 6,199 | $ 3,027 |
Portfolio turnover rate | 25% | 11% | 32% | 14% | 18% |
A Total returns would have been lower if certain expenses had not been reduced during the applicable periods shown.
B Total returns do not include the effect of the contingent deferred sales charge.
C Calculated based on average shares outstanding during the period.
D Amounts do not include the activity of the Underlying Funds.
E The amount shown for a share outstanding does not correspond with the aggregate net gain (loss) on investments for the period due to the timing of sales and repurchases of shares in relation to fluctuating market values of the investments of the Fund.
F Expense ratios reflect operating expenses of the class. Expenses before reductions do not reflect amounts reimbursed by the investment adviser or reductions from expense offset arrangements and do not represent the amount paid by the class during periods when reimbursements or reductions occur. Expense ratios before reductions for start-up periods may not be representative of longer-term operating periods. Expenses net of fee waivers reflect expenses after reimbursement by the investment adviser but prior to reductions from expense offset arrangements. Expenses net of all reductions represent the net expenses paid by the class but do not include expenses of the investment companies in which the Fund invests.
G Total distributions of $.13 per share is comprised of distributions from net investment income of $.057 and distributions from net realized gain of $.076 per share.
Financial Highlights - Institutional Class
Years ended March 31, | 2013 | 2012 | 2011 | 2010 | 2009 |
Selected Per-Share Data | | | | | |
Net asset value, beginning of period | $ 9.83 | $ 10.11 | $ 8.85 | $ 5.87 | $ 10.41 |
Income from Investment Operations | | | | | |
Net investment income (loss) B | .18 | .16 | .15 | .14 | .18 |
Net realized and unrealized gain (loss) | .81 | (.14) E | 1.32 | 3.04 | (4.30) |
Total from investment operations | .99 | .02 | 1.47 | 3.18 | (4.12) |
Distributions from net investment income | (.17) | (.14) | (.13) | (.13) | (.16) |
Distributions from net realized gain | (.15) | (.16) | (.08) | (.07) | (.26) |
Total distributions | (.32) | (.30) | (.21) | (.20) | (.42) |
Net asset value, end of period | $ 10.50 | $ 9.83 | $ 10.11 | $ 8.85 | $ 5.87 |
Total Return A | 10.43% | .45% | 16.86% | 54.35% | (40.81)% |
Ratios to Average Net Assets C,F | | | | | |
Expenses before reductions D | .00% | .00% | .00% | .00% | .00% |
Expenses net of fee waivers, if any | .00% | .00% | .00% | .00% | .00% |
Expenses net of all reductions | .00% | .00% | .00% | .00% | .00% |
Net investment income (loss) | 1.84% | 1.66% | 1.60% | 1.78% | 2.37% |
Supplemental Data | | | | | |
Net assets, end of period (000 omitted) | $ 269,633 | $ 162,772 | $ 83,240 | $ 32,842 | $ 12,078 |
Portfolio turnover rate | 25% | 11% | 32% | 14% | 18% |
A Total returns would have been lower if certain expenses had not been reduced during the applicable periods shown.
B Calculated based on average shares outstanding during the period.
C Amounts do not include the activity of the Underlying Funds.
D Amount represents less than .01%.
E The amount shown for a share outstanding does not correspond with the aggregate net gain (loss) on investments for the period due to the timing of sales and repurchases of shares in relation to fluctuating market values of the investments of the Fund.
F Expense ratios reflect operating expenses of the class. Expenses before reductions do not reflect amounts reimbursed by the investment adviser or reductions from expense offset arrangements and do not represent the amount paid by the class during periods when reimbursements or reductions occur. Expense ratios before reductions for start-up periods may not be representative of longer-term operating periods. Expenses net of fee waivers reflect expenses after reimbursement by the investment adviser but prior to reductions from expense offset arrangements. Expenses net of all reductions represent the net expenses paid by the class but do not include expenses of the investment companies in which the Fund invests.
See accompanying notes which are an integral part of the financial statements.
Annual Report
Fidelity Advisor Freedom 2050 Fund
Investment Changes (Unaudited)
The information in the following tables is based on the direct investments of the Fund. |
Fund Holdings as of March 31, 2013 |
| % of fund's
net assets | % of fund's net assets
6 months ago |
Commodity Funds | | |
Fidelity Series Commodity Strategy Fund | 9.3 | 9.6 |
Domestic Equity Funds | | |
Fidelity Advisor Equity Growth Fund Institutional Class | 7.4 | 6.4 |
Fidelity Advisor Growth & Income Fund Institutional Class | 4.0 | 7.7 |
Fidelity Advisor Large Cap Fund Institutional Class | 4.0 | 7.1 |
Fidelity Advisor Series Equity-Income Fund | 5.1 | 0.0 |
Fidelity Advisor Series Mega Cap Fund | 1.1 | 0.0 |
Fidelity Advisor Series Opportunistic Insights Fund | 3.6 | 0.0 |
Fidelity Advisor Series Stock Selector Large Cap Value Fund | 5.1 | 0.0 |
Fidelity Advisor Small Cap Fund Institutional Class | 3.0 | 2.6 |
Fidelity Series 100 Index Fund | 1.2 | 5.2 |
Fidelity Series All-Sector Equity Fund | 9.8 | 11.1 |
Fidelity Series Large Cap Value Fund | 5.6 | 10.5 |
Fidelity Series Real Estate Equity Fund | 0.8 | 0.8 |
Fidelity Series Small Cap Opportunities Fund | 3.5 | 2.6 |
| 54.2 | 54.0 |
Developed International Equity Funds | | |
Fidelity Series International Growth Fund | 8.1 | 8.2 |
Fidelity Series International Small Cap Fund | 1.7 | 1.6 |
Fidelity Series International Value Fund | 8.0 | 8.2 |
| 17.8 | 18.0 |
Emerging Markets Equity Funds | | |
Fidelity Series Emerging Markets Fund | 4.9 | 5.2 |
High Yield Bond Funds | | |
Fidelity Series Emerging Markets Debt Fund | 0.7 | 0.7 |
Fidelity Series Floating Rate High Income Fund | 0.1 | 0.1 |
Fidelity Series High Income Fund | 9.2 | 9.2 |
Fidelity Series Real Estate Income Fund | 0.3 | 0.1 |
| 10.3 | 10.1 |
Investment Grade Bond Funds | | |
Fidelity Series Investment Grade Bond Fund | 3.5 | 3.1 |
Net Other Assets (Liabilities)* | 0.0 | 0.0 |
| 100.0 | 100.0 |
* Amount represents less than 0.1% |
Asset Allocation (% of fund's net assets) |
Period end |
| Commodity Funds | 9.3% | |
| Domestic Equity Funds | 54.2% | |
| Developed International Equity Funds | 17.8% | |
| Emerging Markets
Equity Funds | 4.9% | |
| High Yield Bond Funds | 10.3% | |
| Investment Grade
Bond Funds | 3.5% | |

Six months ago |
| Commodity Funds | 9.6% | |
| Domestic Equity Funds | 54.0% | |
| Developed International Equity Funds | 18.0% | |
| Emerging Markets
Equity Funds | 5.2% | |
| High Yield Bond Funds | 10.1% | |
| Investment Grade
Bond Funds | 3.1% | |

Expected |
| Commodity Funds | 9.4% | |
| Domestic Equity Funds | 53.1% | |
| Developed International Equity Funds | 17.6% | |
| Emerging Markets
Equity Funds | 5.2% | |
| High Yield Bond Funds | 10.0% | |
| Investment Grade
Bond Funds | 4.7% | |

The fund invests according to an asset allocation strategy that becomes increasingly conservative over time. The six months ago allocation is based on the fund's holdings as of September 30, 2012. The current allocation is based on the fund's holdings as of March 31, 2013. The expected allocation represents the fund's anticipated allocation at September 30, 2013. |
Annual Report
Fidelity Advisor Freedom 2050 Fund
Investments March 31, 2013
Showing Percentage of Net Assets
Domestic Equity Funds - 63.5% |
| Shares | | Value |
Commodity Funds - 9.3% |
Fidelity Series Commodity Strategy Fund (a) | 7,141,032 | | $ 62,055,569 |
Domestic Equity Funds - 54.2% |
Fidelity Advisor Equity Growth Fund Institutional Class | 694,367 | | 49,195,874 |
Fidelity Advisor Growth & Income Fund Institutional Class | 1,187,233 | | 26,225,977 |
Fidelity Advisor Large Cap Fund Institutional Class | 1,114,205 | | 26,484,651 |
Fidelity Advisor Series Equity-Income Fund | 3,040,476 | | 33,840,493 |
Fidelity Advisor Series Mega Cap Fund | 678,605 | | 7,498,583 |
Fidelity Advisor Series Opportunistic Insights Fund | 2,173,001 | | 23,924,742 |
Fidelity Advisor Series Stock Selector Large Cap Value Fund | 3,045,702 | | 34,081,404 |
Fidelity Advisor Small Cap Fund Institutional Class | 750,716 | | 20,231,800 |
Fidelity Series 100 Index Fund | 794,846 | | 8,202,815 |
Fidelity Series All-Sector Equity Fund | 5,076,330 | | 65,230,846 |
Fidelity Series Large Cap Value Fund | 3,193,559 | | 37,173,024 |
Fidelity Series Real Estate Equity Fund | 416,650 | | 5,424,779 |
Fidelity Series Small Cap Opportunities Fund | 1,910,757 | | 23,559,633 |
TOTAL DOMESTIC EQUITY FUNDS | | 361,074,621 |
TOTAL DOMESTIC EQUITY FUNDS (Cost $368,697,399) |
423,130,190
|
International Equity Funds - 22.7% |
| | | |
Developed International Equity Funds - 17.8% |
Fidelity Series International Growth Fund | 4,252,154 | | 53,789,744 |
Fidelity Series International Small Cap Fund | 797,543 | | 10,942,294 |
Fidelity Series International Value Fund | 5,434,776 | | 53,369,497 |
TOTAL DEVELOPED INTERNATIONAL EQUITY FUNDS | | 118,101,535 |
|
| Shares | | Value |
Emerging Markets Equity Funds - 4.9% |
Fidelity Series Emerging Markets Fund | 1,952,601 | | $ 32,667,017 |
TOTAL INTERNATIONAL EQUITY FUNDS (Cost $134,063,958) |
150,768,552
|
Bond Funds - 13.8% |
| | | |
High Yield Bond Funds - 10.3% |
Fidelity Series Emerging Markets Debt Fund | 433,808 | | 4,719,827 |
Fidelity Series Floating Rate High Income Fund | 46,741 | | 496,860 |
Fidelity Series High Income Fund | 5,844,788 | | 61,428,717 |
Fidelity Series Real Estate Income Fund | 174,863 | | 2,040,650 |
TOTAL HIGH YIELD BOND FUNDS | | 68,686,054 |
Investment Grade Bond Funds - 3.5% |
Fidelity Series Investment Grade Bond Fund | 2,036,320 | | 23,478,771 |
TOTAL BOND FUNDS (Cost $89,078,371) |
92,164,825
|
TOTAL INVESTMENT PORTFOLIO - 100.0% (Cost $591,839,728) | | 666,063,567 |
NET OTHER ASSETS (LIABILITIES) - 0.0% | | (125,818) |
NET ASSETS - 100% | $ 665,937,749 |
Legend |
(a) Non-income producing |
Other Information |
All investments are categorized as Level 1 under the Fair Value Hierarchy. The inputs or methodology used for valuing securities may not be an indication of the risk associated with investing in those securities. For more information on valuation inputs, please refer to the Security Valuation section in the accompanying Notes to Financial Statements. |
See accompanying notes which are an integral part of the financial statements.
Annual Report
Fidelity Advisor Freedom 2050 Fund
Statement of Assets and Liabilities
| March 31, 2013 |
| | |
Assets | | |
Investment in securities, at value (cost $591,839,728) - See accompanying schedule | | $ 666,063,567 |
Receivable for fund shares sold | | 1,415,584 |
Receivable from affiliate for expense reductions | | 795 |
Total assets | | 667,479,946 |
| | |
Liabilities | | |
Payable to custodian bank | $ 1 | |
Payable for investments purchased | 496,062 | |
Payable for fund shares redeemed | 919,491 | |
Distribution and service plan fees payable | 126,643 | |
Total liabilities | | 1,542,197 |
| | |
Net Assets | | $ 665,937,749 |
Net Assets consist of: | | |
Paid in capital | | $ 579,190,994 |
Undistributed net investment income | | 657,613 |
Accumulated undistributed net realized gain (loss) on investments | | 11,865,303 |
Net unrealized appreciation (depreciation) on investments | | 74,223,839 |
Net Assets | | $ 665,937,749 |
| | |
Calculation of Maximum Offering Price Class A:
Net Asset Value and redemption price per share ($352,814,210 ÷ 33,954,803 shares) | | $ 10.39 |
| | |
Maximum offering price per share (100/94.25 of $10.39) | | $ 11.02 |
Class T:
Net Asset Value and redemption price per share ($89,196,337 ÷ 8,609,801 shares) | | $ 10.36 |
| | |
Maximum offering price per share (100/96.50 of $10.36) | | $ 10.74 |
Class B:
Net Asset Value and offering price per share ($5,531,512 ÷ 536,605 shares)A | | $ 10.31 |
| | |
Class C:
Net Asset Value and offering price per share ($16,188,095 ÷ 1,570,718 shares)A | | $ 10.31 |
| | |
Institutional Class:
Net Asset Value, offering price and redemption price per share ($202,207,595 ÷ 19,369,681 shares) | | $ 10.44 |
A Redemption price per share is equal to net asset value less any applicable contingent deferred sales charge.
Statement of Operations
| Year ended March 31, 2013 |
| | |
Investment Income | | |
Income distributions from underlying funds | | $ 10,034,385 |
| | |
Expenses | | |
Distribution and service plan fees | $ 1,328,558 | |
Independent trustees' compensation | 1,966 | |
Total expenses before reductions | 1,330,524 | |
Expense reductions | (1,966) | 1,328,558 |
Net investment income (loss) | | 8,705,827 |
Realized and Unrealized Gain (Loss) Realized gain (loss) on sale of underlying fund shares | 4,263,892 | |
Capital gain distributions from underlying funds | 11,322,183 | |
Total net realized gain (loss) | | 15,586,075 |
Change in net unrealized appreciation (depreciation) on underlying funds | | 35,894,143 |
Net gain (loss) | | 51,480,218 |
Net increase (decrease) in net assets resulting from operations | | $ 60,186,045 |
See accompanying notes which are an integral part of the financial statements.
Annual Report
Statement of Changes in Net Assets
| Year ended
March 31,
2013 | Year ended
March 31,
2012 |
Increase (Decrease) in Net Assets | | |
Operations | | |
Net investment income (loss) | $ 8,705,827 | $ 5,163,022 |
Net realized gain (loss) | 15,586,075 | 16,208,511 |
Change in net unrealized appreciation (depreciation) | 35,894,143 | (15,390,288) |
Net increase (decrease) in net assets resulting from operations | 60,186,045 | 5,981,245 |
Distributions to shareholders from net investment income | (8,370,984) | (4,903,717) |
Distributions to shareholders from net realized gain | (2,615,729) | (7,127,717) |
Total distributions | (10,986,713) | (12,031,434) |
Share transactions - net increase (decrease) | 126,263,908 | 133,278,402 |
Total increase (decrease) in net assets | 175,463,240 | 127,228,213 |
| | |
Net Assets | | |
Beginning of period | 490,474,509 | 363,246,296 |
End of period (including undistributed net investment income of $657,613 and undistributed net investment income of $322,770, respectively) | $ 665,937,749 | $ 490,474,509 |
Financial Highlights - Class A
Years ended March 31, | 2013 | 2012 | 2011 | 2010 | 2009 |
Selected Per-Share Data | | | | | |
Net asset value, beginning of period | $ 9.61 | $ 9.93 | $ 8.66 | $ 5.67 | $ 10.32 |
Income from Investment Operations | | | | | |
Net investment income (loss) C | .15 | .12 | .11 | .11 | .16 |
Net realized and unrealized gain (loss) | .82 | (.17) E | 1.34 | 3.05 | (4.39) |
Total from investment operations | .97 | (.05) | 1.45 | 3.16 | (4.23) |
Distributions from net investment income | (.14) | (.11) | (.11) | (.10) | (.13) |
Distributions from net realized gain | (.05) | (.16) | (.08) | (.07) | (.30) |
Total distributions | (.19) | (.27) | (.18) H | (.17) | (.42) G |
Net asset value, end of period | $ 10.39 | $ 9.61 | $ 9.93 | $ 8.66 | $ 5.67 |
Total Return A, B | 10.23% | (.22)% | 16.99% | 55.94% | (42.30)% |
Ratios to Average Net Assets D, F | | | | | |
Expenses before reductions | .25% | .25% | .25% | .25% | .25% |
Expenses net of fee waivers, if any | .25% | .25% | .25% | .25% | .25% |
Expenses net of all reductions | .25% | .25% | .25% | .25% | .25% |
Net investment income (loss) | 1.56% | 1.32% | 1.23% | 1.43% | 2.04% |
Supplemental Data | | | | | |
Net assets, end of period (000 omitted) | $ 352,814 | $ 280,478 | $ 220,549 | $ 137,716 | $ 57,591 |
Portfolio turnover rate | 28% | 12% | 36% | 15% | 16% |
A Total returns would have been lower if certain expenses had not been reduced during the applicable periods shown.
B Total returns do not include the effect of the sales charges.
C Calculated based on average shares outstanding during the period.
D Amounts do not include the activity of the Underlying Funds.
E The amount shown for a share outstanding does not correspond with the aggregate net gain (loss) on investments for the period due to the timing of sales and repurchases of shares in relation to fluctuating market values of the investments of the Fund.
F Expense ratios reflect operating expenses of the class. Expenses before reductions do not reflect amounts reimbursed by the investment adviser or reductions from expense offset arrangements and do not represent the amount paid by the class during periods when reimbursements or reductions occur. Expense ratios before reductions for start-up periods may not be representative of longer-term operating periods. Expenses net of fee waivers reflect expenses after reimbursement by the investment adviser but prior to reductions from expense offset arrangements. Expenses net of all reductions represent the net expenses paid by the class but do not include expenses of the investment companies in which the Fund invests.
G Total distributions of $.42 per share is comprised of distributions from net investment income of $.127 and distributions from net realized gain of $.295 per share.
H Total distributions of $.18 per share is comprised of distributions from net investment income of $.105 and distributions from net realized gain of $.079 per share.
See accompanying notes which are an integral part of the financial statements.
Annual Report
Financial Highlights - Class T
Years ended March 31, | 2013 | 2012 | 2011 | 2010 | 2009 |
Selected Per-Share Data | | | | | |
Net asset value, beginning of period | $ 9.58 | $ 9.90 | $ 8.64 | $ 5.66 | $ 10.30 |
Income from Investment Operations | | | | | |
Net investment income (loss) C | .13 | .10 | .09 | .09 | .14 |
Net realized and unrealized gain (loss) | .81 | (.17) E | 1.33 | 3.05 | (4.37) |
Total from investment operations | .94 | (.07) | 1.42 | 3.14 | (4.23) |
Distributions from net investment income | (.12) | (.09) | (.09) | (.09) | (.11) |
Distributions from net realized gain | (.05) | (.16) | (.08) | (.07) | (.30) |
Total distributions | (.16) I | (.25) | (.16) H | (.16) | (.41) G |
Net asset value, end of period | $ 10.36 | $ 9.58 | $ 9.90 | $ 8.64 | $ 5.66 |
Total Return A, B | 9.99% | (.48)% | 16.66% | 55.57% | (42.41)% |
Ratios to Average Net Assets D, F | | | | | |
Expenses before reductions | .50% | .50% | .50% | .50% | .50% |
Expenses net of fee waivers, if any | .50% | .50% | .50% | .50% | .50% |
Expenses net of all reductions | .50% | .50% | .50% | .50% | .50% |
Net investment income (loss) | 1.31% | 1.07% | .98% | 1.18% | 1.79% |
Supplemental Data | | | | | |
Net assets, end of period (000 omitted) | $ 89,196 | $ 64,512 | $ 61,195 | $ 46,449 | $ 21,186 |
Portfolio turnover rate | 28% | 12% | 36% | 15% | 16% |
A Total returns would have been lower if certain expenses had not been reduced during the applicable periods shown.
B Total returns do not include the effect of the sales charges.
C Calculated based on average shares outstanding during the period.
D Amounts do not include the activity of the Underlying Funds.
E The amount shown for a share outstanding does not correspond with the aggregate net gain (loss) on investments for the period due to the timing of sales and repurchases of shares in relation to fluctuating market values of the investments of the Fund.
F Expense ratios reflect operating expenses of the class. Expenses before reductions do not reflect amounts reimbursed by the investment adviser or reductions from expense offset arrangements and do not represent the amount paid by the class during periods when reimbursements or reductions occur. Expense ratios before reductions for start-up periods may not be representative of longer-term operating periods. Expenses net of fee waivers reflect expenses after reimbursement by the investment adviser but prior to reductions from expense offset arrangements. Expenses net of all reductions represent the net expenses paid by the class but do not include expenses of the investment companies in which the Fund invests.
G Total distributions of $.41 per share is comprised of distributions from net investment income of $.112 and distributions from net realized gain of $.295 per share.
H Total distributions of $.16 per share is comprised of distributions from net investment income of $.085 and distributions from net realized gain of $.079 per share.
I Total distributions of $.16 per share is comprised of distributions from net investment income of $.117 and distributions from net realized gain of $.046 per share.
Financial Highlights - Class B
Years ended March 31, | 2013 | 2012 | 2011 | 2010 | 2009 |
Selected Per-Share Data | | | | | |
Net asset value, beginning of period | $ 9.54 | $ 9.86 | $ 8.60 | $ 5.64 | $ 10.26 |
Income from Investment Operations | | | | | |
Net investment income (loss) C | .08 | .05 | .04 | .05 | .10 |
Net realized and unrealized gain (loss) | .81 | (.17) E | 1.34 | 3.03 | (4.35) |
Total from investment operations | .89 | (.12) | 1.38 | 3.08 | (4.25) |
Distributions from net investment income | (.08) | (.05) | (.05) | (.05) | (.08) |
Distributions from net realized gain | (.05) | (.15) | (.07) | (.07) | (.29) |
Total distributions | (.12) H | (.20) | (.12) | (.12) | (.37) G |
Net asset value, end of period | $ 10.31 | $ 9.54 | $ 9.86 | $ 8.60 | $ 5.64 |
Total Return A, B | 9.47% | (1.06)% | 16.16% | 54.72% | (42.71)% |
Ratios to Average Net Assets D, F | | | | | |
Expenses before reductions | 1.00% | 1.00% | 1.00% | 1.00% | 1.00% |
Expenses net of fee waivers, if any | 1.00% | 1.00% | 1.00% | 1.00% | 1.00% |
Expenses net of all reductions | 1.00% | 1.00% | 1.00% | 1.00% | 1.00% |
Net investment income (loss) | .81% | .57% | .48% | .68% | 1.29% |
Supplemental Data | | | | | |
Net assets, end of period (000 omitted) | $ 5,532 | $ 5,643 | $ 6,704 | $ 5,847 | $ 3,078 |
Portfolio turnover rate | 28% | 12% | 36% | 15% | 16% |
A Total returns would have been lower if certain expenses had not been reduced during the applicable periods shown.
B Total returns do not include the effect of the contingent deferred sales charge.
C Calculated based on average shares outstanding during the period.
D Amounts do not include the activity of the Underlying Funds.
E The amount shown for a share outstanding does not correspond with the aggregate net gain (loss) on investments for the period due to the timing of sales and repurchases of shares in relation to fluctuating market values of the investments of the Fund.
F Expense ratios reflect operating expenses of the class. Expenses before reductions do not reflect amounts reimbursed by the investment adviser or reductions from expense offset arrangements and do not represent the amount paid by the class during periods when reimbursements or reductions occur. Expense ratios before reductions for start-up periods may not be representative of longer-term operating periods. Expenses net of fee waivers reflect expenses after reimbursement by the investment adviser but prior to reductions from expense offset arrangements. Expenses net of all reductions represent the net expenses paid by the class but do not include expenses of the investment companies in which the Fund invests.
G Total distributions of $.37 per share is comprised of distributions from net investment income of $.078 and distributions from net realized gain of $.290 per share.
H Total distributions of $.12 per share is comprised of distributions from net investment income of $.077 and distributions from net realized gain of $.046 per share.
See accompanying notes which are an integral part of the financial statements.
Annual Report
Financial Highlights - Class C
Years ended March 31, | 2013 | 2012 | 2011 | 2010 | 2009 |
Selected Per-Share Data | | | | | |
Net asset value, beginning of period | $ 9.54 | $ 9.87 | $ 8.61 | $ 5.63 | $ 10.25 |
Income from Investment Operations | | | | | |
Net investment income (loss) C | .08 | .05 | .04 | .05 | .10 |
Net realized and unrealized gain (loss) | .82 | (.18) E | 1.34 | 3.05 | (4.35) |
Total from investment operations | .90 | (.13) | 1.38 | 3.10 | (4.25) |
Distributions from net investment income | (.08) | (.05) | (.05) | (.05) | (.08) |
Distributions from net realized gain | (.05) | (.15) | (.07) | (.07) | (.29) |
Total distributions | (.13) | (.20) | (.12) | (.12) | (.37) G |
Net asset value, end of period | $ 10.31 | $ 9.54 | $ 9.87 | $ 8.61 | $ 5.63 |
Total Return A, B | 9.53% | (1.08)% | 16.16% | 55.15% | (42.74)% |
Ratios to Average Net Assets D, F | | | | | |
Expenses before reductions | 1.00% | 1.00% | 1.00% | 1.00% | 1.00% |
Expenses net of fee waivers, if any | 1.00% | 1.00% | 1.00% | 1.00% | 1.00% |
Expenses net of all reductions | 1.00% | 1.00% | 1.00% | 1.00% | 1.00% |
Net investment income (loss) | .81% | .57% | .48% | .68% | 1.29% |
Supplemental Data | | | | | |
Net assets, end of period (000 omitted) | $ 16,188 | $ 13,344 | $ 12,014 | $ 9,646 | $ 5,436 |
Portfolio turnover rate | 28% | 12% | 36% | 15% | 16% |
A Total returns would have been lower if certain expenses had not been reduced during the applicable periods shown.
B Total returns do not include the effect of the contingent deferred sales charge.
C Calculated based on average shares outstanding during the period.
D Amounts do not include the activity of the Underlying Funds.
E The amount shown for a share outstanding does not correspond with the aggregate net gain (loss) on investments for the period due to the timing of sales and repurchases of shares in relation to fluctuating market values of the investments of the Fund.
F Expense ratios reflect operating expenses of the class. Expenses before reductions do not reflect amounts reimbursed by the investment adviser or reductions from expense offset arrangements and do not represent the amount paid by the class during periods when reimbursements or reductions occur. Expense ratios before reductions for start-up periods may not be representative of longer-term operating periods. Expenses net of fee waivers reflect expenses after reimbursement by the investment adviser but prior to reductions from expense offset arrangements. Expenses net of all reductions represent the net expenses paid by the class but do not include expenses of the investment companies in which the Fund invests.
G Total distributions of $.37 per share is comprised of distributions from net investment income of $.080 and distributions from net realized gain of $.290 per share.
Financial Highlights - Institutional Class
Years ended March 31, | 2013 | 2012 | 2011 | 2010 | 2009 |
Selected Per-Share Data | | | | | |
Net asset value, beginning of period | $ 9.65 | $ 9.97 | $ 8.70 | $ 5.68 | $ 10.35 |
Income from Investment Operations | | | | | |
Net investment income (loss) B | .18 | .15 | .13 | .13 | .17 |
Net realized and unrealized gain (loss) | .82 | (.18) E | 1.34 | 3.08 | (4.40) |
Total from investment operations | 1.00 | (.03) | 1.47 | 3.21 | (4.23) |
Distributions from net investment income | (.16) | (.13) | (.13) | (.12) | (.15) |
Distributions from net realized gain | (.05) | (.16) | (.08) | (.07) | (.30) |
Total distributions | (.21) | (.29) | (.20) H | (.19) | (.44) G |
Net asset value, end of period | $ 10.44 | $ 9.65 | $ 9.97 | $ 8.70 | $ 5.68 |
Total Return A | 10.55% | .02% | 17.17% | 56.66% | (42.22)% |
Ratios to Average Net Assets C, F | | | | | |
Expenses before reductions D | .00% | .00% | .00% | .00% | .00% |
Expenses net of fee waivers, if any | .00% | .00% | .00% | .00% | .00% |
Expenses net of all reductions | .00% | .00% | .00% | .00% | .00% |
Net investment income (loss) | 1.81% | 1.57% | 1.48% | 1.68% | 2.29% |
Supplemental Data | | | | | |
Net assets, end of period (000 omitted) | $ 202,208 | $ 126,497 | $ 62,785 | $ 40,214 | $ 15,010 |
Portfolio turnover rate | 28% | 12% | 36% | 15% | 16% |
A Total returns would have been lower if certain expenses had not been reduced during the applicable periods shown.
B Calculated based on average shares outstanding during the period.
C Amounts do not include the activity of the Underlying Funds.
D Amount represents less than .01%.
E The amount shown for a share outstanding does not correspond with the aggregate net gain (loss) on investments for the period due to the timing of sales and repurchases of shares in relation to fluctuating market values of the investments of the Fund.
F Expense ratios reflect operating expenses of the class. Expenses before reductions do not reflect amounts reimbursed by the investment adviser or reductions from expense offset arrangements and do not represent the amount paid by the class during periods when reimbursements or reductions occur. Expense ratios before reductions for start-up periods may not be representative of longer-term operating periods. Expenses net of fee waivers reflect expenses after reimbursement by the investment adviser but prior to reductions from expense offset arrangements. Expenses net of all reductions represent the net expenses paid by the class but do not include expenses of the investment companies in which the Fund invests.
G Total distributions of $.44 per share is comprised of distributions from net investment income of $.146 and distributions from net realized gain of $.295 per share.
H Total distributions of $.20 per share is comprised of distributions from net investment income of $.125 and distributions from net realized gain of $.078 per share.
See accompanying notes which are an integral part of the financial statements.
Annual Report
Fidelity Advisor Freedom 2055 Fund
Investment Changes (Unaudited)
The information in the following tables is based on the direct investments of the Fund. |
Fund Holdings as of March 31, 2013 |
| % of fund's
net assets | % of fund's net assets
6 months ago |
Commodity Funds | | |
Fidelity Series Commodity Strategy Fund | 9.7 | 9.9 |
Domestic Equity Funds | | |
Fidelity Advisor Equity Growth Fund Institutional Class | 8.0 | 6.7 |
Fidelity Advisor Growth & Income Fund Institutional Class | 4.4 | 8.0 |
Fidelity Advisor Large Cap Fund Institutional Class | 4.4 | 7.4 |
Fidelity Advisor Series Equity-Income Fund | 4.5 | 0.0 |
Fidelity Advisor Series Mega Cap Fund | 1.0 | 0.0 |
Fidelity Advisor Series Opportunistic Insights Fund | 3.2 | 0.0 |
Fidelity Advisor Series Stock Selector Large Cap Value Fund | 4.5 | 0.0 |
Fidelity Advisor Small Cap Fund Institutional Class | 3.3 | 2.7 |
Fidelity Series 100 Index Fund | 1.5 | 5.3 |
Fidelity Series All-Sector Equity Fund | 10.6 | 11.4 |
Fidelity Series Large Cap Value Fund | 6.2 | 10.8 |
Fidelity Series Real Estate Equity Fund | 0.9 | 0.8 |
Fidelity Series Small Cap Opportunities Fund | 3.8 | 2.8 |
| 56.3 | 55.9 |
Developed International Equity Funds | | |
Fidelity Series International Growth Fund | 8.4 | 8.4 |
Fidelity Series International Small Cap Fund | 1.7 | 1.7 |
Fidelity Series International Value Fund | 8.4 | 8.5 |
| 18.5 | 18.6 |
Emerging Markets Equity Funds | | |
Fidelity Series Emerging Markets Fund | 5.3 | 5.5 |
High Yield Bond Funds | | |
Fidelity Series Emerging Markets Debt Fund | 0.6 | 0.8 |
Fidelity Series Floating Rate High Income Fund | 0.0* | 0.0* |
Fidelity Series High Income Fund | 9.3 | 9.0 |
Fidelity Series Real Estate Income Fund | 0.2 | 0.0* |
| 10.1 | 9.8 |
Investment Grade Bond Funds | | |
Fidelity Series Investment Grade Bond Fund | 0.1 | 0.3 |
Net Other Assets (Liabilities)* | 0.0 | 0.0 |
| 100.0 | 100.0 |
* Amount represents less than 0.1% |
Asset Allocation (% of fund's net assets) |
Period end |
| Commodity Funds | 9.7% | |
| Domestic Equity Funds | 56.3% | |
| Developed International Equity Funds | 18.5% | |
| Emerging Markets
Equity Funds | 5.3% | |
| High Yield Bond Funds | 10.1% | |
| Investment Grade
Bond Funds | 0.1% | |

Six months ago |
| Commodity Funds | 9.9% | |
| Domestic Equity Funds | 55.9% | |
| Developed International Equity Funds | 18.6% | |
| Emerging Markets
Equity Funds | 5.5% | |
| High Yield Bond Funds | 9.8% | |
| Investment Grade
Bond Funds | 0.3% | |

Expected |
| Commodity Funds | 9.8% | |
| Domestic Equity Funds | 55.8% | |
| Developed International Equity Funds | 18.4% | |
| Emerging Markets
Equity Funds | 5.5% | |
| High Yield Bond Funds | 10.0% | |
| Investment Grade
Bond Funds | 0.5% | |

The fund invests according to an asset allocation strategy that becomes increasingly conservative over time. The six months ago allocation is based on the fund's holdings as of September 30, 2012. The current allocation is based on the fund's holdings as of March 31, 2013. The expected allocation represents the fund's anticipated allocation at September 30, 2013. |
Annual Report
Fidelity Advisor Freedom 2055 Fund
Investments March 31, 2013
Showing Percentage of Net Assets
Domestic Equity Funds - 66.0% |
| Shares | | Value |
Commodity Funds - 9.7% |
Fidelity Series Commodity Strategy Fund (a) | 665,614 | | $ 5,784,182 |
Domestic Equity Funds - 56.3% |
Fidelity Advisor Equity Growth Fund Institutional Class | 66,585 | | 4,717,573 |
Fidelity Advisor Growth & Income Fund Institutional Class | 117,482 | | 2,595,183 |
Fidelity Advisor Large Cap Fund Institutional Class | 109,269 | | 2,597,322 |
Fidelity Advisor Series Equity-Income Fund | 239,379 | | 2,664,286 |
Fidelity Advisor Series Mega Cap Fund | 54,116 | | 597,982 |
Fidelity Advisor Series Opportunistic Insights Fund | 172,163 | | 1,895,518 |
Fidelity Advisor Series Stock Selector Large Cap Value Fund | 239,270 | | 2,677,427 |
Fidelity Advisor Small Cap Fund Institutional Class | 71,980 | | 1,939,859 |
Fidelity Series 100 Index Fund | 84,682 | | 873,917 |
Fidelity Series All-Sector Equity Fund | 489,288 | | 6,287,353 |
Fidelity Series Large Cap Value Fund | 317,758 | | 3,698,707 |
Fidelity Series Real Estate Equity Fund | 41,844 | | 544,808 |
Fidelity Series Small Cap Opportunities Fund | 182,897 | | 2,255,121 |
TOTAL DOMESTIC EQUITY FUNDS | | 33,345,056 |
TOTAL DOMESTIC EQUITY FUNDS (Cost $37,000,276) |
39,129,238
|
International Equity Funds - 23.8% |
| | | |
Developed International Equity Funds - 18.5% |
Fidelity Series International Growth Fund | 395,886 | | 5,007,955 |
Fidelity Series International Small Cap Fund | 73,759 | | 1,011,976 |
Fidelity Series International Value Fund | 505,401 | | 4,963,040 |
TOTAL DEVELOPED INTERNATIONAL EQUITY FUNDS | | 10,982,971 |
|
| Shares | | Value |
Emerging Markets Equity Funds - 5.3% |
Fidelity Series Emerging Markets Fund | 186,093 | | $ 3,113,335 |
TOTAL INTERNATIONAL EQUITY FUNDS (Cost $13,200,537) |
14,096,306
|
Bond Funds - 10.2% |
| | | |
High Yield Bond Funds - 10.1% |
Fidelity Series Emerging Markets Debt Fund | 32,778 | | 356,627 |
Fidelity Series Floating Rate High Income Fund | 183 | | 1,943 |
Fidelity Series High Income Fund | 520,330 | | 5,468,666 |
Fidelity Series Real Estate Income Fund | 11,561 | | 134,922 |
TOTAL HIGH YIELD BOND FUNDS | | 5,962,158 |
Investment Grade Bond Funds - 0.1% |
Fidelity Series Investment Grade Bond Fund | 5,926 | | 68,328 |
TOTAL BOND FUNDS (Cost $5,861,857) |
6,030,486
|
TOTAL INVESTMENT PORTFOLIO - 100.0% (Cost $56,062,670) | | 59,256,030 |
NET OTHER ASSETS (LIABILITIES) - 0.0% | | (9,901) |
NET ASSETS - 100% | $ 59,246,129 |
Legend |
(a) Non-income producing |
Other Information |
All investments are categorized as Level 1 under the Fair Value Hierarchy. The inputs or methodology used for valuing securities may not be an indication of the risk associated with investing in those securities. For more information on valuation inputs, please refer to the Security Valuation section in the accompanying Notes to Financial Statements. |
See accompanying notes which are an integral part of the financial statements.
Annual Report
Fidelity Advisor Freedom 2055 Fund
Statement of Assets and Liabilities
| March 31, 2013 |
| | |
Assets | | |
Investment in securities, at value (cost $56,062,670) - See accompanying schedule | | $ 59,256,030 |
Receivable for fund shares sold | | 322,644 |
Receivable from affiliate for expense reductions | | 239 |
Total assets | | 59,578,913 |
| | |
Liabilities | | |
Payable for investments purchased | $ 193,630 | |
Payable for fund shares redeemed | 129,011 | |
Distribution and service plan fees payable | 10,143 | |
Total liabilities | | 332,784 |
| | |
Net Assets | | $ 59,246,129 |
Net Assets consist of: | | |
Paid in capital | | $ 55,335,797 |
Undistributed net investment income | | 45,086 |
Accumulated undistributed net realized gain (loss) on investments | | 671,886 |
Net unrealized appreciation (depreciation) on investments | | 3,193,360 |
Net Assets | | $ 59,246,129 |
| | |
Calculation of Maximum Offering Price Class A:
Net Asset Value and redemption price per share ($32,475,945 ÷ 3,074,354 shares) | | $ 10.56 |
| | |
Maximum offering price per share (100/94.25 of $10.56) | | $ 11.20 |
Class T:
Net Asset Value and redemption price per share ($7,238,789 ÷ 686,209 shares) | | $ 10.55 |
| | |
Maximum offering price per share (100/96.50 of $10.55) | | $ 10.93 |
Class C:
Net Asset Value and offering price per share ($1,093,620 ÷ 103,505 shares)A | | $ 10.57 |
| | |
Institutional Class:
Net Asset Value, offering price and redemption price per share ($18,437,775 ÷ 1,741,685 shares) | | $ 10.59 |
A Redemption price per share is equal to net asset value less any applicable contingent deferred sales charge.
Statement of Operations
| Year ended March 31, 2013 |
| | |
Investment Income | | |
Income distributions from underlying funds | | $ 580,158 |
| | |
Expenses | | |
Distribution and service plan fees | $ 64,121 | |
Independent trustees' compensation | 88 | |
Total expenses before reductions | 64,209 | |
Expense reductions | (88) | 64,121 |
Net investment income (loss) | | 516,037 |
Realized and Unrealized Gain (Loss) Realized gain (loss) on sale of underlying fund shares | (47,012) | |
Capital gain distributions from underlying funds | 802,719 | |
Total net realized gain (loss) | | 755,707 |
Change in net unrealized appreciation (depreciation) on underlying funds | | 3,283,912 |
Net gain (loss) | | 4,039,619 |
Net increase (decrease) in net assets resulting from operations | | $ 4,555,656 |
See accompanying notes which are an integral part of the financial statements.
Annual Report
Statement of Changes in Net Assets
| Year ended
March 31,
2013 | For the period
June 1, 2011
(commencement of
operations) to
March 31, 2012 |
Increase (Decrease) in Net Assets | | |
Operations | | |
Net investment income (loss) | $ 516,037 | $ 56,691 |
Net realized gain (loss) | 755,707 | 124,116 |
Change in net unrealized appreciation (depreciation) | 3,283,912 | (90,552) |
Net increase (decrease) in net assets resulting from operations | 4,555,656 | 90,255 |
Distributions to shareholders from net investment income | (473,172) | (53,298) |
Distributions to shareholders from net realized gain | (129,809) | (79,300) |
Total distributions | (602,981) | (132,598) |
Share transactions - net increase (decrease) | 47,565,310 | 7,770,487 |
Total increase (decrease) in net assets | 51,517,985 | 7,728,144 |
| | |
Net Assets | | |
Beginning of period | 7,728,144 | - |
End of period (including undistributed net investment income of $45,086 and undistributed net investment income of $2,221, respectively) | $ 59,246,129 | $ 7,728,144 |
Financial Highlights - Class A
Years ended March 31, | 2013 | 2012 H |
Selected Per-Share Data | | |
Net asset value, beginning of period | $ 9.75 | $ 10.00 |
Income from Investment Operations | | |
Net investment income (loss) E | .18 | .11 |
Net realized and unrealized gain (loss) | .83 | (.11) G |
Total from investment operations | 1.01 | - |
Distributions from net investment income | (.13) | (.11) |
Distributions from net realized gain | (.07) | (.15) |
Total distributions | (.20) | (.25) J |
Net asset value, end of period | $ 10.56 | $ 9.75 |
Total Return B, C, D | 10.51% | .29% |
Ratios to Average Net Assets F, I | | |
Expenses before reductions | .25% | .25% A |
Expenses net of fee waivers, if any | .25% | .25% A |
Expenses net of all reductions | .25% | .25% A |
Net investment income (loss) | 1.82% | 1.44% A |
Supplemental Data | | |
Net assets, end of period (000 omitted) | $ 32,476 | $ 2,655 |
Portfolio turnover rate | 29% | 18% A |
A Annualized
B Total returns for periods of less than one year are not annualized.
C Total returns would have been lower if certain expenses had not been reduced during the applicable periods shown.
D Total returns do not include the effect of the sales charges.
E Calculated based on average shares outstanding during the period.
F Amounts do not include the activity of the Underlying Funds.
G The amount shown for a share outstanding does not correspond with the aggregate net gain (loss) on investments for the period due to the timing of sales and repurchases of shares in relation to fluctuating market values of the investments of the Fund.
H For the period June 1, 2011 (commencement of operations) to March 31, 2012.
I Expense ratios reflect operating expenses of the class. Expenses before reductions do not reflect amounts reimbursed by the investment adviser or reductions from expense offset arrangements and do not represent the amount paid by the class during periods when reimbursements or reductions occur. Expenses net of fee waivers reflect expenses after reimbursement by the investment adviser but prior to reductions from expense offset arrangements. Expenses net of all reductions represent the net expenses paid by the class but do not include expenses of the investment companies in which the Fund invests.
J Total distributions of $.25 per share is comprised of distributions from net investment income of $.105 and distributions from net realized gain of $.146 per share.
See accompanying notes which are an integral part of the financial statements.
Annual Report
Financial Highlights - Class T
Years ended March 31, | 2013 | 2012 H |
Selected Per-Share Data | | |
Net asset value, beginning of period | $ 9.75 | $ 10.00 |
Income from Investment Operations | | |
Net investment income (loss) E | .16 | .09 |
Net realized and unrealized gain (loss) | .82 | (.10) G |
Total from investment operations | .98 | (.01) |
Distributions from net investment income | (.11) | (.09) |
Distributions from net realized gain | (.07) | (.15) |
Total distributions | (.18) | (.24) |
Net asset value, end of period | $ 10.55 | $ 9.75 |
Total Return B, C, D | 10.24% | .12% |
Ratios to Average Net Assets F, I | | |
Expenses before reductions | .50% | .50% A |
Expenses net of fee waivers, if any | .50% | .50% A |
Expenses net of all reductions | .50% | .50% A |
Net investment income (loss) | 1.57% | 1.19% A |
Supplemental Data | | |
Net assets, end of period (000 omitted) | $ 7,239 | $ 1,444 |
Portfolio turnover rate | 29% | 18% A |
A Annualized
B Total returns for periods of less than one year are not annualized.
C Total returns would have been lower if certain expenses had not been reduced during the applicable periods shown.
D Total returns do not include the effect of the sales charges.
E Calculated based on average shares outstanding during the period.
F Amounts do not include the activity of the Underlying Funds.
G The amount shown for a share outstanding does not correspond with the aggregate net gain (loss) on investments for the period due to the timing of sales and repurchases of shares in relation to fluctuating market values of the investments of the Fund.
H For the period June 1, 2011 (commencement of operations) to March 31, 2012.
I Expense ratios reflect operating expenses of the class. Expenses before reductions do not reflect amounts reimbursed by the investment adviser or reductions from expense offset arrangements and do not represent the amount paid by the class during periods when reimbursements or reductions occur. Expenses net of fee waivers reflect expenses after reimbursement by the investment adviser but prior to reductions from expense offset arrangements. Expenses net of all reductions represent the net expenses paid by the class but do not include expenses of the investment companies in which the Fund invests.
Financial Highlights - Class C
Years ended March 31, | 2013 | 2012 H |
Selected Per-Share Data | | |
Net asset value, beginning of period | $ 9.74 | $ 10.00 |
Income from Investment Operations | | |
Net investment income (loss) E | .10 | .05 |
Net realized and unrealized gain (loss) | .83 | (.10) G |
Total from investment operations | .93 | (.05) |
Distributions from net investment income | (.03) | (.06) |
Distributions from net realized gain | (.07) | (.15) |
Total distributions | (.10) | (.21) |
Net asset value, end of period | $ 10.57 | $ 9.74 |
Total Return B, C, D | 9.69% | (.27)% |
Ratios to Average Net Assets F, I | | |
Expenses before reductions | 1.00% | 1.00% A |
Expenses net of fee waivers, if any | 1.00% | 1.00% A |
Expenses net of all reductions | 1.00% | 1.00% A |
Net investment income (loss) | 1.07% | .69% A |
Supplemental Data | | |
Net assets, end of period (000 omitted) | $ 1,094 | $ 1,127 |
Portfolio turnover rate | 29% | 18% A |
A Annualized
B Total returns for periods of less than one year are not annualized.
C Total returns would have been lower if certain expenses had not been reduced during the applicable periods shown.
D Total returns do not include the effect of the contingent deferred sales charge.
E Calculated based on average shares outstanding during the period.
F Amounts do not include the activity of the Underlying Funds.
G The amount shown for a share outstanding does not correspond with the aggregate net gain (loss) on investments for the period due to the timing of sales and repurchases of shares in relation to fluctuating market values of the investments of the Fund.
H For the period June 1, 2011 (commencement of operations) to March 31, 2012.
I Expense ratios reflect operating expenses of the class. Expenses before reductions do not reflect amounts reimbursed by the investment adviser or reductions from expense offset arrangements and do not represent the amount paid by the class during periods when reimbursements or reductions occur. Expenses net of fee waivers reflect expenses after reimbursement by the investment adviser but prior to reductions from expense offset arrangements. Expenses net of all reductions represent the net expenses paid by the class but do not include expenses of the investment companies in which the Fund invests.
See accompanying notes which are an integral part of the financial statements.
Annual Report
Financial Highlights - Institutional Class
Years ended March 31, | 2013 | 2012 H |
Selected Per-Share Data | | |
Net asset value, beginning of period | $ 9.76 | $ 10.00 |
Income from Investment Operations | | |
Net investment income (loss) D | .21 | .13 |
Net realized and unrealized gain (loss) | .83 | (.11) G |
Total from investment operations | 1.04 | .02 |
Distributions from net investment income | (.14) | (.12) |
Distributions from net realized gain | (.07) | (.15) |
Total distributions | (.21) | (.26) J |
Net asset value, end of period | $ 10.59 | $ 9.76 |
Total Return B, C | 10.84% | .51% |
Ratios to Average Net Assets E, I | | |
Expenses before reductions F | .00% | .00% A |
Expenses net of fee waivers, if any | .00% | .00% A |
Expenses net of all reductions | .00% | .00% A |
Net investment income (loss) | 2.07% | 1.69% A |
Supplemental Data | | |
Net assets, end of period (000 omitted) | $ 18,438 | $ 2,503 |
Portfolio turnover rate | 29% | 18% A |
A Annualized
B Total returns for periods of less than one year are not annualized.
C Total returns would have been lower if certain expenses had not been reduced during the applicable periods shown.
D Calculated based on average shares outstanding during the period.
E Amounts do not include the activity of the Underlying Funds.
F Amount represents less than .01%.
G The amount shown for a share outstanding does not correspond with the aggregate net gain (loss) on investments for the period due to the timing of sales and repurchases of shares in relation to fluctuating market values of the investments of the Fund.
H For the period June 1, 2011 (commencement of operations) to March 31, 2012.
I Expense ratios reflect operating expenses of the class. Expenses before reductions do not reflect amounts reimbursed by the investment adviser or reductions from expense offset arrangements and do not represent the amount paid by the class during periods when reimbursements or reductions occur. Expenses net of fee waivers reflect expenses after reimbursement by the investment adviser but prior to reductions from expense offset arrangements. Expenses net of all reductions represent the net expenses paid by the class but do not include expenses of the investment companies in which the Fund invests.
J Total distributions of $.26 per share is comprised of distributions from net investment income of $.116 and distributions from net realized gain of $.146 per share.
See accompanying notes which are an integral part of the financial statements.
Annual Report
Notes to Financial Statements
For the period ended March 31, 2013
1. Organization.
Fidelity Advisor Freedom Income Fund, Fidelity Advisor Freedom 2005 Fund, Fidelity Advisor Freedom 2010 Fund, Fidelity Advisor Freedom 2015 Fund, Fidelity Advisor Freedom 2020 Fund, Fidelity Advisor Freedom 2025 Fund, Fidelity Advisor Freedom 2030 Fund, Fidelity Advisor Freedom 2035 Fund, Fidelity Advisor Freedom 2040 Fund, Fidelity Advisor Freedom 2045 Fund, Fidelity Advisor Freedom 2050 Fund and Fidelity Advisor Freedom 2055 Fund (the Funds) are funds of Fidelity Aberdeen Street Trust (the Trust). The Trust is registered under the Investment Company Act of 1940, as amended (the 1940 Act), as an open-end management investment company organized as a Delaware statutory trust. Each Fund is authorized to issue an unlimited number of shares. The Funds invest primarily in a combination of other Fidelity equity, bond and short-term funds (the Underlying Funds) managed by Fidelity Management & Research Company (FMR).
Each Fund offers Class A, Class T, Class C and Institutional Class shares, each of which, along with Class B shares, has equal rights as to assets and voting privileges. Effective after the close of business on September 1, 2010, Class B shares were closed to new accounts and additional purchases, except for exchanges and reinvestments. Each class has exclusive voting rights with respect to matters that affect that class. Class B shares will automatically convert to Class A shares after a holding period of seven years from the initial date of purchase. Investment income, realized and unrealized capital gains and losses, the common expenses of each Fund, and certain fund-level expense reductions, if any, are allocated on a pro-rata basis to each class based on the relative net assets of each class to the total net assets of each Fund. Each class differs with respect to distribution and service plan fees incurred. Certain expense reductions may also differ by class.
2. Significant Accounting Policies.
The financial statements have been prepared in conformity with accounting principles generally accepted in the United States of America (GAAP), which require management to make certain estimates and assumptions at the date of the financial statements. Actual results could differ from those estimates. Subsequent events, if any, through the date that the financial statements were issued have been evaluated in the preparation of the financial statements. The following summarizes the significant accounting policies of the Funds:
Security Valuation. Investments are valued as of 4:00 p.m. Eastern time on the last calendar day of the period. Each Fund categorizes the inputs to valuation techniques used to value its investments into a disclosure hierarchy consisting of three levels as shown below:
Level 1 - quoted prices in active markets for identical investments
Level 2 - other significant observable inputs (including quoted prices for similar investments, interest rates, prepayment speeds, etc.)
Level 3 - unobservable inputs (including the Fund's own assumptions based on the best information available)
Valuation techniques used to value each Fund's investments by major category are as follows. Investments in the Underlying Funds are valued at their closing net asset value (NAV) each business day and are categorized as Level 1 in the hierarchy.
Investment Transactions and Income. For financial reporting purposes, the Funds' investment holdings and NAV include trades executed through the end of the last business day of the period. The NAV per share for processing shareholder transactions is calculated as of the close of business of the New York Stock Exchange (NYSE), normally 4:00 p.m. Eastern time and includes trades executed through the end of the prior business day. Gains and losses on securities sold are determined on the basis of identified cost. Income and capital gain distributions from the Underlying Funds, if any, are recorded on the ex-dividend date.
Expenses. Expenses directly attributable to a fund are charged to that fund. Expenses attributable to more than one fund are allocated among the respective funds on the basis of relative net assets or other appropriate methods. Expenses included in the accompanying financial statements reflect the expenses of each Fund and do not include any expenses associated with the Underlying Funds. Expense estimates are accrued in the period to which they relate and adjustments are made when actual amounts are known.
Income Tax Information and Distributions to Shareholders. Each year, each Fund intends to qualify as a regulated investment company under Subchapter M of the Internal Revenue Code, including distributing substantially all of its taxable income and realized gains. As a result, no provision for income taxes is required. As of March 31, 2013, each Fund did not have any unrecognized tax benefits in the financial statements; nor is each Fund aware of any tax positions for which it is reasonably possible that the total amounts of unrecognized tax benefits will significantly change in the next twelve months. Each Fund files a U.S. federal tax return, in addition to state and local tax returns as required. A fund's federal income tax returns are subject to examination by the Internal Revenue Service (IRS) for a period of three fiscal years after they are filed. State and local tax returns may be subject to examination for an additional fiscal year depending on the jurisdiction.
Distributions are declared and recorded on the ex-dividend date. Income dividends and capital gain distributions are declared separately for each class. Income and capital gain distributions are determined in accordance with income tax regulations, which may differ from GAAP.
Capital accounts within the financial statements are adjusted for permanent book-tax differences. These adjustments have no impact on net assets or the results of operations. Temporary book-tax differences will reverse in a subsequent period.
Annual Report
2. Significant Accounting Policies - continued
Income Tax Information and Distributions to Shareholders - continued
Book-tax differences are primarily due to short-term gain distributions from the Underlying Funds, capital loss carryforwards and losses deferred due to wash sales and excise tax regulations.
The federal tax cost of investment securities and unrealized appreciation (depreciation) as of period end were as follows for each Fund:
| Tax cost | Gross unrealized
appreciation | Gross unrealized
depreciation | Net unrealized
appreciation
(depreciation) on
securities and
other investments |
Advisor Freedom Income | $ 308,887,922 | $ 20,071,621 | $ (1,400,214) | $ 18,671,407 |
Advisor Freedom 2005 | 291,930,308 | 20,619,209 | (2,226,098) | 18,393,111 |
Advisor Freedom 2010 | 853,289,878 | 67,346,266 | (9,911,229) | 57,435,037 |
Advisor Freedom 2015 | 1,818,763,337 | 165,753,270 | (18,902,954) | 146,850,316 |
Advisor Freedom 2020 | 3,058,091,525 | 269,088,437 | (38,735,797) | 230,352,640 |
Advisor Freedom 2025 | 2,696,525,255 | 259,281,521 | (40,826,533) | 218,454,988 |
Advisor Freedom 2030 | 2,738,067,079 | 261,014,164 | (44,536,892) | 216,477,272 |
Advisor Freedom 2035 | 1,922,312,493 | 197,065,552 | (35,102,047) | 161,963,505 |
Advisor Freedom 2040 | 1,875,980,639 | 178,130,610 | (35,341,845) | 142,788,765 |
Advisor Freedom 2045 | 812,974,198 | 108,848,673 | (14,441,501) | 94,407,172 |
Advisor Freedom 2050 | 593,912,303 | 83,256,852 | (11,105,588) | 72,151,264 |
Advisor Freedom 2055 | 56,156,186 | 3,547,789 | (447,945) | 3,099,844 |
The tax-based components of distributable earnings as of period end were as follows for each Fund:
| Undistributed
ordinary income | Undistributed
long-term
capital gain | Net unrealized
appreciation
(depreciation) |
Advisor Freedom Income | $ 462,115 | $ 3,383,496 | $ 18,671,407 |
Advisor Freedom 2005 | 476,621 | 1,838,709 | 18,393,111 |
Advisor Freedom 2010 | 1,474,668 | 8,728,254 | 57,435,037 |
Advisor Freedom 2015 | 3,141,367 | 31,322,730 | 146,850,316 |
Advisor Freedom 2020 | 5,631,670 | 61,913,127 | 230,352,640 |
Advisor Freedom 2025 | 4,880,880 | 84,582,252 | 218,454,988 |
Advisor Freedom 2030 | 5,115,477 | 73,228,005 | 216,477,272 |
Advisor Freedom 2035 | 3,011,843 | 75,581,844 | 161,963,505 |
Advisor Freedom 2040 | 2,694,214 | 72,708,334 | 142,788,765 |
Advisor Freedom 2045 | 1,362,498 | 18,479,090 | 94,407,172 |
Advisor Freedom 2050 | 1,187,067 | 13,408,424 | 72,151,264 |
Advisor Freedom 2055 | 95,591 | 714,897 | 3,099,844 |
The tax character of distributions paid was as follows:
March 31, 2013 | | | |
| Ordinary Income | Long-term
Capital Gains | Total |
Advisor Freedom Income | $ 5,414,666 | $ 1,914,942 | $ 7,329,608 |
Advisor Freedom 2005 | 5,136,657 | - | 5,136,657 |
Advisor Freedom 2010 | 18,067,071 | - | 18,067,071 |
Advisor Freedom 2015 | 38,253,485 | - | 38,253,485 |
Advisor Freedom 2020 | 62,726,354 | - | 62,726,354 |
Advisor Freedom 2025 | 53,196,385 | - | 53,196,385 |
Advisor Freedom 2030 | 53,839,930 | - | 53,839,930 |
Advisor Freedom 2035 | 32,750,670 | - | 32,750,670 |
Advisor Freedom 2040 | 31,788,840 | - | 31,788,840 |
Advisor Freedom 2045 | 13,679,345 | 8,878,964 | 22,558,309 |
Advisor Freedom 2050 | 9,440,533 | 1,546,180 | 10,986,713 |
Advisor Freedom 2055 | 507,335 | 95,646 | 602,981 |
Annual Report
Notes to Financial Statements - continued
2. Significant Accounting Policies - continued
Income Tax Information and Distributions to Shareholders - continued
March 31, 2012 | |
| Ordinary Income |
Advisor Freedom Income | $ 5,769,695 |
Advisor Freedom 2005 | 6,261,150 |
Advisor Freedom 2010 | 23,186,662 |
Advisor Freedom 2015 | 44,291,396 |
Advisor Freedom 2020 | 74,056,217 |
Advisor Freedom 2025 | 61,882,171 |
Advisor Freedom 2030 | 66,057,729 |
Advisor Freedom 2035 | 42,240,111 |
Advisor Freedom 2040 | 44,149,570 |
Advisor Freedom 2045 | 15,943,150 |
Advisor Freedom 2050 | 12,031,434 |
Advisor Freedom 2055 | 132,598 |
3. Purchases and Sales of Investments.
Purchases and redemptions of the Underlying Fund shares are noted in the table below.
| Purchases ($) | Redemptions ($) |
Advisor Freedom Income | 72,296,492 | 53,736,057 |
Advisor Freedom 2005 | 95,078,396 | 65,902,631 |
Advisor Freedom 2010 | 226,005,719 | 235,965,710 |
Advisor Freedom 2015 | 506,659,791 | 368,244,684 |
Advisor Freedom 2020 | 957,684,378 | 620,679,716 |
Advisor Freedom 2025 | 968,287,232 | 552,779,044 |
Advisor Freedom 2030 | 958,660,692 | 596,776,603 |
Advisor Freedom 2035 | 766,764,237 | 443,654,829 |
Advisor Freedom 2040 | 696,449,663 | 464,674,748 |
Advisor Freedom 2045 | 396,157,035 | 185,501,127 |
Advisor Freedom 2050 | 289,066,357 | 153,735,628 |
Advisor Freedom 2055 | 56,533,105 | 8,243,990 |
4. Fees and Other Transactions with Affiliates.
Management Fee. Strategic Advisers, Inc. (Strategic Advisers), an affiliate of FMR, provides the Funds with investment management related services. The Funds do not pay any fees for these services.
Other Transactions. Strategic Advisers has entered into an administration agreement with FMR under which FMR provides management and administrative services (other than investment advisory services) necessary for the operation of each Fund. Pursuant to this agreement, FMR pays all expenses of each Fund, excluding the distribution and service fees, the compensation of the independent Trustees and certain other expenses such as interest expense. FMR also contracts with other Fidelity companies to perform the services necessary for the operation of each Fund. The Funds do not pay any fees for these services.
Distribution and Service Plan Fees. In accordance with Rule 12b-1 of the 1940 Act, the Fund has adopted separate Distribution and Service Plans for each class of shares, except for the Institutional Class. Certain classes pay Fidelity Distributors Corporation (FDC), an affiliate of FMR, separate Distribution and Service Fees, each of which is based on an annual percentage of each class' average net assets. In addition, FDC may pay financial intermediaries for selling shares of the Fund and providing shareholder support services. For the period, the Distribution and Service Fee rates, total fees and amounts retained by FDC were as follows:
Advisor Freedom Income | Distribution
Fee | Service
Fee | Total Fees | Retained
by FDC |
Class A | 0% | .25% | $ 431,607 | $ 23,868 |
Class T | .25% | .25% | 268,168 | 562 |
Class B | .75% | .25% | 26,143 | 19,628 |
Class C | .75% | .25% | 169,320 | 19,250 |
| | | $ 895,238 | $ 63,308 |
Annual Report
4. Fees and Other Transactions with Affiliates - continued
Distribution and Service Plan Fees - continued
Advisor Freedom 2005 | Distribution
Fee | Service
Fee | Total Fees | Retained
by FDC |
Class A | 0% | .25% | $ 489,685 | $ 55,768 |
Class T | .25% | .25% | 111,669 | 181 |
Class B | .75% | .25% | 14,242 | 10,700 |
Class C | .75% | .25% | 75,991 | 6,173 |
| | | $ 691,587 | $ 72,822 |
Advisor Freedom 2010 | | | | |
Class A | 0% | .25% | $ 1,344,257 | $ 149,484 |
Class T | .25% | .25% | 627,612 | 3,522 |
Class B | .75% | .25% | 75,412 | 56,604 |
Class C | .75% | .25% | 376,508 | 24,230 |
| | | $ 2,423,789 | $ 233,840 |
Advisor Freedom 2015 | | | | |
Class A | 0% | .25% | $ 2,812,344 | $ 305,196 |
Class T | .25% | .25% | 1,064,512 | 2,092 |
Class B | .75% | .25% | 199,443 | 149,743 |
Class C | .75% | .25% | 696,249 | 62,213 |
| | | $ 4,772,548 | $ 519,244 |
Advisor Freedom 2020 | | | | |
Class A | 0% | .25% | $ 4,537,511 | $ 457,699 |
Class T | .25% | .25% | 1,973,821 | 3,223 |
Class B | .75% | .25% | 370,225 | 277,950 |
Class C | .75% | .25% | 973,273 | 101,323 |
| | | $ 7,854,830 | $ 840,195 |
Advisor Freedom 2025 | | | | |
Class A | 0% | .25% | $ 4,080,700 | $ 513,206 |
Class T | .25% | .25% | 1,374,990 | 2,672 |
Class B | .75% | .25% | 253,280 | 190,184 |
Class C | .75% | .25% | 681,576 | 77,081 |
| | | $ 6,390,546 | $ 783,143 |
Advisor Freedom 2030 | | | | |
Class A | 0% | .25% | $ 3,958,892 | $ 389,729 |
Class T | .25% | .25% | 1,720,461 | 2,675 |
Class B | .75% | .25% | 296,550 | 222,679 |
Class C | .75% | .25% | 685,776 | 84,605 |
| | | $ 6,661,679 | $ 699,688 |
Advisor Freedom 2035 | | | | |
Class A | 0% | .25% | $ 2,800,759 | $ 331,920 |
Class T | .25% | .25% | 907,405 | 1,426 |
Class B | .75% | .25% | 192,172 | 144,433 |
Class C | .75% | .25% | 392,106 | 50,256 |
| | | $ 4,292,442 | $ 528,035 |
Advisor Freedom 2040 | | | | |
Class A | 0% | .25% | $ 2,555,303 | $ 216,729 |
Class T | .25% | .25% | 1,319,604 | 5,286 |
Class B | .75% | .25% | 269,377 | 202,338 |
Class C | .75% | .25% | 571,010 | 66,961 |
| | | $ 4,715,294 | $ 491,314 |
Advisor Freedom 2045 | | | | |
Class A | 0% | .25% | $ 1,133,305 | $ 137,028 |
Class T | .25% | .25% | 364,438 | 765 |
Class B | .75% | .25% | 35,763 | 26,849 |
Class C | .75% | .25% | 109,264 | 23,157 |
| | | $ 1,642,770 | $ 187,799 |
Annual Report
Notes to Financial Statements - continued
4. Fees and Other Transactions with Affiliates - continued
Distribution and Service Plan Fees - continued
Advisor Freedom 2050 | Distribution
Fee | Service
Fee | Total Fees | Retained
by FDC |
Class A | 0% | .25% | $ 769,411 | $ 56,117 |
Class T | .25% | .25% | 364,127 | 625 |
Class B | .75% | .25% | 53,659 | 40,275 |
Class C | .75% | .25% | 141,361 | 25,425 |
| | | $ 1,328,558 | $ 122,442 |
Advisor Freedom 2055 | | | | |
Class A | 0% | .25% | $ 37,713 | $ 4,829 |
Class T | .25% | .25% | 18,139 | 1,731 |
Class C | .75% | .25% | 8,269 | 7,275 |
| | | $ 64,121 | $ 13,835 |
Sales Load. FDC may receive a front-end sales charge of up to 5.75% for selling Class A shares and 3.50% for selling Class T shares, some of which is paid to financial intermediaries for selling shares of the Fund. Depending on the holding period, FDC may receive contingent deferred sales charges levied on Class A, Class T, Class B, and Class C redemptions. The deferred sales charges range from 5.00% to 1.00% for Class B shares, 1.00% for Class C shares, 1.00% for certain purchases of Class A shares and .25% for certain purchases of Class T shares.
For the period, sales charge amounts retained by FDC were as follows:
Advisor Freedom Income | Retained
by FDC |
Class A | $ 11,181 |
Class T | 2,308 |
Class B* | 7,098 |
Class C* | 1,141 |
| $ 21,728 |
Advisor Freedom 2005 | |
Class A | $ 3,322 |
Class T | 818 |
Class B* | 954 |
Class C* | 297 |
| $ 5,391 |
Advisor Freedom 2010 | |
Class A | $ 11,116 |
Class T | 3,912 |
Class B* | 9,455 |
Class C* | 1,888 |
| $ 26,371 |
Advisor Freedom 2015 | |
Class A | $ 41,373 |
Class T | 15,978 |
Class B* | 20,372 |
Class C* | 6,055 |
| $ 83,778 |
Advisor Freedom 2020 | |
Class A | $ 92,210 |
Class T | 28,704 |
Class B* | 38,185 |
Class C* | 7,173 |
| $ 166,272 |
Advisor Freedom 2025 | |
Class A | $ 69,696 |
Class T | 34,021 |
Class B* | 24,961 |
Class C* | 5,172 |
| $ 133,850 |
Annual Report
4. Fees and Other Transactions with Affiliates - continued
Sales Load - continued
Advisor Freedom 2030 | Retained
by FDC |
Class A | $ 80,781 |
Class T | 32,758 |
Class B* | 29,957 |
Class C* | 7,626 |
| $ 151,122 |
Advisor Freedom 2035 | |
Class A | $ 55,539 |
Class T | 25,957 |
Class B* | 19,192 |
Class C* | 5,881 |
| $ 106,569 |
Advisor Freedom 2040 | |
Class A | $ 73,479 |
Class T | 30,710 |
Class B* | 38,202 |
Class C* | 8,308 |
| $ 150,699 |
Advisor Freedom 2045 | |
Class A | $ 28,665 |
Class T | 12,991 |
Class B* | 7,057 |
Class C* | 2,620 |
| $ 51,333 |
Advisor Freedom 2050 | |
Class A | $ 28,554 |
Class T | 9,656 |
Class B* | 6,915 |
Class C* | 1,975 |
| $ 47,100 |
Advisor Freedom 2055 | |
Class A | $ 4,450 |
Class T | 3,470 |
Class C* | 421 |
| $ 8,341 |
* When Class B and Class C shares are initially sold, FDC pays commissions from its own resources to financial intermediaries through which the sales are made.
Reallocation of Underlying Fund Investments. During the period, Strategic Advisers reallocated investments of the Funds. This involved taxable redemptions of the Funds' interest in Fidelity Advisor Growth & Income Fund Institutional Class, Fidelity Advisor Large Cap Fund Institutional Class, Fidelity Series 100 Index Fund, Fidelity Series All-Sector Equity Fund and Fidelity Series Large Cap Value Fund ("selected Underlying Funds") for cash and securities and non-taxable exchanges of those securities for shares of Fidelity Advisor Series Stock Selector Large Cap Value Fund, Fidelity Advisor Series Equity-Income Fund, Fidelity Advisor Series Opportunistic Insights Fund and Fidelity Advisor Series Mega Cap Fund, all of which are affiliated investment companies managed by FMR. Realized gains and losses on the redemptions of the selected Underlying Funds in connection with the reallocation are included in the accompanying Statements of Operations as "Realized gain (loss) on sale of underlying fund shares."
Annual Report
Notes to Financial Statements - continued
4. Fees and Other Transactions with Affiliates - continued
Reallocation of Underlying Fund Investments - continued
Details of these transactions with the related gain (loss) for the Funds are presented in the accompanying table:
| Value of Cash and Securities reallocated | Realized Gain
(Loss) on
redemption of
selected Underlying
Funds |
Advisor Freedom Income | $ 11,881,595 | $ 1,743,400 |
Advisor Freedom 2005 | 18,304,432 | 4,965,365 |
Advisor Freedom 2010 | 77,159,488 | 13,087,246 |
Advisor Freedom 2015 | 167,762,299 | 43,949,126 |
Advisor Freedom 2020 | 306,197,056 | 60,551,372 |
Advisor Freedom 2025 | 316,559,794 | 84,995,707 |
Advisor Freedom 2030 | 338,074,911 | 68,978,722 |
Advisor Freedom 2035 | 268,747,357 | 69,595,050 |
Advisor Freedom 2040 | 267,536,986 | 47,836,317 |
Advisor Freedom 2045 | 116,934,599 | 6,405,681 |
Advisor Freedom 2050 | 88,326,579 | 4,926,179 |
Advisor Freedom 2055 | 5,434,732 | (23,823) |
5. Expense Reductions.
FMR voluntarily agreed to reimburse funds to the extent annual operating expenses exceeded certain levels of average net assets as noted in the table below. Some expenses, for example interest expense, are excluded from this reimbursement.
The following classes of each applicable Fund were in reimbursement during the period:
| Expense
Limitations | Reimbursement
from affiliate |
| | |
Advisor Freedom Income | | |
Class A | .25% | $ 626 |
Class T | .50% | 194 |
Class B | 1.00% | 9 |
Class C | 1.00% | 61 |
Institutional Class | .00% | 252 |
Advisor Freedom 2005 | | |
Class A | .25% | 706 |
Class T | .50% | 81 |
Class B | 1.00% | 5 |
Class C | 1.00% | 27 |
Institutional Class | .00% | 208 |
Advisor Freedom 2010 | | |
Class A | .25% | 1,953 |
Class T | .50% | 456 |
Class B | 1.00% | 28 |
Class C | 1.00% | 137 |
Institutional Class | .00% | 632 |
Advisor Freedom 2015 | | |
Class A | .25% | 4,060 |
Class T | .50% | 768 |
Class B | 1.00% | 72 |
Class C | 1.00% | 251 |
Institutional Class | .00% | 1,443 |
Annual Report
5. Expense Reductions - continued
| Expense
Limitations | Reimbursement
from affiliate |
Advisor Freedom 2020 | | |
Class A | .25% | $ 6,531 |
Class T | .50% | 1,421 |
Class B | 1.00% | 133 |
Class C | 1.00% | 350 |
Institutional Class | .00% | 2,301 |
Advisor Freedom 2025 | | |
Class A | .25% | 5,846 |
Class T | .50% | 986 |
Class B | 1.00% | 91 |
Class C | 1.00% | 244 |
Institutional Class | .00% | 1,984 |
Advisor Freedom 2030 | | |
Class A | .25% | 5,684 |
Class T | .50% | 1,235 |
Class B | 1.00% | 106 |
Class C | 1.00% | 246 |
Institutional Class | .00% | 2,114 |
Advisor Freedom 2035 | | |
Class A | .25% | 4,005 |
Class T | .50% | 649 |
Class B | 1.00% | 68 |
Class C | 1.00% | 140 |
Institutional Class | .00% | 1,528 |
Advisor Freedom 2040 | | |
Class A | .25% | 3,667 |
Class T | .50% | 947 |
Class B | 1.00% | 97 |
Class C | 1.00% | 205 |
Institutional Class | .00% | 1,468 |
Advisor Freedom 2045 | | |
Class A | .25% | 1,607 |
Class T | .50% | 258 |
Class B | 1.00% | 13 |
Class C | 1.00% | 39 |
Institutional Class | .00% | 717 |
Advisor Freedom 2050 | | |
Class A | .25% | 1,094 |
Class T | .50% | 259 |
Class B | 1.00% | 19 |
Class C | 1.00% | 50 |
Institutional Class | .00% | 544 |
Advisor Freedom 2055 | | |
Class A | .25% | 48 |
Class T | .50% | 11 |
Class C | 1.00% | 3 |
Institutional Class | .00% | 26 |
Annual Report
Notes to Financial Statements - continued
6. Distributions to Shareholders.
Distributions to shareholders of each class were as follows:
Years ended March 31, | 2013 | 2012A |
Advisor Freedom Income | | |
From net investment income | | |
Class A | $ 1,869,112 | $ 2,187,187 |
Class T | 433,735 | 629,755 |
Class B | 9,453 | 19,380 |
Class C | 61,486 | 105,273 |
Institutional Class | 900,709 | 726,511 |
Total | $ 3,274,495 | $ 3,668,106 |
From net realized gain | | |
Class A | $ 2,240,481 | $ 1,181,735 |
Class T | 669,554 | 406,416 |
Class B | 32,437 | 22,819 |
Class C | 210,904 | 121,808 |
Institutional Class | 901,737 | 368,811 |
Total | $ 4,055,113 | $ 2,101,589 |
Advisor Freedom 2005 | | |
From net investment income | | |
Class A | $ 2,280,196 | $ 2,436,350 |
Class T | 219,973 | 208,571 |
Class B | 4,601 | 7,358 |
Class C | 31,434 | 47,660 |
Institutional Class | 820,798 | 646,283 |
Total | $ 3,357,002 | $ 3,346,222 |
From net realized gain | | |
Class A | $ 1,208,263 | $ 2,110,528 |
Class T | 146,502 | 226,243 |
Class B | 8,377 | 17,862 |
Class C | 47,485 | 84,322 |
Institutional Class | 369,028 | 475,973 |
Total | $ 1,779,655 | $ 2,914,928 |
Advisor Freedom 2010 | | |
From net investment income | | |
Class A | $ 7,248,480 | $ 7,710,919 |
Class T | 1,357,322 | 1,583,173 |
Class B | 35,114 | 58,993 |
Class C | 221,866 | 254,685 |
Institutional Class | 2,901,048 | 2,281,575 |
Total | $ 11,763,830 | $ 11,889,345 |
From net realized gain | | |
Class A | $ 3,797,581 | $ 7,072,545 |
Class T | 877,542 | 1,793,526 |
Class B | 49,505 | 137,428 |
Class C | 264,617 | 506,154 |
Institutional Class | 1,313,996 | 1,787,664 |
Total | $ 6,303,241 | $ 11,297,317 |
Advisor Freedom 2015 | | |
From net investment income | | |
Class A | $ 15,443,272 | $ 14,904,161 |
Class T | 2,370,199 | 2,481,473 |
Class B | 95,446 | 158,540 |
Class C | 437,291 | 504,952 |
Institutional Class | 6,470,240 | 4,754,330 |
Total | $ 24,816,448 | $ 22,803,456 |
Annual Report
6. Distributions to Shareholders - continued
Years ended March 31, | 2013 | 2012A |
Advisor Freedom 2015 | | |
From net realized gain | | |
Class A | $ 8,264,610 | $ 13,671,476 |
Class T | 1,548,591 | 2,769,769 |
Class B | 133,932 | 340,954 |
Class C | 514,113 | 915,393 |
Institutional Class | 2,975,791 | 3,790,348 |
Total | $ 13,437,037 | $ 21,487,940 |
Advisor Freedom 2020 | | |
From net investment income | | |
Class A | $ 26,237,034 | $ 23,576,228 |
Class T | 4,698,779 | 4,636,252 |
Class B | 207,668 | 297,637 |
Class C | 650,444 | 696,364 |
Institutional Class | 10,832,707 | 7,640,872 |
Total | $ 42,626,632 | $ 36,847,353 |
From net realized gain | | |
Class A | $ 12,221,481 | $ 23,169,017 |
Class T | 2,642,164 | 5,607,667 |
Class B | 229,820 | 648,689 |
Class C | 642,700 | 1,335,116 |
Institutional Class | 4,363,557 | 6,448,375 |
Total | $ 20,099,722 | $ 37,208,864 |
Advisor Freedom 2025 | | |
From net investment income | | |
Class A | $ 24,790,567 | $ 19,932,334 |
Class T | 3,595,303 | 2,880,883 |
Class B | 163,792 | 205,978 |
Class C | 561,745 | 468,001 |
Institutional Class | 9,737,534 | 6,296,976 |
Total | $ 38,848,941 | $ 29,784,172 |
From net realized gain | | |
Class A | $ 9,143,726 | $ 21,177,159 |
Class T | 1,563,144 | 3,767,040 |
Class B | 130,245 | 458,277 |
Class C | 386,200 | 923,057 |
Institutional Class | 3,124,129 | 5,772,466 |
Total | $ 14,347,444 | $ 32,097,999 |
Advisor Freedom 2030 | | |
From net investment income | | |
Class A | $ 24,782,410 | $ 20,115,725 |
Class T | 4,552,485 | 3,861,655 |
Class B | 210,414 | 250,086 |
Class C | 585,019 | 496,777 |
Institutional Class | 10,634,898 | 7,084,294 |
Total | $ 40,765,226 | $ 31,808,537 |
From net realized gain | | |
Class A | $ 7,915,192 | $ 21,297,759 |
Class T | 1,715,030 | 5,006,885 |
Class B | 137,323 | 541,636 |
Class C | 342,181 | 964,853 |
Institutional Class | 2,964,978 | 6,438,059 |
Total | $ 13,074,704 | $ 34,249,192 |
Annual Report
Notes to Financial Statements - continued
6. Distributions to Shareholders - continued
Years ended March 31, | 2013 | 2012A |
Advisor Freedom 2035 | | |
From net investment income | | |
Class A | $ 16,875,467 | $ 12,155,921 |
Class T | 2,349,822 | 1,567,804 |
Class B | 135,304 | 132,734 |
Class C | 332,280 | 239,769 |
Institutional Class | 7,474,365 | 4,415,268 |
Total | $ 27,167,238 | $ 18,511,496 |
From net realized gain | | |
Class A | $ 3,487,770 | $ 15,521,588 |
Class T | 574,019 | 2,563,657 |
Class B | 55,352 | 353,335 |
Class C | 122,062 | 553,791 |
Institutional Class | 1,344,229 | 4,736,244 |
Total | $ 5,583,432 | $ 23,728,615 |
Advisor Freedom 2040 | | |
From net investment income | | |
Class A | $ 15,416,805 | $ 11,304,090 |
Class T | 3,246,224 | 2,585,003 |
Class B | 187,384 | 196,144 |
Class C | 477,964 | 369,059 |
Institutional Class | 7,173,233 | 4,427,201 |
Total | $ 26,501,610 | $ 18,881,497 |
From net realized gain | | |
Class A | $ 3,045,286 | $ 14,726,886 |
Class T | 769,855 | 4,232,762 |
Class B | 73,757 | 545,075 |
Class C | 168,492 | 902,702 |
Institutional Class | 1,229,840 | 4,860,648 |
Total | $ 5,287,230 | $ 25,268,073 |
Advisor Freedom 2045 | | |
From net investment income | | |
Class A | $ 6,957,403 | $ 4,503,330 |
Class T | 988,121 | 586,545 |
Class B | 27,566 | 22,195 |
Class C | 101,775 | 61,259 |
Institutional Class | 3,609,466 | 1,884,896 |
Total | $ 11,684,331 | $ 7,058,225 |
From net realized gain | | |
Class A | $ 6,744,595 | $ 5,718,089 |
Class T | 1,044,959 | 942,329 |
Class B | 57,582 | 60,090 |
Class C | 162,607 | 143,108 |
Institutional Class | 2,864,235 | 2,021,309 |
Total | $ 10,873,978 | $ 8,884,925 |
Advisor Freedom 2050 | | |
From net investment income | | |
Class A | $ 4,634,192 | $ 2,879,907 |
Class T | 923,527 | 564,306 |
Class B | 42,092 | 29,299 |
Class C | 123,643 | 72,828 |
Institutional Class | 2,647,530 | 1,357,377 |
Total | $ 8,370,984 | $ 4,903,717 |
Annual Report
6. Distributions to Shareholders - continued
Years ended March 31, | 2013 | 2012A |
Advisor Freedom 2050 | | |
From net realized gain | | |
Class A | $ 1,465,892 | $ 4,184,946 |
Class T | 345,032 | 1,020,104 |
Class B | 25,867 | 90,871 |
Class C | 67,326 | 200,027 |
Institutional Class | 711,612 | 1,631,769 |
Total | $ 2,615,729 | $ 7,127,717 |
Advisor Freedom 2055 | | |
From net investment income | | |
Class A | $ 273,976 | $ 13,594 |
Class T | 55,233 | 9,780 |
Class C | 2,070 | 6,716 |
Institutional Class | 141,893 | 23,208 |
Total | $ 473,172 | $ 53,298 |
From net realized gain | | |
Class A | $ 68,154 | $ 18,902 |
Class T | 17,814 | 15,866 |
Class C | 6,257 | 15,322 |
Institutional Class | 37,584 | 29,210 |
Total | $ 129,809 | $ 79,300 |
A Distributions to shareholders for Advisor Freedom 2055 are for the period June 1, 2011 (commencement of sale of shares) to March 31, 2012.
7. Share Transactions.
Transactions for each class of shares were as follows:
| Shares | Dollars |
Years ended March 31, | 2013 | 2012A | 2013 | 2012A |
Advisor Freedom Income | | | | |
Class A | | | | |
Shares sold | 5,667,328 | 6,763,064 | $ 62,675,823 | $ 73,229,954 |
Reinvestment of distributions | 368,047 | 309,472 | 4,049,319 | 3,322,953 |
Shares redeemed | (5,438,505) | (6,417,079) | (60,152,423) | (69,457,016) |
Net increase (decrease) | 596,870 | 655,457 | $ 6,572,719 | $ 7,095,891 |
Class T | | | | |
Shares sold | 1,752,672 | 2,077,443 | $ 19,341,827 | $ 22,457,794 |
Reinvestment of distributions | 97,192 | 90,952 | 1,067,874 | 974,784 |
Shares redeemed | (2,181,141) | (2,331,629) | (24,078,105) | (25,241,205) |
Net increase (decrease) | (331,277) | (163,234) | $ (3,668,404) | $ (1,808,627) |
Class B | | | | |
Shares sold | 13,728 | 6,072 | $ 151,709 | $ 65,035 |
Reinvestment of distributions | 3,419 | 3,507 | 37,528 | 37,482 |
Shares redeemed | (75,727) | (109,320) | (836,079) | (1,183,454) |
Net increase (decrease) | (58,580) | (99,741) | $ (646,842) | $ (1,080,937) |
Class C | | | | |
Shares sold | 326,072 | 421,367 | $ 3,593,856 | $ 4,564,257 |
Reinvestment of distributions | 19,976 | 17,199 | 219,246 | 183,797 |
Shares redeemed | (428,327) | (401,421) | (4,730,145) | (4,324,783) |
Net increase (decrease) | (82,279) | 37,145 | $ (917,043) | $ 423,271 |
Institutional Class | | | | |
Shares sold | 3,768,736 | 3,628,852 | $ 41,751,702 | $ 39,319,829 |
Reinvestment of distributions | 161,577 | 99,130 | 1,781,582 | 1,066,090 |
Shares redeemed | (2,467,458) | (1,251,597) | (27,262,092) | (13,568,839) |
Net increase (decrease) | 1,462,855 | 2,476,385 | $ 16,271,192 | $ 26,817,080 |
Annual Report
Notes to Financial Statements - continued
7. Share Transactions - continued
| Shares | Dollars |
Years ended March 31, | 2013 | 2012A | 2013 | 2012A |
Advisor Freedom 2005 | | | | |
Class A | | | | |
Shares sold | 5,950,479 | 7,786,540 | $ 69,001,688 | $ 87,322,424 |
Reinvestment of distributions | 296,966 | 412,506 | 3,414,979 | 4,511,865 |
Shares redeemed | (6,013,562) | (6,738,587) | (69,615,909) | (75,603,513) |
Net increase (decrease) | 233,883 | 1,460,459 | $ 2,800,758 | $ 16,230,776 |
Class T | | | | |
Shares sold | 1,289,243 | 1,024,147 | $ 14,935,857 | $ 11,495,416 |
Reinvestment of distributions | 30,601 | 38,544 | 352,432 | 421,872 |
Shares redeemed | (1,066,736) | (1,004,234) | (12,303,077) | (11,236,630) |
Net increase (decrease) | 253,108 | 58,457 | $ 2,985,212 | $ 680,658 |
Class B | | | | |
Shares sold | 652 | 3,744 | $ 7,549 | $ 41,659 |
Reinvestment of distributions | 1,083 | 2,169 | 12,534 | 23,707 |
Shares redeemed | (41,276) | (73,115) | (481,200) | (821,480) |
Net increase (decrease) | (39,541) | (67,202) | $ (461,117) | $ (756,114) |
Class C | | | | |
Shares sold | 173,944 | 112,181 | $ 2,021,586 | $ 1,248,134 |
Reinvestment of distributions | 6,077 | 11,279 | 70,003 | 122,598 |
Shares redeemed | (201,333) | (178,517) | (2,316,273) | (1,995,084) |
Net increase (decrease) | (21,312) | (55,057) | $ (224,684) | $ (624,352) |
Institutional Class | | | | |
Shares sold | 3,014,914 | 2,429,586 | $ 35,073,813 | $ 27,506,243 |
Reinvestment of distributions | 102,306 | 101,406 | 1,182,672 | 1,115,392 |
Shares redeemed | (1,314,929) | (1,498,923) | (15,314,119) | (16,931,659) |
Net increase (decrease) | 1,802,291 | 1,032,069 | $ 20,942,366 | $ 11,689,976 |
Advisor Freedom 2010 | | | | |
Class A | | | | |
Shares sold | 12,708,869 | 17,608,014 | $ 153,017,064 | $ 204,386,415 |
Reinvestment of distributions | 915,288 | 1,298,075 | 10,935,441 | 14,610,159 |
Shares redeemed | (16,811,351) | (17,499,800) | (202,005,316) | (202,700,755) |
Net increase (decrease) | (3,187,194) | 1,406,289 | $ (38,052,811) | $ 16,295,819 |
Class T | | | | |
Shares sold | 3,712,396 | 3,132,138 | $ 44,524,286 | $ 36,364,131 |
Reinvestment of distributions | 183,018 | 294,000 | 2,182,056 | 3,301,119 |
Shares redeemed | (4,809,687) | (5,099,183) | (57,632,993) | (59,080,492) |
Net increase (decrease) | (914,273) | (1,673,045) | $ (10,926,651) | $ (19,415,242) |
Class B | | | | |
Shares sold | 9,563 | 30,105 | $ 115,968 | $ 347,386 |
Reinvestment of distributions | 6,587 | 16,202 | 78,910 | 181,659 |
Shares redeemed | (268,639) | (610,001) | (3,216,272) | (7,070,261) |
Net increase (decrease) | (252,489) | (563,694) | $ (3,021,394) | $ (6,541,216) |
Class C | | | | |
Shares sold | 499,095 | 353,574 | $ 5,991,309 | $ 4,060,801 |
Reinvestment of distributions | 36,663 | 61,010 | 435,812 | 680,336 |
Shares redeemed | (681,672) | (947,002) | (8,150,135) | (10,883,002) |
Net increase (decrease) | (145,914) | (532,418) | $ (1,723,014) | $ (6,141,865) |
Institutional Class | | | | |
Shares sold | 7,292,808 | 6,849,441 | $ 88,270,797 | $ 79,864,607 |
Reinvestment of distributions | 351,077 | 357,132 | 4,208,551 | 4,032,766 |
Shares redeemed | (5,034,949) | (3,758,825) | (60,844,334) | (43,759,019) |
Net increase (decrease) | 2,608,936 | 3,447,748 | $ 31,635,014 | $ 40,138,354 |
Annual Report
7. Share Transactions - continued
| Shares | Dollars |
Years ended March 31, | 2013 | 2012A | 2013 | 2012A |
Advisor Freedom 2015 | | | | |
Class A | | | | |
Shares sold | 28,506,295 | 34,624,687 | $ 342,099,746 | $ 399,860,256 |
Reinvestment of distributions | 1,974,621 | 2,528,175 | 23,498,680 | 28,303,874 |
Shares redeemed | (28,730,020) | (28,888,739) | (344,939,129) | (333,768,183) |
Net increase (decrease) | 1,750,896 | 8,264,123 | $ 20,659,297 | $ 94,395,947 |
Class T | | | | |
Shares sold | 7,048,273 | 5,394,979 | $ 84,377,992 | $ 62,336,809 |
Reinvestment of distributions | 321,618 | 453,320 | 3,825,959 | 5,071,415 |
Shares redeemed | (7,173,479) | (7,739,962) | (85,670,361) | (89,491,495) |
Net increase (decrease) | 196,412 | (1,891,663) | $ 2,533,590 | $ (22,083,271) |
Class B | | | | |
Shares sold | 18,918 | 57,144 | $ 230,299 | $ 659,696 |
Reinvestment of distributions | 17,784 | 41,296 | 211,983 | 461,175 |
Shares redeemed | (631,455) | (875,784) | (7,538,504) | (10,114,879) |
Net increase (decrease) | (594,753) | (777,344) | $ (7,096,222) | $ (8,994,008) |
Class C | | | | |
Shares sold | 1,112,764 | 1,085,862 | $ 13,243,553 | $ 12,546,495 |
Reinvestment of distributions | 73,853 | 116,272 | 876,636 | 1,293,137 |
Shares redeemed | (1,330,728) | (1,205,400) | (15,851,708) | (13,842,650) |
Net increase (decrease) | (144,111) | (3,266) | $ (1,731,519) | $ (3,018) |
Institutional Class | | | | |
Shares sold | 16,268,843 | 15,140,133 | $ 196,562,251 | $ 176,381,907 |
Reinvestment of distributions | 782,959 | 741,880 | 9,370,557 | 8,353,211 |
Shares redeemed | (8,997,016) | (6,686,950) | (108,722,993) | (77,631,931) |
Net increase (decrease) | 8,054,786 | 9,195,063 | $ 97,209,815 | $ 107,103,187 |
Advisor Freedom 2020 | | | | |
Class A | | | | |
Shares sold | 44,416,958 | 49,404,994 | $ 555,194,594 | $ 593,663,103 |
Reinvestment of distributions | 3,073,389 | 3,987,583 | 38,099,250 | 46,179,945 |
Shares redeemed | (39,485,922) | (37,475,426) | (494,297,897) | (450,426,886) |
Net increase (decrease) | 8,004,425 | 15,917,151 | $ 98,995,947 | $ 189,416,162 |
Class T | | | | |
Shares sold | 12,011,989 | 8,792,460 | $ 150,203,034 | $ 105,703,636 |
Reinvestment of distributions | 579,475 | 866,942 | 7,192,079 | 10,045,446 |
Shares redeemed | (10,936,020) | (12,474,056) | (136,699,168) | (149,794,855) |
Net increase (decrease) | 1,655,444 | (2,814,654) | $ 20,695,945 | $ (34,045,773) |
Class B | | | | |
Shares sold | 23,018 | 44,465 | $ 283,038 | $ 529,456 |
Reinvestment of distributions | 32,154 | 74,204 | 399,675 | 856,002 |
Shares redeemed | (1,019,496) | (1,602,205) | (12,664,560) | (19,227,315) |
Net increase (decrease) | (964,324) | (1,483,536) | $ (11,981,847) | $ (17,841,857) |
Class C | | | | |
Shares sold | 1,650,086 | 1,454,135 | $ 20,539,871 | $ 17,405,863 |
Reinvestment of distributions | 95,759 | 160,265 | 1,184,544 | 1,841,015 |
Shares redeemed | (1,789,596) | (1,828,349) | (22,192,952) | (21,813,476) |
Net increase (decrease) | (43,751) | (213,949) | $ (468,537) | $ (2,566,598) |
Institutional Class | | | | |
Shares sold | 25,904,119 | 23,399,673 | $ 326,561,698 | $ 282,767,751 |
Reinvestment of distributions | 1,214,162 | 1,189,695 | 15,144,940 | 13,857,103 |
Shares redeemed | (12,665,795) | (9,021,589) | (158,809,529) | (108,893,287) |
Net increase (decrease) | 14,452,486 | 15,567,779 | $ 182,897,109 | $ 187,731,567 |
Annual Report
Notes to Financial Statements - continued
7. Share Transactions - continued
| Shares | Dollars |
Years ended March 31, | 2013 | 2012A | 2013 | 2012A |
Advisor Freedom 2025 | | | | |
Class A | | | | |
Shares sold | 46,832,812 | 48,848,908 | $ 564,656,133 | $ 562,258,705 |
Reinvestment of distributions | 2,817,136 | 3,688,982 | 33,682,400 | 40,792,623 |
Shares redeemed | (36,915,729) | (29,982,380) | (445,620,144) | (345,037,796) |
Net increase (decrease) | 12,734,219 | 22,555,510 | $ 152,718,389 | $ 258,013,532 |
Class T | | | | |
Shares sold | 10,475,315 | 7,637,990 | $ 126,787,508 | $ 88,292,253 |
Reinvestment of distributions | 421,842 | 584,870 | 5,059,334 | 6,482,700 |
Shares redeemed | (7,029,069) | (7,949,975) | (84,713,362) | (91,910,477) |
Net increase (decrease) | 3,868,088 | 272,885 | $ 47,133,480 | $ 2,864,476 |
Class B | | | | |
Shares sold | 33,837 | 42,663 | $ 402,830 | $ 486,555 |
Reinvestment of distributions | 22,745 | 55,370 | 271,803 | 608,468 |
Shares redeemed | (700,042) | (874,149) | (8,354,336) | (10,083,099) |
Net increase (decrease) | (643,460) | (776,116) | $ (7,679,703) | $ (8,988,076) |
Class C | | | | |
Shares sold | 1,362,294 | 1,292,036 | $ 16,242,141 | $ 14,806,798 |
Reinvestment of distributions | 75,516 | 120,148 | 897,881 | 1,315,255 |
Shares redeemed | (1,133,462) | (951,921) | (13,531,664) | (10,872,825) |
Net increase (decrease) | 304,348 | 460,263 | $ 3,608,358 | $ 5,249,228 |
Institutional Class | | | | |
Shares sold | 24,213,764 | 21,538,187 | $ 294,374,445 | $ 249,495,381 |
Reinvestment of distributions | 1,063,922 | 1,059,523 | 12,801,944 | 11,781,405 |
Shares redeemed | (10,933,983) | (6,697,811) | (132,325,157) | (77,533,692) |
Net increase (decrease) | 14,343,703 | 15,899,899 | $ 174,851,232 | $ 183,743,094 |
Advisor Freedom 2030 | | | | |
Class A | | | | |
Shares sold | 41,613,890 | 42,835,455 | $ 525,837,935 | $ 516,945,396 |
Reinvestment of distributions | 2,585,181 | 3,546,218 | 32,378,742 | 41,015,516 |
Shares redeemed | (34,146,152) | (31,045,553) | (432,000,548) | (374,459,437) |
Net increase (decrease) | 10,052,919 | 15,336,120 | $ 126,216,129 | $ 183,501,475 |
Class T | | | | |
Shares sold | 11,109,856 | 8,388,334 | $ 139,954,510 | $ 101,146,779 |
Reinvestment of distributions | 492,157 | 756,879 | 6,152,559 | 8,734,784 |
Shares redeemed | (9,495,122) | (9,670,716) | (119,272,485) | (116,676,153) |
Net increase (decrease) | 2,106,891 | (525,503) | $ 26,834,584 | $ (6,794,590) |
Class B | | | | |
Shares sold | 20,379 | 36,631 | $ 253,313 | $ 434,470 |
Reinvestment of distributions | 25,911 | 63,872 | 324,148 | 732,818 |
Shares redeemed | (766,318) | (1,077,382) | (9,575,940) | (13,009,676) |
Net increase (decrease) | (720,028) | (976,879) | $ (8,998,479) | $ (11,842,388) |
Class C | | | | |
Shares sold | 1,523,134 | 1,073,369 | $ 19,092,460 | $ 12,925,305 |
Reinvestment of distributions | 69,617 | 118,601 | 867,428 | 1,356,119 |
Shares redeemed | (1,266,642) | (1,245,011) | (15,862,398) | (14,990,414) |
Net increase (decrease) | 326,109 | (53,041) | $ 4,097,490 | $ (708,990) |
Institutional Class | | | | |
Shares sold | 22,913,292 | 20,661,419 | $ 291,232,690 | $ 250,301,603 |
Reinvestment of distributions | 1,079,513 | 1,142,818 | 13,569,835 | 13,249,779 |
Shares redeemed | (10,947,359) | (6,631,955) | (138,321,010) | (80,438,467) |
Net increase (decrease) | 13,045,446 | 15,172,282 | $ 166,481,515 | $ 183,112,915 |
Annual Report
7. Share Transactions - continued
| Shares | Dollars |
Years ended March 31, | 2013 | 2012A | 2013 | 2012A |
Advisor Freedom 2035 | | | | |
Class A | | | | |
Shares sold | 34,835,056 | 34,768,661 | $ 415,484,819 | $ 395,110,554 |
Reinvestment of distributions | 1,706,155 | 2,535,573 | 20,199,297 | 27,466,248 |
Shares redeemed | (27,311,897) | (22,595,877) | (326,166,700) | (256,243,586) |
Net increase (decrease) | 9,229,314 | 14,708,357 | $ 109,517,416 | $ 166,333,216 |
Class T | | | | |
Shares sold | 8,091,085 | 5,610,062 | $ 96,019,491 | $ 63,400,892 |
Reinvestment of distributions | 243,254 | 373,246 | 2,870,268 | 4,025,458 |
Shares redeemed | (5,444,520) | (5,835,413) | (64,446,129) | (66,246,222) |
Net increase (decrease) | 2,889,819 | 147,895 | $ 34,443,630 | $ 1,180,128 |
Class B | | | | |
Shares sold | 11,260 | 16,340 | $ 131,688 | $ 193,121 |
Reinvestment of distributions | 15,412 | 42,889 | 181,095 | 457,833 |
Shares redeemed | (493,168) | (542,682) | (5,777,414) | (6,109,260) |
Net increase (decrease) | (466,496) | (483,453) | $ (5,464,631) | $ (5,458,306) |
Class C | | | | |
Shares sold | 873,123 | 842,694 | $ 10,285,137 | $ 9,496,396 |
Reinvestment of distributions | 36,956 | 70,870 | 433,119 | 755,598 |
Shares redeemed | (766,094) | (641,298) | (8,970,033) | (7,207,675) |
Net increase (decrease) | 143,985 | 272,266 | $ 1,748,223 | $ 3,044,319 |
Institutional Class | | | | |
Shares sold | 19,774,112 | 16,658,611 | $ 237,955,566 | $ 189,846,559 |
Reinvestment of distributions | 738,822 | 818,992 | 8,780,433 | 8,903,922 |
Shares redeemed | (8,196,096) | (4,989,829) | (97,924,593) | (57,177,515) |
Net increase (decrease) | 12,316,838 | 12,487,774 | $ 148,811,406 | $ 141,572,966 |
Advisor Freedom 2040 | | | | |
Class A | | | | |
Shares sold | 28,004,111 | 27,553,613 | $ 355,673,696 | $ 334,702,393 |
Reinvestment of distributions | 1,447,450 | 2,231,713 | 18,293,644 | 25,789,507 |
Shares redeemed | (22,935,436) | (19,786,758) | (292,260,264) | (240,137,054) |
Net increase (decrease) | 6,516,125 | 9,998,568 | $ 81,707,076 | $ 120,354,846 |
Class T | | | | |
Shares sold | 7,602,047 | 6,790,457 | $ 96,328,995 | $ 82,309,118 |
Reinvestment of distributions | 312,761 | 582,365 | 3,950,120 | 6,718,555 |
Shares redeemed | (7,559,551) | (7,839,034) | (95,678,684) | (95,324,860) |
Net increase (decrease) | 355,257 | (466,212) | $ 4,600,431 | $ (6,297,187) |
Class B | | | | |
Shares sold | 6,103 | 34,162 | $ 76,395 | $ 399,867 |
Reinvestment of distributions | 19,509 | 59,748 | 245,030 | 684,139 |
Shares redeemed | (739,626) | (833,809) | (9,293,767) | (10,085,732) |
Net increase (decrease) | (714,014) | (739,899) | $ (8,972,342) | $ (9,001,726) |
Class C | | | | |
Shares sold | 962,998 | 941,734 | $ 12,120,904 | $ 11,282,554 |
Reinvestment of distributions | 49,059 | 105,857 | 614,213 | 1,207,626 |
Shares redeemed | (901,869) | (1,037,963) | (11,261,526) | (12,466,739) |
Net increase (decrease) | 110,188 | 9,628 | $ 1,473,591 | $ 23,441 |
Institutional Class | | | | |
Shares sold | 16,906,391 | 14,522,651 | $ 216,610,718 | $ 176,901,050 |
Reinvestment of distributions | 660,482 | 769,888 | 8,377,157 | 8,925,684 |
Shares redeemed | (8,263,973) | (5,040,997) | (105,030,652) | (61,648,732) |
Net increase (decrease) | 9,302,900 | 10,251,542 | $ 119,957,223 | $ 124,178,002 |
Annual Report
Notes to Financial Statements - continued
7. Share Transactions - continued
| Shares | Dollars |
Years ended March 31, | 2013 | 2012A | 2013 | 2012A |
Advisor Freedom 2045 | | | | |
Class A | | | | |
Shares sold | 22,348,428 | 19,758,396 | $ 218,037,471 | $ 185,621,088 |
Reinvestment of distributions | 1,428,096 | 1,134,594 | 13,620,503 | 10,161,242 |
Shares redeemed | (14,594,828) | (11,463,161) | (143,000,136) | (107,406,601) |
Net increase (decrease) | 9,181,696 | 9,429,829 | $ 88,657,838 | $ 88,375,729 |
Class T | | | | |
Shares sold | 5,253,099 | 3,401,988 | $ 51,047,511 | $ 31,874,287 |
Reinvestment of distributions | 213,016 | 166,144 | 2,024,121 | 1,483,402 |
Shares redeemed | (2,939,816) | (3,169,427) | (28,557,658) | (30,052,164) |
Net increase (decrease) | 2,526,299 | 398,705 | $ 24,513,974 | $ 3,305,525 |
Class B | | | | |
Shares sold | 3,515 | 1,569 | $ 31,735 | $ 14,905 |
Reinvestment of distributions | 8,787 | 8,926 | 82,887 | 79,324 |
Shares redeemed | (49,903) | (82,138) | (482,094) | (781,057) |
Net increase (decrease) | (37,601) | (71,643) | $ (367,472) | $ (686,828) |
Class C | | | | |
Shares sold | 518,274 | 354,761 | $ 5,021,009 | $ 3,296,660 |
Reinvestment of distributions | 27,552 | 22,645 | 259,896 | 200,564 |
Shares redeemed | (272,934) | (230,539) | (2,637,588) | (2,135,319) |
Net increase (decrease) | 272,892 | 146,867 | $ 2,643,317 | $ 1,361,905 |
Institutional Class | | | | |
Shares sold | 13,436,841 | 10,643,520 | $ 132,476,916 | $ 100,329,191 |
Reinvestment of distributions | 671,239 | 428,124 | 6,432,276 | 3,841,804 |
Shares redeemed | (4,998,582) | (2,737,721) | (48,855,267) | (25,923,441) |
Net increase (decrease) | 9,109,498 | 8,333,923 | $ 90,053,925 | $ 78,247,554 |
Advisor Freedom 2050 | | | | |
Class A | | | | |
Shares sold | 15,759,974 | 15,354,022 | $ 152,322,278 | $ 142,028,423 |
Reinvestment of distributions | 630,390 | 796,372 | 6,034,537 | 6,986,139 |
Shares redeemed | (11,627,846) | (9,162,643) | (112,817,332) | (84,488,019) |
Net increase (decrease) | 4,762,518 | 6,987,751 | $ 45,539,483 | $ 64,526,543 |
Class T | | | | |
Shares sold | 4,570,956 | 3,433,527 | $ 44,088,375 | $ 31,583,600 |
Reinvestment of distributions | 131,758 | 179,974 | 1,260,447 | 1,573,378 |
Shares redeemed | (2,827,192) | (3,058,786) | (27,249,174) | (28,457,436) |
Net increase (decrease) | 1,875,522 | 554,715 | $ 18,099,648 | $ 4,699,542 |
Class B | | | | |
Shares sold | 330 | 8,292 | $ 3,096 | $ 76,015 |
Reinvestment of distributions | 6,911 | 13,247 | 65,663 | 114,938 |
Shares redeemed | (62,118) | (110,174) | (591,359) | (1,015,943) |
Net increase (decrease) | (54,877) | (88,635) | $ (522,600) | $ (824,990) |
Class C | | | | |
Shares sold | 469,493 | 463,409 | $ 4,511,086 | $ 4,275,978 |
Reinvestment of distributions | 19,364 | 30,263 | 184,167 | 262,422 |
Shares redeemed | (316,364) | (313,018) | (3,039,772) | (2,839,212) |
Net increase (decrease) | 172,493 | 180,654 | $ 1,655,481 | $ 1,699,188 |
Institutional Class | | | | |
Shares sold | 10,323,520 | 8,780,555 | $ 100,853,706 | $ 81,542,570 |
Reinvestment of distributions | 347,891 | 329,360 | 3,344,639 | 2,895,515 |
Shares redeemed | (4,410,206) | (2,296,393) | (42,706,449) | (21,259,966) |
Net increase (decrease) | 6,261,205 | 6,813,522 | $ 61,491,896 | $ 63,178,119 |
Annual Report
7. Share Transactions - continued
| Shares | Dollars |
Years ended March 31, | 2013 | 2012A | 2013 | 2012A |
Advisor Freedom 2055 | | | | |
Class A | | | | |
Shares sold | 3,664,304 | 311,914 | $ 36,168,205 | $ 3,010,798 |
Reinvestment of distributions | 35,066 | 3,701 | 341,179 | 32,496 |
Shares redeemed | (897,204) | (43,427) | (8,919,848) | (412,755) |
Net increase (decrease) | 2,802,166 | 272,188 | $ 27,589,536 | $ 2,630,539 |
Class T | | | | |
Shares sold | 865,233 | 145,637 | $ 8,537,245 | $ 1,433,545 |
Reinvestment of distributions | 7,527 | 2,921 | 73,047 | 25,646 |
Shares redeemed | (334,621) | (488) | (3,311,442) | (4,666) |
Net increase (decrease) | 538,139 | 148,070 | $ 5,298,850 | $ 1,454,525 |
Class C | | | | |
Shares sold | 90,384 | 114,214 | $ 903,238 | $ 1,133,007 |
Reinvestment of distributions | 877 | 2,506 | 8,307 | 22,001 |
Shares redeemed | (103,499) | (977) | (1,002,740) | (8,833) |
Net increase (decrease) | (12,238) | 115,743 | $ (91,195) | $ 1,146,175 |
Institutional Class | | | | |
Shares sold | 1,958,189 | 251,229 | $ 19,433,573 | $ 2,494,347 |
Reinvestment of distributions | 18,452 | 5,970 | 179,477 | 52,418 |
Shares redeemed | (491,376) | (779) | (4,844,931) | (7,517) |
Net increase (decrease) | 1,485,265 | 256,420 | $ 14,768,119 | $ 2,539,248 |
A Share transactions for Advisor Freedom 2055 are for the period June 1, 2011 (commencement of sale of shares) to March 31, 2012.
8. Other.
The Funds' organizational documents provide former and current trustees and officers with a limited indemnification against liabilities arising in connection with the performance of their duties to the Funds. In the normal course of business, the Funds may also enter into contracts that provide general indemnifications. The Funds' maximum exposure under these arrangements is unknown as this would be dependent on future claims that may be made against the Funds. The risk of material loss from such claims is considered remote.
The Funds do not invest in the Underlying Funds for the purpose of exercising management or control; however, investments by the Funds within their principal investment strategies may represent a significant portion of the Underlying Fund's net assets. At the end of the period, the following Advisor Freedom Funds were the owners of record of 10% or more of the total outstanding shares of the Underlying Funds.
Fund | Fidelity Advisor
Freedom 2020 | Fidelity Advisor
Freedom 2025 | Fidelity Advisor
Freedom 2030 | Fidelity Advisor
Freedom 2035 | Fidelity Advisor
Freedom 2040 |
Fidelity Advisor Series Equity-Income Fund | 15% | 16% | 17% | 14% | 14% |
Fidelity Advisor Series Mega Cap Fund | 15% | 16% | 17% | 14% | 14% |
Fidelity Advisor Series Opportunistic Insights Fund | 15% | 16% | 17% | 14% | 14% |
Fidelity Advisor Series Stock Selector Large Cap Value Fund | 15% | 16% | 17% | 14% | 14% |
The Funds, in aggregate, were the owners of record of more than 20% of the total outstanding shares of the following Underlying Funds.
Fund | % of shares held |
Fidelity Advisor Equity Growth Fund | 31% |
Fidelity Advisor Short Fixed-Income Fund | 32% |
Fidelity Advisor Growth & Income Fund | 54% |
Fidelity Advisor Large Cap Fund | 55% |
Fidelity Advisor Series Equity-Income Fund | 100% |
Fidelity Advisor Series Mega Cap Fund | 100% |
Fidelity Advisor Series Opportunistic Insights Fund | 100% |
Fidelity Advisor Series Stock Selector Large Cap Value Fund | 100% |
Annual Report
Report of Independent Registered Public Accounting Firm
To the Trustees of Fidelity Aberdeen Street Trust and the Shareholders of Fidelity Advisor Freedom Income Fund, Fidelity Advisor Freedom 2005 Fund, Fidelity Advisor Freedom 2010 Fund, Fidelity Advisor Freedom 2015 Fund, Fidelity Advisor Freedom 2020 Fund, Fidelity Advisor Freedom 2025 Fund, Fidelity Advisor Freedom 2030 Fund, Fidelity Advisor Freedom 2035 Fund, Fidelity Advisor Freedom 2040 Fund, Fidelity Advisor Freedom 2045 Fund, Fidelity Advisor Freedom 2050 Fund and Fidelity Advisor Freedom 2055 Fund:
We have audited the accompanying statements of assets and liabilities of Fidelity Advisor Freedom Income Fund, Fidelity Advisor Freedom 2005 Fund, Fidelity Advisor Freedom 2010 Fund, Fidelity Advisor Freedom 2015 Fund, Fidelity Advisor Freedom 2020 Fund, Fidelity Advisor Freedom 2025 Fund, Fidelity Advisor Freedom 2030 Fund, Fidelity Advisor Freedom 2035 Fund, Fidelity Advisor Freedom 2040 Fund, Fidelity Advisor Freedom 2045 Fund, Fidelity Advisor Freedom 2050 Fund and Fidelity Advisor Freedom 2055 Fund (the Funds) each a fund of Fidelity Aberdeen Street Trust, including the schedules of investments, as of March 31, 2013, and the related statements of operations, the statements of changes in net assets and the financial highlights for each of the periods presented. These financial statements and financial highlights are the responsibility of the Funds' management. Our responsibility is to express an opinion on these financial statements and financial highlights based on our audits.
We conducted our audits in accordance with the standards of the Public Company Accounting Oversight Board (United States). Those standards require that we plan and perform the audit to obtain reasonable assurance about whether the financial statements and financial highlights are free of material misstatement. The Funds are not required to have, nor were we engaged to perform, an audit of their internal control over financial reporting. Our audits included consideration of internal control over financial reporting as a basis for designing audit procedures that are appropriate in the circumstances, but not for the purpose of expressing an opinion on the effectiveness of the Funds' internal control over financial reporting. Accordingly, we express no such opinion. An audit also includes examining, on a test basis, evidence supporting the amounts and disclosures in the financial statements, assessing the accounting principles used and significant estimates made by management, as well as evaluating the overall financial statement presentation. Our procedures included confirmation of securities owned as of March 31, 2013, by correspondence with the custodians. We believe that our audits provide a reasonable basis for our opinion.
In our opinion, the financial statements and financial highlights referred to above present fairly, in all material respects, the financial position of Fidelity Advisor Freedom Income Fund, Fidelity Advisor Freedom 2005 Fund, Fidelity Advisor Freedom 2010 Fund, Fidelity Advisor Freedom 2015 Fund, Fidelity Advisor Freedom 2020 Fund, Fidelity Advisor Freedom 2025 Fund, Fidelity Advisor Freedom 2030 Fund, Fidelity Advisor Freedom 2035 Fund, Fidelity Advisor Freedom 2040 Fund, Fidelity Advisor Freedom 2045 Fund, Fidelity Advisor Freedom 2050 Fund and Fidelity Advisor Freedom 2055 Fund as of March 31, 2013, the results of their operations, the changes in their net assets and their financial highlights for each of the periods presented, in conformity with accounting principles generally accepted in the United States of America.
DELOITTE & TOUCHE LLP
Boston, Massachusetts
May 17, 2013
Annual Report
The Trustees and executive officers of the trust and funds, as applicable, are listed below. The Board of Trustees governs each Fidelity Advisor Freedom Fund and is responsible for protecting the interests of shareholders. The Trustees are experienced executives who meet periodically throughout the year to oversee each Fidelity Advisor Freedom Fund's activities, review contractual arrangements with companies that provide services to each Fidelity Advisor Freedom Fund, oversee management of the risks associated with such activities and contractual arrangements, and review each Fidelity Advisor Freedom Fund's performance. If the interests of a Fidelity Advisor Freedom Fund and an underlying Fidelity fund were to diverge, a conflict of interest could arise and affect how the Trustees fulfill their fiduciary duties to the affected funds. Strategic Advisers has structured the Fidelity Advisor Freedom Funds to avoid these potential conflicts, although there may be situations where a conflict of interest is unavoidable. In such instances, Strategic Advisers and the Trustees would take reasonable steps to minimize and, if possible, eliminate the conflict. Except for Elizabeth S. Acton and James C. Curvey, each of the Trustees oversees 219 Fidelity funds. Ms. Acton oversees 201 Fidelity funds. Mr. Curvey oversees 453 Fidelity funds.
The Trustees hold office without limit in time except that (a) any Trustee may resign; (b) any Trustee may be removed by written instrument, signed by at least two-thirds of the number of Trustees prior to such removal; (c) any Trustee who requests to be retired or who has become incapacitated by illness or injury may be retired by written instrument signed by a majority of the other Trustees; and (d) any Trustee may be removed at any special meeting of shareholders by a two-thirds vote of the outstanding voting securities of the trust. Each Trustee who is not an interested person of the trust and the funds (as defined in the 1940 Act) (Independent Trustee), shall retire not later than the last day of the month in which his or her 75th birthday occurs. The Independent Trustees may waive this mandatory retirement age policy with respect to individual Trustees. The executive officers hold office without limit in time, except that any officer may resign or may be removed by a vote of a majority of the Trustees at any regular meeting or any special meeting of the Trustees. Except as indicated, each individual has held the office shown or other offices in the same company for the past five years.
Experience, Skills, Attributes, and Qualifications of the Funds' Trustees. The Governance and Nominating Committee has adopted a statement of policy that describes the experience, qualifications, attributes, and skills that are necessary and desirable for potential Independent Trustee candidates (Statement of Policy). The Board believes that each Trustee satisfied at the time he or she was initially elected or appointed a Trustee, and continues to satisfy, the standards contemplated by the Statement of Policy. The Governance and Nominating Committee also engages professional search firms to help identify potential Independent Trustee candidates who have the experience, qualifications, attributes, and skills consistent with the Statement of Policy. From time to time, additional criteria based on the composition and skills of the current Independent Trustees, as well as experience or skills that may be appropriate in light of future changes to board composition, business conditions, and regulatory or other developments, have also been considered by the professional search firms and the Governance and Nominating Committee. In addition, the Board takes into account the Trustees' commitment and participation in Board and committee meetings, as well as their leadership of standing and ad hoc committees throughout their tenure.
In determining that a particular Trustee was and continues to be qualified to serve as a Trustee, the Board has considered a variety of criteria, none of which, in isolation, was controlling. The Board believes that, collectively, the Trustees have balanced and diverse experience, qualifications, attributes, and skills, which allow the Board to operate effectively in governing each fund and protecting the interests of shareholders. Information about the specific experience, skills, attributes, and qualifications of each Trustee, which in each case led to the Board's conclusion that the Trustee should serve (or continue to serve) as a trustee of the funds, is provided below.
Board Structure and Oversight Function. Abigail P. Johnson is an interested person (as defined in the 1940 Act) and currently serves as Chairman. The Trustees have determined that an interested Chairman is appropriate and benefits shareholders because an interested Chairman has a personal and professional stake in the quality and continuity of services provided to the funds. Independent Trustees exercise their informed business judgment to appoint an individual of their choosing to serve as Chairman, regardless of whether the Trustee happens to be independent or a member of management. The Independent Trustees have determined that they can act independently and effectively without having an Independent Trustee serve as Chairman and that a key structural component for assuring that they are in a position to do so is for the Independent Trustees to constitute a substantial majority for the Board. The Independent Trustees also regularly meet in executive session. Albert R. Gamper, Jr. serves as Chairman of the Independent Trustees and as such (i) acts as a liaison between the Independent Trustees and management with respect to matters important to the Independent Trustees and (ii) with management prepares agendas for Board meetings.
Fidelity funds are overseen by different Boards of Trustees. The funds' Board oversees Fidelity's investment-grade bond, money market, and asset allocation funds and another Board oversees Fidelity's equity and high income funds. The asset allocation funds may invest in Fidelity funds that are overseen by such other Board. The use of separate Boards, each with its own committee structure, allows the Trustees of each group of Fidelity funds to focus on the unique issues of the funds they oversee, including common research, investment, and operational issues. On occasion, the separate Boards establish joint committees to address issues of overlapping consequences for the Fidelity funds overseen by each Board.
The Trustees operate using a system of committees to facilitate the timely and efficient consideration of all matters of importance to the Trustees, each fund, and fund shareholders and to facilitate compliance with legal and regulatory requirements and oversight of the funds' activities and associated risks. The Board, acting through its committees, has charged FMR and its affiliates with (i) identifying events or circumstances the occurrence of which could have demonstrably adverse effects on the funds' business and/or reputation; (ii) implementing processes and controls to lessen the possibility that such events or circumstances occur or to mitigate the effects of such events or circumstances if they do occur; and (iii) creating and maintaining a system designed to evaluate continuously business and market conditions in order to facilitate the identification and implementation processes described in (i) and (ii) above. Because the day-to-day operations and activities of the funds are carried out by or through FMR, its affiliates, and other service providers, the funds' exposure to risks is mitigated but not eliminated by the processes overseen by the Trustees. While each of the Board's committees has responsibility for overseeing different aspects of the funds' activities, oversight is exercised primarily through the Operations and Audit Committees. In addition, an ad hoc Board committee of Independent Trustees has worked with FMR to enhance the Board's oversight of investment and financial risks, legal and regulatory risks, technology risks, and operational risks, including the development of additional risk reporting to the Board. Appropriate personnel, including but not limited to the funds' Chief Compliance Officer (CCO), FMR's internal auditor, the independent accountants, the funds' Treasurer and portfolio management personnel, make periodic reports to the Board's committees, as appropriate, including an annual review of FMR's risk management program for the Fidelity funds. The responsibilities of each standing committee, including their oversight responsibilities, are described further under "Standing Committees of the Funds' Trustees."
Annual Report
Trustees and Officers - continued
The funds' Statement of Additional Information (SAI) includes more information about the Trustees. To request a free copy, call Fidelity at 1-877-208-0098.
Interested Trustees*:
Correspondence intended for each Trustee who is an interested person may be sent to Fidelity Investments, 245 Summer Street, Boston, Massachusetts 02210.
Name, Year of Birth; Principal Occupations and Other Relevant Experience+ |
Abigail P. Johnson (1961) |
| Year of Election or Appointment: 2009 Ms. Johnson is Trustee and Chairman of the Board of Trustees of certain Trusts. Ms. Johnson serves as President of Fidelity Financial Services (2012-present) and President of Personal, Workplace and Institutional Services (2005-present). Ms. Johnson is Chairman and Director of FMR Co., Inc. (2011-present), Chairman and Director of FMR (2011-present), and the Vice Chairman and Director (2007-present) of FMR LLC. Previously, Ms. Johnson served as President and a Director of FMR (2001-2005), a Trustee of other investment companies advised by FMR, Fidelity Investments Money Management, Inc., and FMR Co., Inc. (2001-2005), Senior Vice President of the Fidelity funds (2001-2005), and managed a number of Fidelity funds. Ms. Abigail P. Johnson and Mr. Arthur E. Johnson are not related. |
James C. Curvey (1935) |
| Year of Election or Appointment: 2007 Mr. Curvey also serves as Trustee (2007-present) of other investment companies advised by FMR. Mr. Curvey is a Director of Fidelity Investments Money Management, Inc. (2009-present), Director of Fidelity Research & Analysis Co. (2009-present) and Director of FMR and FMR Co., Inc. (2007-present). Mr. Curvey is also Vice Chairman (2007-present) and Director of FMR LLC. In addition, Mr. Curvey serves as an Overseer for the Boston Symphony Orchestra and a member of the Trustees of Villanova University. Previously, Mr. Curvey was the Vice Chairman (2006-2007) and Director (2000-2007) of FMR Corp. |
* Trustees have been determined to be "Interested Trustees" by virtue of, among other things, their affiliation with the trust or various entities under common control with FMR.
+ The information above includes each Trustee's principal occupation during the last five years and other information relating to the experience, attributes, and skills relevant to each Trustee's qualifications to serve as a Trustee, which led to the conclusion that each Trustee should serve as a Trustee for each fund.
Independent Trustees:
Correspondence intended for each Independent Trustee (that is, the Trustees other than the Interested Trustees) may be sent to Fidelity Investments, P.O. Box 55235, Boston, Massachusetts 02205-5235.
Name, Year of Birth; Principal Occupations and Other Relevant Experience+ |
Elizabeth S. Acton (1951) |
| Year of Election or Appointment: 2013 Ms. Acton is Trustee of certain Trusts. Prior to her retirement in April 2012, Ms. Acton was Executive Vice President, Finance (November 2011-April 2012), Executive Vice President, Chief Financial Officer (April 2002-November 2011), and Treasurer (May 2004-May 2005) of Comerica Incorporated (financial services). Prior to joining Comerica, Ms. Acton held a variety of positions at Ford Motor Company (1983-2002), including Vice President and Treasurer (2000-2002) and Executive Vice President and Chief Financial Officer of Ford Motor Credit Company (1998-2000). Ms. Acton currently serves as a member of the Board of Directors and Audit and Finance Committees of Beazer Homes USA, Inc. (homebuilding, 2012-present). |
Albert R. Gamper, Jr. (1942) |
| Year of Election or Appointment: 2006 Mr. Gamper is Chairman of the Independent Trustees of the Fixed Income and Asset Allocation Funds (2012-present). Prior to his retirement in December 2004, Mr. Gamper served as Chairman of the Board of CIT Group Inc. (commercial finance). During his tenure with CIT Group Inc. Mr. Gamper served in numerous senior management positions, including Chairman (1987-1989; 1999-2001; 2002-2004), Chief Executive Officer (1987-2004), and President (2002-2003). Mr. Gamper currently serves as a member of the Board of Directors of Public Service Enterprise Group (utilities, 2000-present), a member of the Board of Trustees, Rutgers University (2004-present), and Chairman of the Board of Barnabas Health Care System. Previously, Mr. Gamper served as Vice Chairman of the Independent Trustees of the Fixed Income and Asset Allocation Funds (2011-2012) and as Chairman of the Board of Governors, Rutgers University (2004-2007). |
Robert F. Gartland (1951) |
| Year of Election or Appointment: 2010 Mr. Gartland is Chairman and an investor in Gartland and Mellina Group Corp. (consulting, 2009-present). Previously, Mr. Gartland served as a partner and investor of Vietnam Partners LLC (investments and consulting, 2008-2011). Prior to his retirement, Mr. Gartland held a variety of positions at Morgan Stanley (financial services, 1979-2007) including Managing Director (1987-2007). |
Arthur E. Johnson (1947) |
| Year of Election or Appointment: 2008 Mr. Johnson serves as a member of the Board of Directors of Eaton Corporation (diversified power management, 2009-present), AGL Resources, Inc. (holding company, 2002-present) and Booz Allen Hamilton (management consulting, 2011-present). Prior to his retirement, Mr. Johnson served as Senior Vice President of Corporate Strategic Development of Lockheed Martin Corporation (defense contractor, 1999-2009). He previously served on the Board of Directors of IKON Office Solutions, Inc. (1999-2008) and Delta Airlines (2005-2007). Mr. Arthur E. Johnson is not related to Ms. Abigail P. Johnson. |
Michael E. Kenneally (1954) |
| Year of Election or Appointment: 2009 Previously, Mr. Kenneally served as a Member of the Advisory Board for certain Fidelity Fixed Income and Asset Allocation Funds (2008-2009). Prior to his retirement, Mr. Kenneally served as Chairman and Global Chief Executive Officer of Credit Suisse Asset Management (2003-2005). Mr. Kenneally was a Director of the Credit Suisse Funds (U.S. mutual funds, 2004-2008) and certain other closed-end funds (2004-2005) and was awarded the Chartered Financial Analyst (CFA) designation in 1991. |
James H. Keyes (1940) |
| Year of Election or Appointment: 2007 Mr. Keyes serves as a member of the Boards of Navistar International Corporation (manufacture and sale of trucks, buses, and diesel engines, since 2002) and Pitney Bowes, Inc. (integrated mail, messaging, and document management solutions, since 1998). Prior to his retirement, Mr. Keyes served as Chairman and Chief Executive Officer of Johnson Controls (automotive, building, and energy, 1998-2002) and as a member of the Board of LSI Logic Corporation (semiconductor technologies, 1984-2008). |
Marie L. Knowles (1946) |
| Year of Election or Appointment: 2001 Ms. Knowles is Vice Chairman of the Independent Trustees of the Fixed Income and Asset Allocation Funds (2012-present). Prior to Ms. Knowles' retirement in June 2000, she served as Executive Vice President and Chief Financial Officer of Atlantic Richfield Company (ARCO) (diversified energy, 1996-2000). From 1993 to 1996, she was a Senior Vice President of ARCO and President of ARCO Transportation Company. She served as a Director of ARCO from 1996 to 1998. Ms. Knowles currently serves as a Director and Chairman of the Audit Committee of McKesson Corporation (healthcare service, since 2002). Ms. Knowles is an Honorary Trustee of the Brookings Institution and a member of the Board of the Catalina Island Conservancy and of the Santa Catalina Island Company (2009-present). She also serves as a member of the Advisory Board for the School of Engineering of the University of Southern California and the Foundation Board of the School of Architecture at the University of Virginia (2007-present). Previously, Ms. Knowles served as a Director of Phelps Dodge Corporation (copper mining and manufacturing, 1994-2007). |
Kenneth L. Wolfe (1939) |
| Year of Election or Appointment: 2005 Prior to his retirement, Mr. Wolfe served as Chairman and a Director (2007-2009) and Chairman and Chief Executive Officer (1994-2001) of Hershey Foods Corporation. He also served as a member of the Boards of Adelphia Communications Corporation (telecommunications, 2003-2006), Bausch & Lomb, Inc. (medical/pharmaceutical, 1993-2007), and Revlon, Inc. (personal care products, 2004-2009). Mr. Wolfe previously served as Chairman of the Independent Trustees of the Fixed Income and Asset Allocation Funds (2008-2012). |
Annual Report
Trustees and Officers - continued
+ The information above includes each Trustee's principal occupation during the last five years and other information relating to the experience, attributes, and skills relevant to each Trustee's qualifications to serve as a Trustee, which led to the conclusion that each Trustee should serve as a Trustee for each fund.
Executive Officers:
Correspondence intended for each executive officer may be sent to Fidelity Investments, 245 Summer Street, Boston, Massachusetts 02210.
Name, Year of Birth; Principal Occupation |
Stephanie J. Dorsey (1969) |
| Year of Election or Appointment: 2013 President and Treasurer of Fidelity's Fixed Income and Asset Allocation Funds. Ms. Dorsey also serves as Assistant Treasurer of other Fidelity funds (2010-present) and is an employee of Fidelity Investments (2008-present). Previously, Ms. Dorsey served as Deputy Treasurer of Fidelity's Fixed Income and Asset Allocation Funds (2008-2013), Treasurer (2004-2008) of the JPMorgan Mutual Funds and Vice President (2004-2008) of JPMorgan Chase Bank. |
Charles S. Morrison (1960) |
| Year of Election or Appointment: 2012 Vice President of Fidelity's Fixed Income and Asset Allocation Funds. Mr. Morrison also serves as President, Fixed Income and is an employee of Fidelity Investments. Previously, Mr. Morrison served as Vice President of Fidelity's Money Market Funds (2005-2009), President, Money Market Group Leader of FMR (2009), and Senior Vice President, Money Market Group of FMR (2004-2009). Mr. Morrison also served as Vice President of Fidelity's Bond Funds (2002-2005), certain Balanced Funds (2002-2005), and certain Asset Allocation Funds (2002-2007), and as Senior Vice President (2002-2005) of Fidelity's Fixed Income Division. |
Derek L. Young (1964) |
| Year of Election or Appointment: 2009 Vice President of Fidelity's Asset Allocation Funds. Mr. Young is also a Trustee of other investment companies advised by Strategic Advisers, Inc. (Strategic Advisers) (2012-present), President and a Director of Strategic Advisers (2011-present), President of Fidelity Global Asset Allocation (GAA) (2011-present), and Vice Chairman of Pyramis Global Advisors LLC (2011-present). Previously, Mr. Young served as Chief Investment Officer of GAA (2009-2011) and as a portfolio manager. |
Andrew Windmueller (1960) |
| Year of Election or Appointment: 2012 Vice President of Fidelity's Asset Allocation Funds. Mr. Windmueller also serves as Chief Investment Officer of Strategic Advisers, Inc. (2011-present), Chief Investment Officer for Global Asset Allocation Multi-Asset Class Strategies (2011-present), and is an employee of Fidelity Investments (2000-present). |
Scott C. Goebel (1968) |
| Year of Election or Appointment: 2008 Secretary and Chief Legal Officer (CLO) of the Fidelity funds. Mr. Goebel also serves as Secretary of Fidelity Investments Money Management, Inc. (FIMM) (2010-present) and Fidelity Research and Analysis Company (FRAC) (2010-present); Secretary and CLO of The North Carolina Capital Management Trust: Cash and Term Portfolios (2008-present); General Counsel, Secretary, and Senior Vice President of FMR (2008-present) and FMR Co., Inc. (2008-present); employed by FMR LLC or an affiliate (2001-present); Chief Legal Officer of Fidelity Management & Research (Hong Kong) Limited (2008-present) and Assistant Secretary of Fidelity Management & Research (Japan) Inc. (2008-present), and Fidelity Management & Research (U.K.) Inc. (2008-present). Previously, Mr. Goebel served as Assistant Secretary of FIMM (2008-2010), FRAC (2008-2010), and the Funds (2007-2008) and as Vice President and Secretary of Fidelity Distributors Corporation (FDC) (2005-2007). |
Ramon Herrera (1974) |
| Year of Election or Appointment: 2012 Assistant Secretary of Fidelity's Fixed Income and Asset Allocation Funds. Mr. Herrera also serves as Vice President, Associate General Counsel (2010-present) and is an employee of Fidelity Investments (2004-present). |
Elizabeth Paige Baumann (1968) |
| Year of Election or Appointment: 2012 Anti-Money Laundering (AML) Officer of the Fidelity funds. Ms. Baumann also serves as AML Officer of The North Carolina Capital Management Trust: Cash and Term Portfolios (2012-present), Chief AML Officer of FMR LLC (2012-present), and is an employee of Fidelity Investments. Previously, Ms. Baumann served as Vice President and Deputy Anti-Money Laundering Officer (2007-2012). |
Christine Reynolds (1958) |
| Year of Election or Appointment: 2008 Chief Financial Officer of the Fidelity funds. Ms. Reynolds became President of Fidelity Pricing and Cash Management Services (FPCMS) in August 2008. Ms. Reynolds served as Chief Operating Officer of FPCMS (2007-2008). Previously, Ms. Reynolds served as President, Treasurer, and Anti-Money Laundering officer of the Fidelity funds (2004-2007). |
Michael H. Whitaker (1967) |
| Year of Election or Appointment: 2008 Chief Compliance Officer of Fidelity's Fixed Income and Asset Allocation Funds. Mr. Whitaker also serves as Chief Compliance Officer of The North Carolina Capital Management Trust: Cash and Term Portfolios (2008-present). Mr. Whitaker is an employee of Fidelity Investments (2007-present). Prior to joining Fidelity Investments, Mr. Whitaker worked at MFS Investment Management where he served as Senior Vice President and Chief Compliance Officer (2004-2006), and Assistant General Counsel. |
Joseph F. Zambello (1957) |
| Year of Election or Appointment: 2011 Deputy Treasurer of the Fidelity funds. Mr. Zambello is an employee of Fidelity Investments. Previously, Mr. Zambello served as Vice President of FMR's Program Management Group (2009-2011) and Vice President of the Transfer Agent Oversight Group (2005-2009). |
Stephen Sadoski (1971) |
| Year of Election or Appointment: 2013 Deputy Treasurer of Fidelity's Fixed Income and Asset Allocation Funds. Mr. Sadoski also serves as Deputy Treasurer of other Fidelity funds (2012-present) and is an employee of Fidelity Investments (2012-present). Previously, Mr. Sadoski served as Assistant Treasurer of Fidelity's Fixed Income and Asset Allocation Funds (2012-2013), an assistant chief accountant in the Division of Investment Management of the Securities and Exchange Commission (SEC) (2009-2012) and as a senior manager at Deloitte & Touche (1997-2009). |
Adrien E. Deberghes (1967) |
| Year of Election or Appointment: 2010 Assistant Treasurer of Fidelity's Fixed Income and Asset Allocation Funds. Mr. Deberghes also serves as Vice President and Assistant Treasurer (2011-present) and Deputy Treasurer (2008-present) of other Fidelity funds, and is an employee of Fidelity Investments (2008-present). Previously, Mr. Deberghes served as Senior Vice President of Mutual Fund Administration at State Street Corporation (2007-2008), Senior Director of Mutual Fund Administration at Investors Bank & Trust (2005-2007), and Director of Finance for Dunkin' Brands (2000-2005). |
Kenneth B. Robins (1969) |
| Year of Election or Appointment: 2009 Assistant Treasurer of the Fidelity Fixed Income and Asset Allocation Funds. Mr. Robins also serves as President and Treasurer of other Fidelity funds (2008-present; 2010-present) and is an employee of Fidelity Investments (2004-present). Previously, Mr. Robins served as Deputy Treasurer of the Fidelity funds (2005-2008) and Treasurer and Chief Financial Officer of The North Carolina Capital Management Trust: Cash and Term Portfolios (2006-2008). |
Gary W. Ryan (1958) |
| Year of Election or Appointment: 2005 Assistant Treasurer of the Fidelity funds. Mr. Ryan is an employee of Fidelity Investments. Previously, Mr. Ryan served as Vice President of Fund Reporting in Fidelity Pricing and Cash Management Services (FPCMS) (1999-2005). |
Jonathan Davis (1968) |
| Year of Election or Appointment: 2010 Assistant Treasurer of the Fidelity funds. Mr. Davis is also Assistant Treasurer of Fidelity Rutland Square Trust II and Fidelity Commonwealth Trust II. Mr. Davis is an employee of Fidelity Investments. Previously, Mr. Davis served as Vice President and Associate General Counsel of FMR LLC (2003-2010). |
Annual Report
The Board of Trustees of each fund voted to pay to shareholders of record at the opening of business on record date, the following distributions per share derived from capital gains realized from sales of portfolio securities and dividends derived from net investment income:
| Pay Date | Record Date | Dividends | Capital Gains |
Fidelity Advisor Freedom Income Fund | | | | |
Institutional Class | 05/06/13 | 05/03/13 | $0.008 | $0.125 |
Fidelity Advisor Freedom 2005 Fund | | | | |
Institutional Class | 05/06/13 | 05/03/13 | $0.024 | $0.073 |
Fidelity Advisor Freedom 2010 Fund | | | | |
Institutional Class | 05/06/13 | 05/03/13 | $0.026 | $0.124 |
Fidelity Advisor Freedom 2015 Fund | | | | |
Institutional Class | 05/13/13 | 05/10/13 | $0.026 | $0.204 |
Fidelity Advisor Freedom 2020 Fund | | | | |
Institutional Class | 05/06/13 | 05/03/13 | $0.027 | $0.250 |
Fidelity Advisor Freedom 2025 Fund | | | | |
Institutional Class | 05/06/13 | 05/03/13 | $0.025 | $0.374 |
Fidelity Advisor Freedom 2030 Fund | | | | |
Institutional Class | 05/06/13 | 05/03/13 | $0.026 | $0.338 |
Fidelity Advisor Freedom 2035 Fund | | | | |
Institutional Class | 05/06/13 | 05/03/13 | $0.020 | $0.466 |
Fidelity Advisor Freedom 2040 Fund | | | | |
Institutional Class | 05/06/13 | 05/03/13 | $0.021 | $0.492 |
Fidelity Advisor Freedom 2045 Fund | | | | |
Institutional Class | 05/13/13 | 05/10/13 | $0.016 | $0.213 |
Fidelity Advisor Freedom 2050 Fund | | | | |
Institutional Class | 05/13/13 | 05/10/13 | $0.015 | $0.214 |
Fidelity Advisor Freedom 2055 Fund | | | | |
Institutional Class | 05/13/13 | 05/10/13 | $0.011 | $0.120 |
The funds hereby designate as capital gain dividend the amounts noted below for the taxable year ended March 31, 2013, or, if subsequently determined to be different, the net capital gain of such year.
Fidelity Advisor Freedom Income Fund | $4,545,642 |
Fidelity Advisor Freedom 2005 Fund | $1,838,709 |
Fidelity Advisor Freedom 2010 Fund | $8,728,254 |
Fidelity Advisor Freedom 2015 Fund | $31,322,730 |
Fidelity Advisor Freedom 2020 Fund | $61,913,127 |
Fidelity Advisor Freedom 2025 Fund | $84,582,251 |
Fidelity Advisor Freedom 2030 Fund | $73,228,005 |
Fidelity Advisor Freedom 2035 Fund | $75,581,843 |
Fidelity Advisor Freedom 2040 Fund | $72,708,334 |
Fidelity Advisor Freedom 2045 Fund | $19,259,685 |
Fidelity Advisor Freedom 2050 Fund | $13,997,836 |
Fidelity Advisor Freedom 2055 Fund | $753,517 |
Annual Report
A percentage of the dividends distributed during the fiscal year for the following funds were derived from interest on U.S. Government securities which is generally exempt from state income tax:
Fidelity Advisor Freedom Income Fund | 18.64% |
Fidelity Advisor Freedom 2005 Fund | 14.31% |
Fidelity Advisor Freedom 2010 Fund | 13.36% |
Fidelity Advisor Freedom 2015 Fund | 13.10% |
Fidelity Advisor Freedom 2020 Fund | 11.12% |
Fidelity Advisor Freedom 2025 Fund | 7.94% |
Fidelity Advisor Freedom 2030 Fund | 6.03% |
Fidelity Advisor Freedom 2035 Fund | 2.65% |
Fidelity Advisor Freedom 2040 Fund | 2.40% |
Fidelity Advisor Freedom 2045 Fund | 1.35% |
Fidelity Advisor Freedom 2050 Fund | 0.89% |
Fidelity Advisor Freedom 2055 Fund | 0.08% |
A percentage of the dividends distributed during the fiscal year for the following funds qualify for the dividends-received deduction for corporate shareholders:
| Institutional Class |
Fidelity Advisor Freedom Income Fund | |
April 2012 | 1% |
May 2012 | 7% |
June 2012 | 8% |
July 2012 | 8% |
August 2012 | 8% |
September 2012 | 8% |
October 2012 | 8% |
November 2012 | 9% |
December 2012 (Ex-Date 12/07/12) | 8% |
December 2012 (Ex-Date 12/28/12) | 11% |
Fidelity Advisor Freedom 2005 Fund | |
May 2012 | 2% |
December 2012 | 17% |
Fidelity Advisor Freedom 2010 Fund | |
May 2012 | 1% |
December 2012 | 19% |
Fidelity Advisor Freedom 2015 Fund | |
May 2012 | 1% |
December 2012 | 20% |
Fidelity Advisor Freedom 2020 Fund | |
May 2012 | 2% |
December 2012 | 22% |
Fidelity Advisor Freedom 2025 Fund | |
May 2012 | 2% |
December 2012 | 27% |
Fidelity Advisor Freedom 2030 Fund | |
May 2012 | 2% |
December 2012 | 28% |
Fidelity Advisor Freedom 2035 Fund | |
May 2012 | 4% |
December 2012 | 36% |
| Institutional Class |
Fidelity Advisor Freedom 2040 Fund | |
May 2012 | 4% |
December 2012 | 36% |
Fidelity Advisor Freedom 2045 Fund | |
May 2012 | 5% |
December 2012 | 37% |
Fidelity Advisor Freedom 2050 Fund | |
May 2012 | 8% |
December 2012 | 40% |
Fidelity Advisor Freedom 2055 Fund | |
May 2012 | 14% |
December 2012 | 48% |
A percentage of the dividends distributed during the fiscal year for the following funds may be taken into account as a dividend for purposes of the maximum rate under section 1(h)(11) of the Internal Revenue Code.
| Institutional Class |
Fidelity Advisor Freedom Income Fund | |
April 2012 | 3% |
May 2012 | 12% |
June 2012 | 13% |
July 2012 | 13% |
August 2012 | 14% |
September 2012 | 14% |
October 2012 | 14% |
November 2012 | 15% |
December 2012 (Ex-Date 12/07/12) | 13% |
December 2012 (Ex-Date 12/28/12) | 17% |
February 2013 | 5% |
March 2013 | 5% |
Fidelity Advisor Freedom 2005 Fund | |
May 2012 | 3% |
December 2012 | 26% |
Fidelity Advisor Freedom 2010 Fund | |
May 2012 | 2% |
December 2012 | 31% |
Fidelity Advisor Freedom 2015 Fund | |
May 2012 | 3% |
December 2012 | 31% |
Fidelity Advisor Freedom 2020 Fund | |
May 2012 | 3% |
December 2012 | 35% |
Fidelity Advisor Freedom 2025 Fund | |
May 2012 | 4% |
December 2012 | 42% |
Fidelity Advisor Freedom 2030 Fund | |
May 2012 | 4% |
December 2012 | 45% |
Fidelity Advisor Freedom 2035 Fund | |
May 2012 | 7% |
December 2012 | 57% |
| Institutional Class |
Fidelity Advisor Freedom 2040 Fund | |
May 2012 | 7% |
December 2012 | 57% |
Fidelity Advisor Freedom 2045 Fund | |
May 2012 | 8% |
December 2012 | 59% |
Fidelity Advisor Freedom 2050 Fund | |
May 2012 | 12% |
December 2012 | 63% |
Fidelity Advisor Freedom 2055 Fund | |
May 2012 | 21% |
December 2012 | 74% |
The funds will notify shareholders in January 2014 of amounts for use in preparing 2013 income tax returns.
Annual Report
Investment Adviser
Strategic Advisers, Inc.
Boston, MA
Administrator
Fidelity Management & Research Company
Boston, MA
General Distributor
Fidelity Distributors Corporation
Smithfield, RI
Transfer and Service Agents
Fidelity Investments Institutional Operations Company, Inc.
Boston, MA
Fidelity Service Company, Inc.
Boston, MA
Custodian
The Bank of New York Mellon
New York, NY
(Fidelity Investment logo)(registered trademark)
AFFI-UANN-0513
1.792135.109
Fidelity Freedom® Index Funds - Class W
Income, 2000, 2005, 2010, 2015, 2020, 2025, 2030, 2035, 2040, 2045, 2050, 2055
Annual Report
March 31, 2013
(Fidelity Cover Art)
Contents
To view a fund's proxy voting guidelines and proxy voting record for the 12-month period ended June 30, visit http://www.fidelity.com/proxyvotingresults or visit the Securities and Exchange Commission's (SEC) web site at http://www.sec.gov. You may also call 1-800-835-5092 to request a free copy of the proxy voting guidelines.
Standard & Poor's, S&P and S&P 500 are registered service marks of The McGraw-Hill Companies, Inc. and have been licensed for use by Fidelity Distributors Corporation.
Other third-party marks appearing herein are the property of their respective owners.
All other marks appearing herein are registered or unregistered trademarks or service marks of FMR LLC or an affiliated company. © 2013 FMR LLC. All rights reserved.
This report and the financial statements contained herein are submitted for the general information of the shareholders of the funds. This report is not authorized for distribution to prospective investors in the funds unless preceded or accompanied by an effective prospectus.
A fund files its complete schedule of portfolio holdings with the SEC for the first and third quarters of each fiscal year on Form N-Q. Forms N-Q are available on the SEC's web site at http://www.sec.gov. A fund's Forms N-Q may be reviewed and copied at the SEC's Public Reference Room in Washington, DC. Information regarding the operation of the SEC's Public Reference Room may be obtained by calling 1-800-SEC-0330. For a complete list of a fund's portfolio holdings, view the most recent holdings listing, semiannual report, or annual report on Fidelity's web site at http://www.fidelity.com, http://www.advisor.fidelity.com, or http://www.401k.com, as applicable.
NOT FDIC INSURED • MAY LOSE VALUE • NO BANK GUARANTEE
Neither the funds nor Fidelity Distributors Corporation is a bank.
Annual Report
Fidelity Freedom® Index Income Fund - Class W
Average annual total return reflects the change in the value of an investment, assuming reinvestment of the fund's distributions from dividend income and capital gains (the profits earned upon the sale of securities that have grown in value, if any) and assuming a constant rate of performance each year. The $10,000 table and the fund's returns do not reflect the deduction of taxes that a shareholder would pay on fund distributions or the redemption of fund shares. During periods of reimbursement by Fidelity, a fund's total return will be greater than it would be had the reimbursement not occurred. How a fund did yesterday is no guarantee of how it will do tomorrow.
Average Annual Total Returns
Periods ended March 31, 2013 | Past 1
year | Life of
fund A |
Fidelity Freedom Index Income Fund - Class W | 3.75% | 4.81% |
A From October 2, 2009.
$10,000 Over Life of Fund
Let's say hypothetically that $10,000 was invested in Fidelity Freedom Index Income Fund - Class W on October 2, 2009, when the fund started. The chart shows how the value of your investment would have changed, and also shows how the Barclays® U.S. Aggregate Bond Index performed over the same period.
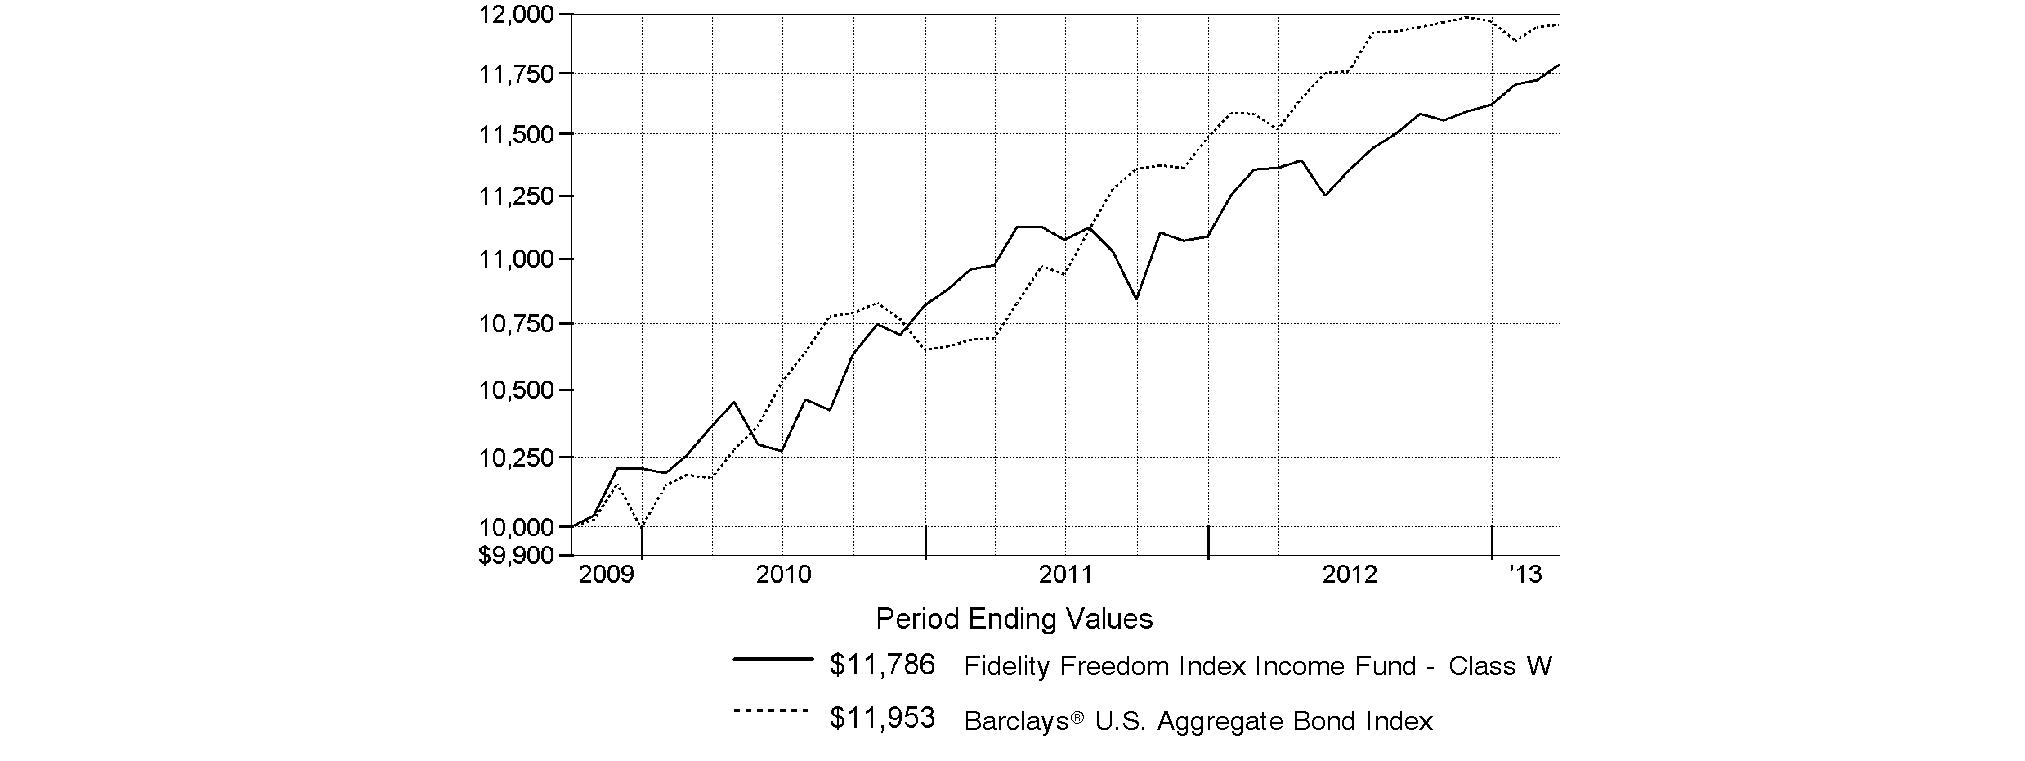
Annual Report
Fidelity Freedom Index 2000 Fund - Class W
Performance: The Bottom Line
Average annual total return reflects the change in the value of an investment, assuming reinvestment of the fund's distributions from dividend income and capital gains (the profits earned upon the sale of securities that have grown in value, if any) and assuming a constant rate of performance each year. The $10,000 table and the fund's returns do not reflect the deduction of taxes that a shareholder would pay on fund distributions or the redemption of fund shares. During periods of reimbursement by Fidelity, a fund's total return will be greater than it would be had the reimbursement not occurred. How a fund did yesterday is no guarantee of how it will do tomorrow.
Average Annual Total Returns
Periods ended March 31, 2013 | Past 1
year | Life of
fund A |
Fidelity Freedom Index 2000 Fund - Class W | 3.76% | 4.91% |
A From October 2, 2009.
$10,000 Over Life of Fund
Let's say hypothetically that $10,000 was invested in Fidelity Freedom Index 2000 Fund - Class W on October 2, 2009, when the fund started. The chart shows how the value of your investment would have changed, and also shows how the Barclays U.S. Aggregate Bond Index performed over the same period.
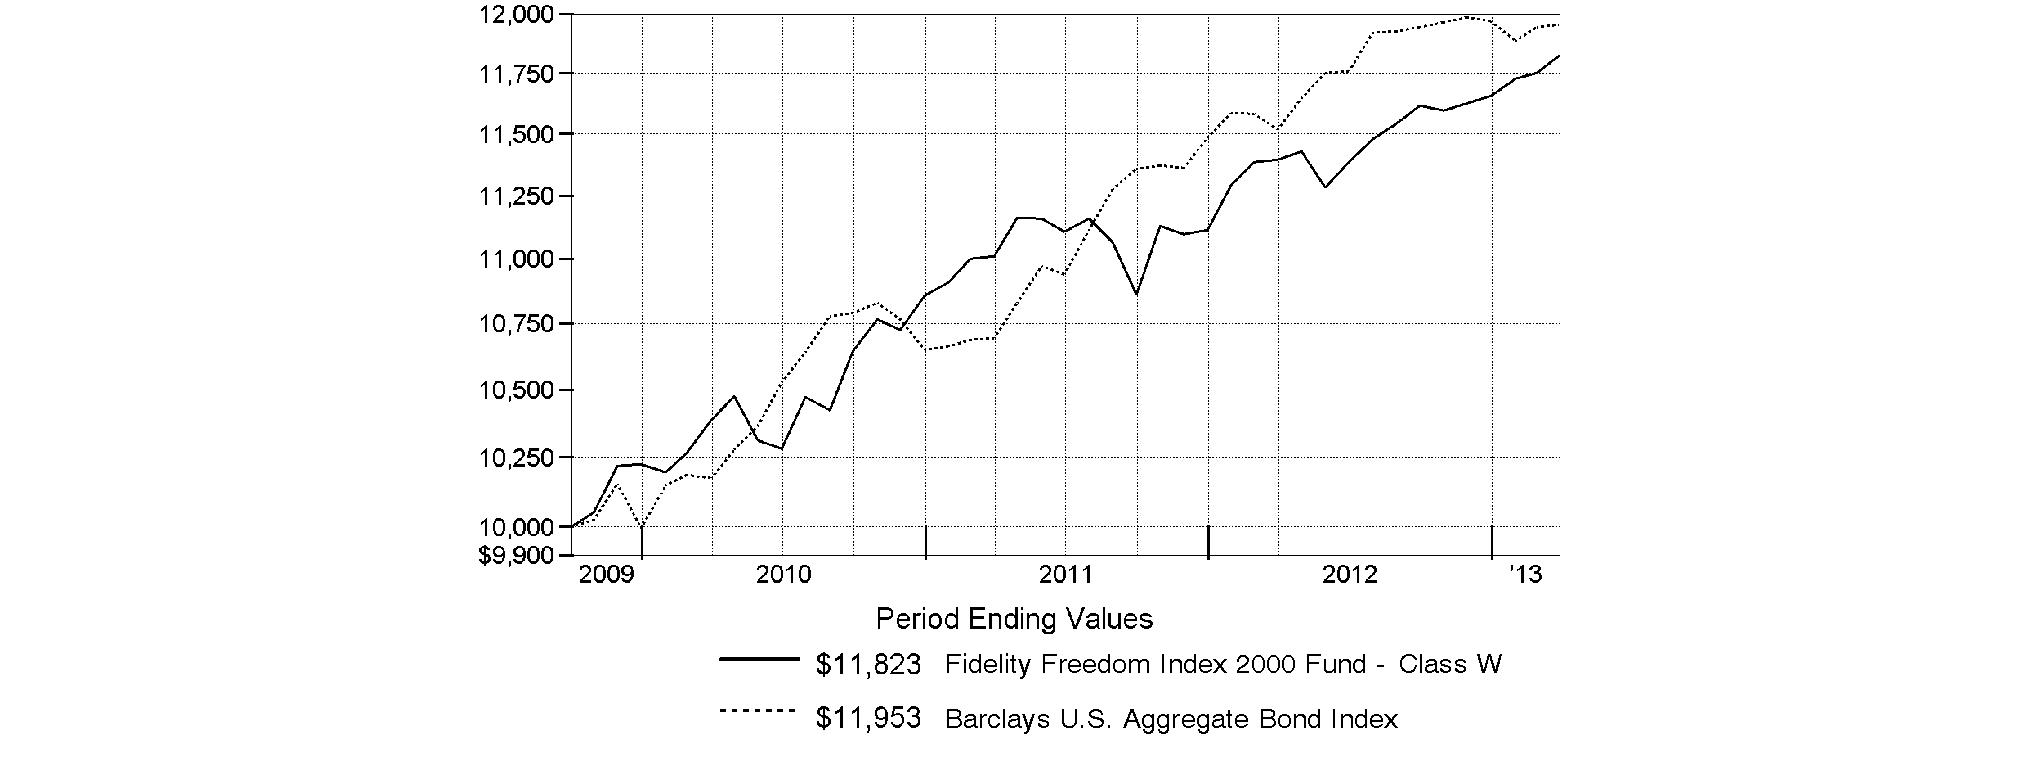
-
Annual Report
Fidelity Freedom Index 2005 Fund - Class W
Performance: The Bottom Line
Average annual total return reflects the change in the value of an investment, assuming reinvestment of the fund's distributions from dividend income and capital gains (the profits earned upon the sale of securities that have grown in value, if any) and assuming a constant rate of performance each year. The $10,000 table and the fund's returns do not reflect the deduction of taxes that a shareholder would pay on fund distributions or the redemption of fund shares. During periods of reimbursement by Fidelity, a fund's total return will be greater than it would be had the reimbursement not occurred. How a fund did yesterday is no guarantee of how it will do tomorrow.
Average Annual Total Returns
Periods ended March 31, 2013 | Past 1
year | Life of
fund A |
Fidelity Freedom Index 2005 Fund - Class W | 5.17% | 7.09% |
A From October 2, 2009.
$10,000 Over Life of Fund
Let's say hypothetically that $10,000 was invested in Fidelity Freedom Index 2005 Fund - Class W on October 2, 2009, when the fund started. The chart shows how the value of your investment would have changed, and also shows how the Barclays U.S. Aggregate Bond Index performed over the same period.
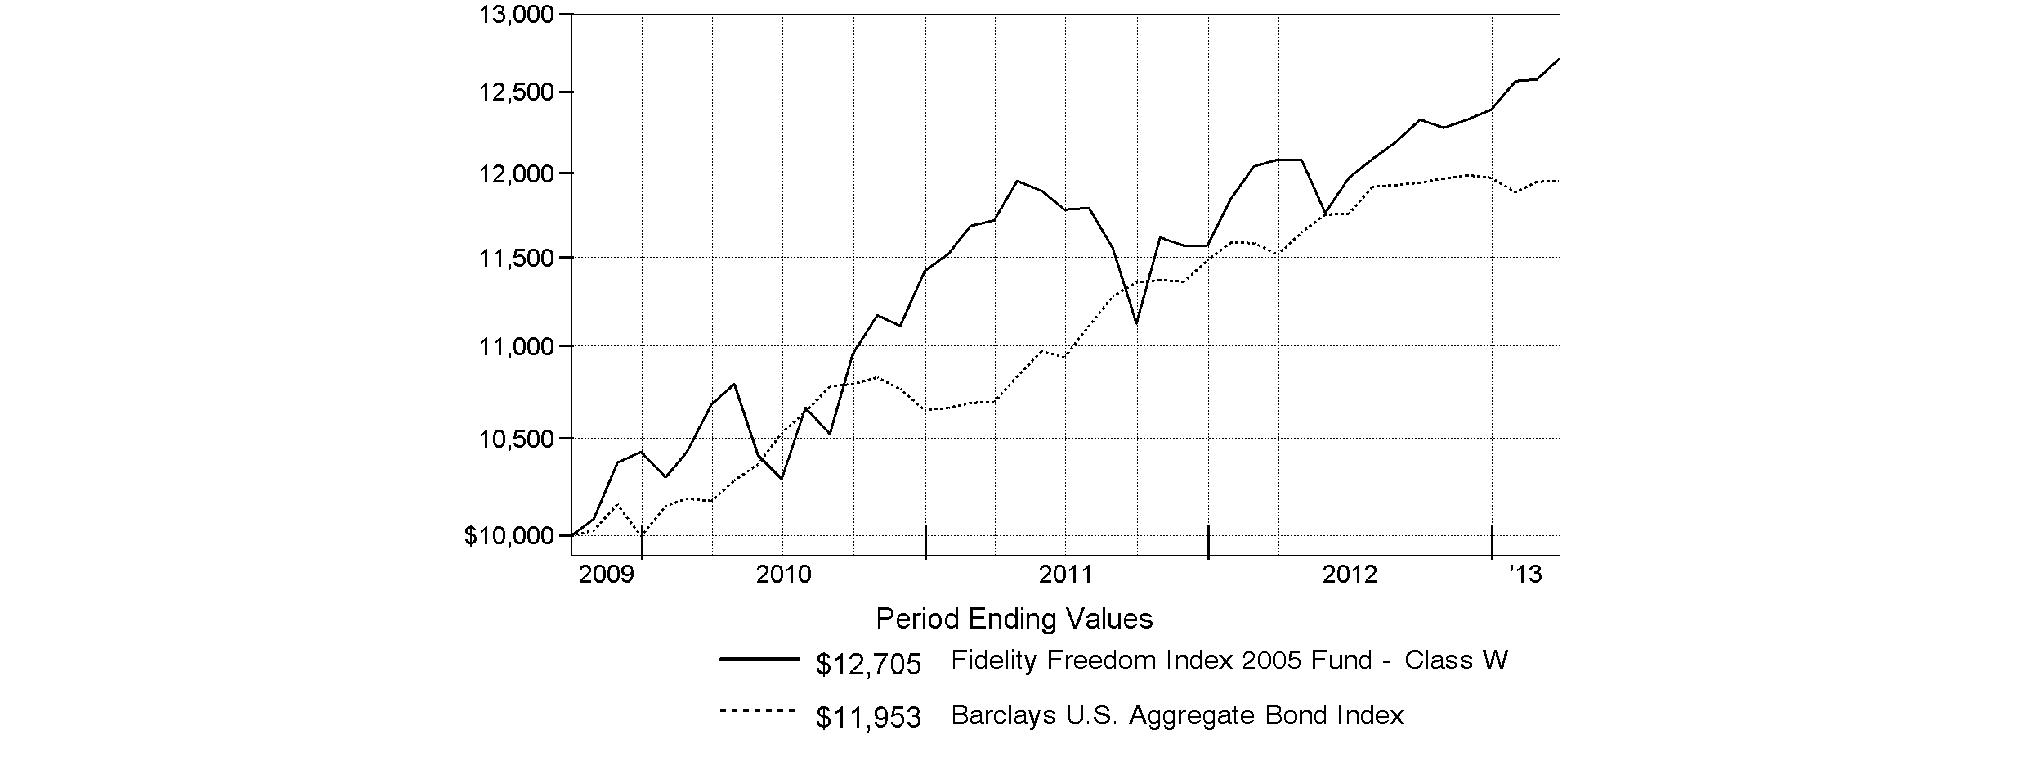
Annual Report
Fidelity Freedom Index 2010 Fund - Class W
Performance: The Bottom Line
Average annual total return reflects the change in the value of an investment, assuming reinvestment of the fund's distributions from dividend income and capital gains (the profits earned upon the sale of securities that have grown in value, if any) and assuming a constant rate of performance each year. The $10,000 table and the fund's returns do not reflect the deduction of taxes that a shareholder would pay on fund distributions or the redemption of fund shares. During periods of reimbursement by Fidelity, a fund's total return will be greater than it would be had the reimbursement not occurred. How a fund did yesterday is no guarantee of how it will do tomorrow.
Average Annual Total Returns
Periods ended March 31, 2013 | Past 1
year | Life of
fund A |
Fidelity Freedom Index 2010 Fund - Class W | 6.80% | 8.30% |
A From October 2, 2009.
$10,000 Over Life of Fund
Let's say hypothetically that $10,000 was invested in Fidelity Freedom Index 2010 Fund - Class W on October 2, 2009, when the fund started. The chart shows how the value of your investment would have changed, and also shows how the Barclays U.S. Aggregate Bond Index performed over the same period.
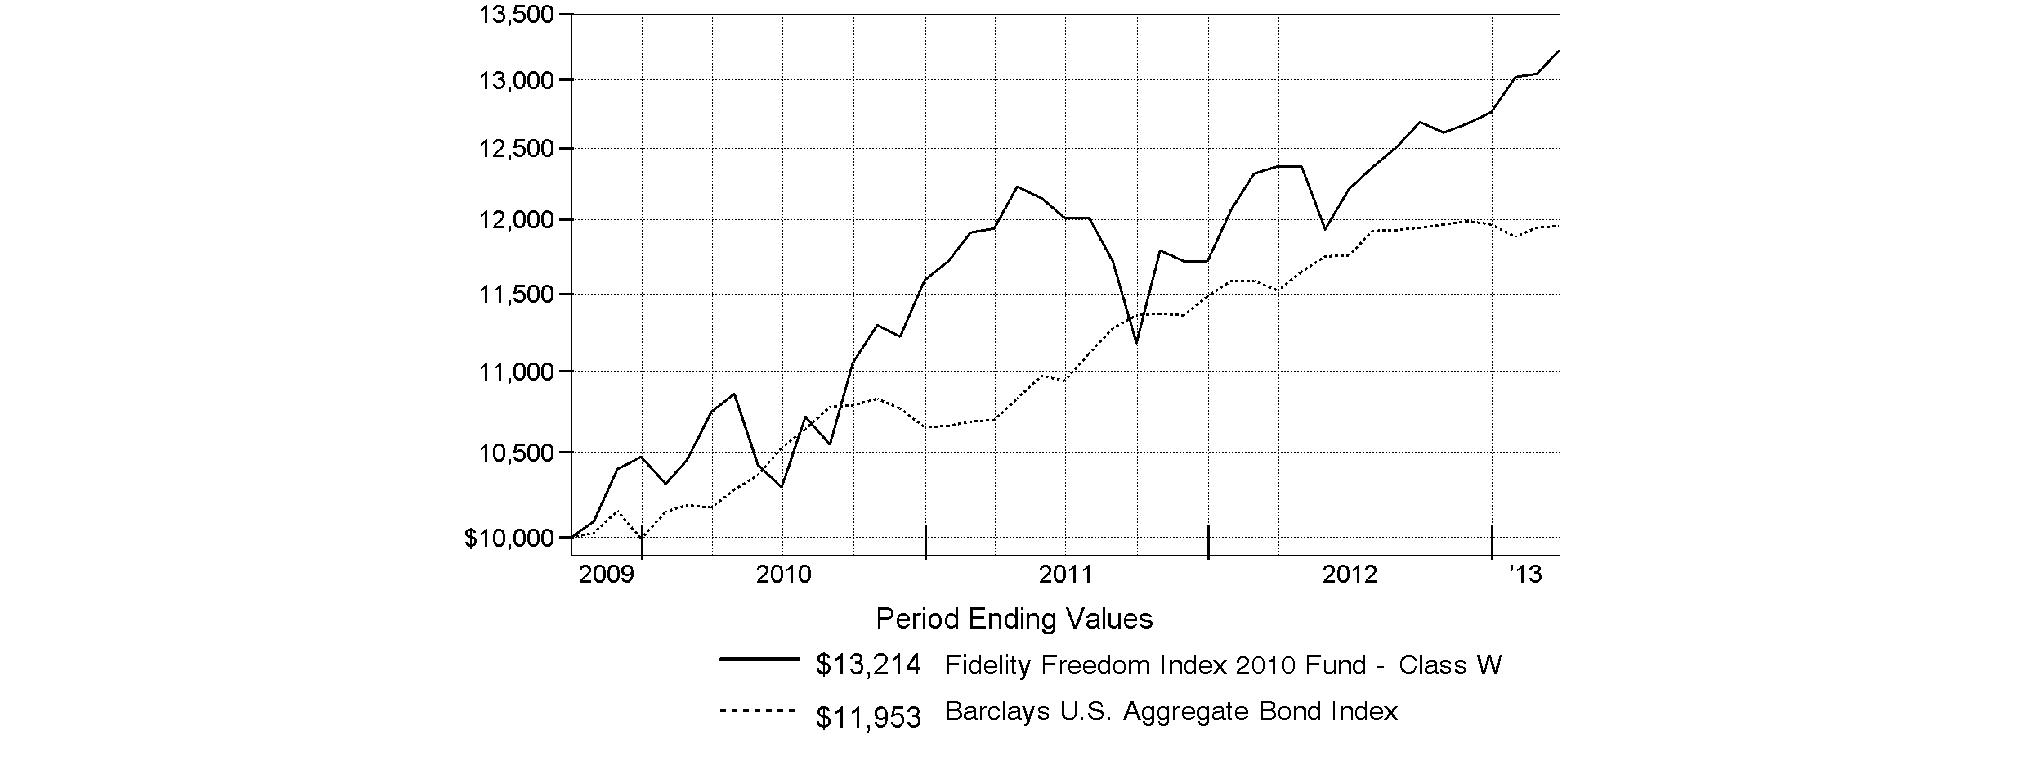
-
Annual Report
Fidelity Freedom Index 2015 Fund - Class W
Performance: The Bottom Line
Average annual total return reflects the change in the value of an investment, assuming reinvestment of the fund's distributions from dividend income and capital gains (the profits earned upon the sale of securities that have grown in value, if any) and assuming a constant rate of performance each year. The $10,000 table and the fund's returns do not reflect the deduction of taxes that a shareholder would pay on fund distributions or the redemption of fund shares. During periods of reimbursement by Fidelity, a fund's total return will be greater than it would be had the reimbursement not occurred. How a fund did yesterday is no guarantee of how it will do tomorrow.
Average Annual Total Returns
Periods ended March 31, 2013 | Past 1
year | Life of
fund A |
Fidelity Freedom Index 2015 Fund - Class W | 7.02% | 8.50% |
A From October 2, 2009.
$10,000 Over Life of Fund
Let's say hypothetically that $10,000 was invested in Fidelity Freedom Index 2015 Fund - Class W on October 2, 2009, when the fund started. The chart shows how the value of your investment would have changed, and also shows how the S&P 500® Index performed over the same period.
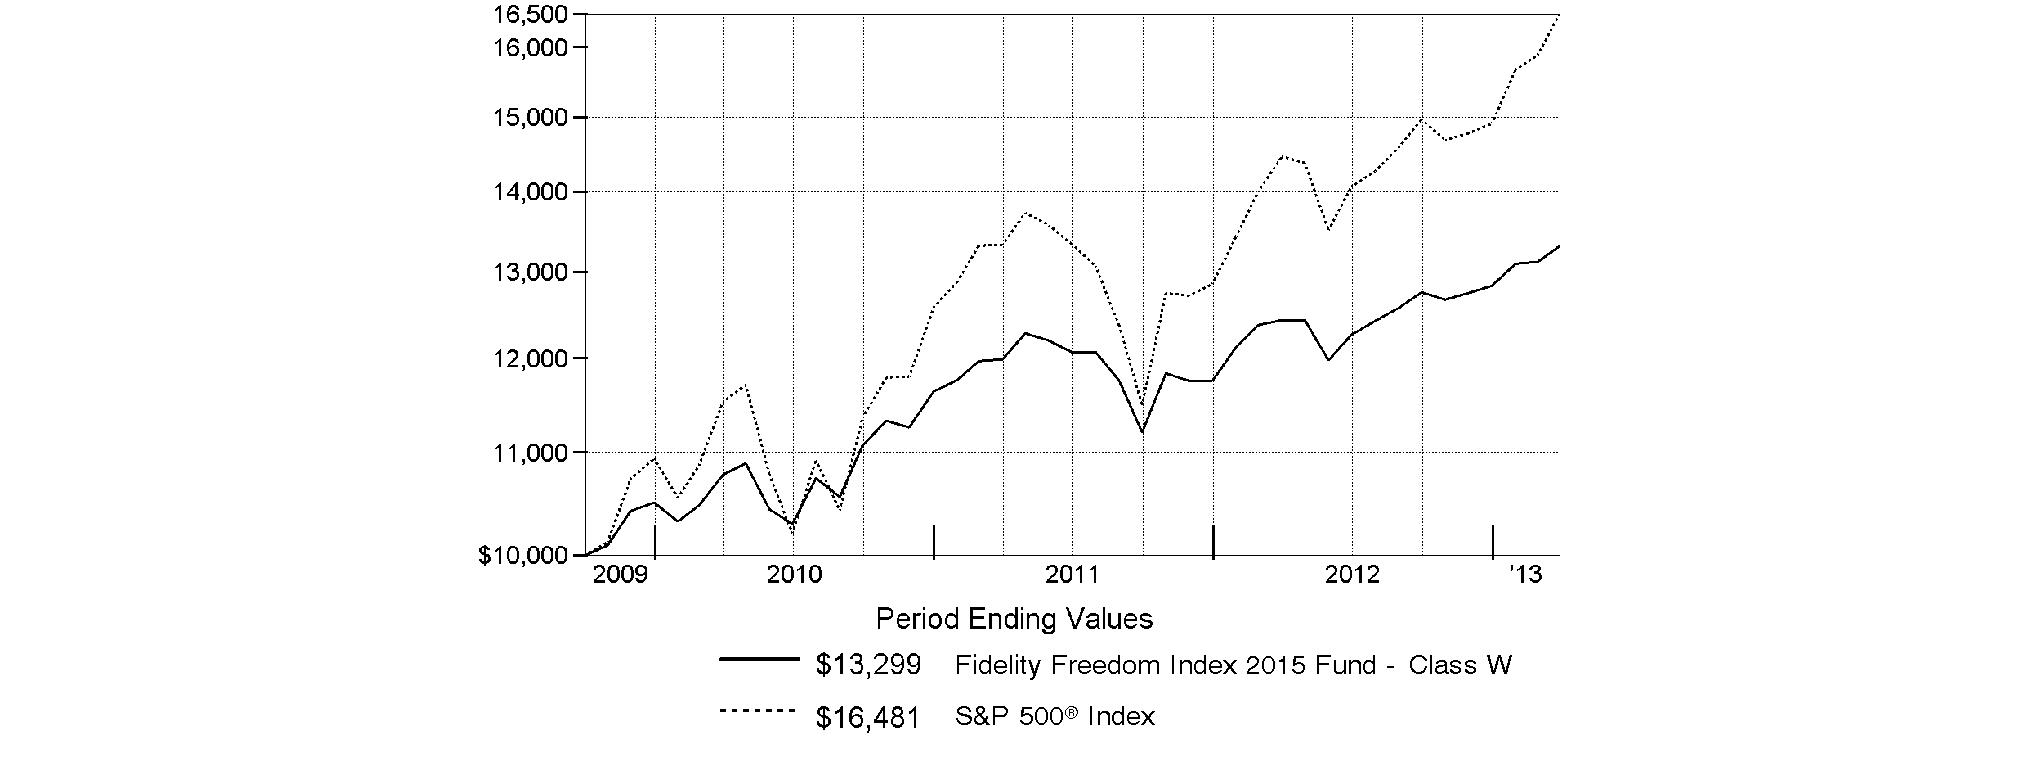
Annual Report
Fidelity Freedom Index 2020 Fund - Class W
Performance: The Bottom Line
Average annual total return reflects the change in the value of an investment, assuming reinvestment of the fund's distributions from dividend income and capital gains (the profits earned upon the sale of securities that have grown in value, if any) and assuming a constant rate of performance each year. The $10,000 table and the fund's returns do not reflect the deduction of taxes that a shareholder would pay on fund distributions or the redemption of fund shares. During periods of reimbursement by Fidelity, a fund's total return will be greater than it would be had the reimbursement not occurred. How a fund did yesterday is no guarantee of how it will do tomorrow.
Average Annual Total Returns
Periods ended March 31, 2013 | Past 1
year | Life of
fund A |
Fidelity Freedom Index 2020 Fund - Class W | 7.38% | 9.32% |
A From October 2, 2009.
$10,000 Over Life of Fund
Let's say hypothetically that $10,000 was invested in Fidelity Freedom Index 2020 Fund - Class W on October 2, 2009, when the fund started. The chart shows how the value of your investment would have changed, and also shows how the S&P 500 Index performed over the same period.
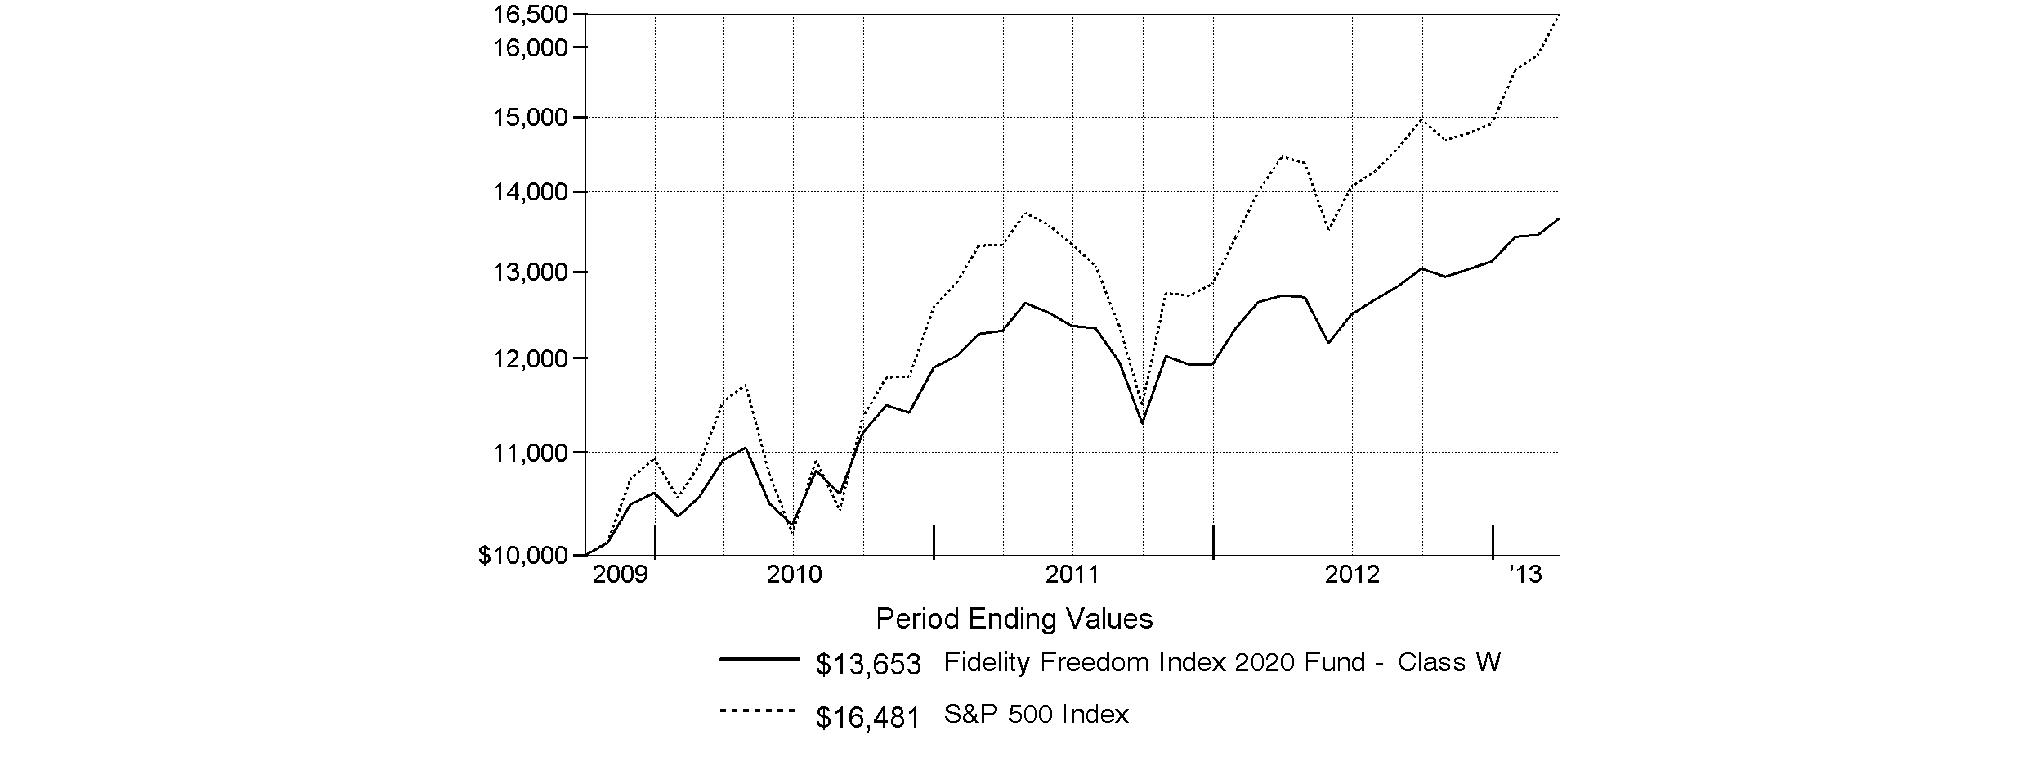
-
Annual Report
Fidelity Freedom Index 2025 Fund - Class W
Performance: The Bottom Line
Average annual total return reflects the change in the value of an investment, assuming reinvestment of the fund's distributions from dividend income and capital gains (the profits earned upon the sale of securities that have grown in value, if any) and assuming a constant rate of performance each year. The $10,000 table and the fund's returns do not reflect the deduction of taxes that a shareholder would pay on fund distributions or the redemption of fund shares. During periods of reimbursement by Fidelity, a fund's total return will be greater than it would be had the reimbursement not occurred. How a fund did yesterday is no guarantee of how it will do tomorrow.
Average Annual Total Returns
Periods ended March 31, 2013 | Past 1
year | Life of
fund A |
Fidelity Freedom Index 2025 Fund - Class W | 8.50% | 10.13% |
A From October 2, 2009.
$10,000 Over Life of Fund
Let's say hypothetically that $10,000 was invested in Fidelity Freedom Index 2025 Fund - Class W on October 2, 2009, when the fund started. The chart shows how the value of your investment would have changed, and also shows how the S&P 500 Index performed over the same period.
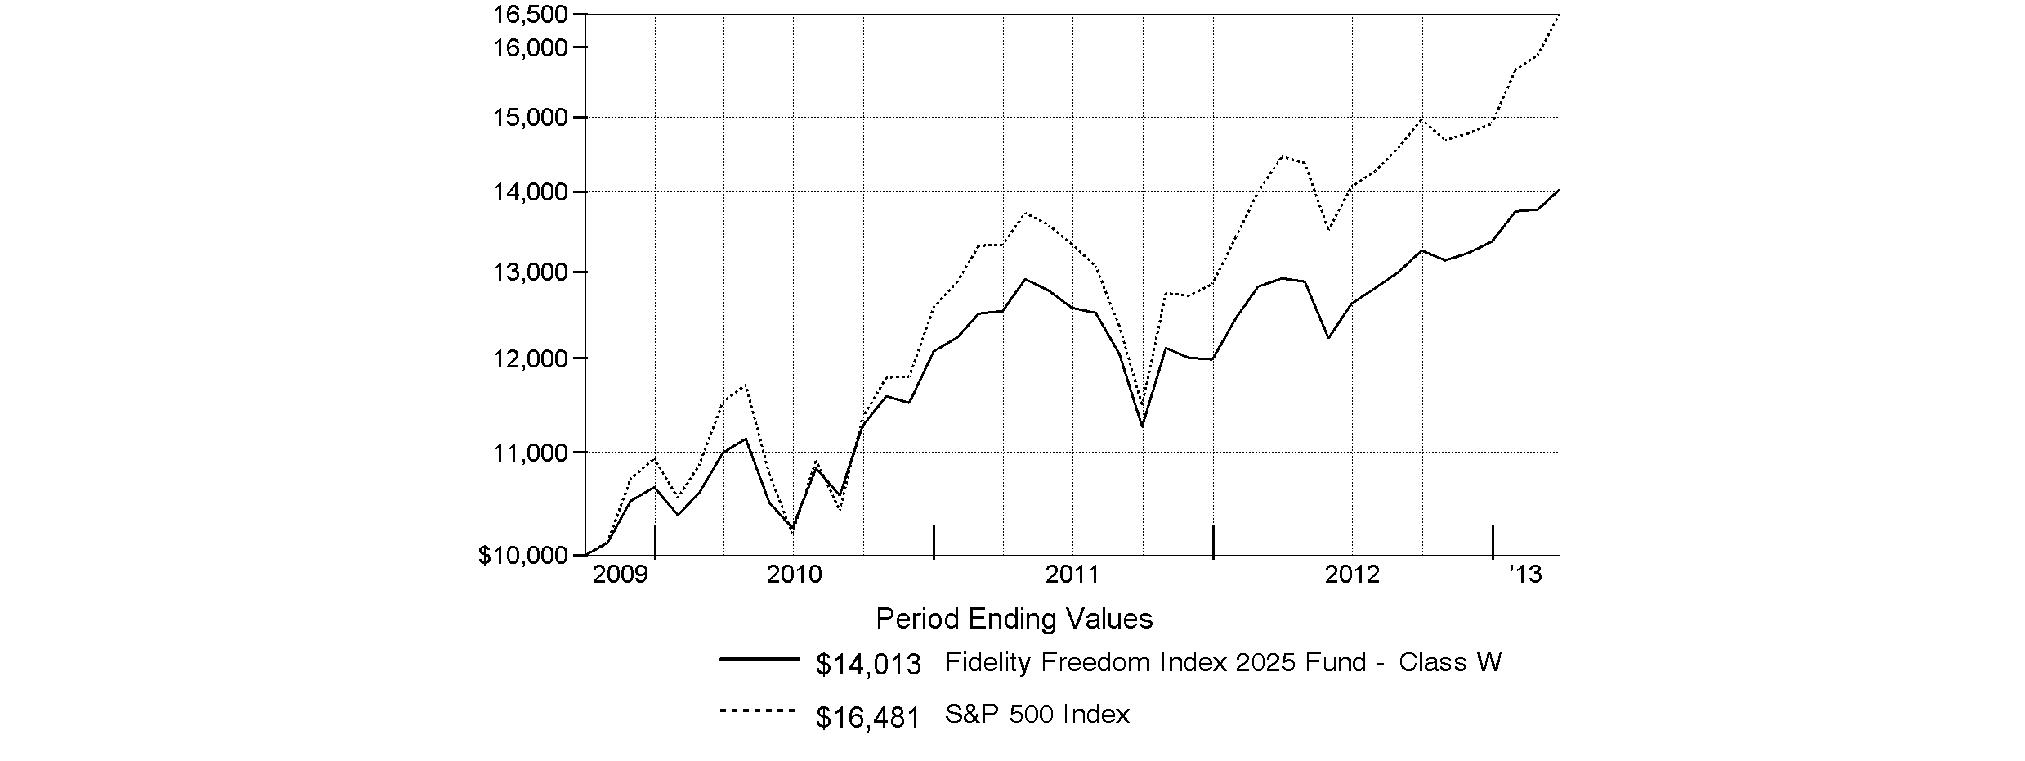
Annual Report
Fidelity Freedom Index 2030 Fund - Class W
Performance: The Bottom Line
Average annual total return reflects the change in the value of an investment, assuming reinvestment of the fund's distributions from dividend income and capital gains (the profits earned upon the sale of securities that have grown in value, if any) and assuming a constant rate of performance each year. The $10,000 table and the fund's returns do not reflect the deduction of taxes that a shareholder would pay on fund distributions or the redemption of fund shares. During periods of reimbursement by Fidelity, a fund's total return will be greater than it would be had the reimbursement not occurred. How a fund did yesterday is no guarantee of how it will do tomorrow.
Average Annual Total Returns
Periods ended March 31, 2013 | Past 1
year | Life of
fund A |
Fidelity Freedom Index 2030 Fund - Class W | 8.80% | 10.43% |
A From October 2, 2009.
$10,000 Over Life of Fund
Let's say hypothetically that $10,000 was invested in Fidelity Freedom Index 2030 Fund - Class W on October 2, 2009, when the fund started. The chart shows how the value of your investment would have changed, and also shows how the S&P 500 Index performed over the same period.

-
Annual Report
Fidelity Freedom Index 2035 Fund - Class W
Performance: The Bottom Line
Average annual total return reflects the change in the value of an investment, assuming reinvestment of the fund's distributions from dividend income and capital gains (the profits earned upon the sale of securities that have grown in value, if any) and assuming a constant rate of performance each year. The $10,000 table and the fund's returns do not reflect the deduction of taxes that a shareholder would pay on fund distributions or the redemption of fund shares. During periods of reimbursement by Fidelity, a fund's total return will be greater than it would be had the reimbursement not occurred. How a fund did yesterday is no guarantee of how it will do tomorrow.
Average Annual Total Returns
Periods ended March 31, 2013 | Past 1
year | Life of
fund A |
Fidelity Freedom Index 2035 Fund - Class W | 9.44% | 10.89% |
A From October 2, 2009.
$10,000 Over Life of Fund
Let's say hypothetically that $10,000 was invested in Fidelity Freedom Index 2035 Fund - Class W on October 2, 2009, when the fund started. The chart shows how the value of your investment would have changed, and also shows how the S&P 500 Index performed over the same period.
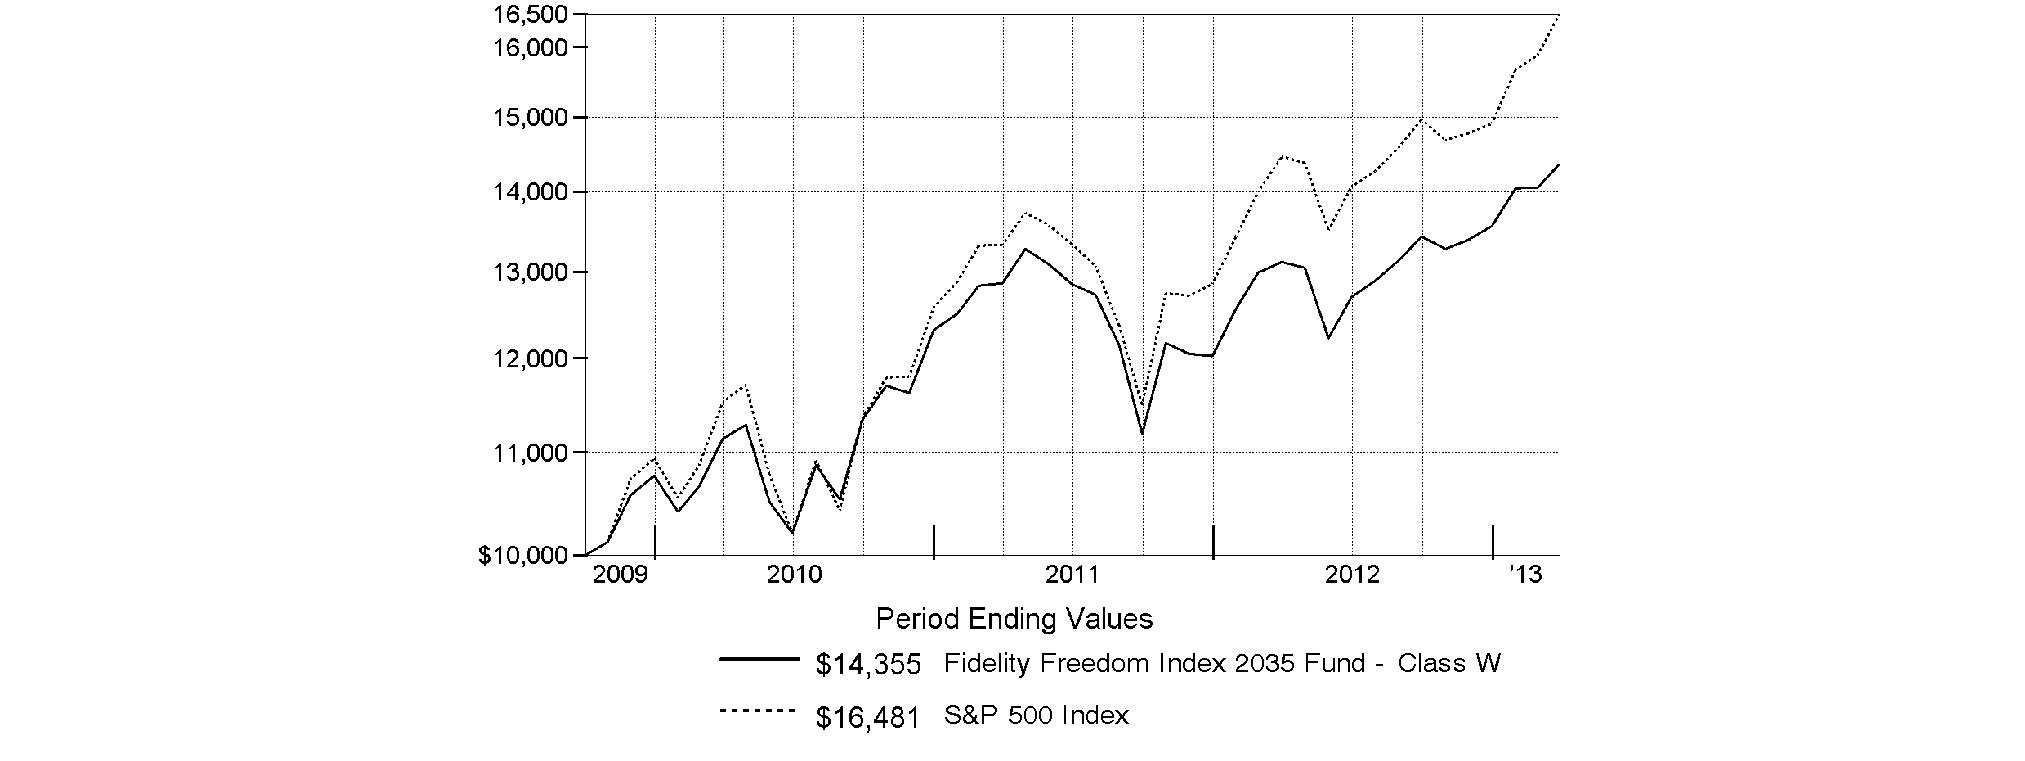
Annual Report
Fidelity Freedom Index 2040 Fund - Class W
Performance: The Bottom Line
Average annual total return reflects the change in the value of an investment, assuming reinvestment of the fund's distributions from dividend income and capital gains (the profits earned upon the sale of securities that have grown in value, if any) and assuming a constant rate of performance each year. The $10,000 table and the fund's returns do not reflect the deduction of taxes that a shareholder would pay on fund distributions or the redemption of fund shares. During periods of reimbursement by Fidelity, a fund's total return will be greater than it would be had the reimbursement not occurred. How a fund did yesterday is no guarantee of how it will do tomorrow.
Average Annual Total Returns
Periods ended March 31, 2013 | Past 1
year | Life of
fund A |
Fidelity Freedom Index 2040 Fund - Class W | 9.59% | 11.01% |
A From October 2, 2009.
$10,000 Over Life of Fund
Let's say hypothetically that $10,000 was invested in Fidelity Freedom Index 2040 Fund - Class W on October 2, 2009, when the fund started. The chart shows how the value of your investment would have changed, and also shows how the S&P 500 Index performed over the same period.

-
Annual Report
Fidelity Freedom Index 2045 Fund - Class W
Performance: The Bottom Line
Average annual total return reflects the change in the value of an investment, assuming reinvestment of the fund's distributions from dividend income and capital gains (the profits earned upon the sale of securities that have grown in value, if any) and assuming a constant rate of performance each year. The $10,000 table and the fund's returns do not reflect the deduction of taxes that a shareholder would pay on fund distributions or the redemption of fund shares. During periods of reimbursement by Fidelity, a fund's total return will be greater than it would be had the reimbursement not occurred. How a fund did yesterday is no guarantee of how it will do tomorrow.
Average Annual Total Returns
Periods ended March 31, 2013 | Past 1
year | Life of
fund A |
Fidelity Freedom Index 2045 Fund - Class W | 9.76% | 11.12% |
A From October 2, 2009.
$10,000 Over Life of Fund
Let's say hypothetically that $10,000 was invested in Fidelity Freedom Index 2045 Fund - Class W on October 2, 2009, when the fund started. The chart shows how the value of your investment would have changed, and also shows how the S&P 500 Index performed over the same period.

Annual Report
Fidelity Freedom Index 2050 Fund - Class W
Performance: The Bottom Line
Average annual total return reflects the change in the value of an investment, assuming reinvestment of the fund's distributions from dividend income and capital gains (the profits earned upon the sale of securities that have grown in value, if any) and assuming a constant rate of performance each year. The $10,000 table and the fund's returns do not reflect the deduction of taxes that a shareholder would pay on fund distributions or the redemption of fund shares. During periods of reimbursement by Fidelity, a fund's total return will be greater than it would be had the reimbursement not occurred. How a fund did yesterday is no guarantee of how it will do tomorrow.
Average Annual Total Returns
Periods ended March 31, 2013 | Past 1
year | Life of
fund A |
Fidelity Freedom Index 2050 Fund - Class W | 9.75% | 11.22% |
A From October 2, 2009.
$10,000 Over Life of Fund
Let's say hypothetically that $10,000 was invested in Fidelity Freedom Index 2050 Fund - Class W on October 2, 2009, when the fund started. The chart shows how the value of your investment would have changed, and also shows how the S&P 500 Index performed over the same period.
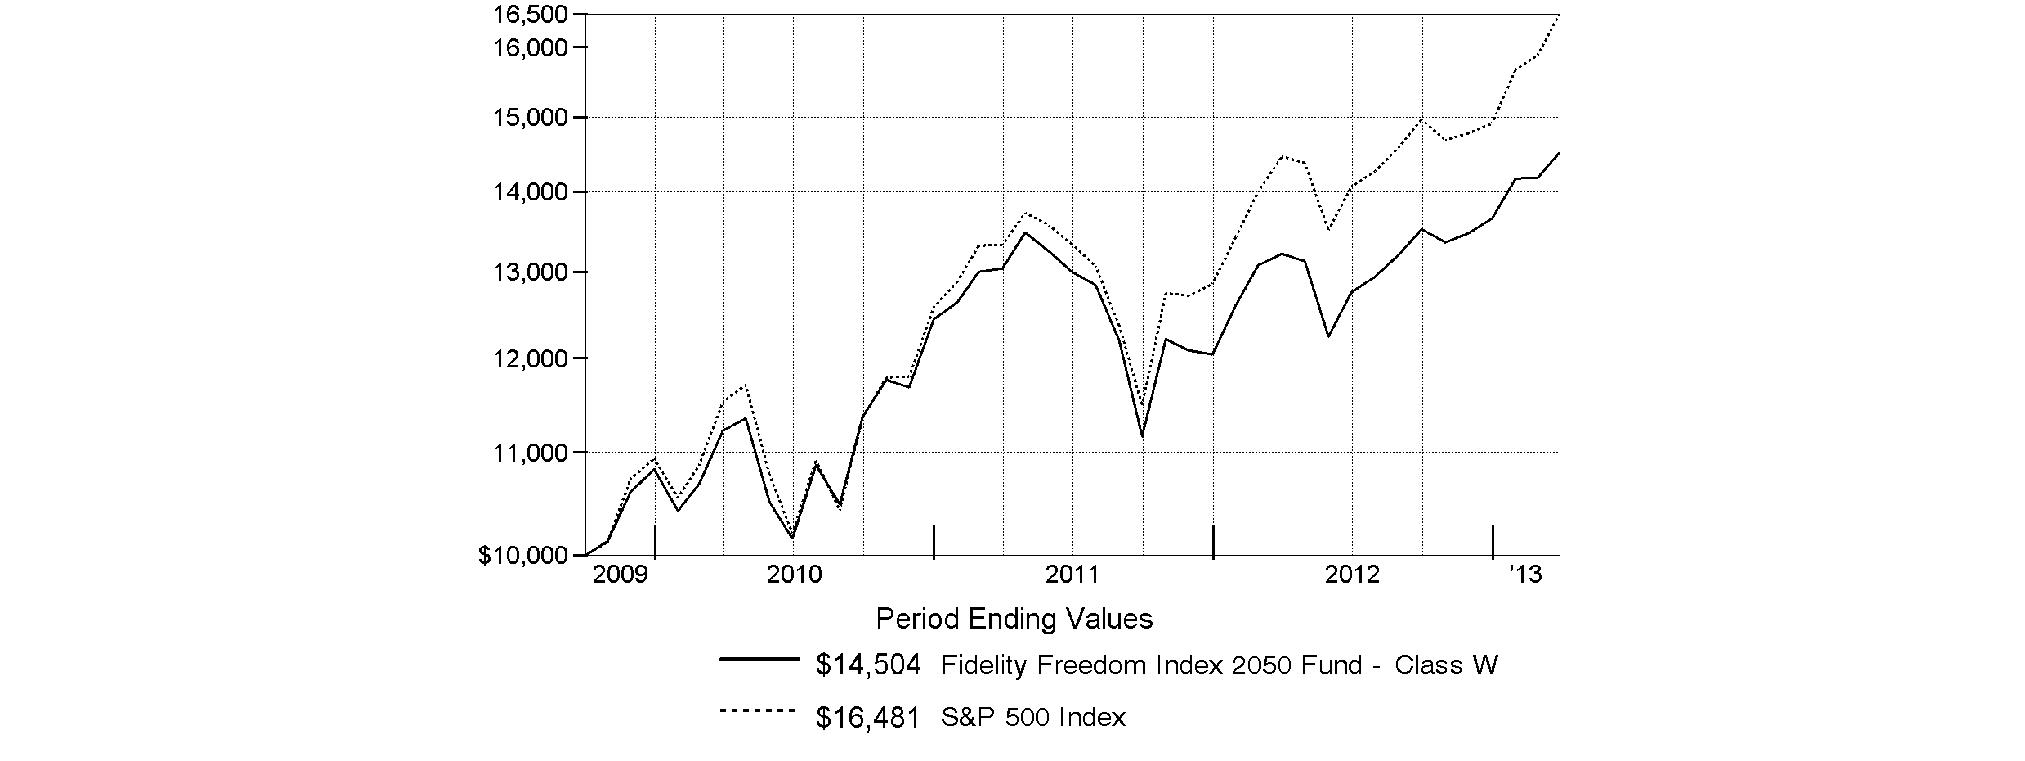
-
Annual Report
Fidelity Freedom Index 2055 Fund - Class W
Performance: The Bottom Line
Average annual total return reflects the change in the value of an investment, assuming reinvestment of the fund's distributions from dividend income and capital gains (the profits earned upon the sale of securities that have grown in value, if any) and assuming a constant rate of performance each year. The $10,000 table and the fund's returns do not reflect the deduction of taxes that a shareholder would pay on fund distributions or the redemption of fund shares. During periods of reimbursement by Fidelity, a fund's total return will be greater than it would be had the reimbursement not occurred. How a fund did yesterday is no guarantee of how it will do tomorrow.
Average Annual Total Returns
Periods ended March 31, 2013 | Past 1
year | Life of
fund A |
Fidelity Freedom Index 2055 Fund - Class W | 10.05% | 6.29% |
A From June 1, 2011.
$10,000 Over Life of Fund
Let's say hypothetically that $10,000 was invested in Fidelity Freedom Index 2055 Fund - Class W on June 1, 2011, when the fund started. The chart shows how the value of your investment would have changed, and also shows how the S&P 500 Index performed over the same period.
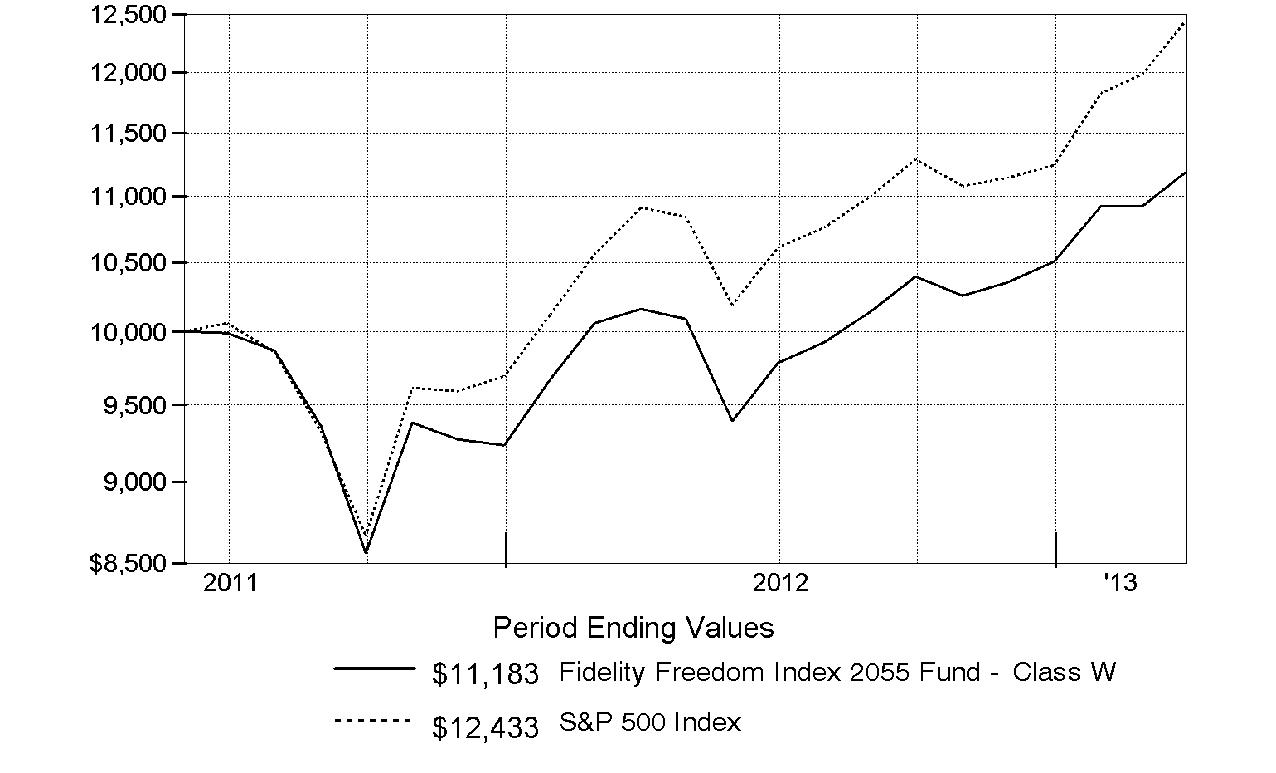
Annual Report
Market Recap: U.S. stock markets extended a four-year bull run and two major equity benchmarks reached record territory during the year ending March 31, 2013, as gains in the global economy and more monetary stimulus from the U.S. Federal Reserve kept markets on the upswing for much of the period. Optimism over the nation's jobs picture and housing market teamed up with solid corporate earnings to make stocks a favorite with investors during the 12-month period. The broad-based S&P 500® Index finished the year up 13.96%, closing at an all-time high at the end of the period, while the blue-chip-laden Dow Jones Industrial AverageSM - which broke its own record in early March - gained 13.37% for the full 12 months. The technology-heavy Nasdaq Composite Index® advanced a more modest 7.14%, curtailed by the weak performance of consumer electronics giant Apple, a large index component. During the year, markets shrugged off an early decline brought on by debt woes in Europe, and another dip later in the period amid pre-election jitters and Congressional gridlock over the federal budget. The year's gains were broad-based, with eight of the 10 sectors in the S&P 500® posting a double-digit increase, led by telecommunication services and health care, while technology fell 1%. Despite the headwind of a stronger U.S. dollar, foreign developed-markets stocks rose strongly, with the MSCI® EAFE® Index adding 11.40%. In the fixed-income arena, U.S. high-yield bonds benefited from investors' overall willingness to take on more risk, with The BofA Merrill LynchSM US High Yield Constrained Index adding 13.06% for the period. The shift away from perceived safety left U.S. investment-grade debt with a relatively modest 3.77% gain for the year, as measured by the Barclays® U.S. Aggregate Bond Index.
Comments from Christopher Sharpe and Andrew Dierdorf, Co-Portfolio Managers of Fidelity Freedom® Index Funds - Class W: For the 12 months ending March 31, 2013, each of the Freedom Index Funds' Class W shares delivered a positive absolute return. Funds with the longest time horizons until retirement - which have greater allocations to underlying equity funds - posted the strongest gains, most in the high single digits and one, Freedom Index 2055 Fund, just breaking into double-digit territory. These results were consistent with what we would expect in an environment where investors preferred riskier asset classes, especially equities. (For specific Fund results, please refer to the performance section of this report.) Equities delivered the highest returns among the Funds' asset classes, reflecting a shift in investor sentiment toward higher-risk securities. The Funds' exposure to the broad U.S. equity market - through their underlying investment in Spartan® Total Market Index Fund Class F - yielded a more than 14% return, fueled in large part by a significant rally in the second half of the period. Gains were broad-based, as nine of the 10 sectors within the index delivered double-digit advances for the year, with only information technology declining. Unlike domestic equities, it was a difficult year for commodity markets amid anticipated sluggish near-term global economic growth. The Funds' allocation to the asset class - through their holdings in Fidelity® Series Commodity Strategy Fund Class F - finished in negative territory, as investors chose to take profits in the precious metals segment during the second half of the period, while severe weather for most of the year weighed on the agricultural subsector. Shifting to the Funds' non-U.S. equity investments, Fidelity® Series Global ex U.S. Index Fund gained more than 8%, in concert with the broad international stock market. Developed-markets equities showed solid performance despite the headwind of a stronger U.S. dollar, while emerging-markets shares struggled in comparison, due in part to falling commodity prices and lackluster economic growth prospects for developing countries. Turning to the fixed-income categories, high-quality bonds largely produced positive absolute returns throughout the past year. In an effort to buoy the economy, the Federal Reserve kept interest rates low. However, Treasury yields still fell below the current inflation rate, which created a challenging environment for fixed-income investors. As such, the most conservative investment-grade bonds - U.S. government securities - delivered the most modest result, while more-credit-sensitive sectors such as corporate debt fared quite well. The Funds' allocation to bonds - through stakes in Spartan® U.S. Bond Index Fund Class F and Fidelity Series Inflation-Protected Bond Index Fund Class F - generated a roughly 4% gain, in line with the investment-grade market overall. In a historically low yield environment, the Funds' investments in short-term instruments - via Fidelity Institutional Money Market Fund Class F - managed only a slightly positive return.
The views expressed above reflect those of the portfolio manager(s) only through the end of the period as stated on the cover of this report and do not necessarily represent the views of Fidelity or any other person in the Fidelity organization. Any such views are subject to change at any time based upon market or other conditions and Fidelity disclaims any responsibility to update such views. These views may not be relied on as investment advice and, because investment decisions for a Fidelity fund are based on numerous factors, may not be relied on as an indication of trading intent on behalf of any Fidelity fund.
Annual Report
As a shareholder of a Fund, you incur two types of costs: (1) transaction costs and (2) ongoing costs, including other Fund expenses. This Example is intended to help you understand your ongoing costs (in dollars) of investing in the Funds and to compare these costs with the ongoing costs of investing in other mutual funds.
The Example is based on an investment of $1,000 invested at the beginning of the period and held for the entire period (October 1, 2012 to March 31, 2013).
Actual Expenses
The first line of the accompanying table for each fund provides information about actual account values and actual expenses. You may use the information in this line, together with the amount you invested, to estimate the expenses that you paid over the period. Simply divide your account value by $1,000.00 (for example, an $8,600 account value divided by $1,000.00 = 8.6), then multiply the result by the number in the first line for a fund under the heading entitled "Expenses Paid During Period" to estimate the expenses you paid on your account during this period. In addition, each Fund, as a shareholder in underlying Fidelity Funds, will indirectly bear its pro-rata share of the fees and expenses incurred by the underlying Fidelity Funds. These fees and expenses are not included in each Fund's annualized expense ratio used to calculate the expense estimates in the table below.
Hypothetical Example for Comparison Purposes
The second line of the accompanying table for each fund provides information about hypothetical account values and hypothetical expenses based on a fund's actual expense ratio and an assumed rate of return of 5% per year before expenses, which is not the Fund's actual return. The hypothetical account values and expenses may not be used to estimate the actual ending account balance or expenses you paid for the period. You may use this information to compare the ongoing costs of investing in the Fund and other funds. To do so, compare this 5% hypothetical example with the 5% hypothetical examples that appear in the shareholder reports of the other funds. In addition, each Fund, as a shareholder in underlying Fidelity Funds, will indirectly bear its pro-rata share of the fees and expenses incurred by the underlying Fidelity Funds. These fees and expenses are not included in each Fund's annualized expense ratio used to calculate the expense estimates in the table below.
Please note that the expenses shown in the table are meant to highlight your ongoing costs only and do not reflect any transaction costs. Therefore, the second line of the table is useful in comparing ongoing costs only, and will not help you determine the relative total costs of owning different funds.
| Annualized
Expense Ratio | Beginning
Account Value
October 1, 2012 | Ending
Account Value
March 31, 2013 | Expenses Paid
During Period*
October 1, 2012
to March 31, 2013 |
Fidelity Freedom Index Income Fund | .10% | | | |
Actual | | $ 1,000.00 | $ 1,017.80 | $ .50 |
HypotheticalA | | $ 1,000.00 | $ 1,024.43 | $ .50 |
Fidelity Freedom Index 2000 Fund | .10% | | | |
Actual | | $ 1,000.00 | $ 1,018.00 | $ .50 |
HypotheticalA | | $ 1,000.00 | $ 1,024.43 | $ .50 |
Fidelity Freedom Index 2005 Fund | .09% | | | |
Actual | | $ 1,000.00 | $ 1,030.50 | $ .46 |
HypotheticalA | | $ 1,000.00 | $ 1,024.48 | $ .45 |
Fidelity Freedom Index 2010 Fund | .10% | | | |
Actual | | $ 1,000.00 | $ 1,041.80 | $ .51 |
HypotheticalA | | $ 1,000.00 | $ 1,024.43 | $ .50 |
Fidelity Freedom Index 2015 Fund | .10% | | | |
Actual | | $ 1,000.00 | $ 1,043.30 | $ .51 |
HypotheticalA | | $ 1,000.00 | $ 1,024.43 | $ .50 |
Fidelity Freedom Index 2020 Fund | .10% | | | |
Actual | | $ 1,000.00 | $ 1,047.40 | $ .51 |
HypotheticalA | | $ 1,000.00 | $ 1,024.43 | $ .50 |
Fidelity Freedom Index 2025 Fund | .10% | | | |
Actual | | $ 1,000.00 | $ 1,057.40 | $ .51 |
HypotheticalA | | $ 1,000.00 | $ 1,024.43 | $ .50 |
Fidelity Freedom Index 2030 Fund | .10% | | | |
Actual | | $ 1,000.00 | $ 1,060.50 | $ .51 |
HypotheticalA | | $ 1,000.00 | $ 1,024.43 | $ .50 |
Fidelity Freedom Index 2035 Fund | .09% | | | |
Actual | | $ 1,000.00 | $ 1,069.30 | $ .46 |
HypotheticalA | | $ 1,000.00 | $ 1,024.48 | $ .45 |
| Annualized
Expense Ratio | Beginning
Account Value
October 1, 2012 | Ending
Account Value
March 31, 2013 | Expenses Paid
During Period*
October 1, 2012
to March 31, 2013 |
Fidelity Freedom Index 2040 Fund | .09% | | | |
Actual | | $ 1,000.00 | $ 1,070.80 | $ .46 |
HypotheticalA | | $ 1,000.00 | $ 1,024.48 | $ .45 |
Fidelity Freedom Index 2045 Fund | .09% | | | |
Actual | | $ 1,000.00 | $ 1,072.80 | $ .47 |
HypotheticalA | | $ 1,000.00 | $ 1,024.48 | $ .45 |
Fidelity Freedom Index 2050 Fund | .09% | | | |
Actual | | $ 1,000.00 | $ 1,072.90 | $ .47 |
HypotheticalA | | $ 1,000.00 | $ 1,024.48 | $ .45 |
Fidelity Freedom Index 2055 Fund | .10% | | | |
Actual | | $ 1,000.00 | $ 1,076.10 | $ .52 |
HypotheticalA | | $ 1,000.00 | $ 1,024.43 | $ .50 |
A 5% return per year before expenses
* Expenses are equal to each Fund's annualized expense ratio, multiplied by the average account value over the period, multiplied by 182/365 (to reflect the one-half year period).
The fees and expenses of the underlying Fidelity Funds in which the Funds invest are not included in the Funds' annualized expense ratio.
Annual Report
Fidelity Freedom Index Income Fund
Investment Changes (Unaudited)
The information in the following tables is based on the direct investments of the Fund. |
Fund Holdings as of March 31, 2013 |
| % of fund's
net assets | % of fund's net assets
6 months ago |
Commodity Funds | | |
Fidelity Series Commodity Strategy Fund Class F | 2.0 | 2.0 |
Domestic Equity Funds | | |
Fidelity Spartan Total Market Index Fund Class F | 12.6 | 12.6 |
Developed International Equity Funds | | |
Fidelity Series Global ex U.S. Index Fund | 5.4 | 5.3 |
Inflation-Protected Bond Funds | | |
Fidelity Series Inflation-Protected Bond Index Fund Class F | 12.0 | 12.0 |
Investment Grade Bond Funds | | |
Fidelity Spartan U.S. Bond Index Fund Class F | 28.0 | 28.1 |
Short-Term Funds | | |
Fidelity Institutional Money Market Portfolio Class F | 40.0 | 40.0 |
Net Other Assets (Liabilities)* | 0.0 | 0.0 |
| 100.0 | 100.0 |
* Amount represents less than 0.1%
Asset Allocation (% of fund's net assets) |
Period end |
 | Commodity Funds | 2.0% | |
 | Domestic Equity Funds | 12.6% | |
 | Developed International Equity Funds | 5.4% | |
 | Inflation-Protected Bond Funds | 12.0% | |
 | Investment Grade Bond Funds | 28.0% | |
 | Short-Term Funds | 40.0% | |

Six months ago |
| Commodity Funds | 2.0% | |
 | Domestic Equity Funds | 12.6% | |
| Developed International Equity Funds | 5.3% | |
| Inflation-Protected Bond Funds | 12.0% | |
| Investment Grade Bond Funds | 28.1% | |
| Short-Term Funds | 40.0% | |

Expected |
| Commodity Funds | 2.0% | |
| Domestic Equity Funds | 12.6% | |
| Developed International Equity Funds | 5.4% | |
| Inflation-Protected Bond Funds | 12.0% | |
| Investment Grade Bond Funds | 28.0% | |
| Short-Term Funds | 40.0% | |

The six months ago allocation is based on the fund's holdings as of September 30, 2012. The current allocation is based on the fund's holdings as of March 31, 2013. The expected allocation represents the fund's anticipated allocation at September 30, 2013. |
Annual Report
Fidelity Freedom Index Income Fund
Investments March 31, 2013
Showing Percentage of Net Assets
Domestic Equity Funds - 14.6% |
| Shares | | Value |
Commodity Funds - 2.0% |
Fidelity Series Commodity Strategy Fund Class F (a) | 302,429 | | $ 2,640,205 |
Domestic Equity Funds - 12.6% |
Fidelity Spartan Total Market Index Fund Class F | 365,426 | | 16,736,513 |
TOTAL DOMESTIC EQUITY FUNDS (Cost $16,356,247) |
19,376,718
|
International Equity Funds - 5.4% |
| | | |
Developed International Equity Funds - 5.4% |
Fidelity Series Global ex U.S. Index Fund
(Cost $6,452,066) | 640,481 | |
7,160,575
|
Bond Funds - 40.0% |
| | | |
Inflation-Protected Bond Funds - 12.0% |
Fidelity Series Inflation-Protected Bond Index Fund Class F | 1,398,601 | | 15,930,060 |
|
| Shares | | Value |
Investment Grade Bond Funds - 28.0% |
Fidelity Spartan U.S. Bond Index Fund Class F | 3,145,687 | | $ 37,182,018 |
TOTAL BOND FUNDS (Cost $52,253,745) |
53,112,078
|
Short-Term Funds - 40.0% |
| | | |
Fidelity Institutional Money Market Portfolio Class F
(Cost $53,113,549) | 53,113,549 | |
53,113,549
|
TOTAL INVESTMENT PORTFOLIO - 100.0% (Cost $128,175,607) | | 132,762,920 |
NET OTHER ASSETS (LIABILITIES) - 0.0% | | (9,838) |
NET ASSETS - 100% | $ 132,753,082 |
Legend |
(a) Non-income producing |
Other Information |
All investments are categorized as Level 1 under the Fair Value Hierarchy. The inputs or methodology used for valuing securities may not be an indication of the risk associated with investing in those securities. For more information on valuation inputs, please refer to the Security Valuation section in the accompanying Notes to Financial Statements. |
See accompanying notes which are an integral part of the financial statements.
Annual Report
Fidelity Freedom Index Income Fund
Statement of Assets and Liabilities
| March 31, 2013 |
| | |
Assets | | |
Investment in securities, at value (cost $128,175,607) - See accompanying schedule | | $ 132,762,920 |
Cash | | 2 |
Receivable for investments sold | | 592,194 |
Receivable for fund shares sold | | 131,529 |
Receivable from affiliate for expense reductions | | 6,632 |
Total assets | | 133,493,277 |
| | |
Liabilities | | |
Payable for investments purchased | $ 401,614 | |
Payable for fund shares redeemed | 322,108 | |
Other affiliated payables | 16,473 | |
Total liabilities | | 740,195 |
| | |
Net Assets | | $ 132,753,082 |
Net Assets consist of: | | |
Paid in capital | | $ 128,213,947 |
Undistributed net investment income | | 82,972 |
Accumulated undistributed net realized gain (loss) on investments | | (131,150) |
Net unrealized appreciation (depreciation) on investments | | 4,587,313 |
Net Assets, for 11,923,349 shares outstanding | | $ 132,753,082 |
Net Asset Value, offering price and redemption price per share ($132,753,082 ÷ 11,923,349 shares) | | $ 11.13 |
Statement of Operations
| Year ended March 31, 2013 |
| | |
Investment Income | | |
Income distributions from underlying funds | | $ 1,261,022 |
| | |
Expenses | | |
Transfer agent fees | $ 164,124 | |
Independent trustees' compensation | 378 | |
Total expenses before reductions | 164,502 | |
Expense reductions | (57,052) | 107,450 |
Net investment income (loss) | | 1,153,572 |
Realized and Unrealized Gain (Loss) Realized gain (loss) on sale of underlying fund shares | 38,949 | |
Capital gain distributions from underlying funds | 611,063 | |
Total net realized gain (loss) | | 650,012 |
Change in net unrealized appreciation (depreciation) on investment securities | | 2,653,892 |
Net gain (loss) | | 3,303,904 |
Net increase (decrease) in net assets resulting from operations | | $ 4,457,476 |
See accompanying notes which are an integral part of the financial statements.
Annual Report
Fidelity Freedom Index Income Fund
Financial Statements - continued
Statement of Changes in Net Assets
| Year ended
March 31,
2013 | Year ended
March 31,
2012 |
Increase (Decrease) in Net Assets | | |
Operations | | |
Net investment income (loss) | $ 1,153,572 | $ 651,537 |
Net realized gain (loss) | 650,012 | 325,074 |
Change in net unrealized appreciation (depreciation) | 2,653,892 | 1,031,293 |
Net increase (decrease) in net assets resulting from operations | 4,457,476 | 2,007,904 |
Distributions to shareholders from net investment income | (1,128,654) | (632,906) |
Distributions to shareholders from net realized gain | (581,226) | (507,773) |
Total distributions | (1,709,880) | (1,140,679) |
Share transactions
Proceeds from sales of shares | 92,203,884 | 45,547,466 |
Reinvestment of distributions | 1,709,880 | 1,140,679 |
Cost of shares redeemed | (31,313,121) | (18,690,664) |
Net increase (decrease) in net assets resulting from share transactions | 62,600,643 | 27,997,481 |
Total increase (decrease) in net assets | 65,348,239 | 28,864,706 |
| | |
Net Assets | | |
Beginning of period | 67,404,843 | 38,540,137 |
End of period (including undistributed net investment income of $82,972 and undistributed net investment income of $58,053, respectively) | $ 132,753,082 | $ 67,404,843 |
Other Information Shares | | |
Sold | 8,425,114 | 4,234,058 |
Issued in reinvestment of distributions | 156,070 | 106,683 |
Redeemed | (2,846,649) | (1,739,141) |
Net increase (decrease) | 5,734,535 | 2,601,600 |
Financial Highlights
Years ended March 31, | 2013 | 2012 | 2011 | 2010 E |
Selected Per-Share Data | | | | |
Net asset value, beginning of period | $ 10.89 | $ 10.74 | $ 10.29 | $ 10.00 |
Income from Investment Operations | | | | |
Net investment income (loss) D | .12 | .13 | .13 | .06 |
Net realized and unrealized gain (loss) | .29 | .24 | .47 | .30 |
Total from investment operations | .41 | .37 | .60 | .36 |
Distributions from net investment income | (.11) | (.13) | (.12) | (.07) |
Distributions from net realized gain | (.05) | (.09) | (.03) | (.01) |
Total distributions | (.17) H | (.22) | (.15) | (.07) I |
Net asset value, end of period | $ 11.13 | $ 10.89 | $ 10.74 | $ 10.29 |
Total Return B, C | 3.75% | 3.52% | 5.89% | 3.62% |
Ratios to Average Net Assets F, G | | | | |
Expenses before reductions | .15% | .15% | .08% | .05% A |
Expenses net of fee waivers, if any | .10% | .09% | .06% | .04% A |
Expenses net of all reductions | .10% | .09% | .06% | .04% A |
Net investment income (loss) | 1.06% | 1.24% | 1.27% | 1.13% A |
Supplemental Data | | | | |
Net assets, end of period (000 omitted) | $ 132,753 | $ 67,405 | $ 38,540 | $ 6,401 |
Portfolio turnover rate | 19% | 31% | 36% | 18% |
A Annualized
B Total returns for periods of less than one year are not annualized.
C Total returns would have been lower if certain expenses had not been reduced during the applicable periods shown.
D Calculated based on average shares outstanding during the period.
E For the period October 2, 2009 (commencement of operations) to March 31, 2010.
F Expense ratios reflect operating expenses of the Fund. Expenses before reductions do not reflect amounts reimbursed by the investment adviser or reductions from expense offset arrangements and do not represent the amount paid by the Fund during periods when reimbursements or reductions occur. Expense ratios before reductions for start-up periods may not be representative of longer term operating periods. Expenses net of fee waivers reflect expenses after reimbursement by the investment adviser but prior to reductions from expense offset arrangements. Expenses net of all reductions represent the net expenses paid by the Fund.
G Amounts do not include the activity of Underlying Funds.
H Total distributions of $.17 per share is comprised of distributions from net investment income of $.112 and distributions from net realized gain of $.053 per share.
I Total distributions of $.07 per share is comprised of distributions from net investment income of $.066 and distributions from net realized gain of $.005 per share.
See accompanying notes which are an integral part of the financial statements.
Annual Report
Fidelity Freedom Index 2000 Fund
Investment Changes (Unaudited)
The information in the following tables is based on the direct investments of the Fund. |
Fund Holdings as of March 31, 2013 |
| % of fund's
net assets | % of fund's net assets
6 months ago |
Commodity Funds | | |
Fidelity Series Commodity Strategy Fund Class F | 2.0 | 2.0 |
Domestic Equity Funds | | |
Fidelity Spartan Total Market Index Fund Class F | 12.6 | 12.6 |
Developed International Equity Funds | | |
Fidelity Series Global ex U.S. Index Fund | 5.4 | 5.3 |
Inflation-Protected Bond Funds | | |
Fidelity Series Inflation-Protected Bond Index Fund Class F | 12.0 | 12.0 |
Investment Grade Bond Funds | | |
Fidelity Spartan U.S. Bond Index Fund Class F | 28.0 | 28.1 |
Short-Term Funds | | |
Fidelity Institutional Money Market Portfolio Class F | 40.0 | 40.0 |
Net Other Assets (Liabilities)* | 0.0 | 0.0 |
| 100.0 | 100.0 |
* Amount represents less than 0.1%
Asset Allocation (% of fund's net assets) |
Period end |
| Commodity Funds | 2.0% | |
| Domestic Equity Funds | 12.6% | |
| Developed International Equity Funds | 5.4% | |
| Inflation-Protected Bond Funds | 12.0% | |
| Investment Grade Bond Funds | 28.0% | |
| Short-Term Funds | 40.0% | |

Six months ago |
| Commodity Funds | 2.0% | |
| Domestic Equity Funds | 12.6% | |
| Developed International Equity Funds | 5.3% | |
| Inflation-Protected Bond Funds | 12.0% | |
| Investment Grade Bond Funds | 28.1% | |
| Short-Term Funds | 40.0% | |

Expected |
| Commodity Funds | 2.0% | |
| Domestic Equity Funds | 12.6% | |
| Developed International Equity Funds | 5.4% | |
| Inflation-Protected Bond Funds | 12.0% | |
| Investment Grade Bond Funds | 28.0% | |
| Short-Term Funds | 40.0% | |

The fund invests according to an asset allocation strategy that becomes increasingly conservative over time. The six months ago allocation is based on the fund's holdings as of September 30, 2012. The current allocation is based on the fund's holdings as of March 31, 2013. The expected allocation represents the fund's anticipated allocation at September 30, 2013. |
Annual Report
Fidelity Freedom Index 2000 Fund
Investments March 31, 2013
Showing Percentage of Net Assets
Domestic Equity Funds - 14.6% |
| Shares | | Value |
Commodity Funds - 2.0% |
Fidelity Series Commodity Strategy Fund Class F (a) | 133,579 | | $ 1,166,142 |
Domestic Equity Funds - 12.6% |
Fidelity Spartan Total Market Index Fund Class F | 162,631 | | 7,448,502 |
TOTAL DOMESTIC EQUITY FUNDS (Cost $7,165,028) |
8,614,644
|
International Equity Funds - 5.4% |
| | | |
Developed International Equity Funds - 5.4% |
Fidelity Series Global ex U.S. Index Fund
(Cost $2,855,998) | 283,067 | |
3,164,687
|
Bond Funds - 40.0% |
| | | |
Inflation-Protected Bond Funds - 12.0% |
Fidelity Series Inflation-Protected Bond Index Fund Class F | 618,330 | | 7,042,780 |
|
| Shares | | Value |
Investment Grade Bond Funds - 28.0% |
Fidelity Spartan U.S. Bond Index Fund Class F | 1,392,355 | | $ 16,457,641 |
TOTAL BOND FUNDS (Cost $22,869,553) |
23,500,421
|
Short-Term Funds - 40.0% |
| | | |
Fidelity Institutional Money Market Portfolio Class F
(Cost $23,501,543) | 23,501,543 | |
23,501,543
|
TOTAL INVESTMENT PORTFOLIO - 100.0% (Cost $56,392,122) | | 58,781,295 |
NET OTHER ASSETS (LIABILITIES) - 0.0% | | (4,375) |
NET ASSETS - 100% | $ 58,776,920 |
Legend |
(a) Non-income producing |
Other Information |
All investments are categorized as Level 1 under the Fair Value Hierarchy. The inputs or methodology used for valuing securities may not be an indication of the risk associated with investing in those securities. For more information on valuation inputs, please refer to the Security Valuation section in the accompanying Notes to Financial Statements. |
See accompanying notes which are an integral part of the financial statements.
Annual Report
Fidelity Freedom Index 2000 Fund
Statement of Assets and Liabilities
| March 31, 2013 |
| | |
Assets | | |
Investment in securities, at value (cost $56,392,122) - See accompanying schedule | | $ 58,781,295 |
Cash | | 2 |
Receivable for investments sold | | 203,949 |
Receivable for fund shares sold | | 30,900 |
Receivable from affiliate for expense reductions | | 2,950 |
Total assets | | 59,019,096 |
| | |
Liabilities | | |
Payable for investments purchased | $ 227,405 | |
Payable for fund shares redeemed | 7,444 | |
Other affiliated payables | 7,327 | |
Total liabilities | | 242,176 |
| | |
Net Assets | | $ 58,776,920 |
Net Assets consist of: | | |
Paid in capital | | $ 56,387,242 |
Undistributed net investment income | | 84,085 |
Accumulated undistributed net realized gain (loss) on investments | | (83,580) |
Net unrealized appreciation (depreciation) on investments | | 2,389,173 |
Net Assets, for 5,257,337 shares outstanding | | $ 58,776,920 |
Net Asset Value, offering price and redemption price per share ($58,776,920 ÷ 5,257,337 shares) | | $ 11.18 |
Statement of Operations
| Year ended March 31, 2013 |
| | |
Investment Income | | |
Income distributions from underlying funds | | $ 596,433 |
| | |
Expenses | | |
Transfer agent fees | $ 78,565 | |
Independent trustees' compensation | 185 | |
Total expenses before reductions | 78,750 | |
Expense reductions | (28,582) | 50,168 |
Net investment income (loss) | | 546,265 |
Realized and Unrealized Gain (Loss) Realized gain (loss) on sale of underlying fund shares | 66,288 | |
Capital gain distributions from underlying funds | 280,700 | |
Total net realized gain (loss) | | 346,988 |
Change in net unrealized appreciation (depreciation) on investment securities | | 1,204,012 |
Net gain (loss) | | 1,551,000 |
Net increase (decrease) in net assets resulting from operations | | $ 2,097,265 |
See accompanying notes which are an integral part of the financial statements.
Annual Report
Fidelity Freedom Index 2000 Fund
Financial Statements - continued
Statement of Changes in Net Assets
| Year ended
March 31,
2013 | Year ended
March 31,
2012 |
Increase (Decrease) in Net Assets | | |
Operations | | |
Net investment income (loss) | $ 546,265 | $ 416,242 |
Net realized gain (loss) | 346,988 | 178,231 |
Change in net unrealized appreciation (depreciation) | 1,204,012 | 542,590 |
Net increase (decrease) in net assets resulting from operations | 2,097,265 | 1,137,063 |
Distributions to shareholders from net investment income | (539,630) | (383,260) |
Distributions to shareholders from net realized gain | (287,389) | (338,538) |
Total distributions | (827,019) | (721,798) |
Share transactions
Proceeds from sales of shares | 30,030,172 | 24,976,823 |
Reinvestment of distributions | 827,019 | 721,798 |
Cost of shares redeemed | (13,149,658) | (11,921,048) |
Net increase (decrease) in net assets resulting from share transactions | 17,707,533 | 13,777,573 |
Total increase (decrease) in net assets | 18,977,779 | 14,192,838 |
| | |
Net Assets | | |
Beginning of period | 39,799,141 | 25,606,303 |
End of period (including undistributed net investment income of $84,085 and undistributed net investment income of $77,451, respectively) | $ 58,776,920 | $ 39,799,141 |
Other Information Shares | | |
Sold | 2,735,231 | 2,304,006 |
Issued in reinvestment of distributions | 75,347 | 67,509 |
Redeemed | (1,191,832) | (1,105,067) |
Net increase (decrease) | 1,618,746 | 1,266,448 |
Financial Highlights
Years ended March 31, | 2013 | 2012 | 2011 | 2010 E |
Selected Per-Share Data | | | | |
Net asset value, beginning of period | $ 10.94 | $ 10.79 | $ 10.32 | $ 10.00 |
Income from Investment Operations | | | | |
Net investment income (loss) D | .12 | .13 | .13 | .05 |
Net realized and unrealized gain (loss) | .29 | .24 | .49 | .34 |
Total from investment operations | .41 | .37 | .62 | .39 |
Distributions from net investment income | (.11) | (.12) | (.11) | (.06) |
Distributions from net realized gain | (.06) | (.10) | (.04) | (.01) |
Total distributions | (.17) | (.22) | (.15) | (.07) |
Net asset value, end of period | $ 11.18 | $ 10.94 | $ 10.79 | $ 10.32 |
Total Return B, C | 3.76% | 3.50% | 6.00% | 3.86% |
Ratios to Average Net Assets F, G | | | | |
Expenses before reductions | .15% | .15% | .08% | .05% A |
Expenses net of fee waivers, if any | .10% | .09% | .05% | .04% A |
Expenses net of all reductions | .10% | .09% | .05% | .04% A |
Net investment income (loss) | 1.04% | 1.23% | 1.25% | 1.09% A |
Supplemental Data | | | | |
Net assets, end of period (000 omitted) | $ 58,777 | $ 39,799 | $ 25,606 | $ 6,841 |
Portfolio turnover rate | 21% | 36% | 33% | 30% |
A Annualized
B Total returns for periods of less than one year are not annualized.
C Total returns would have been lower if certain expenses had not been reduced during the applicable periods shown.
D Calculated based on average shares outstanding during the period.
E For the period October 2, 2009 (commencement of operations) to March 31, 2010.
F Expense ratios reflect operating expenses of the Fund. Expenses before reductions do not reflect amounts reimbursed by the investment adviser or reductions from expense offset arrangements and do not represent the amount paid by the Fund during periods when reimbursements or reductions occur. Expense ratios before reductions for start-up periods may not be representative of longer term operating periods. Expenses net of fee waivers reflect expenses after reimbursement by the investment adviser but prior to reductions from expense offset arrangements. Expenses net of all reductions represent the net expenses paid by the Fund.
G Amounts do not include the activity of Underlying Funds.
See accompanying notes which are an integral part of the financial statements.
Annual Report
Fidelity Freedom Index 2005 Fund
Investment Changes (Unaudited)
The information in the following tables is based on the direct investments of the Fund. |
Fund Holdings as of March 31, 2013 |
| % of fund's
net assets | % of fund's net assets
6 months ago |
Commodity Funds | | |
Fidelity Series Commodity Strategy Fund Class F | 3.8 | 4.0 |
Domestic Equity Funds | | |
Fidelity Spartan Total Market Index Fund Class F | 21.5 | 22.5 |
Developed International Equity Funds | | |
Fidelity Series Global ex U.S. Index Fund | 9.2 | 9.6 |
Inflation-Protected Bond Funds | | |
Fidelity Series Inflation-Protected Bond Index Fund Class F | 9.7 | 9.8 |
Investment Grade Bond Funds | | |
Fidelity Spartan U.S. Bond Index Fund Class F | 24.7 | 24.9 |
Short-Term Funds | | |
Fidelity Institutional Money Market Portfolio Class F | 31.1 | 29.2 |
Net Other Assets (Liabilities)* | 0.0 | 0.0 |
| 100.0 | 100.0 |
* Amount represents less than 0.1%
Asset Allocation (% of fund's net assets) |
Period end |
| Commodity Funds | 3.8% | |
| Domestic Equity Funds | 21.5% | |
| Developed International Equity Funds | 9.2% | |
| Inflation-Protected Bond Funds | 9.7% | |
| Investment Grade Bond Funds | 24.7% | |
| Short-Term Funds | 31.1% | |

Six months ago |
| Commodity Funds | 4.0% | |
| Domestic Equity Funds | 22.5% | |
| Developed International Equity Funds | 9.6% | |
| Inflation-Protected Bond Funds | 9.8% | |
| Investment Grade Bond Funds | 24.9% | |
| Short-Term Funds | 29.2% | |

Expected |
| Commodity Funds | 3.6% | |
| Domestic Equity Funds | 20.4% | |
| Developed International Equity Funds | 8.8% | |
| Inflation-Protected Bond Funds | 9.7% | |
| Investment Grade Bond Funds | 24.6% | |
| Short-Term Funds | 32.9% | |

The fund invests according to an asset allocation strategy that becomes increasingly conservative over time. The six months ago allocation is based on the fund's holdings as of September 30, 2012. The current allocation is based on the fund's holdings as of March 31, 2013. The expected allocation represents the fund's anticipated allocation at September 30, 2013. |
Annual Report
Fidelity Freedom Index 2005 Fund
Investments March 31, 2013
Showing Percentage of Net Assets
Domestic Equity Funds - 25.3% |
| Shares | | Value |
Commodity Funds - 3.8% |
Fidelity Series Commodity Strategy Fund Class F (a) | 273,925 | | $ 2,391,366 |
Domestic Equity Funds - 21.5% |
Fidelity Spartan Total Market Index Fund Class F | 296,045 | | 13,558,872 |
TOTAL DOMESTIC EQUITY FUNDS (Cost $13,694,014) |
15,950,238
|
International Equity Funds - 9.2% |
| | | |
Developed International Equity Funds - 9.2% |
Fidelity Series Global ex U.S. Index Fund
(Cost $5,467,708) | 519,057 | |
5,803,062
|
Bond Funds - 34.4% |
| | | |
Inflation-Protected Bond Funds - 9.7% |
Fidelity Series Inflation-Protected Bond Index Fund Class F | 536,838 | | 6,114,582 |
|
| Shares | | Value |
Investment Grade Bond Funds - 24.7% |
Fidelity Spartan U.S. Bond Index Fund Class F | 1,313,036 | | $ 15,520,084 |
TOTAL BOND FUNDS (Cost $21,071,795) |
21,634,666
|
Short-Term Funds - 31.1% |
| | | |
Fidelity Institutional Money Market Portfolio Class F
(Cost $19,599,320) | 19,599,320 | |
19,599,320
|
TOTAL INVESTMENT PORTFOLIO - 100.0% (Cost $59,832,837) | | 62,987,286 |
NET OTHER ASSETS (LIABILITIES) - 0.0% | | (4,491) |
NET ASSETS - 100% | $ 62,982,795 |
Legend |
(a) Non-income producing |
Other Information |
All investments are categorized as Level 1 under the Fair Value Hierarchy. The inputs or methodology used for valuing securities may not be an indication of the risk associated with investing in those securities. For more information on valuation inputs, please refer to the Security Valuation section in the accompanying Notes to Financial Statements. |
See accompanying notes which are an integral part of the financial statements.
Annual Report
Fidelity Freedom Index 2005 Fund
Statement of Assets and Liabilities
| March 31, 2013 |
| | |
Assets | | |
Investment in securities, at value (cost $59,832,837) - See accompanying schedule | | $ 62,987,286 |
Cash | | 2 |
Receivable for investments sold | | 483,760 |
Receivable for fund shares sold | | 17,114 |
Receivable from affiliate for expense reductions | | 3,296 |
Total assets | | 63,491,458 |
| | |
Liabilities | | |
Payable for investments purchased | $ 446,181 | |
Payable for fund shares redeemed | 54,691 | |
Other affiliated payables | 7,791 | |
Total liabilities | | 508,663 |
| | |
Net Assets | | $ 62,982,795 |
Net Assets consist of: | | |
Paid in capital | | $ 59,884,217 |
Undistributed net investment income | | 71,508 |
Accumulated undistributed net realized gain (loss) on investments | | (127,379) |
Net unrealized appreciation (depreciation) on investments | | 3,154,449 |
Net Assets, for 5,288,480 shares outstanding | | $ 62,982,795 |
Net Asset Value, offering price and redemption price per share ($62,982,795 ÷ 5,288,480 shares) | | $ 11.91 |
Statement of Operations
| Year ended March 31, 2013 |
| | |
Investment Income | | |
Income distributions from underlying funds | | $ 692,557 |
| | |
Expenses | | |
Transfer agent fees | $ 79,531 | |
Independent trustees' compensation | 187 | |
Total expenses before reductions | 79,718 | |
Expense reductions | (31,136) | 48,582 |
Net investment income (loss) | | 643,975 |
Realized and Unrealized Gain (Loss) Realized gain (loss) on sale of underlying fund shares | 47,991 | |
Capital gain distributions from underlying funds | 229,434 | |
Total net realized gain (loss) | | 277,425 |
Change in net unrealized appreciation (depreciation) on investment securities | | 1,988,410 |
Net gain (loss) | | 2,265,835 |
Net increase (decrease) in net assets resulting from operations | | $ 2,909,810 |
See accompanying notes which are an integral part of the financial statements.
Annual Report
Statement of Changes in Net Assets
| Year ended
March 31,
2013 | Year ended
March 31,
2012 |
Increase (Decrease) in Net Assets | | |
Operations | | |
Net investment income (loss) | $ 643,975 | $ 523,714 |
Net realized gain (loss) | 277,425 | 286,898 |
Change in net unrealized appreciation (depreciation) | 1,988,410 | 485,847 |
Net increase (decrease) in net assets resulting from operations | 2,909,810 | 1,296,459 |
Distributions to shareholders from net investment income | (645,508) | (482,346) |
Distributions to shareholders from net realized gain | (199,238) | (476,765) |
Total distributions | (844,746) | (959,111) |
Share transactions
Proceeds from sales of shares | 27,537,973 | 30,398,248 |
Reinvestment of distributions | 844,746 | 959,111 |
Cost of shares redeemed | (11,451,064) | (11,168,026) |
Net increase (decrease) in net assets resulting from share transactions | 16,931,655 | 20,189,333 |
Total increase (decrease) in net assets | 18,996,719 | 20,526,681 |
| | |
Net Assets | | |
Beginning of period | 43,986,076 | 23,459,395 |
End of period (including undistributed net investment income of $71,508 and undistributed net investment income of $73,420, respectively) | $ 62,982,795 | $ 43,986,076 |
Other Information Shares | | |
Sold | 2,379,763 | 2,676,312 |
Issued in reinvestment of distributions | 73,213 | 86,914 |
Redeemed | (989,707) | (989,518) |
Net increase (decrease) | 1,463,269 | 1,773,708 |
Financial Highlights
Years ended March 31, | 2013 | 2012 | 2011 | 2010 E |
Selected Per-Share Data | | | | |
Net asset value, beginning of period | $ 11.50 | $ 11.44 | $ 10.59 | $ 10.00 |
Income from Investment Operations | | | | |
Net investment income (loss) D | .14 | .16 | .16 | .06 |
Net realized and unrealized gain (loss) | .45 | .18 | .86 | .62 |
Total from investment operations | .59 | .34 | 1.02 | .68 |
Distributions from net investment income | (.14) | (.14) | (.12) | (.08) |
Distributions from net realized gain | (.04) | (.14) | (.05) | (.01) |
Total distributions | (.18) | (.28) | (.17) | (.09) |
Net asset value, end of period | $ 11.91 | $ 11.50 | $ 11.44 | $ 10.59 |
Total Return B, C | 5.17% | 3.11% | 9.72% | 6.78% |
Ratios to Average Net Assets F, G | | | | |
Expenses before reductions | .15% | .15% | .09% | .05% A |
Expenses net of fee waivers, if any | .09% | .09% | .06% | .03% A |
Expenses net of all reductions | .09% | .09% | .06% | .03% A |
Net investment income (loss) | 1.22% | 1.45% | 1.42% | 1.19% A |
Supplemental Data | | | | |
Net assets, end of period (000 omitted) | $ 62,983 | $ 43,986 | $ 23,459 | $ 2,167 |
Portfolio turnover rate | 23% | 37% | 53% | 15% |
A Annualized
B Total returns for periods of less than one year are not annualized.
C Total returns would have been lower if certain expenses had not been reduced during the applicable periods shown.
D Calculated based on average shares outstanding during the period.
E For the period October 2, 2009 (commencement of operations) to March 31, 2010.
F Expense ratios reflect operating expenses of the Fund. Expenses before reductions do not reflect amounts reimbursed by the investment adviser or reductions from expense offset arrangements and do not represent the amount paid by the Fund during periods when reimbursements or reductions occur. Expense ratios before reductions for start-up periods may not be representative of longer term operating periods. Expenses net of fee waivers reflect expenses after reimbursement by the investment adviser but prior to reductions from expense offset arrangements. Expenses net of all reductions represent the net expenses paid by the Fund.
G Amounts do not include the activity of Underlying Funds.
See accompanying notes which are an integral part of the financial statements.
Annual Report
Fidelity Freedom Index 2010 Fund
Investment Changes (Unaudited)
The information in the following tables is based on the direct investments of the Fund. |
Fund Holdings as of March 31, 2013 |
| % of fund's
net assets | % of fund's net assets
6 months ago |
Commodity Funds | | |
Fidelity Series Commodity Strategy Fund Class F | 5.2 | 5.4 |
Domestic Equity Funds | | |
Fidelity Spartan Total Market Index Fund Class F | 30.0 | 30.1 |
Developed International Equity Funds | | |
Fidelity Series Global ex U.S. Index Fund | 12.8 | 12.8 |
Inflation-Protected Bond Funds | | |
Fidelity Series Inflation-Protected Bond Index Fund Class F | 10.5 | 10.6 |
Investment Grade Bond Funds | | |
Fidelity Spartan U.S. Bond Index Fund Class F | 28.4 | 28.8 |
Short-Term Funds | | |
Fidelity Institutional Money Market Portfolio Class F | 13.1 | 12.3 |
Net Other Assets (Liabilities)* | 0.0 | 0.0 |
| 100.0 | 100.0 |
* Amount represents less than 0.1%
Asset Allocation (% of fund's net assets) |
Period end |
| Commodity Funds | 5.2% | |
| Domestic Equity Funds | 30.0% | |
| Developed International Equity Funds | 12.8% | |
| Inflation-Protected Bond Funds | 10.5% | |
| Investment Grade Bond Funds | 28.4% | |
| Short-Term Funds | 13.1% | |

Six months ago |
| Commodity Funds | 5.4% | |
| Domestic Equity Funds | 30.1% | |
| Developed International Equity Funds | 12.8% | |
| Inflation-Protected Bond Funds | 10.6% | |
| Investment Grade Bond Funds | 28.8% | |
| Short-Term Funds | 12.3% | |

Expected |
| Commodity Funds | 5.2% | |
| Domestic Equity Funds | 29.4% | |
| Developed International Equity Funds | 12.6% | |
| Inflation-Protected Bond Funds | 10.5% | |
| Investment Grade Bond Funds | 28.1% | |
| Short-Term Funds | 14.2% | |

The fund invests according to an asset allocation strategy that becomes increasingly conservative over time. The six months ago allocation is based on the fund's holdings as of September 30, 2012. The current allocation is based on the fund's holdings as of March 31, 2013. The expected allocation represents the fund's anticipated allocation at September 30, 2013. |
Annual Report
Fidelity Freedom Index 2010 Fund
Investments March 31, 2013
Showing Percentage of Net Assets
Domestic Equity Funds - 35.2% |
| Shares | | Value |
Commodity Funds - 5.2% |
Fidelity Series Commodity Strategy Fund Class F (a) | 2,184,816 | | $ 19,073,441 |
Domestic Equity Funds - 30.0% |
Fidelity Spartan Total Market Index Fund Class F | 2,386,064 | | 109,281,717 |
TOTAL DOMESTIC EQUITY FUNDS (Cost $107,452,336) |
128,355,158
|
International Equity Funds - 12.8% |
| | | |
Developed International Equity Funds - 12.8% |
Fidelity Series Global ex U.S. Index Fund
(Cost $42,440,041) | 4,168,842 | |
46,607,658
|
Bond Funds - 38.9% |
| | | |
Inflation-Protected Bond Funds - 10.5% |
Fidelity Series Inflation-Protected Bond Index Fund Class F | 3,379,476 | | 38,492,235 |
|
| Shares | | Value |
Investment Grade Bond Funds - 28.4% |
Fidelity Spartan U.S. Bond Index Fund Class F | 8,765,652 | | $ 103,610,011 |
TOTAL BOND FUNDS (Cost $138,843,351) |
142,102,246
|
Short-Term Funds - 13.1% |
| | | |
Fidelity Institutional Money Market Portfolio Class F
(Cost $47,815,558) | 47,815,558 | |
47,815,558
|
TOTAL INVESTMENT PORTFOLIO - 100.0% (Cost $336,551,286) | | 364,880,620 |
NET OTHER ASSETS (LIABILITIES) - 0.0% | | (27,994) |
NET ASSETS - 100% | $ 364,852,626 |
Legend |
(a) Non-income producing |
Other Information |
All investments are categorized as Level 1 under the Fair Value Hierarchy. The inputs or methodology used for valuing securities may not be an indication of the risk associated with investing in those securities. For more information on valuation inputs, please refer to the Security Valuation section in the accompanying Notes to Financial Statements. |
See accompanying notes which are an integral part of the financial statements.
Annual Report
Fidelity Freedom Index 2010 Fund
Statement of Assets and Liabilities
| March 31, 2013 |
| | |
Assets | | |
Investment in securities, at value (cost $336,551,286) - See accompanying schedule | | $ 364,880,620 |
Cash | | 2 |
Receivable for investments sold | | 2,665,002 |
Receivable for fund shares sold | | 302,624 |
Receivable from affiliate for expense reductions | | 17,368 |
Total assets | | 367,865,616 |
| | |
Liabilities | | |
Payable for investments purchased | $ 2,623,293 | |
Payable for fund shares redeemed | 344,334 | |
Other affiliated payables | 45,363 | |
Total liabilities | | 3,012,990 |
| | |
Net Assets | | $ 364,852,626 |
Net Assets consist of: | | |
Paid in capital | | $ 336,790,962 |
Undistributed net investment income | | 478,163 |
Accumulated undistributed net realized gain (loss) on investments | | (745,833) |
Net unrealized appreciation (depreciation) on investments | | 28,329,334 |
Net Assets, for 29,743,050 shares outstanding | | $ 364,852,626 |
Net Asset Value, offering price and redemption price per share ($364,852,626 ÷ 29,743,050 shares) | | $ 12.27 |
Statement of Operations
| Year ended March 31, 2013 |
| | |
Investment Income | | |
Income distributions from underlying funds | | $ 5,206,153 |
| | |
Expenses | | |
Transfer agent fees | $ 478,875 | |
Independent trustees' compensation | 1,123 | |
Total expenses before reductions | 479,998 | |
Expense reductions | (165,992) | 314,006 |
Net investment income (loss) | | 4,892,147 |
Realized and Unrealized Gain (Loss) Realized gain (loss) on sale of underlying fund shares | 492,022 | |
Capital gain distributions from underlying funds | 1,639,079 | |
Total net realized gain (loss) | | 2,131,101 |
Change in net unrealized appreciation (depreciation) on investment securities | | 16,619,400 |
Net gain (loss) | | 18,750,501 |
Net increase (decrease) in net assets resulting from operations | | $ 23,642,648 |
See accompanying notes which are an integral part of the financial statements.
Annual Report
Fidelity Freedom Index 2010 Fund
Financial Statements - continued
Statement of Changes in Net Assets
| Year ended
March 31,
2013 | Year ended
March 31,
2012 |
Increase (Decrease) in Net Assets | | |
Operations | | |
Net investment income (loss) | $ 4,892,147 | $ 3,326,671 |
Net realized gain (loss) | 2,131,101 | 1,764,285 |
Change in net unrealized appreciation (depreciation) | 16,619,400 | 3,675,834 |
Net increase (decrease) in net assets resulting from operations | 23,642,648 | 8,766,790 |
Distributions to shareholders from net investment income | (4,819,893) | (3,179,610) |
Distributions to shareholders from net realized gain | (1,596,123) | (3,122,531) |
Total distributions | (6,416,016) | (6,302,141) |
Share transactions
Proceeds from sales of shares | 192,142,131 | 140,455,555 |
Reinvestment of distributions | 6,416,016 | 6,302,141 |
Cost of shares redeemed | (89,089,878) | (55,342,655) |
Net increase (decrease) in net assets resulting from share transactions | 109,468,269 | 91,415,041 |
Total increase (decrease) in net assets | 126,694,901 | 93,879,690 |
| | |
Net Assets | | |
Beginning of period | 238,157,725 | 144,278,035 |
End of period (including undistributed net investment income of $478,163 and undistributed net investment income of $413,704, respectively) | $ 364,852,626 | $ 238,157,725 |
Other Information Shares | | |
Sold | 16,374,593 | 12,227,606 |
Issued in reinvestment of distributions | 545,847 | 565,709 |
Redeemed | (7,514,979) | (4,842,607) |
Net increase (decrease) | 9,405,461 | 7,950,708 |
Financial Highlights
Years ended March 31, | 2013 | 2012 | 2011 | 2010 E |
Selected Per-Share Data | | | | |
Net asset value, beginning of period | $ 11.71 | $ 11.65 | $ 10.65 | $ 10.00 |
Income from Investment Operations | | | | |
Net investment income (loss) D | .18 | .20 | .19 | .05 |
Net realized and unrealized gain (loss) | .61 | .21 | .98 | .70 |
Total from investment operations | .79 | .41 | 1.17 | .75 |
Distributions from net investment income | (.17) | (.18) | (.13) | (.09) |
Distributions from net realized gain | (.06) | (.17) | (.04) | (.01) |
Total distributions | (.23) | (.35) | (.17) | (.10) |
Net asset value, end of period | $ 12.27 | $ 11.71 | $ 11.65 | $ 10.65 |
Total Return B, C | 6.80% | 3.64% | 11.08% | 7.47% |
Ratios to Average Net Assets F, G | | | | |
Expenses before reductions | .15% | .15% | .08% | .05% A |
Expenses net of fee waivers, if any | .10% | .09% | .05% | .03% A |
Expenses net of all reductions | .10% | .09% | .05% | .03% A |
Net investment income (loss) | 1.54% | 1.71% | 1.68% | 1.08% A |
Supplemental Data | | | | |
Net assets, end of period (000 omitted) | $ 364,853 | $ 238,158 | $ 144,278 | $ 19,773 |
Portfolio turnover rate | 21% | 33% | 36% | 21% |
A Annualized
B Total returns for periods of less than one year are not annualized.
C Total returns would have been lower if certain expenses had not been reduced during the applicable periods shown.
D Calculated based on average shares outstanding during the period.
E For the period October 2, 2009 (commencement of operations) to March 31, 2010.
F Expense ratios reflect operating expenses of the Fund. Expenses before reductions do not reflect amounts reimbursed by the investment adviser or reductions from expense offset arrangements and do not represent the amount paid by the Fund during periods when reimbursements or reductions occur. Expense ratios before reductions for start-up periods may not be representative of longer term operating periods. Expenses net of fee waivers reflect expenses after reimbursement by the investment adviser but prior to reductions from expense offset arrangements. Expenses net of all reductions represent the net expenses paid by the Fund.
G Amounts do not include the activity of Underlying Funds.
See accompanying notes which are an integral part of the financial statements.
Annual Report
Fidelity Freedom Index 2015 Fund
Investment Changes (Unaudited)
The information in the following tables is based on the direct investments of the Fund. |
Fund Holdings as of March 31, 2013 |
| % of fund's
net assets | % of fund's net assets
6 months ago |
Commodity Funds | | |
Fidelity Series Commodity Strategy Fund Class F | 5.5 | 5.6 |
Domestic Equity Funds | | |
Fidelity Spartan Total Market Index Fund Class F | 31.3 | 31.2 |
Developed International Equity Funds | | |
Fidelity Series Global ex U.S. Index Fund | 13.4 | 13.3 |
Inflation-Protected Bond Funds | | |
Fidelity Series Inflation-Protected Bond Index Fund Class F | 10.5 | 10.4 |
Investment Grade Bond Funds | | |
Fidelity Spartan U.S. Bond Index Fund Class F | 29.4 | 29.6 |
Short-Term Funds | | |
Fidelity Institutional Money Market Portfolio Class F | 9.9 | 9.9 |
Net Other Assets (Liabilities)* | 0.0 | 0.0 |
| 100.0 | 100.0 |
* Amount represents less than 0.1%
Asset Allocation (% of fund's net assets) |
Period end |
| Commodity Funds | 5.5% | |
| Domestic Equity Funds | 31.3% | |
| Developed International Equity Funds | 13.4% | |
| Inflation-Protected Bond Funds | 10.5% | |
| Investment Grade Bond Funds | 29.4% | |
| Short-Term Funds | 9.9% | |

Six months ago |
| Commodity Funds | 5.6% | |
| Domestic Equity Funds | 31.2% | |
| Developed International Equity Funds | 13.3% | |
| Inflation-Protected Bond Funds | 10.4% | |
| Investment Grade Bond Funds | 29.6% | |
| Short-Term Funds | 9.9% | |

Expected |
| Commodity Funds | 5.5% | |
| Domestic Equity Funds | 31.1% | |
| Developed International Equity Funds | 13.3% | |
| Inflation-Protected Bond Funds | 10.6% | |
| Investment Grade Bond Funds | 29.4% | |
| Short-Term Funds | 10.1% | |

The fund invests according to an asset allocation strategy that becomes increasingly conservative over time. The six months ago allocation is based on the fund's holdings as of September 30, 2012. The current allocation is based on the fund's holdings as of March 31, 2013. The expected allocation represents the fund's anticipated allocation at September 30, 2013. |
Annual Report
Fidelity Freedom Index 2015 Fund
Investments March 31, 2013
Showing Percentage of Net Assets
Domestic Equity Funds - 36.8% |
| Shares | | Value |
Commodity Funds - 5.5% |
Fidelity Series Commodity Strategy Fund Class F (a) | 4,223,119 | | $ 36,867,827 |
Domestic Equity Funds - 31.3% |
Fidelity Spartan Total Market Index Fund Class F | 4,592,262 | | 210,325,614 |
TOTAL DOMESTIC EQUITY FUNDS (Cost $209,541,093) |
247,193,441
|
International Equity Funds - 13.4% |
| | | |
Developed International Equity Funds - 13.4% |
Fidelity Series Global ex U.S. Index Fund
(Cost $82,575,916) | 8,027,517 | |
89,747,642
|
Bond Funds - 39.9% |
| | | |
Inflation-Protected Bond Funds - 10.5% |
Fidelity Series Inflation-Protected Bond Index Fund Class F | 6,189,382 | | 70,497,058 |
|
| Shares | | Value |
Investment Grade Bond Funds - 29.4% |
Fidelity Spartan U.S. Bond Index Fund Class F | 16,754,348 | | $ 198,036,397 |
TOTAL BOND FUNDS (Cost $263,854,987) |
268,533,455
|
Short-Term Funds - 9.9% |
| | | |
Fidelity Institutional Money Market Portfolio Class F
(Cost $66,853,664) | 66,853,664 | |
66,853,664
|
TOTAL INVESTMENT PORTFOLIO - 100.0% (Cost $622,825,660) | | 672,328,202 |
NET OTHER ASSETS (LIABILITIES) - 0.0% | | (51,863) |
NET ASSETS - 100% | $ 672,276,339 |
Legend |
(a) Non-income producing |
Other Information |
All investments are categorized as Level 1 under the Fair Value Hierarchy. The inputs or methodology used for valuing securities may not be an indication of the risk associated with investing in those securities. For more information on valuation inputs, please refer to the Security Valuation section in the accompanying Notes to Financial Statements. |
See accompanying notes which are an integral part of the financial statements.
Annual Report
Fidelity Freedom Index 2015 Fund
Statement of Assets and Liabilities
| March 31, 2013 |
| | |
Assets | | |
Investment in securities, at value (cost $622,825,660) - See accompanying schedule | | $ 672,328,202 |
Cash | | 2 |
Receivable for investments sold | | 4,702,691 |
Receivable for fund shares sold | | 529,307 |
Receivable from affiliate for expense reductions | | 31,466 |
Total assets | | 677,591,668 |
| | |
Liabilities | | |
Payable for investments purchased | $ 4,857,939 | |
Payable for fund shares redeemed | 374,058 | |
Other affiliated payables | 83,332 | |
Total liabilities | | 5,315,329 |
| | |
Net Assets | | $ 672,276,339 |
Net Assets consist of: | | |
Paid in capital | | $ 623,661,737 |
Undistributed net investment income | | 857,365 |
Accumulated undistributed net realized gain (loss) on investments | | (1,745,305) |
Net unrealized appreciation (depreciation) on investments | | 49,502,542 |
Net Assets, for 54,258,898 shares outstanding | | $ 672,276,339 |
Net Asset Value, offering price and redemption price per share ($672,276,339 ÷ 54,258,898 shares) | | $ 12.39 |
Statement of Operations
| Year ended March 31, 2013 |
| | |
Investment Income | | |
Income distributions from underlying funds | | $ 9,570,596 |
| | |
Expenses | | |
Transfer agent fees | $ 856,228 | |
Independent trustees' compensation | 1,999 | |
Total expenses before reductions | 858,227 | |
Expense reductions | (293,867) | 564,360 |
Net investment income (loss) | | 9,006,236 |
Realized and Unrealized Gain (Loss) Realized gain (loss) on sale of underlying fund shares | (430,800) | |
Capital gain distributions from underlying funds | 2,910,517 | |
Total net realized gain (loss) | | 2,479,717 |
Change in net unrealized appreciation (depreciation) on investment securities | | 31,949,447 |
Net gain (loss) | | 34,429,164 |
Net increase (decrease) in net assets resulting from operations | | $ 43,435,400 |
See accompanying notes which are an integral part of the financial statements.
Annual Report
Statement of Changes in Net Assets
| Year ended
March 31,
2013 | Year ended
March 31,
2012 |
Increase (Decrease) in Net Assets | | |
Operations | | |
Net investment income (loss) | $ 9,006,236 | $ 5,433,546 |
Net realized gain (loss) | 2,479,717 | 2,980,662 |
Change in net unrealized appreciation (depreciation) | 31,949,447 | 7,150,024 |
Net increase (decrease) in net assets resulting from operations | 43,435,400 | 15,564,232 |
Distributions to shareholders from net investment income | (8,869,765) | (5,096,608) |
Distributions to shareholders from net realized gain | (2,613,234) | (4,537,088) |
Total distributions | (11,482,999) | (9,633,696) |
Share transactions
Proceeds from sales of shares | 336,987,331 | 242,332,025 |
Reinvestment of distributions | 11,482,999 | 9,633,696 |
Cost of shares redeemed | (120,522,497) | (66,072,172) |
Net increase (decrease) in net assets resulting from share transactions | 227,947,833 | 185,893,549 |
Total increase (decrease) in net assets | 259,900,234 | 191,824,085 |
| | |
Net Assets | | |
Beginning of period | 412,376,105 | 220,552,020 |
End of period (including undistributed net investment income of $857,365 and undistributed net investment income of $720,895, respectively) | $ 672,276,339 | $ 412,376,105 |
Other Information Shares | | |
Sold | 28,430,787 | 20,993,676 |
Issued in reinvestment of distributions | 968,858 | 860,633 |
Redeemed | (10,079,046) | (5,744,654) |
Net increase (decrease) | 19,320,599 | 16,109,655 |
Financial Highlights
Years ended March 31, | 2013 | 2012 | 2011 | 2010 E |
Selected Per-Share Data | | | | |
Net asset value, beginning of period | $ 11.80 | $ 11.71 | $ 10.67 | $ 10.00 |
Income from Investment Operations | | | | |
Net investment income (loss) D | .19 | .20 | .20 | .06 |
Net realized and unrealized gain (loss) | .63 | .22 | 1.00 | .71 |
Total from investment operations | .82 | .42 | 1.20 | .77 |
Distributions from net investment income | (.18) | (.17) | (.12) | (.09) |
Distributions from net realized gain | (.05) | (.15) | (.04) | (.01) |
Total distributions | (.23) | (.33) H | (.16) | (.10) |
Net asset value, end of period | $ 12.39 | $ 11.80 | $ 11.71 | $ 10.67 |
Total Return B, C | 7.02% | 3.70% | 11.29% | 7.67% |
Ratios to Average Net Assets F, G | | | | |
Expenses before reductions | .15% | .15% | .09% | .05% A |
Expenses net of fee waivers, if any | .10% | .09% | .06% | .03% A |
Expenses net of all reductions | .10% | .09% | .06% | .03% A |
Net investment income (loss) | 1.58% | 1.76% | 1.78% | 1.10% A |
Supplemental Data | | | | |
Net assets, end of period (000 omitted) | $ 672,276 | $ 412,376 | $ 220,552 | $ 13,901 |
Portfolio turnover rate | 14% | 23% | 19% | 31% |
A Annualized
B Total returns for periods of less than one year are not annualized.
C Total returns would have been lower if certain expenses had not been reduced during the applicable periods shown.
D Calculated based on average shares outstanding during the period.
E For the period October 2, 2009 (commencement of operations) to March 31, 2010.
F Expense ratios reflect operating expenses of the Fund. Expenses before reductions do not reflect amounts reimbursed by the investment adviser or reductions from expense offset arrangements and do not represent the amount paid by the Fund during periods when reimbursements or reductions occur. Expense ratios before reductions for start-up periods may not be representative of longer term operating periods. Expenses net of fee waivers reflect expenses after reimbursement by the investment adviser but prior to reductions from expense offset arrangements. Expenses net of all reductions represent the net expenses paid by the Fund.
G Amounts do not include the activity of Underlying Funds.
H Total distributions of $.33 per share is comprised of distributions from net investment income of $.174 and distributions from net realized gain of $.151 per share.
See accompanying notes which are an integral part of the financial statements.
Annual Report
Fidelity Freedom Index 2020 Fund
Investment Changes (Unaudited)
The information in the following tables is based on the direct investments of the Fund. |
Fund Holdings as of March 31, 2013 |
| % of fund's
net assets | % of fund's net assets
6 months ago |
Commodity Funds | | |
Fidelity Series Commodity Strategy Fund Class F | 6.0 | 6.2 |
Domestic Equity Funds | | |
Fidelity Spartan Total Market Index Fund Class F | 34.1 | 34.7 |
Developed International Equity Funds | | |
Fidelity Series Global ex U.S. Index Fund | 14.6 | 14.8 |
Inflation-Protected Bond Funds | | |
Fidelity Series Inflation-Protected Bond Index Fund Class F | 8.8 | 8.5 |
Investment Grade Bond Funds | | |
Fidelity Spartan U.S. Bond Index Fund Class F | 29.5 | 29.5 |
Short-Term Funds | | |
Fidelity Institutional Money Market Portfolio Class F | 7.0 | 6.3 |
Net Other Assets (Liabilities)* | 0.0 | 0.0 |
| 100.0 | 100.0 |
* Amount represents less than 0.1%
Asset Allocation (% of fund's net assets) |
Period end |
| Commodity Funds | 6.0% | |
| Domestic Equity Funds | 34.1% | |
| Developed International Equity Funds | 14.6% | |
| Inflation-Protected Bond Funds | 8.8% | |
| Investment Grade Bond Funds | 29.5% | |
| Short-Term Funds | 7.0% | |

Six months ago |
| Commodity Funds | 6.2% | |
| Domestic Equity Funds | 34.7% | |
| Developed International Equity Funds | 14.8% | |
| Inflation-Protected Bond Funds | 8.5% | |
| Investment Grade Bond Funds | 29.5% | |
| Short-Term Funds | 6.3% | |

Expected |
| Commodity Funds | 5.9% | |
| Domestic Equity Funds | 33.4% | |
| Developed International Equity Funds | 14.3% | |
| Inflation-Protected Bond Funds | 9.0% | |
| Investment Grade Bond Funds | 29.7% | |
| Short-Term Funds | 7.7% | |

The fund invests according to an asset allocation strategy that becomes increasingly conservative over time. The six months ago allocation is based on the fund's holdings as of September 30, 2012. The current allocation is based on the fund's holdings as of March 31, 2013. The expected allocation represents the fund's anticipated allocation at September 30, 2013. |
Annual Report
Fidelity Freedom Index 2020 Fund
Investments March 31, 2013
Showing Percentage of Net Assets
Domestic Equity Funds - 40.1% |
| Shares | | Value |
Commodity Funds - 6.0% |
Fidelity Series Commodity Strategy Fund Class F (a) | 9,819,504 | | $ 85,724,274 |
Domestic Equity Funds - 34.1% |
Fidelity Spartan Total Market Index Fund Class F | 10,671,494 | | 488,754,404 |
TOTAL DOMESTIC EQUITY FUNDS (Cost $485,833,824) |
574,478,678
|
International Equity Funds - 14.6% |
| | | |
Developed International Equity Funds - 14.6% |
Fidelity Series Global ex U.S. Index Fund
(Cost $191,045,308) | 18,662,102 | |
208,642,305
|
Bond Funds - 38.3% |
| | | |
Inflation-Protected Bond Funds - 8.8% |
Fidelity Series Inflation-Protected Bond Index Fund Class F | 10,993,706 | | 125,218,309 |
|
| Shares | | Value |
Investment Grade Bond Funds - 29.5% |
Fidelity Spartan U.S. Bond Index Fund Class F | 35,726,238 | | $ 422,284,130 |
TOTAL BOND FUNDS (Cost $539,911,188) |
547,502,439
|
Short-Term Funds - 7.0% |
| | | |
Fidelity Institutional Money Market Portfolio Class F
(Cost $100,319,895) | 100,319,895 | |
100,319,895
|
TOTAL INVESTMENT PORTFOLIO - 100.0% (Cost $1,317,110,215) | | 1,430,943,317 |
NET OTHER ASSETS (LIABILITIES) - 0.0% | | (108,753) |
NET ASSETS - 100% | $ 1,430,834,564 |
Legend |
(a) Non-income producing |
Other Information |
All investments are categorized as Level 1 under the Fair Value Hierarchy. The inputs or methodology used for valuing securities may not be an indication of the risk associated with investing in those securities. For more information on valuation inputs, please refer to the Security Valuation section in the accompanying Notes to Financial Statements. |
See accompanying notes which are an integral part of the financial statements.
Annual Report
Fidelity Freedom Index 2020 Fund
Statement of Assets and Liabilities
| March 31, 2013 |
| | |
Assets | | |
Investment in securities, at value (cost $1,317,110,215) - See accompanying schedule | | $ 1,430,943,317 |
Cash | | 2 |
Receivable for investments sold | | 11,703,170 |
Receivable for fund shares sold | | 1,212,813 |
Receivable from affiliate for expense reductions | | 67,911 |
Total assets | | 1,443,927,213 |
| | |
Liabilities | | |
Payable for investments purchased | $ 12,494,518 | |
Payable for fund shares redeemed | 421,464 | |
Other affiliated payables | 176,667 | |
Total liabilities | | 13,092,649 |
| | |
Net Assets | | $ 1,430,834,564 |
Net Assets consist of: | | |
Paid in capital | | $ 1,319,333,893 |
Undistributed net investment income | | 1,853,604 |
Accumulated undistributed net realized gain (loss) on investments | | (4,186,035) |
Net unrealized appreciation (depreciation) on investments | | 113,833,102 |
Net Assets, for 112,925,219 shares outstanding | | $ 1,430,834,564 |
Net Asset Value, offering price and redemption price per share ($1,430,834,564 ÷ 112,925,219 shares) | | $ 12.67 |
Statement of Operations
| Year ended March 31, 2013 |
| | |
Investment Income | | |
Income distributions from underlying funds | | $ 20,576,021 |
| | |
Expenses | | |
Transfer agent fees | $ 1,740,907 | |
Independent trustees' compensation | 4,036 | |
Total expenses before reductions | 1,744,943 | |
Expense reductions | (594,274) | 1,150,669 |
Net investment income (loss) | | 19,425,352 |
Realized and Unrealized Gain (Loss) Realized gain (loss) on sale of underlying fund shares | (1,162,133) | |
Capital gain distributions from underlying funds | 5,480,301 | |
Total net realized gain (loss) | | 4,318,168 |
Change in net unrealized appreciation (depreciation) on investment securities | | 73,633,077 |
Net gain (loss) | | 77,951,245 |
Net increase (decrease) in net assets resulting from operations | | $ 97,376,597 |
See accompanying notes which are an integral part of the financial statements.
Annual Report
Fidelity Freedom Index 2020 Fund
Financial Statements - continued
Statement of Changes in Net Assets
| Year ended
March 31,
2013 | Year ended
March 31,
2012 |
Increase (Decrease) in Net Assets | | |
Operations | | |
Net investment income (loss) | $ 19,425,352 | $ 11,007,122 |
Net realized gain (loss) | 4,318,168 | 6,064,679 |
Change in net unrealized appreciation (depreciation) | 73,633,077 | 13,310,990 |
Net increase (decrease) in net assets resulting from operations | 97,376,597 | 30,382,791 |
Distributions to shareholders from net investment income | (18,928,616) | (10,382,261) |
Distributions to shareholders from net realized gain | (5,245,578) | (9,302,189) |
Total distributions | (24,174,194) | (19,684,450) |
Share transactions
Proceeds from sales of shares | 692,133,502 | 437,530,199 |
Reinvestment of distributions | 24,174,194 | 19,684,450 |
Cost of shares redeemed | (171,044,352) | (80,390,633) |
Net increase (decrease) in net assets resulting from share transactions | 545,263,344 | 376,824,016 |
Total increase (decrease) in net assets | 618,465,747 | 387,522,357 |
| | |
Net Assets | | |
Beginning of period | 812,368,817 | 424,846,460 |
End of period (including undistributed net investment income of $1,853,604 and undistributed net investment income of $1,356,868, respectively) | $ 1,430,834,564 | $ 812,368,817 |
Other Information Shares | | |
Sold | 57,443,922 | 37,249,596 |
Issued in reinvestment of distributions | 2,002,137 | 1,736,955 |
Redeemed | (14,076,792) | (6,846,542) |
Net increase (decrease) | 45,369,267 | 32,140,009 |
Financial Highlights
Years ended March 31, | 2013 | 2012 | 2011 | 2010 E |
Selected Per-Share Data | | | | |
Net asset value, beginning of period | $ 12.03 | $ 12.00 | $ 10.81 | $ 10.00 |
Income from Investment Operations | | | | |
Net investment income (loss) D | .20 | .22 | .21 | .05 |
Net realized and unrealized gain (loss) | .68 | .16 | 1.15 | .87 |
Total from investment operations | .88 | .38 | 1.36 | .92 |
Distributions from net investment income | (.19) | (.19) | (.14) | (.10) |
Distributions from net realized gain | (.05) | (.16) | (.04) | (.01) |
Total distributions | (.24) | (.35) | (.17) H | (.11) |
Net asset value, end of period | $ 12.67 | $ 12.03 | $ 12.00 | $ 10.81 |
Total Return B, C | 7.38% | 3.36% | 12.67% | 9.18% |
Ratios to Average Net Assets F, G | | | | |
Expenses before reductions | .15% | .15% | .08% | .05% A |
Expenses net of fee waivers, if any | .10% | .09% | .05% | .03% A |
Expenses net of all reductions | .10% | .09% | .05% | .03% A |
Net investment income (loss) | 1.68% | 1.85% | 1.82% | .98% A |
Supplemental Data | | | | |
Net assets, end of period (000 omitted) | $ 1,430,835 | $ 812,369 | $ 424,846 | $ 38,734 |
Portfolio turnover rate | 11% | 20% | 21% | 21% |
A Annualized
B Total returns for periods of less than one year are not annualized.
C Total returns would have been lower if certain expenses had not been reduced during the applicable periods shown.
D Calculated based on average shares outstanding during the period.
E For the period October 2, 2009 (commencement of operations) to March 31, 2010.
F Expense ratios reflect operating expenses of the Fund. Expenses before reductions do not reflect amounts reimbursed by the investment adviser or reductions from expense offset arrangements and do not represent the amount paid by the Fund during periods when reimbursements or reductions occur. Expense ratios before reductions for start-up periods may not be representative of longer term operating periods. Expenses net of fee waivers reflect expenses after reimbursement by the investment adviser but prior to reductions from expense offset arrangements. Expenses net of all reductions represent the net expenses paid by the Fund.
G Amounts do not include the activity of Underlying Funds.
H Total distributions of $.17 per share is comprised of distributions from net investment income of $.135 and distributions from net realized gain of $.037 per share.
See accompanying notes which are an integral part of the financial statements.
Annual Report
Fidelity Freedom Index 2025 Fund
Investment Changes (Unaudited)
The information in the following tables is based on the direct investments of the Fund. |
Fund Holdings as of March 31, 2013 |
| % of fund's
net assets | % of fund's net assets
6 months ago |
Commodity Funds | | |
Fidelity Series Commodity Strategy Fund Class F | 7.3 | 7.5 |
Domestic Equity Funds | | |
Fidelity Spartan Total Market Index Fund Class F | 41.8 | 42.1 |
Developed International Equity Funds | | |
Fidelity Series Global ex U.S. Index Fund | 17.8 | 17.9 |
Inflation-Protected Bond Funds | | |
Fidelity Series Inflation-Protected Bond Index Fund Class F | 5.8 | 5.5 |
Investment Grade Bond Funds | | |
Fidelity Spartan U.S. Bond Index Fund Class F | 26.5 | 26.4 |
Short-Term Funds | | |
Fidelity Institutional Money Market Portfolio Class F | 0.8 | 0.6 |
Net Other Assets (Liabilities)* | 0.0 | 0.0 |
| 100.0 | 100.0 |
* Amount represents less than 0.1%
Asset Allocation (% of fund's net assets) |
Period end |
| Commodity Funds | 7.3% | |
| Domestic Equity Funds | 41.8% | |
| Developed International Equity Funds | 17.8% | |
| Inflation-Protected Bond Funds | 5.8% | |
| Investment Grade Bond Funds | 26.5% | |
| Short-Term Funds | 0.8% | |

Six months ago |
| Commodity Funds | 7.5% | |
| Domestic Equity Funds | 42.1% | |
| Developed International Equity Funds | 17.9% | |
| Inflation-Protected Bond Funds | 5.5% | |
| Investment Grade Bond Funds | 26.4% | |
| Short-Term Funds | 0.6% | |

Expected |
| Commodity Funds | 7.3% | |
| Domestic Equity Funds | 41.1% | |
| Developed International Equity Funds | 17.6% | |
| Inflation-Protected Bond Funds | 6.1% | |
| Investment Grade Bond Funds | 26.8% | |
| Short-Term Funds | 1.1% | |

The fund invests according to an asset allocation strategy that becomes increasingly conservative over time. The six months ago allocation is based on the fund's holdings as of September 30, 2012. The current allocation is based on the fund's holdings as of March 31, 2013. The expected allocation represents the fund's anticipated allocation at September 30, 2013. |
Annual Report
Fidelity Freedom Index 2025 Fund
Investments March 31, 2013
Showing Percentage of Net Assets
Domestic Equity Funds - 49.1% |
| Shares | | Value |
Commodity Funds - 7.3% |
Fidelity Series Commodity Strategy Fund Class F (a) | 8,153,419 | | $ 71,179,350 |
Domestic Equity Funds - 41.8% |
Fidelity Spartan Total Market Index Fund Class F | 8,841,089 | | 404,921,876 |
TOTAL DOMESTIC EQUITY FUNDS (Cost $409,359,952) |
476,101,226
|
International Equity Funds - 17.8% |
| | | |
Developed International Equity Funds - 17.8% |
Fidelity Series Global ex U.S. Index Fund
(Cost $160,096,890) | 15,480,342 | |
173,070,220
|
Bond Funds - 32.3% |
| | | |
Inflation-Protected Bond Funds - 5.8% |
Fidelity Series Inflation-Protected Bond Index Fund Class F | 4,878,924 | | 55,570,948 |
|
| Shares | | Value |
Investment Grade Bond Funds - 26.5% |
Fidelity Spartan U.S. Bond Index Fund Class F | 21,753,207 | | $ 257,122,902 |
TOTAL BOND FUNDS (Cost $308,959,963) |
312,693,850
|
Short-Term Funds - 0.8% |
| | | |
Fidelity Institutional Money Market Portfolio Class F
(Cost $7,600,628) | 7,600,628 | |
7,600,628
|
TOTAL INVESTMENT PORTFOLIO - 100.0% (Cost $886,017,433) | | 969,465,924 |
NET OTHER ASSETS (LIABILITIES) - 0.0% | | (70,683) |
NET ASSETS - 100% | $ 969,395,241 |
Legend |
(a) Non-income producing |
Other Information |
All investments are categorized as Level 1 under the Fair Value Hierarchy. The inputs or methodology used for valuing securities may not be an indication of the risk associated with investing in those securities. For more information on valuation inputs, please refer to the Security Valuation section in the accompanying Notes to Financial Statements. |
See accompanying notes which are an integral part of the financial statements.
Annual Report
Fidelity Freedom Index 2025 Fund
Statement of Assets and Liabilities
| March 31, 2013 |
| | |
Assets | | |
Investment in securities, at value (cost $886,017,433) - See accompanying schedule | | $ 969,465,924 |
Cash | | 2 |
Receivable for investments sold | | 8,036,094 |
Receivable for fund shares sold | | 1,269,279 |
Receivable from affiliate for expense reductions | | 48,945 |
Total assets | | 978,820,244 |
| | |
Liabilities | | |
Payable for investments purchased | $ 8,974,257 | |
Payable for fund shares redeemed | 331,115 | |
Other affiliated payables | 119,631 | |
Total liabilities | | 9,425,003 |
| | |
Net Assets | | $ 969,395,241 |
Net Assets consist of: | | |
Paid in capital | | $ 888,047,539 |
Undistributed net investment income | | 1,046,812 |
Accumulated undistributed net realized gain (loss) on investments | | (3,147,601) |
Net unrealized appreciation (depreciation) on investments | | 83,448,491 |
Net Assets, for 74,638,499 shares outstanding | | $ 969,395,241 |
Net Asset Value, offering price and redemption price per share ($969,395,241 ÷ 74,638,499 shares) | | $ 12.99 |
Statement of Operations
| Year ended March 31, 2013 |
| | |
Investment Income | | |
Income distributions from underlying funds | | $ 14,772,107 |
| | |
Expenses | | |
Transfer agent fees | $ 1,162,755 | |
Independent trustees' compensation | 2,691 | |
Total expenses before reductions | 1,165,446 | |
Expense reductions | (423,182) | 742,264 |
Net investment income (loss) | | 14,029,843 |
Realized and Unrealized Gain (Loss) Realized gain (loss) on sale of underlying fund shares | (1,574,397) | |
Capital gain distributions from underlying funds | 2,880,707 | |
Total net realized gain (loss) | | 1,306,310 |
Change in net unrealized appreciation (depreciation) on investment securities | | 58,469,806 |
Net gain (loss) | | 59,776,116 |
Net increase (decrease) in net assets resulting from operations | | $ 73,805,959 |
See accompanying notes which are an integral part of the financial statements.
Annual Report
Statement of Changes in Net Assets
| Year ended
March 31,
2013 | Year ended
March 31,
2012 |
Increase (Decrease) in Net Assets | | |
Operations | | |
Net investment income (loss) | $ 14,029,843 | $ 7,381,073 |
Net realized gain (loss) | 1,306,310 | 4,034,483 |
Change in net unrealized appreciation (depreciation) | 58,469,806 | 9,750,706 |
Net increase (decrease) in net assets resulting from operations | 73,805,959 | 21,166,262 |
Distributions to shareholders from net investment income | (13,753,827) | (6,931,296) |
Distributions to shareholders from net realized gain | (2,545,865) | (5,936,126) |
Total distributions | (16,299,692) | (12,867,422) |
Share transactions
Proceeds from sales of shares | 450,498,444 | 310,474,750 |
Reinvestment of distributions | 16,299,692 | 12,867,422 |
Cost of shares redeemed | (92,314,075) | (43,841,934) |
Net increase (decrease) in net assets resulting from share transactions | 374,484,061 | 279,500,238 |
Total increase (decrease) in net assets | 431,990,328 | 287,799,078 |
| | |
Net Assets | | |
Beginning of period | 537,404,913 | 249,605,835 |
End of period (including undistributed net investment income of $1,046,812 and undistributed net investment income of $770,796, respectively) | $ 969,395,241 | $ 537,404,913 |
Other Information Shares | | |
Sold | 36,760,609 | 26,171,883 |
Issued in reinvestment of distributions | 1,330,091 | 1,131,081 |
Redeemed | (7,472,036) | (3,706,339) |
Net increase (decrease) | 30,618,664 | 23,596,625 |
Financial Highlights
Years ended March 31, | 2013 | 2012 | 2011 | 2010 E |
Selected Per-Share Data | | | | |
Net asset value, beginning of period | $ 12.21 | $ 12.22 | $ 10.88 | $ 10.00 |
Income from Investment Operations | | | | |
Net investment income (loss) D | .22 | .23 | .22 | .05 |
Net realized and unrealized gain (loss) | .80 | .11 | 1.30 | .94 |
Total from investment operations | 1.02 | .34 | 1.52 | .99 |
Distributions from net investment income | (.21) | (.19) | (.15) | (.10) |
Distributions from net realized gain | (.04) | (.16) | (.03) | (.01) |
Total distributions | (.24) H | (.35) | (.18) | (.11) |
Net asset value, end of period | $ 12.99 | $ 12.21 | $ 12.22 | $ 10.88 |
Total Return B, C | 8.50% | 3.03% | 14.03% | 9.93% |
Ratios to Average Net Assets F, G | | | | |
Expenses before reductions | .15% | .15% | .09% | .05% A |
Expenses net of fee waivers, if any | .10% | .09% | .05% | .03% A |
Expenses net of all reductions | .10% | .09% | .05% | .03% A |
Net investment income (loss) | 1.82% | 1.97% | 1.91% | .92% A |
Supplemental Data | | | | |
Net assets, end of period (000 omitted) | $ 969,395 | $ 537,405 | $ 249,606 | $ 18,150 |
Portfolio turnover rate | 10% | 18% | 18% | 33% |
A Annualized
B Total returns for periods of less than one year are not annualized.
C Total returns would have been lower if certain expenses had not been reduced during the applicable periods shown.
D Calculated based on average shares outstanding during the period.
E For the period October 2, 2009 (commencement of operations) to March 31, 2010.
F Expense ratios reflect operating expenses of the Fund. Expenses before reductions do not reflect amounts reimbursed by the investment adviser or reductions from expense offset arrangements and do not represent the amount paid by the Fund during periods when reimbursements or reductions occur. Expense ratios before reductions for start-up periods may not be representative of longer term operating periods. Expenses net of fee waivers reflect expenses after reimbursement by the investment adviser but prior to reductions from expense offset arrangements. Expenses net of all reductions represent the net expenses paid by the Fund.
G Amounts do not include the activity of Underlying Funds.
H Total distributions of $.24 per share is comprised of distributions from net investment income of $.205 and distributions from net realized gain of $.038 per share.
See accompanying notes which are an integral part of the financial statements.
Annual Report
Fidelity Freedom Index 2030 Fund
Investment Changes (Unaudited)
The information in the following tables is based on the direct investments of the Fund. |
Fund Holdings as of March 31, 2013 |
| % of fund's
net assets | % of fund's net assets
6 months ago |
Commodity Funds | | |
Fidelity Series Commodity Strategy Fund Class F | 7.7 | 7.9 |
Domestic Equity Funds | | |
Fidelity Spartan Total Market Index Fund Class F | 44.0 | 44.0 |
Developed International Equity Funds | | |
Fidelity Series Global ex U.S. Index Fund | 18.8 | 18.8 |
Inflation-Protected Bond Funds | | |
Fidelity Series Inflation-Protected Bond Index Fund Class F | 2.7 | 2.4 |
Investment Grade Bond Funds | | |
Fidelity Spartan U.S. Bond Index Fund Class F | 26.8 | 26.9 |
Net Other Assets (Liabilities)* | 0.0 | 0.0 |
| 100.0 | 100.0 |
* Amount represents less than 0.1%
Asset Allocation (% of fund's net assets) |
Period end |
| Commodity Funds | 7.7% | |
 | Domestic Equity Funds | 44.0% | |
 | Developed International Equity Funds | 18.8% | |
 | Inflation-Protected Bond Funds | 2.7% | |
| Investment Grade Bond Funds | 26.8% | |

Six months ago |
| Commodity Funds | 7.9% | |
| Domestic Equity Funds | 44.0% | |
| Developed International Equity Funds | 18.8% | |
| Inflation-Protected Bond Funds | 2.4% | |
| Investment Grade Bond Funds | 26.9% | |

Expected |
| Commodity Funds | 7.7% | |
| Domestic Equity Funds | 43.8% | |
| Developed International Equity Funds | 18.7% | |
| Inflation-Protected Bond Funds | 3.1% | |
| Investment Grade Bond Funds | 26.7% | |

The fund invests according to an asset allocation strategy that becomes increasingly conservative over time. The six months ago allocation is based on the fund's holdings as of September 30, 2012. The current allocation is based on the fund's holdings as of March 31, 2013. The expected allocation represents the fund's anticipated allocation at September 30, 2013. |
Annual Report
Fidelity Freedom Index 2030 Fund
Investments March 31, 2013
Showing Percentage of Net Assets
Domestic Equity Funds - 51.7% |
| Shares | | Value |
Commodity Funds - 7.7% |
Fidelity Series Commodity Strategy Fund Class F (a) | 10,616,028 | | $ 92,677,921 |
Domestic Equity Funds - 44.0% |
Fidelity Spartan Total Market Index Fund Class F | 11,554,089 | | 529,177,253 |
TOTAL DOMESTIC EQUITY FUNDS (Cost $531,605,848) |
621,855,174
|
International Equity Funds - 18.8% |
| | | |
Developed International Equity Funds - 18.8% |
Fidelity Series Global ex U.S. Index Fund
(Cost $207,440,458) | 20,202,467 | |
225,863,581
|
Bond Funds - 29.5% |
| | | |
Inflation-Protected Bond Funds - 2.7% |
Fidelity Series Inflation-Protected Bond Index Fund Class F | 2,919,912 | | 33,257,799 |
|
| Shares | | Value |
Investment Grade Bond Funds - 26.8% |
Fidelity Spartan U.S. Bond Index Fund Class F | 27,254,966 | | $ 322,153,701 |
TOTAL BOND FUNDS (Cost $351,911,718) |
355,411,500
|
TOTAL INVESTMENT PORTFOLIO - 100.0% (Cost $1,090,958,024) | | 1,203,130,255 |
NET OTHER ASSETS (LIABILITIES) - 0.0% | | (85,991) |
NET ASSETS - 100% | $ 1,203,044,264 |
Legend |
(a) Non-income producing |
Other Information |
All investments are categorized as Level 1 under the Fair Value Hierarchy. The inputs or methodology used for valuing securities may not be an indication of the risk associated with investing in those securities. For more information on valuation inputs, please refer to the Security Valuation section in the accompanying Notes to Financial Statements. |
See accompanying notes which are an integral part of the financial statements.
Annual Report
Fidelity Freedom Index 2030 Fund
Statement of Assets and Liabilities
| March 31, 2013 |
| | |
Assets | | |
Investment in securities, at value (cost $1,090,958,024) - See accompanying schedule | | $ 1,203,130,255 |
Cash | | 1 |
Receivable for investments sold | | 9,357,502 |
Receivable for fund shares sold | | 1,346,473 |
Receivable from affiliate for expense reductions | | 62,698 |
Total assets | | 1,213,896,929 |
| | |
Liabilities | | |
Payable for investments purchased | $ 10,117,397 | |
Payable for fund shares redeemed | 586,577 | |
Other affiliated payables | 148,691 | |
Total liabilities | | 10,852,665 |
| | |
Net Assets | | $ 1,203,044,264 |
Net Assets consist of: | | |
Paid in capital | | $ 1,093,926,866 |
Undistributed net investment income | | 1,319,293 |
Accumulated undistributed net realized gain (loss) on investments | | (4,374,126) |
Net unrealized appreciation (depreciation) on investments | | 112,172,231 |
Net Assets, for 91,864,389 shares outstanding | | $ 1,203,044,264 |
Net Asset Value, offering price and redemption price per share ($1,203,044,264 ÷ 91,864,389 shares) | | $ 13.10 |
Statement of Operations
| Year ended March 31, 2013 |
| | |
Investment Income | | |
Income distributions from underlying funds | | $ 18,909,080 |
| | |
Expenses | | |
Transfer agent fees | $ 1,428,577 | |
Independent trustees' compensation | 3,295 | |
Total expenses before reductions | 1,431,872 | |
Expense reductions | (527,808) | 904,064 |
Net investment income (loss) | | 18,005,016 |
Realized and Unrealized Gain (Loss) Realized gain (loss) on sale of underlying fund shares | (1,973,630) | |
Capital gain distributions from underlying funds | 2,881,720 | |
Total net realized gain (loss) | | 908,090 |
Change in net unrealized appreciation (depreciation) on investment securities | | 77,864,594 |
Net gain (loss) | | 78,772,684 |
Net increase (decrease) in net assets resulting from operations | | $ 96,777,700 |
See accompanying notes which are an integral part of the financial statements.
Annual Report
Fidelity Freedom Index 2030 Fund
Financial Statements - continued
Statement of Changes in Net Assets
| Year ended
March 31,
2013 | Year ended
March 31,
2012 |
Increase (Decrease) in Net Assets | | |
Operations | | |
Net investment income (loss) | $ 18,005,016 | $ 9,052,412 |
Net realized gain (loss) | 908,090 | 4,620,786 |
Change in net unrealized appreciation (depreciation) | 77,864,594 | 10,465,785 |
Net increase (decrease) in net assets resulting from operations | 96,777,700 | 24,138,983 |
Distributions to shareholders from net investment income | (17,577,150) | (8,621,542) |
Distributions to shareholders from net realized gain | (2,817,704) | (7,031,717) |
Total distributions | (20,394,854) | (15,653,259) |
Share transactions
Proceeds from sales of shares | 570,548,909 | 369,961,293 |
Reinvestment of distributions | 20,394,854 | 15,653,259 |
Cost of shares redeemed | (118,202,024) | (57,532,680) |
Net increase (decrease) in net assets resulting from share transactions | 472,741,739 | 328,081,872 |
Total increase (decrease) in net assets | 549,124,585 | 336,567,596 |
| | |
Net Assets | | |
Beginning of period | 653,919,679 | 317,352,083 |
End of period (including undistributed net investment income of $1,319,293 and undistributed net investment income of $891,427, respectively) | $ 1,203,044,264 | $ 653,919,679 |
Other Information Shares | | |
Sold | 46,489,065 | 30,992,636 |
Issued in reinvestment of distributions | 1,653,806 | 1,371,481 |
Redeemed | (9,520,988) | (4,831,461) |
Net increase (decrease) | 38,621,883 | 27,532,656 |
Financial Highlights
Years ended March 31, | 2013 | 2012 | 2011 | 2010 E |
Selected Per-Share Data | | | | |
Net asset value, beginning of period | $ 12.28 | $ 12.34 | $ 10.96 | $ 10.00 |
Income from Investment Operations | | | | |
Net investment income (loss) D | .24 | .24 | .22 | .04 |
Net realized and unrealized gain (loss) | .83 | .07 | 1.34 | 1.04 |
Total from investment operations | 1.07 | .31 | 1.56 | 1.08 |
Distributions from net investment income | (.21) | (.20) | (.15) | (.11) |
Distributions from net realized gain | (.03) | (.16) | (.03) | (.01) |
Total distributions | (.25) I | (.37) H | (.18) | (.12) |
Net asset value, end of period | $ 13.10 | $ 12.28 | $ 12.34 | $ 10.96 |
Total Return B, C | 8.80% | 2.70% | 14.27% | 10.78% |
Ratios to Average Net Assets F, G | | | | |
Expenses before reductions | .15% | .15% | .08% | .05% A |
Expenses net of fee waivers, if any | .10% | .09% | .05% | .03% A |
Expenses net of all reductions | .10% | .09% | .05% | .03% A |
Net investment income (loss) | 1.90% | 1.99% | 1.90% | .78% A |
Supplemental Data | | | | |
Net assets, end of period (000 omitted) | $ 1,203,044 | $ 653,920 | $ 317,352 | $ 27,567 |
Portfolio turnover rate | 10% | 18% | 16% | 21% |
A Annualized
B Total returns for periods of less than one year are not annualized.
C Total returns would have been lower if certain expenses had not been reduced during the applicable periods shown.
D Calculated based on average shares outstanding during the period.
E For the period October 2, 2009 (commencement of operations) to March 31, 2010.
F Expense ratios reflect operating expenses of the Fund. Expenses before reductions do not reflect amounts reimbursed by the investment adviser or reductions from expense offset arrangements and do not represent the amount paid by the Fund during periods when reimbursements or reductions occur. Expense ratios before reductions for start-up periods may not be representative of longer term operating periods. Expenses net of fee waivers reflect expenses after reimbursement by the investment adviser but prior to reductions from expense offset arrangements. Expenses net of all reductions represent the net expenses paid by the Fund.
G Amounts do not include the activity of Underlying Funds.
H Total distributions of $.37 per share is comprised of distributions from net investment income of $.203 and distributions from net realized gain of $.163 per share.
I Total distributions of $.25 per share is comprised of distributions from net investment income of $.211 and distributions from net realized gain of $.034 per share.
See accompanying notes which are an integral part of the financial statements.
Annual Report
Fidelity Freedom Index 2035 Fund
Investment Changes (Unaudited)
The information in the following tables is based on the direct investments of the Fund. |
Fund Holdings as of March 31, 2013 |
| % of fund's
net assets | % of fund's net assets
6 months ago |
Commodity Funds | | |
Fidelity Series Commodity Strategy Fund Class F | 8.8 | 9.1 |
Domestic Equity Funds | | |
Fidelity Spartan Total Market Index Fund Class F | 50.7 | 50.9 |
Developed International Equity Funds | | |
Fidelity Series Global ex U.S. Index Fund | 21.6 | 21.6 |
Investment Grade Bond Funds | | |
Fidelity Spartan U.S. Bond Index Fund Class F | 18.9 | 18.4 |
Net Other Assets (Liabilities)* | 0.0 | 0.0 |
| 100.0 | 100.0 |
* Amount represents less than 0.1%
Asset Allocation (% of fund's net assets) |
Period end |
| Commodity Funds | 8.8% | |
| Domestic Equity Funds | 50.7% | |
| Developed International Equity Funds | 21.6% | |
| Investment Grade Bond Funds | 18.9% | |

Six months ago |
| Commodity Funds | 9.1% | |
| Domestic Equity Funds | 50.9% | |
| Developed International Equity Funds | 21.6% | |
| Investment Grade Bond Funds | 18.4% | |

Expected |
| Commodity Funds | 8.8% | |
| Domestic Equity Funds | 50.0% | |
| Developed International Equity Funds | 21.4% | |
| Inflation-Protected Bond Funds | 0.1% | |
| Investment Grade Bond Funds | 19.7% | |

The fund invests according to an asset allocation strategy that becomes increasingly conservative over time. The six months ago allocation is based on the fund's holdings as of September 30, 2012. The current allocation is based on the fund's holdings as of March 31, 2013. The expected allocation represents the fund's anticipated allocation at September 30, 2013. |
Annual Report
Fidelity Freedom Index 2035 Fund
Investments March 31, 2013
Showing Percentage of Net Assets
Domestic Equity Funds - 59.5% |
| Shares | | Value |
Commodity Funds - 8.8% |
Fidelity Series Commodity Strategy Fund Class F (a) | 6,954,521 | | $ 60,712,970 |
Domestic Equity Funds - 50.7% |
Fidelity Spartan Total Market Index Fund Class F | 7,623,285 | | 349,146,461 |
TOTAL DOMESTIC EQUITY FUNDS (Cost $355,681,669) |
409,859,431
|
International Equity Funds - 21.6% |
| | | |
Developed International Equity Funds - 21.6% |
Fidelity Series Global ex U.S. Index Fund
(Cost $138,568,000) | 13,336,711 | |
149,104,428
|
Bond Funds - 18.9% |
| Shares | | Value |
Investment Grade Bond Funds - 18.9% |
Fidelity Spartan U.S. Bond Index Fund Class F
(Cost $129,038,482) | 11,007,910 | | $ 130,113,491 |
TOTAL INVESTMENT PORTFOLIO - 100.0% (Cost $623,288,151) | | 689,077,350 |
NET OTHER ASSETS (LIABILITIES) - 0.0% | | (44,515) |
NET ASSETS - 100% | $ 689,032,835 |
Legend |
(a) Non-income producing |
Other Information |
All investments are categorized as Level 1 under the Fair Value Hierarchy. The inputs or methodology used for valuing securities may not be an indication of the risk associated with investing in those securities. For more information on valuation inputs, please refer to the Security Valuation section in the accompanying Notes to Financial Statements. |
See accompanying notes which are an integral part of the financial statements.
Annual Report
Fidelity Freedom Index 2035 Fund
Statement of Assets and Liabilities
| March 31, 2013 |
| | |
Assets | | |
Investment in securities, at value (cost $623,288,151) - See accompanying schedule | | $ 689,077,350 |
Cash | | 2 |
Receivable for investments sold | | 5,545,187 |
Receivable for fund shares sold | | 705,387 |
Receivable from affiliate for expense reductions | | 40,405 |
Total assets | | 695,368,331 |
| | |
Liabilities | | |
Payable for investments purchased | $ 5,648,742 | |
Payable for fund shares redeemed | 601,835 | |
Other affiliated payables | 84,919 | |
Total liabilities | | 6,335,496 |
| | |
Net Assets | | $ 689,032,835 |
Net Assets consist of: | | |
Paid in capital | | $ 625,252,907 |
Undistributed net investment income | | 504,272 |
Accumulated undistributed net realized gain (loss) on investments | | (2,513,543) |
Net unrealized appreciation (depreciation) on investments | | 65,789,199 |
Net Assets, for 51,720,936 shares outstanding | | $ 689,032,835 |
Net Asset Value, offering price and redemption price per share ($689,032,835 ÷ 51,720,936 shares) | | $ 13.32 |
Statement of Operations
| Year ended March 31, 2013 |
| | |
Investment Income | | |
Income distributions from underlying funds | | $ 10,559,464 |
| | |
Expenses | | |
Transfer agent fees | $ 794,246 | |
Independent trustees' compensation | 1,826 | |
Total expenses before reductions | 796,072 | |
Expense reductions | (329,340) | 466,732 |
Net investment income (loss) | | 10,092,732 |
Realized and Unrealized Gain (Loss) Realized gain (loss) on sale of underlying fund shares | (1,383,676) | |
Capital gain distributions from underlying funds | 928,790 | |
Total net realized gain (loss) | | (454,886) |
Change in net unrealized appreciation (depreciation) on investment securities | | 49,107,325 |
Net gain (loss) | | 48,652,439 |
Net increase (decrease) in net assets resulting from operations | | $ 58,745,171 |
See accompanying notes which are an integral part of the financial statements.
Annual Report
Fidelity Freedom Index 2035 Fund
Financial Statements - continued
Statement of Changes in Net Assets
| Year ended
March 31,
2013 | Year ended
March 31,
2012 |
Increase (Decrease) in Net Assets | | |
Operations | | |
Net investment income (loss) | $ 10,092,732 | $ 4,626,676 |
Net realized gain (loss) | (454,886) | 2,664,517 |
Change in net unrealized appreciation (depreciation) | 49,107,325 | 5,880,711 |
Net increase (decrease) in net assets resulting from operations | 58,745,171 | 13,171,904 |
Distributions to shareholders from net investment income | (9,902,085) | (4,445,640) |
Distributions to shareholders from net realized gain | (887,993) | (3,816,141) |
Total distributions | (10,790,078) | (8,261,781) |
Share transactions
Proceeds from sales of shares | 332,376,519 | 225,620,489 |
Reinvestment of distributions | 10,790,078 | 8,261,781 |
Cost of shares redeemed | (59,470,635) | (31,509,551) |
Net increase (decrease) in net assets resulting from share transactions | 283,695,962 | 202,372,719 |
Total increase (decrease) in net assets | 331,651,055 | 207,282,842 |
| | |
Net Assets | | |
Beginning of period | 357,381,780 | 150,098,938 |
End of period (including undistributed net investment income of $504,272 and undistributed net investment income of $313,625, respectively) | $ 689,032,835 | $ 357,381,780 |
Other Information Shares | | |
Sold | 26,770,366 | 18,766,314 |
Issued in reinvestment of distributions | 867,578 | 725,332 |
Redeemed | (4,741,259) | (2,635,839) |
Net increase (decrease) | 22,896,685 | 16,855,807 |
Financial Highlights
Years ended March 31, | 2013 | 2012 | 2011 | 2010 F |
Selected Per-Share Data | | | | |
Net asset value, beginning of period | $ 12.40 | $ 12.54 | $ 11.02 | $ 10.00 |
Income from Investment Operations | | | | |
Net investment income (loss) D | .24 | .23 | .21 | .03 |
Net realized and unrealized gain (loss) | .91 | (.01) E | 1.48 | 1.11 |
Total from investment operations | 1.15 | .22 | 1.69 | 1.14 |
Distributions from net investment income | (.22) | (.19) | (.15) | (.11) |
Distributions from net realized gain | (.02) | (.17) | (.03) | (.01) |
Total distributions | (.23) I | (.36) | (.17) J | (.12) |
Net asset value, end of period | $ 13.32 | $ 12.40 | $ 12.54 | $ 11.02 |
Total Return B, C | 9.44% | 2.00% | 15.46% | 11.38% |
Ratios to Average Net Assets G, H | | | | |
Expenses before reductions | .15% | .15% | .09% | .05% A |
Expenses net of fee waivers, if any | .09% | .08% | .05% | .03% A |
Expenses net of all reductions | .09% | .08% | .05% | .03% A |
Net investment income (loss) | 1.91% | 1.93% | 1.83% | .64% A |
Supplemental Data | | | | |
Net assets, end of period (000 omitted) | $ 689,033 | $ 357,382 | $ 150,099 | $ 10,728 |
Portfolio turnover rate | 8% | 15% | 12% | 23% |
A Annualized
B Total returns for periods of less than one year are not annualized.
C Total returns would have been lower if certain expenses had not been reduced during the applicable periods shown.
D Calculated based on average shares outstanding during the period.
E The amount shown for a share outstanding does not correspond with the aggregate net gain (loss) on investments for the period due to the timing of sales and repurchases of shares in relation to fluctuating market values of the investments of the Fund.
F For the period October 2, 2009 (commencement of operations) to March 31, 2010.
G Expense ratios reflect operating expenses of the Fund. Expenses before reductions do not reflect amounts reimbursed by the investment adviser or reductions from expense offset arrangements and do not represent the amount paid by the Fund during periods when reimbursements or reductions occur. Expense ratios before reductions for start-up periods may not be representative of longer term operating periods. Expenses net of fee waivers reflect expenses after reimbursement by the investment adviser but prior to reductions from expense offset arrangements. Expenses net of all reductions represent the net expenses paid by the Fund.
H Amounts do not include the activity of Underlying Funds.
I Total distributions of $.23 per share is comprised of distributions from net investment income of $.215 and distributions from net realized gain of $.019 per share.
J Total distributions of $.17 per share is comprised of distributions from net investment income of $.145 and distributions from net realized gain of $.028 per share.
See accompanying notes which are an integral part of the financial statements.
Annual Report
Fidelity Freedom Index 2040 Fund
Investment Changes (Unaudited)
The information in the following tables is based on the direct investments of the Fund. |
Fund Holdings as of March 31, 2013 |
| % of fund's
net assets | % of fund's net assets
6 months ago |
Commodity Funds | | |
Fidelity Series Commodity Strategy Fund Class F | 9.0 | 9.2 |
Domestic Equity Funds | | |
Fidelity Spartan Total Market Index Fund Class F | 51.6 | 51.5 |
Developed International Equity Funds | | |
Fidelity Series Global ex U.S. Index Fund | 22.0 | 21.9 |
Investment Grade Bond Funds | | |
Fidelity Spartan U.S. Bond Index Fund Class F | 17.4 | 17.4 |
Net Other Assets (Liabilities)* | 0.0 | 0.0 |
| 100.0 | 100.0 |
* Amount represents less than 0.1%
Asset Allocation (% of fund's net assets) |
Period end |
| Commodity Funds | 9.0% | |
| Domestic Equity Funds | 51.6% | |
| Developed International Equity Funds | 22.0% | |
| Investment Grade Bond Funds | 17.4% | |

Six months ago |
| Commodity Funds | 9.2% | |
| Domestic Equity Funds | 51.5% | |
| Developed International Equity Funds | 21.9% | |
 | Investment Grade Bond Funds | 17.4% | |

Expected |
| Commodity Funds | 9.1% | |
| Domestic Equity Funds | 51.5% | |
| Developed International Equity Funds | 22.0% | |
| Investment Grade Bond Funds | 17.4% | |

The fund invests according to an asset allocation strategy that becomes increasingly conservative over time. The six months ago allocation is based on the fund's holdings as of September 30, 2012. The current allocation is based on the fund's holdings as of March 31, 2013. The expected allocation represents the fund's anticipated allocation at September 31, 2013. |
Annual Report
Fidelity Freedom Index 2040 Fund
Investments March 31, 2013
Showing Percentage of Net Assets
Domestic Equity Funds - 60.6% |
| Shares | | Value |
Commodity Funds - 9.0% |
Fidelity Series Commodity Strategy Fund Class F (a) | 8,403,747 | | $ 73,364,708 |
Domestic Equity Funds - 51.6% |
Fidelity Spartan Total Market Index Fund Class F | 9,124,093 | | 417,883,477 |
TOTAL DOMESTIC EQUITY FUNDS (Cost $423,572,767) |
491,248,185
|
International Equity Funds - 22.0% |
| | | |
Developed International Equity Funds - 22.0% |
Fidelity Series Global ex U.S. Index Fund
(Cost $164,513,055) | 15,964,823 | |
178,486,716
|
Bond Funds - 17.4% |
| Shares | | Value |
Investment Grade Bond Funds - 17.4% |
Fidelity Spartan U.S. Bond Index Fund Class F
(Cost $139,600,646) | 11,909,164 | | $ 140,766,317 |
TOTAL INVESTMENT PORTFOLIO - 100.0% (Cost $727,686,468) | | 810,501,218 |
NET OTHER ASSETS (LIABILITIES) - 0.0% | | (51,854) |
NET ASSETS - 100% | $ 810,449,364 |
Legend |
(a) Non-income producing |
Other Information |
All investments are categorized as Level 1 under the Fair Value Hierarchy. The inputs or methodology used for valuing securities may not be an indication of the risk associated with investing in those securities. For more information on valuation inputs, please refer to the Security Valuation section in the accompanying Notes to Financial Statements. |
See accompanying notes which are an integral part of the financial statements.
Annual Report
Fidelity Freedom Index 2040 Fund
Statement of Assets and Liabilities
| March 31, 2013 |
| | |
Assets | | |
Investment in securities, at value (cost $727,686,468) - See accompanying schedule | | $ 810,501,218 |
Cash | | 3 |
Receivable for investments sold | | 6,021,951 |
Receivable for fund shares sold | | 1,144,961 |
Receivable from affiliate for expense reductions | | 48,058 |
Total assets | | 817,716,191 |
| | |
Liabilities | | |
Payable for investments purchased | $ 6,803,364 | |
Payable for fund shares redeemed | 363,550 | |
Other affiliated payables | 99,913 | |
Total liabilities | | 7,266,827 |
| | |
Net Assets | | $ 810,449,364 |
Net Assets consist of: | | |
Paid in capital | | $ 730,220,604 |
Undistributed net investment income | | 498,853 |
Accumulated undistributed net realized gain (loss) on investments | | (3,084,843) |
Net unrealized appreciation (depreciation) on investments | | 82,814,750 |
Net Assets, for 60,685,086 shares outstanding | | $ 810,449,364 |
Net Asset Value, offering price and redemption price per share ($810,449,364 ÷ 60,685,086 shares) | | $ 13.36 |
Statement of Operations
| Year ended March 31, 2013 |
| | |
Investment Income | | |
Income distributions from underlying funds | | $ 12,358,964 |
| | |
Expenses | | |
Transfer agent fees | $ 919,741 | |
Independent trustees' compensation | 2,108 | |
Total expenses before reductions | 921,849 | |
Expense reductions | (379,092) | 542,757 |
Net investment income (loss) | | 11,816,207 |
Realized and Unrealized Gain (Loss) Realized gain (loss) on sale of underlying fund shares | (1,650,682) | |
Capital gain distributions from underlying funds | 1,046,089 | |
Total net realized gain (loss) | | (604,593) |
Change in net unrealized appreciation (depreciation) on investment securities | | 60,336,914 |
Net gain (loss) | | 59,732,321 |
Net increase (decrease) in net assets resulting from operations | | $ 71,548,528 |
See accompanying notes which are an integral part of the financial statements.
Annual Report
Fidelity Freedom Index 2040 Fund
Financial Statements - continued
Statement of Changes in Net Assets
| Year ended
March 31,
2013 | Year ended
March 31,
2012 |
Increase (Decrease) in Net Assets | | |
Operations | | |
Net investment income (loss) | $ 11,816,207 | $ 5,363,712 |
Net realized gain (loss) | (604,593) | 3,223,262 |
Change in net unrealized appreciation (depreciation) | 60,336,914 | 6,132,596 |
Net increase (decrease) in net assets resulting from operations | 71,548,528 | 14,719,570 |
Distributions to shareholders from net investment income | (11,638,431) | (5,208,574) |
Distributions to shareholders from net realized gain | (1,086,469) | (4,616,980) |
Total distributions | (12,724,900) | (9,825,554) |
Share transactions
Proceeds from sales of shares | 409,401,579 | 259,900,679 |
Reinvestment of distributions | 12,724,900 | 9,825,554 |
Cost of shares redeemed | (79,800,351) | (39,484,845) |
Net increase (decrease) in net assets resulting from share transactions | 342,326,128 | 230,241,388 |
Total increase (decrease) in net assets | 401,149,756 | 235,135,404 |
| | |
Net Assets | | |
Beginning of period | 409,299,608 | 174,164,204 |
End of period (including undistributed net investment income of $498,853 and undistributed net investment income of $321,077, respectively) | $ 810,449,364 | $ 409,299,608 |
Other Information Shares | | |
Sold | 33,057,917 | 21,553,328 |
Issued in reinvestment of distributions | 1,021,451 | 861,522 |
Redeemed | (6,356,433) | (3,299,673) |
Net increase (decrease) | 27,722,935 | 19,115,177 |
Financial Highlights
Years ended March 31, | 2013 | 2012 | 2011 | 2010 F |
Selected Per-Share Data | | | | |
Net asset value, beginning of period | $ 12.42 | $ 12.58 | $ 11.04 | $ 10.00 |
Income from Investment Operations | | | | |
Net investment income (loss) D | .24 | .23 | .21 | .03 |
Net realized and unrealized gain (loss) | .93 | (.02) E | 1.50 | 1.13 |
Total from investment operations | 1.17 | .21 | 1.71 | 1.16 |
Distributions from net investment income | (.21) | (.20) | (.15) | (.11) |
Distributions from net realized gain | (.02) | (.17) | (.03) | (.01) |
Total distributions | (.23) | (.37) | (.17) I | (.12) |
Net asset value, end of period | $ 13.36 | $ 12.42 | $ 12.58 | $ 11.04 |
Total Return B, C | 9.59% | 1.92% | 15.59% | 11.58% |
Ratios to Average Net Assets G, H | | | | |
Expenses before reductions | .15% | .15% | .08% | .05% A |
Expenses net of fee waivers, if any | .09% | .08% | .05% | .03% A |
Expenses net of all reductions | .09% | .08% | .05% | .03% A |
Net investment income (loss) | 1.93% | 1.91% | 1.80% | .56% A |
Supplemental Data | | | | |
Net assets, end of period (000 omitted) | $ 810,449 | $ 409,300 | $ 174,164 | $ 16,259 |
Portfolio turnover rate | 8% | 16% | 13% | 22% |
A Annualized
B Total returns for periods of less than one year are not annualized.
C Total returns would have been lower if certain expenses had not been reduced during the applicable periods shown.
D Calculated based on average shares outstanding during the period.
E The amount shown for a share outstanding does not correspond with the aggregate net gain (loss) on investments for the period due to the timing of sales and repurchases of shares in relation to fluctuating market values of the investments of the Fund.
F For the period October 2, 2009 (commencement of operations) to March 31, 2010.
G Expense ratios reflect operating expenses of the Fund. Expenses before reductions do not reflect amounts reimbursed by the investment adviser or reductions from expense offset arrangements and do not represent the amount paid by the Fund during periods when reimbursements or reductions occur. Expense ratios before reductions for start-up periods may not be representative of longer term operating periods. Expenses net of fee waivers reflect expenses after reimbursement by the investment adviser but prior to reductions from expense offset arrangements. Expenses net of all reductions represent the net expenses paid by the Fund.
H Amounts do not include the activity of Underlying Funds.
I Total distributions of $.17 per share is comprised of distributions from net investment income of $.145 and distributions from net realized gain of $.027 per share.
See accompanying notes which are an integral part of the financial statements.
Annual Report
Fidelity Freedom Index 2045 Fund
Investment Changes (Unaudited)
The information in the following tables is based on the direct investments of the Fund. |
Fund Holdings as of March 31, 2013 |
| % of fund's
net assets | % of fund's net assets
6 months ago |
Commodity Funds | | |
Fidelity Series Commodity Strategy Fund Class F | 9.3 | 9.5 |
Domestic Equity Funds | | |
Fidelity Spartan Total Market Index Fund Class F | 52.9 | 52.8 |
Developed International Equity Funds | | |
Fidelity Series Global ex U.S. Index Fund | 22.6 | 22.5 |
Investment Grade Bond Funds | | |
Fidelity Spartan U.S. Bond Index Fund Class F | 15.2 | 15.2 |
Net Other Assets (Liabilities)* | 0.0 | 0.0 |
| 100.0 | 100.0 |
* Amount represents less than 0.1%
Asset Allocation (% of fund's net assets) |
Period end |
| Commodity Funds | 9.3% | |
| Domestic Equity Funds | 52.9% | |
| Developed International Equity Funds | 22.6% | |
| Investment Grade Bond Funds | 15.2% | |

Six months ago |
| Commodity Funds | 9.5% | |
| Domestic Equity Funds | 52.8% | |
| Developed International Equity Funds | 22.5% | |
| Investment Grade Bond Funds | 15.2% | |

Expected |
| Commodity Funds | 9.3% | |
| Domestic Equity Funds | 52.7% | |
| Developed International Equity Funds | 22.6% | |
| Investment Grade Bond Funds | 15.4% | |

The fund invests according to an asset allocation strategy that becomes increasingly conservative over time. The six months ago allocation is based on the fund's holdings as of September 30, 2012. The current allocation is based on the fund's holdings as of March 31, 2013. The expected allocation represents the fund's anticipated allocation at September 30, 2013. |
Annual Report
Fidelity Freedom Index 2045 Fund
Investments March 31, 2013
Showing Percentage of Net Assets
Domestic Equity Funds - 62.2% |
| Shares | | Value |
Commodity Funds - 9.3% |
Fidelity Series Commodity Strategy Fund Class F (a) | 4,036,880 | | $ 35,241,966 |
Domestic Equity Funds - 52.9% |
Fidelity Spartan Total Market Index Fund Class F | 4,394,839 | | 201,283,646 |
TOTAL DOMESTIC EQUITY FUNDS (Cost $207,296,686) |
236,525,612
|
International Equity Funds - 22.6% |
| | | |
Developed International Equity Funds - 22.6% |
Fidelity Series Global ex U.S. Index Fund
(Cost $80,038,190) | 7,689,709 | |
85,970,942
|
Bond Funds - 15.2% |
| Shares | | Value |
Investment Grade Bond Funds - 15.2% |
Fidelity Spartan U.S. Bond Index Fund Class F
(Cost $57,647,545) | 4,906,353 | | $ 57,993,087 |
TOTAL INVESTMENT PORTFOLIO - 100.0% (Cost $344,982,421) | | 380,489,641 |
NET OTHER ASSETS (LIABILITIES) - 0.0% | | (23,741) |
NET ASSETS - 100% | $ 380,465,900 |
Legend |
(a) Non-income producing |
Other Information |
All investments are categorized as Level 1 under the Fair Value Hierarchy. The inputs or methodology used for valuing securities may not be an indication of the risk associated with investing in those securities. For more information on valuation inputs, please refer to the Security Valuation section in the accompanying Notes to Financial Statements. |
See accompanying notes which are an integral part of the financial statements.
Annual Report
Fidelity Freedom Index 2045 Fund
Statement of Assets and Liabilities
| March 31, 2013 |
| | |
Assets | | |
Investment in securities, at value (cost $344,982,421) - See accompanying schedule | | $ 380,489,641 |
Cash | | 2 |
Receivable for investments sold | | 2,835,448 |
Receivable for fund shares sold | | 659,019 |
Receivable from affiliate for expense reductions | | 22,967 |
Total assets | | 384,007,077 |
| | |
Liabilities | | |
Payable for investments purchased | $ 3,126,575 | |
Payable for fund shares redeemed | 367,890 | |
Other affiliated payables | 46,712 | |
Total liabilities | | 3,541,177 |
| | |
Net Assets | | $ 380,465,900 |
Net Assets consist of: | | |
Paid in capital | | $ 346,120,153 |
Undistributed net investment income | | 196,419 |
Accumulated undistributed net realized gain (loss) on investments | | (1,357,892) |
Net unrealized appreciation (depreciation) on investments | | 35,507,220 |
Net Assets, for 28,317,893 shares outstanding | | $ 380,465,900 |
Net Asset Value, offering price and redemption price per share ($380,465,900 ÷ 28,317,893 shares) | | $ 13.44 |
Statement of Operations
| Year ended March 31, 2013 |
| | |
Investment Income | | |
Income distributions from underlying funds | | $ 5,528,254 |
| | |
Expenses | | |
Transfer agent fees | $ 409,403 | |
Independent trustees' compensation | 933 | |
Total expenses before reductions | 410,336 | |
Expense reductions | (171,059) | 239,277 |
Net investment income (loss) | | 5,288,977 |
Realized and Unrealized Gain (Loss) Realized gain (loss) on sale of underlying fund shares | (781,375) | |
Capital gain distributions from underlying funds | 418,678 | |
Total net realized gain (loss) | | (362,697) |
Change in net unrealized appreciation (depreciation) on investment securities | | 27,209,990 |
Net gain (loss) | | 26,847,293 |
Net increase (decrease) in net assets resulting from operations | | $ 32,136,270 |
See accompanying notes which are an integral part of the financial statements.
Annual Report
Fidelity Freedom Index 2045 Fund
Financial Statements - continued
Statement of Changes in Net Assets
| Year ended
March 31,
2013 | Year ended
March 31,
2012 |
Increase (Decrease) in Net Assets | | |
Operations | | |
Net investment income (loss) | $ 5,288,977 | $ 2,114,321 |
Net realized gain (loss) | (362,697) | 1,182,797 |
Change in net unrealized appreciation (depreciation) | 27,209,990 | 3,989,101 |
Net increase (decrease) in net assets resulting from operations | 32,136,270 | 7,286,219 |
Distributions to shareholders from net investment income | (5,205,081) | (2,045,537) |
Distributions to shareholders from net realized gain | (420,754) | (1,751,052) |
Total distributions | (5,625,835) | (3,796,589) |
Share transactions
Proceeds from sales of shares | 206,739,422 | 135,671,559 |
Reinvestment of distributions | 5,625,835 | 3,796,589 |
Cost of shares redeemed | (37,291,170) | (17,623,137) |
Net increase (decrease) in net assets resulting from share transactions | 175,074,087 | 121,845,011 |
Total increase (decrease) in net assets | 201,584,522 | 125,334,641 |
| | |
Net Assets | | |
Beginning of period | 178,881,378 | 53,546,737 |
End of period (including undistributed net investment income of $196,419 and undistributed net investment income of $112,523, respectively) | $ 380,465,900 | $ 178,881,378 |
Other Information Shares | | |
Sold | 16,481,838 | 11,245,414 |
Issued in reinvestment of distributions | 449,676 | 332,359 |
Redeemed | (2,956,898) | (1,475,649) |
Net increase (decrease) | 13,974,616 | 10,102,124 |
Financial Highlights
Years ended March 31, | 2013 | 2012 | 2011 | 2010 F |
Selected Per-Share Data | | | | |
Net asset value, beginning of period | $ 12.47 | $ 12.63 | $ 11.05 | $ 10.00 |
Income from Investment Operations | | | | |
Net investment income (loss) D | .25 | .23 | .21 | .03 |
Net realized and unrealized gain (loss) | .95 | (.04) E | 1.54 | 1.14 |
Total from investment operations | 1.20 | .19 | 1.75 | 1.17 |
Distributions from net investment income | (.21) | (.19) | (.14) | (.11) |
Distributions from net realized gain | (.02) | (.16) | (.03) | (.01) |
Total distributions | (.23) | (.35) | (.17) | (.12) |
Net asset value, end of period | $ 13.44 | $ 12.47 | $ 12.63 | $ 11.05 |
Total Return B, C | 9.76% | 1.74% | 15.91% | 11.68% |
Ratios to Average Net Assets G, H | | | | |
Expenses before reductions | .15% | .15% | .09% | .05% A |
Expenses net of fee waivers, if any | .09% | .09% | .05% | .04% A |
Expenses net of all reductions | .09% | .09% | .05% | .04% A |
Net investment income (loss) | 1.95% | 1.94% | 1.83% | .67% A |
Supplemental Data | | | | |
Net assets, end of period (000 omitted) | $ 380,466 | $ 178,881 | $ 53,547 | $ 4,213 |
Portfolio turnover rate | 7% | 15% | 11% | 24% |
A Annualized
B Total returns for periods of less than one year are not annualized.
C Total returns would have been lower if certain expenses had not been reduced during the applicable periods shown.
D Calculated based on average shares outstanding during the period.
E The amount shown for a share outstanding does not correspond with the aggregate net gain (loss) on investments for the period due to the timing of sales and repurchases of shares in relation to fluctuating market values of the investments of the Fund.
F For the period October 2, 2009 (commencement of operations) to March 31, 2010.
G Expense ratios reflect operating expenses of the Fund. Expenses before reductions do not reflect amounts reimbursed by the investment adviser or reductions from expense offset arrangements and do not represent the amount paid by the Fund during periods when reimbursements or reductions occur. Expense ratios before reductions for start-up periods may not be representative of longer term operating periods. Expenses net of fee waivers reflect expenses after reimbursement by the investment adviser but prior to reductions from expense offset arrangements. Expenses net of all reductions represent the net expenses paid by the Fund.
H Amounts do not include the activity of Underlying Funds.
See accompanying notes which are an integral part of the financial statements.
Annual Report
Fidelity Freedom Index 2050 Fund
Investment Changes (Unaudited)
The information in the following tables is based on the direct investments of the Fund. |
Fund Holdings as of March 31, 2013 |
| % of fund's
net assets | % of fund's net assets
6 months ago |
Commodity Funds | | |
Fidelity Series Commodity Strategy Fund Class F | 9.4 | 9.6 |
Domestic Equity Funds | | |
Fidelity Spartan Total Market Index Fund Class F | 53.5 | 53.9 |
Developed International Equity Funds | | |
Fidelity Series Global ex U.S. Index Fund | 22.9 | 22.9 |
Investment Grade Bond Funds | | |
Fidelity Spartan U.S. Bond Index Fund Class F | 14.2 | 13.6 |
Net Other Assets (Liabilities)* | 0.0 | 0.0 |
| 100.0 | 100.0 |
* Amount represents less than 0.1%
Asset Allocation (% of fund's net assets) |
Period end |
| Commodity Funds | 9.4% | |
| Domestic Equity Funds | 53.5% | |
| Developed International Equity Funds | 22.9% | |
| Investment Grade Bond Funds | 14.2% | |

Six months ago |
| Commodity Funds | 9.6% | |
| Domestic Equity Funds | 53.9% | |
| Developed International Equity Funds | 22.9% | |
| Investment Grade Bond Funds | 13.6% | |

Expected |
| Commodity Funds | 9.4% | |
| Domestic Equity Funds | 53.1% | |
| Developed International Equity Funds | 22.8% | |
| Investment Grade Bond Funds | 14.7% | |

The fund invests according to an asset allocation strategy that becomes increasingly conservative over time. The six months ago allocation is based on the fund's holdings as of September 30, 2012. The current allocation is based on the fund's holdings as of March 31, 2013. The expected allocation represents the fund's anticipated allocation at September 30, 2013. |
Annual Report
Fidelity Freedom Index 2050 Fund
Investments March 31, 2013
Showing Percentage of Net Assets
Domestic Equity Funds - 62.9% |
| Shares | | Value |
Commodity Funds - 9.4% |
Fidelity Series Commodity Strategy Fund Class F (a) | 3,515,241 | | $ 30,688,057 |
Domestic Equity Funds - 53.5% |
Fidelity Spartan Total Market Index Fund Class F | 3,811,624 | | 174,572,370 |
TOTAL DOMESTIC EQUITY FUNDS (Cost $180,401,364) |
205,260,427
|
International Equity Funds - 22.9% |
| | | |
Developed International Equity Funds - 22.9% |
Fidelity Series Global ex U.S. Index Fund
(Cost $69,410,898) | 6,675,553 | |
74,632,682
|
Bond Funds - 14.2% |
| Shares | | Value |
Investment Grade Bond Funds - 14.2% |
Fidelity Spartan U.S. Bond Index Fund Class F
(Cost $46,223,878) | 3,921,118 | | $ 46,347,615 |
TOTAL INVESTMENT PORTFOLIO - 100.0% (Cost $296,036,140) | | 326,240,724 |
NET OTHER ASSETS (LIABILITIES) - 0.0% | | (19,972) |
NET ASSETS - 100% | $ 326,220,752 |
Legend |
(a) Non-income producing |
Other Information |
All investments are categorized as Level 1 under the Fair Value Hierarchy. The inputs or methodology used for valuing securities may not be an indication of the risk associated with investing in those securities. For more information on valuation inputs, please refer to the Security Valuation section in the accompanying Notes to Financial Statements. |
See accompanying notes which are an integral part of the financial statements.
Annual Report
Fidelity Freedom Index 2050 Fund
Statement of Assets and Liabilities
| March 31, 2013 |
| | |
Assets | | |
Investment in securities, at value (cost $296,036,140) - See accompanying schedule | | $ 326,240,724 |
Cash | | 2 |
Receivable for investments sold | | 2,570,089 |
Receivable for fund shares sold | | 673,629 |
Receivable from affiliate for expense reductions | | 19,946 |
Total assets | | 329,504,390 |
| | |
Liabilities | | |
Payable for investments purchased | $ 3,079,068 | |
Payable for fund shares redeemed | 164,652 | |
Other affiliated payables | 39,918 | |
Total liabilities | | 3,283,638 |
| | |
Net Assets | | $ 326,220,752 |
Net Assets consist of: | | |
Paid in capital | | $ 297,049,618 |
Undistributed net investment income | | 145,129 |
Accumulated undistributed net realized gain (loss) on investments | | (1,178,579) |
Net unrealized appreciation (depreciation) on investments | | 30,204,584 |
Net Assets, for 24,148,715 shares outstanding | | $ 326,220,752 |
Net Asset Value, offering price and redemption price per share ($326,220,752 ÷ 24,148,715 shares) | | $ 13.51 |
Statement of Operations
| Year ended March 31, 2013 |
| | |
Investment Income | | |
Income distributions from underlying funds | | $ 4,610,266 |
| | |
Expenses | | |
Transfer agent fees | $ 330,737 | |
Independent trustees' compensation | 747 | |
Total expenses before reductions | 331,484 | |
Expense reductions | (137,309) | 194,175 |
Net investment income (loss) | | 4,416,091 |
Realized and Unrealized Gain (Loss) Realized gain (loss) on sale of underlying fund shares | (709,964) | |
Capital gain distributions from underlying funds | 312,847 | |
Total net realized gain (loss) | | (397,117) |
Change in net unrealized appreciation (depreciation) on investment securities | | 23,614,291 |
Net gain (loss) | | 23,217,174 |
Net increase (decrease) in net assets resulting from operations | | $ 27,633,265 |
See accompanying notes which are an integral part of the financial statements.
Annual Report
Fidelity Freedom Index 2050 Fund
Financial Statements - continued
Statement of Changes in Net Assets
| Year ended
March 31,
2013 | Year ended
March 31,
2012 |
Increase (Decrease) in Net Assets | | |
Operations | | |
Net investment income (loss) | $ 4,416,091 | $ 1,572,594 |
Net realized gain (loss) | (397,117) | 890,227 |
Change in net unrealized appreciation (depreciation) | 23,614,291 | 3,172,660 |
Net increase (decrease) in net assets resulting from operations | 27,633,265 | 5,635,481 |
Distributions to shareholders from net investment income | (4,334,959) | (1,517,162) |
Distributions to shareholders from net realized gain | (315,418) | (1,363,980) |
Total distributions | (4,650,377) | (2,881,142) |
Share transactions
Proceeds from sales of shares | 193,560,408 | 114,576,873 |
Reinvestment of distributions | 4,650,377 | 2,881,142 |
Cost of shares redeemed | (35,627,910) | (16,315,643) |
Net increase (decrease) in net assets resulting from share transactions | 162,582,875 | 101,142,372 |
Total increase (decrease) in net assets | 185,565,763 | 103,896,711 |
| | |
Net Assets | | |
Beginning of period | 140,654,989 | 36,758,278 |
End of period (including undistributed net investment income of $145,129 and undistributed net investment income of $63,997, respectively) | $ 326,220,752 | $ 140,654,989 |
Other Information Shares | | |
Sold | 15,362,337 | 9,444,552 |
Issued in reinvestment of distributions | 370,270 | 251,918 |
Redeemed | (2,810,438) | (1,357,568) |
Net increase (decrease) | 12,922,169 | 8,338,902 |
Financial Highlights
Years ended March 31, | 2013 | 2012 | 2011 | 2010 F |
Selected Per-Share Data | | | | |
Net asset value, beginning of period | $ 12.53 | $ 12.73 | $ 11.10 | $ 10.00 |
Income from Investment Operations | | | | |
Net investment income (loss) D | .25 | .23 | .20 | .04 |
Net realized and unrealized gain (loss) | .95 | (.09) E | 1.59 | 1.18 |
Total from investment operations | 1.20 | .14 | 1.79 | 1.22 |
Distributions from net investment income | (.21) | (.18) | (.14) | (.11) |
Distributions from net realized gain | (.02) | (.16) | (.02) | (.01) |
Total distributions | (.22) I | (.34) | (.16) | (.12) |
Net asset value, end of period | $ 13.51 | $ 12.53 | $ 12.73 | $ 11.10 |
Total Return B, C | 9.75% | 1.39% | 16.19% | 12.18% |
Ratios to Average Net Assets G, H | | | | |
Expenses before reductions | .15% | .15% | .08% | .05% A |
Expenses net of fee waivers, if any | .09% | .08% | .05% | .04% A |
Expenses net of all reductions | .09% | .08% | .05% | .04% A |
Net investment income (loss) | 2.02% | 1.89% | 1.72% | .81% A |
Supplemental Data | | | | |
Net assets, end of period (000 omitted) | $ 326,221 | $ 140,655 | $ 36,758 | $ 1,638 |
Portfolio turnover rate | 8% | 15% | 11% | 19% |
A Annualized
B Total returns for periods of less than one year are not annualized.
C Total returns would have been lower if certain expenses had not been reduced during the applicable periods shown.
D Calculated based on average shares outstanding during the period.
E The amount shown for a share outstanding does not correspond with the aggregate net gain (loss) on investments for the period due to the timing of sales and repurchases of shares in relation to fluctuating market values of the investments of the Fund.
F For the period October 2, 2009 (commencement of operations) to March 31, 2010.
G Expense ratios reflect operating expenses of the Fund. Expenses before reductions do not reflect amounts reimbursed by the investment adviser or reductions from expense offset arrangements and do not represent the amount paid by the Fund during periods when reimbursements or reductions occur. Expense ratios before reductions for start-up periods may not be representative of longer term operating periods. Expenses net of fee waivers reflect expenses after reimbursement by the investment adviser but prior to reductions from expense offset arrangements. Expenses net of all reductions represent the net expenses paid by the Fund.
H Amounts do not include the activity of Underlying Funds.
I Total distributions of $.22 per share is comprised of distributions from net investment income of $.209 and distributions from net realized gain of $.015 per share.
See accompanying notes which are an integral part of the financial statements.
Annual Report
Fidelity Freedom Index 2055 Fund
Investment Changes (Unaudited)
The information in the following tables is based on the direct investments of the Fund. |
Fund Holdings as of March 31, 2013 |
| % of fund's
net assets | % of fund's net assets
6 months ago |
Commodity Funds | | |
Fidelity Series Commodity Strategy Fund Class F | 9.9 | 10.0 |
Domestic Equity Funds | | |
Fidelity Spartan Total Market Index Fund Class F | 55.8 | 55.8 |
Developed International Equity Funds | | |
Fidelity Series Global ex U.S. Index Fund | 23.9 | 23.8 |
Investment Grade Bond Funds | | |
Fidelity Spartan U.S. Bond Index Fund Class F | 10.4 | 10.4 |
Net Other Assets (Liabilities)* | 0.0 | 0.0 |
| 100.0 | 100.0 |
* Amount represents less than 0.1%
Asset Allocation (% of fund's net assets) |
Period end |
| Commodity Funds | 9.9% | |
| Domestic Equity Funds | 55.8% | |
| Developed International Equity Funds | 23.9% | |
| Investment Grade Bond Funds | 10.4% | |

Six months ago |
| Commodity Funds | 10.0% | |
| Domestic Equity Funds | 55.8% | |
| Developed International Equity Funds | 23.8% | |
| Investment Grade Bond Funds | 10.4% | |

Expected |
| Commodity Funds | 9.8% | |
| Domestic Equity Funds | 55.8% | |
| Developed International Equity Funds | 23.9% | |
| Investment Grade Bond Funds | 10.5% | |

The fund invests according to an asset allocation strategy that becomes increasingly conservative over time. The six months ago allocation is based on the fund's holdings as of September 30, 2012. The current allocation is based on the fund's holdings as of March 31, 2013. The expected allocation represents the fund's anticipated allocation at September 30, 2013. |
Annual Report
Fidelity Freedom Index 2055 Fund
Investments March 31, 2013
Showing Percentage of Net Assets
Domestic Equity Funds - 65.7% |
| Shares | | Value |
Commodity Funds - 9.9% |
Fidelity Series Commodity Strategy Fund Class F (a) | 340,826 | | $ 2,975,408 |
Domestic Equity Funds - 55.8% |
Fidelity Spartan Total Market Index Fund Class F | 368,158 | | 16,861,654 |
TOTAL DOMESTIC EQUITY FUNDS (Cost $18,109,040) |
19,837,062
|
International Equity Funds - 23.9% |
| | | |
Developed International Equity Funds - 23.9% |
Fidelity Series Global ex U.S. Index Fund
(Cost $6,921,994) | 646,293 | |
7,225,560
|
Bond Funds - 10.4% |
| Shares | | Value |
Investment Grade Bond Funds - 10.4% |
Fidelity Spartan U.S. Bond Index Fund Class F
(Cost $3,147,337) | 266,038 | | $ 3,144,569 |
TOTAL INVESTMENT PORTFOLIO - 100.0% (Cost $28,178,371) | | 30,207,191 |
NET OTHER ASSETS (LIABILITIES) - 0.0% | | (1,744) |
NET ASSETS - 100% | $ 30,205,447 |
Legend |
(a) Non-income producing |
Other Information |
All investments are categorized as Level 1 under the Fair Value Hierarchy. The inputs or methodology used for valuing securities may not be an indication of the risk associated with investing in those securities. For more information on valuation inputs, please refer to the Security Valuation section in the accompanying Notes to Financial Statements. |
See accompanying notes which are an integral part of the financial statements.
Annual Report
Fidelity Freedom Index 2055 Fund
Statement of Assets and Liabilities
| March 31, 2013 |
| | |
Assets | | |
Investment in securities, at value (cost $28,178,371) - See accompanying schedule | | $ 30,207,191 |
Receivable for investments sold | | 190,317 |
Receivable for fund shares sold | | 127,711 |
Receivable from affiliate for expense reductions | | 1,853 |
Total assets | | 30,527,072 |
| | |
Liabilities | | |
Payable for investments purchased | $ 309,441 | |
Payable for fund shares redeemed | 8,586 | |
Other affiliated payables | 3,598 | |
Total liabilities | | 321,625 |
| | |
Net Assets | | $ 30,205,447 |
Net Assets consist of: | | |
Paid in capital | | $ 28,269,273 |
Undistributed net investment income | | 6,223 |
Accumulated undistributed net realized gain (loss) on investments | | (98,869) |
Net unrealized appreciation (depreciation) on investments | | 2,028,820 |
Net Assets, for 2,831,137 shares outstanding | | $ 30,205,447 |
Net Asset Value, offering price and redemption price per share ($30,205,447 ÷ 2,831,137 shares) | | $ 10.67 |
Statement of Operations
| Year ended March 31, 2013 |
| | |
Investment Income | | |
Income distributions from underlying funds | | $ 336,841 |
| | |
Expenses | | |
Transfer agent fees | $ 23,758 | |
Independent trustees' compensation | 52 | |
Total expenses before reductions | 23,810 | |
Expense reductions | (9,221) | 14,589 |
Net investment income (loss) | | 322,252 |
Realized and Unrealized Gain (Loss) Realized gain (loss) on sale of underlying fund shares | (81,874) | |
Capital gain distributions from underlying funds | 18,331 | |
Total net realized gain (loss) | | (63,543) |
Change in net unrealized appreciation (depreciation) on investment securities | | 1,945,207 |
Net gain (loss) | | 1,881,664 |
Net increase (decrease) in net assets resulting from operations | | $ 2,203,916 |
See accompanying notes which are an integral part of the financial statements.
Annual Report
Fidelity Freedom Index 2055 Fund
Financial Statements - continued
Statement of Changes in Net Assets
| Year ended
March 31,
2013 | For the period
June 1, 2011
(commencement of operations) to March 31, 2012 |
Increase (Decrease) in Net Assets | | |
Operations | | |
Net investment income (loss) | $ 322,252 | $ 82,665 |
Net realized gain (loss) | (63,543) | 69,493 |
Change in net unrealized appreciation (depreciation) | 1,945,207 | 83,613 |
Net increase (decrease) in net assets resulting from operations | 2,203,916 | 235,771 |
Distributions to shareholders from net investment income | (318,679) | (79,792) |
Distributions to shareholders from net realized gain | (20,452) | (84,591) |
Total distributions | (339,131) | (164,383) |
Share transactions
Proceeds from sales of shares | 31,041,974 | 7,938,066 |
Reinvestment of distributions | 339,131 | 164,383 |
Cost of shares redeemed | (10,971,866) | (242,414) |
Net increase (decrease) in net assets resulting from share transactions | 20,409,239 | 7,860,035 |
Total increase (decrease) in net assets | 22,274,024 | 7,931,423 |
| | |
Net Assets | | |
Beginning of period | 7,931,423 | - |
End of period (including undistributed net investment income of $6,223 and undistributed net investment income of $2,649, respectively) | $ 30,205,447 | $ 7,931,423 |
Other Information Shares | | |
Sold | 3,087,682 | 811,446 |
Issued in reinvestment of distributions | 34,273 | 18,326 |
Redeemed | (1,095,160) | (25,430) |
Net increase (decrease) | 2,026,795 | 804,342 |
Financial Highlights
Years ended March 31, | 2013 | 2012 F |
Selected Per-Share Data | | |
Net asset value, beginning of period | $ 9.86 | $ 10.00 |
Income from Investment Operations | | |
Net investment income (loss) D | .21 | .14 |
Net realized and unrealized gain (loss) | .77 | (.01) E |
Total from investment operations | .98 | .13 |
Distributions from net investment income | (.16) | (.13) |
Distributions from net realized gain | (.01) | (.14) |
Total distributions | (.17) | (.27) |
Net asset value, end of period | $ 10.67 | $ 9.86 |
Total Return B, C | 10.05% | 1.61% |
Ratios to Average Net Assets G, H | | |
Expenses before reductions | .15% | .15% A |
Expenses net of fee waivers, if any | .09% | .07% A |
Expenses net of all reductions | .09% | .07% A |
Net investment income (loss) | 2.06% | 1.82% A |
Supplemental Data | | |
Net assets, end of period (000 omitted) | $ 30,205 | $ 7,931 |
Portfolio turnover rate | 19% | 14% A |
A Annualized
B Total returns for periods of less than one year are not annualized.
C Total returns would have been lower if certain expenses had not been reduced during the applicable periods shown.
D Calculated based on average shares outstanding during the period.
E The amount shown for a share outstanding does not correspond with the aggregate net gain (loss) on investments for the period due to the timing of sales and repurchases of shares in relation to fluctuating market values of the investments of the Fund.
F For the period June 1, 2011 (commencement of operations) to March 31, 2012.
G Expense ratios reflect operating expenses of the Fund. Expenses before reductions do not reflect amounts reimbursed by the investment adviser or reductions from expense offset arrangements and do not represent the amount paid by the Fund during periods when reimbursements or reductions occur. Expense ratios before reductions for start-up periods may not be representative of longer term operating periods. Expenses net of fee waivers reflect expenses after reimbursement by the investment adviser but prior to reductions from expense offset arrangements. Expenses net of all reductions represent the net expenses paid by the Fund.
H Amounts do not include the activity of Underlying Funds.
See accompanying notes which are an integral part of the financial statements.
Annual Report
Notes to Financial Statements
For the period ended March 31, 2013
1. Organization.
Fidelity Freedom Index Income Fund, Fidelity Freedom Index 2000 Fund, Fidelity Freedom Index 2005 Fund, Fidelity Freedom Index 2010 Fund, Fidelity Freedom Index 2015 Fund, Fidelity Freedom Index 2020 Fund, Fidelity Freedom Index 2025 Fund, Fidelity Freedom Index 2030 Fund, Fidelity Freedom Index 2035 Fund, Fidelity Freedom Index 2040 Fund, Fidelity Freedom Index 2045 Fund, Fidelity Freedom Index 2050 Fund and Fidelity Freedom Index 2055 Fund (the Funds) are funds of Fidelity Aberdeen Street Trust (the Trust). The Trust is registered under the Investment Company Act of 1940, as amended (the 1940 Act), as an open-end management investment company organized as a Delaware statutory trust. Each Fund is authorized to issue an unlimited number of shares. The Funds invest primarily in a combination of other Fidelity equity, bond, and short-term funds (the Underlying Funds) managed by Fidelity Management & Research Company (FMR).
2. Significant Accounting Policies.
The financial statements have been prepared in conformity with accounting principles generally accepted in the United States of America (GAAP), which require management to make certain estimates and assumptions at the date of the financial statements. Actual results could differ from those estimates. Subsequent events, if any, through the date that the financial statements were issued have been evaluated in the preparation of the financial statements. The following summarizes the significant accounting policies of the Funds:
Security Valuation. Investments are valued as of 4:00 p.m. Eastern time on the last calendar day of the period. Each Fund categorizes the inputs to valuation techniques used to value its investments into a disclosure hierarchy consisting of three levels as shown below:
Level 1 - quoted prices in active markets for identical investments
Level 2 - other significant observable inputs (including quoted prices for similar investments, interest rates, prepayment speeds, etc.)
Level 3 - unobservable inputs (including the Fund's own assumptions based on the best information available)
Valuation techniques used to value each Fund's investments by major category are as follows. Investments in the Underlying Funds are valued at their closing net asset value (NAV) each business day and are categorized as Level 1 in the hierarchy.
Investment Transactions and Income. For financial reporting purposes, the Funds' investment holdings and NAV include trades executed through the end of the last business day of the period. The NAV per share for processing shareholder transactions is calculated as of the close of business of the New York Stock Exchange (NYSE), normally 4:00 p.m. Eastern time and includes trades executed through the end of the prior business day. Gains and losses on securities sold are determined on the basis of identified cost. Income and capital gain distributions from the Underlying Funds, if any, are recorded on the ex-dividend date.
Expenses. Expenses directly attributable to a fund are charged to that fund. Expenses attributable to more than one fund are allocated among the respective funds on the basis of relative net assets or other appropriate methods. Expenses included in the accompanying financial statements reflect the expenses of each Fund and do not include any expenses associated with the Underlying Funds. Expense estimates are accrued in the period to which they relate and adjustments are made when actual amounts are known.
Income Tax Information and Distributions to Shareholders. Each year, each Fund intends to qualify as a regulated investment company under Subchapter M of the Internal Revenue Code, including distributing substantially all of its taxable income and realized gains. As a result, no provision for income taxes is required. As of March 31, 2013, each Fund did not have any unrecognized tax benefits in the financial statements; nor is each Fund aware of any tax positions for which it is reasonably possible that the total amounts of unrecognized tax benefits will significantly change in the next twelve months. Each Fund files a U.S. federal tax return, in addition to state and local tax returns as required. A fund's federal income tax returns are subject to examination by the Internal Revenue Service (IRS) for a period of three fiscal years after they are filed. State and local tax returns may be subject to examination for an additional fiscal year depending on the jurisdiction.
Distributions are declared and recorded on the ex-dividend date. Income and capital gain distributions are determined in accordance with income tax regulations, which may differ from GAAP.
Capital accounts within the financial statements are adjusted for permanent book-tax differences. These adjustments have no impact on net assets or the results of operations. Temporary book-tax differences will reverse in a subsequent period.
Book-tax differences are primarily due to the short-term gain distributions from the Underlying Funds and losses deferred due to wash sales and excise tax regulations.
Annual Report
2. Significant Accounting Policies - continued
Income Tax Information and Distributions to Shareholders - continued
The federal tax cost of investment securities and unrealized appreciation (depreciation) as of period end were as follows for each Fund:
| Tax cost | Gross unrealized
appreciation | Gross unrealized
depreciation | Net unrealized
appreciation
(depreciation) on
securities and
other investments |
Fidelity Freedom Index Income Fund | $ 128,471,471 | $ 4,880,648 | $ (589,199) | $ 4,291,449 |
Fidelity Freedom Index 2000 Fund | 56,567,932 | 2,511,079 | (297,716) | 2,213,363 |
Fidelity Freedom Index 2005 Fund | 60,062,789 | 3,528,512 | (604,015) | 2,924,497 |
Fidelity Freedom Index 2010 Fund | 338,317,359 | 30,413,995 | (3,850,734) | 26,563,261 |
Fidelity Freedom Index 2015 Fund | 625,427,710 | 53,102,048 | (6,201,556) | 46,900,492 |
Fidelity Freedom Index 2020 Fund | 1,322,899,815 | 122,193,694 | (14,150,192) | 108,043,502 |
Fidelity Freedom Index 2025 Fund | 889,831,027 | 90,424,286 | (10,789,389) | 79,634,897 |
Fidelity Freedom Index 2030 Fund | 1,096,085,456 | 120,480,602 | (13,435,803) | 107,044,799 |
Fidelity Freedom Index 2035 Fund | 625,952,769 | 71,640,651 | (8,516,070) | 63,124,581 |
Fidelity Freedom Index 2040 Fund | 730,942,361 | 89,286,891 | (9,728,034) | 79,558,857 |
Fidelity Freedom Index 2045 Fund | 346,389,513 | 38,491,468 | (4,391,340) | 34,100,128 |
Fidelity Freedom Index 2050 Fund | 297,251,954 | 32,566,519 | (3,577,749) | 28,988,770 |
Fidelity Freedom Index 2055 Fund | 28,277,443 | 2,240,812 | (311,064) | 1,929,748 |
The tax-based components of distributable earnings as of period end were as follows for each Fund:
| Undistributed
ordinary
income | Undistributed
long-term
capital gain | Net unrealized
appreciation
(depreciation) |
Fidelity Freedom Index Income Fund | $ 100,694 | $ 146,992 | $ 4,291,449 |
Fidelity Freedom Index 2000 Fund | 87,604 | 88,711 | 2,213,363 |
Fidelity Freedom Index 2005 Fund | 71,508 | 102,573 | 2,924,497 |
Fidelity Freedom Index 2010 Fund | 497,364 | 1,001,039 | 26,563,261 |
Fidelity Freedom Index 2015 Fund | 1,070,825 | 643,285 | 46,900,492 |
Fidelity Freedom Index 2020 Fund | 2,349,269 | 1,107,900 | 108,043,502 |
Fidelity Freedom Index 2025 Fund | 1,249,478 | 463,327 | 79,634,897 |
Fidelity Freedom Index 2030 Fund | 1,636,155 | 436,444 | 107,044,799 |
Fidelity Freedom Index 2035 Fund | 636,166 | 19,181 | 63,124,581 |
Fidelity Freedom Index 2040 Fund | 665,601 | 4,302 | 79,558,857 |
Fidelity Freedom Index 2045 Fund | 224,157 | 21,462 | 34,100,128 |
Fidelity Freedom Index 2050 Fund | 167,706 | 14,658 | 28,988,770 |
Fidelity Freedom Index 2055 Fund | 6,426 | - | 1,929,748 |
The tax character of distributions paid was as follows:
March 31, 2013 | | | |
| Ordinary Income | Long-term
Capital Gains | Total |
Fidelity Freedom Index Income Fund | $ 1,565,762 | $ 144,118 | $ 1,709,880 |
Fidelity Freedom Index 2000 Fund | 738,460 | 88,559 | 827,019 |
Fidelity Freedom Index 2005 Fund | 801,118 | 43,628 | 844,746 |
Fidelity Freedom Index 2010 Fund | 5,948,030 | 467,986 | 6,416,016 |
Fidelity Freedom Index 2015 Fund | 10,867,557 | 615,442 | 11,482,999 |
Fidelity Freedom Index 2020 Fund | 22,683,347 | 1,490,847 | 24,174,194 |
Fidelity Freedom Index 2025 Fund | 15,717,961 | 581,731 | 16,299,692 |
Fidelity Freedom Index 2030 Fund | 19,338,904 | 1,055,950 | 20,394,854 |
Fidelity Freedom Index 2035 Fund | 10,462,923 | 327,155 | 10,790,078 |
Fidelity Freedom Index 2040 Fund | 12,282,773 | 442,127 | 12,724,900 |
Fidelity Freedom Index 2045 Fund | 5,477,334 | 148,501 | 5,625,835 |
Fidelity Freedom Index 2050 Fund | 4,545,238 | 105,139 | 4,650,377 |
Fidelity Freedom Index 2055 Fund | 332,995 | 6,136 | 339,131 |
Annual Report
Notes to Financial Statements - continued
2. Significant Accounting Policies - continued
Income Tax Information and Distributions to Shareholders - continued
March 31, 2012 | | | |
| Ordinary Income | Long-term
Capital Gains | Total |
Fidelity Freedom Index Income Fund | $ 1,057,352 | $ 83,327 | $ 1,140,679 |
Fidelity Freedom Index 2000 Fund | 659,247 | 62,551 | 721,798 |
Fidelity Freedom Index 2005 Fund | 889,212 | 69,899 | 959,111 |
Fidelity Freedom Index 2010 Fund | 5,770,494 | 531,647 | 6,302,141 |
Fidelity Freedom Index 2015 Fund | 8,955,426 | 678,270 | 9,633,696 |
Fidelity Freedom Index 2020 Fund | 18,210,502 | 1,473,948 | 19,684,450 |
Fidelity Freedom Index 2025 Fund | 11,952,668 | 914,754 | 12,867,422 |
Fidelity Freedom Index 2030 Fund | 14,523,494 | 1,129,765 | 15,653,259 |
Fidelity Freedom Index 2035 Fund | 7,715,869 | 545,912 | 8,261,781 |
Fidelity Freedom Index 2040 Fund | 9,159,523 | 666,031 | 9,825,554 |
Fidelity Freedom Index 2045 Fund | 3,552,929 | 243,660 | 3,796,589 |
Fidelity Freedom Index 2050 Fund | 2,703,942 | 177,200 | 2,881,142 |
Fidelity Freedom Index 2055 Fund | 154,784 | 9,599 | 164,383 |
3. Purchases and Sales of Investments.
Purchases and redemptions of the Underlying Fund shares are noted in the table below.
| Purchases ($) | Redemptions ($) |
Fidelity Freedom Index Income Fund | 83,382,627 | 20,722,282 |
Fidelity Freedom Index 2000 Fund | 28,834,031 | 11,125,089 |
Fidelity Freedom Index 2005 Fund | 29,458,893 | 12,497,278 |
Fidelity Freedom Index 2010 Fund | 177,592,553 | 67,999,261 |
Fidelity Freedom Index 2015 Fund | 309,057,426 | 80,655,515 |
Fidelity Freedom Index 2020 Fund | 676,515,637 | 130,472,413 |
Fidelity Freedom Index 2025 Fund | 452,549,159 | 77,422,090 |
Fidelity Freedom Index 2030 Fund | 564,169,461 | 90,894,348 |
Fidelity Freedom Index 2035 Fund | 324,999,980 | 41,050,578 |
Fidelity Freedom Index 2040 Fund | 390,654,885 | 48,164,734 |
Fidelity Freedom Index 2045 Fund | 194,557,440 | 19,388,640 |
Fidelity Freedom Index 2050 Fund | 179,761,094 | 17,087,902 |
Fidelity Freedom Index 2055 Fund | 23,526,468 | 3,114,475 |
4. Fees and Other Transactions with Affiliates.
Management Fee. Strategic Advisers, Inc. (Strategic Advisers), an affiliate of FMR, provides the Funds with investment management related services. The Funds do not pay any fees for these services.
Other Transactions. Strategic Advisers has entered into an administration agreement with FMR under which FMR provides management and administrative services (other than investment advisory services) necessary for the operation of each Fund. Pursuant to this agreement, FMR pays all expenses of each Fund, excluding the transfer agent fees, the compensation of the independent Trustees and certain other expenses such as interest expense. FMR also contracts with other Fidelity companies to perform the services necessary for the operation of each Fund.
Transfer Agent Fees. Fidelity Investments Institutional Operations Company, Inc. (FIIOC), an affiliate of FMR, is the Funds' transfer, dividend disbursing and shareholder servicing agent. FIIOC receives an asset-based fee of.15% based on each Fund's average net assets. FIIOC pays for typesetting, printing and mailing of shareholder reports, except proxy statements.
5. Expense Reductions.
FMR contractually agreed to reimburse each Fund to the extent annual operating expenses, including acquired fund fees and expenses, exceeded certain levels of average net assets as noted in the table below. This reimbursement will remain in place through May 31, 2015. Some expenses, for example interest expense, are excluded from this reimbursement.
Annual Report
5. Expense Reductions - continued
The following Funds were in reimbursement during the period:
| Expense Limitations | Reimbursement
from affiliate |
Fidelity Freedom Index Income Fund | .19% | $ 57,052 |
Fidelity Freedom Index 2000 Fund | .19% | 28,582 |
Fidelity Freedom Index 2005 Fund | .19% | 31,136 |
Fidelity Freedom Index 2010 Fund | .19% | 165,992 |
Fidelity Freedom Index 2015 Fund | .19% | 293,867 |
Fidelity Freedom Index 2020 Fund | .19% | 594,274 |
Fidelity Freedom Index 2025 Fund | .19% | 423,182 |
Fidelity Freedom Index 2030 Fund | .19% | 527,808 |
Fidelity Freedom Index 2035 Fund | .19% | 329,340 |
Fidelity Freedom Index 2040 Fund | .19% | 379,092 |
Fidelity Freedom Index 2045 Fund | .19% | 171,059 |
Fidelity Freedom Index 2050 Fund | .19% | 137,309 |
Fidelity Freedom Index 2055 Fund | .19% | 9,221 |
6. Other.
The Funds' organizational documents provide former and current trustees and officers with a limited indemnification against liabilities arising in connection with the performance of their duties to the Funds. In the normal course of business, the Funds may also enter into contracts that provide general indemnifications. The Funds' maximum exposure under these arrangements is unknown as this would be dependent on future claims that may be made against the Funds. The risk of material loss from such claims is considered remote.
The Funds do not invest in the Underlying Funds for the purpose of exercising management or control; however, investments by the Funds within their principal investment strategies may represent a significant portion of the Underlying Fund's net assets. At the end of the period, the following Freedom Index Funds were the owners of record of 10% or more of the total outstanding shares of the Underlying Funds.
Fund | Fidelity Freedom
Index 2020 | Fidelity Freedom
Index 2025 | Fidelity Freedom
Index 2030 | Fidelity Freedom
Index 2035 | Fidelity Freedom
Index 2040 |
Fidelity Series Global ex U.S. Index Fund | 17% | 14% | 18% | 12% | 14% |
The Funds, in aggregate, were the owners of record of more than 20% of the total outstanding shares of the following Underlying Funds.
Fund | % of shares held |
Fidelity Series Global ex U.S. Index Fund | 100% |
Annual Report
Report of Independent Registered Public Accounting Firm
To the Trustees of Fidelity Aberdeen Street Trust and the Shareholders of Fidelity Freedom Index Income Fund, Fidelity Freedom Index 2000 Fund, Fidelity Freedom Index 2005 Fund, Fidelity Freedom Index 2010 Fund, Fidelity Freedom Index 2015 Fund, Fidelity Freedom Index 2020 Fund, Fidelity Freedom Index 2025 Fund, Fidelity Freedom Index 2030 Fund, Fidelity Freedom Index 2035 Fund, Fidelity Freedom Index 2040 Fund, Fidelity Freedom Index 2045 Fund, Fidelity Freedom Index 2050 fund, and Fidelity Freedom Index 2055 Fund:
We have audited the accompanying statements of assets and liabilities of Fidelity Freedom Index Income Fund, Fidelity Freedom Index 2000 Fund, Fidelity Freedom Index 2005 Fund, Fidelity Freedom Index 2010 Fund, Fidelity Freedom Index 2015 Fund, Fidelity Freedom Index 2020 Fund, Fidelity Freedom Index 2025 Fund, Fidelity Freedom Index 2030 Fund, Fidelity Freedom Index 2035 Fund, Fidelity Freedom Index 2040 Fund, Fidelity Freedom Index 2045 Fund, Fidelity Freedom Index 2050 Fund and Fidelity Freedom Index 2055 Fund (the Funds), including the schedules of investments, as of March 31, 2013, and the related statements of operations, the statements of changes in net assets, and the financial highlights for each of the periods presented. These financial statements and financial highlights are the responsibility of the Funds' management. Our responsibility is to express an opinion on these financial statements and financial highlights based on our audits.
We conducted our audits in accordance with the standards of the Public Company Accounting Oversight Board (United States). Those standards require that we plan and perform the audit to obtain reasonable assurance about whether the financial statements and financial highlights are free of material misstatement. The Funds are not required to have, nor were we engaged to perform, an audit of their internal controls over financial reporting. Our audits included consideration of internal control over financial reporting as a basis for designing audit procedures that are appropriate in the circumstances, but not for the purpose of expressing an opinion on the effectiveness of the Funds' internal control over financial reporting. Accordingly, we express no such opinion. An audit also includes examining, on a test basis, evidence supporting the amounts and disclosures in the financial statements, assessing the accounting principles used and significant estimates made by management, as well as evaluating the overall financial statement presentation. Our procedures included confirmation of securities owned as of March 31, 2013, by correspondence with the custodians and brokers; where replies were not received from brokers, we performed other auditing procedures. We believe that our audits provide a reasonable basis for our opinion.
In our opinion, the financial statements and financial highlights referred to above present fairly, in all material respects, the financial position of Fidelity Freedom Index Income Fund, Fidelity Freedom Index 2000 Fund, Fidelity Freedom Index 2005 Fund, Fidelity Freedom Index 2010 Fund, Fidelity Freedom Index 2015 Fund, Fidelity Freedom Index 2020 Fund, Fidelity Freedom Index 2025 Fund, Fidelity Freedom Index 2030 Fund, Fidelity Freedom Index 2035 Fund, Fidelity Freedom Index 2040 Fund, Fidelity Freedom Index 2045 Fund, Fidelity Freedom Index 2050 Fund and Fidelity Freedom Index 2055 Fund as of March 31, 2013, the results of their operations, the changes in their net assets, and the financial highlights for each of the periods presented, in conformity with accounting principles generally accepted in the United States of America.
DELOITTE & TOUCHE LLP
Boston, Massachusetts
May 21, 2013
Annual Report
The Trustees and executive officers of the trust and funds, as applicable, are listed below. The Board of Trustees governs each Fidelity Freedom Index Fund and is responsible for protecting the interests of shareholders. The Trustees are experienced executives who meet periodically throughout the year to oversee each Fidelity Freedom Index Fund's activities, review contractual arrangements with companies that provide services to each Fidelity Freedom Index Fund, oversee management of the risks associated with such activities and contractual arrangements, and review each Fidelity Freedom Index Fund's performance. If the interests of a Fidelity Freedom Index Fund and an underlying Fidelity fund were to diverge, a conflict of interest could arise and affect how the Trustees fulfill their fiduciary duties to the affected funds. Strategic Advisers has structured the Fidelity Freedom Index Funds to avoid these potential conflicts, although there may be situations where a conflict of interest is unavoidable. In such instances, Strategic Advisers and the Trustees would take reasonable steps to minimize and, if possible, eliminate the conflict. Except for Elizabeth S. Acton and James C. Curvey, each of the Trustees oversees 219 Fidelity funds. Ms. Acton oversees 201 Fidelity funds. Mr. Curvey oversees 453 Fidelity funds.
The Trustees hold office without limit in time except that (a) any Trustee may resign; (b) any Trustee may be removed by written instrument, signed by at least two-thirds of the number of Trustees prior to such removal; (c) any Trustee who requests to be retired or who has become incapacitated by illness or injury may be retired by written instrument signed by a majority of the other Trustees; and (d) any Trustee may be removed at any special meeting of shareholders by a two-thirds vote of the outstanding voting securities of the trust. Each Trustee who is not an interested person of the trust and the funds (as defined in the 1940 Act) (Independent Trustee), shall retire not later than the last day of the month in which his or her 75th birthday occurs. The Independent Trustees may waive this mandatory retirement age policy with respect to individual Trustees. The executive officers hold office without limit in time, except that any officer may resign or may be removed by a vote of a majority of the Trustees at any regular meeting or any special meeting of the Trustees. Except as indicated, each individual has held the office shown or other offices in the same company for the past five years.
Experience, Skills, Attributes, and Qualifications of the Funds' Trustees. The Governance and Nominating Committee has adopted a statement of policy that describes the experience, qualifications, attributes, and skills that are necessary and desirable for potential Independent Trustee candidates (Statement of Policy). The Board believes that each Trustee satisfied at the time he or she was initially elected or appointed a Trustee, and continues to satisfy, the standards contemplated by the Statement of Policy. The Governance and Nominating Committee also engages professional search firms to help identify potential Independent Trustee candidates who have the experience, qualifications, attributes, and skills consistent with the Statement of Policy. From time to time, additional criteria based on the composition and skills of the current Independent Trustees, as well as experience or skills that may be appropriate in light of future changes to board composition, business conditions, and regulatory or other developments, have also been considered by the professional search firms and the Governance and Nominating Committee. In addition, the Board takes into account the Trustees' commitment and participation in Board and committee meetings, as well as their leadership of standing and ad hoc committees throughout their tenure.
In determining that a particular Trustee was and continues to be qualified to serve as a Trustee, the Board has considered a variety of criteria, none of which, in isolation, was controlling. The Board believes that, collectively, the Trustees have balanced and diverse experience, qualifications, attributes, and skills, which allow the Board to operate effectively in governing each fund and protecting the interests of shareholders. Information about the specific experience, skills, attributes, and qualifications of each Trustee, which in each case led to the Board's conclusion that the Trustee should serve (or continue to serve) as a trustee of the funds, is provided below.
Board Structure and Oversight Function. Abigail P. Johnson is an interested person (as defined in the 1940 Act) and currently serves as Chairman. The Trustees have determined that an interested Chairman is appropriate and benefits shareholders because an interested Chairman has a personal and professional stake in the quality and continuity of services provided to the funds. Independent Trustees exercise their informed business judgment to appoint an individual of their choosing to serve as Chairman, regardless of whether the Trustee happens to be independent or a member of management. The Independent Trustees have determined that they can act independently and effectively without having an Independent Trustee serve as Chairman and that a key structural component for assuring that they are in a position to do so is for the Independent Trustees to constitute a substantial majority for the Board. The Independent Trustees also regularly meet in executive session. Albert R. Gamper, Jr. serves as Chairman of the Independent Trustees and as such (i) acts as a liaison between the Independent Trustees and management with respect to matters important to the Independent Trustees and (ii) with management prepares agendas for Board meetings.
Fidelity funds are overseen by different Boards of Trustees. The funds' Board oversees Fidelity's investment-grade bond, money market, and asset allocation funds and another Board oversees Fidelity's equity and high income funds. The asset allocation funds may invest in Fidelity funds that are overseen by such other Board. The use of separate Boards, each with its own committee structure, allows the Trustees of each group of Fidelity funds to focus on the unique issues of the funds they oversee, including common research, investment, and operational issues. On occasion, the separate Boards establish joint committees to address issues of overlapping consequences for the Fidelity funds overseen by each Board.
The Trustees operate using a system of committees to facilitate the timely and efficient consideration of all matters of importance to the Trustees, each fund, and fund shareholders and to facilitate compliance with legal and regulatory requirements and oversight of the funds' activities and associated risks. The Board, acting through its committees, has charged FMR and its affiliates with (i) identifying events or circumstances the occurrence of which could have demonstrably adverse effects on the funds' business and/or reputation; (ii) implementing processes and controls to lessen the possibility that such events or circumstances occur or to mitigate the effects of such events or circumstances if they do occur; and (iii) creating and maintaining a system designed to evaluate continuously business and market conditions in order to facilitate the identification and implementation processes described in (i) and (ii) above. Because the day-to-day operations and activities of the funds are carried out by or through FMR, its affiliates, and other service providers, the funds' exposure to risks is mitigated but not eliminated by the processes overseen by the Trustees. While each of the Board's committees has responsibility for overseeing different aspects of the funds' activities, oversight is exercised primarily through the Operations and Audit Committees. In addition, an ad hoc Board committee of Independent Trustees has worked with FMR to enhance the Board's oversight of investment and financial risks, legal and regulatory risks, technology risks, and operational risks, including the development of additional risk reporting to the Board. Appropriate personnel, including but not limited to the funds' Chief Compliance Officer (CCO), FMR's internal auditor, the independent accountants, the funds' Treasurer and portfolio management personnel, make periodic reports to the Board's committees, as appropriate, including an annual review of FMR's risk management program for the Fidelity funds. The responsibilities of each standing committee, including their oversight responsibilities, are described further under "Standing Committees of the Funds' Trustees."
Annual Report
The funds' Statement of Additional Information (SAI) includes more information about the Trustees. To request a free copy, call Fidelity at 1-800-835-5092.
Interested Trustees*:
Correspondence intended for each Trustee who is an interested person may be sent to Fidelity Investments, 245 Summer Street, Boston, Massachusetts 02210.
Name, Year of Birth; Principal Occupations and Other Relevant Experience+ |
Abigail P. Johnson (1961) |
| Year of Election or Appointment: 2009 Ms. Johnson is Trustee and Chairman of the Board of Trustees of certain Trusts. Ms. Johnson serves as President of Fidelity Financial Services (2012-present) and President of Personal, Workplace and Institutional Services (2005-present). Ms. Johnson is Chairman and Director of FMR Co., Inc. (2011-present), Chairman and Director of FMR (2011-present), and the Vice Chairman and Director (2007-present) of FMR LLC. Previously, Ms. Johnson served as President and a Director of FMR (2001-2005), a Trustee of other investment companies advised by FMR, Fidelity Investments Money Management, Inc., and FMR Co., Inc. (2001-2005), Senior Vice President of the Fidelity funds (2001-2005), and managed a number of Fidelity funds. Ms. Abigail P. Johnson and Mr. Arthur E. Johnson are not related. |
James C. Curvey (1935) |
| Year of Election or Appointment: 2007 Mr. Curvey also serves as Trustee (2007-present) of other investment companies advised by FMR. Mr. Curvey is a Director of Fidelity Investments Money Management, Inc. (2009-present), Director of Fidelity Research & Analysis Co. (2009-present) and Director of FMR and FMR Co., Inc. (2007-present). Mr. Curvey is also Vice Chairman (2007-present) and Director of FMR LLC. In addition, Mr. Curvey serves as an Overseer for the Boston Symphony Orchestra and a member of the Trustees of Villanova University. Previously, Mr. Curvey was the Vice Chairman (2006-2007) and Director (2000-2007) of FMR Corp. |
* Trustees have been determined to be "Interested Trustees" by virtue of, among other things, their affiliation with the trust or various entities under common control with FMR.
+ The information above includes each Trustee's principal occupation during the last five years and other information relating to the experience, attributes, and skills relevant to each Trustee's qualifications to serve as a Trustee, which led to the conclusion that each Trustee should serve as a Trustee for each fund.
Independent Trustees:
Correspondence intended for each Independent Trustee (that is, the Trustees other than the Interested Trustees) may be sent to Fidelity Investments, P.O. Box 55235, Boston, Massachusetts 02205-5235.
Name, Year of Birth; Principal Occupations and Other Relevant Experience+ |
Elizabeth S. Acton (1951) |
| Year of Election or Appointment: 2013 Ms. Acton is Trustee of certain Trusts. Prior to her retirement in April 2012, Ms. Acton was Executive Vice President, Finance (November 2011-April 2012), Executive Vice President, Chief Financial Officer (April 2002-November 2011), and Treasurer (May 2004-May 2005) of Comerica Incorporated (financial services). Prior to joining Comerica, Ms. Acton held a variety of positions at Ford Motor Company (1983-2002), including Vice President and Treasurer (2000-2002) and Executive Vice President and Chief Financial Officer of Ford Motor Credit Company (1998-2000). Ms. Acton currently serves as a member of the Board of Directors and Audit and Finance Committees of Beazer Homes USA, Inc. (homebuilding, 2012-present). |
Albert R. Gamper, Jr. (1942) |
| Year of Election or Appointment: 2006 Mr. Gamper is Chairman of the Independent Trustees of the Fixed Income and Asset Allocation Funds (2012-present). Prior to his retirement in December 2004, Mr. Gamper served as Chairman of the Board of CIT Group Inc. (commercial finance). During his tenure with CIT Group Inc. Mr. Gamper served in numerous senior management positions, including Chairman (1987-1989; 1999-2001; 2002-2004), Chief Executive Officer (1987-2004), and President (2002-2003). Mr. Gamper currently serves as a member of the Board of Directors of Public Service Enterprise Group (utilities, 2000-present), a member of the Board of Trustees, Rutgers University (2004-present), and Chairman of the Board of Barnabas Health Care System. Previously, Mr. Gamper served as Vice Chairman of the Independent Trustees of the Fixed Income and Asset Allocation Funds (2011-2012) and as Chairman of the Board of Governors, Rutgers University (2004-2007). |
Robert F. Gartland (1951) |
| Year of Election or Appointment: 2010 Mr. Gartland is Chairman and an investor in Gartland and Mellina Group Corp. (consulting, 2009-present). Previously, Mr. Gartland served as a partner and investor of Vietnam Partners LLC (investments and consulting, 2008-2011). Prior to his retirement, Mr. Gartland held a variety of positions at Morgan Stanley (financial services, 1979-2007) including Managing Director (1987-2007). |
Arthur E. Johnson (1947) |
| Year of Election or Appointment: 2008 Mr. Johnson serves as a member of the Board of Directors of Eaton Corporation (diversified power management, 2009-present), AGL Resources, Inc. (holding company, 2002-present) and Booz Allen Hamilton (management consulting, 2011-present). Prior to his retirement, Mr. Johnson served as Senior Vice President of Corporate Strategic Development of Lockheed Martin Corporation (defense contractor, 1999-2009). He previously served on the Board of Directors of IKON Office Solutions, Inc. (1999-2008) and Delta Airlines (2005-2007). Mr. Arthur E. Johnson is not related to Ms. Abigail P. Johnson. |
Michael E. Kenneally (1954) |
| Year of Election or Appointment: 2009 Previously, Mr. Kenneally served as a Member of the Advisory Board for certain Fidelity Fixed Income and Asset Allocation Funds (2008-2009). Prior to his retirement, Mr. Kenneally served as Chairman and Global Chief Executive Officer of Credit Suisse Asset Management (2003-2005). Mr. Kenneally was a Director of the Credit Suisse Funds (U.S. mutual funds, 2004-2008) and certain other closed-end funds (2004-2005) and was awarded the Chartered Financial Analyst (CFA) designation in 1991. |
James H. Keyes (1940) |
| Year of Election or Appointment: 2007 Mr. Keyes serves as a member of the Boards of Navistar International Corporation (manufacture and sale of trucks, buses, and diesel engines, since 2002) and Pitney Bowes, Inc. (integrated mail, messaging, and document management solutions, since 1998). Prior to his retirement, Mr. Keyes served as Chairman and Chief Executive Officer of Johnson Controls (automotive, building, and energy, 1998-2002) and as a member of the Board of LSI Logic Corporation (semiconductor technologies, 1984-2008). |
Marie L. Knowles (1946) |
| Year of Election or Appointment: 2001 Ms. Knowles is Vice Chairman of the Independent Trustees of the Fixed Income and Asset Allocation Funds (2012-present). Prior to Ms. Knowles' retirement in June 2000, she served as Executive Vice President and Chief Financial Officer of Atlantic Richfield Company (ARCO) (diversified energy, 1996-2000). From 1993 to 1996, she was a Senior Vice President of ARCO and President of ARCO Transportation Company. She served as a Director of ARCO from 1996 to 1998. Ms. Knowles currently serves as a Director and Chairman of the Audit Committee of McKesson Corporation (healthcare service, since 2002). Ms. Knowles is an Honorary Trustee of the Brookings Institution and a member of the Board of the Catalina Island Conservancy and of the Santa Catalina Island Company (2009-present). She also serves as a member of the Advisory Board for the School of Engineering of the University of Southern California and the Foundation Board of the School of Architecture at the University of Virginia (2007-present). Previously, Ms. Knowles served as a Director of Phelps Dodge Corporation (copper mining and manufacturing, 1994-2007). |
Kenneth L. Wolfe (1939) |
| Year of Election or Appointment: 2005 Prior to his retirement, Mr. Wolfe served as Chairman and a Director (2007-2009) and Chairman and Chief Executive Officer (1994-2001) of Hershey Foods Corporation. He also served as a member of the Boards of Adelphia Communications Corporation (telecommunications, 2003-2006), Bausch & Lomb, Inc. (medical/pharmaceutical, 1993-2007), and Revlon, Inc. (personal care products, 2004-2009). Mr. Wolfe previously served as Chairman of the Independent Trustees of the Fixed Income and Asset Allocation Funds (2008-2012). |
Annual Report
+ The information above includes each Trustee's principal occupation during the last five years and other information relating to the experience, attributes, and skills relevant to each Trustee's qualifications to serve as a Trustee, which led to the conclusion that each Trustee should serve as a Trustee for each fund.
Executive Officers:
Correspondence intended for each executive officer may be sent to Fidelity Investments, 245 Summer Street, Boston, Massachusetts 02210.
Name, Year of Birth; Principal Occupation |
Stephanie J. Dorsey (1969) |
| Year of Election or Appointment: 2013 President and Treasurer of Fidelity's Fixed Income and Asset Allocation Funds. Ms. Dorsey also serves as Assistant Treasurer of other Fidelity funds (2010-present) and is an employee of Fidelity Investments (2008-present). Previously, Ms. Dorsey served as Deputy Treasurer of Fidelity's Fixed Income and Asset Allocation Funds (2008-2013), Treasurer (2004-2008) of the JPMorgan Mutual Funds and Vice President (2004-2008) of JPMorgan Chase Bank. |
Charles S. Morrison (1960) |
| Year of Election or Appointment: 2012 Vice President of Fidelity's Fixed Income and Asset Allocation Funds. Mr. Morrison also serves as President, Fixed Income and is an employee of Fidelity Investments. Previously, Mr. Morrison served as Vice President of Fidelity's Money Market Funds (2005-2009), President, Money Market Group Leader of FMR (2009), and Senior Vice President, Money Market Group of FMR (2004-2009). Mr. Morrison also served as Vice President of Fidelity's Bond Funds (2002-2005), certain Balanced Funds (2002-2005), and certain Asset Allocation Funds (2002-2007), and as Senior Vice President (2002-2005) of Fidelity's Fixed Income Division. |
Derek L. Young (1964) |
| Year of Election or Appointment: 2009 Vice President of Fidelity's Asset Allocation Funds. Mr. Young is also a Trustee of other investment companies advised by Strategic Advisers, Inc. (Strategic Advisers) (2012-present), President and a Director of Strategic Advisers (2011-present), President of Fidelity Global Asset Allocation (GAA) (2011-present), and Vice Chairman of Pyramis Global Advisors LLC (2011-present). Previously, Mr. Young served as Chief Investment Officer of GAA (2009-2011) and as a portfolio manager. |
Andrew Windmueller (1960) |
| Year of Election or Appointment: 2012 Vice President of Fidelity's Asset Allocation Funds. Mr. Windmueller also serves as Chief Investment Officer of Strategic Advisers, Inc. (2011-present), Chief Investment Officer for Global Asset Allocation Multi-Asset Class Strategies (2011-present), and is an employee of Fidelity Investments (2000-present). |
Scott C. Goebel (1968) |
| Year of Election or Appointment: 2008 Secretary and Chief Legal Officer (CLO) of the Fidelity funds. Mr. Goebel also serves as Secretary of Fidelity Investments Money Management, Inc. (FIMM) (2010-present) and Fidelity Research and Analysis Company (FRAC) (2010-present); Secretary and CLO of The North Carolina Capital Management Trust: Cash and Term Portfolios (2008-present); General Counsel, Secretary, and Senior Vice President of FMR (2008-present) and FMR Co., Inc. (2008-present); employed by FMR LLC or an affiliate (2001-present); Chief Legal Officer of Fidelity Management & Research (Hong Kong) Limited (2008-present) and Assistant Secretary of Fidelity Management & Research (Japan) Inc. (2008-present), and Fidelity Management & Research (U.K.) Inc. (2008-present). Previously, Mr. Goebel served as Assistant Secretary of FIMM (2008-2010), FRAC (2008-2010), and the Funds (2007-2008) and as Vice President and Secretary of Fidelity Distributors Corporation (FDC) (2005-2007). |
Ramon Herrera (1974) |
| Year of Election or Appointment: 2012 Assistant Secretary of Fidelity's Fixed Income and Asset Allocation Funds. Mr. Herrera also serves as Vice President, Associate General Counsel (2010-present) and is an employee of Fidelity Investments (2004-present). |
Elizabeth Paige Baumann (1968) |
| Year of Election or Appointment: 2012 Anti-Money Laundering (AML) Officer of the Fidelity funds. Ms. Baumann also serves as AML Officer of The North Carolina Capital Management Trust: Cash and Term Portfolios (2012-present), Chief AML Officer of FMR LLC (2012-present), and is an employee of Fidelity Investments. Previously, Ms. Baumann served as Vice President and Deputy Anti-Money Laundering Officer (2007-2012). |
Christine Reynolds (1958) |
| Year of Election or Appointment: 2008 Chief Financial Officer of the Fidelity funds. Ms. Reynolds became President of Fidelity Pricing and Cash Management Services (FPCMS) in August 2008. Ms. Reynolds served as Chief Operating Officer of FPCMS (2007-2008). Previously, Ms. Reynolds served as President, Treasurer, and Anti-Money Laundering officer of the Fidelity funds (2004-2007). |
Michael H. Whitaker (1967) |
| Year of Election or Appointment: 2008 Chief Compliance Officer of Fidelity's Fixed Income and Asset Allocation Funds. Mr. Whitaker also serves as Chief Compliance Officer of The North Carolina Capital Management Trust: Cash and Term Portfolios (2008-present). Mr. Whitaker is an employee of Fidelity Investments (2007-present). Prior to joining Fidelity Investments, Mr. Whitaker worked at MFS Investment Management where he served as Senior Vice President and Chief Compliance Officer (2004-2006), and Assistant General Counsel. |
Joseph F. Zambello (1957) |
| Year of Election or Appointment: 2011 Deputy Treasurer of the Fidelity funds. Mr. Zambello is an employee of Fidelity Investments. Previously, Mr. Zambello served as Vice President of FMR's Program Management Group (2009-2011) and Vice President of the Transfer Agent Oversight Group (2005-2009). |
Stephen Sadoski (1971) |
| Year of Election or Appointment: 2013 Deputy Treasurer of Fidelity's Fixed Income and Asset Allocation Funds. Mr. Sadoski also serves as Deputy Treasurer of other Fidelity funds (2012-present) and is an employee of Fidelity Investments (2012-present). Previously, Mr. Sadoski served as Assistant Treasurer of Fidelity's Fixed Income and Asset Allocation Funds (2012-2013), an assistant chief accountant in the Division of Investment Management of the Securities and Exchange Commission (SEC) (2009-2012) and as a senior manager at Deloitte & Touche (1997-2009). |
Adrien E. Deberghes (1967) |
| Year of Election or Appointment: 2010 Assistant Treasurer of Fidelity's Fixed Income and Asset Allocation Funds. Mr. Deberghes also serves as Vice President and Assistant Treasurer (2011-present) and Deputy Treasurer (2008-present) of other Fidelity funds, and is an employee of Fidelity Investments (2008-present). Previously, Mr. Deberghes served as Senior Vice President of Mutual Fund Administration at State Street Corporation (2007-2008), Senior Director of Mutual Fund Administration at Investors Bank & Trust (2005-2007), and Director of Finance for Dunkin' Brands (2000-2005). |
Kenneth B. Robins (1969) |
| Year of Election or Appointment: 2009 Assistant Treasurer of the Fidelity Fixed Income and Asset Allocation Funds. Mr. Robins also serves as President and Treasurer of other Fidelity funds (2008-present; 2010-present) and is an employee of Fidelity Investments (2004-present). Previously, Mr. Robins served as Deputy Treasurer of the Fidelity funds (2005-2008) and Treasurer and Chief Financial Officer of The North Carolina Capital Management Trust: Cash and Term Portfolios (2006-2008). |
Gary W. Ryan (1958) |
| Year of Election or Appointment: 2005 Assistant Treasurer of the Fidelity funds. Mr. Ryan is an employee of Fidelity Investments. Previously, Mr. Ryan served as Vice President of Fund Reporting in Fidelity Pricing and Cash Management Services (FPCMS) (1999-2005). |
Jonathan Davis (1968) |
| Year of Election or Appointment: 2010 Assistant Treasurer of the Fidelity funds. Mr. Davis is also Assistant Treasurer of Fidelity Rutland Square Trust II and Fidelity Commonwealth Trust II. Mr. Davis is an employee of Fidelity Investments. Previously, Mr. Davis served as Vice President and Associate General Counsel of FMR LLC (2003-2010). |
Annual Report
The Board of Trustees of each fund voted to pay to shareholders of record at the opening of business on record date, the following distributions per share derived from capital gains realized from sales of portfolio securities and dividends derived from net investment income:
| Pay Date | Record Date | Dividends | Capital Gains |
Fidelity Freedom Index Income Fund | 5/6/2013 | 5/3/2013 | $0.009 | $0.016 |
Fidelity Freedom Index 2000 Fund | 5/6/2013 | 5/3/2013 | $0.016 | $0.019 |
Fidelity Freedom Index 2005 Fund | 5/6/2013 | 5/3/2013 | $0.014 | $0.020 |
Fidelity Freedom Index 2010 Fund | 5/13/2013 | 5/10/2013 | $0.017 | $0.035 |
Fidelity Freedom Index 2015 Fund | 5/13/2013 | 5/10/2013 | $0.016 | $0.017 |
Fidelity Freedom Index 2020 Fund | 5/13/2013 | 5/10/2013 | $0.017 | $0.014 |
Fidelity Freedom Index 2025 Fund | 5/13/2013 | 5/10/2013 | $0.014 | $0.010 |
Fidelity Freedom Index 2030 Fund | 5/6/2013 | 5/3/2013 | $0.014 | $0.009 |
Fidelity Freedom Index 2035 Fund | 5/6/2013 | 5/3/2013 | $0.010 | $0.004 |
Fidelity Freedom Index 2040 Fund | 5/6/2013 | 5/3/2013 | $0.008 | $0.004 |
Fidelity Freedom Index 2045 Fund | 5/6/2013 | 5/3/2013 | $0.007 | $0.003 |
Fidelity Freedom Index 2050 Fund | 5/13/2013 | 5/10/2013 | $0.006 | $0.003 |
Fidelity Freedom Index 2055 Fund | 5/13/2013 | 5/10/2013 | $0.002 | $0.001 |
The funds hereby designate as capital gain dividend the amounts noted below for the taxable year ended March 31, 2013, or, if subsequently determined to be different, the net capital gain of such year.
Fidelity Freedom Index Income Fund | $264,431 |
Fidelity Freedom Index 2000 Fund | 152,315 |
Fidelity Freedom Index 2005 Fund | 125,260 |
Fidelity Freedom Index 2010 Fund | 1,386,273 |
Fidelity Freedom Index 2015 Fund | 1,103,121 |
Fidelity Freedom Index 2020 Fund | 2,408,576 |
Fidelity Freedom Index 2025 Fund | 968,569 |
Fidelity Freedom Index 2030 Fund | 1,434,285 |
Fidelity Freedom Index 2035 Fund | 346,337 |
Fidelity Freedom Index 2040 Fund | 446,429 |
Fidelity Freedom Index 2045 Fund | 169,964 |
Fidelity Freedom Index 2050 Fund | 119,797 |
Fidelity Freedom Index 2055 Fund | 5,871 |
A percentage of the dividends distributed during the fiscal year for the following funds were derived from interest on U.S. Government securities which is generally exempt from state income tax:
Fidelity Freedom Index Income Fund | 32.70% |
Fidelity Freedom Index 2000 Fund | 32.33% |
Fidelity Freedom Index 2005 Fund | 25.23% |
Fidelity Freedom Index 2010 Fund | 23.41% |
Fidelity Freedom Index 2015 Fund | 22.90% |
Fidelity Freedom Index 2020 Fund | 20.19% |
Fidelity Freedom Index 2025 Fund | 15.09% |
Fidelity Freedom Index 2030 Fund | 11.59% |
Fidelity Freedom Index 2035 Fund | 6.09% |
Fidelity Freedom Index 2040 Fund | 5.71% |
Fidelity Freedom Index 2045 Fund | 4.99% |
Fidelity Freedom Index 2050 Fund | 4.31% |
Fidelity Freedom Index 2055 Fund | 3.18% |
Annual Report
Distributions (Unaudited) - continued
A percentage of the dividends distributed during the fiscal year for the following funds qualify for the dividends-received deduction for corporate shareholders:
Fidelity Freedom Index Income Fund | |
May 2012 | 16% |
June 2012 | 19% |
July 2012 | 19% |
August 2012 | 19% |
September 2012 | 19% |
October 2012 | 19% |
November 2012 | 19% |
December 2012 | 19% |
February 2013 | 0% |
March 2013 | 0% |
| |
Fidelity Freedom Index 2000 Fund | |
May 2012 | 1% |
December 2012 | 19% |
Fidelity Freedom Index 2005 Fund | |
May 2012 | 1% |
December 2012 | 29% |
Fidelity Freedom Index 2010 Fund | |
May 2012 | 1% |
December 2012 | 33% |
Fidelity Freedom Index 2015 Fund | |
May 2012 | 1% |
December 2012 | 33% |
Fidelity Freedom Index 2020 Fund | |
May 2012 | 1% |
December 2012 | 36% |
Fidelity Freedom Index 2025 Fund | |
May 2012 | 2% |
December 2012 | 41% |
Fidelity Freedom Index 2030 Fund | |
May 2012 | 2% |
December 2012 | 43% |
Fidelity Freedom Index 2035 Fund | |
May 2012 | 7% |
December 2012 | 51% |
Fidelity Freedom Index 2040 Fund | |
May 2012 | 9% |
December 2012 | 51% |
Fidelity Freedom Index 2045 Fund | |
May 2012 | 7% |
December 2012 | 52% |
Fidelity Freedom Index 2050 Fund | |
May 2012 | 14% |
December 2012 | 54% |
Fidelity Freedom Index 2055 Fund | |
May 2012 | 16% |
December 2012 | 55% |
Annual Report
A percentage of the dividends distributed during the fiscal year for the following funds may be taken into account as a dividend for purposes of the maximum rate under section 1(h)(11) of the Internal Revenue Code.
Fidelity Freedom Index Income Fund | |
May 2012 | 25% |
June 2012 | 29% |
July 2012 | 29% |
August 2012 | 29% |
September 2012 | 29% |
October 2012 | 29% |
November 2012 | 29% |
December 2012 | 29% |
February 2013 | 0% |
March 2013 | 0% |
| |
Fidelity Freedom Index 2000 Fund | |
May 2012 | 2% |
December 2012 | 28% |
Fidelity Freedom Index 2005 Fund | |
May 2012 | 2% |
December 2012 | 44% |
Fidelity Freedom Index 2010 Fund | |
May 2012 | 3% |
December 2012 | 49% |
Fidelity Freedom Index 2015 Fund | |
May 2012 | 2% |
December 2012 | 49% |
Fidelity Freedom Index 2020 Fund | |
May 2012 | 3% |
December 2012 | 53% |
Fidelity Freedom Index 2025 Fund | |
May 2012 | 3% |
December 2012 | 61% |
Fidelity Freedom Index 2030 Fund | |
May 2012 | 4% |
December 2012 | 65% |
Fidelity Freedom Index 2035 Fund | |
May 2012 | 12% |
December 2012 | 75% |
Fidelity Freedom Index 2040 Fund | |
May 2012 | 12% |
December 2012 | 76% |
Fidelity Freedom Index 2045 Fund | |
May 2012 | 12% |
December 2012 | 78% |
Fidelity Freedom Index 2050 Fund | |
May 2012 | 22% |
December 2012 | 80% |
Fidelity Freedom Index 2055 Fund | |
May 2012 | 24% |
December 2012 | 83% |
The funds will notify shareholders in January 2014 of amounts for use in preparing 2013 income tax returns.
Annual Report
Investment Adviser
Strategic Advisers, Inc.
Boston, MA
Administrator
Fidelity Management & Research Company
Boston, MA
General Distributor
Fidelity Distributors Corporation
Smithfield, RI
Transfer and Service Agents
Fidelity Investments Institutional
Operations Company, Inc.
Boston, MA
Fidelity Service Company, Inc.
Boston, MA
Custodians
JPMorgan Chase Bank
New York, NY
Income, 2000, 2005, 2010, 2015, 2020, 2025, 2030, 2035, 2040, 2045, 2050
The Bank of New York Mellon
New York, NY
2055

FRX-W-UANNPRO-0513
1.927082.102
Item 2. Code of Ethics
As of the end of the period, March 31, 2013, Fidelity Aberdeen Street Trust (the trust) has adopted a code of ethics, as defined in Item 2 of Form N-CSR, that applies to its President and Treasurer and its Chief Financial Officer. A copy of the code of ethics is filed as an exhibit to this Form N-CSR.
Item 3. Audit Committee Financial Expert
The Board of Trustees of the trust has determined that James H. Keyes is an audit committee financial expert, as defined in Item 3 of Form N-CSR. Mr. Keyes is independent for purposes of Item 3 of Form N-CSR.
Item 4. Principal Accountant Fees and Services
Fees and Services
The following table presents fees billed by Deloitte & Touche LLP, the member firms of Deloitte Touche Tohmatsu, and their respective affiliates (collectively, "Deloitte Entities") in each of the last two fiscal years for services rendered to Fidelity Advisor Freedom Income Fund, Fidelity Advisor Freedom 2005 Fund, Fidelity Advisor Freedom 2010 Fund, Fidelity Advisor Freedom 2015 Fund, Fidelity Advisor Freedom 2020 Fund, Fidelity Advisor Freedom 2025 Fund, Fidelity Advisor Freedom 2030 Fund, Fidelity Advisor Freedom 2035 Fund, Fidelity Advisor Freedom 2040 Fund, Fidelity Advisor Freedom 2045 Fund, Fidelity Advisor Freedom 2050 Fund, Fidelity Advisor Freedom 2055 Fund, Fidelity Freedom Index Income Fund, Fidelity Freedom Index 2000 Fund, Fidelity Freedom Index 2005 Fund, Fidelity Freedom Index 2010 Fund, Fidelity Freedom Index 2015 Fund, Fidelity Freedom Index 2020 Fund, Fidelity Freedom Index 2025 Fund, Fidelity Freedom Index 2030 Fund, Fidelity Freedom Index 2035 Fund, Fidelity Freedom Index 2040 Fund, Fidelity Freedom Index 2045 Fund, Fidelity Freedom Index 2050 Fund and Fidelity Freedom Index 2055 Fund (the "Funds"):
Services Billed by Deloitte Entities
March 31, 2013 FeesA
| Audit Fees | Audit-Related Fees | Tax Fees | All Other Fees |
Fidelity Advisor Freedom Income Fund | $20,000 | $- | $4,700 | $400 |
Fidelity Advisor Freedom 2005 Fund | $20,000 | $- | $4,700 | $400 |
Fidelity Advisor Freedom 2010 Fund | $20,000 | $- | $4,700 | $400 |
Fidelity Advisor Freedom 2015 Fund | $20,000 | $- | $4,700 | $400 |
Fidelity Advisor Freedom 2020 Fund | $20,000 | $- | $4,700 | $400 |
Fidelity Advisor Freedom 2025 Fund | $20,000 | $- | $4,700 | $400 |
Fidelity Advisor Freedom 2030 Fund | $20,000 | $- | $4,700 | $400 |
Fidelity Advisor Freedom 2035 Fund | $20,000 | $- | $4,700 | $400 |
Fidelity Advisor Freedom 2040 Fund | $20,000 | $- | $4,700 | $400 |
Fidelity Advisor Freedom 2045 Fund | $20,000 | $- | $5,800 | $400 |
Fidelity Advisor Freedom 2050 Fund | $20,000 | $- | $5,800 | $400 |
Fidelity Advisor Freedom 2055 Fund | $20,000 | $- | $4,700 | $400 |
Fidelity Freedom Index Income Fund | $17,000 | $- | $4,700 | $400 |
Fidelity Freedom Index 2000 Fund | $17,000 | $- | $4,700 | $400 |
Fidelity Freedom Index 2005 Fund | $17,000 | $- | $4,700 | $400 |
Fidelity Freedom Index 2010 Fund | $17,000 | $- | $4,700 | $400 |
Fidelity Freedom Index 2015 Fund | $17,000 | $- | $4,700 | $400 |
Fidelity Freedom Index 2020 Fund | $17,000 | $- | $4,700 | $400 |
Fidelity Freedom Index 2025 Fund | $17,000 | $- | $4,700 | $400 |
Fidelity Freedom Index 2030 Fund | $17,000 | $- | $4,700 | $400 |
Fidelity Freedom Index 2035 Fund | $17,000 | $- | $4,700 | $400 |
Fidelity Freedom Index 2040 Fund | $17,000 | $- | $4,700 | $400 |
Fidelity Freedom Index 2045 Fund | $17,000 | $- | $4,700 | $400 |
Fidelity Freedom Index 2050 Fund | $17,000 | $- | $4,700 | $400 |
Fidelity Freedom Index 2055 Fund | $17,000 | $- | $4,700 | $400 |
March 31, 2012 FeesA,B
| Audit Fees | Audit-Related Fees | Tax Fees | All Other Fees |
Fidelity Advisor Freedom Income Fund | $20,000 | $- | $4,600 | $300 |
Fidelity Advisor Freedom 2005 Fund | $20,000 | $- | $4,600 | $300 |
Fidelity Advisor Freedom 2010 Fund | $20,000 | $- | $4,600 | $300 |
Fidelity Advisor Freedom 2015 Fund | $20,000 | $- | $4,600 | $300 |
Fidelity Advisor Freedom 2020 Fund | $20,000 | $- | $4,600 | $300 |
Fidelity Advisor Freedom 2025 Fund | $20,000 | $- | $4,600 | $300 |
Fidelity Advisor Freedom 2030 Fund | $20,000 | $- | $4,600 | $300 |
Fidelity Advisor Freedom 2035 Fund | $20,000 | $- | $4,600 | $300 |
Fidelity Advisor Freedom 2040 Fund | $20,000 | $- | $4,600 | $300 |
Fidelity Advisor Freedom 2045 Fund | $20,000 | $- | $5,700 | $300 |
Fidelity Advisor Freedom 2050 Fund | $20,000 | $- | $5,700 | $300 |
Fidelity Advisor Freedom 2055 Fund | $14,000 | $- | $4,600 | $300 |
Fidelity Freedom Index Income Fund | $16,000 | $- | $4,600 | $300 |
Fidelity Freedom Index 2000 Fund | $16,000 | $- | $4,600 | $300 |
Fidelity Freedom Index 2005 Fund | $16,000 | $- | $4,600 | $300 |
Fidelity Freedom Index 2010 Fund | $16,000 | $- | $4,600 | $300 |
Fidelity Freedom Index 2015 Fund | $16,000 | $- | $4,600 | $300 |
Fidelity Freedom Index 2020 Fund | $16,000 | $- | $4,600 | $300 |
Fidelity Freedom Index 2025 Fund | $16,000 | $- | $4,600 | $300 |
Fidelity Freedom Index 2030 Fund | $16,000 | $- | $4,600 | $300 |
Fidelity Freedom Index 2035 Fund | $16,000 | $- | $4,600 | $300 |
Fidelity Freedom Index 2040 Fund | $16,000 | $- | $4,600 | $300 |
Fidelity Freedom Index 2045 Fund | $16,000 | $- | $4,600 | $300 |
Fidelity Freedom Index 2050 Fund | $16,000 | $- | $4,600 | $300 |
Fidelity Freedom Index 2055 Fund | $12,000 | $- | $4,600 | $300 |
A Amounts may reflect rounding.
B Fidelity Advisor Freedom 2055 Fund and Fidelity Freedom Index 2055 Fund commenced operations on June 1, 2011.
The following table presents fees billed by PricewaterhouseCoopers LLP ("PwC") in each of the last two fiscal years for services rendered to Fidelity Freedom Income Fund, Fidelity Freedom 2000 Fund, Fidelity Freedom 2005 Fund, Fidelity Freedom 2010 Fund, Fidelity Freedom 2015 Fund, Fidelity Freedom 2020 Fund, Fidelity Freedom 2025 Fund, Fidelity Freedom 2030 Fund, Fidelity Freedom 2035 Fund, Fidelity Freedom 2040 Fund, Fidelity Freedom 2045 Fund, Fidelity Freedom 2050 Fund, Fidelity Freedom 2055 Fund, Fidelity Freedom K® Income Fund, Fidelity Freedom K® 2000 Fund, Fidelity Freedom K® 2005 Fund, Fidelity Freedom K® 2010 Fund, Fidelity Freedom K® 2015 Fund, Fidelity Freedom K® 2020 Fund, Fidelity Freedom K® 2025 Fund, Fidelity Freedom K® 2030 Fund, Fidelity Freedom K® 2035 Fund, Fidelity Freedom K® 2040 Fund, Fidelity Freedom K® 2045 Fund, Fidelity Freedom K® 2050 Fund and Fidelity Freedom K® 2055 Fund (the "Funds"):
Services Billed by PwC
March 31, 2013 FeesA
| Audit Fees | Audit-Related Fees | Tax Fees | All Other Fees |
Fidelity Freedom Income Fund | $22,000 | $- | $2,500 | $- |
Fidelity Freedom 2000 Fund | $21,000 | $- | $2,500 | $- |
Fidelity Freedom 2005 Fund | $21,000 | $- | $2,500 | $- |
Fidelity Freedom 2010 Fund | $21,000 | $- | $2,500 | $- |
Fidelity Freedom 2015 Fund | $21,000 | $- | $2,500 | $- |
Fidelity Freedom 2020 Fund | $21,000 | $- | $2,500 | $- |
Fidelity Freedom 2025 Fund | $21,000 | $- | $2,500 | $- |
Fidelity Freedom 2030 Fund | $21,000 | $- | $2,500 | $- |
Fidelity Freedom 2035 Fund | $21,000 | $- | $2,500 | $- |
Fidelity Freedom 2040 Fund | $21,000 | $- | $2,500 | $- |
Fidelity Freedom 2045 Fund | $21,000 | $- | $2,500 | $- |
Fidelity Freedom 2050 Fund | $21,000 | $- | $2,500 | $- |
Fidelity Freedom 2055 Fund | $23,000 | $- | $2,500 | $- |
Fidelity Freedom K® Income Fund | $22,000 | $- | $2,500 | $- |
Fidelity Freedom K® 2000 Fund | $22,000 | $- | $2,500 | $- |
Fidelity Freedom K® 2005 Fund | $22,000 | $- | $2,500 | $- |
Fidelity Freedom K® 2010 Fund | $22,000 | $- | $2,500 | $- |
Fidelity Freedom K® 2015 Fund | $22,000 | $- | $2,500 | $- |
Fidelity Freedom K® 2020 Fund | $22,000 | $- | $2,500 | $- |
Fidelity Freedom K® 2025 Fund | $22,000 | $- | $2,500 | $- |
Fidelity Freedom K® 2030 Fund | $22,000 | $- | $2,500 | $- |
Fidelity Freedom K® 2035 Fund | $22,000 | $- | $2,500 | $- |
Fidelity Freedom K® 2040 Fund | $22,000 | $- | $2,500 | $- |
Fidelity Freedom K® 2045 Fund | $22,000 | $- | $2,500 | $- |
Fidelity Freedom K® 2050 Fund | $22,000 | $- | $2,500 | $- |
Fidelity Freedom K® 2055 Fund | $23,000 | $- | $2,500 | $- |
March 31, 2012 FeesA,B
| Audit Fees | Audit-Related Fees | Tax Fees | All Other Fees |
Fidelity Freedom Income Fund | $21,000 | $- | $2,200 | $- |
Fidelity Freedom 2000 Fund | $21,000 | $- | $2,200 | $- |
Fidelity Freedom 2005 Fund | $21,000 | $- | $2,200 | $- |
Fidelity Freedom 2010 Fund | $21,000 | $- | $2,200 | $- |
Fidelity Freedom 2015 Fund | $21,000 | $- | $2,200 | $- |
Fidelity Freedom 2020 Fund | $21,000 | $- | $2,200 | $- |
Fidelity Freedom 2025 Fund | $21,000 | $- | $2,200 | $- |
Fidelity Freedom 2030 Fund | $21,000 | $- | $2,200 | $- |
Fidelity Freedom 2035 Fund | $21,000 | $- | $2,200 | $- |
Fidelity Freedom 2040 Fund | $21,000 | $- | $2,200 | $- |
Fidelity Freedom 2045 Fund | $21,000 | $- | $2,200 | $- |
Fidelity Freedom 2050 Fund | $21,000 | $- | $2,200 | $- |
Fidelity Freedom 2055 Fund | $16,000 | $- | $2,200 | $- |
Fidelity Freedom K® Income Fund | $19,000 | $- | $2,200 | $- |
Fidelity Freedom K® 2000 Fund | $19,000 | $- | $2,200 | $- |
Fidelity Freedom K® 2005 Fund | $19,000 | $- | $2,200 | $- |
Fidelity Freedom K® 2010 Fund | $19,000 | $- | $2,200 | $- |
Fidelity Freedom K® 2015 Fund | $19,000 | $- | $2,200 | $- |
Fidelity Freedom K® 2020 Fund | $19,000 | $- | $2,200 | $- |
Fidelity Freedom K® 2025 Fund | $19,000 | $- | $2,200 | $- |
Fidelity Freedom K® 2030 Fund | $19,000 | $- | $2,200 | $- |
Fidelity Freedom K® 2035 Fund | $19,000 | $- | $2,200 | $- |
Fidelity Freedom K® 2040 Fund | $19,000 | $- | $2,200 | $- |
Fidelity Freedom K® 2045 Fund | $19,000 | $- | $2,200 | $- |
Fidelity Freedom K® 2050 Fund | $19,000 | $- | $2,200 | $- |
Fidelity Freedom K® 2055 Fund | $18,000 | $- | $2,200 | $- |
A Amounts may reflect rounding.
B Fidelity Freedom 2055 Fund and Fidelity Freedom K® 2055 Fund commenced operations on June 1, 2011.
The following table presents fees billed by PwC and Deloitte Entities that were required to be approved by the Audit Committee for services that relate directly to the operations and financial reporting of the Funds and that are rendered on behalf of Fidelity Management & Research Company ("FMR") and entities controlling, controlled by, or under common control with FMR (not including any sub-adviser whose role is primarily portfolio management and is subcontracted with or overseen by another investment adviser) that provide ongoing services to the Funds ("Fund Service Providers"):
Services Billed by Deloitte Entities
| March 31, 2013A | March 31, 2012A,B |
Audit-Related Fees | $910,000 | $610,000 |
Tax Fees | $- | $- |
All Other Fees | $1,270,000 | $610,000 |
A Amounts may reflect rounding.
B May include amounts billed prior to the Fidelity Advisor Freedom 2055 Fund and Fidelity Freedom Index 2055 Fund's commencement operations.
Services Billed by PwC
| March 31, 2013A | March 31, 2012A,B |
Audit-Related Fees | $4,755,000 | $3,795,000 |
Tax Fees | $- | $- |
All Other Fees | $- | $- |
A Amounts may reflect rounding.
B May include amounts billed prior to the Fidelity Freedom 2055 Fund and Fidelity Freedom K® 2055 Fund's commencement operations.
"Audit-Related Fees" represent fees billed for assurance and related services that are reasonably related to the performance of the fund audit or the review of the fund's financial statements and that are not reported under Audit Fees.
"Tax Fees" represent fees billed for tax compliance, tax advice or tax planning that relate directly to the operations and financial reporting of the fund.
"All Other Fees" represent fees billed for services provided to the fund or Fund Service Provider, a significant portion of which are assurance related, that relate directly to the operations and financial reporting of the fund, excluding those services that are reported under Audit Fees, Audit-Related Fees or Tax Fees.
Assurance services must be performed by an independent public accountant.
* * *
The aggregate non-audit fees billed by PwC and Deloitte Entities for services rendered to the Funds, FMR (not including any sub-adviser whose role is primarily portfolio management and is subcontracted with or overseen by another investment adviser), and any Fund Service Provider for each of the last two fiscal years of the Funds are as follows:
Billed By | March 31, 2013 A | March 31, 2012 A,B |
Deloitte Entities | $2,405,000 | $1,445,000 |
PwC | $5,470,000 | $5,035,000 |
A Amounts may reflect rounding.
B May include amounts billed prior to the Fidelity Advisor Freedom 2055 Fund, Fidelity Freedom Index 2055 Fund, Fidelity Freedom 2055 Fund and Fidelity Freedom K® 2055 Fund's commencement operations.
The trust's Audit Committee has considered non-audit services that were not pre-approved that were provided by PwC and Deloitte Entities to Fund Service Providers to be compatible with maintaining the independence of PwC and Deloitte Entities in their audits of the Funds, taking into account representations from PwC and Deloitte Entities, in accordance with Public Company Accounting Oversight Board rules, regarding their independence from the Funds and their related entities and FMR's review of the appropriateness and permissibility under applicable law of such non-audit services prior to their provision to the Fund Service Providers.
Audit Committee Pre-Approval Policies and Procedures
The trust's Audit Committee must pre-approve all audit and non-audit services provided by a fund's independent registered public accounting firm relating to the operations or financial reporting of the fund. Prior to the commencement of any audit or non-audit services to a fund, the Audit Committee reviews the services to determine whether they are appropriate and permissible under applicable law.
The Audit Committee has adopted policies and procedures to, among other purposes, provide a framework for the Committee's consideration of non-audit services by the audit firms that audit the Fidelity funds. The policies and procedures require that any non-audit service provided by a fund audit firm to a Fidelity fund and any non-audit service provided by a fund auditor to a Fund Service Provider that relates directly to the operations and financial reporting of a Fidelity fund ("Covered Service") are subject to approval by the Audit Committee before such service is provided.
All Covered Services must be approved in advance of provision of the service either: (i) by formal resolution of the Audit Committee, or (ii) by oral or written approval of the service by the Chair of the Audit Committee (or if the Chair is unavailable, such other member of the Audit Committee as may be designated by the Chair to act in the Chair's absence). The approval contemplated by (ii) above is permitted where the Treasurer determines that action on such an engagement is necessary before the next meeting of the Audit Committee.
Non-audit services provided by a fund audit firm to a Fund Service Provider that do not relate directly to the operations and financial reporting of a Fidelity fund are reported to the Audit Committee on a periodic basis.
Non-Audit Services Approved Pursuant to Rule 2-01(c)(7)(i)(C) and (ii) of Regulation S-X ("De Minimis Exception")
There were no non-audit services approved or required to be approved by the Audit Committee pursuant to the De Minimis Exception during the Funds' last two fiscal years relating to services provided to (i) the Funds or (ii) any Fund Service Provider that relate directly to the operations and financial reporting of the Funds.
Item 5. Audit Committee of Listed Registrants
Not applicable.
Item 6. Investments
(a) Not applicable.
(b) Not applicable
Item 7. Disclosure of Proxy Voting Policies and Procedures for Closed-End Management Investment Companies
Not applicable.
Item 8. Portfolio Managers of Closed-End Management Investment Companies
Not applicable.
Item 9. Purchase of Equity Securities by Closed-End Management Investment Company and Affiliated Purchasers
Not applicable.
Item 10. Submission of Matters to a Vote of Security Holders
There were no material changes to the procedures by which shareholders may recommend nominees to the trust's Board of Trustees.
Item 11. Controls and Procedures
(a)(i) The President and Treasurer and the Chief Financial Officer have concluded that the trust's disclosure controls and procedures (as defined in Rule 30a-3(c) under the Investment Company Act) provide reasonable assurances that material information relating to the trust is made known to them by the appropriate persons, based on their evaluation of these controls and procedures as of a date within 90 days of the filing date of this report.
(a)(ii) There was no change in the trust's internal control over financial reporting (as defined in Rule 30a-3(d) under the Investment Company Act) that occurred during the second fiscal quarter of the period covered by this report that has materially affected, or is reasonably likely to materially affect, the trust's internal control over financial reporting.
Item 12. Exhibits
(a) | (1) | Code of Ethics pursuant to Item 2 of Form N-CSR is filed and attached hereto as EX-99.CODE ETH. |
(a) | (2) | Certification pursuant to Rule 30a-2(a) under the Investment Company Act of 1940 (17 CFR 270.30a-2(a)) is filed and attached hereto as Exhibit 99.CERT. |
(a) | (3) | Not applicable. |
(b) | | Certification pursuant to Rule 30a-2(b) under the Investment Company Act of 1940 (17 CFR 270.30a-2(b)) is furnished and attached hereto as Exhibit 99.906CERT. |
SIGNATURES
Pursuant to the requirements of the Securities Exchange Act of 1934 and the Investment Company Act of 1940, the registrant has duly caused this report to be signed on its behalf by the undersigned, thereunto duly authorized.
Fidelity Aberdeen Street Trust
By: | /s/Stephanie J. Dorsey |
| Stephanie J. Dorsey |
| President and Treasurer |
| |
Date: | May 28, 2013 |
Pursuant to the requirements of the Securities Exchange Act of 1934 and the Investment Company Act of 1940, this report has been signed below by the following persons on behalf of the registrant and in the capacities and on the dates indicated.
By: | /s/Stephanie J. Dorsey |
| Stephanie J. Dorsey |
| President and Treasurer |
| |
Date: | May 28, 2013 |
By: | /s/Christine Reynolds |
| Christine Reynolds |
| Chief Financial Officer |
| |
Date: | May 28, 2013 |