UNITED STATES
SECURITIES AND EXCHANGE COMMISSION
Washington, D.C. 20549
FORM N-CSR
CERTIFIED SHAREHOLDER REPORT OF REGISTERED
MANAGEMENT INVESTMENT COMPANIES
Investment Company Act file number 811-6440
Fidelity Aberdeen Street Trust
(Exact name of registrant as specified in charter)
82 Devonshire St., Boston, Massachusetts 02109
(Address of principal executive offices) (Zip code)
Scott C. Goebel, Secretary
82 Devonshire St.
Boston, Massachusetts 02109
(Name and address of agent for service)
Registrant's telephone number, including area code: 617-563-7000
Date of fiscal year end: | March 31 |
| |
Date of reporting period: | March 31, 2011 |
Item 1. Reports to Stockholders
Fidelity Advisor Freedom Funds®-
Income, 2005, 2010, 2015, 2020, 2025, 2030, 2035, 2040, 2045, 2050 - Class A, Class T, Class B and Class C
Annual Report
March 31, 2011
(2_fidelity_logos) (Registered_Trademark)
Contents
To view a fund's proxy voting guidelines and proxy voting record for the 12-month period ended June 30, visit http://www.fidelity.com/proxyvotingresults or visit the Securities and Exchange Commission's (SEC) web site at http://www.sec.gov. You may also call 1-877-208-0098 to request a free copy of the proxy voting guidelines.
Standard & Poor's, S&P and S&P 500 are registered service marks of The McGraw-Hill Companies, Inc. and have been licensed for use by Fidelity Distributors Corporation.
Other third party marks appearing herein are the property of their respective owners.
All other marks appearing herein are registered or unregistered trademarks or service marks of FMR LLC or an affiliated company.
Annual Report
This report and the financial statements contained herein are submitted for the general information of the shareholders of the funds. This report is not authorized for distribution to prospective investors in the funds unless preceded or accompanied by an effective prospectus.
A fund files its complete schedule of portfolio holdings with the SEC for the first and third quarters of each fiscal year on Form N-Q. Forms N-Q are available on the SEC's web site at http://www.sec.gov. A fund's Forms N-Q may be reviewed and copied at the SEC's Public Reference Room in Washington, DC. Information regarding the operation of the SEC's Public Reference Room may be obtained by calling 1-800-SEC-0330. For a complete list of a fund's portfolio holdings, view the most recent holdings listing, semiannual report, or annual report on Fidelity's web site at http://www.fidelity.com, http://www.advisor.fidelity.com, or http://www.401k.com, as applicable.
NOT FDIC INSURED • MAY LOSE VALUE • NO BANK GUARANTEE
Neither the funds nor Fidelity Distributors Corporation is a bank.
Annual Report
(photo_of_Abigail_P_Johnson)
Dear Shareholder:
Amid indications the U.S. economy had turned a corner, U.S. equities continued their generally upward trend in early 2011, overcoming bouts of short-term volatility following unrest in North Africa and the disaster in Japan. Still, questions remained about the longer-term outlook, most notably persistently high unemployment. Financial markets are always unpredictable, of course, but there also are several time-tested investment principles that can help put the odds in your favor.
One of the basic tenets is to invest for the long term. Over time, riding out the markets' inevitable ups and downs has proven much more effective than selling into panic or chasing the hottest trend. Even missing only a few of the markets' best days can significantly diminish investor returns. Patience also affords the benefits of compounding - of earning interest on additional income or reinvested dividends and capital gains. There can be tax advantages and cost benefits to consider as well. While staying the course doesn't eliminate risk, it can considerably lessen the effect of short-term declines.
You can further manage your investing risk through diversification. And today, more than ever, geographic diversification should be taken into account. Studies indicate that asset allocation is the single most important determinant of a portfolio's long-term success. The right mix of stocks, bonds and cash - aligned to your particular risk tolerance and investment objective - is very important. Age-appropriate rebalancing is also an essential aspect of asset allocation. For younger investors, an emphasis on equities - which historically have been the best-performing asset class over time - is encouraged. As investors near their specific goal, such as retirement or sending a child to college, consideration may be given to replacing volatile assets (e.g. common stocks) with more-stable fixed investments (bonds or savings plans).
A third principle - investing regularly - can help lower the average cost of your purchases. Investing a certain amount of money each month or quarter helps ensure you won't pay for all your shares at market highs. This strategy - known as dollar cost averaging - also reduces "emotion" from investing, helping shareholders avoid selling weak performers just prior to an upswing, or chasing a hot performer just before a correction.
We invite you to contact us via the Internet, through our Investor Centers or by phone. It is our privilege to provide you the information you need to make the investments that are right for you.
Sincerely,
(The chairman's signature appears here.)
Abigail P. Johnson
Annual Report
Fidelity Advisor Freedom Income Fund® - Class A, T, B, and C
Performance: The Bottom Line
Average annual total return reflects the change in the value of an investment, assuming reinvestment of the class' distributions from dividend income and capital gains (the profits earned upon the sale of securities that have grown in value, if any) and assuming a constant rate of performance each year. The $10,000 table and the fund's returns do not reflect the deduction of taxes that a shareholder would pay on fund distributions or the redemption of fund shares. During periods of reimbursement by Fidelity, a fund's total return will be greater than it would be had the reimbursement not occurred. How a fund did yesterday is no guarantee of how it will do tomorrow.
Average Annual Total Returns
Periods ended March 31, 2011 | Past 1
year | Past 5
years | Life of
fund A |
Class A (incl. 5.75% sales charge) | 0.95% | 3.01% | 3.39% |
Class T (incl. 3.50% sales charge) | 3.11% | 3.24% | 3.45% |
Class B (incl. contingent deferred sales charge)B | 1.39% | 3.12% | 3.48% |
Class C (incl. contingent deferred sales charge)C | 5.42% | 3.47% | 3.42% |
A From July 24, 2003.
B Class B shares' contingent deferred sales charges included in the past one year, past five years, and life of fund total return figures are 5%, 2%, and 0%, respectively.
C Class C shares' contingent deferred sales charges included in the past one year, past five years, and life of fund total return figures are 1%, 0%, and 0%, respectively.
$10,000 Over Life of Fund
Let's say hypothetically that $10,000 was invested in Fidelity Advisor Freedom Income Fund® - Class A on July 24, 2003, when the fund started, and the current 5.75% sales charge was paid. The chart shows how the value of your investment would have changed, and also shows how the Barclays Capital® U.S. Aggregate Bond Index performed over the same period.
Annual Report
Fidelity Advisor Freedom 2005 Fund ® - Class A, T, B, and C
Performance: The Bottom Line
Average annual total return reflects the change in the value of an investment, assuming reinvestment of the class' distributions from dividend income and capital gains (the profits earned upon the sale of securities that have grown in value, if any) and assuming a constant rate of performance each year. The $10,000 table and the fund's returns do not reflect the deduction of taxes that a shareholder would pay on fund distributions or the redemption of fund shares. During periods of reimbursement by Fidelity, a fund's total return will be greater than it would be had the reimbursement not occurred. How a fund did yesterday is no guarantee of how it will do tomorrow.
Average Annual Total Returns
Periods ended March 31, 2011 | Past 1
year | Past 5
years | Life of
fund A |
Class A (incl. 5.75% sales charge) | 4.36% | 2.48% | 4.02% |
Class T (incl. 3.50% sales charge) | 6.56% | 2.72% | 4.09% |
Class B (incl. contingent deferred sales charge)B | 4.94% | 2.58% | 4.12% |
Class C (incl. contingent deferred sales charge)C | 8.91% | 2.94% | 4.09% |
A From November 6, 2003.
B Class B shares' contingent deferred sales charges included in the past one year, past five years, and life of fund total return figures are 5%, 2%, and 0%, respectively.
C Class C shares' contingent deferred sales charges included in the past one year, past five years, and life of fund total return figures are 1%, 0%, and 0%, respectively.
$10,000 Over Life of Fund
Let's say hypothetically that $10,000 was invested in Fidelity Advisor Freedom 2005 Fund® - Class A on November 6, 2003, when the fund started, and the current 5.75% sales charge was paid. The chart shows how the value of your investment would have changed, and also shows how the Barclays Capital U.S. Aggregate Bond Index performed over the same period.
Annual Report
Fidelity Advisor Freedom 2010 Fund ® - Class A, T, B, and C
Performance: The Bottom Line
Average annual total return reflects the change in the value of an investment, assuming reinvestment of the class' distributions from dividend income and capital gains (the profits earned upon the sale of securities that have grown in value, if any) and assuming a constant rate of performance each year. The $10,000 table and the fund's returns do not reflect the deduction of taxes that a shareholder would pay on fund distributions or the redemption of fund shares. During periods of reimbursement by Fidelity, a fund's total return will be greater than it would be had the reimbursement not occurred. How a fund did yesterday is no guarantee of how it will do tomorrow.
Average Annual Total Returns
Periods ended March 31, 2011 | Past 1
year | Past 5
years | Life of
fund A |
Class A (incl. 5.75% sales charge) | 5.81% | 2.80% | 4.65% |
Class T (incl. 3.50% sales charge) | 8.03% | 3.02% | 4.70% |
Class B (incl. contingent deferred sales charge)B | 6.37% | 2.89% | 4.75% |
Class C (incl. contingent deferred sales charge)C | 10.33% | 3.25% | 4.66% |
A From July 24, 2003.
B Class B shares' contingent deferred sales charges included in the past one year, past five years, and life of fund total return figures are 5%, 2%, and 0%, respectively.
C Class C shares' contingent deferred sales charges included in the past one year, past five years, and life of fund total return figures are 1%, 0%, and 0%, respectively.
$10,000 Over Life of Fund
Let's say hypothetically that $10,000 was invested in Fidelity Advisor Freedom 2010 Fund® - Class A on July 24, 2003, when the fund started, and the current 5.75% sales charge was paid. The chart shows how the value of your investment would have changed, and also shows how the Barclays Capital U.S. Aggregate Bond Index performed over the same period.
Annual Report
Fidelity Advisor Freedom 2015 Fund® - Class A, T, B, and C
Performance: The Bottom Line
Average annual total return reflects the change in the value of an investment, assuming reinvestment of the class' distributions from dividend income and capital gains (the profits earned upon the sale of securities that have grown in value, if any) and assuming a constant rate of performance each year. The $10,000 table and the fund's returns do not reflect the deduction of taxes that a shareholder would pay on fund distributions or the redemption of fund shares. During periods of reimbursement by Fidelity, a fund's total return will be greater than it would be had the reimbursement not occurred. How a fund did yesterday is no guarantee of how it will do tomorrow.
Average Annual Total Returns
Periods ended March 31, 2011 | Past 1
year | Past 5
years | Life of
fund A |
Class A (incl. 5.75% sales charge) | 5.90% | 2.58% | 4.62% |
Class T (incl. 3.50% sales charge) | 8.17% | 2.81% | 4.70% |
Class B (incl. contingent deferred sales charge) B | 6.51% | 2.67% | 4.74% |
Class C (incl. contingent deferred sales charge) C | 10.49% | 3.03% | 4.68% |
A From November 6, 2003.
B Class B shares' contingent deferred sales charges included in the past one year, past five years, and life of fund total return figures are 5%, 2%, and 0%, respectively.
C Class C shares' contingent deferred sales charges included in the past one year, past five years, and life of fund total return figures are 1%, 0%, and 0%, respectively.
$10,000 Over Life of Fund
Let's say hypothetically that $10,000 was invested in Fidelity Advisor Freedom 2015 Fund® - Class A on November 6, 2003, when the fund started, and the current 5.75% sales charge was paid. The chart shows how the value of your investment would have changed, and also shows how the S&P 500® Index performed over the same period.
Annual Report
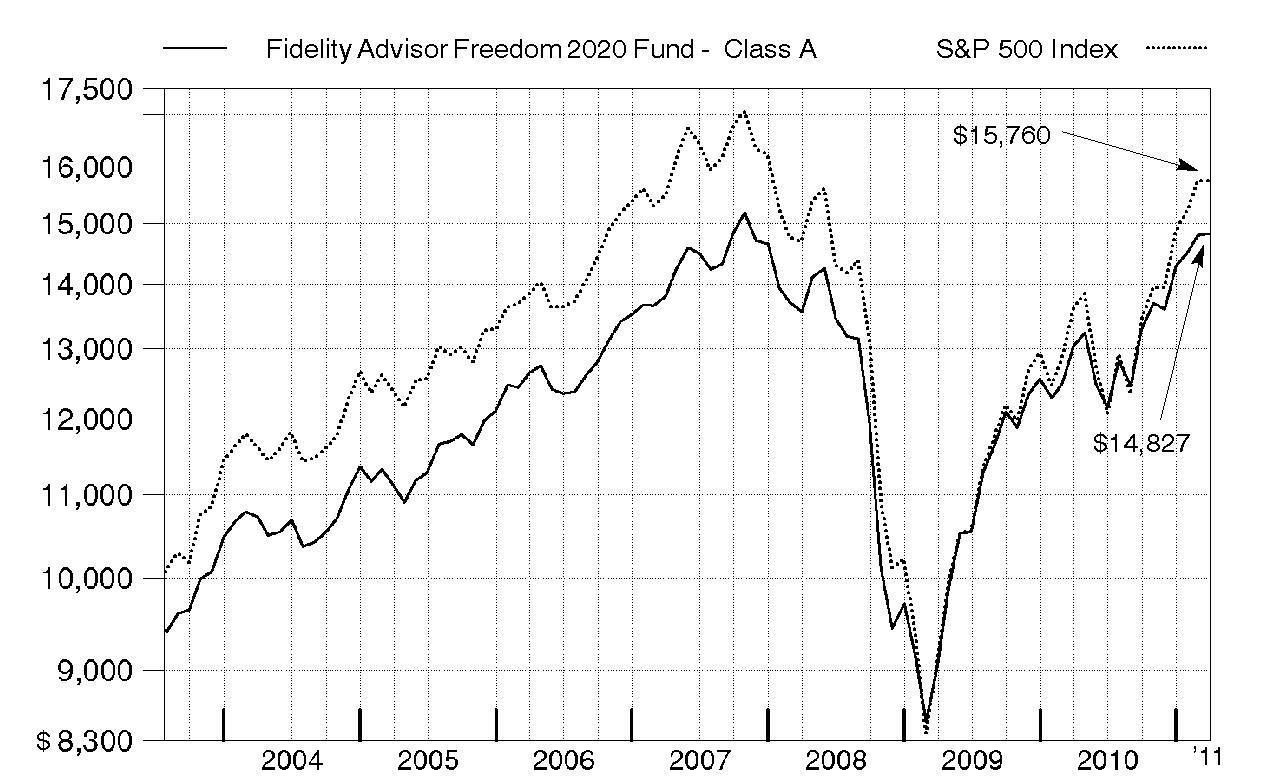
Fidelity Advisor Freedom 2020 Fund® - Class A, T, B, and C
Performance: The Bottom Line
Average annual total return reflects the change in the value of an investment, assuming reinvestment of the class' distributions from dividend income and capital gains (the profits earned upon the sale of securities that have grown in value, if any) and assuming a constant rate of performance each year. The $10,000 table and the fund's returns do not reflect the deduction of taxes that a shareholder would pay on fund distributions or the redemption of fund shares. During periods of reimbursement by Fidelity, a fund's total return will be greater than it would be had the reimbursement not occurred. How a fund did yesterday is no guarantee of how it will do tomorrow.
Average Annual Total Returns
Periods ended March 31, 2011 | Past 1
year | Past 5
years | Life of
fund A |
Class A (incl. 5.75% sales charge) | 7.19% | 2.03% | 5.26% |
Class T (incl. 3.50% sales charge) | 9.52% | 2.27% | 5.33% |
Class B (incl. contingent deferred sales charge) B | 7.87% | 2.13% | 5.36% |
Class C (incl. contingent deferred sales charge) C | 11.89% | 2.49% | 5.30% |
A From July 24, 2003.
B Class B shares' contingent deferred sales charges included in the past one year, past five years, and life of fund total return figures are 5%, 2%, and 0%, respectively.
C Class C shares' contingent deferred sales charges included in the past one year, past five years, and life of fund total return figures are 1%, 0%, and 0%, respectively.
$10,000 Over Life of Fund
Let's say hypothetically that $10,000 was invested in Fidelity Advisor Freedom 2020 Fund® - Class A on July 24, 2003, when the fund started, and the current 5.75% sales charge was paid. The chart shows how the value of your investment would have changed, and also shows how the S&P 500 Index performed over the same period.
Annual Report
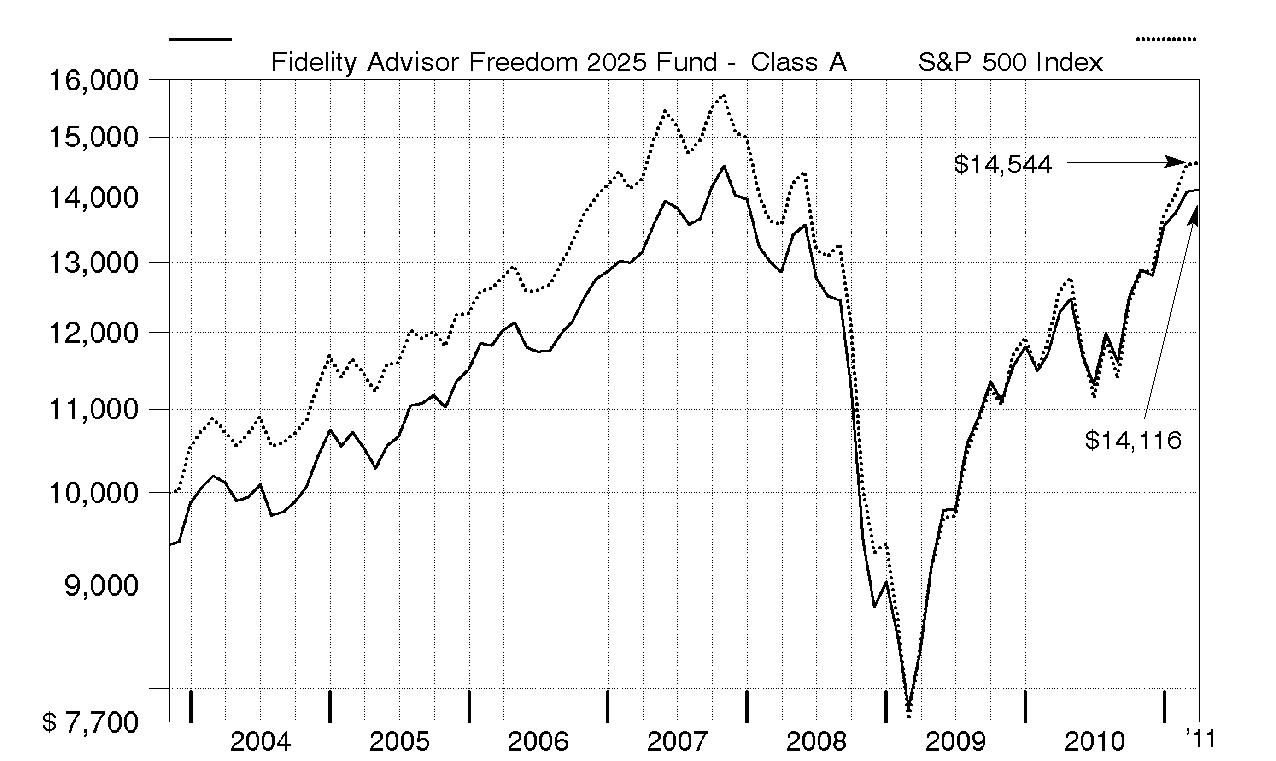
Fidelity Advisor Freedom 2025 Fund® - Class A, T, B, and C
Performance: The Bottom Line
Average annual total return reflects the change in the value of an investment, assuming reinvestment of the class' distributions from dividend income and capital gains (the profits earned upon the sale of securities that have grown in value, if any) and assuming a constant rate of performance each year. The $10,000 table and the fund's returns do not reflect the deduction of taxes that a shareholder would pay on fund distributions or the redemption of fund shares. During periods of reimbursement by Fidelity, a fund's total return will be greater than it would be had the reimbursement not occurred. How a fund did yesterday is no guarantee of how it will do tomorrow.
Average Annual Total Returns
Periods ended March 31, 2011 | Past 1
year | Past 5
years | Life of
fund A |
Class A (incl. 5.75% sales charge) | 8.36% | 2.04% | 4.77% |
Class T (incl. 3.50% sales charge) | 10.66% | 2.28% | 4.89% |
Class B (incl. contingent deferred sales charge) B | 9.02% | 2.13% | 4.87% |
Class C (incl. contingent deferred sales charge) C | 13.01% | 2.49% | 4.82% |
A From November 6, 2003.
B Class B shares' contingent deferred sales charges included in the past one year, past five years, and life of fund total return figures are 5%, 2%, and 0%, respectively.
C Class C shares' contingent deferred sales charges included in the past one year, past five years, and life of fund total return figures are 1%, 0%, and 0%, respectively.
$10,000 Over Life of Fund
Let's say hypothetically that $10,000 was invested in Fidelity Advisor Freedom 2025 Fund® - Class A on November 6, 2003, when the fund started, and the current 5.75% sales charge was paid. The chart shows how the value of your investment would have changed, and also shows how the S&P 500 Index performed over the same period.
Annual Report
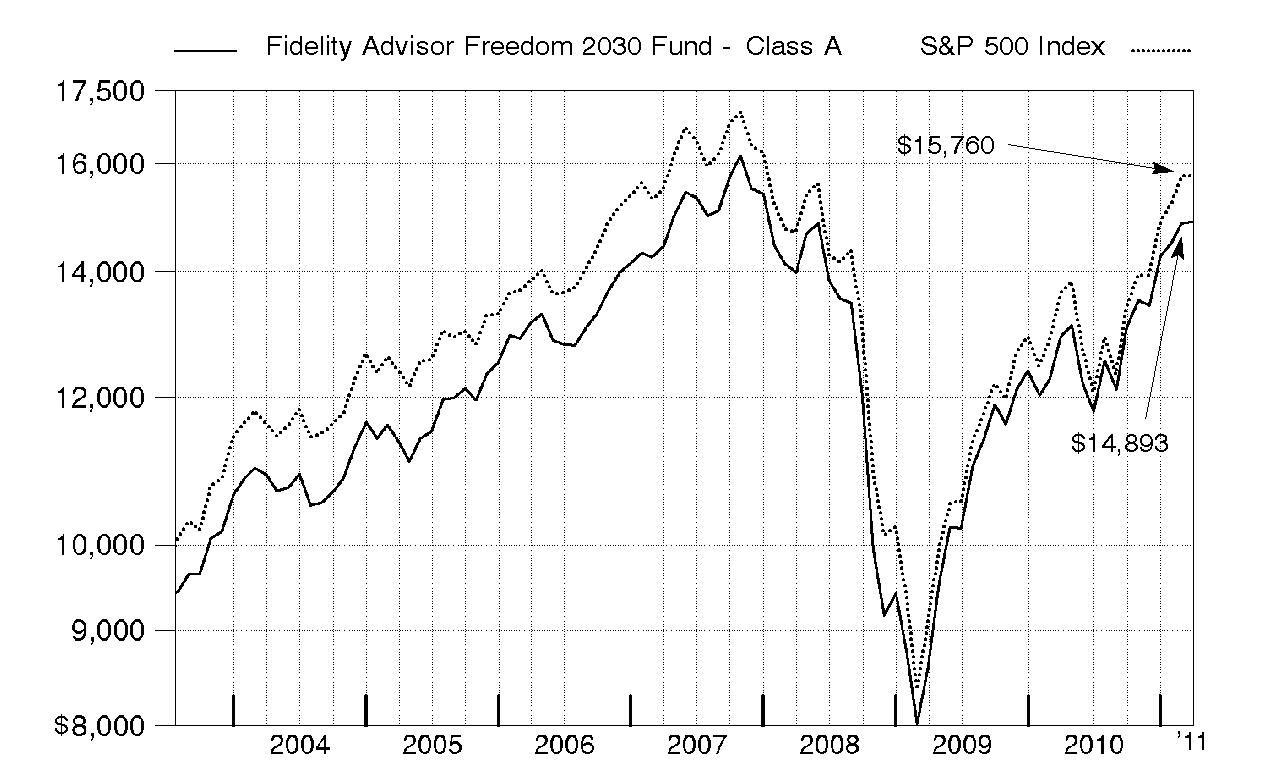
Fidelity Advisor Freedom 2030 Fund® - Class A, T, B, and C
Performance: The Bottom Line
Average annual total return reflects the change in the value of an investment, assuming reinvestment of the class' distributions from dividend income and capital gains (the profits earned upon the sale of securities that have grown in value, if any) and assuming a constant rate of performance each year. The $10,000 table and the fund's returns do not reflect the deduction of taxes that a shareholder would pay on fund distributions or the redemption of fund shares. During periods of reimbursement by Fidelity, a fund's total return will be greater than it would be had the reimbursement not occurred. How a fund did yesterday is no guarantee of how it will do tomorrow.
Average Annual Total Returns
Periods ended March 31, 2011 | Past 1
year | Past 5
years | Life of
fund A |
Class A (incl. 5.75% sales charge) | 8.64% | 1.30% | 5.32% |
Class T (incl. 3.50% sales charge) | 10.96% | 1.52% | 5.37% |
Class B (incl. contingent deferred sales charge) B | 9.38% | 1.38% | 5.41% |
Class C (incl. contingent deferred sales charge)C | 13.38% | 1.73% | 5.34% |
A From July 24, 2003.
B Class B shares' contingent deferred sales charges included in the past one year, past five years, and life of fund total return figures are 5%, 2%, and 0%, respectively.
C Class C shares' contingent deferred sales charges included in the past one year, past five years, and life of fund total return figures are 1%, 0%, and 0%, respectively.
$10,000 Over Life of Fund
Let's say hypothetically that $10,000 was invested in Fidelity Advisor Freedom 2030 Fund® - Class A on July 24, 2003, when the fund started, and the current 5.75% sales charge was paid. The chart shows how the value of your investment would have changed, and also shows how the S&P 500 Index performed over the same period.
Annual Report
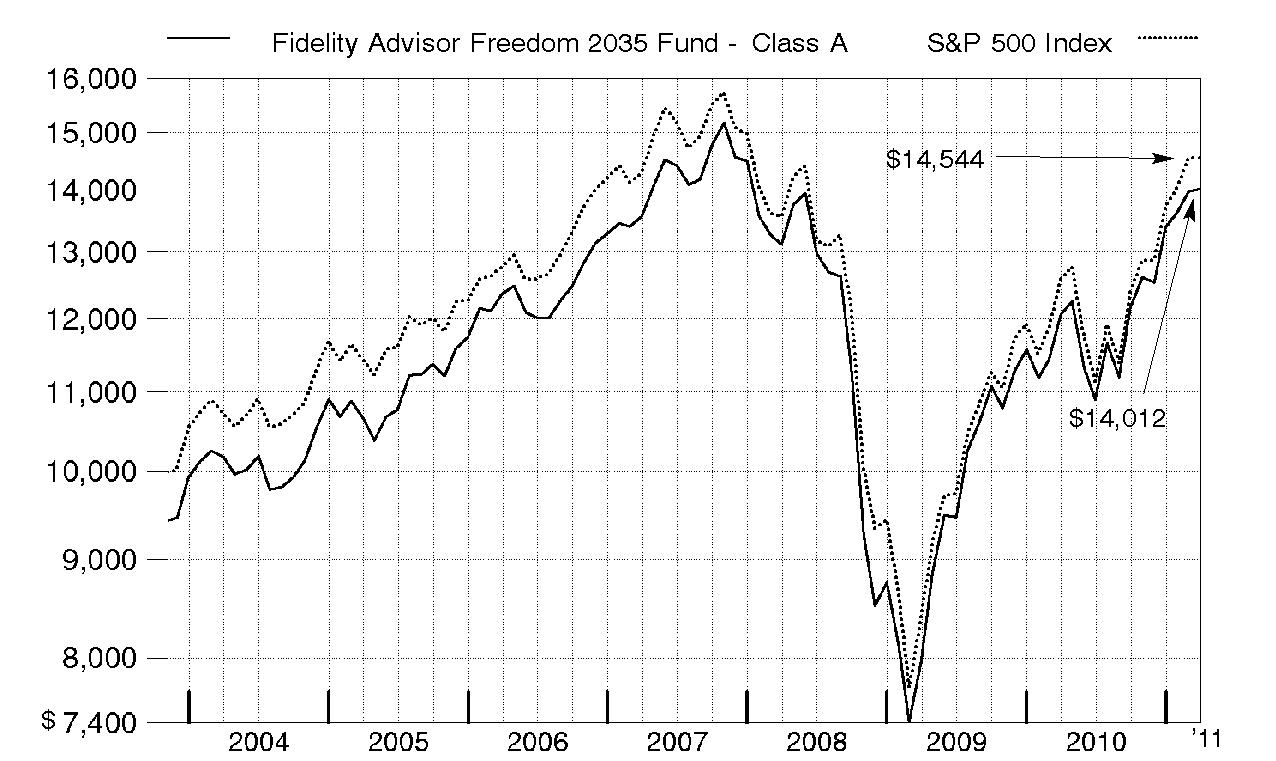
Fidelity Advisor Freedom 2035 Fund® - Class A, T, B, and C
Performance: The Bottom Line
Average annual total return reflects the change in the value of an investment, assuming reinvestment of the class' distributions from dividend income and capital gains (the profits earned upon the sale of securities that have grown in value, if any) and assuming a constant rate of performance each year. The $10,000 table and the fund's returns do not reflect the deduction of taxes that a shareholder would pay on fund distributions or the redemption of fund shares. During periods of reimbursement by Fidelity, a fund's total return will be greater than it would be had the reimbursement not occurred. How a fund did yesterday is no guarantee of how it will do tomorrow.
Average Annual Total Returns
Periods ended March 31, 2011 | Past 1
year | Past 5
years | Life of
fund A |
Class A (incl. 5.75% sales charge) | 9.45% | 1.33% | 4.66% |
Class T (incl. 3.50% sales charge) | 11.79% | 1.54% | 4.71% |
Class B (incl. contingent deferred sales charge) B | 10.28% | 1.41% | 4.73% |
Class C (incl. contingent deferred sales charge)C | 14.33% | 1.78% | 4.71% |
A From November 6, 2003.
B Class B shares' contingent deferred sales charges included in the past one year, past five years, and life of fund total return figures are 5%, 2%, and 0%, respectively.
C Class C shares' contingent deferred sales charges included in the past one year, past five years, and life of fund total return figures are 1%, 0%, and 0%, respectively.
$10,000 Over Life of Fund
Let's say hypothetically that $10,000 was invested in Fidelity Advisor Freedom 2035 Fund® - Class A on November 6, 2003, when the fund started, and the current 5.75% sales charge was paid. The chart shows how the value of your investment would have changed, and also shows how the S&P 500 Index performed over the same period.
Annual Report
Fidelity Advisor Freedom 2040 Fund® - Class A, T, B, and C
Performance: The Bottom Line
Average annual total return reflects the change in the value of an investment, assuming reinvestment of the class' distributions from dividend income and capital gains (the profits earned upon the sale of securities that have grown in value, if any) and assuming a constant rate of performance each year. The $10,000 table and the fund's returns do not reflect the deduction of taxes that a shareholder would pay on fund distributions or the redemption of fund shares. During periods of reimbursement by Fidelity, a fund's total return will be greater than it would be had the reimbursement not occurred. How a fund did yesterday is no guarantee of how it will do tomorrow.
Average Annual Total Returns
Periods ended March 31, 2011 | Past 1
year | Past 5
years | Life of
fund A |
Class A (incl. 5.75% sales charge) | 9.68% | 1.15% | 5.58% |
Class T (incl. 3.50% sales charge) | 12.00% | 1.38% | 5.63% |
Class B (incl. contingent deferred sales charge) B | 10.43% | 1.24% | 5.66% |
Class C (incl. contingent deferred sales charge) C | 14.39% | 1.58% | 5.58% |
A From July 24, 2003.
B Class B shares' contingent deferred sales charges included in the past one year, past five years, and life of fund total return figures are 5%, 2%, and 0%, respectively.
C Class C shares' contingent deferred sales charges included in the past one year, past five years, and life of fund total return figures are 1%, 0%, and 0%, respectively.
$10,000 Over Life of Fund
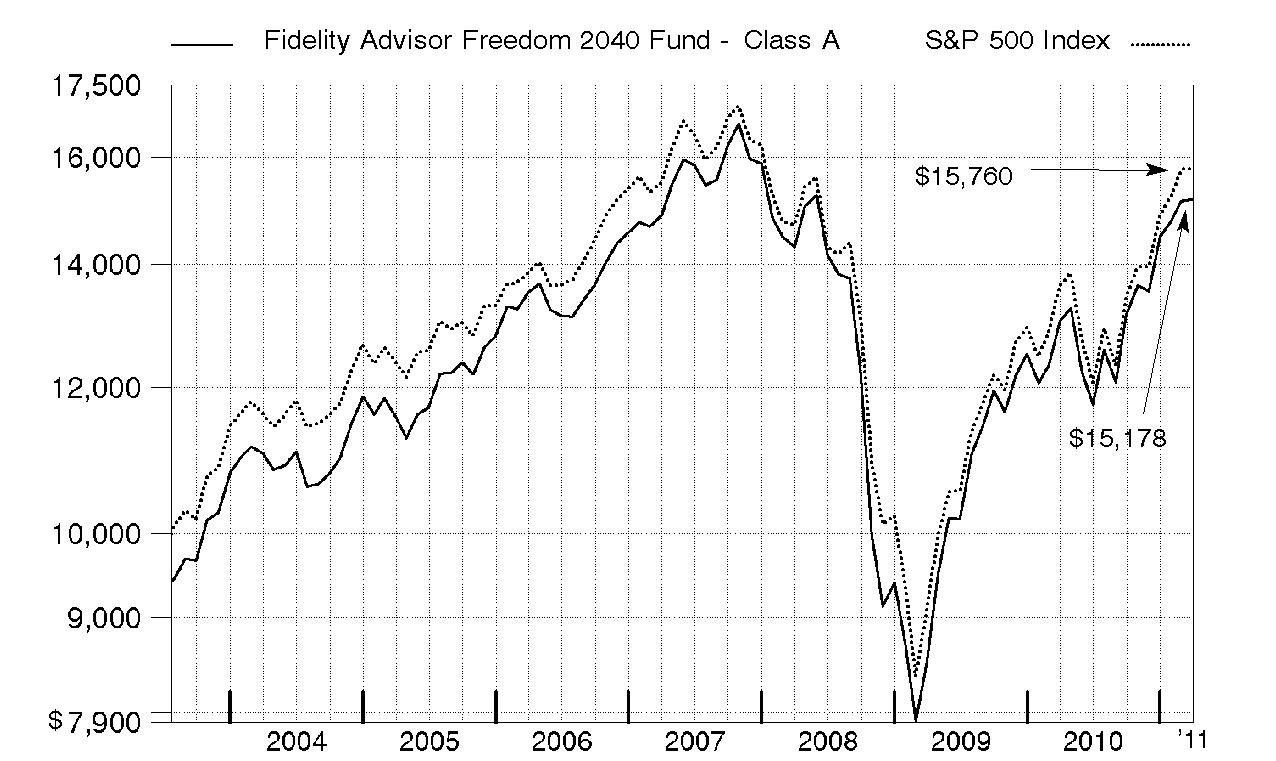
Let's say hypothetically that $10,000 was invested in Fidelity Advisor Freedom 2040 Fund® - Class A on July 24, 2003, when the fund started, and the current 5.75% sales charge was paid. The chart shows how the value of your investment would have changed, and also shows how the S&P 500 Index performed over the same period.
Annual Report
Fidelity Advisor Freedom 2045 Fund® - Class A, T, B, and C
Performance: The Bottom Line
Average annual total return reflects the change in the value of an investment, assuming reinvestment of the class' distributions from dividend income and capital gains (the profits earned upon the sale of securities that have grown in value, if any) and assuming a constant rate of performance each year. The $10,000 table and the fund's returns do not reflect the deduction of taxes that a shareholder would pay on fund distributions or the redemption of fund shares. During periods of reimbursement by Fidelity, a fund's total return will be greater than it would be had the reimbursement not occurred. How a fund did yesterday is no guarantee of how it will do tomorrow.
Average Annual Total Returns
Periods ended March 31, 2011 | Past 1
year | Life of
fund A |
Class A (incl. 5.75% sales charge) | 9.96% | 1.46% |
Class T (incl. 3.50% sales charge) | 12.29% | 1.70% |
Class B (incl. contingent deferred sales charge) B | 10.71% | 1.55% |
Class C (incl. contingent deferred sales charge) C | 14.80% | 1.96% |
A From June 1, 2006.
B Class B shares' contingent deferred sales charges included in the past one year and life of fund total return figures are 5%, and 2%, respectively.
C Class C shares' contingent deferred sales charges included in the past one year and life of fund total return figures are 1% and 0%, respectively.
$10,000 Over Life of Fund
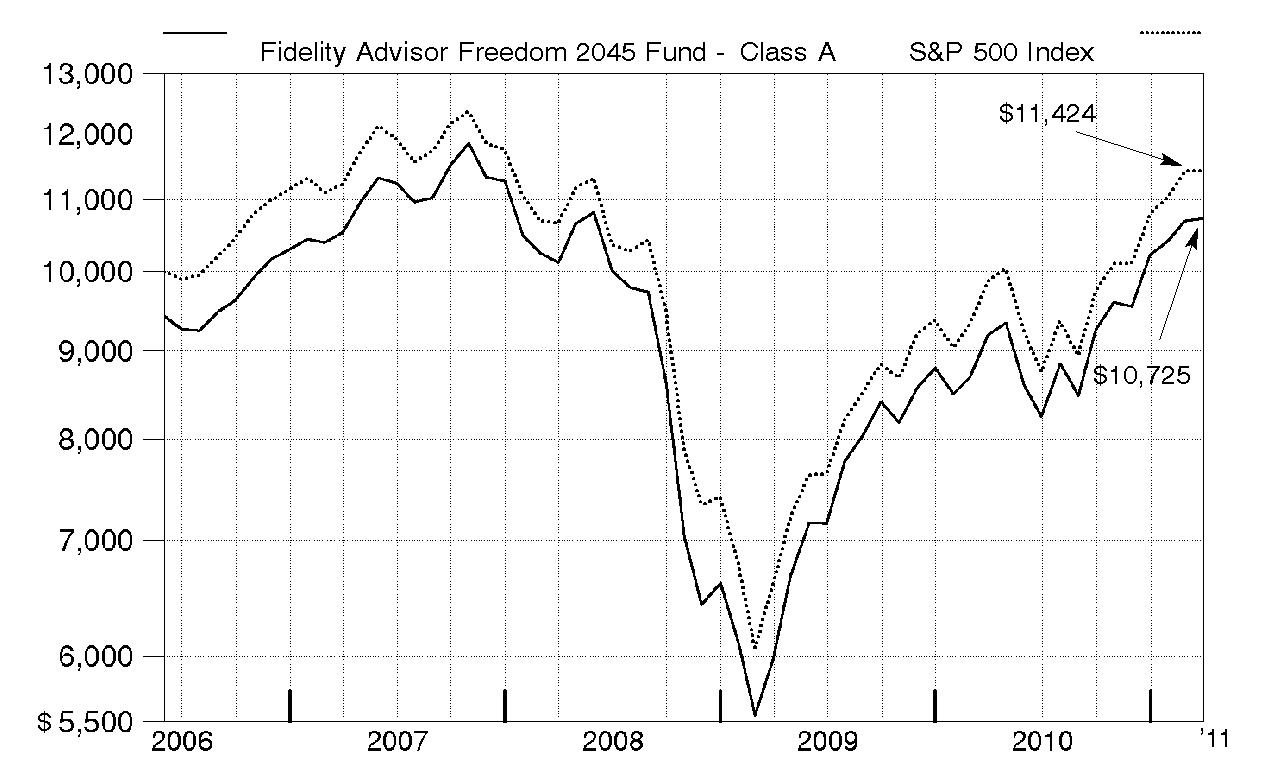
Let's say hypothetically that $10,000 was invested in Fidelity Advisor Freedom 2045 Fund® - Class A on June 1, 2006, when the fund started, and the current 5.75% sales charge was paid. The chart shows how the value of your investment would have changed, and also shows how the S&P 500 Index performed over the same period.
Annual Report
Fidelity Advisor Freedom 2050 Fund® - Class A, T, B, and C
Performance: The Bottom Line
Average annual total return reflects the change in the value of an investment, assuming reinvestment of the class' distributions from dividend income and capital gains (the profits earned upon the sale of securities that have grown in value, if any) and assuming a constant rate of performance each year. The $10,000 table and the fund's returns do not reflect the deduction of taxes that a shareholder would pay on fund distributions or the redemption of fund shares. During periods of reimbursement by Fidelity, a fund's total return will be greater than it would be had the reimbursement not occurred. How a fund did yesterday is no guarantee of how it will do tomorrow.
Average Annual Total Returns
Periods ended March 31, 2011 | | Past 1
year | Life of
fund A |
Class A (incl. 5.75% sales charge) | | 10.26% | 1.27% |
Class T (incl. 3.50% sales charge) | | 12.57% | 1.53% |
Class B (incl. contingent deferred sales charge) B | | 11.16% | 1.41% |
Class C (incl. contingent deferred sales charge) C | | 15.16% | 1.82% |
A From June 1, 2006.
B Class B shares' contingent deferred sales charges included in the past one year and life of fund total return figures are 5% and 2%, respectively.
C Class C shares' contingent deferred sales charges included in the past one year and life of fund total return figures are 1% and 0%, respectively.
$10,000 Over Life of Fund
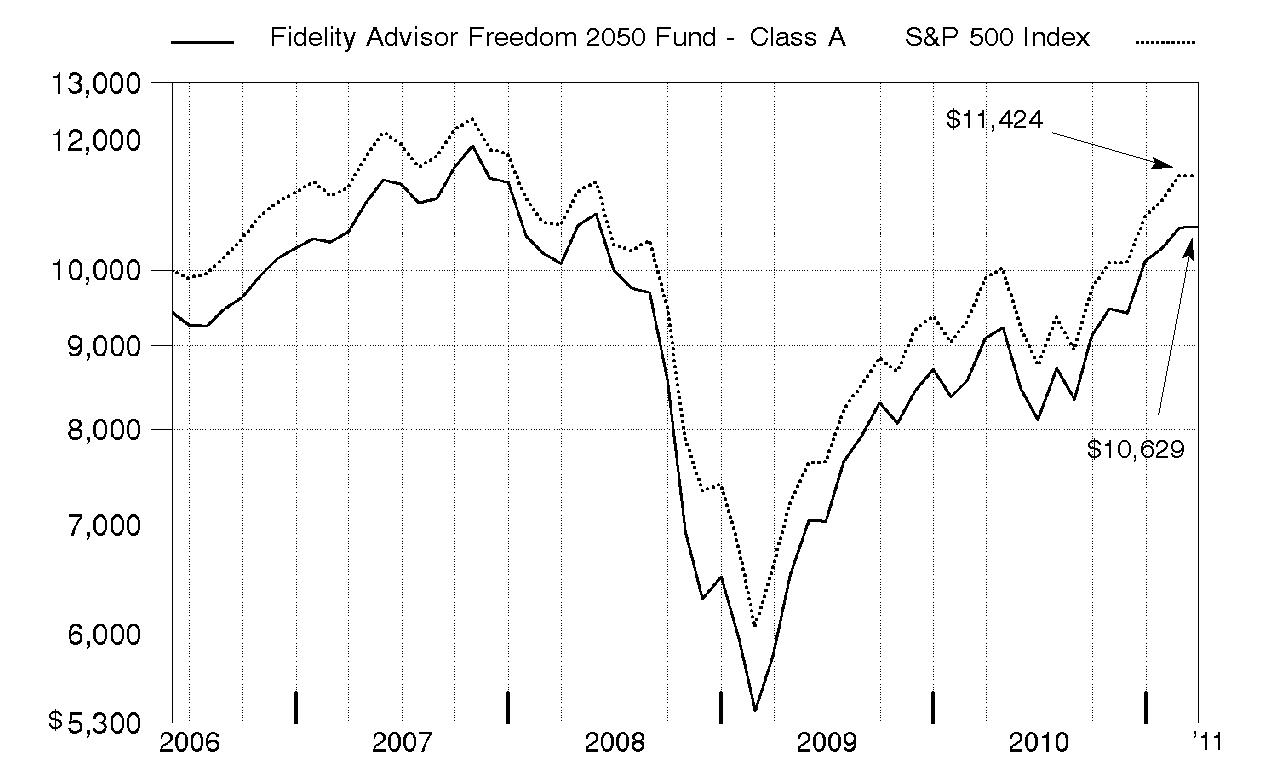
Let's say hypothetically that $10,000 was invested in Fidelity Advisor Freedom 2050 Fund® - Class A on June 1, 2006, when the fund started, and the current 5.75% sales charge was paid. The chart shows how the value of your investment would have changed, and also shows how the S&P 500 Index performed over the same period.
Annual Report
Market Recap: The 12-month period ending March 31, 2011, marked another good stretch for major equity markets, which continued a rally that began two years earlier. Despite early-period volatility brought on by the debt crisis in Europe and worries about a potential "double dip" recession in the U.S., stocks regained strength in late summer and fall, fueled by better-than-expected corporate earnings, encouraging economic activity, stimulative tax policies and the Federal Reserve's second round of quantitative easing involving the purchase of $600 billion in U.S. Treasuries. For the full period, the broad-based, large-cap-oriented S&P 500® Index posted a 15.65% gain, while its blue-chip counterpart, the Dow Jones Industrial AverageSM, rose 16.51% and the technology-laden Nasdaq Composite® Index added 17.06%. Within the S&P 500®, economically sensitive sectors generally saw the biggest gains, led by energy, materials and consumer discretionary. Telecommunication services stocks also rose sharply. By contrast, the financials and health care sectors showed only modest advances. Although global markets were rocked later in the period by heightened unrest in the Arab world and a devastating earthquake in Japan, foreign developed-markets equities, as represented by the MSCI® EAFE® (Europe, Australasia, Far East) Index, finished the year up 10.55%, significantly boosted by a weaker dollar. In the fixed-income area, investor appetite for higher-risk investments yielded solid returns. The BofA Merrill LynchSM US High Yield Constrained Index rose 14.14%, outpacing the 5.12% gain in the Barclays Capital® U.S. Aggregate Bond Index - a broad measure of the domestic investment-grade debt universe, which was held back by the weak returns of government securities.
Comments from Jonathan Shelon and Christopher Sharpe, Co-Portfolio Managers of Fidelity Advisor Freedom Funds®: Each of the Class A, Class T, Class B and Class C shares of the Advisor Freedom Funds (excluding sales charges) delivered a positive result for the one-year period ending March 31, 2011. (For specific Fund results, please refer to the performance section of this report.) The longer-dated Funds, which include more exposure to the U.S. equity and non-U.S. equity asset classes, posted higher returns than Funds with larger allocations to the investment-grade debt and short-term debt asset classes. On an absolute basis, both U.S. equities and non-U.S. equities performed very well for the one-year period, having gained traction in the second half of the period after a challenging initial six months. The equity asset classes were the main drivers of the Funds' absolute performance, which resulted in the longer-dated Funds posting the biggest gains during the one-year period ending March 31, 2011. In aggregate, the Funds' underlying U.S. equity investments outperformed the 17.73% return of the Dow Jones U.S. Total Stock Market IndexSM. Four of the nine underlying funds beat the Dow Jones index, with the strongest results coming from Fidelity® Series Small Cap Opportunities Fund. Fidelity® Series Commodity Strategy Fund, Fidelity Advisor® Small Cap Fund and Fidelity Advisor® Equity Growth Fund also were top contributors, each gaining more than 24%. Despite its strong absolute showing, Fidelity Series Large Cap Value Fund, a major holding, was the weakest performer, rising approximately 12% for the period. In the non-U.S. equity class, the Funds' underlying investments, in aggregate, soundly beat their benchmark, the MSCI® EAFE® (Europe, Australasia, Far East) Index. Five of the six underlying non-U.S. equity funds beat the MSCI index. Fidelity Series International Small Cap Fund and Fidelity Series Emerging Markets Fund led the way, benefiting from a weaker U.S. dollar and the shift toward higher-risk asset classes that occurred in the second half of the period. Turning to the debt asset classes, both investment-grade debt and short-term debt instruments posted a positive absolute return for the year, despite weak performance within these two categories during the second half of the period. Propelled in part by strong relative results from these two categories, the Funds were able to outpace their respective Composite indexes for the one-year period. The Funds' investment-grade debt category handily beat the Barclays Capital® U.S. Aggregate Bond Index. Fidelity Series Investment Grade Bond Fund helped the Funds' results, as did Fidelity Advisor Strategic Real Return Fund, which roared past the broader bond market. The Funds' high-yield holding, Fidelity Advisor High Income Advantage Fund, also did well, as investors' appetite for risk increased. The Funds transitioned out of Advisor High Income Advantage and into Fidelity Series High Income Fund during the period. In the short-term debt asset class, Fidelity Advisor Short Fixed-Income Fund pushed the Funds' aggregate performance in this category well ahead of the 0.19% return of the Barclays Capital® U.S. 3 Month Treasury Bellwether Index.
Comments from Jonathan Shelon and Christopher Sharpe, Co-Portfolio Managers of Fidelity Advisor Freedom Funds®: Each of the Institutional Class shares of the Advisor Freedom Funds delivered a positive result for the one-year period ending March 31, 2011. (For specific Fund results, please refer to the performance section of this report.) The longer-dated Funds, which include more exposure to the U.S. equity and non-U.S. equity asset classes, posted higher returns than the Funds with larger allocations to the investment-grade debt and short-term debt asset classes. On an absolute basis, both U.S. equities and non-U.S. equities performed very well for the one-year period, having gained traction in the second half of the period after a challenging initial six months. The equity asset classes were the main drivers of the Funds' absolute performance, which resulted in the longer-dated Funds posting the biggest gains during the one-year period ending March 31, 2011. In aggregate, the Funds' underlying U.S. equity investments outperformed the 17.73% return of the Dow Jones U.S. Total Stock Market IndexSM. Four of the nine underlying funds beat the Dow Jones index, with the strongest results coming from Fidelity® Series Small Cap Opportunities Fund. Fidelity® Series Commodity Strategy Fund, Fidelity Advisor® Small Cap Fund and Fidelity Advisor® Equity Growth Fund also were top contributors, each gaining more than 24%. Despite its strong absolute showing, Fidelity Series Large Cap Value Fund, a major holding, was the weakest performer, rising approximately 12% for the period. In the non-U.S. equity class, the Funds' underlying investments, in aggregate, soundly beat their benchmark, the MSCI® EAFE® (Europe, Australasia, Far East) Index. Five of the six underlying non-U.S. equity funds beat the MSCI index. Fidelity Series International Small Cap Fund and Fidelity Series Emerging Markets Fund led the way, benefiting from a weaker U.S. dollar and the shift toward higher-risk asset classes that occurred in the second half of the period. Turning to the debt asset classes, both investment-grade debt and short-term debt instruments posted a positive absolute return for the year, despite weak performance within these two categories during the second half of the period. Propelled in part by strong relative results from these two categories, the Funds were able to outpace their respective Composite indexes for the one-year period. The Funds' investment-grade debt category handily beat the Barclays Capital® U.S. Aggregate Bond Index. Fidelity Series Investment Grade Bond Fund helped the Funds' results, as did Fidelity Advisor Strategic Real Return Fund, which roared past the broader bond market. The Funds' high-yield holding, Fidelity Advisor High Income Advantage Fund, also did well, as investors' appetite for risk increased. The Funds transitioned out of Advisor High Income Advantage and into Fidelity Series High Income Fund during the period. In the short-term debt asset class, Fidelity Advisor Short Fixed-Income Fund pushed the Funds' aggregate performance in this category well ahead of the 0.19% return of the Barclays Capital® U.S. 3 Month Treasury Bellwether Index.
Annual Report
The views expressed above reflect those of the portfolio manager(s) only through the end of the period as stated on the cover of this report and do not necessarily represent the views of Fidelity or any other person in the Fidelity organization. Any such views are subject to change at any time based upon market or other conditions and Fidelity disclaims any responsibility to update such views. These views may not be relied on as investment advice and, because investment decisions for a Fidelity fund are based on numerous factors, may not be relied on as an indication of trading intent on behalf of any Fidelity fund.
Annual Report
As a shareholder of a Fund, you incur two types of costs: (1) transaction costs, including sales charges (loads) on purchase payments or redemption proceeds, and (2) ongoing costs, including distribution and/or service (12b-1) fees and other Fund expenses. This Example is intended to help you understand your ongoing costs (in dollars) of investing in the Funds and to compare these costs with the ongoing costs of investing in other mutual funds.
The Example is based on an investment of $1,000 invested at the beginning of the period and held for the entire period (October 1, 2010 to March 31, 2011).
Actual Expenses
The first line of the accompanying table for each class of each fund provides information about actual account values and actual expenses. You may use the information in this line, together with the amount you invested, to estimate the expenses that you paid over the period. Simply divide your account value by $1,000.00 (for example, an $8,600 account value divided by $1,000.00 = 8.6), then multiply the result by the number in the first line for a class of the fund under the heading entitled "Expenses Paid During Period" to estimate the expenses you paid on your account during this period. In addition, each Fund, as a shareholder in underlying Fidelity Funds, will indirectly bear its pro-rata share of the fees and expenses incurred by the underlying Fidelity Funds. These fees and expenses are not included in each Fund's annualized expense ratio used to calculate the expense estimates in the table below.
Hypothetical Example for Comparison Purposes
The second line of the accompanying table for each class of each fund provides information about hypothetical account values and hypothetical expenses based on a Class' actual expense ratio and an assumed rate of return of 5% per year before expenses, which is not the Class' actual return. The hypothetical account values and expenses may not be used to estimate the actual ending account balance or expenses you paid for the period. You may use this information to compare the ongoing costs of investing in the Fund and other funds. To do so, compare this 5% hypothetical example with the 5% hypothetical examples that appear in the shareholder reports of the other funds. In addition, each Fund, as a shareholder in underlying Fidelity Funds, will indirectly bear its pro-rata share of the fees and expenses incurred by the underlying Fidelity Funds. These fees and expenses are not included in each Fund's annualized expense ratio used to calculate the expense estimates in the table below.
Please note that the expenses shown in the table are meant to highlight your ongoing costs only and do not reflect any transaction costs. Therefore, the second line of the table is useful in comparing ongoing costs only, and will not help you determine the relative total costs of owning different funds. In addition, if these transactional costs were included, your costs would have been higher.
| Annualized
Expense Ratio | Beginning
Account Value
October 1, 2010 | Ending
Account Value
March 31, 2011 | Expenses Paid
During Period*
October 1, 2010 to March 31, 2011 |
Advisor Freedom Income | | | | |
Class A | .25% | | | |
Actual | | $ 1,000.00 | $ 1,043.70 | $ 1.27 |
Hypothetical A | | $ 1,000.00 | $ 1,023.68 | $ 1.26 |
Class T | .50% | | | |
Actual | | $ 1,000.00 | $ 1,041.40 | $ 2.54 |
Hypothetical A | | $ 1,000.00 | $ 1,022.44 | $ 2.52 |
Class B | 1.00% | | | |
Actual | | $ 1,000.00 | $ 1,039.60 | $ 5.09 |
Hypothetical A | | $ 1,000.00 | $ 1,019.95 | $ 5.04 |
Class C | 1.00% | | | |
Actual | | $ 1,000.00 | $ 1,039.70 | $ 5.09 |
Hypothetical A | | $ 1,000.00 | $ 1,019.95 | $ 5.04 |
Institutional Class | .00% | | | |
Actual | | $ 1,000.00 | $ 1,045.00 | $ .00 |
Hypothetical A | | $ 1,000.00 | $ 1,024.93 | $ .00 |
Advisor Freedom 2005 | | | | |
Class A | .25% | | | |
Actual | | $ 1,000.00 | $ 1,082.40 | $ 1.30 |
Hypothetical A | | $ 1,000.00 | $ 1,023.68 | $ 1.26 |
Class T | .50% | | | |
Actual | | $ 1,000.00 | $ 1,081.20 | $ 2.59 |
Hypothetical A | | $ 1,000.00 | $ 1,022.44 | $ 2.52 |
| Annualized
Expense Ratio | Beginning
Account Value
October 1, 2010 | Ending
Account Value
March 31, 2011 | Expenses Paid
During Period*
October 1, 2010 to March 31, 2011 |
Class B | 1.00% | | | |
Actual | | $ 1,000.00 | $ 1,078.80 | $ 5.18 |
Hypothetical A | | $ 1,000.00 | $ 1,019.95 | $ 5.04 |
Class C | 1.00% | | | |
Actual | | $ 1,000.00 | $ 1,078.40 | $ 5.18 |
Hypothetical A | | $ 1,000.00 | $ 1,019.95 | $ 5.04 |
Institutional Class | .00% | | | |
Actual | | $ 1,000.00 | $ 1,084.70 | $ .00 |
Hypothetical A | | $ 1,000.00 | $ 1,024.93 | $ .00 |
Advisor Freedom 2010 | | | | |
Class A | .25% | | | |
Actual | | $ 1,000.00 | $ 1,097.00 | $ 1.31 |
Hypothetical A | | $ 1,000.00 | $ 1,023.68 | $ 1.26 |
Class T | .50% | | | |
Actual | | $ 1,000.00 | $ 1,094.50 | $ 2.61 |
Hypothetical A | | $ 1,000.00 | $ 1,022.44 | $ 2.52 |
Class B | 1.00% | | | |
Actual | | $ 1,000.00 | $ 1,092.20 | $ 5.22 |
Hypothetical A | | $ 1,000.00 | $ 1,019.95 | $ 5.04 |
Class C | 1.00% | | | |
Actual | | $ 1,000.00 | $ 1,091.70 | $ 5.21 |
Hypothetical A | | $ 1,000.00 | $ 1,019.95 | $ 5.04 |
Institutional Class | .00% | | | |
Actual | | $ 1,000.00 | $ 1,097.60 | $ .00 |
Hypothetical A | | $ 1,000.00 | $ 1,024.93 | $ .00 |
Advisor Freedom 2015 | | | | |
Class A | .25% | | | |
Actual | | $ 1,000.00 | $ 1,097.80 | $ 1.31 |
Hypothetical A | | $ 1,000.00 | $ 1,023.68 | $ 1.26 |
Class T | .50% | | | |
Actual | | $ 1,000.00 | $ 1,096.70 | $ 2.61 |
Hypothetical A | | $ 1,000.00 | $ 1,022.44 | $ 2.52 |
Class B | 1.00% | | | |
Actual | | $ 1,000.00 | $ 1,094.40 | $ 5.22 |
Hypothetical A | | $ 1,000.00 | $ 1,019.95 | $ 5.04 |
Class C | 1.00% | | | |
Actual | | $ 1,000.00 | $ 1,094.00 | $ 5.22 |
Hypothetical A | | $ 1,000.00 | $ 1,019.95 | $ 5.04 |
Institutional Class | .00% | | | |
Actual | | $ 1,000.00 | $ 1,099.20 | $ .00 |
Hypothetical A | | $ 1,000.00 | $ 1,024.93 | $ .00 |
Advisor Freedom 2020 | | | | |
Class A | .25% | | | |
Actual | | $ 1,000.00 | $ 1,116.40 | $ 1.32 |
Hypothetical A | | $ 1,000.00 | $ 1,023.68 | $ 1.26 |
Class T | .50% | | | |
Actual | | $ 1,000.00 | $ 1,114.80 | $ 2.64 |
Hypothetical A | | $ 1,000.00 | $ 1,022.44 | $ 2.52 |
| Annualized
Expense Ratio | Beginning
Account Value
October 1, 2010 | Ending
Account Value
March 31, 2011 | Expenses Paid
During Period*
October 1, 2010 to March 31, 2011 |
Class B | 1.00% | | | |
Actual | | $ 1,000.00 | $ 1,112.00 | $ 5.27 |
Hypothetical A | | $ 1,000.00 | $ 1,019.95 | $ 5.04 |
Class C | 1.00% | | | |
Actual | | $ 1,000.00 | $ 1,112.20 | $ 5.27 |
Hypothetical A | | $ 1,000.00 | $ 1,019.95 | $ 5.04 |
Institutional Class | .00% | | | |
Actual | | $ 1,000.00 | $ 1,117.40 | $ .00 |
Hypothetical A | | $ 1,000.00 | $ 1,024.93 | $ .00 |
Advisor Freedom 2025 | | | | |
Class A | .25% | | | |
Actual | | $ 1,000.00 | $ 1,131.20 | $ 1.33 |
Hypothetical A | | $ 1,000.00 | $ 1,023.68 | $ 1.26 |
Class T | .50% | | | |
Actual | | $ 1,000.00 | $ 1,130.10 | $ 2.66 |
Hypothetical A | | $ 1,000.00 | $ 1,022.44 | $ 2.52 |
Class B | 1.00% | | | |
Actual | | $ 1,000.00 | $ 1,127.10 | $ 5.30 |
Hypothetical A | | $ 1,000.00 | $ 1,019.95 | $ 5.04 |
Class C | 1.00% | | | |
Actual | | $ 1,000.00 | $ 1,126.70 | $ 5.30 |
Hypothetical A | | $ 1,000.00 | $ 1,019.95 | $ 5.04 |
Institutional Class | .00% | | | |
Actual | | $ 1,000.00 | $ 1,133.20 | $ .00 |
Hypothetical A | | $ 1,000.00 | $ 1,024.93 | $ .00 |
Advisor Freedom 2030 | | | | |
Class A | .25% | | | |
Actual | | $ 1,000.00 | $ 1,139.60 | $ 1.33 |
Hypothetical A | | $ 1,000.00 | $ 1,023.68 | $ 1.26 |
Class T | .50% | | | |
Actual | | $ 1,000.00 | $ 1,137.50 | $ 2.66 |
Hypothetical A | | $ 1,000.00 | $ 1,022.44 | $ 2.52 |
Class B | 1.00% | | | |
Actual | | $ 1,000.00 | $ 1,135.10 | $ 5.32 |
Hypothetical A | | $ 1,000.00 | $ 1,019.95 | $ 5.04 |
Class C | 1.00% | | | |
Actual | | $ 1,000.00 | $ 1,135.00 | $ 5.32 |
Hypothetical A | | $ 1,000.00 | $ 1,019.95 | $ 5.04 |
Institutional Class | .00% | | | |
Actual | | $ 1,000.00 | $ 1,139.90 | $ .00 |
Hypothetical A | | $ 1,000.00 | $ 1,024.93 | $ .00 |
Advisor Freedom 2035 | | | | |
Class A | .25% | | | |
Actual | | $ 1,000.00 | $ 1,152.20 | $ 1.34 |
Hypothetical A | | $ 1,000.00 | $ 1,023.68 | $ 1.26 |
Class T | .50% | | | |
Actual | | $ 1,000.00 | $ 1,151.00 | $ 2.68 |
Hypothetical A | | $ 1,000.00 | $ 1,022.44 | $ 2.52 |
| Annualized
Expense Ratio | Beginning
Account Value
October 1, 2010 | Ending
Account Value
March 31, 2011 | Expenses Paid
During Period*
October 1, 2010 to March 31, 2011 |
Class B | 1.00% | | | |
Actual | | $ 1,000.00 | $ 1,148.00 | $ 5.36 |
Hypothetical A | | $ 1,000.00 | $ 1,019.95 | $ 5.04 |
Class C | 1.00% | | | |
Actual | | $ 1,000.00 | $ 1,148.40 | $ 5.36 |
Hypothetical A | | $ 1,000.00 | $ 1,019.95 | $ 5.04 |
Institutional Class | .00% | | | |
Actual | | $ 1,000.00 | $ 1,154.30 | $ .00 |
Hypothetical A | | $ 1,000.00 | $ 1,024.93 | $ .00 |
Advisor Freedom 2040 | | | | |
Class A | .25% | | | |
Actual | | $ 1,000.00 | $ 1,155.70 | $ 1.34 |
Hypothetical A | | $ 1,000.00 | $ 1,023.68 | $ 1.26 |
Class T | .50% | | | |
Actual | | $ 1,000.00 | $ 1,154.30 | $ 2.69 |
Hypothetical A | | $ 1,000.00 | $ 1,022.44 | $ 2.52 |
Class B | 1.00% | | | |
Actual | | $ 1,000.00 | $ 1,150.50 | $ 5.36 |
Hypothetical A | | $ 1,000.00 | $ 1,019.95 | $ 5.04 |
Class C | 1.00% | | | |
Actual | | $ 1,000.00 | $ 1,151.10 | $ 5.36 |
Hypothetical A | | $ 1,000.00 | $ 1,019.95 | $ 5.04 |
Institutional Class | .00% | | | |
Actual | | $ 1,000.00 | $ 1,156.00 | $ .00 |
Hypothetical A | | $ 1,000.00 | $ 1,024.93 | $ .00 |
Advisor Freedom 2045 | | | | |
Class A | .25% | | | |
Actual | | $ 1,000.00 | $ 1,159.70 | $ 1.35 |
Hypothetical A | | $ 1,000.00 | $ 1,023.68 | $ 1.26 |
Class T | .50% | | | |
Actual | | $ 1,000.00 | $ 1,158.60 | $ 2.69 |
Hypothetical A | | $ 1,000.00 | $ 1,022.44 | $ 2.52 |
Class B | 1.00% | | | |
Actual | | $ 1,000.00 | $ 1,154.70 | $ 5.37 |
Hypothetical A | | $ 1,000.00 | $ 1,019.95 | $ 5.04 |
Class C | 1.00% | | | |
Actual | | $ 1,000.00 | $ 1,155.60 | $ 5.37 |
Hypothetical A | | $ 1,000.00 | $ 1,019.95 | $ 5.04 |
Institutional Class | .00% | | | |
Actual | | $ 1,000.00 | $ 1,160.90 | $ .00 |
Hypothetical A | | $ 1,000.00 | $ 1,024.93 | $ .00 |
Advisor Freedom 2050 | | | | |
Class A | .25% | | | |
Actual | | $ 1,000.00 | $ 1,165.50 | $ 1.35 |
Hypothetical A | | $ 1,000.00 | $ 1,023.68 | $ 1.26 |
Class T | .50% | | | |
Actual | | $ 1,000.00 | $ 1,164.20 | $ 2.70 |
Hypothetical A | | $ 1,000.00 | $ 1,022.44 | $ 2.52 |
| Annualized
Expense Ratio | Beginning
Account Value
October 1, 2010 | Ending
Account Value
March 31, 2011 | Expenses Paid
During Period*
October 1, 2010 to March 31, 2011 |
Class B | 1.00% | | | |
Actual | | $ 1,000.00 | $ 1,162.10 | $ 5.39 |
Hypothetical A | | $ 1,000.00 | $ 1,019.95 | $ 5.04 |
Class C | 1.00% | | | |
Actual | | $ 1,000.00 | $ 1,162.20 | $ 5.39 |
Hypothetical A | | $ 1,000.00 | $ 1,019.95 | $ 5.04 |
Institutional Class | .00% | | | |
Actual | | $ 1,000.00 | $ 1,167.90 | $ .00 |
Hypothetical A | | $ 1,000.00 | $ 1,024.93 | $ .00 |
A 5% return per year before expenses
* Expenses are equal to each Class' annualized expense ratio, multiplied by the average account value over the period, multiplied by 182/ 365 (to reflect the one-half year period). The fees and expenses of the underlying Fidelity Funds in which the Fund invests are not included in each class' annualized expense ratio.
Annual Report
Fidelity Advisor Freedom Income Fund
Investment Changes (Unaudited)
Fund Holdings as of March 31, 2011 |
| % of fund's
net assets | % of fund's net assets
6 months ago |
Commodity Funds | | |
Fidelity Series Commodity Strategy Fund | 0.8 | 0.8 |
Domestic Equity Funds | | |
Fidelity Advisor Equity Growth Fund Institutional Class | 1.4 | 1.4 |
Fidelity Advisor Equity Income Fund Institutional Class | 0.0 | 0.3 |
Fidelity Advisor Growth & Income Fund Institutional Class | 1.9 | 2.0 |
Fidelity Advisor Large Cap Fund Institutional Class | 1.9 | 1.9 |
Fidelity Advisor Small Cap Fund Institutional Class | 0.7 | 0.7 |
Fidelity Series 100 Index Fund | 1.6 | 1.5 |
Fidelity Series All-Sector Equity Fund | 2.7 | 2.8 |
Fidelity Series Large Cap Value Fund | 2.7 | 2.5 |
Fidelity Series Small Cap Opportunities Fund | 0.7 | 0.7 |
| 13.6 | 13.8 |
Developed International Equity Funds | | |
Fidelity Advisor Diversified International Fund Institutional Class | 0.8 | 1.0 |
Fidelity Advisor Overseas Fund Institutional Class | 0.7 | 1.0 |
Fidelity Series International Growth Fund | 1.4 | 1.1 |
Fidelity Series International Small Cap Fund | 0.3 | 0.2 |
Fidelity Series International Value Fund | 1.4 | 1.0 |
| 4.6 | 4.3 |
Emerging Markets Equity Funds | | |
Fidelity Series Emerging Markets Fund | 0.8 | 0.7 |
High Yield Bond Funds | | |
Fidelity Advisor High Income Advantage Fund Institutional Class | 0.0 | 5.1 |
Fidelity Series Emerging Markets Debt Fund | 0.1 | 0.0 |
Fidelity Series High Income Fund | 4.9 | 0.0 |
| 5.0 | 5.1 |
Inflation-Protected Bond Funds | | |
Fidelity Series Inflation-Protected Bond Index Fund | 10.9 | 10.6 |
Investment Grade Bond Funds | | |
Fidelity Advisor Strategic Real Return Fund Institutional Class | 4.4 | 4.6 |
Fidelity Advisor Total Bond Fund Institutional Class | 0.0 | 0.0* |
Fidelity Series Investment Grade Bond Fund | 20.0 | 20.7 |
| 24.4 | 25.3 |
Short-Term Funds | | |
Fidelity Advisor Short Fixed-Income Fund Institutional Class | 19.7 | 19.8 |
Fidelity Institutional Money Market Portfolio Institutional Class | 20.2 | 19.6 |
| 39.9 | 39.4 |
| | |
Net Other Assets (Liabilities)* | 0.0 | 0.0 |
| 100.0 | 100.0 |
* Amount represents less than 0.1% |
Asset Allocation (% of fund's net assets) |
Current |
 | Commodity Funds | 0.8% | |
 | Domestic Equity Funds | 13.6% | |
 | Developed International Equity Funds | 4.6% | |
 | Emerging Markets Equity Funds | 0.8% | |
 | High Yield Bond Funds | 5.0% | |
 | Inflation-Protected Bond Funds | 10.9% | |
 | Investment Grade Bond Funds | 24.4% | |
 | Short-Term Funds | 39.9% | |

Six months ago |
| Commodity Funds | 0.8% | |
| Domestic Equity Funds | 13.8% | |
| Developed International Equity Funds | 4.3% | |
| Emerging Markets Equity Funds | 0.7% | |
| High Yield Bond Funds | 5.1% | |
| Inflation-Protected Bond Funds | 10.6% | |
| Investment Grade Bond Funds | 25.3% | |
| Short-Term Funds | 39.4% | |

Expected |
| Commodity Funds | 2.0% | |
| Domestic Equity Funds | 12.6% | |
| Developed International Equity Funds | 4.6% | |
| Emerging Markets Equity Funds | 0.8% | |
| High Yield Bond Funds | 5.0% | |
| Inflation-Protected Bond Funds | 12.0% | |
| Investment Grade Bond Funds | 23.0% | |
| Short-Term Funds | 40.0% | |

The six months ago allocation is based on the fund's holdings as of September 30, 2010. The current allocation is based on the fund's holdings as of March 31, 2011. The expected allocation represents the fund's anticipated allocation at September 30, 2011. |
Annual Report
Fidelity Advisor Freedom Income Fund
Investments March 31, 2011
Showing Percentage of Net Assets
Domestic Equity Funds - 14.4% |
| Shares | | Value |
Commodity Funds - 0.8% |
Fidelity Series Commodity Strategy Fund | 165,386 | | $ 2,179,789 |
Domestic Equity Funds - 13.6% |
Fidelity Advisor Equity Growth Fund Institutional Class | 58,888 | | 3,659,867 |
Fidelity Advisor Growth & Income Fund Institutional Class | 281,459 | | 5,080,341 |
Fidelity Advisor Large Cap Fund Institutional Class | 255,046 | | 5,032,048 |
Fidelity Advisor Small Cap Fund Institutional Class | 66,842 | | 1,876,252 |
Fidelity Series 100 Index Fund | 473,335 | | 4,354,680 |
Fidelity Series All-Sector Equity Fund | 554,902 | | 7,274,768 |
Fidelity Series Large Cap Value Fund | 600,340 | | 7,330,152 |
Fidelity Series Small Cap Opportunities Fund | 155,731 | | 1,836,063 |
TOTAL DOMESTIC EQUITY FUNDS | | 36,444,171 |
TOTAL DOMESTIC EQUITY FUNDS (Cost $30,881,705) | 38,623,960 |
International Equity Funds - 5.4% |
| | | |
Developed International Equity Funds - 4.6% |
Fidelity Advisor Diversified International Fund Institutional Class | 119,581 | | 2,010,153 |
Fidelity Advisor Overseas Fund Institutional Class | 104,351 | | 1,985,804 |
Fidelity Series International Growth Fund | 330,567 | | 3,804,822 |
Fidelity Series International Small Cap Fund | 60,722 | | 749,304 |
Fidelity Series International Value Fund | 351,560 | | 3,687,862 |
TOTAL DEVELOPED INTERNATIONAL EQUITY FUNDS | | 12,237,945 |
Emerging Markets Equity Funds - 0.8% |
Fidelity Series Emerging Markets Fund | 117,932 | | 2,259,582 |
TOTAL INTERNATIONAL EQUITY FUNDS (Cost $12,325,983) | 14,497,527 |
Bond Funds - 40.3% |
| Shares | | Value |
High Yield Bond Funds - 5.0% |
Fidelity Series Emerging Markets Debt Fund | 19,201 | | $ 192,092 |
Fidelity Series High Income Fund | 1,321,773 | | 13,244,167 |
TOTAL HIGH YIELD BOND FUNDS | | 13,436,259 |
Inflation-Protected Bond Funds - 10.9% |
Fidelity Series Inflation-Protected Bond Index Fund | 2,708,123 | | 29,301,893 |
Investment Grade Bond Funds - 24.4% |
Fidelity Advisor Strategic Real Return Fund Institutional Class | 1,200,452 | | 11,884,475 |
Fidelity Series Investment Grade Bond Fund | 4,709,656 | | 53,595,887 |
TOTAL INVESTMENT GRADE BOND FUNDS | | 65,480,362 |
TOTAL BOND FUNDS (Cost $103,387,048) | 108,218,514 |
Short-Term Funds - 39.9% |
| | | |
Fidelity Advisor Short Fixed-Income Fund Institutional Class | 5,722,115 | | 52,700,684 |
Fidelity Institutional Money Market Portfolio Institutional Class | 54,266,765 | | 54,266,765 |
TOTAL SHORT-TERM FUNDS (Cost $106,964,048) | 106,967,449 |
TOTAL INVESTMENT PORTFOLIO - 100.0% (Cost $253,558,784) | | 268,307,450 |
NET OTHER ASSETS (LIABILITIES) - 0.0% | | (49,116) |
NET ASSETS - 100% | $ 268,258,334 |
Other Information |
All investments are categorized as Level 1 under the Fair Value Hierarchy. The inputs or methodology used for valuing securities may not be an indication of the risk associated with investing in those securities. For more information on valuation inputs, please refer to the Security Valuation section in the accompanying Notes to Financial Statements. |
Income Tax Information |
At March 31, 2011, the Fund had a capital loss carryforward of approximately $1,843,340 all of which will expire in fiscal 2017. Capital loss carryforwards are only available to offset future capital gains of the Fund to the extent provided by regulations and may be limited. |
See accompanying notes which are an integral part of the financial statements.
Annual Report
Fidelity Advisor Freedom Income Fund
Statement of Assets and Liabilities
| March 31, 2011 |
Assets | | |
Investment in securities, at value (cost $253,558,784) - See accompanying schedule | | $ 268,307,450 |
Receivable for investments sold | | 2,390 |
Receivable for fund shares sold | | 381,725 |
Distributions receivable from underlying funds | | 23,375 |
Total assets | | 268,714,940 |
| | |
Liabilities | | |
Payable for investments purchased | $ 15,513 | |
Payable for fund shares redeemed | 367,063 | |
Distribution and service plan fees payable | 74,030 | |
Total liabilities | | 456,606 |
| | |
Net Assets | | $ 268,258,334 |
Net Assets consist of: | | |
Paid in capital | | $ 255,910,201 |
Undistributed net investment income | | 222,243 |
Accumulated undistributed net realized gain (loss) on investments | | (2,622,776) |
Net unrealized appreciation (depreciation) on investments | | 14,748,666 |
Net Assets | | $ 268,258,334 |
| | |
Calculation of Maximum Offering Price Class A:
Net Asset Value and redemption price per share ($157,695,252 ÷ 14,529,763 shares) | | $ 10.85 |
| | |
Maximum offering price per share (100/94.25 of $10.85) | | $ 11.51 |
Class T:
Net Asset Value and redemption price per share ($57,403,896 ÷ 5,293,426 shares) | | $ 10.84 |
| | |
Maximum offering price per share (100/96.50 of $10.84) | | $ 11.23 |
Class B:
Net Asset Value and offering price per share ($3,938,225 ÷ 363,306 shares)A | | $ 10.84 |
| | |
Class C:
Net Asset Value and offering price per share ($16,581,090 ÷ 1,530,108 shares)A | | $ 10.84 |
| | |
| | |
Institutional Class:
Net Asset Value, offering price and redemption price per share ($32,639,871 ÷ 3,001,853 shares) | | $ 10.87 |
A Redemption price per share is equal to net asset value less any applicable contingent deferred sales charge.
Statement of Operations
| Year ended March 31, 2011 |
Investment Income | | |
Income distributions from underlying funds | | $ 4,400,570 |
| | |
Expenses | | |
Distribution and service plan fees | $ 874,011 | |
Independent trustees' compensation | 931 | |
Total expenses before reductions | 874,942 | |
Expense reductions | (931) | 874,011 |
Net investment income (loss) | | 3,526,559 |
Realized and Unrealized Gain (Loss) Realized gain (loss) on sale of underlying fund shares | 1,113,194 | |
Capital gain distributions from underlying funds | 2,920,471 | |
Total net realized gain (loss) | | 4,033,665 |
Change in net unrealized appreciation (depreciation) on underlying funds | | 9,997,963 |
Net gain (loss) | | 14,031,628 |
Net increase (decrease) in net assets resulting from operations | | $ 17,558,187 |
See accompanying notes which are an integral part of the financial statements.
Annual Report
Statement of Changes in Net Assets
| Year ended
March 31,
2011 | Year ended
March 31,
2010 |
Increase (Decrease) in Net Assets | | |
Operations | | |
Net investment income (loss) | $ 3,526,559 | $ 4,173,414 |
Net realized gain (loss) | 4,033,665 | 2,394,982 |
Change in net unrealized appreciation (depreciation) | 9,997,963 | 30,437,609 |
Net increase (decrease) in net assets resulting from operations | 17,558,187 | 37,006,005 |
Distributions to shareholders from net investment income | (3,602,671) | (4,185,152) |
Distributions to shareholders from net realized gain | (1,619,868) | (1,201,062) |
Total distributions | (5,222,539) | (5,386,214) |
Share transactions - net increase (decrease) | 23,030,339 | 40,627,765 |
Total increase (decrease) in net assets | 35,365,987 | 72,247,556 |
| | |
Net Assets | | |
Beginning of period | 232,892,347 | 160,644,791 |
End of period (including undistributed net investment income of $222,243 and undistributed net investment income of $298,355, respectively) | $ 268,258,334 | $ 232,892,347 |
Financial Highlights - Class A
Years ended March 31, | 2011 | 2010 | 2009 | 2008 | 2007 |
Selected Per-Share Data | | | | | |
Net asset value, beginning of period | $ 10.35 | $ 8.74 | $ 10.46 | $ 10.74 | $ 10.52 |
Income from Investment Operations | | | | | |
Net investment income (loss) C | .16 | .22 | .29 | .40 | .36 |
Net realized and unrealized gain (loss) | .57 | 1.66 | (1.60) | (.21) | .29 |
Total from investment operations | .73 | 1.88 | (1.31) | .19 | .65 |
Distributions from net investment income | (.16) | (.22) | (.30) | (.40) | (.35) |
Distributions from net realized gain | (.07) | (.06) | (.11) | (.07) | (.08) |
Total distributions | (.23) | (.27) G | (.41) | (.47) F | (.43) |
Net asset value, end of period | $ 10.85 | $ 10.35 | $ 8.74 | $ 10.46 | $ 10.74 |
Total Return A,B | 7.11% | 21.74% | (12.78)% | 1.73% | 6.38% |
Ratios to Average Net Assets D,E | | | | | |
Expenses before reductions | .25% | .25% | .25% | .25% | .25% |
Expenses net of fee waivers, if any | .25% | .25% | .25% | .25% | .25% |
Expenses net of all reductions | .25% | .25% | .25% | .25% | .25% |
Net investment income (loss) | 1.48% | 2.19% | 3.03% | 3.77% | 3.46% |
Supplemental Data | | | | | |
Net assets, end of period (000 omitted) | $ 157,695 | $ 142,691 | $ 93,865 | $ 87,469 | $ 49,721 |
Portfolio turnover rate | 35% | 31% | 44% | 56% | 38% |
A Total returns would have been lower had certain expenses not been reduced during the periods shown.
B Total returns do not include the effect of the sales charges.
C Calculated based on average shares outstanding during the period.
D Amounts do not include the activity of the underlying funds.
E Expense ratios reflect operating expenses of the class. Expenses before reductions do not reflect amounts reimbursed by the investment adviser or reductions from expense offset arrangements and do not represent the amount paid by the class during periods when reimbursements or reductions occur. Expenses net of fee waivers reflect expenses after reimbursement by the investment adviser but prior to reductions from expense offset arrangements. Expenses net of all reductions represent the net expenses paid by the class but do not include expenses of the investment companies in which the Fund invests.
F Total distributions of $.47 per share is comprised of distributions from net investment income of $.403 and distributions from net realized gain of $.066 per share.
G Total distributions of $.27 per share is comprised of distributions from net investment income of $.217 and distributions from net realized gain of $.056 per share.
See accompanying notes which are an integral part of the financial statements.
Annual Report
Financial Highlights - Class T
Years ended March 31, | 2011 | 2010 | 2009 | 2008 | 2007 |
Selected Per-Share Data | | | | | |
Net asset value, beginning of period | $ 10.34 | $ 8.73 | $ 10.45 | $ 10.73 | $ 10.51 |
Income from Investment Operations | | | | | |
Net investment income (loss) C | .13 | .19 | .27 | .38 | .34 |
Net realized and unrealized gain (loss) | .57 | 1.67 | (1.61) | (.22) | .29 |
Total from investment operations | .70 | 1.86 | (1.34) | .16 | .63 |
Distributions from net investment income | (.13) | (.19) | (.27) | (.38) | (.33) |
Distributions from net realized gain | (.07) | (.06) | (.11) | (.07) | (.08) |
Total distributions | (.20) | (.25) G | (.38) | (.44) F | (.41) |
Net asset value, end of period | $ 10.84 | $ 10.34 | $ 8.73 | $ 10.45 | $ 10.73 |
Total Return A,B | 6.85% | 21.47% | (13.03)% | 1.48% | 6.11% |
Ratios to Average Net Assets D,E | | | | | |
Expenses before reductions | .50% | .50% | .50% | .50% | .50% |
Expenses net of fee waivers, if any | .50% | .50% | .50% | .50% | .50% |
Expenses net of all reductions | .50% | .50% | .50% | .50% | .50% |
Net investment income (loss) | 1.23% | 1.94% | 2.78% | 3.52% | 3.21% |
Supplemental Data | | | | | |
Net assets, end of period (000 omitted) | $ 57,404 | $ 52,047 | $ 42,675 | $ 44,882 | $ 39,739 |
Portfolio turnover rate | 35% | 31% | 44% | 56% | 38% |
A Total returns would have been lower had certain expenses not been reduced during the periods shown.
B Total returns do not include the effect of the sales charges.
C Calculated based on average shares outstanding during the period.
D Amounts do not include the activity of the underlying funds.
E Expense ratios reflect operating expenses of the class. Expenses before reductions do not reflect amounts reimbursed by the investment adviser or reductions from expense offset arrangements and do not represent the amount paid by the class during periods when reimbursements or reductions occur. Expenses net of fee waivers reflect expenses after reimbursement by the investment adviser but prior to reductions from expense offset arrangements. Expenses net of all reductions represent the net expenses paid by the class but do not include expenses of the investment companies in which the Fund invests.
F Total distributions of $.44 per share is comprised of distributions from net investment income of $.377 and distributions from net realized gain of $.066 per share.
G Total distributions of $.25 per share is comprised of distributions from net investment income of $.193 and distributions from net realized gain of $.056 per share.
Financial Highlights - Class B
Years ended March 31, | 2011 | 2010 | 2009 | 2008 | 2007 |
Selected Per-Share Data | | | | | |
Net asset value, beginning of period | $ 10.33 | $ 8.72 | $ 10.44 | $ 10.72 | $ 10.50 |
Income from Investment Operations | | | | | |
Net investment income (loss) C | .08 | .14 | .22 | .32 | .29 |
Net realized and unrealized gain (loss) | .58 | 1.67 | (1.60) | (.21) | .28 |
Total from investment operations | .66 | 1.81 | (1.38) | .11 | .57 |
Distributions from net investment income | (.08) | (.14) | (.23) | (.32) | (.27) |
Distributions from net realized gain | (.07) | (.06) | (.11) | (.07) | (.08) |
Total distributions | (.15) | (.20) G | (.34) | (.39) F | (.35) |
Net asset value, end of period | $ 10.84 | $ 10.33 | $ 8.72 | $ 10.44 | $ 10.72 |
Total Return A,B | 6.39% | 20.86% | (13.48)% | .97% | 5.57% |
Ratios to Average Net Assets D,E | | | | | |
Expenses before reductions | 1.00% | 1.00% | 1.00% | 1.00% | 1.00% |
Expenses net of fee waivers, if any | 1.00% | 1.00% | 1.00% | 1.00% | 1.00% |
Expenses net of all reductions | 1.00% | 1.00% | 1.00% | 1.00% | 1.00% |
Net investment income (loss) | .73% | 1.44% | 2.28% | 3.02% | 2.71% |
Supplemental Data | | | | | |
Net assets, end of period (000 omitted) | $ 3,938 | $ 5,319 | $ 4,282 | $ 5,539 | $ 4,993 |
Portfolio turnover rate | 35% | 31% | 44% | 56% | 38% |
A Total returns would have been lower had certain expenses not been reduced during the periods shown.
B Total returns do not include the effect of the contingent deferred sales charge.
C Calculated based on average shares outstanding during the period.
D Amounts do not include the activity of the underlying funds.
E Expense ratios reflect operating expenses of the class. Expenses before reductions do not reflect amounts reimbursed by the investment adviser or reductions from expense offset arrangements and do not represent the amount paid by the class during periods when reimbursements or reductions occur. Expenses net of fee waivers reflect expenses after reimbursement by the investment adviser but prior to reductions from expense offset arrangements. Expenses net of all reductions represent the net expenses paid by the class but do not include expenses of the investment companies in which the Fund invests.
F Total distributions of $.39 per share is comprised of distributions from net investment income of $.322 and distributions from net realized gain of $.066 per share.
G Total distributions of $.20 per share is comprised of distributions from net investment income of $.142 and distributions from net realized gain of $.056 per share.
See accompanying notes which are an integral part of the financial statements.
Annual Report
Financial Highlights - Class C
Years ended March 31, | 2011 | 2010 | 2009 | 2008 | 2007 |
Selected Per-Share Data | | | | | |
Net asset value, beginning of period | $ 10.33 | $ 8.72 | $ 10.43 | $ 10.71 | $ 10.50 |
Income from Investment Operations | | | | | |
Net investment income (loss) C | .08 | .14 | .22 | .32 | .29 |
Net realized and unrealized gain (loss) | .58 | 1.67 | (1.60) | (.21) | .27 |
Total from investment operations | .66 | 1.81 | (1.38) | .11 | .56 |
Distributions from net investment income | (.08) | (.14) | (.22) | (.32) | (.27) |
Distributions from net realized gain | (.07) | (.06) | (.11) | (.07) | (.08) |
Total distributions | (.15) | (.20) G | (.33) | (.39) F | (.35) |
Net asset value, end of period | $ 10.84 | $ 10.33 | $ 8.72 | $ 10.43 | $ 10.71 |
Total Return A,B | 6.42% | 20.83% | (13.41)% | .97% | 5.48% |
Ratios to Average Net Assets D,E | | | | | |
Expenses before reductions | 1.00% | 1.00% | 1.00% | 1.00% | 1.00% |
Expenses net of fee waivers, if any | 1.00% | 1.00% | 1.00% | 1.00% | 1.00% |
Expenses net of all reductions | 1.00% | 1.00% | 1.00% | 1.00% | 1.00% |
Net investment income (loss) | .73% | 1.44% | 2.28% | 3.02% | 2.71% |
Supplemental Data | | | | | |
Net assets, end of period (000 omitted) | $ 16,581 | $ 14,697 | $ 11,362 | $ 14,718 | $ 13,279 |
Portfolio turnover rate | 35% | 31% | 44% | 56% | 38% |
A Total returns would have been lower had certain expenses not been reduced during the periods shown.
B Total returns do not include the effect of the contingent deferred sales charge.
C Calculated based on average shares outstanding during the period.
D Amounts do not include the activity of the underlying funds.
E Expense ratios reflect operating expenses of the class. Expenses before reductions do not reflect amounts reimbursed by the investment adviser or reductions from expense offset arrangements and do not represent the amount paid by the class during periods when reimbursements or reductions occur. Expenses net of fee waivers reflect expenses after reimbursement by the investment adviser but prior to reductions from expense offset arrangements. Expenses net of all reductions represent the net expenses paid by the class but do not include expenses of the investment companies in which the Fund invests.
F Total distributions of $.39 per share is comprised of distributions from net investment income of $.323 and distributions from net realized gain of $.066 per share.
G Total distributions of $.20 per share is comprised of distributions from net investment income of $.140 and distributions from net realized gain of $.056 per share.
Financial Highlights - Institutional Class
Years ended March 31, | 2011 | 2010 | 2009 | 2008 | 2007 |
Selected Per-Share Data | | | | | |
Net asset value, beginning of period | $ 10.37 | $ 8.75 | $ 10.48 | $ 10.76 | $ 10.53 |
Income from Investment Operations | | | | | |
Net investment income (loss) B | .18 | .24 | .31 | .43 | .39 |
Net realized and unrealized gain (loss) | .57 | 1.68 | (1.61) | (.21) | .30 |
Total from investment operations | .75 | 1.92 | (1.30) | .22 | .69 |
Distributions from net investment income | (.19) | (.24) | (.32) | (.43) | (.38) |
Distributions from net realized gain | (.07) | (.06) | (.11) | (.07) | (.08) |
Total distributions | (.25) H | (.30) G | (.43) | (.50) F | (.46) |
Net asset value, end of period | $ 10.87 | $ 10.37 | $ 8.75 | $ 10.48 | $ 10.76 |
Total Return A | 7.36% | 22.16% | (12.63)% | 2.00% | 6.72% |
Ratios to Average Net Assets C,E | | | | | |
Expenses before reductions D | .00% | .00% | .00% | .00% | .00% |
Expenses net of fee waivers, if any | .00% | .00% | .00% | .00% | .00% |
Expenses net of all reductions | .00% | .00% | .00% | .00% | .00% |
Net investment income (loss) | 1.73% | 2.44% | 3.28% | 4.02% | 3.71% |
Supplemental Data | | | | | |
Net assets, end of period (000 omitted) | $ 32,640 | $ 18,137 | $ 8,461 | $ 9,119 | $ 2,800 |
Portfolio turnover rate | 35% | 31% | 44% | 56% | 38% |
A Total returns would have been lower had certain expenses not been reduced during the periods shown.
B Calculated based on average shares outstanding during the period.
C Amounts do not include the activity of the underlying funds.
D Amount represents less than .01%.
E Expense ratios reflect operating expenses of the class. Expenses before reductions do not reflect amounts reimbursed by the investment adviser or reductions from expense offset arrangements and do not represent the amount paid by the class during periods when reimbursements or reductions occur. Expenses net of fee waivers reflect expenses after reimbursement by the investment adviser but prior to reductions from expense offset arrangements. Expenses net of all reductions represent the net expenses paid by the class but do not include expenses of the investment companies in which the Fund invests.
F Total distributions of $.50 per share is comprised of distributions from net investment income of $.432 and distributions from net realized gain of $.066 per share.
G Total distributions of $.30 per share is comprised of distributions from net investment income of $.243 and distributions from net realized gain of $.056 per share.
H Total distributions of $.25 per share is comprised of distributions from net investment income of $.186 and distributions from net realized gain of $.067 per share.
See accompanying notes which are an integral part of the financial statements.
Annual Report
Fidelity Advisor Freedom 2005 Fund
Investment Changes (Unaudited)
Fund Holdings as of March 31, 2011 |
| % of fund's
net assets | % of fund's net assets
6 months ago |
Commodity Funds | | |
Fidelity Series Commodity Strategy Fund | 3.6 | 4.3 |
Domestic Equity Funds | | |
Fidelity Advisor Equity Growth Fund Institutional Class | 2.6 | 2.9 |
Fidelity Advisor Equity Income Fund Institutional Class | 0.0 | 0.6 |
Fidelity Advisor Growth & Income Fund Institutional Class | 3.7 | 4.0 |
Fidelity Advisor Large Cap Fund Institutional Class | 3.6 | 4.0 |
Fidelity Advisor Small Cap Fund Institutional Class | 1.4 | 1.4 |
Fidelity Series 100 Index Fund | 3.2 | 3.2 |
Fidelity Series All-Sector Equity Fund | 5.3 | 5.6 |
Fidelity Series Large Cap Value Fund | 5.3 | 5.0 |
Fidelity Series Small Cap Opportunities Fund | 1.3 | 1.4 |
| 26.4 | 28.1 |
Developed International Equity Funds | | |
Fidelity Advisor Diversified International Fund Institutional Class | 1.5 | 2.1 |
Fidelity Advisor Overseas Fund Institutional Class | 1.5 | 2.2 |
Fidelity Series International Growth Fund | 2.9 | 2.4 |
Fidelity Series International Small Cap Fund | 0.5 | 0.5 |
Fidelity Series International Value Fund | 2.8 | 2.4 |
| 9.2 | 9.6 |
Emerging Markets Equity Funds | | |
Fidelity Series Emerging Markets Fund | 1.7 | 1.7 |
High Yield Bond Funds | | |
Fidelity Advisor High Income Advantage Fund Institutional Class | 0.0 | 5.0 |
Fidelity Series Emerging Markets Debt Fund | 0.1 | 0.0 |
Fidelity Series High Income Fund | 4.8 | 0.0 |
| 4.9 | 5.0 |
Inflation-Protected Bond Funds | | |
Fidelity Series Inflation-Protected Bond Index Fund | 9.0 | 9.0 |
Investment Grade Bond Funds | | |
Fidelity Advisor Strategic Real Return Fund Institutional Class | 4.0 | 4.1 |
Fidelity Advisor Total Bond Fund Institutional Class | 0.0 | 0.0* |
Fidelity Series Investment Grade Bond Fund | 18.3 | 17.9 |
| 22.3 | 22.0 |
Short-Term Funds | | |
Fidelity Advisor Short Fixed-Income Fund Institutional Class | 10.9 | 10.2 |
Fidelity Institutional Money Market Portfolio Institutional Class | 12.0 | 10.1 |
| 22.9 | 20.3 |
| | |
Net Other Assets (Liabilities)* | 0.0 | 0.0 |
| 100.0 | 100.0 |
* Amount represents less than 0.1% |
Asset Allocation (% of fund's net assets) |
Current |
| Commodity Funds | 3.6% | |
| Domestic Equity Funds | 26.4% | |
| Developed International Equity Funds | 9.2% | |
| Emerging Markets Equity Funds | 1.7% | |
| High Yield Bond Funds | 4.9% | |
| Inflation-Protected Bond Funds | 9.0% | |
| Investment Grade Bond Funds | 22.3% | |
| Short-Term Funds | 22.9% | |

Six months ago |
| Commodity Funds | 4.3% | |
 | Domestic Equity Funds | 28.1% | |
| Developed International Equity Funds | 9.6% | |
| Emerging Markets Equity Funds | 1.7% | |
| High Yield Bond Funds | 5.0% | |
| Inflation-Protected Bond Funds | 9.0% | |
| Investment Grade Bond Funds | 22.0% | |
| Short-Term Funds | 20.3% | |

Expected |
| Commodity Funds | 4.4% | |
| Domestic Equity Funds | 24.7% | |
| Developed International Equity Funds | 9.0% | |
| Emerging Markets Equity Funds | 1.6% | |
| High Yield Bond Funds | 5.0% | |
| Inflation-Protected Bond Funds | 9.9% | |
| Investment Grade Bond Funds | 20.5% | |
| Short-Term Funds | 24.9% | |

The fund invests according to an asset allocation strategy that becomes increasingly conservative over time. The six months ago allocation is based on the fund's holdings as of September 30, 2010. The current allocation is based on the fund's holdings as of March 31, 2011. The expected allocation represents the fund's anticipated allocation at September 30, 2011. |
Annual Report
Fidelity Advisor Freedom 2005 Fund
Investments March 31, 2011
Showing Percentage of Net Assets
Domestic Equity Funds - 30.0% |
| Shares | | Value |
Commodity Funds - 3.6% |
Fidelity Series Commodity Strategy Fund | 666,862 | | $ 8,789,241 |
Domestic Equity Funds - 26.4% |
Fidelity Advisor Equity Growth Fund Institutional Class | 104,352 | | 6,485,452 |
Fidelity Advisor Growth & Income Fund Institutional Class | 501,094 | | 9,044,741 |
Fidelity Advisor Large Cap Fund Institutional Class | 454,068 | | 8,958,752 |
Fidelity Advisor Small Cap Fund Institutional Class | 119,751 | | 3,361,400 |
Fidelity Series 100 Index Fund | 842,253 | | 7,748,727 |
Fidelity Series All-Sector Equity Fund | 986,886 | | 12,938,073 |
Fidelity Series Large Cap Value Fund | 1,067,546 | | 13,034,742 |
Fidelity Series Small Cap Opportunities Fund | 279,032 | | 3,289,786 |
TOTAL DOMESTIC EQUITY FUNDS | | 64,861,673 |
TOTAL DOMESTIC EQUITY FUNDS (Cost $59,782,052) | 73,650,914 |
International Equity Funds - 10.9% |
| | | |
Developed International Equity Funds - 9.2% |
Fidelity Advisor Diversified International Fund Institutional Class | 222,159 | | 3,734,495 |
Fidelity Advisor Overseas Fund Institutional Class | 193,897 | | 3,689,869 |
Fidelity Series International Growth Fund | 612,242 | | 7,046,905 |
Fidelity Series International Small Cap Fund | 110,573 | | 1,364,468 |
Fidelity Series International Value Fund | 651,219 | | 6,831,289 |
TOTAL DEVELOPED INTERNATIONAL EQUITY FUNDS | | 22,667,026 |
Emerging Markets Equity Funds - 1.7% |
Fidelity Series Emerging Markets Fund | 217,277 | | 4,163,018 |
TOTAL INTERNATIONAL EQUITY FUNDS (Cost $23,322,474) | 26,830,044 |
Bond Funds - 36.2% |
| Shares | | Value |
High Yield Bond Funds - 4.9% |
Fidelity Series Emerging Markets Debt Fund | 17,135 | | $ 171,421 |
Fidelity Series High Income Fund | 1,179,539 | | 11,818,976 |
TOTAL HIGH YIELD BOND FUNDS | | 11,990,397 |
Inflation-Protected Bond Funds - 9.0% |
Fidelity Series Inflation-Protected Bond Index Fund | 2,031,485 | | 21,980,667 |
Investment Grade Bond Funds - 22.3% |
Fidelity Advisor Strategic Real Return Fund Institutional Class | 983,128 | | 9,732,966 |
Fidelity Series Investment Grade Bond Fund | 3,948,248 | | 44,931,059 |
TOTAL INVESTMENT GRADE BOND FUNDS | | 54,664,025 |
TOTAL BOND FUNDS (Cost $85,246,544) | 88,635,089 |
Short-Term Funds - 22.9% |
| | | |
Fidelity Advisor Short Fixed-Income Fund Institutional Class | 2,907,692 | | 26,779,841 |
Fidelity Institutional Money Market Portfolio Institutional Class | 29,271,592 | | 29,271,592 |
TOTAL SHORT-TERM FUNDS (Cost $55,892,565) | 56,051,433 |
TOTAL INVESTMENT PORTFOLIO - 100.0% (Cost $224,243,635) | | 245,167,480 |
NET OTHER ASSETS (LIABILITIES) - 0.0% | | (37,309) |
NET ASSETS - 100% | $ 245,130,171 |
Other Information |
All investments are categorized as Level 1 under the Fair Value Hierarchy. The inputs or methodology used for valuing securities may not be an indication of the risk associated with investing in those securities. For more information on valuation inputs, please refer to the Security Valuation section in the accompanying Notes to Financial Statements. |
Income Tax Information |
At March 31, 2011, the Fund had a capital loss carryforward of approximately $10,668,320 of which $5,987,852 and $4,680,468 will expire in fiscal 2017 and 2019, respectively. Capital loss carryforwards are only available to offset future capital gains of the Fund to the extent provided by regulations and may be limited. |
See accompanying notes which are an integral part of the financial statements.
Annual Report
Fidelity Advisor Freedom 2005 Fund
Statement of Assets and Liabilities
| March 31, 2011 |
Assets | | |
Investment in securities, at value (cost $224,243,635) - See accompanying schedule | | $ 245,167,480 |
Cash | | 10 |
Receivable for investments sold | | 189,489 |
Receivable for fund shares sold | | 304,587 |
Distributions receivable from underlying funds | | 20,925 |
Total assets | | 245,682,491 |
| | |
Liabilities | | |
Payable for fund shares redeemed | $ 497,223 | |
Distribution and service plan fees payable | 55,097 | |
Total liabilities | | 552,320 |
| | |
Net Assets | | $ 245,130,171 |
Net Assets consist of: | | |
Paid in capital | | $ 236,303,616 |
Undistributed net investment income | | 407,517 |
Accumulated undistributed net realized gain (loss) on investments | | (12,504,807) |
Net unrealized appreciation (depreciation) on investments | | 20,923,845 |
Net Assets | | $ 245,130,171 |
| | |
Calculation of Maximum Offering Price Class A:
Net Asset Value and redemption price per share ($177,385,481 ÷ 15,485,835 shares) | | $ 11.45 |
| | |
Maximum offering price per share (100/94.25 of $11.45) | | $ 12.15 |
Class T:
Net Asset Value and redemption price per share ($21,658,070 ÷ 1,890,762 shares) | | $ 11.45 |
| | |
Maximum offering price per share (100/96.50 of $11.45) | | $ 11.87 |
Class B:
Net Asset Value and offering price per share ($2,338,143 ÷ 204,197 shares)A | | $ 11.45 |
| | |
Class C:
Net Asset Value and offering price per share ($8,679,380 ÷ 760,133 shares)A | | $ 11.42 |
| | |
| | |
Institutional Class:
Net Asset Value, offering price and redemption price per share ($35,069,097 ÷ 3,044,601 shares) | | $ 11.52 |
A Redemption price per share is equal to net asset value less any applicable contingent deferred sales charge.
Statement of Operations
| Year ended March 31, 2011 |
Investment Income | | |
Income distributions from underlying funds | | $ 3,569,160 |
| | |
Expenses | | |
Distribution and service plan fees | $ 629,766 | |
Independent trustees' compensation | 807 | |
Total expenses before reductions | 630,573 | |
Expense reductions | (807) | 629,766 |
Net investment income (loss) | | 2,939,394 |
Realized and Unrealized Gain (Loss) Realized gain (loss) on sale of underlying fund shares | (3,341,402) | |
Capital gain distributions from underlying funds | 3,551,033 | |
Total net realized gain (loss) | | 209,631 |
Change in net unrealized appreciation (depreciation) on underlying funds | | 19,795,837 |
Net gain (loss) | | 20,005,468 |
Net increase (decrease) in net assets resulting from operations | | $ 22,944,862 |
See accompanying notes which are an integral part of the financial statements.
Annual Report
Statement of Changes in Net Assets
| Year ended
March 31,
2011 | Year ended
March 31,
2010 |
Increase (Decrease) in Net Assets | | |
Operations | | |
Net investment income (loss) | $ 2,939,394 | $ 3,296,419 |
Net realized gain (loss) | 209,631 | 1,795,521 |
Change in net unrealized appreciation (depreciation) | 19,795,837 | 39,634,422 |
Net increase (decrease) in net assets resulting from operations | 22,944,862 | 44,726,362 |
Distributions to shareholders from net investment income | (3,045,204) | (3,251,107) |
Distributions to shareholders from net realized gain | (1,765,154) | (1,348,446) |
Total distributions | (4,810,358) | (4,599,553) |
Share transactions - net increase (decrease) | 17,262,825 | 47,810,477 |
Total increase (decrease) in net assets | 35,397,329 | 87,937,286 |
| | |
Net Assets | | |
Beginning of period | 209,732,842 | 121,795,556 |
End of period (including undistributed net investment income of $407,517 and undistributed net investment income of $513,327, respectively) | $ 245,130,171 | $ 209,732,842 |
Financial Highlights - Class A
Years ended March 31, | 2011 | 2010 | 2009 | 2008 | 2007 |
Selected Per-Share Data | | | | | |
Net asset value, beginning of period | $ 10.57 | $ 8.10 | $ 11.40 | $ 11.83 | $ 11.33 |
Income from Investment Operations | | | | | |
Net investment income (loss) C | .15 | .20 | .27 | .33 | .28 |
Net realized and unrealized gain (loss) | .97 | 2.53 | (3.06) | (.34) | .63 |
Total from investment operations | 1.12 | 2.73 | (2.79) | (.01) | .91 |
Distributions from net investment income | (.15) | (.19) | (.28) | (.26) | (.23) |
Distributions from net realized gain | (.09) | (.07) | (.23) | (.16) | (.18) |
Total distributions | (.24) | (.26) | (.51) | (.42) | (.41) |
Net asset value, end of period | $ 11.45 | $ 10.57 | $ 8.10 | $ 11.40 | $ 11.83 |
Total Return A,B | 10.72% | 33.91% | (25.09)% | (.23)% | 8.21% |
Ratios to Average Net Assets D,E | | | | | |
Expenses before reductions | .25% | .25% | .25% | .25% | .25% |
Expenses net of fee waivers, if any | .25% | .25% | .25% | .25% | .25% |
Expenses net of all reductions | .25% | .25% | .25% | .25% | .25% |
Net investment income (loss) | 1.37% | 2.01% | 2.75% | 2.74% | 2.49% |
Supplemental Data | | | | | |
Net assets, end of period (000 omitted) | $ 177,385 | $ 155,482 | $ 88,593 | $ 98,483 | $ 49,418 |
Portfolio turnover rate | 41% | 35% | 54% | 30% | 30% |
A Total returns would have been lower had certain expenses not been reduced during the periods shown.
B Total returns do not include the effect of the sales charges.
C Calculated based on average shares outstanding during the period.
D Amounts do not include the activity of the underlying funds.
E Expense ratios reflect operating expenses of the class. Expenses before reductions do not reflect amounts reimbursed by the investment adviser or reductions from expense offset arrangements and do not represent the amount paid by the class during periods when reimbursements or reductions occur. Expenses net of fee waivers reflect expenses after reimbursement by the investment adviser but prior to reductions from expense offset arrangements. Expenses net of all reductions represent the net expenses paid by the class but do not include expenses of the investment companies in which the Fund invests.
See accompanying notes which are an integral part of the financial statements.
Annual Report
Financial Highlights - Class T
Years ended March 31, | 2011 | 2010 | 2009 | 2008 | 2007 |
Selected Per-Share Data | | | | | |
Net asset value, beginning of period | $ 10.57 | $ 8.10 | $ 11.39 | $ 11.81 | $ 11.31 |
Income from Investment Operations | | | | | |
Net investment income (loss) C | .12 | .17 | .25 | .30 | .25 |
Net realized and unrealized gain (loss) | .97 | 2.54 | (3.06) | (.33) | .63 |
Total from investment operations | 1.09 | 2.71 | (2.81) | (.03) | .88 |
Distributions from net investment income | (.12) | (.17) | (.25) | (.23) | (.20) |
Distributions from net realized gain | (.09) | (.07) | (.23) | (.16) | (.18) |
Total distributions | (.21) | (.24) | (.48) | (.39) | (.38) |
Net asset value, end of period | $ 11.45 | $ 10.57 | $ 8.10 | $ 11.39 | $ 11.81 |
Total Return A,B | 10.42% | 33.61% | (25.27)% | (.44)% | 7.95% |
Ratios to Average Net Assets D,E | | | | | |
Expenses before reductions | .50% | .50% | .50% | .50% | .50% |
Expenses net of fee waivers, if any | .50% | .50% | .50% | .50% | .50% |
Expenses net of all reductions | .50% | .50% | .50% | .50% | .50% |
Net investment income (loss) | 1.12% | 1.76% | 2.50% | 2.49% | 2.24% |
Supplemental Data | | | | | |
Net assets, end of period (000 omitted) | $ 21,658 | $ 23,113 | $ 14,437 | $ 20,837 | $ 20,289 |
Portfolio turnover rate | 41% | 35% | 54% | 30% | 30% |
A Total returns would have been lower had certain expenses not been reduced during the periods shown.
B Total returns do not include the effect of the sales charges.
C Calculated based on average shares outstanding during the period.
D Amounts do not include the activity of the underlying funds.
E Expense ratios reflect operating expenses of the class. Expenses before reductions do not reflect amounts reimbursed by the investment adviser or reductions from expense offset arrangements and do not represent the amount paid by the class during periods when reimbursements or reductions occur. Expenses net of fee waivers reflect expenses after reimbursement by the investment adviser but prior to reductions from expense offset arrangements. Expenses net of all reductions represent the net expenses paid by the class but do not include expenses of the investment companies in which the Fund invests.
Financial Highlights - Class B
Years ended March 31, | 2011 | 2010 | 2009 | 2008 | 2007 |
Selected Per-Share Data | | | | | |
Net asset value, beginning of period | $ 10.56 | $ 8.09 | $ 11.37 | $ 11.78 | $ 11.28 |
Income from Investment Operations | | | | | |
Net investment income (loss) C | .07 | .12 | .20 | .24 | .20 |
Net realized and unrealized gain (loss) | .97 | 2.53 | (3.06) | (.33) | .62 |
Total from investment operations | 1.04 | 2.65 | (2.86) | (.09) | .82 |
Distributions from net investment income | (.07) | (.11) | (.19) | (.16) | (.14) |
Distributions from net realized gain | (.09) | (.07) | (.23) | (.16) | (.18) |
Total distributions | (.15) F | (.18) | (.42) | (.32) | (.32) |
Net asset value, end of period | $ 11.45 | $ 10.56 | $ 8.09 | $ 11.37 | $ 11.78 |
Total Return A,B | 9.94% | 32.90% | (25.69)% | (.89)% | 7.40% |
Ratios to Average Net Assets D,E | | | | | |
Expenses before reductions | 1.00% | 1.00% | 1.00% | 1.00% | 1.00% |
Expenses net of fee waivers, if any | 1.00% | 1.00% | 1.00% | 1.00% | 1.00% |
Expenses net of all reductions | 1.00% | 1.00% | 1.00% | 1.00% | 1.00% |
Net investment income (loss) | .62% | 1.26% | 2.00% | 1.99% | 1.74% |
Supplemental Data | | | | | |
Net assets, end of period (000 omitted) | $ 2,338 | $ 2,986 | $ 2,692 | $ 4,348 | $ 3,974 |
Portfolio turnover rate | 41% | 35% | 54% | 30% | 30% |
A Total returns would have been lower had certain expenses not been reduced during the periods shown.
B Total returns do not include the effect of the contingent deferred sales charge.
C Calculated based on average shares outstanding during the period.
D Amounts do not include the activity of the underlying funds.
E Expense ratios reflect operating expenses of the class. Expenses before reductions do not reflect amounts reimbursed by the investment adviser or reductions from expense offset arrangements and do not represent the amount paid by the class during periods when reimbursements or reductions occur. Expenses net of fee waivers reflect expenses after reimbursement by the investment adviser but prior to reductions from expense offset arrangements. Expenses net of all reductions represent the net expenses paid by the class but do not include expenses of the investment companies in which the Fund invests.
F Total distributions of $.15 per share is comprised of distributions from net investment income of $.065 and distributions from net realized gain of $.087 per share.
See accompanying notes which are an integral part of the financial statements.
Annual Report
Financial Highlights - Class C
Years ended March 31, | 2011 | 2010 | 2009 | 2008 | 2007 |
Selected Per-Share Data | | | | | |
Net asset value, beginning of period | $ 10.54 | $ 8.08 | $ 11.34 | $ 11.76 | $ 11.27 |
Income from Investment Operations | | | | | |
Net investment income (loss) C | .07 | .12 | .20 | .24 | .20 |
Net realized and unrealized gain (loss) | .97 | 2.53 | (3.04) | (.33) | .62 |
Total from investment operations | 1.04 | 2.65 | (2.84) | (.09) | .82 |
Distributions from net investment income | (.07) | (.12) | (.19) | (.17) | (.15) |
Distributions from net realized gain | (.09) | (.07) | (.23) | (.16) | (.18) |
Total distributions | (.16) | (.19) | (.42) | (.33) | (.33) |
Net asset value, end of period | $ 11.42 | $ 10.54 | $ 8.08 | $ 11.34 | $ 11.76 |
Total Return A,B | 9.91% | 32.90% | (25.61)% | (.91)% | 7.36% |
Ratios to Average Net Assets D,E | | | | | |
Expenses before reductions | 1.00% | 1.00% | 1.00% | 1.00% | 1.00% |
Expenses net of fee waivers, if any | 1.00% | 1.00% | 1.00% | 1.00% | 1.00% |
Expenses net of all reductions | 1.00% | 1.00% | 1.00% | 1.00% | 1.00% |
Net investment income (loss) | .62% | 1.26% | 2.00% | 1.99% | 1.74% |
Supplemental Data | | | | | |
Net assets, end of period (000 omitted) | $ 8,679 | $ 9,377 | $ 6,761 | $ 11,052 | $ 9,107 |
Portfolio turnover rate | 41% | 35% | 54% | 30% | 30% |
A Total returns would have been lower had certain expenses not been reduced during the periods shown.
B Total returns do not include the effect of the contingent deferred sales charge.
C Calculated based on average shares outstanding during the period.
D Amounts do not include the activity of the underlying funds.
E Expense ratios reflect operating expenses of the class. Expenses before reductions do not reflect amounts reimbursed by the investment adviser or reductions from expense offset arrangements and do not represent the amount paid by the class during periods when reimbursements or reductions occur. Expenses net of fee waivers reflect expenses after reimbursement by the investment adviser but prior to reductions from expense offset arrangements. Expenses net of all reductions represent the net expenses paid by the class but do not include expenses of the investment companies in which the Fund invests.
Financial Highlights - Institutional Class
Years ended March 31, | 2011 | 2010 | 2009 | 2008 | 2007 |
Selected Per-Share Data | | | | | |
Net asset value, beginning of period | $ 10.63 | $ 8.14 | $ 11.46 | $ 11.87 | $ 11.37 |
Income from Investment Operations | | | | | |
Net investment income (loss) B | .18 | .22 | .29 | .35 | .31 |
Net realized and unrealized gain (loss) | .98 | 2.55 | (3.07) | (.32) | .62 |
Total from investment operations | 1.16 | 2.77 | (2.78) | .03 | .93 |
Distributions from net investment income | (.18) | (.21) | (.31) | (.28) | (.25) |
Distributions from net realized gain | (.09) | (.07) | (.23) | (.16) | (.18) |
Total distributions | (.27) | (.28) | (.54) | (.44) | (.43) |
Net asset value, end of period | $ 11.52 | $ 10.63 | $ 8.14 | $ 11.46 | $ 11.87 |
Total Return A | 11.02% | 34.28% | (24.93)% | .12% | 8.37% |
Ratios to Average Net Assets C,E | | | | | |
Expenses before reductions D | .00% | .00% | .00% | .00% | .00% |
Expenses net of fee waivers, if any | .00% | .00% | .00% | .00% | .00% |
Expenses net of all reductions | .00% | .00% | .00% | .00% | .00% |
Net investment income (loss) | 1.62% | 2.26% | 3.00% | 2.99% | 2.74% |
Supplemental Data | | | | | |
Net assets, end of period (000 omitted) | $ 35,069 | $ 18,775 | $ 9,313 | $ 9,645 | $ 3,424 |
Portfolio turnover rate | 41% | 35% | 54% | 30% | 30% |
A Total returns would have been lower had certain expenses not been reduced during the periods shown.
B Calculated based on average shares outstanding during the period.
C Amounts do not include the activity of the underlying funds.
D Amount represents less than .01%.
E Expense ratios reflect operating expenses of the class. Expenses before reductions do not reflect amounts reimbursed by the investment adviser or reductions from expense offset arrangements and do not represent the amount paid by the class during periods when reimbursements or reductions occur. Expenses net of fee waivers reflect expenses after reimbursement by the investment adviser but prior to reductions from expense offset arrangements. Expenses net of all reductions represent the net expenses paid by the class but do not include expenses of the investment companies in which the Fund invests.
See accompanying notes which are an integral part of the financial statements.
Annual Report
Fidelity Advisor Freedom 2010 Fund
Investment Changes (Unaudited)
Fund Holdings as of March 31, 2011 |
| % of fund's
net assets | % of fund's net assets
6 months ago |
Commodity Funds | | |
Fidelity Series Commodity Strategy Fund | 4.4 | 5.0 |
Domestic Equity Funds | | |
Fidelity Advisor Equity Growth Fund Institutional Class | 3.2 | 3.3 |
Fidelity Advisor Equity Income Fund Institutional Class | 0.0 | 0.6 |
Fidelity Advisor Growth & Income Fund Institutional Class | 4.4 | 4.6 |
Fidelity Advisor Large Cap Fund Institutional Class | 4.3 | 4.6 |
Fidelity Advisor Small Cap Fund Institutional Class | 1.6 | 1.6 |
Fidelity Series 100 Index Fund | 3.8 | 3.6 |
Fidelity Series All-Sector Equity Fund | 6.3 | 6.4 |
Fidelity Series Large Cap Value Fund | 6.4 | 5.8 |
Fidelity Series Small Cap Opportunities Fund | 1.6 | 1.7 |
| 31.6 | 32.2 |
Developed International Equity Funds | | |
Fidelity Advisor Diversified International Fund Institutional Class | 1.8 | 2.6 |
Fidelity Advisor Overseas Fund Institutional Class | 1.8 | 2.6 |
Fidelity Series International Growth Fund | 3.5 | 2.9 |
Fidelity Series International Small Cap Fund | 0.7 | 0.6 |
Fidelity Series International Value Fund | 3.3 | 2.8 |
| 11.1 | 11.5 |
Emerging Markets Equity Funds | | |
Fidelity Series Emerging Markets Fund | 2.0 | 2.0 |
High Yield Bond Funds | | |
Fidelity Advisor High Income Advantage Fund Institutional Class | 0.0 | 5.0 |
Fidelity Series Emerging Markets Debt Fund | 0.1 | 0.0 |
Fidelity Series High Income Fund | 4.9 | 0.0 |
| 5.0 | 5.0 |
Inflation-Protected Bond Funds | | |
Fidelity Series Inflation-Protected Bond Index Fund | 9.5 | 9.5 |
Investment Grade Bond Funds | | |
Fidelity Advisor Strategic Real Return Fund Institutional Class | 4.7 | 4.6 |
Fidelity Advisor Total Bond Fund Institutional Class | 0.0 | 0.0* |
Fidelity Series Investment Grade Bond Fund | 21.0 | 20.1 |
| 25.7 | 24.7 |
Short-Term Funds | | |
Fidelity Advisor Short Fixed-Income Fund Institutional Class | 5.3 | 5.1 |
Fidelity Institutional Money Market Portfolio Institutional Class | 5.4 | 5.0 |
| 10.7 | 10.1 |
| | |
Net Other Assets (Liabilities)* | 0.0 | 0.0 |
| 100.0 | 100.0 |
* Amount represents less than 0.1% |
Asset Allocation (% of fund's net assets) |
Current |
 | Commodity Funds | 4.4% | |
| Domestic Equity Funds | 31.6% | |
 | Developed International Equity Funds | 11.1% | |
 | Emerging Markets Equity Funds | 2.0% | |
| High Yield Bond Funds | 5.0% | |
 | Inflation-Protected Bond Funds | 9.5% | |
 | Investment Grade Bond Funds | 25.7% | |
| Short-Term Funds | 10.7% | |

Six months ago |
| Commodity Funds | 5.0% | |
| Domestic Equity Funds | 32.2% | |
| Developed International Equity Funds | 11.5% | |
| Emerging Markets Equity Funds | 2.0% | |
| High Yield Bond Funds | 5.0% | |
| Inflation-Protected Bond Funds | 9.5% | |
| Investment Grade Bond Funds | 24.7% | |
| Short-Term Funds | 10.1% | |

Expected |
| Commodity Funds | 5.4% | |
| Domestic Equity Funds | 30.7% | |
| Developed International Equity Funds | 11.1% | |
| Emerging Markets Equity Funds | 2.0% | |
| High Yield Bond Funds | 5.0% | |
| Inflation-Protected Bond Funds | 10.6% | |
| Investment Grade Bond Funds | 24.1% | |
| Short-Term Funds | 11.1% | |

The fund invests according to an asset allocation strategy that becomes increasingly conservative over time. The six months ago allocation is based on the fund's holdings as of September 30, 2010. The current allocation is based on the fund's holdings as of March 31, 2011. The expected allocation represents the fund's anticipated allocation at September 30, 2011. |
Annual Report
Fidelity Advisor Freedom 2010 Fund
Investments March 31, 2011
Showing Percentage of Net Assets
Domestic Equity Funds - 36.0% |
| Shares | | Value |
Commodity Funds - 4.4% |
Fidelity Series Commodity Strategy Fund | 2,873,146 | | $ 37,868,064 |
Domestic Equity Funds - 31.6% |
Fidelity Advisor Equity Growth Fund Institutional Class | 440,755 | | 27,392,915 |
Fidelity Advisor Growth & Income Fund Institutional Class | 2,111,218 | | 38,107,491 |
Fidelity Advisor Large Cap Fund Institutional Class | 1,913,095 | | 37,745,357 |
Fidelity Advisor Small Cap Fund Institutional Class | 502,304 | | 14,099,660 |
Fidelity Series 100 Index Fund | 3,558,060 | | 32,734,153 |
Fidelity Series All-Sector Equity Fund | 4,168,239 | | 54,645,620 |
Fidelity Series Large Cap Value Fund | 4,509,410 | | 55,059,895 |
Fidelity Series Small Cap Opportunities Fund | 1,170,429 | | 13,799,360 |
TOTAL DOMESTIC EQUITY FUNDS | | 273,584,451 |
TOTAL DOMESTIC EQUITY FUNDS (Cost $252,044,614) | 311,452,515 |
International Equity Funds - 13.1% |
| | | |
Developed International Equity Funds - 11.1% |
Fidelity Advisor Diversified International Fund Institutional Class | 936,993 | | 15,750,845 |
Fidelity Advisor Overseas Fund Institutional Class | 817,777 | | 15,562,293 |
Fidelity Series International Growth Fund | 2,593,950 | | 29,856,367 |
Fidelity Series International Small Cap Fund | 471,365 | | 5,816,638 |
Fidelity Series International Value Fund | 2,758,938 | | 28,941,258 |
TOTAL DEVELOPED INTERNATIONAL EQUITY FUNDS | | 95,927,401 |
Emerging Markets Equity Funds - 2.0% |
Fidelity Series Emerging Markets Fund | 921,638 | | 17,658,578 |
TOTAL INTERNATIONAL EQUITY FUNDS (Cost $96,947,868) | 113,585,979 |
Bond Funds - 40.2% |
| Shares | | Value |
High Yield Bond Funds - 5.0% |
Fidelity Series Emerging Markets Debt Fund | 61,531 | | $ 615,568 |
Fidelity Series High Income Fund | 4,235,692 | | 42,441,635 |
TOTAL HIGH YIELD BOND FUNDS | | 43,057,203 |
Inflation-Protected Bond Funds - 9.5% |
Fidelity Series Inflation-Protected Bond Index Fund | 7,595,178 | | 82,179,821 |
Investment Grade Bond Funds - 25.7% |
Fidelity Advisor Strategic Real Return Fund Institutional Class | 4,089,059 | | 40,481,685 |
Fidelity Series Investment Grade Bond Fund | 16,005,793 | | 182,145,924 |
TOTAL INVESTMENT GRADE BOND FUNDS | | 222,627,609 |
TOTAL BOND FUNDS (Cost $334,113,755) | 347,864,633 |
Short-Term Funds - 10.7% |
| | | |
Fidelity Advisor Short Fixed-Income Fund Institutional Class | 4,975,629 | | 45,825,541 |
Fidelity Institutional Money Market Portfolio Institutional Class | 46,635,940 | | 46,635,940 |
TOTAL SHORT-TERM FUNDS (Cost $92,576,531) | 92,461,481 |
TOTAL INVESTMENT PORTFOLIO - 100.0% (Cost $775,682,768) | | 865,364,608 |
NET OTHER ASSETS (LIABILITIES) - 0.0% | | (144,062) |
NET ASSETS - 100% | $ 865,220,546 |
Other Information |
All investments are categorized as Level 1 under the Fair Value Hierarchy. The inputs or methodology used for valuing securities may not be an indication of the risk associated with investing in those securities. For more information on valuation inputs, please refer to the Security Valuation section in the accompanying Notes to Financial Statements. |
Income Tax Information |
At March 31, 2011, the Fund had a capital loss carryforward of approximately $64,568,962 of which $30,891,938, $3,389,708 and $30,287,316 will expire in fiscal 2017, 2018 and 2019, respectively. Capital loss carryforwards are only available to offset future capital gains of the Fund to the extent provided by regulations and may be limited. |
See accompanying notes which are an integral part of the financial statements.
Annual Report
Fidelity Advisor Freedom 2010 Fund
Statement of Assets and Liabilities
| March 31, 2011 |
Assets | | |
Investment in securities, at value (cost $775,682,768) - See accompanying schedule | | $ 865,364,608 |
Receivable for investments sold | | 348,312 |
Receivable for fund shares sold | | 706,244 |
Distributions receivable from underlying funds | | 74,971 |
Total assets | | 866,494,135 |
| | |
Liabilities | | |
Payable to custodian bank | $ 7 | |
Payable for investments purchased | 96 | |
Payable for fund shares redeemed | 1,047,285 | |
Distribution and service plan fees payable | 226,201 | |
Total liabilities | | 1,273,589 |
| | |
Net Assets | | $ 865,220,546 |
Net Assets consist of: | | |
Paid in capital | | $ 840,635,640 |
Undistributed net investment income | | 1,355,324 |
Accumulated undistributed net realized gain (loss) on investments | | (66,452,258) |
Net unrealized appreciation (depreciation) on investments | | 89,681,840 |
Net Assets | | $ 865,220,546 |
| | |
Calculation of Maximum Offering Price Class A:
Net Asset Value and redemption price per share ($536,998,660 ÷ 45,068,943 shares) | | $ 11.92 |
| | |
Maximum offering price per share (100/94.25 of $11.92) | | $ 12.65 |
Class T:
Net Asset Value and redemption price per share ($152,126,276 ÷ 12,806,721 shares) | | $ 11.88 |
| | |
Maximum offering price per share (100/96.50 of $11.88) | | $ 12.31 |
Class B:
Net Asset Value and offering price per share ($15,841,694 ÷ 1,334,631 shares)A | | $ 11.87 |
| | |
Class C:
Net Asset Value and offering price per share ($44,763,751 ÷ 3,790,075 shares)A | | $ 11.81 |
| | |
Institutional Class:
Net Asset Value, offering price and redemption price per share ($115,490,165 ÷ 9,654,151 shares) | | $ 11.96 |
A Redemption price per share is equal to net asset value less any applicable contingent deferred sales charge.
Statement of Operations
| Year ended March 31, 2011 |
Investment Income | | |
Income distributions from underlying funds | | $ 13,424,783 |
| | |
Expenses | | |
Distribution and service plan fees | $ 2,743,069 | |
Independent trustees' compensation | 3,041 | |
Total expenses before reductions | 2,746,110 | |
Expense reductions | (3,041) | 2,743,069 |
Net investment income (loss) | | 10,681,714 |
Realized and Unrealized Gain (Loss) Realized gain (loss) on sale of underlying fund shares | (16,673,785) | |
Capital gain distributions from underlying funds | 14,756,754 | |
Total net realized gain (loss) | | (1,917,031) |
Change in net unrealized appreciation (depreciation) on underlying funds | | 84,401,786 |
Net gain (loss) | | 82,484,755 |
Net increase (decrease) in net assets resulting from operations | | $ 93,166,469 |
See accompanying notes which are an integral part of the financial statements.
Annual Report
Fidelity Advisor Freedom 2010 Fund
Financial Statements - continued
Statement of Changes in Net Assets
| Year ended
March 31,
2011 | Year ended
March 31,
2010 |
Increase (Decrease) in Net Assets | | |
Operations | | |
Net investment income (loss) | $ 10,681,714 | $ 14,588,964 |
Net realized gain (loss) | (1,917,031) | (1,351,879) |
Change in net unrealized appreciation (depreciation) | 84,401,786 | 207,984,174 |
Net increase (decrease) in net assets resulting from operations | 93,166,469 | 221,221,259 |
Distributions to shareholders from net investment income | (11,199,702) | (14,970,360) |
Distributions to shareholders from net realized gain | (7,306,833) | (6,224,738) |
Total distributions | (18,506,535) | (21,195,098) |
Share transactions - net increase (decrease) | (36,738,583) | 25,017,028 |
Total increase (decrease) in net assets | 37,921,351 | 225,043,189 |
| | |
Net Assets | | |
Beginning of period | 827,299,195 | 602,256,006 |
End of period (including undistributed net investment income of $1,355,324 and undistributed net investment income of $1,873,313, respectively) | $ 865,220,546 | $ 827,299,195 |
Financial Highlights - Class A
Years ended March 31, | 2011 | 2010 | 2009 | 2008 | 2007 |
Selected Per-Share Data | | | | | |
Net asset value, beginning of period | $ 10.87 | $ 8.19 | $ 11.78 | $ 12.28 | $ 11.79 |
Income from Investment Operations | | | | | |
Net investment income (loss) C | .15 | .21 | .27 | .33 | .29 |
Net realized and unrealized gain (loss) | 1.17 | 2.76 | (3.28) | (.34) | .66 |
Total from investment operations | 1.32 | 2.97 | (3.01) | (.01) | .95 |
Distributions from net investment income | (.17) | (.21) | (.28) | (.30) | (.26) |
Distributions from net realized gain | (.10) | (.08) | (.30) | (.19) | (.20) |
Total distributions | (.27) | (.29) F | (.58) | (.49) | (.46) |
Net asset value, end of period | $ 11.92 | $ 10.87 | $ 8.19 | $ 11.78 | $ 12.28 |
Total Return A, B | 12.27% | 36.51% | (26.36)% | (.27)% | 8.22% |
Ratios to Average Net Assets D, E | | | | | |
Expenses before reductions | .25% | .25% | .25% | .25% | .25% |
Expenses net of fee waivers, if any | .25% | .25% | .25% | .25% | .25% |
Expenses net of all reductions | .25% | .25% | .25% | .25% | .25% |
Net investment income (loss) | 1.38% | 2.04% | 2.77% | 2.66% | 2.43% |
Supplemental Data | | | | | |
Net assets, end of period (000 omitted) | $ 536,999 | $ 478,025 | $ 339,203 | $ 377,118 | $ 248,500 |
Portfolio turnover rate | 41% | 42% | 44% | 15% | 22% |
A Total returns would have been lower had certain expenses not been reduced during the periods shown.
B Total returns do not include the effect of the sales charges.
C Calculated based on average shares outstanding during the period.
D Amounts do not include the activity of the underlying funds.
E Expense ratios reflect operating expenses of the class. Expenses before reductions do not reflect amounts reimbursed by the investment adviser or reductions from expense offset arrangements and do not represent the amount paid by the class during periods when reimbursements or reductions occur. Expenses net of fee waivers reflect expenses after reimbursement by the investment adviser but prior to reductions from expense offset arrangements. Expenses net of all reductions represent the net expenses paid by the class but do not include expenses of the investment companies in which the Fund invests.
F Total distributions of $.29 per share is comprised of distributions from net investment income of $.211 and distributions from net realized gain of $.083 per share.
See accompanying notes which are an integral part of the financial statements.
Annual Report
Financial Highlights - Class T
Years ended March 31, | 2011 | 2010 | 2009 | 2008 | 2007 |
Selected Per-Share Data | | | | | |
Net asset value, beginning of period | $ 10.83 | $ 8.16 | $ 11.74 | $ 12.24 | $ 11.75 |
Income from Investment Operations | | | | | |
Net investment income (loss) C | .13 | .18 | .25 | .30 | .26 |
Net realized and unrealized gain (loss) | 1.15 | 2.76 | (3.28) | (.34) | .66 |
Total from investment operations | 1.28 | 2.94 | (3.03) | (.04) | .92 |
Distributions from net investment income | (.13) | (.19) | (.25) | (.27) | (.23) |
Distributions from net realized gain | (.10) | (.08) | (.30) | (.19) | (.20) |
Total distributions | (.23) | (.27) F | (.55) | (.46) | (.43) |
Net asset value, end of period | $ 11.88 | $ 10.83 | $ 8.16 | $ 11.74 | $ 12.24 |
Total Return A, B | 11.95% | 36.19% | (26.57)% | (.52)% | 8.00% |
Ratios to Average Net Assets D, E | | | | | |
Expenses before reductions | .50% | .50% | .50% | .50% | .50% |
Expenses net of fee waivers, if any | .50% | .50% | .50% | .50% | .50% |
Expenses net of all reductions | .50% | .50% | .50% | .50% | .50% |
Net investment income (loss) | 1.13% | 1.79% | 2.52% | 2.41% | 2.18% |
Supplemental Data | | | | | |
Net assets, end of period (000 omitted) | $ 152,126 | $ 204,059 | $ 163,842 | $ 216,732 | $ 194,563 |
Portfolio turnover rate | 41% | 42% | 44% | 15% | 22% |
A Total returns would have been lower had certain expenses not been reduced during the periods shown.
B Total returns do not include the effect of the sales charges.
C Calculated based on average shares outstanding during the period.
D Amounts do not include the activity of the underlying funds.
E Expense ratios reflect operating expenses of the class. Expenses before reductions do not reflect amounts reimbursed by the investment adviser or reductions from expense offset arrangements and do not represent the amount paid by the class during periods when reimbursements or reductions occur. Expenses net of fee waivers reflect expenses after reimbursement by the investment adviser but prior to reductions from expense offset arrangements. Expenses net of all reductions represent the net expenses paid by the class but do not include expenses of the investment companies in which the Fund invests.
F Total distributions of $.27 per share is comprised of distributions from net investment income of $.186 and distributions from net realized gain of $.083 per share.
Financial Highlights - Class B
Years ended March 31, | 2011 | 2010 | 2009 | 2008 | 2007 |
Selected Per-Share Data | | | | | |
Net asset value, beginning of period | $ 10.82 | $ 8.15 | $ 11.70 | $ 12.20 | $ 11.71 |
Income from Investment Operations | | | | | |
Net investment income (loss) C | .07 | .13 | .20 | .24 | .20 |
Net realized and unrealized gain (loss) | 1.15 | 2.76 | (3.26) | (.35) | .66 |
Total from investment operations | 1.22 | 2.89 | (3.06) | (.11) | .86 |
Distributions from net investment income | (.07) | (.13) | (.19) | (.20) | (.17) |
Distributions from net realized gain | (.10) | (.08) | (.30) | (.19) | (.20) |
Total distributions | (.17) | (.22) F | (.49) | (.39) | (.37) |
Net asset value, end of period | $ 11.87 | $ 10.82 | $ 8.15 | $ 11.70 | $ 12.20 |
Total Return A, B | 11.37% | 35.54% | (26.92)% | (1.04)% | 7.47% |
Ratios to Average Net Assets D, E | | | | | |
Expenses before reductions | 1.00% | 1.00% | 1.00% | 1.00% | 1.00% |
Expenses net of fee waivers, if any | 1.00% | 1.00% | 1.00% | 1.00% | 1.00% |
Expenses net of all reductions | 1.00% | 1.00% | 1.00% | 1.00% | 1.00% |
Net investment income (loss) | .63% | 1.29% | 2.03% | 1.91% | 1.68% |
Supplemental Data | | | | | |
Net assets, end of period (000 omitted) | $ 15,842 | $ 22,468 | $ 19,950 | $ 34,137 | $ 34,834 |
Portfolio turnover rate | 41% | 42% | 44% | 15% | 22% |
A Total returns would have been lower had certain expenses not been reduced during the periods shown.
B Total returns do not include the effect of the contingent deferred sales charge.
C Calculated based on average shares outstanding during the period.
D Amounts do not include the activity of the underlying funds.
E Expense ratios reflect operating expenses of the class. Expenses before reductions do not reflect amounts reimbursed by the investment adviser or reductions from expense offset arrangements and do not represent the amount paid by the class during periods when reimbursements or reductions occur. Expenses net of fee waivers reflect expenses after reimbursement by the investment adviser but prior to reductions from expense offset arrangements. Expenses net of all reductions represent the net expenses paid by the class but do not include expenses of the investment companies in which the Fund invests.
F Total distributions of $.22 per share is comprised of distributions from net investment income of $.134 and distributions from net realized gain of $.083 per share.
See accompanying notes which are an integral part of the financial statements.
Annual Report
Financial Highlights - Class C
Years ended March 31, | 2011 | 2010 | 2009 | 2008 | 2007 |
Selected Per-Share Data | | | | | |
Net asset value, beginning of period | $ 10.78 | $ 8.13 | $ 11.67 | $ 12.17 | $ 11.69 |
Income from Investment Operations | | | | | |
Net investment income (loss) C | .07 | .13 | .20 | .23 | .20 |
Net realized and unrealized gain (loss) | 1.14 | 2.74 | (3.25) | (.33) | .66 |
Total from investment operations | 1.21 | 2.87 | (3.05) | (.10) | .86 |
Distributions from net investment income | (.08) | (.14) | (.19) | (.21) | (.18) |
Distributions from net realized gain | (.10) | (.08) | (.30) | (.19) | (.20) |
Total distributions | (.18) | (.22) F | (.49) | (.40) | (.38) |
Net asset value, end of period | $ 11.81 | $ 10.78 | $ 8.13 | $ 11.67 | $ 12.17 |
Total Return A, B | 11.33% | 35.45% | (26.88)% | (.97)% | 7.45% |
Ratios to Average Net Assets D, E | | | | | |
Expenses before reductions | 1.00% | 1.00% | 1.00% | 1.00% | 1.00% |
Expenses net of fee waivers, if any | 1.00% | 1.00% | 1.00% | 1.00% | 1.00% |
Expenses net of all reductions | 1.00% | 1.00% | 1.00% | 1.00% | 1.00% |
Net investment income (loss) | .63% | 1.29% | 2.02% | 1.91% | 1.68% |
Supplemental Data | | | | | |
Net assets, end of period (000 omitted) | $ 44,764 | $ 47,178 | $ 37,524 | $ 58,378 | $ 47,918 |
Portfolio turnover rate | 41% | 42% | 44% | 15% | 22% |
A Total returns would have been lower had certain expenses not been reduced during the periods shown.
B Total returns do not include the effect of the contingent deferred sales charge.
C Calculated based on average shares outstanding during the period.
D Amounts do not include the activity of the underlying funds.
E Expense ratios reflect operating expenses of the class. Expenses before reductions do not reflect amounts reimbursed by the investment adviser or reductions from expense offset arrangements and do not represent the amount paid by the class during periods when reimbursements or reductions occur. Expenses net of fee waivers reflect expenses after reimbursement by the investment adviser but prior to reductions from expense offset arrangements. Expenses net of all reductions represent the net expenses paid by the class but do not include expenses of the investment companies in which the Fund invests.
F Total distributions of $.22 per share is comprised of distributions from net investment income of $.139 and distributions from net realized gain of $.083 per share.
Financial Highlights - Institutional Class
Years ended March 31, | 2011 | 2010 | 2009 | 2008 | 2007 |
Selected Per-Share Data | | | | | |
Net asset value, beginning of period | $ 10.91 | $ 8.22 | $ 11.82 | $ 12.32 | $ 11.82 |
Income from Investment Operations | | | | | |
Net investment income (loss) B | .18 | .23 | .30 | .36 | .32 |
Net realized and unrealized gain (loss) | 1.17 | 2.78 | (3.30) | (.34) | .67 |
Total from investment operations | 1.35 | 3.01 | (3.00) | .02 | .99 |
Distributions from net investment income | (.20) | (.23) | (.30) | (.33) | (.29) |
Distributions from net realized gain | (.10) | (.08) | (.30) | (.19) | (.20) |
Total distributions | (.30) | (.32) F | (.60) | (.52) | (.49) |
Net asset value, end of period | $ 11.96 | $ 10.91 | $ 8.22 | $ 11.82 | $ 12.32 |
Total Return A | 12.50% | 36.80% | (26.16)% | (.05)% | 8.52% |
Ratios to Average Net Assets C, E | | | | | |
Expenses before reductions D | .00% | .00% | .00% | .00% | .00% |
Expenses net of fee waivers, if any | .00% | .00% | .00% | .00% | .00% |
Expenses net of all reductions | .00% | .00% | .00% | .00% | .00% |
Net investment income (loss) | 1.63% | 2.29% | 3.02% | 2.91% | 2.68% |
Supplemental Data | | | | | |
Net assets, end of period (000 omitted) | $ 115,490 | $ 75,569 | $ 41,737 | $ 39,922 | $ 21,580 |
Portfolio turnover rate | 41% | 42% | 44% | 15% | 22% |
A Total returns would have been lower had certain expenses not been reduced during the periods shown.
B Calculated based on average shares outstanding during the period.
C Amounts do not include the activity of the underlying funds.
D Amount represents less than .01%.
E Expense ratios reflect operating expenses of the class. Expenses before reductions do not reflect amounts reimbursed by the investment adviser or reductions from expense offset arrangements and do not represent the amount paid by the class during periods when reimbursements or reductions occur. Expenses net of fee waivers reflect expenses after reimbursement by the investment adviser but prior to reductions from expense offset arrangements. Expenses net of all reductions represent the net expenses paid by the class but do not include expenses of the investment companies in which the Fund invests.
F Total distributions of $.32 per share is comprised of distributions from net investment income of $.234 and distributions from net realized gain of $.083 per share.
See accompanying notes which are an integral part of the financial statements.
Annual Report
Fidelity Advisor Freedom 2015 Fund
Investment Changes (Unaudited)
Fund Holdings as of March 31, 2011 |
| % of fund's
net assets | % of fund's net assets
6 months ago |
Commodity Funds | | |
Fidelity Series Commodity Strategy Fund | 4.5 | 5.0 |
Domestic Equity Funds | | |
Fidelity Advisor Equity Growth Fund Institutional Class | 3.2 | 3.4 |
Fidelity Advisor Equity Income Fund Institutional Class | 0.0 | 0.7 |
Fidelity Advisor Growth & Income Fund Institutional Class | 4.5 | 4.7 |
Fidelity Advisor Large Cap Fund Institutional Class | 4.5 | 4.7 |
Fidelity Advisor Small Cap Fund Institutional Class | 1.7 | 1.7 |
Fidelity Series 100 Index Fund | 3.9 | 3.8 |
Fidelity Series All-Sector Equity Fund | 6.4 | 6.7 |
Fidelity Series Large Cap Value Fund | 6.5 | 5.9 |
Fidelity Series Small Cap Opportunities Fund | 1.6 | 1.7 |
| 32.3 | 33.3 |
Developed International Equity Funds | | |
Fidelity Advisor Diversified International Fund Institutional Class | 1.9 | 2.7 |
Fidelity Advisor Overseas Fund Institutional Class | 1.9 | 2.7 |
Fidelity Series International Growth Fund | 3.5 | 2.9 |
Fidelity Series International Small Cap Fund | 0.7 | 0.6 |
Fidelity Series International Value Fund | 3.4 | 2.8 |
| 11.4 | 11.7 |
Emerging Markets Equity Funds | | |
Fidelity Series Emerging Markets Fund | 2.1 | 2.0 |
High Yield Bond Funds | | |
Fidelity Advisor High Income Advantage Fund Institutional Class | 0.0 | 5.1 |
Fidelity Series Emerging Markets Debt Fund | 0.1 | 0.0 |
Fidelity Series High Income Fund | 4.9 | 0.0 |
| 5.0 | 5.1 |
Inflation-Protected Bond Funds | | |
Fidelity Series Inflation-Protected Bond Index Fund | 8.8 | 8.6 |
Investment Grade Bond Funds | | |
Fidelity Advisor Strategic Real Return Fund Institutional Class | 4.7 | 4.6 |
Fidelity Advisor Total Bond Fund Institutional Class | 0.0 | 0.0* |
Fidelity Series Investment Grade Bond Fund | 21.7 | 20.7 |
| 26.4 | 25.3 |
Short-Term Funds | | |
Fidelity Advisor Short Fixed-Income Fund Institutional Class | 4.7 | 4.5 |
Fidelity Institutional Money Market Portfolio Institutional Class | 4.8 | 4.5 |
| 9.5 | 9.0 |
Net Other Assets (Liabilities)* | 0.0 | 0.0 |
| 100.0 | 100.0 |
* Amount represents less than 0.1% |
Asset Allocation (% of fund's net assets) |
Current |
| Commodity Funds | 4.5% | |
| Domestic Equity Funds | 32.3% | |
| Developed International Equity Funds | 11.4% | |
| Emerging Markets Equity Funds | 2.1% | |
| High Yield Bond Funds | 5.0% | |
| Inflation-Protected Bond Funds | 8.8% | |
| Investment Grade Bond Funds | 26.4% | |
| Short-Term Funds | 9.5% | |

Six months ago |
| Commodity Funds | 5.0% | |
| Domestic Equity Funds | 33.3% | |
| Developed International Equity Funds | 11.7% | |
| Emerging Markets Equity Funds | 2.0% | |
| High Yield Bond Funds | 5.1% | |
| Inflation-Protected Bond Funds | 8.6% | |
| Investment Grade Bond Funds | 25.3% | |
| Short-Term Funds | 9.0% | |

Expected |
| Commodity Funds | 5.5% | |
| Domestic Equity Funds | 31.5% | |
| Developed International Equity Funds | 11.5% | |
| Emerging Markets Equity Funds | 2.0% | |
| High Yield Bond Funds | 5.0% | |
| Inflation-Protected Bond Funds | 10.1% | |
| Investment Grade Bond Funds | 24.7% | |
| Short-Term Funds | 9.7% | |

The fund invests according to an asset allocation strategy that becomes increasingly conservative over time. The six months ago allocation is based on the fund's holdings as of September 30, 2010. The current allocation is based on the fund's holdings as of March 31, 2011. The expected allocation represents the fund's anticipated allocation at September 30, 2011. |
Annual Report
Fidelity Advisor Freedom 2015 Fund
Investments March 31, 2011
Showing Percentage of Net Assets
Domestic Equity Funds - 36.8% |
| Shares | | Value |
Commodity Funds - 4.5% |
Fidelity Series Commodity Strategy Fund | 5,384,002 | | $ 70,961,149 |
Domestic Equity Funds - 32.3% |
Fidelity Advisor Equity Growth Fund Institutional Class | 824,047 | | 51,214,540 |
Fidelity Advisor Growth & Income Fund Institutional Class | 3,953,751 | | 71,365,198 |
Fidelity Advisor Large Cap Fund Institutional Class | 3,582,987 | | 70,692,335 |
Fidelity Advisor Small Cap Fund Institutional Class | 944,732 | | 26,518,629 |
Fidelity Series 100 Index Fund | 6,658,099 | | 61,254,508 |
Fidelity Series All-Sector Equity Fund | 7,792,442 | | 102,158,921 |
Fidelity Series Large Cap Value Fund | 8,429,362 | | 102,922,511 |
Fidelity Series Small Cap Opportunities Fund | 2,201,823 | | 25,959,495 |
TOTAL DOMESTIC EQUITY FUNDS | | 512,086,137 |
TOTAL DOMESTIC EQUITY FUNDS (Cost $484,413,580) | 583,047,286 |
International Equity Funds - 13.5% |
| | | |
Developed International Equity Funds - 11.4% |
Fidelity Advisor Diversified International Fund Institutional Class | 1,760,798 | | 29,599,021 |
Fidelity Advisor Overseas Fund Institutional Class | 1,536,919 | | 29,247,560 |
Fidelity Series International Growth Fund | 4,862,501 | | 55,967,387 |
Fidelity Series International Small Cap Fund | 874,353 | | 10,789,522 |
Fidelity Series International Value Fund | 5,172,805 | | 54,262,724 |
TOTAL DEVELOPED INTERNATIONAL EQUITY FUNDS | | 179,866,214 |
Emerging Markets Equity Funds - 2.1% |
Fidelity Series Emerging Markets Fund | 1,726,590 | | 33,081,460 |
TOTAL INTERNATIONAL EQUITY FUNDS (Cost $182,646,576) | 212,947,674 |
Bond Funds - 40.2% |
| Shares | | Value |
High Yield Bond Funds - 5.0% |
Fidelity Series Emerging Markets Debt Fund | 112,107 | | $ 1,121,529 |
Fidelity Series High Income Fund | 7,717,182 | | 77,326,163 |
TOTAL HIGH YIELD BOND FUNDS | | 78,447,692 |
Inflation-Protected Bond Funds - 8.8% |
Fidelity Series Inflation-Protected Bond Index Fund | 12,936,330 | | 139,971,095 |
Investment Grade Bond Funds - 26.4% |
Fidelity Advisor Strategic Real Return Fund Institutional Class | 7,540,015 | | 74,646,153 |
Fidelity Series Investment Grade Bond Fund | 30,166,345 | | 343,292,999 |
TOTAL INVESTMENT GRADE BOND FUNDS | | 417,939,152 |
TOTAL BOND FUNDS (Cost $614,812,581) | 636,357,939 |
Short-Term Funds - 9.5% |
| | | |
Fidelity Advisor Short Fixed-Income Fund Institutional Class | 8,060,772 | | 74,239,710 |
Fidelity Institutional Money Market Portfolio Institutional Class | 76,526,931 | | 76,526,931 |
TOTAL SHORT-TERM FUNDS (Cost $150,423,453) | 150,766,641 |
TOTAL INVESTMENT PORTFOLIO - 100.0% (Cost $1,432,296,190) | | 1,583,119,540 |
NET OTHER ASSETS (LIABILITIES) - 0.0% | | (245,140) |
NET ASSETS - 100% | $ 1,582,874,400 |
Other Information |
All investments are categorized as Level 1 under the Fair Value Hierarchy. The inputs or methodology used for valuing securities may not be an indication of the risk associated with investing in those securities. For more information on valuation inputs, please refer to the Security Valuation section in the accompanying Notes to Financial Statements. |
Income Tax Information |
At March 31, 2011, the Fund had a capital loss carryforward of approximately $70,260,528 of which $35,532,008 and $34,728,520 will expire in fiscal 2017 and 2019, respectively. Capital loss carryforwards are only available to offset future capital gains of the Fund to the extent provided by regulations and may be limited. |
See accompanying notes which are an integral part of the financial statements.
Annual Report
Fidelity Advisor Freedom 2015 Fund
Statement of Assets and Liabilities
| March 31, 2011 |
Assets | | |
Investment in securities, at value (cost $1,432,296,190) - See accompanying schedule | | $ 1,583,119,540 |
Receivable for investments sold | | 278,646 |
Receivable for fund shares sold | | 2,983,200 |
Distributions receivable from underlying funds | | 136,453 |
Total assets | | 1,586,517,839 |
| | |
Liabilities | | |
Payable to custodian bank | $ 1 | |
Payable for investments purchased | 102,328 | |
Payable for fund shares redeemed | 3,148,167 | |
Distribution and service plan fees payable | 392,943 | |
Total liabilities | | 3,643,439 |
| | |
Net Assets | | $ 1,582,874,400 |
Net Assets consist of: | | |
Paid in capital | | $ 1,501,869,265 |
Undistributed net investment income | | 2,522,428 |
Accumulated undistributed net realized gain (loss) on investments | | (72,340,643) |
Net unrealized appreciation (depreciation) on investments | | 150,823,350 |
Net Assets | | $ 1,582,874,400 |
| | |
Calculation of Maximum Offering Price Class A:
Net Asset Value and redemption price per share ($1,004,955,239 ÷ 84,666,829 shares) | | $ 11.87 |
| | |
Maximum offering price per share (100/94.25 of $11.87) | | $ 12.59 |
Class T:
Net Asset Value and redemption price per share ($236,105,753 ÷ 19,921,175 shares) | | $ 11.85 |
| | |
Maximum offering price per share (100/96.50 of $11.85) | | $ 12.28 |
Class B:
Net Asset Value and offering price per share ($32,761,552 ÷ 2,771,302 shares)A | | $ 11.82 |
| | |
Class C:
Net Asset Value and offering price per share ($70,396,444 ÷ 5,969,410 shares)A | | $ 11.79 |
| | |
| | |
Institutional Class:
Net Asset Value, offering price and redemption price per share ($238,655,412 ÷ 19,982,896 shares) | | $ 11.94 |
A Redemption price per share is equal to net asset value less any applicable contingent deferred sales charge.
Statement of Operations
| Year ended March 31, 2011 |
| | |
Investment Income | | |
Income distributions from underlying funds | | $ 23,265,774 |
| | |
Expenses | | |
Distribution and service plan fees | $ 4,358,282 | |
Independent trustees' compensation | 5,071 | |
Total expenses before reductions | 4,363,353 | |
Expense reductions | (5,071) | 4,358,282 |
Net investment income (loss) | | 18,907,492 |
Realized and Unrealized Gain (Loss) Realized gain (loss) on sale of underlying fund shares | (27,299,506) | |
Capital gain distributions from underlying funds | 26,749,012 | |
Total net realized gain (loss) | | (550,494) |
Change in net unrealized appreciation (depreciation) on underlying funds | | 148,398,468 |
Net gain (loss) | | 147,847,974 |
Net increase (decrease) in net assets resulting from operations | | $ 166,755,466 |
See accompanying notes which are an integral part of the financial statements.
Annual Report
Statement of Changes in Net Assets
| Year ended
March 31,
2011 | Year ended
March 31,
2010 |
Increase (Decrease) in Net Assets | | |
Operations | | |
Net investment income (loss) | $ 18,907,492 | $ 20,862,802 |
Net realized gain (loss) | (550,494) | 5,172,111 |
Change in net unrealized appreciation (depreciation) | 148,398,468 | 290,904,573 |
Net increase (decrease) in net assets resulting from operations | 166,755,466 | 316,939,486 |
Distributions to shareholders from net investment income | (19,322,604) | (20,840,116) |
Distributions to shareholders from net realized gain | (12,721,165) | (9,228,273) |
Total distributions | (32,043,769) | (30,068,389) |
Share transactions - net increase (decrease) | 154,535,312 | 214,008,908 |
Total increase (decrease) in net assets | 289,247,009 | 500,880,005 |
| | |
Net Assets | | |
Beginning of period | 1,293,627,391 | 792,747,386 |
End of period (including undistributed net investment income of $2,522,428 and undistributed net investment income of $2,937,541, respectively) | $ 1,582,874,400 | $ 1,293,627,391 |
Financial Highlights - Class A
Years ended March 31, | 2011 | 2010 | 2009 | 2008 | 2007 |
Selected Per-Share Data | | | | | |
Net asset value, beginning of period | $ 10.81 | $ 8.05 | $ 11.85 | $ 12.40 | $ 11.84 |
Income from Investment Operations | | | | | |
Net investment income (loss) C | .16 | .20 | .26 | .31 | .26 |
Net realized and unrealized gain (loss) | 1.16 | 2.84 | (3.47) | (.35) | .74 |
Total from investment operations | 1.32 | 3.04 | (3.21) | (.04) | 1.00 |
Distributions from net investment income | (.16) | (.20) | (.26) | (.27) | (.23) |
Distributions from net realized gain | (.10) | (.08) | (.33) | (.24) | (.21) |
Total distributions | (.26) | (.28) H | (.59) G | (.51) F | (.44) |
Net asset value, end of period | $ 11.87 | $ 10.81 | $ 8.05 | $ 11.85 | $ 12.40 |
Total Return A, B | 12.36% | 37.95% | (28.01)% | (.53)% | 8.56% |
Ratios to Average Net Assets D, E | | | | | |
Expenses before reductions | .25% | .25% | .25% | .25% | .25% |
Expenses net of fee waivers, if any | .25% | .25% | .25% | .25% | .25% |
Expenses net of all reductions | .25% | .25% | .25% | .25% | .25% |
Net investment income (loss) | 1.42% | 2.02% | 2.69% | 2.46% | 2.21% |
Supplemental Data | | | | | |
Net assets, end of period (000 omitted) | $ 1,004,955 | $ 830,024 | $ 477,641 | $ 517,888 | $ 291,783 |
Portfolio turnover rate | 33% | 29% | 36% | 13% | 11% |
A Total returns would have been lower had certain expenses not been reduced during the periods shown.
B Total returns do not include the effect of the sales charges.
C Calculated based on average shares outstanding during the period.
D Amounts do not include the activity of the underlying funds.
E Expense ratios reflect operating expenses of the class. Expenses before reductions do not reflect amounts reimbursed by the investment adviser or reductions from expense offset arrangements and do not represent the amount paid by the class during periods when reimbursements or reductions occur. Expenses net of fee waivers reflect expenses after reimbursement by the investment adviser but prior to reductions from expense offset arrangements. Expenses net of all reductions represent the net expenses paid by the class but do not include expenses of the investment companies in which the Fund invests.
F Total distributions of $.51 per share is comprised of distributions from net investment income of $.268 and distributions from net realized gain of $.243 per share.
G Total distributions of $.59 per share is comprised of distributions from net investment income of $.262 and distributions from net realized gain of $.325 per share.
H Total distributions of $.28 per share is comprised of distributions from net investment income of $.197 and distributions from net realized gain of $.082 per share.
See accompanying notes which are an integral part of the financial statements.
Annual Report
Financial Highlights - Class T
Years ended March 31, | 2011 | 2010 | 2009 | 2008 | 2007 |
Selected Per-Share Data | | | | | |
Net asset value, beginning of period | $ 10.79 | $ 8.04 | $ 11.82 | $ 12.38 | $ 11.81 |
Income from Investment Operations | | | | | |
Net investment income (loss) C | .13 | .18 | .24 | .28 | .23 |
Net realized and unrealized gain (loss) | 1.16 | 2.82 | (3.46) | (.36) | .75 |
Total from investment operations | 1.29 | 3.00 | (3.22) | (.08) | .98 |
Distributions from net investment income | (.13) | (.17) | (.23) | (.23) | (.20) |
Distributions from net realized gain | (.10) | (.08) | (.33) | (.24) | (.21) |
Total distributions | (.23) | (.25) H | (.56) G | (.48) F | (.41) |
Net asset value, end of period | $ 11.85 | $ 10.79 | $ 8.04 | $ 11.82 | $ 12.38 |
Total Return A, B | 12.09% | 37.53% | (28.13)% | (.89)% | 8.40% |
Ratios to Average Net Assets D, E | | | | | |
Expenses before reductions | .50% | .50% | .50% | .50% | .50% |
Expenses net of fee waivers, if any | .50% | .50% | .50% | .50% | .50% |
Expenses net of all reductions | .50% | .50% | .50% | .50% | .50% |
Net investment income (loss) | 1.17% | 1.77% | 2.44% | 2.21% | 1.96% |
Supplemental Data | | | | | |
Net assets, end of period (000 omitted) | $ 236,106 | $ 225,384 | $ 162,439 | $ 203,822 | $ 186,106 |
Portfolio turnover rate | 33% | 29% | 36% | 13% | 11% |
A Total returns would have been lower had certain expenses not been reduced during the periods shown.
B Total returns do not include the effect of the sales charges.
C Calculated based on average shares outstanding during the period.
D Amounts do not include the activity of the underlying funds.
E Expense ratios reflect operating expenses of the class. Expenses before reductions do not reflect amounts reimbursed by the investment adviser or reductions from expense offset arrangements and do not represent the amount paid by the class during periods when reimbursements or reductions occur. Expenses net of fee waivers reflect expenses after reimbursement by the investment adviser but prior to reductions from expense offset arrangements. Expenses net of all reductions represent the net expenses paid by the class but do not include expenses of the investment companies in which the Fund invests.
F Total distributions of $.48 per share is comprised of distributions from net investment income of $.233 and distributions from net realized gain of $.243 per share.
G Total distributions of $.56 per share is comprised of distributions from net investment income of $.234 and distributions from net realized gain of $.325 per share.
H Total distributions of $.25 per share is comprised of distributions from net investment income of $.172 and distributions from net realized gain of $.082 per share.
Financial Highlights - Class B
Years ended March 31, | 2011 | 2010 | 2009 | 2008 | 2007 |
Selected Per-Share Data | | | | | |
Net asset value, beginning of period | $ 10.76 | $ 8.02 | $ 11.77 | $ 12.33 | $ 11.77 |
Income from Investment Operations | | | | | |
Net investment income (loss) C | .07 | .13 | .19 | .21 | .17 |
Net realized and unrealized gain (loss) | 1.16 | 2.82 | (3.44) | (.36) | .74 |
Total from investment operations | 1.23 | 2.95 | (3.25) | (.15) | .91 |
Distributions from net investment income | (.07) | (.12) | (.17) | (.17) | (.14) |
Distributions from net realized gain | (.10) | (.08) | (.33) | (.24) | (.21) |
Total distributions | (.17) | (.21) H | (.50) G | (.41) F | (.35) |
Net asset value, end of period | $ 11.82 | $ 10.76 | $ 8.02 | $ 11.77 | $ 12.33 |
Total Return A, B | 11.51% | 36.85% | (28.47)% | (1.37)% | 7.83% |
Ratios to Average Net Assets D, E | | | | | |
Expenses before reductions | 1.00% | 1.00% | 1.00% | 1.00% | 1.00% |
Expenses net of fee waivers, if any | 1.00% | 1.00% | 1.00% | 1.00% | 1.00% |
Expenses net of all reductions | 1.00% | 1.00% | 1.00% | 1.00% | 1.00% |
Net investment income (loss) | .67% | 1.27% | 1.94% | 1.71% | 1.46% |
Supplemental Data | | | | | |
Net assets, end of period (000 omitted) | $ 32,762 | $ 35,932 | $ 27,727 | $ 43,608 | $ 41,424 |
Portfolio turnover rate | 33% | 29% | 36% | 13% | 11% |
A Total returns would have been lower had certain expenses not been reduced during the periods shown.
B Total returns do not include the effect of the contingent deferred sales charge.
C Calculated based on average shares outstanding during the period.
D Amounts do not include the activity of the underlying funds.
E Expense ratios reflect operating expenses of the class. Expenses before reductions do not reflect amounts reimbursed by the investment adviser or reductions from expense offset arrangements and do not represent the amount paid by the class during periods when reimbursements or reductions occur. Expenses net of fee waivers reflect expenses after reimbursement by the investment adviser but prior to reductions from expense offset arrangements. Expenses net of all reductions represent the net expenses paid by the class but do not include expenses of the investment companies in which the Fund invests.
F Total distributions of $.41 per share is comprised of distributions from net investment income of $.171 and distributions from net realized gain of $.243 per share.
G Total distributions of $.50 per share is comprised of distributions from net investment income of $.173 and distributions from net realized gain of $.325 per share.
H Total distributions of $.21 per share is comprised of distributions from net investment income of $.124 and distributions from net realized gain of $.082 per share.
See accompanying notes which are an integral part of the financial statements.
Annual Report
Financial Highlights - Class C
Years ended March 31, | 2011 | 2010 | 2009 | 2008 | 2007 |
Selected Per-Share Data | | | | | |
Net asset value, beginning of period | $ 10.74 | $ 8.00 | $ 11.76 | $ 12.32 | $ 11.77 |
Income from Investment Operations | | | | | |
Net investment income (loss) C | .07 | .13 | .19 | .21 | .17 |
Net realized and unrealized gain (loss) | 1.15 | 2.82 | (3.45) | (.35) | .74 |
Total from investment operations | 1.22 | 2.95 | (3.26) | (.14) | .91 |
Distributions from net investment income | (.07) | (.13) | (.18) | (.18) | (.15) |
Distributions from net realized gain | (.10) | (.08) | (.33) | (.24) | (.21) |
Total distributions | (.17) | (.21) H | (.50) G | (.42) F | (.36) |
Net asset value, end of period | $ 11.79 | $ 10.74 | $ 8.00 | $ 11.76 | $ 12.32 |
Total Return A, B | 11.49% | 36.97% | (28.53)% | (1.34)% | 7.81% |
Ratios to Average Net Assets D, E | | | | | |
Expenses before reductions | 1.00% | 1.00% | 1.00% | 1.00% | 1.00% |
Expenses net of fee waivers, if any | 1.00% | 1.00% | 1.00% | 1.00% | 1.00% |
Expenses net of all reductions | 1.00% | 1.00% | 1.00% | 1.00% | 1.00% |
Net investment income (loss) | .67% | 1.27% | 1.94% | 1.71% | 1.46% |
Supplemental Data | | | | | |
Net assets, end of period (000 omitted) | $ 70,396 | $ 64,801 | $ 46,942 | $ 65,543 | $ 56,686 |
Portfolio turnover rate | 33% | 29% | 36% | 13% | 11% |
A Total returns would have been lower had certain expenses not been reduced during the periods shown.
B Total returns do not include the effect of the contingent deferred sales charge.
C Calculated based on average shares outstanding during the period.
D Amounts do not include the activity of the underlying funds.
E Expense ratios reflect operating expenses of the class. Expenses before reductions do not reflect amounts reimbursed by the investment adviser or reductions from expense offset arrangements and do not represent the amount paid by the class during periods when reimbursements or reductions occur. Expenses net of fee waivers reflect expenses after reimbursement by the investment adviser but prior to reductions from expense offset arrangements. Expenses net of all reductions represent the net expenses paid by the class but do not include expenses of the investment companies in which the Fund invests.
F Total distributions of $.42 per share is comprised of distributions from net investment income of $.175 and distributions from net realized gain of $.243 per share.
G Total distributions of $.50 per share is comprised of distributions from net investment income of $.179 and distributions from net realized gain of $.325 per share.
H Total distributions of $.21 per share is comprised of distributions from net investment income of $.126 and distributions from net realized gain of $.082 per share.
Financial Highlights - Institutional Class
Years ended March 31, | 2011 | 2010 | 2009 | 2008 | 2007 |
Selected Per-Share Data | | | | | |
Net asset value, beginning of period | $ 10.87 | $ 8.09 | $ 11.91 | $ 12.47 | $ 11.89 |
Income from Investment Operations | | | | | |
Net investment income (loss) B | .19 | .23 | .29 | .34 | .29 |
Net realized and unrealized gain (loss) | 1.17 | 2.85 | (3.50) | (.36) | .75 |
Total from investment operations | 1.36 | 3.08 | (3.21) | (.02) | 1.04 |
Distributions from net investment income | (.19) | (.22) | (.29) | (.29) | (.25) |
Distributions from net realized gain | (.10) | (.08) | (.33) | (.24) | (.21) |
Total distributions | (.29) | (.30) H | (.61) G | (.54) F | (.46) |
Net asset value, end of period | $ 11.94 | $ 10.87 | $ 8.09 | $ 11.91 | $ 12.47 |
Total Return A | 12.67% | 38.30% | (27.85)% | (.42)% | 8.90% |
Ratios to Average Net Assets C, E | | | | | |
Expenses before reductions D | .00% | .00% | .00% | .00% | .00% |
Expenses net of fee waivers, if any | .00% | .00% | .00% | .00% | .00% |
Expenses net of all reductions | .00% | .00% | .00% | .00% | .00% |
Net investment income (loss) | 1.67% | 2.27% | 2.94% | 2.71% | 2.46% |
Supplemental Data | | | | | |
Net assets, end of period (000 omitted) | $ 238,655 | $ 137,487 | $ 77,998 | $ 68,797 | $ 39,631 |
Portfolio turnover rate | 33% | 29% | 36% | 13% | 11% |
A Total returns would have been lower had certain expenses not been reduced during the periods shown.
B Calculated based on average shares outstanding during the period.
C Amounts do not include the activity of the underlying funds.
D Amount represents less than .01%.
E Expense ratios reflect operating expenses of the class. Expenses before reductions do not reflect amounts reimbursed by the investment adviser or reductions from expense offset arrangements and do not represent the amount paid by the class during periods when reimbursements or reductions occur. Expenses net of fee waivers reflect expenses after reimbursement by the investment adviser but prior to reductions from expense offset arrangements. Expenses net of all reductions represent the net expenses paid by the class but do not include expenses of the investment companies in which the Fund invests.
F Total distributions of $.54 per share is comprised of distributions from net investment income of $.293 and distributions from net realized gain of $.243 per share.
G Total distributions of $.61 per share is comprised of distributions from net investment income of $.286 and distributions from net realized gain of $.325 per share.
H Total distributions of $.30 per share is comprised of distributions from net investment income of $.219 and distributions from net realized gain of $.082 per share.
See accompanying notes which are an integral part of the financial statements.
Annual Report
Fidelity Advisor Freedom 2020 Fund
Investment Changes (Unaudited)
Fund Holdings as of March 31, 2011 |
| % of fund's
net assets | % of fund's net assets
6 months ago |
Commodity Funds | | |
Fidelity Series Commodity Strategy Fund | 5.6 | 6.0 |
Domestic Equity Funds | | |
Fidelity Advisor Equity Growth Fund Institutional Class | 3.8 | 4.1 |
Fidelity Advisor Equity Income Fund Institutional Class | 0.0 | 0.8 |
Fidelity Advisor Growth & Income Fund Institutional Class | 5.3 | 5.6 |
Fidelity Advisor Large Cap Fund Institutional Class | 5.2 | 5.6 |
Fidelity Advisor Small Cap Fund Institutional Class | 2.0 | 2.0 |
Fidelity Series 100 Index Fund | 4.5 | 4.4 |
Fidelity Series All-Sector Equity Fund | 7.6 | 7.9 |
Fidelity Series Large Cap Value Fund | 7.7 | 7.1 |
Fidelity Series Small Cap Opportunities Fund | 1.9 | 2.1 |
| 38.0 | 39.6 |
Developed International Equity Funds | | |
Fidelity Advisor Diversified International Fund Institutional Class | 2.2 | 3.2 |
Fidelity Advisor Overseas Fund Institutional Class | 2.2 | 3.3 |
Fidelity Series International Growth Fund | 4.2 | 3.5 |
Fidelity Series International Small Cap Fund | 0.8 | 0.7 |
Fidelity Series International Value Fund | 4.0 | 3.4 |
| 13.4 | 14.1 |
Emerging Markets Equity Funds | | |
Fidelity Series Emerging Markets Fund | 2.5 | 2.4 |
High Yield Bond Funds | | |
Fidelity Advisor High Income Advantage Fund Institutional Class | 0.0 | 6.7 |
Fidelity Series Emerging Markets Debt Fund | 0.1 | 0.0 |
Fidelity Series High Income Fund | 6.3 | 0.0 |
| 6.4 | 6.7 |
Inflation-Protected Bond Funds | | |
Fidelity Series Inflation-Protected Bond Index Fund | 6.7 | 6.4 |
Investment Grade Bond Funds | | |
Fidelity Advisor Strategic Real Return Fund Institutional Class | 4.2 | 3.9 |
Fidelity Advisor Total Bond Fund Institutional Class | 0.0 | 0.0* |
Fidelity Series Investment Grade Bond Fund | 19.2 | 17.7 |
| 23.4 | 21.6 |
Short-Term Funds | | |
Fidelity Advisor Short Fixed-Income Fund Institutional Class | 1.9 | 1.6 |
Fidelity Institutional Money Market Portfolio Institutional Class | 2.1 | 1.6 |
| 4.0 | 3.2 |
| | |
Net Other Assets (Liabilities)* | 0.0 | 0.0 |
| 100.0 | 100.0 |
* Amount represents less than 0.1% |
Asset Allocation (% of fund's net assets) |
Current |
| Commodity Funds | 5.6% | |
| Domestic Equity Funds | 38.0% | |
| Developed International Equity Funds | 13.4% | |
| Emerging Markets Equity Funds | 2.5% | |
| High Yield Bond Funds | 6.4% | |
| Inflation-Protected Bond Funds | 6.7% | |
| Investment Grade Bond Funds | 23.4% | |
| Short-Term Funds | 4.0% | |

Six months ago |
| Commodity Funds | 6.0% | |
| Domestic Equity Funds | 39.6% | |
| Developed International Equity Funds | 14.1% | |
| Emerging Markets Equity Funds | 2.4% | |
| High Yield Bond Funds | 6.7% | |
| Inflation-Protected Bond Funds | 6.4% | |
| Investment Grade Bond Funds | 21.6% | |
| Short-Term Funds | 3.2% | |

Expected |
| Commodity Funds | 6.4% | |
| Domestic Equity Funds | 36.4% | |
| Developed International Equity Funds | 13.3% | |
| Emerging Markets Equity Funds | 2.3% | |
| High Yield Bond Funds | 6.3% | |
| Inflation-Protected Bond Funds | 8.0% | |
| Investment Grade Bond Funds | 22.5% | |
| Short-Term Funds | 4.8% | |

The fund invests according to an asset allocation strategy that becomes increasingly conservative over time. The six months ago allocation is based on the fund's holdings as of September 30, 2010. The current allocation is based on the fund's holdings as of March 31, 2011. The expected allocation represents the fund's anticipated allocation at September 30, 2011. |
Annual Report
Fidelity Advisor Freedom 2020 Fund
Investments March 31, 2011
Showing Percentage of Net Assets
Domestic Equity Funds - 43.6% |
| Shares | | Value |
Commodity Funds - 5.6% |
Fidelity Series Commodity Strategy Fund | 10,706,273 | | $ 141,108,679 |
Domestic Equity Funds - 38.0% |
Fidelity Advisor Equity Growth Fund Institutional Class | 1,534,497 | | 95,368,969 |
Fidelity Advisor Growth & Income Fund Institutional Class | 7,363,893 | | 132,918,267 |
Fidelity Advisor Large Cap Fund Institutional Class | 6,673,635 | | 131,670,827 |
Fidelity Advisor Small Cap Fund Institutional Class | 1,753,679 | | 49,225,776 |
Fidelity Series 100 Index Fund | 12,413,503 | | 114,204,231 |
Fidelity Series All-Sector Equity Fund | 14,518,573 | | 190,338,492 |
Fidelity Series Large Cap Value Fund | 15,738,071 | | 192,161,848 |
Fidelity Series Small Cap Opportunities Fund | 4,087,761 | | 48,194,699 |
TOTAL DOMESTIC EQUITY FUNDS | | 954,083,109 |
TOTAL DOMESTIC EQUITY FUNDS (Cost $890,476,396) | 1,095,191,788 |
International Equity Funds - 15.9% |
| | | |
Developed International Equity Funds - 13.4% |
Fidelity Advisor Diversified International Fund Institutional Class | 3,304,809 | | 55,553,835 |
Fidelity Advisor Overseas Fund Institutional Class | 2,884,664 | | 54,895,152 |
Fidelity Series International Growth Fund | 9,099,633 | | 104,736,774 |
Fidelity Series International Small Cap Fund | 1,651,610 | | 20,380,871 |
Fidelity Series International Value Fund | 9,680,614 | | 101,549,638 |
TOTAL DEVELOPED INTERNATIONAL EQUITY FUNDS | | 337,116,270 |
Emerging Markets Equity Funds - 2.5% |
Fidelity Series Emerging Markets Fund | 3,232,043 | | 61,925,943 |
TOTAL INTERNATIONAL EQUITY FUNDS (Cost $336,978,098) | 399,042,213 |
Bond Funds - 36.5% |
| Shares | | Value |
High Yield Bond Funds - 6.4% |
Fidelity Series Emerging Markets Debt Fund | 231,068 | | $ 2,311,628 |
Fidelity Series High Income Fund | 15,906,179 | | 159,379,913 |
TOTAL HIGH YIELD BOND FUNDS | | 161,691,541 |
Inflation-Protected Bond Funds - 6.7% |
Fidelity Series Inflation-Protected Bond Index Fund | 15,496,233 | | 167,669,239 |
Investment Grade Bond Funds - 23.4% |
Fidelity Advisor Strategic Real Return Fund Institutional Class | 10,506,871 | | 104,018,022 |
Fidelity Series Investment Grade Bond Fund | 42,395,902 | | 482,465,365 |
TOTAL INVESTMENT GRADE BOND FUNDS | | 586,483,387 |
TOTAL BOND FUNDS (Cost $889,459,226) | 915,844,167 |
Short-Term Funds - 4.0% |
| | | |
Fidelity Advisor Short Fixed-Income Fund Institutional Class | 5,273,308 | | 48,567,169 |
Fidelity Institutional Money Market Portfolio Institutional Class | 51,855,421 | | 51,855,421 |
TOTAL SHORT-TERM FUNDS (Cost $100,005,727) | 100,422,590 |
TOTAL INVESTMENT PORTFOLIO - 100.0% (Cost $2,216,919,447) | | 2,510,500,758 |
NET OTHER ASSETS (LIABILITIES) - 0.0% | | (359,478) |
NET ASSETS - 100% | $ 2,510,141,280 |
Other Information |
All investments are categorized as Level 1 under the Fair Value Hierarchy. The inputs or methodology used for valuing securities may not be an indication of the risk associated with investing in those securities. For more information on valuation inputs, please refer to the Security Valuation section in the accompanying Notes to Financial Statements. |
Income Tax Information |
At March 31, 2011, the Fund had a capital loss carryforward of approximately $159,878,472 of which $83,490,631 and $76,387,841 will expire in fiscal 2017 and 2019, respectively. Capital loss carryforwards are only available to offset future capital gains of the Fund to the extent provided by regulations and may be limited. |
See accompanying notes which are an integral part of the financial statements.
Annual Report
Fidelity Advisor Freedom 2020 Fund
Statement of Assets and Liabilities
| March 31, 2011 |
Assets | | |
Investment in securities, at value (cost $2,216,919,447) - See accompanying schedule | | $ 2,510,500,758 |
Receivable for investments sold | | 235,179 |
Receivable for fund shares sold | | 3,321,181 |
Distributions receivable from underlying funds | | 281,193 |
Total assets | | 2,514,338,311 |
| | |
Liabilities | | |
Payable for investments purchased | $ 27,752 | |
Payable for fund shares redeemed | 3,533,983 | |
Distribution and service plan fees payable | 635,296 | |
Total liabilities | | 4,197,031 |
| | |
Net Assets | | $ 2,510,141,280 |
Net Assets consist of: | | |
Paid in capital | | $ 2,377,052,288 |
Undistributed net investment income | | 3,586,191 |
Accumulated undistributed net realized gain (loss) on investments | | (164,078,510) |
Net unrealized appreciation (depreciation) on investments | | 293,581,311 |
Net Assets | | $ 2,510,141,280 |
| | |
Calculation of Maximum Offering Price Class A:
Net Asset Value and redemption price per share ($1,557,401,767 ÷ 125,059,670 shares) | | $ 12.45 |
| | |
Maximum offering price per share (100/94.25 of $12.45) | | $ 13.21 |
Class T:
Net Asset Value and redemption price per share ($424,707,250 ÷ 34,116,964 shares) | | $ 12.45 |
| | |
Maximum offering price per share (100/96.50 of $12.45) | | $ 12.90 |
Class B:
Net Asset Value and offering price per share ($61,855,909 ÷ 4,984,739 shares)A | | $ 12.41 |
| | |
Class C:
Net Asset Value and offering price per share ($101,018,910 ÷ 8,163,494 shares)A | | $ 12.37 |
| | |
| | |
Institutional Class:
Net Asset Value, offering price and redemption price per share ($365,157,444 ÷ 29,147,383 shares) | | $ 12.53 |
A Redemption price per share is equal to net asset value less any applicable contingent deferred sales charge.
Statement of Operations
| Year ended March 31, 2011 |
Investment Income | | |
Income distributions from underlying funds | | $ 37,318,379 |
| | |
Expenses | | |
Distribution and service plan fees | $ 7,206,192 | |
Independent trustees' compensation | 8,108 | |
Total expenses before reductions | 7,214,300 | |
Expense reductions | (8,108) | 7,206,192 |
Net investment income (loss) | | 30,112,187 |
Realized and Unrealized Gain (Loss) Realized gain (loss) on sale of underlying fund shares | (52,410,882) | |
Capital gain distributions from underlying funds | 45,102,302 | |
Total net realized gain (loss) | | (7,308,580) |
Change in net unrealized appreciation (depreciation) on underlying funds | | 268,865,527 |
Net gain (loss) | | 261,556,947 |
Net increase (decrease) in net assets resulting from operations | | $ 291,669,134 |
See accompanying notes which are an integral part of the financial statements.
Annual Report
Statement of Changes in Net Assets
| Year ended
March 31,
2011 | Year ended
March 31,
2010 |
Increase (Decrease) in Net Assets | | |
Operations | | |
Net investment income (loss) | $ 30,112,187 | $ 31,695,503 |
Net realized gain (loss) | (7,308,580) | (9,984,453) |
Change in net unrealized appreciation (depreciation) | 268,865,527 | 562,202,605 |
Net increase (decrease) in net assets resulting from operations | 291,669,134 | 583,913,655 |
Distributions to shareholders from net investment income | (30,543,734) | (31,327,675) |
Distributions to shareholders from net realized gain | (21,278,399) | (15,485,703) |
Total distributions | (51,822,133) | (46,813,378) |
Share transactions - net increase (decrease) | 164,153,585 | 326,679,236 |
Total increase (decrease) in net assets | 404,000,586 | 863,779,513 |
| | |
Net Assets | | |
Beginning of period | 2,106,140,694 | 1,242,361,181 |
End of period (including undistributed net investment income of $3,586,191 and undistributed net investment income of $4,017,738, respectively) | $ 2,510,141,280 | $ 2,106,140,694 |
Financial Highlights - Class A
Years ended March 31, | 2011 | 2010 | 2009 | 2008 | 2007 |
Selected Per-Share Data | | | | | |
Net asset value, beginning of period | $ 11.21 | $ 7.97 | $ 12.73 | $ 13.49 | $ 12.85 |
Income from Investment Operations | | | | | |
Net investment income (loss) C | .16 | .20 | .25 | .28 | .24 |
Net realized and unrealized gain (loss) | 1.36 | 3.32 | (4.33) | (.49) | .92 |
Total from investment operations | 1.52 | 3.52 | (4.08) | (.21) | 1.16 |
Distributions from net investment income | (.17) | (.19) | (.25) | (.25) | (.23) |
Distributions from net realized gain | (.11) | (.09) | (.43) | (.30) | (.30) |
Total distributions | (.28) | (.28) G | (.68) | (.55) | (.52) F |
Net asset value, end of period | $ 12.45 | $ 11.21 | $ 7.97 | $ 12.73 | $ 13.49 |
Total Return A,B | 13.73% | 44.32% | (33.34)% | (1.83)% | 9.21% |
Ratios to Average Net Assets D,E | | | | | |
Expenses before reductions | .25% | .25% | .25% | .25% | .25% |
Expenses net of fee waivers, if any | .25% | .25% | .25% | .25% | .25% |
Expenses net of all reductions | .25% | .25% | .25% | .25% | .25% |
Net investment income (loss) | 1.43% | 1.92% | 2.49% | 2.07% | 1.89% |
Supplemental Data | | | | | |
Net assets, end of period (000 omitted) | $ 1,557,402 | $ 1,238,015 | $ 677,210 | $ 811,992 | $ 511,536 |
Portfolio turnover rate | 39% | 26% | 31% | 10% | 13% |
A Total returns would have been lower had certain expenses not been reduced during the periods shown.
B Total returns do not include the effect of the sales charges.
C Calculated based on average shares outstanding during the period.
D Amounts do not include the activity of the underlying funds.
E Expense ratios reflect operating expenses of the class. Expenses before reductions do not reflect amounts reimbursed by the investment adviser or reductions from expense offset arrangements and do not represent the amount paid by the class during periods when reimbursements or reductions occur. Expenses net of fee waivers reflect expenses after reimbursement by the investment adviser but prior to reductions from expense offset arrangements. Expenses net of all reductions represent the net expenses paid by the class but do not include expenses of the investment companies in which the Fund invests.
F Total distributions of $.52 per share is comprised of distributions from net investment income of $.225 and distributions from net realized gain of $.295 per share.
G Total distributions of $.28 per share is comprised of distributions from net investment income of $.189 and distributions from net realized gain of $.087 per share.
See accompanying notes which are an integral part of the financial statements.
Annual Report
Financial Highlights - Class T
Years ended March 31, | 2011 | 2010 | 2009 | 2008 | 2007 |
Selected Per-Share Data | | | | | |
Net asset value, beginning of period | $ 11.20 | $ 7.96 | $ 12.72 | $ 13.47 | $ 12.83 |
Income from Investment Operations | | | | | |
Net investment income (loss) C | .13 | .17 | .23 | .25 | .21 |
Net realized and unrealized gain (loss) | 1.37 | 3.32 | (4.34) | (.49) | .92 |
Total from investment operations | 1.50 | 3.49 | (4.11) | (.24) | 1.13 |
Distributions from net investment income | (.13) | (.16) | (.22) | (.21) | (.19) |
Distributions from net realized gain | (.11) | (.09) | (.43) | (.30) | (.30) |
Total distributions | (.25) H | (.25) G | (.65) | (.51) | (.49) F |
Net asset value, end of period | $ 12.45 | $ 11.20 | $ 7.96 | $ 12.72 | $ 13.47 |
Total Return A,B | 13.50% | 44.02% | (33.56)% | (2.02)% | 8.97% |
Ratios to Average Net Assets D,E | | | | | |
Expenses before reductions | .50% | .50% | .50% | .50% | .50% |
Expenses net of fee waivers, if any | .50% | .50% | .50% | .50% | .50% |
Expenses net of all reductions | .50% | .50% | .50% | .50% | .50% |
Net investment income (loss) | 1.18% | 1.67% | 2.24% | 1.82% | 1.63% |
Supplemental Data | | | | | |
Net assets, end of period (000 omitted) | $ 424,707 | $ 488,097 | $ 343,919 | $ 458,465 | $ 431,886 |
Portfolio turnover rate | 39% | 26% | 31% | 10% | 13% |
A Total returns would have been lower had certain expenses not been reduced during the periods shown.
B Total returns do not include the effect of the sales charges.
C Calculated based on average shares outstanding during the period.
D Amounts do not include the activity of the underlying funds.
E Expense ratios reflect operating expenses of the class. Expenses before reductions do not reflect amounts reimbursed by the investment adviser or reductions from expense offset arrangements and do not represent the amount paid by the class during periods when reimbursements or reductions occur. Expenses net of fee waivers reflect expenses after reimbursement by the investment adviser but prior to reductions from expense offset arrangements. Expenses net of all reductions represent the net expenses paid by the class but do not include expenses of the investment companies in which the Fund invests.
F Total distributions of $.49 per share is comprised of distributions from net investment income of $.194 and distributions from net realized gain of $.295 per share.
G Total distributions of $.25 per share is comprised of distributions from net investment income of $.163 and distributions from net realized gain of $.087 per share.
H Total distributions of $.25 per share is comprised of distributions from net investment income of $.134 and distributions from net realized gain of $.111 per share.
Financial Highlights - Class B
Years ended March 31, | 2011 | 2010 | 2009 | 2008 | 2007 |
Selected Per-Share Data | | | | | |
Net asset value, beginning of period | $ 11.17 | $ 7.94 | $ 12.66 | $ 13.41 | $ 12.78 |
Income from Investment Operations | | | | | |
Net investment income (loss) C | .08 | .12 | .18 | .18 | .15 |
Net realized and unrealized gain (loss) | 1.35 | 3.31 | (4.31) | (.48) | .91 |
Total from investment operations | 1.43 | 3.43 | (4.13) | (.30) | 1.06 |
Distributions from net investment income | (.08) | (.12) | (.16) | (.15) | (.13) |
Distributions from net realized gain | (.11) | (.09) | (.43) | (.30) | (.30) |
Total distributions | (.19) | (.20) G | (.59) | (.45) | (.43) F |
Net asset value, end of period | $ 12.41 | $ 11.17 | $ 7.94 | $ 12.66 | $ 13.41 |
Total Return A,B | 12.87% | 43.34% | (33.87)% | (2.51)% | 8.40% |
Ratios to Average Net Assets D,E | | | | | |
Expenses before reductions | 1.00% | 1.00% | 1.00% | 1.00% | 1.00% |
Expenses net of fee waivers, if any | 1.00% | 1.00% | 1.00% | 1.00% | 1.00% |
Expenses net of all reductions | 1.00% | 1.00% | 1.00% | 1.00% | 1.00% |
Net investment income (loss) | .68% | 1.17% | 1.74% | 1.32% | 1.13% |
Supplemental Data | | | | | |
Net assets, end of period (000 omitted) | $ 61,856 | $ 71,888 | $ 52,871 | $ 89,049 | $ 85,981 |
Portfolio turnover rate | 39% | 26% | 31% | 10% | 13% |
A Total returns would have been lower had certain expenses not been reduced during the periods shown.
B Total returns do not include the effect of the contingent deferred sales charge.
C Calculated based on average shares outstanding during the period.
D Amounts do not include the activity of the underlying funds.
E Expense ratios reflect operating expenses of the class. Expenses before reductions do not reflect amounts reimbursed by the investment adviser or reductions from expense offset arrangements and do not represent the amount paid by the class during periods when reimbursements or reductions occur. Expenses net of fee waivers reflect expenses after reimbursement by the investment adviser but prior to reductions from expense offset arrangements. Expenses net of all reductions represent the net expenses paid by the class but do not include expenses of the investment companies in which the Fund invests.
F Total distributions of $.43 per share is comprised of distributions from net investment income of $.131 and distributions from net realized gain of $.295 per share.
G Total distributions of $.20 per share is comprised of distributions from net investment income of $.115 and distributions from net realized gain of $.087 per share.
See accompanying notes which are an integral part of the financial statements.
Annual Report
Financial Highlights - Class C
Years ended March 31, | 2011 | 2010 | 2009 | 2008 | 2007 |
Selected Per-Share Data | | | | | |
Net asset value, beginning of period | $ 11.14 | $ 7.92 | $ 12.64 | $ 13.40 | $ 12.77 |
Income from Investment Operations | | | | | |
Net investment income (loss) C | .08 | .12 | .18 | .18 | .15 |
Net realized and unrealized gain (loss) | 1.34 | 3.31 | (4.31) | (.49) | .91 |
Total from investment operations | 1.42 | 3.43 | (4.13) | (.31) | 1.06 |
Distributions from net investment income | (.08) | (.12) | (.16) | (.15) | (.14) |
Distributions from net realized gain | (.11) | (.09) | (.43) | (.30) | (.30) |
Total distributions | (.19) | (.21) G | (.59) | (.45) | (.43) F |
Net asset value, end of period | $ 12.37 | $ 11.14 | $ 7.92 | $ 12.64 | $ 13.40 |
Total Return A,B | 12.89% | 43.38% | (33.90)% | (2.56)% | 8.45% |
Ratios to Average Net Assets D,E | | | | | |
Expenses before reductions | 1.00% | 1.00% | 1.00% | 1.00% | 1.00% |
Expenses net of fee waivers, if any | 1.00% | 1.00% | 1.00% | 1.00% | 1.00% |
Expenses net of all reductions | 1.00% | 1.00% | 1.00% | 1.00% | 1.00% |
Net investment income (loss) | .68% | 1.17% | 1.74% | 1.32% | 1.14% |
Supplemental Data | | | | | |
Net assets, end of period (000 omitted) | $ 101,019 | $ 93,237 | $ 62,702 | $ 95,224 | $ 85,076 |
Portfolio turnover rate | 39% | 26% | 31% | 10% | 13% |
A Total returns would have been lower had certain expenses not been reduced during the periods shown.
B Total returns do not include the effect of the contingent deferred sales charge.
C Calculated based on average shares outstanding during the period.
D Amounts do not include the activity of the underlying funds.
E Expense ratios reflect operating expenses of the class. Expenses before reductions do not reflect amounts reimbursed by the investment adviser or reductions from expense offset arrangements and do not represent the amount paid by the class during periods when reimbursements or reductions occur. Expenses net of fee waivers reflect expenses after reimbursement by the investment adviser but prior to reductions from expense offset arrangements. Expenses net of all reductions represent the net expenses paid by the class but do not include expenses of the investment companies in which the Fund invests.
F Total distributions of $.43 per share is comprised of distributions from net investment income of $.135 and distributions from net realized gain of $.295 per share.
G Total distributions of $.21 per share is comprised of distributions from net investment income of $.119 and distributions from net realized gain of $.087 per share.
Financial Highlights - Institutional Class
Years ended March 31, | 2011 | 2010 | 2009 | 2008 | 2007 |
Selected Per-Share Data | | | | | |
Net asset value, beginning of period | $ 11.27 | $ 8.01 | $ 12.79 | $ 13.55 | $ 12.90 |
Income from Investment Operations | | | | | |
Net investment income (loss) B | .19 | .22 | .28 | .32 | .28 |
Net realized and unrealized gain (loss) | 1.38 | 3.34 | (4.35) | (.50) | .92 |
Total from investment operations | 1.57 | 3.56 | (4.07) | (.18) | 1.20 |
Distributions from net investment income | (.20) | (.21) | (.28) | (.28) | (.25) |
Distributions from net realized gain | (.11) | (.09) | (.43) | (.30) | (.30) |
Total distributions | (.31) | (.30) G | (.71) | (.58) | (.55) F |
Net asset value, end of period | $ 12.53 | $ 11.27 | $ 8.01 | $ 12.79 | $ 13.55 |
Total Return A | 14.09% | 44.65% | (33.16)% | (1.62)% | 9.47% |
Ratios to Average Net Assets C,E | | | | | |
Expenses before reductions D | .00% | .00% | .00% | .00% | .00% |
Expenses net of fee waivers, if any | .00% | .00% | .00% | .00% | .00% |
Expenses net of all reductions | .00% | .00% | .00% | .00% | .00% |
Net investment income (loss) | 1.68% | 2.17% | 2.74% | 2.32% | 2.13% |
Supplemental Data | | | | | |
Net assets, end of period (000 omitted) | $ 365,157 | $ 214,905 | $ 105,660 | $ 87,568 | $ 38,153 |
Portfolio turnover rate | 39% | 26% | 31% | 10% | 13% |
A Total returns would have been lower had certain expenses not been reduced during the periods shown.
B Calculated based on average shares outstanding during the period.
C Amounts do not include the activity of the underlying funds.
D Amount represents less than .01%.
E Expense ratios reflect operating expenses of the class. Expenses before reductions do not reflect amounts reimbursed by the investment adviser or reductions from expense offset arrangements and do not represent the amount paid by the class during periods when reimbursements or reductions occur. Expenses net of fee waivers reflect expenses after reimbursement by the investment adviser but prior to reductions from expense offset arrangements. Expenses net of all reductions represent the net expenses paid by the class but do not include expenses of the investment companies in which the Fund invests.
F Total distributions of $.55 per share is comprised of distributions from net investment income of $.252 and distributions from net realized gain of $.295 per share.
G Total distributions of $.30 per share is comprised of distributions from net investment income of $.211 and distributions from net realized gain of $.087 per share.
See accompanying notes which are an integral part of the financial statements.
Annual Report
Fidelity Advisor Freedom 2025 Fund
Investment Changes (Unaudited)
Fund Holdings as of March 31, 2011 |
| % of fund's
net assets | % of fund's net assets
6 months ago |
Commodity Funds | | |
Fidelity Series Commodity Strategy Fund | 6.8 | 6.8 |
Domestic Equity Funds | | |
Fidelity Advisor Equity Growth Fund Institutional Class | 4.4 | 4.6 |
Fidelity Advisor Equity Income Fund Institutional Class | 0.0 | 1.0 |
Fidelity Advisor Growth & Income Fund Institutional Class | 6.1 | 6.4 |
Fidelity Advisor Large Cap Fund Institutional Class | 6.1 | 6.3 |
Fidelity Advisor Small Cap Fund Institutional Class | 2.3 | 2.3 |
Fidelity Series 100 Index Fund | 5.2 | 5.1 |
Fidelity Series All-Sector Equity Fund | 8.8 | 9.0 |
Fidelity Series Large Cap Value Fund | 8.8 | 8.0 |
Fidelity Series Small Cap Opportunities Fund | 2.2 | 2.3 |
| 43.9 | 45.0 |
Developed International Equity Funds | | |
Fidelity Advisor Diversified International Fund Institutional Class | 2.6 | 3.7 |
Fidelity Advisor Overseas Fund Institutional Class | 2.5 | 3.7 |
Fidelity Series International Growth Fund | 4.9 | 3.9 |
Fidelity Series International Small Cap Fund | 0.9 | 0.8 |
Fidelity Series International Value Fund | 4.7 | 3.8 |
| 15.6 | 15.9 |
Emerging Markets Equity Funds | | |
Fidelity Series Emerging Markets Fund | 2.8 | 2.7 |
High Yield Bond Funds | | |
Fidelity Advisor High Income Advantage Fund Institutional Class | 0.0 | 7.4 |
Fidelity Series Emerging Markets Debt Fund | 0.1 | 0.0 |
Fidelity Series High Income Fund | 7.2 | 0.0 |
| 7.3 | 7.4 |
Inflation-Protected Bond Funds | | |
Fidelity Series Inflation-Protected Bond Index Fund | 3.7 | 3.8 |
Investment Grade Bond Funds | | |
Fidelity Advisor Strategic Real Return Fund Institutional Class | 3.5 | 3.3 |
Fidelity Advisor Total Bond Fund Institutional Class | 0.0 | 0.0* |
Fidelity Series Investment Grade Bond Fund | 16.3 | 15.1 |
| 19.8 | 18.4 |
Short-Term Funds | | |
Fidelity Advisor Short Fixed-Income Fund Institutional Class | 0.0* | 0.0* |
Fidelity Institutional Money Market Portfolio Institutional Class | 0.1 | 0.0* |
| 0.1 | 0.0 |
| | |
Net Other Assets (Liabilities)* | 0.0 | 0.0 |
| 100.0 | 100.0 |
* Amount represents less than 0.1% |
Asset Allocation (% of fund's net assets) |
Current |
| Commodity Funds | 6.8% | |
| Domestic Equity Funds | 43.9% | |
| Developed International Equity Funds | 15.6% | |
| Emerging Markets Equity Funds | 2.8% | |
| High Yield Bond Funds | 7.3% | |
| Inflation-Protected Bond Funds | 3.7% | |
| Investment Grade Bond Funds | 19.8% | |
| Short-Term Funds | 0.1% | |

Six months ago |
| Commodity Funds | 6.8% | |
| Domestic Equity Funds | 45.0% | |
| Developed International Equity Funds | 15.9% | |
| Emerging Markets Equity Funds | 2.7% | |
| High Yield Bond Funds | 7.4% | |
| Inflation-Protected Bond Funds | 3.8% | |
| Investment Grade Bond Funds | 18.4% | |
| Short-Term Funds | 0.0%* | |

Expected |
| Commodity Funds | 7.6% | |
| Domestic Equity Funds | 42.8% | |
| Developed International Equity Funds | 15.6% | |
| Emerging Markets Equity Funds | 2.8% | |
| High Yield Bond Funds | 7.5% | |
| Inflation-Protected Bond Funds | 4.9% | |
| Investment Grade Bond Funds | 18.6% | |
| Short-Term Funds | 0.2% | |

The fund invests according to an asset allocation strategy that becomes increasingly conservative over time. The six months ago allocation is based on the fund's holdings as of September 30, 2010. The current allocation is based on the fund's holdings as of March 31, 2011. The expected allocation represents the fund's anticipated allocation at September 30, 2011. |
Annual Report
Fidelity Advisor Freedom 2025 Fund
Investments March 31, 2011
Showing Percentage of Net Assets
Domestic Equity Funds - 50.7% |
| Shares | | Value |
Commodity Funds - 6.8% |
Fidelity Series Commodity Strategy Fund | 9,975,182 | | $ 131,472,904 |
Domestic Equity Funds - 43.9% |
Fidelity Advisor Equity Growth Fund Institutional Class | 1,364,783 | | 84,821,273 |
Fidelity Advisor Growth & Income Fund Institutional Class | 6,545,761 | | 118,150,979 |
Fidelity Advisor Large Cap Fund Institutional Class | 5,932,540 | | 117,049,018 |
Fidelity Advisor Small Cap Fund Institutional Class | 1,559,466 | | 43,774,210 |
Fidelity Series 100 Index Fund | 11,024,827 | | 101,428,412 |
Fidelity Series All-Sector Equity Fund | 12,912,921 | | 169,288,392 |
Fidelity Series Large Cap Value Fund | 13,995,814 | | 170,888,886 |
Fidelity Series Small Cap Opportunities Fund | 3,635,701 | | 42,864,913 |
TOTAL DOMESTIC EQUITY FUNDS | | 848,266,083 |
TOTAL DOMESTIC EQUITY FUNDS (Cost $814,051,526) | 979,738,987 |
International Equity Funds - 18.4% |
| | | |
Developed International Equity Funds - 15.6% |
Fidelity Advisor Diversified International Fund Institutional Class | 2,953,587 | | 49,649,800 |
Fidelity Advisor Overseas Fund Institutional Class | 2,578,275 | | 49,064,577 |
Fidelity Series International Growth Fund | 8,129,834 | | 93,574,387 |
Fidelity Series International Small Cap Fund | 1,466,917 | | 18,101,757 |
Fidelity Series International Value Fund | 8,649,649 | | 90,734,820 |
TOTAL DEVELOPED INTERNATIONAL EQUITY FUNDS | | 301,125,341 |
Emerging Markets Equity Funds - 2.8% |
Fidelity Series Emerging Markets Fund | 2,882,543 | | 55,229,516 |
TOTAL INTERNATIONAL EQUITY FUNDS (Cost $303,103,993) | 356,354,857 |
Bond Funds - 30.8% |
| Shares | | Value |
High Yield Bond Funds - 7.3% |
Fidelity Series Emerging Markets Debt Fund | 200,524 | | $ 2,006,069 |
Fidelity Series High Income Fund | 13,803,646 | | 138,312,534 |
TOTAL HIGH YIELD BOND FUNDS | | 140,318,603 |
Inflation-Protected Bond Funds - 3.7% |
Fidelity Series Inflation-Protected Bond Index Fund | 6,705,944 | | 72,558,316 |
Investment Grade Bond Funds - 19.8% |
Fidelity Advisor Strategic Real Return Fund Institutional Class | 6,831,453 | | 67,631,381 |
Fidelity Series Investment Grade Bond Fund | 27,632,300 | | 314,455,572 |
TOTAL INVESTMENT GRADE BOND FUNDS | | 382,086,953 |
TOTAL BOND FUNDS (Cost $580,275,017) | 594,963,872 |
Short-Term Funds - 0.1% |
| | | |
Fidelity Advisor Short Fixed-Income Fund Institutional Class | 124,297 | | 1,144,778 |
Fidelity Institutional Money Market Portfolio Institutional Class | 1,327,798 | | 1,327,798 |
TOTAL SHORT-TERM FUNDS (Cost $2,472,741) | 2,472,576 |
TOTAL INVESTMENT PORTFOLIO - 100.0% (Cost $1,699,903,277) | | 1,933,530,292 |
NET OTHER ASSETS (LIABILITIES) - 0.0% | | (215,135) |
NET ASSETS - 100% | $ 1,933,315,157 |
Other Information |
All investments are categorized as Level 1 under the Fair Value Hierarchy. The inputs or methodology used for valuing securities may not be an indication of the risk associated with investing in those securities. For more information on valuation inputs, please refer to the Security Valuation section in the accompanying Notes to Financial Statements. |
Income Tax Information |
At March 31, 2011, the Fund had a capital loss carryforward of approximately $94,931,344 of which $53,781,443 and $41,149,901 will expire in fiscal 2017 and 2019, respectively. Capital loss carryforwards are only available to offset future capital gains of the Fund to the extent provided by regulations and may be limited. |
See accompanying notes which are an integral part of the financial statements.
Annual Report
Fidelity Advisor Freedom 2025 Fund
Statement of Assets and Liabilities
| March 31, 2011 |
Assets | | |
Investment in securities, at value (cost $1,699,903,277) - See accompanying schedule | | $ 1,933,530,292 |
Cash | | 8 |
Receivable for investments sold | | 79,281 |
Receivable for fund shares sold | | 2,870,558 |
Distributions receivable from underlying funds | | 243,918 |
Total assets | | 1,936,724,057 |
| | |
Liabilities | | |
Payable for investments purchased | $ 703,988 | |
Payable for fund shares redeemed | 2,245,718 | |
Distribution and service plan fees payable | 459,194 | |
Total liabilities | | 3,408,900 |
| | |
Net Assets | | $ 1,933,315,157 |
Net Assets consist of: | | |
Paid in capital | | $ 1,794,972,893 |
Undistributed net investment income | | 2,482,027 |
Accumulated undistributed net realized gain (loss) on investments | | (97,766,778) |
Net unrealized appreciation (depreciation) on investments | | 233,627,015 |
Net Assets | | $ 1,933,315,157 |
| | |
Calculation of Maximum Offering Price Class A:
Net Asset Value and redemption price per share ($1,290,254,729 ÷ 106,725,107 shares) | | $ 12.09 |
| | |
Maximum offering price per share (100/94.25 of $12.09) | | $ 12.83 |
Class T:
Net Asset Value and redemption price per share ($258,166,032 ÷ 21,315,194 shares) | | $ 12.11 |
| | |
Maximum offering price per share (100/96.50 of $12.11) | | $ 12.55 |
Class B:
Net Asset Value and offering price per share ($38,945,952 ÷ 3,241,548 shares)A | | $ 12.01 |
| | |
Class C:
Net Asset Value and offering price per share ($61,639,796 ÷ 5,143,282 shares)A | | $ 11.98 |
| | |
Institutional Class:
Net Asset Value, offering price and redemption price per share ($284,308,648 ÷ 23,367,906 shares) | | $ 12.17 |
A Redemption price per share is equal to net asset value less any applicable contingent deferred sales charge.
Statement of Operations
| Year ended March 31, 2011 |
Investment Income | | |
Income distributions from underlying funds | | $ 27,078,142 |
| | |
Expenses | | |
Distribution and service plan fees | $ 4,868,969 | |
Independent trustees' compensation | 5,845 | |
Total expenses before reductions | 4,874,814 | |
Expense reductions | (5,845) | 4,868,969 |
Net investment income (loss) | | 22,209,173 |
Realized and Unrealized Gain (Loss) Realized gain (loss) on sale of underlying fund shares | (35,430,025) | |
Capital gain distributions from underlying funds | 35,886,323 | |
Total net realized gain (loss) | | 456,298 |
Change in net unrealized appreciation (depreciation) on underlying funds | | 215,413,028 |
Net gain (loss) | | 215,869,326 |
Net increase (decrease) in net assets resulting from operations | | $ 238,078,499 |
See accompanying notes which are an integral part of the financial statements.
Annual Report
Statement of Changes in Net Assets
| Year ended
March 31,
2011 | Year ended
March 31,
2010 |
Increase (Decrease) in Net Assets | | |
Operations | | |
Net investment income (loss) | $ 22,209,173 | $ 20,292,796 |
Net realized gain (loss) | 456,298 | (6,348,081) |
Change in net unrealized appreciation (depreciation) | 215,413,028 | 385,554,148 |
Net increase (decrease) in net assets resulting from operations | 238,078,499 | 399,498,863 |
Distributions to shareholders from net investment income | (22,138,802) | (20,082,625) |
Distributions to shareholders from net realized gain | (15,443,713) | (10,724,553) |
Total distributions | (37,582,515) | (30,807,178) |
Share transactions - net increase (decrease) | 270,608,455 | 313,035,081 |
Total increase (decrease) in net assets | 471,104,439 | 681,726,766 |
| | |
Net Assets | | |
Beginning of period | 1,462,210,718 | 780,483,952 |
End of period (including undistributed net investment income of $2,482,027 and undistributed net investment income of $2,411,656, respectively) | $ 1,933,315,157 | $ 1,462,210,718 |
Financial Highlights - Class A
Years ended March 31, | 2011 | 2010 | 2009 | 2008 | 2007 |
Selected Per-Share Data | | | | | |
Net asset value, beginning of period | $ 10.76 | $ 7.51 | $ 12.26 | $ 13.01 | $ 12.34 |
Income from Investment Operations | | | | | |
Net investment income (loss) C | .16 | .18 | .23 | .26 | .22 |
Net realized and unrealized gain (loss) | 1.43 | 3.32 | (4.36) | (.50) | .90 |
Total from investment operations | 1.59 | 3.50 | (4.13) | (.24) | 1.12 |
Distributions from net investment income | (.16) | (.17) | (.22) | (.22) | (.19) |
Distributions from net realized gain | (.11) | (.09) | (.40) | (.29) | (.26) |
Total distributions | (.26) G | (.25) F | (.62) | (.51) | (.45) |
Net asset value, end of period | $ 12.09 | $ 10.76 | $ 7.51 | $ 12.26 | $ 13.01 |
Total Return A,B | 14.97% | 46.86% | (34.98)% | (2.14)% | 9.26% |
Ratios to Average Net Assets D,E | | | | | |
Expenses before reductions | .25% | .25% | .25% | .25% | .25% |
Expenses net of fee waivers, if any | .25% | .25% | .25% | .25% | .25% |
Expenses net of all reductions | .25% | .25% | .25% | .25% | .25% |
Net investment income (loss) | 1.42% | 1.82% | 2.41% | 1.95% | 1.79% |
Supplemental Data | | | | | |
Net assets, end of period (000 omitted) | $ 1,290,255 | $ 999,687 | $ 512,482 | $ 558,890 | $ 306,544 |
Portfolio turnover rate | 34% | 19% | 29% | 10% | 3% |
A Total returns would have been lower had certain expenses not been reduced during the periods shown.
B Total returns do not include the effect of the sales charges.
C Calculated based on average shares outstanding during the period.
D Amounts do not include the activity of the underlying funds.
E Expense ratios reflect operating expenses of the class. Expenses before reductions do not reflect amounts reimbursed by the investment adviser or reductions from expense offset arrangements and do not represent the amount paid by the class during periods when reimbursements or reductions occur. Expenses net of fee waivers reflect expenses after reimbursement by the investment adviser but prior to reductions from expense offset arrangements. Expenses net of all reductions represent the net expenses paid by the class but do not include expenses of the investment companies in which the Fund invests.
F Total distributions of $.25 per share is comprised of distributions from net investment income of $.169 and distributions from net realized gain of $.085 per share.
G Total distributions of $.26 per share is comprised of distributions from net investment income of $.155 and distributions from net realized gain of $.106 per share.
See accompanying notes which are an integral part of the financial statements.
Annual Report
Financial Highlights - Class T
Years ended March 31, | 2011 | 2010 | 2009 | 2008 | 2007 |
Selected Per-Share Data | | | | | |
Net asset value, beginning of period | $ 10.78 | $ 7.52 | $ 12.28 | $ 13.03 | $ 12.35 |
Income from Investment Operations | | | | | |
Net investment income (loss) C | .13 | .15 | .21 | .23 | .19 |
Net realized and unrealized gain (loss) | 1.43 | 3.34 | (4.37) | (.51) | .91 |
Total from investment operations | 1.56 | 3.49 | (4.16) | (.28) | 1.10 |
Distributions from net investment income | (.13) | (.15) | (.20) | (.18) | (.16) |
Distributions from net realized gain | (.11) | (.09) | (.40) | (.29) | (.26) |
Total distributions | (.23) G | (.23) F | (.60) | (.47) | (.42) |
Net asset value, end of period | $ 12.11 | $ 10.78 | $ 7.52 | $ 12.28 | $ 13.03 |
Total Return A,B | 14.67% | 46.60% | (35.20)% | (2.40)% | 9.10% |
Ratios to Average Net Assets D,E | | | | | |
Expenses before reductions | .50% | .50% | .50% | .50% | .50% |
Expenses net of fee waivers, if any | .50% | .50% | .50% | .50% | .50% |
Expenses net of all reductions | .50% | .50% | .50% | .50% | .50% |
Net investment income (loss) | 1.17% | 1.57% | 2.16% | 1.70% | 1.54% |
Supplemental Data | | | | | |
Net assets, end of period (000 omitted) | $ 258,166 | $ 230,003 | $ 139,330 | $ 173,946 | $ 154,042 |
Portfolio turnover rate | 34% | 19% | 29% | 10% | 3% |
A Total returns would have been lower had certain expenses not been reduced during the periods shown.
B Total returns do not include the effect of the sales charges.
C Calculated based on average shares outstanding during the period.
D Amounts do not include the activity of the underlying funds.
E Expense ratios reflect operating expenses of the class. Expenses before reductions do not reflect amounts reimbursed by the investment adviser or reductions from expense offset arrangements and do not represent the amount paid by the class during periods when reimbursements or reductions occur. Expenses net of fee waivers reflect expenses after reimbursement by the investment adviser but prior to reductions from expense offset arrangements. Expenses net of all reductions represent the net expenses paid by the class but do not include expenses of the investment companies in which the Fund invests.
F Total distributions of $.23 per share is comprised of distributions from net investment income of $.146 and distributions from net realized gain of $.085 per share.
G Total distributions of $.23 per share is comprised of distributions from net investment income of $.128 and distributions from net realized gain of $.106 per share.
Financial Highlights - Class B
Years ended March 31, | 2011 | 2010 | 2009 | 2008 | 2007 |
Selected Per-Share Data | | | | | |
Net asset value, beginning of period | $ 10.70 | $ 7.47 | $ 12.17 | $ 12.93 | $ 12.26 |
Income from Investment Operations | | | | | |
Net investment income (loss) C | .07 | .10 | .16 | .16 | .13 |
Net realized and unrealized gain (loss) | 1.42 | 3.32 | (4.32) | (.51) | .90 |
Total from investment operations | 1.49 | 3.42 | (4.16) | (.35) | 1.03 |
Distributions from net investment income | (.07) | (.10) | (.14) | (.12) | (.10) |
Distributions from net realized gain | (.11) | (.09) | (.40) | (.29) | (.26) |
Total distributions | (.18) | (.19) F | (.54) | (.41) | (.36) |
Net asset value, end of period | $ 12.01 | $ 10.70 | $ 7.47 | $ 12.17 | $ 12.93 |
Total Return A,B | 14.02% | 45.83% | (35.45)% | (2.95)% | 8.57% |
Ratios to Average Net Assets D,E | | | | | |
Expenses before reductions | 1.00% | 1.00% | 1.00% | 1.00% | 1.00% |
Expenses net of fee waivers, if any | 1.00% | 1.00% | 1.00% | 1.00% | 1.00% |
Expenses net of all reductions | 1.00% | 1.00% | 1.00% | 1.00% | 1.00% |
Net investment income (loss) | .67% | 1.07% | 1.66% | 1.20% | 1.04% |
Supplemental Data | | | | | |
Net assets, end of period (000 omitted) | $ 38,946 | $ 38,816 | $ 27,207 | $ 43,016 | $ 37,881 |
Portfolio turnover rate | 34% | 19% | 29% | 10% | 3% |
A Total returns would have been lower had certain expenses not been reduced during the periods shown.
B Total returns do not include the effect of the contingent deferred sales charge.
C Calculated based on average shares outstanding during the period.
D Amounts do not include the activity of the underlying funds.
E Expense ratios reflect operating expenses of the class. Expenses before reductions do not reflect amounts reimbursed by the investment adviser or reductions from expense offset arrangements and do not represent the amount paid by the class during periods when reimbursements or reductions occur. Expenses net of fee waivers reflect expenses after reimbursement by the investment adviser but prior to reductions from expense offset arrangements. Expenses net of all reductions represent the net expenses paid by the class but do not include expenses of the investment companies in which the Fund invests.
F Total distributions of $.19 per share is comprised of distributions from net investment income of $.100 and distributions from net realized gain of $.085 per share.
See accompanying notes which are an integral part of the financial statements.
Annual Report
Financial Highlights - Class C
Years ended March 31, | 2011 | 2010 | 2009 | 2008 | 2007 |
Selected Per-Share Data | | | | | |
Net asset value, beginning of period | $ 10.68 | $ 7.46 | $ 12.16 | $ 12.92 | $ 12.26 |
Income from Investment Operations | | | | | |
Net investment income (loss) C | .07 | .10 | .16 | .16 | .13 |
Net realized and unrealized gain (loss) | 1.41 | 3.31 | (4.32) | (.50) | .89 |
Total from investment operations | 1.48 | 3.41 | (4.16) | (.34) | 1.02 |
Distributions from net investment income | (.08) | (.11) | (.14) | (.13) | (.10) |
Distributions from net realized gain | (.11) | (.09) | (.40) | (.29) | (.26) |
Total distributions | (.18) G | (.19) F | (.54) | (.42) | (.36) |
Net asset value, end of period | $ 11.98 | $ 10.68 | $ 7.46 | $ 12.16 | $ 12.92 |
Total Return A,B | 14.01% | 45.83% | (35.44)% | (2.91)% | 8.51% |
Ratios to Average Net Assets D,E | | | | | |
Expenses before reductions | 1.00% | 1.00% | 1.00% | 1.00% | 1.00% |
Expenses net of fee waivers, if any | 1.00% | 1.00% | 1.00% | 1.00% | 1.00% |
Expenses net of all reductions | 1.00% | 1.00% | 1.00% | 1.00% | 1.00% |
Net investment income (loss) | .67% | 1.07% | 1.66% | 1.20% | 1.04% |
Supplemental Data | | | | | |
Net assets, end of period (000 omitted) | $ 61,640 | $ 52,756 | $ 31,735 | $ 40,426 | $ 32,679 |
Portfolio turnover rate | 34% | 19% | 29% | 10% | 3% |
A Total returns would have been lower had certain expenses not been reduced during the periods shown.
B Total returns do not include the effect of the contingent deferred sales charge.
C Calculated based on average shares outstanding during the period.
D Amounts do not include the activity of the underlying funds.
E Expense ratios reflect operating expenses of the class. Expenses before reductions do not reflect amounts reimbursed by the investment adviser or reductions from expense offset arrangements and do not represent the amount paid by the class during periods when reimbursements or reductions occur. Expenses net of fee waivers reflect expenses after reimbursement by the investment adviser but prior to reductions from expense offset arrangements. Expenses net of all reductions represent the net expenses paid by the class but do not include expenses of the investment companies in which the Fund invests.
F Total distributions of $.19 per share is comprised of distributions from net investment income of $.105 and distributions from net realized gain of $.085 per share.
G Total distributions of $.18 per share is comprised of distributions from net investment income of $.077 and distributions from net realized gain of $.106 per share.
Financial Highlights - Institutional Class
Years ended March 31, | 2011 | 2010 | 2009 | 2008 | 2007 |
Selected Per-Share Data | | | | | |
Net asset value, beginning of period | $ 10.83 | $ 7.55 | $ 12.33 | $ 13.08 | $ 12.39 |
Income from Investment Operations | | | | | |
Net investment income (loss) B | .19 | .20 | .26 | .29 | .25 |
Net realized and unrealized gain (loss) | 1.44 | 3.35 | (4.39) | (.50) | .91 |
Total from investment operations | 1.63 | 3.55 | (4.13) | (.21) | 1.16 |
Distributions from net investment income | (.18) | (.19) | (.25) | (.25) | (.21) |
Distributions from net realized gain | (.11) | (.09) | (.40) | (.29) | (.26) |
Total distributions | (.29) | (.27) F | (.65) | (.54) | (.47) |
Net asset value, end of period | $ 12.17 | $ 10.83 | $ 7.55 | $ 12.33 | $ 13.08 |
Total Return A | 15.23% | 47.31% | (34.83)% | (1.93)% | 9.60% |
Ratios to Average Net Assets C,D | | | | | |
Expenses before reductions E | .00% | .00% | .00% | .00% | .00% |
Expenses net of fee waivers, if any | .00% | .00% | .00% | .00% | .00% |
Expenses net of all reductions | .00% | .00% | .00% | .00% | .00% |
Net investment income (loss) | 1.67% | 2.07% | 2.66% | 2.20% | 2.04% |
Supplemental Data | | | | | |
Net assets, end of period (000 omitted) | $ 284,309 | $ 140,948 | $ 69,731 | $ 52,762 | $ 13,903 |
Portfolio turnover rate | 34% | 19% | 29% | 10% | 3% |
A Total returns would have been lower had certain expenses not been reduced during the periods shown.
B Calculated based on average shares outstanding during the period.
C Amounts do not include the activity of the underlying funds.
D Expense ratios reflect operating expenses of the class. Expenses before reductions do not reflect amounts reimbursed by the investment adviser or reductions from expense offset arrangements and do not represent the amount paid by the class during periods when reimbursements or reductions occur. Expenses net of fee waivers reflect expenses after reimbursement by the investment adviser but prior to reductions from expense offset arrangements. Expenses net of all reductions represent the net expenses paid by the class but do not include expenses of the investment companies in which the Fund invests.
E Amount represents less than .01%.
F Total distributions of $.27 per share is comprised of distributions from net investment income of $.189 and distributions from net realized gain of $.085 per share.
See accompanying notes which are an integral part of the financial statements.
Annual Report
Fidelity Advisor Freedom 2030 Fund
Investment Changes (Unaudited)
Fund Holdings as of March 31, 2011 |
| % of fund's
net assets | % of fund's net assets
6 months ago |
Commodity Funds | | |
Fidelity Series Commodity Strategy Fund | 7.4 | 7.3 |
Domestic Equity Funds | | |
Fidelity Advisor Equity Growth Fund Institutional Class | 4.6 | 4.9 |
Fidelity Advisor Equity Income Fund Institutional Class | 0.0 | 1.0 |
Fidelity Advisor Growth & Income Fund Institutional Class | 6.5 | 6.8 |
Fidelity Advisor Large Cap Fund Institutional Class | 6.4 | 6.8 |
Fidelity Advisor Small Cap Fund Institutional Class | 2.4 | 2.4 |
Fidelity Series 100 Index Fund | 5.6 | 5.4 |
Fidelity Series All-Sector Equity Fund | 9.3 | 9.6 |
Fidelity Series Large Cap Value Fund | 9.4 | 8.6 |
Fidelity Series Small Cap Opportunities Fund | 2.3 | 2.5 |
| 46.5 | 48.0 |
Developed International Equity Funds | | |
Fidelity Advisor Diversified International Fund Institutional Class | 2.7 | 3.9 |
Fidelity Advisor Overseas Fund Institutional Class | 2.7 | 4.0 |
Fidelity Series International Growth Fund | 5.1 | 4.2 |
Fidelity Series International Small Cap Fund | 1.0 | 0.9 |
Fidelity Series International Value Fund | 5.0 | 4.1 |
| 16.5 | 17.1 |
Emerging Markets Equity Funds | | |
Fidelity Series Emerging Markets Fund | 3.0 | 2.9 |
High Yield Bond Funds | | |
Fidelity Advisor High Income Advantage Fund Institutional Class | 0.0 | 7.4 |
Fidelity Series Emerging Markets Debt Fund | 0.1 | 0.0 |
Fidelity Series High Income Fund | 7.2 | 0.0 |
| 7.3 | 7.4 |
Inflation-Protected Bond Funds | | |
Fidelity Series Inflation-Protected Bond Index Fund | 0.4 | 0.9 |
Investment Grade Bond Funds | | |
Fidelity Advisor Strategic Real Return Fund Institutional Class | 3.3 | 2.9 |
Fidelity Advisor Total Bond Fund Institutional Class | 0.0 | 0.0* |
Fidelity Series Investment Grade Bond Fund | 15.6 | 13.5 |
| 18.9 | 16.4 |
| | |
Net Other Assets (Liabilities)* | 0.0 | 0.0 |
| 100.0 | 100.0 |
* Amount represents less than 0.1% |
Asset Allocation (% of fund's net assets) |
Current |
| Commodity Funds | 7.4% | |
| Domestic Equity Funds | 46.5% | |
| Developed International Equity Funds | 16.5% | |
| Emerging Markets Equity Funds | 3.0% | |
| High Yield Bond Funds | 7.3% | |
| Inflation-Protected Bond Funds | 0.4% | |
| Investment Grade Bond Funds | 18.9% | |

Six months ago |
| Commodity Funds | 7.3% | |
| Domestic Equity Funds | 48.0% | |
| Developed International Equity Funds | 17.1% | |
| Emerging Markets Equity Funds | 2.9% | |
| High Yield Bond Funds | 7.4% | |
| Inflation-Protected Bond Funds | 0.9% | |
| Investment Grade Bond Funds | 16.4% | |

Expected |
| Commodity Funds | 7.9% | |
| Domestic Equity Funds | 45.0% | |
| Developed International Equity Funds | 16.4% | |
| Emerging Markets Equity Funds | 2.9% | |
| High Yield Bond Funds | 7.5% | |
| Inflation-Protected Bond Funds | 1.7% | |
| Investment Grade Bond Funds | 18.6% | |

The fund invests according to an asset allocation strategy that becomes increasingly conservative over time. The six months ago allocation is based on the fund's holdings as of September 30, 2010. The current allocation is based on the fund's holdings as of March 31, 2011. The expected allocation represents the fund's anticipated allocation at September 30, 2011. |
Annual Report
Fidelity Advisor Freedom 2030 Fund
Investments March 31, 2011
Showing Percentage of Net Assets
Domestic Equity Funds - 53.9% |
| Shares | | Value |
Commodity Funds - 7.4% |
Fidelity Series Commodity Strategy Fund | 11,891,698 | | $ 156,732,574 |
Domestic Equity Funds - 46.5% |
Fidelity Advisor Equity Growth Fund Institutional Class | 1,591,301 | | 98,899,361 |
Fidelity Advisor Growth & Income Fund Institutional Class | 7,634,074 | | 137,795,027 |
Fidelity Advisor Large Cap Fund Institutional Class | 6,918,934 | | 136,510,571 |
Fidelity Advisor Small Cap Fund Institutional Class | 1,822,041 | | 51,144,695 |
Fidelity Series 100 Index Fund | 12,844,782 | | 118,171,996 |
Fidelity Series All-Sector Equity Fund | 15,037,998 | | 197,148,159 |
Fidelity Series Large Cap Value Fund | 16,305,115 | | 199,085,455 |
Fidelity Series Small Cap Opportunities Fund | 4,247,946 | | 50,083,285 |
TOTAL DOMESTIC EQUITY FUNDS | | 988,838,549 |
TOTAL DOMESTIC EQUITY FUNDS (Cost $940,389,483) | 1,145,571,123 |
International Equity Funds - 19.5% |
| | | |
Developed International Equity Funds - 16.5% |
Fidelity Advisor Diversified International Fund Institutional Class | 3,445,522 | | 57,919,221 |
Fidelity Advisor Overseas Fund Institutional Class | 3,007,736 | | 57,237,224 |
Fidelity Series International Growth Fund | 9,489,356 | | 109,222,489 |
Fidelity Series International Small Cap Fund | 1,716,301 | | 21,179,153 |
Fidelity Series International Value Fund | 10,096,032 | | 105,907,376 |
TOTAL DEVELOPED INTERNATIONAL EQUITY FUNDS | | 351,465,463 |
|
| Shares | | Value |
Emerging Markets Equity Funds - 3.0% |
Fidelity Series Emerging Markets Fund | 3,361,246 | | $ 64,401,481 |
TOTAL INTERNATIONAL EQUITY FUNDS (Cost $350,646,037) | 415,866,944 |
Bond Funds - 26.6% |
| | | |
High Yield Bond Funds - 7.3% |
Fidelity Series Emerging Markets Debt Fund | 220,704 | | 2,207,946 |
Fidelity Series High Income Fund | 15,192,758 | | 152,231,440 |
TOTAL HIGH YIELD BOND FUNDS | | 154,439,386 |
Inflation-Protected Bond Funds - 0.4% |
Fidelity Series Inflation-Protected Bond Index Fund | 803,141 | | 8,689,990 |
Investment Grade Bond Funds - 18.9% |
Fidelity Advisor Strategic Real Return Fund Institutional Class | 7,109,801 | | 70,387,031 |
Fidelity Series Investment Grade Bond Fund | 29,127,559 | | 331,471,621 |
TOTAL INVESTMENT GRADE BOND FUNDS | | 401,858,652 |
TOTAL BOND FUNDS (Cost $554,239,965) | 564,988,028 |
TOTAL INVESTMENT PORTFOLIO - 100.0% (Cost $1,845,275,485) | | 2,126,426,095 |
NET OTHER ASSETS (LIABILITIES) - 0.0% | | (245,830) |
NET ASSETS - 100% | $ 2,126,180,265 |
Other Information |
All investments are categorized as Level 1 under the Fair Value Hierarchy. The inputs or methodology used for valuing securities may not be an indication of the risk associated with investing in those securities. For more information on valuation inputs, please refer to the Security Valuation section in the accompanying Notes to Financial Statements. |
Income Tax Information |
At March 31, 2011, the Fund had a capital loss carryforward of approximately $151,905,233 of which $75,012,132 and $76,893,101 will expire in fiscal 2017 and 2019, respectively. Capital loss carryforwards are only available to offset future capital gains of the Fund to the extent provided by regulations and may be limited. |
See accompanying notes which are an integral part of the financial statements.
Annual Report
Fidelity Advisor Freedom 2030 Fund
Statement of Assets and Liabilities
| March 31, 2011 |
Assets | | |
Investment in securities, at value (cost $1,845,275,485) - See accompanying schedule | | $ 2,126,426,095 |
Cash | | 195 |
Receivable for investments sold | | 282,956 |
Receivable for fund shares sold | | 2,942,917 |
Distributions receivable from underlying funds | | 268,530 |
Total assets | | 2,129,920,693 |
| | |
Liabilities | | |
Payable for investments purchased | $ 121,309 | |
Payable for fund shares redeemed | 3,101,798 | |
Distribution and service plan fees payable | 517,321 | |
Total liabilities | | 3,740,428 |
| | |
Net Assets | | $ 2,126,180,265 |
Net Assets consist of: | | |
Paid in capital | | $ 1,997,220,178 |
Undistributed net investment income | | 2,499,240 |
Accumulated undistributed net realized gain (loss) on investments | | (154,689,763) |
Net unrealized appreciation (depreciation) on investments | | 281,150,610 |
Net Assets | | $ 2,126,180,265 |
| | |
Calculation of Maximum Offering Price Class A:
Net Asset Value and redemption price per share ($1,340,583,283 ÷ 105,413,868 shares) | | $ 12.72 |
| | |
Maximum offering price per share (100/94.25 of $12.72) | | $ 13.50 |
Class T:
Net Asset Value and redemption price per share ($348,443,225 ÷ 27,477,019 shares) | | $ 12.68 |
| | |
Maximum offering price per share (100/96.50 of $12.68) | | $ 13.14 |
Class B:
Net Asset Value and offering price per share ($47,275,467 ÷ 3,742,647 shares)A | | $ 12.63 |
| | |
Class C:
Net Asset Value and offering price per share ($68,349,364 ÷ 5,424,038 shares)A | | $ 12.60 |
| | |
| | |
Institutional Class:
Net Asset Value, offering price and redemption price per share ($321,528,926 ÷ 25,173,813 shares) | | $ 12.77 |
A Redemption price per share is equal to net asset value less any applicable contingent deferred sales charge.
Statement of Operations
| Year ended March 31, 2011 |
| | |
Investment Income | | |
Income distributions from underlying funds | | $ 29,733,029 |
| | |
Expenses | | |
Distribution and service plan fees | $ 5,725,834 | |
Independent trustees' compensation | 6,641 | |
Total expenses before reductions | 5,732,475 | |
Expense reductions | (6,641) | 5,725,834 |
Net investment income (loss) | | 24,007,195 |
Realized and Unrealized Gain (Loss) Realized gain (loss) on sale of underlying fund shares | (58,372,129) | |
Capital gain distributions from underlying funds | 40,704,738 | |
Total net realized gain (loss) | | (17,667,391) |
Change in net unrealized appreciation (depreciation) on underlying funds | | 263,557,971 |
Net gain (loss) | | 245,890,580 |
Net increase (decrease) in net assets resulting from operations | | $ 269,897,775 |
See accompanying notes which are an integral part of the financial statements.
Annual Report
Statement of Changes in Net Assets
| Year ended
March 31,
2011 | Year ended
March 31,
2010 |
Increase (Decrease) in Net Assets | | |
Operations | | |
Net investment income (loss) | $ 24,007,195 | $ 20,740,984 |
Net realized gain (loss) | (17,667,391) | (16,413,025) |
Change in net unrealized appreciation (depreciation) | 263,557,971 | 493,374,347 |
Net increase (decrease) in net assets resulting from operations | 269,897,775 | 497,702,306 |
Distributions to shareholders from net investment income | (23,893,943) | (19,871,061) |
Distributions to shareholders from net realized gain | (17,498,965) | (13,024,758) |
Total distributions | (41,392,908) | (32,895,819) |
Share transactions - net increase (decrease) | 191,320,603 | 319,644,448 |
Total increase (decrease) in net assets | 419,825,470 | 784,450,935 |
| | |
Net Assets | | |
Beginning of period | 1,706,354,795 | 921,903,860 |
End of period (including undistributed net investment income of $2,499,240 and undistributed net investment income of $2,385,989, respectively) | $ 2,126,180,265 | $ 1,706,354,795 |
Financial Highlights - Class A
Years ended March 31, | 2011 | 2010 | 2009 | 2008 | 2007 |
Selected Per-Share Data | | | | | |
Net asset value, beginning of period | $ 11.29 | $ 7.69 | $ 13.29 | $ 14.27 | $ 13.47 |
Income from Investment Operations | | | | | |
Net investment income (loss) C | .16 | .16 | .21 | .22 | .20 |
Net realized and unrealized gain (loss) | 1.54 | 3.68 | (5.10) | (.63) | 1.09 |
Total from investment operations | 1.70 | 3.84 | (4.89) | (.41) | 1.29 |
Distributions from net investment income | (.16) | (.15) | (.21) | (.19) | (.18) |
Distributions from net realized gain | (.11) | (.09) | (.50) | (.38) | (.31) |
Total distributions | (.27) | (.24) F | (.71) | (.57) | (.49) |
Net asset value, end of period | $ 12.72 | $ 11.29 | $ 7.69 | $ 13.29 | $ 14.27 |
Total Return A, B | 15.27% | 50.17% | (38.49)% | (3.22)% | 9.82% |
Ratios to Average Net Assets D, E | | | | | |
Expenses before reductions | .25% | .25% | .25% | .25% | .25% |
Expenses net of fee waivers, if any | .25% | .25% | .25% | .25% | .25% |
Expenses net of all reductions | .25% | .25% | .25% | .25% | .25% |
Net investment income (loss) | 1.38% | 1.61% | 2.08% | 1.53% | 1.49% |
Supplemental Data | | | | | |
Net assets, end of period (000 omitted) | $ 1,340,583 | $ 1,030,972 | $ 527,042 | $ 626,641 | $ 343,345 |
Portfolio turnover rate | 38% | 20% | 22% | 10% | 8% |
A Total returns would have been lower had certain expenses not been reduced during the periods shown.
B Total returns do not include the effect of the sales charges.
C Calculated based on average shares outstanding during the period.
D Amounts do not include the activity of the underlying funds.
E Expense ratios reflect operating expenses of the class. Expenses before reductions do not reflect amounts reimbursed by the investment adviser or reductions from expense offset arrangements and do not represent the amount paid by the class during periods when reimbursements or reductions occur. Expenses net of fee waivers reflect expenses after reimbursement by the investment adviser but prior to reductions from expense offset arrangements. Expenses net of all reductions represent the net expenses paid by the class but do not include expenses of the investment companies in which the Fund invests.
F Total distributions of $.24 per share is comprised of distributions from net investment income of $.151 and distributions from net realized gain of $.093 per share.
See accompanying notes which are an integral part of the financial statements.
Annual Report
Financial Highlights - Class T
Years ended March 31, | 2011 | 2010 | 2009 | 2008 | 2007 |
Selected Per-Share Data | | | | | |
Net asset value, beginning of period | $ 11.25 | $ 7.67 | $ 13.25 | $ 14.23 | $ 13.43 |
Income from Investment Operations | | | | | |
Net investment income (loss) C | .13 | .14 | .19 | .19 | .17 |
Net realized and unrealized gain (loss) | 1.54 | 3.66 | (5.09) | (.64) | 1.09 |
Total from investment operations | 1.67 | 3.80 | (4.90) | (.45) | 1.26 |
Distributions from net investment income | (.13) | (.13) | (.18) | (.15) | (.15) |
Distributions from net realized gain | (.11) | (.09) | (.50) | (.38) | (.31) |
Total distributions | (.24) | (.22) F | (.68) | (.53) | (.46) |
Net asset value, end of period | $ 12.68 | $ 11.25 | $ 7.67 | $ 13.25 | $ 14.23 |
Total Return A, B | 14.98% | 49.72% | (38.62)% | (3.49)% | 9.59% |
Ratios to Average Net Assets D, E | | | | | |
Expenses before reductions | .50% | .50% | .50% | .50% | .50% |
Expenses net of fee waivers, if any | .50% | .50% | .50% | .50% | .50% |
Expenses net of all reductions | .50% | .50% | .50% | .50% | .50% |
Net investment income (loss) | 1.12% | 1.36% | 1.83% | 1.28% | 1.24% |
Supplemental Data | | | | | |
Net assets, end of period (000 omitted) | $ 348,443 | $ 382,092 | $ 236,333 | $ 297,618 | $ 281,508 |
Portfolio turnover rate | 38% | 20% | 22% | 10% | 8% |
A Total returns would have been lower had certain expenses not been reduced during the periods shown.
B Total returns do not include the effect of the sales charges.
C Calculated based on average shares outstanding during the period.
D Amounts do not include the activity of the underlying funds.
E Expense ratios reflect operating expenses of the class. Expenses before reductions do not reflect amounts reimbursed by the investment adviser or reductions from expense offset arrangements and do not represent the amount paid by the class during periods when reimbursements or reductions occur. Expenses net of fee waivers reflect expenses after reimbursement by the investment adviser but prior to reductions from expense offset arrangements. Expenses net of all reductions represent the net expenses paid by the class but do not include expenses of the investment companies in which the Fund invests.
F Total distributions of $.22 per share is comprised of distributions from net investment income of $.128 and distributions from net realized gain of $.093 per share.
Financial Highlights - Class B
Years ended March 31, | 2011 | 2010 | 2009 | 2008 | 2007 |
Selected Per-Share Data | | | | | |
Net asset value, beginning of period | $ 11.21 | $ 7.64 | $ 13.17 | $ 14.15 | $ 13.37 |
Income from Investment Operations | | | | | |
Net investment income (loss) C | .07 | .09 | .14 | .11 | .10 |
Net realized and unrealized gain (loss) | 1.53 | 3.65 | (5.06) | (.63) | 1.08 |
Total from investment operations | 1.60 | 3.74 | (4.92) | (.52) | 1.18 |
Distributions from net investment income | (.07) | (.08) | (.11) | (.09) | (.09) |
Distributions from net realized gain | (.11) | (.09) | (.50) | (.37) | (.31) |
Total distributions | (.18) | (.17) F | (.61) | (.46) | (.40) |
Net asset value, end of period | $ 12.63 | $ 11.21 | $ 7.64 | $ 13.17 | $ 14.15 |
Total Return A, B | 14.38% | 49.07% | (38.94)% | (3.96)% | 8.98% |
Ratios to Average Net Assets D, E | | | | | |
Expenses before reductions | 1.00% | 1.00% | 1.00% | 1.00% | 1.00% |
Expenses net of fee waivers, if any | 1.00% | 1.00% | 1.00% | 1.00% | 1.00% |
Expenses net of all reductions | 1.00% | 1.00% | 1.00% | 1.00% | 1.00% |
Net investment income (loss) | .62% | .86% | 1.33% | .78% | .74% |
Supplemental Data | | | | | |
Net assets, end of period (000 omitted) | $ 47,275 | $ 51,360 | $ 35,701 | $ 60,367 | $ 56,845 |
Portfolio turnover rate | 38% | 20% | 22% | 10% | 8% |
A Total returns would have been lower had certain expenses not been reduced during the periods shown.
B Total returns do not include the effect of the contingent deferred sales charge.
C Calculated based on average shares outstanding during the period.
D Amounts do not include the activity of the underlying funds.
E Expense ratios reflect operating expenses of the class. Expenses before reductions do not reflect amounts reimbursed by the investment adviser or reductions from expense offset arrangements and do not represent the amount paid by the class during periods when reimbursements or reductions occur. Expenses net of fee waivers reflect expenses after reimbursement by the investment adviser but prior to reductions from expense offset arrangements. Expenses net of all reductions represent the net expenses paid by the class but do not include expenses of the investment companies in which the Fund invests.
F Total distributions of $.17 per share is comprised of distributions from net investment income of $.080 and distributions from net realized gain of $.092 per share.
See accompanying notes which are an integral part of the financial statements.
Annual Report
Financial Highlights - Class C
Years ended March 31, | 2011 | 2010 | 2009 | 2008 | 2007 |
Selected Per-Share Data | | | | | |
Net asset value, beginning of period | $ 11.19 | $ 7.63 | $ 13.17 | $ 14.15 | $ 13.37 |
Income from Investment Operations | | | | | |
Net investment income (loss) C | .07 | .09 | .14 | .11 | .10 |
Net realized and unrealized gain (loss) | 1.53 | 3.65 | (5.06) | (.63) | 1.08 |
Total from investment operations | 1.60 | 3.74 | (4.92) | (.52) | 1.18 |
Distributions from net investment income | (.08) | (.08) | (.12) | (.09) | (.09) |
Distributions from net realized gain | (.11) | (.09) | (.50) | (.37) | (.31) |
Total distributions | (.19) | (.18) F | (.62) | (.46) | (.40) |
Net asset value, end of period | $ 12.60 | $ 11.19 | $ 7.63 | $ 13.17 | $ 14.15 |
Total Return A, B | 14.38% | 49.06% | (38.96)% | (3.95)% | 9.00% |
Ratios to Average Net Assets D, E | | | | | |
Expenses before reductions | 1.00% | 1.00% | 1.00% | 1.00% | 1.00% |
Expenses net of fee waivers, if any | 1.00% | 1.00% | 1.00% | 1.00% | 1.00% |
Expenses net of all reductions | 1.00% | 1.00% | 1.00% | 1.00% | 1.00% |
Net investment income (loss) | .63% | .86% | 1.33% | .78% | .74% |
Supplemental Data | | | | | |
Net assets, end of period (000 omitted) | $ 68,349 | $ 63,700 | $ 40,294 | $ 58,768 | $ 54,338 |
Portfolio turnover rate | 38% | 20% | 22% | 10% | 8% |
A Total returns would have been lower had certain expenses not been reduced during the periods shown.
B Total returns do not include the effect of the contingent deferred sales charge.
C Calculated based on average shares outstanding during the period.
D Amounts do not include the activity of the underlying funds.
E Expense ratios reflect operating expenses of the class. Expenses before reductions do not reflect amounts reimbursed by the investment adviser or reductions from expense offset arrangements and do not represent the amount paid by the class during periods when reimbursements or reductions occur. Expenses net of fee waivers reflect expenses after reimbursement by the investment adviser but prior to reductions from expense offset arrangements. Expenses net of all reductions represent the net expenses paid by the class but do not include expenses of the investment companies in which the Fund invests.
F Total distributions of $.18 per share is comprised of distributions from net investment income of $.083 and distributions from net realized gain of $.093 per share.
Financial Highlights - Institutional Class
Years ended March 31, | 2011 | 2010 | 2009 | 2008 | 2007 |
Selected Per-Share Data | | | | | |
Net asset value, beginning of period | $ 11.33 | $ 7.72 | $ 13.34 | $ 14.32 | $ 13.51 |
Income from Investment Operations | | | | | |
Net investment income (loss) B | .19 | .19 | .23 | .26 | .24 |
Net realized and unrealized gain (loss) | 1.55 | 3.69 | (5.11) | (.64) | 1.09 |
Total from investment operations | 1.74 | 3.88 | (4.88) | (.38) | 1.33 |
Distributions from net investment income | (.19) | (.17) | (.24) | (.22) | (.21) |
Distributions from net realized gain | (.11) | (.09) | (.50) | (.38) | (.31) |
Total distributions | (.30) | (.27) F | (.74) | (.60) | (.52) |
Net asset value, end of period | $ 12.77 | $ 11.33 | $ 7.72 | $ 13.34 | $ 14.32 |
Total Return A | 15.56% | 50.42% | (38.31)% | (3.01)% | 10.08% |
Ratios to Average Net Assets C, D | | | | | |
Expenses before reductions E | .00% | .00% | .00% | .00% | .00% |
Expenses net of fee waivers, if any | .00% | .00% | .00% | .00% | .00% |
Expenses net of all reductions | .00% | .00% | .00% | .00% | .00% |
Net investment income (loss) | 1.62% | 1.86% | 2.33% | 1.78% | 1.74% |
Supplemental Data | | | | | |
Net assets, end of period (000 omitted) | $ 321,529 | $ 178,232 | $ 82,534 | $ 69,011 | $ 24,902 |
Portfolio turnover rate | 38% | 20% | 22% | 10% | 8% |
A Total returns would have been lower had certain expenses not been reduced during the periods shown.
B Calculated based on average shares outstanding during the period.
C Amounts do not include the activity of the underlying funds.
D Expense ratios reflect operating expenses of the class. Expenses before reductions do not reflect amounts reimbursed by the investment adviser or reductions from expense offset arrangements and do not represent the amount paid by the class during periods when reimbursements or reductions occur. Expenses net of fee waivers reflect expenses after reimbursement by the investment adviser but prior to reductions from expense offset arrangements. Expenses net of all reductions represent the net expenses paid by the class but do not include expenses of the investment companies in which the Fund invests.
E Amount represents less than .01%.
F Total distributions of $.27 per share is comprised of distributions from net investment income of $.173 and distributions from net realized gain of $.093 per share.
See accompanying notes which are an integral part of the financial statements.
Annual Report
Fidelity Advisor Freedom 2035 Fund
Investment Changes (Unaudited)
Fund Holdings as of March 31, 2011 |
| % of fund's
net assets | % of fund's net assets
6 months ago |
Commodity Funds | | |
Fidelity Series Commodity Strategy Fund | 8.7 | 8.0 |
Domestic Equity Funds | | |
Fidelity Advisor Equity Growth Fund Institutional Class | 5.2 | 5.5 |
Fidelity Advisor Equity Income Fund Institutional Class | 0.0 | 1.1 |
Fidelity Advisor Growth & Income Fund Institutional Class | 7.3 | 7.5 |
Fidelity Advisor Large Cap Fund Institutional Class | 7.2 | 7.5 |
Fidelity Advisor Small Cap Fund Institutional Class | 2.7 | 2.7 |
Fidelity Series 100 Index Fund | 6.2 | 6.0 |
Fidelity Series All-Sector Equity Fund | 10.4 | 10.6 |
Fidelity Series Large Cap Value Fund | 10.5 | 9.4 |
Fidelity Series Small Cap Opportunities Fund | 2.6 | 2.7 |
| 52.1 | 53.0 |
Developed International Equity Funds | | |
Fidelity Advisor Diversified International Fund Institutional Class | 3.0 | 4.3 |
Fidelity Advisor Overseas Fund Institutional Class | 3.0 | 4.4 |
Fidelity Series International Growth Fund | 5.8 | 4.6 |
Fidelity Series International Small Cap Fund | 1.1 | 0.9 |
Fidelity Series International Value Fund | 5.6 | 4.5 |
| 18.5 | 18.7 |
Emerging Markets Equity Funds | | |
Fidelity Series Emerging Markets Fund | 3.4 | 3.2 |
High Yield Bond Funds | | |
Fidelity Advisor High Income Advantage Fund Institutional Class | 0.0 | 7.4 |
Fidelity Series Emerging Markets Debt Fund | 0.1 | 0.0 |
Fidelity Series High Income Fund | 7.1 | 0.0 |
| 7.2 | 7.4 |
Investment Grade Bond Funds | | |
Fidelity Advisor Strategic Real Return Fund Institutional Class | 1.8 | 1.7 |
Fidelity Advisor Total Bond Fund Institutional Class | 0.0 | 0.0* |
Fidelity Series Investment Grade Bond Fund | 8.3 | 8.0 |
| 10.1 | 9.7 |
| | |
Net Other Assets (Liabilities)* | 0.0 | 0.0 |
| 100.0 | 100.0 |
* Amount represents less than 0.1% |
Asset Allocation (% of fund's net assets) |
Current |
| Commodity Funds | 8.7% | |
| Domestic Equity Funds | 52.1% | |
| Developed International Equity Funds | 18.5% | |
| Emerging Markets Equity Funds | 3.4% | |
| High Yield Bond Funds | 7.2% | |
| Investment Grade Bond Funds | 10.1% | |

Six months ago |
| Commodity Funds | 8.0% | |
| Domestic Equity Funds | 53.0% | |
| Developed International Equity Funds | 18.7% | |
| Emerging Markets Equity Funds | 3.2% | |
| High Yield Bond Funds | 7.4% | |
| Investment Grade Bond Funds | 9.7% | |

Expected |
| Commodity Funds | 9.0% | |
| Domestic Equity Funds | 51.3% | |
| Developed International Equity Funds | 18.7% | |
| Emerging Markets Equity Funds | 3.3% | |
| High Yield Bond Funds | 7.5% | |
| Investment Grade Bond Funds | 10.2% | |

The fund invests according to an asset allocation strategy that becomes increasingly conservative over time. The six months ago allocation is based on the fund's holdings as of September 30, 2010. The current allocation is based on the fund's holdings as of March 31, 2011. The expected allocation represents the fund's anticipated allocation at September 30, 2011. |
Annual Report
Fidelity Advisor Freedom 2035 Fund
Investments March 31, 2011
Showing Percentage of Net Assets
Domestic Equity Funds - 60.8% |
| Shares | | Value |
Commodity Funds - 8.7% |
Fidelity Series Commodity Strategy Fund | 8,971,260 | | $ 118,241,211 |
Domestic Equity Funds - 52.1% |
Fidelity Advisor Equity Growth Fund Institutional Class | 1,139,798 | | 70,838,453 |
Fidelity Advisor Growth & Income Fund Institutional Class | 5,459,525 | | 98,544,419 |
Fidelity Advisor Large Cap Fund Institutional Class | 4,948,338 | | 97,630,713 |
Fidelity Advisor Small Cap Fund Institutional Class | 1,302,079 | | 36,549,357 |
Fidelity Series 100 Index Fund | 9,199,930 | | 84,639,355 |
Fidelity Series All-Sector Equity Fund | 10,776,266 | | 141,276,842 |
Fidelity Series Large Cap Value Fund | 11,682,539 | | 142,643,801 |
Fidelity Series Small Cap Opportunities Fund | 3,036,089 | | 35,795,489 |
TOTAL DOMESTIC EQUITY FUNDS | | 707,918,429 |
TOTAL DOMESTIC EQUITY FUNDS (Cost $695,143,858) | 826,159,640 |
International Equity Funds - 21.9% |
| | | |
Developed International Equity Funds - 18.5% |
Fidelity Advisor Diversified International Fund Institutional Class | 2,471,989 | | 41,554,135 |
Fidelity Advisor Overseas Fund Institutional Class | 2,158,037 | | 41,067,445 |
Fidelity Series International Growth Fund | 6,802,777 | | 78,299,968 |
Fidelity Series International Small Cap Fund | 1,233,232 | | 15,218,086 |
Fidelity Series International Value Fund | 7,238,249 | | 75,929,230 |
TOTAL DEVELOPED INTERNATIONAL EQUITY FUNDS | | 252,068,864 |
|
| Shares | | Value |
Emerging Markets Equity Funds - 3.4% |
Fidelity Series Emerging Markets Fund | 2,416,231 | | $ 46,294,989 |
TOTAL INTERNATIONAL EQUITY FUNDS (Cost $255,152,465) | 298,363,853 |
Bond Funds - 17.3% |
| | | |
High Yield Bond Funds - 7.2% |
Fidelity Series Emerging Markets Debt Fund | 139,953 | | 1,400,110 |
Fidelity Series High Income Fund | 9,634,078 | | 96,533,459 |
TOTAL HIGH YIELD BOND FUNDS | | 97,933,569 |
Investment Grade Bond Funds - 10.1% |
Fidelity Advisor Strategic Real Return Fund Institutional Class | 2,389,434 | | 23,655,401 |
Fidelity Series Investment Grade Bond Fund | 9,947,997 | | 113,208,201 |
TOTAL INVESTMENT GRADE BOND FUNDS | | 136,863,602 |
TOTAL BOND FUNDS (Cost $231,134,575) | 234,797,171 |
TOTAL INVESTMENT PORTFOLIO - 100.0% (Cost $1,181,430,898) | | 1,359,320,664 |
NET OTHER ASSETS (LIABILITIES) - 0.0% | | (141,586) |
NET ASSETS - 100% | $ 1,359,179,078 |
Other Information |
All investments are categorized as Level 1 under the Fair Value Hierarchy. The inputs or methodology used for valuing securities may not be an indication of the risk associated with investing in those securities. For more information on valuation inputs, please refer to the Security Valuation section in the accompanying Notes to Financial Statements. |
Income Tax Information |
At March 31, 2011, the Fund had a capital loss carryforward of approximately $65,938,206 of which $37,616,185 and $28,322,021 will expire in fiscal 2017 and 2019, respectively. Capital loss carryforwards are only available to offset future capital gains of the Fund to the extent provided by regulations and may be limited. |
See accompanying notes which are an integral part of the financial statements.
Annual Report
Fidelity Advisor Freedom 2035 Fund
Statement of Assets and Liabilities
| March 31, 2011 |
Assets | | |
Investment in securities, at value (cost $1,181,430,898) - See accompanying schedule | | $ 1,359,320,664 |
Cash | | 14 |
Receivable for investments sold | | 263,246 |
Receivable for fund shares sold | | 2,371,470 |
Distributions receivable from underlying funds | | 170,271 |
Total assets | | 1,362,125,665 |
| | |
Liabilities | | |
Payable for investments purchased | $ 28,556 | |
Payable for fund shares redeemed | 2,606,155 | |
Distribution and service plan fees payable | 311,876 | |
Total liabilities | | 2,946,587 |
| | |
Net Assets | | $ 1,359,179,078 |
Net Assets consist of: | | |
Paid in capital | | $ 1,247,592,683 |
Undistributed net investment income | | 1,027,531 |
Accumulated undistributed net realized gain (loss) on investments | | (67,330,902) |
Net unrealized appreciation (depreciation) on investments | | 177,889,766 |
Net Assets | | $ 1,359,179,078 |
| | |
Calculation of Maximum Offering Price Class A:
Net Asset Value and redemption price per share ($906,896,449 ÷ 74,888,743 shares) | | $ 12.11 |
| | |
Maximum offering price per share (100/94.25 of $12.11) | | $ 12.85 |
Class T:
Net Asset Value and redemption price per share ($169,441,773 ÷ 14,058,036 shares) | | $ 12.05 |
| | |
Maximum offering price per share (100/96.50 of $12.05) | | $ 12.49 |
Class B:
Net Asset Value and offering price per share ($28,359,922 ÷ 2,370,406 shares)A | | $ 11.96 |
| | |
Class C:
Net Asset Value and offering price per share ($36,389,127 ÷ 3,042,760 shares)A | | $ 11.96 |
| | |
Institutional Class:
Net Asset Value, offering price and redemption price per share ($218,091,807 ÷ 17,927,403 shares) | | $ 12.17 |
A Redemption price per share is equal to net asset value less any applicable contingent deferred sales charge.
Statement of Operations
| Year ended March 31, 2011 |
Investment Income | | |
Income distributions from underlying funds | | $ 16,633,700 |
| | |
Expenses | | |
Distribution and service plan fees | $ 3,222,095 | |
Independent trustees' compensation | 3,943 | |
Total expenses before reductions | 3,226,038 | |
Expense reductions | (3,943) | 3,222,095 |
Net investment income (loss) | | 13,411,605 |
Realized and Unrealized Gain (Loss) Realized gain (loss) on sale of underlying fund shares | (27,749,300) | |
Capital gain distributions from underlying funds | 25,933,525 | |
Total net realized gain (loss) | | (1,815,775) |
Change in net unrealized appreciation (depreciation) on underlying funds | | 167,217,095 |
Net gain (loss) | | 165,401,320 |
Net increase (decrease) in net assets resulting from operations | | $ 178,812,925 |
See accompanying notes which are an integral part of the financial statements.
Annual Report
Statement of Changes in Net Assets
| Year ended
March 31,
2011 | Year ended
March 31,
2010 |
Increase (Decrease) in Net Assets | | |
Operations | | |
Net investment income (loss) | $ 13,411,605 | $ 10,755,699 |
Net realized gain (loss) | (1,815,775) | (5,148,261) |
Change in net unrealized appreciation (depreciation) | 167,217,095 | 267,687,993 |
Net increase (decrease) in net assets resulting from operations | 178,812,925 | 273,295,431 |
Distributions to shareholders from net investment income | (13,257,727) | (10,794,748) |
Distributions to shareholders from net realized gain | (10,450,172) | (6,934,476) |
Total distributions | (23,707,899) | (17,729,224) |
Share transactions - net increase (decrease) | 235,486,573 | 237,182,238 |
Total increase (decrease) in net assets | 390,591,599 | 492,748,445 |
| | |
Net Assets | | |
Beginning of period | 968,587,479 | 475,839,034 |
End of period (including undistributed net investment income of $1,027,531 and undistributed net investment income of $873,654, respectively) | $ 1,359,179,078 | $ 968,587,479 |
Financial Highlights - Class A
Years ended March 31, | 2011 | 2010 | 2009 | 2008 | 2007 |
Selected Per-Share Data | | | | | |
Net asset value, beginning of period | $ 10.65 | $ 7.18 | $ 12.53 | $ 13.44 | $ 12.67 |
Income from Investment Operations | | | | | |
Net investment income (loss) C | .14 | .14 | .20 | .20 | .19 |
Net realized and unrealized gain (loss) | 1.56 | 3.55 | (4.92) | (.60) | 1.02 |
Total from investment operations | 1.70 | 3.69 | (4.72) | (.40) | 1.21 |
Distributions from net investment income | (.13) | (.14) | (.18) | (.17) | (.15) |
Distributions from net realized gain | (.11) | (.08) | (.45) | (.34) | (.29) |
Total distributions | (.24) | (.22) | (.63) G | (.51) | (.44) F |
Net asset value, end of period | $ 12.11 | $ 10.65 | $ 7.18 | $ 12.53 | $ 13.44 |
Total Return A, B | 16.13% | 51.59% | (39.29)% | (3.34)% | 9.74% |
Ratios to Average Net Assets D, E | | | | | |
Expenses before reductions | .25% | .25% | .25% | .25% | .25% |
Expenses net of fee waivers, if any | .25% | .25% | .25% | .25% | .25% |
Expenses net of all reductions | .25% | .25% | .25% | .25% | .25% |
Net investment income (loss) | 1.26% | 1.51% | 2.04% | 1.51% | 1.48% |
Supplemental Data | | | | | |
Net assets, end of period (000 omitted) | $ 906,896 | $ 669,450 | $ 314,996 | $ 336,805 | $ 146,175 |
Portfolio turnover rate | 30% | 16% | 21% | 9% | 5% |
A Total returns would have been lower had certain expenses not been reduced during the periods shown.
B Total returns do not include the effect of the sales charges.
C Calculated based on average shares outstanding during the period.
D Amounts do not include the activity of the underlying funds.
E Expense ratios reflect operating expenses of the class. Expenses before reductions do not reflect amounts reimbursed by the investment adviser or reductions from expense offset arrangements and do not represent the amount paid by the class during periods when reimbursements or reductions occur. Expenses net of fee waivers reflect expenses after reimbursement by the investment adviser but prior to reductions from expense offset arrangements. Expenses net of all reductions represent the net expenses paid by the class but do not include expenses of the investment companies in which the Fund invests.
F Total distributions of $.44 per share is comprised of distributions from net investment income of $.153 and distributions from net realized gain of $.287 per share.
G Total distributions of $.63 per share is comprised of distributions from net investment income of $.182 and distributions from net realized gain of $.445 per share.
See accompanying notes which are an integral part of the financial statements.
Annual Report
Financial Highlights - Class T
Years ended March 31, | 2011 | 2010 | 2009 | 2008 | 2007 |
Selected Per-Share Data | | | | | |
Net asset value, beginning of period | $ 10.60 | $ 7.15 | $ 12.47 | $ 13.38 | $ 12.62 |
Income from Investment Operations | | | | | |
Net investment income (loss) C | .11 | .12 | .17 | .17 | .16 |
Net realized and unrealized gain (loss) | 1.55 | 3.53 | (4.89) | (.62) | 1.01 |
Total from investment operations | 1.66 | 3.65 | (4.72) | (.45) | 1.17 |
Distributions from net investment income | (.11) | (.12) | (.16) | (.13) | (.13) |
Distributions from net realized gain | (.11) | (.08) | (.45) | (.33) | (.28) |
Total distributions | (.21) H | (.20) | (.60) G | (.46) | (.41) F |
Net asset value, end of period | $ 12.05 | $ 10.60 | $ 7.15 | $ 12.47 | $ 13.38 |
Total Return A, B | 15.84% | 51.17% | (39.42)% | (3.66)% | 9.46% |
Ratios to Average Net Assets D, E | | | | | |
Expenses before reductions | .50% | .50% | .50% | .50% | .50% |
Expenses net of fee waivers, if any | .50% | .50% | .50% | .50% | .50% |
Expenses net of all reductions | .50% | .50% | .50% | .50% | .50% |
Net investment income (loss) | 1.01% | 1.26% | 1.79% | 1.26% | 1.23% |
Supplemental Data | | | | | |
Net assets, end of period (000 omitted) | $ 169,442 | $ 143,106 | $ 81,463 | $ 99,531 | $ 84,368 |
Portfolio turnover rate | 30% | 16% | 21% | 9% | 5% |
A Total returns would have been lower had certain expenses not been reduced during the periods shown.
B Total returns do not include the effect of the sales charges.
C Calculated based on average shares outstanding during the period.
D Amounts do not include the activity of the underlying funds.
E Expense ratios reflect operating expenses of the class. Expenses before reductions do not reflect amounts reimbursed by the investment adviser or reductions from expense offset arrangements and do not represent the amount paid by the class during periods when reimbursements or reductions occur. Expenses net of fee waivers reflect expenses after reimbursement by the investment adviser but prior to reductions from expense offset arrangements. Expenses net of all reductions represent the net expenses paid by the class but do not include expenses of the investment companies in which the Fund invests.
F Total distributions of $.41 per share is comprised of distributions from net investment income of $.131 and distributions from net realized gain of $.280 per share.
G Total distributions of $.60 per share is comprised of distributions from net investment income of $.156 and distributions from net realized gain of $.445 per share.
H Total distributions of $.21 per share is comprised of distributions from net investment income of $.106 and distributions from net realized gain of $.105 per share.
Financial Highlights - Class B
Years ended March 31, | 2011 | 2010 | 2009 | 2008 | 2007 |
Selected Per-Share Data | | | | | |
Net asset value, beginning of period | $ 10.52 | $ 7.10 | $ 12.38 | $ 13.29 | $ 12.54 |
Income from Investment Operations | | | | | |
Net investment income (loss) C | .05 | .07 | .13 | .10 | .09 |
Net realized and unrealized gain (loss) | 1.55 | 3.50 | (4.86) | (.61) | 1.02 |
Total from investment operations | 1.60 | 3.57 | (4.73) | (.51) | 1.11 |
Distributions from net investment income | (.06) | (.07) | (.10) | (.08) | (.09) |
Distributions from net realized gain | (.10) | (.08) | (.45) | (.32) | (.27) |
Total distributions | (.16) | (.15) | (.55) G | (.40) | (.36) F |
Net asset value, end of period | $ 11.96 | $ 10.52 | $ 7.10 | $ 12.38 | $ 13.29 |
Total Return A, B | 15.28% | 50.43% | (39.76)% | (4.10)% | 8.98% |
Ratios to Average Net Assets D, E | | | | | |
Expenses before reductions | 1.00% | 1.00% | 1.00% | 1.00% | 1.00% |
Expenses net of fee waivers, if any | 1.00% | 1.00% | 1.00% | 1.00% | 1.00% |
Expenses net of all reductions | 1.00% | 1.00% | 1.00% | 1.00% | 1.00% |
Net investment income (loss) | .51% | .76% | 1.30% | .76% | .73% |
Supplemental Data | | | | | |
Net assets, end of period (000 omitted) | $ 28,360 | $ 27,408 | $ 17,892 | $ 27,854 | $ 23,065 |
Portfolio turnover rate | 30% | 16% | 21% | 9% | 5% |
A Total returns would have been lower had certain expenses not been reduced during the periods shown.
B Total returns do not include the effect of the contingent deferred sales charge.
C Calculated based on average shares outstanding during the period.
D Amounts do not include the activity of the underlying funds.
E Expense ratios reflect operating expenses of the class. Expenses before reductions do not reflect amounts reimbursed by the investment adviser or reductions from expense offset arrangements and do not represent the amount paid by the class during periods when reimbursements or reductions occur. Expenses net of fee waivers reflect expenses after reimbursement by the investment adviser but prior to reductions from expense offset arrangements. Expenses net of all reductions represent the net expenses paid by the class but do not include expenses of the investment companies in which the Fund invests.
F Total distributions of $.36 per share is comprised of distributions from net investment income of $.086 and distributions from net realized gain of $.270 per share.
G Total distributions of $.55 per share is comprised of distributions from net investment income of $.103 and distributions from net realized gain of $.445 per share.
See accompanying notes which are an integral part of the financial statements.
Annual Report
Financial Highlights - Class C
Years ended March 31, | 2011 | 2010 | 2009 | 2008 | 2007 |
Selected Per-Share Data | | | | | |
Net asset value, beginning of period | $ 10.52 | $ 7.11 | $ 12.39 | $ 13.30 | $ 12.55 |
Income from Investment Operations | | | | | |
Net investment income (loss) C | .06 | .07 | .12 | .10 | .09 |
Net realized and unrealized gain (loss) | 1.54 | 3.50 | (4.85) | (.61) | 1.02 |
Total from investment operations | 1.60 | 3.57 | (4.73) | (.51) | 1.11 |
Distributions from net investment income | (.06) | (.08) | (.11) | (.08) | (.09) |
Distributions from net realized gain | (.10) | (.08) | (.45) | (.32) | (.27) |
Total distributions | (.16) | (.16) | (.55) G | (.40) | (.36) F |
Net asset value, end of period | $ 11.96 | $ 10.52 | $ 7.11 | $ 12.39 | $ 13.30 |
Total Return A, B | 15.33% | 50.28% | (39.70)% | (4.10)% | 8.99% |
Ratios to Average Net Assets D, E | | | | | |
Expenses before reductions | 1.00% | 1.00% | 1.00% | 1.00% | 1.00% |
Expenses net of fee waivers, if any | 1.00% | 1.00% | 1.00% | 1.00% | 1.00% |
Expenses net of all reductions | 1.00% | 1.00% | 1.00% | 1.00% | 1.00% |
Net investment income (loss) | .51% | .76% | 1.29% | .76% | .73% |
Supplemental Data | | | | | |
Net assets, end of period (000 omitted) | $ 36,389 | $ 30,994 | $ 17,821 | $ 23,168 | $ 19,041 |
Portfolio turnover rate | 30% | 16% | 21% | 9% | 5% |
A Total returns would have been lower had certain expenses not been reduced during the periods shown.
B Total returns do not include the effect of the contingent deferred sales charge.
C Calculated based on average shares outstanding during the period.
D Amounts do not include the activity of the underlying funds.
E Expense ratios reflect operating expenses of the class. Expenses before reductions do not reflect amounts reimbursed by the investment adviser or reductions from expense offset arrangements and do not represent the amount paid by the class during periods when reimbursements or reductions occur. Expenses net of fee waivers reflect expenses after reimbursement by the investment adviser but prior to reductions from expense offset arrangements. Expenses net of all reductions represent the net expenses paid by the class but do not include expenses of the investment companies in which the Fund invests.
F Total distributions of $.36 per share is comprised of distributions from net investment income of $.088 and distributions from net realized gain of $.270 per share.
G Total distributions of $.55 per share is comprised of distributions from net investment income of $.107 and distributions from net realized gain of $.445 per share.
Financial Highlights - Institutional Class
Years ended March 31, | 2011 | 2010 | 2009 | 2008 | 2007 |
Selected Per-Share Data | | | | | |
Net asset value, beginning of period | $ 10.69 | $ 7.21 | $ 12.57 | $ 13.49 | $ 12.71 |
Income from Investment Operations | | | | | |
Net investment income (loss) B | .17 | .17 | .22 | .24 | .22 |
Net realized and unrealized gain (loss) | 1.57 | 3.55 | (4.93) | (.62) | 1.02 |
Total from investment operations | 1.74 | 3.72 | (4.71) | (.38) | 1.24 |
Distributions from net investment income | (.16) | (.16) | (.21) | (.20) | (.18) |
Distributions from net realized gain | (.11) | (.08) | (.45) | (.34) | (.29) |
Total distributions | (.26) H | (.24) | (.65) G | (.54) | (.46) F |
Net asset value, end of period | $ 12.17 | $ 10.69 | $ 7.21 | $ 12.57 | $ 13.49 |
Total Return A | 16.51% | 51.81% | (39.08)% | (3.19)% | 9.98% |
Ratios to Average Net Assets C, D | | | | | |
Expenses before reductions E | .00% | .00% | .00% | .00% | .00% |
Expenses net of fee waivers, if any | .00% | .00% | .00% | .00% | .00% |
Expenses net of all reductions | .00% | .00% | .00% | .00% | .00% |
Net investment income (loss) | 1.51% | 1.76% | 2.29% | 1.76% | 1.72% |
Supplemental Data | | | | | |
Net assets, end of period (000 omitted) | $ 218,092 | $ 97,629 | $ 43,667 | $ 34,162 | $ 6,371 |
Portfolio turnover rate | 30% | 16% | 21% | 9% | 5% |
A Total returns would have been lower had certain expenses not been reduced during the periods shown.
B Calculated based on average shares outstanding during the period.
C Amounts do not include the activity of the underlying funds.
D Expense ratios reflect operating expenses of the class. Expenses before reductions do not reflect amounts reimbursed by the investment adviser or reductions from expense offset arrangements and do not represent the amount paid by the class during periods when reimbursements or reductions occur. Expenses net of fee waivers reflect expenses after reimbursement by the investment adviser but prior to reductions from expense offset arrangements. Expenses net of all reductions represent the net expenses paid by the class but do not include expenses of the investment companies in which the Fund invests.
E Amount represents less than .01%.
F Total distributions of $.46 per share is comprised of distributions from net investment income of $.176 and distributions from net realized gain of $.287 per share.
G Total distributions of $.65 per share is comprised of distributions from net investment income of $.206 and distributions from net realized gain of $.445 per share.
H Total distributions of $.26 per share is comprised of distributions from net investment income of $.157 and distributions from net realized gain of $.105 per share.
See accompanying notes which are an integral part of the financial statements.
Annual Report
Fidelity Advisor Freedom 2040 Fund
Investment Changes (Unaudited)
Fund Holdings as of March 31, 2011 |
| % of fund's
net assets | % of fund's net assets
6 months ago |
Commodity Funds | | |
Fidelity Series Commodity Strategy Fund | 8.8 | 8.2 |
Domestic Equity Funds | | |
Fidelity Advisor Equity Growth Fund Institutional Class | 5.3 | 5.5 |
Fidelity Advisor Equity Income Fund Institutional Class | 0.0 | 1.1 |
Fidelity Advisor Growth & Income Fund Institutional Class | 7.3 | 7.5 |
Fidelity Advisor Large Cap Fund Institutional Class | 7.3 | 7.6 |
Fidelity Advisor Small Cap Fund Institutional Class | 2.7 | 2.7 |
Fidelity Series 100 Index Fund | 6.3 | 6.0 |
Fidelity Series All-Sector Equity Fund | 10.5 | 10.7 |
Fidelity Series Large Cap Value Fund | 10.6 | 9.6 |
Fidelity Series Small Cap Opportunities Fund | 2.7 | 2.8 |
| 52.7 | 53.5 |
Developed International Equity Funds | | |
Fidelity Advisor Diversified International Fund Institutional Class | 3.1 | 4.3 |
Fidelity Advisor Overseas Fund Institutional Class | 3.1 | 4.4 |
Fidelity Series International Growth Fund | 5.8 | 4.8 |
Fidelity Series International Small Cap Fund | 1.1 | 1.0 |
Fidelity Series International Value Fund | 5.7 | 4.6 |
| 18.8 | 19.1 |
Emerging Markets Equity Funds | | |
Fidelity Series Emerging Markets Fund | 3.4 | 3.2 |
High Yield Bond Funds | | |
Fidelity Advisor High Income Advantage Fund Institutional Class | 0.0 | 8.4 |
Fidelity Series Emerging Markets Debt Fund | 0.1 | 0.0 |
Fidelity Series High Income Fund | 8.0 | 0.0 |
| 8.1 | 8.4 |
Investment Grade Bond Funds | | |
Fidelity Advisor Strategic Real Return Fund Institutional Class | 1.4 | 1.3 |
Fidelity Advisor Total Bond Fund Institutional Class | 0.0 | 0.0* |
Fidelity Series Investment Grade Bond Fund | 6.8 | 6.3 |
| 8.2 | 7.6 |
| | |
Net Other Assets (Liabilities)* | 0.0 | 0.0 |
| 100.0 | 100.0 |
* Amount represents less than 0.1% |
Asset Allocation (% of fund's net assets) |
Current |
| Commodity Funds | 8.8% | |
| Domestic Equity Funds | 52.7% | |
| Developed International Equity Funds | 18.8% | |
| Emerging Markets Equity Funds | 3.4% | |
| High Yield Bond Funds | 8.1% | |
| Investment Grade Bond Funds | 8.2% | |

Six months ago |
| Commodity Funds | 8.2% | |
| Domestic Equity Funds | 53.5% | |
| Developed International Equity Funds | 19.1% | |
| Emerging Markets Equity Funds | 3.2% | |
| High Yield Bond Funds | 8.4% | |
| Investment Grade Bond Funds | 7.6% | |

Expected |
| Commodity Funds | 9.1% | |
| Domestic Equity Funds | 51.8% | |
| Developed International Equity Funds | 18.9% | |
| Emerging Markets Equity Funds | 3.3% | |
| High Yield Bond Funds | 8.0% | |
| Investment Grade Bond Funds | 8.9% | |

The fund invests according to an asset allocation strategy that becomes increasingly conservative over time. The six months ago allocation is based on the fund's holdings as of September 30, 2010. The current allocation is based on the fund's holdings as of March 31, 2011. The expected allocation represents the fund's anticipated allocation at September 30, 2011. |
Annual Report
Fidelity Advisor Freedom 2040 Fund
Investments March 31, 2011
Showing Percentage of Net Assets
Domestic Equity Funds - 61.5% |
| Shares | | Value |
Commodity Funds - 8.8% |
Fidelity Series Commodity Strategy Fund | 9,885,136 | | $ 130,286,098 |
Domestic Equity Funds - 52.7% |
Fidelity Advisor Equity Growth Fund Institutional Class | 1,246,655 | | 77,479,588 |
Fidelity Advisor Growth & Income Fund Institutional Class | 5,980,065 | | 107,940,174 |
Fidelity Advisor Large Cap Fund Institutional Class | 5,419,923 | | 106,935,072 |
Fidelity Advisor Small Cap Fund Institutional Class | 1,427,034 | | 40,056,850 |
Fidelity Series 100 Index Fund | 10,079,322 | | 92,729,763 |
Fidelity Series All-Sector Equity Fund | 11,796,791 | | 154,655,929 |
Fidelity Series Large Cap Value Fund | 12,785,335 | | 156,108,940 |
Fidelity Series Small Cap Opportunities Fund | 3,327,043 | | 39,225,840 |
TOTAL DOMESTIC EQUITY FUNDS | | 775,132,156 |
TOTAL DOMESTIC EQUITY FUNDS (Cost $809,456,488) | 905,418,254 |
International Equity Funds - 22.2% |
| | | |
Developed International Equity Funds - 18.8% |
Fidelity Advisor Diversified International Fund Institutional Class | 2,701,665 | | 45,414,995 |
Fidelity Advisor Overseas Fund Institutional Class | 2,358,476 | | 44,881,793 |
Fidelity Series International Growth Fund | 7,445,324 | | 85,695,684 |
Fidelity Series International Small Cap Fund | 1,347,657 | | 16,630,085 |
Fidelity Series International Value Fund | 7,921,596 | | 83,097,540 |
TOTAL DEVELOPED INTERNATIONAL EQUITY FUNDS | | 275,720,097 |
|
| Shares | | Value |
Emerging Markets Equity Funds - 3.4% |
Fidelity Series Emerging Markets Fund | 2,640,271 | | $ 50,587,588 |
TOTAL INTERNATIONAL EQUITY FUNDS (Cost $316,699,454) | 326,307,685 |
Bond Funds - 16.3% |
| | | |
High Yield Bond Funds - 8.1% |
Fidelity Series Emerging Markets Debt Fund | 169,520 | | 1,695,900 |
Fidelity Series High Income Fund | 11,669,396 | | 116,927,343 |
TOTAL HIGH YIELD BOND FUNDS | | 118,623,243 |
Investment Grade Bond Funds - 8.2% |
Fidelity Advisor Strategic Real Return Fund Institutional Class | 2,121,333 | | 21,001,193 |
Fidelity Series Investment Grade Bond Fund | 8,762,516 | | 99,717,434 |
TOTAL INVESTMENT GRADE BOND FUNDS | | 120,718,627 |
TOTAL BOND FUNDS (Cost $238,455,637) | 239,341,870 |
TOTAL INVESTMENT PORTFOLIO - 100.0% (Cost $1,364,611,579) | | 1,471,067,809 |
NET OTHER ASSETS (LIABILITIES) - 0.0% | | (145,632) |
NET ASSETS - 100% | $ 1,470,922,177 |
Other Information |
All investments are categorized as Level 1 under the Fair Value Hierarchy. The inputs or methodology used for valuing securities may not be an indication of the risk associated with investing in those securities. For more information on valuation inputs, please refer to the Security Valuation section in the accompanying Notes to Financial Statements. |
Income Tax Information |
At March 31, 2011, the Fund had a capital loss carryforward of approximately $8,343,013 all of which will expire in fiscal 2017. Capital loss carryforwards are only available to offset future capital gains of the Fund to the extent provided by regulations and may be limited. |
See accompanying notes which are an integral part of the financial statements.
Annual Report
Fidelity Advisor Freedom 2040 Fund
Statement of Assets and Liabilities
| March 31, 2011 |
Assets | | |
Investment in securities, at value (cost $1,364,611,579) - See accompanying schedule | | $ 1,471,067,809 |
Cash | | 103 |
Receivable for investments sold | | 88,842 |
Receivable for fund shares sold | | 2,844,424 |
Distributions receivable from underlying funds | | 206,314 |
Total assets | | 1,474,207,492 |
| | |
Liabilities | | |
Payable for investments purchased | $ 1,025,296 | |
Payable for fund shares redeemed | 1,884,280 | |
Distribution and service plan fees payable | 375,739 | |
Total liabilities | | 3,285,315 |
| | |
Net Assets | | $ 1,470,922,177 |
Net Assets consist of: | | |
Paid in capital | | $ 1,372,130,404 |
Undistributed net investment income | | 959,515 |
Accumulated undistributed net realized gain (loss) on investments | | (8,623,972) |
Net unrealized appreciation (depreciation) on investments | | 106,456,230 |
Net Assets | | $ 1,470,922,177 |
| | |
Calculation of Maximum Offering Price Class A:
Net Asset Value and redemption price per share ($865,008,171 ÷ 66,794,945 shares) | | $ 12.95 |
| | |
Maximum offering price per share (100/94.25 of $12.95) | | $ 13.74 |
Class T:
Net Asset Value and redemption price per share ($276,334,726 ÷ 21,389,470 shares) | | $ 12.92 |
| | |
Maximum offering price per share (100/96.50 of $12.92) | | $ 13.39 |
Class B:
Net Asset Value and offering price per share ($41,935,078 ÷ 3,270,683 shares)A | | $ 12.82 |
| | |
Class C:
Net Asset Value and offering price per share ($58,415,958 ÷ 4,562,634 shares)A | | $ 12.80 |
| | |
Institutional Class:
Net Asset Value, offering price and redemption price per share ($229,228,244 ÷ 17,627,009 shares) | | $ 13.00 |
A Redemption price per share is equal to net asset value less any applicable contingent deferred sales charge.
Statement of Operations
| Year ended March 31, 2011 |
Investment Income | | |
Income distributions from underlying funds | | $ 19,022,307 |
| | |
Expenses | | |
Distribution and service plan fees | $ 4,182,766 | |
Independent trustees' compensation | 4,613 | |
Total expenses before reductions | 4,187,379 | |
Expense reductions | (4,613) | 4,182,766 |
Net investment income (loss) | | 14,839,541 |
Realized and Unrealized Gain (Loss) Realized gain (loss) on sale of underlying fund shares | 11,216,272 | |
Capital gain distributions from underlying funds | 28,387,384 | |
Total net realized gain (loss) | | 39,603,656 |
Change in net unrealized appreciation (depreciation) on underlying funds | | 144,982,726 |
Net gain (loss) | | 184,586,382 |
Net increase (decrease) in net assets resulting from operations | | $ 199,425,923 |
See accompanying notes which are an integral part of the financial statements.
Annual Report
Statement of Changes in Net Assets
| Year ended
March 31,
2011 | Year ended
March 31,
2010 |
Increase (Decrease) in Net Assets | | |
Operations | | |
Net investment income (loss) | $ 14,839,541 | $ 13,624,680 |
Net realized gain (loss) | 39,603,656 | 36,682,501 |
Change in net unrealized appreciation (depreciation) | 144,982,726 | 319,580,977 |
Net increase (decrease) in net assets resulting from operations | 199,425,923 | 369,888,158 |
Distributions to shareholders from net investment income | (14,806,752) | (13,844,304) |
Distributions to shareholders from net realized gain | (11,833,286) | (8,692,491) |
Total distributions | (26,640,038) | (22,536,795) |
Share transactions - net increase (decrease) | 103,322,755 | 202,733,553 |
Total increase (decrease) in net assets | 276,108,640 | 550,084,916 |
| | |
Net Assets | | |
Beginning of period | 1,194,813,537 | 644,728,621 |
End of period (including undistributed net investment income of $959,515 and undistributed net investment income of $926,726, respectively) | $ 1,470,922,177 | $ 1,194,813,537 |
Financial Highlights - Class A
Years ended March 31, | 2011 | 2010 | 2009 | 2008 | 2007 |
Selected Per-Share Data | | | | | |
Net asset value, beginning of period | $ 11.37 | $ 7.59 | $ 13.57 | $ 14.69 | $ 13.83 |
Income from Investment Operations | | | | | |
Net investment income (loss) C | .15 | .15 | .21 | .22 | .21 |
Net realized and unrealized gain (loss) | 1.69 | 3.87 | (5.44) | (.74) | 1.16 |
Total from investment operations | 1.84 | 4.02 | (5.23) | (.52) | 1.37 |
Distributions from net investment income | (.15) | (.15) | (.20) | (.20) | (.18) |
Distributions from net realized gain | (.11) | (.09) | (.56) | (.40) | (.33) |
Total distributions | (.26) | (.24) | (.75) G | (.60) | (.51) F |
Net asset value, end of period | $ 12.95 | $ 11.37 | $ 7.59 | $ 13.57 | $ 14.69 |
Total Return A,B | 16.38% | 53.15% | (40.42)% | (3.92)% | 10.09% |
Ratios to Average Net Assets D,E | | | | | |
Expenses before reductions | .25% | .25% | .25% | .25% | .25% |
Expenses net of fee waivers, if any | .25% | .25% | .25% | .25% | .25% |
Expenses net of all reductions | .25% | .25% | .25% | .25% | .25% |
Net investment income (loss) | 1.25% | 1.52% | 2.02% | 1.47% | 1.48% |
Supplemental Data | | | | | |
Net assets, end of period (000 omitted) | $ 865,008 | $ 670,673 | $ 342,357 | $ 428,381 | $ 263,733 |
Portfolio turnover rate | 38% | 18% | 18% | 9% | 7% |
A Total returns would have been lower had certain expenses not been reduced during the periods shown.
B Total returns do not include the effect of the sales charges.
C Calculated based on average shares outstanding during the period.
D Amounts do not include the activity of the underlying funds.
E Expense ratios reflect operating expenses of the class. Expenses before reductions do not reflect amounts reimbursed by the investment adviser or reductions from expense offset arrangements and do not represent the amount paid by the class during periods when reimbursements or reductions occur. Expenses net of fee waivers reflect expenses after reimbursement by the investment adviser but prior to reductions from expense offset arrangements. Expenses net of all reductions represent the net expenses paid by the class but do not include expenses of the investment companies in which the Fund invests.
F Total distributions of $.51 per share is comprised of distributions from net investment income of $.181 and distributions from net realized gain of $.325 per share.
G Total distributions of $.75 per share is comprised of distributions from net investment income of $.197 and distributions from net realized gain of $.555 per share.
See accompanying notes which are an integral part of the financial statements.
Annual Report
Financial Highlights - Class T
Years ended March 31, | 2011 | 2010 | 2009 | 2008 | 2007 |
Selected Per-Share Data | | | | | |
Net asset value, beginning of period | $ 11.34 | $ 7.57 | $ 13.54 | $ 14.64 | $ 13.79 |
Income from Investment Operations | | | | | |
Net investment income (loss) C | .12 | .13 | .18 | .18 | .17 |
Net realized and unrealized gain (loss) | 1.68 | 3.86 | (5.43) | (.72) | 1.16 |
Total from investment operations | 1.80 | 3.99 | (5.25) | (.54) | 1.33 |
Distributions from net investment income | (.11) | (.13) | (.17) | (.16) | (.15) |
Distributions from net realized gain | (.11) | (.09) | (.56) | (.40) | (.33) |
Total distributions | (.22) | (.22) | (.72) G | (.56) | (.48) F |
Net asset value, end of period | $ 12.92 | $ 11.34 | $ 7.57 | $ 13.54 | $ 14.64 |
Total Return A,B | 16.06% | 52.83% | (40.61)% | (4.05)% | 9.81% |
Ratios to Average Net Assets D,E | | | | | |
Expenses before reductions | .50% | .50% | .50% | .50% | .50% |
Expenses net of fee waivers, if any | .50% | .50% | .50% | .50% | .50% |
Expenses net of all reductions | .50% | .50% | .50% | .50% | .50% |
Net investment income (loss) | 1.00% | 1.27% | 1.77% | 1.22% | 1.23% |
Supplemental Data | | | | | |
Net assets, end of period (000 omitted) | $ 276,335 | $ 300,594 | $ 181,917 | $ 238,675 | $ 221,815 |
Portfolio turnover rate | 38% | 18% | 18% | 9% | 7% |
A Total returns would have been lower had certain expenses not been reduced during the periods shown.
B Total returns do not include the effect of the sales charges.
C Calculated based on average shares outstanding during the period.
D Amounts do not include the activity of the underlying funds.
E Expense ratios reflect operating expenses of the class. Expenses before reductions do not reflect amounts reimbursed by the investment adviser or reductions from expense offset arrangements and do not represent the amount paid by the class during periods when reimbursements or reductions occur. Expenses net of fee waivers reflect expenses after reimbursement by the investment adviser but prior to reductions from expense offset arrangements. Expenses net of all reductions represent the net expenses paid by the class but do not include expenses of the investment companies in which the Fund invests.
F Total distributions of $.48 per share is comprised of distributions from net investment income of $.150 and distributions from net realized gain of $.325 per share.
G Total distributions of $.72 per share is comprised of distributions from net investment income of $.168 and distributions from net realized gain of $.555 per share.
Financial Highlights - Class B
Years ended March 31, | 2011 | 2010 | 2009 | 2008 | 2007 |
Selected Per-Share Data | | | | | |
Net asset value, beginning of period | $ 11.26 | $ 7.52 | $ 13.42 | $ 14.53 | $ 13.70 |
Income from Investment Operations | | | | | |
Net investment income (loss) C | .06 | .08 | .13 | .11 | .10 |
Net realized and unrealized gain (loss) | 1.66 | 3.83 | (5.37) | (.73) | 1.14 |
Total from investment operations | 1.72 | 3.91 | (5.24) | (.62) | 1.24 |
Distributions from net investment income | (.06) | (.08) | (.11) | (.10) | (.10) |
Distributions from net realized gain | (.10) | (.09) | (.55) | (.39) | (.32) |
Total distributions | (.16) | (.17) | (.66) G | (.49) | (.41) F |
Net asset value, end of period | $ 12.82 | $ 11.26 | $ 7.52 | $ 13.42 | $ 14.53 |
Total Return A,B | 15.43% | 52.08% | (40.85)% | (4.59)% | 9.25% |
Ratios to Average Net Assets D,E | | | | | |
Expenses before reductions | 1.00% | 1.00% | 1.00% | 1.00% | 1.00% |
Expenses net of fee waivers, if any | 1.00% | 1.00% | 1.00% | 1.00% | 1.00% |
Expenses net of all reductions | 1.00% | 1.00% | 1.00% | 1.00% | 1.00% |
Net investment income (loss) | .50% | .77% | 1.28% | .72% | .73% |
Supplemental Data | | | | | |
Net assets, end of period (000 omitted) | $ 41,935 | $ 43,773 | $ 29,479 | $ 50,827 | $ 46,110 |
Portfolio turnover rate | 38% | 18% | 18% | 9% | 7% |
A Total returns would have been lower had certain expenses not been reduced during the periods shown.
B Total returns do not include the effect of the contingent deferred sales charge.
C Calculated based on average shares outstanding during the period.
D Amounts do not include the activity of the underlying funds.
E Expense ratios reflect operating expenses of the class. Expenses before reductions do not reflect amounts reimbursed by the investment adviser or reductions from expense offset arrangements and do not represent the amount paid by the class during periods when reimbursements or reductions occur. Expenses net of fee waivers reflect expenses after reimbursement by the investment adviser but prior to reductions from expense offset arrangements. Expenses net of all reductions represent the net expenses paid by the class but do not include expenses of the investment companies in which the Fund invests.
F Total distributions of $.41 per share is comprised of distributions from net investment income of $.098 and distributions from net realized gain of $.315 per share.
G Total distributions of $.66 per share is comprised of distributions from net investment income of $.112 and distributions from net realized gain of $.550 per share.
See accompanying notes which are an integral part of the financial statements.
Annual Report
Financial Highlights - Class C
Years ended March 31, | 2011 | 2010 | 2009 | 2008 | 2007 |
Selected Per-Share Data | | | | | |
Net asset value, beginning of period | $ 11.25 | $ 7.51 | $ 13.42 | $ 14.52 | $ 13.70 |
Income from Investment Operations | | | | | |
Net investment income (loss) C | .06 | .08 | .13 | .11 | .10 |
Net realized and unrealized gain (loss) | 1.66 | 3.83 | (5.37) | (.72) | 1.13 |
Total from investment operations | 1.72 | 3.91 | (5.24) | (.61) | 1.23 |
Distributions from net investment income | (.07) | (.08) | (.12) | (.10) | (.10) |
Distributions from net realized gain | (.10) | (.09) | (.55) | (.39) | (.32) |
Total distributions | (.17) | (.17) | (.67) G | (.49) | (.41) F |
Net asset value, end of period | $ 12.80 | $ 11.25 | $ 7.51 | $ 13.42 | $ 14.52 |
Total Return A,B | 15.39% | 52.18% | (40.91)% | (4.54)% | 9.17% |
Ratios to Average Net Assets D,E | | | | | |
Expenses before reductions | 1.00% | 1.00% | 1.00% | 1.00% | 1.00% |
Expenses net of fee waivers, if any | 1.00% | 1.00% | 1.00% | 1.00% | 1.00% |
Expenses net of all reductions | 1.00% | 1.00% | 1.00% | 1.00% | 1.00% |
Net investment income (loss) | .50% | .77% | 1.28% | .72% | .73% |
Supplemental Data | | | | | |
Net assets, end of period (000 omitted) | $ 58,416 | $ 53,334 | $ 34,036 | $ 54,549 | $ 54,022 |
Portfolio turnover rate | 38% | 18% | 18% | 9% | 7% |
A Total returns would have been lower had certain expenses not been reduced during the periods shown.
B Total returns do not include the effect of the contingent deferred sales charge.
C Calculated based on average shares outstanding during the period.
D Amounts do not include the activity of the underlying funds.
E Expense ratios reflect operating expenses of the class. Expenses before reductions do not reflect amounts reimbursed by the investment adviser or reductions from expense offset arrangements and do not represent the amount paid by the class during periods when reimbursements or reductions occur. Expenses net of fee waivers reflect expenses after reimbursement by the investment adviser but prior to reductions from expense offset arrangements. Expenses net of all reductions represent the net expenses paid by the class but do not include expenses of the investment companies in which the Fund invests.
F Total distributions of $.41 per share is comprised of distributions from net investment income of $.098 and distributions from net realized gain of $.315 per share.
G Total distributions of $.67 per share is comprised of distributions from net investment income of $.115 and distributions from net realized gain of $.550 per share.
Financial Highlights - Institutional Class
Years ended March 31, | 2011 | 2010 | 2009 | 2008 | 2007 |
Selected Per-Share Data | | | | | |
Net asset value, beginning of period | $ 11.42 | $ 7.62 | $ 13.62 | $ 14.74 | $ 13.87 |
Income from Investment Operations | | | | | |
Net investment income (loss) B | .18 | .18 | .23 | .25 | .24 |
Net realized and unrealized gain (loss) | 1.69 | 3.88 | (5.45) | (.74) | 1.17 |
Total from investment operations | 1.87 | 4.06 | (5.22) | (.49) | 1.41 |
Distributions from net investment income | (.18) | (.17) | (.22) | (.23) | (.21) |
Distributions from net realized gain | (.11) | (.09) | (.56) | (.40) | (.33) |
Total distributions | (.29) | (.26) | (.78) G | (.63) | (.54) F |
Net asset value, end of period | $ 13.00 | $ 11.42 | $ 7.62 | $ 13.62 | $ 14.74 |
Total Return A | 16.57% | 53.53% | (40.24)% | (3.70)% | 10.36% |
Ratios to Average Net Assets C,E | | | | | |
Expenses before reductions D | .00% | .00% | .00% | .00% | .00% |
Expenses net of fee waivers, if any | .00% | .00% | .00% | .00% | .00% |
Expenses net of all reductions | .00% | .00% | .00% | .00% | .00% |
Net investment income (loss) | 1.50% | 1.77% | 2.27% | 1.72% | 1.73% |
Supplemental Data | | | | | |
Net assets, end of period (000 omitted) | $ 229,228 | $ 126,440 | $ 56,940 | $ 46,457 | $ 19,197 |
Portfolio turnover rate | 38% | 18% | 18% | 9% | 7% |
A Total returns would have been lower had certain expenses not been reduced during the periods shown.
B Calculated based on average shares outstanding during the period.
C Amounts do not include the activity of the underlying funds.
D Amount represents less than .01%.
E Expense ratios reflect operating expenses of the class. Expenses before reductions do not reflect amounts reimbursed by the investment adviser or reductions from expense offset arrangements and do not represent the amount paid by the class during periods when reimbursements or reductions occur. Expenses net of fee waivers reflect expenses after reimbursement by the investment adviser but prior to reductions from expense offset arrangements. Expenses net of all reductions represent the net expenses paid by the class but do not include expenses of the investment companies in which the Fund invests.
F Total distributions of $.54 per share is comprised of distributions from net investment income of $.210 and distributions from net realized gain of $.325 per share.
G Total distributions of $.78 per share is comprised of distributions from net investment income of $.224 and distributions from net realized gain of $.555 per share.
See accompanying notes which are an integral part of the financial statements.
Annual Report
Fidelity Advisor Freedom 2045 Fund
Investment Changes (Unaudited)
Fund Holdings as of March 31, 2011 |
| % of fund's
net assets | % of fund's net assets
6 months ago |
Commodity Funds | | |
Fidelity Series Commodity Strategy Fund | 9.2 | 8.2 |
Domestic Equity Funds | | |
Fidelity Advisor Equity Growth Fund Institutional Class | 5.4 | 5.6 |
Fidelity Advisor Equity Income Fund Institutional Class | 0.0 | 1.1 |
Fidelity Advisor Growth & Income Fund Institutional Class | 7.5 | 7.8 |
Fidelity Advisor Large Cap Fund Institutional Class | 7.4 | 7.7 |
Fidelity Advisor Small Cap Fund Institutional Class | 2.8 | 2.8 |
Fidelity Series 100 Index Fund | 6.4 | 6.2 |
Fidelity Series All-Sector Equity Fund | 10.7 | 10.9 |
Fidelity Series Large Cap Value Fund | 10.9 | 9.7 |
Fidelity Series Small Cap Opportunities Fund | 2.7 | 2.8 |
| 53.8 | 54.6 |
Developed International Equity Funds | | |
Fidelity Advisor Diversified International Fund Institutional Class | 3.2 | 4.4 |
Fidelity Advisor Overseas Fund Institutional Class | 3.1 | 4.4 |
Fidelity Series International Growth Fund | 5.9 | 4.8 |
Fidelity Series International Small Cap Fund | 1.2 | 0.9 |
Fidelity Series International Value Fund | 5.8 | 4.7 |
| 19.2 | 19.2 |
Emerging Markets Equity Funds | | |
Fidelity Series Emerging Markets Fund | 3.5 | 3.3 |
High Yield Bond Funds | | |
Fidelity Advisor High Income Advantage Fund Institutional Class | 0.0 | 9.8 |
Fidelity Series Emerging Markets Debt Fund | 0.1 | 0.0 |
Fidelity Series High Income Fund | 9.3 | 0.0 |
| 9.4 | 9.8 |
Investment Grade Bond Funds | | |
Fidelity Advisor Strategic Real Return Fund Institutional Class | 0.8 | 0.9 |
Fidelity Advisor Total Bond Fund Institutional Class | 0.0 | 0.0* |
Fidelity Series Investment Grade Bond Fund | 4.1 | 4.0 |
| 4.9 | 4.9 |
| | |
Net Other Assets (Liabilities)* | 0.0 | 0.0 |
| 100.0 | 100.0 |
* Amount represents less than 0.1% |
Asset Allocation (% of fund's net assets) |
Current |
| Commodity Funds | 9.2% | |
| Domestic Equity Funds | 53.8% | |
| Developed International Equity Funds | 19.2% | |
| Emerging Markets Equity Funds | 3.5% | |
| High Yield Bond Funds | 9.4% | |
| Investment Grade Bond Funds | 4.9% | |

Six months ago |
| Commodity Funds | 8.2% | |
| Domestic Equity Funds | 54.6% | |
| Developed International Equity Funds | 19.2% | |
| Emerging Markets Equity Funds | 3.3% | |
| High Yield Bond Funds | 9.8% | |
| Investment Grade Bond Funds | 4.9% | |

Expected |
| Commodity Funds | 9.4% | |
| Domestic Equity Funds | 52.9% | |
| Developed International Equity Funds | 19.3% | |
| Emerging Markets Equity Funds | 3.4% | |
| High Yield Bond Funds | 10.0% | |
| Investment Grade Bond Funds | 5.0% | |

The fund invests according to an asset allocation strategy that becomes increasingly conservative over time. The six months ago allocation is based on the fund's holdings as of September 30, 2010. The current allocation is based on the fund's holdings as of March 31, 2011. The expected allocation represents the fund's anticipated allocation at September 30, 2011. |
Annual Report
Fidelity Advisor Freedom 2045 Fund
Investments March 31, 2011
Showing Percentage of Net Assets
Domestic Equity Funds - 63.0% |
| Shares | | Value |
Commodity Funds - 9.2% |
Fidelity Series Commodity Strategy Fund | 3,350,344 | | $ 44,157,536 |
Domestic Equity Funds - 53.8% |
Fidelity Advisor Equity Growth Fund Institutional Class | 413,022 | | 25,669,333 |
Fidelity Advisor Growth & Income Fund Institutional Class | 1,979,559 | | 35,731,036 |
Fidelity Advisor Large Cap Fund Institutional Class | 1,794,490 | | 35,405,292 |
Fidelity Advisor Small Cap Fund Institutional Class | 471,621 | | 13,238,414 |
Fidelity Series 100 Index Fund | 3,332,122 | | 30,655,523 |
Fidelity Series All-Sector Equity Fund | 3,904,704 | | 51,190,666 |
Fidelity Series Large Cap Value Fund | 4,252,729 | | 51,925,827 |
Fidelity Series Small Cap Opportunities Fund | 1,100,141 | | 12,970,665 |
TOTAL DOMESTIC EQUITY FUNDS | | 256,786,756 |
TOTAL DOMESTIC EQUITY FUNDS (Cost $252,033,745) | 300,944,292 |
International Equity Funds - 22.7% |
| | | |
Developed International Equity Funds - 19.2% |
Fidelity Advisor Diversified International Fund Institutional Class | 897,029 | | 15,079,057 |
Fidelity Advisor Overseas Fund Institutional Class | 783,219 | | 14,904,650 |
Fidelity Series International Growth Fund | 2,468,213 | | 28,409,135 |
Fidelity Series International Small Cap Fund | 445,909 | | 5,502,523 |
Fidelity Series International Value Fund | 2,626,970 | | 27,556,910 |
TOTAL DEVELOPED INTERNATIONAL EQUITY FUNDS | | 91,452,275 |
|
| Shares | | Value |
Emerging Markets Equity Funds - 3.5% |
Fidelity Series Emerging Markets Fund | 876,119 | | $ 16,786,444 |
TOTAL INTERNATIONAL EQUITY FUNDS (Cost $92,139,961) | 108,238,719 |
Bond Funds - 14.3% |
| | | |
High Yield Bond Funds - 9.4% |
Fidelity Series Emerging Markets Debt Fund | 64,210 | | 642,360 |
Fidelity Series High Income Fund | 4,420,047 | | 44,288,867 |
TOTAL HIGH YIELD BOND FUNDS | | 44,931,227 |
Investment Grade Bond Funds - 4.9% |
Fidelity Advisor Strategic Real Return Fund Institutional Class | 381,353 | | 3,775,392 |
Fidelity Series Investment Grade Bond Fund | 1,734,346 | | 19,736,854 |
TOTAL INVESTMENT GRADE BOND FUNDS | | 23,512,246 |
TOTAL BOND FUNDS (Cost $67,725,945) | 68,443,473 |
TOTAL INVESTMENT PORTFOLIO - 100.0% (Cost $411,899,651) | | 477,626,484 |
NET OTHER ASSETS (LIABILITIES) - 0.0% | | (23,712) |
NET ASSETS - 100% | $ 477,602,772 |
Other Information |
All investments are categorized as Level 1 under the Fair Value Hierarchy. The inputs or methodology used for valuing securities may not be an indication of the risk associated with investing in those securities. For more information on valuation inputs, please refer to the Security Valuation section in the accompanying Notes to Financial Statements. |
Income Tax Information |
At March 31, 2011, the Fund had a capital loss carryforward of approximately $4,711,973 all of which will expire in fiscal 2017. Capital loss carryforwards are only available to offset future capital gains of the Fund to the extent provided by regulations and may be limited. |
See accompanying notes which are an integral part of the financial statements.
Annual Report
Fidelity Advisor Freedom 2045 Fund
Statement of Assets and Liabilities
| March 31, 2011 |
Assets | | |
Investment in securities, at value (cost $411,899,651) - See accompanying schedule | | $ 477,626,484 |
Cash | | 55 |
Receivable for investments sold | | 9,516 |
Receivable for fund shares sold | | 1,099,500 |
Distributions receivable from underlying funds | | 78,099 |
Total assets | | 478,813,654 |
| | |
Liabilities | | |
Payable for investments purchased | $ 729,823 | |
Payable for fund shares redeemed | 379,190 | |
Distribution and service plan fees payable | 101,869 | |
Total liabilities | | 1,210,882 |
| | |
Net Assets | | $ 477,602,772 |
Net Assets consist of: | | |
Paid in capital | | $ 416,868,005 |
Undistributed net investment income | | 434,537 |
Accumulated undistributed net realized gain (loss) on investments | | (5,426,603) |
Net unrealized appreciation (depreciation) on investments | | 65,726,833 |
Net Assets | | $ 477,602,772 |
| |
Calculation of Maximum Offering Price Class A:
Net Asset Value and redemption price per share ($320,730,680 ÷ 31,834,182 shares) | | $ 10.08 |
| | |
Maximum offering price per share (100/94.25 of $10.08) | | $ 10.69 |
Class T:
Net Asset Value and redemption price per share ($60,267,677 ÷ 6,004,056 shares) | | $ 10.04 |
| | |
Maximum offering price per share (100/96.50 of $10.04) | | $ 10.40 |
Class B:
Net Asset Value and offering price per share ($4,611,679 ÷ 460,577 shares)A | | $ 10.01 |
| | |
Class C:
Net Asset Value and offering price per share ($8,753,183 ÷ 875,390 shares)A | | $ 10.00 |
| | |
Institutional Class:
Net Asset Value, offering price and redemption price per share ($83,239,553 ÷ 8,231,056 shares) | | $ 10.11 |
A Redemption price per share is equal to net asset value less any applicable contingent deferred sales charge.
Statement of Operations
| Year ended March 31, 2011 |
Investment Income | | |
Income distributions from underlying funds | | $ 5,756,548 |
| | |
Expenses | | |
Distribution and service plan fees | $ 986,412 | |
Independent trustees' compensation | 1,269 | |
Total expenses before reductions | 987,681 | |
Expense reductions | (1,269) | 986,412 |
Net investment income (loss) | | 4,770,136 |
Realized and Unrealized Gain (Loss) Realized gain (loss) on sale of underlying fund shares | 621,206 | |
Capital gain distributions from underlying funds | 8,646,888 | |
Total net realized gain (loss) | | 9,268,094 |
Change in net unrealized appreciation (depreciation) on underlying funds | | 48,630,118 |
Net gain (loss) | | 57,898,212 |
Net increase (decrease) in net assets resulting from operations | | $ 62,668,348 |
See accompanying notes which are an integral part of the financial statements.
Annual Report
Statement of Changes in Net Assets
| Year ended
March 31,
2011 | Year ended
March 31,
2010 |
Increase (Decrease) in Net Assets | | |
Operations | | |
Net investment income (loss) | $ 4,770,136 | $ 3,090,802 |
Net realized gain (loss) | 9,268,094 | (580,792) |
Change in net unrealized appreciation (depreciation) | 48,630,118 | 74,319,321 |
Net increase (decrease) in net assets resulting from operations | 62,668,348 | 76,829,331 |
Distributions to shareholders from net investment income | (4,605,379) | (3,060,635) |
Distributions to shareholders from net realized gain | (3,215,417) | (2,023,492) |
Total distributions | (7,820,796) | (5,084,127) |
Share transactions - net increase (decrease) | 130,893,423 | 102,731,596 |
Total increase (decrease) in net assets | 185,740,975 | 174,476,800 |
| | |
Net Assets | | |
Beginning of period | 291,861,797 | 117,384,997 |
End of period (including undistributed net investment income of $434,537 and undistributed net investment income of $269,780, respectively) | $ 477,602,772 | $ 291,861,797 |
Financial Highlights - Class A
Years ended March 31, | 2011 | 2010 | 2009 | 2008 | 2007 G |
Selected Per-Share Data | | | | | |
Net asset value, beginning of period | $ 8.82 | $ 5.86 | $ 10.39 | $ 11.05 | $ 10.00 |
Income from Investment Operations | | | | | |
Net investment income (loss) E | .12 | .12 | .16 | .16 | .12 |
Net realized and unrealized gain (loss) | 1.33 | 3.02 | (4.29) | (.57) | 1.06 |
Total from investment operations | 1.45 | 3.14 | (4.13) | (.41) | 1.18 |
Distributions from net investment income | (.11) | (.11) | (.14) | (.11) | (.08) |
Distributions from net realized gain | (.08) | (.07) | (.26) | (.14) | (.05) |
Total distributions | (.19) | (.18) | (.40) | (.25) I | (.13) |
Net asset value, end of period | $ 10.08 | $ 8.82 | $ 5.86 | $ 10.39 | $ 11.05 |
Total Return B,C,D | 16.67% | 53.81% | (40.93)% | (3.96)% | 11.78% |
Ratios to Average Net Assets F,H | | | | | |
Expenses before reductions | .25% | .25% | .25% | .25% | .25% A |
Expenses net of fee waivers, if any | .25% | .25% | .25% | .25% | .25% A |
Expenses net of all reductions | .25% | .25% | .25% | .25% | .25% A |
Net investment income (loss) | 1.35% | 1.53% | 2.12% | 1.44% | 1.31% A |
Supplemental Data | | | | | |
Net assets, end of period (000 omitted) | $ 320,731 | $ 205,405 | $ 81,985 | $ 61,721 | $ 12,550 |
Portfolio turnover rate | 32% | 14% | 18% | 22% | 16% A |
A Annualized
B Total returns for periods of less than one year are not annualized.
C Total returns would have been lower had certain expenses not been reduced during the periods shown.
D Total returns do not include the effect of the sales charges.
E Calculated based on average shares outstanding during the period.
F Amounts do not include the activity of the underlying funds.
G For the period June 1, 2006 (commencement of operations) to March 31, 2007.
H Expense ratios reflect operating expenses of the class. Expenses before reductions do not reflect amounts reimbursed by the investment adviser or reductions from expense offset arrangements and do not represent the amount paid by the class during periods when reimbursements or reductions occur. Expenses net of fee waivers reflect expenses after reimbursement by the investment adviser but prior to reductions from expense offset arrangements. Expenses net of all reductions represent the net expenses paid by the class but do not include expenses of the investment companies in which the Fund invests.
I Total distributions of $.25 per share is comprised of distributions from net investment income of $.110 and distributions from net realized gain of $.138 per share.
See accompanying notes which are an integral part of the financial statements.
Annual Report
Financial Highlights - Class T
Years ended March 31, | 2011 | 2010 | 2009 | 2008 | 2007 G |
Selected Per-Share Data | | | | | |
Net asset value, beginning of period | $ 8.79 | $ 5.84 | $ 10.36 | $ 11.03 | $ 10.00 |
Income from Investment Operations | | | | | |
Net investment income (loss) E | .10 | .10 | .14 | .13 | .09 |
Net realized and unrealized gain (loss) | 1.32 | 3.02 | (4.28) | (.57) | 1.06 |
Total from investment operations | 1.42 | 3.12 | (4.14) | (.44) | 1.15 |
Distributions from net investment income | (.09) | (.10) | (.12) | (.09) | (.07) |
Distributions from net realized gain | (.08) | (.07) | (.26) | (.14) | (.05) |
Total distributions | (.17) | (.17) | (.38) | (.23) I | (.12) |
Net asset value, end of period | $ 10.04 | $ 8.79 | $ 5.84 | $ 10.36 | $ 11.03 |
Total Return B,C,D | 16.36% | 53.52% | (41.08)% | (4.23)% | 11.53% |
Ratios to Average Net Assets F,H | | | | | |
Expenses before reductions | .50% | .50% | .50% | .50% | .50% A |
Expenses net of fee waivers, if any | .50% | .50% | .50% | .50% | .50% A |
Expenses net of all reductions | .50% | .50% | .50% | .50% | .50% A |
Net investment income (loss) | 1.10% | 1.28% | 1.87% | 1.19% | 1.06% A |
Supplemental Data | | | | | |
Net assets, end of period (000 omitted) | $ 60,268 | $ 43,326 | $ 18,065 | $ 11,746 | $ 3,339 |
Portfolio turnover rate | 32% | 14% | 18% | 22% | 16% A |
A Annualized
B Total returns for periods of less than one year are not annualized.
C Total returns would have been lower had certain expenses not been reduced during the periods shown.
D Total returns do not include the effect of the sales charges.
E Calculated based on average shares outstanding during the period.
F Amounts do not include the activity of the underlying funds.
G For the period June 1, 2006 (commencement of operations) to March 31, 2007.
H Expense ratios reflect operating expenses of the class. Expenses before reductions do not reflect amounts reimbursed by the investment adviser or reductions from expense offset arrangements and do not represent the amount paid by the class during periods when reimbursements or reductions occur. Expenses net of fee waivers reflect expenses after reimbursement by the investment adviser but prior to reductions from expense offset arrangements. Expenses net of all reductions represent the net expenses paid by the class but do not include expenses of the investment companies in which the Fund invests.
I Total distributions of $.23 per share is comprised of distributions from net investment income of $.090 and distributions from net realized gain of $.137 per share.
Financial Highlights - Class B
Years ended March 31, | 2011 | 2010 | 2009 | 2008 | 2007 G |
Selected Per-Share Data | | | | | |
Net asset value, beginning of period | $ 8.77 | $ 5.83 | $ 10.33 | $ 11.01 | $ 10.00 |
Income from Investment Operations | | | | | |
Net investment income (loss) E | .05 | .06 | .11 | .08 | .05 |
Net realized and unrealized gain (loss) | 1.32 | 3.01 | (4.27) | (.57) | 1.06 |
Total from investment operations | 1.37 | 3.07 | (4.16) | (.49) | 1.11 |
Distributions from net investment income | (.05) | (.06) | (.08) | (.06) | (.05) |
Distributions from net realized gain | (.08) | (.07) | (.26) | (.13) | (.05) |
Total distributions | (.13) | (.13) | (.34) | (.19) I | (.10) |
Net asset value, end of period | $ 10.01 | $ 8.77 | $ 5.83 | $ 10.33 | $ 11.01 |
Total Return B,C,D | 15.71% | 52.74% | (41.39)% | (4.65)% | 11.09% |
Ratios to Average Net Assets F,H | | | | | |
Expenses before reductions | 1.00% | 1.00% | 1.00% | 1.00% | 1.00% A |
Expenses net of fee waivers, if any | 1.00% | 1.00% | 1.00% | 1.00% | 1.00% A |
Expenses net of all reductions | 1.00% | 1.00% | 1.00% | 1.00% | 1.00% A |
Net investment income (loss) | .60% | .78% | 1.37% | .69% | .56% A |
Supplemental Data | | | | | |
Net assets, end of period (000 omitted) | $ 4,612 | $ 4,089 | $ 2,231 | $ 2,476 | $ 776 |
Portfolio turnover rate | 32% | 14% | 18% | 22% | 16% A |
A Annualized
B Total returns for periods of less than one year are not annualized.
C Total returns would have been lower had certain expenses not been reduced during the periods shown.
D Total returns do not include the effect of the contingent deferred sales charge.
E Calculated based on average shares outstanding during the period.
F Amounts do not include the activity of the underlying funds.
G For the period June 1, 2006 (commencement of operations) to March 31, 2007.
H Expense ratios reflect operating expenses of the class. Expenses before reductions do not reflect amounts reimbursed by the investment adviser or reductions from expense offset arrangements and do not represent the amount paid by the class during periods when reimbursements or reductions occur. Expenses net of fee waivers reflect expenses after reimbursement by the investment adviser but prior to reductions from expense offset arrangements. Expenses net of all reductions represent the net expenses paid by the class but do not include expenses of the investment companies in which the Fund invests.
I Total distributions of $.19 per share is comprised of distributions from net investment income of $.058 and distributions from net realized gain of $.130 per share.
See accompanying notes which are an integral part of the financial statements.
Annual Report
Financial Highlights - Class C
Years ended March 31, | 2011 | 2010 | 2009 | 2008 | 2007 G |
Selected Per-Share Data | | | | | |
Net asset value, beginning of period | $ 8.76 | $ 5.82 | $ 10.32 | $ 11.01 | $ 10.00 |
Income from Investment Operations | | | | | |
Net investment income (loss) E | .05 | .06 | .11 | .08 | .05 |
Net realized and unrealized gain (loss) | 1.32 | 3.01 | (4.27) | (.58) | 1.06 |
Total from investment operations | 1.37 | 3.07 | (4.16) | (.50) | 1.11 |
Distributions from net investment income | (.06) | (.06) | (.08) | (.06) | (.05) |
Distributions from net realized gain | (.08) | (.07) | (.26) | (.13) | (.05) |
Total distributions | (.13) J | (.13) | (.34) | (.19) I | (.10) |
Net asset value, end of period | $ 10.00 | $ 8.76 | $ 5.82 | $ 10.32 | $ 11.01 |
Total Return B,C,D | 15.80% | 52.90% | (41.39)% | (4.74)% | 11.08% |
Ratios to Average Net Assets F,H | | | | | |
Expenses before reductions | 1.00% | 1.00% | 1.00% | 1.00% | 1.00% A |
Expenses net of fee waivers, if any | 1.00% | 1.00% | 1.00% | 1.00% | 1.00% A |
Expenses net of all reductions | 1.00% | 1.00% | 1.00% | 1.00% | 1.00% A |
Net investment income (loss) | .60% | .78% | 1.37% | .69% | .56% A |
Supplemental Data | | | | | |
Net assets, end of period (000 omitted) | $ 8,753 | $ 6,199 | $ 3,027 | $ 2,539 | $ 770 |
Portfolio turnover rate | 32% | 14% | 18% | 22% | 16% A |
A Annualized
B Total returns for periods of less than one year are not annualized.
C Total returns would have been lower had certain expenses not been reduced during the periods shown.
D Total returns do not include the effect of the contingent deferred sales charge.
E Calculated based on average shares outstanding during the period.
F Amounts do not include the activity of the underlying funds.
G For the period June 1, 2006 (commencement of operations) to March 31, 2007.
H Expense ratios reflect operating expenses of the class. Expenses before reductions do not reflect amounts reimbursed by the investment adviser or reductions from expense offset arrangements and do not represent the amount paid by the class during periods when reimbursements or reductions occur. Expenses net of fee waivers reflect expenses after reimbursement by the investment adviser but prior to reductions from expense offset arrangements. Expenses net of all reductions represent the net expenses paid by the class but do not include expenses of the investment companies in which the Fund invests.
I Total distributions of $.19 per share is comprised of distributions from net investment income of $.058 and distributions from net realized gain of $.130 per share.
J Total distributions of $.13 per share is comprised of distributions from net investment income of $.057 and distributions from net realized gain of $.076 per share.
Financial Highlights - Institutional Class
Years ended March 31, | 2011 | 2010 | 2009 | 2008 | 2007 G |
Selected Per-Share Data | | | | | |
Net asset value, beginning of period | $ 8.85 | $ 5.87 | $ 10.41 | $ 11.07 | $ 10.00 |
Income from Investment Operations | | | | | |
Net investment income (loss) D | .15 | .14 | .18 | .19 | .14 |
Net realized and unrealized gain (loss) | 1.32 | 3.04 | (4.30) | (.59) | 1.06 |
Total from investment operations | 1.47 | 3.18 | (4.12) | (.40) | 1.20 |
Distributions from net investment income | (.13) | (.13) | (.16) | (.13) | (.08) |
Distributions from net realized gain | (.08) | (.07) | (.26) | (.14) | (.05) |
Total distributions | (.21) | (.20) | (.42) | (.26) I | (.13) |
Net asset value, end of period | $ 10.11 | $ 8.85 | $ 5.87 | $ 10.41 | $ 11.07 |
Total Return B,C | 16.86% | 54.35% | (40.81)% | (3.82)% | 12.02% |
Ratios to Average Net Assets E,H | | | | | |
Expenses before reductions F | .00% | .00% | .00% | .00% | .00% A |
Expenses net of fee waivers, if any | .00% | .00% | .00% | .00% | .00% A |
Expenses net of all reductions | .00% | .00% | .00% | .00% | .00% A |
Net investment income (loss) | 1.60% | 1.78% | 2.37% | 1.68% | 1.56% A |
Supplemental Data | | | | | |
Net assets, end of period (000 omitted) | $ 83,240 | $ 32,842 | $ 12,078 | $ 6,631 | $ 629 |
Portfolio turnover rate | 32% | 14% | 18% | 22% | 16% A |
A Annualized
B Total returns for periods of less than one year are not annualized.
C Total returns would have been lower had certain expenses not been reduced during the periods shown.
D Calculated based on average shares outstanding during the period.
E Amounts do not include the activity of the underlying funds.
F Amount represents less than .01%.
G For the period June 1, 2006 (commencement of operations) to March 31, 2007.
H Expense ratios reflect operating expenses of the class. Expenses before reductions do not reflect amounts reimbursed by the investment adviser or reductions from expense offset arrangements and do not represent the amount paid by the class during periods when reimbursements or reductions occur. Expenses net of fee waivers reflect expenses after reimbursement by the investment adviser but prior to reductions from expense offset arrangements. Expenses net of all reductions represent the net expenses paid by the class but do not include expenses of the investment companies in which the Fund invests.
I Total distributions of $.26 per share is comprised of distributions from net investment income of $.126 and distributions from net realized gain of $.138 per share.
See accompanying notes which are an integral part of the financial statements.
Annual Report
Fidelity Advisor Freedom 2050 Fund
Investment Changes (Unaudited)
Fund Holdings as of March 31, 2011 |
| % of fund's
net assets | % of fund's net assets
6 months ago |
Commodity Funds | | |
Fidelity Series Commodity Strategy Fund | 9.9 | 8.6 |
Domestic Equity Funds | | |
Fidelity Advisor Equity Growth Fund Institutional Class | 5.6 | 5.9 |
Fidelity Advisor Equity Income Fund Institutional Class | 0.0 | 1.2 |
Fidelity Advisor Growth & Income Fund Institutional Class | 7.8 | 8.1 |
Fidelity Advisor Large Cap Fund Institutional Class | 7.8 | 8.0 |
Fidelity Advisor Small Cap Fund Institutional Class | 2.9 | 2.9 |
Fidelity Series 100 Index Fund | 6.7 | 6.4 |
Fidelity Series All-Sector Equity Fund | 11.2 | 11.4 |
Fidelity Series Large Cap Value Fund | 11.3 | 10.2 |
Fidelity Series Small Cap Opportunities Fund | 2.8 | 2.9 |
| 56.1 | 57.0 |
Developed International Equity Funds | | |
Fidelity Advisor Diversified International Fund Institutional Class | 3.3 | 4.7 |
Fidelity Advisor Overseas Fund Institutional Class | 3.3 | 4.7 |
Fidelity Series International Growth Fund | 6.2 | 5.1 |
Fidelity Series International Small Cap Fund | 1.2 | 1.0 |
Fidelity Series International Value Fund | 6.0 | 4.9 |
| 20.0 | 20.4 |
Emerging Markets Equity Funds | | |
Fidelity Series Emerging Markets Fund | 3.6 | 3.4 |
High Yield Bond Funds | | |
Fidelity Advisor High Income Advantage Fund Institutional Class | 0.0 | 9.9 |
Fidelity Series Emerging Markets Debt Fund | 0.1 | 0.0 |
Fidelity Series High Income Fund | 9.3 | 0.0 |
| 9.4 | 9.9 |
Investment Grade Bond Funds | | |
Fidelity Advisor Strategic Real Return Fund Institutional Class | 0.1 | 0.1 |
Fidelity Advisor Total Bond Fund Institutional Class | 0.0 | 0.0* |
Fidelity Series Investment Grade Bond Fund | 0.9 | 0.6 |
| 1.0 | 0.7 |
| | |
Net Other Assets (Liabilities)* | 0.0 | 0.0 |
| 100.0 | 100.0 |
* Amount represents less than 0.1% |
Asset Allocation (% of fund's net assets) |
Current |
| Commodity Funds | 9.9% | |
| Domestic Equity Funds | 56.1% | |
| Developed International Equity Funds | 20.0% | |
| Emerging Markets Equity Funds | 3.6% | |
| High Yield Bond Funds | 9.4% | |
| Investment Grade Bond Funds | 1.0% | |

Six months ago |
| Commodity Funds | 8.6% | |
| Domestic Equity Funds | 57.0% | |
| Developed International Equity Funds | 20.4% | |
| Emerging Markets Equity Funds | 3.4% | |
| High Yield Bond Funds | 9.9% | |
| Investment Grade Bond Funds | 0.7% | |

Expected |
| Commodity Funds | 9.7% | |
| Domestic Equity Funds | 55.0% | |
| Developed International Equity Funds | 20.0% | |
| Emerging Markets Equity Funds | 3.6% | |
| High Yield Bond Funds | 10.0% | |
| Investment Grade Bond Funds | 1.7% | |

The fund invests according to an asset allocation strategy that becomes increasingly conservative over time. The six months ago allocation is based on the fund's holdings as of September 30, 2010. The current allocation is based on the fund's holdings as of March 31, 2011. The expected allocation represents the fund's anticipated allocation at September 30, 2011. |
Annual Report
Fidelity Advisor Freedom 2050 Fund
Investments March 31, 2011
Showing Percentage of Net Assets
Domestic Equity Funds - 66.0% |
| Shares | | Value |
Commodity Funds - 9.9% |
Fidelity Series Commodity Strategy Fund | 2,716,092 | | $ 35,798,090 |
Domestic Equity Funds - 56.1% |
Fidelity Advisor Equity Growth Fund Institutional Class | 327,857 | | 20,376,284 |
Fidelity Advisor Growth & Income Fund Institutional Class | 1,571,715 | | 28,369,464 |
Fidelity Advisor Large Cap Fund Institutional Class | 1,424,776 | | 28,110,836 |
Fidelity Advisor Small Cap Fund Institutional Class | 374,358 | | 10,508,233 |
Fidelity Series 100 Index Fund | 2,647,456 | | 24,356,596 |
Fidelity Series All-Sector Equity Fund | 3,108,420 | | 40,751,384 |
Fidelity Series Large Cap Value Fund | 3,361,442 | | 41,043,208 |
Fidelity Series Small Cap Opportunities Fund | 873,271 | | 10,295,866 |
TOTAL DOMESTIC EQUITY FUNDS | | 203,811,871 |
TOTAL DOMESTIC EQUITY FUNDS (Cost $199,831,566) | 239,609,961 |
International Equity Funds - 23.6% |
| | | |
Developed International Equity Funds - 20.0% |
Fidelity Advisor Diversified International Fund Institutional Class | 711,305 | | 11,957,032 |
Fidelity Advisor Overseas Fund Institutional Class | 621,021 | | 11,818,023 |
Fidelity Series International Growth Fund | 1,956,973 | | 22,524,759 |
Fidelity Series International Small Cap Fund | 354,707 | | 4,377,080 |
Fidelity Series International Value Fund | 2,082,798 | | 21,848,550 |
TOTAL DEVELOPED INTERNATIONAL EQUITY FUNDS | | 72,525,444 |
|
| Shares | | Value |
Emerging Markets Equity Funds - 3.6% |
Fidelity Series Emerging Markets Fund | 694,888 | | $ 13,314,059 |
TOTAL INTERNATIONAL EQUITY FUNDS (Cost $72,046,035) | 85,839,503 |
Bond Funds - 10.4% |
| | | |
High Yield Bond Funds - 9.4% |
Fidelity Series Emerging Markets Debt Fund | 48,885 | | 489,053 |
Fidelity Series High Income Fund | 3,365,147 | | 33,718,776 |
TOTAL HIGH YIELD BOND FUNDS | | 34,207,829 |
Investment Grade Bond Funds - 1.0% |
Fidelity Advisor Strategic Real Return Fund Institutional Class | 43,522 | | 430,867 |
Fidelity Series Investment Grade Bond Fund | 279,890 | | 3,185,152 |
TOTAL INVESTMENT GRADE BOND FUNDS | | 3,616,019 |
TOTAL BOND FUNDS (Cost $37,675,727) | 37,823,848 |
TOTAL INVESTMENT PORTFOLIO - 100.0% (Cost $309,553,328) | | 363,273,312 |
NET OTHER ASSETS (LIABILITIES) - 0.0% | | (27,016) |
NET ASSETS - 100% | $ 363,246,296 |
Other Information |
All investments are categorized as Level 1 under the Fair Value Hierarchy. The inputs or methodology used for valuing securities may not be an indication of the risk associated with investing in those securities. For more information on valuation inputs, please refer to the Security Valuation section in the accompanying Notes to Financial Statements. |
Income Tax Information |
At March 31, 2011, the Fund had a capital loss carryforward of approximately $9,460,678 of which $7,387,590 and $2,073,088 will expire in fiscal 2017 and 2019, respectively. Capital loss carryforwards are only available to offset future capital gains of the Fund to the extent provided by regulations and may be limited. |
See accompanying notes which are an integral part of the financial statements.
Annual Report
Fidelity Advisor Freedom 2050 Fund
Statement of Assets and Liabilities
| March 31, 2011 |
Assets | | |
Investment in securities, at value (cost $309,553,328) - See accompanying schedule | | $ 363,273,312 |
Receivable for investments sold | | 58,053 |
Receivable for fund shares sold | | 1,159,908 |
Distributions receivable from underlying funds | | 59,428 |
Total assets | | 364,550,701 |
| | |
Liabilities | | |
Payable to custodian bank | $ 6 | |
Payable for investments purchased | 490,051 | |
Payable for fund shares redeemed | 727,907 | |
Distribution and service plan fees payable | 86,441 | |
Total liabilities | | 1,304,405 |
| | |
Net Assets | | $ 363,246,296 |
Net Assets consist of: | | |
Paid in capital | | $ 319,648,808 |
Undistributed net investment income | | 187,172 |
Accumulated undistributed net realized gain (loss) on investments | | (10,309,668) |
Net unrealized appreciation (depreciation) on investments | | 53,719,984 |
Net Assets | | $ 363,246,296 |
| | |
Calculation of Maximum Offering Price Class A:
Net Asset Value and redemption price per share ($220,548,765 ÷ 22,204,534 shares) | | $ 9.93 |
| | |
Maximum offering price per share (100/94.25 of $9.93) | | $ 10.54 |
Class T:
Net Asset Value and redemption price per share ($61,195,440 ÷ 6,179,564 shares) | | $ 9.90 |
| | |
Maximum offering price per share (100/96.50 of $9.90) | | $ 10.26 |
Class B:
Net Asset Value and offering price per share ($6,703,624 ÷ 680,117 shares)A | | $ 9.86 |
| | |
Class C:
Net Asset Value and offering price per share ($12,013,802 ÷ 1,217,571 shares)A | | $ 9.87 |
| | |
Institutional Class:
Net Asset Value, offering price and redemption price per share ($62,784,665 ÷ 6,294,954 shares) | | $ 9.97 |
A Redemption price per share is equal to net asset value less any applicable contingent deferred sales charge.
Statement of Operations
| Year ended March 31, 2011 |
Investment Income | | |
Income distributions from underlying funds | | $ 4,207,967 |
| | |
Expenses | | |
Distribution and service plan fees | $ 843,917 | |
Independent trustees' compensation | 1,013 | |
Total expenses before reductions | 844,930 | |
Expense reductions | (1,013) | 843,917 |
Net investment income (loss) | | 3,364,050 |
Realized and Unrealized Gain (Loss) Realized gain (loss) on sale of underlying fund shares | (3,912,355) | |
Capital gain distributions from underlying funds | 6,619,448 | |
Total net realized gain (loss) | | 2,707,093 |
Change in net unrealized appreciation (depreciation) on underlying funds | | 43,618,643 |
Net gain (loss) | | 46,325,736 |
Net increase (decrease) in net assets resulting from operations | | $ 49,689,786 |
See accompanying notes which are an integral part of the financial statements.
Annual Report
Statement of Changes in Net Assets
| Year ended
March 31,
2011 | Year ended
March 31,
2010 |
Increase (Decrease) in Net Assets | | |
Operations | | |
Net investment income (loss) | $ 3,364,050 | $ 2,390,969 |
Net realized gain (loss) | 2,707,093 | 234,035 |
Change in net unrealized appreciation (depreciation) | 43,618,643 | 64,796,791 |
Net increase (decrease) in net assets resulting from operations | 49,689,786 | 67,421,795 |
Distributions to shareholders from net investment income | (3,328,255) | (2,382,215) |
Distributions to shareholders from net realized gain | (2,446,029) | (1,702,157) |
Total distributions | (5,774,284) | (4,084,372) |
Share transactions - net increase (decrease) | 79,457,808 | 74,234,725 |
Total increase (decrease) in net assets | 123,373,310 | 137,572,148 |
| | |
Net Assets | | |
Beginning of period | 239,872,986 | 102,300,838 |
End of period (including undistributed net investment income of $187,172 and undistributed net investment income of $151,377, respectively) | $ 363,246,296 | $ 239,872,986 |
Financial Highlights - Class A
Years ended March 31, | 2011 | 2010 | 2009 | 2008 | 2007 G |
Selected Per-Share Data | | | | | |
Net asset value, beginning of period | $ 8.66 | $ 5.67 | $ 10.32 | $ 11.04 | $ 10.00 |
Income from Investment Operations | | | | | |
Net investment income (loss) E | .11 | .11 | .16 | .16 | .13 |
Net realized and unrealized gain (loss) | 1.34 | 3.05 | (4.39) | (.60) | 1.06 |
Total from investment operations | 1.45 | 3.16 | (4.23) | (.44) | 1.19 |
Distributions from net investment income | (.11) | (.10) | (.13) | (.11) | (.09) |
Distributions from net realized gain | (.08) | (.07) | (.30) | (.17) | (.06) |
Total distributions | (.18) J | (.17) | (.42) I | (.28) | (.15) |
Net asset value, end of period | $ 9.93 | $ 8.66 | $ 5.67 | $ 10.32 | $ 11.04 |
Total Return B,C,D | 16.99% | 55.94% | (42.30)% | (4.27)% | 11.91% |
Ratios to Average Net Assets F,H | | | | | |
Expenses before reductions | .25% | .25% | .25% | .25% | .25% A |
Expenses net of fee waivers, if any | .25% | .25% | .25% | .25% | .25% A |
Expenses net of all reductions | .25% | .25% | .25% | .25% | .25% A |
Net investment income (loss) | 1.23% | 1.43% | 2.04% | 1.39% | 1.45% A |
Supplemental Data | | | | | |
Net assets, end of period (000 omitted) | $ 220,549 | $ 137,716 | $ 57,591 | $ 55,250 | $ 12,907 |
Portfolio turnover rate | 36% | 15% | 16% | 25% | 4% A |
A Annualized
B Total returns for periods of less than one year are not annualized.
C Total returns would have been lower had certain expenses not been reduced during the periods shown.
D Total returns do not include the effect of the sales charges.
E Calculated based on average shares outstanding during the period.
F Amounts do not include the activity of the underlying funds.
G For the period June 1, 2006 (commencement of operations) to March 31, 2007.
H Expense ratios reflect operating expenses of the class. Expenses before reductions do not reflect amounts reimbursed by the investment adviser or reductions from expense offset arrangements and do not represent the amount paid by the class during periods when reimbursements or reductions occur. Expenses net of fee waivers reflect expenses after reimbursement by the investment adviser but prior to reductions from expense offset arrangements. Expenses net of all reductions represent the net expenses paid by the class but do not include expenses of the investment companies in which the Fund invests.
I Total distributions of $.42 per share is comprised of distributions from net investment income of $.127 and distributions from net realized gain of $.295 per share.
J Total distributions of $.18 per share is comprised of distributions from net investment income of $.105 and distributions from net realized gain of $.079 per share.
See accompanying notes which are an integral part of the financial statements.
Annual Report
Financial Highlights - Class T
Years ended March 31, | 2011 | 2010 | 2009 | 2008 | 2007 G |
Selected Per-Share Data | | | | | |
Net asset value, beginning of period | $ 8.64 | $ 5.66 | $ 10.30 | $ 11.02 | $ 10.00 |
Income from Investment Operations | | | | | |
Net investment income (loss) E | .09 | .09 | .14 | .13 | .11 |
Net realized and unrealized gain (loss) | 1.33 | 3.05 | (4.37) | (.59) | 1.05 |
Total from investment operations | 1.42 | 3.14 | (4.23) | (.46) | 1.16 |
Distributions from net investment income | (.09) | (.09) | (.11) | (.09) | (.08) |
Distributions from net realized gain | (.08) | (.07) | (.30) | (.17) | (.06) |
Total distributions | (.16) J | (.16) | (.41) I | (.26) | (.14) |
Net asset value, end of period | $ 9.90 | $ 8.64 | $ 5.66 | $ 10.30 | $ 11.02 |
Total Return B,C,D | 16.66% | 55.57% | (42.41)% | (4.45)% | 11.64% |
Ratios to Average Net Assets F,H | | | | | |
Expenses before reductions | .50% | .50% | .50% | .50% | .50% A |
Expenses net of fee waivers, if any | .50% | .50% | .50% | .50% | .50% A |
Expenses net of all reductions | .50% | .50% | .50% | .50% | .50% A |
Net investment income (loss) | .98% | 1.18% | 1.79% | 1.14% | 1.20% A |
Supplemental Data | | | | | |
Net assets, end of period (000 omitted) | $ 61,195 | $ 46,449 | $ 21,186 | $ 15,147 | $ 3,520 |
Portfolio turnover rate | 36% | 15% | 16% | 25% | 4% A |
A Annualized
B Total returns for periods of less than one year are not annualized.
C Total returns would have been lower had certain expenses not been reduced during the periods shown.
D Total returns do not include the effect of the sales charges.
E Calculated based on average shares outstanding during the period.
F Amounts do not include the activity of the underlying funds.
G For the period June 1, 2006 (commencement of operations) to March 31, 2007.
H Expense ratios reflect operating expenses of the class. Expenses before reductions do not reflect amounts reimbursed by the investment adviser or reductions from expense offset arrangements and do not represent the amount paid by the class during periods when reimbursements or reductions occur. Expenses net of fee waivers reflect expenses after reimbursement by the investment adviser but prior to reductions from expense offset arrangements. Expenses net of all reductions represent the net expenses paid by the class but do not include expenses of the investment companies in which the Fund invests.
I Total distributions of $.41 per share is comprised of distributions from net investment income of $.112 and distributions from net realized gain of $.295 per share.
J Total distributions of $.16 per share is comprised of distributions from net investment income of $.085 and distributions from net realized gain of $.079 per share.
Financial Highlights - Class B
Years ended March 31, | 2011 | 2010 | 2009 | 2008 | 2007 G |
Selected Per-Share Data | | | | | |
Net asset value, beginning of period | $ 8.60 | $ 5.64 | $ 10.26 | $ 11.00 | $ 10.00 |
Income from Investment Operations | | | | | |
Net investment income (loss) E | .04 | .05 | .10 | .07 | .06 |
Net realized and unrealized gain (loss) | 1.34 | 3.03 | (4.35) | (.59) | 1.07 |
Total from investment operations | 1.38 | 3.08 | (4.25) | (.52) | 1.13 |
Distributions from net investment income | (.05) | (.05) | (.08) | (.06) | (.07) |
Distributions from net realized gain | (.07) | (.07) | (.29) | (.16) | (.06) |
Total distributions | (.12) | (.12) | (.37) I | (.22) | (.13) |
Net asset value, end of period | $ 9.86 | $ 8.60 | $ 5.64 | $ 10.26 | $ 11.00 |
Total Return B,C,D | 16.16% | 54.72% | (42.71)% | (4.93)% | 11.31% |
Ratios to Average Net Assets F,H | | | | | |
Expenses before reductions | 1.00% | 1.00% | 1.00% | 1.00% | 1.00% A |
Expenses net of fee waivers, if any | 1.00% | 1.00% | 1.00% | 1.00% | 1.00% A |
Expenses net of all reductions | 1.00% | 1.00% | 1.00% | 1.00% | 1.00% A |
Net investment income (loss) | .48% | .68% | 1.29% | .64% | .70% A |
Supplemental Data | | | | | |
Net assets, end of period (000 omitted) | $ 6,704 | $ 5,847 | $ 3,078 | $ 3,414 | $ 1,177 |
Portfolio turnover rate | 36% | 15% | 16% | 25% | 4% A |
A Annualized
B Total returns for periods of less than one year are not annualized.
C Total returns would have been lower had certain expenses not been reduced during the periods shown.
D Total returns do not include the effect of the contingent deferred sales charge.
E Calculated based on average shares outstanding during the period.
F Amounts do not include the activity of the underlying funds.
G For the period June 1, 2006 (commencement of operations) to March 31, 2007.
H Expense ratios reflect operating expenses of the class. Expenses before reductions do not reflect amounts reimbursed by the investment adviser or reductions from expense offset arrangements and do not represent the amount paid by the class during periods when reimbursements or reductions occur. Expenses net of fee waivers reflect expenses after reimbursement by the investment adviser but prior to reductions from expense offset arrangements. Expenses net of all reductions represent the net expenses paid by the class but do not include expenses of the investment companies in which the Fund invests.
I Total distributions of $.37 per share is comprised of distributions from net investment income of $.078 and distributions from net realized gain of $.290 per share.
See accompanying notes which are an integral part of the financial statements.
Annual Report
Financial Highlights - Class C
Years ended March 31, | 2011 | 2010 | 2009 | 2008 | 2007 G |
Selected Per-Share Data | | | | | |
Net asset value, beginning of period | $ 8.61 | $ 5.63 | $ 10.25 | $ 11.00 | $ 10.00 |
Income from Investment Operations | | | | | |
Net investment income (loss) E | .04 | .05 | .10 | .07 | .06 |
Net realized and unrealized gain (loss) | 1.34 | 3.05 | (4.35) | (.59) | 1.06 |
Total from investment operations | 1.38 | 3.10 | (4.25) | (.52) | 1.12 |
Distributions from net investment income | (.05) | (.05) | (.08) | (.07) | (.06) |
Distributions from net realized gain | (.07) | (.07) | (.29) | (.16) | (.06) |
Total distributions | (.12) | (.12) | (.37) I | (.23) | (.12) |
Net asset value, end of period | $ 9.87 | $ 8.61 | $ 5.63 | $ 10.25 | $ 11.00 |
Total Return B,C,D | 16.16% | 55.15% | (42.74)% | (4.99)% | 11.25% |
Ratios to Average Net Assets F,H | | | | | |
Expenses before reductions | 1.00% | 1.00% | 1.00% | 1.00% | 1.00% A |
Expenses net of fee waivers, if any | 1.00% | 1.00% | 1.00% | 1.00% | 1.00% A |
Expenses net of all reductions | 1.00% | 1.00% | 1.00% | 1.00% | 1.00% A |
Net investment income (loss) | .48% | .68% | 1.29% | .64% | .70% A |
Supplemental Data | | | | | |
Net assets, end of period (000 omitted) | $ 12,014 | $ 9,646 | $ 5,436 | $ 5,380 | $ 1,507 |
Portfolio turnover rate | 36% | 15% | 16% | 25% | 4% A |
A Annualized
B Total returns for periods of less than one year are not annualized.
C Total returns would have been lower had certain expenses not been reduced during the periods shown.
D Total returns do not include the effect of the contingent deferred sales charge.
E Calculated based on average shares outstanding during the period.
F Amounts do not include the activity of the underlying funds.
G For the period June 1, 2006 (commencement of operations) to March 31, 2007.
H Expense ratios reflect operating expenses of the class. Expenses before reductions do not reflect amounts reimbursed by the investment adviser or reductions from expense offset arrangements and do not represent the amount paid by the class during periods when reimbursements or reductions occur. Expenses net of fee waivers reflect expenses after reimbursement by the investment adviser but prior to reductions from expense offset arrangements. Expenses net of all reductions represent the net expenses paid by the class but do not include expenses of the investment companies in which the Fund invests.
I Total distributions of $.37 per share is comprised of distributions from net investment income of $.080 and distributions from net realized gain of $.290 per share.
Financial Highlights - Institutional Class
Years ended March 31, | 2011 | 2010 | 2009 | 2008 | 2007 G |
Selected Per-Share Data | | | | | |
Net asset value, beginning of period | $ 8.70 | $ 5.68 | $ 10.35 | $ 11.06 | $ 10.00 |
Income from Investment Operations | | | | | |
Net investment income (loss) D | .13 | .13 | .17 | .18 | .15 |
Net realized and unrealized gain (loss) | 1.34 | 3.08 | (4.40) | (.59) | 1.06 |
Total from investment operations | 1.47 | 3.21 | (4.23) | (.41) | 1.21 |
Distributions from net investment income | (.13) | (.12) | (.15) | (.13) | (.09) |
Distributions from net realized gain | (.08) | (.07) | (.30) | (.17) | (.06) |
Total distributions | (.20) J | (.19) | (.44) I | (.30) | (.15) |
Net asset value, end of period | $ 9.97 | $ 8.70 | $ 5.68 | $ 10.35 | $ 11.06 |
Total Return B,C | 17.17% | 56.66% | (42.22)% | (4.02)% | 12.16% |
Ratios to Average Net Assets E,H | | | | | |
Expenses before reductions F | .00% | .00% | .00% | .00% | .00% A |
Expenses net of fee waivers, if any | .00% | .00% | .00% | .00% | .00% A |
Expenses net of all reductions | .00% | .00% | .00% | .00% | .00% A |
Net investment income (loss) | 1.48% | 1.68% | 2.29% | 1.64% | 1.70% A |
Supplemental Data | | | | | |
Net assets, end of period (000 omitted) | $ 62,785 | $ 40,214 | $ 15,010 | $ 6,882 | $ 982 |
Portfolio turnover rate | 36% | 15% | 16% | 25% | 4% A |
A Annualized
B Total returns for periods of less than one year are not annualized.
C Total returns would have been lower had certain expenses not been reduced during the periods shown.
D Calculated based on average shares outstanding during the period.
E Amounts do not include the activity of the underlying funds.
F Amount represents less than .01%.
G For the period June 1, 2006 (commencement of operations) to March 31, 2007.
H Expense ratios reflect operating expenses of the class. Expenses before reductions do not reflect amounts reimbursed by the investment adviser or reductions from expense offset arrangements and do not represent the amount paid by the class during periods when reimbursements or reductions occur. Expenses net of fee waivers reflect expenses after reimbursement by the investment adviser but prior to reductions from expense offset arrangements. Expenses net of all reductions represent the net expenses paid by the class but do not include expenses of the investment companies in which the Fund invests.
I Total distributions of $.44 per share is comprised of distributions from net investment income of $.146 and distributions from net realized gain of $.295 per share.
J Total distributions of $.20 per share is comprised of distributions from net investment income of $.125 and distributions from net realized gain of $.079 per share.
See accompanying notes which are an integral part of the financial statements.
Annual Report
Notes to Financial Statements
For the period ended March 31, 2011
1. Organization.
Fidelity Advisor Freedom Income Fund, Fidelity Advisor Freedom 2005 Fund, Fidelity Advisor Freedom 2010 Fund, Fidelity Advisor Freedom 2015 Fund, Fidelity Advisor Freedom 2020 Fund, Fidelity Advisor Freedom 2025 Fund, Fidelity Advisor Freedom 2030 Fund, Fidelity Advisor Freedom 2035 Fund, Fidelity Advisor Freedom 2040 Fund, Fidelity Advisor Freedom 2045 Fund and Fidelity Advisor Freedom 2050 Fund (the Funds) are funds of Fidelity Aberdeen Street Trust (the Trust). The Trust is registered under the Investment Company Act of 1940, as amended (the 1940 Act), as an open-end management investment company organized as a Delaware statutory trust. Each Fund is authorized to issue an unlimited number of shares. The Funds invest primarily in a combination of other Fidelity equity, bond, and short-term funds (the Underlying Funds) managed by Fidelity Management & Research Company (FMR).
Each Fund offers Class A, Class T, Class C, and Institutional Class shares, each of which, along with Class B shares, has equal rights as to assets and voting privileges. Effective after the close of business on September 1, 2010, Class B shares were closed to new accounts and additional purchases by existing shareholders. Each class has exclusive voting rights with respect to matters that affect that class. Class B shares will automatically convert to Class A shares after a holding period of seven years from the initial date of purchase. Investment income, realized and unrealized capital gains and losses, the common expenses of the Fund, and certain fund-level expense reductions, if any, are allocated on a pro-rata basis to each class based on the relative net assets of each class to the total net assets of the Fund. Each class differs with respect to distribution and service plan fees incurred. Certain expense reductions may also differ by class.
2. Significant Accounting Policies.
The financial statements have been prepared in conformity with accounting principles generally accepted in the United States of America (GAAP), which require management to make certain estimates and assumptions at the date of the financial statements. Actual results could differ from those estimates. Subsequent events, if any, through the date that the financial statements were issued have been evaluated in the preparation of the financial statements. The following summarizes the significant accounting policies of the Funds:
Security Valuation. Investments are valued as of 4:00 p.m. Eastern time on the last calendar day of the period. Each Fund categorizes the inputs to valuation techniques used to value their investments into a disclosure hierarchy consisting of three levels as shown below.
Level 1 - quoted prices in active markets for identical investments
Level 2 - other significant observable inputs (including quoted prices for similar investments, interest rates, prepayment speeds, etc.)
Level 3 - unobservable inputs (including the Fund's own assumptions based on the best information available)
Valuation techniques used to value each Fund's investments by major category are as follows. Investments in the Underlying Funds are valued at their closing net asset value (NAV) each business day and are categorized as Level 1 in the hierarchy.
Investment Transactions and Income. For financial reporting purposes, the Funds' investment holdings and NAV include trades executed through the end of the last business day of the period. The NAV per share for processing shareholder transactions is calculated as of the close of business of the New York Stock Exchange (NYSE), normally 4:00 p.m. Eastern time and includes trades executed through the end of the prior business day. Gains and losses on securities sold are determined on the basis of identified cost. Income and capital gain distributions from the Underlying Funds, if any, are recorded on the ex-dividend date.
Expenses. Expenses directly attributable to a fund are charged to that fund. Expenses attributable to more than one fund are allocated among the respective funds on the basis of relative net assets or other appropriate methods. Expenses included in the accompanying financial statements reflect the expenses of the Fund and do not include any expenses associated with the Underlying Funds. Expense estimates are accrued in the period to which they relate and adjustments are made when actual amounts are known.
Income Tax Information and Distributions to Shareholders. Each year each Fund intends to qualify as a regulated investment company, including distributing substantially all of its taxable income and realized gains under Subchapter M of the Internal Revenue Code and filing its U.S. federal tax return. As a result, no provision for income taxes is required. As of March 31, 2011, each Fund did not have any unrecognized tax benefits in the accompanying financial statements. A fund's federal tax return is subject to examination by the Internal Revenue Service (IRS) for a period of three years.
Distributions are declared and recorded on the ex-dividend date. Income dividends and capital gain distributions are declared separately for each class. Income and capital gain distributions are determined in accordance with income tax regulations, which may differ from GAAP.
Capital accounts within the financial statements are adjusted for permanent book-tax differences. These adjustments have no impact on net assets or the results of operations. Temporary book-tax differences will reverse in a subsequent period.
Book-tax differences are primarily due to the short-term gain distributions from the Underlying Funds, capital loss carryforwards, losses deferred due to wash sales and excise tax regulations.
Annual Report
2. Significant Accounting Policies - continued
Income Tax Information and Distributions to Shareholders - continued
The federal tax cost of investment securities and unrealized appreciation (depreciation) as of period end were as follows for each Fund:
| Tax cost | Gross unrealized
appreciation | Gross unrealized
depreciation | Net unrealized
appreciation
(depreciation) on
securities and other investments |
Advisor Freedom Income | $ 254,450,368 | $ 15,097,830 | $ (1,240,748) | $ 13,857,082 |
Advisor Freedom 2005 | 226,308,879 | 20,131,453 | (1,272,852) | 18,858,601 |
Advisor Freedom 2010 | 778,578,042 | 90,826,046 | (4,039,480) | 86,786,566 |
Advisor Freedom 2015 | 1,436,244,493 | 155,840,261 | (8,965,214) | 146,875,047 |
Advisor Freedom 2020 | 2,224,605,313 | 299,202,650 | (13,307,205) | 285,895,445 |
Advisor Freedom 2025 | 1,705,974,556 | 240,668,240 | (13,112,504) | 227,555,736 |
Advisor Freedom 2030 | 1,851,836,312 | 287,784,237 | (13,194,454) | 274,589,783 |
Advisor Freedom 2035 | 1,185,450,526 | 185,165,695 | (11,295,557) | 173,870,138 |
Advisor Freedom 2040 | 1,367,918,465 | 142,699,638 | (39,550,294) | 103,149,344 |
Advisor Freedom 2045 | 413,532,657 | 67,404,862 | (3,311,035) | 64,093,827 |
Advisor Freedom 2050 | 311,154,330 | 54,934,408 | (2,815,426) | 52,118,982 |
The tax-based components of distributable earnings as of period end were as follows for each Fund:
| Undistributed
ordinary
income | Capital loss
carryforward | Net unrealized
appreciation
(depreciation) |
Advisor Freedom Income | $ 334,390 | $ (1,843,340) | $ 13,857,082 |
Advisor Freedom 2005 | 636,273 | (10,668,320) | 18,858,601 |
Advisor Freedom 2010 | 2,367,300 | (64,568,962) | 86,786,566 |
Advisor Freedom 2015 | 4,390,617 | (70,260,528) | 146,875,047 |
Advisor Freedom 2020 | 7,072,019 | (159,878,472) | 285,895,445 |
Advisor Freedom 2025 | 5,717,870 | (94,931,344) | 227,555,736 |
Advisor Freedom 2030 | 6,275,538 | (151,905,233) | 274,589,783 |
Advisor Freedom 2035 | 3,654,464 | (65,938,206) | 173,870,138 |
Advisor Freedom 2040 | 3,985,437 | (8,343,013) | 103,149,344 |
Advisor Freedom 2045 | 1,352,912 | (4,711,973) | 64,093,827 |
Advisor Freedom 2050 | 939,183 | (9,460,678) | 52,118,982 |
The tax character of distributions paid was as follows:
March 31, 2011 | |
| Ordinary Income |
Advisor Freedom Income | $ 5,222,539 |
Advisor Freedom 2005 | 4,810,358 |
Advisor Freedom 2010 | 18,506,535 |
Advisor Freedom 2015 | 32,043,769 |
Advisor Freedom 2020 | 51,822,133 |
Advisor Freedom 2025 | 37,582,515 |
Advisor Freedom 2030 | 41,392,908 |
Advisor Freedom 2035 | 23,707,899 |
Advisor Freedom 2040 | 26,640,038 |
Advisor Freedom 2045 | 7,820,796 |
Advisor Freedom 2050 | 5,774,284 |
Annual Report
Notes to Financial Statements - continued
2. Significant Accounting Policies - continued
Income Tax Information and Distributions to Shareholders - continued
March 31, 2010 | |
| Ordinary Income |
Advisor Freedom Income | $ 5,386,214 |
Advisor Freedom 2005 | 4,599,553 |
Advisor Freedom 2010 | 21,195,098 |
Advisor Freedom 2015 | 30,068,389 |
Advisor Freedom 2020 | 46,813,378 |
Advisor Freedom 2025 | 30,807,178 |
Advisor Freedom 2030 | 32,895,819 |
Advisor Freedom 2035 | 17,729,224 |
Advisor Freedom 2040 | 22,536,795 |
Advisor Freedom 2045 | 5,084,127 |
Advisor Freedom 2050 | 4,084,372 |
3. Purchases and Sales of Investments.
Purchases and redemptions of the Underlying Fund shares are noted in the table below.
| Purchases ($) | Redemptions ($) |
Advisor Freedom Income | 112,241,847 | 87,997,563 |
Advisor Freedom 2005 | 110,153,598 | 91,226,065 |
Advisor Freedom 2010 | 334,992,248 | 364,901,354 |
Advisor Freedom 2015 | 623,143,997 | 455,099,699 |
Advisor Freedom 2020 | 1,042,257,096 | 854,948,802 |
Advisor Freedom 2025 | 833,754,838 | 542,793,719 |
Advisor Freedom 2030 | 903,340,959 | 688,923,630 |
Advisor Freedom 2035 | 582,068,528 | 331,050,185 |
Advisor Freedom 2040 | 607,219,512 | 487,507,973 |
Advisor Freedom 2045 | 251,554,644 | 115,106,534 |
Advisor Freedom 2050 | 186,927,428 | 103,293,661 |
4. Fees and Other Transactions with Affiliates.
Management Fee. Strategic Advisers, Inc. (Strategic Advisers), an affiliate of FMR, provides the Funds with investment management related services. The Funds do not pay any fees for these services.
Other Transactions. Strategic Advisers has entered into an administration agreement with FMR under which FMR provides management and administrative services (other than investment advisory services) necessary for the operation of each Fund. Pursuant to this agreement, FMR pays all expenses of each Fund, excluding the distribution and service fees, the compensation of the independent Trustees and certain other expenses such as interest expense. FMR also contracts with other Fidelity companies to perform the services necessary for the operation of each Fund. The Funds do not pay any fees for these services.
Distribution and Service Plan Fees. In accordance with Rule 12b-1 of the 1940 Act, the Fund has adopted separate Distribution and Service Plans for each class of shares. Certain classes pay Fidelity Distributors Corporation (FDC), an affiliate of FMR, separate Distribution and Service Fees, each of which is based on an annual percentage of each class' average net assets. In addition, FDC may pay financial intermediaries for selling shares of the Fund and providing shareholder support services. For the period, the Distribution and Service Fee rates, total fees and amounts retained by FDC were as follows:
Advisor Freedom Income | Distribution
Fee | Service
Fee | Paid to
FDC | Retained by
FDC |
Class A | 0% | .25% | $ 382,574 | $ 43,037 |
Class T | .25% | .25% | 280,121 | 105 |
Class B | .75% | .25% | 48,114 | 36,104 |
Class C | .75% | .25% | 163,202 | 29,930 |
| | | $ 874,011 | $ 109,176 |
Annual Report
4. Fees and Other Transactions with Affiliates - continued
Distribution and Service Plan Fees - continued
Advisor Freedom 2005 | Distribution
Fee | Service
Fee | Paid to
FDC | Retained by
FDC |
Class A | 0% | .25% | $ 403,820 | $ 78,774 |
Class T | .25% | .25% | 108,138 | 307 |
Class B | .75% | .25% | 27,356 | 20,591 |
Class C | .75% | .25% | 90,452 | 8,045 |
| | | $ 629,766 | $ 107,717 |
Advisor Freedom 2010 | | | | |
Class A | 0% | .25% | $ 1,229,508 | $ 179,315 |
Class T | .25% | .25% | 868,770 | 1,831 |
Class B | .75% | .25% | 195,879 | 147,126 |
Class C | .75% | .25% | 448,912 | 37,957 |
| | | $ 2,743,069 | $ 366,229 |
Advisor Freedom 2015 | | | | |
Class A | 0% | .25% | $ 2,213,927 | $ 316,727 |
Class T | .25% | .25% | 1,140,560 | 536 |
Class B | .75% | .25% | 346,317 | 260,025 |
Class C | .75% | .25% | 657,478 | 72,664 |
| | | $ 4,358,282 | $ 649,952 |
Advisor Freedom 2020 | | | | |
Class A | 0% | .25% | $ 3,358,253 | $ 477,829 |
Class T | .25% | .25% | 2,215,736 | 3,050 |
Class B | .75% | .25% | 677,849 | 508,590 |
Class C | .75% | .25% | 954,354 | 109,582 |
| | | $ 7,206,192 | $ 1,099,051 |
Advisor Freedom 2025 | | | | |
Class A | 0% | .25% | $ 2,740,976 | $ 420,238 |
Class T | .25% | .25% | 1,190,671 | 1,713 |
Class B | .75% | .25% | 385,064 | 289,034 |
Class C | .75% | .25% | 552,258 | 71,282 |
| | | $ 4,868,969 | $ 782,267 |
Advisor Freedom 2030 | | | | |
Class A | 0% | .25% | $ 2,826,119 | $ 385,731 |
Class T | .25% | .25% | 1,769,944 | 2,008 |
Class B | .75% | .25% | 494,486 | 371,175 |
Class C | .75% | .25% | 635,285 | 74,027 |
| | | $ 5,725,834 | $ 832,941 |
Advisor Freedom 2035 | | | | |
Class A | 0% | .25% | $ 1,862,832 | $ 288,617 |
Class T | .25% | .25% | 763,441 | 641 |
Class B | .75% | .25% | 273,842 | 205,546 |
Class C | .75% | .25% | 321,980 | 46,619 |
| | | $ 3,222,095 | $ 541,423 |
Advisor Freedom 2040 | | | | |
Class A | 0% | .25% | $ 1,825,053 | $ 200,826 |
Class T | .25% | .25% | 1,392,188 | 4,373 |
Class B | .75% | .25% | 422,918 | 317,439 |
Class C | .75% | .25% | 542,607 | 63,801 |
| | | $ 4,182,766 | $ 586,439 |
Advisor Freedom 2045 | | | | |
Class A | 0% | .25% | $ 619,875 | $ 100,625 |
Class T | .25% | .25% | 251,216 | 613 |
Class B | .75% | .25% | 42,478 | 31,889 |
Class C | .75% | .25% | 72,843 | 15,531 |
| | | $ 986,412 | $ 148,658 |
Annual Report
Notes to Financial Statements - continued
4. Fees and Other Transactions with Affiliates - continued
Distribution and Service Plan Fees - continued
Advisor Freedom 2050 | Distribution
Fee | Service
Fee | Paid to
FDC | Retained by
FDC |
Class A | 0% | .25% | $ 421,189 | $ 41,252 |
Class T | .25% | .25% | 257,576 | 123 |
Class B | .75% | .25% | 61,496 | 46,168 |
Class C | .75% | .25% | 103,656 | 20,163 |
| | | $ 843,917 | $ 107,706 |
Sales Load. FDC may receive a front-end sales charge of up to 5.75% for selling Class A shares, and 3.50% for selling Class T shares, some of which is paid to financial intermediaries for selling shares of the Fund. Depending on the holding period, FDC may receive contingent deferred sales charges levied on Class A, Class T, Class B, and Class C redemptions. The deferred sales charges range from 5% to 1% for Class B, 1% for Class C, 1.00% for certain purchases of Class A shares (1.00% to .50% prior to July 12, 2010) and .25% for certain purchases of Class T shares.
For the period, sales charge amounts retained by FDC were as follows:
Advisor Freedom Income | Retained
by FDC |
Class A | $ 15,037 |
Class T | 3,652 |
Class B* | 18,548 |
Class C* | 2,489 |
| $ 39,726 |
Advisor Freedom 2005 | |
Class A | $ 11,018 |
Class T | 1,338 |
Class B* | 4,560 |
Class C* | 3,219 |
| $ 20,135 |
Advisor Freedom 2010 | |
Class A | $ 21,049 |
Class T | 9,745 |
Class B* | 41,152 |
Class C* | 2,907 |
| $ 74,853 |
Advisor Freedom 2015 | |
Class A | $ 59,492 |
Class T | 17,325 |
Class B* | 64,616 |
Class C* | 5,339 |
| $ 146,772 |
Advisor Freedom 2020 | |
Class A | $ 114,506 |
Class T | 33,114 |
Class B* | 114,487 |
Class C* | 7,092 |
| $ 269,199 |
Advisor Freedom 2025 | |
Class A | $ 89,850 |
Class T | 28,643 |
Class B* | 87,057 |
Class C* | 4,609 |
| $ 210,159 |
Advisor Freedom 2030 | |
Class A | $ 93,615 |
Class T | 31,256 |
Class B* | 104,418 |
Class C* | 8,434 |
| $ 237,723 |
Annual Report
4. Fees and Other Transactions with Affiliates - continued
Sales Load - continued
Advisor Freedom 2035 | Retained
by FDC |
Class A | $ 55,349 |
Class T | 21,209 |
Class B* | 53,297 |
Class C* | 4,118 |
| $ 133,973 |
Advisor Freedom 2040 | |
Class A | $ 83,454 |
Class T | 27,307 |
Class B* | 78,925 |
Class C* | 4,977 |
| $ 194,663 |
Advisor Freedom 2045 | |
Class A | $ 21,043 |
Class T | 7,148 |
Class B* | 14,825 |
Class C* | 1,797 |
| $ 44,813 |
Advisor Freedom 2050 | |
Class A | $ 32,590 |
Class T | 7,407 |
Class B* | 20,649 |
Class C* | 1,895 |
| $ 62,541 |
* When Class B and Class C shares are initially sold, FDC pays commissions from its own resources to financial intermediaries through which the sales are made.
Reallocation of Underlying Fund Investments. During the period, Strategic Advisers reallocated investments of the Funds. This involved taxable redemptions of the Funds' interest in Fidelity Advisor High Income Advantage Fund for cash and securities and non-taxable exchanges of those securities for shares of Fidelity Series High Income Fund. Realized gains and losses on the redemptions of Fidelity Advisor High Income Advantage Fund in connection with the reallocation are presented in the accompanying Statements of Operations as "Realized gain (loss) on sale of underlying fund shares."
Details of these transactions with the related gain (loss) for the Funds are presented in the accompanying table:
| Value of Cash and
Securities reallocated | Realized Gain (Loss) on
redemption of Fidelity Advisor
High Income Advantage Fund |
Advisor Freedom Income | $ 13,455,239 | $ 1,651,656 |
Advisor Freedom 2005 | 12,007,335 | 1,136,043 |
Advisor Freedom 2010 | 43,118,025 | 4,068,771 |
Advisor Freedom 2015 | 78,558,507 | 7,509,054 |
Advisor Freedom 2020 | 161,919,947 | 16,869,136 |
Advisor Freedom 2025 | 140,516,818 | 14,776,402 |
Advisor Freedom 2030 | 154,657,547 | 16,821,605 |
Advisor Freedom 2035 | 98,071,910 | 10,825,565 |
Advisor Freedom 2040 | 118,790,811 | 2,673,435 |
Advisor Freedom 2045 | 44,994,697 | 6,421,204 |
Advisor Freedom 2050 | 34,256,151 | 5,200,248 |
Annual Report
Notes to Financial Statements - continued
5. Expense Reductions.
FMR voluntarily agreed to reimburse funds to the extent annual operating expenses exceeded certain levels of average net assets as noted in the table below. Some expenses, for example interest expense, are excluded from this reimbursement.
The following classes of each applicable Fund were in reimbursement during the period:
| Expense
Limitations | Reimbursement
from adviser |
Advisor Freedom Income | | |
Class A | .25% | $ 560 |
Class T | .50% | 205 |
Class B | 1.00% | 18 |
Class C | 1.00% | 60 |
Institutional Class | .00% | 88 |
Advisor Freedom 2005 | | |
Class A | .25% | 591 |
Class T | .50% | 79 |
Class B | 1.00% | 10 |
Class C | 1.00% | 33 |
Institutional Class | .00% | 94 |
Advisor Freedom 2010 | | |
Class A | .25% | 1,821 |
Class T | .50% | 643 |
Class B | 1.00% | 72 |
Class C | 1.00% | 166 |
Institutional Class | .00% | 339 |
Advisor Freedom 2015 | | |
Class A | .25% | 3,223 |
Class T | .50% | 830 |
Class B | 1.00% | 126 |
Class C | 1.00% | 239 |
Institutional Class | .00% | 653 |
Advisor Freedom 2020 | | |
Class A | .25% | 4,903 |
Class T | .50% | 1,617 |
Class B | 1.00% | 247 |
Class C | 1.00% | 348 |
Institutional Class | .00% | 993 |
Advisor Freedom 2025 | | |
Class A | .25% | 3,956 |
Class T | .50% | 859 |
Class B | 1.00% | 139 |
Class C | 1.00% | 199 |
Institutional Class | .00% | 692 |
Advisor Freedom 2030 | | |
Class A | .25% | 4,106 |
Class T | .50% | 1,285 |
Class B | 1.00% | 179 |
Class C | 1.00% | 231 |
Institutional Class | .00% | 840 |
Annual Report
5. Expense Reductions - continued
| Expense
Limitations | Reimbursement
from adviser |
Advisor Freedom 2035 | | |
Class A | .25% | $ 2,672 |
Class T | .50% | 547 |
Class B | 1.00% | 98 |
Class C | 1.00% | 115 |
Institutional Class | .00% | 511 |
Advisor Freedom 2040 | | |
Class A | .25% | 2,655 |
Class T | .50% | 1,012 |
Class B | 1.00% | 154 |
Class C | 1.00% | 197 |
Institutional Class | .00% | 595 |
Advisor Freedom 2045 | | |
Class A | .25% | 875 |
Class T | .50% | 177 |
Class B | 1.00% | 15 |
Class C | 1.00% | 25 |
Institutional Class | .00% | 177 |
Advisor Freedom 2050 | | |
Class A | .25% | 599 |
Class T | .50% | 183 |
Class B | 1.00% | 22 |
Class C | 1.00% | 38 |
Institutional Class | .00% | 171 |
6. Distributions to Shareholders.
Distributions to shareholders of each class were as follows:
Years ended March 31, | 2011 | 2010 |
Advisor Freedom Income | | |
From net investment income | | |
Class A | $ 2,314,788 | $ 2,649,510 |
Class T | 713,724 | 962,627 |
Class B | 35,269 | 69,674 |
Class C | 126,076 | 185,548 |
Institutional Class | 412,814 | 317,793 |
Total | $ 3,602,671 | $ 4,185,152 |
From net realized gain | | |
Class A | $ 975,505 | $ 732,418 |
Class T | 358,557 | 282,856 |
Class B | 28,200 | 27,780 |
Class C | 104,824 | 75,264 |
Institutional Class | 152,782 | 82,744 |
Total | $ 1,619,868 | $ 1,201,062 |
Advisor Freedom 2005 | | |
From net investment income | | |
Class A | $ 2,294,168 | $ 2,464,352 |
Class T | 241,548 | 327,239 |
Class B | 15,643 | 32,599 |
Class C | 57,338 | 95,996 |
Institutional Class | 436,507 | 330,921 |
Total | $ 3,045,204 | $ 3,251,107 |
Annual Report
Notes to Financial Statements - continued
6. Distributions to Shareholders - continued
Years ended March 31, | 2011 | 2010 |
Advisor Freedom 2005 | | |
From net realized gain | | |
Class A | $ 1,292,493 | $ 994,230 |
Class T | 171,153 | 147,352 |
Class B | 21,561 | 21,486 |
Class C | 72,294 | 61,066 |
Institutional Class | 207,653 | 124,312 |
Total | $ 1,765,154 | $ 1,348,446 |
Advisor Freedom 2010 | | |
From net investment income | | |
Class A | $ 7,309,097 | $ 9,091,104 |
Class T | 1,843,742 | 3,497,344 |
Class B | 113,116 | 293,043 |
Class C | 316,760 | 620,780 |
Institutional Class | 1,616,987 | 1,468,089 |
Total | $ 11,199,702 | $ 14,970,360 |
From net realized gain | | |
Class A | $ 4,424,218 | $ 3,593,351 |
Class T | 1,481,376 | 1,546,799 |
Class B | 170,299 | 178,771 |
Class C | 403,696 | 368,444 |
Institutional Class | 827,244 | 537,373 |
Total | $ 7,306,833 | $ 6,224,738 |
Advisor Freedom 2015 | | |
From net investment income | | |
Class A | $ 12,855,664 | $ 13,679,424 |
Class T | 2,635,413 | 3,527,564 |
Class B | 206,545 | 416,674 |
Class C | 428,961 | 743,299 |
Institutional Class | 3,196,021 | 2,473,155 |
Total | $ 19,322,604 | $ 20,840,116 |
From net realized gain | | |
Class A | $ 8,081,708 | $ 5,842,830 |
Class T | 2,057,692 | 1,678,828 |
Class B | 312,381 | 274,462 |
Class C | 597,134 | 483,221 |
Institutional Class | 1,672,250 | 948,932 |
Total | $ 12,721,165 | $ 9,228,273 |
Advisor Freedom 2020 | | |
From net investment income | | |
Class A | $ 20,017,211 | $ 18,974,843 |
Class T | 4,788,796 | 7,050,784 |
Class B | 417,553 | 736,617 |
Class C | 683,691 | 991,170 |
Institutional Class | 4,636,483 | 3,574,261 |
Total | $ 30,543,734 | $ 31,327,675 |
From net realized gain | | |
Class A | $ 13,012,233 | $ 8,917,115 |
Class T | 4,137,340 | 3,758,542 |
Class B | 643,981 | 555,113 |
Class C | 920,729 | 727,102 |
Institutional Class | 2,564,116 | 1,527,831 |
Total | $ 21,278,399 | $ 15,485,703 |
Annual Report
6. Distributions to Shareholders - continued
Years ended March 31, | 2011 | 2010 |
Advisor Freedom 2025 | | |
From net investment income | | |
Class A | $ 15,436,008 | $ 14,118,695 |
Class T | 2,761,297 | 2,959,037 |
Class B | 249,917 | 362,584 |
Class C | 385,546 | 486,550 |
Institutional Class | 3,306,034 | 2,155,759 |
Total | $ 22,138,802 | $ 20,082,625 |
From net realized gain | | |
Class A | $ 10,435,875 | $ 7,285,104 |
Class T | 2,278,134 | 1,738,010 |
Class B | 366,251 | 307,778 |
Class C | 532,901 | 396,872 |
Institutional Class | 1,830,552 | 996,789 |
Total | $ 15,443,713 | $ 10,724,553 |
Advisor Freedom 2030 | | |
From net investment income | | |
Class A | $ 15,885,460 | $ 12,452,357 |
Class T | 3,544,555 | 4,250,834 |
Class B | 289,353 | 365,617 |
Class C | 417,601 | 474,232 |
Institutional Class | 3,756,974 | 2,328,021 |
Total | $ 23,893,943 | $ 19,871,061 |
From net realized gain | | |
Class A | $ 10,935,573 | $ 7,715,428 |
Class T | 3,356,005 | 3,092,971 |
Class B | 456,867 | 420,885 |
Class C | 601,231 | 529,883 |
Institutional Class | 2,149,289 | 1,265,591 |
Total | $ 17,498,965 | $ 13,024,758 |
Advisor Freedom 2035 | | |
From net investment income | | |
Class A | $ 9,201,625 | $ 7,722,463 |
Class T | 1,508,142 | 1,461,433 |
Class B | 146,233 | 182,301 |
Class C | 187,609 | 206,849 |
Institutional Class | 2,214,118 | 1,221,702 |
Total | $ 13,257,727 | $ 10,794,748 |
From net realized gain | | |
Class A | $ 7,122,431 | $ 4,762,560 |
Class T | 1,471,380 | 1,063,886 |
Class B | 242,360 | 213,235 |
Class C | 289,817 | 229,952 |
Institutional Class | 1,324,184 | 664,843 |
Total | $ 10,450,172 | $ 6,934,476 |
Advisor Freedom 2040 | | |
From net investment income | | |
Class A | $ 9,382,608 | $ 8,229,546 |
Class T | 2,437,956 | 3,279,826 |
Class B | 218,091 | 308,904 |
Class C | 307,296 | 383,546 |
Institutional Class | 2,460,801 | 1,642,482 |
Total | $ 14,806,752 | $ 13,844,304 |
Annual Report
Notes to Financial Statements - continued
6. Distributions to Shareholders - continued
Years ended March 31, | 2011 | 2010 |
Advisor Freedom 2040 | | |
From net realized gain | | |
Class A | $ 6,904,056 | $ 4,852,217 |
Class T | 2,633,448 | 2,246,554 |
Class B | 367,758 | 335,168 |
Class C | 475,772 | 406,856 |
Institutional Class | 1,452,252 | 851,696 |
Total | $ 11,833,286 | $ 8,692,491 |
Advisor Freedom 2045 | | |
From net investment income | | |
Class A | $ 3,205,236 | $ 2,212,999 |
Class T | 540,295 | 408,091 |
Class B | 23,614 | 25,209 |
Class C | 48,491 | 39,467 |
Institutional Class | 787,743 | 374,869 |
Total | $ 4,605,379 | $ 3,060,635 |
From net realized gain | | |
Class A | $ 2,227,851 | $ 1,430,150 |
Class T | 459,052 | 305,415 |
Class B | 35,506 | 29,833 |
Class C | 61,596 | 44,309 |
Institutional Class | 431,412 | 213,785 |
Total | $ 3,215,417 | $ 2,023,492 |
Advisor Freedom 2050 | | |
From net investment income | | |
Class A | $ 2,095,291 | $ 1,439,113 |
Class T | 516,727 | 429,631 |
Class B | 33,895 | 33,433 |
Class C | 62,418 | 56,059 |
Institutional Class | 619,924 | 423,979 |
Total | $ 3,328,255 | $ 2,382,215 |
From net realized gain | | |
Class A | $ 1,473,391 | $ 987,306 |
Class T | 457,203 | 342,451 |
Class B | 48,699 | 43,522 |
Class C | 81,250 | 74,386 |
Institutional Class | 385,486 | 254,492 |
Total | $ 2,446,029 | $ 1,702,157 |
7. Share Transactions.
Transactions for each class of shares were as follows:
| Shares | Dollars |
Years ended March 31, | 2011 | 2010 | 2011 | 2010 |
Advisor Freedom Income | | | | |
Class A | | | | |
Shares sold | 6,742,883 | 5,939,919 | $ 70,990,544 | $ 58,801,119 |
Reinvestment of distributions | 307,703 | 337,348 | 3,244,142 | 3,334,001 |
Shares redeemed | (6,310,616) | (3,231,976) | (66,644,649) | (32,123,087) |
Net increase (decrease) | 739,970 | 3,045,291 | $ 7,590,037 | $ 30,012,033 |
Class T | | | | |
Shares sold | 2,537,111 | 2,030,571 | $ 26,724,748 | $ 19,971,346 |
Reinvestment of distributions | 96,147 | 121,701 | 1,013,774 | 1,199,887 |
Shares redeemed | (2,373,124) | (2,006,879) | (25,096,544) | (19,795,299) |
Net increase (decrease) | 260,134 | 145,393 | $ 2,641,978 | $ 1,375,934 |
Annual Report
7. Share Transactions - continued
| Shares | Dollars |
Years ended March 31, | 2011 | 2010 | 2011 | 2010 |
Advisor Freedom Income | | | | |
Class B | | | | |
Shares sold | 88,084 | 162,405 | $ 914,898 | $ 1,613,389 |
Reinvestment of distributions | 5,485 | 9,197 | 57,752 | 90,890 |
Shares redeemed | (245,009) | (147,684) | (2,582,330) | (1,450,520) |
Net increase (decrease) | (151,440) | 23,918 | $ (1,609,680) | $ 253,759 |
Class C | | | | |
Shares sold | 441,928 | 396,874 | $ 4,643,877 | $ 3,943,497 |
Reinvestment of distributions | 18,498 | 22,975 | 195,080 | 227,312 |
Shares redeemed | (352,733) | (300,368) | (3,743,810) | (2,962,489) |
Net increase (decrease) | 107,693 | 119,481 | $ 1,095,147 | $ 1,208,320 |
Institutional Class | | | | |
Shares sold | 2,556,329 | 1,124,925 | $ 27,181,011 | $ 11,177,705 |
Reinvestment of distributions | 52,562 | 40,001 | 556,359 | 396,841 |
Shares redeemed | (1,356,615) | (381,938) | (14,424,513) | (3,796,827) |
Net increase (decrease) | 1,252,276 | 782,988 | $ 13,312,857 | $ 7,777,719 |
Advisor Freedom 2005 | | | | |
Class A | | | | |
Shares sold | 5,609,613 | 7,317,164 | $ 60,880,533 | $ 72,565,372 |
Reinvestment of distributions | 325,191 | 339,976 | 3,555,363 | 3,435,631 |
Shares redeemed | (5,151,918) | (3,890,338) | (55,840,299) | (38,525,238) |
Net increase (decrease) | 782,886 | 3,766,802 | $ 8,595,597 | $ 37,475,765 |
Class T | | | | |
Shares sold | 730,487 | 1,132,309 | $ 7,924,718 | $ 11,030,532 |
Reinvestment of distributions | 36,423 | 45,061 | 398,016 | 455,100 |
Shares redeemed | (1,062,251) | (773,364) | (11,498,714) | (7,549,693) |
Net increase (decrease) | (295,341) | 404,006 | $ (3,175,980) | $ 3,935,939 |
Class B | | | | |
Shares sold | 8,537 | 54,150 | $ 90,002 | $ 533,127 |
Reinvestment of distributions | 3,019 | 4,964 | 32,958 | 50,271 |
Shares redeemed | (90,010) | (109,244) | (981,855) | (1,080,645) |
Net increase (decrease) | (78,454) | (50,130) | $ (858,895) | $ (497,247) |
Class C | | | | |
Shares sold | 147,121 | 305,167 | $ 1,607,419 | $ 3,018,553 |
Reinvestment of distributions | 10,949 | 14,510 | 119,425 | 146,747 |
Shares redeemed | (287,607) | (267,085) | (3,140,453) | (2,621,078) |
Net increase (decrease) | (129,537) | 52,592 | $ (1,413,609) | $ 544,222 |
Institutional Class | | | | |
Shares sold | 2,075,491 | 937,114 | $ 22,866,153 | $ 9,468,701 |
Reinvestment of distributions | 57,924 | 44,760 | 637,888 | 455,233 |
Shares redeemed | (854,883) | (359,918) | (9,388,329) | (3,572,136) |
Net increase (decrease) | 1,278,532 | 621,956 | $ 14,115,712 | $ 6,351,798 |
Advisor Freedom 2010 | | | | |
Class A | | | | |
Shares sold | 16,095,416 | 18,880,491 | $ 180,711,445 | $ 190,682,441 |
Reinvestment of distributions | 1,025,173 | 1,212,193 | 11,588,751 | 12,543,848 |
Shares redeemed | (16,025,057) | (17,530,431) | (178,906,727) | (178,487,457) |
Net increase (decrease) | 1,095,532 | 2,562,253 | $ 13,393,469 | $ 24,738,832 |
Class T | | | | |
Shares sold | 3,880,033 | 5,949,706 | $ 42,686,442 | $ 58,943,534 |
Reinvestment of distributions | 290,165 | 481,295 | 3,253,690 | 4,961,234 |
Shares redeemed | (10,204,939) | (7,663,328) | (112,184,260) | (76,116,113) |
Net increase (decrease) | (6,034,741) | (1,232,327) | $ (66,244,128) | $ (12,211,345) |
Annual Report
Notes to Financial Statements - continued
7. Share Transactions - continued
| Shares | Dollars |
Years ended March 31, | 2011 | 2010 | 2011 | 2010 |
Advisor Freedom 2010 | | | | |
Class B | | | | |
Shares sold | 93,857 | 182,133 | $ 1,003,129 | $ 1,835,344 |
Reinvestment of distributions | 22,756 | 42,625 | 255,827 | 441,800 |
Shares redeemed | (858,645) | (595,063) | (9,618,220) | (5,991,071) |
Net increase (decrease) | (742,032) | (370,305) | $ (8,359,264) | $ (3,713,927) |
Class C | | | | |
Shares sold | 535,760 | 952,028 | $ 5,915,274 | $ 9,446,683 |
Reinvestment of distributions | 56,804 | 86,895 | 637,277 | 896,335 |
Shares redeemed | (1,180,387) | (1,279,015) | (12,966,143) | (12,836,486) |
Net increase (decrease) | (587,823) | (240,092) | $ (6,413,592) | $ (2,493,468) |
Institutional Class | | | | |
Shares sold | 5,627,504 | 3,337,499 | $ 63,470,104 | $ 33,780,398 |
Reinvestment of distributions | 212,399 | 192,208 | 2,414,202 | 1,998,866 |
Shares redeemed | (3,110,566) | (1,682,623) | (34,999,374) | (17,082,328) |
Net increase (decrease) | 2,729,337 | 1,847,084 | $ 30,884,932 | $ 18,696,936 |
Advisor Freedom 2015 | | | | |
Class A | | | | |
Shares sold | 27,732,699 | 32,164,983 | $ 310,274,647 | $ 323,357,211 |
Reinvestment of distributions | 1,841,287 | 1,876,238 | 20,720,499 | 19,317,105 |
Shares redeemed | (21,697,911) | (16,585,226) | (241,513,846) | (165,743,140) |
Net increase (decrease) | 7,876,075 | 17,455,995 | $ 89,481,300 | $ 176,931,176 |
Class T | | | | |
Shares sold | 5,882,611 | 6,975,850 | $ 65,251,137 | $ 68,177,681 |
Reinvestment of distributions | 404,719 | 490,769 | 4,542,977 | 5,039,209 |
Shares redeemed | (7,251,020) | (6,790,785) | (80,629,160) | (67,432,006) |
Net increase (decrease) | (963,690) | 675,834 | $ (10,835,046) | $ 5,784,884 |
Class B | | | | |
Shares sold | 191,482 | 449,760 | $ 2,066,206 | $ 4,433,310 |
Reinvestment of distributions | 42,030 | 64,006 | 470,481 | 659,460 |
Shares redeemed | (801,776) | (633,005) | (8,927,194) | (6,220,872) |
Net increase (decrease) | (568,264) | (119,239) | $ (6,390,507) | $ (1,128,102) |
Class C | | | | |
Shares sold | 1,233,517 | 1,453,766 | $ 13,642,003 | $ 14,350,142 |
Reinvestment of distributions | 82,686 | 110,378 | 925,371 | 1,134,531 |
Shares redeemed | (1,381,438) | (1,395,406) | (15,136,214) | (13,893,073) |
Net increase (decrease) | (65,235) | 168,738 | $ (568,840) | $ 1,591,600 |
Institutional Class | | | | |
Shares sold | 10,948,482 | 5,176,355 | $ 123,310,581 | $ 52,604,404 |
Reinvestment of distributions | 419,853 | 329,755 | 4,762,383 | 3,408,927 |
Shares redeemed | (4,028,135) | (2,498,861) | (45,224,559) | (25,183,981) |
Net increase (decrease) | 7,340,200 | 3,007,249 | $ 82,848,405 | $ 30,829,350 |
Advisor Freedom 2020 | | | | |
Class A | | | | |
Shares sold | 42,385,127 | 45,183,836 | $ 490,968,694 | $ 463,202,937 |
Reinvestment of distributions | 2,789,668 | 2,595,974 | 32,676,917 | 27,655,510 |
Shares redeemed | (30,533,371) | (22,376,535) | (352,138,611) | (229,963,322) |
Net increase (decrease) | 14,641,424 | 25,403,275 | $ 171,507,000 | $ 260,895,125 |
Class T | | | | |
Shares sold | 10,333,537 | 13,389,476 | $ 118,202,049 | $ 134,409,911 |
Reinvestment of distributions | 753,997 | 1,003,112 | 8,780,977 | 10,676,415 |
Shares redeemed | (20,539,717) | (14,031,668) | (233,180,192) | (143,283,312) |
Net increase (decrease) | (9,452,183) | 360,920 | $ (106,197,166) | $ 1,803,014 |
Annual Report
7. Share Transactions - continued
| Shares | Dollars |
Years ended March 31, | 2011 | 2010 | 2011 | 2010 |
Advisor Freedom 2020 | | | | |
Class B | | | | |
Shares sold | 368,121 | 786,273 | $ 4,060,760 | $ 7,911,628 |
Reinvestment of distributions | 82,240 | 116,218 | 957,119 | 1,242,364 |
Shares redeemed | (1,902,848) | (1,125,596) | (22,013,230) | (11,397,490) |
Net increase (decrease) | (1,452,487) | (223,105) | $ (16,995,351) | $ (2,243,498) |
Class C | | | | |
Shares sold | 1,664,023 | 2,227,854 | $ 18,885,357 | $ 22,595,108 |
Reinvestment of distributions | 124,410 | 147,034 | 1,450,199 | 1,569,561 |
Shares redeemed | (1,991,323) | (1,920,594) | (22,726,168) | (19,584,995) |
Net increase (decrease) | (202,890) | 454,294 | $ (2,390,612) | $ 4,579,674 |
Institutional Class | | | | |
Shares sold | 15,993,749 | 8,404,614 | $ 187,257,774 | $ 87,788,002 |
Reinvestment of distributions | 601,425 | 474,048 | 7,094,949 | 5,075,149 |
Shares redeemed | (6,509,087) | (3,015,266) | (76,123,009) | (31,218,230) |
Net increase (decrease) | 10,086,087 | 5,863,396 | $ 118,229,714 | $ 61,644,921 |
Advisor Freedom 2025 | | | | |
Class A | | | | |
Shares sold | 37,031,547 | 40,250,497 | $ 413,280,512 | $ 395,216,135 |
Reinvestment of distributions | 2,276,155 | 2,082,741 | 25,700,489 | 21,253,319 |
Shares redeemed | (25,478,996) | (17,708,216) | (283,196,123) | (173,855,795) |
Net increase (decrease) | 13,828,706 | 24,625,022 | $ 155,784,878 | $ 242,613,659 |
Class T | | | | |
Shares sold | 6,893,938 | 8,314,781 | $ 76,306,756 | $ 80,263,098 |
Reinvestment of distributions | 434,732 | 448,807 | 4,920,153 | 4,590,362 |
Shares redeemed | (7,345,717) | (5,953,703) | (81,980,377) | (58,549,334) |
Net increase (decrease) | (17,047) | 2,809,885 | $ (753,468) | $ 26,304,126 |
Class B | | | | |
Shares sold | 249,430 | 580,667 | $ 2,611,983 | $ 5,471,445 |
Reinvestment of distributions | 50,463 | 63,222 | 566,440 | 646,389 |
Shares redeemed | (686,905) | (658,819) | (7,580,412) | (6,344,074) |
Net increase (decrease) | (387,012) | (14,930) | $ (4,401,989) | $ (226,240) |
Class C | | | | |
Shares sold | 1,289,642 | 1,510,376 | $ 14,187,941 | $ 14,596,541 |
Reinvestment of distributions | 77,327 | 82,292 | 866,774 | 840,011 |
Shares redeemed | (1,165,343) | (907,187) | (12,701,967) | (8,676,397) |
Net increase (decrease) | 201,626 | 685,481 | $ 2,352,748 | $ 6,760,155 |
Institutional Class | | | | |
Shares sold | 13,417,346 | 4,943,550 | $ 152,104,559 | $ 48,886,534 |
Reinvestment of distributions | 438,558 | 307,002 | 5,003,022 | 3,146,123 |
Shares redeemed | (3,507,339) | (1,470,965) | (39,481,295) | (14,449,276) |
Net increase (decrease) | 10,348,565 | 3,779,587 | $ 117,626,286 | $ 37,583,381 |
Advisor Freedom 2030 | | | | |
Class A | | | | |
Shares sold | 36,308,773 | 38,797,182 | $ 422,799,888 | $ 395,875,652 |
Reinvestment of distributions | 2,244,767 | 1,866,748 | 26,598,860 | 19,998,334 |
Shares redeemed | (24,491,451) | (17,846,987) | (283,894,538) | (181,939,183) |
Net increase (decrease) | 14,062,089 | 22,816,943 | $ 165,504,210 | $ 233,934,803 |
Class T | | | | |
Shares sold | 10,464,373 | 12,307,212 | $ 120,222,230 | $ 122,751,803 |
Reinvestment of distributions | 579,968 | 680,438 | 6,809,846 | 7,274,926 |
Shares redeemed | (17,532,281) | (9,841,745) | (199,844,267) | (99,921,008) |
Net increase (decrease) | (6,487,940) | 3,145,905 | $ (72,812,191) | $ 30,105,721 |
Annual Report
Notes to Financial Statements - continued
7. Share Transactions - continued
| Shares | Dollars |
Years ended March 31, | 2011 | 2010 | 2011 | 2010 |
Advisor Freedom 2030 | | | | |
Class B | | | | |
Shares sold | 273,983 | 600,341 | $ 3,002,253 | $ 5,980,332 |
Reinvestment of distributions | 58,164 | 70,777 | 683,212 | 763,149 |
Shares redeemed | (1,172,272) | (760,195) | (13,660,495) | (7,622,000) |
Net increase (decrease) | (840,125) | (89,077) | $ (9,975,030) | $ (878,519) |
Class C | | | | |
Shares sold | 1,166,069 | 1,605,657 | $ 13,411,785 | $ 16,073,300 |
Reinvestment of distributions | 79,998 | 87,396 | 940,253 | 939,821 |
Shares redeemed | (1,516,187) | (1,278,913) | (17,340,843) | (13,072,332) |
Net increase (decrease) | (270,120) | 414,140 | $ (2,988,805) | $ 3,940,789 |
Institutional Class | | | | |
Shares sold | 14,756,707 | 6,778,493 | $ 173,957,761 | $ 70,133,488 |
Reinvestment of distributions | 486,184 | 333,659 | 5,794,863 | 3,581,406 |
Shares redeemed | (5,798,972) | (2,077,011) | (68,160,205) | (21,173,240) |
Net increase (decrease) | 9,443,919 | 5,035,141 | $ 111,592,419 | $ 52,541,654 |
Advisor Freedom 2035 | | | | |
Class A | | | | |
Shares sold | 27,970,555 | 29,478,855 | $ 308,468,907 | $ 283,259,853 |
Reinvestment of distributions | 1,446,498 | 1,224,913 | 16,211,663 | 12,371,642 |
Shares redeemed | (17,409,245) | (11,681,770) | (190,855,839) | (113,019,155) |
Net increase (decrease) | 12,007,808 | 19,021,998 | $ 133,824,731 | $ 182,612,340 |
Class T | | | | |
Shares sold | 5,393,602 | 5,784,903 | $ 58,683,253 | $ 54,332,277 |
Reinvestment of distributions | 260,979 | 245,284 | 2,909,844 | 2,472,154 |
Shares redeemed | (5,098,171) | (3,918,900) | (56,262,333) | (37,204,051) |
Net increase (decrease) | 556,410 | 2,111,287 | $ 5,330,764 | $ 19,600,380 |
Class B | | | | |
Shares sold | 181,743 | 405,509 | $ 1,860,461 | $ 3,788,136 |
Reinvestment of distributions | 33,086 | 38,336 | 365,557 | 387,872 |
Shares redeemed | (449,264) | (357,555) | (4,866,708) | (3,379,935) |
Net increase (decrease) | (234,435) | 86,290 | $ (2,640,690) | $ 796,073 |
Class C | | | | |
Shares sold | 763,399 | 971,148 | $ 8,246,950 | $ 9,096,299 |
Reinvestment of distributions | 40,998 | 41,555 | 453,892 | 420,018 |
Shares redeemed | (707,167) | (574,523) | (7,564,157) | (5,371,383) |
Net increase (decrease) | 97,230 | 438,180 | $ 1,136,685 | $ 4,144,934 |
Institutional Class | | | | |
Shares sold | 11,027,172 | 3,975,253 | $ 122,599,210 | $ 38,607,280 |
Reinvestment of distributions | 303,802 | 186,356 | 3,441,276 | 1,885,670 |
Shares redeemed | (2,535,451) | (1,088,290) | (28,205,403) | (10,464,439) |
Net increase (decrease) | 8,795,523 | 3,073,319 | $ 97,835,083 | $ 30,028,511 |
Advisor Freedom 2040 | | | | |
Class A | | | | |
Shares sold | 24,772,426 | 24,913,305 | $ 290,957,352 | $ 252,890,462 |
Reinvestment of distributions | 1,347,352 | 1,193,321 | 16,116,359 | 12,861,441 |
Shares redeemed | (18,286,233) | (12,253,872) | (213,969,269) | (125,782,802) |
Net increase (decrease) | 7,833,545 | 13,852,754 | $ 93,104,442 | $ 139,969,101 |
Class T | | | | |
Shares sold | 7,976,427 | 10,000,332 | $ 92,151,888 | $ 99,858,612 |
Reinvestment of distributions | 422,557 | 509,696 | 5,006,423 | 5,481,963 |
Shares redeemed | (13,512,695) | (8,036,589) | (155,218,830) | (81,578,421) |
Net increase (decrease) | (5,113,711) | 2,473,439 | $ (58,060,519) | $ 23,762,154 |
Annual Report
7. Share Transactions - continued
| Shares | Dollars |
Years ended March 31, | 2011 | 2010 | 2011 | 2010 |
Advisor Freedom 2040 | | | | |
Class B | | | | |
Shares sold | 209,959 | 476,095 | $ 2,309,982 | $ 4,732,469 |
Reinvestment of distributions | 46,081 | 58,166 | 543,523 | 628,599 |
Shares redeemed | (873,544) | (566,960) | (10,194,639) | (5,619,118) |
Net increase (decrease) | (617,504) | (32,699) | $ (7,341,134) | $ (258,050) |
Class C | | | | |
Shares sold | 1,118,317 | 1,191,976 | $ 12,931,197 | $ 11,944,778 |
Reinvestment of distributions | 63,034 | 70,129 | 745,182 | 756,765 |
Shares redeemed | (1,361,404) | (1,050,495) | (15,808,490) | (10,581,828) |
Net increase (decrease) | (180,053) | 211,610 | $ (2,132,111) | $ 2,119,715 |
Institutional Class | | | | |
Shares sold | 11,010,598 | 4,937,197 | $ 130,588,540 | $ 50,576,131 |
Reinvestment of distributions | 311,564 | 230,524 | 3,751,417 | 2,486,427 |
Shares redeemed | (4,767,648) | (1,571,826) | (56,587,880) | (15,921,925) |
Net increase (decrease) | 6,554,514 | 3,595,895 | $ 77,752,077 | $ 37,140,633 |
Advisor Freedom 2045 | | | | |
Class A | | | | |
Shares sold | 15,649,671 | 13,663,363 | $ 142,479,055 | $ 108,131,504 |
Reinvestment of distributions | 580,532 | 434,034 | 5,409,938 | 3,629,970 |
Shares redeemed | (7,686,625) | (4,807,430) | (69,866,274) | (38,399,839) |
Net increase (decrease) | 8,543,578 | 9,289,967 | $ 78,022,719 | $ 73,361,635 |
Class T | | | | |
Shares sold | 3,458,321 | 3,019,866 | $ 31,367,898 | $ 23,345,550 |
Reinvestment of distributions | 106,232 | 84,802 | 986,814 | 708,733 |
Shares redeemed | (2,489,332) | (1,269,123) | (22,900,338) | (9,935,840) |
Net increase (decrease) | 1,075,221 | 1,835,545 | $ 9,454,374 | $ 14,118,443 |
Class B | | | | |
Shares sold | 64,679 | 151,912 | $ 553,980 | $ 1,183,636 |
Reinvestment of distributions | 6,187 | 6,409 | 57,081 | 53,934 |
Shares redeemed | (76,608) | (75,001) | (675,735) | (599,710) |
Net increase (decrease) | (5,742) | 83,320 | $ (64,674) | $ 637,860 |
Class C | | | | |
Shares sold | 358,203 | 299,037 | $ 3,208,567 | $ 2,351,191 |
Reinvestment of distributions | 11,564 | 9,804 | 107,229 | 82,368 |
Shares redeemed | (201,823) | (118,526) | (1,842,121) | (901,091) |
Net increase (decrease) | 167,944 | 190,315 | $ 1,473,675 | $ 1,532,468 |
Institutional Class | | | | |
Shares sold | 5,606,405 | 2,136,614 | $ 52,004,125 | $ 16,905,851 |
Reinvestment of distributions | 128,213 | 70,375 | 1,205,418 | 588,654 |
Shares redeemed | (1,215,140) | (553,542) | (11,202,214) | (4,413,315) |
Net increase (decrease) | 4,519,478 | 1,653,447 | $ 42,007,329 | $ 13,081,190 |
Advisor Freedom 2050 | | | | |
Class A | | | | |
Shares sold | 11,629,928 | 9,581,471 | $ 104,240,785 | $ 73,833,021 |
Reinvestment of distributions | 385,855 | 291,959 | 3,532,343 | 2,406,119 |
Shares redeemed | (5,707,133) | (4,148,608) | (51,265,603) | (32,257,966) |
Net increase (decrease) | 6,308,650 | 5,724,822 | $ 56,507,525 | $ 43,981,174 |
Class T | | | | |
Shares sold | 3,483,884 | 3,635,495 | $ 30,992,620 | $ 27,820,143 |
Reinvestment of distributions | 106,163 | 92,896 | 968,745 | 765,843 |
Shares redeemed | (2,786,022) | (2,095,310) | (24,961,552) | (16,196,123) |
Net increase (decrease) | 804,025 | 1,633,081 | $ 6,999,813 | $ 12,389,863 |
Annual Report
Notes to Financial Statements - continued
7. Share Transactions - continued
| Shares | Dollars |
Years ended March 31, | 2011 | 2010 | 2011 | 2010 |
Advisor Freedom 2050 | | | | |
Class B | | | | |
Shares sold | 110,536 | 210,935 | $ 933,871 | $ 1,592,970 |
Reinvestment of distributions | 8,784 | 9,042 | 79,624 | 75,136 |
Shares redeemed | (119,007) | (87,238) | (1,034,921) | (663,372) |
Net increase (decrease) | 313 | 132,739 | $ (21,426) | $ 1,004,734 |
Class C | | | | |
Shares sold | 389,030 | 373,964 | $ 3,445,107 | $ 2,823,004 |
Reinvestment of distributions | 14,950 | 14,928 | 136,149 | 124,197 |
Shares redeemed | (306,396) | (224,961) | (2,713,863) | (1,746,454) |
Net increase (decrease) | 97,584 | 163,931 | $ 867,393 | $ 1,200,747 |
Institutional Class | | | | |
Shares sold | 4,230,159 | 2,689,897 | $ 38,199,787 | $ 21,086,162 |
Reinvestment of distributions | 107,698 | 82,208 | 985,312 | 678,287 |
Shares redeemed | (2,667,285) | (780,619) | (24,080,596) | (6,106,242) |
Net increase (decrease) | 1,670,572 | 1,991,486 | $ 15,104,503 | $ 15,658,207 |
8. Other.
The Funds' organizational documents provide former and current trustees and officers with a limited indemnification against liabilities arising in connection with the performance of their duties to the Funds. In the normal course of business, the Funds may also enter into contracts that provide general indemnifications. The Funds' maximum exposure under these arrangements is unknown as this would be dependent on future claims that may be made against the Funds. The risk of material loss from such claims is considered remote.
The Funds do not invest in the Underlying Funds for the purpose of exercising management or control; however, investments by the Funds within their principal investment strategies may represent a significant portion of the Underlying Fund's net assets. At the end of the period, the following Advisor Freedom Funds were the owners of record of 10% or more of the total outstanding shares of the Underlying Funds.
Fund | Advisor Freedom 2020 | Advisor Freedom 2030 |
Fidelity Advisor Large Cap Fund | 11% | 11% |
The Funds, in aggregate, were the owners of record of more than 20% of the total outstanding shares of the following Underlying Funds.
Fund | % of shares held |
Fidelity Advisor Growth & Income Fund | 54% |
Fidelity Advisor Large Cap Fund | 63% |
Fidelity Advisor Overseas Fund | 29% |
Fidelity Advisor Short Fixed-Income Fund | 21% |
Annual Report
Report of Independent Registered Public Accounting Firm
To the Trustees of Fidelity Aberdeen Street Trust and the Shareholders of Fidelity Advisor Freedom Income Fund, Fidelity Advisor Freedom 2005 Fund, Fidelity Advisor Freedom 2010 Fund, Fidelity Advisor Freedom 2015 Fund, Fidelity Advisor Freedom 2020 Fund, Fidelity Advisor Freedom 2025 Fund, Fidelity Advisor Freedom 2030 Fund, Fidelity Advisor Freedom 2035 Fund, Fidelity Advisor Freedom 2040 Fund, Fidelity Advisor Freedom 2045 Fund and Fidelity Advisor Freedom 2050 Fund:
We have audited the accompanying statements of assets and liabilities of Fidelity Advisor Freedom Income Fund, Fidelity Advisor Freedom 2005 Fund, Fidelity Advisor Freedom 2010 Fund, Fidelity Advisor Freedom 2015 Fund, Fidelity Advisor Freedom 2020 Fund, Fidelity Advisor Freedom 2025 Fund, Fidelity Advisor Freedom 2030 Fund, Fidelity Advisor Freedom 2035 Fund, Fidelity Advisor Freedom 2040 Fund, Fidelity Advisor Freedom 2045 Fund and Fidelity Advisor Freedom 2050 Fund (the Funds), each a fund of Fidelity Aberdeen Street Trust, including the schedules of investments, as of March 31, 2011, and the related statements of operations for the year then ended, the statements of changes in net assets for each of the two years in the period then ended, and the financial highlights for each of the periods presented. These financial statements and financial highlights are the responsibility of the Funds' management. Our responsibility is to express an opinion on these financial statements and financial highlights based on our audits.
We conducted our audits in accordance with the standards of the Public Company Accounting Oversight Board (United States). Those standards require that we plan and perform the audit to obtain reasonable assurance about whether the financial statements and financial highlights are free of material misstatement. The Funds are not required to have, nor were we engaged to perform, an audit of their internal control over financial reporting. Our audits included consideration of internal control over financial reporting as a basis for designing audit procedures that are appropriate in the circumstances, but not for the purpose of expressing an opinion on the effectiveness of the Funds' internal control over financial reporting. Accordingly, we express no such opinion. An audit also includes examining, on a test basis, evidence supporting the amounts and disclosures in the financial statements, assessing the accounting principles used and significant estimates made by management, as well as evaluating the overall financial statement presentation. Our procedures included confirmation of securities owned as of March 31, 2011, by correspondence with the Underlying Funds' transfer agent. We believe that our audits provide a reasonable basis for our opinion.
In our opinion, the financial statements and financial highlights referred to above present fairly, in all material respects, the financial position of Fidelity Advisor Freedom Income Fund, Fidelity Advisor Freedom 2005 Fund, Fidelity Advisor Freedom 2010 Fund, Fidelity Advisor Freedom 2015 Fund, Fidelity Advisor Freedom 2020 Fund, Fidelity Advisor Freedom 2025 Fund, Fidelity Advisor Freedom 2030 Fund, Fidelity Advisor Freedom 2035 Fund, Fidelity Advisor Freedom 2040 Fund, Fidelity Advisor Freedom 2045 Fund and Fidelity Advisor Freedom 2050 Fund as of March 31, 2011, the results of their operations for the year then ended, the changes in their net assets for each of the two years in the period then ended, and the financial highlights for each of the periods presented, in conformity with accounting principles generally accepted in the United States of America.
/s/ Deloitte & Touche LLP
DELOITTE & TOUCHE LLP
Boston, Massachusetts
May 19, 2011
Annual Report
The Trustees and executive officers of the trust and funds, as applicable, are listed below. The Board of Trustees governs each Fidelity Advisor Freedom Fund and is responsible for protecting the interests of shareholders. The Trustees are experienced executives who meet periodically throughout the year to oversee each Fidelity Advisor Freedom Fund's activities, review contractual arrangements with companies that provide services to each Fidelity Advisor Freedom Fund, oversee management of the risks associated with such activities and contractual arrangements, and review each Fidelity Advisor Freedom Fund's performance. If the interests of a Fidelity Advisor Freedom Fund and an underlying Fidelity fund were to diverge, a conflict of interest could arise and affect how the Trustees fulfill their fiduciary duties to the affected funds. Strategic Advisers has structured the Fidelity Advisor Freedom Funds to avoid these potential conflicts, although there may be situations where a conflict of interest is unavoidable. In such instances, Strategic Advisers and the Trustees would take reasonable steps to minimize and, if possible, eliminate the conflict. Except for James C. Curvey, each of the Trustees oversees 190 funds advised by FMR or an affiliate. Mr. Curvey oversees 410 funds advised by FMR or an affiliate.
The Trustees hold office without limit in time except that (a) any Trustee may resign; (b) any Trustee may be removed by written instrument, signed by at least two-thirds of the number of Trustees prior to such removal; (c) any Trustee who requests to be retired or who has become incapacitated by illness or injury may be retired by written instrument signed by a majority of the other Trustees; and (d) any Trustee may be removed at any special meeting of shareholders by a two-thirds vote of the outstanding voting securities of the trust. Each Trustee who is not an interested person (as defined in the 1940 Act) (Independent Trustee), shall retire not later than the last day of the calendar year in which his or her 75th birthday occurs. The Independent Trustees may waive this mandatory retirement age policy with respect to individual Trustees. The executive officers hold office without limit in time, except that any officer may resign or may be removed by a vote of a majority of the Trustees at any regular meeting or any special meeting of the Trustees. Except as indicated, each individual has held the office shown or other offices in the same company for the past five years.
Experience, Skills, Attributes, and Qualifications of the Funds' Trustees. The Governance and Nominating Committee has adopted a statement of policy that describes the experience, qualifications, attributes, and skills that are necessary and desirable for potential Independent Trustee candidates (Statement of Policy). The Board believes that each Trustee satisfied at the time he or she was initially elected or appointed a Trustee, and continues to satisfy, the standards contemplated by the Statement of Policy. The Governance and Nominating Committee also engages professional search firms to help identify potential Independent Trustee candidates who have the experience, qualifications, attributes, and skills consistent with the Statement of Policy. From time to time, additional criteria based on the composition and skills of the current Independent Trustees, as well as experience or skills that may be appropriate in light of future changes to board composition, business conditions, and regulatory or other developments, have also been considered by the professional search firms and the Governance and Nominating Committee. In addition, the Board takes into account the Trustees' commitment and participation in Board and committee meetings, as well as their leadership of standing and ad hoc committees throughout their tenure.
In determining that a particular Trustee was and continues to be qualified to serve as a Trustee, the Board has considered a variety of criteria, none of which, in isolation, was controlling. The Board believes that, collectively, the Trustees have balanced and diverse experience, qualifications, attributes, and skills, which allow the Board to operate effectively in governing each fund and protecting the interests of shareholders. Information about the specific experience, skills, attributes, and qualifications of each Trustee, which in each case led to the Board's conclusion that the Trustee should serve (or continue to serve) as a trustee of the funds, is provided below.
Board Structure and Oversight Function. Abigail P. Johnson is an interested person (as defined in the 1940 Act) and currently serves as Chairman. The Trustees have determined that an interested Chairman is appropriate and benefits shareholders because an interested Chairman has a personal and professional stake in the quality and continuity of services provided to the funds. Independent Trustees exercise their informed business judgment to appoint an individual of their choosing to serve as Chairman, regardless of whether the Trustee happens to be independent or a member of management. The Independent Trustees have determined that they can act independently and effectively without having an Independent Trustee serve as Chairman and that a key structural component for assuring that they are in a position to do so is for the Independent Trustees to constitute a substantial majority for the Board. The Independent Trustees also regularly meet in executive session. Kenneth L. Wolfe serves as Chairman of the Independent Trustees and as such (i) acts as a liaison between the Independent Trustees and management with respect to matters important to the Independent Trustees and (ii) with management prepares agendas for Board meetings.
Fidelity funds are overseen by different Boards of Trustees. The funds' Board oversees Fidelity's investment-grade bond, money market, and asset allocation funds and another Board oversees Fidelity's equity and high income funds. The asset allocation funds may invest in Fidelity funds that are overseen by such other Board. The use of separate Boards, each with its own committee structure, allows the Trustees of each group of Fidelity funds to focus on the unique issues of the funds they oversee, including common research, investment, and operational issues. On occasion, the separate Boards establish joint committees to address issues of overlapping consequences for the Fidelity funds overseen by each Board.
The Trustees operate using a system of committees to facilitate the timely and efficient consideration of all matters of importance to the Trustees, each fund, and fund shareholders and to facilitate compliance with legal and regulatory requirements and oversight of the funds' activities and associated risks. The Board, acting through its committees, has charged FMR and its affiliates with (i) identifying events or circumstances the occurrence of which could have demonstrably adverse effects on the funds' business and/or reputation; (ii) implementing processes and controls to lessen the possibility that such events or circumstances occur or to mitigate the effects of such events or circumstances if they do occur; and (iii) creating and maintaining a system designed to evaluate continuously business and market conditions in order to facilitate the identification and implementation processes described in (i) and (ii) above. Because the day-to-day operations and activities of the funds are carried out by or through FMR, its affiliates and other service providers, the funds' exposure to risks is mitigated but not eliminated by the processes overseen by the Trustees. While each of the Board's committees has responsibility for overseeing different aspects of the funds' activities, oversight is exercised primarily through the Operations and Audit Committees. Appropriate personnel, including but not limited to the funds' Chief Compliance Officer (CCO), FMR's internal auditor, the independent accountants, the funds' Treasurer and portfolio management personnel, make periodic reports to the Board's committees, as appropriate. The responsibilities of each committee, including their oversight responsibilities, are described further under "Standing Committees of the Funds' Trustees."
Annual Report
Trustees and Officers - continued
The funds' Statement of Additional Information (SAI) includes more information about the Trustees. To request a free copy, call Fidelity at 1-877-208-0098.
Interested Trustees*:
Correspondence intended for each Trustee who is an interested person may be sent to Fidelity Investments, 82 Devonshire Street, Boston, Massachusetts 02109.
Name, Age; Principal Occupations and Other Relevant Experience+ |
Abigail P. Johnson (49) |
| Year of Election or Appointment: 2009 Ms. Johnson is Trustee and Chairman of the Board of Trustees of certain Trusts. Ms. Johnson serves as President of Personal, Workplace and Institutional Services (2005-present). Ms. Johnson is the Vice Chairman and Director (2007-present) of FMR LLC. Previously, Ms. Johnson served as President and a Director of FMR (2001-2005), a Trustee of other investment companies advised by FMR, Fidelity Investments Money Management, Inc., and FMR Co., Inc. (2001-2005), Senior Vice President of the Fidelity funds (2001-2005), and managed a number of Fidelity funds. Ms. Abigail P. Johnson and Mr. Arthur E. Johnson are not related. |
James C. Curvey (75) |
| Year of Election or Appointment: 2007 Mr. Curvey also serves as Trustee (2007-present) of other investment companies advised by FMR. Mr. Curvey is a Director of Fidelity Investments Money Management, Inc. (2009-present), Director of Fidelity Research & Analysis Co. (2009-present) and Director of FMR and FMR Co., Inc. (2007-present). Mr. Curvey is also Vice Chairman (2007-present) and Director of FMR LLC. In addition, Mr. Curvey serves as an Overseer for the Boston Symphony Orchestra and a member of the Trustees of Villanova University. Previously, Mr. Curvey was the Vice Chairman (2006-2007) and Director (2000-2007) of FMR Corp. |
* Trustees have been determined to be "Interested Trustees" by virtue of, among other things, their affiliation with the trust or various entities under common control with FMR.
+ The information above includes each Trustee's principal occupation during the last five years and other information relating to the experience, attributes, and skills relevant to each Trustee's qualifications to serve as a Trustee, which led to the conclusion that each Trustee should serve as a Trustee for each fund.
Independent Trustees:
Correspondence intended for each Independent Trustee (that is, the Trustees other than the Interested Trustees) may be sent to Fidelity Investments, P.O. Box 55235, Boston, Massachusetts 02205-5235.
Name, Age; Principal Occupations and Other Relevant Experience+ |
Albert R. Gamper, Jr. (69) |
| Year of Election or Appointment: 2006 Prior to his retirement in December 2004, Mr. Gamper served as Chairman of the Board of CIT Group Inc. (commercial finance). During his tenure with CIT Group Inc. Mr. Gamper served in numerous senior management positions, including Chairman (1987-1989; 1999-2001; 2002-2004), Chief Executive Officer (1987-2004), and President (2002-2003). He also served as President and Chief Executive Officer of Tyco Capital Corporation (2001-2002). Mr. Gamper currently serves as a member of the Board of Directors of Public Service Enterprise Group (utilities, 2000-present), a member of the Board of Trustees, Rutgers University (2004-present), and Chairman of the Board of Saint Barnabas Health Care System. Previously, Mr. Gamper served as Chairman of the Board of Governors, Rutgers University (2004-2007). |
Robert F. Gartland (59) |
| Year of Election or Appointment: 2010 Mr. Gartland is a partner and investor of Vietnam Partners LLC (investments and consulting, 2008-present) and is Chairman and an investor in Gartland and Mellina Group Corp. (consulting, 2009-present). Prior to his retirement, Mr. Gartland held a variety of positions at Morgan Stanley (financial services, 1979-2007) including Managing Director (1987-2007). |
Arthur E. Johnson (64) |
| Year of Election or Appointment: 2008 Mr. Johnson serves as a member of the Board of Directors of Eaton Corporation (diversified power management, 2009-present) and AGL Resources, Inc. (holding company). Prior to his retirement, Mr. Johnson served as Senior Vice President of Corporate Strategic Development of Lockheed Martin Corporation (defense contractor, 1999-2009). He previously served on the Board of Directors of IKON Office Solutions, Inc. (1999-2008) and Delta Airlines (2005-2007). Mr. Arthur E. Johnson and Ms. Abigail P. Johnson are not related. |
Michael E. Kenneally (57) |
| Year of Election or Appointment: 2009 Previously, Mr. Kenneally served as a Member of the Advisory Board for certain Fidelity Fixed Income and Asset Allocation Funds (2008-2009). Prior to his retirement, Mr. Kenneally served as Chairman and Global Chief Executive Officer of Credit Suisse Asset Management (2003-2005). Mr. Kenneally was a Director of the Credit Suisse Funds (U.S. mutual funds, 2004-2008) and certain other closed-end funds (2004-2005) and was awarded the Chartered Financial Analyst (CFA) designation in 1991. |
James H. Keyes (70) |
| Year of Election or Appointment: 2007 Mr. Keyes serves as a member of the Boards of Navistar International Corporation (manufacture and sale of trucks, buses, and diesel engines, since 2002) and Pitney Bowes, Inc. (integrated mail, messaging, and document management solutions, since 1998). Prior to his retirement, Mr. Keyes served as Chairman and Chief Executive Officer of Johnson Controls (automotive, building, and energy, 1998-2002) and as a member of the Board of LSI Logic Corporation (semiconductor technologies, 1984-2008). |
Marie L. Knowles (64) |
| Year of Election or Appointment: 2001 Prior to Ms. Knowles' retirement in June 2000, she served as Executive Vice President and Chief Financial Officer of Atlantic Richfield Company (ARCO) (diversified energy, 1996-2000). From 1993 to 1996, she was a Senior Vice President of ARCO and President of ARCO Transportation Company. She served as a Director of ARCO from 1996 to 1998. Ms. Knowles currently serves as a Director and Chairman of the Audit Committee of McKesson Corporation (healthcare service, since 2002). Ms. Knowles is an Honorary Trustee of the Brookings Institution and a member of the Board of the Catalina Island Conservancy and of the Santa Catalina Island Company (2009-present). She also serves as a member of the Advisory Board for the School of Engineering of the University of Southern California and the Foundation Board of the School of Architecture at the University of Virginia (2007-present). Previously, Ms. Knowles served as a Director of Phelps Dodge Corporation (copper mining and manufacturing, 1994-2007). |
Kenneth L. Wolfe (72) |
| Year of Election or Appointment: 2005 Mr. Wolfe is Chairman of the Independent Trustees of the Fixed Income and Asset Allocation Funds (2008-present). Prior to his retirement, Mr. Wolfe served as Chairman and a Director (2007-2009) and Chairman and Chief Executive Officer (1994-2001) of Hershey Foods Corporation. He also served as a member of the Boards of Adelphia Communications Corporation (telecommunications, 2003-2006), Bausch & Lomb, Inc. (medical/pharmaceutical, 1993-2007), and Revlon, Inc. (personal care products, 2004-2009). |
+ The information above includes each Trustee's principal occupation during the last five years and other information relating to the experience, attributes, and skills relevant to each Trustee's qualifications to serve as a Trustee, which led to the conclusion that each Trustee should serve as a Trustee for each fund.
Executive Officers:
Correspondence intended for each executive officer may be sent to Fidelity Investments, 82 Devonshire Street, Boston, Massachusetts 02109.
Name, Age; Principal Occupation |
John R. Hebble (52) |
| Year of Election or Appointment: 2008 President and Treasurer of Fidelity's Fixed Income and Asset Allocation Funds. Mr. Hebble also serves as Treasurer and Chief Financial Officer of The North Carolina Capital Management Trust: Cash and Term Portfolios (2008-present), Assistant Treasurer of other Fidelity funds (2009-present) and is an employee of Fidelity Investments. |
Boyce I. Greer (55) |
| Year of Election or Appointment: 2005 Vice President of Fidelity's Fixed Income Funds and Asset Allocation Funds (2005). Mr. Greer is also a Trustee of other investment companies advised by FMR. Mr. Greer is head of Institutional Investments for Fidelity Asset Management and Vice Chairman of Pyramis Global Advisors, LLC (2011-present), President of The North Carolina Capital Management Trust: Cash and Term Portfolios (2003-present), the Asset Allocation Division (2008-present), President and a Director of Strategic Advisers, Inc. (2008-present), President of FIMM 130/30 LLC (2008-present), Director of Ballyrock Investment Advisors LLC (2006-present), and an Executive Vice President of FMR (2005-present). Previously, Mr. Greer served as Executive Vice President of FMR Co., Inc. (2005-2009), President and Director of Fidelity Investments Money Management, Inc. (2007-2009) and as a Director and Managing Director of Strategic Advisers, Inc. (2002-2005). |
Derek L. Young (46) |
| Year of Election or Appointment: 2009 Vice President of Fidelity's Asset Allocation Funds. Mr. Young also serves as Chief Investment Officer of the Global Asset Allocation Group (2009-present). Previously, Mr. Young served as a portfolio manager. |
Scott C. Goebel (43) |
| Year of Election or Appointment: 2008 Secretary and Chief Legal Officer (CLO) of the Fidelity funds. Mr. Goebel also serves as Secretary and CLO of The North Carolina Capital Management Trust: Cash and Term Portfolios (2008-present); General Counsel, Secretary, and Senior Vice President of FMR (2008-present) and FMR Co., Inc. (2008-present); Deputy General Counsel of FMR LLC; Chief Legal Officer of Fidelity Management & Research (Hong Kong) Limited (2008-present) and Assistant Secretary of Fidelity Management & Research (Japan) Inc. (2008-present), Fidelity Investments Money Management, Inc. (2008-present), Fidelity Management & Research (U.K.) Inc. (2008-present), and Fidelity Research and Analysis Company (2008-present). Previously, Mr. Goebel served as Assistant Secretary of the Funds (2007-2008) and as Vice President and Secretary of Fidelity Distributors Corporation (FDC) (2005-2007). |
David J. Carter (37) |
| Year of Election or Appointment: 2010 Assistant Secretary of Fidelity's Fixed Income and Asset Allocation Funds. Mr. Carter also serves as Vice President, Associate General Counsel (2010-present) and is an employee of Fidelity Investments (2005-present). |
Holly C. Laurent (56) |
| Year of Election or Appointment: 2008 Anti-Money Laundering (AML) Officer of the Fidelity funds. Ms. Laurent also serves as AML Officer of The North Carolina Capital Management Trust: Cash and Term Portfolios (2008-present) and is an employee of Fidelity Investments. Previously, Ms. Laurent was Senior Vice President and Head of Legal for Fidelity Business Services India Pvt. Ltd. (2006-2008), and Senior Vice President, Deputy General Counsel and Group Head for FMR LLC (2005-2006). |
Christine Reynolds (52) |
| Year of Election or Appointment: 2008 Chief Financial Officer of the Fidelity funds. Ms. Reynolds became President of Fidelity Pricing and Cash Management Services (FPCMS) in August 2008. Ms. Reynolds served as Chief Operating Officer of FPCMS (2007-2008). Previously, Ms. Reynolds served as President, Treasurer, and Anti-Money Laundering officer of the Fidelity funds (2004-2007). |
Michael H. Whitaker (43) |
| Year of Election or Appointment: 2008 Chief Compliance Officer of Fidelity's Fixed Income and Asset Allocation Funds. Mr. Whitaker also serves as Chief Compliance Officer of The North Carolina Capital Management Trust: Cash and Term Portfolios (2008-present). Mr. Whitaker is an employee of Fidelity Investments (2007-present). Prior to joining Fidelity Investments, Mr. Whitaker worked at MFS Investment Management where he served as Senior Vice President and Chief Compliance Officer (2004-2006), and Assistant General Counsel. |
Jeffrey S. Christian (49) |
| Year of Election or Appointment: 2009 Deputy Treasurer of the Fidelity funds. Mr. Christian is an employee of Fidelity Investments. Previously, Mr. Christian served as Chief Financial Officer (2008-2009) of certain Fidelity funds and Senior Vice President of Fidelity Pricing and Cash Management Services (FPCMS) (2004-2009). |
Bryan A. Mehrmann (49) |
| Year of Election or Appointment: 2005 Deputy Treasurer of the Fidelity funds. Mr. Mehrmann is an employee of Fidelity Investments. |
Stephanie J. Dorsey (41) |
| Year of Election or Appointment: 2008 Deputy Treasurer of Fidelity's Fixed Income and Asset Allocation Funds. Ms. Dorsey also serves as Assistant Treasurer of other Fidelity funds (2010-present) and is an employee of Fidelity Investments (2008-present). Previously, Ms. Dorsey served as Treasurer (2004-2008) of the JPMorgan Mutual Funds and Vice President (2004-2008) of JPMorgan Chase Bank. |
Adrien E. Deberghes (43) |
| Year of Election or Appointment: 2010 Assistant Treasurer of Fidelity's Fixed Income and Asset Allocation Funds. Mr. Deberghes also serves as Deputy Treasurer of other Fidelity funds (2008-present) and is an employee of Fidelity Investments (2008-present). Previously, Mr. Deberghes served as Senior Vice President of Mutual Fund Administration at State Street Corporation (2007-2008), Senior Director of Mutual Fund Administration at Investors Bank & Trust (2005-2007), and Director of Finance for Dunkin' Brands (2000-2005). |
Kenneth B. Robins (41) |
| Year of Election or Appointment: 2009 Assistant Treasurer of the Fidelity Fixed Income and Asset Allocation Funds. Mr. Robins also serves as President and Treasurer of other Fidelity funds (2008-present; 2010-present) and is an employee of Fidelity Investments (2004-present). Previously, Mr. Robins served as Deputy Treasurer of the Fidelity funds (2005-2008) and Treasurer and Chief Financial Officer of The North Carolina Capital Management Trust: Cash and Term Portfolios (2006-2008). |
Gary W. Ryan (52) |
| Year of Election or Appointment: 2005 Assistant Treasurer of the Fidelity funds. Mr. Ryan is an employee of Fidelity Investments. Previously, Mr. Ryan served as Vice President of Fund Reporting in Fidelity Pricing and Cash Management Services (FPCMS) (1999-2005). |
Jonathan Davis (42) |
| Year of Election or Appointment: 2010 Assistant Treasurer of the Fidelity funds. Mr. Davis is an employee of Fidelity Investments. Previously, Mr. Davis served as Vice President and Associate General Counsel of FMR LLC (2003-2010). |
Annual Report
The Board of Trustees of each fund voted to pay to shareholders of record at the opening of business on record date, the following distributions per share derived from capital gains realized from sales of portfolio securities and dividends derived from net investment income:
| Pay Date | Record Date | Dividends | Capital Gains |
Fidelity Advisor Freedom Income Fund | | | | |
Class A | 05/09/11 | 05/06/11 | $0.012 | $0.006 |
Class T | 05/09/11 | 05/06/11 | $0.010 | $0.006 |
Class B | 05/09/11 | 05/06/11 | $0.006 | $0.006 |
Class C | 05/09/11 | 05/06/11 | $0.006 | $0.006 |
Fidelity Advisor Freedom 2005 Fund | | | | |
Class A | 05/09/11 | 05/06/11 | $0.019 | $0.013 |
Class T | 05/09/11 | 05/06/11 | $0.012 | $0.013 |
Class B | 05/09/11 | 05/06/11 | $0.000 | $0.005 |
Class C | 05/09/11 | 05/06/11 | $0.000 | $0.000 |
Fidelity Advisor Freedom 2010 Fund | | | | |
Class A | 05/09/11 | 05/06/11 | $0.020 | $0.016 |
Class T | 05/09/11 | 05/06/11 | $0.012 | $0.016 |
Class B | 05/09/11 | 05/06/11 | $0.000 | $0.009 |
Class C | 05/09/11 | 05/06/11 | $0.000 | $0.014 |
Fidelity Advisor Freedom 2015 Fund | | | | |
Class A | 05/12/11 | 05/11/11 | $0.020 | $0.016 |
Class T | 05/12/11 | 05/11/11 | $0.014 | $0.016 |
Class B | 05/12/11 | 05/11/11 | $0.001 | $0.016 |
Class C | 05/12/11 | 05/11/11 | $0.003 | $0.016 |
Fidelity Advisor Freedom 2020 Fund | | | | |
Class A | 05/09/11 | 05/06/11 | $0.019 | $0.020 |
Class T | 05/09/11 | 05/06/11 | $0.011 | $0.020 |
Class B | 05/09/11 | 05/06/11 | $0.000 | $0.012 |
Class C | 05/09/11 | 05/06/11 | $0.000 | $0.015 |
Fidelity Advisor Freedom 2025 Fund | | | | |
Class A | 05/09/11 | 05/06/11 | $0.016 | $0.022 |
Class T | 05/09/11 | 05/06/11 | $0.008 | $0.022 |
Class B | 05/09/11 | 05/06/11 | $0.000 | $0.014 |
Class C | 05/09/11 | 05/06/11 | $0.000 | $0.017 |
Fidelity Advisor Freedom 2030 Fund | | | | |
Class A | 05/09/11 | 05/06/11 | $0.016 | $0.025 |
Class T | 05/09/11 | 05/06/11 | $0.008 | $0.025 |
Class B | 05/09/11 | 05/06/11 | $0.000 | $0.014 |
Class C | 05/09/11 | 05/06/11 | $0.000 | $0.017 |
Fidelity Advisor Freedom 2035 Fund | | | | |
Class A | 05/09/11 | 05/06/11 | $0.009 | $0.026 |
Class T | 05/09/11 | 05/06/11 | $0.001 | $0.026 |
Class B | 05/09/11 | 05/06/11 | $0.000 | $0.011 |
Class C | 05/09/11 | 05/06/11 | $0.000 | $0.013 |
Fidelity Advisor Freedom 2040 Fund | | | | |
Class A | 05/09/11 | 05/06/11 | $0.009 | $0.029 |
Class T | 05/09/11 | 05/06/11 | $0.003 | $0.029 |
Class B | 05/09/11 | 05/06/11 | $0.000 | $0.019 |
Class C | 05/09/11 | 05/06/11 | $0.000 | $0.020 |
| Pay Date | Record Date | Dividends | Capital Gains |
Fidelity Advisor Freedom 2045 Fund | | | | |
Class A | 05/12/11 | 05/11/11 | $0.009 | $0.021 |
Class T | 05/12/11 | 05/11/11 | $0.002 | $0.021 |
Class B | 05/12/11 | 05/11/11 | $0.000 | $0.011 |
Class C | 05/12/11 | 05/11/11 | $0.000 | $0.012 |
Fidelity Advisor Freedom 2050 Fund | | | | |
Class A | 05/12/11 | 05/11/11 | $0.005 | $0.023 |
Class T | 05/12/11 | 05/11/11 | $0.000 | $0.021 |
Class B | 05/12/11 | 05/11/11 | $0.000 | $0.009 |
Class C | 05/12/11 | 05/11/11 | $0.000 | $0.010 |
A percentage of the dividends distributed during the fiscal year for the following funds were derived from interest on U.S. Government securities which is generally exempt from state income tax:
Fidelity Advisor Freedom Income Fund | |
Class A | 12.12% |
Class T | 12.12% |
Class B | 12.12% |
Class C | 12.12% |
Fidelity Advisor Freedom 2005 Fund | |
Class A | 9.11% |
Class T | 9.11% |
Class B | 9.11% |
Class C | 9.11% |
Fidelity Advisor Freedom 2010 Fund | |
Class A | 8.87% |
Class T | 8.87% |
Class B | 8.87% |
Class C | 8.87% |
Fidelity Advisor Freedom 2015 Fund | |
Class A | 8.49% |
Class T | 8.49% |
Class B | 8.49% |
Class C | 8.49% |
Fidelity Advisor Freedom 2020 Fund | |
Class A | 6.84% |
Class T | 6.84% |
Class B | 6.84% |
Class C | 6.84% |
Fidelity Advisor Freedom 2025 Fund | |
Class A | 5.35% |
Class T | 5.35% |
Class B | 5.35% |
Class C | 5.35% |
Fidelity Advisor Freedom 2030 Fund | |
Class A | 4.50% |
Class T | 4.50% |
Class B | 4.50% |
Class C | 4.50% |
Fidelity Advisor Freedom 2035 Fund | |
Class A | 2.91% |
Class T | 2.91% |
Class B | 2.91% |
Class C | 2.91% |
Fidelity Advisor Freedom 2040 Fund | |
Class A | 2.57% |
Class T | 2.57% |
Class B | 2.57% |
Class C | 2.57% |
Fidelity Advisor Freedom 2045 Fund | |
Class A | 1.79% |
Class T | 1.79% |
Class B | 1.79% |
Class C | 1.79% |
Fidelity Advisor Freedom 2050 Fund | |
Class A | 1.01% |
Class T | 1.01% |
Class B | 1.01% |
Class C | 1.01% |
A percentage of the dividends distributed during the fiscal year for the following funds qualify for the dividends-received deduction for corporate shareholders:
| Class A | Class T | Class B | Class C |
Fidelity Advisor Freedom Income Fund | | | | |
May 2010 | 3% | 4% | 5% | 5% |
June 2010 | 7% | 9% | 20% | 16% |
July 2010 | 7% | 9% | 16% | 16% |
August 2010 | 7% | 8% | 15% | 15% |
September 2010 | 7% | 9% | 20% | 20% |
October 2010 | 7% | 9% | 24% | 18% |
November 2010 | 7% | 9% | 20% | 16% |
December 2010 (Ex-Date 12/03/10) | 7% | 10% | 25% | 25% |
December 2010 (Ex-Date 12/30/10) | 8% | 8% | 8% | 8% |
February 2011 | 4% | 5% | 26% | 26% |
March 2011 | 4% | 6% | 38% | 0% |
Fidelity Advisor Freedom 2005 Fund | | | | |
May 2010 | 4% | 4% | 6% | 6% |
December 2010 | 16% | 18% | 25% | 24% |
Fidelity Advisor Freedom 2010 Fund | | | | |
May 2010 | 4% | 4% | 6% | 6% |
December 2010 | 16% | 19% | 25% | 24% |
Fidelity Advisor Freedom 2015 Fund | | | | |
May 2010 | 4% | 5% | 7% | 7% |
December 2010 | 18% | 20% | 27% | 26% |
Fidelity Advisor Freedom 2020 Fund | | | | |
May 2010 | 5% | 5% | 7% | 7% |
December 2010 | 20% | 23% | 30% | 29% |
Fidelity Advisor Freedom 2025 Fund | | | | |
May 2010 | 6% | 6% | 9% | 8% |
December 2010 | 24% | 26% | 34% | 34% |
| Class A | Class T | Class B | Class C |
Fidelity Advisor Freedom 2030 Fund | | | | |
May 2010 | 6% | 7% | 10% | 10% |
December 2010 | 25% | 29% | 37% | 36% |
Fidelity Advisor Freedom 2035 Fund | | | | |
May 2010 | 7% | 8% | 11% | 10% |
December 2010 | 31% | 35% | 47% | 46% |
Fidelity Advisor Freedom 2040 Fund | | | | |
May 2010 | 7% | 8% | 11% | 11% |
December 2010 | 30% | 35% | 48% | 46% |
Fidelity Advisor Freedom 2045 Fund | | | | |
May 2010 | 7% | 7% | 10% | 10% |
December 2010 | 33% | 36% | 50% | 47% |
Fidelity Advisor Freedom 2050 Fund | | | | |
May 2010 | 8% | 9% | 13% | 13% |
December 2010 | 35% | 39% | 54% | 52% |
A percentage of the dividends distributed during the fiscal year for the following funds may be taken into account as a dividend for purposes of the maximum rate under section 1(h)(11) of the Internal Revenue Code.
| Class A | Class T | Class B | Class C |
Fidelity Advisor Freedom Income Fund | | | | |
May 2010 | 6% | 6% | 8% | 8% |
June 2010 | 12% | 14% | 31% | 25% |
July 2010 | 12% | 14% | 25% | 25% |
August 2010 | 12% | 13% | 23% | 23% |
September 2010 | 12% | 14% | 31% | 31% |
October 2010 | 12% | 14% | 38% | 28% |
November 2010 | 12% | 14% | 31% | 25% |
December 2010 (Ex-Date 12/03/10) | 11% | 15% | 40% | 40% |
December 2010 (Ex-Date 12/30/10) | 12% | 13% | 13% | 13% |
February 2011 | 3% | 4% | 16% | 16% |
March 2011 | 3% | 4% | 23% | 0% |
Fidelity Advisor Freedom 2005 Fund | | | | |
May 2010 | 5% | 5% | 7% | 7% |
December 2010 | 24% | 27% | 37% | 36% |
Fidelity Advisor Freedom 2010 Fund | | | | |
May 2010 | 5% | 5% | 7% | 7% |
December 2010 | 26% | 30% | 40% | 37% |
Fidelity Advisor Freedom 2015 Fund | | | | |
May 2010 | 5% | 6% | 8% | 8% |
December 2010 | 27% | 31% | 41% | 40% |
Fidelity Advisor Freedom 2020 Fund | | | | |
May 2010 | 6% | 7% | 9% | 9% |
December 2010 | 31% | 36% | 46% | 44% |
Fidelity Advisor Freedom 2025 Fund | | | | |
May 2010 | 7% | 8% | 11% | 10% |
December 2010 | 36% | 40% | 52% | 51% |
Fidelity Advisor Freedom 2030 Fund | | | | |
May 2010 | 7% | 8% | 12% | 12% |
December 2010 | 39% | 45% | 58% | 56% |
| Class A | Class T | Class B | Class C |
Fidelity Advisor Freedom 2035 Fund | | | | |
May 2010 | 8% | 9% | 13% | 12% |
December 2010 | 47% | 53% | 71% | 69% |
Fidelity Advisor Freedom 2040 Fund | | | | |
May 2010 | 9% | 10% | 13% | 13% |
December 2010 | 47% | 55% | 74% | 72% |
Fidelity Advisor Freedom 2045 Fund | | | | |
May 2010 | 8% | 9% | 12% | 12% |
December 2010 | 49% | 55% | 75% | 71% |
Fidelity Advisor Freedom 2050 Fund | | | | |
May 2010 | 10% | 11% | 15% | 16% |
December 2010 | 53% | 59% | 81% | 79% |
The funds will notify shareholders in January 2012 of amounts for use in preparing 2011 income tax returns.
Annual Report
Investment Adviser
Strategic Advisers, Inc.
Boston, MA
General Distributor
Fidelity Distributors Corporation
Boston, MA
Transfer and Service Agents
Fidelity Investments Institutional Operations Company, Inc.
Boston, MA
Fidelity Service Company, Inc.
Boston, MA
Custodian
The Bank of New York Mellon
New York, NY
AFF-UANN-0511
1.792134.107

Fidelity Advisor Freedom Funds®-
Income, 2005, 2010, 2015, 2020, 2025, 2030, 2035, 2040, 2045, 2050 - Institutional Class
Annual Report
March 31, 2011
(2_fidelity_logos) (Registered_Trademark)
Contents
To view a fund's proxy voting guidelines and proxy voting record for the 12-month period ended June 30, visit http://www.fidelity.com/proxyvotingresults or visit the Securities and Exchange Commission's (SEC) web site at http://www.sec.gov. You may also call 1-877-208-0098 to request a free copy of the proxy voting guidelines.
Standard & Poor's, S&P and S&P 500 are registered service marks of The McGraw-Hill Companies, Inc. and have been licensed for use by Fidelity Distributors Corporation.
Other third party marks appearing herein are the property of their respective owners.
All other marks appearing herein are registered or unregistered trademarks or service marks of FMR LLC or an affiliated company.
Annual Report
This report and the financial statements contained herein are submitted for the general information of the shareholders of the funds. This report is not authorized for distribution to prospective investors in the funds unless preceded or accompanied by an effective prospectus.
A fund files its complete schedule of portfolio holdings with the SEC for the first and third quarters of each fiscal year on Form N-Q. Forms N-Q are available on the SEC's web site at http://www.sec.gov. A fund's Forms N-Q may be reviewed and copied at the SEC's Public Reference Room in Washington, DC. Information regarding the operation of the SEC's Public Reference Room may be obtained by calling 1-800-SEC-0330. For a complete list of a fund's portfolio holdings, view the most recent holdings listing, semiannual report, or annual report on Fidelity's web site at http://www.fidelity.com, http://www.advisor.fidelity.com, or http://www.401k.com, as applicable.
NOT FDIC INSURED • MAY LOSE VALUE • NO BANK GUARANTEE
Neither the funds nor Fidelity Distributors Corporation is a bank.
Annual Report
(photo_of_Abigail_P_Johnson)
Dear Shareholder:
Amid indications the U.S. economy had turned a corner, U.S. equities continued their generally upward trend in early 2011, overcoming bouts of short-term volatility following unrest in North Africa and the disaster in Japan. Still, questions remained about the longer-term outlook, most notably persistently high unemployment. Financial markets are always unpredictable, of course, but there also are several time-tested investment principles that can help put the odds in your favor.
One of the basic tenets is to invest for the long term. Over time, riding out the markets' inevitable ups and downs has proven much more effective than selling into panic or chasing the hottest trend. Even missing only a few of the markets' best days can significantly diminish investor returns. Patience also affords the benefits of compounding - of earning interest on additional income or reinvested dividends and capital gains. There can be tax advantages and cost benefits to consider as well. While staying the course doesn't eliminate risk, it can considerably lessen the effect of short-term declines.
You can further manage your investing risk through diversification. And today, more than ever, geographic diversification should be taken into account. Studies indicate that asset allocation is the single most important determinant of a portfolio's long-term success. The right mix of stocks, bonds and cash - aligned to your particular risk tolerance and investment objective - is very important. Age-appropriate rebalancing is also an essential aspect of asset allocation. For younger investors, an emphasis on equities - which historically have been the best-performing asset class over time - is encouraged. As investors near their specific goal, such as retirement or sending a child to college, consideration may be given to replacing volatile assets (e.g. common stocks) with more-stable fixed investments (bonds or savings plans).
A third principle - investing regularly - can help lower the average cost of your purchases. Investing a certain amount of money each month or quarter helps ensure you won't pay for all your shares at market highs. This strategy - known as dollar cost averaging - also reduces "emotion" from investing, helping shareholders avoid selling weak performers just prior to an upswing, or chasing a hot performer just before a correction.
We invite you to contact us via the Internet, through our Investor Centers or by phone. It is our privilege to provide you the information you need to make the investments that are right for you.
Sincerely,
(The chairman's signature appears here.)
Abigail P. Johnson
Annual Report
Fidelity Advisor Freedom Income Fund® - Institutional Class
Performance: The Bottom Line
Average annual total return reflects the change in the value of an investment, assuming reinvestment of the class' distributions from dividend income and capital gains (the profits earned upon the sale of securities that have grown in value, if any) and assuming a constant rate of performance each year. The $10,000 table and the fund's returns do not reflect the deduction of taxes that a shareholder would pay on fund distributions or the redemption of fund shares. During periods of reimbursement by Fidelity, a fund's total return will be greater than it would be had the reimbursement not occurred. How a fund did yesterday is no guarantee of how it will do tomorrow.
Average Annual Total Returns
Periods ended March 31, 2011 | Past 1
year | Past 5
years | Life of
fund A |
Institutional Class | 7.36% | 4.52% | 4.46% |
A From July 24, 2003.
$10,000 Over Life of Fund
Let's say hypothetically that $10,000 was invested in Fidelity Advisor Freedom Income Fund® - Institutional Class on July 24, 2003, when the fund started. The chart shows how the value of your investment would have changed, and also shows how the Barclays Capital® U.S. Aggregate Bond Index performed over the same period.
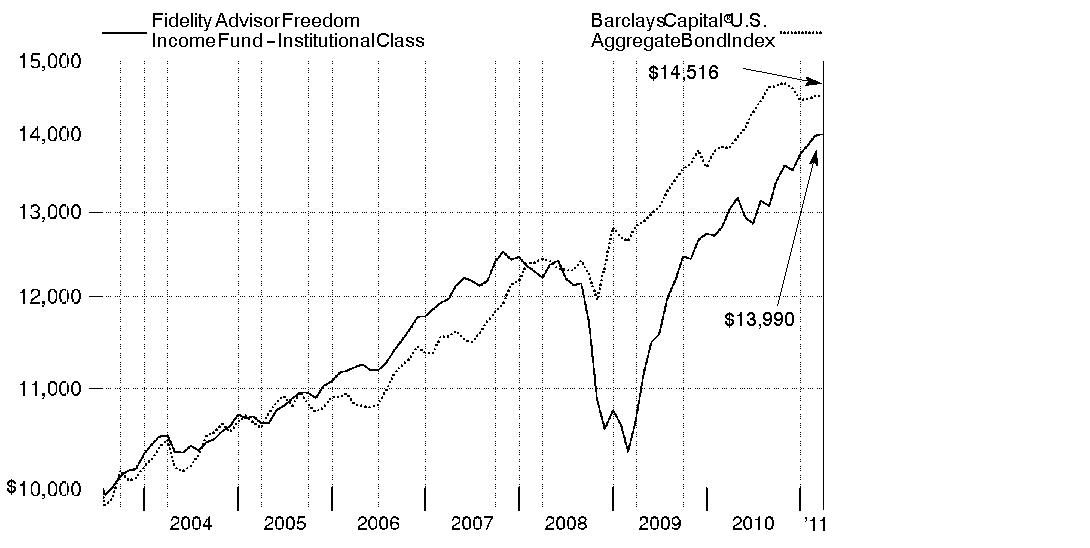
Annual Report
Fidelity Advisor Freedom 2005 Fund ® - Institutional Class
Performance: The Bottom Line
Average annual total return reflects the change in the value of an investment, assuming reinvestment of the class' distributions from dividend income and capital gains (the profits earned upon the sale of securities that have grown in value, if any) and assuming a constant rate of performance each year. The $10,000 table and the fund's returns do not reflect the deduction of taxes that a shareholder would pay on fund distributions or the redemption of fund shares. During periods of reimbursement by Fidelity, a fund's total return will be greater than it would be had the reimbursement not occurred. How a fund did yesterday is no guarantee of how it will do tomorrow.
Average Annual Total Returns
Periods ended March 31, 2011 | Past 1
year | Past 5
years | Life of
fund A |
Institutional Class | 11.02% | 3.96% | 5.12% |
A From November 6, 2003.
$10,000 Over Life of Fund
Let's say hypothetically that $10,000 was invested in Fidelity Advisor Freedom 2005 Fund® - Institutional Class on November 6, 2003, when the fund started. The chart shows how the value of your investment would have changed, and also shows how the Barclays Capital U.S. Aggregate Bond Index performed over the same period.
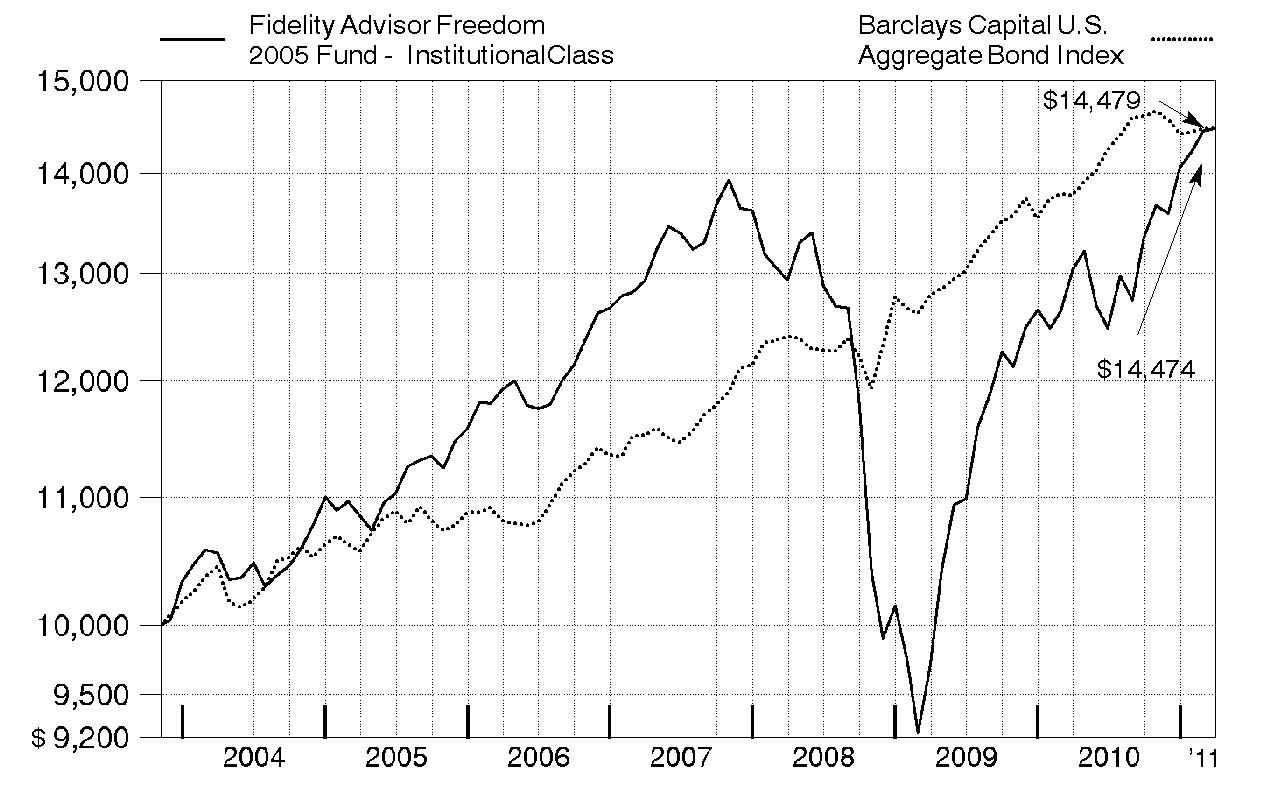
Annual Report
Fidelity Advisor Freedom 2010 Fund ® - Institutional Class
Performance: The Bottom Line
Average annual total return reflects the change in the value of an investment, assuming reinvestment of the class' distributions from dividend income and capital gains (the profits earned upon the sale of securities that have grown in value, if any) and assuming a constant rate of performance each year. The $10,000 table and the fund's returns do not reflect the deduction of taxes that a shareholder would pay on fund distributions or the redemption of fund shares. During periods of reimbursement by Fidelity, a fund's total return will be greater than it would be had the reimbursement not occurred. How a fund did yesterday is no guarantee of how it will do tomorrow.
Average Annual Total Returns
Periods ended March 31, 2011 | Past 1
year | Past 5
years | Life of
fund A |
Institutional Class | 12.50% | 4.27% | 5.71% |
A From July 24, 2003.
$10,000 Over Life of Fund
Let's say hypothetically that $10,000 was invested in Fidelity Advisor Freedom 2010 Fund® - Institutional Class on July 24, 2003, when the fund started. The chart shows how the value of your investment would have changed, and also shows how the Barclays Capital U.S. Aggregate Bond Index performed over the same period.
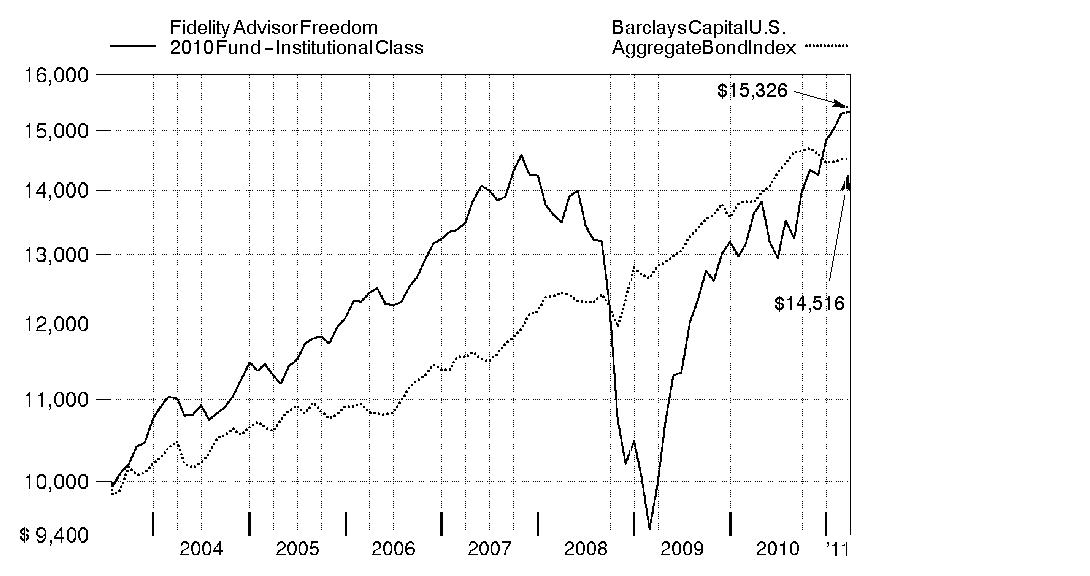
Annual Report
Fidelity Advisor Freedom 2015 Fund ® - Institutional Class
Performance: The Bottom Line
Average annual total return reflects the change in the value of an investment, assuming reinvestment of the class' distributions from dividend income and capital gains (the profits earned upon the sale of securities that have grown in value, if any) and assuming a constant rate of performance each year. The $10,000 table and the fund's returns do not reflect the deduction of taxes that a shareholder would pay on fund distributions or the redemption of fund shares. During periods of reimbursement by Fidelity, a fund's total return will be greater than it would be had the reimbursement not occurred. How a fund did yesterday is no guarantee of how it will do tomorrow.
Average Annual Total Returns
Periods ended March 31, 2011 | Past 1
year | Past 5
years | Life of
fund A |
Institutional Class | 12.67% | 4.04% | 5.73% |
A From November 6, 2003.
$10,000 Over Life of Fund
Let's say hypothetically that $10,000 was invested in Fidelity Advisor Freedom 2015 Fund® - Institutional Class on November 6, 2003, when the fund started. The chart shows how the value of your investment would have changed, and also shows how the S&P 500® Index performed over the same period.
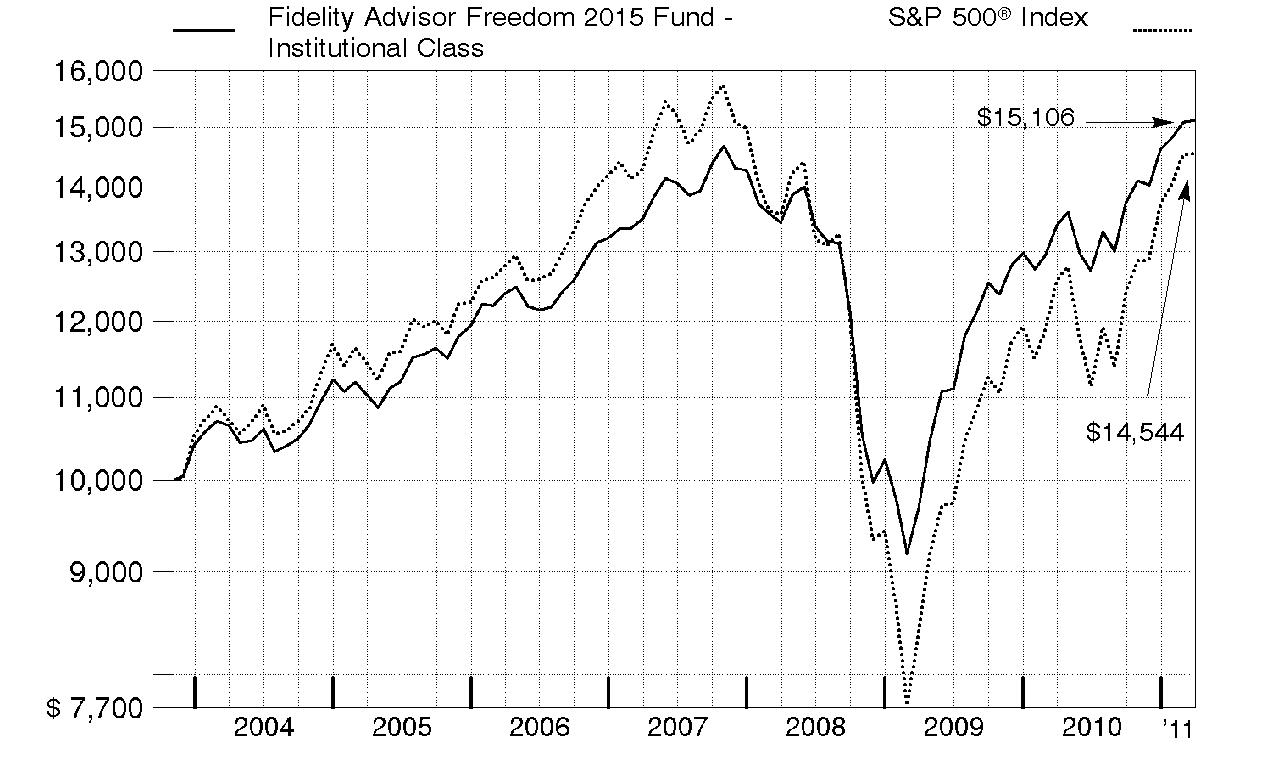
Annual Report
Fidelity Advisor Freedom 2020 Fund ® - Institutional Class
Performance: The Bottom Line
Average annual total return reflects the change in the value of an investment, assuming reinvestment of the class' distributions from dividend income and capital gains (the profits earned upon the sale of securities that have grown in value, if any) and assuming a constant rate of performance each year. The $10,000 table and the fund's returns do not reflect the deduction of taxes that a shareholder would pay on fund distributions or the redemption of fund shares. During periods of reimbursement by Fidelity, a fund's total return will be greater than it would be had the reimbursement not occurred. How a fund did yesterday is no guarantee of how it will do tomorrow.
Average Annual Total Returns
Periods ended March 31, 2011 | Past 1
year | Past 5
years | Life of
fund A |
Institutional Class | 14.09% | 3.51% | 6.35% |
A From July 24, 2003.
$10,000 Over Life of Fund
Let's say hypothetically that $10,000 was invested in Fidelity Advisor Freedom 2020 Fund® - Institutional Class on July 24, 2003, when the fund started. The chart shows how the value of your investment would have changed, and also shows how the S&P 500 Index performed over the same period.
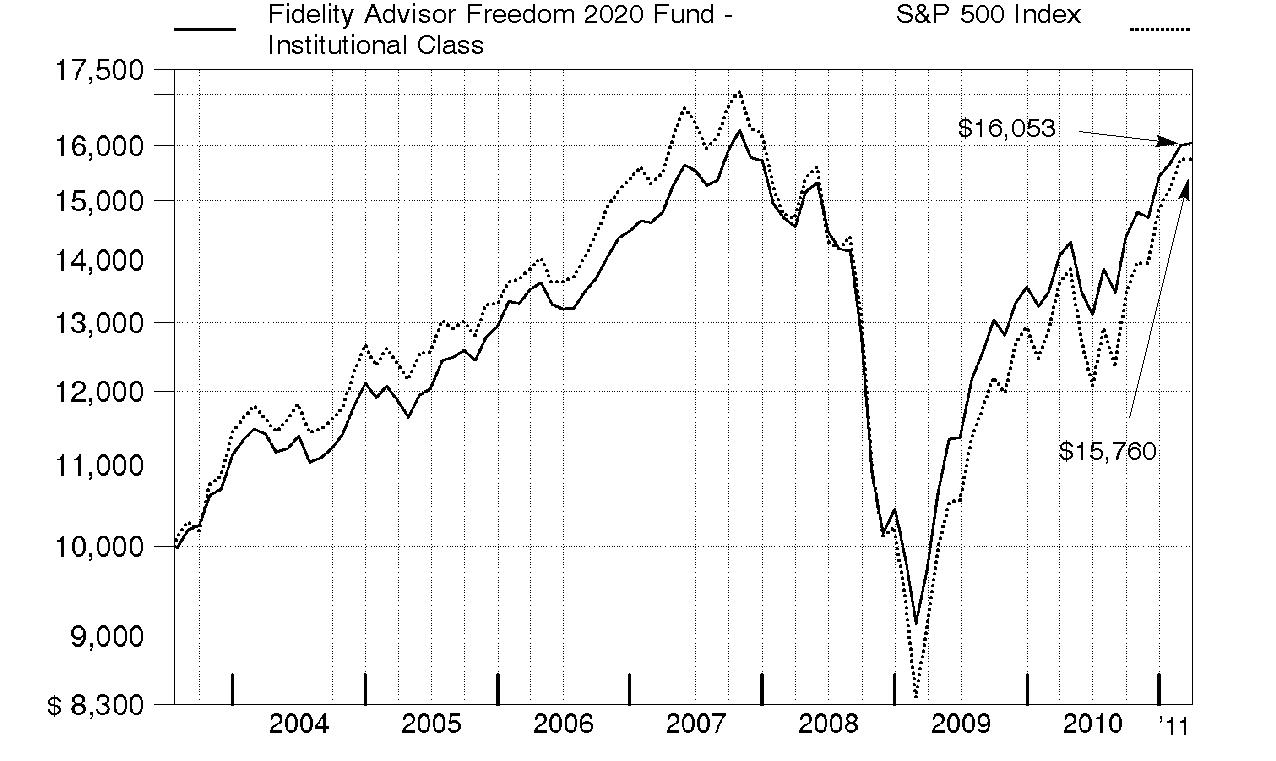
Annual Report
Fidelity Advisor Freedom 2025 Fund ® - Institutional Class
Performance: The Bottom Line
Average annual total return reflects the change in the value of an investment, assuming reinvestment of the class' distributions from dividend income and capital gains (the profits earned upon the sale of securities that have grown in value, if any) and assuming a constant rate of performance each year. The $10,000 table and the fund's returns do not reflect the deduction of taxes that a shareholder would pay on fund distributions or the redemption of fund shares. During periods of reimbursement by Fidelity, a fund's total return will be greater than it would be had the reimbursement not occurred. How a fund did yesterday is no guarantee of how it will do tomorrow.
Average Annual Total Returns
Periods ended March 31, 2011 | Past 1
year | Past 5
years | Life of
fund A |
Institutional Class | 15.23% | 3.52% | 5.88% |
A From November 6, 2003.
$10,000 Over Life of Fund
Let's say hypothetically that $10,000 was invested in Fidelity Advisor Freedom 2025 Fund® - Institutional Class on November 6, 2003, when the fund started. The chart shows how the value of your investment would have changed, and also shows how the S&P 500 Index performed over the same period.
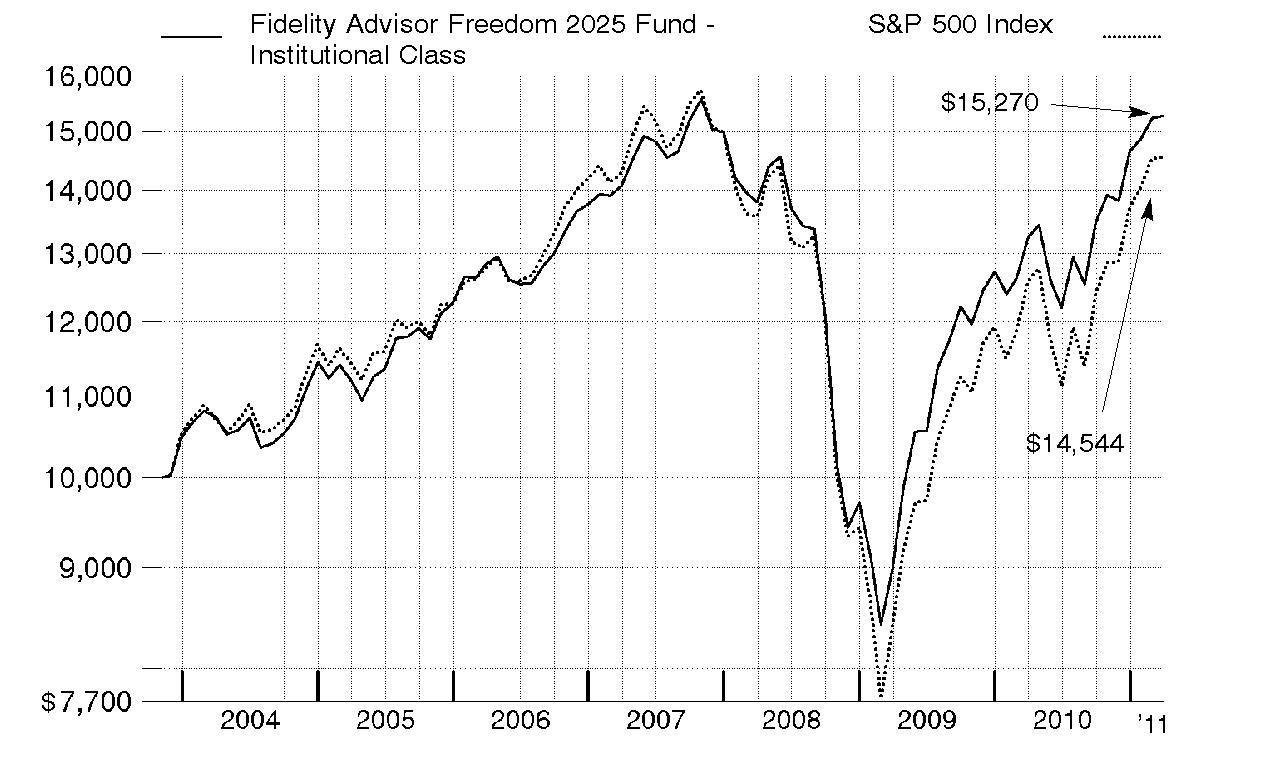
Annual Report
Fidelity Advisor Freedom 2030 Fund ® - Institutional Class
Performance: The Bottom Line
Average annual total return reflects the change in the value of an investment, assuming reinvestment of the class' distributions from dividend income and capital gains (the profits earned upon the sale of securities that have grown in value, if any) and assuming a constant rate of performance each year. The $10,000 table and the fund's returns do not reflect the deduction of taxes that a shareholder would pay on fund distributions or the redemption of fund shares. During periods of reimbursement by Fidelity, a fund's total return will be greater than it would be had the reimbursement not occurred. How a fund did yesterday is no guarantee of how it will do tomorrow.
Average Annual Total Returns
Periods ended March 31, 2011 | Past 1
year | Past 5
years | Life of
fund A |
Institutional Class | 15.56% | 2.74% | 6.38% |
A From July 24, 2003.
$10,000 Over Life of Fund
Let's say hypothetically that $10,000 was invested in Fidelity Advisor Freedom 2030 Fund® - Institutional Class on July 24, 2003, when the fund started. The chart shows how the value of your investment would have changed, and also shows how the S&P 500 Index performed over the same period.
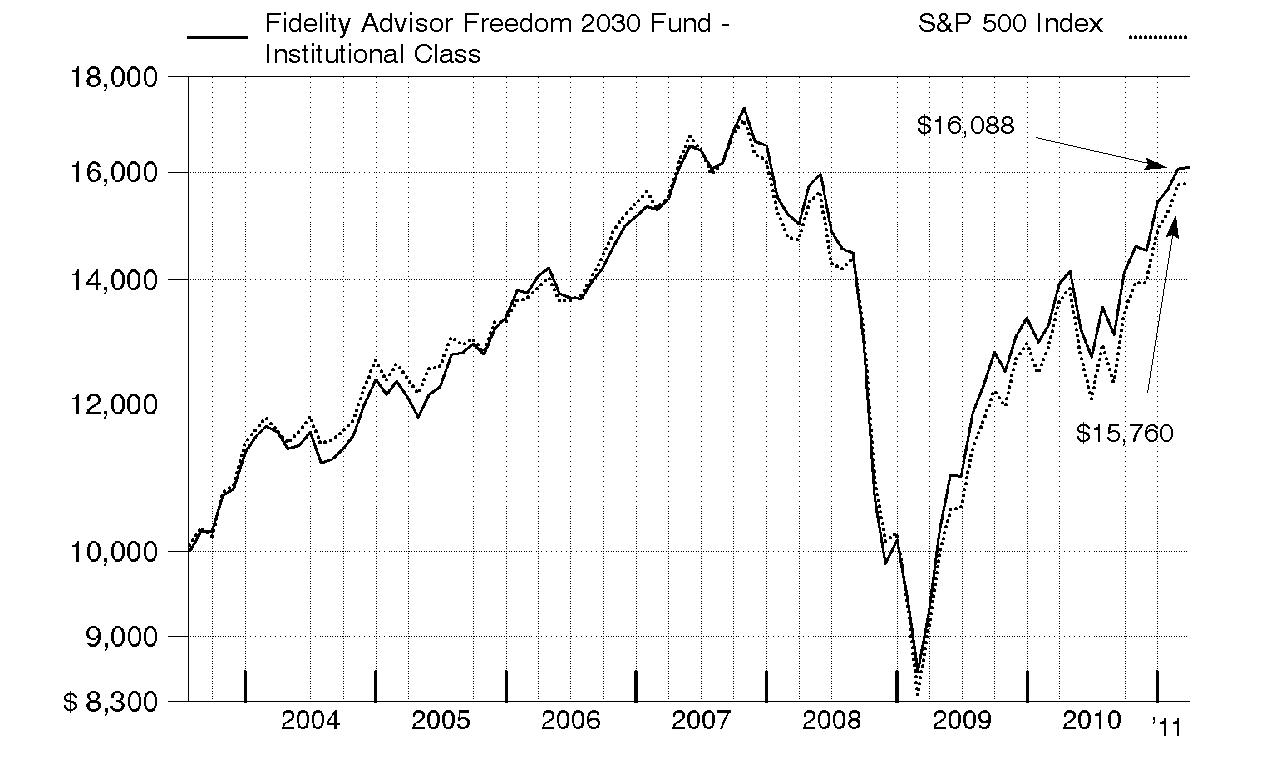
Annual Report
Fidelity Advisor Freedom 2035 Fund ® - Institutional Class
Performance: The Bottom Line
Average annual total return reflects the change in the value of an investment, assuming reinvestment of the class' distributions from dividend income and capital gains (the profits earned upon the sale of securities that have grown in value, if any) and assuming a constant rate of performance each year. The $10,000 table and the fund's returns do not reflect the deduction of taxes that a shareholder would pay on fund distributions or the redemption of fund shares. During periods of reimbursement by Fidelity, a fund's total return will be greater than it would be had the reimbursement not occurred. How a fund did yesterday is no guarantee of how it will do tomorrow.
Average Annual Total Returns
Periods ended March 31, 2011 | Past 1
year | Past 5
years | Life of
fund A |
Institutional Class | 16.51% | 2.79% | 5.75% |
A From November 6, 2003.
$10,000 Over Life of Fund
Let's say hypothetically that $10,000 was invested in Fidelity Advisor Freedom 2035 Fund® - Institutional Class on November 6, 2003, when the fund started. The chart shows how the value of your investment would have changed, and also shows how the S&P 500 Index performed over the same period.
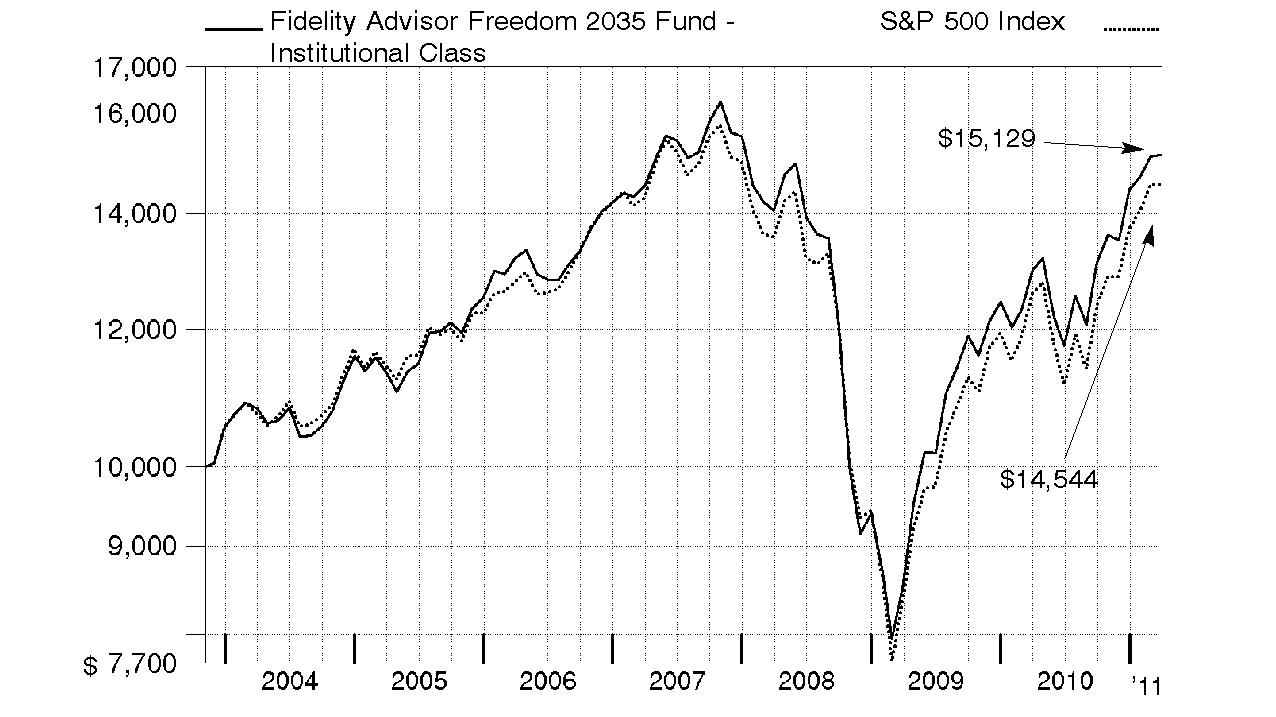
Annual Report
Fidelity Advisor Freedom 2040 Fund® - Institutional Class
Performance: The Bottom Line
Average annual total return reflects the change in the value of an investment, assuming reinvestment of the class' distributions from dividend income and capital gains (the profits earned upon the sale of securities that have grown in value, if any) and assuming a constant rate of performance each year. The $10,000 table and the fund's returns do not reflect the deduction of taxes that a shareholder would pay on fund distributions or the redemption of fund shares. During periods of reimbursement by Fidelity, a fund's total return will be greater than it would be had the reimbursement not occurred. How a fund did yesterday is no guarantee of how it will do tomorrow.
Average Annual Total Returns
Periods ended March 31, 2011 | Past 1
year | Past 5
years | Life of
fund A |
Institutional Class | 16.57% | 2.59% | 6.64% |
A From July 24, 2003.
$10,000 Over Life of Fund
Let's say hypothetically that $10,000 was invested in Fidelity Advisor Freedom 2040 Fund® - Institutional Class on July 24, 2003, when the fund started. The chart shows how the value of your investment would have changed, and also shows how the S&P 500 Index performed over the same period.
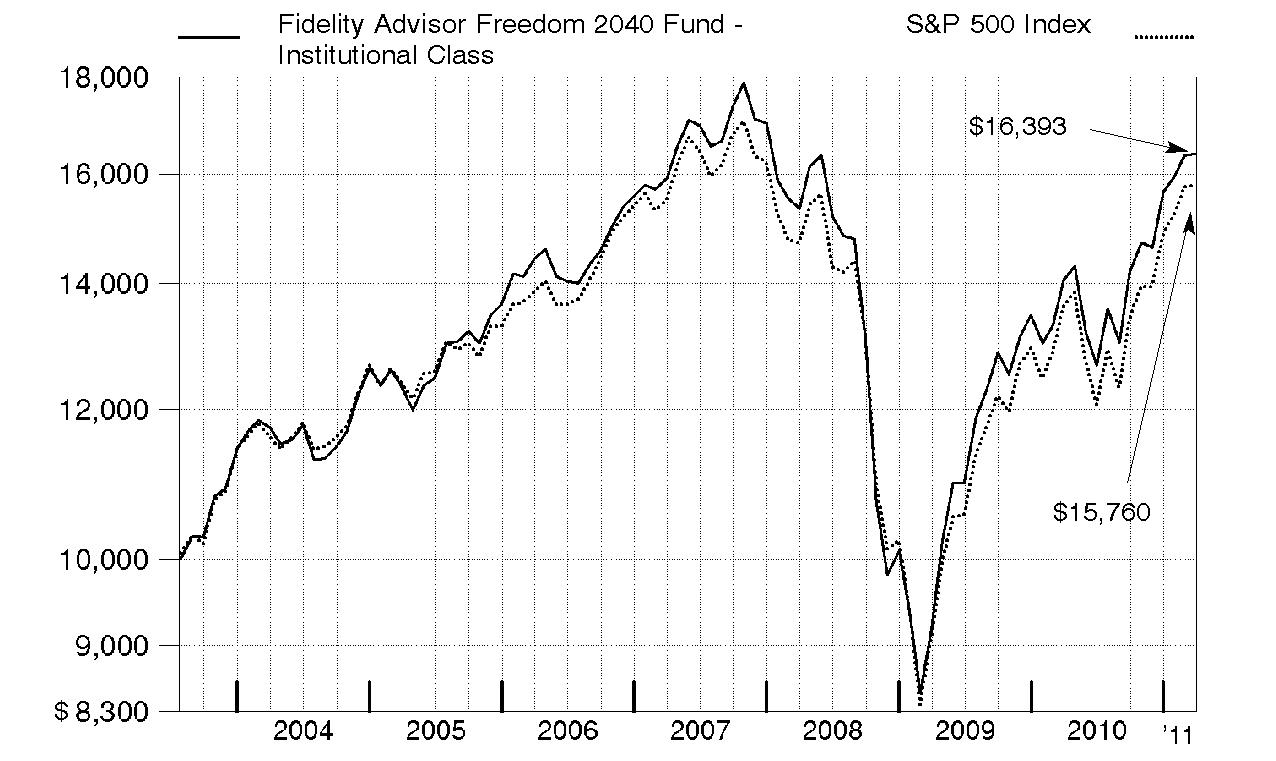
Annual Report
Fidelity Advisor Freedom 2045 Fund® - Institutional Class
Performance: The Bottom Line
Average annual total return reflects the change in the value of an investment, assuming reinvestment of the class' distributions from dividend income and capital gains (the profits earned upon the sale of securities that have grown in value, if any) and assuming a constant rate of performance each year. The $10,000 table and the fund's returns do not reflect the deduction of taxes that a shareholder would pay on fund distributions or the redemption of fund shares. During periods of reimbursement by Fidelity, a fund's total return will be greater than it would be had the reimbursement not occurred. How a fund did yesterday is no guarantee of how it will do tomorrow.
Average Annual Total Returns
Periods ended March 31, 2011 | | Past 1
year | Life of
fund A |
Institutional Class | | 16.86% | 2.94% |
A From June 1, 2006.
$10,000 Over Life of Fund
Let's say hypothetically that $10,000 was invested in Fidelity Advisor Freedom 2045 Fund® - Institutional Class on June 1, 2006, when the fund started. The chart shows how the value of your investment would have changed, and also shows how the S&P 500 Index performed over the same period.
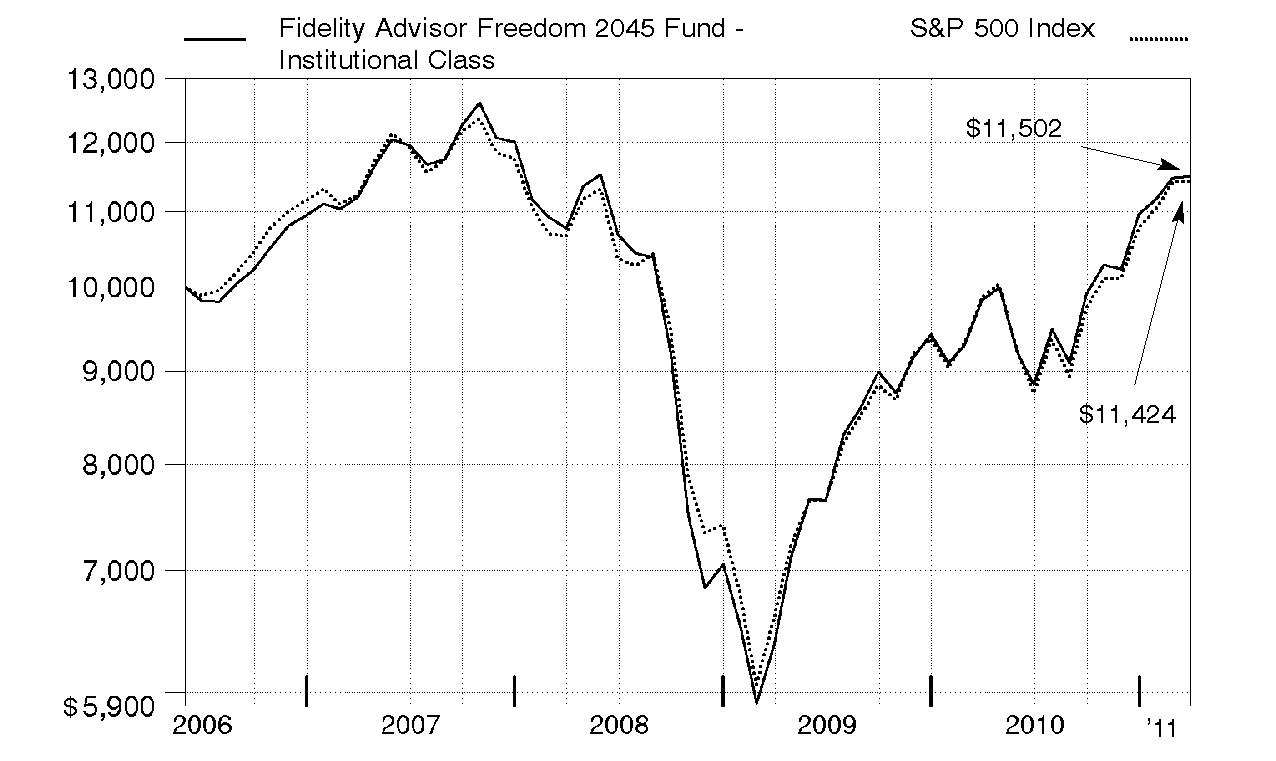
Annual Report
Fidelity Advisor Freedom 2050 Fund® - Institutional Class
Performance: The Bottom Line
Average annual total return reflects the change in the value of an investment, assuming reinvestment of the class' distributions from dividend income and capital gains (the profits earned upon the sale of securities that have grown in value, if any) and assuming a constant rate of performance each year. The $10,000 table and the fund's returns do not reflect the deduction of taxes that a shareholder would pay on fund distributions or the redemption of fund shares. During periods of reimbursement by Fidelity, a fund's total return will be greater than it would be had the reimbursement not occurred. How a fund did yesterday is no guarantee of how it will do tomorrow.
Average Annual Total Returns
Periods ended March 31, 2011 | Past 1
year | Life of
fund A |
Institutional Class | 17.17% | 2.78% |
A From June 1, 2006.
$10,000 Over Life of Fund
Let's say hypothetically that $10,000 was invested in Fidelity Advisor Freedom 2050 Fund® - Institutional Class on June 1, 2006, when the fund started. The chart shows how the value of your investment would have changed, and also shows how the S&P 500 Index performed over the same period.
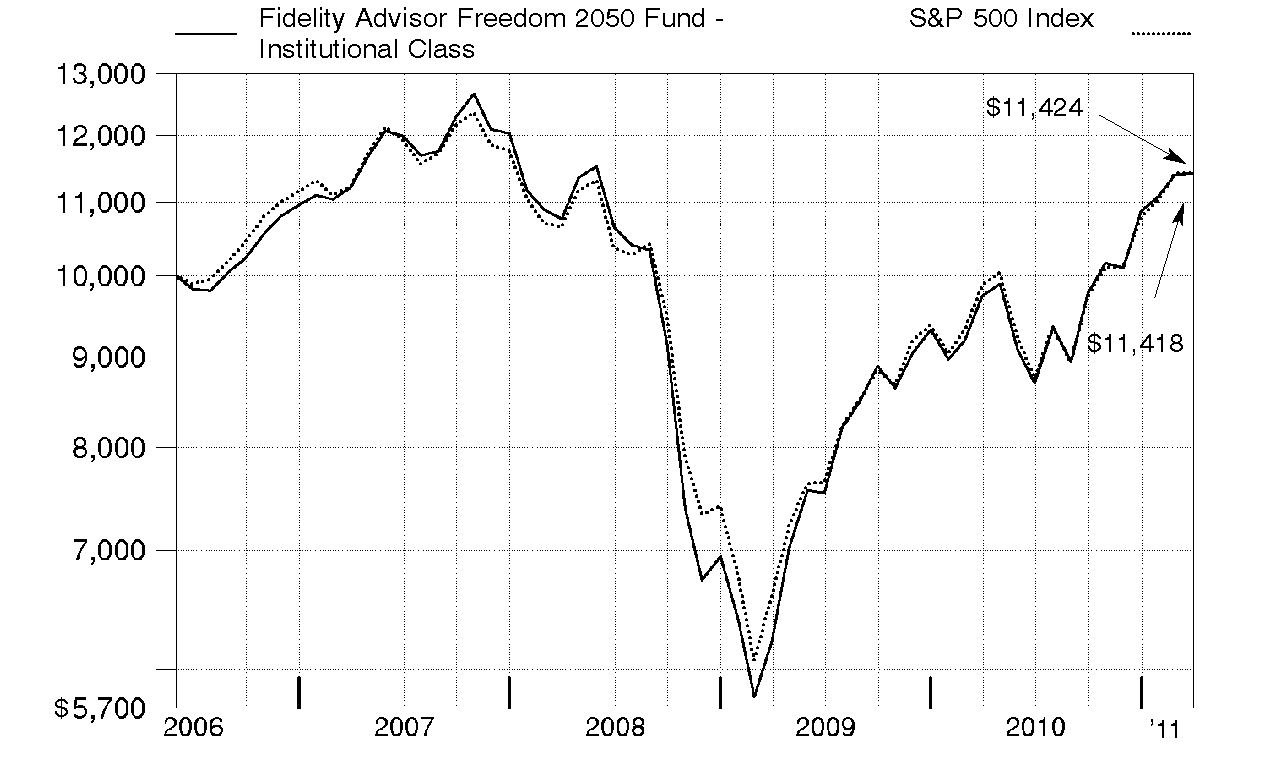
Annual Report
Market Recap: The 12-month period ending March 31, 2011, marked another good stretch for major equity markets, which continued a rally that began two years earlier. Despite early-period volatility brought on by the debt crisis in Europe and worries about a potential "double dip" recession in the U.S., stocks regained strength in late summer and fall, fueled by better-than-expected corporate earnings, encouraging economic activity, stimulative tax policies and the Federal Reserve's second round of quantitative easing involving the purchase of $600 billion in U.S. Treasuries. For the full period, the broad-based, large-cap-oriented S&P 500® Index posted a 15.65% gain, while its blue-chip counterpart, the Dow Jones Industrial AverageSM, rose 16.51% and the technology-laden Nasdaq Composite® Index added 17.06%. Within the S&P 500®, economically sensitive sectors generally saw the biggest gains, led by energy, materials and consumer discretionary. Telecommunication services stocks also rose sharply. By contrast, the financials and health care sectors showed only modest advances. Although global markets were rocked later in the period by heightened unrest in the Arab world and a devastating earthquake in Japan, foreign developed-markets equities, as represented by the MSCI® EAFE® (Europe, Australasia, Far East) Index, finished the year up 10.55%, significantly boosted by a weaker dollar. In the fixed-income area, investor appetite for higher-risk investments yielded solid returns. The BofA Merrill LynchSM US High Yield Constrained Index rose 14.14%, outpacing the 5.12% gain in the Barclays Capital® U.S. Aggregate Bond Index - a broad measure of the domestic investment-grade debt universe, which was held back by the weak returns of government securities.
Comments from Jonathan Shelon and Christopher Sharpe, Co-Portfolio Managers of Fidelity Advisor Freedom Funds®: Each of the Class A, Class T, Class B and Class C shares of the Advisor Freedom Funds (excluding sales charges) delivered a positive result for the one-year period ending March 31, 2011. (For specific Fund results, please refer to the performance section of this report.) The longer-dated Funds, which include more exposure to the U.S. equity and non-U.S. equity asset classes, posted higher returns than Funds with larger allocations to the investment-grade debt and short-term debt asset classes. On an absolute basis, both U.S. equities and non-U.S. equities performed very well for the one-year period, having gained traction in the second half of the period after a challenging initial six months. The equity asset classes were the main drivers of the Funds' absolute performance, which resulted in the longer-dated Funds posting the biggest gains during the one-year period ending March 31, 2011. In aggregate, the Funds' underlying U.S. equity investments outperformed the 17.73% return of the Dow Jones U.S. Total Stock Market IndexSM. Four of the nine underlying funds beat the Dow Jones index, with the strongest results coming from Fidelity® Series Small Cap Opportunities Fund. Fidelity® Series Commodity Strategy Fund, Fidelity Advisor® Small Cap Fund and Fidelity Advisor® Equity Growth Fund also were top contributors, each gaining more than 24%. Despite its strong absolute showing, Fidelity Series Large Cap Value Fund, a major holding, was the weakest performer, rising approximately 12% for the period. In the non-U.S. equity class, the Funds' underlying investments, in aggregate, soundly beat their benchmark, the MSCI® EAFE® (Europe, Australasia, Far East) Index. Five of the six underlying non-U.S. equity funds beat the MSCI index. Fidelity Series International Small Cap Fund and Fidelity Series Emerging Markets Fund led the way, benefiting from a weaker U.S. dollar and the shift toward higher-risk asset classes that occurred in the second half of the period. Turning to the debt asset classes, both investment-grade debt and short-term debt instruments posted a positive absolute return for the year, despite weak performance within these two categories during the second half of the period. Propelled in part by strong relative results from these two categories, the Funds were able to outpace their respective Composite indexes for the one-year period. The Funds' investment-grade debt category handily beat the Barclays Capital® U.S. Aggregate Bond Index. Fidelity Series Investment Grade Bond Fund helped the Funds' results, as did Fidelity Advisor Strategic Real Return Fund, which roared past the broader bond market. The Funds' high-yield holding, Fidelity Advisor High Income Advantage Fund, also did well, as investors' appetite for risk increased. The Funds transitioned out of Advisor High Income Advantage and into Fidelity Series High Income Fund during the period. In the short-term debt asset class, Fidelity Advisor Short Fixed-Income Fund pushed the Funds' aggregate performance in this category well ahead of the 0.19% return of the Barclays Capital® U.S. 3 Month Treasury Bellwether Index.
Comments from Jonathan Shelon and Christopher Sharpe, Co-Portfolio Managers of Fidelity Advisor Freedom Funds®: Each of the Institutional Class shares of the Advisor Freedom Funds delivered a positive result for the one-year period ending March 31, 2011. (For specific Fund results, please refer to the performance section of this report.) The longer-dated Funds, which include more exposure to the U.S. equity and non-U.S. equity asset classes, posted higher returns than the Funds with larger allocations to the investment-grade debt and short-term debt asset classes. On an absolute basis, both U.S. equities and non-U.S. equities performed very well for the one-year period, having gained traction in the second half of the period after a challenging initial six months. The equity asset classes were the main drivers of the Funds' absolute performance, which resulted in the longer-dated Funds posting the biggest gains during the one-year period ending March 31, 2011. In aggregate, the Funds' underlying U.S. equity investments outperformed the 17.73% return of the Dow Jones U.S. Total Stock Market IndexSM. Four of the nine underlying funds beat the Dow Jones index, with the strongest results coming from Fidelity® Series Small Cap Opportunities Fund. Fidelity® Series Commodity Strategy Fund, Fidelity Advisor® Small Cap Fund and Fidelity Advisor® Equity Growth Fund also were top contributors, each gaining more than 24%. Despite its strong absolute showing, Fidelity Series Large Cap Value Fund, a major holding, was the weakest performer, rising approximately 12% for the period. In the non-U.S. equity class, the Funds' underlying investments, in aggregate, soundly beat their benchmark, the MSCI® EAFE® (Europe, Australasia, Far East) Index. Five of the six underlying non-U.S. equity funds beat the MSCI index. Fidelity Series International Small Cap Fund and Fidelity Series Emerging Markets Fund led the way, benefiting from a weaker U.S. dollar and the shift toward higher-risk asset classes that occurred in the second half of the period. Turning to the debt asset classes, both investment-grade debt and short-term debt instruments posted a positive absolute return for the year, despite weak performance within these two categories during the second half of the period. Propelled in part by strong relative results from these two categories, the Funds were able to outpace their respective Composite indexes for the one-year period. The Funds' investment-grade debt category handily beat the Barclays Capital® U.S. Aggregate Bond Index. Fidelity Series Investment Grade Bond Fund helped the Funds' results, as did Fidelity Advisor Strategic Real Return Fund, which roared past the broader bond market. The Funds' high-yield holding, Fidelity Advisor High Income Advantage Fund, also did well, as investors' appetite for risk increased. The Funds transitioned out of Advisor High Income Advantage and into Fidelity Series High Income Fund during the period. In the short-term debt asset class, Fidelity Advisor Short Fixed-Income Fund pushed the Funds' aggregate performance in this category well ahead of the 0.19% return of the Barclays Capital® U.S. 3 Month Treasury Bellwether Index.
The views expressed above reflect those of the portfolio manager(s) only through the end of the period as stated on the cover of this report and do not necessarily represent the views of Fidelity or any other person in the Fidelity organization. Any such views are subject to change at any time based upon market or other conditions and Fidelity disclaims any responsibility to update such views. These views may not be relied on as investment advice and, because investment decisions for a Fidelity fund are based on numerous factors, may not be relied on as an indication of trading intent on behalf of any Fidelity fund.
Annual Report
As a shareholder of a Fund, you incur two types of costs: (1) transaction costs, including sales charges (loads) on purchase payments or redemption proceeds, and (2) ongoing costs, including distribution and/or service (12b-1) fees and other Fund expenses. This Example is intended to help you understand your ongoing costs (in dollars) of investing in the Funds and to compare these costs with the ongoing costs of investing in other mutual funds.
The Example is based on an investment of $1,000 invested at the beginning of the period and held for the entire period (October 1, 2010 to March 31, 2011).
Actual Expenses
The first line of the accompanying table for each class of each fund provides information about actual account values and actual expenses. You may use the information in this line, together with the amount you invested, to estimate the expenses that you paid over the period. Simply divide your account value by $1,000.00 (for example, an $8,600 account value divided by $1,000.00 = 8.6), then multiply the result by the number in the first line for a class of the fund under the heading entitled "Expenses Paid During Period" to estimate the expenses you paid on your account during this period. In addition, each Fund, as a shareholder in underlying Fidelity Funds, will indirectly bear its pro-rata share of the fees and expenses incurred by the underlying Fidelity Funds. These fees and expenses are not included in each Fund's annualized expense ratio used to calculate the expense estimates in the table below.
Hypothetical Example for Comparison Purposes
The second line of the accompanying table for each class of each fund provides information about hypothetical account values and hypothetical expenses based on a Class' actual expense ratio and an assumed rate of return of 5% per year before expenses, which is not the Class' actual return. The hypothetical account values and expenses may not be used to estimate the actual ending account balance or expenses you paid for the period. You may use this information to compare the ongoing costs of investing in the Fund and other funds. To do so, compare this 5% hypothetical example with the 5% hypothetical examples that appear in the shareholder reports of the other funds. In addition, each Fund, as a shareholder in underlying Fidelity Funds, will indirectly bear its pro-rata share of the fees and expenses incurred by the underlying Fidelity Funds. These fees and expenses are not included in each Fund's annualized expense ratio used to calculate the expense estimates in the table below.
Please note that the expenses shown in the table are meant to highlight your ongoing costs only and do not reflect any transaction costs. Therefore, the second line of the table is useful in comparing ongoing costs only, and will not help you determine the relative total costs of owning different funds. In addition, if these transactional costs were included, your costs would have been higher.
| Annualized
Expense Ratio | Beginning
Account Value
October 1, 2010 | Ending
Account Value
March 31, 2011 | Expenses Paid
During Period*
October 1, 2010 to March 31, 2011 |
Advisor Freedom Income | | | | |
Class A | .25% | | | |
Actual | | $ 1,000.00 | $ 1,043.70 | $ 1.27 |
Hypothetical A | | $ 1,000.00 | $ 1,023.68 | $ 1.26 |
Class T | .50% | | | |
Actual | | $ 1,000.00 | $ 1,041.40 | $ 2.54 |
Hypothetical A | | $ 1,000.00 | $ 1,022.44 | $ 2.52 |
Class B | 1.00% | | | |
Actual | | $ 1,000.00 | $ 1,039.60 | $ 5.09 |
Hypothetical A | | $ 1,000.00 | $ 1,019.95 | $ 5.04 |
Class C | 1.00% | | | |
Actual | | $ 1,000.00 | $ 1,039.70 | $ 5.09 |
Hypothetical A | | $ 1,000.00 | $ 1,019.95 | $ 5.04 |
Institutional Class | .00% | | | |
Actual | | $ 1,000.00 | $ 1,045.00 | $ .00 |
Hypothetical A | | $ 1,000.00 | $ 1,024.93 | $ .00 |
Advisor Freedom 2005 | | | | |
Class A | .25% | | | |
Actual | | $ 1,000.00 | $ 1,082.40 | $ 1.30 |
Hypothetical A | | $ 1,000.00 | $ 1,023.68 | $ 1.26 |
Class T | .50% | | | |
Actual | | $ 1,000.00 | $ 1,081.20 | $ 2.59 |
Hypothetical A | | $ 1,000.00 | $ 1,022.44 | $ 2.52 |
| Annualized
Expense Ratio | Beginning
Account Value
October 1, 2010 | Ending
Account Value
March 31, 2011 | Expenses Paid
During Period*
October 1, 2010 to March 31, 2011 |
Class B | 1.00% | | | |
Actual | | $ 1,000.00 | $ 1,078.80 | $ 5.18 |
Hypothetical A | | $ 1,000.00 | $ 1,019.95 | $ 5.04 |
Class C | 1.00% | | | |
Actual | | $ 1,000.00 | $ 1,078.40 | $ 5.18 |
Hypothetical A | | $ 1,000.00 | $ 1,019.95 | $ 5.04 |
Institutional Class | .00% | | | |
Actual | | $ 1,000.00 | $ 1,084.70 | $ .00 |
Hypothetical A | | $ 1,000.00 | $ 1,024.93 | $ .00 |
Advisor Freedom 2010 | | | | |
Class A | .25% | | | |
Actual | | $ 1,000.00 | $ 1,097.00 | $ 1.31 |
Hypothetical A | | $ 1,000.00 | $ 1,023.68 | $ 1.26 |
Class T | .50% | | | |
Actual | | $ 1,000.00 | $ 1,094.50 | $ 2.61 |
Hypothetical A | | $ 1,000.00 | $ 1,022.44 | $ 2.52 |
Class B | 1.00% | | | |
Actual | | $ 1,000.00 | $ 1,092.20 | $ 5.22 |
Hypothetical A | | $ 1,000.00 | $ 1,019.95 | $ 5.04 |
Class C | 1.00% | | | |
Actual | | $ 1,000.00 | $ 1,091.70 | $ 5.21 |
Hypothetical A | | $ 1,000.00 | $ 1,019.95 | $ 5.04 |
Institutional Class | .00% | | | |
Actual | | $ 1,000.00 | $ 1,097.60 | $ .00 |
Hypothetical A | | $ 1,000.00 | $ 1,024.93 | $ .00 |
Advisor Freedom 2015 | | | | |
Class A | .25% | | | |
Actual | | $ 1,000.00 | $ 1,097.80 | $ 1.31 |
Hypothetical A | | $ 1,000.00 | $ 1,023.68 | $ 1.26 |
Class T | .50% | | | |
Actual | | $ 1,000.00 | $ 1,096.70 | $ 2.61 |
Hypothetical A | | $ 1,000.00 | $ 1,022.44 | $ 2.52 |
Class B | 1.00% | | | |
Actual | | $ 1,000.00 | $ 1,094.40 | $ 5.22 |
Hypothetical A | | $ 1,000.00 | $ 1,019.95 | $ 5.04 |
Class C | 1.00% | | | |
Actual | | $ 1,000.00 | $ 1,094.00 | $ 5.22 |
Hypothetical A | | $ 1,000.00 | $ 1,019.95 | $ 5.04 |
Institutional Class | .00% | | | |
Actual | | $ 1,000.00 | $ 1,099.20 | $ .00 |
Hypothetical A | | $ 1,000.00 | $ 1,024.93 | $ .00 |
Advisor Freedom 2020 | | | | |
Class A | .25% | | | |
Actual | | $ 1,000.00 | $ 1,116.40 | $ 1.32 |
Hypothetical A | | $ 1,000.00 | $ 1,023.68 | $ 1.26 |
Class T | .50% | | | |
Actual | | $ 1,000.00 | $ 1,114.80 | $ 2.64 |
Hypothetical A | | $ 1,000.00 | $ 1,022.44 | $ 2.52 |
| Annualized
Expense Ratio | Beginning
Account Value
October 1, 2010 | Ending
Account Value
March 31, 2011 | Expenses Paid
During Period*
October 1, 2010 to March 31, 2011 |
Class B | 1.00% | | | |
Actual | | $ 1,000.00 | $ 1,112.00 | $ 5.27 |
Hypothetical A | | $ 1,000.00 | $ 1,019.95 | $ 5.04 |
Class C | 1.00% | | | |
Actual | | $ 1,000.00 | $ 1,112.20 | $ 5.27 |
Hypothetical A | | $ 1,000.00 | $ 1,019.95 | $ 5.04 |
Institutional Class | .00% | | | |
Actual | | $ 1,000.00 | $ 1,117.40 | $ .00 |
Hypothetical A | | $ 1,000.00 | $ 1,024.93 | $ .00 |
Advisor Freedom 2025 | | | | |
Class A | .25% | | | |
Actual | | $ 1,000.00 | $ 1,131.20 | $ 1.33 |
Hypothetical A | | $ 1,000.00 | $ 1,023.68 | $ 1.26 |
Class T | .50% | | | |
Actual | | $ 1,000.00 | $ 1,130.10 | $ 2.66 |
Hypothetical A | | $ 1,000.00 | $ 1,022.44 | $ 2.52 |
Class B | 1.00% | | | |
Actual | | $ 1,000.00 | $ 1,127.10 | $ 5.30 |
Hypothetical A | | $ 1,000.00 | $ 1,019.95 | $ 5.04 |
Class C | 1.00% | | | |
Actual | | $ 1,000.00 | $ 1,126.70 | $ 5.30 |
Hypothetical A | | $ 1,000.00 | $ 1,019.95 | $ 5.04 |
Institutional Class | .00% | | | |
Actual | | $ 1,000.00 | $ 1,133.20 | $ .00 |
Hypothetical A | | $ 1,000.00 | $ 1,024.93 | $ .00 |
Advisor Freedom 2030 | | | | |
Class A | .25% | | | |
Actual | | $ 1,000.00 | $ 1,139.60 | $ 1.33 |
Hypothetical A | | $ 1,000.00 | $ 1,023.68 | $ 1.26 |
Class T | .50% | | | |
Actual | | $ 1,000.00 | $ 1,137.50 | $ 2.66 |
Hypothetical A | | $ 1,000.00 | $ 1,022.44 | $ 2.52 |
Class B | 1.00% | | | |
Actual | | $ 1,000.00 | $ 1,135.10 | $ 5.32 |
Hypothetical A | | $ 1,000.00 | $ 1,019.95 | $ 5.04 |
Class C | 1.00% | | | |
Actual | | $ 1,000.00 | $ 1,135.00 | $ 5.32 |
Hypothetical A | | $ 1,000.00 | $ 1,019.95 | $ 5.04 |
Institutional Class | .00% | | | |
Actual | | $ 1,000.00 | $ 1,139.90 | $ .00 |
Hypothetical A | | $ 1,000.00 | $ 1,024.93 | $ .00 |
Advisor Freedom 2035 | | | | |
Class A | .25% | | | |
Actual | | $ 1,000.00 | $ 1,152.20 | $ 1.34 |
Hypothetical A | | $ 1,000.00 | $ 1,023.68 | $ 1.26 |
Class T | .50% | | | |
Actual | | $ 1,000.00 | $ 1,151.00 | $ 2.68 |
Hypothetical A | | $ 1,000.00 | $ 1,022.44 | $ 2.52 |
| Annualized
Expense Ratio | Beginning
Account Value
October 1, 2010 | Ending
Account Value
March 31, 2011 | Expenses Paid
During Period*
October 1, 2010 to March 31, 2011 |
Class B | 1.00% | | | |
Actual | | $ 1,000.00 | $ 1,148.00 | $ 5.36 |
Hypothetical A | | $ 1,000.00 | $ 1,019.95 | $ 5.04 |
Class C | 1.00% | | | |
Actual | | $ 1,000.00 | $ 1,148.40 | $ 5.36 |
Hypothetical A | | $ 1,000.00 | $ 1,019.95 | $ 5.04 |
Institutional Class | .00% | | | |
Actual | | $ 1,000.00 | $ 1,154.30 | $ .00 |
Hypothetical A | | $ 1,000.00 | $ 1,024.93 | $ .00 |
Advisor Freedom 2040 | | | | |
Class A | .25% | | | |
Actual | | $ 1,000.00 | $ 1,155.70 | $ 1.34 |
Hypothetical A | | $ 1,000.00 | $ 1,023.68 | $ 1.26 |
Class T | .50% | | | |
Actual | | $ 1,000.00 | $ 1,154.30 | $ 2.69 |
Hypothetical A | | $ 1,000.00 | $ 1,022.44 | $ 2.52 |
Class B | 1.00% | | | |
Actual | | $ 1,000.00 | $ 1,150.50 | $ 5.36 |
Hypothetical A | | $ 1,000.00 | $ 1,019.95 | $ 5.04 |
Class C | 1.00% | | | |
Actual | | $ 1,000.00 | $ 1,151.10 | $ 5.36 |
Hypothetical A | | $ 1,000.00 | $ 1,019.95 | $ 5.04 |
Institutional Class | .00% | | | |
Actual | | $ 1,000.00 | $ 1,156.00 | $ .00 |
Hypothetical A | | $ 1,000.00 | $ 1,024.93 | $ .00 |
Advisor Freedom 2045 | | | | |
Class A | .25% | | | |
Actual | | $ 1,000.00 | $ 1,159.70 | $ 1.35 |
Hypothetical A | | $ 1,000.00 | $ 1,023.68 | $ 1.26 |
Class T | .50% | | | |
Actual | | $ 1,000.00 | $ 1,158.60 | $ 2.69 |
Hypothetical A | | $ 1,000.00 | $ 1,022.44 | $ 2.52 |
Class B | 1.00% | | | |
Actual | | $ 1,000.00 | $ 1,154.70 | $ 5.37 |
Hypothetical A | | $ 1,000.00 | $ 1,019.95 | $ 5.04 |
Class C | 1.00% | | | |
Actual | | $ 1,000.00 | $ 1,155.60 | $ 5.37 |
Hypothetical A | | $ 1,000.00 | $ 1,019.95 | $ 5.04 |
Institutional Class | .00% | | | |
Actual | | $ 1,000.00 | $ 1,160.90 | $ .00 |
Hypothetical A | | $ 1,000.00 | $ 1,024.93 | $ .00 |
Advisor Freedom 2050 | | | | |
Class A | .25% | | | |
Actual | | $ 1,000.00 | $ 1,165.50 | $ 1.35 |
Hypothetical A | | $ 1,000.00 | $ 1,023.68 | $ 1.26 |
Class T | .50% | | | |
Actual | | $ 1,000.00 | $ 1,164.20 | $ 2.70 |
Hypothetical A | | $ 1,000.00 | $ 1,022.44 | $ 2.52 |
| Annualized
Expense Ratio | Beginning
Account Value
October 1, 2010 | Ending
Account Value
March 31, 2011 | Expenses Paid
During Period*
October 1, 2010 to March 31, 2011 |
Class B | 1.00% | | | |
Actual | | $ 1,000.00 | $ 1,162.10 | $ 5.39 |
Hypothetical A | | $ 1,000.00 | $ 1,019.95 | $ 5.04 |
Class C | 1.00% | | | |
Actual | | $ 1,000.00 | $ 1,162.20 | $ 5.39 |
Hypothetical A | | $ 1,000.00 | $ 1,019.95 | $ 5.04 |
Institutional Class | .00% | | | |
Actual | | $ 1,000.00 | $ 1,167.90 | $ .00 |
Hypothetical A | | $ 1,000.00 | $ 1,024.93 | $ .00 |
A 5% return per year before expenses
* Expenses are equal to each Class' annualized expense ratio, multiplied by the average account value over the period, multiplied by 182/ 365 (to reflect the one-half year period). The fees and expenses of the underlying Fidelity Funds in which the Fund invests are not included in each class' annualized expense ratio.
Annual Report
Fidelity Advisor Freedom Income Fund
Investment Changes (Unaudited)
Fund Holdings as of March 31, 2011 |
| % of fund's
net assets | % of fund's net assets
6 months ago |
Commodity Funds | | |
Fidelity Series Commodity Strategy Fund | 0.8 | 0.8 |
Domestic Equity Funds | | |
Fidelity Advisor Equity Growth Fund Institutional Class | 1.4 | 1.4 |
Fidelity Advisor Equity Income Fund Institutional Class | 0.0 | 0.3 |
Fidelity Advisor Growth & Income Fund Institutional Class | 1.9 | 2.0 |
Fidelity Advisor Large Cap Fund Institutional Class | 1.9 | 1.9 |
Fidelity Advisor Small Cap Fund Institutional Class | 0.7 | 0.7 |
Fidelity Series 100 Index Fund | 1.6 | 1.5 |
Fidelity Series All-Sector Equity Fund | 2.7 | 2.8 |
Fidelity Series Large Cap Value Fund | 2.7 | 2.5 |
Fidelity Series Small Cap Opportunities Fund | 0.7 | 0.7 |
| 13.6 | 13.8 |
Developed International Equity Funds | | |
Fidelity Advisor Diversified International Fund Institutional Class | 0.8 | 1.0 |
Fidelity Advisor Overseas Fund Institutional Class | 0.7 | 1.0 |
Fidelity Series International Growth Fund | 1.4 | 1.1 |
Fidelity Series International Small Cap Fund | 0.3 | 0.2 |
Fidelity Series International Value Fund | 1.4 | 1.0 |
| 4.6 | 4.3 |
Emerging Markets Equity Funds | | |
Fidelity Series Emerging Markets Fund | 0.8 | 0.7 |
High Yield Bond Funds | | |
Fidelity Advisor High Income Advantage Fund Institutional Class | 0.0 | 5.1 |
Fidelity Series Emerging Markets Debt Fund | 0.1 | 0.0 |
Fidelity Series High Income Fund | 4.9 | 0.0 |
| 5.0 | 5.1 |
Inflation-Protected Bond Funds | | |
Fidelity Series Inflation-Protected Bond Index Fund | 10.9 | 10.6 |
Investment Grade Bond Funds | | |
Fidelity Advisor Strategic Real Return Fund Institutional Class | 4.4 | 4.6 |
Fidelity Advisor Total Bond Fund Institutional Class | 0.0 | 0.0* |
Fidelity Series Investment Grade Bond Fund | 20.0 | 20.7 |
| 24.4 | 25.3 |
Short-Term Funds | | |
Fidelity Advisor Short Fixed-Income Fund Institutional Class | 19.7 | 19.8 |
Fidelity Institutional Money Market Portfolio Institutional Class | 20.2 | 19.6 |
| 39.9 | 39.4 |
| | |
Net Other Assets (Liabilities)* | 0.0 | 0.0 |
| 100.0 | 100.0 |
* Amount represents less than 0.1% |
Asset Allocation (% of fund's net assets) |
Current |
 | Commodity Funds | 0.8% | |
 | Domestic Equity Funds | 13.6% | |
 | Developed International Equity Funds | 4.6% | |
 | Emerging Markets Equity Funds | 0.8% | |
 | High Yield Bond Funds | 5.0% | |
 | Inflation-Protected Bond Funds | 10.9% | |
 | Investment Grade Bond Funds | 24.4% | |
 | Short-Term Funds | 39.9% | |

Six months ago |
| Commodity Funds | 0.8% | |
| Domestic Equity Funds | 13.8% | |
| Developed International Equity Funds | 4.3% | |
| Emerging Markets Equity Funds | 0.7% | |
| High Yield Bond Funds | 5.1% | |
| Inflation-Protected Bond Funds | 10.6% | |
| Investment Grade Bond Funds | 25.3% | |
| Short-Term Funds | 39.4% | |

Expected |
| Commodity Funds | 2.0% | |
| Domestic Equity Funds | 12.6% | |
| Developed International Equity Funds | 4.6% | |
| Emerging Markets Equity Funds | 0.8% | |
| High Yield Bond Funds | 5.0% | |
| Inflation-Protected Bond Funds | 12.0% | |
| Investment Grade Bond Funds | 23.0% | |
| Short-Term Funds | 40.0% | |

The six months ago allocation is based on the fund's holdings as of September 30, 2010. The current allocation is based on the fund's holdings as of March 31, 2011. The expected allocation represents the fund's anticipated allocation at September 30, 2011. |
Annual Report
Fidelity Advisor Freedom Income Fund
Investments March 31, 2011
Showing Percentage of Net Assets
Domestic Equity Funds - 14.4% |
| Shares | | Value |
Commodity Funds - 0.8% |
Fidelity Series Commodity Strategy Fund | 165,386 | | $ 2,179,789 |
Domestic Equity Funds - 13.6% |
Fidelity Advisor Equity Growth Fund Institutional Class | 58,888 | | 3,659,867 |
Fidelity Advisor Growth & Income Fund Institutional Class | 281,459 | | 5,080,341 |
Fidelity Advisor Large Cap Fund Institutional Class | 255,046 | | 5,032,048 |
Fidelity Advisor Small Cap Fund Institutional Class | 66,842 | | 1,876,252 |
Fidelity Series 100 Index Fund | 473,335 | | 4,354,680 |
Fidelity Series All-Sector Equity Fund | 554,902 | | 7,274,768 |
Fidelity Series Large Cap Value Fund | 600,340 | | 7,330,152 |
Fidelity Series Small Cap Opportunities Fund | 155,731 | | 1,836,063 |
TOTAL DOMESTIC EQUITY FUNDS | | 36,444,171 |
TOTAL DOMESTIC EQUITY FUNDS (Cost $30,881,705) | 38,623,960 |
International Equity Funds - 5.4% |
| | | |
Developed International Equity Funds - 4.6% |
Fidelity Advisor Diversified International Fund Institutional Class | 119,581 | | 2,010,153 |
Fidelity Advisor Overseas Fund Institutional Class | 104,351 | | 1,985,804 |
Fidelity Series International Growth Fund | 330,567 | | 3,804,822 |
Fidelity Series International Small Cap Fund | 60,722 | | 749,304 |
Fidelity Series International Value Fund | 351,560 | | 3,687,862 |
TOTAL DEVELOPED INTERNATIONAL EQUITY FUNDS | | 12,237,945 |
Emerging Markets Equity Funds - 0.8% |
Fidelity Series Emerging Markets Fund | 117,932 | | 2,259,582 |
TOTAL INTERNATIONAL EQUITY FUNDS (Cost $12,325,983) | 14,497,527 |
Bond Funds - 40.3% |
| Shares | | Value |
High Yield Bond Funds - 5.0% |
Fidelity Series Emerging Markets Debt Fund | 19,201 | | $ 192,092 |
Fidelity Series High Income Fund | 1,321,773 | | 13,244,167 |
TOTAL HIGH YIELD BOND FUNDS | | 13,436,259 |
Inflation-Protected Bond Funds - 10.9% |
Fidelity Series Inflation-Protected Bond Index Fund | 2,708,123 | | 29,301,893 |
Investment Grade Bond Funds - 24.4% |
Fidelity Advisor Strategic Real Return Fund Institutional Class | 1,200,452 | | 11,884,475 |
Fidelity Series Investment Grade Bond Fund | 4,709,656 | | 53,595,887 |
TOTAL INVESTMENT GRADE BOND FUNDS | | 65,480,362 |
TOTAL BOND FUNDS (Cost $103,387,048) | 108,218,514 |
Short-Term Funds - 39.9% |
| | | |
Fidelity Advisor Short Fixed-Income Fund Institutional Class | 5,722,115 | | 52,700,684 |
Fidelity Institutional Money Market Portfolio Institutional Class | 54,266,765 | | 54,266,765 |
TOTAL SHORT-TERM FUNDS (Cost $106,964,048) | 106,967,449 |
TOTAL INVESTMENT PORTFOLIO - 100.0% (Cost $253,558,784) | | 268,307,450 |
NET OTHER ASSETS (LIABILITIES) - 0.0% | | (49,116) |
NET ASSETS - 100% | $ 268,258,334 |
Other Information |
All investments are categorized as Level 1 under the Fair Value Hierarchy. The inputs or methodology used for valuing securities may not be an indication of the risk associated with investing in those securities. For more information on valuation inputs, please refer to the Security Valuation section in the accompanying Notes to Financial Statements. |
Income Tax Information |
At March 31, 2011, the Fund had a capital loss carryforward of approximately $1,843,340 all of which will expire in fiscal 2017. Capital loss carryforwards are only available to offset future capital gains of the Fund to the extent provided by regulations and may be limited. |
See accompanying notes which are an integral part of the financial statements.
Annual Report
Fidelity Advisor Freedom Income Fund
Statement of Assets and Liabilities
| March 31, 2011 |
Assets | | |
Investment in securities, at value (cost $253,558,784) - See accompanying schedule | | $ 268,307,450 |
Receivable for investments sold | | 2,390 |
Receivable for fund shares sold | | 381,725 |
Distributions receivable from underlying funds | | 23,375 |
Total assets | | 268,714,940 |
| | |
Liabilities | | |
Payable for investments purchased | $ 15,513 | |
Payable for fund shares redeemed | 367,063 | |
Distribution and service plan fees payable | 74,030 | |
Total liabilities | | 456,606 |
| | |
Net Assets | | $ 268,258,334 |
Net Assets consist of: | | |
Paid in capital | | $ 255,910,201 |
Undistributed net investment income | | 222,243 |
Accumulated undistributed net realized gain (loss) on investments | | (2,622,776) |
Net unrealized appreciation (depreciation) on investments | | 14,748,666 |
Net Assets | | $ 268,258,334 |
| | |
Calculation of Maximum Offering Price Class A:
Net Asset Value and redemption price per share ($157,695,252 ÷ 14,529,763 shares) | | $ 10.85 |
| | |
Maximum offering price per share (100/94.25 of $10.85) | | $ 11.51 |
Class T:
Net Asset Value and redemption price per share ($57,403,896 ÷ 5,293,426 shares) | | $ 10.84 |
| | |
Maximum offering price per share (100/96.50 of $10.84) | | $ 11.23 |
Class B:
Net Asset Value and offering price per share ($3,938,225 ÷ 363,306 shares)A | | $ 10.84 |
| | |
Class C:
Net Asset Value and offering price per share ($16,581,090 ÷ 1,530,108 shares)A | | $ 10.84 |
| | |
| | |
Institutional Class:
Net Asset Value, offering price and redemption price per share ($32,639,871 ÷ 3,001,853 shares) | | $ 10.87 |
A Redemption price per share is equal to net asset value less any applicable contingent deferred sales charge.
Statement of Operations
| Year ended March 31, 2011 |
Investment Income | | |
Income distributions from underlying funds | | $ 4,400,570 |
| | |
Expenses | | |
Distribution and service plan fees | $ 874,011 | |
Independent trustees' compensation | 931 | |
Total expenses before reductions | 874,942 | |
Expense reductions | (931) | 874,011 |
Net investment income (loss) | | 3,526,559 |
Realized and Unrealized Gain (Loss) Realized gain (loss) on sale of underlying fund shares | 1,113,194 | |
Capital gain distributions from underlying funds | 2,920,471 | |
Total net realized gain (loss) | | 4,033,665 |
Change in net unrealized appreciation (depreciation) on underlying funds | | 9,997,963 |
Net gain (loss) | | 14,031,628 |
Net increase (decrease) in net assets resulting from operations | | $ 17,558,187 |
See accompanying notes which are an integral part of the financial statements.
Annual Report
Statement of Changes in Net Assets
| Year ended
March 31,
2011 | Year ended
March 31,
2010 |
Increase (Decrease) in Net Assets | | |
Operations | | |
Net investment income (loss) | $ 3,526,559 | $ 4,173,414 |
Net realized gain (loss) | 4,033,665 | 2,394,982 |
Change in net unrealized appreciation (depreciation) | 9,997,963 | 30,437,609 |
Net increase (decrease) in net assets resulting from operations | 17,558,187 | 37,006,005 |
Distributions to shareholders from net investment income | (3,602,671) | (4,185,152) |
Distributions to shareholders from net realized gain | (1,619,868) | (1,201,062) |
Total distributions | (5,222,539) | (5,386,214) |
Share transactions - net increase (decrease) | 23,030,339 | 40,627,765 |
Total increase (decrease) in net assets | 35,365,987 | 72,247,556 |
| | |
Net Assets | | |
Beginning of period | 232,892,347 | 160,644,791 |
End of period (including undistributed net investment income of $222,243 and undistributed net investment income of $298,355, respectively) | $ 268,258,334 | $ 232,892,347 |
Financial Highlights - Class A
Years ended March 31, | 2011 | 2010 | 2009 | 2008 | 2007 |
Selected Per-Share Data | | | | | |
Net asset value, beginning of period | $ 10.35 | $ 8.74 | $ 10.46 | $ 10.74 | $ 10.52 |
Income from Investment Operations | | | | | |
Net investment income (loss) C | .16 | .22 | .29 | .40 | .36 |
Net realized and unrealized gain (loss) | .57 | 1.66 | (1.60) | (.21) | .29 |
Total from investment operations | .73 | 1.88 | (1.31) | .19 | .65 |
Distributions from net investment income | (.16) | (.22) | (.30) | (.40) | (.35) |
Distributions from net realized gain | (.07) | (.06) | (.11) | (.07) | (.08) |
Total distributions | (.23) | (.27) G | (.41) | (.47) F | (.43) |
Net asset value, end of period | $ 10.85 | $ 10.35 | $ 8.74 | $ 10.46 | $ 10.74 |
Total Return A,B | 7.11% | 21.74% | (12.78)% | 1.73% | 6.38% |
Ratios to Average Net Assets D,E | | | | | |
Expenses before reductions | .25% | .25% | .25% | .25% | .25% |
Expenses net of fee waivers, if any | .25% | .25% | .25% | .25% | .25% |
Expenses net of all reductions | .25% | .25% | .25% | .25% | .25% |
Net investment income (loss) | 1.48% | 2.19% | 3.03% | 3.77% | 3.46% |
Supplemental Data | | | | | |
Net assets, end of period (000 omitted) | $ 157,695 | $ 142,691 | $ 93,865 | $ 87,469 | $ 49,721 |
Portfolio turnover rate | 35% | 31% | 44% | 56% | 38% |
A Total returns would have been lower had certain expenses not been reduced during the periods shown.
B Total returns do not include the effect of the sales charges.
C Calculated based on average shares outstanding during the period.
D Amounts do not include the activity of the underlying funds.
E Expense ratios reflect operating expenses of the class. Expenses before reductions do not reflect amounts reimbursed by the investment adviser or reductions from expense offset arrangements and do not represent the amount paid by the class during periods when reimbursements or reductions occur. Expenses net of fee waivers reflect expenses after reimbursement by the investment adviser but prior to reductions from expense offset arrangements. Expenses net of all reductions represent the net expenses paid by the class but do not include expenses of the investment companies in which the Fund invests.
F Total distributions of $.47 per share is comprised of distributions from net investment income of $.403 and distributions from net realized gain of $.066 per share.
G Total distributions of $.27 per share is comprised of distributions from net investment income of $.217 and distributions from net realized gain of $.056 per share.
See accompanying notes which are an integral part of the financial statements.
Annual Report
Financial Highlights - Class T
Years ended March 31, | 2011 | 2010 | 2009 | 2008 | 2007 |
Selected Per-Share Data | | | | | |
Net asset value, beginning of period | $ 10.34 | $ 8.73 | $ 10.45 | $ 10.73 | $ 10.51 |
Income from Investment Operations | | | | | |
Net investment income (loss) C | .13 | .19 | .27 | .38 | .34 |
Net realized and unrealized gain (loss) | .57 | 1.67 | (1.61) | (.22) | .29 |
Total from investment operations | .70 | 1.86 | (1.34) | .16 | .63 |
Distributions from net investment income | (.13) | (.19) | (.27) | (.38) | (.33) |
Distributions from net realized gain | (.07) | (.06) | (.11) | (.07) | (.08) |
Total distributions | (.20) | (.25) G | (.38) | (.44) F | (.41) |
Net asset value, end of period | $ 10.84 | $ 10.34 | $ 8.73 | $ 10.45 | $ 10.73 |
Total Return A,B | 6.85% | 21.47% | (13.03)% | 1.48% | 6.11% |
Ratios to Average Net Assets D,E | | | | | |
Expenses before reductions | .50% | .50% | .50% | .50% | .50% |
Expenses net of fee waivers, if any | .50% | .50% | .50% | .50% | .50% |
Expenses net of all reductions | .50% | .50% | .50% | .50% | .50% |
Net investment income (loss) | 1.23% | 1.94% | 2.78% | 3.52% | 3.21% |
Supplemental Data | | | | | |
Net assets, end of period (000 omitted) | $ 57,404 | $ 52,047 | $ 42,675 | $ 44,882 | $ 39,739 |
Portfolio turnover rate | 35% | 31% | 44% | 56% | 38% |
A Total returns would have been lower had certain expenses not been reduced during the periods shown.
B Total returns do not include the effect of the sales charges.
C Calculated based on average shares outstanding during the period.
D Amounts do not include the activity of the underlying funds.
E Expense ratios reflect operating expenses of the class. Expenses before reductions do not reflect amounts reimbursed by the investment adviser or reductions from expense offset arrangements and do not represent the amount paid by the class during periods when reimbursements or reductions occur. Expenses net of fee waivers reflect expenses after reimbursement by the investment adviser but prior to reductions from expense offset arrangements. Expenses net of all reductions represent the net expenses paid by the class but do not include expenses of the investment companies in which the Fund invests.
F Total distributions of $.44 per share is comprised of distributions from net investment income of $.377 and distributions from net realized gain of $.066 per share.
G Total distributions of $.25 per share is comprised of distributions from net investment income of $.193 and distributions from net realized gain of $.056 per share.
Financial Highlights - Class B
Years ended March 31, | 2011 | 2010 | 2009 | 2008 | 2007 |
Selected Per-Share Data | | | | | |
Net asset value, beginning of period | $ 10.33 | $ 8.72 | $ 10.44 | $ 10.72 | $ 10.50 |
Income from Investment Operations | | | | | |
Net investment income (loss) C | .08 | .14 | .22 | .32 | .29 |
Net realized and unrealized gain (loss) | .58 | 1.67 | (1.60) | (.21) | .28 |
Total from investment operations | .66 | 1.81 | (1.38) | .11 | .57 |
Distributions from net investment income | (.08) | (.14) | (.23) | (.32) | (.27) |
Distributions from net realized gain | (.07) | (.06) | (.11) | (.07) | (.08) |
Total distributions | (.15) | (.20) G | (.34) | (.39) F | (.35) |
Net asset value, end of period | $ 10.84 | $ 10.33 | $ 8.72 | $ 10.44 | $ 10.72 |
Total Return A,B | 6.39% | 20.86% | (13.48)% | .97% | 5.57% |
Ratios to Average Net Assets D,E | | | | | |
Expenses before reductions | 1.00% | 1.00% | 1.00% | 1.00% | 1.00% |
Expenses net of fee waivers, if any | 1.00% | 1.00% | 1.00% | 1.00% | 1.00% |
Expenses net of all reductions | 1.00% | 1.00% | 1.00% | 1.00% | 1.00% |
Net investment income (loss) | .73% | 1.44% | 2.28% | 3.02% | 2.71% |
Supplemental Data | | | | | |
Net assets, end of period (000 omitted) | $ 3,938 | $ 5,319 | $ 4,282 | $ 5,539 | $ 4,993 |
Portfolio turnover rate | 35% | 31% | 44% | 56% | 38% |
A Total returns would have been lower had certain expenses not been reduced during the periods shown.
B Total returns do not include the effect of the contingent deferred sales charge.
C Calculated based on average shares outstanding during the period.
D Amounts do not include the activity of the underlying funds.
E Expense ratios reflect operating expenses of the class. Expenses before reductions do not reflect amounts reimbursed by the investment adviser or reductions from expense offset arrangements and do not represent the amount paid by the class during periods when reimbursements or reductions occur. Expenses net of fee waivers reflect expenses after reimbursement by the investment adviser but prior to reductions from expense offset arrangements. Expenses net of all reductions represent the net expenses paid by the class but do not include expenses of the investment companies in which the Fund invests.
F Total distributions of $.39 per share is comprised of distributions from net investment income of $.322 and distributions from net realized gain of $.066 per share.
G Total distributions of $.20 per share is comprised of distributions from net investment income of $.142 and distributions from net realized gain of $.056 per share.
See accompanying notes which are an integral part of the financial statements.
Annual Report
Financial Highlights - Class C
Years ended March 31, | 2011 | 2010 | 2009 | 2008 | 2007 |
Selected Per-Share Data | | | | | |
Net asset value, beginning of period | $ 10.33 | $ 8.72 | $ 10.43 | $ 10.71 | $ 10.50 |
Income from Investment Operations | | | | | |
Net investment income (loss) C | .08 | .14 | .22 | .32 | .29 |
Net realized and unrealized gain (loss) | .58 | 1.67 | (1.60) | (.21) | .27 |
Total from investment operations | .66 | 1.81 | (1.38) | .11 | .56 |
Distributions from net investment income | (.08) | (.14) | (.22) | (.32) | (.27) |
Distributions from net realized gain | (.07) | (.06) | (.11) | (.07) | (.08) |
Total distributions | (.15) | (.20) G | (.33) | (.39) F | (.35) |
Net asset value, end of period | $ 10.84 | $ 10.33 | $ 8.72 | $ 10.43 | $ 10.71 |
Total Return A,B | 6.42% | 20.83% | (13.41)% | .97% | 5.48% |
Ratios to Average Net Assets D,E | | | | | |
Expenses before reductions | 1.00% | 1.00% | 1.00% | 1.00% | 1.00% |
Expenses net of fee waivers, if any | 1.00% | 1.00% | 1.00% | 1.00% | 1.00% |
Expenses net of all reductions | 1.00% | 1.00% | 1.00% | 1.00% | 1.00% |
Net investment income (loss) | .73% | 1.44% | 2.28% | 3.02% | 2.71% |
Supplemental Data | | | | | |
Net assets, end of period (000 omitted) | $ 16,581 | $ 14,697 | $ 11,362 | $ 14,718 | $ 13,279 |
Portfolio turnover rate | 35% | 31% | 44% | 56% | 38% |
A Total returns would have been lower had certain expenses not been reduced during the periods shown.
B Total returns do not include the effect of the contingent deferred sales charge.
C Calculated based on average shares outstanding during the period.
D Amounts do not include the activity of the underlying funds.
E Expense ratios reflect operating expenses of the class. Expenses before reductions do not reflect amounts reimbursed by the investment adviser or reductions from expense offset arrangements and do not represent the amount paid by the class during periods when reimbursements or reductions occur. Expenses net of fee waivers reflect expenses after reimbursement by the investment adviser but prior to reductions from expense offset arrangements. Expenses net of all reductions represent the net expenses paid by the class but do not include expenses of the investment companies in which the Fund invests.
F Total distributions of $.39 per share is comprised of distributions from net investment income of $.323 and distributions from net realized gain of $.066 per share.
G Total distributions of $.20 per share is comprised of distributions from net investment income of $.140 and distributions from net realized gain of $.056 per share.
Financial Highlights - Institutional Class
Years ended March 31, | 2011 | 2010 | 2009 | 2008 | 2007 |
Selected Per-Share Data | | | | | |
Net asset value, beginning of period | $ 10.37 | $ 8.75 | $ 10.48 | $ 10.76 | $ 10.53 |
Income from Investment Operations | | | | | |
Net investment income (loss) B | .18 | .24 | .31 | .43 | .39 |
Net realized and unrealized gain (loss) | .57 | 1.68 | (1.61) | (.21) | .30 |
Total from investment operations | .75 | 1.92 | (1.30) | .22 | .69 |
Distributions from net investment income | (.19) | (.24) | (.32) | (.43) | (.38) |
Distributions from net realized gain | (.07) | (.06) | (.11) | (.07) | (.08) |
Total distributions | (.25) H | (.30) G | (.43) | (.50) F | (.46) |
Net asset value, end of period | $ 10.87 | $ 10.37 | $ 8.75 | $ 10.48 | $ 10.76 |
Total Return A | 7.36% | 22.16% | (12.63)% | 2.00% | 6.72% |
Ratios to Average Net Assets C,E | | | | | |
Expenses before reductions D | .00% | .00% | .00% | .00% | .00% |
Expenses net of fee waivers, if any | .00% | .00% | .00% | .00% | .00% |
Expenses net of all reductions | .00% | .00% | .00% | .00% | .00% |
Net investment income (loss) | 1.73% | 2.44% | 3.28% | 4.02% | 3.71% |
Supplemental Data | | | | | |
Net assets, end of period (000 omitted) | $ 32,640 | $ 18,137 | $ 8,461 | $ 9,119 | $ 2,800 |
Portfolio turnover rate | 35% | 31% | 44% | 56% | 38% |
A Total returns would have been lower had certain expenses not been reduced during the periods shown.
B Calculated based on average shares outstanding during the period.
C Amounts do not include the activity of the underlying funds.
D Amount represents less than .01%.
E Expense ratios reflect operating expenses of the class. Expenses before reductions do not reflect amounts reimbursed by the investment adviser or reductions from expense offset arrangements and do not represent the amount paid by the class during periods when reimbursements or reductions occur. Expenses net of fee waivers reflect expenses after reimbursement by the investment adviser but prior to reductions from expense offset arrangements. Expenses net of all reductions represent the net expenses paid by the class but do not include expenses of the investment companies in which the Fund invests.
F Total distributions of $.50 per share is comprised of distributions from net investment income of $.432 and distributions from net realized gain of $.066 per share.
G Total distributions of $.30 per share is comprised of distributions from net investment income of $.243 and distributions from net realized gain of $.056 per share.
H Total distributions of $.25 per share is comprised of distributions from net investment income of $.186 and distributions from net realized gain of $.067 per share.
See accompanying notes which are an integral part of the financial statements.
Annual Report
Fidelity Advisor Freedom 2005 Fund
Investment Changes (Unaudited)
Fund Holdings as of March 31, 2011 |
| % of fund's
net assets | % of fund's net assets
6 months ago |
Commodity Funds | | |
Fidelity Series Commodity Strategy Fund | 3.6 | 4.3 |
Domestic Equity Funds | | |
Fidelity Advisor Equity Growth Fund Institutional Class | 2.6 | 2.9 |
Fidelity Advisor Equity Income Fund Institutional Class | 0.0 | 0.6 |
Fidelity Advisor Growth & Income Fund Institutional Class | 3.7 | 4.0 |
Fidelity Advisor Large Cap Fund Institutional Class | 3.6 | 4.0 |
Fidelity Advisor Small Cap Fund Institutional Class | 1.4 | 1.4 |
Fidelity Series 100 Index Fund | 3.2 | 3.2 |
Fidelity Series All-Sector Equity Fund | 5.3 | 5.6 |
Fidelity Series Large Cap Value Fund | 5.3 | 5.0 |
Fidelity Series Small Cap Opportunities Fund | 1.3 | 1.4 |
| 26.4 | 28.1 |
Developed International Equity Funds | | |
Fidelity Advisor Diversified International Fund Institutional Class | 1.5 | 2.1 |
Fidelity Advisor Overseas Fund Institutional Class | 1.5 | 2.2 |
Fidelity Series International Growth Fund | 2.9 | 2.4 |
Fidelity Series International Small Cap Fund | 0.5 | 0.5 |
Fidelity Series International Value Fund | 2.8 | 2.4 |
| 9.2 | 9.6 |
Emerging Markets Equity Funds | | |
Fidelity Series Emerging Markets Fund | 1.7 | 1.7 |
High Yield Bond Funds | | |
Fidelity Advisor High Income Advantage Fund Institutional Class | 0.0 | 5.0 |
Fidelity Series Emerging Markets Debt Fund | 0.1 | 0.0 |
Fidelity Series High Income Fund | 4.8 | 0.0 |
| 4.9 | 5.0 |
Inflation-Protected Bond Funds | | |
Fidelity Series Inflation-Protected Bond Index Fund | 9.0 | 9.0 |
Investment Grade Bond Funds | | |
Fidelity Advisor Strategic Real Return Fund Institutional Class | 4.0 | 4.1 |
Fidelity Advisor Total Bond Fund Institutional Class | 0.0 | 0.0* |
Fidelity Series Investment Grade Bond Fund | 18.3 | 17.9 |
| 22.3 | 22.0 |
Short-Term Funds | | |
Fidelity Advisor Short Fixed-Income Fund Institutional Class | 10.9 | 10.2 |
Fidelity Institutional Money Market Portfolio Institutional Class | 12.0 | 10.1 |
| 22.9 | 20.3 |
| | |
Net Other Assets (Liabilities)* | 0.0 | 0.0 |
| 100.0 | 100.0 |
* Amount represents less than 0.1% |
Asset Allocation (% of fund's net assets) |
Current |
| Commodity Funds | 3.6% | |
| Domestic Equity Funds | 26.4% | |
| Developed International Equity Funds | 9.2% | |
| Emerging Markets Equity Funds | 1.7% | |
| High Yield Bond Funds | 4.9% | |
| Inflation-Protected Bond Funds | 9.0% | |
| Investment Grade Bond Funds | 22.3% | |
| Short-Term Funds | 22.9% | |

Six months ago |
| Commodity Funds | 4.3% | |
 | Domestic Equity Funds | 28.1% | |
| Developed International Equity Funds | 9.6% | |
| Emerging Markets Equity Funds | 1.7% | |
| High Yield Bond Funds | 5.0% | |
| Inflation-Protected Bond Funds | 9.0% | |
| Investment Grade Bond Funds | 22.0% | |
| Short-Term Funds | 20.3% | |

Expected |
| Commodity Funds | 4.4% | |
| Domestic Equity Funds | 24.7% | |
| Developed International Equity Funds | 9.0% | |
| Emerging Markets Equity Funds | 1.6% | |
| High Yield Bond Funds | 5.0% | |
| Inflation-Protected Bond Funds | 9.9% | |
| Investment Grade Bond Funds | 20.5% | |
| Short-Term Funds | 24.9% | |

The fund invests according to an asset allocation strategy that becomes increasingly conservative over time. The six months ago allocation is based on the fund's holdings as of September 30, 2010. The current allocation is based on the fund's holdings as of March 31, 2011. The expected allocation represents the fund's anticipated allocation at September 30, 2011. |
Annual Report
Fidelity Advisor Freedom 2005 Fund
Investments March 31, 2011
Showing Percentage of Net Assets
Domestic Equity Funds - 30.0% |
| Shares | | Value |
Commodity Funds - 3.6% |
Fidelity Series Commodity Strategy Fund | 666,862 | | $ 8,789,241 |
Domestic Equity Funds - 26.4% |
Fidelity Advisor Equity Growth Fund Institutional Class | 104,352 | | 6,485,452 |
Fidelity Advisor Growth & Income Fund Institutional Class | 501,094 | | 9,044,741 |
Fidelity Advisor Large Cap Fund Institutional Class | 454,068 | | 8,958,752 |
Fidelity Advisor Small Cap Fund Institutional Class | 119,751 | | 3,361,400 |
Fidelity Series 100 Index Fund | 842,253 | | 7,748,727 |
Fidelity Series All-Sector Equity Fund | 986,886 | | 12,938,073 |
Fidelity Series Large Cap Value Fund | 1,067,546 | | 13,034,742 |
Fidelity Series Small Cap Opportunities Fund | 279,032 | | 3,289,786 |
TOTAL DOMESTIC EQUITY FUNDS | | 64,861,673 |
TOTAL DOMESTIC EQUITY FUNDS (Cost $59,782,052) | 73,650,914 |
International Equity Funds - 10.9% |
| | | |
Developed International Equity Funds - 9.2% |
Fidelity Advisor Diversified International Fund Institutional Class | 222,159 | | 3,734,495 |
Fidelity Advisor Overseas Fund Institutional Class | 193,897 | | 3,689,869 |
Fidelity Series International Growth Fund | 612,242 | | 7,046,905 |
Fidelity Series International Small Cap Fund | 110,573 | | 1,364,468 |
Fidelity Series International Value Fund | 651,219 | | 6,831,289 |
TOTAL DEVELOPED INTERNATIONAL EQUITY FUNDS | | 22,667,026 |
Emerging Markets Equity Funds - 1.7% |
Fidelity Series Emerging Markets Fund | 217,277 | | 4,163,018 |
TOTAL INTERNATIONAL EQUITY FUNDS (Cost $23,322,474) | 26,830,044 |
Bond Funds - 36.2% |
| Shares | | Value |
High Yield Bond Funds - 4.9% |
Fidelity Series Emerging Markets Debt Fund | 17,135 | | $ 171,421 |
Fidelity Series High Income Fund | 1,179,539 | | 11,818,976 |
TOTAL HIGH YIELD BOND FUNDS | | 11,990,397 |
Inflation-Protected Bond Funds - 9.0% |
Fidelity Series Inflation-Protected Bond Index Fund | 2,031,485 | | 21,980,667 |
Investment Grade Bond Funds - 22.3% |
Fidelity Advisor Strategic Real Return Fund Institutional Class | 983,128 | | 9,732,966 |
Fidelity Series Investment Grade Bond Fund | 3,948,248 | | 44,931,059 |
TOTAL INVESTMENT GRADE BOND FUNDS | | 54,664,025 |
TOTAL BOND FUNDS (Cost $85,246,544) | 88,635,089 |
Short-Term Funds - 22.9% |
| | | |
Fidelity Advisor Short Fixed-Income Fund Institutional Class | 2,907,692 | | 26,779,841 |
Fidelity Institutional Money Market Portfolio Institutional Class | 29,271,592 | | 29,271,592 |
TOTAL SHORT-TERM FUNDS (Cost $55,892,565) | 56,051,433 |
TOTAL INVESTMENT PORTFOLIO - 100.0% (Cost $224,243,635) | | 245,167,480 |
NET OTHER ASSETS (LIABILITIES) - 0.0% | | (37,309) |
NET ASSETS - 100% | $ 245,130,171 |
Other Information |
All investments are categorized as Level 1 under the Fair Value Hierarchy. The inputs or methodology used for valuing securities may not be an indication of the risk associated with investing in those securities. For more information on valuation inputs, please refer to the Security Valuation section in the accompanying Notes to Financial Statements. |
Income Tax Information |
At March 31, 2011, the Fund had a capital loss carryforward of approximately $10,668,320 of which $5,987,852 and $4,680,468 will expire in fiscal 2017 and 2019, respectively. Capital loss carryforwards are only available to offset future capital gains of the Fund to the extent provided by regulations and may be limited. |
See accompanying notes which are an integral part of the financial statements.
Annual Report
Fidelity Advisor Freedom 2005 Fund
Statement of Assets and Liabilities
| March 31, 2011 |
Assets | | |
Investment in securities, at value (cost $224,243,635) - See accompanying schedule | | $ 245,167,480 |
Cash | | 10 |
Receivable for investments sold | | 189,489 |
Receivable for fund shares sold | | 304,587 |
Distributions receivable from underlying funds | | 20,925 |
Total assets | | 245,682,491 |
| | |
Liabilities | | |
Payable for fund shares redeemed | $ 497,223 | |
Distribution and service plan fees payable | 55,097 | |
Total liabilities | | 552,320 |
| | |
Net Assets | | $ 245,130,171 |
Net Assets consist of: | | |
Paid in capital | | $ 236,303,616 |
Undistributed net investment income | | 407,517 |
Accumulated undistributed net realized gain (loss) on investments | | (12,504,807) |
Net unrealized appreciation (depreciation) on investments | | 20,923,845 |
Net Assets | | $ 245,130,171 |
| | |
Calculation of Maximum Offering Price Class A:
Net Asset Value and redemption price per share ($177,385,481 ÷ 15,485,835 shares) | | $ 11.45 |
| | |
Maximum offering price per share (100/94.25 of $11.45) | | $ 12.15 |
Class T:
Net Asset Value and redemption price per share ($21,658,070 ÷ 1,890,762 shares) | | $ 11.45 |
| | |
Maximum offering price per share (100/96.50 of $11.45) | | $ 11.87 |
Class B:
Net Asset Value and offering price per share ($2,338,143 ÷ 204,197 shares)A | | $ 11.45 |
| | |
Class C:
Net Asset Value and offering price per share ($8,679,380 ÷ 760,133 shares)A | | $ 11.42 |
| | |
| | |
Institutional Class:
Net Asset Value, offering price and redemption price per share ($35,069,097 ÷ 3,044,601 shares) | | $ 11.52 |
A Redemption price per share is equal to net asset value less any applicable contingent deferred sales charge.
Statement of Operations
| Year ended March 31, 2011 |
Investment Income | | |
Income distributions from underlying funds | | $ 3,569,160 |
| | |
Expenses | | |
Distribution and service plan fees | $ 629,766 | |
Independent trustees' compensation | 807 | |
Total expenses before reductions | 630,573 | |
Expense reductions | (807) | 629,766 |
Net investment income (loss) | | 2,939,394 |
Realized and Unrealized Gain (Loss) Realized gain (loss) on sale of underlying fund shares | (3,341,402) | |
Capital gain distributions from underlying funds | 3,551,033 | |
Total net realized gain (loss) | | 209,631 |
Change in net unrealized appreciation (depreciation) on underlying funds | | 19,795,837 |
Net gain (loss) | | 20,005,468 |
Net increase (decrease) in net assets resulting from operations | | $ 22,944,862 |
See accompanying notes which are an integral part of the financial statements.
Annual Report
Statement of Changes in Net Assets
| Year ended
March 31,
2011 | Year ended
March 31,
2010 |
Increase (Decrease) in Net Assets | | |
Operations | | |
Net investment income (loss) | $ 2,939,394 | $ 3,296,419 |
Net realized gain (loss) | 209,631 | 1,795,521 |
Change in net unrealized appreciation (depreciation) | 19,795,837 | 39,634,422 |
Net increase (decrease) in net assets resulting from operations | 22,944,862 | 44,726,362 |
Distributions to shareholders from net investment income | (3,045,204) | (3,251,107) |
Distributions to shareholders from net realized gain | (1,765,154) | (1,348,446) |
Total distributions | (4,810,358) | (4,599,553) |
Share transactions - net increase (decrease) | 17,262,825 | 47,810,477 |
Total increase (decrease) in net assets | 35,397,329 | 87,937,286 |
| | |
Net Assets | | |
Beginning of period | 209,732,842 | 121,795,556 |
End of period (including undistributed net investment income of $407,517 and undistributed net investment income of $513,327, respectively) | $ 245,130,171 | $ 209,732,842 |
Financial Highlights - Class A
Years ended March 31, | 2011 | 2010 | 2009 | 2008 | 2007 |
Selected Per-Share Data | | | | | |
Net asset value, beginning of period | $ 10.57 | $ 8.10 | $ 11.40 | $ 11.83 | $ 11.33 |
Income from Investment Operations | | | | | |
Net investment income (loss) C | .15 | .20 | .27 | .33 | .28 |
Net realized and unrealized gain (loss) | .97 | 2.53 | (3.06) | (.34) | .63 |
Total from investment operations | 1.12 | 2.73 | (2.79) | (.01) | .91 |
Distributions from net investment income | (.15) | (.19) | (.28) | (.26) | (.23) |
Distributions from net realized gain | (.09) | (.07) | (.23) | (.16) | (.18) |
Total distributions | (.24) | (.26) | (.51) | (.42) | (.41) |
Net asset value, end of period | $ 11.45 | $ 10.57 | $ 8.10 | $ 11.40 | $ 11.83 |
Total Return A,B | 10.72% | 33.91% | (25.09)% | (.23)% | 8.21% |
Ratios to Average Net Assets D,E | | | | | |
Expenses before reductions | .25% | .25% | .25% | .25% | .25% |
Expenses net of fee waivers, if any | .25% | .25% | .25% | .25% | .25% |
Expenses net of all reductions | .25% | .25% | .25% | .25% | .25% |
Net investment income (loss) | 1.37% | 2.01% | 2.75% | 2.74% | 2.49% |
Supplemental Data | | | | | |
Net assets, end of period (000 omitted) | $ 177,385 | $ 155,482 | $ 88,593 | $ 98,483 | $ 49,418 |
Portfolio turnover rate | 41% | 35% | 54% | 30% | 30% |
A Total returns would have been lower had certain expenses not been reduced during the periods shown.
B Total returns do not include the effect of the sales charges.
C Calculated based on average shares outstanding during the period.
D Amounts do not include the activity of the underlying funds.
E Expense ratios reflect operating expenses of the class. Expenses before reductions do not reflect amounts reimbursed by the investment adviser or reductions from expense offset arrangements and do not represent the amount paid by the class during periods when reimbursements or reductions occur. Expenses net of fee waivers reflect expenses after reimbursement by the investment adviser but prior to reductions from expense offset arrangements. Expenses net of all reductions represent the net expenses paid by the class but do not include expenses of the investment companies in which the Fund invests.
See accompanying notes which are an integral part of the financial statements.
Annual Report
Financial Highlights - Class T
Years ended March 31, | 2011 | 2010 | 2009 | 2008 | 2007 |
Selected Per-Share Data | | | | | |
Net asset value, beginning of period | $ 10.57 | $ 8.10 | $ 11.39 | $ 11.81 | $ 11.31 |
Income from Investment Operations | | | | | |
Net investment income (loss) C | .12 | .17 | .25 | .30 | .25 |
Net realized and unrealized gain (loss) | .97 | 2.54 | (3.06) | (.33) | .63 |
Total from investment operations | 1.09 | 2.71 | (2.81) | (.03) | .88 |
Distributions from net investment income | (.12) | (.17) | (.25) | (.23) | (.20) |
Distributions from net realized gain | (.09) | (.07) | (.23) | (.16) | (.18) |
Total distributions | (.21) | (.24) | (.48) | (.39) | (.38) |
Net asset value, end of period | $ 11.45 | $ 10.57 | $ 8.10 | $ 11.39 | $ 11.81 |
Total Return A,B | 10.42% | 33.61% | (25.27)% | (.44)% | 7.95% |
Ratios to Average Net Assets D,E | | | | | |
Expenses before reductions | .50% | .50% | .50% | .50% | .50% |
Expenses net of fee waivers, if any | .50% | .50% | .50% | .50% | .50% |
Expenses net of all reductions | .50% | .50% | .50% | .50% | .50% |
Net investment income (loss) | 1.12% | 1.76% | 2.50% | 2.49% | 2.24% |
Supplemental Data | | | | | |
Net assets, end of period (000 omitted) | $ 21,658 | $ 23,113 | $ 14,437 | $ 20,837 | $ 20,289 |
Portfolio turnover rate | 41% | 35% | 54% | 30% | 30% |
A Total returns would have been lower had certain expenses not been reduced during the periods shown.
B Total returns do not include the effect of the sales charges.
C Calculated based on average shares outstanding during the period.
D Amounts do not include the activity of the underlying funds.
E Expense ratios reflect operating expenses of the class. Expenses before reductions do not reflect amounts reimbursed by the investment adviser or reductions from expense offset arrangements and do not represent the amount paid by the class during periods when reimbursements or reductions occur. Expenses net of fee waivers reflect expenses after reimbursement by the investment adviser but prior to reductions from expense offset arrangements. Expenses net of all reductions represent the net expenses paid by the class but do not include expenses of the investment companies in which the Fund invests.
Financial Highlights - Class B
Years ended March 31, | 2011 | 2010 | 2009 | 2008 | 2007 |
Selected Per-Share Data | | | | | |
Net asset value, beginning of period | $ 10.56 | $ 8.09 | $ 11.37 | $ 11.78 | $ 11.28 |
Income from Investment Operations | | | | | |
Net investment income (loss) C | .07 | .12 | .20 | .24 | .20 |
Net realized and unrealized gain (loss) | .97 | 2.53 | (3.06) | (.33) | .62 |
Total from investment operations | 1.04 | 2.65 | (2.86) | (.09) | .82 |
Distributions from net investment income | (.07) | (.11) | (.19) | (.16) | (.14) |
Distributions from net realized gain | (.09) | (.07) | (.23) | (.16) | (.18) |
Total distributions | (.15) F | (.18) | (.42) | (.32) | (.32) |
Net asset value, end of period | $ 11.45 | $ 10.56 | $ 8.09 | $ 11.37 | $ 11.78 |
Total Return A,B | 9.94% | 32.90% | (25.69)% | (.89)% | 7.40% |
Ratios to Average Net Assets D,E | | | | | |
Expenses before reductions | 1.00% | 1.00% | 1.00% | 1.00% | 1.00% |
Expenses net of fee waivers, if any | 1.00% | 1.00% | 1.00% | 1.00% | 1.00% |
Expenses net of all reductions | 1.00% | 1.00% | 1.00% | 1.00% | 1.00% |
Net investment income (loss) | .62% | 1.26% | 2.00% | 1.99% | 1.74% |
Supplemental Data | | | | | |
Net assets, end of period (000 omitted) | $ 2,338 | $ 2,986 | $ 2,692 | $ 4,348 | $ 3,974 |
Portfolio turnover rate | 41% | 35% | 54% | 30% | 30% |
A Total returns would have been lower had certain expenses not been reduced during the periods shown.
B Total returns do not include the effect of the contingent deferred sales charge.
C Calculated based on average shares outstanding during the period.
D Amounts do not include the activity of the underlying funds.
E Expense ratios reflect operating expenses of the class. Expenses before reductions do not reflect amounts reimbursed by the investment adviser or reductions from expense offset arrangements and do not represent the amount paid by the class during periods when reimbursements or reductions occur. Expenses net of fee waivers reflect expenses after reimbursement by the investment adviser but prior to reductions from expense offset arrangements. Expenses net of all reductions represent the net expenses paid by the class but do not include expenses of the investment companies in which the Fund invests.
F Total distributions of $.15 per share is comprised of distributions from net investment income of $.065 and distributions from net realized gain of $.087 per share.
See accompanying notes which are an integral part of the financial statements.
Annual Report
Financial Highlights - Class C
Years ended March 31, | 2011 | 2010 | 2009 | 2008 | 2007 |
Selected Per-Share Data | | | | | |
Net asset value, beginning of period | $ 10.54 | $ 8.08 | $ 11.34 | $ 11.76 | $ 11.27 |
Income from Investment Operations | | | | | |
Net investment income (loss) C | .07 | .12 | .20 | .24 | .20 |
Net realized and unrealized gain (loss) | .97 | 2.53 | (3.04) | (.33) | .62 |
Total from investment operations | 1.04 | 2.65 | (2.84) | (.09) | .82 |
Distributions from net investment income | (.07) | (.12) | (.19) | (.17) | (.15) |
Distributions from net realized gain | (.09) | (.07) | (.23) | (.16) | (.18) |
Total distributions | (.16) | (.19) | (.42) | (.33) | (.33) |
Net asset value, end of period | $ 11.42 | $ 10.54 | $ 8.08 | $ 11.34 | $ 11.76 |
Total Return A,B | 9.91% | 32.90% | (25.61)% | (.91)% | 7.36% |
Ratios to Average Net Assets D,E | | | | | |
Expenses before reductions | 1.00% | 1.00% | 1.00% | 1.00% | 1.00% |
Expenses net of fee waivers, if any | 1.00% | 1.00% | 1.00% | 1.00% | 1.00% |
Expenses net of all reductions | 1.00% | 1.00% | 1.00% | 1.00% | 1.00% |
Net investment income (loss) | .62% | 1.26% | 2.00% | 1.99% | 1.74% |
Supplemental Data | | | | | |
Net assets, end of period (000 omitted) | $ 8,679 | $ 9,377 | $ 6,761 | $ 11,052 | $ 9,107 |
Portfolio turnover rate | 41% | 35% | 54% | 30% | 30% |
A Total returns would have been lower had certain expenses not been reduced during the periods shown.
B Total returns do not include the effect of the contingent deferred sales charge.
C Calculated based on average shares outstanding during the period.
D Amounts do not include the activity of the underlying funds.
E Expense ratios reflect operating expenses of the class. Expenses before reductions do not reflect amounts reimbursed by the investment adviser or reductions from expense offset arrangements and do not represent the amount paid by the class during periods when reimbursements or reductions occur. Expenses net of fee waivers reflect expenses after reimbursement by the investment adviser but prior to reductions from expense offset arrangements. Expenses net of all reductions represent the net expenses paid by the class but do not include expenses of the investment companies in which the Fund invests.
Financial Highlights - Institutional Class
Years ended March 31, | 2011 | 2010 | 2009 | 2008 | 2007 |
Selected Per-Share Data | | | | | |
Net asset value, beginning of period | $ 10.63 | $ 8.14 | $ 11.46 | $ 11.87 | $ 11.37 |
Income from Investment Operations | | | | | |
Net investment income (loss) B | .18 | .22 | .29 | .35 | .31 |
Net realized and unrealized gain (loss) | .98 | 2.55 | (3.07) | (.32) | .62 |
Total from investment operations | 1.16 | 2.77 | (2.78) | .03 | .93 |
Distributions from net investment income | (.18) | (.21) | (.31) | (.28) | (.25) |
Distributions from net realized gain | (.09) | (.07) | (.23) | (.16) | (.18) |
Total distributions | (.27) | (.28) | (.54) | (.44) | (.43) |
Net asset value, end of period | $ 11.52 | $ 10.63 | $ 8.14 | $ 11.46 | $ 11.87 |
Total Return A | 11.02% | 34.28% | (24.93)% | .12% | 8.37% |
Ratios to Average Net Assets C,E | | | | | |
Expenses before reductions D | .00% | .00% | .00% | .00% | .00% |
Expenses net of fee waivers, if any | .00% | .00% | .00% | .00% | .00% |
Expenses net of all reductions | .00% | .00% | .00% | .00% | .00% |
Net investment income (loss) | 1.62% | 2.26% | 3.00% | 2.99% | 2.74% |
Supplemental Data | | | | | |
Net assets, end of period (000 omitted) | $ 35,069 | $ 18,775 | $ 9,313 | $ 9,645 | $ 3,424 |
Portfolio turnover rate | 41% | 35% | 54% | 30% | 30% |
A Total returns would have been lower had certain expenses not been reduced during the periods shown.
B Calculated based on average shares outstanding during the period.
C Amounts do not include the activity of the underlying funds.
D Amount represents less than .01%.
E Expense ratios reflect operating expenses of the class. Expenses before reductions do not reflect amounts reimbursed by the investment adviser or reductions from expense offset arrangements and do not represent the amount paid by the class during periods when reimbursements or reductions occur. Expenses net of fee waivers reflect expenses after reimbursement by the investment adviser but prior to reductions from expense offset arrangements. Expenses net of all reductions represent the net expenses paid by the class but do not include expenses of the investment companies in which the Fund invests.
See accompanying notes which are an integral part of the financial statements.
Annual Report
Fidelity Advisor Freedom 2010 Fund
Investment Changes (Unaudited)
Fund Holdings as of March 31, 2011 |
| % of fund's
net assets | % of fund's net assets
6 months ago |
Commodity Funds | | |
Fidelity Series Commodity Strategy Fund | 4.4 | 5.0 |
Domestic Equity Funds | | |
Fidelity Advisor Equity Growth Fund Institutional Class | 3.2 | 3.3 |
Fidelity Advisor Equity Income Fund Institutional Class | 0.0 | 0.6 |
Fidelity Advisor Growth & Income Fund Institutional Class | 4.4 | 4.6 |
Fidelity Advisor Large Cap Fund Institutional Class | 4.3 | 4.6 |
Fidelity Advisor Small Cap Fund Institutional Class | 1.6 | 1.6 |
Fidelity Series 100 Index Fund | 3.8 | 3.6 |
Fidelity Series All-Sector Equity Fund | 6.3 | 6.4 |
Fidelity Series Large Cap Value Fund | 6.4 | 5.8 |
Fidelity Series Small Cap Opportunities Fund | 1.6 | 1.7 |
| 31.6 | 32.2 |
Developed International Equity Funds | | |
Fidelity Advisor Diversified International Fund Institutional Class | 1.8 | 2.6 |
Fidelity Advisor Overseas Fund Institutional Class | 1.8 | 2.6 |
Fidelity Series International Growth Fund | 3.5 | 2.9 |
Fidelity Series International Small Cap Fund | 0.7 | 0.6 |
Fidelity Series International Value Fund | 3.3 | 2.8 |
| 11.1 | 11.5 |
Emerging Markets Equity Funds | | |
Fidelity Series Emerging Markets Fund | 2.0 | 2.0 |
High Yield Bond Funds | | |
Fidelity Advisor High Income Advantage Fund Institutional Class | 0.0 | 5.0 |
Fidelity Series Emerging Markets Debt Fund | 0.1 | 0.0 |
Fidelity Series High Income Fund | 4.9 | 0.0 |
| 5.0 | 5.0 |
Inflation-Protected Bond Funds | | |
Fidelity Series Inflation-Protected Bond Index Fund | 9.5 | 9.5 |
Investment Grade Bond Funds | | |
Fidelity Advisor Strategic Real Return Fund Institutional Class | 4.7 | 4.6 |
Fidelity Advisor Total Bond Fund Institutional Class | 0.0 | 0.0* |
Fidelity Series Investment Grade Bond Fund | 21.0 | 20.1 |
| 25.7 | 24.7 |
Short-Term Funds | | |
Fidelity Advisor Short Fixed-Income Fund Institutional Class | 5.3 | 5.1 |
Fidelity Institutional Money Market Portfolio Institutional Class | 5.4 | 5.0 |
| 10.7 | 10.1 |
| | |
Net Other Assets (Liabilities)* | 0.0 | 0.0 |
| 100.0 | 100.0 |
* Amount represents less than 0.1% |
Asset Allocation (% of fund's net assets) |
Current |
 | Commodity Funds | 4.4% | |
| Domestic Equity Funds | 31.6% | |
 | Developed International Equity Funds | 11.1% | |
 | Emerging Markets Equity Funds | 2.0% | |
| High Yield Bond Funds | 5.0% | |
 | Inflation-Protected Bond Funds | 9.5% | |
 | Investment Grade Bond Funds | 25.7% | |
| Short-Term Funds | 10.7% | |

Six months ago |
| Commodity Funds | 5.0% | |
| Domestic Equity Funds | 32.2% | |
| Developed International Equity Funds | 11.5% | |
| Emerging Markets Equity Funds | 2.0% | |
| High Yield Bond Funds | 5.0% | |
| Inflation-Protected Bond Funds | 9.5% | |
| Investment Grade Bond Funds | 24.7% | |
| Short-Term Funds | 10.1% | |

Expected |
| Commodity Funds | 5.4% | |
| Domestic Equity Funds | 30.7% | |
| Developed International Equity Funds | 11.1% | |
| Emerging Markets Equity Funds | 2.0% | |
| High Yield Bond Funds | 5.0% | |
| Inflation-Protected Bond Funds | 10.6% | |
| Investment Grade Bond Funds | 24.1% | |
| Short-Term Funds | 11.1% | |

The fund invests according to an asset allocation strategy that becomes increasingly conservative over time. The six months ago allocation is based on the fund's holdings as of September 30, 2010. The current allocation is based on the fund's holdings as of March 31, 2011. The expected allocation represents the fund's anticipated allocation at September 30, 2011. |
Annual Report
Fidelity Advisor Freedom 2010 Fund
Investments March 31, 2011
Showing Percentage of Net Assets
Domestic Equity Funds - 36.0% |
| Shares | | Value |
Commodity Funds - 4.4% |
Fidelity Series Commodity Strategy Fund | 2,873,146 | | $ 37,868,064 |
Domestic Equity Funds - 31.6% |
Fidelity Advisor Equity Growth Fund Institutional Class | 440,755 | | 27,392,915 |
Fidelity Advisor Growth & Income Fund Institutional Class | 2,111,218 | | 38,107,491 |
Fidelity Advisor Large Cap Fund Institutional Class | 1,913,095 | | 37,745,357 |
Fidelity Advisor Small Cap Fund Institutional Class | 502,304 | | 14,099,660 |
Fidelity Series 100 Index Fund | 3,558,060 | | 32,734,153 |
Fidelity Series All-Sector Equity Fund | 4,168,239 | | 54,645,620 |
Fidelity Series Large Cap Value Fund | 4,509,410 | | 55,059,895 |
Fidelity Series Small Cap Opportunities Fund | 1,170,429 | | 13,799,360 |
TOTAL DOMESTIC EQUITY FUNDS | | 273,584,451 |
TOTAL DOMESTIC EQUITY FUNDS (Cost $252,044,614) | 311,452,515 |
International Equity Funds - 13.1% |
| | | |
Developed International Equity Funds - 11.1% |
Fidelity Advisor Diversified International Fund Institutional Class | 936,993 | | 15,750,845 |
Fidelity Advisor Overseas Fund Institutional Class | 817,777 | | 15,562,293 |
Fidelity Series International Growth Fund | 2,593,950 | | 29,856,367 |
Fidelity Series International Small Cap Fund | 471,365 | | 5,816,638 |
Fidelity Series International Value Fund | 2,758,938 | | 28,941,258 |
TOTAL DEVELOPED INTERNATIONAL EQUITY FUNDS | | 95,927,401 |
Emerging Markets Equity Funds - 2.0% |
Fidelity Series Emerging Markets Fund | 921,638 | | 17,658,578 |
TOTAL INTERNATIONAL EQUITY FUNDS (Cost $96,947,868) | 113,585,979 |
Bond Funds - 40.2% |
| Shares | | Value |
High Yield Bond Funds - 5.0% |
Fidelity Series Emerging Markets Debt Fund | 61,531 | | $ 615,568 |
Fidelity Series High Income Fund | 4,235,692 | | 42,441,635 |
TOTAL HIGH YIELD BOND FUNDS | | 43,057,203 |
Inflation-Protected Bond Funds - 9.5% |
Fidelity Series Inflation-Protected Bond Index Fund | 7,595,178 | | 82,179,821 |
Investment Grade Bond Funds - 25.7% |
Fidelity Advisor Strategic Real Return Fund Institutional Class | 4,089,059 | | 40,481,685 |
Fidelity Series Investment Grade Bond Fund | 16,005,793 | | 182,145,924 |
TOTAL INVESTMENT GRADE BOND FUNDS | | 222,627,609 |
TOTAL BOND FUNDS (Cost $334,113,755) | 347,864,633 |
Short-Term Funds - 10.7% |
| | | |
Fidelity Advisor Short Fixed-Income Fund Institutional Class | 4,975,629 | | 45,825,541 |
Fidelity Institutional Money Market Portfolio Institutional Class | 46,635,940 | | 46,635,940 |
TOTAL SHORT-TERM FUNDS (Cost $92,576,531) | 92,461,481 |
TOTAL INVESTMENT PORTFOLIO - 100.0% (Cost $775,682,768) | | 865,364,608 |
NET OTHER ASSETS (LIABILITIES) - 0.0% | | (144,062) |
NET ASSETS - 100% | $ 865,220,546 |
Other Information |
All investments are categorized as Level 1 under the Fair Value Hierarchy. The inputs or methodology used for valuing securities may not be an indication of the risk associated with investing in those securities. For more information on valuation inputs, please refer to the Security Valuation section in the accompanying Notes to Financial Statements. |
Income Tax Information |
At March 31, 2011, the Fund had a capital loss carryforward of approximately $64,568,962 of which $30,891,938, $3,389,708 and $30,287,316 will expire in fiscal 2017, 2018 and 2019, respectively. Capital loss carryforwards are only available to offset future capital gains of the Fund to the extent provided by regulations and may be limited. |
See accompanying notes which are an integral part of the financial statements.
Annual Report
Fidelity Advisor Freedom 2010 Fund
Statement of Assets and Liabilities
| March 31, 2011 |
Assets | | |
Investment in securities, at value (cost $775,682,768) - See accompanying schedule | | $ 865,364,608 |
Receivable for investments sold | | 348,312 |
Receivable for fund shares sold | | 706,244 |
Distributions receivable from underlying funds | | 74,971 |
Total assets | | 866,494,135 |
| | |
Liabilities | | |
Payable to custodian bank | $ 7 | |
Payable for investments purchased | 96 | |
Payable for fund shares redeemed | 1,047,285 | |
Distribution and service plan fees payable | 226,201 | |
Total liabilities | | 1,273,589 |
| | |
Net Assets | | $ 865,220,546 |
Net Assets consist of: | | |
Paid in capital | | $ 840,635,640 |
Undistributed net investment income | | 1,355,324 |
Accumulated undistributed net realized gain (loss) on investments | | (66,452,258) |
Net unrealized appreciation (depreciation) on investments | | 89,681,840 |
Net Assets | | $ 865,220,546 |
| | |
Calculation of Maximum Offering Price Class A:
Net Asset Value and redemption price per share ($536,998,660 ÷ 45,068,943 shares) | | $ 11.92 |
| | |
Maximum offering price per share (100/94.25 of $11.92) | | $ 12.65 |
Class T:
Net Asset Value and redemption price per share ($152,126,276 ÷ 12,806,721 shares) | | $ 11.88 |
| | |
Maximum offering price per share (100/96.50 of $11.88) | | $ 12.31 |
Class B:
Net Asset Value and offering price per share ($15,841,694 ÷ 1,334,631 shares)A | | $ 11.87 |
| | |
Class C:
Net Asset Value and offering price per share ($44,763,751 ÷ 3,790,075 shares)A | | $ 11.81 |
| | |
Institutional Class:
Net Asset Value, offering price and redemption price per share ($115,490,165 ÷ 9,654,151 shares) | | $ 11.96 |
A Redemption price per share is equal to net asset value less any applicable contingent deferred sales charge.
Statement of Operations
| Year ended March 31, 2011 |
Investment Income | | |
Income distributions from underlying funds | | $ 13,424,783 |
| | |
Expenses | | |
Distribution and service plan fees | $ 2,743,069 | |
Independent trustees' compensation | 3,041 | |
Total expenses before reductions | 2,746,110 | |
Expense reductions | (3,041) | 2,743,069 |
Net investment income (loss) | | 10,681,714 |
Realized and Unrealized Gain (Loss) Realized gain (loss) on sale of underlying fund shares | (16,673,785) | |
Capital gain distributions from underlying funds | 14,756,754 | |
Total net realized gain (loss) | | (1,917,031) |
Change in net unrealized appreciation (depreciation) on underlying funds | | 84,401,786 |
Net gain (loss) | | 82,484,755 |
Net increase (decrease) in net assets resulting from operations | | $ 93,166,469 |
See accompanying notes which are an integral part of the financial statements.
Annual Report
Statement of Changes in Net Assets
| Year ended
March 31,
2011 | Year ended
March 31,
2010 |
Increase (Decrease) in Net Assets | | |
Operations | | |
Net investment income (loss) | $ 10,681,714 | $ 14,588,964 |
Net realized gain (loss) | (1,917,031) | (1,351,879) |
Change in net unrealized appreciation (depreciation) | 84,401,786 | 207,984,174 |
Net increase (decrease) in net assets resulting from operations | 93,166,469 | 221,221,259 |
Distributions to shareholders from net investment income | (11,199,702) | (14,970,360) |
Distributions to shareholders from net realized gain | (7,306,833) | (6,224,738) |
Total distributions | (18,506,535) | (21,195,098) |
Share transactions - net increase (decrease) | (36,738,583) | 25,017,028 |
Total increase (decrease) in net assets | 37,921,351 | 225,043,189 |
| | |
Net Assets | | |
Beginning of period | 827,299,195 | 602,256,006 |
End of period (including undistributed net investment income of $1,355,324 and undistributed net investment income of $1,873,313, respectively) | $ 865,220,546 | $ 827,299,195 |
Financial Highlights - Class A
Years ended March 31, | 2011 | 2010 | 2009 | 2008 | 2007 |
Selected Per-Share Data | | | | | |
Net asset value, beginning of period | $ 10.87 | $ 8.19 | $ 11.78 | $ 12.28 | $ 11.79 |
Income from Investment Operations | | | | | |
Net investment income (loss) C | .15 | .21 | .27 | .33 | .29 |
Net realized and unrealized gain (loss) | 1.17 | 2.76 | (3.28) | (.34) | .66 |
Total from investment operations | 1.32 | 2.97 | (3.01) | (.01) | .95 |
Distributions from net investment income | (.17) | (.21) | (.28) | (.30) | (.26) |
Distributions from net realized gain | (.10) | (.08) | (.30) | (.19) | (.20) |
Total distributions | (.27) | (.29) F | (.58) | (.49) | (.46) |
Net asset value, end of period | $ 11.92 | $ 10.87 | $ 8.19 | $ 11.78 | $ 12.28 |
Total Return A, B | 12.27% | 36.51% | (26.36)% | (.27)% | 8.22% |
Ratios to Average Net Assets D, E | | | | | |
Expenses before reductions | .25% | .25% | .25% | .25% | .25% |
Expenses net of fee waivers, if any | .25% | .25% | .25% | .25% | .25% |
Expenses net of all reductions | .25% | .25% | .25% | .25% | .25% |
Net investment income (loss) | 1.38% | 2.04% | 2.77% | 2.66% | 2.43% |
Supplemental Data | | | | | |
Net assets, end of period (000 omitted) | $ 536,999 | $ 478,025 | $ 339,203 | $ 377,118 | $ 248,500 |
Portfolio turnover rate | 41% | 42% | 44% | 15% | 22% |
A Total returns would have been lower had certain expenses not been reduced during the periods shown.
B Total returns do not include the effect of the sales charges.
C Calculated based on average shares outstanding during the period.
D Amounts do not include the activity of the underlying funds.
E Expense ratios reflect operating expenses of the class. Expenses before reductions do not reflect amounts reimbursed by the investment adviser or reductions from expense offset arrangements and do not represent the amount paid by the class during periods when reimbursements or reductions occur. Expenses net of fee waivers reflect expenses after reimbursement by the investment adviser but prior to reductions from expense offset arrangements. Expenses net of all reductions represent the net expenses paid by the class but do not include expenses of the investment companies in which the Fund invests.
F Total distributions of $.29 per share is comprised of distributions from net investment income of $.211 and distributions from net realized gain of $.083 per share.
See accompanying notes which are an integral part of the financial statements.
Annual Report
Financial Highlights - Class T
Years ended March 31, | 2011 | 2010 | 2009 | 2008 | 2007 |
Selected Per-Share Data | | | | | |
Net asset value, beginning of period | $ 10.83 | $ 8.16 | $ 11.74 | $ 12.24 | $ 11.75 |
Income from Investment Operations | | | | | |
Net investment income (loss) C | .13 | .18 | .25 | .30 | .26 |
Net realized and unrealized gain (loss) | 1.15 | 2.76 | (3.28) | (.34) | .66 |
Total from investment operations | 1.28 | 2.94 | (3.03) | (.04) | .92 |
Distributions from net investment income | (.13) | (.19) | (.25) | (.27) | (.23) |
Distributions from net realized gain | (.10) | (.08) | (.30) | (.19) | (.20) |
Total distributions | (.23) | (.27) F | (.55) | (.46) | (.43) |
Net asset value, end of period | $ 11.88 | $ 10.83 | $ 8.16 | $ 11.74 | $ 12.24 |
Total Return A, B | 11.95% | 36.19% | (26.57)% | (.52)% | 8.00% |
Ratios to Average Net Assets D, E | | | | | |
Expenses before reductions | .50% | .50% | .50% | .50% | .50% |
Expenses net of fee waivers, if any | .50% | .50% | .50% | .50% | .50% |
Expenses net of all reductions | .50% | .50% | .50% | .50% | .50% |
Net investment income (loss) | 1.13% | 1.79% | 2.52% | 2.41% | 2.18% |
Supplemental Data | | | | | |
Net assets, end of period (000 omitted) | $ 152,126 | $ 204,059 | $ 163,842 | $ 216,732 | $ 194,563 |
Portfolio turnover rate | 41% | 42% | 44% | 15% | 22% |
A Total returns would have been lower had certain expenses not been reduced during the periods shown.
B Total returns do not include the effect of the sales charges.
C Calculated based on average shares outstanding during the period.
D Amounts do not include the activity of the underlying funds.
E Expense ratios reflect operating expenses of the class. Expenses before reductions do not reflect amounts reimbursed by the investment adviser or reductions from expense offset arrangements and do not represent the amount paid by the class during periods when reimbursements or reductions occur. Expenses net of fee waivers reflect expenses after reimbursement by the investment adviser but prior to reductions from expense offset arrangements. Expenses net of all reductions represent the net expenses paid by the class but do not include expenses of the investment companies in which the Fund invests.
F Total distributions of $.27 per share is comprised of distributions from net investment income of $.186 and distributions from net realized gain of $.083 per share.
Financial Highlights - Class B
Years ended March 31, | 2011 | 2010 | 2009 | 2008 | 2007 |
Selected Per-Share Data | | | | | |
Net asset value, beginning of period | $ 10.82 | $ 8.15 | $ 11.70 | $ 12.20 | $ 11.71 |
Income from Investment Operations | | | | | |
Net investment income (loss) C | .07 | .13 | .20 | .24 | .20 |
Net realized and unrealized gain (loss) | 1.15 | 2.76 | (3.26) | (.35) | .66 |
Total from investment operations | 1.22 | 2.89 | (3.06) | (.11) | .86 |
Distributions from net investment income | (.07) | (.13) | (.19) | (.20) | (.17) |
Distributions from net realized gain | (.10) | (.08) | (.30) | (.19) | (.20) |
Total distributions | (.17) | (.22) F | (.49) | (.39) | (.37) |
Net asset value, end of period | $ 11.87 | $ 10.82 | $ 8.15 | $ 11.70 | $ 12.20 |
Total Return A, B | 11.37% | 35.54% | (26.92)% | (1.04)% | 7.47% |
Ratios to Average Net Assets D, E | | | | | |
Expenses before reductions | 1.00% | 1.00% | 1.00% | 1.00% | 1.00% |
Expenses net of fee waivers, if any | 1.00% | 1.00% | 1.00% | 1.00% | 1.00% |
Expenses net of all reductions | 1.00% | 1.00% | 1.00% | 1.00% | 1.00% |
Net investment income (loss) | .63% | 1.29% | 2.03% | 1.91% | 1.68% |
Supplemental Data | | | | | |
Net assets, end of period (000 omitted) | $ 15,842 | $ 22,468 | $ 19,950 | $ 34,137 | $ 34,834 |
Portfolio turnover rate | 41% | 42% | 44% | 15% | 22% |
A Total returns would have been lower had certain expenses not been reduced during the periods shown.
B Total returns do not include the effect of the contingent deferred sales charge.
C Calculated based on average shares outstanding during the period.
D Amounts do not include the activity of the underlying funds.
E Expense ratios reflect operating expenses of the class. Expenses before reductions do not reflect amounts reimbursed by the investment adviser or reductions from expense offset arrangements and do not represent the amount paid by the class during periods when reimbursements or reductions occur. Expenses net of fee waivers reflect expenses after reimbursement by the investment adviser but prior to reductions from expense offset arrangements. Expenses net of all reductions represent the net expenses paid by the class but do not include expenses of the investment companies in which the Fund invests.
F Total distributions of $.22 per share is comprised of distributions from net investment income of $.134 and distributions from net realized gain of $.083 per share.
See accompanying notes which are an integral part of the financial statements.
Annual Report
Financial Highlights - Class C
Years ended March 31, | 2011 | 2010 | 2009 | 2008 | 2007 |
Selected Per-Share Data | | | | | |
Net asset value, beginning of period | $ 10.78 | $ 8.13 | $ 11.67 | $ 12.17 | $ 11.69 |
Income from Investment Operations | | | | | |
Net investment income (loss) C | .07 | .13 | .20 | .23 | .20 |
Net realized and unrealized gain (loss) | 1.14 | 2.74 | (3.25) | (.33) | .66 |
Total from investment operations | 1.21 | 2.87 | (3.05) | (.10) | .86 |
Distributions from net investment income | (.08) | (.14) | (.19) | (.21) | (.18) |
Distributions from net realized gain | (.10) | (.08) | (.30) | (.19) | (.20) |
Total distributions | (.18) | (.22) F | (.49) | (.40) | (.38) |
Net asset value, end of period | $ 11.81 | $ 10.78 | $ 8.13 | $ 11.67 | $ 12.17 |
Total Return A, B | 11.33% | 35.45% | (26.88)% | (.97)% | 7.45% |
Ratios to Average Net Assets D, E | | | | | |
Expenses before reductions | 1.00% | 1.00% | 1.00% | 1.00% | 1.00% |
Expenses net of fee waivers, if any | 1.00% | 1.00% | 1.00% | 1.00% | 1.00% |
Expenses net of all reductions | 1.00% | 1.00% | 1.00% | 1.00% | 1.00% |
Net investment income (loss) | .63% | 1.29% | 2.02% | 1.91% | 1.68% |
Supplemental Data | | | | | |
Net assets, end of period (000 omitted) | $ 44,764 | $ 47,178 | $ 37,524 | $ 58,378 | $ 47,918 |
Portfolio turnover rate | 41% | 42% | 44% | 15% | 22% |
A Total returns would have been lower had certain expenses not been reduced during the periods shown.
B Total returns do not include the effect of the contingent deferred sales charge.
C Calculated based on average shares outstanding during the period.
D Amounts do not include the activity of the underlying funds.
E Expense ratios reflect operating expenses of the class. Expenses before reductions do not reflect amounts reimbursed by the investment adviser or reductions from expense offset arrangements and do not represent the amount paid by the class during periods when reimbursements or reductions occur. Expenses net of fee waivers reflect expenses after reimbursement by the investment adviser but prior to reductions from expense offset arrangements. Expenses net of all reductions represent the net expenses paid by the class but do not include expenses of the investment companies in which the Fund invests.
F Total distributions of $.22 per share is comprised of distributions from net investment income of $.139 and distributions from net realized gain of $.083 per share.
Financial Highlights - Institutional Class
Years ended March 31, | 2011 | 2010 | 2009 | 2008 | 2007 |
Selected Per-Share Data | | | | | |
Net asset value, beginning of period | $ 10.91 | $ 8.22 | $ 11.82 | $ 12.32 | $ 11.82 |
Income from Investment Operations | | | | | |
Net investment income (loss) B | .18 | .23 | .30 | .36 | .32 |
Net realized and unrealized gain (loss) | 1.17 | 2.78 | (3.30) | (.34) | .67 |
Total from investment operations | 1.35 | 3.01 | (3.00) | .02 | .99 |
Distributions from net investment income | (.20) | (.23) | (.30) | (.33) | (.29) |
Distributions from net realized gain | (.10) | (.08) | (.30) | (.19) | (.20) |
Total distributions | (.30) | (.32) F | (.60) | (.52) | (.49) |
Net asset value, end of period | $ 11.96 | $ 10.91 | $ 8.22 | $ 11.82 | $ 12.32 |
Total Return A | 12.50% | 36.80% | (26.16)% | (.05)% | 8.52% |
Ratios to Average Net Assets C, E | | | | | |
Expenses before reductions D | .00% | .00% | .00% | .00% | .00% |
Expenses net of fee waivers, if any | .00% | .00% | .00% | .00% | .00% |
Expenses net of all reductions | .00% | .00% | .00% | .00% | .00% |
Net investment income (loss) | 1.63% | 2.29% | 3.02% | 2.91% | 2.68% |
Supplemental Data | | | | | |
Net assets, end of period (000 omitted) | $ 115,490 | $ 75,569 | $ 41,737 | $ 39,922 | $ 21,580 |
Portfolio turnover rate | 41% | 42% | 44% | 15% | 22% |
A Total returns would have been lower had certain expenses not been reduced during the periods shown.
B Calculated based on average shares outstanding during the period.
C Amounts do not include the activity of the underlying funds.
D Amount represents less than .01%.
E Expense ratios reflect operating expenses of the class. Expenses before reductions do not reflect amounts reimbursed by the investment adviser or reductions from expense offset arrangements and do not represent the amount paid by the class during periods when reimbursements or reductions occur. Expenses net of fee waivers reflect expenses after reimbursement by the investment adviser but prior to reductions from expense offset arrangements. Expenses net of all reductions represent the net expenses paid by the class but do not include expenses of the investment companies in which the Fund invests.
F Total distributions of $.32 per share is comprised of distributions from net investment income of $.234 and distributions from net realized gain of $.083 per share.
See accompanying notes which are an integral part of the financial statements.
Annual Report
Fidelity Advisor Freedom 2015 Fund
Investment Changes (Unaudited)
Fund Holdings as of March 31, 2011 |
| % of fund's
net assets | % of fund's net assets
6 months ago |
Commodity Funds | | |
Fidelity Series Commodity Strategy Fund | 4.5 | 5.0 |
Domestic Equity Funds | | |
Fidelity Advisor Equity Growth Fund Institutional Class | 3.2 | 3.4 |
Fidelity Advisor Equity Income Fund Institutional Class | 0.0 | 0.7 |
Fidelity Advisor Growth & Income Fund Institutional Class | 4.5 | 4.7 |
Fidelity Advisor Large Cap Fund Institutional Class | 4.5 | 4.7 |
Fidelity Advisor Small Cap Fund Institutional Class | 1.7 | 1.7 |
Fidelity Series 100 Index Fund | 3.9 | 3.8 |
Fidelity Series All-Sector Equity Fund | 6.4 | 6.7 |
Fidelity Series Large Cap Value Fund | 6.5 | 5.9 |
Fidelity Series Small Cap Opportunities Fund | 1.6 | 1.7 |
| 32.3 | 33.3 |
Developed International Equity Funds | | |
Fidelity Advisor Diversified International Fund Institutional Class | 1.9 | 2.7 |
Fidelity Advisor Overseas Fund Institutional Class | 1.9 | 2.7 |
Fidelity Series International Growth Fund | 3.5 | 2.9 |
Fidelity Series International Small Cap Fund | 0.7 | 0.6 |
Fidelity Series International Value Fund | 3.4 | 2.8 |
| 11.4 | 11.7 |
Emerging Markets Equity Funds | | |
Fidelity Series Emerging Markets Fund | 2.1 | 2.0 |
High Yield Bond Funds | | |
Fidelity Advisor High Income Advantage Fund Institutional Class | 0.0 | 5.1 |
Fidelity Series Emerging Markets Debt Fund | 0.1 | 0.0 |
Fidelity Series High Income Fund | 4.9 | 0.0 |
| 5.0 | 5.1 |
Inflation-Protected Bond Funds | | |
Fidelity Series Inflation-Protected Bond Index Fund | 8.8 | 8.6 |
Investment Grade Bond Funds | | |
Fidelity Advisor Strategic Real Return Fund Institutional Class | 4.7 | 4.6 |
Fidelity Advisor Total Bond Fund Institutional Class | 0.0 | 0.0* |
Fidelity Series Investment Grade Bond Fund | 21.7 | 20.7 |
| 26.4 | 25.3 |
Short-Term Funds | | |
Fidelity Advisor Short Fixed-Income Fund Institutional Class | 4.7 | 4.5 |
Fidelity Institutional Money Market Portfolio Institutional Class | 4.8 | 4.5 |
| 9.5 | 9.0 |
Net Other Assets (Liabilities)* | 0.0 | 0.0 |
| 100.0 | 100.0 |
* Amount represents less than 0.1% |
Asset Allocation (% of fund's net assets) |
Current |
| Commodity Funds | 4.5% | |
| Domestic Equity Funds | 32.3% | |
| Developed International Equity Funds | 11.4% | |
| Emerging Markets Equity Funds | 2.1% | |
| High Yield Bond Funds | 5.0% | |
| Inflation-Protected Bond Funds | 8.8% | |
| Investment Grade Bond Funds | 26.4% | |
| Short-Term Funds | 9.5% | |

Six months ago |
| Commodity Funds | 5.0% | |
| Domestic Equity Funds | 33.3% | |
| Developed International Equity Funds | 11.7% | |
| Emerging Markets Equity Funds | 2.0% | |
| High Yield Bond Funds | 5.1% | |
| Inflation-Protected Bond Funds | 8.6% | |
| Investment Grade Bond Funds | 25.3% | |
| Short-Term Funds | 9.0% | |

Expected |
| Commodity Funds | 5.5% | |
| Domestic Equity Funds | 31.5% | |
| Developed International Equity Funds | 11.5% | |
| Emerging Markets Equity Funds | 2.0% | |
| High Yield Bond Funds | 5.0% | |
| Inflation-Protected Bond Funds | 10.1% | |
| Investment Grade Bond Funds | 24.7% | |
| Short-Term Funds | 9.7% | |

The fund invests according to an asset allocation strategy that becomes increasingly conservative over time. The six months ago allocation is based on the fund's holdings as of September 30, 2010. The current allocation is based on the fund's holdings as of March 31, 2011. The expected allocation represents the fund's anticipated allocation at September 30, 2011. |
Annual Report
Fidelity Advisor Freedom 2015 Fund
Investments March 31, 2011
Showing Percentage of Net Assets
Domestic Equity Funds - 36.8% |
| Shares | | Value |
Commodity Funds - 4.5% |
Fidelity Series Commodity Strategy Fund | 5,384,002 | | $ 70,961,149 |
Domestic Equity Funds - 32.3% |
Fidelity Advisor Equity Growth Fund Institutional Class | 824,047 | | 51,214,540 |
Fidelity Advisor Growth & Income Fund Institutional Class | 3,953,751 | | 71,365,198 |
Fidelity Advisor Large Cap Fund Institutional Class | 3,582,987 | | 70,692,335 |
Fidelity Advisor Small Cap Fund Institutional Class | 944,732 | | 26,518,629 |
Fidelity Series 100 Index Fund | 6,658,099 | | 61,254,508 |
Fidelity Series All-Sector Equity Fund | 7,792,442 | | 102,158,921 |
Fidelity Series Large Cap Value Fund | 8,429,362 | | 102,922,511 |
Fidelity Series Small Cap Opportunities Fund | 2,201,823 | | 25,959,495 |
TOTAL DOMESTIC EQUITY FUNDS | | 512,086,137 |
TOTAL DOMESTIC EQUITY FUNDS (Cost $484,413,580) | 583,047,286 |
International Equity Funds - 13.5% |
| | | |
Developed International Equity Funds - 11.4% |
Fidelity Advisor Diversified International Fund Institutional Class | 1,760,798 | | 29,599,021 |
Fidelity Advisor Overseas Fund Institutional Class | 1,536,919 | | 29,247,560 |
Fidelity Series International Growth Fund | 4,862,501 | | 55,967,387 |
Fidelity Series International Small Cap Fund | 874,353 | | 10,789,522 |
Fidelity Series International Value Fund | 5,172,805 | | 54,262,724 |
TOTAL DEVELOPED INTERNATIONAL EQUITY FUNDS | | 179,866,214 |
Emerging Markets Equity Funds - 2.1% |
Fidelity Series Emerging Markets Fund | 1,726,590 | | 33,081,460 |
TOTAL INTERNATIONAL EQUITY FUNDS (Cost $182,646,576) | 212,947,674 |
Bond Funds - 40.2% |
| Shares | | Value |
High Yield Bond Funds - 5.0% |
Fidelity Series Emerging Markets Debt Fund | 112,107 | | $ 1,121,529 |
Fidelity Series High Income Fund | 7,717,182 | | 77,326,163 |
TOTAL HIGH YIELD BOND FUNDS | | 78,447,692 |
Inflation-Protected Bond Funds - 8.8% |
Fidelity Series Inflation-Protected Bond Index Fund | 12,936,330 | | 139,971,095 |
Investment Grade Bond Funds - 26.4% |
Fidelity Advisor Strategic Real Return Fund Institutional Class | 7,540,015 | | 74,646,153 |
Fidelity Series Investment Grade Bond Fund | 30,166,345 | | 343,292,999 |
TOTAL INVESTMENT GRADE BOND FUNDS | | 417,939,152 |
TOTAL BOND FUNDS (Cost $614,812,581) | 636,357,939 |
Short-Term Funds - 9.5% |
| | | |
Fidelity Advisor Short Fixed-Income Fund Institutional Class | 8,060,772 | | 74,239,710 |
Fidelity Institutional Money Market Portfolio Institutional Class | 76,526,931 | | 76,526,931 |
TOTAL SHORT-TERM FUNDS (Cost $150,423,453) | 150,766,641 |
TOTAL INVESTMENT PORTFOLIO - 100.0% (Cost $1,432,296,190) | | 1,583,119,540 |
NET OTHER ASSETS (LIABILITIES) - 0.0% | | (245,140) |
NET ASSETS - 100% | $ 1,582,874,400 |
Other Information |
All investments are categorized as Level 1 under the Fair Value Hierarchy. The inputs or methodology used for valuing securities may not be an indication of the risk associated with investing in those securities. For more information on valuation inputs, please refer to the Security Valuation section in the accompanying Notes to Financial Statements. |
Income Tax Information |
At March 31, 2011, the Fund had a capital loss carryforward of approximately $70,260,528 of which $35,532,008 and $34,728,520 will expire in fiscal 2017 and 2019, respectively. Capital loss carryforwards are only available to offset future capital gains of the Fund to the extent provided by regulations and may be limited. |
See accompanying notes which are an integral part of the financial statements.
Annual Report
Fidelity Advisor Freedom 2015 Fund
Statement of Assets and Liabilities
| March 31, 2011 |
Assets | | |
Investment in securities, at value (cost $1,432,296,190) - See accompanying schedule | | $ 1,583,119,540 |
Receivable for investments sold | | 278,646 |
Receivable for fund shares sold | | 2,983,200 |
Distributions receivable from underlying funds | | 136,453 |
Total assets | | 1,586,517,839 |
| | |
Liabilities | | |
Payable to custodian bank | $ 1 | |
Payable for investments purchased | 102,328 | |
Payable for fund shares redeemed | 3,148,167 | |
Distribution and service plan fees payable | 392,943 | |
Total liabilities | | 3,643,439 |
| | |
Net Assets | | $ 1,582,874,400 |
Net Assets consist of: | | |
Paid in capital | | $ 1,501,869,265 |
Undistributed net investment income | | 2,522,428 |
Accumulated undistributed net realized gain (loss) on investments | | (72,340,643) |
Net unrealized appreciation (depreciation) on investments | | 150,823,350 |
Net Assets | | $ 1,582,874,400 |
| | |
Calculation of Maximum Offering Price Class A:
Net Asset Value and redemption price per share ($1,004,955,239 ÷ 84,666,829 shares) | | $ 11.87 |
| | |
Maximum offering price per share (100/94.25 of $11.87) | | $ 12.59 |
Class T:
Net Asset Value and redemption price per share ($236,105,753 ÷ 19,921,175 shares) | | $ 11.85 |
| | |
Maximum offering price per share (100/96.50 of $11.85) | | $ 12.28 |
Class B:
Net Asset Value and offering price per share ($32,761,552 ÷ 2,771,302 shares)A | | $ 11.82 |
| | |
Class C:
Net Asset Value and offering price per share ($70,396,444 ÷ 5,969,410 shares)A | | $ 11.79 |
| | |
| | |
Institutional Class:
Net Asset Value, offering price and redemption price per share ($238,655,412 ÷ 19,982,896 shares) | | $ 11.94 |
A Redemption price per share is equal to net asset value less any applicable contingent deferred sales charge.
Statement of Operations
| Year ended March 31, 2011 |
| | |
Investment Income | | |
Income distributions from underlying funds | | $ 23,265,774 |
| | |
Expenses | | |
Distribution and service plan fees | $ 4,358,282 | |
Independent trustees' compensation | 5,071 | |
Total expenses before reductions | 4,363,353 | |
Expense reductions | (5,071) | 4,358,282 |
Net investment income (loss) | | 18,907,492 |
Realized and Unrealized Gain (Loss) Realized gain (loss) on sale of underlying fund shares | (27,299,506) | |
Capital gain distributions from underlying funds | 26,749,012 | |
Total net realized gain (loss) | | (550,494) |
Change in net unrealized appreciation (depreciation) on underlying funds | | 148,398,468 |
Net gain (loss) | | 147,847,974 |
Net increase (decrease) in net assets resulting from operations | | $ 166,755,466 |
See accompanying notes which are an integral part of the financial statements.
Annual Report
Fidelity Advisor Freedom 2015 Fund
Financial Statements - continued
Statement of Changes in Net Assets
| Year ended
March 31,
2011 | Year ended
March 31,
2010 |
Increase (Decrease) in Net Assets | | |
Operations | | |
Net investment income (loss) | $ 18,907,492 | $ 20,862,802 |
Net realized gain (loss) | (550,494) | 5,172,111 |
Change in net unrealized appreciation (depreciation) | 148,398,468 | 290,904,573 |
Net increase (decrease) in net assets resulting from operations | 166,755,466 | 316,939,486 |
Distributions to shareholders from net investment income | (19,322,604) | (20,840,116) |
Distributions to shareholders from net realized gain | (12,721,165) | (9,228,273) |
Total distributions | (32,043,769) | (30,068,389) |
Share transactions - net increase (decrease) | 154,535,312 | 214,008,908 |
Total increase (decrease) in net assets | 289,247,009 | 500,880,005 |
| | |
Net Assets | | |
Beginning of period | 1,293,627,391 | 792,747,386 |
End of period (including undistributed net investment income of $2,522,428 and undistributed net investment income of $2,937,541, respectively) | $ 1,582,874,400 | $ 1,293,627,391 |
Financial Highlights - Class A
Years ended March 31, | 2011 | 2010 | 2009 | 2008 | 2007 |
Selected Per-Share Data | | | | | |
Net asset value, beginning of period | $ 10.81 | $ 8.05 | $ 11.85 | $ 12.40 | $ 11.84 |
Income from Investment Operations | | | | | |
Net investment income (loss) C | .16 | .20 | .26 | .31 | .26 |
Net realized and unrealized gain (loss) | 1.16 | 2.84 | (3.47) | (.35) | .74 |
Total from investment operations | 1.32 | 3.04 | (3.21) | (.04) | 1.00 |
Distributions from net investment income | (.16) | (.20) | (.26) | (.27) | (.23) |
Distributions from net realized gain | (.10) | (.08) | (.33) | (.24) | (.21) |
Total distributions | (.26) | (.28) H | (.59) G | (.51) F | (.44) |
Net asset value, end of period | $ 11.87 | $ 10.81 | $ 8.05 | $ 11.85 | $ 12.40 |
Total Return A, B | 12.36% | 37.95% | (28.01)% | (.53)% | 8.56% |
Ratios to Average Net Assets D, E | | | | | |
Expenses before reductions | .25% | .25% | .25% | .25% | .25% |
Expenses net of fee waivers, if any | .25% | .25% | .25% | .25% | .25% |
Expenses net of all reductions | .25% | .25% | .25% | .25% | .25% |
Net investment income (loss) | 1.42% | 2.02% | 2.69% | 2.46% | 2.21% |
Supplemental Data | | | | | |
Net assets, end of period (000 omitted) | $ 1,004,955 | $ 830,024 | $ 477,641 | $ 517,888 | $ 291,783 |
Portfolio turnover rate | 33% | 29% | 36% | 13% | 11% |
A Total returns would have been lower had certain expenses not been reduced during the periods shown.
B Total returns do not include the effect of the sales charges.
C Calculated based on average shares outstanding during the period.
D Amounts do not include the activity of the underlying funds.
E Expense ratios reflect operating expenses of the class. Expenses before reductions do not reflect amounts reimbursed by the investment adviser or reductions from expense offset arrangements and do not represent the amount paid by the class during periods when reimbursements or reductions occur. Expenses net of fee waivers reflect expenses after reimbursement by the investment adviser but prior to reductions from expense offset arrangements. Expenses net of all reductions represent the net expenses paid by the class but do not include expenses of the investment companies in which the Fund invests.
F Total distributions of $.51 per share is comprised of distributions from net investment income of $.268 and distributions from net realized gain of $.243 per share.
G Total distributions of $.59 per share is comprised of distributions from net investment income of $.262 and distributions from net realized gain of $.325 per share.
H Total distributions of $.28 per share is comprised of distributions from net investment income of $.197 and distributions from net realized gain of $.082 per share.
See accompanying notes which are an integral part of the financial statements.
Annual Report
Financial Highlights - Class T
Years ended March 31, | 2011 | 2010 | 2009 | 2008 | 2007 |
Selected Per-Share Data | | | | | |
Net asset value, beginning of period | $ 10.79 | $ 8.04 | $ 11.82 | $ 12.38 | $ 11.81 |
Income from Investment Operations | | | | | |
Net investment income (loss) C | .13 | .18 | .24 | .28 | .23 |
Net realized and unrealized gain (loss) | 1.16 | 2.82 | (3.46) | (.36) | .75 |
Total from investment operations | 1.29 | 3.00 | (3.22) | (.08) | .98 |
Distributions from net investment income | (.13) | (.17) | (.23) | (.23) | (.20) |
Distributions from net realized gain | (.10) | (.08) | (.33) | (.24) | (.21) |
Total distributions | (.23) | (.25) H | (.56) G | (.48) F | (.41) |
Net asset value, end of period | $ 11.85 | $ 10.79 | $ 8.04 | $ 11.82 | $ 12.38 |
Total Return A, B | 12.09% | 37.53% | (28.13)% | (.89)% | 8.40% |
Ratios to Average Net Assets D, E | | | | | |
Expenses before reductions | .50% | .50% | .50% | .50% | .50% |
Expenses net of fee waivers, if any | .50% | .50% | .50% | .50% | .50% |
Expenses net of all reductions | .50% | .50% | .50% | .50% | .50% |
Net investment income (loss) | 1.17% | 1.77% | 2.44% | 2.21% | 1.96% |
Supplemental Data | | | | | |
Net assets, end of period (000 omitted) | $ 236,106 | $ 225,384 | $ 162,439 | $ 203,822 | $ 186,106 |
Portfolio turnover rate | 33% | 29% | 36% | 13% | 11% |
A Total returns would have been lower had certain expenses not been reduced during the periods shown.
B Total returns do not include the effect of the sales charges.
C Calculated based on average shares outstanding during the period.
D Amounts do not include the activity of the underlying funds.
E Expense ratios reflect operating expenses of the class. Expenses before reductions do not reflect amounts reimbursed by the investment adviser or reductions from expense offset arrangements and do not represent the amount paid by the class during periods when reimbursements or reductions occur. Expenses net of fee waivers reflect expenses after reimbursement by the investment adviser but prior to reductions from expense offset arrangements. Expenses net of all reductions represent the net expenses paid by the class but do not include expenses of the investment companies in which the Fund invests.
F Total distributions of $.48 per share is comprised of distributions from net investment income of $.233 and distributions from net realized gain of $.243 per share.
G Total distributions of $.56 per share is comprised of distributions from net investment income of $.234 and distributions from net realized gain of $.325 per share.
H Total distributions of $.25 per share is comprised of distributions from net investment income of $.172 and distributions from net realized gain of $.082 per share.
Financial Highlights - Class B
Years ended March 31, | 2011 | 2010 | 2009 | 2008 | 2007 |
Selected Per-Share Data | | | | | |
Net asset value, beginning of period | $ 10.76 | $ 8.02 | $ 11.77 | $ 12.33 | $ 11.77 |
Income from Investment Operations | | | | | |
Net investment income (loss) C | .07 | .13 | .19 | .21 | .17 |
Net realized and unrealized gain (loss) | 1.16 | 2.82 | (3.44) | (.36) | .74 |
Total from investment operations | 1.23 | 2.95 | (3.25) | (.15) | .91 |
Distributions from net investment income | (.07) | (.12) | (.17) | (.17) | (.14) |
Distributions from net realized gain | (.10) | (.08) | (.33) | (.24) | (.21) |
Total distributions | (.17) | (.21) H | (.50) G | (.41) F | (.35) |
Net asset value, end of period | $ 11.82 | $ 10.76 | $ 8.02 | $ 11.77 | $ 12.33 |
Total Return A, B | 11.51% | 36.85% | (28.47)% | (1.37)% | 7.83% |
Ratios to Average Net Assets D, E | | | | | |
Expenses before reductions | 1.00% | 1.00% | 1.00% | 1.00% | 1.00% |
Expenses net of fee waivers, if any | 1.00% | 1.00% | 1.00% | 1.00% | 1.00% |
Expenses net of all reductions | 1.00% | 1.00% | 1.00% | 1.00% | 1.00% |
Net investment income (loss) | .67% | 1.27% | 1.94% | 1.71% | 1.46% |
Supplemental Data | | | | | |
Net assets, end of period (000 omitted) | $ 32,762 | $ 35,932 | $ 27,727 | $ 43,608 | $ 41,424 |
Portfolio turnover rate | 33% | 29% | 36% | 13% | 11% |
A Total returns would have been lower had certain expenses not been reduced during the periods shown.
B Total returns do not include the effect of the contingent deferred sales charge.
C Calculated based on average shares outstanding during the period.
D Amounts do not include the activity of the underlying funds.
E Expense ratios reflect operating expenses of the class. Expenses before reductions do not reflect amounts reimbursed by the investment adviser or reductions from expense offset arrangements and do not represent the amount paid by the class during periods when reimbursements or reductions occur. Expenses net of fee waivers reflect expenses after reimbursement by the investment adviser but prior to reductions from expense offset arrangements. Expenses net of all reductions represent the net expenses paid by the class but do not include expenses of the investment companies in which the Fund invests.
F Total distributions of $.41 per share is comprised of distributions from net investment income of $.171 and distributions from net realized gain of $.243 per share.
G Total distributions of $.50 per share is comprised of distributions from net investment income of $.173 and distributions from net realized gain of $.325 per share.
H Total distributions of $.21 per share is comprised of distributions from net investment income of $.124 and distributions from net realized gain of $.082 per share.
See accompanying notes which are an integral part of the financial statements.
Annual Report
Financial Highlights - Class C
Years ended March 31, | 2011 | 2010 | 2009 | 2008 | 2007 |
Selected Per-Share Data | | | | | |
Net asset value, beginning of period | $ 10.74 | $ 8.00 | $ 11.76 | $ 12.32 | $ 11.77 |
Income from Investment Operations | | | | | |
Net investment income (loss) C | .07 | .13 | .19 | .21 | .17 |
Net realized and unrealized gain (loss) | 1.15 | 2.82 | (3.45) | (.35) | .74 |
Total from investment operations | 1.22 | 2.95 | (3.26) | (.14) | .91 |
Distributions from net investment income | (.07) | (.13) | (.18) | (.18) | (.15) |
Distributions from net realized gain | (.10) | (.08) | (.33) | (.24) | (.21) |
Total distributions | (.17) | (.21) H | (.50) G | (.42) F | (.36) |
Net asset value, end of period | $ 11.79 | $ 10.74 | $ 8.00 | $ 11.76 | $ 12.32 |
Total Return A, B | 11.49% | 36.97% | (28.53)% | (1.34)% | 7.81% |
Ratios to Average Net Assets D, E | | | | | |
Expenses before reductions | 1.00% | 1.00% | 1.00% | 1.00% | 1.00% |
Expenses net of fee waivers, if any | 1.00% | 1.00% | 1.00% | 1.00% | 1.00% |
Expenses net of all reductions | 1.00% | 1.00% | 1.00% | 1.00% | 1.00% |
Net investment income (loss) | .67% | 1.27% | 1.94% | 1.71% | 1.46% |
Supplemental Data | | | | | |
Net assets, end of period (000 omitted) | $ 70,396 | $ 64,801 | $ 46,942 | $ 65,543 | $ 56,686 |
Portfolio turnover rate | 33% | 29% | 36% | 13% | 11% |
A Total returns would have been lower had certain expenses not been reduced during the periods shown.
B Total returns do not include the effect of the contingent deferred sales charge.
C Calculated based on average shares outstanding during the period.
D Amounts do not include the activity of the underlying funds.
E Expense ratios reflect operating expenses of the class. Expenses before reductions do not reflect amounts reimbursed by the investment adviser or reductions from expense offset arrangements and do not represent the amount paid by the class during periods when reimbursements or reductions occur. Expenses net of fee waivers reflect expenses after reimbursement by the investment adviser but prior to reductions from expense offset arrangements. Expenses net of all reductions represent the net expenses paid by the class but do not include expenses of the investment companies in which the Fund invests.
F Total distributions of $.42 per share is comprised of distributions from net investment income of $.175 and distributions from net realized gain of $.243 per share.
G Total distributions of $.50 per share is comprised of distributions from net investment income of $.179 and distributions from net realized gain of $.325 per share.
H Total distributions of $.21 per share is comprised of distributions from net investment income of $.126 and distributions from net realized gain of $.082 per share.
Financial Highlights - Institutional Class
Years ended March 31, | 2011 | 2010 | 2009 | 2008 | 2007 |
Selected Per-Share Data | | | | | |
Net asset value, beginning of period | $ 10.87 | $ 8.09 | $ 11.91 | $ 12.47 | $ 11.89 |
Income from Investment Operations | | | | | |
Net investment income (loss) B | .19 | .23 | .29 | .34 | .29 |
Net realized and unrealized gain (loss) | 1.17 | 2.85 | (3.50) | (.36) | .75 |
Total from investment operations | 1.36 | 3.08 | (3.21) | (.02) | 1.04 |
Distributions from net investment income | (.19) | (.22) | (.29) | (.29) | (.25) |
Distributions from net realized gain | (.10) | (.08) | (.33) | (.24) | (.21) |
Total distributions | (.29) | (.30) H | (.61) G | (.54) F | (.46) |
Net asset value, end of period | $ 11.94 | $ 10.87 | $ 8.09 | $ 11.91 | $ 12.47 |
Total Return A | 12.67% | 38.30% | (27.85)% | (.42)% | 8.90% |
Ratios to Average Net Assets C, E | | | | | |
Expenses before reductions D | .00% | .00% | .00% | .00% | .00% |
Expenses net of fee waivers, if any | .00% | .00% | .00% | .00% | .00% |
Expenses net of all reductions | .00% | .00% | .00% | .00% | .00% |
Net investment income (loss) | 1.67% | 2.27% | 2.94% | 2.71% | 2.46% |
Supplemental Data | | | | | |
Net assets, end of period (000 omitted) | $ 238,655 | $ 137,487 | $ 77,998 | $ 68,797 | $ 39,631 |
Portfolio turnover rate | 33% | 29% | 36% | 13% | 11% |
A Total returns would have been lower had certain expenses not been reduced during the periods shown.
B Calculated based on average shares outstanding during the period.
C Amounts do not include the activity of the underlying funds.
D Amount represents less than .01%.
E Expense ratios reflect operating expenses of the class. Expenses before reductions do not reflect amounts reimbursed by the investment adviser or reductions from expense offset arrangements and do not represent the amount paid by the class during periods when reimbursements or reductions occur. Expenses net of fee waivers reflect expenses after reimbursement by the investment adviser but prior to reductions from expense offset arrangements. Expenses net of all reductions represent the net expenses paid by the class but do not include expenses of the investment companies in which the Fund invests.
F Total distributions of $.54 per share is comprised of distributions from net investment income of $.293 and distributions from net realized gain of $.243 per share.
G Total distributions of $.61 per share is comprised of distributions from net investment income of $.286 and distributions from net realized gain of $.325 per share.
H Total distributions of $.30 per share is comprised of distributions from net investment income of $.219 and distributions from net realized gain of $.082 per share.
See accompanying notes which are an integral part of the financial statements.
Annual Report
Fidelity Advisor Freedom 2020 Fund
Investment Changes (Unaudited)
Fund Holdings as of March 31, 2011 |
| % of fund's
net assets | % of fund's net assets
6 months ago |
Commodity Funds | | |
Fidelity Series Commodity Strategy Fund | 5.6 | 6.0 |
Domestic Equity Funds | | |
Fidelity Advisor Equity Growth Fund Institutional Class | 3.8 | 4.1 |
Fidelity Advisor Equity Income Fund Institutional Class | 0.0 | 0.8 |
Fidelity Advisor Growth & Income Fund Institutional Class | 5.3 | 5.6 |
Fidelity Advisor Large Cap Fund Institutional Class | 5.2 | 5.6 |
Fidelity Advisor Small Cap Fund Institutional Class | 2.0 | 2.0 |
Fidelity Series 100 Index Fund | 4.5 | 4.4 |
Fidelity Series All-Sector Equity Fund | 7.6 | 7.9 |
Fidelity Series Large Cap Value Fund | 7.7 | 7.1 |
Fidelity Series Small Cap Opportunities Fund | 1.9 | 2.1 |
| 38.0 | 39.6 |
Developed International Equity Funds | | |
Fidelity Advisor Diversified International Fund Institutional Class | 2.2 | 3.2 |
Fidelity Advisor Overseas Fund Institutional Class | 2.2 | 3.3 |
Fidelity Series International Growth Fund | 4.2 | 3.5 |
Fidelity Series International Small Cap Fund | 0.8 | 0.7 |
Fidelity Series International Value Fund | 4.0 | 3.4 |
| 13.4 | 14.1 |
Emerging Markets Equity Funds | | |
Fidelity Series Emerging Markets Fund | 2.5 | 2.4 |
High Yield Bond Funds | | |
Fidelity Advisor High Income Advantage Fund Institutional Class | 0.0 | 6.7 |
Fidelity Series Emerging Markets Debt Fund | 0.1 | 0.0 |
Fidelity Series High Income Fund | 6.3 | 0.0 |
| 6.4 | 6.7 |
Inflation-Protected Bond Funds | | |
Fidelity Series Inflation-Protected Bond Index Fund | 6.7 | 6.4 |
Investment Grade Bond Funds | | |
Fidelity Advisor Strategic Real Return Fund Institutional Class | 4.2 | 3.9 |
Fidelity Advisor Total Bond Fund Institutional Class | 0.0 | 0.0* |
Fidelity Series Investment Grade Bond Fund | 19.2 | 17.7 |
| 23.4 | 21.6 |
Short-Term Funds | | |
Fidelity Advisor Short Fixed-Income Fund Institutional Class | 1.9 | 1.6 |
Fidelity Institutional Money Market Portfolio Institutional Class | 2.1 | 1.6 |
| 4.0 | 3.2 |
| | |
Net Other Assets (Liabilities)* | 0.0 | 0.0 |
| 100.0 | 100.0 |
* Amount represents less than 0.1% |
Asset Allocation (% of fund's net assets) |
Current |
| Commodity Funds | 5.6% | |
| Domestic Equity Funds | 38.0% | |
| Developed International Equity Funds | 13.4% | |
| Emerging Markets Equity Funds | 2.5% | |
| High Yield Bond Funds | 6.4% | |
| Inflation-Protected Bond Funds | 6.7% | |
| Investment Grade Bond Funds | 23.4% | |
| Short-Term Funds | 4.0% | |

Six months ago |
| Commodity Funds | 6.0% | |
| Domestic Equity Funds | 39.6% | |
| Developed International Equity Funds | 14.1% | |
| Emerging Markets Equity Funds | 2.4% | |
| High Yield Bond Funds | 6.7% | |
| Inflation-Protected Bond Funds | 6.4% | |
| Investment Grade Bond Funds | 21.6% | |
| Short-Term Funds | 3.2% | |

Expected |
| Commodity Funds | 6.4% | |
| Domestic Equity Funds | 36.4% | |
| Developed International Equity Funds | 13.3% | |
| Emerging Markets Equity Funds | 2.3% | |
| High Yield Bond Funds | 6.3% | |
| Inflation-Protected Bond Funds | 8.0% | |
| Investment Grade Bond Funds | 22.5% | |
| Short-Term Funds | 4.8% | |

The fund invests according to an asset allocation strategy that becomes increasingly conservative over time. The six months ago allocation is based on the fund's holdings as of September 30, 2010. The current allocation is based on the fund's holdings as of March 31, 2011. The expected allocation represents the fund's anticipated allocation at September 30, 2011. |
Annual Report
Fidelity Advisor Freedom 2020 Fund
Investments March 31, 2011
Showing Percentage of Net Assets
Domestic Equity Funds - 43.6% |
| Shares | | Value |
Commodity Funds - 5.6% |
Fidelity Series Commodity Strategy Fund | 10,706,273 | | $ 141,108,679 |
Domestic Equity Funds - 38.0% |
Fidelity Advisor Equity Growth Fund Institutional Class | 1,534,497 | | 95,368,969 |
Fidelity Advisor Growth & Income Fund Institutional Class | 7,363,893 | | 132,918,267 |
Fidelity Advisor Large Cap Fund Institutional Class | 6,673,635 | | 131,670,827 |
Fidelity Advisor Small Cap Fund Institutional Class | 1,753,679 | | 49,225,776 |
Fidelity Series 100 Index Fund | 12,413,503 | | 114,204,231 |
Fidelity Series All-Sector Equity Fund | 14,518,573 | | 190,338,492 |
Fidelity Series Large Cap Value Fund | 15,738,071 | | 192,161,848 |
Fidelity Series Small Cap Opportunities Fund | 4,087,761 | | 48,194,699 |
TOTAL DOMESTIC EQUITY FUNDS | | 954,083,109 |
TOTAL DOMESTIC EQUITY FUNDS (Cost $890,476,396) | 1,095,191,788 |
International Equity Funds - 15.9% |
| | | |
Developed International Equity Funds - 13.4% |
Fidelity Advisor Diversified International Fund Institutional Class | 3,304,809 | | 55,553,835 |
Fidelity Advisor Overseas Fund Institutional Class | 2,884,664 | | 54,895,152 |
Fidelity Series International Growth Fund | 9,099,633 | | 104,736,774 |
Fidelity Series International Small Cap Fund | 1,651,610 | | 20,380,871 |
Fidelity Series International Value Fund | 9,680,614 | | 101,549,638 |
TOTAL DEVELOPED INTERNATIONAL EQUITY FUNDS | | 337,116,270 |
Emerging Markets Equity Funds - 2.5% |
Fidelity Series Emerging Markets Fund | 3,232,043 | | 61,925,943 |
TOTAL INTERNATIONAL EQUITY FUNDS (Cost $336,978,098) | 399,042,213 |
Bond Funds - 36.5% |
| Shares | | Value |
High Yield Bond Funds - 6.4% |
Fidelity Series Emerging Markets Debt Fund | 231,068 | | $ 2,311,628 |
Fidelity Series High Income Fund | 15,906,179 | | 159,379,913 |
TOTAL HIGH YIELD BOND FUNDS | | 161,691,541 |
Inflation-Protected Bond Funds - 6.7% |
Fidelity Series Inflation-Protected Bond Index Fund | 15,496,233 | | 167,669,239 |
Investment Grade Bond Funds - 23.4% |
Fidelity Advisor Strategic Real Return Fund Institutional Class | 10,506,871 | | 104,018,022 |
Fidelity Series Investment Grade Bond Fund | 42,395,902 | | 482,465,365 |
TOTAL INVESTMENT GRADE BOND FUNDS | | 586,483,387 |
TOTAL BOND FUNDS (Cost $889,459,226) | 915,844,167 |
Short-Term Funds - 4.0% |
| | | |
Fidelity Advisor Short Fixed-Income Fund Institutional Class | 5,273,308 | | 48,567,169 |
Fidelity Institutional Money Market Portfolio Institutional Class | 51,855,421 | | 51,855,421 |
TOTAL SHORT-TERM FUNDS (Cost $100,005,727) | 100,422,590 |
TOTAL INVESTMENT PORTFOLIO - 100.0% (Cost $2,216,919,447) | | 2,510,500,758 |
NET OTHER ASSETS (LIABILITIES) - 0.0% | | (359,478) |
NET ASSETS - 100% | $ 2,510,141,280 |
Other Information |
All investments are categorized as Level 1 under the Fair Value Hierarchy. The inputs or methodology used for valuing securities may not be an indication of the risk associated with investing in those securities. For more information on valuation inputs, please refer to the Security Valuation section in the accompanying Notes to Financial Statements. |
Income Tax Information |
At March 31, 2011, the Fund had a capital loss carryforward of approximately $159,878,472 of which $83,490,631 and $76,387,841 will expire in fiscal 2017 and 2019, respectively. Capital loss carryforwards are only available to offset future capital gains of the Fund to the extent provided by regulations and may be limited. |
See accompanying notes which are an integral part of the financial statements.
Annual Report
Fidelity Advisor Freedom 2020 Fund
Statement of Assets and Liabilities
| March 31, 2011 |
Assets | | |
Investment in securities, at value (cost $2,216,919,447) - See accompanying schedule | | $ 2,510,500,758 |
Receivable for investments sold | | 235,179 |
Receivable for fund shares sold | | 3,321,181 |
Distributions receivable from underlying funds | | 281,193 |
Total assets | | 2,514,338,311 |
| | |
Liabilities | | |
Payable for investments purchased | $ 27,752 | |
Payable for fund shares redeemed | 3,533,983 | |
Distribution and service plan fees payable | 635,296 | |
Total liabilities | | 4,197,031 |
| | |
Net Assets | | $ 2,510,141,280 |
Net Assets consist of: | | |
Paid in capital | | $ 2,377,052,288 |
Undistributed net investment income | | 3,586,191 |
Accumulated undistributed net realized gain (loss) on investments | | (164,078,510) |
Net unrealized appreciation (depreciation) on investments | | 293,581,311 |
Net Assets | | $ 2,510,141,280 |
| | |
Calculation of Maximum Offering Price Class A:
Net Asset Value and redemption price per share ($1,557,401,767 ÷ 125,059,670 shares) | | $ 12.45 |
| | |
Maximum offering price per share (100/94.25 of $12.45) | | $ 13.21 |
Class T:
Net Asset Value and redemption price per share ($424,707,250 ÷ 34,116,964 shares) | | $ 12.45 |
| | |
Maximum offering price per share (100/96.50 of $12.45) | | $ 12.90 |
Class B:
Net Asset Value and offering price per share ($61,855,909 ÷ 4,984,739 shares)A | | $ 12.41 |
| | |
Class C:
Net Asset Value and offering price per share ($101,018,910 ÷ 8,163,494 shares)A | | $ 12.37 |
| | |
| | |
Institutional Class:
Net Asset Value, offering price and redemption price per share ($365,157,444 ÷ 29,147,383 shares) | | $ 12.53 |
A Redemption price per share is equal to net asset value less any applicable contingent deferred sales charge.
Statement of Operations
| Year ended March 31, 2011 |
Investment Income | | |
Income distributions from underlying funds | | $ 37,318,379 |
| | |
Expenses | | |
Distribution and service plan fees | $ 7,206,192 | |
Independent trustees' compensation | 8,108 | |
Total expenses before reductions | 7,214,300 | |
Expense reductions | (8,108) | 7,206,192 |
Net investment income (loss) | | 30,112,187 |
Realized and Unrealized Gain (Loss) Realized gain (loss) on sale of underlying fund shares | (52,410,882) | |
Capital gain distributions from underlying funds | 45,102,302 | |
Total net realized gain (loss) | | (7,308,580) |
Change in net unrealized appreciation (depreciation) on underlying funds | | 268,865,527 |
Net gain (loss) | | 261,556,947 |
Net increase (decrease) in net assets resulting from operations | | $ 291,669,134 |
See accompanying notes which are an integral part of the financial statements.
Annual Report
Fidelity Advisor Freedom 2020 Fund
Financial Statements - continued
Statement of Changes in Net Assets
| Year ended
March 31,
2011 | Year ended
March 31,
2010 |
Increase (Decrease) in Net Assets | | |
Operations | | |
Net investment income (loss) | $ 30,112,187 | $ 31,695,503 |
Net realized gain (loss) | (7,308,580) | (9,984,453) |
Change in net unrealized appreciation (depreciation) | 268,865,527 | 562,202,605 |
Net increase (decrease) in net assets resulting from operations | 291,669,134 | 583,913,655 |
Distributions to shareholders from net investment income | (30,543,734) | (31,327,675) |
Distributions to shareholders from net realized gain | (21,278,399) | (15,485,703) |
Total distributions | (51,822,133) | (46,813,378) |
Share transactions - net increase (decrease) | 164,153,585 | 326,679,236 |
Total increase (decrease) in net assets | 404,000,586 | 863,779,513 |
| | |
Net Assets | | |
Beginning of period | 2,106,140,694 | 1,242,361,181 |
End of period (including undistributed net investment income of $3,586,191 and undistributed net investment income of $4,017,738, respectively) | $ 2,510,141,280 | $ 2,106,140,694 |
Financial Highlights - Class A
Years ended March 31, | 2011 | 2010 | 2009 | 2008 | 2007 |
Selected Per-Share Data | | | | | |
Net asset value, beginning of period | $ 11.21 | $ 7.97 | $ 12.73 | $ 13.49 | $ 12.85 |
Income from Investment Operations | | | | | |
Net investment income (loss) C | .16 | .20 | .25 | .28 | .24 |
Net realized and unrealized gain (loss) | 1.36 | 3.32 | (4.33) | (.49) | .92 |
Total from investment operations | 1.52 | 3.52 | (4.08) | (.21) | 1.16 |
Distributions from net investment income | (.17) | (.19) | (.25) | (.25) | (.23) |
Distributions from net realized gain | (.11) | (.09) | (.43) | (.30) | (.30) |
Total distributions | (.28) | (.28) G | (.68) | (.55) | (.52) F |
Net asset value, end of period | $ 12.45 | $ 11.21 | $ 7.97 | $ 12.73 | $ 13.49 |
Total Return A,B | 13.73% | 44.32% | (33.34)% | (1.83)% | 9.21% |
Ratios to Average Net Assets D,E | | | | | |
Expenses before reductions | .25% | .25% | .25% | .25% | .25% |
Expenses net of fee waivers, if any | .25% | .25% | .25% | .25% | .25% |
Expenses net of all reductions | .25% | .25% | .25% | .25% | .25% |
Net investment income (loss) | 1.43% | 1.92% | 2.49% | 2.07% | 1.89% |
Supplemental Data | | | | | |
Net assets, end of period (000 omitted) | $ 1,557,402 | $ 1,238,015 | $ 677,210 | $ 811,992 | $ 511,536 |
Portfolio turnover rate | 39% | 26% | 31% | 10% | 13% |
A Total returns would have been lower had certain expenses not been reduced during the periods shown.
B Total returns do not include the effect of the sales charges.
C Calculated based on average shares outstanding during the period.
D Amounts do not include the activity of the underlying funds.
E Expense ratios reflect operating expenses of the class. Expenses before reductions do not reflect amounts reimbursed by the investment adviser or reductions from expense offset arrangements and do not represent the amount paid by the class during periods when reimbursements or reductions occur. Expenses net of fee waivers reflect expenses after reimbursement by the investment adviser but prior to reductions from expense offset arrangements. Expenses net of all reductions represent the net expenses paid by the class but do not include expenses of the investment companies in which the Fund invests.
F Total distributions of $.52 per share is comprised of distributions from net investment income of $.225 and distributions from net realized gain of $.295 per share.
G Total distributions of $.28 per share is comprised of distributions from net investment income of $.189 and distributions from net realized gain of $.087 per share.
See accompanying notes which are an integral part of the financial statements.
Annual Report
Financial Highlights - Class T
Years ended March 31, | 2011 | 2010 | 2009 | 2008 | 2007 |
Selected Per-Share Data | | | | | |
Net asset value, beginning of period | $ 11.20 | $ 7.96 | $ 12.72 | $ 13.47 | $ 12.83 |
Income from Investment Operations | | | | | |
Net investment income (loss) C | .13 | .17 | .23 | .25 | .21 |
Net realized and unrealized gain (loss) | 1.37 | 3.32 | (4.34) | (.49) | .92 |
Total from investment operations | 1.50 | 3.49 | (4.11) | (.24) | 1.13 |
Distributions from net investment income | (.13) | (.16) | (.22) | (.21) | (.19) |
Distributions from net realized gain | (.11) | (.09) | (.43) | (.30) | (.30) |
Total distributions | (.25) H | (.25) G | (.65) | (.51) | (.49) F |
Net asset value, end of period | $ 12.45 | $ 11.20 | $ 7.96 | $ 12.72 | $ 13.47 |
Total Return A,B | 13.50% | 44.02% | (33.56)% | (2.02)% | 8.97% |
Ratios to Average Net Assets D,E | | | | | |
Expenses before reductions | .50% | .50% | .50% | .50% | .50% |
Expenses net of fee waivers, if any | .50% | .50% | .50% | .50% | .50% |
Expenses net of all reductions | .50% | .50% | .50% | .50% | .50% |
Net investment income (loss) | 1.18% | 1.67% | 2.24% | 1.82% | 1.63% |
Supplemental Data | | | | | |
Net assets, end of period (000 omitted) | $ 424,707 | $ 488,097 | $ 343,919 | $ 458,465 | $ 431,886 |
Portfolio turnover rate | 39% | 26% | 31% | 10% | 13% |
A Total returns would have been lower had certain expenses not been reduced during the periods shown.
B Total returns do not include the effect of the sales charges.
C Calculated based on average shares outstanding during the period.
D Amounts do not include the activity of the underlying funds.
E Expense ratios reflect operating expenses of the class. Expenses before reductions do not reflect amounts reimbursed by the investment adviser or reductions from expense offset arrangements and do not represent the amount paid by the class during periods when reimbursements or reductions occur. Expenses net of fee waivers reflect expenses after reimbursement by the investment adviser but prior to reductions from expense offset arrangements. Expenses net of all reductions represent the net expenses paid by the class but do not include expenses of the investment companies in which the Fund invests.
F Total distributions of $.49 per share is comprised of distributions from net investment income of $.194 and distributions from net realized gain of $.295 per share.
G Total distributions of $.25 per share is comprised of distributions from net investment income of $.163 and distributions from net realized gain of $.087 per share.
H Total distributions of $.25 per share is comprised of distributions from net investment income of $.134 and distributions from net realized gain of $.111 per share.
Financial Highlights - Class B
Years ended March 31, | 2011 | 2010 | 2009 | 2008 | 2007 |
Selected Per-Share Data | | | | | |
Net asset value, beginning of period | $ 11.17 | $ 7.94 | $ 12.66 | $ 13.41 | $ 12.78 |
Income from Investment Operations | | | | | |
Net investment income (loss) C | .08 | .12 | .18 | .18 | .15 |
Net realized and unrealized gain (loss) | 1.35 | 3.31 | (4.31) | (.48) | .91 |
Total from investment operations | 1.43 | 3.43 | (4.13) | (.30) | 1.06 |
Distributions from net investment income | (.08) | (.12) | (.16) | (.15) | (.13) |
Distributions from net realized gain | (.11) | (.09) | (.43) | (.30) | (.30) |
Total distributions | (.19) | (.20) G | (.59) | (.45) | (.43) F |
Net asset value, end of period | $ 12.41 | $ 11.17 | $ 7.94 | $ 12.66 | $ 13.41 |
Total Return A,B | 12.87% | 43.34% | (33.87)% | (2.51)% | 8.40% |
Ratios to Average Net Assets D,E | | | | | |
Expenses before reductions | 1.00% | 1.00% | 1.00% | 1.00% | 1.00% |
Expenses net of fee waivers, if any | 1.00% | 1.00% | 1.00% | 1.00% | 1.00% |
Expenses net of all reductions | 1.00% | 1.00% | 1.00% | 1.00% | 1.00% |
Net investment income (loss) | .68% | 1.17% | 1.74% | 1.32% | 1.13% |
Supplemental Data | | | | | |
Net assets, end of period (000 omitted) | $ 61,856 | $ 71,888 | $ 52,871 | $ 89,049 | $ 85,981 |
Portfolio turnover rate | 39% | 26% | 31% | 10% | 13% |
A Total returns would have been lower had certain expenses not been reduced during the periods shown.
B Total returns do not include the effect of the contingent deferred sales charge.
C Calculated based on average shares outstanding during the period.
D Amounts do not include the activity of the underlying funds.
E Expense ratios reflect operating expenses of the class. Expenses before reductions do not reflect amounts reimbursed by the investment adviser or reductions from expense offset arrangements and do not represent the amount paid by the class during periods when reimbursements or reductions occur. Expenses net of fee waivers reflect expenses after reimbursement by the investment adviser but prior to reductions from expense offset arrangements. Expenses net of all reductions represent the net expenses paid by the class but do not include expenses of the investment companies in which the Fund invests.
F Total distributions of $.43 per share is comprised of distributions from net investment income of $.131 and distributions from net realized gain of $.295 per share.
G Total distributions of $.20 per share is comprised of distributions from net investment income of $.115 and distributions from net realized gain of $.087 per share.
See accompanying notes which are an integral part of the financial statements.
Annual Report
Financial Highlights - Class C
Years ended March 31, | 2011 | 2010 | 2009 | 2008 | 2007 |
Selected Per-Share Data | | | | | |
Net asset value, beginning of period | $ 11.14 | $ 7.92 | $ 12.64 | $ 13.40 | $ 12.77 |
Income from Investment Operations | | | | | |
Net investment income (loss) C | .08 | .12 | .18 | .18 | .15 |
Net realized and unrealized gain (loss) | 1.34 | 3.31 | (4.31) | (.49) | .91 |
Total from investment operations | 1.42 | 3.43 | (4.13) | (.31) | 1.06 |
Distributions from net investment income | (.08) | (.12) | (.16) | (.15) | (.14) |
Distributions from net realized gain | (.11) | (.09) | (.43) | (.30) | (.30) |
Total distributions | (.19) | (.21) G | (.59) | (.45) | (.43) F |
Net asset value, end of period | $ 12.37 | $ 11.14 | $ 7.92 | $ 12.64 | $ 13.40 |
Total Return A,B | 12.89% | 43.38% | (33.90)% | (2.56)% | 8.45% |
Ratios to Average Net Assets D,E | | | | | |
Expenses before reductions | 1.00% | 1.00% | 1.00% | 1.00% | 1.00% |
Expenses net of fee waivers, if any | 1.00% | 1.00% | 1.00% | 1.00% | 1.00% |
Expenses net of all reductions | 1.00% | 1.00% | 1.00% | 1.00% | 1.00% |
Net investment income (loss) | .68% | 1.17% | 1.74% | 1.32% | 1.14% |
Supplemental Data | | | | | |
Net assets, end of period (000 omitted) | $ 101,019 | $ 93,237 | $ 62,702 | $ 95,224 | $ 85,076 |
Portfolio turnover rate | 39% | 26% | 31% | 10% | 13% |
A Total returns would have been lower had certain expenses not been reduced during the periods shown.
B Total returns do not include the effect of the contingent deferred sales charge.
C Calculated based on average shares outstanding during the period.
D Amounts do not include the activity of the underlying funds.
E Expense ratios reflect operating expenses of the class. Expenses before reductions do not reflect amounts reimbursed by the investment adviser or reductions from expense offset arrangements and do not represent the amount paid by the class during periods when reimbursements or reductions occur. Expenses net of fee waivers reflect expenses after reimbursement by the investment adviser but prior to reductions from expense offset arrangements. Expenses net of all reductions represent the net expenses paid by the class but do not include expenses of the investment companies in which the Fund invests.
F Total distributions of $.43 per share is comprised of distributions from net investment income of $.135 and distributions from net realized gain of $.295 per share.
G Total distributions of $.21 per share is comprised of distributions from net investment income of $.119 and distributions from net realized gain of $.087 per share.
Financial Highlights - Institutional Class
Years ended March 31, | 2011 | 2010 | 2009 | 2008 | 2007 |
Selected Per-Share Data | | | | | |
Net asset value, beginning of period | $ 11.27 | $ 8.01 | $ 12.79 | $ 13.55 | $ 12.90 |
Income from Investment Operations | | | | | |
Net investment income (loss) B | .19 | .22 | .28 | .32 | .28 |
Net realized and unrealized gain (loss) | 1.38 | 3.34 | (4.35) | (.50) | .92 |
Total from investment operations | 1.57 | 3.56 | (4.07) | (.18) | 1.20 |
Distributions from net investment income | (.20) | (.21) | (.28) | (.28) | (.25) |
Distributions from net realized gain | (.11) | (.09) | (.43) | (.30) | (.30) |
Total distributions | (.31) | (.30) G | (.71) | (.58) | (.55) F |
Net asset value, end of period | $ 12.53 | $ 11.27 | $ 8.01 | $ 12.79 | $ 13.55 |
Total Return A | 14.09% | 44.65% | (33.16)% | (1.62)% | 9.47% |
Ratios to Average Net Assets C,E | | | | | |
Expenses before reductions D | .00% | .00% | .00% | .00% | .00% |
Expenses net of fee waivers, if any | .00% | .00% | .00% | .00% | .00% |
Expenses net of all reductions | .00% | .00% | .00% | .00% | .00% |
Net investment income (loss) | 1.68% | 2.17% | 2.74% | 2.32% | 2.13% |
Supplemental Data | | | | | |
Net assets, end of period (000 omitted) | $ 365,157 | $ 214,905 | $ 105,660 | $ 87,568 | $ 38,153 |
Portfolio turnover rate | 39% | 26% | 31% | 10% | 13% |
A Total returns would have been lower had certain expenses not been reduced during the periods shown.
B Calculated based on average shares outstanding during the period.
C Amounts do not include the activity of the underlying funds.
D Amount represents less than .01%.
E Expense ratios reflect operating expenses of the class. Expenses before reductions do not reflect amounts reimbursed by the investment adviser or reductions from expense offset arrangements and do not represent the amount paid by the class during periods when reimbursements or reductions occur. Expenses net of fee waivers reflect expenses after reimbursement by the investment adviser but prior to reductions from expense offset arrangements. Expenses net of all reductions represent the net expenses paid by the class but do not include expenses of the investment companies in which the Fund invests.
F Total distributions of $.55 per share is comprised of distributions from net investment income of $.252 and distributions from net realized gain of $.295 per share.
G Total distributions of $.30 per share is comprised of distributions from net investment income of $.211 and distributions from net realized gain of $.087 per share.
See accompanying notes which are an integral part of the financial statements.
Annual Report
Fidelity Advisor Freedom 2025 Fund
Investment Changes (Unaudited)
Fund Holdings as of March 31, 2011 |
| % of fund's
net assets | % of fund's net assets
6 months ago |
Commodity Funds | | |
Fidelity Series Commodity Strategy Fund | 6.8 | 6.8 |
Domestic Equity Funds | | |
Fidelity Advisor Equity Growth Fund Institutional Class | 4.4 | 4.6 |
Fidelity Advisor Equity Income Fund Institutional Class | 0.0 | 1.0 |
Fidelity Advisor Growth & Income Fund Institutional Class | 6.1 | 6.4 |
Fidelity Advisor Large Cap Fund Institutional Class | 6.1 | 6.3 |
Fidelity Advisor Small Cap Fund Institutional Class | 2.3 | 2.3 |
Fidelity Series 100 Index Fund | 5.2 | 5.1 |
Fidelity Series All-Sector Equity Fund | 8.8 | 9.0 |
Fidelity Series Large Cap Value Fund | 8.8 | 8.0 |
Fidelity Series Small Cap Opportunities Fund | 2.2 | 2.3 |
| 43.9 | 45.0 |
Developed International Equity Funds | | |
Fidelity Advisor Diversified International Fund Institutional Class | 2.6 | 3.7 |
Fidelity Advisor Overseas Fund Institutional Class | 2.5 | 3.7 |
Fidelity Series International Growth Fund | 4.9 | 3.9 |
Fidelity Series International Small Cap Fund | 0.9 | 0.8 |
Fidelity Series International Value Fund | 4.7 | 3.8 |
| 15.6 | 15.9 |
Emerging Markets Equity Funds | | |
Fidelity Series Emerging Markets Fund | 2.8 | 2.7 |
High Yield Bond Funds | | |
Fidelity Advisor High Income Advantage Fund Institutional Class | 0.0 | 7.4 |
Fidelity Series Emerging Markets Debt Fund | 0.1 | 0.0 |
Fidelity Series High Income Fund | 7.2 | 0.0 |
| 7.3 | 7.4 |
Inflation-Protected Bond Funds | | |
Fidelity Series Inflation-Protected Bond Index Fund | 3.7 | 3.8 |
Investment Grade Bond Funds | | |
Fidelity Advisor Strategic Real Return Fund Institutional Class | 3.5 | 3.3 |
Fidelity Advisor Total Bond Fund Institutional Class | 0.0 | 0.0* |
Fidelity Series Investment Grade Bond Fund | 16.3 | 15.1 |
| 19.8 | 18.4 |
Short-Term Funds | | |
Fidelity Advisor Short Fixed-Income Fund Institutional Class | 0.0* | 0.0* |
Fidelity Institutional Money Market Portfolio Institutional Class | 0.1 | 0.0* |
| 0.1 | 0.0 |
| | |
Net Other Assets (Liabilities)* | 0.0 | 0.0 |
| 100.0 | 100.0 |
* Amount represents less than 0.1% |
Asset Allocation (% of fund's net assets) |
Current |
| Commodity Funds | 6.8% | |
| Domestic Equity Funds | 43.9% | |
| Developed International Equity Funds | 15.6% | |
| Emerging Markets Equity Funds | 2.8% | |
| High Yield Bond Funds | 7.3% | |
| Inflation-Protected Bond Funds | 3.7% | |
| Investment Grade Bond Funds | 19.8% | |
| Short-Term Funds | 0.1% | |

Six months ago |
| Commodity Funds | 6.8% | |
| Domestic Equity Funds | 45.0% | |
| Developed International Equity Funds | 15.9% | |
| Emerging Markets Equity Funds | 2.7% | |
| High Yield Bond Funds | 7.4% | |
| Inflation-Protected Bond Funds | 3.8% | |
| Investment Grade Bond Funds | 18.4% | |
| Short-Term Funds | 0.0%* | |

Expected |
| Commodity Funds | 7.6% | |
 | Domestic Equity Funds | 42.8% | |
| Developed International Equity Funds | 15.6% | |
| Emerging Markets Equity Funds | 2.8% | |
| High Yield Bond Funds | 7.5% | |
| Inflation-Protected Bond Funds | 4.9% | |
| Investment Grade Bond Funds | 18.6% | |
| Short-Term Funds | 0.2% | |

The fund invests according to an asset allocation strategy that becomes increasingly conservative over time. The six months ago allocation is based on the fund's holdings as of September 30, 2010. The current allocation is based on the fund's holdings as of March 31, 2011. The expected allocation represents the fund's anticipated allocation at September 30, 2011. |
Annual Report
Fidelity Advisor Freedom 2025 Fund
Investments March 31, 2011
Showing Percentage of Net Assets
Domestic Equity Funds - 50.7% |
| Shares | | Value |
Commodity Funds - 6.8% |
Fidelity Series Commodity Strategy Fund | 9,975,182 | | $ 131,472,904 |
Domestic Equity Funds - 43.9% |
Fidelity Advisor Equity Growth Fund Institutional Class | 1,364,783 | | 84,821,273 |
Fidelity Advisor Growth & Income Fund Institutional Class | 6,545,761 | | 118,150,979 |
Fidelity Advisor Large Cap Fund Institutional Class | 5,932,540 | | 117,049,018 |
Fidelity Advisor Small Cap Fund Institutional Class | 1,559,466 | | 43,774,210 |
Fidelity Series 100 Index Fund | 11,024,827 | | 101,428,412 |
Fidelity Series All-Sector Equity Fund | 12,912,921 | | 169,288,392 |
Fidelity Series Large Cap Value Fund | 13,995,814 | | 170,888,886 |
Fidelity Series Small Cap Opportunities Fund | 3,635,701 | | 42,864,913 |
TOTAL DOMESTIC EQUITY FUNDS | | 848,266,083 |
TOTAL DOMESTIC EQUITY FUNDS (Cost $814,051,526) | 979,738,987 |
International Equity Funds - 18.4% |
| | | |
Developed International Equity Funds - 15.6% |
Fidelity Advisor Diversified International Fund Institutional Class | 2,953,587 | | 49,649,800 |
Fidelity Advisor Overseas Fund Institutional Class | 2,578,275 | | 49,064,577 |
Fidelity Series International Growth Fund | 8,129,834 | | 93,574,387 |
Fidelity Series International Small Cap Fund | 1,466,917 | | 18,101,757 |
Fidelity Series International Value Fund | 8,649,649 | | 90,734,820 |
TOTAL DEVELOPED INTERNATIONAL EQUITY FUNDS | | 301,125,341 |
Emerging Markets Equity Funds - 2.8% |
Fidelity Series Emerging Markets Fund | 2,882,543 | | 55,229,516 |
TOTAL INTERNATIONAL EQUITY FUNDS (Cost $303,103,993) | 356,354,857 |
Bond Funds - 30.8% |
| Shares | | Value |
High Yield Bond Funds - 7.3% |
Fidelity Series Emerging Markets Debt Fund | 200,524 | | $ 2,006,069 |
Fidelity Series High Income Fund | 13,803,646 | | 138,312,534 |
TOTAL HIGH YIELD BOND FUNDS | | 140,318,603 |
Inflation-Protected Bond Funds - 3.7% |
Fidelity Series Inflation-Protected Bond Index Fund | 6,705,944 | | 72,558,316 |
Investment Grade Bond Funds - 19.8% |
Fidelity Advisor Strategic Real Return Fund Institutional Class | 6,831,453 | | 67,631,381 |
Fidelity Series Investment Grade Bond Fund | 27,632,300 | | 314,455,572 |
TOTAL INVESTMENT GRADE BOND FUNDS | | 382,086,953 |
TOTAL BOND FUNDS (Cost $580,275,017) | 594,963,872 |
Short-Term Funds - 0.1% |
| | | |
Fidelity Advisor Short Fixed-Income Fund Institutional Class | 124,297 | | 1,144,778 |
Fidelity Institutional Money Market Portfolio Institutional Class | 1,327,798 | | 1,327,798 |
TOTAL SHORT-TERM FUNDS (Cost $2,472,741) | 2,472,576 |
TOTAL INVESTMENT PORTFOLIO - 100.0% (Cost $1,699,903,277) | | 1,933,530,292 |
NET OTHER ASSETS (LIABILITIES) - 0.0% | | (215,135) |
NET ASSETS - 100% | $ 1,933,315,157 |
Other Information |
All investments are categorized as Level 1 under the Fair Value Hierarchy. The inputs or methodology used for valuing securities may not be an indication of the risk associated with investing in those securities. For more information on valuation inputs, please refer to the Security Valuation section in the accompanying Notes to Financial Statements. |
Income Tax Information |
At March 31, 2011, the Fund had a capital loss carryforward of approximately $94,931,344 of which $53,781,443 and $41,149,901 will expire in fiscal 2017 and 2019, respectively. Capital loss carryforwards are only available to offset future capital gains of the Fund to the extent provided by regulations and may be limited. |
See accompanying notes which are an integral part of the financial statements.
Annual Report
Fidelity Advisor Freedom 2025 Fund
Statement of Assets and Liabilities
| March 31, 2011 |
Assets | | |
Investment in securities, at value (cost $1,699,903,277) - See accompanying schedule | | $ 1,933,530,292 |
Cash | | 8 |
Receivable for investments sold | | 79,281 |
Receivable for fund shares sold | | 2,870,558 |
Distributions receivable from underlying funds | | 243,918 |
Total assets | | 1,936,724,057 |
| | |
Liabilities | | |
Payable for investments purchased | $ 703,988 | |
Payable for fund shares redeemed | 2,245,718 | |
Distribution and service plan fees payable | 459,194 | |
Total liabilities | | 3,408,900 |
| | |
Net Assets | | $ 1,933,315,157 |
Net Assets consist of: | | |
Paid in capital | | $ 1,794,972,893 |
Undistributed net investment income | | 2,482,027 |
Accumulated undistributed net realized gain (loss) on investments | | (97,766,778) |
Net unrealized appreciation (depreciation) on investments | | 233,627,015 |
Net Assets | | $ 1,933,315,157 |
| | |
Calculation of Maximum Offering Price Class A:
Net Asset Value and redemption price per share ($1,290,254,729 ÷ 106,725,107 shares) | | $ 12.09 |
| | |
Maximum offering price per share (100/94.25 of $12.09) | | $ 12.83 |
Class T:
Net Asset Value and redemption price per share ($258,166,032 ÷ 21,315,194 shares) | | $ 12.11 |
| | |
Maximum offering price per share (100/96.50 of $12.11) | | $ 12.55 |
Class B:
Net Asset Value and offering price per share ($38,945,952 ÷ 3,241,548 shares)A | | $ 12.01 |
| | |
Class C:
Net Asset Value and offering price per share ($61,639,796 ÷ 5,143,282 shares)A | | $ 11.98 |
| | |
Institutional Class:
Net Asset Value, offering price and redemption price per share ($284,308,648 ÷ 23,367,906 shares) | | $ 12.17 |
A Redemption price per share is equal to net asset value less any applicable contingent deferred sales charge.
Statement of Operations
| Year ended March 31, 2011 |
Investment Income | | |
Income distributions from underlying funds | | $ 27,078,142 |
| | |
Expenses | | |
Distribution and service plan fees | $ 4,868,969 | |
Independent trustees' compensation | 5,845 | |
Total expenses before reductions | 4,874,814 | |
Expense reductions | (5,845) | 4,868,969 |
Net investment income (loss) | | 22,209,173 |
Realized and Unrealized Gain (Loss) Realized gain (loss) on sale of underlying fund shares | (35,430,025) | |
Capital gain distributions from underlying funds | 35,886,323 | |
Total net realized gain (loss) | | 456,298 |
Change in net unrealized appreciation (depreciation) on underlying funds | | 215,413,028 |
Net gain (loss) | | 215,869,326 |
Net increase (decrease) in net assets resulting from operations | | $ 238,078,499 |
See accompanying notes which are an integral part of the financial statements.
Annual Report
Statement of Changes in Net Assets
| Year ended
March 31,
2011 | Year ended
March 31,
2010 |
Increase (Decrease) in Net Assets | | |
Operations | | |
Net investment income (loss) | $ 22,209,173 | $ 20,292,796 |
Net realized gain (loss) | 456,298 | (6,348,081) |
Change in net unrealized appreciation (depreciation) | 215,413,028 | 385,554,148 |
Net increase (decrease) in net assets resulting from operations | 238,078,499 | 399,498,863 |
Distributions to shareholders from net investment income | (22,138,802) | (20,082,625) |
Distributions to shareholders from net realized gain | (15,443,713) | (10,724,553) |
Total distributions | (37,582,515) | (30,807,178) |
Share transactions - net increase (decrease) | 270,608,455 | 313,035,081 |
Total increase (decrease) in net assets | 471,104,439 | 681,726,766 |
| | |
Net Assets | | |
Beginning of period | 1,462,210,718 | 780,483,952 |
End of period (including undistributed net investment income of $2,482,027 and undistributed net investment income of $2,411,656, respectively) | $ 1,933,315,157 | $ 1,462,210,718 |
Financial Highlights - Class A
Years ended March 31, | 2011 | 2010 | 2009 | 2008 | 2007 |
Selected Per-Share Data | | | | | |
Net asset value, beginning of period | $ 10.76 | $ 7.51 | $ 12.26 | $ 13.01 | $ 12.34 |
Income from Investment Operations | | | | | |
Net investment income (loss) C | .16 | .18 | .23 | .26 | .22 |
Net realized and unrealized gain (loss) | 1.43 | 3.32 | (4.36) | (.50) | .90 |
Total from investment operations | 1.59 | 3.50 | (4.13) | (.24) | 1.12 |
Distributions from net investment income | (.16) | (.17) | (.22) | (.22) | (.19) |
Distributions from net realized gain | (.11) | (.09) | (.40) | (.29) | (.26) |
Total distributions | (.26) G | (.25) F | (.62) | (.51) | (.45) |
Net asset value, end of period | $ 12.09 | $ 10.76 | $ 7.51 | $ 12.26 | $ 13.01 |
Total Return A,B | 14.97% | 46.86% | (34.98)% | (2.14)% | 9.26% |
Ratios to Average Net Assets D,E | | | | | |
Expenses before reductions | .25% | .25% | .25% | .25% | .25% |
Expenses net of fee waivers, if any | .25% | .25% | .25% | .25% | .25% |
Expenses net of all reductions | .25% | .25% | .25% | .25% | .25% |
Net investment income (loss) | 1.42% | 1.82% | 2.41% | 1.95% | 1.79% |
Supplemental Data | | | | | |
Net assets, end of period (000 omitted) | $ 1,290,255 | $ 999,687 | $ 512,482 | $ 558,890 | $ 306,544 |
Portfolio turnover rate | 34% | 19% | 29% | 10% | 3% |
A Total returns would have been lower had certain expenses not been reduced during the periods shown.
B Total returns do not include the effect of the sales charges.
C Calculated based on average shares outstanding during the period.
D Amounts do not include the activity of the underlying funds.
E Expense ratios reflect operating expenses of the class. Expenses before reductions do not reflect amounts reimbursed by the investment adviser or reductions from expense offset arrangements and do not represent the amount paid by the class during periods when reimbursements or reductions occur. Expenses net of fee waivers reflect expenses after reimbursement by the investment adviser but prior to reductions from expense offset arrangements. Expenses net of all reductions represent the net expenses paid by the class but do not include expenses of the investment companies in which the Fund invests.
F Total distributions of $.25 per share is comprised of distributions from net investment income of $.169 and distributions from net realized gain of $.085 per share.
G Total distributions of $.26 per share is comprised of distributions from net investment income of $.155 and distributions from net realized gain of $.106 per share.
See accompanying notes which are an integral part of the financial statements.
Annual Report
Financial Highlights - Class T
Years ended March 31, | 2011 | 2010 | 2009 | 2008 | 2007 |
Selected Per-Share Data | | | | | |
Net asset value, beginning of period | $ 10.78 | $ 7.52 | $ 12.28 | $ 13.03 | $ 12.35 |
Income from Investment Operations | | | | | |
Net investment income (loss) C | .13 | .15 | .21 | .23 | .19 |
Net realized and unrealized gain (loss) | 1.43 | 3.34 | (4.37) | (.51) | .91 |
Total from investment operations | 1.56 | 3.49 | (4.16) | (.28) | 1.10 |
Distributions from net investment income | (.13) | (.15) | (.20) | (.18) | (.16) |
Distributions from net realized gain | (.11) | (.09) | (.40) | (.29) | (.26) |
Total distributions | (.23) G | (.23) F | (.60) | (.47) | (.42) |
Net asset value, end of period | $ 12.11 | $ 10.78 | $ 7.52 | $ 12.28 | $ 13.03 |
Total Return A,B | 14.67% | 46.60% | (35.20)% | (2.40)% | 9.10% |
Ratios to Average Net Assets D,E | | | | | |
Expenses before reductions | .50% | .50% | .50% | .50% | .50% |
Expenses net of fee waivers, if any | .50% | .50% | .50% | .50% | .50% |
Expenses net of all reductions | .50% | .50% | .50% | .50% | .50% |
Net investment income (loss) | 1.17% | 1.57% | 2.16% | 1.70% | 1.54% |
Supplemental Data | | | | | |
Net assets, end of period (000 omitted) | $ 258,166 | $ 230,003 | $ 139,330 | $ 173,946 | $ 154,042 |
Portfolio turnover rate | 34% | 19% | 29% | 10% | 3% |
A Total returns would have been lower had certain expenses not been reduced during the periods shown.
B Total returns do not include the effect of the sales charges.
C Calculated based on average shares outstanding during the period.
D Amounts do not include the activity of the underlying funds.
E Expense ratios reflect operating expenses of the class. Expenses before reductions do not reflect amounts reimbursed by the investment adviser or reductions from expense offset arrangements and do not represent the amount paid by the class during periods when reimbursements or reductions occur. Expenses net of fee waivers reflect expenses after reimbursement by the investment adviser but prior to reductions from expense offset arrangements. Expenses net of all reductions represent the net expenses paid by the class but do not include expenses of the investment companies in which the Fund invests.
F Total distributions of $.23 per share is comprised of distributions from net investment income of $.146 and distributions from net realized gain of $.085 per share.
G Total distributions of $.23 per share is comprised of distributions from net investment income of $.128 and distributions from net realized gain of $.106 per share.
Financial Highlights - Class B
Years ended March 31, | 2011 | 2010 | 2009 | 2008 | 2007 |
Selected Per-Share Data | | | | | |
Net asset value, beginning of period | $ 10.70 | $ 7.47 | $ 12.17 | $ 12.93 | $ 12.26 |
Income from Investment Operations | | | | | |
Net investment income (loss) C | .07 | .10 | .16 | .16 | .13 |
Net realized and unrealized gain (loss) | 1.42 | 3.32 | (4.32) | (.51) | .90 |
Total from investment operations | 1.49 | 3.42 | (4.16) | (.35) | 1.03 |
Distributions from net investment income | (.07) | (.10) | (.14) | (.12) | (.10) |
Distributions from net realized gain | (.11) | (.09) | (.40) | (.29) | (.26) |
Total distributions | (.18) | (.19) F | (.54) | (.41) | (.36) |
Net asset value, end of period | $ 12.01 | $ 10.70 | $ 7.47 | $ 12.17 | $ 12.93 |
Total Return A,B | 14.02% | 45.83% | (35.45)% | (2.95)% | 8.57% |
Ratios to Average Net Assets D,E | | | | | |
Expenses before reductions | 1.00% | 1.00% | 1.00% | 1.00% | 1.00% |
Expenses net of fee waivers, if any | 1.00% | 1.00% | 1.00% | 1.00% | 1.00% |
Expenses net of all reductions | 1.00% | 1.00% | 1.00% | 1.00% | 1.00% |
Net investment income (loss) | .67% | 1.07% | 1.66% | 1.20% | 1.04% |
Supplemental Data | | | | | |
Net assets, end of period (000 omitted) | $ 38,946 | $ 38,816 | $ 27,207 | $ 43,016 | $ 37,881 |
Portfolio turnover rate | 34% | 19% | 29% | 10% | 3% |
A Total returns would have been lower had certain expenses not been reduced during the periods shown.
B Total returns do not include the effect of the contingent deferred sales charge.
C Calculated based on average shares outstanding during the period.
D Amounts do not include the activity of the underlying funds.
E Expense ratios reflect operating expenses of the class. Expenses before reductions do not reflect amounts reimbursed by the investment adviser or reductions from expense offset arrangements and do not represent the amount paid by the class during periods when reimbursements or reductions occur. Expenses net of fee waivers reflect expenses after reimbursement by the investment adviser but prior to reductions from expense offset arrangements. Expenses net of all reductions represent the net expenses paid by the class but do not include expenses of the investment companies in which the Fund invests.
F Total distributions of $.19 per share is comprised of distributions from net investment income of $.100 and distributions from net realized gain of $.085 per share.
See accompanying notes which are an integral part of the financial statements.
Annual Report
Financial Highlights - Class C
Years ended March 31, | 2011 | 2010 | 2009 | 2008 | 2007 |
Selected Per-Share Data | | | | | |
Net asset value, beginning of period | $ 10.68 | $ 7.46 | $ 12.16 | $ 12.92 | $ 12.26 |
Income from Investment Operations | | | | | |
Net investment income (loss) C | .07 | .10 | .16 | .16 | .13 |
Net realized and unrealized gain (loss) | 1.41 | 3.31 | (4.32) | (.50) | .89 |
Total from investment operations | 1.48 | 3.41 | (4.16) | (.34) | 1.02 |
Distributions from net investment income | (.08) | (.11) | (.14) | (.13) | (.10) |
Distributions from net realized gain | (.11) | (.09) | (.40) | (.29) | (.26) |
Total distributions | (.18) G | (.19) F | (.54) | (.42) | (.36) |
Net asset value, end of period | $ 11.98 | $ 10.68 | $ 7.46 | $ 12.16 | $ 12.92 |
Total Return A,B | 14.01% | 45.83% | (35.44)% | (2.91)% | 8.51% |
Ratios to Average Net Assets D,E | | | | | |
Expenses before reductions | 1.00% | 1.00% | 1.00% | 1.00% | 1.00% |
Expenses net of fee waivers, if any | 1.00% | 1.00% | 1.00% | 1.00% | 1.00% |
Expenses net of all reductions | 1.00% | 1.00% | 1.00% | 1.00% | 1.00% |
Net investment income (loss) | .67% | 1.07% | 1.66% | 1.20% | 1.04% |
Supplemental Data | | | | | |
Net assets, end of period (000 omitted) | $ 61,640 | $ 52,756 | $ 31,735 | $ 40,426 | $ 32,679 |
Portfolio turnover rate | 34% | 19% | 29% | 10% | 3% |
A Total returns would have been lower had certain expenses not been reduced during the periods shown.
B Total returns do not include the effect of the contingent deferred sales charge.
C Calculated based on average shares outstanding during the period.
D Amounts do not include the activity of the underlying funds.
E Expense ratios reflect operating expenses of the class. Expenses before reductions do not reflect amounts reimbursed by the investment adviser or reductions from expense offset arrangements and do not represent the amount paid by the class during periods when reimbursements or reductions occur. Expenses net of fee waivers reflect expenses after reimbursement by the investment adviser but prior to reductions from expense offset arrangements. Expenses net of all reductions represent the net expenses paid by the class but do not include expenses of the investment companies in which the Fund invests.
F Total distributions of $.19 per share is comprised of distributions from net investment income of $.105 and distributions from net realized gain of $.085 per share.
G Total distributions of $.18 per share is comprised of distributions from net investment income of $.077 and distributions from net realized gain of $.106 per share.
Financial Highlights - Institutional Class
Years ended March 31, | 2011 | 2010 | 2009 | 2008 | 2007 |
Selected Per-Share Data | | | | | |
Net asset value, beginning of period | $ 10.83 | $ 7.55 | $ 12.33 | $ 13.08 | $ 12.39 |
Income from Investment Operations | | | | | |
Net investment income (loss) B | .19 | .20 | .26 | .29 | .25 |
Net realized and unrealized gain (loss) | 1.44 | 3.35 | (4.39) | (.50) | .91 |
Total from investment operations | 1.63 | 3.55 | (4.13) | (.21) | 1.16 |
Distributions from net investment income | (.18) | (.19) | (.25) | (.25) | (.21) |
Distributions from net realized gain | (.11) | (.09) | (.40) | (.29) | (.26) |
Total distributions | (.29) | (.27) F | (.65) | (.54) | (.47) |
Net asset value, end of period | $ 12.17 | $ 10.83 | $ 7.55 | $ 12.33 | $ 13.08 |
Total Return A | 15.23% | 47.31% | (34.83)% | (1.93)% | 9.60% |
Ratios to Average Net Assets C,D | | | | | |
Expenses before reductions E | .00% | .00% | .00% | .00% | .00% |
Expenses net of fee waivers, if any | .00% | .00% | .00% | .00% | .00% |
Expenses net of all reductions | .00% | .00% | .00% | .00% | .00% |
Net investment income (loss) | 1.67% | 2.07% | 2.66% | 2.20% | 2.04% |
Supplemental Data | | | | | |
Net assets, end of period (000 omitted) | $ 284,309 | $ 140,948 | $ 69,731 | $ 52,762 | $ 13,903 |
Portfolio turnover rate | 34% | 19% | 29% | 10% | 3% |
A Total returns would have been lower had certain expenses not been reduced during the periods shown.
B Calculated based on average shares outstanding during the period.
C Amounts do not include the activity of the underlying funds.
D Expense ratios reflect operating expenses of the class. Expenses before reductions do not reflect amounts reimbursed by the investment adviser or reductions from expense offset arrangements and do not represent the amount paid by the class during periods when reimbursements or reductions occur. Expenses net of fee waivers reflect expenses after reimbursement by the investment adviser but prior to reductions from expense offset arrangements. Expenses net of all reductions represent the net expenses paid by the class but do not include expenses of the investment companies in which the Fund invests.
E Amount represents less than .01%.
F Total distributions of $.27 per share is comprised of distributions from net investment income of $.189 and distributions from net realized gain of $.085 per share.
See accompanying notes which are an integral part of the financial statements.
Annual Report
Fidelity Advisor Freedom 2030 Fund
Investment Changes (Unaudited)
Fund Holdings as of March 31, 2011 |
| % of fund's
net assets | % of fund's net assets
6 months ago |
Commodity Funds | | |
Fidelity Series Commodity Strategy Fund | 7.4 | 7.3 |
Domestic Equity Funds | | |
Fidelity Advisor Equity Growth Fund Institutional Class | 4.6 | 4.9 |
Fidelity Advisor Equity Income Fund Institutional Class | 0.0 | 1.0 |
Fidelity Advisor Growth & Income Fund Institutional Class | 6.5 | 6.8 |
Fidelity Advisor Large Cap Fund Institutional Class | 6.4 | 6.8 |
Fidelity Advisor Small Cap Fund Institutional Class | 2.4 | 2.4 |
Fidelity Series 100 Index Fund | 5.6 | 5.4 |
Fidelity Series All-Sector Equity Fund | 9.3 | 9.6 |
Fidelity Series Large Cap Value Fund | 9.4 | 8.6 |
Fidelity Series Small Cap Opportunities Fund | 2.3 | 2.5 |
| 46.5 | 48.0 |
Developed International Equity Funds | | |
Fidelity Advisor Diversified International Fund Institutional Class | 2.7 | 3.9 |
Fidelity Advisor Overseas Fund Institutional Class | 2.7 | 4.0 |
Fidelity Series International Growth Fund | 5.1 | 4.2 |
Fidelity Series International Small Cap Fund | 1.0 | 0.9 |
Fidelity Series International Value Fund | 5.0 | 4.1 |
| 16.5 | 17.1 |
Emerging Markets Equity Funds | | |
Fidelity Series Emerging Markets Fund | 3.0 | 2.9 |
High Yield Bond Funds | | |
Fidelity Advisor High Income Advantage Fund Institutional Class | 0.0 | 7.4 |
Fidelity Series Emerging Markets Debt Fund | 0.1 | 0.0 |
Fidelity Series High Income Fund | 7.2 | 0.0 |
| 7.3 | 7.4 |
Inflation-Protected Bond Funds | | |
Fidelity Series Inflation-Protected Bond Index Fund | 0.4 | 0.9 |
Investment Grade Bond Funds | | |
Fidelity Advisor Strategic Real Return Fund Institutional Class | 3.3 | 2.9 |
Fidelity Advisor Total Bond Fund Institutional Class | 0.0 | 0.0* |
Fidelity Series Investment Grade Bond Fund | 15.6 | 13.5 |
| 18.9 | 16.4 |
| | |
Net Other Assets (Liabilities)* | 0.0 | 0.0 |
| 100.0 | 100.0 |
* Amount represents less than 0.1% |
Asset Allocation (% of fund's net assets) |
Current |
| Commodity Funds | 7.4% | |
| Domestic Equity Funds | 46.5% | |
| Developed International Equity Funds | 16.5% | |
| Emerging Markets Equity Funds | 3.0% | |
| High Yield Bond Funds | 7.3% | |
| Inflation-Protected Bond Funds | 0.4% | |
| Investment Grade Bond Funds | 18.9% | |

Six months ago |
| Commodity Funds | 7.3% | |
| Domestic Equity Funds | 48.0% | |
| Developed International Equity Funds | 17.1% | |
| Emerging Markets Equity Funds | 2.9% | |
| High Yield Bond Funds | 7.4% | |
| Inflation-Protected Bond Funds | 0.9% | |
| Investment Grade Bond Funds | 16.4% | |

Expected |
| Commodity Funds | 7.9% | |
| Domestic Equity Funds | 45.0% | |
| Developed International Equity Funds | 16.4% | |
| Emerging Markets Equity Funds | 2.9% | |
| High Yield Bond Funds | 7.5% | |
| Inflation-Protected Bond Funds | 1.7% | |
| Investment Grade Bond Funds | 18.6% | |

The fund invests according to an asset allocation strategy that becomes increasingly conservative over time. The six months ago allocation is based on the fund's holdings as of September 30, 2010. The current allocation is based on the fund's holdings as of March 31, 2011. The expected allocation represents the fund's anticipated allocation at September 30, 2011. |
Annual Report
Fidelity Advisor Freedom 2030 Fund
Investments March 31, 2011
Showing Percentage of Net Assets
Domestic Equity Funds - 53.9% |
| Shares | | Value |
Commodity Funds - 7.4% |
Fidelity Series Commodity Strategy Fund | 11,891,698 | | $ 156,732,574 |
Domestic Equity Funds - 46.5% |
Fidelity Advisor Equity Growth Fund Institutional Class | 1,591,301 | | 98,899,361 |
Fidelity Advisor Growth & Income Fund Institutional Class | 7,634,074 | | 137,795,027 |
Fidelity Advisor Large Cap Fund Institutional Class | 6,918,934 | | 136,510,571 |
Fidelity Advisor Small Cap Fund Institutional Class | 1,822,041 | | 51,144,695 |
Fidelity Series 100 Index Fund | 12,844,782 | | 118,171,996 |
Fidelity Series All-Sector Equity Fund | 15,037,998 | | 197,148,159 |
Fidelity Series Large Cap Value Fund | 16,305,115 | | 199,085,455 |
Fidelity Series Small Cap Opportunities Fund | 4,247,946 | | 50,083,285 |
TOTAL DOMESTIC EQUITY FUNDS | | 988,838,549 |
TOTAL DOMESTIC EQUITY FUNDS (Cost $940,389,483) | 1,145,571,123 |
International Equity Funds - 19.5% |
| | | |
Developed International Equity Funds - 16.5% |
Fidelity Advisor Diversified International Fund Institutional Class | 3,445,522 | | 57,919,221 |
Fidelity Advisor Overseas Fund Institutional Class | 3,007,736 | | 57,237,224 |
Fidelity Series International Growth Fund | 9,489,356 | | 109,222,489 |
Fidelity Series International Small Cap Fund | 1,716,301 | | 21,179,153 |
Fidelity Series International Value Fund | 10,096,032 | | 105,907,376 |
TOTAL DEVELOPED INTERNATIONAL EQUITY FUNDS | | 351,465,463 |
|
| Shares | | Value |
Emerging Markets Equity Funds - 3.0% |
Fidelity Series Emerging Markets Fund | 3,361,246 | | $ 64,401,481 |
TOTAL INTERNATIONAL EQUITY FUNDS (Cost $350,646,037) | 415,866,944 |
Bond Funds - 26.6% |
| | | |
High Yield Bond Funds - 7.3% |
Fidelity Series Emerging Markets Debt Fund | 220,704 | | 2,207,946 |
Fidelity Series High Income Fund | 15,192,758 | | 152,231,440 |
TOTAL HIGH YIELD BOND FUNDS | | 154,439,386 |
Inflation-Protected Bond Funds - 0.4% |
Fidelity Series Inflation-Protected Bond Index Fund | 803,141 | | 8,689,990 |
Investment Grade Bond Funds - 18.9% |
Fidelity Advisor Strategic Real Return Fund Institutional Class | 7,109,801 | | 70,387,031 |
Fidelity Series Investment Grade Bond Fund | 29,127,559 | | 331,471,621 |
TOTAL INVESTMENT GRADE BOND FUNDS | | 401,858,652 |
TOTAL BOND FUNDS (Cost $554,239,965) | 564,988,028 |
TOTAL INVESTMENT PORTFOLIO - 100.0% (Cost $1,845,275,485) | | 2,126,426,095 |
NET OTHER ASSETS (LIABILITIES) - 0.0% | | (245,830) |
NET ASSETS - 100% | $ 2,126,180,265 |
Other Information |
All investments are categorized as Level 1 under the Fair Value Hierarchy. The inputs or methodology used for valuing securities may not be an indication of the risk associated with investing in those securities. For more information on valuation inputs, please refer to the Security Valuation section in the accompanying Notes to Financial Statements. |
Income Tax Information |
At March 31, 2011, the Fund had a capital loss carryforward of approximately $151,905,233 of which $75,012,132 and $76,893,101 will expire in fiscal 2017 and 2019, respectively. Capital loss carryforwards are only available to offset future capital gains of the Fund to the extent provided by regulations and may be limited. |
See accompanying notes which are an integral part of the financial statements.
Annual Report
Fidelity Advisor Freedom 2030 Fund
Statement of Assets and Liabilities
| March 31, 2011 |
Assets | | |
Investment in securities, at value (cost $1,845,275,485) - See accompanying schedule | | $ 2,126,426,095 |
Cash | | 195 |
Receivable for investments sold | | 282,956 |
Receivable for fund shares sold | | 2,942,917 |
Distributions receivable from underlying funds | | 268,530 |
Total assets | | 2,129,920,693 |
| | |
Liabilities | | |
Payable for investments purchased | $ 121,309 | |
Payable for fund shares redeemed | 3,101,798 | |
Distribution and service plan fees payable | 517,321 | |
Total liabilities | | 3,740,428 |
| | |
Net Assets | | $ 2,126,180,265 |
Net Assets consist of: | | |
Paid in capital | | $ 1,997,220,178 |
Undistributed net investment income | | 2,499,240 |
Accumulated undistributed net realized gain (loss) on investments | | (154,689,763) |
Net unrealized appreciation (depreciation) on investments | | 281,150,610 |
Net Assets | | $ 2,126,180,265 |
| | |
Calculation of Maximum Offering Price Class A:
Net Asset Value and redemption price per share ($1,340,583,283 ÷ 105,413,868 shares) | | $ 12.72 |
| | |
Maximum offering price per share (100/94.25 of $12.72) | | $ 13.50 |
Class T:
Net Asset Value and redemption price per share ($348,443,225 ÷ 27,477,019 shares) | | $ 12.68 |
| | |
Maximum offering price per share (100/96.50 of $12.68) | | $ 13.14 |
Class B:
Net Asset Value and offering price per share ($47,275,467 ÷ 3,742,647 shares)A | | $ 12.63 |
| | |
Class C:
Net Asset Value and offering price per share ($68,349,364 ÷ 5,424,038 shares)A | | $ 12.60 |
| | |
| | |
Institutional Class:
Net Asset Value, offering price and redemption price per share ($321,528,926 ÷ 25,173,813 shares) | | $ 12.77 |
A Redemption price per share is equal to net asset value less any applicable contingent deferred sales charge.
Statement of Operations
| Year ended March 31, 2011 |
| | |
Investment Income | | |
Income distributions from underlying funds | | $ 29,733,029 |
| | |
Expenses | | |
Distribution and service plan fees | $ 5,725,834 | |
Independent trustees' compensation | 6,641 | |
Total expenses before reductions | 5,732,475 | |
Expense reductions | (6,641) | 5,725,834 |
Net investment income (loss) | | 24,007,195 |
Realized and Unrealized Gain (Loss) Realized gain (loss) on sale of underlying fund shares | (58,372,129) | |
Capital gain distributions from underlying funds | 40,704,738 | |
Total net realized gain (loss) | | (17,667,391) |
Change in net unrealized appreciation (depreciation) on underlying funds | | 263,557,971 |
Net gain (loss) | | 245,890,580 |
Net increase (decrease) in net assets resulting from operations | | $ 269,897,775 |
See accompanying notes which are an integral part of the financial statements.
Annual Report
Fidelity Advisor Freedom 2030 Fund
Financial Statements - continued
Statement of Changes in Net Assets
| Year ended
March 31,
2011 | Year ended
March 31,
2010 |
Increase (Decrease) in Net Assets | | |
Operations | | |
Net investment income (loss) | $ 24,007,195 | $ 20,740,984 |
Net realized gain (loss) | (17,667,391) | (16,413,025) |
Change in net unrealized appreciation (depreciation) | 263,557,971 | 493,374,347 |
Net increase (decrease) in net assets resulting from operations | 269,897,775 | 497,702,306 |
Distributions to shareholders from net investment income | (23,893,943) | (19,871,061) |
Distributions to shareholders from net realized gain | (17,498,965) | (13,024,758) |
Total distributions | (41,392,908) | (32,895,819) |
Share transactions - net increase (decrease) | 191,320,603 | 319,644,448 |
Total increase (decrease) in net assets | 419,825,470 | 784,450,935 |
| | |
Net Assets | | |
Beginning of period | 1,706,354,795 | 921,903,860 |
End of period (including undistributed net investment income of $2,499,240 and undistributed net investment income of $2,385,989, respectively) | $ 2,126,180,265 | $ 1,706,354,795 |
Financial Highlights - Class A
Years ended March 31, | 2011 | 2010 | 2009 | 2008 | 2007 |
Selected Per-Share Data | | | | | |
Net asset value, beginning of period | $ 11.29 | $ 7.69 | $ 13.29 | $ 14.27 | $ 13.47 |
Income from Investment Operations | | | | | |
Net investment income (loss) C | .16 | .16 | .21 | .22 | .20 |
Net realized and unrealized gain (loss) | 1.54 | 3.68 | (5.10) | (.63) | 1.09 |
Total from investment operations | 1.70 | 3.84 | (4.89) | (.41) | 1.29 |
Distributions from net investment income | (.16) | (.15) | (.21) | (.19) | (.18) |
Distributions from net realized gain | (.11) | (.09) | (.50) | (.38) | (.31) |
Total distributions | (.27) | (.24) F | (.71) | (.57) | (.49) |
Net asset value, end of period | $ 12.72 | $ 11.29 | $ 7.69 | $ 13.29 | $ 14.27 |
Total Return A, B | 15.27% | 50.17% | (38.49)% | (3.22)% | 9.82% |
Ratios to Average Net Assets D, E | | | | | |
Expenses before reductions | .25% | .25% | .25% | .25% | .25% |
Expenses net of fee waivers, if any | .25% | .25% | .25% | .25% | .25% |
Expenses net of all reductions | .25% | .25% | .25% | .25% | .25% |
Net investment income (loss) | 1.38% | 1.61% | 2.08% | 1.53% | 1.49% |
Supplemental Data | | | | | |
Net assets, end of period (000 omitted) | $ 1,340,583 | $ 1,030,972 | $ 527,042 | $ 626,641 | $ 343,345 |
Portfolio turnover rate | 38% | 20% | 22% | 10% | 8% |
A Total returns would have been lower had certain expenses not been reduced during the periods shown.
B Total returns do not include the effect of the sales charges.
C Calculated based on average shares outstanding during the period.
D Amounts do not include the activity of the underlying funds.
E Expense ratios reflect operating expenses of the class. Expenses before reductions do not reflect amounts reimbursed by the investment adviser or reductions from expense offset arrangements and do not represent the amount paid by the class during periods when reimbursements or reductions occur. Expenses net of fee waivers reflect expenses after reimbursement by the investment adviser but prior to reductions from expense offset arrangements. Expenses net of all reductions represent the net expenses paid by the class but do not include expenses of the investment companies in which the Fund invests.
F Total distributions of $.24 per share is comprised of distributions from net investment income of $.151 and distributions from net realized gain of $.093 per share.
See accompanying notes which are an integral part of the financial statements.
Annual Report
Financial Highlights - Class T
Years ended March 31, | 2011 | 2010 | 2009 | 2008 | 2007 |
Selected Per-Share Data | | | | | |
Net asset value, beginning of period | $ 11.25 | $ 7.67 | $ 13.25 | $ 14.23 | $ 13.43 |
Income from Investment Operations | | | | | |
Net investment income (loss) C | .13 | .14 | .19 | .19 | .17 |
Net realized and unrealized gain (loss) | 1.54 | 3.66 | (5.09) | (.64) | 1.09 |
Total from investment operations | 1.67 | 3.80 | (4.90) | (.45) | 1.26 |
Distributions from net investment income | (.13) | (.13) | (.18) | (.15) | (.15) |
Distributions from net realized gain | (.11) | (.09) | (.50) | (.38) | (.31) |
Total distributions | (.24) | (.22) F | (.68) | (.53) | (.46) |
Net asset value, end of period | $ 12.68 | $ 11.25 | $ 7.67 | $ 13.25 | $ 14.23 |
Total Return A, B | 14.98% | 49.72% | (38.62)% | (3.49)% | 9.59% |
Ratios to Average Net Assets D, E | | | | | |
Expenses before reductions | .50% | .50% | .50% | .50% | .50% |
Expenses net of fee waivers, if any | .50% | .50% | .50% | .50% | .50% |
Expenses net of all reductions | .50% | .50% | .50% | .50% | .50% |
Net investment income (loss) | 1.12% | 1.36% | 1.83% | 1.28% | 1.24% |
Supplemental Data | | | | | |
Net assets, end of period (000 omitted) | $ 348,443 | $ 382,092 | $ 236,333 | $ 297,618 | $ 281,508 |
Portfolio turnover rate | 38% | 20% | 22% | 10% | 8% |
A Total returns would have been lower had certain expenses not been reduced during the periods shown.
B Total returns do not include the effect of the sales charges.
C Calculated based on average shares outstanding during the period.
D Amounts do not include the activity of the underlying funds.
E Expense ratios reflect operating expenses of the class. Expenses before reductions do not reflect amounts reimbursed by the investment adviser or reductions from expense offset arrangements and do not represent the amount paid by the class during periods when reimbursements or reductions occur. Expenses net of fee waivers reflect expenses after reimbursement by the investment adviser but prior to reductions from expense offset arrangements. Expenses net of all reductions represent the net expenses paid by the class but do not include expenses of the investment companies in which the Fund invests.
F Total distributions of $.22 per share is comprised of distributions from net investment income of $.128 and distributions from net realized gain of $.093 per share.
Financial Highlights - Class B
Years ended March 31, | 2011 | 2010 | 2009 | 2008 | 2007 |
Selected Per-Share Data | | | | | |
Net asset value, beginning of period | $ 11.21 | $ 7.64 | $ 13.17 | $ 14.15 | $ 13.37 |
Income from Investment Operations | | | | | |
Net investment income (loss) C | .07 | .09 | .14 | .11 | .10 |
Net realized and unrealized gain (loss) | 1.53 | 3.65 | (5.06) | (.63) | 1.08 |
Total from investment operations | 1.60 | 3.74 | (4.92) | (.52) | 1.18 |
Distributions from net investment income | (.07) | (.08) | (.11) | (.09) | (.09) |
Distributions from net realized gain | (.11) | (.09) | (.50) | (.37) | (.31) |
Total distributions | (.18) | (.17) F | (.61) | (.46) | (.40) |
Net asset value, end of period | $ 12.63 | $ 11.21 | $ 7.64 | $ 13.17 | $ 14.15 |
Total Return A, B | 14.38% | 49.07% | (38.94)% | (3.96)% | 8.98% |
Ratios to Average Net Assets D, E | | | | | |
Expenses before reductions | 1.00% | 1.00% | 1.00% | 1.00% | 1.00% |
Expenses net of fee waivers, if any | 1.00% | 1.00% | 1.00% | 1.00% | 1.00% |
Expenses net of all reductions | 1.00% | 1.00% | 1.00% | 1.00% | 1.00% |
Net investment income (loss) | .62% | .86% | 1.33% | .78% | .74% |
Supplemental Data | | | | | |
Net assets, end of period (000 omitted) | $ 47,275 | $ 51,360 | $ 35,701 | $ 60,367 | $ 56,845 |
Portfolio turnover rate | 38% | 20% | 22% | 10% | 8% |
A Total returns would have been lower had certain expenses not been reduced during the periods shown.
B Total returns do not include the effect of the contingent deferred sales charge.
C Calculated based on average shares outstanding during the period.
D Amounts do not include the activity of the underlying funds.
E Expense ratios reflect operating expenses of the class. Expenses before reductions do not reflect amounts reimbursed by the investment adviser or reductions from expense offset arrangements and do not represent the amount paid by the class during periods when reimbursements or reductions occur. Expenses net of fee waivers reflect expenses after reimbursement by the investment adviser but prior to reductions from expense offset arrangements. Expenses net of all reductions represent the net expenses paid by the class but do not include expenses of the investment companies in which the Fund invests.
F Total distributions of $.17 per share is comprised of distributions from net investment income of $.080 and distributions from net realized gain of $.092 per share.
See accompanying notes which are an integral part of the financial statements.
Annual Report
Financial Highlights - Class C
Years ended March 31, | 2011 | 2010 | 2009 | 2008 | 2007 |
Selected Per-Share Data | | | | | |
Net asset value, beginning of period | $ 11.19 | $ 7.63 | $ 13.17 | $ 14.15 | $ 13.37 |
Income from Investment Operations | | | | | |
Net investment income (loss) C | .07 | .09 | .14 | .11 | .10 |
Net realized and unrealized gain (loss) | 1.53 | 3.65 | (5.06) | (.63) | 1.08 |
Total from investment operations | 1.60 | 3.74 | (4.92) | (.52) | 1.18 |
Distributions from net investment income | (.08) | (.08) | (.12) | (.09) | (.09) |
Distributions from net realized gain | (.11) | (.09) | (.50) | (.37) | (.31) |
Total distributions | (.19) | (.18) F | (.62) | (.46) | (.40) |
Net asset value, end of period | $ 12.60 | $ 11.19 | $ 7.63 | $ 13.17 | $ 14.15 |
Total Return A, B | 14.38% | 49.06% | (38.96)% | (3.95)% | 9.00% |
Ratios to Average Net Assets D, E | | | | | |
Expenses before reductions | 1.00% | 1.00% | 1.00% | 1.00% | 1.00% |
Expenses net of fee waivers, if any | 1.00% | 1.00% | 1.00% | 1.00% | 1.00% |
Expenses net of all reductions | 1.00% | 1.00% | 1.00% | 1.00% | 1.00% |
Net investment income (loss) | .63% | .86% | 1.33% | .78% | .74% |
Supplemental Data | | | | | |
Net assets, end of period (000 omitted) | $ 68,349 | $ 63,700 | $ 40,294 | $ 58,768 | $ 54,338 |
Portfolio turnover rate | 38% | 20% | 22% | 10% | 8% |
A Total returns would have been lower had certain expenses not been reduced during the periods shown.
B Total returns do not include the effect of the contingent deferred sales charge.
C Calculated based on average shares outstanding during the period.
D Amounts do not include the activity of the underlying funds.
E Expense ratios reflect operating expenses of the class. Expenses before reductions do not reflect amounts reimbursed by the investment adviser or reductions from expense offset arrangements and do not represent the amount paid by the class during periods when reimbursements or reductions occur. Expenses net of fee waivers reflect expenses after reimbursement by the investment adviser but prior to reductions from expense offset arrangements. Expenses net of all reductions represent the net expenses paid by the class but do not include expenses of the investment companies in which the Fund invests.
F Total distributions of $.18 per share is comprised of distributions from net investment income of $.083 and distributions from net realized gain of $.093 per share.
Financial Highlights - Institutional Class
Years ended March 31, | 2011 | 2010 | 2009 | 2008 | 2007 |
Selected Per-Share Data | | | | | |
Net asset value, beginning of period | $ 11.33 | $ 7.72 | $ 13.34 | $ 14.32 | $ 13.51 |
Income from Investment Operations | | | | | |
Net investment income (loss) B | .19 | .19 | .23 | .26 | .24 |
Net realized and unrealized gain (loss) | 1.55 | 3.69 | (5.11) | (.64) | 1.09 |
Total from investment operations | 1.74 | 3.88 | (4.88) | (.38) | 1.33 |
Distributions from net investment income | (.19) | (.17) | (.24) | (.22) | (.21) |
Distributions from net realized gain | (.11) | (.09) | (.50) | (.38) | (.31) |
Total distributions | (.30) | (.27) F | (.74) | (.60) | (.52) |
Net asset value, end of period | $ 12.77 | $ 11.33 | $ 7.72 | $ 13.34 | $ 14.32 |
Total Return A | 15.56% | 50.42% | (38.31)% | (3.01)% | 10.08% |
Ratios to Average Net Assets C, D | | | | | |
Expenses before reductions E | .00% | .00% | .00% | .00% | .00% |
Expenses net of fee waivers, if any | .00% | .00% | .00% | .00% | .00% |
Expenses net of all reductions | .00% | .00% | .00% | .00% | .00% |
Net investment income (loss) | 1.62% | 1.86% | 2.33% | 1.78% | 1.74% |
Supplemental Data | | | | | |
Net assets, end of period (000 omitted) | $ 321,529 | $ 178,232 | $ 82,534 | $ 69,011 | $ 24,902 |
Portfolio turnover rate | 38% | 20% | 22% | 10% | 8% |
A Total returns would have been lower had certain expenses not been reduced during the periods shown.
B Calculated based on average shares outstanding during the period.
C Amounts do not include the activity of the underlying funds.
D Expense ratios reflect operating expenses of the class. Expenses before reductions do not reflect amounts reimbursed by the investment adviser or reductions from expense offset arrangements and do not represent the amount paid by the class during periods when reimbursements or reductions occur. Expenses net of fee waivers reflect expenses after reimbursement by the investment adviser but prior to reductions from expense offset arrangements. Expenses net of all reductions represent the net expenses paid by the class but do not include expenses of the investment companies in which the Fund invests.
E Amount represents less than .01%.
F Total distributions of $.27 per share is comprised of distributions from net investment income of $.173 and distributions from net realized gain of $.093 per share.
See accompanying notes which are an integral part of the financial statements.
Annual Report
Fidelity Advisor Freedom 2035 Fund
Investment Changes (Unaudited)
Fund Holdings as of March 31, 2011 |
| % of fund's
net assets | % of fund's net assets
6 months ago |
Commodity Funds | | |
Fidelity Series Commodity Strategy Fund | 8.7 | 8.0 |
Domestic Equity Funds | | |
Fidelity Advisor Equity Growth Fund Institutional Class | 5.2 | 5.5 |
Fidelity Advisor Equity Income Fund Institutional Class | 0.0 | 1.1 |
Fidelity Advisor Growth & Income Fund Institutional Class | 7.3 | 7.5 |
Fidelity Advisor Large Cap Fund Institutional Class | 7.2 | 7.5 |
Fidelity Advisor Small Cap Fund Institutional Class | 2.7 | 2.7 |
Fidelity Series 100 Index Fund | 6.2 | 6.0 |
Fidelity Series All-Sector Equity Fund | 10.4 | 10.6 |
Fidelity Series Large Cap Value Fund | 10.5 | 9.4 |
Fidelity Series Small Cap Opportunities Fund | 2.6 | 2.7 |
| 52.1 | 53.0 |
Developed International Equity Funds | | |
Fidelity Advisor Diversified International Fund Institutional Class | 3.0 | 4.3 |
Fidelity Advisor Overseas Fund Institutional Class | 3.0 | 4.4 |
Fidelity Series International Growth Fund | 5.8 | 4.6 |
Fidelity Series International Small Cap Fund | 1.1 | 0.9 |
Fidelity Series International Value Fund | 5.6 | 4.5 |
| 18.5 | 18.7 |
Emerging Markets Equity Funds | | |
Fidelity Series Emerging Markets Fund | 3.4 | 3.2 |
High Yield Bond Funds | | |
Fidelity Advisor High Income Advantage Fund Institutional Class | 0.0 | 7.4 |
Fidelity Series Emerging Markets Debt Fund | 0.1 | 0.0 |
Fidelity Series High Income Fund | 7.1 | 0.0 |
| 7.2 | 7.4 |
Investment Grade Bond Funds | | |
Fidelity Advisor Strategic Real Return Fund Institutional Class | 1.8 | 1.7 |
Fidelity Advisor Total Bond Fund Institutional Class | 0.0 | 0.0* |
Fidelity Series Investment Grade Bond Fund | 8.3 | 8.0 |
| 10.1 | 9.7 |
| | |
Net Other Assets (Liabilities)* | 0.0 | 0.0 |
| 100.0 | 100.0 |
* Amount represents less than 0.1% |
Asset Allocation (% of fund's net assets) |
Current |
| Commodity Funds | 8.7% | |
| Domestic Equity Funds | 52.1% | |
| Developed International Equity Funds | 18.5% | |
| Emerging Markets Equity Funds | 3.4% | |
| High Yield Bond Funds | 7.2% | |
| Investment Grade Bond Funds | 10.1% | |

Six months ago |
| Commodity Funds | 8.0% | |
| Domestic Equity Funds | 53.0% | |
| Developed International Equity Funds | 18.7% | |
| Emerging Markets Equity Funds | 3.2% | |
| High Yield Bond Funds | 7.4% | |
| Investment Grade Bond Funds | 9.7% | |

Expected |
| Commodity Funds | 9.0% | |
| Domestic Equity Funds | 51.3% | |
| Developed International Equity Funds | 18.7% | |
| Emerging Markets Equity Funds | 3.3% | |
| High Yield Bond Funds | 7.5% | |
| Investment Grade Bond Funds | 10.2% | |

The fund invests according to an asset allocation strategy that becomes increasingly conservative over time. The six months ago allocation is based on the fund's holdings as of September 30, 2010. The current allocation is based on the fund's holdings as of March 31, 2011. The expected allocation represents the fund's anticipated allocation at September 30, 2011. |
Annual Report
Fidelity Advisor Freedom 2035 Fund
Investments March 31, 2011
Showing Percentage of Net Assets
Domestic Equity Funds - 60.8% |
| Shares | | Value |
Commodity Funds - 8.7% |
Fidelity Series Commodity Strategy Fund | 8,971,260 | | $ 118,241,211 |
Domestic Equity Funds - 52.1% |
Fidelity Advisor Equity Growth Fund Institutional Class | 1,139,798 | | 70,838,453 |
Fidelity Advisor Growth & Income Fund Institutional Class | 5,459,525 | | 98,544,419 |
Fidelity Advisor Large Cap Fund Institutional Class | 4,948,338 | | 97,630,713 |
Fidelity Advisor Small Cap Fund Institutional Class | 1,302,079 | | 36,549,357 |
Fidelity Series 100 Index Fund | 9,199,930 | | 84,639,355 |
Fidelity Series All-Sector Equity Fund | 10,776,266 | | 141,276,842 |
Fidelity Series Large Cap Value Fund | 11,682,539 | | 142,643,801 |
Fidelity Series Small Cap Opportunities Fund | 3,036,089 | | 35,795,489 |
TOTAL DOMESTIC EQUITY FUNDS | | 707,918,429 |
TOTAL DOMESTIC EQUITY FUNDS (Cost $695,143,858) | 826,159,640 |
International Equity Funds - 21.9% |
| | | |
Developed International Equity Funds - 18.5% |
Fidelity Advisor Diversified International Fund Institutional Class | 2,471,989 | | 41,554,135 |
Fidelity Advisor Overseas Fund Institutional Class | 2,158,037 | | 41,067,445 |
Fidelity Series International Growth Fund | 6,802,777 | | 78,299,968 |
Fidelity Series International Small Cap Fund | 1,233,232 | | 15,218,086 |
Fidelity Series International Value Fund | 7,238,249 | | 75,929,230 |
TOTAL DEVELOPED INTERNATIONAL EQUITY FUNDS | | 252,068,864 |
|
| Shares | | Value |
Emerging Markets Equity Funds - 3.4% |
Fidelity Series Emerging Markets Fund | 2,416,231 | | $ 46,294,989 |
TOTAL INTERNATIONAL EQUITY FUNDS (Cost $255,152,465) | 298,363,853 |
Bond Funds - 17.3% |
| | | |
High Yield Bond Funds - 7.2% |
Fidelity Series Emerging Markets Debt Fund | 139,953 | | 1,400,110 |
Fidelity Series High Income Fund | 9,634,078 | | 96,533,459 |
TOTAL HIGH YIELD BOND FUNDS | | 97,933,569 |
Investment Grade Bond Funds - 10.1% |
Fidelity Advisor Strategic Real Return Fund Institutional Class | 2,389,434 | | 23,655,401 |
Fidelity Series Investment Grade Bond Fund | 9,947,997 | | 113,208,201 |
TOTAL INVESTMENT GRADE BOND FUNDS | | 136,863,602 |
TOTAL BOND FUNDS (Cost $231,134,575) | 234,797,171 |
TOTAL INVESTMENT PORTFOLIO - 100.0% (Cost $1,181,430,898) | | 1,359,320,664 |
NET OTHER ASSETS (LIABILITIES) - 0.0% | | (141,586) |
NET ASSETS - 100% | $ 1,359,179,078 |
Other Information |
All investments are categorized as Level 1 under the Fair Value Hierarchy. The inputs or methodology used for valuing securities may not be an indication of the risk associated with investing in those securities. For more information on valuation inputs, please refer to the Security Valuation section in the accompanying Notes to Financial Statements. |
Income Tax Information |
At March 31, 2011, the Fund had a capital loss carryforward of approximately $65,938,206 of which $37,616,185 and $28,322,021 will expire in fiscal 2017 and 2019, respectively. Capital loss carryforwards are only available to offset future capital gains of the Fund to the extent provided by regulations and may be limited. |
See accompanying notes which are an integral part of the financial statements.
Annual Report
Fidelity Advisor Freedom 2035 Fund
Statement of Assets and Liabilities
| March 31, 2011 |
Assets | | |
Investment in securities, at value (cost $1,181,430,898) - See accompanying schedule | | $ 1,359,320,664 |
Cash | | 14 |
Receivable for investments sold | | 263,246 |
Receivable for fund shares sold | | 2,371,470 |
Distributions receivable from underlying funds | | 170,271 |
Total assets | | 1,362,125,665 |
| | |
Liabilities | | |
Payable for investments purchased | $ 28,556 | |
Payable for fund shares redeemed | 2,606,155 | |
Distribution and service plan fees payable | 311,876 | |
Total liabilities | | 2,946,587 |
| | |
Net Assets | | $ 1,359,179,078 |
Net Assets consist of: | | |
Paid in capital | | $ 1,247,592,683 |
Undistributed net investment income | | 1,027,531 |
Accumulated undistributed net realized gain (loss) on investments | | (67,330,902) |
Net unrealized appreciation (depreciation) on investments | | 177,889,766 |
Net Assets | | $ 1,359,179,078 |
| | |
Calculation of Maximum Offering Price Class A:
Net Asset Value and redemption price per share ($906,896,449 ÷ 74,888,743 shares) | | $ 12.11 |
| | |
Maximum offering price per share (100/94.25 of $12.11) | | $ 12.85 |
Class T:
Net Asset Value and redemption price per share ($169,441,773 ÷ 14,058,036 shares) | | $ 12.05 |
| | |
Maximum offering price per share (100/96.50 of $12.05) | | $ 12.49 |
Class B:
Net Asset Value and offering price per share ($28,359,922 ÷ 2,370,406 shares)A | | $ 11.96 |
| | |
Class C:
Net Asset Value and offering price per share ($36,389,127 ÷ 3,042,760 shares)A | | $ 11.96 |
| | |
Institutional Class:
Net Asset Value, offering price and redemption price per share ($218,091,807 ÷ 17,927,403 shares) | | $ 12.17 |
A Redemption price per share is equal to net asset value less any applicable contingent deferred sales charge.
Statement of Operations
| Year ended March 31, 2011 |
Investment Income | | |
Income distributions from underlying funds | | $ 16,633,700 |
| | |
Expenses | | |
Distribution and service plan fees | $ 3,222,095 | |
Independent trustees' compensation | 3,943 | |
Total expenses before reductions | 3,226,038 | |
Expense reductions | (3,943) | 3,222,095 |
Net investment income (loss) | | 13,411,605 |
Realized and Unrealized Gain (Loss) Realized gain (loss) on sale of underlying fund shares | (27,749,300) | |
Capital gain distributions from underlying funds | 25,933,525 | |
Total net realized gain (loss) | | (1,815,775) |
Change in net unrealized appreciation (depreciation) on underlying funds | | 167,217,095 |
Net gain (loss) | | 165,401,320 |
Net increase (decrease) in net assets resulting from operations | | $ 178,812,925 |
See accompanying notes which are an integral part of the financial statements.
Annual Report
Fidelity Advisor Freedom 2035 Fund
Financial Statements - continued
Statement of Changes in Net Assets
| Year ended
March 31,
2011 | Year ended
March 31,
2010 |
Increase (Decrease) in Net Assets | | |
Operations | | |
Net investment income (loss) | $ 13,411,605 | $ 10,755,699 |
Net realized gain (loss) | (1,815,775) | (5,148,261) |
Change in net unrealized appreciation (depreciation) | 167,217,095 | 267,687,993 |
Net increase (decrease) in net assets resulting from operations | 178,812,925 | 273,295,431 |
Distributions to shareholders from net investment income | (13,257,727) | (10,794,748) |
Distributions to shareholders from net realized gain | (10,450,172) | (6,934,476) |
Total distributions | (23,707,899) | (17,729,224) |
Share transactions - net increase (decrease) | 235,486,573 | 237,182,238 |
Total increase (decrease) in net assets | 390,591,599 | 492,748,445 |
| | |
Net Assets | | |
Beginning of period | 968,587,479 | 475,839,034 |
End of period (including undistributed net investment income of $1,027,531 and undistributed net investment income of $873,654, respectively) | $ 1,359,179,078 | $ 968,587,479 |
Financial Highlights - Class A
Years ended March 31, | 2011 | 2010 | 2009 | 2008 | 2007 |
Selected Per-Share Data | | | | | |
Net asset value, beginning of period | $ 10.65 | $ 7.18 | $ 12.53 | $ 13.44 | $ 12.67 |
Income from Investment Operations | | | | | |
Net investment income (loss) C | .14 | .14 | .20 | .20 | .19 |
Net realized and unrealized gain (loss) | 1.56 | 3.55 | (4.92) | (.60) | 1.02 |
Total from investment operations | 1.70 | 3.69 | (4.72) | (.40) | 1.21 |
Distributions from net investment income | (.13) | (.14) | (.18) | (.17) | (.15) |
Distributions from net realized gain | (.11) | (.08) | (.45) | (.34) | (.29) |
Total distributions | (.24) | (.22) | (.63) G | (.51) | (.44) F |
Net asset value, end of period | $ 12.11 | $ 10.65 | $ 7.18 | $ 12.53 | $ 13.44 |
Total Return A, B | 16.13% | 51.59% | (39.29)% | (3.34)% | 9.74% |
Ratios to Average Net Assets D, E | | | | | |
Expenses before reductions | .25% | .25% | .25% | .25% | .25% |
Expenses net of fee waivers, if any | .25% | .25% | .25% | .25% | .25% |
Expenses net of all reductions | .25% | .25% | .25% | .25% | .25% |
Net investment income (loss) | 1.26% | 1.51% | 2.04% | 1.51% | 1.48% |
Supplemental Data | | | | | |
Net assets, end of period (000 omitted) | $ 906,896 | $ 669,450 | $ 314,996 | $ 336,805 | $ 146,175 |
Portfolio turnover rate | 30% | 16% | 21% | 9% | 5% |
A Total returns would have been lower had certain expenses not been reduced during the periods shown.
B Total returns do not include the effect of the sales charges.
C Calculated based on average shares outstanding during the period.
D Amounts do not include the activity of the underlying funds.
E Expense ratios reflect operating expenses of the class. Expenses before reductions do not reflect amounts reimbursed by the investment adviser or reductions from expense offset arrangements and do not represent the amount paid by the class during periods when reimbursements or reductions occur. Expenses net of fee waivers reflect expenses after reimbursement by the investment adviser but prior to reductions from expense offset arrangements. Expenses net of all reductions represent the net expenses paid by the class but do not include expenses of the investment companies in which the Fund invests.
F Total distributions of $.44 per share is comprised of distributions from net investment income of $.153 and distributions from net realized gain of $.287 per share.
G Total distributions of $.63 per share is comprised of distributions from net investment income of $.182 and distributions from net realized gain of $.445 per share.
See accompanying notes which are an integral part of the financial statements.
Annual Report
Financial Highlights - Class T
Years ended March 31, | 2011 | 2010 | 2009 | 2008 | 2007 |
Selected Per-Share Data | | | | | |
Net asset value, beginning of period | $ 10.60 | $ 7.15 | $ 12.47 | $ 13.38 | $ 12.62 |
Income from Investment Operations | | | | | |
Net investment income (loss) C | .11 | .12 | .17 | .17 | .16 |
Net realized and unrealized gain (loss) | 1.55 | 3.53 | (4.89) | (.62) | 1.01 |
Total from investment operations | 1.66 | 3.65 | (4.72) | (.45) | 1.17 |
Distributions from net investment income | (.11) | (.12) | (.16) | (.13) | (.13) |
Distributions from net realized gain | (.11) | (.08) | (.45) | (.33) | (.28) |
Total distributions | (.21) H | (.20) | (.60) G | (.46) | (.41) F |
Net asset value, end of period | $ 12.05 | $ 10.60 | $ 7.15 | $ 12.47 | $ 13.38 |
Total Return A, B | 15.84% | 51.17% | (39.42)% | (3.66)% | 9.46% |
Ratios to Average Net Assets D, E | | | | | |
Expenses before reductions | .50% | .50% | .50% | .50% | .50% |
Expenses net of fee waivers, if any | .50% | .50% | .50% | .50% | .50% |
Expenses net of all reductions | .50% | .50% | .50% | .50% | .50% |
Net investment income (loss) | 1.01% | 1.26% | 1.79% | 1.26% | 1.23% |
Supplemental Data | | | | | |
Net assets, end of period (000 omitted) | $ 169,442 | $ 143,106 | $ 81,463 | $ 99,531 | $ 84,368 |
Portfolio turnover rate | 30% | 16% | 21% | 9% | 5% |
A Total returns would have been lower had certain expenses not been reduced during the periods shown.
B Total returns do not include the effect of the sales charges.
C Calculated based on average shares outstanding during the period.
D Amounts do not include the activity of the underlying funds.
E Expense ratios reflect operating expenses of the class. Expenses before reductions do not reflect amounts reimbursed by the investment adviser or reductions from expense offset arrangements and do not represent the amount paid by the class during periods when reimbursements or reductions occur. Expenses net of fee waivers reflect expenses after reimbursement by the investment adviser but prior to reductions from expense offset arrangements. Expenses net of all reductions represent the net expenses paid by the class but do not include expenses of the investment companies in which the Fund invests.
F Total distributions of $.41 per share is comprised of distributions from net investment income of $.131 and distributions from net realized gain of $.280 per share.
G Total distributions of $.60 per share is comprised of distributions from net investment income of $.156 and distributions from net realized gain of $.445 per share.
H Total distributions of $.21 per share is comprised of distributions from net investment income of $.106 and distributions from net realized gain of $.105 per share.
Financial Highlights - Class B
Years ended March 31, | 2011 | 2010 | 2009 | 2008 | 2007 |
Selected Per-Share Data | | | | | |
Net asset value, beginning of period | $ 10.52 | $ 7.10 | $ 12.38 | $ 13.29 | $ 12.54 |
Income from Investment Operations | | | | | |
Net investment income (loss) C | .05 | .07 | .13 | .10 | .09 |
Net realized and unrealized gain (loss) | 1.55 | 3.50 | (4.86) | (.61) | 1.02 |
Total from investment operations | 1.60 | 3.57 | (4.73) | (.51) | 1.11 |
Distributions from net investment income | (.06) | (.07) | (.10) | (.08) | (.09) |
Distributions from net realized gain | (.10) | (.08) | (.45) | (.32) | (.27) |
Total distributions | (.16) | (.15) | (.55) G | (.40) | (.36) F |
Net asset value, end of period | $ 11.96 | $ 10.52 | $ 7.10 | $ 12.38 | $ 13.29 |
Total Return A, B | 15.28% | 50.43% | (39.76)% | (4.10)% | 8.98% |
Ratios to Average Net Assets D, E | | | | | |
Expenses before reductions | 1.00% | 1.00% | 1.00% | 1.00% | 1.00% |
Expenses net of fee waivers, if any | 1.00% | 1.00% | 1.00% | 1.00% | 1.00% |
Expenses net of all reductions | 1.00% | 1.00% | 1.00% | 1.00% | 1.00% |
Net investment income (loss) | .51% | .76% | 1.30% | .76% | .73% |
Supplemental Data | | | | | |
Net assets, end of period (000 omitted) | $ 28,360 | $ 27,408 | $ 17,892 | $ 27,854 | $ 23,065 |
Portfolio turnover rate | 30% | 16% | 21% | 9% | 5% |
A Total returns would have been lower had certain expenses not been reduced during the periods shown.
B Total returns do not include the effect of the contingent deferred sales charge.
C Calculated based on average shares outstanding during the period.
D Amounts do not include the activity of the underlying funds.
E Expense ratios reflect operating expenses of the class. Expenses before reductions do not reflect amounts reimbursed by the investment adviser or reductions from expense offset arrangements and do not represent the amount paid by the class during periods when reimbursements or reductions occur. Expenses net of fee waivers reflect expenses after reimbursement by the investment adviser but prior to reductions from expense offset arrangements. Expenses net of all reductions represent the net expenses paid by the class but do not include expenses of the investment companies in which the Fund invests.
F Total distributions of $.36 per share is comprised of distributions from net investment income of $.086 and distributions from net realized gain of $.270 per share.
G Total distributions of $.55 per share is comprised of distributions from net investment income of $.103 and distributions from net realized gain of $.445 per share.
See accompanying notes which are an integral part of the financial statements.
Annual Report
Financial Highlights - Class C
Years ended March 31, | 2011 | 2010 | 2009 | 2008 | 2007 |
Selected Per-Share Data | | | | | |
Net asset value, beginning of period | $ 10.52 | $ 7.11 | $ 12.39 | $ 13.30 | $ 12.55 |
Income from Investment Operations | | | | | |
Net investment income (loss) C | .06 | .07 | .12 | .10 | .09 |
Net realized and unrealized gain (loss) | 1.54 | 3.50 | (4.85) | (.61) | 1.02 |
Total from investment operations | 1.60 | 3.57 | (4.73) | (.51) | 1.11 |
Distributions from net investment income | (.06) | (.08) | (.11) | (.08) | (.09) |
Distributions from net realized gain | (.10) | (.08) | (.45) | (.32) | (.27) |
Total distributions | (.16) | (.16) | (.55) G | (.40) | (.36) F |
Net asset value, end of period | $ 11.96 | $ 10.52 | $ 7.11 | $ 12.39 | $ 13.30 |
Total Return A, B | 15.33% | 50.28% | (39.70)% | (4.10)% | 8.99% |
Ratios to Average Net Assets D, E | | | | | |
Expenses before reductions | 1.00% | 1.00% | 1.00% | 1.00% | 1.00% |
Expenses net of fee waivers, if any | 1.00% | 1.00% | 1.00% | 1.00% | 1.00% |
Expenses net of all reductions | 1.00% | 1.00% | 1.00% | 1.00% | 1.00% |
Net investment income (loss) | .51% | .76% | 1.29% | .76% | .73% |
Supplemental Data | | | | | |
Net assets, end of period (000 omitted) | $ 36,389 | $ 30,994 | $ 17,821 | $ 23,168 | $ 19,041 |
Portfolio turnover rate | 30% | 16% | 21% | 9% | 5% |
A Total returns would have been lower had certain expenses not been reduced during the periods shown.
B Total returns do not include the effect of the contingent deferred sales charge.
C Calculated based on average shares outstanding during the period.
D Amounts do not include the activity of the underlying funds.
E Expense ratios reflect operating expenses of the class. Expenses before reductions do not reflect amounts reimbursed by the investment adviser or reductions from expense offset arrangements and do not represent the amount paid by the class during periods when reimbursements or reductions occur. Expenses net of fee waivers reflect expenses after reimbursement by the investment adviser but prior to reductions from expense offset arrangements. Expenses net of all reductions represent the net expenses paid by the class but do not include expenses of the investment companies in which the Fund invests.
F Total distributions of $.36 per share is comprised of distributions from net investment income of $.088 and distributions from net realized gain of $.270 per share.
G Total distributions of $.55 per share is comprised of distributions from net investment income of $.107 and distributions from net realized gain of $.445 per share.
Financial Highlights - Institutional Class
Years ended March 31, | 2011 | 2010 | 2009 | 2008 | 2007 |
Selected Per-Share Data | | | | | |
Net asset value, beginning of period | $ 10.69 | $ 7.21 | $ 12.57 | $ 13.49 | $ 12.71 |
Income from Investment Operations | | | | | |
Net investment income (loss) B | .17 | .17 | .22 | .24 | .22 |
Net realized and unrealized gain (loss) | 1.57 | 3.55 | (4.93) | (.62) | 1.02 |
Total from investment operations | 1.74 | 3.72 | (4.71) | (.38) | 1.24 |
Distributions from net investment income | (.16) | (.16) | (.21) | (.20) | (.18) |
Distributions from net realized gain | (.11) | (.08) | (.45) | (.34) | (.29) |
Total distributions | (.26) H | (.24) | (.65) G | (.54) | (.46) F |
Net asset value, end of period | $ 12.17 | $ 10.69 | $ 7.21 | $ 12.57 | $ 13.49 |
Total Return A | 16.51% | 51.81% | (39.08)% | (3.19)% | 9.98% |
Ratios to Average Net Assets C, D | | | | | |
Expenses before reductions E | .00% | .00% | .00% | .00% | .00% |
Expenses net of fee waivers, if any | .00% | .00% | .00% | .00% | .00% |
Expenses net of all reductions | .00% | .00% | .00% | .00% | .00% |
Net investment income (loss) | 1.51% | 1.76% | 2.29% | 1.76% | 1.72% |
Supplemental Data | | | | | |
Net assets, end of period (000 omitted) | $ 218,092 | $ 97,629 | $ 43,667 | $ 34,162 | $ 6,371 |
Portfolio turnover rate | 30% | 16% | 21% | 9% | 5% |
A Total returns would have been lower had certain expenses not been reduced during the periods shown.
B Calculated based on average shares outstanding during the period.
C Amounts do not include the activity of the underlying funds.
D Expense ratios reflect operating expenses of the class. Expenses before reductions do not reflect amounts reimbursed by the investment adviser or reductions from expense offset arrangements and do not represent the amount paid by the class during periods when reimbursements or reductions occur. Expenses net of fee waivers reflect expenses after reimbursement by the investment adviser but prior to reductions from expense offset arrangements. Expenses net of all reductions represent the net expenses paid by the class but do not include expenses of the investment companies in which the Fund invests.
E Amount represents less than .01%.
F Total distributions of $.46 per share is comprised of distributions from net investment income of $.176 and distributions from net realized gain of $.287 per share.
G Total distributions of $.65 per share is comprised of distributions from net investment income of $.206 and distributions from net realized gain of $.445 per share.
H Total distributions of $.26 per share is comprised of distributions from net investment income of $.157 and distributions from net realized gain of $.105 per share.
See accompanying notes which are an integral part of the financial statements.
Annual Report
Fidelity Advisor Freedom 2040 Fund
Investment Changes (Unaudited)
Fund Holdings as of March 31, 2011 |
| % of fund's
net assets | % of fund's net assets
6 months ago |
Commodity Funds | | |
Fidelity Series Commodity Strategy Fund | 8.8 | 8.2 |
Domestic Equity Funds | | |
Fidelity Advisor Equity Growth Fund Institutional Class | 5.3 | 5.5 |
Fidelity Advisor Equity Income Fund Institutional Class | 0.0 | 1.1 |
Fidelity Advisor Growth & Income Fund Institutional Class | 7.3 | 7.5 |
Fidelity Advisor Large Cap Fund Institutional Class | 7.3 | 7.6 |
Fidelity Advisor Small Cap Fund Institutional Class | 2.7 | 2.7 |
Fidelity Series 100 Index Fund | 6.3 | 6.0 |
Fidelity Series All-Sector Equity Fund | 10.5 | 10.7 |
Fidelity Series Large Cap Value Fund | 10.6 | 9.6 |
Fidelity Series Small Cap Opportunities Fund | 2.7 | 2.8 |
| 52.7 | 53.5 |
Developed International Equity Funds | | |
Fidelity Advisor Diversified International Fund Institutional Class | 3.1 | 4.3 |
Fidelity Advisor Overseas Fund Institutional Class | 3.1 | 4.4 |
Fidelity Series International Growth Fund | 5.8 | 4.8 |
Fidelity Series International Small Cap Fund | 1.1 | 1.0 |
Fidelity Series International Value Fund | 5.7 | 4.6 |
| 18.8 | 19.1 |
Emerging Markets Equity Funds | | |
Fidelity Series Emerging Markets Fund | 3.4 | 3.2 |
High Yield Bond Funds | | |
Fidelity Advisor High Income Advantage Fund Institutional Class | 0.0 | 8.4 |
Fidelity Series Emerging Markets Debt Fund | 0.1 | 0.0 |
Fidelity Series High Income Fund | 8.0 | 0.0 |
| 8.1 | 8.4 |
Investment Grade Bond Funds | | |
Fidelity Advisor Strategic Real Return Fund Institutional Class | 1.4 | 1.3 |
Fidelity Advisor Total Bond Fund Institutional Class | 0.0 | 0.0* |
Fidelity Series Investment Grade Bond Fund | 6.8 | 6.3 |
| 8.2 | 7.6 |
| | |
Net Other Assets (Liabilities)* | 0.0 | 0.0 |
| 100.0 | 100.0 |
* Amount represents less than 0.1% |
Asset Allocation (% of fund's net assets) |
Current |
| Commodity Funds | 8.8% | |
| Domestic Equity Funds | 52.7% | |
| Developed International Equity Funds | 18.8% | |
| Emerging Markets Equity Funds | 3.4% | |
| High Yield Bond Funds | 8.1% | |
| Investment Grade Bond Funds | 8.2% | |

Six months ago |
| Commodity Funds | 8.2% | |
| Domestic Equity Funds | 53.5% | |
| Developed International Equity Funds | 19.1% | |
| Emerging Markets Equity Funds | 3.2% | |
| High Yield Bond Funds | 8.4% | |
| Investment Grade Bond Funds | 7.6% | |

Expected |
| Commodity Funds | 9.1% | |
| Domestic Equity Funds | 51.8% | |
| Developed International Equity Funds | 18.9% | |
| Emerging Markets Equity Funds | 3.3% | |
| High Yield Bond Funds | 8.0% | |
| Investment Grade Bond Funds | 8.9% | |

The fund invests according to an asset allocation strategy that becomes increasingly conservative over time. The six months ago allocation is based on the fund's holdings as of September 30, 2010. The current allocation is based on the fund's holdings as of March 31, 2011. The expected allocation represents the fund's anticipated allocation at September 30, 2011. |
Annual Report
Fidelity Advisor Freedom 2040 Fund
Investments March 31, 2011
Showing Percentage of Net Assets
Domestic Equity Funds - 61.5% |
| Shares | | Value |
Commodity Funds - 8.8% |
Fidelity Series Commodity Strategy Fund | 9,885,136 | | $ 130,286,098 |
Domestic Equity Funds - 52.7% |
Fidelity Advisor Equity Growth Fund Institutional Class | 1,246,655 | | 77,479,588 |
Fidelity Advisor Growth & Income Fund Institutional Class | 5,980,065 | | 107,940,174 |
Fidelity Advisor Large Cap Fund Institutional Class | 5,419,923 | | 106,935,072 |
Fidelity Advisor Small Cap Fund Institutional Class | 1,427,034 | | 40,056,850 |
Fidelity Series 100 Index Fund | 10,079,322 | | 92,729,763 |
Fidelity Series All-Sector Equity Fund | 11,796,791 | | 154,655,929 |
Fidelity Series Large Cap Value Fund | 12,785,335 | | 156,108,940 |
Fidelity Series Small Cap Opportunities Fund | 3,327,043 | | 39,225,840 |
TOTAL DOMESTIC EQUITY FUNDS | | 775,132,156 |
TOTAL DOMESTIC EQUITY FUNDS (Cost $809,456,488) | 905,418,254 |
International Equity Funds - 22.2% |
| | | |
Developed International Equity Funds - 18.8% |
Fidelity Advisor Diversified International Fund Institutional Class | 2,701,665 | | 45,414,995 |
Fidelity Advisor Overseas Fund Institutional Class | 2,358,476 | | 44,881,793 |
Fidelity Series International Growth Fund | 7,445,324 | | 85,695,684 |
Fidelity Series International Small Cap Fund | 1,347,657 | | 16,630,085 |
Fidelity Series International Value Fund | 7,921,596 | | 83,097,540 |
TOTAL DEVELOPED INTERNATIONAL EQUITY FUNDS | | 275,720,097 |
|
| Shares | | Value |
Emerging Markets Equity Funds - 3.4% |
Fidelity Series Emerging Markets Fund | 2,640,271 | | $ 50,587,588 |
TOTAL INTERNATIONAL EQUITY FUNDS (Cost $316,699,454) | 326,307,685 |
Bond Funds - 16.3% |
| | | |
High Yield Bond Funds - 8.1% |
Fidelity Series Emerging Markets Debt Fund | 169,520 | | 1,695,900 |
Fidelity Series High Income Fund | 11,669,396 | | 116,927,343 |
TOTAL HIGH YIELD BOND FUNDS | | 118,623,243 |
Investment Grade Bond Funds - 8.2% |
Fidelity Advisor Strategic Real Return Fund Institutional Class | 2,121,333 | | 21,001,193 |
Fidelity Series Investment Grade Bond Fund | 8,762,516 | | 99,717,434 |
TOTAL INVESTMENT GRADE BOND FUNDS | | 120,718,627 |
TOTAL BOND FUNDS (Cost $238,455,637) | 239,341,870 |
TOTAL INVESTMENT PORTFOLIO - 100.0% (Cost $1,364,611,579) | | 1,471,067,809 |
NET OTHER ASSETS (LIABILITIES) - 0.0% | | (145,632) |
NET ASSETS - 100% | $ 1,470,922,177 |
Other Information |
All investments are categorized as Level 1 under the Fair Value Hierarchy. The inputs or methodology used for valuing securities may not be an indication of the risk associated with investing in those securities. For more information on valuation inputs, please refer to the Security Valuation section in the accompanying Notes to Financial Statements. |
Income Tax Information |
At March 31, 2011, the Fund had a capital loss carryforward of approximately $8,343,013 all of which will expire in fiscal 2017. Capital loss carryforwards are only available to offset future capital gains of the Fund to the extent provided by regulations and may be limited. |
See accompanying notes which are an integral part of the financial statements.
Annual Report
Fidelity Advisor Freedom 2040 Fund
Statement of Assets and Liabilities
| March 31, 2011 |
Assets | | |
Investment in securities, at value (cost $1,364,611,579) - See accompanying schedule | | $ 1,471,067,809 |
Cash | | 103 |
Receivable for investments sold | | 88,842 |
Receivable for fund shares sold | | 2,844,424 |
Distributions receivable from underlying funds | | 206,314 |
Total assets | | 1,474,207,492 |
| | |
Liabilities | | |
Payable for investments purchased | $ 1,025,296 | |
Payable for fund shares redeemed | 1,884,280 | |
Distribution and service plan fees payable | 375,739 | |
Total liabilities | | 3,285,315 |
| | |
Net Assets | | $ 1,470,922,177 |
Net Assets consist of: | | |
Paid in capital | | $ 1,372,130,404 |
Undistributed net investment income | | 959,515 |
Accumulated undistributed net realized gain (loss) on investments | | (8,623,972) |
Net unrealized appreciation (depreciation) on investments | | 106,456,230 |
Net Assets | | $ 1,470,922,177 |
| | |
Calculation of Maximum Offering Price Class A:
Net Asset Value and redemption price per share ($865,008,171 ÷ 66,794,945 shares) | | $ 12.95 |
| | |
Maximum offering price per share (100/94.25 of $12.95) | | $ 13.74 |
Class T:
Net Asset Value and redemption price per share ($276,334,726 ÷ 21,389,470 shares) | | $ 12.92 |
| | |
Maximum offering price per share (100/96.50 of $12.92) | | $ 13.39 |
Class B:
Net Asset Value and offering price per share ($41,935,078 ÷ 3,270,683 shares)A | | $ 12.82 |
| | |
Class C:
Net Asset Value and offering price per share ($58,415,958 ÷ 4,562,634 shares)A | | $ 12.80 |
| | |
Institutional Class:
Net Asset Value, offering price and redemption price per share ($229,228,244 ÷ 17,627,009 shares) | | $ 13.00 |
A Redemption price per share is equal to net asset value less any applicable contingent deferred sales charge.
Statement of Operations
| Year ended March 31, 2011 |
Investment Income | | |
Income distributions from underlying funds | | $ 19,022,307 |
| | |
Expenses | | |
Distribution and service plan fees | $ 4,182,766 | |
Independent trustees' compensation | 4,613 | |
Total expenses before reductions | 4,187,379 | |
Expense reductions | (4,613) | 4,182,766 |
Net investment income (loss) | | 14,839,541 |
Realized and Unrealized Gain (Loss) Realized gain (loss) on sale of underlying fund shares | 11,216,272 | |
Capital gain distributions from underlying funds | 28,387,384 | |
Total net realized gain (loss) | | 39,603,656 |
Change in net unrealized appreciation (depreciation) on underlying funds | | 144,982,726 |
Net gain (loss) | | 184,586,382 |
Net increase (decrease) in net assets resulting from operations | | $ 199,425,923 |
See accompanying notes which are an integral part of the financial statements.
Annual Report
Statement of Changes in Net Assets
| Year ended
March 31,
2011 | Year ended
March 31,
2010 |
Increase (Decrease) in Net Assets | | |
Operations | | |
Net investment income (loss) | $ 14,839,541 | $ 13,624,680 |
Net realized gain (loss) | 39,603,656 | 36,682,501 |
Change in net unrealized appreciation (depreciation) | 144,982,726 | 319,580,977 |
Net increase (decrease) in net assets resulting from operations | 199,425,923 | 369,888,158 |
Distributions to shareholders from net investment income | (14,806,752) | (13,844,304) |
Distributions to shareholders from net realized gain | (11,833,286) | (8,692,491) |
Total distributions | (26,640,038) | (22,536,795) |
Share transactions - net increase (decrease) | 103,322,755 | 202,733,553 |
Total increase (decrease) in net assets | 276,108,640 | 550,084,916 |
| | |
Net Assets | | |
Beginning of period | 1,194,813,537 | 644,728,621 |
End of period (including undistributed net investment income of $959,515 and undistributed net investment income of $926,726, respectively) | $ 1,470,922,177 | $ 1,194,813,537 |
Financial Highlights - Class A
Years ended March 31, | 2011 | 2010 | 2009 | 2008 | 2007 |
Selected Per-Share Data | | | | | |
Net asset value, beginning of period | $ 11.37 | $ 7.59 | $ 13.57 | $ 14.69 | $ 13.83 |
Income from Investment Operations | | | | | |
Net investment income (loss) C | .15 | .15 | .21 | .22 | .21 |
Net realized and unrealized gain (loss) | 1.69 | 3.87 | (5.44) | (.74) | 1.16 |
Total from investment operations | 1.84 | 4.02 | (5.23) | (.52) | 1.37 |
Distributions from net investment income | (.15) | (.15) | (.20) | (.20) | (.18) |
Distributions from net realized gain | (.11) | (.09) | (.56) | (.40) | (.33) |
Total distributions | (.26) | (.24) | (.75) G | (.60) | (.51) F |
Net asset value, end of period | $ 12.95 | $ 11.37 | $ 7.59 | $ 13.57 | $ 14.69 |
Total Return A,B | 16.38% | 53.15% | (40.42)% | (3.92)% | 10.09% |
Ratios to Average Net Assets D,E | | | | | |
Expenses before reductions | .25% | .25% | .25% | .25% | .25% |
Expenses net of fee waivers, if any | .25% | .25% | .25% | .25% | .25% |
Expenses net of all reductions | .25% | .25% | .25% | .25% | .25% |
Net investment income (loss) | 1.25% | 1.52% | 2.02% | 1.47% | 1.48% |
Supplemental Data | | | | | |
Net assets, end of period (000 omitted) | $ 865,008 | $ 670,673 | $ 342,357 | $ 428,381 | $ 263,733 |
Portfolio turnover rate | 38% | 18% | 18% | 9% | 7% |
A Total returns would have been lower had certain expenses not been reduced during the periods shown.
B Total returns do not include the effect of the sales charges.
C Calculated based on average shares outstanding during the period.
D Amounts do not include the activity of the underlying funds.
E Expense ratios reflect operating expenses of the class. Expenses before reductions do not reflect amounts reimbursed by the investment adviser or reductions from expense offset arrangements and do not represent the amount paid by the class during periods when reimbursements or reductions occur. Expenses net of fee waivers reflect expenses after reimbursement by the investment adviser but prior to reductions from expense offset arrangements. Expenses net of all reductions represent the net expenses paid by the class but do not include expenses of the investment companies in which the Fund invests.
F Total distributions of $.51 per share is comprised of distributions from net investment income of $.181 and distributions from net realized gain of $.325 per share.
G Total distributions of $.75 per share is comprised of distributions from net investment income of $.197 and distributions from net realized gain of $.555 per share.
See accompanying notes which are an integral part of the financial statements.
Annual Report
Financial Highlights - Class T
Years ended March 31, | 2011 | 2010 | 2009 | 2008 | 2007 |
Selected Per-Share Data | | | | | |
Net asset value, beginning of period | $ 11.34 | $ 7.57 | $ 13.54 | $ 14.64 | $ 13.79 |
Income from Investment Operations | | | | | |
Net investment income (loss) C | .12 | .13 | .18 | .18 | .17 |
Net realized and unrealized gain (loss) | 1.68 | 3.86 | (5.43) | (.72) | 1.16 |
Total from investment operations | 1.80 | 3.99 | (5.25) | (.54) | 1.33 |
Distributions from net investment income | (.11) | (.13) | (.17) | (.16) | (.15) |
Distributions from net realized gain | (.11) | (.09) | (.56) | (.40) | (.33) |
Total distributions | (.22) | (.22) | (.72) G | (.56) | (.48) F |
Net asset value, end of period | $ 12.92 | $ 11.34 | $ 7.57 | $ 13.54 | $ 14.64 |
Total Return A,B | 16.06% | 52.83% | (40.61)% | (4.05)% | 9.81% |
Ratios to Average Net Assets D,E | | | | | |
Expenses before reductions | .50% | .50% | .50% | .50% | .50% |
Expenses net of fee waivers, if any | .50% | .50% | .50% | .50% | .50% |
Expenses net of all reductions | .50% | .50% | .50% | .50% | .50% |
Net investment income (loss) | 1.00% | 1.27% | 1.77% | 1.22% | 1.23% |
Supplemental Data | | | | | |
Net assets, end of period (000 omitted) | $ 276,335 | $ 300,594 | $ 181,917 | $ 238,675 | $ 221,815 |
Portfolio turnover rate | 38% | 18% | 18% | 9% | 7% |
A Total returns would have been lower had certain expenses not been reduced during the periods shown.
B Total returns do not include the effect of the sales charges.
C Calculated based on average shares outstanding during the period.
D Amounts do not include the activity of the underlying funds.
E Expense ratios reflect operating expenses of the class. Expenses before reductions do not reflect amounts reimbursed by the investment adviser or reductions from expense offset arrangements and do not represent the amount paid by the class during periods when reimbursements or reductions occur. Expenses net of fee waivers reflect expenses after reimbursement by the investment adviser but prior to reductions from expense offset arrangements. Expenses net of all reductions represent the net expenses paid by the class but do not include expenses of the investment companies in which the Fund invests.
F Total distributions of $.48 per share is comprised of distributions from net investment income of $.150 and distributions from net realized gain of $.325 per share.
G Total distributions of $.72 per share is comprised of distributions from net investment income of $.168 and distributions from net realized gain of $.555 per share.
Financial Highlights - Class B
Years ended March 31, | 2011 | 2010 | 2009 | 2008 | 2007 |
Selected Per-Share Data | | | | | |
Net asset value, beginning of period | $ 11.26 | $ 7.52 | $ 13.42 | $ 14.53 | $ 13.70 |
Income from Investment Operations | | | | | |
Net investment income (loss) C | .06 | .08 | .13 | .11 | .10 |
Net realized and unrealized gain (loss) | 1.66 | 3.83 | (5.37) | (.73) | 1.14 |
Total from investment operations | 1.72 | 3.91 | (5.24) | (.62) | 1.24 |
Distributions from net investment income | (.06) | (.08) | (.11) | (.10) | (.10) |
Distributions from net realized gain | (.10) | (.09) | (.55) | (.39) | (.32) |
Total distributions | (.16) | (.17) | (.66) G | (.49) | (.41) F |
Net asset value, end of period | $ 12.82 | $ 11.26 | $ 7.52 | $ 13.42 | $ 14.53 |
Total Return A,B | 15.43% | 52.08% | (40.85)% | (4.59)% | 9.25% |
Ratios to Average Net Assets D,E | | | | | |
Expenses before reductions | 1.00% | 1.00% | 1.00% | 1.00% | 1.00% |
Expenses net of fee waivers, if any | 1.00% | 1.00% | 1.00% | 1.00% | 1.00% |
Expenses net of all reductions | 1.00% | 1.00% | 1.00% | 1.00% | 1.00% |
Net investment income (loss) | .50% | .77% | 1.28% | .72% | .73% |
Supplemental Data | | | | | |
Net assets, end of period (000 omitted) | $ 41,935 | $ 43,773 | $ 29,479 | $ 50,827 | $ 46,110 |
Portfolio turnover rate | 38% | 18% | 18% | 9% | 7% |
A Total returns would have been lower had certain expenses not been reduced during the periods shown.
B Total returns do not include the effect of the contingent deferred sales charge.
C Calculated based on average shares outstanding during the period.
D Amounts do not include the activity of the underlying funds.
E Expense ratios reflect operating expenses of the class. Expenses before reductions do not reflect amounts reimbursed by the investment adviser or reductions from expense offset arrangements and do not represent the amount paid by the class during periods when reimbursements or reductions occur. Expenses net of fee waivers reflect expenses after reimbursement by the investment adviser but prior to reductions from expense offset arrangements. Expenses net of all reductions represent the net expenses paid by the class but do not include expenses of the investment companies in which the Fund invests.
F Total distributions of $.41 per share is comprised of distributions from net investment income of $.098 and distributions from net realized gain of $.315 per share.
G Total distributions of $.66 per share is comprised of distributions from net investment income of $.112 and distributions from net realized gain of $.550 per share.
See accompanying notes which are an integral part of the financial statements.
Annual Report
Financial Highlights - Class C
Years ended March 31, | 2011 | 2010 | 2009 | 2008 | 2007 |
Selected Per-Share Data | | | | | |
Net asset value, beginning of period | $ 11.25 | $ 7.51 | $ 13.42 | $ 14.52 | $ 13.70 |
Income from Investment Operations | | | | | |
Net investment income (loss) C | .06 | .08 | .13 | .11 | .10 |
Net realized and unrealized gain (loss) | 1.66 | 3.83 | (5.37) | (.72) | 1.13 |
Total from investment operations | 1.72 | 3.91 | (5.24) | (.61) | 1.23 |
Distributions from net investment income | (.07) | (.08) | (.12) | (.10) | (.10) |
Distributions from net realized gain | (.10) | (.09) | (.55) | (.39) | (.32) |
Total distributions | (.17) | (.17) | (.67) G | (.49) | (.41) F |
Net asset value, end of period | $ 12.80 | $ 11.25 | $ 7.51 | $ 13.42 | $ 14.52 |
Total Return A,B | 15.39% | 52.18% | (40.91)% | (4.54)% | 9.17% |
Ratios to Average Net Assets D,E | | | | | |
Expenses before reductions | 1.00% | 1.00% | 1.00% | 1.00% | 1.00% |
Expenses net of fee waivers, if any | 1.00% | 1.00% | 1.00% | 1.00% | 1.00% |
Expenses net of all reductions | 1.00% | 1.00% | 1.00% | 1.00% | 1.00% |
Net investment income (loss) | .50% | .77% | 1.28% | .72% | .73% |
Supplemental Data | | | | | |
Net assets, end of period (000 omitted) | $ 58,416 | $ 53,334 | $ 34,036 | $ 54,549 | $ 54,022 |
Portfolio turnover rate | 38% | 18% | 18% | 9% | 7% |
A Total returns would have been lower had certain expenses not been reduced during the periods shown.
B Total returns do not include the effect of the contingent deferred sales charge.
C Calculated based on average shares outstanding during the period.
D Amounts do not include the activity of the underlying funds.
E Expense ratios reflect operating expenses of the class. Expenses before reductions do not reflect amounts reimbursed by the investment adviser or reductions from expense offset arrangements and do not represent the amount paid by the class during periods when reimbursements or reductions occur. Expenses net of fee waivers reflect expenses after reimbursement by the investment adviser but prior to reductions from expense offset arrangements. Expenses net of all reductions represent the net expenses paid by the class but do not include expenses of the investment companies in which the Fund invests.
F Total distributions of $.41 per share is comprised of distributions from net investment income of $.098 and distributions from net realized gain of $.315 per share.
G Total distributions of $.67 per share is comprised of distributions from net investment income of $.115 and distributions from net realized gain of $.550 per share.
Financial Highlights - Institutional Class
Years ended March 31, | 2011 | 2010 | 2009 | 2008 | 2007 |
Selected Per-Share Data | | | | | |
Net asset value, beginning of period | $ 11.42 | $ 7.62 | $ 13.62 | $ 14.74 | $ 13.87 |
Income from Investment Operations | | | | | |
Net investment income (loss) B | .18 | .18 | .23 | .25 | .24 |
Net realized and unrealized gain (loss) | 1.69 | 3.88 | (5.45) | (.74) | 1.17 |
Total from investment operations | 1.87 | 4.06 | (5.22) | (.49) | 1.41 |
Distributions from net investment income | (.18) | (.17) | (.22) | (.23) | (.21) |
Distributions from net realized gain | (.11) | (.09) | (.56) | (.40) | (.33) |
Total distributions | (.29) | (.26) | (.78) G | (.63) | (.54) F |
Net asset value, end of period | $ 13.00 | $ 11.42 | $ 7.62 | $ 13.62 | $ 14.74 |
Total Return A | 16.57% | 53.53% | (40.24)% | (3.70)% | 10.36% |
Ratios to Average Net Assets C,E | | | | | |
Expenses before reductions D | .00% | .00% | .00% | .00% | .00% |
Expenses net of fee waivers, if any | .00% | .00% | .00% | .00% | .00% |
Expenses net of all reductions | .00% | .00% | .00% | .00% | .00% |
Net investment income (loss) | 1.50% | 1.77% | 2.27% | 1.72% | 1.73% |
Supplemental Data | | | | | |
Net assets, end of period (000 omitted) | $ 229,228 | $ 126,440 | $ 56,940 | $ 46,457 | $ 19,197 |
Portfolio turnover rate | 38% | 18% | 18% | 9% | 7% |
A Total returns would have been lower had certain expenses not been reduced during the periods shown.
B Calculated based on average shares outstanding during the period.
C Amounts do not include the activity of the underlying funds.
D Amount represents less than .01%.
E Expense ratios reflect operating expenses of the class. Expenses before reductions do not reflect amounts reimbursed by the investment adviser or reductions from expense offset arrangements and do not represent the amount paid by the class during periods when reimbursements or reductions occur. Expenses net of fee waivers reflect expenses after reimbursement by the investment adviser but prior to reductions from expense offset arrangements. Expenses net of all reductions represent the net expenses paid by the class but do not include expenses of the investment companies in which the Fund invests.
F Total distributions of $.54 per share is comprised of distributions from net investment income of $.210 and distributions from net realized gain of $.325 per share.
G Total distributions of $.78 per share is comprised of distributions from net investment income of $.224 and distributions from net realized gain of $.555 per share.
See accompanying notes which are an integral part of the financial statements.
Annual Report
Fidelity Advisor Freedom 2045 Fund
Investment Changes (Unaudited)
Fund Holdings as of March 31, 2011 |
| % of fund's
net assets | % of fund's net assets
6 months ago |
Commodity Funds | | |
Fidelity Series Commodity Strategy Fund | 9.2 | 8.2 |
Domestic Equity Funds | | |
Fidelity Advisor Equity Growth Fund Institutional Class | 5.4 | 5.6 |
Fidelity Advisor Equity Income Fund Institutional Class | 0.0 | 1.1 |
Fidelity Advisor Growth & Income Fund Institutional Class | 7.5 | 7.8 |
Fidelity Advisor Large Cap Fund Institutional Class | 7.4 | 7.7 |
Fidelity Advisor Small Cap Fund Institutional Class | 2.8 | 2.8 |
Fidelity Series 100 Index Fund | 6.4 | 6.2 |
Fidelity Series All-Sector Equity Fund | 10.7 | 10.9 |
Fidelity Series Large Cap Value Fund | 10.9 | 9.7 |
Fidelity Series Small Cap Opportunities Fund | 2.7 | 2.8 |
| 53.8 | 54.6 |
Developed International Equity Funds | | |
Fidelity Advisor Diversified International Fund Institutional Class | 3.2 | 4.4 |
Fidelity Advisor Overseas Fund Institutional Class | 3.1 | 4.4 |
Fidelity Series International Growth Fund | 5.9 | 4.8 |
Fidelity Series International Small Cap Fund | 1.2 | 0.9 |
Fidelity Series International Value Fund | 5.8 | 4.7 |
| 19.2 | 19.2 |
Emerging Markets Equity Funds | | |
Fidelity Series Emerging Markets Fund | 3.5 | 3.3 |
High Yield Bond Funds | | |
Fidelity Advisor High Income Advantage Fund Institutional Class | 0.0 | 9.8 |
Fidelity Series Emerging Markets Debt Fund | 0.1 | 0.0 |
Fidelity Series High Income Fund | 9.3 | 0.0 |
| 9.4 | 9.8 |
Investment Grade Bond Funds | | |
Fidelity Advisor Strategic Real Return Fund Institutional Class | 0.8 | 0.9 |
Fidelity Advisor Total Bond Fund Institutional Class | 0.0 | 0.0* |
Fidelity Series Investment Grade Bond Fund | 4.1 | 4.0 |
| 4.9 | 4.9 |
| | |
Net Other Assets (Liabilities)* | 0.0 | 0.0 |
| 100.0 | 100.0 |
* Amount represents less than 0.1% |
Asset Allocation (% of fund's net assets) |
Current |
| Commodity Funds | 9.2% | |
| Domestic Equity Funds | 53.8% | |
| Developed International Equity Funds | 19.2% | |
| Emerging Markets Equity Funds | 3.5% | |
| High Yield Bond Funds | 9.4% | |
| Investment Grade Bond Funds | 4.9% | |

Six months ago |
| Commodity Funds | 8.2% | |
| Domestic Equity Funds | 54.6% | |
| Developed International Equity Funds | 19.2% | |
| Emerging Markets Equity Funds | 3.3% | |
| High Yield Bond Funds | 9.8% | |
| Investment Grade Bond Funds | 4.9% | |

Expected |
| Commodity Funds | 9.4% | |
| Domestic Equity Funds | 52.9% | |
| Developed International Equity Funds | 19.3% | |
| Emerging Markets Equity Funds | 3.4% | |
| High Yield Bond Funds | 10.0% | |
| Investment Grade Bond Funds | 5.0% | |

The fund invests according to an asset allocation strategy that becomes increasingly conservative over time. The six months ago allocation is based on the fund's holdings as of September 30, 2010. The current allocation is based on the fund's holdings as of March 31, 2011. The expected allocation represents the fund's anticipated allocation at September 30, 2011. |
Annual Report
Fidelity Advisor Freedom 2045 Fund
Investments March 31, 2011
Showing Percentage of Net Assets
Domestic Equity Funds - 63.0% |
| Shares | | Value |
Commodity Funds - 9.2% |
Fidelity Series Commodity Strategy Fund | 3,350,344 | | $ 44,157,536 |
Domestic Equity Funds - 53.8% |
Fidelity Advisor Equity Growth Fund Institutional Class | 413,022 | | 25,669,333 |
Fidelity Advisor Growth & Income Fund Institutional Class | 1,979,559 | | 35,731,036 |
Fidelity Advisor Large Cap Fund Institutional Class | 1,794,490 | | 35,405,292 |
Fidelity Advisor Small Cap Fund Institutional Class | 471,621 | | 13,238,414 |
Fidelity Series 100 Index Fund | 3,332,122 | | 30,655,523 |
Fidelity Series All-Sector Equity Fund | 3,904,704 | | 51,190,666 |
Fidelity Series Large Cap Value Fund | 4,252,729 | | 51,925,827 |
Fidelity Series Small Cap Opportunities Fund | 1,100,141 | | 12,970,665 |
TOTAL DOMESTIC EQUITY FUNDS | | 256,786,756 |
TOTAL DOMESTIC EQUITY FUNDS (Cost $252,033,745) | 300,944,292 |
International Equity Funds - 22.7% |
| | | |
Developed International Equity Funds - 19.2% |
Fidelity Advisor Diversified International Fund Institutional Class | 897,029 | | 15,079,057 |
Fidelity Advisor Overseas Fund Institutional Class | 783,219 | | 14,904,650 |
Fidelity Series International Growth Fund | 2,468,213 | | 28,409,135 |
Fidelity Series International Small Cap Fund | 445,909 | | 5,502,523 |
Fidelity Series International Value Fund | 2,626,970 | | 27,556,910 |
TOTAL DEVELOPED INTERNATIONAL EQUITY FUNDS | | 91,452,275 |
|
| Shares | | Value |
Emerging Markets Equity Funds - 3.5% |
Fidelity Series Emerging Markets Fund | 876,119 | | $ 16,786,444 |
TOTAL INTERNATIONAL EQUITY FUNDS (Cost $92,139,961) | 108,238,719 |
Bond Funds - 14.3% |
| | | |
High Yield Bond Funds - 9.4% |
Fidelity Series Emerging Markets Debt Fund | 64,210 | | 642,360 |
Fidelity Series High Income Fund | 4,420,047 | | 44,288,867 |
TOTAL HIGH YIELD BOND FUNDS | | 44,931,227 |
Investment Grade Bond Funds - 4.9% |
Fidelity Advisor Strategic Real Return Fund Institutional Class | 381,353 | | 3,775,392 |
Fidelity Series Investment Grade Bond Fund | 1,734,346 | | 19,736,854 |
TOTAL INVESTMENT GRADE BOND FUNDS | | 23,512,246 |
TOTAL BOND FUNDS (Cost $67,725,945) | 68,443,473 |
TOTAL INVESTMENT PORTFOLIO - 100.0% (Cost $411,899,651) | | 477,626,484 |
NET OTHER ASSETS (LIABILITIES) - 0.0% | | (23,712) |
NET ASSETS - 100% | $ 477,602,772 |
Other Information |
All investments are categorized as Level 1 under the Fair Value Hierarchy. The inputs or methodology used for valuing securities may not be an indication of the risk associated with investing in those securities. For more information on valuation inputs, please refer to the Security Valuation section in the accompanying Notes to Financial Statements. |
Income Tax Information |
At March 31, 2011, the Fund had a capital loss carryforward of approximately $4,711,973 all of which will expire in fiscal 2017. Capital loss carryforwards are only available to offset future capital gains of the Fund to the extent provided by regulations and may be limited. |
See accompanying notes which are an integral part of the financial statements.
Annual Report
Fidelity Advisor Freedom 2045 Fund
Statement of Assets and Liabilities
| March 31, 2011 |
Assets | | |
Investment in securities, at value (cost $411,899,651) - See accompanying schedule | | $ 477,626,484 |
Cash | | 55 |
Receivable for investments sold | | 9,516 |
Receivable for fund shares sold | | 1,099,500 |
Distributions receivable from underlying funds | | 78,099 |
Total assets | | 478,813,654 |
| | |
Liabilities | | |
Payable for investments purchased | $ 729,823 | |
Payable for fund shares redeemed | 379,190 | |
Distribution and service plan fees payable | 101,869 | |
Total liabilities | | 1,210,882 |
| | |
Net Assets | | $ 477,602,772 |
Net Assets consist of: | | |
Paid in capital | | $ 416,868,005 |
Undistributed net investment income | | 434,537 |
Accumulated undistributed net realized gain (loss) on investments | | (5,426,603) |
Net unrealized appreciation (depreciation) on investments | | 65,726,833 |
Net Assets | | $ 477,602,772 |
| |
Calculation of Maximum Offering Price Class A:
Net Asset Value and redemption price per share ($320,730,680 ÷ 31,834,182 shares) | | $ 10.08 |
| | |
Maximum offering price per share (100/94.25 of $10.08) | | $ 10.69 |
Class T:
Net Asset Value and redemption price per share ($60,267,677 ÷ 6,004,056 shares) | | $ 10.04 |
| | |
Maximum offering price per share (100/96.50 of $10.04) | | $ 10.40 |
Class B:
Net Asset Value and offering price per share ($4,611,679 ÷ 460,577 shares)A | | $ 10.01 |
| | |
Class C:
Net Asset Value and offering price per share ($8,753,183 ÷ 875,390 shares)A | | $ 10.00 |
| | |
Institutional Class:
Net Asset Value, offering price and redemption price per share ($83,239,553 ÷ 8,231,056 shares) | | $ 10.11 |
A Redemption price per share is equal to net asset value less any applicable contingent deferred sales charge.
Statement of Operations
| Year ended March 31, 2011 |
Investment Income | | |
Income distributions from underlying funds | | $ 5,756,548 |
| | |
Expenses | | |
Distribution and service plan fees | $ 986,412 | |
Independent trustees' compensation | 1,269 | |
Total expenses before reductions | 987,681 | |
Expense reductions | (1,269) | 986,412 |
Net investment income (loss) | | 4,770,136 |
Realized and Unrealized Gain (Loss) Realized gain (loss) on sale of underlying fund shares | 621,206 | |
Capital gain distributions from underlying funds | 8,646,888 | |
Total net realized gain (loss) | | 9,268,094 |
Change in net unrealized appreciation (depreciation) on underlying funds | | 48,630,118 |
Net gain (loss) | | 57,898,212 |
Net increase (decrease) in net assets resulting from operations | | $ 62,668,348 |
See accompanying notes which are an integral part of the financial statements.
Annual Report
Statement of Changes in Net Assets
| Year ended
March 31,
2011 | Year ended
March 31,
2010 |
Increase (Decrease) in Net Assets | | |
Operations | | |
Net investment income (loss) | $ 4,770,136 | $ 3,090,802 |
Net realized gain (loss) | 9,268,094 | (580,792) |
Change in net unrealized appreciation (depreciation) | 48,630,118 | 74,319,321 |
Net increase (decrease) in net assets resulting from operations | 62,668,348 | 76,829,331 |
Distributions to shareholders from net investment income | (4,605,379) | (3,060,635) |
Distributions to shareholders from net realized gain | (3,215,417) | (2,023,492) |
Total distributions | (7,820,796) | (5,084,127) |
Share transactions - net increase (decrease) | 130,893,423 | 102,731,596 |
Total increase (decrease) in net assets | 185,740,975 | 174,476,800 |
| | |
Net Assets | | |
Beginning of period | 291,861,797 | 117,384,997 |
End of period (including undistributed net investment income of $434,537 and undistributed net investment income of $269,780, respectively) | $ 477,602,772 | $ 291,861,797 |
Financial Highlights - Class A
Years ended March 31, | 2011 | 2010 | 2009 | 2008 | 2007 G |
Selected Per-Share Data | | | | | |
Net asset value, beginning of period | $ 8.82 | $ 5.86 | $ 10.39 | $ 11.05 | $ 10.00 |
Income from Investment Operations | | | | | |
Net investment income (loss) E | .12 | .12 | .16 | .16 | .12 |
Net realized and unrealized gain (loss) | 1.33 | 3.02 | (4.29) | (.57) | 1.06 |
Total from investment operations | 1.45 | 3.14 | (4.13) | (.41) | 1.18 |
Distributions from net investment income | (.11) | (.11) | (.14) | (.11) | (.08) |
Distributions from net realized gain | (.08) | (.07) | (.26) | (.14) | (.05) |
Total distributions | (.19) | (.18) | (.40) | (.25) I | (.13) |
Net asset value, end of period | $ 10.08 | $ 8.82 | $ 5.86 | $ 10.39 | $ 11.05 |
Total Return B,C,D | 16.67% | 53.81% | (40.93)% | (3.96)% | 11.78% |
Ratios to Average Net Assets F,H | | | | | |
Expenses before reductions | .25% | .25% | .25% | .25% | .25% A |
Expenses net of fee waivers, if any | .25% | .25% | .25% | .25% | .25% A |
Expenses net of all reductions | .25% | .25% | .25% | .25% | .25% A |
Net investment income (loss) | 1.35% | 1.53% | 2.12% | 1.44% | 1.31% A |
Supplemental Data | | | | | |
Net assets, end of period (000 omitted) | $ 320,731 | $ 205,405 | $ 81,985 | $ 61,721 | $ 12,550 |
Portfolio turnover rate | 32% | 14% | 18% | 22% | 16% A |
A Annualized
B Total returns for periods of less than one year are not annualized.
C Total returns would have been lower had certain expenses not been reduced during the periods shown.
D Total returns do not include the effect of the sales charges.
E Calculated based on average shares outstanding during the period.
F Amounts do not include the activity of the underlying funds.
G For the period June 1, 2006 (commencement of operations) to March 31, 2007.
H Expense ratios reflect operating expenses of the class. Expenses before reductions do not reflect amounts reimbursed by the investment adviser or reductions from expense offset arrangements and do not represent the amount paid by the class during periods when reimbursements or reductions occur. Expenses net of fee waivers reflect expenses after reimbursement by the investment adviser but prior to reductions from expense offset arrangements. Expenses net of all reductions represent the net expenses paid by the class but do not include expenses of the investment companies in which the Fund invests.
I Total distributions of $.25 per share is comprised of distributions from net investment income of $.110 and distributions from net realized gain of $.138 per share.
See accompanying notes which are an integral part of the financial statements.
Annual Report
Financial Highlights - Class T
Years ended March 31, | 2011 | 2010 | 2009 | 2008 | 2007 G |
Selected Per-Share Data | | | | | |
Net asset value, beginning of period | $ 8.79 | $ 5.84 | $ 10.36 | $ 11.03 | $ 10.00 |
Income from Investment Operations | | | | | |
Net investment income (loss) E | .10 | .10 | .14 | .13 | .09 |
Net realized and unrealized gain (loss) | 1.32 | 3.02 | (4.28) | (.57) | 1.06 |
Total from investment operations | 1.42 | 3.12 | (4.14) | (.44) | 1.15 |
Distributions from net investment income | (.09) | (.10) | (.12) | (.09) | (.07) |
Distributions from net realized gain | (.08) | (.07) | (.26) | (.14) | (.05) |
Total distributions | (.17) | (.17) | (.38) | (.23) I | (.12) |
Net asset value, end of period | $ 10.04 | $ 8.79 | $ 5.84 | $ 10.36 | $ 11.03 |
Total Return B,C,D | 16.36% | 53.52% | (41.08)% | (4.23)% | 11.53% |
Ratios to Average Net Assets F,H | | | | | |
Expenses before reductions | .50% | .50% | .50% | .50% | .50% A |
Expenses net of fee waivers, if any | .50% | .50% | .50% | .50% | .50% A |
Expenses net of all reductions | .50% | .50% | .50% | .50% | .50% A |
Net investment income (loss) | 1.10% | 1.28% | 1.87% | 1.19% | 1.06% A |
Supplemental Data | | | | | |
Net assets, end of period (000 omitted) | $ 60,268 | $ 43,326 | $ 18,065 | $ 11,746 | $ 3,339 |
Portfolio turnover rate | 32% | 14% | 18% | 22% | 16% A |
A Annualized
B Total returns for periods of less than one year are not annualized.
C Total returns would have been lower had certain expenses not been reduced during the periods shown.
D Total returns do not include the effect of the sales charges.
E Calculated based on average shares outstanding during the period.
F Amounts do not include the activity of the underlying funds.
G For the period June 1, 2006 (commencement of operations) to March 31, 2007.
H Expense ratios reflect operating expenses of the class. Expenses before reductions do not reflect amounts reimbursed by the investment adviser or reductions from expense offset arrangements and do not represent the amount paid by the class during periods when reimbursements or reductions occur. Expenses net of fee waivers reflect expenses after reimbursement by the investment adviser but prior to reductions from expense offset arrangements. Expenses net of all reductions represent the net expenses paid by the class but do not include expenses of the investment companies in which the Fund invests.
I Total distributions of $.23 per share is comprised of distributions from net investment income of $.090 and distributions from net realized gain of $.137 per share.
Financial Highlights - Class B
Years ended March 31, | 2011 | 2010 | 2009 | 2008 | 2007 G |
Selected Per-Share Data | | | | | |
Net asset value, beginning of period | $ 8.77 | $ 5.83 | $ 10.33 | $ 11.01 | $ 10.00 |
Income from Investment Operations | | | | | |
Net investment income (loss) E | .05 | .06 | .11 | .08 | .05 |
Net realized and unrealized gain (loss) | 1.32 | 3.01 | (4.27) | (.57) | 1.06 |
Total from investment operations | 1.37 | 3.07 | (4.16) | (.49) | 1.11 |
Distributions from net investment income | (.05) | (.06) | (.08) | (.06) | (.05) |
Distributions from net realized gain | (.08) | (.07) | (.26) | (.13) | (.05) |
Total distributions | (.13) | (.13) | (.34) | (.19) I | (.10) |
Net asset value, end of period | $ 10.01 | $ 8.77 | $ 5.83 | $ 10.33 | $ 11.01 |
Total Return B,C,D | 15.71% | 52.74% | (41.39)% | (4.65)% | 11.09% |
Ratios to Average Net Assets F,H | | | | | |
Expenses before reductions | 1.00% | 1.00% | 1.00% | 1.00% | 1.00% A |
Expenses net of fee waivers, if any | 1.00% | 1.00% | 1.00% | 1.00% | 1.00% A |
Expenses net of all reductions | 1.00% | 1.00% | 1.00% | 1.00% | 1.00% A |
Net investment income (loss) | .60% | .78% | 1.37% | .69% | .56% A |
Supplemental Data | | | | | |
Net assets, end of period (000 omitted) | $ 4,612 | $ 4,089 | $ 2,231 | $ 2,476 | $ 776 |
Portfolio turnover rate | 32% | 14% | 18% | 22% | 16% A |
A Annualized
B Total returns for periods of less than one year are not annualized.
C Total returns would have been lower had certain expenses not been reduced during the periods shown.
D Total returns do not include the effect of the contingent deferred sales charge.
E Calculated based on average shares outstanding during the period.
F Amounts do not include the activity of the underlying funds.
G For the period June 1, 2006 (commencement of operations) to March 31, 2007.
H Expense ratios reflect operating expenses of the class. Expenses before reductions do not reflect amounts reimbursed by the investment adviser or reductions from expense offset arrangements and do not represent the amount paid by the class during periods when reimbursements or reductions occur. Expenses net of fee waivers reflect expenses after reimbursement by the investment adviser but prior to reductions from expense offset arrangements. Expenses net of all reductions represent the net expenses paid by the class but do not include expenses of the investment companies in which the Fund invests.
I Total distributions of $.19 per share is comprised of distributions from net investment income of $.058 and distributions from net realized gain of $.130 per share.
See accompanying notes which are an integral part of the financial statements.
Annual Report
Financial Highlights - Class C
Years ended March 31, | 2011 | 2010 | 2009 | 2008 | 2007 G |
Selected Per-Share Data | | | | | |
Net asset value, beginning of period | $ 8.76 | $ 5.82 | $ 10.32 | $ 11.01 | $ 10.00 |
Income from Investment Operations | | | | | |
Net investment income (loss) E | .05 | .06 | .11 | .08 | .05 |
Net realized and unrealized gain (loss) | 1.32 | 3.01 | (4.27) | (.58) | 1.06 |
Total from investment operations | 1.37 | 3.07 | (4.16) | (.50) | 1.11 |
Distributions from net investment income | (.06) | (.06) | (.08) | (.06) | (.05) |
Distributions from net realized gain | (.08) | (.07) | (.26) | (.13) | (.05) |
Total distributions | (.13) J | (.13) | (.34) | (.19) I | (.10) |
Net asset value, end of period | $ 10.00 | $ 8.76 | $ 5.82 | $ 10.32 | $ 11.01 |
Total Return B,C,D | 15.80% | 52.90% | (41.39)% | (4.74)% | 11.08% |
Ratios to Average Net Assets F,H | | | | | |
Expenses before reductions | 1.00% | 1.00% | 1.00% | 1.00% | 1.00% A |
Expenses net of fee waivers, if any | 1.00% | 1.00% | 1.00% | 1.00% | 1.00% A |
Expenses net of all reductions | 1.00% | 1.00% | 1.00% | 1.00% | 1.00% A |
Net investment income (loss) | .60% | .78% | 1.37% | .69% | .56% A |
Supplemental Data | | | | | |
Net assets, end of period (000 omitted) | $ 8,753 | $ 6,199 | $ 3,027 | $ 2,539 | $ 770 |
Portfolio turnover rate | 32% | 14% | 18% | 22% | 16% A |
A Annualized
B Total returns for periods of less than one year are not annualized.
C Total returns would have been lower had certain expenses not been reduced during the periods shown.
D Total returns do not include the effect of the contingent deferred sales charge.
E Calculated based on average shares outstanding during the period.
F Amounts do not include the activity of the underlying funds.
G For the period June 1, 2006 (commencement of operations) to March 31, 2007.
H Expense ratios reflect operating expenses of the class. Expenses before reductions do not reflect amounts reimbursed by the investment adviser or reductions from expense offset arrangements and do not represent the amount paid by the class during periods when reimbursements or reductions occur. Expenses net of fee waivers reflect expenses after reimbursement by the investment adviser but prior to reductions from expense offset arrangements. Expenses net of all reductions represent the net expenses paid by the class but do not include expenses of the investment companies in which the Fund invests.
I Total distributions of $.19 per share is comprised of distributions from net investment income of $.058 and distributions from net realized gain of $.130 per share.
J Total distributions of $.13 per share is comprised of distributions from net investment income of $.057 and distributions from net realized gain of $.076 per share.
Financial Highlights - Institutional Class
Years ended March 31, | 2011 | 2010 | 2009 | 2008 | 2007 G |
Selected Per-Share Data | | | | | |
Net asset value, beginning of period | $ 8.85 | $ 5.87 | $ 10.41 | $ 11.07 | $ 10.00 |
Income from Investment Operations | | | | | |
Net investment income (loss) D | .15 | .14 | .18 | .19 | .14 |
Net realized and unrealized gain (loss) | 1.32 | 3.04 | (4.30) | (.59) | 1.06 |
Total from investment operations | 1.47 | 3.18 | (4.12) | (.40) | 1.20 |
Distributions from net investment income | (.13) | (.13) | (.16) | (.13) | (.08) |
Distributions from net realized gain | (.08) | (.07) | (.26) | (.14) | (.05) |
Total distributions | (.21) | (.20) | (.42) | (.26) I | (.13) |
Net asset value, end of period | $ 10.11 | $ 8.85 | $ 5.87 | $ 10.41 | $ 11.07 |
Total Return B,C | 16.86% | 54.35% | (40.81)% | (3.82)% | 12.02% |
Ratios to Average Net Assets E,H | | | | | |
Expenses before reductions F | .00% | .00% | .00% | .00% | .00% A |
Expenses net of fee waivers, if any | .00% | .00% | .00% | .00% | .00% A |
Expenses net of all reductions | .00% | .00% | .00% | .00% | .00% A |
Net investment income (loss) | 1.60% | 1.78% | 2.37% | 1.68% | 1.56% A |
Supplemental Data | | | | | |
Net assets, end of period (000 omitted) | $ 83,240 | $ 32,842 | $ 12,078 | $ 6,631 | $ 629 |
Portfolio turnover rate | 32% | 14% | 18% | 22% | 16% A |
A Annualized
B Total returns for periods of less than one year are not annualized.
C Total returns would have been lower had certain expenses not been reduced during the periods shown.
D Calculated based on average shares outstanding during the period.
E Amounts do not include the activity of the underlying funds.
F Amount represents less than .01%.
G For the period June 1, 2006 (commencement of operations) to March 31, 2007.
H Expense ratios reflect operating expenses of the class. Expenses before reductions do not reflect amounts reimbursed by the investment adviser or reductions from expense offset arrangements and do not represent the amount paid by the class during periods when reimbursements or reductions occur. Expenses net of fee waivers reflect expenses after reimbursement by the investment adviser but prior to reductions from expense offset arrangements. Expenses net of all reductions represent the net expenses paid by the class but do not include expenses of the investment companies in which the Fund invests.
I Total distributions of $.26 per share is comprised of distributions from net investment income of $.126 and distributions from net realized gain of $.138 per share.
See accompanying notes which are an integral part of the financial statements.
Annual Report
Fidelity Advisor Freedom 2050 Fund
Investment Changes (Unaudited)
Fund Holdings as of March 31, 2011 |
| % of fund's
net assets | % of fund's net assets
6 months ago |
Commodity Funds | | |
Fidelity Series Commodity Strategy Fund | 9.9 | 8.6 |
Domestic Equity Funds | | |
Fidelity Advisor Equity Growth Fund Institutional Class | 5.6 | 5.9 |
Fidelity Advisor Equity Income Fund Institutional Class | 0.0 | 1.2 |
Fidelity Advisor Growth & Income Fund Institutional Class | 7.8 | 8.1 |
Fidelity Advisor Large Cap Fund Institutional Class | 7.8 | 8.0 |
Fidelity Advisor Small Cap Fund Institutional Class | 2.9 | 2.9 |
Fidelity Series 100 Index Fund | 6.7 | 6.4 |
Fidelity Series All-Sector Equity Fund | 11.2 | 11.4 |
Fidelity Series Large Cap Value Fund | 11.3 | 10.2 |
Fidelity Series Small Cap Opportunities Fund | 2.8 | 2.9 |
| 56.1 | 57.0 |
Developed International Equity Funds | | |
Fidelity Advisor Diversified International Fund Institutional Class | 3.3 | 4.7 |
Fidelity Advisor Overseas Fund Institutional Class | 3.3 | 4.7 |
Fidelity Series International Growth Fund | 6.2 | 5.1 |
Fidelity Series International Small Cap Fund | 1.2 | 1.0 |
Fidelity Series International Value Fund | 6.0 | 4.9 |
| 20.0 | 20.4 |
Emerging Markets Equity Funds | | |
Fidelity Series Emerging Markets Fund | 3.6 | 3.4 |
High Yield Bond Funds | | |
Fidelity Advisor High Income Advantage Fund Institutional Class | 0.0 | 9.9 |
Fidelity Series Emerging Markets Debt Fund | 0.1 | 0.0 |
Fidelity Series High Income Fund | 9.3 | 0.0 |
| 9.4 | 9.9 |
Investment Grade Bond Funds | | |
Fidelity Advisor Strategic Real Return Fund Institutional Class | 0.1 | 0.1 |
Fidelity Advisor Total Bond Fund Institutional Class | 0.0 | 0.0* |
Fidelity Series Investment Grade Bond Fund | 0.9 | 0.6 |
| 1.0 | 0.7 |
| | |
Net Other Assets (Liabilities)* | 0.0 | 0.0 |
| 100.0 | 100.0 |
* Amount represents less than 0.1% |
Asset Allocation (% of fund's net assets) |
Current |
| Commodity Funds | 9.9% | |
| Domestic Equity Funds | 56.1% | |
| Developed International Equity Funds | 20.0% | |
| Emerging Markets Equity Funds | 3.6% | |
| High Yield Bond Funds | 9.4% | |
| Investment Grade Bond Funds | 1.0% | |

Six months ago |
| Commodity Funds | 8.6% | |
| Domestic Equity Funds | 57.0% | |
| Developed International Equity Funds | 20.4% | |
| Emerging Markets Equity Funds | 3.4% | |
| High Yield Bond Funds | 9.9% | |
| Investment Grade Bond Funds | 0.7% | |

Expected |
| Commodity Funds | 9.7% | |
| Domestic Equity Funds | 55.0% | |
| Developed International Equity Funds | 20.0% | |
| Emerging Markets Equity Funds | 3.6% | |
| High Yield Bond Funds | 10.0% | |
| Investment Grade Bond Funds | 1.7% | |

The fund invests according to an asset allocation strategy that becomes increasingly conservative over time. The six months ago allocation is based on the fund's holdings as of September 30, 2010. The current allocation is based on the fund's holdings as of March 31, 2011. The expected allocation represents the fund's anticipated allocation at September 30, 2011. |
Annual Report
Fidelity Advisor Freedom 2050 Fund
Investments March 31, 2011
Showing Percentage of Net Assets
Domestic Equity Funds - 66.0% |
| Shares | | Value |
Commodity Funds - 9.9% |
Fidelity Series Commodity Strategy Fund | 2,716,092 | | $ 35,798,090 |
Domestic Equity Funds - 56.1% |
Fidelity Advisor Equity Growth Fund Institutional Class | 327,857 | | 20,376,284 |
Fidelity Advisor Growth & Income Fund Institutional Class | 1,571,715 | | 28,369,464 |
Fidelity Advisor Large Cap Fund Institutional Class | 1,424,776 | | 28,110,836 |
Fidelity Advisor Small Cap Fund Institutional Class | 374,358 | | 10,508,233 |
Fidelity Series 100 Index Fund | 2,647,456 | | 24,356,596 |
Fidelity Series All-Sector Equity Fund | 3,108,420 | | 40,751,384 |
Fidelity Series Large Cap Value Fund | 3,361,442 | | 41,043,208 |
Fidelity Series Small Cap Opportunities Fund | 873,271 | | 10,295,866 |
TOTAL DOMESTIC EQUITY FUNDS | | 203,811,871 |
TOTAL DOMESTIC EQUITY FUNDS (Cost $199,831,566) | 239,609,961 |
International Equity Funds - 23.6% |
| | | |
Developed International Equity Funds - 20.0% |
Fidelity Advisor Diversified International Fund Institutional Class | 711,305 | | 11,957,032 |
Fidelity Advisor Overseas Fund Institutional Class | 621,021 | | 11,818,023 |
Fidelity Series International Growth Fund | 1,956,973 | | 22,524,759 |
Fidelity Series International Small Cap Fund | 354,707 | | 4,377,080 |
Fidelity Series International Value Fund | 2,082,798 | | 21,848,550 |
TOTAL DEVELOPED INTERNATIONAL EQUITY FUNDS | | 72,525,444 |
|
| Shares | | Value |
Emerging Markets Equity Funds - 3.6% |
Fidelity Series Emerging Markets Fund | 694,888 | | $ 13,314,059 |
TOTAL INTERNATIONAL EQUITY FUNDS (Cost $72,046,035) | 85,839,503 |
Bond Funds - 10.4% |
| | | |
High Yield Bond Funds - 9.4% |
Fidelity Series Emerging Markets Debt Fund | 48,885 | | 489,053 |
Fidelity Series High Income Fund | 3,365,147 | | 33,718,776 |
TOTAL HIGH YIELD BOND FUNDS | | 34,207,829 |
Investment Grade Bond Funds - 1.0% |
Fidelity Advisor Strategic Real Return Fund Institutional Class | 43,522 | | 430,867 |
Fidelity Series Investment Grade Bond Fund | 279,890 | | 3,185,152 |
TOTAL INVESTMENT GRADE BOND FUNDS | | 3,616,019 |
TOTAL BOND FUNDS (Cost $37,675,727) | 37,823,848 |
TOTAL INVESTMENT PORTFOLIO - 100.0% (Cost $309,553,328) | | 363,273,312 |
NET OTHER ASSETS (LIABILITIES) - 0.0% | | (27,016) |
NET ASSETS - 100% | $ 363,246,296 |
Other Information |
All investments are categorized as Level 1 under the Fair Value Hierarchy. The inputs or methodology used for valuing securities may not be an indication of the risk associated with investing in those securities. For more information on valuation inputs, please refer to the Security Valuation section in the accompanying Notes to Financial Statements. |
Income Tax Information |
At March 31, 2011, the Fund had a capital loss carryforward of approximately $9,460,678 of which $7,387,590 and $2,073,088 will expire in fiscal 2017 and 2019, respectively. Capital loss carryforwards are only available to offset future capital gains of the Fund to the extent provided by regulations and may be limited. |
See accompanying notes which are an integral part of the financial statements.
Annual Report
Fidelity Advisor Freedom 2050 Fund
Statement of Assets and Liabilities
| March 31, 2011 |
Assets | | |
Investment in securities, at value (cost $309,553,328) - See accompanying schedule | | $ 363,273,312 |
Receivable for investments sold | | 58,053 |
Receivable for fund shares sold | | 1,159,908 |
Distributions receivable from underlying funds | | 59,428 |
Total assets | | 364,550,701 |
| | |
Liabilities | | |
Payable to custodian bank | $ 6 | |
Payable for investments purchased | 490,051 | |
Payable for fund shares redeemed | 727,907 | |
Distribution and service plan fees payable | 86,441 | |
Total liabilities | | 1,304,405 |
| | |
Net Assets | | $ 363,246,296 |
Net Assets consist of: | | |
Paid in capital | | $ 319,648,808 |
Undistributed net investment income | | 187,172 |
Accumulated undistributed net realized gain (loss) on investments | | (10,309,668) |
Net unrealized appreciation (depreciation) on investments | | 53,719,984 |
Net Assets | | $ 363,246,296 |
| | |
Calculation of Maximum Offering Price Class A:
Net Asset Value and redemption price per share ($220,548,765 ÷ 22,204,534 shares) | | $ 9.93 |
| | |
Maximum offering price per share (100/94.25 of $9.93) | | $ 10.54 |
Class T:
Net Asset Value and redemption price per share ($61,195,440 ÷ 6,179,564 shares) | | $ 9.90 |
| | |
Maximum offering price per share (100/96.50 of $9.90) | | $ 10.26 |
Class B:
Net Asset Value and offering price per share ($6,703,624 ÷ 680,117 shares)A | | $ 9.86 |
| | |
Class C:
Net Asset Value and offering price per share ($12,013,802 ÷ 1,217,571 shares)A | | $ 9.87 |
| | |
Institutional Class:
Net Asset Value, offering price and redemption price per share ($62,784,665 ÷ 6,294,954 shares) | | $ 9.97 |
A Redemption price per share is equal to net asset value less any applicable contingent deferred sales charge.
Statement of Operations
| Year ended March 31, 2011 |
Investment Income | | |
Income distributions from underlying funds | | $ 4,207,967 |
| | |
Expenses | | |
Distribution and service plan fees | $ 843,917 | |
Independent trustees' compensation | 1,013 | |
Total expenses before reductions | 844,930 | |
Expense reductions | (1,013) | 843,917 |
Net investment income (loss) | | 3,364,050 |
Realized and Unrealized Gain (Loss) Realized gain (loss) on sale of underlying fund shares | (3,912,355) | |
Capital gain distributions from underlying funds | 6,619,448 | |
Total net realized gain (loss) | | 2,707,093 |
Change in net unrealized appreciation (depreciation) on underlying funds | | 43,618,643 |
Net gain (loss) | | 46,325,736 |
Net increase (decrease) in net assets resulting from operations | | $ 49,689,786 |
See accompanying notes which are an integral part of the financial statements.
Annual Report
Statement of Changes in Net Assets
| Year ended
March 31,
2011 | Year ended
March 31,
2010 |
Increase (Decrease) in Net Assets | | |
Operations | | |
Net investment income (loss) | $ 3,364,050 | $ 2,390,969 |
Net realized gain (loss) | 2,707,093 | 234,035 |
Change in net unrealized appreciation (depreciation) | 43,618,643 | 64,796,791 |
Net increase (decrease) in net assets resulting from operations | 49,689,786 | 67,421,795 |
Distributions to shareholders from net investment income | (3,328,255) | (2,382,215) |
Distributions to shareholders from net realized gain | (2,446,029) | (1,702,157) |
Total distributions | (5,774,284) | (4,084,372) |
Share transactions - net increase (decrease) | 79,457,808 | 74,234,725 |
Total increase (decrease) in net assets | 123,373,310 | 137,572,148 |
| | |
Net Assets | | |
Beginning of period | 239,872,986 | 102,300,838 |
End of period (including undistributed net investment income of $187,172 and undistributed net investment income of $151,377, respectively) | $ 363,246,296 | $ 239,872,986 |
Financial Highlights - Class A
Years ended March 31, | 2011 | 2010 | 2009 | 2008 | 2007 G |
Selected Per-Share Data | | | | | |
Net asset value, beginning of period | $ 8.66 | $ 5.67 | $ 10.32 | $ 11.04 | $ 10.00 |
Income from Investment Operations | | | | | |
Net investment income (loss) E | .11 | .11 | .16 | .16 | .13 |
Net realized and unrealized gain (loss) | 1.34 | 3.05 | (4.39) | (.60) | 1.06 |
Total from investment operations | 1.45 | 3.16 | (4.23) | (.44) | 1.19 |
Distributions from net investment income | (.11) | (.10) | (.13) | (.11) | (.09) |
Distributions from net realized gain | (.08) | (.07) | (.30) | (.17) | (.06) |
Total distributions | (.18) J | (.17) | (.42) I | (.28) | (.15) |
Net asset value, end of period | $ 9.93 | $ 8.66 | $ 5.67 | $ 10.32 | $ 11.04 |
Total Return B,C,D | 16.99% | 55.94% | (42.30)% | (4.27)% | 11.91% |
Ratios to Average Net Assets F,H | | | | | |
Expenses before reductions | .25% | .25% | .25% | .25% | .25% A |
Expenses net of fee waivers, if any | .25% | .25% | .25% | .25% | .25% A |
Expenses net of all reductions | .25% | .25% | .25% | .25% | .25% A |
Net investment income (loss) | 1.23% | 1.43% | 2.04% | 1.39% | 1.45% A |
Supplemental Data | | | | | |
Net assets, end of period (000 omitted) | $ 220,549 | $ 137,716 | $ 57,591 | $ 55,250 | $ 12,907 |
Portfolio turnover rate | 36% | 15% | 16% | 25% | 4% A |
A Annualized
B Total returns for periods of less than one year are not annualized.
C Total returns would have been lower had certain expenses not been reduced during the periods shown.
D Total returns do not include the effect of the sales charges.
E Calculated based on average shares outstanding during the period.
F Amounts do not include the activity of the underlying funds.
G For the period June 1, 2006 (commencement of operations) to March 31, 2007.
H Expense ratios reflect operating expenses of the class. Expenses before reductions do not reflect amounts reimbursed by the investment adviser or reductions from expense offset arrangements and do not represent the amount paid by the class during periods when reimbursements or reductions occur. Expenses net of fee waivers reflect expenses after reimbursement by the investment adviser but prior to reductions from expense offset arrangements. Expenses net of all reductions represent the net expenses paid by the class but do not include expenses of the investment companies in which the Fund invests.
I Total distributions of $.42 per share is comprised of distributions from net investment income of $.127 and distributions from net realized gain of $.295 per share.
J Total distributions of $.18 per share is comprised of distributions from net investment income of $.105 and distributions from net realized gain of $.079 per share.
See accompanying notes which are an integral part of the financial statements.
Annual Report
Financial Highlights - Class T
Years ended March 31, | 2011 | 2010 | 2009 | 2008 | 2007 G |
Selected Per-Share Data | | | | | |
Net asset value, beginning of period | $ 8.64 | $ 5.66 | $ 10.30 | $ 11.02 | $ 10.00 |
Income from Investment Operations | | | | | |
Net investment income (loss) E | .09 | .09 | .14 | .13 | .11 |
Net realized and unrealized gain (loss) | 1.33 | 3.05 | (4.37) | (.59) | 1.05 |
Total from investment operations | 1.42 | 3.14 | (4.23) | (.46) | 1.16 |
Distributions from net investment income | (.09) | (.09) | (.11) | (.09) | (.08) |
Distributions from net realized gain | (.08) | (.07) | (.30) | (.17) | (.06) |
Total distributions | (.16) J | (.16) | (.41) I | (.26) | (.14) |
Net asset value, end of period | $ 9.90 | $ 8.64 | $ 5.66 | $ 10.30 | $ 11.02 |
Total Return B,C,D | 16.66% | 55.57% | (42.41)% | (4.45)% | 11.64% |
Ratios to Average Net Assets F,H | | | | | |
Expenses before reductions | .50% | .50% | .50% | .50% | .50% A |
Expenses net of fee waivers, if any | .50% | .50% | .50% | .50% | .50% A |
Expenses net of all reductions | .50% | .50% | .50% | .50% | .50% A |
Net investment income (loss) | .98% | 1.18% | 1.79% | 1.14% | 1.20% A |
Supplemental Data | | | | | |
Net assets, end of period (000 omitted) | $ 61,195 | $ 46,449 | $ 21,186 | $ 15,147 | $ 3,520 |
Portfolio turnover rate | 36% | 15% | 16% | 25% | 4% A |
A Annualized
B Total returns for periods of less than one year are not annualized.
C Total returns would have been lower had certain expenses not been reduced during the periods shown.
D Total returns do not include the effect of the sales charges.
E Calculated based on average shares outstanding during the period.
F Amounts do not include the activity of the underlying funds.
G For the period June 1, 2006 (commencement of operations) to March 31, 2007.
H Expense ratios reflect operating expenses of the class. Expenses before reductions do not reflect amounts reimbursed by the investment adviser or reductions from expense offset arrangements and do not represent the amount paid by the class during periods when reimbursements or reductions occur. Expenses net of fee waivers reflect expenses after reimbursement by the investment adviser but prior to reductions from expense offset arrangements. Expenses net of all reductions represent the net expenses paid by the class but do not include expenses of the investment companies in which the Fund invests.
I Total distributions of $.41 per share is comprised of distributions from net investment income of $.112 and distributions from net realized gain of $.295 per share.
J Total distributions of $.16 per share is comprised of distributions from net investment income of $.085 and distributions from net realized gain of $.079 per share.
Financial Highlights - Class B
Years ended March 31, | 2011 | 2010 | 2009 | 2008 | 2007 G |
Selected Per-Share Data | | | | | |
Net asset value, beginning of period | $ 8.60 | $ 5.64 | $ 10.26 | $ 11.00 | $ 10.00 |
Income from Investment Operations | | | | | |
Net investment income (loss) E | .04 | .05 | .10 | .07 | .06 |
Net realized and unrealized gain (loss) | 1.34 | 3.03 | (4.35) | (.59) | 1.07 |
Total from investment operations | 1.38 | 3.08 | (4.25) | (.52) | 1.13 |
Distributions from net investment income | (.05) | (.05) | (.08) | (.06) | (.07) |
Distributions from net realized gain | (.07) | (.07) | (.29) | (.16) | (.06) |
Total distributions | (.12) | (.12) | (.37) I | (.22) | (.13) |
Net asset value, end of period | $ 9.86 | $ 8.60 | $ 5.64 | $ 10.26 | $ 11.00 |
Total Return B,C,D | 16.16% | 54.72% | (42.71)% | (4.93)% | 11.31% |
Ratios to Average Net Assets F,H | | | | | |
Expenses before reductions | 1.00% | 1.00% | 1.00% | 1.00% | 1.00% A |
Expenses net of fee waivers, if any | 1.00% | 1.00% | 1.00% | 1.00% | 1.00% A |
Expenses net of all reductions | 1.00% | 1.00% | 1.00% | 1.00% | 1.00% A |
Net investment income (loss) | .48% | .68% | 1.29% | .64% | .70% A |
Supplemental Data | | | | | |
Net assets, end of period (000 omitted) | $ 6,704 | $ 5,847 | $ 3,078 | $ 3,414 | $ 1,177 |
Portfolio turnover rate | 36% | 15% | 16% | 25% | 4% A |
A Annualized
B Total returns for periods of less than one year are not annualized.
C Total returns would have been lower had certain expenses not been reduced during the periods shown.
D Total returns do not include the effect of the contingent deferred sales charge.
E Calculated based on average shares outstanding during the period.
F Amounts do not include the activity of the underlying funds.
G For the period June 1, 2006 (commencement of operations) to March 31, 2007.
H Expense ratios reflect operating expenses of the class. Expenses before reductions do not reflect amounts reimbursed by the investment adviser or reductions from expense offset arrangements and do not represent the amount paid by the class during periods when reimbursements or reductions occur. Expenses net of fee waivers reflect expenses after reimbursement by the investment adviser but prior to reductions from expense offset arrangements. Expenses net of all reductions represent the net expenses paid by the class but do not include expenses of the investment companies in which the Fund invests.
I Total distributions of $.37 per share is comprised of distributions from net investment income of $.078 and distributions from net realized gain of $.290 per share.
See accompanying notes which are an integral part of the financial statements.
Annual Report
Financial Highlights - Class C
Years ended March 31, | 2011 | 2010 | 2009 | 2008 | 2007 G |
Selected Per-Share Data | | | | | |
Net asset value, beginning of period | $ 8.61 | $ 5.63 | $ 10.25 | $ 11.00 | $ 10.00 |
Income from Investment Operations | | | | | |
Net investment income (loss) E | .04 | .05 | .10 | .07 | .06 |
Net realized and unrealized gain (loss) | 1.34 | 3.05 | (4.35) | (.59) | 1.06 |
Total from investment operations | 1.38 | 3.10 | (4.25) | (.52) | 1.12 |
Distributions from net investment income | (.05) | (.05) | (.08) | (.07) | (.06) |
Distributions from net realized gain | (.07) | (.07) | (.29) | (.16) | (.06) |
Total distributions | (.12) | (.12) | (.37) I | (.23) | (.12) |
Net asset value, end of period | $ 9.87 | $ 8.61 | $ 5.63 | $ 10.25 | $ 11.00 |
Total Return B,C,D | 16.16% | 55.15% | (42.74)% | (4.99)% | 11.25% |
Ratios to Average Net Assets F,H | | | | | |
Expenses before reductions | 1.00% | 1.00% | 1.00% | 1.00% | 1.00% A |
Expenses net of fee waivers, if any | 1.00% | 1.00% | 1.00% | 1.00% | 1.00% A |
Expenses net of all reductions | 1.00% | 1.00% | 1.00% | 1.00% | 1.00% A |
Net investment income (loss) | .48% | .68% | 1.29% | .64% | .70% A |
Supplemental Data | | | | | |
Net assets, end of period (000 omitted) | $ 12,014 | $ 9,646 | $ 5,436 | $ 5,380 | $ 1,507 |
Portfolio turnover rate | 36% | 15% | 16% | 25% | 4% A |
A Annualized
B Total returns for periods of less than one year are not annualized.
C Total returns would have been lower had certain expenses not been reduced during the periods shown.
D Total returns do not include the effect of the contingent deferred sales charge.
E Calculated based on average shares outstanding during the period.
F Amounts do not include the activity of the underlying funds.
G For the period June 1, 2006 (commencement of operations) to March 31, 2007.
H Expense ratios reflect operating expenses of the class. Expenses before reductions do not reflect amounts reimbursed by the investment adviser or reductions from expense offset arrangements and do not represent the amount paid by the class during periods when reimbursements or reductions occur. Expenses net of fee waivers reflect expenses after reimbursement by the investment adviser but prior to reductions from expense offset arrangements. Expenses net of all reductions represent the net expenses paid by the class but do not include expenses of the investment companies in which the Fund invests.
I Total distributions of $.37 per share is comprised of distributions from net investment income of $.080 and distributions from net realized gain of $.290 per share.
Financial Highlights - Institutional Class
Years ended March 31, | 2011 | 2010 | 2009 | 2008 | 2007 G |
Selected Per-Share Data | | | | | |
Net asset value, beginning of period | $ 8.70 | $ 5.68 | $ 10.35 | $ 11.06 | $ 10.00 |
Income from Investment Operations | | | | | |
Net investment income (loss) D | .13 | .13 | .17 | .18 | .15 |
Net realized and unrealized gain (loss) | 1.34 | 3.08 | (4.40) | (.59) | 1.06 |
Total from investment operations | 1.47 | 3.21 | (4.23) | (.41) | 1.21 |
Distributions from net investment income | (.13) | (.12) | (.15) | (.13) | (.09) |
Distributions from net realized gain | (.08) | (.07) | (.30) | (.17) | (.06) |
Total distributions | (.20) J | (.19) | (.44) I | (.30) | (.15) |
Net asset value, end of period | $ 9.97 | $ 8.70 | $ 5.68 | $ 10.35 | $ 11.06 |
Total Return B,C | 17.17% | 56.66% | (42.22)% | (4.02)% | 12.16% |
Ratios to Average Net Assets E,H | | | | | |
Expenses before reductions F | .00% | .00% | .00% | .00% | .00% A |
Expenses net of fee waivers, if any | .00% | .00% | .00% | .00% | .00% A |
Expenses net of all reductions | .00% | .00% | .00% | .00% | .00% A |
Net investment income (loss) | 1.48% | 1.68% | 2.29% | 1.64% | 1.70% A |
Supplemental Data | | | | | |
Net assets, end of period (000 omitted) | $ 62,785 | $ 40,214 | $ 15,010 | $ 6,882 | $ 982 |
Portfolio turnover rate | 36% | 15% | 16% | 25% | 4% A |
A Annualized
B Total returns for periods of less than one year are not annualized.
C Total returns would have been lower had certain expenses not been reduced during the periods shown.
D Calculated based on average shares outstanding during the period.
E Amounts do not include the activity of the underlying funds.
F Amount represents less than .01%.
G For the period June 1, 2006 (commencement of operations) to March 31, 2007.
H Expense ratios reflect operating expenses of the class. Expenses before reductions do not reflect amounts reimbursed by the investment adviser or reductions from expense offset arrangements and do not represent the amount paid by the class during periods when reimbursements or reductions occur. Expenses net of fee waivers reflect expenses after reimbursement by the investment adviser but prior to reductions from expense offset arrangements. Expenses net of all reductions represent the net expenses paid by the class but do not include expenses of the investment companies in which the Fund invests.
I Total distributions of $.44 per share is comprised of distributions from net investment income of $.146 and distributions from net realized gain of $.295 per share.
J Total distributions of $.20 per share is comprised of distributions from net investment income of $.125 and distributions from net realized gain of $.079 per share.
See accompanying notes which are an integral part of the financial statements.
Annual Report
Notes to Financial Statements
For the period ended March 31, 2011
1. Organization.
Fidelity Advisor Freedom Income Fund, Fidelity Advisor Freedom 2005 Fund, Fidelity Advisor Freedom 2010 Fund, Fidelity Advisor Freedom 2015 Fund, Fidelity Advisor Freedom 2020 Fund, Fidelity Advisor Freedom 2025 Fund, Fidelity Advisor Freedom 2030 Fund, Fidelity Advisor Freedom 2035 Fund, Fidelity Advisor Freedom 2040 Fund, Fidelity Advisor Freedom 2045 Fund and Fidelity Advisor Freedom 2050 Fund (the Funds) are funds of Fidelity Aberdeen Street Trust (the Trust). The Trust is registered under the Investment Company Act of 1940, as amended (the 1940 Act), as an open-end management investment company organized as a Delaware statutory trust. Each Fund is authorized to issue an unlimited number of shares. The Funds invest primarily in a combination of other Fidelity equity, bond, and short-term funds (the Underlying Funds) managed by Fidelity Management & Research Company (FMR).
Each Fund offers Class A, Class T, Class C, and Institutional Class shares, each of which, along with Class B shares, has equal rights as to assets and voting privileges. Effective after the close of business on September 1, 2010, Class B shares were closed to new accounts and additional purchases by existing shareholders. Each class has exclusive voting rights with respect to matters that affect that class. Class B shares will automatically convert to Class A shares after a holding period of seven years from the initial date of purchase. Investment income, realized and unrealized capital gains and losses, the common expenses of the Fund, and certain fund-level expense reductions, if any, are allocated on a pro-rata basis to each class based on the relative net assets of each class to the total net assets of the Fund. Each class differs with respect to distribution and service plan fees incurred. Certain expense reductions may also differ by class.
2. Significant Accounting Policies.
The financial statements have been prepared in conformity with accounting principles generally accepted in the United States of America (GAAP), which require management to make certain estimates and assumptions at the date of the financial statements. Actual results could differ from those estimates. Subsequent events, if any, through the date that the financial statements were issued have been evaluated in the preparation of the financial statements. The following summarizes the significant accounting policies of the Funds:
Security Valuation. Investments are valued as of 4:00 p.m. Eastern time on the last calendar day of the period. Each Fund categorizes the inputs to valuation techniques used to value their investments into a disclosure hierarchy consisting of three levels as shown below.
Level 1 - quoted prices in active markets for identical investments
Level 2 - other significant observable inputs (including quoted prices for similar investments, interest rates, prepayment speeds, etc.)
Level 3 - unobservable inputs (including the Fund's own assumptions based on the best information available)
Valuation techniques used to value each Fund's investments by major category are as follows. Investments in the Underlying Funds are valued at their closing net asset value (NAV) each business day and are categorized as Level 1 in the hierarchy.
Investment Transactions and Income. For financial reporting purposes, the Funds' investment holdings and NAV include trades executed through the end of the last business day of the period. The NAV per share for processing shareholder transactions is calculated as of the close of business of the New York Stock Exchange (NYSE), normally 4:00 p.m. Eastern time and includes trades executed through the end of the prior business day. Gains and losses on securities sold are determined on the basis of identified cost. Income and capital gain distributions from the Underlying Funds, if any, are recorded on the ex-dividend date.
Expenses. Expenses directly attributable to a fund are charged to that fund. Expenses attributable to more than one fund are allocated among the respective funds on the basis of relative net assets or other appropriate methods. Expenses included in the accompanying financial statements reflect the expenses of the Fund and do not include any expenses associated with the Underlying Funds. Expense estimates are accrued in the period to which they relate and adjustments are made when actual amounts are known.
Income Tax Information and Distributions to Shareholders. Each year each Fund intends to qualify as a regulated investment company, including distributing substantially all of its taxable income and realized gains under Subchapter M of the Internal Revenue Code and filing its U.S. federal tax return. As a result, no provision for income taxes is required. As of March 31, 2011, each Fund did not have any unrecognized tax benefits in the accompanying financial statements. A fund's federal tax return is subject to examination by the Internal Revenue Service (IRS) for a period of three years.
Distributions are declared and recorded on the ex-dividend date. Income dividends and capital gain distributions are declared separately for each class. Income and capital gain distributions are determined in accordance with income tax regulations, which may differ from GAAP.
Capital accounts within the financial statements are adjusted for permanent book-tax differences. These adjustments have no impact on net assets or the results of operations. Temporary book-tax differences will reverse in a subsequent period.
Book-tax differences are primarily due to the short-term gain distributions from the Underlying Funds, capital loss carryforwards, losses deferred due to wash sales and excise tax regulations.
Annual Report
2. Significant Accounting Policies - continued
Income Tax Information and Distributions to Shareholders - continued
The federal tax cost of investment securities and unrealized appreciation (depreciation) as of period end were as follows for each Fund:
| Tax cost | Gross unrealized
appreciation | Gross unrealized
depreciation | Net unrealized
appreciation
(depreciation) on
securities and other investments |
Advisor Freedom Income | $ 254,450,368 | $ 15,097,830 | $ (1,240,748) | $ 13,857,082 |
Advisor Freedom 2005 | 226,308,879 | 20,131,453 | (1,272,852) | 18,858,601 |
Advisor Freedom 2010 | 778,578,042 | 90,826,046 | (4,039,480) | 86,786,566 |
Advisor Freedom 2015 | 1,436,244,493 | 155,840,261 | (8,965,214) | 146,875,047 |
Advisor Freedom 2020 | 2,224,605,313 | 299,202,650 | (13,307,205) | 285,895,445 |
Advisor Freedom 2025 | 1,705,974,556 | 240,668,240 | (13,112,504) | 227,555,736 |
Advisor Freedom 2030 | 1,851,836,312 | 287,784,237 | (13,194,454) | 274,589,783 |
Advisor Freedom 2035 | 1,185,450,526 | 185,165,695 | (11,295,557) | 173,870,138 |
Advisor Freedom 2040 | 1,367,918,465 | 142,699,638 | (39,550,294) | 103,149,344 |
Advisor Freedom 2045 | 413,532,657 | 67,404,862 | (3,311,035) | 64,093,827 |
Advisor Freedom 2050 | 311,154,330 | 54,934,408 | (2,815,426) | 52,118,982 |
The tax-based components of distributable earnings as of period end were as follows for each Fund:
| Undistributed
ordinary
income | Capital loss
carryforward | Net unrealized
appreciation
(depreciation) |
Advisor Freedom Income | $ 334,390 | $ (1,843,340) | $ 13,857,082 |
Advisor Freedom 2005 | 636,273 | (10,668,320) | 18,858,601 |
Advisor Freedom 2010 | 2,367,300 | (64,568,962) | 86,786,566 |
Advisor Freedom 2015 | 4,390,617 | (70,260,528) | 146,875,047 |
Advisor Freedom 2020 | 7,072,019 | (159,878,472) | 285,895,445 |
Advisor Freedom 2025 | 5,717,870 | (94,931,344) | 227,555,736 |
Advisor Freedom 2030 | 6,275,538 | (151,905,233) | 274,589,783 |
Advisor Freedom 2035 | 3,654,464 | (65,938,206) | 173,870,138 |
Advisor Freedom 2040 | 3,985,437 | (8,343,013) | 103,149,344 |
Advisor Freedom 2045 | 1,352,912 | (4,711,973) | 64,093,827 |
Advisor Freedom 2050 | 939,183 | (9,460,678) | 52,118,982 |
The tax character of distributions paid was as follows:
March 31, 2011 | |
| Ordinary Income |
Advisor Freedom Income | $ 5,222,539 |
Advisor Freedom 2005 | 4,810,358 |
Advisor Freedom 2010 | 18,506,535 |
Advisor Freedom 2015 | 32,043,769 |
Advisor Freedom 2020 | 51,822,133 |
Advisor Freedom 2025 | 37,582,515 |
Advisor Freedom 2030 | 41,392,908 |
Advisor Freedom 2035 | 23,707,899 |
Advisor Freedom 2040 | 26,640,038 |
Advisor Freedom 2045 | 7,820,796 |
Advisor Freedom 2050 | 5,774,284 |
Annual Report
Notes to Financial Statements - continued
2. Significant Accounting Policies - continued
Income Tax Information and Distributions to Shareholders - continued
March 31, 2010 | |
| Ordinary Income |
Advisor Freedom Income | $ 5,386,214 |
Advisor Freedom 2005 | 4,599,553 |
Advisor Freedom 2010 | 21,195,098 |
Advisor Freedom 2015 | 30,068,389 |
Advisor Freedom 2020 | 46,813,378 |
Advisor Freedom 2025 | 30,807,178 |
Advisor Freedom 2030 | 32,895,819 |
Advisor Freedom 2035 | 17,729,224 |
Advisor Freedom 2040 | 22,536,795 |
Advisor Freedom 2045 | 5,084,127 |
Advisor Freedom 2050 | 4,084,372 |
3. Purchases and Sales of Investments.
Purchases and redemptions of the Underlying Fund shares are noted in the table below.
| Purchases ($) | Redemptions ($) |
Advisor Freedom Income | 112,241,847 | 87,997,563 |
Advisor Freedom 2005 | 110,153,598 | 91,226,065 |
Advisor Freedom 2010 | 334,992,248 | 364,901,354 |
Advisor Freedom 2015 | 623,143,997 | 455,099,699 |
Advisor Freedom 2020 | 1,042,257,096 | 854,948,802 |
Advisor Freedom 2025 | 833,754,838 | 542,793,719 |
Advisor Freedom 2030 | 903,340,959 | 688,923,630 |
Advisor Freedom 2035 | 582,068,528 | 331,050,185 |
Advisor Freedom 2040 | 607,219,512 | 487,507,973 |
Advisor Freedom 2045 | 251,554,644 | 115,106,534 |
Advisor Freedom 2050 | 186,927,428 | 103,293,661 |
4. Fees and Other Transactions with Affiliates.
Management Fee. Strategic Advisers, Inc. (Strategic Advisers), an affiliate of FMR, provides the Funds with investment management related services. The Funds do not pay any fees for these services.
Other Transactions. Strategic Advisers has entered into an administration agreement with FMR under which FMR provides management and administrative services (other than investment advisory services) necessary for the operation of each Fund. Pursuant to this agreement, FMR pays all expenses of each Fund, excluding the distribution and service fees, the compensation of the independent Trustees and certain other expenses such as interest expense. FMR also contracts with other Fidelity companies to perform the services necessary for the operation of each Fund. The Funds do not pay any fees for these services.
Distribution and Service Plan Fees. In accordance with Rule 12b-1 of the 1940 Act, the Fund has adopted separate Distribution and Service Plans for each class of shares. Certain classes pay Fidelity Distributors Corporation (FDC), an affiliate of FMR, separate Distribution and Service Fees, each of which is based on an annual percentage of each class' average net assets. In addition, FDC may pay financial intermediaries for selling shares of the Fund and providing shareholder support services. For the period, the Distribution and Service Fee rates, total fees and amounts retained by FDC were as follows:
Advisor Freedom Income | Distribution
Fee | Service
Fee | Paid to
FDC | Retained by
FDC |
Class A | 0% | .25% | $ 382,574 | $ 43,037 |
Class T | .25% | .25% | 280,121 | 105 |
Class B | .75% | .25% | 48,114 | 36,104 |
Class C | .75% | .25% | 163,202 | 29,930 |
| | | $ 874,011 | $ 109,176 |
Annual Report
4. Fees and Other Transactions with Affiliates - continued
Distribution and Service Plan Fees - continued
Advisor Freedom 2005 | Distribution
Fee | Service
Fee | Paid to
FDC | Retained by
FDC |
Class A | 0% | .25% | $ 403,820 | $ 78,774 |
Class T | .25% | .25% | 108,138 | 307 |
Class B | .75% | .25% | 27,356 | 20,591 |
Class C | .75% | .25% | 90,452 | 8,045 |
| | | $ 629,766 | $ 107,717 |
Advisor Freedom 2010 | | | | |
Class A | 0% | .25% | $ 1,229,508 | $ 179,315 |
Class T | .25% | .25% | 868,770 | 1,831 |
Class B | .75% | .25% | 195,879 | 147,126 |
Class C | .75% | .25% | 448,912 | 37,957 |
| | | $ 2,743,069 | $ 366,229 |
Advisor Freedom 2015 | | | | |
Class A | 0% | .25% | $ 2,213,927 | $ 316,727 |
Class T | .25% | .25% | 1,140,560 | 536 |
Class B | .75% | .25% | 346,317 | 260,025 |
Class C | .75% | .25% | 657,478 | 72,664 |
| | | $ 4,358,282 | $ 649,952 |
Advisor Freedom 2020 | | | | |
Class A | 0% | .25% | $ 3,358,253 | $ 477,829 |
Class T | .25% | .25% | 2,215,736 | 3,050 |
Class B | .75% | .25% | 677,849 | 508,590 |
Class C | .75% | .25% | 954,354 | 109,582 |
| | | $ 7,206,192 | $ 1,099,051 |
Advisor Freedom 2025 | | | | |
Class A | 0% | .25% | $ 2,740,976 | $ 420,238 |
Class T | .25% | .25% | 1,190,671 | 1,713 |
Class B | .75% | .25% | 385,064 | 289,034 |
Class C | .75% | .25% | 552,258 | 71,282 |
| | | $ 4,868,969 | $ 782,267 |
Advisor Freedom 2030 | | | | |
Class A | 0% | .25% | $ 2,826,119 | $ 385,731 |
Class T | .25% | .25% | 1,769,944 | 2,008 |
Class B | .75% | .25% | 494,486 | 371,175 |
Class C | .75% | .25% | 635,285 | 74,027 |
| | | $ 5,725,834 | $ 832,941 |
Advisor Freedom 2035 | | | | |
Class A | 0% | .25% | $ 1,862,832 | $ 288,617 |
Class T | .25% | .25% | 763,441 | 641 |
Class B | .75% | .25% | 273,842 | 205,546 |
Class C | .75% | .25% | 321,980 | 46,619 |
| | | $ 3,222,095 | $ 541,423 |
Advisor Freedom 2040 | | | | |
Class A | 0% | .25% | $ 1,825,053 | $ 200,826 |
Class T | .25% | .25% | 1,392,188 | 4,373 |
Class B | .75% | .25% | 422,918 | 317,439 |
Class C | .75% | .25% | 542,607 | 63,801 |
| | | $ 4,182,766 | $ 586,439 |
Advisor Freedom 2045 | | | | |
Class A | 0% | .25% | $ 619,875 | $ 100,625 |
Class T | .25% | .25% | 251,216 | 613 |
Class B | .75% | .25% | 42,478 | 31,889 |
Class C | .75% | .25% | 72,843 | 15,531 |
| | | $ 986,412 | $ 148,658 |
Annual Report
Notes to Financial Statements - continued
4. Fees and Other Transactions with Affiliates - continued
Distribution and Service Plan Fees - continued
Advisor Freedom 2050 | Distribution
Fee | Service
Fee | Paid to
FDC | Retained by
FDC |
Class A | 0% | .25% | $ 421,189 | $ 41,252 |
Class T | .25% | .25% | 257,576 | 123 |
Class B | .75% | .25% | 61,496 | 46,168 |
Class C | .75% | .25% | 103,656 | 20,163 |
| | | $ 843,917 | $ 107,706 |
Sales Load. FDC may receive a front-end sales charge of up to 5.75% for selling Class A shares, and 3.50% for selling Class T shares, some of which is paid to financial intermediaries for selling shares of the Fund. Depending on the holding period, FDC may receive contingent deferred sales charges levied on Class A, Class T, Class B, and Class C redemptions. The deferred sales charges range from 5% to 1% for Class B, 1% for Class C, 1.00% for certain purchases of Class A shares (1.00% to .50% prior to July 12, 2010) and .25% for certain purchases of Class T shares.
For the period, sales charge amounts retained by FDC were as follows:
Advisor Freedom Income | Retained
by FDC |
Class A | $ 15,037 |
Class T | 3,652 |
Class B* | 18,548 |
Class C* | 2,489 |
| $ 39,726 |
Advisor Freedom 2005 | |
Class A | $ 11,018 |
Class T | 1,338 |
Class B* | 4,560 |
Class C* | 3,219 |
| $ 20,135 |
Advisor Freedom 2010 | |
Class A | $ 21,049 |
Class T | 9,745 |
Class B* | 41,152 |
Class C* | 2,907 |
| $ 74,853 |
Advisor Freedom 2015 | |
Class A | $ 59,492 |
Class T | 17,325 |
Class B* | 64,616 |
Class C* | 5,339 |
| $ 146,772 |
Advisor Freedom 2020 | |
Class A | $ 114,506 |
Class T | 33,114 |
Class B* | 114,487 |
Class C* | 7,092 |
| $ 269,199 |
Advisor Freedom 2025 | |
Class A | $ 89,850 |
Class T | 28,643 |
Class B* | 87,057 |
Class C* | 4,609 |
| $ 210,159 |
Advisor Freedom 2030 | |
Class A | $ 93,615 |
Class T | 31,256 |
Class B* | 104,418 |
Class C* | 8,434 |
| $ 237,723 |
Annual Report
4. Fees and Other Transactions with Affiliates - continued
Sales Load - continued
Advisor Freedom 2035 | Retained
by FDC |
Class A | $ 55,349 |
Class T | 21,209 |
Class B* | 53,297 |
Class C* | 4,118 |
| $ 133,973 |
Advisor Freedom 2040 | |
Class A | $ 83,454 |
Class T | 27,307 |
Class B* | 78,925 |
Class C* | 4,977 |
| $ 194,663 |
Advisor Freedom 2045 | |
Class A | $ 21,043 |
Class T | 7,148 |
Class B* | 14,825 |
Class C* | 1,797 |
| $ 44,813 |
Advisor Freedom 2050 | |
Class A | $ 32,590 |
Class T | 7,407 |
Class B* | 20,649 |
Class C* | 1,895 |
| $ 62,541 |
* When Class B and Class C shares are initially sold, FDC pays commissions from its own resources to financial intermediaries through which the sales are made.
Reallocation of Underlying Fund Investments. During the period, Strategic Advisers reallocated investments of the Funds. This involved taxable redemptions of the Funds' interest in Fidelity Advisor High Income Advantage Fund for cash and securities and non-taxable exchanges of those securities for shares of Fidelity Series High Income Fund. Realized gains and losses on the redemptions of Fidelity Advisor High Income Advantage Fund in connection with the reallocation are presented in the accompanying Statements of Operations as "Realized gain (loss) on sale of underlying fund shares."
Details of these transactions with the related gain (loss) for the Funds are presented in the accompanying table:
| Value of Cash and
Securities reallocated | Realized Gain (Loss) on
redemption of Fidelity Advisor
High Income Advantage Fund |
Advisor Freedom Income | $ 13,455,239 | $ 1,651,656 |
Advisor Freedom 2005 | 12,007,335 | 1,136,043 |
Advisor Freedom 2010 | 43,118,025 | 4,068,771 |
Advisor Freedom 2015 | 78,558,507 | 7,509,054 |
Advisor Freedom 2020 | 161,919,947 | 16,869,136 |
Advisor Freedom 2025 | 140,516,818 | 14,776,402 |
Advisor Freedom 2030 | 154,657,547 | 16,821,605 |
Advisor Freedom 2035 | 98,071,910 | 10,825,565 |
Advisor Freedom 2040 | 118,790,811 | 2,673,435 |
Advisor Freedom 2045 | 44,994,697 | 6,421,204 |
Advisor Freedom 2050 | 34,256,151 | 5,200,248 |
Annual Report
Notes to Financial Statements - continued
5. Expense Reductions.
FMR voluntarily agreed to reimburse funds to the extent annual operating expenses exceeded certain levels of average net assets as noted in the table below. Some expenses, for example interest expense, are excluded from this reimbursement.
The following classes of each applicable Fund were in reimbursement during the period:
| Expense
Limitations | Reimbursement
from adviser |
Advisor Freedom Income | | |
Class A | .25% | $ 560 |
Class T | .50% | 205 |
Class B | 1.00% | 18 |
Class C | 1.00% | 60 |
Institutional Class | .00% | 88 |
Advisor Freedom 2005 | | |
Class A | .25% | 591 |
Class T | .50% | 79 |
Class B | 1.00% | 10 |
Class C | 1.00% | 33 |
Institutional Class | .00% | 94 |
Advisor Freedom 2010 | | |
Class A | .25% | 1,821 |
Class T | .50% | 643 |
Class B | 1.00% | 72 |
Class C | 1.00% | 166 |
Institutional Class | .00% | 339 |
Advisor Freedom 2015 | | |
Class A | .25% | 3,223 |
Class T | .50% | 830 |
Class B | 1.00% | 126 |
Class C | 1.00% | 239 |
Institutional Class | .00% | 653 |
Advisor Freedom 2020 | | |
Class A | .25% | 4,903 |
Class T | .50% | 1,617 |
Class B | 1.00% | 247 |
Class C | 1.00% | 348 |
Institutional Class | .00% | 993 |
Advisor Freedom 2025 | | |
Class A | .25% | 3,956 |
Class T | .50% | 859 |
Class B | 1.00% | 139 |
Class C | 1.00% | 199 |
Institutional Class | .00% | 692 |
Advisor Freedom 2030 | | |
Class A | .25% | 4,106 |
Class T | .50% | 1,285 |
Class B | 1.00% | 179 |
Class C | 1.00% | 231 |
Institutional Class | .00% | 840 |
Annual Report
5. Expense Reductions - continued
| Expense
Limitations | Reimbursement
from adviser |
Advisor Freedom 2035 | | |
Class A | .25% | $ 2,672 |
Class T | .50% | 547 |
Class B | 1.00% | 98 |
Class C | 1.00% | 115 |
Institutional Class | .00% | 511 |
Advisor Freedom 2040 | | |
Class A | .25% | 2,655 |
Class T | .50% | 1,012 |
Class B | 1.00% | 154 |
Class C | 1.00% | 197 |
Institutional Class | .00% | 595 |
Advisor Freedom 2045 | | |
Class A | .25% | 875 |
Class T | .50% | 177 |
Class B | 1.00% | 15 |
Class C | 1.00% | 25 |
Institutional Class | .00% | 177 |
Advisor Freedom 2050 | | |
Class A | .25% | 599 |
Class T | .50% | 183 |
Class B | 1.00% | 22 |
Class C | 1.00% | 38 |
Institutional Class | .00% | 171 |
6. Distributions to Shareholders.
Distributions to shareholders of each class were as follows:
Years ended March 31, | 2011 | 2010 |
Advisor Freedom Income | | |
From net investment income | | |
Class A | $ 2,314,788 | $ 2,649,510 |
Class T | 713,724 | 962,627 |
Class B | 35,269 | 69,674 |
Class C | 126,076 | 185,548 |
Institutional Class | 412,814 | 317,793 |
Total | $ 3,602,671 | $ 4,185,152 |
From net realized gain | | |
Class A | $ 975,505 | $ 732,418 |
Class T | 358,557 | 282,856 |
Class B | 28,200 | 27,780 |
Class C | 104,824 | 75,264 |
Institutional Class | 152,782 | 82,744 |
Total | $ 1,619,868 | $ 1,201,062 |
Advisor Freedom 2005 | | |
From net investment income | | |
Class A | $ 2,294,168 | $ 2,464,352 |
Class T | 241,548 | 327,239 |
Class B | 15,643 | 32,599 |
Class C | 57,338 | 95,996 |
Institutional Class | 436,507 | 330,921 |
Total | $ 3,045,204 | $ 3,251,107 |
Annual Report
Notes to Financial Statements - continued
6. Distributions to Shareholders - continued
Years ended March 31, | 2011 | 2010 |
Advisor Freedom 2005 | | |
From net realized gain | | |
Class A | $ 1,292,493 | $ 994,230 |
Class T | 171,153 | 147,352 |
Class B | 21,561 | 21,486 |
Class C | 72,294 | 61,066 |
Institutional Class | 207,653 | 124,312 |
Total | $ 1,765,154 | $ 1,348,446 |
Advisor Freedom 2010 | | |
From net investment income | | |
Class A | $ 7,309,097 | $ 9,091,104 |
Class T | 1,843,742 | 3,497,344 |
Class B | 113,116 | 293,043 |
Class C | 316,760 | 620,780 |
Institutional Class | 1,616,987 | 1,468,089 |
Total | $ 11,199,702 | $ 14,970,360 |
From net realized gain | | |
Class A | $ 4,424,218 | $ 3,593,351 |
Class T | 1,481,376 | 1,546,799 |
Class B | 170,299 | 178,771 |
Class C | 403,696 | 368,444 |
Institutional Class | 827,244 | 537,373 |
Total | $ 7,306,833 | $ 6,224,738 |
Advisor Freedom 2015 | | |
From net investment income | | |
Class A | $ 12,855,664 | $ 13,679,424 |
Class T | 2,635,413 | 3,527,564 |
Class B | 206,545 | 416,674 |
Class C | 428,961 | 743,299 |
Institutional Class | 3,196,021 | 2,473,155 |
Total | $ 19,322,604 | $ 20,840,116 |
From net realized gain | | |
Class A | $ 8,081,708 | $ 5,842,830 |
Class T | 2,057,692 | 1,678,828 |
Class B | 312,381 | 274,462 |
Class C | 597,134 | 483,221 |
Institutional Class | 1,672,250 | 948,932 |
Total | $ 12,721,165 | $ 9,228,273 |
Advisor Freedom 2020 | | |
From net investment income | | |
Class A | $ 20,017,211 | $ 18,974,843 |
Class T | 4,788,796 | 7,050,784 |
Class B | 417,553 | 736,617 |
Class C | 683,691 | 991,170 |
Institutional Class | 4,636,483 | 3,574,261 |
Total | $ 30,543,734 | $ 31,327,675 |
From net realized gain | | |
Class A | $ 13,012,233 | $ 8,917,115 |
Class T | 4,137,340 | 3,758,542 |
Class B | 643,981 | 555,113 |
Class C | 920,729 | 727,102 |
Institutional Class | 2,564,116 | 1,527,831 |
Total | $ 21,278,399 | $ 15,485,703 |
Annual Report
6. Distributions to Shareholders - continued
Years ended March 31, | 2011 | 2010 |
Advisor Freedom 2025 | | |
From net investment income | | |
Class A | $ 15,436,008 | $ 14,118,695 |
Class T | 2,761,297 | 2,959,037 |
Class B | 249,917 | 362,584 |
Class C | 385,546 | 486,550 |
Institutional Class | 3,306,034 | 2,155,759 |
Total | $ 22,138,802 | $ 20,082,625 |
From net realized gain | | |
Class A | $ 10,435,875 | $ 7,285,104 |
Class T | 2,278,134 | 1,738,010 |
Class B | 366,251 | 307,778 |
Class C | 532,901 | 396,872 |
Institutional Class | 1,830,552 | 996,789 |
Total | $ 15,443,713 | $ 10,724,553 |
Advisor Freedom 2030 | | |
From net investment income | | |
Class A | $ 15,885,460 | $ 12,452,357 |
Class T | 3,544,555 | 4,250,834 |
Class B | 289,353 | 365,617 |
Class C | 417,601 | 474,232 |
Institutional Class | 3,756,974 | 2,328,021 |
Total | $ 23,893,943 | $ 19,871,061 |
From net realized gain | | |
Class A | $ 10,935,573 | $ 7,715,428 |
Class T | 3,356,005 | 3,092,971 |
Class B | 456,867 | 420,885 |
Class C | 601,231 | 529,883 |
Institutional Class | 2,149,289 | 1,265,591 |
Total | $ 17,498,965 | $ 13,024,758 |
Advisor Freedom 2035 | | |
From net investment income | | |
Class A | $ 9,201,625 | $ 7,722,463 |
Class T | 1,508,142 | 1,461,433 |
Class B | 146,233 | 182,301 |
Class C | 187,609 | 206,849 |
Institutional Class | 2,214,118 | 1,221,702 |
Total | $ 13,257,727 | $ 10,794,748 |
From net realized gain | | |
Class A | $ 7,122,431 | $ 4,762,560 |
Class T | 1,471,380 | 1,063,886 |
Class B | 242,360 | 213,235 |
Class C | 289,817 | 229,952 |
Institutional Class | 1,324,184 | 664,843 |
Total | $ 10,450,172 | $ 6,934,476 |
Advisor Freedom 2040 | | |
From net investment income | | |
Class A | $ 9,382,608 | $ 8,229,546 |
Class T | 2,437,956 | 3,279,826 |
Class B | 218,091 | 308,904 |
Class C | 307,296 | 383,546 |
Institutional Class | 2,460,801 | 1,642,482 |
Total | $ 14,806,752 | $ 13,844,304 |
Annual Report
Notes to Financial Statements - continued
6. Distributions to Shareholders - continued
Years ended March 31, | 2011 | 2010 |
Advisor Freedom 2040 | | |
From net realized gain | | |
Class A | $ 6,904,056 | $ 4,852,217 |
Class T | 2,633,448 | 2,246,554 |
Class B | 367,758 | 335,168 |
Class C | 475,772 | 406,856 |
Institutional Class | 1,452,252 | 851,696 |
Total | $ 11,833,286 | $ 8,692,491 |
Advisor Freedom 2045 | | |
From net investment income | | |
Class A | $ 3,205,236 | $ 2,212,999 |
Class T | 540,295 | 408,091 |
Class B | 23,614 | 25,209 |
Class C | 48,491 | 39,467 |
Institutional Class | 787,743 | 374,869 |
Total | $ 4,605,379 | $ 3,060,635 |
From net realized gain | | |
Class A | $ 2,227,851 | $ 1,430,150 |
Class T | 459,052 | 305,415 |
Class B | 35,506 | 29,833 |
Class C | 61,596 | 44,309 |
Institutional Class | 431,412 | 213,785 |
Total | $ 3,215,417 | $ 2,023,492 |
Advisor Freedom 2050 | | |
From net investment income | | |
Class A | $ 2,095,291 | $ 1,439,113 |
Class T | 516,727 | 429,631 |
Class B | 33,895 | 33,433 |
Class C | 62,418 | 56,059 |
Institutional Class | 619,924 | 423,979 |
Total | $ 3,328,255 | $ 2,382,215 |
From net realized gain | | |
Class A | $ 1,473,391 | $ 987,306 |
Class T | 457,203 | 342,451 |
Class B | 48,699 | 43,522 |
Class C | 81,250 | 74,386 |
Institutional Class | 385,486 | 254,492 |
Total | $ 2,446,029 | $ 1,702,157 |
7. Share Transactions.
Transactions for each class of shares were as follows:
| Shares | Dollars |
Years ended March 31, | 2011 | 2010 | 2011 | 2010 |
Advisor Freedom Income | | | | |
Class A | | | | |
Shares sold | 6,742,883 | 5,939,919 | $ 70,990,544 | $ 58,801,119 |
Reinvestment of distributions | 307,703 | 337,348 | 3,244,142 | 3,334,001 |
Shares redeemed | (6,310,616) | (3,231,976) | (66,644,649) | (32,123,087) |
Net increase (decrease) | 739,970 | 3,045,291 | $ 7,590,037 | $ 30,012,033 |
Class T | | | | |
Shares sold | 2,537,111 | 2,030,571 | $ 26,724,748 | $ 19,971,346 |
Reinvestment of distributions | 96,147 | 121,701 | 1,013,774 | 1,199,887 |
Shares redeemed | (2,373,124) | (2,006,879) | (25,096,544) | (19,795,299) |
Net increase (decrease) | 260,134 | 145,393 | $ 2,641,978 | $ 1,375,934 |
Annual Report
7. Share Transactions - continued
| Shares | Dollars |
Years ended March 31, | 2011 | 2010 | 2011 | 2010 |
Advisor Freedom Income | | | | |
Class B | | | | |
Shares sold | 88,084 | 162,405 | $ 914,898 | $ 1,613,389 |
Reinvestment of distributions | 5,485 | 9,197 | 57,752 | 90,890 |
Shares redeemed | (245,009) | (147,684) | (2,582,330) | (1,450,520) |
Net increase (decrease) | (151,440) | 23,918 | $ (1,609,680) | $ 253,759 |
Class C | | | | |
Shares sold | 441,928 | 396,874 | $ 4,643,877 | $ 3,943,497 |
Reinvestment of distributions | 18,498 | 22,975 | 195,080 | 227,312 |
Shares redeemed | (352,733) | (300,368) | (3,743,810) | (2,962,489) |
Net increase (decrease) | 107,693 | 119,481 | $ 1,095,147 | $ 1,208,320 |
Institutional Class | | | | |
Shares sold | 2,556,329 | 1,124,925 | $ 27,181,011 | $ 11,177,705 |
Reinvestment of distributions | 52,562 | 40,001 | 556,359 | 396,841 |
Shares redeemed | (1,356,615) | (381,938) | (14,424,513) | (3,796,827) |
Net increase (decrease) | 1,252,276 | 782,988 | $ 13,312,857 | $ 7,777,719 |
Advisor Freedom 2005 | | | | |
Class A | | | | |
Shares sold | 5,609,613 | 7,317,164 | $ 60,880,533 | $ 72,565,372 |
Reinvestment of distributions | 325,191 | 339,976 | 3,555,363 | 3,435,631 |
Shares redeemed | (5,151,918) | (3,890,338) | (55,840,299) | (38,525,238) |
Net increase (decrease) | 782,886 | 3,766,802 | $ 8,595,597 | $ 37,475,765 |
Class T | | | | |
Shares sold | 730,487 | 1,132,309 | $ 7,924,718 | $ 11,030,532 |
Reinvestment of distributions | 36,423 | 45,061 | 398,016 | 455,100 |
Shares redeemed | (1,062,251) | (773,364) | (11,498,714) | (7,549,693) |
Net increase (decrease) | (295,341) | 404,006 | $ (3,175,980) | $ 3,935,939 |
Class B | | | | |
Shares sold | 8,537 | 54,150 | $ 90,002 | $ 533,127 |
Reinvestment of distributions | 3,019 | 4,964 | 32,958 | 50,271 |
Shares redeemed | (90,010) | (109,244) | (981,855) | (1,080,645) |
Net increase (decrease) | (78,454) | (50,130) | $ (858,895) | $ (497,247) |
Class C | | | | |
Shares sold | 147,121 | 305,167 | $ 1,607,419 | $ 3,018,553 |
Reinvestment of distributions | 10,949 | 14,510 | 119,425 | 146,747 |
Shares redeemed | (287,607) | (267,085) | (3,140,453) | (2,621,078) |
Net increase (decrease) | (129,537) | 52,592 | $ (1,413,609) | $ 544,222 |
Institutional Class | | | | |
Shares sold | 2,075,491 | 937,114 | $ 22,866,153 | $ 9,468,701 |
Reinvestment of distributions | 57,924 | 44,760 | 637,888 | 455,233 |
Shares redeemed | (854,883) | (359,918) | (9,388,329) | (3,572,136) |
Net increase (decrease) | 1,278,532 | 621,956 | $ 14,115,712 | $ 6,351,798 |
Advisor Freedom 2010 | | | | |
Class A | | | | |
Shares sold | 16,095,416 | 18,880,491 | $ 180,711,445 | $ 190,682,441 |
Reinvestment of distributions | 1,025,173 | 1,212,193 | 11,588,751 | 12,543,848 |
Shares redeemed | (16,025,057) | (17,530,431) | (178,906,727) | (178,487,457) |
Net increase (decrease) | 1,095,532 | 2,562,253 | $ 13,393,469 | $ 24,738,832 |
Class T | | | | |
Shares sold | 3,880,033 | 5,949,706 | $ 42,686,442 | $ 58,943,534 |
Reinvestment of distributions | 290,165 | 481,295 | 3,253,690 | 4,961,234 |
Shares redeemed | (10,204,939) | (7,663,328) | (112,184,260) | (76,116,113) |
Net increase (decrease) | (6,034,741) | (1,232,327) | $ (66,244,128) | $ (12,211,345) |
Annual Report
Notes to Financial Statements - continued
7. Share Transactions - continued
| Shares | Dollars |
Years ended March 31, | 2011 | 2010 | 2011 | 2010 |
Advisor Freedom 2010 | | | | |
Class B | | | | |
Shares sold | 93,857 | 182,133 | $ 1,003,129 | $ 1,835,344 |
Reinvestment of distributions | 22,756 | 42,625 | 255,827 | 441,800 |
Shares redeemed | (858,645) | (595,063) | (9,618,220) | (5,991,071) |
Net increase (decrease) | (742,032) | (370,305) | $ (8,359,264) | $ (3,713,927) |
Class C | | | | |
Shares sold | 535,760 | 952,028 | $ 5,915,274 | $ 9,446,683 |
Reinvestment of distributions | 56,804 | 86,895 | 637,277 | 896,335 |
Shares redeemed | (1,180,387) | (1,279,015) | (12,966,143) | (12,836,486) |
Net increase (decrease) | (587,823) | (240,092) | $ (6,413,592) | $ (2,493,468) |
Institutional Class | | | | |
Shares sold | 5,627,504 | 3,337,499 | $ 63,470,104 | $ 33,780,398 |
Reinvestment of distributions | 212,399 | 192,208 | 2,414,202 | 1,998,866 |
Shares redeemed | (3,110,566) | (1,682,623) | (34,999,374) | (17,082,328) |
Net increase (decrease) | 2,729,337 | 1,847,084 | $ 30,884,932 | $ 18,696,936 |
Advisor Freedom 2015 | | | | |
Class A | | | | |
Shares sold | 27,732,699 | 32,164,983 | $ 310,274,647 | $ 323,357,211 |
Reinvestment of distributions | 1,841,287 | 1,876,238 | 20,720,499 | 19,317,105 |
Shares redeemed | (21,697,911) | (16,585,226) | (241,513,846) | (165,743,140) |
Net increase (decrease) | 7,876,075 | 17,455,995 | $ 89,481,300 | $ 176,931,176 |
Class T | | | | |
Shares sold | 5,882,611 | 6,975,850 | $ 65,251,137 | $ 68,177,681 |
Reinvestment of distributions | 404,719 | 490,769 | 4,542,977 | 5,039,209 |
Shares redeemed | (7,251,020) | (6,790,785) | (80,629,160) | (67,432,006) |
Net increase (decrease) | (963,690) | 675,834 | $ (10,835,046) | $ 5,784,884 |
Class B | | | | |
Shares sold | 191,482 | 449,760 | $ 2,066,206 | $ 4,433,310 |
Reinvestment of distributions | 42,030 | 64,006 | 470,481 | 659,460 |
Shares redeemed | (801,776) | (633,005) | (8,927,194) | (6,220,872) |
Net increase (decrease) | (568,264) | (119,239) | $ (6,390,507) | $ (1,128,102) |
Class C | | | | |
Shares sold | 1,233,517 | 1,453,766 | $ 13,642,003 | $ 14,350,142 |
Reinvestment of distributions | 82,686 | 110,378 | 925,371 | 1,134,531 |
Shares redeemed | (1,381,438) | (1,395,406) | (15,136,214) | (13,893,073) |
Net increase (decrease) | (65,235) | 168,738 | $ (568,840) | $ 1,591,600 |
Institutional Class | | | | |
Shares sold | 10,948,482 | 5,176,355 | $ 123,310,581 | $ 52,604,404 |
Reinvestment of distributions | 419,853 | 329,755 | 4,762,383 | 3,408,927 |
Shares redeemed | (4,028,135) | (2,498,861) | (45,224,559) | (25,183,981) |
Net increase (decrease) | 7,340,200 | 3,007,249 | $ 82,848,405 | $ 30,829,350 |
Advisor Freedom 2020 | | | | |
Class A | | | | |
Shares sold | 42,385,127 | 45,183,836 | $ 490,968,694 | $ 463,202,937 |
Reinvestment of distributions | 2,789,668 | 2,595,974 | 32,676,917 | 27,655,510 |
Shares redeemed | (30,533,371) | (22,376,535) | (352,138,611) | (229,963,322) |
Net increase (decrease) | 14,641,424 | 25,403,275 | $ 171,507,000 | $ 260,895,125 |
Class T | | | | |
Shares sold | 10,333,537 | 13,389,476 | $ 118,202,049 | $ 134,409,911 |
Reinvestment of distributions | 753,997 | 1,003,112 | 8,780,977 | 10,676,415 |
Shares redeemed | (20,539,717) | (14,031,668) | (233,180,192) | (143,283,312) |
Net increase (decrease) | (9,452,183) | 360,920 | $ (106,197,166) | $ 1,803,014 |
Annual Report
7. Share Transactions - continued
| Shares | Dollars |
Years ended March 31, | 2011 | 2010 | 2011 | 2010 |
Advisor Freedom 2020 | | | | |
Class B | | | | |
Shares sold | 368,121 | 786,273 | $ 4,060,760 | $ 7,911,628 |
Reinvestment of distributions | 82,240 | 116,218 | 957,119 | 1,242,364 |
Shares redeemed | (1,902,848) | (1,125,596) | (22,013,230) | (11,397,490) |
Net increase (decrease) | (1,452,487) | (223,105) | $ (16,995,351) | $ (2,243,498) |
Class C | | | | |
Shares sold | 1,664,023 | 2,227,854 | $ 18,885,357 | $ 22,595,108 |
Reinvestment of distributions | 124,410 | 147,034 | 1,450,199 | 1,569,561 |
Shares redeemed | (1,991,323) | (1,920,594) | (22,726,168) | (19,584,995) |
Net increase (decrease) | (202,890) | 454,294 | $ (2,390,612) | $ 4,579,674 |
Institutional Class | | | | |
Shares sold | 15,993,749 | 8,404,614 | $ 187,257,774 | $ 87,788,002 |
Reinvestment of distributions | 601,425 | 474,048 | 7,094,949 | 5,075,149 |
Shares redeemed | (6,509,087) | (3,015,266) | (76,123,009) | (31,218,230) |
Net increase (decrease) | 10,086,087 | 5,863,396 | $ 118,229,714 | $ 61,644,921 |
Advisor Freedom 2025 | | | | |
Class A | | | | |
Shares sold | 37,031,547 | 40,250,497 | $ 413,280,512 | $ 395,216,135 |
Reinvestment of distributions | 2,276,155 | 2,082,741 | 25,700,489 | 21,253,319 |
Shares redeemed | (25,478,996) | (17,708,216) | (283,196,123) | (173,855,795) |
Net increase (decrease) | 13,828,706 | 24,625,022 | $ 155,784,878 | $ 242,613,659 |
Class T | | | | |
Shares sold | 6,893,938 | 8,314,781 | $ 76,306,756 | $ 80,263,098 |
Reinvestment of distributions | 434,732 | 448,807 | 4,920,153 | 4,590,362 |
Shares redeemed | (7,345,717) | (5,953,703) | (81,980,377) | (58,549,334) |
Net increase (decrease) | (17,047) | 2,809,885 | $ (753,468) | $ 26,304,126 |
Class B | | | | |
Shares sold | 249,430 | 580,667 | $ 2,611,983 | $ 5,471,445 |
Reinvestment of distributions | 50,463 | 63,222 | 566,440 | 646,389 |
Shares redeemed | (686,905) | (658,819) | (7,580,412) | (6,344,074) |
Net increase (decrease) | (387,012) | (14,930) | $ (4,401,989) | $ (226,240) |
Class C | | | | |
Shares sold | 1,289,642 | 1,510,376 | $ 14,187,941 | $ 14,596,541 |
Reinvestment of distributions | 77,327 | 82,292 | 866,774 | 840,011 |
Shares redeemed | (1,165,343) | (907,187) | (12,701,967) | (8,676,397) |
Net increase (decrease) | 201,626 | 685,481 | $ 2,352,748 | $ 6,760,155 |
Institutional Class | | | | |
Shares sold | 13,417,346 | 4,943,550 | $ 152,104,559 | $ 48,886,534 |
Reinvestment of distributions | 438,558 | 307,002 | 5,003,022 | 3,146,123 |
Shares redeemed | (3,507,339) | (1,470,965) | (39,481,295) | (14,449,276) |
Net increase (decrease) | 10,348,565 | 3,779,587 | $ 117,626,286 | $ 37,583,381 |
Advisor Freedom 2030 | | | | |
Class A | | | | |
Shares sold | 36,308,773 | 38,797,182 | $ 422,799,888 | $ 395,875,652 |
Reinvestment of distributions | 2,244,767 | 1,866,748 | 26,598,860 | 19,998,334 |
Shares redeemed | (24,491,451) | (17,846,987) | (283,894,538) | (181,939,183) |
Net increase (decrease) | 14,062,089 | 22,816,943 | $ 165,504,210 | $ 233,934,803 |
Class T | | | | |
Shares sold | 10,464,373 | 12,307,212 | $ 120,222,230 | $ 122,751,803 |
Reinvestment of distributions | 579,968 | 680,438 | 6,809,846 | 7,274,926 |
Shares redeemed | (17,532,281) | (9,841,745) | (199,844,267) | (99,921,008) |
Net increase (decrease) | (6,487,940) | 3,145,905 | $ (72,812,191) | $ 30,105,721 |
Annual Report
Notes to Financial Statements - continued
7. Share Transactions - continued
| Shares | Dollars |
Years ended March 31, | 2011 | 2010 | 2011 | 2010 |
Advisor Freedom 2030 | | | | |
Class B | | | | |
Shares sold | 273,983 | 600,341 | $ 3,002,253 | $ 5,980,332 |
Reinvestment of distributions | 58,164 | 70,777 | 683,212 | 763,149 |
Shares redeemed | (1,172,272) | (760,195) | (13,660,495) | (7,622,000) |
Net increase (decrease) | (840,125) | (89,077) | $ (9,975,030) | $ (878,519) |
Class C | | | | |
Shares sold | 1,166,069 | 1,605,657 | $ 13,411,785 | $ 16,073,300 |
Reinvestment of distributions | 79,998 | 87,396 | 940,253 | 939,821 |
Shares redeemed | (1,516,187) | (1,278,913) | (17,340,843) | (13,072,332) |
Net increase (decrease) | (270,120) | 414,140 | $ (2,988,805) | $ 3,940,789 |
Institutional Class | | | | |
Shares sold | 14,756,707 | 6,778,493 | $ 173,957,761 | $ 70,133,488 |
Reinvestment of distributions | 486,184 | 333,659 | 5,794,863 | 3,581,406 |
Shares redeemed | (5,798,972) | (2,077,011) | (68,160,205) | (21,173,240) |
Net increase (decrease) | 9,443,919 | 5,035,141 | $ 111,592,419 | $ 52,541,654 |
Advisor Freedom 2035 | | | | |
Class A | | | | |
Shares sold | 27,970,555 | 29,478,855 | $ 308,468,907 | $ 283,259,853 |
Reinvestment of distributions | 1,446,498 | 1,224,913 | 16,211,663 | 12,371,642 |
Shares redeemed | (17,409,245) | (11,681,770) | (190,855,839) | (113,019,155) |
Net increase (decrease) | 12,007,808 | 19,021,998 | $ 133,824,731 | $ 182,612,340 |
Class T | | | | |
Shares sold | 5,393,602 | 5,784,903 | $ 58,683,253 | $ 54,332,277 |
Reinvestment of distributions | 260,979 | 245,284 | 2,909,844 | 2,472,154 |
Shares redeemed | (5,098,171) | (3,918,900) | (56,262,333) | (37,204,051) |
Net increase (decrease) | 556,410 | 2,111,287 | $ 5,330,764 | $ 19,600,380 |
Class B | | | | |
Shares sold | 181,743 | 405,509 | $ 1,860,461 | $ 3,788,136 |
Reinvestment of distributions | 33,086 | 38,336 | 365,557 | 387,872 |
Shares redeemed | (449,264) | (357,555) | (4,866,708) | (3,379,935) |
Net increase (decrease) | (234,435) | 86,290 | $ (2,640,690) | $ 796,073 |
Class C | | | | |
Shares sold | 763,399 | 971,148 | $ 8,246,950 | $ 9,096,299 |
Reinvestment of distributions | 40,998 | 41,555 | 453,892 | 420,018 |
Shares redeemed | (707,167) | (574,523) | (7,564,157) | (5,371,383) |
Net increase (decrease) | 97,230 | 438,180 | $ 1,136,685 | $ 4,144,934 |
Institutional Class | | | | |
Shares sold | 11,027,172 | 3,975,253 | $ 122,599,210 | $ 38,607,280 |
Reinvestment of distributions | 303,802 | 186,356 | 3,441,276 | 1,885,670 |
Shares redeemed | (2,535,451) | (1,088,290) | (28,205,403) | (10,464,439) |
Net increase (decrease) | 8,795,523 | 3,073,319 | $ 97,835,083 | $ 30,028,511 |
Advisor Freedom 2040 | | | | |
Class A | | | | |
Shares sold | 24,772,426 | 24,913,305 | $ 290,957,352 | $ 252,890,462 |
Reinvestment of distributions | 1,347,352 | 1,193,321 | 16,116,359 | 12,861,441 |
Shares redeemed | (18,286,233) | (12,253,872) | (213,969,269) | (125,782,802) |
Net increase (decrease) | 7,833,545 | 13,852,754 | $ 93,104,442 | $ 139,969,101 |
Class T | | | | |
Shares sold | 7,976,427 | 10,000,332 | $ 92,151,888 | $ 99,858,612 |
Reinvestment of distributions | 422,557 | 509,696 | 5,006,423 | 5,481,963 |
Shares redeemed | (13,512,695) | (8,036,589) | (155,218,830) | (81,578,421) |
Net increase (decrease) | (5,113,711) | 2,473,439 | $ (58,060,519) | $ 23,762,154 |
Annual Report
7. Share Transactions - continued
| Shares | Dollars |
Years ended March 31, | 2011 | 2010 | 2011 | 2010 |
Advisor Freedom 2040 | | | | |
Class B | | | | |
Shares sold | 209,959 | 476,095 | $ 2,309,982 | $ 4,732,469 |
Reinvestment of distributions | 46,081 | 58,166 | 543,523 | 628,599 |
Shares redeemed | (873,544) | (566,960) | (10,194,639) | (5,619,118) |
Net increase (decrease) | (617,504) | (32,699) | $ (7,341,134) | $ (258,050) |
Class C | | | | |
Shares sold | 1,118,317 | 1,191,976 | $ 12,931,197 | $ 11,944,778 |
Reinvestment of distributions | 63,034 | 70,129 | 745,182 | 756,765 |
Shares redeemed | (1,361,404) | (1,050,495) | (15,808,490) | (10,581,828) |
Net increase (decrease) | (180,053) | 211,610 | $ (2,132,111) | $ 2,119,715 |
Institutional Class | | | | |
Shares sold | 11,010,598 | 4,937,197 | $ 130,588,540 | $ 50,576,131 |
Reinvestment of distributions | 311,564 | 230,524 | 3,751,417 | 2,486,427 |
Shares redeemed | (4,767,648) | (1,571,826) | (56,587,880) | (15,921,925) |
Net increase (decrease) | 6,554,514 | 3,595,895 | $ 77,752,077 | $ 37,140,633 |
Advisor Freedom 2045 | | | | |
Class A | | | | |
Shares sold | 15,649,671 | 13,663,363 | $ 142,479,055 | $ 108,131,504 |
Reinvestment of distributions | 580,532 | 434,034 | 5,409,938 | 3,629,970 |
Shares redeemed | (7,686,625) | (4,807,430) | (69,866,274) | (38,399,839) |
Net increase (decrease) | 8,543,578 | 9,289,967 | $ 78,022,719 | $ 73,361,635 |
Class T | | | | |
Shares sold | 3,458,321 | 3,019,866 | $ 31,367,898 | $ 23,345,550 |
Reinvestment of distributions | 106,232 | 84,802 | 986,814 | 708,733 |
Shares redeemed | (2,489,332) | (1,269,123) | (22,900,338) | (9,935,840) |
Net increase (decrease) | 1,075,221 | 1,835,545 | $ 9,454,374 | $ 14,118,443 |
Class B | | | | |
Shares sold | 64,679 | 151,912 | $ 553,980 | $ 1,183,636 |
Reinvestment of distributions | 6,187 | 6,409 | 57,081 | 53,934 |
Shares redeemed | (76,608) | (75,001) | (675,735) | (599,710) |
Net increase (decrease) | (5,742) | 83,320 | $ (64,674) | $ 637,860 |
Class C | | | | |
Shares sold | 358,203 | 299,037 | $ 3,208,567 | $ 2,351,191 |
Reinvestment of distributions | 11,564 | 9,804 | 107,229 | 82,368 |
Shares redeemed | (201,823) | (118,526) | (1,842,121) | (901,091) |
Net increase (decrease) | 167,944 | 190,315 | $ 1,473,675 | $ 1,532,468 |
Institutional Class | | | | |
Shares sold | 5,606,405 | 2,136,614 | $ 52,004,125 | $ 16,905,851 |
Reinvestment of distributions | 128,213 | 70,375 | 1,205,418 | 588,654 |
Shares redeemed | (1,215,140) | (553,542) | (11,202,214) | (4,413,315) |
Net increase (decrease) | 4,519,478 | 1,653,447 | $ 42,007,329 | $ 13,081,190 |
Advisor Freedom 2050 | | | | |
Class A | | | | |
Shares sold | 11,629,928 | 9,581,471 | $ 104,240,785 | $ 73,833,021 |
Reinvestment of distributions | 385,855 | 291,959 | 3,532,343 | 2,406,119 |
Shares redeemed | (5,707,133) | (4,148,608) | (51,265,603) | (32,257,966) |
Net increase (decrease) | 6,308,650 | 5,724,822 | $ 56,507,525 | $ 43,981,174 |
Class T | | | | |
Shares sold | 3,483,884 | 3,635,495 | $ 30,992,620 | $ 27,820,143 |
Reinvestment of distributions | 106,163 | 92,896 | 968,745 | 765,843 |
Shares redeemed | (2,786,022) | (2,095,310) | (24,961,552) | (16,196,123) |
Net increase (decrease) | 804,025 | 1,633,081 | $ 6,999,813 | $ 12,389,863 |
Annual Report
Notes to Financial Statements - continued
7. Share Transactions - continued
| Shares | Dollars |
Years ended March 31, | 2011 | 2010 | 2011 | 2010 |
Advisor Freedom 2050 | | | | |
Class B | | | | |
Shares sold | 110,536 | 210,935 | $ 933,871 | $ 1,592,970 |
Reinvestment of distributions | 8,784 | 9,042 | 79,624 | 75,136 |
Shares redeemed | (119,007) | (87,238) | (1,034,921) | (663,372) |
Net increase (decrease) | 313 | 132,739 | $ (21,426) | $ 1,004,734 |
Class C | | | | |
Shares sold | 389,030 | 373,964 | $ 3,445,107 | $ 2,823,004 |
Reinvestment of distributions | 14,950 | 14,928 | 136,149 | 124,197 |
Shares redeemed | (306,396) | (224,961) | (2,713,863) | (1,746,454) |
Net increase (decrease) | 97,584 | 163,931 | $ 867,393 | $ 1,200,747 |
Institutional Class | | | | |
Shares sold | 4,230,159 | 2,689,897 | $ 38,199,787 | $ 21,086,162 |
Reinvestment of distributions | 107,698 | 82,208 | 985,312 | 678,287 |
Shares redeemed | (2,667,285) | (780,619) | (24,080,596) | (6,106,242) |
Net increase (decrease) | 1,670,572 | 1,991,486 | $ 15,104,503 | $ 15,658,207 |
8. Other.
The Funds' organizational documents provide former and current trustees and officers with a limited indemnification against liabilities arising in connection with the performance of their duties to the Funds. In the normal course of business, the Funds may also enter into contracts that provide general indemnifications. The Funds' maximum exposure under these arrangements is unknown as this would be dependent on future claims that may be made against the Funds. The risk of material loss from such claims is considered remote.
The Funds do not invest in the Underlying Funds for the purpose of exercising management or control; however, investments by the Funds within their principal investment strategies may represent a significant portion of the Underlying Fund's net assets. At the end of the period, the following Advisor Freedom Funds were the owners of record of 10% or more of the total outstanding shares of the Underlying Funds.
Fund | Advisor Freedom 2020 | Advisor Freedom 2030 |
Fidelity Advisor Large Cap Fund | 11% | 11% |
The Funds, in aggregate, were the owners of record of more than 20% of the total outstanding shares of the following Underlying Funds.
Fund | % of shares held |
Fidelity Advisor Growth & Income Fund | 54% |
Fidelity Advisor Large Cap Fund | 63% |
Fidelity Advisor Overseas Fund | 29% |
Fidelity Advisor Short Fixed-Income Fund | 21% |
Annual Report
Report of Independent Registered Public Accounting Firm
To the Trustees of Fidelity Aberdeen Street Trust and the Shareholders of Fidelity Advisor Freedom Income Fund, Fidelity Advisor Freedom 2005 Fund, Fidelity Advisor Freedom 2010 Fund, Fidelity Advisor Freedom 2015 Fund, Fidelity Advisor Freedom 2020 Fund, Fidelity Advisor Freedom 2025 Fund, Fidelity Advisor Freedom 2030 Fund, Fidelity Advisor Freedom 2035 Fund, Fidelity Advisor Freedom 2040 Fund, Fidelity Advisor Freedom 2045 Fund and Fidelity Advisor Freedom 2050 Fund:
We have audited the accompanying statements of assets and liabilities of Fidelity Advisor Freedom Income Fund, Fidelity Advisor Freedom 2005 Fund, Fidelity Advisor Freedom 2010 Fund, Fidelity Advisor Freedom 2015 Fund, Fidelity Advisor Freedom 2020 Fund, Fidelity Advisor Freedom 2025 Fund, Fidelity Advisor Freedom 2030 Fund, Fidelity Advisor Freedom 2035 Fund, Fidelity Advisor Freedom 2040 Fund, Fidelity Advisor Freedom 2045 Fund and Fidelity Advisor Freedom 2050 Fund (the Funds), each a fund of Fidelity Aberdeen Street Trust, including the schedules of investments, as of March 31, 2011, and the related statements of operations for the year then ended, the statements of changes in net assets for each of the two years in the period then ended, and the financial highlights for each of the periods presented. These financial statements and financial highlights are the responsibility of the Funds' management. Our responsibility is to express an opinion on these financial statements and financial highlights based on our audits.
We conducted our audits in accordance with the standards of the Public Company Accounting Oversight Board (United States). Those standards require that we plan and perform the audit to obtain reasonable assurance about whether the financial statements and financial highlights are free of material misstatement. The Funds are not required to have, nor were we engaged to perform, an audit of their internal control over financial reporting. Our audits included consideration of internal control over financial reporting as a basis for designing audit procedures that are appropriate in the circumstances, but not for the purpose of expressing an opinion on the effectiveness of the Funds' internal control over financial reporting. Accordingly, we express no such opinion. An audit also includes examining, on a test basis, evidence supporting the amounts and disclosures in the financial statements, assessing the accounting principles used and significant estimates made by management, as well as evaluating the overall financial statement presentation. Our procedures included confirmation of securities owned as of March 31, 2011, by correspondence with the Underlying Funds' transfer agent. We believe that our audits provide a reasonable basis for our opinion.
In our opinion, the financial statements and financial highlights referred to above present fairly, in all material respects, the financial position of Fidelity Advisor Freedom Income Fund, Fidelity Advisor Freedom 2005 Fund, Fidelity Advisor Freedom 2010 Fund, Fidelity Advisor Freedom 2015 Fund, Fidelity Advisor Freedom 2020 Fund, Fidelity Advisor Freedom 2025 Fund, Fidelity Advisor Freedom 2030 Fund, Fidelity Advisor Freedom 2035 Fund, Fidelity Advisor Freedom 2040 Fund, Fidelity Advisor Freedom 2045 Fund and Fidelity Advisor Freedom 2050 Fund as of March 31, 2011, the results of their operations for the year then ended, the changes in their net assets for each of the two years in the period then ended, and the financial highlights for each of the periods presented, in conformity with accounting principles generally accepted in the United States of America.
/s/ Deloitte & Touche LLP
DELOITTE & TOUCHE LLP
Boston, Massachusetts
May 19, 2011
Annual Report
The Trustees and executive officers of the trust and funds, as applicable, are listed below. The Board of Trustees governs each Fidelity Advisor Freedom Fund and is responsible for protecting the interests of shareholders. The Trustees are experienced executives who meet periodically throughout the year to oversee each Fidelity Advisor Freedom Fund's activities, review contractual arrangements with companies that provide services to each Fidelity Advisor Freedom Fund, oversee management of the risks associated with such activities and contractual arrangements, and review each Fidelity Advisor Freedom Fund's performance. If the interests of a Fidelity Advisor Freedom Fund and an underlying Fidelity fund were to diverge, a conflict of interest could arise and affect how the Trustees fulfill their fiduciary duties to the affected funds. Strategic Advisers has structured the Fidelity Advisor Freedom Funds to avoid these potential conflicts, although there may be situations where a conflict of interest is unavoidable. In such instances, Strategic Advisers and the Trustees would take reasonable steps to minimize and, if possible, eliminate the conflict. Except for James C. Curvey, each of the Trustees oversees 190 funds advised by FMR or an affiliate. Mr. Curvey oversees 410 funds advised by FMR or an affiliate.
The Trustees hold office without limit in time except that (a) any Trustee may resign; (b) any Trustee may be removed by written instrument, signed by at least two-thirds of the number of Trustees prior to such removal; (c) any Trustee who requests to be retired or who has become incapacitated by illness or injury may be retired by written instrument signed by a majority of the other Trustees; and (d) any Trustee may be removed at any special meeting of shareholders by a two-thirds vote of the outstanding voting securities of the trust. Each Trustee who is not an interested person (as defined in the 1940 Act) (Independent Trustee), shall retire not later than the last day of the calendar year in which his or her 75th birthday occurs. The Independent Trustees may waive this mandatory retirement age policy with respect to individual Trustees. The executive officers hold office without limit in time, except that any officer may resign or may be removed by a vote of a majority of the Trustees at any regular meeting or any special meeting of the Trustees. Except as indicated, each individual has held the office shown or other offices in the same company for the past five years.
Experience, Skills, Attributes, and Qualifications of the Funds' Trustees. The Governance and Nominating Committee has adopted a statement of policy that describes the experience, qualifications, attributes, and skills that are necessary and desirable for potential Independent Trustee candidates (Statement of Policy). The Board believes that each Trustee satisfied at the time he or she was initially elected or appointed a Trustee, and continues to satisfy, the standards contemplated by the Statement of Policy. The Governance and Nominating Committee also engages professional search firms to help identify potential Independent Trustee candidates who have the experience, qualifications, attributes, and skills consistent with the Statement of Policy. From time to time, additional criteria based on the composition and skills of the current Independent Trustees, as well as experience or skills that may be appropriate in light of future changes to board composition, business conditions, and regulatory or other developments, have also been considered by the professional search firms and the Governance and Nominating Committee. In addition, the Board takes into account the Trustees' commitment and participation in Board and committee meetings, as well as their leadership of standing and ad hoc committees throughout their tenure.
In determining that a particular Trustee was and continues to be qualified to serve as a Trustee, the Board has considered a variety of criteria, none of which, in isolation, was controlling. The Board believes that, collectively, the Trustees have balanced and diverse experience, qualifications, attributes, and skills, which allow the Board to operate effectively in governing each fund and protecting the interests of shareholders. Information about the specific experience, skills, attributes, and qualifications of each Trustee, which in each case led to the Board's conclusion that the Trustee should serve (or continue to serve) as a trustee of the funds, is provided below.
Board Structure and Oversight Function. Abigail P. Johnson is an interested person (as defined in the 1940 Act) and currently serves as Chairman. The Trustees have determined that an interested Chairman is appropriate and benefits shareholders because an interested Chairman has a personal and professional stake in the quality and continuity of services provided to the funds. Independent Trustees exercise their informed business judgment to appoint an individual of their choosing to serve as Chairman, regardless of whether the Trustee happens to be independent or a member of management. The Independent Trustees have determined that they can act independently and effectively without having an Independent Trustee serve as Chairman and that a key structural component for assuring that they are in a position to do so is for the Independent Trustees to constitute a substantial majority for the Board. The Independent Trustees also regularly meet in executive session. Kenneth L. Wolfe serves as Chairman of the Independent Trustees and as such (i) acts as a liaison between the Independent Trustees and management with respect to matters important to the Independent Trustees and (ii) with management prepares agendas for Board meetings.
Fidelity funds are overseen by different Boards of Trustees. The funds' Board oversees Fidelity's investment-grade bond, money market, and asset allocation funds and another Board oversees Fidelity's equity and high income funds. The asset allocation funds may invest in Fidelity funds that are overseen by such other Board. The use of separate Boards, each with its own committee structure, allows the Trustees of each group of Fidelity funds to focus on the unique issues of the funds they oversee, including common research, investment, and operational issues. On occasion, the separate Boards establish joint committees to address issues of overlapping consequences for the Fidelity funds overseen by each Board.
The Trustees operate using a system of committees to facilitate the timely and efficient consideration of all matters of importance to the Trustees, each fund, and fund shareholders and to facilitate compliance with legal and regulatory requirements and oversight of the funds' activities and associated risks. The Board, acting through its committees, has charged FMR and its affiliates with (i) identifying events or circumstances the occurrence of which could have demonstrably adverse effects on the funds' business and/or reputation; (ii) implementing processes and controls to lessen the possibility that such events or circumstances occur or to mitigate the effects of such events or circumstances if they do occur; and (iii) creating and maintaining a system designed to evaluate continuously business and market conditions in order to facilitate the identification and implementation processes described in (i) and (ii) above. Because the day-to-day operations and activities of the funds are carried out by or through FMR, its affiliates and other service providers, the funds' exposure to risks is mitigated but not eliminated by the processes overseen by the Trustees. While each of the Board's committees has responsibility for overseeing different aspects of the funds' activities, oversight is exercised primarily through the Operations and Audit Committees. Appropriate personnel, including but not limited to the funds' Chief Compliance Officer (CCO), FMR's internal auditor, the independent accountants, the funds' Treasurer and portfolio management personnel, make periodic reports to the Board's committees, as appropriate. The responsibilities of each committee, including their oversight responsibilities, are described further under "Standing Committees of the Funds' Trustees."
Annual Report
Trustees and Officers - continued
The funds' Statement of Additional Information (SAI) includes more information about the Trustees. To request a free copy, call Fidelity at 1-877-208-0098.
Interested Trustees*:
Correspondence intended for each Trustee who is an interested person may be sent to Fidelity Investments, 82 Devonshire Street, Boston, Massachusetts 02109.
Name, Age; Principal Occupations and Other Relevant Experience+ |
Abigail P. Johnson (49) |
| Year of Election or Appointment: 2009 Ms. Johnson is Trustee and Chairman of the Board of Trustees of certain Trusts. Ms. Johnson serves as President of Personal, Workplace and Institutional Services (2005-present). Ms. Johnson is the Vice Chairman and Director (2007-present) of FMR LLC. Previously, Ms. Johnson served as President and a Director of FMR (2001-2005), a Trustee of other investment companies advised by FMR, Fidelity Investments Money Management, Inc., and FMR Co., Inc. (2001-2005), Senior Vice President of the Fidelity funds (2001-2005), and managed a number of Fidelity funds. Ms. Abigail P. Johnson and Mr. Arthur E. Johnson are not related. |
James C. Curvey (75) |
| Year of Election or Appointment: 2007 Mr. Curvey also serves as Trustee (2007-present) of other investment companies advised by FMR. Mr. Curvey is a Director of Fidelity Investments Money Management, Inc. (2009-present), Director of Fidelity Research & Analysis Co. (2009-present) and Director of FMR and FMR Co., Inc. (2007-present). Mr. Curvey is also Vice Chairman (2007-present) and Director of FMR LLC. In addition, Mr. Curvey serves as an Overseer for the Boston Symphony Orchestra and a member of the Trustees of Villanova University. Previously, Mr. Curvey was the Vice Chairman (2006-2007) and Director (2000-2007) of FMR Corp. |
* Trustees have been determined to be "Interested Trustees" by virtue of, among other things, their affiliation with the trust or various entities under common control with FMR.
+ The information above includes each Trustee's principal occupation during the last five years and other information relating to the experience, attributes, and skills relevant to each Trustee's qualifications to serve as a Trustee, which led to the conclusion that each Trustee should serve as a Trustee for each fund.
Independent Trustees:
Correspondence intended for each Independent Trustee (that is, the Trustees other than the Interested Trustees) may be sent to Fidelity Investments, P.O. Box 55235, Boston, Massachusetts 02205-5235.
Name, Age; Principal Occupations and Other Relevant Experience+ |
Albert R. Gamper, Jr. (69) |
| Year of Election or Appointment: 2006 Prior to his retirement in December 2004, Mr. Gamper served as Chairman of the Board of CIT Group Inc. (commercial finance). During his tenure with CIT Group Inc. Mr. Gamper served in numerous senior management positions, including Chairman (1987-1989; 1999-2001; 2002-2004), Chief Executive Officer (1987-2004), and President (2002-2003). He also served as President and Chief Executive Officer of Tyco Capital Corporation (2001-2002). Mr. Gamper currently serves as a member of the Board of Directors of Public Service Enterprise Group (utilities, 2000-present), a member of the Board of Trustees, Rutgers University (2004-present), and Chairman of the Board of Saint Barnabas Health Care System. Previously, Mr. Gamper served as Chairman of the Board of Governors, Rutgers University (2004-2007). |
Robert F. Gartland (59) |
| Year of Election or Appointment: 2010 Mr. Gartland is a partner and investor of Vietnam Partners LLC (investments and consulting, 2008-present) and is Chairman and an investor in Gartland and Mellina Group Corp. (consulting, 2009-present). Prior to his retirement, Mr. Gartland held a variety of positions at Morgan Stanley (financial services, 1979-2007) including Managing Director (1987-2007). |
Arthur E. Johnson (64) |
| Year of Election or Appointment: 2008 Mr. Johnson serves as a member of the Board of Directors of Eaton Corporation (diversified power management, 2009-present) and AGL Resources, Inc. (holding company). Prior to his retirement, Mr. Johnson served as Senior Vice President of Corporate Strategic Development of Lockheed Martin Corporation (defense contractor, 1999-2009). He previously served on the Board of Directors of IKON Office Solutions, Inc. (1999-2008) and Delta Airlines (2005-2007). Mr. Arthur E. Johnson and Ms. Abigail P. Johnson are not related. |
Michael E. Kenneally (57) |
| Year of Election or Appointment: 2009 Previously, Mr. Kenneally served as a Member of the Advisory Board for certain Fidelity Fixed Income and Asset Allocation Funds (2008-2009). Prior to his retirement, Mr. Kenneally served as Chairman and Global Chief Executive Officer of Credit Suisse Asset Management (2003-2005). Mr. Kenneally was a Director of the Credit Suisse Funds (U.S. mutual funds, 2004-2008) and certain other closed-end funds (2004-2005) and was awarded the Chartered Financial Analyst (CFA) designation in 1991. |
James H. Keyes (70) |
| Year of Election or Appointment: 2007 Mr. Keyes serves as a member of the Boards of Navistar International Corporation (manufacture and sale of trucks, buses, and diesel engines, since 2002) and Pitney Bowes, Inc. (integrated mail, messaging, and document management solutions, since 1998). Prior to his retirement, Mr. Keyes served as Chairman and Chief Executive Officer of Johnson Controls (automotive, building, and energy, 1998-2002) and as a member of the Board of LSI Logic Corporation (semiconductor technologies, 1984-2008). |
Marie L. Knowles (64) |
| Year of Election or Appointment: 2001 Prior to Ms. Knowles' retirement in June 2000, she served as Executive Vice President and Chief Financial Officer of Atlantic Richfield Company (ARCO) (diversified energy, 1996-2000). From 1993 to 1996, she was a Senior Vice President of ARCO and President of ARCO Transportation Company. She served as a Director of ARCO from 1996 to 1998. Ms. Knowles currently serves as a Director and Chairman of the Audit Committee of McKesson Corporation (healthcare service, since 2002). Ms. Knowles is an Honorary Trustee of the Brookings Institution and a member of the Board of the Catalina Island Conservancy and of the Santa Catalina Island Company (2009-present). She also serves as a member of the Advisory Board for the School of Engineering of the University of Southern California and the Foundation Board of the School of Architecture at the University of Virginia (2007-present). Previously, Ms. Knowles served as a Director of Phelps Dodge Corporation (copper mining and manufacturing, 1994-2007). |
Kenneth L. Wolfe (72) |
| Year of Election or Appointment: 2005 Mr. Wolfe is Chairman of the Independent Trustees of the Fixed Income and Asset Allocation Funds (2008-present). Prior to his retirement, Mr. Wolfe served as Chairman and a Director (2007-2009) and Chairman and Chief Executive Officer (1994-2001) of Hershey Foods Corporation. He also served as a member of the Boards of Adelphia Communications Corporation (telecommunications, 2003-2006), Bausch & Lomb, Inc. (medical/pharmaceutical, 1993-2007), and Revlon, Inc. (personal care products, 2004-2009). |
+ The information above includes each Trustee's principal occupation during the last five years and other information relating to the experience, attributes, and skills relevant to each Trustee's qualifications to serve as a Trustee, which led to the conclusion that each Trustee should serve as a Trustee for each fund.
Executive Officers:
Correspondence intended for each executive officer may be sent to Fidelity Investments, 82 Devonshire Street, Boston, Massachusetts 02109.
Name, Age; Principal Occupation |
John R. Hebble (52) |
| Year of Election or Appointment: 2008 President and Treasurer of Fidelity's Fixed Income and Asset Allocation Funds. Mr. Hebble also serves as Treasurer and Chief Financial Officer of The North Carolina Capital Management Trust: Cash and Term Portfolios (2008-present), Assistant Treasurer of other Fidelity funds (2009-present) and is an employee of Fidelity Investments. |
Boyce I. Greer (55) |
| Year of Election or Appointment: 2005 Vice President of Fidelity's Fixed Income Funds and Asset Allocation Funds (2005). Mr. Greer is also a Trustee of other investment companies advised by FMR. Mr. Greer is head of Institutional Investments for Fidelity Asset Management and Vice Chairman of Pyramis Global Advisors, LLC (2011-present), President of The North Carolina Capital Management Trust: Cash and Term Portfolios (2003-present), the Asset Allocation Division (2008-present), President and a Director of Strategic Advisers, Inc. (2008-present), President of FIMM 130/30 LLC (2008-present), Director of Ballyrock Investment Advisors LLC (2006-present), and an Executive Vice President of FMR (2005-present). Previously, Mr. Greer served as Executive Vice President of FMR Co., Inc. (2005-2009), President and Director of Fidelity Investments Money Management, Inc. (2007-2009) and as a Director and Managing Director of Strategic Advisers, Inc. (2002-2005). |
Derek L. Young (46) |
| Year of Election or Appointment: 2009 Vice President of Fidelity's Asset Allocation Funds. Mr. Young also serves as Chief Investment Officer of the Global Asset Allocation Group (2009-present). Previously, Mr. Young served as a portfolio manager. |
Scott C. Goebel (43) |
| Year of Election or Appointment: 2008 Secretary and Chief Legal Officer (CLO) of the Fidelity funds. Mr. Goebel also serves as Secretary and CLO of The North Carolina Capital Management Trust: Cash and Term Portfolios (2008-present); General Counsel, Secretary, and Senior Vice President of FMR (2008-present) and FMR Co., Inc. (2008-present); Deputy General Counsel of FMR LLC; Chief Legal Officer of Fidelity Management & Research (Hong Kong) Limited (2008-present) and Assistant Secretary of Fidelity Management & Research (Japan) Inc. (2008-present), Fidelity Investments Money Management, Inc. (2008-present), Fidelity Management & Research (U.K.) Inc. (2008-present), and Fidelity Research and Analysis Company (2008-present). Previously, Mr. Goebel served as Assistant Secretary of the Funds (2007-2008) and as Vice President and Secretary of Fidelity Distributors Corporation (FDC) (2005-2007). |
David J. Carter (37) |
| Year of Election or Appointment: 2010 Assistant Secretary of Fidelity's Fixed Income and Asset Allocation Funds. Mr. Carter also serves as Vice President, Associate General Counsel (2010-present) and is an employee of Fidelity Investments (2005-present). |
Holly C. Laurent (56) |
| Year of Election or Appointment: 2008 Anti-Money Laundering (AML) Officer of the Fidelity funds. Ms. Laurent also serves as AML Officer of The North Carolina Capital Management Trust: Cash and Term Portfolios (2008-present) and is an employee of Fidelity Investments. Previously, Ms. Laurent was Senior Vice President and Head of Legal for Fidelity Business Services India Pvt. Ltd. (2006-2008), and Senior Vice President, Deputy General Counsel and Group Head for FMR LLC (2005-2006). |
Christine Reynolds (52) |
| Year of Election or Appointment: 2008 Chief Financial Officer of the Fidelity funds. Ms. Reynolds became President of Fidelity Pricing and Cash Management Services (FPCMS) in August 2008. Ms. Reynolds served as Chief Operating Officer of FPCMS (2007-2008). Previously, Ms. Reynolds served as President, Treasurer, and Anti-Money Laundering officer of the Fidelity funds (2004-2007). |
Michael H. Whitaker (43) |
| Year of Election or Appointment: 2008 Chief Compliance Officer of Fidelity's Fixed Income and Asset Allocation Funds. Mr. Whitaker also serves as Chief Compliance Officer of The North Carolina Capital Management Trust: Cash and Term Portfolios (2008-present). Mr. Whitaker is an employee of Fidelity Investments (2007-present). Prior to joining Fidelity Investments, Mr. Whitaker worked at MFS Investment Management where he served as Senior Vice President and Chief Compliance Officer (2004-2006), and Assistant General Counsel. |
Jeffrey S. Christian (49) |
| Year of Election or Appointment: 2009 Deputy Treasurer of the Fidelity funds. Mr. Christian is an employee of Fidelity Investments. Previously, Mr. Christian served as Chief Financial Officer (2008-2009) of certain Fidelity funds and Senior Vice President of Fidelity Pricing and Cash Management Services (FPCMS) (2004-2009). |
Bryan A. Mehrmann (49) |
| Year of Election or Appointment: 2005 Deputy Treasurer of the Fidelity funds. Mr. Mehrmann is an employee of Fidelity Investments. |
Stephanie J. Dorsey (41) |
| Year of Election or Appointment: 2008 Deputy Treasurer of Fidelity's Fixed Income and Asset Allocation Funds. Ms. Dorsey also serves as Assistant Treasurer of other Fidelity funds (2010-present) and is an employee of Fidelity Investments (2008-present). Previously, Ms. Dorsey served as Treasurer (2004-2008) of the JPMorgan Mutual Funds and Vice President (2004-2008) of JPMorgan Chase Bank. |
Adrien E. Deberghes (43) |
| Year of Election or Appointment: 2010 Assistant Treasurer of Fidelity's Fixed Income and Asset Allocation Funds. Mr. Deberghes also serves as Deputy Treasurer of other Fidelity funds (2008-present) and is an employee of Fidelity Investments (2008-present). Previously, Mr. Deberghes served as Senior Vice President of Mutual Fund Administration at State Street Corporation (2007-2008), Senior Director of Mutual Fund Administration at Investors Bank & Trust (2005-2007), and Director of Finance for Dunkin' Brands (2000-2005). |
Kenneth B. Robins (41) |
| Year of Election or Appointment: 2009 Assistant Treasurer of the Fidelity Fixed Income and Asset Allocation Funds. Mr. Robins also serves as President and Treasurer of other Fidelity funds (2008-present; 2010-present) and is an employee of Fidelity Investments (2004-present). Previously, Mr. Robins served as Deputy Treasurer of the Fidelity funds (2005-2008) and Treasurer and Chief Financial Officer of The North Carolina Capital Management Trust: Cash and Term Portfolios (2006-2008). |
Gary W. Ryan (52) |
| Year of Election or Appointment: 2005 Assistant Treasurer of the Fidelity funds. Mr. Ryan is an employee of Fidelity Investments. Previously, Mr. Ryan served as Vice President of Fund Reporting in Fidelity Pricing and Cash Management Services (FPCMS) (1999-2005). |
Jonathan Davis (42) |
| Year of Election or Appointment: 2010 Assistant Treasurer of the Fidelity funds. Mr. Davis is an employee of Fidelity Investments. Previously, Mr. Davis served as Vice President and Associate General Counsel of FMR LLC (2003-2010). |
Annual Report
The Board of Trustees of each fund voted to pay to shareholders of record at the opening of business on record date, the following distributions per share derived from capital gains realized from sales of portfolio securities and dividends derived from net investment income:
| Pay Date | Record Date | Dividends | Capital Gains |
Fidelity Advisor Freedom Income Fund | | | | |
Institutional Class | 05/09/11 | 05/06/11 | $0.014 | $0.006 |
Fidelity Advisor Freedom 2005 Fund | | | | |
Institutional Class | 05/09/11 | 05/06/11 | $0.026 | $0.013 |
Fidelity Advisor Freedom 2010 Fund | | | | |
Institutional Class | 05/09/11 | 05/06/11 | $0.028 | $0.016 |
Fidelity Advisor Freedom 2015 Fund | | | | |
Institutional Class | 05/12/11 | 05/11/11 | $0.025 | $0.016 |
Fidelity Advisor Freedom 2020 Fund | | | | |
Institutional Class | 05/09/11 | 05/06/11 | $0.027 | $0.020 |
Fidelity Advisor Freedom 2025 Fund | | | | |
Institutional Class | 05/09/11 | 05/06/11 | $0.023 | $0.022 |
Fidelity Advisor Freedom 2030 Fund | | | | |
Institutional Class | 05/09/11 | 05/06/11 | $0.023 | $0.025 |
Fidelity Advisor Freedom 2035 Fund | | | | |
Institutional Class | 05/09/11 | 05/06/11 | $0.016 | $0.026 |
Fidelity Advisor Freedom 2040 Fund | | | | |
Institutional Class | 05/09/11 | 05/06/11 | $0.015 | $0.029 |
Fidelity Advisor Freedom 2045 Fund | | | | |
Institutional Class | 05/12/11 | 05/11/11 | $0.015 | $0.021 |
Fidelity Advisor Freedom 2050 Fund | | | | |
Institutional Class | 05/12/11 | 05/11/11 | $0.011 | $0.023 |
A percentage of the dividends distributed during the fiscal year for the following funds were derived from interest on U.S. Government securities which is generally exempt from state income tax:
Fidelity Advisor Freedom Income Fund | 12.12% |
Fidelity Advisor Freedom 2005 Fund | 9.11% |
Fidelity Advisor Freedom 2010 Fund | 8.87% |
Fidelity Advisor Freedom 2015 Fund | 8.49% |
Fidelity Advisor Freedom 2020 Fund | 6.84% |
Fidelity Advisor Freedom 2025 Fund | 5.35% |
Fidelity Advisor Freedom 2030 Fund | 4.50% |
Fidelity Advisor Freedom 2035 Fund | 2.91% |
Fidelity Advisor Freedom 2040 Fund | 2.57% |
Fidelity Advisor Freedom 2045 Fund | 1.79% |
Fidelity Advisor Freedom 2050 Fund | 1.01% |
Annual Report
A percentage of the dividends distributed during the fiscal year for the following funds qualify for the dividends-received deduction for corporate shareholders:
| Institutional Class |
Fidelity Advisor Freedom Income Fund | |
May 2010 | 3% |
June 2010 | 6% |
July 2010 | 6% |
August 2010 | 6% |
September 2010 | 6% |
October 2010 | 6% |
November 2010 | 6% |
December 2010 (Ex-Date 12/03/10) | 6% |
December 2010 (Ex-Date 12/30/10) | 8% |
February 2011 | 3% |
March 2011 | 3% |
Fidelity Advisor Freedom 2005 Fund | |
May 2010 | 3% |
December 2010 | 14% |
Fidelity Advisor Freedom 2010 Fund | |
May 2010 | 3% |
December 2010 | 15% |
Fidelity Advisor Freedom 2015 Fund | |
May 2010 | 4% |
December 2010 | 16% |
Fidelity Advisor Freedom 2020 Fund | |
May 2010 | 4% |
December 2010 | 19% |
Fidelity Advisor Freedom 2025 Fund | |
May 2010 | 5% |
December 2010 | 22% |
Fidelity Advisor Freedom 2030 Fund | |
May 2010 | 5% |
December 2010 | 23% |
Fidelity Advisor Freedom 2035 Fund | |
May 2010 | 6% |
December 2010 | 28% |
Fidelity Advisor Freedom 2040 Fund | |
May 2010 | 6% |
December 2010 | 27% |
Fidelity Advisor Freedom 2045 Fund | |
May 2010 | 6% |
December 2010 | 30% |
Fidelity Advisor Freedom 2050 Fund | |
May 2010 | 7% |
December 2010 | 32% |
Annual Report
Distributions (Unaudited) - continued
A percentage of the dividends distributed during the fiscal year for the following funds may be taken into account as a dividend for purposes of the maximum rate under section 1(h)(11) of the Internal Revenue Code.
| Institutional Class |
Fidelity Advisor Freedom Income Fund | |
May 2010 | 5% |
June 2010 | 10% |
July 2010 | 10% |
August 2010 | 10% |
September 2010 | 10% |
October 2010 | 9% |
November 2010 | 9% |
December 2010 (Ex-Date 12/03/10) | 10% |
December 2010 (Ex-Date 12/30/10) | 12% |
February 2011 | 2% |
March 2011 | 3% |
Fidelity Advisor Freedom 2005 Fund | |
May 2010 | 4% |
December 2010 | 22% |
Fidelity Advisor Freedom 2010 Fund | |
May 2010 | 4% |
December 2010 | 24% |
Fidelity Advisor Freedom 2015 Fund | |
May 2010 | 5% |
December 2010 | 25% |
Fidelity Advisor Freedom 2020 Fund | |
May 2010 | 5% |
December 2010 | 29% |
Fidelity Advisor Freedom 2025 Fund | |
May 2010 | 6% |
December 2010 | 33% |
Fidelity Advisor Freedom 2030 Fund | |
May 2010 | 7% |
December 2010 | 36% |
Fidelity Advisor Freedom 2035 Fund | |
May 2010 | 7% |
December 2010 | 43% |
Fidelity Advisor Freedom 2040 Fund | |
May 2010 | 8% |
December 2010 | 42% |
Fidelity Advisor Freedom 2045 Fund | |
May 2010 | 7% |
December 2010 | 45% |
Fidelity Advisor Freedom 2050 Fund | |
May 2010 | 9% |
December 2010 | 48% |
The funds will notify shareholders in January 2012 of amounts for use in preparing 2011 income tax returns.
Annual Report
Investment Adviser
Strategic Advisers, Inc.
Boston, MA
General Distributor
Fidelity Distributors Corporation
Boston, MA
Transfer and Service Agents
Fidelity Investments Institutional Operations Company, Inc.
Boston, MA
Fidelity Service Company, Inc.
Boston, MA
Custodian
The Bank of New York Mellon
New York, NY
AFFI-UANN-0511
1.792135.107
Fidelity Freedom Funds® -
Income, 2000, 2005, 2010, 2015, 2020, 2025, 2030, 2035, 2040, 2045, 2050
Annual Report
March 31, 2011
(2_fidelity_logos) (Registered_Trademark)
Contents
Annual Report
To view a fund's proxy voting guidelines and proxy voting record for the 12-month period ended June 30, visit http://www.fidelity.com/proxyvotingresults or visit the Securities and Exchange Commission's (SEC) web site at http://www.sec.gov. You may also call 1-800-544-8544 to request a free copy of the proxy voting guidelines.
Standard & Poor's, S&P and S&P 500 are registered service marks of The McGraw-Hill Companies, Inc. and have been licensed for use by Fidelity Distributors Corporation.
Other third party marks appearing herein are the property of their respective owners.
All other marks appearing herein are registered or unregistered trademarks or service marks of FMR LLC or an affiliated company.
This report and the financial statements contained herein are submitted for the general information of the shareholders of the funds. This report is not authorized for distribution to prospective investors in the funds unless preceded or accompanied by an effective prospectus.
A fund files its complete schedule of portfolio holdings with the SEC for the first and third quarters of each fiscal year on Form N-Q. Forms N-Q are available on the SEC's web site at http://www.sec.gov. A fund's Forms N-Q may be reviewed and copied at the SEC's Public Reference Room in Washington, DC. Information regarding the operation of the SEC's Public Reference Room may be obtained by calling 1-800-SEC-0330. For a complete list of a fund's portfolio holdings, view the most recent holdings listing, semiannual report, or annual report on Fidelity's web site at http://www.fidelity.com, http://www.advisor.fidelity.com, or http://www.401k.com, as applicable.
NOT FDIC INSURED • MAY LOSE VALUE • NO BANK GUARANTEE
Neither the funds nor Fidelity Distributors Corporation is a bank.
Annual Report
(photo_of_Abigail_P_Johnson)
Dear Shareholder:
Amid indications the U.S. economy had turned a corner, U.S. equities continued their generally upward trend in early 2011, overcoming bouts of short-term volatility following unrest in North Africa and the disaster in Japan. Still, questions remained about the longer-term outlook, most notably persistently high unemployment. Financial markets are always unpredictable, of course, but there also are several time-tested investment principles that can help put the odds in your favor.
One of the basic tenets is to invest for the long term. Over time, riding out the markets' inevitable ups and downs has proven much more effective than selling into panic or chasing the hottest trend. Even missing only a few of the markets' best days can significantly diminish investor returns. Patience also affords the benefits of compounding - of earning interest on additional income or reinvested dividends and capital gains. There can be tax advantages and cost benefits to consider as well. While staying the course doesn't eliminate risk, it can considerably lessen the effect of short-term declines.
You can further manage your investing risk through diversification. And today, more than ever, geographic diversification should be taken into account. Studies indicate that asset allocation is the single most important determinant of a portfolio's long-term success. The right mix of stocks, bonds and cash - aligned to your particular risk tolerance and investment objective - is very important. Age-appropriate rebalancing is also an essential aspect of asset allocation. For younger investors, an emphasis on equities - which historically have been the best-performing asset class over time - is encouraged. As investors near their specific goal, such as retirement or sending a child to college, consideration may be given to replacing volatile assets (e.g. common stocks) with more-stable fixed investments (bonds or savings plans).
A third principle - investing regularly - can help lower the average cost of your purchases. Investing a certain amount of money each month or quarter helps ensure you won't pay for all your shares at market highs. This strategy - known as dollar cost averaging - also reduces "emotion" from investing, helping shareholders avoid selling weak performers just prior to an upswing, or chasing a hot performer just before a correction.
We invite you to contact us via the Internet, through our Investor Centers or by phone. It is our privilege to provide you the information you need to make the investments that are right for you.
Sincerely,
(The chairman's signature appears here.)
Abigail P. Johnson
Annual Report
Fidelity Freedom Income Fund®
Performance: The Bottom Line
Average annual total return reflects the change in the value of an investment, assuming reinvestment of the fund's distributions from dividend income and capital gains (the profits earned upon the sale of securities that have grown in value, if any) and assuming a constant rate of performance each year. The $10,000 table and the fund's returns do not reflect the deduction of taxes that a shareholder would pay on fund distributions or the redemption of fund shares. During periods of reimbursement by Fidelity, a fund's total return will be greater than it would be had the reimbursement not occurred. How a fund did yesterday is no guarantee of how it will do tomorrow.
Average Annual Total Returns
Periods ended March 31, 2011 | Past 1
year | Past 5
years | Past 10
years |
Fidelity Freedom Income Fund® | 7.33% | 4.25% | 4.10% |
$10,000 Over 10 Years
Let's say hypothetically that $10,000 was invested in Fidelity Freedom Income Fund® on March 31, 2001. The chart shows how the value of your investment would have changed, and also shows how the Barclays Capital® U.S. Aggregate Bond Index performed over the same period.
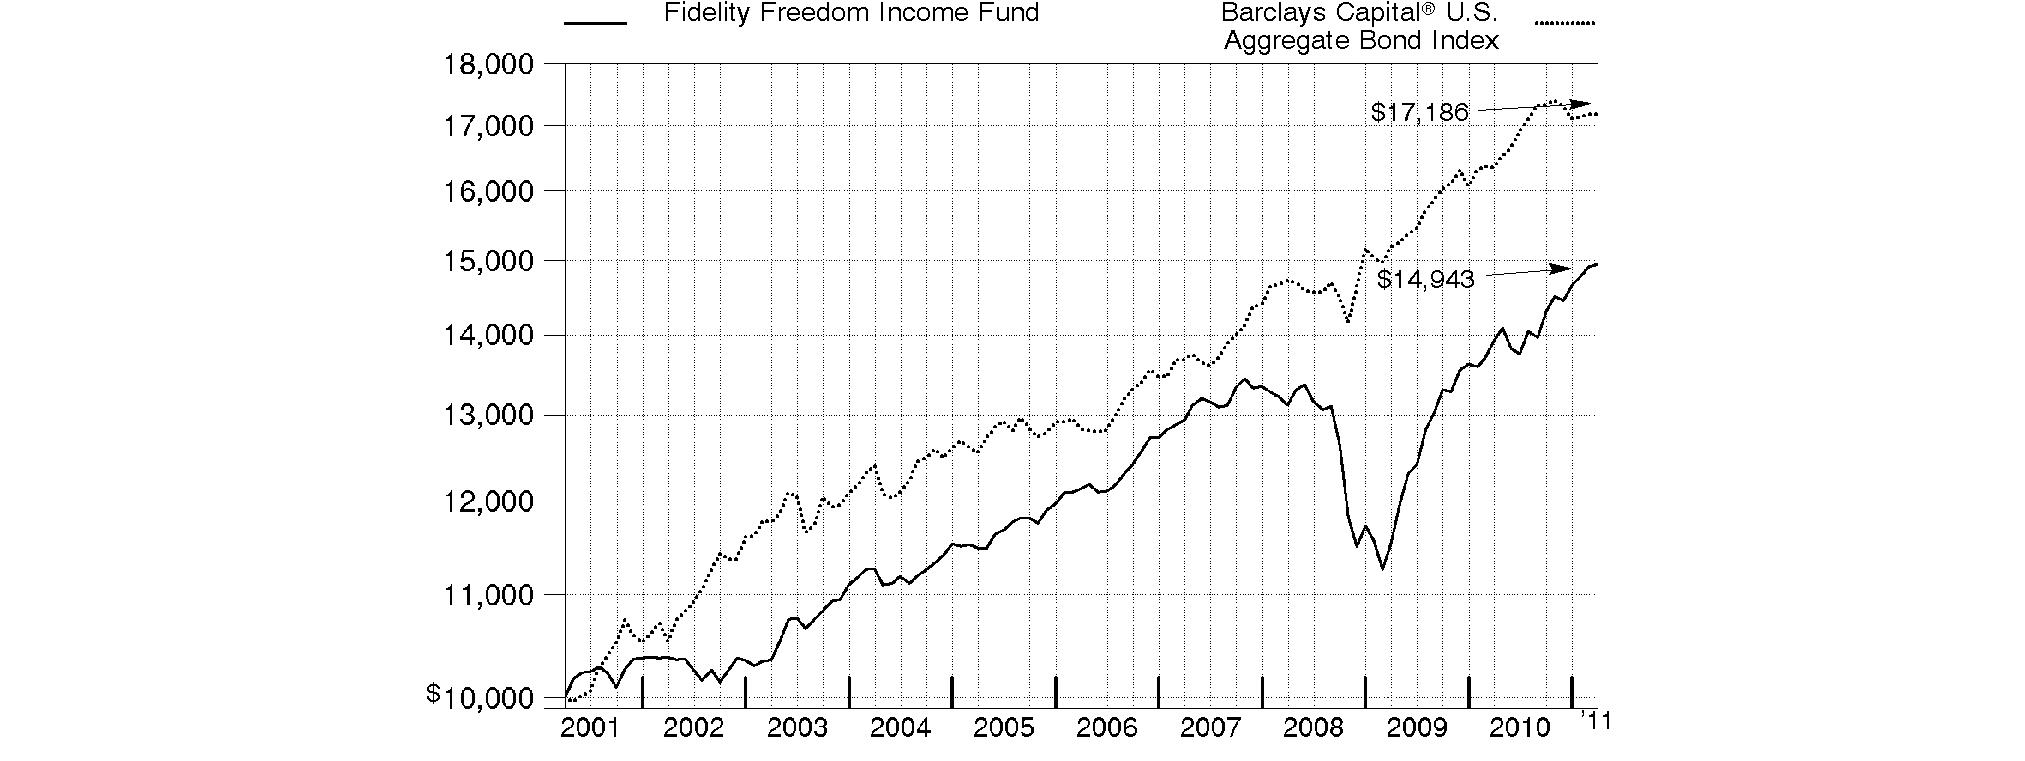
Annual Report
Fidelity Freedom 2000 Fund®
Performance: The Bottom Line
Average annual total return reflects the change in the value of an investment, assuming reinvestment of the fund's distributions from dividend income and capital gains (the profits earned upon the sale of securities that have grown in value, if any) and assuming a constant rate of performance each year. The $10,000 table and the fund's returns do not reflect the deduction of taxes that a shareholder would pay on fund distributions or the redemption of fund shares. During periods of reimbursement by Fidelity, a fund's total return will be greater than it would be had the reimbursement not occurred. How a fund did yesterday is no guarantee of how it will do tomorrow.
Average Annual Total Returns
Periods ended March 31, 2011 | Past 1
year | Past 5
years | Past 10
years |
Fidelity Freedom 2000 Fund® | 7.56% | 4.05% | 4.08% |
$10,000 Over 10 Years
Let's say hypothetically that $10,000 was invested in Fidelity Freedom 2000 Fund® on March 31, 2001. The chart shows how the value of your investment would have changed, and also shows how the Barclays Capital U.S. Aggregate Bond Index performed over the same period.
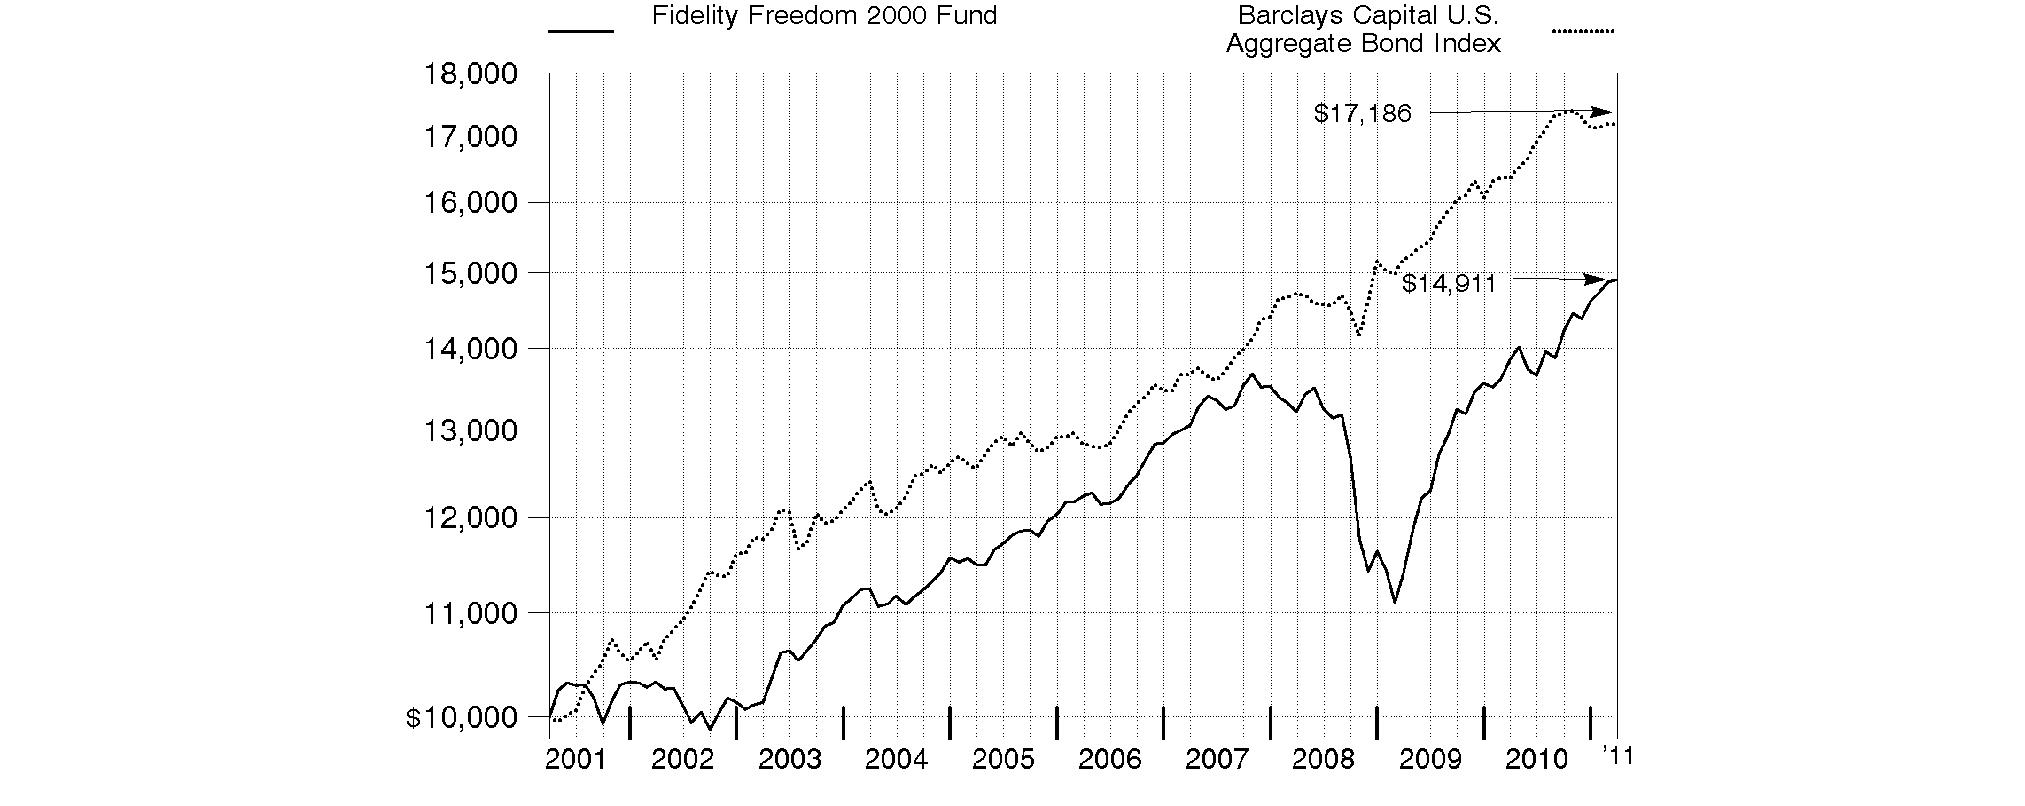
Annual Report
Fidelity Freedom 2005 Fund®
Performance: The Bottom Line
Average annual total return reflects the change in the value of an investment, assuming reinvestment of the fund's distributions from dividend income and capital gains (the profits earned upon the sale of securities that have grown in value, if any) and assuming a constant rate of performance each year. The $10,000 table and the fund's returns do not reflect the deduction of taxes that a shareholder would pay on fund distributions or the redemption of fund shares. During periods of reimbursement by Fidelity, a fund's total return will be greater than it would be had the reimbursement not occurred. How a fund did yesterday is no guarantee of how it will do tomorrow.
Average Annual Total Returns
Periods ended March 31, 2011 | | Past 1
year | Past 5
years | Life of
fund A |
Fidelity Freedom 2005 Fund® | | 10.64% | 3.86% | 5.12% |
A From November 6, 2003.
$10,000 Over Life of Fund
Let's say hypothetically that $10,000 was invested in Fidelity Freedom 2005 Fund® on November 6, 2003, when the fund started. The chart shows how the value of your investment would have changed, and also shows how the Barclays Capital U.S. Aggregate Bond Index performed over the same period.
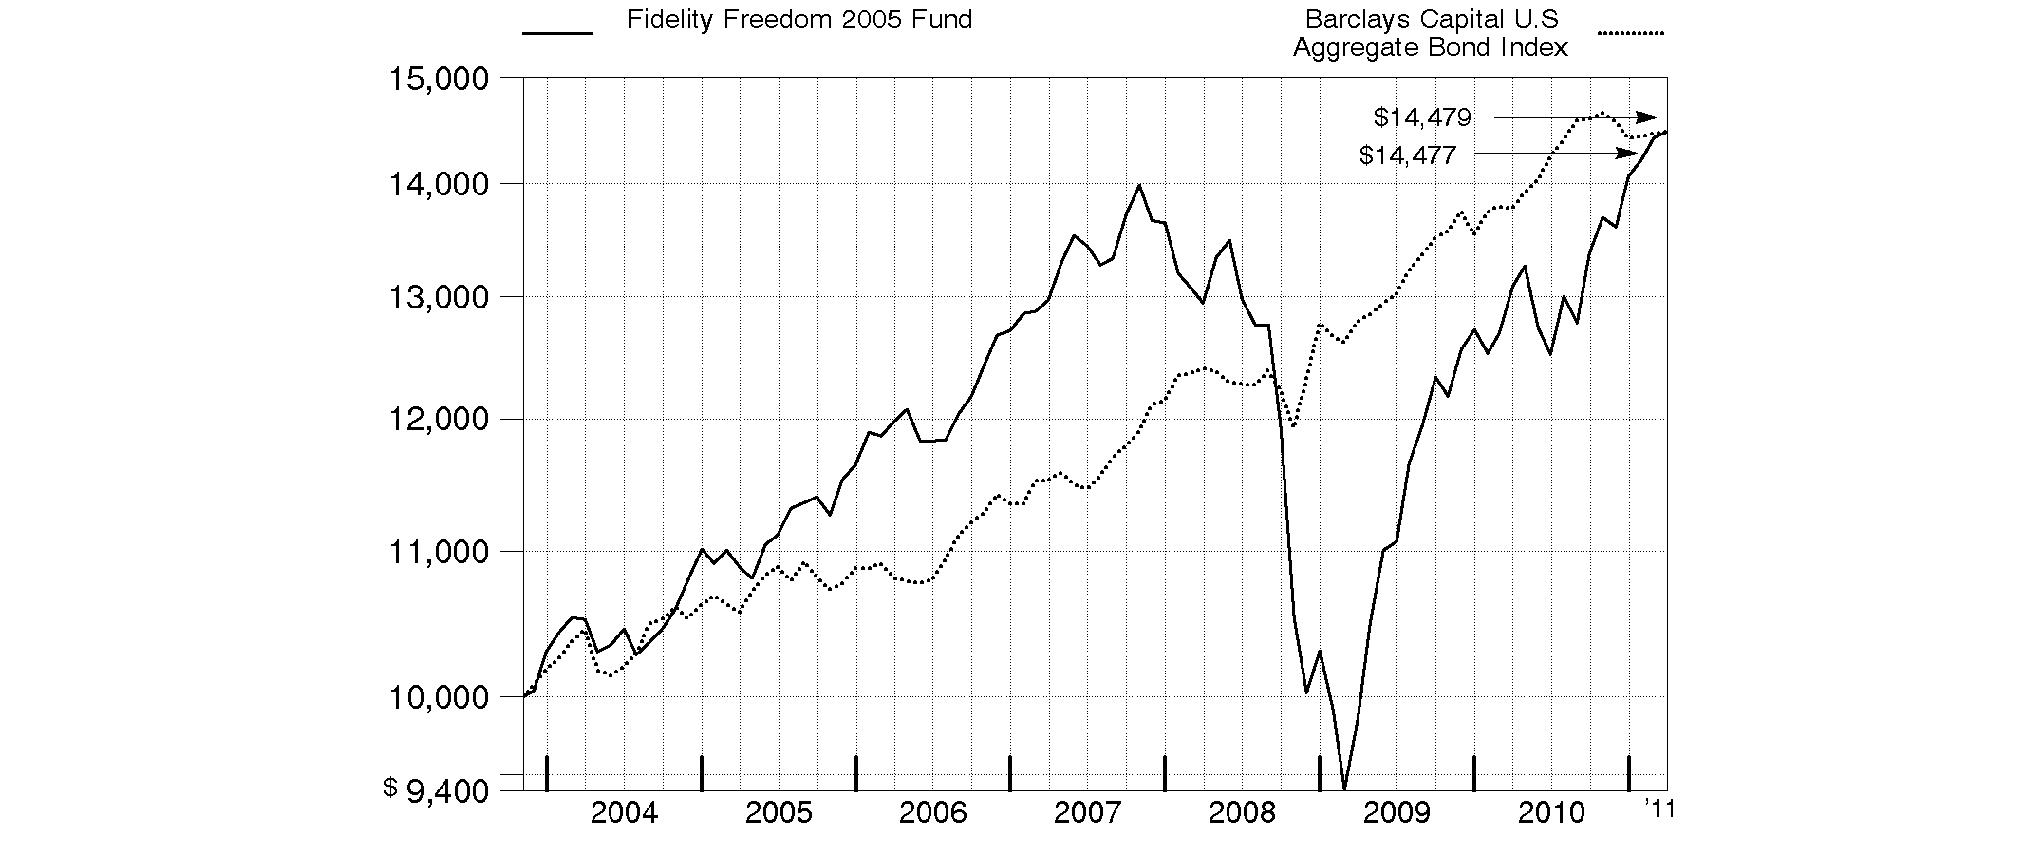
Annual Report
Fidelity Freedom 2010 Fund®
Performance: The Bottom Line
Average annual total return reflects the change in the value of an investment, assuming reinvestment of the fund's distributions from dividend income and capital gains (the profits earned upon the sale of securities that have grown in value, if any) and assuming a constant rate of performance each year. The $10,000 table and the fund's returns do not reflect the deduction of taxes that a shareholder would pay on fund distributions or the redemption of fund shares. During periods of reimbursement by Fidelity, a fund's total return will be greater than it would be had the reimbursement not occurred. How a fund did yesterday is no guarantee of how it will do tomorrow.
Average Annual Total Returns
Periods ended March 31, 2011 | Past 1
year | Past 5
years | Past 10
years |
Fidelity Freedom 2010 Fund® | 12.02% | 4.18% | 4.84% |
$10,000 Over 10 Years
Let's say hypothetically that $10,000 was invested in Fidelity Freedom 2010 Fund® on March 31, 2001. The chart shows how the value of your investment would have changed, and also shows how the Barclays Capital U.S. Aggregate Bond Index performed over the same period.
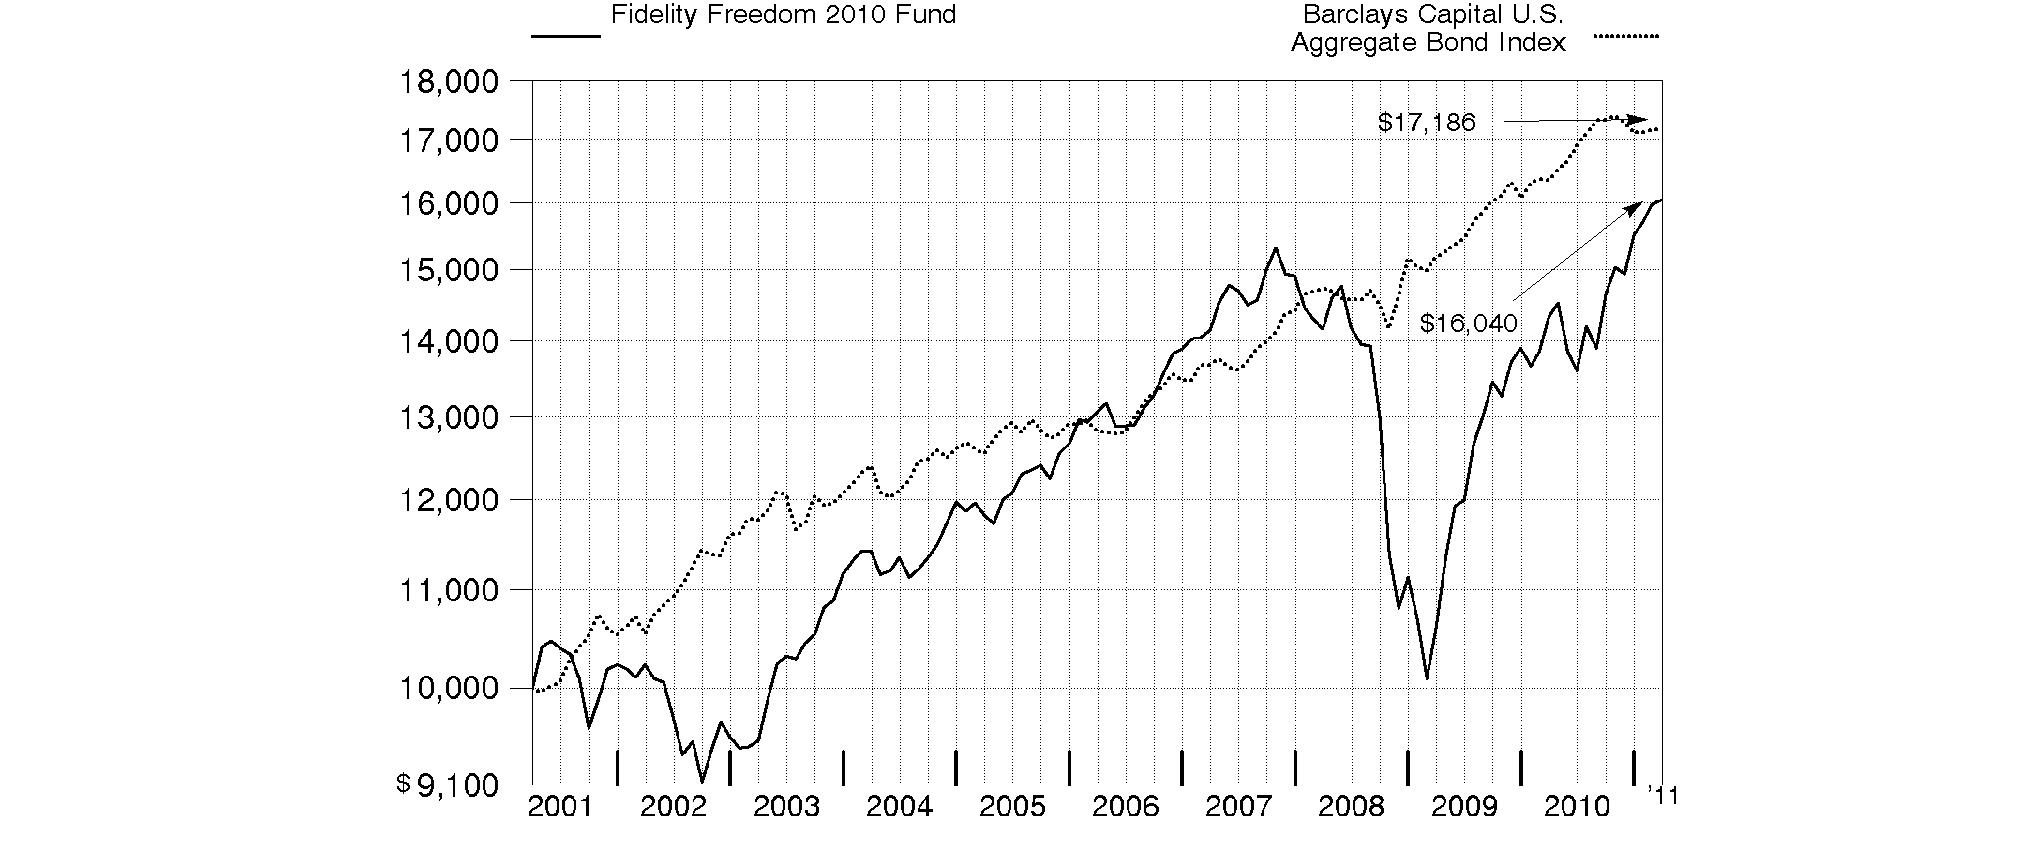
Annual Report
Fidelity Freedom 2015 Fund®
Performance: The Bottom Line
Average annual total return reflects the change in the value of an investment, assuming reinvestment of the fund's distributions from dividend income and capital gains (the profits earned upon the sale of securities that have grown in value, if any) and assuming a constant rate of performance each year. The $10,000 table and the fund's returns do not reflect the deduction of taxes that a shareholder would pay on fund distributions or the redemption of fund shares. During periods of reimbursement by Fidelity, a fund's total return will be greater than it would be had the reimbursement not occurred. How a fund did yesterday is no guarantee of how it will do tomorrow.
Average Annual Total Returns
Periods ended March 31, 2011 | | Past 1
year | Past 5
years | Life of
fund A |
Fidelity Freedom 2015 Fund® | | 12.24% | 3.96% | 5.79% |
A From November 6, 2003.
$10,000 Over Life of Fund
Let's say hypothetically that $10,000 was invested in Fidelity Freedom 2015 Fund® on November 6, 2003, when the fund started. The chart shows how the value of your investment would have changed, and also shows how the S&P 500® Index performed over the same period.
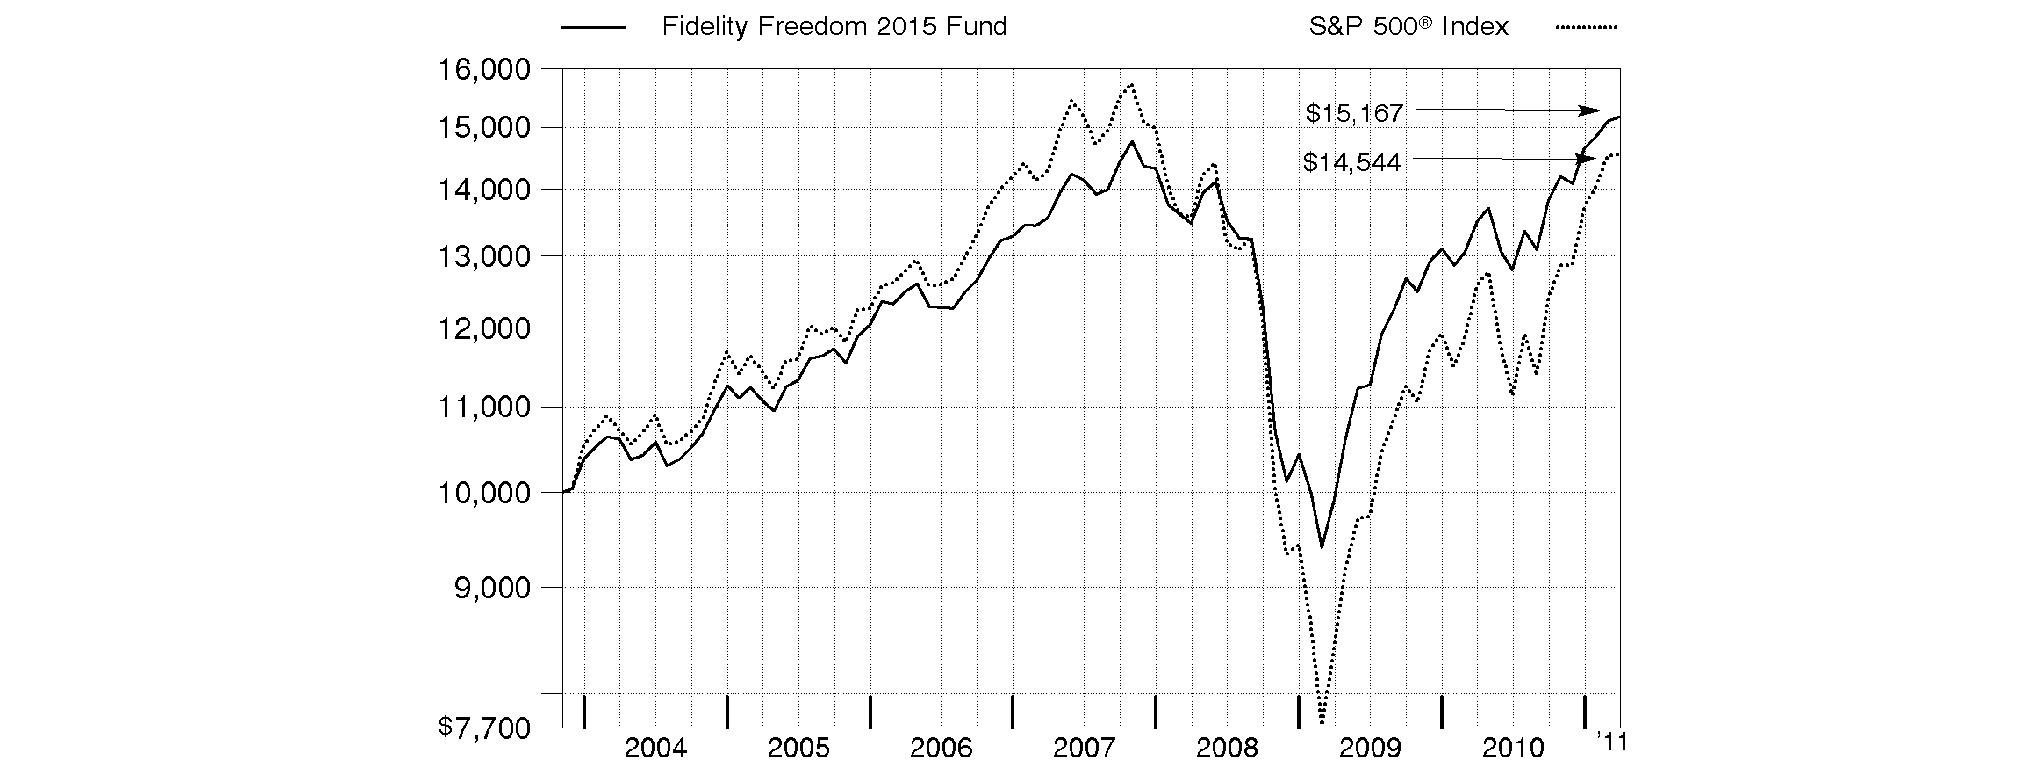
Annual Report
Fidelity Freedom 2020 Fund®
Performance: The Bottom Line
Average annual total return reflects the change in the value of an investment, assuming reinvestment of the fund's distributions from dividend income and capital gains (the profits earned upon the sale of securities that have grown in value, if any) and assuming a constant rate of performance each year. The $10,000 table and the fund's returns do not reflect the deduction of taxes that a shareholder would pay on fund distributions or the redemption of fund shares. During periods of reimbursement by Fidelity, a fund's total return will be greater than it would be had the reimbursement not occurred. How a fund did yesterday is no guarantee of how it will do tomorrow.
Average Annual Total Returns
Periods ended March 31, 2011 | Past 1
year | Past 5
years | Past 10
years |
Fidelity Freedom 2020 Fund® | 13.47% | 3.54% | 4.80% |
$10,000 Over 10 Years
Let's say hypothetically that $10,000 was invested in Fidelity Freedom 2020 Fund® on March 31, 2001. The chart shows how the value of your investment would have changed, and also shows how the S&P 500 Index performed over the same period.
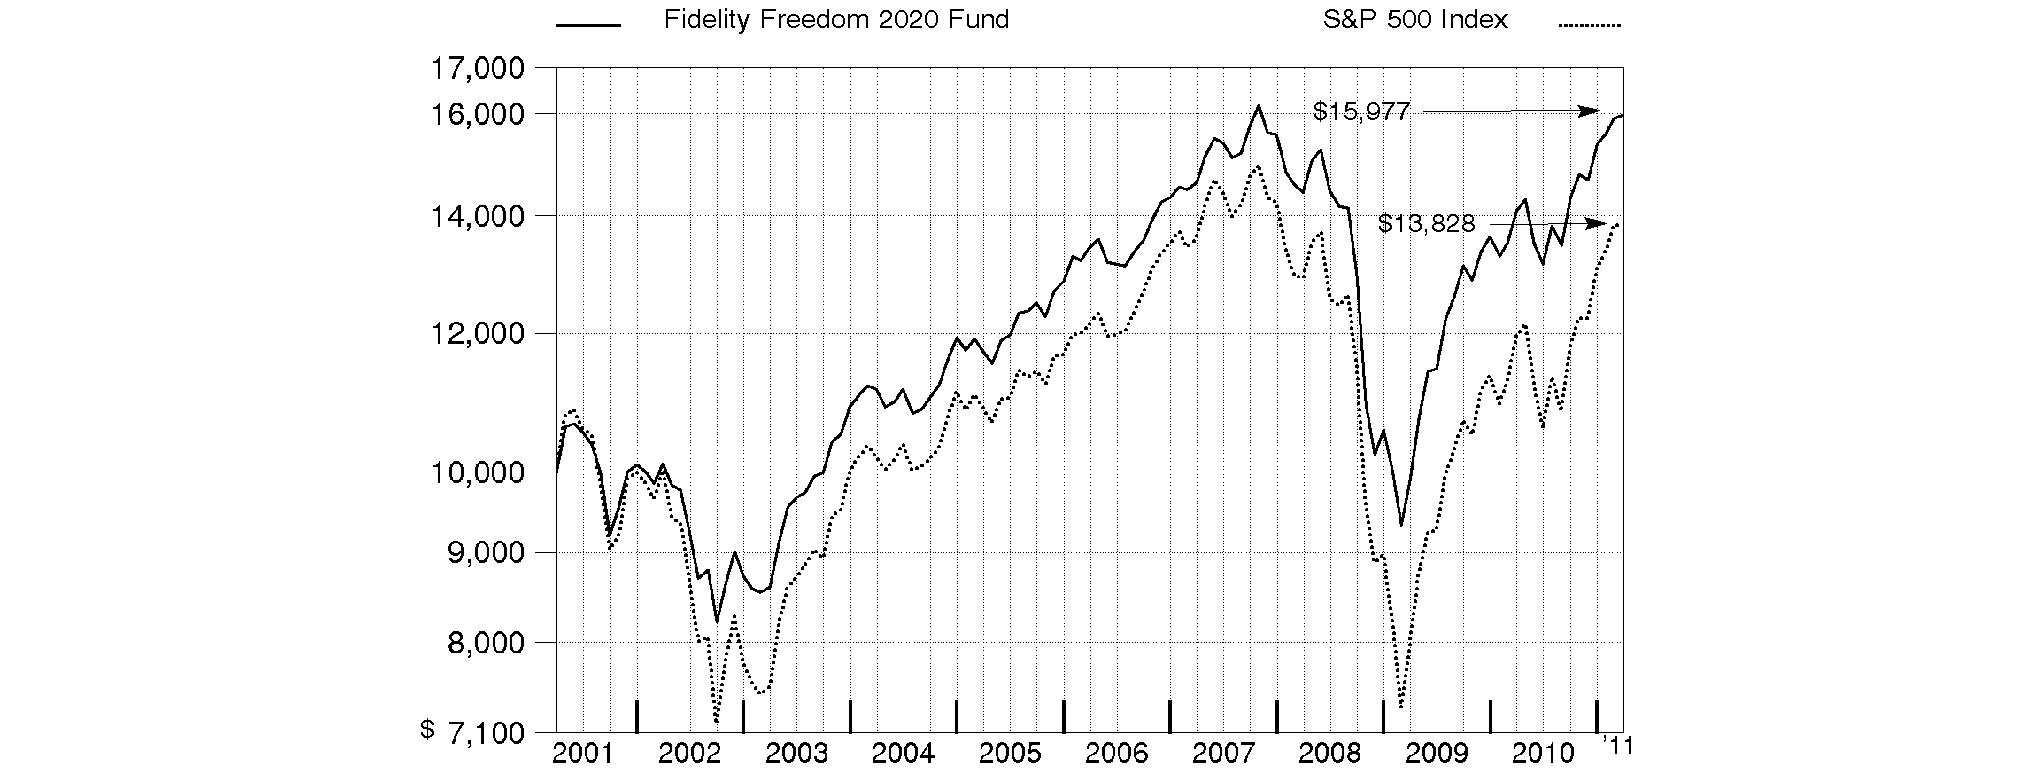
Annual Report
Fidelity Freedom 2025 Fund®
Performance: The Bottom Line
Average annual total return reflects the change in the value of an investment, assuming reinvestment of the fund's distributions from dividend income and capital gains (the profits earned upon the sale of securities that have grown in value, if any) and assuming a constant rate of performance each year. The $10,000 table and the fund's returns do not reflect the deduction of taxes that a shareholder would pay on fund distributions or the redemption of fund shares. During periods of reimbursement by Fidelity, a fund's total return will be greater than it would be had the reimbursement not occurred. How a fund did yesterday is no guarantee of how it will do tomorrow.
Average Annual Total Returns
Periods ended March 31, 2011 | | Past 1
year | Past 5
years | Life of
fundA |
Fidelity Freedom 2025 Fund® | | 14.57% | 3.52% | 6.06% |
A From November 6, 2003.
$10,000 Over Life of Fund
Let's say hypothetically that $10,000 was invested in Fidelity Freedom 2025 Fund® on November 6, 2003, when the fund started. The chart shows how the value of your investment would have changed, and also shows how the S&P 500 Index performed over the same period.
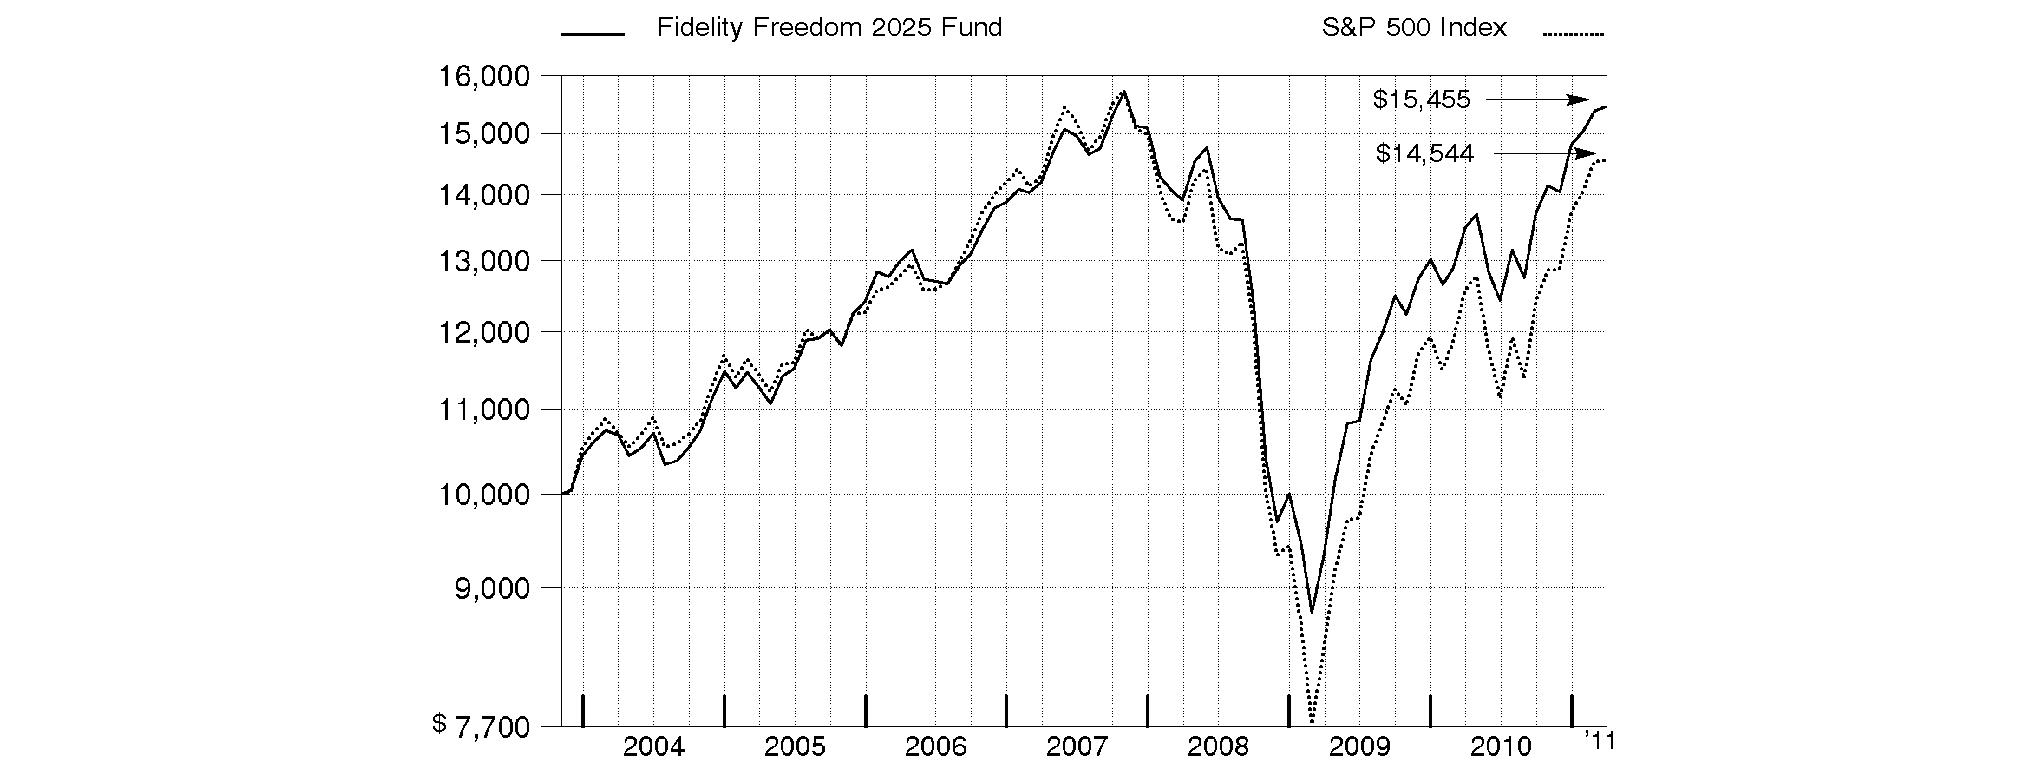
Annual Report
Fidelity Freedom 2030 Fund®
Performance: The Bottom Line
Average annual total return reflects the change in the value of an investment, assuming reinvestment of the fund's distributions from dividend income and capital gains (the profits earned upon the sale of securities that have grown in value, if any) and assuming a constant rate of performance each year. The $10,000 table and the fund's returns do not reflect the deduction of taxes that a shareholder would pay on fund distributions or the redemption of fund shares. During periods of reimbursement by Fidelity, a fund's total return will be greater than it would be had the reimbursement not occurred. How a fund did yesterday is no guarantee of how it will do tomorrow.
Average Annual Total Returns
Periods ended March 31, 2011 | Past 1
year | Past 5
years | Past 10
years |
Fidelity Freedom 2030 Fund® | 14.81% | 2.84% | 4.47% |
$10,000 Over 10 Years
Let's say hypothetically that $10,000 was invested in Fidelity Freedom 2030 Fund® on March 31, 2001. The chart shows how the value of your investment would have changed, and also shows how the S&P 500 Index performed over the same period.
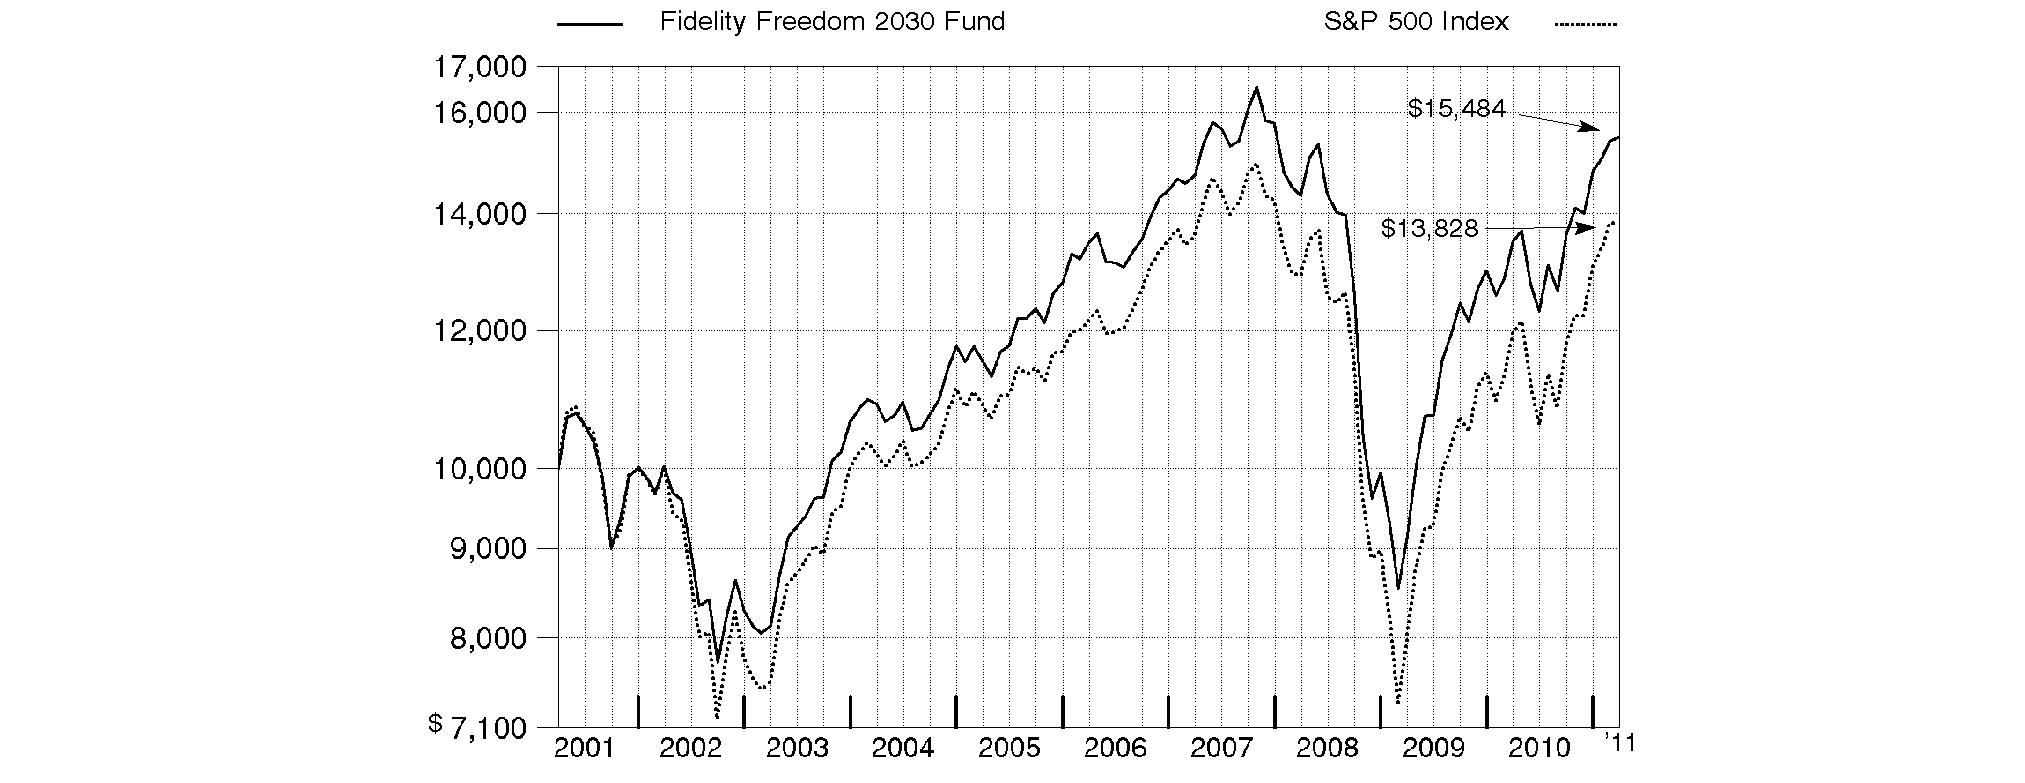
Annual Report
Fidelity Freedom 2035 Fund®
Performance: The Bottom Line
Average annual total return reflects the change in the value of an investment, assuming reinvestment of the fund's distributions from dividend income and capital gains (the profits earned upon the sale of securities that have grown in value, if any) and assuming a constant rate of performance each year. The $10,000 table and the fund's returns do not reflect the deduction of taxes that a shareholder would pay on fund distributions or the redemption of fund shares. During periods of reimbursement by Fidelity, a fund's total return will be greater than it would be had the reimbursement not occurred. How a fund did yesterday is no guarantee of how it will do tomorrow.
Average Annual Total Returns
Periods ended March 31, 2011 | Past 1
year | Past 5
years | Life of
fund A |
Fidelity Freedom 2035 Fund® | 15.63% | 2.82% | 5.96% |
A From November 6, 2003.
$10,000 Over Life of Fund
Let's say hypothetically that $10,000 was invested in Fidelity Freedom 2035 Fund® on November 6, 2003, when the fund started. The chart shows how the value of your investment would have changed, and also shows how the S&P 500 Index performed over the same period.
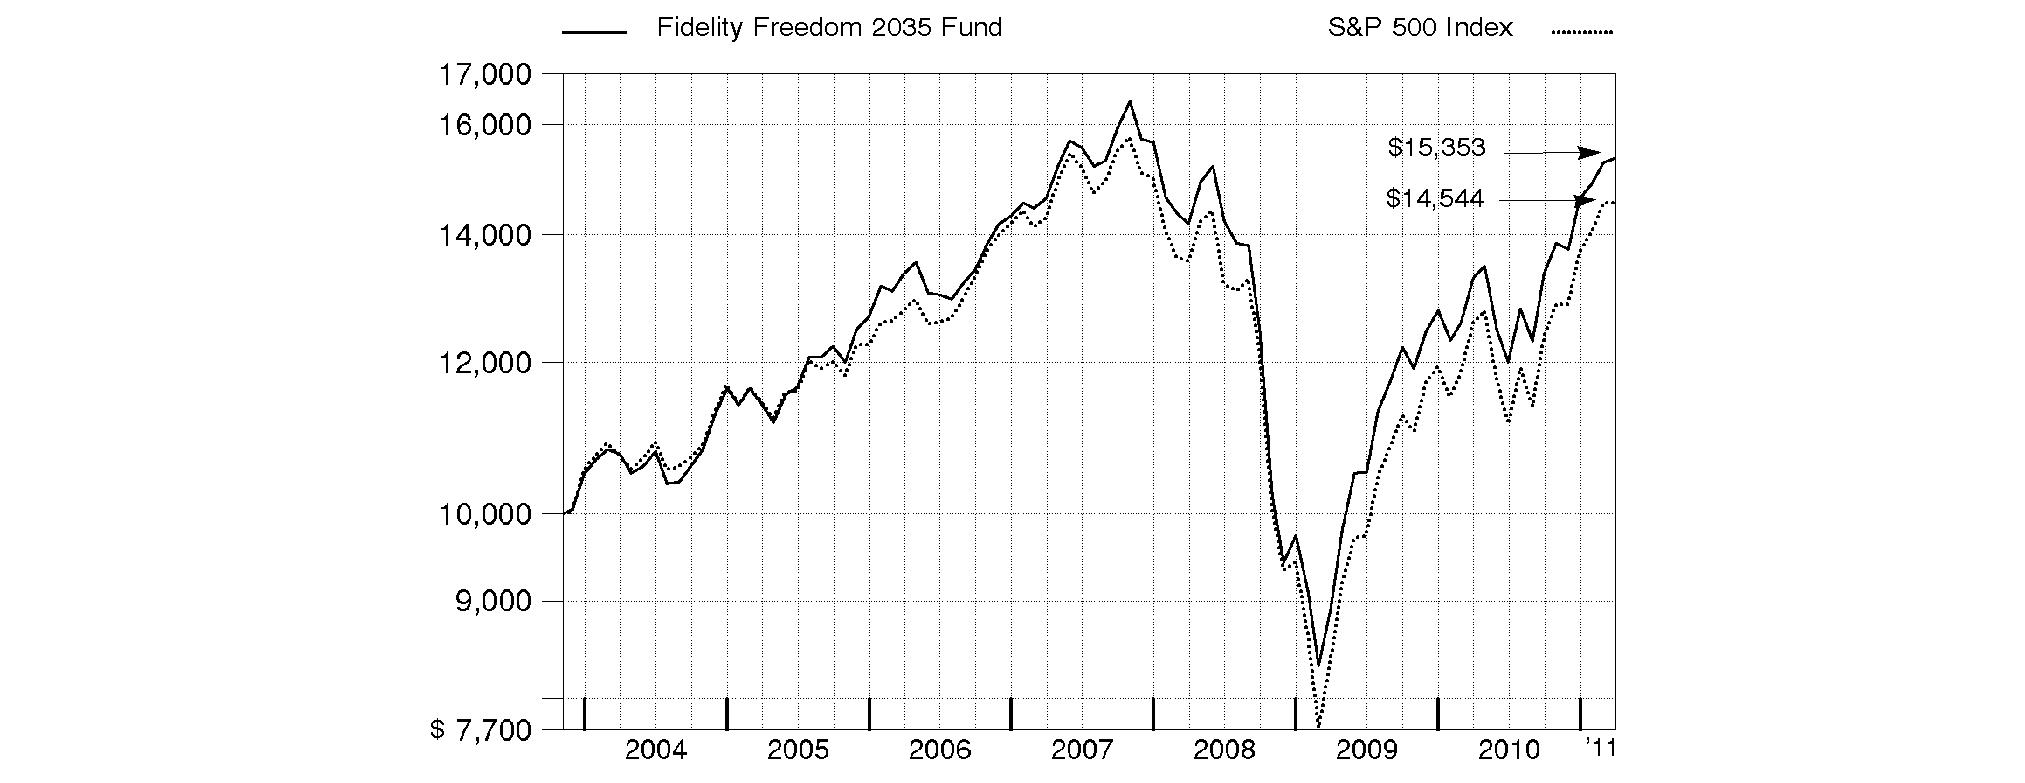
Annual Report
Fidelity Freedom 2040 Fund®
Performance: The Bottom Line
Average annual total return reflects the change in the value of an investment, assuming reinvestment of the fund's distributions from dividend income and capital gains (the profits earned upon the sale of securities that have grown in value, if any) and assuming a constant rate of performance each year. The $10,000 table and the fund's returns do not reflect the deduction of taxes that a shareholder would pay on fund distributions or the redemption of fund shares. During periods of reimbursement by Fidelity, a fund's total return will be greater than it would be had the reimbursement not occurred. How a fund did yesterday is no guarantee of how it will do tomorrow.
Average Annual Total Returns
Periods ended March 31, 2011 | Past 1
year | Past 5
years | Past 10
years |
Fidelity Freedom 2040 Fund® | 15.66% | 2.63% | 4.33% |
$10,000 Over 10 Years
Let's say hypothetically that $10,000 was invested in Fidelity Freedom 2040 Fund® on March 31, 2001. The chart shows how the value of your investment would have changed, and also shows how the S&P 500 Index performed over the same period.

Annual Report
Fidelity Freedom 2045 Fund®
Performance: The Bottom Line
Average annual total return reflects the change in the value of an investment, assuming reinvestment of the fund's distributions from dividend income and capital gains (the profits earned upon the sale of securities that have grown in value, if any) and assuming a constant rate of performance each year. The $10,000 table and the fund's returns do not reflect the deduction of taxes that a shareholder would pay on fund distributions or the redemption of fund shares. During periods of reimbursement by Fidelity, a fund's total return will be greater than it would be had the reimbursement not occurred. How a fund did yesterday is no guarantee of how it will do tomorrow.
Average Annual Total Returns
Periods ended March 31, 2011 | Past 1
year | Life of
fund A |
Fidelity Freedom 2045 Fund® | 15.99% | 3.06% |
A From June 1, 2006.
$10,000 Over Life of Fund
Let's say hypothetically that $10,000 was invested in Fidelity Freedom 2045 Fund® on June 1, 2006, when the fund started. The chart shows how the value of your investment would have changed, and also shows how the S&P 500 Index performed over the same period.
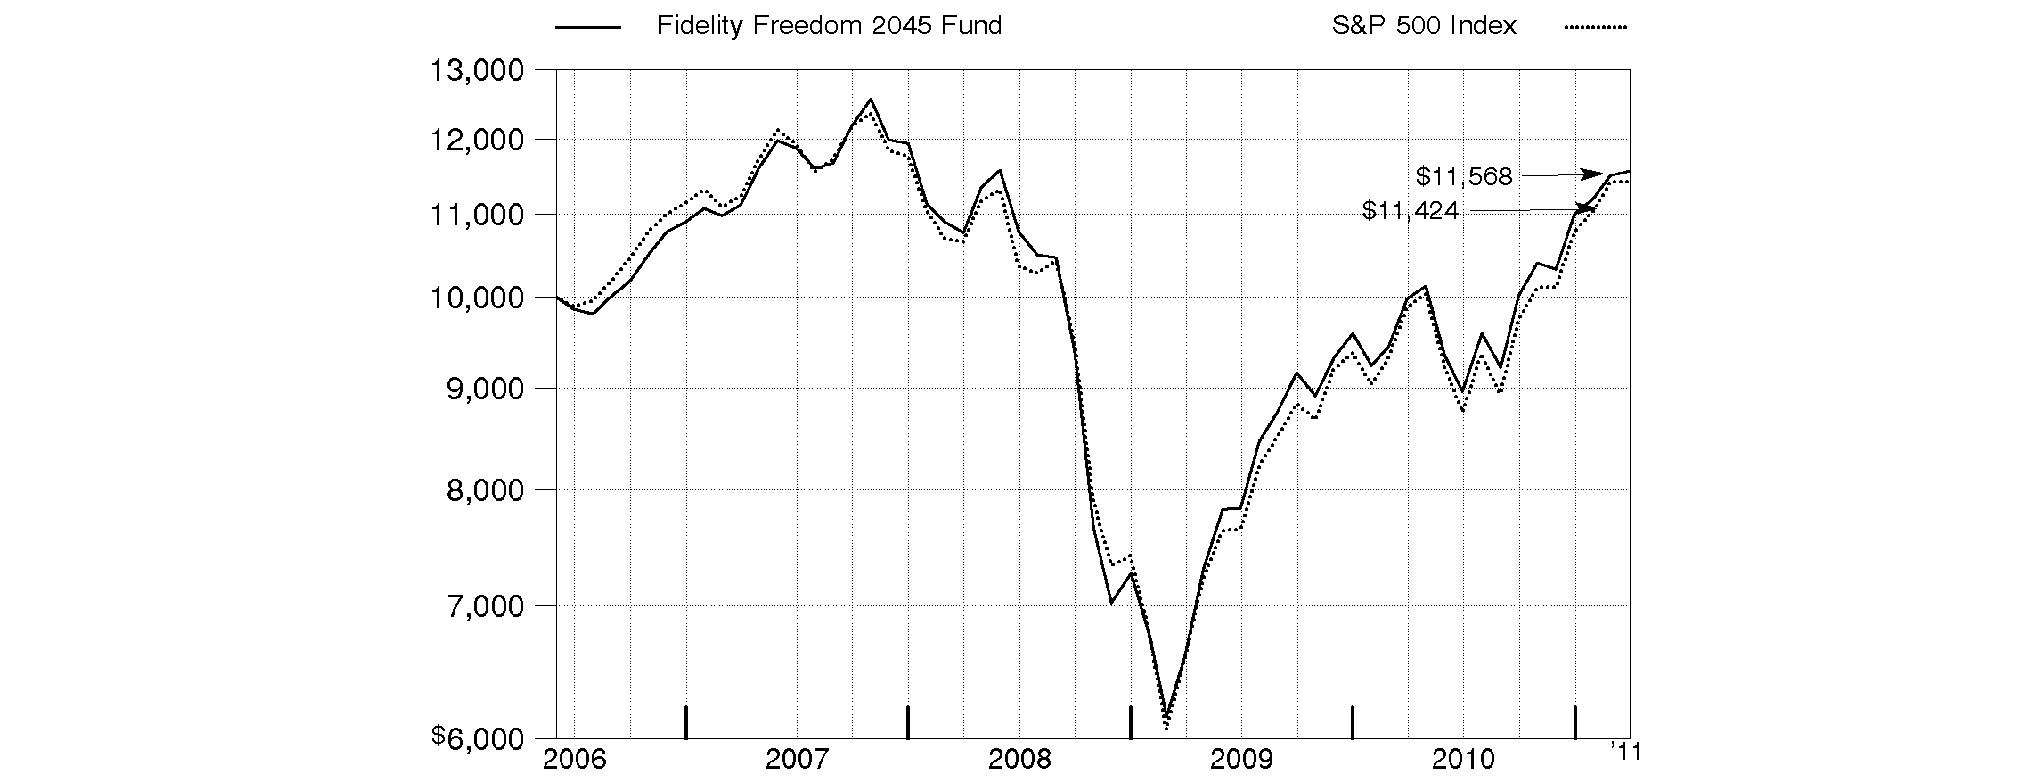
Annual Report
Fidelity Freedom 2050 Fund®
Performance: The Bottom Line
Average annual total return reflects the change in the value of an investment, assuming reinvestment of the fund's distributions from dividend income and capital gains (the profits earned upon the sale of securities that have grown in value, if any) and assuming a constant rate of performance each year. The $10,000 table and the fund's returns do not reflect the deduction of taxes that a shareholder would pay on fund distributions or the redemption of fund shares. During periods of reimbursement by Fidelity, a fund's total return will be greater than it would be had the reimbursement not occurred. How a fund did yesterday is no guarantee of how it will do tomorrow.
Average Annual Total Returns
Periods ended March 31, 2011 | Past 1
year | Life of
fund A |
Fidelity Freedom 2050 Fund® | 16.29% | 2.73% |
A From June 1, 2006.
$10,000 Over Life of Fund
Let's say hypothetically that $10,000 was invested in Fidelity Freedom 2050 Fund® on June 1, 2006, when the fund started. The chart shows how the value of your investment would have changed, and also shows how the S&P 500 Index performed over the same period.
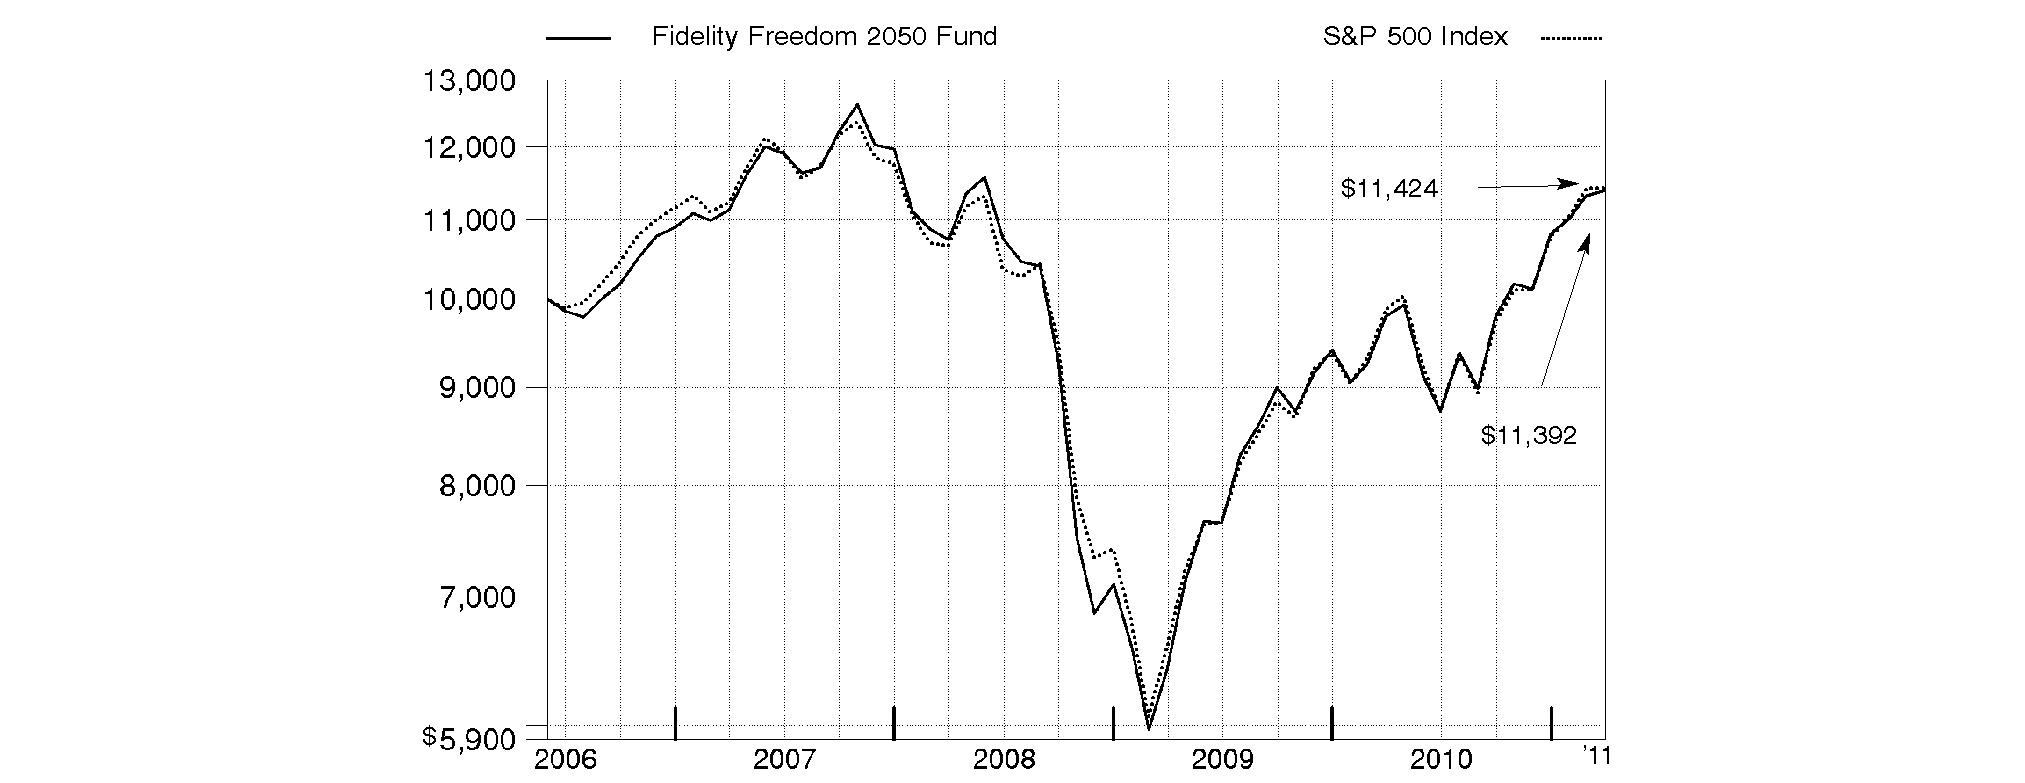
Annual Report
Market Recap: The 12-month period ending March 31, 2011, marked another good stretch for major equity markets, which continued a rally that began two years earlier. Despite early-period volatility brought on by the debt crisis in Europe and worries about a potential "double dip" recession in the U.S., stocks regained strength in late summer and fall, fueled by better-than-expected corporate earnings, encouraging economic activity, stimulative tax policies and the Federal Reserve's second round of quantitative easing involving the purchase of $600 billion in U.S. Treasuries. For the full period, the broad-based, large-cap-oriented S&P 500® Index posted a 15.65% gain, while its blue-chip counterpart, the Dow Jones Industrial AverageSM, rose 16.51% and the technology-laden Nasdaq Composite® Index added 17.06%. Within the S&P 500®, economically sensitive sectors generally saw the biggest gains, led by energy, materials and consumer discretionary. Telecommunication services stocks also rose sharply. By contrast, the financials and health care sectors showed only modest advances. Although global markets were rocked later in the period by heightened unrest in the Arab world and a devastating earthquake in Japan, foreign developed-markets equities, as represented by the MSCI® EAFE® (Europe, Australasia, Far East) Index, finished the year up 10.55%, significantly boosted by a weaker dollar. In the fixed-income area, investor appetite for higher-risk investments yielded solid returns. The BofA Merrill LynchSM US High Yield Constrained Index rose 14.14%, outpacing the 5.12% gain in the Barclays Capital® U.S. Aggregate Bond Index - a broad measure of the domestic investment-grade debt universe, which was held back by the weak returns of government securities.
Comments from Jonathan Shelon and Christopher Sharpe, Co-Portfolio Managers of Fidelity Freedom Funds®: Each of the Freedom Funds delivered a positive result for the one-year period ending March 31, 2011. (For specific Fund results, please refer to the performance section of this report.) The longer-dated Funds, which include more exposure to the U.S. equity and non-U.S. equity asset classes, posted higher returns than the Funds with larger allocations to the investment-grade debt and short-term debt asset classes. On an absolute basis, both U.S. equities and non-U.S. equities performed very well for the one-year period, having gained traction in the second half of the period after a challenging initial six months. The equity asset classes were the main drivers of the Funds' absolute performance, which resulted in the longer-dated Funds posting the biggest gains during the one-year period ending March 31, 2011. In aggregate, the Funds' underlying U.S. equity investments fell just short of the 17.73% return of the Dow Jones U.S. Total Stock Market IndexSM. Even though six of the 10 underlying funds beat the Dow Jones index, major holdings Fidelity® Disciplined Equity Fund and Fidelity® Series Large Cap Value Fund fell short, returning 10.37% and 12.37%, respectively, which dragged on the Funds' overall performance. However, strong results from Fidelity Series Small Cap Opportunities Fund, Fidelity Series Commodity Strategy Fund and Fidelity Small Cap Growth Fund - each gaining more than 26% - buoyed returns. In the non-U.S. equity asset class, the Funds' underlying investments, in aggregate, beat their benchmark, the MSCI® EAFE® (Europe, Australasia, Far East) Index, which gained 10.55%. Five of the six underlying non-U.S. equity funds beat the MSCI index. Fidelity Series International Small Cap Fund and Fidelity Series Emerging Markets Fund led the way, benefiting from a weaker U.S. dollar and the shift toward higher-risk asset classes that occurred in the second half of the period. Turning to the debt asset classes, both investment-grade debt and short-term debt instruments posted a positive absolute return for the year, despite weak performance within these two categories during the second half of the period. Propelled in part by strong relative results from these two categories, the Funds were able to outpace their respective Composite indexes for the one-year period. The Fund's investment-grade debt category handily beat the Barclays Capital® U.S. Aggregate Bond Index. Fidelity Series Investment Grade Bond Fund helped the Funds' results here, as did Fidelity Strategic Real Return Fund, which roared past the broader bond market. The Funds' high-yield holdings, Fidelity Capital & Income Fund and Fidelity High Income Fund, also did well, as investors' appetite for risk increased. The Funds transitioned out of Capital & Income and High Income and into Fidelity Series High Income Fund during the period. In the short-term debt asset class, Fidelity Short-Term Bond Fund pushed the Funds' aggregate performance in this category well ahead of the 0.19% return of the Barclays Capital® U.S. 3 Month Treasury Bellwether Index.
The views expressed above reflect those of the portfolio manager(s) only through the end of the period as stated on the cover of this report and do not necessarily represent the views of Fidelity or any other person in the Fidelity organization. Any such views are subject to change at any time based upon market or other conditions and Fidelity disclaims any responsibility to update such views. These views may not be relied on as investment advice and, because investment decisions for a Fidelity fund are based on numerous factors, may not be relied on as an indication of trading intent on behalf of any Fidelity fund.
Annual Report
As a shareholder of a Fund, you incur two types of costs: (1) transaction costs, and (2) ongoing costs, including other Fund expenses. This Example is intended to help you understand your ongoing costs (in dollars) of investing in the Funds and to compare these costs with the ongoing costs of investing in other mutual funds.
The Example is based on an investment of $1,000 invested at the beginning of the period and held for the entire period (October 1, 2010 to March 31, 2011).
Actual Expenses
The first line of the accompanying table for each fund provides information about actual account values and actual expenses. You may use the information in this line, together with the amount you invested, to estimate the expenses that you paid over the period. Simply divide your account value by $1,000.00 (for example, an $8,600 account value divided by $1,000.00 = 8.6), then multiply the result by the number in the first line for a fund under the heading entitled "Expenses Paid During Period" to estimate the expenses you paid on your account during this period. A small balance maintenance fee of $12.00 that is charged once a year may apply for certain accounts with a value of less than $2,000. This fee is not included in the table below. If it was, the estimate of expenses you paid during the period would be higher, and your ending account value lower, by this amount. In addition, each Fund, as a shareholder in underlying Fidelity Funds, will indirectly bear its pro-rata share of the fees and expenses incurred by the underlying Fidelity Funds. These fees and expenses are not included in each Fund's annualized expense ratio used to calculate the expense estimates in the table below.
Hypothetical Example for Comparison Purposes
The second line of the accompanying table for each fund provides information about hypothetical account values and hypothetical expenses based on a fund's actual expense ratio and an assumed rate of return of 5% per year before expenses, which is not the Fund's actual return. The hypothetical account values and expenses may not be used to estimate the actual ending account balance or expenses you paid for the period. You may use this information to compare the ongoing costs of investing in the Fund and other funds. To do so, compare this 5% hypothetical example with the 5% hypothetical examples that appear in the shareholder reports of the other funds. A small balance maintenance fee of $12.00 that is charged once a year may apply for certain accounts with a value of less than $2,000. This fee is not included in the table below. If it was, the estimate of expenses you paid during the period would be higher, and your ending account value lower, by this amount. In addition, each Fund, as a shareholder in underlying Fidelity Funds, will indirectly bear its pro-rata share of the fees and expenses incurred by the underlying Fidelity Funds. These fees and expenses are not included in each Fund's annualized expense ratio used to calculate the expense estimates in the table below.
Please note that the expenses shown in the table are meant to highlight your ongoing costs only and do not reflect any transaction costs. Therefore, the second line of the table is useful in comparing ongoing costs only, and will not help you determine the relative total costs of owning different funds.
| Annualized Expense Ratio | Beginning
Account Value
October 1, 2010 | Ending
Account Value
March 31, 2011 | Expenses Paid
During Period*
October 1, 2010
to March 31, 2011 |
Freedom Income | 0.0% | | | |
Actual | | $ 1,000.00 | $ 1,044.40 | $ - |
HypotheticalA | | $ 1,000.00 | $ 1,024.93 | $ - |
Freedom 2000 | 0.0% | | | |
Actual | | $ 1,000.00 | $ 1,047.40 | $ - |
HypotheticalA | | $ 1,000.00 | $ 1,024.93 | $ - |
Freedom 2005 | 0.0% | | | |
Actual | | $ 1,000.00 | $ 1,082.50 | $ - |
HypotheticalA | | $ 1,000.00 | $ 1,024.93 | $ - |
Freedom 2010 | 0.0% | | | |
Actual | | $ 1,000.00 | $ 1,095.20 | $ - |
HypotheticalA | | $ 1,000.00 | $ 1,024.93 | $ - |
Freedom 2015 | 0.0% | | | |
Actual | | $ 1,000.00 | $ 1,098.00 | $ - |
HypotheticalA | | $ 1,000.00 | $ 1,024.93 | $ - |
Freedom 2020 | 0.0% | | | |
Actual | | $ 1,000.00 | $ 1,114.90 | $ - |
HypotheticalA | | $ 1,000.00 | $ 1,024.93 | $ - |
Freedom 2025 | 0.0% | | | |
Actual | | $ 1,000.00 | $ 1,129.10 | $ - |
HypotheticalA | | $ 1,000.00 | $ 1,024.93 | $ - |
Freedom 2030 | 0.0% | | | |
Actual | | $ 1,000.00 | $ 1,136.20 | $ - |
HypotheticalA | | $ 1,000.00 | $ 1,024.93 | $ - |
| Annualized Expense Ratio | Beginning
Account Value
October 1, 2010 | Ending
Account Value
March 31, 2011 | Expenses Paid
During Period*
October 1, 2010
to March 31, 2011 |
Freedom 2035 | 0.0% | | | |
Actual | | $ 1,000.00 | $ 1,149.50 | $ - |
HypotheticalA | | $ 1,000.00 | $ 1,024.93 | $ - |
Freedom 2040 | 0.0% | | | |
Actual | | $ 1,000.00 | $ 1,150.70 | $ - |
HypotheticalA | | $ 1,000.00 | $ 1,024.93 | $ - |
Freedom 2045 | 0.0% | | | |
Actual | | $ 1,000.00 | $ 1,155.50 | $ - |
HypotheticalA | | $ 1,000.00 | $ 1,024.93 | $ - |
Freedom 2050 | 0.0% | | | |
Actual | | $ 1,000.00 | $ 1,162.50 | $ - |
HypotheticalA | | $ 1,000.00 | $ 1,024.93 | $ - |
A 5% return per year before expenses
* Expenses are equal to each Fund's annualized expense ratio, multiplied by the average account value over the period, multiplied by 182/365 (to reflect the one-half year period). The fees and expenses of the underlying Fidelity Funds in which the Fund invests are not included in the Fund's annualized expense ratio.
Annual Report
Fidelity Freedom Income Fund
Investment Changes (Unaudited)
Fund Holdings as of March 31, 2011 |
| % of fund's net assets | % of fund's net assets 6 months ago |
Commodity Funds | | |
Fidelity Series Commodity Strategy Fund | 0.8 | 0.8 |
Domestic Equity Funds | | |
Fidelity Blue Chip Growth Fund | 0.8 | 0.8 |
Fidelity Disciplined Equity Fund | 2.4 | 2.5 |
Fidelity Equity-Income Fund | 0.0 | 0.5 |
Fidelity Growth Company Fund | 2.1 | 2.2 |
Fidelity Series 100 Index Fund | 1.6 | 1.7 |
Fidelity Series All-Sector Equity Fund | 2.9 | 2.8 |
Fidelity Series Large Cap Value Fund | 2.7 | 2.6 |
Fidelity Series Small Cap
Opportunities Fund | 0.5 | 0.4 |
Fidelity Small Cap Growth Fund | 0.3 | 0.3 |
Fidelity Small Cap Value Fund | 0.3 | 0.3 |
| 13.6 | 14.1 |
Developed International Equity Funds | | |
Fidelity Diversified International Fund | 0.7 | 0.9 |
Fidelity Japan Fund | 0.0 | 0.0 * |
Fidelity Overseas Fund | 0.7 | 1.0 |
Fidelity Series International Growth Fund | 1.5 | 1.0 |
Fidelity Series International Small Cap Fund | 0.3 | 0.2 |
Fidelity Series International Value Fund | 1.4 | 0.9 |
| 4.6 | 4.0 |
Emerging Markets Equity Funds | | |
Fidelity Series Emerging Markets Fund | 0.8 | 0.7 |
High Yield Bond Funds | | |
Fidelity Capital & Income Fund | 0.0 | 2.6 |
Fidelity High Income Fund | 0.0 | 2.6 |
Fidelity Series Emerging Markets Debt Fund | 0.1 | 0.0 |
Fidelity Series High Income Fund | 4.8 | 0.0 |
| 4.9 | 5.2 |
Inflation-Protected Bond Funds | | |
Fidelity Series Inflation-Protected Bond Index Fund | 11.0 | 10.3 |
Investment Grade Bond Funds | | |
Fidelity Series Investment Grade Bond Fund | 20.2 | 20.7 |
Fidelity Strategic Real Return Fund | 4.2 | 4.9 |
Fidelity Total Bond Fund | 0.0 | 0.0 * |
| 24.4 | 25.6 |
Short-Term Funds | | |
Fidelity Institutional Money Market Portfolio Institutional Class | 22.2 | 19.6 |
Fidelity Short-Term Bond Fund | 17.7 | 19.7 |
| 39.9 | 39.3 |
Net Other Assets (Liabilities) * | 0.0 | 0.0 |
| 100.0 | 100.0 |
Asset Allocation (% of fund's net assets) |
Current |
| Commodity Funds | 0.8% | |
| Domestic Equity Funds | 13.6% | |
| Developed International Equity Funds | 4.6% | |
| Emerging Markets Equity Funds | 0.8% | |
| High Yield Bond Funds | 4.9% | |
| Inflation-Protected Bond Funds | 11.0% | |
| Investment Grade Bond Funds | 24.4% | |
| Short-Term Funds | 39.9% | |

Six months ago |
| Commodity Funds | 0.8% | |
| Domestic Equity Funds | 14.1% | |
| Developed International Equity Funds | 4.0% | |
| Emerging Markets Equity Funds | 0.7% | |
| High Yield Bond Funds | 5.2% | |
| Inflation-Protected Bond Funds | 10.3% | |
| Investment Grade Bond Funds | 25.6% | |
| Short-Term Funds | 39.3% | |

Expected |
| Commodity Funds | 2.0% | |
| Domestic Equity Funds | 12.6% | |
| Developed International Equity Funds | 4.6% | |
| Emerging Markets Equity Funds | 0.8% | |
| High Yield Bond Funds | 5.0% | |
| Inflation-Protected Bond Funds | 12.0% | |
| Investment Grade Bond Funds | 23.0% | |
| Short-Term Funds | 40.0% | |

The fund invests according to an asset allocation strategy that becomes increasingly conservative over time. The six months ago allocation is based on the fund's holdings as of September 30, 2010. The current allocation is based on the fund's holdings as of March 31, 2011. The expected allocation represents the fund's anticipated allocation at September 30, 2011. |
* Amount represents less than 0.1% |
Annual Report
Fidelity Freedom Income Fund
Investments March 31, 2011
Showing Percentage of Net Assets
Domestic Equity Funds - 14.4% |
| Shares | | Value |
Commodity Funds - 0.8% |
Fidelity Series Commodity Strategy Fund | 1,784,805 | | $ 23,523,735 |
Domestic Equity Funds - 13.6% |
Fidelity Blue Chip Growth Fund | 503,570 | | 24,146,203 |
Fidelity Disciplined Equity Fund | 2,831,019 | | 67,972,764 |
Fidelity Growth Company Fund | 672,324 | | 60,536,064 |
Fidelity Series 100 Index Fund | 5,051,778 | | 46,476,353 |
Fidelity Series All-Sector Equity Fund | 6,326,209 | | 82,936,604 |
Fidelity Series Large Cap Value Fund | 6,404,286 | | 78,196,333 |
Fidelity Series Small Cap Opportunities Fund | 1,131,788 | | 13,343,782 |
Fidelity Small Cap Growth Fund | 474,047 | | 8,025,619 |
Fidelity Small Cap Value Fund | 476,992 | | 7,889,446 |
TOTAL DOMESTIC EQUITY FUNDS | | 389,523,168 |
TOTAL DOMESTIC EQUITY FUNDS (Cost $314,673,089) | 413,046,903 |
International Equity Funds - 5.4% |
| | | |
Developed International Equity Funds - 4.6% |
Fidelity Diversified International Fund | 664,126 | | 20,660,947 |
Fidelity Overseas Fund | 619,113 | | 20,678,367 |
Fidelity Series International Growth Fund | 3,574,255 | | 41,139,671 |
Fidelity Series International Small Cap Fund | 649,079 | | 8,009,632 |
Fidelity Series International Value Fund | 3,810,746 | | 39,974,728 |
TOTAL DEVELOPED INTERNATIONAL EQUITY FUNDS | | 130,463,345 |
Emerging Markets Equity Funds - 0.8% |
Fidelity Series Emerging Markets Fund | 1,269,702 | | 24,327,492 |
TOTAL INTERNATIONAL EQUITY FUNDS (Cost $133,327,000) | 154,790,837 |
Bond Funds - 40.3% |
| Shares | | Value |
High Yield Bond Funds - 4.9% |
Fidelity Series Emerging Markets Debt Fund | 202,364 | | $ 2,024,491 |
Fidelity Series High Income Fund | 13,897,936 | | 139,257,314 |
TOTAL HIGH YIELD BOND FUNDS | | 141,281,805 |
Inflation-Protected Bond Funds - 11.0% |
Fidelity Series Inflation-Protected Bond Index Fund | 28,973,416 | | 313,492,363 |
Investment Grade Bond Funds - 24.4% |
Fidelity Series Investment Grade Bond Fund | 50,731,419 | | 577,323,553 |
Fidelity Strategic Real Return Fund | 12,024,439 | | 119,282,431 |
TOTAL INVESTMENT GRADE BOND FUNDS | | 696,605,984 |
TOTAL BOND FUNDS (Cost $1,086,846,086) | 1,151,380,152 |
Short-Term Funds - 39.9% |
| | | |
Fidelity Institutional Money Market Portfolio Institutional Class | 633,524,491 | | 633,524,491 |
Fidelity Short-Term Bond Fund | 59,886,431 | | 506,639,204 |
TOTAL SHORT-TERM FUNDS (Cost $1,154,329,395) | 1,140,163,695 |
TOTAL INVESTMENT PORTFOLIO - 100.0% (Cost $2,689,175,570) | 2,859,381,587 |
NET OTHER ASSETS (LIABILITIES) - 0.0% | | 280,033 |
NET ASSETS - 100% | $ 2,859,661,620 |
Other Information |
All investments are categorized as Level 1 under the Fair Value Hierarchy. The inputs or methodology used for valuing securities may not be an indication of the risk associated with investing in those securities. For more information on valuation inputs, please refer to the Security Valuation section in the accompanying Notes to Financial Statements. |
Income Tax Information |
At March 31, 2011, the Fund had a capital loss carryforward of approximately $75,050,057 of which $6,154,236 and $68,895,821 will expire in fiscal 2017 and 2018, respectively. Capital loss carryforwards are only available to offset future capital gains of the Fund to the extent provided by regulations and may be limited. |
See accompanying notes which are an integral part of the financial statements.
Annual Report
Fidelity Freedom Income Fund
Statement of Assets and Liabilities
| March 31, 2011 |
| | |
Assets | | |
Investment in securities, at value (cost $2,689,175,570) - See accompanying schedule | | $ 2,859,381,587 |
Cash | | 11 |
Receivable for investments sold | | 3,110,889 |
Receivable for fund shares sold | | 4,670,824 |
Distributions receivable from underlying funds | | 281,738 |
Total assets | | 2,867,445,049 |
| | |
Liabilities | | |
Payable for fund shares redeemed | | $ 7,783,429 |
| | |
Net Assets | | $ 2,859,661,620 |
Net Assets consist of: | | |
Paid in capital | | $ 2,764,350,360 |
Undistributed net investment income | | 3,524,711 |
Accumulated undistributed net realized gain (loss) on investments | | (78,419,468) |
Net unrealized appreciation (depreciation) on investments | | 170,206,017 |
Net Assets, for 249,164,641 shares outstanding | | $ 2,859,661,620 |
Net Asset Value, offering price and redemption price per share ($2,859,661,620 ÷ 249,164,641 shares) | | $ 11.48 |
Statement of Operations
| Year ended March 31, 2011 |
| | |
Investment Income | | |
Income distributions from underlying funds | | $ 47,623,333 |
Interest | | 3 |
Total income | | 47,623,336 |
| | |
Expenses | | |
Independent trustees' compensation | $ 10,320 | |
Total expenses before reductions | 10,320 | |
Expense reductions | (10,320) | - |
Net investment income (loss) | | 47,623,336 |
Realized and Unrealized Gain (Loss) Realized gain (loss) on sale of underlying fund shares | 10,162,342 | |
Capital gain distributions from underlying funds | 31,093,927 | |
Total net realized gain (loss) | | 41,256,269 |
Change in net unrealized appreciation (depreciation) on underlying funds | | 107,248,708 |
Net gain (loss) | | 148,504,977 |
Net increase (decrease) in net assets resulting from operations | | $ 196,128,313 |
See accompanying notes which are an integral part of the financial statements.
Annual Report
Statement of Changes in Net Assets
| Year ended
March 31,
2011 | Year ended
March 31,
2010 |
Increase (Decrease) in Net Assets | | |
Operations | | |
Net investment income (loss) | $ 47,623,336 | $ 64,407,433 |
Net realized gain (loss) | 41,256,269 | (8,680,699) |
Change in net unrealized appreciation (depreciation) | 107,248,708 | 403,672,807 |
Net increase (decrease) in net assets resulting from operations | 196,128,313 | 459,399,541 |
Distributions to shareholders from net investment income | (50,619,117) | (63,175,897) |
Distributions to shareholders from net realized gain | (17,566,563) | (14,824,837) |
Total distributions | (68,185,680) | (78,000,734) |
Share transactions
Proceeds from sales of shares | 1,173,160,528 | 968,686,363 |
Reinvestment of distributions | 67,361,382 | 77,241,763 |
Cost of shares redeemed | (1,243,200,851) | (872,834,802) |
Net increase (decrease) in net assets resulting from share transactions | (2,678,941) | 173,093,324 |
Total increase (decrease) in net assets | 125,263,692 | 554,492,131 |
| | |
Net Assets | | |
Beginning of period | 2,734,397,928 | 2,179,905,797 |
End of period (including undistributed net investment income of $3,524,711 and undistributed net investment income of $6,520,492, respectively) | $ 2,859,661,620 | $ 2,734,397,928 |
Other Information Shares | | |
Sold | 105,206,323 | 92,393,391 |
Issued in reinvestment of distributions | 6,047,753 | 7,398,045 |
Redeemed | (111,528,217) | (82,889,945) |
Net increase (decrease) | (274,141) | 16,901,491 |
Financial Highlights
Years ended March 31, | 2011 | 2010 | 2009 | 2008 | 2007 |
Selected Per-Share Data | | | | | |
Net asset value, beginning of period | $ 10.96 | $ 9.37 | $ 11.19 | $ 11.66 | $ 11.49 |
Income from Investment Operations | | | | | |
Net investment income (loss) B | .19 | .26 | .36 | .47 | .44 |
Net realized and unrealized gain (loss) | .60 | 1.65 | (1.66) | (.30) | .29 |
Total from investment operations | .79 | 1.91 | (1.30) | .17 | .73 |
Distributions from net investment income | (.20) | (.26) | (.37) | (.47) | (.44) |
Distributions from net realized gain | (.07) | (.06) | (.15) | (.17) | (.12) |
Total distributions | (.27) | (.32) E | (.52) | (.64) | (.56) |
Net asset value, end of period | $ 11.48 | $ 10.96 | $ 9.37 | $ 11.19 | $ 11.66 |
Total Return A | 7.33% | 20.60% | (11.97)% | 1.41% | 6.54% |
Ratios to Average Net Assets C, D | | | | | |
Expenses before reductions | .00% | .00% | .00% | .00% | .00% |
Expenses net of fee waivers, if any | .00% | .00% | .00% | .00% | .00% |
Expenses net of all reductions | .00% | .00% | .00% | .00% | .00% |
Net investment income (loss) | 1.71% | 2.54% | 3.46% | 4.06% | 3.81% |
Supplemental Data | | | | | |
Net assets, end of period (000 omitted) | $ 2,859,662 | $ 2,734,398 | $ 2,179,906 | $ 2,523,176 | $ 2,376,277 |
Portfolio turnover rate | 38% | 29% | 35% | 33% | 26% |
A Total returns would have been lower had certain expenses not been reduced during the periods shown.
B Calculated based on average shares outstanding during the period.
C Amounts do not include the activity of the underlying funds.
D Expense ratios reflect operating expenses of the Fund. Expenses before reductions do not reflect amounts reimbursed by the investment adviser or reductions from expense offset arrangements and do not represent the amount paid by the Fund during periods when reimbursements or reductions occur. Expenses net of fee waivers reflect expenses after reimbursement by the investment adviser but prior to reductions from expense offset arrangements. Expenses net of all reductions represent the net expenses paid by the Fund but do not include expenses of the investment companies in which the Fund invests.
E Total distributions of $.32 per share is comprised of distributions from net investment income of $.260 and distributions from net realized gain of $.060 per share.
See accompanying notes which are an integral part of the financial statements.
Annual Report
Fidelity Freedom 2000 Fund
Investment Changes (Unaudited)
Fund Holdings as of March 31, 2011 |
| % of fund's net assets | % of fund's net assets 6 months ago |
Commodity Funds | | |
Fidelity Series Commodity Strategy Fund | 1.1 | 2.1 |
Domestic Equity Funds | | |
Fidelity Blue Chip Growth Fund | 0.9 | 0.9 |
Fidelity Disciplined Equity Fund | 2.4 | 2.6 |
Fidelity Equity-Income Fund | 0.0 | 0.5 |
Fidelity Growth Company Fund | 2.2 | 2.3 |
Fidelity Series 100 Index Fund | 1.7 | 1.7 |
Fidelity Series All-Sector Equity Fund | 3.0 | 2.9 |
Fidelity Series Large Cap Value Fund | 2.8 | 2.8 |
Fidelity Series Small Cap Opportunities Fund | 0.5 | 0.5 |
Fidelity Small Cap Growth Fund | 0.3 | 0.3 |
Fidelity Small Cap Value Fund | 0.3 | 0.3 |
| 14.1 | 14.8 |
Developed International Equity Funds | | |
Fidelity Diversified International Fund | 0.7 | 1.0 |
Fidelity Europe Fund | 0.0 | 0.0 * |
Fidelity Japan Fund | 0.0 | 0.0 * |
Fidelity Overseas Fund | 0.8 | 1.0 |
Fidelity Series International Growth Fund | 1.5 | 1.0 |
Fidelity Series International Small Cap Fund | 0.3 | 0.2 |
Fidelity Series International Value Fund | 1.4 | 1.0 |
| 4.7 | 4.2 |
Emerging Markets Equity Funds | | |
Fidelity Series Emerging Markets Fund | 0.9 | 0.7 |
High Yield Bond Funds | | |
Fidelity Capital & Income Fund | 0.0 | 2.6 |
Fidelity High Income Fund | 0.0 | 2.6 |
Fidelity Series Emerging Markets Debt Fund | 0.1 | 0.0 |
Fidelity Series High Income Fund | 4.9 | 0.0 |
| 5.0 | 5.2 |
Inflation-Protected Bond Funds | | |
Fidelity Series Inflation-Protected Bond Index Fund | 10.7 | 9.9 |
Investment Grade Bond Funds | | |
Fidelity Series Investment Grade Bond Fund | 19.6 | 19.3 |
Fidelity Strategic Real Return Fund | 4.1 | 4.6 |
Fidelity Total Bond Fund | 0.0 | 0.0 * |
| 23.7 | 23.9 |
Short-Term Funds | | |
Fidelity Institutional Money Market Portfolio Institutional Class | 22.0 | 19.5 |
Fidelity Short-Term Bond Fund | 17.8 | 19.7 |
| 39.8 | 39.2 |
Net Other Assets (Liabilities) * | 0.0 | 0.0 |
| 100.0 | 100.0 |
Asset Allocation (% of fund's net assets) |
Current |
| Commodity Funds | 1.1% | |
| Domestic Equity Funds | 14.1% | |
| Developed International Equity Funds | 4.7% | |
| Emerging Markets Equity Funds | 0.9% | |
| High Yield Bond Funds | 5.0% | |
| Inflation-Protected Bond Funds | 10.7% | |
| Investment Grade Bond Funds | 23.7% | |
| Short-Term Funds | 39.8% | |

Six months ago |
| Commodity Funds | 2.1% | |
| Domestic Equity Funds | 14.8% | |
| Developed International Equity Funds | 4.2% | |
| Emerging Markets Equity Funds | 0.7% | |
| High Yield Bond Funds | 5.2% | |
| Inflation-Protected Bond Funds | 9.9% | |
| Investment Grade Bond Funds | 23.9% | |
| Short-Term Funds | 39.2% | |

Expected |
| Commodity Funds | 2.1% | |
| Domestic Equity Funds | 12.7% | |
| Developed International Equity Funds | 4.6% | |
| Emerging Markets Equity Funds | 0.8% | |
| High Yield Bond Funds | 5.0% | |
| Inflation-Protected Bond Funds | 11.9% | |
| Investment Grade Bond Funds | 22.9% | |
| Short-Term Funds | 40.0% | |

The fund invests according to an asset allocation strategy that becomes increasingly conservative over time. The six months ago allocation is based on the fund's holdings as of September 30, 2010. The current allocation is based on the fund's holdings as of March 31, 2011. The expected allocation represents the fund's anticipated allocation at September 30, 2011. |
* Amount represents less than 0.1% |
Annual Report
Fidelity Freedom 2000 Fund
Investments March 31, 2011
Showing Percentage of Net Assets
Domestic Equity Funds - 15.2% |
| Shares | | Value |
Commodity Funds - 1.1% |
Fidelity Series Commodity Strategy Fund | 1,273,478 | | $ 16,784,438 |
Domestic Equity Funds - 14.1% |
Fidelity Blue Chip Growth Fund | 270,515 | | 12,971,215 |
Fidelity Disciplined Equity Fund | 1,518,732 | | 36,464,759 |
Fidelity Growth Company Fund | 358,861 | | 32,311,851 |
Fidelity Series 100 Index Fund | 2,685,323 | | 24,704,973 |
Fidelity Series All-Sector Equity Fund | 3,384,747 | | 44,374,033 |
Fidelity Series Large Cap Value Fund | 3,421,267 | | 41,773,674 |
Fidelity Series Small Cap Opportunities Fund | 600,286 | | 7,077,372 |
Fidelity Small Cap Growth Fund | 255,178 | | 4,320,167 |
Fidelity Small Cap Value Fund | 256,531 | | 4,243,025 |
TOTAL DOMESTIC EQUITY FUNDS | | 208,241,069 |
TOTAL DOMESTIC EQUITY FUNDS (Cost $168,958,068) | 225,025,507 |
International Equity Funds - 5.6% |
| | | |
Developed International Equity Funds - 4.7% |
Fidelity Diversified International Fund | 356,280 | | 11,083,870 |
Fidelity Overseas Fund | 332,136 | | 11,093,339 |
Fidelity Series International Growth Fund | 1,913,016 | | 22,018,813 |
Fidelity Series International Small Cap Fund | 347,245 | | 4,285,007 |
Fidelity Series International Value Fund | 2,039,496 | | 21,394,318 |
TOTAL DEVELOPED INTERNATIONAL EQUITY FUNDS | | 69,875,347 |
Emerging Markets Equity Funds - 0.9% |
Fidelity Series Emerging Markets Fund | 679,506 | | 13,019,340 |
TOTAL INTERNATIONAL EQUITY FUNDS (Cost $70,460,926) | 82,894,687 |
Bond Funds - 39.4% |
| Shares | | Value |
High Yield Bond Funds - 5.0% |
Fidelity Series Emerging Markets Debt Fund | 105,382 | | $ 1,054,260 |
Fidelity Series High Income Fund | 7,219,107 | | 72,335,451 |
TOTAL HIGH YIELD BOND FUNDS | | 73,389,711 |
Inflation-Protected Bond Funds - 10.7% |
Fidelity Series Inflation-Protected Bond Index Fund | 14,718,907 | | 159,258,570 |
Investment Grade Bond Funds - 23.7% |
Fidelity Series Investment Grade Bond Fund | 25,525,518 | | 290,480,396 |
Fidelity Strategic Real Return Fund | 6,110,813 | | 60,619,268 |
TOTAL INVESTMENT GRADE BOND FUNDS | | 351,099,664 |
TOTAL BOND FUNDS (Cost $549,220,012) | 583,747,945 |
Short-Term Funds - 39.8% |
| | | |
Fidelity Institutional Money Market Portfolio Institutional Class | 326,570,168 | | 326,570,168 |
Fidelity Short-Term Bond Fund | 31,156,574 | | 263,584,620 |
TOTAL SHORT-TERM FUNDS (Cost $598,518,660) | 590,154,788 |
TOTAL INVESTMENT PORTFOLIO - 100.0% (Cost $1,387,157,666) | 1,481,822,927 |
NET OTHER ASSETS (LIABILITIES) - 0.0% | | 145,858 |
NET ASSETS - 100% | $ 1,481,968,785 |
Other Information |
All investments are categorized as Level 1 under the Fair Value Hierarchy. The inputs or methodology used for valuing securities may not be an indication of the risk associated with investing in those securities. For more information on valuation inputs, please refer to the Security Valuation section in the accompanying Notes to Financial Statements. |
Income Tax Information |
At March 31, 2011, the Fund had a capital loss carryforward of approximately $56,041,166 of which $7,629,953, $46,616,549 and $1,794,664 will expire in fiscal 2017, 2018 and 2019, respectively. Capital loss carryforwards are only available to offset future capital gains of the Fund to the extent provided by regulations and may be limited. |
See accompanying notes which are an integral part of the financial statements.
Annual Report
Fidelity Freedom 2000 Fund
Statement of Assets and Liabilities
| March 31, 2011 |
| | |
Assets | | |
Investment in securities, at value (cost $1,387,157,666) - See accompanying schedule | | $ 1,481,822,927 |
Receivable for investments sold | | 3,832,158 |
Receivable for fund shares sold | | 1,792,304 |
Distributions receivable from underlying funds | | 146,490 |
Total assets | | 1,487,593,879 |
| | |
Liabilities | | |
Payable for investments purchased | $ 47 | |
Payable for fund shares redeemed | 5,625,047 | |
Total liabilities | | 5,625,094 |
| | |
Net Assets | | $ 1,481,968,785 |
Net Assets consist of: | | |
Paid in capital | | $ 1,441,399,545 |
Undistributed net investment income | | 4,221,573 |
Accumulated undistributed net realized gain (loss) on investments | | (58,317,594) |
Net unrealized appreciation (depreciation) on investments | | 94,665,261 |
Net Assets, for 121,654,962 shares outstanding | | $ 1,481,968,785 |
Net Asset Value, offering price and redemption price per share ($1,481,968,785 ÷ 121,654,962 shares) | | $ 12.18 |
Statement of Operations
| Year ended March 31, 2011 |
| | |
Investment Income | | |
Income distributions from underlying funds | | $ 26,133,319 |
| | |
Expenses | | |
Independent trustees' compensation | $ 5,890 | |
Total expenses before reductions | 5,890 | |
Expense reductions | (5,890) | - |
Net investment income (loss) | | 26,133,319 |
Realized and Unrealized Gain (Loss) Realized gain (loss) on sale of underlying fund shares | 10,474,089 | |
Capital gain distributions from underlying funds | 17,041,915 | |
Total net realized gain (loss) | | 27,516,004 |
Change in net unrealized appreciation (depreciation) on underlying funds | | 60,447,814 |
Net gain (loss) | | 87,963,818 |
Net increase (decrease) in net assets resulting from operations | | $ 114,097,137 |
See accompanying notes which are an integral part of the financial statements.
Annual Report
Statement of Changes in Net Assets
| Year ended
March 31,
2011 | Year ended
March 31,
2010 |
Increase (Decrease) in Net Assets | | |
Operations | | |
Net investment income (loss) | $ 26,133,319 | $ 40,393,571 |
Net realized gain (loss) | 27,516,004 | (15,943,454) |
Change in net unrealized appreciation (depreciation) | 60,447,814 | 285,167,878 |
Net increase (decrease) in net assets resulting from operations | 114,097,137 | 309,617,995 |
Distributions to shareholders from net investment income | (28,349,234) | (42,261,213) |
Distributions to shareholders from net realized gain | (10,467,104) | (8,723,849) |
Total distributions | (38,816,338) | (50,985,062) |
Share transactions
Proceeds from sales of shares | 444,763,703 | 455,202,594 |
Reinvestment of distributions | 38,583,881 | 50,682,616 |
Cost of shares redeemed | (785,477,852) | (499,244,047) |
Net increase (decrease) in net assets resulting from share transactions | (302,130,268) | 6,641,163 |
Total increase (decrease) in net assets | (226,849,469) | 265,274,096 |
| | |
Net Assets | | |
Beginning of period | 1,708,818,254 | 1,443,544,158 |
End of period (including undistributed net investment income of $4,221,573 and undistributed net investment income of $6,437,488, respectively) | $ 1,481,968,785 | $ 1,708,818,254 |
Other Information Shares | | |
Sold | 37,650,745 | 41,095,009 |
Issued in reinvestment of distributions | 3,269,333 | 4,538,435 |
Redeemed | (66,483,407) | (44,829,633) |
Net increase (decrease) | (25,563,329) | 803,811 |
Financial Highlights
Years ended March 31, | 2011 | 2010 | 2009 | 2008 | 2007 |
Selected Per-Share Data | | | | | |
Net asset value, beginning of period | $ 11.61 | $ 9.86 | $ 12.08 | $ 12.66 | $ 12.41 |
Income from Investment Operations | | | | | |
Net investment income (loss) B | .20 | .27 | .37 | .48 | .44 |
Net realized and unrealized gain (loss) | .67 | 1.83 | (1.97) | (.31) | .38 |
Total from investment operations | .87 | 2.10 | (1.60) | .17 | .82 |
Distributions from net investment income | (.22) | (.29) | (.41) | (.48) | (.43) |
Distributions from net realized gain | (.08) | (.06) | (.21) | (.27) | (.14) |
Total distributions | (.30) | (.35) E | (.62) | (.75) | (.57) |
Net asset value, end of period | $ 12.18 | $ 11.61 | $ 9.86 | $ 12.08 | $ 12.66 |
Total Return A | 7.56% | 21.46% | (13.60)% | 1.23% | 6.72% |
Ratios to Average Net Assets C, D | | | | | |
Expenses before reductions | .00% | .00% | .00% | .00% | .00% |
Expenses net of fee waivers, if any | .00% | .00% | .00% | .00% | .00% |
Expenses net of all reductions | .00% | .00% | .00% | .00% | .00% |
Net investment income (loss) | 1.67% | 2.47% | 3.33% | 3.80% | 3.54% |
Supplemental Data | | | | | |
Net assets, end of period (000 omitted) | $ 1,481,969 | $ 1,708,818 | $ 1,443,544 | $ 1,780,803 | $ 1,694,377 |
Portfolio turnover rate | 32% | 31% | 33% | 36% | 34% |
A Total returns would have been lower had certain expenses not been reduced during the periods shown.
B Calculated based on average shares outstanding during the period.
C Amounts do not include the activity of the underlying funds.
D Expense ratios reflect operating expenses of the Fund. Expenses before reductions do not reflect amounts reimbursed by the investment adviser or reductions from expense offset arrangements and do not represent the amount paid by the Fund during periods when reimbursements or reductions occur. Expenses net of fee waivers reflect expenses after reimbursement by the investment adviser but prior to reductions from expense offset arrangements. Expenses net of all reductions represent the net expenses paid by the Fund but do not include expenses of the investment companies in which the Fund invests.
E Total distributions of $.35 per share is comprised of distributions from net investment income of $.290 and distributions from net realized gain of $.060 per share.
See accompanying notes which are an integral part of the financial statements.
Annual Report
Fidelity Freedom 2005 Fund
Investment Changes (Unaudited)
Fund Holdings as of March 31, 2011 |
| % of fund's net assets | % of fund's net assets 6 months ago |
Commodity Funds | | |
Fidelity Series Commodity Strategy Fund | 3.6 | 4.1 |
Domestic Equity Funds | | |
Fidelity Blue Chip Growth Fund | 1.7 | 1.7 |
Fidelity Disciplined Equity Fund | 4.7 | 5.0 |
Fidelity Equity-Income Fund | 0.0 | 0.9 |
Fidelity Growth Company Fund | 4.1 | 4.4 |
Fidelity Series 100 Index Fund | 3.2 | 3.4 |
Fidelity Series All-Sector Equity Fund | 5.7 | 5.6 |
Fidelity Series Large Cap Value Fund | 5.4 | 5.4 |
Fidelity Series Small Cap Opportunities Fund | 0.9 | 0.9 |
Fidelity Small Cap Growth Fund | 0.5 | 0.5 |
Fidelity Small Cap Value Fund | 0.5 | 0.6 |
| 26.7 | 28.4 |
Developed International Equity Funds | | |
Fidelity Diversified International Fund | 1.5 | 2.2 |
Fidelity Europe Fund | 0.0 | 0.4 |
Fidelity Japan Fund | 0.0 | 0.2 |
Fidelity Overseas Fund | 1.5 | 2.2 |
Fidelity Series International Growth Fund | 2.9 | 2.2 |
Fidelity Series International Small Cap Fund | 0.6 | 0.4 |
Fidelity Series International Value Fund | 2.8 | 2.2 |
| 9.3 | 9.8 |
Emerging Markets Equity Funds | | |
Fidelity Series Emerging Markets Fund | 1.8 | 1.6 |
High Yield Bond Funds | | |
Fidelity Capital & Income Fund | 0.0 | 2.5 |
Fidelity High Income Fund | 0.0 | 2.6 |
Fidelity Series Emerging Markets Debt Fund | 0.1 | 0.0 |
Fidelity Series High Income Fund | 4.8 | 0.0 |
| 4.9 | 5.1 |
Inflation-Protected Bond Funds | | |
Fidelity Series Inflation-Protected Bond Index Fund | 9.0 | 8.7 |
Investment Grade Bond Funds | | |
Fidelity Series Investment Grade Bond Fund | 18.4 | 17.9 |
Fidelity Strategic Real Return Fund | 3.8 | 4.3 |
Fidelity Total Bond Fund | 0.0 | 0.0* |
| 22.2 | 22.2 |
Short-Term Funds | | |
Fidelity Institutional Money Market Portfolio Institutional Class | 12.5 | 10.0 |
Fidelity Short-Term Bond Fund | 10.0 | 10.1 |
| 22.5 | 20.1 |
Net Other Assets (Liabilities) * | 0.0 | 0.0 |
| 100.0 | 100.0 |
Asset Allocation (% of fund's net assets) |
Current |
| Commodity Funds | 3.6% | |
| Domestic Equity Funds | 26.7% | |
| Developed International Equity Funds | 9.3% | |
| Emerging Markets Equity Funds | 1.8% | |
| High Yield Bond Funds | 4.9% | |
| Inflation-Protected Bond Funds | 9.0% | |
| Investment Grade Bond Funds | 22.2% | |
| Short-Term Funds | 22.5% | |

Six months ago |
| Commodity Funds | 4.1% | |
| Domestic Equity Funds | 28.4% | |
| Developed International Equity Funds | 9.8% | |
| Emerging Markets Equity Funds | 1.6% | |
| High Yield Bond Funds | 5.1% | |
| Inflation-Protected Bond Funds | 8.7% | |
| Investment Grade Bond Funds | 22.2% | |
| Short-Term Funds | 20.1% | |

Expected |
| Commodity Funds | 4.4% | |
| Domestic Equity Funds | 24.7% | |
| Developed International Equity Funds | 9.0% | |
| Emerging Markets Equity Funds | 1.6% | |
| High Yield Bond Funds | 5.0% | |
| Inflation-Protected Bond Funds | 9.9% | |
| Investment Grade Bond Funds | 20.5% | |
| Short-Term Funds | 24.9% | |

The fund invests according to an asset allocation strategy that becomes increasingly conservative over time. The six months ago allocation is based on the fund's holdings as of September 30, 2010. The current allocation is based on the fund's holdings as of March 31, 2011. The expected allocation represents the fund's anticipated allocation at September 30, 2011. |
* Amount represents less than 0.1% |
Annual Report
Fidelity Freedom 2005 Fund
Investments March 31, 2011
Showing Percentage of Net Assets
Domestic Equity Funds - 30.3% |
| Shares | | Value |
Commodity Funds - 3.6% |
Fidelity Series Commodity Strategy Fund | 2,553,443 | | $ 33,654,375 |
Domestic Equity Funds - 26.7% |
Fidelity Blue Chip Growth Fund | 323,695 | | 15,521,175 |
Fidelity Disciplined Equity Fund | 1,813,617 | | 43,544,955 |
Fidelity Growth Company Fund | 430,470 | | 38,759,516 |
Fidelity Series 100 Index Fund | 3,223,590 | | 29,657,025 |
Fidelity Series All-Sector Equity Fund | 4,054,029 | | 53,148,325 |
Fidelity Series Large Cap Value Fund | 4,098,381 | | 50,041,235 |
Fidelity Series Small Cap Opportunities Fund | 724,668 | | 8,543,834 |
Fidelity Small Cap Growth Fund | 298,950 | | 5,061,221 |
Fidelity Small Cap Value Fund | 300,887 | | 4,976,676 |
TOTAL DOMESTIC EQUITY FUNDS | | 249,253,962 |
TOTAL DOMESTIC EQUITY FUNDS (Cost $262,240,164) | 282,908,337 |
International Equity Funds - 11.1% |
| | | |
Developed International Equity Funds - 9.3% |
Fidelity Diversified International Fund | 442,294 | | 13,759,766 |
Fidelity Overseas Fund | 412,335 | | 13,771,990 |
Fidelity Series International Growth Fund | 2,376,924 | | 27,358,394 |
Fidelity Series International Small Cap Fund | 431,589 | | 5,325,808 |
Fidelity Series International Value Fund | 2,534,166 | | 26,583,403 |
TOTAL DEVELOPED INTERNATIONAL EQUITY FUNDS | | 86,799,361 |
Emerging Markets Equity Funds - 1.8% |
Fidelity Series Emerging Markets Fund | 844,301 | | 16,176,809 |
TOTAL INTERNATIONAL EQUITY FUNDS (Cost $100,385,750) | 102,976,170 |
Bond Funds - 36.1% |
| Shares | | Value |
High Yield Bond Funds - 4.9% |
Fidelity Series Emerging Markets Debt Fund | 65,713 | | $ 657,405 |
Fidelity Series High Income Fund | 4,502,649 | | 45,116,539 |
TOTAL HIGH YIELD BOND FUNDS | | 45,773,944 |
Inflation-Protected Bond Funds - 9.0% |
Fidelity Series Inflation-Protected Bond Index Fund | 7,768,936 | | 84,059,884 |
Investment Grade Bond Funds - 22.2% |
Fidelity Series Investment Grade Bond Fund | 15,014,269 | | 170,862,381 |
Fidelity Strategic Real Return Fund | 3,590,681 | | 35,619,556 |
TOTAL INVESTMENT GRADE BOND FUNDS | | 206,481,937 |
TOTAL BOND FUNDS (Cost $331,228,778) | 336,315,765 |
Short-Term Funds - 22.5% |
| | | |
Fidelity Institutional Money Market Portfolio Institutional Class | 116,815,967 | | 116,815,967 |
Fidelity Short-Term Bond Fund | 11,027,419 | | 93,291,967 |
TOTAL SHORT-TERM FUNDS (Cost $212,009,529) | 210,107,934 |
TOTAL INVESTMENT PORTFOLIO - 100.0% (Cost $905,864,221) | 932,308,206 |
NET OTHER ASSETS (LIABILITIES) - 0.0% | | 91,896 |
NET ASSETS - 100% | $ 932,400,102 |
Other Information |
All investments are categorized as Level 1 under the Fair Value Hierarchy. The inputs or methodology used for valuing securities may not be an indication of the risk associated with investing in those securities. For more information on valuation inputs, please refer to the Security Valuation section in the accompanying Notes to Financial Statements. |
Income Tax Information |
At March 31, 2011, the Fund had a capital loss carryforward of approximately $55,536,041 of which $8,171,681 and $47,364,360 will expire in fiscal 2017 and 2018, respectively. Capital loss carryforwards are only available to offset future capital gains of the Fund to the extent provided by regulations and may be limited. |
See accompanying notes which are an integral part of the financial statements.
Annual Report
Fidelity Freedom 2005 Fund
Statement of Assets and Liabilities
| March 31, 2011 |
| | |
Assets | | |
Investment in securities, at value (cost $905,864,221) - See accompanying schedule | | $ 932,308,206 |
Receivable for investments sold | | 1,489,479 |
Receivable for fund shares sold | | 1,587,880 |
Distributions receivable from underlying funds | | 91,896 |
Total assets | | 935,477,461 |
| | |
Liabilities | | |
Payable for fund shares redeemed | | $ 3,077,359 |
| | |
Net Assets | | $ 932,400,102 |
Net Assets consist of: | | |
Paid in capital | | $ 960,242,502 |
Undistributed net investment income | | 2,286,723 |
Accumulated undistributed net realized gain (loss) on investments | | (56,573,108) |
Net unrealized appreciation (depreciation) on investments | | 26,443,985 |
Net Assets, for 83,761,739 shares outstanding | | $ 932,400,102 |
Net Asset Value, offering price and redemption price per share ($932,400,102 ÷ 83,761,739 shares) | | $ 11.13 |
Statement of Operations
| Year ended March 31, 2011 |
| | |
Investment Income | | |
Income distributions from underlying funds | | $ 15,138,582 |
| | |
Expenses | | |
Independent trustees' compensation | $ 3,549 | |
Total expenses before reductions | 3,549 | |
Expense reductions | (3,549) | - |
Net investment income (loss) | | 15,138,582 |
Realized and Unrealized Gain (Loss) Realized gain (loss) on sale of underlying fund shares | 5,448,371 | |
Capital gain distributions from underlying funds | 14,135,123 | |
Total net realized gain (loss) | | 19,583,494 |
Change in net unrealized appreciation (depreciation) on underlying funds | | 57,803,367 |
Net gain (loss) | | 77,386,861 |
Net increase (decrease) in net assets resulting from operations | | $ 92,525,443 |
See accompanying notes which are an integral part of the financial statements.
Annual Report
Statement of Changes in Net Assets
| Year ended
March 31,
2011 | Year ended
March 31,
2010 |
Increase (Decrease) in Net Assets | | |
Operations | | |
Net investment income (loss) | $ 15,138,582 | $ 22,561,635 |
Net realized gain (loss) | 19,583,494 | 1,289,925 |
Change in net unrealized appreciation (depreciation) | 57,803,367 | 232,793,552 |
Net increase (decrease) in net assets resulting from operations | 92,525,443 | 256,645,112 |
Distributions to shareholders from net investment income | (16,529,853) | (22,987,842) |
Distributions to shareholders from net realized gain | (7,551,223) | (7,836,515) |
Total distributions | (24,081,076) | (30,824,357) |
Share transactions
Proceeds from sales of shares | 278,425,092 | 303,175,884 |
Reinvestment of distributions | 23,964,352 | 30,691,240 |
Cost of shares redeemed | (452,357,306) | (316,406,592) |
Net increase (decrease) in net assets resulting from share transactions | (149,967,862) | 17,460,532 |
Total increase (decrease) in net assets | (81,523,495) | 243,281,287 |
| | |
Net Assets | | |
Beginning of period | 1,013,923,597 | 770,642,310 |
End of period (including undistributed net investment income of $2,286,723 and undistributed net investment income of $3,677,994, respectively) | $ 932,400,102 | $ 1,013,923,597 |
Other Information Shares | | |
Sold | 26,430,862 | 31,547,176 |
Issued in reinvestment of distributions | 2,267,115 | 3,127,790 |
Redeemed | (43,179,363) | (32,508,477) |
Net increase (decrease) | (14,481,386) | 2,166,489 |
Financial Highlights
Years ended March 31, | 2011 | 2010 | 2009 | 2008 | 2007 |
Selected Per-Share Data | | | | | |
Net asset value, beginning of period | $ 10.32 | $ 8.02 | $ 11.19 | $ 11.84 | $ 11.44 |
Income from Investment Operations | | | | | |
Net investment income (loss) B | .17 | .23 | .29 | .35 | .31 |
Net realized and unrealized gain (loss) | .91 | 2.39 | (2.88) | (.34) | .62 |
Total from investment operations | 1.08 | 2.62 | (2.59) | .01 | .93 |
Distributions from net investment income | (.19) | (.24) | (.32) | (.32) | (.29) |
Distributions from net realized gain | (.09) | (.08) | (.26) | (.34) | (.24) |
Total distributions | (.27) F | (.32) E | (.58) | (.66) | (.53) |
Net asset value, end of period | $ 11.13 | $ 10.32 | $ 8.02 | $ 11.19 | $ 11.84 |
Total Return A | 10.64% | 32.83% | (23.91)% | (.17)% | 8.27% |
Ratios to Average Net Assets C, D | | | | | |
Expenses before reductions | .00% | .00% | .00% | .00% | .00% |
Expenses net of fee waivers, if any | .00% | .00% | .00% | .00% | .00% |
Expenses net of all reductions | .00% | .00% | .00% | .00% | .00% |
Net investment income (loss) | 1.60% | 2.37% | 3.03% | 2.94% | 2.70% |
Supplemental Data | | | | | |
Net assets, end of period (000 omitted) | $ 932,400 | $ 1,013,924 | $ 770,642 | $ 1,051,703 | $ 867,318 |
Portfolio turnover rate | 38% | 34% | 43% | 31% | 12% |
A Total returns would have been lower had certain expenses not been reduced during the periods shown.
B Calculated based on average shares outstanding during the period.
C Amounts do not include the activity of the underlying funds.
D Expense ratios reflect operating expenses of the Fund. Expenses before reductions do not reflect amounts reimbursed by the investment adviser or reductions from expense offset arrangements and do not represent the amount paid by the Fund during periods when reimbursements or reductions occur. Expenses net of fee waivers reflect expenses after reimbursement by the investment adviser but prior to reductions from expense offset arrangements. Expenses net of all reductions represent the net expenses paid by the Fund but do not include expenses of the investment companies in which the Fund invests.
E Total distributions of $.32 per share is comprised of distributions from net investment income of $.235 and distributions from net realized gain of $.080 per share.
F Total distributions of $.27 per share is comprised of distributions from net investment income of $.188 and distributions from net realized gain of $.085 per share.
See accompanying notes which are an integral part of the financial statements.
Annual Report
Fidelity Freedom 2010 Fund
Investment Changes (Unaudited)
Fund Holdings as of March 31, 2011 |
| % of fund's net assets | % of fund's net assets 6 months ago |
Commodity Funds | | |
Fidelity Series Commodity Strategy Fund | 4.4 | 4.7 |
Domestic Equity Funds | | |
Fidelity Blue Chip Growth Fund | 2.0 | 2.0 |
Fidelity Disciplined Equity Fund | 5.5 | 5.7 |
Fidelity Equity-Income Fund | 0.0 | 1.1 |
Fidelity Growth Company Fund | 4.9 | 5.0 |
Fidelity Series 100 Index Fund | 3.8 | 3.9 |
Fidelity Series All-Sector Equity Fund | 6.8 | 6.4 |
Fidelity Series Large Cap Value Fund | 6.4 | 6.2 |
Fidelity Series Small Cap Opportunities Fund | 1.1 | 1.0 |
Fidelity Small Cap Growth Fund | 0.6 | 0.6 |
Fidelity Small Cap Value Fund | 0.6 | 0.6 |
| 31.7 | 32.5 |
Developed International Equity Funds | | |
Fidelity Diversified International Fund | 1.7 | 2.6 |
Fidelity Europe Fund | 0.0 | 0.6 |
Fidelity Japan Fund | 0.0 | 0.2 |
Fidelity Overseas Fund | 1.8 | 2.7 |
Fidelity Series International Growth Fund | 3.5 | 2.6 |
Fidelity Series International Small Cap Fund | 0.7 | 0.5 |
Fidelity Series International Value Fund | 3.4 | 2.6 |
| 11.1 | 11.8 |
Emerging Markets Equity Funds | | |
Fidelity Series Emerging Markets Fund | 2.0 | 1.8 |
High Yield Bond Funds | | |
Fidelity Capital & Income Fund | 0.0 | 2.5 |
Fidelity High Income Fund | 0.0 | 2.6 |
Fidelity Series Emerging Markets Debt Fund | 0.1 | 0.0 |
Fidelity Series High Income Fund | 4.8 | 0.0 |
| 4.9 | 5.1 |
Inflation-Protected Bond Funds | | |
Fidelity Series Inflation-Protected Bond Index Fund | 9.5 | 8.8 |
Investment Grade Bond Funds | | |
Fidelity Series Investment Grade Bond Fund | 21.2 | 20.3 |
Fidelity Strategic Real Return Fund | 4.5 | 4.9 |
Fidelity Total Bond Fund | 0.0 | 0.0 * |
| 25.7 | 25.2 |
Short-Term Funds | | |
Fidelity Institutional Money Market Portfolio Institutional Class | 5.9 | 5.0 |
Fidelity Short-Term Bond Fund | 4.8 | 5.1 |
| 10.7 | 10.1 |
Net Other Assets (Liabilities) * | 0.0 | 0.0 |
| 100.0 | 100.0 |
Asset Allocation (% of fund's net assets) |
Current |
| Commodity Funds | 4.4% | |
| Domestic Equity Funds | 31.7% | |
| Developed International Equity Funds | 11.1% | |
| Emerging Markets Equity Funds | 2.0% | |
| High Yield Bond Funds | 4.9% | |
| Inflation-Protected Bond Funds | 9.5% | |
| Investment Grade Bond Funds | 25.7% | |
| Short-Term Funds | 10.7% | |

Six months ago |
| Commodity Funds | 4.7% | |
| Domestic Equity Funds | 32.5% | |
| Developed International Equity Funds | 11.8% | |
| Emerging Markets Equity Funds | 1.8% | |
| High Yield Bond Funds | 5.1% | |
| Inflation-Protected Bond Funds | 8.8% | |
| Investment Grade Bond Funds | 25.2% | |
| Short-Term Funds | 10.1% | |

Expected |
| Commodity Funds | 5.4% | |
| Domestic Equity Funds | 30.7% | |
| Developed International Equity Funds | 11.1% | |
| Emerging Markets Equity Funds | 2.0% | |
| High Yield Bond Funds | 5.0% | |
| Inflation-Protected Bond Funds | 10.6% | |
| Investment Grade Bond Funds | 24.1% | |
| Short-Term Funds | 11.1% | |

The fund invests according to an asset allocation strategy that becomes increasingly conservative over time. The six months ago allocation is based on the fund's holdings as of September 30, 2010. The current allocation is based on the fund's holdings as of March 31, 2011. The expected allocation represents the fund's anticipated allocation at September 30, 2011. |
* Amount represents less than 0.1% |
Annual Report
Fidelity Freedom 2010 Fund
Investments March 31, 2011
Showing Percentage of Net Assets
Domestic Equity Funds - 36.1% |
| Shares | | Value |
Commodity Funds - 4.4% |
Fidelity Series Commodity Strategy Fund | 32,218,143 | | $ 424,635,119 |
Domestic Equity Funds - 31.7% |
Fidelity Blue Chip Growth Fund | 3,984,444 | | 191,054,094 |
Fidelity Disciplined Equity Fund | 22,421,361 | | 538,336,878 |
Fidelity Growth Company Fund | 5,312,045 | | 478,296,526 |
Fidelity Series 100 Index Fund | 39,722,902 | | 365,450,701 |
Fidelity Series All-Sector Equity Fund | 50,059,299 | | 656,277,416 |
Fidelity Series Large Cap Value Fund | 50,609,379 | | 617,940,518 |
Fidelity Series Small Cap Opportunities Fund | 8,948,958 | | 105,508,210 |
Fidelity Small Cap Growth Fund | 3,692,435 | | 62,512,925 |
Fidelity Small Cap Value Fund | 3,716,431 | | 61,469,768 |
TOTAL DOMESTIC EQUITY FUNDS | | 3,076,847,036 |
TOTAL DOMESTIC EQUITY FUNDS (Cost $3,151,639,498) | 3,501,482,155 |
International Equity Funds - 13.1% |
| | | |
Developed International Equity Funds - 11.1% |
Fidelity Diversified International Fund | 5,477,501 | | 170,405,046 |
Fidelity Overseas Fund | 5,106,528 | | 170,558,027 |
Fidelity Series International Growth Fund | 29,434,643 | | 338,792,736 |
Fidelity Series International Small Cap Fund | 5,344,865 | | 65,955,632 |
Fidelity Series International Value Fund | 31,380,069 | | 329,176,924 |
TOTAL DEVELOPED INTERNATIONAL EQUITY FUNDS | | 1,074,888,365 |
Emerging Markets Equity Funds - 2.0% |
Fidelity Series Emerging Markets Fund | 10,455,843 | | 200,333,958 |
TOTAL INTERNATIONAL EQUITY FUNDS (Cost $1,223,617,092) | 1,275,222,323 |
Bond Funds - 40.1% |
| Shares | | Value |
High Yield Bond Funds - 4.9% |
Fidelity Series Emerging Markets Debt Fund | 686,953 | | $ 6,872,472 |
Fidelity Series High Income Fund | 46,950,922 | | 470,448,237 |
TOTAL HIGH YIELD BOND FUNDS | | 477,320,709 |
Inflation-Protected Bond Funds - 9.5% |
Fidelity Series Inflation-Protected Bond Index Fund | 85,160,847 | | 921,440,367 |
Investment Grade Bond Funds - 25.7% |
Fidelity Series Investment Grade Bond Fund | 181,008,235 | | 2,059,873,708 |
Fidelity Strategic Real Return Fund | 43,492,371 | | 431,444,319 |
TOTAL INVESTMENT GRADE BOND FUNDS | | 2,491,318,027 |
TOTAL BOND FUNDS (Cost $3,812,939,620) | 3,890,079,103 |
Short-Term Funds - 10.7% |
| | | |
Fidelity Institutional Money Market Portfolio Institutional Class | 571,614,709 | | 571,614,709 |
Fidelity Short-Term Bond Fund | 54,602,917 | | 461,940,674 |
TOTAL SHORT-TERM FUNDS (Cost $1,053,385,051) | 1,033,555,383 |
TOTAL INVESTMENT PORTFOLIO - 100.0% (Cost $9,241,581,261) | 9,700,338,964 |
NET OTHER ASSETS (LIABILITIES) - 0.0% | | 912,191 |
NET ASSETS - 100% | $ 9,701,251,155 |
Other Information |
All investments are categorized as Level 1 under the Fair Value Hierarchy. The inputs or methodology used for valuing securities may not be an indication of the risk associated with investing in those securities. For more information on valuation inputs, please refer to the Security Valuation section in the accompanying Notes to Financial Statements. |
Income Tax Information |
At March 31, 2011, the Fund had a capital loss carryforward of approximately $572,433,574 all of which will expire in fiscal 2018. Capital loss carryforwards are only available to offset future capital gains of the Fund to the extent provided by regulations and may be limited. |
See accompanying notes which are an integral part of the financial statements.
Annual Report
Fidelity Freedom 2010 Fund
Statement of Assets and Liabilities
| March 31, 2011 |
| | |
Assets | | |
Investment in securities, at value (cost $9,241,581,261) - See accompanying schedule | | $ 9,700,338,964 |
Receivable for investments sold | | 16,873,080 |
Receivable for fund shares sold | | 8,588,026 |
Distributions receivable from underlying funds | | 960,961 |
Total assets | | 9,726,761,031 |
| | |
Liabilities | | |
Payable to custodian bank | $ 16 | |
Payable for fund shares redeemed | 25,509,860 | |
Total liabilities | | 25,509,876 |
| | |
Net Assets | | $ 9,701,251,155 |
Net Assets consist of: | | |
Paid in capital | | $ 9,811,323,496 |
Undistributed net investment income | | 22,203,665 |
Accumulated undistributed net realized gain (loss) on investments | | (591,033,709) |
Net unrealized appreciation (depreciation) on investments | | 458,757,703 |
Net Assets, for 690,288,457 shares outstanding | | $ 9,701,251,155 |
Net Asset Value, offering price and redemption price per share ($9,701,251,155 ÷ 690,288,457 shares) | | $ 14.05 |
Statement of Operations
| Year ended March 31, 2011 |
| | |
Investment Income | | |
Income distributions from underlying funds | | $ 166,082,126 |
Interest | | 1 |
Total income | | 166,082,127 |
| | |
Expenses | | |
Independent trustees' compensation | $ 38,066 | |
Total expenses before reductions | 38,066 | |
Expense reductions | (38,066) | - |
Net investment income (loss) | | 166,082,127 |
Realized and Unrealized Gain (Loss) Realized gain (loss) on sale of underlying fund shares | 215,441,881 | |
Capital gain distributions from underlying funds | 172,209,890 | |
Total net realized gain (loss) | | 387,651,771 |
Change in net unrealized appreciation (depreciation) on underlying funds | | 552,582,623 |
Net gain (loss) | | 940,234,394 |
Net increase (decrease) in net assets resulting from operations | | $ 1,106,316,521 |
See accompanying notes which are an integral part of the financial statements.
Annual Report
Statement of Changes in Net Assets
| Year ended
March 31,
2011 | Year ended
March 31,
2010 |
Increase (Decrease) in Net Assets | | |
Operations | | |
Net investment income (loss) | $ 166,082,127 | $ 258,956,797 |
Net realized gain (loss) | 387,651,771 | 10,900,289 |
Change in net unrealized appreciation (depreciation) | 552,582,623 | 2,854,058,038 |
Net increase (decrease) in net assets resulting from operations | 1,106,316,521 | 3,123,915,124 |
Distributions to shareholders from net investment income | (184,295,760) | (269,625,081) |
Distributions to shareholders from net realized gain | (89,137,970) | (92,210,865) |
Total distributions | (273,433,730) | (361,835,946) |
Share transactions
Proceeds from sales of shares | 2,184,615,051 | 2,174,611,735 |
Reinvestment of distributions | 271,563,876 | 360,201,134 |
Cost of shares redeemed | (4,676,038,578) | (3,339,360,670) |
Net increase (decrease) in net assets resulting from share transactions | (2,219,859,651) | (804,547,801) |
Total increase (decrease) in net assets | (1,386,976,860) | 1,957,531,377 |
| | |
Net Assets | | |
Beginning of period | 11,088,228,015 | 9,130,696,638 |
End of period (including undistributed net investment income of $22,203,665 and undistributed net investment income of $40,417,299, respectively) | $ 9,701,251,155 | $ 11,088,228,015 |
Other Information Shares | | |
Sold | 164,740,946 | 182,073,341 |
Issued in reinvestment of distributions | 20,471,880 | 29,453,525 |
Redeemed | (355,131,956) | (276,183,780) |
Net increase (decrease) | (169,919,130) | (64,656,914) |
Financial Highlights
Years ended March 31, | 2011 | 2010 | 2009 | 2008 | 2007 |
Selected Per-Share Data | | | | | |
Net asset value, beginning of period | $ 12.89 | $ 9.87 | $ 14.07 | $ 14.89 | $ 14.48 |
Income from Investment Operations | | | | | |
Net investment income (loss) B | .22 | .29 | .37 | .43 | .39 |
Net realized and unrealized gain (loss) | 1.31 | 3.14 | (3.77) | (.37) | .77 |
Total from investment operations | 1.53 | 3.43 | (3.40) | .06 | 1.16 |
Distributions from net investment income | (.25) | (.31) | (.40) | (.41) | (.38) |
Distributions from net realized gain | (.12) | (.11) | (.40) | (.47) | (.37) |
Total distributions | (.37) | (.41) E | (.80) | (.88) | (.75) |
Net asset value, end of period | $ 14.05 | $ 12.89 | $ 9.87 | $ 14.07 | $ 14.89 |
Total Return A | 12.02% | 34.99% | (25.06)% | .14% | 8.17% |
Ratios to Average Net Assets C, D | | | | | |
Expenses before reductions | .00% | .00% | .00% | .00% | .00% |
Expenses net of fee waivers, if any | .00% | .00% | .00% | .00% | .00% |
Expenses net of all reductions | .00% | .00% | .00% | .00% | .00% |
Net investment income (loss) | 1.64% | 2.40% | 3.03% | 2.86% | 2.67% |
Supplemental Data | | | | | |
Net assets, end of period (000 omitted) | $ 9,701,251 | $ 11,088,228 | $ 9,130,697 | $ 13,903,554 | $ 13,102,900 |
Portfolio turnover rate | 34% | 25% | 39% | 34% | 12% |
A Total returns would have been lower had certain expenses not been reduced during the periods shown.
B Calculated based on average shares outstanding during the period.
C Amounts do not include the activity of the underlying funds.
D Expense ratios reflect operating expenses of the Fund. Expenses before reductions do not reflect amounts reimbursed by the investment adviser or reductions from expense offset arrangements and do not represent the amount paid by the Fund during periods when reimbursements or reductions occur. Expenses net of fee waivers reflect expenses after reimbursement by the investment adviser but prior to reductions from expense offset arrangements. Expenses net of all reductions represent the net expenses paid by the Fund but do not include expenses of the investment companies in which the Fund invests.
E Total distributions of $.41 per share is comprised of distributions from net investment income of $.305 and distributions from net realized gain of $.105 per share.
See accompanying notes which are an integral part of the financial statements.
Annual Report
Fidelity Freedom 2015 Fund
Investment Changes (Unaudited)
Fund Holdings as of March 31, 2011 |
| % of fund's net assets | % of fund's net assets 6 months ago |
Commodity Funds | | |
Fidelity Series Commodity Strategy Fund | 4.5 | 4.8 |
Domestic Equity Funds | | |
Fidelity Blue Chip Growth Fund | 2.0 | 2.0 |
Fidelity Disciplined Equity Fund | 5.7 | 5.9 |
Fidelity Equity-Income Fund | 0.0 | 1.1 |
Fidelity Growth Company Fund | 5.0 | 5.1 |
Fidelity Series 100 Index Fund | 3.9 | 4.0 |
Fidelity Series All-Sector Equity Fund | 6.9 | 6.6 |
Fidelity Series Large Cap Value Fund | 6.5 | 6.3 |
Fidelity Series Small Cap Opportunities Fund | 1.1 | 1.0 |
Fidelity Small Cap Growth Fund | 0.7 | 0.7 |
Fidelity Small Cap Value Fund | 0.7 | 0.7 |
| 32.5 | 33.4 |
Developed International Equity Funds | | |
Fidelity Diversified International Fund | 1.8 | 2.7 |
Fidelity Europe Fund | 0.0 | 0.6 |
Fidelity Japan Fund | 0.0 | 0.2 |
Fidelity Overseas Fund | 1.8 | 2.7 |
Fidelity Series International Growth Fund | 3.6 | 2.7 |
Fidelity Series International Small Cap Fund | 0.7 | 0.5 |
Fidelity Series International Value Fund | 3.5 | 2.7 |
| 11.4 | 12.1 |
Emerging Markets Equity Funds | | |
Fidelity Series Emerging Markets Fund | 2.1 | 1.9 |
High Yield Bond Funds | | |
Fidelity Capital & Income Fund | 0.0 | 2.6 |
Fidelity High Income Fund | 0.0 | 2.6 |
Fidelity Series Emerging Markets Debt Fund | 0.1 | 0.0 |
Fidelity Series High Income Fund | 4.8 | 0.0 |
| 4.9 | 5.2 |
Inflation-Protected Bond Funds | | |
Fidelity Series Inflation-Protected Bond Index Fund | 8.8 | 8.2 |
Investment Grade Bond Funds | | |
Fidelity Series Investment Grade Bond Fund | 21.8 | 20.5 |
Fidelity Strategic Real Return Fund | 4.5 | 4.9 |
Fidelity Total Bond Fund | 0.0 | 0.0 * |
| 26.3 | 25.4 |
Short-Term Funds | | |
Fidelity Institutional Money Market Portfolio Institutional Class | 5.3 | 4.5 |
Fidelity Short-Term Bond Fund | 4.2 | 4.5 |
| 9.5 | 9.0 |
Net Other Assets (Liabilities) * | 0.0 | 0.0 |
| 100.0 | 100.0 |
Asset Allocation (% of fund's net assets) |
Current |
| Commodity Funds | 4.5% | |
| Domestic Equity Funds | 32.5% | |
| Developed International Equity Funds | 11.4% | |
| Emerging Markets Equity Funds | 2.1% | |
| High Yield Bond Funds | 4.9% | |
| Inflation-Protected Bond Funds | 8.8% | |
| Investment Grade Bond Funds | 26.3% | |
| Short-Term Funds | 9.5% | |

Six months ago |
| Commodity Funds | 4.8% | |
| Domestic Equity Funds | 33.4% | |
| Developed International Equity Funds | 12.1% | |
| Emerging Markets Equity Funds | 1.9% | |
| High Yield Bond Funds | 5.2% | |
| Inflation-Protected Bond Funds | 8.2% | |
| Investment Grade Bond Funds | 25.4% | |
| Short-Term Funds | 9.0% | |

Expected |
| Commodity Funds | 5.5% | |
| Domestic Equity Funds | 31.5% | |
| Developed International Equity Funds | 11.5% | |
| Emerging Markets Equity Funds | 2.0% | |
| High Yield Bond Funds | 5.0% | |
| Inflation-Protected Bond Funds | 10.1% | |
| Investment Grade Bond Funds | 24.7% | |
| Short-Term Funds | 9.7% | |

The fund invests according to an asset allocation strategy that becomes increasingly conservative over time. The six months ago allocation is based on the fund's holdings as of September 30, 2010. The current allocation is based on the fund's holdings as of March 31, 2011. The expected allocation represents the fund's anticipated allocation at September 30, 2011. |
* Amount represents less than 0.1% |
Annual Report
Fidelity Freedom 2015 Fund
Investments March 31, 2011
Showing Percentage of Net Assets
Domestic Equity Funds - 37.0% |
| Shares | | Value |
Commodity Funds - 4.5% |
Fidelity Series Commodity Strategy Fund | 30,218,190 | | $ 398,275,739 |
Domestic Equity Funds - 32.5% |
Fidelity Blue Chip Growth Fund | 3,719,160 | | 178,333,702 |
Fidelity Disciplined Equity Fund | 20,912,299 | | 502,104,307 |
Fidelity Growth Company Fund | 4,954,414 | | 446,095,479 |
Fidelity Series 100 Index Fund | 37,111,488 | | 341,425,687 |
Fidelity Series All-Sector Equity Fund | 46,711,027 | | 612,381,567 |
Fidelity Series Large Cap Value Fund | 47,225,600 | | 576,624,573 |
Fidelity Series Small Cap Opportunities Fund | 8,375,613 | | 98,748,477 |
Fidelity Small Cap Growth Fund | 3,468,695 | | 58,725,001 |
Fidelity Small Cap Value Fund | 3,489,047 | | 57,708,840 |
TOTAL DOMESTIC EQUITY FUNDS | | 2,872,147,633 |
TOTAL DOMESTIC EQUITY FUNDS (Cost $2,646,734,490) | 3,270,423,372 |
International Equity Funds - 13.5% |
| | | |
Developed International Equity Funds - 11.4% |
Fidelity Diversified International Fund | 5,129,075 | | 159,565,520 |
Fidelity Overseas Fund | 4,781,618 | | 159,706,040 |
Fidelity Series International Growth Fund | 27,577,958 | | 317,422,296 |
Fidelity Series International Small Cap Fund | 5,006,620 | | 61,781,691 |
Fidelity Series International Value Fund | 29,403,026 | | 308,437,743 |
TOTAL DEVELOPED INTERNATIONAL EQUITY FUNDS | | 1,006,913,290 |
Emerging Markets Equity Funds - 2.1% |
Fidelity Series Emerging Markets Fund | 9,796,317 | | 187,697,426 |
TOTAL INTERNATIONAL EQUITY FUNDS (Cost $973,153,118) | 1,194,610,716 |
Bond Funds - 40.0% |
| Shares | | Value |
High Yield Bond Funds - 4.9% |
Fidelity Series Emerging Markets Debt Fund | 623,032 | | $ 6,232,951 |
Fidelity Series High Income Fund | 42,761,330 | | 428,468,529 |
TOTAL HIGH YIELD BOND FUNDS | | 434,701,480 |
Inflation-Protected Bond Funds - 8.8% |
Fidelity Series Inflation-Protected Bond Index Fund | 72,381,286 | | 783,165,520 |
Investment Grade Bond Funds - 26.3% |
Fidelity Series Investment Grade Bond Fund | 169,737,194 | | 1,931,609,261 |
Fidelity Strategic Real Return Fund | 39,743,399 | | 394,254,523 |
TOTAL INVESTMENT GRADE BOND FUNDS | | 2,325,863,784 |
TOTAL BOND FUNDS (Cost $3,357,722,871) | 3,543,730,784 |
Short-Term Funds - 9.5% |
| | | |
Fidelity Institutional Money Market Portfolio Institutional Class | 468,032,750 | | 468,032,750 |
Fidelity Short-Term Bond Fund | 44,166,800 | | 373,651,125 |
TOTAL SHORT-TERM FUNDS (Cost $842,250,252) | 841,683,875 |
TOTAL INVESTMENT PORTFOLIO - 100.0% (Cost $7,819,860,731) | 8,850,448,747 |
NET OTHER ASSETS (LIABILITIES) - 0.0% | | 866,667 |
NET ASSETS - 100% | $ 8,851,315,414 |
Other Information |
All investments are categorized as Level 1 under the Fair Value Hierarchy. The inputs or methodology used for valuing securities may not be an indication of the risk associated with investing in those securities. For more information on valuation inputs, please refer to the Security Valuation section in the accompanying Notes to Financial Statements. |
Income Tax Information |
At March 31, 2011, the Fund had a capital loss carryforward of approximately $855,522,994 of which $98,777,053, $349,780,510 and $406,965,431 will expire in fiscal 2017, 2018 and 2019, respectively. Capital loss carryforwards are only available to offset future capital gains of the Fund to the extent provided by regulations and may be limited. |
See accompanying notes which are an integral part of the financial statements.
Annual Report
Fidelity Freedom 2015 Fund
Statement of Assets and Liabilities
| March 31, 2011 |
| | |
Assets | | |
Investment in securities, at value (cost $7,819,860,731) - See accompanying schedule | | $ 8,850,448,747 |
Receivable for investments sold | | 16,382,292 |
Receivable for fund shares sold | | 14,119,663 |
Distributions receivable from underlying funds | | 871,343 |
Total assets | | 8,881,822,045 |
| | |
Liabilities | | |
Payable for fund shares redeemed | | $ 30,506,631 |
| | |
Net Assets | | $ 8,851,315,414 |
Net Assets consist of: | | |
Paid in capital | | $ 8,667,518,109 |
Undistributed net investment income | | 20,536,056 |
Accumulated undistributed net realized gain (loss) on investments | | (867,326,767) |
Net unrealized appreciation (depreciation) on investments | | 1,030,588,016 |
Net Assets, for 753,860,366 shares outstanding | | $ 8,851,315,414 |
Net Asset Value, offering price and redemption price per share ($8,851,315,414 ÷ 753,860,366 shares) | | $ 11.74 |
Statement of Operations
| Year ended March 31, 2011 |
| | |
Investment Income | | |
Income distributions from underlying funds | | $ 143,970,641 |
| | |
Expenses | | |
Independent trustees' compensation | $ 32,152 | |
Total expenses before reductions | 32,152 | |
Expense reductions | (32,152) | - |
Net investment income (loss) | | 143,970,641 |
Realized and Unrealized Gain (Loss) Realized gain (loss) on sale of underlying fund shares | (258,642,566) | |
Capital gain distributions from underlying funds | 154,070,274 | |
Total net realized gain (loss) | | (104,572,292) |
Change in net unrealized appreciation (depreciation) on underlying funds | | 943,519,700 |
Net gain (loss) | | 838,947,408 |
Net increase (decrease) in net assets resulting from operations | | $ 982,918,049 |
See accompanying notes which are an integral part of the financial statements.
Annual Report
Statement of Changes in Net Assets
| Year ended
March 31,
2011 | Year ended
March 31,
2010 |
Increase (Decrease) in Net Assets | | |
Operations | | |
Net investment income (loss) | $ 143,970,641 | $ 189,068,555 |
Net realized gain (loss) | (104,572,292) | (252,083,509) |
Change in net unrealized appreciation (depreciation) | 943,519,700 | 2,373,045,954 |
Net increase (decrease) in net assets resulting from operations | 982,918,049 | 2,310,031,000 |
Distributions to shareholders from net investment income | (154,623,688) | (186,347,613) |
Distributions to shareholders from net realized gain | (75,719,796) | (72,444,592) |
Total distributions | (230,343,484) | (258,792,205) |
Share transactions
Proceeds from sales of shares | 2,806,458,296 | 2,794,438,936 |
Reinvestment of distributions | 229,422,760 | 258,226,466 |
Cost of shares redeemed | (3,785,659,212) | (2,344,790,821) |
Net increase (decrease) in net assets resulting from share transactions | (749,778,156) | 707,874,581 |
Total increase (decrease) in net assets | 2,796,409 | 2,759,113,376 |
| | |
Net Assets | | |
Beginning of period | 8,848,519,005 | 6,089,405,629 |
End of period (including undistributed net investment income of $20,536,056 and undistributed net investment income of $31,189,103, respectively) | $ 8,851,315,414 | $ 8,848,519,005 |
Other Information Shares | | |
Sold | 254,891,740 | 280,942,107 |
Issued in reinvestment of distributions | 20,701,558 | 25,204,965 |
Redeemed | (345,392,330) | (231,218,469) |
Net increase (decrease) | (69,799,032) | 74,928,603 |
Financial Highlights
Years ended March 31, | 2011 | 2010 | 2009 | 2008 | 2007 |
Selected Per-Share Data | | | | | |
Net asset value, beginning of period | $ 10.74 | $ 8.13 | $ 11.73 | $ 12.45 | $ 11.98 |
Income from Investment Operations | | | | | |
Net investment income (loss) B | .18 | .24 | .29 | .34 | .29 |
Net realized and unrealized gain (loss) | 1.12 | 2.70 | (3.29) | (.38) | .72 |
Total from investment operations | 1.30 | 2.94 | (3.00) | (.04) | 1.01 |
Distributions from net investment income | (.20) | (.24) | (.30) | (.30) | (.23) |
Distributions from net realized gain | (.10) | (.09) | (.30) | (.38) | (.31) |
Total distributions | (.30) | (.33) E | (.60) | (.68) | (.54) |
Net asset value, end of period | $ 11.74 | $ 10.74 | $ 8.13 | $ 11.73 | $ 12.45 |
Total Return A | 12.24% | 36.33% | (26.45)% | (.62)% | 8.58% |
Ratios to Average Net Assets C, D | | | | | |
Expenses before reductions | .00% | .00% | .00% | .00% | .00% |
Expenses net of fee waivers, if any | .00% | .00% | .00% | .00% | .00% |
Expenses net of all reductions | .00% | .00% | .00% | .00% | .00% |
Net investment income (loss) | 1.66% | 2.38% | 2.97% | 2.68% | 2.37% |
Supplemental Data | | | | | |
Net assets, end of period (000 omitted) | $ 8,851,315 | $ 8,848,519 | $ 6,089,406 | $ 7,116,671 | $ 5,098,514 |
Portfolio turnover rate | 43% | 30% | 36% | 24% | 4% |
A Total returns would have been lower had certain expenses not been reduced during the periods shown.
B Calculated based on average shares outstanding during the period.
C Amounts do not include the activity of the underlying funds.
D Expense ratios reflect operating expenses of the Fund. Expenses before reductions do not reflect amounts reimbursed by the investment adviser or reductions from expense offset arrangements and do not represent the amount paid by the Fund during periods when reimbursements or reductions occur. Expenses net of fee waivers reflect expenses after reimbursement by the investment adviser but prior to reductions from expense offset arrangements. Expenses net of all reductions represent the net expenses paid by the Fund but do not include expenses of the investment companies in which the Fund invests.
E Total distributions of $.33 per share is comprised of distributions from net investment income of $.235 and distributions from net realized gain of $.091 per share.
See accompanying notes which are an integral part of the financial statements.
Annual Report
Fidelity Freedom 2020 Fund
Investment Changes (Unaudited)
Fund Holdings as of March 31, 2011 |
| % of fund's net assets | % of fund's net assets 6 months ago |
Commodity Funds | | |
Fidelity Series Commodity Strategy Fund | 5.6 | 5.6 |
Domestic Equity Funds | | |
Fidelity Blue Chip Growth Fund | 2.4 | 2.4 |
Fidelity Disciplined Equity Fund | 6.7 | 7.0 |
Fidelity Equity-Income Fund | 0.0 | 1.2 |
Fidelity Growth Company Fund | 5.9 | 6.1 |
Fidelity Series 100 Index Fund | 4.5 | 4.7 |
Fidelity Series All-Sector Equity Fund | 8.1 | 7.9 |
Fidelity Series Large Cap Value Fund | 7.7 | 7.5 |
Fidelity Series Small Cap Opportunities Fund | 1.3 | 1.3 |
Fidelity Small Cap Growth Fund | 0.8 | 0.8 |
Fidelity Small Cap Value Fund | 0.8 | 0.8 |
| 38.2 | 39.7 |
Developed International Equity Funds | | |
Fidelity Diversified International Fund | 2.1 | 3.3 |
Fidelity Europe Fund | 0.0 | 0.8 |
Fidelity Japan Fund | 0.0 | 0.3 |
Fidelity Overseas Fund | 2.2 | 3.3 |
Fidelity Series International Growth Fund | 4.3 | 3.2 |
Fidelity Series International Small Cap Fund | 0.8 | 0.6 |
Fidelity Series International Value Fund | 4.1 | 3.2 |
| 13.5 | 14.7 |
Emerging Markets Equity Funds | | |
Fidelity Series Emerging Markets Fund | 2.5 | 2.3 |
High Yield Bond Funds | | |
Fidelity Capital & Income Fund | 0.0 | 3.5 |
Fidelity High Income Fund | 0.0 | 3.4 |
Fidelity Series Emerging Markets Debt Fund | 0.1 | 0.0 |
Fidelity Series High Income Fund | 6.3 | 0.0 |
| 6.4 | 6.9 |
Inflation-Protected Bond Funds | | |
Fidelity Series Inflation-Protected Bond Index Fund | 6.7 | 5.9 |
Investment Grade Bond Funds | | |
Fidelity Series Investment Grade Bond Fund | 19.2 | 17.6 |
Fidelity Strategic Real Return Fund | 4.0 | 4.2 |
Fidelity Total Bond Fund | 0.0 | 0.0 * |
| 23.2 | 21.8 |
Short-Term Funds | | |
Fidelity Institutional Money Market Portfolio Institutional Class | 2.2 | 1.5 |
Fidelity Short-Term Bond Fund | 1.7 | 1.6 |
| 3.9 | 3.1 |
Net Other Assets (Liabilities)* | 0.0 | 0.0 |
| 100.0 | 100.0 |
Asset Allocation (% of fund's net assets) |
Current |
| Commodity Funds | 5.6% | |
| Domestic Equity Funds | 38.2% | |
| Developed International Equity Funds | 13.5% | |
| Emerging Markets Equity Funds | 2.5% | |
| High Yield Bond Funds | 6.4% | |
| Inflation-Protected Bond Funds | 6.7% | |
| Investment Grade Bond Funds | 23.2% | |
| Short-Term Funds | 3.9% | |

Six months ago |
| Commodity Funds | 5.6% | |
| Domestic Equity Funds | 39.7% | |
| Developed International Equity Funds | 14.7% | |
| Emerging Markets Equity Funds | 2.3% | |
| High Yield Bond Funds | 6.9% | |
| Inflation-Protected Bond Funds | 5.9% | |
| Investment Grade Bond Funds | 21.8% | |
| Short-Term Funds | 3.1% | |

Expected |
| Commodity Funds | 6.4% | |
| Domestic Equity Funds | 36.4% | |
| Developed International Equity Funds | 13.3% | |
| Emerging Markets Equity Funds | 2.3% | |
| High Yield Bond Funds | 6.3% | |
| Inflation-Protected Bond Funds | 8.0% | |
| Investment Grade Bond Funds | 22.5% | |
| Short-Term Funds | 4.8% | |

The fund invests according to an asset allocation strategy that becomes increasingly conservative over time. The six months ago allocation is based on the fund's holdings as of September 30, 2010. The current allocation is based on the fund's holdings as of March 31, 2011. The expected allocation represents the fund's anticipated allocation at September 30, 2011. |
* Amount represents less than 0.1% |
Annual Report
Fidelity Freedom 2020 Fund
Investments March 31, 2011
Showing Percentage of Net Assets
Domestic Equity Funds - 43.8% |
| Shares | | Value |
Commodity Funds - 5.6% |
Fidelity Series Commodity Strategy Fund | 84,993,608 | | $ 1,120,215,750 |
Domestic Equity Funds - 38.2% |
Fidelity Blue Chip Growth Fund | 9,846,939 | | 472,160,731 |
Fidelity Disciplined Equity Fund | 55,362,664 | | 1,329,257,555 |
Fidelity Growth Company Fund | 13,130,983 | | 1,182,313,678 |
Fidelity Series 100 Index Fund | 98,405,164 | | 905,327,512 |
Fidelity Series All-Sector Equity Fund | 123,750,051 | | 1,622,363,175 |
Fidelity Series Large Cap Value Fund | 125,123,329 | | 1,527,755,852 |
Fidelity Series Small Cap Opportunities Fund | 22,093,907 | | 260,487,163 |
Fidelity Small Cap Growth Fund | 9,124,812 | | 154,483,060 |
Fidelity Small Cap Value Fund | 9,183,322 | | 151,892,149 |
TOTAL DOMESTIC EQUITY FUNDS | | 7,606,040,875 |
TOTAL DOMESTIC EQUITY FUNDS (Cost $6,894,468,558) | 8,726,256,625 |
International Equity Funds - 16.0% |
| | | |
Developed International Equity Funds - 13.5% |
Fidelity Diversified International Fund | 13,668,608 | | 425,230,400 |
Fidelity Overseas Fund | 12,742,579 | | 425,602,126 |
Fidelity Series International Growth Fund | 73,373,420 | | 844,528,066 |
Fidelity Series International Small Cap Fund | 13,322,181 | | 164,395,712 |
Fidelity Series International Value Fund | 78,226,926 | | 820,600,454 |
TOTAL DEVELOPED INTERNATIONAL EQUITY FUNDS | | 2,680,356,758 |
Emerging Markets Equity Funds - 2.5% |
Fidelity Series Emerging Markets Fund | 26,063,938 | | 499,385,060 |
TOTAL INTERNATIONAL EQUITY FUNDS (Cost $2,516,495,134) | 3,179,741,818 |
Bond Funds - 36.3% |
| Shares | | Value |
High Yield Bond Funds - 6.4% |
Fidelity Series Emerging Markets Debt Fund | 1,834,881 | | $ 18,356,575 |
Fidelity Series High Income Fund | 125,839,774 | | 1,260,914,534 |
TOTAL HIGH YIELD BOND FUNDS | | 1,279,271,109 |
Inflation-Protected Bond Funds - 6.7% |
Fidelity Series Inflation-Protected Bond Index Fund | 122,830,244 | | 1,329,023,240 |
Investment Grade Bond Funds - 23.2% |
Fidelity Series Investment Grade Bond Fund | 336,410,628 | | 3,828,352,946 |
Fidelity Strategic Real Return Fund | 79,725,570 | | 790,877,659 |
TOTAL INVESTMENT GRADE BOND FUNDS | | 4,619,230,605 |
TOTAL BOND FUNDS (Cost $6,897,548,720) | 7,227,524,954 |
Short-Term Funds - 3.9% |
| | | |
Fidelity Institutional Money Market Portfolio Institutional Class | 438,321,940 | | 438,321,940 |
Fidelity Short-Term Bond Fund | 41,252,185 | | 348,993,484 |
TOTAL SHORT-TERM FUNDS (Cost $783,627,358) | 787,315,424 |
TOTAL INVESTMENT PORTFOLIO - 100.0% (Cost $17,092,139,770) | 19,920,838,821 |
NET OTHER ASSETS (LIABILITIES) - 0.0% | | 2,552,132 |
NET ASSETS - 100% | $ 19,923,390,953 |
Other Information |
All investments are categorized as Level 1 under the Fair Value Hierarchy. The inputs or methodology used for valuing securities may not be an indication of the risk associated with investing in those securities. For more information on valuation inputs, please refer to the Security Valuation section in the accompanying Notes to Financial Statements. |
Income Tax Information |
At March 31, 2011, the Fund had a capital loss carryforward of approximately $2,245,475,993 of which $233,519,669, $1,163,777,877 and $848,178,447 will expire in fiscal 2017, 2018 and 2019, respectively. Capital loss carryforwards are only available to offset future capital gains of the Fund to the extent provided by regulations and may be limited. |
See accompanying notes which are an integral part of the financial statements.
Annual Report
Fidelity Freedom 2020 Fund
Statement of Assets and Liabilities
| March 31, 2011 |
| | |
Assets | | |
Investment in securities, at value (cost $17,092,139,770) - See accompanying schedule | | $ 19,920,838,821 |
Cash | | 15 |
Receivable for investments sold | | 29,575,666 |
Receivable for fund shares sold | | 25,122,816 |
Distributions receivable from underlying funds | | 2,560,420 |
Total assets | | 19,978,097,738 |
| | |
Liabilities | | |
Payable for investments purchased | $ 15,452 | |
Payable for fund shares redeemed | 54,691,333 | |
Total liabilities | | 54,706,785 |
| | |
Net Assets | | $ 19,923,390,953 |
Net Assets consist of: | | |
Paid in capital | | $ 19,331,815,680 |
Undistributed net investment income | | 45,602,729 |
Accumulated undistributed net realized gain (loss) on investments | | (2,282,726,507) |
Net unrealized appreciation (depreciation) on investments | | 2,828,699,051 |
Net Assets, for 1,389,939,828 shares outstanding | | $ 19,923,390,953 |
Net Asset Value, offering price and redemption price per share ($19,923,390,953 ÷ 1,389,939,828 shares) | | $ 14.33 |
Statement of Operations
| Year ended March 31, 2011 |
| | |
Investment Income | | |
Income distributions from underlying funds | | $ 330,060,477 |
Interest | | 3 |
Total income | | 330,060,480 |
| | |
Expenses | | |
Independent trustees' compensation | $ 72,931 | |
Total expenses before reductions | 72,931 | |
Expense reductions | (72,931) | - |
Net investment income (loss) | | 330,060,480 |
Realized and Unrealized Gain (Loss) Realized gain (loss) on sale of underlying fund shares | (453,173,888) | |
Capital gain distributions from underlying funds | 369,675,247 | |
Total net realized gain (loss) | | (83,498,641) |
Change in net unrealized appreciation (depreciation) on underlying funds | | 2,176,145,077 |
Net gain (loss) | | 2,092,646,436 |
Net increase (decrease) in net assets resulting from operations | | $ 2,422,706,916 |
See accompanying notes which are an integral part of the financial statements.
Annual Report
Statement of Changes in Net Assets
| Year ended
March 31,
2011 | Year ended
March 31,
2010 |
Increase (Decrease) in Net Assets | | |
Operations | | |
Net investment income (loss) | $ 330,060,480 | $ 430,982,832 |
Net realized gain (loss) | (83,498,641) | (861,069,719) |
Change in net unrealized appreciation (depreciation) | 2,176,145,077 | 6,624,475,024 |
Net increase (decrease) in net assets resulting from operations | 2,422,706,916 | 6,194,388,137 |
Distributions to shareholders from net investment income | (340,613,702) | (444,938,539) |
Distributions to shareholders from net realized gain | (197,974,733) | (164,228,908) |
Total distributions | (538,588,435) | (609,167,447) |
Share transactions
Proceeds from sales of shares | 5,177,636,636 | 5,028,232,698 |
Reinvestment of distributions | 536,267,648 | 607,974,246 |
Cost of shares redeemed | (8,237,671,778) | (4,975,083,602) |
Net increase (decrease) in net assets resulting from share transactions | (2,523,767,494) | 661,123,342 |
Total increase (decrease) in net assets | (639,649,013) | 6,246,344,032 |
| | |
Net Assets | | |
Beginning of period | 20,563,039,966 | 14,316,695,934 |
End of period (including undistributed net investment income of $45,602,729 and undistributed net investment income of $56,155,950, respectively) | $ 19,923,390,953 | $ 20,563,039,966 |
Other Information Shares | | |
Sold | 387,684,909 | 424,742,366 |
Issued in reinvestment of distributions | 40,032,467 | 49,503,195 |
Redeemed | (621,571,000) | (410,596,584) |
Net increase (decrease) | (193,853,624) | 63,648,977 |
Financial Highlights
Years ended March 31, | 2011 | 2010 | 2009 | 2008 | 2007 |
Selected Per-Share Data | | | | | |
Net asset value, beginning of period | $ 12.98 | $ 9.42 | $ 14.66 | $ 15.84 | $ 15.37 |
Income from Investment Operations | | | | | |
Net investment income (loss) B | .22 | .27 | .33 | .36 | .31 |
Net realized and unrealized gain (loss) | 1.50 | 3.68 | (4.74) | (.50) | 1.03 |
Total from investment operations | 1.72 | 3.95 | (4.41) | (.14) | 1.34 |
Distributions from net investment income | (.24) | (.29) | (.31) | (.37) | (.28) |
Distributions from net realized gain | (.14) | (.11) | (.52) | (.67) | (.59) |
Total distributions | (.37) F | (.39) E | (.83) | (1.04) | (.87) |
Net asset value, end of period | $ 14.33 | $ 12.98 | $ 9.42 | $ 14.66 | $ 15.84 |
Total Return A | 13.47% | 42.19% | (31.39)% | (1.32)% | 8.95% |
Ratios to Average Net Assets C, D | | | | | |
Expenses before reductions | .00% | .00% | .00% | .00% | .00% |
Expenses net of fee waivers, if any | .00% | .00% | .00% | .00% | .00% |
Expenses net of all reductions | .00% | .00% | .00% | .00% | .00% |
Net investment income (loss) | 1.69% | 2.30% | 2.73% | 2.24% | 1.99% |
Supplemental Data | | | | | |
Net assets, end of period (000 omitted) | $ 19,923,391 | $ 20,563,040 | $ 14,316,696 | $ 20,028,445 | $ 18,305,525 |
Portfolio turnover rate | 42% | 29% | 35% | 35% | 7% |
A Total returns would have been lower had certain expenses not been reduced during the periods shown.
B Calculated based on average shares outstanding during the period.
C Amounts do not include the activity of the underlying funds.
D Expense ratios reflect operating expenses of the Fund. Expenses before reductions do not reflect amounts reimbursed by the investment adviser or reductions from expense offset arrangements and do not represent the amount paid by the Fund during periods when reimbursements or reductions occur. Expenses net of fee waivers reflect expenses after reimbursement by the investment adviser but prior to reductions from expense offset arrangements. Expenses net of all reductions represent the net expenses paid by the Fund but do not include expenses of the investment companies in which the Fund invests.
E Total distributions of $.39 per share is comprised of distributions from net investment income of $.285 and distributions from net realized gain of $.105 per share.
F Total distributions of $.37 per share is comprised of distributions from net investment income of $.236 and distributions from net realized gain of $.135 per share.
See accompanying notes which are an integral part of the financial statements.
Annual Report
Fidelity Freedom 2025 Fund
Investment Changes (Unaudited)
Fund Holdings as of March 31, 2011 |
| % of fund's net assets | % of fund's net assets 6 months ago |
Commodity Funds | | |
Fidelity Series Commodity Strategy Fund | 6.8 | 6.5 |
Domestic Equity Funds | | |
Fidelity Blue Chip Growth Fund | 2.7 | 2.7 |
Fidelity Disciplined Equity Fund | 7.7 | 7.9 |
Fidelity Equity-Income Fund | 0.0 | 1.5 |
Fidelity Growth Company Fund | 6.9 | 7.0 |
Fidelity Series 100 Index Fund | 5.2 | 5.4 |
Fidelity Series All-Sector Equity Fund | 9.4 | 8.9 |
Fidelity Series Large Cap Value Fund | 8.8 | 8.6 |
Fidelity Series Small Cap Opportunities Fund | 1.5 | 1.4 |
Fidelity Small Cap Growth Fund | 0.9 | 0.9 |
Fidelity Small Cap Value Fund | 0.9 | 0.9 |
| 44.0 | 45.2 |
Developed International Equity Funds | | |
Fidelity Diversified International Fund | 2.5 | 3.7 |
Fidelity Europe Fund | 0.0 | 0.7 |
Fidelity Japan Fund | 0.0 | 0.3 |
Fidelity Overseas Fund | 2.5 | 3.7 |
Fidelity Series International Growth Fund | 4.9 | 3.6 |
Fidelity Series International Small Cap Fund | 0.9 | 0.7 |
Fidelity Series International Value Fund | 4.8 | 3.5 |
| 15.6 | 16.2 |
Emerging Markets Equity Funds | | |
Fidelity Series Emerging Markets Fund | 2.9 | 2.6 |
High Yield Bond Funds | | |
Fidelity Capital & Income Fund | 0.0 | 3.8 |
Fidelity High Income Fund | 0.0 | 3.8 |
Fidelity Series Emerging Markets Debt Fund | 0.1 | 0.0 |
Fidelity Series High Income Fund | 7.1 | 0.0 |
| 7.2 | 7.6 |
Inflation-Protected Bond Funds | | |
Fidelity Series Inflation-Protected Bond Index Fund | 3.7 | 3.5 |
Investment Grade Bond Funds | | |
Fidelity Series Investment Grade Bond Fund | 16.4 | 14.8 |
Fidelity Strategic Real Return Fund | 3.3 | 3.6 |
Fidelity Total Bond Fund | 0.0 | 0.0 * |
| 19.7 | 18.4 |
Short-Term Funds | | |
Fidelity Institutional Money Market Portfolio Institutional Class | 0.1 | 0.0 * |
Fidelity Short-Term Bond Fund * | 0.0 | 0.0 |
| 0.1 | 0.0 * |
Net Other Assets (Liabilities) * | 0.0 | 0.0 |
| 100.0 | 100.0 |
Asset Allocation (% of fund's net assets) |
Current |
| Commodity Funds | 6.8% | |
| Domestic Equity Funds | 44.0% | |
| Developed International Equity Funds | 15.6% | |
| Emerging Markets Equity Funds | 2.9% | |
| High Yield Bond Funds | 7.2% | |
| Inflation-Protected Bond Funds | 3.7% | |
| Investment Grade Bond Funds | 19.7% | |
| Short-Term Funds | 0.1% | |

Six months ago |
| Commodity Funds | 6.5% | |
| Domestic Equity Funds | 45.2% | |
| Developed International Equity Funds | 16.2% | |
| Emerging Markets Equity Funds | 2.6% | |
| High Yield Bond Funds | 7.6% | |
| Inflation-Protected Bond Funds | 3.5% | |
| Investment Grade Bond Funds | 18.4% | |
| Short-Term Funds * | 0.0% | |

Expected |
| Commodity Funds | 7.6% | |
| Domestic Equity Funds | 42.8% | |
| Developed International Equity Funds | 15.6% | |
| Emerging Markets Equity Funds | 2.8% | |
| High Yield Bond Funds | 7.5% | |
| Inflation-Protected Bond Funds | 4.9% | |
| Investment Grade Bond Funds | 18.6% | |
| Short-Term Funds | 0.2% | |

The fund invests according to an asset allocation strategy that becomes increasingly conservative over time. The six months ago allocation is based on the fund's holdings as of September 30, 2010. The current allocation is based on the fund's holdings as of March 31, 2011. The expected allocation represents the fund's anticipated allocation at September 30, 2011. |
* Amount represents less than 0.1% |
Annual Report
Fidelity Freedom 2025 Fund
Investments March 31, 2011
Showing Percentage of Net Assets
Domestic Equity Funds - 50.8% |
| Shares | | Value |
Commodity Funds - 6.8% |
Fidelity Series Commodity Strategy Fund | 52,390,085 | | $ 690,501,317 |
Domestic Equity Funds - 44.0% |
Fidelity Blue Chip Growth Fund | 5,797,521 | | 277,991,143 |
Fidelity Disciplined Equity Fund | 32,532,182 | | 781,097,689 |
Fidelity Growth Company Fund | 7,717,373 | | 694,872,225 |
Fidelity Series 100 Index Fund | 57,746,547 | | 531,268,230 |
Fidelity Series All-Sector Equity Fund | 72,674,097 | | 952,757,409 |
Fidelity Series Large Cap Value Fund | 73,477,522 | | 897,160,548 |
Fidelity Series Small Cap Opportunities Fund | 13,009,295 | | 153,379,587 |
Fidelity Small Cap Growth Fund | 5,386,290 | | 91,189,889 |
Fidelity Small Cap Value Fund | 5,421,020 | | 89,663,678 |
TOTAL DOMESTIC EQUITY FUNDS | | 4,469,380,398 |
TOTAL DOMESTIC EQUITY FUNDS (Cost $4,758,920,483) | 5,159,881,715 |
International Equity Funds - 18.5% |
| | | |
Developed International Equity Funds - 15.6% |
Fidelity Diversified International Fund | 8,048,642 | | 250,393,237 |
Fidelity Overseas Fund | 7,503,395 | | 250,613,400 |
Fidelity Series International Growth Fund | 43,329,199 | | 498,719,076 |
Fidelity Series International Small Cap Fund | 7,866,447 | | 97,071,957 |
Fidelity Series International Value Fund | 46,197,542 | | 484,612,215 |
TOTAL DEVELOPED INTERNATIONAL EQUITY FUNDS | | 1,581,409,885 |
Emerging Markets Equity Funds - 2.9% |
Fidelity Series Emerging Markets Fund | 15,391,434 | | 294,899,885 |
TOTAL INTERNATIONAL EQUITY FUNDS (Cost $1,830,981,793) | 1,876,309,770 |
Bond Funds - 30.6% |
| Shares | | Value |
High Yield Bond Funds - 7.2% |
Fidelity Series Emerging Markets Debt Fund | 1,043,413 | | $ 10,438,525 |
Fidelity Series High Income Fund | 71,676,157 | | 718,195,097 |
TOTAL HIGH YIELD BOND FUNDS | | 728,633,622 |
Inflation-Protected Bond Funds - 3.7% |
Fidelity Series Inflation-Protected Bond Index Fund | 35,182,237 | | 380,671,800 |
Investment Grade Bond Funds - 19.7% |
Fidelity Series Investment Grade Bond Fund | 146,144,333 | | 1,663,122,512 |
Fidelity Strategic Real Return Fund | 34,089,759 | | 338,170,406 |
TOTAL INVESTMENT GRADE BOND FUNDS | | 2,001,292,918 |
TOTAL BOND FUNDS (Cost $3,085,620,399) | 3,110,598,340 |
Short-Term Funds - 0.1% |
| | | |
Fidelity Institutional Money Market Portfolio Institutional Class | 6,704,090 | | 6,704,090 |
Fidelity Short-Term Bond Fund | 595,177 | | 5,035,193 |
TOTAL SHORT-TERM FUNDS (Cost $11,749,580) | 11,739,283 |
TOTAL INVESTMENT PORTFOLIO - 100.0% (Cost $9,687,272,255) | 10,158,529,108 |
NET OTHER ASSETS (LIABILITIES) - 0.0% | | 1,462,260 |
NET ASSETS - 100% | $ 10,159,991,368 |
Other Information |
All investments are categorized as Level 1 under the Fair Value Hierarchy. The inputs or methodology used for valuing securities may not be an indication of the risk associated with investing in those securities. For more information on valuation inputs, please refer to the Security Valuation section in the accompanying Notes to Financial Statements. |
Income Tax Information |
At March 31, 2011, the Fund had a capital loss carryforward of approximately $70,645,658 all of which will expire in fiscal 2018. Capital loss carryforwards are only available to offset future capital gains of the Fund to the extent provided by regulations and may be limited. |
See accompanying notes which are an integral part of the financial statements.
Annual Report
Fidelity Freedom 2025 Fund
Statement of Assets and Liabilities
| March 31, 2011 |
| | |
Assets | | |
Investment in securities, at value (cost $9,687,272,255) - See accompanying schedule | | $ 10,158,529,108 |
Cash | | 1 |
Receivable for investments sold | | 13,165,556 |
Receivable for fund shares sold | | 19,708,938 |
Distributions receivable from underlying funds | | 1,462,441 |
Total assets | | 10,192,866,044 |
| | |
Liabilities | | |
Payable for investments purchased | $ 130 | |
Payable for fund shares redeemed | 32,874,546 | |
Total liabilities | | 32,874,676 |
| | |
Net Assets | | $ 10,159,991,368 |
Net Assets consist of: | | |
Paid in capital | | $ 9,731,577,300 |
Undistributed net investment income | | 21,065,043 |
Accumulated undistributed net realized gain (loss) on investments | | (63,907,828) |
Net unrealized appreciation (depreciation) on investments | | 471,256,853 |
Net Assets, for 845,090,091 shares outstanding | | $ 10,159,991,368 |
Net Asset Value, offering price and redemption price per share ($10,159,991,368 ÷ 845,090,091 shares) | | $ 12.02 |
Statement of Operations
| Year ended March 31, 2011 |
| | |
Investment Income | | |
Income distributions from underlying funds | | $ 156,386,040 |
| | |
Expenses | | |
Independent trustees' compensation | $ 34,526 | |
Total expenses before reductions | 34,526 | |
Expense reductions | (34,526) | - |
Net investment income (loss) | | 156,386,040 |
Realized and Unrealized Gain (Loss) Realized gain (loss) on sale of underlying fund shares | 154,696,944 | |
Capital gain distributions from underlying funds | 191,616,283 | |
Total net realized gain (loss) | | 346,313,227 |
Change in net unrealized appreciation (depreciation) on underlying funds | | 778,505,912 |
Net gain (loss) | | 1,124,819,139 |
Net increase (decrease) in net assets resulting from operations | | $ 1,281,205,179 |
See accompanying notes which are an integral part of the financial statements.
Annual Report
Statement of Changes in Net Assets
| Year ended
March 31,
2011 | Year ended
March 31,
2010 |
Increase (Decrease) in Net Assets | | |
Operations | | |
Net investment income (loss) | $ 156,386,040 | $ 178,667,186 |
Net realized gain (loss) | 346,313,227 | 105,898,735 |
Change in net unrealized appreciation (depreciation) | 778,505,912 | 2,466,360,217 |
Net increase (decrease) in net assets resulting from operations | 1,281,205,179 | 2,750,926,138 |
Distributions to shareholders from net investment income | (160,733,732) | (173,115,738) |
Distributions to shareholders from net realized gain | (89,018,011) | (78,645,788) |
Total distributions | (249,751,743) | (251,761,526) |
Share transactions
Proceeds from sales of shares | 3,110,308,047 | 2,944,744,149 |
Reinvestment of distributions | 249,395,018 | 251,459,641 |
Cost of shares redeemed | (3,532,616,726) | (2,192,604,773) |
Net increase (decrease) in net assets resulting from share transactions | (172,913,661) | 1,003,599,017 |
Total increase (decrease) in net assets | 858,539,775 | 3,502,763,629 |
| | |
Net Assets | | |
Beginning of period | 9,301,451,593 | 5,798,687,964 |
End of period (including undistributed net investment income of $21,065,043 and undistributed net investment income of $25,412,736, respectively) | $ 10,159,991,368 | $ 9,301,451,593 |
Other Information Shares | | |
Sold | 281,556,369 | 301,762,904 |
Issued in reinvestment of distributions | 22,301,079 | 24,578,310 |
Redeemed | (322,211,153) | (218,232,354) |
Net increase (decrease) | (18,353,705) | 108,108,860 |
Financial Highlights
Years ended March 31, | 2011 | 2010 | 2009 | 2008 | 2007 |
Selected Per-Share Data | | | | | |
Net asset value, beginning of period | $ 10.77 | $ 7.68 | $ 12.15 | $ 13.05 | $ 12.52 |
Income from Investment Operations | | | | | |
Net investment income (loss) B | .18 | .22 | .26 | .28 | .24 |
Net realized and unrealized gain (loss) | 1.37 | 3.18 | (4.10) | (.49) | .89 |
Total from investment operations | 1.55 | 3.40 | (3.84) | (.21) | 1.13 |
Distributions from net investment income | (.19) | (.21) | (.26) | (.25) | (.19) |
Distributions from net realized gain | (.11) | (.10) | (.37) | (.44) | (.41) |
Total distributions | (.30) | (.31) E | (.63) | (.69) | (.60) |
Net asset value, end of period | $ 12.02 | $ 10.77 | $ 7.68 | $ 12.15 | $ 13.05 |
Total Return A | 14.57% | 44.43% | (32.84)% | (2.00)% | 9.18% |
Ratios to Average Net Assets C, D | | | | | |
Expenses before reductions | .00% | .00% | .00% | .00% | .00% |
Expenses net of fee waivers, if any | .00% | .00% | .00% | .00% | .00% |
Expenses net of all reductions | .00% | .00% | .00% | .00% | .00% |
Net investment income (loss) | 1.67% | 2.21% | 2.64% | 2.16% | 1.88% |
Supplemental Data | | | | | |
Net assets, end of period (000 omitted) | $ 10,159,991 | $ 9,301,452 | $ 5,798,688 | $ 6,651,041 | $ 4,349,197 |
Portfolio turnover rate | 49% | 26% | 29% | 24% | 3% |
A Total returns would have been lower had certain expenses not been reduced during the periods shown.
B Calculated based on average shares outstanding during the period.
C Amounts do not include the activity of the underlying funds.
D Expense ratios reflect operating expenses of the Fund. Expenses before reductions do not reflect amounts reimbursed by the investment adviser or reductions from expense offset arrangements and do not represent the amount paid by the Fund during periods when reimbursements or reductions occur. Expenses net of fee waivers reflect expenses after reimbursement by the investment adviser but prior to reductions from expense offset arrangements. Expenses net of all reductions represent the net expenses paid by the Fund but do not include expenses of the investment companies in which the Fund invests.
E Total distributions of $.31 per share is comprised of distributions from net investment income of $.210 and distributions from net realized gain of $.095 per share.
See accompanying notes which are an integral part of the financial statements.
Annual Report
Fidelity Freedom 2030 Fund
Investment Changes (Unaudited)
Fund Holdings as of March 31, 2011 |
| % of fund's net assets | % of fund's net assets 6 months ago |
Commodity Funds | | |
Fidelity Series Commodity Strategy Fund | 7.4 | 6.7 |
Domestic Equity Funds | | |
Fidelity Blue Chip Growth Fund | 2.9 | 2.9 |
Fidelity Disciplined Equity Fund | 8.2 | 8.5 |
Fidelity Equity-Income Fund | 0.0 | 1.4 |
Fidelity Growth Company Fund | 7.3 | 7.4 |
Fidelity Series 100 Index Fund | 5.5 | 5.7 |
Fidelity Series All-Sector Equity Fund | 9.9 | 9.6 |
Fidelity Series Large Cap Value Fund | 9.4 | 9.1 |
Fidelity Series Small Cap Opportunities Fund | 1.6 | 1.5 |
Fidelity Small Cap Growth Fund | 0.9 | 1.0 |
Fidelity Small Cap Value Fund | 0.9 | 1.0 |
| 46.6 | 48.1 |
Developed International Equity Funds | | |
Fidelity Diversified International Fund | 2.6 | 4.0 |
Fidelity Europe Fund | 0.0 | 0.9 |
Fidelity Japan Fund | 0.0 | 0.3 |
Fidelity Overseas Fund | 2.6 | 4.0 |
Fidelity Series International Growth Fund | 5.2 | 4.0 |
Fidelity Series International Small Cap Fund | 1.0 | 0.8 |
Fidelity Series International Value Fund | 5.1 | 3.9 |
| 16.5 | 17.9 |
Emerging Markets Equity Funds | | |
Fidelity Series Emerging Markets Fund | 3.1 | 2.8 |
High Yield Bond Funds | | |
Fidelity Capital & Income Fund | 0.0 | 3.8 |
Fidelity High Income Fund | 0.0 | 3.8 |
Fidelity Series Emerging Markets Debt Fund | 0.1 | 0.0 |
Fidelity Series High Income Fund | 7.2 | 0.0 |
| 7.3 | 7.6 |
Inflation-Protected Bond Funds | | |
Fidelity Series Inflation-Protected Bond Index Fund | 0.4 | 0.8 |
Investment Grade Bond Funds | | |
Fidelity Series Investment Grade Bond Fund | 15.5 | 13.0 |
Fidelity Strategic Real Return Fund | 3.2 | 3.1 |
Fidelity Total Bond Fund | 0.0 | 0.0 * |
| 18.7 | 16.1 |
Net Other Assets (Liabilities) * | 0.0 | 0.0 |
| 100.0 | 100.0 |
Asset Allocation (% of fund's net assets) |
Current |
| Commodity Funds | 7.4% | |
| Domestic Equity Funds | 46.6% | |
| Developed International Equity Funds | 16.5% | |
| Emerging Markets Equity Funds | 3.1% | |
| High Yield Bond Funds | 7.3% | |
| Inflation-Protected Bond Funds | 0.4% | |
| Investment Grade Bond Funds | 18.7% | |

Six months ago |
| Commodity Funds | 6.7% | |
| Domestic Equity Funds | 48.1% | |
| Developed International Equity Funds | 17.9% | |
| Emerging Markets Equity Funds | 2.8% | |
| High Yield Bond Funds | 7.6% | |
| Inflation-Protected Bond Funds | 0.8% | |
| Investment Grade Bond Funds | 16.1% | |

Expected |
| Commodity Funds | 7.9% | |
| Domestic Equity Funds | 45.0% | |
| Developed International Equity Funds | 16.4% | |
| Emerging Markets Equity Funds | 2.9% | |
| High Yield Bond Funds | 7.5% | |
| Inflation-Protected Bond Funds | 1.7% | |
| Investment Grade Bond Funds | 18.6% | |

The fund invests according to an asset allocation strategy that becomes increasingly conservative over time. The six months ago allocation is based on the fund's holdings as of September 30, 2010. The current allocation is based on the fund's holdings as of March 31, 2011. The expected allocation represents the fund's anticipated allocation at September 30, 2011. |
* Amount represents less than 0.1% |
Annual Report
Fidelity Freedom 2030 Fund
Investments March 31, 2011
Showing Percentage of Net Assets
Domestic Equity Funds - 54.0% |
| Shares | | Value |
Commodity Funds - 7.4% |
Fidelity Series Commodity Strategy Fund | 82,379,188 | | $ 1,085,757,692 |
Domestic Equity Funds - 46.6% |
Fidelity Blue Chip Growth Fund | 8,930,982 | | 428,240,595 |
Fidelity Disciplined Equity Fund | 50,057,104 | | 1,201,871,070 |
Fidelity Growth Company Fund | 11,880,492 | | 1,069,719,499 |
Fidelity Series 100 Index Fund | 88,954,366 | | 818,380,164 |
Fidelity Series All-Sector Equity Fund | 111,910,818 | | 1,467,150,826 |
Fidelity Series Large Cap Value Fund | 113,122,360 | | 1,381,224,016 |
Fidelity Series Small Cap Opportunities Fund | 20,023,546 | | 236,077,607 |
Fidelity Small Cap Growth Fund | 8,265,479 | | 139,934,567 |
Fidelity Small Cap Value Fund | 8,316,132 | | 137,548,818 |
TOTAL DOMESTIC EQUITY FUNDS | | 6,880,147,162 |
TOTAL DOMESTIC EQUITY FUNDS (Cost $6,428,160,133) | 7,965,904,854 |
International Equity Funds - 19.6% |
| | | |
Developed International Equity Funds - 16.5% |
Fidelity Diversified International Fund | 12,419,816 | | 386,380,468 |
Fidelity Overseas Fund | 11,578,421 | | 386,719,272 |
Fidelity Series International Growth Fund | 66,768,870 | | 768,509,690 |
Fidelity Series International Small Cap Fund | 12,122,142 | | 149,587,237 |
Fidelity Series International Value Fund | 71,187,184 | | 746,753,558 |
TOTAL DEVELOPED INTERNATIONAL EQUITY FUNDS | | 2,437,950,225 |
|
| Shares | | Value |
Emerging Markets Equity Funds - 3.1% |
Fidelity Series Emerging Markets Fund | 23,717,204 | | $ 454,421,625 |
TOTAL INTERNATIONAL EQUITY FUNDS (Cost $2,323,970,687) | 2,892,371,850 |
Bond Funds - 26.4% |
| | | |
High Yield Bond Funds - 7.3% |
Fidelity Series Emerging Markets Debt Fund | 1,526,676 | | 15,273,160 |
Fidelity Series High Income Fund | 104,927,428 | | 1,051,372,829 |
TOTAL HIGH YIELD BOND FUNDS | | 1,066,645,989 |
Inflation-Protected Bond Funds - 0.4% |
Fidelity Series Inflation-Protected Bond Index Fund | 5,366,174 | | 58,062,008 |
Investment Grade Bond Funds - 18.7% |
Fidelity Series Investment Grade Bond Fund | 201,111,154 | | 2,288,644,937 |
Fidelity Strategic Real Return Fund | 47,509,362 | | 471,292,870 |
TOTAL INVESTMENT GRADE BOND FUNDS | | 2,759,937,807 |
TOTAL BOND FUNDS (Cost $3,771,402,458) | 3,884,645,804 |
TOTAL INVESTMENT PORTFOLIO - 100.0% (Cost $12,523,533,278) | 14,742,922,508 |
NET OTHER ASSETS (LIABILITIES) - 0.0% | | 2,130,372 |
NET ASSETS - 100% | $ 14,745,052,880 |
Other Information |
All investments are categorized as Level 1 under the Fair Value Hierarchy. The inputs or methodology used for valuing securities may not be an indication of the risk associated with investing in those securities. For more information on valuation inputs, please refer to the Security Valuation section in the accompanying Notes to Financial Statements. |
Income Tax Information |
At March 31, 2011, the Fund had a capital loss carryforward of approximately $1,876,479,920 of which $175,742,492, $833,827,340 and $866,910,088 will expire in fiscal 2017, 2018 and 2019, respectively. Capital loss carryforwards are only available to offset future capital gains of the Fund to the extent provided by regulations and may be limited. |
See accompanying notes which are an integral part of the financial statements.
Annual Report
Fidelity Freedom 2030 Fund
Statement of Assets and Liabilities
| March 31, 2011 |
| | |
Assets | | |
Investment in securities, at value (cost $12,523,533,278) - See accompanying schedule | | $ 14,742,922,508 |
Cash | | 51 |
Receivable for investments sold | | 13,244,872 |
Receivable for fund shares sold | | 23,453,523 |
Distributions receivable from underlying funds | | 2,130,476 |
Other receivables | | 50,274 |
Total assets | | 14,781,801,704 |
| | |
Liabilities | | |
Payable for investments purchased | $ 1,250 | |
Payable for fund shares redeemed | 36,697,297 | |
Other payables and accrued expenses | 50,277 | |
Total liabilities | | 36,748,824 |
| | |
Net Assets | | $ 14,745,052,880 |
Net Assets consist of: | | |
Paid in capital | | $ 14,384,316,857 |
Undistributed net investment income | | 28,091,722 |
Accumulated undistributed net realized gain (loss) on investments | | (1,886,744,929) |
Net unrealized appreciation (depreciation) on investments | | 2,219,389,230 |
Net Assets, for 1,024,152,286 shares outstanding | | $ 14,745,052,880 |
Net Asset Value, offering price and redemption price per share ($14,745,052,880 ÷ 1,024,152,286 shares) | | $ 14.40 |
Statement of Operations
| Year ended March 31, 2011 |
| | |
Investment Income | | |
Income distributions from underlying funds | | $ 230,242,762 |
Interest | | 1 |
Total income | | 230,242,763 |
| | |
Expenses | | |
Independent trustees' compensation | $ 52,582 | |
Total expenses before reductions | 52,582 | |
Expense reductions | (52,582) | - |
Net investment income (loss) | | 230,242,763 |
Realized and Unrealized Gain (Loss) Realized gain (loss) on sale of underlying fund shares | (532,212,762) | |
Capital gain distributions from underlying funds | 290,162,060 | |
Total net realized gain (loss) | | (242,050,702) |
Change in net unrealized appreciation (depreciation) on underlying funds | | 1,950,741,542 |
Net gain (loss) | | 1,708,690,840 |
Net increase (decrease) in net assets resulting from operations | | $ 1,938,933,603 |
See accompanying notes which are an integral part of the financial statements.
Annual Report
Statement of Changes in Net Assets
| Year ended
March 31,
2011 | Year ended
March 31,
2010 |
Increase (Decrease) in Net Assets | | |
Operations | | |
Net investment income (loss) | $ 230,242,763 | $ 262,653,257 |
Net realized gain (loss) | (242,050,702) | (790,026,782) |
Change in net unrealized appreciation (depreciation) | 1,950,741,542 | 5,268,821,959 |
Net increase (decrease) in net assets resulting from operations | 1,938,933,603 | 4,741,448,434 |
Distributions to shareholders from net investment income | (235,186,693) | (265,989,973) |
Distributions to shareholders from net realized gain | (135,098,225) | (116,585,700) |
Total distributions | (370,284,918) | (382,575,673) |
Share transactions
Proceeds from sales of shares | 3,918,719,285 | 3,811,353,981 |
Reinvestment of distributions | 368,866,050 | 381,969,443 |
Cost of shares redeemed | (5,706,608,924) | (3,642,108,716) |
Net increase (decrease) in net assets resulting from share transactions | (1,419,023,589) | 551,214,708 |
Total increase (decrease) in net assets | 149,625,096 | 4,910,087,469 |
| | |
Net Assets | | |
Beginning of period | 14,595,427,784 | 9,685,340,315 |
End of period (including undistributed net investment income of $28,091,722 and undistributed net investment income of $33,035,653, respectively) | $ 14,745,052,880 | $ 14,595,427,784 |
Other Information Shares | | |
Sold | 297,230,167 | 330,014,978 |
Issued in reinvestment of distributions | 27,686,969 | 31,482,504 |
Redeemed | (435,039,964) | (306,616,363) |
Net increase (decrease) | (110,122,828) | 54,881,119 |
Financial Highlights
Years ended March 31, | 2011 | 2010 | 2009 | 2008 | 2007 |
Selected Per-Share Data | | | | | |
Net asset value, beginning of period | $ 12.87 | $ 8.97 | $ 15.02 | $ 16.36 | $ 15.82 |
Income from Investment Operations | | | | | |
Net investment income (loss) B | .21 | .23 | .27 | .28 | .24 |
Net realized and unrealized gain (loss) | 1.67 | 4.02 | (5.46) | (.63) | 1.21 |
Total from investment operations | 1.88 | 4.25 | (5.19) | (.35) | 1.45 |
Distributions from net investment income | (.22) | (.24) | (.27) | (.27) | (.21) |
Distributions from net realized gain | (.13) | (.11) | (.59) | (.72) | (.70) |
Total distributions | (.35) | (.35) E | (.86) | (.99) | (.91) |
Net asset value, end of period | $ 14.40 | $ 12.87 | $ 8.97 | $ 15.02 | $ 16.36 |
Total Return A | 14.81% | 47.57% | (36.25)% | (2.65)% | 9.40% |
Ratios to Average Net Assets C, D | | | | | |
Expenses before reductions | .00% | .00% | .00% | .00% | .00% |
Expenses net of fee waivers, if any | .00% | .00% | .00% | .00% | .00% |
Expenses net of all reductions | .00% | .00% | .00% | .00% | .00% |
Net investment income (loss) | 1.62% | 2.01% | 2.29% | 1.72% | 1.51% |
Supplemental Data | | | | | |
Net assets, end of period (000 omitted) | $ 14,745,053 | $ 14,595,428 | $ 9,685,340 | $ 13,446,741 | $ 11,878,413 |
Portfolio turnover rate | 44% | 29% | 23% | 36% | 6% |
A Total returns would have been lower had certain expenses not been reduced during the periods shown.
B Calculated based on average shares outstanding during the period.
C Amounts do not include the activity of the underlying funds.
D Expense ratios reflect operating expenses of the Fund. Expenses before reductions do not reflect amounts reimbursed by the investment adviser or reductions from expense offset arrangements and do not represent the amount paid by the Fund during periods when reimbursements or reductions occur. Expenses net of fee waivers reflect expenses after reimbursement by the investment adviser but prior to reductions from expense offset arrangements. Expenses net of all reductions represent the net expenses paid by the Fund but do not include expenses of the investment companies in which the Fund invests.
E Total distributions of $.35 per share is comprised of distributions from net investment income of $.240 and distributions from net realized gain of $.105 per share.
See accompanying notes which are an integral part of the financial statements.
Annual Report
Fidelity Freedom 2035 Fund
Investment Changes (Unaudited)
Fund Holdings as of March 31, 2011 |
| % of fund's net assets | % of fund's net assets 6 months ago |
Commodity Funds | | |
Fidelity Series Commodity Strategy Fund | 8.7 | 7.7 |
Domestic Equity Funds | | |
Fidelity Blue Chip Growth Fund | 3.2 | 3.2 |
Fidelity Disciplined Equity Fund | 9.1 | 9.3 |
Fidelity Equity-Income Fund | 0.0 | 1.7 |
Fidelity Growth Company Fund | 8.1 | 8.2 |
Fidelity Series 100 Index Fund | 6.2 | 6.4 |
Fidelity Series All-Sector Equity Fund | 11.1 | 10.5 |
Fidelity Series Large Cap Value Fund | 10.5 | 10.1 |
Fidelity Series Small Cap Opportunities Fund | 1.8 | 1.7 |
Fidelity Small Cap Growth Fund | 1.1 | 1.1 |
Fidelity Small Cap Value Fund | 1.1 | 1.1 |
| 52.2 | 53.3 |
Developed International Equity Funds | | |
Fidelity Diversified International Fund | 2.9 | 4.3 |
Fidelity Europe Fund | 0.0 | 0.9 |
Fidelity Japan Fund | 0.0 | 0.3 |
Fidelity Overseas Fund | 2.9 | 4.3 |
Fidelity Series International Growth Fund | 5.9 | 4.2 |
Fidelity Series International Small Cap Fund | 1.1 | 0.8 |
Fidelity Series International Value Fund | 5.7 | 4.1 |
| 18.5 | 18.9 |
Emerging Markets Equity Funds | | |
Fidelity Series Emerging Markets Fund | 3.5 | 3.0 |
High Yield Bond Funds | | |
Fidelity Capital & Income Fund | 0.0 | 3.8 |
Fidelity High Income Fund | 0.0 | 3.7 |
Fidelity Series Emerging Markets Debt Fund | 0.1 | 0.0 |
Fidelity Series High Income Fund | 7.0 | 0.0 |
| 7.1 | 7.5 |
Investment Grade Bond Funds | | |
Fidelity Series Investment Grade Bond Fund | 8.2 | 7.8 |
Fidelity Strategic Real Return Fund | 1.8 | 1.8 |
Fidelity Total Bond Fund | 0.0 | 0.0* |
| 10.0 | 9.6 |
Net Other Assets (Liabilities)* | 0.0 | 0.0 |
| 100.0 | 100.0 |
Asset Allocation (% of fund's net assets) |
Current |
| Commodity Funds | 8.7% | |
| Domestic Equity Funds | 52.2% | |
| Developed International Equity Funds | 18.5% | |
| Emerging Markets Equity Funds | 3.5% | |
| High Yield Bond Funds | 7.1% | |
| Investment Grade Bond Funds | 10.0% | |

Six months ago |
| Commodity Funds | 7.7% | |
| Domestic Equity Funds | 53.3% | |
| Developed International Equity Funds | 18.9% | |
| Emerging Markets Equity Funds | 3.0% | |
| High Yield Bond Funds | 7.5% | |
| Investment Grade Bond Funds | 9.6% | |

Expected |
| Commodity Funds | 9.0% | |
| Domestic Equity Funds | 51.3% | |
| Developed International Equity Funds | 18.7% | |
| Emerging Markets Equity Funds | 3.3% | |
| High Yield Bond Funds | 7.5% | |
| Investment Grade Bond Funds | 10.2% | |

The fund invests according to an asset allocation strategy that becomes increasingly conservative over time. The six months ago allocation is based on the fund's holdings as of September 30, 2010. The current allocation is based on the fund's holdings as of March 31, 2011. The expected allocation represents the fund's anticipated allocation at September 30, 2011. |
* Amount represents less than 0.1% |
Annual Report
Fidelity Freedom 2035 Fund
Investments March 31, 2011
Showing Percentage of Net Assets
Domestic Equity Funds - 60.9% |
| Shares | | Value |
Commodity Funds - 8.7% |
Fidelity Series Commodity Strategy Fund | 45,515,447 | | $ 599,893,598 |
Domestic Equity Funds - 52.2% |
Fidelity Blue Chip Growth Fund | 4,671,587 | | 224,002,600 |
Fidelity Disciplined Equity Fund | 26,240,671 | | 630,038,504 |
Fidelity Growth Company Fund | 6,223,688 | | 560,380,872 |
Fidelity Series 100 Index Fund | 46,615,116 | | 428,859,067 |
Fidelity Series All-Sector Equity Fund | 58,635,447 | | 768,710,713 |
Fidelity Series Large Cap Value Fund | 59,248,158 | | 723,420,012 |
Fidelity Series Small Cap Opportunities Fund | 10,511,906 | | 123,935,370 |
Fidelity Small Cap Growth Fund | 4,330,992 | | 73,323,695 |
Fidelity Small Cap Value Fund | 4,357,892 | | 72,079,536 |
TOTAL DOMESTIC EQUITY FUNDS | | 3,604,750,369 |
TOTAL DOMESTIC EQUITY FUNDS (Cost $3,847,124,805) | 4,204,643,967 |
International Equity Funds - 22.0% |
| | | |
Developed International Equity Funds - 18.5% |
Fidelity Diversified International Fund | 6,515,326 | | 202,691,797 |
Fidelity Overseas Fund | 6,073,939 | | 202,869,559 |
Fidelity Series International Growth Fund | 35,081,317 | | 403,785,963 |
Fidelity Series International Small Cap Fund | 6,369,440 | | 78,598,891 |
Fidelity Series International Value Fund | 37,403,902 | | 392,366,936 |
TOTAL DEVELOPED INTERNATIONAL EQUITY FUNDS | | 1,280,313,146 |
Emerging Markets Equity Funds - 3.5% |
Fidelity Series Emerging Markets Fund | 12,462,051 | | 238,772,894 |
TOTAL INTERNATIONAL EQUITY FUNDS (Cost $1,473,380,756) | 1,519,086,040 |
Bond Funds - 17.1% |
| Shares | | Value |
High Yield Bond Funds - 7.1% |
Fidelity Series Emerging Markets Debt Fund | 704,095 | | $ 7,043,902 |
Fidelity Series High Income Fund | 48,427,791 | | 485,246,461 |
TOTAL HIGH YIELD BOND FUNDS | | 492,290,363 |
Investment Grade Bond Funds - 10.0% |
Fidelity Series Investment Grade Bond Fund | 49,856,878 | | 567,371,271 |
Fidelity Strategic Real Return Fund | 12,589,470 | | 124,887,538 |
TOTAL INVESTMENT GRADE BOND FUNDS | | 692,258,809 |
TOTAL BOND FUNDS (Cost $1,179,216,150) | 1,184,549,172 |
TOTAL INVESTMENT PORTFOLIO - 100.0% (Cost $6,499,721,711) | | 6,908,279,179 |
NET OTHER ASSETS (LIABILITIES) - 0.0% | | 986,082 |
NET ASSETS - 100% | $ 6,909,265,261 |
Other Information |
All investments are categorized as Level 1 under the Fair Value Hierarchy. The inputs or methodology used for valuing securities may not be an indication of the risk associated with investing in those securities. For more information on valuation inputs, please refer to the Security Valuation section in the accompanying Notes to Financial Statements. |
Income Tax Information |
At March 31, 2011, the Fund had a capital loss carryforward of approximately $26,359,649 all of which will expire in fiscal 2018. Capital loss carryforwards are only available to offset future capital gains of the Fund to the extent provided by regulations and may be limited. |
See accompanying notes which are an integral part of the financial statements.
Annual Report
Fidelity Freedom 2035 Fund
Statement of Assets and Liabilities
| March 31, 2011 |
| | |
Assets | | |
Investment in securities, at value
(cost $6,499,721,711) - See accompanying schedule | | $ 6,908,279,179 |
Receivable for investments sold | | 4,821,405 |
Receivable for fund shares sold | | 13,732,837 |
Distributions receivable from underlying funds | | 986,146 |
Total assets | | 6,927,819,567 |
| | |
Liabilities | | |
Payable to custodian bank | $ 2 | |
Payable for investments purchased | 61 | |
Payable for fund shares redeemed | 18,554,243 | |
Total liabilities | | 18,554,306 |
| | |
Net Assets | | $ 6,909,265,261 |
Net Assets consist of: | | |
Paid in capital | | $ 6,507,406,886 |
Undistributed net investment income | | 9,890,398 |
Accumulated undistributed net realized gain (loss) on investments | | (16,589,491) |
Net unrealized appreciation (depreciation) on investments | | 408,557,468 |
Net Assets, for 573,992,614 shares outstanding | | $ 6,909,265,261 |
Net Asset Value, offering price and redemption price per share ($6,909,265,261 ÷ 573,992,614 shares) | | $ 12.04 |
Statement of Operations
| Year ended March 31, 2011 |
| | |
Investment Income | | |
Income distributions from underlying funds | | $ 92,844,660 |
| | |
Expenses | | |
Independent trustees' compensation | $ 22,807 | |
Total expenses before reductions | 22,807 | |
Expense reductions | (22,807) | - |
Net investment income (loss) | | 92,844,660 |
Realized and Unrealized Gain (Loss) Realized gain (loss) on sale of underlying fund shares | 87,803,610 | |
Capital gain distributions from underlying funds | 132,658,028 | |
Total net realized gain (loss) | | 220,461,638 |
Change in net unrealized appreciation (depreciation) on underlying funds | | 608,997,870 |
Net gain (loss) | | 829,459,508 |
Net increase (decrease) in net assets resulting from operations | | $ 922,304,168 |
See accompanying notes which are an integral part of the financial statements.
Annual Report
Fidelity Freedom 2035 Fund
Financial Statements - continued
Statement of Changes in Net Assets
| Year ended
March 31,
2011 | Year ended
March 31,
2010 |
Increase (Decrease) in Net Assets | | |
Operations | | |
Net investment income (loss) | $ 92,844,660 | $ 99,093,044 |
Net realized gain (loss) | 220,461,638 | 78,372,080 |
Change in net unrealized appreciation (depreciation) | 608,997,870 | 1,711,374,473 |
Net increase (decrease) in net assets resulting from operations | 922,304,168 | 1,888,839,597 |
Distributions to shareholders from net investment income | (95,007,185) | (97,268,213) |
Distributions to shareholders from net realized gain | (54,001,681) | (51,556,134) |
Total distributions | (149,008,866) | (148,824,347) |
Share transactions
Proceeds from sales of shares | 2,214,999,798 | 2,084,364,224 |
Reinvestment of distributions | 148,849,394 | 148,704,385 |
Cost of shares redeemed | (2,309,882,198) | (1,467,111,621) |
Net increase (decrease) in net assets resulting from share transactions | 53,966,994 | 765,956,988 |
Total increase (decrease) in net assets | 827,262,296 | 2,505,972,238 |
| | |
Net Assets | | |
Beginning of period | 6,082,002,965 | 3,576,030,727 |
End of period (including undistributed net investment income of $9,890,398 and undistributed net investment income of $12,052,923, respectively) | $ 6,909,265,261 | $ 6,082,002,965 |
Other Information Shares | | |
Sold | 203,159,612 | 218,713,922 |
Issued in reinvestment of distributions | 13,424,060 | 14,708,985 |
Redeemed | (213,129,001) | (148,683,585) |
Net increase (decrease) | 3,454,671 | 84,739,322 |
Financial Highlights
Years ended March 31, | 2011 | 2010 | 2009 | 2008 | 2007 |
Selected Per-Share Data | | | | | |
Net asset value, beginning of period | $ 10.66 | $ 7.36 | $ 12.41 | $ 13.48 | $ 12.89 |
Income from Investment Operations | | | | | |
Net investment income (loss) B | .16 | .18 | .22 | .23 | .19 |
Net realized and unrealized gain (loss) | 1.48 | 3.40 | (4.63) | (.57) | 1.01 |
Total from investment operations | 1.64 | 3.58 | (4.41) | (.34) | 1.20 |
Distributions from net investment income | (.17) | (.18) | (.20) | (.21) | (.17) |
Distributions from net realized gain | (.10) | (.10) | (.44) | (.52) | (.44) |
Total distributions | (.26) F | (.28) E | (.64) | (.73) | (.61) |
Net asset value, end of period | $ 12.04 | $ 10.66 | $ 7.36 | $ 12.41 | $ 13.48 |
Total Return A | 15.63% | 48.79% | (37.11)% | (3.00)% | 9.51% |
Ratios to Average Net Assets C, D | | | | | |
Expenses before reductions | .00% | .00% | .00% | .00% | .00% |
Expenses net of fee waivers, if any | .00% | .00% | .00% | .00% | .00% |
Expenses net of all reductions | .00% | .00% | .00% | .00% | .00% |
Net investment income (loss) | 1.49% | 1.91% | 2.24% | 1.70% | 1.50% |
Supplemental Data | | | | | |
Net assets, end of period (000 omitted) | $ 6,909,265 | $ 6,082,003 | $ 3,576,031 | $ 3,914,977 | $ 2,553,737 |
Portfolio turnover rate | 47% | 25% | 20% | 28% | 3% |
A Total returns would have been lower had certain expenses not been reduced during the periods shown.
B Calculated based on average shares outstanding during the period.
C Amounts do not include the activity of the underlying funds.
D Expense ratios reflect operating expenses of the Fund. Expenses before reductions do not reflect amounts reimbursed by the investment adviser or reductions from expense offset arrangements and do not represent the amount paid by the Fund during periods when reimbursements or reductions occur. Expenses net of fee waivers reflect expenses after reimbursement by the investment adviser but prior to reductions from expense offset arrangements. Expenses net of all reductions represent the net expenses paid by the Fund but do not include expenses of the investment companies in which the Fund invests.
E Total distributions of $.28 per share is comprised of distributions from net investment income of $.180 and distributions from net realized gain of $.095 per share.
F Total distributions of $.26 per share is comprised of distributions from net investment income of $.168 and distributions from net realized gain of $.095 per share.
See accompanying notes which are an integral part of the financial statements.
Annual Report
Fidelity Freedom 2040 Fund
Investment Changes (Unaudited)
Fund Holdings as of March 31, 2011 |
| % of fund's net assets | % of fund's net assets 6 months ago |
Commodity Funds | | |
Fidelity Series Commodity Strategy Fund | 8.8 | 7.7 |
Domestic Equity Funds | | |
Fidelity Blue Chip Growth Fund | 3.3 | 3.2 |
Fidelity Disciplined Equity Fund | 9.2 | 9.5 |
Fidelity Equity-Income Fund | 0.0 | 1.8 |
Fidelity Growth Company Fund | 8.2 | 8.3 |
Fidelity Series 100 Index Fund | 6.3 | 6.4 |
Fidelity Series All-Sector Equity Fund | 11.2 | 10.6 |
Fidelity Series Large Cap Value Fund | 10.6 | 10.2 |
Fidelity Series Small Cap Opportunities Fund | 1.8 | 1.7 |
Fidelity Small Cap Growth Fund | 1.1 | 1.1 |
Fidelity Small Cap Value Fund | 1.1 | 1.1 |
| 52.8 | 53.9 |
Developed International Equity Funds | | |
Fidelity Diversified International Fund | 3.0 | 4.4 |
Fidelity Europe Fund | 0.0 | 0.9 |
Fidelity Japan Fund | 0.0 | 0.3 |
Fidelity Overseas Fund | 3.0 | 4.4 |
Fidelity Series International Growth Fund | 5.9 | 4.2 |
Fidelity Series International Small Cap Fund | 1.1 | 0.8 |
Fidelity Series International Value Fund | 5.7 | 4.2 |
| 18.7 | 19.2 |
Emerging Markets Equity Funds | | |
Fidelity Series Emerging Markets Fund | 3.5 | 3.0 |
High Yield Bond Funds | | |
Fidelity Capital & Income Fund | 0.0 | 4.3 |
Fidelity High Income Fund | 0.0 | 4.4 |
Fidelity Series Emerging Markets Debt Fund | 0.1 | 0.0 |
Fidelity Series High Income Fund | 7.9 | 0.0 |
| 8.0 | 8.7 |
Investment Grade Bond Funds | | |
Fidelity Series Investment Grade Bond Fund | 6.7 | 6.1 |
Fidelity Strategic Real Return Fund | 1.5 | 1.4 |
Fidelity Total Bond Fund | 0.0 | 0.0* |
| 8.2 | 7.5 |
Net Other Assets (Liabilities)* | 0.0 | 0.0 |
| 100.0 | 100.0 |
Asset Allocation (% of fund's net assets) |
Current |
| Commodity Funds | 8.8% | |
| Domestic Equity Funds | 52.8% | |
| Developed International Equity Funds | 18.7% | |
| Emerging Markets Equity Funds | 3.5% | |
| High Yield Bond Funds | 8.0% | |
| Investment Grade Bond Funds | 8.2% | |

Six months ago |
| Commodity Funds | 7.7% | |
| Domestic Equity Funds | 53.9% | |
| Developed International Equity Funds | 19.2% | |
| Emerging Markets Equity Funds | 3.0% | |
| High Yield Bond Funds | 8.7% | |
| Investment Grade Bond Funds | 7.5% | |

Expected |
| Commodity Funds | 9.1% | |
| Domestic Equity Funds | 51.8% | |
| Developed International Equity Funds | 18.9% | |
| Emerging Markets Equity Funds | 3.3% | |
| High Yield Bond Funds | 8.0% | |
| Investment Grade Bond Funds | 8.9% | |

The fund invests according to an asset allocation strategy that becomes increasingly conservative over time. The six months ago allocation is based on the fund's holdings as of September 30, 2010. The current allocation is based on the fund's holdings as of March 31, 2011. The expected allocation represents the fund's anticipated allocation at September 30, 2011. |
* Amount represents less than 0.1% |
Annual Report
Fidelity Freedom 2040 Fund
Investments March 31, 2011
Showing Percentage of Net Assets
Domestic Equity Funds - 61.6% |
| Shares | | Value |
Commodity Funds - 8.8% |
Fidelity Series Commodity Strategy Fund | 60,839,753 | | $ 801,867,948 |
Domestic Equity Funds - 52.8% |
Fidelity Blue Chip Growth Fund | 6,211,517 | | 297,842,236 |
Fidelity Disciplined Equity Fund | 34,834,310 | | 836,371,788 |
Fidelity Growth Company Fund | 8,260,116 | | 743,740,875 |
Fidelity Series 100 Index Fund | 61,855,960 | | 569,074,832 |
Fidelity Series All-Sector Equity Fund | 77,822,000 | | 1,020,246,415 |
Fidelity Series Large Cap Value Fund | 78,695,249 | | 960,868,992 |
Fidelity Series Small Cap Opportunities Fund | 13,966,376 | | 164,663,578 |
Fidelity Small Cap Growth Fund | 5,746,426 | | 97,286,998 |
Fidelity Small Cap Value Fund | 5,781,914 | | 95,632,865 |
TOTAL DOMESTIC EQUITY FUNDS | | 4,785,728,579 |
TOTAL DOMESTIC EQUITY FUNDS (Cost $4,576,822,379) | 5,587,596,527 |
International Equity Funds - 22.2% |
| | | |
Developed International Equity Funds - 18.7% |
Fidelity Diversified International Fund | 8,652,208 | | 269,170,186 |
Fidelity Overseas Fund | 8,066,081 | | 269,407,115 |
Fidelity Series International Growth Fund | 46,526,745 | | 535,522,833 |
Fidelity Series International Small Cap Fund | 8,447,310 | | 104,239,804 |
Fidelity Series International Value Fund | 49,605,797 | | 520,364,815 |
TOTAL DEVELOPED INTERNATIONAL EQUITY FUNDS | | 1,698,704,753 |
Emerging Markets Equity Funds - 3.5% |
Fidelity Series Emerging Markets Fund | 16,527,414 | | 316,665,261 |
TOTAL INTERNATIONAL EQUITY FUNDS (Cost $1,649,244,813) | 2,015,370,014 |
Bond Funds - 16.2% |
| Shares | | Value |
High Yield Bond Funds - 8.0% |
Fidelity Series Emerging Markets Debt Fund | 1,038,055 | | $ 10,384,890 |
Fidelity Series High Income Fund | 71,401,553 | | 715,443,564 |
TOTAL HIGH YIELD BOND FUNDS | | 725,828,454 |
Investment Grade Bond Funds - 8.2% |
Fidelity Series Investment Grade Bond Fund | 53,170,045 | | 605,075,116 |
Fidelity Strategic Real Return Fund | 13,915,705 | | 138,043,797 |
TOTAL INVESTMENT GRADE BOND FUNDS | | 743,118,913 |
TOTAL BOND FUNDS (Cost $1,439,526,744) | 1,468,947,367 |
TOTAL INVESTMENT PORTFOLIO - 100.0% (Cost $7,665,593,936) | | 9,071,913,908 |
NET OTHER ASSETS (LIABILITIES) - 0.0% | | 1,449,657 |
NET ASSETS - 100% | $ 9,073,363,565 |
Other Information |
All investments are categorized as Level 1 under the Fair Value Hierarchy. The inputs or methodology used for valuing securities may not be an indication of the risk associated with investing in those securities. For more information on valuation inputs, please refer to the Security Valuation section in the accompanying Notes to Financial Statements. |
Income Tax Information |
At March 31, 2011, the Fund had a capital loss carryforward of approximately $1,012,731,393 of which $90,976,931, $422,718,003 and $499,036,459 will expire in fiscal 2017, 2018 and 2019, respectively. Capital loss carryforwards are only available to offset future capital gains of the Fund to the extent provided by regulations and may be limited. |
See accompanying notes which are an integral part of the financial statements.
Annual Report
Fidelity Freedom 2040 Fund
Statement of Assets and Liabilities
| March 31, 2011 |
| | |
Assets | | |
Investment in securities, at value
(cost $7,665,593,936) - See accompanying schedule | | $ 9,071,913,908 |
Cash | | 36 |
Receivable for investments sold | | 3,646,352 |
Receivable for fund shares sold | | 17,609,952 |
Distributions receivable from underlying funds | | 1,449,672 |
Total assets | | 9,094,619,920 |
| | |
Liabilities | | |
Payable for investments purchased | $ 2,460 | |
Payable for fund shares redeemed | 21,253,895 | |
Total liabilities | | 21,256,355 |
| | |
Net Assets | | $ 9,073,363,565 |
Net Assets consist of: | | |
Paid in capital | | $ 8,673,704,654 |
Undistributed net investment income | | 14,074,596 |
Accumulated undistributed net realized gain (loss) on investments | | (1,020,735,657) |
Net unrealized appreciation (depreciation) on investments | | 1,406,319,972 |
Net Assets, for 1,078,277,096 shares outstanding | | $ 9,073,363,565 |
Net Asset Value, offering price and redemption price per share ($9,073,363,565 ÷ 1,078,277,096 shares) | | $ 8.41 |
Statement of Operations
| Year ended March 31, 2011 |
| | |
Investment Income | | |
Income distributions from underlying funds | | $ 129,674,773 |
Interest | | 1 |
Total income | | 129,674,774 |
| | |
Expenses | | |
Independent trustees' compensation | $ 31,468 | |
Total expenses before reductions | 31,468 | |
Expense reductions | (31,468) | - |
Net investment income (loss) | | 129,674,774 |
Realized and Unrealized Gain (Loss) Realized gain (loss) on sale of underlying fund shares | (342,817,765) | |
Capital gain distributions from underlying funds | 177,701,269 | |
Total net realized gain (loss) | | (165,116,496) |
Change in net unrealized appreciation (depreciation) on underlying funds | | 1,289,117,362 |
Net gain (loss) | | 1,124,000,866 |
Net increase (decrease) in net assets resulting from operations | | $ 1,253,675,640 |
See accompanying notes which are an integral part of the financial statements.
Annual Report
Fidelity Freedom 2040 Fund
Financial Statements - continued
Statement of Changes in Net Assets
| Year ended
March 31,
2011 | Year ended
March 31,
2010 |
Increase (Decrease) in Net Assets | | |
Operations | | |
Net investment income (loss) | $ 129,674,774 | $ 145,813,757 |
Net realized gain (loss) | (165,116,496) | (411,828,625) |
Change in net unrealized appreciation (depreciation) | 1,289,117,362 | 3,087,940,223 |
Net increase (decrease) in net assets resulting from operations | 1,253,675,640 | 2,821,925,355 |
Distributions to shareholders from net investment income | (132,161,283) | (139,996,855) |
Distributions to shareholders from net realized gain | (78,813,054) | (78,180,781) |
Total distributions | (210,974,337) | (218,177,636) |
Share transactions
Proceeds from sales of shares | 2,722,284,469 | 2,742,492,861 |
Reinvestment of distributions | 210,095,122 | 217,751,292 |
Cost of shares redeemed | (3,524,227,863) | (2,277,784,584) |
Net increase (decrease) in net assets resulting from share transactions | (591,848,272) | 682,459,569 |
Total increase (decrease) in net assets | 450,853,031 | 3,286,207,288 |
| | |
Net Assets | | |
Beginning of period | 8,622,510,534 | 5,336,303,246 |
End of period (including undistributed net investment income of $14,074,596 and undistributed net investment income of $16,561,105, respectively) | $ 9,073,363,565 | $ 8,622,510,534 |
Other Information Shares | | |
Sold | 357,969,866 | 412,793,081 |
Issued in reinvestment of distributions | 27,177,456 | 30,945,035 |
Redeemed | (464,241,368) | (333,242,094) |
Net increase (decrease) | (79,094,046) | 110,496,022 |
Financial Highlights
Years ended March 31, | 2011 | 2010 | 2009 | 2008 | 2007 |
Selected Per-Share Data | | | | | |
Net asset value, beginning of period | $ 7.45 | $ 5.10 | $ 8.79 | $ 9.68 | $ 9.33 |
Income from Investment Operations | | | | | |
Net investment income (loss) B | .12 | .13 | .15 | .16 | .14 |
Net realized and unrealized gain (loss) | 1.03 | 2.42 | (3.35) | (.42) | .74 |
Total from investment operations | 1.15 | 2.55 | (3.20) | (.26) | .88 |
Distributions from net investment income | (.12) | (.13) | (.15) | (.15) | (.13) |
Distributions from net realized gain | (.07) | (.07) | (.34) | (.48) | (.40) |
Total distributions | (.19) | (.20) E | (.49) | (.63) | (.53) |
Net asset value, end of period | $ 8.41 | $ 7.45 | $ 5.10 | $ 8.79 | $ 9.68 |
Total Return A | 15.66% | 50.14% | (38.20)% | (3.29)% | 9.68% |
Ratios to Average Net Assets C, D | | | | | |
Expenses before reductions | .00% | .00% | .00% | .00% | .00% |
Expenses net of fee waivers, if any | .00% | .00% | .00% | .00% | .00% |
Expenses net of all reductions | .00% | .00% | .00% | .00% | .00% |
Net investment income (loss) | 1.52% | 1.94% | 2.22% | 1.66% | 1.49% |
Supplemental Data | | | | | |
Net assets, end of period (000 omitted) | $ 9,073,364 | $ 8,622,511 | $ 5,336,303 | $ 7,010,562 | $ 5,894,929 |
Portfolio turnover rate | 46% | 27% | 17% | 37% | 4% |
A Total returns would have been lower had certain expenses not been reduced during the periods shown.
B Calculated based on average shares outstanding during the period.
C Amounts do not include the activity of the underlying funds.
D Expense ratios reflect operating expenses of the Fund. Expenses before reductions do not reflect amounts reimbursed by the investment adviser or reductions from expense offset arrangements and do not represent the amount paid by the Fund during periods when reimbursements or reductions occur. Expenses net of fee waivers reflect expenses after reimbursement by the investment adviser but prior to reductions from expense offset arrangements. Expenses net of all reductions represent the net expenses paid by the Fund but do not include expenses of the investment companies in which the Fund invests.
E Total distributions of $.20 per share is comprised of distributions from net investment income of $.125 and distributions from net realized gain of $.070 per share.
See accompanying notes which are an integral part of the financial statements.
Annual Report
Fidelity Freedom 2045 Fund
Investment Changes (Unaudited)
Fund Holdings as of March 31, 2011 |
| % of fund's net assets | % of fund's net assets 6 months ago |
Commodity Funds | | |
Fidelity Series Commodity Strategy Fund | 9.2 | 7.9 |
Domestic Equity Funds | | |
Fidelity Blue Chip Growth Fund | 3.3 | 3.3 |
Fidelity Disciplined Equity Fund | 9.4 | 9.6 |
Fidelity Equity-Income Fund | 0.0 | 1.8 |
Fidelity Growth Company Fund | 8.4 | 8.5 |
Fidelity Series 100 Index Fund | 6.4 | 6.5 |
Fidelity Series All-Sector Equity Fund | 11.5 | 10.8 |
Fidelity Series Large Cap Value Fund | 10.8 | 10.4 |
Fidelity Series Small Cap Opportunities Fund | 1.8 | 1.7 |
Fidelity Small Cap Growth Fund | 1.1 | 1.1 |
Fidelity Small Cap Value Fund | 1.1 | 1.1 |
| 53.8 | 54.8 |
Developed International Equity Funds | | |
Fidelity Diversified International Fund | 3.0 | 4.4 |
Fidelity Europe Fund | 0.0 | 0.8 |
Fidelity Japan Fund | 0.0 | 0.3 |
Fidelity Overseas Fund | 3.0 | 4.4 |
Fidelity Series International Growth Fund | 6.0 | 4.4 |
Fidelity Series International Small Cap Fund | 1.2 | 0.8 |
Fidelity Series International Value Fund | 5.9 | 4.3 |
| 19.1 | 19.4 |
Emerging Markets Equity Funds | | |
Fidelity Series Emerging Markets Fund | 3.6 | 3.1 |
High Yield Bond Funds | | |
Fidelity Capital & Income Fund | 0.0 | 5.0 |
Fidelity High Income Fund | 0.0 | 5.0 |
Fidelity Series Emerging Markets Debt Fund | 0.2 | 0.0 |
Fidelity Series High Income Fund | 9.2 | 0.0 |
| 9.4 | 10.0 |
Investment Grade Bond Funds | | |
Fidelity Series Investment Grade Bond Fund | 4.0 | 3.9 |
Fidelity Strategic Real Return Fund | 0.9 | 0.9 |
Fidelity Total Bond Fund | 0.0 | 0.0 * |
| 4.9 | 4.8 |
Net Other Assets (Liabilities) * | 0.0 | 0.0 |
| 100.0 | 100.0 |
Asset Allocation (% of fund's net assets) |
Current |
| Commodity Funds | 9.2% | |
| Domestic Equity Funds | 53.8% | |
| Developed International Equity Funds | 19.1% | |
| Emerging Markets Equity Funds | 3.6% | |
| High Yield Bond Funds | 9.4% | |
| Investment Grade Bond Funds | 4.9% | |

Six months ago |
| Commodity Funds | 7.9% | |
| Domestic Equity Funds | 54.8% | |
| Developed International Equity Funds | 19.4% | |
| Emerging Markets Equity Funds | 3.1% | |
| High Yield Bond Funds | 10.0% | |
| Investment Grade Bond Funds | 4.8% | |

Expected |
| Commodity Funds | 9.4% | |
| Domestic Equity Funds | 52.9% | |
| Developed International Equity Funds | 19.3% | |
| Emerging Markets Equity Funds | 3.4% | |
| High Yield Bond Funds | 10.0% | |
| Investment Grade Bond Funds | 5.0% | |

The fund invests according to an asset allocation strategy that becomes increasingly conservative over time. The six months ago allocation is based on the fund's holdings as of September 30, 2010. The current allocation is based on the fund's holdings as of March 31, 2011. The expected allocation represents the fund's anticipated allocation at September 30, 2011. |
* Amount represents less than 0.1% |
Annual Report
Fidelity Freedom 2045 Fund
Investments March 31, 2011
Showing Percentage of Net Assets
Domestic Equity Funds - 63.0% |
| Shares | | Value |
Commodity Funds - 9.2% |
Fidelity Series Commodity Strategy Fund | 18,616,605 | | $ 245,366,849 |
Domestic Equity Funds - 53.8% |
Fidelity Blue Chip Growth Fund | 1,856,199 | | 89,004,728 |
Fidelity Disciplined Equity Fund | 10,406,581 | | 249,862,006 |
Fidelity Growth Company Fund | 2,469,929 | | 222,392,367 |
Fidelity Series 100 Index Fund | 18,507,563 | | 170,269,578 |
Fidelity Series All-Sector Equity Fund | 23,284,197 | | 305,255,824 |
Fidelity Series Large Cap Value Fund | 23,528,411 | | 287,281,900 |
Fidelity Series Small Cap Opportunities Fund | 4,167,149 | | 49,130,682 |
Fidelity Small Cap Growth Fund | 1,717,009 | | 29,068,961 |
Fidelity Small Cap Value Fund | 1,727,791 | | 28,577,663 |
TOTAL DOMESTIC EQUITY FUNDS | | 1,430,843,709 |
TOTAL DOMESTIC EQUITY FUNDS (Cost $1,349,677,520) | 1,676,210,558 |
International Equity Funds - 22.7% |
| | | |
Developed International Equity Funds - 19.1% |
Fidelity Diversified International Fund | 2,580,967 | | 80,293,881 |
Fidelity Overseas Fund | 2,406,092 | | 80,363,466 |
Fidelity Series International Growth Fund | 13,961,149 | | 160,692,828 |
Fidelity Series International Small Cap Fund | 2,534,630 | | 31,277,330 |
Fidelity Series International Value Fund | 14,886,707 | | 156,161,559 |
TOTAL DEVELOPED INTERNATIONAL EQUITY FUNDS | | 508,789,064 |
|
| Shares | | Value |
Emerging Markets Equity Funds - 3.6% |
Fidelity Series Emerging Markets Fund | 4,959,439 | | $ 95,022,848 |
TOTAL INTERNATIONAL EQUITY FUNDS (Cost $500,419,558) | 603,811,912 |
Bond Funds - 14.3% |
| | | |
High Yield Bond Funds - 9.4% |
Fidelity Series Emerging Markets Debt Fund | 354,559 | | 3,547,051 |
Fidelity Series High Income Fund | 24,492,023 | | 245,410,067 |
TOTAL HIGH YIELD BOND FUNDS | | 248,957,118 |
Investment Grade Bond Funds - 4.9% |
Fidelity Series Investment Grade Bond Fund | 9,436,127 | | 107,383,120 |
Fidelity Strategic Real Return Fund | 2,375,486 | | 23,564,823 |
TOTAL INVESTMENT GRADE BOND FUNDS | | 130,947,943 |
TOTAL BOND FUNDS (Cost $373,593,746) | 379,905,061 |
TOTAL INVESTMENT PORTFOLIO - 100.0% (Cost $2,223,690,824) | 2,659,927,531 |
NET OTHER ASSETS (LIABILITIES) - 0.0% | | 495,712 |
NET ASSETS - 100% | $ 2,660,423,243 |
Other Information |
All investments are categorized as Level 1 under the Fair Value Hierarchy. The inputs or methodology used for valuing securities may not be an indication of the risk associated with investing in those securities. For more information on valuation inputs, please refer to the Security Valuation section in the accompanying Notes to Financial Statements. |
Income Tax Information |
At March 31, 2011, the Fund had a capital loss carryforward of approximately $63,832,084 of which $23,238,703, $38,679,503 and $1,913,878 will expire in fiscal 2017, 2018 and 2019, respectively. Capital loss carryforwards are only available to offset future capital gains of the Fund to the extent provided by regulations and may be limited. |
See accompanying notes which are an integral part of the financial statements.
Annual Report
Fidelity Freedom 2045 Fund
Statement of Assets and Liabilities
| March 31, 2011 |
| | |
Assets | | |
Investment in securities, at value (cost $2,223,690,824) - See accompanying schedule | | $ 2,659,927,531 |
Cash | | 3 |
Receivable for investments sold | | 426,935 |
Receivable for fund shares sold | | 8,037,271 |
Distributions receivable from underlying funds | | 495,742 |
Total assets | | 2,668,887,482 |
| | |
Liabilities | | |
Payable for investments purchased | $ 35 | |
Payable for fund shares redeemed | 8,464,204 | |
Total liabilities | | 8,464,239 |
| | |
Net Assets | | $ 2,660,423,243 |
Net Assets consist of: | | |
Paid in capital | | $ 2,291,448,499 |
Undistributed net investment income | | 3,895,884 |
Accumulated undistributed net realized gain (loss) on investments | | (71,157,847) |
Net unrealized appreciation (depreciation) on investments | | 436,236,707 |
Net Assets, for 266,617,863 shares outstanding | | $ 2,660,423,243 |
Net Asset Value, offering price and redemption price per share ($2,660,423,243 ÷ 266,617,863 shares) | | $ 9.98 |
Statement of Operations
| Year ended March 31, 2011 |
| | |
Investment Income | | |
Income distributions from underlying funds | | $ 34,940,099 |
| | |
Expenses | | |
Independent trustees' compensation | $ 8,164 | |
Total expenses before reductions | 8,164 | |
Expense reductions | (8,164) | - |
Net investment income (loss) | | 34,940,099 |
Realized and Unrealized Gain (Loss) Realized gain (loss) on sale of underlying fund shares | 3,006,365 | |
Capital gain distributions from underlying funds | 48,333,539 | |
Total net realized gain (loss) | | 51,339,904 |
Change in net unrealized appreciation (depreciation) on underlying funds | | 271,040,620 |
Net gain (loss) | | 322,380,524 |
Net increase (decrease) in net assets resulting from operations | | $ 357,320,623 |
See accompanying notes which are an integral part of the financial statements.
Annual Report
Statement of Changes in Net Assets
| Year ended
March 31,
2011 | Year ended
March 31,
2010 |
Increase (Decrease) in Net Assets | | |
Operations | | |
Net investment income (loss) | $ 34,940,099 | $ 31,376,404 |
Net realized gain (loss) | 51,339,904 | (41,745,649) |
Change in net unrealized appreciation (depreciation) | 271,040,620 | 589,014,197 |
Net increase (decrease) in net assets resulting from operations | 357,320,623 | 578,644,952 |
Distributions to shareholders from net investment income | (34,780,994) | (30,152,902) |
Distributions to shareholders from net realized gain | (19,789,163) | (14,843,567) |
Total distributions | (54,570,157) | (44,996,469) |
Share transactions
Proceeds from sales of shares | 1,151,849,826 | 997,159,409 |
Reinvestment of distributions | 54,543,239 | 44,980,767 |
Cost of shares redeemed | (919,863,496) | (451,584,379) |
Net increase (decrease) in net assets resulting from share transactions | 286,529,569 | 590,555,797 |
Total increase (decrease) in net assets | 589,280,035 | 1,124,204,280 |
| | |
Net Assets | | |
Beginning of period | 2,071,143,208 | 946,938,928 |
End of period (including undistributed net investment income of $3,895,884 and undistributed net investment income of $3,736,779, respectively) | $ 2,660,423,243 | $ 2,071,143,208 |
Other Information Shares | | |
Sold | 127,776,448 | 127,120,429 |
Issued in reinvestment of distributions | 5,941,159 | 5,354,881 |
Redeemed | (102,201,250) | (55,444,602) |
Net increase (decrease) | 31,516,357 | 77,030,708 |
Financial Highlights
Years ended March 31, | 2011 | 2010 | 2009 | 2008 | 2007 F |
Selected Per-Share Data | | | | | |
Net asset value, beginning of period | $ 8.81 | $ 5.99 | $ 10.24 | $ 10.96 | $ 10.00 |
Income from Investment Operations | | | | | |
Net investment income (loss) D | .14 | .16 | .18 | .18 | .11 |
Net realized and unrealized gain (loss) | 1.25 | 2.88 | (4.00) | (.49) | 1.01 |
Total from investment operations | 1.39 | 3.04 | (3.82) | (.31) | 1.12 |
Distributions from net investment income | (.14) | (.15) | (.15) | (.13) | (.07) |
Distributions from net realized gain | (.08) | (.07) | (.28) | (.28) | (.09) |
Total distributions | (.22) | (.22) H | (.43) | (.41) | (.16) |
Net asset value, end of period | $ 9.98 | $ 8.81 | $ 5.99 | $ 10.24 | $ 10.96 |
Total Return B, C | 15.99% | 50.86% | (38.60)% | (3.19)% | 11.23% |
Ratios to Average Net Assets E, G | | | | | |
Expenses before reductions | .00% | .00% | .00% | .00% | .00% A |
Expenses net of fee waivers, if any | .00% | .00% | .00% | .00% | .00% A |
Expenses net of all reductions | .00% | .00% | .00% | .00% | .00% A |
Net investment income (loss) | 1.55% | 1.97% | 2.29% | 1.65% | 1.30% A |
Supplemental Data | | | | | |
Net assets, end of period (000 omitted) | $ 2,660,423 | $ 2,071,143 | $ 946,939 | $ 656,210 | $ 177,837 |
Portfolio turnover rate | 50% | 24% | 17% | 17% | 0% A |
A Annualized
B Total returns for periods of less than one year are not annualized.
C Total returns would have been lower had certain expenses not been reduced during the periods shown.
D Calculated based on average shares outstanding during the period.
E Amounts do not include the activity of the underlying funds.
F For the period June 1, 2006 (commencement of operations) to March 31, 2007.
G Expense ratios reflect operating expenses of the Fund. Expenses before reductions do not reflect amounts reimbursed by the investment adviser or reductions from expense offset arrangements and do not represent the amount paid by the Fund during periods when reimbursements or reductions occur. Expenses net of fee waivers reflect expenses after reimbursement by the investment adviser but prior to reductions from expense offset arrangements. Expenses net of all reductions represent the net expenses paid by the Fund but do not include expenses of the investment companies in which the Fund invests.
H Total distributions of $.22 per share is comprised of distributions from net investment income of $.145 and distributions from net realized gain of $.070 per share.
See accompanying notes which are an integral part of the financial statements.
Annual Report
Fidelity Freedom 2050 Fund
Investment Changes (Unaudited)
Fund Holdings as of March 31, 2011 |
| % of fund's net assets | % of fund's net assets 6 months ago |
Commodity Funds | | |
Fidelity Series Commodity Strategy Fund | 9.8 | 8.3 |
Domestic Equity Funds | | |
Fidelity Blue Chip Growth Fund | 3.5 | 3.5 |
Fidelity Disciplined Equity Fund | 9.8 | 10.1 |
Fidelity Equity-Income Fund | 0.0 | 1.9 |
Fidelity Growth Company Fund | 8.7 | 8.8 |
Fidelity Series 100 Index Fund | 6.7 | 6.8 |
Fidelity Series All-Sector Equity Fund | 12.0 | 11.3 |
Fidelity Series Large Cap Value Fund | 11.3 | 10.8 |
Fidelity Series Small Cap Opportunities Fund | 1.9 | 1.8 |
Fidelity Small Cap Growth Fund | 1.1 | 1.1 |
Fidelity Small Cap Value Fund | 1.1 | 1.1 |
| 56.1 | 57.2 |
Developed International Equity Funds | | |
Fidelity Diversified International Fund | 3.2 | 4.9 |
Fidelity Europe Fund | 0.0 | 0.9 |
Fidelity Japan Fund | 0.0 | 0.4 |
Fidelity Overseas Fund | 3.2 | 4.8 |
Fidelity Series International Growth Fund | 6.3 | 4.5 |
Fidelity Series International Small Cap Fund | 1.2 | 0.8 |
Fidelity Series International Value Fund | 6.1 | 4.4 |
| 20.0 | 20.7 |
Emerging Markets Equity Funds | | |
Fidelity Series Emerging Markets Fund | 3.7 | 3.3 |
High Yield Bond Funds | | |
Fidelity Capital & Income Fund | 0.0 | 5.0 |
Fidelity High Income Fund | 0.0 | 5.0 |
Fidelity Series Emerging Markets Debt Fund | 0.1 | 0.0 |
Fidelity Series High Income Fund | 9.3 | 0.0 |
| 9.4 | 10.0 |
Investment Grade Bond Funds | | |
Fidelity Series Investment Grade Bond Fund | 0.9 | 0.4 |
Fidelity Strategic Real Return Fund | 0.1 | 0.1 |
Fidelity Total Bond Fund | 0.0 | 0.0 * |
| 1.0 | 0.5 |
Net Other Assets (Liabilities)* | 0.0 | 0.0 |
| 100.0 | 100.0 |
Asset Allocation (% of fund's net assets) |
Current |
| Commodity Funds | 9.8% | |
| Domestic Equity Funds | 56.1% | |
| Developed International Equity Funds | 20.0% | |
| Emerging Markets Equity Funds | 3.7% | |
| High Yield Bond Funds | 9.4% | |
| Investment Grade Bond Funds | 1.0% | |

Six months ago |
| Commodity Funds | 8.3% | |
| Domestic Equity Funds | 57.2% | |
| Developed International Equity Funds | 20.7% | |
| Emerging Markets Equity Funds | 3.3% | |
| High Yield Bond Funds | 10.0% | |
| Investment Grade Bond Funds | 0.5% | |

Expected |
| Commodity Funds | 9.7% | |
| Domestic Equity Funds | 55.0% | |
| Developed International Equity Funds | 20.0% | |
| Emerging Markets Equity Funds | 3.6% | |
| High Yield Bond Funds | 10.0% | |
| Investment Grade Bond Funds | 1.7% | |

The fund invests according to an asset allocation strategy that becomes increasingly conservative over time. The six months ago allocation is based on the fund's holdings as of September 30, 2010. The current allocation is based on the fund's holdings as of March 31, 2011. The expected allocation represents the fund's anticipated allocation at September 30, 2011. |
* Amount represents less than 0.1% |
Annual Report
Fidelity Freedom 2050 Fund
Investments March 31, 2011
Showing Percentage of Net Assets
Domestic Equity Funds - 65.9% |
| Shares | | Value |
Commodity Funds - 9.8% |
Fidelity Series Commodity Strategy Fund | 16,183,139 | | $ 213,293,769 |
Domestic Equity Funds - 56.1% |
Fidelity Blue Chip Growth Fund | 1,575,918 | | 75,565,261 |
Fidelity Disciplined Equity Fund | 8,834,519 | | 212,116,808 |
Fidelity Growth Company Fund | 2,098,361 | | 188,936,423 |
Fidelity Series 100 Index Fund | 15,705,724 | | 144,492,657 |
Fidelity Series All-Sector Equity Fund | 19,757,520 | | 259,021,080 |
Fidelity Series Large Cap Value Fund | 19,965,045 | | 243,773,201 |
Fidelity Series Small Cap Opportunities Fund | 3,545,621 | | 41,802,867 |
Fidelity Small Cap Growth Fund | 1,464,753 | | 24,798,263 |
Fidelity Small Cap Value Fund | 1,474,002 | | 24,379,988 |
TOTAL DOMESTIC EQUITY FUNDS | | 1,214,886,548 |
TOTAL DOMESTIC EQUITY FUNDS (Cost $1,171,000,116) | 1,428,180,317 |
International Equity Funds - 23.7% |
| | | |
Developed International Equity Funds - 20.0% |
Fidelity Diversified International Fund | 2,185,941 | | 68,004,633 |
Fidelity Overseas Fund | 2,037,827 | | 68,063,438 |
Fidelity Series International Growth Fund | 11,853,392 | | 136,432,539 |
Fidelity Series International Small Cap Fund | 2,152,052 | | 26,556,322 |
Fidelity Series International Value Fund | 12,639,762 | | 132,591,105 |
TOTAL DEVELOPED INTERNATIONAL EQUITY FUNDS | | 431,648,037 |
|
| Shares | | Value |
Emerging Markets Equity Funds - 3.7% |
Fidelity Series Emerging Markets Fund | 4,210,650 | | $ 80,676,061 |
TOTAL INTERNATIONAL EQUITY FUNDS (Cost $423,401,369) | 512,324,098 |
Bond Funds - 10.4% |
| | | |
High Yield Bond Funds - 9.4% |
Fidelity Series Emerging Markets Debt Fund | 288,531 | | 2,886,487 |
Fidelity Series High Income Fund | 19,975,250 | | 200,152,004 |
TOTAL HIGH YIELD BOND FUNDS | | 203,038,491 |
Investment Grade Bond Funds - 1.0% |
Fidelity Series Investment Grade Bond Fund | 1,733,464 | | 19,726,822 |
Fidelity Strategic Real Return Fund | 257,808 | | 2,557,452 |
TOTAL INVESTMENT GRADE BOND FUNDS | | 22,284,274 |
TOTAL BOND FUNDS (Cost $224,514,009) | 225,322,765 |
TOTAL INVESTMENT PORTFOLIO - 100.0% (Cost $1,818,915,494) | 2,165,827,180 |
NET OTHER ASSETS (LIABILITIES) - 0.0% | | 401,824 |
NET ASSETS - 100% | $ 2,166,229,004 |
Other Information |
All investments are categorized as Level 1 under the Fair Value Hierarchy. The inputs or methodology used for valuing securities may not be an indication of the risk associated with investing in those securities. For more information on valuation inputs, please refer to the Security Valuation section in the accompanying Notes to Financial Statements. |
Income Tax Information |
At March 31, 2011, the Fund had a capital loss carryforward of approximately $87,094,271 of which $23,028,339, $42,396,294 and $21,669,638 will expire in fiscal 2017, 2018 and 2019, respectively. Capital loss carryforwards are only available to offset future capital gains of the Fund to the extent provided by regulations and may be limited. |
See accompanying notes which are an integral part of the financial statements.
Annual Report
Fidelity Freedom 2050 Fund
Statement of Assets and Liabilities
| March 31, 2011 |
| | |
Assets | | |
Investment in securities, at value (cost $1,818,915,494) - See accompanying schedule | | $ 2,165,827,180 |
Receivable for investments sold | | 5,453 |
Receivable for fund shares sold | | 7,678,653 |
Distributions receivable from underlying funds | | 401,863 |
Total assets | | 2,173,913,149 |
| | |
Liabilities | | |
Payable for investments purchased | $ 386,073 | |
Payable for fund shares redeemed | 7,298,072 | |
Total liabilities | | 7,684,145 |
| | |
Net Assets | | $ 2,166,229,004 |
Net Assets consist of: | | |
Paid in capital | | $ 1,909,739,460 |
Undistributed net investment income | | 2,782,849 |
Accumulated undistributed net realized gain (loss) on investments | | (93,204,991) |
Net unrealized appreciation (depreciation) on investments | | 346,911,686 |
Net Assets, for 219,348,907 shares outstanding | | $ 2,166,229,004 |
Net Asset Value, offering price and redemption price per share ($2,166,229,004 ÷ 219,348,907 shares) | | $ 9.88 |
Statement of Operations
| Year ended March 31, 2011 |
| | |
Investment Income | | |
Income distributions from underlying funds | | $ 26,755,611 |
| | |
Expenses | | |
Independent trustees' compensation | $ 6,560 | |
Total expenses before reductions | 6,560 | |
Expense reductions | (6,560) | - |
Net investment income (loss) | | 26,755,611 |
Realized and Unrealized Gain (Loss) Realized gain (loss) on sale of underlying fund shares | (15,262,730) | |
Capital gain distributions from underlying funds | 38,992,337 | |
Total net realized gain (loss) | | 23,729,607 |
Change in net unrealized appreciation (depreciation) on underlying funds | | 242,695,465 |
Net gain (loss) | | 266,425,072 |
Net increase (decrease) in net assets resulting from operations | | $ 293,180,683 |
See accompanying notes which are an integral part of the financial statements.
Annual Report
Statement of Changes in Net Assets
| Year ended
March 31,
2011 | Year ended
March 31,
2010 |
Increase (Decrease) in Net Assets | | |
Operations | | |
Net investment income (loss) | $ 26,755,611 | $ 23,880,863 |
Net realized gain (loss) | 23,729,607 | (43,375,923) |
Change in net unrealized appreciation (depreciation) | 242,695,465 | 498,333,061 |
Net increase (decrease) in net assets resulting from operations | 293,180,683 | 478,838,001 |
Distributions to shareholders from net investment income | (26,915,933) | (22,281,807) |
Distributions to shareholders from net realized gain | (15,184,852) | (12,878,641) |
Total distributions | (42,100,785) | (35,160,448) |
Share transactions
Proceeds from sales of shares | 1,047,228,772 | 893,918,327 |
Reinvestment of distributions | 41,937,704 | 35,097,259 |
Cost of shares redeemed | (839,313,165) | (475,346,573) |
Net increase (decrease) in net assets resulting from share transactions | 249,853,311 | 453,669,013 |
Total increase (decrease) in net assets | 500,933,209 | 897,346,566 |
| | |
Net Assets | | |
Beginning of period | 1,665,295,795 | 767,949,229 |
End of period (including undistributed net investment income of $2,782,849 and undistributed net investment income of $2,943,171, respectively) | $ 2,166,229,004 | $ 1,665,295,795 |
Other Information Shares | | |
Sold | 117,681,524 | 115,703,679 |
Issued in reinvestment of distributions | 4,638,261 | 4,238,923 |
Redeemed | (94,614,745) | (59,785,173) |
Net increase (decrease) | 27,705,040 | 60,157,429 |
Financial Highlights
Years ended March 31, | 2011 | 2010 | 2009 | 2008 | 2007 F |
Selected Per-Share Data | | | | | |
Net asset value, beginning of period | $ 8.69 | $ 5.84 | $ 10.26 | $ 10.98 | $ 10.00 |
Income from Investment Operations | | | | | |
Net investment income (loss) D | .13 | .14 | .17 | .18 | .11 |
Net realized and unrealized gain (loss) | 1.27 | 2.92 | (4.15) | (.53) | 1.02 |
Total from investment operations | 1.40 | 3.06 | (3.98) | (.35) | 1.13 |
Distributions from net investment income | (.13) | (.13) | (.15) | (.12) | (.06) |
Distributions from net realized gain | (.08) | (.08) | (.29) | (.25) | (.09) |
Total distributions | (.21) | (.21) H | (.44) | (.37) | (.15) |
Net asset value, end of period | $ 9.88 | $ 8.69 | $ 5.84 | $ 10.26 | $ 10.98 |
Total Return B, C | 16.29% | 52.51% | (40.19)% | (3.53)% | 11.33% |
Ratios to Average Net Assets E, G | | | | | |
Expenses before reductions | .00% | .00% | .00% | .00% | .00% A |
Expenses net of fee waivers, if any | .00% | .00% | .00% | .00% | .00% A |
Expenses net of all reductions | .00% | .00% | .00% | .00% | .00% A |
Net investment income (loss) | 1.47% | 1.85% | 2.13% | 1.59% | 1.23% A |
Supplemental Data | | | | | |
Net assets, end of period (000 omitted) | $ 2,166,229 | $ 1,665,296 | $ 767,949 | $ 624,662 | $ 148,033 |
Portfolio turnover rate | 51% | 23% | 20% | 16% | 2% A |
A Annualized
B Total returns for periods of less than one year are not annualized.
C Total returns would have been lower had certain expenses not been reduced during the periods shown.
D Calculated based on average shares outstanding during the period.
E Amounts do not include the activity of the underlying funds.
F For the period June 1, 2006 (commencement of operations) to March 31, 2007.
G Expense ratios reflect operating expenses of the Fund. Expenses before reductions do not reflect amounts reimbursed by the investment adviser or reductions from expense offset arrangements and do not represent the amount paid by the Fund during periods when reimbursements or reductions occur. Expenses net of fee waivers reflect expenses after reimbursement by the investment adviser but prior to reductions from expense offset arrangements. Expenses net of all reductions represent the net expenses paid by the Fund but do not include expenses of the investment companies in which the Fund invests.
H Total distributions of $.21 per share is comprised of distributions from net investment income of $.130 and distributions from net realized gain of $.075 per share.
See accompanying notes which are an integral part of the financial statements.
Annual Report
Notes to Financial Statements
For the period ended March 31, 2011
1. Organization.
Freedom Income Fund, Freedom 2000 Fund, Freedom 2005 Fund, Freedom 2010 Fund, Freedom 2015 Fund, Freedom 2020 Fund, Freedom 2025 Fund, Freedom 2030 Fund, Freedom 2035 Fund, Freedom 2040 Fund, Freedom 2045 Fund and Freedom 2050 Fund (the Funds) are funds of Fidelity Aberdeen Street Trust (the Trust). The Trust is registered under the Investment Company Act of 1940, as amended (the 1940 Act), as an open-end management investment company organized as a Delaware statutory trust. Each Fund is authorized to issue an unlimited number of shares. The Funds invest primarily in a combination of other Fidelity equity, bond, and short-term funds (the Underlying Funds) managed by Fidelity Management & Research Company (FMR).
2. Significant Accounting Policies.
The financial statements have been prepared in conformity with accounting principles generally accepted in the United States of America (GAAP), which require management to make certain estimates and assumptions at the date of the financial statements. Actual results could differ from those estimates. Subsequent events, if any, through the date that the financial statements were issued have been evaluated in the preparation of the financial statements. The following summarizes the significant accounting policies of the Funds:
Security Valuation. Investments are valued as of 4:00 p.m. Eastern time on the last calendar day of the period. Each Fund categorizes the inputs to valuation techniques used to value their investments into a disclosure hierarchy consisting of three levels as shown below.
Level 1 - quoted prices in active markets for identical investments
Level 2 - other significant observable inputs (including quoted prices for similar investments, interest rates, prepayment speeds, etc.)
Level 3 - unobservable inputs (including the Fund's own assumptions based on the best information available)
Valuation techniques used to value each Fund's investments by major category are as follows. Investments in the Underlying Funds are valued at their closing net asset value (NAV) each business day and are categorized as Level 1 in the hierarchy.
Investment Transactions and Income. For financial reporting purposes, the Funds' investment holdings and NAV include trades executed through the end of the last business day of the period. The NAV per share for processing shareholder transactions is calculated as of the close of business of the New York Stock Exchange (NYSE), normally 4:00 p.m. Eastern time and includes trades executed through the end of the prior business day. Gains and losses on securities sold are determined on the basis of identified cost. Income and capital gain distributions from the Underlying Funds, if any, are recorded on the ex-dividend date. Interest income is accrued as earned. Interest income includes coupon interest and amortization of premium and accretion of discount on debt securities.
Expenses. Expenses directly attributable to a fund are charged to that fund. Expenses attributable to more than one fund are allocated among the respective funds on the basis of relative net assets or other appropriate methods. Expenses included in the accompanying financial statements reflect the expenses of the Fund and do not include any expenses associated with the Underlying Funds. Expense estimates are accrued in the period to which they relate and adjustments are made when actual amounts are known.
Deferred Trustee Compensation. Under a Deferred Compensation Plan (the Plan) for Freedom 2010 Fund, Freedom 2020 Fund and Freedom 2030 Fund, independent Trustees may elect to defer receipt of a portion of their annual compensation. Deferred amounts are invested in a cross-section of Fidelity funds, are marked-to-market and remain in the Fund until distributed in accordance with the Plan. The investment of deferred amounts and the offsetting payable to the Trustees are included in the accompanying Statement of Assets and Liabilities.
Income Tax Information and Distributions to Shareholders. Each year each Fund intends to qualify as a regulated investment company, including distributing substantially all of its taxable income and realized gains under Subchapter M of the Internal Revenue Code and filing its U.S. federal tax return. As a result, no provision for income taxes is required. As of March 31, 2011, each Fund did not have any unrecognized tax benefits in the accompanying financial statements. A fund's federal tax return is subject to examination by the Internal Revenue Service (IRS) for a period of three years.
Distributions are declared and recorded on the ex-dividend date. Income and capital gain distributions are determined in accordance with income tax regulations, which may differ from GAAP.
Capital accounts within the financial statements are adjusted for permanent book-tax differences. These adjustments have no impact on net assets or the results of operations. Temporary book-tax differences will reverse in a subsequent period.
Book-tax differences are primarily due to the short-term gain distributions from the Underlying Funds, deferred trustees compensation, capital loss carryforwards, losses deferred due to wash sales and excise tax regulations.
Annual Report
Notes to Financial Statements - continued
2. Significant Accounting Policies - continued
Income Tax Information and Distributions to Shareholders - continued
The federal tax cost of investment securities and unrealized appreciation (depreciation) as of period end were as follows for each Fund:
| Tax cost | Gross unrealized
appreciation | Gross unrealized
depreciation | Net unrealized
appreciation
(depreciation) on
securities and
other investments |
Freedom Income | $ 2,693,490,444 | $ 190,655,735 | $ (27,764,592) | $ 165,891,143 |
Freedom 2000 | 1,390,018,262 | 105,711,279 | (13,906,614) | 91,804,665 |
Freedom 2005 | 907,963,692 | 52,428,452 | (28,083,938) | 24,344,514 |
Freedom 2010 | 9,274,120,785 | 716,431,438 | (290,213,259) | 426,218,179 |
Freedom 2015 | 7,843,317,659 | 1,105,320,646 | (98,189,558) | 1,007,131,088 |
Freedom 2020 | 17,158,051,795 | 2,977,395,850 | (214,608,824) | 2,762,787,026 |
Freedom 2025 | 9,697,015,404 | 838,501,727 | (376,988,023) | 461,513,704 |
Freedom 2030 | 12,565,020,186 | 2,410,854,492 | (232,952,170) | 2,177,902,322 |
Freedom 2035 | 6,505,995,182 | 665,101,705 | (262,817,708) | 402,283,997 |
Freedom 2040 | 7,692,020,159 | 1,534,793,385 | (154,899,636) | 1,379,893,749 |
Freedom 2045 | 2,236,672,532 | 455,876,445 | (32,621,446) | 423,254,999 |
Freedom 2050 | 1,829,664,790 | 368,648,377 | (32,485,987) | 336,162,390 |
The tax-based components of distributable earnings as of period end were as follows for each Fund:
| Undistributed
ordinary income | Capital loss
carryforward | Net unrealized
appreciation
(depreciation) |
Freedom Income | $ 4,470,175 | $ (75,050,057) | $ 165,891,143 |
Freedom 2000 | 4,805,741 | (56,041,166) | 91,804,665 |
Freedom 2005 | 3,349,126 | (55,536,041) | 24,344,514 |
Freedom 2010 | 36,188,241 | (572,433,574) | 426,218,179 |
Freedom 2015 | 32,189,211 | (855,522,994) | 1,007,131,088 |
Freedom 2020 | 74,337,403 | (2,245,475,993) | 2,762,787,026 |
Freedom 2025 | 37,546,021 | (70,645,658) | 461,513,704 |
Freedom 2030 | 59,363,896 | (1,876,479,920) | 2,177,902,322 |
Freedom 2035 | 25,934,027 | (26,359,649) | 402,283,997 |
Freedom 2040 | 32,496,555 | (1,012,731,393) | 1,379,893,749 |
Freedom 2045 | 9,551,827 | (63,832,084) | 423,254,999 |
Freedom 2050 | 7,421,424 | (87,094,271) | 336,162,390 |
The tax character of distributions paid was as follows:
March 31, 2011 | |
| Ordinary Income |
Freedom Income | $ 68,185,680 |
Freedom 2000 | 38,816,338 |
Freedom 2005 | 24,081,076 |
Freedom 2010 | 273,433,730 |
Freedom 2015 | 230,343,484 |
Freedom 2020 | 538,588,435 |
Freedom 2025 | 249,751,743 |
Freedom 2030 | 370,284,918 |
Freedom 2035 | 149,008,866 |
Freedom 2040 | 210,974,337 |
Freedom 2045 | 54,570,157 |
Freedom 2050 | 42,100,785 |
Annual Report
2. Significant Accounting Policies - continued
Income Tax Information and Distributions to Shareholders - continued
March 31, 2010 | |
| Ordinary Income |
Freedom Income | $ 78,000,734 |
Freedom 2000 | 50,985,062 |
Freedom 2005 | 30,824,357 |
Freedom 2010 | 361,835,946 |
Freedom 2015 | 258,792,205 |
Freedom 2020 | 609,167,447 |
Freedom 2025 | 251,761,526 |
Freedom 2030 | 382,575,673 |
Freedom 2035 | 148,824,347 |
Freedom 2040 | 218,177,636 |
Freedom 2045 | 44,996,469 |
Freedom 2050 | 35,160,448 |
3. Purchases and Sales of Investments.
Purchases and redemptions of the Underlying Fund shares are noted in the table below.
| Purchases ($) | Redemptions ($) |
Freedom Income | 1,063,816,606 | 1,056,258,784 |
Freedom 2000 | 504,495,429 | 802,418,948 |
Freedom 2005 | 362,478,991 | 507,348,664 |
Freedom 2010 | 3,410,273,228 | 5,566,207,860 |
Freedom 2015 | 3,674,240,364 | 4,357,204,651 |
Freedom 2020 | 8,156,282,871 | 10,521,463,724 |
Freedom 2025 | 4,573,308,236 | 4,649,436,552 |
Freedom 2030 | 6,208,545,227 | 7,479,613,088 |
Freedom 2035 | 3,048,924,395 | 2,919,451,603 |
Freedom 2040 | 3,905,757,778 | 4,402,656,415 |
Freedom 2045 | 1,441,634,758 | 1,126,939,095 |
Freedom 2050 | 1,197,791,826 | 924,694,459 |
4. Fees and Other Transactions with Affiliates.
Management Fee. Strategic Advisers, Inc. (Strategic Advisers), an affiliate of FMR, provides the Funds with investment management related services. The Funds do not pay any fees for these services.
Other Transactions. Strategic Advisers has entered into an administration agreement with FMR under which FMR provides management and administrative services (other than investment advisory services) necessary for the operation of each Fund. Pursuant to this agreement, FMR pays all expenses of each Fund, excluding the compensation of the independent Trustees and certain other expenses such as interest expense. FMR also contracts with other Fidelity companies to perform the services necessary for the operation of each Fund. The Funds do not pay any fees for these services.
Reallocation of Underlying Fund Investments. During the period, Strategic Advisers reallocated investments of the Funds. This involved taxable redemptions of the Funds' interest in Fidelity Europe Fund, Fidelity Capital & Income Fund and Fidelity High Income Fund for cash and securities and non-taxable exchanges of those securities for shares of Fidelity Series International Growth Fund, Fidelity Series International Value Fund and Fidelity Series High Income Fund. Realized gains and losses on redemptions of Fidelity Europe Fund, Fidelity Capital & Income Fund and Fidelity High Income Fund in connection with the reallocation are presented in the accompanying Statements of Operations as "Realized gain (loss) on sale of underlying fund shares."
Annual Report
Notes to Financial Statements - continued
4. Fees and Other Transactions with Affiliates - continued
Reallocation of Underlying Fund Investments - continued
Details of these transactions with the related gain (loss) for the Funds are presented in the accompanying table:
| Value of Cash and
Securities reallocated | Realized Gain (Loss) on
redemptions of Fidelity
Europe Fund, Fidelity
Capital & Income Fund and
Fidelity High Income Fund |
Freedom Income | $ 143,015,433 | $ 15,432,241 |
Freedom 2000 | 74,495,829 | 8,195,824 |
Freedom 2005 | 56,287,683 | (268,981) |
Freedom 2010 | 623,185,489 | (12,420,528) |
Freedom 2015 | 551,517,974 | 13,149,530 |
Freedom 2020 | 1,613,041,505 | 134,952,742 |
Freedom 2025 | 891,499,542 | (11,816,609) |
Freedom 2030 | 1,348,700,778 | 61,052,060 |
Freedom 2035 | 612,288,799 | (12,651,202) |
Freedom 2040 | 900,552,430 | 45,866,950 |
Freedom 2045 | 287,998,369 | 39,211,477 |
Freedom 2050 | 239,497,106 | 25,688,420 |
5. Expense Reductions.
FMR voluntarily agreed to reimburse each Fund's operating expenses. Some expenses, for example interest expense, are excluded from this reimbursement.
The following Funds were in reimbursement during the period:
| Reimbursement
from adviser |
Freedom Income | $ 10,320 |
Freedom 2000 | 5,890 |
Freedom 2005 | 3,549 |
Freedom 2010 | 38,066 |
Freedom 2015 | 32,152 |
Freedom 2020 | 72,931 |
Freedom 2025 | 34,526 |
Freedom 2030 | 52,582 |
Freedom 2035 | 22,807 |
Freedom 2040 | 31,468 |
Freedom 2045 | 8,164 |
Freedom 2050 | 6,560 |
6. Other.
The Funds' organizational documents provide former and current trustees and officers with a limited indemnification against liabilities arising in connection with the performance of their duties to the Funds. In the normal course of business, the Funds may also enter into contracts that provide general indemnifications. The Funds' maximum exposure under these arrangements is unknown as this would be dependent on future claims that may be made against the Funds. The risk of material loss from such claims is considered remote.
The Funds do not invest in the Underlying Funds for the purpose of exercising management or control; however, investments by the Funds within their principal investment strategies may represent a significant portion of the Underlying Fund's net assets. At the end of the period, the following Freedom Funds were the owners of record of 10% or more of the total outstanding shares of the Underlying Funds.
Annual Report
6. Other - continued
Fund | Freedom 2010 | Freedom 2015 | Freedom 2020 | Freedom 2030 |
Fidelity Disciplined Equity Fund | - | - | 12% | 11% |
Fidelity Series 100 Index Fund | - | - | 14% | 13% |
Fidelity Series All-Sector Equity Fund | - | - | 14% | 13% |
Fidelity Series Commodity Strategy Fund | - | - | 13% | 13% |
Fidelity Series Emerging Markets Debt Fund | - | - | 15% | 12% |
Fidelity Series Emerging Markets Fund | - | - | 14% | 13% |
Fidelity Series High Income Fund | - | - | 15% | 12% |
Fidelity Series Inflation-Protected Bond Index Fund | 16% | 13% | 23% | - |
Fidelity Series International Growth Fund | - | - | 14% | 13% |
Fidelity Series International Small Cap Fund | - | - | 14% | 13% |
Fidelity Series International Value Fund | - | - | 14% | 13% |
Fidelity Series Investment Grade Bond Fund | 10% | - | 19% | 11% |
Fidelity Series Large Cap Value Fund | - | - | 14% | 13% |
Fidelity Small Cap Opportunities Fund | - | - | 13% | 12% |
Fidelity Strategic Real Return Fund | - | - | 13% | - |
The Funds, in aggregate, were the owners of record of more than 20% of the total outstanding shares of the following Underlying Funds.
Fund | % of shares held |
Fidelity Disciplined Equity Fund | 57% |
Fidelity Overseas Fund | 37% |
Fidelity Series 100 Index Fund | 68% |
Fidelity Series All-Sector Equity Fund | 68% |
Fidelity Series Commodity Strategy Fund | 66% |
Fidelity Series Emerging Markets Debt Fund | 68% |
Fidelity Series Emerging Markets Fund | 68% |
Fidelity Series High Income Fund | 68% |
Fidelity Series Inflation-Protected Bond Index Fund | 68% |
Fidelity Series International Growth Fund | 68% |
Fidelity Series International Small Cap Fund | 68% |
Fidelity Series International Value Fund | 68% |
Fidelity Series Investment Grade Bond Fund | 68% |
Fidelity Series Large Cap Value Fund | 68% |
Fidelity Short-Term Bond Fund | 24% |
Fidelity Small Cap Growth Fund | 40% |
Fidelity Small Cap Opportunities Fund | 64% |
Fidelity Small Cap Value Fund | 27% |
Fidelity Strategic Real Return Fund | 46% |
Annual Report
Report of Independent Registered Public Accounting Firm
To the Trustees of Fidelity Aberdeen Street Trust and the Shareholders of Fidelity Freedom Income Fund, Fidelity Freedom 2000 Fund, Fidelity Freedom 2005 Fund, Fidelity Freedom 2010 Fund, Fidelity Freedom 2015 Fund, Fidelity Freedom 2020 Fund, Fidelity Freedom 2025 Fund, Fidelity Freedom 2030 Fund, Fidelity Freedom 2035 Fund, Fidelity Freedom 2040 Fund, Fidelity Freedom 2045 Fund and Fidelity Freedom 2050 Fund:
In our opinion, the accompanying statements of assets and liabilities, including the schedules of investments, and the related statements of operations and of changes in net assets and the financial highlights present fairly, in all material respects, the financial positions of Fidelity Freedom Income Fund, Fidelity Freedom 2000 Fund, Fidelity Freedom 2005 Fund, Fidelity Freedom 2010 Fund, Fidelity Freedom 2015 Fund, Fidelity Freedom 2020 Fund, Fidelity Freedom 2025 Fund, Fidelity Freedom 2030 Fund, Fidelity Freedom 2035 Fund, Fidelity Freedom 2040 Fund, Fidelity Freedom 2045 Fund and Fidelity Freedom 2050 Fund (funds of Fidelity Aberdeen Street Trust) at March 31, 2011, the results of each of their operations for the year then ended, the changes in each of their net assets for each of the two years in the period then ended and the financial highlights for each of the periods indicated, in conformity with accounting principles generally accepted in the United States of America. These financial statements and financial highlights (hereafter referred to as "financial statements") are the responsibility of the Fidelity Aberdeen Street Trust's management. Our responsibility is to express an opinion on these financial statements based on our audits. We conducted our audits of these financial statements in accordance with the standards of the Public Company Accounting Oversight Board (United States). Those standards require that we plan and perform the audit to obtain reasonable assurance about whether the financial statements are free of material misstatement. An audit includes examining, on a test basis, evidence supporting the amounts and disclosures in the financial statements, assessing the accounting principles used and significant estimates made by management, and evaluating the overall financial statement presentation. We believe that our audits, which included confirmation of securities at March 31, 2011 by correspondence with the custodian and transfer agent, provide a reasonable basis for our opinion.
/s/ PricewaterhouseCoopers LLP
PricewaterhouseCoopers LLP
Boston, Massachusetts
May 19, 2011
Annual Report
The Trustees and executive officers of the trust and funds, as applicable, are listed below. The Board of Trustees governs each Fidelity Freedom Fund and is responsible for protecting the interests of shareholders. The Trustees are experienced executives who meet periodically throughout the year to oversee each Fidelity Freedom Fund's activities, review contractual arrangements with companies that provide services to each Fidelity Freedom Fund, oversee management of the risks associated with such activities and contractual arrangements, and review each Fidelity Freedom Fund's performance. If the interests of a Fidelity Freedom Fund and an underlying Fidelity fund were to diverge, a conflict of interest could arise and affect how the Trustees fulfill their fiduciary duties to the affected funds. Strategic Advisers has structured the Fidelity Freedom Funds to avoid these potential conflicts, although there may be situations where a conflict of interest is unavoidable. In such instances, Strategic Advisers and the Trustees would take reasonable steps to minimize and, if possible, eliminate the conflict. Except for James C. Curvey, each of the Trustees oversees 190 funds advised by FMR or an affiliate. Mr. Curvey oversees 410 funds advised by FMR or an affiliate.
The Trustees hold office without limit in time except that (a) any Trustee may resign; (b) any Trustee may be removed by written instrument, signed by at least two-thirds of the number of Trustees prior to such removal; (c) any Trustee who requests to be retired or who has become incapacitated by illness or injury may be retired by written instrument signed by a majority of the other Trustees; and (d) any Trustee may be removed at any special meeting of shareholders by a two-thirds vote of the outstanding voting securities of the trust. Each Trustee who is not an interested person (as defined in the 1940 Act) (Independent Trustee), shall retire not later than the last day of the calendar year in which his or her 75th birthday occurs. The Independent Trustees may waive this mandatory retirement age policy with respect to individual Trustees. The executive officers hold office without limit in time, except that any officer may resign or may be removed by a vote of a majority of the Trustees at any regular meeting or any special meeting of the Trustees. Except as indicated, each individual has held the office shown or other offices in the same company for the past five years.
Experience, Skills, Attributes, and Qualifications of the Funds' Trustees. The Governance and Nominating Committee has adopted a statement of policy that describes the experience, qualifications, attributes, and skills that are necessary and desirable for potential Independent Trustee candidates (Statement of Policy). The Board believes that each Trustee satisfied at the time he or she was initially elected or appointed a Trustee, and continues to satisfy, the standards contemplated by the Statement of Policy. The Governance and Nominating Committee also engages professional search firms to help identify potential Independent Trustee candidates who have the experience, qualifications, attributes, and skills consistent with the Statement of Policy. From time to time, additional criteria based on the composition and skills of the current Independent Trustees, as well as experience or skills that may be appropriate in light of future changes to board composition, business conditions, and regulatory or other developments, have also been considered by the professional search firms and the Governance and Nominating Committee. In addition, the Board takes into account the Trustees' commitment and participation in Board and committee meetings, as well as their leadership of standing and ad hoc committees throughout their tenure.
In determining that a particular Trustee was and continues to be qualified to serve as a Trustee, the Board has considered a variety of criteria, none of which, in isolation, was controlling. The Board believes that, collectively, the Trustees have balanced and diverse experience, qualifications, attributes, and skills, which allow the Board to operate effectively in governing each fund and protecting the interests of shareholders. Information about the specific experience, skills, attributes, and qualifications of each Trustee, which in each case led to the Board's conclusion that the Trustee should serve (or continue to serve) as a trustee of the funds, is provided below.
Board Structure and Oversight Function. Abigail P. Johnson is an interested person (as defined in the 1940 Act) and currently serves as Chairman. The Trustees have determined that an interested Chairman is appropriate and benefits shareholders because an interested Chairman has a personal and professional stake in the quality and continuity of services provided to the funds. Independent Trustees exercise their informed business judgment to appoint an individual of their choosing to serve as Chairman, regardless of whether the Trustee happens to be independent or a member of management. The Independent Trustees have determined that they can act independently and effectively without having an Independent Trustee serve as Chairman and that a key structural component for assuring that they are in a position to do so is for the Independent Trustees to constitute a substantial majority for the Board. The Independent Trustees also regularly meet in executive session. Kenneth L. Wolfe serves as Chairman of the Independent Trustees and as such (i) acts as a liaison between the Independent Trustees and management with respect to matters important to the Independent Trustees and (ii) with management prepares agendas for Board meetings.
Fidelity funds are overseen by different Boards of Trustees. The funds' Board oversees Fidelity's investment-grade bond, money market, and asset allocation funds and another Board oversees Fidelity's equity and high income funds. The asset allocation funds may invest in Fidelity funds that are overseen by such other Board. The use of separate Boards, each with its own committee structure, allows the Trustees of each group of Fidelity funds to focus on the unique issues of the funds they oversee, including common research, investment, and operational issues. On occasion, the separate Boards establish joint committees to address issues of overlapping consequences for the Fidelity funds overseen by each Board.
The Trustees operate using a system of committees to facilitate the timely and efficient consideration of all matters of importance to the Trustees, each fund, and fund shareholders and to facilitate compliance with legal and regulatory requirements and oversight of the funds' activities and associated risks. The Board, acting through its committees, has charged FMR and its affiliates with (i) identifying events or circumstances the occurrence of which could have demonstrably adverse effects on the funds' business and/or reputation; (ii) implementing processes and controls to lessen the possibility that such events or circumstances occur or to mitigate the effects of such events or circumstances if they do occur; and (iii) creating and maintaining a system designed to evaluate continuously business and market conditions in order to facilitate the identification and implementation processes described in (i) and (ii) above. Because the day-to-day operations and activities of the funds are carried out by or through FMR, its affiliates and other service providers, the funds' exposure to risks is mitigated but not eliminated by the processes overseen by the Trustees. While each of the Board's committees has responsibility for overseeing different aspects of the funds' activities, oversight is exercised primarily through the Operations and Audit Committees. Appropriate personnel, including but not limited to the funds' Chief Compliance Officer (CCO), FMR's internal auditor, the independent accountants, the funds' Treasurer and portfolio management personnel, make periodic reports to the Board's committees, as appropriate. The responsibilities of each committee, including their oversight responsibilities, are described further under "Standing Committees of the Funds' Trustees."
Annual Report
The funds' Statement of Additional Information (SAI) includes more information about the Trustees. To request a free copy, call Fidelity at 1-800-544-8544.
Interested Trustees*:
Correspondence intended for each Trustee who is an interested person may be sent to Fidelity Investments, 82 Devonshire Street, Boston, Massachusetts 02109.
Name, Age; Principal Occupations and Other Relevant Experience+ |
Abigail P. Johnson (49) |
| Year of Election or Appointment: 2009 Ms. Johnson is Trustee and Chairman of the Board of Trustees of certain Trusts. Ms. Johnson serves as President of Personal, Workplace and Institutional Services (2005-present). Ms. Johnson is the Vice Chairman and Director (2007-present) of FMR LLC. Previously, Ms. Johnson served as President and a Director of FMR (2001-2005), a Trustee of other investment companies advised by FMR, Fidelity Investments Money Management, Inc., and FMR Co., Inc. (2001-2005), Senior Vice President of the Fidelity funds (2001-2005), and managed a number of Fidelity funds. Ms. Abigail P. Johnson and Mr. Arthur E. Johnson are not related. |
James C. Curvey (75) |
| Year of Election or Appointment: 2007 Mr. Curvey also serves as Trustee (2007-present) of other investment companies advised by FMR. Mr. Curvey is a Director of Fidelity Investments Money Management, Inc. (2009-present), Director of Fidelity Research & Analysis Co. (2009-present) and Director of FMR and FMR Co., Inc. (2007-present). Mr. Curvey is also Vice Chairman (2007-present) and Director of FMR LLC. In addition, Mr. Curvey serves as an Overseer for the Boston Symphony Orchestra and a member of the Trustees of Villanova University. Previously, Mr. Curvey was the Vice Chairman (2006-2007) and Director (2000-2007) of FMR Corp. |
* Trustees have been determined to be "Interested Trustees" by virtue of, among other things, their affiliation with the trust or various entities under common control with FMR.
+ The information above includes each Trustee's principal occupation during the last five years and other information relating to the experience, attributes, and skills relevant to each Trustee's qualifications to serve as a Trustee, which led to the conclusion that each Trustee should serve as a Trustee for each fund.
Independent Trustees:
Correspondence intended for each Independent Trustee (that is, the Trustees other than the Interested Trustees) may be sent to Fidelity Investments, P.O. Box 55235, Boston, Massachusetts 02205-5235.
Name, Age; Principal Occupations and Other Relevant Experience+ |
Albert R. Gamper, Jr. (69) |
| Year of Election or Appointment: 2006 Prior to his retirement in December 2004, Mr. Gamper served as Chairman of the Board of CIT Group Inc. (commercial finance). During his tenure with CIT Group Inc. Mr. Gamper served in numerous senior management positions, including Chairman (1987-1989; 1999-2001; 2002-2004), Chief Executive Officer (1987-2004), and President (2002-2003). He also served as President and Chief Executive Officer of Tyco Capital Corporation (2001-2002). Mr. Gamper currently serves as a member of the Board of Directors of Public Service Enterprise Group (utilities, 2000-present), a member of the Board of Trustees, Rutgers University (2004-present), and Chairman of the Board of Saint Barnabas Health Care System. Previously, Mr. Gamper served as Chairman of the Board of Governors, Rutgers University (2004-2007). |
Robert F. Gartland (59) |
| Year of Election or Appointment: 2010 Mr. Gartland is a partner and investor of Vietnam Partners LLC (investments and consulting, 2008-present) and is Chairman and an investor in Gartland and Mellina Group Corp. (consulting, 2009-present). Prior to his retirement, Mr. Gartland held a variety of positions at Morgan Stanley (financial services, 1979-2007) including Managing Director (1987-2007). |
Arthur E. Johnson (64) |
| Year of Election or Appointment: 2008 Mr. Johnson serves as a member of the Board of Directors of Eaton Corporation (diversified power management, 2009-present) and AGL Resources, Inc. (holding company). Prior to his retirement, Mr. Johnson served as Senior Vice President of Corporate Strategic Development of Lockheed Martin Corporation (defense contractor, 1999-2009). He previously served on the Board of Directors of IKON Office Solutions, Inc. (1999-2008) and Delta Airlines (2005-2007). Mr. Arthur E. Johnson and Ms. Abigail P. Johnson are not related. |
Michael E. Kenneally (57) |
| Year of Election or Appointment: 2009 Previously, Mr. Kenneally served as a Member of the Advisory Board for certain Fidelity Fixed Income and Asset Allocation Funds (2008-2009). Prior to his retirement, Mr. Kenneally served as Chairman and Global Chief Executive Officer of Credit Suisse Asset Management (2003-2005). Mr. Kenneally was a Director of the Credit Suisse Funds (U.S. mutual funds, 2004-2008) and certain other closed-end funds (2004-2005) and was awarded the Chartered Financial Analyst (CFA) designation in 1991. |
James H. Keyes (70) |
| Year of Election or Appointment: 2007 Mr. Keyes serves as a member of the Boards of Navistar International Corporation (manufacture and sale of trucks, buses, and diesel engines, since 2002) and Pitney Bowes, Inc. (integrated mail, messaging, and document management solutions, since 1998). Prior to his retirement, Mr. Keyes served as Chairman and Chief Executive Officer of Johnson Controls (automotive, building, and energy, 1998-2002) and as a member of the Board of LSI Logic Corporation (semiconductor technologies, 1984-2008). |
Marie L. Knowles (64) |
| Year of Election or Appointment: 2001 Prior to Ms. Knowles' retirement in June 2000, she served as Executive Vice President and Chief Financial Officer of Atlantic Richfield Company (ARCO) (diversified energy, 1996-2000). From 1993 to 1996, she was a Senior Vice President of ARCO and President of ARCO Transportation Company. She served as a Director of ARCO from 1996 to 1998. Ms. Knowles currently serves as a Director and Chairman of the Audit Committee of McKesson Corporation (healthcare service, since 2002). Ms. Knowles is an Honorary Trustee of the Brookings Institution and a member of the Board of the Catalina Island Conservancy and of the Santa Catalina Island Company (2009-present). She also serves as a member of the Advisory Board for the School of Engineering of the University of Southern California and the Foundation Board of the School of Architecture at the University of Virginia (2007-present). Previously, Ms. Knowles served as a Director of Phelps Dodge Corporation (copper mining and manufacturing, 1994-2007). |
Kenneth L. Wolfe (72) |
| Year of Election or Appointment: 2005 Mr. Wolfe is Chairman of the Independent Trustees of the Fixed Income and Asset Allocation Funds (2008-present). Prior to his retirement, Mr. Wolfe served as Chairman and a Director (2007-2009) and Chairman and Chief Executive Officer (1994-2001) of Hershey Foods Corporation. He also served as a member of the Boards of Adelphia Communications Corporation (telecommunications, 2003-2006), Bausch & Lomb, Inc. (medical/pharmaceutical, 1993-2007), and Revlon, Inc. (personal care products, 2004-2009). |
+ The information above includes each Trustee's principal occupation during the last five years and other information relating to the experience, attributes, and skills relevant to each Trustee's qualifications to serve as a Trustee, which led to the conclusion that each Trustee should serve as a Trustee for each fund.
Executive Officers:
Correspondence intended for each executive officer may be sent to Fidelity Investments, 82 Devonshire Street, Boston, Massachusetts 02109.
Name, Age; Principal Occupation |
John R. Hebble (52) |
| Year of Election or Appointment: 2008 President and Treasurer of Fidelity's Fixed Income and Asset Allocation Funds. Mr. Hebble also serves as Treasurer and Chief Financial Officer of The North Carolina Capital Management Trust: Cash and Term Portfolios (2008-present), Assistant Treasurer of other Fidelity funds (2009-present) and is an employee of Fidelity Investments. |
Boyce I. Greer (55) |
| Year of Election or Appointment: 2005 Vice President of Fidelity's Fixed Income Funds and Asset Allocation Funds (2005). Mr. Greer is also a Trustee of other investment companies advised by FMR. Mr. Greer is head of Institutional Investments for Fidelity Asset Management and Vice Chairman of Pyramis Global Advisors, LLC (2011-present), President of The North Carolina Capital Management Trust: Cash and Term Portfolios (2003-present), the Asset Allocation Division (2008-present), President and a Director of Strategic Advisers, Inc. (2008-present), President of FIMM 130/30 LLC (2008-present), Director of Ballyrock Investment Advisors LLC (2006-present), and an Executive Vice President of FMR (2005-present). Previously, Mr. Greer served as Executive Vice President of FMR Co., Inc. (2005-2009), President and Director of Fidelity Investments Money Management, Inc. (2007-2009) and as a Director and Managing Director of Strategic Advisers, Inc. (2002-2005). |
Derek L. Young (46) |
| Year of Election or Appointment: 2009 Vice President of Fidelity's Asset Allocation Funds. Mr. Young also serves as Chief Investment Officer of the Global Asset Allocation Group (2009-present). Previously, Mr. Young served as a portfolio manager. |
Scott C. Goebel (43) |
| Year of Election or Appointment: 2008 Secretary and Chief Legal Officer (CLO) of the Fidelity funds. Mr. Goebel also serves as Secretary and CLO of The North Carolina Capital Management Trust: Cash and Term Portfolios (2008-present); General Counsel, Secretary, and Senior Vice President of FMR (2008-present) and FMR Co., Inc. (2008-present); Deputy General Counsel of FMR LLC; Chief Legal Officer of Fidelity Management & Research (Hong Kong) Limited (2008-present) and Assistant Secretary of Fidelity Management & Research (Japan) Inc. (2008-present), Fidelity Investments Money Management, Inc. (2008-present), Fidelity Management & Research (U.K.) Inc. (2008-present), and Fidelity Research and Analysis Company (2008-present). Previously, Mr. Goebel served as Assistant Secretary of the Funds (2007-2008) and as Vice President and Secretary of Fidelity Distributors Corporation (FDC) (2005-2007). |
David J. Carter (37) |
| Year of Election or Appointment: 2010 Assistant Secretary of Fidelity's Fixed Income and Asset Allocation Funds. Mr. Carter also serves as Vice President, Associate General Counsel (2010-present) and is an employee of Fidelity Investments (2005-present). |
Holly C. Laurent (56) |
| Year of Election or Appointment: 2008 Anti-Money Laundering (AML) Officer of the Fidelity funds. Ms. Laurent also serves as AML Officer of The North Carolina Capital Management Trust: Cash and Term Portfolios (2008-present) and is an employee of Fidelity Investments. Previously, Ms. Laurent was Senior Vice President and Head of Legal for Fidelity Business Services India Pvt. Ltd. (2006-2008), and Senior Vice President, Deputy General Counsel and Group Head for FMR LLC (2005-2006). |
Christine Reynolds (52) |
| Year of Election or Appointment: 2008 Chief Financial Officer of the Fidelity funds. Ms. Reynolds became President of Fidelity Pricing and Cash Management Services (FPCMS) in August 2008. Ms. Reynolds served as Chief Operating Officer of FPCMS (2007-2008). Previously, Ms. Reynolds served as President, Treasurer, and Anti-Money Laundering officer of the Fidelity funds (2004-2007). |
Michael H. Whitaker (43) |
| Year of Election or Appointment: 2008 Chief Compliance Officer of Fidelity's Fixed Income and Asset Allocation Funds. Mr. Whitaker also serves as Chief Compliance Officer of The North Carolina Capital Management Trust: Cash and Term Portfolios (2008-present). Mr. Whitaker is an employee of Fidelity Investments (2007-present). Prior to joining Fidelity Investments, Mr. Whitaker worked at MFS Investment Management where he served as Senior Vice President and Chief Compliance Officer (2004-2006), and Assistant General Counsel. |
Jeffrey S. Christian (49) |
| Year of Election or Appointment: 2009 Deputy Treasurer of the Fidelity funds. Mr. Christian is an employee of Fidelity Investments. Previously, Mr. Christian served as Chief Financial Officer (2008-2009) of certain Fidelity funds and Senior Vice President of Fidelity Pricing and Cash Management Services (FPCMS) (2004-2009). |
Bryan A. Mehrmann (49) |
| Year of Election or Appointment: 2005 Deputy Treasurer of the Fidelity funds. Mr. Mehrmann is an employee of Fidelity Investments. |
Stephanie J. Dorsey (41) |
| Year of Election or Appointment: 2008 Deputy Treasurer of Fidelity's Fixed Income and Asset Allocation Funds. Ms. Dorsey also serves as Assistant Treasurer of other Fidelity funds (2010-present) and is an employee of Fidelity Investments (2008-present). Previously, Ms. Dorsey served as Treasurer (2004-2008) of the JPMorgan Mutual Funds and Vice President (2004-2008) of JPMorgan Chase Bank. |
Adrien E. Deberghes (43) |
| Year of Election or Appointment: 2010 Assistant Treasurer of Fidelity's Fixed Income and Asset Allocation Funds. Mr. Deberghes also serves as Deputy Treasurer of other Fidelity funds (2008-present) and is an employee of Fidelity Investments (2008-present). Previously, Mr. Deberghes served as Senior Vice President of Mutual Fund Administration at State Street Corporation (2007-2008), Senior Director of Mutual Fund Administration at Investors Bank & Trust (2005-2007), and Director of Finance for Dunkin' Brands (2000-2005). |
Kenneth B. Robins (41) |
| Year of Election or Appointment: 2009 Assistant Treasurer of the Fidelity Fixed Income and Asset Allocation Funds. Mr. Robins also serves as President and Treasurer of other Fidelity funds (2008-present; 2010-present) and is an employee of Fidelity Investments (2004-present). Previously, Mr. Robins served as Deputy Treasurer of the Fidelity funds (2005-2008) and Treasurer and Chief Financial Officer of The North Carolina Capital Management Trust: Cash and Term Portfolios (2006-2008). |
Gary W. Ryan (52) |
| Year of Election or Appointment: 2005 Assistant Treasurer of the Fidelity funds. Mr. Ryan is an employee of Fidelity Investments. Previously, Mr. Ryan served as Vice President of Fund Reporting in Fidelity Pricing and Cash Management Services (FPCMS) (1999-2005). |
Jonathan Davis (42) |
| Year of Election or Appointment: 2010 Assistant Treasurer of the Fidelity funds. Mr. Davis is an employee of Fidelity Investments. Previously, Mr. Davis served as Vice President and Associate General Counsel of FMR LLC (2003-2010). |
Annual Report
The Board of Trustees of each fund voted to pay to shareholders of record at the opening of business on record date, the following distributions per share derived from capital gains realized from sales of portfolio securities and dividends derived from net investment income:
| Pay Date | Record Date | Dividends | Capital Gains |
Fidelity Freedom Income Fund | 05/09/11 | 05/06/11 | $0.015 | $0.005 |
Fidelity Freedom 2000 Fund | 05/09/11 | 05/06/11 | $0.035 | $0.006 |
Fidelity Freedom 2005 Fund | 05/09/11 | 05/06/11 | $0.028 | $0.013 |
Fidelity Freedom 2010 Fund | 05/09/11 | 05/06/11 | $0.033 | $0.021 |
Fidelity Freedom 2015 Fund | 05/12/11 | 05/11/11 | $0.028 | $0.016 |
Fidelity Freedom 2020 Fund | 05/12/11 | 05/11/11 | $0.034 | $0.021 |
Fidelity Freedom 2025 Fund | 05/09/11 | 05/06/11 | $0.025 | $0.021 |
Fidelity Freedom 2030 Fund | 05/09/11 | 05/06/11 | $0.028 | $0.031 |
Fidelity Freedom 2035 Fund | 05/12/11 | 05/11/11 | $0.018 | $0.028 |
Fidelity Freedom 2040 Fund | 05/09/11 | 05/06/11 | $0.015 | $0.017 |
Fidelity Freedom 2045 Fund | 05/12/11 | 05/11/11 | $0.015 | $0.022 |
Fidelity Freedom 2050 Fund | 05/12/11 | 05/11/11 | $0.013 | $0.022 |
A percentage of the dividends distributed during the fiscal year for the following funds were derived from interest on U.S. Government securities which is generally exempt from state income tax:
Fidelity Freedom Income Fund | 12.31% |
Fidelity Freedom 2000 Fund | 12.16% |
Fidelity Freedom 2005 Fund | 9.29% |
Fidelity Freedom 2010 Fund | 8.95% |
Fidelity Freedom 2015 Fund | 8.63% |
Fidelity Freedom 2020 Fund | 6.89% |
Fidelity Freedom 2025 Fund | 5.43% |
Fidelity Freedom 2030 Fund | 4.53% |
Fidelity Freedom 2035 Fund | 3.03% |
Fidelity Freedom 2040 Fund | 2.57% |
Fidelity Freedom 2045 Fund | 1.91% |
Fidelity Freedom 2050 Fund | 1.03% |
Annual Report
Distributions (Unaudited) - continued
A percentage of the dividends distributed during the fiscal year for the following funds qualify for the dividends-received deduction for corporate shareholders:
Fidelity Freedom Income Fund | |
May 2010
June 2010
July 2010
August 2010
September 2010
October 2010
November 2010
December 2010
February 2011
March 2011 | 1%
7%
7%
7%
7%
7%
7%
7%
1%
1% |
| |
Fidelity Freedom 2000 Fund | |
May 2010
December 2010 | 2%
8% |
Fidelity Freedom 2005 Fund | |
May 2010
December 2010 | 3%
15% |
Fidelity Freedom 2010 Fund | |
May 2010
December 2010 | 3%
16% |
Fidelity Freedom 2015 Fund | |
May 2010
December 2010 | 3%
17% |
Fidelity Freedom 2020 Fund | |
May 2010
December 2010 | 4%
20% |
Fidelity Freedom 2025 Fund | |
May 2010
December 2010 | 4%
23% |
Fidelity Freedom 2030 Fund | |
May 2010
December 2010 | 5%
25% |
Fidelity Freedom 2035 Fund | |
May 2010
December 2010 | 6%
30% |
Fidelity Freedom 2040 Fund | |
May 2010
December 2010 | 6%
29% |
Fidelity Freedom 2045 Fund | |
May 2010
December 2010 | 5%
31% |
Fidelity Freedom 2050 Fund | |
May 2010
December 2010 | 7%
33% |
Annual Report
A percentage of the dividends distributed during the fiscal year for the following funds may be taken into account as a dividend for purposes of the maximum rate under section 1(h)(11) of the Internal Revenue Code.
Fidelity Freedom Income Fund | |
May 2010
June 2010
July 2010
August 2010
September 2010
October 2010
November 2010
December 2010
February 2011
March 2011 | 2%
12%
12%
12%
12%
12%
12%
12%
2%
2% |
| |
Fidelity Freedom 2000 Fund | |
May 2010
December 2010 | 3%
12% |
Fidelity Freedom 2005 Fund | |
May 2010
December 2010 | 4%
23% |
Fidelity Freedom 2010 Fund | |
May 2010
December 2010 | 3%
25% |
Fidelity Freedom 2015 Fund | |
May 2010
December 2010 | 4%
26% |
Fidelity Freedom 2020 Fund | |
May 2010
December 2010 | 5%
30% |
Fidelity Freedom 2025 Fund | |
May 2010
December 2010 | 6%
34% |
Fidelity Freedom 2030 Fund | |
May 2010
December 2010 | 6%
38% |
Fidelity Freedom 2035 Fund | |
May 2010
December 2010 | 8%
45% |
Fidelity Freedom 2040 Fund | |
May 2010
December 2010 | 8%
44% |
Fidelity Freedom 2045 Fund | |
May 2010
December 2010 | 6%
46% |
Fidelity Freedom 2050 Fund | |
May 2010
December 2010 | 9%
50% |
The funds will notify shareholders in January 2012 of amounts for use in preparing 2011 income tax returns.
Annual Report
Managing Your Investments
Fidelity offers several ways to conveniently manage your personal investments via your telephone or PC. You can access your account information, conduct trades and research your investments 24 hours a day.
By Phone
Fidelity Automated Service Telephone provides a single toll-free number to access account balances, positions, quotes and trading. It's easy to navigate the service, and on your first call, the system will help you create a personal identification number (PIN) for security.
(phone_graphic)
Fidelity Automated Service Telephone (FAST®)
1-800-544-5555
Press
 For mutual fund and brokerage trading.
 For quotes.*
 For account balances and holdings.
 To review orders and mutual fund activity.
 To change your PIN.

 To speak to a Fidelity representative.
By PC
Fidelity's web site on the Internet provides a wide range of information, including daily financial news, fund performance, interactive planning tools and news about Fidelity products and services.
(computer_graphic)
Fidelity's Web Site
www.fidelity.com
* When you call the quotes line, please remember that a fund's yield and return will vary and, except for money market funds, share price will also vary. This means that you may have a gain or loss when you sell your shares. There is no assurance that money market funds will be able to maintain a stable $1 share price; an investment in a money market fund is not insured or guaranteed by the U.S. government. Total returns are historical and include changes in share price, reinvestment of dividends and capital gains distributions, and the effects of any sales charges.
Annual Report
Investment Adviser
Strategic Advisers, Inc.
Boston, MA
General Distributor
Fidelity Distributors Corporation
Boston, MA
Transfer and Service Agents
Fidelity Investments Institutional
Operations Company, Inc.
Boston, MA
Fidelity Service Company, Inc.
Boston, MA
Custodian
The Bank of New York Mellon
New York, NY
FF-UANNPRO-0511
1.814503.106
Fidelity FreedomSM Index Funds - Class W
Income, 2000, 2005, 2010, 2015, 2020, 2025, 2030, 2035, 2040, 2045, 2050
(Formerly Fidelity FreedomSM Index Funds - Class K
Income, 2000, 2005, 2010, 2015, 2020, 2025, 2030, 2035, 2040, 2045, 2050)
Annual Report
March 31, 2011
(2_fidelity_logos) (Registered_Trademark)
Contents
Annual Report
To view a fund's proxy voting guidelines and proxy voting record for the 12-month period ended June 30, visit http://www.fidelity.com/proxyvotingresults or visit the Securities and Exchange Commission's (SEC) web site at http://www.sec.gov. You may also call 1-800-835-5092 to request a free copy of the proxy voting guidelines.
Standard & Poor's, S&P and S&P 500 are registered service marks of The McGraw-Hill Companies, Inc. and have been licensed for use by Fidelity Distributors Corporation.
Other third party marks appearing herein are the property of their respective owners.
All other marks appearing herein are registered or unregistered trademarks or service marks of FMR LLC or an affiliated company.
This report and the financial statements contained herein are submitted for the general information of the shareholders of the funds. This report is not authorized for distribution to prospective investors in the funds unless preceded or accompanied by an effective prospectus.
A fund files its complete schedule of portfolio holdings with the SEC for the first and third quarters of each fiscal year on Form N-Q. Forms N-Q are available on the SEC's web site at http://www.sec.gov. A fund's Forms N-Q may be reviewed and copied at the SEC's Public Reference Room in Washington, DC. Information regarding the operation of the SEC's Public Reference Room may be obtained by calling 1-800-SEC-0330. For a complete list of a fund's portfolio holdings, view the most recent holdings listing, semiannual report, or annual report on Fidelity's web site at http://www.fidelity.com, http://www.advisor.fidelity.com, or http://www.401k.com, as applicable.
NOT FDIC INSURED • MAY LOSE VALUE • NO BANK GUARANTEE
Neither the funds nor Fidelity Distributors Corporation is a bank.
Annual Report
(photo_of_Abigail_P_Johnson)
Dear Shareholder:
Amid indications the U.S. economy had turned a corner, U.S. equities continued their generally upward trend in early 2011, overcoming bouts of short-term volatility following unrest in North Africa and the disaster in Japan. Still, questions remained about the longer-term outlook, most notably persistently high unemployment. Financial markets are always unpredictable, of course, but there also are several time-tested investment principles that can help put the odds in your favor.
One of the basic tenets is to invest for the long term. Over time, riding out the markets' inevitable ups and downs has proven much more effective than selling into panic or chasing the hottest trend. Even missing only a few of the markets' best days can significantly diminish investor returns. Patience also affords the benefits of compounding - of earning interest on additional income or reinvested dividends and capital gains. There can be tax advantages and cost benefits to consider as well. While staying the course doesn't eliminate risk, it can considerably lessen the effect of short-term declines.
You can further manage your investing risk through diversification. And today, more than ever, geographic diversification should be taken into account. Studies indicate that asset allocation is the single most important determinant of a portfolio's long-term success. The right mix of stocks, bonds and cash - aligned to your particular risk tolerance and investment objective - is very important. Age-appropriate rebalancing is also an essential aspect of asset allocation. For younger investors, an emphasis on equities - which historically have been the best-performing asset class over time - is encouraged. As investors near their specific goal, such as retirement or sending a child to college, consideration may be given to replacing volatile assets (e.g. common stocks) with more-stable fixed investments (bonds or savings plans).
A third principle - investing regularly - can help lower the average cost of your purchases. Investing a certain amount of money each month or quarter helps ensure you won't pay for all your shares at market highs. This strategy - known as dollar cost averaging - also reduces "emotion" from investing, helping shareholders avoid selling weak performers just prior to an upswing, or chasing a hot performer just before a correction.
We invite you to contact us via the Internet, through our Investor Centers or by phone. It is our privilege to provide you the information you need to make the investments that are right for you.
Sincerely,
(The chairman's signature appears here.)
Abigail P. Johnson
Annual Report
Fidelity Freedom Index Income Fund - Class W
Average annual total return reflects the change in the value of an investment, assuming reinvestment of the fund's distributions from dividend income and capital gains (the profits earned upon the sale of securities that have grown in value, if any) and assuming a constant rate of performance each year. The $10,000 table and the fund's returns do not reflect the deduction of taxes that a shareholder would pay on fund distributions or the redemption of fund shares. During periods of reimbursement by Fidelity, a fund's total return will be greater than it would be had the reimbursement not occurred. How a fund did yesterday is no guarantee of how it will do tomorrow.
Average Annual Total Returns
Periods ended March 31, 2011 | Past 1
year | Life of
fund A |
Fidelity Freedom Index Income Fund - Class W | 5.89% | 6.41% |
A From October 2, 2009.
$10,000 Over Life of Fund
Let's say hypothetically that $10,000 was invested in Fidelity Freedom Index Income Fund - Class W on October 2, 2009, when the fund started. The chart shows how the value of your investment would have changed, and also shows how the Barclays Capital® U.S. Aggregate Bond Index performed over the same period.
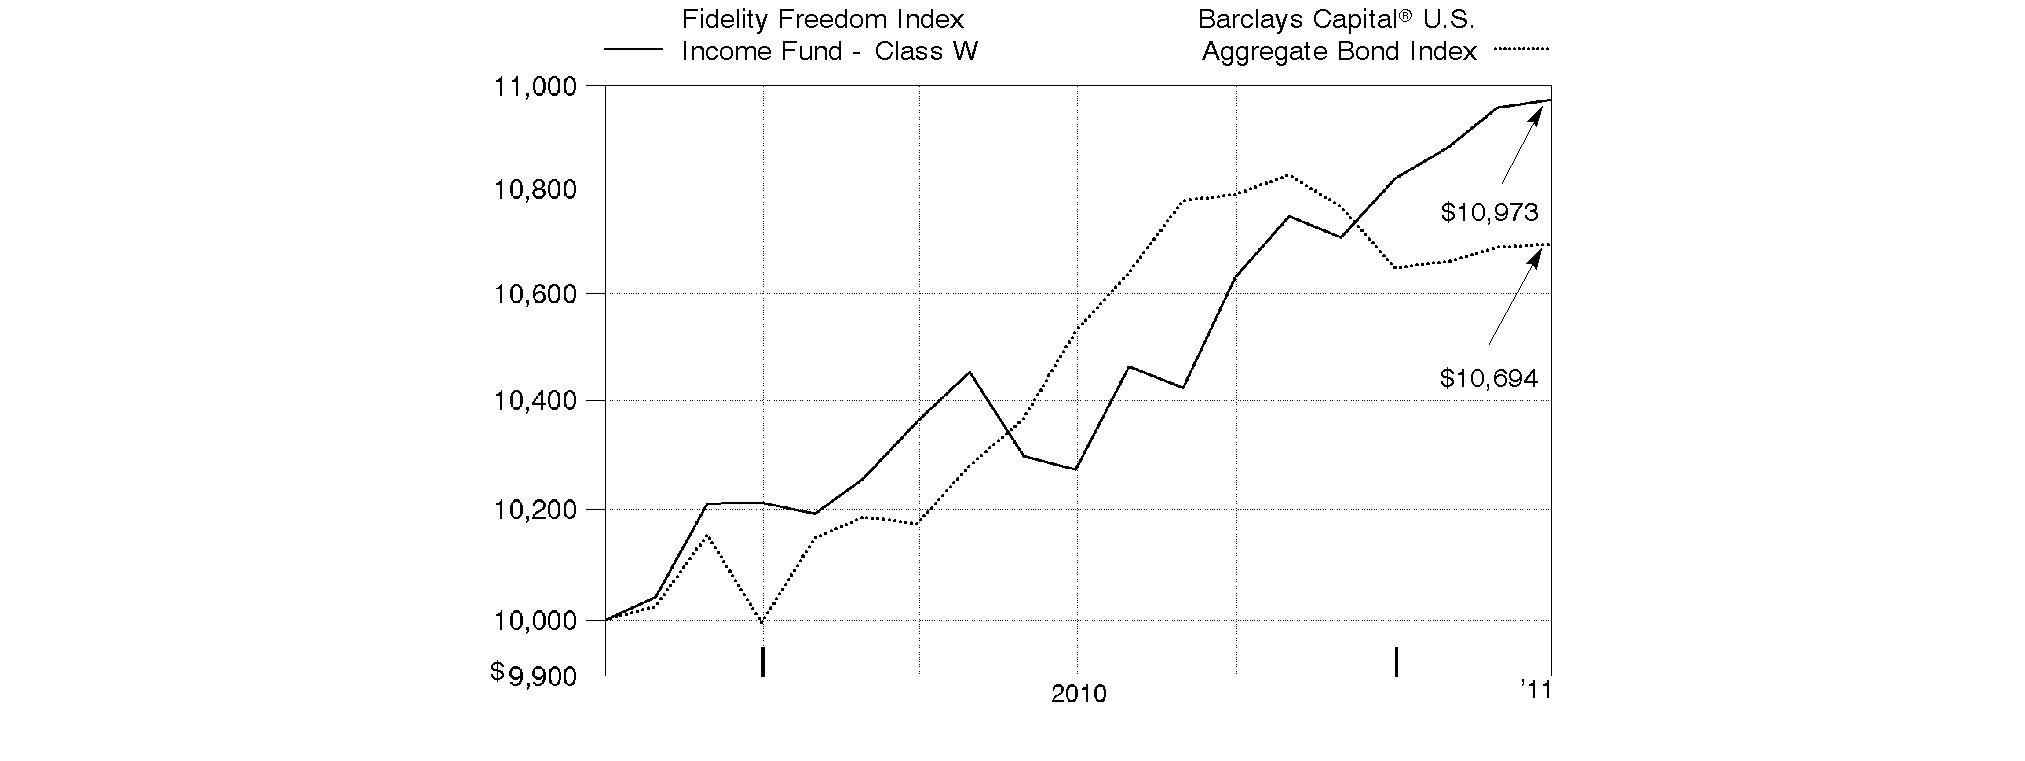
-
Annual Report
Fidelity Freedom Index 2000 Fund - Class W
Performance: The Bottom Line
Average annual total return reflects the change in the value of an investment, assuming reinvestment of the fund's distributions from dividend income and capital gains (the profits earned upon the sale of securities that have grown in value, if any) and assuming a constant rate of performance each year. The $10,000 table and the fund's returns do not reflect the deduction of taxes that a shareholder would pay on fund distributions or the redemption of fund shares. During periods of reimbursement by Fidelity, a fund's total return will be greater than it would be had the reimbursement not occurred. How a fund did yesterday is no guarantee of how it will do tomorrow.
Average Annual Total Returns
Periods ended March 31, 2011 | Past 1
year | Life of
fund A |
Fidelity Freedom Index 2000 Fund - Class W | 6.00% | 6.65% |
A From October 2, 2009.
$10,000 Over Life of Fund
Let's say hypothetically that $10,000 was invested in Fidelity Freedom Index 2000 Fund - Class W on October 2, 2009, when the fund started. The chart shows how the value of your investment would have changed, and also shows how the Barclays Capital U.S. Aggregate Bond Index performed over the same period.
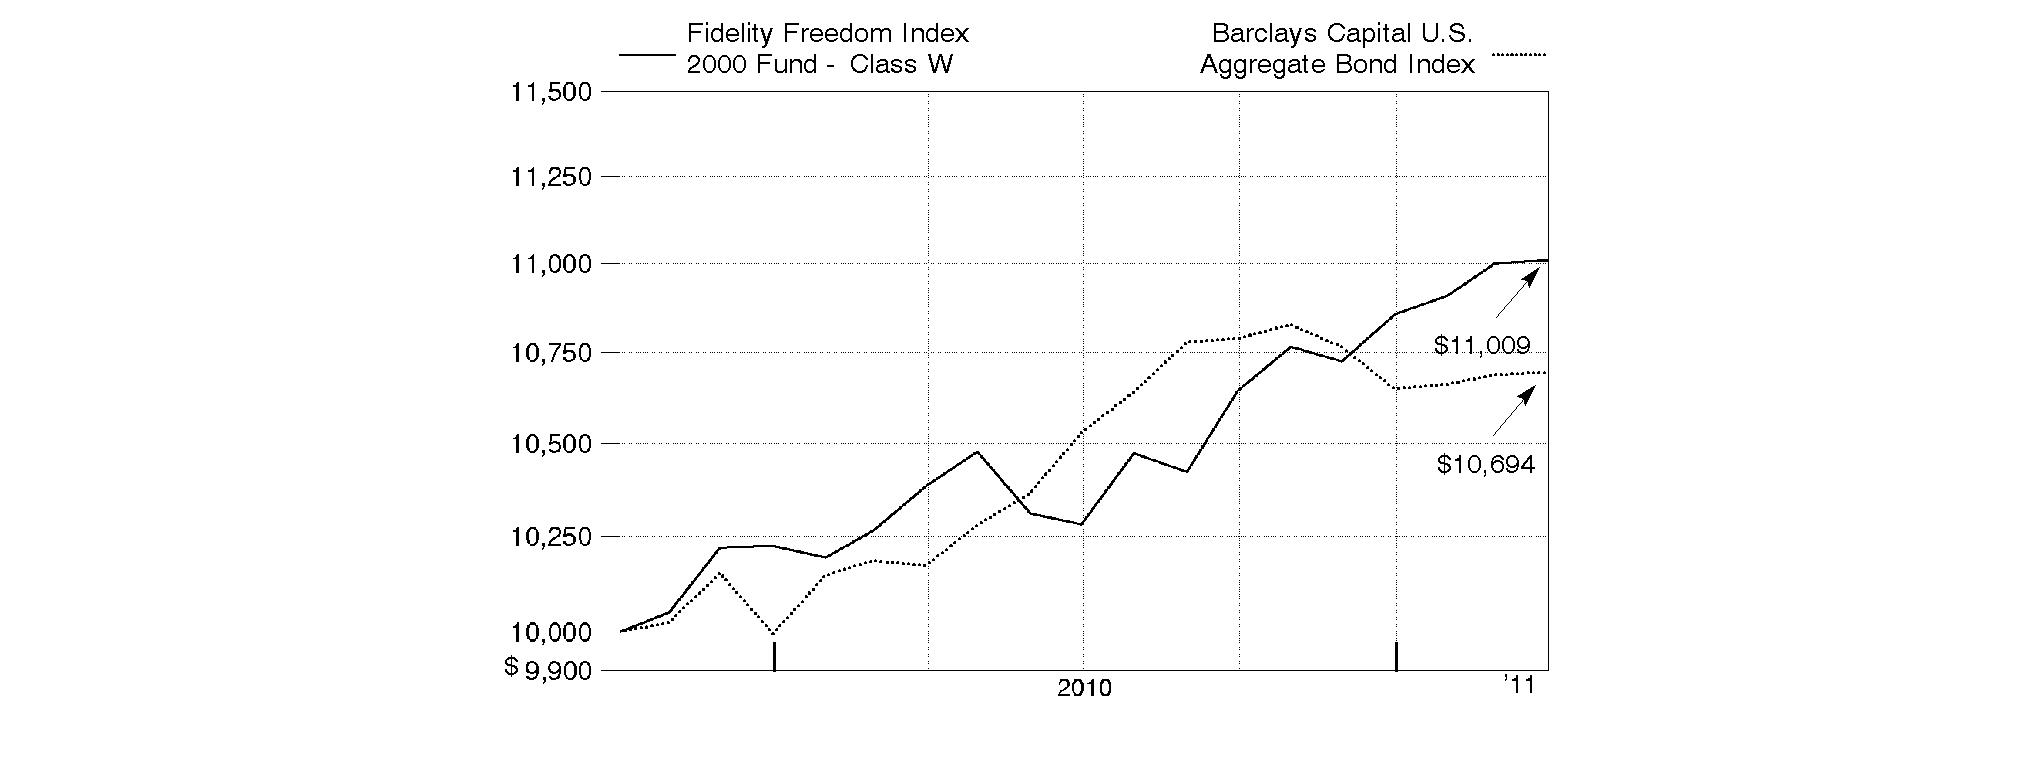
Annual Report
Fidelity Freedom Index 2005 Fund - Class W
Performance: The Bottom Line
Average annual total return reflects the change in the value of an investment, assuming reinvestment of the fund's distributions from dividend income and capital gains (the profits earned upon the sale of securities that have grown in value, if any) and assuming a constant rate of performance each year. The $10,000 table and the fund's returns do not reflect the deduction of taxes that a shareholder would pay on fund distributions or the redemption of fund shares. During periods of reimbursement by Fidelity, a fund's total return will be greater than it would be had the reimbursement not occurred. How a fund did yesterday is no guarantee of how it will do tomorrow.
Average Annual Total Returns
Periods ended March 31, 2011 | Past 1
year | Life of
fund A |
Fidelity Freedom Index 2005 Fund - Class W | 9.72% | 11.19% |
A From October 2, 2009.
$10,000 Over Life of Fund
Let's say hypothetically that $10,000 was invested in Fidelity Freedom Index 2005 Fund - Class W on October 2, 2009, when the fund started. The chart shows how the value of your investment would have changed, and also shows how the Barclays Capital U.S. Aggregate Bond Index performed over the same period.
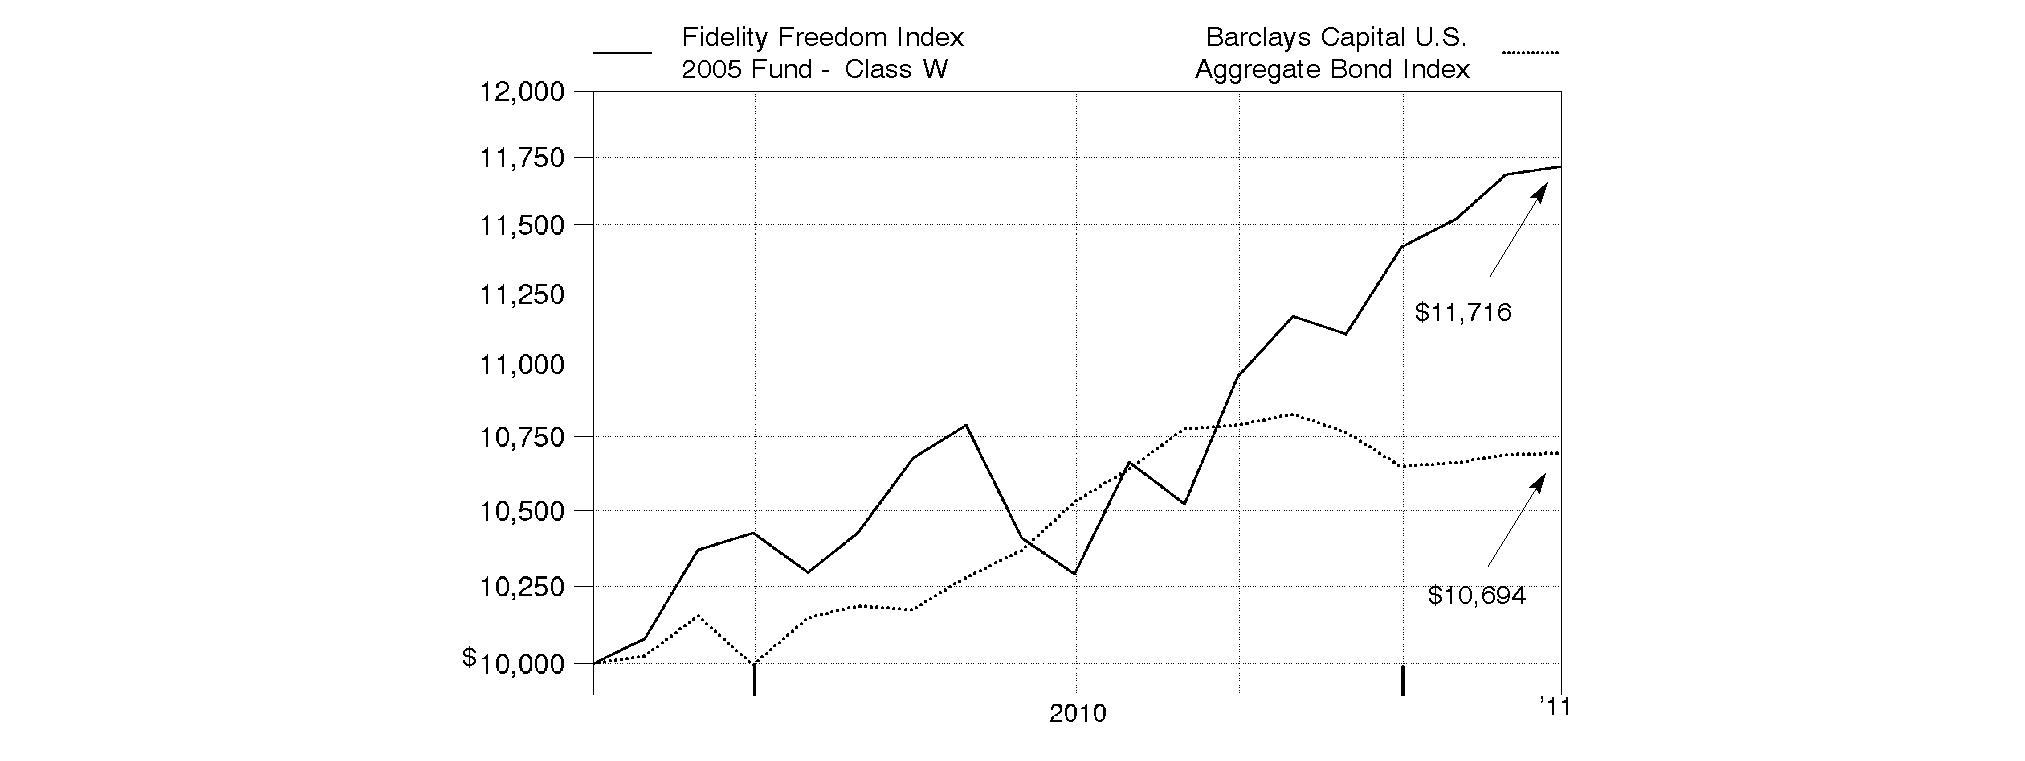
-
Annual Report
Fidelity Freedom Index 2010 Fund - Class W
Performance: The Bottom Line
Average annual total return reflects the change in the value of an investment, assuming reinvestment of the fund's distributions from dividend income and capital gains (the profits earned upon the sale of securities that have grown in value, if any) and assuming a constant rate of performance each year. The $10,000 table and the fund's returns do not reflect the deduction of taxes that a shareholder would pay on fund distributions or the redemption of fund shares. During periods of reimbursement by Fidelity, a fund's total return will be greater than it would be had the reimbursement not occurred. How a fund did yesterday is no guarantee of how it will do tomorrow.
Average Annual Total Returns
Periods ended March 31, 2011 | Past 1
year | Life of
fund A |
Fidelity Freedom Index 2010 Fund - Class W | 11.08% | 12.60% |
A From October 2, 2009.
$10,000 Over Life of Fund
Let's say hypothetically that $10,000 was invested in Fidelity Freedom Index 2010 Fund - Class W on October 2, 2009, when the fund started. The chart shows how the value of your investment would have changed, and also shows how the Barclays Capital U.S. Aggregate Bond Index performed over the same period.
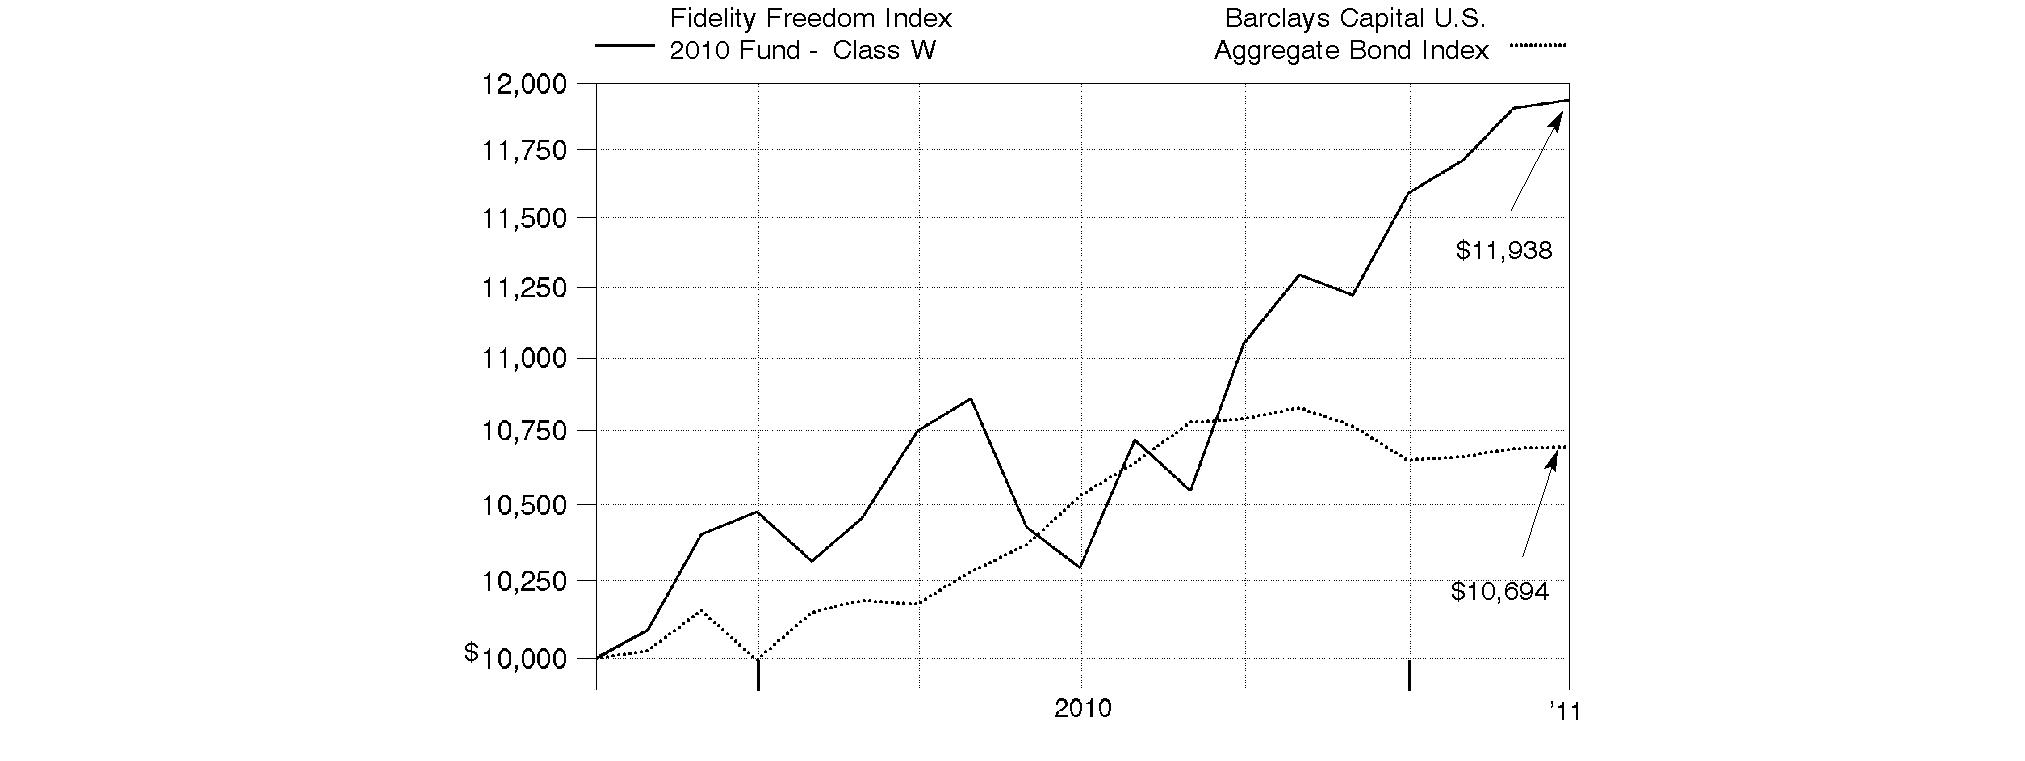
Annual Report
Fidelity Freedom Index 2015 Fund - Class W
Performance: The Bottom Line
Average annual total return reflects the change in the value of an investment, assuming reinvestment of the fund's distributions from dividend income and capital gains (the profits earned upon the sale of securities that have grown in value, if any) and assuming a constant rate of performance each year. The $10,000 table and the fund's returns do not reflect the deduction of taxes that a shareholder would pay on fund distributions or the redemption of fund shares. During periods of reimbursement by Fidelity, a fund's total return will be greater than it would be had the reimbursement not occurred. How a fund did yesterday is no guarantee of how it will do tomorrow.
Average Annual Total Returns
Periods ended March 31, 2011 | Past 1
year | Life of
fund A |
Fidelity Freedom Index 2015 Fund - Class W | 11.29% | 12.88% |
A From October 2, 2009.
$10,000 Over Life of Fund
Let's say hypothetically that $10,000 was invested in Fidelity Freedom Index 2015 Fund - Class W on October 2, 2009, when the fund started. The chart shows how the value of your investment would have changed, and also shows how the S&P 500® Index performed over the same period.
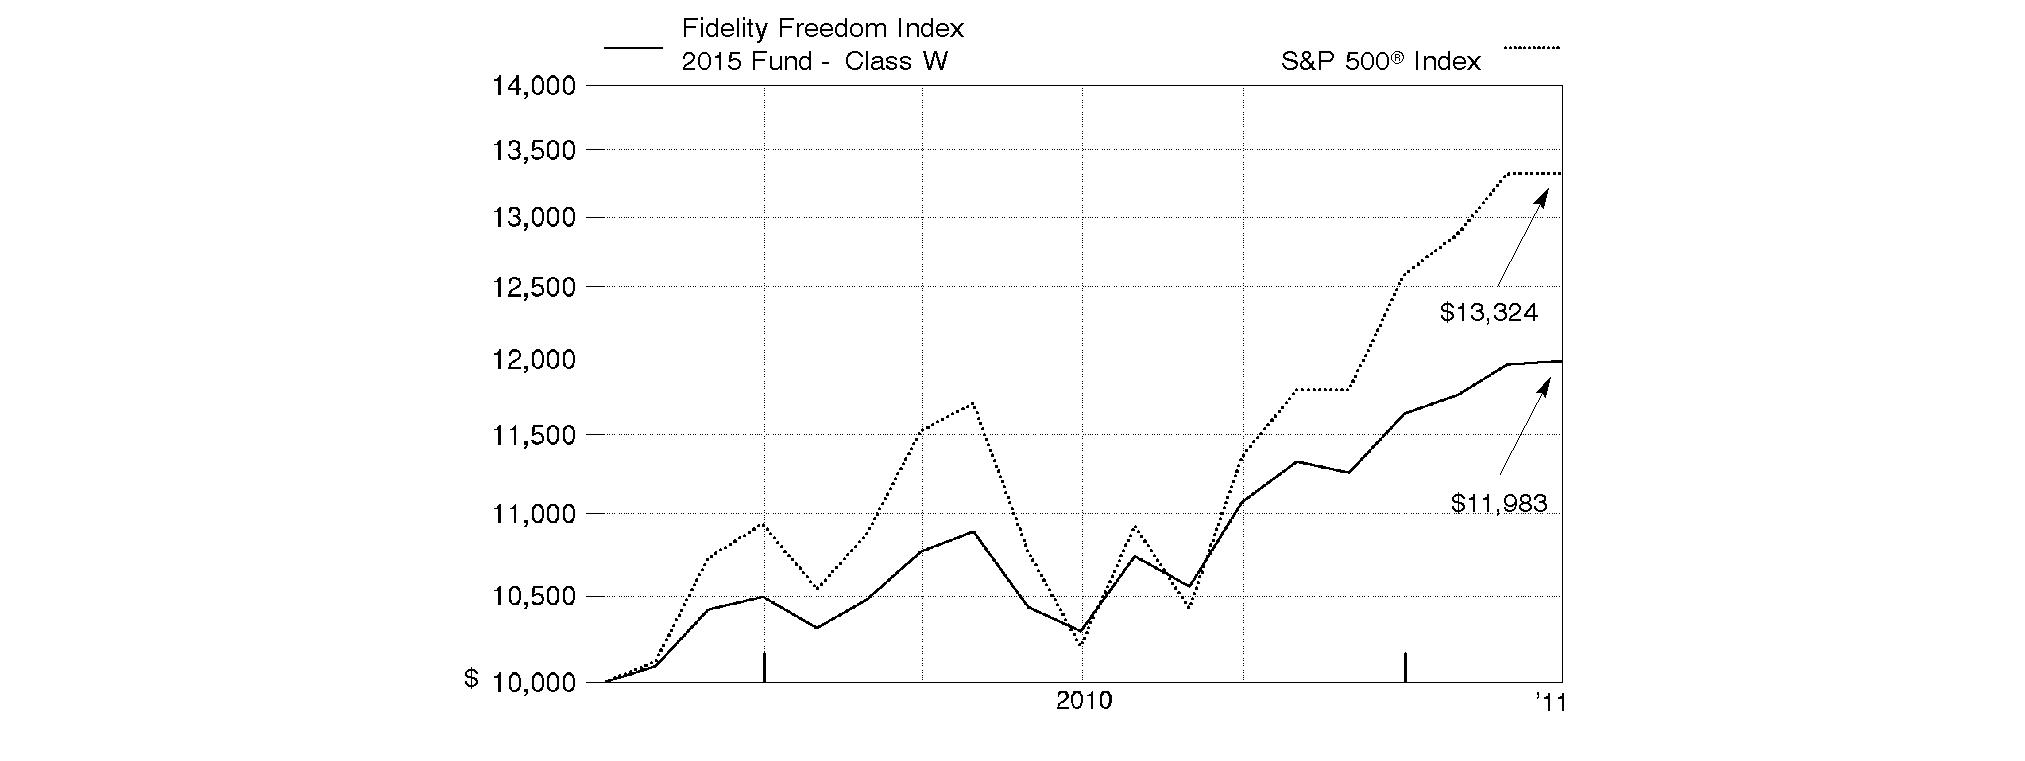
-
Annual Report
Fidelity Freedom Index 2020 Fund - Class W
Performance: The Bottom Line
Average annual total return reflects the change in the value of an investment, assuming reinvestment of the fund's distributions from dividend income and capital gains (the profits earned upon the sale of securities that have grown in value, if any) and assuming a constant rate of performance each year. The $10,000 table and the fund's returns do not reflect the deduction of taxes that a shareholder would pay on fund distributions or the redemption of fund shares. During periods of reimbursement by Fidelity, a fund's total return will be greater than it would be had the reimbursement not occurred. How a fund did yesterday is no guarantee of how it will do tomorrow.
Average Annual Total Returns
Periods ended March 31, 2011 | Past 1
year | Life of
fund A |
Fidelity Freedom Index 2020 Fund - Class W | 12.67% | 14.88% |
A From October 2, 2009.
$10,000 Over Life of Fund
Let's say hypothetically that $10,000 was invested in Fidelity Freedom Index 2020 Fund - Class W on October 2, 2009, when the fund started. The chart shows how the value of your investment would have changed, and also shows how the S&P 500 Index performed over the same period.
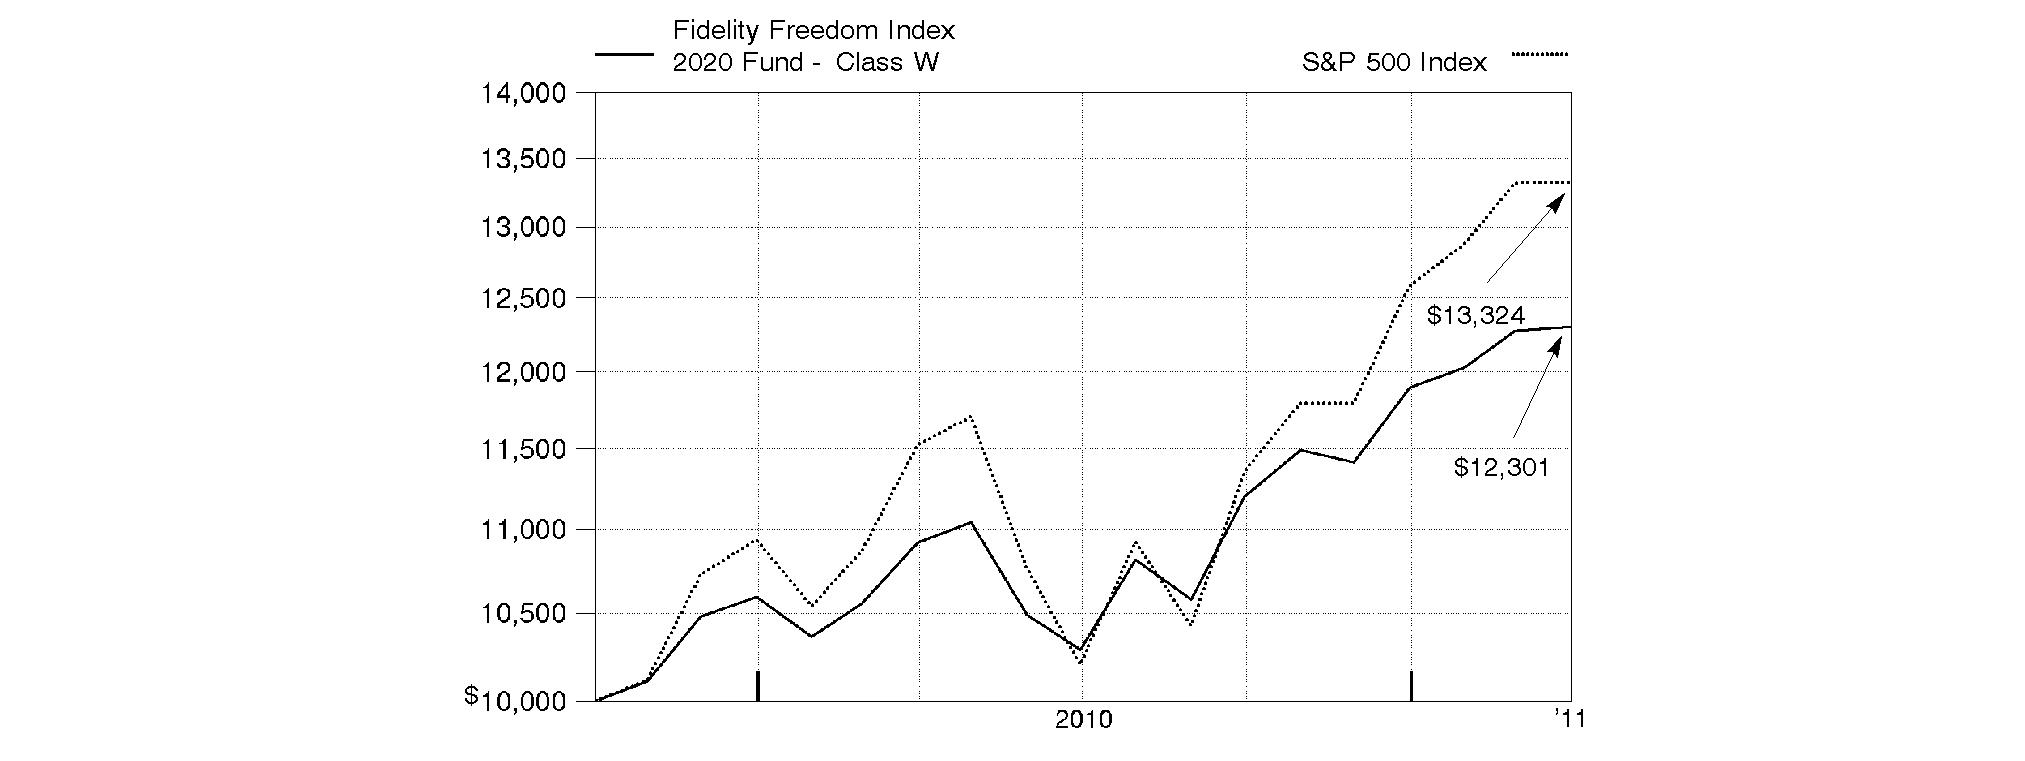
Annual Report
Fidelity Freedom Index 2025 Fund - Class W
Performance: The Bottom Line
Average annual total return reflects the change in the value of an investment, assuming reinvestment of the fund's distributions from dividend income and capital gains (the profits earned upon the sale of securities that have grown in value, if any) and assuming a constant rate of performance each year. The $10,000 table and the fund's returns do not reflect the deduction of taxes that a shareholder would pay on fund distributions or the redemption of fund shares. During periods of reimbursement by Fidelity, a fund's total return will be greater than it would be had the reimbursement not occurred. How a fund did yesterday is no guarantee of how it will do tomorrow.
Average Annual Total Returns
Periods ended March 31, 2011 | Past 1
year | Life of
fund A |
Fidelity Freedom Index 2025 Fund - Class W | 14.03% | 16.34% |
A From October 2, 2009.
$10,000 Over Life of Fund
Let's say hypothetically that $10,000 was invested in Fidelity Freedom Index 2025 Fund - Class W on October 2, 2009, when the fund started. The chart shows how the value of your investment would have changed, and also shows how the S&P 500 Index performed over the same period.
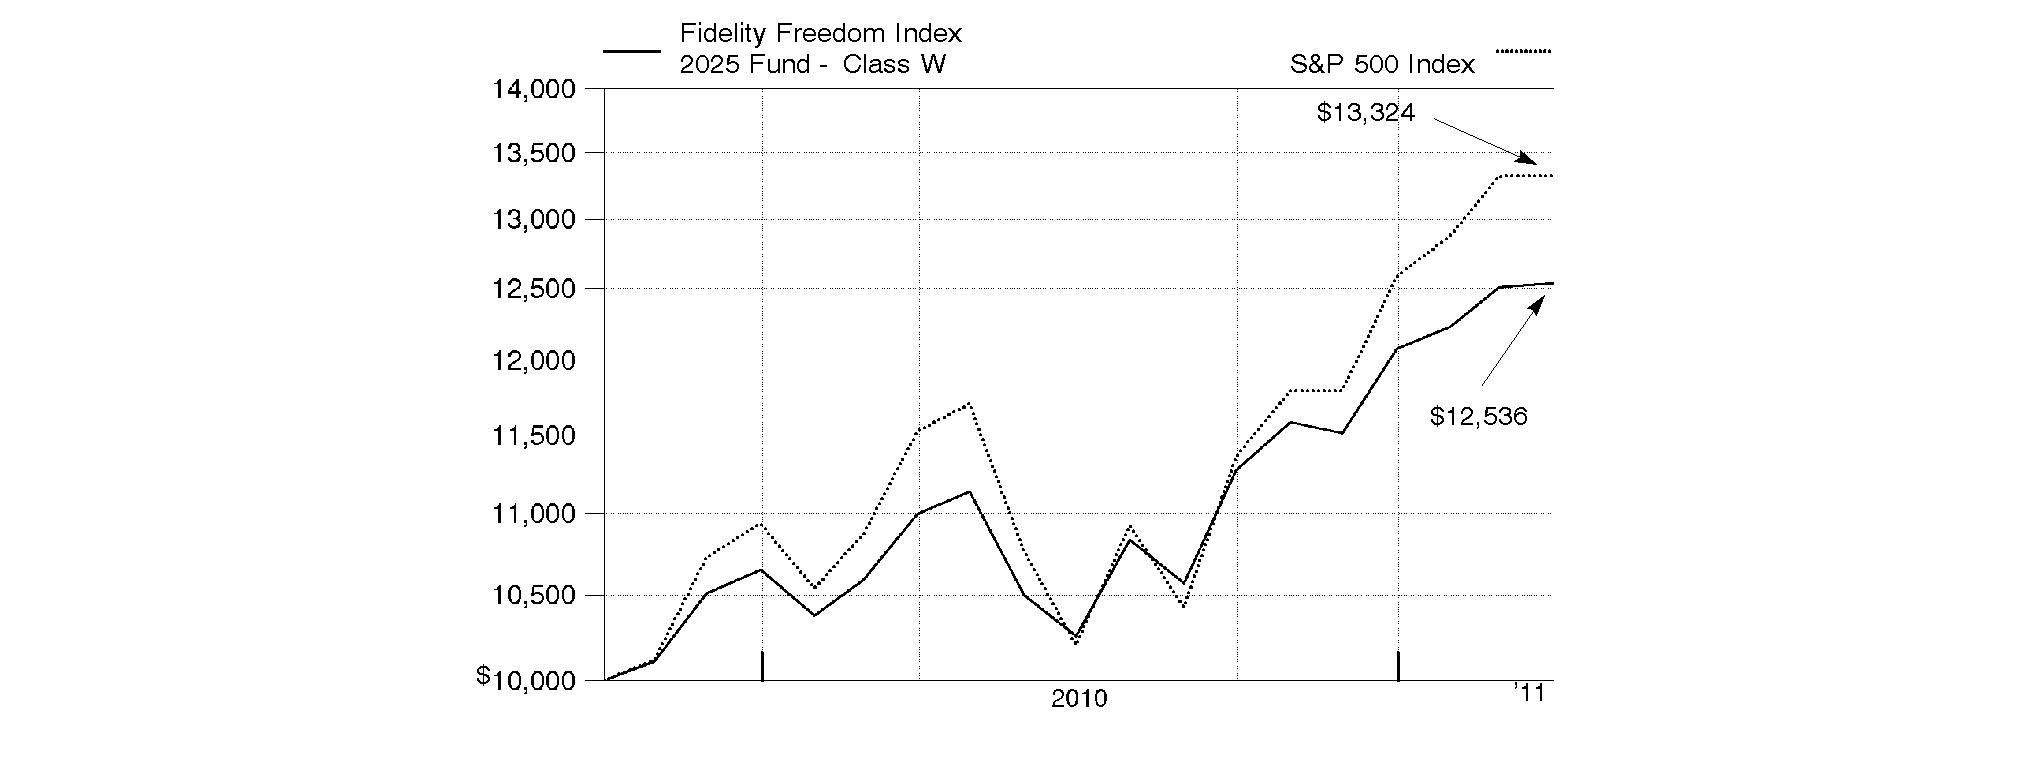
-
Annual Report
Fidelity Freedom Index 2030 Fund - Class W
Performance: The Bottom Line
Average annual total return reflects the change in the value of an investment, assuming reinvestment of the fund's distributions from dividend income and capital gains (the profits earned upon the sale of securities that have grown in value, if any) and assuming a constant rate of performance each year. The $10,000 table and the fund's returns do not reflect the deduction of taxes that a shareholder would pay on fund distributions or the redemption of fund shares. During periods of reimbursement by Fidelity, a fund's total return will be greater than it would be had the reimbursement not occurred. How a fund did yesterday is no guarantee of how it will do tomorrow.
Average Annual Total Returns
Periods ended March 31, 2011 | Past 1
year | Life of
fund A |
Fidelity Freedom Index 2030 Fund - Class W | 14.27% | 17.11% |
A From October 2, 2009.
$10,000 Over Life of Fund
Let's say hypothetically that $10,000 was invested in Fidelity Freedom Index 2030 Fund - Class W on October 2, 2009, when the fund started. The chart shows how the value of your investment would have changed, and also shows how the S&P 500 Index performed over the same period.
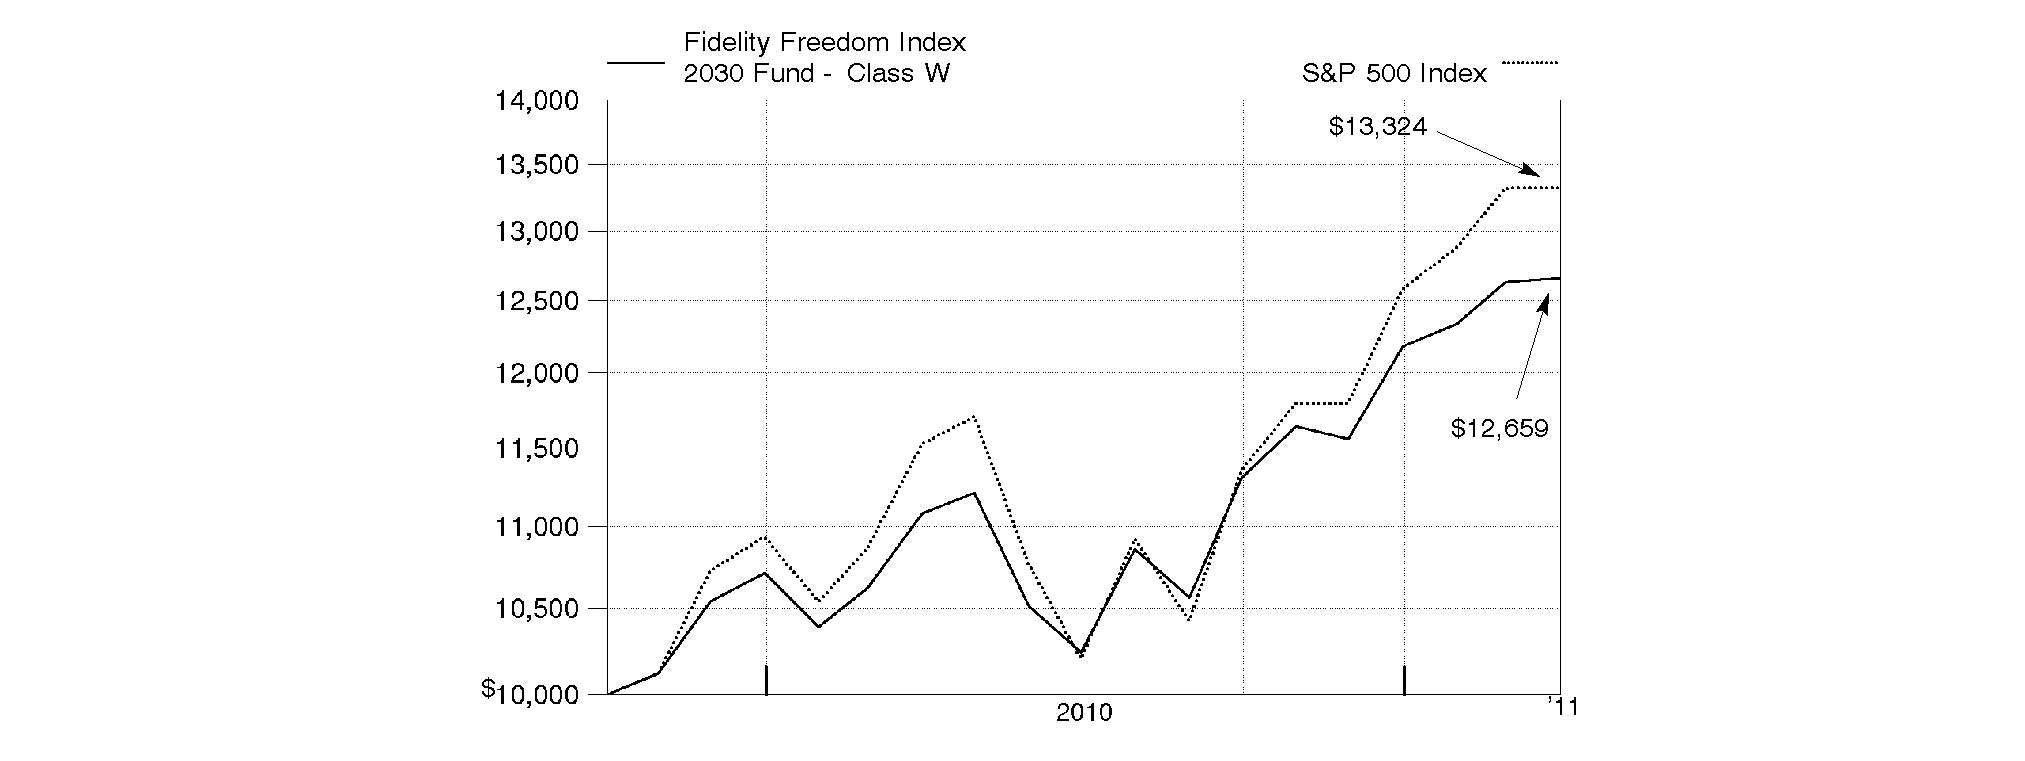
Annual Report
Fidelity Freedom Index 2035 Fund - Class W
Performance: The Bottom Line
Average annual total return reflects the change in the value of an investment, assuming reinvestment of the fund's distributions from dividend income and capital gains (the profits earned upon the sale of securities that have grown in value, if any) and assuming a constant rate of performance each year. The $10,000 table and the fund's returns do not reflect the deduction of taxes that a shareholder would pay on fund distributions or the redemption of fund shares. During periods of reimbursement by Fidelity, a fund's total return will be greater than it would be had the reimbursement not occurred. How a fund did yesterday is no guarantee of how it will do tomorrow.
Average Annual Total Returns
Periods ended March 31, 2011 | Past 1
year | Life of
fund A |
Fidelity Freedom Index 2035 Fund - Class W | 15.46% | 18.35% |
A From October 2, 2009.
$10,000 Over Life of Fund
Let's say hypothetically that $10,000 was invested in Fidelity Freedom Index 2035 Fund - Class W on October 2, 2009, when the fund started. The chart shows how the value of your investment would have changed, and also shows how the S&P 500 Index performed over the same period.
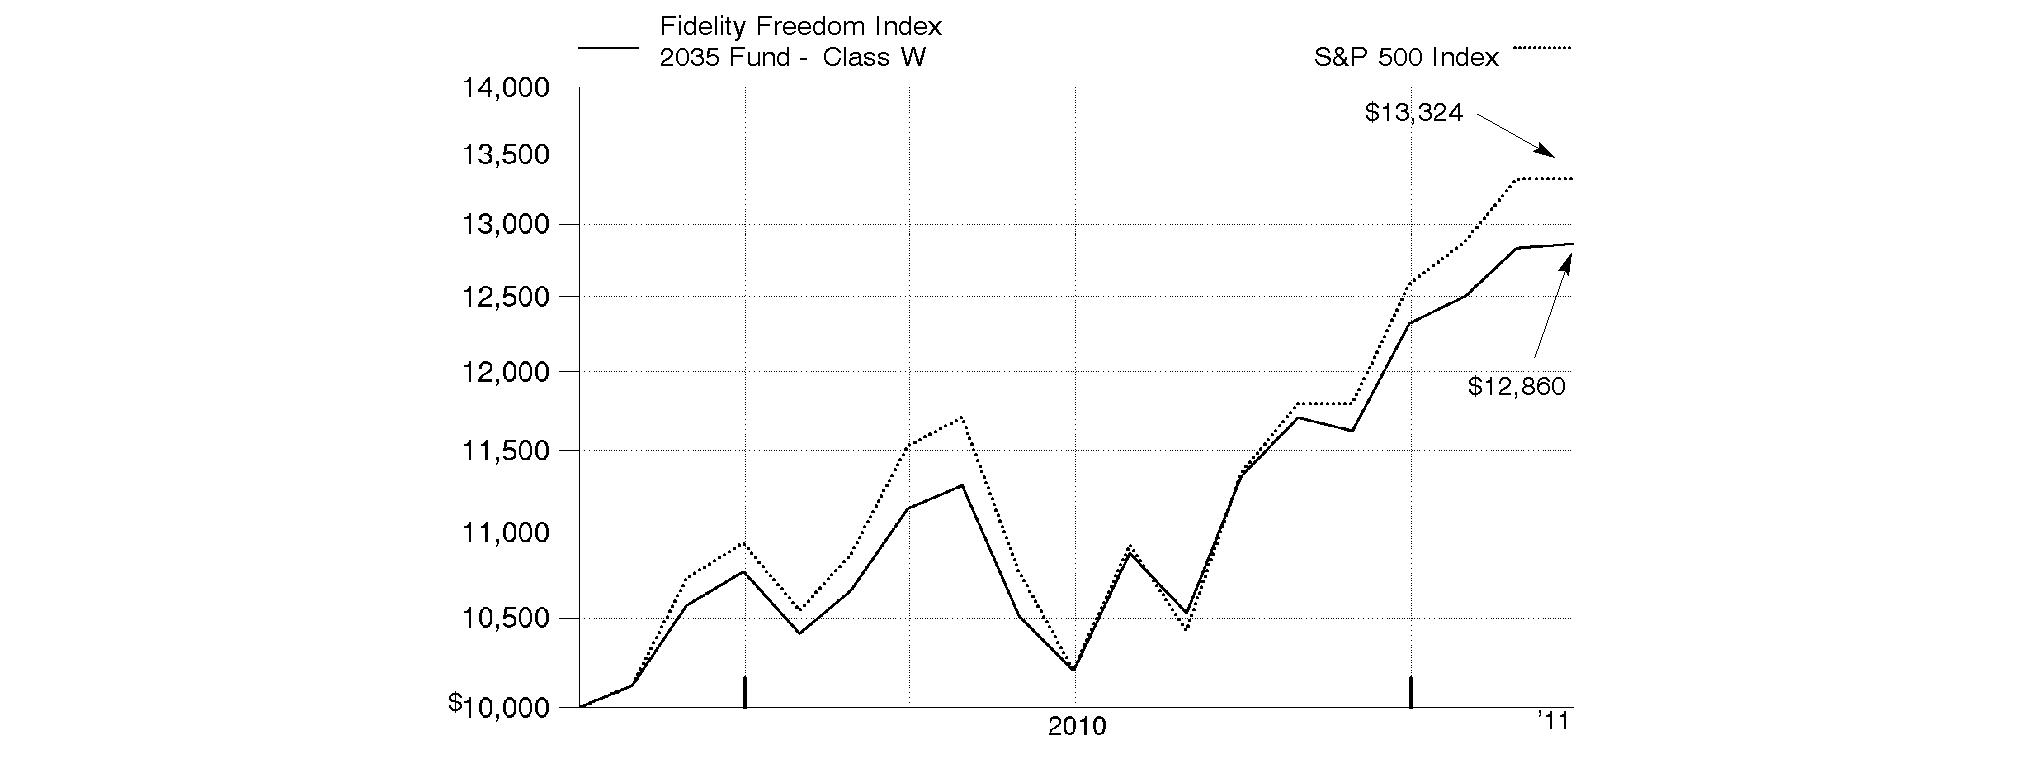
-
Annual Report
Fidelity Freedom Index 2040 Fund - Class W
Performance: The Bottom Line
Average annual total return reflects the change in the value of an investment, assuming reinvestment of the fund's distributions from dividend income and capital gains (the profits earned upon the sale of securities that have grown in value, if any) and assuming a constant rate of performance each year. The $10,000 table and the fund's returns do not reflect the deduction of taxes that a shareholder would pay on fund distributions or the redemption of fund shares. During periods of reimbursement by Fidelity, a fund's total return will be greater than it would be had the reimbursement not occurred. How a fund did yesterday is no guarantee of how it will do tomorrow.
Average Annual Total Returns
Periods ended March 31, 2011 | Past 1
year | Life of
fund A |
Fidelity Freedom Index 2040 Fund - Class W | 15.59% | 18.59% |
A From October 2, 2009.
$10,000 Over Life of Fund
Let's say hypothetically that $10,000 was invested in Fidelity Freedom Index 2040 Fund - Class W on October 2, 2009, when the fund started. The chart shows how the value of your investment would have changed, and also shows how the S&P 500 Index performed over the same period.
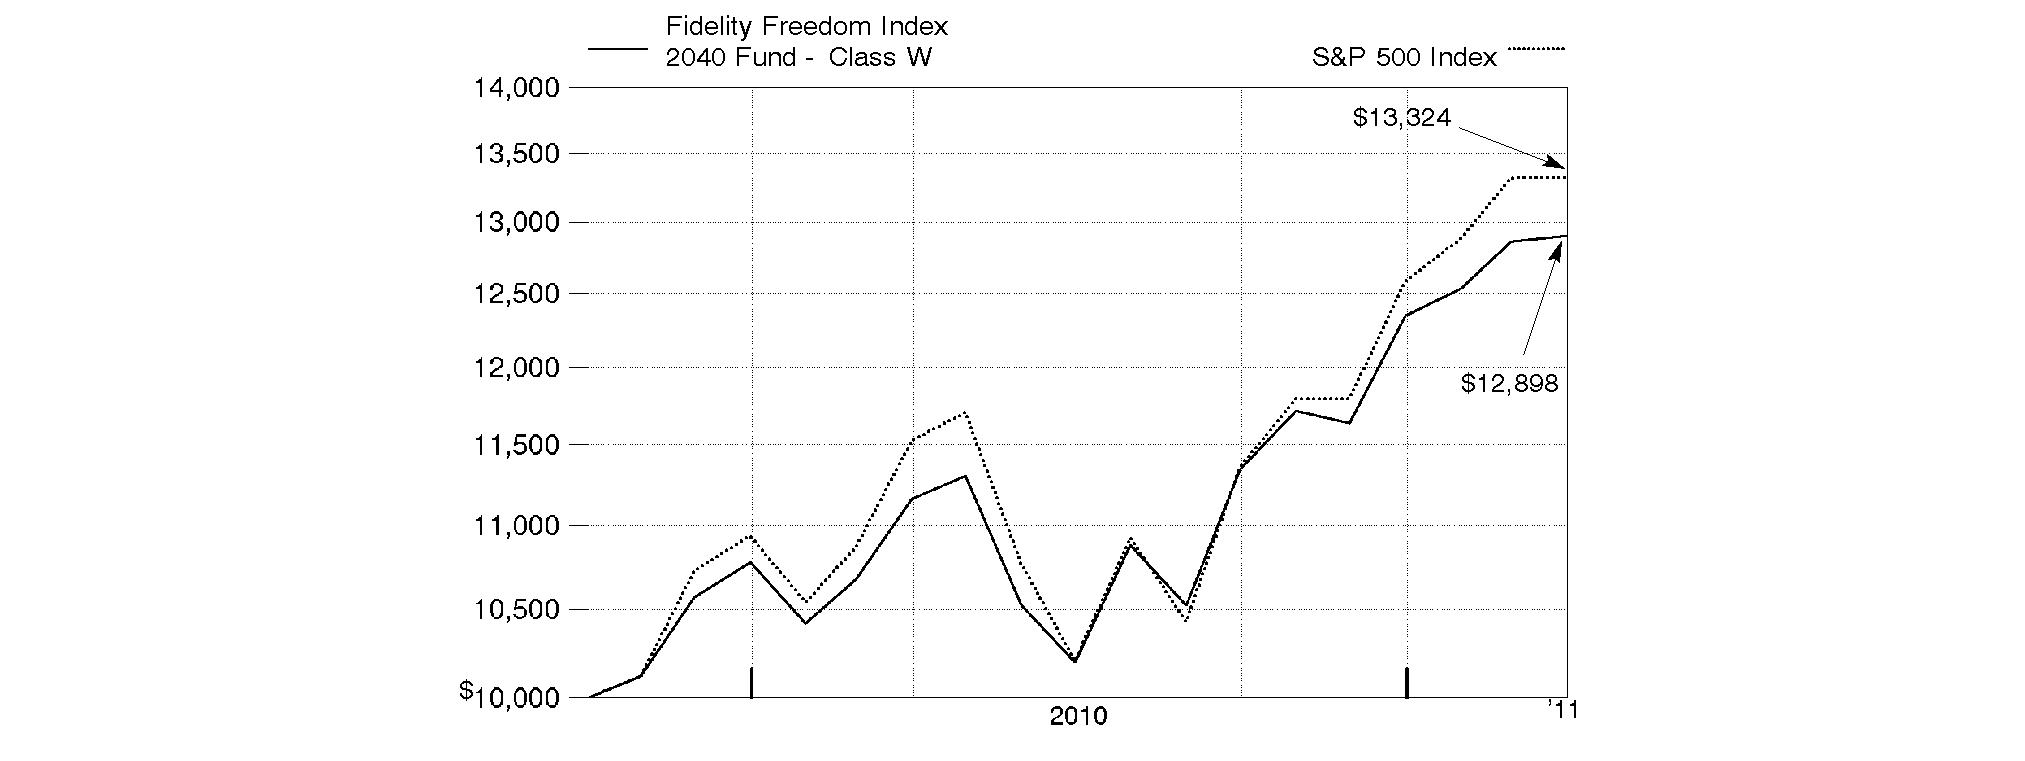
Annual Report
Fidelity Freedom Index 2045 Fund - Class W
Performance: The Bottom Line
Average annual total return reflects the change in the value of an investment, assuming reinvestment of the fund's distributions from dividend income and capital gains (the profits earned upon the sale of securities that have grown in value, if any) and assuming a constant rate of performance each year. The $10,000 table and the fund's returns do not reflect the deduction of taxes that a shareholder would pay on fund distributions or the redemption of fund shares. During periods of reimbursement by Fidelity, a fund's total return will be greater than it would be had the reimbursement not occurred. How a fund did yesterday is no guarantee of how it will do tomorrow.
Average Annual Total Returns
Periods ended March 31, 2011 | Past 1
year | Life of
fund A |
Fidelity Freedom Index 2045 Fund - Class W | 15.91% | 18.87% |
A From October 2, 2009.
$10,000 Over Life of Fund
Let's say hypothetically that $10,000 was invested in Fidelity Freedom Index 2045 Fund - Class W on October 2, 2009, when the fund started. The chart shows how the value of your investment would have changed, and also shows how the S&P 500 Index performed over the same period.
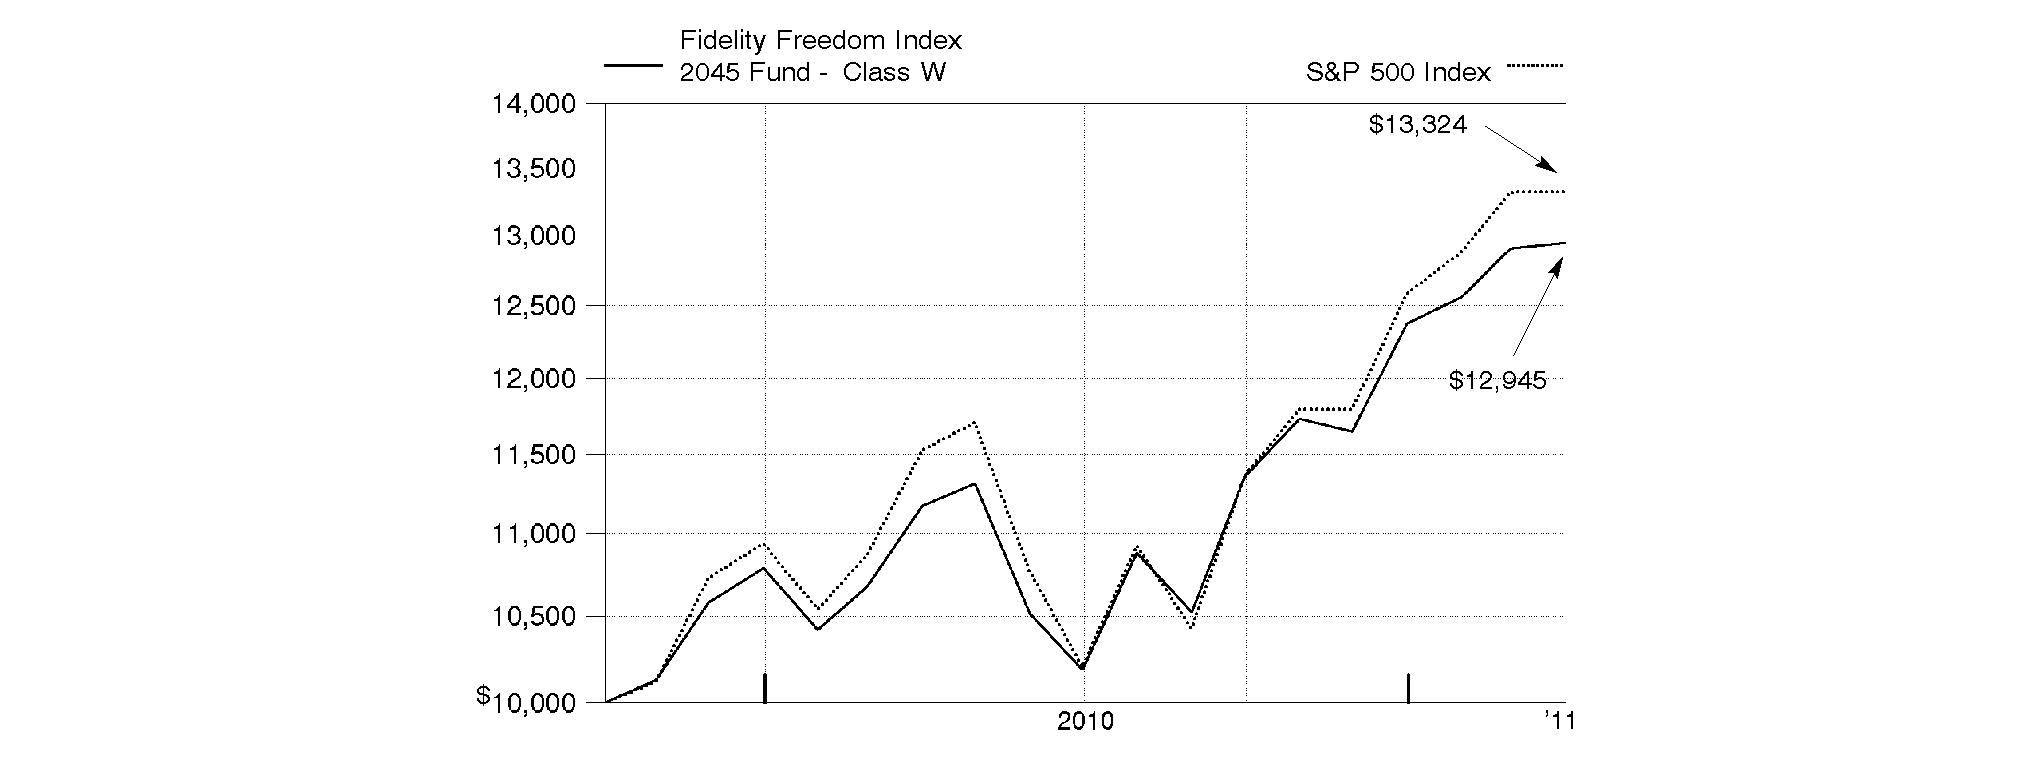
-
Annual Report
Fidelity Freedom Index 2050 Fund - Class W
Performance: The Bottom Line
Average annual total return reflects the change in the value of an investment, assuming reinvestment of the fund's distributions from dividend income and capital gains (the profits earned upon the sale of securities that have grown in value, if any) and assuming a constant rate of performance each year. The $10,000 table and the fund's returns do not reflect the deduction of taxes that a shareholder would pay on fund distributions or the redemption of fund shares. During periods of reimbursement by Fidelity, a fund's total return will be greater than it would be had the reimbursement not occurred. How a fund did yesterday is no guarantee of how it will do tomorrow.
Average Annual Total Returns
Periods ended March 31, 2011 | Past 1
year | Life of
fund A |
Fidelity Freedom Index 2050 Fund - Class W | 16.19% | 19.43% |
A From October 2, 2009.
$10,000 Over Life of Fund
Let's say hypothetically that $10,000 was invested in Fidelity Freedom Index 2050 Fund - Class W on October 2, 2009, when the fund started. The chart shows how the value of your investment would have changed, and also shows how the S&P 500 Index performed over the same period.
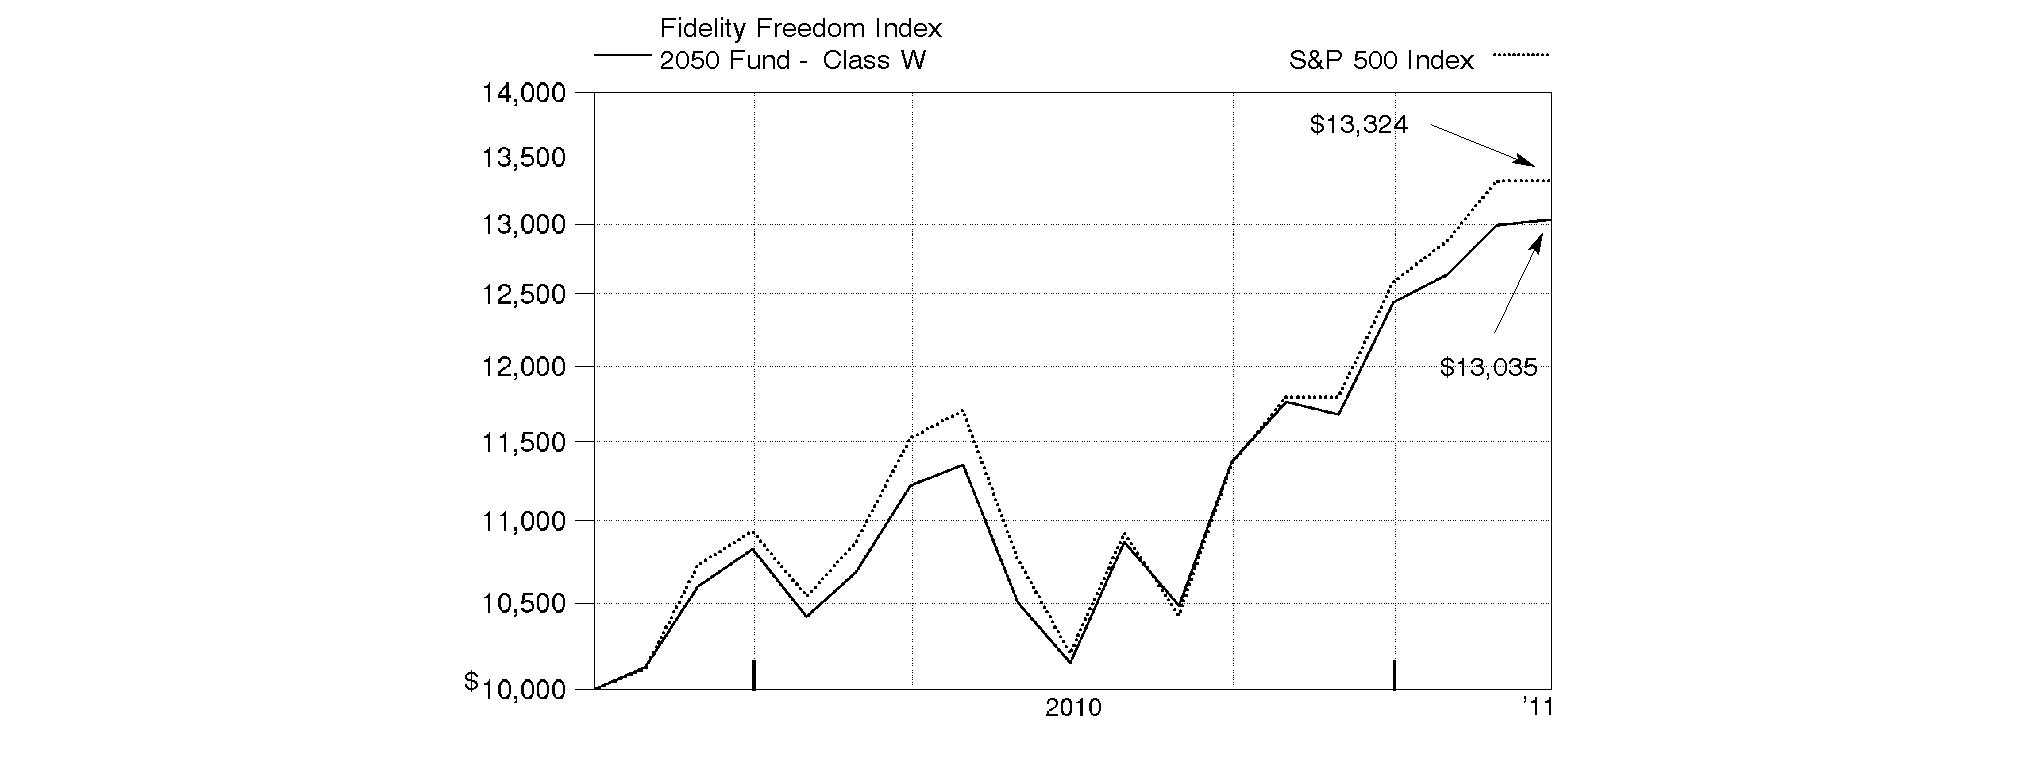
Annual Report
Market Recap: The 12-month period ending March 31, 2011, marked another good stretch for major equity markets, which continued a rally that began two years earlier. Despite early-period volatility brought on by the debt crisis in Europe and worries about a potential "double dip" recession in the U.S., stocks regained strength in late summer and fall, fueled by better-than-expected corporate earnings, encouraging economic activity, stimulative tax policies and the Federal Reserve's second round of quantitative easing involving the purchase of $600 billion in U.S. Treasuries. For the full period, the broad-based, large-cap-oriented S&P 500® Index posted a 15.65% gain, while its blue-chip counterpart, the Dow Jones Industrial AverageSM, rose 16.51% and the technology-laden Nasdaq Composite® Index added 17.06%. Within the S&P 500®, economically sensitive sectors generally saw the biggest gains, led by energy, materials and consumer discretionary. Telecommunication services stocks also rose sharply. By contrast, the financials and health care sectors showed only modest advances. Although global markets were rocked later in the period by heightened unrest in the Arab world and a devastating earthquake in Japan, foreign developed-markets equities, as represented by the MSCI® EAFE® (Europe, Australasia, Far East) Index, finished the year up 10.55%, significantly boosted by a weaker dollar. In the fixed-income area, investor appetite for higher-risk investments yielded solid returns. The BofA Merrill LynchSM US High Yield Constrained Index rose 14.14%, outpacing the 5.12% gain in the Barclays Capital® U.S. Aggregate Bond Index - a broad measure of the domestic investment-grade debt universe, which was held back by the weak returns of government securities.
Comments from Jonathan Shelon and Andrew Dierdorf, Co-Portfolio Managers of Fidelity FreedomSM Index Funds: Each of the Freedom Index Funds' Class W shares delivered a positive result for the one-year period ending March 31, 2011. (For specific Fund results, please refer to the performance section of this report.) The longer-dated Funds, which include more exposure to the U.S. equity and non-U.S. equity asset classes, posted higher returns than the Funds with larger allocations to the investment-grade debt and short-term debt asset classes. In terms of absolute results, the equity asset classes - which includes U.S. equities, non-U.S. equities and commodities - drove performance, with the longer-dated Funds delivering the largest gains for the 12 months ending March 31, 2011. Representing the broad U.S. equity market, the Funds' underlying holding, Spartan® Total Market Index Fund Class F, gained 17.63%. Each of the fund's 10 sectors ended the period well into positive territory, with five sectors turning in results greater than 22%. Energy led the way with a roughly 41% increase. Within commodities, Fidelity® Series Commodity Strategy Fund Class F provided a return of 27.87% during the period, boosted by rising prices for agriculture and precious metals worldwide. Meanwhile, in the non-U.S. equity class, Fidelity® Series Global Ex U.S. Index Fund, which invests in both developed and emerging-markets equities, rose 12.65%. Much of this gain was driven in large part by growth in emerging markets during the second half of the period. Turning to bonds, both investment-grade debt and short-term debt delivered strong results during the first half of the period. However, as interest rates moved higher in the second half, bonds struggled. Despite this challenging environment, these asset categories posted solid results for the one-year period. Fidelity U.S. Bond Index Fund Class F, which is the Funds' investment-grade debt holding, increased 5.08%. For the same time period, Fidelity Series Inflation-Protected Bond Index Fund Class F, which represents the Funds' Treasury Inflation-Protected Securities (TIPS) investment, returned 6.67%. Turning to the Funds' short-term debt category, Fidelity Institutional Money Market Portfolio Class F gained a modest 0.27%.
Note to shareholders: Effective December 1, 2010, Fidelity Freedom Index Funds - Class K was renamed Fidelity Freedom Index Funds - Class W. The features and policies of the class have not changed.
The views expressed above reflect those of the portfolio manager(s) only through the end of the period as stated on the cover of this report and do not necessarily represent the views of Fidelity or any other person in the Fidelity organization. Any such views are subject to change at any time based upon market or other conditions and Fidelity disclaims any responsibility to update such views. These views may not be relied on as investment advice and, because investment decisions for a Fidelity fund are based on numerous factors, may not be relied on as an indication of trading intent on behalf of any Fidelity fund.
Annual Report
As a shareholder of a Fund, you incur two types of costs: (1) transaction costs, and (2) ongoing costs, including other Fund expenses. This Example is intended to help you understand your ongoing costs (in dollars) of investing in the Funds and to compare these costs with the ongoing costs of investing in other mutual funds.
The Example is based on an investment of $1,000 invested at the beginning of the period and held for the entire period (October 1, 2010 to March 31, 2011).
Actual Expenses
The first line of the accompanying table for each fund provides information about actual account values and actual expenses. You may use the information in this line, together with the amount you invested, to estimate the expenses that you paid over the period. Simply divide your account value by $1,000.00 (for example, an $8,600 account value divided by $1,000.00 = 8.6), then multiply the result by the number in the first line for a fund under the heading entitled "Expenses Paid During Period" to estimate the expenses you paid on your account during this period. In addition, each Fund, as a shareholder in underlying Fidelity Funds, will indirectly bear its pro-rata share of the fees and expenses incurred by the underlying Fidelity Funds. These fees and expenses are not included in each Fund's annualized expense ratio used to calculate the expense estimates in the table below.
Hypothetical Example for Comparison Purposes
The second line of the accompanying table for each fund provides information about hypothetical account values and hypothetical expenses based on a fund's actual expense ratio and an assumed rate of return of 5% per year before expenses, which is not the Fund's actual return. The hypothetical account values and expenses may not be used to estimate the actual ending account balance or expenses you paid for the period. You may use this information to compare the ongoing costs of investing in the Fund and other funds. To do so, compare this 5% hypothetical example with the 5% hypothetical examples that appear in the shareholder reports of the other funds. In addition, each Fund, as a shareholder in underlying Fidelity Funds, will indirectly bear its pro-rata share of the fees and expenses incurred by the underlying Fidelity Funds. These fees and expenses are not included in each Fund's annualized expense ratio used to calculate the expense estimates in the table below.
Please note that the expenses shown in the table are meant to highlight your ongoing costs only and do not reflect any transaction costs. Therefore, the second line of the table is useful in comparing ongoing costs only, and will not help you determine the relative total costs of owning different funds.
| Annualized
Expense
Ratio | Beginning
Account Value
October 1, 2010 | Ending
Account Value
March 31, 2011 | Expenses Paid
During Period*
October 1, 2010 to
March 31, 2011 |
Fidelity Freedom Index Income Fund | .06% | | | |
Actual | | $ 1,000.00 | $ 1,032.20 | $ .30 |
HypotheticalA | | $ 1,000.00 | $ 1,024.63 | $ .30 |
Fidelity Freedom Index 2000 Fund | .06% | | | |
Actual | | $ 1,000.00 | $ 1,034.30 | $ .30 |
HypotheticalA | | $ 1,000.00 | $ 1,024.63 | $ .30 |
Fidelity Freedom Index 2005 Fund | .06% | | | |
Actual | | $ 1,000.00 | $ 1,069.30 | $ .31 |
HypotheticalA | | $ 1,000.00 | $ 1,024.63 | $ .30 |
Fidelity Freedom Index 2010 Fund | .06% | | | |
Actual | | $ 1,000.00 | $ 1,080.30 | $ .31 |
HypotheticalA | | $ 1,000.00 | $ 1,024.63 | $ .30 |
Fidelity Freedom Index 2015 Fund | .06% | | | |
Actual | | $ 1,000.00 | $ 1,082.40 | $ .31 |
HypotheticalA | | $ 1,000.00 | $ 1,024.63 | $ .30 |
Fidelity Freedom Index 2020 Fund | .06% | | | |
Actual | | $ 1,000.00 | $ 1,098.60 | $ .31 |
HypotheticalA | | $ 1,000.00 | $ 1,024.63 | $ .30 |
Fidelity Freedom Index 2025 Fund | .06% | | | |
Actual | | $ 1,000.00 | $ 1,112.40 | $ .32 |
HypotheticalA | | $ 1,000.00 | $ 1,024.63 | $ .30 |
Fidelity Freedom Index 2030 Fund | .06% | | | |
Actual | | $ 1,000.00 | $ 1,119.90 | $ .32 |
HypotheticalA | | $ 1,000.00 | $ 1,024.63 | $ .30 |
| Annualized
Expense
Ratio | Beginning
Account Value
October 1, 2010 | Ending
Account Value
March 31, 2011 | Expenses Paid
During Period*
October 1, 2010 to
March 31, 2011 |
Fidelity Freedom Index 2035 Fund | .06% | | | |
Actual | | $ 1,000.00 | $ 1,134.30 | $ .32 |
HypotheticalA | | $ 1,000.00 | $ 1,024.63 | $ .30 |
Fidelity Freedom Index 2040 Fund | .05% | | | |
Actual | | $ 1,000.00 | $ 1,137.30 | $ .27 |
HypotheticalA | | $ 1,000.00 | $ 1,024.68 | $ .25 |
Fidelity Freedom Index 2045 Fund | .06% | | | |
Actual | | $ 1,000.00 | $ 1,140.30 | $ .32 |
HypotheticalA | | $ 1,000.00 | $ 1,024.63 | $ .30 |
Fidelity Freedom Index 2050 Fund | .05% | | | |
Actual | | $ 1,000.00 | $ 1,147.00 | $ .27 |
HypotheticalA | | $ 1,000.00 | $ 1,024.68 | $ .25 |
A 5% return per year before expenses
* Expenses are equal to each Fund's annualized expense ratio, multiplied by the average account value over the period, multiplied by 182/365 (to reflect the one-half year period).
The fees and expenses of the underlying Fidelity Funds in which the Funds invest are not included in the Fund's annualized expense ratio.
Annual Report
Fidelity Freedom Index Income Fund
Investment Changes (Unaudited)
Fund Holdings as of March 31, 2011 |
| % of fund's
net assets | % of fund's net assets
6 months ago |
Commodity Funds | | |
Fidelity Series Commodity Strategy Fund Class F | 2.0 | 2.0 |
Domestic Equity Funds | | |
Fidelity Spartan Total Market Index Fund Class F | 12.6 | 13.3 |
Developed International Equity Funds | | |
Fidelity Series Global ex U.S. Index Fund | 5.4 | 4.6 |
Inflation-Protected Bond Funds | | |
Fidelity Series Inflation-Protected Bond Index Fund Class F | 12.0 | 12.0 |
Investment Grade Bond Funds | | |
Fidelity U.S. Bond Index Fund Class F | 28.0 | 28.1 |
Short-Term Funds | | |
Fidelity Institutional Money Market Portfolio Class F | 40.0 | 40.0 |
Net Other Assets (Liabilities)* | 0.0 | 0.0 |
| 100.0 | 100.0 |
* Amount represents less than 0.1%
Asset Allocation (% of fund's net assets) |
Current |
 | Commodity Funds | 2.0% | |
| Domestic Equity Funds | 12.6% | |
| Developed International Equity Funds | 5.4% | |
| Inflation-Protected Bond Funds | 12.0% | |
| Investment Grade Bond Funds | 28.0% | |
| Short-Term Funds | 40.0% | |

Six months ago |
| Commodity Funds | 2.0% | |
| Domestic Equity Funds | 13.3% | |
| Developed International Equity Funds | 4.6% | |
| Inflation-Protected Bond Funds | 12.0% | |
| Investment Grade Bond Funds | 28.1% | |
| Short-Term Funds | 40.0% | |

Expected |
| Commodity Funds | 2.0% | |
| Domestic Equity Funds | 12.6% | |
| Developed International Equity Funds | 5.4% | |
| Inflation-Protected Bond Funds | 12.0% | |
| Investment Grade Bond Funds | 28.0% | |
| Short-Term Funds | 40.0% | |

The six months ago allocation is based on the fund's holdings as of September 30, 2010. The current allocation is based on the fund's holdings as of March 31, 2011. The expected allocation represents the fund's anticipated allocation at September 30, 2011. |
Annual Report
Fidelity Freedom Index Income Fund
Investments March 31, 2011
Showing Percentage of Net Assets
Domestic Equity Funds - 14.6% |
| Shares | | Value |
Commodity Funds - 2.0% |
Fidelity Series Commodity Strategy Fund Class F | 59,354 | | $ 784,064 |
Domestic Equity Funds - 12.6% |
Fidelity Spartan Total Market Index Fund Class F | 125,207 | | 4,849,262 |
TOTAL DOMESTIC EQUITY FUNDS (Cost $5,032,663) | 5,633,326 |
International Equity Funds - 5.4% |
| | | |
Developed International Equity Funds - 5.4% |
Fidelity Series Global ex U.S. Index Fund
(Cost $1,920,017) | 178,223 | | 2,076,297 |
Bond Funds - 40.0% |
| | | |
Inflation-Protected Bond Funds - 12.0% |
Fidelity Series Inflation-Protected Bond Index Fund Class F | 427,706 | | 4,627,775 |
|
| Shares | | Value |
Investment Grade Bond Funds - 28.0% |
Fidelity U.S. Bond Index Fund Class F | 957,044 | | $ 10,795,461 |
TOTAL BOND FUNDS (Cost $15,278,051) | 15,423,236 |
Short-Term Funds - 40.0% |
| | | |
Fidelity Institutional Money Market Portfolio Class F
(Cost $15,409,849) | 15,409,849 | | 15,409,849 |
TOTAL INVESTMENT PORTFOLIO - 100.0% (Cost $37,640,580) | | 38,542,708 |
NET OTHER ASSETS (LIABILITIES) - 0.0% | | (2,571) |
NET ASSETS - 100% | $ 38,540,137 |
Other Information |
All investments are categorized as Level 1 under the Fair Value Hierarchy. The inputs or methodology used for valuing securities may not be an indication of the risk associated with investing in those securities. For more information on valuation inputs, please refer to the Security Valuation section in the accompanying Notes to Financial Statements. |
See accompanying notes which are an integral part of the financial statements.
Annual Report
Fidelity Freedom Index Income Fund
Statement of Assets and Liabilities
| March 31, 2011 |
| | |
Assets | | |
Investment in securities, at value (cost $37,640,580) - See accompanying schedule | | $ 38,542,708 |
Cash | | 7 |
Receivable for investments sold | | 81,452 |
Receivable for fund shares sold | | 12,524 |
Receivable from affiliate for expense reductions | | 2,322 |
Total assets | | 38,639,013 |
| | |
Liabilities | | |
Payable for investments purchased | $ 18,578 | |
Payable for fund shares redeemed | 75,399 | |
Other affiliated payables | 4,899 | |
Total liabilities | | 98,876 |
| | |
Net Assets | | $ 38,540,137 |
Net Assets consist of: | | |
Paid in capital | | $ 37,615,824 |
Undistributed net investment income | | 38,777 |
Accumulated undistributed net realized gain (loss) on investments | | (16,592) |
Net unrealized appreciation (depreciation) on investments | | 902,128 |
Net Assets, for 3,587,214 shares outstanding | | $ 38,540,137 |
Net Asset Value, offering price and redemption price per share ($38,540,137 ÷ 3,587,214 shares) | | $ 10.74 |
Statement of Operations
| Year ended March 31, 2011 |
| | |
Investment Income | | |
Income distributions from underlying funds | | $ 244,519 |
| | |
Expenses | | |
Transfer agent fees | $ 15,032 | |
Independent trustees' compensation | 57 | |
Total expenses before reductions | 15,089 | |
Expense reductions | (4,870) | 10,219 |
Net investment income (loss) | | 234,300 |
Realized and Unrealized Gain (Loss) Realized gain (loss) on sale of underlying fund shares | (19,735) | |
Capital gain distributions from underlying funds | 65,404 | |
Total net realized gain (loss) | | 45,669 |
Change in net unrealized appreciation (depreciation) on investment securities | | 865,945 |
Net gain (loss) | | 911,614 |
Net increase (decrease) in net assets resulting from operations | | $ 1,145,914 |
See accompanying notes which are an integral part of the financial statements.
Annual Report
Fidelity Freedom Index Income Fund - Class W
Financial Statements - continued
Statement of Changes in Net Assets
| Year ended
March 31,
2011 | For the period
October 2, 2009
(commencement of operations) to
March 31,
2010 |
Increase (Decrease) in Net Assets | | |
Operations | | |
Net investment income (loss) | $ 234,300 | $ 17,172 |
Net realized gain (loss) | 45,669 | 2,305 |
Change in net unrealized appreciation (depreciation) | 865,945 | 36,183 |
Net increase (decrease) in net assets resulting from operations | 1,145,914 | 55,660 |
Distributions to shareholders from net investment income | (204,482) | (7,568) |
Distributions to shareholders from net realized gain | (65,112) | (100) |
Total distributions | (269,594) | (7,668) |
Share transactions
Proceeds from sales of shares | 38,200,684 | 6,763,552 |
Reinvestment of distributions | 269,594 | 7,668 |
Cost of shares redeemed | (7,207,743) | (417,930) |
Net increase (decrease) in net assets resulting from share transactions | 31,262,535 | 6,353,290 |
Total increase (decrease) in net assets | 32,138,855 | 6,401,282 |
| | |
Net Assets | | |
Beginning of period | 6,401,282 | - |
End of period (including undistributed net investment income of $38,777 and undistributed net investment income of $9,604, respectively) | $ 38,540,137 | $ 6,401,282 |
Other Information Shares | | |
Sold | 3,618,341 | 661,779 |
Issued in reinvestment of distributions | 25,573 | 753 |
Redeemed | (678,574) | (40,658) |
Net increase (decrease) | 2,965,340 | 621,874 |
Financial Highlights
Years ended March 31, | 2011 | 2010 E |
Selected Per-Share Data | | |
Net asset value, beginning of period | $ 10.29 | $ 10.00 |
Income from Investment Operations | | |
Net investment income (loss) D | .13 | .06 |
Net realized and unrealized gain (loss) | .47 | .30 |
Total from investment operations | .60 | .36 |
Distributions from net investment income | (.12) | (.07) |
Distributions from net realized gain | (.03) | (.01) |
Total distributions | (.15) | (.07) H |
Net asset value, end of period | $ 10.74 | $ 10.29 |
Total Return B,C | 5.89% | 3.62% |
Ratios to Average Net Assets F,G | | |
Expenses before reductions | .08% | .05% A |
Expenses net of fee waivers, if any | .06% | .04% A |
Expenses net of all reductions | .06% | .04% A |
Net investment income (loss) | 1.27% | 1.13% A |
Supplemental Data | | |
Net assets, end of period (000 omitted) | $ 38,540 | $ 6,401 |
Portfolio turnover rate | 36% | 18% |
A Annualized B Total returns for periods of less than one year are not annualized. C Total returns would have been lower had certain expenses not been reduced during the periods shown. D Calculated based on average shares outstanding during the period. E For the period October 2, 2009 (commencement of operations) to March 31, 2010. F Expense ratios reflect operating expenses of the Fund. Expenses before reductions do not reflect amounts reimbursed by the investment adviser or reductions from expense offset arrangements and do not represent the amount paid by the Fund during periods when reimbursements or reductions occur. Expense ratios before reductions for start-up periods may not be representative of longer term operating periods. Expenses net of fee waivers reflect expenses after reimbursement by the investment adviser but prior to reductions from expense offset arrangements. Expenses net of all reductions represent the net expenses paid by the Fund, but do not include expenses of the investment companies in which the Fund invests. G Amounts do not include the activity of the underlying funds. H Total distributions of $.07 per share is comprised of distributions from net investment income of $.066 and distributions from net realized gain of $.005 per share. |
See accompanying notes which are an integral part of the financial statements.
Annual Report
Fidelity Freedom Index 2000 Fund
Investment Changes (Unaudited)
Fund Holdings as of March 31, 2011 |
| % of fund's
net assets | % of fund's net assets
6 months ago |
Commodity Funds | | |
Fidelity Series Commodity Strategy Fund Class F | 2.2 | 2.3 |
Domestic Equity Funds | | |
Fidelity Spartan Total Market Index Fund Class F | 13.0 | 14.0 |
Developed International Equity Funds | | |
Fidelity Series Global ex U.S. Index Fund | 5.6 | 4.9 |
Inflation-Protected Bond Funds | | |
Fidelity Series Inflation-Protected Bond Index Fund Class F | 11.7 | 11.5 |
Investment Grade Bond Funds | | |
Fidelity U.S. Bond Index Fund Class F | 27.6 | 27.4 |
Short-Term Funds | | |
Fidelity Institutional Money Market Portfolio Class F | 39.9 | 39.9 |
Net Other Assets (Liabilities)* | 0.0 | 0.0 |
| 100.0 | 100.0 |
* Amount represents less than 0.1%
Asset Allocation (% of fund's net assets) |
Current |
| Commodity Funds | 2.2% | |
 | Domestic Equity Funds | 13.0% | |
| Developed International Equity Funds | 5.6% | |
 | Inflation-Protected Bond Funds | 11.7% | |
| Investment Grade Bond Funds | 27.6% | |
| Short-Term Funds | 39.9% | |

Six months ago |
| Commodity Funds | 2.3% | |
| Domestic Equity Funds | 14.0% | |
| Developed International Equity Funds | 4.9% | |
| Inflation-Protected Bond Funds | 11.5% | |
| Investment Grade Bond Funds | 27.4% | |
| Short-Term Funds | 39.9% | |

Expected |
| Commodity Funds | 2.1% | |
| Domestic Equity Funds | 12.7% | |
| Developed International Equity Funds | 5.4% | |
| Inflation-Protected Bond Funds | 11.9% | |
| Investment Grade Bond Funds | 27.9% | |
| Short-Term Funds | 40.0% | |

The fund invests according to an asset allocation strategy that becomes increasingly conservative over time. The six months ago allocation is based on the fund's holdings as of September 30, 2010. The current allocation is based on the fund's holdings as of March 31, 2011. The expected allocation represents the fund's anticipated allocation at September 30, 2011. |
Annual Report
Fidelity Freedom Index 2000 Fund
Investments March 31, 2011
Showing Percentage of Net Assets
Domestic Equity Funds - 15.2% |
| Shares | | Value |
Commodity Funds - 2.2% |
Fidelity Series Commodity Strategy Fund Class F | 43,586 | | $ 575,766 |
Domestic Equity Funds - 13.0% |
Fidelity Spartan Total Market Index Fund Class F | 85,634 | | 3,316,589 |
TOTAL DOMESTIC EQUITY FUNDS (Cost $3,453,066) | 3,892,355 |
International Equity Funds - 5.6% |
| | | |
Developed International Equity Funds - 5.6% |
Fidelity Series Global ex U.S. Index Fund
(Cost $1,302,120) | 121,924 | | 1,420,419 |
Bond Funds - 39.3% |
| | | |
Inflation-Protected Bond Funds - 11.7% |
Fidelity Series Inflation-Protected Bond Index Fund Class F | 277,778 | | 3,005,561 |
|
| Shares | | Value |
Investment Grade Bond Funds - 27.6% |
Fidelity U.S. Bond Index Fund Class F | 626,219 | | $ 7,063,753 |
TOTAL BOND FUNDS (Cost $9,984,331) | 10,069,314 |
Short-Term Funds - 39.9% |
| | | |
Fidelity Institutional Money Market Portfolio Class F
(Cost $10,225,776) | 10,225,776 | | 10,225,776 |
TOTAL INVESTMENT PORTFOLIO - 100.0% (Cost $24,965,293) | | 25,607,864 |
NET OTHER ASSETS (LIABILITIES) - 0.0% | | (1,561) |
NET ASSETS - 100% | $ 25,606,303 |
Other Information |
All investments are categorized as Level 1 under the Fair Value Hierarchy. The inputs or methodology used for valuing securities may not be an indication of the risk associated with investing in those securities. For more information on valuation inputs, please refer to the Security Valuation section in the accompanying Notes to Financial Statements. |
See accompanying notes which are an integral part of the financial statements.
Annual Report
Fidelity Freedom Index 2000 Fund
Statement of Assets and Liabilities
| March 31, 2011 |
| | |
Assets | | |
Investment in securities, at value (cost $24,965,293) - See accompanying schedule | | $ 25,607,864 |
Cash | | 2 |
Receivable for investments sold | | 75,724 |
Receivable for fund shares sold | | 15,827 |
Receivable from affiliate for expense reductions | | 1,456 |
Total assets | | 25,700,873 |
| | |
Liabilities | | |
Payable for investments purchased | $ 6,865 | |
Payable for fund shares redeemed | 84,685 | |
Other affiliated payables | 3,020 | |
Total liabilities | | 94,570 |
| | |
Net Assets | | $ 25,606,303 |
Net Assets consist of: | | |
Paid in capital | | $ 24,902,135 |
Undistributed net investment income | | 44,469 |
Accumulated undistributed net realized gain (loss) on investments | | 17,128 |
Net unrealized appreciation (depreciation) on investments | | 642,571 |
Net Assets, for 2,372,143 shares outstanding | | $ 25,606,303 |
Net Asset Value, offering price and redemption price per share ($25,606,303 ÷ 2,372,143 shares) | | $ 10.79 |
Statement of Operations
| Year ended March 31, 2011 |
| | |
Investment Income | | |
Income distributions from underlying funds | | $ 173,399 |
| | |
Expenses | | |
Transfer agent fees | $ 10,230 | |
Independent trustees' compensation | 43 | |
Total expenses before reductions | 10,273 | |
Expense reductions | (3,473) | 6,800 |
Net investment income (loss) | | 166,599 |
Realized and Unrealized Gain (Loss) Realized gain (loss) on sale of underlying fund shares | 21,363 | |
Capital gain distributions from underlying funds | 47,800 | |
Total net realized gain (loss) | | 69,163 |
Change in net unrealized appreciation (depreciation) on investment securities | | 599,095 |
Net gain (loss) | | 668,258 |
Net increase (decrease) in net assets resulting from operations | | $ 834,857 |
See accompanying notes which are an integral part of the financial statements.
Annual Report
Fidelity Freedom Index 2000 Fund - Class W
Financial Statements - continued
Statement of Changes in Net Assets
| Year ended
March 31,
2011 | For the period
October 2, 2009
(commencement of operations) to
March 31,
2010 |
Increase (Decrease) in Net Assets | | |
Operations | | |
Net investment income (loss) | $ 166,599 | $ 18,234 |
Net realized gain (loss) | 69,163 | 3,463 |
Change in net unrealized appreciation (depreciation) | 599,095 | 43,476 |
Net increase (decrease) in net assets resulting from operations | 834,857 | 65,173 |
Distributions to shareholders from net investment income | (139,164) | (1,200) |
Distributions to shareholders from net realized gain | (55,398) | (100) |
Total distributions | (194,562) | (1,300) |
Share transactions
Proceeds from sales of shares | 21,935,698 | 7,585,006 |
Reinvestment of distributions | 194,562 | 1,300 |
Cost of shares redeemed | (4,005,270) | (809,161) |
Net increase (decrease) in net assets resulting from share transactions | 18,124,990 | 6,777,145 |
Total increase (decrease) in net assets | 18,765,285 | 6,841,018 |
| | |
Net Assets | | |
Beginning of period | 6,841,018 | - |
End of period (including undistributed net investment income of $44,469 and undistributed net investment income of $17,034, respectively) | $ 25,606,303 | $ 6,841,018 |
Other Information Shares | | |
Sold | 2,067,654 | 741,203 |
Issued in reinvestment of distributions | 18,385 | 128 |
Redeemed | (376,575) | (78,652) |
Net increase (decrease) | 1,709,464 | 662,679 |
Financial Highlights
Years ended March 31, | 2011 | 2010 E |
Selected Per-Share Data | | |
Net asset value, beginning of period | $ 10.32 | $ 10.00 |
Income from Investment Operations | | |
Net investment income (loss) D | .13 | .05 |
Net realized and unrealized gain (loss) | .49 | .34 |
Total from investment operations | .62 | .39 |
Distributions from net investment income | (.11) | (.06) |
Distributions from net realized gain | (.04) | (.01) |
Total distributions | (.15) | (.07) |
Net asset value, end of period | $ 10.79 | $ 10.32 |
Total Return B,C | 6.00% | 3.86% |
Ratios to Average Net Assets F,G | | |
Expenses before reductions | .08% | .05% A |
Expenses net of fee waivers, if any | .05% | .04% A |
Expenses net of all reductions | .05% | .04% A |
Net investment income (loss) | 1.25% | 1.09% A |
Supplemental Data | | |
Net assets, end of period (000 omitted) | $ 25,606 | $ 6,841 |
Portfolio turnover rate | 33% | 30% |
A Annualized B Total returns for periods of less than one year are not annualized. C Total returns would have been lower had certain expenses not been reduced during the periods shown. D Calculated based on average shares outstanding during the period. E For the period October 2, 2009 (commencement of operations) to March 31, 2010. F Expense ratios reflect operating expenses of the Fund. Expenses before reductions do not reflect amounts reimbursed by the investment adviser or reductions from expense offset arrangements and do not represent the amount paid by the Fund during periods when reimbursements or reductions occur. Expense ratios before reductions for start-up periods may not be representative of longer term operating periods. Expenses net of fee waivers reflect expenses after reimbursement by the investment adviser but prior to reductions from expense offset arrangements. Expenses net of all reductions represent the net expenses paid by the Fund, but do not include expenses of the investment companies in which the Fund invests. G Amounts do not include the activity of the underlying funds. |
See accompanying notes which are an integral part of the financial statements.
Annual Report
Fidelity Freedom Index 2005 Fund
Investment Changes (Unaudited)
Fund Holdings as of March 31, 2011 |
| % of fund's
net assets | % of fund's net assets
6 months ago |
Commodity Funds | | |
Fidelity Series Commodity Strategy Fund Class F | 4.6 | 4.7 |
Domestic Equity Funds | | |
Fidelity Spartan Total Market Index Fund Class F | 25.7 | 27.3 |
Developed International Equity Funds | | |
Fidelity Series Global ex U.S. Index Fund | 11.0 | 10.7 |
Inflation-Protected Bond Funds | | |
Fidelity Series Inflation-Protected Bond Index Fund Class F | 10.0 | 10.1 |
Investment Grade Bond Funds | | |
Fidelity U.S. Bond Index Fund Class F | 25.9 | 26.4 |
Short-Term Funds | | |
Fidelity Institutional Money Market Portfolio Class F | 22.8 | 20.8 |
Net Other Assets (Liabilities)* | 0.0 | 0.0 |
| 100.0 | 100.0 |
* Amount represents less than 0.1%
Asset Allocation (% of fund's net assets) |
Current |
| Commodity Funds | 4.6% | |
| Domestic Equity Funds | 25.7% | |
| Developed International Equity Funds | 11.0% | |
| Inflation-Protected Bond Funds | 10.0% | |
| Investment Grade Bond Funds | 25.9% | |
| Short-Term Funds | 22.8% | |

Six months ago |
| Commodity Funds | 4.7% | |
| Domestic Equity Funds | 27.3% | |
| Developed International Equity Funds | 10.7% | |
| Inflation-Protected Bond Funds | 10.1% | |
 | Investment Grade Bond Funds | 26.4% | |
 | Short-Term Funds | 20.8% | |

Expected |
| Commodity Funds | 4.4% | |
| Domestic Equity Funds | 24.7% | |
| Developed International Equity Funds | 10.6% | |
| Inflation-Protected Bond Funds | 9.9% | |
| Investment Grade Bond Funds | 25.5% | |
| Short-Term Funds | 24.9% | |

The fund invests according to an asset allocation strategy that becomes increasingly conservative over time. The six months ago allocation is based on the fund's holdings as of September 30, 2010. The current allocation is based on the fund's holdings as of March 31, 2011. The expected allocation represents the fund's anticipated allocation at September 30, 2011. |
Annual Report
Fidelity Freedom Index 2005 Fund
Investments March 31, 2011
Showing Percentage of Net Assets
Domestic Equity Funds - 30.3% |
| Shares | | Value |
Commodity Funds - 4.6% |
Fidelity Series Commodity Strategy Fund Class F | 82,002 | | $ 1,083,241 |
Domestic Equity Funds - 25.7% |
Fidelity Spartan Total Market Index Fund Class F | 155,424 | | 6,019,572 |
TOTAL DOMESTIC EQUITY FUNDS (Cost $6,587,317) | 7,102,813 |
International Equity Funds - 11.0% |
| | | |
Developed International Equity Funds - 11.0% |
Fidelity Series Global ex U.S. Index Fund
(Cost $2,459,493) | 221,148 | | 2,576,376 |
Bond Funds - 35.9% |
| | | |
Inflation-Protected Bond Funds - 10.0% |
Fidelity Series Inflation-Protected Bond Index Fund Class F | 216,699 | | 2,344,681 |
|
| Shares | | Value |
Investment Grade Bond Funds - 25.9% |
Fidelity U.S. Bond Index Fund Class F | 538,555 | | $ 6,074,898 |
TOTAL BOND FUNDS (Cost $8,371,766) | 8,419,579 |
Short-Term Funds - 22.8% |
| | | |
Fidelity Institutional Money Market Portfolio Class F
(Cost $5,362,051) | 5,362,051 | | 5,362,051 |
TOTAL INVESTMENT PORTFOLIO - 100.0% (Cost $22,780,627) | | 23,460,819 |
NET OTHER ASSETS (LIABILITIES) - 0.0% | | (1,424) |
NET ASSETS - 100% | $ 23,459,395 |
Other Information |
All investments are categorized as Level 1 under the Fair Value Hierarchy. The inputs or methodology used for valuing securities may not be an indication of the risk associated with investing in those securities. For more information on valuation inputs, please refer to the Security Valuation section in the accompanying Notes to Financial Statements. |
See accompanying notes which are an integral part of the financial statements.
Annual Report
Fidelity Freedom Index 2005 Fund
Statement of Assets and Liabilities
| March 31, 2011 |
| | |
Assets | | |
Investment in securities, at value (cost $22,780,627) - See accompanying schedule | | $ 23,460,819 |
Cash | | 1 |
Receivable for investments sold | | 111,635 |
Receivable for fund shares sold | | 19,011 |
Receivable from affiliate for expense reductions | | 1,533 |
Total assets | | 23,592,999 |
| | |
Liabilities | | |
Payable for investments purchased | $ 112,966 | |
Payable for fund shares redeemed | 17,680 | |
Other affiliated payables | 2,958 | |
Total liabilities | | 133,604 |
| | |
Net Assets | | $ 23,459,395 |
Net Assets consist of: | | |
Paid in capital | | $ 22,763,230 |
Undistributed net investment income | | 31,776 |
Accumulated undistributed net realized gain (loss) on investments | | (15,803) |
Net unrealized appreciation (depreciation) on investments | | 680,192 |
Net Assets, for 2,051,503 shares outstanding | | $ 23,459,395 |
Net Asset Value, offering price and redemption price per share ($23,459,395 ÷ 2,051,503 shares) | | $ 11.44 |
Statement of Operations
| Year ended March 31, 2011 |
| | |
Investment Income | | |
Income distributions from underlying funds | | $ 111,762 |
| | |
Expenses | | |
Transfer agent fees | $ 6,845 | |
Independent trustees' compensation | 21 | |
Total expenses before reductions | 6,866 | |
Expense reductions | (2,513) | 4,353 |
Net investment income (loss) | | 107,409 |
Realized and Unrealized Gain (Loss) Realized gain (loss) on sale of underlying fund shares | (12,323) | |
Capital gain distributions from underlying funds | 27,020 | |
Total net realized gain (loss) | | 14,697 |
Change in net unrealized appreciation (depreciation) on investment securities | | 650,919 |
Net gain (loss) | | 665,616 |
Net increase (decrease) in net assets resulting from operations | | $ 773,025 |
See accompanying notes which are an integral part of the financial statements.
Annual Report
Fidelity Freedom Index 2005 Fund - Class W
Financial Statements - continued
Statement of Changes in Net Assets
| Year ended
March 31,
2011 | For the period
October 2, 2009
(commencement of operations) to
March 31,
2010 |
Increase (Decrease) in Net Assets | | |
Operations | | |
Net investment income (loss) | $ 107,409 | $ 6,551 |
Net realized gain (loss) | 14,697 | 822 |
Change in net unrealized appreciation (depreciation) | 650,919 | 29,273 |
Net increase (decrease) in net assets resulting from operations | 773,025 | 36,646 |
Distributions to shareholders from net investment income | (79,955) | (1,600) |
Distributions to shareholders from net realized gain | (31,830) | (120) |
Total distributions | (111,785) | (1,720) |
Share transactions
Proceeds from sales of shares | 24,413,515 | 2,208,240 |
Reinvestment of distributions | 111,785 | 1,720 |
Cost of shares redeemed | (3,894,535) | (77,496) |
Net increase (decrease) in net assets resulting from share transactions | 20,630,765 | 2,132,464 |
Total increase (decrease) in net assets | 21,292,005 | 2,167,390 |
| | |
Net Assets | | |
Beginning of period | 2,167,390 | - |
End of period (including undistributed net investment income of $31,776 and undistributed net investment income of $4,951, respectively) | $ 23,459,395 | $ 2,167,390 |
Other Information Shares | | |
Sold | 2,190,189 | 211,842 |
Issued in reinvestment of distributions | 10,088 | 166 |
Redeemed | (353,390) | (7,392) |
Net increase (decrease) | 1,846,887 | 204,616 |
Financial Highlights
Years ended March 31, | 2011 | 2010 E |
Selected Per-Share Data | | |
Net asset value, beginning of period | $ 10.59 | $ 10.00 |
Income from Investment Operations | | |
Net investment income (loss) D | .16 | .06 |
Net realized and unrealized gain (loss) | .86 | .62 |
Total from investment operations | 1.02 | .68 |
Distributions from net investment income | (.12) | (.08) |
Distributions from net realized gain | (.05) | (.01) |
Total distributions | (.17) | (.09) |
Net asset value, end of period | $ 11.44 | $ 10.59 |
Total Return B,C | 9.72% | 6.78% |
Ratios to Average Net Assets F,G | | |
Expenses before reductions | .09% | .05% A |
Expenses net of fee waivers, if any | .06% | .03% A |
Expenses net of all reductions | .06% | .03% A |
Net investment income (loss) | 1.42% | 1.19% A |
Supplemental Data | | |
Net assets, end of period (000 omitted) | $ 23,459 | $ 2,167 |
Portfolio turnover rate | 53% | 15% |
A Annualized B Total returns for periods of less than one year are not annualized. C Total returns would have been lower had certain expenses not been reduced during the periods shown. D Calculated based on average shares outstanding during the period. E For the period October 2, 2009 (commencement of operations) to March 31, 2010. F Expense ratios reflect operating expenses of the Fund. Expenses before reductions do not reflect amounts reimbursed by the investment adviser or reductions from expense offset arrangements and do not represent the amount paid by the Fund during periods when reimbursements or reductions occur. Expense ratios before reductions for start-up periods may not be representative of longer term operating periods. Expenses net of fee waivers reflect expenses after reimbursement by the investment adviser but prior to reductions from expense offset arrangements. Expenses net of all reductions represent the net expenses paid by the Fund, but do not include expenses of the investment companies in which the Fund invests. G Amounts do not include the activity of the underlying funds. |
See accompanying notes which are an integral part of the financial statements.
Annual Report
Fidelity Freedom Index 2010 Fund
Investment Changes (Unaudited)
Fund Holdings as of March 31, 2011 |
| % of fund's
net assets | % of fund's net assets
6 months ago |
Commodity Funds | | |
Fidelity Series Commodity Strategy Fund Class F | 5.5 | 5.5 |
Domestic Equity Funds | | |
Fidelity Spartan Total Market Index Fund Class F | 30.8 | 31.3 |
Developed International Equity Funds | | |
Fidelity Series Global ex U.S. Index Fund | 13.2 | 12.7 |
Inflation-Protected Bond Funds | | |
Fidelity Series Inflation-Protected Bond Index Fund Class F | 10.6 | 10.6 |
Investment Grade Bond Funds | | |
Fidelity U.S. Bond Index Fund Class F | 29.2 | 29.4 |
Short-Term Funds | | |
Fidelity Institutional Money Market Portfolio Class F | 10.7 | 10.5 |
Net Other Assets (Liabilities)* | 0.0 | 0.0 |
| 100.0 | 100.0 |
* Amount represents less than 0.1%
Asset Allocation (% of fund's net assets) |
Current |
| Commodity Funds | 5.5% | |
| Domestic Equity Funds | 30.8% | |
| Developed International Equity Funds | 13.2% | |
| Inflation-Protected Bond Funds | 10.6% | |
| Investment Grade Bond Funds | 29.2% | |
| Short-Term Funds | 10.7% | |

Six months ago |
| Commodity Funds | 5.5% | |
| Domestic Equity Funds | 31.3% | |
 | Developed International Equity Funds | 12.7% | |
| Inflation-Protected Bond Funds | 10.6% | |
| Investment Grade Bond Funds | 29.4% | |
| Short-Term Funds | 10.5% | |

Expected |
| Commodity Funds | 5.4% | |
| Domestic Equity Funds | 30.7% | |
| Developed International Equity Funds | 13.1% | |
| Inflation-Protected Bond Funds | 10.6% | |
| Investment Grade Bond Funds | 29.1% | |
| Short-Term Funds | 11.1% | |

The fund invests according to an asset allocation strategy that becomes increasingly conservative over time. The six months ago allocation is based on the fund's holdings as of September 30, 2010. The current allocation is based on the fund's holdings as of March 31, 2011. The expected allocation represents the fund's anticipated allocation at September 30, 2011. |
Annual Report
Fidelity Freedom Index 2010 Fund
Investments March 31, 2011
Showing Percentage of Net Assets
Domestic Equity Funds - 36.3% |
| Shares | | Value |
Commodity Funds - 5.5% |
Fidelity Series Commodity Strategy Fund Class F | 604,179 | | $ 7,981,210 |
Domestic Equity Funds - 30.8% |
Fidelity Spartan Total Market Index Fund Class F | 1,146,584 | | 44,407,210 |
TOTAL DOMESTIC EQUITY FUNDS (Cost $46,131,993) | 52,388,420 |
International Equity Funds - 13.2% |
| | | |
Developed International Equity Funds - 13.2% |
Fidelity Series Global ex U.S. Index Fund
(Cost $17,440,166) | 1,631,731 | | 19,009,666 |
Bond Funds - 39.8% |
| | | |
Inflation-Protected Bond Funds - 10.6% |
Fidelity Series Inflation-Protected Bond Index Fund Class F | 1,415,301 | | 15,313,559 |
|
| Shares | | Value |
Investment Grade Bond Funds - 29.2% |
Fidelity U.S. Bond Index Fund Class F | 3,733,955 | | $ 42,119,007 |
TOTAL BOND FUNDS (Cost $57,224,393) | 57,432,566 |
Short-Term Funds - 10.7% |
| | | |
Fidelity Institutional Money Market Portfolio Class F
(Cost $15,456,281) | 15,456,281 | | 15,456,281 |
TOTAL INVESTMENT PORTFOLIO - 100.0% (Cost $136,252,833) | | 144,286,933 |
NET OTHER ASSETS (LIABILITIES) - 0.0% | | (8,898) |
NET ASSETS - 100% | $ 144,278,035 |
Other Information |
All investments are categorized as Level 1 under the Fair Value Hierarchy. The inputs or methodology used for valuing securities may not be an indication of the risk associated with investing in those securities. For more information on valuation inputs, please refer to the Security Valuation section in the accompanying Notes to Financial Statements. |
See accompanying notes which are an integral part of the financial statements.
Annual Report
Fidelity Freedom Index 2010 Fund
Statement of Assets and Liabilities
| March 31, 2011 |
| | |
Assets | | |
Investment in securities, at value (cost $136,252,833) - See accompanying schedule | | $ 144,286,933 |
Cash | | 2 |
Receivable for investments sold | | 287,576 |
Receivable for fund shares sold | | 131,989 |
Receivable from affiliate for expense reductions | | 9,144 |
Total assets | | 144,715,644 |
| | |
Liabilities | | |
Payable for investments purchased | $ 286,649 | |
Payable for fund shares redeemed | 132,916 | |
Other affiliated payables | 18,044 | |
Total liabilities | | 437,609 |
| | |
Net Assets | | $ 144,278,035 |
Net Assets consist of: | | |
Paid in capital | | $ 135,907,652 |
Undistributed net investment income | | 266,643 |
Accumulated undistributed net realized gain (loss) on investments | | 69,640 |
Net unrealized appreciation (depreciation) on investments | | 8,034,100 |
Net Assets, for 12,386,881 shares outstanding | | $ 144,278,035 |
Net Asset Value, offering price and redemption price per share ($144,278,035 ÷ 12,386,881 shares) | | $ 11.65 |
Statement of Operations
| Year ended March 31, 2011 |
| | |
Investment Income | | |
Income distributions from underlying funds | | $ 1,261,923 |
| | |
Expenses | | |
Transfer agent fees | $ 58,087 | |
Independent trustees' compensation | 226 | |
Total expenses before reductions | 58,313 | |
Expense reductions | (21,881) | 36,432 |
Net investment income (loss) | | 1,225,491 |
Realized and Unrealized Gain (Loss) Realized gain (loss) on sale of underlying fund shares | 51,731 | |
Capital gain distributions from underlying funds | 338,256 | |
Total net realized gain (loss) | | 389,987 |
Change in net unrealized appreciation (depreciation) on investment securities | | 7,856,652 |
Net gain (loss) | | 8,246,639 |
Net increase (decrease) in net assets resulting from operations | | $ 9,472,130 |
See accompanying notes which are an integral part of the financial statements.
Annual Report
Fidelity Freedom Index 2010 Fund - Class W
Financial Statements - continued
Statement of Changes in Net Assets
| Year ended
March 31,
2011 | For the period
October 2, 2009
(commencement of operations) to
March 31,
2010 |
Increase (Decrease) in Net Assets | | |
Operations | | |
Net investment income (loss) | $ 1,225,491 | $ 48,380 |
Net realized gain (loss) | 389,987 | 1,214 |
Change in net unrealized appreciation (depreciation) | 7,856,652 | 177,448 |
Net increase (decrease) in net assets resulting from operations | 9,472,130 | 227,042 |
Distributions to shareholders from net investment income | (1,005,427) | (1,800) |
Distributions to shareholders from net realized gain | (321,461) | (100) |
Total distributions | (1,326,888) | (1,900) |
Share transactions
Proceeds from sales of shares | 143,362,564 | 20,673,381 |
Reinvestment of distributions | 1,326,888 | 1,900 |
Cost of shares redeemed | (28,329,682) | (1,127,400) |
Net increase (decrease) in net assets resulting from share transactions | 116,359,770 | 19,547,881 |
Total increase (decrease) in net assets | 124,505,012 | 19,773,023 |
| | |
Net Assets | | |
Beginning of period | 19,773,023 | - |
End of period (including undistributed net investment income of $266,643 and undistributed net investment income of $46,580, respectively) | $ 144,278,035 | $ 19,773,023 |
Other Information Shares | | |
Sold | 12,937,611 | 1,965,113 |
Issued in reinvestment of distributions | 117,994 | 182 |
Redeemed | (2,526,033) | (107,986) |
Net increase (decrease) | 10,529,572 | 1,857,309 |
Financial Highlights
Years ended March 31, | 2011 | 2010 E |
Selected Per-Share Data | | |
Net asset value, beginning of period | $ 10.65 | $ 10.00 |
Income from Investment Operations | | |
Net investment income (loss) D | .19 | .05 |
Net realized and unrealized gain (loss) | .98 | .70 |
Total from investment operations | 1.17 | .75 |
Distributions from net investment income | (.13) | (.09) |
Distributions from net realized gain | (.04) | (.01) |
Total distributions | (.17) | (.10) |
Net asset value, end of period | $ 11.65 | $ 10.65 |
Total Return B,C | 11.08% | 7.47% |
Ratios to Average Net Assets F,G | | |
Expenses before reductions | .08% | .05% A |
Expenses net of fee waivers, if any | .05% | .03% A |
Expenses net of all reductions | .05% | .03% A |
Net investment income (loss) | 1.68% | 1.08% A |
Supplemental Data | | |
Net assets, end of period (000 omitted) | $ 144,278 | $ 19,773 |
Portfolio turnover rate | 36% | 21% |
A Annualized B Total returns for periods of less than one year are not annualized. C Total returns would have been lower had certain expenses not been reduced during the periods shown. D Calculated based on average shares outstanding during the period. E For the period October 2, 2009 (commencement of operations) to March 31, 2010. F Expense ratios reflect operating expenses of the Fund. Expenses before reductions do not reflect amounts reimbursed by the investment adviser or reductions from expense offset arrangements and do not represent the amount paid by the Fund during periods when reimbursements or reductions occur. Expense ratios before reductions for start-up periods may not be representative of longer term operating periods. Expenses net of fee waivers reflect expenses after reimbursement by the investment adviser but prior to reductions from expense offset arrangements. Expenses net of all reductions represent the net expenses paid by the Fund, but do not include expenses of the investment companies in which the Fund invests. G Amounts do not include the activity of the underlying funds. |
See accompanying notes which are an integral part of the financial statements.
Annual Report
Fidelity Freedom Index 2015 Fund
Investment Changes (Unaudited)
Fund Holdings as of March 31, 2011 |
| % of fund's
net assets | % of fund's net assets
6 months ago |
Commodity Funds | | |
Fidelity Series Commodity Strategy Fund Class F | 5.7 | 5.6 |
Domestic Equity Funds | | |
Fidelity Spartan Total Market Index Fund Class F | 31.6 | 32.3 |
Developed International Equity Funds | | |
Fidelity Series Global ex U.S. Index Fund | 13.5 | 13.1 |
Inflation-Protected Bond Funds | | |
Fidelity Series Inflation-Protected Bond Index Fund Class F | 10.0 | 9.8 |
Investment Grade Bond Funds | | |
Fidelity U.S. Bond Index Fund Class F | 29.7 | 29.9 |
Short-Term Funds | | |
Fidelity Institutional Money Market Portfolio Class F | 9.5 | 9.3 |
Net Other Assets (Liabilities)* | 0.0 | 0.0 |
| 100.0 | 100.0 |
* Amount represents less than 0.1%
Asset Allocation (% of fund's net assets) |
Current |
| Commodity Funds | 5.7% | |
| Domestic Equity Funds | 31.6% | |
| Developed International Equity Funds | 13.5% | |
| Inflation-Protected Bond Funds | 10.0% | |
| Investment Grade Bond Funds | 29.7% | |
| Short-Term Funds | 9.5% | |

Six months ago |
| Commodity Funds | 5.6% | |
| Domestic Equity Funds | 32.3% | |
| Developed International Equity Funds | 13.1% | |
| Inflation-Protected Bond Funds | 9.8% | |
| Investment Grade Bond Funds | 29.9% | |
| Short-Term Funds | 9.3% | |

Expected |
| Commodity Funds | 5.6% | |
| Domestic Equity Funds | 31.4% | |
| Developed International Equity Funds | 13.5% | |
| Inflation-Protected Bond Funds | 10.1% | |
| Investment Grade Bond Funds | 29.7% | |
| Short-Term Funds | 9.7% | |

The fund invests according to an asset allocation strategy that becomes increasingly conservative over time. The six months ago allocation is based on the fund's holdings as of September 30, 2010. The current allocation is based on the fund's holdings as of March 31, 2011. The expected allocation represents the fund's anticipated allocation at September 30, 2011. |
Annual Report
Fidelity Freedom Index 2015 Fund
Investments March 31, 2011
Showing Percentage of Net Assets
Domestic Equity Funds - 37.3% |
| Shares | | Value |
Commodity Funds - 5.7% |
Fidelity Series Commodity Strategy Fund Class F | 947,359 | | $ 12,514,611 |
Domestic Equity Funds - 31.6% |
Fidelity Spartan Total Market Index Fund Class F | 1,798,791 | | 69,667,180 |
TOTAL DOMESTIC EQUITY FUNDS (Cost $73,621,718) | 82,181,791 |
International Equity Funds - 13.5% |
| | | |
Developed International Equity Funds - 13.5% |
Fidelity Series Global ex U.S. Index Fund
(Cost $27,901,495) | 2,558,565 | | 29,807,278 |
Bond Funds - 39.7% |
| | | |
Inflation-Protected Bond Funds - 10.0% |
Fidelity Series Inflation-Protected Bond Index Fund Class F | 2,030,964 | | 21,975,026 |
|
| Shares | | Value |
Investment Grade Bond Funds - 29.7% |
Fidelity U.S. Bond Index Fund Class F | 5,813,357 | | $ 65,574,670 |
TOTAL BOND FUNDS (Cost $87,612,481) | 87,549,696 |
Short-Term Funds - 9.5% |
| | | |
Fidelity Institutional Money Market Portfolio Class F
(Cost $21,026,636) | 21,026,636 | | 21,026,636 |
TOTAL INVESTMENT PORTFOLIO - 100.0% (Cost $210,162,330) | | 220,565,401 |
NET OTHER ASSETS (LIABILITIES) - 0.0% | | (13,381) |
NET ASSETS - 100% | $ 220,552,020 |
Other Information |
All investments are categorized as Level 1 under the Fair Value Hierarchy. The inputs or methodology used for valuing securities may not be an indication of the risk associated with investing in those securities. For more information on valuation inputs, please refer to the Security Valuation section in the accompanying Notes to Financial Statements. |
See accompanying notes which are an integral part of the financial statements.
Annual Report
Fidelity Freedom Index 2015 Fund
Statement of Assets and Liabilities
| March 31, 2011 |
| | |
Assets | | |
Investment in securities, at value (cost $210,162,330) - See accompanying schedule | | $ 220,565,401 |
Cash | | 1 |
Receivable for investments sold | | 569,170 |
Receivable for fund shares sold | | 216,352 |
Receivable from affiliate for expense reductions | | 13,858 |
Total assets | | 221,364,782 |
| | |
Liabilities | | |
Payable for investments purchased | $ 392,522 | |
Payable for fund shares redeemed | 392,999 | |
Other affiliated payables | 27,241 | |
Total liabilities | | 812,762 |
| | |
Net Assets | | $ 220,552,020 |
Net Assets consist of: | | |
Paid in capital | | $ 209,820,354 |
Undistributed net investment income | | 383,957 |
Accumulated undistributed net realized gain (loss) on investments | | (55,362) |
Net unrealized appreciation (depreciation) on investments | | 10,403,071 |
Net Assets, for 18,828,644 shares outstanding | | $ 220,552,020 |
Net Asset Value, offering price and redemption price per share ($220,552,020 ÷ 18,828,644 shares) | | $ 11.71 |
Statement of Operations
| Year ended March 31, 2011 |
| | |
Investment Income | | |
Income distributions from underlying funds | | $ 1,612,642 |
| | |
Expenses | | |
Transfer agent fees | $ 75,783 | |
Independent trustees' compensation | 252 | |
Total expenses before reductions | 76,035 | |
Expense reductions | (26,471) | 49,564 |
Net investment income (loss) | | 1,563,078 |
Realized and Unrealized Gain (Loss) Realized gain (loss) on sale of underlying fund shares | (96,692) | |
Capital gain distributions from underlying funds | 409,067 | |
Total net realized gain (loss) | | 312,375 |
Change in net unrealized appreciation (depreciation) on investment securities | | 10,242,933 |
Net gain (loss) | | 10,555,308 |
Net increase (decrease) in net assets resulting from operations | | $ 12,118,386 |
See accompanying notes which are an integral part of the financial statements.
Annual Report
Fidelity Freedom Index 2015 Fund - Class W
Financial Statements - continued
Statement of Changes in Net Assets
| Year ended
March 31,
2011 | For the period
October 2, 2009
(commencement of operations) to
March 31,
2010 |
Increase (Decrease) in Net Assets | | |
Operations | | |
Net investment income (loss) | $ 1,563,078 | $ 36,639 |
Net realized gain (loss) | 312,375 | (51) |
Change in net unrealized appreciation (depreciation) | 10,242,933 | 160,138 |
Net increase (decrease) in net assets resulting from operations | 12,118,386 | 196,726 |
Distributions to shareholders from net investment income | (1,213,960) | (1,800) |
Distributions to shareholders from net realized gain | (367,586) | (100) |
Total distributions | (1,581,546) | (1,900) |
Share transactions
Proceeds from sales of shares | 211,007,317 | 15,098,409 |
Reinvestment of distributions | 1,581,546 | 1,900 |
Cost of shares redeemed | (16,474,672) | (1,394,146) |
Net increase (decrease) in net assets resulting from share transactions | 196,114,191 | 13,706,163 |
Total increase (decrease) in net assets | 206,651,031 | 13,900,989 |
| | |
Net Assets | | |
Beginning of period | 13,900,989 | - |
End of period (including undistributed net investment income of $383,957 and undistributed net investment income of $34,839, respectively) | $ 220,552,020 | $ 13,900,989 |
Other Information Shares | | |
Sold | 18,840,617 | 1,436,198 |
Issued in reinvestment of distributions | 139,670 | 182 |
Redeemed | (1,454,574) | (133,449) |
Net increase (decrease) | 17,525,713 | 1,302,931 |
Financial Highlights
Years ended March 31, | 2011 | 2010 E |
Selected Per-Share Data | | |
Net asset value, beginning of period | $ 10.67 | $ 10.00 |
Income from Investment Operations | | |
Net investment income (loss) D | .20 | .06 |
Net realized and unrealized gain (loss) | 1.00 | .71 |
Total from investment operations | 1.20 | .77 |
Distributions from net investment income | (.12) | (.09) |
Distributions from net realized gain | (.04) | (.01) |
Total distributions | (.16) | (.10) |
Net asset value, end of period | $ 11.71 | $ 10.67 |
Total Return B,C | 11.29% | 7.67% |
Ratios to Average Net Assets F,G | | |
Expenses before reductions | .09% | .05% A |
Expenses net of fee waivers, if any | .06% | .03% A |
Expenses net of all reductions | .06% | .03% A |
Net investment income (loss) | 1.78% | 1.10% A |
Supplemental Data | | |
Net assets, end of period (000 omitted) | $ 220,552 | $ 13,901 |
Portfolio turnover rate | 19% | 31% |
A Annualized B Total returns for periods of less than one year are not annualized. C Total returns would have been lower had certain expenses not been reduced during the periods shown. D Calculated based on average shares outstanding during the period. E For the period October 2, 2009 (commencement of operations) to March 31, 2010. F Expense ratios reflect operating expenses of the Fund. Expenses before reductions do not reflect amounts reimbursed by the investment adviser or reductions from expense offset arrangements and do not represent the amount paid by the Fund during periods when reimbursements or reductions occur. Expense ratios before reductions for start-up periods may not be representative of longer term operating periods. Expenses net of fee waivers reflect expenses after reimbursement by the investment adviser but prior to reductions from expense offset arrangements. Expenses net of all reductions represent the net expenses paid by the Fund, but do not include expenses of the investment companies in which the Fund invests. G Amounts do not include the activity of the underlying funds. |
See accompanying notes which are an integral part of the financial statements.
Annual Report
Fidelity Freedom Index 2020 Fund
Investment Changes (Unaudited)
Fund Holdings as of March 31, 2011 |
| % of fund's
net assets | % of fund's net assets
6 months ago |
Commodity Funds | | |
Fidelity Series Commodity Strategy Fund Class F | 6.7 | 6.8 |
Domestic Equity Funds | | |
Fidelity Spartan Total Market Index Fund Class F | 37.2 | 38.6 |
Developed International Equity Funds | | |
Fidelity Series Global ex U.S. Index Fund | 15.9 | 15.7 |
Inflation-Protected Bond Funds | | |
Fidelity Series Inflation-Protected Bond Index Fund Class F | 7.7 | 7.3 |
Investment Grade Bond Funds | | |
Fidelity U.S. Bond Index Fund Class F | 28.5 | 28.3 |
Short-Term Funds | | |
Fidelity Institutional Money Market Portfolio Class F | 4.0 | 3.3 |
Net Other Assets (Liabilities)* | 0.0 | 0.0 |
| 100.0 | 100.0 |
* Amount represents less than 0.1%
Asset Allocation (% of fund's net assets) |
Current |
| Commodity Funds | 6.7% | |
| Domestic Equity Funds | 37.2% | |
| Developed International Equity Funds | 15.9% | |
| Inflation-Protected Bond Funds | 7.7% | |
| Investment Grade Bond Funds | 28.5% | |
| Short-Term Funds | 4.0% | |

Six months ago |
| Commodity Funds | 6.8% | |
| Domestic Equity Funds | 38.6% | |
| Developed International Equity Funds | 15.7% | |
| Inflation-Protected Bond Funds | 7.3% | |
| Investment Grade Bond Funds | 28.3% | |
| Short-Term Funds | 3.3% | |

Expected |
| Commodity Funds | 6.4% | |
| Domestic Equity Funds | 36.4% | |
| Developed International Equity Funds | 15.6% | |
| Inflation-Protected Bond Funds | 7.9% | |
| Investment Grade Bond Funds | 28.9% | |
| Short-Term Funds | 4.8% | |

The fund invests according to an asset allocation strategy that becomes increasingly conservative over time. The six months ago allocation is based on the fund's holdings as of September 30, 2010. The current allocation is based on the fund's holdings as of March 31, 2011. The expected allocation represents the fund's anticipated allocation at September 30, 2011. |
Annual Report
Fidelity Freedom Index 2020 Fund
Investments March 31, 2011
Showing Percentage of Net Assets
Domestic Equity Funds - 43.9% |
| Shares | | Value |
Commodity Funds - 6.7% |
Fidelity Series Commodity Strategy Fund Class F | 2,148,639 | | $ 28,383,524 |
Domestic Equity Funds - 37.2% |
Fidelity Spartan Total Market Index Fund Class F | 4,078,079 | | 157,943,989 |
TOTAL DOMESTIC EQUITY FUNDS (Cost $164,578,275) | 186,327,513 |
International Equity Funds - 15.9% |
| | | |
Developed International Equity Funds - 15.9% |
Fidelity Series Global ex U.S. Index Fund
(Cost $62,328,166) | 5,804,853 | | 67,626,538 |
Bond Funds - 36.2% |
| | | |
Inflation-Protected Bond Funds - 7.7% |
Fidelity Series Inflation-Protected Bond Index Fund Class F | 3,000,795 | | 32,468,599 |
|
| Shares | | Value |
Investment Grade Bond Funds - 28.5% |
Fidelity U.S. Bond Index Fund Class F | 10,749,501 | | $ 121,254,367 |
TOTAL BOND FUNDS (Cost $153,881,541) | 153,722,966 |
Short-Term Funds - 4.0% |
| | | |
Fidelity Institutional Money Market Portfolio Class F
(Cost $17,193,979) | 17,193,979 | | 17,193,979 |
TOTAL INVESTMENT PORTFOLIO - 100.0% (Cost $397,981,961) | | 424,870,996 |
NET OTHER ASSETS (LIABILITIES) - 0.0% | | (24,536) |
NET ASSETS - 100% | $ 424,846,460 |
Other Information |
All investments are categorized as Level 1 under the Fair Value Hierarchy. The inputs or methodology used for valuing securities may not be an indication of the risk associated with investing in those securities. For more information on valuation inputs, please refer to the Security Valuation section in the accompanying Notes to Financial Statements. |
See accompanying notes which are an integral part of the financial statements.
Annual Report
Fidelity Freedom Index 2020 Fund
Statement of Assets and Liabilities
| March 31, 2011 |
| | |
Assets | | |
Investment in securities, at value (cost $397,981,961) - See accompanying schedule | | $ 424,870,996 |
Cash | | 2 |
Receivable for investments sold | | 1,782,354 |
Receivable for fund shares sold | | 297,860 |
Receivable from affiliate for expense reductions | | 27,879 |
Total assets | | 426,979,091 |
| | |
Liabilities | | |
Payable for investments purchased | $ 1,508,202 | |
Payable for fund shares redeemed | 572,011 | |
Other affiliated payables | 52,418 | |
Total liabilities | | 2,132,631 |
| | |
Net Assets | | $ 424,846,460 |
Net Assets consist of: | | |
Paid in capital | | $ 397,246,533 |
Undistributed net investment income | | 732,007 |
Accumulated undistributed net realized gain (loss) on investments | | (21,115) |
Net unrealized appreciation (depreciation) on investments | | 26,889,035 |
Net Assets, for 35,415,943 shares outstanding | | $ 424,846,460 |
Net Asset Value, offering price and redemption price per share ($424,846,460 ÷ 35,415,943 shares) | | $ 12.00 |
Statement of Operations
| Year ended March 31, 2011 |
| | |
Investment Income | | |
Income distributions from underlying funds | | $ 3,668,988 |
| | |
Expenses | | |
Transfer agent fees | $ 160,796 | |
Independent trustees' compensation | 588 | |
Total expenses before reductions | 161,384 | |
Expense reductions | (60,566) | 100,818 |
Net investment income (loss) | | 3,568,170 |
Realized and Unrealized Gain (Loss) Realized gain (loss) on sale of underlying fund shares | (127,476) | |
Capital gain distributions from underlying funds | 891,564 | |
Total net realized gain (loss) | | 764,088 |
Change in net unrealized appreciation (depreciation) on investment securities | | 26,475,776 |
Net gain (loss) | | 27,239,864 |
Net increase (decrease) in net assets resulting from operations | | $ 30,808,034 |
See accompanying notes which are an integral part of the financial statements.
Annual Report
Fidelity Freedom Index 2020 Fund - Class W
Financial Statements - continued
Statement of Changes in Net Assets
| Year ended
March 31,
2011 | For the period
October 2, 2009
(commencement of operations) to
March 31,
2010 |
Increase (Decrease) in Net Assets | | |
Operations | | |
Net investment income (loss) | $ 3,568,170 | $ 87,020 |
Net realized gain (loss) | 764,088 | 4,399 |
Change in net unrealized appreciation (depreciation) | 26,475,776 | 413,259 |
Net increase (decrease) in net assets resulting from operations | 30,808,034 | 504,678 |
Distributions to shareholders from net investment income | (2,921,202) | (1,980) |
Distributions to shareholders from net realized gain | (789,482) | (120) |
Total distributions | (3,710,684) | (2,100) |
Share transactions
Proceeds from sales of shares | 390,218,779 | 40,441,152 |
Reinvestment of distributions | 3,710,684 | 2,100 |
Cost of shares redeemed | (34,914,144) | (2,212,039) |
Net increase (decrease) in net assets resulting from share transactions | 359,015,319 | 38,231,213 |
Total increase (decrease) in net assets | 386,112,669 | 38,733,791 |
| | |
Net Assets | | |
Beginning of period | 38,733,791 | - |
End of period (including undistributed net investment income of $732,007 and undistributed net investment income of $85,040, respectively) | $ 424,846,460 | $ 38,733,791 |
Other Information Shares | | |
Sold | 34,572,860 | 3,793,016 |
Issued in reinvestment of distributions | 321,637 | 199 |
Redeemed | (3,062,793) | (208,976) |
Net increase (decrease) | 31,831,704 | 3,584,239 |
Financial Highlights
Years ended March 31, | 2011 | 2010 E |
Selected Per-Share Data | | |
Net asset value, beginning of period | $ 10.81 | $ 10.00 |
Income from Investment Operations | | |
Net investment income (loss) D | .21 | .05 |
Net realized and unrealized gain (loss) | 1.15 | .87 |
Total from investment operations | 1.36 | .92 |
Distributions from net investment income | (.14) | (.10) |
Distributions from net realized gain | (.04) | (.01) |
Total distributions | (.17) H | (.11) |
Net asset value, end of period | $ 12.00 | $ 10.81 |
Total Return B,C | 12.67% | 9.18% |
Ratios to Average Net Assets F,G | | |
Expenses before reductions | .08% | .05% A |
Expenses net of fee waivers, if any | .05% | .03% A |
Expenses net of all reductions | .05% | .03% A |
Net investment income (loss) | 1.82% | .98% A |
Supplemental Data | | |
Net assets, end of period (000 omitted) | $ 424,846 | $ 38,734 |
Portfolio turnover rate | 21% | 21% |
A Annualized B Total returns for periods of less than one year are not annualized. C Total returns would have been lower had certain expenses not been reduced during the periods shown. D Calculated based on average shares outstanding during the period. E For the period October 2, 2009 (commencement of operations) to March 31, 2010. F Expense ratios reflect operating expenses of the Fund. Expenses before reductions do not reflect amounts reimbursed by the investment adviser or reductions from expense offset arrangements and do not represent the amount paid by the Fund during periods when reimbursements or reductions occur. Expense ratios before reductions for start-up periods may not be representative of longer term operating periods. Expenses net of fee waivers reflect expenses after reimbursement by the investment adviser but prior to reductions from expense offset arrangements. Expenses net of all reductions represent the net expenses paid by the Fund, but do not include expenses of the investment companies in which the Fund invests. G Amounts do not include the activity of the underlying funds. H Total distributions of $.17 per share is comprised of distributions from net investment income of $.135 and distributions from net realized gain of $.037 per share. |
See accompanying notes which are an integral part of the financial statements.
Annual Report
Fidelity Freedom Index 2025 Fund
Investment Changes (Unaudited)
Fund Holdings as of March 31, 2011 |
| % of fund's
net assets | % of fund's net assets
6 months ago |
Commodity Funds | | |
Fidelity Series Commodity Strategy Fund Class F | 7.7 | 7.7 |
Domestic Equity Funds | | |
Fidelity Spartan Total Market Index Fund Class F | 43.1 | 44.0 |
Developed International Equity Funds | | |
Fidelity Series Global ex U.S. Index Fund | 18.5 | 17.9 |
Inflation-Protected Bond Funds | | |
Fidelity Series Inflation-Protected Bond Index Fund Class F | 4.6 | 4.3 |
Investment Grade Bond Funds | | |
Fidelity U.S. Bond Index Fund Class F | 26.0 | 26.0 |
Short-Term Funds | | |
Fidelity Institutional Money Market Portfolio Class F | 0.1 | 0.1 |
Net Other Assets (Liabilities)* | 0.0 | 0.0 |
| 100.0 | 100.0 |
* Amount represents less than 0.1%.
Asset Allocation (% of fund's net assets) |
Current |
| Commodity Funds | 7.7% | |
| Domestic Equity Funds | 43.1% | |
| Developed International Equity Funds | 18.5% | |
| Inflation-Protected Bond Funds | 4.6% | |
| Investment Grade Bond Funds | 26.0% | |
| Short-Term Funds | 0.1% | |

Six months ago |
| Commodity Funds | 7.7% | |
| Domestic Equity Funds | 44.0% | |
| Developed International Equity Funds | 17.9% | |
| Inflation-Protected Bond Funds | 4.3% | |
| Investment Grade Bond Funds | 26.0% | |
| Short-Term Funds | 0.1% | |

Expected |
| Commodity Funds | 7.6% | |
| Domestic Equity Funds | 42.8% | |
| Developed International Equity Funds | 18.4% | |
| Inflation-Protected Bond Funds | 4.9% | |
| Investment Grade Bond Funds | 26.1% | |
| Short-Term Funds | 0.2% | |

The fund invests according to an asset allocation strategy that becomes increasingly conservative over time. The six months ago allocation is based on the fund's holdings as of September 30, 2010. The current allocation is based on the fund's holdings as of March 31, 2011. The expected allocation represents the fund's anticipated allocation at September 30, 2011. |
Annual Report
Fidelity Freedom Index 2025 Fund
Investments March 31, 2011
Showing Percentage of Net Assets
Domestic Equity Funds - 50.8% |
| Shares | | Value |
Commodity Funds - 7.7% |
Fidelity Series Commodity Strategy Fund Class F | 1,463,925 | | $ 19,338,450 |
Domestic Equity Funds - 43.1% |
Fidelity Spartan Total Market Index Fund Class F | 2,775,502 | | 107,495,199 |
TOTAL DOMESTIC EQUITY FUNDS (Cost $114,217,994) | 126,833,649 |
International Equity Funds - 18.5% |
| | | |
Developed International Equity Funds - 18.5% |
Fidelity Series Global ex U.S. Index Fund
(Cost $43,186,581) | 3,951,057 | | 46,029,809 |
Bond Funds - 30.6% |
| | | |
Inflation-Protected Bond Funds - 4.6% |
Fidelity Series Inflation-Protected Bond Index Fund Class F | 1,061,474 | | 11,485,151 |
|
| Shares | | Value |
Investment Grade Bond Funds - 26.0% |
Fidelity U.S. Bond Index Fund Class F | 5,757,650 | | $ 64,946,289 |
TOTAL BOND FUNDS (Cost $76,662,344) | 76,431,440 |
Short-Term Funds - 0.1% |
| | | |
Fidelity Institutional Money Market Portfolio Class F
(Cost $324,244) | 324,244 | | 324,244 |
TOTAL INVESTMENT PORTFOLIO - 100.0% (Cost $234,391,163) | | 249,619,142 |
NET OTHER ASSETS (LIABILITIES) - 0.0% | | (13,307) |
NET ASSETS - 100% | $ 249,605,835 |
Other Information |
All investments are categorized as Level 1 under the Fair Value Hierarchy. The inputs or methodology used for valuing securities may not be an indication of the risk associated with investing in those securities. For more information on valuation inputs, please refer to the Security Valuation section in the accompanying Notes to Financial Statements. |
See accompanying notes which are an integral part of the financial statements.
Annual Report
Fidelity Freedom Index 2025 Fund
Statement of Assets and Liabilities
| March 31, 2011 |
| | |
Assets | | |
Investment in securities, at value (cost $234,391,163) - See accompanying schedule | | $ 249,619,142 |
Cash | | 2 |
Receivable for investments sold | | 324,788 |
Receivable for fund shares sold | | 643,662 |
Receivable from affiliate for expense reductions | | 17,105 |
Total assets | | 250,604,699 |
| | |
Liabilities | | |
Payable for investments purchased | $ 776,386 | |
Payable for fund shares redeemed | 192,063 | |
Other affiliated payables | 30,415 | |
Total liabilities | | 998,864 |
| | |
Net Assets | | $ 249,605,835 |
Net Assets consist of: | | |
Paid in capital | | $ 234,063,240 |
Undistributed net investment income | | 321,019 |
Accumulated undistributed net realized gain (loss) on investments | | (6,403) |
Net unrealized appreciation (depreciation) on investments | | 15,227,979 |
Net Assets, for 20,423,210 shares outstanding | | $ 249,605,835 |
Net Asset Value, offering price and redemption price per share ($249,605,835 ÷ 20,423,210 shares) | | $ 12.22 |
Statement of Operations
| Year ended March 31, 2011 |
| | |
Investment Income | | |
Income distributions from underlying funds | | $ 1,891,995 |
| | |
Expenses | | |
Transfer agent fees | $ 83,479 | |
Independent trustees' compensation | 277 | |
Total expenses before reductions | 83,756 | |
Expense reductions | (31,906) | 51,850 |
Net investment income (loss) | | 1,840,145 |
Realized and Unrealized Gain (Loss) Realized gain (loss) on sale of underlying fund shares | (96,843) | |
Capital gain distributions from underlying funds | 405,198 | |
Total net realized gain (loss) | | 308,355 |
Change in net unrealized appreciation (depreciation) on investment securities | | 14,933,566 |
Net gain (loss) | | 15,241,921 |
Net increase (decrease) in net assets resulting from operations | | $ 17,082,066 |
See accompanying notes which are an integral part of the financial statements.
Annual Report
Fidelity Freedom Index 2025 Fund - Class W
Financial Statements - continued
Statement of Changes in Net Assets
| Year ended
March 31,
2011 | For the period
October 2, 2009
(commencement of operations) to
March 31,
2010 |
Increase (Decrease) in Net Assets | | |
Operations | | |
Net investment income (loss) | $ 1,840,145 | $ 41,051 |
Net realized gain (loss) | 308,355 | (7,717) |
Change in net unrealized appreciation (depreciation) | 14,933,566 | 294,413 |
Net increase (decrease) in net assets resulting from operations | 17,082,066 | 327,747 |
Distributions to shareholders from net investment income | (1,558,093) | (2,080) |
Distributions to shareholders from net realized gain | (306,925) | (120) |
Total distributions | (1,865,018) | (2,200) |
Share transactions
Proceeds from sales of shares | 229,890,433 | 19,882,081 |
Reinvestment of distributions | 1,865,018 | 2,200 |
Cost of shares redeemed | (15,516,302) | (2,060,190) |
Net increase (decrease) in net assets resulting from share transactions | 216,239,149 | 17,824,091 |
Total increase (decrease) in net assets | 231,456,197 | 18,149,638 |
| | |
Net Assets | | |
Beginning of period | 18,149,638 | - |
End of period (including undistributed net investment income of $321,019 and undistributed net investment income of $38,968, respectively) | $ 249,605,835 | $ 18,149,638 |
Other Information Shares | | |
Sold | 19,940,336 | 1,860,696 |
Issued in reinvestment of distributions | 159,348 | 208 |
Redeemed | (1,344,152) | (193,226) |
Net increase (decrease) | 18,755,532 | 1,667,678 |
Financial Highlights
Years ended March 31, | 2011 | 2010 E |
Selected Per-Share Data | | |
Net asset value, beginning of period | $ 10.88 | $ 10.00 |
Income from Investment Operations | | |
Net investment income (loss) D | .22 | .05 |
Net realized and unrealized gain (loss) | 1.30 | .94 |
Total from investment operations | 1.52 | .99 |
Distributions from net investment income | (.15) | (.10) |
Distributions from net realized gain | (.03) | (.01) |
Total distributions | (.18) | (.11) |
Net asset value, end of period | $ 12.22 | $ 10.88 |
Total Return B,C | 14.03% | 9.93% |
Ratios to Average Net Assets F,G | | |
Expenses before reductions | .09% | .05% A |
Expenses net of fee waivers, if any | .05% | .03% A |
Expenses net of all reductions | .05% | .03% A |
Net investment income (loss) | 1.91% | .92% A |
Supplemental Data | | |
Net assets, end of period (000 omitted) | $ 249,606 | $ 18,150 |
Portfolio turnover rate | 18% | 33% |
A Annualized B Total returns for periods of less than one year are not annualized. C Total returns would have been lower had certain expenses not been reduced during the periods shown. D Calculated based on average shares outstanding during the period. E For the period October 2, 2009 (commencement of operations) to March 31, 2010. F Expense ratios reflect operating expenses of the Fund. Expenses before reductions do not reflect amounts reimbursed by the investment adviser or reductions from expense offset arrangements and do not represent the amount paid by the Fund during periods when reimbursements or reductions occur. Expense ratios before reductions for start-up periods may not be representative of longer term operating periods. Expenses net of fee waivers reflect expenses after reimbursement by the investment adviser but prior to reductions from expense offset arrangements. Expenses net of all reductions represent the net expenses paid by the Fund, but do not include expenses of the investment companies in which the Fund invests. G Amounts do not include the activity of the underlying funds. |
See accompanying notes which are an integral part of the financial statements.
Annual Report
Fidelity Freedom Index 2030 Fund
Investment Changes (Unaudited)
Fund Holdings as of March 31, 2011 |
| % of fund's
net assets | % of fund's net assets
6 months ago |
Commodity Funds | | |
Fidelity Series Commodity Strategy Fund Class F | 8.2 | 8.3 |
Domestic Equity Funds | | |
Fidelity Spartan Total Market Index Fund Class F | 45.7 | 47.2 |
Developed International Equity Funds | | |
Fidelity Series Global ex U.S. Index Fund | 19.5 | 19.2 |
Inflation-Protected Bond Funds | | |
Fidelity Series Inflation-Protected Bond Index Fund Class F | 1.3 | 0.9 |
Investment Grade Bond Funds | | |
Fidelity U.S. Bond Index Fund Class F | 25.3 | 24.4 |
Net Other Assets (Liabilities)* | 0.0 | 0.0 |
| 100.0 | 100.0 |
* Amount represents less than 0.1%.
Asset Allocation (% of fund's net assets) |
Current |
| Commodity Funds | 8.2% | |
| Domestic Equity Funds | 45.7% | |
| Developed International Equity Funds | 19.5% | |
 | Inflation-Protected Bond Funds | 1.3% | |
| Investment Grade Bond Funds | 25.3% | |

Six months ago |
| Commodity Funds | 8.3% | |
| Domestic Equity Funds | 47.2% | |
| Developed International Equity Funds | 19.2% | |
| Inflation-Protected Bond Funds | 0.9% | |
| Investment Grade Bond Funds | 24.4% | |

Expected |
| Commodity Funds | 7.9% | |
| Domestic Equity Funds | 45.0% | |
| Developed International Equity Funds | 19.3% | |
| Inflation-Protected Bond Funds | 1.6% | |
| Investment Grade Bond Funds | 26.2% | |

The fund invests according to an asset allocation strategy that becomes increasingly conservative over time. The six months ago allocation is based on the fund's holdings as of September 30, 2010. The current allocation is based on the fund's holdings as of March 31, 2011. The expected allocation represents the fund's anticipated allocation at September 30, 2011. |
Annual Report
Fidelity Freedom Index 2030 Fund
Investments March 31, 2011
Showing Percentage of Net Assets
Domestic Equity Funds - 53.9% |
| Shares | | Value |
Commodity Funds - 8.2% |
Fidelity Series Commodity Strategy Fund Class F | 1,971,283 | | $ 26,040,651 |
Domestic Equity Funds - 45.7% |
Fidelity Spartan Total Market Index Fund Class F | 3,739,845 | | 144,844,200 |
TOTAL DOMESTIC EQUITY FUNDS (Cost $151,196,730) | 170,884,851 |
International Equity Funds - 19.5% |
| | | |
Developed International Equity Funds - 19.5% |
Fidelity Series Global ex U.S. Index Fund
(Cost $57,245,012) | 5,322,254 | | 62,004,254 |
Bond Funds - 26.6% |
| Shares | | Value |
Inflation-Protected Bond Funds - 1.3% |
Fidelity Series Inflation-Protected Bond Index Fund Class F | 369,650 | | $ 3,999,608 |
|
| Shares | | Value |
Investment Grade Bond Funds - 25.3% |
Fidelity U.S. Bond Index Fund Class F | 7,134,710 | | $ 80,479,523 |
TOTAL BOND FUNDS (Cost $85,084,642) | 84,479,131 |
TOTAL INVESTMENT PORTFOLIO - 100.0% (Cost $293,526,384) | | 317,368,236 |
NET OTHER ASSETS (LIABILITIES) - 0.0% | | (16,153) |
NET ASSETS - 100% | $ 317,352,083 |
Other Information |
All investments are categorized as Level 1 under the Fair Value Hierarchy. The inputs or methodology used for valuing securities may not be an indication of the risk associated with investing in those securities. For more information on valuation inputs, please refer to the Security Valuation section in the accompanying Notes to Financial Statements. |
See accompanying notes which are an integral part of the financial statements.
Annual Report
Fidelity Freedom Index 2030 Fund
Statement of Assets and Liabilities
| March 31, 2011 |
| | |
Assets | | |
Investment in securities, at value (cost $293,526,384) - See accompanying schedule | | $ 317,368,236 |
Cash | | 41 |
Receivable for investments sold | | 999,872 |
Receivable for fund shares sold | | 459,137 |
Receivable from affiliate for expense reductions | | 22,629 |
Total assets | | 318,849,915 |
| | |
Liabilities | | |
Payable for investments purchased | $ 1,221,707 | |
Payable for fund shares redeemed | 237,302 | |
Other affiliated payables | 38,823 | |
Total liabilities | | 1,497,832 |
| | |
Net Assets | | $ 317,352,083 |
Net Assets consist of: | | |
Paid in capital | | $ 293,103,256 |
Undistributed net investment income | | 460,557 |
Accumulated undistributed net realized gain (loss) on investments | | (53,582) |
Net unrealized appreciation (depreciation) on investments | | 23,841,852 |
Net Assets, for 25,709,850 shares outstanding | | $ 317,352,083 |
Net Asset Value, offering price and redemption price per share ($317,352,083 ÷ 25,709,850 shares) | | $ 12.34 |
Statement of Operations
| Year ended March 31, 2011 |
| | |
Investment Income | | |
Income distributions from underlying funds | | $ 2,775,609 |
| | |
Expenses | | |
Transfer agent fees | $ 117,902 | |
Independent trustees' compensation | 425 | |
Total expenses before reductions | 118,327 | |
Expense reductions | (47,095) | 71,232 |
Net investment income (loss) | | 2,704,377 |
Realized and Unrealized Gain (Loss) Realized gain (loss) on sale of underlying fund shares | (150,186) | |
Capital gain distributions from underlying funds | 566,240 | |
Total net realized gain (loss) | | 416,054 |
Change in net unrealized appreciation (depreciation) on investment securities | | 23,464,646 |
Net gain (loss) | | 23,880,700 |
Net increase (decrease) in net assets resulting from operations | | $ 26,585,077 |
See accompanying notes which are an integral part of the financial statements.
Annual Report
Fidelity Freedom Index 2030 Fund - Class W
Financial Statements - continued
Statement of Changes in Net Assets
| Year ended
March 31,
2011 | For the period
October 2, 2009
(commencement of operations) to
March 31,
2010 |
Increase (Decrease) in Net Assets | | |
Operations | | |
Net investment income (loss) | $ 2,704,377 | $ 49,478 |
Net realized gain (loss) | 416,054 | (6,385) |
Change in net unrealized appreciation (depreciation) | 23,464,646 | 377,206 |
Net increase (decrease) in net assets resulting from operations | 26,585,077 | 420,299 |
Distributions to shareholders from net investment income | (2,291,099) | (2,200) |
Distributions to shareholders from net realized gain | (463,152) | (100) |
Total distributions | (2,754,251) | (2,300) |
Share transactions
Proceeds from sales of shares | 280,096,122 | 28,776,953 |
Reinvestment of distributions | 2,754,251 | 2,300 |
Cost of shares redeemed | (16,895,639) | (1,630,729) |
Net increase (decrease) in net assets resulting from share transactions | 265,954,734 | 27,148,524 |
Total increase (decrease) in net assets | 289,785,560 | 27,566,523 |
| | |
Net Assets | | |
Beginning of period | 27,566,523 | - |
End of period (including undistributed net investment income of $460,557 and undistributed net investment income of $47,278, respectively) | $ 317,352,083 | $ 27,566,523 |
Other Information Shares | | |
Sold | 24,414,790 | 2,669,440 |
Issued in reinvestment of distributions | 233,211 | 216 |
Redeemed | (1,454,320) | (153,487) |
Net increase (decrease) | 23,193,681 | 2,516,169 |
Financial Highlights
Years ended March 31, | 2011 | 2010 E |
Selected Per-Share Data | | |
Net asset value, beginning of period | $ 10.96 | $ 10.00 |
Income from Investment Operations | | |
Net investment income (loss)D | .22 | .04 |
Net realized and unrealized gain (loss) | 1.34 | 1.04 |
Total from investment operations | 1.56 | 1.08 |
Distributions from net investment income | (.15) | (.11) |
Distributions from net realized gain | (.03) | (.01) |
Total distributions | (.18) | (.12) |
Net asset value, end of period | $ 12.34 | $ 10.96 |
Total ReturnB,C | 14.27% | 10.78% |
Ratios to Average Net AssetsF,G | | |
Expenses before reductions | .08% | .05% A |
Expenses net of fee waivers, if any | .05% | .03% A |
Expenses net of all reductions | .05% | .03% A |
Net investment income (loss) | 1.90% | .78% A |
Supplemental Data | | |
Net assets, end of period (000 omitted) | $ 317,352 | $ 27,567 |
Portfolio turnover rate | 16% | 21% |
A Annualized B Total returns for periods of less than one year are not annualized. C Total returns would have been lower had certain expenses not been reduced during the periods shown. D Calculated based on average shares outstanding during the period. E For the period October 2, 2009 (commencement of operations) to March 31, 2010. F Expense ratios reflect operating expenses of the Fund. Expenses before reductions do not reflect amounts reimbursed by the investment adviser or reductions from expense offset arrangements and do not represent the amount paid by the Fund during periods when reimbursements or reductions occur. Expense ratios before reductions for start-up periods may not be representative of longer term operating periods. Expenses net of fee waivers reflect expenses after reimbursement by the investment adviser but prior to reductions from expense offset arrangements. Expenses net of all reductions represent the net expenses paid by the Fund, but do not include expenses of the investment companies in which the Fund invests. G Amounts do not include the activity of the underlying funds. |
See accompanying notes which are an integral part of the financial statements.
Annual Report
Fidelity Freedom Index 2035 Fund
Investment Changes (Unaudited)
Fund Holdings as of March 31, 2011 |
| % of fund's
net assets | % of fund's net assets
6 months ago |
Commodity Funds | | |
Fidelity Series Commodity Strategy Fund Class F | 9.2 | 9.1 |
Domestic Equity Funds | | |
Fidelity Spartan Total Market Index Fund Class F | 51.3 | 52.1 |
Developed International Equity Funds | | |
Fidelity Series Global ex U.S. Index Fund | 21.9 | 21.2 |
Investment Grade Bond Funds | | |
Fidelity U.S. Bond Index Fund Class F | 17.6 | 17.6 |
Net Other Assets (Liabilities)* | 0.0 | 0.0 |
| 100.0 | 100.0 |
* Amount represents less than 0.1%.
Asset Allocation (% of fund's net assets) |
Current |
| Commodity Funds | 9.2% | |
| Domestic Equity Funds | 51.3% | |
| Developed International Equity Funds | 21.9% | |
| Investment Grade Bond Funds | 17.6% | |

Six months ago |
| Commodity Funds | 9.1% | |
| Domestic Equity Funds | 52.1% | |
| Developed International Equity Funds | 21.2% | |
| Investment Grade Bond Funds | 17.6% | |

Expected |
| Commodity Funds | 9.1% | |
| Domestic Equity Funds | 51.2% | |
| Developed International Equity Funds | 22.0% | |
| Investment Grade Bond Funds | 17.7% | |

The fund invests according to an asset allocation strategy that becomes increasingly conservative over time. The six months ago allocation is based on the fund's holdings as of September 30, 2010. The current allocation is based on the fund's holdings as of March 31, 2011. The expected allocation represents the fund's anticipated allocation at September 30, 2011. |
Annual Report
Fidelity Freedom Index 2035 Fund
Investments March 31, 2011
Showing Percentage of Net Assets
Domestic Equity Funds - 60.5% |
| Shares | | Value |
Commodity Funds - 9.2% |
Fidelity Series Commodity Strategy Fund Class F | 1,047,804 | | $ 13,841,493 |
Domestic Equity Funds - 51.3% |
Fidelity Spartan Total Market Index Fund Class F | 1,986,270 | | 76,928,225 |
TOTAL DOMESTIC EQUITY FUNDS (Cost $81,785,399) | 90,769,718 |
International Equity Funds - 21.9% |
| | | |
Developed International Equity Funds - 21.9% |
Fidelity Series Global ex U.S. Index Fund
(Cost $30,921,385) | 2,828,251 | | 32,949,119 |
Bond Funds - 17.6% |
| Shares | | Value |
Investment Grade Bond Funds - 17.6% |
Fidelity U.S. Bond Index Fund Class F
(Cost $26,597,648) | 2,339,252 | | $ 26,386,758 |
TOTAL INVESTMENT PORTFOLIO - 100.0% (Cost $139,304,432) | | 150,105,595 |
NET OTHER ASSETS (LIABILITIES) - 0.0% | | (6,657) |
NET ASSETS - 100% | $ 150,098,938 |
Other Information |
All investments are categorized as Level 1 under the Fair Value Hierarchy. The inputs or methodology used for valuing securities may not be an indication of the risk associated with investing in those securities. For more information on valuation inputs, please refer to the Security Valuation section in the accompanying Notes to Financial Statements. |
See accompanying notes which are an integral part of the financial statements.
Annual Report
Fidelity Freedom Index 2035 Fund
Statement of Assets and Liabilities
| March 31, 2011 |
| | |
Assets | | |
Investment in securities, at value (cost $139,304,432) - See accompanying schedule | | $ 150,105,595 |
Cash | | 2 |
Receivable for investments sold | | 157,482 |
Receivable for fund shares sold | | 318,317 |
Receivable from affiliate for expense reductions | | 11,586 |
Total assets | | 150,592,982 |
| | |
Liabilities | | |
Payable for investments purchased | $ 320,990 | |
Payable for fund shares redeemed | 154,810 | |
Other affiliated payables | 18,244 | |
Total liabilities | | 494,044 |
| | |
Net Assets | | $ 150,098,938 |
Net Assets consist of: | | |
Paid in capital | | $ 139,184,226 |
Undistributed net investment income | | 132,757 |
Accumulated undistributed net realized gain (loss) on investments | | (19,208) |
Net unrealized appreciation (depreciation) on investments | | 10,801,163 |
Net Assets, for 11,968,444 shares outstanding | | $ 150,098,938 |
Net Asset Value, offering price and redemption price per share ($150,098,938 ÷ 11,968,444 shares) | | $ 12.54 |
Statement of Operations
| Year ended March 31, 2011 |
| | |
Investment Income | | |
Income distributions from underlying funds | | $ 1,093,955 |
| | |
Expenses | | |
Transfer agent fees | $ 50,347 | |
Independent trustees' compensation | 166 | |
Total expenses before reductions | 50,513 | |
Expense reductions | (20,160) | 30,353 |
Net investment income (loss) | | 1,063,602 |
Realized and Unrealized Gain (Loss) Realized gain (loss) on sale of underlying fund shares | (53,325) | |
Capital gain distributions from underlying funds | 196,545 | |
Total net realized gain (loss) | | 143,220 |
Change in net unrealized appreciation (depreciation) on investment securities | | 10,604,098 |
Net gain (loss) | | 10,747,318 |
Net increase (decrease) in net assets resulting from operations | | $ 11,810,920 |
See accompanying notes which are an integral part of the financial statements.
Annual Report
Fidelity Freedom Index 2035 Fund - Class W
Financial Statements - continued
Statement of Changes in Net Assets
| Year ended
March 31,
2011 | For the period
October 2, 2009
(commencement of operations) to
March 31,
2010 |
Increase (Decrease) in Net Assets | | |
Operations | | |
Net investment income (loss) | $ 1,063,602 | $ 16,387 |
Net realized gain (loss) | 143,220 | (1,600) |
Change in net unrealized appreciation (depreciation) | 10,604,098 | 197,065 |
Net increase (decrease) in net assets resulting from operations | 11,810,920 | 211,852 |
Distributions to shareholders from net investment income | (944,966) | (2,200) |
Distributions to shareholders from net realized gain | (160,795) | (100) |
Total distributions | (1,105,761) | (2,300) |
Share transactions
Proceeds from sales of shares | 135,125,711 | 11,279,888 |
Reinvestment of distributions | 1,105,761 | 2,300 |
Cost of shares redeemed | (7,565,851) | (763,582) |
Net increase (decrease) in net assets resulting from share transactions | 128,665,621 | 10,518,606 |
Total increase (decrease) in net assets | 139,370,780 | 10,728,158 |
| | |
Net Assets | | |
Beginning of period | 10,728,158 | - |
End of period (including undistributed net investment income of $132,757 and undistributed net investment income of $14,200, respectively) | $ 150,098,938 | $ 10,728,158 |
Other Information Shares | | |
Sold | 11,548,299 | 1,044,052 |
Issued in reinvestment of distributions | 92,474 | 215 |
Redeemed | (645,493) | (71,103) |
Net increase (decrease) | 10,995,280 | 973,164 |
Financial Highlights
Years ended March 31, | 2011 | 2010 E |
Selected Per-Share Data | | |
Net asset value, beginning of period | $ 11.02 | $ 10.00 |
Income from Investment Operations | | |
Net investment income (loss) D | .21 | .03 |
Net realized and unrealized gain (loss) | 1.48 | 1.11 |
Total from investment operations | 1.69 | 1.14 |
Distributions from net investment income | (.15) | (.11) |
Distributions from net realized gain | (.03) | (.01) |
Total distributions | (.17) H | (.12) |
Net asset value, end of period | $ 12.54 | $ 11.02 |
Total Return B,C | 15.46% | 11.38% |
Ratios to Average Net Assets F,G | | |
Expenses before reductions | .09% | .05% A |
Expenses net of fee waivers, if any | .05% | .03% A |
Expenses net of all reductions | .05% | .03% A |
Net investment income (loss) | 1.83% | .64% A |
Supplemental Data | | |
Net assets, end of period (000 omitted) | $ 150,099 | $ 10,728 |
Portfolio turnover rate | 12% | 23% |
A Annualized B Total returns for periods of less than one year are not annualized. C Total returns would have been lower had certain expenses not been reduced during the periods shown. D Calculated based on average shares outstanding during the period. E For the period October 2, 2009 (commencement of operations) to March 31, 2010. F Expense ratios reflect operating expenses of the Fund. Expenses before reductions do not reflect amounts reimbursed by the investment adviser or reductions from expense offset arrangements and do not represent the amount paid by the Fund during periods when reimbursements or reductions occur. Expense ratios before reductions for start-up periods may not be representative of longer term operating periods. Expenses net of fee waivers reflect expenses after reimbursement by the investment adviser but prior to reductions from expense offset arrangements. Expenses net of all reductions represent the net expenses paid by the Fund, but do not include expenses of the investment companies in which the Fund invests. G Amounts do not include the activity of the underlying funds. H Total distributions of $.17 per share is comprised of distributions from net investment income of $.145 and distributions from net realized gain of $.028 per share. |
See accompanying notes which are an integral part of the financial statements.
Annual Report
Fidelity Freedom Index 2040 Fund
Investment Changes (Unaudited)
Fund Holdings as of March 31, 2011 |
| % of fund's
net assets | % of fund's net assets
6 months ago |
Commodity Funds | | |
Fidelity Series Commodity Strategy Fund Class F | 9.3 | 9.2 |
Domestic Equity Funds | | |
Fidelity Spartan Total Market Index Fund Class F | 51.8 | 52.8 |
Developed International Equity Funds | | |
Fidelity Series Global ex U.S. Index Fund | 22.2 | 21.5 |
Investment Grade Bond Funds | | |
Fidelity U.S. Bond Index Fund Class F | 16.7 | 16.5 |
Net Other Assets (Liabilities)* | 0.0 | 0.0 |
| 100.0 | 100.0 |
* Amount represents less than 0.1%.
Asset Allocation (% of fund's net assets) |
Current |
| Commodity Funds | 9.3% | |
| Domestic Equity Funds | 51.8% | |
| Developed International Equity Funds | 22.2% | |
| Investment Grade Bond Funds | 16.7% | |

Six months ago |
| Commodity Funds | 9.2% | |
| Domestic Equity Funds | 52.8% | |
| Developed International Equity Funds | 21.5% | |
| Investment Grade Bond Funds | 16.5% | |

Expected |
| Commodity Funds | 9.1% | |
| Domestic Equity Funds | 51.8% | |
| Developed International Equity Funds | 22.2% | |
| Investment Grade Bond Funds | 16.9% | |

The fund invests according to an asset allocation strategy that becomes increasingly conservative over time. The six months ago allocation is based on the fund's holdings as of September 30, 2010. The current allocation is based on the fund's holdings as of March 31, 2011. The expected allocation represents the fund's anticipated allocation at September 30, 2011. |
Annual Report
Fidelity Freedom Index 2040 Fund
Investments March 31, 2011
Showing Percentage of Net Assets
Domestic Equity Funds - 61.1% |
| Shares | | Value |
Commodity Funds - 9.3% |
Fidelity Series Commodity Strategy Fund Class F | 1,227,850 | | $ 16,219,901 |
Domestic Equity Funds - 51.8% |
Fidelity Spartan Total Market Index Fund Class F | 2,328,067 | | 90,166,016 |
TOTAL DOMESTIC EQUITY FUNDS (Cost $93,081,589) | 106,385,917 |
International Equity Funds - 22.2% |
| | | |
Developed International Equity Funds - 22.2% |
Fidelity Series Global ex U.S. Index Fund
(Cost $35,298,220) | 3,314,499 | | 38,613,913 |
Bond Funds - 16.7% |
| Shares | | Value |
Investment Grade Bond Funds - 16.7% |
Fidelity U.S. Bond Index Fund Class F
(Cost $29,446,787) | 2,586,171 | | $ 29,172,006 |
TOTAL INVESTMENT PORTFOLIO - 100.0% (Cost $157,826,596) | | 174,171,836 |
NET OTHER ASSETS (LIABILITIES) - 0.0% | | (7,632) |
NET ASSETS - 100% | $ 174,164,204 |
Other Information |
All investments are categorized as Level 1 under the Fair Value Hierarchy. The inputs or methodology used for valuing securities may not be an indication of the risk associated with investing in those securities. For more information on valuation inputs, please refer to the Security Valuation section in the accompanying Notes to Financial Statements. |
See accompanying notes which are an integral part of the financial statements.
Annual Report
Fidelity Freedom Index 2040 Fund
Statement of Assets and Liabilities
| March 31, 2011 |
| | |
Assets | | |
Investment in securities, at value (cost $157,826,596) - See accompanying schedule | | $ 174,171,836 |
Cash | | 2 |
Receivable for investments sold | | 172,785 |
Receivable for fund shares sold | | 407,981 |
Receivable from affiliate for expense reductions | | 13,612 |
Total assets | | 174,766,216 |
| | |
Liabilities | | |
Payable for investments purchased | $ 460,327 | |
Payable for fund shares redeemed | 120,440 | |
Other affiliated payables | 21,245 | |
Total liabilities | | 602,012 |
| | |
Net Assets | | $ 174,164,204 |
Net Assets consist of: | | |
Paid in capital | | $ 157,653,089 |
Undistributed net investment income | | 165,938 |
Accumulated undistributed net realized gain (loss) on investments | | (63) |
Net unrealized appreciation (depreciation) on investments | | 16,345,240 |
Net Assets, for 13,846,974 shares outstanding | | $ 174,164,204 |
Net Asset Value, offering price and redemption price per share ($174,164,204 ÷ 13,846,974 shares) | | $ 12.58 |
Statement of Operations
| Year ended March 31, 2011 |
| | |
Investment Income | | |
Income distributions from underlying funds | | $ 1,561,075 |
| | |
Expenses | | |
Transfer agent fees | $ 68,547 | |
Independent trustees' compensation | 257 | |
Total expenses before reductions | 68,804 | |
Expense reductions | (27,448) | 41,356 |
Net investment income (loss) | | 1,519,719 |
Realized and Unrealized Gain (Loss) Realized gain (loss) on sale of underlying fund shares | (49,316) | |
Capital gain distributions from underlying funds | 298,117 | |
Total net realized gain (loss) | | 248,801 |
Change in net unrealized appreciation (depreciation) on investment securities | | 16,124,017 |
Net gain (loss) | | 16,372,818 |
Net increase (decrease) in net assets resulting from operations | | $ 17,892,537 |
See accompanying notes which are an integral part of the financial statements.
Annual Report
Fidelity Freedom Index 2040 Fund - Class W
Financial Statements - continued
Statement of Changes in Net Assets
| Year ended
March 31,
2011 | For the period
October 2, 2009
(commencement of operations) to
March 31,
2010 |
Increase (Decrease) in Net Assets | | |
Operations | | |
Net investment income (loss) | $ 1,519,719 | $ 21,059 |
Net realized gain (loss) | 248,801 | (4,677) |
Change in net unrealized appreciation (depreciation) | 16,124,017 | 221,223 |
Net increase (decrease) in net assets resulting from operations | 17,892,537 | 237,605 |
Distributions to shareholders from net investment income | (1,372,639) | (2,200) |
Distributions to shareholders from net realized gain | (244,087) | (100) |
Total distributions | (1,616,726) | (2,300) |
Share transactions
Proceeds from sales of shares | 150,551,902 | 17,226,575 |
Reinvestment of distributions | 1,616,726 | 2,300 |
Cost of shares redeemed | (10,539,220) | (1,205,195) |
Net increase (decrease) in net assets resulting from share transactions | 141,629,408 | 16,023,680 |
Total increase (decrease) in net assets | 157,905,219 | 16,258,985 |
| | |
Net Assets | | |
Beginning of period | 16,258,985 | - |
End of period (including undistributed net investment income of $165,938 and undistributed net investment income of $18,859, respectively) | $ 174,164,204 | $ 16,258,985 |
Other Information Shares | | |
Sold | 13,146,818 | 1,584,140 |
Issued in reinvestment of distributions | 134,917 | 214 |
Redeemed | (906,863) | (112,252) |
Net increase (decrease) | 12,374,872 | 1,472,102 |
Financial Highlights
Years ended March 31, | 2011 | 2010 E |
Selected Per-Share Data | | |
Net asset value, beginning of period | $ 11.04 | $ 10.00 |
Income from Investment Operations | | |
Net investment income (loss) D | .21 | .03 |
Net realized and unrealized gain (loss) | 1.50 | 1.13 |
Total from investment operations | 1.71 | 1.16 |
Distributions from net investment income | (.15) | (.11) |
Distributions from net realized gain | (.03) | (.01) |
Total distributions | (.17) H | (.12) |
Net asset value, end of period | $ 12.58 | $ 11.04 |
Total Return B,C | 15.59% | 11.58% |
Ratios to Average Net Assets F,G | | |
Expenses before reductions | .08% | .05% A |
Expenses net of fee waivers, if any | .05% | .03% A |
Expenses net of all reductions | .05% | .03% A |
Net investment income (loss) | 1.80% | .56% A |
Supplemental Data | | |
Net assets, end of period (000 omitted) | $ 174,164 | $ 16,259 |
Portfolio turnover rate | 13% | 22% |
A Annualized B Total returns for periods of less than one year are not annualized. C Total returns would have been lower had certain expenses not been reduced during the periods shown. D Calculated based on average shares outstanding during the period. E For the period October 2, 2009 (commencement of operations) to March 31, 2010. F Expense ratios reflect operating expenses of the Fund. Expenses before reductions do not reflect amounts reimbursed by the investment adviser or reductions from expense offset arrangements and do not represent the amount paid by the Fund during periods when reimbursements or reductions occur. Expense ratios before reductions for start-up periods may not be representative of longer term operating periods. Expenses net of fee waivers reflect expenses after reimbursement by the investment adviser but prior to reductions from expense offset arrangements. Expenses net of all reductions represent the net expenses paid by the Fund, but do not include expenses of the investment companies in which the Fund invests. G Amounts do not include the activity of the underlying funds. H Total distributions of $.17 per share is comprised of distributions from net investment income of $.145 and distributions from net realized gain of $.027 per share. |
See accompanying notes which are an integral part of the financial statements.
Annual Report
Fidelity Freedom Index 2045 Fund
Investment Changes (Unaudited)
Fund Holdings as of March 31, 2011 |
| % of fund's
net assets | % of fund's net assets
6 months ago |
Commodity Funds | | |
Fidelity Series Commodity Strategy Fund Class F | 9.5 | 9.4 |
Domestic Equity Funds | | |
Fidelity Spartan Total Market Index Fund Class F | 52.9 | 53.7 |
Developed International Equity Funds | | |
Fidelity Series Global ex U.S. Index Fund | 22.6 | 21.9 |
Investment Grade Bond Funds | | |
Fidelity U.S. Bond Index Fund Class F | 15.0 | 15.0 |
Net Other Assets (Liabilities)* | 0.0 | 0.0 |
| 100.0 | 100.0 |
* Amount represents less than 0.1%
Asset Allocation (% of fund's net assets) |
Current |
| Commodity Funds | 9.5% | |
| Domestic Equity Funds | 52.9% | |
| Developed International Equity Funds | 22.6% | |
| Investment Grade Bond Funds | 15.0% | |

Six months ago |
| Commodity Funds | 9.4% | |
| Domestic Equity Funds | 53.7% | |
| Developed International Equity Funds | 21.9% | |
| Investment Grade Bond Funds | 15.0% | |

Expected |
| Commodity Funds | 9.3% | |
| Domestic Equity Funds | 53.0% | |
| Developed International Equity Funds | 22.7% | |
| Investment Grade Bond Funds | 15.0% | |

The fund invests according to an asset allocation strategy that becomes increasingly conservative over time. The six months ago allocation is based on the fund's holdings as of September 30, 2010. The current allocation is based on the fund's holdings as of March 31, 2011. The expected allocation represents the fund's anticipated allocation at September 30, 2011. |
Annual Report
Fidelity Freedom Index 2045 Fund
Investments March 31, 2011
Showing Percentage of Net Assets
Domestic Equity Funds - 62.4% |
| Shares | | Value |
Commodity Funds - 9.5% |
Fidelity Series Commodity Strategy Fund Class F | 385,313 | | $ 5,089,979 |
Domestic Equity Funds - 52.9% |
Fidelity Spartan Total Market Index Fund Class F | 730,672 | | 28,298,925 |
TOTAL DOMESTIC EQUITY FUNDS (Cost $29,825,207) | 33,388,904 |
International Equity Funds - 22.6% |
| | | |
Developed International Equity Funds - 22.6% |
Fidelity Series Global ex U.S. Index Fund
(Cost $11,297,577) | 1,040,136 | | 12,117,579 |
Bond Funds - 15.0% |
| Shares | | Value |
Investment Grade Bond Funds - 15.0% |
Fidelity U.S. Bond Index Fund Class F
(Cost $8,118,078) | 712,988 | | $ 8,042,508 |
TOTAL INVESTMENT PORTFOLIO - 100.0% (Cost $49,240,862) | | 53,548,991 |
NET OTHER ASSETS (LIABILITIES) - 0.0% | | (2,254) |
NET ASSETS - 100% | $ 53,546,737 |
Other Information |
All investments are categorized as Level 1 under the Fair Value Hierarchy. The inputs or methodology used for valuing securities may not be an indication of the risk associated with investing in those securities. For more information on valuation inputs, please refer to the Security Valuation section in the accompanying Notes to Financial Statements. |
See accompanying notes which are an integral part of the financial statements.
Annual Report
Fidelity Freedom Index 2045 Fund
Statement of Assets and Liabilities
| March 31, 2011 |
| | |
Assets | | |
Investment in securities, at value (cost $49,240,862) - See accompanying schedule | | $ 53,548,991 |
Cash | | 2 |
Receivable for fund shares sold | | 279,531 |
Receivable from affiliate for expense reductions | | 4,230 |
Total assets | | 53,832,754 |
| | |
Liabilities | | |
Payable for investments purchased | $ 238,316 | |
Payable for fund shares redeemed | 41,215 | |
Other affiliated payables | 6,486 | |
Total liabilities | | 286,017 |
| | |
Net Assets | | $ 53,546,737 |
Net Assets consist of: | | |
Paid in capital | | $ 49,201,055 |
Undistributed net investment income | | 44,709 |
Accumulated undistributed net realized gain (loss) on investments | | (7,156) |
Net unrealized appreciation (depreciation) on investments | | 4,308,129 |
Net Assets, for 4,241,153 shares outstanding | | $ 53,546,737 |
Net Asset Value, offering price and redemption price per share ($53,546,737 ÷ 4,241,153 shares) | | $ 12.63 |
Statement of Operations
| Year ended March 31, 2011 |
| | |
Investment Income | | |
Income distributions from underlying funds | | $ 412,520 |
| | |
Expenses | | |
Transfer agent fees | $ 18,797 | |
Independent trustees' compensation | 64 | |
Total expenses before reductions | 18,861 | |
Expense reductions | (7,435) | 11,426 |
Net investment income (loss) | | 401,094 |
Realized and Unrealized Gain (Loss) Realized gain (loss) on sale of underlying fund shares | (17,578) | |
Capital gain distributions from underlying funds | 72,068 | |
Total net realized gain (loss) | | 54,490 |
Change in net unrealized appreciation (depreciation) on investment securities | | 4,221,501 |
Net gain (loss) | | 4,275,991 |
Net increase (decrease) in net assets resulting from operations | | $ 4,677,085 |
See accompanying notes which are an integral part of the financial statements.
Annual Report
Fidelity Freedom Index 2045 Fund - Class W
Financial Statements - continued
Statement of Changes in Net Assets
| Year ended
March 31,
2011 | For the period
October 2, 2009
(commencement of operations) to
March 31,
2010 |
Increase (Decrease) in Net Assets | | |
Operations | | |
Net investment income (loss) | $ 401,094 | $ 6,808 |
Net realized gain (loss) | 54,490 | (817) |
Change in net unrealized appreciation (depreciation) | 4,221,501 | 86,628 |
Net increase (decrease) in net assets resulting from operations | 4,677,085 | 92,619 |
Distributions to shareholders from net investment income | (360,994) | (2,200) |
Distributions to shareholders from net realized gain | (60,729) | (100) |
Total distributions | (421,723) | (2,300) |
Share transactions
Proceeds from sales of shares | 48,244,564 | 4,466,705 |
Reinvestment of distributions | 421,723 | 2,300 |
Cost of shares redeemed | (3,587,725) | (346,511) |
Net increase (decrease) in net assets resulting from share transactions | 45,078,562 | 4,122,494 |
Total increase (decrease) in net assets | 49,333,924 | 4,212,813 |
| | |
Net Assets | | |
Beginning of period | 4,212,813 | - |
End of period (including undistributed net investment income of $44,709 and undistributed net investment income of $4,608, respectively) | $ 53,546,737 | $ 4,212,813 |
Other Information Shares | | |
Sold | 4,132,540 | 412,963 |
Issued in reinvestment of distributions | 35,073 | 214 |
Redeemed | (307,550) | (32,087) |
Net increase (decrease) | 3,860,063 | 381,090 |
Financial Highlights
Years ended March 31, | 2011 | 2010 E |
Selected Per-Share Data | | |
Net asset value, beginning of period | $ 11.05 | $ 10.00 |
Income from Investment Operations | | |
Net investment income (loss) D | .21 | .03 |
Net realized and unrealized gain (loss) | 1.54 | 1.14 |
Total from investment operations | 1.75 | 1.17 |
Distributions from net investment income | (.14) | (.11) |
Distributions from net realized gain | (.03) | (.01) |
Total distributions | (.17) | (.12) |
Net asset value, end of period | $ 12.63 | $ 11.05 |
Total Return B,C | 15.91% | 11.68% |
Ratios to Average Net Assets F,G | | |
Expenses before reductions | .09% | .05% A |
Expenses net of fee waivers, if any | .05% | .04% A |
Expenses net of all reductions | .05% | .04% A |
Net investment income (loss) | 1.83% | .67% A |
Supplemental Data | | |
Net assets, end of period (000 omitted) | $ 53,547 | $ 4,213 |
Portfolio turnover rate | 11% | 24% |
A Annualized B Total returns for periods of less than one year are not annualized. C Total returns would have been lower had certain expenses not been reduced during the periods shown. D Calculated based on average shares outstanding during the period. E For the period October 2, 2009 (commencement of operations) to March 31, 2010. F Expense ratios reflect operating expenses of the Fund. Expenses before reductions do not reflect amounts reimbursed by the investment adviser or reductions from expense offset arrangements and do not represent the amount paid by the Fund during periods when reimbursements or reductions occur. Expense ratios before reductions for start-up periods may not be representative of longer term operating periods. Expenses net of fee waivers reflect expenses after reimbursement by the investment adviser but prior to reductions from expense offset arrangements. Expenses net of all reductions represent the net expenses paid by the Fund, but do not include expenses of the investment companies in which the Fund invests. G Amounts do not include the activity of the underlying funds. |
See accompanying notes which are an integral part of the financial statements.
Annual Report
Fidelity Freedom Index 2050 Fund
Investment Changes (Unaudited)
Fund Holdings as of March 31, 2011 |
| % of fund's
net assets | % of fund's net assets
6 months ago |
Commodity Funds | | |
Fidelity Series Commodity Strategy Fund Class F | 9.9 | 9.9 |
Domestic Equity Funds | | |
Fidelity Spartan Total Market Index Fund Class F | 55.3 | 56.1 |
Developed International Equity Funds | | |
Fidelity Series Global ex U.S. Index Fund | 23.7 | 23.3 |
Investment Grade Bond Funds | | |
Fidelity U.S. Bond Index Fund Class F | 11.1 | 10.7 |
Net Other Assets (Liabilities)* | 0.0 | 0.0 |
| 100.0 | 100.0 |
* Amount represents less than 0.1%
Asset Allocation (% of fund's net assets) |
Current |
| Commodity Funds | 9.9% | |
| Domestic Equity Funds | 55.3% | |
| Developed International Equity Funds | 23.7% | |
| Investment Grade Bond Funds | 11.1% | |

Six months ago |
| Commodity Funds | 9.9% | |
| Domestic Equity Funds | 56.1% | |
| Developed International Equity Funds | 23.3% | |
| Investment Grade Bond Funds | 10.7% | |

Expected |
| Commodity Funds | 9.7% | |
| Domestic Equity Funds | 55.0% | |
| Developed International Equity Funds | 23.6% | |
| Investment Grade Bond Funds | 11.7% | |

The fund invests according to an asset allocation strategy that becomes increasingly conservative over time. The six months ago allocation is based on the fund's holdings as of September 30, 2010. The current allocation is based on the fund's holdings as of March 31, 2011. The expected allocation represents the fund's anticipated allocation at September 30, 2011. |
Annual Report
Fidelity Freedom Index 2050 Fund
Investments March 31, 2011
Showing Percentage of Net Assets
Domestic Equity Funds - 65.2% |
| Shares | | Value |
Commodity Funds - 9.9% |
Fidelity Series Commodity Strategy Fund Class F | 276,669 | | $ 3,654,801 |
Domestic Equity Funds - 55.3% |
Fidelity Spartan Total Market Index Fund Class F | 524,512 | | 20,314,355 |
TOTAL DOMESTIC EQUITY FUNDS (Cost $21,203,306) | 23,969,156 |
International Equity Funds - 23.7% |
| | | |
Developed International Equity Funds - 23.7% |
Fidelity Series Global ex U.S. Index Fund
(Cost $8,005,588) | 746,747 | | 8,699,608 |
Bond Funds - 11.1% |
| Shares | | Value |
Investment Grade Bond Funds - 11.1% |
Fidelity U.S. Bond Index Fund Class F
(Cost $4,133,143) | 362,669 | | $ 4,090,906 |
TOTAL INVESTMENT PORTFOLIO - 100.0% (Cost $33,342,037) | | 36,759,670 |
NET OTHER ASSETS (LIABILITIES) - 0.0% | | (1,392) |
NET ASSETS - 100% | $ 36,758,278 |
Other Information |
All investments are categorized as Level 1 under the Fair Value Hierarchy. The inputs or methodology used for valuing securities may not be an indication of the risk associated with investing in those securities. For more information on valuation inputs, please refer to the Security Valuation section in the accompanying Notes to Financial Statements. |
See accompanying notes which are an integral part of the financial statements.
Annual Report
Fidelity Freedom Index 2050 Fund
Statement of Assets and Liabilities
| March 31, 2011 |
| | |
Assets | | |
Investment in securities, at value (cost $33,342,037) - See accompanying schedule | | $ 36,759,670 |
Cash | | 2 |
Receivable for fund shares sold | | 156,223 |
Receivable from affiliate for expense reductions | | 2,994 |
Total assets | | 36,918,889 |
| | |
Liabilities | | |
Payable for investments purchased | $ 146,265 | |
Payable for fund shares redeemed | 9,959 | |
Other affiliated payables | 4,387 | |
Total liabilities | | 160,611 |
| | |
Net Assets | | $ 36,758,278 |
Net Assets consist of: | | |
Paid in capital | | $ 33,324,371 |
Undistributed net investment income | | 17,566 |
Accumulated undistributed net realized gain (loss) on investments | | (1,292) |
Net unrealized appreciation (depreciation) on investments | | 3,417,633 |
Net Assets, for 2,887,644 shares outstanding | | $ 36,758,278 |
Net Asset Value, offering price and redemption price per share ($36,758,278 ÷ 2,887,644 shares) | | $ 12.73 |
Statement of Operations
| Year ended March 31, 2011 |
| | |
Investment Income | | |
Income distributions from underlying funds | | $ 285,080 |
| | |
Expenses | | |
Transfer agent fees | $ 13,474 | |
Independent trustees' compensation | 47 | |
Total expenses before reductions | 13,521 | |
Expense reductions | (5,351) | 8,170 |
Net investment income (loss) | | 276,910 |
Realized and Unrealized Gain (Loss) Realized gain (loss) on sale of underlying fund shares | (10,594) | |
Capital gain distributions from underlying funds | 49,245 | |
Total net realized gain (loss) | | 38,651 |
Change in net unrealized appreciation (depreciation) on investment securities | | 3,376,487 |
Net gain (loss) | | 3,415,138 |
Net increase (decrease) in net assets resulting from operations | | $ 3,692,048 |
See accompanying notes which are an integral part of the financial statements.
Annual Report
Fidelity Freedom Index 2050 Fund - Class W
Financial Statements - continued
Statement of Changes in Net Assets
| Year ended
March 31,
2011 | For the period
October 2, 2009
(commencement of operations) to
March 31,
2010 |
Increase (Decrease) in Net Assets | | |
Operations | | |
Net investment income (loss) | $ 276,910 | $ 3,371 |
Net realized gain (loss) | 38,651 | (1,572) |
Change in net unrealized appreciation (depreciation) | 3,376,487 | 41,146 |
Net increase (decrease) in net assets resulting from operations | 3,692,048 | 42,945 |
Distributions to shareholders from net investment income | (260,515) | (2,200) |
Distributions to shareholders from net realized gain | (38,272) | (100) |
Total distributions | (298,787) | (2,300) |
Share transactions
Proceeds from sales of shares | 34,393,320 | 1,707,439 |
Reinvestment of distributions | 298,787 | 2,300 |
Cost of shares redeemed | (2,965,316) | (112,158) |
Net increase (decrease) in net assets resulting from share transactions | 31,726,791 | 1,597,581 |
Total increase (decrease) in net assets | 35,120,052 | 1,638,226 |
| | |
Net Assets | | |
Beginning of period | 1,638,226 | - |
End of period (including undistributed net investment income of $17,566 and undistributed net investment income of $1,171, respectively) | $ 36,758,278 | $ 1,638,226 |
Other Information Shares | | |
Sold | 2,970,926 | 157,905 |
Issued in reinvestment of distributions | 24,655 | 213 |
Redeemed | (255,549) | (10,506) |
Net increase (decrease) | 2,740,032 | 147,612 |
Financial Highlights
Years ended March 31, | 2011 | 2010 E |
Selected Per-Share Data | | |
Net asset value, beginning of period | $ 11.10 | $ 10.00 |
Income from Investment Operations | | |
Net investment income (loss) D | .20 | .04 |
Net realized and unrealized gain (loss) | 1.59 | 1.18 |
Total from investment operations | 1.79 | 1.22 |
Distributions from net investment income | (.14) | (.11) |
Distributions from net realized gain | (.02) | (.01) |
Total distributions | (.16) | (.12) |
Net asset value, end of period | $ 12.73 | $ 11.10 |
Total Return B,C | 16.19% | 12.18% |
Ratios to Average Net Assets F,G | | |
Expenses before reductions | .08% | .05% A |
Expenses net of fee waivers, if any | .05% | .04% A |
Expenses net of all reductions | .05% | .04% A |
Net investment income (loss) | 1.72% | .81% A |
Supplemental Data | | |
Net assets, end of period (000 omitted) | $ 36,758 | $ 1,638 |
Portfolio turnover rate G | 11% | 19% |
A Annualized B Total returns for periods of less than one year are not annualized. C Total returns would have been lower had certain expenses not been reduced during the periods shown. D Calculated based on average shares outstanding during the period. E For the period October 2, 2009 (commencement of operations) to March 31, 2010. F Expense ratios reflect operating expenses of the Fund. Expenses before reductions do not reflect amounts reimbursed by the investment adviser or reductions from expense offset arrangements and do not represent the amount paid by the Fund during periods when reimbursements or reductions occur. Expense ratios before reductions for start-up periods may not be representative of longer term operating periods. Expenses net of fee waivers reflect expenses after reimbursement by the investment adviser but prior to reductions from expense offset arrangements. Expenses net of all reductions represent the net expenses paid by the Fund, but do not include expenses of the investment companies in which the Fund invests. G Amounts do not include the activity of the underlying funds. |
See accompanying notes which are an integral part of the financial statements.
Annual Report
Notes to Financial Statements
For the period ended March 31, 2011
1. Organization.
Fidelity Freedom Index Income Fund, Fidelity Freedom Index 2000 Fund, Fidelity Freedom Index 2005 Fund, Fidelity Freedom Index 2010 Fund, Fidelity Freedom Index 2015 Fund, Fidelity Freedom Index 2020 Fund, Fidelity Freedom Index 2025 Fund, Fidelity Freedom Index 2030 Fund, Fidelity Freedom Index 2035 Fund, Fidelity Freedom Index 2040 Fund, Fidelity Freedom Index 2045 Fund, and Fidelity Freedom Index 2050 Fund (the Funds) are funds of Fidelity Aberdeen Street Trust (the Trust). The Trust is registered under the Investment Company Act of 1940, as amended (the 1940 Act), as an open-end management investment company organized as a Delaware statutory trust. Each Fund is authorized to issue an unlimited number of shares. Each fund currently offers Class W (formerly Class K) shares. The Funds invest primarily in a combination of other Fidelity equity, bond, and short-term funds (the Underlying Funds) managed by Fidelity Management & Research Company (FMR).
2. Significant Accounting Policies.
The financial statements have been prepared in conformity with accounting principles generally accepted in the United States of America (GAAP), which require management to make certain estimates and assumptions at the date of the financial statements. Actual results could differ from those estimates. Subsequent events, if any, through the date that the financial statements were issued have been evaluated in the preparation of the financial statements. The following summarizes the significant accounting policies of the Funds:
Security Valuation. Investments are valued as of 4:00 p.m. Eastern time on the last calendar day of the period. Each Fund categorizes the inputs to valuation techniques used to value their investments into a disclosure hierarchy consisting of three levels as shown below.
Level 1 - quoted prices in active markets for identical investments
Level 2 - other significant observable inputs (including quoted prices for similar investments, interest rates, prepayment speeds, etc.)
Level 3 - unobservable inputs (including the Fund's own assumptions based on the best information available)
Valuation techniques used to value each Fund's investments by major category are as follows. Investments in the Underlying Funds are valued at their closing net asset value (NAV) each business day and are categorized as Level 1 in the hierarchy.
Investment Transactions and Income. For financial reporting purposes, the Funds' investment holdings and NAV include trades executed through the end of the last business day of the period. The NAV per share for processing shareholder transactions is calculated as of the close of business of the New York Stock Exchange (NYSE), normally 4:00 p.m. Eastern time and includes trades executed through the end of the prior business day. Gains and losses on securities sold are determined on the basis of identified cost. Income and capital gain distributions from the Underlying Funds, if any, are recorded on the ex-dividend date.
Expenses. Expenses directly attributable to a fund are charged to that fund. Expenses attributable to more than one fund are allocated among the respective funds on the basis of relative net assets or other appropriate methods. Expenses included in the accompanying financial statements reflect the expenses of the Fund and do not include any expenses associated with the Underlying Funds. Expense estimates are accrued in the period to which they relate and adjustments are made when actual amounts are known.
Income Tax Information and Distributions to Shareholders. Each year each Fund intends to qualify as a regulated investment company, including distributing substantially all of its taxable income and realized gains under Subchapter M of the Internal Revenue Code and filing its U.S. federal tax return. As a result, no provision for income taxes is required. As of March 31, 2011, each Fund did not have any unrecognized tax benefits in the accompanying financial statements. A fund's federal tax return is subject to examination by the Internal Revenue Service (IRS) for a period of three years.
Distributions are declared and recorded on the ex-dividend date. Income and capital gain distributions are determined in accordance with income tax regulations, which may differ from GAAP.
Capital accounts within the financial statements are adjusted for permanent book-tax differences. These adjustments have no impact on net assets or the results of operations. Temporary book-tax differences will reverse in a subsequent period.
Book-tax differences are primarily due to the short-term gain distributions from the Underlying Funds and losses deferred due to wash sales.
Annual Report
2. Significant Accounting Policies - continued
Income Tax Information and Distributions to Shareholders - continued
The federal tax cost of investment securities and unrealized appreciation (depreciation) as of period end were as follows for each Fund:
| Tax cost | Gross
unrealized
appreciation | Gross
unrealized
depreciation | Net unrealized
appreciation
(depreciation) on
securities and
other investments |
Fidelity Freedom Index Income Fund | $ 37,683,468 | $ 943,152 | $ (83,912) | $ 859,240 |
Fidelity Freedom Index 2000 Fund | 24,984,050 | 683,356 | (59,542) | 623,814 |
Fidelity Freedom Index 2005 Fund | 22,811,894 | 727,480 | (78,555) | 648,925 |
Fidelity Freedom Index 2010 Fund | 136,408,838 | 8,435,156 | (557,061) | 7,878,095 |
Fidelity Freedom Index 2015 Fund | 210,333,105 | 11,229,992 | (997,696) | 10,232,296 |
Fidelity Freedom Index 2020 Fund | 398,289,832 | 28,282,552 | (1,701,388) | 26,581,164 |
Fidelity Freedom Index 2025 Fund | 234,559,360 | 16,102,450 | (1,042,668) | 15,059,782 |
Fidelity Freedom Index 2030 Fund | 293,771,312 | 24,869,899 | (1,272,975) | 23,596,924 |
Fidelity Freedom Index 2035 Fund | 139,387,917 | 11,224,155 | (506,477) | 10,717,678 |
Fidelity Freedom Index 2040 Fund | 157,933,131 | 16,723,659 | (484,954) | 16,238,705 |
Fidelity Freedom Index 2045 Fund | 49,270,968 | 4,427,598 | (149,575) | 4,278,023 |
Fidelity Freedom Index 2050 Fund | 33,358,393 | 3,464,195 | (62,918) | 3,401,277 |
The tax-based components of distributable earnings as of period end were as follows for each Fund:
| Undistributed
ordinary
income | Undistributed
long-term
capital gain | Net unrealized
appreciation
(depreciation) |
Fidelity Freedom Index Income Fund | $ 56,279 | $ 8,794 | $ 859,240 |
Fidelity Freedom Index 2000 Fund | 60,856 | 19,498 | 623,814 |
Fidelity Freedom Index 2005 Fund | 38,868 | 8,373 | 648,925 |
Fidelity Freedom Index 2010 Fund | 346,324 | 145,964 | 7,878,095 |
Fidelity Freedom Index 2015 Fund | 414,311 | 85,058 | 10,232,296 |
Fidelity Freedom Index 2020 Fund | 796,666 | 222,098 | 26,581,164 |
Fidelity Freedom Index 2025 Fund | 363,363 | 119,451 | 15,059,782 |
Fidelity Freedom Index 2030 Fund | 510,373 | 141,529 | 23,596,924 |
Fidelity Freedom Index 2035 Fund | 149,756 | 47,278 | 10,717,678 |
Fidelity Freedom Index 2040 Fund | 196,563 | 75,847 | 16,238,705 |
Fidelity Freedom Index 2045 Fund | 50,416 | 17,242 | 4,278,023 |
Fidelity Freedom Index 2050 Fund | 19,312 | 13,317 | 3,401,277 |
The tax character of distributions paid was as follows:
March 31, 2011 | Ordinary
Income | Long-term
Capital Gains | Total |
Fidelity Freedom Index Income Fund | $ 242,921 | $ 26,673 | $ 269,594 |
Fidelity Freedom Index 2000 Fund | 173,011 | 21,551 | 194,562 |
Fidelity Freedom Index 2005 Fund | 101,909 | 9,876 | 111,785 |
Fidelity Freedom Index 2010 Fund | 1,203,761 | 123,127 | 1,326,888 |
Fidelity Freedom Index 2015 Fund | 1,425,865 | 155,681 | 1,581,546 |
Fidelity Freedom Index 2020 Fund | 3,388,245 | 322,439 | 3,710,684 |
Fidelity Freedom Index 2025 Fund | 1,748,235 | 116,783 | 1,865,018 |
Fidelity Freedom Index 2030 Fund | 2,554,982 | 199,269 | 2,754,251 |
Fidelity Freedom Index 2035 Fund | 1,043,801 | 61,960 | 1,105,761 |
Fidelity Freedom Index 2040 Fund | 1,528,581 | 88,145 | 1,616,726 |
Fidelity Freedom Index 2045 Fund | 403,246 | 18,477 | 421,723 |
Fidelity Freedom Index 2050 Fund | 289,219 | 9,568 | 298,787 |
Annual Report
Notes to Financial Statements - continued
2. Significant Accounting Policies - continued
Income Tax Information and Distributions to Shareholders - continued
The tax character of distributions paid was as follows: - continued
March 31, 2010 | Ordinary
Income |
Fidelity Freedom Index Income Fund | $ 7,668 |
Fidelity Freedom Index 2000 Fund | 1,300 |
Fidelity Freedom Index 2005 Fund | 1,720 |
Fidelity Freedom Index 2010 Fund | 1,900 |
Fidelity Freedom Index 2015 Fund | 1,900 |
Fidelity Freedom Index 2020 Fund | 2,100 |
Fidelity Freedom Index 2025 Fund | 2,200 |
Fidelity Freedom Index 2030 Fund | 2,300 |
Fidelity Freedom Index 2035 Fund | 2,300 |
Fidelity Freedom Index 2040 Fund | 2,300 |
Fidelity Freedom Index 2045 Fund | 2,300 |
Fidelity Freedom Index 2050 Fund | 2,300 |
3. Purchases and Sales of Investments.
Purchases and redemptions of the Underlying Fund shares are noted in the table below.
| Purchases ($) | Redemptions ($) |
Fidelity Freedom Index Income Fund | 37,978,170 | 6,683,157 |
Fidelity Freedom Index 2000 Fund | 22,615,130 | 4,468,963 |
Fidelity Freedom Index 2005 Fund | 24,952,934 | 4,298,158 |
Fidelity Freedom Index 2010 Fund | 142,908,522 | 26,303,461 |
Fidelity Freedom Index 2015 Fund | 213,627,148 | 17,109,299 |
Fidelity Freedom Index 2020 Fund | 401,306,153 | 41,518,154 |
Fidelity Freedom Index 2025 Fund | 234,457,570 | 17,825,221 |
Fidelity Freedom Index 2030 Fund | 289,797,972 | 23,311,340 |
Fidelity Freedom Index 2035 Fund | 136,035,526 | 7,209,153 |
Fidelity Freedom Index 2040 Fund | 152,999,360 | 11,161,666 |
Fidelity Freedom Index 2045 Fund | 47,659,070 | 2,526,934 |
Fidelity Freedom Index 2050 Fund | 33,456,952 | 1,701,448 |
4. Fees and Other Transactions with Affiliates.
Management Fee. Strategic Advisers, Inc. (Strategic Advisers), an affiliate of FMR, provides the Funds with investment management related services. The Funds do not pay any fees for these services.
Other Transactions. Strategic Advisers has entered into an administration agreement with FMR under which FMR provides management and administrative services (other than investment advisory services) necessary for the operation of each Fund. Pursuant to this agreement, FMR pays all expenses of each Fund, excluding the transfer agent fees, the compensation of the independent Trustees and certain other expenses such as interest expense. FMR also contracts with other Fidelity companies to perform the services necessary for the operation of each Fund. The funds do not pay any fees for these services.
Annual Report
4. Fees and Other Transactions with Affiliates - continued
Transfer Agent Fees. Fidelity Investments Institutional Operations Company, Inc. (FIIOC), an affiliate of FMR, is the Funds' transfer, dividend disbursing and shareholder servicing agent. FIIOC receives an asset-based fee based on each Fund's average net assets. FIIOC pays for typesetting, printing and mailing of shareholder reports, except proxy statements. For the period, transfer agent fees for each Fund were as follows:
| Amount | % of Average
Net Assets* |
Fidelity Freedom Index Income Fund | $ 15,032 | .08% |
Fidelity Freedom Index 2000 Fund | 10,230 | .08% |
Fidelity Freedom Index 2005 Fund | 6,845 | .09% |
Fidelity Freedom Index 2010 Fund | 58,087 | .08% |
Fidelity Freedom Index 2015 Fund | 75,783 | .09% |
Fidelity Freedom Index 2020 Fund | 160,796 | .08% |
Fidelity Freedom Index 2025 Fund | 83,479 | .09% |
Fidelity Freedom Index 2030 Fund | 117,902 | .08% |
Fidelity Freedom Index 2035 Fund | 50,347 | .09% |
Fidelity Freedom Index 2040 Fund | 68,547 | .08% |
Fidelity Freedom Index 2045 Fund | 18,797 | .09% |
Fidelity Freedom Index 2050 Fund | 13,474 | .08% |
* Effective February 1, 2011 the transfer agent fee increased from .05% to .15%.
5. Expense Reductions.
FMR contractually agreed to reimburse each Fund to the extent annual operating expenses, including acquired fund fees and expenses, exceeded certain levels of average net assets as noted in the table below. This reimbursement will remain in place through May 30, 2012. Some expenses, for example interest expense, are excluded from this reimbursement.
The following Funds were in reimbursement during the period:
| Expense
Limitations | Reimbursement
from adviser |
Fidelity Freedom Index Income Fund | .19% | $ 4,870 |
Fidelity Freedom Index 2000 Fund | .19% | 3,473 |
Fidelity Freedom Index 2005 Fund | .19% | 2,513 |
Fidelity Freedom Index 2010 Fund | .19% | 21,881 |
Fidelity Freedom Index 2015 Fund | .19% | 26,471 |
Fidelity Freedom Index 2020 Fund | .19% | 60,566 |
Fidelity Freedom Index 2025 Fund | .19% | 31,906 |
Fidelity Freedom Index 2030 Fund | .19% | 47,095 |
Fidelity Freedom Index 2035 Fund | .19% | 20,160 |
Fidelity Freedom Index 2040 Fund | .19% | 27,448 |
Fidelity Freedom Index 2045 Fund | .19% | 7,435 |
Fidelity Freedom Index 2050 Fund | .19% | 5,351 |
6. Other.
The Funds' organizational documents provide former and current trustees and officers with a limited indemnification against liabilities arising in connection with the performance of their duties to the Funds. In the normal course of business, the Funds may also enter into contracts that provide general indemnifications. The Funds' maximum exposure under these arrangements is unknown as this would be dependent on future claims that may be made against the Funds. The risk of material loss from such claims is considered remote.
Annual Report
Notes to Financial Statements - continued
6. Other - continued
The Funds do not invest in the Underlying Funds for the purpose of exercising management or control; however, investments by the Funds within their principal investment strategies may represent a significant portion of the Underlying Fund's net assets. At the end of the period, the following Freedom Index Funds were the owners of record of 10% or more of the total outstanding shares of the Underlying Funds.
Fund | Fidelity Freedom
Index 2020 | Fidelity Freedom
Index 2025 | Fidelity Freedom
Index 2030 | Fidelity Freedom
Index 2035 | Fidelity Freedom
Index 2040 |
Fidelity Series Global ex U.S. Index Fund | 21% | 14% | 19% | 10% | 12% |
The Funds, in aggregate, were the owners of record of more than 20% of the total outstanding shares of the following Underlying Funds.
Fund | % of shares held |
Fidelity Series Global ex U.S. Index Fund | 100% |
In addition, at the end of the period, certain otherwise unaffiliated shareholders were the owners of record of more than 50% of the outstanding shares of the following funds:
| Number of
Unaffiliated
Shareholders | Unaffiliated
Shareholders % |
Fidelity Freedom Index 2005 Fund | 1 | 52% |
Annual Report
Report of Independent Registered Public Accounting Firm
To the Trustees of Fidelity Aberdeen Street Trust and the Shareholders of Fidelity Freedom Index Income Fund, Fidelity Freedom Index 2000 Fund, Fidelity Freedom Index 2005 Fund, Fidelity Freedom Index 2010 Fund, Fidelity Freedom Index 2015 Fund, Fidelity Freedom Index 2020 Fund, Fidelity Freedom Index 2025 Fund, Fidelity Freedom Index 2030 Fund, Fidelity Freedom Index 2035 Fund, Fidelity Freedom Index 2040 Fund, Fidelity Freedom Index 2045 Fund and Fidelity Freedom Index 2050 Fund:
We have audited the accompanying statements of assets and liabilities of Fidelity Freedom Index Income Fund, Fidelity Freedom Index 2000 Fund, Fidelity Freedom Index 2005 Fund, Fidelity Freedom Index 2010 Fund, Fidelity Freedom Index 2015 Fund, Fidelity Freedom Index 2020 Fund, Fidelity Freedom Index 2025 Fund, Fidelity Freedom Index 2030 Fund, Fidelity Freedom Index 2035 Fund, Fidelity Freedom Index 2040 Fund, Fidelity Freedom Index 2045 Fund and Fidelity Freedom Index 2050 Fund (the Funds), funds of Fidelity Aberdeen Street Trust, including the schedules of investments, as of March 31, 2011, and the related statements of operations for the year then ended, the statements of changes in net assets and the financial highlights for the year ended March 31, 2011 and for the period from October 2, 2009 (commencement of operations) to March 31, 2010. These financial statements and financial highlights are the responsibility of the Funds' management. Our responsibility is to express an opinion on these financial statements and financial highlights based on our audits.
We conducted our audits in accordance with the standards of the Public Company Accounting Oversight Board (United States). Those standards require that we plan and perform the audit to obtain reasonable assurance about whether the financial statements and financial highlights are free of material misstatement. The Funds are not required to have, nor were we engaged to perform, an audit of its internal control over financial reporting. Our audits included consideration of internal control over financial reporting as a basis for designing audit procedures that are appropriate in the circumstances, but not for the purpose of expressing an opinion on the effectiveness of the Fund's internal control over financial reporting. Accordingly, we express no such opinion. An audit also includes examining, on a test basis, evidence supporting the amounts and disclosures in the financial statements, assessing the accounting principles used and significant estimates made by management, as well as evaluating the overall financial statement presentation. Our procedures included confirmation of securities owned as of March 31, 2011, by correspondence with the custodians and brokers. We believe that our audits provide a reasonable basis for our opinion.
In our opinion, the financial statements and financial highlights referred to above present fairly, in all material respects, the financial positions of Fidelity Freedom Index Income Fund, Fidelity Freedom Index 2000 Fund, Fidelity Freedom Index 2005 Fund, Fidelity Freedom Index 2010 Fund, Fidelity Freedom Index 2015 Fund, Fidelity Freedom Index 2020 Fund, Fidelity Freedom Index 2025 Fund, Fidelity Freedom Index 2030 Fund, Fidelity Freedom Index 2035 Fund, Fidelity Freedom Index 2040 Fund, Fidelity Freedom Index 2045 Fund, and Fidelity Freedom Index 2050 Fund as of March 31, 2011, the results of their operations for the year then ended, the changes in their net assets and their financial highlights for the year ended March 31, 2011 and for the period from October 2, 2009 (commencement of operations) to March 31, 2010, in conformity with accounting principles generally accepted in the United States of America.
/s/ Deloitte & Touche LLP
DELOITTE & TOUCHE LLP
Boston, Massachusetts
May 18, 2011
Annual Report
The Trustees and executive officers of the trust and funds, as applicable, are listed below. The Board of Trustees governs each Fidelity Freedom Index Fund and is responsible for protecting the interests of shareholders. The Trustees are experienced executives who meet periodically throughout the year to oversee each Fidelity Freedom Index Fund's activities, review contractual arrangements with companies that provide services to each Fidelity Freedom Index Fund, oversee management of the risks associated with such activities and contractual arrangements, and review each Fidelity Freedom Index Fund's performance. If the interests of a Fidelity Freedom Index Fund and an underlying Fidelity fund were to diverge, a conflict of interest could arise and affect how the Trustees fulfill their fiduciary duties to the affected funds. Strategic Advisers has structured the Fidelity Freedom Index Funds to avoid these potential conflicts, although there may be situations where a conflict of interest is unavoidable. In such instances, Strategic Advisers and the Trustees would take reasonable steps to minimize and, if possible, eliminate the conflict. Except for James C. Curvey, each of the Trustees oversees 190 funds advised by FMR or an affiliate. Mr. Curvey oversees 410 funds advised by FMR or an affiliate.
The Trustees hold office without limit in time except that (a) any Trustee may resign; (b) any Trustee may be removed by written instrument, signed by at least two-thirds of the number of Trustees prior to such removal; (c) any Trustee who requests to be retired or who has become incapacitated by illness or injury may be retired by written instrument signed by a majority of the other Trustees; and (d) any Trustee may be removed at any special meeting of shareholders by a two-thirds vote of the outstanding voting securities of the trust. Each Trustee who is not an interested person (as defined in the 1940 Act) (Independent Trustee), shall retire not later than the last day of the calendar year in which his or her 75th birthday occurs. The Independent Trustees may waive this mandatory retirement age policy with respect to individual Trustees. The executive officers hold office without limit in time, except that any officer may resign or may be removed by a vote of a majority of the Trustees at any regular meeting or any special meeting of the Trustees. Except as indicated, each individual has held the office shown or other offices in the same company for the past five years.
Experience, Skills, Attributes, and Qualifications of the Funds' Trustees. The Governance and Nominating Committee has adopted a statement of policy that describes the experience, qualifications, attributes, and skills that are necessary and desirable for potential Independent Trustee candidates (Statement of Policy). The Board believes that each Trustee satisfied at the time he or she was initially elected or appointed a Trustee, and continues to satisfy, the standards contemplated by the Statement of Policy. The Governance and Nominating Committee also engages professional search firms to help identify potential Independent Trustee candidates who have the experience, qualifications, attributes, and skills consistent with the Statement of Policy. From time to time, additional criteria based on the composition and skills of the current Independent Trustees, as well as experience or skills that may be appropriate in light of future changes to board composition, business conditions, and regulatory or other developments, have also been considered by the professional search firms and the Governance and Nominating Committee. In addition, the Board takes into account the Trustees' commitment and participation in Board and committee meetings, as well as their leadership of standing and ad hoc committees throughout their tenure.
In determining that a particular Trustee was and continues to be qualified to serve as a Trustee, the Board has considered a variety of criteria, none of which, in isolation, was controlling. The Board believes that, collectively, the Trustees have balanced and diverse experience, qualifications, attributes, and skills, which allow the Board to operate effectively in governing each fund and protecting the interests of shareholders. Information about the specific experience, skills, attributes, and qualifications of each Trustee, which in each case led to the Board's conclusion that the Trustee should serve (or continue to serve) as a trustee of the funds, is provided below.
Board Structure and Oversight Function. Abigail P. Johnson is an interested person (as defined in the 1940 Act) and currently serves as Chairman. The Trustees have determined that an interested Chairman is appropriate and benefits shareholders because an interested Chairman has a personal and professional stake in the quality and continuity of services provided to the funds. Independent Trustees exercise their informed business judgment to appoint an individual of their choosing to serve as Chairman, regardless of whether the Trustee happens to be independent or a member of management. The Independent Trustees have determined that they can act independently and effectively without having an Independent Trustee serve as Chairman and that a key structural component for assuring that they are in a position to do so is for the Independent Trustees to constitute a substantial majority for the Board. The Independent Trustees also regularly meet in executive session. Kenneth L. Wolfe serves as Chairman of the Independent Trustees and as such (i) acts as a liaison between the Independent Trustees and management with respect to matters important to the Independent Trustees and (ii) with management prepares agendas for Board meetings.
Fidelity funds are overseen by different Boards of Trustees. The funds' Board oversees Fidelity's investment-grade bond, money market, and asset allocation funds and another Board oversees Fidelity's equity and high income funds. The asset allocation funds may invest in Fidelity funds that are overseen by such other Board. The use of separate Boards, each with its own committee structure, allows the Trustees of each group of Fidelity funds to focus on the unique issues of the funds they oversee, including common research, investment, and operational issues. On occasion, the separate Boards establish joint committees to address issues of overlapping consequences for the Fidelity funds overseen by each Board.
The Trustees operate using a system of committees to facilitate the timely and efficient consideration of all matters of importance to the Trustees, each fund, and fund shareholders and to facilitate compliance with legal and regulatory requirements and oversight of the funds' activities and associated risks. The Board, acting through its committees, has charged FMR and its affiliates with (i) identifying events or circumstances the occurrence of which could have demonstrably adverse effects on the funds' business and/or reputation; (ii) implementing processes and controls to lessen the possibility that such events or circumstances occur or to mitigate the effects of such events or circumstances if they do occur; and (iii) creating and maintaining a system designed to evaluate continuously business and market conditions in order to facilitate the identification and implementation processes described in (i) and (ii) above. Because the day-to-day operations and activities of the funds are carried out by or through FMR, its affiliates and other service providers, the funds' exposure to risks is mitigated but not eliminated by the processes overseen by the Trustees. While each of the Board's committees has responsibility for overseeing different aspects of the funds' activities, oversight is exercised primarily through the Operations and Audit Committees. Appropriate personnel, including but not limited to the funds' Chief Compliance Officer (CCO), FMR's internal auditor, the independent accountants, the funds' Treasurer and portfolio management personnel, make periodic reports to the Board's committees, as appropriate. The responsibilities of each committee, including their oversight responsibilities, are described further under "Standing Committees of the Funds' Trustees."
Annual Report
The funds' Statement of Additional Information (SAI) includes more information about the Trustees. To request a free copy, call Fidelity at 1-800-835-5092.
Interested Trustees*:
Correspondence intended for each Trustee who is an interested person may be sent to Fidelity Investments, 82 Devonshire Street, Boston, Massachusetts 02109.
Name, Age; Principal Occupations and Other Relevant Experience+ |
Abigail P. Johnson (49) |
| Year of Election or Appointment: 2009 Ms. Johnson is Trustee and Chairman of the Board of Trustees of certain Trusts. Ms. Johnson serves as President of Personal, Workplace and Institutional Services (2005-present). Ms. Johnson is the Vice Chairman and Director (2007-present) of FMR LLC. Previously, Ms. Johnson served as President and a Director of FMR (2001-2005), a Trustee of other investment companies advised by FMR, Fidelity Investments Money Management, Inc., and FMR Co., Inc. (2001-2005), Senior Vice President of the Fidelity funds (2001-2005), and managed a number of Fidelity funds. Ms. Abigail P. Johnson and Mr. Arthur E. Johnson are not related. |
James C. Curvey (75) |
| Year of Election or Appointment: 2007 Mr. Curvey also serves as Trustee (2007-present) of other investment companies advised by FMR. Mr. Curvey is a Director of Fidelity Investments Money Management, Inc. (2009-present), Director of Fidelity Research & Analysis Co. (2009-present) and Director of FMR and FMR Co., Inc. (2007-present). Mr. Curvey is also Vice Chairman (2007-present) and Director of FMR LLC. In addition, Mr. Curvey serves as an Overseer for the Boston Symphony Orchestra and a member of the Trustees of Villanova University. Previously, Mr. Curvey was the Vice Chairman (2006-2007) and Director (2000-2007) of FMR Corp. |
* Trustees have been determined to be "Interested Trustees" by virtue of, among other things, their affiliation with the trust or various entities under common control with FMR.
+ The information above includes each Trustee's principal occupation during the last five years and other information relating to the experience, attributes, and skills relevant to each Trustee's qualifications to serve as a Trustee, which led to the conclusion that each Trustee should serve as a Trustee for each fund.
Independent Trustees:
Correspondence intended for each Independent Trustee (that is, the Trustees other than the Interested Trustees) may be sent to Fidelity Investments, P.O. Box 55235, Boston, Massachusetts 02205-5235.
Name, Age; Principal Occupations and Other Relevant Experience+ |
Albert R. Gamper, Jr. (69) |
| Year of Election or Appointment: 2006 Prior to his retirement in December 2004, Mr. Gamper served as Chairman of the Board of CIT Group Inc. (commercial finance). During his tenure with CIT Group Inc. Mr. Gamper served in numerous senior management positions, including Chairman (1987-1989; 1999-2001; 2002-2004), Chief Executive Officer (1987-2004), and President (2002-2003). He also served as President and Chief Executive Officer of Tyco Capital Corporation (2001-2002). Mr. Gamper currently serves as a member of the Board of Directors of Public Service Enterprise Group (utilities, 2000-present), a member of the Board of Trustees, Rutgers University (2004-present), and Chairman of the Board of Saint Barnabas Health Care System. Previously, Mr. Gamper served as Chairman of the Board of Governors, Rutgers University (2004-2007). |
Robert F. Gartland (59) |
| Year of Election or Appointment: 2010 Mr. Gartland is a partner and investor of Vietnam Partners LLC (investments and consulting, 2008-present) and is Chairman and an investor in Gartland and Mellina Group Corp. (consulting, 2009-present). Prior to his retirement, Mr. Gartland held a variety of positions at Morgan Stanley (financial services, 1979-2007) including Managing Director (1987-2007). |
Arthur E. Johnson (64) |
| Year of Election or Appointment: 2008 Mr. Johnson serves as a member of the Board of Directors of Eaton Corporation (diversified power management, 2009-present) and AGL Resources, Inc. (holding company). Prior to his retirement, Mr. Johnson served as Senior Vice President of Corporate Strategic Development of Lockheed Martin Corporation (defense contractor, 1999-2009). He previously served on the Board of Directors of IKON Office Solutions, Inc. (1999-2008) and Delta Airlines (2005-2007). Mr. Arthur E. Johnson and Ms. Abigail P. Johnson are not related. |
Michael E. Kenneally (57) |
| Year of Election or Appointment: 2009 Previously, Mr. Kenneally served as a Member of the Advisory Board for certain Fidelity Fixed Income and Asset Allocation Funds (2008-2009). Prior to his retirement, Mr. Kenneally served as Chairman and Global Chief Executive Officer of Credit Suisse Asset Management (2003-2005). Mr. Kenneally was a Director of the Credit Suisse Funds (U.S. mutual funds, 2004-2008) and certain other closed-end funds (2004-2005) and was awarded the Chartered Financial Analyst (CFA) designation in 1991. |
James H. Keyes (70) |
| Year of Election or Appointment: 2007 Mr. Keyes serves as a member of the Boards of Navistar International Corporation (manufacture and sale of trucks, buses, and diesel engines, since 2002) and Pitney Bowes, Inc. (integrated mail, messaging, and document management solutions, since 1998). Prior to his retirement, Mr. Keyes served as Chairman and Chief Executive Officer of Johnson Controls (automotive, building, and energy, 1998-2002) and as a member of the Board of LSI Logic Corporation (semiconductor technologies, 1984-2008). |
Marie L. Knowles (64) |
| Year of Election or Appointment: 2001 Prior to Ms. Knowles' retirement in June 2000, she served as Executive Vice President and Chief Financial Officer of Atlantic Richfield Company (ARCO) (diversified energy, 1996-2000). From 1993 to 1996, she was a Senior Vice President of ARCO and President of ARCO Transportation Company. She served as a Director of ARCO from 1996 to 1998. Ms. Knowles currently serves as a Director and Chairman of the Audit Committee of McKesson Corporation (healthcare service, since 2002). Ms. Knowles is an Honorary Trustee of the Brookings Institution and a member of the Board of the Catalina Island Conservancy and of the Santa Catalina Island Company (2009-present). She also serves as a member of the Advisory Board for the School of Engineering of the University of Southern California and the Foundation Board of the School of Architecture at the University of Virginia (2007-present). Previously, Ms. Knowles served as a Director of Phelps Dodge Corporation (copper mining and manufacturing, 1994-2007). |
Kenneth L. Wolfe (72) |
| Year of Election or Appointment: 2005 Mr. Wolfe is Chairman of the Independent Trustees of the Fixed Income and Asset Allocation Funds (2008-present). Prior to his retirement, Mr. Wolfe served as Chairman and a Director (2007-2009) and Chairman and Chief Executive Officer (1994-2001) of Hershey Foods Corporation. He also served as a member of the Boards of Adelphia Communications Corporation (telecommunications, 2003-2006), Bausch & Lomb, Inc. (medical/pharmaceutical, 1993-2007), and Revlon, Inc. (personal care products, 2004-2009). |
+ The information above includes each Trustee's principal occupation during the last five years and other information relating to the experience, attributes, and skills relevant to each Trustee's qualifications to serve as a Trustee, which led to the conclusion that each Trustee should serve as a Trustee for each fund.
Executive Officers:
Correspondence intended for each executive officer may be sent to Fidelity Investments, 82 Devonshire Street, Boston, Massachusetts 02109.
Name, Age; Principal Occupation |
John R. Hebble (52) |
| Year of Election or Appointment: 2008 President and Treasurer of Fidelity's Fixed Income and Asset Allocation Funds. Mr. Hebble also serves as Treasurer and Chief Financial Officer of The North Carolina Capital Management Trust: Cash and Term Portfolios (2008-present), Assistant Treasurer of other Fidelity funds (2009-present) and is an employee of Fidelity Investments. |
Boyce I. Greer (55) |
| Year of Election or Appointment: 2005 Vice President of Fidelity's Fixed Income Funds and Asset Allocation Funds (2005). Mr. Greer is also a Trustee of other investment companies advised by FMR. Mr. Greer is head of Institutional Investments for Fidelity Asset Management and Vice Chairman of Pyramis Global Advisors, LLC (2011-present), President of The North Carolina Capital Management Trust: Cash and Term Portfolios (2003-present), the Asset Allocation Division (2008-present), President and a Director of Strategic Advisers, Inc. (2008-present), President of FIMM 130/30 LLC (2008-present), Director of Ballyrock Investment Advisors LLC (2006-present), and an Executive Vice President of FMR (2005-present). Previously, Mr. Greer served as Executive Vice President of FMR Co., Inc. (2005-2009), President and Director of Fidelity Investments Money Management, Inc. (2007-2009) and as a Director and Managing Director of Strategic Advisers, Inc. (2002-2005). |
Derek L. Young (46) |
| Year of Election or Appointment: 2009 Vice President of Fidelity's Asset Allocation Funds. Mr. Young also serves as Chief Investment Officer of the Global Asset Allocation Group (2009-present). Previously, Mr. Young served as a portfolio manager. |
Scott C. Goebel (43) |
| Year of Election or Appointment: 2008 Secretary and Chief Legal Officer (CLO) of the Fidelity funds. Mr. Goebel also serves as Secretary and CLO of The North Carolina Capital Management Trust: Cash and Term Portfolios (2008-present); General Counsel, Secretary, and Senior Vice President of FMR (2008-present) and FMR Co., Inc. (2008-present); Deputy General Counsel of FMR LLC; Chief Legal Officer of Fidelity Management & Research (Hong Kong) Limited (2008-present) and Assistant Secretary of Fidelity Management & Research (Japan) Inc. (2008-present), Fidelity Investments Money Management, Inc. (2008-present), Fidelity Management & Research (U.K.) Inc. (2008-present), and Fidelity Research and Analysis Company (2008-present). Previously, Mr. Goebel served as Assistant Secretary of the Funds (2007-2008) and as Vice President and Secretary of Fidelity Distributors Corporation (FDC) (2005-2007). |
David J. Carter (37) |
| Year of Election or Appointment: 2010 Assistant Secretary of Fidelity's Fixed Income and Asset Allocation Funds. Mr. Carter also serves as Vice President, Associate General Counsel (2010-present) and is an employee of Fidelity Investments (2005-present). |
Holly C. Laurent (56) |
| Year of Election or Appointment: 2008 Anti-Money Laundering (AML) Officer of the Fidelity funds. Ms. Laurent also serves as AML Officer of The North Carolina Capital Management Trust: Cash and Term Portfolios (2008-present) and is an employee of Fidelity Investments. Previously, Ms. Laurent was Senior Vice President and Head of Legal for Fidelity Business Services India Pvt. Ltd. (2006-2008), and Senior Vice President, Deputy General Counsel and Group Head for FMR LLC (2005-2006). |
Christine Reynolds (52) |
| Year of Election or Appointment: 2008 Chief Financial Officer of the Fidelity funds. Ms. Reynolds became President of Fidelity Pricing and Cash Management Services (FPCMS) in August 2008. Ms. Reynolds served as Chief Operating Officer of FPCMS (2007-2008). Previously, Ms. Reynolds served as President, Treasurer, and Anti-Money Laundering officer of the Fidelity funds (2004-2007). |
Michael H. Whitaker (43) |
| Year of Election or Appointment: 2008 Chief Compliance Officer of Fidelity's Fixed Income and Asset Allocation Funds. Mr. Whitaker also serves as Chief Compliance Officer of The North Carolina Capital Management Trust: Cash and Term Portfolios (2008-present). Mr. Whitaker is an employee of Fidelity Investments (2007-present). Prior to joining Fidelity Investments, Mr. Whitaker worked at MFS Investment Management where he served as Senior Vice President and Chief Compliance Officer (2004-2006), and Assistant General Counsel. |
Jeffrey S. Christian (49) |
| Year of Election or Appointment: 2009 Deputy Treasurer of the Fidelity funds. Mr. Christian is an employee of Fidelity Investments. Previously, Mr. Christian served as Chief Financial Officer (2008-2009) of certain Fidelity funds and Senior Vice President of Fidelity Pricing and Cash Management Services (FPCMS) (2004-2009). |
Bryan A. Mehrmann (49) |
| Year of Election or Appointment: 2005 Deputy Treasurer of the Fidelity funds. Mr. Mehrmann is an employee of Fidelity Investments. |
Stephanie J. Dorsey (41) |
| Year of Election or Appointment: 2008 Deputy Treasurer of Fidelity's Fixed Income and Asset Allocation Funds. Ms. Dorsey also serves as Assistant Treasurer of other Fidelity funds (2010-present) and is an employee of Fidelity Investments (2008-present). Previously, Ms. Dorsey served as Treasurer (2004-2008) of the JPMorgan Mutual Funds and Vice President (2004-2008) of JPMorgan Chase Bank. |
Adrien E. Deberghes (43) |
| Year of Election or Appointment: 2010 Assistant Treasurer of Fidelity's Fixed Income and Asset Allocation Funds. Mr. Deberghes also serves as Deputy Treasurer of other Fidelity funds (2008-present) and is an employee of Fidelity Investments (2008-present). Previously, Mr. Deberghes served as Senior Vice President of Mutual Fund Administration at State Street Corporation (2007-2008), Senior Director of Mutual Fund Administration at Investors Bank & Trust (2005-2007), and Director of Finance for Dunkin' Brands (2000-2005). |
Kenneth B. Robins (41) |
| Year of Election or Appointment: 2009 Assistant Treasurer of the Fidelity Fixed Income and Asset Allocation Funds. Mr. Robins also serves as President and Treasurer of other Fidelity funds (2008-present; 2010-present) and is an employee of Fidelity Investments (2004-present). Previously, Mr. Robins served as Deputy Treasurer of the Fidelity funds (2005-2008) and Treasurer and Chief Financial Officer of The North Carolina Capital Management Trust: Cash and Term Portfolios (2006-2008). |
Gary W. Ryan (52) |
| Year of Election or Appointment: 2005 Assistant Treasurer of the Fidelity funds. Mr. Ryan is an employee of Fidelity Investments. Previously, Mr. Ryan served as Vice President of Fund Reporting in Fidelity Pricing and Cash Management Services (FPCMS) (1999-2005). |
Jonathan Davis (42) |
| Year of Election or Appointment: 2010 Assistant Treasurer of the Fidelity funds. Mr. Davis is an employee of Fidelity Investments. Previously, Mr. Davis served as Vice President and Associate General Counsel of FMR LLC (2003-2010). |
Annual Report
The Board of Trustees of each fund voted to pay to shareholders of record at the opening of business on record date, the following distributions per share derived from capital gains realized from sales of portfolio securities and dividends derived from net investment income:
| Pay Date | Record Date | Dividends | Capital Gains |
Fidelity Freedom Index Income Fund | 05/09/11 | 05/06/11 | $0.010 | $0.008 |
Fidelity Freedom Index 2000 Fund | 05/09/11 | 05/06/11 | $0.019 | $0.016 |
Fidelity Freedom Index 2005 Fund | 05/09/11 | 05/06/11 | $0.015 | $0.009 |
Fidelity Freedom Index 2010 Fund | 05/12/11 | 05/11/11 | $0.022 | $0.019 |
Fidelity Freedom Index 2015 Fund | 05/12/11 | 05/11/11 | $0.020 | $0.007 |
Fidelity Freedom Index 2020 Fund | 05/12/11 | 05/11/11 | $0.021 | $0.009 |
Fidelity Freedom Index 2025 Fund | 05/12/11 | 05/11/11 | $0.016 | $0.008 |
Fidelity Freedom Index 2030 Fund | 05/09/11 | 05/06/11 | $0.018 | $0.008 |
Fidelity Freedom Index 2035 Fund | 05/09/11 | 05/06/11 | $0.011 | $0.006 |
Fidelity Freedom Index 2040 Fund | 05/09/11 | 05/06/11 | $0.011 | $0.008 |
Fidelity Freedom Index 2045 Fund | 05/09/11 | 05/06/11 | $0.009 | $0.006 |
Fidelity Freedom Index 2050 Fund | 05/12/11 | 05/11/11 | $0.005 | $0.005 |
The funds hereby designate as capital gain dividend the amounts noted below for the taxable year ended March 31, 2011, or, if subsequently determined to be different, the net capital gain of such year.
Fidelity Freedom Index Income Fund | $ 36,289 |
Fidelity Freedom Index 2000 Fund | $ 41,050 |
Fidelity Freedom Index 2005 Fund | $ 17,571 |
Fidelity Freedom Index 2010 Fund | $ 269,091 |
Fidelity Freedom Index 2015 Fund | $ 240,738 |
Fidelity Freedom Index 2020 Fund | $ 544,538 |
Fidelity Freedom Index 2025 Fund | $ 236,234 |
Fidelity Freedom Index 2030 Fund | $ 340,798 |
Fidelity Freedom Index 2035 Fund | $ 109,238 |
Fidelity Freedom Index 2040 Fund | $ 163,992 |
Fidelity Freedom Index 2045 Fund | $ 38,311 |
Fidelity Freedom Index 2050 Fund | $ 22,885 |
A percentage of the dividends distributed during the fiscal year for the following funds were derived from interest on U.S. Government securities which is generally exempt from state income tax:
Fidelity Freedom Index Income Fund | 15.72% |
Fidelity Freedom Index 2000 Fund | 15.59% |
Fidelity Freedom Index 2005 Fund | 13.28% |
Fidelity Freedom Index 2010 Fund | 12.40% |
Fidelity Freedom Index 2015 Fund | 12.03% |
Fidelity Freedom Index 2020 Fund | 10.98% |
Fidelity Freedom Index 2025 Fund | 9.62% |
Fidelity Freedom Index 2030 Fund | 9.01% |
Fidelity Freedom Index 2035 Fund | 6.70% |
Fidelity Freedom Index 2040 Fund | 6.42% |
Fidelity Freedom Index 2045 Fund | 5.78% |
Fidelity Freedom Index 2050 Fund | 4.42% |
Annual Report
Distributions - continued
A percentage of the dividends distributed during the fiscal year for the following funds qualify for the dividends-received deduction for corporate shareholders:
Fidelity Freedom Index Income Fund | |
May 2010 | 11% |
June 2010 | 19% |
July 2010 | 19% |
August 2010 | 19% |
September 2010 | 19% |
October 2010 | 19% |
November 2010 | 19% |
December 2010 | 19% |
January 2011 | 0% |
February 2011 | 0% |
March 2011 | 0% |
Fidelity Freedom Index 2000 Fund | |
May 2010 | 0% |
December 2010 | 20% |
Fidelity Freedom Index 2005 Fund | |
May 2010
December 2010 | 6%
32% |
Fidelity Freedom Index 2010 Fund | |
May 2010
December 2010 | 8%
34% |
Fidelity Freedom Index 2015 Fund | |
May 2010
December 2010 | 2%
38% |
Fidelity Freedom Index 2020 Fund | |
May 2010
December 2010 | 3%
41% |
Fidelity Freedom Index 2025 Fund | |
May 2010
December 2010 | 2%
46% |
Fidelity Freedom Index 2030 Fund | |
May 2010
December 2010 | 5%
48% |
Fidelity Freedom Index 2035 Fund | |
May 2010
December 2010 | 5%
55% |
Fidelity Freedom Index 2040 Fund | |
May 2010
December 2010 | 4%
54% |
Fidelity Freedom Index 2045 Fund | |
May 2010
December 2010 | 5%
56% |
Fidelity Freedom Index 2050 Fund | |
May 2010
December 2010 | 19%
57% |
Annual Report
A percentage of the dividends distributed during the fiscal year for the following funds may be taken into account as a dividend for purposes of the maximum rate under section 1(h)(11) of the Internal Revenue Code.
Fidelity Freedom Index Income Fund | |
May 2010 | 16% |
June 2010 | 27% |
July 2010 | 27% |
August 2010 | 27% |
September 2010 | 27% |
October 2010 | 27% |
November 2010 | 27% |
December 2010 | 27% |
January 2011 | 0% |
February 2011 | 0% |
March 2011 | 0% |
Fidelity Freedom Index 2000 Fund | |
May 2010
December 2010 | 1%
26% |
Fidelity Freedom Index 2005 Fund | |
May 2010
December 2010 | 9%
42% |
Fidelity Freedom Index 2010 Fund | |
May 2010
December 2010 | 11%
46% |
Fidelity Freedom Index 2015 Fund | |
May 2010
December 2010 | 3%
51% |
Fidelity Freedom Index 2020 Fund | |
May 2010
December 2010 | 4%
54% |
Fidelity Freedom Index 2025 Fund | |
May 2010
December 2010 | 3%
62% |
Fidelity Freedom Index 2030 Fund | |
May 2010
December 2010 | 7%
64% |
Fidelity Freedom Index 2035 Fund | |
May 2010
December 2010 | 7%
73% |
Fidelity Freedom Index 2040 Fund | |
May 2010
December 2010 | 6%
72% |
Fidelity Freedom Index 2045 Fund | |
May 2010
December 2010 | 7%
74% |
Fidelity Freedom Index 2050 Fund | |
May 2010
December 2010 | 25%
76% |
The funds will notify shareholders in January 2012 of amounts for use in preparing 2011 income tax returns.
Annual Report
Managing Your Investments
Fidelity offers several ways to conveniently manage your personal investments via your telephone or PC. You can access your account information, conduct trades and research your investments 24 hours a day.
By Phone
Fidelity Automated Service Telephone provides a single toll-free number to access account balances, positions, quotes and trading. It's easy to navigate the service, and on your first call, the system will help you create a personal identification number (PIN) for security.
(phone_graphic)
Fidelity Automated Service Telephone (FAST®)
1-800-544-5555
Press
For mutual fund and brokerage trading.
For quotes.*
For account balances and holdings.
To review orders and mutual fund activity.
To change your PIN.
To speak to a Fidelity representative.
By PC
Fidelity's web site on the Internet provides a wide range of information, including daily financial news, fund performance, interactive planning tools and news about Fidelity products and services.
(computer_graphic)
Fidelity's Web Site
www.fidelity.com
* When you call the quotes line, please remember that a fund's yield and return will vary and, except for money market funds, share price will also vary. This means that you may have a gain or loss when you sell your shares. There is no assurance that money market funds will be able to maintain a stable $1 share price; an investment in a money market fund is not insured or guaranteed by the U.S. government. Total returns are historical and include changes in share price, reinvestment of dividends and capital gains distributions, and the effects of any sales charges.
Annual Report
Investment Adviser
Strategic Advisers, Inc.
Boston, MA
General Distributor
Fidelity Distributors Corporation
Boston, MA
Transfer and Service Agents
Fidelity Investments Institutional
Operations Company, Inc.
Boston, MA
Fidelity Service Company, Inc.
Boston, MA
Custodian
JPMorgan Chase Bank
New York, NY
FRX-W-UANNPRO-0511
1.927082.100
Fidelity Freedom K® Funds -
Income, 2000, 2005, 2010, 2015, 2020, 2025, 2030, 2035, 2040, 2045, 2050
Annual Report
March 31, 2011
(2_fidelity_logos) (Registered_Trademark)
Contents
Annual Report
To view a fund's proxy voting guidelines and proxy voting record for the 12-month period ended June 30, visit http://www.fidelity.com/proxyvotingresults or visit the Securities and Exchange Commission's (SEC) web site at http://www.sec.gov. You may also call 1-800-835-5092 to request a free copy of the proxy voting guidelines.
Standard & Poor's, S&P and S&P 500 are registered service marks of The McGraw-Hill Companies, Inc. and have been licensed for use by Fidelity Distributors Corporation.
Other third party marks appearing herein are the property of their respective owners.
All other marks appearing herein are registered or unregistered trademarks or service marks of FMR LLC or an affiliated company.
This report and the financial statements contained herein are submitted for the general information of the shareholders of the funds. This report is not authorized for distribution to prospective investors in the funds unless preceded or accompanied by an effective prospectus.
A fund files its complete schedule of portfolio holdings with the SEC for the first and third quarters of each fiscal year on Form N-Q. Forms N-Q are available on the SEC's web site at http://www.sec.gov. A fund's Forms N-Q may be reviewed and copied at the SEC's Public Reference Room in Washington, DC. Information regarding the operation of the SEC's Public Reference Room may be obtained by calling 1-800-SEC-0330. For a complete list of a fund's portfolio holdings, view the most recent holdings listing, semiannual report, or annual report on Fidelity's web site at http://www.fidelity.com, http://www.advisor.fidelity.com, or http://www.401k.com, as applicable.
NOT FDIC INSURED • MAY LOSE VALUE • NO BANK GUARANTEE
Neither the funds nor Fidelity Distributors Corporation is a bank.
Annual Report
(photo_of_Abigail_P_Johnson)
Dear Shareholder:
Amid indications the U.S. economy had turned a corner, U.S. equities continued their generally upward trend in early 2011, overcoming bouts of short-term volatility following unrest in North Africa and the disaster in Japan. Still, questions remained about the longer-term outlook, most notably persistently high unemployment. Financial markets are always unpredictable, of course, but there also are several time-tested investment principles that can help put the odds in your favor.
One of the basic tenets is to invest for the long term. Over time, riding out the markets' inevitable ups and downs has proven much more effective than selling into panic or chasing the hottest trend. Even missing only a few of the markets' best days can significantly diminish investor returns. Patience also affords the benefits of compounding - of earning interest on additional income or reinvested dividends and capital gains. There can be tax advantages and cost benefits to consider as well. While staying the course doesn't eliminate risk, it can considerably lessen the effect of short-term declines.
You can further manage your investing risk through diversification. And today, more than ever, geographic diversification should be taken into account. Studies indicate that asset allocation is the single most important determinant of a portfolio's long-term success. The right mix of stocks, bonds and cash - aligned to your particular risk tolerance and investment objective - is very important. Age-appropriate rebalancing is also an essential aspect of asset allocation. For younger investors, an emphasis on equities - which historically have been the best-performing asset class over time - is encouraged. As investors near their specific goal, such as retirement or sending a child to college, consideration may be given to replacing volatile assets (e.g. common stocks) with more-stable fixed investments (bonds or savings plans).
A third principle - investing regularly - can help lower the average cost of your purchases. Investing a certain amount of money each month or quarter helps ensure you won't pay for all your shares at market highs. This strategy - known as dollar cost averaging - also reduces "emotion" from investing, helping shareholders avoid selling weak performers just prior to an upswing, or chasing a hot performer just before a correction.
We invite you to contact us via the Internet, through our Investor Centers or by phone. It is our privilege to provide you the information you need to make the investments that are right for you.
Sincerely,
(The chairman's signature appears here.)
Abigail P. Johnson
Annual Report
Fidelity Freedom K® Income Fund
Average annual total return reflects the change in the value of an investment, assuming reinvestment of the fund's distributions from dividend income and capital gains (the profits earned upon the sale of securities that have grown in value, if any) and assuming a constant rate of performance each year. The $10,000 table and the fund's returns do not reflect the deduction of taxes that a shareholder would pay on fund distributions or the redemption of fund shares. During periods of reimbursement by Fidelity, a fund's total return will be greater than it would be had the reimbursement not occurred. How a fund did yesterday is no guarantee of how it will do tomorrow.
Average Annual Total Returns
Periods ended March 31, 2011 | Past 1
year | Life of
fund A |
Fidelity Freedom K® Income Fund | 7.37% | 11.52% |
A From July 2, 2009.
$10,000 Over Life of Fund
Let's say hypothetically that $10,000 was invested in Fidelity Freedom K® Income Fund on July 2, 2009, when the fund started. The chart shows how the value of your investment would have changed, and also shows how the Barclays Capital® U.S. Aggregate Bond Index performed over the same period. See above for additional information regarding the performance of Fidelity Freedom K® Income Fund.
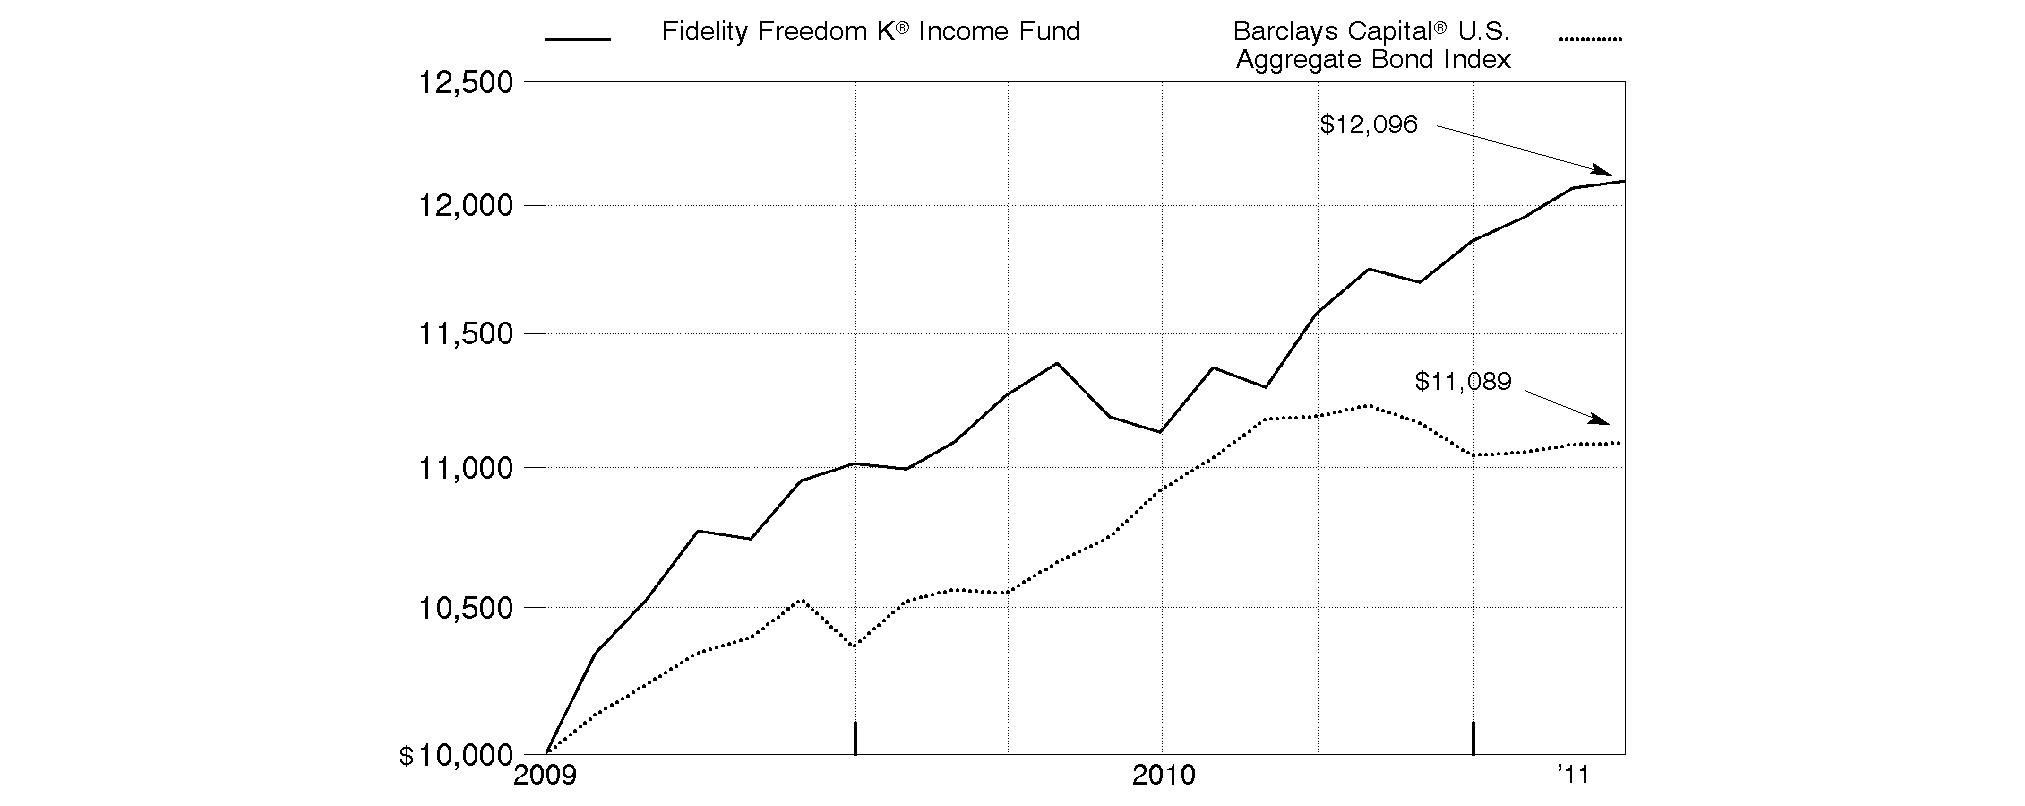
Annual Report
Fidelity Freedom K® 2000 Fund
Performance: The Bottom Line
Average annual total return reflects the change in the value of an investment, assuming reinvestment of the fund's distributions from dividend income and capital gains (the profits earned upon the sale of securities that have grown in value, if any) and assuming a constant rate of performance each year. The $10,000 table and the fund's returns do not reflect the deduction of taxes that a shareholder would pay on fund distributions or the redemption of fund shares. During periods of reimbursement by Fidelity, a fund's total return will be greater than it would be had the reimbursement not occurred. How a fund did yesterday is no guarantee of how it will do tomorrow.
Average Annual Total Returns
Periods ended March 31, 2011 | Past 1
year | Life of
fund A |
Fidelity Freedom K® 2000 Fund | 7.68% | 11.97% |
A From July 2, 2009.
$10,000 Over Life of Fund
Let's say hypothetically that $10,000 was invested in Fidelity Freedom K® 2000 Fund on July 2, 2009, when the fund started. The chart shows how the value of your investment would have changed, and also shows how the Barclays Capital® U.S. Aggregate Bond Index performed over the same period. See above for additional information regarding the performance of Fidelity Freedom K® 2000 Fund.
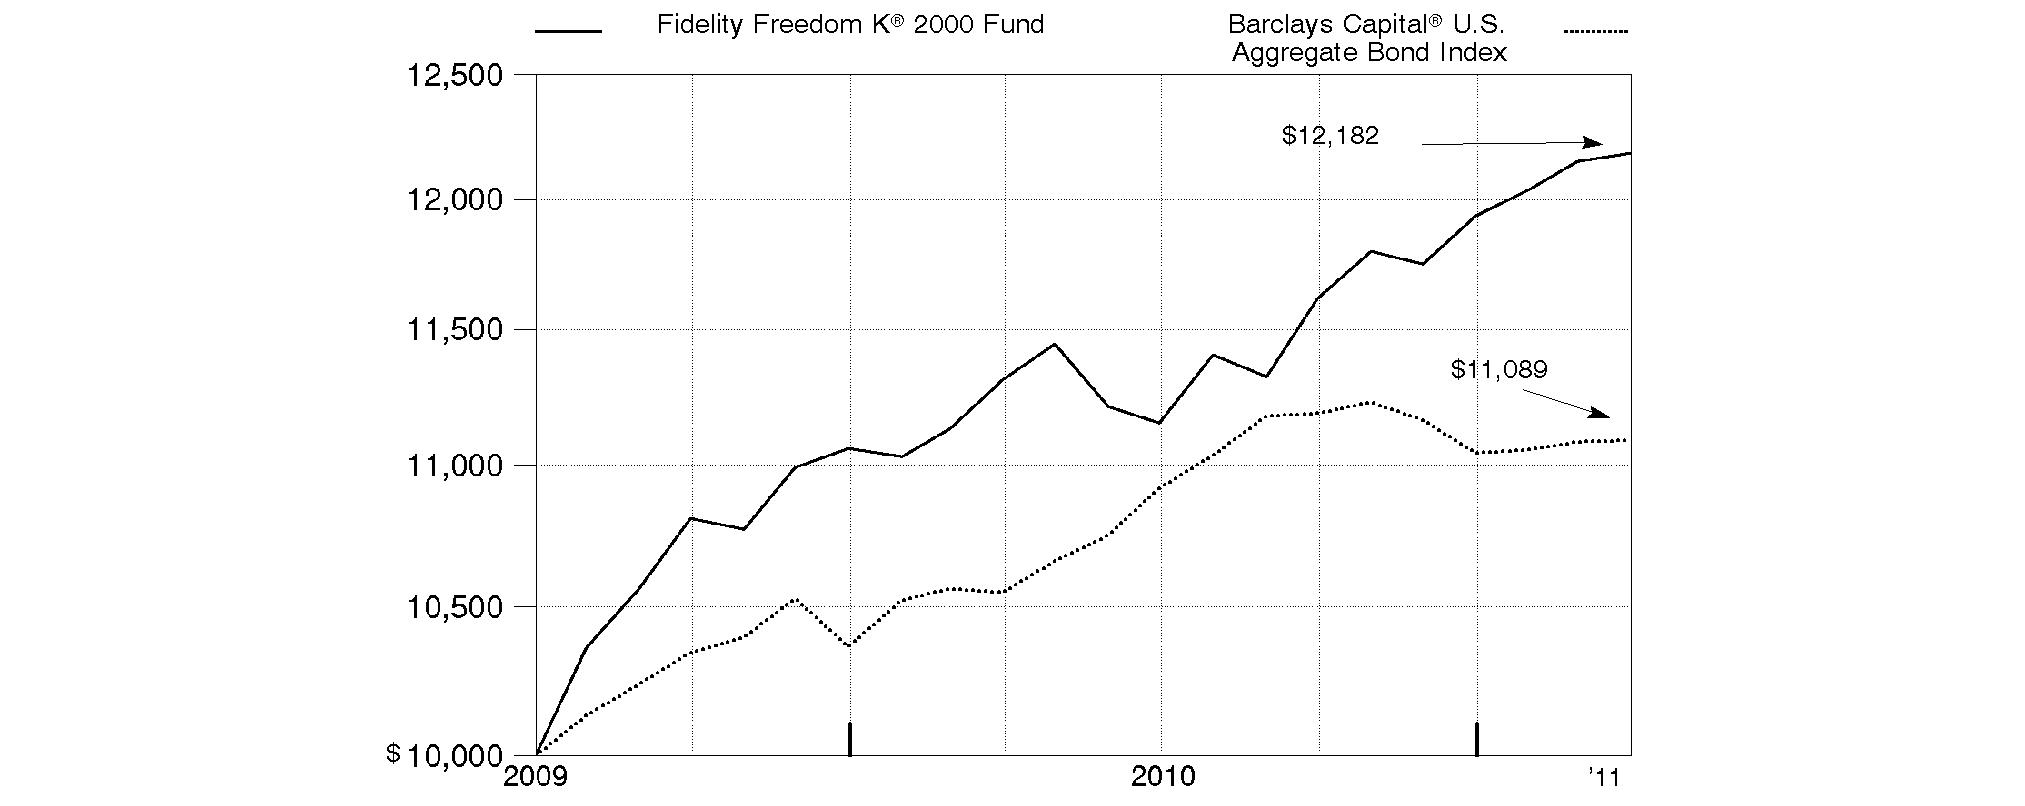
Annual Report
Fidelity Freedom K® 2005 Fund
Performance: The Bottom Line
Average annual total return reflects the change in the value of an investment, assuming reinvestment of the fund's distributions from dividend income and capital gains (the profits earned upon the sale of securities that have grown in value, if any) and assuming a constant rate of performance each year. The $10,000 table and the fund's returns do not reflect the deduction of taxes that a shareholder would pay on fund distributions or the redemption of fund shares. During periods of reimbursement by Fidelity, a fund's total return will be greater than it would be had the reimbursement not occurred. How a fund did yesterday is no guarantee of how it will do tomorrow.
Average Annual Total Returns
Periods ended March 31, 2011 | Past 1
year | Life of
fund A |
Fidelity Freedom K® 2005 Fund | 10.75% | 17.38% |
A From July 2, 2009.
$10,000 Over Life of Fund
Let's say hypothetically that $10,000 was invested in Fidelity Freedom K® 2005 Fund on July 2, 2009, when the fund started. The chart shows how the value of your investment would have changed, and also shows how the Barclays Capital® U.S. Aggregate Bond Index performed over the same period. See above for additional information regarding the performance of Fidelity Freedom K® 2005 Fund.
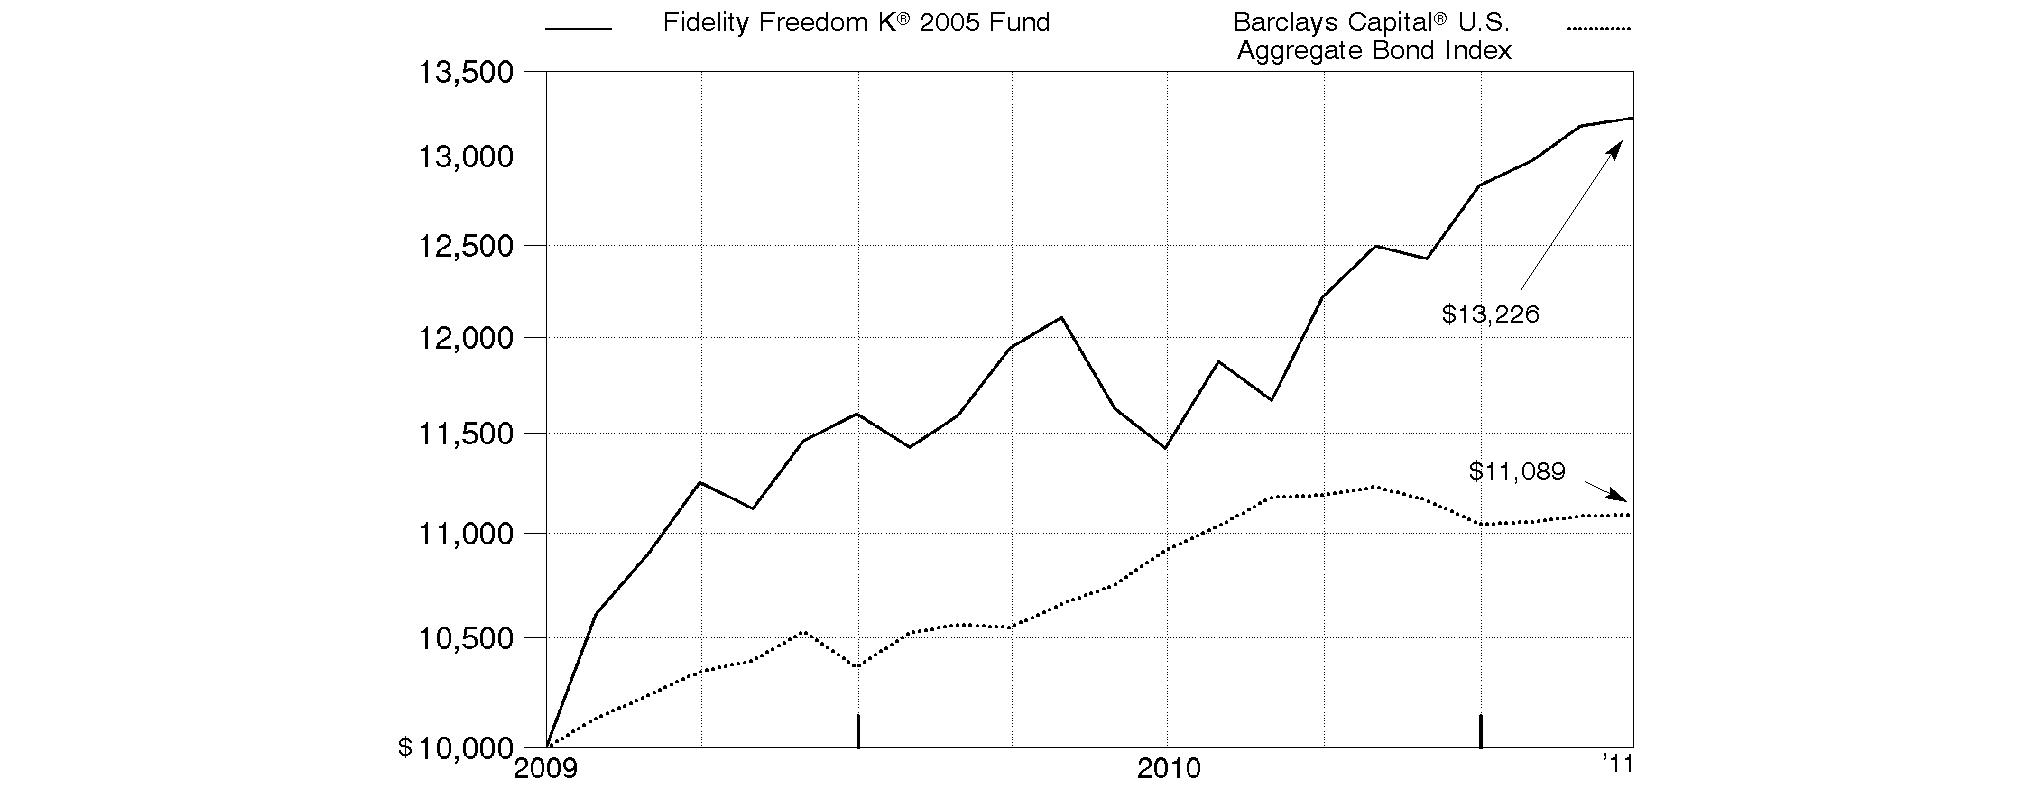
Annual Report
Fidelity Freedom K® 2010 Fund
Performance: The Bottom Line
Average annual total return reflects the change in the value of an investment, assuming reinvestment of the fund's distributions from dividend income and capital gains (the profits earned upon the sale of securities that have grown in value, if any) and assuming a constant rate of performance each year. The $10,000 table and the fund's returns do not reflect the deduction of taxes that a shareholder would pay on fund distributions or the redemption of fund shares. During periods of reimbursement by Fidelity, a fund's total return will be greater than it would be had the reimbursement not occurred. How a fund did yesterday is no guarantee of how it will do tomorrow.
Average Annual Total Returns
Periods ended March 31, 2011 | Past 1
year | Life of
fund A |
Fidelity Freedom K® 2010 Fund | 12.17% | 18.92% |
A From July 2, 2009.
$10,000 Over Life of Fund
Let's say hypothetically that $10,000 was invested in Fidelity Freedom K® 2010 Fund on July 2, 2009, when the fund started. The chart shows how the value of your investment would have changed, and also shows how the Barclays Capital® U.S. Aggregate Bond Index performed over the same period. See above for additional information regarding the performance of Fidelity Freedom K® 2010 Fund.
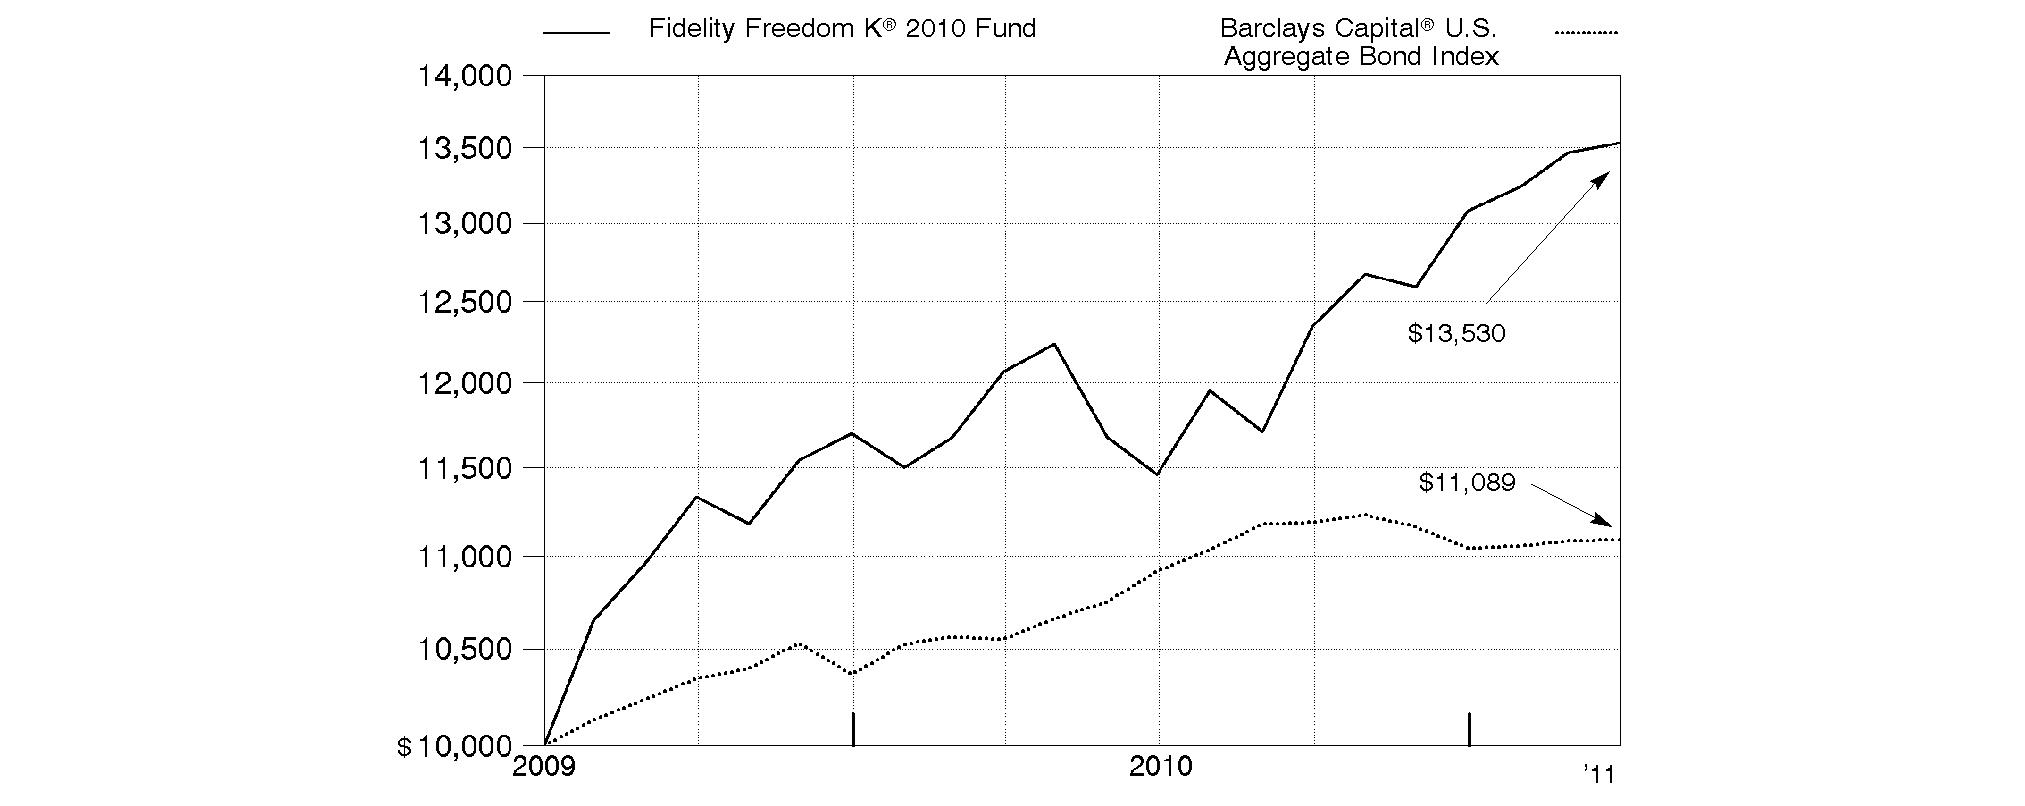
Annual Report
Fidelity Freedom K® 2015 Fund
Performance: The Bottom Line
Average annual total return reflects the change in the value of an investment, assuming reinvestment of the fund's distributions from dividend income and capital gains (the profits earned upon the sale of securities that have grown in value, if any) and assuming a constant rate of performance each year. The $10,000 table and the fund's returns do not reflect the deduction of taxes that a shareholder would pay on fund distributions or the redemption of fund shares. During periods of reimbursement by Fidelity, a fund's total return will be greater than it would be had the reimbursement not occurred. How a fund did yesterday is no guarantee of how it will do tomorrow.
Average Annual Total Returns
Periods ended March 31, 2011 | Past 1
year | Life of
fund A |
Fidelity Freedom K® 2015 Fund | 12.42% | 19.50% |
A From July 2, 2009.
$10,000 Over Life of Fund
Let's say hypothetically that $10,000 was invested in Fidelity Freedom K® 2015 Fund on July 2, 2009, when the fund started. The chart shows how the value of your investment would have changed, and also shows how the S&P 500® Index performed over the same period. See above for additional information regarding the performance of Fidelity Freedom K® 2015 Fund.
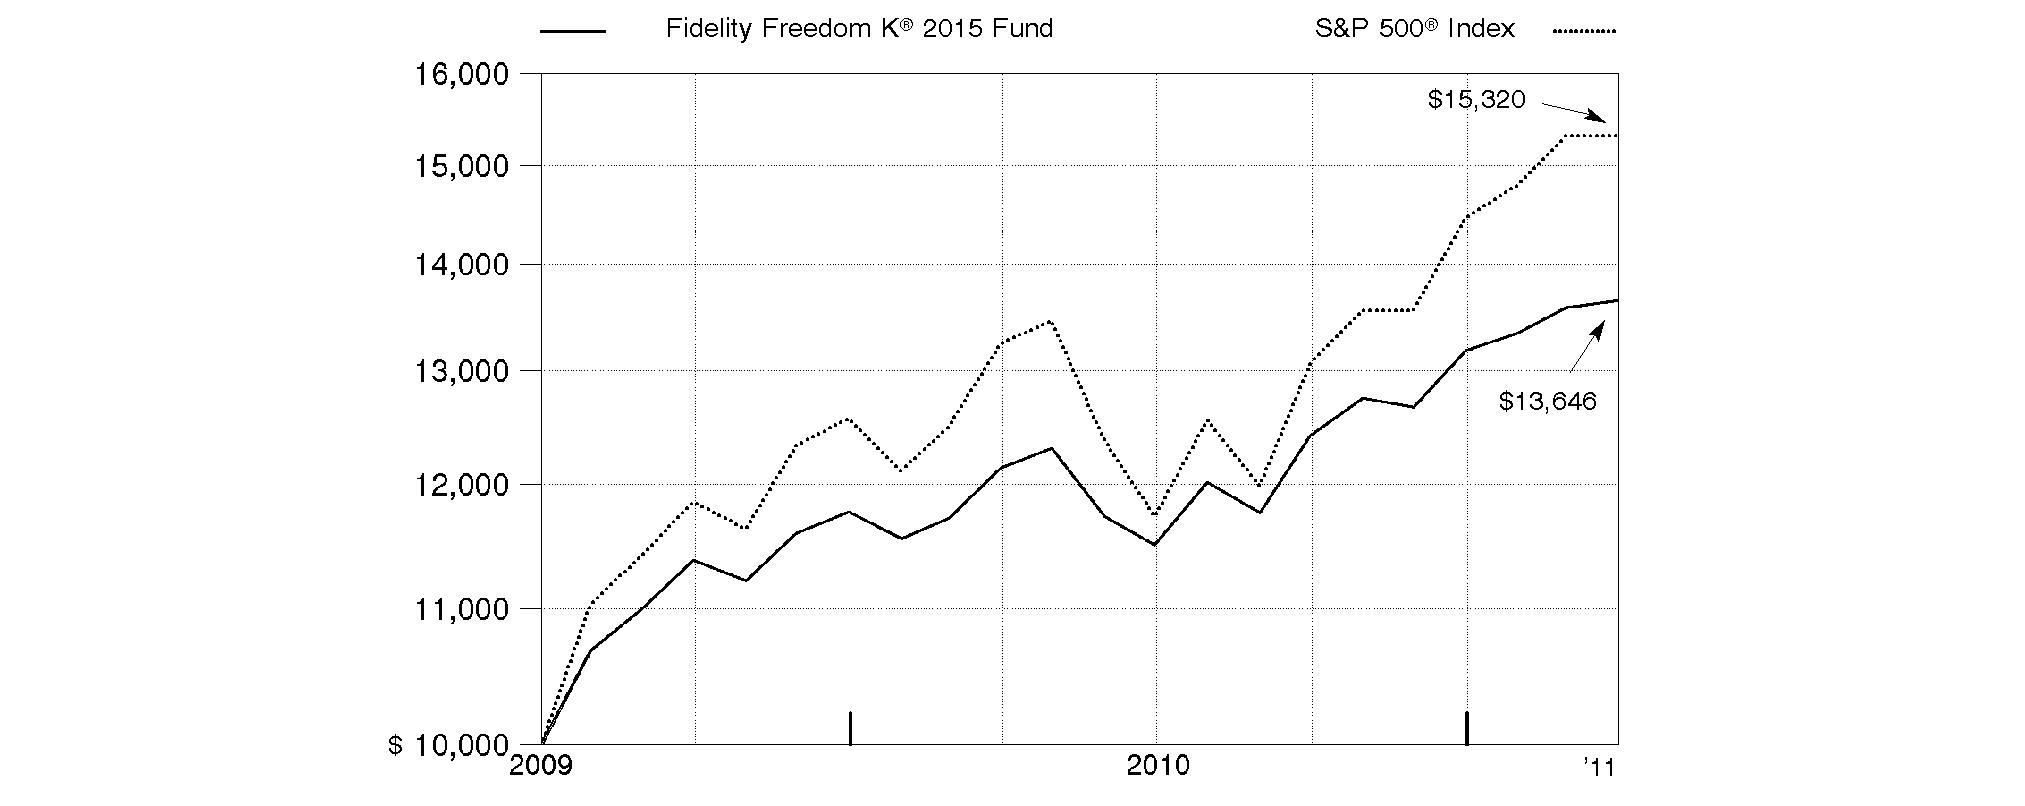
Annual Report
Fidelity Freedom K® 2020 Fund
Performance: The Bottom Line
Average annual total return reflects the change in the value of an investment, assuming reinvestment of the fund's distributions from dividend income and capital gains (the profits earned upon the sale of securities that have grown in value, if any) and assuming a constant rate of performance each year. The $10,000 table and the fund's returns do not reflect the deduction of taxes that a shareholder would pay on fund distributions or the redemption of fund shares. During periods of reimbursement by Fidelity, a fund's total return will be greater than it would be had the reimbursement not occurred. How a fund did yesterday is no guarantee of how it will do tomorrow.
Average Annual Total Returns
Periods ended March 31, 2011 | Past 1
year | Life of
fund A |
Fidelity Freedom K® 2020 Fund | 13.62% | 22.14% |
A From July 2, 2009.
$10,000 Over Life of Fund
Let's say hypothetically that $10,000 was invested in Fidelity Freedom K® 2020 Fund on July 2, 2009, when the fund started. The chart shows how the value of your investment would have changed, and also shows how the S&P 500® Index performed over the same period. See above for additional information regarding the performance of Fidelity Freedom K® 2020 Fund.
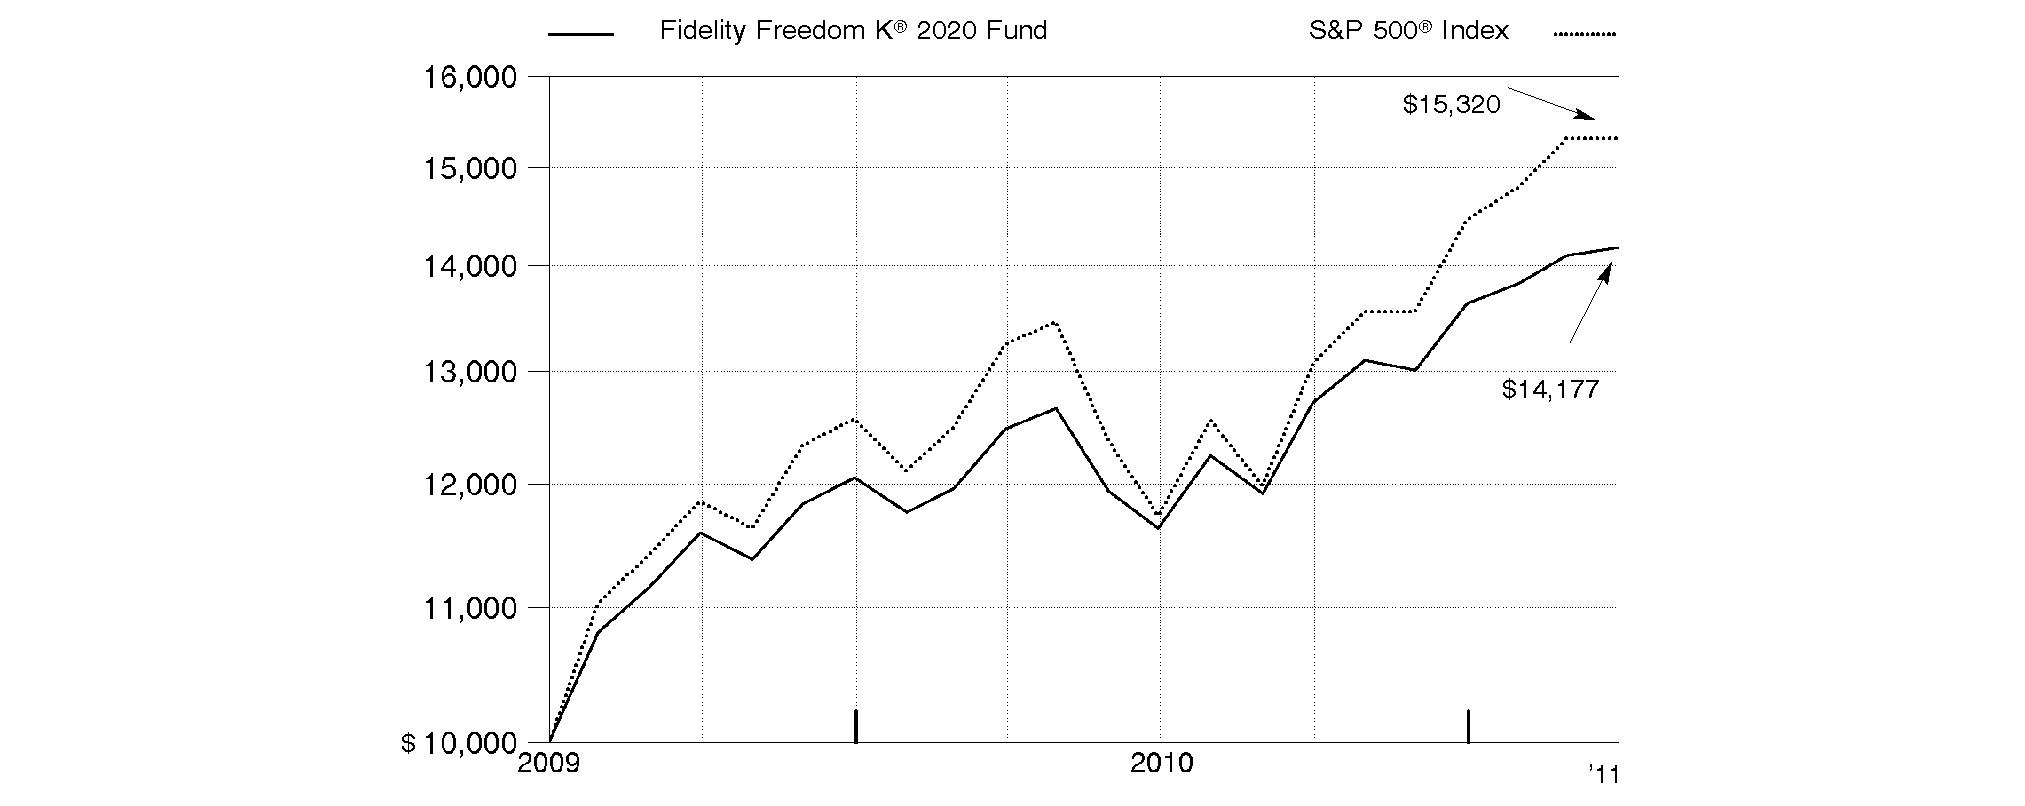
Annual Report
Fidelity Freedom K® 2025 Fund
Performance: The Bottom Line
Average annual total return reflects the change in the value of an investment, assuming reinvestment of the fund's distributions from dividend income and capital gains (the profits earned upon the sale of securities that have grown in value, if any) and assuming a constant rate of performance each year. The $10,000 table and the fund's returns do not reflect the deduction of taxes that a shareholder would pay on fund distributions or the redemption of fund shares. During periods of reimbursement by Fidelity, a fund's total return will be greater than it would be had the reimbursement not occurred. How a fund did yesterday is no guarantee of how it will do tomorrow.
Average Annual Total Returns
Periods ended March 31, 2011 | Past 1
year | Life of
fund A |
Fidelity Freedom K® 2025 Fund | 14.72% | 23.64% |
A From July 2, 2009.
$10,000 Over Life of Fund
Let's say hypothetically that $10,000 was invested in Fidelity Freedom K® 2025 Fund on July 2, 2009, when the fund started. The chart shows how the value of your investment would have changed, and also shows how the S&P 500® Index performed over the same period. See above for additional information regarding the performance of Fidelity Freedom K® 2025 Fund.
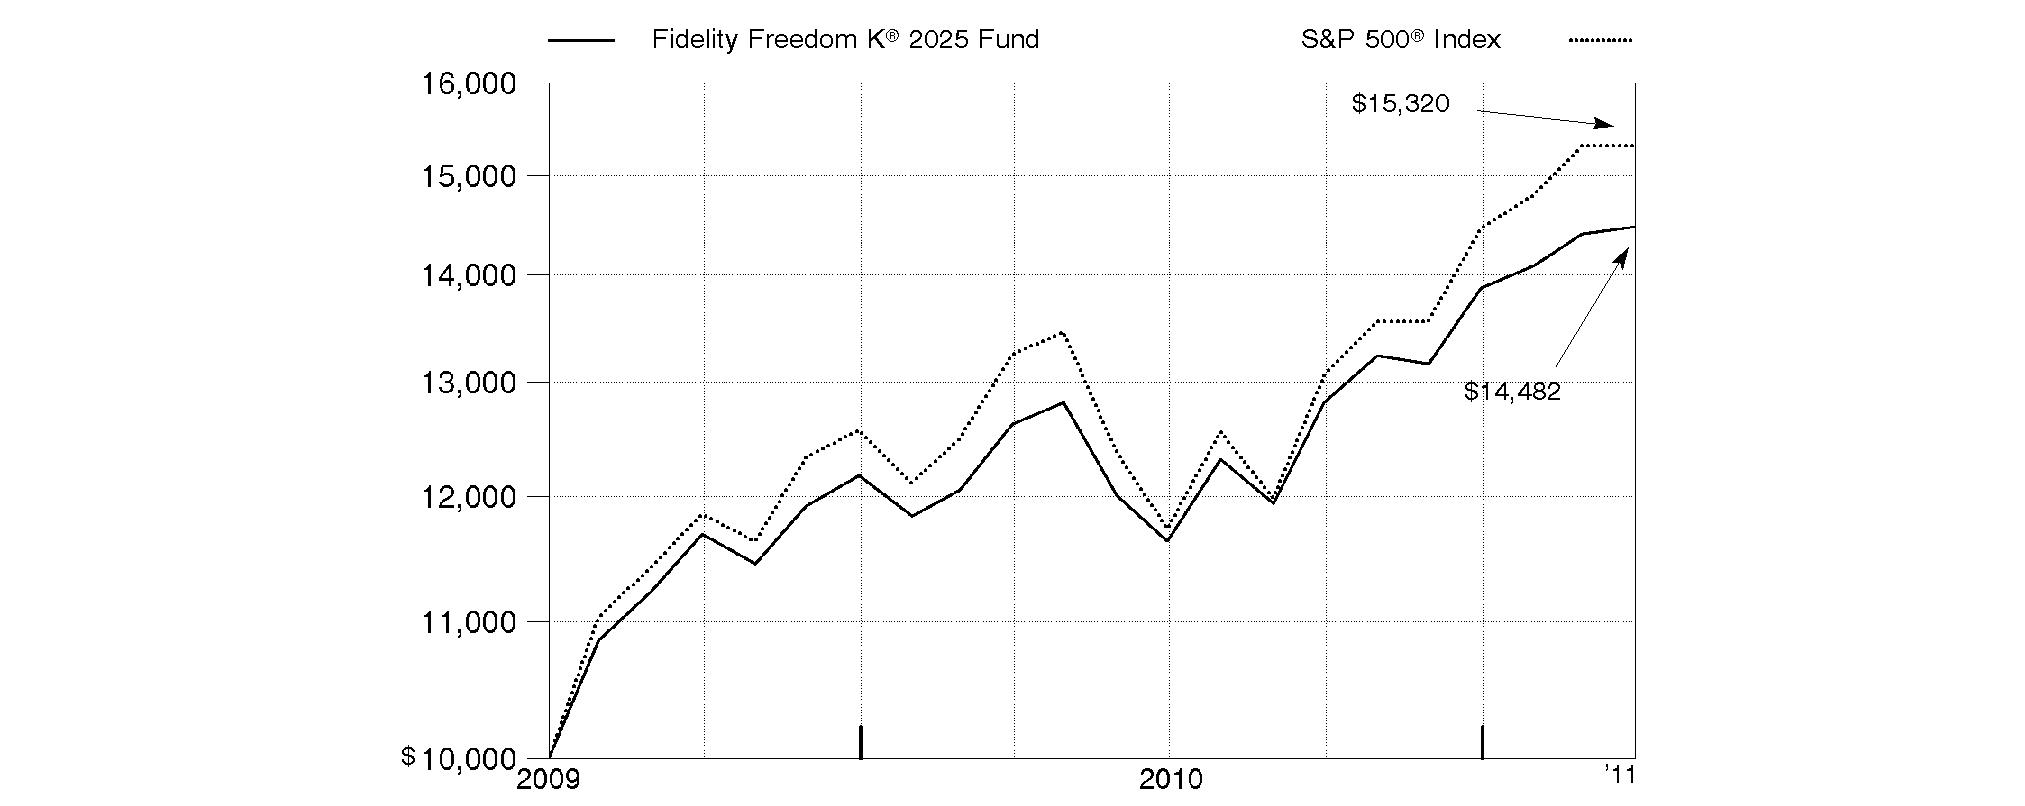
Annual Report
Fidelity Freedom K® 2030 Fund
Performance: The Bottom Line
Average annual total return reflects the change in the value of an investment, assuming reinvestment of the fund's distributions from dividend income and capital gains (the profits earned upon the sale of securities that have grown in value, if any) and assuming a constant rate of performance each year. The $10,000 table and the fund's returns do not reflect the deduction of taxes that a shareholder would pay on fund distributions or the redemption of fund shares. During periods of reimbursement by Fidelity, a fund's total return will be greater than it would be had the reimbursement not occurred. How a fund did yesterday is no guarantee of how it will do tomorrow.
Average Annual Total Returns
Periods ended March 31, 2011 | Past 1
year | Life of
fund A |
Fidelity Freedom K® 2030 Fund | 14.95% | 24.74% |
A From July 2, 2009.
$10,000 Over Life of Fund
Let's say hypothetically that $10,000 was invested in Fidelity Freedom K® 2030 Fund on July 2, 2009, when the fund started. The chart shows how the value of your investment would have changed, and also shows how the S&P 500® Index performed over the same period. See above for additional information regarding the performance of Fidelity Freedom K® 2030 Fund.
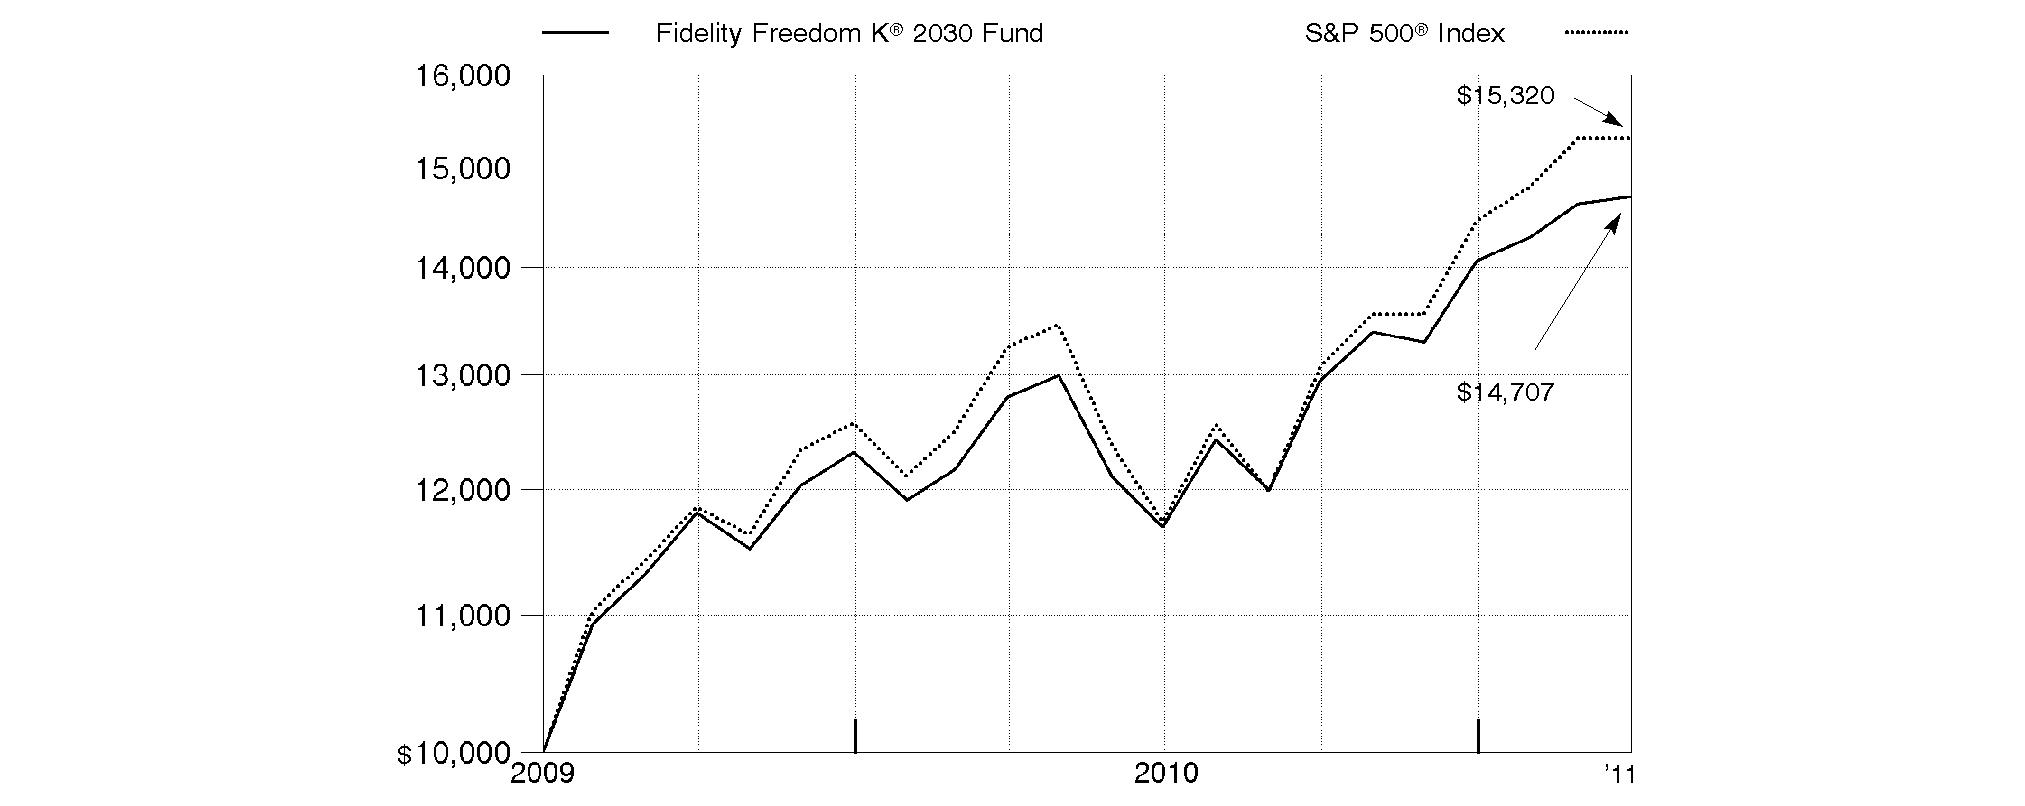
Annual Report
Fidelity Freedom K® 2035 Fund
Performance: The Bottom Line
Average annual total return reflects the change in the value of an investment, assuming reinvestment of the fund's distributions from dividend income and capital gains (the profits earned upon the sale of securities that have grown in value, if any) and assuming a constant rate of performance each year. The $10,000 table and the fund's returns do not reflect the deduction of taxes that a shareholder would pay on fund distributions or the redemption of fund shares. During periods of reimbursement by Fidelity, a fund's total return will be greater than it would be had the reimbursement not occurred. How a fund did yesterday is no guarantee of how it will do tomorrow.
Average Annual Total Returns
Periods ended March 31, 2011 | Past 1
year | Life of
fund A |
Fidelity Freedom K® 2035 Fund | 15.76% | 25.80% |
A From July 2, 2009.
$10,000 Over Life of Fund
Let's say hypothetically that $10,000 was invested in Fidelity Freedom K® 2035 Fund on July 2, 2009, when the fund started. The chart shows how the value of your investment would have changed, and also shows how the S&P 500® Index performed over the same period. See above for additional information regarding the performance of Fidelity Freedom K® 2035 Fund.
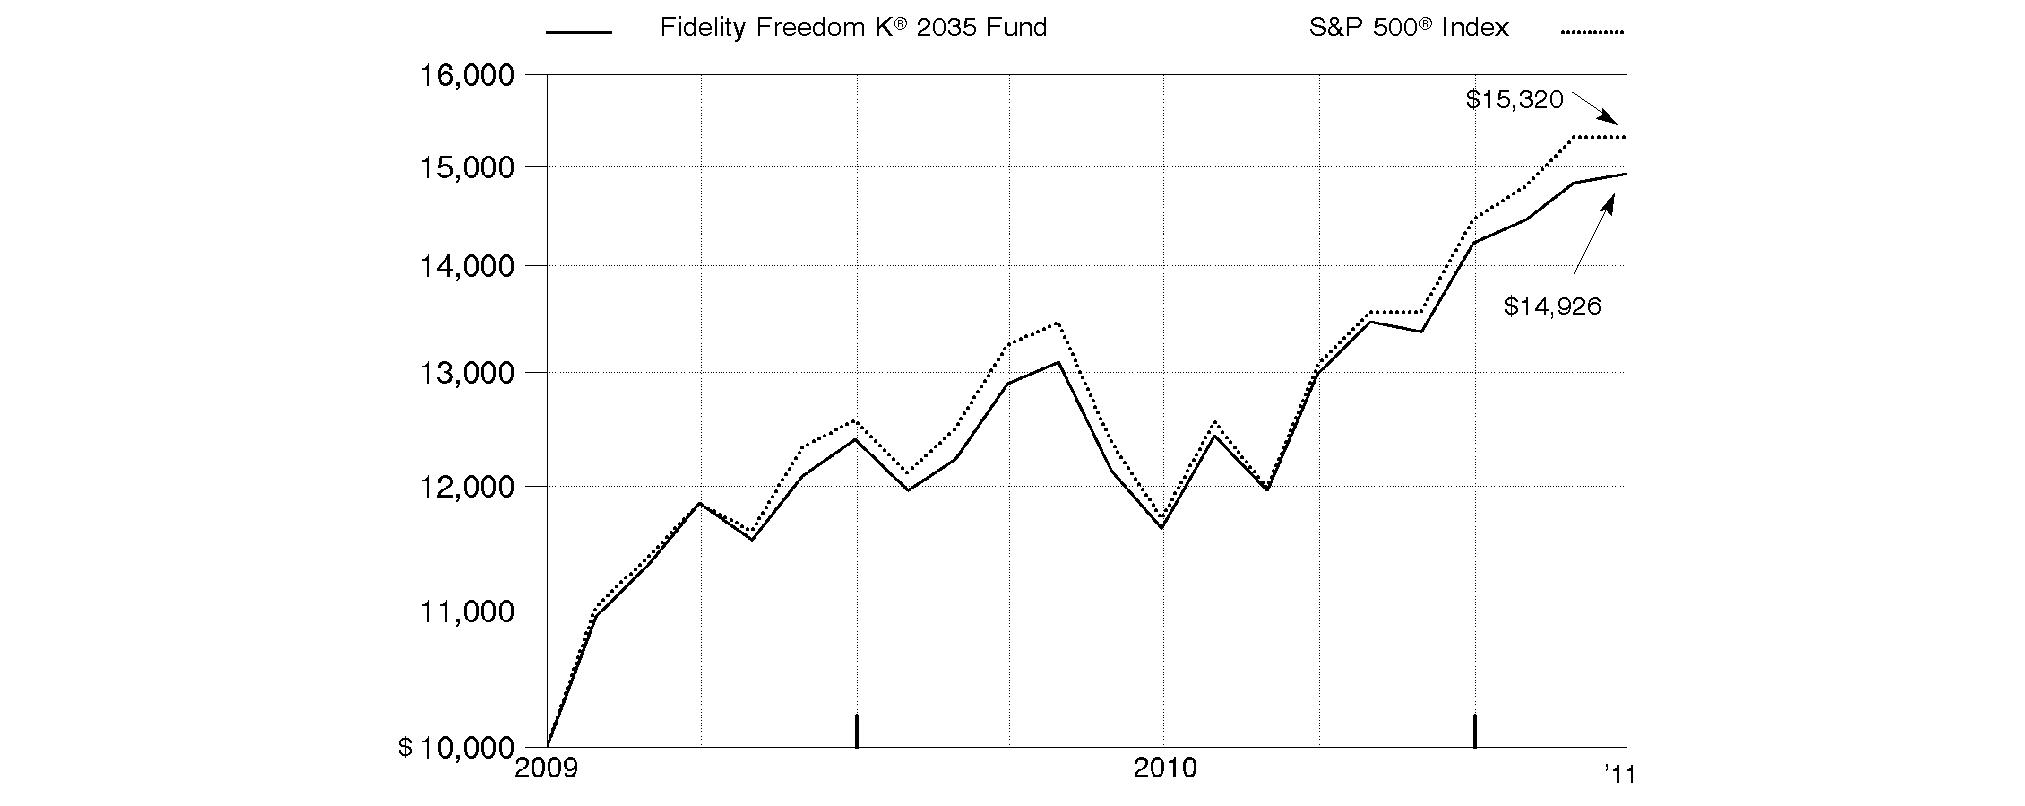
Annual Report
Fidelity Freedom K® 2040 Fund
Performance: The Bottom Line
Average annual total return reflects the change in the value of an investment, assuming reinvestment of the fund's distributions from dividend income and capital gains (the profits earned upon the sale of securities that have grown in value, if any) and assuming a constant rate of performance each year. The $10,000 table and the fund's returns do not reflect the deduction of taxes that a shareholder would pay on fund distributions or the redemption of fund shares. During periods of reimbursement by Fidelity, a fund's total return will be greater than it would be had the reimbursement not occurred. How a fund did yesterday is no guarantee of how it will do tomorrow.
Average Annual Total Returns
Periods ended March 31, 2011 | Past 1
year | Life of
fund A |
Fidelity Freedom K® 2040 Fund | 15.81% | 26.22% |
A From July 2, 2009.
$10,000 Over Life of Fund
Let's say hypothetically that $10,000 was invested in Fidelity Freedom K® 2040 Fund on July 2, 2009, when the fund started. The chart shows how the value of your investment would have changed, and also shows how the S&P 500® Index performed over the same period. See above for additional information regarding the performance of Fidelity Freedom K® 2040 Fund.

Annual Report
Fidelity Freedom K® 2045 Fund
Performance: The Bottom Line
Average annual total return reflects the change in the value of an investment, assuming reinvestment of the fund's distributions from dividend income and capital gains (the profits earned upon the sale of securities that have grown in value, if any) and assuming a constant rate of performance each year. The $10,000 table and the fund's returns do not reflect the deduction of taxes that a shareholder would pay on fund distributions or the redemption of fund shares. During periods of reimbursement by Fidelity, a fund's total return will be greater than it would be had the reimbursement not occurred. How a fund did yesterday is no guarantee of how it will do tomorrow.
Average Annual Total Returns
Periods ended March 31, 2011 | Past 1
year | Life of
fund A |
Fidelity Freedom K® 2045 Fund | 16.12% | 26.63% |
A From July 2, 2009.
$10,000 Over Life of Fund
Let's say hypothetically that $10,000 was invested in Fidelity Freedom K® 2045 Fund on July 2, 2009, when the fund started. The chart shows how the value of your investment would have changed, and also shows how the S&P 500® Index performed over the same period. See above for additional information regarding the performance of Fidelity Freedom K® 2045 Fund.
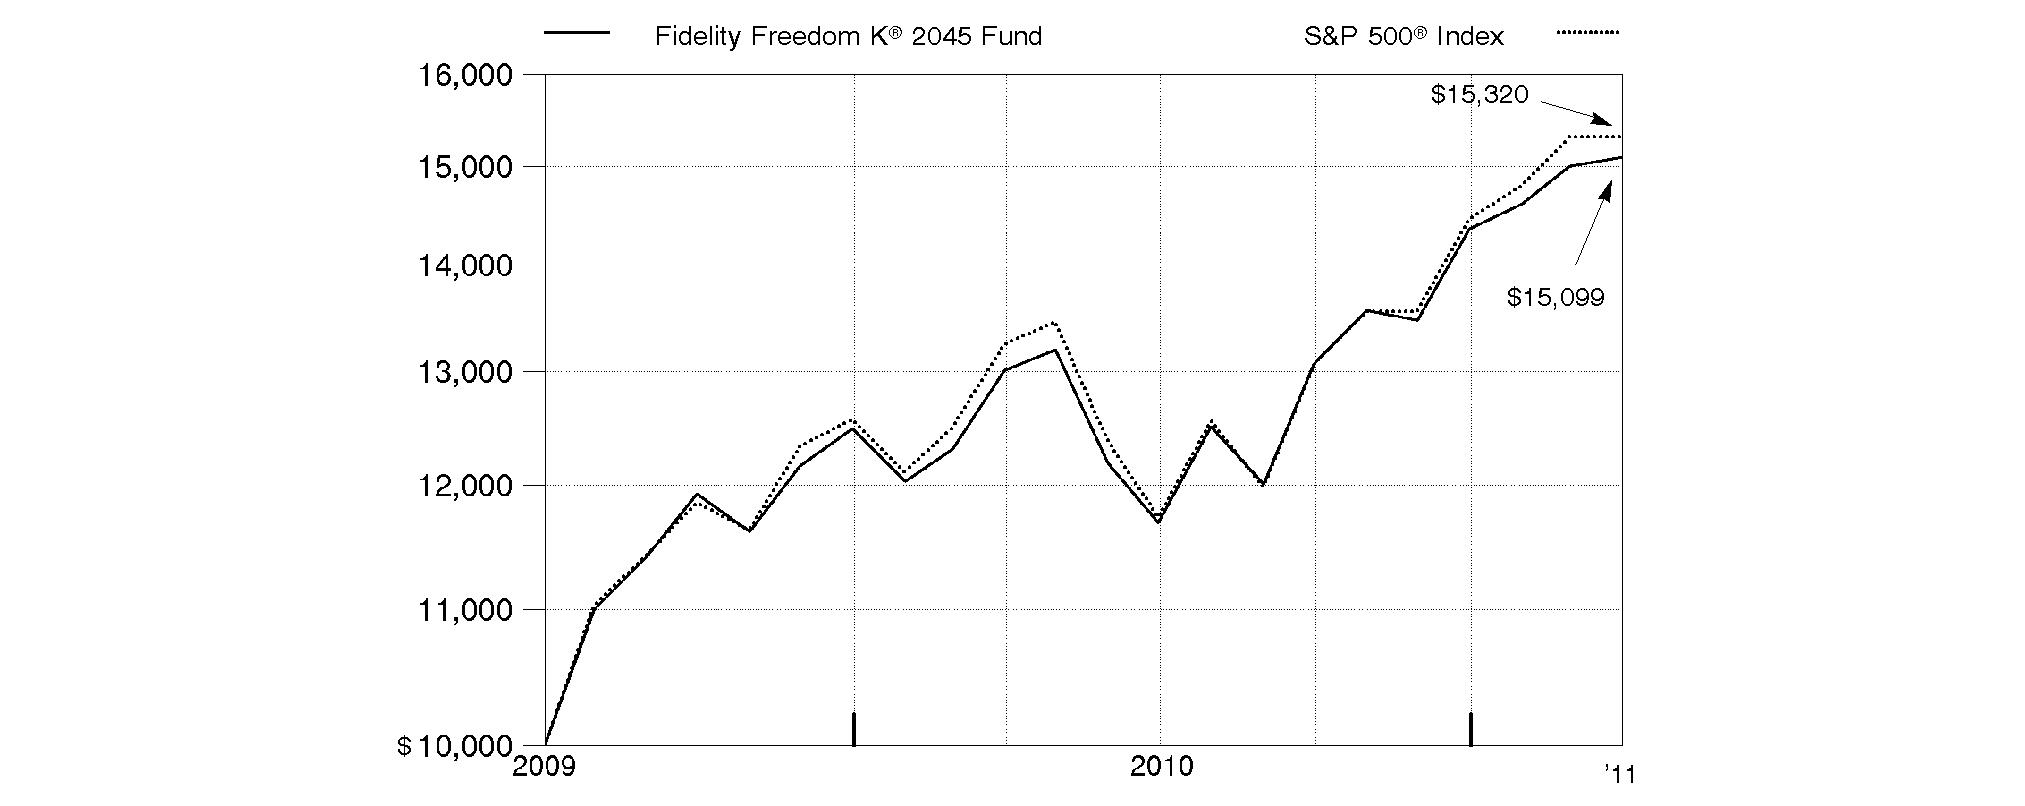
Annual Report
Fidelity Freedom K® 2050 Fund
Performance: The Bottom Line
Average annual total return reflects the change in the value of an investment, assuming reinvestment of the fund's distributions from dividend income and capital gains (the profits earned upon the sale of securities that have grown in value, if any) and assuming a constant rate of performance each year. The $10,000 table and the fund's returns do not reflect the deduction of taxes that a shareholder would pay on fund distributions or the redemption of fund shares. During periods of reimbursement by Fidelity, a fund's total return will be greater than it would be had the reimbursement not occurred. How a fund did yesterday is no guarantee of how it will do tomorrow.
Average Annual Total Returns
Periods ended March 31, 2011 | Past 1
year | Life of
fund A |
Fidelity Freedom K® 2050 Fund | 16.43% | 27.14% |
A From July 2, 2009.
$10,000 Over Life of Fund
Let's say hypothetically that $10,000 was invested in Fidelity Freedom K® 2050 Fund on July 2, 2009, when the fund started. The chart shows how the value of your investment would have changed, and also shows how the S&P 500® Index performed over the same period. See above for additional information regarding the performance of Fidelity Freedom K® 2050 Fund.
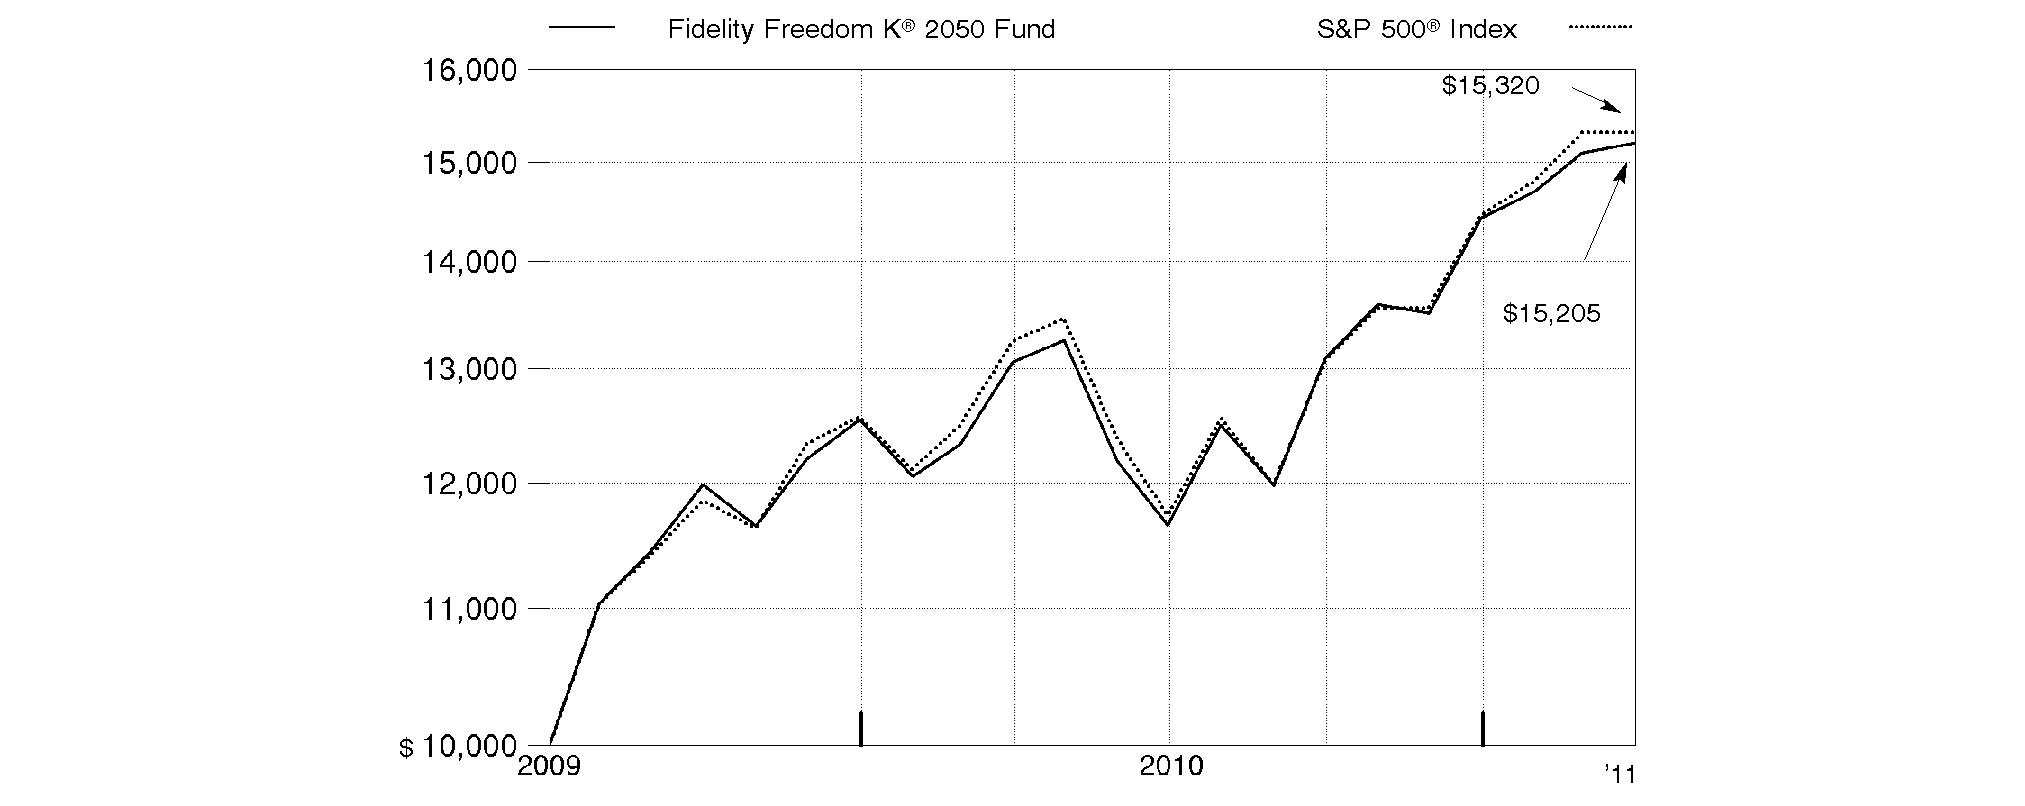
Annual Report
Market Recap: The 12-month period ending March 31, 2011, marked another good stretch for major equity markets, which continued a rally that began two years earlier. Despite early-period volatility brought on by the debt crisis in Europe and worries about a potential "double dip" recession in the U.S., stocks regained strength in late summer and fall, fueled by better-than-expected corporate earnings, encouraging economic activity, stimulative tax policies and the Federal Reserve's second round of quantitative easing involving the purchase of $600 billion in U.S. Treasuries. For the full period, the broad-based, large-cap-oriented S&P 500® Index posted a 15.65% gain, while its blue-chip counterpart, the Dow Jones Industrial AverageSM, rose 16.51% and the technology-laden Nasdaq Composite® Index added 17.06%. Within the S&P 500®, economically sensitive sectors generally saw the biggest gains, led by energy, materials and consumer discretionary. Telecommunication services stocks also rose sharply. By contrast, the financials and health care sectors showed only modest advances. Although global markets were rocked later in the period by heightened unrest in the Arab world and a devastating earthquake in Japan, foreign developed-markets equities, as represented by the MSCI® EAFE® (Europe, Australasia, Far East) Index, finished the year up 10.55%, significantly boosted by a weaker dollar. In the fixed-income area, investor appetite for higher-risk investments yielded solid returns. The BofA Merrill LynchSM US High Yield Constrained Index rose 14.14%, outpacing the 5.12% gain in the Barclays Capital® U.S. Aggregate Bond Index - a broad measure of the domestic investment-grade debt universe, which was held back by the weak returns of government securities.
Comments from Jonathan Shelon and Christopher Sharpe, Co-Portfolio Managers of Fidelity Freedom K® Funds: Each of the Freedom K Funds delivered a positive result for the one-year period ending March 31, 2011. (For specific Fund results, please refer to the performance section of this report.) The longer-dated Funds, which include more exposure to the U.S. equity and non-U.S. equity asset classes, posted higher returns than the Funds with larger allocations to the investment-grade debt and short-term debt asset classes. On an absolute basis, both U.S. equities and non-U.S. equities performed very well for the one-year period, having gained traction in the second half of the period after a challenging initial six months. The equity asset classes were the main drivers of the Funds' absolute performance, which resulted in the longer-dated Funds posting the biggest gains during the one-year period ending March 31, 2011. In aggregate, the Funds' underlying U.S. equity investments fell just short of the 17.73% return of the Dow Jones U.S. Total Stock Market IndexSM. Even though seven of the 10 underlying funds (Class F shares) beat the Dow Jones index, major holdings Fidelity® Disciplined Equity Fund and Fidelity® Series Large Cap Value Fund fell short, returning 10.59% and 12.68%, respectively, which dragged on the Funds' overall performance. However, strong results from Fidelity Series Small Cap Opportunities Fund, Fidelity Series Commodity Strategy Fund and Fidelity Small Cap Growth Fund - each gaining more than 26% - buoyed returns. In the non-U.S. equity asset class, the Funds' underlying investments, in aggregate, beat their benchmark, the MSCI® EAFE® (Europe, Australasia, Far East) Index, which gained 10.55%. All six underlying non-U.S. equity funds beat the MSCI index. Fidelity Series International Small Cap Fund and Fidelity Series Emerging Markets Fund led the way, benefiting from a weaker U.S. dollar and the shift toward higher-risk asset classes that occurred in the second half of the period. Turning to the debt asset classes, both investment-grade debt and short-term debt instruments posted a positive absolute return for the year, despite weak performance within these two categories during the second half of the period. Propelled in part by solid relative results from these two categories, the Funds were able to outpace their respective Composite indexes for the 12-month period. The Funds' investment-grade debt category handily beat the Barclays Capital® U.S. Aggregate Bond Index. Fidelity Series Investment Grade Bond Fund helped the Funds' results here, as did Fidelity Strategic Real Return Fund, which roared past the broader bond market. The Funds' high-yield holdings, Fidelity Capital & Income Fund and Fidelity High Income Fund, also did well, as investors' appetite for risk increased. The Funds transitioned out of Capital & Income and High Income and into Fidelity Series High Income Fund during the period. In the short-term debt asset class, Fidelity Short-Term Bond Fund pushed the Funds' aggregate performance in this category well ahead of the 0.19% return of the Barclays Capital® U.S. 3 Month Treasury Bellwether Index.
The views expressed above reflect those of the portfolio manager(s) only through the end of the period as stated on the cover of this report and do not necessarily represent the views of Fidelity or any other person in the Fidelity organization. Any such views are subject to change at any time based upon market or other conditions and Fidelity disclaims any responsibility to update such views. These views may not be relied on as investment advice and, because investment decisions for a Fidelity fund are based on numerous factors, may not be relied on as an indication of trading intent on behalf of any Fidelity fund.
Annual Report
As a shareholder of a Fund, you incur two types of costs: (1) transaction costs, and (2) ongoing costs, including other Fund expenses. This Example is intended to help you understand your ongoing costs (in dollars) of investing in the Funds and to compare these costs with the ongoing costs of investing in other mutual funds.
The Example is based on an investment of $1,000 invested at the beginning of the period and held for the entire period (October 1, 2010 to March 31, 2011).
Actual Expenses
The first line of the accompanying table for each fund provides information about actual account values and actual expenses. You may use the information in this line, together with the amount you invested, to estimate the expenses that you paid over the period. Simply divide your account value by $1,000.00 (for example, an $8,600 account value divided by $1,000.00 = 8.6), then multiply the result by the number in the first line for a fund under the heading entitled "Expenses Paid During Period" to estimate the expenses you paid on your account during this period. In addition, each Fund, as a shareholder in underlying Fidelity Funds, will indirectly bear its pro-rata share of the fees and expenses incurred by the underlying Fidelity Funds. These fees and expenses are not included in each Fund's annualized expense ratio used to calculate the expense estimates in the table below.
Hypothetical Example for Comparison Purposes
The second line of the accompanying table for each fund provides information about hypothetical account values and hypothetical expenses based on a fund's actual expense ratio and an assumed rate of return of 5% per year before expenses, which is not the Fund's actual return. The hypothetical account values and expenses may not be used to estimate the actual ending account balance or expenses you paid for the period. You may use this information to compare the ongoing costs of investing in the Fund and other funds. To do so, compare this 5% hypothetical example with the 5% hypothetical examples that appear in the shareholder reports of the other funds. In addition, each Fund, as a shareholder in underlying Fidelity Funds, will indirectly bear its pro-rata share of the fees and expenses incurred by the underlying Fidelity Funds. These fees and expenses are not included in each Fund's annualized expense ratio used to calculate the expense estimates in the table below.
Please note that the expenses shown in the table are meant to highlight your ongoing costs only and do not reflect any transaction costs. Therefore, the second line of the table is useful in comparing ongoing costs only, and will not help you determine the relative total costs of owning different funds.
| Annualized
Expense Ratio | Beginning
Account Value
October 1, 2010 | Ending
Account Value
March 31, 2011 | Expenses Paid
During Period*
October 1, 2010 to
March 31, 2011 |
Fidelity Freedom K® Income Fund | .05% | | | |
Actual | | $ 1,000.00 | $ 1,045.20 | $ .25 |
HypotheticalA | | $ 1,000.00 | $ 1,024.68 | $ .25 |
Fidelity Freedom K® 2000 Fund | .05% | | | |
Actual | | $ 1,000.00 | $ 1,048.70 | $ .26 |
HypotheticalA | | $ 1,000.00 | $ 1,024.68 | $ .25 |
Fidelity Freedom K® 2005 Fund | .05% | | | |
Actual | | $ 1,000.00 | $ 1,083.00 | $ .26 |
HypotheticalA | | $ 1,000.00 | $ 1,024.68 | $ .25 |
Fidelity Freedom K® 2010 Fund | .05% | | | |
Actual | | $ 1,000.00 | $ 1,095.90 | $ .26 |
HypotheticalA | | $ 1,000.00 | $ 1,024.68 | $ .25 |
Fidelity Freedom K® 2015 Fund | .05% | | | |
Actual | | $ 1,000.00 | $ 1,099.10 | $ .26 |
HypotheticalA | | $ 1,000.00 | $ 1,024.68 | $ .25 |
Fidelity Freedom K® 2020 Fund | .05% | | | |
Actual | | $ 1,000.00 | $ 1,115.90 | $ .26 |
HypotheticalA | | $ 1,000.00 | $ 1,024.68 | $ .25 |
Fidelity Freedom K® 2025 Fund | .05% | | | |
Actual | | $ 1,000.00 | $ 1,130.20 | $ .27 |
HypotheticalA | | $ 1,000.00 | $ 1,024.68 | $ .25 |
Fidelity Freedom K® 2030 Fund | .05% | | | |
Actual | | $ 1,000.00 | $ 1,136.50 | $ .27 |
HypotheticalA | | $ 1,000.00 | $ 1,024.68 | $ .25 |
Fidelity Freedom K® 2035 Fund | .05% | | | |
Actual | | $ 1,000.00 | $ 1,149.70 | $ .27 |
HypotheticalA | | $ 1,000.00 | $ 1,024.68 | $ .25 |
| Annualized
Expense Ratio | Beginning
Account Value
October 1, 2010 | Ending
Account Value
March 31, 2011 | Expenses Paid
During Period*
October 1, 2010 to
March 31, 2011 |
Fidelity Freedom K® 2040 Fund | .05% | | | |
Actual | | $ 1,000.00 | $ 1,152.30 | $ .27 |
HypotheticalA | | $ 1,000.00 | $ 1,024.68 | $ .25 |
Fidelity Freedom K® 2045 Fund | .05% | | | |
Actual | | $ 1,000.00 | $ 1,155.60 | $ .27 |
HypotheticalA | | $ 1,000.00 | $ 1,024.68 | $ .25 |
Fidelity Freedom K® 2050 Fund | .05% | | | |
Actual | | $ 1,000.00 | $ 1,162.80 | $ .27 |
HypotheticalA | | $ 1,000.00 | $ 1,024.68 | $ .25 |
A 5% return per year before expenses
* Expenses are equal to each Fund's annualized expense ratio, multiplied by the average account value over the period, multiplied by 182/365 (to reflect the one-half year period). The fees and expenses of the underlying Fidelity Funds in which the Fund invests are not included in the Fund's annualized expense ratio.
Annual Report
Fidelity Freedom K® Income Fund
Investment Changes (Unaudited)
Fund Holdings as of March 31, 2011 |
| % of fund's
net assets | % of fund's net assets
6 months ago |
Commodity Funds | | |
Fidelity Series Commodity Strategy Fund Class F | 0.8 | 0.8 |
Domestic Equity Funds | | |
Fidelity Blue Chip Growth Fund Class F | 0.8 | 0.8 |
Fidelity Disciplined Equity Fund Class F | 2.4 | 2.5 |
Fidelity Growth Company Fund Class F | 2.1 | 2.2 |
Fidelity Series 100 Index Fund | 1.6 | 1.7 |
Fidelity Series All-Sector Equity Fund Class F | 2.9 | 2.8 |
Fidelity Series Large Cap Value Fund
Class F | 2.7 | 2.6 |
Fidelity Series Small Cap Opportunities Fund Class F | 0.5 | 0.4 |
Fidelity Small Cap Growth Fund Class F | 0.3 | 0.3 |
Fidelity Small Cap Value Fund Class F | 0.3 | 0.3 |
Fidelity Equity-Income Fund Class F | 0.0 | 0.5 |
| 13.6 | 14.1 |
Developed International Equity Funds | | |
Fidelity Diversified International Fund Class F | 0.7 | 0.9 |
Fidelity Overseas Fund Class F | 0.7 | 1.0 |
Fidelity Series International Growth Fund Class F | 1.5 | 1.0 |
Fidelity Series International Small Cap Fund Class F | 0.3 | 0.2 |
Fidelity Series International Value Fund
Class F | 1.4 | 0.9 |
Fidelity Japan Fund Class F | 0.0 | 0.0* |
| 4.6 | 4.0 |
Emerging Markets Equity Funds | | |
Fidelity Series Emerging Markets Fund
Class F | 0.8 | 0.7 |
High Yield Bond Funds | | |
Fidelity Series Emerging Markets Debt Fund Class F | 0.0* | 0.0 |
Fidelity Series High Income Fund Class F | 4.9 | 0.0 |
Fidelity Capital & Income Fund Class F | 0.0 | 2.6 |
Fidelity High Income Fund Class F | 0.0 | 2.6 |
| 4.9 | 5.2 |
Inflation-Protected Bond Funds | | |
Fidelity Series Inflation-Protected Bond Index Fund Class F | 11.0 | 10.3 |
Investment Grade Bond Funds | | |
Fidelity Series Investment Grade Bond Fund Class F | 20.2 | 20.7 |
Fidelity Strategic Real Return Fund Class F | 4.2 | 4.9 |
| 24.4 | 25.6 |
Short-Term Funds | | |
Fidelity Institutional Money Market Portfolio Class F | 22.2 | 19.6 |
Fidelity Short-Term Bond Fund Class F | 17.7 | 19.7 |
| 39.9 | 39.3 |
Net Other Assets (Liabilities)* | 0.0 | 0.0 |
| 100.0 | 100.0 |
* Amount represents less than 0.1% |
Asset Allocation (% of fund's net assets) |
Current |
| Commodity Funds | 0.8% | |
| Domestic Equity Funds | 13.6% | |
| Developed International Equity Funds | 4.6% | |
| Emerging Markets Equity Funds | 0.8% | |
| High Yield Bond Funds | 4.9% | |
| Inflation-Protected Bond Funds | 11.0% | |
| Investment Grade Bond Funds | 24.4% | |
| Short-Term Funds | 39.9% | |

Six months ago |
| Commodity Funds | 0.8% | |
| Domestic Equity Funds | 14.1% | |
| Developed International Equity Funds | 4.0% | |
| Emerging Markets Equity Funds | 0.7% | |
| High Yield Bond Funds | 5.2% | |
| Inflation-Protected Bond Funds | 10.3% | |
| Investment Grade Bond Funds | 25.6% | |
| Short-Term Funds | 39.3% | |

Expected |
| Commodity Funds | 2.0% | |
| Domestic Equity Funds | 12.6% | |
| Developed International Equity Funds | 4.6% | |
| Emerging Markets Equity Funds | 0.8% | |
| High Yield Bond Funds | 5.0% | |
| Inflation-Protected Bond Funds | 12.0% | |
| Investment Grade Bond Funds | 23.0% | |
| Short-Term Funds | 40.0% | |

The six months ago allocation is based on the fund's holdings as of September 30, 2010. The current allocation is based on the fund's holdings as of March 31, 2011. The expected allocation represents the fund's anticipated allocation at September 30, 2011. |
Annual Report
Fidelity Freedom K® Income Fund
Investments March 31, 2011
Showing Percentage of Net Assets
Domestic Equity Funds - 14.4% |
| Shares | | Value |
Commodity Funds - 0.8% |
Fidelity Series Commodity Strategy Fund Class F | 395,953 | | $ 5,230,544 |
Domestic Equity Funds - 13.6% |
Fidelity Blue Chip Growth Fund Class F | 111,949 | | 5,371,303 |
Fidelity Disciplined Equity Fund Class F | 630,340 | | 15,121,847 |
Fidelity Growth Company Fund Class F | 149,633 | | 13,467,001 |
Fidelity Series 100 Index Fund | 1,123,731 | | 10,338,326 |
Fidelity Series All-Sector Equity Fund Class F | 1,406,110 | | 18,448,160 |
Fidelity Series Large Cap Value Fund Class F | 1,424,697 | | 17,409,803 |
Fidelity Series Small Cap Opportunities Fund Class F | 250,867 | | 2,967,758 |
Fidelity Small Cap Growth Fund Class F | 105,021 | | 1,785,349 |
Fidelity Small Cap Value Fund Class F | 106,074 | | 1,755,529 |
TOTAL DOMESTIC EQUITY FUNDS | | 86,665,076 |
TOTAL DOMESTIC EQUITY FUNDS (Cost $79,998,899) | 91,895,620 |
International Equity Funds - 5.4% |
| | | |
Developed International Equity Funds - 4.6% |
Fidelity Diversified International Fund Class F | 147,884 | | 4,597,720 |
Fidelity Overseas Fund Class F | 137,947 | | 4,601,915 |
Fidelity Series International Growth Fund Class F | 793,494 | | 9,156,924 |
Fidelity Series International Small Cap Fund Class F | 144,170 | | 1,783,385 |
Fidelity Series International Value Fund Class F | 845,863 | | 8,890,019 |
TOTAL DEVELOPED INTERNATIONAL EQUITY FUNDS | | 29,029,963 |
Emerging Markets Equity Funds - 0.8% |
Fidelity Series Emerging Markets Fund Class F | 281,827 | | 5,411,070 |
TOTAL INTERNATIONAL EQUITY FUNDS (Cost $30,688,036) | 34,441,033 |
Bond Funds - 40.3% |
| Shares | | Value |
High Yield Bond Funds - 4.9% |
Fidelity Series Emerging Markets Debt Fund Class F | 44,553 | | $ 445,703 |
Fidelity Series High Income Fund Class F | 3,091,731 | | 30,979,145 |
TOTAL HIGH YIELD BOND FUNDS | | 31,424,848 |
Inflation-Protected Bond Funds - 11.0% |
Fidelity Series Inflation-Protected Bond Index Fund Class F | 6,444,479 | | 69,729,263 |
Investment Grade Bond Funds - 24.4% |
Fidelity Series Investment Grade Bond Fund Class F | 11,285,009 | | 128,536,248 |
Fidelity Strategic Real Return Fund Class F | 2,680,344 | | 26,562,212 |
TOTAL INVESTMENT GRADE BOND FUNDS | | 155,098,460 |
TOTAL BOND FUNDS (Cost $252,978,843) | 256,252,571 |
Short-Term Funds - 39.9% |
| | | |
Fidelity Institutional Money Market Portfolio Class F | 140,957,282 | | 140,957,282 |
Fidelity Short-Term Bond Fund
Class F | 13,317,769 | | 112,535,149 |
TOTAL SHORT-TERM FUNDS (Cost $253,110,965) | 253,492,431 |
TOTAL INVESTMENT PORTFOLIO - 100.0% (Cost $616,776,743) | | 636,081,655 |
NET OTHER ASSETS (LIABILITIES) - 0.0% | | (26,123) |
NET ASSETS - 100% | $ 636,055,532 |
Other Information |
All investments are categorized as Level 1 under the Fair Value Hierarchy. The inputs or methodology used for valuing securities may not be an indication of the risk associated with investing in those securities. For more information on valuation inputs, please refer to the Security Valuation section in the accompanying Notes to Financial Statements. |
See accompanying notes which are an integral part of the financial statements.
Annual Report
Fidelity Freedom K® Income Fund
Statement of Assets and Liabilities
| March 31, 2011 |
Assets | | |
Investment in securities, at value (cost $616,776,743) - See accompanying schedule | | $ 636,081,655 |
Receivable for fund shares sold | | 857,867 |
Total assets | | 636,939,522 |
| | |
Liabilities | | |
Payable to custodian bank | $ 3 | |
Payable for investments purchased | 676,196 | |
Payable for fund shares redeemed | 181,670 | |
Transfer agent fees payable | 26,121 | |
Total liabilities | | 883,990 |
| | |
Net Assets | | $ 636,055,532 |
Net Assets consist of: | | |
Paid in capital | | $ 611,696,042 |
Undistributed net investment income | | 728,326 |
Accumulated undistributed net realized gain (loss) on investments | | 4,326,252 |
Net unrealized appreciation (depreciation) on investments | | 19,304,912 |
Net Assets, for 54,662,303 shares outstanding | | $ 636,055,532 |
Net Asset Value, offering price and redemption price per share ($636,055,532 ÷ 54,662,303 shares) | | $ 11.64 |
Statement of Operations
| Year ended March 31, 2011 |
Investment Income | | |
Income distributions from underlying funds | | $ 7,175,720 |
| | |
Expenses | | |
Transfer agent fees | $ 205,761 | |
Independent trustees' compensation | 1,276 | |
Total expenses | | 207,037 |
Net investment income (loss) | | 6,968,683 |
Realized and Unrealized Gain (Loss) Realized gain (loss) on sale of underlying fund shares | 2,289,263 | |
Capital gain distributions from underlying funds | 5,369,267 | |
Total net realized gain (loss) | | 7,658,530 |
Change in net unrealized appreciation (depreciation) on underlying funds | | 17,616,003 |
Net gain (loss) | | 25,274,533 |
Net increase (decrease) in net assets resulting from operations | | $ 32,243,216 |
See accompanying notes which are an integral part of the financial statements.
Annual Report
Statement of Changes in Net Assets
| Year ended
March 31,
2011 | For the period
July 2, 2009
(commencement of
operations) to March 31, 2010 |
Increase (Decrease) in Net Assets | | |
Operations | | |
Net investment income (loss) | $ 6,968,683 | $ 604,437 |
Net realized gain (loss) | 7,658,530 | 260,460 |
Change in net unrealized appreciation (depreciation) | 17,616,003 | 1,688,909 |
Net increase (decrease) in net assets resulting from operations | 32,243,216 | 2,553,806 |
Distributions to shareholders from net investment income | (6,456,673) | (388,119) |
Distributions to shareholders from net realized gain | (3,451,587) | (141,152) |
Total distributions | (9,908,260) | (529,271) |
Share transactions
Proceeds from sales of shares | 628,789,328 | 130,282,128 |
Reinvestment of distributions | 9,908,260 | 529,271 |
Cost of shares redeemed | (148,753,789) | (9,059,157) |
Net increase (decrease) in net assets resulting from share transactions | 489,943,799 | 121,752,242 |
Total increase (decrease) in net assets | 512,278,755 | 123,776,777 |
| | |
Net Assets | | |
Beginning of period | 123,776,777 | - |
End of period (including undistributed net investment income of $728,326 and undistributed net investment income of $216,318, respectively) | $ 636,055,532 | $ 123,776,777 |
Other Information Shares | | |
Sold | 55,680,023 | 11,929,920 |
Issued in reinvestment of distributions | 870,986 | 48,564 |
Redeemed | (13,039,974) | (827,216) |
Net increase (decrease) | 43,511,035 | 11,151,268 |
Financial Highlights
Years ended March 31, | 2011 | 2010 E |
Selected Per-Share Data | | |
Net asset value, beginning of period | $ 11.10 | $ 10.00 |
Income from Investment Operations | | |
Net investment income (loss) C | .20 | .17 |
Net realized and unrealized gain (loss) | .61 | 1.09 |
Total from investment operations | .81 | 1.26 |
Distributions from net investment income | (.18) | (.13) |
Distributions from net realized gain | (.09) | (.03) |
Total distributions | (.27) | (.16) |
Net asset value, end of period | $ 11.64 | $ 11.10 |
Total Return B | 7.37% | 12.66% |
Ratios to Average Net Assets D, F | | |
Expenses before reductions | .05% | .05% A |
Expenses net of fee waivers, if any | .05% | .05% A |
Expenses net of all reductions | .05% | .05% A |
Net investment income (loss) | 1.77% | 2.18% A |
Supplemental Data | | |
Net assets, end of period (000 omitted) | $ 636,056 | $ 123,777 |
Portfolio turnover rate | 32% | 32% A |
A Annualized
B Total returns for periods of less than one year are not annualized.
C Calculated based on average shares outstanding during the period.
D Amounts do not include the activity of the underlying funds.
E For the period July 2, 2009 (commencement of operations) to March 31, 2010.
F Expense ratios reflect operating expenses of the Fund. Expenses before reductions do not reflect amounts reimbursed by the investment adviser or reductions from expense offset arrangements and do not represent the amount paid by the Fund during periods when reimbursements or reductions occur. Expenses net of fee waivers reflect expenses after reimbursement by the investment adviser but prior to reductions from expense offset arrangements. Expenses net of all reductions represent the net expenses paid by the Fund but do not include expenses of the investment companies in which the Fund invests.
See accompanying notes which are an integral part of the financial statements.
Annual Report
Fidelity Freedom K® 2000 Fund
Investment Changes (Unaudited)
Fund Holdings as of March 31, 2011 |
| % of fund's
net assets | % of fund's net assets
6 months ago |
Commodity Funds | | |
Fidelity Series Commodity Strategy Fund Class F | 1.1 | 2.1 |
Domestic Equity Funds | | |
Fidelity Blue Chip Growth Fund Class F | 0.9 | 0.9 |
Fidelity Disciplined Equity Fund Class F | 2.4 | 2.6 |
Fidelity Growth Company Fund Class F | 2.2 | 2.3 |
Fidelity Series 100 Index Fund | 1.7 | 1.7 |
Fidelity Series All-Sector Equity Fund Class F | 3.0 | 2.9 |
Fidelity Series Large Cap Value Fund
Class F | 2.8 | 2.8 |
Fidelity Series Small Cap Opportunities Fund Class F | 0.5 | 0.5 |
Fidelity Small Cap Growth Fund Class F | 0.3 | 0.3 |
Fidelity Small Cap Value Fund Class F | 0.3 | 0.3 |
Fidelity Equity-Income Fund Class F | 0.0 | 0.5 |
| 14.1 | 14.8 |
Developed International Equity Funds | | |
Fidelity Diversified International Fund Class F | 0.7 | 1.0 |
Fidelity Overseas Fund Class F | 0.7 | 1.0 |
Fidelity Series International Growth Fund Class F | 1.5 | 1.0 |
Fidelity Series International Small Cap Fund Class F | 0.3 | 0.2 |
Fidelity Series International Value Fund
Class F | 1.5 | 1.0 |
Fidelity Europe Fund Class F | 0.0 | 0.0* |
Fidelity Japan Fund Class F | 0.0 | 0.0* |
| 4.7 | 4.2 |
Emerging Markets Equity Funds | | |
Fidelity Series Emerging Markets Fund
Class F | 0.9 | 0.7 |
High Yield Bond Funds | | |
Fidelity Series Emerging Markets Debt Fund Class F | 0.1 | 0.0 |
Fidelity Series High Income Fund Class F | 4.9 | 0.0 |
Fidelity Capital & Income Fund Class F | 0.0 | 2.6 |
Fidelity High Income Fund Class F | 0.0 | 2.6 |
| 5.0 | 5.2 |
Inflation-Protected Bond Funds | | |
Fidelity Series Inflation-Protected Bond Index Fund Class F | 10.7 | 9.9 |
Investment Grade Bond Funds | | |
Fidelity Series Investment Grade Bond Fund Class F | 19.6 | 19.2 |
Fidelity Strategic Real Return Fund Class F | 4.1 | 4.7 |
| 23.7 | 23.9 |
Short-Term Funds | | |
Fidelity Institutional Money Market Portfolio Class F | 22.1 | 19.5 |
Fidelity Short-Term Bond Fund Class F | 17.7 | 19.7 |
| 39.8 | 39.2 |
Net Other Assets (Liabilities)* | 0.0 | 0.0 |
| 100.0 | 100.0 |
* Amount represents less than 0.1% |
Asset Allocation (% of fund's net assets) |
Current |
| Commodity Funds | 1.1% | |
| Domestic Equity Funds | 14.1% | |
| Developed International Equity Funds | 4.7% | |
| Emerging Markets Equity Funds | 0.9% | |
| High Yield Bond Funds | 5.0% | |
| Inflation-Protected Bond Funds | 10.7% | |
| Investment Grade Bond Funds | 23.7% | |
| Short-Term Funds | 39.8% | |

Six months ago |
| Commodity Funds | 2.1% | |
| Domestic Equity Funds | 14.8% | |
| Developed International Equity Funds | 4.2% | |
| Emerging Markets Equity Funds | 0.7% | |
| High Yield Bond Funds | 5.2% | |
| Inflation-Protected Bond Funds | 9.9% | |
| Investment Grade Bond Funds | 23.9% | |
| Short-Term Funds | 39.2% | |

Expected |
| Commodity Funds | 2.1% | |
| Domestic Equity Funds | 12.7% | |
| Developed International Equity Funds | 4.6% | |
| Emerging Markets Equity Funds | 0.8% | |
| High Yield Bond Funds | 5.0% | |
| Inflation-Protected Bond Funds | 11.9% | |
| Investment Grade Bond Funds | 22.9% | |
| Short-Term Funds | 40.0% | |

The fund invests according to an asset allocation strategy that becomes increasingly conservative over time. The six months ago allocation is based on the fund's holdings as of September 30, 2010. The current allocation is based on the fund's holdings as of March 31, 2011. The expected allocation represents the fund's anticipated allocation at September 30, 2011. |
Annual Report
Fidelity Freedom K® 2000 Fund
Investments March 31, 2011
Showing Percentage of Net Assets
Domestic Equity Funds - 15.2% |
| Shares | | Value |
Commodity Funds - 1.1% |
Fidelity Series Commodity Strategy Fund Class F | 355,414 | | $ 4,695,022 |
Domestic Equity Funds - 14.1% |
Fidelity Blue Chip Growth Fund Class F | 75,741 | | 3,634,044 |
Fidelity Disciplined Equity Fund Class F | 426,003 | | 10,219,802 |
Fidelity Growth Company Fund Class F | 100,611 | | 9,054,948 |
Fidelity Series 100 Index Fund | 752,460 | | 6,922,628 |
Fidelity Series All-Sector Equity Fund Class F | 947,737 | | 12,434,312 |
Fidelity Series Large Cap Value Fund Class F | 958,766 | | 11,716,120 |
Fidelity Series Small Cap Opportunities Fund Class F | 167,569 | | 1,982,339 |
Fidelity Small Cap Growth Fund Class F | 71,227 | | 1,210,861 |
Fidelity Small Cap Value Fund Class F | 71,860 | | 1,189,285 |
TOTAL DOMESTIC EQUITY FUNDS | | 58,364,339 |
TOTAL DOMESTIC EQUITY FUNDS (Cost $54,922,276) | 63,059,361 |
International Equity Funds - 5.6% |
| | | |
Developed International Equity Funds - 4.7% |
Fidelity Diversified International Fund Class F | 99,378 | | 3,089,667 |
Fidelity Overseas Fund Class F | 92,715 | | 3,092,967 |
Fidelity Series International Growth Fund Class F | 535,988 | | 6,185,306 |
Fidelity Series International Small Cap Fund Class F | 97,289 | | 1,203,467 |
Fidelity Series International Value Fund Class F | 571,370 | | 6,005,101 |
TOTAL DEVELOPED INTERNATIONAL EQUITY FUNDS | | 19,576,508 |
Emerging Markets Equity Funds - 0.9% |
Fidelity Series Emerging Markets Fund Class F | 190,333 | | 3,654,398 |
TOTAL INTERNATIONAL EQUITY FUNDS (Cost $20,648,792) | 23,230,906 |
Bond Funds - 39.4% |
| Shares | | Value |
High Yield Bond Funds - 5.0% |
Fidelity Series Emerging Markets Debt Fund Class F | 29,279 | | $ 292,905 |
Fidelity Series High Income Fund Class F | 2,022,979 | | 20,270,250 |
TOTAL HIGH YIELD BOND FUNDS | | 20,563,155 |
Inflation-Protected Bond Funds - 10.7% |
Fidelity Series Inflation-Protected Bond Index Fund Class F | 4,123,045 | | 44,611,343 |
Investment Grade Bond Funds - 23.7% |
Fidelity Series Investment Grade Bond Fund Class F | 7,150,794 | | 81,447,549 |
Fidelity Strategic Real Return Fund
Class F | 1,718,237 | | 17,027,733 |
TOTAL INVESTMENT GRADE BOND FUNDS | | 98,475,282 |
TOTAL BOND FUNDS (Cost $161,251,269) | 163,649,780 |
Short-Term Funds - 39.8% |
| | | |
Fidelity Institutional Money Market Portfolio Class F | 91,566,605 | | 91,566,605 |
Fidelity Short-Term Bond Fund
Class F | 8,721,511 | | 73,696,766 |
TOTAL SHORT-TERM FUNDS (Cost $164,913,446) | 165,263,371 |
TOTAL INVESTMENT PORTFOLIO - 100.0% (Cost $401,735,783) | | 415,203,418 |
NET OTHER ASSETS (LIABILITIES) - 0.0% | | (17,102) |
NET ASSETS - 100% | $ 415,186,316 |
Other Information |
All investments are categorized as Level 1 under the Fair Value Hierarchy. The inputs or methodology used for valuing securities may not be an indication of the risk associated with investing in those securities. For more information on valuation inputs, please refer to the Security Valuation section in the accompanying Notes to Financial Statements. |
See accompanying notes which are an integral part of the financial statements.
Annual Report
Fidelity Freedom K® 2000 Fund
Statement of Assets and Liabilities
| March 31, 2011 |
Assets | | |
Investment in securities, at value (cost $401,735,783) - See accompanying schedule | | $ 415,203,418 |
Receivable for fund shares sold | | 415,029 |
Total assets | | 415,618,447 |
| | |
Liabilities | | |
Payable to custodian bank | $ 2 | |
Payable for investments purchased | 189,563 | |
Payable for fund shares redeemed | 225,466 | |
Transfer agent fees payable | 17,100 | |
Total liabilities | | 432,131 |
| | |
Net Assets | | $ 415,186,316 |
Net Assets consist of: | | |
Paid in capital | | $ 397,071,614 |
Undistributed net investment income | | 1,132,386 |
Accumulated undistributed net realized gain (loss) on investments | | 3,514,681 |
Net unrealized appreciation (depreciation) on investments | | 13,467,635 |
Net Assets, for 35,107,585 shares outstanding | | $ 415,186,316 |
Net Asset Value, offering price and redemption price per share ($415,186,316 ÷ 35,107,585 shares) | | $ 11.83 |
Statement of Operations
| Year ended March 31, 2011 |
| | |
Investment Income | | |
Income distributions from underlying funds | | $ 5,054,556 |
| | |
Expenses | | |
Transfer agent fees | $ 147,991 | |
Independent trustees' compensation | 930 | |
Total expenses | | 148,921 |
Net investment income (loss) | | 4,905,635 |
Realized and Unrealized Gain (Loss) Realized gain (loss) on sale of underlying fund shares | 1,973,490 | |
Capital gain distributions from underlying funds | 3,701,081 | |
Total net realized gain (loss) | | 5,674,571 |
Change in net unrealized appreciation (depreciation) on underlying funds | | 11,835,565 |
Net gain (loss) | | 17,510,136 |
Net increase (decrease) in net assets resulting from operations | | $ 22,415,771 |
See accompanying notes which are an integral part of the financial statements.
Annual Report
Statement of Changes in Net Assets
| Year ended
March 31,
2011 | For the period
July 2, 2009
(commencement of
operations) to March 31, 2010 |
Increase (Decrease) in Net Assets | | |
Operations | | |
Net investment income (loss) | $ 4,905,635 | $ 583,523 |
Net realized gain (loss) | 5,674,571 | 354,117 |
Change in net unrealized appreciation (depreciation) | 11,835,565 | 1,632,070 |
Net increase (decrease) in net assets resulting from operations | 22,415,771 | 2,569,710 |
Distributions to shareholders from net investment income | (4,071,749) | (285,023) |
Distributions to shareholders from net realized gain | (2,276,488) | (237,519) |
Total distributions | (6,348,237) | (522,542) |
Share transactions
Proceeds from sales of shares | 383,681,237 | 91,423,228 |
Reinvestment of distributions | 6,348,237 | 522,542 |
Cost of shares redeemed | (78,384,622) | (6,519,008) |
Net increase (decrease) in net assets resulting from share transactions | 311,644,852 | 85,426,762 |
Total increase (decrease) in net assets | 327,712,386 | 87,473,930 |
| | |
Net Assets | | |
Beginning of period | 87,473,930 | - |
End of period (including undistributed net investment income of $1,132,386 and undistributed net investment income of $298,500, respectively) | $ 415,186,316 | $ 87,473,930 |
Other Information Shares | | |
Sold | 33,527,557 | 8,351,510 |
Issued in reinvestment of distributions | 550,228 | 47,634 |
Redeemed | (6,779,360) | (589,984) |
Net increase (decrease) | 27,298,425 | 7,809,160 |
Financial Highlights
Years ended March 31, | 2011 | 2010 E |
Selected Per-Share Data | | |
Net asset value, beginning of period | $ 11.20 | $ 10.00 |
Income from Investment Operations | | |
Net investment income (loss) C | .20 | .19 |
Net realized and unrealized gain (loss) | .65 | 1.12 |
Total from investment operations | .85 | 1.31 |
Distributions from net investment income | (.14) | (.06) |
Distributions from net realized gain | (.08) | (.05) |
Total distributions | (.22) | (.11) |
Net asset value, end of period | $ 11.83 | $ 11.20 |
Total Return B | 7.68% | 13.12% |
Ratios to Average Net Assets D, F | | |
Expenses before reductions | .05% | .05% A |
Expenses net of fee waivers, if any | .05% | .05% A |
Expenses net of all reductions | .05% | .05% A |
Net investment income (loss) | 1.74% | 2.40% A |
Supplemental Data | | |
Net assets, end of period (000 omitted) | $ 415,186 | $ 87,474 |
Portfolio turnover rate | 36% | 35% A |
A Annualized
B Total returns for periods of less than one year are not annualized.
C Calculated based on average shares outstanding during the period.
D Amounts do not include the activity of the underlying funds.
E For the period July 2, 2009 (commencement of operations) to March 31, 2010.
F Expense ratios reflect operating expenses of the Fund. Expenses before reductions do not reflect amounts reimbursed by the investment adviser or reductions from expense offset arrangements and do not represent the amount paid by the Fund during periods when reimbursements or reductions occur. Expenses net of fee waivers reflect expenses after reimbursement by the investment adviser but prior to reductions from expense offset arrangements. Expenses net of all reductions represent the net expenses paid by the Fund but do not include expenses of the investment companies in which the Fund invests.
See accompanying notes which are an integral part of the financial statements.
Annual Report
Fidelity Freedom K® 2005 Fund
Investment Changes (Unaudited)
Fund Holdings as of March 31, 2011 |
| % of fund's
net assets | % of fund's net assets
6 months ago |
Commodity Funds | | |
Fidelity Series Commodity Strategy Fund Class F | 3.6 | 4.0 |
Domestic Equity Funds | | |
Fidelity Blue Chip Growth Fund Class F | 1.7 | 1.7 |
Fidelity Disciplined Equity Fund Class F | 4.7 | 5.0 |
Fidelity Growth Company Fund Class F | 4.2 | 4.4 |
Fidelity Series 100 Index Fund | 3.2 | 3.4 |
Fidelity Series All-Sector Equity Fund Class F | 5.7 | 5.6 |
Fidelity Series Large Cap Value Fund
Class F | 5.4 | 5.4 |
Fidelity Series Small Cap Opportunities Fund Class F | 0.9 | 0.9 |
Fidelity Small Cap Growth Fund Class F | 0.5 | 0.5 |
Fidelity Small Cap Value Fund Class F | 0.5 | 0.6 |
Fidelity Equity-Income Fund Class F | 0.0 | 1.0 |
| 26.8 | 28.5 |
Developed International Equity Funds | | |
Fidelity Diversified International Fund
Class F | 1.5 | 2.2 |
Fidelity Overseas Fund Class F | 1.5 | 2.2 |
Fidelity Series International Growth Fund Class F | 2.9 | 2.2 |
Fidelity Series International Small Cap Fund Class F | 0.6 | 0.4 |
Fidelity Series International Value Fund Class F | 2.8 | 2.1 |
Fidelity Europe Fund Class F | 0.0 | 0.5 |
Fidelity Japan Fund Class F | 0.0 | 0.2 |
| 9.3 | 9.8 |
Emerging Markets Equity Funds | | |
Fidelity Series Emerging Markets Fund
Class F | 1.7 | 1.6 |
High Yield Bond Funds | | |
Fidelity Series Emerging Markets Debt Fund Class F | 0.1 | 0.0 |
Fidelity Series High Income Fund Class F | 4.8 | 0.0 |
Fidelity Capital & Income Fund Class F | 0.0 | 2.5 |
Fidelity High Income Fund Class F | 0.0 | 2.6 |
| 4.9 | 5.1 |
Inflation-Protected Bond Funds | | |
Fidelity Series Inflation-Protected Bond Index Fund Class F | 9.0 | 8.5 |
Investment Grade Bond Funds | | |
Fidelity Series Investment Grade Bond Fund Class F | 18.4 | 18.1 |
Fidelity Strategic Real Return Fund Class F | 3.8 | 4.3 |
| 22.2 | 22.4 |
Short-Term Funds | | |
Fidelity Institutional Money Market Portfolio Class F | 12.5 | 10.0 |
Fidelity Short-Term Bond Fund Class F | 10.0 | 10.1 |
| 22.5 | 20.1 |
Net Other Assets (Liabilities)* | 0.0 | 0.0 |
| 100.0 | 100.0 |
* Amount represents less than 0.1% |
Asset Allocation (% of fund's net assets) |
Current |
| Commodity Funds | 3.6% | |
| Domestic Equity Funds | 26.8% | |
| Developed International Equity Funds | 9.3% | |
| Emerging Markets Equity Funds | 1.7% | |
| High Yield Bond Funds | 4.9% | |
| Inflation-Protected Bond Funds | 9.0% | |
| Investment Grade Bond Funds | 22.2% | |
| Short-Term Funds | 22.5% | |

Six months ago |
| Commodity Funds | 4.0% | |
| Domestic Equity Funds | 28.5% | |
| Developed International Equity Funds | 9.8% | |
| Emerging Markets Equity Funds | 1.6% | |
| High Yield Bond Funds | 5.1% | |
| Inflation-Protected Bond Funds | 8.5% | |
| Investment Grade Bond Funds | 22.4% | |
| Short-Term Funds | 20.1% | |

Expected |
| Commodity Funds | 4.4% | |
| Domestic Equity Funds | 24.7% | |
| Developed International Equity Funds | 9.0% | |
| Emerging Markets Equity Funds | 1.6% | |
| High Yield Bond Funds | 5.0% | |
| Inflation-Protected Bond Funds | 9.9% | |
| Investment Grade Bond Funds | 20.5% | |
| Short-Term Funds | 24.9% | |

The fund invests according to an asset allocation strategy that becomes increasingly conservative over time. The six months ago allocation is based on the fund's holdings as of September 30, 2010. The current allocation is based on the fund's holdings as of March 31, 2011. The expected allocation represents the fund's anticipated allocation at September 30, 2011. |
Annual Report
Fidelity Freedom K® 2005 Fund
Investments March 31, 2011
Showing Percentage of Net Assets
Domestic Equity Funds - 30.4% |
| Shares | | Value |
Commodity Funds - 3.6% |
Fidelity Series Commodity Strategy Fund Class F | 704,875 | | $ 9,311,401 |
Domestic Equity Funds - 26.8% |
Fidelity Blue Chip Growth Fund Class F | 89,458 | | 4,292,177 |
Fidelity Disciplined Equity Fund Class F | 501,928 | | 12,041,257 |
Fidelity Growth Company Fund Class F | 119,086 | | 10,717,707 |
Fidelity Series 100 Index Fund | 891,341 | | 8,200,334 |
Fidelity Series All-Sector Equity Fund Class F | 1,120,082 | | 14,695,477 |
Fidelity Series Large Cap Value Fund Class F | 1,133,241 | | 13,848,203 |
Fidelity Series Small Cap Opportunities Fund Class F | 199,652 | | 2,361,883 |
Fidelity Small Cap Growth Fund Class F | 82,351 | | 1,399,965 |
Fidelity Small Cap Value Fund Class F | 83,136 | | 1,375,898 |
TOTAL DOMESTIC EQUITY FUNDS | | 68,932,901 |
TOTAL DOMESTIC EQUITY FUNDS (Cost $67,398,710) | 78,244,302 |
International Equity Funds - 11.0% |
| | | |
Developed International Equity Funds - 9.3% |
Fidelity Diversified International Fund Class F | 121,540 | | 3,778,679 |
Fidelity Overseas Fund Class F | 113,377 | | 3,782,270 |
Fidelity Series International Growth Fund Class F | 657,646 | | 7,589,240 |
Fidelity Series International Small Cap Fund Class F | 119,407 | | 1,477,065 |
Fidelity Series International Value Fund Class F | 701,096 | | 7,368,518 |
TOTAL DEVELOPED INTERNATIONAL EQUITY FUNDS | | 23,995,772 |
Emerging Markets Equity Funds - 1.7% |
Fidelity Series Emerging Markets Fund Class F | 233,547 | | 4,484,094 |
TOTAL INTERNATIONAL EQUITY FUNDS (Cost $25,199,638) | 28,479,866 |
Bond Funds - 36.1% |
| Shares | | Value |
High Yield Bond Funds - 4.9% |
Fidelity Series Emerging Markets Debt Fund Class F | 18,061 | | $ 180,686 |
Fidelity Series High Income Fund Class F | 1,245,063 | | 12,475,533 |
TOTAL HIGH YIELD BOND FUNDS | | 12,656,219 |
Inflation-Protected Bond Funds - 9.0% |
Fidelity Series Inflation-Protected Bond Index Fund Class F | 2,148,069 | | 23,242,108 |
Investment Grade Bond Funds - 22.2% |
Fidelity Series Investment Grade Bond Fund Class F | 4,151,579 | | 47,286,481 |
Fidelity Strategic Real Return Fund
Class F | 994,415 | | 9,854,655 |
TOTAL INVESTMENT GRADE BOND FUNDS | | 57,141,136 |
TOTAL BOND FUNDS (Cost $91,762,412) | 93,039,463 |
Short-Term Funds - 22.5% |
| | | |
Fidelity Institutional Money Market Portfolio Class F | 32,316,640 | | 32,316,640 |
Fidelity Short-Term Bond Fund
Class F | 3,046,989 | | 25,747,059 |
TOTAL SHORT-TERM FUNDS (Cost $57,989,281) | 58,063,699 |
TOTAL INVESTMENT PORTFOLIO - 100.0% (Cost $242,350,041) | | 257,827,330 |
NET OTHER ASSETS (LIABILITIES) - 0.0% | | (10,605) |
NET ASSETS - 100% | $ 257,816,725 |
Other Information |
All investments are categorized as Level 1 under the Fair Value Hierarchy. The inputs or methodology used for valuing securities may not be an indication of the risk associated with investing in those securities. For more information on valuation inputs, please refer to the Security Valuation section in the accompanying Notes to Financial Statements. |
See accompanying notes which are an integral part of the financial statements.
Annual Report
Fidelity Freedom K® 2005 Fund
Statement of Assets and Liabilities
| March 31, 2011 |
Assets | | |
Investment in securities, at value (cost $242,350,041) - See accompanying schedule | | $ 257,827,330 |
Cash | | 1 |
Receivable for fund shares sold | | 319,359 |
Total assets | | 258,146,690 |
| | |
Liabilities | | |
Payable for investments purchased | $ 122,795 | |
Payable for fund shares redeemed | 196,565 | |
Transfer agent fees payable | 10,605 | |
Total liabilities | | 329,965 |
| | |
Net Assets | | $ 257,816,725 |
Net Assets consist of: | | |
Paid in capital | | $ 239,099,178 |
Undistributed net investment income | | 556,880 |
Accumulated undistributed net realized gain (loss) on investments | | 2,683,378 |
Net unrealized appreciation (depreciation) on investments | | 15,477,289 |
Net Assets, for 20,113,569 shares outstanding | | $ 257,816,725 |
Net Asset Value, offering price and redemption price per share ($257,816,725 ÷ 20,113,569 shares) | | $ 12.82 |
Statement of Operations
| Year ended March 31, 2011 |
| | |
Investment Income | | |
Income distributions from underlying funds | | $ 2,858,945 |
| | |
Expenses | | |
Transfer agent fees | $ 84,566 | |
Independent trustees' compensation | 524 | |
Total expenses | | 85,090 |
Net investment income (loss) | | 2,773,855 |
Realized and Unrealized Gain (Loss) Realized gain (loss) on sale of underlying fund shares | 1,183,105 | |
Capital gain distributions from underlying funds | 3,066,869 | |
Total net realized gain (loss) | | 4,249,974 |
Change in net unrealized appreciation (depreciation) on underlying funds | | 13,852,837 |
Net gain (loss) | | 18,102,811 |
Net increase (decrease) in net assets resulting from operations | | $ 20,876,666 |
See accompanying notes which are an integral part of the financial statements.
Annual Report
Statement of Changes in Net Assets
| Year ended
March 31,
2011 | For the period
July 2, 2009
(commencement of
operations) to March 31, 2010 |
Increase (Decrease) in Net Assets | | |
Operations | | |
Net investment income (loss) | $ 2,773,855 | $ 354,814 |
Net realized gain (loss) | 4,249,974 | 260,156 |
Change in net unrealized appreciation (depreciation) | 13,852,837 | 1,624,452 |
Net increase (decrease) in net assets resulting from operations | 20,876,666 | 2,239,422 |
Distributions to shareholders from net investment income | (2,403,590) | (168,200) |
Distributions to shareholders from net realized gain | (1,692,191) | (134,560) |
Total distributions | (4,095,781) | (302,760) |
Share transactions
Proceeds from sales of shares | 232,606,824 | 67,784,563 |
Reinvestment of distributions | 4,095,781 | 302,759 |
Cost of shares redeemed | (60,749,803) | (4,940,946) |
Net increase (decrease) in net assets resulting from share transactions | 175,952,802 | 63,146,376 |
Total increase (decrease) in net assets | 192,733,687 | 65,083,038 |
| | |
Net Assets | | |
Beginning of period | 65,083,038 | - |
End of period (including undistributed net investment income of $556,880 and undistributed net investment income of $186,614, respectively) | $ 257,816,725 | $ 65,083,038 |
Other Information Shares | | |
Sold | 19,228,006 | 5,890,801 |
Issued in reinvestment of distributions | 332,048 | 26,190 |
Redeemed | (4,938,344) | (425,132) |
Net increase (decrease) | 14,621,710 | 5,491,859 |
Financial Highlights
Years ended March 31, | 2011 | 2010 E |
Selected Per-Share Data | | |
Net asset value, beginning of period | $ 11.85 | $ 10.00 |
Income from Investment Operations | | |
Net investment income (loss) C | .21 | .18 |
Net realized and unrealized gain (loss) | 1.05 | 1.76 |
Total from investment operations | 1.26 | 1.94 |
Distributions from net investment income | (.17) | (.05) |
Distributions from net realized gain | (.12) | (.04) |
Total distributions | (.29) | (.09) |
Net asset value, end of period | $ 12.82 | $ 11.85 |
Total Return B | 10.75% | 19.42% |
Ratios to Average Net Assets D, F | | |
Expenses before reductions | .05% | .06% A |
Expenses net of fee waivers, if any | .05% | .06% A |
Expenses net of all reductions | .05% | .06% A |
Net investment income (loss) | 1.73% | 2.11% A |
Supplemental Data | | |
Net assets, end of period (000 omitted) | $ 257,817 | $ 65,083 |
Portfolio turnover rate | 47% | 40% A |
A Annualized
B Total returns for periods of less than one year are not annualized.
C Calculated based on average shares outstanding during the period.
D Amounts do not include the activity of the underlying funds.
E For the period July 2, 2009 (commencement of operations) to March 31, 2010.
F Expense ratios reflect operating expenses of the Fund. Expenses before reductions do not reflect amounts reimbursed by the investment adviser or reductions from expense offset arrangements and do not represent the amount paid by the Fund during periods when reimbursements or reductions occur. Expenses net of fee waivers reflect expenses after reimbursement by the investment adviser but prior to reductions from expense offset arrangements. Expenses net of all reductions represent the net expenses paid by the Fund but do not include expenses of the investment companies in which the Fund invests.
See accompanying notes which are an integral part of the financial statements.
Annual Report
Fidelity Freedom K® 2010 Fund
Investment Changes (Unaudited)
Fund Holdings as of March 31, 2011 |
| % of fund's
net assets | % of fund's net assets
6 months ago |
Commodity Funds | | |
Fidelity Series Commodity Strategy Fund Class F | 4.4 | 4.7 |
Domestic Equity Funds | | |
Fidelity Blue Chip Growth Fund Class F | 2.0 | 2.0 |
Fidelity Disciplined Equity Fund Class F | 5.5 | 5.7 |
Fidelity Growth Company Fund Class F | 4.9 | 5.0 |
Fidelity Series 100 Index Fund | 3.8 | 3.9 |
Fidelity Series All-Sector Equity Fund Class F | 6.8 | 6.4 |
Fidelity Series Large Cap Value Fund
Class F | 6.4 | 6.2 |
Fidelity Series Small Cap Opportunities Fund Class F | 1.1 | 1.0 |
Fidelity Small Cap Growth Fund Class F | 0.6 | 0.6 |
Fidelity Small Cap Value Fund Class F | 0.6 | 0.6 |
Fidelity Equity-Income Fund Class F | 0.0 | 1.1 |
| 31.7 | 32.5 |
Developed International Equity Funds | | |
Fidelity Diversified International Fund Class F | 1.7 | 2.6 |
Fidelity Overseas Fund Class F | 1.8 | 2.7 |
Fidelity Series International Growth Fund Class F | 3.5 | 2.6 |
Fidelity Series International Small Cap Fund Class F | 0.7 | 0.5 |
Fidelity Series International Value Fund
Class F | 3.4 | 2.6 |
Fidelity Europe Fund Class F | 0.0 | 0.6 |
Fidelity Japan Fund Class F | 0.0 | 0.2 |
| 11.1 | 11.8 |
Emerging Markets Equity Funds | | |
Fidelity Series Emerging Markets Fund
Class F | 2.1 | 1.8 |
High Yield Bond Funds | | |
Fidelity Series Emerging Markets Debt Fund Class F | 0.1 | 0.0 |
Fidelity Series High Income Fund Class F | 4.8 | 0.0 |
Fidelity Capital & Income Fund Class F | 0.0 | 2.6 |
Fidelity High Income Fund Class F | 0.0 | 2.5 |
| 4.9 | 5.1 |
Inflation-Protected Bond Funds | | |
Fidelity Series Inflation-Protected Bond Index Fund Class F | 9.5 | 8.8 |
Investment Grade Bond Funds | | |
Fidelity Series Investment Grade Bond Fund Class F | 21.2 | 20.2 |
Fidelity Strategic Real Return Fund Class F | 4.5 | 5.0 |
| 25.7 | 25.2 |
Short-Term Funds | | |
Fidelity Institutional Money Market Portfolio Class F | 5.9 | 5.0 |
Fidelity Short-Term Bond Fund Class F | 4.7 | 5.1 |
| 10.6 | 10.1 |
Net Other Assets (Liabilities)* | 0.0 | 0.0 |
| 100.0 | 100.0 |
* Amount represents less than 0.1% |
Asset Allocation (% of fund's net assets) |
Current |
| Commodity Funds | 4.4% | |
| Domestic Equity Funds | 31.7% | |
| Developed International Equity Funds | 11.1% | |
| Emerging Markets Equity Funds | 2.1% | |
| High Yield Bond Funds | 4.9% | |
| Inflation-Protected Bond Funds | 9.5% | |
| Investment Grade Bond Funds | 25.7% | |
| Short-Term Funds | 10.6% | |

Six months ago |
| Commodity Funds | 4.7% | |
| Domestic Equity Funds | 32.5% | |
| Developed International Equity Funds | 11.8% | |
| Emerging Markets Equity Funds | 1.8% | |
| High Yield Bond Funds | 5.1% | |
| Inflation-Protected Bond Funds | 8.8% | |
| Investment Grade Bond Funds | 25.2% | |
| Short-Term Funds | 10.1% | |

Expected |
| Commodity Funds | 5.4% | |
| Domestic Equity Funds | 30.7% | |
| Developed International Equity Funds | 11.1% | |
| Emerging Markets Equity Funds | 2.0% | |
| High Yield Bond Funds | 5.0% | |
| Inflation-Protected Bond Funds | 10.6% | |
| Investment Grade Bond Funds | 24.1% | |
| Short-Term Funds | 11.1% | |

The fund invests according to an asset allocation strategy that becomes increasingly conservative over time. The six months ago allocation is based on the fund's holdings as of September 30, 2010. The current allocation is based on the fund's holdings as of March 31, 2011. The expected allocation represents the fund's anticipated allocation at September 30, 2011. |
Annual Report
Fidelity Freedom K® 2010 Fund
Investments March 31, 2011
Showing Percentage of Net Assets
Domestic Equity Funds - 36.1% |
| Shares | | Value |
Commodity Funds - 4.4% |
Fidelity Series Commodity Strategy Fund Class F | 8,833,701 | | $ 116,693,190 |
Domestic Equity Funds - 31.7% |
Fidelity Blue Chip Growth Fund Class F | 1,093,628 | | 52,472,269 |
Fidelity Disciplined Equity Fund Class F | 6,164,877 | | 147,895,396 |
Fidelity Growth Company Fund Class F | 1,459,909 | | 131,391,808 |
Fidelity Series 100 Index Fund | 10,911,878 | | 100,389,277 |
Fidelity Series All-Sector Equity Fund Class F | 13,739,977 | | 180,268,503 |
Fidelity Series Large Cap Value Fund Class F | 13,902,558 | | 169,889,256 |
Fidelity Series Small Cap Opportunities Fund Class F | 2,449,241 | | 28,974,516 |
Fidelity Small Cap Growth Fund Class F | 1,010,476 | | 17,178,100 |
Fidelity Small Cap Value Fund Class F | 1,020,108 | | 16,882,791 |
TOTAL DOMESTIC EQUITY FUNDS | | 845,341,916 |
TOTAL DOMESTIC EQUITY FUNDS (Cost $838,355,192) | 962,035,106 |
International Equity Funds - 13.2% |
| | | |
Developed International Equity Funds - 11.1% |
Fidelity Diversified International Fund Class F | 1,498,192 | | 46,578,791 |
Fidelity Overseas Fund Class F | 1,397,587 | | 46,623,511 |
Fidelity Series International Growth Fund Class F | 8,084,893 | | 93,299,665 |
Fidelity Series International Small Cap Fund Class F | 1,468,293 | | 18,162,780 |
Fidelity Series International Value Fund Class F | 8,618,285 | | 90,578,176 |
TOTAL DEVELOPED INTERNATIONAL EQUITY FUNDS | | 295,242,923 |
Emerging Markets Equity Funds - 2.1% |
Fidelity Series Emerging Markets Fund Class F | 2,871,368 | | 55,130,268 |
TOTAL INTERNATIONAL EQUITY FUNDS (Cost $312,576,378) | 350,373,191 |
Bond Funds - 40.1% |
| Shares | | Value |
High Yield Bond Funds - 4.9% |
Fidelity Series Emerging Markets Debt Fund Class F | 187,589 | | $ 1,876,664 |
Fidelity Series High Income Fund Class F | 12,898,100 | | 129,238,963 |
TOTAL HIGH YIELD BOND FUNDS | | 131,115,627 |
Inflation-Protected Bond Funds - 9.5% |
Fidelity Series Inflation-Protected Bond Index Fund Class F | 23,388,866 | | 253,067,530 |
Investment Grade Bond Funds - 25.7% |
Fidelity Series Investment Grade Bond Fund Class F | 49,720,181 | | 566,312,858 |
Fidelity Strategic Real Return Fund Class F | 11,977,845 | | 118,700,441 |
TOTAL INVESTMENT GRADE BOND FUNDS | | 685,013,299 |
TOTAL BOND FUNDS (Cost $1,054,738,080) | 1,069,196,456 |
Short-Term Funds - 10.6% |
| | | |
Fidelity Institutional Money Market Portfolio Class F | 157,081,410 | | 157,081,410 |
Fidelity Short-Term Bond Fund
Class F | 14,989,352 | | 126,660,023 |
TOTAL SHORT-TERM FUNDS (Cost $283,282,908) | 283,741,433 |
TOTAL INVESTMENT PORTFOLIO - 100.0% (Cost $2,488,952,558) | | 2,665,346,186 |
NET OTHER ASSETS (LIABILITIES) - 0.0% | | (109,672) |
NET ASSETS - 100% | $ 2,665,236,514 |
Other Information |
All investments are categorized as Level 1 under the Fair Value Hierarchy. The inputs or methodology used for valuing securities may not be an indication of the risk associated with investing in those securities. For more information on valuation inputs, please refer to the Security Valuation section in the accompanying Notes to Financial Statements. |
See accompanying notes which are an integral part of the financial statements.
Annual Report
Fidelity Freedom K® 2010 Fund
Statement of Assets and Liabilities
| March 31, 2011 |
Assets | | |
Investment in securities, at value (cost $2,488,952,558) - See accompanying schedule | | $ 2,665,346,186 |
Cash | | 3 |
Receivable for fund shares sold | | 3,527,674 |
Total assets | | 2,668,873,863 |
| | |
Liabilities | | |
Payable for investments purchased | $ 419,104 | |
Payable for fund shares redeemed | 3,108,579 | |
Transfer agent fees payable | 109,666 | |
Total liabilities | | 3,637,349 |
| | |
Net Assets | | $ 2,665,236,514 |
Net Assets consist of: | | |
Paid in capital | | $ 2,452,322,567 |
Undistributed net investment income | | 5,939,567 |
Accumulated undistributed net realized gain (loss) on investments | | 30,580,752 |
Net unrealized appreciation (depreciation) on investments | | 176,393,628 |
Net Assets, for 203,101,090 shares outstanding | | $ 2,665,236,514 |
Net Asset Value, offering price and redemption price per share ($2,665,236,514 ÷ 203,101,090 shares) | | $ 13.12 |
Statement of Operations
| Year ended March 31, 2011 |
Investment Income | | |
Income distributions from underlying funds | | $ 30,952,988 |
| | |
Expenses | | |
Transfer agent fees | $ 859,378 | |
Independent trustees' compensation | 5,405 | |
Total expenses | | 864,783 |
Net investment income (loss) | | 30,088,205 |
Realized and Unrealized Gain (Loss) Realized gain (loss) on sale of underlying fund shares | 10,595,588 | |
Capital gain distributions from underlying funds | 36,586,057 | |
Total net realized gain (loss) | | 47,181,645 |
Change in net unrealized appreciation (depreciation) on underlying funds | | 159,524,123 |
Net gain (loss) | | 206,705,768 |
Net increase (decrease) in net assets resulting from operations | | $ 236,793,973 |
See accompanying notes which are an integral part of the financial statements.
Annual Report
Statement of Changes in Net Assets
| Year ended
March 31,
2011 | For the period
July 2, 2009
(commencement of
operations) to March 31, 2010 |
Increase (Decrease) in Net Assets | | |
Operations | | |
Net investment income (loss) | $ 30,088,205 | $ 3,251,744 |
Net realized gain (loss) | 47,181,645 | 2,684,403 |
Change in net unrealized appreciation (depreciation) | 159,524,123 | 16,869,505 |
Net increase (decrease) in net assets resulting from operations | 236,793,973 | 22,805,652 |
Distributions to shareholders from net investment income | (25,935,679) | (1,464,703) |
Distributions to shareholders from net realized gain | (18,113,533) | (1,171,762) |
Total distributions | (44,049,212) | (2,636,465) |
Share transactions
Proceeds from sales of shares | 2,276,638,377 | 694,362,957 |
Reinvestment of distributions | 44,049,211 | 2,636,465 |
Cost of shares redeemed | (523,899,605) | (41,464,839) |
Net increase (decrease) in net assets resulting from share transactions | 1,796,787,983 | 655,534,583 |
Total increase (decrease) in net assets | 1,989,532,744 | 675,703,770 |
| | |
Net Assets | | |
Beginning of period | 675,703,770 | - |
End of period (including undistributed net investment income of $5,939,567 and undistributed net investment income of $1,787,041, respectively) | $ 2,665,236,514 | $ 675,703,770 |
Other Information Shares | | |
Sold | 185,049,197 | 59,763,680 |
Issued in reinvestment of distributions | 3,505,722 | 226,112 |
Redeemed | (41,896,237) | (3,547,384) |
Net increase (decrease) | 146,658,682 | 56,442,408 |
Financial Highlights
Years ended March 31, | 2011 | 2010 E |
Selected Per-Share Data | | |
Net asset value, beginning of period | $ 11.97 | $ 10.00 |
Income from Investment Operations | | |
Net investment income (loss) C | .23 | .17 |
Net realized and unrealized gain (loss) | 1.21 | 1.89 |
Total from investment operations | 1.44 | 2.06 |
Distributions from net investment income | (.17) | (.05) |
Distributions from net realized gain | (.12) | (.04) |
Total distributions | (.29) | (.09) |
Net asset value, end of period | $ 13.12 | $ 11.97 |
Total Return B | 12.17% | 20.62% |
Ratios to Average Net Assets D, F | | |
Expenses before reductions | .05% | .05% A |
Expenses net of fee waivers, if any | .05% | .05% A |
Expenses net of all reductions | .05% | .05% A |
Net investment income (loss) | 1.82% | 2.04% A |
Supplemental Data | | |
Net assets, end of period (000 omitted) | $ 2,665,237 | $ 675,704 |
Portfolio turnover rate | 42% | 29% A |
A Annualized
B Total returns for periods of less than one year are not annualized.
C Calculated based on average shares outstanding during the period.
D Amounts do not include the activity of the underlying funds.
E For the period July 2, 2009 (commencement of operations) to March 31, 2010.
F Expense ratios reflect operating expenses of the Fund. Expenses before reductions do not reflect amounts reimbursed by the investment adviser or reductions from expense offset arrangements and do not represent the amount paid by the Fund during periods when reimbursements or reductions occur. Expenses net of fee waivers reflect expenses after reimbursement by the investment adviser but prior to reductions from expense offset arrangements. Expenses net of all reductions represent the net expenses paid by the Fund but do not include expenses of the investment companies in which the Fund invests.
See accompanying notes which are an integral part of the financial statements.
Annual Report
Fidelity Freedom K® 2015 Fund
Investment Changes (Unaudited)
Fund Holdings as of March 31, 2011 |
| % of fund's
net assets | % of fund's net assets
6 months ago |
Commodity Funds | | |
Fidelity Series Commodity Strategy Fund Class F | 4.5 | 4.8 |
Domestic Equity Funds | | |
Fidelity Blue Chip Growth Fund Class F | 2.0 | 2.0 |
Fidelity Disciplined Equity Fund Class F | 5.7 | 5.9 |
Fidelity Growth Company Fund Class F | 5.0 | 5.2 |
Fidelity Series 100 Index Fund | 3.9 | 4.0 |
Fidelity Series All-Sector Equity Fund Class F | 6.9 | 6.6 |
Fidelity Series Large Cap Value Fund
Class F | 6.5 | 6.3 |
Fidelity Series Small Cap Opportunities Fund Class F | 1.1 | 1.0 |
Fidelity Small Cap Growth Fund Class F | 0.7 | 0.7 |
Fidelity Small Cap Value Fund Class F | 0.7 | 0.7 |
Fidelity Equity-Income Fund Class F | 0.0 | 1.1 |
| 32.5 | 33.5 |
Developed International Equity Funds | | |
Fidelity Diversified International Fund Class F | 1.8 | 2.7 |
Fidelity Overseas Fund Class F | 1.8 | 2.7 |
Fidelity Series International Growth Fund Class F | 3.6 | 2.7 |
Fidelity Series International Small Cap Fund Class F | 0.7 | 0.5 |
Fidelity Series International Value Fund
Class F | 3.5 | 2.6 |
Fidelity Europe Fund Class F | 0.0 | 0.6 |
Fidelity Japan Fund Class F | 0.0 | 0.2 |
| 11.4 | 12.0 |
Emerging Markets Equity Funds | | |
Fidelity Series Emerging Markets Fund
Class F | 2.1 | 1.9 |
High Yield Bond Funds | | |
Fidelity Series Emerging Markets Debt Fund Class F | 0.1 | 0.0 |
Fidelity Series High Income Fund Class F | 4.8 | 0.0 |
Fidelity Capital & Income Fund Class F | 0.0 | 2.6 |
Fidelity High Income Fund Class F | 0.0 | 2.6 |
| 4.9 | 5.2 |
Inflation-Protected Bond Funds | | |
Fidelity Series Inflation-Protected Bond Index Fund Class F | 8.8 | 8.1 |
Investment Grade Bond Funds | | |
Fidelity Series Investment Grade Bond Fund Class F | 21.8 | 20.5 |
Fidelity Strategic Real Return Fund Class F | 4.5 | 5.0 |
| 26.3 | 25.5 |
Short-Term Funds | | |
Fidelity Institutional Money Market Portfolio Class F | 5.3 | 4.5 |
Fidelity Short-Term Bond Fund Class F | 4.2 | 4.5 |
| 9.5 | 9.0 |
Net Other Assets (Liabilities)* | 0.0 | 0.0 |
| 100.0 | 100.0 |
* Amount represents less than 0.1% |
Asset Allocation (% of fund's net assets) |
Current |
| Commodity Funds | 4.5% | |
| Domestic Equity Funds | 32.5% | |
| Developed International Equity Funds | 11.4% | |
| Emerging Markets Equity Funds | 2.1% | |
| High Yield Bond Funds | 4.9% | |
| Inflation-Protected Bond Funds | 8.8% | |
| Investment Grade Bond Funds | 26.3% | |
| Short-Term Funds | 9.5% | |

Six months ago |
| Commodity Funds | 4.8% | |
| Domestic Equity Funds | 33.5% | |
| Developed International Equity Funds | 12.0% | |
| Emerging Markets Equity Funds | 1.9% | |
| High Yield Bond Funds | 5.2% | |
| Inflation-Protected Bond Funds | 8.1% | |
| Investment Grade Bond Funds | 25.5% | |
| Short-Term Funds | 9.0% | |

Expected |
| Commodity Funds | 5.5% | |
| Domestic Equity Funds | 31.5% | |
| Developed International Equity Funds | 11.5% | |
| Emerging Markets Equity Funds | 2.0% | |
| High Yield Bond Funds | 5.0% | |
| Inflation-Protected Bond Funds | 10.1% | |
| Investment Grade Bond Funds | 24.7% | |
| Short-Term Funds | 9.7% | |

The fund invests according to an asset allocation strategy that becomes increasingly conservative over time. The six months ago allocation is based on the fund's holdings as of September 30, 2010. The current allocation is based on the fund's holdings as of March 31, 2011. The expected allocation represents the fund's anticipated allocation ot September 30, 2011. |
Annual Report
Fidelity Freedom K® 2015 Fund
Investments March 31, 2011
Showing Percentage of Net Assets
Domestic Equity Funds - 37.0% |
| Shares | | Value |
Commodity Funds - 4.5% |
Fidelity Series Commodity Strategy Fund Class F | 10,731,406 | | $ 141,761,872 |
Domestic Equity Funds - 32.5% |
Fidelity Blue Chip Growth Fund Class F | 1,322,197 | | 63,439,035 |
Fidelity Disciplined Equity Fund Class F | 7,445,228 | | 178,611,014 |
Fidelity Growth Company Fund Class F | 1,763,091 | | 158,678,172 |
Fidelity Series 100 Index Fund | 13,200,409 | | 121,443,759 |
Fidelity Series All-Sector Equity Fund Class F | 16,602,136 | | 217,820,027 |
Fidelity Series Large Cap Value Fund Class F | 16,798,169 | | 205,273,631 |
Fidelity Series Small Cap Opportunities Fund Class F | 2,968,365 | | 35,115,754 |
Fidelity Small Cap Growth Fund Class F | 1,229,157 | | 20,895,671 |
Fidelity Small Cap Value Fund Class F | 1,240,386 | | 20,528,391 |
TOTAL DOMESTIC EQUITY FUNDS | | 1,021,805,454 |
TOTAL DOMESTIC EQUITY FUNDS (Cost $1,011,895,166) | 1,163,567,326 |
International Equity Funds - 13.5% |
| | | |
Developed International Equity Funds - 11.4% |
Fidelity Diversified International Fund Class F | 1,826,372 | | 56,781,909 |
Fidelity Overseas Fund Class F | 1,703,623 | | 56,832,873 |
Fidelity Series International Growth Fund Class F | 9,789,727 | | 112,973,450 |
Fidelity Series International Small Cap Fund Class F | 1,777,594 | | 21,988,839 |
Fidelity Series International Value Fund Class F | 10,436,692 | | 109,689,638 |
TOTAL DEVELOPED INTERNATIONAL EQUITY FUNDS | | 358,266,709 |
Emerging Markets Equity Funds - 2.1% |
Fidelity Series Emerging Markets Fund Class F | 3,476,714 | | 66,752,915 |
TOTAL INTERNATIONAL EQUITY FUNDS (Cost $379,896,634) | 425,019,624 |
Bond Funds - 40.0% |
| Shares | | Value |
High Yield Bond Funds - 4.9% |
Fidelity Series Emerging Markets Debt Fund Class F | 220,977 | | $ 2,210,706 |
Fidelity Series High Income Fund Class F | 15,210,079 | | 152,404,994 |
TOTAL HIGH YIELD BOND FUNDS | | 154,615,700 |
Inflation-Protected Bond Funds - 8.8% |
Fidelity Series Inflation-Protected Bond Index Fund Class F | 25,745,232 | | 278,563,412 |
Investment Grade Bond Funds - 26.3% |
Fidelity Series Investment Grade Bond Fund Class F | 60,377,977 | | 687,705,153 |
Fidelity Strategic Real Return Fund
Class F | 14,155,499 | | 140,281,000 |
TOTAL INVESTMENT GRADE BOND FUNDS | | 827,986,153 |
TOTAL BOND FUNDS (Cost $1,245,090,672) | 1,261,165,265 |
Short-Term Funds - 9.5% |
| | | |
Fidelity Institutional Money Market Portfolio Class F | 166,469,273 | | 166,469,273 |
Fidelity Short-Term Bond Fund
Class F | 15,711,379 | | 132,761,155 |
TOTAL SHORT-TERM FUNDS (Cost $298,763,998) | 299,230,428 |
TOTAL INVESTMENT PORTFOLIO - 100.0% (Cost $2,935,646,470) | | 3,148,982,643 |
NET OTHER ASSETS (LIABILITIES) - 0.0% | | (129,074) |
NET ASSETS - 100% | $ 3,148,853,569 |
Other Information |
All investments are categorized as Level 1 under the Fair Value Hierarchy. The inputs or methodology used for valuing securities may not be an indication of the risk associated with investing in those securities. For more information on valuation inputs, please refer to the Security Valuation section in the accompanying Notes to Financial Statements. |
See accompanying notes which are an integral part of the financial statements.
Annual Report
Fidelity Freedom K® 2015 Fund
Statement of Assets and Liabilities
| March 31, 2011 |
Assets | | |
Investment in securities, at value (cost $2,935,646,470) - See accompanying schedule | | $ 3,148,982,643 |
Receivable for fund shares sold | | 6,410,234 |
Total assets | | 3,155,392,877 |
| | |
Liabilities | | |
Payable for investments purchased | $ 4,621,970 | |
Payable for fund shares redeemed | 1,788,267 | |
Transfer agent fees payable | 129,071 | |
Total liabilities | | 6,539,308 |
| | |
Net Assets | | $ 3,148,853,569 |
Net Assets consist of: | | |
Paid in capital | | $ 2,893,408,858 |
Undistributed net investment income | | 6,900,416 |
Accumulated undistributed net realized gain (loss) on investments | | 35,208,122 |
Net unrealized appreciation (depreciation) on investments | | 213,336,173 |
Net Assets, for 239,156,232 shares outstanding | | $ 3,148,853,569 |
Net Asset Value, offering price and redemption price per share ($3,148,853,569 ÷ 239,156,232 shares) | | $ 13.17 |
Statement of Operations
| Year ended March 31, 2011 |
| | |
Investment Income | | |
Income distributions from underlying funds | | $ 35,971,468 |
| | |
Expenses | | |
Transfer agent fees | $ 992,240 | |
Independent trustees' compensation | 6,245 | |
Total expenses | | 998,485 |
Net investment income (loss) | | 34,972,983 |
Realized and Unrealized Gain (Loss) Realized gain (loss) on sale of underlying fund shares | 12,638,264 | |
Capital gain distributions from underlying funds | 42,981,321 | |
Total net realized gain (loss) | | 55,619,585 |
Change in net unrealized appreciation (depreciation) on underlying funds | | 190,169,904 |
Net gain (loss) | | 245,789,489 |
Net increase (decrease) in net assets resulting from operations | | $ 280,762,472 |
See accompanying notes which are an integral part of the financial statements.
Annual Report
Statement of Changes in Net Assets
| Year ended
March 31,
2011 | For the period
July 2, 2009
(commencement of
operations) to March 31, 2010 |
Increase (Decrease) in Net Assets | | |
Operations | | |
Net investment income (loss) | $ 34,972,983 | $ 5,103,464 |
Net realized gain (loss) | 55,619,585 | 4,530,965 |
Change in net unrealized appreciation (depreciation) | 190,169,904 | 23,166,269 |
Net increase (decrease) in net assets resulting from operations | 280,762,472 | 32,800,698 |
Distributions to shareholders from net investment income | (30,312,704) | (2,863,327) |
Distributions to shareholders from net realized gain | (22,692,671) | (2,249,757) |
Total distributions | (53,005,375) | (5,113,084) |
Share transactions
Proceeds from sales of shares | 2,514,470,292 | 876,846,062 |
Reinvestment of distributions | 53,005,375 | 5,113,083 |
Cost of shares redeemed | (516,721,607) | (39,304,347) |
Net increase (decrease) in net assets resulting from share transactions | 2,050,754,060 | 842,654,798 |
Total increase (decrease) in net assets | 2,278,511,157 | 870,342,412 |
| | |
Net Assets | | |
Beginning of period | 870,342,412 | - |
End of period (including undistributed net investment income of $6,900,416 and undistributed net investment income of $2,240,137, respectively) | $ 3,148,853,569 | $ 870,342,412 |
Other Information Shares | | |
Sold | 203,481,934 | 75,347,988 |
Issued in reinvestment of distributions | 4,211,833 | 437,016 |
Redeemed | (40,976,287) | (3,346,252) |
Net increase (decrease) | 166,717,480 | 72,438,752 |
Financial Highlights
Years ended March 31, | 2011 | 2010 E |
Selected Per-Share Data | | |
Net asset value, beginning of period | $ 12.01 | $ 10.00 |
Income from Investment Operations | | |
Net investment income (loss) C | .23 | .19 |
Net realized and unrealized gain (loss) | 1.24 | 1.95 |
Total from investment operations | 1.47 | 2.14 |
Distributions from net investment income | (.18) | (.07) |
Distributions from net realized gain | (.14) | (.06) |
Total distributions | (.31) G | (.13) |
Net asset value, end of period | $ 13.17 | $ 12.01 |
Total Return B | 12.42% | 21.38% |
Ratios to Average Net Assets D, F | | |
Expenses before reductions | .05% | .05% A |
Expenses net of fee waivers, if any | .05% | .05% A |
Expenses net of all reductions | .05% | .05% A |
Net investment income (loss) | 1.83% | 2.26% A |
Supplemental Data | | |
Net assets, end of period (000 omitted) | $ 3,148,854 | $ 870,342 |
Portfolio turnover rate | 35% | 23% A |
A Annualized
B Total returns for periods of less than one year are not annualized.
C Calculated based on average shares outstanding during the period.
D Amounts do not include the activity of the underlying funds.
E For the period July 2, 2009 (commencement of operations) to March 31, 2010.
F Expense ratios reflect operating expenses of the Fund. Expenses before reductions do not reflect amounts reimbursed by the investment adviser or reductions from expense offset arrangements and do not represent the amount paid by the Fund during periods when reimbursements or reductions occur. Expenses net of fee waivers reflect expenses after reimbursement by the investment adviser but prior to reductions from expense offset arrangements. Expenses net of all reductions represent the net expenses paid by the Fund but do not include expenses of the investment companies in which the Fund invests.
G Total distributions of $.31 per share is comprised of distributions from net investment income of $.176 and distributions from net realized gain of $.137 per share.
See accompanying notes which are an integral part of the financial statements.
Annual Report
Fidelity Freedom K® 2020 Fund
Investment Changes (Unaudited)
Fund Holdings as of March 31, 2011 |
| % of fund's
net assets | % of fund's net assets
6 months ago |
Commodity Funds | | |
Fidelity Series Commodity Strategy Fund Class F | 5.6 | 5.6 |
Domestic Equity Funds | | |
Fidelity Blue Chip Growth Fund Class F | 2.4 | 2.4 |
Fidelity Disciplined Equity Fund Class F | 6.7 | 7.0 |
Fidelity Growth Company Fund Class F | 5.9 | 6.1 |
Fidelity Series 100 Index Fund | 4.5 | 4.7 |
Fidelity Series All-Sector Equity Fund Class F | 8.1 | 7.8 |
Fidelity Series Large Cap Value Fund
Class F | 7.7 | 7.5 |
Fidelity Series Small Cap Opportunities Fund Class F | 1.3 | 1.3 |
Fidelity Small Cap Growth Fund Class F | 0.8 | 0.8 |
Fidelity Small Cap Value Fund Class F | 0.8 | 0.8 |
Fidelity Equity-Income Fund Class F | 0.0 | 1.3 |
| 38.2 | 39.7 |
Developed International Equity Funds | | |
Fidelity Diversified International Fund Class F | 2.1 | 3.3 |
Fidelity Overseas Fund Class F | 2.2 | 3.3 |
Fidelity Series International Growth Fund Class F | 4.3 | 3.2 |
Fidelity Series International Small Cap Fund Class F | 0.8 | 0.6 |
Fidelity Series International Value Fund
Class F | 4.1 | 3.2 |
Fidelity Europe Fund Class F | 0.0 | 0.8 |
Fidelity Japan Fund Class F | 0.0 | 0.3 |
| 13.5 | 14.7 |
Emerging Markets Equity Funds | | |
Fidelity Series Emerging Markets Fund
Class F | 2.5 | 2.3 |
High Yield Bond Funds | | |
Fidelity Series Emerging Markets Debt Fund Class F | 0.1 | 0.0 |
Fidelity Series High Income Fund Class F | 6.3 | 0.0 |
Fidelity Capital & Income Fund Class F | 0.0 | 3.5 |
Fidelity High Income Fund Class F | 0.0 | 3.4 |
| 6.4 | 6.9 |
Inflation-Protected Bond Funds | | |
Fidelity Series Inflation-Protected Bond Index Fund Class F | 6.7 | 5.9 |
Investment Grade Bond Funds | | |
Fidelity Series Investment Grade Bond Fund Class F | 19.2 | 17.6 |
Fidelity Strategic Real Return Fund Class F | 4.0 | 4.2 |
| 23.2 | 21.8 |
Short-Term Funds | | |
Fidelity Institutional Money Market Portfolio Class F | 2.2 | 1.5 |
Fidelity Short-Term Bond Fund Class F | 1.7 | 1.6 |
| 3.9 | 3.1 |
Net Other Assets (Liabilities)* | 0.0 | 0.0 |
| 100.0 | 100.0 |
* Amount represents less than 0.1% |
Asset Allocation (% of fund's net assets) |
Current |
| Commodity Funds | 5.6% | |
| Domestic Equity Funds | 38.2% | |
| Developed International Equity Funds | 13.5% | |
| Emerging Markets Equity Funds | 2.5% | |
| High Yield Bond Funds | 6.4% | |
| Inflation-Protected Bond Funds | 6.7% | |
| Investment Grade Bond Funds | 23.2% | |
| Short-Term Funds | 3.9% | |

Six months ago |
| Commodity Funds | 5.6% | |
| Domestic Equity Funds | 39.7% | |
| Developed International Equity Funds | 14.7% | |
| Emerging Markets Equity Funds | 2.3% | |
| High Yield Bond Funds | 6.9% | |
| Inflation-Protected Bond Funds | 5.9% | |
| Investment Grade Bond Funds | 21.8% | |
| Short-Term Funds | 3.1% | |

Expected |
| Commodity Funds | 6.4% | |
| Domestic Equity Funds | 36.4% | |
| Developed International Equity Funds | 13.3% | |
| Emerging Markets Equity Funds | 2.3% | |
| High Yield Bond Funds | 6.3% | |
| Inflation-Protected Bond Funds | 8.0% | |
| Investment Grade Bond Funds | 22.5% | |
| Short-Term Funds | 4.8% | |

The fund invests according to an asset allocation strategy that becomes increasingly conservative over time. The six months ago allocation is based on the fund's holdings as of September 30, 2010. The current allocation is based on the fund's holdings as of March 31, 2011. The expected allocation represents the fund's anticipated allocation at September 30, 2011. |
Annual Report
Fidelity Freedom K® 2020 Fund
Investments March 31, 2011
Showing Percentage of Net Assets
Domestic Equity Funds - 43.8% |
| Shares | | Value |
Commodity Funds - 5.6% |
Fidelity Series Commodity Strategy Fund Class F | 28,254,287 | | $ 373,239,129 |
Domestic Equity Funds - 38.2% |
Fidelity Blue Chip Growth Fund Class F | 3,274,949 | | 157,132,035 |
Fidelity Disciplined Equity Fund Class F | 18,443,751 | | 442,465,596 |
Fidelity Growth Company Fund Class F | 4,372,899 | | 393,560,894 |
Fidelity Series 100 Index Fund | 32,755,049 | | 301,346,449 |
Fidelity Series All-Sector Equity Fund Class F | 41,159,078 | | 540,007,097 |
Fidelity Series Large Cap Value Fund Class F | 41,648,457 | | 508,944,145 |
Fidelity Series Small Cap Opportunities Fund Class F | 7,327,858 | | 86,688,561 |
Fidelity Small Cap Growth Fund Class F | 3,025,779 | | 51,438,244 |
Fidelity Small Cap Value Fund Class F | 3,055,041 | | 50,560,930 |
TOTAL DOMESTIC EQUITY FUNDS | | 2,532,143,951 |
TOTAL DOMESTIC EQUITY FUNDS (Cost $2,543,948,487) | 2,905,383,080 |
International Equity Funds - 16.0% |
| | | |
Developed International Equity Funds - 13.5% |
Fidelity Diversified International Fund Class F | 4,546,682 | | 141,356,339 |
Fidelity Overseas Fund Class F | 4,241,282 | | 141,489,155 |
Fidelity Series International Growth Fund Class F | 24,390,218 | | 281,463,115 |
Fidelity Series International Small Cap Fund Class F | 4,429,109 | | 54,788,084 |
Fidelity Series International Value Fund Class F | 26,001,650 | | 273,277,340 |
TOTAL DEVELOPED INTERNATIONAL EQUITY FUNDS | | 892,374,033 |
Emerging Markets Equity Funds - 2.5% |
Fidelity Series Emerging Markets Fund Class F | 8,662,236 | | 166,314,936 |
TOTAL INTERNATIONAL EQUITY FUNDS (Cost $947,311,404) | 1,058,688,969 |
Bond Funds - 36.3% |
| Shares | | Value |
High Yield Bond Funds - 6.4% |
Fidelity Series Emerging Markets Debt Fund Class F | 605,832 | | $ 6,060,771 |
Fidelity Series High Income Fund Class F | 41,884,081 | | 419,678,489 |
TOTAL HIGH YIELD BOND FUNDS | | 425,739,260 |
Inflation-Protected Bond Funds - 6.7% |
Fidelity Series Inflation-Protected Bond Index Fund Class F | 40,892,473 | | 442,456,555 |
Investment Grade Bond Funds - 23.2% |
Fidelity Series Investment Grade Bond Fund Class F | 111,992,733 | | 1,275,597,222 |
Fidelity Strategic Real Return Fund Class F | 26,540,712 | | 263,018,455 |
TOTAL INVESTMENT GRADE BOND FUNDS | | 1,538,615,677 |
TOTAL BOND FUNDS (Cost $2,380,202,582) | 2,406,811,492 |
Short-Term Funds - 3.9% |
| | | |
Fidelity Institutional Money Market Portfolio Class F | 145,927,615 | | 145,927,615 |
Fidelity Short-Term Bond Fund
Class F | 13,731,110 | | 116,027,882 |
TOTAL SHORT-TERM FUNDS (Cost $261,759,172) | 261,955,497 |
TOTAL INVESTMENT PORTFOLIO - 100.0% (Cost $6,133,221,645) | | 6,632,839,038 |
NET OTHER ASSETS (LIABILITIES) - 0.0% | | (270,185) |
NET ASSETS - 100% | $ 6,632,568,853 |
Other Information |
All investments are categorized as Level 1 under the Fair Value Hierarchy. The inputs or methodology used for valuing securities may not be an indication of the risk associated with investing in those securities. For more information on valuation inputs, please refer to the Security Valuation section in the accompanying Notes to Financial Statements. |
See accompanying notes which are an integral part of the financial statements.
Annual Report
Fidelity Freedom K® 2020 Fund
Statement of Assets and Liabilities
| March 31, 2011 |
Assets | | |
Investment in securities, at value (cost $6,133,221,645) - See accompanying schedule | | $ 6,632,839,038 |
Receivable for fund shares sold | | 7,910,678 |
Total assets | | 6,640,749,716 |
| | |
Liabilities | | |
Payable for investments purchased | $ 5,469,322 | |
Payable for fund shares redeemed | 2,441,382 | |
Transfer agent fees payable | 270,159 | |
Total liabilities | | 8,180,863 |
| | |
Net Assets | | $ 6,632,568,853 |
Net Assets consist of: | | |
Paid in capital | | $ 6,031,377,185 |
Undistributed net investment income | | 13,788,564 |
Accumulated undistributed net realized gain (loss) on investments | | 87,785,711 |
Net unrealized appreciation (depreciation) on investments | | 499,617,393 |
Net Assets, for 483,459,132 shares outstanding | | $ 6,632,568,853 |
Net Asset Value, offering price and redemption price per share ($6,632,568,853 ÷ 483,459,132 shares) | | $ 13.72 |
Statement of Operations
| Year ended March 31, 2011 |
Investment Income | | |
Income distributions from underlying funds | | $ 76,365,449 |
| | |
Expenses | | |
Transfer agent fees | $ 2,036,245 | |
Independent trustees' compensation | 12,718 | |
Total expenses | | 2,048,963 |
Net investment income (loss) | | 74,316,486 |
Realized and Unrealized Gain (Loss) Realized gain (loss) on sale of underlying fund shares | 29,783,155 | |
Capital gain distributions from underlying funds | 95,997,494 | |
Total net realized gain (loss) | | 125,780,649 |
Change in net unrealized appreciation (depreciation) on underlying funds | | 451,256,230 |
Net gain (loss) | | 577,036,879 |
Net increase (decrease) in net assets resulting from operations | | $ 651,353,365 |
See accompanying notes which are an integral part of the financial statements.
Annual Report
Statement of Changes in Net Assets
| Year ended
March 31,
2011 | For the period
July 2, 2009
(commencement of
operations) to March 31, 2010 |
Increase (Decrease) in Net Assets | | |
Operations | | |
Net investment income (loss) | $ 74,316,486 | $ 7,657,611 |
Net realized gain (loss) | 125,780,649 | 7,624,485 |
Change in net unrealized appreciation (depreciation) | 451,256,230 | 48,361,163 |
Net increase (decrease) in net assets resulting from operations | 651,353,365 | 63,643,259 |
Distributions to shareholders from net investment income | (64,244,076) | (3,941,456) |
Distributions to shareholders from net realized gain | (42,663,330) | (2,956,092) |
Total distributions | (106,907,406) | (6,897,548) |
Share transactions
Proceeds from sales of shares | 5,176,080,099 | 1,574,861,111 |
Reinvestment of distributions | 106,907,406 | 6,897,547 |
Cost of shares redeemed | (780,214,211) | (53,154,769) |
Net increase (decrease) in net assets resulting from share transactions | 4,502,773,294 | 1,528,603,889 |
Total increase (decrease) in net assets | 5,047,219,253 | 1,585,349,600 |
| | |
Net Assets | | |
Beginning of period | 1,585,349,600 | - |
End of period (including undistributed net investment income of $13,788,564 and undistributed net investment income of $3,716,155, respectively) | $ 6,632,568,853 | $ 1,585,349,600 |
Other Information Shares | | |
Sold | 407,011,827 | 132,007,180 |
Issued in reinvestment of distributions | 8,197,375 | 573,839 |
Redeemed | (59,907,306) | (4,423,783) |
Net increase (decrease) | 355,301,896 | 128,157,236 |
Financial Highlights
Years ended March 31, | 2011 | 2010 E |
Selected Per-Share Data | | |
Net asset value, beginning of period | $ 12.37 | $ 10.00 |
Income from Investment Operations | | |
Net investment income (loss) C | .24 | .18 |
Net realized and unrealized gain (loss) | 1.42 | 2.30 |
Total from investment operations | 1.66 | 2.48 |
Distributions from net investment income | (.18) | (.06) |
Distributions from net realized gain | (.13) | (.05) |
Total distributions | (.31) | (.11) |
Net asset value, end of period | $ 13.72 | $ 12.37 |
Total Return B | 13.62% | 24.78% |
Ratios to Average Net Assets D, F | | |
Expenses before reductions | .05% | .05% A |
Expenses net of fee waivers, if any | .05% | .05% A |
Expenses net of all reductions | .05% | .05% A |
Net investment income (loss) | 1.89% | 2.01% A |
Supplemental Data | | |
Net assets, end of period (000 omitted) | $ 6,632,569 | $ 1,585,350 |
Portfolio turnover rate | 37% | 20% A |
A Annualized
B Total returns for periods of less than one year are not annualized.
C Calculated based on average shares outstanding during the period.
D Amounts do not include the activity of the underlying funds.
E For the period July 2, 2009 (commencement of operations) to March 31, 2010.
F Expense ratios reflect operating expenses of the Fund. Expenses before reductions do not reflect amounts reimbursed by the investment adviser or reductions from expense offset arrangements and do not represent the amount paid by the Fund during periods when reimbursements or reductions occur. Expenses net of fee waivers reflect expenses after reimbursement by the investment adviser but prior to reductions from expense offset arrangements. Expenses net of all reductions represent the net expenses paid by the Fund but do not include expenses of the investment companies in which the Fund invests.
See accompanying notes which are an integral part of the financial statements.
Annual Report
Fidelity Freedom K® 2025 Fund
Investment Changes (Unaudited)
Fund Holdings as of March 31, 2011 |
| % of fund's
net assets | % of fund's net assets
6 months ago |
Commodity Funds | | |
Fidelity Series Commodity Strategy Fund Class F | 6.8 | 6.4 |
Domestic Equity Funds | | |
Fidelity Blue Chip Growth Fund Class F | 2.7 | 2.7 |
Fidelity Disciplined Equity Fund Class F | 7.7 | 8.0 |
Fidelity Growth Company Fund Class F | 6.9 | 7.0 |
Fidelity Series 100 Index Fund | 5.2 | 5.4 |
Fidelity Series All-Sector Equity Fund Class F | 9.4 | 8.9 |
Fidelity Series Large Cap Value Fund Class F | 8.8 | 8.6 |
Fidelity Series Small Cap Opportunities Fund Class F | 1.5 | 1.4 |
Fidelity Small Cap Growth Fund Class F | 0.9 | 0.9 |
Fidelity Small Cap Value Fund Class F | 0.9 | 0.9 |
Fidelity Equity-Income Fund Class F | 0.0 | 1.5 |
| 44.0 | 45.3 |
Developed International Equity Funds | | |
Fidelity Diversified International Fund Class F | 2.5 | 3.7 |
Fidelity Overseas Fund Class F | 2.5 | 3.7 |
Fidelity Series International Growth Fund Class F | 4.9 | 3.6 |
Fidelity Series International Small Cap Fund Class F | 0.9 | 0.7 |
Fidelity Series International Value Fund Class F | 4.8 | 3.5 |
Fidelity Europe Fund Class F | 0.0 | 0.7 |
Fidelity Japan Fund Class F | 0.0 | 0.3 |
| 15.6 | 16.2 |
Emerging Markets Equity Funds | | |
Fidelity Series Emerging Markets Fund Class F | 2.9 | 2.6 |
High Yield Bond Funds | | |
Fidelity Series Emerging Markets Debt Fund Class F | 0.1 | 0.0 |
Fidelity Series High Income Fund Class F | 7.1 | 0.0 |
Fidelity Capital & Income Fund Class F | 0.0 | 3.8 |
Fidelity High Income Fund Class F | 0.0 | 3.7 |
| 7.2 | 7.5 |
Inflation-Protected Bond Funds | | |
Fidelity Series Inflation-Protected Bond Index Fund Class F | 3.7 | 3.5 |
Investment Grade Bond Funds | | |
Fidelity Series Investment Grade Bond Fund Class F | 16.4 | 14.9 |
Fidelity Strategic Real Return Fund Class F | 3.3 | 3.6 |
| 19.7 | 18.5 |
Short-Term Funds | | |
Fidelity Institutional Money Market Portfolio Class F | 0.1 | 0.0* |
Fidelity Short-Term Bond Fund Class F | 0.0* | 0.0* |
| 0.1 | 0.0* |
Net Other Assets (Liabilities)* | 0.0 | 0.0 |
| 100.0 | 100.0 |
* Amount represents less than 0.1% |
Asset Allocation (% of fund's net assets) |
Current |
| Commodity Funds | 6.8% | |
| Domestic Equity Funds | 44.0% | |
| Developed International Equity Funds | 15.6% | |
| Emerging Markets Equity Funds | 2.9% | |
| High Yield Bond Funds | 7.2% | |
| Inflation-Protected Bond Funds | 3.7% | |
| Investment Grade Bond Funds | 19.7% | |
| Short-Term Funds | 0.1% | |

Six months ago |
| Commodity Funds | 6.4% | |
| Domestic Equity Funds | 45.3% | |
| Developed International Equity Funds | 16.2% | |
| Emerging Markets Equity Funds | 2.6% | |
| High Yield Bond Funds | 7.5% | |
| Inflation-Protected Bond Funds | 3.5% | |
| Investment Grade Bond Funds | 18.5% | |
| Short-Term Funds | 0.0%* | |

Expected |
| Commodity Funds | 7.6% | |
| Domestic Equity Funds | 42.8% | |
| Developed International Equity Funds | 15.6% | |
| Emerging Markets Equity Funds | 2.8% | |
| High Yield Bond Funds | 7.5% | |
| Inflation-Protected Bond Funds | 4.9% | |
| Investment Grade Bond Funds | 18.6% | |
| Short-Term Funds | 0.2% | |

The fund invests according to an asset allocation strategy that becomes increasingly conservative over time. The six months ago allocation is based on the fund's holdings as of September 30, 2010. The current allocation is based on the fund's holdings as of March 31, 2011. The expected allocation represents the fund's anticipated allocation at September 30, 2011. |
Annual Report
Fidelity Freedom K® 2025 Fund
Investments March 31, 2011
Showing Percentage of Net Assets
Domestic Equity Funds - 50.8% |
| Shares | | Value |
Commodity Funds - 6.8% |
Fidelity Series Commodity Strategy Fund Class F | 17,784,819 | | $ 234,937,460 |
Domestic Equity Funds - 44.0% |
Fidelity Blue Chip Growth Fund Class F | 1,969,623 | | 94,502,529 |
Fidelity Disciplined Equity Fund Class F | 11,068,153 | | 265,524,997 |
Fidelity Growth Company Fund Class F | 2,624,592 | | 236,213,238 |
Fidelity Series 100 Index Fund | 19,629,921 | | 180,595,271 |
Fidelity Series All-Sector Equity Fund Class F | 24,684,783 | | 323,864,352 |
Fidelity Series Large Cap Value Fund Class F | 24,977,069 | | 305,219,786 |
Fidelity Series Small Cap Opportunities Fund Class F | 4,406,556 | | 52,129,555 |
Fidelity Small Cap Growth Fund Class F | 1,824,074 | | 31,009,265 |
Fidelity Small Cap Value Fund Class F | 1,841,740 | | 30,480,795 |
TOTAL DOMESTIC EQUITY FUNDS | | 1,519,539,788 |
TOTAL DOMESTIC EQUITY FUNDS (Cost $1,533,575,849) | 1,754,477,248 |
International Equity Funds - 18.5% |
| | | |
Developed International Equity Funds - 15.6% |
Fidelity Diversified International Fund Class F | 2,735,354 | | 85,042,169 |
Fidelity Overseas Fund Class F | 2,551,515 | | 85,118,529 |
Fidelity Series International Growth Fund Class F | 14,706,812 | | 169,716,614 |
Fidelity Series International Small Cap Fund Class F | 2,670,464 | | 33,033,639 |
Fidelity Series International Value Fund Class F | 15,679,453 | | 164,791,048 |
TOTAL DEVELOPED INTERNATIONAL EQUITY FUNDS | | 537,701,999 |
Emerging Markets Equity Funds - 2.9% |
Fidelity Series Emerging Markets Fund Class F | 5,223,045 | | 100,282,470 |
TOTAL INTERNATIONAL EQUITY FUNDS (Cost $572,689,629) | 637,984,469 |
Bond Funds - 30.6% |
| Shares | | Value |
High Yield Bond Funds - 7.2% |
Fidelity Series Emerging Markets Debt Fund Class F | 352,880 | | $ 3,530,256 |
Fidelity Series High Income Fund Class F | 24,362,179 | | 244,109,031 |
TOTAL HIGH YIELD BOND FUNDS | | 247,639,287 |
Inflation-Protected Bond Funds - 3.7% |
Fidelity Series Inflation-Protected Bond Index Fund Class F | 11,963,106 | | 129,440,805 |
Investment Grade Bond Funds - 19.7% |
Fidelity Series Investment Grade Bond Fund Class F | 49,685,318 | | 565,915,775 |
Fidelity Strategic Real Return Fund Class F | 11,588,095 | | 114,838,022 |
TOTAL INVESTMENT GRADE BOND FUNDS | | 680,753,797 |
TOTAL BOND FUNDS (Cost $1,047,487,060) | 1,057,833,889 |
Short-Term Funds - 0.1% |
| | | |
Fidelity Institutional Money Market Portfolio Class F | 2,280,340 | | 2,280,340 |
Fidelity Short-Term Bond Fund
Class F | 202,446 | | 1,710,671 |
TOTAL SHORT-TERM FUNDS (Cost $3,994,371) | 3,991,011 |
TOTAL INVESTMENT PORTFOLIO - 100.0% (Cost $3,157,746,909) | | 3,454,286,617 |
NET OTHER ASSETS (LIABILITIES) - 0.0% | | (140,185) |
NET ASSETS - 100% | $ 3,454,146,432 |
Other Information |
All investments are categorized as Level 1 under the Fair Value Hierarchy. The inputs or methodology used for valuing securities may not be an indication of the risk associated with investing in those securities. For more information on valuation inputs, please refer to the Security Valuation section in the accompanying Notes to Financial Statements. |
See accompanying notes which are an integral part of the financial statements.
Annual Report
Fidelity Freedom K® 2025 Fund
Statement of Assets and Liabilities
| March 31, 2011 |
Assets | | |
Investment in securities, at value (cost $3,157,746,909) - See accompanying schedule | | $ 3,454,286,617 |
Receivable for fund shares sold | | 5,029,376 |
Total assets | | 3,459,315,993 |
| | |
Liabilities | | |
Payable for investments purchased | $ 2,756,155 | |
Payable for fund shares redeemed | 2,273,241 | |
Transfer agent fees payable | 140,165 | |
Total liabilities | | 5,169,561 |
| | |
Net Assets | | $ 3,454,146,432 |
Net Assets consist of: | | |
Paid in capital | | $ 3,098,645,294 |
Undistributed net investment income | | 6,594,635 |
Accumulated undistributed net realized gain (loss) on investments | | 52,366,795 |
Net unrealized appreciation (depreciation) on investments | | 296,539,708 |
Net Assets, for 246,852,352 shares outstanding | | $ 3,454,146,432 |
Net Asset Value, offering price and redemption price per share ($3,454,146,432 ÷ 246,852,352 shares) | | $ 13.99 |
Statement of Operations
| Year ended March 31, 2011 |
Investment Income | | |
Income distributions from underlying funds | | $ 40,170,717 |
| | |
Expenses | | |
Transfer agent fees | $ 1,072,463 | |
Independent trustees' compensation | 6,722 | |
Total expenses | | 1,079,185 |
Net investment income (loss) | | 39,091,532 |
Realized and Unrealized Gain (Loss) Realized gain (loss) on sale of underlying fund shares | 18,592,819 | |
Capital gain distributions from underlying funds | 53,560,334 | |
Total net realized gain (loss) | | 72,153,153 |
Change in net unrealized appreciation (depreciation) on underlying funds | | 265,539,042 |
Net gain (loss) | | 337,692,195 |
Net increase (decrease) in net assets resulting from operations | | $ 376,783,727 |
See accompanying notes which are an integral part of the financial statements.
Annual Report
Statement of Changes in Net Assets
| Year ended
March 31,
2011 | For the period
July 2, 2009
(commencement
of operations) to
March 31, 2010 |
Increase (Decrease) in Net Assets | | |
Operations | | |
Net investment income (loss) | $ 39,091,532 | $ 4,790,898 |
Net realized gain (loss) | 72,153,153 | 5,316,627 |
Change in net unrealized appreciation (depreciation) | 265,539,042 | 31,000,666 |
Net increase (decrease) in net assets resulting from operations | 376,783,727 | 41,108,191 |
Distributions to shareholders from net investment income | (34,402,821) | (2,884,974) |
Distributions to shareholders from net realized gain | (23,042,290) | (2,060,695) |
Total distributions | (57,445,111) | (4,945,669) |
Share transactions
Proceeds from sales of shares | 2,604,764,940 | 924,624,223 |
Reinvestment of distributions | 57,445,111 | 4,945,668 |
Cost of shares redeemed | (457,819,704) | (35,314,944) |
Net increase (decrease) in net assets resulting from share transactions | 2,204,390,347 | 894,254,947 |
Total increase (decrease) in net assets | 2,523,728,963 | 930,417,469 |
| | |
Net Assets | | |
Beginning of period | 930,417,469 | - |
End of period (including undistributed net investment income of $6,594,635 and undistributed net investment income of $1,905,924, respectively) | $ 3,454,146,432 | $ 930,417,469 |
Other Information Shares | | |
Sold | 202,487,978 | 76,929,257 |
Issued in reinvestment of distributions | 4,343,712 | 407,722 |
Redeemed | (34,400,118) | (2,916,199) |
Net increase (decrease) | 172,431,572 | 74,420,780 |
Financial Highlights
Years ended March 31, | 2011 | 2010 E |
Selected Per-Share Data | | |
Net asset value, beginning of period | $ 12.50 | $ 10.00 |
Income from Investment Operations | | |
Net investment income (loss) C | .25 | .18 |
Net realized and unrealized gain (loss) | 1.57 | 2.44 |
Total from investment operations | 1.82 | 2.62 |
Distributions from net investment income | (.19) | (.07) |
Distributions from net realized gain | (.14) | (.05) |
Total distributions | (.33) | (.12) |
Net asset value, end of period | $ 13.99 | $ 12.50 |
Total Return B | 14.72% | 26.24% |
Ratios to Average Net Assets D, F | | |
Expenses before reductions | .05% | .05% A |
Expenses net of fee waivers, if any | .05% | .05% A |
Expenses net of all reductions | .05% | .05% A |
Net investment income (loss) | 1.90% | 2.02% A |
Supplemental Data | | |
Net assets, end of period (000 omitted) | $ 3,454,146 | $ 930,417 |
Portfolio turnover rate | 38% | 19% A |
A Annualized
B Total returns for periods of less than one year are not annualized.
C Calculated based on average shares outstanding during the period.
D Amounts do not include the activity of the underlying funds.
E For the period July 2, 2009 (commencement of operations) to March 31, 2010.
F Expense ratios reflect operating expenses of the Fund. Expenses before reductions do not reflect amounts reimbursed by the investment adviser or reductions from expense offset arrangements and do not represent the amount paid by the Fund during periods when reimbursements or reductions occur. Expenses net of fee waivers reflect expenses after reimbursement by the investment adviser but prior to reductions from expense offset arrangements. Expenses net of all reductions represent the net expenses paid by the Fund but do not include expenses of the investment companies in which the Fund invests.
See accompanying notes which are an integral part of the financial statements.
Annual Report
Fidelity Freedom K® 2030 Fund
Investment Changes (Unaudited)
Fund Holdings as of March 31, 2011 |
| % of fund's
net assets | % of fund's net assets
6 months ago |
Commodity Funds | | |
Fidelity Series Commodity Strategy Fund Class F | 7.4 | 6.7 |
Domestic Equity Funds | | |
Fidelity Blue Chip Growth Fund Class F | 2.9 | 2.9 |
Fidelity Disciplined Equity Fund Class F | 8.2 | 8.5 |
Fidelity Growth Company Fund Class F | 7.3 | 7.4 |
Fidelity Series 100 Index Fund | 5.5 | 5.7 |
Fidelity Series All-Sector Equity Fund Class F | 9.9 | 9.6 |
Fidelity Series Large Cap Value Fund Class F | 9.4 | 9.1 |
Fidelity Series Small Cap Opportunities Fund Class F | 1.6 | 1.5 |
Fidelity Small Cap Growth Fund Class F | 0.9 | 1.0 |
Fidelity Small Cap Value Fund Class F | 0.9 | 1.0 |
Fidelity Equity-Income Fund Class F | 0.0 | 1.5 |
| 46.6 | 48.2 |
Developed International Equity Funds | | |
Fidelity Diversified International Fund Class F | 2.6 | 4.0 |
Fidelity Overseas Fund Class F | 2.6 | 4.0 |
Fidelity Series International Growth Fund Class F | 5.2 | 4.0 |
Fidelity Series International Small Cap Fund Class F | 1.0 | 0.7 |
Fidelity Series International Value Fund Class F | 5.1 | 3.9 |
Fidelity Europe Fund Class F | 0.0 | 0.9 |
Fidelity Japan Fund Class F | 0.0 | 0.4 |
| 16.5 | 17.9 |
Emerging Markets Equity Funds | | |
Fidelity Series Emerging Markets Fund Class F | 3.1 | 2.8 |
High Yield Bond Funds | | |
Fidelity Series Emerging Markets Debt Fund Class F | 0.1 | 0.0 |
Fidelity Series High Income Fund Class F | 7.2 | 0.0 |
Fidelity Capital & Income Fund Class F | 0.0 | 3.8 |
Fidelity High Income Fund Class F | 0.0 | 3.7 |
| 7.3 | 7.5 |
Inflation-Protected Bond Funds | | |
Fidelity Series Inflation-Protected Bond Index Fund Class F | 0.4 | 0.7 |
Investment Grade Bond Funds | | |
Fidelity Series Investment Grade Bond Fund Class F | 15.5 | 13.0 |
Fidelity Strategic Real Return Fund Class F | 3.2 | 3.2 |
| 18.7 | 16.2 |
Net Other Assets (Liabilities)* | 0.0 | 0.0 |
| 100.0 | 100.0 |
* Amount represents less than 0.1% |
Asset Allocation (% of fund's net assets) |
Current |
| Commodity Funds | 7.4% | |
| Domestic Equity Funds | 46.6% | |
| Developed International Equity Funds | 16.5% | |
| Emerging Markets Equity Funds | 3.1% | |
| High Yield Bond Funds | 7.3% | |
| Inflation-Protected Bond Funds | 0.4% | |
| Investment Grade Bond Funds | 18.7% | |

Six months ago |
| Commodity Funds | 6.7% | |
| Domestic Equity Funds | 48.2% | |
| Developed International Equity Funds | 17.9% | |
| Emerging Markets Equity Funds | 2.8% | |
| High Yield Bond Funds | 7.5% | |
| Inflation-Protected Bond Funds | 0.7% | |
| Investment Grade Bond Funds | 16.2% | |

Expected |
| Commodity Funds | 7.9% | |
| Domestic Equity Funds | 45.0% | |
| Developed International Equity Funds | 16.4% | |
| Emerging Markets Equity Funds | 2.9% | |
| High Yield Bond Funds | 7.5% | |
| Inflation-Protected Bond Funds | 1.7% | |
| Investment Grade Bond Funds | 18.6% | |

The fund invests according to an asset allocation strategy that becomes increasingly conservative over time. The six months ago allocation is based on the fund's holdings as of September 30, 2010. The current allocation is based on the fund's holdings as of March 31, 2011. The expected allocation represents the fund's anticipated allocation at September 30, 2011. |
Annual Report
Fidelity Freedom K® 2030 Fund
Investments March 31, 2011
Showing Percentage of Net Assets
Domestic Equity Funds - 54.0% |
| Shares | | Value |
Commodity Funds - 7.4% |
Fidelity Series Commodity Strategy Fund Class F | 27,277,273 | | $ 360,332,781 |
Domestic Equity Funds - 46.6% |
Fidelity Blue Chip Growth Fund Class F | 2,959,617 | | 142,002,402 |
Fidelity Disciplined Equity Fund Class F | 16,614,553 | | 398,583,137 |
Fidelity Growth Company Fund Class F | 3,941,642 | | 354,747,806 |
Fidelity Series 100 Index Fund | 29,498,884 | | 271,389,734 |
Fidelity Series All-Sector Equity Fund Class F | 37,082,187 | | 486,518,292 |
Fidelity Series Large Cap Value Fund Class F | 37,512,884 | | 458,407,442 |
Fidelity Series Small Cap Opportunities Fund Class F | 6,616,330 | | 78,271,183 |
Fidelity Small Cap Growth Fund Class F | 2,730,685 | | 46,421,645 |
Fidelity Small Cap Value Fund Class F | 2,755,913 | | 45,610,359 |
TOTAL DOMESTIC EQUITY FUNDS | | 2,281,952,000 |
TOTAL DOMESTIC EQUITY FUNDS (Cost $2,317,159,761) | 2,642,284,781 |
International Equity Funds - 19.6% |
| | | |
Developed International Equity Funds - 16.5% |
Fidelity Diversified International Fund Class F | 4,121,592 | | 128,140,301 |
Fidelity Overseas Fund Class F | 3,844,703 | | 128,259,299 |
Fidelity Series International Growth Fund Class F | 22,099,928 | | 255,033,172 |
Fidelity Series International Small Cap Fund Class F | 4,013,071 | | 49,641,688 |
Fidelity Series International Value Fund Class F | 23,560,247 | | 247,618,198 |
TOTAL DEVELOPED INTERNATIONAL EQUITY FUNDS | | 808,692,658 |
|
| Shares | | Value |
Emerging Markets Equity Funds - 3.1% |
Fidelity Series Emerging Markets Fund Class F | 7,848,680 | | $ 150,694,655 |
TOTAL INTERNATIONAL EQUITY FUNDS (Cost $861,543,162) | 959,387,313 |
Bond Funds - 26.4% |
| | | |
High Yield Bond Funds - 7.3% |
Fidelity Series Emerging Markets Debt Fund Class F | 504,008 | | 5,042,152 |
Fidelity Series High Income Fund Class F | 34,797,059 | | 348,666,530 |
TOTAL HIGH YIELD BOND FUNDS | | 353,708,682 |
Inflation-Protected Bond Funds - 0.4% |
Fidelity Series Inflation-Protected Bond Index Fund Class F | 1,778,746 | | 19,246,033 |
Investment Grade Bond Funds - 18.7% |
Fidelity Series Investment Grade Bond Fund Class F | 66,695,698 | | 759,664,003 |
Fidelity Strategic Real Return Fund Class F | 15,773,275 | | 156,313,152 |
TOTAL INVESTMENT GRADE BOND FUNDS | | 915,977,155 |
TOTAL BOND FUNDS (Cost $1,280,842,039) | 1,288,931,870 |
TOTAL INVESTMENT PORTFOLIO - 100.0% (Cost $4,459,544,962) | | 4,890,603,964 |
NET OTHER ASSETS (LIABILITIES) - 0.0% | | (198,794) |
NET ASSETS - 100% | $ 4,890,405,170 |
Other Information |
All investments are categorized as Level 1 under the Fair Value Hierarchy. The inputs or methodology used for valuing securities may not be an indication of the risk associated with investing in those securities. For more information on valuation inputs, please refer to the Security Valuation section in the accompanying Notes to Financial Statements. |
See accompanying notes which are an integral part of the financial statements.
Annual Report
Fidelity Freedom K® 2030 Fund
Statement of Assets and Liabilities
| March 31, 2011 |
Assets | | |
Investment in securities, at value (cost $4,459,544,962) - See accompanying schedule | | $ 4,890,603,964 |
Receivable for fund shares sold | | 6,856,599 |
Total assets | | 4,897,460,563 |
| | |
Liabilities | | |
Payable for investments purchased | $ 5,058,220 | |
Payable for fund shares redeemed | 1,798,398 | |
Transfer agent fees payable | 198,775 | |
Total liabilities | | 7,055,393 |
| | |
Net Assets | | $ 4,890,405,170 |
Net Assets consist of: | | |
Paid in capital | | $ 4,374,675,253 |
Undistributed net investment income | | 8,883,471 |
Accumulated undistributed net realized gain (loss) on investments | | 75,787,444 |
Net unrealized appreciation (depreciation) on investments | | 431,059,002 |
Net Assets, for 343,796,115 shares outstanding | | $ 4,890,405,170 |
Net Asset Value, offering price and redemption price per share ($4,890,405,170 ÷ 343,796,115 shares) | | $ 14.22 |
Statement of Operations
| Year ended March 31, 2011 |
Investment Income | | |
Income distributions from underlying funds | | $ 55,690,028 |
| | |
Expenses | | |
Transfer agent fees | $ 1,500,902 | |
Independent trustees' compensation | 9,384 | |
Total expenses | | 1,510,286 |
Net investment income (loss) | | 54,179,742 |
Realized and Unrealized Gain (Loss) Realized gain (loss) on sale of underlying fund shares | 24,869,392 | |
Capital gain distributions from underlying funds | 77,288,648 | |
Total net realized gain (loss) | | 102,158,040 |
Change in net unrealized appreciation (depreciation) on underlying funds | | 383,358,240 |
Net gain (loss) | | 485,516,280 |
Net increase (decrease) in net assets resulting from operations | | $ 539,696,022 |
See accompanying notes which are an integral part of the financial statements.
Annual Report
Fidelity Freedom K® 2030 Fund
Financial Statements - continued
Statement of Changes in Net Assets
| Year ended
March 31,
2011 | For the period
July 2, 2009
(commencement
of operations) to
March 31, 2010 |
Increase (Decrease) in Net Assets | | |
Operations | | |
Net investment income (loss) | $ 54,179,742 | $ 6,361,295 |
Net realized gain (loss) | 102,158,040 | 8,047,518 |
Change in net unrealized appreciation (depreciation) | 383,358,240 | 47,700,762 |
Net increase (decrease) in net assets resulting from operations | 539,696,022 | 62,109,575 |
Distributions to shareholders from net investment income | (47,456,102) | (4,201,464) |
Distributions to shareholders from net realized gain | (31,417,069) | (3,001,045) |
Total distributions | (78,873,171) | (7,202,509) |
Share transactions
Proceeds from sales of shares | 3,635,287,928 | 1,268,664,895 |
Reinvestment of distributions | 78,873,171 | 7,202,508 |
Cost of shares redeemed | (565,489,153) | (49,864,096) |
Net increase (decrease) in net assets resulting from share transactions | 3,148,671,946 | 1,226,003,307 |
Total increase (decrease) in net assets | 3,609,494,797 | 1,280,910,373 |
| | |
Net Assets | | |
Beginning of period | 1,280,910,373 | - |
End of period (including undistributed net investment income of $8,883,471 and undistributed net investment income of $2,159,831, respectively) | $ 4,890,405,170 | $ 1,280,910,373 |
Other Information Shares | | |
Sold | 278,967,300 | 104,547,125 |
Issued in reinvestment of distributions | 5,875,382 | 586,523 |
Redeemed | (42,112,445) | (4,067,770) |
Net increase (decrease) | 242,730,237 | 101,065,878 |
Financial Highlights
Years ended March 31, | 2011 | 2010 E |
Selected Per-Share Data | | |
Net asset value, beginning of period | $ 12.67 | $ 10.00 |
Income from Investment Operations | | |
Net investment income (loss) C | .25 | .17 |
Net realized and unrealized gain (loss) | 1.62 | 2.62 |
Total from investment operations | 1.87 | 2.79 |
Distributions from net investment income | (.18) | (.07) |
Distributions from net realized gain | (.14) | (.05) |
Total distributions | (.32) | (.12) |
Net asset value, end of period | $ 14.22 | $ 12.67 |
Total Return B | 14.95% | 27.94% |
Ratios to Average Net Assets D, F | | |
Expenses before reductions | .05% | .05% A |
Expenses net of fee waivers, if any | .05% | .05% A |
Expenses net of all reductions | .05% | .05% A |
Net investment income (loss) | 1.88% | 1.93% A |
Supplemental Data | | |
Net assets, end of period (000 omitted) | $ 4,890,405 | $ 1,280,910 |
Portfolio turnover rate | 37% | 23% A |
A Annualized
B Total returns for periods of less than one year are not annualized.
C Calculated based on average shares outstanding during the period.
D Amounts do not include the activity of the underlying funds.
E For the period July 2, 2009 (commencement of operations) to March 31, 2010.
F Expense ratios reflect operating expenses of the Fund. Expenses before reductions do not reflect amounts reimbursed by the investment adviser or reductions from expense offset arrangements and do not represent the amount paid by the Fund during periods when reimbursements or reductions occur. Expenses net of fee waivers reflect expenses after reimbursement by the investment adviser but prior to reductions from expense offset arrangements. Expenses net of all reductions represent the net expenses paid by the Fund but do not include expenses of the investment companies in which the Fund invests.
See accompanying notes which are an integral part of the financial statements.
Annual Report
Fidelity Freedom K® 2035 Fund
Investment Changes (Unaudited)
Fund Holdings as of March 31, 2011 |
| % of fund's
net assets | % of fund's net assets
6 months ago |
Commodity Funds | | |
Fidelity Series Commodity Strategy Fund Class F | 8.7 | 7.6 |
Domestic Equity Funds | | |
Fidelity Blue Chip Growth Fund Class F | 3.2 | 3.2 |
Fidelity Disciplined Equity Fund Class F | 9.1 | 9.4 |
Fidelity Growth Company Fund Class F | 8.1 | 8.2 |
Fidelity Series 100 Index Fund | 6.2 | 6.4 |
Fidelity Series All-Sector Equity Fund Class F | 11.1 | 10.5 |
Fidelity Series Large Cap Value Fund Class F | 10.5 | 10.1 |
Fidelity Series Small Cap Opportunities Fund Class F | 1.8 | 1.7 |
Fidelity Small Cap Growth Fund Class F | 1.1 | 1.0 |
Fidelity Small Cap Value Fund Class F | 1.1 | 1.1 |
Fidelity Equity-Income Fund Class F | 0.0 | 1.8 |
| 52.2 | 53.4 |
Developed International Equity Funds | | |
Fidelity Diversified International Fund Class F | 2.9 | 4.3 |
Fidelity Overseas Fund Class F | 2.9 | 4.3 |
Fidelity Series International Growth Fund Class F | 5.9 | 4.2 |
Fidelity Series International Small Cap Fund Class F | 1.1 | 0.8 |
Fidelity Series International Value Fund Class F | 5.7 | 4.1 |
Fidelity Europe Fund Class F | 0.0 | 0.9 |
Fidelity Japan Fund Class F | 0.0 | 0.3 |
| 18.5 | 18.9 |
Emerging Markets Equity Funds | | |
Fidelity Series Emerging Markets Fund Class F | 3.5 | 3.0 |
High Yield Bond Funds | | |
Fidelity Series Emerging Markets Debt Fund Class F | 0.1 | 0.0 |
Fidelity Series High Income Fund Class F | 7.0 | 0.0 |
Fidelity Capital & Income Fund Class F | 0.0 | 3.8 |
Fidelity High Income Fund Class F | 0.0 | 3.7 |
| 7.1 | 7.5 |
Investment Grade Bond Funds | | |
Fidelity Series Investment Grade Bond Fund Class F | 8.2 | 7.8 |
Fidelity Strategic Real Return Fund Class F | 1.8 | 1.8 |
| 10.0 | 9.6 |
Net Other Assets (Liabilities)* | 0.0 | 0.0 |
| 100.0 | 100.0 |
* Amount represents less than 0.1% |
Asset Allocation (% of fund's net assets) |
Current |
| Commodity Funds | 8.7% | |
| Domestic Equity Funds | 52.2% | |
| Developed International Equity Funds | 18.5% | |
| Emerging Markets Equity Funds | 3.5% | |
| High Yield Bond Funds | 7.1% | |
| Investment Grade Bond Funds | 10.0% | |

Six months ago |
| Commodity Funds | 7.6% | |
| Domestic Equity Funds | 53.4% | |
| Developed International Equity Funds | 18.9% | |
| Emerging Markets Equity Funds | 3.0% | |
| High Yield Bond Funds | 7.5% | |
| Investment Grade Bond Funds | 9.6% | |

Expected |
| Commodity Funds | 9.0% | |
| Domestic Equity Funds | 51.3% | |
| Developed International Equity Funds | 18.7% | |
| Emerging Markets Equity Funds | 3.3% | |
| High Yield Bond Funds | 7.5% | |
| Investment Grade Bond Funds | 10.2% | |

The fund invests according to an asset allocation strategy that becomes increasingly conservative over time. The six months ago allocation is based on the fund's holdings as of September 30, 2010. The current allocation is based on the fund's holdings as of March 31, 2011. The expected allocation represents the fund's anticipated allocation at September 30, 2011. |
Annual Report
Fidelity Freedom K® 2035 Fund
Investments March 31, 2011
Showing Percentage of Net Assets
Domestic Equity Funds - 60.9% |
| Shares | | Value |
Commodity Funds - 8.7% |
Fidelity Series Commodity Strategy Fund Class F | 15,272,150 | | $ 201,745,097 |
Domestic Equity Funds - 52.2% |
Fidelity Blue Chip Growth Fund Class F | 1,568,785 | | 75,270,312 |
Fidelity Disciplined Equity Fund Class F | 8,825,032 | | 211,712,521 |
Fidelity Growth Company Fund Class F | 2,092,263 | | 188,303,649 |
Fidelity Series 100 Index Fund | 15,664,081 | | 144,109,543 |
Fidelity Series All-Sector Equity Fund Class F | 19,687,644 | | 258,301,881 |
Fidelity Series Large Cap Value Fund Class F | 19,908,763 | | 243,285,088 |
Fidelity Series Small Cap Opportunities Fund Class F | 3,519,736 | | 41,638,479 |
Fidelity Small Cap Growth Fund Class F | 1,449,818 | | 24,646,904 |
Fidelity Small Cap Value Fund Class F | 1,463,421 | | 24,219,622 |
TOTAL DOMESTIC EQUITY FUNDS | | 1,211,487,999 |
TOTAL DOMESTIC EQUITY FUNDS (Cost $1,240,429,206) | 1,413,233,096 |
International Equity Funds - 22.0% |
| | | |
Developed International Equity Funds - 18.5% |
Fidelity Diversified International Fund Class F | 2,187,405 | | 68,006,429 |
Fidelity Overseas Fund Class F | 2,040,417 | | 68,068,321 |
Fidelity Series International Growth Fund Class F | 11,773,514 | | 135,866,353 |
Fidelity Series International Small Cap Fund Class F | 2,137,820 | | 26,444,838 |
Fidelity Series International Value Fund Class F | 12,552,353 | | 131,925,229 |
TOTAL DEVELOPED INTERNATIONAL EQUITY FUNDS | | 430,311,170 |
|
| Shares | | Value |
Emerging Markets Equity Funds - 3.5% |
Fidelity Series Emerging Markets Fund Class F | 4,181,121 | | $ 80,277,522 |
TOTAL INTERNATIONAL EQUITY FUNDS (Cost $460,297,353) | 510,588,692 |
Bond Funds - 17.1% |
| | | |
High Yield Bond Funds - 7.1% |
Fidelity Series Emerging Markets Debt Fund Class F | 236,332 | | 2,364,332 |
Fidelity Series High Income Fund Class F | 16,269,736 | | 163,022,760 |
TOTAL HIGH YIELD BOND FUNDS | | 165,387,092 |
Investment Grade Bond Funds - 10.0% |
Fidelity Series Investment Grade Bond Fund Class F | 16,757,802 | | 190,871,363 |
Fidelity Strategic Real Return Fund Class F | 4,229,777 | | 41,917,095 |
TOTAL INVESTMENT GRADE BOND FUNDS | | 232,788,458 |
TOTAL BOND FUNDS (Cost $395,917,889) | 398,175,550 |
TOTAL INVESTMENT PORTFOLIO - 100.0% (Cost $2,096,644,448) | | 2,321,997,338 |
NET OTHER ASSETS (LIABILITIES) - 0.0% | | (94,167) |
NET ASSETS - 100% | $ 2,321,903,171 |
Other Information |
All investments are categorized as Level 1 under the Fair Value Hierarchy. The inputs or methodology used for valuing securities may not be an indication of the risk associated with investing in those securities. For more information on valuation inputs, please refer to the Security Valuation section in the accompanying Notes to Financial Statements. |
See accompanying notes which are an integral part of the financial statements.
Annual Report
Fidelity Freedom K® 2035 Fund
Statement of Assets and Liabilities
| March 31, 2011 |
Assets | | |
Investment in securities, at value (cost $2,096,644,448) - See accompanying schedule | | $ 2,321,997,338 |
Receivable for fund shares sold | | 4,356,927 |
Total assets | | 2,326,354,265 |
| | |
Liabilities | | |
Payable to custodian bank | $ 1 | |
Payable for investments purchased | 2,880,208 | |
Payable for fund shares redeemed | 1,476,738 | |
Transfer agent fees payable | 94,147 | |
Total liabilities | | 4,451,094 |
| | |
Net Assets | | $ 2,321,903,171 |
Net Assets consist of: | | |
Paid in capital | | $ 2,054,953,518 |
Undistributed net investment income | | 3,176,144 |
Accumulated undistributed net realized gain (loss) on investments | | 38,420,619 |
Net unrealized appreciation (depreciation) on investments | | 225,352,890 |
Net Assets, for 160,564,417 shares outstanding | | $ 2,321,903,171 |
Net Asset Value, offering price and redemption price per share ($2,321,903,171 ÷ 160,564,417 shares) | | $ 14.46 |
Statement of Operations
| Year ended March 31, 2011 |
Investment Income | | |
Income distributions from underlying funds | | $ 24,715,626 |
| | |
Expenses | | |
Transfer agent fees | $ 715,647 | |
Independent trustees' compensation | 4,464 | |
Total expenses | | 720,111 |
Net investment income (loss) | | 23,995,515 |
Realized and Unrealized Gain (Loss) Realized gain (loss) on sale of underlying fund shares | 11,896,273 | |
Capital gain distributions from underlying funds | 37,773,406 | |
Total net realized gain (loss) | | 49,669,679 |
Change in net unrealized appreciation (depreciation) on underlying funds | | 200,927,540 |
Net gain (loss) | | 250,597,219 |
Net increase (decrease) in net assets resulting from operations | | $ 274,592,734 |
See accompanying notes which are an integral part of the financial statements.
Annual Report
Statement of Changes in Net Assets
| Year ended
March 31,
2011 | For the period
July 2, 2009
(commencement
of operations) to
March 31, 2010 |
Increase (Decrease) in Net Assets | | |
Operations | | |
Net investment income (loss) | $ 23,995,515 | $ 2,789,678 |
Net realized gain (loss) | 49,669,679 | 3,718,641 |
Change in net unrealized appreciation (depreciation) | 200,927,540 | 24,425,350 |
Net increase (decrease) in net assets resulting from operations | 274,592,734 | 30,933,669 |
Distributions to shareholders from net investment income | (21,882,051) | (1,726,998) |
Distributions to shareholders from net realized gain | (13,528,536) | (1,439,165) |
Total distributions | (35,410,587) | (3,166,163) |
Share transactions
Proceeds from sales of shares | 1,728,304,359 | 625,206,915 |
Reinvestment of distributions | 35,410,587 | 3,166,162 |
Cost of shares redeemed | (313,046,023) | (24,088,482) |
Net increase (decrease) in net assets resulting from share transactions | 1,450,668,923 | 604,284,595 |
Total increase (decrease) in net assets | 1,689,851,070 | 632,052,101 |
| | |
Net Assets | | |
Beginning of period | 632,052,101 | - |
End of period (including undistributed net investment income of $3,176,144 and undistributed net investment income of $1,062,680, respectively) | $ 2,321,903,171 | $ 632,052,101 |
Other Information Shares | | |
Sold | 131,473,248 | 51,160,662 |
Issued in reinvestment of distributions | 2,608,012 | 255,748 |
Redeemed | (22,974,454) | (1,958,799) |
Net increase (decrease) | 111,106,806 | 49,457,611 |
Financial Highlights
Years ended March 31, | 2011 | 2010 E |
Selected Per-Share Data | | |
Net asset value, beginning of period | $ 12.78 | $ 10.00 |
Income from Investment Operations | | |
Net investment income (loss) C | .23 | .15 |
Net realized and unrealized gain (loss) | 1.76 | 2.74 |
Total from investment operations | 1.99 | 2.89 |
Distributions from net investment income | (.18) | (.06) |
Distributions from net realized gain | (.13) | (.05) |
Total distributions | (.31) | (.11) |
Net asset value, end of period | $ 14.46 | $ 12.78 |
Total Return B | 15.76% | 28.94% |
Ratios to Average Net Assets D, F | | |
Expenses before reductions | .05% | .05% A |
Expenses net of fee waivers, if any | .05% | .05% A |
Expenses net of all reductions | .05% | .05% A |
Net investment income (loss) | 1.75% | 1.72% A |
Supplemental Data | | |
Net assets, end of period (000 omitted) | $ 2,321,903 | $ 632,052 |
Portfolio turnover rate | 37% | 19% A |
A Annualized
B Total returns for periods of less than one year are not annualized.
C Calculated based on average shares outstanding during the period.
D Amounts do not include the activity of the underlying funds.
E For the period July 2, 2009 (commencement of operations) to March 31, 2010.
F Expense ratios reflect operating expenses of the Fund. Expenses before reductions do not reflect amounts reimbursed by the investment adviser or reductions from expense offset arrangements and do not represent the amount paid by the Fund during periods when reimbursements or reductions occur. Expenses net of fee waivers reflect expenses after reimbursement by the investment adviser but prior to reductions from expense offset arrangements. Expenses net of all reductions represent the net expenses paid by the Fund but do not include expenses of the investment companies in which the Fund invests.
See accompanying notes which are an integral part of the financial statements.
Annual Report
Fidelity Freedom K® 2040 Fund
Investment Changes (Unaudited)
Fund Holdings as of March 31, 2011 |
| % of fund's
net assets | % of fund's net assets
6 months ago |
Commodity Funds | | |
Fidelity Series Commodity Strategy Fund Class F | 8.8 | 7.7 |
Domestic Equity Funds | | |
Fidelity Blue Chip Growth Fund Class F | 3.3 | 3.3 |
Fidelity Disciplined Equity Fund Class F | 9.2 | 9.5 |
Fidelity Growth Company Fund Class F | 8.2 | 8.3 |
Fidelity Series 100 Index Fund | 6.3 | 6.4 |
Fidelity Series All-Sector Equity Fund Class F | 11.2 | 10.6 |
Fidelity Series Large Cap Value Fund
Class F | 10.6 | 10.2 |
Fidelity Series Small Cap Opportunities Fund Class F | 1.8 | 1.7 |
Fidelity Small Cap Growth Fund Class F | 1.1 | 1.1 |
Fidelity Small Cap Value Fund Class F | 1.1 | 1.1 |
Fidelity Equity-Income Fund Class F | 0.0 | 1.8 |
| 52.8 | 54.0 |
Developed International Equity Funds | | |
Fidelity Diversified International Fund Class F | 3.0 | 4.4 |
Fidelity Overseas Fund Class F | 3.0 | 4.4 |
Fidelity Series International Growth Fund Class F | 5.9 | 4.2 |
Fidelity Series International Small Cap Fund Class F | 1.1 | 0.8 |
Fidelity Series International Value Fund
Class F | 5.7 | 4.2 |
Fidelity Europe Fund Class F | 0.0 | 0.9 |
Fidelity Japan Fund Class F | 0.0 | 0.3 |
| 18.7 | 19.2 |
Emerging Markets Equity Funds | | |
Fidelity Series Emerging Markets Fund
Class F | 3.5 | 3.0 |
High Yield Bond Funds | | |
Fidelity Series Emerging Markets Debt Fund Class F | 0.1 | 0.0 |
Fidelity Series High Income Fund Class F | 7.9 | 0.0 |
Fidelity Capital & Income Fund Class F | 0.0 | 4.3 |
Fidelity High Income Fund Class F | 0.0 | 4.3 |
| 8.0 | 8.6 |
Investment Grade Bond Funds | | |
Fidelity Series Investment Grade Bond Fund Class F | 6.7 | 6.1 |
Fidelity Strategic Real Return Fund Class F | 1.5 | 1.4 |
| 8.2 | 7.5 |
Net Other Assets (Liabilities)* | 0.0 | 0.0 |
| 100.0 | 100.0 |
* Amount represents less than 0.1% |
Asset Allocation (% of fund's net assets) |
Current |
| Commodity Funds | 8.8% | |
| Domestic Equity Funds | 52.8% | |
| Developed International Equity Funds | 18.7% | |
| Emerging Markets Equity Funds | 3.5% | |
| High Yield Bond Funds | 8.0% | |
| Investment Grade Bond Funds | 8.2% | |

Six months ago |
| Commodity Funds | 7.7% | |
| Domestic Equity Funds | 54.0% | |
| Developed International Equity Funds | 19.2% | |
| Emerging Markets Equity Funds | 3.0% | |
| High Yield Bond Funds | 8.6% | |
| Investment Grade Bond Funds | 7.5% | |

Expected |
| Commodity Funds | 9.1% | |
| Domestic Equity Funds | 51.8% | |
| Developed International Equity Funds | 18.9% | |
| Emerging Markets Equity Funds | 3.3% | |
| High Yield Bond Funds | 8.0% | |
| Investment Grade Bond Funds | 8.9% | |

The fund invests according to an asset allocation strategy that becomes increasingly conservative over time. The six months ago allocation is based on the fund's holdings as of September 30, 2010. The current allocation is based on the fund's holdings as of March 31, 2011. The expected allocation represents the fund's anticipated allocation at September 30, 2011. |
Annual Report
Fidelity Freedom K® 2040 Fund
Investments March 31, 2011
Showing Percentage of Net Assets
Domestic Equity Funds - 61.6% |
| Shares | | Value |
Commodity Funds - 8.8% |
Fidelity Series Commodity Strategy Fund Class F | 19,293,637 | | $ 254,868,948 |
Domestic Equity Funds - 52.8% |
Fidelity Blue Chip Growth Fund Class F | 1,971,482 | | 94,591,689 |
Fidelity Disciplined Equity Fund Class F | 11,072,496 | | 265,629,175 |
Fidelity Growth Company Fund Class F | 2,624,572 | | 236,211,489 |
Fidelity Series 100 Index Fund | 19,644,756 | | 180,731,758 |
Fidelity Series All-Sector Equity Fund Class F | 24,696,249 | | 324,014,790 |
Fidelity Series Large Cap Value Fund Class F | 24,992,724 | | 305,411,083 |
Fidelity Series Small Cap Opportunities Fund Class F | 4,419,819 | | 52,286,464 |
Fidelity Small Cap Growth Fund Class F | 1,818,130 | | 30,908,205 |
Fidelity Small Cap Value Fund Class F | 1,835,106 | | 30,371,010 |
TOTAL DOMESTIC EQUITY FUNDS | | 1,520,155,663 |
TOTAL DOMESTIC EQUITY FUNDS (Cost $1,558,822,751) | 1,775,024,611 |
International Equity Funds - 22.2% |
| | | |
Developed International Equity Funds - 18.7% |
Fidelity Diversified International Fund Class F | 2,746,525 | | 85,389,455 |
Fidelity Overseas Fund Class F | 2,561,974 | | 85,467,468 |
Fidelity Series International Growth Fund Class F | 14,755,523 | | 170,278,736 |
Fidelity Series International Small Cap Fund Class F | 2,679,501 | | 33,145,431 |
Fidelity Series International Value Fund Class F | 15,731,515 | | 165,338,220 |
TOTAL DEVELOPED INTERNATIONAL EQUITY FUNDS | | 539,619,310 |
|
| Shares | | Value |
Emerging Markets Equity Funds - 3.5% |
Fidelity Series Emerging Markets Fund Class F | 5,240,054 | | $ 100,609,029 |
TOTAL INTERNATIONAL EQUITY FUNDS (Cost $576,765,161) | 640,228,339 |
Bond Funds - 16.2% |
| | | |
High Yield Bond Funds - 8.0% |
Fidelity Series Emerging Markets Debt Fund Class F | 330,455 | | 3,305,982 |
Fidelity Series High Income Fund Class F | 22,673,568 | | 227,189,151 |
TOTAL HIGH YIELD BOND FUNDS | | 230,495,133 |
Investment Grade Bond Funds - 8.2% |
Fidelity Series Investment Grade Bond Fund Class F | 16,890,327 | | 192,380,825 |
Fidelity Strategic Real Return Fund Class F | 4,421,507 | | 43,817,139 |
TOTAL INVESTMENT GRADE BOND FUNDS | | 236,197,964 |
TOTAL BOND FUNDS (Cost $464,504,569) | 466,693,097 |
TOTAL INVESTMENT PORTFOLIO - 100.0% (Cost $2,600,092,481) | | 2,881,946,047 |
NET OTHER ASSETS (LIABILITIES) - 0.0% | | (117,545) |
NET ASSETS - 100% | $ 2,881,828,502 |
Other Information |
All investments are categorized as Level 1 under the Fair Value Hierarchy. The inputs or methodology used for valuing securities may not be an indication of the risk associated with investing in those securities. For more information on valuation inputs, please refer to the Security Valuation section in the accompanying Notes to Financial Statements. |
See accompanying notes which are an integral part of the financial statements.
Annual Report
Fidelity Freedom K® 2040 Fund
Statement of Assets and Liabilities
| March 31, 2011 |
Assets | | |
Investment in securities, at value (cost $2,600,092,481) - See accompanying schedule | | $ 2,881,946,047 |
Receivable for fund shares sold | | 5,280,141 |
Total assets | | 2,887,226,188 |
| | |
Liabilities | | |
Payable for investments purchased | $ 3,499,774 | |
Payable for fund shares redeemed | 1,780,378 | |
Transfer agent fees payable | 117,534 | |
Total liabilities | | 5,397,686 |
| | |
Net Assets | | $ 2,881,828,502 |
Net Assets consist of: | | |
Paid in capital | | $ 2,546,423,686 |
Undistributed net investment income | | 3,978,804 |
Accumulated undistributed net realized gain (loss) on investments | | 49,572,446 |
Net unrealized appreciation (depreciation) on investments | | 281,853,566 |
Net Assets, for 198,018,923 shares outstanding | | $ 2,881,828,502 |
Net Asset Value, offering price and redemption price per share ($2,881,828,502 ÷ 198,018,923 shares) | | $ 14.55 |
Statement of Operations
| Year ended March 31, 2011 |
Investment Income | | |
Income distributions from underlying funds | | $ 31,278,842 |
| | |
Expenses | | |
Transfer agent fees | $ 888,080 | |
Independent trustees' compensation | 5,524 | |
Total expenses | | 893,604 |
Net investment income (loss) | | 30,385,238 |
Realized and Unrealized Gain (Loss) Realized gain (loss) on sale of underlying fund shares | 16,128,822 | |
Capital gain distributions from underlying funds | 46,930,634 | |
Total net realized gain (loss) | | 63,059,456 |
Change in net unrealized appreciation (depreciation) on underlying funds | | 252,233,574 |
Net gain (loss) | | 315,293,030 |
Net increase (decrease) in net assets resulting from operations | | $ 345,678,268 |
See accompanying notes which are an integral part of the financial statements.
Annual Report
Fidelity Freedom K® 2040 Fund
Financial Statements - continued
Statement of Changes in Net Assets
| Year ended
March 31,
2011 | For the period
July 2, 2009
(commencement of
operations) to March 31, 2010 |
Increase (Decrease) in Net Assets | | |
Operations | | |
Net investment income (loss) | $ 30,385,238 | $ 3,060,472 |
Net realized gain (loss) | 63,059,456 | 4,172,484 |
Change in net unrealized appreciation (depreciation) | 252,233,574 | 29,619,992 |
Net increase (decrease) in net assets resulting from operations | 345,678,268 | 36,852,948 |
Distributions to shareholders from net investment income | (27,511,689) | (1,955,217) |
Distributions to shareholders from net realized gain | (16,305,881) | (1,353,612) |
Total distributions | (43,817,570) | (3,308,829) |
Share transactions
Proceeds from sales of shares | 2,179,187,715 | 742,165,707 |
Reinvestment of distributions | 43,817,570 | 3,308,828 |
Cost of shares redeemed | (392,397,500) | (29,658,635) |
Net increase (decrease) in net assets resulting from share transactions | 1,830,607,785 | 715,815,900 |
Total increase (decrease) in net assets | 2,132,468,483 | 749,360,019 |
| | |
Net Assets | | |
Beginning of period | 749,360,019 | - |
End of period (including undistributed net investment income of $3,978,804 and undistributed net investment income of $1,105,255, respectively) | $ 2,881,828,502 | $ 749,360,019 |
Other Information Shares | | |
Sold | 165,241,338 | 60,467,063 |
Issued in reinvestment of distributions | 3,207,578 | 265,983 |
Redeemed | (28,765,359) | (2,397,680) |
Net increase (decrease) | 139,683,557 | 58,335,366 |
Financial Highlights
Years ended March 31, | 2011 | 2010 E |
Selected Per-Share Data | | |
Net asset value, beginning of period | $ 12.85 | $ 10.00 |
Income from Investment Operations | | |
Net investment income (loss) C | .24 | .15 |
Net realized and unrealized gain (loss) | 1.77 | 2.81 |
Total from investment operations | 2.01 | 2.96 |
Distributions from net investment income | (.18) | (.07) |
Distributions from net realized gain | (.13) | (.05) |
Total distributions | (.31) | (.11) G |
Net asset value, end of period | $ 14.55 | $ 12.85 |
Total Return B | 15.81% | 29.64% |
Ratios to Average Net Assets D, F | | |
Expenses before reductions | .05% | .05% A |
Expenses net of fee waivers, if any | .05% | .05% A |
Expenses net of all reductions | .05% | .05% A |
Net investment income (loss) | 1.79% | 1.70% A |
Supplemental Data | | |
Net assets, end of period (000 omitted) | $ 2,881,829 | $ 749,360 |
Portfolio turnover rate | 38% | 19% A |
A Annualized
B Total returns for periods of less than one year are not annualized.
C Calculated based on average shares outstanding during the period.
D Amounts do not include the activity of the underlying funds.
E For the period July 2, 2009 (commencement of operations) to March 31, 2010.
F Expense ratios reflect operating expenses of the Fund. Expenses before reductions do not reflect amounts reimbursed by the investment adviser or reductions from expense offset arrangements and do not represent the amount paid by the Fund during periods when reimbursements or reductions occur. Expenses net of fee waivers reflect expenses after reimbursement by the investment adviser but prior to reductions from expense offset arrangements. Expenses net of all reductions represent the net expenses paid by the Fund but do not include expenses of the investment companies in which the Fund invests.
G Total distributions of $.11 per share is comprised of distributions from net investment income of $.065 and distributions from net realized gain of $.045 per share.
See accompanying notes which are an integral part of the financial statements.
Annual Report
Fidelity Freedom K® 2045 Fund
Investment Changes (Unaudited)
Fund Holdings as of March 31, 2011 |
| % of fund's
net assets | % of fund's net assets
6 months ago |
Commodity Funds | | |
Fidelity Series Commodity Strategy Fund Class F | 9.2 | 7.9 |
Domestic Equity Funds | | |
Fidelity Blue Chip Growth Fund Class F | 3.3 | 3.3 |
Fidelity Disciplined Equity Fund Class F | 9.4 | 9.6 |
Fidelity Growth Company Fund Class F | 8.4 | 8.5 |
Fidelity Series 100 Index Fund | 6.4 | 6.5 |
Fidelity Series All-Sector Equity Fund
Class F | 11.5 | 10.8 |
Fidelity Series Large Cap Value Fund
Class F | 10.8 | 10.4 |
Fidelity Series Small Cap Opportunities Fund Class F | 1.8 | 1.7 |
Fidelity Small Cap Growth Fund Class F | 1.1 | 1.1 |
Fidelity Small Cap Value Fund Class F | 1.1 | 1.1 |
Fidelity Equity-Income Fund Class F | 0.0 | 1.8 |
| 53.8 | 54.8 |
Developed International Equity Funds | | |
Fidelity Diversified International Fund
Class F | 3.0 | 4.4 |
Fidelity Overseas Fund Class F | 3.0 | 4.4 |
Fidelity Series International Growth Fund Class F | 6.0 | 4.4 |
Fidelity Series International Small Cap Fund Class F | 1.2 | 0.8 |
Fidelity Series International Value Fund Class F | 5.9 | 4.3 |
Fidelity Europe Fund Class F | 0.0 | 0.8 |
Fidelity Japan Fund Class F | 0.0 | 0.3 |
| 19.1 | 19.4 |
Emerging Markets Equity Funds | | |
Fidelity Series Emerging Markets Fund Class F | 3.6 | 3.1 |
High Yield Bond Funds | | |
Fidelity Series Emerging Markets Debt Fund Class F | 0.2 | 0.0 |
Fidelity Series High Income Fund Class F | 9.2 | 0.0 |
Fidelity Capital & Income Fund Class F | 0.0 | 5.0 |
Fidelity High Income Fund Class F | 0.0 | 5.0 |
| 9.4 | 10.0 |
Investment Grade Bond Funds | | |
Fidelity Series Investment Grade Bond Fund Class F | 4.0 | 3.9 |
Fidelity Strategic Real Return Fund
Class F | 0.9 | 0.9 |
| 4.9 | 4.8 |
Net Other Assets (Liabilities)* | 0.0 | 0.0 |
| 100.0 | 100.0 |
* Amount represents less than 0.1% |
Asset Allocation (% of fund's net assets) |
Current |
| Commodity Funds | 9.2% | |
| Domestic Equity Funds | 53.8% | |
| Developed International Equity Funds | 19.1% | |
| Emerging Markets Equity Funds | 3.6% | |
| High Yield Bond Funds | 9.4% | |
| Investment Grade Bond Funds | 4.9% | |

Six months ago |
| Commodity Funds | 7.9% | |
| Domestic Equity Funds | 54.8% | |
| Developed International Equity Funds | 19.4% | |
| Emerging Markets Equity Funds | 3.1% | |
| High Yield Bond Funds | 10.0% | |
| Investment Grade Bond Funds | 4.8% | |

Expected |
| Commodity Funds | 9.4% | |
| Domestic Equity Funds | 52.9% | |
| Developed International Equity Funds | 19.3% | |
| Emerging Markets Equity Funds | 3.4% | |
| High Yield Bond Funds | 10.0% | |
| Investment Grade Bond Funds | 5.0% | |

The fund invests according to an asset allocation strategy that becomes increasingly conservative over time. The six months ago allocation is based on the fund's holdings as of September 30, 2010. The current allocation is based on the fund's holdings as of March 31, 2011. The expected allocation represents the fund's anticipated allocation at September 30, 2011. |
Annual Report
Fidelity Freedom K® 2045 Fund
Investments March 31, 2011
Showing Percentage of Net Assets
Domestic Equity Funds - 63.0% |
| Shares | | Value |
Commodity Funds - 9.2% |
Fidelity Series Commodity Strategy Fund Class F | 6,479,669 | | $ 85,596,429 |
Domestic Equity Funds - 53.8% |
Fidelity Blue Chip Growth Fund Class F | 646,655 | | 31,026,487 |
Fidelity Disciplined Equity Fund Class F | 3,630,723 | | 87,101,053 |
Fidelity Growth Company Fund Class F | 861,381 | | 77,524,267 |
Fidelity Series 100 Index Fund | 6,451,597 | | 59,354,695 |
Fidelity Series All-Sector Equity Fund Class F | 8,110,270 | | 106,406,747 |
Fidelity Series Large Cap Value Fund Class F | 8,201,674 | | 100,224,456 |
Fidelity Series Small Cap Opportunities Fund Class F | 1,447,497 | | 17,123,889 |
Fidelity Small Cap Growth Fund Class F | 596,273 | | 10,136,642 |
Fidelity Small Cap Value Fund Class F | 601,911 | | 9,961,628 |
TOTAL DOMESTIC EQUITY FUNDS | | 498,859,864 |
TOTAL DOMESTIC EQUITY FUNDS (Cost $520,507,362) | 584,456,293 |
International Equity Funds - 22.7% |
| | | |
Developed International Equity Funds - 19.1% |
Fidelity Diversified International Fund Class F | 899,778 | | 27,974,113 |
Fidelity Overseas Fund Class F | 839,322 | | 27,999,766 |
Fidelity Series International Growth Fund Class F | 4,858,896 | | 56,071,656 |
Fidelity Series International Small Cap Fund Class F | 882,199 | | 10,912,799 |
Fidelity Series International Value Fund Class F | 5,180,669 | | 54,448,827 |
TOTAL DEVELOPED INTERNATIONAL EQUITY FUNDS | | 177,407,161 |
|
| Shares | | Value |
Emerging Markets Equity Funds - 3.6% |
Fidelity Series Emerging Markets Fund Class F | 1,725,561 | | $ 33,130,777 |
TOTAL INTERNATIONAL EQUITY FUNDS (Cost $192,129,047) | 210,537,938 |
Bond Funds - 14.3% |
| | | |
High Yield Bond Funds - 9.4% |
Fidelity Series Emerging Markets Debt Fund Class F | 124,356 | | 1,244,119 |
Fidelity Series High Income Fund Class F | 8,536,212 | | 85,532,840 |
TOTAL HIGH YIELD BOND FUNDS | | 86,776,959 |
Investment Grade Bond Funds - 4.9% |
Fidelity Series Investment Grade Bond Fund Class F | 3,290,252 | | 37,475,974 |
Fidelity Strategic Real Return Fund
Class F | 828,272 | | 8,208,177 |
TOTAL INVESTMENT GRADE BOND FUNDS | | 45,684,151 |
TOTAL BOND FUNDS (Cost $132,119,671) | 132,461,110 |
TOTAL INVESTMENT PORTFOLIO - 100.0% (Cost $844,756,080) | | 927,455,341 |
NET OTHER ASSETS (LIABILITIES) - 0.0% | | (37,610) |
NET ASSETS - 100% | $ 927,417,731 |
Other Information |
All investments are categorized as Level 1 under the Fair Value Hierarchy. The inputs or methodology used for valuing securities may not be an indication of the risk associated with investing in those securities. For more information on valuation inputs, please refer to the Security Valuation section in the accompanying Notes to Financial Statements. |
See accompanying notes which are an integral part of the financial statements.
Annual Report
Fidelity Freedom K® 2045 Fund
Statement of Assets and Liabilities
| March 31, 2011 |
Assets | | |
Investment in securities, at value (cost $844,756,080) - See accompanying schedule | | $ 927,455,341 |
Receivable for fund shares sold | | 3,125,277 |
Total assets | | 930,580,618 |
| | |
Liabilities | | |
Payable for investments purchased | $ 2,629,965 | |
Payable for fund shares redeemed | 495,322 | |
Transfer agent fees payable | 37,600 | |
Total liabilities | | 3,162,887 |
| | |
Net Assets | | $ 927,417,731 |
Net Assets consist of: | | |
Paid in capital | | $ 828,226,410 |
Undistributed net investment income | | 1,223,232 |
Accumulated undistributed net realized gain (loss) on investments | | 15,268,828 |
Net unrealized appreciation (depreciation) on investments | | 82,699,261 |
Net Assets, for 63,178,045 shares outstanding | | $ 927,417,731 |
Net Asset Value, offering price and redemption price per share ($927,417,731 ÷ 63,178,045 shares) | | $ 14.68 |
Statement of Operations
| Year ended March 31, 2011 |
Investment Income | | |
Income distributions from underlying funds | | $ 9,175,713 |
| | |
Expenses | | |
Transfer agent fees | $ 256,126 | |
Independent trustees' compensation | 1,532 | |
Total expenses | | 257,658 |
Net investment income (loss) | | 8,918,055 |
Realized and Unrealized Gain (Loss) Realized gain (loss) on sale of underlying fund shares | 4,534,570 | |
Capital gain distributions from underlying funds | 14,152,115 | |
Total net realized gain (loss) | | 18,686,685 |
Change in net unrealized appreciation (depreciation) on underlying funds | | 75,539,859 |
Net gain (loss) | | 94,226,544 |
Net increase (decrease) in net assets resulting from operations | | $ 103,144,599 |
See accompanying notes which are an integral part of the financial statements.
Annual Report
Statement of Changes in Net Assets
| Year ended
March 31,
2011 | For the period
July 2, 2009
(commencement of
operations) to March 31, 2010 |
Increase (Decrease) in Net Assets | | |
Operations | | |
Net investment income (loss) | $ 8,918,055 | $ 640,871 |
Net realized gain (loss) | 18,686,685 | 861,178 |
Change in net unrealized appreciation (depreciation) | 75,539,859 | 7,159,402 |
Net increase (decrease) in net assets resulting from operations | 103,144,599 | 8,661,451 |
Distributions to shareholders from net investment income | (7,939,123) | (396,568) |
Distributions to shareholders from net realized gain | (4,026,676) | (252,361) |
Total distributions | (11,965,799) | (648,929) |
Share transactions
Proceeds from sales of shares | 753,455,411 | 175,251,337 |
Reinvestment of distributions | 11,965,799 | 648,928 |
Cost of shares redeemed | (105,174,571) | (7,920,495) |
Net increase (decrease) in net assets resulting from share transactions | 660,246,639 | 167,979,770 |
Total increase (decrease) in net assets | 751,425,439 | 175,992,292 |
| | |
Net Assets | | |
Beginning of period | 175,992,292 | - |
End of period (including undistributed net investment income of $1,223,232 and undistributed net investment income of $244,301, respectively) | $ 927,417,731 | $ 175,992,292 |
Other Information Shares | | |
Sold | 56,341,207 | 14,220,480 |
Issued in reinvestment of distributions | 868,421 | 51,956 |
Redeemed | (7,667,390) | (636,629) |
Net increase (decrease) | 49,542,238 | 13,635,807 |
Financial Highlights
Years ended March 31, | 2011 | 2010 E |
Selected Per-Share Data | | |
Net asset value, beginning of period | $ 12.91 | $ 10.00 |
Income from Investment Operations | | |
Net investment income (loss) C | .25 | .14 |
Net realized and unrealized gain (loss) | 1.81 | 2.86 |
Total from investment operations | 2.06 | 3.00 |
Distributions from net investment income | (.18) | (.06) |
Distributions from net realized gain | (.11) | (.04) |
Total distributions | (.29) | (.09) G |
Net asset value, end of period | $ 14.68 | $ 12.91 |
Total Return B | 16.12% | 30.03% |
Ratios to Average Net Assets D, F | | |
Expenses before reductions | .05% | .05% A |
Expenses net of fee waivers, if any | .05% | .05% A |
Expenses net of all reductions | .05% | .05% A |
Net investment income (loss) | 1.83% | 1.55% A |
Supplemental Data | | |
Net assets, end of period (000 omitted) | $ 927,418 | $ 175,992 |
Portfolio turnover rate | 39% | 20% A |
A Annualized
B Total returns for periods of less than one year are not annualized.
C Calculated based on average shares outstanding during the period.
D Amounts do not include the activity of the underlying funds.
E For the period July 2, 2009 (commencement of operations) to March 31, 2010.
F Expense ratios reflect operating expenses of the Fund. Expenses before reductions do not reflect amounts reimbursed by the investment adviser or reductions from expense offset arrangements and do not represent the amount paid by the Fund during periods when reimbursements or reductions occur. Expenses net of fee waivers reflect expenses after reimbursement by the investment adviser but prior to reductions from expense offset arrangements. Expenses net of all reductions represent the net expenses paid by the Fund but do not include expenses of the investment companies in which the Fund invests.
G Total distributions of $.09 per share is comprised of distributions from net investment income of $.055 and distributions from net realized gain of $.035 per share.
See accompanying notes which are an integral part of the financial statements.
Annual Report
Fidelity Freedom K® 2050 Fund
Investment Changes (Unaudited)
Fund Holdings as of March 31, 2011 |
| % of fund's
net assets | % of fund's net assets
6 months ago |
Commodity Funds | | |
Fidelity Series Commodity Strategy Fund Class F | 9.8 | 8.3 |
Domestic Equity Funds | | |
Fidelity Blue Chip Growth Fund
Class F | 3.5 | 3.5 |
Fidelity Disciplined Equity Fund
Class F | 9.8 | 10.1 |
Fidelity Growth Company Fund
Class F | 8.7 | 8.8 |
Fidelity Series 100 Index Fund | 6.7 | 6.8 |
Fidelity Series All-Sector Equity Fund Class F | 12.0 | 11.3 |
Fidelity Series Large Cap Value Fund Class F | 11.3 | 10.8 |
Fidelity Series Small Cap Opportunities Fund Class F | 1.9 | 1.8 |
Fidelity Small Cap Growth Fund
Class F | 1.1 | 1.1 |
Fidelity Small Cap Value Fund Class F | 1.1 | 1.1 |
Fidelity Equity-Income Fund Class F | 0.0 | 1.9 |
| 56.1 | 57.2 |
Developed International Equity Funds | | |
Fidelity Diversified International Fund Class F | 3.1 | 4.9 |
Fidelity Overseas Fund Class F | 3.2 | 4.8 |
Fidelity Series International Growth Fund Class F | 6.3 | 4.5 |
Fidelity Series International Small Cap Fund Class F | 1.2 | 0.8 |
Fidelity Series International Value Fund Class F | 6.2 | 4.4 |
Fidelity Europe Fund Class F | 0.0 | 0.9 |
Fidelity Japan Fund Class F | 0.0 | 0.4 |
| 20.0 | 20.7 |
Emerging Markets Equity Funds | | |
Fidelity Series Emerging Markets Fund Class F | 3.7 | 3.3 |
High Yield Bond Funds | | |
Fidelity Series Emerging Markets Debt Fund Class F | 0.2 | 0.0 |
Fidelity Series High Income Fund Class F | 9.2 | 0.0 |
Fidelity Capital & Income Fund
Class F | 0.0 | 5.0 |
Fidelity High Income Fund Class F | 0.0 | 4.9 |
| 9.4 | 9.9 |
Investment Grade Bond Funds | | |
Fidelity Series Investment Grade Bond Fund Class F | 0.9 | 0.5 |
Fidelity Strategic Real Return Fund Class F | 0.1 | 0.1 |
| 1.0 | 0.6 |
Net Other Assets (Liabilities)* | 0.0 | 0.0 |
| 100.0 | 100.0 |
* Amount represents less than 0.1% |
Asset Allocation (% of fund's net assets) |
Current |
| Commodity Funds | 9.8% | |
| Domestic Equity Funds | 56.1% | |
| Developed International Equity Funds | 20.0% | |
| Emerging Markets Equity Funds | 3.7% | |
| High Yield Bond Funds | 9.4% | |
| Investment Grade Bond Funds | 1.0% | |

Six months ago |
| Commodity Funds | 8.3% | |
| Domestic Equity Funds | 57.2% | |
| Developed International Equity Funds | 20.7% | |
| Emerging Markets Equity Funds | 3.3% | |
| High Yield Bond Funds | 9.9% | |
| Investment Grade Bond Funds | 0.6% | |

Expected |
| Commodity Funds | 9.7% | |
| Domestic Equity Funds | 55.0% | |
| Developed International Equity Funds | 20.0% | |
| Emerging Markets Equity Funds | 3.6% | |
| High Yield Bond Funds | 10.0% | |
| Investment Grade Bond Funds | 1.7% | |

The fund invests according to an asset allocation strategy that becomes increasingly conservative over time. The six months ago allocation is based on the fund's holdings as of September 30, 2010. The current allocation is based on the fund's holdings as of March 31, 2011. The expected allocation represents the fund's anticipated allocation at September 30, 2011. |
Annual Report
Fidelity Freedom K® 2050 Fund
Investments March 31, 2011
Showing Percentage of Net Assets
Domestic Equity Funds - 65.9% |
| Shares | | Value |
Commodity Funds - 9.8% |
Fidelity Series Commodity Strategy Fund Class F | 5,050,130 | | $ 66,712,219 |
Domestic Equity Funds - 56.1% |
Fidelity Blue Chip Growth Fund Class F | 492,290 | | 23,620,083 |
Fidelity Disciplined Equity Fund Class F | 2,763,327 | | 66,292,215 |
Fidelity Growth Company Fund Class F | 656,134 | | 59,052,052 |
Fidelity Series 100 Index Fund | 4,908,551 | | 45,158,667 |
Fidelity Series All-Sector Equity Fund Class F | 6,170,381 | | 80,955,401 |
Fidelity Series Large Cap Value Fund Class F | 6,239,577 | | 76,247,635 |
Fidelity Series Small Cap Opportunities Fund Class F | 1,104,268 | | 13,063,496 |
Fidelity Small Cap Growth Fund Class F | 456,100 | | 7,753,707 |
Fidelity Small Cap Value Fund Class F | 460,450 | | 7,620,445 |
TOTAL DOMESTIC EQUITY FUNDS | | 379,763,701 |
TOTAL DOMESTIC EQUITY FUNDS (Cost $399,688,456) | 446,475,920 |
International Equity Funds - 23.7% |
| | | |
Developed International Equity Funds - 20.0% |
Fidelity Diversified International Fund Class F | 681,078 | | 21,174,729 |
Fidelity Overseas Fund Class F | 635,329 | | 21,194,580 |
Fidelity Series International Growth Fund Class F | 3,703,234 | | 42,735,315 |
Fidelity Series International Small Cap Fund Class F | 672,399 | | 8,317,578 |
Fidelity Series International Value Fund Class F | 3,949,048 | | 41,504,493 |
TOTAL DEVELOPED INTERNATIONAL EQUITY FUNDS | | 134,926,695 |
|
| Shares | | Value |
Emerging Markets Equity Funds - 3.7% |
Fidelity Series Emerging Markets Fund Class F | 1,315,096 | | $ 25,249,852 |
TOTAL INTERNATIONAL EQUITY FUNDS (Cost $146,603,120) | 160,176,547 |
Bond Funds - 10.4% |
| | | |
High Yield Bond Funds - 9.4% |
Fidelity Series Emerging Markets Debt Fund Class F | 91,305 | | 913,476 |
Fidelity Series High Income Fund Class F | 6,236,593 | | 62,490,663 |
TOTAL HIGH YIELD BOND FUNDS | | 63,404,139 |
Investment Grade Bond Funds - 1.0% |
Fidelity Series Investment Grade Bond Fund Class F | 542,701 | | 6,181,368 |
Fidelity Strategic Real Return Fund Class F | 80,409 | | 796,855 |
TOTAL INVESTMENT GRADE BOND FUNDS | | 6,978,223 |
TOTAL BOND FUNDS (Cost $70,200,227) | 70,382,362 |
TOTAL INVESTMENT PORTFOLIO - 100.0% (Cost $616,491,803) | | 677,034,829 |
NET OTHER ASSETS (LIABILITIES) - 0.0% | | (27,565) |
NET ASSETS - 100% | $ 677,007,264 |
Other Information |
All investments are categorized as Level 1 under the Fair Value Hierarchy. The inputs or methodology used for valuing securities may not be an indication of the risk associated with investing in those securities. For more information on valuation inputs, please refer to the Security Valuation section in the accompanying Notes to Financial Statements. |
See accompanying notes which are an integral part of the financial statements.
Annual Report
Fidelity Freedom K® 2050 Fund
Statement of Assets and Liabilities
| March 31, 2011 |
Assets | | |
Investment in securities, at value (cost $616,491,803) - See accompanying schedule | | $ 677,034,829 |
Cash | | 2 |
Receivable for fund shares sold | | 2,380,865 |
Total assets | | 679,415,696 |
| | |
Liabilities | | |
Payable for investments purchased | $ 2,037,235 | |
Payable for fund shares redeemed | 343,637 | |
Transfer agent fees payable | 27,560 | |
Total liabilities | | 2,408,432 |
| | |
Net Assets | | $ 677,007,264 |
Net Assets consist of: | | |
Paid in capital | | $ 604,878,817 |
Undistributed net investment income | | 752,147 |
Accumulated undistributed net realized gain (loss) on investments | | 10,833,274 |
Net unrealized appreciation (depreciation) on investments | | 60,543,026 |
Net Assets, for 45,841,118 shares outstanding | | $ 677,007,264 |
Net Asset Value, offering price and redemption price per share ($677,007,264 ÷ 45,841,118 shares) | | $ 14.77 |
Statement of Operations
| Year ended March 31, 2011 |
Investment Income | | |
Income distributions from underlying funds | | $ 6,253,362 |
| | |
Expenses | | |
Transfer agent fees | $ 181,416 | |
Independent trustees' compensation | 1,072 | |
Total expenses | | 182,488 |
Net investment income (loss) | | 6,070,874 |
Realized and Unrealized Gain (Loss) Realized gain (loss) on sale of underlying fund shares | 2,817,423 | |
Capital gain distributions from underlying funds | 10,244,849 | |
Total net realized gain (loss) | | 13,062,272 |
Change in net unrealized appreciation (depreciation) on underlying funds | | 55,537,732 |
Net gain (loss) | | 68,600,004 |
Net increase (decrease) in net assets resulting from operations | | $ 74,670,878 |
See accompanying notes which are an integral part of the financial statements.
Annual Report
Fidelity Freedom K® 2050 Fund
Financial Statements - continued
Statement of Changes in Net Assets
| Year ended
March 31,
2011 | For the period
July 2, 2009
(commencement of
operations) to March 31, 2010 |
Increase (Decrease) in Net Assets | | |
Operations | | |
Net investment income (loss) | $ 6,070,874 | $ 439,221 |
Net realized gain (loss) | 13,062,272 | 595,854 |
Change in net unrealized appreciation (depreciation) | 55,537,732 | 5,005,294 |
Net increase (decrease) in net assets resulting from operations | 74,670,878 | 6,040,369 |
Distributions to shareholders from net investment income | (5,452,228) | (305,720) |
Distributions to shareholders from net realized gain | (2,628,317) | (196,535) |
Total distributions | (8,080,545) | (502,255) |
Share transactions
Proceeds from sales of shares | 585,668,292 | 120,013,597 |
Reinvestment of distributions | 8,080,545 | 502,254 |
Cost of shares redeemed | (101,225,776) | (8,160,095) |
Net increase (decrease) in net assets resulting from share transactions | 492,523,061 | 112,355,756 |
Total increase (decrease) in net assets | 559,113,394 | 117,893,870 |
| | |
Net Assets | | |
Beginning of period | 117,893,870 | - |
End of period (including undistributed net investment income of $752,147 and undistributed net investment income of $133,501, respectively) | $ 677,007,264 | $ 117,893,870 |
Other Information Shares | | |
Sold | 43,494,851 | 9,729,235 |
Issued in reinvestment of distributions | 583,758 | 40,084 |
Redeemed | (7,347,575) | (659,235) |
Net increase (decrease) | 36,731,034 | 9,110,084 |
Financial Highlights
Years ended March 31, | 2011 | 2010 E |
Selected Per-Share Data | | |
Net asset value, beginning of period | $ 12.94 | $ 10.00 |
Income from Investment Operations | | |
Net investment income (loss) C | .24 | .15 |
Net realized and unrealized gain (loss) | 1.86 | 2.91 |
Total from investment operations | 2.10 | 3.06 |
Distributions from net investment income | (.17) | (.07) |
Distributions from net realized gain | (.11) | (.05) |
Total distributions | (.27) G | (.12) |
Net asset value, end of period | $ 14.77 | $ 12.94 |
Total Return B | 16.43% | 30.59% |
Ratios to Average Net Assets D, F | | |
Expenses before reductions | .05% | .05% A |
Expenses net of fee waivers, if any | .05% | .05% A |
Expenses net of all reductions | .05% | .05% A |
Net investment income (loss) | 1.77% | 1.62% A |
Supplemental Data | | |
Net assets, end of period (000 omitted) | $ 677,007 | $ 117,894 |
Portfolio turnover rate | 42% | 24% A |
A Annualized
B Total returns for periods of less than one year are not annualized.
C Calculated based on average shares outstanding during the period.
D Amounts do not include the activity of the underlying funds.
E For the period July 2, 2009 (commencement of operations) to March 31, 2010.
F Expense ratios reflect operating expenses of the Fund. Expenses before reductions do not reflect amounts reimbursed by the investment adviser or reductions from expense offset arrangements and do not represent the amount paid by the Fund during periods when reimbursements or reductions occur. Expenses net of fee waivers reflect expenses after reimbursement by the investment adviser but prior to reductions from expense offset arrangements. Expenses net of all reductions represent the net expenses paid by the Fund but do not include expenses of the investment companies in which the Fund invests.
G Total distributions of $.27 per share is comprised of distributions from net investment income of $.167 and distributions from net realized gain of $.106 per share.
See accompanying notes which are an integral part of the financial statements.
Annual Report
Notes to Financial Statements
For the period ended March 31, 2011
1. Organization.
Fidelity Freedom K® Income Fund, Fidelity Freedom K® 2000 Fund, Fidelity Freedom K® 2005 Fund, Fidelity Freedom K® 2010 Fund, Fidelity Freedom K® 2015 Fund, Fidelity Freedom K® 2020 Fund, Fidelity Freedom K® 2025 Fund, Fidelity Freedom K® 2030 Fund, Fidelity Freedom K® 2035 Fund, Fidelity Freedom K® 2040 Fund, Fidelity Freedom K® 2045 Fund and Fidelity Freedom K® 2050 Fund (the Funds) are funds of Fidelity Aberdeen Street Trust (the Trust). The Trust is registered under the Investment Company Act of 1940, as amended (the 1940 Act), as an open-end management investment company organized as a Delaware statutory trust. Each Fund is authorized to issue an unlimited number of shares. The Funds invest primarily in a combination of other Fidelity equity, bond, and short-term funds (the Underlying Funds) managed by Fidelity Management & Research Company (FMR).
2. Significant Accounting Policies.
The financial statements have been prepared in conformity with accounting principles generally accepted in the United States of America (GAAP), which require management to make certain estimates and assumptions at the date of the financial statements. Actual results could differ from those estimates. Subsequent events, if any, through the date that the financial statements were issued have been evaluated in the preparation of the financial statements. The following summarizes the significant accounting policies of the Funds:
Security Valuation. Investments are valued as of 4:00 p.m. Eastern time on the last calendar day of the period. Each Fund categorizes the inputs to valuation techniques used to value their investments into a disclosure hierarchy consisting of three levels as shown below.
Level 1 - quoted prices in active markets for identical investments
Level 2 - other significant observable inputs (including quoted prices for similar investments, interest rates, prepayment speeds, etc.)
Level 3 - unobservable inputs (including the Fund's own assumptions based on the best information available)
Valuation techniques used to value each Fund's investments by major category are as follows. Investments in the Underlying Funds are valued at their closing net asset value (NAV) each business day and are categorized as Level 1 in the hierarchy.
Investment Transactions and Income. For financial reporting purposes, the Funds' investment holdings and NAV include trades executed through the end of the last business day of the period. The NAV per share for processing shareholder transactions is calculated as of the close of business of the New York Stock Exchange (NYSE), normally 4:00 p.m. Eastern time and includes trades executed through the end of the prior business day. Gains and losses on securities sold are determined on the basis of identified cost. Income and capital gain distributions from the Underlying Funds, if any, are recorded on the ex-dividend date.
Expenses. Expenses directly attributable to a fund are charged to that fund. Expenses attributable to more than one fund are allocated among the respective funds on the basis of relative net assets or other appropriate methods. Expenses included in the accompanying financial statements reflect the expenses of the Fund and do not include any expenses associated with the Underlying Funds. Expense estimates are accrued in the period to which they relate and adjustments are made when actual amounts are known.
Income Tax Information and Distributions to Shareholders. Each year each Fund intends to qualify as a regulated investment company, including distributing substantially all of its taxable income and realized gains under Subchapter M of the Internal Revenue Code and filing its U.S. federal tax return. As a result, no provision for income taxes is required. As of March 31, 2011, each Fund did not have any unrecognized tax benefits in the accompanying financial statements. A fund's federal tax return is subject to examination by the Internal Revenue Service (IRS) for a period of three years.
Distributions are declared and recorded on the ex-dividend date. Income and capital gain distributions are determined in accordance with income tax regulations, which may differ from GAAP.
Capital accounts within the financial statements are adjusted for permanent book-tax differences. These adjustments have no impact on net assets or the results of operations. Temporary book-tax differences will reverse in a subsequent period.
Book-tax differences are primarily due to the short-term gain distributions from the Underlying Funds and losses deferred due to wash sales.
The federal tax cost of investment securities and unrealized appreciation (depreciation) as of period end were as follows for each Fund:
| Tax cost | Gross unrealized
appreciation | Gross unrealized
depreciation | Net unrealized
appreciation
(depreciation) on
securities and other
investments |
Fidelity Freedom K® Income | $ 617,188,512 | $ 21,042,897 | $ (2,149,754) | $ 18,893,143 |
Fidelity Freedom K® 2000 | 402,099,702 | 14,231,615 | (1,127,899) | 13,103,716 |
Fidelity Freedom K® 2005 | 242,621,778 | 15,888,466 | (682,914) | 15,205,552 |
Annual Report
2. Significant Accounting Policies - continued
Income Tax Information and Distributions to Shareholders - continued
| Tax cost | Gross unrealized
appreciation | Gross unrealized
depreciation | Net unrealized
appreciation
(depreciation) on
securities and other
investments |
Fidelity Freedom K® 2010 | $ 2,491,376,100 | $ 181,377,417 | $ (7,407,331) | $ 173,970,086 |
Fidelity Freedom K® 2015 | 2,939,092,828 | 219,270,853 | (9,381,038) | 209,889,815 |
Fidelity Freedom K® 2020 | 6,140,761,950 | 509,051,837 | (16,974,749) | 492,077,088 |
Fidelity Freedom K® 2025 | 3,161,312,143 | 300,851,670 | (7,877,196) | 292,974,474 |
Fidelity Freedom K® 2030 | 4,464,838,039 | 436,906,894 | (11,140,969) | 425,765,925 |
Fidelity Freedom K® 2035 | 2,099,390,419 | 226,151,815 | (3,544,896) | 222,606,919 |
Fidelity Freedom K® 2040 | 2,603,574,734 | 282,432,136 | (4,060,823) | 278,371,313 |
Fidelity Freedom K® 2045 | 845,957,934 | 82,770,901 | (1,273,494) | 81,497,407 |
Fidelity Freedom K® 2050 | 617,691,762 | 60,186,173 | (843,106) | 59,343,067 |
The tax-based components of distributable earnings as of period end were as follows for each Fund:
| Undistributed
ordinary income | Undistributed long-term
capital gain | Net unrealized
appreciation
(depreciation) |
Fidelity Freedom K® Income | $ 2,903,403 | $ 2,562,944 | $ 18,893,143 |
Fidelity Freedom K® 2000 | 2,977,462 | 2,033,525 | 13,103,716 |
Fidelity Freedom K® 2005 | 1,629,699 | 1,882,296 | 15,205,552 |
Fidelity Freedom K® 2010 | 17,230,088 | 21,713,774 | 173,970,086 |
Fidelity Freedom K® 2015 | 18,441,653 | 27,113,243 | 209,889,815 |
Fidelity Freedom K® 2020 | 44,384,169 | 64,730,411 | 492,077,088 |
Fidelity Freedom K® 2025 | 23,434,644 | 39,092,019 | 292,974,474 |
Fidelity Freedom K® 2030 | 32,602,201 | 57,361,792 | 425,765,925 |
Fidelity Freedom K® 2035 | 14,998,611 | 29,344,123 | 222,606,919 |
Fidelity Freedom K® 2040 | 19,892,631 | 37,140,873 | 278,371,313 |
Fidelity Freedom K® 2045 | 6,733,809 | 10,960,106 | 81,497,407 |
Fidelity Freedom K® 2050 | 4,766,924 | 8,018,457 | 59,343,067 |
The tax character of distributions paid was as follows:
March 31, 2011 | | | |
| Ordinary
Income | Long-term
Capital Gains | Total |
Fidelity Freedom K® Income | $ 9,031,796 | $ 876,464 | $ 9,908,260 |
Fidelity Freedom K® 2000 | 5,802,709 | 545,528 | 6,348,237 |
Fidelity Freedom K® 2005 | 3,735,835 | 359,946 | 4,095,781 |
Fidelity Freedom K® 2010 | 40,493,077 | 3,556,135 | 44,049,212 |
Fidelity Freedom K® 2015 | 48,605,504 | 4,399,871 | 53,005,375 |
Fidelity Freedom K® 2020 | 99,970,480 | 6,936,926 | 106,907,406 |
Fidelity Freedom K® 2025 | 53,580,840 | 3,864,271 | 57,445,111 |
Fidelity Freedom K® 2030 | 74,023,842 | 4,849,329 | 78,873,171 |
Fidelity Freedom K® 2035 | 33,522,183 | 1,888,404 | 35,410,587 |
Fidelity Freedom K® 2040 | 41,475,652 | 2,341,918 | 43,817,570 |
Fidelity Freedom K® 2045 | 11,544,851 | 420,948 | 11,965,799 |
Fidelity Freedom K® 2050 | 7,888,642 | 191,903 | 8,080,545 |
March 31, 2010 | |
| Ordinary Income |
Fidelity Freedom K® Income | $ 529,271 |
Fidelity Freedom K® 2000 | 522,542 |
Fidelity Freedom K® 2005 | 302,760 |
Fidelity Freedom K® 2010 | 2,636,465 |
Fidelity Freedom K® 2015 | 5,113,084 |
Fidelity Freedom K® 2020 | 6,897,548 |
Annual Report
Notes to Financial Statements - continued
2. Significant Accounting Policies - continued
Income Tax Information and Distributions to Shareholders - continued
March 31, 2010 | |
| Ordinary Income |
Fidelity Freedom K® 2025 | $ 4,945,669 |
Fidelity Freedom K® 2030 | 7,202,509 |
Fidelity Freedom K® 2035 | 3,166,163 |
Fidelity Freedom K® 2040 | 3,308,829 |
Fidelity Freedom K® 2045 | 648,929 |
Fidelity Freedom K® 2050 | 502,255 |
3. Purchases and Sales of Investments.
Purchases and redemptions of the Underlying Fund shares are noted in the table below.
| Purchases ($) | Redemptions ($) |
Fidelity Freedom K® Income | 616,969,452 | 124,576,225 |
Fidelity Freedom K® 2000 | 416,181,261 | 102,265,377 |
Fidelity Freedom K® 2005 | 252,971,617 | 75,267,256 |
Fidelity Freedom K® 2010 | 2,513,204,948 | 693,719,354 |
Fidelity Freedom K® 2015 | 2,751,445,654 | 675,657,530 |
Fidelity Freedom K® 2020 | 6,009,116,395 | 1,442,757,313 |
Fidelity Freedom K® 2025 | 3,022,625,682 | 782,940,140 |
Fidelity Freedom K® 2030 | 4,263,743,352 | 1,062,363,690 |
Fidelity Freedom K® 2035 | 1,986,163,100 | 509,078,827 |
Fidelity Freedom K® 2040 | 2,511,714,029 | 647,536,491 |
Fidelity Freedom K® 2045 | 859,611,658 | 188,240,784 |
Fidelity Freedom K® 2050 | 646,851,948 | 146,075,666 |
4. Fees and Other Transactions with Affiliates.
Management Fee. Strategic Advisers, Inc. (Strategic Advisers), an affiliate of FMR, provides the Funds with investment management related services. The Funds do not pay any fees for these services.
Other Transactions. Strategic Advisers has entered into an administration agreement with FMR under which FMR provides management and administrative services (other than investment advisory services) necessary for the operation of each Fund. Pursuant to this agreement, FMR pays all expenses of each Fund, excluding the transfer agent fees, the compensation of the independent Trustees and certain other expenses such as interest expense. FMR also contracts with other Fidelity companies to perform the services necessary for the operation of each Fund. The Funds do not pay any fees for these services.
Transfer Agent Fees. Fidelity Investments Institutional Operations Company, Inc. (FIIOC), an affiliate of FMR, is the Funds' transfer, dividend disbursing and shareholder servicing agent. FIIOC receives an asset-based fee based on each Fund's average net assets. FIIOC pays for typesetting, printing and mailing of shareholder reports, except proxy statements. For the period, transfer agent fees for each Fund were as follows:
| Amount | % of Average
Net Assets |
Fidelity Freedom K® Income | $ 205,761 | .05% |
Fidelity Freedom K® 2000 | 147,991 | .05% |
Fidelity Freedom K® 2005 | 84,566 | .05% |
Fidelity Freedom K® 2010 | 859,378 | .05% |
Fidelity Freedom K® 2015 | 992,240 | .05% |
Fidelity Freedom K® 2020 | 2,036,245 | .05% |
Fidelity Freedom K® 2025 | 1,072,463 | .05% |
Fidelity Freedom K® 2030 | 1,500,902 | .05% |
Fidelity Freedom K® 2035 | 715,647 | .05% |
Fidelity Freedom K® 2040 | 888,080 | .05% |
Fidelity Freedom K® 2045 | 256,126 | .05% |
Fidelity Freedom K® 2050 | 181,416 | .05% |
Annual Report
4. Fees and Other Transactions with Affiliates - continued
Reallocation of Underlying Fund Investments. During the period, Strategic Advisers reallocated investments of the Funds. This involved taxable redemptions of the Funds' interest in Fidelity Europe Fund Class F, Fidelity Capital & Income Fund Class F and Fidelity High Income Fund Class F for cash and securities and non-taxable exchanges of those securities for shares of Fidelity Series International Growth Fund Class F, Fidelity Series International Value Fund Class F, and Fidelity Series High Income Fund Class F. Realized gains and losses on redemptions of Fidelity Europe Fund Class F, Fidelity Capital & Income Fund Class F and Fidelity High Income Fund Class F in connection with the reallocation are presented in the accompanying Statements of Operations as "Realized gain (loss) on sale of underlying fund shares."
Details of these transactions with the related gain (loss) for the Funds are presented in the accompanying table:
| Value of
Cash and
Securities
reallocated | Realized Gain (Loss) on
redemptions of Fidelity Europe
Fund Class F, Fidelity Capital &
Income Fund Class F and
Fidelity High Income
Fund Class F |
Fidelity Freedom K® Income | $ 31,129,548 | $ 2,088,761 |
Fidelity Freedom K® 2000 | 20,485,959 | 1,386,928 |
Fidelity Freedom K® 2005 | 14,010,650 | 914,376 |
Fidelity Freedom K® 2010 | 149,650,330 | 9,178,431 |
Fidelity Freedom K® 2015 | 175,090,879 | 11,146,097 |
Fidelity Freedom K® 2020 | 475,205,392 | 29,497,828 |
Fidelity Freedom K® 2025 | 274,252,315 | 17,110,119 |
Fidelity Freedom K® 2030 | 397,639,008 | 24,114,644 |
Fidelity Freedom K® 2035 | 186,504,836 | 11,279,625 |
Fidelity Freedom K® 2040 | 259,727,230 | 16,065,896 |
Fidelity Freedom K® 2045 | 94,000,932 | 4,964,557 |
Fidelity Freedom K® 2050 | 69,914,253 | 3,501,261 |
5. Other.
The Funds' organizational documents provide former and current trustees and officers with a limited indemnification against liabilities arising in connection with the performance of their duties to the Funds. In the normal course of business, the Funds may also enter into contracts that provide general indemnifications. The Funds' maximum exposure under these arrangements is unknown as this would be dependent on future claims that may be made against the Funds. The risk of material loss from such claims is considered remote.
The Funds do not invest in the Underlying Funds for the purpose of exercising management or control; however, investments by the Funds within their principal investment strategies may represent a significant portion of the Underlying Fund's net assets. At the end of the period, the Funds, in aggregate, were the owners of record of more than 20% of the total outstanding shares of the following Underlying Funds.
Fund | % of shares held |
Fidelity Series 100 Index Fund | 22% |
Fidelity Series All-Sector Equity Fund | 22% |
Fidelity Series Commodity Strategy Fund | 22% |
Fidelity Series Emerging Markets Debt Fund | 22% |
Fidelity Series Emerging Markets Fund | 22% |
Fidelity Series High Income Fund | 22% |
Fidelity Series Inflation-Protected Bond Index Fund | 21% |
Fidelity Series International Growth Fund | 22% |
Fidelity Series International Small Cap Fund | 22% |
Fidelity Series International Value Fund | 22% |
Fidelity Series Investment Grade Bond Fund | 22% |
Fidelity Series Large Cap Value Fund | 22% |
Fidelity Series Small Cap Opportunities Fund | 21% |
Annual Report
Report of Independent Registered Public Accounting Firm
To the Trustees of Fidelity Aberdeen Street Trust and the Shareholders of Fidelity Freedom K® Income Fund, Fidelity Freedom K® 2000 Fund, Fidelity Freedom K® 2005 Fund, Fidelity Freedom K® 2010 Fund, Fidelity Freedom K® 2015 Fund, Fidelity Freedom K® 2020 Fund, Fidelity Freedom K® 2025 Fund, Fidelity Freedom K® 2030 Fund, Fidelity Freedom K® 2035 Fund, Fidelity Freedom K® 2040 Fund, Fidelity Freedom K® 2045 Fund, Fidelity Freedom K® 2050 Fund:
In our opinion, the accompanying statements of assets and liabilities, including the schedules of investments, and the related statements of operations and of changes in net assets and the financial highlights present fairly, in all material respects, the financial positions of Fidelity Freedom K® Income Fund, Fidelity Freedom K® 2000 Fund, Fidelity Freedom K® 2005 Fund, Fidelity Freedom K® 2010 Fund, Fidelity Freedom K® 2015 Fund, Fidelity Freedom K® 2020 Fund, Fidelity Freedom K® 2025 Fund, Fidelity Freedom K® 2030 Fund, Fidelity Freedom K® 2035 Fund, Fidelity Freedom K® 2040 Fund, Fidelity Freedom K® 2045 Fund, Fidelity Freedom K® 2050 Fund (funds of Fidelity Aberdeen Street Trust) at March 31, 2011, the results of each of their operations for the year then ended, the changes in each of their net assets for each of the two years in the period then ended and the financial highlights for each of the periods indicated, in conformity with accounting principles generally accepted in the United States of America. These financial statements and financial highlights (hereafter referred to as "financial statements") are the responsibility of the Fidelity Aberdeen Street Trust's management. Our responsibility is to express an opinion on these financial statements based on our audits. We conducted our audits of these financial statements in accordance with the standards of the Public Company Accounting Oversight Board (United States). Those standards require that we plan and perform the audit to obtain reasonable assurance about whether the financial statements are free of material misstatement. An audit includes examining, on a test basis, evidence supporting the amounts and disclosures in the financial statements, assessing the accounting principles used and significant estimates made by management, and evaluating the overall financial statement presentation. We believe that our audits, which included confirmation of securities at March 31, 2011 by correspondence with the transfer agent, provide a reasonable basis for our opinion.
/s/ PricewaterhouseCoopers LLP
PricewaterhouseCoopers LLP
Boston, Massachusetts
May 17, 2011
Annual Report
The Trustees and executive officers of the trust and funds, as applicable, are listed below. The Board of Trustees governs each Fidelity Freedom K® Fund and is responsible for protecting the interests of shareholders. The Trustees are experienced executives who meet periodically throughout the year to oversee each Fidelity Freedom K® Fund's activities, review contractual arrangements with companies that provide services to each Fidelity Freedom K® Fund, oversee management of the risks associated with such activities and contractual arrangements, and review each Fidelity Freedom K® Fund's performance. If the interests of a Fidelity Freedom K® Fund and an underlying Fidelity fund were to diverge, a conflict of interest could arise and affect how the Trustees fulfill their fiduciary duties to the affected funds. Strategic Advisers has structured the Fidelity Freedom K® Funds to avoid these potential conflicts, although there may be situations where a conflict of interest is unavoidable. In such instances, Strategic Advisers and the Trustees would take reasonable steps to minimize and, if possible, eliminate the conflict. Except for James C. Curvey, each of the Trustees oversees 190 funds advised by FMR or an affiliate. Mr. Curvey oversees 410 funds advised by FMR or an affiliate.
The Trustees hold office without limit in time except that (a) any Trustee may resign; (b) any Trustee may be removed by written instrument, signed by at least two-thirds of the number of Trustees prior to such removal; (c) any Trustee who requests to be retired or who has become incapacitated by illness or injury may be retired by written instrument signed by a majority of the other Trustees; and (d) any Trustee may be removed at any special meeting of shareholders by a two-thirds vote of the outstanding voting securities of the trust. Each Trustee who is not an interested person (as defined in the 1940 Act) (Independent Trustee), shall retire not later than the last day of the calendar year in which his or her 75th birthday occurs. The Independent Trustees may waive this mandatory retirement age policy with respect to individual Trustees. The executive officers hold office without limit in time, except that any officer may resign or may be removed by a vote of a majority of the Trustees at any regular meeting or any special meeting of the Trustees. Except as indicated, each individual has held the office shown or other offices in the same company for the past five years.
Experience, Skills, Attributes, and Qualifications of the Funds' Trustees. The Governance and Nominating Committee has adopted a statement of policy that describes the experience, qualifications, attributes, and skills that are necessary and desirable for potential Independent Trustee candidates (Statement of Policy). The Board believes that each Trustee satisfied at the time he or she was initially elected or appointed a Trustee, and continues to satisfy, the standards contemplated by the Statement of Policy. The Governance and Nominating Committee also engages professional search firms to help identify potential Independent Trustee candidates who have the experience, qualifications, attributes, and skills consistent with the Statement of Policy. From time to time, additional criteria based on the composition and skills of the current Independent Trustees, as well as experience or skills that may be appropriate in light of future changes to board composition, business conditions, and regulatory or other developments, have also been considered by the professional search firms and the Governance and Nominating Committee. In addition, the Board takes into account the Trustees' commitment and participation in Board and committee meetings, as well as their leadership of standing and ad hoc committees throughout their tenure.
In determining that a particular Trustee was and continues to be qualified to serve as a Trustee, the Board has considered a variety of criteria, none of which, in isolation, was controlling. The Board believes that, collectively, the Trustees have balanced and diverse experience, qualifications, attributes, and skills, which allow the Board to operate effectively in governing each fund and protecting the interests of shareholders. Information about the specific experience, skills, attributes, and qualifications of each Trustee, which in each case led to the Board's conclusion that the Trustee should serve (or continue to serve) as a trustee of the funds, is provided below.
Board Structure and Oversight Function. Abigail P. Johnson is an interested person (as defined in the 1940 Act) and currently serves as Chairman. The Trustees have determined that an interested Chairman is appropriate and benefits shareholders because an interested Chairman has a personal and professional stake in the quality and continuity of services provided to the funds. Independent Trustees exercise their informed business judgment to appoint an individual of their choosing to serve as Chairman, regardless of whether the Trustee happens to be independent or a member of management. The Independent Trustees have determined that they can act independently and effectively without having an Independent Trustee serve as Chairman and that a key structural component for assuring that they are in a position to do so is for the Independent Trustees to constitute a substantial majority for the Board. The Independent Trustees also regularly meet in executive session. Kenneth L. Wolfe serves as Chairman of the Independent Trustees and as such (i) acts as a liaison between the Independent Trustees and management with respect to matters important to the Independent Trustees and (ii) with management prepares agendas for Board meetings.
Fidelity funds are overseen by different Boards of Trustees. The funds' Board oversees Fidelity's investment-grade bond, money market, and asset allocation funds and another Board oversees Fidelity's equity and high income funds. The asset allocation funds may invest in Fidelity funds that are overseen by such other Board. The use of separate Boards, each with its own committee structure, allows the Trustees of each group of Fidelity funds to focus on the unique issues of the funds they oversee, including common research, investment, and operational issues. On occasion, the separate Boards establish joint committees to address issues of overlapping consequences for the Fidelity funds overseen by each Board.
The Trustees operate using a system of committees to facilitate the timely and efficient consideration of all matters of importance to the Trustees, each fund, and fund shareholders and to facilitate compliance with legal and regulatory requirements and oversight of the funds' activities and associated risks. The Board, acting through its committees, has charged FMR and its affiliates with (i) identifying events or circumstances the occurrence of which could have demonstrably adverse effects on the funds' business and/or reputation; (ii) implementing processes and controls to lessen the possibility that such events or circumstances occur or to mitigate the effects of such events or circumstances if they do occur; and (iii) creating and maintaining a system designed to evaluate continuously business and market conditions in order to facilitate the identification and implementation processes described in (i) and (ii) above. Because the day-to-day operations and activities of the funds are carried out by or through FMR, its affiliates and other service providers, the funds' exposure to risks is mitigated but not eliminated by the processes overseen by the Trustees. While each of the Board's committees has responsibility for overseeing different aspects of the funds' activities, oversight is exercised primarily through the Operations and Audit Committees. Appropriate personnel, including but not limited to the funds' Chief Compliance Officer (CCO), FMR's internal auditor, the independent accountants, the funds' Treasurer and portfolio management personnel, make periodic reports to the Board's committees, as appropriate. The responsibilities of each committee, including their oversight responsibilities, are described further under "Standing Committees of the Funds' Trustees."
Annual Report
The funds' Statement of Additional Information (SAI) includes more information about the Trustees. To request a free copy, call Fidelity at 1-800-835-5092.
Interested Trustees*:
Correspondence intended for each Trustee who is an interested person may be sent to Fidelity Investments, 82 Devonshire Street, Boston, Massachusetts 02109.
Name, Age; Principal Occupations and Other Relevant Experience+ |
Abigail P. Johnson (49) |
| Year of Election or Appointment: 2009 Ms. Johnson is Trustee and Chairman of the Board of Trustees of certain Trusts. Ms. Johnson serves as President of Personal, Workplace and Institutional Services (2005-present). Ms. Johnson is the Vice Chairman and Director (2007-present) of FMR LLC. Previously, Ms. Johnson served as President and a Director of FMR (2001-2005), a Trustee of other investment companies advised by FMR, Fidelity Investments Money Management, Inc., and FMR Co., Inc. (2001-2005), Senior Vice President of the Fidelity funds (2001-2005), and managed a number of Fidelity funds. Ms. Abigail P. Johnson and Mr. Arthur E. Johnson are not related. |
James C. Curvey (75) |
| Year of Election or Appointment: 2007 Mr. Curvey also serves as Trustee (2007-present) of other investment companies advised by FMR. Mr. Curvey is a Director of Fidelity Investments Money Management, Inc. (2009-present), Director of Fidelity Research & Analysis Co. (2009-present) and Director of FMR and FMR Co., Inc. (2007-present). Mr. Curvey is also Vice Chairman (2007-present) and Director of FMR LLC. In addition, Mr. Curvey serves as an Overseer for the Boston Symphony Orchestra and a member of the Trustees of Villanova University. Previously, Mr. Curvey was the Vice Chairman (2006-2007) and Director (2000-2007) of FMR Corp. |
* Trustees have been determined to be "Interested Trustees" by virtue of, among other things, their affiliation with the trust or various entities under common control with FMR.
+ The information above includes each Trustee's principal occupation during the last five years and other information relating to the experience, attributes, and skills relevant to each Trustee's qualifications to serve as a Trustee, which led to the conclusion that each Trustee should serve as a Trustee for each fund.
Independent Trustees:
Correspondence intended for each Independent Trustee (that is, the Trustees other than the Interested Trustees) may be sent to Fidelity Investments, P.O. Box 55235, Boston, Massachusetts 02205-5235.
Name, Age; Principal Occupations and Other Relevant Experience+ |
Albert R. Gamper, Jr. (69) |
| Year of Election or Appointment: 2006 Prior to his retirement in December 2004, Mr. Gamper served as Chairman of the Board of CIT Group Inc. (commercial finance). During his tenure with CIT Group Inc. Mr. Gamper served in numerous senior management positions, including Chairman (1987-1989; 1999-2001; 2002-2004), Chief Executive Officer (1987-2004), and President (2002-2003). He also served as President and Chief Executive Officer of Tyco Capital Corporation (2001-2002). Mr. Gamper currently serves as a member of the Board of Directors of Public Service Enterprise Group (utilities, 2000-present), a member of the Board of Trustees, Rutgers University (2004-present), and Chairman of the Board of Saint Barnabas Health Care System. Previously, Mr. Gamper served as Chairman of the Board of Governors, Rutgers University (2004-2007). |
Robert F. Gartland (59) |
| Year of Election or Appointment: 2010 Mr. Gartland is a partner and investor of Vietnam Partners LLC (investments and consulting, 2008-present) and is Chairman and an investor in Gartland and Mellina Group Corp. (consulting, 2009-present). Prior to his retirement, Mr. Gartland held a variety of positions at Morgan Stanley (financial services, 1979-2007) including Managing Director (1987-2007). |
Arthur E. Johnson (64) |
| Year of Election or Appointment: 2008 Mr. Johnson serves as a member of the Board of Directors of Eaton Corporation (diversified power management, 2009-present) and AGL Resources, Inc. (holding company). Prior to his retirement, Mr. Johnson served as Senior Vice President of Corporate Strategic Development of Lockheed Martin Corporation (defense contractor, 1999-2009). He previously served on the Board of Directors of IKON Office Solutions, Inc. (1999-2008) and Delta Airlines (2005-2007). Mr. Arthur E. Johnson and Ms. Abigail P. Johnson are not related. |
Michael E. Kenneally (57) |
| Year of Election or Appointment: 2009 Previously, Mr. Kenneally served as a Member of the Advisory Board for certain Fidelity Fixed Income and Asset Allocation Funds (2008-2009). Prior to his retirement, Mr. Kenneally served as Chairman and Global Chief Executive Officer of Credit Suisse Asset Management (2003-2005). Mr. Kenneally was a Director of the Credit Suisse Funds (U.S. mutual funds, 2004-2008) and certain other closed-end funds (2004-2005) and was awarded the Chartered Financial Analyst (CFA) designation in 1991. |
James H. Keyes (70) |
| Year of Election or Appointment: 2007 Mr. Keyes serves as a member of the Boards of Navistar International Corporation (manufacture and sale of trucks, buses, and diesel engines, since 2002) and Pitney Bowes, Inc. (integrated mail, messaging, and document management solutions, since 1998). Prior to his retirement, Mr. Keyes served as Chairman and Chief Executive Officer of Johnson Controls (automotive, building, and energy, 1998-2002) and as a member of the Board of LSI Logic Corporation (semiconductor technologies, 1984-2008). |
Marie L. Knowles (64) |
| Year of Election or Appointment: 2001 Prior to Ms. Knowles' retirement in June 2000, she served as Executive Vice President and Chief Financial Officer of Atlantic Richfield Company (ARCO) (diversified energy, 1996-2000). From 1993 to 1996, she was a Senior Vice President of ARCO and President of ARCO Transportation Company. She served as a Director of ARCO from 1996 to 1998. Ms. Knowles currently serves as a Director and Chairman of the Audit Committee of McKesson Corporation (healthcare service, since 2002). Ms. Knowles is an Honorary Trustee of the Brookings Institution and a member of the Board of the Catalina Island Conservancy and of the Santa Catalina Island Company (2009-present). She also serves as a member of the Advisory Board for the School of Engineering of the University of Southern California and the Foundation Board of the School of Architecture at the University of Virginia (2007-
present). Previously, Ms. Knowles served as a Director of Phelps Dodge Corporation (copper mining and manufacturing, 1994-2007). |
Kenneth L. Wolfe (72) |
| Year of Election or Appointment: 2005 Mr. Wolfe is Chairman of the Independent Trustees of the Fixed Income and Asset Allocation Funds (2008-present). Prior to his retirement, Mr. Wolfe served as Chairman and a Director (2007-2009) and Chairman and Chief Executive Officer (1994-2001) of Hershey Foods Corporation. He also served as a member of the Boards of Adelphia Communications Corporation (telecommunications, 2003-2006), Bausch & Lomb, Inc. (medical/pharmaceutical, 1993-2007), and Revlon, Inc. (personal care products, 2004-2009). |
+ The information above includes each Trustee's principal occupation during the last five years and other information relating to the experience, attributes, and skills relevant to each Trustee's qualifications to serve as a Trustee, which led to the conclusion that each Trustee should serve as a Trustee for each fund.
Executive Officers:
Correspondence intended for each executive officer may be sent to Fidelity Investments, 82 Devonshire Street, Boston, Massachusetts 02109.
Name, Age; Principal Occupation |
John R. Hebble (52) |
| Year of Election or Appointment: 2008 President and Treasurer of Fidelity's Fixed Income and Asset Allocation Funds. Mr. Hebble also serves as Treasurer and Chief Financial Officer of The North Carolina Capital Management Trust: Cash and Term Portfolios (2008-present), Assistant Treasurer of other Fidelity funds (2009-present) and is an employee of Fidelity Investments. |
Boyce I. Greer (55) |
| Year of Election or Appointment: 2005 Vice President of Fidelity's Fixed Income Funds and Asset Allocation Funds (2005). Mr. Greer is also a Trustee of other investment companies advised by FMR. Mr. Greer is head of Institutional Investments for Fidelity Asset Management and Vice Chairman of Pyramis Global Advisors, LLC (2011-present), President of The North Carolina Capital Management Trust: Cash and Term Portfolios (2003-present), the Asset Allocation Division (2008-present), President and a Director of Strategic Advisers, Inc. (2008-present), President of FIMM 130/30 LLC (2008-present), Director of Ballyrock Investment Advisors LLC (2006-present), and an Executive Vice President of FMR (2005-present). Previously, Mr. Greer served as Executive Vice President of FMR Co., Inc. (2005-2009), President and Director of Fidelity Investments Money Management, Inc. (2007-2009) and as a Director and Managing Director of Strategic Advisers, Inc. (2002-2005) |
Derek L. Young (46) |
| Year of Election or Appointment: 2009 Vice President of Fidelity's Asset Allocation Funds. Mr. Young also serves as Chief Investment Officer of the Global Asset Allocation Group (2009-present). Previously, Mr. Young served as a portfolio manager. |
Scott C. Goebel (43) |
| Year of Election or Appointment: 2008 Secretary and Chief Legal Officer (CLO) of the Fidelity funds. Mr. Goebel also serves as Secretary and CLO of The North Carolina Capital Management Trust: Cash and Term Portfolios (2008-present); General Counsel, Secretary, and Senior Vice President of FMR (2008-present) and FMR Co., Inc. (2008-present); Deputy General Counsel of FMR LLC; Chief Legal Officer of Fidelity Management & Research (Hong Kong) Limited (2008-present) and Assistant Secretary of Fidelity Management & Research (Japan) Inc. (2008-present), Fidelity Investments Money Management, Inc. (2008-present), Fidelity Management & Research (U.K.) Inc. (2008-present), and Fidelity Research and Analysis Company (2008-present). Previously, Mr. Goebel served as Assistant Secretary of the Funds (2007-2008) and as Vice President and Secretary of Fidelity Distributors Corporation (FDC) (2005-2007). |
David J. Carter (37) |
| Year of Election or Appointment: 2010 Assistant Secretary of Fidelity's Fixed Income and Asset Allocation Funds. Mr. Carter also serves as Vice President, Associate General Counsel (2010-present) and is an employee of Fidelity Investments (2005-present). |
Holly C. Laurent (56) |
| Year of Election or Appointment: 2008 Anti-Money Laundering (AML) Officer of the Fidelity funds. Ms. Laurent also serves as AML Officer of The North Carolina Capital Management Trust: Cash and Term Portfolios (2008-present) and is an employee of Fidelity Investments. Previously, Ms. Laurent was Senior Vice President and Head of Legal for Fidelity Business Services India Pvt. Ltd. (2006-2008), and Senior Vice President, Deputy General Counsel and Group Head for FMR LLC (2005-2006). |
Christine Reynolds (52) |
| Year of Election or Appointment: 2008 Chief Financial Officer of the Fidelity funds. Ms. Reynolds became President of Fidelity Pricing and Cash Management Services (FPCMS) in August 2008. Ms. Reynolds served as Chief Operating Officer of FPCMS (2007-2008). Previously, Ms. Reynolds served as President, Treasurer, and Anti-Money Laundering officer of the Fidelity funds (2004-2007). |
Michael H. Whitaker (43) |
| Year of Election or Appointment: 2008 Chief Compliance Officer of Fidelity's Fixed Income and Asset Allocation Funds. Mr. Whitaker also serves as Chief Compliance Officer of The North Carolina Capital Management Trust: Cash and Term Portfolios (2008-present). Mr. Whitaker is an employee of Fidelity Investments (2007-present). Prior to joining Fidelity Investments, Mr. Whitaker worked at MFS Investment Management where he served as Senior Vice President and Chief Compliance Officer (2004-2006), and Assistant General Counsel. |
Jeffrey S. Christian (49) |
| Year of Election or Appointment: 2009 Deputy Treasurer of the Fidelity funds. Mr. Christian is an employee of Fidelity Investments. Previously, Mr. Christian served as Chief Financial Officer (2008-2009) of certain Fidelity funds and Senior Vice President of Fidelity Pricing and Cash Management Services (FPCMS) (2004-2009). |
Bryan A. Mehrmann (49) |
| Year of Election or Appointment: 2005 Deputy Treasurer of the Fidelity funds. Mr. Mehrmann is an employee of Fidelity Investments. |
Stephanie J. Dorsey (41) |
| Year of Election or Appointment: 2008 Deputy Treasurer of Fidelity's Fixed Income and Asset Allocation Funds. Ms. Dorsey also serves as Assistant Treasurer of other Fidelity funds (2010-present) and is an employee of Fidelity Investments (2008-present). Previously, Ms. Dorsey served as Treasurer (2004-2008) of the JPMorgan Mutual Funds and Vice President (2004-2008) of JPMorgan Chase Bank. |
Adrien E. Deberghes (43) |
| Year of Election or Appointment: 2010 Assistant Treasurer of Fidelity's Fixed Income and Asset Allocation Funds. Mr. Deberghes also serves as Deputy Treasurer of other Fidelity funds (2008-present) and is an employee of Fidelity Investments (2008-present). Previously, Mr. Deberghes served as Senior Vice President of Mutual Fund Administration at State Street Corporation (2007-2008), Senior Director of Mutual Fund Administration at Investors Bank & Trust (2005-2007), and Director of Finance for Dunkin' Brands (2000-2005). |
Kenneth B. Robins (41) |
| Year of Election or Appointment: 2009 Assistant Treasurer of the Fidelity Fixed Income and Asset Allocation Funds. Mr. Robins also serves as President and Treasurer of other Fidelity funds (2008-present; 2010-present) and is an employee of Fidelity Investments (2004-present). Previously, Mr. Robins served as Deputy Treasurer of the Fidelity funds (2005-2008) and Treasurer and Chief Financial Officer of The North Carolina Capital Management Trust: Cash and Term Portfolios (2006-2008). |
Gary W. Ryan (52) |
| Year of Election or Appointment: 2005 Assistant Treasurer of the Fidelity funds. Mr. Ryan is an employee of Fidelity Investments. Previously, Mr. Ryan served as Vice President of Fund Reporting in Fidelity Pricing and Cash Management Services (FPCMS) (1999-2005). |
Jonathan Davis (42) |
| Year of Election or Appointment: 2010 Assistant Treasurer of the Fidelity funds. Mr. Davis is an employee of Fidelity Investments. Previously, Mr. Davis served as Vice President and Associate General Counsel of FMR LLC (2003-2010). |
Annual Report
The Board of Trustees of each fund voted to pay to shareholders of record at the opening of business on record date, the following distributions per share derived from capital gains realized from sales of portfolio securities and dividends derived from net investment income:
| Pay Date | Record Date | Dividends | Capital Gains |
Fidelity Freedom K® Income Fund | 05/09/11 | 05/06/11 | $0.015 | $0.085 |
Fidelity Freedom K® 2000 Fund | 05/09/11 | 05/06/11 | $0.032 | $0.107 |
Fidelity Freedom K® 2005 Fund | 05/09/11 | 05/06/11 | $0.027 | $0.142 |
Fidelity Freedom K® 2010 Fund | 05/09/11 | 05/06/11 | $0.029 | $0.161 |
Fidelity Freedom K® 2015 Fund | 05/12/11 | 05/11/11 | $0.028 | $0.157 |
Fidelity Freedom K® 2020 Fund | 05/12/11 | 05/11/11 | $0.028 | $0.191 |
Fidelity Freedom K® 2025 Fund | 05/12/11 | 05/11/11 | $0.026 | $0.216 |
Fidelity Freedom K® 2030 Fund | 05/12/11 | 05/11/11 | $0.025 | $0.227 |
Fidelity Freedom K® 2035 Fund | 05/09/11 | 05/06/11 | $0.019 | $0.243 |
Fidelity Freedom K® 2040 Fund | 05/09/11 | 05/06/11 | $0.019 | $0.256 |
Fidelity Freedom K® 2045 Fund | 05/09/11 | 05/06/11 | $0.018 | $0.244 |
Fidelity Freedom K® 2050 Fund | 05/09/11 | 05/06/11 | $0.016 | $0.243 |
The funds hereby designate as capital gain dividend the amounts noted below for the taxable year ended March 31, 2011, or, if subsequently determined to be different, the net capital gain of such year.
Fidelity Freedom K® Income Fund | $3,407,966 |
Fidelity Freedom K® 2000 Fund | $2,548,791 |
Fidelity Freedom K® 2005 Fund | $2,207,459 |
Fidelity Freedom K® 2010 Fund | $24,894,893 |
Fidelity Freedom K® 2015 Fund | $30,967,868 |
Fidelity Freedom K® 2020 Fund | $70,554,823 |
Fidelity Freedom K® 2025 Fund | $42,201,439 |
Fidelity Freedom K® 2030 Fund | $61,106,794 |
Fidelity Freedom K® 2035 Fund | $30,640,147 |
Fidelity Freedom K® 2040 Fund | $38,798,379 |
Fidelity Freedom K® 2045 Fund | $11,226,327 |
Fidelity Freedom K® 2050 Fund | $8,104,783 |
A percentage of the dividends distributed during the fiscal year for the following funds were derived from interest on U.S. Government securities which is generally exempt from state income tax:
Fidelity Freedom K® Income Fund | 11.18% |
Fidelity Freedom K® 2000 Fund | 10.80% |
Fidelity Freedom K® 2005 Fund | 7.75% |
Fidelity Freedom K® 2010 Fund | 7.30% |
Fidelity Freedom K® 2015 Fund | 7.23% |
Fidelity Freedom K® 2020 Fund | 5.61% |
Fidelity Freedom K® 2025 Fund | 4.41% |
Fidelity Freedom K® 2030 Fund | 3.77% |
Fidelity Freedom K® 2035 Fund | 2.20% |
Fidelity Freedom K® 2040 Fund | 1.72% |
Fidelity Freedom K® 2045 Fund | 1.03% |
Fidelity Freedom K® 2050 Fund | 0.14% |
Annual Report
Distributions (Unaudited) - continued
A percentage of the dividends distributed during the fiscal year for the following funds qualify for the dividends-received deduction for corporate shareholders:
Fidelity Freedom K® Income Fund | |
May 2010 | 3% |
June 2010 | 10% |
July 2010 | 10% |
August 2010 | 10% |
September 2010 | 10% |
October 2010 | 10% |
November 2010 | 10% |
December 2010 (Ex-Date 12/03/10) | 10% |
December 2010 (Ex-Date 12/30/10) | 10% |
February 2011 | 1% |
March 2011 | 1% |
Fidelity Freedom K® 2000 Fund | |
May 2010 | 3% |
December 2010 | 10% |
Fidelity Freedom K® 2005 Fund | |
May 2010 | 5% |
December 2010 | 18% |
Fidelity Freedom K® 2010 Fund | |
May 2010 | 5% |
December 2010 | 20% |
Fidelity Freedom K® 2015 Fund | |
May 2010 | 6% |
December 2010 | 20% |
Fidelity Freedom K® 2020 Fund | |
May 2010 | 7% |
December 2010 | 23% |
Fidelity Freedom K® 2025 Fund | |
May 2010 | 6% |
December 2010 | 26% |
Fidelity Freedom K® 2030 Fund | |
May 2010 | 7% |
December 2010 | 28% |
Fidelity Freedom K® 2035 Fund | |
May 2010 | 7% |
December 2010 | 33% |
Fidelity Freedom K® 2040 Fund | |
May 2010 | 7% |
December 2010 | 34% |
Fidelity Freedom K® 2045 Fund | |
May 2010 | 8% |
December 2010 | 35% |
Fidelity Freedom K® 2050 Fund | |
May 2010 | 7% |
December 2010 | 38% |
Annual Report
A percentage of the dividends distributed during the fiscal year for the following funds may be taken into account as a dividend for purposes of the maximum rate under section 1(h)(11) of the Internal Revenue Code.
Fidelity Freedom K® Income Fund | |
May 2010 | 5% |
June 2010 | 15% |
July 2010 | 15% |
August 2010 | 15% |
September 2010 | 15% |
October 2010 | 15% |
November 2010 | 15% |
December 2010 (Ex-Date 12/03/10) | 15% |
December 2010 (Ex-Date 12/30/10) | 15% |
February 2011 | 3% |
March 2011 | 3% |
Fidelity Freedom K® 2000 Fund | |
May 2010 | 4% |
December 2010 | 15% |
Fidelity Freedom K® 2005 Fund | |
May 2010 | 5% |
December 2010 | 26% |
Fidelity Freedom K® 2010 Fund | |
May 2010 | 6% |
December 2010 | 30% |
Fidelity Freedom K® 2015 Fund | |
May 2010 | 6% |
December 2010 | 30% |
Fidelity Freedom K® 2020 Fund | |
May 2010 | 9% |
December 2010 | 35% |
Fidelity Freedom K® 2025 Fund | |
May 2010 | 5% |
December 2010 | 39% |
Fidelity Freedom K® 2030 Fund | |
May 2010 | 5% |
December 2010 | 42% |
Fidelity Freedom K® 2035 Fund | |
May 2010 | 6% |
December 2010 | 49% |
Fidelity Freedom K® 2040 Fund | |
May 2010 | 6% |
December 2010 | 50% |
Fidelity Freedom K® 2045 Fund | |
May 2010 | 8% |
December 2010 | 52% |
Fidelity Freedom K® 2050 Fund | |
May 2010 | 6% |
December 2010 | 56% |
The funds will notify shareholders in January 2012 of amounts for use in preparing 2011 income tax returns.
Annual Report
Investment Adviser
Strategic Advisers, Inc.
Boston, MA
General Distributor
Fidelity Distributors Corporation
Boston, MA
Transfer and Service Agents
Fidelity Investments Institutional
Operations Company, Inc.
Boston, MA
Fidelity Service Company, Inc.
Boston, MA
Custodian
JPMorgan Chase Bank
New York, NY
FF-K-UANNPRO-0511
1.927081.100
Item 2. Code of Ethics
As of the end of the period, March 31, 2011, Fidelity Aberdeen Street Trust (the trust) has adopted a code of ethics, as defined in Item 2 of Form N-CSR, that applies to its President and Treasurer and its Chief Financial Officer. A copy of the code of ethics is filed as an exhibit to this Form N-CSR.
Item 3. Audit Committee Financial Expert
The Board of Trustees of the trust has determined that Marie L. Knowles is an audit committee financial expert, as defined in Item 3 of Form N-CSR. Ms. Knowles is independent for purposes of Item 3 of Form N-CSR.
Item 4. Principal Accountant Fees and Services
Fees and Services
The following table presents fees billed by Deloitte & Touche LLP, the member firms of Deloitte Touche Tohmatsu, and their respective affiliates (collectively, "Deloitte Entities") in each of the last two fiscal years for services rendered to Fidelity Advisor Freedom Income Fund, Fidelity Advisor Freedom 2005 Fund, Fidelity Advisor Freedom 2010 Fund, Fidelity Advisor Freedom 2015 Fund, Fidelity Advisor Freedom 2020 Fund, Fidelity Advisor Freedom 2025 Fund, Fidelity Advisor Freedom 2030 Fund, Fidelity Advisor Freedom 2035 Fund, Fidelity Advisor Freedom 2040 Fund, Fidelity Advisor Freedom 2045 Fund, Fidelity Advisor Freedom 2050 Fund, Fidelity Freedom Index Income Fund, Fidelity Freedom Index 2000 Fund, Fidelity Freedom Index 2005 Fund, Fidelity Freedom Index 2010 Fund, Fidelity Freedom Index 2015 Fund, Fidelity Freedom Index 2020 Fund, Fidelity Freedom Index 2025 Fund, Fidelity Freedom Index 2030 Fund, Fidelity Freedom Index 2035 Fund, Fidelity Freedom Index 2040 Fund, Fidelity Freedom Index 2045 Fund, and Fidelity Freedom Index 2050 Fund (the "Funds"):
Services Billed by Deloitte Entities
March 31, 2011 FeesA
| Audit Fees | Audit-Related Fees | Tax Fees | All Other Fees |
Fidelity Advisor Freedom Income Fund | $20,000 | $- | $4,600 | $100 |
Fidelity Advisor Freedom 2005 Fund | $20,000 | $- | $4,600 | $100 |
Fidelity Advisor Freedom 2010 Fund | $20,000 | $- | $4,600 | $100 |
Fidelity Advisor Freedom 2015 Fund | $20,000 | $- | $4,600 | $100 |
Fidelity Advisor Freedom 2020 Fund | $20,000 | $- | $4,600 | $100 |
Fidelity Advisor Freedom 2025 Fund | $20,000 | $- | $4,600 | $100 |
Fidelity Advisor Freedom 2030 Fund | $20,000 | $- | $4,600 | $100 |
Fidelity Advisor Freedom 2035 Fund | $20,000 | $- | $4,600 | $100 |
Fidelity Advisor Freedom 2040 Fund | $20,000 | $- | $4,600 | $100 |
Fidelity Advisor Freedom 2045 Fund | $21,000 | $- | $5,700 | $100 |
Fidelity Advisor Freedom 2050 Fund | $21,000 | $- | $5,700 | $100 |
Fidelity Freedom Index Income Fund | $16,000 | $- | $4,600 | $100 |
Fidelity Freedom Index 2000 Fund | $16,000 | $- | $4,600 | $100 |
Fidelity Freedom Index 2005 Fund | $16,000 | $- | $4,600 | $100 |
Fidelity Freedom Index 2010 Fund | $16,000 | $- | $4,600 | $100 |
Fidelity Freedom Index 2015 Fund | $16,000 | $- | $4,600 | $100 |
Fidelity Freedom Index 2020 Fund | $16,000 | $- | $4,600 | $100 |
Fidelity Freedom Index 2025 Fund | $16,000 | $- | $4,600 | $100 |
Fidelity Freedom Index 2030 Fund | $16,000 | $- | $4,600 | $100 |
Fidelity Freedom Index 2035 Fund | $16,000 | $- | $4,600 | $100 |
Fidelity Freedom Index 2040 Fund | $16,000 | $- | $4,600 | $100 |
Fidelity Freedom Index 2045 Fund | $16,000 | $- | $4,600 | $100 |
Fidelity Freedom Index 2050 Fund | $16,000 | $- | $4,600 | $100 |
March 31, 2010 FeesA,B
| Audit Fees | Audit-Related Fees | Tax Fees | All Other Fees |
Fidelity Advisor Freedom Income Fund | $24,000 | $- | $4,500 | $- |
Fidelity Advisor Freedom 2005 Fund | $24,000 | $- | $4,500 | $- |
Fidelity Advisor Freedom 2010 Fund | $24,000 | $- | $4,500 | $- |
Fidelity Advisor Freedom 2015 Fund | $24,000 | $- | $4,500 | $- |
Fidelity Advisor Freedom 2020 Fund | $24,000 | $- | $4,500 | $- |
Fidelity Advisor Freedom 2025 Fund | $24,000 | $- | $4,500 | $- |
Fidelity Advisor Freedom 2030 Fund | $24,000 | $- | $4,500 | $- |
Fidelity Advisor Freedom 2035 Fund | $24,000 | $- | $4,500 | $- |
Fidelity Advisor Freedom 2040 Fund | $24,000 | $- | $4,500 | $- |
Fidelity Advisor Freedom 2045 Fund | $24,000 | $- | $5,600 | $- |
Fidelity Advisor Freedom 2050 Fund | $24,000 | $- | $5,600 | $- |
Fidelity Freedom Index Income Fund | $12,000 | $- | $4,500 | $- |
Fidelity Freedom Index 2000 Fund | $12,000 | $- | $4,500 | $- |
Fidelity Freedom Index 2005 Fund | $12,000 | $- | $4,500 | $- |
Fidelity Freedom Index 2010 Fund | $12,000 | $- | $4,500 | $- |
Fidelity Freedom Index 2015 Fund | $12,000 | $- | $4,500 | $- |
Fidelity Freedom Index 2020 Fund | $12,000 | $- | $4,500 | $- |
Fidelity Freedom Index 2025 Fund | $12,000 | $- | $4,500 | $- |
Fidelity Freedom Index 2030 Fund | $12,000 | $- | $4,500 | $- |
Fidelity Freedom Index 2035 Fund | $12,000 | $- | $4,500 | $- |
Fidelity Freedom Index 2040 Fund | $12,000 | $- | $4,500 | $- |
Fidelity Freedom Index 2045 Fund | $12,000 | $- | $4,500 | $- |
Fidelity Freedom Index 2050 Fund | $12,000 | $- | $4,500 | $- |
A Amounts may reflect rounding.
B Fidelity Freedom Index Income Fund, Fidelity Freedom Index 2000 Fund, Fidelity Freedom Index 2005 Fund, Fidelity Freedom Index 2010 Fund, Fidelity Freedom Index 2015 Fund, Fidelity Freedom Index 2020 Fund, Fidelity Freedom Index 2025 Fund, Fidelity Freedom Index 2030 Fund, Fidelity Freedom Index 2035 Fund, Fidelity Freedom Index 2040 Fund, Fidelity Freedom Index 2045 Fund, and Fidelity Freedom Index 2050 Fund commenced operations on October 2, 2009.
The following table presents fees billed by PricewaterhouseCoopers LLP ("PwC") in each of the last two fiscal years for services rendered to Fidelity Freedom Income Fund, Fidelity Freedom 2000 Fund, Fidelity Freedom 2005 Fund, Fidelity Freedom 2010 Fund, Fidelity Freedom 2015 Fund, Fidelity Freedom 2020 Fund, Fidelity Freedom 2025 Fund, Fidelity Freedom 2030 Fund, Fidelity Freedom 2035 Fund, Fidelity Freedom 2040 Fund, Fidelity Freedom 2045 Fund, Fidelity Freedom 2050 Fund, Fidelity Freedom K® Income Fund, Fidelity Freedom K® 2000 Fund, Fidelity Freedom K® 2005 Fund, Fidelity Freedom K® 2010 Fund, Fidelity Freedom K® 2015 Fund, Fidelity Freedom K® 2020 Fund, Fidelity Freedom K® 2025 Fund, Fidelity Freedom K® 2030 Fund, Fidelity Freedom K® 2035 Fund, Fidelity Freedom K® 2040 Fund, Fidelity Freedom K® 2045 Fund, and Fidelity Freedom K® 2050 Fund (the "Funds"):
Services Billed by PwC
March 31, 2011 FeesA
| Audit Fees | Audit-Related Fees | Tax Fees | All Other Fees |
Fidelity Freedom Income Fund | $21,000 | $- | $2,200 | $100 |
Fidelity Freedom 2000 Fund | $21,000 | $- | $2,200 | $100 |
Fidelity Freedom 2005 Fund | $21,000 | $- | $2,200 | $100 |
Fidelity Freedom 2010 Fund | $21,000 | $- | $2,200 | $100 |
Fidelity Freedom 2015 Fund | $21,000 | $- | $2,200 | $100 |
Fidelity Freedom 2020 Fund | $21,000 | $- | $2,200 | $100 |
Fidelity Freedom 2025 Fund | $21,000 | $- | $2,200 | $100 |
Fidelity Freedom 2030 Fund | $21,000 | $- | $2,200 | $100 |
Fidelity Freedom 2035 Fund | $21,000 | $- | $2,200 | $100 |
Fidelity Freedom 2040 Fund | $21,000 | $- | $2,200 | $100 |
Fidelity Freedom 2045 Fund | $21,000 | $- | $2,200 | $100 |
Fidelity Freedom 2050 Fund | $21,000 | $- | $2,200 | $100 |
Fidelity Freedom K® Income Fund | $20,000 | $- | $2,200 | $100 |
Fidelity Freedom K® 2000 Fund | $20,000 | $- | $2,200 | $100 |
Fidelity Freedom K® 2005 Fund | $20,000 | $- | $2,200 | $100 |
Fidelity Freedom K® 2010 Fund | $20,000 | $- | $2,200 | $100 |
Fidelity Freedom K® 2015 Fund | $20,000 | $- | $2,200 | $100 |
Fidelity Freedom K® 2020 Fund | $20,000 | $- | $2,200 | $100 |
Fidelity Freedom K® 2025 Fund | $20,000 | $- | $2,200 | $100 |
Fidelity Freedom K® 2030 Fund | $20,000 | $- | $2,200 | $100 |
Fidelity Freedom K® 2035 Fund | $20,000 | $- | $2,200 | $100 |
Fidelity Freedom K® 2040 Fund | $20,000 | $- | $2,200 | $100 |
Fidelity Freedom K® 2045 Fund | $20,000 | $- | $2,200 | $100 |
Fidelity Freedom K® 2050 Fund | $20,000 | $- | $2,200 | $100 |
March 31, 2010 FeesA,B
| Audit Fees | Audit-Related Fees | Tax Fees | All Other Fees |
Fidelity Freedom Income Fund | $27,000 | $- | $2,200 | $100 |
Fidelity Freedom 2000 Fund | $27,000 | $- | $2,200 | $100 |
Fidelity Freedom 2005 Fund | $27,000 | $- | $2,200 | $100 |
Fidelity Freedom 2010 Fund | $27,000 | $- | $2,200 | $100 |
Fidelity Freedom 2015 Fund | $27,000 | $- | $2,200 | $100 |
Fidelity Freedom 2020 Fund | $27,000 | $- | $2,200 | $100 |
Fidelity Freedom 2025 Fund | $27,000 | $- | $2,200 | $100 |
Fidelity Freedom 2030 Fund | $27,000 | $- | $2,200 | $100 |
Fidelity Freedom 2035 Fund | $27,000 | $- | $2,200 | $100 |
Fidelity Freedom 2040 Fund | $27,000 | $- | $2,200 | $100 |
Fidelity Freedom 2045 Fund | $27,000 | $- | $2,200 | $100 |
Fidelity Freedom 2050 Fund | $27,000 | $- | $2,200 | $100 |
Fidelity Freedom K® Income Fund | $14,000 | $- | $2,200 | $100 |
Fidelity Freedom K® 2000 Fund | $14,000 | $- | $2,200 | $100 |
Fidelity Freedom K® 2005 Fund | $14,000 | $- | $2,200 | $100 |
Fidelity Freedom K® 2010 Fund | $14,000 | $- | $2,200 | $100 |
Fidelity Freedom K® 2015 Fund | $14,000 | $- | $2,200 | $100 |
Fidelity Freedom K® 2020 Fund | $14,000 | $- | $2,200 | $100 |
Fidelity Freedom K® 2025 Fund | $14,000 | $- | $2,200 | $100 |
Fidelity Freedom K® 2030 Fund | $14,000 | $- | $2,200 | $100 |
Fidelity Freedom K® 2035 Fund | $14,000 | $- | $2,200 | $100 |
Fidelity Freedom K® 2040 Fund | $14,000 | $- | $2,200 | $100 |
Fidelity Freedom K® 2045 Fund | $14,000 | $- | $2,200 | $100 |
Fidelity Freedom K® 2050 Fund | $14,000 | $- | $2,200 | $100 |
A Amounts may reflect rounding.
B Fidelity Freedom K® Income Fund, Fidelity Freedom K® 2000 Fund, Fidelity Freedom K® 2005 Fund, Fidelity Freedom K® 2010 Fund, Fidelity Freedom K® 2015 Fund, Fidelity Freedom K® 2020 Fund, Fidelity Freedom K® 2025 Fund, Fidelity Freedom K® 2030 Fund, Fidelity Freedom K® 2035 Fund, Fidelity Freedom K® 2040 Fund, Fidelity Freedom K® 2045 Fund, and Fidelity Freedom K® 2050 Fund commenced operations on July 2, 2009.
The following table presents fees billed by PwC and Deloitte Entities that were required to be approved by the Audit Committee for services that relate directly to the operations and financial reporting of the Funds and that are rendered on behalf of Fidelity Management & Research Company ("FMR") and entities controlling, controlled by, or under common control with FMR (not including any sub-adviser whose role is primarily portfolio management and is subcontracted with or overseen by another investment adviser) that provide ongoing services to the Funds ("Fund Service Providers"):
Services Billed by Deloitte Entities
| March 31, 2011A | March 31, 2010A |
Audit-Related Fees | $645,000 | $725,000 |
Tax Fees | $- | $- |
All Other Fees | $730,000 | $450,000 |
A Amounts may reflect rounding.
Services Billed by PwC
| March 31, 2011A | March 31, 2010A |
Audit-Related Fees | $2,550,000 | $1,595,000 |
Tax Fees | $- | $- |
All Other Fees | $510,000 | $- |
A Amounts may reflect rounding.
"Audit-Related Fees" represent fees billed for assurance and related services that are reasonably related to the performance of the fund audit or the review of the fund's financial statements and that are not reported under Audit Fees.
"Tax Fees" represent fees billed for tax compliance, tax advice or tax planning that relate directly to the operations and financial reporting of the fund.
"All Other Fees" represent fees billed for services provided to the fund or Fund Service Provider, a significant portion of which are assurance related, that relate directly to the operations and financial reporting of the fund, excluding those services that are reported under Audit Fees, Audit-Related Fees or Tax Fees.
Assurance services must be performed by an independent public accountant.
* * *
The aggregate non-audit fees billed by PwC and Deloitte Entities for services rendered to the Funds, FMR (not including any sub-adviser whose role is primarily portfolio management and is subcontracted with or overseen by another investment adviser), and any Fund Service Provider for each of the last two fiscal years of the Funds are as follows:
Billed By | March 31, 2011 A | March 31, 2010 A |
Deloitte Entities | $1,580,000 | $1,295,000B |
PwC | $4,970,000 | $3,825,000 |
A Amounts may reflect rounding.
B Reflects current period presentation.
The trust's Audit Committee has considered non-audit services that were not pre-approved that were provided by PwC and Deloitte Entities to Fund Service Providers to be compatible with maintaining the independence of PwC and Deloitte Entities in their audits of the Funds, taking into account representations from PwC and Deloitte Entities, in accordance with Public Company Accounting Oversight Board rules, regarding their independence from the Funds and their related entities and FMR's review of the appropriateness and permissibility under applicable law of such non-audit services prior to their provision to the Fund Service Providers.
Audit Committee Pre-Approval Policies and Procedures
The trust's Audit Committee must pre-approve all audit and non-audit services provided by a fund's independent registered public accounting firm relating to the operations or financial reporting of the fund. Prior to the commencement of any audit or non-audit services to a fund, the Audit Committee reviews the services to determine whether they are appropriate and permissible under applicable law.
The Audit Committee has adopted policies and procedures to, among other purposes, provide a framework for the Committee's consideration of non-audit services by the audit firms that audit the Fidelity funds. The policies and procedures require that any non-audit service provided by a fund audit firm to a Fidelity fund and any non-audit service provided by a fund auditor to a Fund Service Provider that relates directly to the operations and financial reporting of a Fidelity fund ("Covered Service") are subject to approval by the Audit Committee before such service is provided.
All Covered Services must be approved in advance of provision of the service either: (i) by formal resolution of the Audit Committee, or (ii) by oral or written approval of the service by the Chair of the Audit Committee (or if the Chair is unavailable, such other member of the Audit Committee as may be designated by the Chair to act in the Chair's absence). The approval contemplated by (ii) above is permitted where the Treasurer determines that action on such an engagement is necessary before the next meeting of the Audit Committee.
Non-audit services provided by a fund audit firm to a Fund Service Provider that do not relate directly to the operations and financial reporting of a Fidelity fund are reported to the Audit Committee on a periodic basis.
Non-Audit Services Approved Pursuant to Rule 2-01(c)(7)(i)(C) and (ii) of Regulation S-X ("De Minimis Exception")
There were no non-audit services approved or required to be approved by the Audit Committee pursuant to the De Minimis Exception during the Funds' last two fiscal years relating to services provided to (i) the Funds or (ii) any Fund Service Provider that relate directly to the operations and financial reporting of the Funds.
Item 5. Audit Committee of Listed Registrants
Not applicable.
Item 6. Investments
(a) Not applicable.
(b) Not applicable
Item 7. Disclosure of Proxy Voting Policies and Procedures for Closed-End Management Investment Companies
Not applicable.
Item 8. Portfolio Managers of Closed-End Management Investment Companies
Not applicable.
Item 9. Purchase of Equity Securities by Closed-End Management Investment Company and Affiliated Purchasers
Not applicable.
Item 10. Submission of Matters to a Vote of Security Holders
There were no material changes to the procedures by which shareholders may recommend nominees to the trust's Board of Trustees.
Item 11. Controls and Procedures
(a)(i) The President and Treasurer and the Chief Financial Officer have concluded that the trust's disclosure controls and procedures (as defined in Rule 30a-3(c) under the Investment Company Act) provide reasonable assurances that material information relating to the trust is made known to them by the appropriate persons, based on their evaluation of these controls and procedures as of a date within 90 days of the filing date of this report.
(a)(ii) There was no change in the trust's internal control over financial reporting (as defined in Rule 30a-3(d) under the Investment Company Act) that occurred during the second fiscal quarter of the period covered by this report that has materially affected, or is reasonably likely to materially affect, the trust's internal control over financial reporting.
Item 12. Exhibits
(a) | (1) | Code of Ethics pursuant to Item 2 of Form N-CSR is filed and attached hereto as EX-99.CODE ETH. |
(a) | (2) | Certification pursuant to Rule 30a-2(a) under the Investment Company Act of 1940 (17 CFR 270.30a-2(a)) is filed and attached hereto as Exhibit 99.CERT. |
(a) | (3) | Not applicable. |
(b) | | Certification pursuant to Rule 30a-2(b) under the Investment Company Act of 1940 (17 CFR 270.30a-2(b)) is furnished and attached hereto as Exhibit 99.906CERT. |
SIGNATURES
Pursuant to the requirements of the Securities Exchange Act of 1934 and the Investment Company Act of 1940, the registrant has duly caused this report to be signed on its behalf by the undersigned, thereunto duly authorized.
Fidelity Aberdeen Street Trust
By: | /s/John R. Hebble |
| John R. Hebble |
| President and Treasurer |
| |
Date: | May 25, 2011 |
Pursuant to the requirements of the Securities Exchange Act of 1934 and the Investment Company Act of 1940, this report has been signed below by the following persons on behalf of the registrant and in the capacities and on the dates indicated.
By: | /s/John R. Hebble |
| John R. Hebble |
| President and Treasurer |
| |
Date: | May 25, 2011 |
By: | /s/Christine Reynolds |
| Christine Reynolds |
| Chief Financial Officer |
| |
Date: | May 25, 2011 |