UNITED STATES
SECURITIES AND EXCHANGE COMMISSION
Washington, D.C. 20549
FORM N-CSR
CERTIFIED SHAREHOLDER REPORT OF REGISTERED
MANAGEMENT INVESTMENT COMPANIES
Investment Company Act file number 811-06440
Fidelity Aberdeen Street Trust
(Exact name of registrant as specified in charter)
245 Summer St., Boston, MA 02210
(Address of principal executive offices) (Zip code)
Nicole Macarchuk, Secretary
245 Summer St.
Boston, Massachusetts 02210
(Name and address of agent for service)
Registrant's telephone number, including area code:
617-563-7000
| |
Date of fiscal year end: | March 31 |
|
|
Date of reporting period: | September 30, 2024 |
This report on Form N-CSR relates solely to the Registrant’s Fidelity Flex Freedom Blend 2010 Fund, Fidelity Flex Freedom Blend 2015 Fund, Fidelity Flex Freedom Blend 2020 Fund, Fidelity Flex Freedom Blend 2025 Fund, Fidelity Flex Freedom Blend 2030 Fund, Fidelity Flex Freedom Blend 2035 Fund, Fidelity Flex Freedom Blend 2040 Fund, Fidelity Flex Freedom Blend 2045 Fund, Fidelity Flex Freedom Blend 2050 Fund, Fidelity Flex Freedom Blend 2055 Fund, Fidelity Flex Freedom Blend 2060 Fund, Fidelity Flex Freedom Blend 2065 Fund, Fidelity Flex Freedom Blend 2070 Fund, Fidelity Flex Freedom Blend Income Fund, Fidelity Freedom Index 2010 Fund, Fidelity Freedom Index 2015 Fund, Fidelity Freedom Index 2020 Fund, Fidelity Freedom Index 2025 Fund, Fidelity Freedom Index 2030 Fund, Fidelity Freedom Index 2035 Fund, Fidelity Freedom Index 2040 Fund, Fidelity Freedom Index 2045 Fund, Fidelity Freedom Index 2050 Fund, Fidelity Freedom Index 2055 Fund, Fidelity Freedom Index 2060 Fund, Fidelity Freedom Index 2065 Fund, Fidelity Freedom Index 2070 Fund, and Fidelity Freedom Index Income Fund (the “Funds”).
Item 1.
Reports to Stockholders
| |
| | SEMI-ANNUAL SHAREHOLDER REPORT | AS OF SEPTEMBER 30, 2024 | |
| | Fidelity Freedom® Index 2050 Fund Fidelity Freedom® Index 2050 Fund Premier II Class : FAVQX |
| | | |
This semi-annual shareholder report contains information about Fidelity Freedom® Index 2050 Fund for the period August 22, 2024 to September 30, 2024. You can find additional information about the Fund at fundresearch.fidelity.com/prospectus/sec. You can also request this information by contacting us at 1-800-544-3455 or by sending an e-mail to fidfunddocuments@fidelity.com.
What were your Fund costs for the last six months?(based on hypothetical $10,000 investment)
| | Costs of a $10,000 investment | Costs paid as a percentage of a $10,000 investment | |
Premier II Class A | $ 0 B | 0.04% | |
AExpenses for the full reporting period would be higher.
BAmount represents less than $.50
Key Fund Statistics (as of September 30, 2024)
KEY FACTS | | |
| Fund Size | $19,727,473,878 | |
| Number of Holdings | 5 | |
| Portfolio Turnover | 7% | |
What did the Fund invest in?
(as of September 30, 2024)
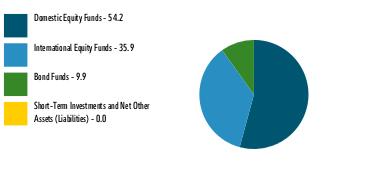
| Domestic Equity Funds | 54.2 |
| International Equity Funds | 35.9 |
| Bond Funds | 9.9 |
| Short-Term Investments and Net Other Assets (Liabilities) | 0.0 |
ASSET ALLOCATION (% of Fund's net assets) |
|
|
TOP HOLDINGS (% of Fund's net assets) | | |
| Fidelity Series Total Market Index Fund | 54.2 | |
| Fidelity Series Global ex U.S. Index Fund | 35.9 | |
| Fidelity Series Long-Term Treasury Bond Index Fund | 5.0 | |
| Fidelity Series Bond Index Fund | 4.0 | |
| Fidelity Series International Developed Markets Bond Index Fund | 0.9 | |
| | 100.0 | |
| Fidelity, the Fidelity Investments Logo and all other Fidelity trademarks or service marks used herein are trademarks or service marks of FMR LLC. Any third-party marks that are used herein are trademarks or service marks of their respective owners. © 2024 FMR LLC. All rights reserved. |
| | For additional information about the Fund; including its prospectus, financial information, holdings and proxy information, scan the QR code or visit fundresearch.fidelity.com/prospectus/sec 1.9917125.101 7714-TSRS-1124 |
| |
| | SEMI-ANNUAL SHAREHOLDER REPORT | AS OF SEPTEMBER 30, 2024 | |
| | Fidelity Freedom® Index 2055 Fund Fidelity Freedom® Index 2055 Fund Premier II Class : FAVRX |
| | | |
This semi-annual shareholder report contains information about Fidelity Freedom® Index 2055 Fund for the period August 22, 2024 to September 30, 2024. You can find additional information about the Fund at fundresearch.fidelity.com/prospectus/sec. You can also request this information by contacting us at 1-800-544-3455 or by sending an e-mail to fidfunddocuments@fidelity.com.
What were your Fund costs for the last six months?(based on hypothetical $10,000 investment)
| | Costs of a $10,000 investment | Costs paid as a percentage of a $10,000 investment | |
Premier II Class A | $ 0 B | 0.04% | |
AExpenses for the full reporting period would be higher.
BAmount represents less than $.50
Key Fund Statistics (as of September 30, 2024)
KEY FACTS | | |
| Fund Size | $14,448,762,506 | |
| Number of Holdings | 5 | |
| Portfolio Turnover | 6% | |
What did the Fund invest in?
(as of September 30, 2024)
| Domestic Equity Funds | 54.2 |
| International Equity Funds | 35.9 |
| Bond Funds | 9.9 |
| Short-Term Investments and Net Other Assets (Liabilities) | 0.0 |
ASSET ALLOCATION (% of Fund's net assets) |
|
|
TOP HOLDINGS (% of Fund's net assets) | | |
| Fidelity Series Total Market Index Fund | 54.2 | |
| Fidelity Series Global ex U.S. Index Fund | 35.9 | |
| Fidelity Series Long-Term Treasury Bond Index Fund | 5.0 | |
| Fidelity Series Bond Index Fund | 4.0 | |
| Fidelity Series International Developed Markets Bond Index Fund | 0.9 | |
| | 100.0 | |
| Fidelity, the Fidelity Investments Logo and all other Fidelity trademarks or service marks used herein are trademarks or service marks of FMR LLC. Any third-party marks that are used herein are trademarks or service marks of their respective owners. © 2024 FMR LLC. All rights reserved. |
| | For additional information about the Fund; including its prospectus, financial information, holdings and proxy information, scan the QR code or visit fundresearch.fidelity.com/prospectus/sec 1.9917127.101 7715-TSRS-1124 |
| |
| | SEMI-ANNUAL SHAREHOLDER REPORT | AS OF SEPTEMBER 30, 2024 | |
| | Fidelity Freedom® Index 2065 Fund Fidelity Freedom® Index 2065 Fund Premier II Class : FAVVX |
| | | |
This semi-annual shareholder report contains information about Fidelity Freedom® Index 2065 Fund for the period August 22, 2024 to September 30, 2024. You can find additional information about the Fund at fundresearch.fidelity.com/prospectus/sec. You can also request this information by contacting us at 1-800-544-3455 or by sending an e-mail to fidfunddocuments@fidelity.com.
What were your Fund costs for the last six months?(based on hypothetical $10,000 investment)
| | Costs of a $10,000 investment | Costs paid as a percentage of a $10,000 investment | |
Premier II Class A | $ 0 B | 0.04% | |
AExpenses for the full reporting period would be higher.
BAmount represents less than $.50
Key Fund Statistics (as of September 30, 2024)
KEY FACTS | | |
| Fund Size | $2,413,130,862 | |
| Number of Holdings | 6 | |
| Portfolio Turnover | 4% | |
What did the Fund invest in?
(as of September 30, 2024)
| Domestic Equity Funds | 54.2 |
| International Equity Funds | 35.9 |
| Bond Funds | 9.9 |
| Short-Term Investments and Net Other Assets (Liabilities) | 0.0 |
ASSET ALLOCATION (% of Fund's net assets) |
|
|
TOP HOLDINGS (% of Fund's net assets) | | |
| Fidelity Series Total Market Index Fund | 54.2 | |
| Fidelity Series Global ex U.S. Index Fund | 35.9 | |
| Fidelity Series Long-Term Treasury Bond Index Fund | 5.0 | |
| Fidelity Series Bond Index Fund | 4.0 | |
| Fidelity Series International Developed Markets Bond Index Fund | 0.9 | |
| | 100.0 | |
| Fidelity, the Fidelity Investments Logo and all other Fidelity trademarks or service marks used herein are trademarks or service marks of FMR LLC. Any third-party marks that are used herein are trademarks or service marks of their respective owners. © 2024 FMR LLC. All rights reserved. |
| | For additional information about the Fund; including its prospectus, financial information, holdings and proxy information, scan the QR code or visit fundresearch.fidelity.com/prospectus/sec 1.9917131.101 7718-TSRS-1124 |
| |
| | SEMI-ANNUAL SHAREHOLDER REPORT | AS OF SEPTEMBER 30, 2024 | |
| | Fidelity Freedom® Index 2045 Fund Fidelity Freedom® Index 2045 Fund Premier II Class : FAVPX |
| | | |
This semi-annual shareholder report contains information about Fidelity Freedom® Index 2045 Fund for the period August 22, 2024 to September 30, 2024. You can find additional information about the Fund at fundresearch.fidelity.com/prospectus/sec. You can also request this information by contacting us at 1-800-544-3455 or by sending an e-mail to fidfunddocuments@fidelity.com.
What were your Fund costs for the last six months?(based on hypothetical $10,000 investment)
| | Costs of a $10,000 investment | Costs paid as a percentage of a $10,000 investment | |
Premier II Class A | $ 0 B | 0.04% | |
AExpenses for the full reporting period would be higher.
BAmount represents less than $.50
Key Fund Statistics (as of September 30, 2024)
KEY FACTS | | |
| Fund Size | $20,629,221,628 | |
| Number of Holdings | 5 | |
| Portfolio Turnover | 8% | |
What did the Fund invest in?
(as of September 30, 2024)
| Domestic Equity Funds | 54.2 |
| International Equity Funds | 35.9 |
| Bond Funds | 9.9 |
| Short-Term Investments and Net Other Assets (Liabilities) | 0.0 |
ASSET ALLOCATION (% of Fund's net assets) |
|
|
TOP HOLDINGS (% of Fund's net assets) | | |
| Fidelity Series Total Market Index Fund | 54.2 | |
| Fidelity Series Global ex U.S. Index Fund | 35.9 | |
| Fidelity Series Long-Term Treasury Bond Index Fund | 5.0 | |
| Fidelity Series Bond Index Fund | 4.0 | |
| Fidelity Series International Developed Markets Bond Index Fund | 0.9 | |
| | 100.0 | |
| Fidelity, the Fidelity Investments Logo and all other Fidelity trademarks or service marks used herein are trademarks or service marks of FMR LLC. Any third-party marks that are used herein are trademarks or service marks of their respective owners. © 2024 FMR LLC. All rights reserved. |
| | For additional information about the Fund; including its prospectus, financial information, holdings and proxy information, scan the QR code or visit fundresearch.fidelity.com/prospectus/sec 1.9917123.101 7713-TSRS-1124 |
| |
| | SEMI-ANNUAL SHAREHOLDER REPORT | AS OF SEPTEMBER 30, 2024 | |
| | Fidelity Freedom® Index 2040 Fund Fidelity Freedom® Index 2040 Fund Premier II Class : FAVOX |
| | | |
This semi-annual shareholder report contains information about Fidelity Freedom® Index 2040 Fund for the period August 22, 2024 to September 30, 2024. You can find additional information about the Fund at fundresearch.fidelity.com/prospectus/sec. You can also request this information by contacting us at 1-800-544-3455 or by sending an e-mail to fidfunddocuments@fidelity.com.
What were your Fund costs for the last six months?(based on hypothetical $10,000 investment)
| | Costs of a $10,000 investment | Costs paid as a percentage of a $10,000 investment | |
Premier II Class A | $ 0 B | 0.04% | |
AExpenses for the full reporting period would be higher.
BAmount represents less than $.50
Key Fund Statistics (as of September 30, 2024)
KEY FACTS | | |
| Fund Size | $23,405,059,072 | |
| Number of Holdings | 5 | |
| Portfolio Turnover | 9% | |
What did the Fund invest in?
(as of September 30, 2024)
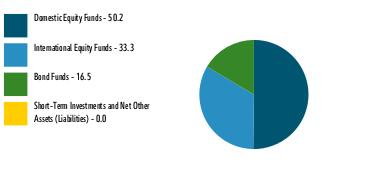
| Domestic Equity Funds | 50.2 |
| International Equity Funds | 33.3 |
| Bond Funds | 16.5 |
| Short-Term Investments and Net Other Assets (Liabilities) | 0.0 |
ASSET ALLOCATION (% of Fund's net assets) |
|
|
TOP HOLDINGS (% of Fund's net assets) | | |
| Fidelity Series Total Market Index Fund | 50.2 | |
| Fidelity Series Global ex U.S. Index Fund | 33.3 | |
| Fidelity Series Bond Index Fund | 9.4 | |
| Fidelity Series Long-Term Treasury Bond Index Fund | 5.0 | |
| Fidelity Series International Developed Markets Bond Index Fund | 2.1 | |
| | 100.0 | |
| Fidelity, the Fidelity Investments Logo and all other Fidelity trademarks or service marks used herein are trademarks or service marks of FMR LLC. Any third-party marks that are used herein are trademarks or service marks of their respective owners. © 2024 FMR LLC. All rights reserved. |
| | For additional information about the Fund; including its prospectus, financial information, holdings and proxy information, scan the QR code or visit fundresearch.fidelity.com/prospectus/sec 1.9917121.101 7712-TSRS-1124 |
| |
| | SEMI-ANNUAL SHAREHOLDER REPORT | AS OF SEPTEMBER 30, 2024 | |
| | Fidelity Freedom® Index 2070 Fund Fidelity Freedom® Index 2070 Fund Premier II Class : FAVWX |
| | | |
This semi-annual shareholder report contains information about Fidelity Freedom® Index 2070 Fund for the period August 22, 2024 to September 30, 2024. You can find additional information about the Fund at fundresearch.fidelity.com/prospectus/sec. You can also request this information by contacting us at 1-800-544-3455 or by sending an e-mail to fidfunddocuments@fidelity.com.
What were your Fund costs for the last six months?(based on hypothetical $10,000 investment)
| | Costs of a $10,000 investment | Costs paid as a percentage of a $10,000 investment | |
Premier II Class A | $ 0 B | 0.04% | |
AExpenses for the full reporting period would be higher.
BAmount represents less than $.50
Key Fund Statistics (as of September 30, 2024)
KEY FACTS | | |
| Fund Size | $2,518,147 | |
| Number of Holdings | 5 | |
Portfolio TurnoverB | 0%A | |
A Amount represents less than 1%
B Amount not annualized
What did the Fund invest in?
(as of September 30, 2024)
| Domestic Equity Funds | 54.2 |
| International Equity Funds | 35.9 |
| Bond Funds | 9.9 |
| Short-Term Investments and Net Other Assets (Liabilities) | 0.0 |
ASSET ALLOCATION (% of Fund's net assets) |
|
|
TOP HOLDINGS (% of Fund's net assets) | | |
| Fidelity Series Total Market Index Fund | 54.2 | |
| Fidelity Series Global ex U.S. Index Fund | 35.9 | |
| Fidelity Series Long-Term Treasury Bond Index Fund | 5.0 | |
| Fidelity Series Bond Index Fund | 4.0 | |
| Fidelity Series International Developed Markets Bond Index Fund | 0.9 | |
| | 100.0 | |
| Fidelity, the Fidelity Investments Logo and all other Fidelity trademarks or service marks used herein are trademarks or service marks of FMR LLC. Any third-party marks that are used herein are trademarks or service marks of their respective owners. © 2024 FMR LLC. All rights reserved. |
| | For additional information about the Fund; including its prospectus, financial information, holdings and proxy information, scan the QR code or visit fundresearch.fidelity.com/prospectus/sec 1.9917133.101 7719-TSRS-1124 |
| |
| | SEMI-ANNUAL SHAREHOLDER REPORT | AS OF SEPTEMBER 30, 2024 | |
| | Fidelity Freedom® Index 2010 Fund Fidelity Freedom® Index 2010 Fund Premier II Class : FATUX |
| | | |
This semi-annual shareholder report contains information about Fidelity Freedom® Index 2010 Fund for the period August 22, 2024 to September 30, 2024. You can find additional information about the Fund at fundresearch.fidelity.com/prospectus/sec. You can also request this information by contacting us at 1-800-544-3455 or by sending an e-mail to fidfunddocuments@fidelity.com.
What were your Fund costs for the last six months?(based on hypothetical $10,000 investment)
| | Costs of a $10,000 investment | Costs paid as a percentage of a $10,000 investment | |
Premier II Class A | $ 0 B | 0.04% | |
AExpenses for the full reporting period would be higher.
BAmount represents less than $.50
Key Fund Statistics (as of September 30, 2024)
KEY FACTS | | |
| Fund Size | $733,849,570 | |
| Number of Holdings | 8 | |
| Portfolio Turnover | 14% | |
What did the Fund invest in?
(as of September 30, 2024)
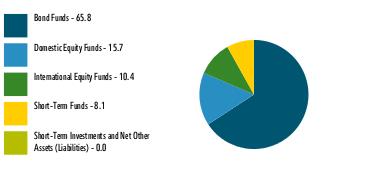
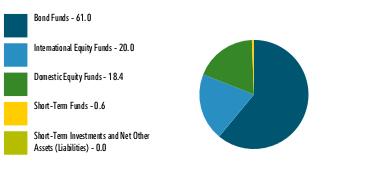
| Bond Funds | 65.8 |
| Domestic Equity Funds | 15.7 |
| International Equity Funds | 10.4 |
| Short-Term Funds | 8.1 |
| Short-Term Investments and Net Other Assets (Liabilities) | 0.0 |
ASSET ALLOCATION (% of Fund's net assets) |
|
|
TOP HOLDINGS (% of Fund's net assets) | | |
| Fidelity Series Bond Index Fund | 40.2 | |
| Fidelity Series Total Market Index Fund | 15.7 | |
| Fidelity Series 0-5 Year Inflation-Protected Bond Index Fund | 15.4 | |
| Fidelity Series Global ex U.S. Index Fund | 10.4 | |
| Fidelity Series Treasury Bill Index Fund | 8.1 | |
| Fidelity Series International Developed Markets Bond Index Fund | 4.9 | |
| Fidelity Series Long-Term Treasury Bond Index Fund | 3.2 | |
| Fidelity Series 5+ Year Inflation-Protected Bond Index Fund | 2.1 | |
| | 100.0 | |
| Fidelity, the Fidelity Investments Logo and all other Fidelity trademarks or service marks used herein are trademarks or service marks of FMR LLC. Any third-party marks that are used herein are trademarks or service marks of their respective owners. © 2024 FMR LLC. All rights reserved. |
| | For additional information about the Fund; including its prospectus, financial information, holdings and proxy information, scan the QR code or visit fundresearch.fidelity.com/prospectus/sec 1.9917109.101 7706-TSRS-1124 |
| |
| | SEMI-ANNUAL SHAREHOLDER REPORT | AS OF SEPTEMBER 30, 2024 | |
| | Fidelity Freedom® Index 2035 Fund Fidelity Freedom® Index 2035 Fund Premier II Class : FAVNX |
| | | |
This semi-annual shareholder report contains information about Fidelity Freedom® Index 2035 Fund for the period August 22, 2024 to September 30, 2024. You can find additional information about the Fund at fundresearch.fidelity.com/prospectus/sec. You can also request this information by contacting us at 1-800-544-3455 or by sending an e-mail to fidfunddocuments@fidelity.com.
What were your Fund costs for the last six months?(based on hypothetical $10,000 investment)
| | Costs of a $10,000 investment | Costs paid as a percentage of a $10,000 investment | |
Premier II Class A | $ 0 B | 0.04% | |
AExpenses for the full reporting period would be higher.
BAmount represents less than $.50
Key Fund Statistics (as of September 30, 2024)
KEY FACTS | | |
| Fund Size | $22,859,083,179 | |
| Number of Holdings | 6 | |
| Portfolio Turnover | 11% | |
What did the Fund invest in?
(as of September 30, 2024)
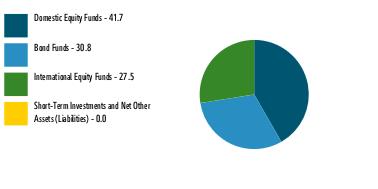
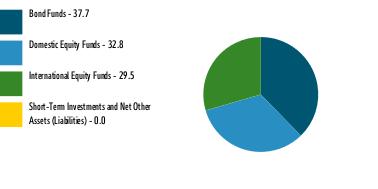
| Domestic Equity Funds | 41.7 |
| Bond Funds | 30.8 |
| International Equity Funds | 27.5 |
| Short-Term Investments and Net Other Assets (Liabilities) | 0.0 |
ASSET ALLOCATION (% of Fund's net assets) |
|
|
TOP HOLDINGS (% of Fund's net assets) | | |
| Fidelity Series Total Market Index Fund | 41.7 | |
| Fidelity Series Global ex U.S. Index Fund | 27.5 | |
| Fidelity Series Bond Index Fund | 20.7 | |
| Fidelity Series Long-Term Treasury Bond Index Fund | 4.9 | |
| Fidelity Series International Developed Markets Bond Index Fund | 4.2 | |
| Fidelity Series 5+ Year Inflation-Protected Bond Index Fund | 1.0 | |
| | 100.0 | |
| Fidelity, the Fidelity Investments Logo and all other Fidelity trademarks or service marks used herein are trademarks or service marks of FMR LLC. Any third-party marks that are used herein are trademarks or service marks of their respective owners. © 2024 FMR LLC. All rights reserved. |
| | For additional information about the Fund; including its prospectus, financial information, holdings and proxy information, scan the QR code or visit fundresearch.fidelity.com/prospectus/sec 1.9917119.101 7711-TSRS-1124 |
| |
| | SEMI-ANNUAL SHAREHOLDER REPORT | AS OF SEPTEMBER 30, 2024 | |
| | Fidelity Freedom® Index Income Fund Fidelity Freedom® Index Income Fund Premier II Class : FATQX |
| | | |
This semi-annual shareholder report contains information about Fidelity Freedom® Index Income Fund for the period August 22, 2024 to September 30, 2024. You can find additional information about the Fund at fundresearch.fidelity.com/prospectus/sec. You can also request this information by contacting us at 1-800-544-3455 or by sending an e-mail to fidfunddocuments@fidelity.com.
What were your Fund costs for the last six months?(based on hypothetical $10,000 investment)
| | Costs of a $10,000 investment | Costs paid as a percentage of a $10,000 investment | |
Premier II Class A | $ 0 B | 0.04% | |
AExpenses for the full reporting period would be higher.
BAmount represents less than $.50
Key Fund Statistics (as of September 30, 2024)
KEY FACTS | | |
| Fund Size | $1,681,067,537 | |
| Number of Holdings | 8 | |
| Portfolio Turnover | 14% | |
What did the Fund invest in?
(as of September 30, 2024)
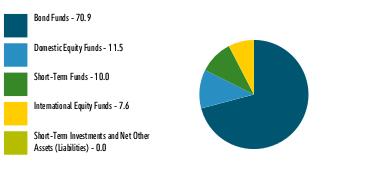
| Bond Funds | 70.9 |
| Domestic Equity Funds | 11.5 |
| Short-Term Funds | 10.0 |
| International Equity Funds | 7.6 |
| Short-Term Investments and Net Other Assets (Liabilities) | 0.0 |
ASSET ALLOCATION (% of Fund's net assets) |
|
|
TOP HOLDINGS (% of Fund's net assets) | | |
| Fidelity Series Bond Index Fund | 43.0 | |
| Fidelity Series 0-5 Year Inflation-Protected Bond Index Fund | 19.9 | |
| Fidelity Series Total Market Index Fund | 11.5 | |
| Fidelity Series Treasury Bill Index Fund | 10.0 | |
| Fidelity Series Global ex U.S. Index Fund | 7.6 | |
| Fidelity Series International Developed Markets Bond Index Fund | 5.0 | |
| Fidelity Series Long-Term Treasury Bond Index Fund | 3.0 | |
| Fidelity Series 5+ Year Inflation-Protected Bond Index Fund | 0.0 | |
| | 100.0 | |
| Fidelity, the Fidelity Investments Logo and all other Fidelity trademarks or service marks used herein are trademarks or service marks of FMR LLC. Any third-party marks that are used herein are trademarks or service marks of their respective owners. © 2024 FMR LLC. All rights reserved. |
| | For additional information about the Fund; including its prospectus, financial information, holdings and proxy information, scan the QR code or visit fundresearch.fidelity.com/prospectus/sec 1.9917107.101 7705-TSRS-1124 |
| |
| | SEMI-ANNUAL SHAREHOLDER REPORT | AS OF SEPTEMBER 30, 2024 | |
| | Fidelity Freedom® Index 2060 Fund Fidelity Freedom® Index 2060 Fund Premier II Class : FAVUX |
| | | |
This semi-annual shareholder report contains information about Fidelity Freedom® Index 2060 Fund for the period August 22, 2024 to September 30, 2024. You can find additional information about the Fund at fundresearch.fidelity.com/prospectus/sec. You can also request this information by contacting us at 1-800-544-3455 or by sending an e-mail to fidfunddocuments@fidelity.com.
What were your Fund costs for the last six months?(based on hypothetical $10,000 investment)
| | Costs of a $10,000 investment | Costs paid as a percentage of a $10,000 investment | |
Premier II Class A | $ 0 B | 0.04% | |
AExpenses for the full reporting period would be higher.
BAmount represents less than $.50
Key Fund Statistics (as of September 30, 2024)
KEY FACTS | | |
| Fund Size | $8,047,655,750 | |
| Number of Holdings | 5 | |
| Portfolio Turnover | 5% | |
What did the Fund invest in?
(as of September 30, 2024)
| Domestic Equity Funds | 54.2 |
| International Equity Funds | 35.9 |
| Bond Funds | 9.9 |
| Short-Term Investments and Net Other Assets (Liabilities) | 0.0 |
ASSET ALLOCATION (% of Fund's net assets) |
|
|
TOP HOLDINGS (% of Fund's net assets) | | |
| Fidelity Series Total Market Index Fund | 54.2 | |
| Fidelity Series Global ex U.S. Index Fund | 35.9 | |
| Fidelity Series Long-Term Treasury Bond Index Fund | 5.0 | |
| Fidelity Series Bond Index Fund | 4.0 | |
| Fidelity Series International Developed Markets Bond Index Fund | 0.9 | |
| | 100.0 | |
| Fidelity, the Fidelity Investments Logo and all other Fidelity trademarks or service marks used herein are trademarks or service marks of FMR LLC. Any third-party marks that are used herein are trademarks or service marks of their respective owners. © 2024 FMR LLC. All rights reserved. |
| | For additional information about the Fund; including its prospectus, financial information, holdings and proxy information, scan the QR code or visit fundresearch.fidelity.com/prospectus/sec 1.9917129.101 7717-TSRS-1124 |
| |
| | SEMI-ANNUAL SHAREHOLDER REPORT | AS OF SEPTEMBER 30, 2024 | |
| | Fidelity Freedom® Index 2030 Fund Fidelity Freedom® Index 2030 Fund Premier II Class : FAUYX |
| | | |
This semi-annual shareholder report contains information about Fidelity Freedom® Index 2030 Fund for the period August 22, 2024 to September 30, 2024. You can find additional information about the Fund at fundresearch.fidelity.com/prospectus/sec. You can also request this information by contacting us at 1-800-544-3455 or by sending an e-mail to fidfunddocuments@fidelity.com.
What were your Fund costs for the last six months?(based on hypothetical $10,000 investment)
| | Costs of a $10,000 investment | Costs paid as a percentage of a $10,000 investment | |
Premier II Class A | $ 0 B | 0.04% | |
AExpenses for the full reporting period would be higher.
BAmount represents less than $.50
Key Fund Statistics (as of September 30, 2024)
KEY FACTS | | |
| Fund Size | $22,274,558,937 | |
| Number of Holdings | 6 | |
| Portfolio Turnover | 10% | |
What did the Fund invest in?
(as of September 30, 2024)
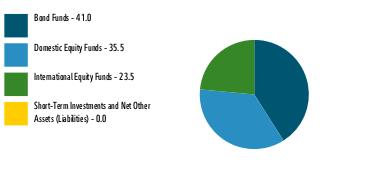
| Bond Funds | 41.0 |
| Domestic Equity Funds | 35.5 |
| International Equity Funds | 23.5 |
| Short-Term Investments and Net Other Assets (Liabilities) | 0.0 |
ASSET ALLOCATION (% of Fund's net assets) |
|
|
TOP HOLDINGS (% of Fund's net assets) | | |
| Fidelity Series Total Market Index Fund | 35.5 | |
| Fidelity Series Bond Index Fund | 26.5 | |
| Fidelity Series Global ex U.S. Index Fund | 23.5 | |
| Fidelity Series 5+ Year Inflation-Protected Bond Index Fund | 5.2 | |
| Fidelity Series International Developed Markets Bond Index Fund | 4.8 | |
| Fidelity Series Long-Term Treasury Bond Index Fund | 4.5 | |
| | 100.0 | |
| Fidelity, the Fidelity Investments Logo and all other Fidelity trademarks or service marks used herein are trademarks or service marks of FMR LLC. Any third-party marks that are used herein are trademarks or service marks of their respective owners. © 2024 FMR LLC. All rights reserved. |
| | For additional information about the Fund; including its prospectus, financial information, holdings and proxy information, scan the QR code or visit fundresearch.fidelity.com/prospectus/sec 1.9917117.101 7710-TSRS-1124 |
| |
| | SEMI-ANNUAL SHAREHOLDER REPORT | AS OF SEPTEMBER 30, 2024 | |
| | Fidelity Freedom® Index 2015 Fund Fidelity Freedom® Index 2015 Fund Premier II Class : FATVX |
| | | |
This semi-annual shareholder report contains information about Fidelity Freedom® Index 2015 Fund for the period August 22, 2024 to September 30, 2024. You can find additional information about the Fund at fundresearch.fidelity.com/prospectus/sec. You can also request this information by contacting us at 1-800-544-3455 or by sending an e-mail to fidfunddocuments@fidelity.com.
What were your Fund costs for the last six months?(based on hypothetical $10,000 investment)
| | Costs of a $10,000 investment | Costs paid as a percentage of a $10,000 investment | |
Premier II Class A | $ 0 B | 0.04% | |
AExpenses for the full reporting period would be higher.
BAmount represents less than $.50
Key Fund Statistics (as of September 30, 2024)
KEY FACTS | | |
| Fund Size | $2,055,460,161 | |
| Number of Holdings | 8 | |
| Portfolio Turnover | 11% | |
What did the Fund invest in?
(as of September 30, 2024)
| Bond Funds | 59.6 |
| Domestic Equity Funds | 21.2 |
| International Equity Funds | 14.0 |
| Short-Term Funds | 5.2 |
| Short-Term Investments and Net Other Assets (Liabilities) | 0.0 |
ASSET ALLOCATION (% of Fund's net assets) |
|
|
TOP HOLDINGS (% of Fund's net assets) | | |
| Fidelity Series Bond Index Fund | 36.7 | |
| Fidelity Series Total Market Index Fund | 21.2 | |
| Fidelity Series Global ex U.S. Index Fund | 14.0 | |
| Fidelity Series 0-5 Year Inflation-Protected Bond Index Fund | 9.8 | |
| Fidelity Series Treasury Bill Index Fund | 5.2 | |
| Fidelity Series International Developed Markets Bond Index Fund | 4.9 | |
| Fidelity Series 5+ Year Inflation-Protected Bond Index Fund | 4.7 | |
| Fidelity Series Long-Term Treasury Bond Index Fund | 3.5 | |
| | 100.0 | |
| Fidelity, the Fidelity Investments Logo and all other Fidelity trademarks or service marks used herein are trademarks or service marks of FMR LLC. Any third-party marks that are used herein are trademarks or service marks of their respective owners. © 2024 FMR LLC. All rights reserved. |
| | For additional information about the Fund; including its prospectus, financial information, holdings and proxy information, scan the QR code or visit fundresearch.fidelity.com/prospectus/sec 1.9917111.101 7707-TSRS-1124 |
| |
| | SEMI-ANNUAL SHAREHOLDER REPORT | AS OF SEPTEMBER 30, 2024 | |
| | Fidelity Freedom® Index 2025 Fund Fidelity Freedom® Index 2025 Fund Premier II Class : FATZX |
| | | |
This semi-annual shareholder report contains information about Fidelity Freedom® Index 2025 Fund for the period August 22, 2024 to September 30, 2024. You can find additional information about the Fund at fundresearch.fidelity.com/prospectus/sec. You can also request this information by contacting us at 1-800-544-3455 or by sending an e-mail to fidfunddocuments@fidelity.com.
What were your Fund costs for the last six months?(based on hypothetical $10,000 investment)
| | Costs of a $10,000 investment | Costs paid as a percentage of a $10,000 investment | |
Premier II Class A | $ 0 B | 0.04% | |
AExpenses for the full reporting period would be higher.
BAmount represents less than $.50
Key Fund Statistics (as of September 30, 2024)
KEY FACTS | | |
| Fund Size | $14,699,618,165 | |
| Number of Holdings | 6 | |
| Portfolio Turnover | 8% | |
What did the Fund invest in?
(as of September 30, 2024)
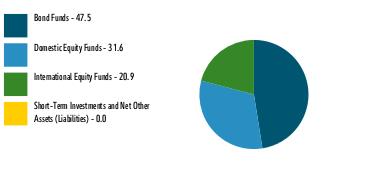
| Bond Funds | 47.5 |
| Domestic Equity Funds | 31.6 |
| International Equity Funds | 20.9 |
| Short-Term Investments and Net Other Assets (Liabilities) | 0.0 |
ASSET ALLOCATION (% of Fund's net assets) |
|
|
TOP HOLDINGS (% of Fund's net assets) | | |
| Fidelity Series Total Market Index Fund | 31.6 | |
| Fidelity Series Bond Index Fund | 29.2 | |
| Fidelity Series Global ex U.S. Index Fund | 20.9 | |
| Fidelity Series 5+ Year Inflation-Protected Bond Index Fund | 9.3 | |
| Fidelity Series International Developed Markets Bond Index Fund | 4.9 | |
| Fidelity Series Long-Term Treasury Bond Index Fund | 4.1 | |
| | 100.0 | |
| Fidelity, the Fidelity Investments Logo and all other Fidelity trademarks or service marks used herein are trademarks or service marks of FMR LLC. Any third-party marks that are used herein are trademarks or service marks of their respective owners. © 2024 FMR LLC. All rights reserved. |
| | For additional information about the Fund; including its prospectus, financial information, holdings and proxy information, scan the QR code or visit fundresearch.fidelity.com/prospectus/sec 1.9917115.101 7709-TSRS-1124 |
| |
| | SEMI-ANNUAL SHAREHOLDER REPORT | AS OF SEPTEMBER 30, 2024 | |
| | Fidelity Freedom® Index 2020 Fund Fidelity Freedom® Index 2020 Fund Premier II Class : FATYX |
| | | |
This semi-annual shareholder report contains information about Fidelity Freedom® Index 2020 Fund for the period August 22, 2024 to September 30, 2024. You can find additional information about the Fund at fundresearch.fidelity.com/prospectus/sec. You can also request this information by contacting us at 1-800-544-3455 or by sending an e-mail to fidfunddocuments@fidelity.com.
What were your Fund costs for the last six months?(based on hypothetical $10,000 investment)
| | Costs of a $10,000 investment | Costs paid as a percentage of a $10,000 investment | |
Premier II Class A | $ 0 B | 0.04% | |
AExpenses for the full reporting period would be higher.
BAmount represents less than $.50
Key Fund Statistics (as of September 30, 2024)
KEY FACTS | | |
| Fund Size | $7,157,854,253 | |
| Number of Holdings | 8 | |
| Portfolio Turnover | 8% | |
What did the Fund invest in?
(as of September 30, 2024)
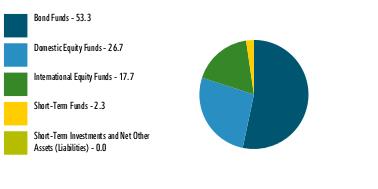
| Bond Funds | 53.3 |
| Domestic Equity Funds | 26.7 |
| International Equity Funds | 17.7 |
| Short-Term Funds | 2.3 |
| Short-Term Investments and Net Other Assets (Liabilities) | 0.0 |
ASSET ALLOCATION (% of Fund's net assets) |
|
|
TOP HOLDINGS (% of Fund's net assets) | | |
| Fidelity Series Bond Index Fund | 33.1 | |
| Fidelity Series Total Market Index Fund | 26.7 | |
| Fidelity Series Global ex U.S. Index Fund | 17.7 | |
| Fidelity Series 5+ Year Inflation-Protected Bond Index Fund | 7.3 | |
| Fidelity Series International Developed Markets Bond Index Fund | 5.0 | |
| Fidelity Series 0-5 Year Inflation-Protected Bond Index Fund | 4.2 | |
| Fidelity Series Long-Term Treasury Bond Index Fund | 3.7 | |
| Fidelity Series Treasury Bill Index Fund | 2.3 | |
| | 100.0 | |
| Fidelity, the Fidelity Investments Logo and all other Fidelity trademarks or service marks used herein are trademarks or service marks of FMR LLC. Any third-party marks that are used herein are trademarks or service marks of their respective owners. © 2024 FMR LLC. All rights reserved. |
| | For additional information about the Fund; including its prospectus, financial information, holdings and proxy information, scan the QR code or visit fundresearch.fidelity.com/prospectus/sec 1.9917113.101 7708-TSRS-1124 |
| |
| | SEMI-ANNUAL SHAREHOLDER REPORT | AS OF SEPTEMBER 30, 2024 | |
| | Fidelity Freedom® Index 2030 Fund Fidelity Freedom® Index 2030 Fund Institutional Premium Class : FFEGX |
| | | |
This semi-annual shareholder report contains information about Fidelity Freedom® Index 2030 Fund for the period April 1, 2024 to September 30, 2024. You can find additional information about the Fund at fundresearch.fidelity.com/prospectus/sec. You can also request this information by contacting us at 1-800-544-8544 or by sending an e-mail to fidfunddocuments@fidelity.com.
What were your Fund costs for the last six months?(based on hypothetical $10,000 investment)
| | Costs of a $10,000 investment | Costs paid as a percentage of a $10,000 investment | |
| Institutional Premium Class | $ 4 | 0.08% | |
Key Fund Statistics (as of September 30, 2024)
KEY FACTS | | |
| Fund Size | $22,274,558,937 | |
| Number of Holdings | 6 | |
| Portfolio Turnover | 10% | |
What did the Fund invest in?
(as of September 30, 2024)
| Bond Funds | 41.0 |
| Domestic Equity Funds | 35.5 |
| International Equity Funds | 23.5 |
| Short-Term Investments and Net Other Assets (Liabilities) | 0.0 |
ASSET ALLOCATION (% of Fund's net assets) |
|
|
TOP HOLDINGS (% of Fund's net assets) | | |
| Fidelity Series Total Market Index Fund | 35.5 | |
| Fidelity Series Bond Index Fund | 26.5 | |
| Fidelity Series Global ex U.S. Index Fund | 23.5 | |
| Fidelity Series 5+ Year Inflation-Protected Bond Index Fund | 5.2 | |
| Fidelity Series International Developed Markets Bond Index Fund | 4.8 | |
| Fidelity Series Long-Term Treasury Bond Index Fund | 4.5 | |
| | 100.0 | |
| Fidelity, the Fidelity Investments Logo and all other Fidelity trademarks or service marks used herein are trademarks or service marks of FMR LLC. Any third-party marks that are used herein are trademarks or service marks of their respective owners. © 2024 FMR LLC. All rights reserved. |
| | For additional information about the Fund; including its prospectus, financial information, holdings and proxy information, scan the QR code or visit fundresearch.fidelity.com/prospectus/sec 1.9914720.100 2770-TSRS-1124 |
| |
| | SEMI-ANNUAL SHAREHOLDER REPORT | AS OF SEPTEMBER 30, 2024 | |
| | Fidelity Flex® Freedom Blend 2040 Fund Fidelity Flex® Freedom Blend 2040 Fund : FCLSX |
| | | |
This semi-annual shareholder report contains information about Fidelity Flex® Freedom Blend 2040 Fund for the period April 1, 2024 to September 30, 2024. You can find additional information about the Fund at fundresearch.fidelity.com/prospectus/sec. You can also request this information by contacting us at 1-800-544-3455 or by sending an e-mail to fidfunddocuments@fidelity.com.
What were your Fund costs for the last six months?(based on hypothetical $10,000 investment)
| | Costs of a $10,000 investment | Costs paid as a percentage of a $10,000 investment | |
| Fidelity Flex® Freedom Blend 2040 Fund | $ 0 A | 0.00%B | |
A Amount represents less than $.50
B Amount represents less than 0.005%
Key Fund Statistics (as of September 30, 2024)
KEY FACTS | | |
| Fund Size | $69,470,313 | |
| Number of Holdings | 30 | |
| Portfolio Turnover | 38% | |
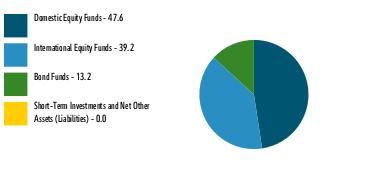
What did the Fund invest in?
(as of September 30, 2024)
| Domestic Equity Funds | 47.6 |
| International Equity Funds | 39.2 |
| Bond Funds | 13.2 |
| Short-Term Investments and Net Other Assets (Liabilities) | 0.0 |
ASSET ALLOCATION (% of Fund's net assets) |
|
|
TOP HOLDINGS (% of Fund's net assets) | | |
| Fidelity Series Large Cap Value Index Fund | 13.3 | |
| Fidelity Series Blue Chip Growth Fund | 10.9 | |
| Fidelity Series Emerging Markets Opportunities Fund | 10.5 | |
| Fidelity Series Long-Term Treasury Bond Index Fund | 7.3 | |
| Fidelity Series Large Cap Growth Index Fund | 7.1 | |
| Fidelity Series International Value Fund | 6.5 | |
| Fidelity Series Overseas Fund | 6.5 | |
| Fidelity Series International Growth Fund | 6.5 | |
| Fidelity Series Large Cap Stock Fund | 6.4 | |
| Fidelity Series Value Discovery Fund | 4.6 | |
| | 79.6 | |
| Fidelity, the Fidelity Investments Logo and all other Fidelity trademarks or service marks used herein are trademarks or service marks of FMR LLC. Any third-party marks that are used herein are trademarks or service marks of their respective owners. © 2024 FMR LLC. All rights reserved. |
| | For additional information about the Fund; including its prospectus, financial information, holdings and proxy information, scan the QR code or visit fundresearch.fidelity.com/prospectus/sec 1.9914769.100 2909-TSRS-1124 |
| |
| | SEMI-ANNUAL SHAREHOLDER REPORT | AS OF SEPTEMBER 30, 2024 | |
| | Fidelity Freedom® Index 2015 Fund Fidelity Freedom® Index 2015 Fund Investor Class : FLIFX |
| | | |
This semi-annual shareholder report contains information about Fidelity Freedom® Index 2015 Fund for the period April 1, 2024 to September 30, 2024. You can find additional information about the Fund at fundresearch.fidelity.com/prospectus/sec. You can also request this information by contacting us at 1-800-544-8544 or by sending an e-mail to fidfunddocuments@fidelity.com.
What were your Fund costs for the last six months?(based on hypothetical $10,000 investment)
| | Costs of a $10,000 investment | Costs paid as a percentage of a $10,000 investment | |
| Investor Class | $ 6 | 0.12% | |
Key Fund Statistics (as of September 30, 2024)
KEY FACTS | | |
| Fund Size | $2,055,460,161 | |
| Number of Holdings | 8 | |
| Portfolio Turnover | 11% | |
What did the Fund invest in?
(as of September 30, 2024)
| Bond Funds | 59.6 |
| Domestic Equity Funds | 21.2 |
| International Equity Funds | 14.0 |
| Short-Term Funds | 5.2 |
| Short-Term Investments and Net Other Assets (Liabilities) | 0.0 |
ASSET ALLOCATION (% of Fund's net assets) |
|
|
TOP HOLDINGS (% of Fund's net assets) | | |
| Fidelity Series Bond Index Fund | 36.7 | |
| Fidelity Series Total Market Index Fund | 21.2 | |
| Fidelity Series Global ex U.S. Index Fund | 14.0 | |
| Fidelity Series 0-5 Year Inflation-Protected Bond Index Fund | 9.8 | |
| Fidelity Series Treasury Bill Index Fund | 5.2 | |
| Fidelity Series International Developed Markets Bond Index Fund | 4.9 | |
| Fidelity Series 5+ Year Inflation-Protected Bond Index Fund | 4.7 | |
| Fidelity Series Long-Term Treasury Bond Index Fund | 3.5 | |
| | 100.0 | |
| Fidelity, the Fidelity Investments Logo and all other Fidelity trademarks or service marks used herein are trademarks or service marks of FMR LLC. Any third-party marks that are used herein are trademarks or service marks of their respective owners. © 2024 FMR LLC. All rights reserved. |
| | For additional information about the Fund; including its prospectus, financial information, holdings and proxy information, scan the QR code or visit fundresearch.fidelity.com/prospectus/sec 1.9914734.100 2242-TSRS-1124 |
| |
| | SEMI-ANNUAL SHAREHOLDER REPORT | AS OF SEPTEMBER 30, 2024 | |
| | Fidelity Flex® Freedom Blend 2045 Fund Fidelity Flex® Freedom Blend 2045 Fund : FOLSX |
| | | |
This semi-annual shareholder report contains information about Fidelity Flex® Freedom Blend 2045 Fund for the period April 1, 2024 to September 30, 2024. You can find additional information about the Fund at fundresearch.fidelity.com/prospectus/sec. You can also request this information by contacting us at 1-800-544-3455 or by sending an e-mail to fidfunddocuments@fidelity.com.
What were your Fund costs for the last six months?(based on hypothetical $10,000 investment)
| | Costs of a $10,000 investment | Costs paid as a percentage of a $10,000 investment | |
| Fidelity Flex® Freedom Blend 2045 Fund | $ 0 A | 0.00%B | |
A Amount represents less than $.50
B Amount represents less than 0.005%
Key Fund Statistics (as of September 30, 2024)
KEY FACTS | | |
| Fund Size | $74,664,722 | |
| Number of Holdings | 28 | |
| Portfolio Turnover | 26% | |
What did the Fund invest in?
(as of September 30, 2024)
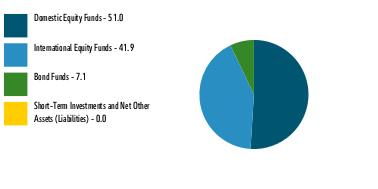
| Domestic Equity Funds | 51.0 |
| International Equity Funds | 41.9 |
| Bond Funds | 7.1 |
| Short-Term Investments and Net Other Assets (Liabilities) | 0.0 |
ASSET ALLOCATION (% of Fund's net assets) |
|
|
TOP HOLDINGS (% of Fund's net assets) | | |
| Fidelity Series Large Cap Value Index Fund | 14.2 | |
| Fidelity Series Blue Chip Growth Fund | 11.7 | |
| Fidelity Series Emerging Markets Opportunities Fund | 11.1 | |
| Fidelity Series Large Cap Growth Index Fund | 7.6 | |
| Fidelity Series International Value Fund | 7.0 | |
| Fidelity Series Overseas Fund | 7.0 | |
| Fidelity Series International Growth Fund | 7.0 | |
| Fidelity Series Large Cap Stock Fund | 6.8 | |
| Fidelity Series Long-Term Treasury Bond Index Fund | 5.5 | |
| Fidelity Series Value Discovery Fund | 4.9 | |
| | 82.8 | |
| Fidelity, the Fidelity Investments Logo and all other Fidelity trademarks or service marks used herein are trademarks or service marks of FMR LLC. Any third-party marks that are used herein are trademarks or service marks of their respective owners. © 2024 FMR LLC. All rights reserved. |
| | For additional information about the Fund; including its prospectus, financial information, holdings and proxy information, scan the QR code or visit fundresearch.fidelity.com/prospectus/sec 1.9914770.100 2910-TSRS-1124 |
| |
| | SEMI-ANNUAL SHAREHOLDER REPORT | AS OF SEPTEMBER 30, 2024 | |
| | Fidelity Freedom® Index 2070 Fund Fidelity Freedom® Index 2070 Fund Investor Class : FRBVX |
| | | |
This semi-annual shareholder report contains information about Fidelity Freedom® Index 2070 Fund for the period June 28, 2024 to September 30, 2024. You can find additional information about the Fund at fundresearch.fidelity.com/prospectus/sec. You can also request this information by contacting us at 1-800-544-8544 or by sending an e-mail to fidfunddocuments@fidelity.com.
What were your Fund costs for the last six months?(based on hypothetical $10,000 investment)
| | Costs of a $10,000 investment | Costs paid as a percentage of a $10,000 investment | |
Investor Class A | $ 3 | 0.12% | |
AExpenses for the full reporting period would be higher.
Key Fund Statistics (as of September 30, 2024)
KEY FACTS | | |
| Fund Size | $2,518,147 | |
| Number of Holdings | 5 | |
Portfolio TurnoverB | 0%A | |
A Amount represents less than 1%
B Amount not annualized
What did the Fund invest in?
(as of September 30, 2024)
| Domestic Equity Funds | 54.2 |
| International Equity Funds | 35.9 |
| Bond Funds | 9.9 |
| Short-Term Investments and Net Other Assets (Liabilities) | 0.0 |
ASSET ALLOCATION (% of Fund's net assets) |
|
|
TOP HOLDINGS (% of Fund's net assets) | | |
| Fidelity Series Total Market Index Fund | 54.2 | |
| Fidelity Series Global ex U.S. Index Fund | 35.9 | |
| Fidelity Series Long-Term Treasury Bond Index Fund | 5.0 | |
| Fidelity Series Bond Index Fund | 4.0 | |
| Fidelity Series International Developed Markets Bond Index Fund | 0.9 | |
| | 100.0 | |
| Fidelity, the Fidelity Investments Logo and all other Fidelity trademarks or service marks used herein are trademarks or service marks of FMR LLC. Any third-party marks that are used herein are trademarks or service marks of their respective owners. © 2024 FMR LLC. All rights reserved. |
| | For additional information about the Fund; including its prospectus, financial information, holdings and proxy information, scan the QR code or visit fundresearch.fidelity.com/prospectus/sec 1.9918271.100 7653-TSRS-1124 |
| |
| | SEMI-ANNUAL SHAREHOLDER REPORT | AS OF SEPTEMBER 30, 2024 | |
| | Fidelity Freedom® Index 2020 Fund Fidelity Freedom® Index 2020 Fund Institutional Premium Class : FIWTX |
| | | |
This semi-annual shareholder report contains information about Fidelity Freedom® Index 2020 Fund for the period April 1, 2024 to September 30, 2024. You can find additional information about the Fund at fundresearch.fidelity.com/prospectus/sec. You can also request this information by contacting us at 1-800-544-8544 or by sending an e-mail to fidfunddocuments@fidelity.com.
What were your Fund costs for the last six months?(based on hypothetical $10,000 investment)
| | Costs of a $10,000 investment | Costs paid as a percentage of a $10,000 investment | |
| Institutional Premium Class | $ 4 | 0.08% | |
Key Fund Statistics (as of September 30, 2024)
KEY FACTS | | |
| Fund Size | $7,157,854,253 | |
| Number of Holdings | 8 | |
| Portfolio Turnover | 8% | |
What did the Fund invest in?
(as of September 30, 2024)
| Bond Funds | 53.3 |
| Domestic Equity Funds | 26.7 |
| International Equity Funds | 17.7 |
| Short-Term Funds | 2.3 |
| Short-Term Investments and Net Other Assets (Liabilities) | 0.0 |
ASSET ALLOCATION (% of Fund's net assets) |
|
|
TOP HOLDINGS (% of Fund's net assets) | | |
| Fidelity Series Bond Index Fund | 33.1 | |
| Fidelity Series Total Market Index Fund | 26.7 | |
| Fidelity Series Global ex U.S. Index Fund | 17.7 | |
| Fidelity Series 5+ Year Inflation-Protected Bond Index Fund | 7.3 | |
| Fidelity Series International Developed Markets Bond Index Fund | 5.0 | |
| Fidelity Series 0-5 Year Inflation-Protected Bond Index Fund | 4.2 | |
| Fidelity Series Long-Term Treasury Bond Index Fund | 3.7 | |
| Fidelity Series Treasury Bill Index Fund | 2.3 | |
| | 100.0 | |
| Fidelity, the Fidelity Investments Logo and all other Fidelity trademarks or service marks used herein are trademarks or service marks of FMR LLC. Any third-party marks that are used herein are trademarks or service marks of their respective owners. © 2024 FMR LLC. All rights reserved. |
| | For additional information about the Fund; including its prospectus, financial information, holdings and proxy information, scan the QR code or visit fundresearch.fidelity.com/prospectus/sec 1.9914714.100 2768-TSRS-1124 |
| |
| | SEMI-ANNUAL SHAREHOLDER REPORT | AS OF SEPTEMBER 30, 2024 | |
| | Fidelity Freedom® Index 2020 Fund Fidelity Freedom® Index 2020 Fund Investor Class : FPIFX |
| | | |
This semi-annual shareholder report contains information about Fidelity Freedom® Index 2020 Fund for the period April 1, 2024 to September 30, 2024. You can find additional information about the Fund at fundresearch.fidelity.com/prospectus/sec. You can also request this information by contacting us at 1-800-544-8544 or by sending an e-mail to fidfunddocuments@fidelity.com.
What were your Fund costs for the last six months?(based on hypothetical $10,000 investment)
| | Costs of a $10,000 investment | Costs paid as a percentage of a $10,000 investment | |
| Investor Class | $ 6 | 0.12% | |
Key Fund Statistics (as of September 30, 2024)
KEY FACTS | | |
| Fund Size | $7,157,854,253 | |
| Number of Holdings | 8 | |
| Portfolio Turnover | 8% | |
What did the Fund invest in?
(as of September 30, 2024)
| Bond Funds | 53.3 |
| Domestic Equity Funds | 26.7 |
| International Equity Funds | 17.7 |
| Short-Term Funds | 2.3 |
| Short-Term Investments and Net Other Assets (Liabilities) | 0.0 |
ASSET ALLOCATION (% of Fund's net assets) |
|
|
TOP HOLDINGS (% of Fund's net assets) | | |
| Fidelity Series Bond Index Fund | 33.1 | |
| Fidelity Series Total Market Index Fund | 26.7 | |
| Fidelity Series Global ex U.S. Index Fund | 17.7 | |
| Fidelity Series 5+ Year Inflation-Protected Bond Index Fund | 7.3 | |
| Fidelity Series International Developed Markets Bond Index Fund | 5.0 | |
| Fidelity Series 0-5 Year Inflation-Protected Bond Index Fund | 4.2 | |
| Fidelity Series Long-Term Treasury Bond Index Fund | 3.7 | |
| Fidelity Series Treasury Bill Index Fund | 2.3 | |
| | 100.0 | |
| Fidelity, the Fidelity Investments Logo and all other Fidelity trademarks or service marks used herein are trademarks or service marks of FMR LLC. Any third-party marks that are used herein are trademarks or service marks of their respective owners. © 2024 FMR LLC. All rights reserved. |
| | For additional information about the Fund; including its prospectus, financial information, holdings and proxy information, scan the QR code or visit fundresearch.fidelity.com/prospectus/sec 1.9914713.100 2228-TSRS-1124 |
| |
| | SEMI-ANNUAL SHAREHOLDER REPORT | AS OF SEPTEMBER 30, 2024 | |
| | Fidelity Freedom® Index 2055 Fund Fidelity Freedom® Index 2055 Fund Institutional Premium Class : FFLDX |
| | | |
This semi-annual shareholder report contains information about Fidelity Freedom® Index 2055 Fund for the period April 1, 2024 to September 30, 2024. You can find additional information about the Fund at fundresearch.fidelity.com/prospectus/sec. You can also request this information by contacting us at 1-800-544-8544 or by sending an e-mail to fidfunddocuments@fidelity.com.
What were your Fund costs for the last six months?(based on hypothetical $10,000 investment)
| | Costs of a $10,000 investment | Costs paid as a percentage of a $10,000 investment | |
| Institutional Premium Class | $ 4 | 0.08% | |
Key Fund Statistics (as of September 30, 2024)
KEY FACTS | | |
| Fund Size | $14,448,762,506 | |
| Number of Holdings | 5 | |
| Portfolio Turnover | 6% | |
What did the Fund invest in?
(as of September 30, 2024)
| Domestic Equity Funds | 54.2 |
| International Equity Funds | 35.9 |
| Bond Funds | 9.9 |
| Short-Term Investments and Net Other Assets (Liabilities) | 0.0 |
ASSET ALLOCATION (% of Fund's net assets) |
|
|
TOP HOLDINGS (% of Fund's net assets) | | |
| Fidelity Series Total Market Index Fund | 54.2 | |
| Fidelity Series Global ex U.S. Index Fund | 35.9 | |
| Fidelity Series Long-Term Treasury Bond Index Fund | 5.0 | |
| Fidelity Series Bond Index Fund | 4.0 | |
| Fidelity Series International Developed Markets Bond Index Fund | 0.9 | |
| | 100.0 | |
| Fidelity, the Fidelity Investments Logo and all other Fidelity trademarks or service marks used herein are trademarks or service marks of FMR LLC. Any third-party marks that are used herein are trademarks or service marks of their respective owners. © 2024 FMR LLC. All rights reserved. |
| | For additional information about the Fund; including its prospectus, financial information, holdings and proxy information, scan the QR code or visit fundresearch.fidelity.com/prospectus/sec 1.9914747.100 2775-TSRS-1124 |
| |
| | SEMI-ANNUAL SHAREHOLDER REPORT | AS OF SEPTEMBER 30, 2024 | |
| | Fidelity Freedom® Index 2060 Fund Fidelity Freedom® Index 2060 Fund Investor Class : FDKLX |
| | | |
This semi-annual shareholder report contains information about Fidelity Freedom® Index 2060 Fund for the period April 1, 2024 to September 30, 2024. You can find additional information about the Fund at fundresearch.fidelity.com/prospectus/sec. You can also request this information by contacting us at 1-800-544-8544 or by sending an e-mail to fidfunddocuments@fidelity.com.
What were your Fund costs for the last six months?(based on hypothetical $10,000 investment)
| | Costs of a $10,000 investment | Costs paid as a percentage of a $10,000 investment | |
| Investor Class | $ 6 | 0.12% | |
Key Fund Statistics (as of September 30, 2024)
KEY FACTS | | |
| Fund Size | $8,047,655,750 | |
| Number of Holdings | 5 | |
| Portfolio Turnover | 5% | |
What did the Fund invest in?
(as of September 30, 2024)
| Domestic Equity Funds | 54.2 |
| International Equity Funds | 35.9 |
| Bond Funds | 9.9 |
| Short-Term Investments and Net Other Assets (Liabilities) | 0.0 |
ASSET ALLOCATION (% of Fund's net assets) |
|
|
TOP HOLDINGS (% of Fund's net assets) | | |
| Fidelity Series Total Market Index Fund | 54.2 | |
| Fidelity Series Global ex U.S. Index Fund | 35.9 | |
| Fidelity Series Long-Term Treasury Bond Index Fund | 5.0 | |
| Fidelity Series Bond Index Fund | 4.0 | |
| Fidelity Series International Developed Markets Bond Index Fund | 0.9 | |
| | 100.0 | |
| Fidelity, the Fidelity Investments Logo and all other Fidelity trademarks or service marks used herein are trademarks or service marks of FMR LLC. Any third-party marks that are used herein are trademarks or service marks of their respective owners. © 2024 FMR LLC. All rights reserved. |
| | For additional information about the Fund; including its prospectus, financial information, holdings and proxy information, scan the QR code or visit fundresearch.fidelity.com/prospectus/sec 1.9914758.100 2714-TSRS-1124 |
| |
| | SEMI-ANNUAL SHAREHOLDER REPORT | AS OF SEPTEMBER 30, 2024 | |
| | Fidelity Freedom® Index 2065 Fund Fidelity Freedom® Index 2065 Fund Institutional Premium Class : FFIKX |
| | | |
This semi-annual shareholder report contains information about Fidelity Freedom® Index 2065 Fund for the period April 1, 2024 to September 30, 2024. You can find additional information about the Fund at fundresearch.fidelity.com/prospectus/sec. You can also request this information by contacting us at 1-800-544-8544 or by sending an e-mail to fidfunddocuments@fidelity.com.
What were your Fund costs for the last six months?(based on hypothetical $10,000 investment)
| | Costs of a $10,000 investment | Costs paid as a percentage of a $10,000 investment | |
| Institutional Premium Class | $ 4 | 0.08% | |
Key Fund Statistics (as of September 30, 2024)
KEY FACTS | | |
| Fund Size | $2,413,130,862 | |
| Number of Holdings | 6 | |
| Portfolio Turnover | 4% | |
What did the Fund invest in?
(as of September 30, 2024)
| Domestic Equity Funds | 54.2 |
| International Equity Funds | 35.9 |
| Bond Funds | 9.9 |
| Short-Term Investments and Net Other Assets (Liabilities) | 0.0 |
ASSET ALLOCATION (% of Fund's net assets) |
|
|
TOP HOLDINGS (% of Fund's net assets) | | |
| Fidelity Series Total Market Index Fund | 54.2 | |
| Fidelity Series Global ex U.S. Index Fund | 35.9 | |
| Fidelity Series Long-Term Treasury Bond Index Fund | 5.0 | |
| Fidelity Series Bond Index Fund | 4.0 | |
| Fidelity Series International Developed Markets Bond Index Fund | 0.9 | |
| | 100.0 | |
| Fidelity, the Fidelity Investments Logo and all other Fidelity trademarks or service marks used herein are trademarks or service marks of FMR LLC. Any third-party marks that are used herein are trademarks or service marks of their respective owners. © 2024 FMR LLC. All rights reserved. |
| | For additional information about the Fund; including its prospectus, financial information, holdings and proxy information, scan the QR code or visit fundresearch.fidelity.com/prospectus/sec 1.9914926.100 3427-TSRS-1124 |
| |
| | SEMI-ANNUAL SHAREHOLDER REPORT | AS OF SEPTEMBER 30, 2024 | |
| | Fidelity Flex® Freedom Blend 2010 Fund Fidelity Flex® Freedom Blend 2010 Fund : FISNX |
| | | |
This semi-annual shareholder report contains information about Fidelity Flex® Freedom Blend 2010 Fund for the period April 1, 2024 to September 30, 2024. You can find additional information about the Fund at fundresearch.fidelity.com/prospectus/sec. You can also request this information by contacting us at 1-800-544-3455 or by sending an e-mail to fidfunddocuments@fidelity.com.
What were your Fund costs for the last six months?(based on hypothetical $10,000 investment)
| | Costs of a $10,000 investment | Costs paid as a percentage of a $10,000 investment | |
| Fidelity Flex® Freedom Blend 2010 Fund | $ 0 A | 0.00%B | |
A Amount represents less than $.50
B Amount represents less than 0.005%
Key Fund Statistics (as of September 30, 2024)
KEY FACTS | | |
| Fund Size | $2,638,576 | |
| Number of Holdings | 33 | |
| Portfolio Turnover | 25% | |
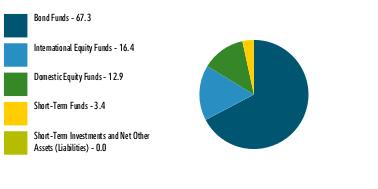
What did the Fund invest in?
(as of September 30, 2024)
| Bond Funds | 67.3 |
| International Equity Funds | 16.4 |
| Domestic Equity Funds | 12.9 |
| Short-Term Funds | 3.4 |
| Short-Term Investments and Net Other Assets (Liabilities) | 0.0 |
ASSET ALLOCATION (% of Fund's net assets) |
|
|
TOP HOLDINGS (% of Fund's net assets) | | |
| Fidelity Series 0-5 Year Inflation-Protected Bond Index Fund | 16.2 | |
| Fidelity Series Government Bond Index Fund | 12.5 | |
| Fidelity Series Investment Grade Bond Fund | 12.0 | |
| Fidelity Series Corporate Bond Fund | 7.9 | |
| Fidelity Series Investment Grade Securitized Fund | 7.7 | |
| Fidelity Series Emerging Markets Opportunities Fund | 5.0 | |
| Fidelity Series International Developed Markets Bond Index Fund | 4.0 | |
| Fidelity Series Large Cap Value Index Fund | 3.6 | |
| Fidelity Series Blue Chip Growth Fund | 3.0 | |
| Fidelity Series Long-Term Treasury Bond Index Fund | 2.9 | |
| | 74.8 | |
| Fidelity, the Fidelity Investments Logo and all other Fidelity trademarks or service marks used herein are trademarks or service marks of FMR LLC. Any third-party marks that are used herein are trademarks or service marks of their respective owners. © 2024 FMR LLC. All rights reserved. |
| | For additional information about the Fund; including its prospectus, financial information, holdings and proxy information, scan the QR code or visit fundresearch.fidelity.com/prospectus/sec 1.9914763.100 2903-TSRS-1124 |
| |
| | SEMI-ANNUAL SHAREHOLDER REPORT | AS OF SEPTEMBER 30, 2024 | |
| | Fidelity Freedom® Index 2035 Fund Fidelity Freedom® Index 2035 Fund Institutional Premium Class : FFEZX |
| | | |
This semi-annual shareholder report contains information about Fidelity Freedom® Index 2035 Fund for the period April 1, 2024 to September 30, 2024. You can find additional information about the Fund at fundresearch.fidelity.com/prospectus/sec. You can also request this information by contacting us at 1-800-544-8544 or by sending an e-mail to fidfunddocuments@fidelity.com.
What were your Fund costs for the last six months?(based on hypothetical $10,000 investment)
| | Costs of a $10,000 investment | Costs paid as a percentage of a $10,000 investment | |
| Institutional Premium Class | $ 4 | 0.08% | |
Key Fund Statistics (as of September 30, 2024)
KEY FACTS | | |
| Fund Size | $22,859,083,179 | |
| Number of Holdings | 6 | |
| Portfolio Turnover | 11% | |
What did the Fund invest in?
(as of September 30, 2024)
| Domestic Equity Funds | 41.7 |
| Bond Funds | 30.8 |
| International Equity Funds | 27.5 |
| Short-Term Investments and Net Other Assets (Liabilities) | 0.0 |
ASSET ALLOCATION (% of Fund's net assets) |
|
|
TOP HOLDINGS (% of Fund's net assets) | | |
| Fidelity Series Total Market Index Fund | 41.7 | |
| Fidelity Series Global ex U.S. Index Fund | 27.5 | |
| Fidelity Series Bond Index Fund | 20.7 | |
| Fidelity Series Long-Term Treasury Bond Index Fund | 4.9 | |
| Fidelity Series International Developed Markets Bond Index Fund | 4.2 | |
| Fidelity Series 5+ Year Inflation-Protected Bond Index Fund | 1.0 | |
| | 100.0 | |
| Fidelity, the Fidelity Investments Logo and all other Fidelity trademarks or service marks used herein are trademarks or service marks of FMR LLC. Any third-party marks that are used herein are trademarks or service marks of their respective owners. © 2024 FMR LLC. All rights reserved. |
| | For additional information about the Fund; including its prospectus, financial information, holdings and proxy information, scan the QR code or visit fundresearch.fidelity.com/prospectus/sec 1.9914723.100 2771-TSRS-1124 |
| |
| | SEMI-ANNUAL SHAREHOLDER REPORT | AS OF SEPTEMBER 30, 2024 | |
| | Fidelity Flex® Freedom Blend 2070 Fund Fidelity Flex® Freedom Blend 2070 Fund : FRBQX |
| | | |
This semi-annual shareholder report contains information about Fidelity Flex® Freedom Blend 2070 Fund for the period June 28, 2024 to September 30, 2024. You can find additional information about the Fund at fundresearch.fidelity.com/prospectus/sec. You can also request this information by contacting us at 1-800-544-8544 or by sending an e-mail to fidfunddocuments@fidelity.com.
What were your Fund costs for the last six months?(based on hypothetical $10,000 investment)
| | Costs of a $10,000 investment | Costs paid as a percentage of a $10,000 investment | |
Fidelity Flex® Freedom Blend 2070 Fund A | $ 0 B | 0.00%C | |
A Expenses for the full reporting period would be higher.
B Amount represents less than $.50
C Amount represents less than 0.005%
Key Fund Statistics (as of September 30, 2024)
KEY FACTS | | |
| Fund Size | $2,034,592 | |
| Number of Holdings | 26 | |
Portfolio TurnoverA | 7% | |
A Amount not annualized
What did the Fund invest in?
(as of September 30, 2024)
| Domestic Equity Funds | 51.0 |
| International Equity Funds | 41.9 |
| Bond Funds | 7.1 |
| Short-Term Investments and Net Other Assets (Liabilities) | 0.0 |
ASSET ALLOCATION (% of Fund's net assets) |
|
|
TOP HOLDINGS (% of Fund's net assets) | | |
| Fidelity Series Large Cap Value Index Fund | 14.2 | |
| Fidelity Series Blue Chip Growth Fund | 11.7 | |
| Fidelity Series Emerging Markets Opportunities Fund | 11.1 | |
| Fidelity Series Large Cap Growth Index Fund | 7.6 | |
| Fidelity Series International Value Fund | 7.0 | |
| Fidelity Series Overseas Fund | 7.0 | |
| Fidelity Series International Growth Fund | 7.0 | |
| Fidelity Series Large Cap Stock Fund | 6.8 | |
| Fidelity Series Long-Term Treasury Bond Index Fund | 5.5 | |
| Fidelity Series Value Discovery Fund | 4.9 | |
| | 82.8 | |
| Fidelity, the Fidelity Investments Logo and all other Fidelity trademarks or service marks used herein are trademarks or service marks of FMR LLC. Any third-party marks that are used herein are trademarks or service marks of their respective owners. © 2024 FMR LLC. All rights reserved. |
| | For additional information about the Fund; including its prospectus, financial information, holdings and proxy information, scan the QR code or visit fundresearch.fidelity.com/prospectus/sec 1.9918265.100 7649-TSRS-1124 |
| |
| | SEMI-ANNUAL SHAREHOLDER REPORT | AS OF SEPTEMBER 30, 2024 | |
| | Fidelity Freedom® Index 2065 Fund Fidelity Freedom® Index 2065 Fund Premier Class : FVIPX |
| | | |
This semi-annual shareholder report contains information about Fidelity Freedom® Index 2065 Fund for the period April 1, 2024 to September 30, 2024. You can find additional information about the Fund at fundresearch.fidelity.com/prospectus/sec. You can also request this information by contacting us at 1-800-544-3455 or by sending an e-mail to fidfunddocuments@fidelity.com.
What were your Fund costs for the last six months?(based on hypothetical $10,000 investment)
| | Costs of a $10,000 investment | Costs paid as a percentage of a $10,000 investment | |
| Premier Class | $ 3 | 0.05% | |
Key Fund Statistics (as of September 30, 2024)
KEY FACTS | | |
| Fund Size | $2,413,130,862 | |
| Number of Holdings | 6 | |
| Portfolio Turnover | 4% | |
What did the Fund invest in?
(as of September 30, 2024)
| Domestic Equity Funds | 54.2 |
| International Equity Funds | 35.9 |
| Bond Funds | 9.9 |
| Short-Term Investments and Net Other Assets (Liabilities) | 0.0 |
ASSET ALLOCATION (% of Fund's net assets) |
|
|
TOP HOLDINGS (% of Fund's net assets) | | |
| Fidelity Series Total Market Index Fund | 54.2 | |
| Fidelity Series Global ex U.S. Index Fund | 35.9 | |
| Fidelity Series Long-Term Treasury Bond Index Fund | 5.0 | |
| Fidelity Series Bond Index Fund | 4.0 | |
| Fidelity Series International Developed Markets Bond Index Fund | 0.9 | |
| | 100.0 | |
| Fidelity, the Fidelity Investments Logo and all other Fidelity trademarks or service marks used herein are trademarks or service marks of FMR LLC. Any third-party marks that are used herein are trademarks or service marks of their respective owners. © 2024 FMR LLC. All rights reserved. |
| | For additional information about the Fund; including its prospectus, financial information, holdings and proxy information, scan the QR code or visit fundresearch.fidelity.com/prospectus/sec 1.9914928.100 6204-TSRS-1124 |
| |
| | SEMI-ANNUAL SHAREHOLDER REPORT | AS OF SEPTEMBER 30, 2024 | |
| | Fidelity Freedom® Index 2045 Fund Fidelity Freedom® Index 2045 Fund Investor Class : FIOFX |
| | | |
This semi-annual shareholder report contains information about Fidelity Freedom® Index 2045 Fund for the period April 1, 2024 to September 30, 2024. You can find additional information about the Fund at fundresearch.fidelity.com/prospectus/sec. You can also request this information by contacting us at 1-800-544-8544 or by sending an e-mail to fidfunddocuments@fidelity.com.
What were your Fund costs for the last six months?(based on hypothetical $10,000 investment)
| | Costs of a $10,000 investment | Costs paid as a percentage of a $10,000 investment | |
| Investor Class | $ 6 | 0.12% | |
Key Fund Statistics (as of September 30, 2024)
KEY FACTS | | |
| Fund Size | $20,629,221,628 | |
| Number of Holdings | 5 | |
| Portfolio Turnover | 8% | |
What did the Fund invest in?
(as of September 30, 2024)
| Domestic Equity Funds | 54.2 |
| International Equity Funds | 35.9 |
| Bond Funds | 9.9 |
| Short-Term Investments and Net Other Assets (Liabilities) | 0.0 |
ASSET ALLOCATION (% of Fund's net assets) |
|
|
TOP HOLDINGS (% of Fund's net assets) | | |
| Fidelity Series Total Market Index Fund | 54.2 | |
| Fidelity Series Global ex U.S. Index Fund | 35.9 | |
| Fidelity Series Long-Term Treasury Bond Index Fund | 5.0 | |
| Fidelity Series Bond Index Fund | 4.0 | |
| Fidelity Series International Developed Markets Bond Index Fund | 0.9 | |
| | 100.0 | |
| Fidelity, the Fidelity Investments Logo and all other Fidelity trademarks or service marks used herein are trademarks or service marks of FMR LLC. Any third-party marks that are used herein are trademarks or service marks of their respective owners. © 2024 FMR LLC. All rights reserved. |
| | For additional information about the Fund; including its prospectus, financial information, holdings and proxy information, scan the QR code or visit fundresearch.fidelity.com/prospectus/sec 1.9914728.100 2240-TSRS-1124 |
| |
| | SEMI-ANNUAL SHAREHOLDER REPORT | AS OF SEPTEMBER 30, 2024 | |
| | Fidelity Freedom® Index 2030 Fund Fidelity Freedom® Index 2030 Fund Investor Class : FXIFX |
| | | |
This semi-annual shareholder report contains information about Fidelity Freedom® Index 2030 Fund for the period April 1, 2024 to September 30, 2024. You can find additional information about the Fund at fundresearch.fidelity.com/prospectus/sec. You can also request this information by contacting us at 1-800-544-8544 or by sending an e-mail to fidfunddocuments@fidelity.com.
What were your Fund costs for the last six months?(based on hypothetical $10,000 investment)
| | Costs of a $10,000 investment | Costs paid as a percentage of a $10,000 investment | |
| Investor Class | $ 6 | 0.12% | |
Key Fund Statistics (as of September 30, 2024)
KEY FACTS | | |
| Fund Size | $22,274,558,937 | |
| Number of Holdings | 6 | |
| Portfolio Turnover | 10% | |
What did the Fund invest in?
(as of September 30, 2024)
| Bond Funds | 41.0 |
| Domestic Equity Funds | 35.5 |
| International Equity Funds | 23.5 |
| Short-Term Investments and Net Other Assets (Liabilities) | 0.0 |
ASSET ALLOCATION (% of Fund's net assets) |
|
|
TOP HOLDINGS (% of Fund's net assets) | | |
| Fidelity Series Total Market Index Fund | 35.5 | |
| Fidelity Series Bond Index Fund | 26.5 | |
| Fidelity Series Global ex U.S. Index Fund | 23.5 | |
| Fidelity Series 5+ Year Inflation-Protected Bond Index Fund | 5.2 | |
| Fidelity Series International Developed Markets Bond Index Fund | 4.8 | |
| Fidelity Series Long-Term Treasury Bond Index Fund | 4.5 | |
| | 100.0 | |
| Fidelity, the Fidelity Investments Logo and all other Fidelity trademarks or service marks used herein are trademarks or service marks of FMR LLC. Any third-party marks that are used herein are trademarks or service marks of their respective owners. © 2024 FMR LLC. All rights reserved. |
| | For additional information about the Fund; including its prospectus, financial information, holdings and proxy information, scan the QR code or visit fundresearch.fidelity.com/prospectus/sec 1.9914719.100 2235-TSRS-1124 |
| |
| | SEMI-ANNUAL SHAREHOLDER REPORT | AS OF SEPTEMBER 30, 2024 | |
| | Fidelity Freedom® Index 2040 Fund Fidelity Freedom® Index 2040 Fund Investor Class : FBIFX |
| | | |
This semi-annual shareholder report contains information about Fidelity Freedom® Index 2040 Fund for the period April 1, 2024 to September 30, 2024. You can find additional information about the Fund at fundresearch.fidelity.com/prospectus/sec. You can also request this information by contacting us at 1-800-544-8544 or by sending an e-mail to fidfunddocuments@fidelity.com.
What were your Fund costs for the last six months?(based on hypothetical $10,000 investment)
| | Costs of a $10,000 investment | Costs paid as a percentage of a $10,000 investment | |
| Investor Class | $ 6 | 0.12% | |
Key Fund Statistics (as of September 30, 2024)
KEY FACTS | | |
| Fund Size | $23,405,059,072 | |
| Number of Holdings | 5 | |
| Portfolio Turnover | 9% | |
What did the Fund invest in?
(as of September 30, 2024)
| Domestic Equity Funds | 50.2 |
| International Equity Funds | 33.3 |
| Bond Funds | 16.5 |
| Short-Term Investments and Net Other Assets (Liabilities) | 0.0 |
ASSET ALLOCATION (% of Fund's net assets) |
|
|
TOP HOLDINGS (% of Fund's net assets) | | |
| Fidelity Series Total Market Index Fund | 50.2 | |
| Fidelity Series Global ex U.S. Index Fund | 33.3 | |
| Fidelity Series Bond Index Fund | 9.4 | |
| Fidelity Series Long-Term Treasury Bond Index Fund | 5.0 | |
| Fidelity Series International Developed Markets Bond Index Fund | 2.1 | |
| | 100.0 | |
| Fidelity, the Fidelity Investments Logo and all other Fidelity trademarks or service marks used herein are trademarks or service marks of FMR LLC. Any third-party marks that are used herein are trademarks or service marks of their respective owners. © 2024 FMR LLC. All rights reserved. |
| | For additional information about the Fund; including its prospectus, financial information, holdings and proxy information, scan the QR code or visit fundresearch.fidelity.com/prospectus/sec 1.9914725.100 2239-TSRS-1124 |
| |
| | SEMI-ANNUAL SHAREHOLDER REPORT | AS OF SEPTEMBER 30, 2024 | |
| | Fidelity Freedom® Index 2045 Fund Fidelity Freedom® Index 2045 Fund Institutional Premium Class : FFOLX |
| | | |
This semi-annual shareholder report contains information about Fidelity Freedom® Index 2045 Fund for the period April 1, 2024 to September 30, 2024. You can find additional information about the Fund at fundresearch.fidelity.com/prospectus/sec. You can also request this information by contacting us at 1-800-544-8544 or by sending an e-mail to fidfunddocuments@fidelity.com.
What were your Fund costs for the last six months?(based on hypothetical $10,000 investment)
| | Costs of a $10,000 investment | Costs paid as a percentage of a $10,000 investment | |
| Institutional Premium Class | $ 4 | 0.08% | |
Key Fund Statistics (as of September 30, 2024)
KEY FACTS | | |
| Fund Size | $20,629,221,628 | |
| Number of Holdings | 5 | |
| Portfolio Turnover | 8% | |
What did the Fund invest in?
(as of September 30, 2024)
| Domestic Equity Funds | 54.2 |
| International Equity Funds | 35.9 |
| Bond Funds | 9.9 |
| Short-Term Investments and Net Other Assets (Liabilities) | 0.0 |
ASSET ALLOCATION (% of Fund's net assets) |
|
|
TOP HOLDINGS (% of Fund's net assets) | | |
| Fidelity Series Total Market Index Fund | 54.2 | |
| Fidelity Series Global ex U.S. Index Fund | 35.9 | |
| Fidelity Series Long-Term Treasury Bond Index Fund | 5.0 | |
| Fidelity Series Bond Index Fund | 4.0 | |
| Fidelity Series International Developed Markets Bond Index Fund | 0.9 | |
| | 100.0 | |
| Fidelity, the Fidelity Investments Logo and all other Fidelity trademarks or service marks used herein are trademarks or service marks of FMR LLC. Any third-party marks that are used herein are trademarks or service marks of their respective owners. © 2024 FMR LLC. All rights reserved. |
| | For additional information about the Fund; including its prospectus, financial information, holdings and proxy information, scan the QR code or visit fundresearch.fidelity.com/prospectus/sec 1.9914729.100 2773-TSRS-1124 |
| |
| | SEMI-ANNUAL SHAREHOLDER REPORT | AS OF SEPTEMBER 30, 2024 | |
| | Fidelity Freedom® Index 2010 Fund Fidelity Freedom® Index 2010 Fund Investor Class : FKIFX |
| | | |
This semi-annual shareholder report contains information about Fidelity Freedom® Index 2010 Fund for the period April 1, 2024 to September 30, 2024. You can find additional information about the Fund at fundresearch.fidelity.com/prospectus/sec. You can also request this information by contacting us at 1-800-544-8544 or by sending an e-mail to fidfunddocuments@fidelity.com.
What were your Fund costs for the last six months?(based on hypothetical $10,000 investment)
| | Costs of a $10,000 investment | Costs paid as a percentage of a $10,000 investment | |
| Investor Class | $ 6 | 0.12% | |
Key Fund Statistics (as of September 30, 2024)
KEY FACTS | | |
| Fund Size | $733,849,570 | |
| Number of Holdings | 8 | |
| Portfolio Turnover | 14% | |
What did the Fund invest in?
(as of September 30, 2024)
| Bond Funds | 65.8 |
| Domestic Equity Funds | 15.7 |
| International Equity Funds | 10.4 |
| Short-Term Funds | 8.1 |
| Short-Term Investments and Net Other Assets (Liabilities) | 0.0 |
ASSET ALLOCATION (% of Fund's net assets) |
|
|
TOP HOLDINGS (% of Fund's net assets) | | |
| Fidelity Series Bond Index Fund | 40.2 | |
| Fidelity Series Total Market Index Fund | 15.7 | |
| Fidelity Series 0-5 Year Inflation-Protected Bond Index Fund | 15.4 | |
| Fidelity Series Global ex U.S. Index Fund | 10.4 | |
| Fidelity Series Treasury Bill Index Fund | 8.1 | |
| Fidelity Series International Developed Markets Bond Index Fund | 4.9 | |
| Fidelity Series Long-Term Treasury Bond Index Fund | 3.2 | |
| Fidelity Series 5+ Year Inflation-Protected Bond Index Fund | 2.1 | |
| | 100.0 | |
| Fidelity, the Fidelity Investments Logo and all other Fidelity trademarks or service marks used herein are trademarks or service marks of FMR LLC. Any third-party marks that are used herein are trademarks or service marks of their respective owners. © 2024 FMR LLC. All rights reserved. |
| | For additional information about the Fund; including its prospectus, financial information, holdings and proxy information, scan the QR code or visit fundresearch.fidelity.com/prospectus/sec 1.9914710.100 2226-TSRS-1124 |
| |
| | SEMI-ANNUAL SHAREHOLDER REPORT | AS OF SEPTEMBER 30, 2024 | |
| | Fidelity Flex® Freedom Blend 2020 Fund Fidelity Flex® Freedom Blend 2020 Fund : FULSX |
| | | |
This semi-annual shareholder report contains information about Fidelity Flex® Freedom Blend 2020 Fund for the period April 1, 2024 to September 30, 2024. You can find additional information about the Fund at fundresearch.fidelity.com/prospectus/sec. You can also request this information by contacting us at 1-800-544-3455 or by sending an e-mail to fidfunddocuments@fidelity.com.
What were your Fund costs for the last six months?(based on hypothetical $10,000 investment)
| | Costs of a $10,000 investment | Costs paid as a percentage of a $10,000 investment | |
| Fidelity Flex® Freedom Blend 2020 Fund | $ 0 A | 0.00%B | |
A Amount represents less than $.50
B Amount represents less than 0.005%
Key Fund Statistics (as of September 30, 2024)
KEY FACTS | | |
| Fund Size | $30,455,366 | |
| Number of Holdings | 32 | |
| Portfolio Turnover | 23% | |
What did the Fund invest in?
(as of September 30, 2024)
| Bond Funds | 52.2 |
| Domestic Equity Funds | 23.9 |
| International Equity Funds | 23.7 |
| Short-Term Funds | 0.2 |
| Short-Term Investments and Net Other Assets (Liabilities) | 0.0 |
ASSET ALLOCATION (% of Fund's net assets) |
|
|
TOP HOLDINGS (% of Fund's net assets) | | |
| Fidelity Series Government Bond Index Fund | 9.0 | |
| Fidelity Series Investment Grade Bond Fund | 8.7 | |
| Fidelity Series 5+ Year Inflation-Protected Bond Index Fund | 7.9 | |
| Fidelity Series Emerging Markets Opportunities Fund | 6.8 | |
| Fidelity Series Large Cap Value Index Fund | 6.7 | |
| Fidelity Series Corporate Bond Fund | 5.8 | |
| Fidelity Series Investment Grade Securitized Fund | 5.6 | |
| Fidelity Series Blue Chip Growth Fund | 5.5 | |
| Fidelity Series 0-5 Year Inflation-Protected Bond Index Fund | 5.0 | |
| Fidelity Series Long-Term Treasury Bond Index Fund | 4.8 | |
| | 65.8 | |
| Fidelity, the Fidelity Investments Logo and all other Fidelity trademarks or service marks used herein are trademarks or service marks of FMR LLC. Any third-party marks that are used herein are trademarks or service marks of their respective owners. © 2024 FMR LLC. All rights reserved. |
| | For additional information about the Fund; including its prospectus, financial information, holdings and proxy information, scan the QR code or visit fundresearch.fidelity.com/prospectus/sec 1.9914765.100 2905-TSRS-1124 |
| |
| | SEMI-ANNUAL SHAREHOLDER REPORT | AS OF SEPTEMBER 30, 2024 | |
| | Fidelity Freedom® Index 2040 Fund Fidelity Freedom® Index 2040 Fund Institutional Premium Class : FFIZX |
| | | |
This semi-annual shareholder report contains information about Fidelity Freedom® Index 2040 Fund for the period April 1, 2024 to September 30, 2024. You can find additional information about the Fund at fundresearch.fidelity.com/prospectus/sec. You can also request this information by contacting us at 1-800-544-8544 or by sending an e-mail to fidfunddocuments@fidelity.com.
What were your Fund costs for the last six months?(based on hypothetical $10,000 investment)
| | Costs of a $10,000 investment | Costs paid as a percentage of a $10,000 investment | |
| Institutional Premium Class | $ 4 | 0.08% | |
Key Fund Statistics (as of September 30, 2024)
KEY FACTS | | |
| Fund Size | $23,405,059,072 | |
| Number of Holdings | 5 | |
| Portfolio Turnover | 9% | |
What did the Fund invest in?
(as of September 30, 2024)
| Domestic Equity Funds | 50.2 |
| International Equity Funds | 33.3 |
| Bond Funds | 16.5 |
| Short-Term Investments and Net Other Assets (Liabilities) | 0.0 |
ASSET ALLOCATION (% of Fund's net assets) |
|
|
TOP HOLDINGS (% of Fund's net assets) | | |
| Fidelity Series Total Market Index Fund | 50.2 | |
| Fidelity Series Global ex U.S. Index Fund | 33.3 | |
| Fidelity Series Bond Index Fund | 9.4 | |
| Fidelity Series Long-Term Treasury Bond Index Fund | 5.0 | |
| Fidelity Series International Developed Markets Bond Index Fund | 2.1 | |
| | 100.0 | |
| Fidelity, the Fidelity Investments Logo and all other Fidelity trademarks or service marks used herein are trademarks or service marks of FMR LLC. Any third-party marks that are used herein are trademarks or service marks of their respective owners. © 2024 FMR LLC. All rights reserved. |
| | For additional information about the Fund; including its prospectus, financial information, holdings and proxy information, scan the QR code or visit fundresearch.fidelity.com/prospectus/sec 1.9914726.100 2772-TSRS-1124 |
| |
| | SEMI-ANNUAL SHAREHOLDER REPORT | AS OF SEPTEMBER 30, 2024 | |
| | Fidelity Freedom® Index 2060 Fund Fidelity Freedom® Index 2060 Fund Premier Class : FUIPX |
| | | |
This semi-annual shareholder report contains information about Fidelity Freedom® Index 2060 Fund for the period April 1, 2024 to September 30, 2024. You can find additional information about the Fund at fundresearch.fidelity.com/prospectus/sec. You can also request this information by contacting us at 1-800-544-3455 or by sending an e-mail to fidfunddocuments@fidelity.com.
What were your Fund costs for the last six months?(based on hypothetical $10,000 investment)
| | Costs of a $10,000 investment | Costs paid as a percentage of a $10,000 investment | |
| Premier Class | $ 3 | 0.05% | |
Key Fund Statistics (as of September 30, 2024)
KEY FACTS | | |
| Fund Size | $8,047,655,750 | |
| Number of Holdings | 5 | |
| Portfolio Turnover | 5% | |
What did the Fund invest in?
(as of September 30, 2024)
| Domestic Equity Funds | 54.2 |
| International Equity Funds | 35.9 |
| Bond Funds | 9.9 |
| Short-Term Investments and Net Other Assets (Liabilities) | 0.0 |
ASSET ALLOCATION (% of Fund's net assets) |
|
|
TOP HOLDINGS (% of Fund's net assets) | | |
| Fidelity Series Total Market Index Fund | 54.2 | |
| Fidelity Series Global ex U.S. Index Fund | 35.9 | |
| Fidelity Series Long-Term Treasury Bond Index Fund | 5.0 | |
| Fidelity Series Bond Index Fund | 4.0 | |
| Fidelity Series International Developed Markets Bond Index Fund | 0.9 | |
| | 100.0 | |
| Fidelity, the Fidelity Investments Logo and all other Fidelity trademarks or service marks used herein are trademarks or service marks of FMR LLC. Any third-party marks that are used herein are trademarks or service marks of their respective owners. © 2024 FMR LLC. All rights reserved. |
| | For additional information about the Fund; including its prospectus, financial information, holdings and proxy information, scan the QR code or visit fundresearch.fidelity.com/prospectus/sec 1.9914760.100 6203-TSRS-1124 |
| |
| | SEMI-ANNUAL SHAREHOLDER REPORT | AS OF SEPTEMBER 30, 2024 | |
| | Fidelity Flex® Freedom Blend Income Fund Fidelity Flex® Freedom Blend Income Fund : FTLSX |
| | | |
This semi-annual shareholder report contains information about Fidelity Flex® Freedom Blend Income Fund for the period April 1, 2024 to September 30, 2024. You can find additional information about the Fund at fundresearch.fidelity.com/prospectus/sec. You can also request this information by contacting us at 1-800-544-3455 or by sending an e-mail to fidfunddocuments@fidelity.com.
What were your Fund costs for the last six months?(based on hypothetical $10,000 investment)
| | Costs of a $10,000 investment | Costs paid as a percentage of a $10,000 investment | |
| Fidelity Flex® Freedom Blend Income Fund | $ 0 A | 0.00%B | |
A Amount represents less than $.50
B Amount represents less than 0.005%
Key Fund Statistics (as of September 30, 2024)
KEY FACTS | | |
| Fund Size | $3,845,593 | |
| Number of Holdings | 33 | |
| Portfolio Turnover | 25% | |
What did the Fund invest in?
(as of September 30, 2024)
| Bond Funds | 72.4 |
| International Equity Funds | 13.6 |
| Domestic Equity Funds | 8.7 |
| Short-Term Funds | 5.3 |
| Short-Term Investments and Net Other Assets (Liabilities) | 0.0 |
ASSET ALLOCATION (% of Fund's net assets) |
|
|
TOP HOLDINGS (% of Fund's net assets) | | |
| Fidelity Series 0-5 Year Inflation-Protected Bond Index Fund | 20.7 | |
| Fidelity Series Government Bond Index Fund | 13.3 | |
| Fidelity Series Investment Grade Bond Fund | 12.9 | |
| Fidelity Series Corporate Bond Fund | 8.5 | |
| Fidelity Series Investment Grade Securitized Fund | 8.3 | |
| Fidelity Series Emerging Markets Opportunities Fund | 4.4 | |
| Fidelity Series International Developed Markets Bond Index Fund | 4.0 | |
| Fidelity Series Treasury Bill Index Fund | 3.2 | |
| Fidelity Series Long-Term Treasury Bond Index Fund | 2.7 | |
| Fidelity Series Large Cap Value Index Fund | 2.4 | |
| | 80.4 | |
| Fidelity, the Fidelity Investments Logo and all other Fidelity trademarks or service marks used herein are trademarks or service marks of FMR LLC. Any third-party marks that are used herein are trademarks or service marks of their respective owners. © 2024 FMR LLC. All rights reserved. |
| | For additional information about the Fund; including its prospectus, financial information, holdings and proxy information, scan the QR code or visit fundresearch.fidelity.com/prospectus/sec 1.9914761.100 2901-TSRS-1124 |
| |
| | SEMI-ANNUAL SHAREHOLDER REPORT | AS OF SEPTEMBER 30, 2024 | |
| | Fidelity Freedom® Index 2035 Fund Fidelity Freedom® Index 2035 Fund Investor Class : FIHFX |
| | | |
This semi-annual shareholder report contains information about Fidelity Freedom® Index 2035 Fund for the period April 1, 2024 to September 30, 2024. You can find additional information about the Fund at fundresearch.fidelity.com/prospectus/sec. You can also request this information by contacting us at 1-800-544-8544 or by sending an e-mail to fidfunddocuments@fidelity.com.
What were your Fund costs for the last six months?(based on hypothetical $10,000 investment)
| | Costs of a $10,000 investment | Costs paid as a percentage of a $10,000 investment | |
| Investor Class | $ 6 | 0.12% | |
Key Fund Statistics (as of September 30, 2024)
KEY FACTS | | |
| Fund Size | $22,859,083,179 | |
| Number of Holdings | 6 | |
| Portfolio Turnover | 11% | |
What did the Fund invest in?
(as of September 30, 2024)
| Domestic Equity Funds | 41.7 |
| Bond Funds | 30.8 |
| International Equity Funds | 27.5 |
| Short-Term Investments and Net Other Assets (Liabilities) | 0.0 |
ASSET ALLOCATION (% of Fund's net assets) |
|
|
TOP HOLDINGS (% of Fund's net assets) | | |
| Fidelity Series Total Market Index Fund | 41.7 | |
| Fidelity Series Global ex U.S. Index Fund | 27.5 | |
| Fidelity Series Bond Index Fund | 20.7 | |
| Fidelity Series Long-Term Treasury Bond Index Fund | 4.9 | |
| Fidelity Series International Developed Markets Bond Index Fund | 4.2 | |
| Fidelity Series 5+ Year Inflation-Protected Bond Index Fund | 1.0 | |
| | 100.0 | |
| Fidelity, the Fidelity Investments Logo and all other Fidelity trademarks or service marks used herein are trademarks or service marks of FMR LLC. Any third-party marks that are used herein are trademarks or service marks of their respective owners. © 2024 FMR LLC. All rights reserved. |
| | For additional information about the Fund; including its prospectus, financial information, holdings and proxy information, scan the QR code or visit fundresearch.fidelity.com/prospectus/sec 1.9914722.100 2238-TSRS-1124 |
| |
| | SEMI-ANNUAL SHAREHOLDER REPORT | AS OF SEPTEMBER 30, 2024 | |
| | Fidelity Freedom® Index Income Fund Fidelity Freedom® Index Income Fund Investor Class : FIKFX |
| | | |
This semi-annual shareholder report contains information about Fidelity Freedom® Index Income Fund for the period April 1, 2024 to September 30, 2024. You can find additional information about the Fund at fundresearch.fidelity.com/prospectus/sec. You can also request this information by contacting us at 1-800-544-8544 or by sending an e-mail to fidfunddocuments@fidelity.com.
What were your Fund costs for the last six months?(based on hypothetical $10,000 investment)
| | Costs of a $10,000 investment | Costs paid as a percentage of a $10,000 investment | |
| Investor Class | $ 6 | 0.12% | |
Key Fund Statistics (as of September 30, 2024)
KEY FACTS | | |
| Fund Size | $1,681,067,537 | |
| Number of Holdings | 8 | |
| Portfolio Turnover | 14% | |
What did the Fund invest in?
(as of September 30, 2024)
| Bond Funds | 70.9 |
| Domestic Equity Funds | 11.5 |
| Short-Term Funds | 10.0 |
| International Equity Funds | 7.6 |
| Short-Term Investments and Net Other Assets (Liabilities) | 0.0 |
ASSET ALLOCATION (% of Fund's net assets) |
|
|
TOP HOLDINGS (% of Fund's net assets) | | |
| Fidelity Series Bond Index Fund | 43.0 | |
| Fidelity Series 0-5 Year Inflation-Protected Bond Index Fund | 19.9 | |
| Fidelity Series Total Market Index Fund | 11.5 | |
| Fidelity Series Treasury Bill Index Fund | 10.0 | |
| Fidelity Series Global ex U.S. Index Fund | 7.6 | |
| Fidelity Series International Developed Markets Bond Index Fund | 5.0 | |
| Fidelity Series Long-Term Treasury Bond Index Fund | 3.0 | |
| Fidelity Series 5+ Year Inflation-Protected Bond Index Fund | 0.0 | |
| | 100.0 | |
| Fidelity, the Fidelity Investments Logo and all other Fidelity trademarks or service marks used herein are trademarks or service marks of FMR LLC. Any third-party marks that are used herein are trademarks or service marks of their respective owners. © 2024 FMR LLC. All rights reserved. |
| | For additional information about the Fund; including its prospectus, financial information, holdings and proxy information, scan the QR code or visit fundresearch.fidelity.com/prospectus/sec 1.9914704.100 2216-TSRS-1124 |
| |
| | SEMI-ANNUAL SHAREHOLDER REPORT | AS OF SEPTEMBER 30, 2024 | |
| | Fidelity Flex® Freedom Blend 2035 Fund Fidelity Flex® Freedom Blend 2035 Fund : FJLSX |
| | | |
This semi-annual shareholder report contains information about Fidelity Flex® Freedom Blend 2035 Fund for the period April 1, 2024 to September 30, 2024. You can find additional information about the Fund at fundresearch.fidelity.com/prospectus/sec. You can also request this information by contacting us at 1-800-544-3455 or by sending an e-mail to fidfunddocuments@fidelity.com.
What were your Fund costs for the last six months?(based on hypothetical $10,000 investment)
| | Costs of a $10,000 investment | Costs paid as a percentage of a $10,000 investment | |
| Fidelity Flex® Freedom Blend 2035 Fund | $ 0 A | 0.00%B | |
A Amount represents less than $.50
B Amount represents less than 0.005%
Key Fund Statistics (as of September 30, 2024)
KEY FACTS | | |
| Fund Size | $84,600,359 | |
| Number of Holdings | 40 | |
| Portfolio Turnover | 30% | |
What did the Fund invest in?
(as of September 30, 2024)
| Domestic Equity Funds | 40.0 |
| International Equity Funds | 33.0 |
| Bond Funds | 26.7 |
| Short-Term Funds | 0.1 |
| Short-Term Investments and Net Other Assets (Liabilities) | 0.2 |
ASSET ALLOCATION (% of Fund's net assets) |
|
|
TOP HOLDINGS (% of Fund's net assets) | | |
| Fidelity Series Large Cap Value Index Fund | 11.2 | |
| Fidelity Series Blue Chip Growth Fund | 9.2 | |
| Fidelity Series Emerging Markets Opportunities Fund | 8.7 | |
| Fidelity Series Large Cap Growth Index Fund | 5.9 | |
| Fidelity Series International Value Fund | 5.4 | |
| Fidelity Series Overseas Fund | 5.4 | |
| Fidelity Series International Growth Fund | 5.4 | |
| Fidelity Series Large Cap Stock Fund | 5.4 | |
| Fidelity Series Government Bond Index Fund | 4.8 | |
| Fidelity Series Long-Term Treasury Bond Index Fund | 4.7 | |
| | 66.1 | |
| Fidelity, the Fidelity Investments Logo and all other Fidelity trademarks or service marks used herein are trademarks or service marks of FMR LLC. Any third-party marks that are used herein are trademarks or service marks of their respective owners. © 2024 FMR LLC. All rights reserved. |
| | For additional information about the Fund; including its prospectus, financial information, holdings and proxy information, scan the QR code or visit fundresearch.fidelity.com/prospectus/sec 1.9914768.100 2908-TSRS-1124 |
| |
| | SEMI-ANNUAL SHAREHOLDER REPORT | AS OF SEPTEMBER 30, 2024 | |
| | Fidelity Freedom® Index Income Fund Fidelity Freedom® Index Income Fund Institutional Premium Class : FFGZX |
| | | |
This semi-annual shareholder report contains information about Fidelity Freedom® Index Income Fund for the period April 1, 2024 to September 30, 2024. You can find additional information about the Fund at fundresearch.fidelity.com/prospectus/sec. You can also request this information by contacting us at 1-800-544-8544 or by sending an e-mail to fidfunddocuments@fidelity.com.
What were your Fund costs for the last six months?(based on hypothetical $10,000 investment)
| | Costs of a $10,000 investment | Costs paid as a percentage of a $10,000 investment | |
| Institutional Premium Class | $ 4 | 0.08% | |
Key Fund Statistics (as of September 30, 2024)
KEY FACTS | | |
| Fund Size | $1,681,067,537 | |
| Number of Holdings | 8 | |
| Portfolio Turnover | 14% | |
What did the Fund invest in?
(as of September 30, 2024)
| Bond Funds | 70.9 |
| Domestic Equity Funds | 11.5 |
| Short-Term Funds | 10.0 |
| International Equity Funds | 7.6 |
| Short-Term Investments and Net Other Assets (Liabilities) | 0.0 |
ASSET ALLOCATION (% of Fund's net assets) |
|
|
TOP HOLDINGS (% of Fund's net assets) | | |
| Fidelity Series Bond Index Fund | 43.0 | |
| Fidelity Series 0-5 Year Inflation-Protected Bond Index Fund | 19.9 | |
| Fidelity Series Total Market Index Fund | 11.5 | |
| Fidelity Series Treasury Bill Index Fund | 10.0 | |
| Fidelity Series Global ex U.S. Index Fund | 7.6 | |
| Fidelity Series International Developed Markets Bond Index Fund | 5.0 | |
| Fidelity Series Long-Term Treasury Bond Index Fund | 3.0 | |
| Fidelity Series 5+ Year Inflation-Protected Bond Index Fund | 0.0 | |
| | 100.0 | |
| Fidelity, the Fidelity Investments Logo and all other Fidelity trademarks or service marks used herein are trademarks or service marks of FMR LLC. Any third-party marks that are used herein are trademarks or service marks of their respective owners. © 2024 FMR LLC. All rights reserved. |
| | For additional information about the Fund; including its prospectus, financial information, holdings and proxy information, scan the QR code or visit fundresearch.fidelity.com/prospectus/sec 1.9914705.100 2764-TSRS-1124 |
| |
| | SEMI-ANNUAL SHAREHOLDER REPORT | AS OF SEPTEMBER 30, 2024 | |
| | Fidelity Freedom® Index 2010 Fund Fidelity Freedom® Index 2010 Fund Premier Class : FCYPX |
| | | |
This semi-annual shareholder report contains information about Fidelity Freedom® Index 2010 Fund for the period April 1, 2024 to September 30, 2024. You can find additional information about the Fund at fundresearch.fidelity.com/prospectus/sec. You can also request this information by contacting us at 1-800-544-3455 or by sending an e-mail to fidfunddocuments@fidelity.com.
What were your Fund costs for the last six months?(based on hypothetical $10,000 investment)
| | Costs of a $10,000 investment | Costs paid as a percentage of a $10,000 investment | |
| Premier Class | $ 3 | 0.05% | |
Key Fund Statistics (as of September 30, 2024)
KEY FACTS | | |
| Fund Size | $733,849,570 | |
| Number of Holdings | 8 | |
| Portfolio Turnover | 14% | |
What did the Fund invest in?
(as of September 30, 2024)
| Bond Funds | 65.8 |
| Domestic Equity Funds | 15.7 |
| International Equity Funds | 10.4 |
| Short-Term Funds | 8.1 |
| Short-Term Investments and Net Other Assets (Liabilities) | 0.0 |
ASSET ALLOCATION (% of Fund's net assets) |
|
|
TOP HOLDINGS (% of Fund's net assets) | | |
| Fidelity Series Bond Index Fund | 40.2 | |
| Fidelity Series Total Market Index Fund | 15.7 | |
| Fidelity Series 0-5 Year Inflation-Protected Bond Index Fund | 15.4 | |
| Fidelity Series Global ex U.S. Index Fund | 10.4 | |
| Fidelity Series Treasury Bill Index Fund | 8.1 | |
| Fidelity Series International Developed Markets Bond Index Fund | 4.9 | |
| Fidelity Series Long-Term Treasury Bond Index Fund | 3.2 | |
| Fidelity Series 5+ Year Inflation-Protected Bond Index Fund | 2.1 | |
| | 100.0 | |
| Fidelity, the Fidelity Investments Logo and all other Fidelity trademarks or service marks used herein are trademarks or service marks of FMR LLC. Any third-party marks that are used herein are trademarks or service marks of their respective owners. © 2024 FMR LLC. All rights reserved. |
| | For additional information about the Fund; including its prospectus, financial information, holdings and proxy information, scan the QR code or visit fundresearch.fidelity.com/prospectus/sec 1.9914712.100 6193-TSRS-1124 |
| |
| | SEMI-ANNUAL SHAREHOLDER REPORT | AS OF SEPTEMBER 30, 2024 | |
| | Fidelity Freedom® Index 2045 Fund Fidelity Freedom® Index 2045 Fund Premier Class : FQIPX |
| | | |
This semi-annual shareholder report contains information about Fidelity Freedom® Index 2045 Fund for the period April 1, 2024 to September 30, 2024. You can find additional information about the Fund at fundresearch.fidelity.com/prospectus/sec. You can also request this information by contacting us at 1-800-544-3455 or by sending an e-mail to fidfunddocuments@fidelity.com.
What were your Fund costs for the last six months?(based on hypothetical $10,000 investment)
| | Costs of a $10,000 investment | Costs paid as a percentage of a $10,000 investment | |
| Premier Class | $ 3 | 0.05% | |
Key Fund Statistics (as of September 30, 2024)
KEY FACTS | | |
| Fund Size | $20,629,221,628 | |
| Number of Holdings | 5 | |
| Portfolio Turnover | 8% | |
What did the Fund invest in?
(as of September 30, 2024)
| Domestic Equity Funds | 54.2 |
| International Equity Funds | 35.9 |
| Bond Funds | 9.9 |
| Short-Term Investments and Net Other Assets (Liabilities) | 0.0 |
ASSET ALLOCATION (% of Fund's net assets) |
|
|
TOP HOLDINGS (% of Fund's net assets) | | |
| Fidelity Series Total Market Index Fund | 54.2 | |
| Fidelity Series Global ex U.S. Index Fund | 35.9 | |
| Fidelity Series Long-Term Treasury Bond Index Fund | 5.0 | |
| Fidelity Series Bond Index Fund | 4.0 | |
| Fidelity Series International Developed Markets Bond Index Fund | 0.9 | |
| | 100.0 | |
| Fidelity, the Fidelity Investments Logo and all other Fidelity trademarks or service marks used herein are trademarks or service marks of FMR LLC. Any third-party marks that are used herein are trademarks or service marks of their respective owners. © 2024 FMR LLC. All rights reserved. |
| | For additional information about the Fund; including its prospectus, financial information, holdings and proxy information, scan the QR code or visit fundresearch.fidelity.com/prospectus/sec 1.9914730.100 6200-TSRS-1124 |
| |
| | SEMI-ANNUAL SHAREHOLDER REPORT | AS OF SEPTEMBER 30, 2024 | |
| | Fidelity Flex® Freedom Blend 2025 Fund Fidelity Flex® Freedom Blend 2025 Fund : FELSX |
| | | |
This semi-annual shareholder report contains information about Fidelity Flex® Freedom Blend 2025 Fund for the period April 1, 2024 to September 30, 2024. You can find additional information about the Fund at fundresearch.fidelity.com/prospectus/sec. You can also request this information by contacting us at 1-800-544-3455 or by sending an e-mail to fidfunddocuments@fidelity.com.
What were your Fund costs for the last six months?(based on hypothetical $10,000 investment)
| | Costs of a $10,000 investment | Costs paid as a percentage of a $10,000 investment | |
| Fidelity Flex® Freedom Blend 2025 Fund | $ 0 A | 0.00%B | |
A Amount represents less than $.50
B Amount represents less than 0.005%
Key Fund Statistics (as of September 30, 2024)
KEY FACTS | | |
| Fund Size | $48,550,715 | |
| Number of Holdings | 30 | |
| Portfolio Turnover | 30% | |
What did the Fund invest in?
(as of September 30, 2024)
| Bond Funds | 44.3 |
| Domestic Equity Funds | 28.8 |
| International Equity Funds | 26.9 |
| Short-Term Investments and Net Other Assets (Liabilities) | 0.0 |
ASSET ALLOCATION (% of Fund's net assets) |
|
|
TOP HOLDINGS (% of Fund's net assets) | | |
| Fidelity Series 5+ Year Inflation-Protected Bond Index Fund | 10.0 | |
| Fidelity Series Large Cap Value Index Fund | 8.0 | |
| Fidelity Series Emerging Markets Opportunities Fund | 7.5 | |
| Fidelity Series Government Bond Index Fund | 6.8 | |
| Fidelity Series Blue Chip Growth Fund | 6.6 | |
| Fidelity Series Investment Grade Bond Fund | 6.5 | |
| Fidelity Series Long-Term Treasury Bond Index Fund | 6.5 | |
| Fidelity Series Corporate Bond Fund | 4.3 | |
| Fidelity Series Large Cap Growth Index Fund | 4.3 | |
| Fidelity Series International Value Fund | 4.2 | |
| | 64.7 | |
| Fidelity, the Fidelity Investments Logo and all other Fidelity trademarks or service marks used herein are trademarks or service marks of FMR LLC. Any third-party marks that are used herein are trademarks or service marks of their respective owners. © 2024 FMR LLC. All rights reserved. |
| | For additional information about the Fund; including its prospectus, financial information, holdings and proxy information, scan the QR code or visit fundresearch.fidelity.com/prospectus/sec 1.9914766.100 2906-TSRS-1124 |
| |
| | SEMI-ANNUAL SHAREHOLDER REPORT | AS OF SEPTEMBER 30, 2024 | |
| | Fidelity Flex® Freedom Blend 2065 Fund Fidelity Flex® Freedom Blend 2065 Fund : FDFPX |
| | | |
This semi-annual shareholder report contains information about Fidelity Flex® Freedom Blend 2065 Fund for the period April 1, 2024 to September 30, 2024. You can find additional information about the Fund at fundresearch.fidelity.com/prospectus/sec. You can also request this information by contacting us at 1-800-544-3455 or by sending an e-mail to fidfunddocuments@fidelity.com.
What were your Fund costs for the last six months?(based on hypothetical $10,000 investment)
| | Costs of a $10,000 investment | Costs paid as a percentage of a $10,000 investment | |
| Fidelity Flex® Freedom Blend 2065 Fund | $ 0 A | 0.00%B | |
A Amount represents less than $.50
B Amount represents less than 0.005%
Key Fund Statistics (as of September 30, 2024)
KEY FACTS | | |
| Fund Size | $9,459,386 | |
| Number of Holdings | 28 | |
| Portfolio Turnover | 21% | |
What did the Fund invest in?
(as of September 30, 2024)
| Domestic Equity Funds | 51.0 |
| International Equity Funds | 41.9 |
| Bond Funds | 7.1 |
| Short-Term Investments and Net Other Assets (Liabilities) | 0.0 |
ASSET ALLOCATION (% of Fund's net assets) |
|
|
TOP HOLDINGS (% of Fund's net assets) | | |
| Fidelity Series Large Cap Value Index Fund | 14.2 | |
| Fidelity Series Blue Chip Growth Fund | 11.7 | |
| Fidelity Series Emerging Markets Opportunities Fund | 11.1 | |
| Fidelity Series Large Cap Growth Index Fund | 7.6 | |
| Fidelity Series International Value Fund | 7.0 | |
| Fidelity Series Overseas Fund | 7.0 | |
| Fidelity Series International Growth Fund | 7.0 | |
| Fidelity Series Large Cap Stock Fund | 6.8 | |
| Fidelity Series Long-Term Treasury Bond Index Fund | 5.5 | |
| Fidelity Series Value Discovery Fund | 4.9 | |
| | 82.8 | |
| Fidelity, the Fidelity Investments Logo and all other Fidelity trademarks or service marks used herein are trademarks or service marks of FMR LLC. Any third-party marks that are used herein are trademarks or service marks of their respective owners. © 2024 FMR LLC. All rights reserved. |
| | For additional information about the Fund; including its prospectus, financial information, holdings and proxy information, scan the QR code or visit fundresearch.fidelity.com/prospectus/sec 1.9914911.100 3414-TSRS-1124 |
| |
| | SEMI-ANNUAL SHAREHOLDER REPORT | AS OF SEPTEMBER 30, 2024 | |
| | Fidelity Freedom® Index 2070 Fund Fidelity Freedom® Index 2070 Fund Institutional Premium Class : FRBUX |
| | | |
This semi-annual shareholder report contains information about Fidelity Freedom® Index 2070 Fund for the period June 28, 2024 to September 30, 2024. You can find additional information about the Fund at fundresearch.fidelity.com/prospectus/sec. You can also request this information by contacting us at 1-800-544-8544 or by sending an e-mail to fidfunddocuments@fidelity.com.
What were your Fund costs for the last six months?(based on hypothetical $10,000 investment)
| | Costs of a $10,000 investment | Costs paid as a percentage of a $10,000 investment | |
Institutional Premium Class A | $ 2 | 0.08% | |
AExpenses for the full reporting period would be higher.
Key Fund Statistics (as of September 30, 2024)
KEY FACTS | | |
| Fund Size | $2,518,147 | |
| Number of Holdings | 5 | |
Portfolio TurnoverB | 0%A | |
A Amount represents less than 1%
B Amount not annualized
What did the Fund invest in?
(as of September 30, 2024)
| Domestic Equity Funds | 54.2 |
| International Equity Funds | 35.9 |
| Bond Funds | 9.9 |
| Short-Term Investments and Net Other Assets (Liabilities) | 0.0 |
ASSET ALLOCATION (% of Fund's net assets) |
|
|
TOP HOLDINGS (% of Fund's net assets) | | |
| Fidelity Series Total Market Index Fund | 54.2 | |
| Fidelity Series Global ex U.S. Index Fund | 35.9 | |
| Fidelity Series Long-Term Treasury Bond Index Fund | 5.0 | |
| Fidelity Series Bond Index Fund | 4.0 | |
| Fidelity Series International Developed Markets Bond Index Fund | 0.9 | |
| | 100.0 | |
| Fidelity, the Fidelity Investments Logo and all other Fidelity trademarks or service marks used herein are trademarks or service marks of FMR LLC. Any third-party marks that are used herein are trademarks or service marks of their respective owners. © 2024 FMR LLC. All rights reserved. |
| | For additional information about the Fund; including its prospectus, financial information, holdings and proxy information, scan the QR code or visit fundresearch.fidelity.com/prospectus/sec 1.9918267.100 7650-TSRS-1124 |
| |
| | SEMI-ANNUAL SHAREHOLDER REPORT | AS OF SEPTEMBER 30, 2024 | |
| | Fidelity Freedom® Index 2025 Fund Fidelity Freedom® Index 2025 Fund Institutional Premium Class : FFEDX |
| | | |
This semi-annual shareholder report contains information about Fidelity Freedom® Index 2025 Fund for the period April 1, 2024 to September 30, 2024. You can find additional information about the Fund at fundresearch.fidelity.com/prospectus/sec. You can also request this information by contacting us at 1-800-544-8544 or by sending an e-mail to fidfunddocuments@fidelity.com.
What were your Fund costs for the last six months?(based on hypothetical $10,000 investment)
| | Costs of a $10,000 investment | Costs paid as a percentage of a $10,000 investment | |
| Institutional Premium Class | $ 4 | 0.08% | |
Key Fund Statistics (as of September 30, 2024)
KEY FACTS | | |
| Fund Size | $14,699,618,165 | |
| Number of Holdings | 6 | |
| Portfolio Turnover | 8% | |
What did the Fund invest in?
(as of September 30, 2024)
| Bond Funds | 47.5 |
| Domestic Equity Funds | 31.6 |
| International Equity Funds | 20.9 |
| Short-Term Investments and Net Other Assets (Liabilities) | 0.0 |
ASSET ALLOCATION (% of Fund's net assets) |
|
|
TOP HOLDINGS (% of Fund's net assets) | | |
| Fidelity Series Total Market Index Fund | 31.6 | |
| Fidelity Series Bond Index Fund | 29.2 | |
| Fidelity Series Global ex U.S. Index Fund | 20.9 | |
| Fidelity Series 5+ Year Inflation-Protected Bond Index Fund | 9.3 | |
| Fidelity Series International Developed Markets Bond Index Fund | 4.9 | |
| Fidelity Series Long-Term Treasury Bond Index Fund | 4.1 | |
| | 100.0 | |
| Fidelity, the Fidelity Investments Logo and all other Fidelity trademarks or service marks used herein are trademarks or service marks of FMR LLC. Any third-party marks that are used herein are trademarks or service marks of their respective owners. © 2024 FMR LLC. All rights reserved. |
| | For additional information about the Fund; including its prospectus, financial information, holdings and proxy information, scan the QR code or visit fundresearch.fidelity.com/prospectus/sec 1.9914717.100 2769-TSRS-1124 |
| |
| | SEMI-ANNUAL SHAREHOLDER REPORT | AS OF SEPTEMBER 30, 2024 | |
| | Fidelity Flex® Freedom Blend 2015 Fund Fidelity Flex® Freedom Blend 2015 Fund : FILSX |
| | | |
This semi-annual shareholder report contains information about Fidelity Flex® Freedom Blend 2015 Fund for the period April 1, 2024 to September 30, 2024. You can find additional information about the Fund at fundresearch.fidelity.com/prospectus/sec. You can also request this information by contacting us at 1-800-544-3455 or by sending an e-mail to fidfunddocuments@fidelity.com.
What were your Fund costs for the last six months?(based on hypothetical $10,000 investment)
| | Costs of a $10,000 investment | Costs paid as a percentage of a $10,000 investment | |
| Fidelity Flex® Freedom Blend 2015 Fund | $ 0 A | 0.00%B | |
A Amount represents less than $.50
B Amount represents less than 0.005%
Key Fund Statistics (as of September 30, 2024)
KEY FACTS | | |
| Fund Size | $10,722,112 | |
| Number of Holdings | 33 | |
| Portfolio Turnover | 22% | |
What did the Fund invest in?
(as of September 30, 2024)
| Bond Funds | 61.0 |
| International Equity Funds | 20.0 |
| Domestic Equity Funds | 18.4 |
| Short-Term Funds | 0.6 |
| Short-Term Investments and Net Other Assets (Liabilities) | 0.0 |
ASSET ALLOCATION (% of Fund's net assets) |
|
|
TOP HOLDINGS (% of Fund's net assets) | | |
| Fidelity Series Government Bond Index Fund | 11.4 | |
| Fidelity Series Investment Grade Bond Fund | 11.0 | |
| Fidelity Series 0-5 Year Inflation-Protected Bond Index Fund | 10.6 | |
| Fidelity Series Corporate Bond Fund | 7.2 | |
| Fidelity Series Investment Grade Securitized Fund | 7.0 | |
| Fidelity Series Emerging Markets Opportunities Fund | 5.9 | |
| Fidelity Series 5+ Year Inflation-Protected Bond Index Fund | 5.3 | |
| Fidelity Series Large Cap Value Index Fund | 5.1 | |
| Fidelity Series Blue Chip Growth Fund | 4.2 | |
| Fidelity Series International Developed Markets Bond Index Fund | 4.0 | |
| | 71.7 | |
| Fidelity, the Fidelity Investments Logo and all other Fidelity trademarks or service marks used herein are trademarks or service marks of FMR LLC. Any third-party marks that are used herein are trademarks or service marks of their respective owners. © 2024 FMR LLC. All rights reserved. |
| | For additional information about the Fund; including its prospectus, financial information, holdings and proxy information, scan the QR code or visit fundresearch.fidelity.com/prospectus/sec 1.9914764.100 2904-TSRS-1124 |
| |
| | SEMI-ANNUAL SHAREHOLDER REPORT | AS OF SEPTEMBER 30, 2024 | |
| | Fidelity Flex® Freedom Blend 2055 Fund Fidelity Flex® Freedom Blend 2055 Fund : FQLSX |
| | | |
This semi-annual shareholder report contains information about Fidelity Flex® Freedom Blend 2055 Fund for the period April 1, 2024 to September 30, 2024. You can find additional information about the Fund at fundresearch.fidelity.com/prospectus/sec. You can also request this information by contacting us at 1-800-544-3455 or by sending an e-mail to fidfunddocuments@fidelity.com.
What were your Fund costs for the last six months?(based on hypothetical $10,000 investment)
| | Costs of a $10,000 investment | Costs paid as a percentage of a $10,000 investment | |
| Fidelity Flex® Freedom Blend 2055 Fund | $ 0 A | 0.00%B | |
A Amount represents less than $.50
B Amount represents less than 0.005%
Key Fund Statistics (as of September 30, 2024)
KEY FACTS | | |
| Fund Size | $38,431,227 | |
| Number of Holdings | 28 | |
| Portfolio Turnover | 24% | |
What did the Fund invest in?
(as of September 30, 2024)
| Domestic Equity Funds | 51.0 |
| International Equity Funds | 41.9 |
| Bond Funds | 7.1 |
| Short-Term Investments and Net Other Assets (Liabilities) | 0.0 |
ASSET ALLOCATION (% of Fund's net assets) |
|
|
TOP HOLDINGS (% of Fund's net assets) | | |
| Fidelity Series Large Cap Value Index Fund | 14.2 | |
| Fidelity Series Blue Chip Growth Fund | 11.7 | |
| Fidelity Series Emerging Markets Opportunities Fund | 11.1 | |
| Fidelity Series Large Cap Growth Index Fund | 7.6 | |
| Fidelity Series International Value Fund | 7.0 | |
| Fidelity Series Overseas Fund | 7.0 | |
| Fidelity Series International Growth Fund | 7.0 | |
| Fidelity Series Large Cap Stock Fund | 6.8 | |
| Fidelity Series Long-Term Treasury Bond Index Fund | 5.5 | |
| Fidelity Series Value Discovery Fund | 4.9 | |
| | 82.8 | |
| Fidelity, the Fidelity Investments Logo and all other Fidelity trademarks or service marks used herein are trademarks or service marks of FMR LLC. Any third-party marks that are used herein are trademarks or service marks of their respective owners. © 2024 FMR LLC. All rights reserved. |
| | For additional information about the Fund; including its prospectus, financial information, holdings and proxy information, scan the QR code or visit fundresearch.fidelity.com/prospectus/sec 1.9914772.100 2912-TSRS-1124 |
| |
| | SEMI-ANNUAL SHAREHOLDER REPORT | AS OF SEPTEMBER 30, 2024 | |
| | Fidelity Freedom® Index 2030 Fund Fidelity Freedom® Index 2030 Fund Premier Class : FMKPX |
| | | |
This semi-annual shareholder report contains information about Fidelity Freedom® Index 2030 Fund for the period April 1, 2024 to September 30, 2024. You can find additional information about the Fund at fundresearch.fidelity.com/prospectus/sec. You can also request this information by contacting us at 1-800-544-3455 or by sending an e-mail to fidfunddocuments@fidelity.com.
What were your Fund costs for the last six months?(based on hypothetical $10,000 investment)
| | Costs of a $10,000 investment | Costs paid as a percentage of a $10,000 investment | |
| Premier Class | $ 3 | 0.05% | |
Key Fund Statistics (as of September 30, 2024)
KEY FACTS | | |
| Fund Size | $22,274,558,937 | |
| Number of Holdings | 6 | |
| Portfolio Turnover | 10% | |
What did the Fund invest in?
(as of September 30, 2024)
| Bond Funds | 41.0 |
| Domestic Equity Funds | 35.5 |
| International Equity Funds | 23.5 |
| Short-Term Investments and Net Other Assets (Liabilities) | 0.0 |
ASSET ALLOCATION (% of Fund's net assets) |
|
|
TOP HOLDINGS (% of Fund's net assets) | | |
| Fidelity Series Total Market Index Fund | 35.5 | |
| Fidelity Series Bond Index Fund | 26.5 | |
| Fidelity Series Global ex U.S. Index Fund | 23.5 | |
| Fidelity Series 5+ Year Inflation-Protected Bond Index Fund | 5.2 | |
| Fidelity Series International Developed Markets Bond Index Fund | 4.8 | |
| Fidelity Series Long-Term Treasury Bond Index Fund | 4.5 | |
| | 100.0 | |
| Fidelity, the Fidelity Investments Logo and all other Fidelity trademarks or service marks used herein are trademarks or service marks of FMR LLC. Any third-party marks that are used herein are trademarks or service marks of their respective owners. © 2024 FMR LLC. All rights reserved. |
| | For additional information about the Fund; including its prospectus, financial information, holdings and proxy information, scan the QR code or visit fundresearch.fidelity.com/prospectus/sec 1.9914721.100 6197-TSRS-1124 |
| |
| | SEMI-ANNUAL SHAREHOLDER REPORT | AS OF SEPTEMBER 30, 2024 | |
| | Fidelity Freedom® Index 2010 Fund Fidelity Freedom® Index 2010 Fund Institutional Premium Class : FFWTX |
| | | |
This semi-annual shareholder report contains information about Fidelity Freedom® Index 2010 Fund for the period April 1, 2024 to September 30, 2024. You can find additional information about the Fund at fundresearch.fidelity.com/prospectus/sec. You can also request this information by contacting us at 1-800-544-8544 or by sending an e-mail to fidfunddocuments@fidelity.com.
What were your Fund costs for the last six months?(based on hypothetical $10,000 investment)
| | Costs of a $10,000 investment | Costs paid as a percentage of a $10,000 investment | |
| Institutional Premium Class | $ 4 | 0.08% | |
Key Fund Statistics (as of September 30, 2024)
KEY FACTS | | |
| Fund Size | $733,849,570 | |
| Number of Holdings | 8 | |
| Portfolio Turnover | 14% | |
What did the Fund invest in?
(as of September 30, 2024)
| Bond Funds | 65.8 |
| Domestic Equity Funds | 15.7 |
| International Equity Funds | 10.4 |
| Short-Term Funds | 8.1 |
| Short-Term Investments and Net Other Assets (Liabilities) | 0.0 |
ASSET ALLOCATION (% of Fund's net assets) |
|
|
TOP HOLDINGS (% of Fund's net assets) | | |
| Fidelity Series Bond Index Fund | 40.2 | |
| Fidelity Series Total Market Index Fund | 15.7 | |
| Fidelity Series 0-5 Year Inflation-Protected Bond Index Fund | 15.4 | |
| Fidelity Series Global ex U.S. Index Fund | 10.4 | |
| Fidelity Series Treasury Bill Index Fund | 8.1 | |
| Fidelity Series International Developed Markets Bond Index Fund | 4.9 | |
| Fidelity Series Long-Term Treasury Bond Index Fund | 3.2 | |
| Fidelity Series 5+ Year Inflation-Protected Bond Index Fund | 2.1 | |
| | 100.0 | |
| Fidelity, the Fidelity Investments Logo and all other Fidelity trademarks or service marks used herein are trademarks or service marks of FMR LLC. Any third-party marks that are used herein are trademarks or service marks of their respective owners. © 2024 FMR LLC. All rights reserved. |
| | For additional information about the Fund; including its prospectus, financial information, holdings and proxy information, scan the QR code or visit fundresearch.fidelity.com/prospectus/sec 1.9914711.100 2766-TSRS-1124 |
| |
| | SEMI-ANNUAL SHAREHOLDER REPORT | AS OF SEPTEMBER 30, 2024 | |
| | Fidelity Freedom® Index 2020 Fund Fidelity Freedom® Index 2020 Fund Premier Class : FKIPX |
| | | |
This semi-annual shareholder report contains information about Fidelity Freedom® Index 2020 Fund for the period April 1, 2024 to September 30, 2024. You can find additional information about the Fund at fundresearch.fidelity.com/prospectus/sec. You can also request this information by contacting us at 1-800-544-3455 or by sending an e-mail to fidfunddocuments@fidelity.com.
What were your Fund costs for the last six months?(based on hypothetical $10,000 investment)
| | Costs of a $10,000 investment | Costs paid as a percentage of a $10,000 investment | |
| Premier Class | $ 3 | 0.05% | |
Key Fund Statistics (as of September 30, 2024)
KEY FACTS | | |
| Fund Size | $7,157,854,253 | |
| Number of Holdings | 8 | |
| Portfolio Turnover | 8% | |
What did the Fund invest in?
(as of September 30, 2024)
| Bond Funds | 53.3 |
| Domestic Equity Funds | 26.7 |
| International Equity Funds | 17.7 |
| Short-Term Funds | 2.3 |
| Short-Term Investments and Net Other Assets (Liabilities) | 0.0 |
ASSET ALLOCATION (% of Fund's net assets) |
|
|
TOP HOLDINGS (% of Fund's net assets) | | |
| Fidelity Series Bond Index Fund | 33.1 | |
| Fidelity Series Total Market Index Fund | 26.7 | |
| Fidelity Series Global ex U.S. Index Fund | 17.7 | |
| Fidelity Series 5+ Year Inflation-Protected Bond Index Fund | 7.3 | |
| Fidelity Series International Developed Markets Bond Index Fund | 5.0 | |
| Fidelity Series 0-5 Year Inflation-Protected Bond Index Fund | 4.2 | |
| Fidelity Series Long-Term Treasury Bond Index Fund | 3.7 | |
| Fidelity Series Treasury Bill Index Fund | 2.3 | |
| | 100.0 | |
| Fidelity, the Fidelity Investments Logo and all other Fidelity trademarks or service marks used herein are trademarks or service marks of FMR LLC. Any third-party marks that are used herein are trademarks or service marks of their respective owners. © 2024 FMR LLC. All rights reserved. |
| | For additional information about the Fund; including its prospectus, financial information, holdings and proxy information, scan the QR code or visit fundresearch.fidelity.com/prospectus/sec 1.9914715.100 6195-TSRS-1124 |
| |
| | SEMI-ANNUAL SHAREHOLDER REPORT | AS OF SEPTEMBER 30, 2024 | |
| | Fidelity Freedom® Index 2070 Fund Fidelity Freedom® Index 2070 Fund Premier Class : FRBWX |
| | | |
This semi-annual shareholder report contains information about Fidelity Freedom® Index 2070 Fund for the period June 28, 2024 to September 30, 2024. You can find additional information about the Fund at fundresearch.fidelity.com/prospectus/sec. You can also request this information by contacting us at 1-800-544-3455 or by sending an e-mail to fidfunddocuments@fidelity.com.
What were your Fund costs for the last six months?(based on hypothetical $10,000 investment)
| | Costs of a $10,000 investment | Costs paid as a percentage of a $10,000 investment | |
Premier Class A | $ 1 | 0.05% | |
AExpenses for the full reporting period would be higher.
Key Fund Statistics (as of September 30, 2024)
KEY FACTS | | |
| Fund Size | $2,518,147 | |
| Number of Holdings | 5 | |
Portfolio TurnoverB | 0%A | |
A Amount represents less than 1%
B Amount not annualized
What did the Fund invest in?
(as of September 30, 2024)
| Domestic Equity Funds | 54.2 |
| International Equity Funds | 35.9 |
| Bond Funds | 9.9 |
| Short-Term Investments and Net Other Assets (Liabilities) | 0.0 |
ASSET ALLOCATION (% of Fund's net assets) |
|
|
TOP HOLDINGS (% of Fund's net assets) | | |
| Fidelity Series Total Market Index Fund | 54.2 | |
| Fidelity Series Global ex U.S. Index Fund | 35.9 | |
| Fidelity Series Long-Term Treasury Bond Index Fund | 5.0 | |
| Fidelity Series Bond Index Fund | 4.0 | |
| Fidelity Series International Developed Markets Bond Index Fund | 0.9 | |
| | 100.0 | |
| Fidelity, the Fidelity Investments Logo and all other Fidelity trademarks or service marks used herein are trademarks or service marks of FMR LLC. Any third-party marks that are used herein are trademarks or service marks of their respective owners. © 2024 FMR LLC. All rights reserved. |
| | For additional information about the Fund; including its prospectus, financial information, holdings and proxy information, scan the QR code or visit fundresearch.fidelity.com/prospectus/sec 1.9918269.100 7652-TSRS-1124 |
| |
| | SEMI-ANNUAL SHAREHOLDER REPORT | AS OF SEPTEMBER 30, 2024 | |
| | Fidelity Freedom® Index 2060 Fund Fidelity Freedom® Index 2060 Fund Institutional Premium Class : FFLEX |
| | | |
This semi-annual shareholder report contains information about Fidelity Freedom® Index 2060 Fund for the period April 1, 2024 to September 30, 2024. You can find additional information about the Fund at fundresearch.fidelity.com/prospectus/sec. You can also request this information by contacting us at 1-800-544-8544 or by sending an e-mail to fidfunddocuments@fidelity.com.
What were your Fund costs for the last six months?(based on hypothetical $10,000 investment)
| | Costs of a $10,000 investment | Costs paid as a percentage of a $10,000 investment | |
| Institutional Premium Class | $ 4 | 0.08% | |
Key Fund Statistics (as of September 30, 2024)
KEY FACTS | | |
| Fund Size | $8,047,655,750 | |
| Number of Holdings | 5 | |
| Portfolio Turnover | 5% | |
What did the Fund invest in?
(as of September 30, 2024)
| Domestic Equity Funds | 54.2 |
| International Equity Funds | 35.9 |
| Bond Funds | 9.9 |
| Short-Term Investments and Net Other Assets (Liabilities) | 0.0 |
ASSET ALLOCATION (% of Fund's net assets) |
|
|
TOP HOLDINGS (% of Fund's net assets) | | |
| Fidelity Series Total Market Index Fund | 54.2 | |
| Fidelity Series Global ex U.S. Index Fund | 35.9 | |
| Fidelity Series Long-Term Treasury Bond Index Fund | 5.0 | |
| Fidelity Series Bond Index Fund | 4.0 | |
| Fidelity Series International Developed Markets Bond Index Fund | 0.9 | |
| | 100.0 | |
| Fidelity, the Fidelity Investments Logo and all other Fidelity trademarks or service marks used herein are trademarks or service marks of FMR LLC. Any third-party marks that are used herein are trademarks or service marks of their respective owners. © 2024 FMR LLC. All rights reserved. |
| | For additional information about the Fund; including its prospectus, financial information, holdings and proxy information, scan the QR code or visit fundresearch.fidelity.com/prospectus/sec 1.9914759.100 2776-TSRS-1124 |
| |
| | SEMI-ANNUAL SHAREHOLDER REPORT | AS OF SEPTEMBER 30, 2024 | |
| | Fidelity Flex® Freedom Blend 2050 Fund Fidelity Flex® Freedom Blend 2050 Fund : FYLSX |
| | | |
This semi-annual shareholder report contains information about Fidelity Flex® Freedom Blend 2050 Fund for the period April 1, 2024 to September 30, 2024. You can find additional information about the Fund at fundresearch.fidelity.com/prospectus/sec. You can also request this information by contacting us at 1-800-544-3455 or by sending an e-mail to fidfunddocuments@fidelity.com.
What were your Fund costs for the last six months?(based on hypothetical $10,000 investment)
| | Costs of a $10,000 investment | Costs paid as a percentage of a $10,000 investment | |
| Fidelity Flex® Freedom Blend 2050 Fund | $ 0 A | 0.00%B | |
A Amount represents less than $.50
B Amount represents less than 0.005%
Key Fund Statistics (as of September 30, 2024)
KEY FACTS | | |
| Fund Size | $55,138,849 | |
| Number of Holdings | 28 | |
| Portfolio Turnover | 27% | |
What did the Fund invest in?
(as of September 30, 2024)
| Domestic Equity Funds | 51.0 |
| International Equity Funds | 41.9 |
| Bond Funds | 7.1 |
| Short-Term Investments and Net Other Assets (Liabilities) | 0.0 |
ASSET ALLOCATION (% of Fund's net assets) |
|
|
TOP HOLDINGS (% of Fund's net assets) | | |
| Fidelity Series Large Cap Value Index Fund | 14.2 | |
| Fidelity Series Blue Chip Growth Fund | 11.7 | |
| Fidelity Series Emerging Markets Opportunities Fund | 11.1 | |
| Fidelity Series Large Cap Growth Index Fund | 7.6 | |
| Fidelity Series International Value Fund | 7.0 | |
| Fidelity Series Overseas Fund | 7.0 | |
| Fidelity Series International Growth Fund | 7.0 | |
| Fidelity Series Large Cap Stock Fund | 6.8 | |
| Fidelity Series Long-Term Treasury Bond Index Fund | 5.5 | |
| Fidelity Series Value Discovery Fund | 4.9 | |
| | 82.8 | |
| Fidelity, the Fidelity Investments Logo and all other Fidelity trademarks or service marks used herein are trademarks or service marks of FMR LLC. Any third-party marks that are used herein are trademarks or service marks of their respective owners. © 2024 FMR LLC. All rights reserved. |
| | For additional information about the Fund; including its prospectus, financial information, holdings and proxy information, scan the QR code or visit fundresearch.fidelity.com/prospectus/sec 1.9914771.100 2911-TSRS-1124 |
| |
| | SEMI-ANNUAL SHAREHOLDER REPORT | AS OF SEPTEMBER 30, 2024 | |
| | Fidelity Freedom® Index 2035 Fund Fidelity Freedom® Index 2035 Fund Premier Class : FNIPX |
| | | |
This semi-annual shareholder report contains information about Fidelity Freedom® Index 2035 Fund for the period April 1, 2024 to September 30, 2024. You can find additional information about the Fund at fundresearch.fidelity.com/prospectus/sec. You can also request this information by contacting us at 1-800-544-3455 or by sending an e-mail to fidfunddocuments@fidelity.com.
What were your Fund costs for the last six months?(based on hypothetical $10,000 investment)
| | Costs of a $10,000 investment | Costs paid as a percentage of a $10,000 investment | |
| Premier Class | $ 3 | 0.05% | |
Key Fund Statistics (as of September 30, 2024)
KEY FACTS | | |
| Fund Size | $22,859,083,179 | |
| Number of Holdings | 6 | |
| Portfolio Turnover | 11% | |
What did the Fund invest in?
(as of September 30, 2024)
| Domestic Equity Funds | 41.7 |
| Bond Funds | 30.8 |
| International Equity Funds | 27.5 |
| Short-Term Investments and Net Other Assets (Liabilities) | 0.0 |
ASSET ALLOCATION (% of Fund's net assets) |
|
|
TOP HOLDINGS (% of Fund's net assets) | | |
| Fidelity Series Total Market Index Fund | 41.7 | |
| Fidelity Series Global ex U.S. Index Fund | 27.5 | |
| Fidelity Series Bond Index Fund | 20.7 | |
| Fidelity Series Long-Term Treasury Bond Index Fund | 4.9 | |
| Fidelity Series International Developed Markets Bond Index Fund | 4.2 | |
| Fidelity Series 5+ Year Inflation-Protected Bond Index Fund | 1.0 | |
| | 100.0 | |
| Fidelity, the Fidelity Investments Logo and all other Fidelity trademarks or service marks used herein are trademarks or service marks of FMR LLC. Any third-party marks that are used herein are trademarks or service marks of their respective owners. © 2024 FMR LLC. All rights reserved. |
| | For additional information about the Fund; including its prospectus, financial information, holdings and proxy information, scan the QR code or visit fundresearch.fidelity.com/prospectus/sec 1.9914724.100 6198-TSRS-1124 |
| |
| | SEMI-ANNUAL SHAREHOLDER REPORT | AS OF SEPTEMBER 30, 2024 | |
| | Fidelity Freedom® Index 2040 Fund Fidelity Freedom® Index 2040 Fund Premier Class : FPIPX |
| | | |
This semi-annual shareholder report contains information about Fidelity Freedom® Index 2040 Fund for the period April 1, 2024 to September 30, 2024. You can find additional information about the Fund at fundresearch.fidelity.com/prospectus/sec. You can also request this information by contacting us at 1-800-544-3455 or by sending an e-mail to fidfunddocuments@fidelity.com.
What were your Fund costs for the last six months?(based on hypothetical $10,000 investment)
| | Costs of a $10,000 investment | Costs paid as a percentage of a $10,000 investment | |
| Premier Class | $ 3 | 0.05% | |
Key Fund Statistics (as of September 30, 2024)
KEY FACTS | | |
| Fund Size | $23,405,059,072 | |
| Number of Holdings | 5 | |
| Portfolio Turnover | 9% | |
What did the Fund invest in?
(as of September 30, 2024)
| Domestic Equity Funds | 50.2 |
| International Equity Funds | 33.3 |
| Bond Funds | 16.5 |
| Short-Term Investments and Net Other Assets (Liabilities) | 0.0 |
ASSET ALLOCATION (% of Fund's net assets) |
|
|
TOP HOLDINGS (% of Fund's net assets) | | |
| Fidelity Series Total Market Index Fund | 50.2 | |
| Fidelity Series Global ex U.S. Index Fund | 33.3 | |
| Fidelity Series Bond Index Fund | 9.4 | |
| Fidelity Series Long-Term Treasury Bond Index Fund | 5.0 | |
| Fidelity Series International Developed Markets Bond Index Fund | 2.1 | |
| | 100.0 | |
| Fidelity, the Fidelity Investments Logo and all other Fidelity trademarks or service marks used herein are trademarks or service marks of FMR LLC. Any third-party marks that are used herein are trademarks or service marks of their respective owners. © 2024 FMR LLC. All rights reserved. |
| | For additional information about the Fund; including its prospectus, financial information, holdings and proxy information, scan the QR code or visit fundresearch.fidelity.com/prospectus/sec 1.9914727.100 6199-TSRS-1124 |
| |
| | SEMI-ANNUAL SHAREHOLDER REPORT | AS OF SEPTEMBER 30, 2024 | |
| | Fidelity Flex® Freedom Blend 2030 Fund Fidelity Flex® Freedom Blend 2030 Fund : FVLSX |
| | | |
This semi-annual shareholder report contains information about Fidelity Flex® Freedom Blend 2030 Fund for the period April 1, 2024 to September 30, 2024. You can find additional information about the Fund at fundresearch.fidelity.com/prospectus/sec. You can also request this information by contacting us at 1-800-544-3455 or by sending an e-mail to fidfunddocuments@fidelity.com.
What were your Fund costs for the last six months?(based on hypothetical $10,000 investment)
| | Costs of a $10,000 investment | Costs paid as a percentage of a $10,000 investment | |
| Fidelity Flex® Freedom Blend 2030 Fund | $ 0 A | 0.00%B | |
A Amount represents less than $.50
B Amount represents less than 0.005%
Key Fund Statistics (as of September 30, 2024)
KEY FACTS | | |
| Fund Size | $79,209,508 | |
| Number of Holdings | 30 | |
| Portfolio Turnover | 28% | |
What did the Fund invest in?
(as of September 30, 2024)
| Bond Funds | 37.7 |
| Domestic Equity Funds | 32.8 |
| International Equity Funds | 29.5 |
| Short-Term Investments and Net Other Assets (Liabilities) | 0.0 |
ASSET ALLOCATION (% of Fund's net assets) |
|
|
TOP HOLDINGS (% of Fund's net assets) | | |
| Fidelity Series Large Cap Value Index Fund | 9.1 | |
| Fidelity Series Emerging Markets Opportunities Fund | 8.1 | |
| Fidelity Series Blue Chip Growth Fund | 7.5 | |
| Fidelity Series Long-Term Treasury Bond Index Fund | 6.9 | |
| Fidelity Series Government Bond Index Fund | 5.9 | |
| Fidelity Series 5+ Year Inflation-Protected Bond Index Fund | 5.8 | |
| Fidelity Series Investment Grade Bond Fund | 5.7 | |
| Fidelity Series Large Cap Growth Index Fund | 4.9 | |
| Fidelity Series International Value Fund | 4.7 | |
| Fidelity Series Overseas Fund | 4.7 | |
| | 63.3 | |
| Fidelity, the Fidelity Investments Logo and all other Fidelity trademarks or service marks used herein are trademarks or service marks of FMR LLC. Any third-party marks that are used herein are trademarks or service marks of their respective owners. © 2024 FMR LLC. All rights reserved. |
| | For additional information about the Fund; including its prospectus, financial information, holdings and proxy information, scan the QR code or visit fundresearch.fidelity.com/prospectus/sec 1.9914767.100 2907-TSRS-1124 |
| |
| | SEMI-ANNUAL SHAREHOLDER REPORT | AS OF SEPTEMBER 30, 2024 | |
| | Fidelity Freedom® Index 2025 Fund Fidelity Freedom® Index 2025 Fund Premier Class : FLIPX |
| | | |
This semi-annual shareholder report contains information about Fidelity Freedom® Index 2025 Fund for the period April 1, 2024 to September 30, 2024. You can find additional information about the Fund at fundresearch.fidelity.com/prospectus/sec. You can also request this information by contacting us at 1-800-544-3455 or by sending an e-mail to fidfunddocuments@fidelity.com.
What were your Fund costs for the last six months?(based on hypothetical $10,000 investment)
| | Costs of a $10,000 investment | Costs paid as a percentage of a $10,000 investment | |
| Premier Class | $ 3 | 0.05% | |
Key Fund Statistics (as of September 30, 2024)
KEY FACTS | | |
| Fund Size | $14,699,618,165 | |
| Number of Holdings | 6 | |
| Portfolio Turnover | 8% | |
What did the Fund invest in?
(as of September 30, 2024)
| Bond Funds | 47.5 |
| Domestic Equity Funds | 31.6 |
| International Equity Funds | 20.9 |
| Short-Term Investments and Net Other Assets (Liabilities) | 0.0 |
ASSET ALLOCATION (% of Fund's net assets) |
|
|
TOP HOLDINGS (% of Fund's net assets) | | |
| Fidelity Series Total Market Index Fund | 31.6 | |
| Fidelity Series Bond Index Fund | 29.2 | |
| Fidelity Series Global ex U.S. Index Fund | 20.9 | |
| Fidelity Series 5+ Year Inflation-Protected Bond Index Fund | 9.3 | |
| Fidelity Series International Developed Markets Bond Index Fund | 4.9 | |
| Fidelity Series Long-Term Treasury Bond Index Fund | 4.1 | |
| | 100.0 | |
| Fidelity, the Fidelity Investments Logo and all other Fidelity trademarks or service marks used herein are trademarks or service marks of FMR LLC. Any third-party marks that are used herein are trademarks or service marks of their respective owners. © 2024 FMR LLC. All rights reserved. |
| | For additional information about the Fund; including its prospectus, financial information, holdings and proxy information, scan the QR code or visit fundresearch.fidelity.com/prospectus/sec 1.9914718.100 6196-TSRS-1124 |
| |
| | SEMI-ANNUAL SHAREHOLDER REPORT | AS OF SEPTEMBER 30, 2024 | |
| | Fidelity Freedom® Index 2050 Fund Fidelity Freedom® Index 2050 Fund Institutional Premium Class : FFOPX |
| | | |
This semi-annual shareholder report contains information about Fidelity Freedom® Index 2050 Fund for the period April 1, 2024 to September 30, 2024. You can find additional information about the Fund at fundresearch.fidelity.com/prospectus/sec. You can also request this information by contacting us at 1-800-544-8544 or by sending an e-mail to fidfunddocuments@fidelity.com.
What were your Fund costs for the last six months?(based on hypothetical $10,000 investment)
| | Costs of a $10,000 investment | Costs paid as a percentage of a $10,000 investment | |
| Institutional Premium Class | $ 4 | 0.08% | |
Key Fund Statistics (as of September 30, 2024)
KEY FACTS | | |
| Fund Size | $19,727,473,878 | |
| Number of Holdings | 5 | |
| Portfolio Turnover | 7% | |
What did the Fund invest in?
(as of September 30, 2024)
| Domestic Equity Funds | 54.2 |
| International Equity Funds | 35.9 |
| Bond Funds | 9.9 |
| Short-Term Investments and Net Other Assets (Liabilities) | 0.0 |
ASSET ALLOCATION (% of Fund's net assets) |
|
|
TOP HOLDINGS (% of Fund's net assets) | | |
| Fidelity Series Total Market Index Fund | 54.2 | |
| Fidelity Series Global ex U.S. Index Fund | 35.9 | |
| Fidelity Series Long-Term Treasury Bond Index Fund | 5.0 | |
| Fidelity Series Bond Index Fund | 4.0 | |
| Fidelity Series International Developed Markets Bond Index Fund | 0.9 | |
| | 100.0 | |
| Fidelity, the Fidelity Investments Logo and all other Fidelity trademarks or service marks used herein are trademarks or service marks of FMR LLC. Any third-party marks that are used herein are trademarks or service marks of their respective owners. © 2024 FMR LLC. All rights reserved. |
| | For additional information about the Fund; including its prospectus, financial information, holdings and proxy information, scan the QR code or visit fundresearch.fidelity.com/prospectus/sec 1.9914732.100 2774-TSRS-1124 |
| |
| | SEMI-ANNUAL SHAREHOLDER REPORT | AS OF SEPTEMBER 30, 2024 | |
| | Fidelity Freedom® Index 2015 Fund Fidelity Freedom® Index 2015 Fund Institutional Premium Class : FIWFX |
| | | |
This semi-annual shareholder report contains information about Fidelity Freedom® Index 2015 Fund for the period April 1, 2024 to September 30, 2024. You can find additional information about the Fund at fundresearch.fidelity.com/prospectus/sec. You can also request this information by contacting us at 1-800-544-8544 or by sending an e-mail to fidfunddocuments@fidelity.com.
What were your Fund costs for the last six months?(based on hypothetical $10,000 investment)
| | Costs of a $10,000 investment | Costs paid as a percentage of a $10,000 investment | |
| Institutional Premium Class | $ 4 | 0.08% | |
Key Fund Statistics (as of September 30, 2024)
KEY FACTS | | |
| Fund Size | $2,055,460,161 | |
| Number of Holdings | 8 | |
| Portfolio Turnover | 11% | |
What did the Fund invest in?
(as of September 30, 2024)
| Bond Funds | 59.6 |
| Domestic Equity Funds | 21.2 |
| International Equity Funds | 14.0 |
| Short-Term Funds | 5.2 |
| Short-Term Investments and Net Other Assets (Liabilities) | 0.0 |
ASSET ALLOCATION (% of Fund's net assets) |
|
|
TOP HOLDINGS (% of Fund's net assets) | | |
| Fidelity Series Bond Index Fund | 36.7 | |
| Fidelity Series Total Market Index Fund | 21.2 | |
| Fidelity Series Global ex U.S. Index Fund | 14.0 | |
| Fidelity Series 0-5 Year Inflation-Protected Bond Index Fund | 9.8 | |
| Fidelity Series Treasury Bill Index Fund | 5.2 | |
| Fidelity Series International Developed Markets Bond Index Fund | 4.9 | |
| Fidelity Series 5+ Year Inflation-Protected Bond Index Fund | 4.7 | |
| Fidelity Series Long-Term Treasury Bond Index Fund | 3.5 | |
| | 100.0 | |
| Fidelity, the Fidelity Investments Logo and all other Fidelity trademarks or service marks used herein are trademarks or service marks of FMR LLC. Any third-party marks that are used herein are trademarks or service marks of their respective owners. © 2024 FMR LLC. All rights reserved. |
| | For additional information about the Fund; including its prospectus, financial information, holdings and proxy information, scan the QR code or visit fundresearch.fidelity.com/prospectus/sec 1.9914735.100 2767-TSRS-1124 |
| |
| | SEMI-ANNUAL SHAREHOLDER REPORT | AS OF SEPTEMBER 30, 2024 | |
| | Fidelity Freedom® Index 2050 Fund Fidelity Freedom® Index 2050 Fund Premier Class : FRLPX |
| | | |
This semi-annual shareholder report contains information about Fidelity Freedom® Index 2050 Fund for the period April 1, 2024 to September 30, 2024. You can find additional information about the Fund at fundresearch.fidelity.com/prospectus/sec. You can also request this information by contacting us at 1-800-544-3455 or by sending an e-mail to fidfunddocuments@fidelity.com.
What were your Fund costs for the last six months?(based on hypothetical $10,000 investment)
| | Costs of a $10,000 investment | Costs paid as a percentage of a $10,000 investment | |
| Premier Class | $ 3 | 0.05% | |
Key Fund Statistics (as of September 30, 2024)
KEY FACTS | | |
| Fund Size | $19,727,473,878 | |
| Number of Holdings | 5 | |
| Portfolio Turnover | 7% | |
What did the Fund invest in?
(as of September 30, 2024)
| Domestic Equity Funds | 54.2 |
| International Equity Funds | 35.9 |
| Bond Funds | 9.9 |
| Short-Term Investments and Net Other Assets (Liabilities) | 0.0 |
ASSET ALLOCATION (% of Fund's net assets) |
|
|
TOP HOLDINGS (% of Fund's net assets) | | |
| Fidelity Series Total Market Index Fund | 54.2 | |
| Fidelity Series Global ex U.S. Index Fund | 35.9 | |
| Fidelity Series Long-Term Treasury Bond Index Fund | 5.0 | |
| Fidelity Series Bond Index Fund | 4.0 | |
| Fidelity Series International Developed Markets Bond Index Fund | 0.9 | |
| | 100.0 | |
| Fidelity, the Fidelity Investments Logo and all other Fidelity trademarks or service marks used herein are trademarks or service marks of FMR LLC. Any third-party marks that are used herein are trademarks or service marks of their respective owners. © 2024 FMR LLC. All rights reserved. |
| | For additional information about the Fund; including its prospectus, financial information, holdings and proxy information, scan the QR code or visit fundresearch.fidelity.com/prospectus/sec 1.9914733.100 6201-TSRS-1124 |
| |
| | SEMI-ANNUAL SHAREHOLDER REPORT | AS OF SEPTEMBER 30, 2024 | |
| | Fidelity Freedom® Index 2050 Fund Fidelity Freedom® Index 2050 Fund Investor Class : FIPFX |
| | | |
This semi-annual shareholder report contains information about Fidelity Freedom® Index 2050 Fund for the period April 1, 2024 to September 30, 2024. You can find additional information about the Fund at fundresearch.fidelity.com/prospectus/sec. You can also request this information by contacting us at 1-800-544-8544 or by sending an e-mail to fidfunddocuments@fidelity.com.
What were your Fund costs for the last six months?(based on hypothetical $10,000 investment)
| | Costs of a $10,000 investment | Costs paid as a percentage of a $10,000 investment | |
| Investor Class | $ 6 | 0.12% | |
Key Fund Statistics (as of September 30, 2024)
KEY FACTS | | |
| Fund Size | $19,727,473,878 | |
| Number of Holdings | 5 | |
| Portfolio Turnover | 7% | |
What did the Fund invest in?
(as of September 30, 2024)
| Domestic Equity Funds | 54.2 |
| International Equity Funds | 35.9 |
| Bond Funds | 9.9 |
| Short-Term Investments and Net Other Assets (Liabilities) | 0.0 |
ASSET ALLOCATION (% of Fund's net assets) |
|
|
TOP HOLDINGS (% of Fund's net assets) | | |
| Fidelity Series Total Market Index Fund | 54.2 | |
| Fidelity Series Global ex U.S. Index Fund | 35.9 | |
| Fidelity Series Long-Term Treasury Bond Index Fund | 5.0 | |
| Fidelity Series Bond Index Fund | 4.0 | |
| Fidelity Series International Developed Markets Bond Index Fund | 0.9 | |
| | 100.0 | |
| Fidelity, the Fidelity Investments Logo and all other Fidelity trademarks or service marks used herein are trademarks or service marks of FMR LLC. Any third-party marks that are used herein are trademarks or service marks of their respective owners. © 2024 FMR LLC. All rights reserved. |
| | For additional information about the Fund; including its prospectus, financial information, holdings and proxy information, scan the QR code or visit fundresearch.fidelity.com/prospectus/sec 1.9914731.100 2241-TSRS-1124 |
| |
| | SEMI-ANNUAL SHAREHOLDER REPORT | AS OF SEPTEMBER 30, 2024 | |
| | Fidelity Freedom® Index 2055 Fund Fidelity Freedom® Index 2055 Fund Investor Class : FDEWX |
| | | |
This semi-annual shareholder report contains information about Fidelity Freedom® Index 2055 Fund for the period April 1, 2024 to September 30, 2024. You can find additional information about the Fund at fundresearch.fidelity.com/prospectus/sec. You can also request this information by contacting us at 1-800-544-8544 or by sending an e-mail to fidfunddocuments@fidelity.com.
What were your Fund costs for the last six months?(based on hypothetical $10,000 investment)
| | Costs of a $10,000 investment | Costs paid as a percentage of a $10,000 investment | |
| Investor Class | $ 6 | 0.12% | |
Key Fund Statistics (as of September 30, 2024)
KEY FACTS | | |
| Fund Size | $14,448,762,506 | |
| Number of Holdings | 5 | |
| Portfolio Turnover | 6% | |
What did the Fund invest in?
(as of September 30, 2024)
| Domestic Equity Funds | 54.2 |
| International Equity Funds | 35.9 |
| Bond Funds | 9.9 |
| Short-Term Investments and Net Other Assets (Liabilities) | 0.0 |
ASSET ALLOCATION (% of Fund's net assets) |
|
|
TOP HOLDINGS (% of Fund's net assets) | | |
| Fidelity Series Total Market Index Fund | 54.2 | |
| Fidelity Series Global ex U.S. Index Fund | 35.9 | |
| Fidelity Series Long-Term Treasury Bond Index Fund | 5.0 | |
| Fidelity Series Bond Index Fund | 4.0 | |
| Fidelity Series International Developed Markets Bond Index Fund | 0.9 | |
| | 100.0 | |
| Fidelity, the Fidelity Investments Logo and all other Fidelity trademarks or service marks used herein are trademarks or service marks of FMR LLC. Any third-party marks that are used herein are trademarks or service marks of their respective owners. © 2024 FMR LLC. All rights reserved. |
| | For additional information about the Fund; including its prospectus, financial information, holdings and proxy information, scan the QR code or visit fundresearch.fidelity.com/prospectus/sec 1.9914746.100 2338-TSRS-1124 |
| |
| | SEMI-ANNUAL SHAREHOLDER REPORT | AS OF SEPTEMBER 30, 2024 | |
| | Fidelity Freedom® Index 2025 Fund Fidelity Freedom® Index 2025 Fund Investor Class : FQIFX |
| | | |
This semi-annual shareholder report contains information about Fidelity Freedom® Index 2025 Fund for the period April 1, 2024 to September 30, 2024. You can find additional information about the Fund at fundresearch.fidelity.com/prospectus/sec. You can also request this information by contacting us at 1-800-544-8544 or by sending an e-mail to fidfunddocuments@fidelity.com.
What were your Fund costs for the last six months?(based on hypothetical $10,000 investment)
| | Costs of a $10,000 investment | Costs paid as a percentage of a $10,000 investment | |
| Investor Class | $ 6 | 0.12% | |
Key Fund Statistics (as of September 30, 2024)
KEY FACTS | | |
| Fund Size | $14,699,618,165 | |
| Number of Holdings | 6 | |
| Portfolio Turnover | 8% | |
What did the Fund invest in?
(as of September 30, 2024)
| Bond Funds | 47.5 |
| Domestic Equity Funds | 31.6 |
| International Equity Funds | 20.9 |
| Short-Term Investments and Net Other Assets (Liabilities) | 0.0 |
ASSET ALLOCATION (% of Fund's net assets) |
|
|
TOP HOLDINGS (% of Fund's net assets) | | |
| Fidelity Series Total Market Index Fund | 31.6 | |
| Fidelity Series Bond Index Fund | 29.2 | |
| Fidelity Series Global ex U.S. Index Fund | 20.9 | |
| Fidelity Series 5+ Year Inflation-Protected Bond Index Fund | 9.3 | |
| Fidelity Series International Developed Markets Bond Index Fund | 4.9 | |
| Fidelity Series Long-Term Treasury Bond Index Fund | 4.1 | |
| | 100.0 | |
| Fidelity, the Fidelity Investments Logo and all other Fidelity trademarks or service marks used herein are trademarks or service marks of FMR LLC. Any third-party marks that are used herein are trademarks or service marks of their respective owners. © 2024 FMR LLC. All rights reserved. |
| | For additional information about the Fund; including its prospectus, financial information, holdings and proxy information, scan the QR code or visit fundresearch.fidelity.com/prospectus/sec 1.9914716.100 2232-TSRS-1124 |
| |
| | SEMI-ANNUAL SHAREHOLDER REPORT | AS OF SEPTEMBER 30, 2024 | |
| | Fidelity Freedom® Index Income Fund Fidelity Freedom® Index Income Fund Premier Class : FAPIX |
| | | |
This semi-annual shareholder report contains information about Fidelity Freedom® Index Income Fund for the period April 1, 2024 to September 30, 2024. You can find additional information about the Fund at fundresearch.fidelity.com/prospectus/sec. You can also request this information by contacting us at 1-800-544-3455 or by sending an e-mail to fidfunddocuments@fidelity.com.
What were your Fund costs for the last six months?(based on hypothetical $10,000 investment)
| | Costs of a $10,000 investment | Costs paid as a percentage of a $10,000 investment | |
| Premier Class | $ 3 | 0.05% | |
Key Fund Statistics (as of September 30, 2024)
KEY FACTS | | |
| Fund Size | $1,681,067,537 | |
| Number of Holdings | 8 | |
| Portfolio Turnover | 14% | |
What did the Fund invest in?
(as of September 30, 2024)
| Bond Funds | 70.9 |
| Domestic Equity Funds | 11.5 |
| Short-Term Funds | 10.0 |
| International Equity Funds | 7.6 |
| Short-Term Investments and Net Other Assets (Liabilities) | 0.0 |
ASSET ALLOCATION (% of Fund's net assets) |
|
|
TOP HOLDINGS (% of Fund's net assets) | | |
| Fidelity Series Bond Index Fund | 43.0 | |
| Fidelity Series 0-5 Year Inflation-Protected Bond Index Fund | 19.9 | |
| Fidelity Series Total Market Index Fund | 11.5 | |
| Fidelity Series Treasury Bill Index Fund | 10.0 | |
| Fidelity Series Global ex U.S. Index Fund | 7.6 | |
| Fidelity Series International Developed Markets Bond Index Fund | 5.0 | |
| Fidelity Series Long-Term Treasury Bond Index Fund | 3.0 | |
| Fidelity Series 5+ Year Inflation-Protected Bond Index Fund | 0.0 | |
| | 100.0 | |
| Fidelity, the Fidelity Investments Logo and all other Fidelity trademarks or service marks used herein are trademarks or service marks of FMR LLC. Any third-party marks that are used herein are trademarks or service marks of their respective owners. © 2024 FMR LLC. All rights reserved. |
| | For additional information about the Fund; including its prospectus, financial information, holdings and proxy information, scan the QR code or visit fundresearch.fidelity.com/prospectus/sec 1.9914706.100 6191-TSRS-1124 |
| |
| | SEMI-ANNUAL SHAREHOLDER REPORT | AS OF SEPTEMBER 30, 2024 | |
| | Fidelity Freedom® Index 2065 Fund Fidelity Freedom® Index 2065 Fund Investor Class : FFIJX |
| | | |
This semi-annual shareholder report contains information about Fidelity Freedom® Index 2065 Fund for the period April 1, 2024 to September 30, 2024. You can find additional information about the Fund at fundresearch.fidelity.com/prospectus/sec. You can also request this information by contacting us at 1-800-544-8544 or by sending an e-mail to fidfunddocuments@fidelity.com.
What were your Fund costs for the last six months?(based on hypothetical $10,000 investment)
| | Costs of a $10,000 investment | Costs paid as a percentage of a $10,000 investment | |
| Investor Class | $ 6 | 0.12% | |
Key Fund Statistics (as of September 30, 2024)
KEY FACTS | | |
| Fund Size | $2,413,130,862 | |
| Number of Holdings | 6 | |
| Portfolio Turnover | 4% | |
What did the Fund invest in?
(as of September 30, 2024)
| Domestic Equity Funds | 54.2 |
| International Equity Funds | 35.9 |
| Bond Funds | 9.9 |
| Short-Term Investments and Net Other Assets (Liabilities) | 0.0 |
ASSET ALLOCATION (% of Fund's net assets) |
|
|
TOP HOLDINGS (% of Fund's net assets) | | |
| Fidelity Series Total Market Index Fund | 54.2 | |
| Fidelity Series Global ex U.S. Index Fund | 35.9 | |
| Fidelity Series Long-Term Treasury Bond Index Fund | 5.0 | |
| Fidelity Series Bond Index Fund | 4.0 | |
| Fidelity Series International Developed Markets Bond Index Fund | 0.9 | |
| | 100.0 | |
| Fidelity, the Fidelity Investments Logo and all other Fidelity trademarks or service marks used herein are trademarks or service marks of FMR LLC. Any third-party marks that are used herein are trademarks or service marks of their respective owners. © 2024 FMR LLC. All rights reserved. |
| | For additional information about the Fund; including its prospectus, financial information, holdings and proxy information, scan the QR code or visit fundresearch.fidelity.com/prospectus/sec 1.9914927.100 3463-TSRS-1124 |
| |
| | SEMI-ANNUAL SHAREHOLDER REPORT | AS OF SEPTEMBER 30, 2024 | |
| | Fidelity Freedom® Index 2015 Fund Fidelity Freedom® Index 2015 Fund Premier Class : FFYPX |
| | | |
This semi-annual shareholder report contains information about Fidelity Freedom® Index 2015 Fund for the period April 1, 2024 to September 30, 2024. You can find additional information about the Fund at fundresearch.fidelity.com/prospectus/sec. You can also request this information by contacting us at 1-800-544-3455 or by sending an e-mail to fidfunddocuments@fidelity.com.
What were your Fund costs for the last six months?(based on hypothetical $10,000 investment)
| | Costs of a $10,000 investment | Costs paid as a percentage of a $10,000 investment | |
| Premier Class | $ 3 | 0.05% | |
Key Fund Statistics (as of September 30, 2024)
KEY FACTS | | |
| Fund Size | $2,055,460,161 | |
| Number of Holdings | 8 | |
| Portfolio Turnover | 11% | |
What did the Fund invest in?
(as of September 30, 2024)
| Bond Funds | 59.6 |
| Domestic Equity Funds | 21.2 |
| International Equity Funds | 14.0 |
| Short-Term Funds | 5.2 |
| Short-Term Investments and Net Other Assets (Liabilities) | 0.0 |
ASSET ALLOCATION (% of Fund's net assets) |
|
|
TOP HOLDINGS (% of Fund's net assets) | | |
| Fidelity Series Bond Index Fund | 36.7 | |
| Fidelity Series Total Market Index Fund | 21.2 | |
| Fidelity Series Global ex U.S. Index Fund | 14.0 | |
| Fidelity Series 0-5 Year Inflation-Protected Bond Index Fund | 9.8 | |
| Fidelity Series Treasury Bill Index Fund | 5.2 | |
| Fidelity Series International Developed Markets Bond Index Fund | 4.9 | |
| Fidelity Series 5+ Year Inflation-Protected Bond Index Fund | 4.7 | |
| Fidelity Series Long-Term Treasury Bond Index Fund | 3.5 | |
| | 100.0 | |
| Fidelity, the Fidelity Investments Logo and all other Fidelity trademarks or service marks used herein are trademarks or service marks of FMR LLC. Any third-party marks that are used herein are trademarks or service marks of their respective owners. © 2024 FMR LLC. All rights reserved. |
| | For additional information about the Fund; including its prospectus, financial information, holdings and proxy information, scan the QR code or visit fundresearch.fidelity.com/prospectus/sec 1.9914736.100 6194-TSRS-1124 |
| |
| | SEMI-ANNUAL SHAREHOLDER REPORT | AS OF SEPTEMBER 30, 2024 | |
| | Fidelity Freedom® Index 2055 Fund Fidelity Freedom® Index 2055 Fund Premier Class : FTYPX |
| | | |
This semi-annual shareholder report contains information about Fidelity Freedom® Index 2055 Fund for the period April 1, 2024 to September 30, 2024. You can find additional information about the Fund at fundresearch.fidelity.com/prospectus/sec. You can also request this information by contacting us at 1-800-544-3455 or by sending an e-mail to fidfunddocuments@fidelity.com.
What were your Fund costs for the last six months?(based on hypothetical $10,000 investment)
| | Costs of a $10,000 investment | Costs paid as a percentage of a $10,000 investment | |
| Premier Class | $ 3 | 0.05% | |
Key Fund Statistics (as of September 30, 2024)
KEY FACTS | | |
| Fund Size | $14,448,762,506 | |
| Number of Holdings | 5 | |
| Portfolio Turnover | 6% | |
What did the Fund invest in?
(as of September 30, 2024)
| Domestic Equity Funds | 54.2 |
| International Equity Funds | 35.9 |
| Bond Funds | 9.9 |
| Short-Term Investments and Net Other Assets (Liabilities) | 0.0 |
ASSET ALLOCATION (% of Fund's net assets) |
|
|
TOP HOLDINGS (% of Fund's net assets) | | |
| Fidelity Series Total Market Index Fund | 54.2 | |
| Fidelity Series Global ex U.S. Index Fund | 35.9 | |
| Fidelity Series Long-Term Treasury Bond Index Fund | 5.0 | |
| Fidelity Series Bond Index Fund | 4.0 | |
| Fidelity Series International Developed Markets Bond Index Fund | 0.9 | |
| | 100.0 | |
| Fidelity, the Fidelity Investments Logo and all other Fidelity trademarks or service marks used herein are trademarks or service marks of FMR LLC. Any third-party marks that are used herein are trademarks or service marks of their respective owners. © 2024 FMR LLC. All rights reserved. |
| | For additional information about the Fund; including its prospectus, financial information, holdings and proxy information, scan the QR code or visit fundresearch.fidelity.com/prospectus/sec 1.9914748.100 6202-TSRS-1124 |
| |
| | SEMI-ANNUAL SHAREHOLDER REPORT | AS OF SEPTEMBER 30, 2024 | |
| | Fidelity Flex® Freedom Blend 2060 Fund Fidelity Flex® Freedom Blend 2060 Fund : FWLSX |
| | | |
This semi-annual shareholder report contains information about Fidelity Flex® Freedom Blend 2060 Fund for the period April 1, 2024 to September 30, 2024. You can find additional information about the Fund at fundresearch.fidelity.com/prospectus/sec. You can also request this information by contacting us at 1-800-544-3455 or by sending an e-mail to fidfunddocuments@fidelity.com.
What were your Fund costs for the last six months?(based on hypothetical $10,000 investment)
| | Costs of a $10,000 investment | Costs paid as a percentage of a $10,000 investment | |
| Fidelity Flex® Freedom Blend 2060 Fund | $ 0 A | 0.00%B | |
A Amount represents less than $.50
B Amount represents less than 0.005%
Key Fund Statistics (as of September 30, 2024)
KEY FACTS | | |
| Fund Size | $20,349,137 | |
| Number of Holdings | 28 | |
| Portfolio Turnover | 28% | |
What did the Fund invest in?
(as of September 30, 2024)
| Domestic Equity Funds | 51.0 |
| International Equity Funds | 41.9 |
| Bond Funds | 7.1 |
| Short-Term Investments and Net Other Assets (Liabilities) | 0.0 |
ASSET ALLOCATION (% of Fund's net assets) |
|
|
TOP HOLDINGS (% of Fund's net assets) | | |
| Fidelity Series Large Cap Value Index Fund | 14.2 | |
| Fidelity Series Blue Chip Growth Fund | 11.7 | |
| Fidelity Series Emerging Markets Opportunities Fund | 11.1 | |
| Fidelity Series Large Cap Growth Index Fund | 7.6 | |
| Fidelity Series International Value Fund | 7.0 | |
| Fidelity Series Overseas Fund | 7.0 | |
| Fidelity Series International Growth Fund | 7.0 | |
| Fidelity Series Large Cap Stock Fund | 6.8 | |
| Fidelity Series Long-Term Treasury Bond Index Fund | 5.5 | |
| Fidelity Series Value Discovery Fund | 4.9 | |
| | 82.8 | |
| Fidelity, the Fidelity Investments Logo and all other Fidelity trademarks or service marks used herein are trademarks or service marks of FMR LLC. Any third-party marks that are used herein are trademarks or service marks of their respective owners. © 2024 FMR LLC. All rights reserved. |
| | For additional information about the Fund; including its prospectus, financial information, holdings and proxy information, scan the QR code or visit fundresearch.fidelity.com/prospectus/sec 1.9914773.100 2913-TSRS-1124 |
Item 2.
Code of Ethics
Not applicable.
Item 3.
Audit Committee Financial Expert
Not applicable.
Item 4.
Principal Accountant Fees and Services
Not applicable.
Item 5.
Audit Committee of Listed Registrants
Not applicable.
Item 6.
Investments
(a)
Not applicable.
(b)
Not applicable
Item 7.
Financial Statements and Financial Highlights for Open-End Management Investment Companies
Fidelity Freedom® Index Funds
Fidelity Freedom® Index Income Fund
Fidelity Freedom® Index 2010 Fund
Fidelity Freedom® Index 2015 Fund
Fidelity Freedom® Index 2020 Fund
Fidelity Freedom® Index 2025 Fund
Fidelity Freedom® Index 2030 Fund
Fidelity Freedom® Index 2035 Fund
Fidelity Freedom® Index 2040 Fund
Fidelity Freedom® Index 2045 Fund
Fidelity Freedom® Index 2050 Fund
Fidelity Freedom® Index 2055 Fund
Fidelity Freedom® Index 2060 Fund
Fidelity Freedom® Index 2065 Fund
Fidelity Freedom® Index 2070 Fund
Semi-Annual Report
September 30, 2024
Contents
To view a fund's proxy voting guidelines and proxy voting record for the 12-month period ended June 30, visit http://www.fidelity.com/proxyvotingresults or visit the Securities and Exchange Commission's (SEC) web site at http://www.sec.gov.
You may also call 1-800-544-8544 to request a free copy of the proxy voting guidelines.
BLOOMBERG ® is a trademark and service mark of Bloomberg Finance L.P. and its affiliates (collectively "Bloomberg"). Bloomberg or Bloomberg's licensors own all proprietary rights in the Bloomberg Indices. Neither Bloomberg nor Bloomberg's licensors approves or endorses this material, or guarantees the accuracy or completeness of any information herein, or makes any warranty, express or implied, as to the results to be obtained therefrom and, to the maximum extent allowed by law, neither shall have any liability or responsibility for injury or damages arising in connection therewith.
Standard & Poor's®; and S&P®; are registered trademarks of Standard & Poor's Financial Services LLC ("S&P") and Dow Jones®; is a registered trademark of Dow Jones Trademark Holdings LLC ("Dow Jones"). The fund is not sponsored, endorsed, sold or promoted by SPDJI, Dow Jones, S&P, or their respective affiliates and none of such parties make any representation regarding the advisability of investing in such product(s) nor do they have any liability for any errors, omissions, or interruptions of the index or indices.
Standard & Poor's, S&P and S&P 500 are registered service marks of The McGraw-Hill Companies, Inc. and have been licensed for use by Fidelity Distributors Corporation.
Other third-party marks appearing herein are the property of their respective owners.
All other marks appearing herein are registered or unregistered trademarks or service marks of FMR LLC or an affiliated company. © 2024 FMR LLC. All rights reserved.
This report and the financial statements contained herein are submitted for the general information of the shareholders of the Funds. This report is not authorized for distribution to prospective investors in the Funds unless preceded or accompanied by an effective prospectus.
A fund files its complete schedule of portfolio holdings with the SEC for the first and third quarters of each fiscal year on Form N-PORT. Forms N-PORT are available on the SEC's web site at http://www.sec.gov. A fund's Forms N-PORT may be reviewed and copied at the SEC's Public Reference Room in Washington, DC. Information regarding the operation of the SEC's Public Reference Room may be obtained by calling 1-800-SEC-0330.
For a complete list of a fund's portfolio holdings, view the most recent holdings listing, semiannual report, or annual report on Fidelity's web site at http://www.fidelity.com, http://www.institutional.fidelity.com, or http://www.401k.com, as applicable.
NOT FDIC INSURED •MAY LOSE VALUE •NO BANK GUARANTEE
Neither the Funds nor Fidelity Distributors Corporation is a bank.
Item 7: Financial Statements and Financial Highlights for Open-End Management Investment Companies (Semi-Annual Report)
Fidelity Freedom® Index Income Fund
Schedule of Investments September 30, 2024 (Unaudited)
Showing Percentage of Net Assets
| Domestic Equity Funds - 11.5% |
| | | Shares | Value ($) |
Fidelity Series Total Market Index Fund (a) (Cost $105,160,658) | | 10,265,038 | 193,803,909 |
| | | | |
| International Equity Funds - 7.6% |
| | | Shares | Value ($) |
Fidelity Series Global ex U.S. Index Fund (a) (Cost $94,360,081) | | 8,105,548 | 127,905,549 |
| | | | |
| Bond Funds - 51.0% |
| | | Shares | Value ($) |
| Fidelity Series Bond Index Fund (a) | | 78,254,675 | 723,073,195 |
| Fidelity Series International Developed Markets Bond Index Fund (a) | | 9,391,093 | 83,298,994 |
| Fidelity Series Long-Term Treasury Bond Index Fund (a) | | 8,663,888 | 50,857,024 |
| TOTAL BOND FUNDS (Cost $947,140,882) | | | 857,229,213 |
| | | | |
| Inflation-Protected Bond Funds - 19.9% |
| | | Shares | Value ($) |
| Fidelity Series 0-5 Year Inflation-Protected Bond Index Fund (a) | | 33,984,742 | 334,409,857 |
| Fidelity Series 5+ Year Inflation-Protected Bond Index Fund (a) | | 5,591 | 44,557 |
| TOTAL INFLATION-PROTECTED BOND FUNDS (Cost $337,497,315) | | | 334,454,414 |
| | | | |
| Short-Term Funds - 10.0% |
| | | Shares | Value ($) |
Fidelity Series Treasury Bill Index Fund (a) (Cost $168,364,319) | | 16,861,691 | 167,773,827 |
| | | | |
| TOTAL INVESTMENT IN SECURITIES - 100.0% (Cost $1,652,523,255) | 1,681,166,912 |
NET OTHER ASSETS (LIABILITIES) - 0.0% | (99,375) |
| NET ASSETS - 100.0% | 1,681,067,537 |
| | |
Legend
Affiliated Central Funds
Fiscal year to date information regarding the Fund's investments in Fidelity Central Funds, including the ownership percentage, is presented below.
| Affiliate | Value, beginning of period ($) | Purchases ($) | Sales Proceeds ($) | Dividend Income ($) | Realized Gain (loss) ($) | Change in Unrealized appreciation (depreciation) ($) | Value, end of period ($) | % ownership, end of period |
| Fidelity Cash Central Fund 4.89% | 7,936 | 406,143 | 425,149 | 293 | - | - | - | 0.0% |
| Total | 7,936 | 406,143 | 425,149 | 293 | - | - | - | |
| | | | | | | | | |
Amounts in the dividend income column in the above table include any capital gain distributions from underlying funds, which are presented in the corresponding line item in the Statement of Operations, if applicable.
Amounts included in the purchases and sales proceeds columns may include in-kind transactions, if applicable.
Affiliated Underlying Funds
Fiscal year to date information regarding the Fund's investments in affiliated Underlying Funds is presented below. Exchanges between classes of the same affiliated Underlying Funds may occur. If an Underlying Funds changes its name, the name presented below is the name in effect at period end.
| Affiliate | Value, beginning of period ($) | Purchases ($) | Sales Proceeds ($) | Dividend Income ($) | Realized Gain (loss) ($) | Change in Unrealized appreciation (depreciation) ($) | Value, end of period ($) |
| Fidelity Series 0-5 Year Inflation-Protected Bond Index Fund | 279,325,612 | 29,911,444 | 24,264,706 | 2,952,090 | 14,014 | 9,326,998 | 334,409,857 |
| Fidelity Series 5+ Year Inflation-Protected Bond Index Fund | - | 6,430 | - | 443 | - | 1,704 | 44,557 |
| Fidelity Series Bond Index Fund | 602,397,579 | 59,977,093 | 51,252,017 | 12,028,320 | (1,233,499) | 25,604,358 | 723,073,195 |
| Fidelity Series Global ex U.S. Index Fund | 106,909,593 | 8,532,609 | 13,222,353 | - | 332,828 | 10,208,171 | 127,905,549 |
| Fidelity Series International Developed Markets Bond Index Fund | 69,742,440 | 7,333,836 | 5,421,626 | 1,068,323 | 4,442 | 1,513,981 | 83,298,994 |
| Fidelity Series Long-Term Treasury Bond Index Fund | 41,704,238 | 5,352,828 | 4,621,333 | 812,003 | (51,843) | 2,231,679 | 50,857,024 |
| Fidelity Series Total Market Index Fund | 160,297,610 | 14,874,923 | 21,280,259 | 323,802 | 1,915,227 | 14,479,952 | 193,803,909 |
| Fidelity Series Treasury Bill Index Fund | 140,123,082 | 20,249,846 | 12,952,013 | 4,028,073 | (2,297) | 331,320 | 167,773,827 |
| | 1,400,500,154 | 146,239,009 | 133,014,307 | 21,213,054 | 978,872 | 63,698,163 | 1,681,166,912 |
Amounts in the dividend income column in the above table include any capital gain distributions from underlying funds, which are presented in the corresponding line item in the Statement of Operations, if applicable.
Amounts included in the purchases and sales proceeds columns may include in-kind transactions, if applicable.
Investment Valuation
The following is a summary of the inputs used, as of September 30, 2024, involving the Fund's assets and liabilities carried at fair value. The inputs or methodology used for valuing securities may not be an indication of the risk associated with investing in those securities. For more information on valuation inputs, and their aggregation into the levels used below, please refer to the Investment Valuation section in the accompanying Notes to Financial Statements.
| Valuation Inputs at Reporting Date: |
| Description | Total ($) | Level 1 ($) | Level 2 ($) | Level 3 ($) |
Investments in Securities: | | | | |
|
| Domestic Equity Funds | 193,803,909 | 193,803,909 | - | - |
|
| International Equity Funds | 127,905,549 | 127,905,549 | - | - |
|
| Bond Funds | 1,191,683,627 | 1,191,683,627 | - | - |
|
| Short-Term Funds | 167,773,827 | 167,773,827 | - | - |
| Total Investments in Securities: | 1,681,166,912 | 1,681,166,912 | - | - |
Fidelity Freedom® Index Income Fund
Financial Statements (Unaudited)
| Statement of Assets and Liabilities |
| As of September 30, 2024 (Unaudited) |
| Assets | | | | |
| Investment in securities, at value - See accompanying schedule: | | | | |
Affiliated issuers (cost $1,652,523,255) | $ | 1,681,166,912 | | |
| | | | | |
| | | | | |
| Total Investment in Securities (cost $1,652,523,255) | | | $ | 1,681,166,912 |
| Receivable for investments sold | | | | 1,733,259 |
| Receivable for fund shares sold | | | | 2,613,558 |
Total assets | | | | 1,685,513,729 |
| Liabilities | | | | |
| Payable for investments purchased | $ | 1,748,075 | | |
| Payable for fund shares redeemed | | 2,598,743 | | |
| Accrued management fee | | 99,374 | | |
| Total liabilities | | | | 4,446,192 |
| Net Assets | | | $ | 1,681,067,537 |
| Net Assets consist of: | | | | |
| Paid in capital | | | $ | 1,662,625,528 |
| Total accumulated earnings (loss) | | | | 18,442,009 |
| Net Assets | | | $ | 1,681,067,537 |
| | | | | |
| Net Asset Value and Maximum Offering Price | | | | |
| Investor Class : | | | | |
Net Asset Value, offering price and redemption price per share ($212,087,567 ÷ 17,494,219 shares) | | | $ | 12.12 |
| Institutional Premium Class : | | | | |
Net Asset Value, offering price and redemption price per share ($932,998,336 ÷ 77,101,423 shares) | | | $ | 12.10 |
| Premier Class : | | | | |
Net Asset Value, offering price and redemption price per share ($535,973,807 ÷ 44,326,333 shares) | | | $ | 12.09 |
| Premier II Class : | | | | |
Net Asset Value, offering price and redemption price per share ($7,827 ÷ 647 shares) | | | $ | 12.10 |
| Statement of Operations |
Six months ended September 30, 2024 (Unaudited) |
| Investment Income | | | | |
| Dividends: | | | | |
| Affiliated issuers | | | $ | 21,213,054 |
| Income from Fidelity Central Funds | | | | 293 |
| Total income | | | | 21,213,347 |
| Expenses | | | | |
| Management fee | $ | 581,259 | | |
| Independent trustees' fees and expenses | | 1,943 | | |
| Total expenses before reductions | | 583,202 | | |
| Expense reductions | | (328) | | |
| Total expenses after reductions | | | | 582,874 |
| Net Investment income (loss) | | | | 20,630,473 |
| Realized and Unrealized Gain (Loss) | | | | |
| Net realized gain (loss) on: | | | | |
| Investment Securities: | | | | |
| Affiliated issuers | | 978,872 | | |
| Total net realized gain (loss) | | | | 978,872 |
| Change in net unrealized appreciation (depreciation) on: | | | | |
| Investment Securities: | | | | |
| Affiliated issuers | | 63,698,163 | | |
| Total change in net unrealized appreciation (depreciation) | | | | 63,698,163 |
| Net gain (loss) | | | | 64,677,035 |
| Net increase (decrease) in net assets resulting from operations | | | $ | 85,307,508 |
| Statement of Changes in Net Assets |
| |
| | Six months ended September 30, 2024 (Unaudited) | | Year ended March 31, 2024 |
| Increase (Decrease) in Net Assets | | | | |
| Operations | | | | |
| Net investment income (loss) | $ | 20,630,473 | $ | 40,900,498 |
| Net realized gain (loss) | | 978,872 | | 2,262,029 |
| Change in net unrealized appreciation (depreciation) | | 63,698,163 | | 35,638,179 |
| Net increase (decrease) in net assets resulting from operations | | 85,307,508 | | 78,800,706 |
| Distributions to shareholders | | (20,637,566) | | (40,009,145) |
| | | | | |
| Share transactions - net increase (decrease) | | 215,954,533 | | 66,931,811 |
| Total increase (decrease) in net assets | | 280,624,475 | | 105,723,372 |
| | | | | |
| Net Assets | | | | |
| Beginning of period | | 1,400,443,062 | | 1,294,719,690 |
| End of period | $ | 1,681,067,537 | $ | 1,400,443,062 |
| | | | | |
| | | | | |
Financial Highlights
Fidelity Freedom® Index Income Fund Investor Class |
| |
| | Six months ended (Unaudited) September 30, 2024 | | Years ended March 31, 2024 | | 2023 | | 2022 | | 2021 | | 2020 |
Selected Per-Share Data | | | | | | | | | | | | |
| Net asset value, beginning of period | $ | 11.65 | $ | 11.32 | $ | 12.15 | $ | 12.46 | $ | 11.60 | $ | 11.98 |
| Income from Investment Operations | | | | | | | | | | | | |
Net investment income (loss) A,B | | .16 | | .34 | | .34 | | .20 | | .14 | | .24 |
| Net realized and unrealized gain (loss) | | .47 | | .33 | | (.82) | | (.25) | | .98 | | .23 |
| Total from investment operations | | .63 | | .67 | | (.48) | | (.05) | | 1.12 | | .47 |
| Distributions from net investment income | | (.16) | | (.34) | | (.33) | | (.18) | | (.15) | | (.24) |
| Distributions from net realized gain | | - | | - | | (.02) | | (.08) | | (.12) | | (.62) |
| Total distributions | | (.16) | | (.34) | | (.35) | | (.26) | | (.26) C | | (.85) C |
| Net asset value, end of period | $ | 12.12 | $ | 11.65 | $ | 11.32 | $ | 12.15 | $ | 12.46 | $ | 11.60 |
Total Return D,E | | | | 5.98% | | (3.90)% | | (.50)% | | 9.72% | | 3.83% |
Ratios to Average Net Assets B,F,G | | | | | | | | | | | | |
| Expenses before reductions | | .12% H | | .12% | | .12% | | .12% | | .12% | | .12% |
| Expenses net of fee waivers, if any | | | | .12% | | .12% | | .12% | | .12% | | .12% |
| Expenses net of all reductions | | .12% H | | .12% | | .12% | | .12% | | .12% | | .12% |
| Net investment income (loss) | | 2.64% H | | 3.03% | | 2.97% | | 1.59% | | 1.13% | | 1.96% |
| Supplemental Data | | | | | | | | | | | | |
| Net assets, end of period (000 omitted) | $ | 212,088 | $ | 168,686 | $ | 182,799 | $ | 219,579 | $ | 469,552 | $ | 282,522 |
Portfolio turnover rate I | | | | 17% | | 22% | | 38% | | 33% | | 67% |
ACalculated based on average shares outstanding during the period.
BNet investment income (loss) is affected by the timing of the declaration of dividends by any underlying mutual funds or exchange-traded funds (ETFs). Net investment income (loss) of any mutual funds or ETFs is not included in the Fund's net investment income (loss) ratio.
CTotal distributions per share do not sum due to rounding.
DTotal returns for periods of less than one year are not annualized.
ETotal returns would have been lower if certain expenses had not been reduced during the applicable periods shown.
FFees and expenses of any underlying mutual funds or exchange-traded funds (ETFs) are not included in the Fund's expense ratio. The Fund indirectly bears its proportionate share of these expenses. For additional expense information related to investments in Fidelity Central Funds, please refer to the "Investments in Fidelity Central Funds" note found in the Notes to Financial Statements section of the most recent Annual or Semi-Annual report.
GExpense ratios reflect operating expenses of the class. Expenses before reductions do not reflect amounts reimbursed, waived, or reduced through arrangements with the investment adviser, brokerage services, or other offset arrangements, if applicable, and do not represent the amount paid by the class during periods when reimbursements, waivers or reductions occur.
HAnnualized.
IAmount does not include the portfolio activity of any underlying mutual funds or exchange-traded funds (ETFs).
JThe portfolio turnover rate does not include the assets acquired in the reorganization.
Fidelity Freedom® Index Income Fund Institutional Premium Class |
| |
| | Six months ended (Unaudited) September 30, 2024 | | Years ended March 31, 2024 | | 2023 | | 2022 | | 2021 | | 2020 |
Selected Per-Share Data | | | | | | | | | | | | |
| Net asset value, beginning of period | $ | 11.63 | $ | 11.30 | $ | 12.13 | $ | 12.44 | $ | 11.59 | $ | 11.96 |
| Income from Investment Operations | | | | | | | | | | | | |
Net investment income (loss) A,B | | .16 | | .35 | | .34 | | .21 | | .14 | | .24 |
| Net realized and unrealized gain (loss) | | .47 | | .32 | | (.82) | | (.25) | | .98 | | .25 |
| Total from investment operations | | .63 | | .67 | | (.48) | | (.04) | | 1.12 | | .49 |
| Distributions from net investment income | | (.16) | | (.34) | | (.33) | | (.19) | | (.15) | | (.24) |
| Distributions from net realized gain | | - | | - | | (.02) | | (.08) | | (.12) | | (.62) |
| Total distributions | | (.16) | | (.34) | | (.35) | | (.27) | | (.27) | | (.86) |
| Net asset value, end of period | $ | 12.10 | $ | 11.63 | $ | 11.30 | $ | 12.13 | $ | 12.44 | $ | 11.59 |
Total Return C,D | | | | 6.03% | | (3.88)% | | (.44)% | | 9.68% | | 3.98% |
Ratios to Average Net Assets B,E,F | | | | | | | | | | | | |
| Expenses before reductions | | .08% G | | .08% | | .08% | | .08% | | .08% | | .08% |
| Expenses net of fee waivers, if any | | | | .08% | | .08% | | .08% | | .08% | | .08% |
| Expenses net of all reductions | | .08% G | | .08% | | .08% | | .08% | | .08% | | .08% |
| Net investment income (loss) | | 2.68% G | | 3.07% | | 3.01% | | 1.63% | | 1.17% | | 2.00% |
| Supplemental Data | | | | | | | | | | | | |
| Net assets, end of period (000 omitted) | $ | 932,998 | $ | 792,169 | $ | 732,262 | $ | 733,168 | $ | 410,094 | $ | 276,297 |
Portfolio turnover rate H | | | | 17% | | 22% | | 38% | | 33% | | 67% |
ACalculated based on average shares outstanding during the period.
BNet investment income (loss) is affected by the timing of the declaration of dividends by any underlying mutual funds or exchange-traded funds (ETFs). Net investment income (loss) of any mutual funds or ETFs is not included in the Fund's net investment income (loss) ratio.
CTotal returns for periods of less than one year are not annualized.
DTotal returns would have been lower if certain expenses had not been reduced during the applicable periods shown.
EFees and expenses of any underlying mutual funds or exchange-traded funds (ETFs) are not included in the Fund's expense ratio. The Fund indirectly bears its proportionate share of these expenses. For additional expense information related to investments in Fidelity Central Funds, please refer to the "Investments in Fidelity Central Funds" note found in the Notes to Financial Statements section of the most recent Annual or Semi-Annual report.
FExpense ratios reflect operating expenses of the class. Expenses before reductions do not reflect amounts reimbursed, waived, or reduced through arrangements with the investment adviser, brokerage services, or other offset arrangements, if applicable, and do not represent the amount paid by the class during periods when reimbursements, waivers or reductions occur.
GAnnualized.
HAmount does not include the portfolio activity of any underlying mutual funds or exchange-traded funds (ETFs).
IThe portfolio turnover rate does not include the assets acquired in the reorganization.
Fidelity Freedom® Index Income Fund Premier Class |
| |
| | Six months ended (Unaudited) September 30, 2024 | | Years ended March 31, 2024 | | 2023 | | 2022 | | 2021 A |
Selected Per-Share Data | | | | | | | | | | |
| Net asset value, beginning of period | $ | 11.62 | $ | 11.30 | $ | 12.12 | $ | 12.43 | $ | 12.07 |
| Income from Investment Operations | | | | | | | | | | |
Net investment income (loss) B,C | | .16 | | .35 | | .34 | | .21 | | .18 |
| Net realized and unrealized gain (loss) | | .47 | | .31 | | (.81) | | (.25) | | .38 |
| Total from investment operations | | .63 | | .66 | | (.47) | | (.04) | | .56 |
| Distributions from net investment income | | (.16) | | (.34) | | (.33) | | (.19) | | (.11) |
| Distributions from net realized gain | | - | | - | | (.02) | | (.08) | | (.09) |
| Total distributions | | (.16) | | (.34) | | (.35) | | (.27) | | (.20) |
| Net asset value, end of period | $ | 12.09 | $ | 11.62 | $ | 11.30 | $ | 12.12 | $ | 12.43 |
Total Return D,E | | | | 5.95% | | (3.78)% | | (.40)% | | 4.59% |
Ratios to Average Net Assets C,F,G | | | | | | | | | | |
| Expenses before reductions | | .05% H | | .06% | | .06% | | .06% | | .06% H |
| Expenses net of fee waivers, if any | | | | .06% | | .06% | | .06% | | .06% H |
| Expenses net of all reductions | | .05% H | | .06% | | .06% | | .06% | | .06% H |
| Net investment income (loss) | | 2.71% H | | 3.09% | | 3.03% | | 1.65% | | 1.93% H |
| Supplemental Data | | | | | | | | | | |
| Net assets, end of period (000 omitted) | $ | 535,974 | $ | 439,588 | $ | 379,658 | $ | 360,871 | $ | 117,463 |
Portfolio turnover rate I | | | | 17% | | 22% | | 38% | | 33% |
AFor the period June 24, 2020 (commencement of sale of shares) through March 31, 2021.
BCalculated based on average shares outstanding during the period.
CNet investment income (loss) is affected by the timing of the declaration of dividends by any underlying mutual funds or exchange-traded funds (ETFs). Net investment income (loss) of any mutual funds or ETFs is not included in the Fund's net investment income (loss) ratio.
DTotal returns for periods of less than one year are not annualized.
ETotal returns would have been lower if certain expenses had not been reduced during the applicable periods shown.
FFees and expenses of any underlying mutual funds or exchange-traded funds (ETFs) are not included in the Fund's expense ratio. The Fund indirectly bears its proportionate share of these expenses. For additional expense information related to investments in Fidelity Central Funds, please refer to the "Investments in Fidelity Central Funds" note found in the Notes to Financial Statements section of the most recent Annual or Semi-Annual report.
GExpense ratios reflect operating expenses of the class. Expenses before reductions do not reflect amounts reimbursed, waived, or reduced through arrangements with the investment adviser, brokerage services, or other offset arrangements, if applicable, and do not represent the amount paid by the class during periods when reimbursements, waivers or reductions occur.
HAnnualized.
IAmount does not include the portfolio activity of any underlying mutual funds or exchange-traded funds (ETFs).
JThe portfolio turnover rate does not include the assets acquired in the reorganization.
Fidelity Freedom® Index Income Fund Premier II Class |
| |
| | Six months ended (Unaudited) September 30, 2024 A |
Selected Per-Share Data | | |
| Net asset value, beginning of period | $ | 11.93 |
| Income from Investment Operations | | |
Net investment income (loss) B,C | | .03 |
| Net realized and unrealized gain (loss) | | .17 |
| Total from investment operations | | .20 |
| Distributions from net investment income | | (.03) |
| Total distributions | | (.03) |
| Net asset value, end of period | $ | 12.10 |
Total Return D,E | | |
Ratios to Average Net Assets C,F,G | | |
| Expenses before reductions | | .04% H |
| Expenses net of fee waivers, if any | | |
| Expenses net of all reductions | | .04% H |
| Net investment income (loss) | | 2.11% H |
| Supplemental Data | | |
| Net assets, end of period (000 omitted) | $ | 8 |
Portfolio turnover rate I | | |
AFor the period August 22, 2024 (commencement of sale of shares) through September 30, 2024.
BCalculated based on average shares outstanding during the period.
CNet investment income (loss) is affected by the timing of the declaration of dividends by any underlying mutual funds or exchange-traded funds (ETFs). Net investment income (loss) of any mutual funds or ETFs is not included in the Fund's net investment income (loss) ratio.
DTotal returns for periods of less than one year are not annualized.
ETotal returns would have been lower if certain expenses had not been reduced during the applicable periods shown.
FFees and expenses of any underlying mutual funds or exchange-traded funds (ETFs) are not included in the Fund's expense ratio. The Fund indirectly bears its proportionate share of these expenses. For additional expense information related to investments in Fidelity Central Funds, please refer to the "Investments in Fidelity Central Funds" note found in the Notes to Financial Statements section of the most recent Annual or Semi-Annual report.
GExpense ratios reflect operating expenses of the class. Expenses before reductions do not reflect amounts reimbursed, waived, or reduced through arrangements with the investment adviser, brokerage services, or other offset arrangements, if applicable, and do not represent the amount paid by the class during periods when reimbursements, waivers or reductions occur.
HAnnualized.
IAmount does not include the portfolio activity of any underlying mutual funds or exchange-traded funds (ETFs).
JThe portfolio turnover rate does not include the assets acquired in the reorganization.
Fidelity Freedom® Index 2010 Fund
Schedule of Investments September 30, 2024 (Unaudited)
Showing Percentage of Net Assets
| Domestic Equity Funds - 15.7% |
| | | Shares | Value ($) |
Fidelity Series Total Market Index Fund (a) (Cost $58,310,190) | | 6,098,294 | 115,135,785 |
| | | | |
| International Equity Funds - 10.4% |
| | | Shares | Value ($) |
Fidelity Series Global ex U.S. Index Fund (a) (Cost $48,616,132) | | 4,829,055 | 76,202,487 |
| | | | |
| Bond Funds - 48.3% |
| | | Shares | Value ($) |
| Fidelity Series Bond Index Fund (a) | | 31,873,158 | 294,507,980 |
| Fidelity Series International Developed Markets Bond Index Fund (a) | | 4,098,379 | 36,352,621 |
| Fidelity Series Long-Term Treasury Bond Index Fund (a) | | 4,016,983 | 23,579,691 |
| TOTAL BOND FUNDS (Cost $390,846,761) | | | 354,440,292 |
| | | | |
| Inflation-Protected Bond Funds - 17.6% |
| | | Shares | Value ($) |
| Fidelity Series 0-5 Year Inflation-Protected Bond Index Fund (a) | | 11,510,370 | 113,262,041 |
| Fidelity Series 5+ Year Inflation-Protected Bond Index Fund (a) | | 1,975,699 | 15,746,321 |
| TOTAL INFLATION-PROTECTED BOND FUNDS (Cost $133,000,184) | | | 129,008,362 |
| | | | |
| Short-Term Funds - 8.0% |
| | | Shares | Value ($) |
Fidelity Series Treasury Bill Index Fund (a) (Cost $59,312,047) | | 5,940,744 | 59,110,408 |
| | | | |
| TOTAL INVESTMENT IN SECURITIES - 100.0% (Cost $690,085,314) | 733,897,334 |
NET OTHER ASSETS (LIABILITIES) - 0.0% | (47,764) |
| NET ASSETS - 100.0% | 733,849,570 |
| | |
Legend
Affiliated Central Funds
Fiscal year to date information regarding the Fund's investments in Fidelity Central Funds, including the ownership percentage, is presented below.
| Affiliate | Value, beginning of period ($) | Purchases ($) | Sales Proceeds ($) | Dividend Income ($) | Realized Gain (loss) ($) | Change in Unrealized appreciation (depreciation) ($) | Value, end of period ($) | % ownership, end of period |
| Fidelity Cash Central Fund 4.89% | 6,141 | 62,241 | 68,382 | 129 | - | - | - | 0.0% |
| Total | 6,141 | 62,241 | 68,382 | 129 | - | - | - | |
| | | | | | | | | |
Amounts in the dividend income column in the above table include any capital gain distributions from underlying funds, which are presented in the corresponding line item in the Statement of Operations, if applicable.
Amounts included in the purchases and sales proceeds columns may include in-kind transactions, if applicable.
Affiliated Underlying Funds
Fiscal year to date information regarding the Fund's investments in affiliated Underlying Funds is presented below. Exchanges between classes of the same affiliated Underlying Funds may occur. If an Underlying Funds changes its name, the name presented below is the name in effect at period end.
| Affiliate | Value, beginning of period ($) | Purchases ($) | Sales Proceeds ($) | Dividend Income ($) | Realized Gain (loss) ($) | Change in Unrealized appreciation (depreciation) ($) | Value, end of period ($) |
| Fidelity Series 0-5 Year Inflation-Protected Bond Index Fund | 111,149,126 | 12,064,450 | 13,248,183 | 1,013,054 | 27,599 | 3,269,049 | 113,262,041 |
| Fidelity Series 5+ Year Inflation-Protected Bond Index Fund | 18,077,281 | 724,334 | 3,797,985 | 177,883 | (973,345) | 1,716,036 | 15,746,321 |
| Fidelity Series Bond Index Fund | 297,121,072 | 18,604,787 | 31,154,079 | 5,297,682 | (1,410,735) | 11,346,935 | 294,507,980 |
| Fidelity Series Global ex U.S. Index Fund | 80,539,877 | 3,152,228 | 13,955,788 | - | 2,851,564 | 3,614,606 | 76,202,487 |
| Fidelity Series International Developed Markets Bond Index Fund | 37,055,980 | 2,745,287 | 4,020,630 | 546,861 | (197,349) | 769,333 | 36,352,621 |
| Fidelity Series Long-Term Treasury Bond Index Fund | 23,738,196 | 1,913,393 | 3,087,557 | 411,309 | (341,179) | 1,356,838 | 23,579,691 |
| Fidelity Series Total Market Index Fund | 120,837,386 | 4,707,905 | 20,674,751 | 243,526 | 6,979,639 | 3,285,606 | 115,135,785 |
| Fidelity Series Treasury Bill Index Fund | 58,032,392 | 8,148,249 | 7,185,914 | 1,508,830 | (1,724) | 117,405 | 59,110,408 |
| | 746,551,310 | 52,060,633 | 97,124,887 | 9,199,145 | 6,934,470 | 25,475,808 | 733,897,334 |
Amounts in the dividend income column in the above table include any capital gain distributions from underlying funds, which are presented in the corresponding line item in the Statement of Operations, if applicable.
Amounts included in the purchases and sales proceeds columns may include in-kind transactions, if applicable.
Investment Valuation
The following is a summary of the inputs used, as of September 30, 2024, involving the Fund's assets and liabilities carried at fair value. The inputs or methodology used for valuing securities may not be an indication of the risk associated with investing in those securities. For more information on valuation inputs, and their aggregation into the levels used below, please refer to the Investment Valuation section in the accompanying Notes to Financial Statements.
| Valuation Inputs at Reporting Date: |
| Description | Total ($) | Level 1 ($) | Level 2 ($) | Level 3 ($) |
Investments in Securities: | | | | |
|
| Domestic Equity Funds | 115,135,785 | 115,135,785 | - | - |
|
| International Equity Funds | 76,202,487 | 76,202,487 | - | - |
|
| Bond Funds | 483,448,654 | 483,448,654 | - | - |
|
| Short-Term Funds | 59,110,408 | 59,110,408 | - | - |
| Total Investments in Securities: | 733,897,334 | 733,897,334 | - | - |
Fidelity Freedom® Index 2010 Fund
Financial Statements (Unaudited)
| Statement of Assets and Liabilities |
| As of September 30, 2024 (Unaudited) |
| Assets | | | | |
| Investment in securities, at value - See accompanying schedule: | | | | |
Affiliated issuers (cost $690,085,314) | $ | 733,897,334 | | |
| | | | | |
| | | | | |
| Total Investment in Securities (cost $690,085,314) | | | $ | 733,897,334 |
| Receivable for investments sold | | | | 2,461,551 |
| Receivable for fund shares sold | | | | 656,940 |
Total assets | | | | 737,015,825 |
| Liabilities | | | | |
| Payable for investments purchased | $ | 2,943,381 | | |
| Payable for fund shares redeemed | | 175,109 | | |
| Accrued management fee | | 47,765 | | |
| Total liabilities | | | | 3,166,255 |
| Net Assets | | | $ | 733,849,570 |
| Net Assets consist of: | | | | |
| Paid in capital | | | $ | 679,269,456 |
| Total accumulated earnings (loss) | | | | 54,580,114 |
| Net Assets | | | $ | 733,849,570 |
| | | | | |
| Net Asset Value and Maximum Offering Price | | | | |
| Investor Class : | | | | |
Net Asset Value, offering price and redemption price per share ($156,789,422 ÷ 11,564,806 shares) | | | $ | 13.56 |
| Institutional Premium Class : | | | | |
Net Asset Value, offering price and redemption price per share ($482,024,373 ÷ 35,559,943 shares) | | | $ | 13.56 |
| Premier Class : | | | | |
Net Asset Value, offering price and redemption price per share ($95,028,543 ÷ 7,012,572 shares) | | | $ | 13.55 |
| Premier II Class : | | | | |
Net Asset Value, offering price and redemption price per share ($7,232 ÷ 533 shares)(a) | | | $ | 13.56 |
(a)Corresponding Net Asset Value does not calculate due to rounding of fractional net assets and/or shares. |
| Statement of Operations |
Six months ended September 30, 2024 (Unaudited) |
| Investment Income | | | | |
| Dividends: | | | | |
| Affiliated issuers | | | $ | 9,199,145 |
| Income from Fidelity Central Funds | | | | 129 |
| Total income | | | | 9,199,274 |
| Expenses | | | | |
| Management fee | $ | 307,064 | | |
| Independent trustees' fees and expenses | | 930 | | |
| Total expenses before reductions | | 307,994 | | |
| Expense reductions | | (16) | | |
| Total expenses after reductions | | | | 307,978 |
| Net Investment income (loss) | | | | 8,891,296 |
| Realized and Unrealized Gain (Loss) | | | | |
| Net realized gain (loss) on: | | | | |
| Investment Securities: | | | | |
| Affiliated issuers | | 6,934,470 | | |
| Total net realized gain (loss) | | | | 6,934,470 |
| Change in net unrealized appreciation (depreciation) on: | | | | |
| Investment Securities: | | | | |
| Affiliated issuers | | 25,475,808 | | |
| Total change in net unrealized appreciation (depreciation) | | | | 25,475,808 |
| Net gain (loss) | | | | 32,410,278 |
| Net increase (decrease) in net assets resulting from operations | | | $ | 41,301,574 |
| Statement of Changes in Net Assets |
| |
| | Six months ended September 30, 2024 (Unaudited) | | Year ended March 31, 2024 |
| Increase (Decrease) in Net Assets | | | | |
| Operations | | | | |
| Net investment income (loss) | $ | 8,891,296 | $ | 21,885,687 |
| Net realized gain (loss) | | 6,934,470 | | 13,793,556 |
| Change in net unrealized appreciation (depreciation) | | 25,475,808 | | 17,649,318 |
| Net increase (decrease) in net assets resulting from operations | | 41,301,574 | | 53,328,561 |
| Distributions to shareholders | | (10,225,350) | | (24,414,672) |
| | | | | |
| Share transactions - net increase (decrease) | | (43,734,750) | | (34,143,571) |
| Total increase (decrease) in net assets | | (12,658,526) | | (5,229,682) |
| | | | | |
| Net Assets | | | | |
| Beginning of period | | 746,508,096 | | 751,737,778 |
| End of period | $ | 733,849,570 | $ | 746,508,096 |
| | | | | |
| | | | | |
Financial Highlights
Fidelity Freedom® Index 2010 Fund Investor Class |
| |
| | Six months ended (Unaudited) September 30, 2024 | | Years ended March 31, 2024 | | 2023 | | 2022 | | 2021 | | 2020 |
Selected Per-Share Data | | | | | | | | | | | | |
| Net asset value, beginning of period | $ | 12.99 | $ | 12.49 | $ | 13.61 | $ | 14.06 | $ | 12.33 | $ | 14.17 |
| Income from Investment Operations | | | | | | | | | | | | |
Net investment income (loss) A,B | | .16 | | .37 | | .35 | | .22 | | .18 | | .27 |
| Net realized and unrealized gain (loss) | | .59 | | .55 | | (1.02) | | (.15) | | 1.91 | | .04 |
| Total from investment operations | | .75 | | .92 | | (.67) | | .07 | | 2.09 | | .31 |
| Distributions from net investment income | | (.06) | | (.34) | | (.34) | | (.21) | | (.19) | | (.27) |
| Distributions from net realized gain | | (.12) | | (.07) | | (.11) | | (.30) | | (.17) | | (1.88) |
| Total distributions | | (.18) | | (.42) | | (.45) | | (.52) C | | (.36) | | (2.15) |
| Net asset value, end of period | $ | 13.56 | $ | 12.99 | $ | 12.49 | $ | 13.61 | $ | 14.06 | $ | 12.33 |
Total Return D,E | | | | 7.42% | | (4.86)% | | .33% | | 17.04% | | 1.34% |
Ratios to Average Net Assets B,F,G | | | | | | | | | | | | |
| Expenses before reductions | | .12% H | | .12% | | .12% | | .12% | | .12% | | .12% |
| Expenses net of fee waivers, if any | | | | .12% | | .12% | | .12% | | .12% | | .12% |
| Expenses net of all reductions | | .12% H | | .12% | | .12% | | .12% | | .12% | | .12% |
| Net investment income (loss) | | 2.40% H | | 2.90% | | 2.79% | | 1.52% | | 1.28% | | 1.93% |
| Supplemental Data | | | | | | | | | | | | |
| Net assets, end of period (000 omitted) | $ | 156,789 | $ | 161,962 | $ | 175,127 | $ | 222,429 | $ | 477,015 | $ | 353,955 |
Portfolio turnover rate I | | | | 18% | | 26% | | 38% | | 27% | | 83% |
ACalculated based on average shares outstanding during the period.
BNet investment income (loss) is affected by the timing of the declaration of dividends by any underlying mutual funds or exchange-traded funds (ETFs). Net investment income (loss) of any mutual funds or ETFs is not included in the Fund's net investment income (loss) ratio.
CTotal distributions per share do not sum due to rounding.
DTotal returns for periods of less than one year are not annualized.
ETotal returns would have been lower if certain expenses had not been reduced during the applicable periods shown.
FFees and expenses of any underlying mutual funds or exchange-traded funds (ETFs) are not included in the Fund's expense ratio. The Fund indirectly bears its proportionate share of these expenses. For additional expense information related to investments in Fidelity Central Funds, please refer to the "Investments in Fidelity Central Funds" note found in the Notes to Financial Statements section of the most recent Annual or Semi-Annual report.
GExpense ratios reflect operating expenses of the class. Expenses before reductions do not reflect amounts reimbursed, waived, or reduced through arrangements with the investment adviser, brokerage services, or other offset arrangements, if applicable, and do not represent the amount paid by the class during periods when reimbursements, waivers or reductions occur.
HAnnualized.
IAmount does not include the portfolio activity of any underlying mutual funds or exchange-traded funds (ETFs).
Fidelity Freedom® Index 2010 Fund Institutional Premium Class |
| |
| | Six months ended (Unaudited) September 30, 2024 | | Years ended March 31, 2024 | | 2023 | | 2022 | | 2021 | | 2020 |
Selected Per-Share Data | | | | | | | | | | | | |
| Net asset value, beginning of period | $ | 12.99 | $ | 12.49 | $ | 13.61 | $ | 14.07 | $ | 12.33 | $ | 14.17 |
| Income from Investment Operations | | | | | | | | | | | | |
Net investment income (loss) A,B | | .16 | | .37 | | .35 | | .22 | | .18 | | .28 |
| Net realized and unrealized gain (loss) | | .59 | | .55 | | (1.02) | | (.15) | | 1.93 | | .04 |
| Total from investment operations | | .75 | | .92 | | (.67) | | .07 | | 2.11 | | .32 |
| Distributions from net investment income | | (.06) | | (.35) | | (.34) | | (.23) | | (.19) | | (.28) |
| Distributions from net realized gain | | (.12) | | (.07) | | (.11) | | (.30) | | (.17) | | (1.88) |
| Total distributions | | (.18) | | (.42) | | (.45) | | (.53) | | (.37) C | | (2.16) |
| Net asset value, end of period | $ | 13.56 | $ | 12.99 | $ | 12.49 | $ | 13.61 | $ | 14.07 | $ | 12.33 |
Total Return D,E | | | | 7.46% | | (4.82)% | | .35% | | 17.17% | | 1.37% |
Ratios to Average Net Assets B,F,G | | | | | | | | | | | | |
| Expenses before reductions | | .08% H | | .08% | | .08% | | .08% | | .08% | | .08% |
| Expenses net of fee waivers, if any | | | | .08% | | .08% | | .08% | | .08% | | .08% |
| Expenses net of all reductions | | .08% H | | .08% | | .08% | | .08% | | .08% | | .08% |
| Net investment income (loss) | | 2.44% H | | 2.94% | | 2.83% | | 1.56% | | 1.33% | | 1.98% |
| Supplemental Data | | | | | | | | | | | | |
| Net assets, end of period (000 omitted) | $ | 482,024 | $ | 499,977 | $ | 507,025 | $ | 567,760 | $ | 389,414 | $ | 322,946 |
Portfolio turnover rate I | | | | 18% | | 26% | | 38% | | 27% | | 83% |
ACalculated based on average shares outstanding during the period.
BNet investment income (loss) is affected by the timing of the declaration of dividends by any underlying mutual funds or exchange-traded funds (ETFs). Net investment income (loss) of any mutual funds or ETFs is not included in the Fund's net investment income (loss) ratio.
CTotal distributions per share do not sum due to rounding.
DTotal returns for periods of less than one year are not annualized.
ETotal returns would have been lower if certain expenses had not been reduced during the applicable periods shown.
FFees and expenses of any underlying mutual funds or exchange-traded funds (ETFs) are not included in the Fund's expense ratio. The Fund indirectly bears its proportionate share of these expenses. For additional expense information related to investments in Fidelity Central Funds, please refer to the "Investments in Fidelity Central Funds" note found in the Notes to Financial Statements section of the most recent Annual or Semi-Annual report.
GExpense ratios reflect operating expenses of the class. Expenses before reductions do not reflect amounts reimbursed, waived, or reduced through arrangements with the investment adviser, brokerage services, or other offset arrangements, if applicable, and do not represent the amount paid by the class during periods when reimbursements, waivers or reductions occur.
HAnnualized.
IAmount does not include the portfolio activity of any underlying mutual funds or exchange-traded funds (ETFs).
Fidelity Freedom® Index 2010 Fund Premier Class |
| |
| | Six months ended (Unaudited) September 30, 2024 | | Years ended March 31, 2024 | | 2023 | | 2022 | | 2021 A |
Selected Per-Share Data | | | | | | | | | | |
| Net asset value, beginning of period | $ | 12.98 | $ | 12.49 | $ | 13.61 | $ | 14.07 | $ | 13.15 |
| Income from Investment Operations | | | | | | | | | | |
Net investment income (loss) B,C | | .16 | | .37 | | .35 | | .22 | | .07 |
| Net realized and unrealized gain (loss) | | .59 | | .55 | | (1.02) | | (.15) | | 1.12 |
| Total from investment operations | | .75 | | .92 | | (.67) | | .07 | | 1.19 |
| Distributions from net investment income | | (.06) | | (.35) | | (.34) | | (.23) | | (.16) |
| Distributions from net realized gain | | (.12) | | (.07) | | (.11) | | (.30) | | (.11) |
| Total distributions | | (.18) | | (.43) D | | (.45) | | (.53) | | (.27) |
| Net asset value, end of period | $ | 13.55 | $ | 12.98 | $ | 12.49 | $ | 13.61 | $ | 14.07 |
Total Return E,F | | | | 7.41% | | (4.79)% | | .37% | | 9.06% |
Ratios to Average Net Assets C,G,H | | | | | | | | | | |
| Expenses before reductions | | .05% I | | .06% | | .06% | | .06% | | .06% I |
| Expenses net of fee waivers, if any | | | | .06% | | .06% | | .06% | | .06% I |
| Expenses net of all reductions | | .05% I | | .06% | | .06% | | .06% | | .06% I |
| Net investment income (loss) | | 2.47% I | | 2.96% | | 2.85% | | 1.58% | | .64% I |
| Supplemental Data | | | | | | | | | | |
| Net assets, end of period (000 omitted) | $ | 95,029 | $ | 84,570 | $ | 69,585 | $ | 46,300 | $ | 7,583 |
Portfolio turnover rate J | | | | 18% | | 26% | | 38% | | 27% |
AFor the period June 24, 2020 (commencement of sale of shares) through March 31, 2021.
BCalculated based on average shares outstanding during the period.
CNet investment income (loss) is affected by the timing of the declaration of dividends by any underlying mutual funds or exchange-traded funds (ETFs). Net investment income (loss) of any mutual funds or ETFs is not included in the Fund's net investment income (loss) ratio.
DTotal distributions per share do not sum due to rounding.
ETotal returns for periods of less than one year are not annualized.
FTotal returns would have been lower if certain expenses had not been reduced during the applicable periods shown.
GFees and expenses of any underlying mutual funds or exchange-traded funds (ETFs) are not included in the Fund's expense ratio. The Fund indirectly bears its proportionate share of these expenses. For additional expense information related to investments in Fidelity Central Funds, please refer to the "Investments in Fidelity Central Funds" note found in the Notes to Financial Statements section of the most recent Annual or Semi-Annual report.
HExpense ratios reflect operating expenses of the class. Expenses before reductions do not reflect amounts reimbursed, waived, or reduced through arrangements with the investment adviser, brokerage services, or other offset arrangements, if applicable, and do not represent the amount paid by the class during periods when reimbursements, waivers or reductions occur.
IAnnualized.
JAmount does not include the portfolio activity of any underlying mutual funds or exchange-traded funds (ETFs).
Fidelity Freedom® Index 2010 Fund Premier II Class |
| |
| | Six months ended (Unaudited) September 30, 2024 A |
Selected Per-Share Data | | |
| Net asset value, beginning of period | $ | 13.31 |
| Income from Investment Operations | | |
Net investment income (loss) B,C | | .03 |
| Net realized and unrealized gain (loss) | | .22 |
| Total from investment operations | | .25 |
| Net asset value, end of period | $ | 13.56 |
Total Return D,E | | |
Ratios to Average Net Assets C,F,G | | |
| Expenses before reductions | | .04% H |
| Expenses net of fee waivers, if any | | |
| Expenses net of all reductions | | .04% H |
| Net investment income (loss) | | 1.91% H |
| Supplemental Data | | |
| Net assets, end of period (000 omitted) | $ | 7 |
Portfolio turnover rate I | | |
AFor the period August 22, 2024 (commencement of sale of shares) through September 30, 2024.
BCalculated based on average shares outstanding during the period.
CNet investment income (loss) is affected by the timing of the declaration of dividends by any underlying mutual funds or exchange-traded funds (ETFs). Net investment income (loss) of any mutual funds or ETFs is not included in the Fund's net investment income (loss) ratio.
DTotal returns for periods of less than one year are not annualized.
ETotal returns would have been lower if certain expenses had not been reduced during the applicable periods shown.
FFees and expenses of any underlying mutual funds or exchange-traded funds (ETFs) are not included in the Fund's expense ratio. The Fund indirectly bears its proportionate share of these expenses. For additional expense information related to investments in Fidelity Central Funds, please refer to the "Investments in Fidelity Central Funds" note found in the Notes to Financial Statements section of the most recent Annual or Semi-Annual report.
GExpense ratios reflect operating expenses of the class. Expenses before reductions do not reflect amounts reimbursed, waived, or reduced through arrangements with the investment adviser, brokerage services, or other offset arrangements, if applicable, and do not represent the amount paid by the class during periods when reimbursements, waivers or reductions occur.
HAnnualized.
IAmount does not include the portfolio activity of any underlying mutual funds or exchange-traded funds (ETFs).
Fidelity Freedom® Index 2015 Fund
Schedule of Investments September 30, 2024 (Unaudited)
Showing Percentage of Net Assets
| Domestic Equity Funds - 21.2% |
| | | Shares | Value ($) |
Fidelity Series Total Market Index Fund (a) (Cost $224,414,777) | | 23,089,740 | 435,934,288 |
| | | | |
| International Equity Funds - 14.0% |
| | | Shares | Value ($) |
Fidelity Series Global ex U.S. Index Fund (a) (Cost $195,384,056) | | 18,282,555 | 288,498,726 |
| | | | |
| Bond Funds - 45.0% |
| | | Shares | Value ($) |
| Fidelity Series Bond Index Fund (a) | | 81,356,748 | 751,736,347 |
| Fidelity Series International Developed Markets Bond Index Fund (a) | | 11,443,621 | 101,504,915 |
| Fidelity Series Long-Term Treasury Bond Index Fund (a) | | 12,131,436 | 71,211,532 |
| TOTAL BOND FUNDS (Cost $1,027,720,358) | | | 924,452,794 |
| | | | |
| Inflation-Protected Bond Funds - 14.6% |
| | | Shares | Value ($) |
| Fidelity Series 0-5 Year Inflation-Protected Bond Index Fund (a) | | 20,563,621 | 202,346,027 |
| Fidelity Series 5+ Year Inflation-Protected Bond Index Fund (a) | | 12,238,572 | 97,541,419 |
| TOTAL INFLATION-PROTECTED BOND FUNDS (Cost $319,698,968) | | | 299,887,446 |
| | | | |
| Short-Term Funds - 5.2% |
| | | Shares | Value ($) |
Fidelity Series Treasury Bill Index Fund (a) (Cost $107,141,912) | | 10,734,682 | 106,810,085 |
| | | | |
| TOTAL INVESTMENT IN SECURITIES - 100.0% (Cost $1,874,360,071) | 2,055,583,339 |
NET OTHER ASSETS (LIABILITIES) - 0.0% | (123,178) |
| NET ASSETS - 100.0% | 2,055,460,161 |
| | |
Legend
Affiliated Central Funds
Fiscal year to date information regarding the Fund's investments in Fidelity Central Funds, including the ownership percentage, is presented below.
| Affiliate | Value, beginning of period ($) | Purchases ($) | Sales Proceeds ($) | Dividend Income ($) | Realized Gain (loss) ($) | Change in Unrealized appreciation (depreciation) ($) | Value, end of period ($) | % ownership, end of period |
| Fidelity Cash Central Fund 4.89% | 1,836 | - | 1,836 | 1 | - | - | - | 0.0% |
| Total | 1,836 | - | 1,836 | 1 | - | - | - | |
| | | | | | | | | |
Amounts in the dividend income column in the above table include any capital gain distributions from underlying funds, which are presented in the corresponding line item in the Statement of Operations, if applicable.
Amounts included in the purchases and sales proceeds columns may include in-kind transactions, if applicable.
Affiliated Underlying Funds
Fiscal year to date information regarding the Fund's investments in affiliated Underlying Funds is presented below. Exchanges between classes of the same affiliated Underlying Funds may occur. If an Underlying Funds changes its name, the name presented below is the name in effect at period end.
| Affiliate | Value, beginning of period ($) | Purchases ($) | Sales Proceeds ($) | Dividend Income ($) | Realized Gain (loss) ($) | Change in Unrealized appreciation (depreciation) ($) | Value, end of period ($) |
| Fidelity Series 0-5 Year Inflation-Protected Bond Index Fund | 193,785,153 | 21,975,564 | 19,265,543 | 1,807,270 | 58,287 | 5,792,566 | 202,346,027 |
| Fidelity Series 5+ Year Inflation-Protected Bond Index Fund | 103,025,642 | 3,076,816 | 13,263,682 | 1,079,124 | (2,675,758) | 7,378,401 | 97,541,419 |
| Fidelity Series Bond Index Fund | 754,022,396 | 39,410,031 | 67,361,364 | 13,541,579 | (2,045,557) | 27,710,841 | 751,736,347 |
| Fidelity Series Global ex U.S. Index Fund | 300,648,065 | 9,317,491 | 45,882,298 | - | 7,199,101 | 17,216,367 | 288,498,726 |
| Fidelity Series International Developed Markets Bond Index Fund | 103,620,699 | 5,976,201 | 9,729,130 | 1,532,074 | (309,313) | 1,946,458 | 101,504,915 |
| Fidelity Series Long-Term Treasury Bond Index Fund | 71,322,348 | 4,354,449 | 7,566,589 | 1,241,314 | (1,230,879) | 4,332,203 | 71,211,532 |
| Fidelity Series Total Market Index Fund | 451,144,988 | 14,614,074 | 68,718,137 | 911,124 | 23,770,936 | 15,122,427 | 435,934,288 |
| Fidelity Series Treasury Bill Index Fund | 102,622,720 | 14,739,162 | 10,760,023 | 2,703,166 | (3,749) | 211,975 | 106,810,085 |
| | 2,080,192,011 | 113,463,788 | 242,546,766 | 22,815,651 | 24,763,068 | 79,711,238 | 2,055,583,339 |
Amounts in the dividend income column in the above table include any capital gain distributions from underlying funds, which are presented in the corresponding line item in the Statement of Operations, if applicable.
Amounts included in the purchases and sales proceeds columns may include in-kind transactions, if applicable.
Investment Valuation
The following is a summary of the inputs used, as of September 30, 2024, involving the Fund's assets and liabilities carried at fair value. The inputs or methodology used for valuing securities may not be an indication of the risk associated with investing in those securities. For more information on valuation inputs, and their aggregation into the levels used below, please refer to the Investment Valuation section in the accompanying Notes to Financial Statements.
| Valuation Inputs at Reporting Date: |
| Description | Total ($) | Level 1 ($) | Level 2 ($) | Level 3 ($) |
Investments in Securities: | | | | |
|
| Domestic Equity Funds | 435,934,288 | 435,934,288 | - | - |
|
| International Equity Funds | 288,498,726 | 288,498,726 | - | - |
|
| Bond Funds | 1,224,340,240 | 1,224,340,240 | - | - |
|
| Short-Term Funds | 106,810,085 | 106,810,085 | - | - |
| Total Investments in Securities: | 2,055,583,339 | 2,055,583,339 | - | - |
Fidelity Freedom® Index 2015 Fund
Financial Statements (Unaudited)
| Statement of Assets and Liabilities |
| As of September 30, 2024 (Unaudited) |
| Assets | | | | |
| Investment in securities, at value - See accompanying schedule: | | | | |
Affiliated issuers (cost $1,874,360,071) | $ | 2,055,583,339 | | |
| | | | | |
| | | | | |
| Total Investment in Securities (cost $1,874,360,071) | | | $ | 2,055,583,339 |
| Receivable for investments sold | | | | 9,039,131 |
| Receivable for fund shares sold | | | | 1,689,412 |
Total assets | | | | 2,066,311,882 |
| Liabilities | | | | |
| Payable for investments purchased | $ | 7,994,023 | | |
| Payable for fund shares redeemed | | 2,734,520 | | |
| Accrued management fee | | 123,178 | | |
| Total liabilities | | | | 10,851,721 |
| Net Assets | | | $ | 2,055,460,161 |
| Net Assets consist of: | | | | |
| Paid in capital | | | $ | 1,843,564,693 |
| Total accumulated earnings (loss) | | | | 211,895,468 |
| Net Assets | | | $ | 2,055,460,161 |
| | | | | |
| Net Asset Value and Maximum Offering Price | | | | |
| Investor Class : | | | | |
Net Asset Value, offering price and redemption price per share ($446,385,830 ÷ 29,471,030 shares) | | | $ | 15.15 |
| Institutional Premium Class : | | | | |
Net Asset Value, offering price and redemption price per share ($1,049,841,781 ÷ 69,381,994 shares) | | | $ | 15.13 |
| Premier Class : | | | | |
Net Asset Value, offering price and redemption price per share ($559,225,300 ÷ 36,969,379 shares) | | | $ | 15.13 |
| Premier II Class : | | | | |
Net Asset Value, offering price and redemption price per share ($7,250 ÷ 479 shares)(a) | | | $ | 15.13 |
(a)Corresponding Net Asset Value does not calculate due to rounding of fractional net assets and/or shares. |
| Statement of Operations |
Six months ended September 30, 2024 (Unaudited) |
| Investment Income | | | | |
| Dividends: | | | | |
| Affiliated issuers | | | $ | 22,815,651 |
| Income from Fidelity Central Funds | | | | 1 |
| Total income | | | | 22,815,652 |
| Expenses | | | | |
| Management fee | $ | 819,817 | | |
| Independent trustees' fees and expenses | | 2,608 | | |
| Total expenses before reductions | | 822,425 | | |
| Expense reductions | | (24) | | |
| Total expenses after reductions | | | | 822,401 |
| Net Investment income (loss) | | | | 21,993,251 |
| Realized and Unrealized Gain (Loss) | | | | |
| Net realized gain (loss) on: | | | | |
| Investment Securities: | | | | |
| Affiliated issuers | | 24,763,068 | | |
| Total net realized gain (loss) | | | | 24,763,068 |
| Change in net unrealized appreciation (depreciation) on: | | | | |
| Investment Securities: | | | | |
| Affiliated issuers | | 79,711,238 | | |
| Total change in net unrealized appreciation (depreciation) | | | | 79,711,238 |
| Net gain (loss) | | | | 104,474,306 |
| Net increase (decrease) in net assets resulting from operations | | | $ | 126,467,557 |
| Statement of Changes in Net Assets |
| |
| | Six months ended September 30, 2024 (Unaudited) | | Year ended March 31, 2024 |
| Increase (Decrease) in Net Assets | | | | |
| Operations | | | | |
| Net investment income (loss) | $ | 21,993,251 | $ | 58,752,955 |
| Net realized gain (loss) | | 24,763,068 | | 43,175,411 |
| Change in net unrealized appreciation (depreciation) | | 79,711,238 | | 75,800,839 |
| Net increase (decrease) in net assets resulting from operations | | 126,467,557 | | 177,729,205 |
| Distributions to shareholders | | (26,215,098) | | (54,035,267) |
| | | | | |
| Share transactions - net increase (decrease) | | (124,846,193) | | (202,936,658) |
| Total increase (decrease) in net assets | | (24,593,734) | | (79,242,720) |
| | | | | |
| Net Assets | | | | |
| Beginning of period | | 2,080,053,895 | | 2,159,296,615 |
| End of period | $ | 2,055,460,161 | $ | 2,080,053,895 |
| | | | | |
| | | | | |
Financial Highlights
Fidelity Freedom® Index 2015 Fund Investor Class |
| |
| | Six months ended (Unaudited) September 30, 2024 | | Years ended March 31, 2024 | | 2023 | | 2022 | | 2021 | | 2020 |
Selected Per-Share Data | | | | | | | | | | | | |
| Net asset value, beginning of period | $ | 14.42 | $ | 13.58 | $ | 14.83 | $ | 15.12 | $ | 12.74 | $ | 15.09 |
| Income from Investment Operations | | | | | | | | | | | | |
Net investment income (loss) A,B | | .15 | | .38 | | .36 | | .26 | | .19 | | .29 |
| Net realized and unrealized gain (loss) | | .76 | | .82 | | (1.21) | | (.11) | | 2.59 | | (.12) |
| Total from investment operations | | .91 | | 1.20 | | (.85) | | .15 | | 2.78 | | .17 |
| Distributions from net investment income | | (.06) | | (.36) | | (.35) | | (.23) | | (.20) | | (.29) |
| Distributions from net realized gain | | (.12) | | - | | (.05) | | (.21) | | (.19) | | (2.23) |
| Total distributions | | (.18) | | (.36) | | (.40) | | (.44) | | (.40) C | | (2.52) |
| Net asset value, end of period | $ | 15.15 | $ | 14.42 | $ | 13.58 | $ | 14.83 | $ | 15.12 | $ | 12.74 |
Total Return D,E | | | | 8.91% | | (5.62)% | | .86% | | 21.92% | | (.17)% |
Ratios to Average Net Assets B,F,G | | | | | | | | | | | | |
| Expenses before reductions | | .12% H | | .12% | | .12% | | .12% | | .12% | | .12% |
| Expenses net of fee waivers, if any | | | | .12% | | .12% | | .12% | | .12% | | .12% |
| Expenses net of all reductions | | .12% H | | .12% | | .12% | | .12% | | .12% | | .12% |
| Net investment income (loss) | | 2.11% H | | 2.77% | | 2.66% | | 1.65% | | 1.32% | | 1.93% |
| Supplemental Data | | | | | | | | | | | | |
| Net assets, end of period (000 omitted) | $ | 446,386 | $ | 451,530 | $ | 479,276 | $ | 604,032 | $ | 1,197,347 | $ | 887,110 |
Portfolio turnover rate I | | | | 14% | | 22% | | 33% | | 30% | | 87% |
ACalculated based on average shares outstanding during the period.
BNet investment income (loss) is affected by the timing of the declaration of dividends by any underlying mutual funds or exchange-traded funds (ETFs). Net investment income (loss) of any mutual funds or ETFs is not included in the Fund's net investment income (loss) ratio.
CTotal distributions per share do not sum due to rounding.
DTotal returns for periods of less than one year are not annualized.
ETotal returns would have been lower if certain expenses had not been reduced during the applicable periods shown.
FFees and expenses of any underlying mutual funds or exchange-traded funds (ETFs) are not included in the Fund's expense ratio. The Fund indirectly bears its proportionate share of these expenses. For additional expense information related to investments in Fidelity Central Funds, please refer to the "Investments in Fidelity Central Funds" note found in the Notes to Financial Statements section of the most recent Annual or Semi-Annual report.
GExpense ratios reflect operating expenses of the class. Expenses before reductions do not reflect amounts reimbursed, waived, or reduced through arrangements with the investment adviser, brokerage services, or other offset arrangements, if applicable, and do not represent the amount paid by the class during periods when reimbursements, waivers or reductions occur.
HAnnualized.
IAmount does not include the portfolio activity of any underlying mutual funds or exchange-traded funds (ETFs).
Fidelity Freedom® Index 2015 Fund Institutional Premium Class |
| |
| | Six months ended (Unaudited) September 30, 2024 | | Years ended March 31, 2024 | | 2023 | | 2022 | | 2021 | | 2020 |
Selected Per-Share Data | | | | | | | | | | | | |
| Net asset value, beginning of period | $ | 14.41 | $ | 13.57 | $ | 14.82 | $ | 15.11 | $ | 12.73 | $ | 15.08 |
| Income from Investment Operations | | | | | | | | | | | | |
Net investment income (loss) A,B | | .16 | | .39 | | .36 | | .26 | | .20 | | .30 |
| Net realized and unrealized gain (loss) | | .75 | | .82 | | (1.20) | | (.10) | | 2.58 | | (.12) |
| Total from investment operations | | .91 | | 1.21 | | (.84) | | .16 | | 2.78 | | .18 |
| Distributions from net investment income | | (.06) | | (.37) | | (.36) | | (.24) | | (.21) | | (.29) |
| Distributions from net realized gain | | (.12) | | - | | (.05) | | (.21) | | (.19) | | (2.23) |
| Total distributions | | (.19) C | | (.37) | | (.41) | | (.45) | | (.40) | | (2.53) C |
| Net asset value, end of period | $ | 15.13 | $ | 14.41 | $ | 13.57 | $ | 14.82 | $ | 15.11 | $ | 12.73 |
Total Return D,E | | | | 8.96% | | (5.58)% | | .96% | | 21.98% | | (.15)% |
Ratios to Average Net Assets B,F,G | | | | | | | | | | | | |
| Expenses before reductions | | .08% H | | .08% | | .08% | | .08% | | .08% | | .08% |
| Expenses net of fee waivers, if any | | | | .08% | | .08% | | .08% | | .08% | | .08% |
| Expenses net of all reductions | | .08% H | | .08% | | .08% | | .08% | | .08% | | .08% |
| Net investment income (loss) | | 2.15% H | | 2.81% | | 2.70% | | 1.69% | | 1.36% | | 1.97% |
| Supplemental Data | | | | | | | | | | | | |
| Net assets, end of period (000 omitted) | $ | 1,049,842 | $ | 1,083,439 | $ | 1,161,199 | $ | 1,343,537 | $ | 789,557 | $ | 677,766 |
Portfolio turnover rate I | | | | 14% | | 22% | | 33% | | 30% | | 87% |
ACalculated based on average shares outstanding during the period.
BNet investment income (loss) is affected by the timing of the declaration of dividends by any underlying mutual funds or exchange-traded funds (ETFs). Net investment income (loss) of any mutual funds or ETFs is not included in the Fund's net investment income (loss) ratio.
CTotal distributions per share do not sum due to rounding.
DTotal returns for periods of less than one year are not annualized.
ETotal returns would have been lower if certain expenses had not been reduced during the applicable periods shown.
FFees and expenses of any underlying mutual funds or exchange-traded funds (ETFs) are not included in the Fund's expense ratio. The Fund indirectly bears its proportionate share of these expenses. For additional expense information related to investments in Fidelity Central Funds, please refer to the "Investments in Fidelity Central Funds" note found in the Notes to Financial Statements section of the most recent Annual or Semi-Annual report.
GExpense ratios reflect operating expenses of the class. Expenses before reductions do not reflect amounts reimbursed, waived, or reduced through arrangements with the investment adviser, brokerage services, or other offset arrangements, if applicable, and do not represent the amount paid by the class during periods when reimbursements, waivers or reductions occur.
HAnnualized.
IAmount does not include the portfolio activity of any underlying mutual funds or exchange-traded funds (ETFs).
Fidelity Freedom® Index 2015 Fund Premier Class |
| |
| | Six months ended (Unaudited) September 30, 2024 | | Years ended March 31, 2024 | | 2023 | | 2022 | | 2021 A |
Selected Per-Share Data | | | | | | | | | | |
| Net asset value, beginning of period | $ | 14.40 | $ | 13.56 | $ | 14.81 | $ | 15.11 | $ | 13.77 |
| Income from Investment Operations | | | | | | | | | | |
Net investment income (loss) B,C | | .16 | | .39 | | .37 | | .26 | | .27 |
| Net realized and unrealized gain (loss) | | .76 | | .82 | | (1.21) | | (.10) | | 1.38 |
| Total from investment operations | | .92 | | 1.21 | | (.84) | | .16 | | 1.65 |
| Distributions from net investment income | | (.06) | | (.37) | | (.36) | | (.25) | | (.18) |
| Distributions from net realized gain | | (.12) | | - | | (.05) | | (.21) | | (.13) |
| Total distributions | | (.19) D | | (.37) | | (.41) | | (.46) | | (.31) |
| Net asset value, end of period | $ | 15.13 | $ | 14.40 | $ | 13.56 | $ | 14.81 | $ | 15.11 |
Total Return E,F | | | | 8.99% | | (5.57)% | | .92% | | 11.98% |
Ratios to Average Net Assets C,G,H | | | | | | | | | | |
| Expenses before reductions | | .05% I | | .06% | | .06% | | .06% | | .06% I |
| Expenses net of fee waivers, if any | | | | .06% | | .06% | | .06% | | .06% I |
| Expenses net of all reductions | | .05% I | | .06% | | .06% | | .06% | | .06% I |
| Net investment income (loss) | | 2.18% I | | 2.83% | | 2.72% | | 1.71% | | 2.36% I |
| Supplemental Data | | | | | | | | | | |
| Net assets, end of period (000 omitted) | $ | 559,225 | $ | 545,084 | $ | 518,822 | $ | 515,045 | $ | 161,189 |
Portfolio turnover rate J | | | | 14% | | 22% | | 33% | | 30% |
AFor the period June 24, 2020 (commencement of sale of shares) through March 31, 2021.
BCalculated based on average shares outstanding during the period.
CNet investment income (loss) is affected by the timing of the declaration of dividends by any underlying mutual funds or exchange-traded funds (ETFs). Net investment income (loss) of any mutual funds or ETFs is not included in the Fund's net investment income (loss) ratio.
DTotal distributions per share do not sum due to rounding.
ETotal returns for periods of less than one year are not annualized.
FTotal returns would have been lower if certain expenses had not been reduced during the applicable periods shown.
GFees and expenses of any underlying mutual funds or exchange-traded funds (ETFs) are not included in the Fund's expense ratio. The Fund indirectly bears its proportionate share of these expenses. For additional expense information related to investments in Fidelity Central Funds, please refer to the "Investments in Fidelity Central Funds" note found in the Notes to Financial Statements section of the most recent Annual or Semi-Annual report.
HExpense ratios reflect operating expenses of the class. Expenses before reductions do not reflect amounts reimbursed, waived, or reduced through arrangements with the investment adviser, brokerage services, or other offset arrangements, if applicable, and do not represent the amount paid by the class during periods when reimbursements, waivers or reductions occur.
IAnnualized.
JAmount does not include the portfolio activity of any underlying mutual funds or exchange-traded funds (ETFs).
Fidelity Freedom® Index 2015 Fund Premier II Class |
| |
| | Six months ended (Unaudited) September 30, 2024 A |
Selected Per-Share Data | | |
| Net asset value, beginning of period | $ | 14.82 |
| Income from Investment Operations | | |
Net investment income (loss) B,C | | .03 |
| Net realized and unrealized gain (loss) | | .28 |
| Total from investment operations | | .31 |
| Net asset value, end of period | $ | 15.13 |
Total Return D,E | | |
Ratios to Average Net Assets C,F,G | | |
| Expenses before reductions | | .04% H |
| Expenses net of fee waivers, if any | | |
| Expenses net of all reductions | | .04% H |
| Net investment income (loss) | | 1.65% H |
| Supplemental Data | | |
| Net assets, end of period (000 omitted) | $ | 7 |
Portfolio turnover rate I | | |
AFor the period August 22, 2024 (commencement of sale of shares) through September 30, 2024.
BCalculated based on average shares outstanding during the period.
CNet investment income (loss) is affected by the timing of the declaration of dividends by any underlying mutual funds or exchange-traded funds (ETFs). Net investment income (loss) of any mutual funds or ETFs is not included in the Fund's net investment income (loss) ratio.
DTotal returns for periods of less than one year are not annualized.
ETotal returns would have been lower if certain expenses had not been reduced during the applicable periods shown.
FFees and expenses of any underlying mutual funds or exchange-traded funds (ETFs) are not included in the Fund's expense ratio. The Fund indirectly bears its proportionate share of these expenses. For additional expense information related to investments in Fidelity Central Funds, please refer to the "Investments in Fidelity Central Funds" note found in the Notes to Financial Statements section of the most recent Annual or Semi-Annual report.
GExpense ratios reflect operating expenses of the class. Expenses before reductions do not reflect amounts reimbursed, waived, or reduced through arrangements with the investment adviser, brokerage services, or other offset arrangements, if applicable, and do not represent the amount paid by the class during periods when reimbursements, waivers or reductions occur.
HAnnualized.
IAmount does not include the portfolio activity of any underlying mutual funds or exchange-traded funds (ETFs).
Fidelity Freedom® Index 2020 Fund
Schedule of Investments September 30, 2024 (Unaudited)
Showing Percentage of Net Assets
| Domestic Equity Funds - 26.7% |
| | | Shares | Value ($) |
Fidelity Series Total Market Index Fund (a) (Cost $991,819,386) | | 101,373,549 | 1,913,932,613 |
| | | | |
| International Equity Funds - 17.7% |
| | | Shares | Value ($) |
Fidelity Series Global ex U.S. Index Fund (a) (Cost $888,033,404) | | 80,280,096 | 1,266,819,909 |
| | | | |
| Bond Funds - 41.7% |
| | | Shares | Value ($) |
| Fidelity Series Bond Index Fund (a) | | 255,765,266 | 2,363,271,054 |
| Fidelity Series International Developed Markets Bond Index Fund (a) | | 39,948,278 | 354,341,228 |
| Fidelity Series Long-Term Treasury Bond Index Fund (a) | | 44,939,599 | 263,795,445 |
| TOTAL BOND FUNDS (Cost $3,292,338,171) | | | 2,981,407,727 |
| | | | |
| Inflation-Protected Bond Funds - 11.6% |
| | | Shares | Value ($) |
| Fidelity Series 0-5 Year Inflation-Protected Bond Index Fund (a) | | 30,896,761 | 304,024,124 |
| Fidelity Series 5+ Year Inflation-Protected Bond Index Fund (a) | | 65,989,629 | 525,937,339 |
| TOTAL INFLATION-PROTECTED BOND FUNDS (Cost $927,953,661) | | | 829,961,463 |
| | | | |
| Short-Term Funds - 2.3% |
| | | Shares | Value ($) |
Fidelity Series Treasury Bill Index Fund (a) (Cost $166,398,520) | | 16,697,856 | 166,143,669 |
| | | | |
| TOTAL INVESTMENT IN SECURITIES - 100.0% (Cost $6,266,543,142) | 7,158,265,381 |
NET OTHER ASSETS (LIABILITIES) - 0.0% | (411,128) |
| NET ASSETS - 100.0% | 7,157,854,253 |
| | |
Legend
Affiliated Central Funds
Fiscal year to date information regarding the Fund's investments in Fidelity Central Funds, including the ownership percentage, is presented below.
| Affiliate | Value, beginning of period ($) | Purchases ($) | Sales Proceeds ($) | Dividend Income ($) | Realized Gain (loss) ($) | Change in Unrealized appreciation (depreciation) ($) | Value, end of period ($) | % ownership, end of period |
| Fidelity Cash Central Fund 4.89% | - | 56,656 | 56,656 | 48 | - | - | - | 0.0% |
| Total | - | 56,656 | 56,656 | 48 | - | - | - | |
| | | | | | | | | |
Amounts in the dividend income column in the above table include any capital gain distributions from underlying funds, which are presented in the corresponding line item in the Statement of Operations, if applicable.
Amounts included in the purchases and sales proceeds columns may include in-kind transactions, if applicable.
Affiliated Underlying Funds
Fiscal year to date information regarding the Fund's investments in affiliated Underlying Funds is presented below. Exchanges between classes of the same affiliated Underlying Funds may occur. If an Underlying Funds changes its name, the name presented below is the name in effect at period end.
| Affiliate | Value, beginning of period ($) | Purchases ($) | Sales Proceeds ($) | Dividend Income ($) | Realized Gain (loss) ($) | Change in Unrealized appreciation (depreciation) ($) | Value, end of period ($) |
| Fidelity Series 0-5 Year Inflation-Protected Bond Index Fund | 271,359,025 | 49,311,442 | 25,120,252 | 2,589,567 | (16,696) | 8,490,605 | 304,024,124 |
| Fidelity Series 5+ Year Inflation-Protected Bond Index Fund | 550,529,346 | 9,597,602 | 59,398,674 | 5,768,421 | (13,676,234) | 38,885,299 | 525,937,339 |
| Fidelity Series Bond Index Fund | 2,386,723,801 | 110,846,516 | 214,447,125 | 42,516,105 | (9,008,269) | 89,156,131 | 2,363,271,054 |
| Fidelity Series Global ex U.S. Index Fund | 1,323,106,730 | 27,859,421 | 190,891,750 | - | 26,965,574 | 79,779,934 | 1,266,819,909 |
| Fidelity Series International Developed Markets Bond Index Fund | 363,852,401 | 19,873,184 | 34,973,194 | 5,350,865 | (909,269) | 6,498,106 | 354,341,228 |
| Fidelity Series Long-Term Treasury Bond Index Fund | 267,299,419 | 15,080,196 | 30,187,368 | 4,635,534 | (8,379,386) | 19,982,584 | 263,795,445 |
| Fidelity Series Total Market Index Fund | 1,985,964,627 | 30,746,777 | 272,476,785 | 3,999,468 | 105,514,470 | 64,183,524 | 1,913,932,613 |
| Fidelity Series Treasury Bill Index Fund | 149,562,516 | 30,145,133 | 13,880,268 | 4,038,237 | (12,816) | 329,104 | 166,143,669 |
| | 7,298,397,865 | 293,460,271 | 841,375,416 | 68,898,197 | 100,477,374 | 307,305,287 | 7,158,265,381 |
Amounts in the dividend income column in the above table include any capital gain distributions from underlying funds, which are presented in the corresponding line item in the Statement of Operations, if applicable.
Amounts included in the purchases and sales proceeds columns may include in-kind transactions, if applicable.
Investment Valuation
The following is a summary of the inputs used, as of September 30, 2024, involving the Fund's assets and liabilities carried at fair value. The inputs or methodology used for valuing securities may not be an indication of the risk associated with investing in those securities. For more information on valuation inputs, and their aggregation into the levels used below, please refer to the Investment Valuation section in the accompanying Notes to Financial Statements.
| Valuation Inputs at Reporting Date: |
| Description | Total ($) | Level 1 ($) | Level 2 ($) | Level 3 ($) |
Investments in Securities: | | | | |
|
| Domestic Equity Funds | 1,913,932,613 | 1,913,932,613 | - | - |
|
| International Equity Funds | 1,266,819,909 | 1,266,819,909 | - | - |
|
| Bond Funds | 3,811,369,190 | 3,811,369,190 | - | - |
|
| Short-Term Funds | 166,143,669 | 166,143,669 | - | - |
| Total Investments in Securities: | 7,158,265,381 | 7,158,265,381 | - | - |
Fidelity Freedom® Index 2020 Fund
Financial Statements (Unaudited)
| Statement of Assets and Liabilities |
| As of September 30, 2024 (Unaudited) |
| Assets | | | | |
| Investment in securities, at value - See accompanying schedule: | | | | |
Affiliated issuers (cost $6,266,543,142) | $ | 7,158,265,381 | | |
| | | | | |
| | | | | |
| Total Investment in Securities (cost $6,266,543,142) | | | $ | 7,158,265,381 |
| Receivable for investments sold | | | | 31,530,885 |
| Receivable for fund shares sold | | | | 6,111,426 |
Total assets | | | | 7,195,907,692 |
| Liabilities | | | | |
| Payable for investments purchased | $ | 27,587,986 | | |
| Payable for fund shares redeemed | | 10,054,324 | | |
| Accrued management fee | | 411,129 | | |
| Total liabilities | | | | 38,053,439 |
| Net Assets | | | $ | 7,157,854,253 |
| Net Assets consist of: | | | | |
| Paid in capital | | | $ | 6,154,733,164 |
| Total accumulated earnings (loss) | | | | 1,003,121,089 |
| Net Assets | | | $ | 7,157,854,253 |
| | | | | |
| Net Asset Value and Maximum Offering Price | | | | |
| Investor Class : | | | | |
Net Asset Value, offering price and redemption price per share ($1,332,098,464 ÷ 79,087,215 shares) | | | $ | 16.84 |
| Institutional Premium Class : | | | | |
Net Asset Value, offering price and redemption price per share ($4,046,124,750 ÷ 240,442,365 shares) | | | $ | 16.83 |
| Premier Class : | | | | |
Net Asset Value, offering price and redemption price per share ($1,779,623,770 ÷ 105,801,867 shares) | | | $ | 16.82 |
| Premier II Class : | | | | |
Net Asset Value, offering price and redemption price per share ($7,269 ÷ 432 shares) | | | $ | 16.83 |
| Statement of Operations |
Six months ended September 30, 2024 (Unaudited) |
| Investment Income | | | | |
| Dividends: | | | | |
| Affiliated issuers | | | $ | 68,898,197 |
| Income from Fidelity Central Funds | | | | 48 |
| Total income | | | | 68,898,245 |
| Expenses | | | | |
| Management fee | $ | 2,817,362 | | |
| Independent trustees' fees and expenses | | 9,090 | | |
| Total expenses before reductions | | 2,826,452 | | |
| Expense reductions | | (114) | | |
| Total expenses after reductions | | | | 2,826,338 |
| Net Investment income (loss) | | | | 66,071,907 |
| Realized and Unrealized Gain (Loss) | | | | |
| Net realized gain (loss) on: | | | | |
| Investment Securities: | | | | |
| Affiliated issuers | | 100,477,374 | | |
| Total net realized gain (loss) | | | | 100,477,374 |
| Change in net unrealized appreciation (depreciation) on: | | | | |
| Investment Securities: | | | | |
| Affiliated issuers | | 307,305,287 | | |
| Total change in net unrealized appreciation (depreciation) | | | | 307,305,287 |
| Net gain (loss) | | | | 407,782,661 |
| Net increase (decrease) in net assets resulting from operations | | | $ | 473,854,568 |
| Statement of Changes in Net Assets |
| |
| | Six months ended September 30, 2024 (Unaudited) | | Year ended March 31, 2024 |
| Increase (Decrease) in Net Assets | | | | |
| Operations | | | | |
| Net investment income (loss) | $ | 66,071,907 | $ | 194,042,337 |
| Net realized gain (loss) | | 100,477,374 | | 176,277,811 |
| Change in net unrealized appreciation (depreciation) | | 307,305,287 | | 349,911,888 |
| Net increase (decrease) in net assets resulting from operations | | 473,854,568 | | 720,232,036 |
| Distributions to shareholders | | (119,312,959) | | (178,382,852) |
| | | | | |
| Share transactions - net increase (decrease) | | (494,656,727) | | (594,014,309) |
| Total increase (decrease) in net assets | | (140,115,118) | | (52,165,125) |
| | | | | |
| Net Assets | | | | |
| Beginning of period | | 7,297,969,371 | | 7,350,134,496 |
| End of period | $ | 7,157,854,253 | $ | 7,297,969,371 |
| | | | | |
| | | | | |
Financial Highlights
Fidelity Freedom® Index 2020 Fund Investor Class |
| |
| | Six months ended (Unaudited) September 30, 2024 | | Years ended March 31, 2024 | | 2023 | | 2022 | | 2021 | | 2020 |
Selected Per-Share Data | | | | | | | | | | | | |
| Net asset value, beginning of period | $ | 16.02 | $ | 14.86 | $ | 16.34 | $ | 16.54 | $ | 13.41 | $ | 16.01 |
| Income from Investment Operations | | | | | | | | | | | | |
Net investment income (loss) A,B | | .15 | | .40 | | .37 | | .28 | | .22 | | .31 |
| Net realized and unrealized gain (loss) | | .94 | | 1.14 | | (1.43) | | (.02) | | 3.33 | | (.31) |
| Total from investment operations | | 1.09 | | 1.54 | | (1.06) | | .26 | | 3.55 | | - C |
| Distributions from net investment income | | (.06) | | (.38) | | (.37) | | (.26) | | (.23) | | (.30) |
| Distributions from net realized gain | | (.21) | | - | | (.05) | | (.20) | | (.19) | | (2.30) |
| Total distributions | | (.27) | | (.38) | | (.42) | | (.46) | | (.42) | | (2.60) |
| Net asset value, end of period | $ | 16.84 | $ | 16.02 | $ | 14.86 | $ | 16.34 | $ | 16.54 | $ | 13.41 |
Total Return D,E | | | | 10.42% | | (6.40)% | | 1.46% | | 26.61% | | (1.62)% |
Ratios to Average Net Assets B,F,G | | | | | | | | | | | | |
| Expenses before reductions | | .12% H | | .12% | | .12% | | .12% | | .12% | | .12% |
| Expenses net of fee waivers, if any | | | | .12% | | .12% | | .12% | | .12% | | .12% |
| Expenses net of all reductions | | .12% H | | .12% | | .12% | | .12% | | .12% | | .12% |
| Net investment income (loss) | | 1.82% H | | 2.65% | | 2.54% | | 1.66% | | 1.40% | | 1.92% |
| Supplemental Data | | | | | | | | | | | | |
| Net assets, end of period (000 omitted) | $ | 1,332,098 | $ | 1,349,032 | $ | 1,456,902 | $ | 1,825,354 | $ | 3,660,550 | $ | 2,544,746 |
Portfolio turnover rate I | | | | 14% | | 21% | | 35% | | 28% | | 87% |
ACalculated based on average shares outstanding during the period.
BNet investment income (loss) is affected by the timing of the declaration of dividends by any underlying mutual funds or exchange-traded funds (ETFs). Net investment income (loss) of any mutual funds or ETFs is not included in the Fund's net investment income (loss) ratio.
CAmount represents less than $.005 per share.
DTotal returns for periods of less than one year are not annualized.
ETotal returns would have been lower if certain expenses had not been reduced during the applicable periods shown.
FFees and expenses of any underlying mutual funds or exchange-traded funds (ETFs) are not included in the Fund's expense ratio. The Fund indirectly bears its proportionate share of these expenses. For additional expense information related to investments in Fidelity Central Funds, please refer to the "Investments in Fidelity Central Funds" note found in the Notes to Financial Statements section of the most recent Annual or Semi-Annual report.
GExpense ratios reflect operating expenses of the class. Expenses before reductions do not reflect amounts reimbursed, waived, or reduced through arrangements with the investment adviser, brokerage services, or other offset arrangements, if applicable, and do not represent the amount paid by the class during periods when reimbursements, waivers or reductions occur.
HAnnualized.
IAmount does not include the portfolio activity of any underlying mutual funds or exchange-traded funds (ETFs).
Fidelity Freedom® Index 2020 Fund Institutional Premium Class |
| |
| | Six months ended (Unaudited) September 30, 2024 | | Years ended March 31, 2024 | | 2023 | | 2022 | | 2021 | | 2020 |
Selected Per-Share Data | | | | | | | | | | | | |
| Net asset value, beginning of period | $ | 16.01 | $ | 14.84 | $ | 16.32 | $ | 16.54 | $ | 13.41 | $ | 16.01 |
| Income from Investment Operations | | | | | | | | | | | | |
Net investment income (loss) A,B | | .15 | | .41 | | .38 | | .29 | | .22 | | .31 |
| Net realized and unrealized gain (loss) | | .94 | | 1.14 | | (1.44) | | (.03) | | 3.33 | | (.31) |
| Total from investment operations | | 1.09 | | 1.55 | | (1.06) | | .26 | | 3.55 | | - C |
| Distributions from net investment income | | (.06) | | (.38) | | (.38) | | (.28) | | (.23) | | (.31) |
| Distributions from net realized gain | | (.21) | | - | | (.05) | | (.20) | | (.19) | | (2.30) |
| Total distributions | | (.27) | | (.38) | | (.42) D | | (.48) | | (.42) | | (2.60) D |
| Net asset value, end of period | $ | 16.83 | $ | 16.01 | $ | 14.84 | $ | 16.32 | $ | 16.54 | $ | 13.41 |
Total Return E,F | | | | 10.55% | | (6.37)% | | 1.44% | | 26.66% | | (1.57)% |
Ratios to Average Net Assets B,G,H | | | | | | | | | | | | |
| Expenses before reductions | | .08% I | | .08% | | .08% | | .08% | | .08% | | .08% |
| Expenses net of fee waivers, if any | | | | .08% | | .08% | | .08% | | .08% | | .08% |
| Expenses net of all reductions | | .08% I | | .08% | | .08% | | .08% | | .08% | | .08% |
| Net investment income (loss) | | 1.86% I | | 2.69% | | 2.58% | | 1.70% | | 1.44% | | 1.96% |
| Supplemental Data | | | | | | | | | | | | |
| Net assets, end of period (000 omitted) | $ | 4,046,125 | $ | 4,227,718 | $ | 4,340,679 | $ | 5,076,226 | $ | 3,331,247 | $ | 2,713,138 |
Portfolio turnover rate J | | | | 14% | | 21% | | 35% | | 28% | | 87% |
ACalculated based on average shares outstanding during the period.
BNet investment income (loss) is affected by the timing of the declaration of dividends by any underlying mutual funds or exchange-traded funds (ETFs). Net investment income (loss) of any mutual funds or ETFs is not included in the Fund's net investment income (loss) ratio.
CAmount represents less than $.005 per share.
DTotal distributions per share do not sum due to rounding.
ETotal returns for periods of less than one year are not annualized.
FTotal returns would have been lower if certain expenses had not been reduced during the applicable periods shown.
GFees and expenses of any underlying mutual funds or exchange-traded funds (ETFs) are not included in the Fund's expense ratio. The Fund indirectly bears its proportionate share of these expenses. For additional expense information related to investments in Fidelity Central Funds, please refer to the "Investments in Fidelity Central Funds" note found in the Notes to Financial Statements section of the most recent Annual or Semi-Annual report.
HExpense ratios reflect operating expenses of the class. Expenses before reductions do not reflect amounts reimbursed, waived, or reduced through arrangements with the investment adviser, brokerage services, or other offset arrangements, if applicable, and do not represent the amount paid by the class during periods when reimbursements, waivers or reductions occur.
IAnnualized.
JAmount does not include the portfolio activity of any underlying mutual funds or exchange-traded funds (ETFs).
Fidelity Freedom® Index 2020 Fund Premier Class |
| |
| | Six months ended (Unaudited) September 30, 2024 | | Years ended March 31, 2024 | | 2023 | | 2022 | | 2021 A |
Selected Per-Share Data | | | | | | | | | | |
| Net asset value, beginning of period | $ | 16.00 | $ | 14.84 | $ | 16.32 | $ | 16.54 | $ | 14.69 |
| Income from Investment Operations | | | | | | | | | | |
Net investment income (loss) B,C | | .15 | | .41 | | .38 | | .29 | | .30 |
| Net realized and unrealized gain (loss) | | .94 | | 1.14 | | (1.43) | | (.03) | | 1.88 |
| Total from investment operations | | 1.09 | | 1.55 | | (1.05) | | .26 | | 2.18 |
| Distributions from net investment income | | (.06) | | (.39) | | (.38) | | (.28) | | (.20) |
| Distributions from net realized gain | | (.21) | | - | | (.05) | | (.20) | | (.12) |
| Total distributions | | (.27) | | (.39) | | (.43) | | (.48) | | (.33) D |
| Net asset value, end of period | $ | 16.82 | $ | 16.00 | $ | 14.84 | $ | 16.32 | $ | 16.54 |
Total Return E,F | | | | 10.51% | | (6.34)% | | 1.46% | | 14.83% |
Ratios to Average Net Assets C,G,H | | | | | | | | | | |
| Expenses before reductions | | .05% I | | .06% | | .06% | | .06% | | .06% I |
| Expenses net of fee waivers, if any | | | | .06% | | .06% | | .06% | | .06% I |
| Expenses net of all reductions | | .05% I | | .06% | | .06% | | .06% | | .06% I |
| Net investment income (loss) | | 1.88% I | | 2.71% | | 2.60% | | 1.72% | | 2.40% I |
| Supplemental Data | | | | | | | | | | |
| Net assets, end of period (000 omitted) | $ | 1,779,624 | $ | 1,721,219 | $ | 1,552,553 | $ | 1,551,607 | $ | 546,553 |
Portfolio turnover rate J | | | | 14% | | 21% | | 35% | | 28% |
AFor the period June 24, 2020 (commencement of sale of shares) through March 31, 2021.
BCalculated based on average shares outstanding during the period.
CNet investment income (loss) is affected by the timing of the declaration of dividends by any underlying mutual funds or exchange-traded funds (ETFs). Net investment income (loss) of any mutual funds or ETFs is not included in the Fund's net investment income (loss) ratio.
DTotal distributions per share do not sum due to rounding.
ETotal returns for periods of less than one year are not annualized.
FTotal returns would have been lower if certain expenses had not been reduced during the applicable periods shown.
GFees and expenses of any underlying mutual funds or exchange-traded funds (ETFs) are not included in the Fund's expense ratio. The Fund indirectly bears its proportionate share of these expenses. For additional expense information related to investments in Fidelity Central Funds, please refer to the "Investments in Fidelity Central Funds" note found in the Notes to Financial Statements section of the most recent Annual or Semi-Annual report.
HExpense ratios reflect operating expenses of the class. Expenses before reductions do not reflect amounts reimbursed, waived, or reduced through arrangements with the investment adviser, brokerage services, or other offset arrangements, if applicable, and do not represent the amount paid by the class during periods when reimbursements, waivers or reductions occur.
IAnnualized.
JAmount does not include the portfolio activity of any underlying mutual funds or exchange-traded funds (ETFs).
Fidelity Freedom® Index 2020 Fund Premier II Class |
| |
| | Six months ended (Unaudited) September 30, 2024 A |
Selected Per-Share Data | | |
| Net asset value, beginning of period | $ | 16.44 |
| Income from Investment Operations | | |
Net investment income (loss) B,C | | .03 |
| Net realized and unrealized gain (loss) | | .36 |
| Total from investment operations | | .39 |
| Net asset value, end of period | $ | 16.83 |
Total Return D,E | | |
Ratios to Average Net Assets C,F,G | | |
| Expenses before reductions | | .04% H |
| Expenses net of fee waivers, if any | | |
| Expenses net of all reductions | | .04% H |
| Net investment income (loss) | | 1.40% H |
| Supplemental Data | | |
| Net assets, end of period (000 omitted) | $ | 7 |
Portfolio turnover rate I | | |
AFor the period August 22, 2024 (commencement of sale of shares) through September 30, 2024.
BCalculated based on average shares outstanding during the period.
CNet investment income (loss) is affected by the timing of the declaration of dividends by any underlying mutual funds or exchange-traded funds (ETFs). Net investment income (loss) of any mutual funds or ETFs is not included in the Fund's net investment income (loss) ratio.
DTotal returns for periods of less than one year are not annualized.
ETotal returns would have been lower if certain expenses had not been reduced during the applicable periods shown.
FFees and expenses of any underlying mutual funds or exchange-traded funds (ETFs) are not included in the Fund's expense ratio. The Fund indirectly bears its proportionate share of these expenses. For additional expense information related to investments in Fidelity Central Funds, please refer to the "Investments in Fidelity Central Funds" note found in the Notes to Financial Statements section of the most recent Annual or Semi-Annual report.
GExpense ratios reflect operating expenses of the class. Expenses before reductions do not reflect amounts reimbursed, waived, or reduced through arrangements with the investment adviser, brokerage services, or other offset arrangements, if applicable, and do not represent the amount paid by the class during periods when reimbursements, waivers or reductions occur.
HAnnualized.
IAmount does not include the portfolio activity of any underlying mutual funds or exchange-traded funds (ETFs).
Fidelity Freedom® Index 2025 Fund
Schedule of Investments September 30, 2024 (Unaudited)
Showing Percentage of Net Assets
| Domestic Equity Funds - 31.6% |
| | | Shares | Value ($) |
Fidelity Series Total Market Index Fund (a) (Cost $2,441,634,535) | | 245,950,314 | 4,643,541,930 |
| | | | |
| International Equity Funds - 20.9% |
| | | Shares | Value ($) |
Fidelity Series Global ex U.S. Index Fund (a) (Cost $2,330,030,979) | | 194,730,096 | 3,072,840,919 |
| | | | |
| Bond Funds - 38.2% |
| | | Shares | Value ($) |
| Fidelity Series Bond Index Fund (a) | | 464,716,313 | 4,293,978,731 |
| Fidelity Series International Developed Markets Bond Index Fund (a) | | 80,859,040 | 717,219,686 |
| Fidelity Series Long-Term Treasury Bond Index Fund (a) | | 103,265,076 | 606,165,997 |
| TOTAL BOND FUNDS (Cost $6,161,498,886) | | | 5,617,364,414 |
| | | | |
| Inflation-Protected Bond Funds - 9.3% |
| | | Shares | Value ($) |
Fidelity Series 5+ Year Inflation-Protected Bond Index Fund (a) (Cost $1,541,407,779) | | 171,478,902 | 1,366,686,853 |
| | | | |
| TOTAL INVESTMENT IN SECURITIES - 100.0% (Cost $12,474,572,179) | 14,700,434,116 |
NET OTHER ASSETS (LIABILITIES) - 0.0% | (815,951) |
| NET ASSETS - 100.0% | 14,699,618,165 |
| | |
Legend
Affiliated Central Funds
Fiscal year to date information regarding the Fund's investments in Fidelity Central Funds, including the ownership percentage, is presented below.
| Affiliate | Value, beginning of period ($) | Purchases ($) | Sales Proceeds ($) | Dividend Income ($) | Realized Gain (loss) ($) | Change in Unrealized appreciation (depreciation) ($) | Value, end of period ($) | % ownership, end of period |
| Fidelity Cash Central Fund 4.89% | - | 393,177 | 393,177 | 194 | - | - | - | 0.0% |
| Total | - | 393,177 | 393,177 | 194 | - | - | - | |
| | | | | | | | | |
Amounts in the dividend income column in the above table include any capital gain distributions from underlying funds, which are presented in the corresponding line item in the Statement of Operations, if applicable.
Amounts included in the purchases and sales proceeds columns may include in-kind transactions, if applicable.
Affiliated Underlying Funds
Fiscal year to date information regarding the Fund's investments in affiliated Underlying Funds is presented below. Exchanges between classes of the same affiliated Underlying Funds may occur. If an Underlying Funds changes its name, the name presented below is the name in effect at period end.
| Affiliate | Value, beginning of period ($) | Purchases ($) | Sales Proceeds ($) | Dividend Income ($) | Realized Gain (loss) ($) | Change in Unrealized appreciation (depreciation) ($) | Value, end of period ($) |
| Fidelity Series 5+ Year Inflation-Protected Bond Index Fund | 1,289,360,328 | 88,114,349 | 74,344,040 | 14,089,040 | (2,086,012) | 65,642,228 | 1,366,686,853 |
| Fidelity Series Bond Index Fund | 4,184,683,535 | 227,323,343 | 262,045,310 | 75,665,517 | 1,741,369 | 142,275,794 | 4,293,978,731 |
| Fidelity Series Global ex U.S. Index Fund | 3,068,306,133 | 79,878,812 | 330,882,721 | - | 13,343,116 | 242,195,579 | 3,072,840,919 |
| Fidelity Series International Developed Markets Bond Index Fund | 710,521,774 | 44,749,411 | 49,575,726 | 10,517,716 | 150,041 | 11,374,186 | 717,219,686 |
| Fidelity Series Long-Term Treasury Bond Index Fund | 588,702,758 | 34,101,229 | 42,951,320 | 10,365,532 | (11,855,507) | 38,168,837 | 606,165,997 |
| Fidelity Series Total Market Index Fund | 4,606,924,262 | 83,640,723 | 453,162,755 | 9,308,404 | 121,305,202 | 284,834,498 | 4,643,541,930 |
| | 14,448,498,790 | 557,807,867 | 1,212,961,872 | 119,946,209 | 122,598,209 | 784,491,122 | 14,700,434,116 |
Amounts in the dividend income column in the above table include any capital gain distributions from underlying funds, which are presented in the corresponding line item in the Statement of Operations, if applicable.
Amounts included in the purchases and sales proceeds columns may include in-kind transactions, if applicable.
Investment Valuation
The following is a summary of the inputs used, as of September 30, 2024, involving the Fund's assets and liabilities carried at fair value. The inputs or methodology used for valuing securities may not be an indication of the risk associated with investing in those securities. For more information on valuation inputs, and their aggregation into the levels used below, please refer to the Investment Valuation section in the accompanying Notes to Financial Statements.
| Valuation Inputs at Reporting Date: |
| Description | Total ($) | Level 1 ($) | Level 2 ($) | Level 3 ($) |
Investments in Securities: | | | | |
|
| Domestic Equity Funds | 4,643,541,930 | 4,643,541,930 | - | - |
|
| International Equity Funds | 3,072,840,919 | 3,072,840,919 | - | - |
|
| Bond Funds | 6,984,051,267 | 6,984,051,267 | - | - |
| Total Investments in Securities: | 14,700,434,116 | 14,700,434,116 | - | - |
Fidelity Freedom® Index 2025 Fund
Financial Statements (Unaudited)
| Statement of Assets and Liabilities |
| As of September 30, 2024 (Unaudited) |
| Assets | | | | |
| Investment in securities, at value - See accompanying schedule: | | | | |
Affiliated issuers (cost $12,474,572,179) | $ | 14,700,434,116 | | |
| | | | | |
| | | | | |
| Total Investment in Securities (cost $12,474,572,179) | | | $ | 14,700,434,116 |
| Receivable for investments sold | | | | 32,285,138 |
| Receivable for fund shares sold | | | | 23,121,693 |
Total assets | | | | 14,755,840,947 |
| Liabilities | | | | |
| Payable for investments purchased | $ | 38,426,139 | | |
| Payable for fund shares redeemed | | 17,000,790 | | |
| Accrued management fee | | 795,853 | | |
| Total liabilities | | | | 56,222,782 |
| Net Assets | | | $ | 14,699,618,165 |
| Net Assets consist of: | | | | |
| Paid in capital | | | $ | 12,399,437,426 |
| Total accumulated earnings (loss) | | | | 2,300,180,739 |
| Net Assets | | | $ | 14,699,618,165 |
| | | | | |
| Net Asset Value and Maximum Offering Price | | | | |
| Investor Class : | | | | |
Net Asset Value, offering price and redemption price per share ($2,126,596,585 ÷ 108,018,206 shares) | | | $ | 19.69 |
| Institutional Premium Class : | | | | |
Net Asset Value, offering price and redemption price per share ($8,766,456,097 ÷ 445,369,286 shares) | | | $ | 19.68 |
| Premier Class : | | | | |
Net Asset Value, offering price and redemption price per share ($3,806,558,197 ÷ 193,465,974 shares) | | | $ | 19.68 |
| Premier II Class : | | | | |
Net Asset Value, offering price and redemption price per share ($7,286 ÷ 370 shares)(a) | | | $ | 19.68 |
(a)Corresponding Net Asset Value does not calculate due to rounding of fractional net assets and/or shares. |
| Statement of Operations |
Six months ended September 30, 2024 (Unaudited) |
| Investment Income | | | | |
| Dividends: | | | | |
| Affiliated issuers | | | $ | 119,946,209 |
| Income from Fidelity Central Funds | | | | 194 |
| Total income | | | | 119,946,403 |
| Expenses | | | | |
| Management fee | $ | 5,511,132 | | |
| Independent trustees' fees and expenses | | 18,149 | | |
| Total expenses before reductions | | 5,529,281 | | |
| Expense reductions | | (74) | | |
| Total expenses after reductions | | | | 5,529,207 |
| Net Investment income (loss) | | | | 114,417,196 |
| Realized and Unrealized Gain (Loss) | | | | |
| Net realized gain (loss) on: | | | | |
| Investment Securities: | | | | |
| Affiliated issuers | | 122,598,209 | | |
| Total net realized gain (loss) | | | | 122,598,209 |
| Change in net unrealized appreciation (depreciation) on: | | | | |
| Investment Securities: | | | | |
| Affiliated issuers | | 784,491,122 | | |
| Total change in net unrealized appreciation (depreciation) | | | | 784,491,122 |
| Net gain (loss) | | | | 907,089,331 |
| Net increase (decrease) in net assets resulting from operations | | | $ | 1,021,506,527 |
| Statement of Changes in Net Assets |
| |
| | Six months ended September 30, 2024 (Unaudited) | | Year ended March 31, 2024 |
| Increase (Decrease) in Net Assets | | | | |
| Operations | | | | |
| Net investment income (loss) | $ | 114,417,196 | $ | 356,436,172 |
| Net realized gain (loss) | | 122,598,209 | | 93,845,913 |
| Change in net unrealized appreciation (depreciation) | | 784,491,122 | | 1,114,822,007 |
| Net increase (decrease) in net assets resulting from operations | | 1,021,506,527 | | 1,565,104,092 |
| Distributions to shareholders | | (23,410,642) | | (336,648,722) |
| | | | | |
| Share transactions - net increase (decrease) | | (746,163,441) | | (45,421,881) |
| Total increase (decrease) in net assets | | 251,932,444 | | 1,183,033,489 |
| | | | | |
| Net Assets | | | | |
| Beginning of period | | 14,447,685,721 | | 13,264,652,232 |
| End of period | $ | 14,699,618,165 | $ | 14,447,685,721 |
| | | | | |
| | | | | |
Financial Highlights
Fidelity Freedom® Index 2025 Fund Investor Class |
| |
| | Six months ended (Unaudited) September 30, 2024 | | Years ended March 31, 2024 | | 2023 | | 2022 | | 2021 | | 2020 |
Selected Per-Share Data | | | | | | | | | | | | |
| Net asset value, beginning of period | $ | 18.37 | $ | 16.81 | $ | 18.48 | $ | 18.52 | $ | 14.57 | $ | 17.05 |
| Income from Investment Operations | | | | | | | | | | | | |
Net investment income (loss) A,B | | .15 | | .44 | | .40 | | .33 | | .25 | | .33 |
| Net realized and unrealized gain (loss) | | 1.20 | | 1.54 | | (1.65) | | .04 | | 4.13 | | (.54) |
| Total from investment operations | | 1.35 | | 1.98 | | (1.25) | | .37 | | 4.38 | | (.21) |
| Distributions from net investment income | | (.03) | | (.42) | | (.39) | | (.30) | | (.25) | | (.31) |
| Distributions from net realized gain | | - | | - | | (.03) | | (.12) | | (.18) | | (1.96) |
| Total distributions | | (.03) | | (.42) | | (.42) | | (.41) C | | (.43) | | (2.27) |
| Net asset value, end of period | $ | 19.69 | $ | 18.37 | $ | 16.81 | $ | 18.48 | $ | 18.52 | $ | 14.57 |
Total Return D,E | | | | 11.88% | | (6.65)% | | 1.91% | | 30.27% | | (2.75)% |
Ratios to Average Net Assets B,F,G | | | | | | | | | | | | |
| Expenses before reductions | | .12% H | | .12% | | .12% | | .12% | | .12% | | .12% |
| Expenses net of fee waivers, if any | | | | .12% | | .12% | | .12% | | .12% | | .12% |
| Expenses net of all reductions | | .12% H | | .12% | | .12% | | .12% | | .12% | | .12% |
| Net investment income (loss) | | 1.56% H | | 2.57% | | 2.43% | | 1.71% | | 1.46% | | 1.93% |
| Supplemental Data | | | | | | | | | | | | |
| Net assets, end of period (000 omitted) | $ | 2,126,597 | $ | 2,129,589 | $ | 2,192,387 | $ | 2,585,678 | $ | 5,538,556 | $ | 3,443,936 |
Portfolio turnover rate I | | | | 16% | | 18% | | 24% | | 26% | | 82% |
ACalculated based on average shares outstanding during the period.
BNet investment income (loss) is affected by the timing of the declaration of dividends by any underlying mutual funds or exchange-traded funds (ETFs). Net investment income (loss) of any mutual funds or ETFs is not included in the Fund's net investment income (loss) ratio.
CTotal distributions per share do not sum due to rounding.
DTotal returns for periods of less than one year are not annualized.
ETotal returns would have been lower if certain expenses had not been reduced during the applicable periods shown.
FFees and expenses of any underlying mutual funds or exchange-traded funds (ETFs) are not included in the Fund's expense ratio. The Fund indirectly bears its proportionate share of these expenses. For additional expense information related to investments in Fidelity Central Funds, please refer to the "Investments in Fidelity Central Funds" note found in the Notes to Financial Statements section of the most recent Annual or Semi-Annual report.
GExpense ratios reflect operating expenses of the class. Expenses before reductions do not reflect amounts reimbursed, waived, or reduced through arrangements with the investment adviser, brokerage services, or other offset arrangements, if applicable, and do not represent the amount paid by the class during periods when reimbursements, waivers or reductions occur.
HAnnualized.
IAmount does not include the portfolio activity of any underlying mutual funds or exchange-traded funds (ETFs).
Fidelity Freedom® Index 2025 Fund Institutional Premium Class |
| |
| | Six months ended (Unaudited) September 30, 2024 | | Years ended March 31, 2024 | | 2023 | | 2022 | | 2021 | | 2020 |
Selected Per-Share Data | | | | | | | | | | | | |
| Net asset value, beginning of period | $ | 18.36 | $ | 16.81 | $ | 18.48 | $ | 18.53 | $ | 14.57 | $ | 17.05 |
| Income from Investment Operations | | | | | | | | | | | | |
Net investment income (loss) A,B | | .15 | | .45 | | .41 | | .34 | | .26 | | .34 |
| Net realized and unrealized gain (loss) | | 1.20 | | 1.53 | | (1.65) | | .04 | | 4.14 | | (.54) |
| Total from investment operations | | 1.35 | | 1.98 | | (1.24) | | .38 | | 4.40 | | (.20) |
| Distributions from net investment income | | (.03) | | (.43) | | (.40) | | (.32) | | (.26) | | (.32) |
| Distributions from net realized gain | | - | | - | | (.03) | | (.12) | | (.18) | | (1.96) |
| Total distributions | | (.03) | | (.43) | | (.43) | | (.43) C | | (.44) | | (2.28) |
| Net asset value, end of period | $ | 19.68 | $ | 18.36 | $ | 16.81 | $ | 18.48 | $ | 18.53 | $ | 14.57 |
Total Return D,E | | | | 11.87% | | (6.61)% | | 1.96% | | 30.37% | | (2.71)% |
Ratios to Average Net Assets B,F,G | | | | | | | | | | | | |
| Expenses before reductions | | .08% H | | .08% | | .08% | | .08% | | .08% | | .08% |
| Expenses net of fee waivers, if any | | | | .08% | | .08% | | .08% | | .08% | | .08% |
| Expenses net of all reductions | | .08% H | | .08% | | .08% | | .08% | | .08% | | .08% |
| Net investment income (loss) | | 1.60% H | | 2.61% | | 2.47% | | 1.75% | | 1.50% | | 1.97% |
| Supplemental Data | | | | | | | | | | | | |
| Net assets, end of period (000 omitted) | $ | 8,766,456 | $ | 8,737,620 | $ | 8,118,470 | $ | 8,419,298 | $ | 4,504,542 | $ | 2,966,352 |
Portfolio turnover rate I | | | | 16% | | 18% | | 24% | | 26% | | 82% |
ACalculated based on average shares outstanding during the period.
BNet investment income (loss) is affected by the timing of the declaration of dividends by any underlying mutual funds or exchange-traded funds (ETFs). Net investment income (loss) of any mutual funds or ETFs is not included in the Fund's net investment income (loss) ratio.
CTotal distributions per share do not sum due to rounding.
DTotal returns for periods of less than one year are not annualized.
ETotal returns would have been lower if certain expenses had not been reduced during the applicable periods shown.
FFees and expenses of any underlying mutual funds or exchange-traded funds (ETFs) are not included in the Fund's expense ratio. The Fund indirectly bears its proportionate share of these expenses. For additional expense information related to investments in Fidelity Central Funds, please refer to the "Investments in Fidelity Central Funds" note found in the Notes to Financial Statements section of the most recent Annual or Semi-Annual report.
GExpense ratios reflect operating expenses of the class. Expenses before reductions do not reflect amounts reimbursed, waived, or reduced through arrangements with the investment adviser, brokerage services, or other offset arrangements, if applicable, and do not represent the amount paid by the class during periods when reimbursements, waivers or reductions occur.
HAnnualized.
IAmount does not include the portfolio activity of any underlying mutual funds or exchange-traded funds (ETFs).
Fidelity Freedom® Index 2025 Fund Premier Class |
| |
| | Six months ended (Unaudited) September 30, 2024 | | Years ended March 31, 2024 | | 2023 | | 2022 | | 2021 A |
Selected Per-Share Data | | | | | | | | | | |
| Net asset value, beginning of period | $ | 18.35 | $ | 16.80 | $ | 18.47 | $ | 18.52 | $ | 16.14 |
| Income from Investment Operations | | | | | | | | | | |
Net investment income (loss) B,C | | .15 | | .45 | | .41 | | .34 | | .35 |
| Net realized and unrealized gain (loss) | | 1.21 | | 1.53 | | (1.65) | | .05 | | 2.38 |
| Total from investment operations | | 1.36 | | 1.98 | | (1.24) | | .39 | | 2.73 |
| Distributions from net investment income | | (.03) | | (.43) | | (.40) | | (.32) | | (.23) |
| Distributions from net realized gain | | - | | - | | (.03) | | (.12) | | (.12) |
| Total distributions | | (.03) | | (.43) | | (.43) | | (.44) | | (.35) |
| Net asset value, end of period | $ | 19.68 | $ | 18.35 | $ | 16.80 | $ | 18.47 | $ | 18.52 |
Total Return D,E | | | | 11.90% | | (6.59)% | | 1.98% | | 16.94% |
Ratios to Average Net Assets C,F,G | | | | | | | | | | |
| Expenses before reductions | | .05% H | | .06% | | .06% | | .06% | | .06% H |
| Expenses net of fee waivers, if any | | | | .06% | | .06% | | .06% | | .06% H |
| Expenses net of all reductions | | .05% H | | .06% | | .06% | | .06% | | .06% H |
| Net investment income (loss) | | 1.62% H | | 2.63% | | 2.49% | | 1.77% | | 2.53% H |
| Supplemental Data | | | | | | | | | | |
| Net assets, end of period (000 omitted) | $ | 3,806,558 | $ | 3,580,476 | $ | 2,953,795 | $ | 2,610,862 | $ | 912,597 |
Portfolio turnover rate I | | | | 16% | | 18% | | 24% | | 26% |
AFor the period June 24, 2020 (commencement of sale of shares) through March 31, 2021.
BCalculated based on average shares outstanding during the period.
CNet investment income (loss) is affected by the timing of the declaration of dividends by any underlying mutual funds or exchange-traded funds (ETFs). Net investment income (loss) of any mutual funds or ETFs is not included in the Fund's net investment income (loss) ratio.
DTotal returns for periods of less than one year are not annualized.
ETotal returns would have been lower if certain expenses had not been reduced during the applicable periods shown.
FFees and expenses of any underlying mutual funds or exchange-traded funds (ETFs) are not included in the Fund's expense ratio. The Fund indirectly bears its proportionate share of these expenses. For additional expense information related to investments in Fidelity Central Funds, please refer to the "Investments in Fidelity Central Funds" note found in the Notes to Financial Statements section of the most recent Annual or Semi-Annual report.
GExpense ratios reflect operating expenses of the class. Expenses before reductions do not reflect amounts reimbursed, waived, or reduced through arrangements with the investment adviser, brokerage services, or other offset arrangements, if applicable, and do not represent the amount paid by the class during periods when reimbursements, waivers or reductions occur.
HAnnualized.
IAmount does not include the portfolio activity of any underlying mutual funds or exchange-traded funds (ETFs).
Fidelity Freedom® Index 2025 Fund Premier II Class |
| |
| | Six months ended (Unaudited) September 30, 2024 A |
Selected Per-Share Data | | |
| Net asset value, beginning of period | $ | 19.18 |
| Income from Investment Operations | | |
Net investment income (loss) B,C | | .02 |
| Net realized and unrealized gain (loss) | | .48 |
| Total from investment operations | | .50 |
| Net asset value, end of period | $ | 19.68 |
Total Return D,E | | |
Ratios to Average Net Assets C,F,G | | |
| Expenses before reductions | | .04% H |
| Expenses net of fee waivers, if any | | |
| Expenses net of all reductions | | .04% H |
| Net investment income (loss) | | 1.14% H |
| Supplemental Data | | |
| Net assets, end of period (000 omitted) | $ | 7 |
Portfolio turnover rate I | | |
AFor the period August 22, 2024 (commencement of sale of shares) through September 30, 2024.
BCalculated based on average shares outstanding during the period.
CNet investment income (loss) is affected by the timing of the declaration of dividends by any underlying mutual funds or exchange-traded funds (ETFs). Net investment income (loss) of any mutual funds or ETFs is not included in the Fund's net investment income (loss) ratio.
DTotal returns for periods of less than one year are not annualized.
ETotal returns would have been lower if certain expenses had not been reduced during the applicable periods shown.
FFees and expenses of any underlying mutual funds or exchange-traded funds (ETFs) are not included in the Fund's expense ratio. The Fund indirectly bears its proportionate share of these expenses. For additional expense information related to investments in Fidelity Central Funds, please refer to the "Investments in Fidelity Central Funds" note found in the Notes to Financial Statements section of the most recent Annual or Semi-Annual report.
GExpense ratios reflect operating expenses of the class. Expenses before reductions do not reflect amounts reimbursed, waived, or reduced through arrangements with the investment adviser, brokerage services, or other offset arrangements, if applicable, and do not represent the amount paid by the class during periods when reimbursements, waivers or reductions occur.
HAnnualized.
IAmount does not include the portfolio activity of any underlying mutual funds or exchange-traded funds (ETFs).
Fidelity Freedom® Index 2030 Fund
Schedule of Investments September 30, 2024 (Unaudited)
Showing Percentage of Net Assets
| Domestic Equity Funds - 35.5% |
| | | Shares | Value ($) |
Fidelity Series Total Market Index Fund (a) (Cost $4,412,903,391) | | 419,330,492 | 7,916,959,686 |
| | | | |
| International Equity Funds - 23.5% |
| | | Shares | Value ($) |
Fidelity Series Global ex U.S. Index Fund (a) (Cost $4,088,537,376) | | 332,005,817 | 5,239,051,799 |
| | | | |
| Bond Funds - 35.8% |
| | | Shares | Value ($) |
| Fidelity Series Bond Index Fund (a) | | 636,836,180 | 5,884,366,303 |
| Fidelity Series International Developed Markets Bond Index Fund (a) | | 121,379,037 | 1,076,632,056 |
| Fidelity Series Long-Term Treasury Bond Index Fund (a) | | 172,259,909 | 1,011,165,667 |
| TOTAL BOND FUNDS (Cost $8,616,359,861) | | | 7,972,164,026 |
| | | | |
| Inflation-Protected Bond Funds - 5.2% |
| | | Shares | Value ($) |
Fidelity Series 5+ Year Inflation-Protected Bond Index Fund (a) (Cost $1,233,691,252) | | 143,983,567 | 1,147,549,030 |
| | | | |
| TOTAL INVESTMENT IN SECURITIES - 100.0% (Cost $18,351,491,880) | 22,275,724,541 |
NET OTHER ASSETS (LIABILITIES) - 0.0% | (1,165,604) |
| NET ASSETS - 100.0% | 22,274,558,937 |
| | |
Legend
Affiliated Central Funds
Fiscal year to date information regarding the Fund's investments in Fidelity Central Funds, including the ownership percentage, is presented below.
| Affiliate | Value, beginning of period ($) | Purchases ($) | Sales Proceeds ($) | Dividend Income ($) | Realized Gain (loss) ($) | Change in Unrealized appreciation (depreciation) ($) | Value, end of period ($) | % ownership, end of period |
| Fidelity Cash Central Fund 4.89% | - | 778,086 | 778,086 | 391 | - | - | - | 0.0% |
| Total | - | 778,086 | 778,086 | 391 | - | - | - | |
| | | | | | | | | |
Amounts in the dividend income column in the above table include any capital gain distributions from underlying funds, which are presented in the corresponding line item in the Statement of Operations, if applicable.
Amounts included in the purchases and sales proceeds columns may include in-kind transactions, if applicable.
Affiliated Underlying Funds
Fiscal year to date information regarding the Fund's investments in affiliated Underlying Funds is presented below. Exchanges between classes of the same affiliated Underlying Funds may occur. If an Underlying Funds changes its name, the name presented below is the name in effect at period end.
| Affiliate | Value, beginning of period ($) | Purchases ($) | Sales Proceeds ($) | Dividend Income ($) | Realized Gain (loss) ($) | Change in Unrealized appreciation (depreciation) ($) | Value, end of period ($) |
| Fidelity Series 5+ Year Inflation-Protected Bond Index Fund | 992,641,100 | 129,838,742 | 27,244,400 | 11,349,531 | (1,232,576) | 53,546,164 | 1,147,549,030 |
| Fidelity Series Bond Index Fund | 5,458,340,809 | 398,156,529 | 167,919,495 | 101,096,894 | 1,484,372 | 194,304,088 | 5,884,366,303 |
| Fidelity Series Global ex U.S. Index Fund | 4,977,189,447 | 202,693,746 | 371,113,056 | - | 1,113,856 | 429,167,806 | 5,239,051,799 |
| Fidelity Series International Developed Markets Bond Index Fund | 1,019,467,763 | 77,322,899 | 37,945,654 | 15,189,594 | (46,126) | 17,833,174 | 1,076,632,056 |
| Fidelity Series Long-Term Treasury Bond Index Fund | 937,449,529 | 67,371,903 | 37,324,180 | 16,859,731 | 245,658 | 43,422,757 | 1,011,165,667 |
| Fidelity Series Total Market Index Fund | 7,472,602,677 | 231,902,488 | 471,747,141 | 15,158,664 | 62,675,511 | 621,526,151 | 7,916,959,686 |
| | 20,857,691,325 | 1,107,286,307 | 1,113,293,926 | 159,654,414 | 64,240,695 | 1,359,800,140 | 22,275,724,541 |
Amounts in the dividend income column in the above table include any capital gain distributions from underlying funds, which are presented in the corresponding line item in the Statement of Operations, if applicable.
Amounts included in the purchases and sales proceeds columns may include in-kind transactions, if applicable.
Investment Valuation
The following is a summary of the inputs used, as of September 30, 2024, involving the Fund's assets and liabilities carried at fair value. The inputs or methodology used for valuing securities may not be an indication of the risk associated with investing in those securities. For more information on valuation inputs, and their aggregation into the levels used below, please refer to the Investment Valuation section in the accompanying Notes to Financial Statements.
| Valuation Inputs at Reporting Date: |
| Description | Total ($) | Level 1 ($) | Level 2 ($) | Level 3 ($) |
Investments in Securities: | | | | |
|
| Domestic Equity Funds | 7,916,959,686 | 7,916,959,686 | - | - |
|
| International Equity Funds | 5,239,051,799 | 5,239,051,799 | - | - |
|
| Bond Funds | 9,119,713,056 | 9,119,713,056 | - | - |
| Total Investments in Securities: | 22,275,724,541 | 22,275,724,541 | - | - |
Fidelity Freedom® Index 2030 Fund
Financial Statements (Unaudited)
| Statement of Assets and Liabilities |
| As of September 30, 2024 (Unaudited) |
| Assets | | | | |
| Investment in securities, at value - See accompanying schedule: | | | | |
Affiliated issuers (cost $18,351,491,880) | $ | 22,275,724,541 | | |
| | | | | |
| | | | | |
| Total Investment in Securities (cost $18,351,491,880) | | | $ | 22,275,724,541 |
| Receivable for investments sold | | | | 57,741,532 |
| Receivable for fund shares sold | | | | 26,791,678 |
| Other receivables | | | | 86,383 |
Total assets | | | | 22,360,344,134 |
| Liabilities | | | | |
| Payable for investments purchased | $ | 62,223,298 | | |
| Payable for fund shares redeemed | | 22,308,557 | | |
| Accrued management fee | | 1,167,010 | | |
| Other payables and accrued expenses | | 86,332 | | |
| Total liabilities | | | | 85,785,197 |
| Net Assets | | | $ | 22,274,558,937 |
| Net Assets consist of: | | | | |
| Paid in capital | | | $ | 18,360,218,433 |
| Total accumulated earnings (loss) | | | | 3,914,340,504 |
| Net Assets | | | $ | 22,274,558,937 |
| | | | | |
| Net Asset Value and Maximum Offering Price | | | | |
| Investor Class : | | | | |
Net Asset Value, offering price and redemption price per share ($2,870,402,819 ÷ 135,460,632 shares) | | | $ | 21.19 |
| Institutional Premium Class : | | | | |
Net Asset Value, offering price and redemption price per share ($13,801,296,687 ÷ 651,566,342 shares) | | | $ | 21.18 |
| Premier Class : | | | | |
Net Asset Value, offering price and redemption price per share ($5,602,852,135 ÷ 264,608,801 shares) | | | $ | 21.17 |
| Premier II Class : | | | | |
Net Asset Value, offering price and redemption price per share ($7,296 ÷ 344 shares)(a) | | | $ | 21.18 |
(a)Corresponding Net Asset Value does not calculate due to rounding of fractional net assets and/or shares. |
| Statement of Operations |
Six months ended September 30, 2024 (Unaudited) |
| Investment Income | | | | |
| Dividends: | | | | |
| Affiliated issuers | | | $ | 159,654,414 |
| Income from Fidelity Central Funds | | | | 391 |
| Total income | | | | 159,654,805 |
| Expenses | | | | |
| Management fee | $ | 8,061,607 | | |
| Independent trustees' fees and expenses | | 26,552 | | |
| Total expenses before reductions | | 8,088,159 | | |
| Expense reductions | | (193) | | |
| Total expenses after reductions | | | | 8,087,966 |
| Net Investment income (loss) | | | | 151,566,839 |
| Realized and Unrealized Gain (Loss) | | | | |
| Net realized gain (loss) on: | | | | |
| Investment Securities: | | | | |
| Affiliated issuers | | 64,240,695 | | |
| Total net realized gain (loss) | | | | 64,240,695 |
| Change in net unrealized appreciation (depreciation) on: | | | | |
| Investment Securities: | | | | |
| Affiliated issuers | | 1,359,800,140 | | |
| Total change in net unrealized appreciation (depreciation) | | | | 1,359,800,140 |
| Net gain (loss) | | | | 1,424,040,835 |
| Net increase (decrease) in net assets resulting from operations | | | $ | 1,575,607,674 |
| Statement of Changes in Net Assets |
| |
| | Six months ended September 30, 2024 (Unaudited) | | Year ended March 31, 2024 |
| Increase (Decrease) in Net Assets | | | | |
| Operations | | | | |
| Net investment income (loss) | $ | 151,566,839 | $ | 477,865,067 |
| Net realized gain (loss) | | 64,240,695 | | 88,714,165 |
| Change in net unrealized appreciation (depreciation) | | 1,359,800,140 | | 1,894,197,711 |
| Net increase (decrease) in net assets resulting from operations | | 1,575,607,674 | | 2,460,776,943 |
| Distributions to shareholders | | (37,013,394) | | (450,488,980) |
| | | | | |
| Share transactions - net increase (decrease) | | (120,590,188) | | 1,376,492,643 |
| Total increase (decrease) in net assets | | 1,418,004,092 | | 3,386,780,606 |
| | | | | |
| Net Assets | | | | |
| Beginning of period | | 20,856,554,845 | | 17,469,774,239 |
| End of period | $ | 22,274,558,937 | $ | 20,856,554,845 |
| | | | | |
| | | | | |
Financial Highlights
Fidelity Freedom® Index 2030 Fund Investor Class |
| |
| | Six months ended (Unaudited) September 30, 2024 | | Years ended March 31, 2024 | | 2023 | | 2022 | | 2021 | | 2020 |
Selected Per-Share Data | | | | | | | | | | | | |
| Net asset value, beginning of period | $ | 19.73 | $ | 17.79 | $ | 19.51 | $ | 19.45 | $ | 14.73 | $ | 17.99 |
| Income from Investment Operations | | | | | | | | | | | | |
Net investment income (loss) A,B | | .14 | | .46 | | .39 | | .35 | | .27 | | .34 |
| Net realized and unrealized gain (loss) | | 1.35 | | 1.91 | | (1.71) | | .15 | | 4.91 | | (.74) |
| Total from investment operations | | 1.49 | | 2.37 | | (1.32) | | .50 | | 5.18 | | (.40) |
| Distributions from net investment income | | (.03) | | (.43) | | (.37) | | (.32) | | (.27) | | (.33) |
| Distributions from net realized gain | | - | | - | | (.03) | | (.12) | | (.19) | | (2.53) |
| Total distributions | | (.03) | | (.43) | | (.40) | | (.44) | | (.46) | | (2.86) |
| Net asset value, end of period | $ | 21.19 | $ | 19.73 | $ | 17.79 | $ | 19.51 | $ | 19.45 | $ | 14.73 |
Total Return C,D | | | | 13.42% | | (6.65)% | | 2.47% | | 35.36% | | (4.38)% |
Ratios to Average Net Assets B,E,F | | | | | | | | | | | | |
| Expenses before reductions | | .12% G | | .12% | | .12% | | .12% | | .12% | | .12% |
| Expenses net of fee waivers, if any | | | | .12% | | .12% | | .12% | | .12% | | .12% |
| Expenses net of all reductions | | .12% G | | .12% | | .12% | | .12% | | .12% | | .12% |
| Net investment income (loss) | | 1.39% G | | 2.50% | | 2.24% | | 1.74% | | 1.52% | | 1.92% |
| Supplemental Data | | | | | | | | | | | | |
| Net assets, end of period (000 omitted) | $ | 2,870,403 | $ | 2,713,477 | $ | 2,500,987 | $ | 2,775,100 | $ | 6,036,702 | $ | 3,610,892 |
Portfolio turnover rate H | | | | 12% | | 15% | | 20% | | 26% | | 85% |
ACalculated based on average shares outstanding during the period.
BNet investment income (loss) is affected by the timing of the declaration of dividends by any underlying mutual funds or exchange-traded funds (ETFs). Net investment income (loss) of any mutual funds or ETFs is not included in the Fund's net investment income (loss) ratio.
CTotal returns for periods of less than one year are not annualized.
DTotal returns would have been lower if certain expenses had not been reduced during the applicable periods shown.
EFees and expenses of any underlying mutual funds or exchange-traded funds (ETFs) are not included in the Fund's expense ratio. The Fund indirectly bears its proportionate share of these expenses. For additional expense information related to investments in Fidelity Central Funds, please refer to the "Investments in Fidelity Central Funds" note found in the Notes to Financial Statements section of the most recent Annual or Semi-Annual report.
FExpense ratios reflect operating expenses of the class. Expenses before reductions do not reflect amounts reimbursed, waived, or reduced through arrangements with the investment adviser, brokerage services, or other offset arrangements, if applicable, and do not represent the amount paid by the class during periods when reimbursements, waivers or reductions occur.
GAnnualized.
HAmount does not include the portfolio activity of any underlying mutual funds or exchange-traded funds (ETFs).
Fidelity Freedom® Index 2030 Fund Institutional Premium Class |
| |
| | Six months ended (Unaudited) September 30, 2024 | | Years ended March 31, 2024 | | 2023 | | 2022 | | 2021 | | 2020 |
Selected Per-Share Data | | | | | | | | | | | | |
| Net asset value, beginning of period | $ | 19.72 | $ | 17.79 | $ | 19.51 | $ | 19.45 | $ | 14.73 | $ | 18.00 |
| Income from Investment Operations | | | | | | | | | | | | |
Net investment income (loss) A,B | | .14 | | .47 | | .40 | | .36 | | .28 | | .35 |
| Net realized and unrealized gain (loss) | | 1.36 | | 1.90 | | (1.71) | | .16 | | 4.90 | | (.75) |
| Total from investment operations | | 1.50 | | 2.37 | | (1.31) | | .52 | | 5.18 | | (.40) |
| Distributions from net investment income | | (.04) | | (.44) | | (.38) | | (.34) | | (.27) | | (.34) |
| Distributions from net realized gain | | - | | - | | (.03) | | (.12) | | (.19) | | (2.53) |
| Total distributions | | (.04) | | (.44) | | (.41) | | (.46) | | (.46) | | (2.87) |
| Net asset value, end of period | $ | 21.18 | $ | 19.72 | $ | 17.79 | $ | 19.51 | $ | 19.45 | $ | 14.73 |
Total Return C,D | | | | 13.41% | | (6.60)% | | 2.57% | | 35.41% | | (4.40)% |
Ratios to Average Net Assets B,E,F | | | | | | | | | | | | |
| Expenses before reductions | | .08% G | | .08% | | .08% | | .08% | | .08% | | .08% |
| Expenses net of fee waivers, if any | | | | .08% | | .08% | | .08% | | .08% | | .08% |
| Expenses net of all reductions | | .08% G | | .08% | | .08% | | .08% | | .08% | | .08% |
| Net investment income (loss) | | 1.43% G | | 2.54% | | 2.28% | | 1.78% | | 1.56% | | 1.96% |
| Supplemental Data | | | | | | | | | | | | |
| Net assets, end of period (000 omitted) | $ | 13,801,297 | $ | 13,110,035 | $ | 11,271,364 | $ | 10,927,825 | $ | 5,916,521 | $ | 3,884,151 |
Portfolio turnover rate H | | | | 12% | | 15% | | 20% | | 26% | | 85% |
ACalculated based on average shares outstanding during the period.
BNet investment income (loss) is affected by the timing of the declaration of dividends by any underlying mutual funds or exchange-traded funds (ETFs). Net investment income (loss) of any mutual funds or ETFs is not included in the Fund's net investment income (loss) ratio.
CTotal returns for periods of less than one year are not annualized.
DTotal returns would have been lower if certain expenses had not been reduced during the applicable periods shown.
EFees and expenses of any underlying mutual funds or exchange-traded funds (ETFs) are not included in the Fund's expense ratio. The Fund indirectly bears its proportionate share of these expenses. For additional expense information related to investments in Fidelity Central Funds, please refer to the "Investments in Fidelity Central Funds" note found in the Notes to Financial Statements section of the most recent Annual or Semi-Annual report.
FExpense ratios reflect operating expenses of the class. Expenses before reductions do not reflect amounts reimbursed, waived, or reduced through arrangements with the investment adviser, brokerage services, or other offset arrangements, if applicable, and do not represent the amount paid by the class during periods when reimbursements, waivers or reductions occur.
GAnnualized.
HAmount does not include the portfolio activity of any underlying mutual funds or exchange-traded funds (ETFs).
Fidelity Freedom® Index 2030 Fund Premier Class |
| |
| | Six months ended (Unaudited) September 30, 2024 | | Years ended March 31, 2024 | | 2023 | | 2022 | | 2021 A |
Selected Per-Share Data | | | | | | | | | | |
| Net asset value, beginning of period | $ | 19.71 | $ | 17.78 | $ | 19.50 | $ | 19.45 | $ | 16.56 |
| Income from Investment Operations | | | | | | | | | | |
Net investment income (loss) B,C | | .15 | | .47 | | .40 | | .36 | | .39 |
| Net realized and unrealized gain (loss) | | 1.35 | | 1.90 | | (1.70) | | .16 | | 2.88 |
| Total from investment operations | | 1.50 | | 2.37 | | (1.30) | | .52 | | 3.27 |
| Distributions from net investment income | | (.04) | | (.44) | | (.39) | | (.34) | | (.26) |
| Distributions from net realized gain | | - | | - | | (.03) | | (.12) | | (.12) |
| Total distributions | | (.04) | | (.44) | | (.42) | | (.47) D | | (.38) |
| Net asset value, end of period | $ | 21.17 | $ | 19.71 | $ | 17.78 | $ | 19.50 | $ | 19.45 |
Total Return E,F | | | | 13.45% | | (6.59)% | | 2.54% | | 19.78% |
Ratios to Average Net Assets C,G,H | | | | | | | | | | |
| Expenses before reductions | | .05% I | | .06% | | .06% | | .06% | | .06% I |
| Expenses net of fee waivers, if any | | | | .06% | | .06% | | .06% | | .06% I |
| Expenses net of all reductions | | .05% I | | .06% | | .06% | | .06% | | .06% I |
| Net investment income (loss) | | 1.46% I | | 2.56% | | 2.30% | | 1.80% | | 2.66% I |
| Supplemental Data | | | | | | | | | | |
| Net assets, end of period (000 omitted) | $ | 5,602,852 | $ | 5,033,043 | $ | 3,697,423 | $ | 3,153,635 | $ | 1,118,562 |
Portfolio turnover rate J | | | | 12% | | 15% | | 20% | | 26% |
AFor the period June 24, 2020 (commencement of sale of shares) through March 31, 2021.
BCalculated based on average shares outstanding during the period.
CNet investment income (loss) is affected by the timing of the declaration of dividends by any underlying mutual funds or exchange-traded funds (ETFs). Net investment income (loss) of any mutual funds or ETFs is not included in the Fund's net investment income (loss) ratio.
DTotal distributions per share do not sum due to rounding.
ETotal returns for periods of less than one year are not annualized.
FTotal returns would have been lower if certain expenses had not been reduced during the applicable periods shown.
GFees and expenses of any underlying mutual funds or exchange-traded funds (ETFs) are not included in the Fund's expense ratio. The Fund indirectly bears its proportionate share of these expenses. For additional expense information related to investments in Fidelity Central Funds, please refer to the "Investments in Fidelity Central Funds" note found in the Notes to Financial Statements section of the most recent Annual or Semi-Annual report.
HExpense ratios reflect operating expenses of the class. Expenses before reductions do not reflect amounts reimbursed, waived, or reduced through arrangements with the investment adviser, brokerage services, or other offset arrangements, if applicable, and do not represent the amount paid by the class during periods when reimbursements, waivers or reductions occur.
IAnnualized.
JAmount does not include the portfolio activity of any underlying mutual funds or exchange-traded funds (ETFs).
Fidelity Freedom® Index 2030 Fund Premier II Class |
| |
| | Six months ended (Unaudited) September 30, 2024 A |
Selected Per-Share Data | | |
| Net asset value, beginning of period | $ | 20.61 |
| Income from Investment Operations | | |
Net investment income (loss) B,C | | .02 |
| Net realized and unrealized gain (loss) | | .55 |
| Total from investment operations | | .57 |
| Net asset value, end of period | $ | 21.18 |
Total Return D,E | | |
Ratios to Average Net Assets C,F,G | | |
| Expenses before reductions | | .04% H |
| Expenses net of fee waivers, if any | | |
| Expenses net of all reductions | | .04% H |
| Net investment income (loss) | | 1.02% H |
| Supplemental Data | | |
| Net assets, end of period (000 omitted) | $ | 7 |
Portfolio turnover rate I | | |
AFor the period August 22, 2024 (commencement of sale of shares) through September 30, 2024.
BCalculated based on average shares outstanding during the period.
CNet investment income (loss) is affected by the timing of the declaration of dividends by any underlying mutual funds or exchange-traded funds (ETFs). Net investment income (loss) of any mutual funds or ETFs is not included in the Fund's net investment income (loss) ratio.
DTotal returns for periods of less than one year are not annualized.
ETotal returns would have been lower if certain expenses had not been reduced during the applicable periods shown.
FFees and expenses of any underlying mutual funds or exchange-traded funds (ETFs) are not included in the Fund's expense ratio. The Fund indirectly bears its proportionate share of these expenses. For additional expense information related to investments in Fidelity Central Funds, please refer to the "Investments in Fidelity Central Funds" note found in the Notes to Financial Statements section of the most recent Annual or Semi-Annual report.
GExpense ratios reflect operating expenses of the class. Expenses before reductions do not reflect amounts reimbursed, waived, or reduced through arrangements with the investment adviser, brokerage services, or other offset arrangements, if applicable, and do not represent the amount paid by the class during periods when reimbursements, waivers or reductions occur.
HAnnualized.
IAmount does not include the portfolio activity of any underlying mutual funds or exchange-traded funds (ETFs).
Fidelity Freedom® Index 2035 Fund
Schedule of Investments September 30, 2024 (Unaudited)
Showing Percentage of Net Assets
| Domestic Equity Funds - 41.7% |
| | | Shares | Value ($) |
Fidelity Series Total Market Index Fund (a) (Cost $5,685,003,378) | | 504,940,845 | 9,533,283,147 |
| | | | |
| International Equity Funds - 27.5% |
| | | Shares | Value ($) |
Fidelity Series Global ex U.S. Index Fund (a) (Cost $5,101,817,834) | | 399,087,702 | 6,297,603,943 |
| | | | |
| Bond Funds - 29.8% |
| | | Shares | Value ($) |
| Fidelity Series Bond Index Fund (a) | | 511,141,261 | 4,722,945,255 |
| Fidelity Series International Developed Markets Bond Index Fund (a) | | 108,329,072 | 960,878,868 |
| Fidelity Series Long-Term Treasury Bond Index Fund (a) | | 190,881,180 | 1,120,472,525 |
| TOTAL BOND FUNDS (Cost $7,196,340,593) | | | 6,804,296,648 |
| | | | |
| Inflation-Protected Bond Funds - 1.0% |
| | | Shares | Value ($) |
Fidelity Series 5+ Year Inflation-Protected Bond Index Fund (a) (Cost $215,197,062) | | 28,236,865 | 225,047,816 |
| | | | |
| TOTAL INVESTMENT IN SECURITIES - 100.0% (Cost $18,198,358,867) | 22,860,231,554 |
NET OTHER ASSETS (LIABILITIES) - 0.0% | (1,148,375) |
| NET ASSETS - 100.0% | 22,859,083,179 |
| | |
Legend
Affiliated Central Funds
Fiscal year to date information regarding the Fund's investments in Fidelity Central Funds, including the ownership percentage, is presented below.
| Affiliate | Value, beginning of period ($) | Purchases ($) | Sales Proceeds ($) | Dividend Income ($) | Realized Gain (loss) ($) | Change in Unrealized appreciation (depreciation) ($) | Value, end of period ($) | % ownership, end of period |
| Fidelity Cash Central Fund 4.89% | 14,668 | 1,645,785 | 1,660,453 | 655 | - | - | - | 0.0% |
| Total | 14,668 | 1,645,785 | 1,660,453 | 655 | - | - | - | |
| | | | | | | | | |
Amounts in the dividend income column in the above table include any capital gain distributions from underlying funds, which are presented in the corresponding line item in the Statement of Operations, if applicable.
Amounts included in the purchases and sales proceeds columns may include in-kind transactions, if applicable.
Affiliated Underlying Funds
Fiscal year to date information regarding the Fund's investments in affiliated Underlying Funds is presented below. Exchanges between classes of the same affiliated Underlying Funds may occur. If an Underlying Funds changes its name, the name presented below is the name in effect at period end.
| Affiliate | Value, beginning of period ($) | Purchases ($) | Sales Proceeds ($) | Dividend Income ($) | Realized Gain (loss) ($) | Change in Unrealized appreciation (depreciation) ($) | Value, end of period ($) |
| Fidelity Series 5+ Year Inflation-Protected Bond Index Fund | 125,433,271 | 93,178,037 | 3,202,663 | 1,865,400 | (2,912) | 9,642,083 | 225,047,816 |
| Fidelity Series Bond Index Fund | 4,079,642,799 | 586,464,920 | 99,114,247 | 78,108,178 | 757,391 | 155,194,392 | 4,722,945,255 |
| Fidelity Series Global ex U.S. Index Fund | 5,872,563,793 | 345,925,506 | 436,694,768 | - | (4,038,070) | 519,847,482 | 6,297,603,943 |
| Fidelity Series International Developed Markets Bond Index Fund | 844,383,632 | 119,346,459 | 19,339,063 | 12,708,385 | (8,561) | 16,496,401 | 960,878,868 |
| Fidelity Series Long-Term Treasury Bond Index Fund | 1,020,259,309 | 94,040,041 | 42,395,808 | 18,574,830 | 422,758 | 48,146,225 | 1,120,472,525 |
| Fidelity Series Total Market Index Fund | 8,816,991,034 | 423,968,935 | 527,550,826 | 17,931,969 | 53,073,776 | 766,800,228 | 9,533,283,147 |
| | 20,759,273,838 | 1,662,923,898 | 1,128,297,375 | 129,188,762 | 50,204,382 | 1,516,126,811 | 22,860,231,554 |
Amounts in the dividend income column in the above table include any capital gain distributions from underlying funds, which are presented in the corresponding line item in the Statement of Operations, if applicable.
Amounts included in the purchases and sales proceeds columns may include in-kind transactions, if applicable.
Investment Valuation
The following is a summary of the inputs used, as of September 30, 2024, involving the Fund's assets and liabilities carried at fair value. The inputs or methodology used for valuing securities may not be an indication of the risk associated with investing in those securities. For more information on valuation inputs, and their aggregation into the levels used below, please refer to the Investment Valuation section in the accompanying Notes to Financial Statements.
| Valuation Inputs at Reporting Date: |
| Description | Total ($) | Level 1 ($) | Level 2 ($) | Level 3 ($) |
Investments in Securities: | | | | |
|
| Domestic Equity Funds | 9,533,283,147 | 9,533,283,147 | - | - |
|
| International Equity Funds | 6,297,603,943 | 6,297,603,943 | - | - |
|
| Bond Funds | 7,029,344,464 | 7,029,344,464 | - | - |
| Total Investments in Securities: | 22,860,231,554 | 22,860,231,554 | - | - |
Fidelity Freedom® Index 2035 Fund
Financial Statements (Unaudited)
| Statement of Assets and Liabilities |
| As of September 30, 2024 (Unaudited) |
| Assets | | | | |
| Investment in securities, at value - See accompanying schedule: | | | | |
Affiliated issuers (cost $18,198,358,867) | $ | 22,860,231,554 | | |
| | | | | |
| | | | | |
| Total Investment in Securities (cost $18,198,358,867) | | | $ | 22,860,231,554 |
| Receivable for investments sold | | | | 73,729,223 |
| Receivable for fund shares sold | | | | 37,930,307 |
Total assets | | | | 22,971,891,084 |
| Liabilities | | | | |
| Payable for investments purchased | $ | 88,580,756 | | |
| Payable for fund shares redeemed | | 23,093,231 | | |
| Accrued management fee | | 1,133,918 | | |
| Total liabilities | | | | 112,807,905 |
| Net Assets | | | $ | 22,859,083,179 |
| Net Assets consist of: | | | | |
| Paid in capital | | | $ | 18,249,699,256 |
| Total accumulated earnings (loss) | | | | 4,609,383,923 |
| Net Assets | | | $ | 22,859,083,179 |
| | | | | |
| Net Asset Value and Maximum Offering Price | | | | |
| Investor Class : | | | | |
Net Asset Value, offering price and redemption price per share ($2,819,112,286 ÷ 115,592,794 shares) | | | $ | 24.39 |
| Institutional Premium Class : | | | | |
Net Asset Value, offering price and redemption price per share ($13,831,671,777 ÷ 567,268,787 shares) | | | $ | 24.38 |
| Premier Class : | | | | |
Net Asset Value, offering price and redemption price per share ($6,208,291,803 ÷ 254,607,167 shares) | | | $ | 24.38 |
| Premier II Class : | | | | |
Net Asset Value, offering price and redemption price per share ($7,313 ÷ 300 shares) | | | $ | 24.38 |
| Statement of Operations |
Six months ended September 30, 2024 (Unaudited) |
| Investment Income | | | | |
| Dividends: | | | | |
| Affiliated issuers | | | $ | 129,188,762 |
| Income from Fidelity Central Funds | | | | 655 |
| Total income | | | | 129,189,417 |
| Expenses | | | | |
| Management fee | $ | 8,010,984 | | |
| Independent trustees' fees and expenses | | 26,645 | | |
| Total expenses before reductions | | 8,037,629 | | |
| Expense reductions | | (60) | | |
| Total expenses after reductions | | | | 8,037,569 |
| Net Investment income (loss) | | | | 121,151,848 |
| Realized and Unrealized Gain (Loss) | | | | |
| Net realized gain (loss) on: | | | | |
| Investment Securities: | | | | |
| Affiliated issuers | | 50,204,382 | | |
| Total net realized gain (loss) | | | | 50,204,382 |
| Change in net unrealized appreciation (depreciation) on: | | | | |
| Investment Securities: | | | | |
| Affiliated issuers | | 1,516,126,811 | | |
| Total change in net unrealized appreciation (depreciation) | | | | 1,516,126,811 |
| Net gain (loss) | | | | 1,566,331,193 |
| Net increase (decrease) in net assets resulting from operations | | | $ | 1,687,483,041 |
| Statement of Changes in Net Assets |
| |
| | Six months ended September 30, 2024 (Unaudited) | | Year ended March 31, 2024 |
| Increase (Decrease) in Net Assets | | | | |
| Operations | | | | |
| Net investment income (loss) | $ | 121,151,848 | $ | 429,901,058 |
| Net realized gain (loss) | | 50,204,382 | | 59,033,844 |
| Change in net unrealized appreciation (depreciation) | | 1,516,126,811 | | 2,322,638,271 |
| Net increase (decrease) in net assets resulting from operations | | 1,687,483,041 | | 2,811,573,173 |
| Distributions to shareholders | | (52,573,639) | | (404,344,248) |
| | | | | |
| Share transactions - net increase (decrease) | | 465,979,987 | | 2,306,814,735 |
| Total increase (decrease) in net assets | | 2,100,889,389 | | 4,714,043,660 |
| | | | | |
| Net Assets | | | | |
| Beginning of period | | 20,758,193,790 | | 16,044,150,130 |
| End of period | $ | 22,859,083,179 | $ | 20,758,193,790 |
| | | | | |
| | | | | |
Financial Highlights
Fidelity Freedom® Index 2035 Fund Investor Class |
| |
| | Six months ended (Unaudited) September 30, 2024 | | Years ended March 31, 2024 | | 2023 | | 2022 | | 2021 | | 2020 |
Selected Per-Share Data | | | | | | | | | | | | |
| Net asset value, beginning of period | $ | 22.64 | $ | 19.91 | $ | 21.83 | $ | 21.45 | $ | 15.20 | $ | 19.07 |
| Income from Investment Operations | | | | | | | | | | | | |
Net investment income (loss) A,B | | .13 | | .49 | | .38 | | .39 | | .30 | | .36 |
| Net realized and unrealized gain (loss) | | 1.68 | | 2.69 | | (1.92) | | .44 | | 6.40 | | (1.26) |
| Total from investment operations | | 1.81 | | 3.18 | | (1.54) | | .83 | | 6.70 | | (.90) |
| Distributions from net investment income | | (.05) | | (.45) | | (.36) | | (.34) | | (.29) | | (.33) |
| Distributions from net realized gain | | (.01) | | - | | (.02) | | (.11) | | (.16) | | (2.64) |
| Total distributions | | (.06) | | (.45) | | (.38) | | (.45) | | (.45) | | (2.97) |
| Net asset value, end of period | $ | 24.39 | $ | 22.64 | $ | 19.91 | $ | 21.83 | $ | 21.45 | $ | 15.20 |
Total Return C,D | | | | 16.10% | | (6.95)% | | 3.76% | | 44.28% | | (7.39)% |
Ratios to Average Net Assets B,E,F | | | | | | | | | | | | |
| Expenses before reductions | | .12% G | | .12% | | .12% | | .12% | | .12% | | .12% |
| Expenses net of fee waivers, if any | | | | .12% | | .12% | | .12% | | .12% | | .12% |
| Expenses net of all reductions | | .12% G | | .12% | | .12% | | .12% | | .12% | | .12% |
| Net investment income (loss) | | 1.09% G | | 2.35% | | 1.97% | | 1.71% | | 1.56% | | 1.87% |
| Supplemental Data | | | | | | | | | | | | |
| Net assets, end of period (000 omitted) | $ | 2,819,112 | $ | 2,557,710 | $ | 2,052,573 | $ | 2,174,422 | $ | 5,124,327 | $ | 2,844,302 |
Portfolio turnover rate H | | | | 12% | | 13% | | 15% | | 24% | | 80% |
ACalculated based on average shares outstanding during the period.
BNet investment income (loss) is affected by the timing of the declaration of dividends by any underlying mutual funds or exchange-traded funds (ETFs). Net investment income (loss) of any mutual funds or ETFs is not included in the Fund's net investment income (loss) ratio.
CTotal returns for periods of less than one year are not annualized.
DTotal returns would have been lower if certain expenses had not been reduced during the applicable periods shown.
EFees and expenses of any underlying mutual funds or exchange-traded funds (ETFs) are not included in the Fund's expense ratio. The Fund indirectly bears its proportionate share of these expenses. For additional expense information related to investments in Fidelity Central Funds, please refer to the "Investments in Fidelity Central Funds" note found in the Notes to Financial Statements section of the most recent Annual or Semi-Annual report.
FExpense ratios reflect operating expenses of the class. Expenses before reductions do not reflect amounts reimbursed, waived, or reduced through arrangements with the investment adviser, brokerage services, or other offset arrangements, if applicable, and do not represent the amount paid by the class during periods when reimbursements, waivers or reductions occur.
GAnnualized.
HAmount does not include the portfolio activity of any underlying mutual funds or exchange-traded funds (ETFs).
Fidelity Freedom® Index 2035 Fund Institutional Premium Class |
| |
| | Six months ended (Unaudited) September 30, 2024 | | Years ended March 31, 2024 | | 2023 | | 2022 | | 2021 | | 2020 |
Selected Per-Share Data | | | | | | | | | | | | |
| Net asset value, beginning of period | $ | 22.63 | $ | 19.91 | $ | 21.83 | $ | 21.46 | $ | 15.21 | $ | 19.08 |
| Income from Investment Operations | | | | | | | | | | | | |
Net investment income (loss) A,B | | .13 | | .50 | | .39 | | .40 | | .31 | | .37 |
| Net realized and unrealized gain (loss) | | 1.68 | | 2.68 | | (1.92) | | .44 | | 6.39 | | (1.26) |
| Total from investment operations | | 1.81 | | 3.18 | | (1.53) | | .84 | | 6.70 | | (.89) |
| Distributions from net investment income | | (.05) | | (.46) | | (.37) | | (.37) | | (.30) | | (.34) |
| Distributions from net realized gain | | (.01) | | - | | (.02) | | (.11) | | (.16) | | (2.64) |
| Total distributions | | (.06) | | (.46) | | (.39) | | (.47) C | | (.45) C | | (2.98) |
| Net asset value, end of period | $ | 24.38 | $ | 22.63 | $ | 19.91 | $ | 21.83 | $ | 21.46 | $ | 15.21 |
Total Return D,E | | | | 16.09% | | (6.91)% | | 3.82% | | 44.31% | | (7.33)% |
Ratios to Average Net Assets B,F,G | | | | | | | | | | | | |
| Expenses before reductions | | .08% H | | .08% | | .08% | | .08% | | .08% | | .08% |
| Expenses net of fee waivers, if any | | | | .08% | | .08% | | .08% | | .08% | | .08% |
| Expenses net of all reductions | | .08% H | | .08% | | .08% | | .08% | | .08% | | .08% |
| Net investment income (loss) | | 1.13% H | | 2.39% | | 2.01% | | 1.75% | | 1.60% | | 1.92% |
| Supplemental Data | | | | | | | | | | | | |
| Net assets, end of period (000 omitted) | $ | 13,831,672 | $ | 12,741,172 | $ | 10,184,661 | $ | 9,501,029 | $ | 4,357,280 | $ | 2,512,748 |
Portfolio turnover rate I | | | | 12% | | 13% | | 15% | | 24% | | 80% |
ACalculated based on average shares outstanding during the period.
BNet investment income (loss) is affected by the timing of the declaration of dividends by any underlying mutual funds or exchange-traded funds (ETFs). Net investment income (loss) of any mutual funds or ETFs is not included in the Fund's net investment income (loss) ratio.
CTotal distributions per share do not sum due to rounding.
DTotal returns for periods of less than one year are not annualized.
ETotal returns would have been lower if certain expenses had not been reduced during the applicable periods shown.
FFees and expenses of any underlying mutual funds or exchange-traded funds (ETFs) are not included in the Fund's expense ratio. The Fund indirectly bears its proportionate share of these expenses. For additional expense information related to investments in Fidelity Central Funds, please refer to the "Investments in Fidelity Central Funds" note found in the Notes to Financial Statements section of the most recent Annual or Semi-Annual report.
GExpense ratios reflect operating expenses of the class. Expenses before reductions do not reflect amounts reimbursed, waived, or reduced through arrangements with the investment adviser, brokerage services, or other offset arrangements, if applicable, and do not represent the amount paid by the class during periods when reimbursements, waivers or reductions occur.
HAnnualized.
IAmount does not include the portfolio activity of any underlying mutual funds or exchange-traded funds (ETFs).
Fidelity Freedom® Index 2035 Fund Premier Class |
| |
| | Six months ended (Unaudited) September 30, 2024 | | Years ended March 31, 2024 | | 2023 | | 2022 | | 2021 A |
Selected Per-Share Data | | | | | | | | | | |
| Net asset value, beginning of period | $ | 22.63 | $ | 19.91 | $ | 21.82 | $ | 21.46 | $ | 17.48 |
| Income from Investment Operations | | | | | | | | | | |
Net investment income (loss) B,C | | .13 | | .50 | | .39 | | .40 | | .45 |
| Net realized and unrealized gain (loss) | | 1.68 | | 2.68 | | (1.91) | | .44 | | 3.92 |
| Total from investment operations | | 1.81 | | 3.18 | | (1.52) | | .84 | | 4.37 |
| Distributions from net investment income | | (.05) | | (.46) | | (.38) | | (.37) | | (.29) |
| Distributions from net realized gain | | (.01) | | - | | (.02) | | (.11) | | (.10) |
| Total distributions | | (.06) | | (.46) | | (.39) D | | (.48) | | (.39) |
| Net asset value, end of period | $ | 24.38 | $ | 22.63 | $ | 19.91 | $ | 21.82 | $ | 21.46 |
Total Return E,F | | | | 16.12% | | (6.85)% | | 3.80% | | 25.06% |
Ratios to Average Net Assets C,G,H | | | | | | | | | | |
| Expenses before reductions | | .05% I | | .06% | | .06% | | .06% | | .06% I |
| Expenses net of fee waivers, if any | | | | .06% | | .06% | | .06% | | .06% I |
| Expenses net of all reductions | | .05% I | | .06% | | .06% | | .06% | | .06% I |
| Net investment income (loss) | | 1.16% I | | 2.41% | | 2.03% | | 1.77% | | 2.86% I |
| Supplemental Data | | | | | | | | | | |
| Net assets, end of period (000 omitted) | $ | 6,208,292 | $ | 5,459,312 | $ | 3,806,916 | $ | 3,083,204 | $ | 1,163,973 |
Portfolio turnover rate J | | | | 12% | | 13% | | 15% | | 24% |
AFor the period June 24, 2020 (commencement of sale of shares) through March 31, 2021.
BCalculated based on average shares outstanding during the period.
CNet investment income (loss) is affected by the timing of the declaration of dividends by any underlying mutual funds or exchange-traded funds (ETFs). Net investment income (loss) of any mutual funds or ETFs is not included in the Fund's net investment income (loss) ratio.
DTotal distributions per share do not sum due to rounding.
ETotal returns for periods of less than one year are not annualized.
FTotal returns would have been lower if certain expenses had not been reduced during the applicable periods shown.
GFees and expenses of any underlying mutual funds or exchange-traded funds (ETFs) are not included in the Fund's expense ratio. The Fund indirectly bears its proportionate share of these expenses. For additional expense information related to investments in Fidelity Central Funds, please refer to the "Investments in Fidelity Central Funds" note found in the Notes to Financial Statements section of the most recent Annual or Semi-Annual report.
HExpense ratios reflect operating expenses of the class. Expenses before reductions do not reflect amounts reimbursed, waived, or reduced through arrangements with the investment adviser, brokerage services, or other offset arrangements, if applicable, and do not represent the amount paid by the class during periods when reimbursements, waivers or reductions occur.
IAnnualized.
JAmount does not include the portfolio activity of any underlying mutual funds or exchange-traded funds (ETFs).
Fidelity Freedom® Index 2035 Fund Premier II Class |
| |
| | Six months ended (Unaudited) September 30, 2024 A |
Selected Per-Share Data | | |
| Net asset value, beginning of period | $ | 23.67 |
| Income from Investment Operations | | |
Net investment income (loss) B,C | | .02 |
| Net realized and unrealized gain (loss) | | .69 |
| Total from investment operations | | .71 |
| Net asset value, end of period | $ | 24.38 |
Total Return D,E | | |
Ratios to Average Net Assets C,F,G | | |
| Expenses before reductions | | .04% H |
| Expenses net of fee waivers, if any | | |
| Expenses net of all reductions | | .04% H |
| Net investment income (loss) | | .89% H |
| Supplemental Data | | |
| Net assets, end of period (000 omitted) | $ | 7 |
Portfolio turnover rate I | | |
AFor the period August 22, 2024 (commencement of sale of shares) through September 30, 2024.
BCalculated based on average shares outstanding during the period.
CNet investment income (loss) is affected by the timing of the declaration of dividends by any underlying mutual funds or exchange-traded funds (ETFs). Net investment income (loss) of any mutual funds or ETFs is not included in the Fund's net investment income (loss) ratio.
DTotal returns for periods of less than one year are not annualized.
ETotal returns would have been lower if certain expenses had not been reduced during the applicable periods shown.
FFees and expenses of any underlying mutual funds or exchange-traded funds (ETFs) are not included in the Fund's expense ratio. The Fund indirectly bears its proportionate share of these expenses. For additional expense information related to investments in Fidelity Central Funds, please refer to the "Investments in Fidelity Central Funds" note found in the Notes to Financial Statements section of the most recent Annual or Semi-Annual report.
GExpense ratios reflect operating expenses of the class. Expenses before reductions do not reflect amounts reimbursed, waived, or reduced through arrangements with the investment adviser, brokerage services, or other offset arrangements, if applicable, and do not represent the amount paid by the class during periods when reimbursements, waivers or reductions occur.
HAnnualized.
IAmount does not include the portfolio activity of any underlying mutual funds or exchange-traded funds (ETFs).
Fidelity Freedom® Index 2040 Fund
Schedule of Investments September 30, 2024 (Unaudited)
Showing Percentage of Net Assets
| Domestic Equity Funds - 50.2% |
| | | Shares | Value ($) |
Fidelity Series Total Market Index Fund (a) (Cost $7,205,727,768) | | 622,625,157 | 11,755,162,960 |
| | | | |
| International Equity Funds - 33.3% |
| | | Shares | Value ($) |
Fidelity Series Global ex U.S. Index Fund (a) (Cost $6,369,200,772) | | 493,520,955 | 7,787,760,675 |
| | | | |
| Bond Funds - 16.5% |
| | | Shares | Value ($) |
| Fidelity Series Bond Index Fund (a) | | 236,446,447 | 2,184,765,172 |
| Fidelity Series International Developed Markets Bond Index Fund (a) | | 56,296,960 | 499,354,038 |
| Fidelity Series Long-Term Treasury Bond Index Fund (a) | | 200,845,889 | 1,178,965,370 |
| TOTAL BOND FUNDS (Cost $4,101,322,451) | | | 3,863,084,580 |
| | | | |
| TOTAL INVESTMENT IN SECURITIES - 100.0% (Cost $17,676,250,991) | 23,406,008,215 |
NET OTHER ASSETS (LIABILITIES) - 0.0% | (949,143) |
| NET ASSETS - 100.0% | 23,405,059,072 |
| | |
Legend
Affiliated Central Funds
Fiscal year to date information regarding the Fund's investments in Fidelity Central Funds, including the ownership percentage, is presented below.
| Affiliate | Value, beginning of period ($) | Purchases ($) | Sales Proceeds ($) | Dividend Income ($) | Realized Gain (loss) ($) | Change in Unrealized appreciation (depreciation) ($) | Value, end of period ($) | % ownership, end of period |
| Fidelity Cash Central Fund 4.89% | - | 1,685,801 | 1,685,801 | 608 | - | - | - | 0.0% |
| Total | - | 1,685,801 | 1,685,801 | 608 | - | - | - | |
| | | | | | | | | |
Amounts in the dividend income column in the above table include any capital gain distributions from underlying funds, which are presented in the corresponding line item in the Statement of Operations, if applicable.
Amounts included in the purchases and sales proceeds columns may include in-kind transactions, if applicable.
Affiliated Underlying Funds
Fiscal year to date information regarding the Fund's investments in affiliated Underlying Funds is presented below. Exchanges between classes of the same affiliated Underlying Funds may occur. If an Underlying Funds changes its name, the name presented below is the name in effect at period end.
| Affiliate | Value, beginning of period ($) | Purchases ($) | Sales Proceeds ($) | Dividend Income ($) | Realized Gain (loss) ($) | Change in Unrealized appreciation (depreciation) ($) | Value, end of period ($) |
| Fidelity Series Bond Index Fund | 1,757,935,142 | 392,817,689 | 37,660,936 | 34,752,060 | 111,349 | 71,561,928 | 2,184,765,172 |
| Fidelity Series Global ex U.S. Index Fund | 7,121,977,032 | 460,247,172 | 427,501,352 | - | 11,264,360 | 621,773,463 | 7,787,760,675 |
| Fidelity Series International Developed Markets Bond Index Fund | 405,502,930 | 92,182,035 | 7,145,518 | 6,183,207 | 15,006 | 8,799,585 | 499,354,038 |
| Fidelity Series Long-Term Treasury Bond Index Fund | 1,044,612,499 | 106,534,114 | 23,154,683 | 19,221,152 | 233,550 | 50,739,890 | 1,178,965,370 |
| Fidelity Series Total Market Index Fund | 10,698,418,415 | 543,276,290 | 492,652,474 | 21,778,642 | 35,344,831 | 970,775,898 | 11,755,162,960 |
| | 21,028,446,018 | 1,595,057,300 | 988,114,963 | 81,935,061 | 46,969,096 | 1,723,650,764 | 23,406,008,215 |
Amounts in the dividend income column in the above table include any capital gain distributions from underlying funds, which are presented in the corresponding line item in the Statement of Operations, if applicable.
Amounts included in the purchases and sales proceeds columns may include in-kind transactions, if applicable.
Investment Valuation
The following is a summary of the inputs used, as of September 30, 2024, involving the Fund's assets and liabilities carried at fair value. The inputs or methodology used for valuing securities may not be an indication of the risk associated with investing in those securities. For more information on valuation inputs, and their aggregation into the levels used below, please refer to the Investment Valuation section in the accompanying Notes to Financial Statements.
| Valuation Inputs at Reporting Date: |
| Description | Total ($) | Level 1 ($) | Level 2 ($) | Level 3 ($) |
Investments in Securities: | | | | |
|
| Domestic Equity Funds | 11,755,162,960 | 11,755,162,960 | - | - |
|
| International Equity Funds | 7,787,760,675 | 7,787,760,675 | - | - |
|
| Bond Funds | 3,863,084,580 | 3,863,084,580 | - | - |
| Total Investments in Securities: | 23,406,008,215 | 23,406,008,215 | - | - |
Fidelity Freedom® Index 2040 Fund
Financial Statements (Unaudited)
| Statement of Assets and Liabilities |
| As of September 30, 2024 (Unaudited) |
| Assets | | | | |
| Investment in securities, at value - See accompanying schedule: | | | | |
Affiliated issuers (cost $17,676,250,991) | $ | 23,406,008,215 | | |
| | | | | |
| | | | | |
| Total Investment in Securities (cost $17,676,250,991) | | | $ | 23,406,008,215 |
| Receivable for investments sold | | | | 61,602,374 |
| Receivable for fund shares sold | | | | 44,394,963 |
Total assets | | | | 23,512,005,552 |
| Liabilities | | | | |
| Payable to custodian bank | $ | 9 | | |
| Payable for investments purchased | | 87,230,383 | | |
| Payable for fund shares redeemed | | 18,635,158 | | |
| Accrued management fee | | 1,080,930 | | |
| Total liabilities | | | | 106,946,480 |
| Net Assets | | | $ | 23,405,059,072 |
| Net Assets consist of: | | | | |
| Paid in capital | | | $ | 17,775,854,395 |
| Total accumulated earnings (loss) | | | | 5,629,204,677 |
| Net Assets | | | $ | 23,405,059,072 |
| | | | | |
| Net Asset Value and Maximum Offering Price | | | | |
| Investor Class : | | | | |
Net Asset Value, offering price and redemption price per share ($2,532,219,043 ÷ 98,734,328 shares) | | | $ | 25.65 |
| Institutional Premium Class : | | | | |
Net Asset Value, offering price and redemption price per share ($14,428,240,311 ÷ 562,973,689 shares) | | | $ | 25.63 |
| Premier Class : | | | | |
Net Asset Value, offering price and redemption price per share ($6,444,592,379 ÷ 251,551,578 shares) | | | $ | 25.62 |
| Premier II Class : | | | | |
Net Asset Value, offering price and redemption price per share ($7,339 ÷ 286 shares)(a) | | | $ | 25.63 |
(a)Corresponding Net Asset Value does not calculate due to rounding of fractional net assets and/or shares. |
| Statement of Operations |
Six months ended September 30, 2024 (Unaudited) |
| Investment Income | | | | |
| Dividends: | | | | |
| Affiliated issuers | | | $ | 81,935,061 |
| Income from Fidelity Central Funds | | | | 608 |
| Total income | | | | 81,935,669 |
| Expenses | | | | |
| Management fee | $ | 8,010,836 | | |
| Independent trustees' fees and expenses | | 27,064 | | |
| Total expenses before reductions | | 8,037,900 | | |
| Expense reductions | | (257) | | |
| Total expenses after reductions | | | | 8,037,643 |
| Net Investment income (loss) | | | | 73,898,026 |
| Realized and Unrealized Gain (Loss) | | | | |
| Net realized gain (loss) on: | | | | |
| Investment Securities: | | | | |
| Affiliated issuers | | 46,969,096 | | |
| Total net realized gain (loss) | | | | 46,969,096 |
| Change in net unrealized appreciation (depreciation) on: | | | | |
| Investment Securities: | | | | |
| Affiliated issuers | | 1,723,650,764 | | |
| Total change in net unrealized appreciation (depreciation) | | | | 1,723,650,764 |
| Net gain (loss) | | | | 1,770,619,860 |
| Net increase (decrease) in net assets resulting from operations | | | $ | 1,844,517,886 |
| Statement of Changes in Net Assets |
| |
| | Six months ended September 30, 2024 (Unaudited) | | Year ended March 31, 2024 |
| Increase (Decrease) in Net Assets | | | | |
| Operations | | | | |
| Net investment income (loss) | $ | 73,898,026 | $ | 399,548,624 |
| Net realized gain (loss) | | 46,969,096 | | 46,804,461 |
| Change in net unrealized appreciation (depreciation) | | 1,723,650,764 | | 2,825,710,370 |
| Net increase (decrease) in net assets resulting from operations | | 1,844,517,886 | | 3,272,063,455 |
| Distributions to shareholders | | (31,420,288) | | (382,552,214) |
| | | | | |
| Share transactions - net increase (decrease) | | 564,545,882 | | 2,317,810,442 |
| Total increase (decrease) in net assets | | 2,377,643,480 | | 5,207,321,683 |
| | | | | |
| Net Assets | | | | |
| Beginning of period | | 21,027,415,592 | | 15,820,093,909 |
| End of period | $ | 23,405,059,072 | $ | 21,027,415,592 |
| | | | | |
| | | | | |
Financial Highlights
Fidelity Freedom® Index 2040 Fund Investor Class |
| |
| | Six months ended (Unaudited) September 30, 2024 | | Years ended March 31, 2024 | | 2023 | | 2022 | | 2021 | | 2020 |
Selected Per-Share Data | | | | | | | | | | | | |
| Net asset value, beginning of period | $ | 23.65 | $ | 20.28 | $ | 22.30 | $ | 21.68 | $ | 14.77 | $ | 19.19 |
| Income from Investment Operations | | | | | | | | | | | | |
Net investment income (loss) A,B | | .08 | | .47 | | .39 | | .40 | | .30 | | .35 |
| Net realized and unrealized gain (loss) | | 1.95 | | 3.34 | | (2.01) | | .69 | | 7.03 | | (1.43) |
| Total from investment operations | | 2.03 | | 3.81 | | (1.62) | | 1.09 | | 7.33 | | (1.08) |
| Distributions from net investment income | | (.02) | | (.44) | | (.37) | | (.36) | | (.29) | | (.33) |
| Distributions from net realized gain | | (.01) | | - | | (.02) | | (.10) | | (.12) | | (3.00) |
| Total distributions | | (.03) | | (.44) | | (.40) C | | (.47) C | | (.42) C | | (3.34) C |
| Net asset value, end of period | $ | 25.65 | $ | 23.65 | $ | 20.28 | $ | 22.30 | $ | 21.68 | $ | 14.77 |
Total Return D,E | | | | 18.91% | | (7.18)% | | 4.90% | | 49.86% | | (8.93)% |
Ratios to Average Net Assets B,F,G | | | | | | | | | | | | |
| Expenses before reductions | | .12% H | | .12% | | .12% | | .12% | | .12% | | .12% |
| Expenses net of fee waivers, if any | | | | .12% | | .12% | | .12% | | .12% | | .12% |
| Expenses net of all reductions | | .12% H | | .12% | | .12% | | .12% | | .12% | | .12% |
| Net investment income (loss) | | .64% H | | 2.19% | | 1.96% | | 1.74% | | 1.56% | | 1.82% |
| Supplemental Data | | | | | | | | | | | | |
| Net assets, end of period (000 omitted) | $ | 2,532,219 | $ | 2,249,083 | $ | 1,759,546 | $ | 1,823,668 | $ | 4,532,047 | $ | 2,405,077 |
Portfolio turnover rate I | | | | 10% | | 12% | | 13% | | 20% | | 78% |
ACalculated based on average shares outstanding during the period.
BNet investment income (loss) is affected by the timing of the declaration of dividends by any underlying mutual funds or exchange-traded funds (ETFs). Net investment income (loss) of any mutual funds or ETFs is not included in the Fund's net investment income (loss) ratio.
CTotal distributions per share do not sum due to rounding.
DTotal returns for periods of less than one year are not annualized.
ETotal returns would have been lower if certain expenses had not been reduced during the applicable periods shown.
FFees and expenses of any underlying mutual funds or exchange-traded funds (ETFs) are not included in the Fund's expense ratio. The Fund indirectly bears its proportionate share of these expenses. For additional expense information related to investments in Fidelity Central Funds, please refer to the "Investments in Fidelity Central Funds" note found in the Notes to Financial Statements section of the most recent Annual or Semi-Annual report.
GExpense ratios reflect operating expenses of the class. Expenses before reductions do not reflect amounts reimbursed, waived, or reduced through arrangements with the investment adviser, brokerage services, or other offset arrangements, if applicable, and do not represent the amount paid by the class during periods when reimbursements, waivers or reductions occur.
HAnnualized.
IAmount does not include the portfolio activity of any underlying mutual funds or exchange-traded funds (ETFs).
Fidelity Freedom® Index 2040 Fund Institutional Premium Class |
| |
| | Six months ended (Unaudited) September 30, 2024 | | Years ended March 31, 2024 | | 2023 | | 2022 | | 2021 | | 2020 |
Selected Per-Share Data | | | | | | | | | | | | |
| Net asset value, beginning of period | $ | 23.63 | $ | 20.26 | $ | 22.28 | $ | 21.68 | $ | 14.77 | $ | 19.19 |
| Income from Investment Operations | | | | | | | | | | | | |
Net investment income (loss) A,B | | .08 | | .48 | | .39 | | .41 | | .31 | | .36 |
| Net realized and unrealized gain (loss) | | 1.96 | | 3.34 | | (2.01) | | .68 | | 7.02 | | (1.43) |
| Total from investment operations | | 2.04 | | 3.82 | | (1.62) | | 1.09 | | 7.33 | | (1.07) |
| Distributions from net investment income | | (.03) | | (.45) | | (.38) | | (.38) | | (.30) | | (.34) |
| Distributions from net realized gain | | (.01) | | - | | (.02) | | (.11) | | (.12) | | (3.00) |
| Total distributions | | (.04) | | (.45) | | (.40) | | (.49) | | (.42) | | (3.35) C |
| Net asset value, end of period | $ | 25.63 | $ | 23.63 | $ | 20.26 | $ | 22.28 | $ | 21.68 | $ | 14.77 |
Total Return D,E | | | | 18.97% | | (7.15)% | | 4.92% | | 49.89% | | (8.89)% |
Ratios to Average Net Assets B,F,G | | | | | | | | | | | | |
| Expenses before reductions | | .08% H | | .08% | | .08% | | .08% | | .08% | | .08% |
| Expenses net of fee waivers, if any | | | | .08% | | .08% | | .08% | | .08% | | .08% |
| Expenses net of all reductions | | .08% H | | .08% | | .08% | | .08% | | .08% | | .08% |
| Net investment income (loss) | | .68% H | | 2.23% | | 2.00% | | 1.78% | | 1.60% | | 1.86% |
| Supplemental Data | | | | | | | | | | | | |
| Net assets, end of period (000 omitted) | $ | 14,428,240 | $ | 13,173,146 | $ | 10,285,592 | $ | 9,622,454 | $ | 4,910,687 | $ | 2,861,535 |
Portfolio turnover rate I | | | | 10% | | 12% | | 13% | | 20% | | 78% |
ACalculated based on average shares outstanding during the period.
BNet investment income (loss) is affected by the timing of the declaration of dividends by any underlying mutual funds or exchange-traded funds (ETFs). Net investment income (loss) of any mutual funds or ETFs is not included in the Fund's net investment income (loss) ratio.
CTotal distributions per share do not sum due to rounding.
DTotal returns for periods of less than one year are not annualized.
ETotal returns would have been lower if certain expenses had not been reduced during the applicable periods shown.
FFees and expenses of any underlying mutual funds or exchange-traded funds (ETFs) are not included in the Fund's expense ratio. The Fund indirectly bears its proportionate share of these expenses. For additional expense information related to investments in Fidelity Central Funds, please refer to the "Investments in Fidelity Central Funds" note found in the Notes to Financial Statements section of the most recent Annual or Semi-Annual report.
GExpense ratios reflect operating expenses of the class. Expenses before reductions do not reflect amounts reimbursed, waived, or reduced through arrangements with the investment adviser, brokerage services, or other offset arrangements, if applicable, and do not represent the amount paid by the class during periods when reimbursements, waivers or reductions occur.
HAnnualized.
IAmount does not include the portfolio activity of any underlying mutual funds or exchange-traded funds (ETFs).
Fidelity Freedom® Index 2040 Fund Premier Class |
| |
| | Six months ended (Unaudited) September 30, 2024 | | Years ended March 31, 2024 | | 2023 | | 2022 | | 2021 A |
Selected Per-Share Data | | | | | | | | | | |
| Net asset value, beginning of period | $ | 23.62 | $ | 20.25 | $ | 22.27 | $ | 21.67 | $ | 17.16 |
| Income from Investment Operations | | | | | | | | | | |
Net investment income (loss) B,C | | .08 | | .48 | | .40 | | .41 | | .47 |
| Net realized and unrealized gain (loss) | | 1.96 | | 3.34 | | (2.01) | | .69 | | 4.40 |
| Total from investment operations | | 2.04 | | 3.82 | | (1.61) | | 1.10 | | 4.87 |
| Distributions from net investment income | | (.03) | | (.45) | | (.39) | | (.39) | | (.30) |
| Distributions from net realized gain | | (.01) | | - | | (.02) | | (.11) | | (.07) |
| Total distributions | | (.04) | | (.45) | | (.41) | | (.50) | | (.36) D |
| Net asset value, end of period | $ | 25.62 | $ | 23.62 | $ | 20.25 | $ | 22.27 | $ | 21.67 |
Total Return E,F | | | | 19.01% | | (7.13)% | | 4.94% | | 28.49% |
Ratios to Average Net Assets C,G,H | | | | | | | | | | |
| Expenses before reductions | | .05% I | | .06% | | .06% | | .06% | | .06% I |
| Expenses net of fee waivers, if any | | | | .06% | | .06% | | .06% | | .06% I |
| Expenses net of all reductions | | .05% I | | .06% | | .06% | | .06% | | .06% I |
| Net investment income (loss) | | .70% I | | 2.25% | | 2.02% | | 1.80% | | 2.95% I |
| Supplemental Data | | | | | | | | | | |
| Net assets, end of period (000 omitted) | $ | 6,444,592 | $ | 5,605,187 | $ | 3,774,956 | $ | 3,048,126 | $ | 1,197,248 |
Portfolio turnover rate J | | | | 10% | | 12% | | 13% | | 20% |
AFor the period June 24, 2020 (commencement of sale of shares) through March 31, 2021.
BCalculated based on average shares outstanding during the period.
CNet investment income (loss) is affected by the timing of the declaration of dividends by any underlying mutual funds or exchange-traded funds (ETFs). Net investment income (loss) of any mutual funds or ETFs is not included in the Fund's net investment income (loss) ratio.
DTotal distributions per share do not sum due to rounding.
ETotal returns for periods of less than one year are not annualized.
FTotal returns would have been lower if certain expenses had not been reduced during the applicable periods shown.
GFees and expenses of any underlying mutual funds or exchange-traded funds (ETFs) are not included in the Fund's expense ratio. The Fund indirectly bears its proportionate share of these expenses. For additional expense information related to investments in Fidelity Central Funds, please refer to the "Investments in Fidelity Central Funds" note found in the Notes to Financial Statements section of the most recent Annual or Semi-Annual report.
HExpense ratios reflect operating expenses of the class. Expenses before reductions do not reflect amounts reimbursed, waived, or reduced through arrangements with the investment adviser, brokerage services, or other offset arrangements, if applicable, and do not represent the amount paid by the class during periods when reimbursements, waivers or reductions occur.
IAnnualized.
JAmount does not include the portfolio activity of any underlying mutual funds or exchange-traded funds (ETFs).
Fidelity Freedom® Index 2040 Fund Premier II Class |
| |
| | Six months ended (Unaudited) September 30, 2024 A |
Selected Per-Share Data | | |
| Net asset value, beginning of period | $ | 24.80 |
| Income from Investment Operations | | |
Net investment income (loss) B,C | | .01 |
| Net realized and unrealized gain (loss) | | .82 |
| Total from investment operations | | .83 |
| Net asset value, end of period | $ | 25.63 |
Total Return D,E | | |
Ratios to Average Net Assets C,F,G | | |
| Expenses before reductions | | .04% H |
| Expenses net of fee waivers, if any | | |
| Expenses net of all reductions | | .04% H |
| Net investment income (loss) | | .51% H |
| Supplemental Data | | |
| Net assets, end of period (000 omitted) | $ | 7 |
Portfolio turnover rate I | | |
AFor the period August 22, 2024 (commencement of sale of shares) through September 30, 2024.
BCalculated based on average shares outstanding during the period.
CNet investment income (loss) is affected by the timing of the declaration of dividends by any underlying mutual funds or exchange-traded funds (ETFs). Net investment income (loss) of any mutual funds or ETFs is not included in the Fund's net investment income (loss) ratio.
DTotal returns for periods of less than one year are not annualized.
ETotal returns would have been lower if certain expenses had not been reduced during the applicable periods shown.
FFees and expenses of any underlying mutual funds or exchange-traded funds (ETFs) are not included in the Fund's expense ratio. The Fund indirectly bears its proportionate share of these expenses. For additional expense information related to investments in Fidelity Central Funds, please refer to the "Investments in Fidelity Central Funds" note found in the Notes to Financial Statements section of the most recent Annual or Semi-Annual report.
GExpense ratios reflect operating expenses of the class. Expenses before reductions do not reflect amounts reimbursed, waived, or reduced through arrangements with the investment adviser, brokerage services, or other offset arrangements, if applicable, and do not represent the amount paid by the class during periods when reimbursements, waivers or reductions occur.
HAnnualized.
IAmount does not include the portfolio activity of any underlying mutual funds or exchange-traded funds (ETFs).
Fidelity Freedom® Index 2045 Fund
Schedule of Investments September 30, 2024 (Unaudited)
Showing Percentage of Net Assets
| Domestic Equity Funds - 54.2% |
| | | Shares | Value ($) |
Fidelity Series Total Market Index Fund (a) (Cost $7,210,252,821) | | 591,899,260 | 11,175,058,026 |
| | | | |
| International Equity Funds - 35.9% |
| | | Shares | Value ($) |
Fidelity Series Global ex U.S. Index Fund (a) (Cost $6,129,634,183) | | 468,969,977 | 7,400,346,233 |
| | | | |
| Bond Funds - 9.9% |
| | | Shares | Value ($) |
| Fidelity Series Bond Index Fund (a) | | 89,006,616 | 822,421,129 |
| Fidelity Series International Developed Markets Bond Index Fund (a) | | 22,829,250 | 202,495,447 |
| Fidelity Series Long-Term Treasury Bond Index Fund (a) | | 175,437,135 | 1,029,815,981 |
| TOTAL BOND FUNDS (Cost $2,257,672,607) | | | 2,054,732,557 |
| | | | |
| TOTAL INVESTMENT IN SECURITIES - 100.0% (Cost $15,597,559,611) | 20,630,136,816 |
NET OTHER ASSETS (LIABILITIES) - 0.0% | (915,188) |
| NET ASSETS - 100.0% | 20,629,221,628 |
| | |
Legend
Affiliated Central Funds
Fiscal year to date information regarding the Fund's investments in Fidelity Central Funds, including the ownership percentage, is presented below.
| Affiliate | Value, beginning of period ($) | Purchases ($) | Sales Proceeds ($) | Dividend Income ($) | Realized Gain (loss) ($) | Change in Unrealized appreciation (depreciation) ($) | Value, end of period ($) | % ownership, end of period |
| Fidelity Cash Central Fund 4.89% | - | 1,929,088 | 1,929,088 | 614 | - | - | - | 0.0% |
| Total | - | 1,929,088 | 1,929,088 | 614 | - | - | - | |
| | | | | | | | | |
Amounts in the dividend income column in the above table include any capital gain distributions from underlying funds, which are presented in the corresponding line item in the Statement of Operations, if applicable.
Amounts included in the purchases and sales proceeds columns may include in-kind transactions, if applicable.
Affiliated Underlying Funds
Fiscal year to date information regarding the Fund's investments in affiliated Underlying Funds is presented below. Exchanges between classes of the same affiliated Underlying Funds may occur. If an Underlying Funds changes its name, the name presented below is the name in effect at period end.
| Affiliate | Value, beginning of period ($) | Purchases ($) | Sales Proceeds ($) | Dividend Income ($) | Realized Gain (loss) ($) | Change in Unrealized appreciation (depreciation) ($) | Value, end of period ($) |
| Fidelity Series Bond Index Fund | 727,969,337 | 79,999,718 | 12,840,396 | 13,826,426 | 74,772 | 27,217,698 | 822,421,129 |
| Fidelity Series Global ex U.S. Index Fund | 6,586,089,498 | 538,438,573 | 319,718,111 | - | (3,838,803) | 599,375,076 | 7,400,346,233 |
| Fidelity Series International Developed Markets Bond Index Fund | 177,960,556 | 24,247,651 | 3,205,706 | 2,679,462 | 3,448 | 3,489,498 | 202,495,447 |
| Fidelity Series Long-Term Treasury Bond Index Fund | 909,893,781 | 102,496,715 | 27,227,487 | 16,796,412 | 155,141 | 44,497,831 | 1,029,815,981 |
| Fidelity Series Total Market Index Fund | 9,895,744,105 | 724,562,582 | 393,658,654 | 20,153,822 | 7,279,661 | 941,130,332 | 11,175,058,026 |
| | 18,297,657,277 | 1,469,745,239 | 756,650,354 | 53,456,122 | 3,674,219 | 1,615,710,435 | 20,630,136,816 |
Amounts in the dividend income column in the above table include any capital gain distributions from underlying funds, which are presented in the corresponding line item in the Statement of Operations, if applicable.
Amounts included in the purchases and sales proceeds columns may include in-kind transactions, if applicable.
Investment Valuation
The following is a summary of the inputs used, as of September 30, 2024, involving the Fund's assets and liabilities carried at fair value. The inputs or methodology used for valuing securities may not be an indication of the risk associated with investing in those securities. For more information on valuation inputs, and their aggregation into the levels used below, please refer to the Investment Valuation section in the accompanying Notes to Financial Statements.
| Valuation Inputs at Reporting Date: |
| Description | Total ($) | Level 1 ($) | Level 2 ($) | Level 3 ($) |
Investments in Securities: | | | | |
|
| Domestic Equity Funds | 11,175,058,026 | 11,175,058,026 | - | - |
|
| International Equity Funds | 7,400,346,233 | 7,400,346,233 | - | - |
|
| Bond Funds | 2,054,732,557 | 2,054,732,557 | - | - |
| Total Investments in Securities: | 20,630,136,816 | 20,630,136,816 | - | - |
Fidelity Freedom® Index 2045 Fund
Financial Statements (Unaudited)
| Statement of Assets and Liabilities |
| As of September 30, 2024 (Unaudited) |
| Assets | | | | |
| Investment in securities, at value - See accompanying schedule: | | | | |
Affiliated issuers (cost $15,597,559,611) | $ | 20,630,136,816 | | |
| | | | | |
| | | | | |
| Total Investment in Securities (cost $15,597,559,611) | | | $ | 20,630,136,816 |
| Receivable for investments sold | | | | 33,188,281 |
| Receivable for fund shares sold | | | | 51,208,234 |
Total assets | | | | 20,714,533,331 |
| Liabilities | | | | |
| Payable for investments purchased | $ | 60,595,256 | | |
| Payable for fund shares redeemed | | 23,802,636 | | |
| Accrued management fee | | 913,811 | | |
| Total liabilities | | | | 85,311,703 |
| Net Assets | | | $ | 20,629,221,628 |
| Net Assets consist of: | | | | |
| Paid in capital | | | $ | 15,747,783,901 |
| Total accumulated earnings (loss) | | | | 4,881,437,727 |
| Net Assets | | | $ | 20,629,221,628 |
| | | | | |
| Net Asset Value and Maximum Offering Price | | | | |
| Investor Class : | | | | |
Net Asset Value, offering price and redemption price per share ($2,040,768,866 ÷ 75,739,995 shares) | | | $ | 26.94 |
| Institutional Premium Class : | | | | |
Net Asset Value, offering price and redemption price per share ($12,527,865,255 ÷ 465,032,473 shares) | | | $ | 26.94 |
| Premier Class : | | | | |
Net Asset Value, offering price and redemption price per share ($6,060,580,157 ÷ 224,984,528 shares) | | | $ | 26.94 |
| Premier II Class : | | | | |
Net Asset Value, offering price and redemption price per share ($7,350 ÷ 273 shares)(a) | | | $ | 26.94 |
(a)Corresponding Net Asset Value does not calculate due to rounding of fractional net assets and/or shares. |
| Statement of Operations |
Six months ended September 30, 2024 (Unaudited) |
| Investment Income | | | | |
| Dividends: | | | | |
| Affiliated issuers | | | $ | 53,456,122 |
| Income from Fidelity Central Funds | | | | 614 |
| Total income | | | | 53,456,736 |
| Expenses | | | | |
| Management fee | $ | 6,905,442 | | |
| Independent trustees' fees and expenses | | 23,626 | | |
| Total expenses before reductions | | 6,929,068 | | |
| Expense reductions | | (137) | | |
| Total expenses after reductions | | | | 6,928,931 |
| Net Investment income (loss) | | | | 46,527,805 |
| Realized and Unrealized Gain (Loss) | | | | |
| Net realized gain (loss) on: | | | | |
| Investment Securities: | | | | |
| Affiliated issuers | | 3,674,219 | | |
| Total net realized gain (loss) | | | | 3,674,219 |
| Change in net unrealized appreciation (depreciation) on: | | | | |
| Investment Securities: | | | | |
| Affiliated issuers | | 1,615,710,435 | | |
| Total change in net unrealized appreciation (depreciation) | | | | 1,615,710,435 |
| Net gain (loss) | | | | 1,619,384,654 |
| Net increase (decrease) in net assets resulting from operations | | | $ | 1,665,912,459 |
| Statement of Changes in Net Assets |
| |
| | Six months ended September 30, 2024 (Unaudited) | | Year ended March 31, 2024 |
| Increase (Decrease) in Net Assets | | | | |
| Operations | | | | |
| Net investment income (loss) | $ | 46,527,805 | $ | 335,267,691 |
| Net realized gain (loss) | | 3,674,219 | | 11,376,823 |
| Change in net unrealized appreciation (depreciation) | | 1,615,710,435 | | 2,586,030,221 |
| Net increase (decrease) in net assets resulting from operations | | 1,665,912,459 | | 2,932,674,735 |
| Distributions to shareholders | | (9,019,284) | | (324,777,662) |
| | | | | |
| Share transactions - net increase (decrease) | | 675,545,376 | | 2,409,953,091 |
| Total increase (decrease) in net assets | | 2,332,438,551 | | 5,017,850,164 |
| | | | | |
| Net Assets | | | | |
| Beginning of period | | 18,296,783,077 | | 13,278,932,913 |
| End of period | $ | 20,629,221,628 | $ | 18,296,783,077 |
| | | | | |
| | | | | |
Financial Highlights
Fidelity Freedom® Index 2045 Fund Investor Class |
| |
| | Six months ended (Unaudited) September 30, 2024 | | Years ended March 31, 2024 | | 2023 | | 2022 | | 2021 | | 2020 |
Selected Per-Share Data | | | | | | | | | | | | |
| Net asset value, beginning of period | $ | 24.77 | $ | 21.07 | $ | 23.14 | $ | 22.49 | $ | 15.31 | $ | 19.33 |
| Income from Investment Operations | | | | | | | | | | | | |
Net investment income (loss) A,B | | .06 | | .48 | | .40 | | .42 | | .31 | | .36 |
| Net realized and unrealized gain (loss) | | 2.12 | | 3.67 | | (2.07) | | .70 | | 7.29 | | (1.56) |
| Total from investment operations | | 2.18 | | 4.15 | | (1.67) | | 1.12 | | 7.60 | | (1.20) |
| Distributions from net investment income | | (.01) | | (.45) | | (.39) | | (.37) | | (.30) | | (.33) |
| Distributions from net realized gain | | - | | - | | (.01) | | (.10) | | (.12) | | (2.49) |
| Total distributions | | (.01) | | (.45) | | (.40) | | (.47) | | (.42) | | (2.82) |
| Net asset value, end of period | $ | 26.94 | $ | 24.77 | $ | 21.07 | $ | 23.14 | $ | 22.49 | $ | 15.31 |
Total Return C,D | | | | 19.85% | | (7.11)% | | 4.88% | | 49.89% | | (8.96)% |
Ratios to Average Net Assets B,E,F | | | | | | | | | | | | |
| Expenses before reductions | | .12% G | | .12% | | .12% | | .12% | | .12% | | .12% |
| Expenses net of fee waivers, if any | | | | .12% | | .12% | | .12% | | .12% | | .12% |
| Expenses net of all reductions | | .12% G | | .12% | | .12% | | .12% | | .12% | | .12% |
| Net investment income (loss) | | .45% G | | 2.15% | | 1.97% | | 1.75% | | 1.55% | | 1.85% |
| Supplemental Data | | | | | | | | | | | | |
| Net assets, end of period (000 omitted) | $ | 2,040,769 | $ | 1,773,680 | $ | 1,338,764 | $ | 1,355,157 | $ | 3,625,141 | $ | 1,810,294 |
Portfolio turnover rate H | | | | 8% | | 11% | | 12% | | 20% | | 77% |
ACalculated based on average shares outstanding during the period.
BNet investment income (loss) is affected by the timing of the declaration of dividends by any underlying mutual funds or exchange-traded funds (ETFs). Net investment income (loss) of any mutual funds or ETFs is not included in the Fund's net investment income (loss) ratio.
CTotal returns for periods of less than one year are not annualized.
DTotal returns would have been lower if certain expenses had not been reduced during the applicable periods shown.
EFees and expenses of any underlying mutual funds or exchange-traded funds (ETFs) are not included in the Fund's expense ratio. The Fund indirectly bears its proportionate share of these expenses. For additional expense information related to investments in Fidelity Central Funds, please refer to the "Investments in Fidelity Central Funds" note found in the Notes to Financial Statements section of the most recent Annual or Semi-Annual report.
FExpense ratios reflect operating expenses of the class. Expenses before reductions do not reflect amounts reimbursed, waived, or reduced through arrangements with the investment adviser, brokerage services, or other offset arrangements, if applicable, and do not represent the amount paid by the class during periods when reimbursements, waivers or reductions occur.
GAnnualized.
HAmount does not include the portfolio activity of any underlying mutual funds or exchange-traded funds (ETFs).
Fidelity Freedom® Index 2045 Fund Institutional Premium Class |
| |
| | Six months ended (Unaudited) September 30, 2024 | | Years ended March 31, 2024 | | 2023 | | 2022 | | 2021 | | 2020 |
Selected Per-Share Data | | | | | | | | | | | | |
| Net asset value, beginning of period | $ | 24.76 | $ | 21.06 | $ | 23.14 | $ | 22.50 | $ | 15.32 | $ | 19.33 |
| Income from Investment Operations | | | | | | | | | | | | |
Net investment income (loss) A,B | | .06 | | .49 | | .41 | | .43 | | .31 | | .37 |
| Net realized and unrealized gain (loss) | | 2.13 | | 3.67 | | (2.08) | | .71 | | 7.30 | | (1.55) |
| Total from investment operations | | 2.19 | | 4.16 | | (1.67) | | 1.14 | | 7.61 | | (1.18) |
| Distributions from net investment income | | (.01) | | (.46) | | (.40) | | (.40) | | (.31) | | (.34) |
| Distributions from net realized gain | | - | | - | | (.01) | | (.10) | | (.12) | | (2.49) |
| Total distributions | | (.01) | | (.46) | | (.41) | | (.50) | | (.43) | | (2.83) |
| Net asset value, end of period | $ | 26.94 | $ | 24.76 | $ | 21.06 | $ | 23.14 | $ | 22.50 | $ | 15.32 |
Total Return C,D | | | | 19.90% | | (7.10)% | | 4.95% | | 49.89% | | (8.88)% |
Ratios to Average Net Assets B,E,F | | | | | | | | | | | | |
| Expenses before reductions | | .08% G | | .08% | | .08% | | .08% | | .08% | | .08% |
| Expenses net of fee waivers, if any | | | | .08% | | .08% | | .08% | | .08% | | .08% |
| Expenses net of all reductions | | .08% G | | .08% | | .08% | | .08% | | .08% | | .08% |
| Net investment income (loss) | | .49% G | | 2.19% | | 2.01% | | 1.79% | | 1.59% | | 1.89% |
| Supplemental Data | | | | | | | | | | | | |
| Net assets, end of period (000 omitted) | $ | 12,527,865 | $ | 11,319,156 | $ | 8,572,583 | $ | 7,627,068 | $ | 3,397,662 | $ | 1,890,160 |
Portfolio turnover rate H | | | | 8% | | 11% | | 12% | | 20% | | 77% |
ACalculated based on average shares outstanding during the period.
BNet investment income (loss) is affected by the timing of the declaration of dividends by any underlying mutual funds or exchange-traded funds (ETFs). Net investment income (loss) of any mutual funds or ETFs is not included in the Fund's net investment income (loss) ratio.
CTotal returns for periods of less than one year are not annualized.
DTotal returns would have been lower if certain expenses had not been reduced during the applicable periods shown.
EFees and expenses of any underlying mutual funds or exchange-traded funds (ETFs) are not included in the Fund's expense ratio. The Fund indirectly bears its proportionate share of these expenses. For additional expense information related to investments in Fidelity Central Funds, please refer to the "Investments in Fidelity Central Funds" note found in the Notes to Financial Statements section of the most recent Annual or Semi-Annual report.
FExpense ratios reflect operating expenses of the class. Expenses before reductions do not reflect amounts reimbursed, waived, or reduced through arrangements with the investment adviser, brokerage services, or other offset arrangements, if applicable, and do not represent the amount paid by the class during periods when reimbursements, waivers or reductions occur.
GAnnualized.
HAmount does not include the portfolio activity of any underlying mutual funds or exchange-traded funds (ETFs).
Fidelity Freedom® Index 2045 Fund Premier Class |
| |
| | Six months ended (Unaudited) September 30, 2024 | | Years ended March 31, 2024 | | 2023 | | 2022 | | 2021 A |
Selected Per-Share Data | | | | | | | | | | |
| Net asset value, beginning of period | $ | 24.75 | $ | 21.06 | $ | 23.13 | $ | 22.50 | $ | 17.81 |
| Income from Investment Operations | | | | | | | | | | |
Net investment income (loss) B,C | | .06 | | .49 | | .41 | | .43 | | .49 |
| Net realized and unrealized gain (loss) | | 2.14 | | 3.66 | | (2.07) | | .70 | | 4.57 |
| Total from investment operations | | 2.20 | | 4.15 | | (1.66) | | 1.13 | | 5.06 |
| Distributions from net investment income | | (.01) | | (.46) | | (.40) | | (.40) | | (.31) |
| Distributions from net realized gain | | - | | - | | (.01) | | (.10) | | (.07) |
| Total distributions | | (.01) | | (.46) | | (.41) | | (.50) | | (.37) D |
| Net asset value, end of period | $ | 26.94 | $ | 24.75 | $ | 21.06 | $ | 23.13 | $ | 22.50 |
Total Return E,F | | | | 19.88% | | (7.05)% | | 4.93% | | 28.52% |
Ratios to Average Net Assets C,G,H | | | | | | | | | | |
| Expenses before reductions | | .05% I | | .06% | | .06% | | .06% | | .06% I |
| Expenses net of fee waivers, if any | | | | .06% | | .06% | | .06% | | .06% I |
| Expenses net of all reductions | | .05% I | | .06% | | .06% | | .06% | | .06% I |
| Net investment income (loss) | | .51% I | | 2.21% | | 2.03% | | 1.81% | | 2.96% I |
| Supplemental Data | | | | | | | | | | |
| Net assets, end of period (000 omitted) | $ | 6,060,580 | $ | 5,203,947 | $ | 3,367,586 | $ | 2,647,519 | $ | 1,128,413 |
Portfolio turnover rate J | | | | 8% | | 11% | | 12% | | 20% |
AFor the period June 24, 2020 (commencement of sale of shares) through March 31, 2021.
BCalculated based on average shares outstanding during the period.
CNet investment income (loss) is affected by the timing of the declaration of dividends by any underlying mutual funds or exchange-traded funds (ETFs). Net investment income (loss) of any mutual funds or ETFs is not included in the Fund's net investment income (loss) ratio.
DTotal distributions per share do not sum due to rounding.
ETotal returns for periods of less than one year are not annualized.
FTotal returns would have been lower if certain expenses had not been reduced during the applicable periods shown.
GFees and expenses of any underlying mutual funds or exchange-traded funds (ETFs) are not included in the Fund's expense ratio. The Fund indirectly bears its proportionate share of these expenses. For additional expense information related to investments in Fidelity Central Funds, please refer to the "Investments in Fidelity Central Funds" note found in the Notes to Financial Statements section of the most recent Annual or Semi-Annual report.
HExpense ratios reflect operating expenses of the class. Expenses before reductions do not reflect amounts reimbursed, waived, or reduced through arrangements with the investment adviser, brokerage services, or other offset arrangements, if applicable, and do not represent the amount paid by the class during periods when reimbursements, waivers or reductions occur.
IAnnualized.
JAmount does not include the portfolio activity of any underlying mutual funds or exchange-traded funds (ETFs).
Fidelity Freedom® Index 2045 Fund Premier II Class |
| |
| | Six months ended (Unaudited) September 30, 2024 A |
Selected Per-Share Data | | |
| Net asset value, beginning of period | $ | 26.02 |
| Income from Investment Operations | | |
Net investment income (loss) B,C | | .01 |
| Net realized and unrealized gain (loss) | | .91 |
| Total from investment operations | | .92 |
| Net asset value, end of period | $ | 26.94 |
Total Return D,E | | |
Ratios to Average Net Assets C,F,G | | |
| Expenses before reductions | | .04% H |
| Expenses net of fee waivers, if any | | |
| Expenses net of all reductions | | .04% H |
| Net investment income (loss) | | .25% H |
| Supplemental Data | | |
| Net assets, end of period (000 omitted) | $ | 7 |
Portfolio turnover rate I | | |
AFor the period August 22, 2024 (commencement of sale of shares) through September 30, 2024.
BCalculated based on average shares outstanding during the period.
CNet investment income (loss) is affected by the timing of the declaration of dividends by any underlying mutual funds or exchange-traded funds (ETFs). Net investment income (loss) of any mutual funds or ETFs is not included in the Fund's net investment income (loss) ratio.
DTotal returns for periods of less than one year are not annualized.
ETotal returns would have been lower if certain expenses had not been reduced during the applicable periods shown.
FFees and expenses of any underlying mutual funds or exchange-traded funds (ETFs) are not included in the Fund's expense ratio. The Fund indirectly bears its proportionate share of these expenses. For additional expense information related to investments in Fidelity Central Funds, please refer to the "Investments in Fidelity Central Funds" note found in the Notes to Financial Statements section of the most recent Annual or Semi-Annual report.
GExpense ratios reflect operating expenses of the class. Expenses before reductions do not reflect amounts reimbursed, waived, or reduced through arrangements with the investment adviser, brokerage services, or other offset arrangements, if applicable, and do not represent the amount paid by the class during periods when reimbursements, waivers or reductions occur.
HAnnualized.
IAmount does not include the portfolio activity of any underlying mutual funds or exchange-traded funds (ETFs).
Fidelity Freedom® Index 2050 Fund
Schedule of Investments September 30, 2024 (Unaudited)
Showing Percentage of Net Assets
| Domestic Equity Funds - 54.2% |
| | | Shares | Value ($) |
Fidelity Series Total Market Index Fund (a) (Cost $6,965,373,563) | | 566,025,919 | 10,686,569,346 |
| | | | |
| International Equity Funds - 35.9% |
| | | Shares | Value ($) |
Fidelity Series Global ex U.S. Index Fund (a) (Cost $5,861,657,377) | | 448,471,067 | 7,076,873,439 |
| | | | |
| Bond Funds - 9.9% |
| | | Shares | Value ($) |
| Fidelity Series Bond Index Fund (a) | | 85,116,756 | 786,478,822 |
| Fidelity Series International Developed Markets Bond Index Fund (a) | | 21,832,348 | 193,652,925 |
| Fidelity Series Long-Term Treasury Bond Index Fund (a) | | 167,764,489 | 984,777,549 |
| TOTAL BOND FUNDS (Cost $2,147,581,183) | | | 1,964,909,296 |
| | | | |
| TOTAL INVESTMENT IN SECURITIES - 100.0% (Cost $14,974,612,123) | 19,728,352,081 |
NET OTHER ASSETS (LIABILITIES) - 0.0% | (878,203) |
| NET ASSETS - 100.0% | 19,727,473,878 |
| | |
Legend
Affiliated Central Funds
Fiscal year to date information regarding the Fund's investments in Fidelity Central Funds, including the ownership percentage, is presented below.
| Affiliate | Value, beginning of period ($) | Purchases ($) | Sales Proceeds ($) | Dividend Income ($) | Realized Gain (loss) ($) | Change in Unrealized appreciation (depreciation) ($) | Value, end of period ($) | % ownership, end of period |
| Fidelity Cash Central Fund 4.89% | - | 1,410,998 | 1,410,998 | 367 | - | - | - | 0.0% |
| Total | - | 1,410,998 | 1,410,998 | 367 | - | - | - | |
| | | | | | | | | |
Amounts in the dividend income column in the above table include any capital gain distributions from underlying funds, which are presented in the corresponding line item in the Statement of Operations, if applicable.
Amounts included in the purchases and sales proceeds columns may include in-kind transactions, if applicable.
Affiliated Underlying Funds
Fiscal year to date information regarding the Fund's investments in affiliated Underlying Funds is presented below. Exchanges between classes of the same affiliated Underlying Funds may occur. If an Underlying Funds changes its name, the name presented below is the name in effect at period end.
| Affiliate | Value, beginning of period ($) | Purchases ($) | Sales Proceeds ($) | Dividend Income ($) | Realized Gain (loss) ($) | Change in Unrealized appreciation (depreciation) ($) | Value, end of period ($) |
| Fidelity Series Bond Index Fund | 689,548,148 | 80,184,270 | 9,295,581 | 13,157,267 | 24,397 | 26,017,588 | 786,478,822 |
| Fidelity Series Global ex U.S. Index Fund | 6,238,497,146 | 540,098,382 | 270,367,556 | - | (3,549,347) | 572,194,814 | 7,076,873,439 |
| Fidelity Series International Developed Markets Bond Index Fund | 168,568,212 | 24,195,518 | 2,457,713 | 2,542,680 | (1,380) | 3,348,288 | 193,652,925 |
| Fidelity Series Long-Term Treasury Bond Index Fund | 861,870,978 | 102,391,295 | 22,114,474 | 15,982,934 | 138,022 | 42,491,728 | 984,777,549 |
| Fidelity Series Total Market Index Fund | 9,373,478,637 | 746,939,321 | 338,615,923 | 19,121,642 | 6,130,417 | 898,636,894 | 10,686,569,346 |
| | 17,331,963,121 | 1,493,808,786 | 642,851,247 | 50,804,523 | 2,742,109 | 1,542,689,312 | 19,728,352,081 |
Amounts in the dividend income column in the above table include any capital gain distributions from underlying funds, which are presented in the corresponding line item in the Statement of Operations, if applicable.
Amounts included in the purchases and sales proceeds columns may include in-kind transactions, if applicable.
Investment Valuation
The following is a summary of the inputs used, as of September 30, 2024, involving the Fund's assets and liabilities carried at fair value. The inputs or methodology used for valuing securities may not be an indication of the risk associated with investing in those securities. For more information on valuation inputs, and their aggregation into the levels used below, please refer to the Investment Valuation section in the accompanying Notes to Financial Statements.
| Valuation Inputs at Reporting Date: |
| Description | Total ($) | Level 1 ($) | Level 2 ($) | Level 3 ($) |
Investments in Securities: | | | | |
|
| Domestic Equity Funds | 10,686,569,346 | 10,686,569,346 | - | - |
|
| International Equity Funds | 7,076,873,439 | 7,076,873,439 | - | - |
|
| Bond Funds | 1,964,909,296 | 1,964,909,296 | - | - |
| Total Investments in Securities: | 19,728,352,081 | 19,728,352,081 | - | - |
Fidelity Freedom® Index 2050 Fund
Financial Statements (Unaudited)
| Statement of Assets and Liabilities |
| As of September 30, 2024 (Unaudited) |
| Assets | | | | |
| Investment in securities, at value - See accompanying schedule: | | | | |
Affiliated issuers (cost $14,974,612,123) | $ | 19,728,352,081 | | |
| | | | | |
| | | | | |
| Total Investment in Securities (cost $14,974,612,123) | | | $ | 19,728,352,081 |
| Receivable for investments sold | | | | 28,885,376 |
| Receivable for fund shares sold | | | | 55,939,388 |
| Distributions receivable from Fidelity Central Funds | | | | 88 |
Total assets | | | | 19,813,176,933 |
| Liabilities | | | | |
| Payable for investments purchased | $ | 62,887,244 | | |
| Payable for fund shares redeemed | | 21,941,340 | | |
| Accrued management fee | | 874,471 | | |
| Total liabilities | | | | 85,703,055 |
| Net Assets | | | $ | 19,727,473,878 |
| Net Assets consist of: | | | | |
| Paid in capital | | | $ | 15,105,858,439 |
| Total accumulated earnings (loss) | | | | 4,621,615,439 |
| Net Assets | | | $ | 19,727,473,878 |
| | | | | |
| Net Asset Value and Maximum Offering Price | | | | |
| Investor Class : | | | | |
Net Asset Value, offering price and redemption price per share ($1,887,233,006 ÷ 69,885,857 shares) | | | $ | 27.00 |
| Institutional Premium Class : | | | | |
Net Asset Value, offering price and redemption price per share ($12,136,842,302 ÷ 449,760,436 shares) | | | $ | 26.99 |
| Premier Class : | | | | |
Net Asset Value, offering price and redemption price per share ($5,703,391,219 ÷ 211,378,999 shares) | | | $ | 26.98 |
| Premier II Class : | | | | |
Net Asset Value, offering price and redemption price per share ($7,351 ÷ 272 shares)(a) | | | $ | 26.99 |
(a)Corresponding Net Asset Value does not calculate due to rounding of fractional net assets and/or shares. |
| Statement of Operations |
Six months ended September 30, 2024 (Unaudited) |
| Investment Income | | | | |
| Dividends: | | | | |
| Affiliated issuers | | | $ | 50,804,523 |
| Income from Fidelity Central Funds | | | | 367 |
| Total income | | | | 50,804,890 |
| Expenses | | | | |
| Management fee | $ | 6,571,162 | | |
| Independent trustees' fees and expenses | | 22,439 | | |
| Total expenses before reductions | | 6,593,601 | | |
| Expense reductions | | (166) | | |
| Total expenses after reductions | | | | 6,593,435 |
| Net Investment income (loss) | | | | 44,211,455 |
| Realized and Unrealized Gain (Loss) | | | | |
| Net realized gain (loss) on: | | | | |
| Investment Securities: | | | | |
| Affiliated issuers | | 2,742,109 | | |
| Total net realized gain (loss) | | | | 2,742,109 |
| Change in net unrealized appreciation (depreciation) on: | | | | |
| Investment Securities: | | | | |
| Affiliated issuers | | 1,542,689,312 | | |
| Total change in net unrealized appreciation (depreciation) | | | | 1,542,689,312 |
| Net gain (loss) | | | | 1,545,431,421 |
| Net increase (decrease) in net assets resulting from operations | | | $ | 1,589,642,876 |
| Statement of Changes in Net Assets |
| |
| | Six months ended September 30, 2024 (Unaudited) | | Year ended March 31, 2024 |
| Increase (Decrease) in Net Assets | | | | |
| Operations | | | | |
| Net investment income (loss) | $ | 44,211,455 | $ | 315,350,684 |
| Net realized gain (loss) | | 2,742,109 | | 14,590,643 |
| Change in net unrealized appreciation (depreciation) | | 1,542,689,312 | | 2,432,281,805 |
| Net increase (decrease) in net assets resulting from operations | | 1,589,642,876 | | 2,762,223,132 |
| Distributions to shareholders | | (9,259,271) | | (305,632,351) |
| | | | | |
| Share transactions - net increase (decrease) | | 815,964,524 | | 2,539,357,554 |
| Total increase (decrease) in net assets | | 2,396,348,129 | | 4,995,948,335 |
| | | | | |
| Net Assets | | | | |
| Beginning of period | | 17,331,125,749 | | 12,335,177,414 |
| End of period | $ | 19,727,473,878 | $ | 17,331,125,749 |
| | | | | |
| | | | | |
Financial Highlights
Fidelity Freedom® Index 2050 Fund Investor Class |
| |
| | Six months ended (Unaudited) September 30, 2024 | | Years ended March 31, 2024 | | 2023 | | 2022 | | 2021 | | 2020 |
Selected Per-Share Data | | | | | | | | | | | | |
| Net asset value, beginning of period | $ | 24.82 | $ | 21.11 | $ | 23.19 | $ | 22.54 | $ | 15.34 | $ | 19.41 |
| Income from Investment Operations | | | | | | | | | | | | |
Net investment income (loss) A,B | | .06 | | .48 | | .40 | | .42 | | .31 | | .36 |
| Net realized and unrealized gain (loss) | | 2.13 | | 3.68 | | (2.08) | | .71 | | 7.31 | | (1.55) |
| Total from investment operations | | 2.19 | | 4.16 | | (1.68) | | 1.13 | | 7.62 | | (1.19) |
| Distributions from net investment income | | (.01) | | (.45) | | (.39) | | (.37) | | (.30) | | (.34) |
| Distributions from net realized gain | | - | | - | | (.01) | | (.10) | | (.12) | | (2.54) |
| Total distributions | | (.01) | | (.45) | | (.40) | | (.48) C | | (.42) | | (2.88) |
| Net asset value, end of period | $ | 27.00 | $ | 24.82 | $ | 21.11 | $ | 23.19 | $ | 22.54 | $ | 15.34 |
Total Return D,E | | | | 19.85% | | (7.14)% | | 4.89% | | 49.93% | | (8.95)% |
Ratios to Average Net Assets B,F,G | | | | | | | | | | | | |
| Expenses before reductions | | .12% H | | .12% | | .12% | | .12% | | .12% | | .12% |
| Expenses net of fee waivers, if any | | | | .12% | | .12% | | .12% | | .12% | | .12% |
| Expenses net of all reductions | | .12% H | | .12% | | .12% | | .12% | | .12% | | .12% |
| Net investment income (loss) | | .44% H | | 2.15% | | 1.97% | | 1.74% | | 1.54% | | 1.84% |
| Supplemental Data | | | | | | | | | | | | |
| Net assets, end of period (000 omitted) | $ | 1,887,233 | $ | 1,638,555 | $ | 1,217,159 | $ | 1,179,926 | $ | 3,177,558 | $ | 1,524,955 |
Portfolio turnover rate I | | | | 7% | | 11% | | 12% | | 20% | | 77% |
ACalculated based on average shares outstanding during the period.
BNet investment income (loss) is affected by the timing of the declaration of dividends by any underlying mutual funds or exchange-traded funds (ETFs). Net investment income (loss) of any mutual funds or ETFs is not included in the Fund's net investment income (loss) ratio.
CTotal distributions per share do not sum due to rounding.
DTotal returns for periods of less than one year are not annualized.
ETotal returns would have been lower if certain expenses had not been reduced during the applicable periods shown.
FFees and expenses of any underlying mutual funds or exchange-traded funds (ETFs) are not included in the Fund's expense ratio. The Fund indirectly bears its proportionate share of these expenses. For additional expense information related to investments in Fidelity Central Funds, please refer to the "Investments in Fidelity Central Funds" note found in the Notes to Financial Statements section of the most recent Annual or Semi-Annual report.
GExpense ratios reflect operating expenses of the class. Expenses before reductions do not reflect amounts reimbursed, waived, or reduced through arrangements with the investment adviser, brokerage services, or other offset arrangements, if applicable, and do not represent the amount paid by the class during periods when reimbursements, waivers or reductions occur.
HAnnualized.
IAmount does not include the portfolio activity of any underlying mutual funds or exchange-traded funds (ETFs).
Fidelity Freedom® Index 2050 Fund Institutional Premium Class |
| |
| | Six months ended (Unaudited) September 30, 2024 | | Years ended March 31, 2024 | | 2023 | | 2022 | | 2021 | | 2020 |
Selected Per-Share Data | | | | | | | | | | | | |
| Net asset value, beginning of period | $ | 24.80 | $ | 21.09 | $ | 23.17 | $ | 22.54 | $ | 15.34 | $ | 19.41 |
| Income from Investment Operations | | | | | | | | | | | | |
Net investment income (loss) A,B | | .06 | | .49 | | .41 | | .42 | | .31 | | .37 |
| Net realized and unrealized gain (loss) | | 2.14 | | 3.68 | | (2.08) | | .72 | | 7.32 | | (1.55) |
| Total from investment operations | | 2.20 | | 4.17 | | (1.67) | | 1.14 | | 7.63 | | (1.18) |
| Distributions from net investment income | | (.01) | | (.46) | | (.40) | | (.40) | | (.31) | | (.34) |
| Distributions from net realized gain | | - | | - | | (.01) | | (.11) | | (.12) | | (2.54) |
| Total distributions | | (.01) | | (.46) | | (.41) | | (.51) | | (.43) | | (2.89) C |
| Net asset value, end of period | $ | 26.99 | $ | 24.80 | $ | 21.09 | $ | 23.17 | $ | 22.54 | $ | 15.34 |
Total Return D,E | | | | 19.92% | | (7.11)% | | 4.93% | | 49.96% | | (8.91)% |
Ratios to Average Net Assets B,F,G | | | | | | | | | | | | |
| Expenses before reductions | | .08% H | | .08% | | .08% | | .08% | | .08% | | .08% |
| Expenses net of fee waivers, if any | | | | .08% | | .08% | | .08% | | .08% | | .08% |
| Expenses net of all reductions | | .08% H | | .08% | | .08% | | .08% | | .08% | | .08% |
| Net investment income (loss) | | .48% H | | 2.19% | | 2.01% | | 1.78% | | 1.59% | | 1.89% |
| Supplemental Data | | | | | | | | | | | | |
| Net assets, end of period (000 omitted) | $ | 12,136,842 | $ | 10,849,977 | $ | 8,045,136 | $ | 6,949,488 | $ | 3,119,255 | $ | 1,815,237 |
Portfolio turnover rate I | | | | 7% | | 11% | | 12% | | 20% | | 77% |
ACalculated based on average shares outstanding during the period.
BNet investment income (loss) is affected by the timing of the declaration of dividends by any underlying mutual funds or exchange-traded funds (ETFs). Net investment income (loss) of any mutual funds or ETFs is not included in the Fund's net investment income (loss) ratio.
CTotal distributions per share do not sum due to rounding.
DTotal returns for periods of less than one year are not annualized.
ETotal returns would have been lower if certain expenses had not been reduced during the applicable periods shown.
FFees and expenses of any underlying mutual funds or exchange-traded funds (ETFs) are not included in the Fund's expense ratio. The Fund indirectly bears its proportionate share of these expenses. For additional expense information related to investments in Fidelity Central Funds, please refer to the "Investments in Fidelity Central Funds" note found in the Notes to Financial Statements section of the most recent Annual or Semi-Annual report.
GExpense ratios reflect operating expenses of the class. Expenses before reductions do not reflect amounts reimbursed, waived, or reduced through arrangements with the investment adviser, brokerage services, or other offset arrangements, if applicable, and do not represent the amount paid by the class during periods when reimbursements, waivers or reductions occur.
HAnnualized.
IAmount does not include the portfolio activity of any underlying mutual funds or exchange-traded funds (ETFs).
Fidelity Freedom® Index 2050 Fund Premier Class |
| |
| | Six months ended (Unaudited) September 30, 2024 | | Years ended March 31, 2024 | | 2023 | | 2022 | | 2021 A |
Selected Per-Share Data | | | | | | | | | | |
| Net asset value, beginning of period | $ | 24.80 | $ | 21.09 | $ | 23.17 | $ | 22.54 | $ | 17.84 |
| Income from Investment Operations | | | | | | | | | | |
Net investment income (loss) B,C | | .06 | | .49 | | .42 | | .43 | | .50 |
| Net realized and unrealized gain (loss) | | 2.13 | | 3.68 | | (2.09) | | .71 | | 4.57 |
| Total from investment operations | | 2.19 | | 4.17 | | (1.67) | | 1.14 | | 5.07 |
| Distributions from net investment income | | (.01) | | (.46) | | (.40) | | (.40) | | (.31) |
| Distributions from net realized gain | | - | | - | | (.01) | | (.11) | | (.07) |
| Total distributions | | (.01) | | (.46) | | (.41) | | (.51) | | (.37) D |
| Net asset value, end of period | $ | 26.98 | $ | 24.80 | $ | 21.09 | $ | 23.17 | $ | 22.54 |
Total Return E,F | | | | 19.94% | | (7.09)% | | 4.95% | | 28.53% |
Ratios to Average Net Assets C,G,H | | | | | | | | | | |
| Expenses before reductions | | .05% I | | .06% | | .06% | | .06% | | .06% I |
| Expenses net of fee waivers, if any | | | | .06% | | .06% | | .06% | | .06% I |
| Expenses net of all reductions | | .05% I | | .06% | | .06% | | .06% | | .06% I |
| Net investment income (loss) | | .51% I | | 2.21% | | 2.03% | | 1.80% | | 3.03% I |
| Supplemental Data | | | | | | | | | | |
| Net assets, end of period (000 omitted) | $ | 5,703,391 | $ | 4,842,594 | $ | 3,072,883 | $ | 2,292,324 | $ | 1,044,525 |
Portfolio turnover rate J | | | | 7% | | 11% | | 12% | | 20% |
AFor the period June 24, 2020 (commencement of sale of shares) through March 31, 2021.
BCalculated based on average shares outstanding during the period.
CNet investment income (loss) is affected by the timing of the declaration of dividends by any underlying mutual funds or exchange-traded funds (ETFs). Net investment income (loss) of any mutual funds or ETFs is not included in the Fund's net investment income (loss) ratio.
DTotal distributions per share do not sum due to rounding.
ETotal returns would have been lower if certain expenses had not been reduced during the applicable periods shown.
FTotal returns for periods of less than one year are not annualized.
GFees and expenses of any underlying mutual funds or exchange-traded funds (ETFs) are not included in the Fund's expense ratio. The Fund indirectly bears its proportionate share of these expenses. For additional expense information related to investments in Fidelity Central Funds, please refer to the "Investments in Fidelity Central Funds" note found in the Notes to Financial Statements section of the most recent Annual or Semi-Annual report.
HExpense ratios reflect operating expenses of the class. Expenses before reductions do not reflect amounts reimbursed, waived, or reduced through arrangements with the investment adviser, brokerage services, or other offset arrangements, if applicable, and do not represent the amount paid by the class during periods when reimbursements, waivers or reductions occur.
IAnnualized.
JAmount does not include the portfolio activity of any underlying mutual funds or exchange-traded funds (ETFs).
Fidelity Freedom® Index 2050 Fund Premier II Class |
| |
| | Six months ended (Unaudited) September 30, 2024 A |
Selected Per-Share Data | | |
| Net asset value, beginning of period | $ | 26.07 |
| Income from Investment Operations | | |
Net investment income (loss) B,C | | .01 |
| Net realized and unrealized gain (loss) | | .91 |
| Total from investment operations | | .92 |
| Net asset value, end of period | $ | 26.99 |
Total Return D,E | | |
Ratios to Average Net Assets C,F,G | | |
| Expenses before reductions | | .04% H |
| Expenses net of fee waivers, if any | | |
| Expenses net of all reductions | | .04% H |
| Net investment income (loss) | | .25% H |
| Supplemental Data | | |
| Net assets, end of period (000 omitted) | $ | 7 |
Portfolio turnover rate I | | |
AFor the period August 22, 2024 (commencement of sale of shares) through September 30, 2024.
BCalculated based on average shares outstanding during the period.
CNet investment income (loss) is affected by the timing of the declaration of dividends by any underlying mutual funds or exchange-traded funds (ETFs). Net investment income (loss) of any mutual funds or ETFs is not included in the Fund's net investment income (loss) ratio.
DTotal returns for periods of less than one year are not annualized.
ETotal returns would have been lower if certain expenses had not been reduced during the applicable periods shown.
FFees and expenses of any underlying mutual funds or exchange-traded funds (ETFs) are not included in the Fund's expense ratio. The Fund indirectly bears its proportionate share of these expenses. For additional expense information related to investments in Fidelity Central Funds, please refer to the "Investments in Fidelity Central Funds" note found in the Notes to Financial Statements section of the most recent Annual or Semi-Annual report.
GExpense ratios reflect operating expenses of the class. Expenses before reductions do not reflect amounts reimbursed, waived, or reduced through arrangements with the investment adviser, brokerage services, or other offset arrangements, if applicable, and do not represent the amount paid by the class during periods when reimbursements, waivers or reductions occur.
HAnnualized.
IAmount does not include the portfolio activity of any underlying mutual funds or exchange-traded funds (ETFs).
Fidelity Freedom® Index 2055 Fund
Schedule of Investments September 30, 2024 (Unaudited)
Showing Percentage of Net Assets
| Domestic Equity Funds - 54.2% |
| | | Shares | Value ($) |
Fidelity Series Total Market Index Fund (a) (Cost $5,348,172,208) | | 414,568,920 | 7,827,061,202 |
| | | | |
| International Equity Funds - 35.9% |
| | | Shares | Value ($) |
Fidelity Series Global ex U.S. Index Fund (a) (Cost $4,348,696,891) | | 328,468,278 | 5,183,229,433 |
| | | | |
| Bond Funds - 9.9% |
| | | Shares | Value ($) |
| Fidelity Series Bond Index Fund (a) | | 62,341,121 | 576,031,956 |
| Fidelity Series International Developed Markets Bond Index Fund (a) | | 15,990,741 | 141,837,870 |
| Fidelity Series Long-Term Treasury Bond Index Fund (a) | | 122,871,223 | 721,254,077 |
| TOTAL BOND FUNDS (Cost $1,548,338,711) | | | 1,439,123,903 |
| | | | |
| TOTAL INVESTMENT IN SECURITIES - 100.0% (Cost $11,245,207,810) | 14,449,414,538 |
NET OTHER ASSETS (LIABILITIES) - 0.0% | (652,032) |
| NET ASSETS - 100.0% | 14,448,762,506 |
| | |
Legend
Affiliated Central Funds
Fiscal year to date information regarding the Fund's investments in Fidelity Central Funds, including the ownership percentage, is presented below.
| Affiliate | Value, beginning of period ($) | Purchases ($) | Sales Proceeds ($) | Dividend Income ($) | Realized Gain (loss) ($) | Change in Unrealized appreciation (depreciation) ($) | Value, end of period ($) | % ownership, end of period |
| Fidelity Cash Central Fund 4.89% | - | 1,849,724 | 1,849,724 | 777 | - | - | - | 0.0% |
| Total | - | 1,849,724 | 1,849,724 | 777 | - | - | - | |
| | | | | | | | | |
Amounts in the dividend income column in the above table include any capital gain distributions from underlying funds, which are presented in the corresponding line item in the Statement of Operations, if applicable.
Amounts included in the purchases and sales proceeds columns may include in-kind transactions, if applicable.
Affiliated Underlying Funds
Fiscal year to date information regarding the Fund's investments in affiliated Underlying Funds is presented below. Exchanges between classes of the same affiliated Underlying Funds may occur. If an Underlying Funds changes its name, the name presented below is the name in effect at period end.
| Affiliate | Value, beginning of period ($) | Purchases ($) | Sales Proceeds ($) | Dividend Income ($) | Realized Gain (loss) ($) | Change in Unrealized appreciation (depreciation) ($) | Value, end of period ($) |
| Fidelity Series Bond Index Fund | 493,875,827 | 67,906,380 | 4,837,184 | 9,547,021 | 29,667 | 19,057,266 | 576,031,956 |
| Fidelity Series Global ex U.S. Index Fund | 4,468,323,435 | 469,295,524 | 169,551,208 | - | (265,662) | 415,427,344 | 5,183,229,433 |
| Fidelity Series International Developed Markets Bond Index Fund | 120,729,442 | 19,907,334 | 1,286,841 | 1,828,350 | 2,247 | 2,485,688 | 141,837,870 |
| Fidelity Series Long-Term Treasury Bond Index Fund | 617,300,646 | 85,464,632 | 12,875,231 | 11,596,734 | 63,238 | 31,300,792 | 721,254,077 |
| Fidelity Series Total Market Index Fund | 6,713,722,020 | 668,417,029 | 215,513,676 | 13,708,091 | 2,153,077 | 658,282,752 | 7,827,061,202 |
| | 12,413,951,370 | 1,310,990,899 | 404,064,140 | 36,680,196 | 1,982,567 | 1,126,553,842 | 14,449,414,538 |
Amounts in the dividend income column in the above table include any capital gain distributions from underlying funds, which are presented in the corresponding line item in the Statement of Operations, if applicable.
Amounts included in the purchases and sales proceeds columns may include in-kind transactions, if applicable.
Investment Valuation
The following is a summary of the inputs used, as of September 30, 2024, involving the Fund's assets and liabilities carried at fair value. The inputs or methodology used for valuing securities may not be an indication of the risk associated with investing in those securities. For more information on valuation inputs, and their aggregation into the levels used below, please refer to the Investment Valuation section in the accompanying Notes to Financial Statements.
| Valuation Inputs at Reporting Date: |
| Description | Total ($) | Level 1 ($) | Level 2 ($) | Level 3 ($) |
Investments in Securities: | | | | |
|
| Domestic Equity Funds | 7,827,061,202 | 7,827,061,202 | - | - |
|
| International Equity Funds | 5,183,229,433 | 5,183,229,433 | - | - |
|
| Bond Funds | 1,439,123,903 | 1,439,123,903 | - | - |
| Total Investments in Securities: | 14,449,414,538 | 14,449,414,538 | - | - |
Fidelity Freedom® Index 2055 Fund
Financial Statements (Unaudited)
| Statement of Assets and Liabilities |
| As of September 30, 2024 (Unaudited) |
| Assets | | | | |
| Investment in securities, at value - See accompanying schedule: | | | | |
Affiliated issuers (cost $11,245,207,810) | $ | 14,449,414,538 | | |
| | | | | |
| | | | | |
| Total Investment in Securities (cost $11,245,207,810) | | | $ | 14,449,414,538 |
| Receivable for investments sold | | | | 23,328,662 |
| Receivable for fund shares sold | | | | 38,322,095 |
Total assets | | | | 14,511,065,295 |
| Liabilities | | | | |
| Payable for investments purchased | $ | 42,450,366 | | |
| Payable for fund shares redeemed | | 19,203,696 | | |
| Accrued management fee | | 648,727 | | |
| Total liabilities | | | | 62,302,789 |
| Net Assets | | | $ | 14,448,762,506 |
| Net Assets consist of: | | | | |
| Paid in capital | | | $ | 11,342,264,701 |
| Total accumulated earnings (loss) | | | | 3,106,497,805 |
| Net Assets | | | $ | 14,448,762,506 |
| | | | | |
| Net Asset Value and Maximum Offering Price | | | | |
| Investor Class : | | | | |
Net Asset Value, offering price and redemption price per share ($1,390,334,400 ÷ 62,644,782 shares) | | | $ | 22.19 |
| Institutional Premium Class : | | | | |
Net Asset Value, offering price and redemption price per share ($9,172,487,138 ÷ 413,071,043 shares) | | | $ | 22.21 |
| Premier Class : | | | | |
Net Asset Value, offering price and redemption price per share ($3,885,933,618 ÷ 175,042,165 shares) | | | $ | 22.20 |
| Premier II Class : | | | | |
Net Asset Value, offering price and redemption price per share ($7,350 ÷ 331 shares) | | | $ | 22.21 |
| Statement of Operations |
Six months ended September 30, 2024 (Unaudited) |
| Investment Income | | | | |
| Dividends: | | | | |
| Affiliated issuers | | | $ | 36,680,196 |
| Income from Fidelity Central Funds | | | | 777 |
| Total income | | | | 36,680,973 |
| Expenses | | | | |
| Management fee | $ | 4,806,044 | | |
| Independent trustees' fees and expenses | | 16,201 | | |
| Total expenses before reductions | | 4,822,245 | | |
| Expense reductions | | (68) | | |
| Total expenses after reductions | | | | 4,822,177 |
| Net Investment income (loss) | | | | 31,858,796 |
| Realized and Unrealized Gain (Loss) | | | | |
| Net realized gain (loss) on: | | | | |
| Investment Securities: | | | | |
| Affiliated issuers | | 1,982,567 | | |
| Total net realized gain (loss) | | | | 1,982,567 |
| Change in net unrealized appreciation (depreciation) on: | | | | |
| Investment Securities: | | | | |
| Affiliated issuers | | 1,126,553,842 | | |
| Total change in net unrealized appreciation (depreciation) | | | | 1,126,553,842 |
| Net gain (loss) | | | | 1,128,536,409 |
| Net increase (decrease) in net assets resulting from operations | | | $ | 1,160,395,205 |
| Statement of Changes in Net Assets |
| |
| | Six months ended September 30, 2024 (Unaudited) | | Year ended March 31, 2024 |
| Increase (Decrease) in Net Assets | | | | |
| Operations | | | | |
| Net investment income (loss) | $ | 31,858,796 | $ | 220,511,301 |
| Net realized gain (loss) | | 1,982,567 | | (5,674,331) |
| Change in net unrealized appreciation (depreciation) | | 1,126,553,842 | | 1,725,422,409 |
| Net increase (decrease) in net assets resulting from operations | | 1,160,395,205 | | 1,940,259,379 |
| Distributions to shareholders | | (6,862,788) | | (213,250,543) |
| | | | | |
| Share transactions - net increase (decrease) | | 881,880,651 | | 2,376,571,756 |
| Total increase (decrease) in net assets | | 2,035,413,068 | | 4,103,580,592 |
| | | | | |
| Net Assets | | | | |
| Beginning of period | | 12,413,349,438 | | 8,309,768,846 |
| End of period | $ | 14,448,762,506 | $ | 12,413,349,438 |
| | | | | |
| | | | | |
Financial Highlights
Fidelity Freedom® Index 2055 Fund Investor Class |
| |
| | Six months ended (Unaudited) September 30, 2024 | | Years ended March 31, 2024 | | 2023 | | 2022 | | 2021 | | 2020 |
Selected Per-Share Data | | | | | | | | | | | | |
| Net asset value, beginning of period | $ | 20.40 | $ | 17.35 | $ | 19.05 | $ | 18.51 | $ | 12.59 | $ | 15.33 |
| Income from Investment Operations | | | | | | | | | | | | |
Net investment income (loss) A,B | | .05 | | .40 | | .33 | | .34 | | .26 | | .28 |
| Net realized and unrealized gain (loss) | | 1.75 | | 3.02 | | (1.70) | | .58 | | 5.99 | | (1.33) |
| Total from investment operations | | 1.80 | | 3.42 | | (1.37) | | .92 | | 6.25 | | (1.05) |
| Distributions from net investment income | | (.01) | | (.37) | | (.31) | | (.31) | | (.24) | | (.26) |
| Distributions from net realized gain | | - | | - | | (.01) | | (.08) | | (.09) | | (1.42) |
| Total distributions | | (.01) | | (.37) | | (.33) C | | (.38) C | | (.33) | | (1.69) C |
| Net asset value, end of period | $ | 22.19 | $ | 20.40 | $ | 17.35 | $ | 19.05 | $ | 18.51 | $ | 12.59 |
Total Return D,E | | | | 19.83% | | (7.11)% | | 4.88% | | 49.88% | | (8.94)% |
Ratios to Average Net Assets B,F,G | | | | | | | | | | | | |
| Expenses before reductions | | .12% H | | .12% | | .12% | | .12% | | .12% | | .12% |
| Expenses net of fee waivers, if any | | | | .12% | | .12% | | .12% | | .12% | | .12% |
| Expenses net of all reductions | | .12% H | | .12% | | .12% | | .12% | | .12% | | .12% |
| Net investment income (loss) | | .44% H | | 2.16% | | 1.99% | | 1.75% | | 1.59% | | 1.83% |
| Supplemental Data | | | | | | | | | | | | |
| Net assets, end of period (000 omitted) | $ | 1,390,334 | $ | 1,192,139 | $ | 851,207 | $ | 781,317 | $ | 1,962,061 | $ | 867,162 |
Portfolio turnover rate I | | | | 8% | | 11% | | 12% | | 21% | | 74% |
ACalculated based on average shares outstanding during the period.
BNet investment income (loss) is affected by the timing of the declaration of dividends by any underlying mutual funds or exchange-traded funds (ETFs). Net investment income (loss) of any mutual funds or ETFs is not included in the Fund's net investment income (loss) ratio.
CTotal distributions per share do not sum due to rounding.
DTotal returns for periods of less than one year are not annualized.
ETotal returns would have been lower if certain expenses had not been reduced during the applicable periods shown.
FFees and expenses of any underlying mutual funds or exchange-traded funds (ETFs) are not included in the Fund's expense ratio. The Fund indirectly bears its proportionate share of these expenses. For additional expense information related to investments in Fidelity Central Funds, please refer to the "Investments in Fidelity Central Funds" note found in the Notes to Financial Statements section of the most recent Annual or Semi-Annual report.
GExpense ratios reflect operating expenses of the class. Expenses before reductions do not reflect amounts reimbursed, waived, or reduced through arrangements with the investment adviser, brokerage services, or other offset arrangements, if applicable, and do not represent the amount paid by the class during periods when reimbursements, waivers or reductions occur.
HAnnualized.
IAmount does not include the portfolio activity of any underlying mutual funds or exchange-traded funds (ETFs).
Fidelity Freedom® Index 2055 Fund Institutional Premium Class |
| |
| | Six months ended (Unaudited) September 30, 2024 | | Years ended March 31, 2024 | | 2023 | | 2022 | | 2021 | | 2020 |
Selected Per-Share Data | | | | | | | | | | | | |
| Net asset value, beginning of period | $ | 20.41 | $ | 17.36 | $ | 19.06 | $ | 18.53 | $ | 12.61 | $ | 15.34 |
| Income from Investment Operations | | | | | | | | | | | | |
Net investment income (loss) A,B | | .05 | | .40 | | .34 | | .35 | | .27 | | .29 |
| Net realized and unrealized gain (loss) | | 1.76 | | 3.03 | | (1.71) | | .58 | | 5.99 | | (1.33) |
| Total from investment operations | | 1.81 | | 3.43 | | (1.37) | | .93 | | 6.26 | | (1.04) |
| Distributions from net investment income | | (.01) | | (.38) | | (.32) | | (.33) | | (.25) | | (.27) |
| Distributions from net realized gain | | - | | - | | (.01) | | (.08) | | (.09) | | (1.42) |
| Total distributions | | (.01) | | (.38) | | (.33) | | (.40) C | | (.34) | | (1.69) |
| Net asset value, end of period | $ | 22.21 | $ | 20.41 | $ | 17.36 | $ | 19.06 | $ | 18.53 | $ | 12.61 |
Total Return D,E | | | | 19.88% | | (7.07)% | | 4.92% | | 49.87% | | (8.85)% |
Ratios to Average Net Assets B,F,G | | | | | | | | | | | | |
| Expenses before reductions | | .08% H | | .08% | | .08% | | .08% | | .08% | | .08% |
| Expenses net of fee waivers, if any | | | | .08% | | .08% | | .08% | | .08% | | .08% |
| Expenses net of all reductions | | .08% H | | .08% | | .08% | | .08% | | .08% | | .08% |
| Net investment income (loss) | | .48% H | | 2.20% | | 2.03% | | 1.79% | | 1.63% | | 1.87% |
| Supplemental Data | | | | | | | | | | | | |
| Net assets, end of period (000 omitted) | $ | 9,172,487 | $ | 8,010,495 | $ | 5,604,999 | $ | 4,444,575 | $ | 1,659,777 | $ | 713,027 |
Portfolio turnover rate I | | | | 8% | | 11% | | 12% | | 21% | | 74% |
ACalculated based on average shares outstanding during the period.
BNet investment income (loss) is affected by the timing of the declaration of dividends by any underlying mutual funds or exchange-traded funds (ETFs). Net investment income (loss) of any mutual funds or ETFs is not included in the Fund's net investment income (loss) ratio.
CTotal distributions per share do not sum due to rounding.
DTotal returns for periods of less than one year are not annualized.
ETotal returns would have been lower if certain expenses had not been reduced during the applicable periods shown.
FFees and expenses of any underlying mutual funds or exchange-traded funds (ETFs) are not included in the Fund's expense ratio. The Fund indirectly bears its proportionate share of these expenses. For additional expense information related to investments in Fidelity Central Funds, please refer to the "Investments in Fidelity Central Funds" note found in the Notes to Financial Statements section of the most recent Annual or Semi-Annual report.
GExpense ratios reflect operating expenses of the class. Expenses before reductions do not reflect amounts reimbursed, waived, or reduced through arrangements with the investment adviser, brokerage services, or other offset arrangements, if applicable, and do not represent the amount paid by the class during periods when reimbursements, waivers or reductions occur.
HAnnualized.
IAmount does not include the portfolio activity of any underlying mutual funds or exchange-traded funds (ETFs).
Fidelity Freedom® Index 2055 Fund Premier Class |
| |
| | Six months ended (Unaudited) September 30, 2024 | | Years ended March 31, 2024 | | 2023 | | 2022 | | 2021 A |
Selected Per-Share Data | | | | | | | | | | |
| Net asset value, beginning of period | $ | 20.40 | $ | 17.35 | $ | 19.06 | $ | 18.52 | $ | 14.66 |
| Income from Investment Operations | | | | | | | | | | |
Net investment income (loss) B,C | | .05 | | .41 | | .34 | | .35 | | .39 |
| Net realized and unrealized gain (loss) | | 1.76 | | 3.02 | | (1.71) | | .60 | | 3.77 |
| Total from investment operations | | 1.81 | | 3.43 | | (1.37) | | .95 | | 4.16 |
| Distributions from net investment income | | (.01) | | (.38) | | (.32) | | (.33) | | (.25) |
| Distributions from net realized gain | | - | | - | | (.01) | | (.08) | | (.05) |
| Total distributions | | (.01) | | (.38) | | (.34) D | | (.41) | | (.30) |
| Net asset value, end of period | $ | 22.20 | $ | 20.40 | $ | 17.35 | $ | 19.06 | $ | 18.52 |
Total Return E,F | | | | 19.91% | | (7.10)% | | 4.99% | | 28.47% |
Ratios to Average Net Assets C,G,H | | | | | | | | | | |
| Expenses before reductions | | .05% I | | .06% | | .06% | | .06% | | .06% I |
| Expenses net of fee waivers, if any | | | | .06% | | .06% | | .06% | | .06% I |
| Expenses net of all reductions | | .05% I | | .06% | | .06% | | .06% | | .06% I |
| Net investment income (loss) | | .51% I | | 2.22% | | 2.05% | | 1.81% | | 2.84% I |
| Supplemental Data | | | | | | | | | | |
| Net assets, end of period (000 omitted) | $ | 3,885,934 | $ | 3,210,715 | $ | 1,853,562 | $ | 1,183,840 | $ | 463,953 |
Portfolio turnover rate J | | | | 8% | | 11% | | 12% | | 21% |
AFor the period June 24, 2020 (commencement of sale of shares) through March 31, 2021.
BCalculated based on average shares outstanding during the period.
CNet investment income (loss) is affected by the timing of the declaration of dividends by any underlying mutual funds or exchange-traded funds (ETFs). Net investment income (loss) of any mutual funds or ETFs is not included in the Fund's net investment income (loss) ratio.
DTotal distributions per share do not sum due to rounding.
ETotal returns for periods of less than one year are not annualized.
FTotal returns would have been lower if certain expenses had not been reduced during the applicable periods shown.
GFees and expenses of any underlying mutual funds or exchange-traded funds (ETFs) are not included in the Fund's expense ratio. The Fund indirectly bears its proportionate share of these expenses. For additional expense information related to investments in Fidelity Central Funds, please refer to the "Investments in Fidelity Central Funds" note found in the Notes to Financial Statements section of the most recent Annual or Semi-Annual report.
HExpense ratios reflect operating expenses of the class. Expenses before reductions do not reflect amounts reimbursed, waived, or reduced through arrangements with the investment adviser, brokerage services, or other offset arrangements, if applicable, and do not represent the amount paid by the class during periods when reimbursements, waivers or reductions occur.
IAnnualized.
JAmount does not include the portfolio activity of any underlying mutual funds or exchange-traded funds (ETFs).
Fidelity Freedom® Index 2055 Fund Premier II Class |
| |
| | Six months ended (Unaudited) September 30, 2024 A |
Selected Per-Share Data | | |
| Net asset value, beginning of period | $ | 21.45 |
| Income from Investment Operations | | |
Net investment income (loss) B,C | | .01 |
| Net realized and unrealized gain (loss) | | .75 |
| Total from investment operations | | .76 |
| Net asset value, end of period | $ | 22.21 |
Total Return D,E | | |
Ratios to Average Net Assets C,F,G | | |
| Expenses before reductions | | .04% H |
| Expenses net of fee waivers, if any | | |
| Expenses net of all reductions | | .04% H |
| Net investment income (loss) | | .25% H |
| Supplemental Data | | |
| Net assets, end of period (000 omitted) | $ | 7 |
Portfolio turnover rate I | | |
AFor the period August 22, 2024 (commencement of sale of shares) through September 30, 2024.
BCalculated based on average shares outstanding during the period.
CNet investment income (loss) is affected by the timing of the declaration of dividends by any underlying mutual funds or exchange-traded funds (ETFs). Net investment income (loss) of any mutual funds or ETFs is not included in the Fund's net investment income (loss) ratio.
DTotal returns for periods of less than one year are not annualized.
ETotal returns would have been lower if certain expenses had not been reduced during the applicable periods shown.
FFees and expenses of any underlying mutual funds or exchange-traded funds (ETFs) are not included in the Fund's expense ratio. The Fund indirectly bears its proportionate share of these expenses. For additional expense information related to investments in Fidelity Central Funds, please refer to the "Investments in Fidelity Central Funds" note found in the Notes to Financial Statements section of the most recent Annual or Semi-Annual report.
GExpense ratios reflect operating expenses of the class. Expenses before reductions do not reflect amounts reimbursed, waived, or reduced through arrangements with the investment adviser, brokerage services, or other offset arrangements, if applicable, and do not represent the amount paid by the class during periods when reimbursements, waivers or reductions occur.
HAnnualized.
IAmount does not include the portfolio activity of any underlying mutual funds or exchange-traded funds (ETFs).
Fidelity Freedom® Index 2060 Fund
Schedule of Investments September 30, 2024 (Unaudited)
Showing Percentage of Net Assets
| Domestic Equity Funds - 54.2% |
| | | Shares | Value ($) |
Fidelity Series Total Market Index Fund (a) (Cost $3,106,978,350) | | 230,906,777 | 4,359,519,951 |
| | | | |
| International Equity Funds - 35.9% |
| | | Shares | Value ($) |
Fidelity Series Global ex U.S. Index Fund (a) (Cost $2,441,890,431) | | 182,950,199 | 2,886,954,140 |
| | | | |
| Bond Funds - 9.9% |
| | | Shares | Value ($) |
| Fidelity Series Bond Index Fund (a) | | 34,723,505 | 320,845,188 |
| Fidelity Series International Developed Markets Bond Index Fund (a) | | 8,907,560 | 79,010,056 |
| Fidelity Series Long-Term Treasury Bond Index Fund (a) | | 68,431,739 | 401,694,308 |
| TOTAL BOND FUNDS (Cost $845,709,308) | | | 801,549,552 |
| | | | |
| TOTAL INVESTMENT IN SECURITIES - 100.0% (Cost $6,394,578,089) | 8,048,023,643 |
NET OTHER ASSETS (LIABILITIES) - 0.0% | (367,893) |
| NET ASSETS - 100.0% | 8,047,655,750 |
| | |
Legend
Affiliated Central Funds
Fiscal year to date information regarding the Fund's investments in Fidelity Central Funds, including the ownership percentage, is presented below.
| Affiliate | Value, beginning of period ($) | Purchases ($) | Sales Proceeds ($) | Dividend Income ($) | Realized Gain (loss) ($) | Change in Unrealized appreciation (depreciation) ($) | Value, end of period ($) | % ownership, end of period |
| Fidelity Cash Central Fund 4.89% | - | 292,450 | 292,450 | 88 | - | - | - | 0.0% |
| Total | - | 292,450 | 292,450 | 88 | - | - | - | |
| | | | | | | | | |
Amounts in the dividend income column in the above table include any capital gain distributions from underlying funds, which are presented in the corresponding line item in the Statement of Operations, if applicable.
Amounts included in the purchases and sales proceeds columns may include in-kind transactions, if applicable.
Affiliated Underlying Funds
Fiscal year to date information regarding the Fund's investments in affiliated Underlying Funds is presented below. Exchanges between classes of the same affiliated Underlying Funds may occur. If an Underlying Funds changes its name, the name presented below is the name in effect at period end.
| Affiliate | Value, beginning of period ($) | Purchases ($) | Sales Proceeds ($) | Dividend Income ($) | Realized Gain (loss) ($) | Change in Unrealized appreciation (depreciation) ($) | Value, end of period ($) |
| Fidelity Series Bond Index Fund | 265,106,657 | 46,287,290 | 1,148,209 | 5,230,042 | 3,824 | 10,595,626 | 320,845,188 |
| Fidelity Series Global ex U.S. Index Fund | 2,398,563,855 | 330,767,564 | 72,288,005 | - | (1,026,830) | 230,937,556 | 2,886,954,140 |
| Fidelity Series International Developed Markets Bond Index Fund | 64,806,910 | 13,136,831 | 342,801 | 986,985 | (1,009) | 1,410,125 | 79,010,056 |
| Fidelity Series Long-Term Treasury Bond Index Fund | 331,359,886 | 57,622,862 | 4,788,767 | 6,352,227 | (22,846) | 17,523,173 | 401,694,308 |
| Fidelity Series Total Market Index Fund | 3,603,870,830 | 484,983,722 | 94,974,368 | 7,375,924 | 818,671 | 364,821,096 | 4,359,519,951 |
| | 6,663,708,138 | 932,798,269 | 173,542,150 | 19,945,178 | (228,190) | 625,287,576 | 8,048,023,643 |
Amounts in the dividend income column in the above table include any capital gain distributions from underlying funds, which are presented in the corresponding line item in the Statement of Operations, if applicable.
Amounts included in the purchases and sales proceeds columns may include in-kind transactions, if applicable.
Investment Valuation
The following is a summary of the inputs used, as of September 30, 2024, involving the Fund's assets and liabilities carried at fair value. The inputs or methodology used for valuing securities may not be an indication of the risk associated with investing in those securities. For more information on valuation inputs, and their aggregation into the levels used below, please refer to the Investment Valuation section in the accompanying Notes to Financial Statements.
| Valuation Inputs at Reporting Date: |
| Description | Total ($) | Level 1 ($) | Level 2 ($) | Level 3 ($) |
Investments in Securities: | | | | |
|
| Domestic Equity Funds | 4,359,519,951 | 4,359,519,951 | - | - |
|
| International Equity Funds | 2,886,954,140 | 2,886,954,140 | - | - |
|
| Bond Funds | 801,549,552 | 801,549,552 | - | - |
| Total Investments in Securities: | 8,048,023,643 | 8,048,023,643 | - | - |
Fidelity Freedom® Index 2060 Fund
Financial Statements (Unaudited)
| Statement of Assets and Liabilities |
| As of September 30, 2024 (Unaudited) |
| Assets | | | | |
| Investment in securities, at value - See accompanying schedule: | | | | |
Affiliated issuers (cost $6,394,578,089) | $ | 8,048,023,643 | | |
| | | | | |
| | | | | |
| Total Investment in Securities (cost $6,394,578,089) | | | $ | 8,048,023,643 |
| Receivable for investments sold | | | | 12,637,580 |
| Receivable for fund shares sold | | | | 22,145,917 |
Total assets | | | | 8,082,807,140 |
| Liabilities | | | | |
| Payable for investments purchased | $ | 24,261,252 | | |
| Payable for fund shares redeemed | | 10,523,338 | | |
| Accrued management fee | | 366,800 | | |
| Total liabilities | | | | 35,151,390 |
| Net Assets | | | $ | 8,047,655,750 |
| Net Assets consist of: | | | | |
| Paid in capital | | | $ | 6,444,389,909 |
| Total accumulated earnings (loss) | | | | 1,603,265,841 |
| Net Assets | | | $ | 8,047,655,750 |
| | | | | |
| Net Asset Value and Maximum Offering Price | | | | |
| Investor Class : | | | | |
Net Asset Value, offering price and redemption price per share ($851,818,513 ÷ 45,299,628 shares) | | | $ | 18.80 |
| Institutional Premium Class : | | | | |
Net Asset Value, offering price and redemption price per share ($5,110,862,492 ÷ 271,736,681 shares) | | | $ | 18.81 |
| Premier Class : | | | | |
Net Asset Value, offering price and redemption price per share ($2,084,967,395 ÷ 110,815,227 shares) | | | $ | 18.81 |
| Premier II Class : | | | | |
Net Asset Value, offering price and redemption price per share ($7,350 ÷ 391 shares)(a) | | | $ | 18.81 |
(a)Corresponding Net Asset Value does not calculate due to rounding of fractional net assets and/or shares. |
| Statement of Operations |
Six months ended September 30, 2024 (Unaudited) |
| Investment Income | | | | |
| Dividends: | | | | |
| Affiliated issuers | | | $ | 19,945,178 |
| Income from Fidelity Central Funds | | | | 88 |
| Total income | | | | 19,945,266 |
| Expenses | | | | |
| Management fee | $ | 2,658,113 | | |
| Independent trustees' fees and expenses | | 8,805 | | |
| Total expenses before reductions | | 2,666,918 | | |
| Expense reductions | | (42) | | |
| Total expenses after reductions | | | | 2,666,876 |
| Net Investment income (loss) | | | | 17,278,390 |
| Realized and Unrealized Gain (Loss) | | | | |
| Net realized gain (loss) on: | | | | |
| Investment Securities: | | | | |
| Affiliated issuers | | (228,190) | | |
| Total net realized gain (loss) | | | | (228,190) |
| Change in net unrealized appreciation (depreciation) on: | | | | |
| Investment Securities: | | | | |
| Affiliated issuers | | 625,287,576 | | |
| Total change in net unrealized appreciation (depreciation) | | | | 625,287,576 |
| Net gain (loss) | | | | 625,059,386 |
| Net increase (decrease) in net assets resulting from operations | | | $ | 642,337,776 |
| Statement of Changes in Net Assets |
| |
| | Six months ended September 30, 2024 (Unaudited) | | Year ended March 31, 2024 |
| Increase (Decrease) in Net Assets | | | | |
| Operations | | | | |
| Net investment income (loss) | $ | 17,278,390 | $ | 114,571,017 |
| Net realized gain (loss) | | (228,190) | | (6,138,472) |
| Change in net unrealized appreciation (depreciation) | | 625,287,576 | | 908,827,861 |
| Net increase (decrease) in net assets resulting from operations | | 642,337,776 | | 1,017,260,406 |
| Distributions to shareholders | | (3,192,840) | | (110,308,157) |
| | | | | |
| Share transactions - net increase (decrease) | | 745,130,405 | | 1,653,051,416 |
| Total increase (decrease) in net assets | | 1,384,275,341 | | 2,560,003,665 |
| | | | | |
| Net Assets | | | | |
| Beginning of period | | 6,663,380,409 | | 4,103,376,744 |
| End of period | $ | 8,047,655,750 | $ | 6,663,380,409 |
| | | | | |
| | | | | |
Financial Highlights
Fidelity Freedom® Index 2060 Fund Investor Class |
| |
| | Six months ended (Unaudited) September 30, 2024 | | Years ended March 31, 2024 | | 2023 | | 2022 | | 2021 | | 2020 |
Selected Per-Share Data | | | | | | | | | | | | |
| Net asset value, beginning of period | $ | 17.28 | $ | 14.69 | $ | 16.13 | $ | 15.67 | $ | 10.65 | $ | 12.49 |
| Income from Investment Operations | | | | | | | | | | | | |
Net investment income (loss) A,B | | .04 | | .34 | | .28 | | .29 | | .23 | | .24 |
| Net realized and unrealized gain (loss) | | 1.49 | | 2.56 | | (1.45) | | .49 | | 5.06 | | (1.19) |
| Total from investment operations | | 1.53 | | 2.90 | | (1.17) | | .78 | | 5.29 | | (.95) |
| Distributions from net investment income | | (.01) | | (.31) | | (.26) | | (.26) | | (.20) | | (.21) |
| Distributions from net realized gain | | - | | - | | (.01) | | (.06) | | (.07) | | (.68) |
| Total distributions | | (.01) | | (.31) | | (.27) | | (.32) | | (.27) | | (.89) |
| Net asset value, end of period | $ | 18.80 | $ | 17.28 | $ | 14.69 | $ | 16.13 | $ | 15.67 | $ | 10.65 |
Total Return C,D | | | | 19.85% | | (7.13)% | | 4.87% | | 49.89% | | (8.95)% |
Ratios to Average Net Assets B,E,F | | | | | | | | | | | | |
| Expenses before reductions | | .12% G | | .12% | | .12% | | .12% | | .12% | | .12% |
| Expenses net of fee waivers, if any | | | | .12% | | .12% | | .12% | | .12% | | .12% |
| Expenses net of all reductions | | .12% G | | .12% | | .12% | | .12% | | .12% | | .12% |
| Net investment income (loss) | | .44% G | | 2.17% | | 2.00% | | 1.76% | | 1.58% | | 1.85% |
| Supplemental Data | | | | | | | | | | | | |
| Net assets, end of period (000 omitted) | $ | 851,819 | $ | 720,817 | $ | 490,978 | $ | 402,772 | $ | 813,216 | $ | 323,054 |
Portfolio turnover rate H | | | | 7% | | 12% | | 12% | | 24% | | 67% |
ACalculated based on average shares outstanding during the period.
BNet investment income (loss) is affected by the timing of the declaration of dividends by any underlying mutual funds or exchange-traded funds (ETFs). Net investment income (loss) of any mutual funds or ETFs is not included in the Fund's net investment income (loss) ratio.
CTotal returns for periods of less than one year are not annualized.
DTotal returns would have been lower if certain expenses had not been reduced during the applicable periods shown.
EFees and expenses of any underlying mutual funds or exchange-traded funds (ETFs) are not included in the Fund's expense ratio. The Fund indirectly bears its proportionate share of these expenses. For additional expense information related to investments in Fidelity Central Funds, please refer to the "Investments in Fidelity Central Funds" note found in the Notes to Financial Statements section of the most recent Annual or Semi-Annual report.
FExpense ratios reflect operating expenses of the class. Expenses before reductions do not reflect amounts reimbursed, waived, or reduced through arrangements with the investment adviser, brokerage services, or other offset arrangements, if applicable, and do not represent the amount paid by the class during periods when reimbursements, waivers or reductions occur.
GAnnualized.
HAmount does not include the portfolio activity of any underlying mutual funds or exchange-traded funds (ETFs).
Fidelity Freedom® Index 2060 Fund Institutional Premium Class |
| |
| | Six months ended (Unaudited) September 30, 2024 | | Years ended March 31, 2024 | | 2023 | | 2022 | | 2021 | | 2020 |
Selected Per-Share Data | | | | | | | | | | | | |
| Net asset value, beginning of period | $ | 17.28 | $ | 14.70 | $ | 16.14 | $ | 15.68 | $ | 10.66 | $ | 12.50 |
| Income from Investment Operations | | | | | | | | | | | | |
Net investment income (loss) A,B | | .04 | | .34 | | .29 | | .30 | | .23 | | .24 |
| Net realized and unrealized gain (loss) | | 1.50 | | 2.55 | | (1.45) | | .50 | | 5.07 | | (1.19) |
| Total from investment operations | | 1.54 | | 2.89 | | (1.16) | | .80 | | 5.30 | | (.95) |
| Distributions from net investment income | | (.01) | | (.31) | | (.27) | | (.27) | | (.21) | | (.21) |
| Distributions from net realized gain | | - | | - | | (.01) | | (.06) | | (.07) | | (.68) |
| Total distributions | | (.01) | | (.31) | | (.28) | | (.34) C | | (.28) | | (.89) |
| Net asset value, end of period | $ | 18.81 | $ | 17.28 | $ | 14.70 | $ | 16.14 | $ | 15.68 | $ | 10.66 |
Total Return D,E | | | | 19.83% | | (7.08)% | | 4.96% | | 49.92% | | (8.93)% |
Ratios to Average Net Assets B,F,G | | | | | | | | | | | | |
| Expenses before reductions | | .08% H | | .08% | | .08% | | .08% | | .08% | | .08% |
| Expenses net of fee waivers, if any | | | | .08% | | .08% | | .08% | | .08% | | .08% |
| Expenses net of all reductions | | .08% H | | .08% | | .08% | | .08% | | .08% | | .08% |
| Net investment income (loss) | | .48% H | | 2.21% | | 2.04% | | 1.80% | | 1.62% | | 1.90% |
| Supplemental Data | | | | | | | | | | | | |
| Net assets, end of period (000 omitted) | $ | 5,110,862 | $ | 4,286,335 | $ | 2,743,603 | $ | 1,938,419 | $ | 633,265 | $ | 241,263 |
Portfolio turnover rate I | | | | 7% | | 12% | | 12% | | 24% | | 67% |
ACalculated based on average shares outstanding during the period.
BNet investment income (loss) is affected by the timing of the declaration of dividends by any underlying mutual funds or exchange-traded funds (ETFs). Net investment income (loss) of any mutual funds or ETFs is not included in the Fund's net investment income (loss) ratio.
CTotal distributions per share do not sum due to rounding.
DTotal returns for periods of less than one year are not annualized.
ETotal returns would have been lower if certain expenses had not been reduced during the applicable periods shown.
FFees and expenses of any underlying mutual funds or exchange-traded funds (ETFs) are not included in the Fund's expense ratio. The Fund indirectly bears its proportionate share of these expenses. For additional expense information related to investments in Fidelity Central Funds, please refer to the "Investments in Fidelity Central Funds" note found in the Notes to Financial Statements section of the most recent Annual or Semi-Annual report.
GExpense ratios reflect operating expenses of the class. Expenses before reductions do not reflect amounts reimbursed, waived, or reduced through arrangements with the investment adviser, brokerage services, or other offset arrangements, if applicable, and do not represent the amount paid by the class during periods when reimbursements, waivers or reductions occur.
HAnnualized.
IAmount does not include the portfolio activity of any underlying mutual funds or exchange-traded funds (ETFs).
Fidelity Freedom® Index 2060 Fund Premier Class |
| |
| | Six months ended (Unaudited) September 30, 2024 | | Years ended March 31, 2024 | | 2023 | | 2022 | | 2021 A |
Selected Per-Share Data | | | | | | | | | | |
| Net asset value, beginning of period | $ | 17.29 | $ | 14.70 | $ | 16.14 | $ | 15.69 | $ | 12.41 |
| Income from Investment Operations | | | | | | | | | | |
Net investment income (loss) B,C | | .04 | | .35 | | .29 | | .30 | | .32 |
| Net realized and unrealized gain (loss) | | 1.49 | | 2.56 | | (1.45) | | .49 | | 3.21 |
| Total from investment operations | | 1.53 | | 2.91 | | (1.16) | | .79 | | 3.53 |
| Distributions from net investment income | | (.01) | | (.32) | | (.27) | | (.27) | | (.21) |
| Distributions from net realized gain | | - | | - | | (.01) | | (.06) | | (.04) |
| Total distributions | | (.01) | | (.32) | | (.28) | | (.34) D | | (.25) |
| Net asset value, end of period | $ | 18.81 | $ | 17.29 | $ | 14.70 | $ | 16.14 | $ | 15.69 |
Total Return E,F | | | | 19.92% | | (7.06)% | | 4.91% | | 28.52% |
Ratios to Average Net Assets C,G,H | | | | | | | | | | |
| Expenses before reductions | | .05% I | | .06% | | .06% | | .06% | | .06% I |
| Expenses net of fee waivers, if any | | | | .06% | | .06% | | .06% | | .06% I |
| Expenses net of all reductions | | .05% I | | .06% | | .06% | | .06% | | .06% I |
| Net investment income (loss) | | .50% I | | 2.23% | | 2.06% | | 1.82% | | 2.82% I |
| Supplemental Data | | | | | | | | | | |
| Net assets, end of period (000 omitted) | $ | 2,084,967 | $ | 1,656,229 | $ | 868,796 | $ | 506,652 | $ | 183,530 |
Portfolio turnover rate J | | | | 7% | | 12% | | 12% | | 24% |
AFor the period June 24, 2020 (commencement of sale of shares) through March 31, 2021.
BCalculated based on average shares outstanding during the period.
CNet investment income (loss) is affected by the timing of the declaration of dividends by any underlying mutual funds or exchange-traded funds (ETFs). Net investment income (loss) of any mutual funds or ETFs is not included in the Fund's net investment income (loss) ratio.
DTotal distributions per share do not sum due to rounding.
ETotal returns for periods of less than one year are not annualized.
FTotal returns would have been lower if certain expenses had not been reduced during the applicable periods shown.
GFees and expenses of any underlying mutual funds or exchange-traded funds (ETFs) are not included in the Fund's expense ratio. The Fund indirectly bears its proportionate share of these expenses. For additional expense information related to investments in Fidelity Central Funds, please refer to the "Investments in Fidelity Central Funds" note found in the Notes to Financial Statements section of the most recent Annual or Semi-Annual report.
HExpense ratios reflect operating expenses of the class. Expenses before reductions do not reflect amounts reimbursed, waived, or reduced through arrangements with the investment adviser, brokerage services, or other offset arrangements, if applicable, and do not represent the amount paid by the class during periods when reimbursements, waivers or reductions occur.
IAnnualized.
JAmount does not include the portfolio activity of any underlying mutual funds or exchange-traded funds (ETFs).
Fidelity Freedom® Index 2060 Fund Premier II Class |
| |
| | Six months ended (Unaudited) September 30, 2024 A |
Selected Per-Share Data | | |
| Net asset value, beginning of period | $ | 18.17 |
| Income from Investment Operations | | |
Net investment income (loss) B,C | | .01 |
| Net realized and unrealized gain (loss) | | .63 |
| Total from investment operations | | .64 |
| Net asset value, end of period | $ | 18.81 |
Total Return D,E | | |
Ratios to Average Net Assets C,F,G | | |
| Expenses before reductions | | .04% H |
| Expenses net of fee waivers, if any | | |
| Expenses net of all reductions | | .04% H |
| Net investment income (loss) | | .25% H |
| Supplemental Data | | |
| Net assets, end of period (000 omitted) | $ | 7 |
Portfolio turnover rate I | | |
AFor the period August 22, 2024 (commencement of sale of shares) through September 30, 2024.
BCalculated based on average shares outstanding during the period.
CNet investment income (loss) is affected by the timing of the declaration of dividends by any underlying mutual funds or exchange-traded funds (ETFs). Net investment income (loss) of any mutual funds or ETFs is not included in the Fund's net investment income (loss) ratio.
DTotal returns for periods of less than one year are not annualized.
ETotal returns would have been lower if certain expenses had not been reduced during the applicable periods shown.
FFees and expenses of any underlying mutual funds or exchange-traded funds (ETFs) are not included in the Fund's expense ratio. The Fund indirectly bears its proportionate share of these expenses. For additional expense information related to investments in Fidelity Central Funds, please refer to the "Investments in Fidelity Central Funds" note found in the Notes to Financial Statements section of the most recent Annual or Semi-Annual report.
GExpense ratios reflect operating expenses of the class. Expenses before reductions do not reflect amounts reimbursed, waived, or reduced through arrangements with the investment adviser, brokerage services, or other offset arrangements, if applicable, and do not represent the amount paid by the class during periods when reimbursements, waivers or reductions occur.
HAnnualized.
IAmount does not include the portfolio activity of any underlying mutual funds or exchange-traded funds (ETFs).
Fidelity Freedom® Index 2065 Fund
Schedule of Investments September 30, 2024 (Unaudited)
Showing Percentage of Net Assets
| Domestic Equity Funds - 54.2% |
| | | Shares | Value ($) |
Fidelity Series Total Market Index Fund (a) (Cost $1,002,536,679) | | 69,238,926 | 1,307,230,933 |
| | | | |
| International Equity Funds - 35.9% |
| | | Shares | Value ($) |
Fidelity Series Global ex U.S. Index Fund (a) (Cost $745,870,264) | | 54,858,487 | 865,666,930 |
| | | | |
| Bond Funds - 9.9% |
| | | Shares | Value ($) |
| Fidelity Series Bond Index Fund (a) | | 10,412,232 | 96,209,024 |
| Fidelity Series International Developed Markets Bond Index Fund (a) | | 2,671,413 | 23,695,433 |
| Fidelity Series Long-Term Treasury Bond Index Fund (a) | | 20,517,123 | 120,435,514 |
| TOTAL BOND FUNDS (Cost $244,406,839) | | | 240,339,971 |
| | | | |
| TOTAL INVESTMENT IN SECURITIES - 100.0% (Cost $1,992,813,782) | 2,413,237,834 |
NET OTHER ASSETS (LIABILITIES) - 0.0% | (106,972) |
| NET ASSETS - 100.0% | 2,413,130,862 |
| | |
Legend
Affiliated Central Funds
Fiscal year to date information regarding the Fund's investments in Fidelity Central Funds, including the ownership percentage, is presented below.
| Affiliate | Value, beginning of period ($) | Purchases ($) | Sales Proceeds ($) | Dividend Income ($) | Realized Gain (loss) ($) | Change in Unrealized appreciation (depreciation) ($) | Value, end of period ($) | % ownership, end of period |
| Fidelity Cash Central Fund 4.89% | - | 563,609 | 563,609 | 112 | - | - | - | 0.0% |
| Total | - | 563,609 | 563,609 | 112 | - | - | - | |
| | | | | | | | | |
Amounts in the dividend income column in the above table include any capital gain distributions from underlying funds, which are presented in the corresponding line item in the Statement of Operations, if applicable.
Amounts included in the purchases and sales proceeds columns may include in-kind transactions, if applicable.
Affiliated Underlying Funds
Fiscal year to date information regarding the Fund's investments in affiliated Underlying Funds is presented below. Exchanges between classes of the same affiliated Underlying Funds may occur. If an Underlying Funds changes its name, the name presented below is the name in effect at period end.
| Affiliate | Value, beginning of period ($) | Purchases ($) | Sales Proceeds ($) | Dividend Income ($) | Realized Gain (loss) ($) | Change in Unrealized appreciation (depreciation) ($) | Value, end of period ($) |
| Fidelity Series Bond Index Fund | 72,524,487 | 20,711,526 | 176,443 | 1,505,394 | 2,155 | 3,147,299 | 96,209,024 |
| Fidelity Series Global ex U.S. Index Fund | 656,427,920 | 159,146,889 | 17,636,901 | - | 195,886 | 67,533,136 | 865,666,930 |
| Fidelity Series International Developed Markets Bond Index Fund | 17,717,491 | 5,582,515 | 44,046 | 274,036 | 51 | 439,422 | 23,695,433 |
| Fidelity Series Long-Term Treasury Bond Index Fund | 90,658,489 | 25,438,269 | 915,007 | 1,827,942 | (5,706) | 5,259,469 | 120,435,514 |
| Fidelity Series Total Market Index Fund | 986,206,266 | 235,818,799 | 22,395,770 | 2,033,555 | (24,227) | 107,625,865 | 1,307,230,933 |
| | 1,823,534,653 | 446,697,998 | 41,168,167 | 5,640,927 | 168,159 | 184,005,191 | 2,413,237,834 |
Amounts in the dividend income column in the above table include any capital gain distributions from underlying funds, which are presented in the corresponding line item in the Statement of Operations, if applicable.
Amounts included in the purchases and sales proceeds columns may include in-kind transactions, if applicable.
Investment Valuation
The following is a summary of the inputs used, as of September 30, 2024, involving the Fund's assets and liabilities carried at fair value. The inputs or methodology used for valuing securities may not be an indication of the risk associated with investing in those securities. For more information on valuation inputs, and their aggregation into the levels used below, please refer to the Investment Valuation section in the accompanying Notes to Financial Statements.
| Valuation Inputs at Reporting Date: |
| Description | Total ($) | Level 1 ($) | Level 2 ($) | Level 3 ($) |
Investments in Securities: | | | | |
|
| Domestic Equity Funds | 1,307,230,933 | 1,307,230,933 | - | - |
|
| International Equity Funds | 865,666,930 | 865,666,930 | - | - |
|
| Bond Funds | 240,339,971 | 240,339,971 | - | - |
| Total Investments in Securities: | 2,413,237,834 | 2,413,237,834 | - | - |
Fidelity Freedom® Index 2065 Fund
Financial Statements (Unaudited)
| Statement of Assets and Liabilities |
| As of September 30, 2024 (Unaudited) |
| Assets | | | | |
| Investment in securities, at value - See accompanying schedule: | | | | |
Affiliated issuers (cost $1,992,813,782) | $ | 2,413,237,834 | | |
| | | | | |
| | | | | |
| Total Investment in Securities (cost $1,992,813,782) | | | $ | 2,413,237,834 |
| Receivable for investments sold | | | | 4,221,764 |
| Receivable for fund shares sold | | | | 6,598,177 |
| Distributions receivable from Fidelity Central Funds | | | | 49 |
Total assets | | | | 2,424,057,824 |
| Liabilities | | | | |
| Payable for investments purchased | $ | 6,534,166 | | |
| Payable for fund shares redeemed | | 4,284,292 | | |
| Accrued management fee | | 108,504 | | |
| Total liabilities | | | | 10,926,962 |
| Net Assets | | | $ | 2,413,130,862 |
| Net Assets consist of: | | | | |
| Paid in capital | | | $ | 2,002,440,215 |
| Total accumulated earnings (loss) | | | | 410,690,647 |
| Net Assets | | | $ | 2,413,130,862 |
| | | | | |
| Net Asset Value and Maximum Offering Price | | | | |
| Investor Class : | | | | |
Net Asset Value, offering price and redemption price per share ($254,243,522 ÷ 16,716,407 shares) | | | $ | 15.21 |
| Institutional Premium Class : | | | | |
Net Asset Value, offering price and redemption price per share ($1,443,113,770 ÷ 94,880,096 shares) | | | $ | 15.21 |
| Premier Class : | | | | |
Net Asset Value, offering price and redemption price per share ($715,766,220 ÷ 47,054,845 shares) | | | $ | 15.21 |
| Premier II Class : | | | | |
Net Asset Value, offering price and redemption price per share ($7,350 ÷ 483 shares)(a) | | | $ | 15.21 |
(a)Corresponding Net Asset Value does not calculate due to rounding of fractional net assets and/or shares. |
| Statement of Operations |
Six months ended September 30, 2024 (Unaudited) |
| Investment Income | | | | |
| Dividends: | | | | |
| Affiliated issuers | | | $ | 5,640,927 |
| Income from Fidelity Central Funds | | | | 112 |
| Total income | | | | 5,641,039 |
| Expenses | | | | |
| Management fee | $ | 755,365 | | |
| Independent trustees' fees and expenses | | 2,486 | | |
| Miscellaneous | | 13 | | |
| Total expenses before reductions | | 757,864 | | |
| Expense reductions | | (9) | | |
| Total expenses after reductions | | | | 757,855 |
| Net Investment income (loss) | | | | 4,883,184 |
| Realized and Unrealized Gain (Loss) | | | | |
| Net realized gain (loss) on: | | | | |
| Investment Securities: | | | | |
| Affiliated issuers | | 168,159 | | |
| Total net realized gain (loss) | | | | 168,159 |
| Change in net unrealized appreciation (depreciation) on: | | | | |
| Investment Securities: | | | | |
| Affiliated issuers | | 184,005,191 | | |
| Total change in net unrealized appreciation (depreciation) | | | | 184,005,191 |
| Net gain (loss) | | | | 184,173,350 |
| Net increase (decrease) in net assets resulting from operations | | | $ | 189,056,534 |
| Statement of Changes in Net Assets |
| |
| | Six months ended September 30, 2024 (Unaudited) | | Year ended March 31, 2024 |
| Increase (Decrease) in Net Assets | | | | |
| Operations | | | | |
| Net investment income (loss) | $ | 4,883,184 | $ | 29,175,727 |
| Net realized gain (loss) | | 168,159 | | (2,244,343) |
| Change in net unrealized appreciation (depreciation) | | 184,005,191 | | 235,683,520 |
| Net increase (decrease) in net assets resulting from operations | | 189,056,534 | | 262,614,904 |
| Distributions to shareholders | | (521,059) | | (28,087,856) |
| | | | | |
| Share transactions - net increase (decrease) | | 401,154,090 | | 667,708,998 |
| Total increase (decrease) in net assets | | 589,689,565 | | 902,236,046 |
| | | | | |
| Net Assets | | | | |
| Beginning of period | | 1,823,441,297 | | 921,205,251 |
| End of period | $ | 2,413,130,862 | $ | 1,823,441,297 |
| | | | | |
| | | | | |
Financial Highlights
Fidelity Freedom® Index 2065 Fund Investor Class |
| |
| | Six months ended (Unaudited) September 30, 2024 | | Years ended March 31, 2024 | | 2023 | | 2022 | | 2021 | | 2020 A |
Selected Per-Share Data | | | | | | | | | | | | |
| Net asset value, beginning of period | $ | 13.98 | $ | 11.88 | $ | 13.04 | $ | 12.65 | $ | 8.60 | $ | 10.00 |
| Income from Investment Operations | | | | | | | | | | | | |
Net investment income (loss) B,C | | .03 | | .28 | | .23 | | .25 | | .12 | | .25 |
| Net realized and unrealized gain (loss) | | 1.20 | | 2.06 | | (1.17) | | .38 | | 4.15 | | (1.43) |
| Total from investment operations | | 1.23 | | 2.34 | | (.94) | | .63 | | 4.27 | | (1.18) |
| Distributions from net investment income | | - D | | (.24) | | (.21) | | (.20) | | (.15) | | (.19) |
| Distributions from net realized gain | | - | | - | | (.01) | | (.04) | | (.07) | | (.02) |
| Total distributions | | - D | | (.24) | | (.22) | | (.24) | | (.22) | | (.22) E |
| Net asset value, end of period | $ | 15.21 | $ | 13.98 | $ | 11.88 | $ | 13.04 | $ | 12.65 | $ | 8.60 |
Total Return F,G | | | | 19.87% | | (7.12)% | | 4.87% | | 49.88% | | (12.24)% |
Ratios to Average Net Assets C,H,I | | | | | | | | | | | | |
| Expenses before reductions | | .12% J | | .12% | | .12% | | .12% | | .12% | | .12% J |
| Expenses net of fee waivers, if any | | | | .12% | | .12% | | .12% | | .12% | | .12% J |
| Expenses net of all reductions | | .12% J | | .12% | | .12% | | .12% | | .12% | | .12% J |
| Net investment income (loss) | | .43% J | | 2.21% | | 2.04% | | 1.88% | | 1.04% | | 3.25% J |
| Supplemental Data | | | | | | | | | | | | |
| Net assets, end of period (000 omitted) | $ | 254,244 | $ | 198,041 | $ | 117,042 | $ | 74,401 | $ | 86,437 | $ | 15,363 |
Portfolio turnover rate K | | | | 7% | | 12% | | 11% | | 33% | | 103% J |
AFor the period June 28, 2019 (commencement of operations) through March 31, 2020.
BCalculated based on average shares outstanding during the period.
CNet investment income (loss) is affected by the timing of the declaration of dividends by any underlying mutual funds or exchange-traded funds (ETFs). Net investment income (loss) of any mutual funds or ETFs is not included in the Fund's net investment income (loss) ratio.
DAmount represents less than $.005 per share.
ETotal distributions per share do not sum due to rounding.
FTotal returns for periods of less than one year are not annualized.
GTotal returns would have been lower if certain expenses had not been reduced during the applicable periods shown.
HFees and expenses of any underlying mutual funds or exchange-traded funds (ETFs) are not included in the Fund's expense ratio. The Fund indirectly bears its proportionate share of these expenses. For additional expense information related to investments in Fidelity Central Funds, please refer to the "Investments in Fidelity Central Funds" note found in the Notes to Financial Statements section of the most recent Annual or Semi-Annual report.
IExpense ratios reflect operating expenses of the class. Expenses before reductions do not reflect amounts reimbursed, waived, or reduced through arrangements with the investment adviser, brokerage services, or other offset arrangements, if applicable, and do not represent the amount paid by the class during periods when reimbursements, waivers or reductions occur.
JAnnualized.
KAmount does not include the portfolio activity of any underlying mutual funds or exchange-traded funds (ETFs).
Fidelity Freedom® Index 2065 Fund Institutional Premium Class |
| |
| | Six months ended (Unaudited) September 30, 2024 | | Years ended March 31, 2024 | | 2023 | | 2022 | | 2021 | | 2020 A |
Selected Per-Share Data | | | | | | | | | | | | |
| Net asset value, beginning of period | $ | 13.98 | $ | 11.88 | $ | 13.04 | $ | 12.65 | $ | 8.60 | $ | 10.00 |
| Income from Investment Operations | | | | | | | | | | | | |
Net investment income (loss) B,C | | .03 | | .28 | | .24 | | .26 | | .12 | | .25 |
| Net realized and unrealized gain (loss) | | 1.20 | | 2.07 | | (1.18) | | .38 | | 4.15 | | (1.43) |
| Total from investment operations | | 1.23 | | 2.35 | | (.94) | | .64 | | 4.27 | | (1.18) |
| Distributions from net investment income | | - D | | (.25) | | (.22) | | (.21) | | (.15) | | (.19) |
| Distributions from net realized gain | | - | | - | | (.01) | | (.04) | | (.07) | | (.02) |
| Total distributions | | - D | | (.25) | | (.22) E | | (.25) | | (.22) | | (.22) E |
| Net asset value, end of period | $ | 15.21 | $ | 13.98 | $ | 11.88 | $ | 13.04 | $ | 12.65 | $ | 8.60 |
Total Return F,G | | | | 19.92% | | (7.08)% | | 4.95% | | 49.92% | | (12.23)% |
Ratios to Average Net Assets C,H,I | | | | | | | | | | | | |
| Expenses before reductions | | .08% J | | .08% | | .08% | | .08% | | .08% | | .08% J |
| Expenses net of fee waivers, if any | | | | .08% | | .08% | | .08% | | .08% | | .08% J |
| Expenses net of all reductions | | .08% J | | .08% | | .08% | | .08% | | .08% | | .08% J |
| Net investment income (loss) | | .47% J | | 2.25% | | 2.08% | | 1.92% | | 1.08% | | 3.29% J |
| Supplemental Data | | | | | | | | | | | | |
| Net assets, end of period (000 omitted) | $ | 1,443,114 | $ | 1,107,946 | $ | 581,491 | $ | 298,536 | $ | 66,985 | $ | 9,896 |
Portfolio turnover rate K | | | | 7% | | 12% | | 11% | | 33% | | 103% J |
AFor the period June 28, 2019 (commencement of operations) through March 31, 2020.
BCalculated based on average shares outstanding during the period.
CNet investment income (loss) is affected by the timing of the declaration of dividends by any underlying mutual funds or exchange-traded funds (ETFs). Net investment income (loss) of any mutual funds or ETFs is not included in the Fund's net investment income (loss) ratio.
DAmount represents less than $.005 per share.
ETotal distributions per share do not sum due to rounding.
FTotal returns for periods of less than one year are not annualized.
GTotal returns would have been lower if certain expenses had not been reduced during the applicable periods shown.
HFees and expenses of any underlying mutual funds or exchange-traded funds (ETFs) are not included in the Fund's expense ratio. The Fund indirectly bears its proportionate share of these expenses. For additional expense information related to investments in Fidelity Central Funds, please refer to the "Investments in Fidelity Central Funds" note found in the Notes to Financial Statements section of the most recent Annual or Semi-Annual report.
IExpense ratios reflect operating expenses of the class. Expenses before reductions do not reflect amounts reimbursed, waived, or reduced through arrangements with the investment adviser, brokerage services, or other offset arrangements, if applicable, and do not represent the amount paid by the class during periods when reimbursements, waivers or reductions occur.
JAnnualized.
KAmount does not include the portfolio activity of any underlying mutual funds or exchange-traded funds (ETFs).
Fidelity Freedom® Index 2065 Fund Premier Class |
| |
| | Six months ended (Unaudited) September 30, 2024 | | Years ended March 31, 2024 | | 2023 | | 2022 | | 2021 A |
Selected Per-Share Data | | | | | | | | | | |
| Net asset value, beginning of period | $ | 13.97 | $ | 11.88 | $ | 13.04 | $ | 12.65 | $ | 9.99 |
| Income from Investment Operations | | | | | | | | | | |
Net investment income (loss) B,C | | .04 | | .29 | | .24 | | .26 | | .59 |
| Net realized and unrealized gain (loss) | | 1.20 | | 2.05 | | (1.17) | | .38 | | 2.25 |
| Total from investment operations | | 1.24 | | 2.34 | | (.93) | | .64 | | 2.84 |
| Distributions from net investment income | | - D | | (.25) | | (.22) | | (.21) | | (.15) |
| Distributions from net realized gain | | - | | - | | (.01) | | (.04) | | (.03) |
| Total distributions | | - D | | (.25) | | (.23) | | (.25) | | (.18) |
| Net asset value, end of period | $ | 15.21 | $ | 13.97 | $ | 11.88 | $ | 13.04 | $ | 12.65 |
Total Return E,F | | | | 19.85% | | (7.06)% | | 4.96% | | 28.47% |
Ratios to Average Net Assets C,G,H | | | | | | | | | | |
| Expenses before reductions | | .05% I | | .06% | | .06% | | .06% | | .06% I |
| Expenses net of fee waivers, if any | | | | .06% | | .06% | | .06% | | .06% I |
| Expenses net of all reductions | | .05% I | | .06% | | .06% | | .06% | | .06% I |
| Net investment income (loss) | | .50% I | | 2.27% | | 2.10% | | 1.94% | | 6.34% I |
| Supplemental Data | | | | | | | | | | |
| Net assets, end of period (000 omitted) | $ | 715,766 | $ | 517,455 | $ | 222,672 | $ | 105,651 | $ | 29,849 |
Portfolio turnover rate J | | | | 7% | | 12% | | 11% | | 33% |
AFor the period June 24, 2020 (commencement of sale of shares) through March 31, 2021.
BCalculated based on average shares outstanding during the period.
CNet investment income (loss) is affected by the timing of the declaration of dividends by any underlying mutual funds or exchange-traded funds (ETFs). Net investment income (loss) of any mutual funds or ETFs is not included in the Fund's net investment income (loss) ratio.
DAmount represents less than $.005 per share.
ETotal returns for periods of less than one year are not annualized.
FTotal returns would have been lower if certain expenses had not been reduced during the applicable periods shown.
GFees and expenses of any underlying mutual funds or exchange-traded funds (ETFs) are not included in the Fund's expense ratio. The Fund indirectly bears its proportionate share of these expenses. For additional expense information related to investments in Fidelity Central Funds, please refer to the "Investments in Fidelity Central Funds" note found in the Notes to Financial Statements section of the most recent Annual or Semi-Annual report.
HExpense ratios reflect operating expenses of the class. Expenses before reductions do not reflect amounts reimbursed, waived, or reduced through arrangements with the investment adviser, brokerage services, or other offset arrangements, if applicable, and do not represent the amount paid by the class during periods when reimbursements, waivers or reductions occur.
IAnnualized.
JAmount does not include the portfolio activity of any underlying mutual funds or exchange-traded funds (ETFs).
Fidelity Freedom® Index 2065 Fund Premier II Class |
| |
| | Six months ended (Unaudited) September 30, 2024 A |
Selected Per-Share Data | | |
| Net asset value, beginning of period | $ | 14.69 |
| Income from Investment Operations | | |
| Net realized and unrealized gain (loss) | | .52 |
| Total from investment operations | | .52 |
| Net asset value, end of period | $ | 15.21 |
Total Return D,E | | |
Ratios to Average Net Assets C,F,G | | |
| Expenses before reductions | | .04% H |
| Expenses net of fee waivers, if any | | |
| Expenses net of all reductions | | .04% H |
| Net investment income (loss) | | .25% H |
| Supplemental Data | | |
| Net assets, end of period (000 omitted) | $ | 7 |
Portfolio turnover rate I | | |
AFor the period August 22, 2024 (commencement of sale of shares) through September 30, 2024.
BCalculated based on average shares outstanding during the period.
CNet investment income (loss) is affected by the timing of the declaration of dividends by any underlying mutual funds or exchange-traded funds (ETFs). Net investment income (loss) of any mutual funds or ETFs is not included in the Fund's net investment income (loss) ratio.
DTotal returns for periods of less than one year are not annualized.
ETotal returns would have been lower if certain expenses had not been reduced during the applicable periods shown.
FFees and expenses of any underlying mutual funds or exchange-traded funds (ETFs) are not included in the Fund's expense ratio. The Fund indirectly bears its proportionate share of these expenses. For additional expense information related to investments in Fidelity Central Funds, please refer to the "Investments in Fidelity Central Funds" note found in the Notes to Financial Statements section of the most recent Annual or Semi-Annual report.
GExpense ratios reflect operating expenses of the class. Expenses before reductions do not reflect amounts reimbursed, waived, or reduced through arrangements with the investment adviser, brokerage services, or other offset arrangements, if applicable, and do not represent the amount paid by the class during periods when reimbursements, waivers or reductions occur.
HAnnualized.
IAmount does not include the portfolio activity of any underlying mutual funds or exchange-traded funds (ETFs).
Fidelity Freedom® Index 2070 Fund
Schedule of Investments September 30, 2024 (Unaudited)
Showing Percentage of Net Assets
| Domestic Equity Funds - 54.2% |
| | | Shares | Value ($) |
Fidelity Series Total Market Index Fund (a) (Cost $1,297,429) | | 72,257 | 1,364,217 |
| | | | |
| International Equity Funds - 35.9% |
| | | Shares | Value ($) |
Fidelity Series Global ex U.S. Index Fund (a) (Cost $854,297) | | 57,251 | 903,415 |
| | | | |
| Bond Funds - 9.9% |
| | | Shares | Value ($) |
| Fidelity Series Bond Index Fund (a) | | 10,866 | 100,406 |
| Fidelity Series International Developed Markets Bond Index Fund (a) | | 2,792 | 24,769 |
| Fidelity Series Long-Term Treasury Bond Index Fund (a) | | 21,385 | 125,529 |
| TOTAL BOND FUNDS (Cost $247,399) | | | 250,704 |
| | | | |
| TOTAL INVESTMENT IN SECURITIES - 100.0% (Cost $2,399,125) | 2,518,336 |
NET OTHER ASSETS (LIABILITIES) - 0.0% | (189) |
| NET ASSETS - 100.0% | 2,518,147 |
| | |
Legend
Affiliated Central Funds
Fiscal year to date information regarding the Fund's investments in Fidelity Central Funds, including the ownership percentage, is presented below.
| Affiliate | Value, beginning of period ($) | Purchases ($) | Sales Proceeds ($) | Dividend Income ($) | Realized Gain (loss) ($) | Change in Unrealized appreciation (depreciation) ($) | Value, end of period ($) | % ownership, end of period |
| Fidelity Cash Central Fund 4.89% | - | 500,000 | 500,000 | 221 | - | - | - | 0.0% |
| Total | - | 500,000 | 500,000 | 221 | - | - | - | |
| | | | | | | | | |
Amounts in the dividend income column in the above table include any capital gain distributions from underlying funds, which are presented in the corresponding line item in the Statement of Operations, if applicable.
Amounts included in the purchases and sales proceeds columns may include in-kind transactions, if applicable.
Affiliated Underlying Funds
Fiscal year to date information regarding the Fund's investments in affiliated Underlying Funds is presented below. Exchanges between classes of the same affiliated Underlying Funds may occur. If an Underlying Funds changes its name, the name presented below is the name in effect at period end.
| Affiliate | Value, beginning of period ($) | Purchases ($) | Sales Proceeds ($) | Dividend Income ($) | Realized Gain (loss) ($) | Change in Unrealized appreciation (depreciation) ($) | Value, end of period ($) |
| Fidelity Series Bond Index Fund | - | 99,149 | - | 425 | - | 1,257 | 100,406 |
| Fidelity Series Global ex U.S. Index Fund | - | 854,598 | 289 | - | (11) | 49,117 | 903,415 |
| Fidelity Series International Developed Markets Bond Index Fund | - | 24,412 | - | 16 | - | 357 | 24,769 |
| Fidelity Series Long-Term Treasury Bond Index Fund | - | 124,126 | 292 | 508 | 4 | 1,691 | 125,529 |
| Fidelity Series Total Market Index Fund | - | 1,297,428 | - | - | - | 66,789 | 1,364,217 |
| | - | 2,399,713 | 581 | 949 | (7) | 119,211 | 2,518,336 |
Amounts in the dividend income column in the above table include any capital gain distributions from underlying funds, which are presented in the corresponding line item in the Statement of Operations, if applicable.
Amounts included in the purchases and sales proceeds columns may include in-kind transactions, if applicable.
Investment Valuation
The following is a summary of the inputs used, as of September 30, 2024, involving the Fund's assets and liabilities carried at fair value. The inputs or methodology used for valuing securities may not be an indication of the risk associated with investing in those securities. For more information on valuation inputs, and their aggregation into the levels used below, please refer to the Investment Valuation section in the accompanying Notes to Financial Statements.
| Valuation Inputs at Reporting Date: |
| Description | Total ($) | Level 1 ($) | Level 2 ($) | Level 3 ($) |
Investments in Securities: | | | | |
|
| Domestic Equity Funds | 1,364,217 | 1,364,217 | - | - |
|
| International Equity Funds | 903,415 | 903,415 | - | - |
|
| Bond Funds | 250,704 | 250,704 | - | - |
|
| Unclassified | - | - | - | - |
| Total Investments in Securities: | 2,518,336 | 2,518,336 | - | - |
Fidelity Freedom® Index 2070 Fund
Financial Statements (Unaudited)
| Statement of Assets and Liabilities |
| As of September 30, 2024 (Unaudited) |
| Assets | | | | |
| Investment in securities, at value - See accompanying schedule: | | | | |
Affiliated issuers (cost $2,399,125) | $ | 2,518,336 | | |
| | | | | |
| | | | | |
| Total Investment in Securities (cost $2,399,125) | | | $ | 2,518,336 |
| Receivable for fund shares sold | | | | 17,317 |
Total assets | | | | 2,535,653 |
| Liabilities | | | | |
| Payable for investments purchased | $ | 17,317 | | |
| Accrued management fee | | 189 | | |
| Total liabilities | | | | 17,506 |
| Net Assets | | | $ | 2,518,147 |
| Net Assets consist of: | | | | |
| Paid in capital | | | $ | 2,398,074 |
| Total accumulated earnings (loss) | | | | 120,073 |
| Net Assets | | | $ | 2,518,147 |
| | | | | |
| Net Asset Value and Maximum Offering Price | | | | |
| Investor Class : | | | | |
Net Asset Value, offering price and redemption price per share ($2,025,359 ÷ 189,715 shares) | | | $ | 10.68 |
| Institutional Premium Class : | | | | |
Net Asset Value, offering price and redemption price per share ($372,409 ÷ 34,888 shares) | | | $ | 10.67 |
| Premier Class : | | | | |
Net Asset Value, offering price and redemption price per share ($113,029 ÷ 10,588 shares) | | | $ | 10.68 |
| Premier II Class : | | | | |
Net Asset Value, offering price and redemption price per share ($7,350 ÷ 689 shares) | | | $ | 10.67 |
| Statement of Operations |
For the period June 28, 2024 (commencement of operations) through September 30, 2024 (Unaudited)
|
| Investment Income | | | | |
| Dividends: | | | | |
| Affiliated issuers | | | $ | 949 |
| Income from Fidelity Central Funds | | | | 221 |
| Total income | | | | 1,170 |
| Expenses | | | | |
| Management fee | $ | 301 | | |
| Total expenses | | | | 301 |
| Net Investment income (loss) | | | | 869 |
| Realized and Unrealized Gain (Loss) | | | | |
| Net realized gain (loss) on: | | | | |
| Investment Securities: | | | | |
| Affiliated issuers | | (7) | | |
| Total net realized gain (loss) | | | | (7) |
| Change in net unrealized appreciation (depreciation) on: | | | | |
| Investment Securities: | | | | |
| Affiliated issuers | | 119,211 | | |
| Total change in net unrealized appreciation (depreciation) | | | | 119,211 |
| Net gain (loss) | | | | 119,204 |
| Net increase (decrease) in net assets resulting from operations | | | $ | 120,073 |
| Statement of Changes in Net Assets |
| |
| | For the period June 28, 2024 (commencement of operations) through September 30, 2024 (Unaudited) |
| Increase (Decrease) in Net Assets | | |
| Operations | | |
| Net investment income (loss) | $ | 869 |
| Net realized gain (loss) | | (7) |
| Change in net unrealized appreciation (depreciation) | | 119,211 |
| Net increase (decrease) in net assets resulting from operations | | 120,073 |
| | | |
| Share transactions - net increase (decrease) | | 2,398,074 |
| Total increase (decrease) in net assets | | 2,518,147 |
| | | |
| Net Assets | | |
| Beginning of period | | - |
| End of period | $ | 2,518,147 |
| | | |
| | | |
Financial Highlights
Fidelity Freedom® Index 2070 Fund Investor Class |
| |
| | Six months ended (Unaudited) September 30, 2024 A |
Selected Per-Share Data | | |
| Net asset value, beginning of period | $ | 10.00 |
| Income from Investment Operations | | |
Net investment income (loss) B,C | | .01 |
| Net realized and unrealized gain (loss) | | .67 |
| Total from investment operations | | .68 |
| Net asset value, end of period | $ | 10.68 |
Total Return D | | |
Ratios to Average Net Assets C,E,F | | |
| Expenses before reductions | | .12% G |
| Expenses net of fee waivers, if any | | |
| Expenses net of all reductions | | .12% G |
| Net investment income (loss) | | .28% G |
| Supplemental Data | | |
| Net assets, end of period (000 omitted) | $ | 2,025 |
Portfolio turnover rate H | | |
AFor the period June 28, 2024 (commencement of operations) through September 30, 2024.
BCalculated based on average shares outstanding during the period.
CNet investment income (loss) is affected by the timing of the declaration of dividends by any underlying mutual funds or exchange-traded funds (ETFs). Net investment income (loss) of any mutual funds or ETFs is not included in the Fund's net investment income (loss) ratio.
DTotal returns for periods of less than one year are not annualized.
EFees and expenses of any underlying mutual funds or exchange-traded funds (ETFs) are not included in the Fund's expense ratio. The Fund indirectly bears its proportionate share of these expenses. For additional expense information related to investments in Fidelity Central Funds, please refer to the "Investments in Fidelity Central Funds" note found in the Notes to Financial Statements section of the most recent Annual or Semi-Annual report.
FExpense ratios reflect operating expenses of the class. Expenses before reductions do not reflect amounts reimbursed, waived, or reduced through arrangements with the investment adviser, brokerage services, or other offset arrangements, if applicable, and do not represent the amount paid by the class during periods when reimbursements, waivers or reductions occur.
GAnnualized.
HAmount does not include the portfolio activity of any underlying mutual funds or exchange-traded funds (ETFs).
IAmount not annualized.
Fidelity Freedom® Index 2070 Fund Institutional Premium Class |
| |
| | Six months ended (Unaudited) September 30, 2024 A |
Selected Per-Share Data | | |
| Net asset value, beginning of period | $ | 10.00 |
| Income from Investment Operations | | |
Net investment income (loss) B,C | | .01 |
| Net realized and unrealized gain (loss) | | .66 |
| Total from investment operations | | .67 |
| Net asset value, end of period | $ | 10.67 |
Total Return D | | |
Ratios to Average Net Assets C,E,F | | |
| Expenses before reductions | | .08% G |
| Expenses net of fee waivers, if any | | |
| Expenses net of all reductions | | .08% G |
| Net investment income (loss) | | .32% G |
| Supplemental Data | | |
| Net assets, end of period (000 omitted) | $ | 372 |
Portfolio turnover rate H | | |
AFor the period June 28, 2024 (commencement of operations) through September 30, 2024.
BCalculated based on average shares outstanding during the period.
CNet investment income (loss) is affected by the timing of the declaration of dividends by any underlying mutual funds or exchange-traded funds (ETFs). Net investment income (loss) of any mutual funds or ETFs is not included in the Fund's net investment income (loss) ratio.
DTotal returns for periods of less than one year are not annualized.
EFees and expenses of any underlying mutual funds or exchange-traded funds (ETFs) are not included in the Fund's expense ratio. The Fund indirectly bears its proportionate share of these expenses. For additional expense information related to investments in Fidelity Central Funds, please refer to the "Investments in Fidelity Central Funds" note found in the Notes to Financial Statements section of the most recent Annual or Semi-Annual report.
FExpense ratios reflect operating expenses of the class. Expenses before reductions do not reflect amounts reimbursed, waived, or reduced through arrangements with the investment adviser, brokerage services, or other offset arrangements, if applicable, and do not represent the amount paid by the class during periods when reimbursements, waivers or reductions occur.
GAnnualized.
HAmount does not include the portfolio activity of any underlying mutual funds or exchange-traded funds (ETFs).
IAmount not annualized.
Fidelity Freedom® Index 2070 Fund Premier Class |
| |
| | Six months ended (Unaudited) September 30, 2024 A |
Selected Per-Share Data | | |
| Net asset value, beginning of period | $ | 10.00 |
| Income from Investment Operations | | |
Net investment income (loss) B,C | | .01 |
| Net realized and unrealized gain (loss) | | .67 |
| Total from investment operations | | .68 |
| Net asset value, end of period | $ | 10.68 |
Total Return D | | |
Ratios to Average Net Assets C,E,F | | |
| Expenses before reductions | | .05% G |
| Expenses net of fee waivers, if any | | |
| Expenses net of all reductions | | .05% G |
| Net investment income (loss) | | .35% G |
| Supplemental Data | | |
| Net assets, end of period (000 omitted) | $ | 113 |
Portfolio turnover rate H | | |
AFor the period June 28, 2024 (commencement of operations) through September 30, 2024.
BCalculated based on average shares outstanding during the period.
CNet investment income (loss) is affected by the timing of the declaration of dividends by any underlying mutual funds or exchange-traded funds (ETFs). Net investment income (loss) of any mutual funds or ETFs is not included in the Fund's net investment income (loss) ratio.
DTotal returns for periods of less than one year are not annualized.
EFees and expenses of any underlying mutual funds or exchange-traded funds (ETFs) are not included in the Fund's expense ratio. The Fund indirectly bears its proportionate share of these expenses. For additional expense information related to investments in Fidelity Central Funds, please refer to the "Investments in Fidelity Central Funds" note found in the Notes to Financial Statements section of the most recent Annual or Semi-Annual report.
FExpense ratios reflect operating expenses of the class. Expenses before reductions do not reflect amounts reimbursed, waived, or reduced through arrangements with the investment adviser, brokerage services, or other offset arrangements, if applicable, and do not represent the amount paid by the class during periods when reimbursements, waivers or reductions occur.
GAnnualized.
HAmount does not include the portfolio activity of any underlying mutual funds or exchange-traded funds (ETFs).
IAmount not annualized.
Fidelity Freedom® Index 2070 Fund Premier II Class |
| |
| | Six months ended (Unaudited) September 30, 2024 A |
Selected Per-Share Data | | |
| Net asset value, beginning of period | $ | 10.31 |
| Income from Investment Operations | | |
| Net realized and unrealized gain (loss) | | .36 |
| Total from investment operations | | .36 |
| Net asset value, end of period | $ | 10.67 |
Total Return D | | |
Ratios to Average Net Assets C,E,F | | |
| Expenses before reductions | | .04% G |
| Expenses net of fee waivers, if any | | |
| Expenses net of all reductions | | .04% G |
| Net investment income (loss) | | .38% G |
| Supplemental Data | | |
| Net assets, end of period (000 omitted) | $ | 7 |
Portfolio turnover rate H | | |
AFor the period August 22, 2024 (commencement of operations) through September 30, 2024.
BCalculated based on average shares outstanding during the period.
CNet investment income (loss) is affected by the timing of the declaration of dividends by any underlying mutual funds or exchange-traded funds (ETFs). Net investment income (loss) of any mutual funds or ETFs is not included in the Fund's net investment income (loss) ratio.
DTotal returns for periods of less than one year are not annualized.
EFees and expenses of any underlying mutual funds or exchange-traded funds (ETFs) are not included in the Fund's expense ratio. The Fund indirectly bears its proportionate share of these expenses. For additional expense information related to investments in Fidelity Central Funds, please refer to the "Investments in Fidelity Central Funds" note found in the Notes to Financial Statements section of the most recent Annual or Semi-Annual report.
FExpense ratios reflect operating expenses of the class. Expenses before reductions do not reflect amounts reimbursed, waived, or reduced through arrangements with the investment adviser, brokerage services, or other offset arrangements, if applicable, and do not represent the amount paid by the class during periods when reimbursements, waivers or reductions occur.
GAnnualized.
HAmount does not include the portfolio activity of any underlying mutual funds or exchange-traded funds (ETFs).
IAmount not annualized.
Notes to Financial Statements
(Unaudited)For the period ended September 30, 2024
1. Organization.
Fidelity Freedom Index Income Fund, Fidelity Freedom Index 2010 Fund, Fidelity Freedom Index 2015 Fund, Fidelity Freedom Index 2020 Fund, Fidelity Freedom Index 2025 Fund, Fidelity Freedom Index 2030 Fund, Fidelity Freedom Index 2035 Fund, Fidelity Freedom Index 2040 Fund, Fidelity Freedom Index 2045 Fund, Fidelity Freedom Index 2050 Fund, Fidelity Freedom Index 2055 Fund, Fidelity Freedom Index 2060 Fund, Fidelity Freedom Index 2065 Fund and Fidelity Freedom Index 2070 Fund (the Funds) are funds of Fidelity Aberdeen Street Trust (the Trust). The Trust is registered under the Investment Company Act of 1940, as amended (the 1940 Act), as an open-end management investment company organized as a Delaware statutory trust. Each Fund is authorized to issue an unlimited number of shares. Each Fund offers Investor Class, Institutional Premium Class, Premier Class shares and Premier Class II shares, each of which has equal rights as to assets and voting privileges. Premier Class II shares commenced sale of shares on August 22, 2024. Each class has exclusive voting rights with respect to matters that affect that class.
2. Investments in Fidelity Central Funds.
Funds may invest in Fidelity Central Funds, which are open-end investment companies generally available only to other investment companies and accounts managed by the investment adviser and its affiliates. The Schedule of Investments lists any Fidelity Central Funds held as an investment as of period end, but does not include the underlying holdings of each Fidelity Central Fund. An investing fund indirectly bears its proportionate share of the expenses of the underlying Fidelity Central Funds.
Based on its investment objective, each Fidelity Central Fund may invest or participate in various investment vehicles or strategies that are similar to those of the investing fund. These strategies are consistent with the investment objectives of the investing fund and may involve certain economic risks which may cause a decline in value of each of the Fidelity Central Funds and thus a decline in the value of the investing fund.
| Fidelity Central Fund | Investment Manager | Investment Objective | Investment Practices | Expense RatioA |
| Fidelity Money Market Central Funds | Fidelity Management & Research Company LLC (FMR) | Each fund seeks to obtain a high level of current income consistent with the preservation of capital and liquidity. | Short-term Investments | Less than .005% |
A Expenses expressed as a percentage of average net assets and are as of each underlying Central Fund's most recent annual or semi-annual shareholder report.
A complete unaudited list of holdings for each Fidelity Central Fund is available upon request or at the Securities and Exchange Commission website at www.sec.gov. In addition, the financial statements of the Fidelity Central Funds which contain the significant accounting policies (including investment valuation policies) of those funds, and are not covered by the Report of Independent Registered Public Accounting Firm, are available on the Securities and Exchange Commission website or upon request.
3. Significant Accounting Policies.
Each Fund is an investment company and applies the accounting and reporting guidance of the Financial Accounting Standards Board (FASB) Accounting Standards Codification Topic 946 Financial Services - Investment Companies. The financial statements have been prepared in conformity with accounting principles generally accepted in the United States of America (GAAP), which require management to make certain estimates and assumptions at the date of the financial statements. Actual results could differ from those estimates. Subsequent events, if any, through the date that the financial statements were issued have been evaluated in the preparation of the financial statements. Each Fund's Schedule of Investments lists any underlying mutual funds or exchange-traded funds (ETFs) but does not include the underlying holdings of these funds. The following summarizes the significant accounting policies of each Fund:
Investment Valuation. Investments are valued as of 4:00 p.m. Eastern time on the last calendar day of the period. Each Fund categorizes the inputs to valuation techniques used to value its investments into a disclosure hierarchy consisting of three levels as shown below:
Level 1 - unadjusted quoted prices in active markets for identical investments
Level 2 - other significant observable inputs (including quoted prices for similar investments, interest rates, prepayment speeds, etc.)
Level 3 - unobservable inputs (including the Fund's own assumptions based on the best information available)
Valuation techniques used to value each Fund's investments by major category are as follows:
Investments in open-end mutual funds are valued at their closing net asset value (NAV) each business day and are categorized as Level 1 in the hierarchy. The aggregate value of investments by input level as of September 30, 2024 is included at the end of each Fund's Schedule of Investments.
Investment Transactions and Income. For financial reporting purposes, the Funds' investment holdings and NAV include trades executed through the end of the last business day of the period. The NAV per share for processing shareholder transactions is calculated as of the close of business of the New York Stock Exchange (NYSE), normally 4:00 p.m. Eastern time and includes trades executed through the end of the prior business day. Gains and losses on securities sold are determined on the basis of identified cost. Income and capital gain distributions from any underlying mutual funds or exchange-traded funds (ETFs) are recorded on the ex-dividend date.
Class Allocations and Expenses. Investment income, realized and unrealized capital gains and losses, common expenses of a fund, and certain fund-level expense reductions, if any, are allocated daily on a pro-rata basis to each class based on the relative net assets of each class to the total net assets of a fund. Each class differs with respect to transfer agent and distribution and service plan fees incurred, as applicable. Certain expense reductions may also differ by class, if applicable. For the reporting period, the allocated portion of income and expenses to each class as a percent of its average net assets may vary due to the timing of recording these transactions in relation to fluctuating net assets of the classes. Expenses directly attributable to a fund are charged to that fund. Expenses attributable to more than one fund are allocated among the respective funds on the basis of relative net assets or other appropriate methods. Expenses included in the accompanying financial statements reflect the expenses of that fund and do not include any expenses associated with any underlying mutual funds or exchange-traded funds (ETFs). Although not included in a fund's expenses, a fund indirectly bears its proportionate share of these expenses through the net asset value of each underlying mutual fund or exchange-traded fund (ETF). Expense estimates are accrued in the period to which they relate and adjustments are made when actual amounts are known.
Deferred Trustee Compensation. Under a Deferred Compensation Plan (the Plan) for certain Funds, certain independent Trustees have elected to defer receipt of a portion of their annual compensation. Deferred amounts are invested in affiliated mutual funds, are marked-to-market and remain in a fund until distributed in accordance with the Plan. The investment of deferred amounts and the offsetting payable to the Trustees presented below are included in the accompanying Statement of Assets and Liabilities in other receivables and other payables and accrued expenses, as applicable.
| Fidelity Freedom Index 2030 Fund | 86,383 |
Income Tax Information and Distributions to Shareholders. Each year, each Fund intends to qualify as a regulated investment company under Subchapter M of the Internal Revenue Code, including distributing substantially all of its taxable income and realized gains. As a result, no provision for U.S. Federal income taxes is required. Each Fund files a U.S. federal tax return, in addition to state and local tax returns as required. Each Fund's federal income tax returns are subject to examination by the Internal Revenue Service (IRS) for a period of three fiscal years after they are filed. State and local tax returns may be subject to examination for an additional fiscal year depending on the jurisdiction.
Distributions are declared and recorded on the ex-dividend date. Income and capital gain distributions are declared separately for each class. Income and capital gain distributions are determined in accordance with income tax regulations, which may differ from GAAP.
Capital accounts within the financial statements are adjusted for permanent book-tax differences. These adjustments have no impact on net assets or the results of operations. Capital accounts are not adjusted for temporary book-tax differences which will reverse in a subsequent period.
Book-tax differences are primarily due to capital loss carryforwards and losses deferred due to wash sales and excise tax regulations.
As of period end, the cost and unrealized appreciation (depreciation) in securities, and derivatives if applicable, for federal income tax purposes were as follows for each Fund:
| | Tax cost ($) | Gross unrealized appreciation ($) | Gross unrealized depreciation ($) | Net unrealized appreciation (depreciation)($) |
| Fidelity Freedom Index Income Fund | 1,660,537,530 | 127,801,382 | (107,172,000) | 20,629,382 |
| Fidelity Freedom Index 2010 Fund | 692,746,202 | 85,059,568 | (43,908,436) | 41,151,132 |
| Fidelity Freedom Index 2015 Fund | 1,884,179,244 | 305,105,270 | (133,701,175) | 171,404,095 |
| Fidelity Freedom Index 2020 Fund | 6,304,102,746 | 1,305,268,531 | (451,105,896) | 854,162,635 |
| Fidelity Freedom Index 2025 Fund | 12,578,839,202 | 2,953,493,685 | (831,898,771) | 2,121,594,914 |
| Fidelity Freedom Index 2030 Fund | 18,546,106,746 | 4,676,323,474 | (946,705,679) | 3,729,617,795 |
| Fidelity Freedom Index 2035 Fund | 18,399,221,155 | 5,052,438,803 | (591,428,404) | 4,461,010,399 |
| Fidelity Freedom Index 2040 Fund | 17,866,754,937 | 5,901,206,549 | (361,953,271) | 5,539,253,278 |
| Fidelity Freedom Index 2045 Fund | 15,800,769,614 | 5,102,935,823 | (273,568,621) | 4,829,367,202 |
| Fidelity Freedom Index 2050 Fund | 15,155,257,625 | 4,820,964,168 | (247,869,712) | 4,573,094,456 |
| Fidelity Freedom Index 2055 Fund | 11,376,373,889 | 3,230,712,525 | (157,671,876) | 3,073,040,649 |
| Fidelity Freedom Index 2060 Fund | 6,462,334,740 | 1,658,162,934 | (72,474,031) | 1,585,688,903 |
| Fidelity Freedom Index 2065 Fund | 2,007,142,008 | 419,374,210 | (13,278,384) | 406,095,826 |
| Fidelity Freedom Index 2070 Fund | 2,399,135 | 120,063 | (862) | 119,201 |
Capital loss carryforwards are only available to offset future capital gains of the Funds to the extent provided by regulations and may be limited. The capital loss carryforward information presented below, including any applicable limitation, is estimated as of prior fiscal period end and is subject to adjustment.
| | Short-term ($) | Long-term ($) | Total capital loss carryforward ($) |
| Fidelity Freedom Index Income Fund | (1,549,599) | (2,716,916) | (4,266,515) |
| Fidelity Freedom Index 2025 Fund | (17,041,378) | - | (17,041,378) |
| Fidelity Freedom Index 2030 Fund | (7,872,983) | - | (7,872,983) |
4. Purchases and Sales of Investments.
Purchases and sales of securities, other than short-term securities, securities acquired in the reorganization and in-kind transactions, as applicable, are noted in the table below.
| | Purchases ($) | Sales ($) |
| Fidelity Freedom Index Income Fund | 146,239,009 | 133,014,307 |
| Fidelity Freedom Index 2010 Fund | 52,060,633 | 97,124,887 |
| Fidelity Freedom Index 2015 Fund | 113,463,788 | 242,546,766 |
| Fidelity Freedom Index 2020 Fund | 293,460,271 | 841,375,416 |
| Fidelity Freedom Index 2025 Fund | 557,807,866 | 1,212,961,872 |
| Fidelity Freedom Index 2030 Fund | 1,107,286,307 | 1,113,293,926 |
| Fidelity Freedom Index 2035 Fund | 1,662,923,898 | 1,128,297,375 |
| Fidelity Freedom Index 2040 Fund | 1,595,057,300 | 988,114,963 |
| Fidelity Freedom Index 2045 Fund | 1,469,745,239 | 756,650,354 |
| Fidelity Freedom Index 2050 Fund | 1,493,808,786 | 642,851,247 |
| Fidelity Freedom Index 2055 Fund | 1,310,990,899 | 404,064,140 |
| Fidelity Freedom Index 2060 Fund | 932,798,269 | 173,542,150 |
| Fidelity Freedom Index 2065 Fund | 446,697,998 | 41,168,167 |
| Fidelity Freedom Index 2070 Fund | 2,399,713 | 581 |
5. Fees and Other Transactions with Affiliates.
Management Fee and Expense Contract. Fidelity Management & Research Company LLC (the investment adviser) provides the Funds with investment management related services. Under the management contract, Investor Class, Institutional Premium Class, Premier Class and Premier II Class of each Fund pays an all-inclusive monthly management fee at an annual rate of .12%, .08%, .05% and .04% of class-level average net assets, respectively. Under the management contract, each Fund's investment adviser pays all ordinary operating expenses of the Fund, except fees and expenses of the independent Trustees and certain miscellaneous expenses such as interest expense. In addition, under the expense contract, total expenses, including acquired fund fees and expenses, are limited to an annual rate of .12%, .08%, .05% and .04% of class-level average net assets for Investor Class, Institutional Premium Class, Premier Class and Premier Class II, respectively, with certain exceptions.
Prior to June 1, 2024, each Fund's Premier Class paid a monthly management fee that was based on an annual rate of .06% of class-level average net assets. In addition, each Fund's Premier Class total expenses, including acquired fund fees and expenses, were limited to an annual rate of .06% of class-level average net assets.
Interfund Trades. Funds may purchase from or sell securities to other Fidelity Funds under procedures adopted by the Board. The procedures have been designed to ensure these interfund trades are executed in accordance with Rule 17a-7 of the 1940 Act. Any interfund trades are included within the respective purchases and sales amounts shown in the Purchases and Sales of Investments note. During the period, there were no interfund trades.
6. Expense Reductions.
Through arrangements with each applicable Fund's custodian, credits realized as a result of certain uninvested cash balances were used to reduce each applicable Fund's or class' expenses. All of the applicable expense reductions are noted in the table below.
| | Custodian credits ($) |
| Fidelity Freedom Index Income Fund | 328 |
| Fidelity Freedom Index 2010 Fund | 16 |
| Fidelity Freedom Index 2015 Fund | 24 |
| Fidelity Freedom Index 2020 Fund | 114 |
| Fidelity Freedom Index 2025 Fund | 74 |
| Fidelity Freedom Index 2030 Fund | 193 |
| Fidelity Freedom Index 2035 Fund | 60 |
| Fidelity Freedom Index 2040 Fund | 257 |
| Fidelity Freedom Index 2045 Fund | 137 |
| Fidelity Freedom Index 2050 Fund | 166 |
| Fidelity Freedom Index 2055 Fund | 68 |
| Fidelity Freedom Index 2060 Fund | 42 |
| Fidelity Freedom Index 2065 Fund | 9 |
7. Distributions to Shareholders.
Distributions to shareholders of each class were as follows:
| | Six months ended September 30, 2024 A | Year ended March 31, 2024 |
| Fidelity Freedom Index Income Fund | | |
| Distributions to shareholders | | |
| Investor Class | $2,518,655 | $5,080,609 |
| Institutional Premium Class | 11,489,703 | 22,994,914 |
| Premier Class | 6,629,190 | 11,933,622 |
| Premier II Class | 18 | - |
Total | $20,637,566 | $40,009,145 |
| Fidelity Freedom Index 2010 Fund | | |
| Distributions to shareholders | | |
| Investor Class | $2,224,099 | $5,238,982 |
| Institutional Premium Class | 6,756,162 | 16,545,557 |
| Premier Class | 1,245,089 | 2,630,133 |
Total | $10,225,350 | $24,414,672 |
| Fidelity Freedom Index 2015 Fund | | |
| Distributions to shareholders | | |
| Investor Class | $5,633,920 | $ 11,487,593 |
| Institutional Premium Class | 13,656,329 | 28,825,397 |
| Premier Class | 6,924,849 | 13,722,277 |
Total | $26,215,098 | $54,035,267 |
| Fidelity Freedom Index 2020 Fund | | |
| Distributions to shareholders | | |
| Investor Class | $21,920,303 | $32,865,075 |
| Institutional Premium Class | 68,958,159 | 104,180,058 |
| Premier Class | 28,434,497 | 41,337,719 |
Total | $119,312,959 | $178,382,852 |
| Fidelity Freedom Index 2025 Fund | | |
| Distributions to shareholders | | |
| Investor Class | $3,313,286 | $49,961,338 |
| Institutional Premium Class | 14,071,614 | 205,356,816 |
| Premier Class | 6,025,742 | 81,330,568 |
Total | $23,410,642 | $336,648,722 |
| Fidelity Freedom Index 2030 Fund | | |
| Distributions to shareholders | | |
| Investor Class | $4,518,400 | $58,497,902 |
| Institutional Premium Class | 23,235,428 | 286,637,233 |
| Premier Class | 9,259,566 | 105,353,845 |
Total | $37,013,394 | $450,488,980 |
| Fidelity Freedom Index 2035 Fund | | |
| Distributions to shareholders | | |
| Investor Class | $6,256,300 | $48,683,638 |
| Institutional Premium Class | 32,133,655 | 251,394,116 |
| Premier Class | 14,183,684 | 104,266,494 |
Total | $52,573,639 | $404,344,248 |
| Fidelity Freedom Index 2040 Fund | | |
| Distributions to shareholders | | |
| Investor Class | $3,178,214 | $39,781,756 |
| Institutional Premium Class | 19,573,914 | 242,914,725 |
| Premier Class | 8,668,160 | 99,855,733 |
Total | $31,420,288 | $382,552,214 |
| Fidelity Freedom Index 2045 Fund | | |
| Distributions to shareholders | | |
| Investor Class | $730,742 | $30,354,660 |
| Institutional Premium Class | 5,500,312 | 203,994,320 |
| Premier Class | 2,788,230 | 90,428,682 |
Total | $9,019,284 | $324,777,662 |
| Fidelity Freedom Index 2050 Fund | | |
| Distributions to shareholders | | |
| Investor Class | $740,307 | $27,987,484 |
| Institutional Premium Class | 5,722,068 | 193,697,735 |
| Premier Class | 2,796,896 | 83,947,132 |
Total | $9,259,271 | $305,632,351 |
| Fidelity Freedom Index 2055 Fund | | |
| Distributions to shareholders | | |
| Investor Class | $536,059 | $19,825,810 |
| Institutional Premium Class | 4,377,314 | 139,282,979 |
| Premier Class | 1,949,415 | 54,141,754 |
Total | $6,862,788 | $213,250,543 |
| Fidelity Freedom Index 2060 Fund | | |
| Distributions to shareholders | | |
| Investor Class | $257,522 | $11,679,759 |
| Institutional Premium Class | 2,035,566 | 71,580,626 |
| Premier Class | 899,752 | 27,047,772 |
Total | $3,192,840 | $110,308,157 |
| Fidelity Freedom Index 2065 Fund | | |
| Distributions to shareholders | | |
| Investor Class | $30,042 | $3,057,730 |
| Institutional Premium Class | 333,143 | 17,150,501 |
| Premier Class | 157,874 | 7,879,625 |
Total | $521,059 | $28,087,856 |
| | | |
A Distributions for Premier II Class are for the period August 22, 2024 (commencement of sale of shares) through September 30, 2024.
8. Share Transactions.
Share transactions for each class were as follows and may contain in-kind transactions, automatic conversions between classes or exchanges between affiliated funds:
| | Shares | Shares | Dollars | Dollars |
| | Six months ended September 30, 2024 A | Year ended March 31, 2024 | Six months ended September 30, 2024 A | Year ended March 31, 2024 |
| Fidelity Freedom Index Income Fund | | | | |
| Investor Class | | | | |
| Shares sold | 1,482,492 | 2,423,212 | $17,418,669 | $27,478,003 |
| Issued in exchange for the shares of the Acquired Fund(s) | 3,242,029 | - | 37,931,674 | - |
| Reinvestment of distributions | 195,174 | 401,819 | 2,288,428 | 4,572,486 |
| Shares redeemed | (1,904,976) | (4,492,033) | (22,321,688) | (50,595,785) |
| Net increase (decrease) | 3,014,719 | (1,667,002) | $35,317,083 | $(18,545,296) |
| Institutional Premium Class | | | | |
| Shares sold | 8,783,526 | 22,608,551 | $102,939,954 | $255,725,418 |
| Issued in exchange for the shares of the Acquired Fund(s) | 12,160,763 | - | 142,037,855 | - |
| Reinvestment of distributions | 977,044 | 2,010,553 | 11,432,345 | 22,850,837 |
| Shares redeemed | (12,937,586) | (21,288,945) | (151,423,202) | (240,750,089) |
| Net increase (decrease) | 8,983,747 | 3,330,159 | $104,986,952 | $37,826,166 |
| Premier Class | | | | |
| Shares sold | 9,589,215 | 10,282,109 | $111,871,587 | $116,410,962 |
| Issued in exchange for the shares of the Acquired Fund(s) | 1,971,359 | - | 23,005,757 | - |
| Reinvestment of distributions | 567,037 | 1,049,955 | 6,628,380 | 11,932,113 |
| Shares redeemed | (5,622,053) | (7,123,924) | (65,862,944) | (80,692,134) |
| Net increase (decrease) | 6,505,558 | 4,208,140 | $75,642,780 | $47,650,941 |
| Premier II Class | | | | |
| Shares sold | 647 | - | $7,700 | $ - |
| Reinvestment of distributions | 2 | - | 18 | - |
| Net increase (decrease) | 649 | - | $7,718 | $ - |
| Fidelity Freedom Index 2010 Fund | | | | |
| Investor Class | | | | |
| Shares sold | 369,928 | 872,059 | $4,864,677 | $11,076,114 |
| Reinvestment of distributions | 161,225 | 379,614 | 2,054,010 | 4,839,703 |
| Shares redeemed | (1,434,165) | (2,801,027) | (18,718,813) | (35,265,909) |
| Net increase (decrease) | (903,012) | (1,549,354) | $(11,800,126) | $(19,350,092) |
| Institutional Premium Class | | | | |
| Shares sold | 3,676,314 | 8,418,535 | $47,980,203 | $105,703,372 |
| Reinvestment of distributions | 529,574 | 1,295,323 | 6,741,480 | 16,514,116 |
| Shares redeemed | (7,146,620) | (11,808,409) | (93,048,077) | (148,834,742) |
| Net increase (decrease) | (2,940,732) | (2,094,551) | $(38,326,394) | $(26,617,254) |
| Premier Class | | | | |
| Shares sold | 2,008,633 | 2,110,508 | $26,038,989 | $26,564,620 |
| Reinvestment of distributions | 97,806 | 206,423 | 1,245,076 | 2,630,103 |
| Shares redeemed | (1,608,699) | (1,374,951) | (20,899,395) | (17,370,948) |
| Net increase (decrease) | 497,740 | 941,980 | $6,384,670 | $11,823,775 |
| Premier II Class | | | | |
| Shares sold | 533 | - | $7,100 | $ - |
| Net increase (decrease) | 533 | - | $7,100 | $ - |
| Fidelity Freedom Index 2015 Fund | | | | |
| Investor Class | | | | |
| Shares sold | 1,045,406 | 1,609,248 | $15,138,229 | $22,264,598 |
| Reinvestment of distributions | 370,228 | 758,374 | 5,242,421 | 10,662,949 |
| Shares redeemed | (3,249,233) | (6,349,154) | (47,075,482) | (87,467,159) |
| Net increase (decrease) | (1,833,599) | (3,981,532) | $(26,694,832) | $(54,539,612) |
| Institutional Premium Class | | | | |
| Shares sold | 7,347,532 | 14,412,961 | $106,089,131 | $198,064,531 |
| Reinvestment of distributions | 963,915 | 2,049,650 | 13,629,751 | 28,778,349 |
| Shares redeemed | (14,129,113) | (26,846,838) | (205,184,384) | (370,236,697) |
| Net increase (decrease) | (5,817,666) | (10,384,227) | $(85,465,502) | $(143,393,817) |
| Premier Class | | | | |
| Shares sold | 3,704,573 | 6,816,933 | $53,642,662 | $93,903,104 |
| Reinvestment of distributions | 489,723 | 977,958 | 6,924,686 | 13,721,961 |
| Shares redeemed | (5,071,844) | (8,199,422) | (73,260,307) | (112,628,294) |
| Net increase (decrease) | (877,548) | (404,531) | $(12,692,959) | $(5,003,229) |
| Premier II Class | | | | |
| Shares sold | 479 | - | $7,100 | $ - |
| Net increase (decrease) | 479 | - | $7,100 | $ - |
| Fidelity Freedom Index 2020 Fund | | | | |
| Investor Class | | | | |
| Shares sold | 2,381,973 | 7,407,488 | $38,519,185 | $112,256,055 |
| Reinvestment of distributions | 1,268,970 | 1,907,285 | 19,872,076 | 29,615,219 |
| Shares redeemed | (8,759,488) | (23,172,722) | (140,532,567) | (351,268,267) |
| Net increase (decrease) | (5,108,545) | (13,857,949) | $(82,141,306) | $(209,396,993) |
| Institutional Premium Class | | | | |
| Shares sold | 22,080,810 | 55,126,074 | $353,607,667 | $833,552,290 |
| Reinvestment of distributions | 4,392,963 | 6,695,744 | 68,705,585 | 103,824,944 |
| Shares redeemed | (50,150,998) | (90,106,669) | (805,234,598) | (1,366,968,232) |
| Net increase (decrease) | (23,677,225) | (28,284,851) | $(382,921,346) | $(429,590,998) |
| Premier Class | | | | |
| Shares sold | 9,416,718 | 21,983,309 | $150,976,079 | $333,114,877 |
| Reinvestment of distributions | 1,817,804 | 2,666,743 | 28,430,457 | 41,330,975 |
| Shares redeemed | (13,017,271) | (21,696,583) | (209,007,711) | (329,472,170) |
| Net increase (decrease) | (1,782,749) | 2,953,469 | $(29,601,175) | $44,973,682 |
| Premier II Class | | | | |
| Shares sold | 432 | - | $7,100 | $ - |
| Net increase (decrease) | 432 | - | $7,100 | $ - |
| Fidelity Freedom Index 2025 Fund | | | | |
| Investor Class | | | | |
| Shares sold | 7,550,612 | 17,437,842 | $141,195,754 | $300,775,837 |
| Reinvestment of distributions | 165,944 | 2,568,299 | 3,025,153 | 45,465,217 |
| Shares redeemed | (15,625,562) | (34,467,894) | (291,810,179) | (593,557,993) |
| Net increase (decrease) | (7,909,006) | (14,461,753) | $(147,589,272) | $(247,316,939) |
| Institutional Premium Class | | | | |
| Shares sold | 49,921,877 | 126,464,214 | $929,252,549 | $2,177,941,120 |
| Reinvestment of distributions | 769,168 | 11,566,993 | 14,014,207 | 204,656,583 |
| Shares redeemed | (81,151,814) | (145,191,084) | (1,512,127,210) | (2,512,249,808) |
| Net increase (decrease) | (30,460,769) | (7,159,877) | $(568,860,454) | $(129,652,105) |
| Premier Class | | | | |
| Shares sold | 21,994,257 | 49,486,703 | $409,903,519 | $853,441,093 |
| Reinvestment of distributions | 330,884 | 4,598,451 | 6,025,393 | 81,323,047 |
| Shares redeemed | (23,942,112) | (34,813,946) | (445,649,727) | (603,216,977) |
| Net increase (decrease) | (1,616,971) | 19,271,208 | $(29,720,815) | $331,547,163 |
| Premier II Class | | | | |
| Shares sold | 370 | - | $7,100 | $ - |
| Net increase (decrease) | 370 | - | $7,100 | $ - |
| Fidelity Freedom Index 2030 Fund | | | | |
| Investor Class | | | | |
| Shares sold | 12,338,682 | 25,763,089 | $247,783,975 | $474,106,569 |
| Reinvestment of distributions | 212,476 | 2,845,495 | 4,162,398 | 53,771,155 |
| Shares redeemed | (14,621,100) | (31,632,522) | (292,982,954) | (580,919,130) |
| Net increase (decrease) | (2,069,942) | (3,023,938) | $(41,036,581) | $(53,041,406) |
| Institutional Premium Class | | | | |
| Shares sold | 71,624,846 | 173,638,074 | $1,431,503,502 | $3,187,629,461 |
| Reinvestment of distributions | 1,181,777 | 15,122,447 | 23,139,185 | 285,610,683 |
| Shares redeemed | (86,037,524) | (157,696,207) | (1,720,981,860) | (2,913,342,419) |
| Net increase (decrease) | (13,230,901) | 31,064,314 | $(266,339,173) | $559,897,725 |
| Premier Class | | | | |
| Shares sold | 33,319,514 | 73,957,838 | $667,653,656 | $1,359,216,261 |
| Reinvestment of distributions | 473,048 | 5,578,546 | 9,257,551 | 105,329,251 |
| Shares redeemed | (24,517,007) | (32,167,375) | (490,132,741) | (594,909,188) |
| Net increase (decrease) | 9,275,555 | 47,369,009 | $186,778,466 | $869,636,324 |
| Premier II Class | | | | |
| Shares sold | 344 | - | $7,100 | $ - |
| Net increase (decrease) | 344 | - | $7,100 | $ - |
| Fidelity Freedom Index 2035 Fund | | | | |
| Investor Class | | | | |
| Shares sold | 13,646,645 | 28,186,367 | $313,789,249 | $588,517,043 |
| Reinvestment of distributions | 258,182 | 2,092,815 | 5,806,523 | 44,967,248 |
| Shares redeemed | (11,286,675) | (20,371,841) | (259,583,165) | (424,282,667) |
| Net increase (decrease) | 2,618,152 | 9,907,341 | $60,012,607 | $209,201,624 |
| Institutional Premium Class | | | | |
| Shares sold | 67,886,212 | 160,202,641 | $1,560,315,487 | $3,330,872,540 |
| Reinvestment of distributions | 1,424,485 | 11,674,573 | 32,022,423 | 250,673,011 |
| Shares redeemed | (65,010,473) | (120,486,267) | (1,493,081,536) | (2,522,627,799) |
| Net increase (decrease) | 4,300,224 | 51,390,947 | $99,256,374 | $1,058,917,752 |
| Premier Class | | | | |
| Shares sold | 32,280,575 | 69,719,435 | $742,056,232 | $1,451,859,697 |
| Reinvestment of distributions | 630,742 | 4,853,345 | 14,179,084 | 104,227,255 |
| Shares redeemed | (19,536,432) | (24,572,668) | (449,531,410) | (517,391,593) |
| Net increase (decrease) | 13,374,885 | 50,000,112 | $306,703,906 | $1,038,695,359 |
| Premier II Class | | | | |
| Shares sold | 300 | - | $7,100 | $ - |
| Net increase (decrease) | 300 | - | $7,100 | $ - |
| Fidelity Freedom Index 2040 Fund | | | | |
| Investor Class | | | | |
| Shares sold | 11,261,838 | 21,513,881 | $271,201,088 | $462,561,368 |
| Reinvestment of distributions | 124,612 | 1,638,725 | 2,935,859 | 36,440,748 |
| Shares redeemed | (7,743,726) | (14,841,117) | (186,459,160) | (317,972,570) |
| Net increase (decrease) | 3,642,724 | 8,311,489 | $87,677,787 | $181,029,546 |
| Institutional Premium Class | | | | |
| Shares sold | 64,929,394 | 152,995,212 | $1,561,508,865 | $3,272,051,663 |
| Reinvestment of distributions | 829,085 | 10,906,222 | 19,516,651 | 242,223,545 |
| Shares redeemed | (60,207,463) | (114,189,793) | (1,446,511,784) | (2,465,700,533) |
| Net increase (decrease) | 5,551,016 | 49,711,641 | $134,513,732 | $1,048,574,675 |
| Premier Class | | | | |
| Shares sold | 30,548,766 | 68,271,222 | $734,546,168 | $1,463,773,305 |
| Reinvestment of distributions | 368,323 | 4,497,100 | 8,666,649 | 99,834,181 |
| Shares redeemed | (16,656,324) | (21,891,478) | (400,865,554) | (475,401,265) |
| Net increase (decrease) | 14,260,765 | 50,876,844 | $342,347,263 | $1,088,206,221 |
| Premier II Class | | | | |
| Shares sold | 286 | - | $7,100 | $ - |
| Net increase (decrease) | 286 | - | $7,100 | $ - |
| Fidelity Freedom Index 2045 Fund | | | | |
| Investor Class | | | | |
| Shares sold | 9,828,025 | 17,859,535 | $247,604,015 | $400,783,008 |
| Reinvestment of distributions | 27,265 | 1,197,457 | 673,727 | 27,793,509 |
| Shares redeemed | (5,735,685) | (10,988,900) | (145,144,578) | (244,291,917) |
| Net increase (decrease) | 4,119,605 | 8,068,092 | $103,133,164 | $184,284,600 |
| Institutional Premium Class | | | | |
| Shares sold | 59,421,528 | 137,363,435 | $1,499,300,207 | $3,063,668,801 |
| Reinvestment of distributions | 222,044 | 8,772,820 | 5,484,472 | 203,457,804 |
| Shares redeemed | (51,802,281) | (96,031,905) | (1,303,640,119) | (2,162,269,628) |
| Net increase (decrease) | 7,841,291 | 50,104,350 | $201,144,560 | $1,104,856,977 |
| Premier Class | | | | |
| Shares sold | 29,329,672 | 64,806,439 | $740,024,027 | $1,447,270,154 |
| Reinvestment of distributions | 112,863 | 3,900,175 | 2,787,716 | 90,408,904 |
| Shares redeemed | (14,684,339) | (18,420,107) | (371,551,191) | (416,867,544) |
| Net increase (decrease) | 14,758,196 | 50,286,507 | $371,260,552 | $1,120,811,514 |
| Premier II Class | | | | |
| Shares sold | 273 | - | $7,100 | $ - |
| Net increase (decrease) | 273 | - | $7,100 | $ - |
| Fidelity Freedom Index 2050 Fund | | | | |
| Investor Class | | | | |
| Shares sold | 8,376,499 | 16,934,089 | $211,691,547 | $379,963,374 |
| Reinvestment of distributions | 27,583 | 1,103,229 | 683,243 | 25,661,854 |
| Shares redeemed | (4,531,337) | (9,677,336) | (114,740,012) | (215,702,295) |
| Net increase (decrease) | 3,872,745 | 8,359,982 | $97,634,778 | $189,922,933 |
| Institutional Premium Class | | | | |
| Shares sold | 60,375,042 | 138,934,931 | $1,525,232,000 | $3,103,594,226 |
| Reinvestment of distributions | 230,727 | 8,317,985 | 5,708,196 | 193,244,222 |
| Shares redeemed | (48,332,438) | (91,160,990) | (1,217,694,002) | (2,053,336,539) |
| Net increase (decrease) | 12,273,331 | 56,091,926 | $313,246,194 | $1,243,501,909 |
| Premier Class | | | | |
| Shares sold | 29,296,043 | 64,070,911 | $739,673,531 | $1,432,363,024 |
| Reinvestment of distributions | 113,025 | 3,614,106 | 2,796,239 | 83,923,957 |
| Shares redeemed | (13,333,307) | (18,086,048) | (337,393,318) | (410,354,269) |
| Net increase (decrease) | 16,075,761 | 49,598,969 | $405,076,452 | $1,105,932,712 |
| Premier II Class | | | | |
| Shares sold | 272 | - | $7,100 | $ - |
| Net increase (decrease) | 272 | - | $7,100 | $ - |
| Fidelity Freedom Index 2055 Fund | | | | |
| Investor Class | | | | |
| Shares sold | 8,077,398 | 16,874,445 | $167,838,797 | $311,539,265 |
| Reinvestment of distributions | 24,031 | 939,093 | 489,051 | 17,955,839 |
| Shares redeemed | (3,895,583) | (8,443,601) | (80,917,834) | (154,577,337) |
| Net increase (decrease) | 4,205,846 | 9,369,937 | $87,410,014 | $174,917,767 |
| Institutional Premium Class | | | | |
| Shares sold | 64,775,452 | 147,245,507 | $1,346,198,249 | $2,707,844,820 |
| Reinvestment of distributions | 214,486 | 7,269,650 | 4,366,933 | 138,975,953 |
| Shares redeemed | (44,430,030) | (84,952,857) | (922,205,688) | (1,571,917,793) |
| Net increase (decrease) | 20,559,908 | 69,562,300 | $428,359,494 | $1,274,902,980 |
| Premier Class | | | | |
| Shares sold | 29,428,217 | 63,400,296 | $611,590,817 | $1,165,364,621 |
| Reinvestment of distributions | 95,783 | 2,833,242 | 1,949,180 | 54,133,517 |
| Shares redeemed | (11,858,470) | (15,689,300) | (247,435,954) | (292,747,129) |
| Net increase (decrease) | 17,665,530 | 50,544,238 | $366,104,043 | $926,751,009 |
| Premier II Class | | | | |
| Shares sold | 331 | - | $7,100 | $ - |
| Net increase (decrease) | 331 | - | $7,100 | $ - |
| Fidelity Freedom Index 2060 Fund | | | | |
| Investor Class | | | | |
| Shares sold | 6,625,541 | 13,870,645 | $116,565,199 | $216,910,580 |
| Reinvestment of distributions | 13,358 | 637,739 | 230,426 | 10,337,742 |
| Shares redeemed | (3,047,676) | (6,216,873) | (53,684,312) | (96,609,036) |
| Net increase (decrease) | 3,591,223 | 8,291,511 | $63,111,313 | $130,639,286 |
| Institutional Premium Class | | | | |
| Shares sold | 52,391,564 | 113,699,695 | $922,257,311 | $1,770,665,080 |
| Reinvestment of distributions | 117,708 | 4,409,129 | 2,030,462 | 71,413,570 |
| Shares redeemed | (28,759,392) | (56,813,027) | (506,260,068) | (889,844,055) |
| Net increase (decrease) | 23,749,880 | 61,295,797 | $418,027,705 | $952,234,595 |
| Premier Class | | | | |
| Shares sold | 21,888,989 | 45,297,012 | $385,578,622 | $705,840,102 |
| Reinvestment of distributions | 52,151 | 1,669,812 | 899,610 | 27,042,853 |
| Shares redeemed | (6,920,548) | (10,274,574) | (122,493,945) | (162,705,420) |
| Net increase (decrease) | 15,020,592 | 36,692,250 | $263,984,287 | $570,177,535 |
| Premier II Class | | | | |
| Shares sold | 391 | - | $7,100 | $ - |
| Net increase (decrease) | 391 | - | $7,100 | $ - |
| Fidelity Freedom Index 2065 Fund | | | | |
| Investor Class | | | | |
| Shares sold | 3,753,450 | 6,885,431 | $53,413,407 | $87,096,328 |
| Reinvestment of distributions | 1,879 | 201,446 | 26,213 | 2,639,166 |
| Shares redeemed | (1,209,500) | (2,769,686) | (17,296,490) | (34,790,693) |
| Net increase (decrease) | 2,545,829 | 4,317,191 | $36,143,130 | $54,944,801 |
| Institutional Premium Class | | | | |
| Shares sold | 27,194,829 | 49,781,838 | $387,622,067 | $628,420,862 |
| Reinvestment of distributions | 23,790 | 1,304,079 | 331,868 | 17,080,713 |
| Shares redeemed | (11,617,337) | (20,762,044) | (165,856,505) | (263,098,207) |
| Net increase (decrease) | 15,601,282 | 30,323,873 | $222,097,430 | $382,403,368 |
| Premier Class | | | | |
| Shares sold | 13,555,358 | 21,953,654 | $193,548,886 | $277,266,410 |
| Reinvestment of distributions | 11,312 | 601,239 | 157,809 | 7,876,093 |
| Shares redeemed | (3,539,613) | (4,275,169) | (50,800,265) | (54,781,674) |
| Net increase (decrease) | 10,027,057 | 18,279,724 | $142,906,430 | $230,360,829 |
| Premier II Class | | | | |
| Shares sold | 483 | - | $7,100 | $ - |
| Net increase (decrease) | 483 | - | $7,100 | $ - |
Fidelity Freedom Index 2070 Fund B | | | | |
| Investor Class | | | | |
| Shares sold | 192,411 | - | $1,963,646 | $ - |
| Shares redeemed | (2,696) | - | (27,679) | - |
| Net increase (decrease) | 189,715 | - | $1,935,967 | $ - |
| Institutional Premium Class | | | | |
| Shares sold | 34,942 | - | $349,538 | $ - |
| Shares redeemed | (54) | - | (553) | - |
| Net increase (decrease) | 34,888 | - | $348,985 | $ - |
| Premier Class | | | | |
| Shares sold | 10,588 | - | $106,022 | $ - |
| Net increase (decrease) | 10,588 | - | $106,022 | $ - |
| Premier II Class | | | | |
| Shares sold | 689 | - | $7,100 | $ - |
| Net increase (decrease) | 689 | - | $7,100 | $ - |
A Share transactions for Premier II Class are for the period August 22, 2024 (commencement of sale of shares) through September 30, 2024.
B For the period June 28, 2024 (commencement of operations) through September 30, 2024.
9. Other.
A fund's organizational documents provide former and current trustees and officers with a limited indemnification against liabilities arising in connection with the performance of their duties to the fund. In the normal course of business, a fund may also enter into contracts that provide general indemnifications. A fund's maximum exposure under these arrangements is unknown as this would be dependent on future claims that may be made against a fund. The risk of material loss from such claims is considered remote.
At the end of the period, the investment adviser or its affiliates were owners of record of more than 10% of the outstanding shares as follows:
| Fund | Affiliated % |
| Fidelity Freedom Index 2070 Fund | 22% |
Funds do not invest in underlying mutual funds for the purpose of exercising management or control; however, investments by funds within their principal investment strategies may represent a significant portion of the underlying mutual fund's net assets. At the end of the period, certain Funds were the owners of record of 10% or more of the total outstanding shares of the following underlying mutual funds as shown below.
| Fund | Fidelity Freedom Index Income Fund | Fidelity Freedom Index 2020 Fund | Fidelity Freedom Index 2025 Fund | Fidelity Freedom Index 2030 Fund | Fidelity Freedom Index 2035 Fund | Fidelity Freedom Index 2040 Fund | Fidelity Freedom Index 2045 Fund | Fidelity Freedom Index 2050 Fund | Fidelity Freedom Index 2055 Fund |
| Fidelity Series 5+ Year Inflation-Protected Bond Index Fund | -% | -% | 12% | 10% | -% | -% | -% | -% | -% |
| Fidelity Series Bond Index Fund | -% | -% | 16% | 22% | 18% | -% | -% | -% | -% |
| Fidelity Series Global ex U.S. Index Fund | -% | -% | -% | 11% | 13% | 16% | 15% | 14% | 10% |
| Fidelity Series Total Market Index Fund | -% | -% | -% | 11% | 13% | 16% | 15% | 14% | 10% |
| Fidelity Series Treasury Bill Index Fund | 12% | 12% | -% | -% | -% | -% | -% | -% | -% |
The Funds, in aggregate, were the owners of record of more than 20% of the total outstanding shares of the following underlying mutual funds.
| Fund | % of shares held |
| Fidelity Series 5+ Year Inflation-Protected Bond Index Fund | 30% |
| Fidelity Series Bond Index Fund | 90% |
| Fidelity Series Global ex U.S. Index Fund | 95% |
| Fidelity Series International Developed Markets Bond Index Fund | 40% |
| Fidelity Series Long-Term Treasury Bond Index Fund | 38% |
| Fidelity Series Total Market Index Fund | 95% |
| Fidelity Series Treasury Bill Index Fund | 35% |
10. Risk and Uncertainties.
Many factors affect a fund's performance. Developments that disrupt global economies and financial markets, such as pandemics, epidemics, outbreaks of infectious diseases, war, terrorism, and environmental disasters, may significantly affect a fund's investment performance. The effects of these developments to a fund will be impacted by the types of securities in which a fund invests, the financial condition, industry, economic sector, and geographic location of an issuer, and a fund's level of investment in the securities of that issuer. Significant concentrations in security types, issuers, industries, sectors, and geographic locations may magnify the factors that affect a fund's performance.
11. Reorganization Information.
On June 14, 2024, Fidelity Freedom Index Income Fund acquired all of the assets and assumed all of the liabilities of Fidelity Freedom Index 2005 Fund ("Acquired Fund") pursuant to an Agreement and Plan of Reorganization (Agreements) approved by the Board of Trustees ("The Board"). The securities held by the Acquired Fund were the primary assets acquired by Fidelity Freedom Index Income Fund. The acquisition was accomplished by an exchange of each class of Fidelity Freedom Index Income Fund for corresponding shares then outstanding of the Acquired Fund at its respective net asset value on the acquisition date. The reorganization provides shareholders of the Acquired Fund access to a larger portfolio with a similar investment objective and lower projected expenses. For financial reporting purposes, the assets and liabilities of the Acquired Fund and shares issued by Fidelity Freedom Index Income Fund were recorded at fair value; however, the cost basis of the investments received from the Acquired Fund were carried forward and will be utilized for purposes of Fidelity Freedom Index Income Fund ongoing reporting of realized and unrealized gains and losses to more closely align subsequent reporting of realized gains with amounts distributable to shareholders for tax purposes. The reorganization qualified as a tax-free reorganization for federal income tax purposes with no gain or loss recognized to the funds or their shareholders.
| Acquired Fund and Share Class | Investments $ | Unrealized appreciation (depreciation) $ | Net Assets $ | Shares Exchanged | Shares Exchanged Ratio |
| Fidelity Freedom Index 2005 Fund | 202,776,090 | (3,441,542) | | | |
| Investor Class | | | 37,931,674 | 3,242,029 | 1.085367521 |
| Premier Class | | | 23,005,757 | 1,971,359 | 1.086958012 |
| Institutional Premium Class | | | 142,037,855 | 12,160,763 | 1.086635274 |
| Acquiring Fund | Net Assets $ | Total net assets after acquisition |
| Fidelity Freedom Index Income Fund | 1,439,722,914 | 1,642,698,200 |
Pro forma results of operations of the combined entity for the entire period ended September 30, 2024, as though the acquisition had occurred as of the beginning of the year (rather than on the actual acquisition date), are as follows:
Net investment (loss) | $21,961,986 |
| Total net realized gain (loss) | 3,405,946 |
| Total change in net unrealized appreciation (depreciation) | 61,979,269 |
| Net Increase (decrease) in net assets resulting from operations | $87,347,201 |
Because the combined investment portfolios have been managed as a single portfolio since the acquisition was completed, it is not practical to separate the amounts of revenue and earnings of the acquired funds that have been included in the Fidelity Freedom Index income Fund accompanying Statement of Operations since June 14, 2024.
Item 8: Changes in and Disagreements with Accountants for Open-End Management Investment Companies
(Unaudited)
Note: This is not applicable for any fund included in this document.
Item 9: Proxy Disclosures for Open-End Management Investment Companies
(Unaudited)
Note: This is not applicable for any fund included in this document.
Item 10: Remuneration Paid to Directors, Officers, and others of Open-End Management Investment Companies
(Unaudited)
Note: This information is disclosed as part of the financial statements for each Fund as part of Item 7: Financial Statements and Financial Highlights for Open-End Management Investment companies.
Item 11: Statement Regarding Basis for Approval of Investment Advisory Contract
(Unaudited)
Board Approval of Investment Advisory Contracts and Management Fees
Fidelity Freedom Index 2070 Fund
At its March 2024 meeting, the Board of Trustees, including the Independent Trustees (together, the Board), voted to approve the management contract (the Advisory Contract) with Fidelity Management & Research Company LLC (FMR) for the fund. The Board, assisted by the advice of fund counsel and Independent Trustees' counsel, considered a broad range of information.
Nature, Extent, and Quality of Services Provided. The Board considered Fidelity's staffing as it relates to the fund, including the backgrounds of investment personnel of FMR, and also considered the fund's investment objective, strategies, and related investment philosophy. The Board considered the structure of the investment personnel compensation program and whether this structure provides appropriate incentives to act in the best interests of the fund.
Resources Dedicated to Investment Management and Support Services. The Board reviewed the general qualifications and capabilities of Fidelity's investment staff, including its size, education, experience, and resources, as well as Fidelity's approach to recruiting, training, managing, and compensating investment personnel. The Board noted the resources devoted to Fidelity's global investment organization and that Fidelity's analysts have extensive resources, tools and capabilities that allow them to conduct sophisticated quantitative and fundamental analysis, as well as credit analysis of issuers, counterparties and guarantors. Further, the Board considered that Fidelity's investment professionals have sufficient access to global information and data so as to provide competitive investment results over time, and that those professionals also have access to sophisticated tools that permit them to assess portfolio construction and risk and performance attribution characteristics continuously, as well as to transmit new information and research conclusions rapidly around the world. Additionally, in its deliberations, the Board considered Fidelity's risk management, compliance, cybersecurity, and technology and operations capabilities and resources, which are integral parts of the investment management process.
Shareholder and Administrative Services. The Board considered the nature, extent, quality, and cost of advisory, administrative, and shareholder services to be performed by Fidelity under the Advisory Contract. The Board also considered the nature and extent of the supervision of third party service providers, principally custodians, subcustodians, and pricing vendors.
The Board noted that the growth of fund assets over time across the complex allows Fidelity to reinvest in the development of services designed to enhance the value and convenience of the Fidelity funds as investment vehicles. These services include 24-hour access to account information and market information over the Internet and through telephone representatives, investor education materials and asset allocation tools. The Board also considered that it reviews customer service metrics such as telephone response times, continuity of services on the website and metrics addressing services at Fidelity Investor Centers.
Investment Performance. The fund is a new fund and therefore had no historical performance for the Board to review at the time it approved the fund's Advisory Contract. The Board considered FMR's strength in managing asset allocation funds, which the Board is familiar with through its supervision of other target date funds. The Board also considered the fact that it oversees funds managed by FMR that have similar investment objectives and policies as the fund.
Based on its review, the Board concluded that the nature, extent, and quality of services to be provided to the fund under the Advisory Contract should benefit the shareholders of the fund.
Competitiveness of Management Fee and Total Expense Ratio. The Board considered the fund's proposed class-level management fee rate out of which FMR will pay all operating expenses of the fund, with certain limited exceptions. In reviewing the Advisory Contract, the Board also considered the projected total expense ratio of each class of the fund. The Board noted that the fund's proposed class-level management fee rates rank above the median of its competitor funds because the majority of such competitor funds do not have top-level management fees that cover expenses for services beyond portfolio management.
The Board also considered that the projected total net expense ratio (including acquired fund fees and expenses) of each class of the fund is below the median of those funds and classes used by the Board for management fee comparisons that have a similar sales load structure.
The Board noted that the difference in management fee rates between classes is the result of separate arrangements for class level services and/or waivers of certain expenses. The Board further noted that such difference is not the result of any difference in advisory or custodial fees or other expenses related to the management of a fund's assets, which do not vary by class.
The Board considered that the proposed contractual arrangements for the fund oblige FMR to pay all "class-level" expenses of the fund to the extent necessary to limit total operating expenses, with certain exceptions, to an amount specified in the applicable expense contract.
These contractual arrangements may not be amended to increase the fees or expenses payable by the fund except by a vote of a majority of the Board of Trustees of the fund.
Based on its review, the Board concluded that the management fee and the projected total expense ratio of each class of the fund were reasonable in light of the services that the fund and its shareholders will receive and the other factors considered.
Costs of the Services and Profitability. The fund is a new fund and therefore no revenue, cost, or profitability data were available for the Board to review in respect of the fund at the time it approved the Advisory Contract. In connection with its consideration of future renewals of the fund's Advisory Contract, the Board will consider the revenues earned and the expenses incurred by Fidelity in conducting the business of developing, marketing, distributing, managing, administering and servicing the Series Funds in which the fund invests and servicing the fund's shareholders.
Economies of Scale. The Board will consider economies of scale when there is operating experience to permit assessment thereof. It noted that, notwithstanding the entrepreneurial risk associated with a new fund, the management fee was at a level normally associated with very high fund net assets, and Fidelity asserted to the Board that the level of the fee anticipated economies of scale at lower asset levels even before, if ever, economies of scale are achieved. The Board also noted that the fund and its shareholders would have access to the very considerable number and variety of services available through Fidelity and its affiliates.
Based on its evaluation of all of the conclusions noted above, and after considering all factors it believed relevant, the Board concluded that the advisory fee arrangements are fair and reasonable, and that the fund's Advisory Contract should be approved.
Board Approval of Investment Advisory Contracts and Management Fees
Fidelity Freedom Index Income Fund
Fidelity Freedom Index 2010 Fund
Fidelity Freedom Index 2015 Fund
Fidelity Freedom Index 2020 Fund
Fidelity Freedom Index 2025 Fund
Fidelity Freedom Index 2030 Fund
Fidelity Freedom Index 2035 Fund
Fidelity Freedom Index 2040 Fund
Fidelity Freedom Index 2045 Fund
Fidelity Freedom Index 2055 Fund
Fidelity Freedom Index 2060 Fund
Fidelity Freedom Index 2065 Fund
Fidelity Freedom Index 2070 Fund
At its May 2024 meeting, the Board of Trustees, including the Independent Trustees (together, the Board), voted to approve an amended and restated management contract (the Amended Contract) for the fund to decrease the management fees of Premier Class of the fund paid to Fidelity Management & Research Company LLC (FMR), the fund's investment adviser, by 1 basis point, effective June 1, 2024, and to add the fee schedule for the new Premier Class II of the fund. The Board, assisted by the advice of fund counsel and Independent Trustees' counsel, requested and considered a broad range of information.
Nature, Extent, and Quality of Services Provided. The Board previously received and considered materials relating to the nature, extent and quality of services provided by FMR to the fund, including the resources dedicated to investment management and support services, shareholder and administrative services, the benefits to shareholders of investment in a large fund family, and the investment performance of the fund in connection with the annual renewal of the fund's current management contract. At its September 2023 meeting, the Board concluded that the nature, extent and quality of the services provided to the fund under the existing management contract should continue to benefit the fund's shareholders. In connection with its approval of the Amended Contract at its May 2024 meeting, the Board noted that such approval would not change the fund's portfolio managers, the investment processes, the level or nature of services provided, the resources and personnel allocated or trading and compliance operations. The Board concluded that the nature, extent, and quality of services to be provided to Premier Class and Premier II Class of the fund under the Amended Contract will continue to benefit the fund's shareholders.
Competitiveness of Management Fee and Total Expense Ratio. The Board considered that it received and reviewed information regarding the management fee rate and total expense ratio compared to "mapped groups" of competitive funds and classes at the current management fee and expense levels in connection with the annual renewal of the management contract. Based on its review, the Board concluded at its September 2023 meeting that the current management fee and total expenses of Premier Class are fair and reasonable in light of the services that the class receives and the other factors considered. In its review of the proposed management fee rate under the Amended Contract, the Board considered that the proposed fee rate for Premier Class is lower by 1 basis point than the current management fee rate. The Board also considered that FMR will retain its obligation to pay all operating expenses, with certain limited exceptions, under the management contract.
The Board considered the proposed class-level management fee rate of the new Premier II Class for the fund out of which FMR will pay all operating expenses of the fund, with certain limited exceptions. In reviewing the Amended Contract, the Board also considered the projected total expense ratio of the new Premier II Class of the fund. The Board noted that the proposed class-level management fee for the new Premier II Class of the fund ranks below median of its competitor funds. The Board also considered that the projected total net expense ratio (including acquired fees and expenses) of the new Premier II Class of the fund is below the median of those funds and classes used by the Board for management fee comparisons that have a similar sales load structure.
The Board noted that the difference in management fee rates between classes is the result of separate arrangements for class level services and/or waivers of certain expenses. The Board further noted that such differences are not the result of any difference in advisory or custodial fees or other expense related to the management of the fund's assets, which do not vary by class.
The Board also considered that the proposed contractual arrangements for Premier II Class of the fund oblige FMR to pay all "class-level" expenses to the extent necessary to limit total operating expenses, with certain exceptions, to an amount specified in the applicable expense contract. These contractual arrangements may not be amended to increase the fees or expenses payable by Premier II Class of the fund except by a vote of a majority of the Board of Trustees of the fund.
Based on its review, the Board concluded that the management fee and the projected total expense ratio of Premier Class of the fund continue to be fair and reasonable in light of the services that the class receives and the other factors considered. The Board also concluded that the management fee and the projected total expense ratio of the new Premier II Class of the fund were reasonable in light of the services that the fund and its shareholders will receive and the other factors considered.
Costs of the Services and Profitability. The Board considered that it previously reviewed information regarding the revenues earned and the expenses incurred by FMR in providing services to the fund and the level of FMR's profitability. At its September 2023 meeting, the Board concluded that it was satisfied that the profitability of FMR in connection with the operation of the fund was not excessive. Because the Board was approving an arrangement under which the management fee for Premier Class of the fund was being reduced, the Board did not consider FMR's costs of services, revenues, or profitability to be significant factors in its decision to approve the reduced management fee rate for Premier Class of the fund.
Economies of Scale. The Board considered that it previously received and reviewed information regarding whether there have been economies of scale in respect of the management of the Fidelity funds, whether the Fidelity funds (including the fund) have appropriately benefited from any such economies of scale, and whether there is a potential realization of any further economies of scale and that it concluded, at its September 2023 meeting, that economies of scale, if any, are being appropriately shared between fund shareholders and Fidelity. The Board will continue to review economies of scale in connection with future renewals of the Amended Contract. In connection with the approval of the reduced management fee rate for Premier Class of the fund, the Board did not consider economies of scale because the proposed fee arrangement lowers Premier Class's management fee.
Conclusion. Based on its evaluation of all of the conclusions noted above, and after considering all factors it believed relevant, the Board ultimately concluded that the advisory fee structure for Premier Class and Premier II Class is fair and reasonable, and that the fund's Amended Contract should be approved.
Board Approval of Investment Advisory Contracts and Management Fees
Fidelity Freedom Index Income Fund
Fidelity Freedom Index 2010 Fund
Fidelity Freedom Index 2015 Fund
Fidelity Freedom Index 2020 Fund
Fidelity Freedom Index 2025 Fund
Fidelity Freedom Index 2030 Fund
Fidelity Freedom Index 2035 Fund
Fidelity Freedom Index 2040 Fund
Fidelity Freedom Index 2045 Fund
Fidelity Freedom Index 2050 Fund
Fidelity Freedom Index 2055 Fund
Fidelity Freedom Index 2060 Fund
Fidelity Freedom Index 2065 Fund
Each year, the Board of Trustees, including the Independent Trustees (together, the Board), considers the renewal of each fund's management contract with Fidelity Management & Research Company LLC (FMR) (the Advisory Contract). The Board, assisted by the advice of fund counsel and Independent Trustees' counsel, requests and considers a broad range of information relevant to the renewal of the Advisory Contracts throughout the year.
The Board meets regularly and, at each of its meetings, covers an extensive agenda of topics and materials and considers factors that are relevant to its annual consideration of the renewal of each fund's Advisory Contract, including the services and support provided to each fund and its shareholders. The Board's Operations Committee, of which all the Independent Trustees are members, meets regularly throughout the year and requests, receives and considers, among other matters, information related to the annual consideration of the renewal of each fund's Advisory Contracts before making its recommendation to the Board. The Board also meets as needed to review matters specifically related to the Board's annual consideration of the renewal of the Advisory Contracts. Members of the Board may also meet from time to time with trustees of other Fidelity funds through joint ad hoc committees to discuss certain matters relevant to all of the Fidelity funds.
At its September 2024 meeting, the Board unanimously determined to renew each fund's Advisory Contract. In reaching its determination, the Board considered all factors it believed relevant, including (i) the nature, extent, and quality of the services provided to each fund and its shareholders (including the investment performance of each fund); (ii) the competitiveness relative to peer funds of each fund's management fee and the total expense ratio of a representative class (Institutional Premium Class, which was selected because it was the largest class without 12b-1 fees); (iii) the total costs of the services provided by and the profits realized by FMR and its affiliates (Fidelity) from its relationships with each fund; and (iv) the extent to which, if any, economies of scale exist and are realized as each fund grows, and whether any economies of scale are appropriately shared with fund shareholders. The Board also considered the broad range of investment choices available to shareholders from FMR's competitors and that each fund's shareholders have chosen to invest in that fund, which is part of the Fidelity family of funds. The Board's decision to renew the funds' Advisory Contracts was not based on any single factor and the factors may have been weighed differently by different Trustees.
The Board also considered that each fund pays an all-inclusive management fee that covers all operating expenses of the fund, subject to certain exceptions, and varies by class (unitary fee) and the underlying Fidelity funds in which the fund invests (Series Funds) do not pay expenses, with certain limited exceptions. The Board and the board of other funds that invest their assets in Series Funds and the boards of the Series Funds previously formed a joint ad hoc committee to review the responsibilities of each board related to the consideration of the renewal of the Advisory Contracts for the funds, other funds that invest substantially all of their assets in Series Funds, and the Series Funds. The Board's deliberations were informed by the conclusions of such committee.
The Board reached a determination, with the assistance of fund counsel and Independent Trustees' counsel and through the exercise of its business judgment, that the renewal of the Advisory Contract was in the best interests of each fund and its shareholders and that the compensation payable under the Advisory Contract was fair and reasonable in light of all of the surrounding circumstances.
Nature, Extent, and Quality of Services Provided. The Board considered Fidelity's staffing as it relates to the funds, including the backgrounds and experience of investment personnel, and also considered FMR's implementation of each fund's investment program. The Independent Trustees also had discussions with senior management of Fidelity's investment operations and investment groups with responsibility for the Series Funds. The Board considered the structure of the investment personnel compensation program and whether this structure provides appropriate incentives to act in the best interests of each fund. Additionally, the Board considered the portfolio managers' investments, if any, in the funds that they manage.
Resources Dedicated to Investment Management and Support Services. The Board reviewed the general qualifications and capabilities of Fidelity's investment staff, including its size, education, experience, and resources, as well as Fidelity's approach to recruiting, training, managing, and compensating investment personnel. The Board noted the resources devoted to Fidelity's global investment organization, and that Fidelity's analysts have extensive resources, tools, and capabilities that allow them to conduct quantitative and fundamental analysis, as well as credit analysis of issuers, counterparties, and guarantors. Further, the Board considered that Fidelity's investment professionals have sufficient access to global information and data so as to provide competitive investment results over time, and that those professionals also have access to sophisticated tools that permit them to assess portfolio construction and risk and performance attribution characteristics continuously, as well as to transmit new information and research conclusions rapidly around the world. Additionally, in its deliberations, the Board considered Fidelity's risk management, compliance, cybersecurity, and technology and operations capabilities and resources, which are integral parts of the investment management process.
Shareholder and Administrative Services. The Board considered (i) the nature, extent, quality, and cost of advisory, administrative, and shareholder services performed by Fidelity under the Advisory Contract and under separate agreements covering transfer agency and pricing and bookkeeping services for each fund; (ii) the nature and extent of Fidelity's supervision of third party service providers, principally custodians, subcustodians, and pricing vendors; and (iii) the resources devoted by Fidelity to, and the record of compliance with, each fund's compliance policies and procedures, including with respect to liquidity risk management.
The Board noted that the growth of fund assets over time across the complex allows Fidelity to reinvest in the development of services designed to enhance the value and convenience of the Fidelity funds as investment vehicles. These services include 24-hour access to account information and market information over the Internet and through telephone representatives, investor education materials and asset allocation tools. The Board also considered that it reviews customer service metrics such as telephone response times, continuity of services on the website and metrics addressing services at Fidelity Investor Centers.
Investment in a Large Fund Family. The Board considered the benefits to shareholders of investing in a fund that is part of a large family of funds offering a variety of investment disciplines and providing a large variety of fund investor services. The Board noted that Fidelity had taken, or had made recommendations to the Board that resulted in the Fidelity funds taking, a number of actions over the previous year that benefited particular funds and/or the Fidelity funds in general.
Investment Performance. The Board took into account discussions that occur with representatives of Fidelity, or reports it receives, at Board meetings throughout the year relating to fund investment performance. In this regard the Board noted that as part of regularly scheduled fund reviews and other reports to the Board on fund performance, the Board considered annualized return information for each fund for different time periods, measured against one or more appropriate securities market indices, including a customized blended index that reflects the respective weights of the fund's asset classes (each a benchmark index). The Board also considered information about performance attribution. In its evaluation of fund investment performance at meetings throughout the year, the Board gave particular attention to information indicating underperformance of certain Fidelity funds over different time periods and discussed with Fidelity the reasons for such underperformance.
In addition to reviewing absolute and relative fund performance, the Independent Trustees periodically consider the appropriateness of fund performance metrics in evaluating the results achieved. The Independent Trustees generally give greater weight to fund performance over longer time periods than over shorter time periods. Depending on the circumstances, the Independent Trustees may be satisfied with a fund's performance notwithstanding that it lags its benchmark index for certain periods.
Based on its review, the Board concluded that the nature, extent, and quality of services provided to each fund under the Advisory Contracts should continue to benefit the shareholders of each fund.
Competitiveness of Management Fee and Total Expense Ratio. The Board was provided with information regarding industry trends in management fees and expenses. The Board considered each fund's class-level management fee rates under the Advisory Contract. The Board also considered other expenses, such as transfer agent fees, pricing and bookkeeping fees, and custodial, legal, and audit fees, paid by FMR under the unitary fee arrangement for each fund. The Board also noted that Fidelity may agree to waive fees or reimburse expenses from time to time, and the extent to which, if any, it has done so for each fund.
Comparisons of Management Fees and Total Expense Ratios. Among other things, the Board reviewed data for selected groups of competitive funds and classes (referred to as "mapped groups") that were compiled by Fidelity based on combining similar investment objective categories (as classified by Morningstar) that have comparable investment mandates. For each fund, data reviewed by the Board included (i) gross management fee comparisons (before taking into account expense reimbursements or caps) relative to the total universe of funds within the mapped group; (ii) gross management fee comparisons relative to a subset of non-Fidelity funds in the mapped group that are similar in size and management fee structure to the fund (referred to as the "asset size peer group"); (iii) total expense comparisons of Institutional Premium Class of the fund relative to funds and classes in the mapped group that have a similar sales load structure to Institutional Premium Class of the fund (referred to as the "similar sales load structure group"); and (iv) total expense comparisons of Institutional Premium Class of the fund relative to funds and classes in the similar sales load structure group that are similar in size and management fee structure to the fund (referred to as the "total expense asset size peer group").
The information provided to the Board indicated that the management fee of each fund ranked below the competitive median of the mapped group for 2023 and the management fee of each fund ranked below the competitive median of the asset size peer group for 2023. Further, the information provided to the Board indicated that the total expenses of Institutional Premium Class of each fund ranked below the competitive median of the similar sales load structure group for 2023 and below the competitive median of the total expense asset size peer group for 2023.
The Board noted that each fund's unitary fee arrangement covers all operating expenses of the fund, subject to certain exceptions, and that the fee structures of the majority of peer funds do not include top-level management fees. The Board noted that for this reason, Fidelity believes that a comparison of total expense ratios (including acquired fund fees and expenses) is more useful than comparisons of the unitary advisory fee paid by each class and the advisory fee paid by most competitor funds. The Board also noted that the primary comparisons for the funds are against competitor target date funds with holdings that are passively managed, but that there is still wide dispersion in the strategic and active allocation among competitors, regardless of whether the funds have similar vintages.
The Board noted that a different unitary (subject to certain limited exceptions) management fee rate is applicable to each class of each fund. The Board considered that the difference in management fee rates between classes is the result of separate arrangements for class-level services and/or waivers of certain expenses and not the result of any difference in advisory or custodial fees or other expenses related to the management of a fund's assets.
Other Contractual Arrangements. The Board considered that current contractual arrangements for the fund oblige FMR to pay all "class-level" expenses of each of Investor Class, Institutional Premium Class, and Premier Class of each fund to the extent necessary to limit total operating expenses, with certain exceptions, as follows: 0.12%, 0.08%, and 0.06%. These contractual arrangements may not be amended to increase the fees or expenses payable except by a vote of a majority of the Board.
Fees Charged to Other Fidelity Clients. The Board also considered Fidelity fee structures and other information with respect to clients of Fidelity, such as other funds advised or subadvised by Fidelity, pension plan clients, and other institutional clients with similar mandates. The Board noted that a joint ad hoc committee created by it and the boards of other Fidelity funds periodically reviews and compares Fidelity's institutional investment advisory business with its business of providing services to the Fidelity funds and also noted the most recent findings of the committee. The Board noted that the committee's review included a consideration of the differences in services provided, fees charged, and costs incurred, as well as competition in the markets serving the different categories of clients.
Based on its review, the Board concluded that each fund's management fee is fair and reasonable in light of the services that the fund receives and the other factors considered. Further, based on its review of total expense ratios and fees charged to other Fidelity clients, the Board concluded that the total expense ratio of each class of each fund was reasonable in light of the services that the fund and its shareholders receive and the other factors considered.
Costs of the Services and Profitability. The Board considered the revenues earned and the expenses incurred by Fidelity in conducting the business of developing, marketing, distributing, managing, administering and servicing each fund and the Series Funds in which each fund invests and in servicing each fund's shareholders. The Board also considered the level of Fidelity's profits in respect of all the Fidelity funds.
On an annual basis, Fidelity presents to the Board information about the profitability of its relationships with each fund. Fidelity calculates profitability information for each Fidelity fund, as well as aggregate profitability information for groups of Fidelity funds and all Fidelity funds, using a series of detailed revenue and cost allocation methodologies which originate with the books and records of Fidelity on which Fidelity's audited financial statements are based. The Audit Committee of the Board reviews any significant changes from the prior year's methodologies.
A public accounting firm has been engaged annually by the Board as part of the Board's assessment of Fidelity's profitability analysis. The engagement includes the review and assessment of the methodologies used by Fidelity in determining the revenues and expenses attributable to Fidelity's fund business. After considering the reports issued under the engagement and information provided by Fidelity, the Board concluded that while other allocation methods may also be reasonable, Fidelity's profitability methodologies are reasonable in all material respects.
The Board also reviewed Fidelity's non-fund businesses and potential indirect benefits such businesses may have received as a result of their association with Fidelity's fund business (i.e., fall-out benefits) as well as cases where Fidelity's affiliates may benefit from the funds' business. The Board considered areas where potential indirect benefits to the Fidelity funds from their relationships with Fidelity may exist. The Board's consideration of these matters was informed by the findings of a joint ad hoc committee created by it and the boards of other Fidelity funds to evaluate potential fall-out benefits.
The Board considered the costs of the services provided by and the profits realized by Fidelity in connection with the operation of each fund and was satisfied that the profitability was not excessive.
Economies of Scale. The Board considered whether there have been economies of scale in respect of the management of the Fidelity funds, whether the Fidelity funds (including each fund) have appropriately benefited from any such economies of scale, and whether there is potential for realization of any further economies of scale. The Board considered the extent to which each fund will benefit from economies of scale as assets grow through increased services to the fund, through waivers or reimbursements, or through fee or expense ratio reductions. The Board recognized that, due to each fund's current contractual arrangements, its expense ratio will not decline if the fund's operating costs decrease as assets grow, or rise as assets decrease. The Board also noted that a committee created by it and the boards of other Fidelity funds periodically analyzes whether Fidelity attains economies of scale in respect of the management and servicing of the Fidelity funds, whether the Fidelity funds have appropriately benefited from such economies of scale, and whether there is potential for realization of any further economies of scale.
The Board concluded, taking into account the analysis of the committee, that economies of scale, if any, are being appropriately shared between fund shareholders and Fidelity.
Additional Information Requested by the Board. In order to develop fully the factual basis for consideration of the Fidelity funds' advisory contracts, the Board requested and received additional information on certain topics, including: (i) portfolio manager changes that have occurred during the past year; (ii) hiring, training, compensating, and retaining adviser and sub-adviser personnel; (iii) the terms of the funds' various management fee structures and arrangements for transfer agent and pricing and bookkeeping services; (iv) Fidelity's fund profitability methodology, profitability trends for certain funds, the allocation of various costs to different funds, and the impact of certain factors on fund profitability results; (v) the impact on fund profitability of recent industry trends, such as the growth in passively managed funds and the changes in flows for different types of funds; (vi) the types of management fee and total expense comparisons provided, and the challenges and limitations associated with such information; (vii) explanations regarding the relative total expense ratios and management fees of certain funds and classes, total expense and management fee competitive trends, and methodologies for total expense and management fee competitive comparisons; (viii) matters related to money market funds, exchange-traded funds, and target date funds; (ix) the arrangements with and compensation paid to certain fund sub-advisers and the treatment of such compensation within Fidelity's fund profitability methodology; and (x) the terms of management contracts between Fidelity and other funds and products not overseen by the Board.
Conclusion. Based on its evaluation of all of the conclusions noted above, and after considering all factors it believed relevant, the Board, including the Independent Trustees, concluded that the advisory fee arrangements are fair and reasonable in light of all of the surrounding circumstances and that each fund's Advisory Contract should be renewed through September 30, 2025.
1.899267.114
FRX-SANN-1124
Fidelity Flex® Freedom Blend Funds
Fidelity Flex® Freedom Blend Income Fund
Fidelity Flex® Freedom Blend 2010 Fund
Fidelity Flex® Freedom Blend 2015 Fund
Fidelity Flex® Freedom Blend 2020 Fund
Fidelity Flex® Freedom Blend 2025 Fund
Fidelity Flex® Freedom Blend 2030 Fund
Fidelity Flex® Freedom Blend 2035 Fund
Fidelity Flex® Freedom Blend 2040 Fund
Fidelity Flex® Freedom Blend 2045 Fund
Fidelity Flex® Freedom Blend 2050 Fund
Fidelity Flex® Freedom Blend 2055 Fund
Fidelity Flex® Freedom Blend 2060 Fund
Fidelity Flex® Freedom Blend 2065 Fund
Fidelity Flex® Freedom Blend 2070 Fund
Semi-Annual Report
September 30, 2024
Contents
To view a fund's proxy voting guidelines and proxy voting record for the 12-month period ended June 30, visit http://www.fidelity.com/proxyvotingresults or visit the Securities and Exchange Commission's (SEC) web site at http://www.sec.gov.
You may also call 1-800-544-8544 if you're an individual investing directly with Fidelity, call 1-800-835-5092 if you're a plan sponsor or participant with Fidelity as your recordkeeper or call 1-877-208-0098 on institutional accounts or if you're an advisor or invest through one to request a free copy of the proxy voting guidelines.
You may also call 1-800-544-3455 (for managed account clients) or 1-800-835-5092 (for retirement plan participants) to request a free copy of the proxy voting guidelines.
Standard & Poor's, S&P and S&P 500 are registered service marks of The McGraw-Hill Companies, Inc. and have been licensed for use by Fidelity Distributors Corporation.
Other third-party marks appearing herein are the property of their respective owners.
All other marks appearing herein are registered or unregistered trademarks or service marks of FMR LLC or an affiliated company. © 2024 FMR LLC. All rights reserved.
This report and the financial statements contained herein are submitted for the general information of the shareholders of the Funds. This report is not authorized for distribution to prospective investors in the Funds unless preceded or accompanied by an effective prospectus.
A fund files its complete schedule of portfolio holdings with the SEC for the first and third quarters of each fiscal year on Form N-PORT. Forms N-PORT are available on the SEC's web site at http://www.sec.gov. A fund's Forms N-PORT may be reviewed and copied at the SEC's Public Reference Room in Washington, DC. Information regarding the operation of the SEC's Public Reference Room may be obtained by calling 1-800-SEC-0330.
For a complete list of a fund's portfolio holdings, view the most recent holdings listing, semiannual report, or annual report on Fidelity's web site at http://www.fidelity.com, http://www.institutional.fidelity.com, or http://www.401k.com, as applicable.
NOT FDIC INSURED •MAY LOSE VALUE •NO BANK GUARANTEE
Neither the Funds nor Fidelity Distributors Corporation is a bank.
Item 7: Financial Statements and Financial Highlights for Open-End Management Investment Companies (Semi-Annual Report)
Fidelity Flex® Freedom Blend Income Fund
Schedule of Investments September 30, 2024 (Unaudited)
Showing Percentage of Net Assets
| Domestic Equity Funds - 8.7% |
| | | Shares | Value ($) |
| Fidelity Series Blue Chip Growth Fund (a) | | 4,108 | 74,840 |
| Fidelity Series Commodity Strategy Fund (a) | | 100 | 8,831 |
| Fidelity Series Large Cap Growth Index Fund (a) | | 2,037 | 48,513 |
| Fidelity Series Large Cap Stock Fund (a) | | 1,915 | 43,900 |
| Fidelity Series Large Cap Value Index Fund (a) | | 5,316 | 91,113 |
| Fidelity Series Small Cap Core Fund (a) | | 1,716 | 21,344 |
| Fidelity Series Small Cap Opportunities Fund (a) | | 854 | 12,970 |
| Fidelity Series Value Discovery Fund (a) | | 1,906 | 31,784 |
| TOTAL DOMESTIC EQUITY FUNDS (Cost $256,115) | | | 333,295 |
| | | | |
| International Equity Funds - 13.6% |
| | | Shares | Value ($) |
| Fidelity Series Canada Fund (a) | | 1,707 | 28,123 |
| Fidelity Series Emerging Markets Fund (a) | | 4,342 | 41,815 |
| Fidelity Series Emerging Markets Opportunities Fund (a) | | 8,390 | 168,380 |
| Fidelity Series International Growth Fund (a) | | 3,493 | 67,270 |
| Fidelity Series International Index Fund (a) | | 1,926 | 25,635 |
| Fidelity Series International Small Cap Fund (a) | | 3,054 | 57,295 |
| Fidelity Series International Value Fund (a) | | 4,992 | 67,487 |
| Fidelity Series Overseas Fund (a) | | 4,495 | 67,297 |
| TOTAL INTERNATIONAL EQUITY FUNDS (Cost $419,127) | | | 523,302 |
| | | | |
| Bond Funds - 72.3% |
| | | Shares | Value ($) |
| Fidelity Series 0-5 Year Inflation-Protected Bond Index Fund (a) | | 80,897 | 796,023 |
| Fidelity Series 5+ Year Inflation-Protected Bond Index Fund (a) | | 2,704 | 21,553 |
| Fidelity Series Corporate Bond Fund (a) | | 34,203 | 327,321 |
| Fidelity Series Emerging Markets Debt Fund (a) | | 2,499 | 20,414 |
| Fidelity Series Emerging Markets Debt Local Currency Fund (a) | | 641 | 6,171 |
| Fidelity Series Floating Rate High Income Fund (a) | | 433 | 3,881 |
| Fidelity Series Government Bond Index Fund (a) | | 54,498 | 511,189 |
| Fidelity Series High Income Fund (a) | | 2,389 | 20,860 |
| Fidelity Series International Credit Fund (a) | | 15 | 124 |
| Fidelity Series International Developed Markets Bond Index Fund (a) | | 17,360 | 153,982 |
| Fidelity Series Investment Grade Bond Fund (a) | | 48,141 | 495,857 |
| Fidelity Series Investment Grade Securitized Fund (a) | | 34,624 | 317,845 |
| Fidelity Series Long-Term Treasury Bond Index Fund (a) | | 17,469 | 102,543 |
| Fidelity Series Real Estate Income Fund (a) | | 381 | 3,845 |
| TOTAL BOND FUNDS (Cost $2,766,981) | | | 2,781,608 |
| | | | |
| Short-Term Funds - 5.4% |
| | | Shares | Value ($) |
| Fidelity Series Government Money Market Fund 5.03% (a)(b) | | 40,454 | 40,454 |
| Fidelity Series Short-Term Credit Fund (a) | | 4,192 | 42,214 |
| Fidelity Series Treasury Bill Index Fund (a) | | 12,534 | 124,716 |
| TOTAL SHORT-TERM FUNDS (Cost $205,712) | | | 207,384 |
| | | | |
| TOTAL INVESTMENT IN SECURITIES - 100.0% (Cost $3,647,935) | 3,845,589 |
NET OTHER ASSETS (LIABILITIES) - 0.0% | 4 |
| NET ASSETS - 100.0% | 3,845,593 |
| | |
Legend
| (b) | The rate quoted is the annualized seven-day yield of the fund at period end. |
Affiliated Underlying Funds
Fiscal year to date information regarding the Fund's investments in affiliated Underlying Funds is presented below. Exchanges between classes of the same affiliated Underlying Funds may occur. If an Underlying Funds changes its name, the name presented below is the name in effect at period end.
| Affiliate | Value, beginning of period ($) | Purchases ($) | Sales Proceeds ($) | Dividend Income ($) | Realized Gain (loss) ($) | Change in Unrealized appreciation (depreciation) ($) | Value, end of period ($) |
| Fidelity Series 0-5 Year Inflation-Protected Bond Index Fund | 206,464 | 88,424 | 37,826 | 6,566 | 168 | 17,727 | 796,023 |
| Fidelity Series 5+ Year Inflation-Protected Bond Index Fund | 5,782 | 1,404 | 1,327 | 219 | 4 | 857 | 21,553 |
| Fidelity Series Blue Chip Growth Fund | 20,379 | 16,324 | 12,397 | 6,442 | 944 | (4,382) | 74,840 |
| Fidelity Series Canada Fund | 6,498 | 3,363 | 1,784 | - | 9 | 2,480 | 28,123 |
| Fidelity Series Commodity Strategy Fund | 7,304 | 4,909 | 24,481 | 838 | (12,924) | 10,955 | 8,831 |
| Fidelity Series Corporate Bond Fund | 91,525 | 21,248 | 26,042 | 5,105 | 70 | 11,373 | 327,321 |
| Fidelity Series Emerging Markets Debt Fund | 5,404 | 1,493 | 1,010 | 302 | 14 | 788 | 20,414 |
| Fidelity Series Emerging Markets Debt Local Currency Fund | 1,743 | 262 | 644 | - | 12 | 504 | 6,171 |
| Fidelity Series Emerging Markets Fund | 9,961 | 4,368 | 4,004 | - | 114 | 2,826 | 41,815 |
| Fidelity Series Emerging Markets Opportunities Fund | 39,979 | 20,551 | 21,488 | - | 773 | 14,228 | 168,380 |
| Fidelity Series Floating Rate High Income Fund | 1,035 | 464 | 194 | 122 | (1) | (18) | 3,881 |
| Fidelity Series Government Bond Index Fund | 133,827 | 41,365 | 25,246 | 5,864 | 87 | 14,679 | 511,189 |
| Fidelity Series Government Money Market Fund 5.03% | 12,417 | 4,082 | 3,513 | 760 | - | - | 40,454 |
| Fidelity Series High Income Fund | 5,578 | 1,554 | 1,082 | 449 | 10 | 691 | 20,860 |
| Fidelity Series International Credit Fund | 58 | 2 | - | 2 | - | 5 | 124 |
| Fidelity Series International Developed Markets Bond Index Fund | 41,187 | 11,026 | 7,450 | 951 | 7 | 3,945 | 153,982 |
| Fidelity Series International Growth Fund | 16,302 | 7,088 | 3,807 | - | 64 | 3,004 | 67,270 |
| Fidelity Series International Index Fund | 6,172 | 2,491 | 1,427 | - | 24 | 1,760 | 25,635 |
| Fidelity Series International Small Cap Fund | 15,283 | 5,206 | 6,103 | - | 475 | 4,455 | 57,295 |
| Fidelity Series International Value Fund | 16,381 | 6,764 | 4,693 | - | 83 | 5,075 | 67,487 |
| Fidelity Series Investment Grade Bond Fund | 134,690 | 31,751 | 28,817 | 7,314 | 15 | 16,059 | 495,857 |
| Fidelity Series Investment Grade Securitized Fund | 88,833 | 19,801 | 24,524 | 4,738 | (174) | 11,102 | 317,845 |
| Fidelity Series Large Cap Growth Index Fund | 12,919 | 7,540 | 9,433 | 81 | 775 | 2,138 | 48,513 |
| Fidelity Series Large Cap Stock Fund | 13,680 | 4,971 | 11,004 | 2,181 | 1,018 | 334 | 43,900 |
| Fidelity Series Large Cap Value Index Fund | 24,453 | 9,089 | 11,328 | - | 367 | 7,708 | 91,113 |
| Fidelity Series Long-Term Treasury Bond Index Fund | 32,744 | 7,491 | 14,427 | 1,238 | (1,848) | 5,766 | 102,543 |
| Fidelity Series Overseas Fund | 16,341 | 5,708 | 3,533 | - | 66 | 4,281 | 67,297 |
| Fidelity Series Real Estate Income Fund | 1,004 | 311 | 205 | 75 | (2) | 151 | 3,845 |
| Fidelity Series Short-Term Credit Fund | 11,458 | 2,725 | 1,945 | 596 | 10 | 826 | 42,214 |
| Fidelity Series Small Cap Core Fund | 221 | 21,106 | 1,732 | 6 | (5) | 1,082 | 21,344 |
| Fidelity Series Small Cap Opportunities Fund | 6,050 | 7,652 | 16,404 | 958 | 1,816 | (795) | 12,970 |
| Fidelity Series Treasury Bill Index Fund | 36,616 | 16,128 | 11,126 | 2,242 | - | 243 | 124,716 |
| Fidelity Series Value Discovery Fund | 9,032 | 2,660 | 4,995 | - | 179 | 2,547 | 31,784 |
| | 1,031,320 | 379,321 | 323,991 | 47,049 | (7,850) | 142,394 | 3,845,589 |
Amounts in the dividend income column in the above table include any capital gain distributions from underlying funds, which are presented in the corresponding line item in the Statement of Operations, if applicable.
Amounts included in the purchases and sales proceeds columns may include in-kind transactions, if applicable.
Investment Valuation
The following is a summary of the inputs used, as of September 30, 2024, involving the Fund's assets and liabilities carried at fair value. The inputs or methodology used for valuing securities may not be an indication of the risk associated with investing in those securities. For more information on valuation inputs, and their aggregation into the levels used below, please refer to the Investment Valuation section in the accompanying Notes to Financial Statements.
| Valuation Inputs at Reporting Date: |
| Description | Total ($) | Level 1 ($) | Level 2 ($) | Level 3 ($) |
Investments in Securities: | | | | |
|
| Domestic Equity Funds | 333,295 | 333,295 | - | - |
|
| International Equity Funds | 523,302 | 523,302 | - | - |
|
| Bond Funds | 2,781,608 | 2,781,608 | - | - |
|
| Short-Term Funds | 207,384 | 207,384 | - | - |
| Total Investments in Securities: | 3,845,589 | 3,845,589 | - | - |
Fidelity Flex® Freedom Blend Income Fund
Financial Statements (Unaudited)
| Statement of Assets and Liabilities |
| As of September 30, 2024 (Unaudited) |
| Assets | | | | |
| Investment in securities, at value - See accompanying schedule: | | | | |
Affiliated issuers (cost $3,647,935) | $ | 3,845,589 | | |
| | | | | |
| | | | | |
| Total Investment in Securities (cost $3,647,935) | | | $ | 3,845,589 |
| Receivable for investments sold | | | | 11,325 |
| Receivable for fund shares sold | | | | 2,923 |
Total assets | | | | 3,859,837 |
| Liabilities | | | | |
| Payable for investments purchased | $ | 14,244 | | |
| Total liabilities | | | | 14,244 |
| Net Assets | | | $ | 3,845,593 |
| Net Assets consist of: | | | | |
| Paid in capital | | | $ | 3,780,124 |
| Total accumulated earnings (loss) | | | | 65,469 |
| Net Assets | | | $ | 3,845,593 |
Net Asset Value, offering price and redemption price per share ($3,845,593 ÷ 388,033 shares) | | | $ | 9.91 |
| Statement of Operations |
Six months ended September 30, 2024 (Unaudited) |
| Investment Income | | | | |
| Dividends: | | | | |
| Affiliated issuers | | | $ | 38,314 |
| Expenses | | | | |
| Independent trustees' fees and expenses | $ | 3 | | |
| Total expenses | | | | 3 |
| Net Investment income (loss) | | | | 38,311 |
| Realized and Unrealized Gain (Loss) | | | | |
| Net realized gain (loss) on: | | | | |
| Investment Securities: | | | | |
| Affiliated issuers | | (7,850) | | |
| Capital gain distributions from underlying funds: | | | | |
| Affiliated issuers | | 8,735 | | |
| Total net realized gain (loss) | | | | 885 |
| Change in net unrealized appreciation (depreciation) on: | | | | |
| Investment Securities: | | | | |
| Affiliated issuers | | 142,394 | | |
| Total change in net unrealized appreciation (depreciation) | | | | 142,394 |
| Net gain (loss) | | | | 143,279 |
| Net increase (decrease) in net assets resulting from operations | | | $ | 181,590 |
| Statement of Changes in Net Assets |
| |
| | Six months ended September 30, 2024 (Unaudited) | | Year ended March 31, 2024 |
| Increase (Decrease) in Net Assets | | | | |
| Operations | | | | |
| Net investment income (loss) | $ | 38,311 | $ | 35,281 |
| Net realized gain (loss) | | 885 | | (3,388) |
| Change in net unrealized appreciation (depreciation) | | 142,394 | | 32,297 |
| Net increase (decrease) in net assets resulting from operations | | 181,590 | | 64,190 |
| Distributions to shareholders | | (31,044) | | (34,758) |
| | | | | |
| Share transactions | | | | |
| Proceeds from sales of shares | | 458,922 | | 575,972 |
| Net asset value of shares issued in exchange for the net assets of the Acquired Fund(s) (see Reorganization Information note) | | 2,626,768 | | - |
| Reinvestment of distributions | | 31,044 | | 34,758 |
| Cost of shares redeemed | | (453,012) | | (428,762) |
| | | | | |
Net increase (decrease) in net assets resulting from share transactions | | 2,663,722 | | 181,968 |
| Total increase (decrease) in net assets | | 2,814,268 | | 211,400 |
| | | | | |
| Net Assets | | | | |
| Beginning of period | | 1,031,325 | | 819,925 |
| End of period | $ | 3,845,593 | $ | 1,031,325 |
| | | | | |
| Other Information | | | | |
| Shares | | | | |
| Sold | | 47,531 | | 62,628 |
| Issued in exchange for the shares of the Acquired Fund(s) (see Reorganization Information note) | | 275,344 | | - |
| Issued in reinvestment of distributions | | 3,223 | | 3,746 |
| Redeemed | | (46,655) | | (46,398) |
| Net increase (decrease) | | 279,443 | | 19,976 |
| | | | | |
Financial Highlights
Fidelity Flex® Freedom Blend Income Fund |
| |
| | Six months ended (Unaudited) September 30, 2024 | | Years ended March 31, 2024 | | 2023 | | 2022 | | 2021 | | 2020 |
Selected Per-Share Data | | | | | | | | | | | | |
| Net asset value, beginning of period | $ | 9.50 | $ | 9.25 | $ | 10.15 | $ | 10.72 | $ | 9.79 | $ | 10.01 |
| Income from Investment Operations | | | | | | | | | | | | |
Net investment income (loss) A,B | | .14 | | .32 | | .35 | | .28 | | .14 | | .23 |
| Net realized and unrealized gain (loss) | | .39 | | .24 | | (.77) | | (.33) | | 1.11 | | - C |
| Total from investment operations | | .53 | | .56 | | (.42) | | (.05) | | 1.25 | | .23 |
| Distributions from net investment income | | (.12) | | (.31) | | (.36) | | (.28) | | (.15) | | (.24) |
| Distributions from net realized gain | | - | | - | | (.12) | | (.24) | | (.17) | | (.21) |
| Total distributions | | (.12) | | (.31) | | (.48) | | (.52) | | (.32) | | (.45) |
| Net asset value, end of period | $ | 9.91 | $ | 9.50 | $ | 9.25 | $ | 10.15 | $ | 10.72 | $ | 9.79 |
Total Return D | | | | 6.14% | | (4.01)% | | (.61)% | | 12.84% | | 2.17% |
Ratios to Average Net Assets B,E,F | | | | | | | | | | | | |
Expenses before reductions G | | -% H | | -% | | -% | | -% | | -% | | -% |
Expenses net of fee waivers, if any G | | | | -% | | -% | | -% | | -% | | -% |
Expenses net of all reductions G | | -% H | | -% | | -% | | -% | | -% | | -% |
| Net investment income (loss) | | 2.91% H | | 3.49% | | 3.83% | | 2.62% | | 1.37% | | 2.31% |
| Supplemental Data | | | | | | | | | | | | |
| Net assets, end of period (000 omitted) | $ | 3,846 | $ | 1,031 | $ | 820 | $ | 151 | $ | 123 | $ | 109 |
Portfolio turnover rate I | | | | 45% | | 178% | | 36% | | 25% | | 63% |
ACalculated based on average shares outstanding during the period.
BNet investment income (loss) is affected by the timing of the declaration of dividends by any underlying mutual funds or exchange-traded funds (ETFs). Net investment income (loss) of any mutual funds or ETFs is not included in the Fund's net investment income (loss) ratio.
CAmount represents less than $.005 per share.
DTotal returns for periods of less than one year are not annualized.
EFees and expenses of any underlying mutual funds or exchange-traded funds (ETFs) are not included in the Fund's expense ratio. The Fund indirectly bears its proportionate share of these expenses.
FExpense ratios reflect operating expenses of the class. Expenses before reductions do not reflect amounts reimbursed, waived, or reduced through arrangements with the investment adviser, brokerage services, or other offset arrangements, if applicable, and do not represent the amount paid by the class during periods when reimbursements, waivers or reductions occur.
GAmount represents less than .005%.
HAnnualized.
IAmount does not include the portfolio activity of any underlying mutual funds or exchange-traded funds (ETFs).
JThe portfolio turnover rate does not include the assets acquired in the reorganization.
Fidelity Flex® Freedom Blend 2010 Fund
Schedule of Investments September 30, 2024 (Unaudited)
Showing Percentage of Net Assets
| Domestic Equity Funds - 12.9% |
| | | Shares | Value ($) |
| Fidelity Series Blue Chip Growth Fund (a) | | 4,225 | 76,971 |
| Fidelity Series Commodity Strategy Fund (a) | | 69 | 6,060 |
| Fidelity Series Large Cap Growth Index Fund (a) | | 2,095 | 49,896 |
| Fidelity Series Large Cap Stock Fund (a) | | 1,969 | 45,150 |
| Fidelity Series Large Cap Value Index Fund (a) | | 5,467 | 93,707 |
| Fidelity Series Small Cap Core Fund (a) | | 1,750 | 21,771 |
| Fidelity Series Small Cap Opportunities Fund (a) | | 883 | 13,415 |
| Fidelity Series Value Discovery Fund (a) | | 1,971 | 32,884 |
| TOTAL DOMESTIC EQUITY FUNDS (Cost $256,730) | | | 339,854 |
| | | | |
| International Equity Funds - 16.4% |
| | | Shares | Value ($) |
| Fidelity Series Canada Fund (a) | | 1,516 | 24,981 |
| Fidelity Series Emerging Markets Fund (a) | | 3,422 | 32,956 |
| Fidelity Series Emerging Markets Opportunities Fund (a) | | 6,612 | 132,704 |
| Fidelity Series International Growth Fund (a) | | 3,102 | 59,747 |
| Fidelity Series International Index Fund (a) | | 1,711 | 22,769 |
| Fidelity Series International Small Cap Fund (a) | | 2,095 | 39,302 |
| Fidelity Series International Value Fund (a) | | 4,434 | 59,942 |
| Fidelity Series Overseas Fund (a) | | 3,993 | 59,771 |
| TOTAL INTERNATIONAL EQUITY FUNDS (Cost $342,062) | | | 432,172 |
| | | | |
| Bond Funds - 67.3% |
| | | Shares | Value ($) |
| Fidelity Series 0-5 Year Inflation-Protected Bond Index Fund (a) | | 43,480 | 427,845 |
| Fidelity Series 5+ Year Inflation-Protected Bond Index Fund (a) | | 8,781 | 69,987 |
| Fidelity Series Corporate Bond Fund (a) | | 21,909 | 209,674 |
| Fidelity Series Emerging Markets Debt Fund (a) | | 1,613 | 13,179 |
| Fidelity Series Emerging Markets Debt Local Currency Fund (a) | | 525 | 5,061 |
| Fidelity Series Floating Rate High Income Fund (a) | | 295 | 2,650 |
| Fidelity Series Government Bond Index Fund (a) | | 34,911 | 327,462 |
| Fidelity Series High Income Fund (a) | | 1,640 | 14,313 |
| Fidelity Series International Credit Fund (a) | | 7 | 63 |
| Fidelity Series International Developed Markets Bond Index Fund (a) | | 11,913 | 105,668 |
| Fidelity Series Investment Grade Bond Fund (a) | | 30,839 | 317,637 |
| Fidelity Series Investment Grade Securitized Fund (a) | | 22,180 | 203,609 |
| Fidelity Series Long-Term Treasury Bond Index Fund (a) | | 12,837 | 75,355 |
| Fidelity Series Real Estate Income Fund (a) | | 261 | 2,638 |
| TOTAL BOND FUNDS (Cost $1,762,939) | | | 1,775,141 |
| | | | |
| Short-Term Funds - 3.4% |
| | | Shares | Value ($) |
| Fidelity Series Government Money Market Fund 5.03% (a)(b) | | 18,991 | 18,991 |
| Fidelity Series Short-Term Credit Fund (a) | | 1,516 | 15,263 |
| Fidelity Series Treasury Bill Index Fund (a) | | 5,744 | 57,152 |
| TOTAL SHORT-TERM FUNDS (Cost $90,709) | | | 91,406 |
| | | | |
| TOTAL INVESTMENT IN SECURITIES - 100.0% (Cost $2,452,440) | 2,638,573 |
NET OTHER ASSETS (LIABILITIES) - 0.0% | 3 |
| NET ASSETS - 100.0% | 2,638,576 |
| | |
Legend
| (b) | The rate quoted is the annualized seven-day yield of the fund at period end. |
Affiliated Underlying Funds
Fiscal year to date information regarding the Fund's investments in affiliated Underlying Funds is presented below. Exchanges between classes of the same affiliated Underlying Funds may occur. If an Underlying Funds changes its name, the name presented below is the name in effect at period end.
| Affiliate | Value, beginning of period ($) | Purchases ($) | Sales Proceeds ($) | Dividend Income ($) | Realized Gain (loss) ($) | Change in Unrealized appreciation (depreciation) ($) | Value, end of period ($) |
| Fidelity Series 0-5 Year Inflation-Protected Bond Index Fund | 785,961 | 67,056 | 436,441 | 3,689 | (20,936) | 32,205 | 427,845 |
| Fidelity Series 5+ Year Inflation-Protected Bond Index Fund | 152,965 | 4,693 | 88,600 | 776 | (17,764) | 18,693 | 69,987 |
| Fidelity Series Blue Chip Growth Fund | 162,207 | 15,817 | 98,705 | 6,570 | 33,448 | (35,796) | 76,971 |
| Fidelity Series Canada Fund | 45,665 | 5,203 | 26,884 | - | 938 | 59 | 24,981 |
| Fidelity Series Commodity Strategy Fund | 37,165 | 11,165 | 41,958 | 566 | (27,631) | 27,319 | 6,060 |
| Fidelity Series Corporate Bond Fund | 431,448 | 18,543 | 241,411 | 5,329 | (9,564) | 10,658 | 209,674 |
| Fidelity Series Emerging Markets Debt Fund | 27,429 | 1,231 | 15,646 | 374 | 134 | 31 | 13,179 |
| Fidelity Series Emerging Markets Debt Local Currency Fund | 8,846 | 204 | 4,249 | - | 179 | 81 | 5,061 |
| Fidelity Series Emerging Markets Fund | 59,793 | 6,663 | 36,315 | - | 1,514 | 1,301 | 32,956 |
| Fidelity Series Emerging Markets Opportunities Fund | 239,991 | 26,695 | 148,994 | - | 7,239 | 7,773 | 132,704 |
| Fidelity Series Floating Rate High Income Fund | 5,281 | 371 | 2,970 | 136 | 24 | (56) | 2,650 |
| Fidelity Series Government Bond Index Fund | 630,859 | 30,966 | 336,280 | 5,993 | (21,285) | 23,202 | 327,462 |
| Fidelity Series Government Money Market Fund 5.03% | 40,091 | 3,134 | 24,234 | 576 | - | - | 18,991 |
| Fidelity Series High Income Fund | 28,384 | 1,328 | 15,604 | 501 | (267) | 472 | 14,313 |
| Fidelity Series International Credit Fund | 60 | 1 | - | 1 | - | 2 | 63 |
| Fidelity Series International Developed Markets Bond Index Fund | 209,819 | 12,237 | 115,142 | 2,762 | (3,442) | 2,196 | 105,668 |
| Fidelity Series International Growth Fund | 114,551 | 12,334 | 65,827 | - | 10,234 | (11,545) | 59,747 |
| Fidelity Series International Index Fund | 43,373 | 3,877 | 25,229 | - | 3,313 | (2,565) | 22,769 |
| Fidelity Series International Small Cap Fund | 77,763 | 3,499 | 42,948 | - | 3,928 | (2,940) | 39,302 |
| Fidelity Series International Value Fund | 115,109 | 9,901 | 67,759 | - | 10,500 | (7,809) | 59,942 |
| Fidelity Series Investment Grade Bond Fund | 634,926 | 27,606 | 346,087 | 7,604 | (20,362) | 21,554 | 317,637 |
| Fidelity Series Investment Grade Securitized Fund | 418,760 | 17,495 | 232,852 | 4,948 | (16,724) | 16,930 | 203,609 |
| Fidelity Series Large Cap Growth Index Fund | 102,822 | 6,488 | 62,594 | 83 | 17,634 | (14,454) | 49,896 |
| Fidelity Series Large Cap Stock Fund | 108,881 | 6,211 | 71,390 | 2,268 | 13,752 | (12,304) | 45,150 |
| Fidelity Series Large Cap Value Index Fund | 194,637 | 11,494 | 114,370 | - | 8,711 | (6,765) | 93,707 |
| Fidelity Series Long-Term Treasury Bond Index Fund | 177,646 | 5,770 | 105,667 | 1,505 | (24,199) | 21,805 | 75,355 |
| Fidelity Series Overseas Fund | 114,825 | 10,261 | 66,326 | - | 11,368 | (10,357) | 59,771 |
| Fidelity Series Real Estate Income Fund | 5,110 | 299 | 2,859 | 76 | (296) | 384 | 2,638 |
| Fidelity Series Short-Term Credit Fund | 34,717 | 1,387 | 21,045 | 358 | 330 | (126) | 15,263 |
| Fidelity Series Small Cap Core Fund | 1,775 | 19,764 | 802 | 12 | (11) | 1,045 | 21,771 |
| Fidelity Series Small Cap Opportunities Fund | 48,156 | 2,755 | 35,788 | 977 | 5,987 | (7,695) | 13,415 |
| Fidelity Series Treasury Bill Index Fund | 116,695 | 15,568 | 75,217 | 1,634 | (189) | 295 | 57,152 |
| Fidelity Series Value Discovery Fund | 71,893 | 3,886 | 43,211 | - | 933 | (617) | 32,884 |
| | 5,247,603 | 363,902 | 3,013,404 | 46,738 | (32,504) | 72,976 | 2,638,573 |
Amounts in the dividend income column in the above table include any capital gain distributions from underlying funds, which are presented in the corresponding line item in the Statement of Operations, if applicable.
Amounts included in the purchases and sales proceeds columns may include in-kind transactions, if applicable.
Investment Valuation
The following is a summary of the inputs used, as of September 30, 2024, involving the Fund's assets and liabilities carried at fair value. The inputs or methodology used for valuing securities may not be an indication of the risk associated with investing in those securities. For more information on valuation inputs, and their aggregation into the levels used below, please refer to the Investment Valuation section in the accompanying Notes to Financial Statements.
| Valuation Inputs at Reporting Date: |
| Description | Total ($) | Level 1 ($) | Level 2 ($) | Level 3 ($) |
Investments in Securities: | | | | |
|
| Domestic Equity Funds | 339,854 | 339,854 | - | - |
|
| International Equity Funds | 432,172 | 432,172 | - | - |
|
| Bond Funds | 1,775,141 | 1,775,141 | - | - |
|
| Short-Term Funds | 91,406 | 91,406 | - | - |
| Total Investments in Securities: | 2,638,573 | 2,638,573 | - | - |
Fidelity Flex® Freedom Blend 2010 Fund
Financial Statements (Unaudited)
| Statement of Assets and Liabilities |
| As of September 30, 2024 (Unaudited) |
| Assets | | | | |
| Investment in securities, at value - See accompanying schedule: | | | | |
Affiliated issuers (cost $2,452,440) | $ | 2,638,573 | | |
| | | | | |
| | | | | |
| Total Investment in Securities (cost $2,452,440) | | | $ | 2,638,573 |
| Receivable for investments sold | | | | 11,490 |
| Receivable for fund shares sold | | | | 1,033 |
Total assets | | | | 2,651,096 |
| Liabilities | | | | |
| Payable for investments purchased | $ | 12,520 | | |
| Total liabilities | | | | 12,520 |
| Net Assets | | | $ | 2,638,576 |
| Net Assets consist of: | | | | |
| Paid in capital | | | $ | 2,567,862 |
| Total accumulated earnings (loss) | | | | 70,714 |
| Net Assets | | | $ | 2,638,576 |
Net Asset Value, offering price and redemption price per share ($2,638,576 ÷ 257,881 shares) | | | $ | 10.23 |
| Statement of Operations |
Six months ended September 30, 2024 (Unaudited) |
| Investment Income | | | | |
| Dividends: | | | | |
| Affiliated issuers | | | $ | 37,791 |
| Expenses | | | | |
| Independent trustees' fees and expenses | $ | 4 | | |
| Total expenses | | | | 4 |
| Net Investment income (loss) | | | | 37,787 |
| Realized and Unrealized Gain (Loss) | | | | |
| Net realized gain (loss) on: | | | | |
| Investment Securities: | | | | |
| Affiliated issuers | | (32,504) | | |
| Capital gain distributions from underlying funds: | | | | |
| Affiliated issuers | | 8,947 | | |
| Total net realized gain (loss) | | | | (23,557) |
| Change in net unrealized appreciation (depreciation) on: | | | | |
| Investment Securities: | | | | |
| Affiliated issuers | | 72,976 | | |
| Total change in net unrealized appreciation (depreciation) | | | | 72,976 |
| Net gain (loss) | | | | 49,419 |
| Net increase (decrease) in net assets resulting from operations | | | $ | 87,206 |
| Statement of Changes in Net Assets |
| |
| | Six months ended September 30, 2024 (Unaudited) | | Year ended March 31, 2024 |
| Increase (Decrease) in Net Assets | | | | |
| Operations | | | | |
| Net investment income (loss) | $ | 37,787 | $ | 183,689 |
| Net realized gain (loss) | | (23,557) | | 17,905 |
| Change in net unrealized appreciation (depreciation) | | 72,976 | | 212,379 |
| Net increase (decrease) in net assets resulting from operations | | 87,206 | | 413,973 |
| Distributions to shareholders | | (28,531) | | (182,341) |
| | | | | |
| Share transactions | | | | |
| Proceeds from sales of shares | | 173,664 | | 272,849 |
| Reinvestment of distributions | | 28,531 | | 182,341 |
| Cost of shares redeemed | | (2,869,912) | | (1,263,567) |
| | | | | |
Net increase (decrease) in net assets resulting from share transactions | | (2,667,717) | | (808,377) |
| Total increase (decrease) in net assets | | (2,609,042) | | (576,745) |
| | | | | |
| Net Assets | | | | |
| Beginning of period | | 5,247,618 | | 5,824,363 |
| End of period | $ | 2,638,576 | $ | 5,247,618 |
| | | | | |
| Other Information | | | | |
| Shares | | | | |
| Sold | | 17,763 | | 28,976 |
| Issued in reinvestment of distributions | | 2,966 | | 19,094 |
| Redeemed | | (300,258) | | (133,241) |
| Net increase (decrease) | | (279,529) | | (85,171) |
| | | | | |
Financial Highlights
Fidelity Flex® Freedom Blend 2010 Fund |
| |
| | Six months ended (Unaudited) September 30, 2024 | | Years ended March 31, 2024 | | 2023 | | 2022 | | 2021 | | 2020 |
Selected Per-Share Data | | | | | | | | | | | | |
| Net asset value, beginning of period | $ | 9.76 | $ | 9.36 | $ | 10.38 | $ | 11.06 | $ | 9.52 | $ | 10.07 |
| Income from Investment Operations | | | | | | | | | | | | |
Net investment income (loss) A,B | | .13 | | .31 | | .39 | | .30 | | .15 | | .24 |
| Net realized and unrealized gain (loss) | | .46 | | .39 | | (.90) | | (.27) | | 1.82 | | (.24) |
| Total from investment operations | | .59 | | .70 | | (.51) | | .03 | | 1.97 | | - C |
| Distributions from net investment income | | (.12) | | (.30) | | (.33) | | (.30) | | (.17) | | (.25) |
| Distributions from net realized gain | | - | | - C | | (.18) | | (.41) | | (.27) | | (.30) |
| Total distributions | | (.12) | | (.30) | | (.51) | | (.71) | | (.43) D | | (.55) |
| Net asset value, end of period | $ | 10.23 | $ | 9.76 | $ | 9.36 | $ | 10.38 | $ | 11.06 | $ | 9.52 |
Total Return E | | | | 7.59% | | (4.76)% | | .02% | | 20.94% | | (.34)% |
Ratios to Average Net Assets B,F,G | | | | | | | | | | | | |
Expenses before reductions H | | -% I | | -% | | -% | | -% | | -% | | -% |
Expenses net of fee waivers, if any H | | | | -% | | -% | | -% | | -% | | -% |
Expenses net of all reductions H | | -% I | | -% | | -% | | -% | | -% | | -% |
| Net investment income (loss) | | 2.57% I | | 3.24% | | 4.27% | | 2.67% | | 1.45% | | 2.32% |
| Supplemental Data | | | | | | | | | | | | |
| Net assets, end of period (000 omitted) | $ | 2,639 | $ | 5,248 | $ | 5,824 | $ | 135 | $ | 131 | $ | 108 |
Portfolio turnover rate J | | | | 23% | | 98% | | 33% | | 26% | | 65% |
ACalculated based on average shares outstanding during the period.
BNet investment income (loss) is affected by the timing of the declaration of dividends by any underlying mutual funds or exchange-traded funds (ETFs). Net investment income (loss) of any mutual funds or ETFs is not included in the Fund's net investment income (loss) ratio.
CAmount represents less than $.005 per share.
DTotal distributions per share do not sum due to rounding.
ETotal returns for periods of less than one year are not annualized.
FFees and expenses of any underlying mutual funds or exchange-traded funds (ETFs) are not included in the Fund's expense ratio. The Fund indirectly bears its proportionate share of these expenses.
GExpense ratios reflect operating expenses of the class. Expenses before reductions do not reflect amounts reimbursed, waived, or reduced through arrangements with the investment adviser, brokerage services, or other offset arrangements, if applicable, and do not represent the amount paid by the class during periods when reimbursements, waivers or reductions occur.
HAmount represents less than .005%.
IAnnualized.
JAmount does not include the portfolio activity of any underlying mutual funds or exchange-traded funds (ETFs).
Fidelity Flex® Freedom Blend 2015 Fund
Schedule of Investments September 30, 2024 (Unaudited)
Showing Percentage of Net Assets
| Domestic Equity Funds - 18.4% |
| | | Shares | Value ($) |
| Fidelity Series Blue Chip Growth Fund (a) | | 24,668 | 449,454 |
| Fidelity Series Commodity Strategy Fund (a) | | 279 | 24,626 |
| Fidelity Series Large Cap Growth Index Fund (a) | | 12,231 | 291,352 |
| Fidelity Series Large Cap Stock Fund (a) | | 11,498 | 263,644 |
| Fidelity Series Large Cap Value Index Fund (a) | | 31,924 | 547,182 |
| Fidelity Series Small Cap Core Fund (a) | | 10,246 | 127,459 |
| Fidelity Series Small Cap Opportunities Fund (a) | | 5,140 | 78,081 |
| Fidelity Series Value Discovery Fund (a) | | 11,475 | 191,402 |
| TOTAL DOMESTIC EQUITY FUNDS (Cost $1,492,768) | | | 1,973,200 |
| | | | |
| International Equity Funds - 20.0% |
| | | Shares | Value ($) |
| Fidelity Series Canada Fund (a) | | 8,003 | 131,883 |
| Fidelity Series Emerging Markets Fund (a) | | 16,278 | 156,758 |
| Fidelity Series Emerging Markets Opportunities Fund (a) | | 31,450 | 631,206 |
| Fidelity Series International Growth Fund (a) | | 16,377 | 315,424 |
| Fidelity Series International Index Fund (a) | | 9,031 | 120,207 |
| Fidelity Series International Small Cap Fund (a) | | 8,574 | 160,846 |
| Fidelity Series International Value Fund (a) | | 23,406 | 316,455 |
| Fidelity Series Overseas Fund (a) | | 21,079 | 315,550 |
| TOTAL INTERNATIONAL EQUITY FUNDS (Cost $1,706,259) | | | 2,148,329 |
| | | | |
| Bond Funds - 61.0% |
| | | Shares | Value ($) |
| Fidelity Series 0-5 Year Inflation-Protected Bond Index Fund (a) | | 115,737 | 1,138,855 |
| Fidelity Series 5+ Year Inflation-Protected Bond Index Fund (a) | | 70,835 | 564,556 |
| Fidelity Series Corporate Bond Fund (a) | | 81,131 | 776,421 |
| Fidelity Series Emerging Markets Debt Fund (a) | | 6,937 | 56,678 |
| Fidelity Series Emerging Markets Debt Local Currency Fund (a) | | 1,813 | 17,456 |
| Fidelity Series Floating Rate High Income Fund (a) | | 1,206 | 10,821 |
| Fidelity Series Government Bond Index Fund (a) | | 129,273 | 1,212,580 |
| Fidelity Series High Income Fund (a) | | 6,663 | 58,164 |
| Fidelity Series International Credit Fund (a) | | 8 | 64 |
| Fidelity Series International Developed Markets Bond Index Fund (a) | | 48,442 | 429,677 |
| Fidelity Series Investment Grade Bond Fund (a) | | 114,194 | 1,176,200 |
| Fidelity Series Investment Grade Securitized Fund (a) | | 82,130 | 753,950 |
| Fidelity Series Long-Term Treasury Bond Index Fund (a) | | 56,376 | 330,925 |
| Fidelity Series Real Estate Income Fund (a) | | 1,062 | 10,722 |
| TOTAL BOND FUNDS (Cost $6,573,680) | | | 6,537,069 |
| | | | |
| Short-Term Funds - 0.6% |
| | | Shares | Value ($) |
| Fidelity Series Government Money Market Fund 5.03% (a)(b) | | 12,153 | 12,153 |
| Fidelity Series Short-Term Credit Fund (a) | | 937 | 9,433 |
| Fidelity Series Treasury Bill Index Fund (a) | | 4,214 | 41,925 |
| TOTAL SHORT-TERM FUNDS (Cost $63,072) | | | 63,511 |
| | | | |
| TOTAL INVESTMENT IN SECURITIES - 100.0% (Cost $9,835,779) | 10,722,109 |
NET OTHER ASSETS (LIABILITIES) - 0.0% | 3 |
| NET ASSETS - 100.0% | 10,722,112 |
| | |
Legend
| (b) | The rate quoted is the annualized seven-day yield of the fund at period end. |
Affiliated Underlying Funds
Fiscal year to date information regarding the Fund's investments in affiliated Underlying Funds is presented below. Exchanges between classes of the same affiliated Underlying Funds may occur. If an Underlying Funds changes its name, the name presented below is the name in effect at period end.
| Affiliate | Value, beginning of period ($) | Purchases ($) | Sales Proceeds ($) | Dividend Income ($) | Realized Gain (loss) ($) | Change in Unrealized appreciation (depreciation) ($) | Value, end of period ($) |
| Fidelity Series 0-5 Year Inflation-Protected Bond Index Fund | 1,027,379 | 188,642 | 108,031 | 9,253 | (2,639) | 33,504 | 1,138,855 |
| Fidelity Series 5+ Year Inflation-Protected Bond Index Fund | 605,235 | 21,227 | 87,497 | 6,086 | (12,506) | 38,097 | 564,556 |
| Fidelity Series Blue Chip Growth Fund | 479,985 | 78,394 | 114,817 | 38,309 | 27,194 | (21,302) | 449,454 |
| Fidelity Series Canada Fund | 125,778 | 13,629 | 16,565 | - | 255 | 8,786 | 131,883 |
| Fidelity Series Commodity Strategy Fund | 77,520 | 24,982 | 74,795 | 2,301 | (48,374) | 45,293 | 24,626 |
| Fidelity Series Corporate Bond Fund | 820,230 | 47,873 | 118,762 | 17,168 | (1,921) | 29,001 | 776,421 |
| Fidelity Series Emerging Markets Debt Fund | 57,256 | 3,705 | 6,375 | 1,333 | 48 | 2,044 | 56,678 |
| Fidelity Series Emerging Markets Debt Local Currency Fund | 18,410 | 404 | 2,534 | - | 76 | 1,100 | 17,456 |
| Fidelity Series Emerging Markets Fund | 146,786 | 21,830 | 25,901 | - | 498 | 13,545 | 156,758 |
| Fidelity Series Emerging Markets Opportunities Fund | 589,145 | 88,090 | 116,969 | - | 4,553 | 66,387 | 631,206 |
| Fidelity Series Floating Rate High Income Fund | 11,016 | 1,168 | 1,269 | 480 | (1) | (93) | 10,821 |
| Fidelity Series Government Bond Index Fund | 1,199,329 | 105,271 | 128,200 | 19,463 | (4,277) | 40,457 | 1,212,580 |
| Fidelity Series Government Money Market Fund 5.03% | 20,404 | 5,487 | 13,738 | 337 | - | - | 12,153 |
| Fidelity Series High Income Fund | 59,206 | 4,055 | 6,839 | 1,776 | (48) | 1,790 | 58,164 |
| Fidelity Series International Credit Fund | 60 | 2 | - | 1 | - | 2 | 64 |
| Fidelity Series International Developed Markets Bond Index Fund | 437,723 | 32,429 | 46,758 | 6,372 | (785) | 7,068 | 429,677 |
| Fidelity Series International Growth Fund | 315,521 | 36,034 | 46,121 | - | 2,527 | 7,463 | 315,424 |
| Fidelity Series International Index Fund | 119,466 | 11,221 | 18,204 | - | 1,312 | 6,412 | 120,207 |
| Fidelity Series International Small Cap Fund | 163,296 | 14,200 | 27,715 | - | 2,017 | 9,048 | 160,846 |
| Fidelity Series International Value Fund | 317,056 | 30,818 | 53,409 | - | 4,875 | 17,115 | 316,455 |
| Fidelity Series Investment Grade Bond Fund | 1,207,057 | 78,298 | 147,454 | 24,537 | (4,108) | 42,407 | 1,176,200 |
| Fidelity Series Investment Grade Securitized Fund | 796,110 | 43,265 | 111,338 | 15,931 | (3,691) | 29,604 | 753,950 |
| Fidelity Series Large Cap Growth Index Fund | 304,264 | 28,032 | 72,746 | 494 | 12,761 | 19,041 | 291,352 |
| Fidelity Series Large Cap Stock Fund | 322,186 | 24,288 | 97,913 | 13,288 | 17,475 | (2,392) | 263,644 |
| Fidelity Series Large Cap Value Index Fund | 575,927 | 34,802 | 99,550 | - | 5,864 | 30,139 | 547,182 |
| Fidelity Series Long-Term Treasury Bond Index Fund | 396,858 | 26,933 | 104,438 | 5,757 | (19,269) | 30,841 | 330,925 |
| Fidelity Series Overseas Fund | 316,274 | 27,252 | 46,704 | - | 4,307 | 14,421 | 315,550 |
| Fidelity Series Real Estate Income Fund | 10,660 | 745 | 1,122 | 317 | (84) | 523 | 10,722 |
| Fidelity Series Short-Term Credit Fund | 10,493 | 528 | 1,790 | 190 | 24 | 178 | 9,433 |
| Fidelity Series Small Cap Core Fund | 5,196 | 122,445 | 6,483 | 33 | (54) | 6,355 | 127,459 |
| Fidelity Series Small Cap Opportunities Fund | 142,503 | 10,121 | 73,771 | 5,696 | 14,036 | (14,808) | 78,081 |
| Fidelity Series Treasury Bill Index Fund | 54,609 | 36,323 | 49,065 | 909 | (8) | 66 | 41,925 |
| Fidelity Series Value Discovery Fund | 212,740 | 13,159 | 44,243 | - | 1,781 | 7,965 | 191,402 |
| | 10,945,678 | 1,175,652 | 1,871,116 | 170,031 | 1,838 | 470,057 | 10,722,109 |
Amounts in the dividend income column in the above table include any capital gain distributions from underlying funds, which are presented in the corresponding line item in the Statement of Operations, if applicable.
Amounts included in the purchases and sales proceeds columns may include in-kind transactions, if applicable.
Investment Valuation
The following is a summary of the inputs used, as of September 30, 2024, involving the Fund's assets and liabilities carried at fair value. The inputs or methodology used for valuing securities may not be an indication of the risk associated with investing in those securities. For more information on valuation inputs, and their aggregation into the levels used below, please refer to the Investment Valuation section in the accompanying Notes to Financial Statements.
| Valuation Inputs at Reporting Date: |
| Description | Total ($) | Level 1 ($) | Level 2 ($) | Level 3 ($) |
Investments in Securities: | | | | |
|
| Domestic Equity Funds | 1,973,200 | 1,973,200 | - | - |
|
| International Equity Funds | 2,148,329 | 2,148,329 | - | - |
|
| Bond Funds | 6,537,069 | 6,537,069 | - | - |
|
| Short-Term Funds | 63,511 | 63,511 | - | - |
| Total Investments in Securities: | 10,722,109 | 10,722,109 | - | - |
Fidelity Flex® Freedom Blend 2015 Fund
Financial Statements (Unaudited)
| Statement of Assets and Liabilities |
| As of September 30, 2024 (Unaudited) |
| Assets | | | | |
| Investment in securities, at value - See accompanying schedule: | | | | |
Affiliated issuers (cost $9,835,779) | $ | 10,722,109 | | |
| | | | | |
| | | | | |
| Total Investment in Securities (cost $9,835,779) | | | $ | 10,722,109 |
| Receivable for investments sold | | | | 48,176 |
| Receivable for fund shares sold | | | | 2,715 |
Total assets | | | | 10,773,000 |
| Liabilities | | | | |
| Payable for investments purchased | $ | 50,113 | | |
| Payable for fund shares redeemed | | 775 | | |
| Total liabilities | | | | 50,888 |
| Net Assets | | | $ | 10,722,112 |
| Net Assets consist of: | | | | |
| Paid in capital | | | $ | 9,989,690 |
| Total accumulated earnings (loss) | | | | 732,422 |
| Net Assets | | | $ | 10,722,112 |
Net Asset Value, offering price and redemption price per share ($10,722,112 ÷ 1,006,663 shares) | | | $ | 10.65 |
| Statement of Operations |
Six months ended September 30, 2024 (Unaudited) |
| Investment Income | | | | |
| Dividends: | | | | |
| Affiliated issuers | | | $ | 117,815 |
| Expenses | | | | |
| Independent trustees' fees and expenses | $ | 13 | | |
| Total expenses | | | | 13 |
| Net Investment income (loss) | | | | 117,802 |
| Realized and Unrealized Gain (Loss) | | | | |
| Net realized gain (loss) on: | | | | |
| Investment Securities: | | | | |
| Affiliated issuers | | 1,838 | | |
| Capital gain distributions from underlying funds: | | | | |
| Affiliated issuers | | 52,216 | | |
| Total net realized gain (loss) | | | | 54,054 |
| Change in net unrealized appreciation (depreciation) on: | | | | |
| Investment Securities: | | | | |
| Affiliated issuers | | 470,057 | | |
| Total change in net unrealized appreciation (depreciation) | | | | 470,057 |
| Net gain (loss) | | | | 524,111 |
| Net increase (decrease) in net assets resulting from operations | | | $ | 641,913 |
| Statement of Changes in Net Assets |
| |
| | Six months ended September 30, 2024 (Unaudited) | | Year ended March 31, 2024 |
| Increase (Decrease) in Net Assets | | | | |
| Operations | | | | |
| Net investment income (loss) | $ | 117,802 | $ | 331,381 |
| Net realized gain (loss) | | 54,054 | | 74,898 |
| Change in net unrealized appreciation (depreciation) | | 470,057 | | 565,326 |
| Net increase (decrease) in net assets resulting from operations | | 641,913 | | 971,605 |
| Distributions to shareholders | | (48,680) | | (329,206) |
| | | | | |
| Share transactions | | | | |
| Proceeds from sales of shares | | 396,630 | | 818,797 |
| Reinvestment of distributions | | 48,680 | | 329,206 |
| Cost of shares redeemed | | (1,262,125) | | (1,910,253) |
| | | | | |
Net increase (decrease) in net assets resulting from share transactions | | (816,815) | | (762,250) |
| Total increase (decrease) in net assets | | (223,582) | | (119,851) |
| | | | | |
| Net Assets | | | | |
| Beginning of period | | 10,945,694 | | 11,065,545 |
| End of period | $ | 10,722,112 | $ | 10,945,694 |
| | | | | |
| Other Information | | | | |
| Shares | | | | |
| Sold | | 39,118 | | 85,332 |
| Issued in reinvestment of distributions | | 4,883 | | 33,751 |
| Redeemed | | (126,232) | | (198,685) |
| Net increase (decrease) | | (82,231) | | (79,602) |
| | | | | |
Financial Highlights
Fidelity Flex® Freedom Blend 2015 Fund |
| |
| | Six months ended (Unaudited) September 30, 2024 | | Years ended March 31, 2024 | | 2023 | | 2022 | | 2021 | | 2020 |
Selected Per-Share Data | | | | | | | | | | | | |
| Net asset value, beginning of period | $ | 10.05 | $ | 9.47 | $ | 10.62 | $ | 11.29 | $ | 9.35 | $ | 10.09 |
| Income from Investment Operations | | | | | | | | | | | | |
Net investment income (loss) A,B | | .11 | | .29 | | .38 | | .31 | | .16 | | .24 |
| Net realized and unrealized gain (loss) | | .54 | | .59 | | (.98) | | (.22) | | 2.27 | | (.39) |
| Total from investment operations | | .65 | | .88 | | (.60) | | .09 | | 2.43 | | (.15) |
| Distributions from net investment income | | (.05) | | (.30) | | (.37) | | (.30) | | (.17) | | (.25) |
| Distributions from net realized gain | | - | | (.01) | | (.18) | | (.46) | | (.31) | | (.34) |
| Total distributions | | (.05) | | (.30) C | | (.55) | | (.76) | | (.49) C | | (.59) |
| Net asset value, end of period | $ | 10.65 | $ | 10.05 | $ | 9.47 | $ | 10.62 | $ | 11.29 | $ | 9.35 |
Total Return D | | | | 9.41% | | (5.53)% | | .49% | | 26.24% | | (1.91)% |
Ratios to Average Net Assets B,E,F | | | | | | | | | | | | |
Expenses before reductions G | | -% H | | -% | | -% | | -% | | -% | | -% |
Expenses net of fee waivers, if any G | | | | -% | | -% | | -% | | -% | | -% |
Expenses net of all reductions G | | -% H | | -% | | -% | | -% | | -% | | -% |
| Net investment income (loss) | | 2.26% H | | 3.04% | | 4.09% | | 2.72% | | 1.50% | | 2.34% |
| Supplemental Data | | | | | | | | | | | | |
| Net assets, end of period (000 omitted) | $ | 10,722 | $ | 10,946 | $ | 11,066 | $ | 170 | $ | 136 | $ | 108 |
Portfolio turnover rate I | | | | 24% | | 93% | | 32% | | 26% | | 66% |
ACalculated based on average shares outstanding during the period.
BNet investment income (loss) is affected by the timing of the declaration of dividends by any underlying mutual funds or exchange-traded funds (ETFs). Net investment income (loss) of any mutual funds or ETFs is not included in the Fund's net investment income (loss) ratio.
CTotal distributions per share do not sum due to rounding.
DTotal returns for periods of less than one year are not annualized.
EFees and expenses of any underlying mutual funds or exchange-traded funds (ETFs) are not included in the Fund's expense ratio. The Fund indirectly bears its proportionate share of these expenses.
FExpense ratios reflect operating expenses of the class. Expenses before reductions do not reflect amounts reimbursed, waived, or reduced through arrangements with the investment adviser, brokerage services, or other offset arrangements, if applicable, and do not represent the amount paid by the class during periods when reimbursements, waivers or reductions occur.
GAmount represents less than .005%.
HAnnualized.
IAmount does not include the portfolio activity of any underlying mutual funds or exchange-traded funds (ETFs).
Fidelity Flex® Freedom Blend 2020 Fund
Schedule of Investments September 30, 2024 (Unaudited)
Showing Percentage of Net Assets
| Domestic Equity Funds - 23.9% |
| | | Shares | Value ($) |
| Fidelity Series Blue Chip Growth Fund (a) | | 91,413 | 1,665,549 |
| Fidelity Series Commodity Strategy Fund (a) | | 791 | 69,952 |
| Fidelity Series Large Cap Growth Index Fund (a) | | 45,326 | 1,079,664 |
| Fidelity Series Large Cap Stock Fund (a) | | 42,607 | 976,986 |
| Fidelity Series Large Cap Value Index Fund (a) | | 118,303 | 2,027,707 |
| Fidelity Series Small Cap Core Fund (a) | | 38,211 | 475,341 |
| Fidelity Series Small Cap Opportunities Fund (a) | | 18,992 | 288,496 |
| Fidelity Series Value Discovery Fund (a) | | 42,392 | 707,104 |
| TOTAL DOMESTIC EQUITY FUNDS (Cost $5,484,786) | | | 7,290,799 |
| | | | |
| International Equity Funds - 23.7% |
| | | Shares | Value ($) |
| Fidelity Series Canada Fund (a) | | 27,985 | 461,201 |
| Fidelity Series Emerging Markets Fund (a) | | 52,972 | 510,123 |
| Fidelity Series Emerging Markets Opportunities Fund (a) | | 102,343 | 2,054,027 |
| Fidelity Series International Growth Fund (a) | | 57,271 | 1,103,043 |
| Fidelity Series International Index Fund (a) | | 31,583 | 420,368 |
| Fidelity Series International Small Cap Fund (a) | | 24,355 | 456,893 |
| Fidelity Series International Value Fund (a) | | 81,853 | 1,106,649 |
| Fidelity Series Overseas Fund (a) | | 73,713 | 1,103,482 |
| TOTAL INTERNATIONAL EQUITY FUNDS (Cost $5,708,169) | | | 7,215,786 |
| | | | |
| Bond Funds - 52.2% |
| | | Shares | Value ($) |
| Fidelity Series 0-5 Year Inflation-Protected Bond Index Fund (a) | | 155,258 | 1,527,738 |
| Fidelity Series 5+ Year Inflation-Protected Bond Index Fund (a) | | 301,051 | 2,399,374 |
| Fidelity Series Corporate Bond Fund (a) | | 182,926 | 1,750,606 |
| Fidelity Series Emerging Markets Debt Fund (a) | | 19,736 | 161,244 |
| Fidelity Series Emerging Markets Debt Local Currency Fund (a) | | 5,124 | 49,340 |
| Fidelity Series Floating Rate High Income Fund (a) | | 3,427 | 30,738 |
| Fidelity Series Government Bond Index Fund (a) | | 291,473 | 2,734,020 |
| Fidelity Series High Income Fund (a) | | 18,925 | 165,219 |
| Fidelity Series International Credit Fund (a) | | 9 | 78 |
| Fidelity Series International Developed Markets Bond Index Fund (a) | | 137,613 | 1,220,624 |
| Fidelity Series Investment Grade Bond Fund (a) | | 257,475 | 2,651,991 |
| Fidelity Series Investment Grade Securitized Fund (a) | | 185,179 | 1,699,939 |
| Fidelity Series Long-Term Treasury Bond Index Fund (a) | | 250,317 | 1,469,359 |
| Fidelity Series Real Estate Income Fund (a) | | 3,015 | 30,456 |
| TOTAL BOND FUNDS (Cost $16,144,009) | | | 15,890,726 |
| | | | |
| Short-Term Funds - 0.2% |
| | | Shares | Value ($) |
| Fidelity Series Government Money Market Fund 5.03% (a)(b) | | 11,724 | 11,724 |
| Fidelity Series Treasury Bill Index Fund (a) | | 4,656 | 46,329 |
| TOTAL SHORT-TERM FUNDS (Cost $58,012) | | | 58,053 |
| | | | |
| TOTAL INVESTMENT IN SECURITIES - 100.0% (Cost $27,394,976) | 30,455,364 |
NET OTHER ASSETS (LIABILITIES) - 0.0% | 2 |
| NET ASSETS - 100.0% | 30,455,366 |
| | |
Legend
| (b) | The rate quoted is the annualized seven-day yield of the fund at period end. |
Affiliated Underlying Funds
Fiscal year to date information regarding the Fund's investments in affiliated Underlying Funds is presented below. Exchanges between classes of the same affiliated Underlying Funds may occur. If an Underlying Funds changes its name, the name presented below is the name in effect at period end.
| Affiliate | Value, beginning of period ($) | Purchases ($) | Sales Proceeds ($) | Dividend Income ($) | Realized Gain (loss) ($) | Change in Unrealized appreciation (depreciation) ($) | Value, end of period ($) |
| Fidelity Series 0-5 Year Inflation-Protected Bond Index Fund | 1,176,451 | 447,265 | 135,460 | 11,507 | 1,409 | 38,073 | 1,527,738 |
| Fidelity Series 5+ Year Inflation-Protected Bond Index Fund | 2,531,509 | 87,065 | 334,720 | 26,723 | (44,896) | 160,416 | 2,399,374 |
| Fidelity Series Blue Chip Growth Fund | 1,766,415 | 281,365 | 415,175 | 141,740 | 105,478 | (72,534) | 1,665,549 |
| Fidelity Series Canada Fund | 443,880 | 48,255 | 63,410 | - | 2,124 | 30,352 | 461,201 |
| Fidelity Series Commodity Strategy Fund | 220,143 | 66,702 | 207,519 | 6,536 | (134,005) | 124,631 | 69,952 |
| Fidelity Series Corporate Bond Fund | 1,855,225 | 111,312 | 281,654 | 39,934 | 32 | 65,691 | 1,750,606 |
| Fidelity Series Emerging Markets Debt Fund | 162,771 | 10,407 | 18,209 | 3,946 | 367 | 5,908 | 161,244 |
| Fidelity Series Emerging Markets Debt Local Currency Fund | 52,138 | 886 | 7,093 | - | 510 | 2,899 | 49,340 |
| Fidelity Series Emerging Markets Fund | 480,128 | 67,473 | 84,607 | - | 1,610 | 45,519 | 510,123 |
| Fidelity Series Emerging Markets Opportunities Fund | 1,927,046 | 265,332 | 374,899 | - | 14,529 | 222,019 | 2,054,027 |
| Fidelity Series Floating Rate High Income Fund | 31,292 | 3,740 | 4,018 | 1,406 | (6) | (270) | 30,738 |
| Fidelity Series Government Bond Index Fund | 2,712,641 | 247,295 | 313,353 | 45,294 | 1,081 | 86,356 | 2,734,020 |
| Fidelity Series Government Money Market Fund 5.03% | 30,734 | 15,890 | 34,900 | 334 | - | - | 11,724 |
| Fidelity Series High Income Fund | 168,166 | 11,526 | 19,665 | 5,202 | 105 | 5,087 | 165,219 |
| Fidelity Series International Credit Fund | 73 | 2 | - | 2 | - | 3 | 78 |
| Fidelity Series International Developed Markets Bond Index Fund | 1,243,212 | 107,865 | 150,164 | 18,266 | (595) | 20,306 | 1,220,624 |
| Fidelity Series International Growth Fund | 1,113,547 | 119,069 | 167,614 | - | 12,171 | 25,870 | 1,103,043 |
| Fidelity Series International Index Fund | 421,617 | 34,211 | 63,858 | - | 6,186 | 22,212 | 420,368 |
| Fidelity Series International Small Cap Fund | 463,760 | 39,711 | 79,591 | - | 6,951 | 26,062 | 456,893 |
| Fidelity Series International Value Fund | 1,118,945 | 94,740 | 187,287 | - | 21,119 | 59,132 | 1,106,649 |
| Fidelity Series Investment Grade Bond Fund | 2,730,193 | 181,686 | 352,864 | 57,088 | (2,381) | 95,357 | 2,651,991 |
| Fidelity Series Investment Grade Securitized Fund | 1,800,692 | 100,607 | 264,539 | 37,051 | (5,669) | 68,848 | 1,699,939 |
| Fidelity Series Large Cap Growth Index Fund | 1,119,598 | 101,179 | 265,461 | 1,894 | 62,978 | 61,370 | 1,079,664 |
| Fidelity Series Large Cap Stock Fund | 1,185,552 | 83,677 | 350,091 | 51,674 | 67,855 | (10,007) | 976,986 |
| Fidelity Series Large Cap Value Index Fund | 2,119,503 | 154,211 | 385,489 | - | 37,360 | 102,122 | 2,027,707 |
| Fidelity Series Long-Term Treasury Bond Index Fund | 1,665,668 | 117,724 | 374,747 | 26,161 | (57,894) | 118,608 | 1,469,359 |
| Fidelity Series Overseas Fund | 1,116,197 | 84,925 | 167,072 | - | 21,429 | 48,003 | 1,103,482 |
| Fidelity Series Real Estate Income Fund | 30,277 | 2,254 | 3,384 | 924 | (170) | 1,479 | 30,456 |
| Fidelity Series Short-Term Credit Fund | 137 | 11 | 148 | - | - | - | - |
| Fidelity Series Small Cap Core Fund | 21,388 | 475,013 | 44,617 | 122 | (797) | 24,354 | 475,341 |
| Fidelity Series Small Cap Opportunities Fund | 524,135 | 35,101 | 270,126 | 21,077 | 55,234 | (55,848) | 288,496 |
| Fidelity Series Treasury Bill Index Fund | 71,801 | 91,265 | 116,779 | 826 | (8) | 50 | 46,329 |
| Fidelity Series Value Discovery Fund | 782,684 | 47,898 | 161,095 | - | 8,333 | 29,284 | 707,104 |
| | 31,087,518 | 3,535,662 | 5,699,608 | 497,707 | 180,440 | 1,351,352 | 30,455,364 |
Amounts in the dividend income column in the above table include any capital gain distributions from underlying funds, which are presented in the corresponding line item in the Statement of Operations, if applicable.
Amounts included in the purchases and sales proceeds columns may include in-kind transactions, if applicable.
Investment Valuation
The following is a summary of the inputs used, as of September 30, 2024, involving the Fund's assets and liabilities carried at fair value. The inputs or methodology used for valuing securities may not be an indication of the risk associated with investing in those securities. For more information on valuation inputs, and their aggregation into the levels used below, please refer to the Investment Valuation section in the accompanying Notes to Financial Statements.
| Valuation Inputs at Reporting Date: |
| Description | Total ($) | Level 1 ($) | Level 2 ($) | Level 3 ($) |
Investments in Securities: | | | | |
|
| Domestic Equity Funds | 7,290,799 | 7,290,799 | - | - |
|
| International Equity Funds | 7,215,786 | 7,215,786 | - | - |
|
| Bond Funds | 15,890,726 | 15,890,726 | - | - |
|
| Short-Term Funds | 58,053 | 58,053 | - | - |
| Total Investments in Securities: | 30,455,364 | 30,455,364 | - | - |
Fidelity Flex® Freedom Blend 2020 Fund
Financial Statements (Unaudited)
| Statement of Assets and Liabilities |
| As of September 30, 2024 (Unaudited) |
| Assets | | | | |
| Investment in securities, at value - See accompanying schedule: | | | | |
Affiliated issuers (cost $27,394,976) | $ | 30,455,364 | | |
| | | | | |
| | | | | |
| Total Investment in Securities (cost $27,394,976) | | | $ | 30,455,364 |
| Receivable for investments sold | | | | 139,843 |
| Receivable for fund shares sold | | | | 5,893 |
Total assets | | | | 30,601,100 |
| Liabilities | | | | |
| Payable for investments purchased | $ | 145,044 | | |
| Payable for fund shares redeemed | | 690 | | |
| Total liabilities | | | | 145,734 |
| Net Assets | | | $ | 30,455,366 |
| Net Assets consist of: | | | | |
| Paid in capital | | | $ | 27,434,042 |
| Total accumulated earnings (loss) | | | | 3,021,324 |
| Net Assets | | | $ | 30,455,366 |
Net Asset Value, offering price and redemption price per share ($30,455,366 ÷ 2,708,095 shares) | | | $ | 11.25 |
| Statement of Operations |
Six months ended September 30, 2024 (Unaudited) |
| Investment Income | | | | |
| Dividends: | | | | |
| Affiliated issuers | | | $ | 302,383 |
| Expenses | | | | |
| Independent trustees' fees and expenses | $ | 39 | | |
| Total expenses | | | | 39 |
| Net Investment income (loss) | | | | 302,344 |
| Realized and Unrealized Gain (Loss) | | | | |
| Net realized gain (loss) on: | | | | |
| Investment Securities: | | | | |
| Affiliated issuers | | 180,440 | | |
| Capital gain distributions from underlying funds: | | | | |
| Affiliated issuers | | 195,324 | | |
| Total net realized gain (loss) | | | | 375,764 |
| Change in net unrealized appreciation (depreciation) on: | | | | |
| Investment Securities: | | | | |
| Affiliated issuers | | 1,351,352 | | |
| Total change in net unrealized appreciation (depreciation) | | | | 1,351,352 |
| Net gain (loss) | | | | 1,727,116 |
| Net increase (decrease) in net assets resulting from operations | | | $ | 2,029,460 |
| Statement of Changes in Net Assets |
| |
| | Six months ended September 30, 2024 (Unaudited) | | Year ended March 31, 2024 |
| Increase (Decrease) in Net Assets | | | | |
| Operations | | | | |
| Net investment income (loss) | $ | 302,344 | $ | 1,039,394 |
| Net realized gain (loss) | | 375,764 | | 265,372 |
| Change in net unrealized appreciation (depreciation) | | 1,351,352 | | 2,129,954 |
| Net increase (decrease) in net assets resulting from operations | | 2,029,460 | | 3,434,720 |
| Distributions to shareholders | | (43,691) | | (942,984) |
| | | | | |
| Share transactions | | | | |
| Proceeds from sales of shares | | 986,779 | | 2,222,445 |
| Reinvestment of distributions | | 43,691 | | 942,984 |
| Cost of shares redeemed | | (3,648,427) | | (17,304,603) |
| | | | | |
Net increase (decrease) in net assets resulting from share transactions | | (2,617,957) | | (14,139,174) |
| Total increase (decrease) in net assets | | (632,188) | | (11,647,438) |
| | | | | |
| Net Assets | | | | |
| Beginning of period | | 31,087,554 | | 42,734,992 |
| End of period | $ | 30,455,366 | $ | 31,087,554 |
| | | | | |
| Other Information | | | | |
| Shares | | | | |
| Sold | | 92,348 | | 223,496 |
| Issued in reinvestment of distributions | | 4,169 | | 92,449 |
| Redeemed | | (338,204) | | (1,751,063) |
| Net increase (decrease) | | (241,687) | | (1,435,118) |
| | | | | |
Financial Highlights
Fidelity Flex® Freedom Blend 2020 Fund |
| |
| | Six months ended (Unaudited) September 30, 2024 | | Years ended March 31, 2024 | | 2023 | | 2022 | | 2021 | | 2020 |
Selected Per-Share Data | | | | | | | | | | | | |
| Net asset value, beginning of period | $ | 10.54 | $ | 9.75 | $ | 10.93 | $ | 11.51 | $ | 9.20 | $ | 10.10 |
| Income from Investment Operations | | | | | | | | | | | | |
Net investment income (loss) A,B | | .11 | | .28 | | .39 | | .31 | | .17 | | .24 |
| Net realized and unrealized gain (loss) | | .62 | | .80 | | (1.09) | | (.16) | | 2.67 | | (.51) |
| Total from investment operations | | .73 | | 1.08 | | (.70) | | .15 | | 2.84 | | (.27) |
| Distributions from net investment income | | (.02) | | (.28) | | (.33) | | (.27) | | (.18) | | (.25) |
| Distributions from net realized gain | | - | | (.01) | | (.15) | | (.46) | | (.36) | | (.38) |
| Total distributions | | (.02) | | (.29) | | (.48) | | (.73) | | (.53) C | | (.63) |
| Net asset value, end of period | $ | 11.25 | $ | 10.54 | $ | 9.75 | $ | 10.93 | $ | 11.51 | $ | 9.20 |
Total Return D | | | | 11.14% | | (6.22)% | | .98% | | 31.33% | | (3.23)% |
Ratios to Average Net Assets B,E,F | | | | | | | | | | | | |
Expenses before reductions G | | -% H | | -% | | -% | | -% | | -% | | -% |
Expenses net of fee waivers, if any G | | | | -% | | -% | | -% | | -% | | -% |
Expenses net of all reductions G | | -% H | | -% | | -% | | -% | | -% | | -% |
| Net investment income (loss) | | 1.98% H | | 2.81% | | 4.09% | | 2.70% | | 1.55% | | 2.35% |
| Supplemental Data | | | | | | | | | | | | |
| Net assets, end of period (000 omitted) | $ | 30,455 | $ | 31,088 | $ | 42,735 | $ | 263 | $ | 140 | $ | 107 |
Portfolio turnover rate I | | | | 22% | | 63% | | 36% | | 26% | | 67% |
ACalculated based on average shares outstanding during the period.
BNet investment income (loss) is affected by the timing of the declaration of dividends by any underlying mutual funds or exchange-traded funds (ETFs). Net investment income (loss) of any mutual funds or ETFs is not included in the Fund's net investment income (loss) ratio.
CTotal distributions per share do not sum due to rounding.
DTotal returns for periods of less than one year are not annualized.
EFees and expenses of any underlying mutual funds or exchange-traded funds (ETFs) are not included in the Fund's expense ratio. The Fund indirectly bears its proportionate share of these expenses.
FExpense ratios reflect operating expenses of the class. Expenses before reductions do not reflect amounts reimbursed, waived, or reduced through arrangements with the investment adviser, brokerage services, or other offset arrangements, if applicable, and do not represent the amount paid by the class during periods when reimbursements, waivers or reductions occur.
GAmount represents less than .005%.
HAnnualized.
IAmount does not include the portfolio activity of any underlying mutual funds or exchange-traded funds (ETFs).
Fidelity Flex® Freedom Blend 2025 Fund
Schedule of Investments September 30, 2024 (Unaudited)
Showing Percentage of Net Assets
| Domestic Equity Funds - 28.8% |
| | | Shares | Value ($) |
| Fidelity Series Blue Chip Growth Fund (a) | | 175,617 | 3,199,746 |
| Fidelity Series Commodity Strategy Fund (a) | | 1,262 | 111,519 |
| Fidelity Series Large Cap Growth Index Fund (a) | | 87,077 | 2,074,176 |
| Fidelity Series Large Cap Stock Fund (a) | | 81,855 | 1,876,924 |
| Fidelity Series Large Cap Value Index Fund (a) | | 227,277 | 3,895,527 |
| Fidelity Series Small Cap Core Fund (a) | | 73,387 | 912,931 |
| Fidelity Series Small Cap Opportunities Fund (a) | | 36,664 | 556,923 |
| Fidelity Series Value Discovery Fund (a) | | 81,296 | 1,356,022 |
| TOTAL DOMESTIC EQUITY FUNDS (Cost $10,507,852) | | | 13,983,768 |
| | | | |
| International Equity Funds - 26.9% |
| | | Shares | Value ($) |
| Fidelity Series Canada Fund (a) | | 51,959 | 856,290 |
| Fidelity Series Emerging Markets Fund (a) | | 93,793 | 903,227 |
| Fidelity Series Emerging Markets Opportunities Fund (a) | | 181,205 | 3,636,784 |
| Fidelity Series International Growth Fund (a) | | 106,335 | 2,048,012 |
| Fidelity Series International Index Fund (a) | | 58,639 | 780,481 |
| Fidelity Series International Small Cap Fund (a) | | 38,826 | 728,381 |
| Fidelity Series International Value Fund (a) | | 151,974 | 2,054,692 |
| Fidelity Series Overseas Fund (a) | | 136,862 | 2,048,831 |
| TOTAL INTERNATIONAL EQUITY FUNDS (Cost $10,287,056) | | | 13,056,698 |
| | | | |
| Bond Funds - 44.3% |
| | | Shares | Value ($) |
| Fidelity Series 0-5 Year Inflation-Protected Bond Index Fund (a) | | 35,497 | 349,294 |
| Fidelity Series 5+ Year Inflation-Protected Bond Index Fund (a) | | 605,564 | 4,826,346 |
| Fidelity Series Corporate Bond Fund (a) | | 219,283 | 2,098,542 |
| Fidelity Series Emerging Markets Debt Fund (a) | | 31,416 | 256,670 |
| Fidelity Series Emerging Markets Debt Local Currency Fund (a) | | 8,208 | 79,045 |
| Fidelity Series Floating Rate High Income Fund (a) | | 5,463 | 49,001 |
| Fidelity Series Government Bond Index Fund (a) | | 349,401 | 3,277,379 |
| Fidelity Series High Income Fund (a) | | 30,173 | 263,407 |
| Fidelity Series International Credit Fund (a) | | 9 | 78 |
| Fidelity Series International Developed Markets Bond Index Fund (a) | | 216,097 | 1,916,780 |
| Fidelity Series Investment Grade Bond Fund (a) | | 308,649 | 3,179,082 |
| Fidelity Series Investment Grade Securitized Fund (a) | | 221,983 | 2,037,806 |
| Fidelity Series Long-Term Treasury Bond Index Fund (a) | | 532,925 | 3,128,268 |
| Fidelity Series Real Estate Income Fund (a) | | 4,807 | 48,553 |
| TOTAL BOND FUNDS (Cost $21,920,324) | | | 21,510,251 |
| | | | |
| TOTAL INVESTMENT IN SECURITIES - 100.0% (Cost $42,715,232) | 48,550,717 |
NET OTHER ASSETS (LIABILITIES) - 0.0% | (2) |
| NET ASSETS - 100.0% | 48,550,715 |
| | |
Legend
Affiliated Underlying Funds
Fiscal year to date information regarding the Fund's investments in affiliated Underlying Funds is presented below. Exchanges between classes of the same affiliated Underlying Funds may occur. If an Underlying Funds changes its name, the name presented below is the name in effect at period end.
| Affiliate | Value, beginning of period ($) | Purchases ($) | Sales Proceeds ($) | Dividend Income ($) | Realized Gain (loss) ($) | Change in Unrealized appreciation (depreciation) ($) | Value, end of period ($) |
| Fidelity Series 0-5 Year Inflation-Protected Bond Index Fund | 25,998 | 350,168 | 31,806 | 229 | 105 | 4,829 | 349,294 |
| Fidelity Series 5+ Year Inflation-Protected Bond Index Fund | 4,965,716 | 556,013 | 926,444 | 52,332 | (56,616) | 287,677 | 4,826,346 |
| Fidelity Series Blue Chip Growth Fund | 3,531,513 | 665,211 | 1,058,169 | 272,647 | 255,505 | (194,314) | 3,199,746 |
| Fidelity Series Canada Fund | 867,026 | 110,856 | 181,427 | - | 4,755 | 55,080 | 856,290 |
| Fidelity Series Commodity Strategy Fund | 368,832 | 115,873 | 358,775 | 10,444 | (226,722) | 212,311 | 111,519 |
| Fidelity Series Corporate Bond Fund | 2,371,309 | 233,303 | 584,987 | 49,418 | (2,676) | 81,593 | 2,098,542 |
| Fidelity Series Emerging Markets Debt Fund | 272,606 | 27,701 | 53,718 | 6,454 | 1,134 | 8,947 | 256,670 |
| Fidelity Series Emerging Markets Debt Local Currency Fund | 87,388 | 3,934 | 17,738 | - | 996 | 4,465 | 79,045 |
| Fidelity Series Emerging Markets Fund | 892,643 | 149,170 | 221,904 | - | 3,696 | 79,622 | 903,227 |
| Fidelity Series Emerging Markets Opportunities Fund | 3,582,979 | 590,188 | 955,116 | - | 32,241 | 386,492 | 3,636,784 |
| Fidelity Series Floating Rate High Income Fund | 52,415 | 7,560 | 10,521 | 2,301 | 12 | (465) | 49,001 |
| Fidelity Series Government Bond Index Fund | 3,467,241 | 454,791 | 750,674 | 56,107 | (15,193) | 121,214 | 3,277,379 |
| Fidelity Series Government Money Market Fund 5.03% | 38,808 | 529 | 39,337 | 268 | - | - | - |
| Fidelity Series High Income Fund | 281,685 | 29,443 | 56,030 | 8,513 | 115 | 8,194 | 263,407 |
| Fidelity Series International Credit Fund | 74 | 1 | - | 2 | - | 3 | 78 |
| Fidelity Series International Developed Markets Bond Index Fund | 2,051,416 | 240,051 | 404,433 | 29,851 | (2,662) | 32,408 | 1,916,780 |
| Fidelity Series International Growth Fund | 2,174,847 | 292,531 | 486,723 | - | 43,306 | 24,051 | 2,048,012 |
| Fidelity Series International Index Fund | 823,487 | 88,314 | 183,980 | - | 18,521 | 34,139 | 780,481 |
| Fidelity Series International Small Cap Fund | 776,855 | 93,569 | 194,553 | - | 15,030 | 37,480 | 728,381 |
| Fidelity Series International Value Fund | 2,185,469 | 245,021 | 525,061 | - | 60,669 | 88,594 | 2,054,692 |
| Fidelity Series Investment Grade Bond Fund | 3,489,674 | 384,264 | 807,014 | 70,710 | (12,373) | 124,531 | 3,179,082 |
| Fidelity Series Investment Grade Securitized Fund | 2,301,544 | 222,654 | 562,338 | 45,886 | (14,918) | 90,864 | 2,037,806 |
| Fidelity Series Large Cap Growth Index Fund | 2,237,152 | 275,479 | 676,765 | 3,661 | 148,757 | 89,553 | 2,074,176 |
| Fidelity Series Large Cap Stock Fund | 2,370,432 | 230,308 | 835,942 | 99,128 | 151,031 | (38,905) | 1,876,924 |
| Fidelity Series Large Cap Value Index Fund | 4,237,600 | 388,617 | 996,211 | - | 79,794 | 185,727 | 3,895,527 |
| Fidelity Series Long-Term Treasury Bond Index Fund | 3,645,594 | 369,186 | 1,017,885 | 57,084 | (122,515) | 253,888 | 3,128,268 |
| Fidelity Series Overseas Fund | 2,180,060 | 223,340 | 481,500 | - | 62,777 | 64,154 | 2,048,831 |
| Fidelity Series Real Estate Income Fund | 50,706 | 5,087 | 9,374 | 1,505 | (469) | 2,603 | 48,553 |
| Fidelity Series Small Cap Core Fund | 42,006 | 949,793 | 123,480 | 262 | (2,436) | 47,048 | 912,931 |
| Fidelity Series Small Cap Opportunities Fund | 1,048,279 | 86,862 | 577,088 | 40,878 | 114,472 | (115,602) | 556,923 |
| Fidelity Series Treasury Bill Index Fund | 91,167 | 1,362 | 92,529 | 535 | - | - | - |
| Fidelity Series Value Discovery Fund | 1,565,081 | 139,471 | 419,804 | - | 17,822 | 53,452 | 1,356,022 |
| | 52,077,602 | 7,530,650 | 13,641,326 | 808,215 | 554,158 | 2,029,633 | 48,550,717 |
Amounts in the dividend income column in the above table include any capital gain distributions from underlying funds, which are presented in the corresponding line item in the Statement of Operations, if applicable.
Amounts included in the purchases and sales proceeds columns may include in-kind transactions, if applicable.
Investment Valuation
The following is a summary of the inputs used, as of September 30, 2024, involving the Fund's assets and liabilities carried at fair value. The inputs or methodology used for valuing securities may not be an indication of the risk associated with investing in those securities. For more information on valuation inputs, and their aggregation into the levels used below, please refer to the Investment Valuation section in the accompanying Notes to Financial Statements.
| Valuation Inputs at Reporting Date: |
| Description | Total ($) | Level 1 ($) | Level 2 ($) | Level 3 ($) |
Investments in Securities: | | | | |
|
| Domestic Equity Funds | 13,983,768 | 13,983,768 | - | - |
|
| International Equity Funds | 13,056,698 | 13,056,698 | - | - |
|
| Bond Funds | 21,510,251 | 21,510,251 | - | - |
| Total Investments in Securities: | 48,550,717 | 48,550,717 | - | - |
Fidelity Flex® Freedom Blend 2025 Fund
Financial Statements (Unaudited)
| Statement of Assets and Liabilities |
| As of September 30, 2024 (Unaudited) |
| Assets | | | | |
| Investment in securities, at value - See accompanying schedule: | | | | |
Affiliated issuers (cost $42,715,232) | $ | 48,550,717 | | |
| | | | | |
| | | | | |
| Total Investment in Securities (cost $42,715,232) | | | $ | 48,550,717 |
| Receivable for investments sold | | | | 191,508 |
| Receivable for fund shares sold | | | | 44,128 |
Total assets | | | | 48,786,353 |
| Liabilities | | | | |
| Payable for investments purchased | $ | 229,111 | | |
| Payable for fund shares redeemed | | 6,527 | | |
| Total liabilities | | | | 235,638 |
| Net Assets | | | $ | 48,550,715 |
| Net Assets consist of: | | | | |
| Paid in capital | | | $ | 41,757,555 |
| Total accumulated earnings (loss) | | | | 6,793,160 |
| Net Assets | | | $ | 48,550,715 |
Net Asset Value, offering price and redemption price per share ($48,550,715 ÷ 4,196,577 shares) | | | $ | 11.57 |
| Statement of Operations |
Six months ended September 30, 2024 (Unaudited) |
| Investment Income | | | | |
| Dividends: | | | | |
| Affiliated issuers | | | $ | 432,449 |
| Expenses | | | | |
| Independent trustees' fees and expenses | $ | 64 | | |
| Total expenses | | | | 64 |
| Net Investment income (loss) | | | | 432,385 |
| Realized and Unrealized Gain (Loss) | | | | |
| Net realized gain (loss) on: | | | | |
| Investment Securities: | | | | |
| Affiliated issuers | | 554,158 | | |
| Capital gain distributions from underlying funds: | | | | |
| Affiliated issuers | | 375,766 | | |
| Total net realized gain (loss) | | | | 929,924 |
| Change in net unrealized appreciation (depreciation) on: | | | | |
| Investment Securities: | | | | |
| Affiliated issuers | | 2,029,633 | | |
| Total change in net unrealized appreciation (depreciation) | | | | 2,029,633 |
| Net gain (loss) | | | | 2,959,557 |
| Net increase (decrease) in net assets resulting from operations | | | $ | 3,391,942 |
| Statement of Changes in Net Assets |
| |
| | Six months ended September 30, 2024 (Unaudited) | | Year ended March 31, 2024 |
| Increase (Decrease) in Net Assets | | | | |
| Operations | | | | |
| Net investment income (loss) | $ | 432,385 | $ | 1,666,563 |
| Net realized gain (loss) | | 929,924 | | 899,429 |
| Change in net unrealized appreciation (depreciation) | | 2,029,633 | | 4,005,641 |
| Net increase (decrease) in net assets resulting from operations | | 3,391,942 | | 6,571,633 |
| Distributions to shareholders | | (436,543) | | (1,603,886) |
| | | | | |
| Share transactions | | | | |
| Proceeds from sales of shares | | 4,425,793 | | 8,376,194 |
| Reinvestment of distributions | | 436,543 | | 1,603,886 |
| Cost of shares redeemed | | (11,344,670) | | (33,671,026) |
| | | | | |
Net increase (decrease) in net assets resulting from share transactions | | (6,482,334) | | (23,690,946) |
| Total increase (decrease) in net assets | | (3,526,935) | | (18,723,199) |
| | | | | |
| Net Assets | | | | |
| Beginning of period | | 52,077,650 | | 70,800,849 |
| End of period | $ | 48,550,715 | $ | 52,077,650 |
| | | | | |
| Other Information | | | | |
| Shares | | | | |
| Sold | | 400,129 | | 821,022 |
| Issued in reinvestment of distributions | | 40,609 | | 153,676 |
| Redeemed | | (1,027,749) | | (3,319,294) |
| Net increase (decrease) | | (587,011) | | (2,344,596) |
| | | | | |
Financial Highlights
Fidelity Flex® Freedom Blend 2025 Fund |
| |
| | Six months ended (Unaudited) September 30, 2024 | | Years ended March 31, 2024 | | 2023 | | 2022 | | 2021 | | 2020 |
Selected Per-Share Data | | | | | | | | | | | | |
| Net asset value, beginning of period | $ | 10.89 | $ | 9.93 | $ | 11.10 | $ | 11.67 | $ | 9.07 | $ | 10.11 |
| Income from Investment Operations | | | | | | | | | | | | |
Net investment income (loss) A,B | | .10 | | .28 | | .38 | | .32 | | .17 | | .24 |
| Net realized and unrealized gain (loss) | | .67 | | .98 | | (1.12) | | (.12) | | 3.00 | | (.61) |
| Total from investment operations | | .77 | | 1.26 | | (.74) | | .20 | | 3.17 | | (.37) |
| Distributions from net investment income | | (.04) | | (.30) | | (.31) | | (.28) | | (.18) | | (.24) |
| Distributions from net realized gain | | (.06) | | - | | (.12) | | (.49) | | (.39) | | (.42) |
| Total distributions | | (.09) C | | (.30) | | (.43) | | (.77) | | (.57) | | (.67) C |
| Net asset value, end of period | $ | 11.57 | $ | 10.89 | $ | 9.93 | $ | 11.10 | $ | 11.67 | $ | 9.07 |
Total Return D | | | | 12.78% | | (6.51)% | | 1.41% | | 35.43% | | (4.34)% |
Ratios to Average Net Assets B,E,F | | | | | | | | | | | | |
Expenses before reductions G | | -% H | | -% | | -% | | -% | | -% | | -% |
Expenses net of fee waivers, if any G | | | | -% | | -% | | -% | | -% | | -% |
Expenses net of all reductions G | | -% H | | -% | | -% | | -% | | -% | | -% |
| Net investment income (loss) | | 1.73% H | | 2.71% | | 3.95% | | 2.78% | | 1.59% | | 2.35% |
| Supplemental Data | | | | | | | | | | | | |
| Net assets, end of period (000 omitted) | $ | 48,551 | $ | 52,078 | $ | 70,801 | $ | 436 | $ | 143 | $ | 106 |
Portfolio turnover rate I | | | | 23% | | 64% | | 39% | | 25% | | 68% |
ACalculated based on average shares outstanding during the period.
BNet investment income (loss) is affected by the timing of the declaration of dividends by any underlying mutual funds or exchange-traded funds (ETFs). Net investment income (loss) of any mutual funds or ETFs is not included in the Fund's net investment income (loss) ratio.
CTotal distributions per share do not sum due to rounding.
DTotal returns for periods of less than one year are not annualized.
EFees and expenses of any underlying mutual funds or exchange-traded funds (ETFs) are not included in the Fund's expense ratio. The Fund indirectly bears its proportionate share of these expenses.
FExpense ratios reflect operating expenses of the class. Expenses before reductions do not reflect amounts reimbursed, waived, or reduced through arrangements with the investment adviser, brokerage services, or other offset arrangements, if applicable, and do not represent the amount paid by the class during periods when reimbursements, waivers or reductions occur.
GAmount represents less than .005%.
HAnnualized.
IAmount does not include the portfolio activity of any underlying mutual funds or exchange-traded funds (ETFs).
Fidelity Flex® Freedom Blend 2030 Fund
Schedule of Investments September 30, 2024 (Unaudited)
Showing Percentage of Net Assets
| Domestic Equity Funds - 32.8% |
| | | Shares | Value ($) |
| Fidelity Series Blue Chip Growth Fund (a) | | 326,139 | 5,942,258 |
| Fidelity Series Commodity Strategy Fund (a) | | 2,058 | 181,956 |
| Fidelity Series Large Cap Growth Index Fund (a) | | 161,710 | 3,851,934 |
| Fidelity Series Large Cap Stock Fund (a) | | 152,011 | 3,485,608 |
| Fidelity Series Large Cap Value Index Fund (a) | | 421,189 | 7,219,175 |
| Fidelity Series Small Cap Core Fund (a) | | 137,776 | 1,713,928 |
| Fidelity Series Small Cap Opportunities Fund (a) | | 68,339 | 1,038,063 |
| Fidelity Series Value Discovery Fund (a) | | 150,550 | 2,511,170 |
| TOTAL DOMESTIC EQUITY FUNDS (Cost $19,589,626) | | | 25,944,092 |
| | | | |
| International Equity Funds - 29.5% |
| | | Shares | Value ($) |
| Fidelity Series Canada Fund (a) | | 94,496 | 1,557,297 |
| Fidelity Series Emerging Markets Fund (a) | | 165,694 | 1,595,636 |
| Fidelity Series Emerging Markets Opportunities Fund (a) | | 320,120 | 6,424,802 |
| Fidelity Series International Growth Fund (a) | | 193,378 | 3,724,457 |
| Fidelity Series International Index Fund (a) | | 106,639 | 1,419,371 |
| Fidelity Series International Small Cap Fund (a) | | 63,351 | 1,188,472 |
| Fidelity Series International Value Fund (a) | | 276,368 | 3,736,498 |
| Fidelity Series Overseas Fund (a) | | 248,890 | 3,725,883 |
| TOTAL INTERNATIONAL EQUITY FUNDS (Cost $18,463,401) | | | 23,372,416 |
| | | | |
| Bond Funds - 37.7% |
| | | Shares | Value ($) |
| Fidelity Series 0-5 Year Inflation-Protected Bond Index Fund (a) | | 57,920 | 569,928 |
| Fidelity Series 5+ Year Inflation-Protected Bond Index Fund (a) | | 574,186 | 4,576,260 |
| Fidelity Series Corporate Bond Fund (a) | | 311,963 | 2,985,485 |
| Fidelity Series Emerging Markets Debt Fund (a) | | 51,487 | 420,653 |
| Fidelity Series Emerging Markets Debt Local Currency Fund (a) | | 13,187 | 126,995 |
| Fidelity Series Floating Rate High Income Fund (a) | | 8,914 | 79,961 |
| Fidelity Series Government Bond Index Fund (a) | | 497,077 | 4,662,585 |
| Fidelity Series High Income Fund (a) | | 49,229 | 429,771 |
| Fidelity Series International Credit Fund (a) | | 8 | 67 |
| Fidelity Series International Developed Markets Bond Index Fund (a) | | 349,941 | 3,103,976 |
| Fidelity Series Investment Grade Bond Fund (a) | | 439,095 | 4,522,676 |
| Fidelity Series Investment Grade Securitized Fund (a) | | 315,803 | 2,899,076 |
| Fidelity Series Long-Term Treasury Bond Index Fund (a) | | 926,125 | 5,436,352 |
| Fidelity Series Real Estate Income Fund (a) | | 7,844 | 79,220 |
| TOTAL BOND FUNDS (Cost $30,248,767) | | | 29,893,005 |
| | | | |
| TOTAL INVESTMENT IN SECURITIES - 100.0% (Cost $68,301,794) | 79,209,513 |
NET OTHER ASSETS (LIABILITIES) - 0.0% | (5) |
| NET ASSETS - 100.0% | 79,209,508 |
| | |
Legend
Affiliated Underlying Funds
Fiscal year to date information regarding the Fund's investments in affiliated Underlying Funds is presented below. Exchanges between classes of the same affiliated Underlying Funds may occur. If an Underlying Funds changes its name, the name presented below is the name in effect at period end.
| Affiliate | Value, beginning of period ($) | Purchases ($) | Sales Proceeds ($) | Dividend Income ($) | Realized Gain (loss) ($) | Change in Unrealized appreciation (depreciation) ($) | Value, end of period ($) |
| Fidelity Series 0-5 Year Inflation-Protected Bond Index Fund | 38,901 | 533,632 | 10,459 | 356 | 36 | 7,818 | 569,928 |
| Fidelity Series 5+ Year Inflation-Protected Bond Index Fund | 4,175,325 | 554,565 | 365,618 | 46,485 | (2,367) | 214,355 | 4,576,260 |
| Fidelity Series Blue Chip Growth Fund | 6,006,140 | 1,073,103 | 1,234,947 | 507,150 | 271,900 | (173,938) | 5,942,258 |
| Fidelity Series Canada Fund | 1,452,411 | 158,901 | 161,736 | - | (181) | 107,902 | 1,557,297 |
| Fidelity Series Commodity Strategy Fund | 551,759 | 181,932 | 527,700 | 17,083 | (262,630) | 238,595 | 181,956 |
| Fidelity Series Corporate Bond Fund | 3,104,472 | 278,120 | 507,103 | 67,249 | (946) | 110,942 | 2,985,485 |
| Fidelity Series Emerging Markets Debt Fund | 408,651 | 36,014 | 40,289 | 10,046 | 393 | 15,884 | 420,653 |
| Fidelity Series Emerging Markets Debt Local Currency Fund | 129,961 | 4,260 | 15,833 | - | (22) | 8,629 | 126,995 |
| Fidelity Series Emerging Markets Fund | 1,449,172 | 210,872 | 209,694 | - | 2,172 | 143,114 | 1,595,636 |
| Fidelity Series Emerging Markets Opportunities Fund | 5,816,283 | 781,932 | 902,957 | - | 24,684 | 704,860 | 6,424,802 |
| Fidelity Series Floating Rate High Income Fund | 78,414 | 10,577 | 8,333 | 3,584 | (19) | (678) | 79,961 |
| Fidelity Series Government Bond Index Fund | 4,539,440 | 556,441 | 579,742 | 76,357 | 3,244 | 143,202 | 4,662,585 |
| Fidelity Series Government Money Market Fund 5.03% | 58,385 | 1,061 | 59,446 | 413 | - | - | - |
| Fidelity Series High Income Fund | 421,445 | 38,749 | 43,761 | 13,260 | 160 | 13,178 | 429,771 |
| Fidelity Series International Credit Fund | 63 | 1 | - | 1 | - | 3 | 67 |
| Fidelity Series International Developed Markets Bond Index Fund | 3,046,129 | 325,261 | 317,559 | 45,141 | 955 | 49,190 | 3,103,976 |
| Fidelity Series International Growth Fund | 3,643,995 | 424,275 | 471,647 | - | 13,909 | 113,925 | 3,724,457 |
| Fidelity Series International Index Fund | 1,379,662 | 126,495 | 181,145 | - | 11,637 | 82,722 | 1,419,371 |
| Fidelity Series International Small Cap Fund | 1,162,466 | 125,442 | 183,582 | - | 11,880 | 72,266 | 1,188,472 |
| Fidelity Series International Value Fund | 3,661,507 | 349,260 | 539,172 | - | 42,863 | 222,040 | 3,736,498 |
| Fidelity Series Investment Grade Bond Fund | 4,568,667 | 477,087 | 678,776 | 96,186 | (887) | 156,585 | 4,522,676 |
| Fidelity Series Investment Grade Securitized Fund | 3,013,292 | 269,890 | 489,704 | 62,425 | (6,617) | 112,215 | 2,899,076 |
| Fidelity Series Large Cap Growth Index Fund | 3,804,941 | 399,631 | 784,311 | 6,521 | 122,820 | 308,853 | 3,851,934 |
| Fidelity Series Large Cap Stock Fund | 4,031,193 | 353,625 | 1,104,719 | 176,921 | 205,341 | 168 | 3,485,608 |
| Fidelity Series Large Cap Value Index Fund | 7,206,343 | 652,629 | 1,132,827 | - | 66,187 | 426,843 | 7,219,175 |
| Fidelity Series Long-Term Treasury Bond Index Fund | 5,782,187 | 531,694 | 1,102,627 | 94,494 | (136,643) | 361,741 | 5,436,352 |
| Fidelity Series Overseas Fund | 3,652,588 | 322,613 | 479,682 | - | 41,174 | 189,190 | 3,725,883 |
| Fidelity Series Real Estate Income Fund | 75,900 | 6,698 | 6,720 | 2,378 | (95) | 3,437 | 79,220 |
| Fidelity Series Small Cap Core Fund | 71,519 | 1,679,092 | 118,634 | 478 | (1,850) | 83,801 | 1,713,928 |
| Fidelity Series Small Cap Opportunities Fund | 1,782,434 | 140,606 | 875,124 | 76,354 | 168,003 | (177,856) | 1,038,063 |
| Fidelity Series Treasury Bill Index Fund | 136,235 | 2,803 | 139,038 | 819 | - | - | - |
| Fidelity Series Value Discovery Fund | 2,661,465 | 217,251 | 500,708 | - | 20,704 | 112,458 | 2,511,170 |
| | 77,911,345 | 10,824,512 | 13,773,593 | 1,303,701 | 595,805 | 3,651,444 | 79,209,513 |
Amounts in the dividend income column in the above table include any capital gain distributions from underlying funds, which are presented in the corresponding line item in the Statement of Operations, if applicable.
Amounts included in the purchases and sales proceeds columns may include in-kind transactions, if applicable.
Investment Valuation
The following is a summary of the inputs used, as of September 30, 2024, involving the Fund's assets and liabilities carried at fair value. The inputs or methodology used for valuing securities may not be an indication of the risk associated with investing in those securities. For more information on valuation inputs, and their aggregation into the levels used below, please refer to the Investment Valuation section in the accompanying Notes to Financial Statements.
| Valuation Inputs at Reporting Date: |
| Description | Total ($) | Level 1 ($) | Level 2 ($) | Level 3 ($) |
Investments in Securities: | | | | |
|
| Domestic Equity Funds | 25,944,092 | 25,944,092 | - | - |
|
| International Equity Funds | 23,372,416 | 23,372,416 | - | - |
|
| Bond Funds | 29,893,005 | 29,893,005 | - | - |
| Total Investments in Securities: | 79,209,513 | 79,209,513 | - | - |
Fidelity Flex® Freedom Blend 2030 Fund
Financial Statements (Unaudited)
| Statement of Assets and Liabilities |
| As of September 30, 2024 (Unaudited) |
| Assets | | | | |
| Investment in securities, at value - See accompanying schedule: | | | | |
Affiliated issuers (cost $68,301,794) | $ | 79,209,513 | | |
| | | | | |
| | | | | |
| Total Investment in Securities (cost $68,301,794) | | | $ | 79,209,513 |
| Receivable for investments sold | | | | 429,201 |
| Receivable for fund shares sold | | | | 47,709 |
Total assets | | | | 79,686,423 |
| Liabilities | | | | |
| Payable for investments purchased | $ | 282,485 | | |
| Payable for fund shares redeemed | | 194,430 | | |
| Total liabilities | | | | 476,915 |
| Net Assets | | | $ | 79,209,508 |
| Net Assets consist of: | | | | |
| Paid in capital | | | $ | 66,938,512 |
| Total accumulated earnings (loss) | | | | 12,270,996 |
| Net Assets | | | $ | 79,209,508 |
Net Asset Value, offering price and redemption price per share ($79,209,508 ÷ 6,511,449 shares) | | | $ | 12.16 |
| Statement of Operations |
Six months ended September 30, 2024 (Unaudited) |
| Investment Income | | | | |
| Dividends: | | | | |
| Affiliated issuers | | | $ | 610,813 |
| Expenses | | | | |
| Independent trustees' fees and expenses | $ | 98 | | |
| Total expenses | | | | 98 |
| Net Investment income (loss) | | | | 610,715 |
| Realized and Unrealized Gain (Loss) | | | | |
| Net realized gain (loss) on: | | | | |
| Investment Securities: | | | | |
| Affiliated issuers | | 595,805 | | |
| Capital gain distributions from underlying funds: | | | | |
| Affiliated issuers | | 692,888 | | |
| Total net realized gain (loss) | | | | 1,288,693 |
| Change in net unrealized appreciation (depreciation) on: | | | | |
| Investment Securities: | | | | |
| Affiliated issuers | | 3,651,444 | | |
| Total change in net unrealized appreciation (depreciation) | | | | 3,651,444 |
| Net gain (loss) | | | | 4,940,137 |
| Net increase (decrease) in net assets resulting from operations | | | $ | 5,550,852 |
| Statement of Changes in Net Assets |
| |
| | Six months ended September 30, 2024 (Unaudited) | | Year ended March 31, 2024 |
| Increase (Decrease) in Net Assets | | | | |
| Operations | | | | |
| Net investment income (loss) | $ | 610,715 | $ | 2,023,515 |
| Net realized gain (loss) | | 1,288,693 | | 928,558 |
| Change in net unrealized appreciation (depreciation) | | 3,651,444 | | 7,013,537 |
| Net increase (decrease) in net assets resulting from operations | | 5,550,852 | | 9,965,610 |
| Distributions to shareholders | | (379,402) | | (1,857,190) |
| | | | | |
| Share transactions | | | | |
| Proceeds from sales of shares | | 5,756,208 | | 11,411,382 |
| Reinvestment of distributions | | 379,402 | | 1,857,190 |
| Cost of shares redeemed | | (10,008,967) | | (24,476,370) |
| | | | | |
Net increase (decrease) in net assets resulting from share transactions | | (3,873,357) | | (11,207,798) |
| Total increase (decrease) in net assets | | 1,298,093 | | (3,099,378) |
| | | | | |
| Net Assets | | | | |
| Beginning of period | | 77,911,415 | | 81,010,793 |
| End of period | $ | 79,209,508 | $ | 77,911,415 |
| | | | | |
| Other Information | | | | |
| Shares | | | | |
| Sold | | 500,473 | | 1,081,901 |
| Issued in reinvestment of distributions | | 33,575 | | 170,958 |
| Redeemed | | (864,791) | | (2,351,414) |
| Net increase (decrease) | | (330,743) | | (1,098,555) |
| | | | | |
Financial Highlights
Fidelity Flex® Freedom Blend 2030 Fund |
| |
| | Six months ended (Unaudited) September 30, 2024 | | Years ended March 31, 2024 | | 2023 | | 2022 | | 2021 | | 2020 |
Selected Per-Share Data | | | | | | | | | | | | |
| Net asset value, beginning of period | $ | 11.39 | $ | 10.20 | $ | 11.37 | $ | 11.85 | $ | 8.90 | $ | 10.13 |
| Income from Investment Operations | | | | | | | | | | | | |
Net investment income (loss) A,B | | .09 | | .28 | | .37 | | .29 | | .18 | | .24 |
| Net realized and unrealized gain (loss) | | .74 | | 1.18 | | (1.11) | | (.03) | | 3.40 | | (.75) |
| Total from investment operations | | .83 | | 1.46 | | (.74) | | .26 | | 3.58 | | (.51) |
| Distributions from net investment income | | (.03) | | (.27) | | (.30) | | (.26) | | (.18) | | (.24) |
| Distributions from net realized gain | | (.02) | | - C | | (.13) | | (.48) | | (.44) | | (.47) |
| Total distributions | | (.06) D | | (.27) | | (.43) | | (.74) | | (.63) D | | (.72) D |
| Net asset value, end of period | $ | 12.16 | $ | 11.39 | $ | 10.20 | $ | 11.37 | $ | 11.85 | $ | 8.90 |
Total Return E | | | | 14.48% | | (6.33)% | | 1.87% | | 40.91% | | (5.88)% |
Ratios to Average Net Assets B,F,G | | | | | | | | | | | | |
Expenses before reductions H | | -% I | | -% | | -% | | -% | | -% | | -% |
Expenses net of fee waivers, if any H | | | | -% | | -% | | -% | | -% | | -% |
Expenses net of all reductions H | | -% I | | -% | | -% | | -% | | -% | | -% |
| Net investment income (loss) | | 1.57% I | | 2.63% | | 3.75% | | 2.49% | | 1.64% | | 2.36% |
| Supplemental Data | | | | | | | | | | | | |
| Net assets, end of period (000 omitted) | $ | 79,210 | $ | 77,911 | $ | 81,011 | $ | 1,065 | $ | 148 | $ | 105 |
Portfolio turnover rate J | | | | 27% | | 53% | | 47% | | 25% | | 68% |
ACalculated based on average shares outstanding during the period.
BNet investment income (loss) is affected by the timing of the declaration of dividends by any underlying mutual funds or exchange-traded funds (ETFs). Net investment income (loss) of any mutual funds or ETFs is not included in the Fund's net investment income (loss) ratio.
CAmount represents less than $.005 per share.
DTotal distributions per share do not sum due to rounding.
ETotal returns for periods of less than one year are not annualized.
FFees and expenses of any underlying mutual funds or exchange-traded funds (ETFs) are not included in the Fund's expense ratio. The Fund indirectly bears its proportionate share of these expenses.
GExpense ratios reflect operating expenses of the class. Expenses before reductions do not reflect amounts reimbursed, waived, or reduced through arrangements with the investment adviser, brokerage services, or other offset arrangements, if applicable, and do not represent the amount paid by the class during periods when reimbursements, waivers or reductions occur.
HAmount represents less than .005%.
IAnnualized.
JAmount does not include the portfolio activity of any underlying mutual funds or exchange-traded funds (ETFs).
Fidelity Flex® Freedom Blend 2035 Fund
Schedule of Investments September 30, 2024 (Unaudited)
Showing Percentage of Net Assets
| U.S. Treasury Obligations - 0.2% |
| | | Principal Amount (a) | Value ($) |
U.S. Treasury Bills, yield at date of purchase 5.02% to 5.04% 11/29/24 to 12/5/24 (b) (Cost $158,681) | | 160,000 | 158,760 |
| | | | |
| Domestic Equity Funds - 39.9% |
| | | Shares | Value ($) |
| Fidelity Series Blue Chip Growth Fund (c) | | 425,758 | 7,757,302 |
| Fidelity Series Commodity Strategy Fund (c) | | 1,912 | 169,013 |
| Fidelity Series Large Cap Growth Index Fund (c) | | 211,105 | 5,028,517 |
| Fidelity Series Large Cap Stock Fund (c) | | 198,444 | 4,550,310 |
| Fidelity Series Large Cap Value Index Fund (c) | | 549,728 | 9,422,339 |
| Fidelity Series Small Cap Core Fund (c) | | 181,422 | 2,256,891 |
| Fidelity Series Small Cap Opportunities Fund (c) | | 88,051 | 1,337,490 |
| Fidelity Series Value Discovery Fund (c) | | 196,512 | 3,277,814 |
| TOTAL DOMESTIC EQUITY FUNDS (Cost $25,702,514) | | | 33,799,676 |
| | | | |
| International Equity Funds - 33.0% |
| | | Shares | Value ($) |
| Fidelity Series Canada Fund (c) | | 116,385 | 1,918,032 |
| Fidelity Series Emerging Markets Fund (c) | | 192,014 | 1,849,099 |
| Fidelity Series Emerging Markets Opportunities Fund (c) | | 366,573 | 7,357,112 |
| Fidelity Series International Growth Fund (c) | | 238,176 | 4,587,264 |
| Fidelity Series International Index Fund (c) | | 131,345 | 1,748,202 |
| Fidelity Series International Small Cap Fund (c) | | 65,542 | 1,229,564 |
| Fidelity Series International Value Fund (c) | | 340,407 | 4,602,304 |
| Fidelity Series Overseas Fund (c) | | 306,553 | 4,589,101 |
| TOTAL INTERNATIONAL EQUITY FUNDS (Cost $21,990,670) | | | 27,880,678 |
| | | | |
| Bond Funds - 26.7% |
| | | Shares | Value ($) |
| Fidelity Series 0-5 Year Inflation-Protected Bond Index Fund (c) | | 60,044 | 590,833 |
| Fidelity Series 5+ Year Inflation-Protected Bond Index Fund (c) | | 113,590 | 905,312 |
| Fidelity Series Corporate Bond Fund (c) | | 273,656 | 2,618,884 |
| Fidelity Series Emerging Markets Debt Fund (c) | | 52,412 | 428,207 |
| Fidelity Series Emerging Markets Debt Local Currency Fund (c) | | 13,886 | 133,724 |
| Fidelity Series Floating Rate High Income Fund (c) | | 7,973 | 71,514 |
| Fidelity Series Government Bond Index Fund (c) | | 436,316 | 4,092,640 |
| Fidelity Series High Income Fund (c) | | 50,511 | 440,959 |
| Fidelity Series International Credit Fund (c) | | 6 | 54 |
| Fidelity Series International Developed Markets Bond Index Fund (c) | | 309,601 | 2,746,158 |
| Fidelity Series Investment Grade Bond Fund (c) | | 385,407 | 3,969,689 |
| Fidelity Series Investment Grade Securitized Fund (c) | | 277,015 | 2,542,994 |
| Fidelity Series Long-Term Treasury Bond Index Fund (c) | | 676,608 | 3,971,687 |
| Fidelity Series Real Estate Income Fund (c) | | 7,947 | 80,261 |
| TOTAL BOND FUNDS (Cost $22,577,457) | | | 22,592,916 |
| | | | |
| Short-Term Funds - 0.2% |
| | | Shares | Value ($) |
| Fidelity Cash Central Fund 4.89% (d) | | 96,481 | 96,501 |
| Fidelity Series Government Money Market Fund 5.03% (c)(e) | | 19,707 | 19,707 |
| Fidelity Series Treasury Bill Index Fund (c) | | 6,452 | 64,193 |
| TOTAL SHORT-TERM FUNDS (Cost $180,341) | | | 180,401 |
| | | | |
| TOTAL INVESTMENT IN SECURITIES - 100.0% (Cost $70,609,663) | 84,612,431 |
NET OTHER ASSETS (LIABILITIES) - 0.0% | (12,072) |
| NET ASSETS - 100.0% | 84,600,359 |
| | |
| Futures Contracts |
| | Number of contracts | Expiration Date | Notional Amount ($) | Value ($) | Unrealized Appreciation/ (Depreciation) ($) |
| Purchased | | | | | |
| | | | | | |
| Equity Index Contracts | | | | | |
| ICE E-mini MSCI Emerging Markets Index Contracts (United States) | 5 | Dec 2024 | 293,175 | 18,771 | 18,771 |
| ICE MSCI EAFE Index Contracts (United States) | 2 | Dec 2024 | 248,780 | 2,348 | 2,348 |
| | | | | | |
| TOTAL EQUITY INDEX CONTRACTS | | | | | 21,119 |
| | | | | | |
| Treasury Contracts | | | | | |
| CBOT 10-Year U.S. Treasury Note Contracts (United States) | 27 | Dec 2024 | 3,085,594 | (4,862) | (4,862) |
| CBOT 5-Year U.S. Treasury Note Contracts (United States) | 17 | Dec 2024 | 1,868,008 | 848 | 848 |
| | | | | | |
| TOTAL TREASURY CONTRACTS | | | | | (4,014) |
| | | | | | |
| TOTAL PURCHASED | | | | | 17,105 |
| | | | | | |
| Sold | | | | | |
| | | | | | |
| Equity Index Contracts | | | | | |
| CME E-mini S&P 500 Index Contracts (United States) | 4 | Dec 2024 | 1,162,850 | (24,786) | (24,786) |
| | | | | | |
| TOTAL FUTURES CONTRACTS | | | | | (7,681) |
| The notional amount of futures purchased as a percentage of Net Assets is 6.4% |
| The notional amount of futures sold as a percentage of Net Assets is 1.4% |
Legend
| (a) | Amount is stated in United States dollars unless otherwise noted. |
| (b) | Security or a portion of the security was pledged to cover margin requirements for futures contracts. At period end, the value of securities pledged amounted to $158,760. |
| (d) | Affiliated fund that is generally available only to investment companies and other accounts managed by Fidelity Investments. The rate quoted is the annualized seven-day yield of the fund at period end. A complete unaudited listing of the fund's holdings as of its most recent quarter end is available upon request. In addition, each Fidelity Central Fund's financial statements are available on the SEC's website or upon request. |
| (e) | The rate quoted is the annualized seven-day yield of the fund at period end. |
Affiliated Central Funds
Fiscal year to date information regarding the Fund's investments in Fidelity Central Funds, including the ownership percentage, is presented below.
| Affiliate | Value, beginning of period ($) | Purchases ($) | Sales Proceeds ($) | Dividend Income ($) | Realized Gain (loss) ($) | Change in Unrealized appreciation (depreciation) ($) | Value, end of period ($) | % ownership, end of period |
| Fidelity Cash Central Fund 4.89% | 68,096 | 515,529 | 487,126 | 2,411 | 2 | - | 96,501 | 0.0% |
| Total | 68,096 | 515,529 | 487,126 | 2,411 | 2 | - | 96,501 | |
| | | | | | | | | |
Amounts in the dividend income column in the above table include any capital gain distributions from underlying funds, which are presented in the corresponding line item in the Statement of Operations, if applicable.
Amounts included in the purchases and sales proceeds columns may include in-kind transactions, if applicable.
Affiliated Underlying Funds
Fiscal year to date information regarding the Fund's investments in affiliated Underlying Funds is presented below. Exchanges between classes of the same affiliated Underlying Funds may occur. If an Underlying Funds changes its name, the name presented below is the name in effect at period end.
| Affiliate | Value, beginning of period ($) | Purchases ($) | Sales Proceeds ($) | Dividend Income ($) | Realized Gain (loss) ($) | Change in Unrealized appreciation (depreciation) ($) | Value, end of period ($) |
| Fidelity Series 0-5 Year Inflation-Protected Bond Index Fund | 31,115 | 556,569 | 4,513 | 283 | 22 | 7,640 | 590,833 |
| Fidelity Series 5+ Year Inflation-Protected Bond Index Fund | 501,809 | 418,191 | 51,140 | 7,116 | 229 | 36,223 | 905,312 |
| Fidelity Series Blue Chip Growth Fund | 7,496,496 | 1,498,751 | 1,367,095 | 655,813 | 353,795 | (224,645) | 7,757,302 |
| Fidelity Series Canada Fund | 1,784,293 | 166,568 | 163,530 | - | 1,568 | 129,133 | 1,918,032 |
| Fidelity Series Commodity Strategy Fund | 529,444 | 196,840 | 534,234 | 15,692 | (240,020) | 216,983 | 169,013 |
| Fidelity Series Corporate Bond Fund | 2,458,430 | 282,462 | 214,977 | 55,918 | (1,426) | 94,395 | 2,618,884 |
| Fidelity Series Emerging Markets Debt Fund | 406,722 | 42,538 | 37,019 | 10,013 | 68 | 15,898 | 428,207 |
| Fidelity Series Emerging Markets Debt Local Currency Fund | 127,115 | 7,264 | 9,423 | - | (152) | 8,920 | 133,724 |
| Fidelity Series Emerging Markets Fund | 1,778,062 | 110,037 | 209,959 | - | 7,407 | 163,552 | 1,849,099 |
| Fidelity Series Emerging Markets Opportunities Fund | 7,136,426 | 438,030 | 1,071,620 | - | 67,536 | 786,740 | 7,357,112 |
| Fidelity Series Floating Rate High Income Fund | 70,428 | 8,452 | 6,731 | 3,264 | (25) | (610) | 71,514 |
| Fidelity Series Government Bond Index Fund | 3,600,024 | 668,365 | 298,796 | 63,318 | (2,968) | 126,015 | 4,092,640 |
| Fidelity Series Government Money Market Fund 5.03% | 371 | 20,057 | 721 | 175 | - | - | 19,707 |
| Fidelity Series High Income Fund | 411,905 | 52,034 | 36,155 | 13,118 | (70) | 13,245 | 440,959 |
| Fidelity Series International Credit Fund | 51 | 1 | - | 1 | - | 2 | 54 |
| Fidelity Series International Developed Markets Bond Index Fund | 2,430,149 | 464,481 | 192,768 | 36,291 | (2,483) | 46,779 | 2,746,158 |
| Fidelity Series International Growth Fund | 4,476,961 | 448,052 | 493,767 | - | 11,287 | 144,731 | 4,587,264 |
| Fidelity Series International Index Fund | 1,694,967 | 120,943 | 181,914 | - | 12,305 | 101,901 | 1,748,202 |
| Fidelity Series International Small Cap Fund | 1,194,376 | 75,257 | 121,776 | - | 5,354 | 76,353 | 1,229,564 |
| Fidelity Series International Value Fund | 4,498,326 | 351,571 | 570,257 | - | 50,633 | 272,031 | 4,602,304 |
| Fidelity Series Investment Grade Bond Fund | 3,623,228 | 506,099 | 291,094 | 79,930 | (2,359) | 133,815 | 3,969,689 |
| Fidelity Series Investment Grade Securitized Fund | 2,386,117 | 265,968 | 198,141 | 51,878 | (1,671) | 90,721 | 2,542,994 |
| Fidelity Series Large Cap Growth Index Fund | 4,749,291 | 576,335 | 856,527 | 8,512 | 174,619 | 384,799 | 5,028,517 |
| Fidelity Series Large Cap Stock Fund | 5,031,333 | 529,504 | 1,275,376 | 226,229 | 250,180 | 14,669 | 4,550,310 |
| Fidelity Series Large Cap Value Index Fund | 8,994,135 | 937,213 | 1,134,737 | - | 42,309 | 583,419 | 9,422,339 |
| Fidelity Series Long-Term Treasury Bond Index Fund | 4,194,061 | 416,104 | 789,879 | 67,684 | (74,654) | 226,055 | 3,971,687 |
| Fidelity Series Overseas Fund | 4,487,445 | 355,104 | 534,860 | - | 41,755 | 239,657 | 4,589,101 |
| Fidelity Series Real Estate Income Fund | 76,111 | 7,606 | 6,731 | 2,416 | (272) | 3,547 | 80,261 |
| Fidelity Series Small Cap Core Fund | 90,295 | 2,136,502 | 80,931 | 766 | 149 | 110,876 | 2,256,891 |
| Fidelity Series Small Cap Opportunities Fund | 2,224,405 | 190,254 | 1,054,761 | 97,521 | 192,653 | (215,061) | 1,337,490 |
| Fidelity Series Treasury Bill Index Fund | 1,156 | 65,151 | 2,173 | 503 | - | 59 | 64,193 |
| Fidelity Series Value Discovery Fund | 3,321,591 | 384,227 | 597,845 | - | 18,752 | 151,089 | 3,277,814 |
| | 79,806,638 | 12,296,530 | 12,389,450 | 1,396,441 | 904,521 | 3,738,931 | 84,357,170 |
Amounts in the dividend income column in the above table include any capital gain distributions from underlying funds, which are presented in the corresponding line item in the Statement of Operations, if applicable.
Amounts included in the purchases and sales proceeds columns may include in-kind transactions, if applicable.
Investment Valuation
The following is a summary of the inputs used, as of September 30, 2024, involving the Fund's assets and liabilities carried at fair value. The inputs or methodology used for valuing securities may not be an indication of the risk associated with investing in those securities. For more information on valuation inputs, and their aggregation into the levels used below, please refer to the Investment Valuation section in the accompanying Notes to Financial Statements.
| Valuation Inputs at Reporting Date: |
| Description | Total ($) | Level 1 ($) | Level 2 ($) | Level 3 ($) |
Investments in Securities: | | | | |
|
| Other Short-Term Investments and Net Other Assets | 158,760 | - | 158,760 | - |
|
| Domestic Equity Funds | 33,799,676 | 33,799,676 | - | - |
|
| International Equity Funds | 27,880,678 | 27,880,678 | - | - |
|
| Bond Funds | 22,592,916 | 22,592,916 | - | - |
|
| Short-Term Funds | 180,401 | 180,401 | - | - |
| Total Investments in Securities: | 84,612,431 | 84,453,671 | 158,760 | - |
Derivative Instruments: Assets | | | | |
Futures Contracts | 21,967 | 21,967 | - | - |
| Total Assets | 21,967 | 21,967 | - | - |
| Liabilities | | | | |
Futures Contracts | (29,648) | (29,648) | - | - |
| Total Liabilities | (29,648) | (29,648) | - | - |
| Total Derivative Instruments: | (7,681) | (7,681) | - | - |
Value of Derivative Instruments
The following table is a summary of the Fund's value of derivative instruments by primary risk exposure as of September 30, 2024. For additional information on derivative instruments, please refer to the Derivative Instruments section in the accompanying Notes to Financial Statements.
Primary Risk Exposure / Derivative Type | Value |
| Asset ($) | Liability ($) |
| Equity Risk | | |
Futures Contracts (a) | 21,119 | (24,786) |
| Total Equity Risk | 21,119 | (24,786) |
| Interest Rate Risk | | |
Futures Contracts (a) | 848 | (4,862) |
| Total Interest Rate Risk | 848 | (4,862) |
| Total Value of Derivatives | 21,967 | (29,648) |
(a)Reflects gross cumulative appreciation (depreciation) on futures contracts as presented in the Schedule of Investments. In the Statement of Assets and Liabilities, the period end daily variation margin is included in receivable or payable for daily variation margin on futures contracts, and the net cumulative appreciation (depreciation) is included in Total accumulated earnings (loss).
Fidelity Flex® Freedom Blend 2035 Fund
Financial Statements (Unaudited)
| Statement of Assets and Liabilities |
| As of September 30, 2024 (Unaudited) |
| Assets | | | | |
| Investment in securities, at value - See accompanying schedule: | | | | |
Unaffiliated issuers (cost $158,680) | $ | 158,760 | | |
Fidelity Central Funds (cost $96,501) | | 96,501 | | |
Other affiliated issuers (cost $70,354,482) | | 84,357,170 | | |
| | | | | |
| | | | | |
| Total Investment in Securities (cost $70,609,663) | | | $ | 84,612,431 |
| Cash | | | | 16,166 |
| Receivable for investments sold | | | | 509,018 |
| Receivable for fund shares sold | | | | 1,239,149 |
| Distributions receivable from Fidelity Central Funds | | | | 435 |
Total assets | | | | 86,377,199 |
| Liabilities | | | | |
| Payable for investments purchased | $ | 473,820 | | |
| Payable for fund shares redeemed | | 1,274,346 | | |
| Payable for daily variation margin on futures contracts | | 28,674 | | |
| Total liabilities | | | | 1,776,840 |
| Net Assets | | | $ | 84,600,359 |
| Net Assets consist of: | | | | |
| Paid in capital | | | $ | 68,735,290 |
| Total accumulated earnings (loss) | | | | 15,865,069 |
| Net Assets | | | $ | 84,600,359 |
Net Asset Value, offering price and redemption price per share ($84,600,359 ÷ 6,566,487 shares) | | | $ | 12.88 |
| Statement of Operations |
Six months ended September 30, 2024 (Unaudited) |
| Investment Income | | | | |
| Dividends: | | | | |
| Affiliated issuers | | | $ | 503,583 |
| Interest | | | | 3,814 |
| Income from Fidelity Central Funds | | | | 2,411 |
| Total income | | | | 509,808 |
| Expenses | | | | |
| Independent trustees' fees and expenses | $ | 102 | | |
| Total expenses before reductions | | 102 | | |
| Expense reductions | | (338) | | |
| Total expenses after reductions | | | | (236) |
| Net Investment income (loss) | | | | 510,044 |
| Realized and Unrealized Gain (Loss) | | | | |
| Net realized gain (loss) on: | | | | |
| Investment Securities: | | | | |
| Fidelity Central Funds | | 2 | | |
| Other affiliated issuers | | 904,521 | | |
| Futures contracts | | 83,528 | | |
| Capital gain distributions from underlying funds: | | | | |
| Affiliated issuers | | 892,858 | | |
| Total net realized gain (loss) | | | | 1,880,909 |
| Change in net unrealized appreciation (depreciation) on: | | | | |
| Investment Securities: | | | | |
| Unaffiliated issuers | | 85 | | |
| Affiliated issuers | | 3,738,931 | | |
| Futures contracts | | (21,828) | | |
| Total change in net unrealized appreciation (depreciation) | | | | 3,717,188 |
| Net gain (loss) | | | | 5,598,097 |
| Net increase (decrease) in net assets resulting from operations | | | $ | 6,108,141 |
| Statement of Changes in Net Assets |
| |
| | Six months ended September 30, 2024 (Unaudited) | | Year ended March 31, 2024 |
| Increase (Decrease) in Net Assets | | | | |
| Operations | | | | |
| Net investment income (loss) | $ | 510,044 | $ | 1,921,521 |
| Net realized gain (loss) | | 1,880,909 | | 1,142,697 |
| Change in net unrealized appreciation (depreciation) | | 3,717,188 | | 9,303,888 |
| Net increase (decrease) in net assets resulting from operations | | 6,108,141 | | 12,368,106 |
| Distributions to shareholders | | (571,609) | | (1,869,213) |
| | | | | |
| Share transactions | | | | |
| Proceeds from sales of shares | | 9,047,251 | | 17,898,055 |
| Reinvestment of distributions | | 571,609 | | 1,869,213 |
| Cost of shares redeemed | | (10,590,090) | | (28,461,597) |
| | | | | |
Net increase (decrease) in net assets resulting from share transactions | | (971,230) | | (8,694,329) |
| Total increase (decrease) in net assets | | 4,565,302 | | 1,804,564 |
| | | | | |
| Net Assets | | | | |
| Beginning of period | | 80,035,057 | | 78,230,493 |
| End of period | $ | 84,600,359 | $ | 80,035,057 |
| | | | | |
| Other Information | | | | |
| Shares | | | | |
| Sold | | 738,337 | | 1,622,540 |
| Issued in reinvestment of distributions | | 47,873 | | 163,966 |
| Redeemed | | (864,509) | | (2,576,228) |
| Net increase (decrease) | | (78,299) | | (789,722) |
| | | | | |
Financial Highlights
Fidelity Flex® Freedom Blend 2035 Fund |
| |
| | Six months ended (Unaudited) September 30, 2024 | | Years ended March 31, 2024 | | 2023 | | 2022 | | 2021 | | 2020 |
Selected Per-Share Data | | | | | | | | | | | | |
| Net asset value, beginning of period | $ | 12.04 | $ | 10.52 | $ | 11.84 | $ | 12.21 | $ | 8.61 | $ | 10.15 |
| Income from Investment Operations | | | | | | | | | | | | |
Net investment income (loss) A,B | | .08 | | .27 | | .35 | | .37 | | .18 | | .24 |
| Net realized and unrealized gain (loss) | | .85 | | 1.54 | | (1.15) | | .02 | | 4.10 | | (1.02) |
| Total from investment operations | | .93 | | 1.81 | | (.80) | | .39 | | 4.28 | | (.78) |
| Distributions from net investment income | | (.03) | | (.26) | | (.29) | | (.25) | | (.18) | | (.24) |
| Distributions from net realized gain | | (.06) | | (.02) | | (.24) | | (.51) | | (.49) | | (.52) |
| Total distributions | | (.09) | | (.29) C | | (.52) C | | (.76) | | (.68) C | | (.76) |
| Net asset value, end of period | $ | 12.88 | $ | 12.04 | $ | 10.52 | $ | 11.84 | $ | 12.21 | $ | 8.61 |
Total Return D,E | | | | 17.31% | | (6.53)% | | 2.94% | | 50.67% | | (8.74)% |
Ratios to Average Net Assets B,F,G | | | | | | | | | | | | |
Expenses before reductions H | | -% I | | -% | | -% | | -% | | -% | | -% |
Expenses net of fee waivers, if any H | | | | -% | | -% | | -% | | -% | | -% |
Expenses net of all reductions H | | -% I | | -% | | -% | | -% | | -% | | -% |
| Net investment income (loss) | | 1.26% I | | 2.45% | | 3.50% | | 3.00% | | 1.68% | | 2.32% |
| Supplemental Data | | | | | | | | | | | | |
| Net assets, end of period (000 omitted) | $ | 84,600 | $ | 80,035 | $ | 78,230 | $ | 1,108 | $ | 155 | $ | 103 |
Portfolio turnover rate J | | | | 33% | | 53% | | 38% | | 23% | | 65% |
ACalculated based on average shares outstanding during the period.
BNet investment income (loss) is affected by the timing of the declaration of dividends by any underlying mutual funds or exchange-traded funds (ETFs). Net investment income (loss) of any mutual funds or ETFs is not included in the Fund's net investment income (loss) ratio.
CTotal distributions per share do not sum due to rounding.
DTotal returns for periods of less than one year are not annualized.
ETotal returns would have been lower if certain expenses had not been reduced during the applicable periods shown.
FFees and expenses of any underlying mutual funds or exchange-traded funds (ETFs) are not included in the Fund's expense ratio. The Fund indirectly bears its proportionate share of these expenses. For additional expense information related to investments in Fidelity Central Funds, please refer to the "Investments in Fidelity Central Funds" note found in the Notes to Financial Statements section of the most recent Annual or Semi-Annual report.
GExpense ratios reflect operating expenses of the class. Expenses before reductions do not reflect amounts reimbursed, waived, or reduced through arrangements with the investment adviser, brokerage services, or other offset arrangements, if applicable, and do not represent the amount paid by the class during periods when reimbursements, waivers or reductions occur.
HAmount represents less than .005%.
IAnnualized.
JAmount does not include the portfolio activity of any underlying mutual funds or exchange-traded funds (ETFs).
Fidelity Flex® Freedom Blend 2040 Fund
Schedule of Investments September 30, 2024 (Unaudited)
Showing Percentage of Net Assets
| Domestic Equity Funds - 47.6% |
| | | Shares | Value ($) |
| Fidelity Series Blue Chip Growth Fund (a) | | 416,215 | 7,583,432 |
| Fidelity Series Commodity Strategy Fund (a) | | 1,813 | 160,306 |
| Fidelity Series Large Cap Growth Index Fund (a) | | 206,382 | 4,916,020 |
| Fidelity Series Large Cap Stock Fund (a) | | 193,693 | 4,441,387 |
| Fidelity Series Large Cap Value Index Fund (a) | | 535,410 | 9,176,933 |
| Fidelity Series Small Cap Core Fund (a) | | 180,731 | 2,248,288 |
| Fidelity Series Small Cap Opportunities Fund (a) | | 86,849 | 1,319,238 |
| Fidelity Series Value Discovery Fund (a) | | 191,334 | 3,191,447 |
| TOTAL DOMESTIC EQUITY FUNDS (Cost $24,911,639) | | | 33,037,051 |
| | | | |
| International Equity Funds - 39.2% |
| | | Shares | Value ($) |
| Fidelity Series Canada Fund (a) | | 114,870 | 1,893,051 |
| Fidelity Series Emerging Markets Fund (a) | | 186,092 | 1,792,067 |
| Fidelity Series Emerging Markets Opportunities Fund (a) | | 359,591 | 7,216,997 |
| Fidelity Series International Growth Fund (a) | | 235,024 | 4,526,565 |
| Fidelity Series International Index Fund (a) | | 129,634 | 1,725,425 |
| Fidelity Series International Small Cap Fund (a) | | 55,580 | 1,042,689 |
| Fidelity Series International Value Fund (a) | | 335,920 | 4,541,632 |
| Fidelity Series Overseas Fund (a) | | 302,500 | 4,528,431 |
| TOTAL INTERNATIONAL EQUITY FUNDS (Cost $21,616,366) | | | 27,266,857 |
| | | | |
| Bond Funds - 13.2% |
| | | Shares | Value ($) |
| Fidelity Series 0-5 Year Inflation-Protected Bond Index Fund (a) | | 50,815 | 500,020 |
| Fidelity Series 5+ Year Inflation-Protected Bond Index Fund (a) | | 48,887 | 389,633 |
| Fidelity Series Corporate Bond Fund (a) | | 33,993 | 325,314 |
| Fidelity Series Emerging Markets Debt Fund (a) | | 45,248 | 369,674 |
| Fidelity Series Emerging Markets Debt Local Currency Fund (a) | | 11,309 | 108,908 |
| Fidelity Series Floating Rate High Income Fund (a) | | 7,824 | 70,184 |
| Fidelity Series Government Bond Index Fund (a) | | 54,188 | 508,282 |
| Fidelity Series High Income Fund (a) | | 15,999 | 139,671 |
| Fidelity Series International Credit Fund (a) | | 6 | 54 |
| Fidelity Series International Developed Markets Bond Index Fund (a) | | 91,861 | 814,804 |
| Fidelity Series Investment Grade Bond Fund (a) | | 47,877 | 493,136 |
| Fidelity Series Investment Grade Securitized Fund (a) | | 34,458 | 316,321 |
| Fidelity Series Long-Term Treasury Bond Index Fund (a) | | 862,164 | 5,060,902 |
| Fidelity Series Real Estate Income Fund (a) | | 6,881 | 69,502 |
| TOTAL BOND FUNDS (Cost $9,267,858) | | | 9,166,405 |
| | | | |
| TOTAL INVESTMENT IN SECURITIES - 100.0% (Cost $55,795,863) | 69,470,313 |
NET OTHER ASSETS (LIABILITIES) - 0.0% | 0 |
| NET ASSETS - 100.0% | 69,470,313 |
| | |
Legend
Affiliated Underlying Funds
Fiscal year to date information regarding the Fund's investments in affiliated Underlying Funds is presented below. Exchanges between classes of the same affiliated Underlying Funds may occur. If an Underlying Funds changes its name, the name presented below is the name in effect at period end.
| Affiliate | Value, beginning of period ($) | Purchases ($) | Sales Proceeds ($) | Dividend Income ($) | Realized Gain (loss) ($) | Change in Unrealized appreciation (depreciation) ($) | Value, end of period ($) |
| Fidelity Series 0-5 Year Inflation-Protected Bond Index Fund | 32,387 | 480,484 | 19,869 | 311 | 86 | 6,932 | 500,020 |
| Fidelity Series 5+ Year Inflation-Protected Bond Index Fund | 363,866 | 35,723 | 28,697 | 4,096 | 720 | 18,021 | 389,633 |
| Fidelity Series Blue Chip Growth Fund | 7,293,218 | 1,620,414 | 1,428,187 | 664,770 | 144,541 | (46,554) | 7,583,432 |
| Fidelity Series Canada Fund | 1,702,198 | 242,840 | 187,268 | - | 1,320 | 133,961 | 1,893,051 |
| Fidelity Series Commodity Strategy Fund | 459,337 | 172,680 | 449,724 | 15,390 | (160,982) | 138,995 | 160,306 |
| Fidelity Series Corporate Bond Fund | 289,766 | 164,745 | 141,403 | 6,655 | 1,076 | 11,130 | 325,314 |
| Fidelity Series Emerging Markets Debt Fund | 340,894 | 45,383 | 31,400 | 8,685 | 1,103 | 13,694 | 369,674 |
| Fidelity Series Emerging Markets Debt Local Currency Fund | 107,515 | 6,905 | 13,113 | - | 180 | 7,421 | 108,908 |
| Fidelity Series Emerging Markets Fund | 1,563,784 | 271,504 | 206,539 | - | 3,910 | 159,408 | 1,792,067 |
| Fidelity Series Emerging Markets Opportunities Fund | 6,276,199 | 1,067,548 | 945,312 | - | 24,249 | 794,313 | 7,216,997 |
| Fidelity Series Floating Rate High Income Fund | 65,281 | 10,750 | 5,255 | 3,113 | (14) | (578) | 70,184 |
| Fidelity Series Government Bond Index Fund | 423,817 | 289,300 | 220,479 | 7,564 | 724 | 14,920 | 508,282 |
| Fidelity Series Government Money Market Fund 5.03% | 48,616 | 1,312 | 49,928 | 308 | - | - | - |
| Fidelity Series High Income Fund | 129,950 | 16,788 | 11,531 | 4,266 | 143 | 4,321 | 139,671 |
| Fidelity Series International Credit Fund | 51 | 1 | - | 1 | - | 2 | 54 |
| Fidelity Series International Developed Markets Bond Index Fund | 622,640 | 208,771 | 32,296 | 9,583 | 139 | 15,550 | 814,804 |
| Fidelity Series International Growth Fund | 4,270,851 | 630,221 | 538,114 | - | 10,551 | 153,056 | 4,526,565 |
| Fidelity Series International Index Fund | 1,616,981 | 193,753 | 202,257 | - | 5,554 | 111,394 | 1,725,425 |
| Fidelity Series International Small Cap Fund | 967,819 | 135,817 | 136,828 | - | 5,788 | 70,093 | 1,042,689 |
| Fidelity Series International Value Fund | 4,291,309 | 555,330 | 631,003 | - | 21,596 | 304,400 | 4,541,632 |
| Fidelity Series Investment Grade Bond Fund | 426,513 | 273,148 | 223,436 | 9,503 | 1,464 | 15,447 | 493,136 |
| Fidelity Series Investment Grade Securitized Fund | 281,363 | 161,253 | 137,697 | 6,177 | 575 | 10,827 | 316,321 |
| Fidelity Series Large Cap Growth Index Fund | 4,620,647 | 650,855 | 901,950 | 8,057 | 51,090 | 495,378 | 4,916,020 |
| Fidelity Series Large Cap Stock Fund | 4,894,838 | 589,099 | 1,300,962 | 229,960 | 180,104 | 78,308 | 4,441,387 |
| Fidelity Series Large Cap Value Index Fund | 8,750,532 | 1,167,128 | 1,393,659 | - | 68,891 | 584,041 | 9,176,933 |
| Fidelity Series Long-Term Treasury Bond Index Fund | 5,060,559 | 733,882 | 953,848 | 86,661 | (23,062) | 243,371 | 5,060,902 |
| Fidelity Series Overseas Fund | 4,280,888 | 511,910 | 551,059 | - | 15,341 | 271,351 | 4,528,431 |
| Fidelity Series Real Estate Income Fund | 63,195 | 8,554 | 5,203 | 2,086 | (7) | 2,963 | 69,502 |
| Fidelity Series Small Cap Core Fund | 89,864 | 2,175,377 | 124,530 | 715 | (501) | 108,078 | 2,248,288 |
| Fidelity Series Small Cap Opportunities Fund | 2,163,954 | 250,307 | 1,078,223 | 99,326 | 178,507 | (195,307) | 1,319,238 |
| Fidelity Series Treasury Bill Index Fund | 113,581 | 3,588 | 117,169 | 735 | - | - | - |
| Fidelity Series Value Discovery Fund | 3,231,437 | 400,665 | 621,283 | - | 31,577 | 149,051 | 3,191,447 |
| | 64,843,850 | 13,076,035 | 12,688,222 | 1,167,962 | 564,663 | 3,673,987 | 69,470,313 |
Amounts in the dividend income column in the above table include any capital gain distributions from underlying funds, which are presented in the corresponding line item in the Statement of Operations, if applicable.
Amounts included in the purchases and sales proceeds columns may include in-kind transactions, if applicable.
Investment Valuation
The following is a summary of the inputs used, as of September 30, 2024, involving the Fund's assets and liabilities carried at fair value. The inputs or methodology used for valuing securities may not be an indication of the risk associated with investing in those securities. For more information on valuation inputs, and their aggregation into the levels used below, please refer to the Investment Valuation section in the accompanying Notes to Financial Statements.
| Valuation Inputs at Reporting Date: |
| Description | Total ($) | Level 1 ($) | Level 2 ($) | Level 3 ($) |
Investments in Securities: | | | | |
|
| Domestic Equity Funds | 33,037,051 | 33,037,051 | - | - |
|
| International Equity Funds | 27,266,857 | 27,266,857 | - | - |
|
| Bond Funds | 9,166,405 | 9,166,405 | - | - |
| Total Investments in Securities: | 69,470,313 | 69,470,313 | - | - |
Fidelity Flex® Freedom Blend 2040 Fund
Financial Statements (Unaudited)
| Statement of Assets and Liabilities |
| As of September 30, 2024 (Unaudited) |
| Assets | | | | |
| Investment in securities, at value - See accompanying schedule: | | | | |
Affiliated issuers (cost $55,795,863) | $ | 69,470,313 | | |
| | | | | |
| | | | | |
| Total Investment in Securities (cost $55,795,863) | | | $ | 69,470,313 |
| Receivable for investments sold | | | | 2,505,480 |
| Receivable for fund shares sold | | | | 71,478 |
Total assets | | | | 72,047,271 |
| Liabilities | | | | |
| Payable for investments purchased | $ | 87,755 | | |
| Payable for fund shares redeemed | | 2,489,203 | | |
| Total liabilities | | | | 2,576,958 |
| Net Assets | | | $ | 69,470,313 |
| Net Assets consist of: | | | | |
| Paid in capital | | | $ | 54,420,207 |
| Total accumulated earnings (loss) | | | | 15,050,106 |
| Net Assets | | | $ | 69,470,313 |
Net Asset Value, offering price and redemption price per share ($69,470,313 ÷ 5,129,159 shares) | | | $ | 13.54 |
| Statement of Operations |
Six months ended September 30, 2024 (Unaudited) |
| Investment Income | | | | |
| Dividends: | | | | |
| Affiliated issuers | | | $ | 261,988 |
| Expenses | | | | |
| Independent trustees' fees and expenses | $ | 84 | | |
| Total expenses | | | | 84 |
| Net Investment income (loss) | | | | 261,904 |
| Realized and Unrealized Gain (Loss) | | | | |
| Net realized gain (loss) on: | | | | |
| Investment Securities: | | | | |
| Affiliated issuers | | 564,663 | | |
| Capital gain distributions from underlying funds: | | | | |
| Affiliated issuers | | 905,974 | | |
| Total net realized gain (loss) | | | | 1,470,637 |
| Change in net unrealized appreciation (depreciation) on: | | | | |
| Investment Securities: | | | | |
| Affiliated issuers | | 3,673,987 | | |
| Total change in net unrealized appreciation (depreciation) | | | | 3,673,987 |
| Net gain (loss) | | | | 5,144,624 |
| Net increase (decrease) in net assets resulting from operations | | | $ | 5,406,528 |
| Statement of Changes in Net Assets |
| |
| | Six months ended September 30, 2024 (Unaudited) | | Year ended March 31, 2024 |
| Increase (Decrease) in Net Assets | | | | |
| Operations | | | | |
| Net investment income (loss) | $ | 261,904 | $ | 1,309,124 |
| Net realized gain (loss) | | 1,470,637 | | 1,046,968 |
| Change in net unrealized appreciation (depreciation) | | 3,673,987 | | 8,962,275 |
| Net increase (decrease) in net assets resulting from operations | | 5,406,528 | | 11,318,367 |
| Distributions to shareholders | | (534,763) | | (1,291,765) |
| | | | | |
| Share transactions | | | | |
| Proceeds from sales of shares | | 7,340,907 | | 14,264,376 |
| Reinvestment of distributions | | 534,763 | | 1,291,765 |
| Cost of shares redeemed | | (8,121,034) | | (23,765,231) |
| | | | | |
Net increase (decrease) in net assets resulting from share transactions | | (245,364) | | (8,209,090) |
| Total increase (decrease) in net assets | | 4,626,401 | | 1,817,512 |
| | | | | |
| Net Assets | | | | |
| Beginning of period | | 64,843,912 | | 63,026,400 |
| End of period | $ | 69,470,313 | $ | 64,843,912 |
| | | | | |
| Other Information | | | | |
| Shares | | | | |
| Sold | | 574,486 | | 1,252,904 |
| Issued in reinvestment of distributions | | 42,679 | | 109,564 |
| Redeemed | | (621,779) | | (2,116,118) |
| Net increase (decrease) | | (4,614) | | (753,650) |
| | | | | |
Financial Highlights
Fidelity Flex® Freedom Blend 2040 Fund |
| |
| | Six months ended (Unaudited) September 30, 2024 | | Years ended March 31, 2024 | | 2023 | | 2022 | | 2021 | | 2020 |
Selected Per-Share Data | | | | | | | | | | | | |
| Net asset value, beginning of period | $ | 12.63 | $ | 10.71 | $ | 12.07 | $ | 12.46 | $ | 8.46 | $ | 10.13 |
| Income from Investment Operations | | | | | | | | | | | | |
Net investment income (loss) A,B | | .05 | | .24 | | .35 | | .35 | | .18 | | .23 |
| Net realized and unrealized gain (loss) | | .96 | | 1.94 | | (1.17) | | .18 | | 4.51 | | (1.16) |
| Total from investment operations | | 1.01 | | 2.18 | | (.82) | | .53 | | 4.69 | | (.93) |
| Distributions from net investment income | | (.02) | | (.24) | | (.29) | | (.27) | | (.18) | | (.24) |
| Distributions from net realized gain | | (.09) | | (.01) | | (.25) | | (.65) | | (.50) | | (.51) |
| Total distributions | | (.10) C | | (.26) C | | (.54) | | (.92) | | (.69) C | | (.74) C |
| Net asset value, end of period | $ | 13.54 | $ | 12.63 | $ | 10.71 | $ | 12.07 | $ | 12.46 | $ | 8.46 |
Total Return D | | | | 20.51% | | (6.56)% | | 3.91% | | 56.53% | | (10.27)% |
Ratios to Average Net Assets B,E,F | | | | | | | | | | | | |
Expenses before reductions G | | -% H | | -% | | -% | | -% | | -% | | -% |
Expenses net of fee waivers, if any G | | | | -% | | -% | | -% | | -% | | -% |
Expenses net of all reductions G | | -% H | | -% | | -% | | -% | | -% | | -% |
| Net investment income (loss) | | .78% H | | 2.09% | | 3.39% | | 2.84% | | 1.67% | | 2.30% |
| Supplemental Data | | | | | | | | | | | | |
| Net assets, end of period (000 omitted) | $ | 69,470 | $ | 64,844 | $ | 63,026 | $ | 846 | $ | 158 | $ | 101 |
Portfolio turnover rate I | | | | 33% | | 44% | | 33% | | 18% | | 61% |
ACalculated based on average shares outstanding during the period.
BNet investment income (loss) is affected by the timing of the declaration of dividends by any underlying mutual funds or exchange-traded funds (ETFs). Net investment income (loss) of any mutual funds or ETFs is not included in the Fund's net investment income (loss) ratio.
CTotal distributions per share do not sum due to rounding.
DTotal returns for periods of less than one year are not annualized.
EFees and expenses of any underlying mutual funds or exchange-traded funds (ETFs) are not included in the Fund's expense ratio. The Fund indirectly bears its proportionate share of these expenses.
FExpense ratios reflect operating expenses of the class. Expenses before reductions do not reflect amounts reimbursed, waived, or reduced through arrangements with the investment adviser, brokerage services, or other offset arrangements, if applicable, and do not represent the amount paid by the class during periods when reimbursements, waivers or reductions occur.
GAmount represents less than .005%.
HAnnualized.
IAmount does not include the portfolio activity of any underlying mutual funds or exchange-traded funds (ETFs).
Fidelity Flex® Freedom Blend 2045 Fund
Schedule of Investments September 30, 2024 (Unaudited)
Showing Percentage of Net Assets
| Domestic Equity Funds - 51.0% |
| | | Shares | Value ($) |
| Fidelity Series Blue Chip Growth Fund (a) | | 479,847 | 8,742,808 |
| Fidelity Series Commodity Strategy Fund (a) | | 1,943 | 171,734 |
| Fidelity Series Large Cap Growth Index Fund (a) | | 237,918 | 5,667,213 |
| Fidelity Series Large Cap Stock Fund (a) | | 222,460 | 5,101,009 |
| Fidelity Series Large Cap Value Index Fund (a) | | 615,509 | 10,549,819 |
| Fidelity Series Small Cap Core Fund (a) | | 214,224 | 2,664,950 |
| Fidelity Series Small Cap Opportunities Fund (a) | | 99,206 | 1,506,941 |
| Fidelity Series Value Discovery Fund (a) | | 220,063 | 3,670,657 |
| TOTAL DOMESTIC EQUITY FUNDS (Cost $29,423,388) | | | 38,075,131 |
| | | | |
| International Equity Funds - 41.9% |
| | | Shares | Value ($) |
| Fidelity Series Canada Fund (a) | | 132,576 | 2,184,857 |
| Fidelity Series Emerging Markets Fund (a) | | 211,936 | 2,040,945 |
| Fidelity Series Emerging Markets Opportunities Fund (a) | | 409,406 | 8,216,771 |
| Fidelity Series International Growth Fund (a) | | 271,352 | 5,226,239 |
| Fidelity Series International Index Fund (a) | | 149,631 | 1,991,590 |
| Fidelity Series International Small Cap Fund (a) | | 59,739 | 1,120,702 |
| Fidelity Series International Value Fund (a) | | 387,797 | 5,243,015 |
| Fidelity Series Overseas Fund (a) | | 349,251 | 5,228,292 |
| TOTAL INTERNATIONAL EQUITY FUNDS (Cost $25,263,189) | | | 31,252,411 |
| | | | |
| Bond Funds - 7.1% |
| | | Shares | Value ($) |
| Fidelity Series 0-5 Year Inflation-Protected Bond Index Fund (a) | | 54,619 | 537,454 |
| Fidelity Series 5+ Year Inflation-Protected Bond Index Fund (a) | | 52,543 | 418,768 |
| Fidelity Series Corporate Bond Fund (a) | | 5 | 44 |
| Fidelity Series Emerging Markets Debt Fund (a) | | 12,701 | 103,765 |
| Fidelity Series Emerging Markets Debt Local Currency Fund (a) | | 3,149 | 30,328 |
| Fidelity Series Floating Rate High Income Fund (a) | | 8,406 | 75,400 |
| Fidelity Series Government Bond Index Fund (a) | | 5 | 45 |
| Fidelity Series International Credit Fund (a) | | 6 | 54 |
| Fidelity Series Investment Grade Bond Fund (a) | | 5 | 46 |
| Fidelity Series Investment Grade Securitized Fund (a) | | 5 | 43 |
| Fidelity Series Long-Term Treasury Bond Index Fund (a) | | 697,881 | 4,096,559 |
| Fidelity Series Real Estate Income Fund (a) | | 7,396 | 74,702 |
| TOTAL BOND FUNDS (Cost $5,555,728) | | | 5,337,208 |
| | | | |
| TOTAL INVESTMENT IN SECURITIES - 100.0% (Cost $60,242,305) | 74,664,750 |
NET OTHER ASSETS (LIABILITIES) - 0.0% | (28) |
| NET ASSETS - 100.0% | 74,664,722 |
| | |
Legend
Affiliated Underlying Funds
Fiscal year to date information regarding the Fund's investments in affiliated Underlying Funds is presented below. Exchanges between classes of the same affiliated Underlying Funds may occur. If an Underlying Funds changes its name, the name presented below is the name in effect at period end.
| Affiliate | Value, beginning of period ($) | Purchases ($) | Sales Proceeds ($) | Dividend Income ($) | Realized Gain (loss) ($) | Change in Unrealized appreciation (depreciation) ($) | Value, end of period ($) |
| Fidelity Series 0-5 Year Inflation-Protected Bond Index Fund | 31,845 | 504,335 | 5,864 | 310 | 7 | 7,131 | 537,454 |
| Fidelity Series 5+ Year Inflation-Protected Bond Index Fund | 357,837 | 59,556 | 17,526 | 4,095 | 362 | 18,539 | 418,768 |
| Fidelity Series Blue Chip Growth Fund | 7,578,832 | 2,122,227 | 1,058,418 | 724,055 | 174,243 | (74,076) | 8,742,808 |
| Fidelity Series Canada Fund | 1,778,270 | 347,811 | 89,880 | - | 744 | 147,912 | 2,184,857 |
| Fidelity Series Commodity Strategy Fund | 451,690 | 188,823 | 446,079 | 15,668 | (155,924) | 133,224 | 171,734 |
| Fidelity Series Corporate Bond Fund | 23,426 | 26,083 | 49,343 | 192 | 1,655 | (1,777) | 44 |
| Fidelity Series Emerging Markets Debt Fund | 87,540 | 15,896 | 3,593 | 2,255 | 57 | 3,865 | 103,765 |
| Fidelity Series Emerging Markets Debt Local Currency Fund | 27,496 | 3,129 | 2,306 | - | 10 | 1,999 | 30,328 |
| Fidelity Series Emerging Markets Fund | 1,611,714 | 365,857 | 110,543 | - | (131) | 174,048 | 2,040,945 |
| Fidelity Series Emerging Markets Opportunities Fund | 6,468,434 | 1,379,873 | 504,102 | - | (149) | 872,715 | 8,216,771 |
| Fidelity Series Floating Rate High Income Fund | 64,193 | 15,283 | 3,491 | 3,112 | (9) | (576) | 75,400 |
| Fidelity Series Government Bond Index Fund | 34,251 | 49,547 | 83,361 | 218 | 929 | (1,321) | 45 |
| Fidelity Series Government Money Market Fund 5.03% | 47,806 | 924 | 48,730 | 250 | - | - | - |
| Fidelity Series International Credit Fund | 51 | 1 | - | 1 | - | 2 | 54 |
| Fidelity Series International Growth Fund | 4,462,162 | 822,815 | 242,636 | - | 1,680 | 182,218 | 5,226,239 |
| Fidelity Series International Index Fund | 1,689,356 | 275,768 | 101,441 | - | 2,474 | 125,433 | 1,991,590 |
| Fidelity Series International Small Cap Fund | 951,789 | 185,906 | 94,517 | - | 3,175 | 74,349 | 1,120,702 |
| Fidelity Series International Value Fund | 4,483,366 | 749,015 | 344,341 | - | 6,210 | 348,765 | 5,243,015 |
| Fidelity Series Investment Grade Bond Fund | 34,472 | 47,119 | 81,203 | 276 | 1,602 | (1,944) | 46 |
| Fidelity Series Investment Grade Securitized Fund | 22,736 | 25,521 | 47,963 | 177 | 1,190 | (1,441) | 43 |
| Fidelity Series Large Cap Growth Index Fund | 4,801,745 | 971,922 | 697,921 | 8,551 | 42,089 | 549,378 | 5,667,213 |
| Fidelity Series Large Cap Stock Fund | 5,086,366 | 803,996 | 1,061,728 | 250,172 | 138,039 | 134,336 | 5,101,009 |
| Fidelity Series Large Cap Value Index Fund | 9,092,945 | 1,620,842 | 874,683 | - | 17,477 | 693,238 | 10,549,819 |
| Fidelity Series Long-Term Treasury Bond Index Fund | 4,229,343 | 639,498 | 937,393 | 69,385 | (41,244) | 206,355 | 4,096,559 |
| Fidelity Series Overseas Fund | 4,472,566 | 681,350 | 239,766 | - | 1,512 | 312,630 | 5,228,292 |
| Fidelity Series Real Estate Income Fund | 62,127 | 11,634 | 2,028 | 2,102 | 30 | 2,939 | 74,702 |
| Fidelity Series Small Cap Core Fund | 94,042 | 2,609,648 | 156,983 | 812 | (509) | 118,752 | 2,664,950 |
| Fidelity Series Small Cap Opportunities Fund | 2,248,420 | 303,174 | 1,064,598 | 108,591 | 205,088 | (185,143) | 1,506,941 |
| Fidelity Series Treasury Bill Index Fund | 111,522 | 2,417 | 113,939 | 545 | - | - | - |
| Fidelity Series Value Discovery Fund | 3,357,737 | 575,422 | 457,648 | - | 20,026 | 175,120 | 3,670,657 |
| | 63,764,079 | 15,405,392 | 8,942,024 | 1,190,767 | 420,633 | 4,016,670 | 74,664,750 |
Amounts in the dividend income column in the above table include any capital gain distributions from underlying funds, which are presented in the corresponding line item in the Statement of Operations, if applicable.
Amounts included in the purchases and sales proceeds columns may include in-kind transactions, if applicable.
Investment Valuation
The following is a summary of the inputs used, as of September 30, 2024, involving the Fund's assets and liabilities carried at fair value. The inputs or methodology used for valuing securities may not be an indication of the risk associated with investing in those securities. For more information on valuation inputs, and their aggregation into the levels used below, please refer to the Investment Valuation section in the accompanying Notes to Financial Statements.
| Valuation Inputs at Reporting Date: |
| Description | Total ($) | Level 1 ($) | Level 2 ($) | Level 3 ($) |
Investments in Securities: | | | | |
|
| Domestic Equity Funds | 38,075,131 | 38,075,131 | - | - |
|
| International Equity Funds | 31,252,411 | 31,252,411 | - | - |
|
| Bond Funds | 5,337,208 | 5,337,208 | - | - |
| Total Investments in Securities: | 74,664,750 | 74,664,750 | - | - |
Fidelity Flex® Freedom Blend 2045 Fund
Financial Statements (Unaudited)
| Statement of Assets and Liabilities |
| As of September 30, 2024 (Unaudited) |
| Assets | | | | |
| Investment in securities, at value - See accompanying schedule: | | | | |
Affiliated issuers (cost $60,242,305) | $ | 74,664,750 | | |
| | | | | |
| | | | | |
| Total Investment in Securities (cost $60,242,305) | | | $ | 74,664,750 |
| Receivable for investments sold | | | | 75,240 |
| Receivable for fund shares sold | | | | 709,487 |
Total assets | | | | 75,449,477 |
| Liabilities | | | | |
| Payable for investments purchased | $ | 782,869 | | |
| Payable for fund shares redeemed | | 1,886 | | |
| Total liabilities | | | | 784,755 |
| Net Assets | | | $ | 74,664,722 |
| Net Assets consist of: | | | | |
| Paid in capital | | | $ | 59,114,836 |
| Total accumulated earnings (loss) | | | | 15,549,886 |
| Net Assets | | | $ | 74,664,722 |
Net Asset Value, offering price and redemption price per share ($74,664,722 ÷ 5,524,132 shares) | | | $ | 13.52 |
| Statement of Operations |
Six months ended September 30, 2024 (Unaudited) |
| Investment Income | | | | |
| Dividends: | | | | |
| Affiliated issuers | | | $ | 203,913 |
| Expenses | | | | |
| Independent trustees' fees and expenses | $ | 83 | | |
| Total expenses | | | | 83 |
| Net Investment income (loss) | | | | 203,830 |
| Realized and Unrealized Gain (Loss) | | | | |
| Net realized gain (loss) on: | | | | |
| Investment Securities: | | | | |
| Affiliated issuers | | 420,633 | | |
| Capital gain distributions from underlying funds: | | | | |
| Affiliated issuers | | 986,854 | | |
| Total net realized gain (loss) | | | | 1,407,487 |
| Change in net unrealized appreciation (depreciation) on: | | | | |
| Investment Securities: | | | | |
| Affiliated issuers | | 4,016,670 | | |
| Total change in net unrealized appreciation (depreciation) | | | | 4,016,670 |
| Net gain (loss) | | | | 5,424,157 |
| Net increase (decrease) in net assets resulting from operations | | | $ | 5,627,987 |
| Statement of Changes in Net Assets |
| |
| | Six months ended September 30, 2024 (Unaudited) | | Year ended March 31, 2024 |
| Increase (Decrease) in Net Assets | | | | |
| Operations | | | | |
| Net investment income (loss) | $ | 203,830 | $ | 1,244,415 |
| Net realized gain (loss) | | 1,407,487 | | 869,849 |
| Change in net unrealized appreciation (depreciation) | | 4,016,670 | | 9,378,508 |
| Net increase (decrease) in net assets resulting from operations | | 5,627,987 | | 11,492,772 |
| Distributions to shareholders | | (445,997) | | (1,266,509) |
| | | | | |
| Share transactions | | | | |
| Proceeds from sales of shares | | 10,201,467 | | 16,748,269 |
| Reinvestment of distributions | | 445,997 | | 1,266,509 |
| Cost of shares redeemed | | (4,928,875) | | (22,315,395) |
| | | | | |
Net increase (decrease) in net assets resulting from share transactions | | 5,718,589 | | (4,300,617) |
| Total increase (decrease) in net assets | | 10,900,579 | | 5,925,646 |
| | | | | |
| Net Assets | | | | |
| Beginning of period | | 63,764,143 | | 57,838,497 |
| End of period | $ | 74,664,722 | $ | 63,764,143 |
| | | | | |
| Other Information | | | | |
| Shares | | | | |
| Sold | | 798,708 | | 1,485,105 |
| Issued in reinvestment of distributions | | 35,708 | | 108,434 |
| Redeemed | | (384,663) | | (1,994,641) |
| Net increase (decrease) | | 449,753 | | (401,102) |
| | | | | |
Financial Highlights
Fidelity Flex® Freedom Blend 2045 Fund |
| |
| | Six months ended (Unaudited) September 30, 2024 | | Years ended March 31, 2024 | | 2023 | | 2022 | | 2021 | | 2020 |
Selected Per-Share Data | | | | | | | | | | | | |
| Net asset value, beginning of period | $ | 12.57 | $ | 10.56 | $ | 11.91 | $ | 12.47 | $ | 8.46 | $ | 10.13 |
| Income from Investment Operations | | | | | | | | | | | | |
Net investment income (loss) A,B | | .04 | | .24 | | .34 | | .36 | | .18 | | .23 |
| Net realized and unrealized gain (loss) | | 1.00 | | 2.02 | | (1.16) | | .18 | | 4.51 | | (1.16) |
| Total from investment operations | | 1.04 | | 2.26 | | (.82) | | .54 | | 4.69 | | (.93) |
| Distributions from net investment income | | (.01) | | (.23) | | (.29) | | (.32) | | (.19) | | (.23) |
| Distributions from net realized gain | | (.08) | | (.02) | | (.24) | | (.78) | | (.49) | | (.51) |
| Total distributions | | (.09) | | (.25) | | (.53) | | (1.10) | | (.68) | | (.74) |
| Net asset value, end of period | $ | 13.52 | $ | 12.57 | $ | 10.56 | $ | 11.91 | $ | 12.47 | $ | 8.46 |
Total Return C | | | | 21.56% | | (6.63)% | | 3.89% | | 56.58% | | (10.26)% |
Ratios to Average Net Assets B,D,E | | | | | | | | | | | | |
Expenses before reductions F | | -% G | | -% | | -% | | -% | | -% | | -% |
Expenses net of fee waivers, if any F | | | | -% | | -% | | -% | | -% | | -% |
Expenses net of all reductions F | | -% G | | -% | | -% | | -% | | -% | | -% |
| Net investment income (loss) | | .60% G | | 2.10% | | 3.40% | | 2.89% | | 1.67% | | 2.30% |
| Supplemental Data | | | | | | | | | | | | |
| Net assets, end of period (000 omitted) | $ | 74,665 | $ | 63,764 | $ | 57,838 | $ | 967 | $ | 158 | $ | 101 |
Portfolio turnover rate H | | | | 37% | | 47% | | 50% | | 18% | | 61% |
ACalculated based on average shares outstanding during the period.
BNet investment income (loss) is affected by the timing of the declaration of dividends by any underlying mutual funds or exchange-traded funds (ETFs). Net investment income (loss) of any mutual funds or ETFs is not included in the Fund's net investment income (loss) ratio.
CTotal returns for periods of less than one year are not annualized.
DFees and expenses of any underlying mutual funds or exchange-traded funds (ETFs) are not included in the Fund's expense ratio. The Fund indirectly bears its proportionate share of these expenses.
EExpense ratios reflect operating expenses of the class. Expenses before reductions do not reflect amounts reimbursed, waived, or reduced through arrangements with the investment adviser, brokerage services, or other offset arrangements, if applicable, and do not represent the amount paid by the class during periods when reimbursements, waivers or reductions occur.
FAmount represents less than .005%.
GAnnualized.
HAmount does not include the portfolio activity of any underlying mutual funds or exchange-traded funds (ETFs).
Fidelity Flex® Freedom Blend 2050 Fund
Schedule of Investments September 30, 2024 (Unaudited)
Showing Percentage of Net Assets
| Domestic Equity Funds - 51.0% |
| | | Shares | Value ($) |
| Fidelity Series Blue Chip Growth Fund (a) | | 354,375 | 6,456,715 |
| Fidelity Series Commodity Strategy Fund (a) | | 1,435 | 126,821 |
| Fidelity Series Large Cap Growth Index Fund (a) | | 175,709 | 4,185,388 |
| Fidelity Series Large Cap Stock Fund (a) | | 164,284 | 3,767,025 |
| Fidelity Series Large Cap Value Index Fund (a) | | 454,513 | 7,790,354 |
| Fidelity Series Small Cap Core Fund (a) | | 158,180 | 1,967,755 |
| Fidelity Series Small Cap Opportunities Fund (a) | | 73,391 | 1,114,808 |
| Fidelity Series Value Discovery Fund (a) | | 162,485 | 2,710,254 |
| TOTAL DOMESTIC EQUITY FUNDS (Cost $21,610,726) | | | 28,119,120 |
| | | | |
| International Equity Funds - 41.9% |
| | | Shares | Value ($) |
| Fidelity Series Canada Fund (a) | | 97,907 | 1,613,515 |
| Fidelity Series Emerging Markets Fund (a) | | 156,494 | 1,507,035 |
| Fidelity Series Emerging Markets Opportunities Fund (a) | | 302,320 | 6,067,555 |
| Fidelity Series International Growth Fund (a) | | 200,377 | 3,859,269 |
| Fidelity Series International Index Fund (a) | | 110,496 | 1,470,703 |
| Fidelity Series International Small Cap Fund (a) | | 44,117 | 827,627 |
| Fidelity Series International Value Fund (a) | | 286,373 | 3,871,767 |
| Fidelity Series Overseas Fund (a) | | 257,902 | 3,860,799 |
| TOTAL INTERNATIONAL EQUITY FUNDS (Cost $18,575,672) | | | 23,078,270 |
| | | | |
| Bond Funds - 7.1% |
| | | Shares | Value ($) |
| Fidelity Series 0-5 Year Inflation-Protected Bond Index Fund (a) | | 40,335 | 396,901 |
| Fidelity Series 5+ Year Inflation-Protected Bond Index Fund (a) | | 38,803 | 309,258 |
| Fidelity Series Corporate Bond Fund (a) | | 3 | 32 |
| Fidelity Series Emerging Markets Debt Fund (a) | | 9,374 | 76,588 |
| Fidelity Series Emerging Markets Debt Local Currency Fund (a) | | 2,329 | 22,431 |
| Fidelity Series Floating Rate High Income Fund (a) | | 6,208 | 55,686 |
| Fidelity Series Government Bond Index Fund (a) | | 3 | 32 |
| Fidelity Series International Credit Fund (a) | | 6 | 54 |
| Fidelity Series Investment Grade Bond Fund (a) | | 3 | 33 |
| Fidelity Series Investment Grade Securitized Fund (a) | | 3 | 32 |
| Fidelity Series Long-Term Treasury Bond Index Fund (a) | | 515,375 | 3,025,251 |
| Fidelity Series Real Estate Income Fund (a) | | 5,462 | 55,167 |
| TOTAL BOND FUNDS (Cost $4,087,977) | | | 3,941,465 |
| | | | |
| TOTAL INVESTMENT IN SECURITIES - 100.0% (Cost $44,274,375) | 55,138,855 |
NET OTHER ASSETS (LIABILITIES) - 0.0% | (6) |
| NET ASSETS - 100.0% | 55,138,849 |
| | |
Legend
Affiliated Underlying Funds
Fiscal year to date information regarding the Fund's investments in affiliated Underlying Funds is presented below. Exchanges between classes of the same affiliated Underlying Funds may occur. If an Underlying Funds changes its name, the name presented below is the name in effect at period end.
| Affiliate | Value, beginning of period ($) | Purchases ($) | Sales Proceeds ($) | Dividend Income ($) | Realized Gain (loss) ($) | Change in Unrealized appreciation (depreciation) ($) | Value, end of period ($) |
| Fidelity Series 0-5 Year Inflation-Protected Bond Index Fund | 24,096 | 370,575 | 3,079 | 231 | 3 | 5,306 | 396,901 |
| Fidelity Series 5+ Year Inflation-Protected Bond Index Fund | 270,778 | 37,187 | 12,673 | 3,041 | 155 | 13,811 | 309,258 |
| Fidelity Series Blue Chip Growth Fund | 5,734,995 | 1,399,947 | 740,833 | 539,365 | 159,739 | (97,133) | 6,456,715 |
| Fidelity Series Canada Fund | 1,345,632 | 228,558 | 70,768 | - | (375) | 110,468 | 1,613,515 |
| Fidelity Series Commodity Strategy Fund | 341,801 | 134,640 | 332,886 | 11,672 | (110,885) | 94,151 | 126,821 |
| Fidelity Series Corporate Bond Fund | 17,727 | 22,314 | 39,937 | 149 | 1,252 | (1,324) | 32 |
| Fidelity Series Emerging Markets Debt Fund | 66,204 | 10,207 | 2,725 | 1,681 | 29 | 2,873 | 76,588 |
| Fidelity Series Emerging Markets Debt Local Currency Fund | 20,845 | 1,875 | 1,786 | - | 5 | 1,492 | 22,431 |
| Fidelity Series Emerging Markets Fund | 1,219,590 | 240,411 | 82,266 | - | (650) | 129,950 | 1,507,035 |
| Fidelity Series Emerging Markets Opportunities Fund | 4,894,713 | 947,605 | 424,389 | - | 2,984 | 646,642 | 6,067,555 |
| Fidelity Series Floating Rate High Income Fund | 48,575 | 10,262 | 2,716 | 2,320 | (7) | (428) | 55,686 |
| Fidelity Series Government Bond Index Fund | 25,921 | 39,834 | 65,447 | 162 | 719 | (995) | 32 |
| Fidelity Series Government Money Market Fund 5.03% | 36,183 | 737 | 36,920 | 188 | - | - | - |
| Fidelity Series International Credit Fund | 51 | 1 | - | 1 | - | 2 | 54 |
| Fidelity Series International Growth Fund | 3,376,502 | 561,412 | 212,897 | - | 253 | 133,999 | 3,859,269 |
| Fidelity Series International Index Fund | 1,278,335 | 179,376 | 81,682 | - | 554 | 94,120 | 1,470,703 |
| Fidelity Series International Small Cap Fund | 720,222 | 124,476 | 74,421 | - | 2,393 | 54,957 | 827,627 |
| Fidelity Series International Value Fund | 3,392,568 | 498,276 | 281,931 | - | 4,202 | 258,652 | 3,871,767 |
| Fidelity Series Investment Grade Bond Fund | 26,088 | 38,022 | 63,833 | 205 | 1,217 | (1,461) | 33 |
| Fidelity Series Investment Grade Securitized Fund | 17,207 | 21,893 | 38,891 | 137 | 914 | (1,091) | 32 |
| Fidelity Series Large Cap Growth Index Fund | 3,633,511 | 581,576 | 462,543 | 6,329 | 43,188 | 389,656 | 4,185,388 |
| Fidelity Series Large Cap Stock Fund | 3,848,940 | 534,039 | 820,135 | 184,812 | 116,045 | 88,136 | 3,767,025 |
| Fidelity Series Large Cap Value Index Fund | 6,880,762 | 1,038,119 | 659,839 | - | 18,042 | 513,270 | 7,790,354 |
| Fidelity Series Long-Term Treasury Bond Index Fund | 3,200,352 | 451,531 | 746,692 | 51,709 | (57,487) | 177,547 | 3,025,251 |
| Fidelity Series Overseas Fund | 3,384,385 | 456,874 | 212,126 | - | 120 | 231,546 | 3,860,799 |
| Fidelity Series Real Estate Income Fund | 47,009 | 7,485 | 1,536 | 1,561 | 15 | 2,194 | 55,167 |
| Fidelity Series Small Cap Core Fund | 71,051 | 1,876,165 | 67,873 | 548 | (266) | 88,678 | 1,967,755 |
| Fidelity Series Small Cap Opportunities Fund | 1,701,453 | 208,169 | 779,120 | 80,887 | 132,946 | (148,640) | 1,114,808 |
| Fidelity Series Treasury Bill Index Fund | 84,447 | 2,023 | 86,470 | 411 | - | - | - |
| Fidelity Series Value Discovery Fund | 2,540,879 | 377,074 | 355,938 | - | 14,723 | 133,516 | 2,710,254 |
| | 48,250,822 | 10,400,663 | 6,762,352 | 885,409 | 329,828 | 2,919,894 | 55,138,855 |
Amounts in the dividend income column in the above table include any capital gain distributions from underlying funds, which are presented in the corresponding line item in the Statement of Operations, if applicable.
Amounts included in the purchases and sales proceeds columns may include in-kind transactions, if applicable.
Investment Valuation
The following is a summary of the inputs used, as of September 30, 2024, involving the Fund's assets and liabilities carried at fair value. The inputs or methodology used for valuing securities may not be an indication of the risk associated with investing in those securities. For more information on valuation inputs, and their aggregation into the levels used below, please refer to the Investment Valuation section in the accompanying Notes to Financial Statements.
| Valuation Inputs at Reporting Date: |
| Description | Total ($) | Level 1 ($) | Level 2 ($) | Level 3 ($) |
Investments in Securities: | | | | |
|
| Domestic Equity Funds | 28,119,120 | 28,119,120 | - | - |
|
| International Equity Funds | 23,078,270 | 23,078,270 | - | - |
|
| Bond Funds | 3,941,465 | 3,941,465 | - | - |
| Total Investments in Securities: | 55,138,855 | 55,138,855 | - | - |
Fidelity Flex® Freedom Blend 2050 Fund
Financial Statements (Unaudited)
| Statement of Assets and Liabilities |
| As of September 30, 2024 (Unaudited) |
| Assets | | | | |
| Investment in securities, at value - See accompanying schedule: | | | | |
Affiliated issuers (cost $44,274,375) | $ | 55,138,855 | | |
| | | | | |
| | | | | |
| Total Investment in Securities (cost $44,274,375) | | | $ | 55,138,855 |
| Receivable for investments sold | | | | 199,542 |
| Receivable for fund shares sold | | | | 69,181 |
Total assets | | | | 55,407,578 |
| Liabilities | | | | |
| Payable for investments purchased | $ | 263,187 | | |
| Payable for fund shares redeemed | | 5,542 | | |
| Total liabilities | | | | 268,729 |
| Net Assets | | | $ | 55,138,849 |
| Net Assets consist of: | | | | |
| Paid in capital | | | $ | 43,385,293 |
| Total accumulated earnings (loss) | | | | 11,753,556 |
| Net Assets | | | $ | 55,138,849 |
Net Asset Value, offering price and redemption price per share ($55,138,849 ÷ 4,041,189 shares) | | | $ | 13.64 |
| Statement of Operations |
Six months ended September 30, 2024 (Unaudited) |
| Investment Income | | | | |
| Dividends: | | | | |
| Affiliated issuers | | | $ | 151,603 |
| Expenses | | | | |
| Independent trustees' fees and expenses | $ | 62 | | |
| Total expenses | | | | 62 |
| Net Investment income (loss) | | | | 151,541 |
| Realized and Unrealized Gain (Loss) | | | | |
| Net realized gain (loss) on: | | | | |
| Investment Securities: | | | | |
| Affiliated issuers | | 329,828 | | |
| Capital gain distributions from underlying funds: | | | | |
| Affiliated issuers | | 733,806 | | |
| Total net realized gain (loss) | | | | 1,063,634 |
| Change in net unrealized appreciation (depreciation) on: | | | | |
| Investment Securities: | | | | |
| Affiliated issuers | | 2,919,894 | | |
| Total change in net unrealized appreciation (depreciation) | | | | 2,919,894 |
| Net gain (loss) | | | | 3,983,528 |
| Net increase (decrease) in net assets resulting from operations | | | $ | 4,135,069 |
| Statement of Changes in Net Assets |
| |
| | Six months ended September 30, 2024 (Unaudited) | | Year ended March 31, 2024 |
| Increase (Decrease) in Net Assets | | | | |
| Operations | | | | |
| Net investment income (loss) | $ | 151,541 | $ | 945,131 |
| Net realized gain (loss) | | 1,063,634 | | 602,943 |
| Change in net unrealized appreciation (depreciation) | | 2,919,894 | | 7,209,168 |
| Net increase (decrease) in net assets resulting from operations | | 4,135,069 | | 8,757,242 |
| Distributions to shareholders | | (337,986) | | (989,936) |
| | | | | |
| Share transactions | | | | |
| Proceeds from sales of shares | | 6,945,046 | | 12,197,756 |
| Reinvestment of distributions | | 337,986 | | 989,936 |
| Cost of shares redeemed | | (4,192,124) | | (15,398,935) |
| | | | | |
Net increase (decrease) in net assets resulting from share transactions | | 3,090,908 | | (2,211,243) |
| Total increase (decrease) in net assets | | 6,887,991 | | 5,556,063 |
| | | | | |
| Net Assets | | | | |
| Beginning of period | | 48,250,858 | | 42,694,795 |
| End of period | $ | 55,138,849 | $ | 48,250,858 |
| | | | | |
| Other Information | | | | |
| Shares | | | | |
| Sold | | 540,036 | | 1,078,577 |
| Issued in reinvestment of distributions | | 26,782 | | 83,893 |
| Redeemed | | (327,144) | | (1,359,402) |
| Net increase (decrease) | | 239,674 | | (196,932) |
| | | | | |
Financial Highlights
Fidelity Flex® Freedom Blend 2050 Fund |
| |
| | Six months ended (Unaudited) September 30, 2024 | | Years ended March 31, 2024 | | 2023 | | 2022 | | 2021 | | 2020 |
Selected Per-Share Data | | | | | | | | | | | | |
| Net asset value, beginning of period | $ | 12.69 | $ | 10.68 | $ | 12.09 | $ | 12.46 | $ | 8.46 | $ | 10.13 |
| Income from Investment Operations | | | | | | | | | | | | |
Net investment income (loss) A,B | | .04 | | .24 | | .35 | | .39 | | .18 | | .23 |
| Net realized and unrealized gain (loss) | | 1.00 | | 2.03 | | (1.18) | | .14 | | 4.50 | | (1.15) |
| Total from investment operations | | 1.04 | | 2.27 | | (.83) | | .53 | | 4.68 | | (.92) |
| Distributions from net investment income | | (.01) | | (.24) | | (.29) | | (.28) | | (.18) | | (.23) |
| Distributions from net realized gain | | (.08) | | (.02) | | (.29) | | (.61) | | (.50) | | (.51) |
| Total distributions | | (.09) | | (.26) | | (.58) | | (.90) C | | (.68) | | (.75) C |
| Net asset value, end of period | $ | 13.64 | $ | 12.69 | $ | 10.68 | $ | 12.09 | $ | 12.46 | $ | 8.46 |
Total Return D | | | | 21.45% | | (6.62)% | | 3.89% | | 56.50% | | (10.25)% |
Ratios to Average Net Assets B,E,F | | | | | | | | | | | | |
Expenses before reductions G | | -% H | | -% | | -% | | -% | | -% | | -% |
Expenses net of fee waivers, if any G | | | | -% | | -% | | -% | | -% | | -% |
Expenses net of all reductions G | | -% H | | -% | | -% | | -% | | -% | | -% |
| Net investment income (loss) | | .60% H | | 2.10% | | 3.39% | | 3.11% | | 1.67% | | 2.30% |
| Supplemental Data | | | | | | | | | | | | |
| Net assets, end of period (000 omitted) | $ | 55,139 | $ | 48,251 | $ | 42,695 | $ | 662 | $ | 158 | $ | 101 |
Portfolio turnover rate I | | | | 35% | | 40% | | 32% | | 19% | | 61% |
ACalculated based on average shares outstanding during the period.
BNet investment income (loss) is affected by the timing of the declaration of dividends by any underlying mutual funds or exchange-traded funds (ETFs). Net investment income (loss) of any mutual funds or ETFs is not included in the Fund's net investment income (loss) ratio.
CTotal distributions per share do not sum due to rounding.
DTotal returns for periods of less than one year are not annualized.
EFees and expenses of any underlying mutual funds or exchange-traded funds (ETFs) are not included in the Fund's expense ratio. The Fund indirectly bears its proportionate share of these expenses.
FExpense ratios reflect operating expenses of the class. Expenses before reductions do not reflect amounts reimbursed, waived, or reduced through arrangements with the investment adviser, brokerage services, or other offset arrangements, if applicable, and do not represent the amount paid by the class during periods when reimbursements, waivers or reductions occur.
GAmount represents less than .005%.
HAnnualized.
IAmount does not include the portfolio activity of any underlying mutual funds or exchange-traded funds (ETFs).
Fidelity Flex® Freedom Blend 2055 Fund
Schedule of Investments September 30, 2024 (Unaudited)
Showing Percentage of Net Assets
| Domestic Equity Funds - 51.0% |
| | | Shares | Value ($) |
| Fidelity Series Blue Chip Growth Fund (a) | | 246,995 | 4,500,248 |
| Fidelity Series Commodity Strategy Fund (a) | | 1,000 | 88,389 |
| Fidelity Series Large Cap Growth Index Fund (a) | | 122,467 | 2,917,155 |
| Fidelity Series Large Cap Stock Fund (a) | | 114,504 | 2,625,584 |
| Fidelity Series Large Cap Value Index Fund (a) | | 316,803 | 5,430,007 |
| Fidelity Series Small Cap Core Fund (a) | | 110,220 | 1,371,135 |
| Fidelity Series Small Cap Opportunities Fund (a) | | 51,144 | 776,875 |
| Fidelity Series Value Discovery Fund (a) | | 113,266 | 1,889,274 |
| TOTAL DOMESTIC EQUITY FUNDS (Cost $15,290,650) | | | 19,598,667 |
| | | | |
| International Equity Funds - 41.9% |
| | | Shares | Value ($) |
| Fidelity Series Canada Fund (a) | | 68,241 | 1,124,605 |
| Fidelity Series Emerging Markets Fund (a) | | 109,072 | 1,050,361 |
| Fidelity Series Emerging Markets Opportunities Fund (a) | | 210,707 | 4,228,891 |
| Fidelity Series International Growth Fund (a) | | 139,662 | 2,689,893 |
| Fidelity Series International Index Fund (a) | | 77,015 | 1,025,076 |
| Fidelity Series International Small Cap Fund (a) | | 30,749 | 576,845 |
| Fidelity Series International Value Fund (a) | | 199,603 | 2,698,632 |
| Fidelity Series Overseas Fund (a) | | 179,758 | 2,690,970 |
| TOTAL INTERNATIONAL EQUITY FUNDS (Cost $13,168,576) | | | 16,085,273 |
| | | | |
| Bond Funds - 7.1% |
| | | Shares | Value ($) |
| Fidelity Series 0-5 Year Inflation-Protected Bond Index Fund (a) | | 28,113 | 276,636 |
| Fidelity Series 5+ Year Inflation-Protected Bond Index Fund (a) | | 27,045 | 215,549 |
| Fidelity Series Corporate Bond Fund (a) | | 2 | 21 |
| Fidelity Series Emerging Markets Debt Fund (a) | | 6,543 | 53,452 |
| Fidelity Series Emerging Markets Debt Local Currency Fund (a) | | 1,618 | 15,578 |
| Fidelity Series Floating Rate High Income Fund (a) | | 4,327 | 38,810 |
| Fidelity Series Government Bond Index Fund (a) | | 2 | 21 |
| Fidelity Series International Credit Fund (a) | | 5 | 41 |
| Fidelity Series Investment Grade Bond Fund (a) | | 2 | 22 |
| Fidelity Series Investment Grade Securitized Fund (a) | | 2 | 21 |
| Fidelity Series Long-Term Treasury Bond Index Fund (a) | | 359,231 | 2,108,689 |
| Fidelity Series Real Estate Income Fund (a) | | 3,807 | 38,451 |
| TOTAL BOND FUNDS (Cost $2,843,719) | | | 2,747,291 |
| | | | |
| TOTAL INVESTMENT IN SECURITIES - 100.0% (Cost $31,302,945) | 38,431,231 |
NET OTHER ASSETS (LIABILITIES) - 0.0% | (4) |
| NET ASSETS - 100.0% | 38,431,227 |
| | |
Legend
Affiliated Underlying Funds
Fiscal year to date information regarding the Fund's investments in affiliated Underlying Funds is presented below. Exchanges between classes of the same affiliated Underlying Funds may occur. If an Underlying Funds changes its name, the name presented below is the name in effect at period end.
| Affiliate | Value, beginning of period ($) | Purchases ($) | Sales Proceeds ($) | Dividend Income ($) | Realized Gain (loss) ($) | Change in Unrealized appreciation (depreciation) ($) | Value, end of period ($) |
| Fidelity Series 0-5 Year Inflation-Protected Bond Index Fund | 15,617 | 259,353 | 1,979 | 155 | (1) | 3,646 | 276,636 |
| Fidelity Series 5+ Year Inflation-Protected Bond Index Fund | 175,507 | 37,095 | 6,648 | 2,051 | 135 | 9,460 | 215,549 |
| Fidelity Series Blue Chip Growth Fund | 3,717,264 | 1,200,988 | 453,616 | 372,035 | 29,247 | 6,365 | 4,500,248 |
| Fidelity Series Canada Fund | 872,193 | 214,263 | 37,852 | - | (356) | 76,357 | 1,124,605 |
| Fidelity Series Commodity Strategy Fund | 221,538 | 103,280 | 224,662 | 8,051 | (61,737) | 49,970 | 88,389 |
| Fidelity Series Corporate Bond Fund | 11,489 | 15,330 | 26,758 | 100 | 829 | (869) | 21 |
| Fidelity Series Emerging Markets Debt Fund | 42,926 | 9,870 | 1,347 | 1,127 | 19 | 1,984 | 53,452 |
| Fidelity Series Emerging Markets Debt Local Currency Fund | 13,495 | 2,113 | 1,058 | - | 6 | 1,022 | 15,578 |
| Fidelity Series Emerging Markets Fund | 790,504 | 218,481 | 46,460 | - | (698) | 88,534 | 1,050,361 |
| Fidelity Series Emerging Markets Opportunities Fund | 3,172,591 | 866,409 | 251,873 | - | (920) | 442,684 | 4,228,891 |
| Fidelity Series Floating Rate High Income Fund | 31,483 | 9,035 | 1,420 | 1,563 | (3) | (285) | 38,810 |
| Fidelity Series Government Bond Index Fund | 16,797 | 27,299 | 43,898 | 105 | 473 | (650) | 21 |
| Fidelity Series Government Money Market Fund 5.03% | 23,445 | 640 | 24,085 | 123 | - | - | - |
| Fidelity Series International Credit Fund | 38 | 1 | - | 1 | - | 2 | 41 |
| Fidelity Series International Growth Fund | 2,188,591 | 525,797 | 119,193 | - | 227 | 94,471 | 2,689,893 |
| Fidelity Series International Index Fund | 828,590 | 176,387 | 45,158 | - | 317 | 64,940 | 1,025,076 |
| Fidelity Series International Small Cap Fund | 466,827 | 114,409 | 43,889 | - | 1,183 | 38,315 | 576,845 |
| Fidelity Series International Value Fund | 2,198,982 | 482,428 | 163,041 | - | 1,027 | 179,236 | 2,698,632 |
| Fidelity Series Investment Grade Bond Fund | 16,905 | 26,109 | 42,840 | 137 | 804 | (956) | 22 |
| Fidelity Series Investment Grade Securitized Fund | 11,151 | 15,038 | 26,057 | 88 | 597 | (708) | 21 |
| Fidelity Series Large Cap Growth Index Fund | 2,355,130 | 552,030 | 283,627 | 4,279 | 9,574 | 284,048 | 2,917,155 |
| Fidelity Series Large Cap Stock Fund | 2,494,770 | 515,337 | 521,683 | 126,673 | 52,507 | 84,653 | 2,625,584 |
| Fidelity Series Large Cap Value Index Fund | 4,459,884 | 1,007,048 | 405,173 | - | 7,886 | 360,362 | 5,430,007 |
| Fidelity Series Long-Term Treasury Bond Index Fund | 2,074,391 | 425,461 | 475,568 | 34,815 | (15,239) | 99,644 | 2,108,689 |
| Fidelity Series Overseas Fund | 2,193,690 | 452,906 | 115,487 | - | (16) | 159,877 | 2,690,970 |
| Fidelity Series Real Estate Income Fund | 30,473 | 7,138 | 664 | 1,060 | 7 | 1,497 | 38,451 |
| Fidelity Series Small Cap Core Fund | 45,851 | 1,316,620 | 51,142 | 400 | (633) | 60,439 | 1,371,135 |
| Fidelity Series Small Cap Opportunities Fund | 1,102,830 | 175,584 | 491,845 | 55,789 | 76,272 | (85,966) | 776,875 |
| Fidelity Series Treasury Bill Index Fund | 54,676 | 1,717 | 56,393 | 269 | - | - | - |
| Fidelity Series Value Discovery Fund | 1,646,921 | 358,543 | 219,971 | - | 7,746 | 96,035 | 1,889,274 |
| | 31,274,549 | 9,116,709 | 4,183,387 | 608,821 | 109,253 | 2,114,107 | 38,431,231 |
Amounts in the dividend income column in the above table include any capital gain distributions from underlying funds, which are presented in the corresponding line item in the Statement of Operations, if applicable.
Amounts included in the purchases and sales proceeds columns may include in-kind transactions, if applicable.
Investment Valuation
The following is a summary of the inputs used, as of September 30, 2024, involving the Fund's assets and liabilities carried at fair value. The inputs or methodology used for valuing securities may not be an indication of the risk associated with investing in those securities. For more information on valuation inputs, and their aggregation into the levels used below, please refer to the Investment Valuation section in the accompanying Notes to Financial Statements.
| Valuation Inputs at Reporting Date: |
| Description | Total ($) | Level 1 ($) | Level 2 ($) | Level 3 ($) |
Investments in Securities: | | | | |
|
| Domestic Equity Funds | 19,598,667 | 19,598,667 | - | - |
|
| International Equity Funds | 16,085,273 | 16,085,273 | - | - |
|
| Bond Funds | 2,747,291 | 2,747,291 | - | - |
| Total Investments in Securities: | 38,431,231 | 38,431,231 | - | - |
Fidelity Flex® Freedom Blend 2055 Fund
Financial Statements (Unaudited)
| Statement of Assets and Liabilities |
| As of September 30, 2024 (Unaudited) |
| Assets | | | | |
| Investment in securities, at value - See accompanying schedule: | | | | |
Affiliated issuers (cost $31,302,945) | $ | 38,431,231 | | |
| | | | | |
| | | | | |
| Total Investment in Securities (cost $31,302,945) | | | $ | 38,431,231 |
| Receivable for investments sold | | | | 125,006 |
| Receivable for fund shares sold | | | | 78,709 |
Total assets | | | | 38,634,946 |
| Liabilities | | | | |
| Payable to custodian bank | $ | 1 | | |
| Payable for investments purchased | | 196,822 | | |
| Payable for fund shares redeemed | | 6,896 | | |
| Total liabilities | | | | 203,719 |
| Net Assets | | | $ | 38,431,227 |
| Net Assets consist of: | | | | |
| Paid in capital | | | $ | 30,799,716 |
| Total accumulated earnings (loss) | | | | 7,631,511 |
| Net Assets | | | $ | 38,431,227 |
Net Asset Value, offering price and redemption price per share ($38,431,227 ÷ 2,833,603 shares) | | | $ | 13.56 |
| Statement of Operations |
Six months ended September 30, 2024 (Unaudited) |
| Investment Income | | | | |
| Dividends: | | | | |
| Affiliated issuers | | | $ | 103,387 |
| Expenses | | | | |
| Independent trustees' fees and expenses | $ | 41 | | |
| Total expenses | | | | 41 |
| Net Investment income (loss) | | | | 103,346 |
| Realized and Unrealized Gain (Loss) | | | | |
| Net realized gain (loss) on: | | | | |
| Investment Securities: | | | | |
| Affiliated issuers | | 109,253 | | |
| Capital gain distributions from underlying funds: | | | | |
| Affiliated issuers | | 505,434 | | |
| Total net realized gain (loss) | | | | 614,687 |
| Change in net unrealized appreciation (depreciation) on: | | | | |
| Investment Securities: | | | | |
| Affiliated issuers | | 2,114,107 | | |
| Total change in net unrealized appreciation (depreciation) | | | | 2,114,107 |
| Net gain (loss) | | | | 2,728,794 |
| Net increase (decrease) in net assets resulting from operations | | | $ | 2,832,140 |
| Statement of Changes in Net Assets |
| |
| | Six months ended September 30, 2024 (Unaudited) | | Year ended March 31, 2024 |
| Increase (Decrease) in Net Assets | | | | |
| Operations | | | | |
| Net investment income (loss) | $ | 103,346 | $ | 589,410 |
| Net realized gain (loss) | | 614,687 | | 288,842 |
| Change in net unrealized appreciation (depreciation) | | 2,114,107 | | 4,605,689 |
| Net increase (decrease) in net assets resulting from operations | | 2,832,140 | | 5,483,941 |
| Distributions to shareholders | | (167,482) | | (596,625) |
| | | | | |
| Share transactions | | | | |
| Proceeds from sales of shares | | 7,115,458 | | 10,804,448 |
| Reinvestment of distributions | | 167,482 | | 596,625 |
| Cost of shares redeemed | | (2,790,912) | | (10,187,839) |
| | | | | |
Net increase (decrease) in net assets resulting from share transactions | | 4,492,028 | | 1,213,234 |
| Total increase (decrease) in net assets | | 7,156,686 | | 6,100,550 |
| | | | | |
| Net Assets | | | | |
| Beginning of period | | 31,274,541 | | 25,173,991 |
| End of period | $ | 38,431,227 | $ | 31,274,541 |
| | | | | |
| Other Information | | | | |
| Shares | | | | |
| Sold | | 555,073 | | 961,328 |
| Issued in reinvestment of distributions | | 13,356 | | 50,950 |
| Redeemed | | (218,068) | | (907,987) |
| Net increase (decrease) | | 350,361 | | 104,291 |
| | | | | |
Financial Highlights
Fidelity Flex® Freedom Blend 2055 Fund |
| |
| | Six months ended (Unaudited) September 30, 2024 | | Years ended March 31, 2024 | | 2023 | | 2022 | | 2021 | | 2020 |
Selected Per-Share Data | | | | | | | | | | | | |
| Net asset value, beginning of period | $ | 12.59 | $ | 10.58 | $ | 11.97 | $ | 12.47 | $ | 8.46 | $ | 10.13 |
| Income from Investment Operations | | | | | | | | | | | | |
Net investment income (loss) A,B | | .04 | | .24 | | .35 | | .35 | | .18 | | .23 |
| Net realized and unrealized gain (loss) | | 1.00 | | 2.01 | | (1.17) | | .18 | | 4.51 | | (1.15) |
| Total from investment operations | | 1.04 | | 2.25 | | (.82) | | .53 | | 4.69 | | (.92) |
| Distributions from net investment income | | (.01) | | (.23) | | (.28) | | (.29) | | (.18) | | (.24) |
| Distributions from net realized gain | | (.05) | | (.02) | | (.29) | | (.74) | | (.50) | | (.51) |
| Total distributions | | (.07) C | | (.24) C | | (.57) | | (1.03) | | (.68) | | (.75) |
| Net asset value, end of period | $ | 13.56 | $ | 12.59 | $ | 10.58 | $ | 11.97 | $ | 12.47 | $ | 8.46 |
Total Return D | | | | 21.47% | | (6.60)% | | 3.84% | | 56.63% | | (10.24)% |
Ratios to Average Net Assets B,E,F | | | | | | | | | | | | |
Expenses before reductions G | | -% H | | -% | | -% | | -% | | -% | | -% |
Expenses net of fee waivers, if any G | | | | -% | | -% | | -% | | -% | | -% |
Expenses net of all reductions G | | -% H | | -% | | -% | | -% | | -% | | -% |
| Net investment income (loss) | | .61% H | | 2.11% | | 3.41% | | 2.77% | | 1.67% | | 2.30% |
| Supplemental Data | | | | | | | | | | | | |
| Net assets, end of period (000 omitted) | $ | 38,431 | $ | 31,275 | $ | 25,174 | $ | 347 | $ | 158 | $ | 101 |
Portfolio turnover rate I | | | | 37% | | 38% | | 39% | | 18% | | 61% |
ACalculated based on average shares outstanding during the period.
BNet investment income (loss) is affected by the timing of the declaration of dividends by any underlying mutual funds or exchange-traded funds (ETFs). Net investment income (loss) of any mutual funds or ETFs is not included in the Fund's net investment income (loss) ratio.
CTotal distributions per share do not sum due to rounding.
DTotal returns for periods of less than one year are not annualized.
EFees and expenses of any underlying mutual funds or exchange-traded funds (ETFs) are not included in the Fund's expense ratio. The Fund indirectly bears its proportionate share of these expenses.
FExpense ratios reflect operating expenses of the class. Expenses before reductions do not reflect amounts reimbursed, waived, or reduced through arrangements with the investment adviser, brokerage services, or other offset arrangements, if applicable, and do not represent the amount paid by the class during periods when reimbursements, waivers or reductions occur.
GAmount represents less than .005%.
HAnnualized.
IAmount does not include the portfolio activity of any underlying mutual funds or exchange-traded funds (ETFs).
Fidelity Flex® Freedom Blend 2060 Fund
Schedule of Investments September 30, 2024 (Unaudited)
Showing Percentage of Net Assets
| Domestic Equity Funds - 51.0% |
| | | Shares | Value ($) |
| Fidelity Series Blue Chip Growth Fund (a) | | 130,784 | 2,382,878 |
| Fidelity Series Commodity Strategy Fund (a) | | 529 | 46,796 |
| Fidelity Series Large Cap Growth Index Fund (a) | | 64,846 | 1,544,636 |
| Fidelity Series Large Cap Stock Fund (a) | | 60,631 | 1,390,258 |
| Fidelity Series Large Cap Value Index Fund (a) | | 167,737 | 2,875,020 |
| Fidelity Series Small Cap Core Fund (a) | | 58,372 | 726,142 |
| Fidelity Series Small Cap Opportunities Fund (a) | | 27,090 | 411,496 |
| Fidelity Series Value Discovery Fund (a) | | 59,967 | 1,000,247 |
| TOTAL DOMESTIC EQUITY FUNDS (Cost $8,186,378) | | | 10,377,473 |
| | | | |
| International Equity Funds - 41.9% |
| | | Shares | Value ($) |
| Fidelity Series Canada Fund (a) | | 36,133 | 595,474 |
| Fidelity Series Emerging Markets Fund (a) | | 57,752 | 556,151 |
| Fidelity Series Emerging Markets Opportunities Fund (a) | | 111,567 | 2,239,158 |
| Fidelity Series International Growth Fund (a) | | 73,949 | 1,424,265 |
| Fidelity Series International Index Fund (a) | | 40,779 | 542,768 |
| Fidelity Series International Small Cap Fund (a) | | 16,281 | 305,437 |
| Fidelity Series International Value Fund (a) | | 105,688 | 1,428,901 |
| Fidelity Series Overseas Fund (a) | | 95,179 | 1,424,836 |
| TOTAL INTERNATIONAL EQUITY FUNDS (Cost $7,005,137) | | | 8,516,990 |
| | | | |
| Bond Funds - 7.1% |
| | | Shares | Value ($) |
| Fidelity Series 0-5 Year Inflation-Protected Bond Index Fund (a) | | 14,886 | 146,477 |
| Fidelity Series 5+ Year Inflation-Protected Bond Index Fund (a) | | 14,320 | 114,132 |
| Fidelity Series Corporate Bond Fund (a) | | 1 | 10 |
| Fidelity Series Emerging Markets Debt Fund (a) | | 3,460 | 28,272 |
| Fidelity Series Emerging Markets Debt Local Currency Fund (a) | | 860 | 8,281 |
| Fidelity Series Floating Rate High Income Fund (a) | | 2,291 | 20,550 |
| Fidelity Series Government Bond Index Fund (a) | | 1 | 10 |
| Fidelity Series International Credit Fund (a) | | 5 | 41 |
| Fidelity Series Investment Grade Bond Fund (a) | | 1 | 10 |
| Fidelity Series Investment Grade Securitized Fund (a) | | 1 | 10 |
| Fidelity Series Long-Term Treasury Bond Index Fund (a) | | 190,209 | 1,116,529 |
| Fidelity Series Real Estate Income Fund (a) | | 2,016 | 20,360 |
| TOTAL BOND FUNDS (Cost $1,477,945) | | | 1,454,682 |
| | | | |
| TOTAL INVESTMENT IN SECURITIES - 100.0% (Cost $16,669,460) | 20,349,145 |
NET OTHER ASSETS (LIABILITIES) - 0.0% | (8) |
| NET ASSETS - 100.0% | 20,349,137 |
| | |
Legend
Affiliated Underlying Funds
Fiscal year to date information regarding the Fund's investments in affiliated Underlying Funds is presented below. Exchanges between classes of the same affiliated Underlying Funds may occur. If an Underlying Funds changes its name, the name presented below is the name in effect at period end.
| Affiliate | Value, beginning of period ($) | Purchases ($) | Sales Proceeds ($) | Dividend Income ($) | Realized Gain (loss) ($) | Change in Unrealized appreciation (depreciation) ($) | Value, end of period ($) |
| Fidelity Series 0-5 Year Inflation-Protected Bond Index Fund | 8,265 | 136,995 | 713 | 81 | - | 1,930 | 146,477 |
| Fidelity Series 5+ Year Inflation-Protected Bond Index Fund | 92,905 | 21,542 | 5,369 | 1,074 | 49 | 5,005 | 114,132 |
| Fidelity Series Blue Chip Growth Fund | 1,967,966 | 674,032 | 278,518 | 197,952 | 8,526 | 10,872 | 2,382,878 |
| Fidelity Series Canada Fund | 461,703 | 119,051 | 25,219 | - | (244) | 40,183 | 595,474 |
| Fidelity Series Commodity Strategy Fund | 117,275 | 56,149 | 120,437 | 4,283 | (18,623) | 12,432 | 46,796 |
| Fidelity Series Corporate Bond Fund | 6,085 | 8,038 | 14,092 | 49 | 426 | (447) | 10 |
| Fidelity Series Emerging Markets Debt Fund | 22,694 | 5,732 | 1,213 | 591 | 17 | 1,042 | 28,272 |
| Fidelity Series Emerging Markets Debt Local Currency Fund | 7,169 | 1,265 | 695 | - | 5 | 537 | 8,281 |
| Fidelity Series Emerging Markets Fund | 418,453 | 126,266 | 34,919 | - | (159) | 46,510 | 556,151 |
| Fidelity Series Emerging Markets Opportunities Fund | 1,679,428 | 500,970 | 174,696 | - | 672 | 232,784 | 2,239,158 |
| Fidelity Series Floating Rate High Income Fund | 16,662 | 5,102 | 1,063 | 822 | (1) | (150) | 20,550 |
| Fidelity Series Government Bond Index Fund | 8,896 | 14,273 | 23,066 | 54 | 248 | (341) | 10 |
| Fidelity Series Government Money Market Fund 5.03% | 12,423 | 380 | 12,803 | 64 | - | - | - |
| Fidelity Series International Credit Fund | 38 | 1 | - | 1 | - | 2 | 41 |
| Fidelity Series International Growth Fund | 1,158,510 | 298,145 | 82,787 | - | 5 | 50,392 | 1,424,265 |
| Fidelity Series International Index Fund | 438,609 | 101,337 | 31,510 | - | (63) | 34,395 | 542,768 |
| Fidelity Series International Small Cap Fund | 247,115 | 66,357 | 28,891 | - | 582 | 20,274 | 305,437 |
| Fidelity Series International Value Fund | 1,164,026 | 276,281 | 106,114 | - | (32) | 94,740 | 1,428,901 |
| Fidelity Series Investment Grade Bond Fund | 8,953 | 13,675 | 22,539 | 69 | 419 | (498) | 10 |
| Fidelity Series Investment Grade Securitized Fund | 5,905 | 7,884 | 13,722 | 45 | 321 | (378) | 10 |
| Fidelity Series Large Cap Growth Index Fund | 1,246,703 | 315,881 | 173,876 | 2,229 | 6,133 | 149,795 | 1,544,636 |
| Fidelity Series Large Cap Stock Fund | 1,320,838 | 297,110 | 300,969 | 66,025 | 24,999 | 48,280 | 1,390,258 |
| Fidelity Series Large Cap Value Index Fund | 2,361,095 | 570,393 | 250,349 | - | 4,991 | 188,890 | 2,875,020 |
| Fidelity Series Long-Term Treasury Bond Index Fund | 1,097,997 | 245,673 | 271,462 | 18,316 | (5,915) | 50,236 | 1,116,529 |
| Fidelity Series Overseas Fund | 1,161,215 | 268,447 | 89,389 | - | 34 | 84,529 | 1,424,836 |
| Fidelity Series Real Estate Income Fund | 16,132 | 4,150 | 709 | 564 | 5 | 782 | 20,360 |
| Fidelity Series Small Cap Core Fund | 23,319 | 696,017 | 25,145 | 264 | (193) | 32,144 | 726,142 |
| Fidelity Series Small Cap Opportunities Fund | 584,009 | 108,093 | 275,331 | 29,679 | 35,612 | (40,887) | 411,496 |
| Fidelity Series Treasury Bill Index Fund | 28,996 | 1,110 | 30,106 | 141 | - | - | - |
| Fidelity Series Value Discovery Fund | 872,025 | 206,713 | 132,689 | - | 4,686 | 49,512 | 1,000,247 |
| | 16,555,409 | 5,147,062 | 2,528,391 | 322,303 | 62,500 | 1,112,565 | 20,349,145 |
Amounts in the dividend income column in the above table include any capital gain distributions from underlying funds, which are presented in the corresponding line item in the Statement of Operations, if applicable.
Amounts included in the purchases and sales proceeds columns may include in-kind transactions, if applicable.
Investment Valuation
The following is a summary of the inputs used, as of September 30, 2024, involving the Fund's assets and liabilities carried at fair value. The inputs or methodology used for valuing securities may not be an indication of the risk associated with investing in those securities. For more information on valuation inputs, and their aggregation into the levels used below, please refer to the Investment Valuation section in the accompanying Notes to Financial Statements.
| Valuation Inputs at Reporting Date: |
| Description | Total ($) | Level 1 ($) | Level 2 ($) | Level 3 ($) |
Investments in Securities: | | | | |
|
| Domestic Equity Funds | 10,377,473 | 10,377,473 | - | - |
|
| International Equity Funds | 8,516,990 | 8,516,990 | - | - |
|
| Bond Funds | 1,454,682 | 1,454,682 | - | - |
| Total Investments in Securities: | 20,349,145 | 20,349,145 | - | - |
Fidelity Flex® Freedom Blend 2060 Fund
Financial Statements (Unaudited)
| Statement of Assets and Liabilities |
| As of September 30, 2024 (Unaudited) |
| Assets | | | | |
| Investment in securities, at value - See accompanying schedule: | | | | |
Affiliated issuers (cost $16,669,460) | $ | 20,349,145 | | |
| | | | | |
| | | | | |
| Total Investment in Securities (cost $16,669,460) | | | $ | 20,349,145 |
| Receivable for investments sold | | | | 82,818 |
| Receivable for fund shares sold | | | | 25,571 |
Total assets | | | | 20,457,534 |
| Liabilities | | | | |
| Payable for investments purchased | $ | 88,768 | | |
| Payable for fund shares redeemed | | 19,629 | | |
| Total liabilities | | | | 108,397 |
| Net Assets | | | $ | 20,349,137 |
| Net Assets consist of: | | | | |
| Paid in capital | | | $ | 16,424,095 |
| Total accumulated earnings (loss) | | | | 3,925,042 |
| Net Assets | | | $ | 20,349,137 |
Net Asset Value, offering price and redemption price per share ($20,349,137 ÷ 1,516,194 shares) | | | $ | 13.42 |
| Statement of Operations |
Six months ended September 30, 2024 (Unaudited) |
| Investment Income | | | | |
| Dividends: | | | | |
| Affiliated issuers | | | $ | 54,566 |
| Expenses | | | | |
| Independent trustees' fees and expenses | $ | 22 | | |
| Total expenses | | | | 22 |
| Net Investment income (loss) | | | | 54,544 |
| Realized and Unrealized Gain (Loss) | | | | |
| Net realized gain (loss) on: | | | | |
| Investment Securities: | | | | |
| Affiliated issuers | | 62,500 | | |
| Capital gain distributions from underlying funds: | | | | |
| Affiliated issuers | | 267,737 | | |
| Total net realized gain (loss) | | | | 330,237 |
| Change in net unrealized appreciation (depreciation) on: | | | | |
| Investment Securities: | | | | |
| Affiliated issuers | | 1,112,565 | | |
| Total change in net unrealized appreciation (depreciation) | | | | 1,112,565 |
| Net gain (loss) | | | | 1,442,802 |
| Net increase (decrease) in net assets resulting from operations | | | $ | 1,497,346 |
| Statement of Changes in Net Assets |
| |
| | Six months ended September 30, 2024 (Unaudited) | | Year ended March 31, 2024 |
| Increase (Decrease) in Net Assets | | | | |
| Operations | | | | |
| Net investment income (loss) | $ | 54,544 | $ | 294,617 |
| Net realized gain (loss) | | 330,237 | | 116,214 |
| Change in net unrealized appreciation (depreciation) | | 1,112,565 | | 2,326,472 |
| Net increase (decrease) in net assets resulting from operations | | 1,497,346 | | 2,737,303 |
| Distributions to shareholders | | (82,462) | | (334,283) |
| | | | | |
| Share transactions | | | | |
| Proceeds from sales of shares | | 4,205,471 | | 7,347,429 |
| Reinvestment of distributions | | 82,462 | | 334,283 |
| Cost of shares redeemed | | (1,909,015) | | (4,671,369) |
| | | | | |
Net increase (decrease) in net assets resulting from share transactions | | 2,378,918 | | 3,010,343 |
| Total increase (decrease) in net assets | | 3,793,802 | | 5,413,363 |
| | | | | |
| Net Assets | | | | |
| Beginning of period | | 16,555,335 | | 11,141,972 |
| End of period | $ | 20,349,137 | $ | 16,555,335 |
| | | | | |
| Other Information | | | | |
| Shares | | | | |
| Sold | | 331,516 | | 659,068 |
| Issued in reinvestment of distributions | | 6,645 | | 28,993 |
| Redeemed | | (150,818) | | (420,552) |
| Net increase (decrease) | | 187,343 | | 267,509 |
| | | | | |
Financial Highlights
Fidelity Flex® Freedom Blend 2060 Fund |
| |
| | Six months ended (Unaudited) September 30, 2024 | | Years ended March 31, 2024 | | 2023 | | 2022 | | 2021 | | 2020 |
Selected Per-Share Data | | | | | | | | | | | | |
| Net asset value, beginning of period | $ | 12.46 | $ | 10.50 | $ | 11.85 | $ | 12.46 | $ | 8.46 | $ | 10.13 |
| Income from Investment Operations | | | | | | | | | | | | |
Net investment income (loss) A,B | | .04 | | .25 | | .34 | | .36 | | .18 | | .23 |
| Net realized and unrealized gain (loss) | | .98 | | 1.98 | | (1.14) | | .18 | | 4.51 | | (1.15) |
| Total from investment operations | | 1.02 | | 2.23 | | (.80) | | .54 | | 4.69 | | (.92) |
| Distributions from net investment income | | (.01) | | (.23) | | (.27) | | (.34) | | (.18) | | (.24) |
| Distributions from net realized gain | | (.05) | | (.04) | | (.28) | | (.81) | | (.50) | | (.51) |
| Total distributions | | (.06) | | (.27) | | (.55) | | (1.15) | | (.69) C | | (.75) |
| Net asset value, end of period | $ | 13.42 | $ | 12.46 | $ | 10.50 | $ | 11.85 | $ | 12.46 | $ | 8.46 |
Total Return D,E | | | | 21.48% | | (6.53)% | | 3.84% | | 56.58% | | (10.24)% |
Ratios to Average Net Assets B,F,G | | | | | | | | | | | | |
Expenses before reductions H | | -% I | | -% | | -% | | -% | | -% | | -% |
Expenses net of fee waivers, if any H | | | | -% | | -% | | -% | | -% | | -% |
Expenses net of all reductions H | | -% I | | -% | | -% | | -% | | -% | | -% |
| Net investment income (loss) | | .61% I | | 2.21% | | 3.38% | | 2.81% | | 1.67% | | 2.30% |
| Supplemental Data | | | | | | | | | | | | |
| Net assets, end of period (000 omitted) | $ | 20,349 | $ | 16,555 | $ | 11,142 | $ | 328 | $ | 158 | $ | 101 |
Portfolio turnover rate J | | | | 34% | | 35% | | 31% | | 19% | | 62% |
ACalculated based on average shares outstanding during the period.
BNet investment income (loss) is affected by the timing of the declaration of dividends by any underlying mutual funds or exchange-traded funds (ETFs). Net investment income (loss) of any mutual funds or ETFs is not included in the Fund's net investment income (loss) ratio.
CTotal distributions per share do not sum due to rounding.
DTotal returns for periods of less than one year are not annualized.
ETotal returns would have been lower if certain expenses had not been reduced during the applicable periods shown.
FFees and expenses of any underlying mutual funds or exchange-traded funds (ETFs) are not included in the Fund's expense ratio. The Fund indirectly bears its proportionate share of these expenses.
GExpense ratios reflect operating expenses of the class. Expenses before reductions do not reflect amounts reimbursed, waived, or reduced through arrangements with the investment adviser, brokerage services, or other offset arrangements, if applicable, and do not represent the amount paid by the class during periods when reimbursements, waivers or reductions occur.
HAmount represents less than .005%.
IAnnualized.
JAmount does not include the portfolio activity of any underlying mutual funds or exchange-traded funds (ETFs).
Fidelity Flex® Freedom Blend 2065 Fund
Schedule of Investments September 30, 2024 (Unaudited)
Showing Percentage of Net Assets
| Domestic Equity Funds - 51.0% |
| | | Shares | Value ($) |
| Fidelity Series Blue Chip Growth Fund (a) | | 60,795 | 1,107,683 |
| Fidelity Series Commodity Strategy Fund (a) | | 246 | 21,748 |
| Fidelity Series Large Cap Growth Index Fund (a) | | 30,144 | 718,023 |
| Fidelity Series Large Cap Stock Fund (a) | | 28,185 | 646,287 |
| Fidelity Series Large Cap Value Index Fund (a) | | 77,981 | 1,336,604 |
| Fidelity Series Small Cap Core Fund (a) | | 27,121 | 337,391 |
| Fidelity Series Small Cap Opportunities Fund (a) | | 12,586 | 191,186 |
| Fidelity Series Value Discovery Fund (a) | | 27,882 | 465,068 |
| TOTAL DOMESTIC EQUITY FUNDS (Cost $4,013,855) | | | 4,823,990 |
| | | | |
| International Equity Funds - 41.9% |
| | | Shares | Value ($) |
| Fidelity Series Canada Fund (a) | | 16,797 | 276,809 |
| Fidelity Series Emerging Markets Fund (a) | | 26,847 | 258,533 |
| Fidelity Series Emerging Markets Opportunities Fund (a) | | 51,863 | 1,040,887 |
| Fidelity Series International Growth Fund (a) | | 34,376 | 662,087 |
| Fidelity Series International Index Fund (a) | | 18,957 | 252,312 |
| Fidelity Series International Small Cap Fund (a) | | 7,568 | 141,984 |
| Fidelity Series International Value Fund (a) | | 49,130 | 664,243 |
| Fidelity Series Overseas Fund (a) | | 44,245 | 662,353 |
| TOTAL INTERNATIONAL EQUITY FUNDS (Cost $3,384,708) | | | 3,959,208 |
| | | | |
| Bond Funds - 7.1% |
| | | Shares | Value ($) |
| Fidelity Series 0-5 Year Inflation-Protected Bond Index Fund (a) | | 6,920 | 68,091 |
| Fidelity Series 5+ Year Inflation-Protected Bond Index Fund (a) | | 6,657 | 53,055 |
| Fidelity Series Emerging Markets Debt Fund (a) | | 1,611 | 13,166 |
| Fidelity Series Emerging Markets Debt Local Currency Fund (a) | | 398 | 3,832 |
| Fidelity Series Floating Rate High Income Fund (a) | | 1,065 | 9,552 |
| Fidelity Series International Credit Fund (a) | | 4 | 33 |
| Fidelity Series Long-Term Treasury Bond Index Fund (a) | | 88,420 | 519,023 |
| Fidelity Series Real Estate Income Fund (a) | | 937 | 9,464 |
| TOTAL BOND FUNDS (Cost $666,861) | | | 676,216 |
| | | | |
| TOTAL INVESTMENT IN SECURITIES - 100.0% (Cost $8,065,424) | 9,459,414 |
NET OTHER ASSETS (LIABILITIES) - 0.0% | (28) |
| NET ASSETS - 100.0% | 9,459,386 |
| | |
Legend
Affiliated Underlying Funds
Fiscal year to date information regarding the Fund's investments in affiliated Underlying Funds is presented below. Exchanges between classes of the same affiliated Underlying Funds may occur. If an Underlying Funds changes its name, the name presented below is the name in effect at period end.
| Affiliate | Value, beginning of period ($) | Purchases ($) | Sales Proceeds ($) | Dividend Income ($) | Realized Gain (loss) ($) | Change in Unrealized appreciation (depreciation) ($) | Value, end of period ($) |
| Fidelity Series 0-5 Year Inflation-Protected Bond Index Fund | 3,167 | 64,205 | 157 | 35 | - | 876 | 68,091 |
| Fidelity Series 5+ Year Inflation-Protected Bond Index Fund | 35,640 | 15,981 | 873 | 467 | 13 | 2,294 | 53,055 |
| Fidelity Series Blue Chip Growth Fund | 755,059 | 430,939 | 81,126 | 90,572 | 220 | 2,591 | 1,107,683 |
| Fidelity Series Canada Fund | 177,141 | 86,529 | 5,302 | - | (118) | 18,559 | 276,809 |
| Fidelity Series Commodity Strategy Fund | 44,989 | 31,992 | 52,237 | 1,960 | (3,936) | 940 | 21,748 |
| Fidelity Series Corporate Bond Fund | 2,333 | 3,708 | 6,038 | 21 | 166 | (169) | - |
| Fidelity Series Emerging Markets Debt Fund | 8,704 | 4,135 | 163 | 251 | 2 | 488 | 13,166 |
| Fidelity Series Emerging Markets Debt Local Currency Fund | 2,749 | 1,020 | 187 | - | 2 | 248 | 3,832 |
| Fidelity Series Emerging Markets Fund | 160,548 | 84,440 | 7,014 | - | 234 | 20,325 | 258,533 |
| Fidelity Series Emerging Markets Opportunities Fund | 644,345 | 335,915 | 42,927 | - | 1,579 | 101,975 | 1,040,887 |
| Fidelity Series Floating Rate High Income Fund | 6,388 | 3,439 | 212 | 354 | - | (63) | 9,552 |
| Fidelity Series Government Bond Index Fund | 3,411 | 6,551 | 9,928 | 23 | 94 | (128) | - |
| Fidelity Series Government Money Market Fund 5.03% | 4,759 | 306 | 5,065 | 26 | - | - | - |
| Fidelity Series International Credit Fund | 31 | 1 | - | 1 | - | 1 | 33 |
| Fidelity Series International Growth Fund | 444,505 | 211,653 | 18,046 | - | (72) | 24,047 | 662,087 |
| Fidelity Series International Index Fund | 168,287 | 75,559 | 7,011 | - | (50) | 15,527 | 252,312 |
| Fidelity Series International Small Cap Fund | 94,807 | 45,663 | 8,023 | - | 448 | 9,089 | 141,984 |
| Fidelity Series International Value Fund | 446,613 | 203,947 | 28,512 | - | (201) | 42,396 | 664,243 |
| Fidelity Series Investment Grade Bond Fund | 3,433 | 6,295 | 9,701 | 29 | 160 | (187) | - |
| Fidelity Series Investment Grade Securitized Fund | 2,264 | 3,639 | 5,883 | 19 | 122 | (142) | - |
| Fidelity Series Large Cap Growth Index Fund | 478,324 | 222,497 | 50,839 | 970 | 654 | 67,387 | 718,023 |
| Fidelity Series Large Cap Stock Fund | 506,770 | 216,204 | 107,831 | 29,888 | 2,271 | 28,873 | 646,287 |
| Fidelity Series Large Cap Value Index Fund | 905,881 | 408,279 | 67,840 | - | 795 | 89,489 | 1,336,604 |
| Fidelity Series Long-Term Treasury Bond Index Fund | 421,280 | 169,398 | 93,327 | 7,866 | (1,807) | 23,479 | 519,023 |
| Fidelity Series Overseas Fund | 445,539 | 195,012 | 16,455 | - | (252) | 38,509 | 662,353 |
| Fidelity Series Real Estate Income Fund | 6,186 | 2,967 | 44 | 244 | 1 | 354 | 9,464 |
| Fidelity Series Small Cap Core Fund | 8,867 | 328,906 | 14,722 | 187 | (215) | 14,555 | 337,391 |
| Fidelity Series Small Cap Opportunities Fund | 224,069 | 72,219 | 103,477 | 13,579 | 7,542 | (9,167) | 191,186 |
| Fidelity Series Treasury Bill Index Fund | 11,097 | 848 | 11,945 | 56 | - | - | - |
| Fidelity Series Value Discovery Fund | 334,573 | 147,048 | 42,424 | - | 1,483 | 24,388 | 465,068 |
| | 6,351,759 | 3,379,295 | 797,309 | 146,548 | 9,135 | 516,534 | 9,459,414 |
Amounts in the dividend income column in the above table include any capital gain distributions from underlying funds, which are presented in the corresponding line item in the Statement of Operations, if applicable.
Amounts included in the purchases and sales proceeds columns may include in-kind transactions, if applicable.
Investment Valuation
The following is a summary of the inputs used, as of September 30, 2024, involving the Fund's assets and liabilities carried at fair value. The inputs or methodology used for valuing securities may not be an indication of the risk associated with investing in those securities. For more information on valuation inputs, and their aggregation into the levels used below, please refer to the Investment Valuation section in the accompanying Notes to Financial Statements.
| Valuation Inputs at Reporting Date: |
| Description | Total ($) | Level 1 ($) | Level 2 ($) | Level 3 ($) |
Investments in Securities: | | | | |
|
| Domestic Equity Funds | 4,823,990 | 4,823,990 | - | - |
|
| International Equity Funds | 3,959,208 | 3,959,208 | - | - |
|
| Bond Funds | 676,216 | 676,216 | - | - |
| Total Investments in Securities: | 9,459,414 | 9,459,414 | - | - |
Fidelity Flex® Freedom Blend 2065 Fund
Financial Statements (Unaudited)
| Statement of Assets and Liabilities |
| As of September 30, 2024 (Unaudited) |
| Assets | | | | |
| Investment in securities, at value - See accompanying schedule: | | | | |
Affiliated issuers (cost $8,065,424) | $ | 9,459,414 | | |
| | | | | |
| | | | | |
| Total Investment in Securities (cost $8,065,424) | | | $ | 9,459,414 |
| Receivable for investments sold | | | | 28,654 |
| Receivable for fund shares sold | | | | 24,998 |
Total assets | | | | 9,513,066 |
| Liabilities | | | | |
| Payable for investments purchased | $ | 50,577 | | |
| Payable for fund shares redeemed | | 3,103 | | |
| Total liabilities | | | | 53,680 |
| Net Assets | | | $ | 9,459,386 |
| Net Assets consist of: | | | | |
| Paid in capital | | | $ | 7,951,673 |
| Total accumulated earnings (loss) | | | | 1,507,713 |
| Net Assets | | | $ | 9,459,386 |
Net Asset Value, offering price and redemption price per share ($9,459,386 ÷ 697,949 shares) | | | $ | 13.55 |
| Statement of Operations |
Six months ended September 30, 2024 (Unaudited) |
| Investment Income | | | | |
| Dividends: | | | | |
| Affiliated issuers | | | $ | 24,322 |
| Expenses | | | | |
| Independent trustees' fees and expenses | $ | 9 | | |
| Total expenses before reductions | | 9 | | |
| Expense reductions | | (1) | | |
| Total expenses after reductions | | | | 8 |
| Net Investment income (loss) | | | | 24,314 |
| Realized and Unrealized Gain (Loss) | | | | |
| Net realized gain (loss) on: | | | | |
| Investment Securities: | | | | |
| Affiliated issuers | | 9,135 | | |
| Capital gain distributions from underlying funds: | | | | |
| Affiliated issuers | | 122,226 | | |
| Total net realized gain (loss) | | | | 131,361 |
| Change in net unrealized appreciation (depreciation) on: | | | | |
| Investment Securities: | | | | |
| Affiliated issuers | | 516,534 | | |
| Total change in net unrealized appreciation (depreciation) | | | | 516,534 |
| Net gain (loss) | | | | 647,895 |
| Net increase (decrease) in net assets resulting from operations | | | $ | 672,209 |
| Statement of Changes in Net Assets |
| |
| | Six months ended September 30, 2024 (Unaudited) | | Year ended March 31, 2024 |
| Increase (Decrease) in Net Assets | | | | |
| Operations | | | | |
| Net investment income (loss) | $ | 24,314 | $ | 98,134 |
| Net realized gain (loss) | | 131,361 | | 34,642 |
| Change in net unrealized appreciation (depreciation) | | 516,534 | | 808,073 |
| Net increase (decrease) in net assets resulting from operations | | 672,209 | | 940,849 |
| Distributions to shareholders | | (24,222) | | (108,724) |
| | | | | |
| Share transactions | | | | |
| Proceeds from sales of shares | | 3,018,268 | | 3,983,396 |
| Reinvestment of distributions | | 24,222 | | 108,724 |
| Cost of shares redeemed | | (582,823) | | (1,320,608) |
| | | | | |
Net increase (decrease) in net assets resulting from share transactions | | 2,459,667 | | 2,771,512 |
| Total increase (decrease) in net assets | | 3,107,654 | | 3,603,637 |
| | | | | |
| Net Assets | | | | |
| Beginning of period | | 6,351,732 | | 2,748,095 |
| End of period | $ | 9,459,386 | $ | 6,351,732 |
| | | | | |
| Other Information | | | | |
| Shares | | | | |
| Sold | | 236,243 | | 353,385 |
| Issued in reinvestment of distributions | | 1,933 | | 9,361 |
| Redeemed | | (45,770) | | (117,103) |
| Net increase (decrease) | | 192,406 | | 245,643 |
| | | | | |
Financial Highlights
Fidelity Flex® Freedom Blend 2065 Fund |
| |
| | Six months ended (Unaudited) September 30, 2024 | | Years ended March 31, 2024 | | 2023 | | 2022 | | 2021 | | 2020 A |
Selected Per-Share Data | | | | | | | | | | | | |
| Net asset value, beginning of period | $ | 12.56 | $ | 10.57 | $ | 11.92 | $ | 12.47 | $ | 8.42 | $ | 10.00 |
| Income from Investment Operations | | | | | | | | | | | | |
Net investment income (loss) B,C | | .04 | | .26 | | .33 | | .35 | | .18 | | .22 |
| Net realized and unrealized gain (loss) | | 1.00 | | 1.99 | | (1.15) | | .19 | | 4.51 | | (1.46) |
| Total from investment operations | | 1.04 | | 2.25 | | (.82) | | .54 | | 4.69 | | (1.24) |
| Distributions from net investment income | | (.01) | | (.22) | | (.25) | | (.32) | | (.18) | | (.22) |
| Distributions from net realized gain | | (.03) | | (.04) | | (.28) | | (.76) | | (.45) | | (.12) |
| Total distributions | | (.05) D | | (.26) | | (.53) | | (1.09) D | | (.64) D | | (.34) |
| Net asset value, end of period | $ | 13.55 | $ | 12.56 | $ | 10.57 | $ | 11.92 | $ | 12.47 | $ | 8.42 |
Total Return E,F | | | | 21.49% | | (6.62)% | | 3.86% | | 56.66% | | (13.10)% |
Ratios to Average Net Assets C,G,H | | | | | | | | | | | | |
| Expenses before reductions | | -% I,J | | .01% | | -% I | | -% I | | -% I | | -% I,J |
Expenses net of fee waivers, if any I | | | | -% | | -% | | -% | | -% | | -% J |
Expenses net of all reductions I | | -% J | | -% | | -% | | -% | | -% | | -% J |
| Net investment income (loss) | | .63% J | | 2.29% | | 3.24% | | 2.78% | | 1.67% | | 2.88% J |
| Supplemental Data | | | | | | | | | | | | |
| Net assets, end of period (000 omitted) | $ | 9,459 | $ | 6,352 | $ | 2,748 | $ | 301 | $ | 136 | $ | 87 |
Portfolio turnover rate K | | | | 24% | | 34% | | 31% | | 19% | | 208% J |
AFor the period June 28, 2019 (commencement of operations) through March 31, 2020.
BCalculated based on average shares outstanding during the period.
CNet investment income (loss) is affected by the timing of the declaration of dividends by any underlying mutual funds or exchange-traded funds (ETFs). Net investment income (loss) of any mutual funds or ETFs is not included in the Fund's net investment income (loss) ratio.
DTotal distributions per share do not sum due to rounding.
ETotal returns for periods of less than one year are not annualized.
FTotal returns would have been lower if certain expenses had not been reduced during the applicable periods shown.
GFees and expenses of any underlying mutual funds or exchange-traded funds (ETFs) are not included in the Fund's expense ratio. The Fund indirectly bears its proportionate share of these expenses.
HExpense ratios reflect operating expenses of the class. Expenses before reductions do not reflect amounts reimbursed, waived, or reduced through arrangements with the investment adviser, brokerage services, or other offset arrangements, if applicable, and do not represent the amount paid by the class during periods when reimbursements, waivers or reductions occur.
IAmount represents less than .005%.
JAnnualized.
KAmount does not include the portfolio activity of any underlying mutual funds or exchange-traded funds (ETFs).
Fidelity Flex® Freedom Blend 2070 Fund
Schedule of Investments September 30, 2024 (Unaudited)
Showing Percentage of Net Assets
| Domestic Equity Funds - 51.0% |
| | | Shares | Value ($) |
| Fidelity Series Blue Chip Growth Fund (a) | | 13,075 | 238,222 |
| Fidelity Series Commodity Strategy Fund (a) | | 53 | 4,676 |
| Fidelity Series Large Cap Growth Index Fund (a) | | 6,483 | 154,414 |
| Fidelity Series Large Cap Stock Fund (a) | | 6,062 | 139,008 |
| Fidelity Series Large Cap Value Index Fund (a) | | 16,763 | 287,309 |
| Fidelity Series Small Cap Core Fund (a) | | 5,879 | 73,132 |
| Fidelity Series Small Cap Opportunities Fund (a) | | 2,675 | 40,633 |
| Fidelity Series Value Discovery Fund (a) | | 5,999 | 100,067 |
| TOTAL DOMESTIC EQUITY FUNDS (Cost $1,014,322) | | | 1,037,461 |
| | | | |
| International Equity Funds - 41.9% |
| | | Shares | Value ($) |
| Fidelity Series Canada Fund (a) | | 3,613 | 59,536 |
| Fidelity Series Emerging Markets Fund (a) | | 5,776 | 55,623 |
| Fidelity Series Emerging Markets Opportunities Fund (a) | | 11,157 | 223,917 |
| Fidelity Series International Growth Fund (a) | | 7,395 | 142,433 |
| Fidelity Series International Index Fund (a) | | 4,078 | 54,276 |
| Fidelity Series International Small Cap Fund (a) | | 1,628 | 30,539 |
| Fidelity Series International Value Fund (a) | | 10,569 | 142,886 |
| Fidelity Series Overseas Fund (a) | | 9,518 | 142,488 |
| TOTAL INTERNATIONAL EQUITY FUNDS (Cost $809,676) | | | 851,698 |
| | | | |
| Bond Funds - 7.1% |
| | | Shares | Value ($) |
| Fidelity Series 0-5 Year Inflation-Protected Bond Index Fund (a) | | 1,488 | 14,646 |
| Fidelity Series 5+ Year Inflation-Protected Bond Index Fund (a) | | 1,432 | 11,411 |
| Fidelity Series Emerging Markets Debt Fund (a) | | 353 | 2,881 |
| Fidelity Series Emerging Markets Debt Local Currency Fund (a) | | 82 | 790 |
| Fidelity Series Floating Rate High Income Fund (a) | | 229 | 2,053 |
| Fidelity Series Long-Term Treasury Bond Index Fund (a) | | 19,015 | 111,616 |
| Fidelity Series Real Estate Income Fund (a) | | 202 | 2,036 |
| TOTAL BOND FUNDS (Cost $142,184) | | | 145,433 |
| | | | |
| TOTAL INVESTMENT IN SECURITIES - 100.0% (Cost $1,966,182) | 2,034,592 |
NET OTHER ASSETS (LIABILITIES) - 0.0% | 0 |
| NET ASSETS - 100.0% | 2,034,592 |
| | |
Legend
Affiliated Central Funds
Fiscal year to date information regarding the Fund's investments in Fidelity Central Funds, including the ownership percentage, is presented below.
| Affiliate | Value, beginning of period ($) | Purchases ($) | Sales Proceeds ($) | Dividend Income ($) | Realized Gain (loss) ($) | Change in Unrealized appreciation (depreciation) ($) | Value, end of period ($) | % ownership, end of period |
| Fidelity Cash Central Fund 4.89% | - | 500,000 | 500,000 | 221 | - | - | - | 0.0% |
| Total | - | 500,000 | 500,000 | 221 | - | - | - | |
| | | | | | | | | |
Amounts in the dividend income column in the above table include any capital gain distributions from underlying funds, which are presented in the corresponding line item in the Statement of Operations, if applicable.
Amounts included in the purchases and sales proceeds columns may include in-kind transactions, if applicable.
Affiliated Underlying Funds
Fiscal year to date information regarding the Fund's investments in affiliated Underlying Funds is presented below. Exchanges between classes of the same affiliated Underlying Funds may occur. If an Underlying Funds changes its name, the name presented below is the name in effect at period end.
| Affiliate | Value, beginning of period ($) | Purchases ($) | Sales Proceeds ($) | Dividend Income ($) | Realized Gain (loss) ($) | Change in Unrealized appreciation (depreciation) ($) | Value, end of period ($) |
| Fidelity Series 0-5 Year Inflation-Protected Bond Index Fund | - | 14,994 | 492 | 2 | 1 | 143 | 14,646 |
| Fidelity Series 5+ Year Inflation-Protected Bond Index Fund | - | 11,533 | 382 | 29 | - | 260 | 11,411 |
| Fidelity Series Blue Chip Growth Fund | - | 255,206 | 7,821 | 16,632 | (620) | (8,543) | 238,222 |
| Fidelity Series Canada Fund | - | 58,425 | 1,968 | - | (11) | 3,090 | 59,536 |
| Fidelity Series Commodity Strategy Fund | - | 10,109 | 5,044 | 361 | (152) | (237) | 4,676 |
| Fidelity Series Corporate Bond Fund | - | 345 | 348 | 1 | 3 | - | - |
| Fidelity Series Emerging Markets Debt Fund | - | 2,904 | 98 | 12 | - | 75 | 2,881 |
| Fidelity Series Emerging Markets Debt Local Currency Fund | - | 796 | 45 | - | - | 39 | 790 |
| Fidelity Series Emerging Markets Fund | - | 54,772 | 1,828 | - | (35) | 2,714 | 55,623 |
| Fidelity Series Emerging Markets Opportunities Fund | - | 217,042 | 7,487 | - | (115) | 14,477 | 223,917 |
| Fidelity Series Floating Rate High Income Fund | - | 2,120 | 68 | 27 | - | 1 | 2,053 |
| Fidelity Series Government Bond Index Fund | - | 633 | 633 | 1 | - | - | - |
| Fidelity Series International Growth Fund | - | 141,913 | 4,791 | - | (69) | 5,380 | 142,433 |
| Fidelity Series International Index Fund | - | 53,544 | 1,814 | - | (21) | 2,567 | 54,276 |
| Fidelity Series International Small Cap Fund | - | 30,395 | 1,483 | - | (12) | 1,639 | 30,539 |
| Fidelity Series International Value Fund | - | 141,519 | 4,791 | - | (70) | 6,228 | 142,886 |
| Fidelity Series Investment Grade Bond Fund | - | 606 | 608 | 2 | 2 | - | - |
| Fidelity Series Investment Grade Securitized Fund | - | 338 | 340 | 1 | 2 | - | - |
| Fidelity Series Large Cap Growth Index Fund | - | 153,610 | 5,068 | - | (106) | 5,978 | 154,414 |
| Fidelity Series Large Cap Stock Fund | - | 146,308 | 10,359 | 3,153 | (218) | 3,277 | 139,008 |
| Fidelity Series Large Cap Value Index Fund | - | 282,169 | 10,239 | - | (59) | 15,438 | 287,309 |
| Fidelity Series Long-Term Treasury Bond Index Fund | - | 113,279 | 4,325 | 562 | (31) | 2,693 | 111,616 |
| Fidelity Series Overseas Fund | - | 141,427 | 4,787 | - | (77) | 5,925 | 142,488 |
| Fidelity Series Real Estate Income Fund | - | 2,065 | 68 | 24 | - | 39 | 2,036 |
| Fidelity Series Small Cap Core Fund | - | 72,780 | 2,199 | - | (74) | 2,625 | 73,132 |
| Fidelity Series Small Cap Opportunities Fund | - | 42,378 | 1,357 | 2,476 | (86) | (302) | 40,633 |
| Fidelity Series Value Discovery Fund | - | 99,223 | 4,062 | - | 2 | 4,904 | 100,067 |
| | - | 2,050,433 | 82,505 | 23,283 | (1,746) | 68,410 | 2,034,592 |
Amounts in the dividend income column in the above table include any capital gain distributions from underlying funds, which are presented in the corresponding line item in the Statement of Operations, if applicable.
Amounts included in the purchases and sales proceeds columns may include in-kind transactions, if applicable.
Investment Valuation
The following is a summary of the inputs used, as of September 30, 2024, involving the Fund's assets and liabilities carried at fair value. The inputs or methodology used for valuing securities may not be an indication of the risk associated with investing in those securities. For more information on valuation inputs, and their aggregation into the levels used below, please refer to the Investment Valuation section in the accompanying Notes to Financial Statements.
| Valuation Inputs at Reporting Date: |
| Description | Total ($) | Level 1 ($) | Level 2 ($) | Level 3 ($) |
Investments in Securities: | | | | |
|
| Domestic Equity Funds | 1,037,461 | 1,037,461 | - | - |
|
| International Equity Funds | 851,698 | 851,698 | - | - |
|
| Bond Funds | 145,433 | 145,433 | - | - |
| Total Investments in Securities: | 2,034,592 | 2,034,592 | - | - |
Fidelity Flex® Freedom Blend 2070 Fund
Financial Statements (Unaudited)
| Statement of Assets and Liabilities |
| As of September 30, 2024 (Unaudited) |
| Assets | | | | |
| Investment in securities, at value - See accompanying schedule: | | | | |
Affiliated issuers (cost $1,966,182) | $ | 2,034,592 | | |
| | | | | |
| | | | | |
| Total Investment in Securities (cost $1,966,182) | | | $ | 2,034,592 |
| Receivable for investments sold | | | | 6 |
| Receivable for fund shares sold | | | | 54,712 |
Total assets | | | | 2,089,310 |
| Liabilities | | | | |
| Payable for investments purchased | $ | 51,987 | | |
| Payable for fund shares redeemed | | 2,731 | | |
| Total liabilities | | | | 54,718 |
| Net Assets | | | $ | 2,034,592 |
| Net Assets consist of: | | | | |
| Paid in capital | | | $ | 1,944,424 |
| Total accumulated earnings (loss) | | | | 90,168 |
| Net Assets | | | $ | 2,034,592 |
Net Asset Value, offering price and redemption price per share ($2,034,592 ÷ 191,596 shares) | | | $ | 10.62 |
| Statement of Operations |
For the period June 28, 2024 (commencement of operations) through September 30, 2024 (Unaudited)
|
| Investment Income | | | | |
| Dividends: | | | | |
| Affiliated issuers | | | $ | 2,831 |
| Income from Fidelity Central Funds | | | | 221 |
| Total income | | | | 3,052 |
| Net Investment income (loss) | | | | 3,052 |
| Realized and Unrealized Gain (Loss) | | | | |
| Net realized gain (loss) on: | | | | |
| Investment Securities: | | | | |
| Affiliated issuers | | (1,746) | | |
| Capital gain distributions from underlying funds: | | | | |
| Affiliated issuers | | 20,452 | | |
| Total net realized gain (loss) | | | | 18,706 |
| Change in net unrealized appreciation (depreciation) on: | | | | |
| Investment Securities: | | | | |
| Affiliated issuers | | 68,410 | | |
| Total change in net unrealized appreciation (depreciation) | | | | 68,410 |
| Net gain (loss) | | | | 87,116 |
| Net increase (decrease) in net assets resulting from operations | | | $ | 90,168 |
| Statement of Changes in Net Assets |
| |
| | For the period June 28, 2024 (commencement of operations) through September 30, 2024 (Unaudited) |
| Increase (Decrease) in Net Assets | | |
| Operations | | |
| Net investment income (loss) | $ | 3,052 |
| Net realized gain (loss) | | 18,706 |
| Change in net unrealized appreciation (depreciation) | | 68,410 |
| Net increase (decrease) in net assets resulting from operations | | 90,168 |
| | | |
| Share transactions | | |
| Proceeds from sales of shares | | 2,105,231 |
| Cost of shares redeemed | | (160,807) |
| | | |
Net increase (decrease) in net assets resulting from share transactions | | 1,944,424 |
| Total increase (decrease) in net assets | | 2,034,592 |
| | | |
| Net Assets | | |
| Beginning of period | | - |
| End of period | $ | 2,034,592 |
| | | |
| Other Information | | |
| Shares | | |
| Sold | | 207,244 |
| Redeemed | | (15,648) |
| Net increase (decrease) | | 191,596 |
| | | |
Financial Highlights
Fidelity Flex® Freedom Blend 2070 Fund |
| |
| | Six months ended (Unaudited) September 30, 2024 A |
Selected Per-Share Data | | |
| Net asset value, beginning of period | $ | 10.00 |
| Income from Investment Operations | | |
Net investment income (loss) B,C | | .03 |
| Net realized and unrealized gain (loss) | | .59 |
| Total from investment operations | | .62 |
| Net asset value, end of period | $ | 10.62 |
Total Return D | | |
Ratios to Average Net Assets C,E,F | | |
| Expenses before reductions | | -% G |
| Expenses net of fee waivers, if any | | |
| Expenses net of all reductions | | -% G |
| Net investment income (loss) | | 1.06% G |
| Supplemental Data | | |
| Net assets, end of period (000 omitted) | $ | 2,035 |
Portfolio turnover rate H | | |
AFor the period June 28, 2024 (commencement of operations) through September 30, 2024.
BCalculated based on average shares outstanding during the period.
CNet investment income (loss) is affected by the timing of the declaration of dividends by any underlying mutual funds or exchange-traded funds (ETFs). Net investment income (loss) of any mutual funds or ETFs is not included in the Fund's net investment income (loss) ratio.
DTotal returns for periods of less than one year are not annualized.
EFees and expenses of any underlying mutual funds or exchange-traded funds (ETFs) are not included in the Fund's expense ratio. The Fund indirectly bears its proportionate share of these expenses. For additional expense information related to investments in Fidelity Central Funds, please refer to the "Investments in Fidelity Central Funds" note found in the Notes to Financial Statements section of the most recent Annual or Semi-Annual report.
FExpense ratios reflect operating expenses of the class. Expenses before reductions do not reflect amounts reimbursed, waived, or reduced through arrangements with the investment adviser, brokerage services, or other offset arrangements, if applicable, and do not represent the amount paid by the class during periods when reimbursements, waivers or reductions occur.
GAnnualized.
HAmount does not include the portfolio activity of any underlying mutual funds or exchange-traded funds (ETFs).
IAmount not annualized.
Notes to Financial Statements
(Unaudited)For the period ended September 30, 2024
1. Organization.
Fidelity Flex Freedom Blend Income Fund, Fidelity Flex Freedom Blend 2010 Fund, Fidelity Flex Freedom Blend 2015 Fund, Fidelity Flex Freedom Blend 2020 Fund, Fidelity Flex Freedom Blend 2025 Fund, Fidelity Flex Freedom Blend 2030 Fund, Fidelity Flex Freedom Blend 2035 Fund, Fidelity Flex Freedom Blend 2040 Fund, Fidelity Flex Freedom Blend 2045 Fund, Fidelity Flex Freedom Blend 2050 Fund, Fidelity Flex Freedom Blend 2055 Fund, Fidelity Flex Freedom Blend 2060 Fund, Fidelity Flex Freedom Blend 2065 Fund and Fidelity Flex Freedom Blend 2070 Fund (the Funds) are funds of Fidelity Aberdeen Street Trust (the Trust). The Trust is registered under the Investment Company Act of 1940, as amended (the 1940 Act), as an open-end management investment company organized as a Delaware statutory trust. Each Fund is authorized to issue an unlimited number of shares. The Funds are available only to certain fee-based accounts and advisory programs offered by Fidelity. Share transactions on the Statement of Changes in Net Assets may contain exchanges between affiliated funds.
2. Investments in Fidelity Central Funds.
Funds may invest in Fidelity Central Funds, which are open-end investment companies generally available only to other investment companies and accounts managed by the investment adviser and its affiliates. The Schedule of Investments lists any Fidelity Central Funds held as an investment as of period end, but does not include the underlying holdings of each Fidelity Central Fund. An investing fund indirectly bears its proportionate share of the expenses of the underlying Fidelity Central Funds.
Based on its investment objective, each Fidelity Central Fund may invest or participate in various investment vehicles or strategies that are similar to those of the investing fund. These strategies are consistent with the investment objectives of the investing fund and may involve certain economic risks which may cause a decline in value of each of the Fidelity Central Funds and thus a decline in the value of the investing fund.
| Fidelity Central Fund | Investment Manager | Investment Objective | Investment Practices | Expense RatioA |
| Fidelity Money Market Central Funds | Fidelity Management & Research Company LLC (FMR) | Each fund seeks to obtain a high level of current income consistent with the preservation of capital and liquidity. | Short-term Investments | Less than .005% |
A Expenses expressed as a percentage of average net assets and are as of each underlying Central Fund's most recent annual or semi-annual shareholder report.
A complete unaudited list of holdings for each Fidelity Central Fund is available upon request or at the Securities and Exchange Commission website at www.sec.gov. In addition, the financial statements of the Fidelity Central Funds which contain the significant accounting policies (including investment valuation policies) of those funds, and are not covered by the Report of Independent Registered Public Accounting Firm, are available on the Securities and Exchange Commission website or upon request.
3. Significant Accounting Policies.
Each Fund is an investment company and applies the accounting and reporting guidance of the Financial Accounting Standards Board (FASB) Accounting Standards Codification Topic 946 Financial Services - Investment Companies. The financial statements have been prepared in conformity with accounting principles generally accepted in the United States of America (GAAP), which require management to make certain estimates and assumptions at the date of the financial statements. Actual results could differ from those estimates. Subsequent events, if any, through the date that the financial statements were issued have been evaluated in the preparation of the financial statements. Each Fund's Schedule of Investments lists any underlying mutual funds or exchange-traded funds (ETFs) but does not include the underlying holdings of these funds. The following summarizes the significant accounting policies of each Fund:
Investment Valuation. Investments are valued as of 4:00 p.m. Eastern time on the last calendar day of the period. The Board of Trustees (the Board) has designated each Fund's investment adviser as the valuation designee responsible for the fair valuation function and performing fair value determinations as needed. The investment adviser has established a Fair Value Committee (the Committee) to carry out the day-to-day fair valuation responsibilities and has adopted policies and procedures to govern the fair valuation process and the activities of the Committee. In accordance with these fair valuation policies and procedures, which have been approved by the Board, each Fund attempts to obtain prices from one or more third party pricing services or brokers to value its investments. When current market prices, quotations or currency exchange rates are not readily available or reliable, investments will be fair valued in good faith by the Committee, in accordance with the policies and procedures. Factors used in determining fair value vary by investment type and may include market or investment specific events, transaction data, estimated cash flows, and market observations of comparable investments. The frequency that the fair valuation procedures are used cannot be predicted and they may be utilized to a significant extent. The Committee manages each Fund's fair valuation practices and maintains the fair valuation policies and procedures. Each Fund's investment adviser reports to the Board information regarding the fair valuation process and related material matters. Each Fund categorizes the inputs to valuation techniques used to value its investments into a disclosure hierarchy consisting of three levels as shown below:
Level 1 - unadjusted quoted prices in active markets for identical investments
Level 2 - other significant observable inputs (including quoted prices for similar investments, interest rates, prepayment speeds, etc.)
Level 3 - unobservable inputs (including the Fund's own assumptions based on the best information available)
Valuation techniques used to value each Fund's investments by major category are as follows:
Investments in open-end mutual funds, including the Fidelity Central Funds, are valued at their closing net asset value (NAV) each business day and are categorized as Level 1 in the hierarchy.
Debt securities, including restricted securities, are valued based on evaluated prices received from third party pricing services or from brokers who make markets in such securities. U.S. government and government agency obligations are valued by pricing services who utilize matrix pricing which considers yield or price of bonds of comparable quality, coupon, maturity and type or by broker-supplied prices. When independent prices are unavailable or unreliable, debt securities may be valued utilizing pricing methodologies which consider similar factors that would be used by third party pricing services. Debt securities are generally categorized as Level 2 in the hierarchy but may be Level 3 depending on the circumstances.
Futures contracts are valued at the settlement price established each day by the board of trade or exchange on which they are traded and are categorized as Level 1 in the hierarchy.
Changes in valuation techniques may result in transfers in or out of an assigned level within the disclosure hierarchy. The aggregate value of investments by input level as of September 30, 2024 is included at the end of each Fund's Schedule of Investments.
Investment Transactions and Income. For financial reporting purposes, the Funds' investment holdings and NAV include trades executed through the end of the last business day of the period. The NAV per share for processing shareholder transactions is calculated as of the close of business of the New York Stock Exchange (NYSE), normally 4:00 p.m. Eastern time and includes trades executed through the end of the prior business day. Gains and losses on securities sold are determined on the basis of identified cost. Income and capital gain distributions from any underlying mutual funds or exchange-traded funds (ETFs) are recorded on the ex-dividend date. Distributions from any underlying mutual funds or exchange-traded funds (ETFs) that are deemed to be return of capital are recorded as a reduction of cost of investments. Interest income is accrued as earned. Interest income includes coupon interest and amortization of premium and accretion of discount on debt securities as applicable.
Expenses. Expenses directly attributable to a fund are charged to that fund. Expenses attributable to more than one fund are allocated among the respective funds on the basis of relative net assets or other appropriate methods. Expenses included in the accompanying financial statements reflect the expenses of that fund and do not include any expenses associated with any underlying mutual funds or exchange-traded funds. Although not included in a fund's expenses, a fund indirectly bears its proportionate share of these expenses through the net asset value of each underlying mutual fund or exchange-traded fund. Expense estimates are accrued in the period to which they relate and adjustments are made when actual amounts are known.
Income Tax Information and Distributions to Shareholders. Each year, each Fund intends to qualify as a regulated investment company under Subchapter M of the Internal Revenue Code, including distributing substantially all of its taxable income and realized gains. As a result, no provision for U.S. Federal income taxes is required. Each Fund files a U.S. federal tax return, in addition to state and local tax returns as required. Each Fund's federal income tax returns are subject to examination by the Internal Revenue Service (IRS) for a period of three fiscal years after they are filed. State and local tax returns may be subject to examination for an additional fiscal year depending on the jurisdiction.
Distributions are declared and recorded on the ex-dividend date. Income and capital gain distributions are determined in accordance with income tax regulations, which may differ from GAAP.
Capital accounts within the financial statements are adjusted for permanent book-tax differences. These adjustments have no impact on net assets or the results of operations. Capital accounts are not adjusted for temporary book-tax differences which will reverse in a subsequent period.
Book-tax differences are primarily due to the short-term gain distributions from the underlying mutual funds or exchange-traded funds (ETFs), futures contracts, capital loss carryforwards and losses deferred due to wash sales and excise tax regulations.
As of period end, the cost and unrealized appreciation (depreciation) in securities, and derivatives if applicable, for federal income tax purposes were as follows for each Fund:
| | Tax cost ($) | Gross unrealized appreciation ($) | Gross unrealized depreciation ($) | Net unrealized appreciation (depreciation)($) |
Fidelity Flex Freedom Blend Income Fund | 3,658,637 | 217,070 | (30,118) | 186,952 |
| Fidelity Flex Freedom Blend 2010 Fund | 2,465,778 | 195,981 | (23,186) | 172,795 |
| Fidelity Flex Freedom Blend 2015 Fund | 9,869,348 | 989,482 | (136,721) | 852,761 |
| Fidelity Flex Freedom Blend 2020 Fund | 27,542,041 | 3,429,390 | (516,067) | 2,913,323 |
| Fidelity Flex Freedom Blend 2025 Fund | 43,007,133 | 6,377,424 | (833,840) | 5,543,584 |
| Fidelity Flex Freedom Blend 2030 Fund | 68,535,279 | 11,559,753 | (885,519) | 10,674,234 |
| Fidelity Flex Freedom Blend 2035 Fund | 70,780,066 | 14,399,673 | (574,989) | 13,824,684 |
| Fidelity Flex Freedom Blend 2040 Fund | 55,930,579 | 13,966,606 | (426,872) | 13,539,734 |
| Fidelity Flex Freedom Blend 2045 Fund | 60,413,453 | 14,676,099 | (424,802) | 14,251,297 |
| Fidelity Flex Freedom Blend 2050 Fund | 44,415,638 | 11,025,092 | (301,875) | 10,723,217 |
| Fidelity Flex Freedom Blend 2055 Fund | 31,419,566 | 7,226,568 | (214,903) | 7,011,665 |
| Fidelity Flex Freedom Blend 2060 Fund | 16,750,524 | 3,700,203 | (101,582) | 3,598,621 |
| Fidelity Flex Freedom Blend 2065 Fund | 8,092,366 | 1,405,539 | (38,491) | 1,367,048 |
| Fidelity Flex Freedom Blend 2070 Fund | 1,968,049 | 78,953 | (12,410) | 66,543 |
Capital loss carryforwards are only available to offset future capital gains of the Funds to the extent provided by regulations and may be limited. The capital loss carryforward information presented below, including any applicable limitation, is estimated as of prior fiscal period end and is subject to adjustment.
| | Short-term ($) | Long-term ($) | Total capital loss carryforward ($) |
Fidelity Flex Freedom Blend Income Fund | (118,931) | (18,078) | (137,009) |
| Fidelity Flex Freedom Blend 2010 Fund | (103,396) | - | (103,396) |
| Fidelity Flex Freedom Blend 2015 Fund | (285,033) | - | (285,033) |
| Fidelity Flex Freedom Blend 2020 Fund | (485,439) | - | (485,439) |
Due to large redemptions in a prior period, approximately $52,087 of Fidelity Flex Freedom Blend Income Fund's realized capital losses are subject to limitation. Due to this limitation, the Fund will only be permitted to use approximately $23,704 of those capital losses per year to offset capital gains.
4. Derivative Instruments.
Risk Exposures and the Use of Derivative Instruments. Each Fund's investment objectives allow for various types of derivative instruments, including futures contracts. Derivatives are investments whose value is primarily derived from underlying assets, indices or reference rates and may be transacted on an exchange or over-the-counter (OTC). Derivatives may involve a future commitment to buy or sell a specified asset based on specified terms, to exchange future cash flows at periodic intervals based on a notional principal amount, or for one party to make one or more payments upon the occurrence of specified events in exchange for periodic payments from the other party.
Derivatives were used to increase returns and to manage exposure to certain risks as defined below. The success of any strategy involving derivatives depends on analysis of numerous economic factors, and if the strategies for investment do not work as intended, the objectives may not be achieved.
Derivatives were used to increase or decrease exposure to the following risk(s):
| | |
| Equity Risk | Equity risk relates to the fluctuations in the value of financial instruments as a result of changes in market prices (other than those arising from interest rate risk or foreign exchange risk), whether caused by factors specific to an individual investment, its issuer, or all factors affecting all instruments traded in a market or market segment. |
| Interest Rate Risk | Interest rate risk relates to the fluctuations in the value of interest-bearing securities due to changes in the prevailing levels of market interest rates. |
Funds are also exposed to additional risks from investing in derivatives, such as liquidity risk and counterparty credit risk. Liquidity risk is the risk that a fund will be unable to close out the derivative in the open market in a timely manner. Counterparty credit risk is the risk that the counterparty will not be able to fulfill its obligation to a fund. Counterparty credit risk related to exchange-traded contracts may be mitigated by the protection provided by the exchange on which they trade.
Investing in derivatives may involve greater risks than investing in the underlying assets directly and, to varying degrees, may involve risk of loss in excess of any initial investment and collateral received and amounts recognized in the Statement of Assets and Liabilities. In addition, there may be the risk that the change in value of the derivative contract does not correspond to the change in value of the underlying instrument.
Net Realized Gain (Loss) and Change in Net Unrealized Appreciation (Depreciation) on Derivatives. The table below, which reflects the impacts of derivatives on the financial performance, summarizes the net realized gain (loss) and change in net unrealized appreciation (depreciation) for derivatives during the period as presented in the Statement of Operations.
| Primary Risk Exposure / Derivative Type | Net Realized Gain (Loss)($) | Change in Net Unrealized Appreciation (Depreciation)($) |
| Fidelity Flex Freedom Blend 2035 Fund | | |
| Equity Risk | | |
| Futures Contracts | (50,857) | 3,494 |
| Total Equity Risk | (50,857) | 3,494 |
| Interest Rate Risk | | |
| Futures Contracts | 134,385 | (25,322) |
| Total Interest Rate Risk | 134,385 | (25,322) |
| Totals | 83,528 | (21,828) |
If there are any open positions at period end, a summary of the value of derivatives by primary risk exposure is included at the end of the Schedule of Investments.
Futures Contracts. A futures contract is an agreement between two parties to buy or sell a specified underlying instrument for a fixed price at a specified future date. Futures contracts were used to manage exposure to the stock market, bond market and fluctuations in interest rates.
Upon entering into a futures contract, a fund is required to deposit either cash or securities (initial margin) with a clearing broker in an amount equal to a certain percentage of the face value of the contract. Futures contracts are marked-to-market daily and subsequent daily payments are made or received by a fund depending on the daily fluctuations in the value of the futures contracts and are recorded as unrealized appreciation or (depreciation). This receivable and/or payable, if any, is included in daily variation margin on futures contracts in the Statement of Assets and Liabilities. Realized gain or (loss) is recorded upon the expiration or closing of a futures contract. The net realized gain (loss) and change in net unrealized appreciation (depreciation) on futures contracts during the period is presented in the Statement of Operations.
Any open futures contracts at period end are presented in the Schedule of Investments under the caption "Futures Contracts". The notional amount at value reflects each contract's exposure to the underlying instrument or index at period end, and is representative of volume of activity during the period unless an average notional amount is presented. Any securities deposited to meet initial margin requirements are identified in the Schedule of Investments. Any cash deposited to meet initial margin requirements is presented as segregated cash with brokers for derivative instruments in the Statement of Assets and Liabilities.
5. Purchases and Sales of Investments.
Purchases and sales of securities, other than short-term securities, U.S. government securities, securities acquired in the reorganization and in-kind transactions, as applicable, are noted in the table below.
| | Purchases ($) | Sales ($) |
| Fidelity Flex Freedom Blend Income Fund | 379,321 | 323,991 |
| Fidelity Flex Freedom Blend 2010 Fund | 363,902 | 3,013,404 |
| Fidelity Flex Freedom Blend 2015 Fund | 1,175,652 | 1,871,116 |
| Fidelity Flex Freedom Blend 2020 Fund | 3,535,662 | 5,699,608 |
| Fidelity Flex Freedom Blend 2025 Fund | 7,530,650 | 13,641,326 |
| Fidelity Flex Freedom Blend 2030 Fund | 10,824,512 | 13,773,593 |
| Fidelity Flex Freedom Blend 2035 Fund | 12,296,530 | 12,389,450 |
| Fidelity Flex Freedom Blend 2040 Fund | 13,076,035 | 12,688,222 |
| Fidelity Flex Freedom Blend 2045 Fund | 15,405,392 | 8,942,024 |
| Fidelity Flex Freedom Blend 2050 Fund | 10,400,663 | 6,762,352 |
| Fidelity Flex Freedom Blend 2055 Fund | 9,116,709 | 4,183,387 |
| Fidelity Flex Freedom Blend 2060 Fund | 5,147,062 | 2,528,391 |
| Fidelity Flex Freedom Blend 2065 Fund | 3,379,295 | 797,309 |
| Fidelity Flex Freedom Blend 2070 Fund | 2,050,433 | 82,505 |
6. Fees and Other Transactions with Affiliates.
Management Fee. Fidelity Management & Research Company LLC (the investment adviser) and its affiliates provide the Funds with investment management related services and the Funds do not pay any fees for these services. Under the management contract, the investment adviser or an affiliate pays all other expenses of the Funds, excluding fees and expenses of the independent Trustees, and certain miscellaneous expenses such as proxy and shareholder meeting expenses.
Interfund Trades. Funds may purchase from or sell securities to other Fidelity Funds under procedures adopted by the Board. The procedures have been designed to ensure these interfund trades are executed in accordance with Rule 17a-7 of the 1940 Act. Any interfund trades are included within the respective purchases and sales amounts shown in the Purchases and Sales of Investments note. During the period, there were no interfund trades.
7. Expense Reductions.
Through arrangements with each applicable Fund's custodian, credits realized as a result of certain uninvested cash balances were used to reduce each applicable Fund's expenses. All of the applicable expense reductions are noted in the table below.
| | Custodian credits ($) |
Fidelity Flex Freedom Blend 2035 Fund | 338 |
Fidelity Flex Freedom Blend 2065 Fund | 1 |
8. Other.
A fund's organizational documents provide former and current trustees and officers with a limited indemnification against liabilities arising in connection with the performance of their duties to the fund. In the normal course of business, a fund may also enter into contracts that provide general indemnifications. A fund's maximum exposure under these arrangements is unknown as this would be dependent on future claims that may be made against a fund. The risk of material loss from such claims is considered remote.
At the end of the period, the investment adviser or its affiliates were owners of record of more than 10% of the outstanding shares as follows:
| | Affiliated % |
Fidelity Flex Freedom Blend 2070 Fund | 27% |
9. Risk and Uncertainties.
Many factors affect a fund's performance. Developments that disrupt global economies and financial markets, such as pandemics, epidemics, outbreaks of infectious diseases, war, terrorism, and environmental disasters, may significantly affect a fund's investment performance. The effects of these developments to a fund will be impacted by the types of securities in which a fund invests, the financial condition, industry, economic sector, and geographic location of an issuer, and a fund's level of investment in the securities of that issuer. Significant concentrations in security types, issuers, industries, sectors, and geographic locations may magnify the factors that affect a fund's performance.
10. Reorganization Information.
On June 14, 2024, Fidelity Flex Freedom Blend Income Fund acquired all of the assets and assumed all of the liabilities of Fidelity Flex Freedom Blend 2005 Fund ("Acquired Fund") pursuant to an Agreement and Plan of Reorganization (Agreements) approved by the Board of Trustees ("The Board"). The securities held by the Acquired Fund were the primary assets acquired by Fidelity Flex Freedom Blend Income Fund. The acquisition was accomplished by an exchange of shares of Fidelity Flex Freedom Blend Income Fund for shares then outstanding of the Acquired Fund at its respective net asset value on the acquisition date. The reorganization provides shareholders of the Acquired Fund access to a larger portfolio with a similar investment objective and lower projected expenses. For financial reporting purposes, the assets and liabilities of the Acquired Fund and shares issued by Fidelity Flex Freedom Blend Income Fund were recorded at fair value; however, the cost basis of the investments received from the Acquired Fund were carried forward and will be utilized for purposes of Fidelity Flex Freedom Blend Income Fund ongoing reporting of realized and unrealized gains and losses to more closely align subsequent reporting of realized gains with amounts distributable to shareholders for tax purposes. The reorganization qualified as a tax-free reorganization for federal income tax purposes with no gain or loss recognized to the funds or their shareholders.
| Acquired Fund and Share Class | Investments $ | Unrealized appreciation (depreciation) $ | Net Assets $ | Shares Exchanged | Shares Exchanged Ratio |
| Fidelity Flex Freedom Blend 2005 Fund | 2,624,395 | 30,237 | 2,626,768 | 275,344 | .9957442348 |
| Acquiring Fund | Net Assets $ | Total net assets after the acquisition $ |
| Fidelity Flex Freedom Blend Income Fund | 1,064,920 | 3,691,688 |
Pro forma results of operations of the combined entity for the entire period ended September 30, 2024, as though the acquisition had occurred as of the beginning of the year (rather than on the actual acquisition date), are as follows:
| Net investment income (loss) | $51,810 |
| Total net realized gain (loss) | (2,118) |
| Total change in net unrealized appreciation (depreciation) | 159,884 |
| Net increase (decrease) in net assets resulting from operations | $209,576 |
Because the combined investment portfolios have been managed as a single portfolio since the acquisition was completed, it is not practicable to separate the amounts of revenue and earnings of the acquired funds that have been included in the Fidelity Flex Freedom Blend Income Fund accompanying Statement of Operations since June 14, 2024.
Item 8: Changes in and Disagreements with Accountants for Open-End Management Investment Companies
(Unaudited)
Note: This is not applicable for any fund included in this document.
Item 9: Proxy Disclosures for Open-End Management Investment Companies
(Unaudited)
Note: This is not applicable for any fund included in this document.
Item 10: Remuneration Paid to Directors, Officers, and others of Open-End Management Investment Companies
(Unaudited)
Note: This information is disclosed as part of the financial statements for each Fund as part of Item 7: Financial Statements and Financial Highlights for Open-End Management Investment companies.
Item 11: Statement Regarding Basis for Approval of Investment Advisory Contract
(Unaudited)
Board Approval of Investment Advisory Contracts and Management Fees
Fidelity Flex Freedom Blend 2070 Fund
At its March 2024 meeting, the Board of Trustees, including the Independent Trustees (together, the Board), voted to approve the management contract (the Advisory Contract) with Fidelity Management & Research Company LLC (FMR) for the fund. The Board, assisted by the advice of fund counsel and Independent Trustees' counsel, considered a broad range of information.
Nature, Extent, and Quality of Services Provided. The Board considered Fidelity's staffing as it relates to the fund, including the backgrounds of investment personnel of FMR, and also considered the fund's investment objective, strategies, and related investment philosophy. The Board considered the structure of the investment personnel compensation program and whether this structure provides appropriate incentives to act in the best interests of the fund.
Resources Dedicated to Investment Management and Support Services. The Board reviewed the general qualifications and capabilities of Fidelity's investment staff, including its size, education, experience, and resources, as well as Fidelity's approach to recruiting, training, managing, and compensating investment personnel. The Board noted the resources devoted to Fidelity's global investment organization and that Fidelity's analysts have extensive resources, tools and capabilities that allow them to conduct sophisticated quantitative and fundamental analysis, as well as credit analysis of issuers, counterparties and guarantors. Further, the Board considered that Fidelity's investment professionals have sufficient access to global information and data so as to provide competitive investment results over time, and that those professionals also have access to sophisticated tools that permit them to assess portfolio construction and risk and performance attribution characteristics continuously, as well as to transmit new information and research conclusions rapidly around the world. Additionally, in its deliberations, the Board considered Fidelity's risk management, compliance, cybersecurity, and technology and operations capabilities and resources, which are integral parts of the investment management process.
Shareholder and Administrative Services. The Board considered the nature, extent, quality, and cost of advisory, administrative, and shareholder services to be performed by Fidelity under the Advisory Contract. The Board also considered the nature and extent of the supervision of third party service providers, principally custodians, subcustodians, and pricing vendors.
The Board noted that the growth of fund assets over time across the complex allows Fidelity to reinvest in the development of services designed to enhance the value and convenience of the Fidelity funds as investment vehicles. These services include 24-hour access to account information and market information over the Internet and through telephone representatives, investor education materials and asset allocation tools. The Board also considered that it reviews customer service metrics such as telephone response times, continuity of services on the website and metrics addressing services at Fidelity Investor Centers.
Investment Performance. The fund is a new fund and therefore had no historical performance for the Board to review at the time it approved the fund's Advisory Contract. The Board considered FMR's strength in managing asset allocation funds, which the Board is familiar with through its supervision of other target date funds. The Board also considered the fact that it oversees funds managed by FMR that have similar investment objectives and policies as the fund.
Based on its review, the Board concluded that the nature, extent, and quality of services to be provided to the fund under the Advisory Contract should benefit the shareholders of the fund.
Competitiveness of Management Fee and Total Expense Ratio. The Board noted that the fund is available exclusively to accounts offered through certain Fidelity fee-based programs. The Board considered that while the fund does not pay a management fee, FMR is indirectly compensated for its services out of the account-based fee and that its compensation for advisory services will be the same regardless of variations in the account-based fee paid by investing accounts. The Board noted that FMR or an affiliate pays all operating expenses, with certain limited exceptions, on behalf of the fund.
Based on its review, the Board concluded that the fund does not pay a management fee and concluded that the total expense ratio of each class of the fund was reasonable in light of the services that the fund and its shareholders will receive and the other factors considered.
Costs of the Services and Profitability. The fund is a new fund and therefore no revenue, cost, or profitability data were available for the Board to review in respect of the fund at the time it approved the Advisory Contract. In connection with its consideration of future renewals of the fund's Advisory Contract, the Board will consider the level of Fidelity's profits in respect of all the Fidelity funds.
Economies of Scale. The Board concluded that because the fund will pay no advisory fees and FMR or an affiliate will bear all expenses of the fund, with certain limited exceptions, the realization of economies of scale was not a material factor in the Board's decision to approve the fund's Advisory Contract.
Based on its evaluation of all of the conclusions noted above, and after considering all factors it believed relevant, the Board concluded that the advisory fee arrangements are fair and reasonable, and that the fund's Advisory Contract should be approved.
Board Approval of Investment Advisory Contracts and Management Fees
Fidelity Flex Freedom Blend Income Fund
Fidelity Flex Freedom Blend 2010 Fund
Fidelity Flex Freedom Blend 2015 Fund
Fidelity Flex Freedom Blend 2020 Fund
Fidelity Flex Freedom Blend 2025 Fund
Fidelity Flex Freedom Blend 2030 Fund
Fidelity Flex Freedom Blend 2035 Fund
Fidelity Flex Freedom Blend 2040 Fund
Fidelity Flex Freedom Blend 2045 Fund
Fidelity Flex Freedom Blend 2050 Fund
Fidelity Flex Freedom Blend 2055 Fund
Fidelity Flex Freedom Blend 2060 Fund
Fidelity Flex Freedom Blend 2065 Fund
Each year, the Board of Trustees, including the Independent Trustees (together, the Board), considers the renewal of the fund's management contract with Fidelity Management & Research Company LLC (FMR) (the Advisory Contract) for each fund. The Board, assisted by the advice of fund counsel and Independent Trustees' counsel, requests and considers a broad range of information relevant to the renewal of the Advisory Contracts throughout the year.
The Board meets regularly and, at each of its meetings, covers an extensive agenda of topics and materials and considers factors that are relevant to its annual consideration of the renewal of the fund's Advisory Contracts, including the services and support provided to the fund and its shareholders. The Board's Operations Committee, of which all the Independent Trustees are members, meets regularly throughout the year and requests, receives and considers, among other matters, information related to the annual consideration of the renewal of the fund's Advisory Contracts before making its recommendation to the Board. The Board also meets as needed to review matters specifically related to the Board's annual consideration of the renewal of the Advisory Contracts. Members of the Board may also meet from time to time with trustees of other Fidelity funds through joint ad hoc committees to discuss certain matters relevant to all of the Fidelity funds.
At its September 2024 meeting, the Board unanimously determined to renew each fund's Advisory Contract. In considering whether to renew the Advisory Contract for each fund, the Board considered all factors it believed relevant and reached a determination, with the assistance of fund counsel and Independent Trustees' counsel and through the exercise of its business judgment, that the renewal of the Advisory Contract was in the best interests of each fund and its shareholders and the fact that no fee is payable under the management contract was fair and reasonable. The Board's decision to renew the funds' Advisory Contracts was not based on any single factor and the factors may have been weighed differently by different Trustees.
Nature, Extent, and Quality of Services Provided. The Board considered FMR's staffing as it relates to the funds, including the backgrounds of investment personnel, and also considered FMR's implementation of the funds' investment program and experience. The Independent Trustees also had discussions with senior management of Fidelity's investment operations and investment groups with responsibility for the Series Funds. The Board considered the structure of the investment personnel compensation program and whether this structure provides appropriate incentives to act in the best interests of each fund. Additionally, the Board considered the portfolio managers' investments, if any, in the funds that they manage.
Resources Dedicated to Investment Management and Support Services. The Board reviewed the general qualifications and capabilities of Fidelity's investment staff, including its size, education, experience, and resources, as well as Fidelity's approach to recruiting, training, managing, and compensating investment personnel. The Board noted the resources devoted to Fidelity's global investment organization, and that Fidelity's analysts have extensive resources, tools and capabilities that allow them to conduct quantitative and fundamental analysis, as well as credit analysis of issuers, counterparties and guarantors. Further, the Board considered that Fidelity's investment professionals have sufficient access to global information and data so as to provide competitive investment results over time, and that those professionals also have access to sophisticated tools that permit them to assess portfolio construction and risk and performance attribution characteristics continuously, as well as to transmit new information and research conclusions rapidly around the world. Additionally, in its deliberations, the Board considered Fidelity's risk management, compliance, cybersecurity, and technology and operations capabilities and resources, which are integral parts of the investment management process.
Shareholder and Administrative Services. The Board considered (i) the nature, extent, quality, and cost of advisory, administrative, and shareholder services performed by Fidelity under the Advisory Contract and under separate agreements covering transfer agency and pricing and bookkeeping services for each fund; (ii) the nature and extent of Fidelity's supervision of third party service providers, principally custodians, subcustodians, and pricing vendors; and (iii) the resources devoted by Fidelity to, and the record of compliance with, each fund's compliance policies and procedures, including with respect to liquidity risk management.
The Board noted that the growth of fund assets over time across the complex allows Fidelity to reinvest in the development of services designed to enhance the value and convenience of the Fidelity funds as investment vehicles. These services include 24-hour access to account information and market information over the Internet and through telephone representatives, investor education materials and asset allocation tools. The Board also considered that it reviews customer service metrics such as telephone response times, continuity of services on the website and metrics addressing services at Fidelity Investor Centers.
Investment in a Large Fund Family. The Board considered the benefits to shareholders of investing in a fund that is part of a large family of funds offering a variety of investment disciplines and providing a large variety of fund investor services. The Board noted that Fidelity had taken, or had made recommendations to the Board that resulted in the Fidelity funds taking, a number of actions over the previous year that benefited particular funds and/or the Fidelity funds in general.
Investment Performance. The Board reviewed the absolute investment performance of each fund, as well as each fund's relative investment performance. The Board noted that the funds are available exclusively to certain fee-based accounts and advisor programs offered by Fidelity, including certain employer-sponsored plans and discretionary investment programs. For each of Fidelity Flex Freedom Blend Income Fund, Fidelity Flex Freedom Blend 2010 Fund and Fidelity Flex Freedom Blend 2015 Fund, and Fidelity Freedom Blend 2020 Fund, the fund underperformed its benchmark and peers for the one- and three-year periods ended January 31, 2024, and as a result, the Board continues to engage in discussions with FMR regarding the steps it is taking to address the fund's performance.
Based on its review, the Board concluded that the nature, extent, and quality of services provided to each fund under the Advisory Contracts should continue to benefit the shareholders of each fund.
Competitiveness of Management Fee and Total Expense Ratio. The Board noted that each fund is available exclusively through certain Fidelity fee-based accounts and advisory programs. The Board considered that each fund does not pay FMR a management fee for investment advisory services, but that FMR is indirectly compensated for its services out of Fidelity fee-based account and advisory program fees. The Board also noted that FMR or an affiliate undertakes to pay all operating expenses of each fund, except Independent Trustee fees and expenses, proxy and shareholder meeting expenses, interest, taxes, and extraordinary expenses (such as litigation expenses). The Board further noted that each fund pays its non-operating expenses, including brokerage commissions and fees and expenses associated with the fund's securities lending program, if applicable.
Based on its review, the Board considered that each fund does not pay a management fee and concluded that each fund's total expense ratio was reasonable in light of the services that the fund and its shareholders receive and the other factors considered.
Costs of the Services and Profitability. The Board considered the level of Fidelity's profits in respect of all the Fidelity funds.
A public accounting firm has been engaged annually by the Board as part of the Board's assessment of Fidelity's profitability analysis. The engagement includes the review and assessment of the methodologies used by Fidelity in determining the revenues and expenses attributable to Fidelity's fund business. After considering the reports issued under the engagement and information provided by Fidelity, the Board concluded that while other allocation methods may also be reasonable, Fidelity's profitability methodologies are reasonable in all material respects.
The Board also reviewed Fidelity's non-fund businesses and potential indirect benefits such businesses may have received as a result of their association with Fidelity's fund business (i.e., fall-out benefits) as well as cases where Fidelity's affiliates may benefit from the funds' business. The Board considered areas where potential indirect benefits to the Fidelity funds from their relationships with Fidelity may exist. The Board's consideration of these matters was informed by the findings of a joint ad hoc committee created by it and the boards of other Fidelity funds to evaluate potential fall-out benefits.
The Board concluded that the costs of the services provided by and the profits realized by Fidelity in connection with the operation of the funds were not relevant to the renewal of the Advisory Contracts because the funds pay no advisory fees and FMR or an affiliate bears all expenses of the funds, with limited exceptions.
Economies of Scale. The Board concluded that because the funds pay no advisory fees and FMR or an affiliate bears all expenses of the funds with certain limited exceptions, the realization of economies of scale was not a material factor in the Board's decision to renew the funds' Advisory Contracts.
Additional Information Requested by the Board. In order to develop fully the factual basis for consideration of the Fidelity funds' advisory contracts, the Board requested and received additional information on certain topics, including: (i) portfolio manager changes that have occurred during the past year; (ii) hiring, training, compensating, and retaining adviser and sub-adviser personnel; (iii) the terms of the funds' various management fee structures and arrangements for transfer agent and pricing and bookkeeping services; (iv) Fidelity's fund profitability methodology, profitability trends for certain funds, the allocation of various costs to different funds, and the impact of certain factors on fund profitability results; (v) the impact on fund profitability of recent industry trends, such as the growth in passively managed funds and the changes in flows for different types of funds; (vi) the types of management fee and total expense comparisons provided, and the challenges and limitations associated with such information; (vii) explanations regarding the relative total expense ratios and management fees of certain funds and classes, total expense and management fee competitive trends, and methodologies for total expense and management fee competitive comparisons; (viii) matters related to money market funds, exchange-traded funds, and target date funds; (ix) the arrangements with and compensation paid to certain fund sub-advisers and the treatment of such compensation within Fidelity's fund profitability methodology; and (x) the terms of management contracts between Fidelity and other funds and products not overseen by the Board.
Conclusion. Based on its evaluation of all of the conclusions noted above, and after considering all factors it believed relevant, the Board, including the Independent Trustees, concluded that the advisory fee arrangements are fair and reasonable, and that each fund's Advisory Contract should be renewed through September 30, 2025.
1.9884227.107
XFC-SANN-1124
Item 8.
Changes in and Disagreements with Accountants for Open-End Management Investment Companies
See Item 7.
Item 9.
Proxy Disclosures for Open-End Management Investment Companies
See Item 7.
Item 10.
Remuneration Paid to Directors, Officers, and Others of Open-End Management Investment Companies
See Item 7.
Item 11.
Statement Regarding Basis for Approval of Investment Advisory Contract
See Item 7.
Item 12.
Disclosure of Proxy Voting Policies and Procedures for Closed-End Management Investment Companies
Not applicable.
Item 13.
Portfolio Managers of Closed-End Management Investment Companies
Not applicable.
Item 14.
Purchases of Equity Securities by Closed-End Management Investment Company and Affiliated Purchasers
Not applicable.
Item 15.
Submission of Matters to a Vote of Security Holders
There were no material changes to the procedures by which shareholders may recommend nominees to the Fidelity Aberdeen Street Trust’s Board of Trustees.
Item 16.
Controls and Procedures
(a)(i) The President and Treasurer and the Chief Financial Officer have concluded that the Fidelity Aberdeen Street Trust’s (the “Trust”) disclosure controls and procedures (as defined in Rule 30a-3(c) under the Investment Company Act) provide reasonable assurances that material information relating to the Trust is made known to them by the appropriate persons, based on their evaluation of these controls and procedures as of a date within 90 days of the filing date of this report.
(a)(ii) There was no change in the Trust’s internal control over financial reporting (as defined in Rule 30a-3(d) under the Investment Company Act) that occurred during the period covered by this report that has materially affected, or is reasonably likely to materially affect, the Trust’s internal control over financial reporting.
Item 17.
Disclosure of Securities Lending Activities for Closed-End Management Investment Companies
Not applicable.
Item 18.
Recovery of Erroneously Awarded Compensation
(a)
Not applicable.
(b)
Not applicable.
Item 19.
Exhibits
SIGNATURES
Pursuant to the requirements of the Securities Exchange Act of 1934 and the Investment Company Act of 1940, the registrant has duly caused this report to be signed on its behalf by the undersigned, thereunto duly authorized.
Fidelity Aberdeen Street Trust
|
By: | /s/Laura M. Del Prato |
| Laura M. Del Prato |
| President and Treasurer (Principal Executive Officer) |
|
|
Date: | November 21, 2024 |
Pursuant to the requirements of the Securities Exchange Act of 1934 and the Investment Company Act of 1940, this report has been signed below by the following persons on behalf of the registrant and in the capacities and on the dates indicated.
|
By: | /s/Laura M. Del Prato |
| Laura M. Del Prato |
| President and Treasurer (Principal Executive Officer) |
|
|
Date: | November 21, 2024 |
|
By: | /s/Stephanie Caron |
| Stephanie Caron |
| Chief Financial Officer (Principal Financial Officer) |
|
|
Date: | November 21, 2024 |