UNITED STATES
SECURITIES AND EXCHANGE COMMISSION
Washington, D.C. 20549
FORM N-CSR
CERTIFIED SHAREHOLDER REPORT OF REGISTERED
MANAGEMENT INVESTMENT COMPANIES
| | | | | | | | | | | | | | | | | | | | |
| Investment Company Act file number | 811-06441 |
| |
| AMERICAN CENTURY INTERNATIONAL BOND FUNDS |
| (Exact name of registrant as specified in charter) |
| |
| 4500 MAIN STREET, KANSAS CITY, MISSOURI | 64111 |
| (Address of principal executive offices) | (Zip Code) |
| |
JOHN PAK
4500 MAIN STREET, KANSAS CITY, MISSOURI 64111 |
| (Name and address of agent for service) |
| |
| Registrant’s telephone number, including area code: | 816-531-5575 |
| |
| Date of fiscal year end: | 10-31 |
| |
| Date of reporting period: | 10-31-2021 |
ITEM 1. REPORTS TO STOCKHOLDERS.
(a) Provided under separate cover.
| | | | | |
| |
| Annual Report |
| |
| October 31, 2021 |
| |
| Emerging Markets Debt Fund |
| Investor Class (AEDVX) |
| I Class (AEHDX) |
| Y Class (AEYDX) |
| A Class (AEDQX) |
| C Class (AEDHX) |
| R Class (AEDWX) |
| R5 Class (AEDJX) |
| R6 Class (AEXDX) |
| G Class (AEDGX) |
| | | | | |
| President’s Letter | |
| Performance | |
| Portfolio Commentary | |
| Fund Characteristics | |
| Shareholder Fee Example | |
| Schedule of Investments | |
| Statement of Assets and Liabilities | |
| Statement of Operations | |
| Statement of Changes in Net Assets | |
| Notes to Financial Statements | |
| Financial Highlights | |
| Report of Independent Registered Public Accounting Firm | |
| Management | |
| Approval of Management Agreement | |
| |
| |
| Additional Information | |
Any opinions expressed in this report reflect those of the author as of the date of the report, and do not necessarily represent the opinions of American Century Investments® or any other person in the American Century Investments organization. Any such opinions are subject to change at any time based upon market or other conditions and American Century Investments disclaims any responsibility to update such opinions. These opinions may not be relied upon as investment advice and, because investment decisions made by American Century Investments funds are based on numerous factors, may not be relied upon as an indication of trading intent on behalf of any American Century Investments fund. Security examples are used for representational purposes only and are not intended as recommendations to purchase or sell securities. Performance information for comparative indices and securities is provided to American Century Investments by third party vendors. To the best of American Century Investments’ knowledge, such information is accurate at the time of printing.
 Jonathan Thomas
Dear Investor:
Thank you for reviewing this annual report for the period ended October 31, 2021. Annual reports help convey important information about fund returns, including market factors that affected performance. For additional investment insights, please visit americancentury.com.
Economic, Earnings Gains Fueled Rally Among Risk-On Assets
Stocks and other risk-on assets rallied for the 12-month period, despite lingering pandemic-related challenges. Upbeat data on U.S. manufacturing, employment and housing, along with central bank and federal government support and positive vaccine developments, helped boost corporate earnings and promote investor optimism. Outside the U.S., most economies recovered, but generally at a slower pace. Virus outbreaks and slower vaccine rollouts, particularly in emerging markets, led to lingering lockdowns in some regions.
As the period progressed, steady economic gains combined with ongoing monetary and fiscal support, rising energy prices and severe supply chain disruptions pushed global interest rates and inflation higher. In the U.S., year-over-year headline inflation climbed to 6.2% in October 2021, the largest 12-month increase in nearly 31 years.
Late in the period, the Federal Reserve (Fed) confirmed it would start tapering its bond buying in November. Yet despite inflation’s surge, the Fed left short-term interest rates unchanged. Central banks in Europe and the U.K. maintained their supportive interest rate and bond-buying programs as inflation ticked higher.
Overall, stocks delivered stellar performance for the 12-month period, highlighted by the S&P 500 Index’s gain of nearly 43%. Assets offering inflation-fighting potential, including real estate investment trusts, fared even better. Meanwhile, global bonds retreated as interest rates rose. However, emerging markets bonds largely advanced, benefiting from risk-on sentiment.
Several Factors Shaping Market Dynamics
The return to pre-pandemic life is progressing, albeit somewhat cautiously due to COVID-19’s lingering effects. As the economy and markets respond to this fluid backdrop, investors will face opportunities and ongoing challenges. Economic growth, inflation, the virus’s trajectory, supply chain normalization and fiscal and monetary policy likely will sway market dynamics.
We appreciate your confidence in us during these extraordinary times. Our firm has a long history of helping clients weather unpredictable markets, and we’re confident we will continue to meet today’s challenges.
Sincerely,
Jonathan Thomas
President and Chief Executive Officer
American Century Investments
| | | | | | | | | | | | | | | | | | |
| Total Returns as of October 31, 2021 |
| | | | | | |
| | | | Average Annual Returns | |
| | Ticker Symbol | | 1 year | 5 years | Since Inception | Inception Date |
| Investor Class | AEDVX | | 5.29% | 4.16% | 4.39% | 7/29/14 |
| JPMorgan Corporate Emerging Market Bond (CEMBI) Broad Diversified Index | — | | 5.27% | 5.11% | 4.98% | — |
| I Class | AEHDX | | 5.30% | — | 4.22% | 4/10/17 |
| Y Class | AEYDX | | 5.40% | — | 4.32% | 4/10/17 |
| A Class | AEDQX | | | | | 7/29/14 |
| No sales charge | | | 5.03% | 3.88% | 4.13% | |
| With sales charge | | | 0.27% | 2.92% | 3.47% | |
| C Class | AEDHX | | 4.25% | 3.11% | 3.35% | 7/29/14 |
| R Class | AEDWX | | 4.67% | 3.63% | 3.86% | 7/29/14 |
| R5 Class | AEDJX | | 5.49% | 4.38% | 4.60% | 7/29/14 |
| R6 Class | AEXDX | | 5.56% | 4.40% | 4.65% | 7/29/14 |
| G Class | AEDGX | | 6.20% | — | 5.01% | 11/14/17 |
G Class returns would have been lower if a portion of the fees had not been waived.
C Class shares will automatically convert to A Class shares after being held for approximately eight years. C Class average annual returns do not reflect this conversion.
Sales charges include initial sales charges and contingent deferred sales charges (CDSCs), as applicable. A Class shares have a 4.50% maximum initial sales charge and may be subject to a maximum CDSC of 1.00%. C Class shares redeemed within 12 months of purchase are subject to a maximum CDSC of 1.00%. The SEC requires that mutual funds provide performance information net of maximum sales charges in all cases where charges could be applied.
Data presented reflect past performance. Past performance is no guarantee of future results. Current performance may be higher or lower than the performance shown. Total returns for periods less than one year are not annualized. Investment return and principal value will fluctuate, and redemption value may be more or less than original cost. Data assumes reinvestment of dividends and capital gains, and none of the charts reflect the deduction of taxes that a shareholder would pay on fund distributions or the redemption of fund shares. To obtain performance data current to the most recent month end, please call 1-800-345-2021 or visit americancentury.com. For additional information about the fund, please consult the prospectus.
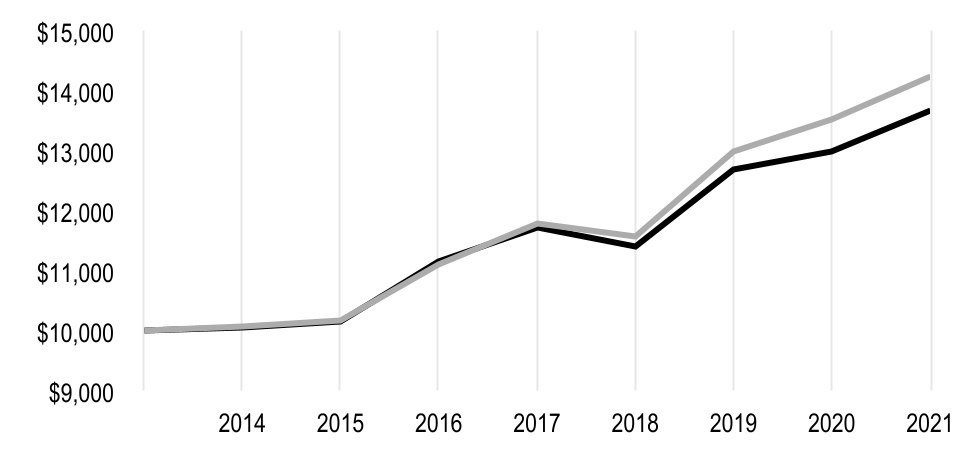
| | |
| Growth of $10,000 Over Life of Class |
| $10,000 investment made July 29, 2014 |
| Performance for other share classes will vary due to differences in fee structure. |
| | | | | |
| Value on October 31, 2021 |
| Investor Class — $13,662 |
|
| JPMorgan CEMBI Broad Diversified Index — $14,229 |
|
| | | | | | | | | | | | | | | | | | | | | | | | | | |
| Total Annual Fund Operating Expenses | |
| Investor Class | I Class | Y Class | A Class | C Class | R Class | R5 Class | R6 Class | G Class |
| 0.98% | 0.88% | 0.78% | 1.23% | 1.98% | 1.48% | 0.78% | 0.73% | 0.73% |
The total annual fund operating expenses shown is as stated in the fund’s prospectus current as of the date of this report. The prospectus may vary from the expense ratio shown elsewhere in this report because it is based on a different time period, includes acquired fund fees and expenses, and, if applicable, does not include fee waivers or expense reimbursements.
Data presented reflect past performance. Past performance is no guarantee of future results. Current performance may be higher or lower than the performance shown. Total returns for periods less than one year are not annualized. Investment return and principal value will fluctuate, and redemption value may be more or less than original cost. Data assumes reinvestment of dividends and capital gains, and none of the charts reflect the deduction of taxes that a shareholder would pay on fund distributions or the redemption of fund shares. To obtain performance data current to the most recent month end, please call 1-800-345-2021 or visit americancentury.com. For additional information about the fund, please consult the prospectus.
Portfolio Managers: John Lovito, Thomas Youn and Alessandra Alecci
Brian Howell, Vice President and Senior Portfolio Manager, left the fund’s portfolio management team August 1, 2021. He is retiring, effective December 31, 2021.
Performance Summary
Emerging Markets Debt returned 5.29%* for the fiscal year ended October 31, 2021. By comparison, the JPMorgan Corporate Emerging Markets Bond (CEMBI) Broad Diversified Index rose 5.27% over the same time period. Fund returns reflect operating expenses, while index returns do not.
Market Review
Emerging markets bonds generally outperformed those from developed economies during the 12-month period. Encouraging signs regarding the world’s recovery from pandemic-related challenges stoked higher risk appetites. The period wasn’t without obstacles, however, as surging economic activity sent inflation soaring, while recurring spikes in infection rates selectively tempered enthusiasm.
The reporting period opened boldly as encouraging news around COVID-19 vaccines heartened investors in late 2020 and contributed to gains in emerging markets debt. Improving economic expectations supported a rally in commodity prices, which also benefited from a declining U.S. dollar.
The landscape changed dramatically during the first quarter of 2021. U.S. lawmakers approved $2.2 trillion in fiscal stimulus, and U.S. Treasury yields rose swiftly and sharply. These events, along with a faster-than-expected U.S. rollout of COVID-19 vaccines, fueled sizable upgrades in U.S. economic outlooks. The U.S. dollar also surged. Rising yields and falling bond prices triggered fears of financial stress among many emerging markets governments and corporations with strained balance sheets.
However, Treasury yields eased through much of the second and third quarters, restoring demand for emerging markets bonds. Although the U.S. dollar continued to outperform most other global currencies, commodity prices, which tend to falter as the dollar gains, largely advanced. Improving global growth expectations aided oil and metals prices, while copper and silver also drew support from green technologies. Protection from rising inflation further aided the asset class.
Due in part to soaring inflation, the Federal Reserve (Fed) started preparing the financial markets for the tapering of the bond-buying program it implemented after the pandemic’s onset. It also indicated it may raise its key lending rate sooner than previously anticipated.
Despite the Fed’s hawkish tone, Treasury yields remained near historic lows, which generally led to sustained demand for higher-yielding emerging markets bonds. Growth expectations remained largely healthy for most emerging markets countries. However, China’s prospects faded late in the period amid potential high-profile defaults in the real estate industry.
Broadly speaking, high-yield securities benefited from elevated risk tolerances and largely outperformed higher-quality securities. Gains among corporate bonds generally topped those from sovereign securities, which ended on a weak note amid the Fed’s posturing.
*All fund returns referenced in this commentary are for Investor Class shares. Performance for other share classes will vary due to differences in fee structure; when Investor Class performance exceeds that of the fund’s index, other share classes may not. See page 3 for returns for all share classes.
Asset Allocation Bolstered Performance
An underweight position relative to the index in China lifted relative returns. China’s property crisis, global supply chain issues and energy shortage eroded the nation’s growth outlook. An overweight stake in Ghana enhanced gains, as oil and gas sector holdings benefited from rising energy prices. Our underweight position in investment-grade bonds proved advantageous amid the high-yield rally. From a sector perspective, underweight exposure to the real estate and financials sectors supplied a lift.
Conversely, an underweight stake in the lowest quality high-yield names hindered performance, most notably in Argentina, where many corporate issues are rated CCC or lower. An underweight to corporate bonds in Turkey, where we preferred sovereign securities, detracted, as did hedges in Mexico and Brazil.
Security Selection, Duration Mixed
Investments in Mexico aided relative results, most notably in the financials and oil and gas sectors. Holdings among shipping port and renewable energy entities lifted our exposure in India. Security selection among chemicals and petrochemicals companies and in the metals and mining sector further boosted performance, as did investments in higher-rated, high-yield securities.
Alternatively, investments in the technology, media and telecommunications sector diminished results amid the Chinese government’s continued pressure on major technology firms. Our security selection within Ghana’s advancing oil and gas sector also detracted from relative returns. Our duration positioning underperformed, especially holdings in the intermediate portion of the U.S. Treasury curve that slumped as the curve steepened.
Positioning for the Future
Although comprehensive COVID-19 vaccination programs have proven problematic, we believe emerging markets hold greater recovery potential than developed markets. We are wary, however, of potential complications in China. We largely hold a positive view of Latin American countries outside of Brazil, where posturing around the 2022 presidential election has already begun.
We expect longer-maturity Treasury yields to move higher amid solid economic growth, higher inflation and massive government spending. However, a hawkish shift by the Fed may prove challenging, given slowing growth in China and the rising possibility of accommodative measures by the Chinese government. Nevertheless, the real interest rate differential continues to favor emerging markets, given early moves by several central banks to contain nascent inflation. Recent strength in the U.S. dollar may prove to be short lived as longer-maturity yields rise. Additionally, we believe the specter of sustained inflation will continue to make commodity-tied assets attractive as an inflation hedge.
Against this backdrop, our overweight in high-yield exposure was largely focused on higher-quality names at period-end. We also increased exposure to the defensive utilities and technology, media and telecommunications sectors. Our duration remained short but closer to neutral by period-end. As always, we remain focused on select, bottom-up opportunities.
| | | | | |
| OCTOBER 31, 2021 |
| Types of Investments in Portfolio | % of net assets |
| Corporate Bonds | 86.8% |
| Sovereign Governments and Agencies | 4.2% |
| Preferred Stocks | 2.5% |
| U.S. Treasury Securities | 1.3% |
| Exchange-Traded Funds | 0.1% |
| Temporary Cash Investments | 4.2% |
| Temporary Cash Investments - Securities Lending Collateral | 2.8% |
| Other Assets and Liabilities | (1.9)% |
Fund shareholders may incur two types of costs: (1) transaction costs, including sales charges (loads) on purchase payments and redemption/exchange fees; and (2) ongoing costs, including management fees; distribution and service (12b-1) fees; and other fund expenses. This example is intended to help you understand your ongoing costs (in dollars) of investing in your fund and to compare these costs with the ongoing cost of investing in other mutual funds.
The example is based on an investment of $1,000 made at the beginning of the period and held for the entire period from May 1, 2021 to October 31, 2021.
Actual Expenses
The table provides information about actual account values and actual expenses for each class. You may use the information, together with the amount you invested, to estimate the expenses that you paid over the period. First, identify the share class you own. Then simply divide your account value by $1,000 (for example, an $8,600 account value divided by $1,000 = 8.6), then multiply the result by the number under the heading “Expenses Paid During Period” to estimate the expenses you paid on your account during this period.
If you hold Investor Class shares of any American Century Investments fund, or I Class shares of the American Century Diversified Bond Fund, in an American Century Investments account (i.e., not through a financial intermediary or employer-sponsored retirement plan account), American Century Investments may charge you a $25.00 annual account maintenance fee if the value of those shares is less than $10,000. We will redeem shares automatically in one of your accounts to pay the $25.00 fee. In determining your total eligible investment amount, we will include your investments in all personal accounts (including American Century Investments brokerage accounts) registered under your Social Security number. Personal accounts include individual accounts, joint accounts, UGMA/UTMA accounts, personal trusts, Coverdell Education Savings Accounts and IRAs (including traditional, Roth, Rollover, SEP-, SARSEP- and SIMPLE-IRAs), and certain other retirement accounts. If you have only business, business retirement, employer-sponsored or American Century Investments brokerage accounts, you are currently not subject to this fee. If you are subject to the account maintenance fee, your account value could be reduced by the fee amount.
Hypothetical Example for Comparison Purposes
The table also provides information about hypothetical account values and hypothetical expenses based on the actual expense ratio of each class of your fund and an assumed rate of return of 5% per year before expenses, which is not the actual return of a fund’s share class. The hypothetical account values and expenses may not be used to estimate the actual ending account balance or expenses you paid for the period. You may use this information to compare the ongoing costs of investing in your fund and other funds. To do so, compare this 5% hypothetical example with the 5% hypothetical examples that appear in the shareholder reports of the other funds.
Please note that the expenses shown in the table are meant to highlight your ongoing costs only and do not reflect any transactional costs, such as sales charges (loads) or redemption/exchange fees. Therefore, the table is useful in comparing ongoing costs only, and will not help you determine the relative total costs of owning different funds. In addition, if these transactional costs were included, your costs would have been higher.
| | | | | | | | | | | | | | |
| Beginning
Account Value
5/1/21 | Ending
Account Value
10/31/21 | Expenses Paid During Period(1) 5/1/21 - 10/31/21 | Annualized Expense Ratio(1) |
| Actual | | | | |
| Investor Class | $1,000 | $1,006.00 | $4.90 | 0.97% |
| I Class | $1,000 | $1,005.60 | $4.40 | 0.87% |
| Y Class | $1,000 | $1,006.10 | $3.89 | 0.77% |
| A Class | $1,000 | $1,004.80 | $6.16 | 1.22% |
| C Class | $1,000 | $1,000.90 | $9.94 | 1.97% |
| R Class | $1,000 | $1,003.50 | $7.42 | 1.47% |
| R5 Class | $1,000 | $1,007.00 | $3.90 | 0.77% |
| R6 Class | $1,000 | $1,007.30 | $3.64 | 0.72% |
| G Class | $1,000 | $1,009.90 | $0.05 | 0.01% |
| Hypothetical | | | | |
| Investor Class | $1,000 | $1,020.32 | $4.94 | 0.97% |
| I Class | $1,000 | $1,020.82 | $4.43 | 0.87% |
| Y Class | $1,000 | $1,021.32 | $3.92 | 0.77% |
| A Class | $1,000 | $1,019.06 | $6.21 | 1.22% |
| C Class | $1,000 | $1,015.28 | $10.01 | 1.97% |
| R Class | $1,000 | $1,017.80 | $7.48 | 1.47% |
| R5 Class | $1,000 | $1,021.32 | $3.92 | 0.77% |
| R6 Class | $1,000 | $1,021.58 | $3.67 | 0.72% |
| G Class | $1,000 | $1,025.16 | $0.05 | 0.01% |
(1)Expenses are equal to the class's annualized expense ratio listed in the table above, multiplied by the average account value over the period, multiplied by 184, the number of days in the most recent fiscal half-year, divided by 365, to reflect the one-half year period. Annualized expense ratio reflects actual expenses, including any applicable fee waivers or expense reimbursements and excluding any acquired fund fees and expenses.
OCTOBER 31, 2021 | | | | | | | | |
| Shares/
Principal Amount | Value |
| CORPORATE BONDS — 86.8% |
|
|
| Argentina — 0.2% | | |
| YPF SA, 8.50%, 7/28/25 | $ | 500,000 | | $ | 405,380 | |
YPF SA, 4.00%, 2/12/26(1) | 168,000 | | 144,895 | |
YPF SA, 1.50%, 9/30/33(1) | 1,200,000 | | 671,226 | |
| | 1,221,501 | |
| Austria — 0.6% | | |
Iochpe-Maxion Austria GmbH / Maxion Wheels de Mexico S de RL de CV, 5.00%, 5/7/28(1) | 4,050,000 | | 3,951,463 | |
| Brazil — 10.7% | | |
| Azul Investments LLP, 5.875%, 10/26/24 | 3,000,000 | | 2,787,675 | |
Azul Investments LLP, 7.25%, 6/15/26(1)(2) | 2,000,000 | | 1,858,310 | |
B2W Digital Lux Sarl, 4.375%, 12/20/30(1) | 3,800,000 | | 3,539,054 | |
Banco BTG Pactual SA, 4.50%, 1/10/25(1) | 1,400,000 | | 1,424,500 | |
| Banco BTG Pactual SA, 4.50%, 1/10/25 | 500,000 | | 508,750 | |
CSN Inova Ventures, 6.75%, 1/28/28(1) | 4,900,000 | | 5,209,925 | |
| CSN Resources SA, 7.625%, 4/17/26 | 1,500,000 | | 1,580,265 | |
Embraer Netherlands Finance BV, 6.95%, 1/17/28(1) | 6,000,000 | | 6,665,040 | |
| Embraer Overseas Ltd., 5.70%, 9/16/23 | 2,000,000 | | 2,110,820 | |
FS Luxembourg Sarl, 10.00%, 12/15/25(1) | 1,000,000 | | 1,104,130 | |
Gol Finance SA, 8.00%, 6/30/26(1) | 1,000,000 | | 968,225 | |
| GTL Trade Finance, Inc., 7.25%, 4/16/44 | 1,700,000 | | 2,257,192 | |
Guara Norte Sarl, 5.20%, 6/15/34(1) | 7,268,946 | | 7,134,398 | |
GUSAP III LP, 4.25%, 1/21/30(1)(2) | 5,000,000 | | 5,265,825 | |
Itau Unibanco Holding SA, VRN, 4.50%, 11/21/29(1) | 4,000,000 | | 3,995,040 | |
Itau Unibanco Holding SA, VRN, 3.875%, 4/15/31(1) | 400,000 | | 384,940 | |
| JBS USA Food Co., 5.75%, 1/15/28 | 1,900,000 | | 1,983,144 | |
JSM Global Sarl, 4.75%, 10/20/30(1) | 3,000,000 | | 2,861,280 | |
Klabin Austria GmbH, 5.75%, 4/3/29(2) | 2,000,000 | | 2,180,000 | |
MARB BondCo plc, 3.95%, 1/29/31(1) | 4,650,000 | | 4,428,916 | |
MC Brazil Downstream Trading SARL, 7.25%, 6/30/31(1) | 3,371,000 | | 3,286,725 | |
| NBM US Holdings, Inc., 7.00%, 5/14/26 | 1,000,000 | | 1,059,750 | |
| NBM US Holdings, Inc., 6.625%, 8/6/29 | 2,000,000 | | 2,180,020 | |
| Petrobras Global Finance BV, 6.875%, 1/20/40 | 3,000,000 | | 3,264,810 | |
| Petrobras Global Finance BV, 5.50%, 6/10/51 | 2,800,000 | | 2,462,656 | |
Simpar Europe SA, 5.20%, 1/26/31(1) | 3,800,000 | | 3,661,965 | |
| Suzano Austria GmbH, 3.125%, 1/15/32 | 1,000,000 | | 946,135 | |
Tupy Overseas SA, 4.50%, 2/16/31(1) | 2,000,000 | | 1,890,120 | |
| | 76,999,610 | |
| Chile — 3.5% | | |
Alfa Desarrollo SpA, 4.55%, 9/27/51(1) | 2,900,000 | | 2,837,839 | |
| Celulosa Arauco y Constitucion SA, 4.25%, 4/30/29 | 2,000,000 | | 2,125,070 | |
Empresa Nacional de Telecomunicaciones SA, 3.05%, 9/14/32(1) | 2,700,000 | | 2,639,115 | |
Engie Energia Chile SA, 3.40%, 1/28/30(1) | 2,000,000 | | 2,012,530 | |
Falabella SA, 3.375%, 1/15/32(1) | 1,800,000 | | 1,788,750 | |
Interchile SA, 4.50%, 6/30/56(1) | 1,000,000 | | 1,055,940 | |
Kenbourne Invest SA, 6.875%, 11/26/24(1) | 3,750,000 | | 3,914,062 | |
| | | | | | | | |
| Shares/
Principal Amount | Value |
Kenbourne Invest SA, 4.70%, 1/22/28(1) | $ | 2,800,000 | | $ | 2,789,500 | |
VTR Comunicaciones SpA, 4.375%, 4/15/29(1) | 2,000,000 | | 2,019,400 | |
VTR Finance NV, 6.375%, 7/15/28(1) | 4,000,000 | | 4,268,800 | |
| | 25,451,006 | |
| China — 2.8% | | |
| Country Garden Holdings Co. Ltd., 3.875%, 10/22/30 | 2,000,000 | | 1,840,381 | |
| Huarong Finance 2019 Co. Ltd., MTN, 2.50%, 2/24/23 | 1,500,000 | | 1,449,375 | |
| Logan Group Co. Ltd., 6.90%, 6/9/24 | 1,450,000 | | 1,416,729 | |
Meituan, 2.125%, 10/28/25(1)(2) | 5,300,000 | | 5,113,412 | |
| Shimao Group Holdings Ltd., 4.75%, 7/3/22 | 1,000,000 | | 966,419 | |
Tencent Holdings Ltd., MTN, 3.24%, 6/3/50(2) | 2,000,000 | | 1,943,716 | |
| Vanke Real Estate Hong Kong Co. Ltd., MTN, 5.35%, 3/11/24 | 1,000,000 | | 1,072,819 | |
| Vanke Real Estate Hong Kong Co. Ltd., MTN, 3.50%, 11/12/29 | 400,000 | | 398,462 | |
| Weibo Corp., 3.375%, 7/8/30 | 6,100,000 | | 6,030,446 | |
| | 20,231,759 | |
| Colombia — 5.8% | | |
| AI Candelaria Spain SLU, 7.50%, 12/15/28 | 3,000,000 | | 3,232,500 | |
Banco GNB Sudameris SA, VRN, 7.50%, 4/16/31(1) | 4,050,000 | | 4,106,821 | |
| Bancolombia SA, VRN, 4.625%, 12/18/29 | 1,500,000 | | 1,530,000 | |
| Ecopetrol SA, 6.875%, 4/29/30 | 3,200,000 | | 3,700,512 | |
Ecopetrol SA, 4.625%, 11/2/31(3) | 1,060,000 | | 1,053,529 | |
| Ecopetrol SA, 5.875%, 5/28/45 | 3,150,000 | | 3,193,943 | |
Ecopetrol SA, 5.875%, 11/2/51(3) | 900,000 | | 894,632 | |
| Geopark Ltd., 6.50%, 9/21/24 | 3,014,000 | | 3,107,886 | |
Geopark Ltd., 5.50%, 1/17/27(1)(2) | 6,918,000 | | 6,882,199 | |
| Grupo de Inversiones Suramericana SA, 5.50%, 4/29/26 | 2,700,000 | | 2,920,752 | |
| Millicom International Cellular SA, 6.25%, 3/25/29 | 1,800,000 | | 1,959,750 | |
Millicom International Cellular SA, 4.50%, 4/27/31(1) | 3,000,000 | | 3,082,560 | |
Oleoducto Central SA, 4.00%, 7/14/27(1) | 3,800,000 | | 3,892,283 | |
Promigas SA ESP / Gases del Pacifico SAC, 3.75%, 10/16/29(1) | 2,000,000 | | 1,992,140 | |
| | 41,549,507 | |
| Ghana — 1.5% | | |
Kosmos Energy Ltd., 7.125%, 4/4/26(1)(2) | 4,092,000 | | 4,088,542 | |
Kosmos Energy Ltd., 7.50%, 3/1/28(1)(2) | 2,800,000 | | 2,748,634 | |
Tullow Oil plc, 10.25%, 5/15/26(1) | 3,500,000 | | 3,692,133 | |
| | 10,529,309 | |
| Hong Kong — 0.2% | | |
CK Hutchison International 20 Ltd., 2.50%, 5/8/30(1) | 1,500,000 | | 1,511,400 | |
| India — 6.9% | | |
Adani Electricity Mumbai Ltd., 3.95%, 2/12/30(1) | 2,000,000 | | 1,983,780 | |
Adani Green Energy Ltd., 4.375%, 9/8/24(1) | 1,800,000 | | 1,824,483 | |
| Adani Ports & Special Economic Zone Ltd., 4.00%, 7/30/27 | 2,800,000 | | 2,881,557 | |
Adani Ports & Special Economic Zone Ltd., 4.20%, 8/4/27(1) | 3,900,000 | | 4,039,487 | |
Adani Ports & Special Economic Zone Ltd., 3.10%, 2/2/31(1) | 2,000,000 | | 1,908,435 | |
Adani Ports & Special Economic Zone Ltd., 3.83%, 2/2/32(1) | 2,000,000 | | 1,984,600 | |
Adani Transmission Ltd., 4.25%, 5/21/36(1) | 2,992,000 | | 3,041,086 | |
Azure Power Solar Energy Pvt Ltd., 5.65%, 12/24/24(1) | 1,050,000 | | 1,105,125 | |
Continuum Energy Levanter Pte Ltd., 4.50%, 2/9/27(1) | 4,267,750 | | 4,385,113 | |
Delhi International Airport Ltd., 6.45%, 6/4/29(1) | 3,000,000 | | 2,978,580 | |
| GMR Hyderabad International Airport Ltd., 5.375%, 4/10/24 | 2,000,000 | | 2,060,397 | |
GMR Hyderabad International Airport Ltd., 4.75%, 2/2/26(1) | 800,000 | | 808,231 | |
| | | | | | | | |
| Shares/
Principal Amount | Value |
Greenko Dutch BV, 3.85%, 3/29/26(1) | $ | 2,167,000 | | $ | 2,191,162 | |
Greenko Investment Co., 4.875%, 8/16/23(1) | 3,300,000 | | 3,335,064 | |
| Greenko Solar Mauritius Ltd., 5.95%, 7/29/26 | 1,000,000 | | 1,057,102 | |
| ICICI Bank Ltd., MTN, 4.00%, 3/18/26 | 3,625,000 | | 3,882,400 | |
Indian Railway Finance Corp. Ltd., 2.80%, 2/10/31(1) | 3,000,000 | | 2,900,579 | |
ReNew Wind Energy AP2 / ReNew Power Pvt Ltd. other 9 Subsidiaries, 4.50%, 7/14/28(1) | 1,000,000 | | 1,017,186 | |
Vedanta Resources Finance II plc, 8.95%, 3/11/25(1) | 6,000,000 | | 6,099,060 | |
| | 49,483,427 | |
| Indonesia — 5.3% | | |
| Cikarang Listrindo Tbk PT, 4.95%, 9/14/26 | 6,901,000 | | 7,068,349 | |
| Indika Energy Capital III Pte Ltd., 5.875%, 11/9/24 | 1,000,000 | | 1,016,750 | |
Indika Energy Capital IV Pte Ltd., 8.25%, 10/22/25(1) | 5,000,000 | | 5,309,375 | |
Indonesia Asahan Aluminium Persero PT, 5.45%, 5/15/30(1) | 5,000,000 | | 5,721,900 | |
Indonesia Asahan Aluminium Persero PT, 5.80%, 5/15/50(1) | 3,250,000 | | 3,807,245 | |
Medco Bell Pte Ltd., 6.375%, 1/30/27(1) | 2,500,000 | | 2,564,375 | |
| Medco Oak Tree Pte Ltd., 7.375%, 5/14/26 | 1,500,000 | | 1,610,625 | |
| Medco Platinum Road Pte Ltd., 6.75%, 1/30/25 | 2,700,000 | | 2,819,894 | |
Perusahaan Perseroan (Persero) PT Perusahaan Listrik Negara, 6.25%, 1/25/49(2) | 1,000,000 | | 1,254,145 | |
Perusahaan Perseroan (Persero) PT Perusahaan Listrik Negara, 4.875%, 7/17/49(2) | 4,000,000 | | 4,251,280 | |
| Perusahaan Perseroan (Persero) PT Perusahaan Listrik Negara, MTN, 3.00%, 6/30/30 | 2,000,000 | | 1,988,090 | |
| Star Energy Geothermal Wayang Windu Ltd., 6.75%, 4/24/33 | 838,700 | | 938,509 | |
| | 38,350,537 | |
| Ireland — 0.1% | | |
Aragvi Finance International DAC, 8.45%, 4/29/26(1) | 1,000,000 | | 1,034,117 | |
| Israel — 3.8% | | |
| Altice Financing SA, 5.00%, 1/15/28 | 2,000,000 | | 1,929,740 | |
Altice Financing SA, 5.00%, 1/15/28(1) | 5,500,000 | | 5,306,785 | |
Energean Israel Finance Ltd., 4.50%, 3/30/24(1) | 9,907,000 | | 10,132,409 | |
Leviathan Bond Ltd., 5.75%, 6/30/23(1) | 3,500,000 | | 3,639,305 | |
| Teva Pharmaceutical Finance Netherlands III BV, 2.80%, 7/21/23 | 2,950,000 | | 2,975,223 | |
| Teva Pharmaceutical Finance Netherlands III BV, 6.00%, 4/15/24 | 2,000,000 | | 2,100,000 | |
| Teva Pharmaceutical Finance Netherlands III BV, 7.125%, 1/31/25 | 1,500,000 | | 1,612,035 | |
| | 27,695,497 | |
| Jamaica — 0.4% | | |
Digicel International Finance Ltd. / Digicel International Holdings Ltd., 8.75%, 5/25/24(1) | 3,000,000 | | 3,116,250 | |
| Kazakhstan — 0.6% | | |
| KazMunayGas National Co. JSC, 4.75%, 4/19/27 | 2,500,000 | | 2,779,234 | |
| KazMunayGas National Co. JSC, 5.75%, 4/19/47 | 1,500,000 | | 1,814,239 | |
| | 4,593,473 | |
| Kuwait — 0.3% | | |
Equate Petrochemical BV, 2.625%, 4/28/28(1) | 1,000,000 | | 1,000,111 | |
| Kuwait Projects Co. SPC Ltd., 5.00%, 3/15/23 | 1,350,000 | | 1,353,794 | |
| | 2,353,905 | |
| Luxembourg — 0.6% | | |
Petrorio Luxembourg Sarl, 6.125%, 6/9/26(1) | 4,300,000 | | 4,337,625 | |
| Macau — 2.3% | | |
Melco Resorts Finance Ltd., 5.75%, 7/21/28(1) | 5,500,000 | | 5,486,250 | |
| | | | | | | | |
| Shares/
Principal Amount | Value |
| Sands China Ltd., 5.125%, 8/8/25 | $ | 3,300,000 | | $ | 3,511,695 | |
| Sands China Ltd., 5.40%, 8/8/28 | 2,000,000 | | 2,163,000 | |
Studio City Finance Ltd., 5.00%, 1/15/29(1) | 5,000,000 | | 4,534,225 | |
Wynn Macau Ltd., 5.50%, 1/15/26(1) | 500,000 | | 470,945 | |
Wynn Macau Ltd., 5.625%, 8/26/28(1) | 700,000 | | 654,731 | |
| | 16,820,846 | |
| Mauritius — 0.4% | | |
India Toll Roads, 5.50%, 8/19/24(1) | 3,000,000 | | 2,970,180 | |
| Mexico — 10.6% | | |
Axtel SAB de CV, 6.375%, 11/14/24(1) | 4,759,000 | | 4,914,905 | |
BBVA Bancomer SA, VRN, 5.125%, 1/18/33(1) | 7,000,000 | | 7,229,915 | |
BBVA Bancomer SA, VRN, 5.875%, 9/13/34(1) | 2,700,000 | | 2,940,259 | |
Braskem Idesa SAPI, 6.99%, 2/20/32(1) | 3,200,000 | | 3,280,000 | |
| Cemex SAB de CV, 5.45%, 11/19/29 | 2,000,000 | | 2,168,900 | |
Cemex SAB de CV, 3.875%, 7/11/31(1) | 5,000,000 | | 5,024,750 | |
Cemex SAB de CV, VRN, 5.125%, 6/8/26(1) | 4,000,000 | | 4,137,696 | |
Cometa Energia SA de CV, 6.375%, 4/24/35(1) | 2,921,750 | | 3,323,505 | |
Comision Federal de Electricidad, 3.875%, 7/26/33(1) | 4,300,000 | | 4,157,842 | |
FEL Energy VI Sarl, 5.75%, 12/1/40(1) | 7,519,305 | | 7,452,232 | |
Fresnillo plc, 4.25%, 10/2/50(1)(2) | 800,000 | | 819,152 | |
Industrias Penoles SAB de CV, 4.75%, 8/6/50(1)(2) | 1,750,000 | | 1,901,384 | |
| Infraestructura Energetica Nova SAB de CV, 4.875%, 1/14/48 | 1,500,000 | | 1,535,978 | |
Infraestructura Energetica Nova SAB de CV, 4.75%, 1/15/51(1) | 4,300,000 | | 4,397,051 | |
| Infraestructura Energetica Nova SAB de CV, 4.75%, 1/15/51 | 500,000 | | 511,285 | |
Minera Mexico SA de CV, 4.50%, 1/26/50(1) | 2,650,000 | | 2,899,074 | |
Operadora de Servicios Mega SA de CV Sofom ER, 8.25%, 2/11/25(1) | 3,750,000 | | 3,682,387 | |
Petroleos Mexicanos, 6.875%, 10/16/25(1) | 850,000 | | 929,713 | |
| Petroleos Mexicanos, 6.49%, 1/23/27 | 2,200,000 | | 2,341,680 | |
| Petroleos Mexicanos, 6.50%, 3/13/27 | 3,300,000 | | 3,522,354 | |
| Petroleos Mexicanos, 5.35%, 2/12/28 | 2,000,000 | | 1,998,950 | |
| Petroleos Mexicanos, 5.95%, 1/28/31 | 2,000,000 | | 1,971,650 | |
| Petroleos Mexicanos, 6.50%, 6/2/41 | 3,400,000 | | 3,084,140 | |
| Sigma Finance Netherlands BV, 4.875%, 3/27/28 | 2,000,000 | | 2,237,520 | |
| | 76,462,322 | |
| Morocco — 1.0% | | |
| OCP SA, 6.875%, 4/25/44 | 5,900,000 | | 7,101,765 | |
| Nigeria — 2.0% | | |
| IHS Netherlands Holdco BV, 7.125%, 3/18/25 | 4,000,000 | | 4,145,000 | |
IHS Netherlands Holdco BV, 8.00%, 9/18/27(1) | 6,000,000 | | 6,390,000 | |
SEPLAT Energy plc, 7.75%, 4/1/26(1) | 4,000,000 | | 4,126,000 | |
| | 14,661,000 | |
| Panama — 2.5% | | |
AES Panama Generation Holdings SRL, 4.375%, 5/31/30(1) | 2,000,000 | | 2,064,860 | |
C&W Senior Financing DAC, 6.875%, 9/15/27(1) | 9,095,000 | | 9,595,225 | |
Cable Onda SA, 4.50%, 1/30/30(1) | 5,950,000 | | 6,179,819 | |
| | 17,839,904 | |
| Peru — 4.5% | | |
| Banco Internacional del Peru SAA Interbank, 3.25%, 10/4/26 | 1,000,000 | | 1,025,450 | |
| Banco Internacional del Peru SAA Interbank, VRN, 6.625%, 3/19/29 | 200,000 | | 213,776 | |
| | | | | | | | |
| Shares/
Principal Amount | Value |
Banco Internacional del Peru SAA Interbank, VRN, 4.00%, 7/8/30(1) | $ | 2,000,000 | | $ | 2,022,200 | |
| Fenix Power Peru SA, 4.32%, 9/20/27 | 1,487,647 | | 1,515,593 | |
| Inkia Energy Ltd., 5.875%, 11/9/27 | 8,700,000 | | 9,060,093 | |
Intercorp Financial Services, Inc., 4.125%, 10/19/27(1) | 4,960,000 | | 4,976,566 | |
| Kallpa Generacion SA, 4.875%, 5/24/26 | 2,000,000 | | 2,135,110 | |
| Kallpa Generacion SA, 4.125%, 8/16/27 | 2,904,000 | | 3,020,349 | |
Minsur SA, 4.50%, 10/28/31(1) | 600,000 | | 592,785 | |
Nexa Resources SA, 5.375%, 5/4/27(2) | 1,500,000 | | 1,595,655 | |
| Petroleos del Peru SA, 4.75%, 6/19/32 | 1,000,000 | | 1,058,065 | |
Petroleos del Peru SA, 5.625%, 6/19/47(1) | 2,900,000 | | 2,947,473 | |
SAN Miguel Industrias Pet SA / NG PET R&P Latin America SA, 3.50%, 8/2/28(1) | 2,000,000 | | 1,969,760 | |
| | 32,132,875 | |
| Qatar — 0.4% | | |
Nakilat, Inc., 6.07%, 12/31/33(1) | 974,151 | | 1,194,411 | |
| Nakilat, Inc., 6.27%, 12/31/33 | 526,455 | | 655,337 | |
Ooredoo International Finance Ltd., 2.625%, 4/8/31(1) | 400,000 | | 404,570 | |
| Ooredoo International Finance Ltd., MTN, 5.00%, 10/19/25 | 300,000 | | 341,594 | |
| | 2,595,912 | |
| Russia — 2.2% | | |
| Gazprom PJSC Via Gaz Capital SA, 4.95%, 3/23/27 | 1,600,000 | | 1,764,216 | |
| Gazprom PJSC Via Gaz Capital SA, MTN, 7.29%, 8/16/37 | 1,450,000 | | 1,961,292 | |
Gazprom PJSC via Gaz Finance plc, 3.25%, 2/25/30(1) | 3,700,000 | | 3,663,374 | |
Lukoil Capital DAC, 3.60%, 10/26/31(1) | 896,000 | | 895,074 | |
| Lukoil Securities BV, 3.875%, 5/6/30 | 2,000,000 | | 2,078,500 | |
Lukoil Securities BV, 3.875%, 5/6/30(1) | 1,500,000 | | 1,558,875 | |
VEON Holdings BV, 3.375%, 11/25/27(1) | 4,000,000 | | 4,016,460 | |
| | 15,937,791 | |
| Saudi Arabia — 3.2% | | |
| Dar Al-Arkan Sukuk Co. Ltd., 6.875%, 3/21/23 | 3,800,000 | | 3,964,251 | |
| Dar Al-Arkan Sukuk Co. Ltd., 6.875%, 2/26/27 | 1,000,000 | | 1,051,307 | |
| Dar Al-Arkan Sukuk Co. Ltd., MTN, 6.875%, 4/10/22 | 1,000,000 | | 1,019,734 | |
SA Global Sukuk Ltd., 2.69%, 6/17/31(1) | 1,290,000 | | 1,294,386 | |
SABIC Capital II BV, 4.50%, 10/10/28(1) | 4,300,000 | | 4,892,510 | |
Saudi Arabian Oil Co., 3.50%, 4/16/29(1) | 2,700,000 | | 2,887,183 | |
| Saudi Arabian Oil Co., MTN, 4.25%, 4/16/39 | 4,200,000 | | 4,719,523 | |
| Saudi Electricity Global Sukuk Co. 4, 4.72%, 9/27/28 | 2,900,000 | | 3,374,389 | |
| | 23,203,283 | |
| Singapore — 0.7% | | |
| BOC Aviation Ltd., MTN, 2.625%, 9/17/30 | 1,000,000 | | 981,651 | |
BOC Aviation USA Corp., 1.625%, 4/29/24(1) | 2,000,000 | | 2,004,125 | |
United Overseas Bank Ltd., VRN, 2.00%, 10/14/31(1) | 2,000,000 | | 1,990,690 | |
| | 4,976,466 | |
| South Africa — 3.4% | | |
| AngloGold Ashanti Holdings plc, 6.50%, 4/15/40 | 2,000,000 | | 2,434,940 | |
Liquid Telecommunications Financing plc, 5.50%, 9/4/26(1) | 1,500,000 | | 1,563,540 | |
| MTN Mauritius Investments Ltd., 4.76%, 11/11/24 | 3,125,000 | | 3,277,962 | |
Prosus NV, 3.68%, 1/21/30(1) | 6,950,000 | | 7,151,415 | |
| Prosus NV, 3.83%, 2/8/51 | 2,000,000 | | 1,816,853 | |
| SASOL Financing USA LLC, 5.875%, 3/27/24 | 3,000,000 | | 3,174,750 | |
| Sasol Financing USA LLC, 5.50%, 3/18/31 | 5,000,000 | | 5,142,750 | |
| | 24,562,210 | |
| | | | | | | | |
| Shares/
Principal Amount | Value |
| South Korea — 0.1% | | |
Shinhan Financial Group Co. Ltd., VRN, 3.34%, 2/5/30(1) | $ | 1,000,000 | | $ | 1,033,858 | |
| Spain — 0.8% | | |
EnfraGen Energia Sur SA / EnfraGen Spain SA / Prime Energia SpA, 5.375%, 12/30/30(1) | 6,000,000 | | 5,754,090 | |
| Tanzania, United Republic Of — 1.0% | | |
HTA Group Ltd., 7.00%, 12/18/25(1) | 6,700,000 | | 7,029,774 | |
| Thailand — 0.4% | | |
Thaioil Treasury Center Co. Ltd., 3.50%, 10/17/49(1) | 3,000,000 | | 2,666,924 | |
| Turkey — 0.9% | | |
| KOC Holding AS, 5.25%, 3/15/23 | 3,300,000 | | 3,373,550 | |
| Turk Telekomunikasyon AS, 4.875%, 6/19/24 | 1,500,000 | | 1,535,359 | |
Turkiye Sise ve Cam Fabrikalari AS, 6.95%, 3/14/26(1) | 1,700,000 | | 1,841,957 | |
| | 6,750,866 | |
| Ukraine — 2.3% | | |
Kernel Holding SA, 6.50%, 10/17/24(1) | 1,850,000 | | 1,966,045 | |
Kernel Holding SA, 6.75%, 10/27/27(1) | 1,250,000 | | 1,330,132 | |
Metinvest BV, 7.65%, 10/1/27(1) | 2,000,000 | | 2,202,370 | |
Metinvest BV, 7.75%, 10/17/29(1) | 2,000,000 | | 2,183,200 | |
| MHP Lux SA, 6.95%, 4/3/26 | 1,000,000 | | 1,066,064 | |
MHP SE, 7.75%, 5/10/24(1) | 3,200,000 | | 3,460,819 | |
| VF Ukraine PAT via VFU Funding plc, 6.20%, 2/11/25 | 4,000,000 | | 4,146,262 | |
| | 16,354,892 | |
| United Arab Emirates — 0.5% | | |
Abu Dhabi National Energy Co. PJSC, 2.00%, 4/29/28(1) | 240,000 | | 239,391 | |
Abu Dhabi National Energy Co. PJSC, 4.875%, 4/23/30(1) | 2,000,000 | | 2,380,100 | |
DP World Ltd., 4.70%, 9/30/49(1) | 1,000,000 | | 1,083,569 | |
| | 3,703,060 | |
| United Arab Emirates — 1.9% | | |
DAE Funding LLC, 1.55%, 8/1/24(1) | 3,150,000 | | 3,111,412 | |
| DP World Crescent Ltd., MTN, 4.85%, 9/26/28 | 1,600,000 | | 1,802,284 | |
| DP World Crescent Ltd., MTN, 3.875%, 7/18/29 | 4,600,000 | | 4,902,681 | |
Galaxy Pipeline Assets Bidco Ltd., 2.625%, 3/31/36(1) | 3,000,000 | | 2,929,970 | |
Galaxy Pipeline Assets Bidco Ltd., 2.94%, 9/30/40(1) | 1,150,000 | | 1,133,065 | |
| | 13,879,412 | |
| United Kingdom — 0.1% | | |
Endeavour Mining plc, 5.00%, 10/14/26(1) | 1,000,000 | | 1,010,950 | |
| United States — 1.0% | | |
JBS Finance Luxembourg Sarl, 3.625%, 1/15/32(1) | 1,500,000 | | 1,483,005 | |
LCPR Senior Secured Financing DAC, 6.75%, 10/15/27(1) | 1,000,000 | | 1,051,250 | |
SierraCol Energy Andina LLC, 6.00%, 6/15/28(1) | 5,000,000 | | 4,913,550 | |
| | 7,447,805 | |
| Zambia — 1.3% | | |
First Quantum Minerals Ltd., 6.50%, 3/1/24(1) | 3,200,000 | | 3,252,000 | |
| First Quantum Minerals Ltd., 6.875%, 3/1/26 | 4,500,000 | | 4,691,250 | |
First Quantum Minerals Ltd., 6.875%, 10/15/27(1) | 1,000,000 | | 1,068,750 | |
| | 9,012,000 | |
TOTAL CORPORATE BONDS (Cost $617,315,015) | | 626,318,571 | |
| SOVEREIGN GOVERNMENTS AND AGENCIES — 4.2% |
|
|
| Brazil — 0.5% | | |
| Brazilian Government International Bond, 3.875%, 6/12/30 | 2,000,000 | | 1,880,080 | |
| | | | | | | | |
| Shares/
Principal Amount | Value |
| Brazilian Government International Bond, 4.75%, 1/14/50 | $ | 2,000,000 | | $ | 1,712,880 | |
| | 3,592,960 | |
| Colombia — 0.5% | | |
| Colombia Government International Bond, 3.125%, 4/15/31 | 500,000 | | 469,140 | |
| Colombia Government International Bond, 6.125%, 1/18/41 | 3,000,000 | | 3,341,235 | |
| | 3,810,375 | |
| Dominican Republic — 0.5% | | |
| Dominican Republic International Bond, 5.95%, 1/25/27 | 2,500,000 | | 2,793,775 | |
Dominican Republic International Bond, 4.50%, 1/30/30(1) | 1,000,000 | | 1,015,010 | |
| | 3,808,785 | |
| El Salvador — 0.1% | | |
| El Salvador Government International Bond, 6.375%, 1/18/27 | 1,100,000 | | 852,500 | |
| India — 0.2% | | |
| Export-Import Bank of India, 3.375%, 8/5/26 | 613,000 | | 645,896 | |
| Export-Import Bank of India, 3.875%, 2/1/28 | 400,000 | | 429,228 | |
| | 1,075,124 | |
Jordan† | | |
Jordan Government International Bond, 7.375%, 10/10/47(1) | 200,000 | | 207,464 | |
| Nigeria — 0.5% | | |
| Nigeria Government International Bond, MTN, 6.50%, 11/28/27 | 3,100,000 | | 3,180,755 | |
| Oman — 0.6% | | |
| Oman Government International Bond, MTN, 6.00%, 8/1/29 | 1,000,000 | | 1,075,885 | |
Oman Sovereign Sukuk Co., 4.875%, 6/15/30(1) | 2,800,000 | | 2,985,808 | |
| | 4,061,693 | |
| Saudi Arabia — 0.3% | | |
Saudi Government International Bond, 2.25%, 2/2/33(1) | 2,500,000 | | 2,416,748 | |
| Turkey — 0.9% | | |
| Turkey Government International Bond, 5.60%, 11/14/24 | 1,600,000 | | 1,614,846 | |
| Turkey Government International Bond, 4.875%, 10/9/26 | 2,000,000 | | 1,901,564 | |
| Turkey Government International Bond, 5.125%, 2/17/28 | 1,000,000 | | 940,995 | |
| Turkey Government International Bond, 6.875%, 3/17/36 | 2,000,000 | | 1,941,404 | |
| | 6,398,809 | |
| Ukraine — 0.1% | | |
Ukraine Government International Bond, 7.25%, 3/15/33(1) | 750,000 | | 765,683 | |
TOTAL SOVEREIGN GOVERNMENTS AND AGENCIES
(Cost $30,819,621) | | 30,170,896 | |
| PREFERRED STOCKS — 2.5% |
|
|
| Brazil — 0.4% | | |
| Banco do Brasil SA, 6.25% | 3,000,000 | | 2,953,710 | |
| India — 0.4% | | |
Network i2i Ltd., 3.98%(1) | 3,000,000 | | 3,030,255 | |
| Mexico — 1.3% | | |
| Banco Mercantil del Norte SA, 6.875% | 1,855,000 | | 1,886,303 | |
Banco Mercantil del Norte SA, 8.375%(1) | 6,100,000 | | 7,139,196 | |
| | 9,025,499 | |
| Russia — 0.2% | | |
| Gazprom PJSC via Gaz Finance plc, 4.60% | 1,000,000 | | 1,040,000 | |
| United Arab Emirates — 0.2% | | |
| DP World Salaam, 6.00% | 1,500,000 | | 1,643,040 | |
TOTAL PREFERRED STOCKS (Cost $17,046,735) | | 17,692,504 | |
| | | | | | | | |
| Shares/
Principal Amount | Value |
| U.S. TREASURY SECURITIES — 1.3% |
|
|
| U.S. Treasury Bonds, 2.00%, 8/15/51 | $ | 2,000,000 | | $ | 2,029,062 | |
U.S. Treasury Notes, 2.875%, 8/15/28(4) | 3,885,000 | | 4,249,902 | |
| U.S. Treasury Notes, 1.25%, 8/15/31 | 3,000,000 | | 2,915,625 | |
TOTAL U.S. TREASURY SECURITIES (Cost $9,339,678) | | 9,194,589 | |
| EXCHANGE-TRADED FUNDS — 0.1% |
|
|
Energy Select Sector SPDR Fund (Cost $451,837) | 16,000 | | 919,520 | |
TEMPORARY CASH INVESTMENTS(5) — 4.2% |
|
|
| Repurchase Agreement, BMO Capital Markets Corp., (collateralized by various U.S. Treasury obligations, 2.00%, 11/15/26, valued at $6,861,336), in a joint trading account at 0.01%, dated 10/29/21, due 11/1/21 (Delivery value $6,718,635) | | 6,718,629 | |
| Repurchase Agreement, Fixed Income Clearing Corp., (collateralized by various U.S. Treasury obligations, 4.75%, 2/15/41, valued at $22,846,084), at 0.01%, dated 10/29/21, due 11/1/21 (Delivery value $22,398,019) | | 22,398,000 | |
| State Street Institutional U.S. Government Money Market Fund, Premier Class | 1,549,327 | | 1,549,327 | |
TOTAL TEMPORARY CASH INVESTMENTS (Cost $30,665,956) | | 30,665,956 | |
TEMPORARY CASH INVESTMENTS - SECURITIES LENDING COLLATERAL(6) — 2.8% |
State Street Navigator Securities Lending Government Money Market Portfolio (Cost $20,479,520) | 20,479,520 | | 20,479,520 | |
TOTAL INVESTMENT SECURITIES — 101.9% (Cost $726,118,362) |
| 735,441,556 | |
| OTHER ASSETS AND LIABILITIES — (1.9)% |
| (13,767,022) | |
| TOTAL NET ASSETS — 100.0% |
| $ | 721,674,534 | |
| | | | | | | | | | | | | | |
| FUTURES CONTRACTS PURCHASED |
| Reference Entity | Contracts | Expiration
Date | Notional
Amount | Unrealized
Appreciation
(Depreciation)^ |
| U.S. Treasury 2-Year Notes | 243 | December 2021 | $ | 53,277,750 | | $ | (254,794) | |
| U.S. Treasury 5-Year Notes | 201 | December 2021 | 24,471,750 | | (375,697) | |
| U.S. Treasury Long Bonds | 1 | December 2021 | 160,844 | | (2,558) | |
| | | $ | 77,910,344 | | $ | (633,049) | |
^Amount represents value and unrealized appreciation (depreciation).
| | | | | | | | | | | | | | |
| FUTURES CONTRACTS SOLD |
| Reference Entity | Contracts | Expiration
Date | Notional
Amount | Unrealized
Appreciation
(Depreciation)^ |
| U.S. Treasury 10-Year Notes | 382 | December 2021 | $ | 49,928,594 | | $ | 1,073,630 | |
| U.S. Treasury 10-Year Ultra Notes | 281 | December 2021 | 40,753,781 | | 846,843 | |
| U.S. Treasury Ultra Bonds | 46 | December 2021 | 9,034,688 | | 67,173 | |
| | | $ | 99,717,063 | | $ | 1,987,646 | |
^Amount represents value and unrealized appreciation (depreciation).
| | | | | | | | | | | | | | | | | | | | | | | |
| CENTRALLY CLEARED CREDIT DEFAULT SWAP AGREEMENTS |
| Reference Entity | Type | Fixed Rate
Received
(Paid)
Quarterly | Termination
Date | Notional
Amount | Premiums Paid
(Received) | Unrealized
Appreciation
(Depreciation) | Value^ |
| Markit CDX North America High Yield Index Series 34 | Buy | (5.00)% | 6/20/25 | $ | 4,968,000 | | $ | (155,800) | | $ | (289,442) | | $ | (445,242) | |
^The value for credit default swap agreements serves as an indicator of the current status of the payment/performance risk and represent the likelihood of an expected liability or profit at the period end. Increasing values in absolute terms when compared to the notional amount of the credit default swap agreement represent a deterioration of the referenced entity's credit soundness and an increased likelihood or risk of a credit event occurring as defined in the agreement.
| | | | | | | | | | | | | | | | | | | | | | | |
| CREDIT DEFAULT SWAP AGREEMENTS |
Counterparty/ Reference Entity | Type | Fixed Rate Received (Paid) Quarterly | Termination Date | Notional Amount | Premiums Paid
(Received) | Unrealized Appreciation (Depreciation) | Value^ |
| Morgan Stanley/ Brazilian Government International Bond | Buy | (1.00)% | 12/20/26 | $ | 32,800,000 | | $ | 1,580,727 | | $ | 663,641 | | $ | 2,244,368 | |
| Morgan Stanley/ Colombia Government International Bond | Buy | (1.00)% | 12/20/26 | $ | 11,400,000 | | 276,789 | | 53,783 | | 330,572 | |
| Morgan Stanley/ Mexico Government International Bond | Buy | (1.00)% | 12/20/26 | $ | 50,300,000 | | (49,737) | | 70,209 | | 20,472 | |
| $ | 1,807,779 | | $ | 787,633 | | $ | 2,595,412 | |
^The value for credit default swap agreements serves as an indicator of the current status of the payment/performance risk and represent the likelihood of an expected liability or profit at the period end. Increasing values in absolute terms when compared to the notional amount of the credit default swap agreement represent a deterioration of the referenced entity's credit soundness and an increased likelihood or risk of a credit event occurring as defined in the agreement.
| | | | | | | | |
| NOTES TO SCHEDULE OF INVESTMENTS |
| CDX | - | Credit Derivatives Indexes |
| MTN | - | Medium Term Note |
| VRN | - | Variable Rate Note. The rate adjusts periodically based upon the terms set forth in the security’s offering documents. The rate shown is effective at the period end and the reference rate and spread, if any, is indicated. The security's effective maturity date may be shorter than the final maturity date shown. |
†Category is less than 0.05% of total net assets.
(1)Security was purchased pursuant to Rule 144A or Section 4(2) under the Securities Act of 1933 and may be sold in transactions exempt from registration, normally to qualified institutional investors. The aggregate value of these securities at the period end was $420,727,347, which represented 58.3% of total net assets.
(2)Security, or a portion thereof, is on loan. At the period end, the aggregate value of securities on loan was $19,831,427. The amount of securities on loan indicated may not correspond with the securities on loan identified because securities with pending sales are in the process of recall from the brokers.
(3)When-issued security. The issue price and yield are fixed on the date of the commitment, but payment and delivery are scheduled for a future date.
(4)Security, or a portion thereof, has been pledged at the custodian bank or with a broker for collateral requirements on futures contracts and/or swap agreements. At the period end, the aggregate value of securities pledged was $1,716,488.
(5)Category includes collateral received at the custodian bank for collateral requirements on swap agreements. At the period end, the aggregate value of cash deposits received was $2,300,000.
(6)Investment of cash collateral from securities on loan. At the period end, the aggregate value of the collateral held by the fund was $20,479,520.
See Notes to Financial Statements.
| | |
| Statement of Assets and Liabilities |
| | | | | |
| OCTOBER 31, 2021 | |
| Assets | |
| Investment securities, at value (cost of $705,638,842) — including $19,831,427 of securities on loan | $ | 714,962,036 | |
| Investment made with cash collateral received for securities on loan, at value (cost of $20,479,520) | 20,479,520 | |
| Total investment securities, at value (cost of $726,118,362) | 735,441,556 | |
| Receivable for investments sold | 30,045 | |
| Receivable for capital shares sold | 1,027,545 | |
| Receivable for variation margin on swap agreements | 10,430 | |
| Swap agreements, at value (including net premiums paid (received) of $1,807,779) | 2,595,412 | |
| Interest and dividends receivable | 8,191,187 | |
| Securities lending receivable | 5,633 | |
| 747,301,808 | |
| |
| Liabilities | |
| Payable for collateral received for securities on loan | 20,479,520 | |
| Payable for collateral received for swap agreements | 2,300,000 | |
| Payable for investments purchased | 2,279,853 | |
| Payable for capital shares redeemed | 402,345 | |
| Payable for variation margin on futures contracts | 53,547 | |
| Accrued management fees | 110,746 | |
| Distribution and service fees payable | 158 | |
| Dividends payable | 1,105 | |
| 25,627,274 | |
| |
| Net Assets | $ | 721,674,534 | |
| |
| Net Assets Consist of: | |
| Capital paid in | $ | 722,219,379 | |
| Distributable earnings | (544,845) | |
| $ | 721,674,534 | |
| | | | | | | | | | | |
| Net Assets | Shares Outstanding | Net Asset Value Per Share |
| Investor Class | $103,625,588 | 9,892,513 | $10.48 |
| I Class | $12,356,147 | 1,179,802 | $10.47 |
| Y Class | $26,538,687 | 2,533,663 | $10.47 |
| A Class | $270,896 | 25,885 | $10.47* |
| C Class | $36,316 | 3,476 | $10.45 |
| R Class | $161,434 | 15,430 | $10.46 |
| R5 Class | $8,259 | 788 | $10.48 |
| R6 Class | $350,337 | 33,439 | $10.48 |
| G Class | $578,326,870 | 55,214,050 | $10.47 |
*Maximum offering price $10.96 (net asset value divided by 0.955).
See Notes to Financial Statements.
| | | | | |
| YEAR ENDED OCTOBER 31, 2021 |
| Investment Income (Loss) | |
| Income: | |
| Interest (net of foreign taxes withheld of $6,293) | $ | 31,396,059 | |
| Dividends | 130,112 | |
| Securities lending, net | 58,615 | |
| 31,584,786 | |
| |
| Expenses: | |
| Management fees | 4,987,660 | |
| Distribution and service fees: | |
| A Class | 897 | |
| C Class | 399 | |
| R Class | 779 | |
| Trustees' fees and expenses | 44,350 | |
| Other expenses | 3,127 | |
| 5,037,212 | |
| Fees waived - G Class | (3,779,286) | |
| 1,257,926 | |
| |
| Net investment income (loss) | 30,326,860 | |
| |
| Realized and Unrealized Gain (Loss) | |
| Net realized gain (loss) on: | |
| Investment transactions | 8,224,176 | |
| Futures contract transactions | 343,491 | |
| Swap agreement transactions | (3,711,146) | |
| 4,856,521 | |
| |
| Change in net unrealized appreciation (depreciation) on: | |
| Investments | (2,325,154) | |
| Futures contracts | 960,169 | |
| Swap agreements | 1,324,911 | |
| (40,074) | |
| |
| Net realized and unrealized gain (loss) | 4,816,447 | |
| |
| Net Increase (Decrease) in Net Assets Resulting from Operations | $ | 35,143,307 | |
See Notes to Financial Statements.
| | |
| Statement of Changes in Net Assets |
| | | | | | | | |
| YEARS ENDED OCTOBER 31, 2021 AND OCTOBER 31, 2020 |
| Increase (Decrease) in Net Assets | October 31, 2021 | October 31, 2020 |
| Operations | | |
| Net investment income (loss) | $ | 30,326,860 | | $ | 18,169,864 | |
| Net realized gain (loss) | 4,856,521 | | (6,157,533) | |
| Change in net unrealized appreciation (depreciation) | (40,074) | | (787,549) | |
| Net increase (decrease) in net assets resulting from operations | 35,143,307 | | 11,224,782 | |
| | |
| Distributions to Shareholders | | |
| From earnings: | | |
| Investor Class | (3,602,033) | | (3,226,082) | |
| I Class | (261,282) | | (204,981) | |
| Y Class | (900,693) | | (539,319) | |
| A Class | (12,117) | | (11,442) | |
| C Class | (1,048) | | (1,203) | |
| R Class | (4,869) | | (3,820) | |
| R5 Class | (307) | | (288) | |
| R6 Class | (56,731) | | (328,277) | |
| G Class | (24,414,299) | | (13,127,583) | |
| Decrease in net assets from distributions | (29,253,379) | | (17,442,995) | |
| | |
| Capital Share Transactions | | |
| Net increase (decrease) in net assets from capital share transactions (Note 5) | 167,932,843 | | 171,319,312 | |
| | |
| Net increase (decrease) in net assets | 173,822,771 | | 165,101,099 | |
| | |
| Net Assets | | |
| Beginning of period | 547,851,763 | | 382,750,664 | |
| End of period | $ | 721,674,534 | | $ | 547,851,763 | |
See Notes to Financial Statements.
| | |
| Notes to Financial Statements |
OCTOBER 31, 2021
1. Organization
American Century International Bond Funds (the trust) is registered under the Investment Company Act of 1940, as amended (the 1940 Act), as an open-end management investment company and is organized as a Massachusetts business trust. Emerging Markets Debt Fund (the fund) is one fund in a series issued by the trust. The fund’s investment objective is to seek total return.
The fund offers the Investor Class, I Class, Y Class, A Class, C Class, R Class, R5 Class, R6 Class and G Class. The A Class may incur an initial sales charge. The A Class and C Class may be subject to a contingent deferred sales charge.
2. Significant Accounting Policies
The following is a summary of significant accounting policies consistently followed by the fund in preparation of its financial statements. The fund is an investment company and follows accounting and reporting guidance in accordance with accounting principles generally accepted in the United States of America. This may require management to make certain estimates and assumptions at the date of the financial statements. Actual results could differ from these estimates. Management evaluated the impact of events or transactions occurring through the date the financial statements were issued that would merit recognition or disclosure.
Investment Valuations — The fund determines the fair value of its investments and computes its net asset value (NAV) per share at the close of regular trading (usually 4 p.m. Eastern time) on the New York Stock Exchange (NYSE) on each day the NYSE is open. The Board of Trustees has adopted valuation policies and procedures to guide the investment advisor in the fund’s investment valuation process and to provide methodologies for the oversight of the fund’s pricing function.
Fixed income securities are valued at the evaluated mean as provided by independent pricing services or at the mean of the most recent bid and asked prices as provided by investment dealers. Corporate bonds, U.S. Treasury and Government Agency securities, and sovereign governments and agencies are valued using market models that consider trade data, quotations from dealers and active market makers, relevant yield curve and spread data, creditworthiness, trade data or market information on comparable securities, and other relevant security specific information.
Equity securities that are listed or traded on a domestic securities exchange are valued at the last reported sales price or at the official closing price as provided by the exchange. Equity securities traded on foreign securities exchanges are generally valued at the closing price of such securities on the exchange where primarily traded or at the close of the NYSE, if that is earlier. If no last sales price is reported, or if local convention or regulation so provides, the mean of the latest bid and asked prices may be used. Securities traded over-the-counter are valued at the mean of the latest bid and asked prices, the last sales price, or the official closing price.
Hybrid securities are valued at the evaluated mean as provided by independent pricing services or at the mean of the most recent bid and asked prices as provided by investment dealers. Preferred stocks and convertible preferred stocks with perpetual maturities are valued using market models that consider trade data, quotations from dealers and active market makers, relevant yield curve and spread data, creditworthiness, trade data or market information on comparable securities, and other relevant security specific information.
Open-end management investment companies are valued at the reported NAV per share. Repurchase agreements are valued at cost, which approximates fair value. Exchange-traded futures contracts are valued at the settlement price as provided by the appropriate exchange. Swap agreements are valued at an evaluated mean as provided by independent pricing services or independent brokers.
If the fund determines that the market price for an investment is not readily available or the valuation methods mentioned above do not reflect an investment’s fair value, such investment is valued as determined in good faith by the Board of Trustees or its delegate, in accordance with policies and procedures adopted by the Board of Trustees. In its determination of fair value, the fund may review several factors including, but not limited to, market information regarding the specific investment or comparable investments and correlation with other investment types, futures indices or general market indicators. Circumstances that may cause the fund to use these procedures to value an investment include, but are not limited to: an investment has been declared in default or is distressed; trading in a security has been suspended during the trading day or a security is not actively trading on its principal exchange; prices received from a regular pricing source are deemed unreliable; or there is a foreign market holiday and no trading occurred.
The fund monitors for significant events occurring after the close of an investment’s primary exchange but before the fund’s NAV per share is determined. Significant events may include, but are not limited to: corporate announcements and transactions; governmental action and political unrest that could impact a specific investment or an investment sector; or armed conflicts, natural disasters and similar events that could affect investments in a specific country or region. The fund also monitors for significant fluctuations between domestic and foreign markets, as evidenced by the U.S. market or such other indicators that the Board of Trustees, or its delegate, deems appropriate. The fund may apply a model-derived factor to the closing price of equity securities traded on foreign securities exchanges. The factor is based on observable market data as provided by an independent pricing service.
Security Transactions — Security transactions are accounted for as of the trade date. Net realized gains and losses are determined on the identified cost basis, which is also used for federal income tax purposes.
Investment Income — Interest income less foreign taxes withheld, if any, is recorded on the accrual basis and includes paydown gain (loss) and accretion of discounts and amortization of premiums. Inflation adjustments related to inflation-linked debt securities are reflected as interest income. Dividend income less foreign taxes withheld, if any, is recorded as of the ex-dividend date. Distributions received on securities that represent a return of capital or long-term capital gain are recorded as a reduction of cost of investments and/or as a realized gain. The fund may estimate the components of distributions received that may be considered nontaxable distributions or long-term capital gain distributions for income tax purposes. Securities lending income is net of fees and rebates earned by the lending agent for its services.
Repurchase Agreements — The fund may enter into repurchase agreements with institutions that American Century Investment Management, Inc. (ACIM) (the investment advisor) has determined are creditworthy pursuant to criteria adopted by the Board of Trustees. The fund requires that the collateral, represented by securities, received in a repurchase transaction be transferred to the custodian in a manner sufficient to enable the fund to obtain those securities in the event of a default under the repurchase agreement. ACIM monitors, on a daily basis, the securities transferred to ensure the value, including accrued interest, of the securities under each repurchase agreement is equal to or greater than amounts owed to the fund under each repurchase agreement.
Joint Trading Account — Pursuant to an Exemptive Order issued by the Securities and Exchange Commission, the fund, along with certain other funds in the American Century Investments family of funds, may transfer uninvested cash balances into a joint trading account. These balances are invested in one or more repurchase agreements that are collateralized by U.S. Treasury or Agency obligations.
Segregated Assets — In accordance with the 1940 Act, the fund segregates assets on its books and records to cover certain types of investment securities and other financial instruments. ACIM monitors, on a daily basis, the securities segregated to ensure the fund designates a sufficient amount of liquid assets, marked-to-market daily. The fund may also receive assets or be required to pledge assets at the custodian bank or with a broker for collateral requirements.
Income Tax Status — It is the fund’s policy to distribute substantially all net investment income and net realized gains to shareholders and to otherwise qualify as a regulated investment company under provisions of the Internal Revenue Code. Accordingly, no provision has been made for income taxes. The fund files U.S. federal, state, local and non-U.S. tax returns as applicable. The fund's tax returns are subject to examination by the relevant taxing authority until expiration of the applicable statute of limitations, which is generally three years from the date of filing but can be longer in certain jurisdictions. At this time, management believes there are no uncertain tax positions which, based on their technical merit, would not be sustained upon examination and for which it is reasonably possible that the total amounts of unrecognized tax benefits will significantly change in the next twelve months.
Multiple Class — All shares of the fund represent an equal pro rata interest in the net assets of the class to which such shares belong, and have identical voting, dividend, liquidation and other rights and the same terms and conditions, except for class specific expenses and exclusive rights to vote on matters affecting only individual classes. Income, non-class specific expenses, and realized and unrealized capital gains and losses of the fund are allocated to each class of shares based on their relative net assets.
Distributions to Shareholders — Distributions from net investment income, if any, are declared daily and paid monthly. Distributions from net realized gains, if any, are generally declared and paid annually.
Indemnifications — Under the trust’s organizational documents, its officers and trustees are indemnified against certain liabilities arising out of the performance of their duties to the fund. In addition, in the normal course of business, the fund enters into contracts that provide general indemnifications. The maximum exposure under these arrangements is unknown as this would involve future claims that may be made against a fund. The risk of material loss from such claims is considered by management to be remote.
Securities Lending — Securities are lent to qualified financial institutions and brokers. State Street Bank & Trust Co. serves as securities lending agent to the fund pursuant to a Securities Lending Agreement. The lending of securities exposes the fund to risks such as: the borrowers may fail to return the loaned securities, the borrowers may not be able to provide additional collateral, the fund may experience delays in recovery of the loaned securities or delays in access to collateral, or the fund may experience losses related to the investment collateral. To minimize certain risks, loan counterparties pledge collateral in the form of cash and/or securities. The lending agent has agreed to indemnify the fund in the case of default of any securities borrowed. Cash collateral received is invested in the State Street Navigator Securities Lending Government Money Market Portfolio, a money market mutual fund registered under the 1940 Act. The loans may also be secured by U.S. government securities in an amount at least equal to the market value of the securities loaned, plus accrued interest and dividends, determined on a daily basis and adjusted accordingly. By lending securities, the fund seeks to increase its net investment income through the receipt of interest and fees. Such income is reflected separately within the Statement of Operations. The value of loaned securities and related collateral outstanding at period end, if any, are shown on a gross basis within the Schedule of Investments and Statement of Assets and Liabilities.
The following table reflects a breakdown of transactions accounted for as secured borrowings, the gross obligation by the type of collateral pledged, and the remaining contractual maturity of those transactions as of October 31, 2021.
| | | | | | | | | | | | | | | | | |
| Remaining Contractual Maturity of Agreements |
| Overnight and
Continuous | <30 days | Between 30 & 90 days | >90 days | Total |
Securities Lending Transactions(1) | | | | |
| Corporate Bonds | $ | 20,479,520 | | — | | — | | — | | $ | 20,479,520 | |
| Gross amount of recognized liabilities for securities lending transactions | $ | 20,479,520 | |
(1)Amount represents the payable for cash collateral received for securities on loan. This will generally be in the Overnight and Continuous column as the securities are typically callable on demand.
3. Fees and Transactions with Related Parties
Certain officers and trustees of the trust are also officers and/or directors of American Century Companies, Inc. (ACC). The trust's investment advisor, ACIM, the trust's distributor, American Century Investment Services, Inc. (ACIS), and the trust's transfer agent, American Century Services, LLC, are wholly owned, directly or indirectly, by ACC. Various funds issued by American Century Asset Allocation Portfolios, Inc. own, in aggregate, 54% of the shares of the fund. Related parties do not invest in the fund for the purpose of exercising management or control.
Management Fees — The trust has entered into a management agreement with ACIM, under which ACIM provides the fund with investment advisory and management services in exchange for a single, unified management fee (the fee) per class. The agreement provides that ACIM will pay all expenses of managing and operating the fund, except brokerage expenses, taxes, interest, fees and expenses of the independent trustees (including legal counsel fees), extraordinary expenses, and expenses incurred in connection with the provision of shareholder services and distribution services under a plan adopted pursuant to Rule 12b-1 under the 1940 Act. The fee is computed and accrued daily based on each class's daily net assets and paid monthly in arrears. The difference in the fee among the classes is a result of their separate arrangements for non-Rule 12b-1 shareholder services. It is not the result of any difference in advisory or custodial fees or other expenses related to the management of the fund’s assets, which do not vary by class. The investment advisor agreed to waive the G Class's management fee in its entirety. The investment advisor expects this waiver to remain in effect permanently and cannot terminate it without the approval of the Board of Trustees.
The annual management fee for each class is as follows:
| | | | | | | | | | | | | | | | | | | | | | | | | | |
| Investor Class | I Class | Y Class | A Class | C Class | R Class | R5 Class | R6 Class | G Class |
| 0.96% | 0.86% | 0.76% | 0.96% | 0.96% | 0.96% | 0.76% | 0.71% | 0.00%(1) |
(1)Annual management fee before waiver was 0.71%.
Distribution and Service Fees — The Board of Trustees has adopted a separate Master Distribution and Individual Shareholder Services Plan for each of the A Class, C Class and R Class (collectively the plans), pursuant to Rule 12b-1 of the 1940 Act. The plans provide that the A Class will pay ACIS an annual distribution and service fee of 0.25%. The plans provide that the C Class will pay ACIS an annual distribution and service fee of 1.00%, of which 0.25% is paid for individual shareholder services and 0.75% is paid for distribution services. The plans provide that the R Class will pay ACIS an annual distribution and service fee of 0.50%. The fees are computed and accrued daily based on each class’s daily net assets and paid monthly in arrears. The fees are used to pay financial intermediaries for distribution and individual shareholder services. Fees incurred under the plans during the period ended October 31, 2021 are detailed in the Statement of Operations.
Trustees’ Fees and Expenses — The Board of Trustees is responsible for overseeing the investment advisor’s management and operations of the fund. The trustees receive detailed information about the fund and its investment advisor regularly throughout the year, and meet at least quarterly with management of the investment advisor to review reports about fund operations. The fund’s officers do not receive compensation from the fund.
Interfund Transactions — The fund may enter into security transactions with other American Century Investments funds and other client accounts of the investment advisor, in accordance with the 1940 Act rules and procedures adopted by the Board of Trustees. The rules and procedures require, among other things, that these transactions be effected at the independent current market price of the security. There were no interfund transactions during the period.
4. Investment Transactions
Purchases of investment securities, excluding short-term investments, for the period ended October 31, 2021 totaled $486,926,901, of which $10,497,813 represented U.S. Treasury and Government Agency obligations.
Sales of investment securities, excluding short-term investments, for the period ended October 31, 2021 totaled $320,556,641, of which $2,088,906 represented U.S. Treasury and Government Agency obligations.
5. Capital Share Transactions
Transactions in shares of the fund were as follows (unlimited number of shares authorized):
| | | | | | | | | | | | | | |
| Year ended
October 31, 2021 | Year ended
October 31, 2020 |
| Shares | Amount | Shares | Amount |
| Investor Class | | | | |
| Sold | 1,580,485 | | $ | 16,761,176 | | 1,463,383 | | $ | 14,801,160 | |
| Issued in reinvestment of distributions | 337,339 | | 3,587,451 | | 315,642 | | 3,211,040 | |
| Redeemed | (701,297) | | (7,442,116) | | (1,958,287) | | (19,638,937) | |
| 1,216,527 | | 12,906,511 | | (179,262) | | (1,626,737) | |
| I Class | | | | |
| Sold | 1,212,272 | | 12,908,117 | | 2,012,193 | | 20,492,202 | |
| Issued in reinvestment of distributions | 24,645 | | 261,265 | | 18,815 | | 193,373 | |
| Redeemed | (239,991) | | (2,552,321) | | (2,032,840) | | (20,693,388) | |
| 996,926 | | 10,617,061 | | (1,832) | | (7,813) | |
| Y Class | | | | |
| Sold | 823,073 | | 8,761,698 | | 764,976 | | 7,764,614 | |
| Issued in reinvestment of distributions | 84,742 | | 900,693 | | 53,070 | | 539,319 | |
| Redeemed | (164,975) | | (1,753,520) | | (116,235) | | (1,174,160) | |
| 742,840 | | 7,908,871 | | 701,811 | | 7,129,773 | |
| A Class | | | | |
| Sold | 6,350 | | 67,960 | | 12,868 | | 133,795 | |
| Issued in reinvestment of distributions | 1,140 | | 12,117 | | 1,124 | | 11,422 | |
| Redeemed | (16,816) | | (177,342) | | (8,966) | | (91,228) | |
| (9,326) | | (97,265) | | 5,026 | | 53,989 | |
| C Class | | | | |
| Issued in reinvestment of distributions | 99 | | 1,048 | | 119 | | 1,203 | |
| Redeemed | (587) | | (6,245) | | (668) | | (6,905) | |
| (488) | | (5,197) | | (549) | | (5,702) | |
| R Class | | | | |
| Sold | 5,285 | | 56,103 | | 9,188 | | 92,668 | |
| Issued in reinvestment of distributions | 436 | | 4,629 | | 373 | | 3,782 | |
| Redeemed | (3,819) | | (40,719) | | (4,477) | | (44,403) | |
| 1,902 | | 20,013 | | 5,084 | | 52,047 | |
| R5 Class | | | | |
| Sold | 14 | | 157 | | — | | — | |
| Issued in reinvestment of distributions | 29 | | 307 | | 29 | | 288 | |
| 43 | | 464 | | 29 | | 288 | |
| R6 Class | | | | |
| Sold | 4,227 | | 44,826 | | 216,660 | | 2,216,101 | |
| Issued in reinvestment of distributions | 4,806 | | 51,264 | | 32,163 | | 326,412 | |
| Redeemed | (165,343) | | (1,762,393) | | (1,036,586) | | (10,571,471) | |
| (156,310) | | (1,666,303) | | (787,763) | | (8,028,958) | |
| G Class | | | | |
| Sold | 12,229,586 | | 130,092,657 | | 20,040,002 | | 207,455,864 | |
| Issued in reinvestment of distributions | 2,296,537 | | 24,414,299 | | 1,287,138 | | 13,127,491 | |
| Redeemed | (1,524,902) | | (16,258,268) | | (4,548,550) | | (46,830,930) | |
| 13,001,221 | | 138,248,688 | | 16,778,590 | | 173,752,425 | |
| Net increase (decrease) | 15,793,335 | | $ | 167,932,843 | | 16,521,134 | | $ | 171,319,312 | |
6. Fair Value Measurements
The fund’s investments valuation process is based on several considerations and may use multiple inputs to determine the fair value of the investments held by the fund. In conformity with accounting principles generally accepted in the United States of America, the inputs used to determine a valuation are classified into three broad levels.
•Level 1 valuation inputs consist of unadjusted quoted prices in an active market for identical investments.
•Level 2 valuation inputs consist of direct or indirect observable market data (including quoted prices for comparable investments, evaluations of subsequent market events, interest rates, prepayment speeds, credit risk, etc.). These inputs also consist of quoted prices for identical investments initially expressed in local currencies that are adjusted through translation into U.S. dollars.
•Level 3 valuation inputs consist of unobservable data (including a fund’s own assumptions).
The level classification is based on the lowest level input that is significant to the fair valuation measurement. The valuation inputs are not necessarily an indication of the risks associated with investing in these securities or other financial instruments.
The following is a summary of the level classifications as of period end. The Schedule of Investments provides additional information on the fund’s portfolio holdings.
| | | | | | | | | | | |
| Level 1 | Level 2 | Level 3 |
| Assets | | | |
| Investment Securities | | | |
| Corporate Bonds | — | | $ | 626,318,571 | | — | |
| Sovereign Governments and Agencies | — | | 30,170,896 | | — | |
| Preferred Stocks | — | | 17,692,504 | | — | |
| U.S. Treasury Securities | — | | 9,194,589 | | — | |
| Exchange-Traded Funds | $ | 919,520 | | — | | — | |
| Temporary Cash Investments | 1,549,327 | | 29,116,629 | | — | |
| Temporary Cash Investments - Securities Lending Collateral | 20,479,520 | | — | | — | |
| $ | 22,948,367 | | $ | 712,493,189 | | — | |
| Other Financial Instruments | | | |
| Futures Contracts | $ | 1,987,646 | | — | | — | |
| Swap Agreements | — | | $ | 2,595,412 | | — | |
| $ | 1,987,646 | | $ | 2,595,412 | | — | |
| | | |
| Liabilities | | | |
| Other Financial Instruments | | | |
| Futures Contracts | $ | 633,049 | | — | | — | |
| Swap Agreements | — | | $ | 445,242 | | — | |
| $ | 633,049 | | $ | 445,242 | | — | |
7. Derivative Instruments
Credit Risk — The fund is subject to credit risk in the normal course of pursuing its investment objectives. The value of a bond generally declines as the credit quality of its issuer declines. Credit default swap agreements enable a fund to buy/sell protection against a credit event of a specific issuer or index. A fund may attempt to enhance returns by selling protection or attempt to mitigate credit risk by buying protection. The buyer/seller of credit protection against a security or basket of securities may pay/receive an up-front or periodic payment to compensate for/against potential default events. Changes in value, including the periodic amounts of interest to be paid or received on swap agreements, are recorded as unrealized appreciation (depreciation) on swap agreements. Upon entering into a centrally cleared swap, a fund is required to deposit cash or securities (initial margin) with a financial intermediary in an amount equal to a certain percentage of the notional amount. Subsequent payments (variation margin) are made or received daily, in cash, by a fund. The variation margin is equal to the daily change in the value and is a component of unrealized gains and losses. Realized gain or loss is recorded upon receipt or payment of a periodic settlement or termination of swap agreements. Net realized and unrealized gains or losses occurring during the holding period of swap agreements are a component of net realized gain (loss) on swap agreement transactions and change in net unrealized appreciation (depreciation) on swap agreements, respectively. The risks of entering into swap agreements include the possible lack of liquidity, failure of the counterparty to meet its obligations, and that there may be unfavorable changes in the underlying investments or instruments. The fund's average notional amount held during the period was $90,734,667.
Interest Rate Risk — The fund is subject to interest rate risk in the normal course of pursuing its investment objectives. The value of bonds generally declines as interest rates rise. A fund may enter into futures contracts based on a bond index or a specific underlying security. A fund may purchase futures contracts to gain exposure to increases in market value or sell futures contracts to protect against a decline in market value. Upon entering into a futures contract, a fund will segregate cash, cash equivalents or other appropriate liquid securities on its records in amounts sufficient to meet requirements. Subsequent payments (variation margin) are made or received daily, in cash, by a fund. The variation margin is equal to the daily change in the contract value and is recorded as unrealized gains and losses. A fund recognizes a realized gain or loss when the futures contract is closed or expires. Net realized and unrealized gains or losses occurring during the holding period of futures contracts are a component of net realized gain (loss) on futures contract transactions and change in net unrealized appreciation (depreciation) on futures contracts, respectively. One of the risks of entering into futures contracts is the possibility that the change in value of the contract may not correlate with the changes in value of the underlying securities. The fund's average notional exposure to interest rate risk derivative instruments held during the period was $73,704,403 futures contracts purchased and $80,364,647 futures contracts sold.
Value of Derivative Instruments as of October 31, 2021
| | | | | | | | | | | | | | |
| Asset Derivatives | Liability Derivatives |
| Type of Risk Exposure | Location on Statement of Assets and Liabilities | Value | Location on Statement of Assets and Liabilities | Value |
| Credit Risk | Receivable for variation margin on swap agreements* | $ | 10,430 | | Payable for variation margin on swap agreements* | — | |
| Credit Risk | Swap agreements | 2,595,412 | | Swap agreements | — | |
| Interest Rate Risk | Receivable for variation margin on futures contracts* | — | | Payable for variation margin on futures contracts* | $ | 53,547 | |
| | $ | 2,605,842 | | | $ | 53,547 | |
*Included in the unrealized appreciation (depreciation) on futures contracts or centrally cleared swap agreements, as applicable, as reported in the Schedule of Investments.
Effect of Derivative Instruments on the Statement of Operations for the Year Ended October 31, 2021 | | | | | | | | | | | | | | |
| Net Realized Gain (Loss) | Change in Net Unrealized Appreciation (Depreciation) |
| Type of Risk Exposure | Location on Statement of Operations | Value | Location on Statement of Operations | Value |
| Credit Risk | Net realized gain (loss) on swap agreement transactions | $ | (3,711,146) | | Change in net unrealized appreciation (depreciation) on swap agreements | $ | 1,324,911 | |
| Interest Rate Risk | Net realized gain (loss) on futures contract transactions | 343,491 | | Change in net unrealized appreciation (depreciation) on futures contracts | 960,169 | |
| | $ | (3,367,655) | | | $ | 2,285,080 | |
8. Risk Factors
The value of the fund’s shares will go up and down, sometimes rapidly or unpredictably, based on the performance of the securities owned by the fund and other factors generally affecting the securities market. Market risks, including political, regulatory, economic and social developments, can affect the value of the fund’s investments. Natural disasters, public health emergencies, terrorism and other unforeseeable events may lead to increased market volatility and may have adverse long-term effects on world economies and markets generally.
There are certain risks involved in investing in foreign securities. These risks include those resulting from political events (such as civil unrest, national elections and imposition of exchange controls), social and economic events (such as labor strikes and rising inflation), and natural disasters. Securities of foreign issuers may be less liquid and more volatile. Investing in emerging markets or a significant portion of assets in one country or region may accentuate these risks.
The fund may invest in lower-rated debt securities, which are subject to substantial risks including liquidity risk and credit risk.
The majority of the fund is owned by a relatively small number of shareholders. To the extent that a large shareholder (including a fund of funds) invests in the fund, the fund may experience relatively large redemptions as such shareholder reallocates its assets. In the event of a large shareholder redemption, the ongoing operations of the fund may be at risk.
9. Federal Tax Information
The tax character of distributions paid during the years ended October 31, 2021 and October 31, 2020 were as follows:
| | | | | | | | |
| 2021 | 2020 |
| Distributions Paid From | | |
| Ordinary income | $ | 29,253,379 | | $ | 17,442,995 | |
| Long-term capital gains | — | | — | |
The book-basis character of distributions made during the year from net investment income or net realized gains may differ from their ultimate characterization for federal income tax purposes. These differences reflect the differing character of certain income items and net realized gains and losses for financial statement and tax purposes, and may result in reclassification among certain capital accounts on the financial statements.
As of period end, the federal tax cost of investments and the components of distributable earnings on a tax-basis were as follows:
| | | | | |
| Federal tax cost of investments | $ | 726,318,647 | |
| Gross tax appreciation of investments | $ | 17,790,568 | |
| Gross tax depreciation of investments | (8,667,659) | |
| Net tax appreciation (depreciation) of investments | 9,122,909 | |
| Net tax appreciation (depreciation) on derivatives | 637,421 | |
| Net tax appreciation (depreciation) | $ | 9,760,330 | |
| Undistributed ordinary income | $ | 72,678 | |
| Accumulated short-term capital losses | $ | (8,063,712) | |
| Accumulated long-term capital losses | $ | (2,314,141) | |
The difference between book-basis and tax-basis unrealized appreciation (depreciation) is attributable primarily to the realization for tax purposes on unrealized gains (losses) on futures contracts.
Accumulated capital losses represent net capital loss carryovers that may be used to offset future realized capital gains for federal income tax purposes. The capital loss carryovers may be carried forward for an unlimited period. Future capital loss carryover utilization in any given year may be subject to Internal Revenue Code limitations.
| | | | | | | | | | | | | | | | | | | | | | | | | | | | | | | | | | | | | | | | | | | | | | | |
| For a Share Outstanding Throughout the Years Ended October 31 (except as noted) | | | | | |
| Per-Share Data | Ratios and Supplemental Data |
| | Income From Investment Operations: | Distributions From: | | | Ratio to Average Net Assets of: | | |
| Net Asset
Value,
Beginning
of Period | Net
Investment
Income
(Loss)(1) | Net
Realized
and
Unrealized
Gain (Loss) | Total From
Investment
Operations | Net
Investment
Income | Net
Realized
Gains | Total
Distributions | Net Asset
Value,
End
of Period | Total
Return(2) | Operating
Expenses | Operating
Expenses
(before
expense
waiver) | Net
Investment
Income
(Loss) | Net
Investment
Income
(Loss)
(before
expense
waiver) | Portfolio
Turnover
Rate | Net
Assets,
End of
Period
(in thousands) |
| Investor Class | | | | | | | | | | | | | | |
| 2021 | $10.32 | 0.40 | 0.15 | 0.55 | (0.39) | — | (0.39) | $10.48 | 5.29% | 0.97% | 0.97% | 3.77% | 3.77% | 51% | $103,626 | |
| 2020 | $10.46 | 0.39 | (0.16) | 0.23 | (0.37) | — | (0.37) | $10.32 | 2.34% | 0.97% | 0.97% | 3.83% | 3.83% | 68% | $89,509 | |
| 2019 | $9.79 | 0.43 | 0.66 | 1.09 | (0.42) | — | (0.42) | $10.46 | 11.35% | 0.97% | 0.97% | 4.24% | 4.24% | 75% | $92,647 | |
| 2018 | $10.43 | 0.35 | (0.64) | (0.29) | (0.33) | (0.02) | (0.35) | $9.79 | (2.76)% | 0.97% | 0.97% | 3.52% | 3.52% | 85% | $90,831 | |
| 2017 | $10.32 | 0.35 | 0.16 | 0.51 | (0.34) | (0.06) | (0.40) | $10.43 | 5.11% | 0.97% | 0.97% | 3.39% | 3.39% | 154% | $6,634 | |
| I Class | | | | | | | | | | | | | |
| 2021 | $10.32 | 0.41 | 0.14 | 0.55 | (0.40) | — | (0.40) | $10.47 | 5.30% | 0.87% | 0.87% | 3.87% | 3.87% | 51% | $12,356 | |
| 2020 | $10.46 | 0.40 | (0.16) | 0.24 | (0.38) | — | (0.38) | $10.32 | 2.44% | 0.87% | 0.87% | 3.93% | 3.93% | 68% | $1,887 | |
| 2019 | $9.79 | 0.44 | 0.66 | 1.10 | (0.43) | — | (0.43) | $10.46 | 11.47% | 0.87% | 0.87% | 4.34% | 4.34% | 75% | $1,932 | |
| 2018 | $10.44 | 0.34 | (0.63) | (0.29) | (0.34) | (0.02) | (0.36) | $9.79 | (2.76)% | 0.87% | 0.87% | 3.62% | 3.62% | 85% | $6 | |
2017(3) | $10.30 | 0.20 | 0.14 | 0.34 | (0.20) | — | (0.20) | $10.44 | 3.28% | 0.87%(4) | 0.87%(4) | 3.38%(4) | 3.38%(4) | 154%(5) | $38 | |
| | | | | | | | | | | | | | | | | | | | | | | | | | | | | | | | | | | | | | | | | | | | | | | |
| For a Share Outstanding Throughout the Years Ended October 31 (except as noted) | | | | | |
| Per-Share Data | Ratios and Supplemental Data |
| | Income From Investment Operations: | Distributions From: | | | Ratio to Average Net Assets of: | | |
| Net Asset
Value,
Beginning
of Period | Net
Investment
Income
(Loss)(1) | Net
Realized
and
Unrealized
Gain (Loss) | Total From
Investment
Operations | Net
Investment
Income | Net
Realized
Gains | Total
Distributions | Net Asset
Value,
End
of Period | Total
Return(2) | Operating
Expenses | Operating
Expenses
(before
expense
waiver) | Net
Investment
Income
(Loss) | Net
Investment
Income
(Loss)
(before
expense
waiver) | Portfolio
Turnover
Rate | Net
Assets,
End of
Period
(in thousands) |
| Y Class | | | | | | | | | | | | | |
| 2021 | $10.32 | 0.42 | 0.14 | 0.56 | (0.41) | — | (0.41) | $10.47 | 5.40% | 0.77% | 0.77% | 3.97% | 3.97% | 51% | $26,539 | |
| 2020 | $10.46 | 0.41 | (0.16) | 0.25 | (0.39) | — | (0.39) | $10.32 | 2.55% | 0.77% | 0.77% | 4.03% | 4.03% | 68% | $18,475 | |
| 2019 | $9.79 | 0.45 | 0.66 | 1.11 | (0.44) | — | (0.44) | $10.46 | 11.57% | 0.77% | 0.77% | 4.44% | 4.44% | 75% | $11,393 | |
| 2018 | $10.44 | 0.40 | (0.68) | (0.28) | (0.35) | (0.02) | (0.37) | $9.79 | (2.67)% | 0.77% | 0.77% | 3.72% | 3.72% | 85% | $3,218 | |
2017(3) | $10.30 | 0.21 | 0.13 | 0.34 | (0.20) | — | (0.20) | $10.44 | 3.33% | 0.77%(4) | 0.77%(4) | 3.52%(4) | 3.52%(4) | 154%(5) | $5 | |
| A Class |
| 2021 | $10.31 | 0.38 | 0.14 | 0.52 | (0.36) | — | (0.36) | $10.47 | 5.03% | 1.22% | 1.22% | 3.52% | 3.52% | 51% | $271 | |
| 2020 | $10.45 | 0.37 | (0.16) | 0.21 | (0.35) | — | (0.35) | $10.31 | 2.08% | 1.22% | 1.22% | 3.58% | 3.58% | 68% | $363 | |
| 2019 | $9.78 | 0.40 | 0.66 | 1.06 | (0.39) | — | (0.39) | $10.45 | 11.08% | 1.22% | 1.22% | 3.99% | 3.99% | 75% | $316 | |
| 2018 | $10.43 | 0.28 | (0.60) | (0.32) | (0.31) | (0.02) | (0.33) | $9.78 | (3.11)% | 1.22% | 1.22% | 3.27% | 3.27% | 85% | $164 | |
| 2017 | $10.32 | 0.32 | 0.17 | 0.49 | (0.32) | (0.06) | (0.38) | $10.43 | 4.84% | 1.22% | 1.22% | 3.14% | 3.14% | 154% | $6,619 | |
| C Class |
| 2021 | $10.29 | 0.30 | 0.14 | 0.44 | (0.28) | — | (0.28) | $10.45 | 4.25% | 1.97% | 1.97% | 2.77% | 2.77% | 51% | $36 | |
| 2020 | $10.44 | 0.29 | (0.17) | 0.12 | (0.27) | — | (0.27) | $10.29 | 1.23% | 1.97% | 1.97% | 2.83% | 2.83% | 68% | $41 | |
| 2019 | $9.77 | 0.33 | 0.66 | 0.99 | (0.32) | — | (0.32) | $10.44 | 10.26% | 1.97% | 1.97% | 3.24% | 3.24% | 75% | $47 | |
| 2018 | $10.41 | 0.20 | (0.59) | (0.39) | (0.23) | (0.02) | (0.25) | $9.77 | (3.74)% | 1.97% | 1.97% | 2.52% | 2.52% | 85% | $32 | |
| 2017 | $10.30 | 0.25 | 0.16 | 0.41 | (0.24) | (0.06) | (0.30) | $10.41 | 4.07% | 1.97% | 1.97% | 2.39% | 2.39% | 154% | $1,144 | |
| | | | | | | | | | | | | | | | | | | | | | | | | | | | | | | | | | | | | | | | | | | | | | | |
| For a Share Outstanding Throughout the Years Ended October 31 (except as noted) | | | | | |
| Per-Share Data | Ratios and Supplemental Data |
| | Income From Investment Operations: | Distributions From: | | | Ratio to Average Net Assets of: | | |
| Net Asset
Value,
Beginning
of Period | Net
Investment
Income
(Loss)(1) | Net
Realized
and
Unrealized
Gain (Loss) | Total From
Investment
Operations | Net
Investment
Income | Net
Realized
Gains | Total
Distributions | Net Asset
Value,
End
of Period | Total
Return(2) | Operating
Expenses | Operating
Expenses
(before
expense
waiver) | Net
Investment
Income
(Loss) | Net
Investment
Income
(Loss)
(before
expense
waiver) | Portfolio
Turnover
Rate | Net
Assets,
End of
Period
(in thousands) |
| R Class |
| 2021 | $10.30 | 0.35 | 0.14 | 0.49 | (0.33) | — | (0.33) | $10.46 | 4.67% | 1.47% | 1.47% | 3.27% | 3.27% | 51% | $161 | |
| 2020 | $10.45 | 0.34 | (0.17) | 0.17 | (0.32) | — | (0.32) | $10.30 | 1.84% | 1.47% | 1.47% | 3.33% | 3.33% | 68% | $139 | |
| 2019 | $9.78 | 0.38 | 0.66 | 1.04 | (0.37) | — | (0.37) | $10.45 | 10.80% | 1.47% | 1.47% | 3.74% | 3.74% | 75% | $88 | |
| 2018 | $10.42 | 0.26 | (0.60) | (0.34) | (0.28) | (0.02) | (0.30) | $9.78 | (3.26)% | 1.47% | 1.47% | 3.02% | 3.02% | 85% | $56 | |
| 2017 | $10.31 | 0.30 | 0.16 | 0.46 | (0.29) | (0.06) | (0.35) | $10.42 | 4.58% | 1.47% | 1.47% | 2.89% | 2.89% | 154% | $1,205 | |
| R5 Class |
| 2021 | $10.32 | 0.42 | 0.15 | 0.57 | (0.41) | — | (0.41) | $10.48 | 5.49% | 0.77% | 0.77% | 3.97% | 3.97% | 51% | $8 | |
| 2020 | $10.46 | 0.41 | (0.16) | 0.25 | (0.39) | — | (0.39) | $10.32 | 2.56% | 0.77% | 0.77% | 4.03% | 4.03% | 68% | $8 | |
| 2019 | $9.79 | 0.45 | 0.66 | 1.11 | (0.44) | — | (0.44) | $10.46 | 11.59% | 0.77% | 0.77% | 4.44% | 4.44% | 75% | $7 | |
| 2018 | $10.43 | 0.31 | (0.57) | (0.26) | (0.36) | (0.02) | (0.38) | $9.79 | (2.55)% | 0.77% | 0.77% | 3.72% | 3.72% | 85% | $7 | |
| 2017 | $10.32 | 0.37 | 0.16 | 0.53 | (0.36) | (0.06) | (0.42) | $10.43 | 5.31% | 0.77% | 0.77% | 3.59% | 3.59% | 154% | $5,986 | |
| R6 Class |
| 2021 | $10.32 | 0.43 | 0.14 | 0.57 | (0.41) | — | (0.41) | $10.48 | 5.56% | 0.72% | 0.72% | 4.02% | 4.02% | 51% | $350 | |
| 2020 | $10.46 | 0.42 | (0.16) | 0.26 | (0.40) | — | (0.40) | $10.32 | 2.60% | 0.72% | 0.72% | 4.08% | 4.08% | 68% | $1,958 | |
| 2019 | $9.79 | 0.46 | 0.66 | 1.12 | (0.45) | — | (0.45) | $10.46 | 11.62% | 0.72% | 0.72% | 4.49% | 4.49% | 75% | $10,229 | |
| 2018 | $10.44 | 0.37 | (0.64) | (0.27) | (0.36) | (0.02) | (0.38) | $9.79 | (2.61)% | 0.72% | 0.72% | 3.77% | 3.77% | 85% | $9,336 | |
| 2017 | $10.33 | 0.38 | 0.16 | 0.54 | (0.37) | (0.06) | (0.43) | $10.44 | 5.37% | 0.72% | 0.72% | 3.64% | 3.64% | 154% | $16,492 | |
| | | | | | | | | | | | | | | | | | | | | | | | | | | | | | | | | | | | | | | | | | | | | | | |
| For a Share Outstanding Throughout the Years Ended October 31 (except as noted) | | | | | |
| Per-Share Data | Ratios and Supplemental Data |
| | Income From Investment Operations: | Distributions From: | | | Ratio to Average Net Assets of: | | |
| Net Asset
Value,
Beginning
of Period | Net
Investment
Income
(Loss)(1) | Net
Realized
and
Unrealized
Gain (Loss) | Total From
Investment
Operations | Net
Investment
Income | Net
Realized
Gains | Total
Distributions | Net Asset
Value,
End
of Period | Total
Return(2) | Operating
Expenses | Operating
Expenses
(before
expense
waiver) | Net
Investment
Income
(Loss) | Net
Investment
Income
(Loss)
(before
expense
waiver) | Portfolio
Turnover
Rate | Net
Assets,
End of
Period
(in thousands) |
| G Class |
| 2021 | $10.32 | 0.50 | 0.14 | 0.64 | (0.49) | — | (0.49) | $10.47 | 6.20% | 0.01% | 0.72% | 4.73% | 4.02% | 51% | $578,327 | |
| 2020 | $10.46 | 0.49 | (0.16) | 0.33 | (0.47) | — | (0.47) | $10.32 | 3.33% | 0.01% | 0.72% | 4.79% | 4.08% | 68% | $435,472 | |
| 2019 | $9.79 | 0.53 | 0.66 | 1.19 | (0.52) | — | (0.52) | $10.46 | 12.41% | 0.01% | 0.72% | 5.20% | 4.49% | 75% | $266,091 | |
2018(6) | $10.40 | 0.44 | (0.62) | (0.18) | (0.41) | (0.02) | (0.43) | $9.79 | (1.59)% | 0.01%(4) | 0.72%(4) | 4.49%(4) | 3.78%(4) | 85%(7) | $308,199 | |
| | |
| Notes to Financial Highlights |
(1)Computed using average shares outstanding throughout the period.
(2)Total returns are calculated based on the net asset value of the last business day and do not reflect applicable sales charges, if any. Total returns for periods less than one year are not annualized.
(3)April 10, 2017 (commencement of sale) through October 31, 2017.
(4)Annualized.
(5)Portfolio turnover is calculated at the fund level. Percentage indicated was calculated for the year ended October 31, 2017.
(6)November 14, 2017 (commencement of sale) through October 31, 2018.
(7)Portfolio turnover is calculated at the fund level. Percentage indicated was calculated for the year ended October 31, 2018.
See Notes to Financial Statements.
| | |
| Report of Independent Registered Public Accounting Firm |
To the Board of Trustees of American Century International Bond Funds and Shareholders of Emerging Markets Debt Fund
Opinion on the Financial Statements
We have audited the accompanying statement of assets and liabilities, including the schedule of investments, of Emerging Markets Debt Fund (one of the funds constituting American Century International Bond Funds, referred to hereafter as the “Fund”) as of October 31, 2021, the related statement of operations for the year ended October 31, 2021, the statement of changes in net assets for each of the two years in the period ended October 31, 2021, including the related notes, and the financial highlights for each of the periods indicated therein (collectively referred to as the “financial statements”). In our opinion, the financial statements present fairly, in all material respects, the financial position of the Fund as of October 31, 2021, the results of its operations for the year then ended, the changes in its net assets for each of the two years in the period ended October 31, 2021 and the financial highlights for each of the periods indicated therein in conformity with accounting principles generally accepted in the United States of America.
Basis for Opinion
These financial statements are the responsibility of the Fund’s management. Our responsibility is to express an opinion on the Fund’s financial statements based on our audits. We are a public accounting firm registered with the Public Company Accounting Oversight Board (United States) (“PCAOB”) and are required to be independent with respect to the Fund in accordance with the U.S. federal securities laws and the applicable rules and regulations of the Securities and Exchange Commission and the PCAOB.
We conducted our audits of these financial statements in accordance with the standards of the PCAOB. Those standards require that we plan and perform the audit to obtain reasonable assurance about whether the financial statements are free of material misstatement, whether due to error or fraud.
Our audits included performing procedures to assess the risks of material misstatement of the financial statements, whether due to error or fraud, and performing procedures that respond to those risks. Such procedures included examining, on a test basis, evidence regarding the amounts and disclosures in the financial statements. Our audits also included evaluating the accounting principles used and significant estimates made by management, as well as evaluating the overall presentation of the financial statements. Our procedures included confirmation of securities owned as of October 31, 2021 by correspondence with the custodian and brokers; when replies were not received from brokers, we performed other auditing procedures. We believe that our audits provide a reasonable basis for our opinion.
/s/ PricewaterhouseCoopers LLP
Kansas City, Missouri
December 17, 2021
We have served as the auditor of one or more investment companies in American Century Investments since 1997.
Board of Trustees
The individuals listed below serve as trustees of the funds. Each trustee will continue to serve in this capacity until death, retirement, resignation or removal from office. The board has adopted a mandatory retirement age for trustees who are not “interested persons,” as that term is defined in the Investment Company Act (independent trustees). Independent trustees shall retire on December 31 of the year in which they reach their 75th birthday; provided, however, that on or after January 1, 2022, independent trustees shall retire on December 31 of the year in which they reach their 76th birthday.
Jonathan S. Thomas is an “interested person” because he currently serves as President and Chief Executive Officer of American Century Companies, Inc. (ACC), the parent company of American Century Investment Management, Inc. (ACIM or the advisor). The other trustees (more than three-fourths of the total number) are independent. They are not employees, directors or officers of, and have no financial interest in, ACC or any of its wholly owned, direct or indirect, subsidiaries, including ACIM, American Century Investment Services, Inc. (ACIS) and American Century Services, LLC (ACS), and they do not have any other affiliations, positions or relationships that would cause them to be considered “interested persons” under the Investment Company Act. The trustees serve in this capacity for eight (in the case of Jonathan S. Thomas, 16; and Ronald J. Gilson, 9) registered investment companies in the American Century Investments family of funds.
The following table presents additional information about the trustees. The mailing address for each trustee other than Mr. Thomas is 1665 Charleston Road, Mountain View, California 94043. The mailing address for Mr. Thomas is 4500 Main Street, Kansas City, Missouri 64111.
| | | | | | | | | | | | | | | | | |
Name
(Year of Birth) | Position(s) Held with Funds | Length of Time Served | Principal Occupation(s) During Past 5 Years | Number of American Century Portfolios Overseen by Trustee | Other Directorships Held During Past 5 Years |
| Independent Trustees | | |
Tanya S. Beder
(1955) | Trustee | Since 2011 | Chairman and CEO, SBCC Group Inc. (independent advisory services) (2006 to present) | 38 | Kirby Corporation; Nabors Industries Ltd.; CYS Investments, Inc. (2012 to 2017) |
Jeremy I. Bulow
(1954) | Trustee | Since 2011 | Professor of Economics, Stanford University, Graduate School of Business (1979 to present) | 38 | None |
Jennifer Cabalquinto
(1968) | Trustee | Since 2021 | Special Advisor, GSW Sports, LLC (2020 to Present); Chief Financial Officer, GSW Sports, LLC (2013 to 2020) | 38 | None |
Anne Casscells
(1958) | Trustee | Since 2016 | Co-Chief Executive Officer and Chief Investment Officer, Aetos Alternatives Management (investment advisory firm) (2001 to present); Lecturer in Accounting, Stanford University, Graduate School of Business (2009 to 2017) | 38 | None |
Ronald J. Gilson
(1946) | Trustee and Chairman of the Board | Since 1995
(Chairman since 2005) | Charles J. Meyers Professor of Law and Business, Emeritus (since 2018). Stanford Law School (1979 to 2016); Marc and Eva Stern Professor of Law and Business, Columbia University School of Law (1992 to present) | 73 | None |
| | | | | | | | | | | | | | | | | |
Name
(Year of Birth) | Position(s) Held with Funds | Length of Time Served | Principal Occupation(s) During Past 5 Years | Number of American Century Portfolios Overseen by Trustee | Other Directorships Held During Past 5 Years |
| Independent Trustees | | |
Frederick L. A. Grauer
(1946) | Trustee | Since 2008 | Senior Advisor, Credit Sesame, Inc. (credit monitoring firm) (2018 to present); Senior Advisor, Course Hero (an educational technology company) (2015 to present) | 38 | None |
Jonathan D. Levin
(1972) | Trustee | Since 2016 | Philip H. Knight Professor and Dean, Graduate School of Business, Stanford University (2016 to present); Professor, Stanford University, (2000 to present) | 38 | None |
Peter F. Pervere
(1947) | Trustee | Since 2007 | Retired | 38 | None |
John B. Shoven
(1947) | Trustee | Since 2002 | Charles R. Schwab Professor of Economics, Stanford University (1973 to present, emeritus since 2019) | 38 | Cadence Design Systems; Exponent; Financial Engines |
| Interested Trustee | | |
Jonathan S. Thomas
(1963) | Trustee | Since 2007 | President and Chief Executive Officer, ACC (2007 to present). Also serves as Chief Executive Officer, ACS; Director, ACC and other ACC subsidiaries | 145 | None |
The Statement of Additional Information has additional information about the fund's trustees and is available without charge, upon request, by calling 1-800-345-2021.
Officers
The following table presents certain information about the executive officers of the funds. Each officer serves as an officer for 16 (in the case of Robert J. Leach, 15) investment companies in the American Century family of funds. No officer is compensated for his or her service as an officer of the funds. The listed officers are interested persons of the funds and are appointed or re-appointed on an annual basis. The mailing address for each of the officers listed below is 4500 Main Street, Kansas City, Missouri 64111.
| | | | | | | | |
Name
(Year of Birth) | Offices with the Funds | Principal Occupation(s) During the Past Five Years |
Patrick Bannigan
(1965) | President since 2019 | Executive Vice President and Director, ACC (2012 to present); Chief Financial Officer, Chief Accounting Officer and Treasurer, ACC (2015 to present)). Also serves as President, ACS; Vice President, ACIM; Chief Financial Officer, Chief Accounting Officer and/or Director, ACIM, ACS and other ACC subsidiaries |
R. Wes Campbell
(1974) | Chief Financial Officer and Treasurer since 2018 | Vice President, ACS, (2020 to present); Investment
Operations and Investment Accounting, ACS (2000 to
present) |
Amy D. Shelton
(1964) | Chief Compliance Officer and Vice President since 2014 | Chief Compliance Officer, American Century funds, (2014 to present); Chief Compliance Officer, ACIM (2014 to present); Chief Compliance Officer, ACIS (2009 to present). Also serves as Vice President, ACIS |
Jon Pak
(1968) | General Counsel and Senior Vice President since 2021 | General Counsel and Senior Vice President, ACC (2021 to present). Also serves as General Counsel and Senior Vice President, ACIM, ACS and ACIS. Chief Legal Officer of Investment and Wealth Management, The Bank of New York Mellon (2014 to 2021) |
C. Jean Wade
(1964) | Vice President since 2012 | Senior Vice President, ACS (2017 to present); Vice President ACS (2000 to 2017) |
Robert J. Leach
(1966) | Vice President since 2006 | Vice President, ACS (2000 to present) |
David H. Reinmiller
(1963) | Vice President since 2000 | Attorney, ACC (1994 to present). Also serves as Vice President, ACIM and ACS |
Ward D. Stauffer
(1960) | Secretary since 2005 | Attorney, ACC (2003 to present) |
| | |
| Approval of Management Agreement |
At a meeting held on June 16, 2021, the Fund’s Board of Trustees (the "Board") unanimously approved the renewal of the management agreement pursuant to which American Century Investment Management, Inc. (the “Advisor”) acts as the investment advisor for the Fund. Under Section 15(c) of the Investment Company Act, contracts for investment advisory services are required to be reviewed, evaluated, and approved by a majority of a fund’s Trustees, including a majority of the independent Trustees, each year. The Board regards this annual evaluation and renewal as one of its most important responsibilities.
The independent Trustees have memorialized a statement regarding the relationship between their ongoing obligations to oversee and evaluate the performance of the Advisor and their annual consideration of renewal of the management agreement. In that statement, the independent Trustees noted that their assessment of the Advisor’s performance is an ongoing process that takes place over the entire year and is informed by all of the extensive information that the Board and its committees receive and consider over time. This information, together with the additional materials provided specifically in connection with the review, are central to the Board’s assessment of the Advisor’s performance and its determination whether to renew the Fund’s management agreement.
Prior to its consideration of the renewal of the management agreement, the Board requested and reviewed extensive data and analysis relating to the proposed renewal. This information and analysis was compiled by the Advisor and certain independent providers of evaluation data concerning the Fund and the services provided to the Fund by the Advisor.
In connection with its consideration of the renewal of the management agreement, the Board’s review and evaluation of the services provided by the Advisor and its affiliates included, but was not limited to, the following:
•the nature, extent, and quality of investment management, shareholder services, and other services provided and to be provided to the Fund including without limitation portfolio management and trading services, shareholder and intermediary service levels and quality, compliance and legal services, fund accounting and financial reporting, and fund share distribution;
•the wide range of other programs and services provided and to be provided by the Advisor and its affiliates to the Fund and its shareholders on a routine and non-routine basis;
•the Fund’s investment performance, including data comparing the Fund’s performance to appropriate benchmarks and/or a peer group of other mutual funds with similar investment objectives and strategies;
•the cost of owning the Fund compared to the cost of owning similar funds;
•the compliance policies, procedures, and regulatory experience of the Advisor and its affiliates and certain other Fund service providers;
•financial data showing the cost of services provided by the Advisor and its affiliates to the Fund, the profitability of the Fund to the Advisor, and the overall profitability of the Advisor;
•the Advisor’s strategic plans, COVID-19 pandemic response, vendor management practices, and social justice initiatives;
•the Advisor’s business continuity plans and cyber security practices;
•any economies of scale associated with the Advisor’s management of the Fund;
•services provided and charges to the Advisor’s other investment management clients;
•fees and expenses associated with any investment by the Fund in other funds;
•payments and practices in connection with financial intermediaries holding shares of the Fund on behalf of their clients and the services provided by intermediaries in connection therewith; and
•any collateral benefits derived by the Advisor from the management of the Fund.
In keeping with its practice, the Board held two meetings and the independent Trustees met in private session to discuss the renewal and to review and discuss the information provided in response to their request. The Board held active discussions with the Advisor regarding the renewal of the management agreement. The independent Trustees had the benefit of the advice of their independent counsel throughout the process.
Factors Considered
The Trustees considered all of the information provided by the Advisor, the independent data providers, and the independent Trustees’ independent counsel in connection with the approval. They determined that the information was sufficient for them to evaluate the management agreement for the Fund. In connection with their review, the Trustees did not identify any single factor as being all-important or controlling and each Trustee may have attributed different levels of importance to different factors. In deciding to renew the management agreement, the Board based its decision on a number of factors, including the following:
Nature, Extent and Quality of Services — Generally. Under the management agreement, the Advisor is responsible for providing or arranging for all services necessary for the operation of the Fund. The Board noted that the Advisor provides or arranges at its own expense a wide variety of services including:
•constructing and designing the Fund
•portfolio research and security selection
•initial capitalization/funding
•securities trading
•Fund administration
•custody of Fund assets
•daily valuation of the Fund’s portfolio
•shareholder servicing and transfer agency, including shareholder confirmations, recordkeeping, and communications
•legal services (except the independent Trustees’ counsel)
•regulatory and portfolio compliance
•financial reporting
•marketing and distribution (except amounts paid by the Fund under Rule 12b-1 plans)
The Board noted that many of these services have expanded over time in terms of both quantity and complexity in response to shareholder demands, competition in the industry, changing distribution channels, and the changing regulatory environment.
Investment Management Services. The nature of the investment management services provided to the Fund is quite complex and allows Fund shareholders access to professional money management, instant diversification of their investments within an asset class, the opportunity to easily diversify among asset classes by investing in or exchanging among various American Century Investments funds, and liquidity. In evaluating investment performance, the Board expects the Advisor to manage the Fund in accordance with its investment objectives and approved strategies. Further, the Trustees recognize that the Advisor has an obligation to seek the best execution of fund trades. In providing these services, the Advisor utilizes teams of investment professionals (portfolio managers, analysts, research assistants, and securities traders) who require extensive information technology, research, training, compliance, and other systems to conduct their business. The Board, directly and through its Portfolio Committee, regularly reviews investment performance information for the Fund, together with comparative information for appropriate benchmarks and/or peer groups of similarly-managed funds, over different time horizons. The Trustees also review investment performance information during the management agreement renewal process. If performance concerns are identified, the Fund receives special reviews until performance improves, during which the Board discusses with the Advisor the reasons for such results (e.g., market conditions, security selection) and any efforts being undertaken to improve performance. The Fund’s performance was above its benchmark for the
one-, three-, and five-year periods reviewed by the Board. The Board discussed the Fund’s performance with the Advisor and was satisfied with the efforts being undertaken by the Advisor. The Board found the investment management services provided by the Advisor to the Fund to be satisfactory and consistent with the management agreement.
Shareholder and Other Services. Under the management agreement, the Advisor, either directly or through affiliates or third parties, provides the Fund with a comprehensive package of transfer agency, shareholder, and other services. The Board, directly and through its various committees, regularly reviews reports and evaluations of such services at its regular meetings. These reports include, but are not limited to, information regarding the operational efficiency and accuracy of the shareholder and transfer agency services provided, staffing levels, shareholder satisfaction, technology support (including cyber security), new products and services offered to Fund shareholders, securities trading activities, portfolio valuation services, auditing services, and legal and operational compliance activities. The Board found the services provided by the Advisor to the Fund under the management agreement to be competitive and of high quality.
Costs of Services and Profitability. The Advisor provides detailed information concerning its cost of providing various services to the Fund, its profitability in managing the Fund, its overall profitability, and its financial condition. The Trustees have reviewed with the Advisor the methodology used to prepare this financial information. This information is considered in evaluating the Advisor’s financial condition, its ability to continue to provide services under the management agreement, and the reasonableness of the current management fee. The Board concluded that the Advisor’s profits were reasonable in light of the services provided to the Fund.
Ethics. The Board generally considers the Advisor’s commitment to providing quality services to shareholders and to conducting its business ethically. They noted that the Advisor’s practices generally meet or exceed industry best practices.
Economies of Scale. The Board also reviewed information provided by the Advisor regarding the possible existence of economies of scale in connection with the management of the Fund. The Board concluded that economies of scale are difficult to measure and predict with precision, especially on a fund-by-fund basis. The Board concluded that the Advisor is appropriately sharing economies of scale, to the extent they exist, through its competitive fee structure, offering competitive fees from fund inception, and through reinvestment in its business, infrastructure, investment capabilities and initiatives to provide shareholders enhanced and expanded services.
Comparison to Other Funds’ Fees. The management agreement provides that the Fund pays the Advisor a single, all-inclusive (or unified) management fee for providing all services necessary for the management and operation of the Fund, other than brokerage expenses, expenses attributable to short sales, taxes, interest, extraordinary expenses, fees and expenses of the Fund’s independent Trustees (including their independent legal counsel), and expenses incurred in connection with the provision of shareholder services and distribution services under a plan adopted pursuant to Rule 12b-1 under the Investment Company Act. Under this unified fee structure, the Advisor is responsible for providing all investment advisory, custody, audit, administrative, compliance, recordkeeping, marketing, and shareholder services, or arranging and supervising third parties to provide such services. By contrast, most other funds are charged a variety of fees, including an investment advisory fee, a transfer agency fee, an administrative fee, and other expenses. Other than their investment advisory fees and any applicable Rule 12b-1 distribution fees, all other components of the total fees charged by these other funds may be increased without shareholder approval. The Board believes the unified fee structure is a benefit to Fund shareholders because it clearly discloses to shareholders the cost of owning Fund shares, and, since the unified fee cannot be increased without a vote of Fund shareholders, it shifts to the Advisor the risk of increased costs of operating the Fund and provides a direct incentive to minimize administrative inefficiencies. Part of the Board’s analysis of fee levels involves reviewing certain evaluative data compiled by an independent provider and comparing the Fund’s unified fee to the total expense ratio of peer funds. The unified fee charged to shareholders of the Fund was above the median of the total expense ratios of the Fund’s peer group. The Board concluded that
the management fee paid by the Fund to the Advisor under the management agreement is reasonable in light of the services provided to the Fund.
Comparison to Fees and Services Provided to Other Clients of the Advisor. The Board also requested and received information from the Advisor concerning the nature of the services, fees, costs, and profitability of its advisory services to advisory clients other than the Fund. They observed that these varying types of client accounts require different services and involve different regulatory and entrepreneurial risks than the management of the Fund. The Board analyzed this information and concluded that the fees charged and services provided to the Fund were reasonable by comparison.
Payments to Intermediaries. The Trustees also requested and received a description of payments made to intermediaries by the Fund and the Advisor and services provided by intermediaries. These payments include various payments made by the Fund or the Advisor to different types of intermediaries and recordkeepers for distribution and service activities provided with respect to the Fund. The Trustees reviewed such information and received representations from the Advisor that all such payments by the Fund were made pursuant to the Fund’s Rule 12b-1 Plan and that all such payments by the Advisor were made from the Advisor’s resources and reasonable profits. The Board found such payments to be reasonable in scope and purpose.
Collateral or “Fall-Out” Benefits Derived by the Advisor. The Board considered the possible existence of collateral benefits the Advisor may receive as a result of its relationship with the Fund. The Board noted that the Advisor’s primary business is managing funds and it generally does not use fund or shareholder information to generate profits in other lines of business, and therefore does not derive any significant collateral benefits from them. The Board noted that the Advisor may receive proprietary research from broker-dealers that execute fund portfolio transactions. The Board also determined that the Advisor is able to provide investment management services to certain clients other than the Fund, at least in part, due to its existing infrastructure built to serve the fund complex.
Existing Relationship. The Board also considered whether there was any reason for not continuing the existing arrangement with the Advisor. In this regard, the Board was mindful of the potential disruptions of the Fund’s operations and various risks, uncertainties, and other effects that could occur as a result of a decision not to continue such relationship. In particular, the Board recognized that most shareholders have invested in the Fund on the strength of the Advisor’s industry standing and reputation and in the expectation that the Advisor will have a continuing role in providing advisory services to the Fund.
Conclusion of the Trustees. As a result of this process, the Board, including all of the independent Trustees and assisted by the advice of independent legal counsel, taking into account all of the factors discussed above and the information provided by the Advisor and others in connection with its review and throughout the year, concluded that the management agreement between the Fund and the Advisor is fair and reasonable in light of the services provided and should be renewed.
Retirement Account Information
As required by law, distributions you receive from certain retirement accounts are subject to federal income tax withholding, unless you elect not to have withholding apply*. Tax will be withheld on the total amount withdrawn even though you may be receiving amounts that are not subject to withholding, such as nondeductible contributions. In such case, excess amounts of withholding could occur. You may adjust your withholding election so that a greater or lesser amount will be withheld.
If you don’t want us to withhold on this amount, you must notify us to not withhold the federal income tax. You may notify us in writing or in certain situations by telephone or through other electronic means. For systematic withdrawals, your withholding election will remain in effect until revoked or changed by filing a new election. You have the right to revoke your election at any time and change your withholding percentage for future distributions.
Remember, even if you elect not to have income tax withheld, you are liable for paying income tax on the taxable portion of your withdrawal. If you elect not to have income tax withheld or you don’t have enough income tax withheld, you may be responsible for payment of estimated tax. You may incur penalties under the estimated tax rules if your withholding and estimated tax payments are not sufficient. You can reduce or defer the income tax on a distribution by directly or indirectly rolling such distribution over to another IRA or eligible plan. You should consult your tax advisor for additional information.
State tax will be withheld if, at the time of your distribution, your address is within one of the mandatory withholding states and you have federal income tax withheld (or as otherwise required by state law). State taxes will be withheld from your distribution in accordance with the respective state rules.
*Some 403(b), 457 and qualified retirement plan distributions may be subject to 20% mandatory withholding, as they are subject to special tax and withholding rules. Your plan administrator or plan sponsor is required to provide you with a special tax notice explaining those rules at the time you request a distribution. If applicable, federal and/or state taxes may be withheld from your distribution amount.
Proxy Voting Policies
Descriptions of the principles and policies that the fund's investment advisor uses in exercising the voting rights associated with the securities purchased and/or held by the fund are available without charge, upon request, by calling 1-800-345-2021 or visiting American Century Investments’ website at americancentury.com/proxy. A description of the policies is also available on the Securities and Exchange Commission’s website at sec.gov. Information regarding how the investment advisor voted proxies relating to portfolio securities during the most recent 12-month period ended June 30 is available on americancentury.com/proxy. It is also available at sec.gov.
Quarterly Portfolio Disclosure
The fund files its complete schedule of portfolio holdings with the Securities and Exchange Commission (SEC) for the first and third quarters of each fiscal year as an exhibit to its reports on Form N-PORT. These portfolio holdings are available on the fund's website at americancentury.com and, upon request, by calling 1-800-345-2021. The fund’s Form N-PORT reports are available on the SEC’s website at sec.gov.
Change in Independent Registered Public Accounting Firm
On September 24, 2021, the fund’s Audit and Compliance Committee and Board of Trustees approved a change to the fund’s independent registered public accountant. PricewaterhouseCoopers LLP was dismissed and Deloitte & Touche LLP was appointed as the independent registered public accounting firm for the fiscal year ending October 31, 2022.
During the fiscal years ended October 31, 2020 and October 31, 2021, there were no disagreements with PricewaterhouseCoopers LLP on any matter of accounting principles or practices, financial statement disclosure, or auditing scope or procedure, which disagreements, if not resolved to their satisfaction would have caused them to make reference to the subject matter of the disagreements in connection with their reports or reportable events, as such term is described in Item 304(a)(1) of Regulation S-K of the Securities Exchange Act of 1934, as amended. The audit reports of PricewaterhouseCoopers LLP on the financial statements of the fund for the fiscal years ended October 31, 2020 and October 31, 2021, did not contain any adverse opinion or disclaimer of opinion, nor were they qualified or modified as to uncertainty, audit scope or accounting principles.
During the fiscal years ended October 31, 2020 and October 31, 2021, neither the fund, nor anyone on its behalf, consulted with Deloitte & Touche LLP, on behalf of the fund, regarding the application of accounting principles to a specified transaction (either completed or proposed), the type of audit opinion that might be rendered on the fund’s financial statements, or any matter that was either the subject of a disagreement or a reportable event, as such terms are described in Item 304(a)(1) of Regulation S-K of the Securities Exchange Act of 1934, as amended.
The fund requested that PricewaterhouseCoopers LLP furnish it with a letter addressed to the Securities and Exchange Commission stating whether PricewaterhouseCoopers LLP agrees with the statements contained above. A copy of the letter from PricewaterhouseCoopers LLP to the Securities and Exchange Commission is filed as an exhibit hereto.
| | | | | | | | |
| |
| | |
| Contact Us | americancentury.com | |
| Automated Information Line | 1-800-345-8765 | |
| Investor Services Representative | 1-800-345-2021
or 816-531-5575 | |
| Investors Using Advisors | 1-800-378-9878 | |
Business, Not-For-Profit, Employer-Sponsored
Retirement Plans | 1-800-345-3533 | |
Banks and Trust Companies, Broker-Dealers,
Financial Professionals, Insurance Companies | 1-800-345-6488 | |
| Telecommunications Relay Service for the Deaf | 711 | |
| | |
| American Century International Bond Funds | |
| | |
Investment Advisor: American Century Investment Management, Inc. Kansas City, Missouri | |
| | |
| This report and the statements it contains are submitted for the general information of our shareholders. The report is not authorized for distribution to prospective investors unless preceded or accompanied by an effective prospectus. | |
| | |
©2021 American Century Proprietary Holdings, Inc. All rights reserved.
CL-ANN-90985 2112 | |

| | | | | |
| |
| Annual Report |
| |
| October 31, 2021 |
| |
| Global Bond Fund |
| Investor Class (AGBVX) |
| I Class (AGBHX) |
| Y Class (AGBWX) |
| A Class (AGBAX) |
| C Class (AGBTX) |
| R Class (AGBRX) |
| R5 Class (AGBNX) |
| R6 Class (AGBDX) |
| G Class (AGBGX) |
| | | | | |
| President’s Letter | |
| Performance | |
| Portfolio Commentary | |
| Fund Characteristics | |
| Shareholder Fee Example | |
| Schedule of Investments | |
| Statement of Assets and Liabilities | |
| Statement of Operations | |
| Statement of Changes in Net Assets | |
| Notes to Financial Statements | |
| Financial Highlights | |
| Report of Independent Registered Public Accounting Firm | |
| Management | |
| Approval of Management Agreement | |
| |
| |
| Additional Information | |
Any opinions expressed in this report reflect those of the author as of the date of the report, and do not necessarily represent the opinions of American Century Investments® or any other person in the American Century Investments organization. Any such opinions are subject to change at any time based upon market or other conditions and American Century Investments disclaims any responsibility to update such opinions. These opinions may not be relied upon as investment advice and, because investment decisions made by American Century Investments funds are based on numerous factors, may not be relied upon as an indication of trading intent on behalf of any American Century Investments fund. Security examples are used for representational purposes only and are not intended as recommendations to purchase or sell securities. Performance information for comparative indices and securities is provided to American Century Investments by third party vendors. To the best of American Century Investments’ knowledge, such information is accurate at the time of printing.
Jonathan Thomas
Dear Investor:
Thank you for reviewing this annual report for the period ended October 31, 2021. Annual reports help convey important information about fund returns, including market factors that affected performance. For additional investment insights, please visit americancentury.com.
Economic, Earnings Gains Fueled Rally Among Risk-On Assets
Stocks and other risk-on assets rallied for the 12-month period, despite lingering pandemic-related challenges. Upbeat data on U.S. manufacturing, employment and housing, along with central bank and federal government support and positive vaccine developments, helped boost corporate earnings and promote investor optimism. Outside the U.S., most economies recovered, but generally at a slower pace. Virus outbreaks and slower vaccine rollouts, particularly in emerging markets, led to lingering lockdowns in some regions.
As the period progressed, steady economic gains combined with ongoing monetary and fiscal support, rising energy prices and severe supply chain disruptions pushed global interest rates and inflation higher. In the U.S., year-over-year headline inflation climbed to 6.2% in October 2021, the largest 12-month increase in nearly 31 years.
Late in the period, the Federal Reserve (Fed) confirmed it would start tapering its bond buying in November. Yet despite inflation’s surge, the Fed left short-term interest rates unchanged. Central banks in Europe and the U.K. maintained their supportive interest rate and bond-buying programs as inflation ticked higher.
Overall, stocks delivered stellar performance for the 12-month period, highlighted by the S&P 500 Index’s gain of nearly 43%. Assets offering inflation-fighting potential, including real estate investment trusts, fared even better. Meanwhile, global bonds retreated as interest rates rose. However, emerging markets bonds largely advanced, benefiting from risk-on sentiment.
Several Factors Shaping Market Dynamics
The return to pre-pandemic life is progressing, albeit somewhat cautiously due to COVID-19’s lingering effects. As the economy and markets respond to this fluid backdrop, investors will face opportunities and ongoing challenges. Economic growth, inflation, the virus’s trajectory, supply chain normalization and fiscal and monetary policy likely will sway market dynamics.
We appreciate your confidence in us during these extraordinary times. Our firm has a long history of helping clients weather unpredictable markets, and we’re confident we will continue to meet today’s challenges.
Sincerely,
Jonathan Thomas
President and Chief Executive Officer
American Century Investments
| | | | | | | | | | | | | | | | | | |
| Total Returns as of October 31, 2021 |
| | | | Average
Annual Returns | |
| Ticker Symbol | | 1 year | 5 years | Since Inception | Inception Date |
| Investor Class | AGBVX | | 0.59% | 2.68% | 3.01% | 1/31/12 |
| Bloomberg Global Aggregate Bond Index (USD, Hedged) | — | | -0.83% | 3.04% | 3.44% | — |
| I Class | AGBHX | | 0.70% | — | 3.07% | 4/10/17 |
| Y Class | AGBWX | | 0.80% | — | 3.20% | 4/10/17 |
| A Class | AGBAX | | | | | 1/31/12 |
| No sales charge | | | 0.30% | 2.40% | 2.75% | |
| With sales charge | | | -4.23% | 1.47% | 2.26% | |
| C Class | AGBTX | | -0.48% | 1.65% | 1.99% | 1/31/12 |
| R Class | AGBRX | | 0.11% | 2.16% | 2.49% | 1/31/12 |
| R5 Class | AGBNX | | 0.80% | 2.88% | 3.21% | 1/31/12 |
| R6 Class | AGBDX | | 0.86% | 2.92% | 3.36% | 7/26/13 |
| G Class | AGBGX | | 1.35% | — | 3.68% | 7/28/17 |
Fund returns would have been lower if a portion of the fees had not been waived.
C Class shares will automatically convert to A Class shares after being held for approximately eight years. C Class average annual returns do not reflect this conversion.
Sales charges include initial sales charges and contingent deferred sales charges (CDSCs), as applicable. A Class shares have a 4.50% maximum initial sales charge and may be subject to a maximum CDSC of 1.00%. C Class shares redeemed within 12 months of purchase are subject to a maximum CDSC of 1.00%. The SEC requires that mutual funds provide performance information net of maximum sales charges in all cases where charges could be applied.
Data presented reflect past performance. Past performance is no guarantee of future results. Current performance may be higher or lower than the performance shown. Total returns for periods less than one year are not annualized. Investment return and principal value will fluctuate, and redemption value may be more or less than original cost. Data assumes reinvestment of dividends and capital gains, and none of the charts reflect the deduction of taxes that a shareholder would pay on fund distributions or the redemption of fund shares. To obtain performance data current to the most recent month end, please call 1-800-345-2021 or visit americancentury.com. For additional information about the fund, please consult the prospectus.
| | |
| Growth of $10,000 Over Life of Class |
| $10,000 investment made January 31, 2012 |
| Performance for other share classes will vary due to differences in fee structure. |
| | | | | |
| Value on October 31, 2021 |
| Investor Class — $13,354 |
|
| Bloomberg Global Aggregate Bond Index (USD,
Hedged) — $13,909 |
|
Ending value of Investor Class would have been lower if a portion of the fees had not been waived.
| | | | | | | | | | | | | | | | | | | | | | | | | | |
| Total Annual Fund Operating Expenses | | | |
| Investor Class | I Class | Y Class | A Class | C Class | R Class | R5 Class | R6 Class | G Class |
| 0.85% | 0.75% | 0.65% | 1.10% | 1.85% | 1.35% | 0.65% | 0.60% | 0.60% |
The total annual fund operating expenses shown is as stated in the fund’s prospectus current as of the date of this report. The prospectus may vary from the expense ratio shown elsewhere in this report because it is based on a different time period, includes acquired fund fees and expenses, and, if applicable, does not include fee waivers or expense reimbursements.
Data presented reflect past performance. Past performance is no guarantee of future results. Current performance may be higher or lower than the performance shown. Total returns for periods less than one year are not annualized. Investment return and principal value will fluctuate, and redemption value may be more or less than original cost. Data assumes reinvestment of dividends and capital gains, and none of the charts reflect the deduction of taxes that a shareholder would pay on fund distributions or the redemption of fund shares. To obtain performance data current to the most recent month end, please call 1-800-345-2021 or visit americancentury.com. For additional information about the fund, please consult the prospectus.
Portfolio Managers: John Lovito, Simon Chester, Robert Gahagan and Lynn Chen
Lynn Chen joined the fund’s portfolio management team on September 3, 2021. Abdelak Adjriou left the fund’s portfolio management team August 24, 2021.
Performance Summary
Global Bond returned 0.59%* for the fiscal year ended October 31, 2021. By comparison, the Bloomberg Global Aggregate Bond Index (USD, Hedged) returned -0.83% over the same time period. Fund returns reflect operating expenses, while index returns do not.
Market Review
Global bond markets generated mixed returns during the 12-month period. Encouraging signs regarding the world’s recovery from pandemic-related challenges generally stoked higher risk appetites. However, surging economic activity sent inflation soaring, and recurring spikes in COVID-19 infection rates selectively tempered enthusiasm.
The reporting period opened boldly, as encouraging news around COVID-19 vaccines heartened investors in late 2020 and contributed to advances in global bonds. As economic prospects brightened and the U.S. Treasury yield curve steepened, riskier assets, including U.S. high-yield bonds, U.S. securitized debt and emerging markets bonds, benefited. Gains in European bonds were more muted amid a surge in COVID-19 infections, although investment-grade corporate bonds rallied with U.S. investment-grade corporates to near pre-pandemic levels.
The landscape changed dramatically during the first quarter of 2021. U.S. lawmakers approved $2.2 trillion in fiscal stimulus, and U.S. Treasury yields rose swiftly and sharply. These events, along with a faster-than-expected U.S. rollout of COVID-19 vaccines, fueled sizable upgrades in U.S. economic outlooks. The U.S. dollar also surged. Higher-yielding assets largely declined but still generally outperformed government bonds. Inflation-linked securities gained as inflation expectations grew. Rising yields unsettled many emerging markets governments and corporations with strained balance sheets, especially amid sluggish growth rates, renewed lockdowns in several countries and strength in the U.S. dollar.
Treasury yields generally eased through the second and third quarters, absorbing considerable volatility stemming from new COVID-19 infections, rising inflation and fiscal policy unknowns. Despite political wrangling over the U.S. debt ceiling and two massive fiscal spending bills, the U.S. dollar advanced to a one-year high. Squeezed supplies of semiconductor chips and other key materials, higher energy prices and labor market challenges fueled inflation’s rise worldwide. This prompted leading central banks to consider paring back accommodative measures implemented in response to the pandemic. The Federal Reserve (Fed) also indicated it may raise its key lending rate sooner than previously anticipated.
Despite the Fed’s hawkish tone, Treasury yields remained near historic lows. This environment generally led to sustained demand for higher-yielding securities, which largely outperformed lower-yielding, higher-quality securities.
Inflation-Linked Securities, High-Yield Bonds Bolstered Performance
Within the portfolio, exposure to out-of-index inflation-linked bonds, most notably in the U.S., Japan and France, aided returns. We reduced our stake late in the period. An out-of-index position in
*All fund returns referenced in this commentary are for Investor Class shares. Fund returns would have been lower if a portion of the fees had not been waived. Performance for other share classes will vary due to differences in fee structure; when Investor Class performance exceeds that of the fund’s index, other share classes may not. See page 3 for returns for all share classes.
high-yield corporate securities further lifted performance, as higher-yielding bonds considerably outgained investment-grade bonds. Our positioning benefited from exposure to the industrials sector and select securities in the financials sector.
Security Selection, Emerging Markets Debt Helped Results
Security selection among U.S. securitized debt proved advantageous. Specifically, our collateralized loan obligations and non-agency commercial mortgage-backed securities advanced in the low-rate environment. Our investments in investment-grade corporate bonds further enhanced relative results, with U.S.-based holdings outperforming our European corporates, which also advanced.
Our exposure in out-of-index emerging markets bonds also provided a lift. Chinese government bonds advanced as the country’s slowing economic activity raised expectations for central bank action. Select positions in South Africa and Chile also proved advantageous and helped offset downturns in local rates bond and currency investments.
Yield Curve Positioning Diminished Returns
Our short-duration positioning generated positive returns as rates advanced through much of the period, but periods of declining rates reduced the positive impact. As the U.S. Treasury curve steepened, holdings in the intermediate portion detracted. Similar positioning in Europe and the U.K. also hindered results.
Positioning for the Future
While we expect continued economic growth going forward, elevated inflation due to continued supply and demand imbalances and soaring energy prices may moderate the pace. A challenging labor market remains a concern in the U.S., while reduced consumer activity has tempered the otherwise upbeat U.K. outlook. Europe’s prospects have brightened modestly amid solid labor market data.
We believe U.S. rates likely will head higher against a backdrop of solid economic growth, elevated inflation and massive government spending. Despite inflation concerns, we expect Fed policy will remain largely accommodative as it winds down its quantitative easing program. As shorter-maturity yields remain tied to the Fed’s interest rate policy, we anticipate a steepening U.S. yield curve and continued strength in the U.S. dollar.
Meanwhile, the European Central Bank has some latitude to reduce its bond-buying efforts. The traditionally inflation-sensitive Bank of England remains the most likely leading central bank to first raise rates, despite an unexpected late-period delay in that decision.
Overall, we believe U.S. securitized assets continue to offer attractive valuations, relative to other assets. We’re also adding to lower-rated, longer-maturity investment-grade corporate bonds. We selectively reduced our exposure to inflation-linked holdings and investment-grade corporates as they rallied, although we believe the asset classes still offer value. From a duration standpoint, we ended the period with a modestly short bias in the U.S., Europe, the U.K. and Japan. Among emerging markets bonds, we prefer high-yield bonds and exposure to select currencies poised to potentially perform well due to attractive valuations, strong fundamentals and high commodity prices.
| | | | | |
| OCTOBER 31, 2021 |
| Types of Investments in Portfolio | % of net assets |
| Sovereign Governments and Agencies | 39.0% |
| Corporate Bonds | 31.1% |
| Collateralized Loan Obligations | 7.1% |
| Collateralized Mortgage Obligations | 5.0% |
| Preferred Stocks | 4.1% |
| Asset-Backed Securities | 3.2% |
| Exchange-Traded Funds | 2.8% |
| U.S. Treasury Securities | 2.5% |
| U.S. Government Agency Mortgage-Backed Securities | 2.0% |
| Commercial Mortgage-Backed Securities | 1.0% |
| Municipal Securities | 0.6% |
| Bank Loan Obligations | 0.2% |
| Temporary Cash Investments | 2.4% |
| Other Assets and Liabilities | (1.0)% |
Fund shareholders may incur two types of costs: (1) transaction costs, including sales charges (loads) on purchase payments and redemption/exchange fees; and (2) ongoing costs, including management fees; distribution and service (12b-1) fees; and other fund expenses. This example is intended to help you understand your ongoing costs (in dollars) of investing in your fund and to compare these costs with the ongoing cost of investing in other mutual funds.
The example is based on an investment of $1,000 made at the beginning of the period and held for the entire period from May 1, 2021 to October 31, 2021.
Actual Expenses
The table provides information about actual account values and actual expenses for each class. You may use the information, together with the amount you invested, to estimate the expenses that you paid over the period. First, identify the share class you own. Then simply divide your account value by $1,000 (for example, an $8,600 account value divided by $1,000 = 8.6), then multiply the result by the number under the heading “Expenses Paid During Period” to estimate the expenses you paid on your account during this period.
If you hold Investor Class shares of any American Century Investments fund, or I Class shares of the American Century Diversified Bond Fund, in an American Century Investments account (i.e., not through a financial intermediary or employer-sponsored retirement plan account), American Century Investments may charge you a $25.00 annual account maintenance fee if the value of those shares is less than $10,000. We will redeem shares automatically in one of your accounts to pay the $25.00 fee. In determining your total eligible investment amount, we will include your investments in all personal accounts (including American Century Investments brokerage accounts) registered under your Social Security number. Personal accounts include individual accounts, joint accounts, UGMA/UTMA accounts, personal trusts, Coverdell Education Savings Accounts and IRAs (including traditional, Roth, Rollover, SEP-, SARSEP- and SIMPLE-IRAs), and certain other retirement accounts. If you have only business, business retirement, employer-sponsored or American Century Investments brokerage accounts, you are currently not subject to this fee. If you are subject to the account maintenance fee, your account value could be reduced by the fee amount.
Hypothetical Example for Comparison Purposes
The table also provides information about hypothetical account values and hypothetical expenses based on the actual expense ratio of each class of your fund and an assumed rate of return of 5% per year before expenses, which is not the actual return of a fund’s share class. The hypothetical account values and expenses may not be used to estimate the actual ending account balance or expenses you paid for the period. You may use this information to compare the ongoing costs of investing in your fund and other funds. To do so, compare this 5% hypothetical example with the 5% hypothetical examples that appear in the shareholder reports of the other funds.
Please note that the expenses shown in the table are meant to highlight your ongoing costs only and do not reflect any transactional costs, such as sales charges (loads) or redemption/exchange fees. Therefore, the table is useful in comparing ongoing costs only, and will not help you determine the relative total costs of owning different funds. In addition, if these transactional costs were included, your costs would have been higher.
| | | | | | | | | | | | | | |
| Beginning
Account Value
5/1/21 | Ending
Account Value
10/31/21 | Expenses Paid During Period(1) 5/1/21 - 10/31/21 | Annualized Expense Ratio(1) |
| Actual | | | | |
| Investor Class | $1,000 | $1,003.80 | $4.04 | 0.80% |
| I Class | $1,000 | $1,003.80 | $3.54 | 0.70% |
| Y Class | $1,000 | $1,004.20 | $3.03 | 0.60% |
| A Class | $1,000 | $1,001.90 | $5.30 | 1.05% |
| C Class | $1,000 | $998.00 | $9.06 | 1.80% |
| R Class | $1,000 | $1,001.00 | $6.56 | 1.30% |
| R5 Class | $1,000 | $1,004.30 | $3.03 | 0.60% |
| R6 Class | $1,000 | $1,004.60 | $2.78 | 0.55% |
| G Class | $1,000 | $1,006.60 | $0.05 | 0.01% |
| Hypothetical | | | | |
| Investor Class | $1,000 | $1,021.17 | $4.08 | 0.80% |
| I Class | $1,000 | $1,021.68 | $3.57 | 0.70% |
| Y Class | $1,000 | $1,022.18 | $3.06 | 0.60% |
| A Class | $1,000 | $1,019.91 | $5.35 | 1.05% |
| C Class | $1,000 | $1,016.13 | $9.15 | 1.80% |
| R Class | $1,000 | $1,018.65 | $6.61 | 1.30% |
| R5 Class | $1,000 | $1,022.18 | $3.06 | 0.60% |
| R6 Class | $1,000 | $1,022.43 | $2.80 | 0.55% |
| G Class | $1,000 | $1,025.16 | $0.05 | 0.01% |
(1)Expenses are equal to the class's annualized expense ratio listed in the table above, multiplied by the average account value over the period, multiplied by 184, the number of days in the most recent fiscal half-year, divided by 365, to reflect the one-half year period. Annualized expense ratio reflects actual expenses, including any applicable fee waivers or expense reimbursements and excluding any acquired fund fees and expenses.
OCTOBER 31, 2021
| | | | | | | | | | | |
| | Principal Amount/Shares | Value |
| SOVEREIGN GOVERNMENTS AND AGENCIES — 39.0% |
| Australia — 0.6% | | | |
| Australia Government Bond, 2.75%, 4/21/24 | AUD | 3,192,000 | | $ | 2,519,939 | |
| Australia Government Bond, 1.50%, 6/21/31 | AUD | 6,500,000 | | 4,655,155 | |
| Australia Government Bond, 3.00%, 3/21/47 | AUD | 7,150,000 | | 5,598,535 | |
| Australia Government Bond, 1.75%, 6/21/51 | AUD | 5,500,000 | | 3,282,973 | |
| | | 16,056,602 | |
| Austria — 0.6% | | | |
Republic of Austria Government Bond, 3.40%, 11/22/22(1) | EUR | 4,325,000 | | 5,210,739 | |
Republic of Austria Government Bond, 0.75%, 10/20/26(1) | EUR | 4,192,000 | | 5,105,535 | |
Republic of Austria Government Bond, 4.15%, 3/15/37(1) | EUR | 2,539,000 | | 4,637,890 | |
| | | 14,954,164 | |
| Belgium — 0.3% | | | |
Kingdom of Belgium Government Bond, 4.25%, 3/28/41(1) | EUR | 1,716,000 | | 3,312,085 | |
Kingdom of Belgium Government Bond, 1.60%, 6/22/47(1) | EUR | 3,836,000 | | 5,300,702 | |
| | | 8,612,787 | |
| Brazil — 0.1% | | | |
| Brazilian Government International Bond, 7.125%, 1/20/37 | | $ | 3,000,000 | | 3,526,575 | |
| Canada — 2.0% | | | |
| Canadian Government Bond, 0.25%, 3/1/26 | CAD | 10,000,000 | | 7,677,279 | |
| Canadian Government Bond, 0.50%, 12/1/30 | CAD | 11,300,000 | | 8,213,135 | |
| Canadian Government Bond, 2.75%, 12/1/48 | CAD | 3,250,000 | | 3,049,693 | |
| Province of British Columbia Canada, 3.25%, 12/18/21 | CAD | 1,588,000 | | 1,287,839 | |
| Province of British Columbia Canada, 2.85%, 6/18/25 | CAD | 10,911,000 | | 9,238,406 | |
| Province of Quebec Canada, 3.00%, 9/1/23 | CAD | 3,058,000 | | 2,555,745 | |
| Province of Quebec Canada, 5.75%, 12/1/36 | CAD | 10,032,000 | | 11,365,439 | |
| Province of Quebec Canada, 3.50%, 12/1/48 | CAD | 7,300,000 | | 6,801,534 | |
| | | 50,189,070 | |
| China — 10.8% | | | |
| China Development Bank, 2.89%, 6/22/25 | CNY | 177,000,000 | | 27,528,447 | |
| China Development Bank, 3.50%, 8/13/26 | CNY | 159,000,000 | | 25,212,281 | |
| China Government Bond, 2.57%, 5/20/23 | CNY | 42,000,000 | | 6,570,692 | |
| China Government Bond, 2.36%, 7/2/23 | CNY | 153,000,000 | | 23,838,841 | |
| China Government Bond, 2.88%, 11/5/23 | CNY | 399,000,000 | | 62,724,673 | |
| China Government Bond, 1.99%, 4/9/25 | CNY | 118,000,000 | | 17,967,834 | |
| China Government Bond, 3.25%, 6/6/26 | CNY | 155,700,000 | | 24,808,241 | |
| China Government Bond, 3.12%, 12/5/26 | CNY | 154,800,000 | | 24,512,042 | |
| China Government Bond, 2.85%, 6/4/27 | CNY | 67,000,000 | | 10,443,511 | |
| China Government Bond, 3.01%, 5/13/28 | CNY | 47,000,000 | | 7,370,663 | |
| China Government Bond, 3.29%, 5/23/29 | CNY | 11,000,000 | | 1,757,569 | |
| China Government Bond, 2.68%, 5/21/30 | CNY | 111,500,000 | | 16,902,984 | |
| China Government Bond, 3.86%, 7/22/49 | CNY | 35,600,000 | | 5,860,457 | |
| China Government Bond, 3.39%, 3/16/50 | CNY | 46,500,000 | | 7,072,079 | |
| China Government Bond, 3.81%, 9/14/50 | CNY | 36,000,000 | | 5,913,783 | |
| | | 268,484,097 | |
| Czech Republic — 0.1% | | | |
| Czech Republic Government Bond, 4.70%, 9/12/22 | CZK | 74,800,000 | | 3,432,957 | |
| | | | | | | | | | | |
| | Principal Amount/Shares | Value |
| Denmark — 2.2% | | | |
| Denmark Government Bond, 0.50%, 11/15/27 | DKK | 46,720,000 | | $ | 7,540,492 | |
Denmark Government Bond, 0.50%, 11/15/29(1) | DKK | 93,000,000 | | 15,031,676 | |
Denmark Government Bond, 0.00%, 11/15/31(1)(2) | DKK | 112,500,000 | | 17,251,167 | |
| Denmark Government Bond, 4.50%, 11/15/39 | DKK | 38,630,000 | | 10,613,075 | |
Denmark Government Bond, 0.25%, 11/15/52(1) | DKK | 25,000,000 | | 3,768,753 | |
| | | 54,205,163 | |
| Dominican Republic — 0.1% | | | |
| Dominican Republic International Bond, 5.95%, 1/25/27 | | $ | 1,800,000 | | 2,011,518 | |
Dominican Republic International Bond, 5.95%, 1/25/27(1) | | $ | 800,000 | | 894,008 | |
| | | 2,905,526 | |
| Egypt — 0.1% | | | |
Egypt Government International Bond, 7.50%, 1/31/27(1) | | $ | 1,200,000 | | 1,246,781 | |
| Egypt Government International Bond, 8.50%, 1/31/47 | | $ | 2,000,000 | | 1,853,972 | |
| | | 3,100,753 | |
| El Salvador — 0.1% | | | |
| El Salvador Government International Bond, 8.625%, 2/28/29 | | $ | 2,000,000 | | 1,611,000 | |
| Finland — 0.8% | | | |
Finland Government Bond, 4.00%, 7/4/25(1) | EUR | 5,169,000 | | 6,965,315 | |
Finland Government Bond, 0.125%, 4/15/36(1) | EUR | 6,500,000 | | 7,320,789 | |
Finland Government Bond, 1.375%, 4/15/47(1) | EUR | 3,045,000 | | 4,385,372 | |
Finland Government Bond, 0.125%, 4/15/52(1) | EUR | 1,100,000 | | 1,152,682 | |
| | | 19,824,158 | |
| France — 1.5% | | | |
| French Republic Government Bond OAT, 1.75%, 11/25/24 | EUR | 2,539,000 | | 3,135,369 | |
| French Republic Government Bond OAT, 5.50%, 4/25/29 | EUR | 5,742,980 | | 9,382,607 | |
French Republic Government Bond OAT, 0.00%, 11/25/29(2) | EUR | 3,150,000 | | 3,618,782 | |
| French Republic Government Bond OAT, 2.50%, 5/25/30 | EUR | 3,845,000 | | 5,360,877 | |
| French Republic Government Bond OAT, 1.50%, 5/25/31 | EUR | 3,675,000 | | 4,772,776 | |
| French Republic Government Bond OAT, 5.75%, 10/25/32 | EUR | 2,675,000 | | 4,942,726 | |
| French Republic Government Bond OAT, 3.25%, 5/25/45 | EUR | 3,433,000 | | 6,210,933 | |
| | | 37,424,070 | |
| Germany — 0.2% | | | |
Bundesrepublik Deutschland Bundesanleihe, 0.00%, 8/15/50(2) | EUR | 3,600,000 | | 4,018,299 | |
| Ghana — 0.1% | | | |
| Ghana Government International Bond, 7.875%, 2/11/35 | | $ | 2,000,000 | | 1,708,117 | |
| Greece — 0.3% | | | |
Hellenic Republic Government Bond, 0.75%, 6/18/31(1) | EUR | 7,145,000 | | 7,847,596 | |
| Guatemala — 0.1% | | | |
| Guatemala Government Bond, 4.875%, 2/13/28 | | $ | 2,000,000 | | 2,183,000 | |
| Indonesia — 0.4% | | | |
| Indonesia Government International Bond, 3.50%, 2/14/50 | | $ | 2,800,000 | | 2,855,618 | |
| Indonesia Treasury Bond, 8.375%, 9/15/26 | IDR | 90,000,000,000 | | 7,199,385 | |
| | | 10,055,003 | |
| Ireland — 1.5% | | | |
| Ireland Government Bond, 3.40%, 3/18/24 | EUR | 6,186,000 | | 7,822,528 | |
| Ireland Government Bond, 1.10%, 5/15/29 | EUR | 13,350,000 | | 16,608,468 | |
| Ireland Government Bond, 0.20%, 10/18/30 | EUR | 1,500,000 | | 1,734,189 | |
| Ireland Government Bond, 0.40%, 5/15/35 | EUR | 8,650,000 | | 9,936,072 | |
| Ireland Government Bond, 1.50%, 5/15/50 | EUR | 320,000 | | 435,027 | |
| | | 36,536,284 | |
| | | | | | | | | | | |
| | Principal Amount/Shares | Value |
| Italy — 3.4% | | | |
| Italy Buoni Poliennali Del Tesoro, 2.00%, 12/1/25 | EUR | 19,964,000 | | $ | 24,691,214 | |
Italy Buoni Poliennali Del Tesoro, 0.00%, 4/1/26(2) | EUR | 19,650,000 | | 22,348,426 | |
| Italy Buoni Poliennali Del Tesoro, 1.60%, 6/1/26 | EUR | 3,000,000 | | 3,659,035 | |
| Italy Buoni Poliennali Del Tesoro, 0.25%, 3/15/28 | EUR | 14,100,000 | | 15,854,916 | |
| Italy Buoni Poliennali Del Tesoro, 1.35%, 4/1/30 | EUR | 3,550,000 | | 4,232,753 | |
Italy Buoni Poliennali Del Tesoro, 0.60%, 8/1/31(1) | EUR | 1,000,000 | | 1,101,644 | |
Italy Buoni Poliennali Del Tesoro, 4.75%, 9/1/44(1) | EUR | 7,519,000 | | 13,668,754 | |
Italy Buoni Poliennali Del Tesoro, 1.70%, 9/1/51(1) | EUR | 500,000 | | 558,582 | |
| | | 86,115,324 | |
| Japan — 6.3% | | | |
| Japan Government Ten Year Bond, 0.10%, 3/20/30 | JPY | 5,755,000,000 | | 50,875,440 | |
| Japan Government Thirty Year Bond, 2.40%, 3/20/37 | JPY | 877,450,000 | | 10,104,601 | |
| Japan Government Thirty Year Bond, 2.00%, 9/20/41 | JPY | 1,234,500,000 | | 13,968,807 | |
| Japan Government Thirty Year Bond, 1.40%, 12/20/45 | JPY | 2,023,400,000 | | 21,135,555 | |
| Japan Government Thirty Year Bond, 0.40%, 3/20/50 | JPY | 700,000,000 | | 5,729,742 | |
| Japan Government Twenty Year Bond, 2.10%, 12/20/26 | JPY | 672,500,000 | | 6,562,875 | |
| Japan Government Twenty Year Bond, 0.30%, 12/20/39 | JPY | 1,078,800,000 | | 9,266,812 | |
| Japanese Government CPI Linked Bond, 0.10%, 3/10/28 | JPY | 2,971,374,234 | | 26,946,369 | |
| Japanese Government CPI Linked Bond, 0.10%, 3/10/29 | JPY | 1,278,097,590 | | 11,613,054 | |
| | | 156,203,255 | |
| Jordan — 0.1% | | | |
| Jordan Government International Bond, 7.375%, 10/10/47 | | $ | 1,200,000 | | 1,244,787 | |
Jordan Government International Bond, 7.375%, 10/10/47(1) | | $ | 200,000 | | 207,464 | |
| Jordan Government International Bond, 7.375%, 10/10/47 | | $ | 400,000 | | 414,439 | |
| | | 1,866,690 | |
| Malaysia — 0.3% | | | |
| Malaysia Government Bond, 3.96%, 9/15/25 | MYR | 27,150,000 | | 6,784,357 | |
| Mexico — 0.5% | | | |
| Mexican Bonos, 5.75%, 3/5/26 | MXN | 97,500,000 | | 4,475,615 | |
| Mexico Government International Bond, 4.15%, 3/28/27 | | $ | 2,700,000 | | 3,018,182 | |
| Nacional Financiera SNC, MTN, 0.78%, 3/29/22 | JPY | 500,000,000 | | 4,396,436 | |
| | | 11,890,233 | |
| Namibia — 0.1% | | | |
| Namibia International Bonds, 5.25%, 10/29/25 | | $ | 2,600,000 | | 2,774,772 | |
| Netherlands — 0.8% | | | |
Netherlands Government Bond, 0.00%, 1/15/22(1)(2) | EUR | 5,557,000 | | 6,431,267 | |
Netherlands Government Bond, 0.50%, 7/15/26(1) | EUR | 7,389,000 | | 8,890,141 | |
Netherlands Government Bond, 2.75%, 1/15/47(1) | EUR | 2,080,000 | | 3,938,395 | |
| | | 19,259,803 | |
| New Zealand — 0.1% | | | |
| New Zealand Government Bond, 1.50%, 5/15/31 | NZD | 2,750,000 | | 1,805,364 | |
| Norway — 0.2% | | | |
Norway Government Bond, 2.00%, 5/24/23(1) | NOK | 43,725,000 | | 5,247,543 | |
Norway Government Bond, 1.75%, 2/17/27(1) | NOK | 2,800,000 | | 333,990 | |
| | | 5,581,533 | |
| Oman — 0.1% | | | |
| Oman Government International Bond, 5.625%, 1/17/28 | | $ | 2,000,000 | | 2,111,305 | |
| Philippines — 0.1% | | | |
| Philippine Government International Bond, 6.375%, 10/23/34 | | $ | 1,400,000 | | 1,927,263 | |
| Poland — 0.2% | | | |
| Republic of Poland Government Bond, 4.00%, 10/25/23 | PLN | 16,520,000 | | 4,305,448 | |
| | | | | | | | | | | |
| | Principal Amount/Shares | Value |
| Republic of Poland Government International Bond, 4.00%, 1/22/24 | | $ | 500,000 | | $ | 533,019 | |
| | | 4,838,467 | |
| Portugal — 0.2% | | | |
Portugal Obrigacoes do Tesouro OT, 0.90%, 10/12/35(1) | EUR | 1,000,000 | | 1,177,622 | |
Portugal Obrigacoes do Tesouro OT, 4.10%, 2/15/45(1) | EUR | 2,350,000 | | 4,455,092 | |
| | | 5,632,714 | |
| Russia — 0.1% | | | |
| Russian Foreign Bond - Eurobond, 5.25%, 6/23/47 | | $ | 2,800,000 | | 3,571,546 | |
| Singapore — 0.1% | | | |
| Singapore Government Bond, 2.875%, 7/1/29 | SGD | 4,240,000 | | 3,373,849 | |
South Africa† | | | |
| Republic of South Africa Government International Bond, 4.67%, 1/17/24 | | $ | 250,000 | | 266,199 | |
| Republic of South Africa Government International Bond, 5.875%, 6/22/30 | | $ | 800,000 | | 879,992 | |
| | | 1,146,191 | |
| Spain — 1.5% | | | |
Spain Government Bond, 0.00%, 1/31/28(2) | EUR | 6,000,000 | | 6,866,225 | |
Spain Government Bond, 5.15%, 10/31/28(1) | EUR | 1,263,000 | | 1,961,675 | |
Spain Government Bond, 1.25%, 10/31/30(1) | EUR | 1,500,000 | | 1,854,860 | |
Spain Government Bond, 0.10%, 4/30/31(1) | EUR | 11,750,000 | | 13,044,318 | |
Spain Government Bond, 1.85%, 7/30/35(1) | EUR | 2,200,000 | | 2,882,450 | |
Spain Government Bond, 2.70%, 10/31/48(1) | EUR | 7,100,000 | | 11,034,478 | |
| | | 37,644,006 | |
| Sri Lanka — 0.1% | | | |
| Sri Lanka Government International Bond, 7.55%, 3/28/30 | | $ | 2,000,000 | | 1,261,720 | |
| Sweden — 0.1% | | | |
| Sweden Government Bond, 3.50%, 3/30/39 | SEK | 15,600,000 | | 2,696,628 | |
| Switzerland — 0.5% | | | |
| Swiss Confederation Government Bond, 1.25%, 5/28/26 | CHF | 5,902,000 | | 6,902,977 | |
| Swiss Confederation Government Bond, 2.50%, 3/8/36 | CHF | 2,534,000 | | 3,755,495 | |
Swiss Confederation Government Bond, 0.00%, 7/24/39(2) | CHF | 2,500,000 | | 2,721,112 | |
| | | 13,379,584 | |
| Thailand — 0.5% | | | |
| Thailand Government Bond, 3.625%, 6/16/23 | THB | 78,650,000 | | 2,484,539 | |
| Thailand Government Bond, 3.85%, 12/12/25 | THB | 335,100,000 | | 11,211,247 | |
| | | 13,695,786 | |
| Tunisia — 0.1% | | | |
| Banque Centrale de Tunisie International Bond, 5.75%, 1/30/25 | | $ | 2,000,000 | | 1,609,156 | |
| Turkey — 0.2% | | | |
| Turkey Government International Bond, 6.875%, 3/17/36 | | $ | 4,600,000 | | 4,465,229 | |
| United Kingdom — 1.5% | | | |
| United Kingdom Gilt, 0.125%, 1/30/26 | GBP | 7,000,000 | | 9,333,434 | |
| United Kingdom Gilt, 4.75%, 12/7/30 | GBP | 3,600,000 | | 6,544,470 | |
| United Kingdom Gilt, 4.50%, 12/7/42 | GBP | 954,000 | | 2,121,566 | |
| United Kingdom Gilt, 4.25%, 12/7/49 | GBP | 3,720,000 | | 8,917,411 | |
| United Kingdom Gilt, 4.25%, 12/7/55 | GBP | 3,780,000 | | 9,876,006 | |
| | | 36,792,887 | |
TOTAL SOVEREIGN GOVERNMENTS AND AGENCIES (Cost $954,847,463) |
| | 973,102,883 | |
| | | | | | | | | | | |
| | Principal Amount/Shares | Value |
| CORPORATE BONDS — 31.1% |
| Aerospace and Defense — 0.5% | | | |
| Boeing Co. (The), 2.20%, 2/4/26 | | $ | 2,460,000 | | $ | 2,464,940 | |
| Boeing Co. (The), 3.625%, 2/1/31 | | 1,000,000 | | 1,065,561 | |
| Boeing Co. (The), 5.81%, 5/1/50 | | 530,000 | | 727,586 | |
| Raytheon Technologies Corp., 4.125%, 11/16/28 | | 2,580,000 | | 2,925,310 | |
| TransDigm, Inc., 4.625%, 1/15/29 | | 4,460,000 | | 4,437,700 | |
| | | 11,621,097 | |
Air Freight and Logistics† | | | |
GXO Logistics, Inc., 2.65%, 7/15/31(1) | | 1,016,000 | | 1,005,977 | |
| Airlines — 0.8% | | | |
Air Canada, 3.875%, 8/15/26(1) | | 3,450,000 | | 3,497,437 | |
American Airlines 2021-1 Class A Pass Through Trust, 2.875%, 1/11/36(3) | | 2,240,000 | | 2,256,800 | |
American Airlines, Inc. / AAdvantage Loyalty IP Ltd., 5.50%, 4/20/26(1) | | 5,103,000 | | 5,359,426 | |
British Airways 2021-1 Class B Pass Through Trust, 3.90%, 3/15/33(1) | | 1,536,000 | | 1,543,915 | |
Delta Air Lines, Inc. / SkyMiles IP Ltd., 4.75%, 10/20/28(1) | | 2,900,000 | | 3,221,757 | |
| United Airlines Pass Through Trust, 4.875%, 7/15/27 | | 1,452,066 | | 1,536,696 | |
United Airlines, Inc., 4.625%, 4/15/29(1) | | 2,032,000 | | 2,097,491 | |
| | | 19,513,522 | |
Auto Components† | | | |
Goodyear Tire & Rubber Co. (The), 5.00%, 7/15/29(1) | | 908,000 | | 959,075 | |
| Automobiles — 0.4% | | | |
| Ford Motor Credit Co. LLC, 3.10%, 5/4/23 | | 1,400,000 | | 1,424,500 | |
| Ford Motor Credit Co. LLC, 3.375%, 11/13/25 | | 2,000,000 | | 2,057,500 | |
| General Motors Co., 5.15%, 4/1/38 | | 560,000 | | 677,117 | |
| General Motors Financial Co., Inc., 2.75%, 6/20/25 | | 3,248,000 | | 3,373,812 | |
| General Motors Financial Co., Inc., 2.70%, 8/20/27 | | 817,000 | | 834,388 | |
| General Motors Financial Co., Inc., 2.40%, 10/15/28 | | 1,387,000 | | 1,379,039 | |
| | | 9,746,356 | |
| Banks — 4.2% | | | |
| Banco Santander SA, 2.96%, 3/25/31 | | 2,200,000 | | 2,242,555 | |
| Banco Santander SA, VRN, 1.72%, 9/14/27 | | 800,000 | | 788,238 | |
| Bank of America Corp., MTN, 2.30%, 7/25/25 | GBP | 1,500,000 | | 2,122,812 | |
| Bank of America Corp., MTN, VRN, 2.68%, 6/19/41 | | $ | 1,670,000 | | 1,611,047 | |
| Bank of America Corp., VRN, 3.42%, 12/20/28 | | 1,035,000 | | 1,107,332 | |
| Bank of America Corp., VRN, 2.57%, 10/20/32 | | 5,553,000 | | 5,569,047 | |
| Bank of America Corp., VRN, 2.48%, 9/21/36 | | 835,000 | | 812,576 | |
Bank of Ireland Group plc, VRN, 2.03%, 9/30/27(1) | | 1,004,000 | | 991,926 | |
| Barclays plc, 4.84%, 5/9/28 | | 1,120,000 | | 1,248,566 | |
| Barclays plc, MTN, VRN, 1.375%, 1/24/26 | EUR | 600,000 | | 717,245 | |
| Barclays plc, MTN, VRN, 2.00%, 2/7/28 | EUR | 2,000,000 | | 2,357,775 | |
| BNP Paribas SA, MTN, VRN, 2.00%, 5/24/31 | GBP | 1,400,000 | | 1,893,495 | |
BNP Paribas SA, VRN, 2.16%, 9/15/29(1) | | $ | 739,000 | | 726,163 | |
BNP Paribas SA, VRN, 4.375%, 3/1/33(1) | | 885,000 | | 967,184 | |
BPCE SA, 4.50%, 3/15/25(1) | | 1,115,000 | | 1,214,722 | |
| CaixaBank SA, MTN, VRN, 2.75%, 7/14/28 | EUR | 1,600,000 | | 1,920,395 | |
| CaixaBank SA, MTN, VRN, 2.25%, 4/17/30 | EUR | 2,700,000 | | 3,259,428 | |
| Citigroup, Inc., VRN, 3.52%, 10/27/28 | | $ | 3,108,000 | | 3,340,446 | |
Citigroup, Inc., VRN, 2.52%, 11/3/32(3) | | 1,472,000 | | 1,468,961 | |
| | | | | | | | | | | |
| | Principal Amount/Shares | Value |
| Commerzbank AG, MTN, VRN, 4.00%, 12/5/30 | EUR | 2,500,000 | | $ | 3,137,782 | |
Commonwealth Bank of Australia, VRN, 3.61%, 9/12/34(1) | | $ | 1,335,000 | | 1,405,511 | |
DNB Bank ASA, VRN, 1.61%, 3/30/28(1) | | 764,000 | | 750,899 | |
| European Financial Stability Facility, MTN, 0.40%, 5/31/26 | EUR | 11,000,000 | | 13,036,853 | |
| European Financial Stability Facility, MTN, 2.35%, 7/29/44 | EUR | 410,000 | | 670,703 | |
| FNB Corp., 2.20%, 2/24/23 | | $ | 1,160,000 | | 1,173,659 | |
| HSBC Holdings plc, VRN, 2.80%, 5/24/32 | | 1,560,000 | | 1,571,641 | |
| ING Groep NV, MTN, 2.125%, 1/10/26 | EUR | 2,600,000 | | 3,241,180 | |
Intesa Sanpaolo SpA, 4.20%, 6/1/32(1) | | $ | 5,090,000 | | 5,135,951 | |
| Intesa Sanpaolo SpA, MTN, 3.93%, 9/15/26 | EUR | 2,600,000 | | 3,335,717 | |
Itau Unibanco Holding SA, VRN, 3.875%, 4/15/31(1) | | $ | 1,400,000 | | 1,347,290 | |
| JPMorgan Chase & Co., VRN, 2.07%, 6/1/29 | | 2,285,000 | | 2,263,247 | |
| JPMorgan Chase & Co., VRN, 3.16%, 4/22/42 | | 3,210,000 | | 3,354,317 | |
| Kreditanstalt fuer Wiederaufbau, 4.625%, 1/4/23 | EUR | 4,860,000 | | 5,961,979 | |
| Lloyds Banking Group plc, MTN, VRN, 1.75%, 9/7/28 | EUR | 800,000 | | 951,459 | |
| Lloyds Banking Group plc, VRN, 1.875%, 1/15/26 | GBP | 700,000 | | 965,111 | |
| Lloyds Banking Group plc, VRN, 1.99%, 12/15/31 | GBP | 1,400,000 | | 1,887,087 | |
National Australia Bank Ltd., 2.99%, 5/21/31(1) | | $ | 3,050,000 | | 3,066,983 | |
| NatWest Group plc, MTN, VRN, 2.11%, 11/28/31 | GBP | 1,900,000 | | 2,561,318 | |
| Royal Bank of Canada, MTN, 2.30%, 11/3/31 | | $ | 620,000 | | 618,955 | |
| Societe Generale SA, MTN, 1.25%, 12/7/27 | GBP | 1,500,000 | | 1,959,660 | |
Societe Generale SA, VRN, 1.79%, 6/9/27(1) | | $ | 1,545,000 | | 1,521,583 | |
| Truist Financial Corp., MTN, VRN, 1.89%, 6/7/29 | | 570,000 | | 564,322 | |
| UniCredit SpA, MTN, VRN, 2.00%, 9/23/29 | EUR | 1,700,000 | | 1,978,420 | |
UniCredit SpA, VRN, 1.98%, 6/3/27(1) | | $ | 2,700,000 | | 2,655,316 | |
UniCredit SpA, VRN, 3.13%, 6/3/32(1) | | 2,700,000 | | 2,689,575 | |
US Bancorp, VRN, 2.49%, 11/3/36(3) | | 1,250,000 | | 1,245,355 | |
| Wells Fargo & Co., VRN, 3.07%, 4/30/41 | | 1,345,000 | | 1,382,729 | |
| | | 104,794,515 | |
| Beverages — 0.2% | | | |
| Anheuser-Busch Cos. LLC / Anheuser-Busch InBev Worldwide, Inc., 4.90%, 2/1/46 | | 1,065,000 | | 1,360,226 | |
| Anheuser-Busch InBev SA, MTN, 1.65%, 3/28/31 | EUR | 1,000,000 | | 1,242,315 | |
| Anheuser-Busch InBev Worldwide, Inc., 4.75%, 1/23/29 | | $ | 1,100,000 | | 1,292,052 | |
| | | 3,894,593 | |
| Biotechnology — 0.1% | | | |
| AbbVie, Inc., 3.20%, 11/21/29 | | 1,130,000 | | 1,208,292 | |
| Gilead Sciences, Inc., 3.65%, 3/1/26 | | 1,935,000 | | 2,098,965 | |
| | | 3,307,257 | |
| Building Products — 0.1% | | | |
Builders FirstSource, Inc., 5.00%, 3/1/30(1) | | 2,501,000 | | 2,644,845 | |
| Lennox International, Inc., 1.70%, 8/1/27 | | 710,000 | | 699,631 | |
| | | 3,344,476 | |
| Capital Markets — 2.5% | | | |
Ares Finance Co. III LLC, VRN, 4.125%, 6/30/51(1) | | 954,000 | | 980,759 | |
| Bain Capital Specialty Finance, Inc., 2.95%, 3/10/26 | | 3,350,000 | | 3,379,303 | |
| Bain Capital Specialty Finance, Inc., 2.55%, 10/13/26 | | 3,200,000 | | 3,131,301 | |
Blackstone Secured Lending Fund, 2.85%, 9/30/28(1) | | 850,000 | | 834,399 | |
Blue Owl Finance LLC, 3.125%, 6/10/31(1) | | 415,000 | | 408,353 | |
Blue Owl Finance LLC, 4.125%, 10/7/51(1) | | 1,283,000 | | 1,324,556 | |
Coinbase Global, Inc., 3.375%, 10/1/28(1) | | 8,075,000 | | 7,802,469 | |
Depository Trust & Clearing Corp. (The), VRN, 3.375%(1)(4) | | 1,250,000 | | 1,264,844 | |
| | | | | | | | | | | |
| | Principal Amount/Shares | Value |
| Deutsche Bank AG, MTN, 2.625%, 12/16/24 | GBP | 2,100,000 | | $ | 2,943,516 | |
| Deutsche Bank AG, VRN, 4.30%, 5/24/28 | | $ | 2,766,000 | | 2,866,791 | |
| Deutsche Bank AG (New York), VRN, 3.73%, 1/14/32 | | 2,521,000 | | 2,586,267 | |
FS KKR Capital Corp., 4.25%, 2/14/25(1) | | 1,001,000 | | 1,053,891 | |
| FS KKR Capital Corp., 3.125%, 10/12/28 | | 1,820,000 | | 1,794,683 | |
| Goldman Sachs Group, Inc. (The), MTN, 4.25%, 1/29/26 | GBP | 1,400,000 | | 2,120,434 | |
| Goldman Sachs Group, Inc. (The), MTN, VRN, 2.38%, 7/21/32 | | $ | 4,280,000 | | 4,210,107 | |
| Goldman Sachs Group, Inc. (The), VRN, 1.95%, 10/21/27 | | 791,000 | | 792,064 | |
| Goldman Sachs Group, Inc. (The), VRN, 2.91%, 7/21/42 | | 1,310,000 | | 1,309,300 | |
| Golub Capital BDC, Inc., 2.05%, 2/15/27 | | 576,000 | | 560,054 | |
| Hercules Capital, Inc., 2.625%, 9/16/26 | | 1,019,000 | | 1,004,409 | |
LPL Holdings, Inc., 4.625%, 11/15/27(1) | | 3,865,000 | | 3,985,781 | |
LPL Holdings, Inc., 4.375%, 5/15/31(1) | | 3,479,000 | | 3,566,062 | |
| Main Street Capital Corp., 3.00%, 7/14/26 | | 1,370,000 | | 1,383,525 | |
| Morgan Stanley, MTN, VRN, 2.24%, 7/21/32 | | 640,000 | | 625,329 | |
| Morgan Stanley, VRN, 1.59%, 5/4/27 | | 836,000 | | 828,460 | |
| Morgan Stanley, VRN, 2.48%, 9/16/36 | | 1,528,000 | | 1,485,658 | |
Owl Rock Core Income Corp., 3.125%, 9/23/26(1) | | 2,158,000 | | 2,110,453 | |
Owl Rock Technology Finance Corp., 6.75%, 6/30/25(1) | | 1,770,000 | | 2,015,177 | |
Owl Rock Technology Finance Corp., 3.75%, 6/17/26(1) | | 560,000 | | 584,815 | |
| Owl Rock Technology Finance Corp., 2.50%, 1/15/27 | | 1,530,000 | | 1,515,426 | |
| Prospect Capital Corp., 3.71%, 1/22/26 | | 1,255,000 | | 1,278,887 | |
| Prospect Capital Corp., 3.44%, 10/15/28 | | 1,230,000 | | 1,183,807 | |
UBS Group AG, VRN, 1.49%, 8/10/27(1) | | 1,235,000 | | 1,210,309 | |
| | | 62,141,189 | |
| Chemicals — 0.1% | | | |
Tronox, Inc., 4.625%, 3/15/29(1) | | 2,050,000 | | 2,012,239 | |
| Westlake Chemical Corp., 2.875%, 8/15/41 | | 445,000 | | 430,778 | |
| | | 2,443,017 | |
| Commercial Services and Supplies — 0.2% | | | |
GFL Environmental, Inc., 4.00%, 8/1/28(1) | | 2,950,000 | | 2,879,937 | |
| Waste Connections, Inc., 2.60%, 2/1/30 | | 720,000 | | 741,064 | |
| Waste Connections, Inc., 2.95%, 1/15/52 | | 672,000 | | 669,868 | |
| | | 4,290,869 | |
| Communications Equipment — 0.2% | | | |
CommScope Technologies LLC, 5.00%, 3/15/27(1) | | 4,260,000 | | 3,961,180 | |
| Construction and Engineering — 0.1% | | | |
| Quanta Services, Inc., 2.35%, 1/15/32 | | 1,365,000 | | 1,337,719 | |
| Construction Materials — 0.3% | | | |
Cemex SAB de CV, 5.20%, 9/17/30(1) | | 2,810,000 | | 3,046,152 | |
Cemex SAB de CV, 3.875%, 7/11/31(1) | | 3,000,000 | | 3,014,850 | |
| Eagle Materials, Inc., 2.50%, 7/1/31 | | 843,000 | | 835,004 | |
| | | 6,896,006 | |
| Consumer Finance — 0.9% | | | |
| AerCap Ireland Capital DAC / AerCap Global Aviation Trust, 3.00%, 10/29/28 | | 1,243,000 | | 1,261,172 | |
| AerCap Ireland Capital DAC / AerCap Global Aviation Trust, 3.30%, 1/30/32 | | 2,321,000 | | 2,364,321 | |
| AerCap Ireland Capital DAC / AerCap Global Aviation Trust, 3.40%, 10/29/33 | | 1,000,000 | | 1,019,009 | |
| AerCap Ireland Capital DAC / AerCap Global Aviation Trust, 3.85%, 10/29/41 | | 344,000 | | 356,713 | |
| | | | | | | | | | | |
| | Principal Amount/Shares | Value |
| Ally Financial, Inc., 5.75%, 11/20/25 | | $ | 3,720,000 | | $ | 4,224,566 | |
Ally Financial, Inc., 2.20%, 11/2/28(3) | | 1,560,000 | | 1,541,234 | |
Avolon Holdings Funding Ltd., 4.25%, 4/15/26(1) | | 748,000 | | 804,059 | |
Capital One Financial Corp., VRN, 1.88%, 11/2/27(3) | | 1,880,000 | | 1,875,380 | |
Castlelake Aviation Finance DAC, 5.00%, 4/15/27(1) | | 2,775,000 | | 2,770,671 | |
LFS Topco LLC, 5.875%, 10/15/26(1) | | 1,645,000 | | 1,694,350 | |
| OneMain Finance Corp., 3.50%, 1/15/27 | | 1,512,000 | | 1,479,870 | |
SLM Corp., 3.125%, 11/2/26(3) | | 3,201,000 | | 3,176,993 | |
| | | 22,568,338 | |
| Containers and Packaging — 0.4% | | | |
Ardagh Metal Packaging Finance USA LLC / Ardagh Metal Packaging Finance plc, 4.00%, 9/1/29(1) | | 2,800,000 | | 2,787,820 | |
Ardagh Packaging Finance plc / Ardagh Holdings USA, Inc., 5.25%, 8/15/27(1) | | 4,800,000 | | 4,794,000 | |
| Berry Global, Inc., 1.57%, 1/15/26 | | 730,000 | | 722,047 | |
| WRKCo, Inc., 3.00%, 9/15/24 | | 648,000 | | 680,517 | |
| | | 8,984,384 | |
| Diversified Financial Services — 0.2% | | | |
Antares Holdings LP, 2.75%, 1/15/27(1) | | 713,000 | | 706,222 | |
Blackstone Private Credit Fund, 1.75%, 9/15/24(1) | | 763,000 | | 756,184 | |
Blackstone Private Credit Fund, 2.625%, 12/15/26(1) | | 924,000 | | 907,012 | |
| Block Financial LLC, 3.875%, 8/15/30 | | 700,000 | | 746,396 | |
| GE Capital Funding LLC, 4.40%, 5/15/30 | | 1,170,000 | | 1,368,240 | |
| GE Capital International Funding Co. Unlimited Co., 4.42%, 11/15/35 | | 410,000 | | 499,231 | |
| | | 4,983,285 | |
| Diversified Telecommunication Services — 0.9% | | | |
| AT&T, Inc., 2.55%, 12/1/33 | | 2,040,000 | | 1,982,867 | |
| AT&T, Inc., 3.55%, 9/15/55 | | 1,260,000 | | 1,278,165 | |
British Telecommunications plc, 3.25%, 11/8/29(1) | | 1,630,000 | | 1,688,651 | |
| Deutsche Telekom AG, MTN, 1.375%, 7/5/34 | EUR | 1,100,000 | | 1,334,983 | |
| Deutsche Telekom International Finance BV, MTN, 1.25%, 10/6/23 | GBP | 1,700,000 | | 2,334,401 | |
Level 3 Financing, Inc., 4.625%, 9/15/27(1) | | $ | 2,621,000 | | 2,689,801 | |
Ooredoo International Finance Ltd., 2.625%, 4/8/31(1) | | 1,500,000 | | 1,517,139 | |
| Orange SA, MTN, 5.25%, 12/5/25 | GBP | 470,000 | | 745,263 | |
| Telecom Italia Capital SA, 6.375%, 11/15/33 | | $ | 3,205,000 | | 3,681,279 | |
| Telecom Italia SpA, MTN, 5.875%, 5/19/23 | GBP | 200,000 | | 290,626 | |
| Telecom Italia SpA, MTN, 4.00%, 4/11/24 | EUR | 1,200,000 | | 1,473,435 | |
| Verizon Communications, Inc., 4.33%, 9/21/28 | | $ | 892,000 | | 1,018,679 | |
| Verizon Communications, Inc., 1.75%, 1/20/31 | | 1,490,000 | | 1,407,977 | |
| Verizon Communications, Inc., 2.65%, 11/20/40 | | 1,369,000 | | 1,295,401 | |
| | | 22,738,667 | |
| Electric Utilities — 0.9% | | | |
| AEP Texas, Inc., 2.10%, 7/1/30 | | 1,750,000 | | 1,696,803 | |
Alfa Desarrollo SpA, 4.55%, 9/27/51(1) | | 1,000,000 | | 978,565 | |
| Baltimore Gas and Electric Co., 2.25%, 6/15/31 | | 678,000 | | 676,695 | |
| Berkshire Hathaway Energy Co., 3.50%, 2/1/25 | | 797,000 | | 849,793 | |
| Commonwealth Edison Co., 3.20%, 11/15/49 | | 640,000 | | 680,450 | |
| DTE Electric Co., 2.25%, 3/1/30 | | 820,000 | | 829,992 | |
| Duke Energy Carolinas LLC, 2.55%, 4/15/31 | | 462,000 | | 475,543 | |
| Duke Energy Corp., 2.55%, 6/15/31 | | 480,000 | | 482,698 | |
| | | | | | | | | | | |
| | Principal Amount/Shares | Value |
| Duke Energy Florida LLC, 1.75%, 6/15/30 | | $ | 1,360,000 | | $ | 1,314,788 | |
| Duke Energy Progress LLC, 4.15%, 12/1/44 | | 280,000 | | 333,704 | |
| EDP - Energias de Portugal SA, VRN, 1.70%, 7/20/80 | EUR | 700,000 | | 811,747 | |
| Exelon Corp., 4.45%, 4/15/46 | | $ | 780,000 | | 965,885 | |
FEL Energy VI Sarl, 5.75%, 12/1/40(1) | | 3,222,559 | | 3,193,814 | |
| Florida Power & Light Co., 4.125%, 2/1/42 | | 680,000 | | 825,438 | |
| Indiana Michigan Power Co., 3.25%, 5/1/51 | | 429,000 | | 458,679 | |
| MidAmerican Energy Co., 4.40%, 10/15/44 | | 365,000 | | 452,760 | |
| NextEra Energy Capital Holdings, Inc., 3.55%, 5/1/27 | | 800,000 | | 868,213 | |
NextEra Energy Operating Partners LP, 4.50%, 9/15/27(1) | | 664,000 | | 711,177 | |
| Northern States Power Co., 3.20%, 4/1/52 | | 650,000 | | 707,880 | |
NRG Energy, Inc., 2.00%, 12/2/25(1) | | 2,130,000 | | 2,155,229 | |
| Pacific Gas and Electric Co., 4.20%, 6/1/41 | | 465,000 | | 469,439 | |
| PacifiCorp, 3.30%, 3/15/51 | | 870,000 | | 922,673 | |
| PacifiCorp, 2.90%, 6/15/52 | | 440,000 | | 438,313 | |
| Southern Co. Gas Capital Corp., 1.75%, 1/15/31 | | 760,000 | | 715,868 | |
| Southern Co. Gas Capital Corp., 3.95%, 10/1/46 | | 695,000 | | 789,563 | |
| Xcel Energy, Inc., 3.40%, 6/1/30 | | 810,000 | | 879,730 | |
| | | 23,685,439 | |
Electrical Equipment† | | | |
| Rockwell Automation, Inc., 2.80%, 8/15/61 | | 413,000 | | 410,978 | |
Electronic Equipment, Instruments and Components† | | | |
| Teledyne Technologies, Inc., 2.25%, 4/1/28 | | 1,000,000 | | 1,006,311 | |
Energy Equipment and Services† | | | |
| Halliburton Co., 2.92%, 3/1/30 | | 1,000,000 | | 1,033,991 | |
| Entertainment — 0.1% | | | |
Netflix, Inc., 3.625%, 6/15/25(1) | | 497,000 | | 529,054 | |
| Netflix, Inc., 4.875%, 4/15/28 | | 1,000,000 | | 1,146,880 | |
| | | 1,675,934 | |
| Equity Real Estate Investment Trusts (REITs) — 2.5% | | | |
American Finance Trust, Inc. / American Finance Operating Partrner LP, 4.50%, 9/30/28(1) | | 2,820,000 | | 2,823,525 | |
| Broadstone Net Lease LLC, 2.60%, 9/15/31 | | 635,000 | | 623,301 | |
| Corporate Office Properties LP, 2.00%, 1/15/29 | | 1,390,000 | | 1,349,269 | |
| Crown Castle International Corp., 3.30%, 7/1/30 | | 980,000 | | 1,036,567 | |
| EPR Properties, 4.75%, 12/15/26 | | 1,618,000 | | 1,759,098 | |
| EPR Properties, 4.95%, 4/15/28 | | 7,809,000 | | 8,556,027 | |
| EPR Properties, 3.60%, 11/15/31 | | 1,094,000 | | 1,097,878 | |
| Host Hotels & Resorts LP, 4.00%, 6/15/25 | | 1,180,000 | | 1,255,495 | |
| IIP Operating Partnership LP, 5.50%, 5/25/26 | | 2,880,000 | | 3,041,632 | |
Iron Mountain, Inc., 4.875%, 9/15/29(1) | | 4,545,000 | | 4,701,302 | |
| Lexington Realty Trust, 2.375%, 10/1/31 | | 1,790,000 | | 1,723,997 | |
| Life Storage LP, 2.40%, 10/15/31 | | 1,748,000 | | 1,727,170 | |
| MPT Operating Partnership LP / MPT Finance Corp., 5.00%, 10/15/27 | | 5,365,000 | | 5,654,442 | |
| National Health Investors, Inc., 3.00%, 2/1/31 | | 2,275,000 | | 2,187,990 | |
| National Retail Properties, Inc., 3.00%, 4/15/52 | | 600,000 | | 588,672 | |
| Office Properties Income Trust, 2.40%, 2/1/27 | | 1,029,000 | | 1,003,920 | |
| Omega Healthcare Investors, Inc., 3.375%, 2/1/31 | | 558,000 | | 566,775 | |
| Phillips Edison Grocery Center Operating Partnership I LP, 2.625%, 11/15/31 | | 665,000 | | 652,042 | |
| Physicians Realty LP, 2.625%, 11/1/31 | | 1,615,000 | | 1,614,012 | |
| | | | | | | | | | | |
| | Principal Amount/Shares | Value |
| Piedmont Operating Partnership LP, 2.75%, 4/1/32 | | $ | 1,100,000 | | $ | 1,078,126 | |
| Rexford Industrial Realty LP, 2.15%, 9/1/31 | | 436,000 | | 417,566 | |
| RHP Hotel Properties LP / RHP Finance Corp., 4.75%, 10/15/27 | | 4,276,000 | | 4,366,865 | |
RHP Hotel Properties LP / RHP Finance Corp., 4.50%, 2/15/29(1) | | 2,296,000 | | 2,275,910 | |
| Sabra Health Care LP, 3.20%, 12/1/31 | | 2,318,000 | | 2,270,001 | |
| STORE Capital Corp., 4.625%, 3/15/29 | | 509,000 | | 573,781 | |
| Tanger Properties LP, 2.75%, 9/1/31 | | 1,510,000 | | 1,445,916 | |
VICI Properties LP / VICI Note Co., Inc., 4.125%, 8/15/30(1) | | 3,860,000 | | 4,057,825 | |
XHR LP, 4.875%, 6/1/29(1) | | 4,574,000 | | 4,698,413 | |
| | | 63,147,517 | |
| Food and Staples Retailing — 0.8% | | | |
Albertsons Cos., Inc. / Safeway, Inc. / New Albertsons LP / Albertsons LLC, 4.875%, 2/15/30(1) | | 3,702,000 | | 3,972,616 | |
CK Hutchison International 20 Ltd., 2.50%, 5/8/30(1) | | 1,500,000 | | 1,511,400 | |
| Kroger Co. (The), 3.875%, 10/15/46 | | 530,000 | | 599,022 | |
| Sysco Corp., 5.95%, 4/1/30 | | 1,505,000 | | 1,906,108 | |
United Natural Foods, Inc., 6.75%, 10/15/28(1) | | 2,020,000 | | 2,189,175 | |
| Walmart, Inc., 0.18%, 7/15/22 | JPY | 750,000,000 | | 6,579,765 | |
| Walmart, Inc., 1.80%, 9/22/31 | | $ | 450,000 | | 443,754 | |
| Wm Morrison Supermarkets plc, MTN, 3.50%, 7/27/26 | GBP | 1,300,000 | | 1,787,972 | |
| | | 18,989,812 | |
| Food Products — 0.5% | | | |
JDE Peet's NV, 2.25%, 9/24/31(1) | | $ | 1,394,000 | | 1,362,272 | |
Lamb Weston Holdings, Inc., 4.125%, 1/31/30(1)(3) | | 2,983,000 | | 2,989,563 | |
MARB BondCo plc, 3.95%, 1/29/31(1) | | 4,400,000 | | 4,190,802 | |
US Foods, Inc., 4.75%, 2/15/29(1) | | 3,130,000 | | 3,170,752 | |
| | | 11,713,389 | |
| Gas Utilities — 0.1% | | | |
Infraestructura Energetica Nova SAB de CV, 4.75%, 1/15/51(1) | | 2,100,000 | | 2,147,397 | |
| Health Care Equipment and Supplies — 0.3% | | | |
Avantor Funding, Inc., 4.625%, 7/15/28(1) | | 1,023,000 | | 1,062,590 | |
Avantor Funding, Inc., 3.875%, 11/1/29(1) | | 3,760,000 | | 3,763,497 | |
Mozart Debt Merger Sub, Inc., 3.875%, 4/1/29(1) | | 1,795,000 | | 1,788,269 | |
| | | 6,614,356 | |
| Health Care Providers and Services — 0.9% | | | |
Catalent Pharma Solutions, Inc., 5.00%, 7/15/27(1) | | 1,615,000 | | 1,669,506 | |
| Centene Corp., 4.625%, 12/15/29 | | 920,000 | | 993,600 | |
| Centene Corp., 3.375%, 2/15/30 | | 2,241,000 | | 2,302,751 | |
CHS / Community Health Systems, Inc., 6.875%, 4/15/29(1) | | 1,405,000 | | 1,447,522 | |
| CVS Health Corp., 1.75%, 8/21/30 | | 1,580,000 | | 1,505,922 | |
| CVS Health Corp., 4.78%, 3/25/38 | | 320,000 | | 391,872 | |
DaVita, Inc., 4.625%, 6/1/30(1) | | 1,930,000 | | 1,942,062 | |
| HCA, Inc., 2.375%, 7/15/31 | | 2,050,000 | | 2,004,808 | |
| HCA, Inc., 3.50%, 7/15/51 | | 950,000 | | 964,237 | |
| Humana, Inc., 2.15%, 2/3/32 | | 872,000 | | 844,270 | |
| Kaiser Foundation Hospitals, 3.00%, 6/1/51 | | 470,000 | | 489,347 | |
| Tenet Healthcare Corp., 6.75%, 6/15/23 | | 1,630,000 | | 1,754,288 | |
Tenet Healthcare Corp., 6.125%, 10/1/28(1) | | 2,545,000 | | 2,675,304 | |
Universal Health Services, Inc., 1.65%, 9/1/26(1) | | 1,533,000 | | 1,510,296 | |
| | | | | | | | | | | |
| | Principal Amount/Shares | Value |
Universal Health Services, Inc., 2.65%, 10/15/30(1) | | $ | 1,425,000 | | $ | 1,416,044 | |
| | | 21,911,829 | |
| Hotels, Restaurants and Leisure — 0.7% | | | |
1011778 BC ULC / New Red Finance, Inc., 4.375%, 1/15/28(1) | | 880,000 | | 885,720 | |
Caesars Entertainment, Inc., 4.625%, 10/15/29(1) | | 1,728,000 | | 1,738,454 | |
Carnival Corp., 5.75%, 3/1/27(1) | | 1,950,000 | | 1,986,563 | |
Hilton Domestic Operating Co., Inc., 3.75%, 5/1/29(1) | | 3,515,000 | | 3,519,394 | |
International Game Technology plc, 5.25%, 1/15/29(1) | | 1,810,000 | | 1,905,025 | |
| Marriott International, Inc., 3.50%, 10/15/32 | | 2,132,000 | | 2,256,673 | |
Penn National Gaming, Inc., 4.125%, 7/1/29(1) | | 1,788,000 | | 1,745,535 | |
Scientific Games International, Inc., 7.25%, 11/15/29(1) | | 2,400,000 | | 2,715,192 | |
Viking Ocean Cruises Ship VII Ltd., 5.625%, 2/15/29(1) | | 1,839,000 | | 1,827,506 | |
| | | 18,580,062 | |
| Household Durables — 0.4% | | | |
| D.R. Horton, Inc., 2.50%, 10/15/24 | | 800,000 | | 832,762 | |
| KB Home, 4.80%, 11/15/29 | | 4,103,000 | | 4,426,111 | |
Mattamy Group Corp., 4.625%, 3/1/30(1) | | 1,590,000 | | 1,614,775 | |
Tempur Sealy International, Inc., 3.875%, 10/15/31(1) | | 2,069,000 | | 2,052,862 | |
| | | 8,926,510 | |
| Industrial Conglomerates — 0.2% | | | |
| General Electric Co., 4.35%, 5/1/50 | | 1,340,000 | | 1,708,474 | |
| Siemens Financieringsmaatschappij NV, MTN, 1.00%, 2/20/25 | GBP | 1,800,000 | | 2,453,895 | |
| | | 4,162,369 | |
| Insurance — 1.2% | | | |
| American International Group, Inc., 6.25%, 5/1/36 | | $ | 1,840,000 | | 2,536,056 | |
| American International Group, Inc., 4.50%, 7/16/44 | | 1,100,000 | | 1,344,841 | |
| Assured Guaranty US Holdings, Inc., 3.60%, 9/15/51 | | 1,168,000 | | 1,227,970 | |
Athene Global Funding, 1.99%, 8/19/28(1) | | 2,189,000 | | 2,130,607 | |
Athene Global Funding, 2.67%, 6/7/31(1) | | 2,200,000 | | 2,205,407 | |
Brighthouse Financial Global Funding, 2.00%, 6/28/28(1) | | 1,915,000 | | 1,891,269 | |
| Credit Agricole Assurances SA, VRN, 2.625%, 1/29/48 | EUR | 1,800,000 | | 2,213,613 | |
Equitable Financial Life Global Funding, 1.80%, 3/8/28(1) | | $ | 1,740,000 | | 1,711,792 | |
Global Atlantic Fin Co., 3.125%, 6/15/31(1) | | 698,000 | | 700,977 | |
Global Atlantic Fin Co., VRN, 4.70%, 10/15/51(1) | | 3,740,000 | | 3,855,189 | |
Guardian Life Global Funding, 1.625%, 9/16/28(1) | | 1,388,000 | | 1,352,852 | |
Sammons Financial Group, Inc., 3.35%, 4/16/31(1) | | 3,360,000 | | 3,495,643 | |
SBL Holdings, Inc., 5.125%, 11/13/26(1) | | 985,000 | | 1,083,026 | |
SBL Holdings, Inc., 5.00%, 2/18/31(1) | | 960,000 | | 1,019,698 | |
SBL Holdings, Inc., VRN, 6.50%(1)(4) | | 4,035,000 | | 3,984,562 | |
| | | 30,753,502 | |
| Internet and Direct Marketing Retail — 0.1% | | | |
| Amazon.com, Inc., 2.875%, 5/12/41 | | 3,275,000 | | 3,397,571 | |
| Machinery — 0.1% | | | |
| Cummins, Inc., 2.60%, 9/1/50 | | 1,120,000 | | 1,072,870 | |
| Westinghouse Air Brake Technologies Corp., 4.95%, 9/15/28 | | 2,364,000 | | 2,720,854 | |
| | | 3,793,724 | |
| Media — 1.8% | | | |
| AMC Networks, Inc., 4.25%, 2/15/29 | | 6,325,000 | | 6,238,031 | |
CCO Holdings LLC / CCO Holdings Capital Corp., 5.00%, 2/1/28(1) | | 3,630,000 | | 3,779,737 | |
CCO Holdings LLC / CCO Holdings Capital Corp., 4.25%, 2/1/31(1) | | 5,000,000 | | 4,984,400 | |
| | | | | | | | | | | |
| | Principal Amount/Shares | Value |
| Charter Communications Operating LLC / Charter Communications Operating Capital, 4.91%, 7/23/25 | | $ | 1,085,000 | | $ | 1,206,965 | |
| Charter Communications Operating LLC / Charter Communications Operating Capital, 3.50%, 6/1/41 | | 910,000 | | 894,763 | |
| Charter Communications Operating LLC / Charter Communications Operating Capital, 5.125%, 7/1/49 | | 1,820,000 | | 2,157,357 | |
| Comcast Corp., 3.75%, 4/1/40 | | 1,285,000 | | 1,441,643 | |
Cox Communications, Inc., 2.60%, 6/15/31(1) | | 1,587,000 | | 1,602,546 | |
CSC Holdings LLC, 7.50%, 4/1/28(1) | | 1,720,000 | | 1,831,800 | |
CSC Holdings LLC, 4.50%, 11/15/31(1) | | 1,400,000 | | 1,358,315 | |
| Discovery Communications LLC, 4.65%, 5/15/50 | | 735,000 | | 867,558 | |
Gray Escrow II, Inc., 5.375%, 11/15/31(1)(3) | | 3,163,000 | | 3,198,584 | |
Sinclair Television Group, Inc., 4.125%, 12/1/30(1) | | 3,750,000 | | 3,576,769 | |
Sirius XM Radio, Inc., 5.00%, 8/1/27(1) | | 2,177,000 | | 2,274,965 | |
Sirius XM Radio, Inc., 5.50%, 7/1/29(1) | | 4,234,000 | | 4,572,720 | |
| Time Warner Cable LLC, 4.50%, 9/15/42 | | 1,735,000 | | 1,898,985 | |
| ViacomCBS, Inc., 4.375%, 3/15/43 | | 505,000 | | 578,240 | |
VTR Finance NV, 6.375%, 7/15/28(1) | | 3,070,000 | | 3,276,304 | |
| | | 45,739,682 | |
| Metals and Mining — 0.9% | | | |
Alcoa Nederland Holding BV, 4.125%, 3/31/29(1) | | 2,940,000 | | 3,061,231 | |
Cleveland-Cliffs, Inc., 4.625%, 3/1/29(1) | | 5,739,000 | | 5,954,212 | |
| Freeport-McMoRan, Inc., 4.625%, 8/1/30 | | 3,481,000 | | 3,768,182 | |
Glencore Funding LLC, 2.625%, 9/23/31(1) | | 1,280,000 | | 1,248,470 | |
Minera Mexico SA de CV, 4.50%, 1/26/50(1) | | 2,200,000 | | 2,406,778 | |
Novelis Corp., 4.75%, 1/30/30(1) | | 1,283,000 | | 1,335,924 | |
Novelis Corp., 3.875%, 8/15/31(1) | | 1,315,000 | | 1,285,478 | |
| Steel Dynamics, Inc., 3.45%, 4/15/30 | | 405,000 | | 435,459 | |
| Steel Dynamics, Inc., 3.25%, 1/15/31 | | 1,890,000 | | 2,007,551 | |
| Teck Resources Ltd., 6.25%, 7/15/41 | | 1,200,000 | | 1,606,495 | |
| | | 23,109,780 | |
| Mortgage Real Estate Investment Trusts (REITs) — 0.4% | | | |
Blackstone Mortgage Trust, Inc., 3.75%, 1/15/27(1) | | 3,950,000 | | 3,934,595 | |
Ladder Capital Finance Holdings LLLP / Ladder Capital Finance Corp., 4.75%, 6/15/29(1) | | 5,140,000 | | 5,184,975 | |
| | | 9,119,570 | |
| Multi-Utilities — 0.4% | | | |
Abu Dhabi National Energy Co. PJSC, 2.00%, 4/29/28(1) | | 1,645,000 | | 1,640,823 | |
| Ameren Corp., 3.50%, 1/15/31 | | 1,243,000 | | 1,346,644 | |
| CenterPoint Energy, Inc., 4.25%, 11/1/28 | | 1,020,000 | | 1,154,564 | |
| Dominion Energy, Inc., 2.25%, 8/15/31 | | 600,000 | | 592,071 | |
| Dominion Energy, Inc., 4.90%, 8/1/41 | | 750,000 | | 943,050 | |
| NiSource, Inc., 5.65%, 2/1/45 | | 967,000 | | 1,352,084 | |
| Sempra Energy, 3.25%, 6/15/27 | | 770,000 | | 820,682 | |
| WEC Energy Group, Inc., 1.375%, 10/15/27 | | 1,240,000 | | 1,207,256 | |
| | | 9,057,174 | |
| Multiline Retail — 0.1% | | | |
| Marks & Spencer plc, 4.50%, 7/10/27 | GBP | 1,400,000 | | 2,017,756 | |
| Oil, Gas and Consumable Fuels — 2.6% | | | |
Aker BP ASA, 3.75%, 1/15/30(1) | | $ | 2,580,000 | | 2,758,192 | |
Aker BP ASA, 4.00%, 1/15/31(1) | | 650,000 | | 706,755 | |
| BP Capital Markets America, Inc., 3.06%, 6/17/41 | | 750,000 | | 758,497 | |
| Chevron Corp., 2.00%, 5/11/27 | | 550,000 | | 560,893 | |
| | | | | | | | | | | |
| | Principal Amount/Shares | Value |
| Diamondback Energy, Inc., 3.50%, 12/1/29 | | $ | 680,000 | | $ | 724,913 | |
Ecopetrol SA, 4.625%, 11/2/31(3) | | 1,800,000 | | 1,789,011 | |
| Enbridge, Inc., 3.40%, 8/1/51 | | 900,000 | | 927,351 | |
Energean Israel Finance Ltd., 4.50%, 3/30/24(1) | | 3,250,000 | | 3,323,946 | |
| Energy Transfer LP, 3.60%, 2/1/23 | | 949,000 | | 974,998 | |
| Energy Transfer LP, 3.75%, 5/15/30 | | 500,000 | | 533,209 | |
| Energy Transfer LP, 4.90%, 3/15/35 | | 450,000 | | 511,802 | |
| Enterprise Products Operating LLC, 4.85%, 3/15/44 | | 1,365,000 | | 1,652,977 | |
| Enterprise Products Operating LLC, 3.30%, 2/15/53 | | 644,000 | | 646,437 | |
EQM Midstream Partners LP, 4.50%, 1/15/29(1) | | 1,525,000 | | 1,570,758 | |
| Equinor ASA, 3.25%, 11/18/49 | | 320,000 | | 347,068 | |
Flex Intermediate Holdco LLC, 3.36%, 6/30/31(1) | | 775,000 | | 785,024 | |
Galaxy Pipeline Assets Bidco Ltd., 2.94%, 9/30/40(1) | | 4,500,000 | | 4,433,731 | |
Gazprom PJSC via Gaz Finance plc, 3.25%, 2/25/30(1) | | 3,500,000 | | 3,465,354 | |
| Geopark Ltd., 6.50%, 9/21/24 | | 809,000 | | 834,200 | |
Geopark Ltd., 5.50%, 1/17/27(1) | | 2,250,000 | | 2,238,356 | |
| Kinder Morgan Energy Partners LP, 6.50%, 9/1/39 | | 690,000 | | 946,652 | |
Lukoil Capital DAC, 3.60%, 10/26/31(1) | | 4,469,000 | | 4,464,383 | |
Lundin Energy Finance BV, 3.10%, 7/15/31(1) | | 650,000 | | 655,683 | |
Medco Bell Pte Ltd., 6.375%, 1/30/27(1) | | 3,500,000 | | 3,590,125 | |
MEG Energy Corp., 5.875%, 2/1/29(1) | | 4,000,000 | | 4,120,000 | |
Petroleos Mexicanos, 6.875%, 10/16/25(1) | | 640,000 | | 700,019 | |
| Petroleos Mexicanos, 5.95%, 1/28/31 | | 6,000,000 | | 5,914,950 | |
| Petroleos Mexicanos, 6.625%, 6/15/35 | | 1,290,000 | | 1,252,055 | |
SA Global Sukuk Ltd., 2.69%, 6/17/31(1) | | 5,250,000 | | 5,267,850 | |
| Sabine Pass Liquefaction LLC, 5.625%, 3/1/25 | | 2,185,000 | | 2,454,109 | |
| Southwestern Energy Co., 5.375%, 3/15/30 | | 2,256,000 | | 2,382,855 | |
| TransCanada PipeLines Ltd., 2.50%, 10/12/31 | | 1,320,000 | | 1,311,697 | |
| Transcontinental Gas Pipe Line Co. LLC, 3.25%, 5/15/30 | | 580,000 | | 615,552 | |
| Williams Cos., Inc. (The), 4.55%, 6/24/24 | | 1,040,000 | | 1,126,132 | |
| | | 64,345,534 | |
Paper and Forest Products† | | | |
Georgia-Pacific LLC, 2.10%, 4/30/27(1) | | 920,000 | | 935,670 | |
| Pharmaceuticals — 0.3% | | | |
| Astrazeneca Finance LLC, 1.75%, 5/28/28 | | 736,000 | | 733,461 | |
Bausch Health Cos., Inc., 4.875%, 6/1/28(1) | | 1,575,000 | | 1,623,904 | |
| Bayer AG, VRN, 2.375%, 11/12/79 | EUR | 1,800,000 | | 2,080,821 | |
| Bristol-Myers Squibb Co., 2.55%, 11/13/50 | | $ | 1,678,000 | | 1,607,497 | |
| Viatris, Inc., 4.00%, 6/22/50 | | 1,007,000 | | 1,081,100 | |
| | | 7,126,783 | |
| Real Estate Management and Development — 0.2% | | | |
| Essential Properties LP, 2.95%, 7/15/31 | | 1,330,000 | | 1,327,410 | |
Howard Hughes Corp. (The), 4.375%, 2/1/31(1) | | 3,293,000 | | 3,298,302 | |
Ontario Teachers' Cadillac Fairview Properties Trust, 2.50%, 10/15/31(1) | | 676,000 | | 677,938 | |
| | | 5,303,650 | |
| Road and Rail — 0.4% | | | |
| Burlington Northern Santa Fe LLC, 4.15%, 4/1/45 | | 757,000 | | 931,842 | |
| Burlington Northern Santa Fe LLC, 3.30%, 9/15/51 | | 550,000 | | 610,371 | |
DAE Funding LLC, 1.55%, 8/1/24(1) | | 1,289,000 | | 1,273,210 | |
DAE Funding LLC, 3.375%, 3/20/28(1) | | 1,145,000 | | 1,171,258 | |
Triton Container International Ltd., 3.15%, 6/15/31(1) | | 1,360,000 | | 1,376,683 | |
| | | | | | | | | | | |
| | Principal Amount/Shares | Value |
| Union Pacific Corp., 2.40%, 2/5/30 | | $ | 910,000 | | $ | 936,973 | |
| Union Pacific Corp., MTN, 3.55%, 8/15/39 | | 1,400,000 | | 1,566,571 | |
XPO Logistics, Inc., 6.25%, 5/1/25(1) | | 2,399,000 | | 2,530,225 | |
| | | 10,397,133 | |
| Semiconductors and Semiconductor Equipment — 0.5% | | | |
| Intel Corp., 2.80%, 8/12/41 | | 1,680,000 | | 1,678,359 | |
| Microchip Technology, Inc., 4.25%, 9/1/25 | | 6,015,000 | | 6,257,706 | |
| Qorvo, Inc., 4.375%, 10/15/29 | | 2,712,000 | | 2,915,400 | |
Qorvo, Inc., 3.375%, 4/1/31(1) | | 1,364,000 | | 1,411,890 | |
| | | 12,263,355 | |
| Software — 0.2% | | | |
| Autodesk, Inc., 2.40%, 12/15/31 | | 957,000 | | 941,926 | |
NCR Corp., 5.125%, 4/15/29(1) | | 2,700,000 | | 2,764,341 | |
| Oracle Corp., 3.60%, 4/1/40 | | 1,600,000 | | 1,670,020 | |
| | | 5,376,287 | |
| Specialty Retail — 0.4% | | | |
| AutoNation, Inc., 1.95%, 8/1/28 | | 900,000 | | 878,494 | |
| Home Depot, Inc. (The), 3.90%, 6/15/47 | | 630,000 | | 757,942 | |
| Home Depot, Inc. (The), 2.375%, 3/15/51 | | 540,000 | | 503,716 | |
LBM Acquisition LLC, 6.25%, 1/15/29(1) | | 1,905,000 | | 1,852,984 | |
| Lowe's Cos., Inc., 2.625%, 4/1/31 | | 1,855,000 | | 1,897,876 | |
Michaels Cos., Inc. (The), 5.25%, 5/1/28(1) | | 2,015,000 | | 2,037,769 | |
Victoria's Secret & Co., 4.625%, 7/15/29(1) | | 1,620,000 | | 1,629,153 | |
| | | 9,557,934 | |
| Technology Hardware, Storage and Peripherals — 0.7% | | | |
| Apple, Inc., 2.65%, 2/8/51 | | 2,585,000 | | 2,556,689 | |
| Dell International LLC / EMC Corp., 4.90%, 10/1/26 | | 2,450,000 | | 2,792,733 | |
| Dell International LLC / EMC Corp., 8.10%, 7/15/36 | | 896,000 | | 1,359,032 | |
| Dell International LLC / EMC Corp., 8.35%, 7/15/46 | | 840,000 | | 1,398,094 | |
HP, Inc., 2.65%, 6/17/31(1) | | 1,650,000 | | 1,625,497 | |
| Seagate HDD Cayman, 4.875%, 3/1/24 | | 537,000 | | 573,274 | |
| Seagate HDD Cayman, 4.875%, 6/1/27 | | 2,440,000 | | 2,692,582 | |
| Western Digital Corp., 4.75%, 2/15/26 | | 4,359,000 | | 4,794,900 | |
| | | 17,792,801 | |
| Thrifts and Mortgage Finance — 0.4% | | | |
Freedom Mortgage Corp., 6.625%, 1/15/27(1) | | 3,640,000 | | 3,454,833 | |
| Nationwide Building Society, MTN, VRN, 2.00%, 7/25/29 | EUR | 2,400,000 | | 2,890,150 | |
Nationwide Building Society, VRN, 4.125%, 10/18/32(1) | | $ | 1,845,000 | | 1,991,741 | |
PennyMac Financial Services, Inc., 5.375%, 10/15/25(1) | | 2,925,000 | | 3,020,063 | |
| | | 11,356,787 | |
| Trading Companies and Distributors — 0.1% | | | |
Aircastle Ltd., 5.25%, 8/11/25(1) | | 989,000 | | 1,093,375 | |
| BOC Aviation Ltd., MTN, 1.75%, 1/21/26 | | 2,000,000 | | 1,968,948 | |
| | | 3,062,323 | |
| Water Utilities — 0.1% | | | |
| Essential Utilities, Inc., 2.70%, 4/15/30 | | 1,410,000 | | 1,442,796 | |
| Wireless Telecommunication Services — 0.7% | | | |
| Sprint Corp., 7.625%, 2/15/25 | | 3,310,000 | | 3,852,012 | |
| T-Mobile USA, Inc., 4.75%, 2/1/28 | | 2,350,000 | | 2,482,188 | |
T-Mobile USA, Inc., 3.50%, 4/15/31(1) | | 745,000 | | 772,010 | |
| T-Mobile USA, Inc., 3.50%, 4/15/31 | | 3,553,000 | | 3,681,814 | |
| | | | | | | | | | | |
| | Principal Amount/Shares | Value |
T-Mobile USA, Inc., 3.40%, 10/15/52(1) | | $ | 1,320,000 | | $ | 1,316,113 | |
| Vodafone Group plc, VRN, 4.20%, 10/3/78 | EUR | 3,000,000 | | 3,870,877 | |
| Vodafone Group plc, VRN, 2.625%, 8/27/80 | EUR | 1,000,000 | | 1,184,573 | |
| | | 17,159,587 | |
TOTAL CORPORATE BONDS (Cost $769,895,192) |
| | 775,646,815 | |
| COLLATERALIZED LOAN OBLIGATIONS — 7.1% |
Aimco CLO Ltd., Series 2019-10A, Class CR, VRN, 2.03%, (3-month LIBOR plus 1.90%), 7/22/32(1) | | $ | 6,000,000 | | 5,999,482 | |
Aimco CLO Ltd., Series 2019-10A, Class DR, VRN, 3.03%, (3-month LIBOR plus 2.90%), 7/22/32(1) | | 2,200,000 | | 2,208,760 | |
AMMC CLO XIII Ltd., Series 2013-13A, Class A3R2, VRN, 2.375%, (3-month LIBOR plus 2.25%), 7/24/29(1) | | 4,500,000 | | 4,504,711 | |
Anchorage Credit Opportunities CLO Ltd., Series 2019-1A, Class B1, VRN, 3.03%, (3-month LIBOR plus 2.90%), 1/20/32(1) | | 8,850,000 | | 8,877,690 | |
ARES LII CLO Ltd., Series 2019-52A, Class CR, VRN, 2.23%, (3-month LIBOR plus 2.10%), 4/22/31(1) | | 2,400,000 | | 2,404,168 | |
ARES LII CLO Ltd., Series 2019-52A, Class DR, VRN, 3.43%, (3-month LIBOR plus 3.30%), 4/22/31(1) | | 5,200,000 | | 5,225,887 | |
Ares LVI CLO Ltd., Series 2020-56A, Class C, VRN, 2.52%, (3-month LIBOR plus 2.40%), 10/25/31(1) | | 4,625,000 | | 4,625,231 | |
Ares XXXIV CLO Ltd., Series 2015-2A, Class BR2, VRN, 1.72%, (3-month LIBOR plus 1.60%), 4/17/33(1) | | 5,650,000 | | 5,637,980 | |
Ares XXXIX CLO Ltd., Series 2016-39A, Class CR2, VRN, 2.17%, (3-month LIBOR plus 2.05%), 4/18/31(1) | | 6,225,000 | | 6,234,235 | |
Bean Creek CLO Ltd., Series 2015-1A, Class BR, VRN, 1.58%, (3-month LIBOR plus 1.45%), 4/20/31(1) | | 4,700,000 | | 4,685,406 | |
CarVal CLO III Ltd., Series 2019-2A, Class CR, VRN, 2.08%, (3-month LIBOR plus 1.95%), 7/20/32(1) | | 3,000,000 | | 3,002,992 | |
CarVal CLO III Ltd., Series 2019-2A, Class DR, VRN, 3.08%, (3-month LIBOR plus 2.95%), 7/20/32(1) | | 3,900,000 | | 3,910,995 | |
CBAM Ltd., Series 2018-5A, Class B1, VRN, 1.52%, (3-month LIBOR plus 1.40%), 4/17/31(1) | | 4,684,800 | | 4,677,633 | |
Dewolf Park CLO Ltd., Series 2017-1A, Class CR, VRN, 1.97%, (3-month LIBOR plus 1.85%), 10/15/30(1) | | 4,250,000 | | 4,250,044 | |
Dryden CLO Ltd., Series 2019-72A, Class CR, VRN, 1.97%, (3-month LIBOR plus 1.85%), 5/15/32(1) | | 3,050,000 | | 3,048,190 | |
Dryden CLO Ltd., Series 2021-87A, Class D, VRN, 3.09%, (3-month LIBOR plus 2.95%), 5/20/34(1) | | 6,400,000 | | 6,436,691 | |
Elmwood CLO IV Ltd., Series 2020-1A, Class C, VRN, 2.17%, (3-month LIBOR plus 2.05%), 4/15/33(1) | | 3,250,000 | | 3,250,162 | |
Elmwood CLO IV Ltd., Series 2020-1A, Class D, VRN, 3.27%, (3-month LIBOR plus 3.15%), 4/15/33(1) | | 3,700,000 | | 3,700,185 | |
Elmwood CLO V Ltd., Series 2020-2A, Class CR, VRN, 2.13%, (3-month LIBOR plus 2.00%), 10/20/34(1) | | 5,375,000 | | 5,366,761 | |
Elmwood CLO VII Ltd., Series 2020-4A, Class C, VRN, 2.37%, (3-month LIBOR plus 2.25%), 1/17/34(1) | | 3,275,000 | | 3,286,378 | |
Elmwood CLO VIII Ltd., Series 2021-1A, Class D, VRN, 3.13%, (3-month LIBOR plus 3.00%), 1/20/34(1) | | 6,000,000 | | 6,036,291 | |
Elmwood CLO X Ltd., Series 2021-3A, Class C, VRN, 2.04%, (3-month LIBOR plus 1.95%), 10/20/34(1) | | 3,000,000 | | 2,997,950 | |
Elmwood CLO X Ltd., Series 2021-3A, Class D, VRN, 2.99%, (3-month LIBOR plus 2.90%), 10/20/34(1) | | 7,500,000 | | 7,530,797 | |
Goldentree Loan Opportunities X Ltd., Series 2015-10A, Class AR, VRN, 1.25%, (3-month LIBOR plus 1.12%), 7/20/31(1) | | 3,025,000 | | 3,025,600 | |
KKR CLO Ltd., Series 18, Class CR, VRN, 2.22%, (3-month LIBOR plus 2.10%), 7/18/30(1) | | 5,975,000 | | 5,975,035 | |
| | | | | | | | | | | |
| | Principal Amount/Shares | Value |
KKR CLO Ltd., Series 2022A, Class B, VRN, 1.73%, (3-month LIBOR plus 1.60%), 7/20/31(1) | | $ | 4,000,000 | | $ | 3,997,625 | |
Magnetite VIII Ltd., Series 2014-8A, Class BR2, VRN, 1.62%, (3-month LIBOR plus 1.50%), 4/15/31(1) | | 3,750,000 | | 3,738,031 | |
Magnetite XIV-R Ltd., Series 2015-14RA, Class B, VRN, 1.72%, (3-month LIBOR plus 1.60%), 10/18/31(1) | | 3,850,000 | | 3,851,915 | |
Magnetite XXV Ltd., Series 2020-25A, Class C, VRN, 2.22%, (3-month LIBOR plus 2.10%), 1/25/32(1) | | 5,200,000 | | 5,207,632 | |
Neuberger Berman Loan Advisers CLO Ltd., Series 2018-30A, Class DR, VRN, 2.98%, (3-month LIBOR plus 2.85%), 1/20/31(1) | | 3,500,000 | | 3,511,927 | |
Neuberger Berman Loan Advisers CLO Ltd., Series 2019-34A, Class C1, VRN, 2.73%, (3-month LIBOR plus 2.60%), 1/20/33(1) | | 4,485,000 | | 4,496,852 | |
Octagon Investment Partners XV Ltd., Series 2013-1A, Class CRR, VRN, 2.13%, (3-month LIBOR plus 2.00%), 7/19/30(1) | | 4,500,000 | | 4,497,128 | |
OHA Credit Funding Ltd., Series 2020-7A, Class B, VRN, 1.82%, (3-month LIBOR plus 1.70%), 10/19/32(1) | | 3,750,000 | | 3,751,865 | |
Reese Park CLO Ltd., Series 2020-1A, Class C1, VRN, 2.57%, (3-month LIBOR plus 2.45%), 10/15/32(1) | | 3,650,000 | | 3,653,597 | |
Rockford Tower CLO Ltd., Series 2020-1A, Class C, VRN, 2.48%, (3-month LIBOR plus 2.35%), 1/20/32(1) | | 4,000,000 | | 4,006,659 | |
Sound Point CLO IX Ltd., Series 2015-2A, Class CRRR, VRN, 2.63%, (3-month LIBOR plus 2.50%), 7/20/32(1) | | 8,000,000 | | 8,031,390 | |
Symphony CLO XXII Ltd., Series 2020-22A, Class B, VRN, 1.82%, (3-month LIBOR plus 1.70%), 4/18/33(1) | | 4,750,000 | | 4,754,709 | |
Taconic Park CLO Ltd., Series 2016-1A, Class BR, VRN, 2.03%, (3-month LIBOR plus 1.90%), 1/20/29(1) | | 3,400,000 | | 3,403,389 | |
TCI Symphony CLO, Series 2016 -1A, Class CR2, VRN, 2.28%, (3-month LIBOR plus 2.15%), 10/13/32(1)(3) | | 3,850,000 | | 3,850,000 | |
TOTAL COLLATERALIZED LOAN OBLIGATIONS (Cost $176,866,551) |
| | 177,651,973 | |
| COLLATERALIZED MORTGAGE OBLIGATIONS — 5.0% |
| Private Sponsor Collateralized Mortgage Obligations — 3.8% |
Angel Oak Mortgage Trust, Series 2019-6, Class M1, VRN, 3.39%, 11/25/59(1) | | 5,500,000 | | 5,510,327 | |
| Bear Stearns Adjustable Rate Mortgage Trust, Series 2006-1, Class A1, VRN, 2.37%, (1-year H15T1Y plus 2.25%), 2/25/36 | | 236,697 | | 241,708 | |
Bellemeade Re Ltd., Series 2019-1A, Class B1, VRN, 4.09%, (1-month LIBOR plus 4.00%), 3/25/29(1) | | 3,700,000 | | 3,709,870 | |
Bellemeade Re Ltd., Series 2021-3A, Class M1C, VRN, 1.60%, (SOFR plus 1.55%), 9/25/31(1) | | 5,900,000 | | 5,869,704 | |
| Citigroup Mortgage Loan Trust, Inc., Series 2004-UST1, Class A5, VRN, 1.94%, 8/25/34 | | 662,606 | | 682,151 | |
COLT Mortgage Loan Trust, Series 2020-1, Class M1 SEQ, VRN, 3.33%, 2/25/50(1) | | 4,851,000 | | 4,852,032 | |
Deephaven Residential Mortgage Trust, Series 2020-2, Class B1, VRN, 5.89%, 5/25/65(1) | | 4,482,000 | | 4,654,824 | |
Ellington Financial Mortgage Trust, Series 2020-1, Class B1, VRN, 5.28%, 5/25/65(1) | | 3,900,000 | | 4,056,668 | |
GCAT Trust, Series 2019-NQM2, Class M1, VRN, 3.31%, 9/25/59(1) | | 6,000,000 | | 6,032,671 | |
Homeward Opportunities Fund I Trust, Series 2019-3, Class M1, VRN, 3.52%, 11/25/59(1) | | 3,135,000 | | 3,215,533 | |
Imperial Fund Mortgage Trust, Series 2021-NQM1, Class M1, VRN, 2.38%, 6/25/56(1) | | 5,000,000 | | 4,959,530 | |
| JP Morgan Mortgage Trust, Series 2006-S1, Class 1A2 SEQ, 6.50%, 4/25/36 | | 228,429 | | 239,242 | |
| MASTR Adjustable Rate Mortgages Trust, Series 2004-13, Class 3A7, VRN, 2.72%, 11/21/34 | | 390,819 | | 397,236 | |
| | | | | | | | | | | |
| | Principal Amount/Shares | Value |
| Merrill Lynch Mortgage Investors Trust, Series 2005-3, Class 2A, VRN, 2.15%, 11/25/35 | | $ | 24,372 | | $ | 24,443 | |
| Merrill Lynch Mortgage Investors Trust, Series 2005-A2, Class A1, VRN, 2.84%, 2/25/35 | | 346,955 | | 352,989 | |
| Merrill Lynch Mortgage Investors Trust, Series 2005-A2, Class A2, VRN, 2.84%, 2/25/35 | | 178,400 | | 182,024 | |
New Residential Mortgage Loan Trust, Series 2015-2A, Class B5, VRN, 5.48%, 8/25/55(1) | | 4,782,300 | | 4,989,621 | |
New Residential Mortgage Loan Trust, Series 2019-NQM4, Class B1, VRN, 3.74%, 9/25/59(1) | | 5,154,000 | | 5,197,037 | |
Oaktown Re IV Ltd., Series 2020-1A, Class M2, VRN, 7.09%, (1-month LIBOR plus 7.00%), 7/25/30(1) | | 3,811,419 | | 3,875,938 | |
Radnor Re Ltd., Series 2018-1, Class M2, VRN, 2.79%, (1-month LIBOR plus 2.70%), 3/25/28(1) | | 12,500,000 | | 12,590,095 | |
Radnor RE Ltd., Series 2021-1, Class M1B, VRN, 1.75%, (SOFR plus 1.70%), 12/27/33(1) | | 6,500,000 | | 6,509,025 | |
Starwood Mortgage Residential Trust, Series 2020-2 Class B2E, VRN, 3.00%, 4/25/60(1) | | 5,000,000 | | 4,992,352 | |
Starwood Mortgage Residential Trust, Series 2020-3, Class M1 SEQ, VRN, 3.54%, 4/25/65(1) | | 3,529,000 | | 3,567,020 | |
| Structured Adjustable Rate Mortgage Loan Trust, Series 2004-8, Class 2A1, VRN, 2.40%, 7/25/34 | | 497,213 | | 512,491 | |
Verus Securitization Trust, Series 2021-2, Class A3, VRN, 1.55%, 2/25/66(1) | | 2,803,045 | | 2,797,098 | |
Verus Securitization Trust, Series 2021-5, Class M1, VRN, 2.33%, 9/25/66(1) | | 5,250,000 | | 5,215,656 | |
| | | 95,227,285 | |
| U.S. Government Agency Collateralized Mortgage Obligations — 1.2% |
| FHLMC, Series 2015-HQ2, Class M3, VRN, 3.34%, (1-month LIBOR plus 3.25%), 5/25/25 | | 829,695 | | 842,455 | |
FHLMC, Series 2018-DNA3, Class M2, VRN, 2.19%, (1-month LIBOR plus 2.10%), 9/25/48(1) | | 5,500,000 | | 5,576,877 | |
FHLMC, Series 2020-HQA4, Class M2, VRN, 3.24%, (1-month LIBOR plus 3.15%), 9/25/50(1) | | 1,076,867 | | 1,082,810 | |
FHLMC, Series 2021-DNA6, Class B1, VRN, 3.45%, (SOFR plus 3.40%), 10/25/41(1) | | 5,670,000 | | 5,699,739 | |
| FHLMC, Series 5123, Class HI, IO, 5.00%, 1/25/42 | | 669,651 | | 118,473 | |
| FHLMC, Series 5146, Class DI, IO, 5.50%, 7/25/39 | | 1,174,165 | | 219,600 | |
| FNMA, Series 2013-C01, Class M2, VRN, 5.34%, (1-month LIBOR plus 5.25%), 10/25/23 | | 3,160,554 | | 3,290,963 | |
| FNMA, Series 2014-C02, Class 2M2, VRN, 2.69%, (1-month LIBOR plus 2.60%), 5/25/24 | | 1,985,710 | | 2,019,499 | |
| FNMA, Series 2015-C04, Class 1M2, VRN, 5.79%, (1-month LIBOR plus 5.70%), 4/25/28 | | 1,725,517 | | 1,828,073 | |
| FNMA, Series 2016-C03, Class 2M2, VRN, 5.99%, (1-month LIBOR plus 5.90%), 10/25/28 | | 845,719 | | 891,305 | |
| FNMA, Series 2016-C06, Class 1M2, VRN, 4.34%, (1-month LIBOR plus 4.25%), 4/25/29 | | 3,989,620 | | 4,148,777 | |
| FNMA, Series 2018-C04, Class 2M2, VRN, 2.64%, (1-month LIBOR plus 2.55%), 12/25/30 | | 3,934,941 | | 4,003,446 | |
| | | 29,722,017 | |
TOTAL COLLATERALIZED MORTGAGE OBLIGATIONS (Cost $125,102,760) |
| | 124,949,302 | |
| PREFERRED STOCKS — 4.1% |
| Automobiles — 0.2% | | | |
| Volkswagen International Finance NV, 3.875% | | 4,500,000 | | 5,678,768 | |
| Banks — 0.6% | | | |
| Banco Santander SA, 4.75% | | 3,800,000 | | 3,829,146 | |
| Banque Federative du Credit Mutuel SA, MTN, 0.15% | | 800,000 | | 886,634 | |
| | | | | | | | | | | |
| | Principal Amount/Shares | Value |
| Citigroup, Inc., 4.15% | | 1,350,000 | | $ | 1,358,100 | |
| ING Groep NV, 3.875% | | 3,900,000 | | 3,763,500 | |
| PNC Financial Services Group, Inc. (The), 3.40% | | 603,000 | | 596,216 | |
| SVB Financial Group, 4.25% | | 3,245,000 | | 3,260,819 | |
| US Bancorp, 3.70% | | 1,880,000 | | 1,877,274 | |
| | | 15,571,689 | |
| Capital Markets — 0.2% | | | |
| Goldman Sachs Group, Inc. (The), 4.125% | | 4,160,000 | | 4,176,432 | |
| Consumer Finance — 0.1% | | | |
| Ally Financial, Inc., 4.70% | | 2,630,000 | | 2,682,600 | |
| Diversified Telecommunication Services — 0.3% | | | |
| Orange SA, MTN, 2.375% | | 1,000,000 | | 1,208,395 | |
| Telefonica Europe BV, 2.38% | | 1,000,000 | | 1,113,800 | |
| Telefonica Europe BV, 2.50% | | 700,000 | | 825,384 | |
| Telefonica Europe BV, 2.875% | | 1,800,000 | | 2,124,892 | |
| Telefonica Europe BV, 3.00% | | 1,100,000 | | 1,311,827 | |
| | | 6,584,298 | |
| Electric Utilities — 0.4% | | | |
| Electricite de France SA, 3.375% | | 3,000,000 | | 3,613,586 | |
| Enel SpA, 2.25% | | 1,900,000 | | 2,279,869 | |
| Naturgy Finance BV, 4.125% | | 700,000 | | 842,600 | |
| SSE plc, 3.125% | | 2,600,000 | | 3,222,919 | |
| | | 9,958,974 | |
| Hotels, Restaurants and Leisure — 0.1% | | | |
| Accor SA, 2.625% | | 2,600,000 | | 2,883,167 | |
| Insurance — 1.2% | | | |
| Allianz SE, 2.625% | | 2,000,000 | | 2,282,718 | |
Allianz SE, 3.20%(1) | | 10,595,000 | | 10,263,906 | |
| Assicurazioni Generali SpA, MTN, 4.60% | | 3,900,000 | | 4,990,722 | |
| AXA SA, MTN, 6.69% | | 1,230,000 | | 2,035,177 | |
| BNP Paribas Cardif SA, 4.03% | | 3,100,000 | | 4,016,122 | |
| Credit Agricole Assurances SA, 4.25% | | 3,300,000 | | 4,195,707 | |
| Intesa Sanpaolo Vita SpA, 4.75% | | 2,300,000 | | 2,892,774 | |
| | | 30,677,126 | |
| Oil, Gas and Consumable Fuels — 0.6% | | | |
| Eni SpA, 3.375% | | 4,700,000 | | 5,737,676 | |
| TotalEnergies SE, MTN, 2.625% | | 3,292,000 | | 4,005,343 | |
| Wintershall Dea Finance 2 BV, 2.50% | | 2,100,000 | | 2,408,538 | |
| Wintershall Dea Finance 2 BV, 3.00% | | 1,400,000 | | 1,592,231 | |
| | | 13,743,788 | |
| Trading Companies and Distributors — 0.4% | | | |
| Air Lease Corp., 4.125% | | 4,320,000 | | 4,266,000 | |
Aircastle Ltd., 5.25%(1) | | 5,290,000 | | 5,448,700 | |
| | | 9,714,700 | |
TOTAL PREFERRED STOCKS (Cost $101,332,569) |
| | 101,671,542 | |
| ASSET-BACKED SECURITIES — 3.2% |
Blackbird Capital Aircraft, Series 2021-1A, Class A SEQ, 2.44%, 7/15/46(1) | | $ | 4,823,438 | | 4,835,568 | |
Diamond Resorts Owner Trust, Series 2021-1A, Class B, 2.05%, 11/21/33(1) | | 3,881,231 | | 3,880,881 | |
FirstKey Homes Trust, Series 2020-SFR1, Class C, 1.94%, 8/17/37(1) | | 4,057,000 | | 4,041,698 | |
| | | | | | | | | | | |
| | Principal Amount/Shares | Value |
FirstKey Homes Trust, Series 2020-SFR2, Class E, 2.67%, 10/19/37(1) | | $ | 13,400,000 | | $ | 13,485,192 | |
FirstKey Homes Trust, Series 2021-SFR1, Class F1, 3.24%, 8/17/38(1) | | 5,800,000 | | 5,752,985 | |
Goodgreen Trust, Series 2018-1A, Class A, VRN, 3.93%, 10/15/53(1) | | 1,862,886 | | 1,958,322 | |
Goodgreen Trust, Series 2021-1A, Class A SEQ, 2.66%, 10/15/56(1) | | 3,006,606 | | 2,998,169 | |
InStar Leasing III LLC, Series 2021-1A, Class A SEQ, 2.30%, 2/15/54(1) | | 8,679,408 | | 8,720,315 | |
Lunar Aircarft Ltd., Series 2020-1A, Class A SEQ, 3.38%, 2/15/45(1) | | 6,045,933 | | 5,933,129 | |
MAPS Trust, Series 2021-1A, Class A SEQ, 2.52%, 6/15/46(1) | | 11,229,960 | | 11,192,627 | |
Progress Residential Trust, Series 2021-SFR1, Class F, 2.76%, 4/17/38(1) | | 7,500,000 | | 7,349,612 | |
Progress Residential Trust, Series 2021-SFR8, Class E1, 2.38%, 10/17/38(1) | | 5,400,000 | | 5,324,514 | |
Sierra Timeshare Receivables Funding LLC, Series 2021-1A, Class D, 3.17%, 11/20/37(1) | | 1,897,920 | | 1,894,158 | |
VSE VOI Mortgage LLC, Series 2016-A, Class A SEQ, 2.54%, 7/20/33(1) | | 1,402,094 | | 1,401,620 | |
TOTAL ASSET-BACKED SECURITIES (Cost $78,999,671) |
| | 78,768,790 | |
| EXCHANGE-TRADED FUNDS — 2.8% |
| iShares JP Morgan USD Emerging Markets Bond ETF | | 230,000 | | 25,274,700 | |
| VanEck J. P. Morgan EM Local Currency Bond ETF | | 1,530,000 | | 45,043,200 | |
TOTAL EXCHANGE-TRADED FUNDS (Cost $73,235,959) |
| | 70,317,900 | |
| U.S. TREASURY SECURITIES — 2.5% |
U.S. Treasury Bills, 0.09%, 11/4/21(5) | | $ | 22,500,000 | | 22,499,944 | |
U.S. Treasury Bills, 0.08%, 12/30/21(5)(6) | | 2,900,000 | | 2,899,620 | |
| U.S. Treasury Bonds, 4.50%, 5/15/38 | | 650,000 | | 907,613 | |
| U.S. Treasury Bonds, 3.50%, 2/15/39 | | 50,000 | | 62,541 | |
U.S. Treasury Bonds, 1.125%, 5/15/40(6) | | 4,500,000 | | 3,897,949 | |
U.S. Treasury Bonds, 1.375%, 11/15/40(6) | | 15,500,000 | | 13,999,043 | |
| U.S. Treasury Bonds, 3.00%, 5/15/42 | | 400,000 | | 470,109 | |
| U.S. Treasury Bonds, 2.875%, 5/15/43 | | 100,000 | | 115,617 | |
| U.S. Treasury Bonds, 3.75%, 11/15/43 | | 500,000 | | 658,662 | |
| U.S. Treasury Bonds, 3.00%, 11/15/44 | | 300,000 | | 356,684 | |
| U.S. Treasury Bonds, 2.50%, 2/15/45 | | 720,000 | | 789,328 | |
| U.S. Treasury Bonds, 3.00%, 5/15/45 | | 800,000 | | 955,688 | |
| U.S. Treasury Bonds, 2.50%, 5/15/46 | | 1,150,000 | | 1,268,684 | |
U.S. Treasury Bonds, 2.25%, 8/15/49(6) | | 2,250,000 | | 2,400,249 | |
| U.S. Treasury Bonds, 2.375%, 11/15/49 | | 600,000 | | 657,059 | |
U.S. Treasury Bonds, 1.25%, 5/15/50(6) | | 8,750,000 | | 7,405,542 | |
U.S. Treasury Bonds, 1.375%, 8/15/50(6) | | 3,500,000 | | 3,053,818 | |
TOTAL U.S. TREASURY SECURITIES (Cost $65,239,612) |
| | 62,398,150 | |
| U.S. GOVERNMENT AGENCY MORTGAGE-BACKED SECURITIES — 2.0% |
| Adjustable-Rate U.S. Government Agency Mortgage-Backed Securities — 0.2% |
| FHLMC, VRN, 2.34%, (1-year H15T1Y plus 2.25%), 9/1/35 | | 521,293 | | 557,925 | |
| FHLMC, VRN, 1.875%, (12-month LIBOR plus 1.63%), 8/1/46 | | 500,333 | | 520,804 | |
| FNMA, VRN, 1.82%, (6-month LIBOR plus 1.57%), 6/1/35 | | 308,138 | | 321,205 | |
| FNMA, VRN, 1.82%, (6-month LIBOR plus 1.57%), 6/1/35 | | 247,300 | | 257,792 | |
| FNMA, VRN, 1.68%, (6-month LIBOR plus 1.54%), 9/1/35 | | 547,003 | | 569,706 | |
| FNMA, VRN, 3.20%, (12-month LIBOR plus 1.61%), 3/1/47 | | 983,306 | | 1,020,697 | |
| | | | | | | | | | | |
| | Principal Amount/Shares | Value |
| FNMA, VRN, 3.10%, (12-month LIBOR plus 1.61%), 4/1/47 | | $ | 677,207 | | $ | 703,262 | |
| FNMA, VRN, 3.24%, (12-month LIBOR plus 1.62%), 5/1/47 | | 882,561 | | 915,359 | |
| | | 4,866,750 | |
| Fixed-Rate U.S. Government Agency Mortgage-Backed Securities — 1.8% |
| FHLMC, 6.00%, 2/1/38 | | 1,009 | | 1,193 | |
| FHLMC, 3.00%, 6/1/51 | | 474,243 | | 495,223 | |
| FHLMC, 2.50%, 9/1/51 | | 137,760 | | 141,687 | |
| FHLMC, 3.50%, 9/1/51 | | 1,138,276 | | 1,204,474 | |
| FHLMC, 2.50%, 10/1/51 | | 136,807 | | 140,647 | |
| FNMA, 3.50%, 10/1/40 | | 1,165,546 | | 1,265,043 | |
| FNMA, 4.50%, 9/1/41 | | 7,393 | | 8,271 | |
| FNMA, 3.50%, 12/1/41 | | 63,618 | | 68,792 | |
| FNMA, 3.50%, 5/1/42 | | 23,990 | | 26,040 | |
| FNMA, 3.50%, 6/1/42 | | 13,416 | | 14,564 | |
| FNMA, 3.50%, 8/1/42 | | 84,276 | | 91,369 | |
| FNMA, 3.50%, 9/1/42 | | 7,938 | | 8,615 | |
| FNMA, 4.00%, 2/1/46 | | 156,641 | | 170,381 | |
| FNMA, 2.50%, 6/1/51 | | 971,610 | | 999,234 | |
| FNMA, 3.50%, 8/1/51 | | 542,345 | | 576,038 | |
| FNMA, 3.50%, 9/1/51 | | 1,156,749 | | 1,229,492 | |
| GNMA, 2.50%, TBA | | 2,250,000 | | 2,313,062 | |
| GNMA, 6.00%, 7/15/33 | | 2,207 | | 2,609 | |
| GNMA, 5.50%, 1/15/39 | | 2,365 | | 2,792 | |
| GNMA, 5.50%, 9/15/39 | | 9,342 | | 10,891 | |
| GNMA, 4.50%, 10/15/39 | | 3,135 | | 3,577 | |
| GNMA, 5.00%, 10/15/39 | | 5,447 | | 6,317 | |
| GNMA, 4.50%, 1/15/40 | | 3,920 | | 4,440 | |
| GNMA, 4.00%, 12/15/40 | | 4,857 | | 5,384 | |
| GNMA, 4.50%, 12/15/40 | | 18,194 | | 20,849 | |
| GNMA, 3.50%, 6/20/42 | | 2,589,809 | | 2,787,384 | |
| GNMA, 3.50%, 3/15/46 | | 428,187 | | 459,969 | |
| GNMA, 3.50%, 6/20/51 | | 1,116,309 | | 1,170,206 | |
| GNMA, 3.00%, 7/20/51 | | 7,364,937 | | 7,656,792 | |
| GNMA, 3.00%, 8/20/51 | | 7,419,807 | | 7,730,685 | |
| GNMA, 2.50%, 9/20/51 | | 747,523 | | 768,958 | |
| GNMA, 3.00%, 9/20/51 | | 14,917,730 | | 15,562,417 | |
| UMBS, 2.50%, TBA | | 825,000 | | 847,349 | |
| | | 45,794,744 | |
TOTAL U.S. GOVERNMENT AGENCY MORTGAGE-BACKED SECURITIES (Cost $50,641,644) | 50,661,494 | |
| COMMERCIAL MORTGAGE-BACKED SECURITIES — 1.0% |
BX Commercial Mortgage Trust, Series 2020-VIV2, Class C, VRN, 3.54%, 3/9/44(1) | | 5,700,000 | | 5,950,441 | |
BX Commercial Mortgage Trust, Series 2020-VIVA, Class D, VRN, 3.55%, 3/11/44(1) | | 6,200,000 | | 6,295,608 | |
BXMT Ltd., Series 2020-FL2, Class D, VRN, 2.11%, (SOFR plus 2.06%), 2/15/38(1) | | 8,000,000 | | 7,976,849 | |
PFP Ltd., Series 2021-8, Class D, VRN, 2.24%, (1-month LIBOR plus 2.15%), 8/9/37(1) | | 4,800,000 | | 4,795,761 | |
TOTAL COMMERCIAL MORTGAGE-BACKED SECURITIES (Cost $25,188,000) | 25,018,659 | |
| MUNICIPAL SECURITIES — 0.6% |
| Bay Area Toll Authority Rev., 6.92%, 4/1/40 | | 605,000 | | 916,807 | |
| California State University Rev., 2.98%, 11/1/51 | | 825,000 | | 847,423 | |
| | | | | | | | | | | |
| | Principal Amount/Shares | Value |
| Chicago GO, 7.05%, 1/1/29 | | $ | 385,000 | | $ | 440,307 | |
| Dallas Area Rapid Transit Rev., 6.00%, 12/1/44 | | 25,000 | | 37,080 | |
| Escambia County Health Facilities Authority Rev., (Baptist Health Care Corp. Obligated Group), 3.61%, 8/15/40 (AGM) | | 725,000 | | 767,619 | |
| Golden State Tobacco Securitization Corp. Rev., 2.75%, 6/1/34 | | 1,905,000 | | 1,921,575 | |
| Grand Parkway Transportation Corp. Rev., 3.24%, 10/1/52 | | 565,000 | | 590,110 | |
| Los Angeles Community College District GO, 6.75%, 8/1/49 | | 675,000 | | 1,163,946 | |
| Los Angeles Department of Airports Rev., 6.58%, 5/15/39 | | 75,000 | | 99,346 | |
| Metropolitan Transportation Authority Rev., 6.69%, 11/15/40 | | 200,000 | | 285,047 | |
| Michigan Strategic Fund Rev., (Flint Water Advocacy Fund), 3.23%, 9/1/47 | | 1,600,000 | | 1,638,179 | |
| Missouri Highway & Transportation Commission Rev., 5.45%, 5/1/33 | | 175,000 | | 219,923 | |
| New Jersey Turnpike Authority Rev., 7.41%, 1/1/40 | | 100,000 | | 163,888 | |
| New Jersey Turnpike Authority Rev., 7.10%, 1/1/41 | | 230,000 | | 367,911 | |
| New York City Water & Sewer System Rev., 5.95%, 6/15/42 | | 45,000 | | 68,475 | |
| Ohio Turnpike & Infrastructure Commission Rev., 3.22%, 2/15/48 | | 830,000 | | 858,684 | |
| Pennsylvania Turnpike Commission Rev., 5.56%, 12/1/49 | | 130,000 | | 193,123 | |
| Port Authority of New York & New Jersey Rev., 4.93%, 10/1/51 | | 400,000 | | 572,467 | |
| Regents of the University of California Medical Center Pooled Rev., 3.26%, 5/15/60 | | 450,000 | | 487,500 | |
| Rutgers The State University of New Jersey Rev., 5.67%, 5/1/40 | | 205,000 | | 278,307 | |
| San Francisco Public Utilities Commission Water Rev., 6.00%, 11/1/40 | | 200,000 | | 274,432 | |
| Santa Clara Valley Transportation Authority Rev., 5.88%, 4/1/32 | | 300,000 | | 370,498 | |
| State of California GO, 4.60%, 4/1/38 | | 120,000 | | 139,233 | |
| State of California GO, 7.55%, 4/1/39 | | 410,000 | | 691,239 | |
| State of California GO, 7.30%, 10/1/39 | | 595,000 | | 946,668 | |
| State of California GO, 7.60%, 11/1/40 | | 20,000 | | 34,725 | |
TOTAL MUNICIPAL SECURITIES (Cost $13,630,862) |
| | 14,374,512 | |
BANK LOAN OBLIGATIONS(7) — 0.2% |
| Media — 0.2% | | | |
DirecTV Financing, LLC, Term Loan, 7/22/27(8) (Cost $6,090,188) |
| 6,075,000 | | 6,086,391 | |
| TEMPORARY CASH INVESTMENTS — 2.4% |
Credit Agricole Corporate and Investment Bank, 0.06%, 11/1/21(1)(5) | | 43,337,000 | | 43,336,765 | |
Landesbank Baden-Wuerttemberg, 0.06%, 11/1/21(1)(5) | | 15,073,000 | | 15,072,888 | |
| Repurchase Agreement, BMO Capital Markets Corp., (collateralized by various U.S. Treasury obligations, 2.00%, 11/15/26, valued at $150,599), in a joint trading account at 0.01%, dated 10/29/21, due 11/1/21 (Delivery value $147,467) | | | 147,467 | |
| Repurchase Agreement, Fixed Income Clearing Corp., (collateralized by various U.S. Treasury obligations, 2.25%, 5/15/41, valued at $498,882), at 0.01%, dated 10/29/21, due 11/1/21 (Delivery value $489,000) | | | 489,000 | |
TOTAL TEMPORARY CASH INVESTMENTS (Cost $59,046,467) |
| | 59,046,120 | |
TOTAL INVESTMENT SECURITIES — 101.0% (Cost $2,500,116,938) |
|
| 2,519,694,531 | |
| OTHER ASSETS AND LIABILITIES — (1.0)% |
|
| (25,714,207) | |
| TOTAL NET ASSETS — 100.0% |
|
| $ | 2,493,980,324 | |
FORWARD FOREIGN CURRENCY EXCHANGE CONTRACTS
| | | | | | | | | | | | | | | | | | | | |
| Currency Purchased | Currency Sold | Counterparty | Settlement Date | Unrealized Appreciation
(Depreciation) |
| USD | 14,474,846 | | AUD | 19,627,974 | | Bank of America N.A. | 12/15/21 | $ | (292,763) | |
| USD | 2,582,586 | | AUD | 3,423,805 | | Bank of America N.A. | 12/15/21 | 6,598 | |
| USD | 42,647,770 | | CAD | 54,067,776 | | Bank of America N.A. | 12/15/21 | (1,042,771) | |
| USD | 8,365,555 | | CAD | 10,597,460 | | Bank of America N.A. | 12/15/21 | (197,933) | |
| USD | 13,723,409 | | CHF | 12,631,575 | | Morgan Stanley | 12/15/21 | (90,110) | |
| CLP | 5,447,795,324 | | USD | 6,661,118 | | Goldman Sachs & Co. | 12/15/21 | 3,362 | |
| USD | 6,934,155 | | CLP | 5,504,471,272 | | Goldman Sachs & Co. | 12/15/21 | 200,342 | |
| USD | 268,083,141 | | CNY | 1,746,829,747 | | Goldman Sachs & Co. | 12/15/21 | (3,508,635) | |
| COP | 94,596,155,853 | | USD | 25,250,286 | | Goldman Sachs & Co. | 12/15/21 | (203,588) | |
| USD | 3,772,143 | | CZK | 81,211,551 | | UBS AG | 12/15/21 | 120,645 | |
| USD | 55,924,540 | | DKK | 351,404,530 | | UBS AG | 12/15/21 | 1,256,528 | |
| USD | 393,590,293 | | EUR | 339,269,220 | | JPMorgan Chase Bank N.A. | 11/17/21 | 1,280,862 | |
| USD | 4,038,977 | | EUR | 3,474,042 | | JPMorgan Chase Bank N.A. | 11/17/21 | 21,815 | |
| USD | 3,998,947 | | EUR | 3,462,501 | | JPMorgan Chase Bank N.A. | 11/17/21 | (4,870) | |
| GBP | 1,467,176 | | USD | 1,991,891 | | Bank of America N.A. | 12/15/21 | 16,314 | |
| USD | 58,841,833 | | GBP | 42,714,534 | | Bank of America N.A. | 12/15/21 | 376,105 | |
| USD | 5,061,977 | | GBP | 3,721,820 | | Bank of America N.A. | 12/15/21 | (32,283) | |
| USD | 1,995,907 | | GBP | 1,465,384 | | Bank of America N.A. | 12/15/21 | (9,844) | |
| USD | 1,349,291 | | GBP | 989,931 | | Bank of America N.A. | 12/15/21 | (5,682) | |
| USD | 7,279,492 | | IDR | 105,079,462,925 | | Goldman Sachs & Co. | 12/15/21 | (74,122) | |
| JPY | 573,101,413 | | USD | 5,039,008 | | Bank of America N.A. | 11/17/21 | (10,189) | |
| USD | 172,814,330 | | JPY | 19,720,302,866 | | Bank of America N.A. | 11/17/21 | (226,322) | |
| MXN | 514,537,652 | | USD | 25,088,383 | | Morgan Stanley | 12/15/21 | (259,289) | |
| USD | 4,809,881 | | MXN | 97,212,501 | | Morgan Stanley | 12/15/21 | 118,876 | |
| MYR | 32,449,671 | | USD | 7,795,717 | | Goldman Sachs & Co. | 12/15/21 | 15,717 | |
| USD | 14,587,889 | | MYR | 60,970,083 | | Goldman Sachs & Co. | 12/15/21 | (89,108) | |
| USD | 5,638,411 | | NOK | 49,122,798 | | UBS AG | 12/15/21 | (174,514) | |
| USD | 1,907,154 | | NZD | 2,687,343 | | Bank of America N.A. | 12/15/21 | (17,360) | |
| USD | 4,895,725 | | PLN | 18,676,921 | | UBS AG | 12/15/21 | 218,746 | |
| RUB | 2,332,700,922 | | USD | 33,091,852 | | Goldman Sachs & Co. | 12/15/21 | (492,501) | |
| USD | 2,597,520 | | RUB | 193,742,507 | | Goldman Sachs & Co. | 12/15/21 | (110,020) | |
| USD | 28,281,883 | | RUB | 2,045,012,018 | | Goldman Sachs & Co. | 12/15/21 | (297,034) | |
| USD | 2,781,661 | | SEK | 23,942,732 | | UBS AG | 12/15/21 | (7,915) | |
| USD | 3,642,303 | | SGD | 4,902,030 | | Bank of America N.A. | 12/15/21 | 7,825 | |
| USD | 14,166,865 | | THB | 465,098,171 | | Goldman Sachs & Co. | 12/15/21 | 154,798 | |
| | | | | | $ | (3,348,320) | |
| | | | | | | | | | | | | | |
| FUTURES CONTRACTS PURCHASED |
| Reference Entity | Contracts | Expiration Date | Notional Amount | Unrealized Appreciation
(Depreciation)^ |
| Euro-Bobl 5-Year Bonds | 1,053 | December 2021 | $ | 162,821,749 | | $ | (2,459,675) | |
| Euro-OAT 10-Year Bonds | 308 | December 2021 | 58,391,866 | | (1,676,161) | |
| Japanese 10-Year Government Bonds | 117 | December 2021 | 155,336,170 | | (554,043) | |
| Japanese 10-Year Mini Government Bonds | 76 | December 2021 | 10,088,212 | | (41,230) | |
| Korean Treasury 10-Year Bonds | 277 | December 2021 | 28,658,851 | | (1,327,931) | |
| U.K. Gilt 10-Year Bonds | 477 | December 2021 | 81,547,612 | | (2,033,596) | |
| U.S. Treasury 2-Year Notes | 379 | December 2021 | 83,095,750 | | (321,903) | |
| U.S. Treasury 5-Year Notes | 192 | December 2021 | 23,376,000 | | 1,126 | |
| | | $ | 603,316,210 | | $ | (8,413,413) | |
^Amount represents value and unrealized appreciation (depreciation).
| | | | | | | | | | | | | | |
| FUTURES CONTRACTS SOLD | | | | |
| Reference Entity | Contracts | Expiration Date | Notional Amount | Unrealized Appreciation
(Depreciation)^ |
| Euro-Bund 10-Year Bonds | 155 | December 2021 | $ | 30,123,738 | | $ | 596,375 | |
| Euro-Buxl 30-Year Bonds | 65 | December 2021 | 15,702,756 | | 92,981 | |
| U.S. Treasury 10-Year Notes | 455 | December 2021 | 59,469,922 | | (169,027) | |
| U.S. Treasury 10-Year Ultra Notes | 693 | December 2021 | 100,506,656 | | 1,386,446 | |
| U.S. Treasury Long Bonds | 187 | December 2021 | 30,077,781 | | 443,760 | |
| | | $ | 235,880,853 | | $ | 2,350,535 | |
^Amount represents value and unrealized appreciation (depreciation).
| | | | | | | | | | | | | | | | | | | | | | | |
| CENTRALLY CLEARED CREDIT DEFAULT SWAP AGREEMENTS | |
| Reference Entity | Type | Fixed Rate Received (Paid) Quarterly | Termination Date | Notional
Amount | Premiums
Paid
(Received) | Unrealized
Appreciation
(Depreciation) | Value^ |
| Markit CDX North America High Yield Index Series 34 | Buy | (5.00)% | 6/20/25 | $ | 30,038,000 | | $ | (400,653) | | $ | (2,289,488) | | $ | (2,690,141) | |
| Markit CDX North America High Yield Index Series 35 | Buy | (5.00)% | 12/20/25 | $ | 139,000,000 | | (10,377,233) | | (2,661,576) | | (13,038,809) | |
| Markit CDX North America High Yield Index Series 36 | Buy | (5.00)% | 6/20/26 | $ | 35,000,000 | | (3,169,959) | | (137,516) | | (3,307,475) | |
| Markit CDX North America Investment Grade Index Series 34 | Buy | (1.00)% | 6/20/25 | $ | 27,000,000 | | 364,427 | | (921,713) | | (557,286) | |
| | | | | $ | (13,583,418) | | $ | (6,010,293) | | $ | (19,593,711) | |
^The value for credit default swap agreements serves as an indicator of the current status of the payment/performance risk and represent the likelihood of an expected liability or profit at the period end. Increasing values in absolute terms when compared to the notional amount of the credit default swap agreement represent a deterioration of the referenced entity's credit soundness and an increased likelihood or risk of a credit event occurring as defined in the agreement.
| | | | | | | | | | | | | | | | | | | | | | | | | | |
| CENTRALLY CLEARED INTEREST RATE SWAP AGREEMENTS |
| Floating Rate Index | Pay/Receive Floating Rate Index at Monthly | Fixed Rate | Termination
Date | Notional
Amount | Premiums Paid (Received) | Unrealized
Appreciation
(Depreciation) | Value |
| MXIBTIIE | Pay | 5.44% | 5/22/23 | MXN | 1,247,000,000 | | $ | 514 | | $ | (1,470,858) | | $ | (1,470,344) | |
| MXIBTIIE | Pay | 5.44% | 5/22/23 | MXN | 1,247,000,000 | | 514 | | (1,470,858) | | (1,470,344) | |
| | | | | | $ | 1,028 | | $ | (2,941,716) | | $ | (2,940,688) | |
| | | | | | | | | | | | | | | | | | | | | | | |
| INTEREST RATE SWAP AGREEMENTS |
| Counterparty | Floating
Rate Index | Pay/Receive
Floating Rate
Index
Monthly | Fixed Rate | Termination
Date | Notional
Amount | Value* |
| Goldman Sachs & Co. | BZDIOVRA | Pay | 7.31% | 1/2/24 | BRL | 174,737,000 | | $ | (2,492,513) | |
*Amount represents value and unrealized appreciation (depreciation).
| | | | | | | | | | | | | | | | | | | | | | | |
| CENTRALLY CLEARED TOTAL RETURN SWAP AGREEMENTS |
| Floating Rate Index | Pay/Receive Floating Rate Index at Termination | Fixed Rate | Termination
Date | Notional
Amount | Premiums Paid (Received) | Unrealized
Appreciation
(Depreciation) | Value |
| CPURNSA | Receive | 1.78% | 8/5/24 | $ | 6,750,000 | | $ | (554) | | $ | 522,507 | | $ | 521,953 | |
| CPURNSA | Receive | 2.30% | 2/24/26 | $ | 23,000,000 | | 640 | | 1,566,489 | | 1,567,129 | |
| CPURNSA | Receive | 2.29% | 2/24/26 | $ | 23,000,000 | | 640 | | 1,580,093 | | 1,580,733 | |
| | | | | $ | 726 | | $ | 3,669,089 | | $ | 3,669,815 | |
| | | | | | | | | | | | | | | | | |
| NOTES TO SCHEDULE OF INVESTMENTS | | | |
| AGM | - | Assured Guaranty Municipal Corporation | MTN | - | Medium Term Note |
| | MXIBTIIE | - | 28-day Mexico Interbank Equilibrium Interest Rate Index |
| AUD | - | Australian Dollar | |
| BRL | - | Brazilian Real | MXN | - | Mexican Peso |
| BZDIOVRA | - | Brazil Interbank Deposit Rate | MYR | - | Malaysian Ringgit |
| CAD | - | Canadian Dollar | NOK | - | Norwegian Krone |
| CDX | - | Credit Derivatives Indexes | NZD | - | New Zealand Dollar |
| CHF | - | Swiss Franc | PLN | - | Polish Zloty |
| CLP | - | Chilean Peso | RUB | - | Russian Ruble |
| CNY | - | Chinese Yuan | SEK | - | Swedish Krona |
| COP | - | Colombian Peso | SEQ | - | Sequential Payer |
| CPI | - | Consumer Price Index | SGD | - | Singapore Dollar |
| CPURNSA | - | U.S. Consumer Price Index Urban Consumers Not Seasonally Adjusted Index | SOFR | - | Secured Overnight Financing Rate |
| | TBA | - | To-Be-Announced. Security was purchased on a forward commitment basis with an approximate principal amount and maturity date. Actual principal amount and maturity date will be determined upon settlement. |
| CZK | - | Czech Koruna |
| DKK | - | Danish Krone |
| EUR | - | Euro |
| FHLMC | - | Federal Home Loan Mortgage Corporation | THB | - | Thai Baht |
| UMBS | - | Uniform Mortgage-Backed Securities |
| FNMA | - | Federal National Mortgage Association | USD | - | United States Dollar |
| GBP | - | British Pound | VRN | - | Variable Rate Note. The rate adjusts periodically based upon the terms set forth in the security’s offering documents. The rate shown is effective at the period end and the reference rate and spread, if any, is indicated. The security's effective maturity date may be shorter than the final maturity date shown. |
| GNMA | - | Government National Mortgage Association |
| GO | - | General Obligation |
| H15T1Y | - | Constant Maturity U.S. Treasury Note Yield Curve Rate Index |
| IDR | - | Indonesian Rupiah |
| IO | - | Interest Only |
| JPY | - | Japanese Yen | | | |
| LIBOR | - | London Interbank Offered Rate | | | |
†Category is less than 0.05% of total net assets.
(1)Security was purchased pursuant to Rule 144A or Section 4(2) under the Securities Act of 1933 and may be sold in transactions exempt from registration, normally to qualified institutional investors. The aggregate value of these securities at the period end was $971,512,324, which represented 39.0% of total net assets. Of these securities, 5.4% of total net assets were deemed illiquid under policies approved by the Board of Trustees.
(2)Security is a zero-coupon bond.
(3)When-issued security. The issue price and yield are fixed on the date of the commitment, but payment and delivery are scheduled for a future date.
(4)Perpetual maturity with no stated maturity date.
(5)The rate indicated is the yield to maturity at purchase.
(6)Security, or a portion thereof, has been pledged at the custodian bank or with a broker for collateral requirements on forward commitments, forward foreign currency exchange contracts, futures contracts and/or swap agreements. At the period end, the aggregate value of securities pledged was $31,865,560.
(7)The interest rate on a bank loan obligation adjusts periodically based on a predetermined schedule. Rate or range of rates shown is effective at period end. The maturity date on a bank loan obligation may be less than indicated as a result of contractual or optional prepayments. These prepayments cannot be predicted with certainty.
(8)The interest rate will be determined upon settlement of the bank loan obligation after period end.
See Notes to Financial Statements.
| | |
| Statement of Assets and Liabilities |
| | | | | |
| OCTOBER 31, 2021 |
| Assets |
| Investment securities, at value (cost of $2,500,116,938) | $ | 2,519,694,531 | |
| Cash | 5,609,977 | |
| Foreign currency holdings, at value (cost of $33,340) | 17,579 | |
| Foreign deposits with broker for futures contracts, at value (cost of $544,628) | 515,897 | |
| Receivable for investments sold | 11,737,400 | |
| Receivable for capital shares sold | 1,687,032 | |
| Receivable for variation margin on futures contracts | 81,401 | |
| Receivable for variation margin on swap agreements | 482,621 | |
| Unrealized appreciation on forward foreign currency exchange contracts | 3,798,533 | |
| Interest and dividends receivable | 18,415,830 | |
| 2,562,040,801 | |
| |
| Liabilities | |
| Payable for investments purchased | 52,830,891 | |
| Payable for capital shares redeemed | 2,645,382 | |
| Payable for variation margin on futures contracts | 2,202,288 | |
| Payable for variation margin on swap agreements | 433,648 | |
| Unrealized depreciation on forward foreign currency exchange contracts | 7,146,853 | |
| Swap agreements, at value | 2,492,513 | |
| Accrued management fees | 256,148 | |
| Distribution and service fees payable | 917 | |
| Accrued foreign taxes | 51,837 | |
| 68,060,477 | |
| |
| Net Assets | $ | 2,493,980,324 | |
| |
| Net Assets Consist of: | |
| Capital paid in | $ | 2,442,002,949 | |
| Distributable earnings | 51,977,375 | |
| $ | 2,493,980,324 | |
| | | | | | | | | | | |
| Net Assets | Shares Outstanding | Net Asset Value Per Share |
| Investor Class | $298,790,256 | 28,656,113 | $10.43 |
| I Class | $18,975,044 | 1,813,652 | $10.46 |
| Y Class | $62,274,285 | 5,944,502 | $10.48 |
| A Class | $1,450,401 | 139,959 | $10.36* |
| C Class | $571,027 | 56,074 | $10.18 |
| R Class | $286,543 | 27,820 | $10.30 |
| R5 Class | $15,135,902 | 1,447,297 | $10.46 |
| R6 Class | $7,318,625 | 699,878 | $10.46 |
| G Class | $2,089,178,241 | 199,284,546 | $10.48 |
*Maximum offering price $10.85 (net asset value divided by 0.955).
See Notes to Financial Statements.
| | | | | | |
| YEAR ENDED OCTOBER 31, 2021 | | |
| Investment Income (Loss) | |
| Income: | | |
| Interest (net of foreign taxes withheld of $44,753) | $ | 52,106,798 | | |
| Dividends | 1,452,539 | | |
| 53,559,337 | | |
| | |
| Expenses: | | |
| Management fees | 14,522,928 | | |
| Distribution and service fees: | | |
| A Class | 4,488 | | |
| C Class | 6,356 | | |
| R Class | 1,452 | | |
| Trustees' fees and expenses | 158,194 | | |
| Other expenses | 12,343 | | |
| 14,705,761 | | |
Fees waived(1) | (11,623,715) | | |
| 3,082,046 | | |
| | |
| Net investment income (loss) | 50,477,291 | | |
| | |
| Realized and Unrealized Gain (Loss) | | |
| Net realized gain (loss) on: | | |
| Investment transactions | 23,100,273 | | |
| Forward foreign currency exchange contract transactions | 4,405,518 | | |
| Futures contract transactions | 1,007,915 | | |
| Swap agreement transactions | (3,171,134) | | |
| Foreign currency translation transactions | 506,719 | | |
| 25,849,291 | | |
| | |
| Change in net unrealized appreciation (depreciation) on: | | |
| Investments (includes (increase) decrease in accrued foreign taxes of $(14,136)) | (33,093,176) | | |
| Forward foreign currency exchange contracts | (7,148,772) | | |
| Futures contracts | (7,362,744) | | |
| Swap agreements | (3,685,967) | | |
| Translation of assets and liabilities in foreign currencies | (273,163) | | |
| (51,563,822) | | |
| | |
| Net realized and unrealized gain (loss) | (25,714,531) | | |
| | |
| Net Increase (Decrease) in Net Assets Resulting from Operations | $ | 24,762,760 | | |
(1)Amount consists of $116,371, $7,372, $21,511, $718, $254, $116, $6,283, $3,130 and $11,467,960 for Investor Class, I Class, Y Class, A Class, C Class, R Class, R5 Class, R6 Class and G Class, respectively.
See Notes to Financial Statements.
| | |
| Statement of Changes in Net Assets |
| | | | | | | | |
| YEARS ENDED OCTOBER 31, 2021 AND OCTOBER 31, 2020 |
| Increase (Decrease) in Net Assets | October 31, 2021 | October 31, 2020 |
| Operations | | |
| Net investment income (loss) | $ | 50,477,291 | | $ | 29,712,258 | |
| Net realized gain (loss) | 25,849,291 | | (13,296,212) | |
| Change in net unrealized appreciation (depreciation) | (51,563,822) | | 15,728,899 | |
| Net increase (decrease) in net assets resulting from operations | 24,762,760 | | 32,144,945 | |
| | |
| Distributions to Shareholders | | |
| From earnings: | | |
| Investor Class | (846,117) | | (6,442,817) | |
| I Class | (51,424) | | (405,704) | |
| Y Class | (198,452) | | (789,597) | |
| A Class | (5,640) | | (34,296) | |
| C Class | (2,138) | | (8,313) | |
| R Class | (903) | | (2,675) | |
| R5 Class | (65,875) | | (510,969) | |
| R6 Class | (38,615) | | (191,492) | |
| G Class | (22,655,670) | | (33,969,939) | |
| Decrease in net assets from distributions | (23,864,834) | | (42,355,802) | |
| | |
| Capital Share Transactions | | |
| Net increase (decrease) in net assets from capital share transactions (Note 5) | 542,594,964 | | 636,572,804 | |
| | |
| Net increase (decrease) in net assets | 543,492,890 | | 626,361,947 | |
| | |
| Net Assets | | |
| Beginning of period | 1,950,487,434 | | 1,324,125,487 | |
| End of period | $ | 2,493,980,324 | | $ | 1,950,487,434 | |
See Notes to Financial Statements.
| | |
| Notes to Financial Statements |
OCTOBER 31, 2021
1. Organization
American Century International Bond Funds (the trust) is registered under the Investment Company Act of 1940, as amended (the 1940 Act), as an open-end management investment company and is organized as a Massachusetts business trust. Global Bond Fund (the fund) is one fund in a series issued by the trust. The fund’s investment objective is to seek long-term total return.
The fund offers the Investor Class, I Class, Y Class, A Class, C Class, R Class, R5 Class, R6 Class and G Class. The A Class may incur an initial sales charge. The A Class and C Class may be subject to a contingent deferred sales charge.
2. Significant Accounting Policies
The following is a summary of significant accounting policies consistently followed by the fund in preparation of its financial statements. The fund is an investment company and follows accounting and reporting guidance in accordance with accounting principles generally accepted in the United States of America. This may require management to make certain estimates and assumptions at the date of the financial statements. Actual results could differ from these estimates. Management evaluated the impact of events or transactions occurring through the date the financial statements were issued that would merit recognition or disclosure.
Investment Valuations — The fund determines the fair value of its investments and computes its net asset value (NAV) per share at the close of regular trading (usually 4 p.m. Eastern time) on the New York Stock Exchange (NYSE) on each day the NYSE is open. The Board of Trustees has adopted valuation policies and procedures to guide the investment advisor in the fund’s investment valuation process and to provide methodologies for the oversight of the fund’s pricing function.
Fixed income securities are valued at the evaluated mean as provided by independent pricing services or at the mean of the most recent bid and asked prices as provided by investment dealers. Corporate bonds, U.S. Treasury and Government Agency securities, convertible bonds, bank loan obligations, municipal securities, and sovereign governments and agencies are valued using market models that consider trade data, quotations from dealers and active market makers, relevant yield curve and spread data, creditworthiness, trade data or market information on comparable securities, and other relevant security specific information. Mortgage-related and asset-backed securities are valued based on models that consider trade data, prepayment and default projections, benchmark yield and spread data and estimated cash flows of each tranche of the issuer. Collateralized loan obligations are valued based on discounted cash flow models that consider trade and economic data, prepayment assumptions and default projections. Commercial paper is valued using a curve-based approach that considers money market rates for specific instruments, programs, currencies and maturity points from a variety of active market makers. Fixed income securities initially expressed in local currencies are translated into U.S. dollars at the mean of the appropriate currency exchange rate at the close of the NYSE as provided by an independent pricing service.
Equity securities that are listed or traded on a domestic securities exchange are valued at the last reported sales price or at the official closing price as provided by the exchange. Equity securities traded on foreign securities exchanges are generally valued at the closing price of such securities on the exchange where primarily traded or at the close of the NYSE, if that is earlier. If no last sales price is reported, or if local convention or regulation so provides, the mean of the latest bid and asked prices may be used. Securities traded over-the-counter are valued at the mean of the latest bid and asked prices, the last sales price, or the official closing price. Equity securities initially expressed in local currencies are translated into U.S. dollars at the mean of the appropriate currency exchange rate at the close of the NYSE as provided by an independent pricing service.
Hybrid securities are valued at the evaluated mean as provided by independent pricing services or at the mean of the most recent bid and asked prices as provided by investment dealers. Preferred stocks and convertible preferred stocks with perpetual maturities are valued using market models that consider trade data, quotations from dealers and active market makers, relevant yield curve and spread data, creditworthiness, trade data or market information on comparable securities, and other relevant security
specific information. Hybrid securities initially expressed in local currencies are translated into U.S. dollars at the mean of the appropriate currency exchange rate at the close of the NYSE as provided by an independent pricing service.
Open-end management investment companies are valued at the reported NAV per share. Repurchase agreements are valued at cost, which approximates fair value. Exchange-traded futures contracts are valued at the settlement price as provided by the appropriate exchange. Swap agreements are valued at an evaluated mean as provided by independent pricing services or independent brokers. Forward foreign currency exchange contracts are valued at the mean of the appropriate forward exchange rate at the close of the NYSE as provided by an independent pricing service. Investments initially expressed in local currencies are translated into U.S. dollars at the mean of the appropriate currency exchange rate at the close of the NYSE as provided by an independent pricing service.
If the fund determines that the market price for an investment is not readily available or the valuation methods mentioned above do not reflect an investment’s fair value, such investment is valued as determined in good faith by the Board of Trustees or its delegate, in accordance with policies and procedures adopted by the Board of Trustees. In its determination of fair value, the fund may review several factors including, but not limited to, market information regarding the specific investment or comparable investments and correlation with other investment types, futures indices or general market indicators. Circumstances that may cause the fund to use these procedures to value an investment include, but are not limited to: an investment has been declared in default or is distressed; trading in a security has been suspended during the trading day or a security is not actively trading on its principal exchange; prices received from a regular pricing source are deemed unreliable; or there is a foreign market holiday and no trading occurred.
The fund monitors for significant events occurring after the close of an investment’s primary exchange but before the fund’s NAV per share is determined. Significant events may include, but are not limited to: corporate announcements and transactions; governmental action and political unrest that could impact a specific investment or an investment sector; or armed conflicts, natural disasters and similar events that could affect investments in a specific country or region. The fund also monitors for significant fluctuations between domestic and foreign markets, as evidenced by the U.S. market or such other indicators that the Board of Trustees, or its delegate, deems appropriate. The fund may apply a model-derived factor to the closing price of equity securities traded on foreign securities exchanges. The factor is based on observable market data as provided by an independent pricing service.
Security Transactions — Security transactions are accounted for as of the trade date. Net realized gains and losses are determined on the identified cost basis, which is also used for federal income tax purposes. Certain countries impose taxes on realized gains on the sale of securities registered in their country. The fund records the foreign tax expense, if any, on an accrual basis. The foreign tax expense on realized gains and unrealized appreciation reduces the net realized gain (loss) on investment transactions and net unrealized appreciation (depreciation) on investments, respectively.
Investment Income — Interest income less foreign taxes withheld, if any, is recorded on the accrual basis and includes paydown gain (loss) and accretion of discounts and amortization of premiums. Inflation adjustments related to inflation-linked debt securities are reflected as interest income. Dividend income less foreign taxes withheld, if any, is recorded as of the ex-dividend date. Distributions received on securities that represent a return of capital or long-term capital gain are recorded as a reduction of cost of investments and/or as a realized gain. The fund may estimate the components of distributions received that may be considered nontaxable distributions or long-term capital gain distributions for income tax purposes.
Foreign Currency Translations — All assets and liabilities initially expressed in foreign currencies are translated into U.S. dollars at prevailing exchange rates at period end. The fund may enter into spot foreign currency exchange contracts to facilitate transactions denominated in a foreign currency. Purchases and sales of investment securities, dividend and interest income, spot foreign currency exchange contracts, and expenses are translated at the rates of exchange prevailing on the respective dates of such transactions. Net realized and unrealized foreign currency exchange gains or losses related to investment securities are a component of net realized gain (loss) on investment transactions and change in net unrealized appreciation (depreciation) on investments, respectively.
Forward Commitments — The fund may engage in securities transactions on a forward commitment basis. In these transactions, the securities’ prices and yields are fixed on the date of the commitment. The fund may sell a to-be-announced (TBA) security and at the same time make a commitment to purchase the same security at a future date at a specified price. Conversely, the fund may purchase a TBA security and at the same time make a commitment to sell the same security at a future date at a specified price. These types of
transactions are known as “TBA roll” transactions and are accounted for as purchases and sales. The fund will segregate cash, cash equivalents or other appropriate liquid securities on its records in amounts sufficient to meet the purchase price.
Repurchase Agreements — The fund may enter into repurchase agreements with institutions that American Century Investment Management, Inc. (ACIM) (the investment advisor) has determined are creditworthy pursuant to criteria adopted by the Board of Trustees. The fund requires that the collateral, represented by securities, received in a repurchase transaction be transferred to the custodian in a manner sufficient to enable the fund to obtain those securities in the event of a default under the repurchase agreement. ACIM monitors, on a daily basis, the securities transferred to ensure the value, including accrued interest, of the securities under each repurchase agreement is equal to or greater than amounts owed to the fund under each repurchase agreement.
Joint Trading Account — Pursuant to an Exemptive Order issued by the Securities and Exchange Commission, the fund, along with certain other funds in the American Century Investments family of funds, may transfer uninvested cash balances into a joint trading account. These balances are invested in one or more repurchase agreements that are collateralized by U.S. Treasury or Agency obligations.
Segregated Assets — In accordance with the 1940 Act, the fund segregates assets on its books and records to cover certain types of investment securities and other financial instruments. ACIM monitors, on a daily basis, the securities segregated to ensure the fund designates a sufficient amount of liquid assets, marked-to-market daily. The fund may also receive assets or be required to pledge assets at the custodian bank or with a broker for collateral requirements.
Income Tax Status — It is the fund’s policy to distribute substantially all net investment income and net realized gains to shareholders and to otherwise qualify as a regulated investment company under provisions of the Internal Revenue Code. Accordingly, no provision has been made for income taxes. The fund files U.S. federal, state, local and non-U.S. tax returns as applicable. The fund's tax returns are subject to examination by the relevant taxing authority until expiration of the applicable statute of limitations, which is generally three years from the date of filing but can be longer in certain jurisdictions. At this time, management believes there are no uncertain tax positions which, based on their technical merit, would not be sustained upon examination and for which it is reasonably possible that the total amounts of unrecognized tax benefits will significantly change in the next twelve months.
Multiple Class — All shares of the fund represent an equal pro rata interest in the net assets of the class to which such shares belong, and have identical voting, dividend, liquidation and other rights and the same terms and conditions, except for class specific expenses and exclusive rights to vote on matters affecting only individual classes. Income, non-class specific expenses, and realized and unrealized capital gains and losses of the fund are allocated to each class of shares based on their relative net assets.
Distributions to Shareholders — Distributions from net investment income, if any, are generally declared and paid quarterly, but may be paid less frequently. Distributions from net realized gains, if any, are generally declared and paid annually.
Indemnifications — Under the trust’s organizational documents, its officers and trustees are indemnified against certain liabilities arising out of the performance of their duties to the fund. In addition, in the normal course of business, the fund enters into contracts that provide general indemnifications. The maximum exposure under these arrangements is unknown as this would involve future claims that may be made against a fund. The risk of material loss from such claims is considered by management to be remote.
3. Fees and Transactions with Related Parties
Certain officers and trustees of the trust are also officers and/or directors of American Century Companies, Inc. (ACC). The trust's investment advisor, ACIM, the trust's distributor, American Century Investment Services, Inc. (ACIS), and the trust's transfer agent, American Century Services, LLC, are wholly owned, directly or indirectly, by ACC. Various funds issued by American Century Asset Allocation Portfolios, Inc. own, in aggregate, 56% of the shares of the fund. Related parties do not invest in the fund for the purpose of exercising management or control.
Management Fees — The trust has entered into a management agreement with ACIM, under which ACIM provides the fund with investment advisory and management services in exchange for a single, unified management fee (the fee) per class. The agreement provides that ACIM will pay all expenses of managing and operating the fund, except brokerage expenses, taxes, interest, fees and expenses of the independent
trustees (including legal counsel fees), extraordinary expenses, and expenses incurred in connection with the provision of shareholder services and distribution services under a plan adopted pursuant to Rule 12b-1 under the 1940 Act. The fee is computed and accrued daily based on each class's daily net assets and paid monthly in arrears. The difference in the fee among the classes is a result of their separate arrangements for non-Rule 12b-1 shareholder services. It is not the result of any difference in advisory or custodial fees or other expenses related to the management of the fund’s assets, which do not vary by class. During the period ended October 31, 2021, the investment advisor agreed to waive 0.04% of the fund's management fee. The investment advisor expects this waiver to continue until July 31, 2022 and cannot terminate it prior to such date without the approval of the Board of Trustees. The investment advisor agreed to waive the G Class's management fee in its entirety. The investment advisor expects this waiver to remain in effect permanently and cannot terminate it without the approval of the Board of Trustees.
The annual management fee and the effective annual management fee after waiver for each class for the period ended October 31, 2021 are as follows:
| | | | | | | | |
| Annual Management Fee | Effective Annual Management
Fee After Waiver |
| Investor Class | 0.83% | 0.79% |
| I Class | 0.73% | 0.69% |
| Y Class | 0.63% | 0.59% |
| A Class | 0.83% | 0.79% |
| C Class | 0.83% | 0.79% |
| R Class | 0.83% | 0.79% |
| R5 Class | 0.63% | 0.59% |
| R6 Class | 0.58% | 0.54% |
| G Class | 0.58% | 0.00% |
Distribution and Service Fees — The Board of Trustees has adopted a separate Master Distribution and Individual Shareholder Services Plan for each of the A Class, C Class and R Class (collectively the plans), pursuant to Rule 12b-1 of the 1940 Act. The plans provide that the A Class will pay ACIS an annual distribution and service fee of 0.25%. The plans provide that the C Class will pay ACIS an annual distribution and service fee of 1.00%, of which 0.25% is paid for individual shareholder services and 0.75% is paid for distribution services. The plans provide that the R Class will pay ACIS an annual distribution and service fee of 0.50%. The fees are computed and accrued daily based on each class’s daily net assets and paid monthly in arrears. The fees are used to pay financial intermediaries for distribution and individual shareholder services. Fees incurred under the plans during the period ended October 31, 2021 are detailed in the Statement of Operations.
Trustees’ Fees and Expenses — The Board of Trustees is responsible for overseeing the investment advisor’s management and operations of the fund. The trustees receive detailed information about the fund and its investment advisor regularly throughout the year, and meet at least quarterly with management of the investment advisor to review reports about fund operations. The fund’s officers do not receive compensation from the fund.
Interfund Transactions — The fund may enter into security transactions with other American Century Investments funds and other client accounts of the investment advisor, in accordance with the 1940 Act rules and procedures adopted by the Board of Trustees. The rules and procedures require, among other things, that these transactions be effected at the independent current market price of the security. There were no interfund transactions during the period.
4. Investment Transactions
Purchases of investment securities, excluding short-term investments, for the period ended October 31, 2021 totaled $3,172,743,843, of which $1,004,015,289 represented U.S. Treasury and Government Agency obligations.
Sales of investment securities, excluding short-term investments, for the period ended October 31, 2021 totaled $2,704,268,124, of which $1,136,285,667 represented U.S. Treasury and Government Agency obligations.
5. Capital Share Transactions
Transactions in shares of the fund were as follows (unlimited number of shares authorized):
| | | | | | | | | | | | | | |
| Year ended
October 31, 2021 | Year ended
October 31, 2020 |
| Shares | Amount | Shares | Amount |
| Investor Class | | | | |
| Sold | 3,750,010 | | $ | 39,221,655 | | 2,901,386 | | $ | 29,829,893 | |
| Issued in reinvestment of distributions | 80,044 | | 845,266 | | 628,783 | | 6,435,572 | |
| Redeemed | (603,064) | | (6,307,220) | | (4,647,767) | | (47,204,255) | |
| 3,226,990 | | 33,759,701 | | (1,117,598) | | (10,938,790) | |
| I Class | | | | |
| Sold | 810,801 | | 8,491,204 | | 935,486 | | 9,616,163 | |
| Issued in reinvestment of distributions | 4,772 | | 50,486 | | 37,501 | | 384,558 | |
| Redeemed | (544,320) | | (5,726,745) | | (1,038,427) | | (10,755,512) | |
| 271,253 | | 2,814,945 | | (65,440) | | (754,791) | |
| Y Class | | | | |
| Sold | 2,228,724 | | 23,475,195 | | 1,768,289 | | 18,254,229 | |
| Issued in reinvestment of distributions | 18,735 | | 198,452 | | 76,907 | | 789,597 | |
| Redeemed | (430,219) | | (4,524,426) | | (487,011) | | (5,011,517) | |
| 1,817,240 | | 19,149,221 | | 1,358,185 | | 14,032,309 | |
| A Class | | | | |
| Sold | 11,998 | | 125,420 | | 64,527 | | 665,103 | |
| Issued in reinvestment of distributions | 504 | | 5,302 | | 3,136 | | 32,005 | |
| Redeemed | (70,811) | | (739,616) | | (56,234) | | (578,290) | |
| (58,309) | | (608,894) | | 11,429 | | 118,818 | |
| C Class | | | | |
| Sold | 710 | | 7,295 | | 9,715 | | 96,605 | |
| Issued in reinvestment of distributions | 191 | | 1,986 | | 647 | | 6,553 | |
| Redeemed | (13,845) | | (141,943) | | (41,877) | | (421,013) | |
| (12,944) | | (132,662) | | (31,515) | | (317,855) | |
| R Class | | | | |
| Sold | 7,588 | | 78,826 | | 17,363 | | 176,841 | |
| Issued in reinvestment of distributions | 50 | | 519 | | 263 | | 2,675 | |
| Redeemed | (8,297) | | (85,807) | | (5,071) | | (51,995) | |
| (659) | | (6,462) | | 12,555 | | 127,521 | |
| R5 Class | | | | |
| Sold | 6,718 | | 70,225 | | 11,015 | | 113,608 | |
| Issued in reinvestment of distributions | 6,231 | | 65,875 | | 49,872 | | 510,969 | |
| Redeemed | (100,295) | | (1,056,279) | | (492,500) | | (4,993,872) | |
| (87,346) | | (920,179) | | (431,613) | | (4,369,295) | |
| R6 Class | | | | |
| Sold | 148,131 | | 1,556,559 | | 239,879 | | 2,476,324 | |
| Issued in reinvestment of distributions | 3,652 | | 38,615 | | 18,687 | | 191,492 | |
| Redeemed | (230,687) | | (2,423,000) | | (170,356) | | (1,744,967) | |
| (78,904) | | (827,826) | | 88,210 | | 922,849 | |
| G Class | | | | |
| Sold | 53,795,515 | | 568,179,957 | | 77,670,330 | | 810,254,412 | |
| Issued in reinvestment of distributions | 2,137,571 | | 22,655,670 | | 3,309,225 | | 33,969,939 | |
| Redeemed | (9,606,581) | | (101,468,507) | | (20,070,888) | | (206,472,313) | |
| 46,326,505 | | 489,367,120 | | 60,908,667 | | 637,752,038 | |
| Net increase (decrease) | 51,403,826 | | $ | 542,594,964 | | 60,732,880 | | $ | 636,572,804 | |
6. Fair Value Measurements
The fund’s investments valuation process is based on several considerations and may use multiple inputs to determine the fair value of the investments held by the fund. In conformity with accounting principles generally accepted in the United States of America, the inputs used to determine a valuation are classified into three broad levels.
•Level 1 valuation inputs consist of unadjusted quoted prices in an active market for identical investments.
•Level 2 valuation inputs consist of direct or indirect observable market data (including quoted prices for comparable investments, evaluations of subsequent market events, interest rates, prepayment speeds, credit risk, etc.). These inputs also consist of quoted prices for identical investments initially expressed in local currencies that are adjusted through translation into U.S. dollars.
•Level 3 valuation inputs consist of unobservable data (including a fund’s own assumptions).
The level classification is based on the lowest level input that is significant to the fair valuation measurement. The valuation inputs are not necessarily an indication of the risks associated with investing in these securities or other financial instruments.
The following is a summary of the level classifications as of period end. The Schedule of Investments provides additional information on the fund’s portfolio holdings.
| | | | | | | | | | | |
| Level 1 | Level 2 | Level 3 |
| Assets | | | |
| Investment Securities | | | |
| Sovereign Governments and Agencies | — | | $ | 973,102,883 | | — | |
| Corporate Bonds | — | | 775,646,815 | | — | |
| Collateralized Loan Obligations | — | | 177,651,973 | | — | |
| Collateralized Mortgage Obligations | — | | 124,949,302 | | — | |
| Preferred Stocks | — | | 101,671,542 | | — | |
| Asset-Backed Securities | — | | 78,768,790 | | — | |
| Exchange-Traded Funds | $ | 70,317,900 | | — | | — | |
| U.S. Treasury Securities | — | | 62,398,150 | | — | |
| U.S. Government Agency Mortgage-Backed Securities | — | | 50,661,494 | | — | |
| Commercial Mortgage-Backed Securities | — | | 25,018,659 | | — | |
| Municipal Securities | — | | 14,374,512 | | — | |
| Bank Loan Obligations | — | | 6,086,391 | | — | |
| Temporary Cash Investments | — | | 59,046,120 | | — | |
| $ | 70,317,900 | | $ | 2,449,376,631 | | — | |
| Other Financial Instruments | | | |
| Futures Contracts | $ | 1,831,332 | | $ | 689,356 | | — | |
| Swap Agreements | — | | 3,669,815 | | — | |
| Forward Foreign Currency Exchange Contracts | — | | 3,798,533 | | — | |
| $ | 1,831,332 | | $ | 8,157,704 | | — | |
| | | |
| Liabilities | | | |
| Other Financial Instruments | | | |
| Futures Contracts | $ | 490,930 | | $ | 8,092,636 | | — | |
| Swap Agreements | — | | 25,026,912 | | — | |
| Forward Foreign Currency Exchange Contracts | — | | 7,146,853 | | — | |
| $ | 490,930 | | $ | 40,266,401 | | — | |
7. Derivative Instruments
Credit Risk — The fund is subject to credit risk in the normal course of pursuing its investment objectives. The value of a bond generally declines as the credit quality of its issuer declines. Credit default swap agreements enable a fund to buy/sell protection against a credit event of a specific issuer or index. A fund may attempt to enhance returns by selling protection or attempt to mitigate credit risk by buying protection. The buyer/seller of credit protection against a security or basket of securities may pay/receive an up-front or periodic payment to compensate for/against potential default events. Changes in value, including the periodic amounts of interest to be paid or received on swap agreements, are recorded as unrealized appreciation (depreciation) on swap agreements. Upon entering into a centrally cleared swap, a fund is required to deposit cash or securities (initial margin) with a financial intermediary in an amount equal to a certain percentage of the notional amount. Subsequent payments (variation margin) are made or received daily, in cash, by a fund. The variation margin is equal to the daily change in the value and is a component of unrealized gains and losses. Realized gain or loss is recorded upon receipt or payment of a periodic settlement or termination of swap agreements. Net realized and unrealized gains or losses occurring during the holding period of swap agreements are a component of net realized gain (loss) on swap agreement transactions and change in net unrealized appreciation (depreciation) on swap agreements, respectively. The risks of entering into swap agreements include the possible lack of liquidity, failure of the counterparty to meet its obligations, and that there may be unfavorable changes in the underlying investments or instruments. The fund's average notional amount held during the period was $209,388,833.
Foreign Currency Risk — The fund is subject to foreign currency exchange rate risk in the normal course of pursuing its investment objectives. The value of foreign investments held by a fund may be significantly affected by changes in foreign currency exchange rates. The dollar value of a foreign security generally decreases when the value of the dollar rises against the foreign currency in which the security is denominated and tends to increase when the value of the dollar declines against such foreign currency. A fund may enter into forward foreign currency exchange contracts to reduce a fund's exposure to foreign currency exchange rate fluctuations or to gain exposure to the fluctuations in the value of foreign currencies. The net U.S. dollar value of foreign currency underlying all contractual commitments held by a fund and the resulting unrealized appreciation or depreciation are determined daily. Realized gain or loss is recorded upon settlement of the contract. Net realized and unrealized gains or losses occurring during the holding period of forward foreign currency exchange contracts are a component of net realized gain (loss) on forward foreign currency exchange contract transactions and change in net unrealized appreciation (depreciation) on forward foreign currency exchange contracts, respectively. A fund bears the risk of an unfavorable change in the foreign currency exchange rate underlying the forward contract. Additionally, losses, up to the fair value, may arise if the counterparties do not perform under the contract terms. The fund's average U.S. dollar exposure to foreign currency risk derivative instruments held during the period was $1,211,224,663.
Interest Rate Risk — The fund is subject to interest rate risk in the normal course of pursuing its investment objectives. A fund may enter into futures contracts or interest rate swap agreements in order to manage its exposure to changes in market conditions. The value of bonds generally declines as interest rates rise. The risks of entering into interest rate risk derivative instruments include the possible lack of liquidity, failure of the counterparty to meet its obligations, and that there may be unfavorable changes in the underlying investments or instruments.
A fund may enter into futures contracts based on a bond index or a specific underlying security. A fund may purchase futures contracts to gain exposure to increases in market value or sell futures contracts to protect against a decline in market value. Upon entering into a futures contract, a fund will segregate cash, cash equivalents or other appropriate liquid securities on its records in amounts sufficient to meet requirements. Subsequent payments (variation margin) are made or received daily, in cash, by a fund. The variation margin is equal to the daily change in the contract value and is recorded as unrealized gains and losses. A fund recognizes a realized gain or loss when the futures contract is closed or expires. Net realized and unrealized gains or losses occurring during the holding period of futures contracts are a component of net realized gain (loss) on futures contract transactions and change in net unrealized appreciation (depreciation) on futures contracts, respectively. The fund's average notional exposure to these interest rate risk derivative instruments held during the period was $432,758,960 futures contracts purchased and $226,923,755 futures contracts sold.
A fund may enter into interest rate swap agreements to gain exposure to declines in interest rates, to protect against increases in interest rates, or to maintain its ability to generate income at prevailing interest rates. A fund will segregate cash, cash equivalents or other appropriate liquid securities on its records in amounts sufficient to meet requirements. Changes in value, including the periodic amounts of interest to be paid or received on swap agreements, are recorded as unrealized appreciation (depreciation) on swap agreements. Upon entering into a centrally cleared swap, a fund is required to deposit cash or securities (initial margin) with a financial intermediary in an amount equal to a certain percentage of the notional amount. Subsequent payments (variation margin) are made or received daily, in cash, by a fund. The variation margin is equal to the daily change in the value and is a component of unrealized gains and losses. Realized gain or loss is recorded upon receipt or payment of a periodic settlement or termination of swap agreements. Net realized and unrealized gains or losses occurring during the holding period of swap agreements are a component of net realized gain (loss) on swap agreement transactions and change in net unrealized appreciation (depreciation) on swap agreements, respectively. The fund's average notional amount on interest rate swap agreements held during the period was $124,253,834.
Other Contracts — A fund may enter into total return swap agreements in order to attempt to obtain or preserve a particular return or spread at a lower cost than obtaining a return or spread through purchases and/or sales of instruments in other markets or gain exposure to certain markets in the most economical way possible. A fund will segregate cash, cash equivalents or other appropriate liquid securities on its records in amounts sufficient to meet requirements. Changes in value, including the periodic amounts of interest to be paid or received on swap agreements, are recorded as unrealized appreciation (depreciation) on swap agreements. Upon entering into a centrally cleared swap, a fund is required to deposit cash or securities (initial margin) with a financial intermediary in an amount equal to a certain percentage of the notional amount. Subsequent payments (variation margin) are made or received daily, in cash, by a fund. The variation margin is equal to the daily change in the value and is a component of unrealized gains and losses. Realized gain or loss is recorded upon receipt or payment of a periodic settlement or termination of swap agreements. Net realized and unrealized gains or losses occurring during the holding period of swap agreements are a component of net realized gain (loss) on swap agreement transactions and change in net unrealized appreciation (depreciation) on swap agreements, respectively. The risks of entering into swap agreements include the possible lack of liquidity, failure of the counterparty to meet its obligations, and that there may be unfavorable changes in the underlying investments or instruments, including inflationary risk. The fund's average notional amount held during the period was $101,333,333.
Value of Derivative Instruments as of October 31, 2021
| | | | | | | | | | | | | | |
| Asset Derivatives | Liability Derivatives |
| Type of Risk Exposure | Location on Statement of Assets and Liabilities | Value | Location on Statement of Assets and Liabilities | Value |
| Credit Risk | Receivable for variation margin on swap agreements* | $ | 482,621 | | Payable for variation margin on swap agreements* | — | |
| Foreign Currency Risk | Unrealized appreciation on forward foreign currency exchange contracts | 3,798,533 | | Unrealized depreciation on forward foreign currency exchange contracts | $ | 7,146,853 | |
| Interest Rate Risk | Receivable for variation margin on futures contracts* | 81,401 | | Payable for variation margin on futures contracts* | 2,202,288 | |
| Interest Rate Risk | Receivable for variation margin on swap agreements* | — | | Payable for variation margin on swap agreements* | 352,248 | |
| Interest Rate Risk | Swap agreements | — | | Swap agreements | 2,492,513 | |
| Other Contracts | Receivable for variation margin on swap agreements* | — | | Payable for variation margin on swap agreements* | 81,400 | |
| | $ | 4,362,555 | | | $ | 12,275,302 | |
*Included in the unrealized appreciation (depreciation) on futures contracts or centrally cleared swap agreements, as applicable, as reported in the Schedule of Investments.
Effect of Derivative Instruments on the Statement of Operations for the Year Ended October 31, 2021
| | | | | | | | | | | | | | |
| Net Realized Gain (Loss) | Change in Net Unrealized Appreciation (Depreciation) |
| Type of Risk Exposure | Location on Statement of Operations | Value | Location on Statement of Operations | Value |
| Credit Risk | Net realized gain (loss) on swap agreement transactions | $ | (9,354,194) | | Change in net unrealized appreciation (depreciation) on swap agreements | $ | (2,500,893) | |
| Foreign Currency Risk | Net realized gain (loss) on forward foreign currency exchange contract transactions | 4,405,518 | | Change in net unrealized appreciation (depreciation) on forward foreign currency exchange contracts | (7,148,772) | |
| Interest Rate Risk | Net realized gain (loss) on futures contract transactions | 1,007,915 | | Change in net unrealized appreciation (depreciation) on futures contracts | (7,362,744) | |
| Interest Rate Risk | Net realized gain (loss) on swap agreement transactions | 137,803 | | Change in net unrealized appreciation (depreciation) on swap agreements | (4,915,043) | |
| Other Contracts | Net realized gain (loss) on swap agreement transactions | 6,045,257 | | Change in net unrealized appreciation (depreciation) on swap agreements | 3,729,969 | |
| | $ | 2,242,299 | | | $ | (18,197,483) | |
8. Risk Factors
The value of the fund’s shares will go up and down, sometimes rapidly or unpredictably, based on the performance of the securities owned by the fund and other factors generally affecting the securities market. Market risks, including political, regulatory, economic and social developments, can affect the value of the fund’s investments. Natural disasters, public health emergencies, terrorism and other unforeseeable events may lead to increased market volatility and may have adverse long-term effects on world economies and markets generally.
The fund may invest in instruments that have variable or floating coupon rates based on the London Interbank Offered Rate (LIBOR). LIBOR is a benchmark interest rate intended to be representative of the rate at which certain major international banks lend to one another over short-terms. However, LIBOR is expected to be phased out and the transition process may lead to increased volatility or illiquidity in markets for instruments that rely on LIBOR. This could result in a change to the value of such instruments.
There are certain risks involved in investing in foreign securities. These risks include those resulting from political events (such as civil unrest, national elections and imposition of exchange controls), social and economic events (such as labor strikes and rising inflation), and natural disasters. Securities of foreign issuers may be less liquid and more volatile. Investing in emerging markets or a significant portion of assets in one country or region may accentuate these risks.
The majority of the fund is owned by a relatively small number of shareholders. To the extent that a large shareholder (including a fund of funds) invests in the fund, the fund may experience relatively large redemptions as such shareholder reallocates its assets. In the event of a large shareholder redemption, the ongoing operations of the fund may be at risk.
The fund’s investment process may result in high portfolio turnover, which could mean high transaction costs, affecting both performance and capital gains tax liabilities to investors.
9. Federal Tax Information
The tax character of distributions paid during the years ended October 31, 2021 and October 31, 2020 were as follows:
| | | | | | | | |
| 2021 | 2020 |
| Distributions Paid From | | |
| Ordinary income | $ | 19,659,548 | | $ | 42,355,802 | |
| Long-term capital gains | $ | 4,205,286 | | — | |
The book-basis character of distributions made during the year from net investment income or net realized gains may differ from their ultimate characterization for federal income tax purposes. These differences reflect the differing character of certain income items and net realized gains and losses for financial statement and tax purposes, and may result in reclassification among certain capital accounts on the financial statements.
As of period end, the federal tax cost of investments and the components of distributable earnings on a tax-basis were as follows:
| | | | | |
| Federal tax cost of investments | $ | 2,502,221,319 | |
| Gross tax appreciation of investments | $ | 50,856,522 | |
| Gross tax depreciation of investments | (33,383,310) | |
| Net tax appreciation (depreciation) of investments | 17,473,212 | |
| Net tax appreciation (depreciation) on derivatives and translation of assets and liabilities in foreign currencies | (7,457,000) | |
| Net tax appreciation (depreciation) | $ | 10,016,212 | |
| Other book-to-tax adjustments | $ | (4,844,137) | |
| Undistributed ordinary income | $ | 38,916,767 | |
| Accumulated long-term gains | $ | 7,888,533 | |
The difference between book-basis and tax-basis unrealized appreciation (depreciation) is attributable primarily to the realization for tax purposes of unrealized gain (losses) on certain foreign currency exchange contracts and futures contracts. Other book-to-tax adjustments are attributable primarily to the tax deferral of losses on straddle positions.
| | | | | | | | | | | | | | | | | | | | | | | | | | | | | | | | | | | | | | | | | | | | | | | |
| For a Share Outstanding Throughout the Years Ended October 31 (except as noted) | | | | | |
| Per-Share Data | Ratios and Supplemental Data |
| | Income From Investment Operations: | Distributions From: | | | Ratio to Average Net Assets of: | | |
| Net Asset
Value,
Beginning
of Period | Net Investment Income (Loss)(1) | Net
Realized
and
Unrealized
Gain (Loss) | Total From
Investment
Operations | Net
Investment
Income | Net
Realized
Gains | Total
Distributions | Net Asset
Value,
End
of Period | Total Return(2) | Operating
Expenses | Operating
Expenses
(before
expense
waiver) | Net
Investment
Income
(Loss) | Net
Investment
Income
(Loss)
(before
expense
waiver) | Portfolio
Turnover
Rate | Net
Assets,
End of
Period
(in thousands) |
| Investor Class | | | | | | | | | | | | | | |
| 2021 | $10.40 | 0.15 | (0.09) | 0.06 | — | (0.03) | (0.03) | $10.43 | 0.59% | 0.80% | 0.84% | 1.46% | 1.42% | 119% | $298,790 | |
| 2020 | $10.44 | 0.15 | 0.05 | 0.20 | (0.24) | — | (0.24) | $10.40 | 1.96% | 0.83% | 0.84% | 1.46% | 1.45% | 106% | $264,352 | |
| 2019 | $10.03 | 0.21 | 0.78 | 0.99 | (0.58) | — | (0.58) | $10.44 | 10.36% | 0.84% | 0.84% | 2.10% | 2.10% | 46% | $277,044 | |
| 2018 | $10.36 | 0.23 | (0.36) | (0.13) | (0.17) | (0.03) | (0.20) | $10.03 | (1.33)% | 0.84% | 0.93% | 2.26% | 2.17% | 78% | $299,230 | |
| 2017 | $10.28 | 0.13 | 0.09 | 0.22 | (0.11) | (0.03) | (0.14) | $10.36 | 2.23% | 0.84% | 0.96% | 1.32% | 1.20% | 130% | $294,535 | |
| I Class | | | | | | | | | | | | | |
| 2021 | $10.42 | 0.17 | (0.10) | 0.07 | —(3) | (0.03) | (0.03) | $10.46 | 0.70% | 0.70% | 0.74% | 1.56% | 1.52% | 119% | $18,975 | |
| 2020 | $10.47 | 0.16 | 0.04 | 0.20 | (0.25) | — | (0.25) | $10.42 | 2.01% | 0.73% | 0.74% | 1.56% | 1.55% | 106% | $16,077 | |
| 2019 | $10.06 | 0.22 | 0.78 | 1.00 | (0.59) | — | (0.59) | $10.47 | 10.44% | 0.74% | 0.74% | 2.20% | 2.20% | 46% | $16,830 | |
| 2018 | $10.38 | 0.24 | (0.35) | (0.11) | (0.18) | (0.03) | (0.21) | $10.06 | (1.16)% | 0.74% | 0.83% | 2.36% | 2.27% | 78% | $10,569 | |
2017(4) | $10.14 | 0.09 | 0.15 | 0.24 | — | — | — | $10.38 | 2.37% | 0.74%(5) | 0.86%(5) | 1.51%(5) | 1.39%(5) | 130%(6) | $11,856 | |
| | | | | | | | | | | | | | | | | | | | | | | | | | | | | | | | | | | | | | | | | | | | | | | |
| For a Share Outstanding Throughout the Years Ended October 31 (except as noted) | | | | | |
| Per-Share Data | Ratios and Supplemental Data |
| | Income From Investment Operations: | Distributions From: | | | Ratio to Average Net Assets of: | | |
| Net Asset
Value,
Beginning
of Period | Net Investment Income (Loss)(1) | Net
Realized
and
Unrealized
Gain (Loss) | Total From
Investment
Operations | Net
Investment
Income | Net
Realized
Gains | Total
Distributions | Net Asset
Value,
End
of Period | Total Return(2) | Operating
Expenses | Operating
Expenses
(before
expense
waiver) | Net
Investment
Income
(Loss) | Net
Investment
Income
(Loss)
(before
expense
waiver) | Portfolio
Turnover
Rate | Net
Assets,
End of
Period
(in thousands) |
| Y Class | | | | | | | | | | | | | |
| 2021 | $10.44 | 0.18 | (0.10) | 0.08 | (0.01) | (0.03) | (0.04) | $10.48 | 0.80% | 0.60% | 0.64% | 1.66% | 1.62% | 119% | $62,274 | |
| 2020 | $10.49 | 0.17 | 0.05 | 0.22 | (0.27) | — | (0.27) | $10.44 | 2.15% | 0.63% | 0.64% | 1.66% | 1.65% | 106% | $43,071 | |
| 2019 | $10.07 | 0.22 | 0.80 | 1.02 | (0.60) | — | (0.60) | $10.49 | 10.65% | 0.64% | 0.64% | 2.30% | 2.30% | 46% | $29,035 | |
| 2018 | $10.39 | 0.27 | (0.38) | (0.11) | (0.18) | (0.03) | (0.21) | $10.07 | (1.09)% | 0.64% | 0.73% | 2.46% | 2.37% | 78% | $7,891 | |
2017(4) | $10.14 | 0.09 | 0.16 | 0.25 | — | — | — | $10.39 | 2.47% | 0.64%(5) | 0.76%(5) | 1.59%(5) | 1.47%(5) | 130%(6) | $5 | |
| A Class |
| 2021 | $10.36 | 0.13 | (0.10) | 0.03 | — | (0.03) | (0.03) | $10.36 | 0.30% | 1.05% | 1.09% | 1.21% | 1.17% | 119% | $1,450 | |
| 2020 | $10.39 | 0.12 | 0.05 | 0.17 | (0.20) | — | (0.20) | $10.36 | 1.69% | 1.08% | 1.09% | 1.21% | 1.20% | 106% | $2,054 | |
| 2019 | $9.98 | 0.18 | 0.78 | 0.96 | (0.55) | — | (0.55) | $10.39 | 10.12% | 1.09% | 1.09% | 1.85% | 1.85% | 46% | $1,941 | |
| 2018 | $10.31 | 0.20 | (0.36) | (0.16) | (0.14) | (0.03) | (0.17) | $9.98 | (1.59)% | 1.09% | 1.18% | 2.01% | 1.92% | 78% | $1,753 | |
| 2017 | $10.24 | 0.10 | 0.09 | 0.19 | (0.09) | (0.03) | (0.12) | $10.31 | 1.88% | 1.09% | 1.21% | 1.07% | 0.95% | 130% | $2,157 | |
| C Class |
| 2021 | $10.26 | 0.05 | (0.10) | (0.05) | — | (0.03) | (0.03) | $10.18 | (0.48)% | 1.80% | 1.84% | 0.46% | 0.42% | 119% | $571 | |
| 2020 | $10.25 | 0.05 | 0.05 | 0.10 | (0.09) | — | (0.09) | $10.26 | 0.97% | 1.83% | 1.84% | 0.46% | 0.45% | 106% | $708 | |
| 2019 | $9.85 | 0.11 | 0.76 | 0.87 | (0.47) | — | (0.47) | $10.25 | 9.27% | 1.84% | 1.84% | 1.10% | 1.10% | 46% | $1,030 | |
| 2018 | $10.17 | 0.12 | (0.34) | (0.22) | (0.07) | (0.03) | (0.10) | $9.85 | (2.27)% | 1.84% | 1.93% | 1.26% | 1.17% | 78% | $1,196 | |
| 2017 | $10.10 | 0.03 | 0.08 | 0.11 | (0.01) | (0.03) | (0.04) | $10.17 | 1.13% | 1.84% | 1.96% | 0.32% | 0.20% | 130% | $1,824 | |
| | | | | | | | | | | | | | | | | | | | | | | | | | | | | | | | | | | | | | | | | | | | | | | |
| For a Share Outstanding Throughout the Years Ended October 31 (except as noted) | | | | | |
| Per-Share Data | Ratios and Supplemental Data |
| | Income From Investment Operations: | Distributions From: | | | Ratio to Average Net Assets of: | | |
| Net Asset
Value,
Beginning
of Period | Net Investment Income (Loss)(1) | Net
Realized
and
Unrealized
Gain (Loss) | Total From
Investment
Operations | Net
Investment
Income | Net
Realized
Gains | Total
Distributions | Net Asset
Value,
End
of Period | Total Return(2) | Operating
Expenses | Operating
Expenses
(before
expense
waiver) | Net
Investment
Income
(Loss) | Net
Investment
Income
(Loss)
(before
expense
waiver) | Portfolio
Turnover
Rate | Net
Assets,
End of
Period
(in thousands) |
| R Class |
| 2021 | $10.32 | 0.10 | (0.09) | 0.01 | — | (0.03) | (0.03) | $10.30 | 0.11% | 1.30% | 1.34% | 0.96% | 0.92% | 119% | $287 | |
| 2020 | $10.34 | 0.10 | 0.04 | 0.14 | (0.16) | — | (0.16) | $10.32 | 1.42% | 1.33% | 1.34% | 0.96% | 0.95% | 106% | $294 | |
| 2019 | $9.94 | 0.15 | 0.77 | 0.92 | (0.52) | — | (0.52) | $10.34 | 9.77% | 1.34% | 1.34% | 1.60% | 1.60% | 46% | $165 | |
| 2018 | $10.26 | 0.17 | (0.34) | (0.17) | (0.12) | (0.03) | (0.15) | $9.94 | (1.75)% | 1.34% | 1.43% | 1.76% | 1.67% | 78% | $97 | |
| 2017 | $10.19 | 0.09 | 0.07 | 0.16 | (0.06) | (0.03) | (0.09) | $10.26 | 1.63% | 1.34% | 1.46% | 0.82% | 0.70% | 130% | $146 | |
| R5 Class |
| 2021 | $10.42 | 0.17 | (0.09) | 0.08 | (0.01) | (0.03) | (0.04) | $10.46 | 0.80% | 0.60% | 0.64% | 1.66% | 1.62% | 119% | $15,136 | |
| 2020 | $10.47 | 0.17 | 0.05 | 0.22 | (0.27) | — | (0.27) | $10.42 | 2.16% | 0.63% | 0.64% | 1.66% | 1.65% | 106% | $15,988 | |
| 2019 | $10.06 | 0.23 | 0.78 | 1.01 | (0.60) | — | (0.60) | $10.47 | 10.55% | 0.64% | 0.64% | 2.30% | 2.30% | 46% | $20,582 | |
| 2018 | $10.39 | 0.25 | (0.36) | (0.11) | (0.19) | (0.03) | (0.22) | $10.06 | (1.13)% | 0.64% | 0.73% | 2.46% | 2.37% | 78% | $28,832 | |
| 2017 | $10.31 | 0.15 | 0.10 | 0.25 | (0.14) | (0.03) | (0.17) | $10.39 | 2.43% | 0.64% | 0.76% | 1.52% | 1.40% | 130% | $32,206 | |
| R6 Class |
| 2021 | $10.42 | 0.18 | (0.09) | 0.09 | (0.02) | (0.03) | (0.05) | $10.46 | 0.86% | 0.55% | 0.59% | 1.71% | 1.67% | 119% | $7,319 | |
| 2020 | $10.47 | 0.18 | 0.05 | 0.23 | (0.28) | — | (0.28) | $10.42 | 2.23% | 0.58% | 0.59% | 1.71% | 1.70% | 106% | $8,114 | |
| 2019 | $10.06 | 0.22 | 0.79 | 1.01 | (0.60) | — | (0.60) | $10.47 | 10.62% | 0.59% | 0.59% | 2.35% | 2.35% | 46% | $7,231 | |
| 2018 | $10.39 | 0.25 | (0.36) | (0.11) | (0.19) | (0.03) | (0.22) | $10.06 | (1.08)% | 0.59% | 0.68% | 2.51% | 2.42% | 78% | $1,015 | |
| 2017 | $10.32 | 0.16 | 0.08 | 0.24 | (0.14) | (0.03) | (0.17) | $10.39 | 2.38% | 0.59% | 0.71% | 1.57% | 1.45% | 130% | $1,489 | |
| | | | | | | | | | | | | | | | | | | | | | | | | | | | | | | | | | | | | | | | | | | | | | | |
| For a Share Outstanding Throughout the Years Ended October 31 (except as noted) | | | | | |
| Per-Share Data | Ratios and Supplemental Data |
| | Income From Investment Operations: | Distributions From: | | | Ratio to Average Net Assets of: | | |
| Net Asset
Value,
Beginning
of Period | Net Investment Income (Loss)(1) | Net
Realized
and
Unrealized
Gain (Loss) | Total From
Investment
Operations | Net
Investment
Income | Net
Realized
Gains | Total
Distributions | Net Asset
Value,
End
of Period | Total Return(2) | Operating
Expenses | Operating
Expenses
(before
expense
waiver) | Net
Investment
Income
(Loss) | Net
Investment
Income
(Loss)
(before
expense
waiver) | Portfolio
Turnover
Rate | Net
Assets,
End of
Period
(in thousands) |
| G Class |
| 2021 | $10.46 | 0.24 | (0.10) | 0.14 | (0.09) | (0.03) | (0.12) | $10.48 | 1.35% | 0.01% | 0.59% | 2.25% | 1.67% | 119% | $2,089,178 | |
| 2020 | $10.54 | 0.24 | 0.04 | 0.28 | (0.36) | — | (0.36) | $10.46 | 2.80% | 0.01% | 0.59% | 2.28% | 1.70% | 106% | $1,599,830 | |
| 2019 | $10.13 | 0.30 | 0.77 | 1.07 | (0.66) | — | (0.66) | $10.54 | 11.21% | 0.01% | 0.59% | 2.93% | 2.35% | 46% | $970,268 | |
| 2018 | $10.41 | 0.32 | (0.37) | (0.05) | (0.20) | (0.03) | (0.23) | $10.13 | (0.49)% | 0.01% | 0.68% | 3.09% | 2.42% | 78% | $1,083,103 | |
2017(7) | $10.29 | 0.06 | 0.06 | 0.12 | — | — | — | $10.41 | 1.17% | 0.01%(5) | 0.71%(5) | 2.27%(5) | 1.57%(5) | 130%(6) | $1,007,151 | |
| | |
| Notes to Financial Highlights |
(1)Computed using average shares outstanding throughout the period.
(2)Total returns are calculated based on the net asset value of the last business day and do not reflect applicable sales charges, if any. Total returns for periods less than one year are not annualized.
(3)Per-share amount was less than $0.005.
(4)April 10, 2017 (commencement of sale) through October 31, 2017.
(5)Annualized.
(6)Portfolio turnover is calculated at the fund level. Percentage indicated was calculated for the year ended October 31, 2017.
(7)July 28, 2017 (commencement of sale) through October 31, 2017.
See Notes to Financial Statements.
| | |
| Report of Independent Registered Public Accounting Firm |
To the Board of Trustees of American Century International Bond Funds and Shareholders of Global Bond Fund
Opinion on the Financial Statements
We have audited the accompanying statement of assets and liabilities, including the schedule of investments, of Global Bond Fund (one of the funds constituting American Century International Bond Funds, referred to hereafter as the “Fund”) as of October 31, 2021, the related statement of operations for the year ended October 31, 2021, the statement of changes in net assets for each of the two years in the period ended October 31, 2021, including the related notes, and the financial highlights for each of the periods indicated therein (collectively referred to as the “financial statements”). In our opinion, the financial statements present fairly, in all material respects, the financial position of the Fund as of October 31, 2021, the results of its operations for the year then ended, the changes in its net assets for each of the two years in the period ended October 31, 2021 and the financial highlights for each of the periods indicated therein in conformity with accounting principles generally accepted in the United States of America.
Basis for Opinion
These financial statements are the responsibility of the Fund’s management. Our responsibility is to express an opinion on the Fund’s financial statements based on our audits. We are a public accounting firm registered with the Public Company Accounting Oversight Board (United States) (“PCAOB”) and are required to be independent with respect to the Fund in accordance with the U.S. federal securities laws and the applicable rules and regulations of the Securities and Exchange Commission and the PCAOB.
We conducted our audits of these financial statements in accordance with the standards of the PCAOB. Those standards require that we plan and perform the audit to obtain reasonable assurance about whether the financial statements are free of material misstatement, whether due to error or fraud.
Our audits included performing procedures to assess the risks of material misstatement of the financial statements, whether due to error or fraud, and performing procedures that respond to those risks. Such procedures included examining, on a test basis, evidence regarding the amounts and disclosures in the financial statements. Our audits also included evaluating the accounting principles used and significant estimates made by management, as well as evaluating the overall presentation of the financial statements. Our procedures included confirmation of securities owned as of October 31, 2021 by correspondence with the custodian, brokers, and agent banks; when replies were not received from brokers, we performed other auditing procedures. We believe that our audits provide a reasonable basis for our opinion.
/s/ PricewaterhouseCoopers LLP
Kansas City, Missouri
December 17, 2021
We have served as the auditor of one or more investment companies in American Century Investments since 1997.
Board of Trustees
The individuals listed below serve as trustees of the funds. Each trustee will continue to serve in this capacity until death, retirement, resignation or removal from office. The board has adopted a mandatory retirement age for trustees who are not “interested persons,” as that term is defined in the Investment Company Act (independent trustees). Independent trustees shall retire on December 31 of the year in which they reach their 75th birthday; provided, however, that on or after January 1, 2022, independent trustees shall retire on December 31 of the year in which they reach their 76th birthday.
Jonathan S. Thomas is an “interested person” because he currently serves as President and Chief Executive Officer of American Century Companies, Inc. (ACC), the parent company of American Century Investment Management, Inc. (ACIM or the advisor). The other trustees (more than three-fourths of the total number) are independent. They are not employees, directors or officers of, and have no financial interest in, ACC or any of its wholly owned, direct or indirect, subsidiaries, including ACIM, American Century Investment Services, Inc. (ACIS) and American Century Services, LLC (ACS), and they do not have any other affiliations, positions or relationships that would cause them to be considered “interested persons” under the Investment Company Act. The trustees serve in this capacity for eight (in the case of Jonathan S. Thomas, 16; and Ronald J. Gilson, 9) registered investment companies in the American Century Investments family of funds.
The following table presents additional information about the trustees. The mailing address for each trustee other than Mr. Thomas is 1665 Charleston Road, Mountain View, California 94043. The mailing address for Mr. Thomas is 4500 Main Street, Kansas City, Missouri 64111.
| | | | | | | | | | | | | | | | | |
Name
(Year of Birth) | Position(s) Held with Funds | Length of Time Served | Principal Occupation(s) During Past 5 Years | Number of American Century Portfolios Overseen by Trustee | Other Directorships Held During Past 5 Years |
| Independent Trustees | | |
Tanya S. Beder
(1955) | Trustee | Since 2011 | Chairman and CEO, SBCC Group Inc. (independent advisory services) (2006 to present) | 38 | Kirby Corporation; Nabors Industries Ltd.; CYS Investments, Inc. (2012 to 2017) |
Jeremy I. Bulow
(1954) | Trustee | Since 2011 | Professor of Economics, Stanford University, Graduate School of Business (1979 to present) | 38 | None |
Jennifer Cabalquinto
(1968) | Trustee | Since 2021 | Special Advisor, GSW Sports, LLC (2020 to Present); Chief Financial Officer, GSW Sports, LLC (2013 to 2020) | 38 | None |
Anne Casscells
(1958) | Trustee | Since 2016 | Co-Chief Executive Officer and Chief Investment Officer, Aetos Alternatives Management (investment advisory firm) (2001 to present); Lecturer in Accounting, Stanford University, Graduate School of Business (2009 to 2017) | 38 | None |
Ronald J. Gilson
(1946) | Trustee and Chairman of the Board | Since 1995
(Chairman since 2005) | Charles J. Meyers Professor of Law and Business, Emeritus (since 2018). Stanford Law School (1979 to 2016); Marc and Eva Stern Professor of Law and Business, Columbia University School of Law (1992 to present) | 73 | None |
| | | | | | | | | | | | | | | | | |
Name
(Year of Birth) | Position(s) Held with Funds | Length of Time Served | Principal Occupation(s) During Past 5 Years | Number of American Century Portfolios Overseen by Trustee | Other Directorships Held During Past 5 Years |
| Independent Trustees | | |
Frederick L. A. Grauer
(1946) | Trustee | Since 2008 | Senior Advisor, Credit Sesame, Inc. (credit monitoring firm) (2018 to present); Senior Advisor, Course Hero (an educational technology company) (2015 to present) | 38 | None |
Jonathan D. Levin
(1972) | Trustee | Since 2016 | Philip H. Knight Professor and Dean, Graduate School of Business, Stanford University (2016 to present); Professor, Stanford University, (2000 to present) | 38 | None |
Peter F. Pervere
(1947) | Trustee | Since 2007 | Retired | 38 | None |
John B. Shoven
(1947) | Trustee | Since 2002 | Charles R. Schwab Professor of Economics, Stanford University (1973 to present, emeritus since 2019) | 38 | Cadence Design Systems; Exponent; Financial Engines |
| Interested Trustee | | |
Jonathan S. Thomas
(1963) | Trustee | Since 2007 | President and Chief Executive Officer, ACC (2007 to present). Also serves as Chief Executive Officer, ACS; Director, ACC and other ACC subsidiaries | 145 | None |
The Statement of Additional Information has additional information about the fund's trustees and is available without charge, upon request, by calling 1-800-345-2021.
Officers
The following table presents certain information about the executive officers of the funds. Each officer serves as an officer for 16 (in the case of Robert J. Leach, 15) investment companies in the American Century family of funds. No officer is compensated for his or her service as an officer of the funds. The listed officers are interested persons of the funds and are appointed or re-appointed on an annual basis. The mailing address for each of the officers listed below is 4500 Main Street, Kansas City, Missouri 64111.
| | | | | | | | |
Name
(Year of Birth) | Offices with the Funds | Principal Occupation(s) During the Past Five Years |
Patrick Bannigan
(1965) | President since 2019 | Executive Vice President and Director, ACC (2012 to present); Chief Financial Officer, Chief Accounting Officer and Treasurer, ACC (2015 to present)). Also serves as President, ACS; Vice President, ACIM; Chief Financial Officer, Chief Accounting Officer and/or Director, ACIM, ACS and other ACC subsidiaries |
R. Wes Campbell
(1974) | Chief Financial Officer and Treasurer since 2018 | Vice President, ACS, (2020 to present); Investment
Operations and Investment Accounting, ACS (2000 to
present) |
Amy D. Shelton
(1964) | Chief Compliance Officer and Vice President since 2014 | Chief Compliance Officer, American Century funds, (2014 to present); Chief Compliance Officer, ACIM (2014 to present); Chief Compliance Officer, ACIS (2009 to present). Also serves as Vice President, ACIS |
Jon Pak
(1968) | General Counsel and Senior Vice President since 2021 | General Counsel and Senior Vice President, ACC (2021 to present). Also serves as General Counsel and Senior Vice President, ACIM, ACS and ACIS. Chief Legal Officer of Investment and Wealth Management, The Bank of New York Mellon (2014 to 2021) |
C. Jean Wade
(1964) | Vice President since 2012 | Senior Vice President, ACS (2017 to present); Vice President ACS (2000 to 2017) |
Robert J. Leach
(1966) | Vice President since 2006 | Vice President, ACS (2000 to present) |
David H. Reinmiller
(1963) | Vice President since 2000 | Attorney, ACC (1994 to present). Also serves as Vice President, ACIM and ACS |
Ward D. Stauffer
(1960) | Secretary since 2005 | Attorney, ACC (2003 to present) |
| | |
| Approval of Management Agreement |
At a meeting held on June 16, 2021, the Fund’s Board of Trustees (the "Board") unanimously approved the renewal of the management agreement pursuant to which American Century Investment Management, Inc. (the “Advisor”) acts as the investment advisor for the Fund. Under Section 15(c) of the Investment Company Act, contracts for investment advisory services are required to be reviewed, evaluated, and approved by a majority of a fund’s Trustees, including a majority of the independent Trustees, each year. The Board regards this annual evaluation and renewal as one of its most important responsibilities.
The independent Trustees have memorialized a statement regarding the relationship between their ongoing obligations to oversee and evaluate the performance of the Advisor and their annual consideration of renewal of the management agreement. In that statement, the independent Trustees noted that their assessment of the Advisor’s performance is an ongoing process that takes place over the entire year and is informed by all of the extensive information that the Board and its committees receive and consider over time. This information, together with the additional materials provided specifically in connection with the review, are central to the Board’s assessment of the Advisor’s performance and its determination whether to renew the Fund’s management agreement.
Prior to its consideration of the renewal of the management agreement, the Board requested and reviewed extensive data and analysis relating to the proposed renewal. This information and analysis was compiled by the Advisor and certain independent providers of evaluation data concerning the Fund and the services provided to the Fund by the Advisor.
In connection with its consideration of the renewal of the management agreement, the Board’s review and evaluation of the services provided by the Advisor and its affiliates included, but was not limited to, the following:
•the nature, extent, and quality of investment management, shareholder services, and other services provided and to be provided to the Fund including without limitation portfolio management and trading services, shareholder and intermediary service levels and quality, compliance and legal services, fund accounting and financial reporting, and fund share distribution;
•the wide range of other programs and services provided and to be provided by the Advisor and its affiliates to the Fund and its shareholders on a routine and non-routine basis;
•the Fund’s investment performance, including data comparing the Fund’s performance to appropriate benchmarks and/or a peer group of other mutual funds with similar investment objectives and strategies;
•the cost of owning the Fund compared to the cost of owning similar funds;
•the compliance policies, procedures, and regulatory experience of the Advisor and its affiliates and certain other Fund service providers;
•financial data showing the cost of services provided by the Advisor and its affiliates to the Fund, the profitability of the Fund to the Advisor, and the overall profitability of the Advisor;
•the Advisor’s strategic plans, COVID-19 pandemic response, vendor management practices, and social justice initiatives;
•the Advisor’s business continuity plans and cyber security practices;
•any economies of scale associated with the Advisor’s management of the Fund;
•services provided and charges to the Advisor’s other investment management clients;
•fees and expenses associated with any investment by the Fund in other funds;
•payments and practices in connection with financial intermediaries holding shares of the Fund on behalf of their clients and the services provided by intermediaries in connection therewith; and
•any collateral benefits derived by the Advisor from the management of the Fund.
In keeping with its practice, the Board held two meetings and the independent Trustees met in private session to discuss the renewal and to review and discuss the information provided in response to their request. The Board held active discussions with the Advisor regarding the renewal of the management agreement. The independent Trustees had the benefit of the advice of their independent counsel throughout the process.
Factors Considered
The Trustees considered all of the information provided by the Advisor, the independent data providers, and the independent Trustees’ independent counsel in connection with the approval. They determined that the information was sufficient for them to evaluate the management agreement for the Fund. In connection with their review, the Trustees did not identify any single factor as being all-important or controlling and each Trustee may have attributed different levels of importance to different factors. In deciding to renew the management agreement, the Board based its decision on a number of factors, including the following:
Nature, Extent and Quality of Services — Generally. Under the management agreement, the Advisor is responsible for providing or arranging for all services necessary for the operation of the Fund. The Board noted that the Advisor provides or arranges at its own expense a wide variety of services including:
•constructing and designing the Fund
•portfolio research and security selection
•initial capitalization/funding
•securities trading
•Fund administration
•custody of Fund assets
•daily valuation of the Fund’s portfolio
•shareholder servicing and transfer agency, including shareholder confirmations, recordkeeping, and communications
•legal services (except the independent Trustees’ counsel)
•regulatory and portfolio compliance
•financial reporting
•marketing and distribution (except amounts paid by the Fund under Rule 12b-1 plans)
The Board noted that many of these services have expanded over time in terms of both quantity and complexity in response to shareholder demands, competition in the industry, changing distribution channels, and the changing regulatory environment.
Investment Management Services. The nature of the investment management services provided to the Fund is quite complex and allows Fund shareholders access to professional money management, instant diversification of their investments within an asset class, the opportunity to easily diversify among asset classes by investing in or exchanging among various American Century Investments funds, and liquidity. In evaluating investment performance, the Board expects the Advisor to manage the Fund in accordance with its investment objectives and approved strategies. Further, the Trustees recognize that the Advisor has an obligation to seek the best execution of fund trades. In providing these services, the Advisor utilizes teams of investment professionals (portfolio managers, analysts, research assistants, and securities traders) who require extensive information technology, research, training, compliance, and other systems to conduct their business. The Board, directly and through its Portfolio Committee, regularly reviews investment performance information for the Fund, together with comparative information for appropriate benchmarks and/or peer groups of similarly-managed funds, over different time horizons. The Trustees also review investment performance information during the management agreement renewal process. If performance concerns are identified, the Fund receives special reviews until performance improves, during which the Board discusses with the Advisor the reasons for such results (e.g., market conditions, security selection) and any efforts being undertaken to improve performance. The Fund’s performance was above its benchmark for the
five-year period, and below its benchmark for the one- and three-year periods reviewed by the Board. The Board discussed the Fund’s performance with the Advisor and was satisfied with the efforts being undertaken by the Advisor. The Board found the investment management services provided by the Advisor to the Fund to be satisfactory and consistent with the management agreement.
Shareholder and Other Services. Under the management agreement, the Advisor, either directly or through affiliates or third parties, provides the Fund with a comprehensive package of transfer agency, shareholder, and other services. The Board, directly and through its various committees, regularly reviews reports and evaluations of such services at its regular meetings. These reports include, but are not limited to, information regarding the operational efficiency and accuracy of the shareholder and transfer agency services provided, staffing levels, shareholder satisfaction, technology support (including cyber security), new products and services offered to Fund shareholders, securities trading activities, portfolio valuation services, auditing services, and legal and operational compliance activities. The Board found the services provided by the Advisor to the Fund under the management agreement to be competitive and of high quality.
Costs of Services and Profitability. The Advisor provides detailed information concerning its cost of providing various services to the Fund, its profitability in managing the Fund, its overall profitability, and its financial condition. The Trustees have reviewed with the Advisor the methodology used to prepare this financial information. This information is considered in evaluating the Advisor’s financial condition, its ability to continue to provide services under the management agreement, and the reasonableness of the current management fee. The Board concluded that the Advisor’s profits were reasonable in light of the services provided to the Fund.
Ethics. The Board generally considers the Advisor’s commitment to providing quality services to shareholders and to conducting its business ethically. They noted that the Advisor’s practices generally meet or exceed industry best practices.
Economies of Scale. The Board also reviewed information provided by the Advisor regarding the possible existence of economies of scale in connection with the management of the Fund. The Board concluded that economies of scale are difficult to measure and predict with precision, especially on a fund-by-fund basis. The Board concluded that the Advisor is appropriately sharing economies of scale, to the extent they exist, through its competitive fee structure, offering competitive fees from fund inception, and through reinvestment in its business, infrastructure, investment capabilities and initiatives to provide shareholders enhanced and expanded services.
Comparison to Other Funds’ Fees. The management agreement provides that the Fund pays the Advisor a single, all-inclusive (or unified) management fee for providing all services necessary for the management and operation of the Fund, other than brokerage expenses, expenses attributable to short sales, taxes, interest, extraordinary expenses, fees and expenses of the Fund’s independent Trustees (including their independent legal counsel), and expenses incurred in connection with the provision of shareholder services and distribution services under a plan adopted pursuant to Rule 12b-1 under the Investment Company Act. Under this unified fee structure, the Advisor is responsible for providing all investment advisory, custody, audit, administrative, compliance, recordkeeping, marketing, and shareholder services, or arranging and supervising third parties to provide such services. By contrast, most other funds are charged a variety of fees, including an investment advisory fee, a transfer agency fee, an administrative fee, and other expenses. Other than their investment advisory fees and any applicable Rule 12b-1 distribution fees, all other components of the total fees charged by these other funds may be increased without shareholder approval. The Board believes the unified fee structure is a benefit to Fund shareholders because it clearly discloses to shareholders the cost of owning Fund shares, and, since the unified fee cannot be increased without a vote of Fund shareholders, it shifts to the Advisor the risk of increased costs of operating the Fund and provides a direct incentive to minimize administrative inefficiencies. Part of the Board’s analysis of fee levels involves reviewing certain evaluative data compiled by an independent provider and comparing the Fund’s unified fee to the total expense ratio of peer funds. The unified fee charged to shareholders of the Fund was
below the median of the total expense ratios of the Fund’s peer group. The Board and the Advisor agreed to an extension of the current temporary reduction of the Fund's annual unified management fee of 0.04% (e.g., the Investor Class unified fee will be reduced from 0.83% to 0.79%) for at least one year beginning August 1, 2021. The Board concluded that the management fee paid by the Fund to the Advisor under the management agreement is reasonable in light of the services provided to the Fund.
Comparison to Fees and Services Provided to Other Clients of the Advisor. The Board also requested and received information from the Advisor concerning the nature of the services, fees, costs, and profitability of its advisory services to advisory clients other than the Fund. They observed that these varying types of client accounts require different services and involve different regulatory and entrepreneurial risks than the management of the Fund. The Board analyzed this information and concluded that the fees charged and services provided to the Fund were reasonable by comparison.
Payments to Intermediaries. The Trustees also requested and received a description of payments made to intermediaries by the Fund and the Advisor and services provided by intermediaries. These payments include various payments made by the Fund or the Advisor to different types of intermediaries and recordkeepers for distribution and service activities provided with respect to the Fund. The Trustees reviewed such information and received representations from the Advisor that all such payments by the Fund were made pursuant to the Fund’s Rule 12b-1 Plan and that all such payments by the Advisor were made from the Advisor’s resources and reasonable profits. The Board found such payments to be reasonable in scope and purpose.
Collateral or “Fall-Out” Benefits Derived by the Advisor. The Board considered the possible existence of collateral benefits the Advisor may receive as a result of its relationship with the Fund. The Board noted that the Advisor’s primary business is managing funds and it generally does not use fund or shareholder information to generate profits in other lines of business, and therefore does not derive any significant collateral benefits from them. The Board noted that the Advisor may receive proprietary research from broker-dealers that execute fund portfolio transactions. The Board also determined that the Advisor is able to provide investment management services to certain clients other than the Fund, at least in part, due to its existing infrastructure built to serve the fund complex. The Board noted that the assets of those other accounts are, where applicable, included with the assets of the Fund to determine breakpoints in the management fee schedule.
Existing Relationship. The Board also considered whether there was any reason for not continuing the existing arrangement with the Advisor. In this regard, the Board was mindful of the potential disruptions of the Fund’s operations and various risks, uncertainties, and other effects that could occur as a result of a decision not to continue such relationship. In particular, the Board recognized that most shareholders have invested in the Fund on the strength of the Advisor’s industry standing and reputation and in the expectation that the Advisor will have a continuing role in providing advisory services to the Fund.
Conclusion of the Trustees. As a result of this process, the Board, including all of the independent Trustees and assisted by the advice of independent legal counsel, taking into account all of the factors discussed above and the information provided by the Advisor and others in connection with its review and throughout the year, concluded that the management agreement between the Fund and the Advisor is fair and reasonable in light of the services provided and should be renewed.
Retirement Account Information
As required by law, distributions you receive from certain retirement accounts are subject to federal income tax withholding, unless you elect not to have withholding apply*. Tax will be withheld on the total amount withdrawn even though you may be receiving amounts that are not subject to withholding, such as nondeductible contributions. In such case, excess amounts of withholding could occur. You may adjust your withholding election so that a greater or lesser amount will be withheld.
If you don’t want us to withhold on this amount, you must notify us to not withhold the federal income tax. You may notify us in writing or in certain situations by telephone or through other electronic means. For systematic withdrawals, your withholding election will remain in effect until revoked or changed by filing a new election. You have the right to revoke your election at any time and change your withholding percentage for future distributions.
Remember, even if you elect not to have income tax withheld, you are liable for paying income tax on the taxable portion of your withdrawal. If you elect not to have income tax withheld or you don’t have enough income tax withheld, you may be responsible for payment of estimated tax. You may incur penalties under the estimated tax rules if your withholding and estimated tax payments are not sufficient. You can reduce or defer the income tax on a distribution by directly or indirectly rolling such distribution over to another IRA or eligible plan. You should consult your tax advisor for additional information.
State tax will be withheld if, at the time of your distribution, your address is within one of the mandatory withholding states and you have federal income tax withheld (or as otherwise required by state law). State taxes will be withheld from your distribution in accordance with the respective state rules.
*Some 403(b), 457 and qualified retirement plan distributions may be subject to 20% mandatory withholding, as they are subject to special tax and withholding rules. Your plan administrator or plan sponsor is required to provide you with a special tax notice explaining those rules at the time you request a distribution. If applicable, federal and/or state taxes may be withheld from your distribution amount.
Proxy Voting Policies
Descriptions of the principles and policies that the fund's investment advisor uses in exercising the voting rights associated with the securities purchased and/or held by the fund are available without charge, upon request, by calling 1-800-345-2021 or visiting American Century Investments’ website at americancentury.com/proxy. A description of the policies is also available on the Securities and Exchange Commission’s website at sec.gov. Information regarding how the investment advisor voted proxies relating to portfolio securities during the most recent 12-month period ended June 30 is available on americancentury.com/proxy. It is also available at sec.gov.
Quarterly Portfolio Disclosure
The fund files its complete schedule of portfolio holdings with the Securities and Exchange Commission (SEC) for the first and third quarters of each fiscal year as an exhibit to its reports on Form N-PORT. These portfolio holdings are available on the fund's website at americancentury.com and, upon request, by calling 1-800-345-2021. The fund’s Form N-PORT reports are available on the SEC’s website at sec.gov.
Other Tax Information
The following information is provided pursuant to provisions of the Internal Revenue Code.
The fund hereby designates $4,205,286, or up to the maximum amount allowable, as long-term capital gain distributions (20% rate gain distributions) for the fiscal year ended October 31, 2021.
The fund hereby designates $2,364,166 as qualified short-term capital gain distributions for purposes of Internal Revenue Code Section 871 for the fiscal year ended October 31, 2021.
Change in Independent Registered Public Accounting Firm
On September 24, 2021, the fund’s Audit and Compliance Committee and Board of Trustees approved a change to the fund’s independent registered public accountant. PricewaterhouseCoopers LLP was dismissed and Deloitte & Touche LLP was appointed as the independent registered public accounting firm for the fiscal year ending October 31, 2022.
During the fiscal years ended October 31, 2020 and October 31, 2021, there were no disagreements with PricewaterhouseCoopers LLP on any matter of accounting principles or practices, financial statement disclosure, or auditing scope or procedure, which disagreements, if not resolved to their satisfaction would have caused them to make reference to the subject matter of the disagreements in connection with their reports or reportable events, as such term is described in Item 304(a)(1) of Regulation S-K of the Securities Exchange Act of 1934, as amended. The audit reports of PricewaterhouseCoopers LLP on the financial statements of the fund for the fiscal years ended October 31, 2020 and October 31, 2021, did not contain any adverse opinion or disclaimer of opinion, nor were they qualified or modified as to uncertainty, audit scope or accounting principles.
During the fiscal years ended October 31, 2020 and October 31, 2021, neither the fund, nor anyone on its behalf, consulted with Deloitte & Touche LLP, on behalf of the fund, regarding the application of accounting principles to a specified transaction (either completed or proposed), the type of audit opinion that might be rendered on the fund’s financial statements, or any matter that was either the subject of a disagreement or a reportable event, as such terms are described in Item 304(a)(1) of Regulation S-K of the Securities Exchange Act of 1934, as amended.
The fund requested that PricewaterhouseCoopers LLP furnish it with a letter addressed to the Securities and Exchange Commission stating whether PricewaterhouseCoopers LLP agrees with the statements contained above. A copy of the letter from PricewaterhouseCoopers LLP to the Securities and Exchange Commission is filed as an exhibit hereto.
| | | | | | | | |
| |
| | |
| Contact Us | americancentury.com | |
| Automated Information Line | 1-800-345-8765 | |
| Investor Services Representative | 1-800-345-2021
or 816-531-5575 | |
| Investors Using Advisors | 1-800-378-9878 | |
Business, Not-For-Profit, Employer-Sponsored
Retirement Plans | 1-800-345-3533 | |
Banks and Trust Companies, Broker-Dealers,
Financial Professionals, Insurance Companies | 1-800-345-6488 | |
| Telecommunications Relay Service for the Deaf | 711 | |
| | |
| American Century International Bond Funds | |
| | |
Investment Advisor: American Century Investment Management, Inc. Kansas City, Missouri | |
| | |
| This report and the statements it contains are submitted for the general information of our shareholders. The report is not authorized for distribution to prospective investors unless preceded or accompanied by an effective prospectus. | |
| | |
©2021 American Century Proprietary Holdings, Inc. All rights reserved.
CL-ANN-90984 2112 | |
| | | | | |
| |
| Annual Report |
| |
| October 31, 2021 |
| |
| International Bond Fund |
| Investor Class (BEGBX) |
| I Class (AIBHX) |
| Y Class (AIBYX) |
| A Class (AIBDX) |
| C Class (AIQCX) |
| R Class (AIBRX) |
| R5 Class (AIDIX) |
| R6 Class (AIDDX) |
| G Class (AIBGX) |
| | | | | |
| President’s Letter | |
| Performance | |
| Portfolio Commentary | |
| Fund Characteristics | |
| Shareholder Fee Example | |
| Schedule of Investments | |
| Statement of Assets and Liabilities | |
| Statement of Operations | |
| Statement of Changes in Net Assets | |
| Notes to Financial Statements | |
| Financial Highlights | |
| Report of Independent Registered Public Accounting Firm | |
| Management | |
| Approval of Management Agreement | |
| |
| |
| Additional Information | |
Any opinions expressed in this report reflect those of the author as of the date of the report, and do not necessarily represent the opinions of American Century Investments® or any other person in the American Century Investments organization. Any such opinions are subject to change at any time based upon market or other conditions and American Century Investments disclaims any responsibility to update such opinions. These opinions may not be relied upon as investment advice and, because investment decisions made by American Century Investments funds are based on numerous factors, may not be relied upon as an indication of trading intent on behalf of any American Century Investments fund. Security examples are used for representational purposes only and are not intended as recommendations to purchase or sell securities. Performance information for comparative indices and securities is provided to American Century Investments by third party vendors. To the best of American Century Investments’ knowledge, such information is accurate at the time of printing.
Jonathan Thomas
Dear Investor:
Thank you for reviewing this annual report for the period ended October 31, 2021. Annual reports help convey important information about fund returns, including market factors that affected performance. For additional investment insights, please visit americancentury.com.
Economic, Earnings Gains Fueled Rally Among Risk-On Assets
Stocks and other risk-on assets rallied for the 12-month period, despite lingering pandemic-related challenges. Upbeat data on U.S. manufacturing, employment and housing, along with central bank and federal government support and positive vaccine developments, helped boost corporate earnings and promote investor optimism. Outside the U.S., most economies recovered, but generally at a slower pace. Virus outbreaks and slower vaccine rollouts, particularly in emerging markets, led to lingering lockdowns in some regions.
As the period progressed, steady economic gains combined with ongoing monetary and fiscal support, rising energy prices and severe supply chain disruptions pushed global interest rates and inflation higher. In the U.S., year-over-year headline inflation climbed to 6.2% in October 2021, the largest 12-month increase in nearly 31 years.
Late in the period, the Federal Reserve (Fed) confirmed it would start tapering its bond buying in November. Yet despite inflation’s surge, the Fed left short-term interest rates unchanged. Central banks in Europe and the U.K. maintained their supportive interest rate and bond-buying programs as inflation ticked higher.
Overall, stocks delivered stellar performance for the 12-month period, highlighted by the S&P 500 Index’s gain of nearly 43%. Assets offering inflation-fighting potential, including real estate investment trusts, fared even better. Meanwhile, global bonds retreated as interest rates rose. However, emerging markets bonds largely advanced, benefiting from risk-on sentiment.
Several Factors Shaping Market Dynamics
The return to pre-pandemic life is progressing, albeit somewhat cautiously due to COVID-19’s lingering effects. As the economy and markets respond to this fluid backdrop, investors will face opportunities and ongoing challenges. Economic growth, inflation, the virus’s trajectory, supply chain normalization and fiscal and monetary policy likely will sway market dynamics.
We appreciate your confidence in us during these extraordinary times. Our firm has a long history of helping clients weather unpredictable markets, and we’re confident we will continue to meet today’s challenges.
Sincerely,
Jonathan Thomas
President and Chief Executive Officer
American Century Investments
| | | | | | | | | | | | | | | | | | | | | |
| Total Returns as of October 31, 2021 |
| | | | Average Annual Returns | |
| Ticker
Symbol | | 1 year | 5 years | 10 years | Since
Inception | Inception
Date |
| Investor Class | BEGBX | | -0.83% | 1.39% | 0.07% | — | 1/7/92 |
| Bloomberg Global Aggregate Bond Index ex-USD (Unhedged) | — | | -1.99% | 1.92% | 0.65% | — | — |
| I Class | AIBHX | | -0.73% | — | — | 2.58% | 4/10/17 |
| Y Class | AIBYX | | -0.62% | — | — | 2.69% | 4/10/17 |
| A Class | AIBDX | | | | | | 10/27/98 |
| No sales charge | | | -1.10% | 1.13% | -0.18% | — | |
| With sales charge | | | -5.54% | 0.20% | -0.63% | — | |
| C Class | AIQCX | | -1.86% | 0.38% | -0.92% | — | 9/28/07 |
| R Class | AIBRX | | -1.37% | 0.89% | -0.43% | — | 9/28/07 |
| R5 Class | AIDIX | | -0.62% | 1.60% | 0.27% | — | 8/2/04 |
| R6 Class | AIDDX | | -0.65% | 1.64% | — | 0.78% | 7/26/13 |
| G Class | AIBGX | | -0.03% | — | — | 1.96% | 7/28/17 |
Average annual returns since inception are presented when ten years of performance history is not available.
G Class returns would have been lower if a portion of the fees had not been waived.
C Class shares will automatically convert to A Class shares after being held for approximately eight years. C Class average annual returns do not reflect this conversion.
Sales charges include initial sales charges and contingent deferred sales charges (CDSCs), as applicable. A Class shares have a 4.50% maximum initial sales charge and may be subject to a maximum CDSC of 1.00%. C Class shares redeemed within 12 months of purchase are subject to a maximum CDSC of 1.00%. The SEC requires that mutual funds provide performance information net of maximum sales charges in all cases where charges could be applied.
Data presented reflect past performance. Past performance is no guarantee of future results. Current performance may be higher or lower than the performance shown. Total returns for periods less than one year are not annualized. Investment return and principal value will fluctuate, and redemption value may be more or less than original cost. Data assumes reinvestment of dividends and capital gains, and none of the charts reflect the deduction of taxes that a shareholder would pay on fund distributions or the redemption of fund shares. To obtain performance data current to the most recent month end, please call 1-800-345-2021 or visit americancentury.com. For additional information about the fund, please consult the prospectus.
| | |
| Growth of $10,000 Over 10 Years |
| $10,000 investment made October 31, 2011 |
| Performance for other share classes will vary due to differences in fee structure. |
| | | | | |
| Value on October 31, 2021 |
| Investor Class — $10,075 |
|
| Bloomberg Global Aggregate Bond Index ex-USD
(Unhedged) — $10,669 |
|
| | | | | | | | | | | | | | | | | | | | | | | | | | |
| Total Annual Fund Operating Expenses | | | | |
Investor
Class | I Class | Y Class | A Class | C Class | R Class | R5 Class | R6 Class | G Class |
| 0.81% | 0.71% | 0.61% | 1.06% | 1.81% | 1.31% | 0.61% | 0.56% | 0.56% |
The total annual fund operating expenses shown is as stated in the fund’s prospectus current as of the date of this report. The prospectus may vary from the expense ratio shown elsewhere in this report because it is based on a different time period, includes acquired fund fees and expenses, and, if applicable, does not include fee waivers or expense reimbursements.
Data presented reflect past performance. Past performance is no guarantee of future results. Current performance may be higher or lower than the performance shown. Total returns for periods less than one year are not annualized. Investment return and principal value will fluctuate, and redemption value may be more or less than original cost. Data assumes reinvestment of dividends and capital gains, and none of the charts reflect the deduction of taxes that a shareholder would pay on fund distributions or the redemption of fund shares. To obtain performance data current to the most recent month end, please call 1-800-345-2021 or visit americancentury.com. For additional information about the fund, please consult the prospectus.
Portfolio Managers: John Lovito, Simon Chester and Lynn Chen
Lynn Chen joined the fund’s portfolio management team on September 3, 2021. Brian Howell left the portfolio management team August 1, 2021. He is retiring, effective December 31, 2021. Abdelak Adjriou left the fund’s portfolio management team August 24, 2021.
Performance Summary
International Bond returned -0.83%* for the fiscal year ended October 31, 2021. By comparison, the Bloomberg Global Aggregate Bond Index ex-USD (Unhedged) returned -1.99% over the same time period. Fund returns reflect operating expenses, while index returns do not.
Market Review
Global bond markets generated mixed returns during the 12-month period. Encouraging signs regarding the world’s recovery from pandemic-related challenges generally stoked higher risk appetites. However, surging economic activity sent inflation soaring, and recurring spikes in COVID-19 infection rates selectively tempered enthusiasm.
The reporting period opened boldly, as encouraging news around COVID-19 vaccines heartened investors in late 2020 and contributed to advances in global bonds. As economic prospects brightened and the U.S. Treasury yield curve steepened, riskier assets, including U.S. high-yield bonds, U.S. securitized debt and emerging markets bonds, benefited. Gains in European bonds were more muted amid a surge in COVID-19 infections, although investment-grade corporate bonds rallied with U.S. investment-grade corporates to near pre-pandemic levels.
The landscape changed dramatically during the first quarter of 2021. U.S. lawmakers approved $2.2 trillion in fiscal stimulus, and U.S. Treasury yields rose swiftly and sharply. These events, along with a faster-than-expected U.S. rollout of COVID-19 vaccines, fueled sizable upgrades in U.S. economic outlooks. The U.S. dollar also surged. Higher-yielding assets largely declined but still generally outperformed government bonds. Inflation-linked securities gained as inflation expectations grew. Rising yields unsettled many emerging markets governments and corporations with strained balance sheets, especially amid sluggish growth rates, renewed lockdowns in several countries and strength in the U.S. dollar.
Treasury yields generally eased through the second and third quarters, absorbing considerable volatility stemming from new COVID-19 infections, rising inflation and fiscal policy unknowns. Despite political wrangling over the U.S. debt ceiling and two massive fiscal spending bills, the U.S. dollar advanced to a one-year high. Squeezed supplies of semiconductor chips and other key materials, higher energy prices and labor market challenges fueled inflation’s rise worldwide. This prompted leading central banks to consider paring back accommodative measures implemented in response to the pandemic. The Federal Reserve (Fed) also indicated it may raise its key lending rate sooner than previously anticipated.
Despite the Fed’s hawkish tone, Treasury yields remained near historic lows. This environment generally led to sustained demand for higher-yielding securities, which largely outperformed lower-yielding, higher-quality securities.
Inflation-Linked Securities, High-Yield Bonds Bolstered Performance
Within the portfolio, exposure to out-of-index inflation linked bonds, most notably in the U.S., Japan and France, aided returns. We reduced our stake late in the period. An out-of-index position in
*All fund returns referenced in this commentary are for Investor Class shares. Performance for other share classes will vary due to differences in fee structure; when Investor Class performance exceeds that of the fund’s index, other share classes may not. See page 3 for returns for all share classes.
high-yield corporate securities further lifted performance as higher-yielding bonds considerably outgained investment-grade bonds. Our positioning benefited from exposure to the industrials sector and select securities in the financials sector.
Security Selection, Emerging Markets Debt Helped Results
Security selection among out-of-index U.S. securitized debt proved advantageous. Specifically, our collateralized loan obligations and non-agency commercial mortgage-backed securities advanced in the low-rate environment. Our investments in investment-grade corporate bonds further enhanced relative results, with out-of-index U.S.-based holdings outperforming our European corporates, which also advanced.
Our exposure in out-of-index emerging markets bonds also provided a lift. Chinese government bonds advanced as the country’s slowing economic activity raised expectations for central bank action. Select positions in South Africa and Chile also proved advantageous and helped offset downturns in local rates bond and currency investments.
Yield Curve Positioning Diminished Returns
Our short-duration positioning generated positive returns as rates advanced through much of the period, but periods of declining rates reduced the positive impact. As the U.S. Treasury curve steepened, out-of-index holdings in the intermediate portion detracted. Similar positioning in Europe and the U.K. also hindered results.
Positioning for the Future
While we expect continued economic growth going forward, elevated inflation due to continued supply and demand imbalances and soaring energy prices may moderate the pace. A challenging labor market remains a concern in the U.S., while reduced consumer activity has tempered the otherwise upbeat U.K. outlook. Europe’s prospects have brightened modestly amid solid labor market data.
We believe U.S. rates likely will head higher against a backdrop of solid economic growth, elevated inflation and massive government spending. Despite inflation concerns, we expect Fed policy will remain largely accommodative as it winds down its quantitative easing program. As shorter-maturity yields remain tied to the Fed’s interest rate policy, we anticipate a steepening U.S. yield curve and continued strength in the U.S. dollar.
Meanwhile, the European Central Bank has some latitude to reduce its bond-buying efforts. The traditionally inflation-sensitive Bank of England remains the most likely leading central bank to first raise rates, despite an unexpected late-period delay in that decision.
Overall, we believe U.S. securitized assets continue to offer attractive valuations, relative to other assets. We’re also adding to lower-rated, longer-maturity investment-grade corporate bonds. We selectively reduced our exposure to inflation-linked holdings and investment-grade corporates as they rallied, although we believe the asset classes still offer value. From a duration standpoint,
we ended the period with a modestly short bias in the U.S., Europe, the U.K. and Japan. Among emerging markets bonds, we prefer high-yield bonds and exposure to select currencies poised to potentially perform well due to attractive valuations, strong fundamentals and high commodity prices.
| | | | | |
| OCTOBER 31, 2021 |
| Types of Investments in Portfolio | % of net assets |
| Sovereign Governments and Agencies | 61.1% |
| Corporate Bonds | 22.9% |
| Preferred Stocks | 5.7% |
| Exchange-Traded Funds | 2.8% |
| Collateralized Loan Obligations | 2.6% |
| Asset-Backed Securities | 1.7% |
| U.S. Treasury Securities | 1.3% |
| Bank Loan Obligations | 0.3% |
| Temporary Cash Investments | 1.5% |
| Other Assets and Liabilities | 0.1% |
Fund shareholders may incur two types of costs: (1) transaction costs, including sales charges (loads) on purchase payments and redemption/exchange fees; and (2) ongoing costs, including management fees; distribution and service (12b-1) fees; and other fund expenses. This example is intended to help you understand your ongoing costs (in dollars) of investing in your fund and to compare these costs with the ongoing cost of investing in other mutual funds.
The example is based on an investment of $1,000 made at the beginning of the period and held for the entire period from May 1, 2021 to October 31, 2021.
Actual Expenses
The table provides information about actual account values and actual expenses for each class. You may use the information, together with the amount you invested, to estimate the expenses that you paid over the period. First, identify the share class you own. Then simply divide your account value by $1,000 (for example, an $8,600 account value divided by $1,000 = 8.6), then multiply the result by the number under the heading “Expenses Paid During Period” to estimate the expenses you paid on your account during this period.
If you hold Investor Class shares of any American Century Investments fund, or I Class shares of the American Century Diversified Bond Fund, in an American Century Investments account (i.e., not through a financial intermediary or employer-sponsored retirement plan account), American Century Investments may charge you a $25.00 annual account maintenance fee if the value of those shares is less than $10,000. We will redeem shares automatically in one of your accounts to pay the $25.00 fee. In determining your total eligible investment amount, we will include your investments in all personal accounts (including American Century Investments brokerage accounts) registered under your Social Security number. Personal accounts include individual accounts, joint accounts, UGMA/UTMA accounts, personal trusts, Coverdell Education Savings Accounts and IRAs (including traditional, Roth, Rollover, SEP-, SARSEP- and SIMPLE-IRAs), and certain other retirement accounts. If you have only business, business retirement, employer-sponsored or American Century Investments brokerage accounts, you are currently not subject to this fee. If you are subject to the account maintenance fee, your account value could be reduced by the fee amount.
Hypothetical Example for Comparison Purposes
The table also provides information about hypothetical account values and hypothetical expenses based on the actual expense ratio of each class of your fund and an assumed rate of return of 5% per year before expenses, which is not the actual return of a fund’s share class. The hypothetical account values and expenses may not be used to estimate the actual ending account balance or expenses you paid for the period. You may use this information to compare the ongoing costs of investing in your fund and other funds. To do so, compare this 5% hypothetical example with the 5% hypothetical examples that appear in the shareholder reports of the other funds.
Please note that the expenses shown in the table are meant to highlight your ongoing costs only and do not reflect any transactional costs, such as sales charges (loads) or redemption/exchange fees. Therefore, the table is useful in comparing ongoing costs only, and will not help you determine the relative total costs of owning different funds. In addition, if these transactional costs were included, your costs would have been higher.
| | | | | | | | | | | | | | |
| Beginning
Account Value
5/1/21 | Ending
Account Value
10/31/21 | Expenses Paid During Period(1) 5/1/21 - 10/31/21 | Annualized Expense Ratio(1) |
| Actual | | | | |
| Investor Class | $1,000 | $969.30 | $3.92 | 0.79% |
| I Class | $1,000 | $970.20 | $3.43 | 0.69% |
| Y Class | $1,000 | $970.30 | $2.93 | 0.59% |
| A Class | $1,000 | $968.20 | $5.16 | 1.04% |
| C Class | $1,000 | $964.70 | $8.86 | 1.79% |
| R Class | $1,000 | $967.10 | $6.40 | 1.29% |
| R5 Class | $1,000 | $970.30 | $2.93 | 0.59% |
| R6 Class | $1,000 | $970.30 | $2.68 | 0.54% |
| G Class | $1,000 | $973.50 | $0.05 | 0.01% |
| Hypothetical | | | | |
| Investor Class | $1,000 | $1,021.22 | $4.02 | 0.79% |
| I Class | $1,000 | $1,021.73 | $3.52 | 0.69% |
| Y Class | $1,000 | $1,022.23 | $3.01 | 0.59% |
| A Class | $1,000 | $1,019.96 | $5.30 | 1.04% |
| C Class | $1,000 | $1,016.18 | $9.10 | 1.79% |
| R Class | $1,000 | $1,018.70 | $6.56 | 1.29% |
| R5 Class | $1,000 | $1,022.23 | $3.01 | 0.59% |
| R6 Class | $1,000 | $1,022.48 | $2.75 | 0.54% |
| G Class | $1,000 | $1,025.16 | $0.05 | 0.01% |
(1)Expenses are equal to the class's annualized expense ratio listed in the table above, multiplied by the average account value over the period, multiplied by 184, the number of days in the most recent fiscal half-year, divided by 365, to reflect the one-half year period. Annualized expense ratio reflects actual expenses, including any applicable fee waivers or expense reimbursements and excluding any acquired fund fees and expenses.
OCTOBER 31, 2021
| | | | | | | | | | | |
| | Principal
Amount/Shares | Value |
| SOVEREIGN GOVERNMENTS AND AGENCIES — 61.1% |
| Australia — 3.1% | | | |
| Australia Government Bond, 2.75%, 4/21/24 | AUD | 19,437,000 | | $ | 15,344,629 | |
| Australia Government Bond, 1.50%, 6/21/31 | AUD | 6,500,000 | | 4,655,154 | |
| Australia Government Bond, 3.00%, 3/21/47 | AUD | 2,140,000 | | 1,675,646 | |
| New South Wales Treasury Corp., 3.00%, 3/20/28 | AUD | 4,748,000 | | 3,807,621 | |
| | | 25,483,050 | |
| Austria — 1.2% | | | |
Republic of Austria Government Bond, 3.40%, 11/22/22(1) | EUR | 2,598,000 | | 3,130,057 | |
Republic of Austria Government Bond, 0.75%, 10/20/26(1) | EUR | 2,352,000 | | 2,864,556 | |
Republic of Austria Government Bond, 4.15%, 3/15/37(1) | EUR | 2,220,000 | | 4,055,186 | |
| | | 10,049,799 | |
| Belgium — 0.7% | | | |
Kingdom of Belgium Government Bond, 4.25%, 3/28/41(1) | EUR | 576,000 | | 1,111,749 | |
Kingdom of Belgium Government Bond, 1.60%, 6/22/47(1) | EUR | 3,329,000 | | 4,600,114 | |
| | | 5,711,863 | |
| Canada — 3.7% | | | |
| Canadian Government Bond, 0.25%, 4/1/24 | CAD | 4,000,000 | | 3,163,542 | |
| Canadian Government Bond, 0.25%, 3/1/26 | CAD | 2,000,000 | | 1,535,456 | |
| Canadian Government Bond, 0.50%, 12/1/30 | CAD | 16,700,000 | | 12,137,996 | |
| Canadian Government Bond, 2.75%, 12/1/48 | CAD | 1,250,000 | | 1,172,959 | |
| Province of Ontario Canada, 2.85%, 6/2/23 | CAD | 549,000 | | 456,103 | |
| Province of Quebec Canada, 5.75%, 12/1/36 | CAD | 8,744,000 | | 9,906,240 | |
| Province of Quebec Canada, 5.00%, 12/1/41 | CAD | 800,000 | | 881,681 | |
| Province of Quebec Canada, 3.50%, 12/1/48 | CAD | 1,751,000 | | 1,631,436 | |
| | | 30,885,413 | |
| China — 15.2% | | | |
| China Development Bank, 3.50%, 8/13/26 | CNY | 128,500,000 | | 20,375,963 | |
| China Development Bank, 3.50%, 8/13/26 | CNY | 23,000,000 | | 3,647,199 | |
| China Government Bond, 2.57%, 5/20/23 | CNY | 98,000,000 | | 15,331,614 | |
| China Government Bond, 2.88%, 11/5/23 | CNY | 153,000,000 | | 24,052,318 | |
| China Government Bond, 1.99%, 4/9/25 | CNY | 53,000,000 | | 8,070,298 | |
| China Government Bond, 3.25%, 6/6/26 | CNY | 120,400,000 | | 19,183,765 | |
| China Government Bond, 3.12%, 12/5/26 | CNY | 38,700,000 | | 6,128,011 | |
| China Government Bond, 2.85%, 6/4/27 | CNY | 1,500,000 | | 233,810 | |
| China Government Bond, 3.01%, 5/13/28 | CNY | 16,000,000 | | 2,509,162 | |
| China Government Bond, 3.29%, 5/23/29 | CNY | 15,000,000 | | 2,396,685 | |
| China Government Bond, 2.68%, 5/21/30 | CNY | 78,200,000 | | 11,854,828 | |
| China Government Bond, 3.86%, 7/22/49 | CNY | 30,900,000 | | 5,086,745 | |
| China Government Bond, 3.39%, 3/16/50 | CNY | 24,800,000 | | 3,771,776 | |
| China Government Bond, 3.81%, 9/14/50 | CNY | 20,000,000 | | 3,285,435 | |
| | | 125,927,609 | |
| Czech Republic — 0.3% | | | |
| Czech Republic Government Bond, 4.70%, 9/12/22 | CZK | 58,020,000 | | 2,662,836 | |
| Denmark — 2.1% | | | |
| Denmark Government Bond, 0.50%, 11/15/27 | DKK | 3,808,000 | | 614,602 | |
Denmark Government Bond, 0.50%, 11/15/29(1) | DKK | 27,000,000 | | 4,364,035 | |
Denmark Government Bond, 0.00%, 11/15/31(1)(2) | DKK | 41,850,000 | | 6,417,434 | |
| | | | | | | | | | | |
| | Principal
Amount/Shares | Value |
| Denmark Government Bond, 4.50%, 11/15/39 | DKK | 14,620,000 | | $ | 4,016,649 | |
Denmark Government Bond, 0.25%, 11/15/52(1) | DKK | 14,000,000 | | 2,110,502 | |
| | | 17,523,222 | |
| Dominican Republic — 0.2% | | | |
| Dominican Republic International Bond, 5.95%, 1/25/27 | | $ | 1,400,000 | | 1,564,514 | |
| Egypt — 0.6% | | | |
Egypt Government International Bond, 7.50%, 1/31/27(1) | | $ | 4,900,000 | | 5,091,022 | |
| Finland — 0.8% | | | |
Finland Government Bond, 0.125%, 4/15/36(1) | EUR | 2,500,000 | | 2,815,688 | |
Finland Government Bond, 1.375%, 4/15/47(1) | EUR | 2,390,000 | | 3,442,049 | |
Finland Government Bond, 0.125%, 4/15/52(1) | EUR | 600,000 | | 628,736 | |
| | | 6,886,473 | |
| France — 2.5% | | | |
| French Republic Government Bond OAT, 1.75%, 11/25/24 | EUR | 234,680 | | 289,803 | |
| French Republic Government Bond OAT, 5.50%, 4/25/29 | EUR | 346,000 | | 565,278 | |
French Republic Government Bond OAT, 0.00%, 11/25/29(2) | EUR | 1,850,000 | | 2,125,316 | |
| French Republic Government Bond OAT, 2.50%, 5/25/30 | EUR | 3,535,000 | | 4,928,661 | |
| French Republic Government Bond OAT, 1.50%, 5/25/31 | EUR | 1,460,000 | | 1,896,123 | |
| French Republic Government Bond OAT, 5.75%, 10/25/32 | EUR | 1,060,000 | | 1,958,613 | |
| French Republic Government Bond OAT, 3.25%, 5/25/45 | EUR | 4,688,000 | | 8,481,460 | |
| | | 20,245,254 | |
| Germany — 0.6% | | | |
Bundesrepublik Deutschland Bundesanleihe, 0.00%, 8/15/50(2) | EUR | 4,150,000 | | 4,632,206 | |
| Ghana — 0.2% | | | |
| Ghana Government International Bond, 7.875%, 3/26/27 | | $ | 1,700,000 | | 1,584,209 | |
| Greece — 0.3% | | | |
Hellenic Republic Government Bond, 0.75%, 6/18/31(1) | EUR | 2,600,000 | | 2,855,668 | |
| Indonesia — 0.4% | | | |
| Indonesia Treasury Bond, 8.375%, 9/15/26 | IDR | 41,300,000,000 | | 3,303,718 | |
| Ireland — 1.4% | | | |
| Ireland Government Bond, 1.10%, 5/15/29 | EUR | 4,650,000 | | 5,784,972 | |
Ireland Government Bond, 0.00%, 10/18/31(2) | EUR | 750,000 | | 840,430 | |
| Ireland Government Bond, 0.40%, 5/15/35 | EUR | 4,500,000 | | 5,169,055 | |
| Ireland Government Bond, 1.50%, 5/15/50 | EUR | 60,000 | | 81,567 | |
| | | 11,876,024 | |
| Italy — 5.9% | | | |
| Italy Buoni Poliennali Del Tesoro, 1.50%, 6/1/25 | EUR | 8,152,000 | | 9,867,954 | |
| Italy Buoni Poliennali Del Tesoro, 2.00%, 12/1/25 | EUR | 9,382,000 | | 11,603,535 | |
Italy Buoni Poliennali Del Tesoro, 0.00%, 4/1/26(2) | EUR | 8,850,000 | | 10,065,321 | |
| Italy Buoni Poliennali Del Tesoro, 0.25%, 3/15/28 | EUR | 5,400,000 | | 6,072,096 | |
| Italy Buoni Poliennali Del Tesoro, 1.35%, 4/1/30 | EUR | 1,450,000 | | 1,728,871 | |
Italy Buoni Poliennali Del Tesoro, 4.75%, 9/1/44(1) | EUR | 5,194,000 | | 9,442,148 | |
| | | 48,779,925 | |
| Japan — 8.2% | | | |
| Japan Government Thirty Year Bond, 2.40%, 3/20/37 | JPY | 1,922,200,000 | | 22,135,806 | |
| Japan Government Thirty Year Bond, 2.00%, 9/20/41 | JPY | 2,303,950,000 | | 26,070,014 | |
| Japan Government Thirty Year Bond, 1.40%, 12/20/45 | JPY | 96,350,000 | | 1,006,430 | |
| Japan Government Thirty Year Bond, 0.70%, 9/20/51 | JPY | 260,000,000 | | 2,296,080 | |
| Japan Government Twenty Year Bond, 0.30%, 12/20/39 | JPY | 427,200,000 | | 3,669,616 | |
| Japanese Government CPI Linked Bond, 0.10%, 3/10/28 | JPY | 1,248,700,446 | | 11,324,034 | |
| Japanese Government CPI Linked Bond, 0.10%, 3/10/29 | JPY | 161,962,780 | | 1,471,627 | |
| | | 67,973,607 | |
| | | | | | | | | | | |
| | Principal
Amount/Shares | Value |
| Jordan — 0.2% | | | |
Jordan Government International Bond, 7.375%, 10/10/47(1) | | $ | 1,700,000 | | $ | 1,763,447 | |
| Malaysia — 0.6% | | | |
| Malaysia Government Bond, 3.96%, 9/15/25 | MYR | 20,675,000 | | 5,166,357 | |
| Mexico — 0.8% | | | |
| Mexican Bonos, 5.75%, 3/5/26 | MXN | 70,600,000 | | 3,240,805 | |
| Nacional Financiera SNC, MTN, 0.78%, 3/29/22 | JPY | 400,000,000 | | 3,517,148 | |
| | | 6,757,953 | |
| Netherlands — 1.3% | | | |
Netherlands Government Bond, 0.50%, 7/15/26(1) | EUR | 7,639,000 | | 9,190,931 | |
Netherlands Government Bond, 2.75%, 1/15/47(1) | EUR | 913,000 | | 1,728,728 | |
| | | 10,919,659 | |
| New Zealand — 0.2% | | | |
| New Zealand Government Bond, 1.50%, 5/15/31 | NZD | 2,180,000 | | 1,431,162 | |
| Norway — 0.1% | | | |
Norway Government Bond, 1.75%, 9/6/29(1) | NOK | 8,270,000 | | 985,244 | |
| Poland — 0.4% | | | |
| Republic of Poland Government Bond, 4.00%, 10/25/23 | PLN | 12,035,000 | | 3,136,566 | |
| Portugal — 0.2% | | | |
Portugal Obrigacoes do Tesouro OT, 4.10%, 2/15/45(1) | EUR | 950,000 | | 1,800,995 | |
| Singapore — 0.4% | | | |
| Singapore Government Bond, 2.875%, 7/1/29 | SGD | 3,760,000 | | 2,991,904 | |
| Spain — 3.4% | | | |
Spain Government Bond, 4.40%, 10/31/23(1) | EUR | 2,275,000 | | 2,888,074 | |
Spain Government Bond, 1.60%, 4/30/25(1) | EUR | 4,823,000 | | 5,938,600 | |
Spain Government Bond, 0.00%, 1/31/28(2) | EUR | 2,000,000 | | 2,288,742 | |
Spain Government Bond, 5.15%, 10/31/28(1) | EUR | 3,933,000 | | 6,108,683 | |
Spain Government Bond, 0.10%, 4/30/31(1) | EUR | 3,750,000 | | 4,163,080 | |
Spain Government Bond, 1.85%, 7/30/35(1) | EUR | 800,000 | | 1,048,164 | |
Spain Government Bond, 5.15%, 10/31/44(1) | EUR | 380,000 | | 803,935 | |
Spain Government Bond, 2.70%, 10/31/48(1) | EUR | 3,210,000 | | 4,988,827 | |
| | | 28,228,105 | |
| Sweden — 0.2% | | | |
| Sweden Government Bond, 3.50%, 3/30/39 | SEK | 9,400,000 | | 1,624,892 | |
| Switzerland — 0.5% | | | |
| Swiss Confederation Government Bond, 0.50%, 5/27/30 | CHF | 1,233,000 | | 1,415,964 | |
| Swiss Confederation Government Bond, 2.50%, 3/8/36 | CHF | 1,995,000 | | 2,956,674 | |
| | | 4,372,638 | |
| Thailand — 0.9% | | | |
| Thailand Government Bond, 3.85%, 12/12/25 | THB | 210,450,000 | | 7,040,904 | |
| Tunisia — 0.2% | | | |
| Banque Centrale de Tunisie International Bond, 5.75%, 1/30/25 | | $ | 1,600,000 | | 1,287,325 | |
| Turkey — 0.3% | | | |
| Turkey Government International Bond, 6.875%, 3/17/36 | | $ | 2,200,000 | | 2,135,544 | |
| United Kingdom — 4.0% | | | |
| United Kingdom Gilt, 0.125%, 1/30/26 | GBP | 5,000,000 | | 6,666,739 | |
| United Kingdom Gilt, 4.75%, 12/7/30 | GBP | 2,520,000 | | 4,581,129 | |
| United Kingdom Gilt, 4.50%, 12/7/42 | GBP | 4,128,000 | | 9,180,112 | |
| United Kingdom Gilt, 4.25%, 12/7/49 | GBP | 2,016,000 | | 4,832,661 | |
| | | | | | | | | | | |
| | Principal
Amount/Shares | Value |
| United Kingdom Gilt, 4.25%, 12/7/55 | GBP | 2,990,000 | | $ | 7,811,973 | |
| | | 33,072,614 | |
TOTAL SOVEREIGN GOVERNMENTS AND AGENCIES (Cost $478,811,612) |
| | 505,751,721 | |
| CORPORATE BONDS — 22.9% |
|
|
|
| Belgium — 0.1% | | | |
| Anheuser-Busch InBev SA, MTN, 1.65%, 3/28/31 | EUR | 1,000,000 | | 1,242,315 | |
| Bermuda — 0.2% | | | |
Aircastle Ltd., 5.25%, 8/11/25(1) | | $ | 413,000 | | 456,586 | |
Triton Container International Ltd., 3.15%, 6/15/31(1) | | 480,000 | | 485,888 | |
Viking Ocean Cruises Ship VII Ltd., 5.625%, 2/15/29(1) | | 640,000 | | 636,000 | |
| | | 1,578,474 | |
| Canada — 0.2% | | | |
1011778 BC ULC / New Red Finance, Inc., 4.375%, 1/15/28(1) | | 320,000 | | 322,080 | |
Bausch Health Cos., Inc., 4.875%, 6/1/28(1) | | 575,000 | | 592,854 | |
Mattamy Group Corp., 4.625%, 3/1/30(1) | | 580,000 | | 589,037 | |
| TransCanada PipeLines Ltd., 2.50%, 10/12/31 | | 480,000 | | 476,981 | |
| | | 1,980,952 | |
| Cayman Islands — 0.2% | | | |
Avolon Holdings Funding Ltd., 4.25%, 4/15/26(1) | | 264,000 | | 283,786 | |
| Seagate HDD Cayman, 4.875%, 3/1/24 | | 318,000 | | 339,481 | |
| Seagate HDD Cayman, 4.875%, 6/1/27 | | 865,000 | | 954,542 | |
| | | 1,577,809 | |
| France — 0.5% | | | |
| BNP Paribas SA, MTN, VRN, 2.00%, 5/24/31 | GBP | 600,000 | | 811,498 | |
BNP Paribas SA, VRN, 4.375%, 3/1/33(1) | | $ | 315,000 | | 344,252 | |
BPCE SA, 4.50%, 3/15/25(1) | | 390,000 | | 424,880 | |
| BPCE SA, MTN, 2.875%, 4/22/26 | EUR | 100,000 | | 127,433 | |
| Caisse de Refinancement de l'Habitat SA, MTN, 4.00%, 1/10/22 | EUR | 15,000 | | 17,490 | |
| Cie de Financement Foncier SA, MTN, 4.25%, 1/19/22 | EUR | 55,000 | | 64,239 | |
| Credit Agricole Assurances SA, VRN, 2.625%, 1/29/48 | EUR | 1,000,000 | | 1,229,785 | |
| Orange SA, MTN, 5.25%, 12/5/25 | GBP | 150,000 | | 237,850 | |
| Societe Generale SA, MTN, 1.25%, 12/7/27 | GBP | 600,000 | | 783,864 | |
| | | 4,041,291 | |
| Germany — 1.6% | | | |
| Bayer AG, VRN, 2.375%, 11/12/79 | EUR | 1,000,000 | | 1,156,011 | |
| Commerzbank AG, MTN, VRN, 4.00%, 12/5/30 | EUR | 1,100,000 | | 1,380,624 | |
| Daimler AG, MTN, 1.00%, 11/15/27 | EUR | 1,000,000 | | 1,202,408 | |
| Deutsche Bank AG, MTN, 2.625%, 12/16/24 | GBP | 1,500,000 | | 2,102,512 | |
| Deutsche Bank AG, VRN, 4.30%, 5/24/28 | | $ | 991,000 | | 1,027,111 | |
| Deutsche Bank AG (New York), VRN, 3.73%, 1/14/32 | | 996,000 | | 1,021,786 | |
| Deutsche Telekom AG, MTN, 1.375%, 7/5/34 | EUR | 700,000 | | 849,535 | |
| Kreditanstalt fuer Wiederaufbau, 4.625%, 1/4/23 | EUR | 2,585,000 | | 3,171,135 | |
| Kreditanstalt fuer Wiederaufbau, MTN, 0.01%, 5/5/27 | EUR | 1,000,000 | | 1,162,677 | |
| | | 13,073,799 | |
| Ireland — 0.3% | | | |
| AerCap Ireland Capital DAC / AerCap Global Aviation Trust, 3.00%, 10/29/28 | | $ | 322,000 | | 326,707 | |
| AerCap Ireland Capital DAC / AerCap Global Aviation Trust, 3.30%, 1/30/32 | | 858,000 | | 874,015 | |
| AerCap Ireland Capital DAC / AerCap Global Aviation Trust, 3.40%, 10/29/33 | | 340,000 | | 346,463 | |
| | | | | | | | | | | |
| | Principal
Amount/Shares | Value |
| AerCap Ireland Capital DAC / AerCap Global Aviation Trust, 3.85%, 10/29/41 | | $ | 153,000 | | $ | 158,654 | |
Castlelake Aviation Finance DAC, 5.00%, 4/15/27(1) | | 965,000 | | 963,495 | |
| | | 2,669,334 | |
| Italy — 0.8% | | | |
Intesa Sanpaolo SpA, 4.20%, 6/1/32(1) | | 1,645,000 | | 1,659,851 | |
| Intesa Sanpaolo SpA, MTN, 3.93%, 9/15/26 | EUR | 1,600,000 | | 2,052,748 | |
| Telecom Italia SpA, MTN, 4.00%, 4/11/24 | EUR | 500,000 | | 613,931 | |
| UniCredit SpA, MTN, VRN, 2.00%, 9/23/29 | EUR | 600,000 | | 698,266 | |
UniCredit SpA, VRN, 1.98%, 6/3/27(1) | | $ | 950,000 | | 934,278 | |
UniCredit SpA, VRN, 3.13%, 6/3/32(1) | | 950,000 | | 946,332 | |
| | | 6,905,406 | |
| Luxembourg — 1.3% | | | |
| European Financial Stability Facility, MTN, 0.40%, 5/31/26 | EUR | 3,370,000 | | 3,994,017 | |
| European Financial Stability Facility, MTN, 2.75%, 12/3/29 | EUR | 2,000,000 | | 2,813,410 | |
| European Financial Stability Facility, MTN, 2.35%, 7/29/44 | EUR | 1,531,000 | | 2,504,504 | |
| Telecom Italia Capital SA, 6.375%, 11/15/33 | | $ | 1,155,000 | | 1,326,639 | |
| | | 10,638,570 | |
| Mexico — 0.1% | | | |
Minera Mexico SA de CV, 4.50%, 1/26/50(1) | | 800,000 | | 875,192 | |
| Multinational — 0.6% | | | |
American Airlines, Inc. / AAdvantage Loyalty IP Ltd., 5.50%, 4/20/26(1) | | 1,899,000 | | 1,994,425 | |
Ardagh Metal Packaging Finance USA LLC / Ardagh Metal Packaging Finance plc, 4.00%, 9/1/29(1) | | 1,019,000 | | 1,014,567 | |
Ardagh Packaging Finance plc / Ardagh Holdings USA, Inc., 5.25%, 8/15/27(1) | | 2,025,000 | | 2,022,469 | |
| | | 5,031,461 | |
| Netherlands — 0.6% | | | |
| Deutsche Telekom International Finance BV, MTN, 1.25%, 10/6/23 | GBP | 1,150,000 | | 1,579,153 | |
| ING Groep NV, MTN, 2.125%, 1/10/26 | EUR | 1,500,000 | | 1,869,912 | |
Lundin Energy Finance BV, 3.10%, 7/15/31(1) | | $ | 240,000 | | 242,099 | |
| Siemens Financieringsmaatschappij NV, MTN, 1.00%, 2/20/25 | GBP | 800,000 | | 1,090,620 | |
| | | 4,781,784 | |
| Norway — 0.3% | | | |
| Equinor ASA, MTN, 0.875%, 2/17/23 | EUR | 1,950,000 | | 2,282,312 | |
| Portugal — 0.2% | | | |
| EDP - Energias de Portugal SA, VRN, 1.70%, 7/20/80 | EUR | 1,500,000 | | 1,739,458 | |
| Spain — 0.4% | | | |
| Banco Santander SA, VRN, 1.72%, 9/14/27 | | $ | 200,000 | | 197,060 | |
| CaixaBank SA, MTN, VRN, 2.75%, 7/14/28 | EUR | 900,000 | | 1,080,222 | |
| CaixaBank SA, MTN, VRN, 2.25%, 4/17/30 | EUR | 1,400,000 | | 1,690,074 | |
| | | 2,967,356 | |
| United Arab Emirates — 0.1% | | | |
DAE Funding LLC, 1.55%, 8/1/24(1) | | $ | 433,000 | | 427,696 | |
| United Kingdom — 2.0% | | | |
| Barclays plc, MTN, VRN, 2.00%, 2/7/28 | EUR | 1,000,000 | | 1,178,888 | |
British Telecommunications plc, 3.25%, 11/8/29(1) | | $ | 610,000 | | 631,949 | |
| Co-Operative Bank plc (The), 4.75%, 11/11/21 (Secured) | GBP | 2,640,000 | | 3,616,709 | |
International Game Technology plc, 5.25%, 1/15/29(1) | | $ | 780,000 | | 820,950 | |
| Lloyds Banking Group plc, VRN, 1.875%, 1/15/26 | GBP | 770,000 | | 1,061,622 | |
| | | | | | | | | | | |
| | Principal
Amount/Shares | Value |
| Lloyds Banking Group plc, VRN, 1.99%, 12/15/31 | GBP | 600,000 | | $ | 808,752 | |
| Marks & Spencer plc, 4.50%, 7/10/27 | GBP | 600,000 | | 864,753 | |
| Nationwide Building Society, MTN, VRN, 2.00%, 7/25/29 | EUR | 700,000 | | 842,961 | |
Nationwide Building Society, VRN, 4.125%, 10/18/32(1) | | $ | 650,000 | | 701,697 | |
| NatWest Group plc, MTN, VRN, 2.11%, 11/28/31 | GBP | 900,000 | | 1,213,256 | |
| Tesco plc, MTN, 5.00%, 3/24/23 | GBP | 1,150,000 | | 1,657,060 | |
| Vodafone Group plc, VRN, 4.20%, 10/3/78 | EUR | 1,400,000 | | 1,806,409 | |
| Vodafone Group plc, VRN, 2.625%, 8/27/80 | EUR | 500,000 | | 592,286 | |
| Wm Morrison Supermarkets plc, MTN, 3.50%, 7/27/26 | GBP | 700,000 | | 962,754 | |
| | | 16,760,046 | |
| United States — 13.4% | | | |
Albertsons Cos., Inc. / Safeway, Inc. / New Albertsons LP / Albertsons LLC, 4.875%, 2/15/30(1) | | $ | 1,318,000 | | 1,414,346 | |
| Ally Financial, Inc., 5.75%, 11/20/25 | | 1,355,000 | | 1,538,787 | |
| AMC Networks, Inc., 4.25%, 2/15/29 | | 2,065,000 | | 2,036,606 | |
American Airlines 2021-1 Class A Pass Through Trust, 2.875%, 1/11/36(3) | | 760,000 | | 765,700 | |
American Finance Trust, Inc. / American Finance Operating Partrner LP, 4.50%, 9/30/28(1) | | 2,020,000 | | 2,022,525 | |
| Astrazeneca Finance LLC, 1.75%, 5/28/28 | | 255,000 | | 254,120 | |
| AT&T, Inc., 1.80%, 9/14/39 | EUR | 700,000 | | 827,487 | |
| AT&T, Inc., 3.55%, 9/15/55 | | $ | 396,000 | | 401,709 | |
Athene Global Funding, 2.67%, 6/7/31(1) | | 715,000 | | 716,757 | |
Avantor Funding, Inc., 4.625%, 7/15/28(1) | | 363,000 | | 377,048 | |
Avantor Funding, Inc., 3.875%, 11/1/29(1) | | 1,360,000 | | 1,361,265 | |
| Bank of America Corp., MTN, 2.30%, 7/25/25 | GBP | 900,000 | | 1,273,687 | |
| Berry Global, Inc., 1.57%, 1/15/26 | | $ | 260,000 | | 257,167 | |
Blackstone Mortgage Trust, Inc., 3.75%, 1/15/27(1) | | 1,400,000 | | 1,394,540 | |
Blue Owl Finance LLC, 3.125%, 6/10/31(1) | | 132,000 | | 129,886 | |
| Bristol-Myers Squibb Co., 2.55%, 11/13/50 | | 590,000 | | 565,211 | |
Builders FirstSource, Inc., 5.00%, 3/1/30(1) | | 553,000 | | 584,806 | |
Catalent Pharma Solutions, Inc., 5.00%, 7/15/27(1) | | 830,000 | | 858,013 | |
CCO Holdings LLC / CCO Holdings Capital Corp., 5.00%, 2/1/28(1) | | 1,270,000 | | 1,322,387 | |
CCO Holdings LLC / CCO Holdings Capital Corp., 4.25%, 2/1/31(1) | | 2,030,000 | | 2,023,666 | |
| Centene Corp., 4.625%, 12/15/29 | | 320,000 | | 345,600 | |
| Centene Corp., 3.375%, 2/15/30 | | 884,000 | | 908,359 | |
| Charter Communications Operating LLC / Charter Communications Operating Capital, 3.50%, 6/1/41 | | 295,000 | | 290,060 | |
CHS / Community Health Systems, Inc., 6.875%, 4/15/29(1) | | 505,000 | | 520,284 | |
Cleveland-Cliffs, Inc., 4.625%, 3/1/29(1) | | 750,000 | | 778,125 | |
Coinbase Global, Inc., 3.375%, 10/1/28(1) | | 2,270,000 | | 2,193,387 | |
| Comcast Corp., 3.75%, 4/1/40 | | 120,000 | | 134,628 | |
CommScope Technologies LLC, 5.00%, 3/15/27(1) | | 1,577,000 | | 1,466,380 | |
CSC Holdings LLC, 7.50%, 4/1/28(1) | | 615,000 | | 654,975 | |
CSC Holdings LLC, 4.50%, 11/15/31(1) | | 490,000 | | 475,410 | |
DAE Funding LLC, 3.375%, 3/20/28(1) | | 429,000 | | 438,838 | |
DaVita, Inc., 4.625%, 6/1/30(1) | | 670,000 | | 674,188 | |
| Dell International LLC / EMC Corp., 4.90%, 10/1/26 | | 870,000 | | 991,705 | |
Depository Trust & Clearing Corp. (The), VRN, 3.375%(1)(4) | | 500,000 | | 505,938 | |
| EPR Properties, 4.95%, 4/15/28 | | 3,274,000 | | 3,587,198 | |
| EPR Properties, 3.60%, 11/15/31 | | 369,000 | | 370,308 | |
| | | | | | | | | | | |
| | Principal
Amount/Shares | Value |
EQM Midstream Partners LP, 4.50%, 1/15/29(1) | | $ | 590,000 | | $ | 607,703 | |
Flex Intermediate Holdco LLC, 3.36%, 6/30/31(1) | | 270,000 | | 273,492 | |
| Freeport-McMoRan, Inc., 4.625%, 8/1/30 | | 1,210,000 | | 1,309,825 | |
FS KKR Capital Corp., 4.25%, 2/14/25(1) | | 343,000 | | 361,123 | |
| General Electric Co., 4.35%, 5/1/50 | | 520,000 | | 662,990 | |
| General Motors Financial Co., Inc., 1.55%, 7/30/27 | GBP | 1,000,000 | | 1,330,321 | |
| General Motors Financial Co., Inc., 2.40%, 10/15/28 | | $ | 510,000 | | 507,073 | |
Glencore Funding LLC, 2.625%, 9/23/31(1) | | 450,000 | | 438,915 | |
Global Atlantic Fin Co., 3.125%, 6/15/31(1) | | 235,000 | | 236,002 | |
| Goldman Sachs Group, Inc. (The), MTN, 4.25%, 1/29/26 | GBP | 900,000 | | 1,363,136 | |
Gray Escrow II, Inc., 5.375%, 11/15/31(1)(3) | | $ | 1,147,000 | | 1,159,904 | |
Howard Hughes Corp. (The), 4.375%, 2/1/31(1) | | 1,278,000 | | 1,280,058 | |
HP, Inc., 2.65%, 6/17/31(1) | | 570,000 | | 561,535 | |
| IIP Operating Partnership LP, 5.50%, 5/25/26 | | 1,020,000 | | 1,077,245 | |
| International Business Machines Corp., 1.75%, 3/7/28 | EUR | 1,100,000 | | 1,378,600 | |
Iron Mountain, Inc., 4.875%, 9/15/29(1) | | $ | 1,620,000 | | 1,675,712 | |
| JPMorgan Chase & Co., VRN, 2.07%, 6/1/29 | | 350,000 | | 346,668 | |
| KB Home, 4.80%, 11/15/29 | | 1,557,000 | | 1,679,614 | |
Ladder Capital Finance Holdings LLLP / Ladder Capital Finance Corp., 4.75%, 6/15/29(1) | | 1,720,000 | | 1,735,050 | |
LBM Acquisition LLC, 6.25%, 1/15/29(1) | | 728,000 | | 708,122 | |
Level 3 Financing, Inc., 4.625%, 9/15/27(1) | | 923,000 | | 947,229 | |
LFS Topco LLC, 5.875%, 10/15/26(1) | | 598,000 | | 615,940 | |
LPL Holdings, Inc., 4.375%, 5/15/31(1) | | 2,166,000 | | 2,220,204 | |
| Microchip Technology, Inc., 4.25%, 9/1/25 | | 2,055,000 | | 2,137,919 | |
| Mondelez International, Inc., 1.375%, 3/17/41 | EUR | 1,600,000 | | 1,825,099 | |
Mozart Debt Merger Sub, Inc., 3.875%, 4/1/29(1) | | $ | 645,000 | | 642,581 | |
| MPT Operating Partnership LP / MPT Finance Corp., 5.00%, 10/15/27 | | 1,955,000 | | 2,060,472 | |
| National Health Investors, Inc., 3.00%, 2/1/31 | | 810,000 | | 779,021 | |
NCR Corp., 5.125%, 4/15/29(1) | | 975,000 | | 998,234 | |
Netflix, Inc., 3.625%, 6/15/25(1) | | 178,000 | | 189,480 | |
| Netflix, Inc., 4.875%, 4/15/28 | | 378,000 | | 433,521 | |
NextEra Energy Operating Partners LP, 4.50%, 9/15/27(1) | | 452,000 | | 484,115 | |
Novelis Corp., 4.75%, 1/30/30(1) | | 462,000 | | 481,058 | |
Novelis Corp., 3.875%, 8/15/31(1) | | 486,000 | | 475,089 | |
| Omega Healthcare Investors, Inc., 3.375%, 2/1/31 | | 211,000 | | 214,318 | |
| OneMain Finance Corp., 3.50%, 1/15/27 | | 506,000 | | 495,248 | |
| Oracle Corp., 3.60%, 4/1/40 | | 550,000 | | 574,069 | |
Owl Rock Technology Finance Corp., 6.75%, 6/30/25(1) | | 717,000 | | 816,318 | |
Owl Rock Technology Finance Corp., 3.75%, 6/17/26(1) | | 860,000 | | 898,108 | |
| Owl Rock Technology Finance Corp., 2.50%, 1/15/27 | | 520,000 | | 515,047 | |
Penn National Gaming, Inc., 4.125%, 7/1/29(1) | | 658,000 | | 642,373 | |
PennyMac Financial Services, Inc., 5.375%, 10/15/25(1) | | 1,175,000 | | 1,213,187 | |
| Prospect Capital Corp., 3.71%, 1/22/26 | | 445,000 | | 453,470 | |
| Qorvo, Inc., 4.375%, 10/15/29 | | 964,000 | | 1,036,300 | |
Qorvo, Inc., 3.375%, 4/1/31(1) | | 485,000 | | 502,028 | |
| RHP Hotel Properties LP / RHP Finance Corp., 4.75%, 10/15/27 | | 1,516,000 | | 1,548,215 | |
RHP Hotel Properties LP / RHP Finance Corp., 4.50%, 2/15/29(1) | | 825,000 | | 817,781 | |
| Sabra Health Care LP, 3.20%, 12/1/31 | | 521,000 | | 510,212 | |
SBL Holdings, Inc., 5.00%, 2/18/31(1) | | 345,000 | | 366,454 | |
| | | | | | | | | | | |
| | Principal
Amount/Shares | Value |
SBL Holdings, Inc., VRN, 6.50%(1)(4) | | $ | 1,400,000 | | $ | 1,382,500 | |
Scientific Games International, Inc., 7.25%, 11/15/29(1) | | 900,000 | | 1,018,197 | |
Sinclair Television Group, Inc., 4.125%, 12/1/30(1) | | 1,350,000 | | 1,287,637 | |
Sirius XM Radio, Inc., 5.00%, 8/1/27(1) | | 777,000 | | 811,965 | |
Sirius XM Radio, Inc., 5.50%, 7/1/29(1) | | 1,505,000 | | 1,625,400 | |
SLM Corp., 3.125%, 11/2/26(3) | | 1,081,000 | | 1,072,892 | |
| Sprint Corp., 7.625%, 2/15/25 | | 1,200,000 | | 1,396,500 | |
| Steel Dynamics, Inc., 3.25%, 1/15/31 | | 750,000 | | 796,647 | |
| Sysco Corp., 5.95%, 4/1/30 | | 584,000 | | 739,646 | |
| T-Mobile USA, Inc., 4.75%, 2/1/28 | | 820,000 | | 866,125 | |
| T-Mobile USA, Inc., 3.50%, 4/15/31 | | 523,000 | | 541,961 | |
T-Mobile USA, Inc., 3.50%, 4/15/31(1) | | 970,000 | | 1,005,167 | |
Tempur Sealy International, Inc., 3.875%, 10/15/31(1) | | 753,000 | | 747,127 | |
| Tenet Healthcare Corp., 6.75%, 6/15/23 | | 700,000 | | 753,375 | |
Tenet Healthcare Corp., 6.125%, 10/1/28(1) | | 840,000 | | 883,008 | |
| Time Warner Cable LLC, 4.50%, 9/15/42 | | 570,000 | | 623,874 | |
| TransDigm, Inc., 4.625%, 1/15/29 | | 1,650,000 | | 1,641,750 | |
Tronox, Inc., 4.625%, 3/15/29(1) | | 760,000 | | 746,001 | |
| Truist Financial Corp., MTN, VRN, 1.89%, 6/7/29 | | 190,000 | | 188,107 | |
| United Airlines Pass Through Trust, 4.875%, 7/15/27 | | 502,880 | | 532,189 | |
United Airlines, Inc., 4.625%, 4/15/29(1) | | 685,000 | | 707,078 | |
United Natural Foods, Inc., 6.75%, 10/15/28(1) | | 795,000 | | 861,581 | |
US Foods, Inc., 4.75%, 2/15/29(1) | | 1,055,000 | | 1,068,736 | |
| Verizon Communications, Inc., 4.33%, 9/21/28 | | 330,000 | | 376,865 | |
| Verizon Communications, Inc., 2.65%, 11/20/40 | | 369,000 | | 349,162 | |
| ViacomCBS, Inc., 4.375%, 3/15/43 | | 105,000 | | 120,228 | |
| Viatris, Inc., 4.00%, 6/22/50 | | 393,000 | | 421,919 | |
Victoria's Secret & Co., 4.625%, 7/15/29(1) | | 590,000 | | 593,334 | |
| Walmart, Inc., 0.18%, 7/15/22 | JPY | 450,000,000 | | 3,947,859 | |
| Wells Fargo & Co., VRN, 3.07%, 4/30/41 | | $ | 805,000 | | 827,582 | |
| Western Digital Corp., 4.75%, 2/15/26 | | 1,444,000 | | 1,588,400 | |
| Westinghouse Air Brake Technologies Corp., 4.95%, 9/15/28 | | 880,000 | | 1,012,839 | |
XHR LP, 4.875%, 6/1/29(1) | | 2,403,000 | | 2,468,362 | |
| | | 111,051,287 | |
TOTAL CORPORATE BONDS (Cost $188,579,071) |
| | 189,624,542 | |
| PREFERRED STOCKS — 5.7% |
|
|
|
| Bermuda — 0.2% | | | |
Aircastle Ltd., 5.25%(1) | | 1,875,000 | | 1,931,250 | |
| France — 1.7% | | | |
| Accor SA, 2.625% | | 1,300,000 | | 1,441,583 | |
| AXA SA, MTN, 6.69% | | 1,270,000 | | 2,101,361 | |
| Banque Federative du Credit Mutuel SA, MTN, 0.15% | | 300,000 | | 332,488 | |
| BNP Paribas Cardif SA, 4.03% | | 1,400,000 | | 1,813,733 | |
| Credit Agricole Assurances SA, 4.25% | | 1,900,000 | | 2,415,710 | |
| Electricite de France SA, 3.375% | | 1,200,000 | | 1,445,434 | |
| Orange SA, MTN, 2.375% | | 500,000 | | 604,198 | |
| TotalEnergies SE, MTN, 2.625% | | 2,900,000 | | 3,528,401 | |
| | | 13,682,908 | |
| Germany — 0.5% | | | |
Allianz SE, 3.20%(1) | | 3,705,000 | | 3,589,219 | |
| | | | | | | | | | | |
| | Principal
Amount/Shares | Value |
| Allianz SE, 2.625% | | 800,000 | | $ | 913,087 | |
| | | 4,502,306 | |
| Italy — 1.0% | | | |
| Assicurazioni Generali SpA, MTN, 4.60% | | 2,200,000 | | 2,815,279 | |
| Enel SpA, 2.25% | | 600,000 | | 719,959 | |
| Eni SpA, 3.375% | | 2,700,000 | | 3,296,111 | |
| Intesa Sanpaolo Vita SpA, 4.75% | | 1,000,000 | | 1,257,728 | |
| | | 8,089,077 | |
| Netherlands — 1.3% | | | |
| ING Groep NV, 3.875% | | 1,400,000 | | 1,351,000 | |
| Naturgy Finance BV, 4.125% | | 300,000 | | 361,114 | |
| Telefonica Europe BV, 3.00% | | 400,000 | | 477,028 | |
| Telefonica Europe BV, 2.50% | | 300,000 | | 353,736 | |
| Telefonica Europe BV, 2.875% | | 1,200,000 | | 1,416,595 | |
| Telefonica Europe BV, 2.38% | | 500,000 | | 556,900 | |
| Volkswagen International Finance NV, 3.875% | | 3,500,000 | | 4,416,820 | |
| Wintershall Dea Finance 2 BV, 3.00% | | 600,000 | | 682,384 | |
| Wintershall Dea Finance 2 BV, 2.50% | | 700,000 | | 802,846 | |
| | | 10,418,423 | |
| Spain — 0.2% | | | |
| Banco Santander SA, 4.75% | | 1,350,000 | | 1,360,354 | |
| United Kingdom — 0.1% | | | |
| SSE plc, 3.125% | | 1,000,000 | | 1,239,584 | |
| United States — 0.7% | | | |
| Air Lease Corp., 4.125% | | 1,485,000 | | 1,466,438 | |
| Ally Financial, Inc., 4.70% | | 930,000 | | 948,600 | |
| Goldman Sachs Group, Inc. (The), 4.125% | | 1,436,000 | | 1,441,672 | |
| PNC Financial Services Group, Inc. (The), 3.40% | | 200,000 | | 197,750 | |
| SVB Financial Group, 4.25% | | 1,175,000 | | 1,180,728 | |
| US Bancorp, 3.70% | | 680,000 | | 679,014 | |
| | | 5,914,202 | |
TOTAL PREFERRED STOCKS (Cost $46,726,791) |
| | 47,138,104 | |
| EXCHANGE-TRADED FUNDS — 2.8% |
|
|
|
| iShares JP Morgan USD Emerging Markets Bond ETF | | 76,000 | | 8,351,640 | |
| VanEck J. P. Morgan EM Local Currency Bond ETF | | 516,000 | | 15,191,040 | |
TOTAL EXCHANGE-TRADED FUNDS (Cost $24,528,891) |
| | 23,542,680 | |
| COLLATERALIZED LOAN OBLIGATIONS — 2.6% |
|
|
|
Aimco CLO Ltd., Series 2019-10A, Class CR, VRN, 2.03%, (3-month LIBOR plus 1.90%), 7/22/32(1) | | $ | 2,200,000 | | 2,199,810 | |
Aimco CLO Ltd., Series 2019-10A, Class DR, VRN, 3.03%, (3-month LIBOR plus 2.90%), 7/22/32(1) | | 750,000 | | 752,987 | |
Anchorage Capital CLO Ltd., Series 2021-19A, Class B1, VRN, 2.01%, (3-month LIBOR plus 1.85%), 10/15/34(1) | | 1,750,000 | | 1,752,551 | |
Ares XXXIX CLO Ltd., Series 2016-39A, Class CR2, VRN, 2.17%, (3-month LIBOR plus 2.05%), 4/18/31(1) | | 2,000,000 | | 2,002,967 | |
CarVal CLO III Ltd., Series 2019-2A, Class CR, VRN, 2.08%, (3-month LIBOR plus 1.95%), 7/20/32(1) | | 1,100,000 | | 1,101,097 | |
CarVal CLO III Ltd., Series 2019-2A, Class DR, VRN, 3.08%, (3-month LIBOR plus 2.95%), 7/20/32(1) | | 1,400,000 | | 1,403,947 | |
CBAM Ltd., Series 2018-7A, Class B1, VRN, 1.73%, (3-month LIBOR plus 1.60%), 7/20/31(1) | | 2,300,000 | | 2,284,522 | |
CIFC Funding Ltd., Series 2021-4A, Class C, VRN, 1.97%, (3-month LIBOR plus 1.85%), 7/15/33(1) | | 3,800,000 | | 3,797,677 | |
| | | | | | | | | | | |
| | Principal
Amount/Shares | Value |
Elmwood CLO VIII Ltd., Series 2021-1A, Class C1, VRN, 2.08%, (3-month LIBOR plus 1.95%), 1/20/34(1) | | $ | 1,775,000 | | $ | 1,766,206 | |
Elmwood CLO VIII Ltd., Series 2021-1A, Class D, VRN, 3.13%, (3-month LIBOR plus 3.00%), 1/20/34(1) | | 1,000,000 | | 1,006,049 | |
Magnetite VIII Ltd., Series 2014-8A, Class BR2, VRN, 1.62%, (3-month LIBOR plus 1.50%), 4/15/31(1) | | 2,050,000 | | 2,043,457 | |
Symphony CLO XXII Ltd., Series 2020-22A, Class B, VRN, 1.82%, (3-month LIBOR plus 1.70%), 4/18/33(1) | | 1,500,000 | | 1,501,487 | |
TOTAL COLLATERALIZED LOAN OBLIGATIONS (Cost $21,577,902) |
| | 21,612,757 | |
| ASSET-BACKED SECURITIES — 1.7% |
|
|
|
Blackbird Capital Aircraft, Series 2021-1A, Class A SEQ, 2.44%, 7/15/46(1) | | 1,771,875 | | 1,776,331 | |
FirstKey Homes Trust, Series 2020-SFR2, Class E, 2.67%, 10/19/37(1) | | 5,800,000 | | 5,836,874 | |
Goodgreen Trust, Series 2018-1A, Class A, VRN, 3.93%, 10/15/53(1) | | 882,419 | | 927,626 | |
Goodgreen Trust, Series 2020-1A, Class A SEQ, 2.63%, 4/15/55(1) | | 1,719,420 | | 1,731,984 | |
Goodgreen Trust, Series 2021-1A, Class A SEQ, 2.66%, 10/15/56(1) | | 1,127,477 | | 1,124,313 | |
Progress Residential Trust, Series 2020-SFR2, Class C, 3.08%, 6/17/37(1) | | 750,000 | | 764,863 | |
Sierra Timeshare Receivables Funding LLC, Series 2019-3A, Class D, 4.18%, 8/20/36(1) | | 869,157 | | 872,590 | |
Sierra Timeshare Receivables Funding LLC, Series 2021-1A, Class D, 3.17%, 11/20/37(1) | | 702,933 | | 701,540 | |
TOTAL ASSET-BACKED SECURITIES (Cost $13,611,001) |
| | 13,736,121 | |
| U.S. TREASURY SECURITIES — 1.3% |
|
|
|
U.S. Treasury Bills, 0.10%, 11/4/21(5)(6) | | 9,500,000 | | 9,499,976 | |
U.S. Treasury Bills, 0.08%, 12/30/21(5)(6) | | 1,000,000 | | 999,869 | |
TOTAL U.S. TREASURY SECURITIES (Cost $10,499,822) |
| | 10,499,845 | |
BANK LOAN OBLIGATIONS(7) — 0.3% |
|
|
|
DirecTV Financing, LLC, Term Loan, 7/22/27(8) (Cost $2,210,513) |
| 2,205,000 | | 2,209,134 | |
| TEMPORARY CASH INVESTMENTS — 1.5% |
|
|
|
Credit Agricole Corporate and Investment Bank, 0.06%, 11/1/21(1)(5) | | 8,005,000 | | 8,004,957 | |
Landesbank Baden-Wuerttemberg, 0.06%, 11/1/21(1)(5) | | 2,956,000 | | 2,955,978 | |
| State Street Institutional U.S. Government Money Market Fund, Premier Class | | 1,880,260 | | 1,880,260 | |
TOTAL TEMPORARY CASH INVESTMENTS (Cost $12,841,260) |
| | 12,841,195 | |
TOTAL INVESTMENT SECURITIES — 99.9% (Cost $799,386,863) |
|
| 826,956,099 | |
| OTHER ASSETS AND LIABILITIES — 0.1% |
|
| 509,760 | |
| TOTAL NET ASSETS — 100.0% |
|
| $ | 827,465,859 | |
| | | | | | | | | | | | | | | | | | | | |
| FORWARD FOREIGN CURRENCY EXCHANGE CONTRACTS |
| Currency Purchased | Currency Sold | Counterparty | Settlement Date | Unrealized Appreciation
(Depreciation) |
| AUD | 744,091 | | USD | 539,974 | | Bank of America N.A. | 12/15/21 | $ | 19,862 | |
| USD | 3,684,922 | | AUD | 4,996,775 | | Bank of America N.A. | 12/15/21 | (74,530) | |
| USD | 1,844,704 | | AUD | 2,445,575 | | Bank of America N.A. | 12/15/21 | 4,713 | |
| CAD | 17,772,916 | | USD | 14,018,983 | | Bank of America N.A. | 12/15/21 | 342,775 | |
| CAD | 848,470 | | USD | 669,005 | | Bank of America N.A. | 12/15/21 | 16,618 | |
| USD | 4,960,108 | | CAD | 6,283,450 | | Bank of America N.A. | 12/15/21 | (117,359) | |
| CHF | 2,491,939 | | USD | 2,707,335 | | Morgan Stanley | 12/15/21 | 17,777 | |
| CLP | 2,245,871,984 | | USD | 2,746,068 | | Goldman Sachs & Co. | 12/15/21 | 1,386 | |
| USD | 2,150,995 | | CLP | 1,707,502,578 | | Goldman Sachs & Co. | 12/15/21 | 62,147 | |
| CNY | 4,218,175 | | USD | 649,100 | | Goldman Sachs & Co. | 12/15/21 | 6,729 | |
| CNY | 12,060,108 | | USD | 1,856,544 | | Goldman Sachs & Co. | 12/15/21 | 18,525 | |
| USD | 24,560,629 | | CNY | 160,037,056 | | Goldman Sachs & Co. | 12/15/21 | (321,446) | |
| COP | 31,581,852,765 | | USD | 8,392,733 | | Goldman Sachs & Co. | 12/15/21 | (30,647) | |
| COP | 4,849,124,556 | | USD | 1,262,721 | | Goldman Sachs & Co. | 12/15/21 | 21,207 | |
| USD | 1,321,419 | | CZK | 28,449,223 | | UBS AG | 12/15/21 | 42,263 | |
| DKK | 6,913,639 | | USD | 1,074,403 | | UBS AG | 12/15/21 | 1,152 | |
| USD | 15,752,618 | | DKK | 98,982,333 | | UBS AG | 12/15/21 | 353,934 | |
| EUR | 96,029,786 | | USD | 111,405,307 | | JPMorgan Chase Bank N.A. | 11/17/21 | (362,547) | |
| USD | 1,487,442 | | EUR | 1,279,392 | | JPMorgan Chase Bank N.A. | 11/17/21 | 8,034 | |
| USD | 1,438,072 | | EUR | 1,245,160 | | JPMorgan Chase Bank N.A. | 11/17/21 | (1,751) | |
| GBP | 14,590,749 | | USD | 20,099,632 | | Bank of America N.A. | 12/15/21 | (128,473) | |
| USD | 2,188,964 | | GBP | 1,609,437 | | Bank of America N.A. | 12/15/21 | (13,960) | |
| USD | 798,363 | | GBP | 586,154 | | Bank of America N.A. | 12/15/21 | (3,938) | |
| USD | 436,779 | | GBP | 321,720 | | Bank of America N.A. | 12/15/21 | (3,577) | |
| USD | 674,645 | | GBP | 494,965 | | Bank of America N.A. | 12/15/21 | (2,841) | |
| USD | 1,343,218 | | GBP | 973,068 | | Bank of America N.A. | 12/15/21 | 11,326 | |
| HUF | 356,816,416 | | USD | 1,202,443 | | UBS AG | 12/15/21 | (58,166) | |
| IDR | 29,502,188,342 | | USD | 2,043,796 | | Goldman Sachs & Co. | 12/15/21 | 20,811 | |
| ILS | 6,310,895 | | USD | 1,970,681 | | UBS AG | 12/15/21 | 24,277 | |
| JPY | 12,076,535,113 | | USD | 105,829,933 | | Bank of America N.A. | 11/17/21 | 138,597 | |
| JPY | 731,950,623 | | USD | 6,441,369 | | Bank of America N.A. | 11/17/21 | (18,688) | |
| USD | 2,300,666 | | JPY | 261,504,010 | | Morgan Stanley | 11/17/21 | 6,035 | |
| KRW | 18,126,452,165 | | USD | 15,513,910 | | Goldman Sachs & Co. | 12/15/21 | (98,261) | |
| MXN | 169,131,976 | | USD | 8,246,720 | | Morgan Stanley | 12/15/21 | (85,230) | |
| MYR | 10,961,693 | | USD | 2,633,123 | | Goldman Sachs & Co. | 12/15/21 | 5,625 | |
| USD | 3,606,047 | | MYR | 15,071,472 | | Goldman Sachs & Co. | 12/15/21 | (22,027) | |
| NOK | 4,081,288 | | USD | 471,399 | | UBS AG | 12/15/21 | 11,559 | |
| NZD | 1,016,705 | | USD | 721,535 | | Bank of America N.A. | 12/15/21 | 6,568 | |
| PEN | 1,506,873 | | USD | 367,745 | | Goldman Sachs & Co. | 12/15/21 | 9,277 | |
| USD | 490,448 | | PLN | 1,871,034 | | UBS AG | 12/15/21 | 21,914 | |
| RON | 3,539,956 | | USD | 840,425 | | Goldman Sachs & Co. | 12/15/21 | (15,961) | |
| RUB | 774,103,967 | | USD | 10,981,491 | | Goldman Sachs & Co. | 12/15/21 | (163,436) | |
| RUB | 58,803,080 | | USD | 788,377 | | Goldman Sachs & Co. | 12/15/21 | 33,392 | |
| USD | 9,397,085 | | RUB | 679,486,337 | | Goldman Sachs & Co. | 12/15/21 | (98,694) | |
| SEK | 35,251,881 | | USD | 4,095,556 | | UBS AG | 12/15/21 | 11,654 | |
| USD | 733,842 | | SGD | 987,648 | | Bank of America N.A. | 12/15/21 | 1,576 | |
| USD | 3,137,444 | | THB | 103,002,290 | | Goldman Sachs & Co. | 12/15/21 | 34,282 | |
| | | | | | $ | (367,517) | |
| | | | | | | | | | | | | | |
| FUTURES CONTRACTS PURCHASED |
| Reference Entity | Contracts | Expiration
Date | Notional
Amount | Unrealized
Appreciation
(Depreciation)^ |
| Euro-Bobl 5-Year Bonds | 546 | December 2021 | $ | 84,426,092 | | $ | (1,232,714) | |
| Euro-OAT 10-Year Bonds | 162 | December 2021 | 30,712,605 | | (861,202) | |
| Japanese 10-Year Government Bonds | 58 | December 2021 | 77,004,255 | | (274,780) | |
| Japanese 10-Year Mini Government Bonds | 268 | December 2021 | 35,574,223 | | (145,390) | |
| Korean Treasury 10-Year Bonds | 155 | December 2021 | 16,036,541 | | (743,066) | |
| U.K. Gilt 10-Year Bonds | 173 | December 2021 | 29,575,968 | | (770,821) | |
| | | $ | 273,329,684 | | $ | (4,027,973) | |
^Amount represents value and unrealized appreciation (depreciation).
| | | | | | | | | | | | | | |
| FUTURES CONTRACTS SOLD |
| Reference Entity | Contracts | Expiration
Date | Notional
Amount | Unrealized
Appreciation
(Depreciation)^ |
| Euro-Bund 10-Year Bonds | 92 | December 2021 | $ | 17,879,896 | | $ | 406,781 | |
| Euro-Buxl 30-Year Bonds | 15 | December 2021 | 3,623,713 | | 31,155 | |
| U.S. Treasury 5-Year Notes | 345 | December 2021 | 42,003,750 | | 632,655 | |
| U.S. Treasury 10-Year Notes | 147 | December 2021 | 19,213,359 | | (54,609) | |
| U.S. Treasury 10-Year Ultra Notes | 495 | December 2021 | 71,790,469 | | 1,271,582 | |
| U.S. Treasury Long Bonds | 188 | December 2021 | 30,238,625 | | 446,133 | |
| U.S. Treasury Ultra Bonds | 47 | December 2021 | 9,231,094 | | 68,633 | |
| | | $ | 193,980,906 | | $ | 2,802,330 | |
^Amount represents value and unrealized appreciation (depreciation).
| | | | | | | | | | | | | | | | | | | | | | | |
| CENTRALLY CLEARED CREDIT DEFAULT SWAP AGREEMENTS |
| Reference Entity | Type | Fixed Rate
Received
(Paid)
Quarterly | Termination
Date | Notional
Amount | Premiums
Paid
(Received) | Unrealized
Appreciation
(Depreciation) | Value^ |
| Markit CDX North America High Yield Index Series 34 | Buy | (5.00)% | 6/20/25 | $ | 16,031,000 | | $ | (158,503) | | $ | (1,277,200) | | $ | (1,435,703) | |
| Markit CDX North America High Yield Index Series 35 | Buy | (5.00)% | 12/20/25 | $ | 42,300,000 | | (3,178,108) | | (789,465) | | (3,967,573) | |
| Markit CDX North America High Yield Index Series 36 | Buy | (5.00)% | 6/20/26 | $ | 12,000,000 | | (1,086,690) | | (47,301) | | (1,133,991) | |
| | | | | $ | (4,423,301) | | $ | (2,113,966) | | $ | (6,537,267) | |
^The value for credit default swap agreements serves as an indicator of the current status of the payment/performance risk and represent the likelihood of an expected liability or profit at the period end. Increasing values in absolute terms when compared to the notional amount of the credit default swap agreement represent a deterioration of the referenced entity's credit soundness and an increased likelihood or risk of a credit event occurring as defined in the agreement.
| | | | | | | | | | | | | | | | | | | | | | | | | | |
| CENTRALLY CLEARED INTEREST RATE SWAP AGREEMENTS |
| Floating Rate Index | Pay/Receive Floating
Rate Index Monthly | Fixed
Rate | Termination
Date | Notional
Amount | Premiums Paid (Received) | Unrealized
Appreciation
(Depreciation) | Value |
| MXIBTIIE | Pay | 5.44% | 5/22/23 | MXN | 422,000,000 | | $ | 433 | $ | (498,015) | | $ | (497,582) | |
| MXIBTIIE | Pay | 5.44% | 5/22/23 | MXN | 422,000,000 | | 433 | (498,015) | | (497,582) | |
| | | | | | $ | 866 | $ | (996,030) | | $ | (995,164) | |
| | | | | | | | | | | | | | | | | | | | | | | |
| INTEREST RATE SWAP AGREEMENTS |
| Counterparty | Floating
Rate Index | Pay/Receive
Floating Rate Index
Monthly | Fixed Rate | Termination
Date | Notional
Amount | Value* |
| Goldman Sachs & Co. | BZDIOVRA | Pay | 7.31 | % | 1/2/24 | BRL | 59,213,018 | | $ | (844,636) | |
*Amount represents value and unrealized appreciation (depreciation).
| | | | | | | | | | | | | | | | | | | | | | | |
| CENTRALLY CLEARED TOTAL RETURN SWAP AGREEMENTS |
| Floating Rate Index | Pay/Receive Floating
Rate Index at Termination | Fixed Rate | Termination
Date | Notional
Amount | Premiums Paid (Received) | Unrealized
Appreciation
(Depreciation) | Value |
| CPURNSA | Receive | 1.78% | 8/5/24 | $ | 3,250,000 | $ | (527) | | $ | 251,837 | | $ | 251,310 | |
| CPURNSA | Receive | 2.30% | 2/24/26 | $ | 8,000,000 | 549 | | 544,540 | | 545,089 | |
| CPURNSA | Receive | 2.29% | 2/24/26 | $ | 8,000,000 | 549 | | 549,271 | | 549,820 | |
| | | | | $ | 571 | | $ | 1,345,648 | | $ | 1,346,219 | |
| | | | | | | | |
| NOTES TO SCHEDULE OF INVESTMENTS |
| AUD | - | Australian Dollar |
| BRL | - | Brazilian Real |
| BZDIOVRA | - | Brazil Interbank Deposit Rate |
| CAD | - | Canadian Dollar |
| CDX | - | Credit Derivatives Indexes |
| CHF | - | Swiss Franc |
| CLP | - | Chilean Peso |
| CNY | - | Chinese Yuan |
| COP | - | Colombian Peso |
| CPI | - | Consumer Price Index |
| CPURNSA | - | U.S. Consumer Price Index Urban Consumers Not Seasonally Adjusted Index |
| CZK | - | Czech Koruna |
| DKK | - | Danish Krone |
| EUR | - | Euro |
| GBP | - | British Pound |
| HUF | - | Hungarian Forint |
| IDR | - | Indonesian Rupiah |
| ILS | - | Israeli Shekel |
| JPY | - | Japanese Yen |
| KRW | - | South Korean Won |
| LIBOR | - | London Interbank Offered Rate |
| MTN | - | Medium Term Note |
| MXIBTIIE | - | 28-day Mexico Interbank Equilibrium Interest Rate Index |
| MXN | - | Mexican Peso |
| MYR | - | Malaysian Ringgit |
| NOK | - | Norwegian Krone |
| NZD | - | New Zealand Dollar |
| PEN | - | Peruvian Sol |
| PLN | - | Polish Zloty |
| RON | - | New Romanian Leu |
| RUB | - | Russian Ruble |
| SEK | - | Swedish Krona |
| SEQ | - | Sequential Payer |
| SGD | - | Singapore Dollar |
| THB | - | Thai Baht |
| USD | - | United States Dollar |
| VRN | - | Variable Rate Note. The rate adjusts periodically based upon the terms set forth in the security’s offering documents. The rate shown is effective at the period end and the reference rate and spread, if any, is indicated. The security's effective maturity date may be shorter than the final maturity date shown. |
(1)Security was purchased pursuant to Rule 144A or Section 4(2) under the Securities Act of 1933 and may be sold in transactions exempt from registration, normally to qualified institutional investors. The aggregate value of these securities at the period end was $220,004,949, which represented 26.6% of total net assets.
(2)Security is a zero-coupon bond.
(3)When-issued security. The issue price and yield are fixed on the date of the commitment, but payment and delivery are scheduled for a future date.
(4)Perpetual maturity with no stated maturity date.
(5)The rate indicated is the yield to maturity at purchase.
(6)Security, or a portion thereof, has been pledged at the custodian bank or with a broker for collateral requirements on forward foreign currency exchange contracts, futures contracts and/or swap agreements. At the period end, the aggregate value of securities pledged was $10,324,838.
(7)The interest rate on a bank loan obligation adjusts periodically based on a predetermined schedule. Rate or range of rates shown is effective at period end. The maturity date on a bank loan obligation may be less than indicated as a result of contractual or optional prepayments. These prepayments cannot be predicted with certainty.
(8)The interest rate will be determined upon settlement of the bank loan obligation after period end.
See Notes to Financial Statements.
| | |
| Statement of Assets and Liabilities |
| | | | | |
| OCTOBER 31, 2021 | |
| Assets | |
| Investment securities, at value (cost of $799,386,863) | $ | 826,956,099 | |
| Foreign currency holdings, at value (cost of $24,744) | 21,386 | |
| Foreign deposits with broker for futures contracts, at value (cost of $307,829) | 293,169 | |
| Receivable for investments sold | 6,417,061 | |
| Receivable for capital shares sold | 186,607 | |
| Receivable for variation margin on futures contracts | 134,112 | |
| Receivable for variation margin on swap agreements | 161,117 | |
| Unrealized appreciation on forward foreign currency exchange contracts | 1,254,015 | |
| Interest and dividends receivable | 7,340,740 | |
| 842,764,306 | |
| |
| Liabilities | |
| Disbursements in excess of demand deposit cash | 2,117 | |
| Payable for investments purchased | 11,298,862 | |
| Payable for capital shares redeemed | 60,752 | |
| Payable for variation margin on futures contracts | 999,640 | |
| Payable for variation margin on swap agreements | 148,211 | |
| Unrealized depreciation on forward foreign currency exchange contracts | 1,621,532 | |
| Swap agreements, at value | 844,636 | |
| Accrued management fees | 304,141 | |
| Distribution and service fees payable | 925 | |
| Accrued foreign taxes | 17,631 | |
| 15,298,447 | |
| |
| Net Assets | $ | 827,465,859 | |
| |
| Net Assets Consist of: | |
| Capital paid in | $ | 796,884,089 | |
| Distributable earnings | 30,581,770 | |
| $ | 827,465,859 | |
| | | | | | | | | | | |
| | Net Assets | Shares Outstanding | Net Asset Value Per Share |
| Investor Class | $253,748,017 | 19,105,946 | $13.28 |
| I Class | $197,724,756 | 14,821,823 | $13.34 |
| Y Class | $27,123,714 | 2,026,774 | $13.38 |
| A Class | $3,766,258 | 287,932 | $13.08* |
| C Class | $102,850 | 8,180 | $12.57 |
| R Class | $61,698 | 4,767 | $12.94 |
| R5 Class | $4,779,609 | 357,243 | $13.38 |
| R6 Class | $317,863 | 23,731 | $13.39 |
| G Class | $339,841,094 | 25,047,658 | $13.57 |
*Maximum offering price $13.70 (net asset value divided by 0.955).
See Notes to Financial Statements.
| | | | | | |
| YEAR ENDED OCTOBER 31, 2021 | | |
| Investment Income (Loss) | | |
| Income: | | |
| Interest (net of foreign taxes withheld of $35,754) | $ | 16,963,866 | | |
| Dividends | 438,914 | | |
| 17,402,780 | | |
| | |
| Expenses: | | |
| Management fees | 5,350,350 | | |
| Distribution and service fees: | | |
| A Class | 10,271 | | |
| C Class | 1,395 | | |
| R Class | 394 | | |
| Trustees' fees and expenses | 54,589 | | |
| Other expenses | 9,376 | | |
| 5,426,375 | | |
| Fees waived - G Class | (1,708,697) | | |
| 3,717,678 | | |
| | |
| Net investment income (loss) | 13,685,102 | | |
| | |
| Realized and Unrealized Gain (Loss) | | |
| Net realized gain (loss) on: | | |
| Investment transactions | 6,367,819 | | |
| Forward foreign currency exchange contract transactions | (9,154,898) | | |
| Futures contract transactions | 4,553,154 | | |
| Swap agreement transactions | (1,527,587) | | |
| Foreign currency translation transactions | 437,628 | | |
| 676,116 | | |
| | |
| Change in net unrealized appreciation (depreciation) on: | | |
| Investments (includes (increase) decrease in accrued foreign taxes of $(6,289)) | (14,957,390) | | |
| Forward foreign currency exchange contracts | (335,405) | | |
| Futures contracts | (3,378,736) | | |
| Swap agreements | (1,220,526) | | |
| Translation of assets and liabilities in foreign currencies | (166,691) | | |
| (20,058,748) | | |
| | |
| Net realized and unrealized gain (loss) | (19,382,632) | | |
| | |
| Net Increase (Decrease) in Net Assets Resulting from Operations | $ | (5,697,530) | | |
See Notes to Financial Statements.
| | |
| Statement of Changes in Net Assets |
| | | | | | | | |
| YEARS ENDED OCTOBER 31, 2021 AND OCTOBER 31, 2020 |
| Increase (Decrease) in Net Assets | October 31, 2021 | October 31, 2020 |
| Operations | | |
| Net investment income (loss) | $ | 13,685,102 | | $ | 9,629,595 | |
| Net realized gain (loss) | 676,116 | | 3,447,000 | |
| Change in net unrealized appreciation (depreciation) | (20,058,748) | | 9,106,097 | |
| Net increase (decrease) in net assets resulting from operations | (5,697,530) | | 22,182,692 | |
| | |
| Distributions to Shareholders | | |
| From earnings: | | |
| Investor Class | (6,034,310) | | — | |
| I Class | (1,285,351) | | — | |
| Y Class | (420,073) | | — | |
| A Class | (63,080) | | — | |
| C Class | (1,276) | | — | |
| R Class | (1,014) | | — | |
| R5 Class | (94,336) | | — | |
| R6 Class | (6,300) | | — | |
| G Class | (7,141,645) | | — | |
| Decrease in net assets from distributions | (15,047,385) | | — | |
| | |
| Capital Share Transactions | | |
| Net increase (decrease) in net assets from capital share transactions (Note 5) | 87,317,873 | | 94,238,036 | |
| | |
| Net increase (decrease) in net assets | 66,572,958 | | 116,420,728 | |
| | |
| Net Assets | | |
| Beginning of period | 760,892,901 | | 644,472,173 | |
| End of period | $ | 827,465,859 | | $ | 760,892,901 | |
See Notes to Financial Statements.
| | |
| Notes to Financial Statements |
OCTOBER 31, 2021
1. Organization
American Century International Bond Funds (the trust) is registered under the Investment Company Act of 1940, as amended (the 1940 Act), as an open-end management investment company and is organized as a Massachusetts business trust. International Bond Fund (the fund) is one fund in a series issued by the trust. The fund’s investment objective is to seek total return.
The fund offers the Investor Class, I Class, Y Class, A Class, C Class, R Class, R5 Class, R6 Class and G Class. The A Class may incur an initial sales charge. The A Class and C Class may be subject to a contingent deferred sales charge.
2. Significant Accounting Policies
The following is a summary of significant accounting policies consistently followed by the fund in preparation of its financial statements. The fund is an investment company and follows accounting and reporting guidance in accordance with accounting principles generally accepted in the United States of America. This may require management to make certain estimates and assumptions at the date of the financial statements. Actual results could differ from these estimates. Management evaluated the impact of events or transactions occurring through the date the financial statements were issued that would merit recognition or disclosure.
Investment Valuations — The fund determines the fair value of its investments and computes its net asset value (NAV) per share at the close of regular trading (usually 4 p.m. Eastern time) on the New York Stock Exchange (NYSE) on each day the NYSE is open. The Board of Trustees has adopted valuation policies and procedures to guide the investment advisor in the fund’s investment valuation process and to provide methodologies for the oversight of the fund’s pricing function.
Fixed income securities are valued at the evaluated mean as provided by independent pricing services or at the mean of the most recent bid and asked prices as provided by investment dealers. Corporate bonds, U.S. Treasury and Government Agency securities, bank loan obligations, and sovereign governments and agencies are valued using market models that consider trade data, quotations from dealers and active market makers, relevant yield curve and spread data, creditworthiness, trade data or market information on comparable securities, and other relevant security specific information. Mortgage-related and asset-backed securities are valued based on models that consider trade data, prepayment and default projections, benchmark yield and spread data and estimated cash flows of each tranche of the issuer. Collateralized loan obligations are valued based on discounted cash flow models that consider trade and economic data, prepayment assumptions and default projections. Commercial paper is valued using a curve-based approach that considers money market rates for specific instruments, programs, currencies and maturity points from a variety of active market makers. Fixed income securities initially expressed in local currencies are translated into U.S. dollars at the mean of the appropriate currency exchange rate at the close of the NYSE as provided by an independent pricing service.
Equity securities that are listed or traded on a domestic securities exchange are valued at the last reported sales price or at the official closing price as provided by the exchange. Equity securities traded on foreign securities exchanges are generally valued at the closing price of such securities on the exchange where primarily traded or at the close of the NYSE, if that is earlier. If no last sales price is reported, or if local convention or regulation so provides, the mean of the latest bid and asked prices may be used. Securities traded over-the-counter are valued at the mean of the latest bid and asked prices, the last sales price, or the official closing price. Equity securities initially expressed in local currencies are translated into U.S. dollars at the mean of the appropriate currency exchange rate at the close of the NYSE as provided by an independent pricing service.
Hybrid securities are valued at the evaluated mean as provided by independent pricing services or at the mean of the most recent bid and asked prices as provided by investment dealers. Preferred stocks and convertible preferred stocks with perpetual maturities are valued using market models that consider trade data, quotations from dealers and active market makers, relevant yield curve and spread data, creditworthiness, trade data or market information on comparable securities, and other relevant security specific information. Hybrid securities initially expressed in local currencies are translated into U.S. dollars at the mean of the appropriate currency exchange rate at the close of the NYSE as provided by an independent pricing service.
Open-end management investment companies are valued at the reported NAV per share. Repurchase agreements are valued at cost, which approximates fair value. Exchange-traded futures contracts are valued at the settlement price as provided by the appropriate exchange. Swap agreements are valued at an evaluated mean as provided by independent pricing services or independent brokers. Forward foreign currency exchange contracts are valued at the mean of the appropriate forward exchange rate at the close of the NYSE as provided by an independent pricing service. Investments initially expressed in local currencies are translated into U.S. dollars at the mean of the appropriate currency exchange rate at the close of the NYSE as provided by an independent pricing service.
If the fund determines that the market price for an investment is not readily available or the valuation methods mentioned above do not reflect an investment’s fair value, such investment is valued as determined in good faith by the Board of Trustees or its delegate, in accordance with policies and procedures adopted by the Board of Trustees. In its determination of fair value, the fund may review several factors including, but not limited to, market information regarding the specific investment or comparable investments and correlation with other investment types, futures indices or general market indicators. Circumstances that may cause the fund to use these procedures to value an investment include, but are not limited to: an investment has been declared in default or is distressed; trading in a security has been suspended during the trading day or a security is not actively trading on its principal exchange; prices received from a regular pricing source are deemed unreliable; or there is a foreign market holiday and no trading occurred.
The fund monitors for significant events occurring after the close of an investment’s primary exchange but before the fund’s NAV per share is determined. Significant events may include, but are not limited to: corporate announcements and transactions; governmental action and political unrest that could impact a specific investment or an investment sector; or armed conflicts, natural disasters and similar events that could affect investments in a specific country or region. The fund also monitors for significant fluctuations between domestic and foreign markets, as evidenced by the U.S. market or such other indicators that the Board of Trustees, or its delegate, deems appropriate. The fund may apply a model-derived factor to the closing price of equity securities traded on foreign securities exchanges. The factor is based on observable market data as provided by an independent pricing service.
Security Transactions — Security transactions are accounted for as of the trade date. Net realized gains and losses are determined on the identified cost basis, which is also used for federal income tax purposes. Certain countries impose taxes on realized gains on the sale of securities registered in their country. The fund records the foreign tax expense, if any, on an accrual basis. The foreign tax expense on realized gains and unrealized appreciation reduces the net realized gain (loss) on investment transactions and net unrealized appreciation (depreciation) on investments, respectively.
Investment Income — Interest income less foreign taxes withheld, if any, is recorded on the accrual basis and includes paydown gain (loss) and accretion of discounts and amortization of premiums. Inflation adjustments related to inflation-linked debt securities are reflected as interest income. Dividend income less foreign taxes withheld, if any, is recorded as of the ex-dividend date. Distributions received on securities that represent a return of capital or long-term capital gain are recorded as a reduction of cost of investments and/or as a realized gain. The fund may estimate the components of distributions received that may be considered nontaxable distributions or long-term capital gain distributions for income tax purposes.
Foreign Currency Translations — All assets and liabilities initially expressed in foreign currencies are translated into U.S. dollars at prevailing exchange rates at period end. The fund may enter into spot foreign currency exchange contracts to facilitate transactions denominated in a foreign currency. Purchases and sales of investment securities, dividend and interest income, spot foreign currency exchange contracts, and expenses are translated at the rates of exchange prevailing on the respective dates of such transactions. Net realized and unrealized foreign currency exchange gains or losses related to investment securities are a component of net realized gain (loss) on investment transactions and change in net unrealized appreciation (depreciation) on investments, respectively.
Repurchase Agreements — The fund may enter into repurchase agreements with institutions that American Century Investment Management, Inc. (ACIM) (the investment advisor) has determined are creditworthy pursuant to criteria adopted by the Board of Trustees. The fund requires that the collateral, represented by securities, received in a repurchase transaction be transferred to the custodian in a manner sufficient to enable the fund to obtain those securities in the event of a default under the repurchase agreement. ACIM monitors, on a daily basis, the securities transferred to ensure the value, including accrued interest, of the securities under each repurchase agreement is equal to or greater than amounts owed to the fund under each repurchase agreement.
Joint Trading Account — Pursuant to an Exemptive Order issued by the Securities and Exchange Commission, the fund, along with certain other funds in the American Century Investments family of funds, may transfer uninvested cash balances into a joint trading account. These balances are invested in one or more repurchase agreements that are collateralized by U.S. Treasury or Agency obligations.
Segregated Assets — In accordance with the 1940 Act, the fund segregates assets on its books and records to cover certain types of investment securities and other financial instruments. ACIM monitors, on a daily basis, the securities segregated to ensure the fund designates a sufficient amount of liquid assets, marked-to-market daily. The fund may also receive assets or be required to pledge assets at the custodian bank or with a broker for collateral requirements.
Income Tax Status — It is the fund’s policy to distribute substantially all net investment income and net realized gains to shareholders and to otherwise qualify as a regulated investment company under provisions of the Internal Revenue Code. Accordingly, no provision has been made for income taxes. The fund files U.S. federal, state, local and non-U.S. tax returns as applicable. The fund's tax returns are subject to examination by the relevant taxing authority until expiration of the applicable statute of limitations, which is generally three years from the date of filing but can be longer in certain jurisdictions. At this time, management believes there are no uncertain tax positions which, based on their technical merit, would not be sustained upon examination and for which it is reasonably possible that the total amounts of unrecognized tax benefits will significantly change in the next twelve months.
Multiple Class — All shares of the fund represent an equal pro rata interest in the net assets of the class to which such shares belong, and have identical voting, dividend, liquidation and other rights and the same terms and conditions, except for class specific expenses and exclusive rights to vote on matters affecting only individual classes. Income, non-class specific expenses, and realized and unrealized capital gains and losses of the fund are allocated to each class of shares based on their relative net assets.
Distributions to Shareholders — Distributions from net investment income, if any, are generally declared and paid quarterly, but may be paid less frequently. Distributions from net realized gains, if any, are generally declared and paid annually.
Indemnifications — Under the trust’s organizational documents, its officers and trustees are indemnified against certain liabilities arising out of the performance of their duties to the fund. In addition, in the normal course of business, the fund enters into contracts that provide general indemnifications. The maximum exposure under these arrangements is unknown as this would involve future claims that may be made against a fund. The risk of material loss from such claims is considered by management to be remote.
3. Fees and Transactions with Related Parties
Certain officers and trustees of the trust are also officers and/or directors of American Century Companies, Inc. (ACC). The trust's investment advisor, ACIM, the trust's distributor, American Century Investment Services, Inc. (ACIS), and the trust's transfer agent, American Century Services, LLC, are wholly owned, directly or indirectly, by ACC. Various funds issued by American Century Asset Allocation Portfolios, Inc. own, in aggregate, 41% of the shares of the fund. Related parties do not invest in the fund for the purpose of exercising management or control.
Management Fees — The trust has entered into a management agreement with ACIM, under which ACIM provides the fund with investment advisory and management services in exchange for a single, unified management fee (the fee) per class. The agreement provides that ACIM will pay all expenses of managing and operating the fund, except brokerage expenses, taxes, interest, fees and expenses of the independent trustees (including legal counsel fees), extraordinary expenses, and expenses incurred in connection with the provision of shareholder services and distribution services under a plan adopted pursuant to Rule 12b-1 under the 1940 Act. The fee is computed and accrued daily based on each class’s daily net assets and paid monthly in arrears. The difference in the fee among the classes is a result of their separate arrangements for non-Rule 12b-1 shareholder services. It is not the result of any difference in advisory or custodial fees or other expenses related to the management of the fund’s assets, which do not vary by class. The fee consists of (1) an Investment Category Fee based on the daily net assets of the fund and certain other accounts managed by the investment advisor that are in the same broad investment category as the fund and (2) a Complex Fee based on the assets of all the funds in the American Century Investments family of funds. The investment advisor agreed to waive the G Class's management fee in its entirety. The investment advisor expects this waiver to remain in effect permanently and cannot terminate it without the approval of the Board of Trustees.
The Investment Category Fee range, the Complex Fee range and the effective annual management fee for each class for the period ended October 31, 2021 are as follows:
| | | | | | | | | | | |
| Investment Category Fee Range | Complex Fee Range | Effective Annual Management Fee |
| Investor Class | 0.4925%
to 0.6100% | 0.2500% to 0.3100% | 0.78% |
| I Class | 0.1500% to 0.2100% | 0.68% |
| Y Class | 0.0500% to 0.1100% | 0.58% |
| A Class | 0.2500% to 0.3100% | 0.78% |
| C Class | 0.2500% to 0.3100% | 0.78% |
| R Class | 0.2500% to 0.3100% | 0.78% |
| R5 Class | 0.0500% to 0.1100% | 0.58% |
| R6 Class | 0.0000% to 0.0600% | 0.53% |
| G Class | 0.0000% to 0.0600% | 0.00%(1) |
(1)Effective annual management fee before waiver was 0.53%.
Distribution and Service Fees — The Board of Trustees has adopted a separate Master Distribution and Individual Shareholder Services Plan for each of the A Class, C Class and R Class (collectively the plans), pursuant to Rule 12b-1 of the 1940 Act. The plans provide that the A Class will pay ACIS an annual distribution and service fee of 0.25%. The plans provide that the C Class will pay ACIS an annual distribution and service fee of 1.00%, of which 0.25% is paid for individual shareholder services and 0.75% is paid for distribution services. The plans provide that the R Class will pay ACIS an annual distribution and service fee of 0.50%. The fees are computed and accrued daily based on each class’s daily net assets and paid monthly in arrears. The fees are used to pay financial intermediaries for distribution and individual shareholder services. Fees incurred under the plans during the period ended October 31, 2021 are detailed in the Statement of Operations.
Trustees’ Fees and Expenses — The Board of Trustees is responsible for overseeing the investment advisor’s management and operations of the fund. The trustees receive detailed information about the fund and its investment advisor regularly throughout the year, and meet at least quarterly with management of the investment advisor to review reports about fund operations. The fund’s officers do not receive compensation from the fund.
Interfund Transactions — The fund may enter into security transactions with other American Century Investments funds and other client accounts of the investment advisor, in accordance with the 1940 Act rules and procedures adopted by the Board of Trustees. The rules and procedures require, among other things, that these transactions be effected at the independent current market price of the security. There were no interfund transactions during the period.
4. Investment Transactions
Purchases of investment securities, excluding short-term investments, for the period ended October 31, 2021 totaled $517,072,408, of which $5,926,719 represented U.S. Treasury and Government Agency obligations.
Sales of investment securities, excluding short-term investments, for the period ended October 31, 2021 totaled $442,323,732, of which $16,363,956 represented U.S. Treasury and Government Agency obligations.
5. Capital Share Transactions
Transactions in shares of the fund were as follows (unlimited number of shares authorized):
| | | | | | | | | | | | | | |
| Year ended
October 31, 2021 | Year ended
October 31, 2020 |
| Shares | Amount | Shares | Amount |
| Investor Class | | | | |
| Sold | 2,569,371 | | $ | 35,331,750 | | 3,130,534 | | $ | 40,732,170 | |
| Issued in reinvestment of distributions | 420,774 | | 5,915,593 | | — | | — | |
| Redeemed | (10,213,660) | | (141,719,386) | | (3,489,702) | | (45,210,439) | |
| (7,223,515) | | (100,472,043) | | (359,168) | | (4,478,269) | |
| I Class | | | | |
| Sold | 11,306,441 | | 157,250,275 | | 986,814 | | 12,873,867 | |
| Issued in reinvestment of distributions | 91,084 | | 1,285,196 | | — | | — | |
| Redeemed | (1,723,304) | | (24,043,128) | | (1,657,749) | | (21,655,181) | |
| 9,674,221 | | 134,492,343 | | (670,935) | | (8,781,314) | |
| Y Class | | | | |
| Sold | 628,290 | | 8,738,960 | | 651,064 | | 8,582,571 | |
| Issued in reinvestment of distributions | 29,708 | | 420,073 | | — | | — | |
| Redeemed | (163,804) | | (2,273,004) | | (155,038) | | (2,015,077) | |
| 494,194 | | 6,886,029 | | 496,026 | | 6,567,494 | |
| A Class | | | | |
| Sold | 47,642 | | 644,426 | | 177,092 | | 2,279,255 | |
| Issued in reinvestment of distributions | 4,410 | | 61,216 | | — | | — | |
| Redeemed | (84,186) | | (1,146,190) | | (547,253) | | (7,055,293) | |
| (32,134) | | (440,548) | | (370,161) | | (4,776,038) | |
| C Class | | | | |
| Sold | 840 | | 10,991 | | 1,348 | | 16,786 | |
| Issued in reinvestment of distributions | 92 | | 1,235 | | — | | — | |
| Redeemed | (8,147) | | (108,076) | | (10,524) | | (131,388) | |
| (7,215) | | (95,850) | | (9,176) | | (114,602) | |
| R Class | | | | |
| Sold | 1,405 | | 18,969 | | 6,677 | | 86,410 | |
| Issued in reinvestment of distributions | 74 | | 1,014 | | — | | — | |
| Redeemed | (3,017) | | (40,571) | | (6,355) | | (79,243) | |
| (1,538) | | (20,588) | | 322 | | 7,167 | |
| R5 Class | | | | |
| Sold | 444 | | 6,200 | | 1,861 | | 24,379 | |
| Issued in reinvestment of distributions | 555 | | 7,849 | | — | | — | |
| Redeemed | (8,853) | | (120,316) | | (79,965) | | (1,075,604) | |
| (7,854) | | (106,267) | | (78,104) | | (1,051,225) | |
| R6 Class | | | | |
| Sold | 9,153 | | 128,268 | | 14,587 | | 198,401 | |
| Issued in reinvestment of distributions | 445 | | 6,300 | | — | | — | |
| Redeemed | (20,927) | | (294,547) | | (2,896) | | (36,597) | |
| (11,329) | | (159,979) | | 11,691 | | 161,804 | |
| G Class | | | | |
| Sold | 4,502,887 | | 63,206,626 | | 10,629,790 | | 146,219,355 | |
| Issued in reinvestment of distributions | 500,466 | | 7,141,645 | | — | | — | |
| Redeemed | (1,621,399) | | (23,113,495) | | (2,948,339) | | (39,516,336) | |
| 3,381,954 | | 47,234,776 | | 7,681,451 | | 106,703,019 | |
| Net increase (decrease) | 6,266,784 | | $ | 87,317,873 | | 6,701,946 | | $ | 94,238,036 | |
6. Fair Value Measurements
The fund’s investments valuation process is based on several considerations and may use multiple inputs to determine the fair value of the investments held by the fund. In conformity with accounting principles generally accepted in the United States of America, the inputs used to determine a valuation are classified into three broad levels.
•Level 1 valuation inputs consist of unadjusted quoted prices in an active market for identical investments.
•Level 2 valuation inputs consist of direct or indirect observable market data (including quoted prices for comparable investments, evaluations of subsequent market events, interest rates, prepayment speeds, credit risk, etc.). These inputs also consist of quoted prices for identical investments initially expressed in local currencies that are adjusted through translation into U.S. dollars.
•Level 3 valuation inputs consist of unobservable data (including a fund’s own assumptions).
The level classification is based on the lowest level input that is significant to the fair valuation measurement. The valuation inputs are not necessarily an indication of the risks associated with investing in these securities or other financial instruments.
The following is a summary of the level classifications as of period end. The Schedule of Investments provides additional information on the fund’s portfolio holdings.
| | | | | | | | | | | |
| Level 1 | Level 2 | Level 3 |
| Assets | | | |
| Investment Securities | | | |
| Sovereign Governments and Agencies | — | | $ | 505,751,721 | | — | |
| Corporate Bonds | — | | 189,624,542 | | — | |
| Preferred Stocks | — | | 47,138,104 | | — | |
| Exchange-Traded Funds | $ | 23,542,680 | | — | | — | |
| Collateralized Loan Obligations | — | | 21,612,757 | | — | |
| Asset-Backed Securities | — | | 13,736,121 | | — | |
| U.S. Treasury Securities | — | | 10,499,845 | | — | |
| Bank Loan Obligations | — | | 2,209,134 | | — | |
| Temporary Cash Investments | 1,880,260 | | 10,960,935 | | — | |
| $ | 25,422,940 | | $ | 801,533,159 | | — | |
| Other Financial Instruments | | | |
| Futures Contracts | $ | 2,419,003 | | $ | 437,936 | | — | |
| Swap Agreements | — | | 1,346,219 | | — | |
| Forward Foreign Currency Exchange Contracts | — | | 1,254,015 | | — | |
| $ | 2,419,003 | | $ | 3,038,170 | | — | |
| | | |
| Liabilities | | | |
| Other Financial Instruments | | | |
| Futures Contracts | $ | 54,609 | | $ | 4,027,973 | | — | |
| Swap Agreements | — | | 8,377,067 | | — | |
| Forward Foreign Currency Exchange Contracts | — | | 1,621,532 | | — | |
| $ | 54,609 | | $ | 14,026,572 | | — | |
7. Derivative Instruments
Credit Risk — The fund is subject to credit risk in the normal course of pursuing its investment objectives. The value of a bond generally declines as the credit quality of its issuer declines. Credit default swap agreements enable a fund to buy/sell protection against a credit event of a specific issuer or index. A fund may attempt to enhance returns by selling protection or attempt to mitigate credit risk by buying protection. The buyer/seller of credit protection against a security or basket of securities may pay/receive an up-front or periodic payment to compensate for/against potential default events. Changes in value, including the periodic amounts of interest to be paid or received on swap agreements, are recorded as unrealized appreciation (depreciation) on swap agreements. Upon entering into a centrally cleared swap, a fund is required to deposit cash or securities (initial margin) with a financial intermediary in an amount equal to a certain percentage of the notional amount. Subsequent payments (variation margin) are made or received daily, in cash, by a fund. The variation margin is equal to the daily change in the value and is a component of unrealized gains and losses. Realized gain or loss is recorded upon receipt or payment of a periodic settlement or termination of swap agreements. Net realized and unrealized gains or losses occurring during the holding period of swap agreements are a component of net realized gain (loss) on swap agreement transactions and change in net unrealized appreciation (depreciation) on swap agreements, respectively. The risks of entering into swap agreements include the possible lack of liquidity, failure of the counterparty to meet its obligations, and that there may be unfavorable changes in the underlying investments or instruments. The fund's average notional amount held during the period was $64,256,000.
Foreign Currency Risk — The fund is subject to foreign currency exchange rate risk in the normal course of pursuing its investment objectives. The value of foreign investments held by a fund may be significantly affected by changes in foreign currency exchange rates. The dollar value of a foreign security generally decreases when the value of the dollar rises against the foreign currency in which the security is denominated and tends to increase when the value of the dollar declines against such foreign currency. A fund may enter into forward foreign currency exchange contracts to reduce a fund's exposure to foreign currency exchange rate fluctuations or to gain exposure to the fluctuations in the value of foreign currencies. The net U.S. dollar value of foreign currency underlying all contractual commitments held by a fund and the resulting unrealized appreciation or depreciation are determined daily. Realized gain or loss is recorded upon settlement of the contract. Net realized and unrealized gains or losses occurring during the holding period of forward foreign currency exchange contracts are a component of net realized gain (loss) on forward foreign currency exchange contract transactions and change in net unrealized appreciation (depreciation) on forward foreign currency exchange contracts, respectively. A fund bears the risk of an unfavorable change in the foreign currency exchange rate underlying the forward contract. Additionally, losses, up to the fair value, may arise if the counterparties do not perform under the contract terms. The fund's average U.S. dollar exposure to foreign currency risk derivative instruments held during the period was $406,675,122.
Interest Rate Risk — The fund is subject to interest rate risk in the normal course of pursuing its investment objectives. A fund may enter into futures contracts or interest rate swap agreements in order to manage its exposure to changes in market conditions. The value of bonds generally declines as interest rates rise. The risks of entering into interest rate risk derivative instruments include the possible lack of liquidity, failure of the counterparty to meet its obligations, and that there may be unfavorable changes in the underlying investments or instruments.
A fund may enter into futures contracts based on a bond index or a specific underlying security. A fund may purchase futures contracts to gain exposure to increases in market value or sell futures contracts to protect against a decline in market value. Upon entering into a futures contract, a fund will segregate cash, cash equivalents or other appropriate liquid securities on its records in amounts sufficient to meet requirements. Subsequent payments (variation margin) are made or received daily, in cash, by a fund. The variation margin is equal to the daily change in the contract value and is recorded as unrealized gains and losses. A fund recognizes a realized gain or loss when the futures contract is closed or expires. Net realized and unrealized gains or losses occurring during the holding period of futures contracts are a component of net realized gain (loss) on futures contract transactions and change in net unrealized appreciation (depreciation) on futures contracts, respectively. The fund's average notional exposure to these interest rate risk derivative instruments held during the period was $217,276,419 futures contracts purchased and $180,501,237 futures contracts sold.
A fund may enter into interest rate swap agreements to gain exposure to declines in interest rates, to protect against increases in interest rates, or to maintain its ability to generate income at prevailing interest rates. A fund will segregate cash, cash equivalents or other appropriate liquid securities on its records in amounts sufficient to meet requirements. Changes in value, including the periodic amounts of interest to be paid or received on swap agreements, are recorded as unrealized appreciation (depreciation) on swap agreements. Upon entering into a centrally cleared swap, a fund is required to deposit cash or securities (initial margin) with a financial intermediary in an amount equal to a certain percentage of the notional amount. Subsequent payments (variation margin) are made or received daily, in cash, by a fund. The variation margin is equal to the daily change in the value and is a component of unrealized gains and losses. Realized gain or loss is recorded upon receipt or payment of a periodic settlement or termination of swap agreements. Net realized and unrealized gains or losses occurring during the holding period of swap agreements are a component of net realized gain (loss) on swap agreement transactions and change in net unrealized appreciation (depreciation) on swap agreements, respectively. The fund's average notional amount on interest rate swap agreements held during the period was $42,630,029.
Other Contracts — A fund may enter into total return swap agreements in order to attempt to obtain or preserve a particular return or spread at a lower cost than obtaining a return or spread through purchases and/or sales of instruments in other markets or gain exposure to certain markets in the most economical way possible. A fund will segregate cash, cash equivalents or other appropriate liquid securities on its records in amounts sufficient to meet requirements. Changes in value, including the periodic amounts of interest to be paid or received on swap agreements, are recorded as unrealized appreciation (depreciation) on swap agreements. Upon entering into a centrally cleared swap, a fund is required to deposit cash or securities (initial margin) with a financial intermediary in an amount equal to a certain percentage of the notional amount. Subsequent payments (variation margin) are made or received daily, in cash, by a fund. The variation margin is equal to the daily change in the value and is a component of unrealized gains and losses. Realized gain or loss is recorded upon receipt or payment of a periodic settlement or termination of swap agreements. Net realized and unrealized gains or losses occurring during the holding period of swap agreements are a component of net realized gain (loss) on swap agreement transactions and change in net unrealized appreciation (depreciation) on swap agreements, respectively. The risks of entering into swap agreements include the possible lack of liquidity, failure of the counterparty to meet its obligations, and that there may be unfavorable changes in the underlying investments or instruments, including inflationary risk. The fund's average notional amount held during the period was $28,250,000.
Value of Derivative Instruments as of October 31, 2021
| | | | | | | | | | | | | | |
| Asset Derivatives | Liability Derivatives |
| Type of Risk Exposure | Location on Statement of Assets and Liabilities | Value | Location on Statement of Assets and Liabilities | Value |
| Credit Risk | Receivable for variation margin on swap agreements* | $ | 161,117 | | Payable for variation margin on swap agreements* | — | |
| Foreign Currency Risk | Unrealized appreciation on forward foreign currency exchange contracts | 1,254,015 | | Unrealized depreciation on forward foreign currency exchange contracts | $ | 1,621,532 | |
| Interest Rate Risk | Receivable for variation margin on futures contracts* | 134,112 | | Payable for variation margin on futures contracts* | 999,640 | |
| Interest Rate Risk | Receivable for variation margin on swap agreements* | — | | Payable for variation margin on swap agreements* | 119,205 | |
| Interest Rate Risk | Swap agreements | — | | Swap agreements | 844,636 | |
| Other Contracts | Receivable for variation margin on swap agreements* | — | | Payable for variation margin on swap agreements* | 29,006 | |
| | $ | 1,549,244 | | | $ | 3,614,019 | |
*Included in the unrealized appreciation (depreciation) on futures contracts or centrally cleared swap agreements, as applicable, as reported in the Schedule of Investments.
Effect of Derivative Instruments on the Statement of Operations for the Year Ended October 31, 2021
| | | | | | | | | | | | | | |
| Net Realized Gain (Loss) | Change in Net Unrealized Appreciation (Depreciation) |
| Type of Risk Exposure | Location on Statement of Operations | Value | Location on Statement of Operations | Value |
| Credit Risk | Net realized gain (loss) on swap agreement transactions | $ | (2,794,243) | | Change in net unrealized appreciation (depreciation) on swap agreements | $ | (960,658) | |
| Foreign Currency Risk | Net realized gain (loss) on forward foreign currency exchange contract transactions | (9,154,898) | | Change in net unrealized appreciation (depreciation) on forward foreign currency exchange contracts | (335,405) | |
| Interest Rate Risk | Net realized gain (loss) on futures contract transactions | 4,553,154 | | Change in net unrealized appreciation (depreciation) on futures contracts | (3,378,736) | |
| Interest Rate Risk | Net realized gain (loss) on swap agreement transactions | 33,385 | | Change in net unrealized appreciation (depreciation) on swap agreements | (1,634,148) |
| Other Contracts | Net realized gain (loss) on swap agreement transactions | 1,233,271 | | Change in net unrealized appreciation (depreciation) on swap agreements | 1,374,280 |
| | $ | (6,129,331) | | | $ | (4,934,667) | |
8. Risk Factors
The value of the fund’s shares will go up and down, sometimes rapidly or unpredictably, based on the performance of the securities owned by the fund and other factors generally affecting the securities market. Market risks, including political, regulatory, economic and social developments, can affect the value of the fund’s investments. Natural disasters, public health emergencies, terrorism and other unforeseeable events may lead to increased market volatility and may have adverse long-term effects on world economies and markets generally.
The fund may invest in instruments that have variable or floating coupon rates based on the London Interbank Offered Rate (LIBOR). LIBOR is a benchmark interest rate intended to be representative of the rate at which certain major international banks lend to one another over short-terms. However, LIBOR is expected to be phased out and the transition process may lead to increased volatility or illiquidity in markets for instruments that rely on LIBOR. This could result in a change to the value of such instruments.
There are certain risks involved in investing in foreign securities. These risks include those resulting from political events (such as civil unrest, national elections and imposition of exchange controls), social and economic events (such as labor strikes and rising inflation), and natural disasters. Securities of foreign issuers may be less liquid and more volatile. Investing in emerging markets or a significant portion of assets in one country or region may accentuate these risks.
9. Federal Tax Information
The tax character of distributions paid during the years ended October 31, 2021 and October 31, 2020 were as follows:
| | | | | | | | |
| 2021 | 2020 |
| Distributions Paid From | | |
| Ordinary income | $ | 15,047,385 | | — | |
| Long-term capital gains | — | | — | |
The book-basis character of distributions made during the year from net investment income or net realized gains may differ from their ultimate characterization for federal income tax purposes. These differences reflect the differing character of certain income items and net realized gains and losses for financial statement and tax purposes, and may result in reclassification among certain capital accounts on the financial statements.
As of period end, the federal tax cost of investments and the components of distributable earnings on a tax-basis were as follows:
| | | | | |
| Federal tax cost of investments | $ | 800,354,997 | |
| Gross tax appreciation of investments | $ | 35,611,975 | |
| Gross tax depreciation of investments | (9,010,873) | |
| Net tax appreciation (depreciation) of investments | 26,601,102 | |
Net tax appreciation (depreciation) on derivatives and translation of assets and
liabilities in foreign currencies | (3,084,306) | |
| Net tax appreciation (depreciation) | $ | 23,516,796 | |
| Other book-to-tax adjustments | $ | (947,471) | |
| Undistributed ordinary income | $ | 3,356,256 | |
| Accumulated long-term gains | $ | 4,656,189 | |
The difference between book-basis and tax-basis unrealized appreciation (depreciation) is attributable primarily to the tax deferral of losses on wash sales and the realization for tax purposes of unrealized gains (losses) on certain foreign currency exchange contracts and unsettled interest on swap agreements. Other book-to-tax adjustments are attributable primarily to the tax deferral of losses on straddle positions.
| | | | | | | | | | | | | | | | | | | | | | | | | | | | | | | | | | | | | | | | | | | | | | | |
| For a Share Outstanding Throughout the Years Ended October 31 (except as noted) |
| Per-Share Data | Ratios and Supplemental Data |
| | | Income From Investment Operations: | Distributions From: | | | Ratio to Average Net Assets of: | | |
| | Net Asset
Value,
Beginning
of Period | Net Investment Income (Loss)(1) | Net Realized
and Unrealized
Gain (Loss) | Total From Investment Operations | Net
Investment
Income | Net
Realized
Gains | Total
Distributions | Net Asset
Value, End
of Period | Total Return(2) | Operating
Expenses | Operating Expenses (before expense waiver) | Net
Investment
Income
(Loss) | Net
Investment
Income
(Loss) (before expense waiver) | Portfolio
Turnover
Rate | Net Assets,
End of Period
(in thousands) |
| Investor Class |
| 2021 | $13.61 | 0.19 | (0.29) | (0.10) | (0.23) | — | (0.23) | $13.28 | (0.83)% | 0.79% | 0.79% | 1.37% | 1.37% | 58% | $253,748 | |
| 2020 | $13.18 | 0.16 | 0.27 | 0.43 | — | — | — | $13.61 | 3.26% | 0.80% | 0.80% | 1.25% | 1.25% | 72% | $358,334 | |
| 2019 | $12.40 | 0.20 | 0.76 | 0.96 | (0.18) | — | (0.18) | $13.18 | 7.80% | 0.81% | 0.81% | 1.57% | 1.57% | 46% | $351,630 | |
| 2018 | $12.96 | 0.23 | (0.74) | (0.51) | — | (0.05) | (0.05) | $12.40 | (3.98)% | 0.81% | 0.81% | 1.76% | 1.76% | 40% | $407,913 | |
| 2017 | $12.82 | 0.09 | 0.05 | 0.14 | — | — | — | $12.96 | 1.09% | 0.80% | 0.80% | 0.74% | 0.74% | 87% | $452,514 | |
| I Class |
| 2021 | $13.67 | 0.20 | (0.29) | (0.09) | (0.24) | — | (0.24) | $13.34 | (0.73)% | 0.69% | 0.69% | 1.47% | 1.47% | 58% | $197,725 | |
| 2020 | $13.22 | 0.18 | 0.27 | 0.45 | — | — | — | $13.67 | 3.40% | 0.70% | 0.70% | 1.35% | 1.35% | 72% | $70,363 | |
| 2019 | $12.44 | 0.19 | 0.78 | 0.97 | (0.19) | — | (0.19) | $13.22 | 7.88% | 0.71% | 0.71% | 1.67% | 1.67% | 46% | $76,919 | |
| 2018 | $12.99 | 0.25 | (0.75) | (0.50) | — | (0.05) | (0.05) | $12.44 | (3.90)% | 0.71% | 0.71% | 1.86% | 1.86% | 40% | $18,592 | |
2017(3) | $12.31 | 0.06 | 0.62 | 0.68 | — | — | — | $12.99 | 5.52% | 0.70%(4) | 0.70%(4) | 0.88%(4) | 0.88%(4) | 87%(5) | $20,782 | |
| | | | | | | | | | | | | | | | | | | | | | | | | | | | | | | | | | | | | | | | | | | | | | | |
| For a Share Outstanding Throughout the Years Ended October 31 (except as noted) |
| Per-Share Data | Ratios and Supplemental Data |
| | | Income From Investment Operations: | Distributions From: | | | Ratio to Average Net Assets of: | | |
| | Net Asset
Value,
Beginning
of Period | Net Investment Income (Loss)(1) | Net Realized
and Unrealized
Gain (Loss) | Total From Investment Operations | Net
Investment
Income | Net
Realized
Gains | Total
Distributions | Net Asset
Value, End
of Period | Total Return(2) | Operating
Expenses | Operating Expenses (before expense waiver) | Net
Investment
Income
(Loss) | Net
Investment
Income
(Loss) (before expense waiver) | Portfolio
Turnover
Rate | Net Assets,
End of Period
(in thousands) |
| Y Class |
| 2021 | $13.71 | 0.22 | (0.29) | (0.07) | (0.26) | — | (0.26) | $13.38 | (0.62)% | 0.59% | 0.59% | 1.57% | 1.57% | 58% | $27,124 | |
| 2020 | $13.25 | 0.19 | 0.27 | 0.46 | — | — | — | $13.71 | 3.47% | 0.60% | 0.60% | 1.45% | 1.45% | 72% | $21,015 | |
| 2019 | $12.47 | 0.22 | 0.76 | 0.98 | (0.20) | — | (0.20) | $13.25 | 7.97% | 0.61% | 0.61% | 1.77% | 1.77% | 46% | $13,732 | |
| 2018 | $13.01 | 0.28 | (0.77) | (0.49) | — | (0.05) | (0.05) | $12.47 | (3.81)% | 0.61% | 0.61% | 1.96% | 1.96% | 40% | $3,766 | |
2017(3) | $12.31 | 0.07 | 0.63 | 0.70 | — | — | — | $13.01 | 5.69% | 0.60%(4) | 0.60%(4) | 0.96%(4) | 0.96%(4) | 87%(5) | $5 | |
| A Class |
| 2021 | $13.41 | 0.15 | (0.29) | (0.14) | (0.19) | — | (0.19) | $13.08 | (1.10)% | 1.04% | 1.04% | 1.12% | 1.12% | 58% | $3,766 | |
| 2020 | $13.01 | 0.13 | 0.27 | 0.40 | — | — | — | $13.41 | 3.07% | 1.05% | 1.05% | 1.00% | 1.00% | 72% | $4,291 | |
| 2019 | $12.25 | 0.17 | 0.73 | 0.90 | (0.14) | — | (0.14) | $13.01 | 7.45% | 1.06% | 1.06% | 1.32% | 1.32% | 46% | $8,981 | |
| 2018 | $12.83 | 0.20 | (0.73) | (0.53) | — | (0.05) | (0.05) | $12.25 | (4.18)% | 1.06% | 1.06% | 1.51% | 1.51% | 40% | $9,192 | |
| 2017 | $12.73 | 0.06 | 0.04 | 0.10 | — | — | — | $12.83 | 0.79% | 1.05% | 1.05% | 0.49% | 0.49% | 87% | $11,031 | |
| C Class |
| 2021 | $12.89 | 0.05 | (0.28) | (0.23) | (0.09) | — | (0.09) | $12.57 | (1.86)% | 1.79% | 1.79% | 0.37% | 0.37% | 58% | $103 | |
| 2020 | $12.60 | 0.03 | 0.26 | 0.29 | — | — | — | $12.89 | 2.30% | 1.80% | 1.80% | 0.25% | 0.25% | 72% | $198 | |
| 2019 | $11.86 | 0.08 | 0.71 | 0.79 | (0.05) | — | (0.05) | $12.60 | 6.69% | 1.81% | 1.81% | 0.57% | 0.57% | 46% | $310 | |
| 2018 | $12.52 | 0.09 | (0.70) | (0.61) | — | (0.05) | (0.05) | $11.86 | (4.92)% | 1.81% | 1.81% | 0.76% | 0.76% | 40% | $482 | |
| 2017 | $12.51 | (0.03) | 0.04 | 0.01 | — | — | — | $12.52 | 0.08% | 1.80% | 1.80% | (0.26)% | (0.26)% | 87% | $812 | |
| | | | | | | | | | | | | | | | | | | | | | | | | | | | | | | | | | | | | | | | | | | | | | | |
| For a Share Outstanding Throughout the Years Ended October 31 (except as noted) |
| Per-Share Data | Ratios and Supplemental Data |
| | | Income From Investment Operations: | Distributions From: | | | Ratio to Average Net Assets of: | | |
| | Net Asset
Value,
Beginning
of Period | Net Investment Income (Loss)(1) | Net Realized
and Unrealized
Gain (Loss) | Total From Investment Operations | Net
Investment
Income | Net
Realized
Gains | Total
Distributions | Net Asset
Value, End
of Period | Total Return(2) | Operating
Expenses | Operating Expenses (before expense waiver) | Net
Investment
Income
(Loss) | Net
Investment
Income
(Loss) (before expense waiver) | Portfolio
Turnover
Rate | Net Assets,
End of Period
(in thousands) |
| R Class |
| 2021 | $13.27 | 0.11 | (0.28) | (0.17) | (0.16) | — | (0.16) | $12.94 | (1.37)% | 1.29% | 1.29% | 0.87% | 0.87% | 58% | $62 | |
| 2020 | $12.91 | 0.09 | 0.27 | 0.36 | — | — | — | $13.27 | 2.79% | 1.30% | 1.30% | 0.75% | 0.75% | 72% | $84 | |
| 2019 | $12.15 | 0.13 | 0.74 | 0.87 | (0.11) | — | (0.11) | $12.91 | 7.24% | 1.31% | 1.31% | 1.07% | 1.07% | 46% | $77 | |
| 2018 | $12.76 | 0.16 | (0.72) | (0.56) | — | (0.05) | (0.05) | $12.15 | (4.44)% | 1.31% | 1.31% | 1.26% | 1.26% | 40% | $68 | |
| 2017 | $12.68 | 0.03 | 0.05 | 0.08 | — | — | — | $12.76 | 0.63% | 1.30% | 1.30% | 0.24% | 0.24% | 87% | $151 | |
| R5 Class |
| 2021 | $13.71 | 0.22 | (0.29) | (0.07) | (0.26) | — | (0.26) | $13.38 | (0.62)% | 0.59% | 0.59% | 1.57% | 1.57% | 58% | $4,780 | |
| 2020 | $13.24 | 0.19 | 0.28 | 0.47 | — | — | — | $13.71 | 3.55% | 0.60% | 0.60% | 1.45% | 1.45% | 72% | $5,005 | |
| 2019 | $12.46 | 0.23 | 0.75 | 0.98 | (0.20) | — | (0.20) | $13.24 | 7.97% | 0.61% | 0.61% | 1.77% | 1.77% | 46% | $5,870 | |
| 2018 | $13.00 | 0.26 | (0.75) | (0.49) | — | (0.05) | (0.05) | $12.46 | (3.82)% | 0.61% | 0.61% | 1.96% | 1.96% | 40% | $5,608 | |
| 2017 | $12.83 | 0.11 | 0.06 | 0.17 | — | — | — | $13.00 | 1.33% | 0.60% | 0.60% | 0.94% | 0.94% | 87% | $6,005 | |
| R6 Class | | | | | | | | | | | | | | |
| 2021 | $13.72 | 0.22 | (0.28) | (0.06) | (0.27) | — | (0.27) | $13.39 | (0.65)% | 0.54% | 0.54% | 1.62% | 1.62% | 58% | $318 | |
| 2020 | $13.25 | 0.20 | 0.27 | 0.47 | — | — | — | $13.72 | 3.62% | 0.55% | 0.55% | 1.50% | 1.50% | 72% | $481 | |
| 2019 | $12.47 | 0.26 | 0.73 | 0.99 | (0.21) | — | (0.21) | $13.25 | 8.02% | 0.56% | 0.56% | 1.82% | 1.82% | 46% | $310 | |
| 2018 | $13.00 | 0.27 | (0.75) | (0.48) | — | (0.05) | (0.05) | $12.47 | (3.74)% | 0.56% | 0.56% | 2.01% | 2.01% | 40% | $2,691 | |
| 2017 | $12.83 | 0.12 | 0.05 | 0.17 | — | — | — | $13.00 | 1.33% | 0.55% | 0.55% | 0.99% | 0.99% | 87% | $3,800 | |
| | | | | | | | | | | | | | | | | | | | | | | | | | | | | | | | | | | | | | | | | | | | | | | |
| For a Share Outstanding Throughout the Years Ended October 31 (except as noted) |
| Per-Share Data | Ratios and Supplemental Data |
| | | Income From Investment Operations: | Distributions From: | | | Ratio to Average Net Assets of: | | |
| | Net Asset
Value,
Beginning
of Period | Net Investment Income (Loss)(1) | Net Realized
and Unrealized
Gain (Loss) | Total From Investment Operations | Net
Investment
Income | Net
Realized
Gains | Total
Distributions | Net Asset
Value, End
of Period | Total Return(2) | Operating
Expenses | Operating Expenses (before expense waiver) | Net
Investment
Income
(Loss) | Net
Investment
Income
(Loss) (before expense waiver) | Portfolio
Turnover
Rate | Net Assets,
End of Period
(in thousands) |
| G Class | | | | | | | | | | | | | | |
| 2021 | $13.90 | 0.30 | (0.29) | 0.01 | (0.34) | — | (0.34) | $13.57 | (0.03)% | 0.01% | 0.54% | 2.15% | 1.62% | 58% | $339,841 | |
| 2020 | $13.35 | 0.27 | 0.28 | 0.55 | — | — | — | $13.90 | 4.12% | 0.01% | 0.55% | 2.04% | 1.50% | 72% | $301,122 | |
| 2019 | $12.56 | 0.31 | 0.75 | 1.06 | (0.27) | — | (0.27) | $13.35 | 8.62% | 0.02% | 0.56% | 2.36% | 1.82% | 46% | $186,644 | |
| 2018 | $13.02 | 0.33 | (0.74) | (0.41) | — | (0.05) | (0.05) | $12.56 | (3.19)% | 0.02% | 0.56% | 2.55% | 2.01% | 40% | $207,787 | |
2017(6) | $13.12 | 0.06 | (0.16) | (0.10) | — | — | — | $13.02 | (0.76)% | 0.01%(4) | 0.55%(4) | 1.66%(4) | 1.12%(4) | 87%(5) | $454,794 | |
| | |
| Notes to Financial Highlights |
(1)Computed using average shares outstanding throughout the period.
(2)Total returns are calculated based on the net asset value of the last business day and do not reflect applicable sales charges, if any. Total returns for periods less than one year are not annualized.
(3)April 10, 2017 (commencement of sale) through October 31, 2017.
(4)Annualized.
(5)Portfolio turnover is calculated at the fund level. Percentage indicated was calculated for the year ended October 31, 2017.
(6)July 28, 2017 (commencement of sale) through October 31, 2017.
See Notes to Financial Statements.
| | |
| Report of Independent Registered Public Accounting Firm |
To the Board of Trustees of American Century International Bond Funds and Shareholders of International Bond Fund
Opinion on the Financial Statements
We have audited the accompanying statement of assets and liabilities, including the schedule of investments, of International Bond Fund (one of the funds constituting American Century International Bond Funds, referred to hereafter as the “Fund”) as of October 31, 2021, the related statement of operations for the year ended October 31, 2021, the statement of changes in net assets for each of the two years in the period ended October 31, 2021, including the related notes, and the financial highlights for each of the periods indicated therein (collectively referred to as the “financial statements”). In our opinion, the financial statements present fairly, in all material respects, the financial position of the Fund as of October 31, 2021, the results of its operations for the year then ended, the changes in its net assets for each of the two years in the period ended October 31, 2021 and the financial highlights for each of the periods indicated therein in conformity with accounting principles generally accepted in the United States of America.
Basis for Opinion
These financial statements are the responsibility of the Fund’s management. Our responsibility is to express an opinion on the Fund’s financial statements based on our audits. We are a public accounting firm registered with the Public Company Accounting Oversight Board (United States) (“PCAOB”) and are required to be independent with respect to the Fund in accordance with the U.S. federal securities laws and the applicable rules and regulations of the Securities and Exchange Commission and the PCAOB.
We conducted our audits of these financial statements in accordance with the standards of the PCAOB. Those standards require that we plan and perform the audit to obtain reasonable assurance about whether the financial statements are free of material misstatement, whether due to error or fraud.
Our audits included performing procedures to assess the risks of material misstatement of the financial statements, whether due to error or fraud, and performing procedures that respond to those risks. Such procedures included examining, on a test basis, evidence regarding the amounts and disclosures in the financial statements. Our audits also included evaluating the accounting principles used and significant estimates made by management, as well as evaluating the overall presentation of the financial statements. Our procedures included confirmation of securities owned as of October 31, 2021 by correspondence with the custodian, brokers, and agent banks; when replies were not received from brokers, we performed other auditing procedures. We believe that our audits provide a reasonable basis for our opinion.
/s/ PricewaterhouseCoopers LLP
Kansas City, Missouri
December 17, 2021
We have served as the auditor of one or more investment companies in American Century Investments since 1997.
Board of Trustees
The individuals listed below serve as trustees of the funds. Each trustee will continue to serve in this capacity until death, retirement, resignation or removal from office. The board has adopted a mandatory retirement age for trustees who are not “interested persons,” as that term is defined in the Investment Company Act (independent trustees). Independent trustees shall retire on December 31 of the year in which they reach their 75th birthday; provided, however, that on or after January 1, 2022, independent trustees shall retire on December 31 of the year in which they reach their 76th birthday.
Jonathan S. Thomas is an “interested person” because he currently serves as President and Chief Executive Officer of American Century Companies, Inc. (ACC), the parent company of American Century Investment Management, Inc. (ACIM or the advisor). The other trustees (more than three-fourths of the total number) are independent. They are not employees, directors or officers of, and have no financial interest in, ACC or any of its wholly owned, direct or indirect, subsidiaries, including ACIM, American Century Investment Services, Inc. (ACIS) and American Century Services, LLC (ACS), and they do not have any other affiliations, positions or relationships that would cause them to be considered “interested persons” under the Investment Company Act. The trustees serve in this capacity for eight (in the case of Jonathan S. Thomas, 16; and Ronald J. Gilson, 9) registered investment companies in the American Century Investments family of funds.
The following table presents additional information about the trustees. The mailing address for each trustee other than Mr. Thomas is 1665 Charleston Road, Mountain View, California 94043. The mailing address for Mr. Thomas is 4500 Main Street, Kansas City, Missouri 64111.
| | | | | | | | | | | | | | | | | |
Name
(Year of Birth) | Position(s) Held with Funds | Length of Time Served | Principal Occupation(s) During Past 5 Years | Number of American Century Portfolios Overseen by Trustee | Other Directorships Held During Past 5 Years |
| Independent Trustees | | |
Tanya S. Beder
(1955) | Trustee | Since 2011 | Chairman and CEO, SBCC Group Inc. (independent advisory services) (2006 to present) | 38 | Kirby Corporation; Nabors Industries Ltd.; CYS Investments, Inc. (2012 to 2017) |
Jeremy I. Bulow
(1954) | Trustee | Since 2011 | Professor of Economics, Stanford University, Graduate School of Business (1979 to present) | 38 | None |
Jennifer Cabalquinto
(1968) | Trustee | Since 2021 | Special Advisor, GSW Sports, LLC (2020 to Present); Chief Financial Officer, GSW Sports, LLC (2013 to 2020) | 38 | None |
Anne Casscells
(1958) | Trustee | Since 2016 | Co-Chief Executive Officer and Chief Investment Officer, Aetos Alternatives Management (investment advisory firm) (2001 to present); Lecturer in Accounting, Stanford University, Graduate School of Business (2009 to 2017) | 38 | None |
Ronald J. Gilson
(1946) | Trustee and Chairman of the Board | Since 1995
(Chairman since 2005) | Charles J. Meyers Professor of Law and Business, Emeritus (since 2018). Stanford Law School (1979 to 2016); Marc and Eva Stern Professor of Law and Business, Columbia University School of Law (1992 to present) | 73 | None |
| | | | | | | | | | | | | | | | | |
Name
(Year of Birth) | Position(s) Held with Funds | Length of Time Served | Principal Occupation(s) During Past 5 Years | Number of American Century Portfolios Overseen by Trustee | Other Directorships Held During Past 5 Years |
| Independent Trustees | | |
Frederick L. A. Grauer
(1946) | Trustee | Since 2008 | Senior Advisor, Credit Sesame, Inc. (credit monitoring firm) (2018 to present); Senior Advisor, Course Hero (an educational technology company) (2015 to present) | 38 | None |
Jonathan D. Levin
(1972) | Trustee | Since 2016 | Philip H. Knight Professor and Dean, Graduate School of Business, Stanford University (2016 to present); Professor, Stanford University, (2000 to present) | 38 | None |
Peter F. Pervere
(1947) | Trustee | Since 2007 | Retired | 38 | None |
John B. Shoven
(1947) | Trustee | Since 2002 | Charles R. Schwab Professor of Economics, Stanford University (1973 to present, emeritus since 2019) | 38 | Cadence Design Systems; Exponent; Financial Engines |
| Interested Trustee | | |
Jonathan S. Thomas
(1963) | Trustee | Since 2007 | President and Chief Executive Officer, ACC (2007 to present). Also serves as Chief Executive Officer, ACS; Director, ACC and other ACC subsidiaries | 145 | None |
The Statement of Additional Information has additional information about the fund's trustees and is available without charge, upon request, by calling 1-800-345-2021.
Officers
The following table presents certain information about the executive officers of the funds. Each officer serves as an officer for 16 (in the case of Robert J. Leach, 15) investment companies in the American Century family of funds. No officer is compensated for his or her service as an officer of the funds. The listed officers are interested persons of the funds and are appointed or re-appointed on an annual basis. The mailing address for each of the officers listed below is 4500 Main Street, Kansas City, Missouri 64111.
| | | | | | | | |
Name
(Year of Birth) | Offices with the Funds | Principal Occupation(s) During the Past Five Years |
Patrick Bannigan
(1965) | President since 2019 | Executive Vice President and Director, ACC (2012 to present); Chief Financial Officer, Chief Accounting Officer and Treasurer, ACC (2015 to present)). Also serves as President, ACS; Vice President, ACIM; Chief Financial Officer, Chief Accounting Officer and/or Director, ACIM, ACS and other ACC subsidiaries |
R. Wes Campbell
(1974) | Chief Financial Officer and Treasurer since 2018 | Vice President, ACS, (2020 to present); Investment
Operations and Investment Accounting, ACS (2000 to
present) |
Amy D. Shelton
(1964) | Chief Compliance Officer and Vice President since 2014 | Chief Compliance Officer, American Century funds, (2014 to present); Chief Compliance Officer, ACIM (2014 to present); Chief Compliance Officer, ACIS (2009 to present). Also serves as Vice President, ACIS |
Jon Pak
(1968) | General Counsel and Senior Vice President since 2021 | General Counsel and Senior Vice President, ACC (2021 to present). Also serves as General Counsel and Senior Vice President, ACIM, ACS and ACIS. Chief Legal Officer of Investment and Wealth Management, The Bank of New York Mellon (2014 to 2021) |
C. Jean Wade
(1964) | Vice President since 2012 | Senior Vice President, ACS (2017 to present); Vice President ACS (2000 to 2017) |
Robert J. Leach
(1966) | Vice President since 2006 | Vice President, ACS (2000 to present) |
David H. Reinmiller
(1963) | Vice President since 2000 | Attorney, ACC (1994 to present). Also serves as Vice President, ACIM and ACS |
Ward D. Stauffer
(1960) | Secretary since 2005 | Attorney, ACC (2003 to present) |
| | |
| Approval of Management Agreement |
At a meeting held on June 16, 2021, the Fund’s Board of Trustees (the "Board") unanimously approved the renewal of the management agreement pursuant to which American Century Investment Management, Inc. (the “Advisor”) acts as the investment advisor for the Fund. Under Section 15(c) of the Investment Company Act, contracts for investment advisory services are required to be reviewed, evaluated, and approved by a majority of a fund’s Trustees, including a majority of the independent Trustees, each year. The Board regards this annual evaluation and renewal as one of its most important responsibilities.
The independent Trustees have memorialized a statement regarding the relationship between their ongoing obligations to oversee and evaluate the performance of the Advisor and their annual consideration of renewal of the management agreement. In that statement, the independent Trustees noted that their assessment of the Advisor’s performance is an ongoing process that takes place over the entire year and is informed by all of the extensive information that the Board and its committees receive and consider over time. This information, together with the additional materials provided specifically in connection with the review, are central to the Board’s assessment of the Advisor’s performance and its determination whether to renew the Fund’s management agreement.
Prior to its consideration of the renewal of the management agreement, the Board requested and reviewed extensive data and analysis relating to the proposed renewal. This information and analysis was compiled by the Advisor and certain independent providers of evaluation data concerning the Fund and the services provided to the Fund by the Advisor.
In connection with its consideration of the renewal of the management agreement, the Board’s review and evaluation of the services provided by the Advisor and its affiliates included, but was not limited to, the following:
•the nature, extent, and quality of investment management, shareholder services, and other services provided and to be provided to the Fund including without limitation portfolio management and trading services, shareholder and intermediary service levels and quality, compliance and legal services, fund accounting and financial reporting, and fund share distribution;
•the wide range of other programs and services provided and to be provided by the Advisor and its affiliates to the Fund and its shareholders on a routine and non-routine basis;
•the Fund’s investment performance, including data comparing the Fund’s performance to appropriate benchmarks and/or a peer group of other mutual funds with similar investment objectives and strategies;
•the cost of owning the Fund compared to the cost of owning similar funds;
•the compliance policies, procedures, and regulatory experience of the Advisor and its affiliates and certain other Fund service providers;
•financial data showing the cost of services provided by the Advisor and its affiliates to the Fund, the profitability of the Fund to the Advisor, and the overall profitability of the Advisor;
•the Advisor’s strategic plans, COVID-19 pandemic response, vendor management practices, and social justice initiatives;
•the Advisor’s business continuity plans and cyber security practices;
•any economies of scale associated with the Advisor’s management of the Fund;
•services provided and charges to the Advisor’s other investment management clients;
•fees and expenses associated with any investment by the Fund in other funds;
•payments and practices in connection with financial intermediaries holding shares of the Fund on behalf of their clients and the services provided by intermediaries in connection therewith; and
•any collateral benefits derived by the Advisor from the management of the Fund.
In keeping with its practice, the Board held two meetings and the independent Trustees met in private session to discuss the renewal and to review and discuss the information provided in response to their request. The Board held active discussions with the Advisor regarding the renewal of the management agreement. The independent Trustees had the benefit of the advice of their independent counsel throughout the process.
Factors Considered
The Trustees considered all of the information provided by the Advisor, the independent data providers, and the independent Trustees’ independent counsel in connection with the approval. They determined that the information was sufficient for them to evaluate the management agreement for the Fund. In connection with their review, the Trustees did not identify any single factor as being all-important or controlling and each Trustee may have attributed different levels of importance to different factors. In deciding to renew the management agreement, the Board based its decision on a number of factors, including the following:
Nature, Extent and Quality of Services — Generally. Under the management agreement, the Advisor is responsible for providing or arranging for all services necessary for the operation of the Fund. The Board noted that the Advisor provides or arranges at its own expense a wide variety of services including:
•constructing and designing the Fund
•portfolio research and security selection
•initial capitalization/funding
•securities trading
•Fund administration
•custody of Fund assets
•daily valuation of the Fund’s portfolio
•shareholder servicing and transfer agency, including shareholder confirmations, recordkeeping, and communications
•legal services (except the independent Trustees’ counsel)
•regulatory and portfolio compliance
•financial reporting
•marketing and distribution (except amounts paid by the Fund under Rule 12b-1 plans)
The Board noted that many of these services have expanded over time in terms of both quantity and complexity in response to shareholder demands, competition in the industry, changing distribution channels, and the changing regulatory environment.
Investment Management Services. The nature of the investment management services provided to the Fund is quite complex and allows Fund shareholders access to professional money management, instant diversification of their investments within an asset class, the opportunity to easily diversify among asset classes by investing in or exchanging among various American Century Investments funds, and liquidity. In evaluating investment performance, the Board expects the Advisor to manage the Fund in accordance with its investment objectives and approved strategies. Further, the Trustees recognize that the Advisor has an obligation to seek the best execution of fund trades. In providing these services, the Advisor utilizes teams of investment professionals (portfolio managers, analysts, research assistants, and securities traders) who require extensive information technology, research, training, compliance, and other systems to conduct their business. The Board, directly and through its Portfolio Committee, regularly reviews investment performance information for the Fund, together with comparative information for appropriate benchmarks and/or peer groups of similarly-managed funds, over different time horizons. The Trustees also review investment performance information during the management agreement renewal process. If performance concerns are identified, the Fund receives special reviews until performance improves, during which the Board discusses with the Advisor the reasons for such results (e.g., market conditions, security selection) and any efforts being undertaken to improve performance. The Fund’s performance was above its benchmark for the
one-, three-, and five-year periods, and below its benchmark for the ten-year period reviewed by the Board. The Board found the investment management services provided by the Advisor to the Fund to be satisfactory and consistent with the management agreement.
Shareholder and Other Services. Under the management agreement, the Advisor, either directly or through affiliates or third parties, provides the Fund with a comprehensive package of transfer agency, shareholder, and other services. The Board, directly and through its various committees, regularly reviews reports and evaluations of such services at its regular meetings. These reports include, but are not limited to, information regarding the operational efficiency and accuracy of the shareholder and transfer agency services provided, staffing levels, shareholder satisfaction, technology support (including cyber security), new products and services offered to Fund shareholders, securities trading activities, portfolio valuation services, auditing services, and legal and operational compliance activities. The Board found the services provided by the Advisor to the Fund under the management agreement to be competitive and of high quality.
Costs of Services and Profitability. The Advisor provides detailed information concerning its cost of providing various services to the Fund, its profitability in managing the Fund, its overall profitability, and its financial condition. The Trustees have reviewed with the Advisor the methodology used to prepare this financial information. This information is considered in evaluating the Advisor’s financial condition, its ability to continue to provide services under the management agreement, and the reasonableness of the current management fee. The Board concluded that the Advisor’s profits were reasonable in light of the services provided to the Fund.
Ethics. The Board generally considers the Advisor’s commitment to providing quality services to shareholders and to conducting its business ethically. They noted that the Advisor’s practices generally meet or exceed industry best practices.
Economies of Scale. The Board also reviewed information provided by the Advisor regarding the possible existence of economies of scale in connection with the management of the Fund. The Board concluded that economies of scale are difficult to measure and predict with precision, especially on a fund-by-fund basis. The Board concluded that the Advisor is appropriately sharing economies of scale, to the extent they exist, through its competitive fee structure, offering competitive fees from fund inception, and through reinvestment in its business, infrastructure, investment capabilities and initiatives to provide shareholders enhanced and expanded services.
Comparison to Other Funds’ Fees. The management agreement provides that the Fund pays the Advisor a single, all-inclusive (or unified) management fee for providing all services necessary for the management and operation of the Fund, other than brokerage expenses, expenses attributable to short sales, taxes, interest, extraordinary expenses, fees and expenses of the Fund’s independent Trustees (including their independent legal counsel), and expenses incurred in connection with the provision of shareholder services and distribution services under a plan adopted pursuant to Rule 12b-1 under the Investment Company Act. Under this unified fee structure, the Advisor is responsible for providing all investment advisory, custody, audit, administrative, compliance, recordkeeping, marketing, and shareholder services, or arranging and supervising third parties to provide such services. By contrast, most other funds are charged a variety of fees, including an investment advisory fee, a transfer agency fee, an administrative fee, and other expenses. Other than their investment advisory fees and any applicable Rule 12b-1 distribution fees, all other components of the total fees charged by these other funds may be increased without shareholder approval. The Board believes the unified fee structure is a benefit to Fund shareholders because it clearly discloses to shareholders the cost of owning Fund shares, and, since the unified fee cannot be increased without a vote of Fund shareholders, it shifts to the Advisor the risk of increased costs of operating the Fund and provides a direct incentive to minimize administrative inefficiencies. Part of the Board’s analysis of fee levels involves reviewing certain evaluative data compiled by an independent provider and comparing the Fund’s unified fee to the total expense ratio of peer funds. The unified fee charged to shareholders of the Fund was below the median of the total expense ratios of the Fund’s peer group. The Board concluded that
the management fee paid by the Fund to the Advisor under the management agreement is reasonable in light of the services provided to the Fund.
Comparison to Fees and Services Provided to Other Clients of the Advisor. The Board also requested and received information from the Advisor concerning the nature of the services, fees, costs, and profitability of its advisory services to advisory clients other than the Fund. They observed that these varying types of client accounts require different services and involve different regulatory and entrepreneurial risks than the management of the Fund. The Board analyzed this information and concluded that the fees charged and services provided to the Fund were reasonable by comparison.
Payments to Intermediaries. The Trustees also requested and received a description of payments made to intermediaries by the Fund and the Advisor and services provided by intermediaries. These payments include various payments made by the Fund or the Advisor to different types of intermediaries and recordkeepers for distribution and service activities provided with respect to the Fund. The Trustees reviewed such information and received representations from the Advisor that all such payments by the Fund were made pursuant to the Fund’s Rule 12b-1 Plan and that all such payments by the Advisor were made from the Advisor’s resources and reasonable profits. The Board found such payments to be reasonable in scope and purpose.
Collateral or “Fall-Out” Benefits Derived by the Advisor. The Board considered the possible existence of collateral benefits the Advisor may receive as a result of its relationship with the Fund. The Board noted that the Advisor’s primary business is managing funds and it generally does not use fund or shareholder information to generate profits in other lines of business, and therefore does not derive any significant collateral benefits from them. The Board noted that the Advisor may receive proprietary research from broker-dealers that execute fund portfolio transactions. The Board also determined that the Advisor is able to provide investment management services to certain clients other than the Fund, at least in part, due to its existing infrastructure built to serve the fund complex. The Board noted that the assets of those other accounts are, where applicable, included with the assets of the Fund to determine breakpoints in the management fee schedule.
Existing Relationship. The Board also considered whether there was any reason for not continuing the existing arrangement with the Advisor. In this regard, the Board was mindful of the potential disruptions of the Fund’s operations and various risks, uncertainties, and other effects that could occur as a result of a decision not to continue such relationship. In particular, the Board recognized that most shareholders have invested in the Fund on the strength of the Advisor’s industry standing and reputation and in the expectation that the Advisor will have a continuing role in providing advisory services to the Fund.
Conclusion of the Trustees. As a result of this process, the Board, including all of the independent Trustees and assisted by the advice of independent legal counsel, taking into account all of the factors discussed above and the information provided by the Advisor and others in connection with its review and throughout the year, concluded that the management agreement between the Fund and the Advisor is fair and reasonable in light of the services provided and should be renewed.
Retirement Account Information
As required by law, distributions you receive from certain retirement accounts are subject to federal income tax withholding, unless you elect not to have withholding apply*. Tax will be withheld on the total amount withdrawn even though you may be receiving amounts that are not subject to withholding, such as nondeductible contributions. In such case, excess amounts of withholding could occur. You may adjust your withholding election so that a greater or lesser amount will be withheld.
If you don’t want us to withhold on this amount, you must notify us to not withhold the federal income tax. You may notify us in writing or in certain situations by telephone or through other electronic means. For systematic withdrawals, your withholding election will remain in effect until revoked or changed by filing a new election. You have the right to revoke your election at any time and change your withholding percentage for future distributions.
Remember, even if you elect not to have income tax withheld, you are liable for paying income tax on the taxable portion of your withdrawal. If you elect not to have income tax withheld or you don’t have enough income tax withheld, you may be responsible for payment of estimated tax. You may incur penalties under the estimated tax rules if your withholding and estimated tax payments are not sufficient. You can reduce or defer the income tax on a distribution by directly or indirectly rolling such distribution over to another IRA or eligible plan. You should consult your tax advisor for additional information.
State tax will be withheld if, at the time of your distribution, your address is within one of the mandatory withholding states and you have federal income tax withheld (or as otherwise required by state law). State taxes will be withheld from your distribution in accordance with the respective state rules.
*Some 403(b), 457 and qualified retirement plan distributions may be subject to 20% mandatory withholding, as they are subject to special tax and withholding rules. Your plan administrator or plan sponsor is required to provide you with a special tax notice explaining those rules at the time you request a distribution. If applicable, federal and/or state taxes may be withheld from your distribution amount.
Proxy Voting Policies
Descriptions of the principles and policies that the fund's investment advisor uses in exercising the voting rights associated with the securities purchased and/or held by the fund are available without charge, upon request, by calling 1-800-345-2021 or visiting American Century Investments’ website at americancentury.com/proxy. A description of the policies is also available on the Securities and Exchange Commission’s website at sec.gov. Information regarding how the investment advisor voted proxies relating to portfolio securities during the most recent 12-month period ended June 30 is available on americancentury.com/proxy. It is also available at sec.gov.
Quarterly Portfolio Disclosure
The fund files its complete schedule of portfolio holdings with the Securities and Exchange Commission (SEC) for the first and third quarters of each fiscal year as an exhibit to its reports on Form N-PORT. These portfolio holdings are available on the fund's website at americancentury.com and, upon request, by calling 1-800-345-2021. The fund’s Form N-PORT reports are available on the SEC’s website at sec.gov.
Change in Independent Registered Public Accounting Firm
On September 24, 2021, the fund’s Audit and Compliance Committee and Board of Trustees approved a change to the fund’s independent registered public accountant. PricewaterhouseCoopers LLP was dismissed and Deloitte & Touche LLP was appointed as the independent registered public accounting firm for the fiscal year ending October 31, 2022.
During the fiscal years ended October 31, 2020 and October 31, 2021, there were no disagreements with PricewaterhouseCoopers LLP on any matter of accounting principles or practices, financial statement disclosure, or auditing scope or procedure, which disagreements, if not resolved to their satisfaction would have caused them to make reference to the subject matter of the disagreements in connection with their reports or reportable events, as such term is described in Item 304(a)(1) of Regulation S-K of the Securities Exchange Act of 1934, as amended. The audit reports of PricewaterhouseCoopers LLP on the financial statements of the fund for the fiscal years ended October 31, 2020 and October 31, 2021, did not contain any adverse opinion or disclaimer of opinion, nor were they qualified or modified as to uncertainty, audit scope or accounting principles.
During the fiscal years ended October 31, 2020 and October 31, 2021, neither the fund, nor anyone on its behalf, consulted with Deloitte & Touche LLP, on behalf of the fund, regarding the application of accounting principles to a specified transaction (either completed or proposed), the type of audit opinion that might be rendered on the fund’s financial statements, or any matter that was either the subject of a disagreement or a reportable event, as such terms are described in Item 304(a)(1) of Regulation S-K of the Securities Exchange Act of 1934, as amended.
The fund requested that PricewaterhouseCoopers LLP furnish it with a letter addressed to the Securities and Exchange Commission stating whether PricewaterhouseCoopers LLP agrees with the statements contained above. A copy of the letter from PricewaterhouseCoopers LLP to the Securities and Exchange Commission is filed as an exhibit hereto.
| | | | | | | | |
| |
| | |
| Contact Us | americancentury.com | |
| Automated Information Line | 1-800-345-8765 | |
| Investor Services Representative | 1-800-345-2021
or 816-531-5575 | |
| Investors Using Advisors | 1-800-378-9878 | |
Business, Not-For-Profit, Employer-Sponsored
Retirement Plans | 1-800-345-3533 | |
Banks and Trust Companies, Broker-Dealers,
Financial Professionals, Insurance Companies | 1-800-345-6488 | |
| Telecommunications Relay Service for the Deaf | 711 | |
| | |
| American Century International Bond Funds | |
| | |
Investment Advisor: American Century Investment Management, Inc. Kansas City, Missouri | |
| | |
| This report and the statements it contains are submitted for the general information of our shareholders. The report is not authorized for distribution to prospective investors unless preceded or accompanied by an effective prospectus. | |
| | |
©2021 American Century Proprietary Holdings, Inc. All rights reserved.
CL-ANN-90983 2112 | |
(b) None.
ITEM 2. CODE OF ETHICS.
(a) The registrant has adopted a Code of Ethics for Senior Financial Officers that applies to the registrant’s principal executive officer, principal financial officer, principal accounting officer, and persons performing similar functions.
(b) No response required.
(c) None.
(d) None.
(e) Not applicable.
(f) The registrant’s Code of Ethics for Senior Financial Officers was filed as Exhibit 12 (a)(1) to American Century Asset Allocation Portfolios, Inc.’s Annual Certified Shareholder Report on Form N-CSR, File No. 811-21591, on September 29, 2005, and is incorporated herein by reference.
ITEM 3. AUDIT COMMITTEE FINANCIAL EXPERT.
(a)(1) The registrant's board has determined that the registrant has at least one audit committee financial expert serving on its audit committee.
(a)(2) Tanya S. Beder, Jennifer Cabalquinto, Anne Casscells, Peter F. Pervere and Ronald J. Gilson are the registrant's designated audit committee financial experts. They are "independent" as defined in Item 3 of Form N-CSR.
(a)(3) Not applicable.
(b) No response required.
(c) No response required.
(d) No response required.
ITEM 4. PRINCIPAL ACCOUNTANT FEES AND SERVICES.
(a) Audit Fees.
The aggregate fees billed for each of the last two fiscal years for professional services rendered by the principal accountant for the audit of the registrant’s annual financial statements or services that are normally provided by the accountant in connection with statutory and regulatory filings or engagements for those fiscal years were as follows:
FY 2020: $126,881
FY 2021: $131,997
(b) Audit-Related Fees.
The aggregate fees billed in each of the last two fiscal years for assurance and related services by the principal accountant that are reasonably related to the performance of the audit of the registrant’s financial statements and are not reported under paragraph (a) of this Item were as follows:
For services rendered to the registrant:
FY 2020: $0
FY 2021: $0
Fees required to be approved pursuant to paragraph (c)(7)(ii) of Rule 2-01 of Regulation S-X (relating to certain engagements for non-audit services with the registrant’s investment adviser and its affiliates):
FY 2020: $0
FY 2021: $0
(c) Tax Fees.
The aggregate fees billed in each of the last two fiscal years for professional services rendered by the principal accountant for tax compliance, tax advice, and tax planning were as follows:
For services rendered to the registrant:
FY 2020: $0
FY 2021: $0
Fees required to be approved pursuant to paragraph (c)(7)(ii) of Rule 2-01 of Regulation S-X (relating to certain engagements for non-audit services with the registrant’s investment adviser and its affiliates):
FY 2020: $0
FY 2021: $0
(d) All Other Fees.
The aggregate fees billed in each of the last two fiscal years for products and services provided by the principal accountant, other than the services reported in paragraphs (a) through (c) of this Item were as follows:
For services rendered to the registrant:
FY 2020: $0
FY 2021: $0
Fees required to be approved pursuant to paragraph (c)(7)(ii) of Rule 2-01 of Regulation S-X (relating to certain engagements for non-audit services with the registrant’s investment adviser and its affiliates):
FY 2020: $0
FY 2021: $0
(e)(1) In accordance with paragraph (c)(7)(i)(A) of Rule 2-01 of Regulation S-X, before the accountant is engaged by the registrant to render audit or non-audit services, the engagement is approved by the registrant’s audit committee. Pursuant to paragraph (c)(7)(ii) of Rule 2-01 of Regulation S-X, the registrant’s audit committee also pre-approves its accountant’s engagements for non-audit services with the registrant’s investment adviser, its parent company, and any entity controlled by, or under common control with the investment adviser that provides ongoing services to the registrant, if the engagement relates directly to the operations and financial reporting of the registrant.
(e)(2) All services described in each of paragraphs (b) through (d) of this Item were pre-approved before the engagement by the registrant’s audit committee pursuant to paragraph (c)(7)(i)(A) of Rule 2-01 of Regulation S-X.
Consequently, none of such services were required to be approved by the audit committee pursuant to paragraph (c)(7)(i)(C).
(f) The percentage of hours expended on the principal accountant’s engagement to audit the registrant’s financial statements for the most recent fiscal year that were attributed to work performed by persons other than the principal accountant’s full-time, permanent employees was less than 50%.
(g) The aggregate non-audit fees billed by the registrant’s accountant for services rendered to the registrant, and rendered to the registrant’s investment adviser (not including any sub-adviser whose role is primarily portfolio management and is subcontracted with or overseen by another investment adviser), and any entity controlling, controlled by, or under common control with the adviser that provides ongoing services to the registrant for each of the last two fiscal years of the registrant were as follows:
FY 2020: $157,500
FY 2021: $140,900
(h) The registrant’s investment adviser and accountant have notified the registrant’s audit committee of all non-audit services that were rendered by the registrant’s accountant to the registrant’s investment adviser, its parent company, and any entity controlled by, or under common control with the investment adviser that provides services to the registrant, which services were not required to be pre-approved pursuant to paragraph (c)(7)(ii) of Rule 2-01 of Regulation S-X. The notification provided to the registrant’s audit committee included sufficient details regarding such services to allow the registrant’s audit committee to consider the continuing independence of its principal accountant.
ITEM 5. AUDIT COMMITTEE OF LISTED REGISTRANTS.
Not applicable.
ITEM 6. INVESTMENTS.
(a) The schedule of investments is included as part of the report to stockholders filed under Item 1 of this Form.
(b) Not applicable.
ITEM 7. DISCLOSURE OF PROXY VOTING POLICIES AND PROCEDURES FOR CLOSED-END MANAGEMENT INVESTMENT COMPANIES.
Not applicable.
ITEM 8. PORTFOLIO MANAGERS OF CLOSED-END MANAGEMENT INVESTMENT COMPANIES.
Not applicable.
ITEM 9. PURCHASES OF EQUITY SECURITIES BY CLOSED-END MANAGEMENT INVESTMENT COMPANY AND AFFILIATED PURCHASERS.
Not applicable.
ITEM 10. SUBMISSION OF MATTERS TO A VOTE OF SECURITY HOLDERS.
During the reporting period, there were no material changes to the procedures by which shareholders may recommend nominees to the registrant’s board.
ITEM 11. CONTROLS AND PROCEDURES.
(a) The registrant's principal executive officer and principal financial officer have concluded that the registrant's disclosure controls and procedures (as defined in Rule 30a-3(c) under the Investment Company Act of 1940) are effective based on their evaluation of these controls and procedures as of a date within 90 days of the filing date of this report.
(b) There were no changes in the registrant's internal control over financial reporting (as defined in Rule 30a-3(d) under the Investment Company Act of 1940) that occurred during the period covered by this report that have materially affected, or are reasonably likely to materially affect, the registrant's internal control over financial reporting.
ITEM 12. DISCLOSURE OF SECURITIES LENDING ACTIVITIES FOR CLOSED-END MANAGEMENT INVESTMENT COMPANIES.
Not applicable.
ITEM 13. EXHIBITS.
(a)(1) Registrant’s Code of Ethics for Senior Financial Officers, which is the subject of the disclosure required by Item 2 of Form N-CSR, was filed as Exhibit 12(a)(1) to American Century Asset Allocation Portfolios, Inc.’s Certified Shareholder Report on Form N-CSR, File No. 811-21591, on September 29, 2005.
(a)(3) Not applicable.
SIGNATURES
Pursuant to the requirements of the Securities Exchange Act of 1934 and the Investment Company Act of 1940, the registrant has duly caused this report to be signed on its behalf by the undersigned, thereunto duly authorized.
| | | | | | | | | | | | | | |
| Registrant: | American Century International Bond Funds |
| | | |
| By: | /s/ Patrick Bannigan | |
| Name: | Patrick Bannigan | |
| Title: | President | |
| | | |
| Date: | December 29, 2021 | |
Pursuant to the requirements of the Securities Exchange Act of 1934 and the Investment Company Act of 1940, this report has been signed below by the following persons on behalf of the registrant and in the capacities and on the dates indicated.
| | | | | | | | | | | |
| By: | /s/ Patrick Bannigan | |
| Name: | Patrick Bannigan | |
| Title: | President | |
| | (principal executive officer) | |
| | | |
| Date: | December 29, 2021 | |
| | | | | | | | | | | |
| By: | /s/ R. Wes Campbell | |
| Name: | R. Wes Campbell | |
| Title: | Treasurer and | |
| | Chief Financial Officer | |
| | (principal financial officer) | |
| | | |
| Date: | December 29, 2021 | |