UNITED STATES
SECURITIES AND EXCHANGE COMMISSION
Washington, D.C. 20549
FORM N-CSR
CERTIFIED SHAREHOLDER REPORT OF REGISTERED
MANAGEMENT INVESTMENT COMPANIES
|
| | | | | | |
| Investment Company Act file number | 811-06441 |
| | |
| AMERICAN CENTURY INTERNATIONAL BOND FUNDS |
| (Exact name of registrant as specified in charter) |
| | |
| 4500 MAIN STREET, KANSAS CITY, MISSOURI | 64111 |
| (Address of principal executive offices) | (Zip Code) |
| | |
CHARLES A. ETHERINGTON 4500 MAIN STREET, KANSAS CITY, MISSOURI 64111 |
| (Name and address of agent for service) |
| | |
| Registrant’s telephone number, including area code: | 816-531-5575 |
| | |
| Date of fiscal year end: | 10-31 |
| | |
| Date of reporting period: | 10-31-2018 |
ITEM 1. REPORTS TO STOCKHOLDERS.
|
| |
| | |
| | Annual Report |
| | |
| | October 31, 2018 |
| | |
| | Emerging Markets Debt Fund |
| | Investor Class (AEDVX) |
| | I Class (AEHDX) |
| | Y Class (AEYDX) |
| | A Class (AEDQX) |
| | C Class (AEDHX) |
| | R Class (AEDWX) |
| | R5 Class (AEDJX) |
| | R6 Class (AEXDX) |
| | G Class (AEDGX) |
|
| | |
| President’s Letter | 2 |
|
| Performance | 3 |
|
| Portfolio Commentary | |
|
| Fund Characteristics | |
|
| Shareholder Fee Example | |
|
| Schedule of Investments | |
|
| Statement of Assets and Liabilities | |
|
| Statement of Operations | |
|
| Statement of Changes in Net Assets | |
|
| Notes to Financial Statements | |
|
| Financial Highlights | |
|
| Report of Independent Registered Public Accounting Firm | |
|
| Management | |
|
| Approval of Management Agreement | |
|
| Additional Information | |
|
Any opinions expressed in this report reflect those of the author as of the date of the report, and do not necessarily represent the opinions of American Century Investments® or any other person in the American Century Investments organization. Any such opinions are subject to change at any time based upon market or other conditions and American Century Investments disclaims any responsibility to update such opinions. These opinions may not be relied upon as investment advice and, because investment decisions made by American Century Investments funds are based on numerous factors, may not be relied upon as an indication of trading intent on behalf of any American Century Investments fund. Security examples are used for representational purposes only and are not intended as recommendations to purchase or sell securities. Performance information for comparative indices and securities is provided to American Century Investments by third party vendors. To the best of American Century Investments’ knowledge, such information is accurate at the time of printing.
 Jonathan Thomas
Dear Investor:
Thank you for reviewing this annual report for the 12 months ended October 31, 2018. Annual reports help convey important information about fund returns, including market factors that affected performance during the reporting period. For additional investment and market insights, we encourage you to visit our website, americancentury.com.
Rising Rates, Heightened Volatility Challenge Investors
U.S. stocks generally delivered gains for the period, but returns were considerably weaker than the robust, double-digit results of the previous fiscal year. Early on, a backdrop of robust corporate earnings results, improving global economic growth, and growth-oriented U.S. tax reform helped drive stock prices higher. The S&P 500 Index returned more than 10% just in the first three months of the reporting period.
Investor sentiment shifted dramatically in early February, as volatility resurfaced after an extended period of relative dormancy. Better-than-expected U.S. economic data triggered expectations for rising inflation, higher interest rates, and a more-hawkish Federal Reserve (Fed). In response, U.S. Treasury yields soared, and stock prices plunged. Although this bout of market unrest quickly subsided, volatility remained a formidable force throughout the rest of the period. Stocks remained resilient, though, and the S&P 500 Index advanced 7.35% for the 12-month period. Growth stocks outpaced value stocks, and large-cap stocks outperformed small-cap stocks. Meanwhile, rising U.S. Treasury yields and Fed rate hikes weighed on interest-rate sensitive assets, including investment-grade bonds and real estate investment trusts.
Outside the U.S., economic growth moderated as the period unfolded, and global bond yields were flat to modestly higher. The U.S. dollar continued to gain ground versus other currencies, which drove down non-U.S. bond returns for unhedged investors. The strong dollar, combined with rising U.S. interest rates, geopolitical tensions, and fiscal challenges in several developing countries, led to negative results for emerging markets bonds.
With global economic growth diverging, Treasury yields rising, and volatility lingering, investors likely will face opportunities and challenges in the months ahead. We believe this scenario underscores the importance of using professionally managed portfolios in pursuit of investment goals. We appreciate your continued trust and confidence in us.
Sincerely,
Jonathan Thomas
President and Chief Executive Officer
American Century Investments
|
| | | | |
| Total Returns as of October 31, 2018 |
| | | | Average Annual Returns | |
| | Ticker Symbol | 1 year | Since Inception | Inception Date |
| Investor Class | AEDVX | -2.76% | 3.09% | 7/29/14 |
| JPMorgan Corporate Emerging Market Bond (CEMBI) Broad Diversified Index | — | -1.86% | 3.45% | — |
| I Class | AEHDX | -2.76% | 0.27% | 4/10/17 |
| Y Class | AEYDX | -2.67% | 0.36% | 4/10/17 |
| A Class | AEDQX | | | 7/29/14 |
| No sales charge | | -3.11% | 2.83% | |
| With sales charge | | -7.45% | 1.73% | |
| C Class | AEDHX | -3.74% | 2.08% | 7/29/14 |
| R Class | AEDWX | -3.26% | 2.59% | 7/29/14 |
| R5 Class | AEDJX | -2.55% | 3.31% | 7/29/14 |
| R6 Class | AEXDX | -2.61% | 3.35% | 7/29/14 |
| G Class | AEDGX | — | -1.59% | 11/14/17 |
G Class returns would have been lower if a portion of the fees had not been waived.
Sales charges include initial sales charges and contingent deferred sales charges (CDSCs), as applicable. A Class shares have a 4.50% maximum initial sales charge and may be subject to a maximum CDSC of 1.00%. C Class shares redeemed within 12 months of purchase are subject to a maximum CDSC of 1.00%. The SEC requires that mutual funds provide performance information net of maximum sales charges in all cases where charges could be applied.
Data presented reflect past performance. Past performance is no guarantee of future results. Current performance may be higher or lower than the performance shown. Total returns for periods less than one year are not annualized. Investment return and principal value will fluctuate, and redemption value may be more or less than original cost. Data assumes reinvestment of dividends and capital gains, and none of the charts reflect the deduction of taxes that a shareholder would pay on fund distributions or the redemption of fund shares. To obtain performance data current to the most recent month end, please call 1-800-345-2021 or visit americancentury.com. For additional information about the fund, please consult the prospectus.
|
|
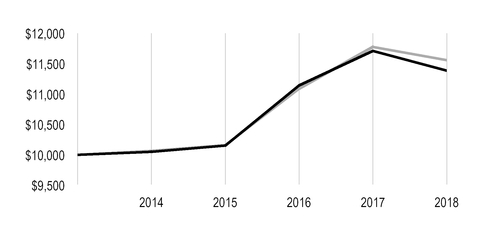
| Growth of $10,000 Over Life of Class |
| $10,000 investment made July 29, 2014 |
| Performance for other share classes will vary due to differences in fee structure. |
|
| |
| Value on October 31, 2018 |
| | Investor Class — $11,386 |
| |
| | JPMorgan CEMBI Broad Diversified Index — $11,577 |
| |
|
| | | | | | | | |
| Total Annual Fund Operating Expenses | |
| Investor Class | I Class | Y Class | A Class | C Class | R Class | R5 Class | R6 Class | G Class |
| 0.97% | 0.87% | 0.77% | 1.22% | 1.97% | 1.47% | 0.77% | 0.72% | 0.72% |
The total annual fund operating expenses shown is as stated in the fund’s prospectus current as of the date of this report. The prospectus may vary from the expense ratio shown elsewhere in this report because it is based on a different time period, includes acquired fund fees and expenses, and, if applicable, does not include fee waivers or expense reimbursements.
Data presented reflect past performance. Past performance is no guarantee of future results. Current performance may be higher or lower than the performance shown. Total returns for periods less than one year are not annualized. Investment return and principal value will fluctuate, and redemption value may be more or less than original cost. Data assumes reinvestment of dividends and capital gains, and none of the charts reflect the deduction of taxes that a shareholder would pay on fund distributions or the redemption of fund shares. To obtain performance data current to the most recent month end, please call 1-800-345-2021 or visit americancentury.com. For additional information about the fund, please consult the prospectus.
Portfolio Managers: Margé Karner, John Lovito, Brian Howell, Kevin Akioka, and Thomas Youn
Thomas Youn joined the fund's management team in 2018.
Performance Summary
Emerging Markets Debt declined -2.76%* for the fiscal year ended October 31, 2018. By comparison, the JPMorgan Corporate Emerging Market Bond (CEMBI) Broad Diversified Index declined -1.86% over the same time period. Portfolio returns reflect operating expenses, while index returns do not.
Market Review
Performance in the broad emerging markets debt asset class was mixed in the reporting period amid volatile market trends. Early in the reporting period, emerging markets debt securities generally rallied in a risk-on environment. A favorable election result in South Africa enabled the country to maintain its investment-grade rating, while oil and other commodity prices were stable or rising. The spreads (differences in yield) between high-yield and investment-grade issuers narrowed to near-historic levels.
Later in the period, several broad influences began weighing on performance. Tax cuts in the U.S. helped drive domestic economic growth higher, exacerbating the gap between the growth rate in the U.S. and the growth rates in other developed markets. These dynamics pushed U.S. interest rates and the U.S. dollar higher, pressuring export activity among emerging markets and straining the solvency of countries with high external debt loads, especially Argentina and Turkey. Global trade tensions also weighed on emerging markets. In particular, escalating tariffs between the U.S. and China pressured trade volumes and eroded investor confidence. Slowing growth in China was another headwind for the asset class.
Argentina and Turkey were key sources of volatility. Despite positive policy reforms, Argentina faced an economic crisis as U.S. dollar-linked external debt payments escalated. The country secured a financing package from the International Monetary Fund (IMF) in June, and the IMF expanded the package in September, alleviating investor worries about short-term fiscal pressures. Although growth in Turkey was strong, Turkish central bankers faced a credibility crisis when they declined to raise interest rates to combat accelerating inflation. Meanwhile, political tensions between Turkey and the U.S. escalated and added to investor unease. Central bankers finally enacted a steep rate hike late in the period, quelling inflation and calming investors. Additionally, U.S.-Turkey relations improved after Turkish authorities released an American pastor held captive for two years.
Allocation Weighed on Results but Security Selection Contributed
In an environment of heightened volatility, investment-grade securities generally outpaced lower-quality bonds. As the high-yield sector sold off and valuations began to appear more reasonable, we moved from an underweight position relative to the index in high-yield securities to an overweight allocation. This positioning detracted from overall results, but our selections among securities with credit ratings of B and BB aided the portfolio’s relative results.
*All fund returns referenced in this commentary are for Investor Class shares. Performance for other share classes will vary due to differences in fee structure; when Investor Class performance exceeds that of the market index, other share classes may not. See page 3 for returns for all share classes.
Given the turmoil in Argentina and Turkey, our overweight exposure in those countries weighed on relative performance from an asset allocation perspective. In addition, our sovereign holdings in
Argentina detracted from performance. However, strong security selection in Turkey, primarily our
positions in the highest-quality banks, lifted relative results within Turkey, despite the negative effects of our overweight to the financials sector. Elsewhere, security selection in Russia, Chile, and Indonesia contributed to performance, as did an underweight position in real estate, especially in China and Indonesia.
Positioning for the Future
Looking ahead, we anticipate continued volatility. We expect U.S.-China trade tensions, diverging global growth, interest rate trends, and geopolitical events to challenge investor confidence. We believe prevailing risks include external financing needs (Turkey) and continued domestic political challenges (Turkey, Argentina, South Africa). However, the worst in Argentina and Turkey seems to be over after recent policy actions. In China, deleveraging and a possible slowdown while rebalancing to a consumption-led economy remain important drivers for commodities and the economic outlooks for many countries.
We continue to balance these dynamics with our long-term constructive view on emerging markets debt based on fundamental improvement across countries and companies. We remain cautiously constructive on emerging markets fundamentals, believing valuations are fairer after recent underperformance. We also believe U.S. dollar strength will moderate in conjunction with a slowdown in U.S. growth.
|
| |
| OCTOBER 31, 2018 |
| Portfolio at a Glance |
| Average Duration (effective) | 4.5 years |
| Weighted Average Life to Maturity | 5.5 years |
| | |
| Holdings by Country | % of net assets |
| China | 7.7% |
| Mexico | 7.1% |
| Turkey | 6.4% |
| Russia | 5.5% |
| Brazil | 5.3% |
| Colombia | 5.1% |
| India | 5.0% |
| Indonesia | 4.9% |
| South Africa | 4.0% |
| Peru | 3.5% |
| Other Countries | 33.2% |
| Cash and Equivalents* | 12.3% |
| *Includes temporary cash investments and other assets and liabilities. |
| | |
| Types of Investments in Portfolio | % of net assets |
| Corporate Bonds | 82.9% |
| Sovereign Governments and Agencies | 4.0% |
| U.S. Treasury Securities | 0.8% |
| Common Stocks | —** |
| Temporary Cash Investments | 12.0% |
| Other Assets and Liabilities | 0.3% |
**Category is less than 0.05% of total net assets.
Fund shareholders may incur two types of costs: (1) transaction costs, including sales charges (loads) on purchase payments and redemption/exchange fees; and (2) ongoing costs, including management fees; distribution and service (12b-1) fees; and other fund expenses. This example is intended to help you understand your ongoing costs (in dollars) of investing in your fund and to compare these costs with the ongoing cost of investing in other mutual funds.
The example is based on an investment of $1,000 made at the beginning of the period and held for the entire period from May 1, 2018 to October 31, 2018.
Actual Expenses
The table provides information about actual account values and actual expenses for each class. You may use the information, together with the amount you invested, to estimate the expenses that you paid over the period. First, identify the share class you own. Then simply divide your account value by $1,000 (for example, an $8,600 account value divided by $1,000 = 8.6), then multiply the result by the number under the heading “Expenses Paid During Period” to estimate the expenses you paid on your account during this period.
If you hold Investor Class shares of any American Century Investments fund, or I Class shares of the American Century Diversified Bond Fund, in an American Century Investments account (i.e., not a financial intermediary or retirement plan account), American Century Investments may charge you a $12.50 semiannual account maintenance fee if the value of those shares is less than $10,000. We will redeem shares automatically in one of your accounts to pay the $12.50 fee. In determining your total eligible investment amount, we will include your investments in all personal accounts (including American Century Investments Brokerage accounts) registered under your Social Security number. Personal accounts include individual accounts, joint accounts, UGMA/UTMA accounts, personal trusts, Coverdell Education Savings Accounts and IRAs (including traditional, Roth, Rollover, SEP-, SARSEP- and SIMPLE-IRAs), and certain other retirement accounts. If you have only business, business retirement, employer-sponsored or American Century Investments Brokerage accounts, you are currently not subject to this fee. If you are subject to the Account Maintenance Fee, your account value could be reduced by the fee amount.
Hypothetical Example for Comparison Purposes
The table also provides information about hypothetical account values and hypothetical expenses based on the actual expense ratio of each class of your fund and an assumed rate of return of 5% per year before expenses, which is not the actual return of a fund’s share class. The hypothetical account values and expenses may not be used to estimate the actual ending account balance or expenses you paid for the period. You may use this information to compare the ongoing costs of investing in your fund and other funds. To do so, compare this 5% hypothetical example with the 5% hypothetical examples that appear in the shareholder reports of the other funds.
Please note that the expenses shown in the table are meant to highlight your ongoing costs only and do not reflect any transactional costs, such as sales charges (loads) or redemption/exchange fees. Therefore, the table is useful in comparing ongoing costs only, and will not help you determine the relative total costs of owning different funds. In addition, if these transactional costs were included, your costs would have been higher.
|
| | | | |
| | Beginning
Account Value
5/1/18 | Ending
Account Value
10/31/18 | Expenses Paid
During Period(1)
5/1/18 - 10/31/18 |
Annualized
Expense Ratio(1) |
| Actual | | | | |
| Investor Class | $1,000 | $990.70 | $4.87 | 0.97% |
| I Class | $1,000 | $991.30 | $4.37 | 0.87% |
| Y Class | $1,000 | $991.70 | $3.87 | 0.77% |
| A Class | $1,000 | $989.50 | $6.12 | 1.22% |
| C Class | $1,000 | $986.70 | $9.86 | 1.97% |
| R Class | $1,000 | $988.20 | $7.37 | 1.47% |
| R5 Class | $1,000 | $991.80 | $3.87 | 0.77% |
| R6 Class | $1,000 | $992.00 | $3.62 | 0.72% |
| G Class | $1,000 | $995.50 | $0.05 | 0.01% |
| Hypothetical | | | | |
| Investor Class | $1,000 | $1,020.32 | $4.94 | 0.97% |
| I Class | $1,000 | $1,020.82 | $4.43 | 0.87% |
| Y Class | $1,000 | $1,021.32 | $3.92 | 0.77% |
| A Class | $1,000 | $1,019.06 | $6.21 | 1.22% |
| C Class | $1,000 | $1,015.28 | $10.01 | 1.97% |
| R Class | $1,000 | $1,017.80 | $7.48 | 1.47% |
| R5 Class | $1,000 | $1,021.32 | $3.92 | 0.77% |
| R6 Class | $1,000 | $1,021.58 | $3.67 | 0.72% |
| G Class | $1,000 | $1,025.16 | $0.05 | 0.01% |
| |
| (1) | Expenses are equal to the class's annualized expense ratio listed in the table above, multiplied by the average account value over the period, multiplied by 184, the number of days in the most recent fiscal half-year, divided by 365, to reflect the one-half year period. Annualized expense ratio reflects actual expenses, including any applicable fee waivers or expense reimbursements and excluding any acquired fund fees and expenses. |
OCTOBER 31, 2018
|
| | | | | | |
| | Principal Amount | Value |
| CORPORATE BONDS — 82.9% | | |
| Argentina — 2.3% | | |
Rio Energy SA / UGEN SA / UENSA SA, 6.875%, 2/1/25(1) | $ | 3,200,000 |
| $ | 2,528,000 |
|
| YPF SA, 8.75%, 4/4/24 | 6,750,000 |
| 6,665,625 |
|
| YPF SA, 6.95%, 7/21/27 | 200,000 |
| 169,790 |
|
| | | 9,363,415 |
|
| Brazil — 5.3% | | |
| Banco Do Brasil SA, 4.625%, 1/15/25 | 4,300,000 |
| 4,046,343 |
|
| Globo Comunicacao e Participacoes SA, 5.125%, 3/31/27 | 200,000 |
| 186,252 |
|
Globo Comunicacao e Participacoes SA, 5.125%, 3/31/27(1) | 200,000 |
| 186,252 |
|
| GTL Trade Finance, Inc., 7.25%, 4/16/44 | 1,200,000 |
| 1,249,512 |
|
| Minerva Luxembourg SA, 6.50%, 9/20/26 | 3,800,000 |
| 3,524,500 |
|
Minerva Luxembourg SA, 5.875%, 1/19/28(1) | 2,500,000 |
| 2,171,125 |
|
| Petrobras Global Finance BV, 8.75%, 5/23/26 | 3,950,000 |
| 4,427,357 |
|
| Petrobras Global Finance BV, 5.75%, 2/1/29 | 4,840,000 |
| 4,489,100 |
|
| Rumo Luxembourg Sarl, 7.375%, 2/9/24 | 500,000 |
| 518,750 |
|
Rumo Luxembourg Sarl, 5.875%, 1/18/25(1) | 1,200,000 |
| 1,143,762 |
|
| | | 21,942,953 |
|
| Chile — 2.0% | | |
| Geopark Ltd., 6.50%, 9/21/24 | 6,100,000 |
| 6,092,375 |
|
| VTR Finance BV, 6.875%, 1/15/24 | 1,955,000 |
| 1,986,769 |
|
| | | 8,079,144 |
|
| China — 7.7% | | |
| Avi Funding Co. Ltd., MTN, 3.80%, 9/16/25 | 2,000,000 |
| 1,939,666 |
|
| Baidu, Inc., 2.75%, 6/9/19 | 1,450,000 |
| 1,445,411 |
|
| China Overseas Finance Cayman V Ltd., 3.95%, 11/15/22 | 3,950,000 |
| 3,886,468 |
|
| China Resources Gas Group Ltd., MTN, 4.50%, 4/5/22 | 4,650,000 |
| 4,694,296 |
|
| CITIC Ltd., MTN, 6.80%, 1/17/23 | 2,250,000 |
| 2,455,708 |
|
| CNOOC Finance 2013 Ltd., 3.00%, 5/9/23 | 6,450,000 |
| 6,166,793 |
|
| CNPC General Capital Ltd., 2.75%, 5/14/19 | 400,000 |
| 398,755 |
|
| CRCC Yuxiang Ltd., 3.50%, 5/16/23 | 1,400,000 |
| 1,357,751 |
|
| JD.com, Inc., 3.875%, 4/29/26 | 3,500,000 |
| 3,149,579 |
|
Sinopec Group Overseas Development 2015 Ltd., 2.50%, 4/28/20(1) | 200,000 |
| 196,897 |
|
| Sinopec Group Overseas Development 2016 Ltd., 2.125%, 5/3/19 | 600,000 |
| 596,834 |
|
Sinopec Group Overseas Development 2017 Ltd., 2.25%, 9/13/20(1) | 700,000 |
| 683,836 |
|
Tencent Holdings Ltd., 3.60%, 1/19/28(1) | 5,150,000 |
| 4,730,938 |
|
| | | 31,702,932 |
|
| Colombia — 5.1% | | |
AI Candelaria Spain SLU, 7.50%, 12/15/28(1) | 3,900,000 |
| 3,856,125 |
|
| Ecopetrol SA, 7.625%, 7/23/19 | 3,000,000 |
| 3,094,500 |
|
| Ecopetrol SA, 5.875%, 5/28/45 | 1,800,000 |
| 1,720,350 |
|
Gran Tierra Energy International Holdings Ltd., 6.25%, 2/15/25(1) | 3,800,000 |
| 3,648,000 |
|
| Grupo de Inversiones Suramericana SA, 5.50%, 4/29/26 | 2,200,000 |
| 2,222,000 |
|
|
| | | | | | |
| | Principal Amount | Value |
Millicom International Cellular SA, 5.125%, 1/15/28(1) | $ | 500,000 |
| $ | 455,500 |
|
| SURA Asset Management SA, 4.875%, 4/17/24 | 3,200,000 |
| 3,175,200 |
|
| SURA Asset Management SA, 4.375%, 4/11/27 | 1,600,000 |
| 1,516,016 |
|
Transportadora de Gas Internacional SA ESP, 5.55%, 11/1/28(1)(2) | 1,200,000 |
| 1,209,120 |
|
| | | 20,896,811 |
|
| Ghana — 1.0% | | |
Tullow Oil plc, 7.00%, 3/1/25(1) | 4,300,000 |
| 4,219,805 |
|
| Guatemala — 1.6% | | |
| Comunicaciones Celulares SA Via Comcel Trust, 6.875%, 2/6/24 | 6,300,000 |
| 6,463,800 |
|
| Hong Kong — 1.0% | | |
Bank of East Asia Ltd. (The), MTN, VRN, 4.25%, 11/20/19(3) | 200,000 |
| 199,546 |
|
| China CITIC Bank International Ltd., MTN, 6.875%, 6/24/20 | 1,000,000 |
| 1,038,902 |
|
CK Hutchison International 17 II Ltd., 2.25%, 9/29/20(1) | 2,000,000 |
| 1,951,251 |
|
| HPHT Finance 17 Ltd., 2.75%, 9/11/22 | 1,000,000 |
| 945,983 |
|
| Hutchison Whampoa International 09 Ltd., 7.625%, 4/9/19 | 100,000 |
| 101,842 |
|
| | | 4,237,524 |
|
| India — 5.0% | | |
| Axis Bank Ltd., MTN, 3.00%, 8/8/22 | 2,800,000 |
| 2,663,786 |
|
| Bharti Airtel International Netherlands BV, 5.125%, 3/11/23 | 6,450,000 |
| 6,270,651 |
|
Greenko Investment Co., 4.875%, 8/16/23(1) | 2,400,000 |
| 2,151,000 |
|
| ICICI Bank Ltd., 5.75%, 11/16/20 | 400,000 |
| 413,420 |
|
| ICICI Bank Ltd., MTN, 4.00%, 3/18/26 | 2,500,000 |
| 2,319,228 |
|
| Reliance Industries Ltd., 4.125%, 1/28/25 | 2,400,000 |
| 2,311,600 |
|
Vedanta Resources plc, 6.125%, 8/9/24(1) | 3,400,000 |
| 3,016,970 |
|
| Vedanta Resources plc, 6.125%, 8/9/24 | 1,800,000 |
| 1,597,219 |
|
| | | 20,743,874 |
|
| Indonesia — 4.9% | | |
| Indika Energy Capital III Pte Ltd., 5.875%, 11/9/24 | 2,158,000 |
| 1,935,359 |
|
| Indo Energy Finance II BV, 6.375%, 1/24/23 | 5,400,000 |
| 5,186,700 |
|
| Listrindo Capital BV, 4.95%, 9/14/26 | 3,800,000 |
| 3,397,200 |
|
Minejesa Capital BV, 4.625%, 8/10/30(1) | 2,800,000 |
| 2,477,832 |
|
| Perusahaan Gas Negara Persero Tbk, 5.125%, 5/16/24 | 2,800,000 |
| 2,779,045 |
|
| Saka Energi Indonesia PT, 4.45%, 5/5/24 | 2,800,000 |
| 2,585,428 |
|
| TBG Global Pte Ltd., 5.25%, 2/10/22 | 1,700,000 |
| 1,668,276 |
|
| | | 20,029,840 |
|
| Ireland — 0.3% | | |
C&W Senior Financing DAC, 7.50%, 10/15/26(1) | 1,400,000 |
| 1,407,000 |
|
| Israel — 2.1% | | |
| Altice Financing SA, 7.50%, 5/15/26 | 2,000,000 |
| 1,885,000 |
|
Israel Electric Corp. Ltd., 6.875%, 6/21/23(1) | 1,300,000 |
| 1,424,462 |
|
Israel Electric Corp. Ltd., 5.00%, 11/12/24(1) | 800,000 |
| 810,000 |
|
| Teva Pharmaceutical Finance Netherlands III BV, 2.80%, 7/21/23 | 4,100,000 |
| 3,620,880 |
|
| Teva Pharmaceutical Finance Netherlands III BV, 6.75%, 3/1/28 | 1,000,000 |
| 1,024,324 |
|
| | | 8,764,666 |
|
| Jamaica — 1.5% | | |
| Digicel Group Ltd., 8.25%, 9/30/20 | 6,300,000 |
| 4,528,125 |
|
|
| | | | | | |
| | Principal Amount | Value |
| Digicel Ltd., 6.00%, 4/15/21 | $ | 1,600,000 |
| $ | 1,458,000 |
|
| | | 5,986,125 |
|
| Kazakhstan — 0.8% | | |
KazTransGas JSC, 4.375%, 9/26/27(1) | 3,400,000 |
| 3,218,549 |
|
| Kuwait — 0.6% | | |
| Equate Petrochemical BV, MTN, 4.25%, 11/3/26 | 1,584,000 |
| 1,537,088 |
|
| Kuwait Projects Co. SPC Ltd., 5.00%, 3/15/23 | 950,000 |
| 951,136 |
|
| | | 2,488,224 |
|
| Macau — 0.6% | | |
Sands China Ltd., 5.125%, 8/8/25(1) | 2,400,000 |
| 2,356,684 |
|
| Malaysia — 0.2% | | |
| Axiata SPV1 Labuan Ltd., 5.375%, 4/28/20 | 1,000,000 |
| 1,027,169 |
|
| Mexico — 7.1% | | |
Axtel SAB de CV, 6.375%, 11/14/24(1) | 1,550,000 |
| 1,488,000 |
|
| Banco Inbursa SA Institucion De Banca Multiple Grupo Financiero Inbursa, 4.125%, 6/6/24 | 4,300,000 |
| 4,095,750 |
|
Banco Mercantil del Norte SA, VRN, 5.75%, 10/4/26(3) | 4,000,000 |
| 3,663,800 |
|
BBVA Bancomer SA, VRN, 5.125%, 1/18/28(1)(3) | 3,300,000 |
| 2,923,833 |
|
| Cemex SAB de CV, 6.125%, 5/5/25 | 5,000,000 |
| 4,975,000 |
|
Cometa Energia SA de CV, 6.375%, 4/24/35(1) | 5,132,400 |
| 4,977,402 |
|
Controladora Mabe SA de CV, 5.60%, 10/23/28(1) | 3,100,000 |
| 2,983,750 |
|
| Grupo KUO SAB De CV, 5.75%, 7/7/27 | 2,450,000 |
| 2,303,906 |
|
Sixsigma Networks Mexico SA de CV, 7.50%, 5/2/25(1) | 1,950,000 |
| 1,850,063 |
|
| | | 29,261,504 |
|
| Nigeria — 1.7% | | |
| Guaranty Trust Bank plc, MTN, 6.00%, 11/8/18 | 500,000 |
| 501,109 |
|
IHS Netherlands Holdco BV, 9.50%, 10/27/21(1) | 2,130,000 |
| 2,154,127 |
|
| Zenith Bank plc, MTN, 6.25%, 4/22/19 | 4,400,000 |
| 4,423,918 |
|
| | | 7,079,154 |
|
| Panama — 1.9% | | |
| Banistmo SA, 3.65%, 9/19/22 | 3,886,000 |
| 3,696,558 |
|
C&W Senior Financing DAC, 6.875%, 9/15/27(1) | 4,179,000 |
| 4,001,392 |
|
| | | 7,697,950 |
|
| Peru — 3.5% | | |
Banco de Credito del Peru, 2.25%, 10/25/19(1) | 200,000 |
| 198,130 |
|
Banco Internacional del Peru SAA Interbank, 3.375%, 1/18/23(1) | 3,000,000 |
| 2,857,500 |
|
Banco Internacional del Peru SAA Interbank, VRN, 6.625%, 3/19/24(3) | 200,000 |
| 213,750 |
|
| Fenix Power Peru SA, 4.32%, 9/20/27 | 4,039,706 |
| 3,817,522 |
|
Intercorp Financial Services, Inc., 4.125%, 10/19/27(1) | 4,600,000 |
| 4,151,500 |
|
| Kallpa Generacion SA, 4.125%, 8/16/27 | 3,404,000 |
| 3,123,204 |
|
| | | 14,361,606 |
|
Philippines† | | |
| FPT Finance Ltd., 6.375%, 9/28/20 | 100,000 |
| 104,880 |
|
| Qatar — 2.8% | | |
Nakilat, Inc., 6.07%, 12/31/33(1) | 800,000 |
| 878,000 |
|
| Nakilat, Inc., 6.27%, 12/31/33 | 201,030 |
| 220,793 |
|
Ooredoo International Finance Ltd., 7.875%, 6/10/19(1) | 2,249,000 |
| 2,316,133 |
|
|
| | | | | | |
| | Principal Amount | Value |
| Ooredoo International Finance Ltd., MTN, 5.00%, 10/19/25 | $ | 3,500,000 |
| $ | 3,587,297 |
|
| Ooredoo Tamweel Ltd., 3.04%, 12/3/18 | 600,000 |
| 600,210 |
|
Ras Laffan Liquefied Natural Gas Co. Ltd. II, 5.30%, 9/30/20(1) | 286,780 |
| 292,085 |
|
| Ras Laffan Liquefied Natural Gas Co. Ltd. II, 5.30%, 9/30/20 | 220,600 |
| 224,681 |
|
Ras Laffan Liquefied Natural Gas Co. Ltd. III, 6.75%, 9/30/19(1) | 2,800,000 |
| 2,876,742 |
|
| Ras Laffan Liquefied Natural Gas Co. Ltd. III, 6.75%, 9/30/19 | 400,000 |
| 410,963 |
|
| | | 11,406,904 |
|
| Russia — 5.4% | | |
| Gazprom OAO Via Gaz Capital SA, 9.25%, 4/23/19 | 7,000,000 |
| 7,168,714 |
|
| Gazprom OAO Via Gaz Capital SA, MTN, 7.29%, 8/16/37 | 1,600,000 |
| 1,769,458 |
|
GTH Finance BV, 7.25%, 4/26/23(1) | 4,300,000 |
| 4,464,969 |
|
| Lukoil International Finance BV, 6.125%, 11/9/20 | 200,000 |
| 207,380 |
|
| Sberbank of Russia Via SB Capital SA, 5.18%, 6/28/19 | 4,600,000 |
| 4,624,729 |
|
| VEON Holdings BV, 5.20%, 2/13/19 | 2,400,000 |
| 2,410,800 |
|
| VEON Holdings BV, 4.95%, 6/16/24 | 1,500,000 |
| 1,423,605 |
|
| | | 22,069,655 |
|
| Saudi Arabia — 0.7% | | |
SABIC Capital II BV, 4.50%, 10/10/28(1) | 3,000,000 |
| 2,945,700 |
|
| Singapore — 2.5% | | |
| Oversea-Chinese Banking Corp. Ltd., MTN, 4.25%, 6/19/24 | 3,000,000 |
| 2,981,130 |
|
Oversea-Chinese Banking Corp. Ltd., MTN, VRN, 4.00%, 10/15/19(3) | 2,300,000 |
| 2,308,108 |
|
United Overseas Bank Ltd., MTN, VRN, 3.75%, 9/19/19(3) | 2,300,000 |
| 2,301,495 |
|
United Overseas Bank Ltd., MTN, VRN, 2.88%, 3/8/22(3) | 3,000,000 |
| 2,881,230 |
|
| | | 10,471,963 |
|
| South Africa — 3.0% | | |
Liquid Telecommunications Financing plc, 8.50%, 7/13/22(1) | 2,250,000 |
| 2,306,417 |
|
| MTN Mauritius Investments Ltd., 4.76%, 11/11/24 | 5,351,000 |
| 4,815,392 |
|
| Myriad International Holdings BV, 6.00%, 7/18/20 | 2,000,000 |
| 2,068,260 |
|
| SASOL Financing USA LLC, 6.50%, 9/27/28 | 1,500,000 |
| 1,520,979 |
|
| Stillwater Mining Co., 7.125%, 6/27/25 | 1,600,000 |
| 1,530,579 |
|
| | | 12,241,627 |
|
| South Korea — 2.0% | | |
Harvest Operations Corp., 3.00%, 9/21/22(1) | 2,800,000 |
| 2,714,307 |
|
| Hyundai Capital America, 2.55%, 2/6/19 | 200,000 |
| 199,699 |
|
| KEB Hana Bank, MTN, 4.375%, 9/30/24 | 3,200,000 |
| 3,160,464 |
|
| Woori Bank, MTN, 4.75%, 4/30/24 | 2,250,000 |
| 2,252,790 |
|
| | | 8,327,260 |
|
| Tanzania, United Republic Of — 0.4% | | |
| HTA Group Ltd., 9.125%, 3/8/22 | 1,600,000 |
| 1,637,867 |
|
| Thailand — 0.9% | | |
PTTEP Treasury Center Co. Ltd., VRN, 4.875%, 6/18/19(3) | 3,250,000 |
| 3,265,629 |
|
| Siam Commercial Bank PCL, MTN, 3.50%, 4/7/19 | 400,000 |
| 400,280 |
|
| | | 3,665,909 |
|
| Turkey — 5.8% | | |
Akbank Turk AS, VRN, 6.80%, 4/27/23(1)(3) | 3,700,000 |
| 2,978,981 |
|
| QNB Finansbank AS, MTN, 6.25%, 4/30/19 | 200,000 |
| 200,410 |
|
| Turk Telekomunikasyon AS, 3.75%, 6/19/19 | 2,750,000 |
| 2,717,927 |
|
|
| | | | | | |
| | Principal Amount | Value |
| Turk Telekomunikasyon AS, 4.875%, 6/19/24 | $ | 2,200,000 |
| $ | 1,913,710 |
|
| Turkiye Garanti Bankasi AS, MTN, 4.75%, 10/17/19 | 3,680,000 |
| 3,626,901 |
|
Turkiye Garanti Bankasi AS, VRN, 6.125%, 5/24/22(1)(3) | 2,600,000 |
| 2,169,450 |
|
Turkiye Is Bankasi AS, 6.125%, 4/25/24(1) | 300,000 |
| 249,722 |
|
| Turkiye Is Bankasi AS, MTN, 5.375%, 10/6/21 | 2,600,000 |
| 2,305,222 |
|
| Yapi ve Kredi Bankasi AS, 5.25%, 12/3/18 | 200,000 |
| 199,922 |
|
| Yapi ve Kredi Bankasi AS, 5.125%, 10/22/19 | 2,000,000 |
| 1,947,156 |
|
Yapi ve Kredi Bankasi AS, 5.85%, 6/21/24(1) | 2,300,000 |
| 1,964,614 |
|
| Yapi ve Kredi Bankasi AS, MTN, 6.10%, 3/16/23 | 4,050,000 |
| 3,554,122 |
|
| | | 23,828,137 |
|
| Ukraine — 0.4% | | |
MHP SE, 7.75%, 5/10/24(1) | 1,700,000 |
| 1,683,213 |
|
| United Arab Emirates — 0.7% | | |
Abu Dhabi National Energy Co. PJSC, 4.875%, 4/23/30(1) | 1,500,000 |
| 1,493,580 |
|
| ADCB Finance Cayman Ltd., MTN, 4.50%, 3/6/23 | 700,000 |
| 702,041 |
|
MDC GMTN B.V. Co., 4.50%, 11/7/28(1)(2) | 800,000 |
| 796,688 |
|
| | | 2,992,309 |
|
| Zambia — 2.1% | | |
| First Quantum Minerals Ltd., 7.25%, 4/1/23 | 1,450,000 |
| 1,344,875 |
|
First Quantum Minerals Ltd., 6.50%, 3/1/24(1) | 4,000,000 |
| 3,505,000 |
|
First Quantum Minerals Ltd., 6.875%, 3/1/26(1) | 4,450,000 |
| 3,860,375 |
|
| | | 8,710,250 |
|
TOTAL CORPORATE BONDS
(Cost $357,214,132) | | 341,414,403 |
|
| SOVEREIGN GOVERNMENTS AND AGENCIES — 4.0% | | |
| Argentina — 0.8% | | |
| Argentine Republic Government International Bond, 6.875%, 1/26/27 | 3,700,000 |
| 3,106,612 |
|
Jordan† | | |
Jordan Government International Bond, 7.375%, 10/10/47(1) | 200,000 |
| 181,638 |
|
| Oman — 0.4% | | |
| Oman Government International Bond, 5.375%, 3/8/27 | 1,800,000 |
| 1,698,246 |
|
| Russia — 0.1% | | |
| Russian Foreign Bond - Eurobond, 5.00%, 4/29/20 | 200,000 |
| 203,692 |
|
| Senegal — 0.4% | | |
Senegal Government International Bond, 6.75%, 3/13/48(1) | 2,050,000 |
| 1,696,887 |
|
| South Africa — 1.0% | | |
| Republic of South Africa Government International Bond, 5.50%, 3/9/20 | 4,100,000 |
| 4,148,987 |
|
| South Korea — 0.7% | | |
| Korea Gas Corp., 3.875%, 2/12/24 | 2,800,000 |
| 2,794,454 |
|
| Turkey — 0.6% | | |
| Turkey Government International Bond, 4.875%, 10/9/26 | 300,000 |
| 254,460 |
|
| Turkey Government International Bond, 5.75%, 3/22/24 | 2,550,000 |
| 2,381,052 |
|
| | | 2,635,512 |
|
TOTAL SOVEREIGN GOVERNMENTS AND AGENCIES
(Cost $17,423,520) | | 16,466,028 |
|
|
| | | | | | |
| | Principal Amount/Shares | Value |
| U.S. TREASURY SECURITIES — 0.8% | | |
| U.S. Treasury Notes, 2.25%, 8/15/27 | $ | 10,000 |
| $ | 9,325 |
|
| U.S. Treasury Notes, 2.875%, 8/15/28 | 3,365,000 |
| 3,287,973 |
|
| | | 3,297,298 |
|
TOTAL U.S. TREASURY SECURITIES
(Cost $3,367,897) | | 3,297,298 |
|
COMMON STOCKS† | | |
Colombia† | | |
Frontera Energy Corp.(4)
(Cost $202,817) | 2,078 |
| 27,076 |
|
TEMPORARY CASH INVESTMENTS(5) — 12.0% | | |
| Repurchase Agreement, BMO Capital Markets Corp., (collateralized by various U.S. Treasury obligations, 1.625% - 4.75%, 1/31/20 - 8/15/45, valued at $7,777,961), in a joint trading account at 2.00%, dated 10/31/18, due 11/1/18 (Delivery value $7,620,462) | | 7,620,039 |
|
| Repurchase Agreement, Fixed Income Clearing Corp., (collateralized by various U.S. Treasury obligations, 3.00%, 5/15/45, valued at $3,891,615), at 1.05%, dated 10/31/18, due 11/1/18 (Delivery value $3,813,111) | | 3,813,000 |
|
U.S. Treasury Bills, 2.11%, 11/15/18(6) | $ | 21,450,000 |
| 21,432,399 |
|
U.S. Treasury Bills, 2.15%, 12/6/18(6)(7) | 15,000,000 |
| 14,968,883 |
|
U.S. Treasury Bills, 2.34%, 1/24/19(6) | 1,700,000 |
| 1,691,035 |
|
TOTAL TEMPORARY CASH INVESTMENTS
(Cost $49,525,968) | | 49,525,356 |
|
TOTAL INVESTMENT SECURITIES — 99.7%
(Cost $427,734,334) | | 410,730,161 |
|
| OTHER ASSETS AND LIABILITIES — 0.3% | | 1,119,507 |
|
| TOTAL NET ASSETS — 100.0% | | $ | 411,849,668 |
|
FUTURES CONTRACTS PURCHASED
|
| | | | | | | | | | | | |
| Reference Entity | Contracts | Expiration
Date | Notional
Amount | Underlying
Contract
Value | Unrealized
Appreciation
(Depreciation) |
| U.S. Treasury 2-Year Notes | 205 |
| December 2018 | $ | 41,000,000 |
| $ | 43,184,532 |
| $ | (112,571 | ) |
| U.S. Treasury 5-Year Notes | 149 |
| December 2018 | $ | 14,900,000 |
| 16,745,039 |
| (116,165 | ) |
| U.S. Treasury Long Bonds | 79 |
| December 2018 | $ | 7,900,000 |
| 10,911,875 |
| (385,154 | ) |
| U.S. Treasury Ultra Bonds | 8 |
| December 2018 | $ | 800,000 |
| 1,193,750 |
| (76,643 | ) |
| | | | | $ | 72,035,196 |
| $ | (690,533 | ) |
FUTURES CONTRACTS SOLD
|
| | | | | | | | | | | | |
| Reference Entity | Contracts | Expiration
Date | Notional
Amount | Underlying
Contract
Value | Unrealized
Appreciation
(Depreciation) |
| U.S. Treasury 10-Year Ultra Notes | 77 |
| December 2018 | $ | 7,700,000 |
| $ | 9,633,422 |
| $ | 78,764 |
|
CREDIT DEFAULT SWAP AGREEMENTS |
| | | | | | | | | | | | | | | |
| Counterparty/ Reference Entity | Type | Fixed Rate
Received
(Paid) | Termination
Date | Notional
Amount | Premiums Paid (Received) | Unrealized
Appreciation
(Depreciation) | Value^ |
| Bank of America N.A. / Republic of Korea | Buy | (1.00)% | 12/20/23 | $ | 12,200,000 |
| $ | (346,324 | ) | $ | (10,535 | ) | $ | (356,859 | ) |
| Bank of America N.A. / Colombia Government International Bond | Buy | (1.00)% | 12/20/23 | $ | 10,350,000 |
| 59,867 |
| 64,867 |
| 124,734 |
|
| Bank of America N.A. / Mexican Government International Bond | Buy | (1.00)% | 12/20/23 | $ | 2,700,000 |
| 21,231 |
| 30,709 |
| 51,940 |
|
| Goldman Sachs & Co. / Republic of Korea | Buy | (1.00)% | 12/20/23 | $ | 16,600,000 |
| (447,182 | ) | (38,381 | ) | (485,563 | ) |
| Goldman Sachs & Co. / China International Bond | Buy | (1.00)% | 12/20/23 | $ | 13,760,000 |
| (257,952 | ) | 60,016 |
| (197,936 | ) |
| Goldman Sachs & Co. / Republic of Chile | Buy | (1.00)% | 12/20/23 | $ | 10,300,000 |
| (258,295 | ) | 20,532 |
| (237,763 | ) |
| Morgan Stanley / Mexican Government International Bond | Buy | (1.00)% | 12/20/23 | $ | 12,900,000 |
| 101,436 |
| 146,722 |
| 248,158 |
|
| | $ | (1,127,219 | ) | $ | 273,930 |
| $ | (853,289 | ) |
^The value for credit default swap agreements serve as an indicator of the current status of the payment/performance risk and represent the likelihood of an expected liability or profit at the period end. Increasing values in absolute terms when compared to the notional amount of the credit default swap agreement represent a deterioration of the referenced entity's credit soundness and an increased likelihood or risk of a credit event occurring as defined in the agreement.
|
| | |
| NOTES TO SCHEDULE OF INVESTMENTS |
| MTN | - | Medium Term Note |
| VRN | - | Variable Rate Note. Interest reset date is indicated. Rate shown is effective at the period end. |
| |
| † | Category is less than 0.05% of total net assets. |
| |
| (1) | Security was purchased pursuant to Rule 144A under the Securities Act of 1933 and may be sold in transactions exempt from registration, normally to qualified institutional investors. The aggregate value of these securities at the period end was $110,803,306, which represented 26.9% of total net assets. |
| |
| (2) | When-issued security. The issue price and yield are fixed on the date of the commitment, but payment and delivery are scheduled for a future date. |
| |
| (3) | Coupon rate adjusts periodically based upon a predetermined schedule. Interest reset date is indicated. Rate shown is effective at the period end. |
| |
| (5) | Category includes collateral received at the custodian bank for collateral requirements on swap agreements. At the period end, the aggregate value of cash deposits received was $130,000. |
| |
| (6) | The rate indicated is the yield to maturity at purchase. |
| |
| (7) | Security, or a portion thereof, has been pledged at the custodian bank or with a broker for collateral requirements on futures contracts and/or swap agreements. At the period end, the aggregate value of securities pledged was $1,735,285. |
See Notes to Financial Statements.
|
|
| Statement of Assets and Liabilities |
|
| | | |
| OCTOBER 31, 2018 | |
| Assets | |
| Investment securities, at value (cost of $427,734,334) | $ | 410,730,161 |
|
| Cash | 83,359 |
|
| Receivable for capital shares sold | 30,609 |
|
| Swap agreements, at value (including net premiums paid (received) of $182,534) | 424,832 |
|
| Interest receivable | 4,163,122 |
|
| | 415,432,083 |
|
| | |
| Liabilities | |
| Payable for collateral received for swap agreements | 130,000 |
|
| Payable for investments purchased | 1,996,688 |
|
| Payable for capital shares redeemed | 1,640 |
|
| Payable for variation margin on futures contracts | 93,344 |
|
| Swap agreements, at value (including net premiums paid (received) of $(1,309,753)) | 1,278,121 |
|
| Accrued management fees | 81,927 |
|
| Distribution and service fees payable | 86 |
|
| Dividends payable | 609 |
|
| | 3,582,415 |
|
| | |
| Net Assets | $ | 411,849,668 |
|
| | |
| Net Assets Consist of: | |
| Capital paid in | $ | 436,812,304 |
|
| Distributable earnings | (24,962,636 | ) |
| | $ | 411,849,668 |
|
|
| | | | | | |
| | Net Assets | Shares Outstanding | Net Asset Value Per Share |
| Investor Class |
| $90,831,110 |
| 9,276,324 |
| $9.79 |
| I Class |
| $6,165 |
| 630 |
| $9.79 |
| Y Class |
| $3,217,681 |
| 328,635 |
| $9.79 |
| A Class |
| $163,850 |
| 16,747 |
| $9.78* |
| C Class |
| $32,117 |
| 3,288 |
| $9.77 |
| R Class |
| $56,482 |
| 5,775 |
| $9.78 |
| R5 Class |
| $6,716 |
| 686 |
| $9.79 |
| R6 Class |
| $9,336,116 |
| 953,332 |
| $9.79 |
| G Class |
| $308,199,431 |
| 31,478,225 |
| $9.79 |
*Maximum offering price $10.24 (net asset value divided by 0.955).
See Notes to Financial Statements.
|
| | | |
| YEAR ENDED OCTOBER 31, 2018 |
| Investment Income (Loss) | |
| Income: | |
| Interest (net of foreign taxes withheld of $1,365) | $ | 18,275,865 |
|
| | |
| Expenses: | |
| Management fees | 3,127,095 |
|
| Distribution and service fees: | |
| A Class | 1,916 |
|
| C Class | 1,293 |
|
| R Class | 868 |
|
| Trustees' fees and expenses | 24,899 |
|
| Other expenses | 10,593 |
|
| | 3,166,664 |
|
| Fees waived - G Class | (2,156,198 | ) |
| | 1,010,466 |
|
| | |
| Net investment income (loss) | 17,265,399 |
|
| | |
| Realized and Unrealized Gain (Loss) | |
| Net realized gain (loss) on: | |
| Investment transactions | (8,533,598 | ) |
| Forward foreign currency exchange contract transactions | (39,063 | ) |
| Futures contract transactions | 500,635 |
|
| Swap agreement transactions | (231,590 | ) |
| Foreign currency translation transactions | (27,461 | ) |
| | (8,331,077 | ) |
| | |
| Change in net unrealized appreciation (depreciation) on: | |
| Investments | (17,455,578 | ) |
| Forward foreign currency exchange contracts | (119,506 | ) |
| Futures contracts | (576,945 | ) |
| Swap agreements | 306,085 |
|
| Translation of assets and liabilities in foreign currencies | 73 |
|
| | (17,845,871 | ) |
| | |
| Net realized and unrealized gain (loss) | (26,176,948 | ) |
| | |
| Net Increase (Decrease) in Net Assets Resulting from Operations | $ | (8,911,549 | ) |
See Notes to Financial Statements.
|
|
| Statement of Changes in Net Assets |
|
| | | | | | |
| YEARS ENDED OCTOBER 31, 2018 AND OCTOBER 31, 2017 |
| Increase (Decrease) in Net Assets | October 31, 2018 | October 31, 2017 |
| Operations | | |
| Net investment income (loss) | $ | 17,265,399 |
| $ | 1,256,846 |
|
| Net realized gain (loss) | (8,331,077 | ) | 917,716 |
|
| Change in net unrealized appreciation (depreciation) | (17,845,871 | ) | (271,674 | ) |
| Net increase (decrease) in net assets resulting from operations | (8,911,549 | ) | 1,902,888 |
|
| | | |
| Distributions to Shareholders | | |
From earnings:(1) | | |
| Investor Class | (3,255,567 | ) | (154,699 | ) |
| I Class | (602 | ) | (429 | ) |
| Y Class | (33,864 | ) | (98 | ) |
| A Class | (20,233 | ) | (232,487 | ) |
| C Class | (2,413 | ) | (32,513 | ) |
| R Class | (4,376 | ) | (39,275 | ) |
| R5 Class | (16,456 | ) | (237,479 | ) |
| R6 Class | (329,821 | ) | (735,708 | ) |
| G Class | (13,802,738 | ) | — |
|
| Decrease in net assets from distributions | (17,466,070 | ) | (1,432,688 | ) |
| | | |
| Capital Share Transactions | | |
| Net increase (decrease) in net assets from capital share transactions (Note 5) | 400,103,186 |
| 4,094,966 |
|
| | | |
| Net increase (decrease) in net assets | 373,725,567 |
| 4,565,166 |
|
| | | |
| Net Assets | | |
| Beginning of period | 38,124,101 |
| 33,558,935 |
|
| End of period | $ | 411,849,668 |
| $ | 38,124,101 |
|
| |
| (1) | Prior period presentation has been updated to reflect the current period combination of distributions to shareholders from net investment income and net realized gains. Distributions from net investment income were $(136,419), $(429), $(98), $(195,891), $(26,040), $(32,720), $(204,399) and $(635,782) for Investor Class, I Class, Y Class, A Class, C Class, R Class, R5 Class and R6 Class, respectively. Distributions from net realized gains were $(18,280), $(36,596), $(6,473), $(6,555), $(33,080) and $(99,926) for Investor Class, A Class, C Class, R Class, R5 Class and R6 Class, respectively. |
See Notes to Financial Statements.
|
|
| Notes to Financial Statements |
OCTOBER 31, 2018
1. Organization
American Century International Bond Funds (the trust) is registered under the Investment Company Act of 1940, as amended (the 1940 Act), as an open-end management investment company and is organized as a Massachusetts business trust. Emerging Markets Debt Fund (the fund) is one fund in a series issued by the trust. The fund’s investment objective is to seek total return.
The fund offers the Investor Class, I Class, Y Class, A Class, C Class, R Class, R5 Class, R6 Class and G Class. The A Class may incur an initial sales charge. The A Class and C Class may be subject to a contingent deferred sales charge. Sale of the I Class and Y Class commenced on April 10, 2017 and sale of the G Class commenced on November 14, 2017.
2. Significant Accounting Policies
The following is a summary of significant accounting policies consistently followed by the fund in preparation of its financial statements. The fund is an investment company and follows accounting and reporting guidance in accordance with accounting principles generally accepted in the United States of America. This may require management to make certain estimates and assumptions at the date of the financial statements. Actual results could differ from these estimates. Management evaluated the impact of events or transactions occurring through the date the financial statements were issued that would merit recognition or disclosure.
Investment Valuations — The fund determines the fair value of its investments and computes its net asset value per share at the close of regular trading (usually 4 p.m. Eastern time) on the New York Stock Exchange (NYSE) on each day the NYSE is open. The Board of Trustees has adopted valuation policies and procedures to guide the investment advisor in the fund’s investment valuation process and to provide methodologies for the oversight of the fund’s pricing function.
Fixed income securities are valued at the evaluated mean as provided by independent pricing services or at the mean of the most recent bid and asked prices as provided by investment dealers. Sovereign governments and agencies, corporate bonds, and U.S. Treasury and Government Agency securities are valued using market models that consider trade data, quotations from dealers and active market makers, relevant yield curve and spread data, creditworthiness, trade data or market information on comparable securities, and other relevant security specific information.
Equity securities that are listed or traded on a domestic securities exchange are valued at the last reported sales price or at the official closing price as provided by the exchange. Equity securities traded on foreign securities exchanges are generally valued at the closing price of such securities on the exchange where primarily traded or at the close of the NYSE, if that is earlier. If no last sales price is reported, or if local convention or regulation so provides, the mean of the latest bid and asked prices may be used. Securities traded over-the-counter are valued at the mean of the latest bid and asked prices, the last sales price, or the official closing price. Equity securities initially expressed in local currencies are translated into U.S. dollars at the mean of the appropriate currency exchange rate at the close of the NYSE as provided by an independent pricing service.
Open-end management investment companies are valued at the reported net asset value per share. Repurchase agreements are valued at cost, which approximates fair value. Exchange-traded futures contracts are valued at the settlement price as provided by the appropriate exchange. Swap agreements are valued at an evaluated mean as provided by independent pricing services or independent brokers. Forward foreign currency exchange contracts are valued at the mean of the appropriate forward exchange rate at the close of the NYSE as provided by an independent pricing service.
If the fund determines that the market price for an investment is not readily available or the valuation methods mentioned above do not reflect an investment’s fair value, such investment is valued as determined in good faith by the Board of Trustees or its delegate, in accordance with policies and procedures adopted by the Board of Trustees. In its determination of fair value, the fund may review several factors including, but not limited to, market information regarding the specific investment or comparable investments and correlation with other investment types, futures indices or general market indicators. Circumstances that may cause the fund to use these procedures to value an investment include, but are not limited to: an investment has been
declared in default or is distressed; trading in a security has been suspended during the trading day or a security is not actively trading on its principal exchange; prices received from a regular pricing source are deemed unreliable; or there is a foreign market holiday and no trading occurred.
The fund monitors for significant events occurring after the close of an investment’s primary exchange but before the fund’s net asset value per share is determined. Significant events may include, but are not limited to: corporate announcements and transactions; governmental action and political unrest that could impact a specific investment or an investment sector; or armed conflicts, natural disasters and similar events that could affect investments in a specific country or region. The fund also monitors for significant fluctuations between domestic and foreign markets, as evidenced by the U.S. market or such other indicators that the Board of Trustees, or its delegate, deems appropriate. If significant fluctuations in foreign markets are identified, the fund may apply a model-derived factor to the closing price of equity securities traded on foreign securities exchanges. The factor is based on observable market data as provided by an independent pricing service.
Security Transactions — Security transactions are accounted for as of the trade date. Net realized gains and losses are determined on the identified cost basis, which is also used for federal income tax purposes.
Investment Income — Interest income less foreign taxes withheld, if any, is recorded on the accrual basis and includes accretion of discounts and amortization of premiums. Inflation adjustments related to inflation-linked debt securities are reflected as interest income.
Foreign Currency Translations — All assets and liabilities initially expressed in foreign currencies are translated into U.S. dollars at prevailing exchange rates at period end. The fund may enter into spot foreign currency exchange contracts to facilitate transactions denominated in a foreign currency. Purchases and sales of investment securities, dividend and interest income, spot foreign currency exchange contracts, and expenses are translated at the rates of exchange prevailing on the respective dates of such transactions. Net realized and unrealized foreign currency exchange gains or losses related to investment securities are a component of net realized gain (loss) on investment transactions and change in net unrealized appreciation (depreciation) on investments, respectively.
Repurchase Agreements — The fund may enter into repurchase agreements with institutions that American Century Investment Management, Inc. (ACIM) (the investment advisor) has determined are creditworthy pursuant to criteria adopted by the Board of Trustees. The fund requires that the collateral, represented by securities, received in a repurchase transaction be transferred to the custodian in a manner sufficient to enable the fund to obtain those securities in the event of a default under the repurchase agreement. ACIM monitors, on a daily basis, the securities transferred to ensure the value, including accrued interest, of the securities under each repurchase agreement is equal to or greater than amounts owed to the fund under each repurchase agreement.
Joint Trading Account — Pursuant to an Exemptive Order issued by the Securities and Exchange Commission, the fund, along with certain other funds in the American Century Investments family of funds, may transfer uninvested cash balances into a joint trading account. These balances are invested in one or more repurchase agreements that are collateralized by U.S. Treasury or Agency obligations.
Segregated Assets — In accordance with the 1940 Act, the fund segregates assets on its books and records to cover certain types of investment securities and other financial instruments. ACIM monitors, on a daily basis, the securities segregated to ensure the fund designates a sufficient amount of liquid assets, marked-to-market daily. The fund may also receive assets or be required to pledge assets at the custodian bank or with a broker for collateral requirements.
Income Tax Status — It is the fund’s policy to distribute substantially all net investment income and net realized gains to shareholders and to otherwise qualify as a regulated investment company under provisions of the Internal Revenue Code. Accordingly, no provision has been made for income taxes. The fund files U.S. federal, state, local and non-U.S. tax returns as applicable. The fund's tax returns are subject to examination by the relevant taxing authority until expiration of the applicable statute of limitations, which is generally three years from the date of filing but can be longer in certain jurisdictions. At this time, management believes there are no uncertain tax positions which, based on their technical merit, would not be sustained upon examination and for which it is reasonably possible that the total amounts of unrecognized tax benefits will significantly change in the next twelve months.
Multiple Class — All shares of the fund represent an equal pro rata interest in the net assets of the class to which such shares belong, and have identical voting, dividend, liquidation and other rights and the same terms and conditions, except for class specific expenses and exclusive rights to vote on matters affecting only individual classes. Income, non-class specific expenses, and realized and unrealized capital gains and losses of the fund are allocated to each class of shares based on their relative net assets.
Distributions to Shareholders — Distributions from net investment income, if any, are declared daily and paid monthly. Distributions from net realized gains, if any, are generally declared and paid annually.
Indemnifications — Under the trust’s organizational documents, its officers and trustees are indemnified against certain liabilities arising out of the performance of their duties to the fund. In addition, in the normal course of business, the fund enters into contracts that provide general indemnifications. The maximum exposure under these arrangements is unknown as this would involve future claims that may be made against a fund. The risk of material loss from such claims is considered by management to be remote.
3. Fees and Transactions with Related Parties
Certain officers and trustees of the trust are also officers and/or directors of American Century Companies, Inc. (ACC). The trust's investment advisor, ACIM, the trust's distributor, American Century Investment Services, Inc. (ACIS), and the trust's transfer agent, American Century Services, LLC, are wholly owned, directly or indirectly, by ACC. Various funds issued by American Century Asset Allocation Portfolios, Inc., American Century Strategic Asset Allocations, Inc. and American Century Investment Trust own, in aggregate, 98% of the shares of the fund. Related parties do not invest in the fund for the purpose of exercising management or control.
Management Fees — The trust has entered into a management agreement with ACIM, under which ACIM provides the fund with investment advisory and management services in exchange for a single, unified management fee (the fee) per class. The agreement provides that all expenses of managing and operating the fund, except distribution and service fees, brokerage expenses, taxes, interest, fees and expenses of the independent trustees (including legal counsel fees), and extraordinary expenses, will be paid by ACIM. The fee is computed and accrued daily based on each class's daily net assets and paid monthly in arrears. The difference in the fee among the classes is a result of their separate arrangements for non-Rule 12b-1 shareholder services. It is not the result of any difference in advisory or custodial fees or other expenses related to the management of the fund’s assets, which do not vary by class. Effective November 14, 2017, the investment advisor agreed to waive the G Class’s management fee in its entirety. The investment advisor expects this waiver to remain in effect permanently and cannot terminate it without the approval of the Board of Trustees.
The annual management fee for each class is as follows:
|
| | | | | | | | |
| Investor Class | I Class | Y Class | A Class | C Class | R Class | R5 Class | R6 Class | G Class |
| 0.96% | 0.86% | 0.76% | 0.96% | 0.96% | 0.96% | 0.76% | 0.71% | 0.00%(1) |
(1) Effective annual management fee before waiver was 0.71%.
Distribution and Service Fees — The Board of Trustees has adopted a separate Master Distribution and Individual Shareholder Services Plan for each of the A Class, C Class and R Class (collectively the plans), pursuant to Rule 12b-1 of the 1940 Act. The plans provide that the A Class will pay ACIS an annual distribution and service fee of 0.25%. The plans provide that the C Class will pay ACIS an annual distribution and service fee of 1.00%, of which 0.25% is paid for individual shareholder services and 0.75% is paid for distribution services. The plans provide that the R Class will pay ACIS an annual distribution and service fee of 0.50%. The fees are computed and accrued daily based on each class’s daily net assets and paid monthly in arrears. The fees are used to pay financial intermediaries for distribution and individual shareholder services. Fees incurred under the plans during the period ended October 31, 2018 are detailed in the Statement of Operations.
Trustees’ Fees and Expenses — The Board of Trustees is responsible for overseeing the investment advisor’s management and operations of the fund. The trustees receive detailed information about the fund and its investment advisor regularly throughout the year, and meet at least quarterly with management of the investment advisor to review reports about fund operations. The fund’s officers do not receive compensation from the fund.
Interfund Transactions — The fund may enter into security transactions with other American Century
Investments funds and other client accounts of the investment advisor, in accordance with the 1940 Act rules
and procedures adopted by the Board of Trustees. The rules and procedures require, among other things, that
these transactions be effected at the independent current market price of the security. There were no interfund
transactions during the period.
4. Investment Transactions
Purchases of investment securities, excluding short-term investments, for the period ended October 31, 2018 totaled $639,596,793, of which $3,357,902 represented U.S. Treasury and Government Agency obligations.
Sales of investment securities, excluding short-term investments, for the period ended October 31, 2018 totaled $285,211,500, none of which were U.S. Treasury and Government Agency obligations.
5. Capital Share Transactions
Transactions in shares of the fund were as follows (unlimited number of shares authorized):
|
| | | | | | | | | | |
| | Year ended
October 31, 2018(1) | Year ended October 31, 2017(2) |
| | Shares | Amount | Shares | Amount |
| Investor Class | | | | |
| Sold | 9,147,728 |
| $ | 95,335,284 |
| 582,422 |
| $ | 6,023,796 |
|
| Issued in reinvestment of distributions | 322,406 |
| 3,246,066 |
| 14,657 |
| 150,735 |
|
| Redeemed | (829,610 | ) | (8,449,493 | ) | (338,952 | ) | (3,465,672 | ) |
| | 8,640,524 |
| 90,131,857 |
| 258,127 |
| 2,708,859 |
|
| I Class | | | | |
| Sold | 3,252 |
| 32,258 |
| 3,639 |
| 37,719 |
|
| Issued in reinvestment of distributions | 58 |
| 588 |
| 41 |
| 429 |
|
| Redeemed | (6,340 | ) | (63,956 | ) | (20 | ) | (204 | ) |
| | (3,030 | ) | (31,110 | ) | 3,660 |
| 37,944 |
|
| Y Class | | | | |
| Sold | 337,441 |
| 3,343,360 |
| 485 |
| 5,000 |
|
| Issued in reinvestment of distributions | 3,433 |
| 33,864 |
| 10 |
| 98 |
|
| Redeemed | (12,734 | ) | (127,715 | ) | — |
| — |
|
| | 328,140 |
| 3,249,509 |
| 495 |
| 5,098 |
|
| A Class | | | | |
| Sold | 3,959 |
| 41,014 |
| 11,352 |
| 118,176 |
|
| Issued in reinvestment of distributions | 1,794 |
| 18,489 |
| 22,681 |
| 232,487 |
|
| Redeemed | (623,646 | ) | (6,491,855 | ) | (8,319 | ) | (86,038 | ) |
| | (617,893 | ) | (6,432,352 | ) | 25,714 |
| 264,625 |
|
| C Class | | | | |
| Sold | 2,033 |
| 20,410 |
| 962 |
| 10,000 |
|
| Issued in reinvestment of distributions | 235 |
| 2,413 |
| 3,180 |
| 32,497 |
|
| Redeemed | (108,899 | ) | (1,132,372 | ) | (2,044 | ) | (21,053 | ) |
| | (106,631 | ) | (1,109,549 | ) | 2,098 |
| 21,444 |
|
| R Class | | | | |
| Sold | 5,130 |
| 51,958 |
| 4,099 |
| 42,218 |
|
| Issued in reinvestment of distributions | 399 |
| 4,078 |
| 3,835 |
| 39,275 |
|
| Redeemed | (115,392 | ) | (1,198,873 | ) | (951 | ) | (9,915 | ) |
| | (109,863 | ) | (1,142,837 | ) | 6,983 |
| 71,578 |
|
| R5 Class | | | | |
| Issued in reinvestment of distributions | 1,582 |
| 16,456 |
| 23,143 |
| 237,479 |
|
| Redeemed | (574,523 | ) | (5,986,535 | ) | — |
| — |
|
| | (572,941 | ) | (5,970,079 | ) | 23,143 |
| 237,479 |
|
| R6 Class | | | | |
| Sold | 454,041 |
| 4,596,064 |
| 349,756 |
| 3,540,873 |
|
| Issued in reinvestment of distributions | 32,460 |
| 326,652 |
| 71,619 |
| 735,307 |
|
| Redeemed | (1,113,021 | ) | (11,555,409 | ) | (339,248 | ) | (3,528,241 | ) |
| | (626,520 | ) | (6,632,693 | ) | 82,127 |
| 747,939 |
|
| G Class | | | N/A |
| |
| Sold | 33,180,882 |
| 345,146,979 |
| | |
| Issued in reinvestment of distributions | 1,373,015 |
| 13,802,738 |
| | |
| Redeemed | (3,075,672 | ) | (30,909,277 | ) | | |
| | 31,478,225 |
| 328,040,440 |
| | |
| Net increase (decrease) | 38,410,011 |
| $ | 400,103,186 |
| 402,347 |
| $ | 4,094,966 |
|
| |
| (1) | November 14, 2017 (commencement of sale) through October 31, 2018 for the G Class. |
| |
| (2) | April 10, 2017 (commencement of sale) through October 31, 2017 for the I Class and Y Class. |
6. Fair Value Measurements
The fund’s investments valuation process is based on several considerations and may use multiple inputs to determine the fair value of the investments held by the fund. In conformity with accounting principles generally accepted in the United States of America, the inputs used to determine a valuation are classified into three broad levels.
| |
| • | Level 1 valuation inputs consist of unadjusted quoted prices in an active market for identical investments. |
| |
| • | Level 2 valuation inputs consist of direct or indirect observable market data (including quoted prices for comparable investments, evaluations of subsequent market events, interest rates, prepayment speeds, credit risk, etc.). These inputs also consist of quoted prices for identical investments initially expressed in local currencies that are adjusted through translation into U.S. dollars. |
| |
| • | Level 3 valuation inputs consist of unobservable data (including a fund’s own assumptions). |
The level classification is based on the lowest level input that is significant to the fair valuation measurement. The valuation inputs are not necessarily an indication of the risks associated with investing in these securities or other financial instruments.
The following is a summary of the level classifications as of period end. The Schedule of Investments provides additional information on the fund’s portfolio holdings.
|
| | | | | | | | |
| | Level 1 | Level 2 | Level 3 |
| Assets | | | |
| Investment Securities | | | |
| Corporate Bonds | — |
| $ | 341,414,403 |
| — |
|
| Sovereign Governments and Agencies | — |
| 16,466,028 |
| — |
|
| U.S. Treasury Securities | — |
| 3,297,298 |
| — |
|
| Common Stocks | $ | 27,076 |
| — |
| — |
|
| Temporary Cash Investments | — |
| 49,525,356 |
| — |
|
| | $ | 27,076 |
| $ | 410,703,085 |
| — |
|
| Other Financial Instruments | | | |
| Futures Contracts | $ | 78,764 |
| — |
| — |
|
| Swap Agreements | — |
| $ | 424,832 |
| — |
|
| | $ | 78,764 |
| $ | 424,832 |
| — |
|
| | | | |
| Liabilities | | | |
| Other Financial Instruments | | | |
| Futures Contracts | $ | 690,533 |
| — |
| — |
|
| Swap Agreements | — |
| $ | 1,278,121 |
| — |
|
| | $ | 690,533 |
| $ | 1,278,121 |
| — |
|
7. Derivative Instruments
Credit Risk — The fund is subject to credit risk in the normal course of pursuing its investment objectives. The value of a bond generally declines as the credit quality of its issuer declines. Credit default swap agreements enable a fund to buy/sell protection against a credit event of a specific issuer or index. A fund may attempt to enhance returns by selling protection or attempt to mitigate credit risk by buying protection. The buyer/seller of credit protection against a security or basket of securities may pay/receive an up-front or periodic payment to compensate for/against potential default events. Changes in value, including the periodic amounts of interest to be paid or received on swap agreements, are recorded as unrealized appreciation (depreciation) on swap agreements. Upon entering into a centrally cleared swap, a fund is required to deposit cash or securities (initial margin) with a financial intermediary in an amount equal to a certain percentage of the notional amount. Subsequent payments (variation margin) are made or received daily, in cash, by a fund. The variation margin is equal to the daily change in the value and is a component of unrealized gains and losses. Realized gain or loss is recorded upon receipt or payment of a periodic settlement or termination of swap agreements. Net realized and unrealized gains or losses occurring during the holding period of swap agreements are a component of net realized gain (loss) on swap agreement transactions and change in net unrealized appreciation (depreciation) on swap agreements, respectively. The risks of entering into swap agreements include the possible lack of liquidity, failure of the counterparty to meet its obligations, and that there may be unfavorable changes in the underlying investments or instruments. The fund's average notional amount held during the period was $64,024,167.
Foreign Currency Risk — The fund is subject to foreign currency exchange rate risk in the normal course of pursuing its investment objectives. The value of foreign investments held by a fund may be significantly affected by changes in foreign currency exchange rates. The dollar value of a foreign security generally decreases when the value of the dollar rises against the foreign currency in which the security is denominated and tends to increase when the value of the dollar declines against such foreign currency. A fund may enter into forward foreign currency exchange contracts to reduce a fund's exposure to foreign currency exchange rate fluctuations or to gain exposure to the fluctuations in the value of foreign currencies. The net U.S. dollar value of foreign currency underlying all contractual commitments held by a fund and the resulting unrealized appreciation or depreciation are determined daily. Realized gain or loss is recorded upon the termination of the contract. Net realized and unrealized gains or losses occurring during the holding period of forward foreign currency exchange contracts are a component of net realized gain (loss) on forward foreign currency exchange contract transactions and change in net unrealized appreciation (depreciation) on forward foreign currency exchange contracts, respectively. A fund bears the risk of an unfavorable change in the foreign currency exchange rate underlying the forward contract. Additionally, losses, up to the fair value, may arise if the counterparties do not perform under the contract terms. The fund's average U.S. dollar exposure to foreign currency risk derivative instruments held during the period was $9,591,909.
Interest Rate Risk — The fund is subject to interest rate risk in the normal course of pursuing its investment objectives. The value of bonds generally declines as interest rates rise. A fund may enter into futures contracts based on a bond index or a specific underlying security. A fund may purchase futures contracts to gain exposure to increases in market value or sell futures contracts to protect against a decline in market value. Upon entering into a futures contract, a fund will segregate cash, cash equivalents or other appropriate liquid securities on its records in amounts sufficient to meet requirements. Subsequent payments (variation margin) are made or received daily, in cash, by a fund. The variation margin is equal to the daily change in the contract value and is recorded as unrealized gains and losses. A fund recognizes a realized gain or loss when the futures contract is closed or expires. Net realized and unrealized gains or losses occurring during the holding period of futures contracts are a component of net realized gain (loss) on futures contract transactions and change in net unrealized appreciation (depreciation) on futures contracts, respectively. One of the risks of entering into futures contracts is the possibility that the change in value of the contract may not correlate with the changes in value of the underlying securities. The fund's average notional exposure to these interest rate risk derivative instruments held during the period was $63,366,667 futures contracts purchased and $16,041,667 futures contracts sold.
Value of Derivative Instruments as of October 31, 2018
|
| | | | | | | | |
| | Asset Derivatives | Liability Derivatives |
| Type of Risk Exposure | Location on Statement of Assets and Liabilities | Value | Location on Statement of Assets and Liabilities | Value |
| Credit Risk | Swap agreements | $ | 424,832 |
| Swap agreements | $ | 1,278,121 |
|
| Interest Rate Risk | Receivable for variation margin on futures contracts* | — |
| Payable for variation margin on futures contracts* | 93,344 |
|
| | | $ | 424,832 |
| | $ | 1,371,465 |
|
* Included in the unrealized appreciation (depreciation) on futures contracts as reported in the Schedule of Investments.
Effect of Derivative Instruments on the Statement of Operations for the Year Ended October 31, 2018
|
| | | | | | | | |
| | Net Realized Gain (Loss) | Change in Net Unrealized Appreciation (Depreciation) |
| Type of Risk Exposure | Location on Statement of Operations | Value | Location on Statement of Operations | Value |
| Credit Risk | Net realized gain (loss) on swap agreement transactions | $ | (231,590 | ) | Change in net unrealized appreciation (depreciation) on swap agreements | $ | 306,085 |
|
| Foreign Currency Risk | Net realized gain (loss) on forward foreign currency exchange contract transactions | (39,063 | ) | Change in net unrealized appreciation (depreciation) on forward foreign currency exchange contracts | (119,506 | ) |
| Interest Rate Risk | Net realized gain (loss) on futures contract transactions | 500,635 |
| Change in net unrealized appreciation (depreciation) on futures contracts | (576,945 | ) |
| | | $ | 229,982 |
| | $ | (390,366 | ) |
8. Risk Factors
There are certain risks involved in investing in foreign securities. These risks include those resulting from future adverse political, social and economic developments, fluctuations in currency exchange rates, the possible imposition of exchange controls, and other foreign laws or restrictions. Investing in emerging markets may accentuate these risks.
The fund may invest in lower-rated debt securities, which are subject to substantial risks including liquidity risk and credit risk.
9. Federal Tax Information
The tax character of distributions paid during the years ended October 31, 2018 and October 31, 2017 were as follows:
|
| | | | | | |
| | 2018 | 2017 |
| Distributions Paid From | | |
| Ordinary income | $ | 17,144,275 |
| $ | 1,432,688 |
|
| Long-term capital gains | $ | 321,795 |
| — |
|
The book-basis character of distributions made during the year from net investment income or net realized gains may differ from their ultimate characterization for federal income tax purposes. These differences reflect the differing character of certain income items and net realized gains and losses for financial statement and tax purposes, and may result in reclassification among certain capital accounts on the financial statements.
As of period end, the federal tax cost of investments and the components of distributable earnings on a tax-basis were as follows:
|
| | | |
| Federal tax cost of investments | $ | 427,744,328 |
|
| Gross tax appreciation of investments | $ | 296,641 |
|
| Gross tax depreciation of investments | (17,310,808 | ) |
| Net tax appreciation (depreciation) of investments | (17,014,167 | ) |
| Net tax appreciation (depreciation) on derivatives and translation of assets and liabilities in foreign currencies | 365,875 |
|
| Net tax appreciation (depreciation) | $ | (16,648,292 | ) |
| Undistributed ordinary income | $ | 266,764 |
|
| Accumulated short-term capital losses | $ | (8,509,166 | ) |
| Accumulated long-term capital losses | $ | (71,942 | ) |
The difference between book-basis and tax-basis unrealized appreciation (depreciation) is attributable primarily to the realization for tax purposes of unrealized gains (losses) on futures contracts.
Accumulated capital losses represent net capital loss carryovers that may be used to offset future realized capital gains for federal income tax purposes. The capital loss carryovers may be carried forward for an unlimited period. Future capital loss carryover utilization in any given year may be subject to Internal Revenue Code limitations.
10. Recently Issued Accounting Standards
In March 2017, the Financial Accounting Standards Board (FASB) issued Accounting Standards Update No. 2017-08, “Receivables - Nonrefundable Fees and Other Costs (Subtopic 310-20), Premium Amortization on Purchased Callable Debt Securities” (ASU 2017-08). ASU 2017-08 amends the amortization period for certain purchased callable debt securities held at a premium, shortening such period to the earliest call date. The amendments are effective for fiscal years, and interim periods within those fiscal years, beginning after December 15, 2018. Management is currently evaluating the impact that adopting ASU 2017-08 will have on the financial statements.
|
| | | | | | | | | | | | | | | |
| For a Share Outstanding Throughout the Years Ended October 31 (except as noted) | | | |
| Per-Share Data | | | | | | | | | Ratios and Supplemental Data |
| | | Income From Investment Operations: | Distributions From: | | | Ratio to Average Net Assets of: | | |
| | Net Asset
Value,
Beginning
of Period | Net
Investment
Income
(Loss)(1) | Net
Realized
and
Unrealized
Gain (Loss) | Total From
Investment
Operations | Net
Investment
Income | Net
Realized
Gains | Total
Distributions | Net Asset
Value,
End
of Period | Total
Return(2) | Operating
Expenses | Net
Investment
Income
(Loss) | Portfolio
Turnover
Rate | Net
Assets,
End of
Period
(in thousands) |
| Investor Class | | | | | | | | | | | | |
| 2018 | $10.43 | 0.35 | (0.64) | (0.29) | (0.33) | (0.02) | (0.35) | $9.79 | (2.76)% | 0.97% | 3.52% | 85% |
| $90,831 |
|
| 2017 | $10.32 | 0.35 | 0.16 | 0.51 | (0.34) | (0.06) | (0.40) | $10.43 | 5.11% | 0.97% | 3.39% | 154% |
| $6,634 |
|
| 2016 | $9.75 | 0.36 | 0.57 | 0.93 | (0.36) | — | (0.36) | $10.32 | 9.77% | 0.97% | 3.59% | 97% |
| $3,898 |
|
2015(3) | $9.88 | 0.11 | (0.13) | (0.02) | (0.11) | — | (0.11) | $9.75 | (0.22)% | 0.97%(4) | 3.19%(4) | 35% |
| $1,878 |
|
2015(5) | $10.00 | 0.28 | (0.11) | 0.17 | (0.29) | — | (0.29) | $9.88 | 1.72% | 0.97%(4) | 3.18%(4) | 46% |
| $3,312 |
|
| I Class | | | | | | | | | | | |
| 2018 | $10.44 | 0.34 | (0.63) | (0.29) | (0.34) | (0.02) | (0.36) | $9.79 | (2.76)% | 0.87% | 3.62% | 85% |
| $6 |
|
2017(6) | $10.30 | 0.20 | 0.14 | 0.34 | (0.20) | — | (0.20) | $10.44 | 3.28% | 0.87%(4) | 3.38%(4) | 154%(7) |
| $38 |
|
| Y Class | | | | | | | | | | | |
| 2018 | $10.44 | 0.40 | (0.68) | (0.28) | (0.35) | (0.02) | (0.37) | $9.79 | (2.67)% | 0.77% | 3.72% | 85% |
| $3,218 |
|
2017(6) | $10.30 | 0.21 | 0.13 | 0.34 | (0.20) | — | (0.20) | $10.44 | 3.33% | 0.77%(4) | 3.52%(4) | 154%(7) |
| $5 |
|
| A Class | | | | | | | | | | | | |
| 2018 | $10.43 | 0.28 | (0.60) | (0.32) | (0.31) | (0.02) | (0.33) | $9.78 | (3.11)% | 1.22% | 3.27% | 85% |
| $164 |
|
| 2017 | $10.32 | 0.32 | 0.17 | 0.49 | (0.32) | (0.06) | (0.38) | $10.43 | 4.84% | 1.22% | 3.14% | 154% |
| $6,619 |
|
| 2016 | $9.74 | 0.33 | 0.59 | 0.92 | (0.34) | — | (0.34) | $10.32 | 9.61% | 1.22% | 3.34% | 97% |
| $6,282 |
|
2015(3) | $9.87 | 0.10 | (0.13) | (0.03) | (0.10) | — | (0.10) | $9.74 | (0.31)% | 1.22%(4) | 2.94%(4) | 35% |
| $5,671 |
|
2015(5) | $10.00 | 0.27 | (0.13) | 0.14 | (0.27) | — | (0.27) | $9.87 | 1.45% | 1.22%(4) | 2.93%(4) | 46% |
| $6,660 |
|
|
| | | | | | | | | | | | | | | |
| For a Share Outstanding Throughout the Years Ended October 31 (except as noted) | | | |
| Per-Share Data | | | | | | | | | Ratios and Supplemental Data |
| | | Income From Investment Operations: | Distributions From: | | | Ratio to Average Net Assets of: | | |
| | Net Asset
Value,
Beginning
of Period | Net
Investment
Income
(Loss)(1) | Net
Realized
and
Unrealized
Gain (Loss) | Total From
Investment
Operations | Net
Investment
Income | Net
Realized
Gains | Total
Distributions | Net Asset
Value,
End
of Period | Total
Return(2) | Operating
Expenses | Net
Investment
Income
(Loss) | Portfolio
Turnover
Rate | Net
Assets,
End of
Period
(in thousands) |
| C Class | | | | | | | | |
| 2018 | $10.41 | 0.20 | (0.59) | (0.39) | (0.23) | (0.02) | (0.25) | $9.77 | (3.74)% | 1.97% | 2.52% | 85% |
| $32 |
|
| 2017 | $10.30 | 0.25 | 0.16 | 0.41 | (0.24) | (0.06) | (0.30) | $10.41 | 4.07% | 1.97% | 2.39% | 154% |
| $1,144 |
|
| 2016 | $9.72 | 0.26 | 0.58 | 0.84 | (0.26) | — | (0.26) | $10.30 | 8.81% | 1.97% | 2.59% | 97% |
| $1,110 |
|
2015(3) | $9.85 | 0.07 | (0.13) | (0.06) | (0.07) | — | (0.07) | $9.72 | (0.57)% | 1.97%(4) | 2.19%(4) | 35% |
| $1,013 |
|
2015(5) | $10.00 | 0.20 | (0.13) | 0.07 | (0.22) | — | (0.22) | $9.85 | 0.74% | 1.97%(4) | 2.18%(4) | 46% |
| $1,019 |
|
| R Class | | | | | | | | |
| 2018 | $10.42 | 0.26 | (0.60) | (0.34) | (0.28) | (0.02) | (0.30) | $9.78 | (3.26)% | 1.47% | 3.02% | 85% |
| $56 |
|
| 2017 | $10.31 | 0.30 | 0.16 | 0.46 | (0.29) | (0.06) | (0.35) | $10.42 | 4.58% | 1.47% | 2.89% | 154% |
| $1,205 |
|
| 2016 | $9.73 | 0.31 | 0.58 | 0.89 | (0.31) | — | (0.31) | $10.31 | 9.34% | 1.47% | 3.09% | 97% |
| $1,120 |
|
2015(3) | $9.86 | 0.09 | (0.13) | (0.04) | (0.09) | — | (0.09) | $9.73 | (0.40)% | 1.47%(4) | 2.69%(4) | 35% |
| $1,009 |
|
2015(5) | $10.00 | 0.24 | (0.12) | 0.12 | (0.26) | — | (0.26) | $9.86 | 1.18% | 1.47%(4) | 2.68%(4) | 46% |
| $1,012 |
|
| R5 Class | | | | | | | | |
| 2018 | $10.43 | 0.31 | (0.57) | (0.26) | (0.36) | (0.02) | (0.38) | $9.79 | (2.55)% | 0.77% | 3.72% | 85% |
| $7 |
|
| 2017 | $10.32 | 0.37 | 0.16 | 0.53 | (0.36) | (0.06) | (0.42) | $10.43 | 5.31% | 0.77% | 3.59% | 154% |
| $5,986 |
|
| 2016 | $9.75 | 0.38 | 0.57 | 0.95 | (0.38) | — | (0.38) | $10.32 | 9.99% | 0.77% | 3.79% | 97% |
| $5,682 |
|
2015(3) | $9.87 | 0.11 | (0.12) | (0.01) | (0.11) | — | (0.11) | $9.75 | (0.16)% | 0.77%(4) | 3.39%(4) | 35% |
| $5,164 |
|
2015(5) | $10.00 | 0.31 | (0.13) | 0.18 | (0.31) | — | (0.31) | $9.87 | 1.91% | 0.77%(4) | 3.38%(4) | 46% |
| $6,671 |
|
|
| | | | | | | | | | | | | | | |
| For a Share Outstanding Throughout the Years Ended October 31 (except as noted) | | | |
| Per-Share Data | | | | | | | | | Ratios and Supplemental Data |
| | | Income From Investment Operations: | Distributions From: | | | Ratio to Average Net Assets of: | | |
| | Net Asset
Value,
Beginning
of Period | Net
Investment
Income
(Loss)(1) | Net
Realized
and
Unrealized
Gain (Loss) | Total From
Investment
Operations | Net
Investment
Income | Net
Realized
Gains | Total
Distributions | Net Asset
Value,
End
of Period | Total
Return(2) | Operating
Expenses | Net
Investment
Income
(Loss) | Portfolio
Turnover
Rate | Net
Assets,
End of
Period
(in thousands) |
| R6 Class | | | | | | | | |
| 2018 | $10.44 | 0.37 | (0.64) | (0.27) | (0.36) | (0.02) | (0.38) | $9.79 | (2.61)% | 0.72% | 3.77% | 85% |
| $9,336 |
|
| 2017 | $10.33 | 0.38 | 0.16 | 0.54 | (0.37) | (0.06) | (0.43) | $10.44 | 5.37% | 0.72% | 3.64% | 154% |
| $16,492 |
|
| 2016 | $9.75 | 0.38 | 0.59 | 0.97 | (0.39) | — | (0.39) | $10.33 | 10.15% | 0.72% | 3.84% | 97% |
| $15,465 |
|
2015(3) | $9.88 | 0.11 | (0.12) | (0.01) | (0.12) | — | (0.12) | $9.75 | (0.14)% | 0.72%(4) | 3.44%(4) | 35% |
| $12,290 |
|
2015(5) | $10.00 | 0.32 | (0.13) | 0.19 | (0.31) | — | (0.31) | $9.88 | 1.96% | 0.72%(4) | 3.43%(4) | 46% |
| $8,699 |
|
| G Class | | | | | | | | |
2018(8) | $10.40 | 0.44 | (0.62) | (0.18) | (0.41) | (0.02) | (0.43) | $9.79 | (1.59)% | 0.01%(4)(9) | 4.49%(4)(9) | 85%(10) |
| $308,199 |
|
|
|
| Notes to Financial Highlights |
| |
| (1) | Computed using average shares outstanding throughout the period. |
| |
| (2) | Total returns are calculated based on the net asset value of the last business day and do not reflect applicable sales charges, if any. Total returns for periods less than one year are not annualized. |
| |
| (3) | July 1, 2015 through October 31, 2015. The fund's fiscal year end was changed from June 30 to October 31, resulting in a four-month annual reporting period. |
| |
| (5) | July 29, 2014 (fund inception) through June 30, 2015. |
| |
| (6) | April 10, 2017 (commencement of sale) through October 31, 2017. |
| |
| (7) | Portfolio turnover is calculated at the fund level. Percentage indicated was calculated for the year ended October 31, 2017. |
| |
| (8) | November 14, 2017 (commencement of sale) through October 31, 2018. |
| |
| (9) | The annualized ratio of operating expenses to average net assets before expense waiver and the annualized ratio of net investment income (loss) to average net assets before expense waiver was 0.72% and 3.78%, respectively. |
| |
| (10) | Portfolio turnover is calculated at the fund level. Percentage indicated was calculated for the year ended October 31, 2018. |
See Notes to Financial Statements.
|
|
| Report of Independent Registered Public Accounting Firm |
To the Board of Trustees of American Century International Bond Funds and Shareholders of Emerging Markets Debt Fund:
Opinion on the Financial Statements
We have audited the accompanying statement of assets and liabilities, including the schedule of investments, of Emerging Markets Debt Fund (one of the funds constituting American Century International Bond Funds, referred to hereafter as the “Fund”) as of October 31, 2018, the related statement of operations for the year ended October 31, 2018, the statement of changes in net assets for each of the two years in the period ended October 31, 2018, including the related notes, and the financial highlights for each of the periods indicated therein (collectively referred to as the “financial statements”). In our opinion, the financial statements present fairly, in all material respects, the financial position of the Fund as of October 31, 2018, the results of its operations for the year then ended, the changes in its net assets for each of the two years in the period ended October 31, 2018 and the financial highlights for each of the periods indicated therein in conformity with accounting principles generally accepted in the United States of America.
Basis for Opinion
These financial statements are the responsibility of the Fund’s management. Our responsibility is to express an opinion on the Fund’s financial statements based on our audits. We are a public accounting firm registered with the Public Company Accounting Oversight Board (United States) (“PCAOB”) and are required to be independent with respect to the Fund in accordance with the U.S. federal securities laws and the applicable rules and regulations of the Securities and Exchange Commission and the PCAOB.
We conducted our audits of these financial statements in accordance with the standards of the PCAOB. Those standards require that we plan and perform the audit to obtain reasonable assurance about whether the financial statements are free of material misstatement, whether due to error or fraud.
Our audits included performing procedures to assess the risks of material misstatement of the financial statements, whether due to error or fraud, and performing procedures that respond to those risks. Such procedures included examining, on a test basis, evidence regarding the amounts and disclosures in the financial statements. Our audits also included evaluating the accounting principles used and significant estimates made by management, as well as evaluating the overall presentation of the financial statements. Our procedures included confirmation of securities owned as of October 31, 2018 by correspondence with the custodian and brokers; when replies were not received from brokers, we performed other auditing procedures. We believe that our audits provide a reasonable basis for our opinion.
/s/ PricewaterhouseCoopers LLP
Kansas City, Missouri
December 18, 2018
We have served as the auditor of one or more investment companies in American Century Investments since 1997.
Board of Trustees
The individuals listed below serve as trustees of the funds. Each trustee will continue to serve in this capacity until death, retirement, resignation or removal from office. The board has adopted a mandatory retirement age for trustees who are not “interested persons,” as that term is defined in the Investment Company Act (independent trustees). Independent trustees shall retire on December 31 of the year in which they reach their 75th birthday; provided, however, that on or after January 1, 2022, independent trustees shall retire on December 31 of the year in which they reach their 76th birthday.
Mr. Thomas is an “interested person” because he currently serves as President and Chief Executive Officer of American Century Companies, Inc. (ACC), the parent company of American Century Investment Management, Inc. (ACIM or the advisor). The other trustees (more than three-fourths of the total number) are independent. They are not employees, directors or officers of, and have no financial interest in, ACC or any of its wholly owned, direct or indirect, subsidiaries, including ACIM, American Century Investment Services, Inc. (ACIS) and American Century Services, LLC (ACS), and they do not have any other affiliations, positions or relationships that would cause them to be considered “interested persons” under the Investment Company Act. The trustees serve in this capacity for eight (in the case of Jonathan S. Thomas, 16; and Ronald J. Gilson, 9) registered investment companies in the American Century Investments family of funds.
The following table presents additional information about the trustees. The mailing address for each trustee other than Mr. Thomas is 1665 Charleston Road, Mountain View, California 94043. The mailing address for Mr. Thomas is 4500 Main Street, Kansas City, Missouri 64111.
|
| | | | | |
Name
(Year of Birth) | Position(s) Held with Funds | Length of Time Served | Principal Occupation(s) During Past 5 Years | Number of American Century Portfolios Overseen by Trustee | Other Directorships Held During Past 5 Years |
| Independent Trustees |
|
|
Tanya S. Beder
(1955) | Trustee | Since 2011 | Chairman and CEO, SBCC Group Inc. (independent advisory services) (2006 to present) | 45 | CYS Investments, Inc.; Nabors Industries Ltd. |
Jeremy I. Bulow
(1954) | Trustee | Since 2011 | Professor of Economics, Stanford University, Graduate School of Business (1979 to present) | 45 | None |
Anne Casscells
(1958) | Trustee | Since 2016 | Co-Chief Executive Officer and Chief Investment Officer, Aetos Alternatives Management (investment advisory firm) (2001 to present); Lecturer in Accounting, Stanford University, Graduate School of Business (2009 to present) | 45 | None |
Ronald J. Gilson
(1946) | Trustee and Chairman of the Board | Since 1995
(Chairman since 2005) | Charles J. Meyers Professor of Law and Business, Emeritus, Stanford Law School (1979 to present); Marc and Eva Stern Professor of Law and Business, Columbia University School of Law (1992 to present) | 50 | None |
|
| | | | | |
Name
(Year of Birth) | Position(s) Held with Funds | Length of Time Served | Principal Occupation(s) During Past 5 Years | Number of American Century Portfolios Overseen by Trustee | Other Directorships Held During Past 5 Years |
| Independent Trustees |
|
|
Frederick L. A. Grauer
(1946) | Trustee | Since 2008 | Senior Advisor, iShares by BlackRock, Inc. (investment management firm) (2010 to 2011, 2013 to 2015); Senior Advisor, Course Hero (an educational technology company) (2015 to present) | 45 | None |
Jonathan D. Levin
(1972) | Trustee | Since 2016 | Philip H. Knight Professor and Dean, Graduate School of Business, Stanford University (2016 to present); Professor, Stanford University, (2000 to present); Chair, Department of Economics, Stanford University (2011 to 2014) | 45 | None |
Peter F. Pervere
(1947) | Trustee | Since 2007 | Retired | 45 | None |
John B. Shoven
(1947) | Trustee | Since 2002 | Charles R. Schwab Professor of Economics, Stanford University (1973 to present) | 45 | Cadence Design Systems; Exponent; Financial Engines |
| Interested Trustee |
|
|
Jonathan S. Thomas
(1963) | Trustee and President | Since 2007 | President and Chief Executive Officer, ACC (March 2007 to present). Also serves as Chief Executive Officer, ACS; Executive Vice President, ACIM; Director, ACC, ACIM and other ACC subsidiaries | 117 | BioMed Valley Discoveries, Inc. |
The Statement of Additional Information has additional information about the fund's trustees and is available without charge, upon request, by calling 1-800-345-2021.
Officers
The following table presents certain information about the executive officers of the funds. Each officer serves as an officer for 16 (in the case of Robert J. Leach, 15) investment companies in the American Century family of funds. No officer is compensated for his or her service as an officer of the funds. The listed officers are interested persons of the funds and are appointed or re-appointed on an annual basis. The mailing address for each of the officers listed below is 4500 Main Street, Kansas City, Missouri 64111.
|
| | |
Name
(Year of Birth) | Offices with the Funds | Principal Occupation(s) During the Past Five Years |
Jonathan S. Thomas
(1963) | Trustee and President since 2007 | President and Chief Executive Officer, ACC (2007 to present). Also serves as Chief Executive Officer, ACS; Executive Vice President, ACIM; Director, ACC, ACIM and other ACC subsidiaries |
R. Wes Campbell
(1974) | Chief Financial Officer and Treasurer since 2018
| Investment Operations and Investment Accounting, ACS (2000 to present)
|
Amy D. Shelton
(1964) | Chief Compliance Officer and Vice President since 2014 | Chief Compliance Officer, American Century funds, (2014 to present); Chief Compliance Officer, ACIM (2014 to present); Chief Compliance Officer, ACIS (2009 to present); Vice President, Client Interactions and Marketing, ACIS (2013 to 2014). Also serves as Vice President, ACIS |
Charles A. Etherington
(1957) | General Counsel since 2007 and Senior Vice President since 2006 | Attorney, ACC (1994 to present); Vice President, ACC (2005 to present); General Counsel, ACC (2007 to present). Also serves as General Counsel, ACIM, ACS, ACIS and other ACC subsidiaries; and Senior Vice President, ACIM and ACS |
C. Jean Wade
(1964) | Vice President since 2012 | Senior Vice President, ACS (2017 to present); Vice President ACS (2000 to 2017) |
Robert J. Leach
(1966) | Vice President since 2006 | Vice President, ACS (2000 to present) |
David H. Reinmiller
(1963) | Vice President since 2000 | Attorney, ACC (1994 to present). Also serves as Vice President, ACIM and ACS |
Ward D. Stauffer
(1960) | Secretary since 2005 | Attorney, ACC (2003 to present) |
|
|
Approval of Management Agreement
|
At a meeting held on June 19, 2018, the Fund’s Board of Trustees (the "Board") unanimously approved the renewal of the management agreement pursuant to which American Century Investment Management, Inc. (the “Advisor”) acts as the investment advisor for the Fund. Under Section 15(c) of the Investment Company Act, contracts for investment advisory services are required to be reviewed, evaluated, and approved by a majority of a fund’s directors/trustees, including a majority of the independent Trustees, each year. The Board regards this annual evaluation and renewal as one of its most important responsibilities.
The independent Trustees have memorialized a statement regarding the relationship between their ongoing obligations to oversee and evaluate the performance of the Advisor and their annual consideration of renewal of the management agreement. In that statement, the independent Trustees noted that their assessment of the Advisor’s performance is an ongoing process that takes place over the entire year and is informed by all of the extensive information that the Board and its committees receive and consider over time. This information, together with the additional materials provided specifically in connection with the review, are central to the Board’s assessment of the Advisor’s performance and its determination whether to renew the Fund’s management agreement.
Prior to its consideration of the renewal of the management agreement, the Board requested and reviewed extensive data and analysis relating to the proposed renewal. This information and analysis was compiled by the Advisor and certain independent providers of evaluation data concerning the Fund and the services provided to the Fund by the Advisor.
In connection with its consideration of the renewal of the management agreement, the Board’s review and evaluation of the services provided by the Advisor included, but was not limited to, the following:
| |
| • | the nature, extent, and quality of investment management, shareholder services, and other services provided to the Fund; |
| |
| • | the wide range of other programs and services the Advisor provides to the Fund and its shareholders on a routine and non-routine basis; |
| |
| • | the investment performance of the Fund, including data comparing the Fund’s performance to appropriate benchmarks and/or a peer group of other mutual funds with similar investment objectives and strategies; |
| |
| • | the cost of owning the Fund compared to the cost of owning similar funds; |
| |
| • | the Advisor’s compliance policies, procedures, and regulatory experience; |
| |
| • | financial data showing the cost of services provided to the Fund, the profitability of the Fund to the Advisor, and the overall profitability of the Advisor; |
| |
| • | strategic plans of the Advisor; |
| |
| • | any economies of scale associated with the Advisor’s management of the Fund and other accounts; |
| |
| • | services provided and charges to other investment management clients of the Advisor; |
| |
| • | acquired fund fees and expenses; |
| |
| • | payments and practices in connection with financial intermediaries holding shares of the Fund and the services provided by intermediaries in connection therewith; and |
| |
| • | any collateral benefits derived by the Advisor from the management of the Fund. |
In keeping with its practice, the Board held two in-person meetings to review and discuss the information provided in response to their request and held active discussions with the Advisor regarding the renewal of the management agreement. The independent Trustees had the benefit of the advice of their independent counsel throughout the process.
Factors Considered
The Trustees considered all of the information provided by the Advisor, the independent data providers, and the independent Trustees’ independent counsel in connection with the approval. They determined that the information was sufficient for them to evaluate the management agreement for the Fund. In connection with their review, the Trustees did not identify any single factor as being all-important or controlling and each Trustee may have attributed different levels of importance to different factors. In deciding to renew the management agreement, the Board based its decision on a number of factors, including the following:
Nature, Extent and Quality of Services - Generally. Under the management agreement, the Advisor is responsible for providing or arranging for all services necessary for the operation of the Fund. The Board noted that the Advisor provides or arranges at its own expense a wide variety of services including:
| |
| • | constructing and designing the Fund |
| |
| • | portfolio research and security selection |
| |
| • | initial capitalization/funding |
| |
| • | daily valuation of the Fund’s portfolio |
| |
| • | shareholder servicing and transfer agency, including shareholder confirmations, recordkeeping, and communications |
| |
| • | legal services (except the independent Trustees’ counsel) |
| |
| • | regulatory and portfolio compliance |
| |
| • | marketing and distribution (except amounts paid by the Fund under Rule 12b-1 plans) |
The Board noted that many of these services have expanded over time in terms of both quantity and complexity in response to shareholder demands, competition in the industry, changing distribution channels, and the changing regulatory environment.
Investment Management, Shareholder, and Other Services. The nature of the investment management services provided to the Fund is quite complex and allows Fund shareholders access to professional money management, instant diversification of their investments within an asset class, the opportunity to easily diversify among asset classes by investing in or exchanging among various American Century Investments funds, and liquidity. In evaluating investment performance, the Board expects the Advisor to manage the Fund in accordance with its investment objectives and approved strategies. Further, the Trustees recognize that the Advisor has an obligation to seek the best execution of fund trades. In providing these services, the Advisor utilizes teams of investment professionals (portfolio managers, analysts, research assistants, and securities traders) who require extensive information technology, research, training, compliance, and other systems to conduct their business. The Board, directly and through its Portfolio Committee, regularly reviews investment performance information for the Fund, together with comparative information for appropriate benchmarks and/or peer groups of similarly-managed funds, over different time horizons. The Trustees also review detailed performance information during the management agreement approval process. If performance concerns are identified, the Fund receives special reviews until performance improves, during which the Board discusses with the Advisor the reasons for such results (e.g., market conditions, security selection) and any efforts being undertaken to improve performance. The Fund’s performance was above its benchmark for the three-year period and below its benchmark for the one-year period reviewed by the Board. The Board found the investment management services provided by the Advisor to the Fund to be satisfactory and consistent with the management agreement.
Under the management agreement, the Advisor provides the Fund with a comprehensive package of transfer agency, shareholder, and other services. The Board, directly and through various committees of the Board, regularly reviews reports and evaluations of such services at its regular meetings. These reports include, but are not limited to, information regarding the operational efficiency and accuracy of the shareholder and transfer agency services provided, staffing levels, shareholder satisfaction (as measured by external as well as internal sources), technology support, new products and services offered to Fund shareholders, securities trading activities, portfolio valuation services, auditing services, and legal and operational compliance activities. The Board found the services provided by the Advisor to the Fund under the management agreement to be competitive and of high quality.
Costs of Services and Profitability. The Advisor provides detailed information concerning its cost of providing various services to the Fund, its profitability in managing the Fund, its overall profitability, and its financial condition. The Trustees have reviewed with the Advisor the methodology used to prepare this financial information. This information is considered in evaluating the Advisor’s financial condition, its ability to continue to provide services under the management agreement, and the reasonableness of the current management fee. The Board concluded that the Advisor’s profits were reasonable in light of the services provided to the Fund.
Economies of Scale. The Board also reviewed information provided by the Advisor regarding the possible existence of economies of scale in connection with the management of the Fund. The Board concluded that economies of scale are difficult to measure and predict with precision, especially on a fund-by-fund basis. The Board concluded that the Advisor is appropriately sharing economies of scale through its competitive fee structure, offering competitive fees from fund inception, and through reinvestment in its business to provide shareholders enhanced and expanded services.
Comparison to Other Funds’ Fees. The management agreement provides that the Fund pays the Advisor a single, all-inclusive (or unified) management fee for providing all services necessary for the management and operation of the Fund, other than brokerage expenses, expenses attributable to short sales, taxes, interest, extraordinary expenses, the fees and expenses of the Fund’s independent Trustees (including their independent legal counsel), and expenses incurred in connection with the provision of shareholder services and distribution services under a plan adopted pursuant to Rule 12b-1 under the 1940 Act. Under the unified fee structure, the Advisor is responsible for providing all investment advisory, custody, audit, administrative, compliance, recordkeeping, marketing, and shareholder services, or arranging and supervising third parties to provide such services. By contrast, most other funds are charged a variety of fees, including an investment advisory fee, a transfer agency fee, an administrative fee, distribution charges, and other expenses. Other than their investment advisory fees and any applicable Rule 12b-1 distribution fees, all other components of the total fees charged by these other funds may be increased without shareholder approval. The Board believes the unified fee structure is a benefit to Fund shareholders because it clearly discloses to shareholders the cost of owning Fund shares, and, since the unified fee cannot be increased without a vote of Fund shareholders, it shifts to the Advisor the risk of increased costs of operating the Fund and provides a direct incentive to minimize administrative inefficiencies. Part of the Board’s analysis of fee levels involves reviewing certain evaluative data compiled by an independent provider and comparing the Fund’s unified fee to the total expense ratio of peer funds. The unified fee charged to shareholders of the Fund was below the median of the total expense ratios of the Fund’s peer universe. The Board concluded that the management fee paid by the Fund to the Advisor under the management agreement is reasonable in light of the services provided to the Fund.
Comparison to Fees and Services Provided to Other Clients of the Advisor. The Board also requested and received information from the Advisor concerning the nature of the services, fees, costs, and profitability of its advisory services to advisory clients other than the Fund. They observed that these varying types of client accounts require different services and involve different regulatory and entrepreneurial risks than the management of the Fund. The Board analyzed this
information and concluded that the fees charged and services provided to the Fund were reasonable by comparison.
Payments to Intermediaries. The Trustees also requested and received a description of payments made to intermediaries by the Fund and the Advisor and services provided by intermediaries. These payments include various payments made by the Fund or the Advisor to different types of intermediaries and recordkeepers for distribution and service activities provided for the Fund. The Trustees reviewed such information and received representations from the Advisor that all such payments by the Fund were made pursuant to the Fund’s Rule 12b-1 Plan and that all such payments by the Advisor were made from the Advisor’s resources and reasonable profits. The Board found such payments to be reasonable in scope and purpose.
Collateral or “Fall-Out” Benefits Derived by the Advisor. The Board considered the existence of collateral benefits the Advisor may receive as a result of its relationship with the Fund. The Board noted that the Advisor’s primary business is managing mutual funds and it generally does not use fund or shareholder information to generate profits in other lines of business, and therefore does not derive any significant collateral benefits from them. The Board noted that the Advisor may receive proprietary research from broker-dealers that execute fund portfolio transactions. The Board also determined that the Advisor is able to provide investment management services to certain clients other than the Fund, at least in part, due to its existing infrastructure built to serve the fund complex.
Existing Relationship. The Board also considered whether there was any reason for not continuing the existing arrangement with the Advisor. In this regard, the Board was mindful of the potential disruptions of the Fund’s operations and various risks, uncertainties, and other effects that could occur as a result of a decision not to continue such relationship. In particular, the Board recognized that most shareholders have invested in the Fund on the strength of the Advisor’s industry standing and reputation and in the expectation that the Advisor will have a continuing role in providing advisory services to the Fund.
Conclusion of the Trustees. As a result of this process, the Board, including all of the independent Trustees and assisted by the advice of independent legal counsel, taking into account all of the factors discussed above and the information provided by the Advisor and others in connection with its review and throughout the year, concluded that the management agreement between the Fund and the Advisor is fair and reasonable in light of the services provided and should be renewed.
Retirement Account Information
As required by law, distributions you receive from certain retirement accounts are subject to federal income tax withholding, unless you elect not to have withholding apply*. Tax will be withheld on the total amount withdrawn even though you may be receiving amounts that are not subject to withholding, such as nondeductible contributions. In such case, excess amounts of withholding could occur. You may adjust your withholding election so that a greater or lesser amount will be withheld.
If you don’t want us to withhold on this amount, you must notify us to not withhold the federal income tax. You may notify us in writing or in certain situations by telephone or through other electronic means. For systematic withdrawals, your withholding election will remain in effect until revoked or changed by filing a new election. You have the right to revoke your election at any time and change your withholding percentage for future distributions.
Remember, even if you elect not to have income tax withheld, you are liable for paying income tax on the taxable portion of your withdrawal. If you elect not to have income tax withheld or you don’t have enough income tax withheld, you may be responsible for payment of estimated tax. You may incur penalties under the estimated tax rules if your withholding and estimated tax payments are not sufficient. You can reduce or defer the income tax on a distribution by directly or indirectly rolling such distribution over to another IRA or eligible plan. You should consult your tax advisor for additional information.
State tax will be withheld if, at the time of your distribution, your address is within one of the mandatory withholding states and you have federal income tax withheld (or as otherwise required by state law). State taxes will be withheld from your distribution in accordance with the respective state rules.
*Some 403(b), 457 and qualified retirement plan distributions may be subject to 20% mandatory withholding, as they are subject to special tax and withholding rules. Your plan administrator or plan sponsor is required to provide you with a special tax notice explaining those rules at the time you request a distribution. If applicable, federal and/or state taxes may be withheld from your distribution amount.
Proxy Voting Policies
Descriptions of the principles and policies that the fund's investment advisor uses in exercising the voting rights associated with the securities purchased and/or held by the fund are available without charge, upon request, by calling 1-800-345-2021 or visiting the "About Us" page of American Century Investments’ website at americancentury.com. A description of the policies is also available on the Securities and Exchange Commission’s website at sec.gov. Information regarding how the investment advisor voted proxies relating to portfolio securities during the most recent 12-month period ended June 30 is available on the "About Us" page at americancentury.com. It is also available at sec.gov.
Quarterly Portfolio Disclosure
The fund files its complete schedule of portfolio holdings with the Securities and Exchange Commission (SEC) for the first and third quarters of each fiscal year on Form N-Q. The fund’s Forms N-Q are available on the SEC’s website at sec.gov. The fund also makes its complete schedule of portfolio holdings for the most recent quarter of its fiscal year available on its website at americancentury.com and, upon request, by calling 1-800-345-2021.
Other Tax Information
The following information is provided pursuant to provisions of the Internal Revenue Code.
The fund hereby designates $641,173 as qualified short-term capital gain distributions for purposes of Internal Revenue Code Section 871 for the fiscal year ended October 31, 2018.
The fund hereby designates $321,795, or up to the maximum amount allowable, as long-term capital gain distributions (20% rate gain distributions) for the fiscal year ended October 31, 2018.
|
| | |
| |
| | | |
| Contact Us | americancentury.com | |
| Automated Information Line | 1-800-345-8765 | |
| Investor Services Representative | 1-800-345-2021
or 816-531-5575 | |
| Investors Using Advisors | 1-800-378-9878 | |
Business, Not-For-Profit, Employer-Sponsored
Retirement Plans | 1-800-345-3533 | |
Banks and Trust Companies, Broker-Dealers,
Financial Professionals, Insurance Companies | 1-800-345-6488 | |
| Telecommunications Relay Service for the Deaf | 711 | |
| | | |
| American Century International Bond Funds | |
| | | |
Investment Advisor: American Century Investment Management, Inc. Kansas City, Missouri | |
| | | |
| This report and the statements it contains are submitted for the general information of our shareholders. The report is not authorized for distribution to prospective investors unless preceded or accompanied by an effective prospectus. | |
| | | |
©2018 American Century Proprietary Holdings, Inc. All rights reserved.
CL-ANN-90985 1812 | |

|
| |
| | |
| | Annual Report |
| | |
| | October 31, 2018 |
| | |
| | Global Bond Fund |
| | Investor Class (AGBVX) |
| | I Class (AGBHX) |
| | Y Class (AGBWX) |
| | A Class (AGBAX) |
| | C Class (AGBTX) |
| | R Class (AGBRX) |
| | R5 Class (AGBNX) |
| | R6 Class (AGBDX) |
| | G Class (AGBGX) |
|
| | |
| President’s Letter | 2 |
|
| Performance | 3 |
|
| Portfolio Commentary | |
|
| Fund Characteristics | |
|
| Shareholder Fee Example | |
|
| Schedule of Investments | |
|
| Statement of Assets and Liabilities | |
|
| Statement of Operations | |
|
| Statement of Changes in Net Assets | |
|
| Notes to Financial Statements | |
|
| Financial Highlights | |
|
| Report of Independent Registered Public Accounting Firm | |
|
| Management | |
|
| Approval of Management Agreement | |
|
| Additional Information | |
|
Any opinions expressed in this report reflect those of the author as of the date of the report, and do not necessarily represent the opinions of American Century Investments® or any other person in the American Century Investments organization. Any such opinions are subject to change at any time based upon market or other conditions and American Century Investments disclaims any responsibility to update such opinions. These opinions may not be relied upon as investment advice and, because investment decisions made by American Century Investments funds are based on numerous factors, may not be relied upon as an indication of trading intent on behalf of any American Century Investments fund. Security examples are used for representational purposes only and are not intended as recommendations to purchase or sell securities. Performance information for comparative indices and securities is provided to American Century Investments by third party vendors. To the best of American Century Investments’ knowledge, such information is accurate at the time of printing.
Jonathan Thomas
Dear Investor:
Thank you for reviewing this annual report for the 12 months ended October 31, 2018. Annual reports help convey important information about fund returns, including market factors that affected performance during the reporting period. For additional investment and market insights, we encourage you to visit our website, americancentury.com.
Rising Rates, Heightened Volatility Challenge Investors
U.S. stocks generally delivered gains for the period, but returns were considerably weaker than the robust, double-digit results of the previous fiscal year. Early on, a backdrop of robust corporate earnings results, improving global economic growth, and growth-oriented U.S. tax reform helped drive stock prices higher. The S&P 500 Index returned more than 10% just in the first three months of the reporting period.
Investor sentiment shifted dramatically in early February, as volatility resurfaced after an extended period of relative dormancy. Better-than-expected U.S. economic data triggered expectations for rising inflation, higher interest rates, and a more-hawkish Federal Reserve (Fed). In response, U.S. Treasury yields soared, and stock prices plunged. Although this bout of market unrest quickly subsided, volatility remained a formidable force throughout the rest of the period. Stocks remained resilient, though, and the S&P 500 Index advanced 7.35% for the 12-month period. Growth stocks outpaced value stocks, and large-cap stocks outperformed small-cap stocks. Meanwhile, rising U.S. Treasury yields and Fed rate hikes weighed on interest-rate sensitive assets, including investment-grade bonds and real estate investment trusts.
Outside the U.S., economic growth moderated as the period unfolded, and global bond yields were flat to modestly higher. The U.S. dollar continued to gain ground versus other currencies, which drove down non-U.S. bond returns for unhedged investors. The strong dollar, combined with rising U.S. interest rates, geopolitical tensions, and fiscal challenges in several developing countries, led to negative results for emerging markets bonds.
With global economic growth diverging, Treasury yields rising, and volatility lingering, investors likely will face opportunities and challenges in the months ahead. We believe this scenario underscores the importance of using professionally managed portfolios in pursuit of investment goals. We appreciate your continued trust and confidence in us.
Sincerely,
Jonathan Thomas
President and Chief Executive Officer
American Century Investments
|
| | | | | |
| Total Returns as of October 31, 2018 |
| | | | Average Annual Returns | |
| | Ticker Symbol | 1 year | 5 years | Since Inception | Inception Date |
| Investor Class | AGBVX | -1.33% | 2.43% | 2.48% | 1/31/12 |
| Bloomberg Barclays Global Aggregate Bond Index (USD, Hedged) | — | 0.20% | 2.91% | 2.92% | — |
| I Class | AGBHX | -1.16% | — | 0.75% | 4/10/17 |
| Y Class | AGBWX | -1.09% | — | 0.86% | 4/10/17 |
| A Class | AGBAX | | | | 1/31/12 |
| No sales charge | | -1.59% | 2.16% | 2.22% | |
| With sales charge | | -6.06% | 1.21% | 1.53% | |
| C Class | AGBTX | -2.27% | 1.41% | 1.47% | 1/31/12 |
| R Class | AGBRX | -1.75% | 1.93% | 1.97% | 1/31/12 |
| R5 Class | AGBNX | -1.13% | 2.64% | 2.68% | 1/31/12 |
| R6 Class | AGBDX | -1.08% | 2.67% | 2.73% | 7/26/13 |
| G Class | AGBGX | -0.49% | — | 0.53% | 7/28/17 |
Fund returns would have been lower if a portion of the fees had not been waived.
Sales charges include initial sales charges and contingent deferred sales charges (CDSCs), as applicable. A Class shares have a 4.50% maximum initial sales charge and may be subject to a maximum CDSC of 1.00%. C Class shares redeemed within 12 months of purchase are subject to a maximum CDSC of 1.00%. The SEC requires that mutual funds provide performance information net of maximum sales charges in all cases where charges could be applied.
Data presented reflect past performance. Past performance is no guarantee of future results. Current performance may be higher or lower than the performance shown. Total returns for periods less than one year are not annualized. Investment return and principal value will fluctuate, and redemption value may be more or less than original cost. Data assumes reinvestment of dividends and capital gains, and none of the charts reflect the deduction of taxes that a shareholder would pay on fund distributions or the redemption of fund shares. To obtain performance data current to the most recent month end, please call 1-800-345-2021 or visit americancentury.com. For additional information about the fund, please consult the prospectus.
|
|
| Growth of $10,000 Over Life of Class |
| $10,000 investment made January 31, 2012 |
| Performance for other share classes will vary due to differences in fee structure. |
|
| |
| Value on October 31, 2018 |
| | Investor Class — $11,799 |
| |
| | Bloomberg Barclays Global Aggregate Bond Index (USD, Hedged) — $12,147 |
| |
Ending value of Investor Class would have been lower if a portion of the fees had not been waived.
|
| | | | | | | | |
| Total Annual Fund Operating Expenses | | | |
| Investor Class | I Class | Y Class | A Class | C Class | R Class | R5 Class | R6 Class | G Class |
| 0.84% | 0.74% | 0.64% | 1.09% | 1.84% | 1.34% | 0.64% | 0.59% | 0.59% |
The total annual fund operating expenses shown is as stated in the fund’s prospectus current as of the date of this report. The prospectus may vary from the expense ratio shown elsewhere in this report because it is based on a different time period, includes acquired fund fees and expenses, and, if applicable, does not include fee waivers or expense reimbursements.
Data presented reflect past performance. Past performance is no guarantee of future results. Current performance may be higher or lower than the performance shown. Total returns for periods less than one year are not annualized. Investment return and principal value will fluctuate, and redemption value may be more or less than original cost. Data assumes reinvestment of dividends and capital gains, and none of the charts reflect the deduction of taxes that a shareholder would pay on fund distributions or the redemption of fund shares. To obtain performance data current to the most recent month end, please call 1-800-345-2021 or visit americancentury.com. For additional information about the fund, please consult the prospectus.
Portfolio Managers: John Lovito, Simon Chester, Robert Gahagan, and Abdelak Adjriou
Performance Summary
Global Bond declined -1.33%* for the fiscal year ended October 31, 2018. By comparison, the Bloomberg Barclays Global Aggregate Bond Index (USD, Hedged) returned 0.20% over the same time period. Portfolio returns reflect operating expenses, while index returns do not.
Market Review
Volatility characterized global bond markets over the reporting period. The economic backdrop was generally positive, though the gap between stronger U.S. growth and slower growth in other developed markets grew more pronounced. U.S. momentum surged after a domestic tax cut at the end of 2017, while growth in other developed markets softened incrementally in the second and third calendar quarters of 2018. The Federal Reserve hiked U.S. rates four times over the period, and U.S. Treasury yields increased across all maturities. Of note, the 10-year U.S. Treasury yield topped 3% for the first time in several years. Elsewhere, the Bank of England enacted two rate hikes, while the European Central Bank (ECB) and Bank of Japan held target rates steady. The ECB began tapering its monthly bond purchases, aiming to end the program by December 2018. Inflation edged modestly higher across developed markets, ending the period at or near central bank targets.
Meanwhile, U.S. dollar strength, global trade tensions, and softening growth in China drove higher volatility in emerging markets. The countries most reliant on external funding came under distress, notably Argentina and Turkey, which helped drive the entire asset class lower. Both countries made progress late in the period, with Argentina securing a financing package from the International Monetary Fund and Turkish assets rallying after central bankers finally enacted a steep rate hike.
In this environment, global bonds declined on an unhedged basis. With hedging against the rising U.S. dollar, the global bond benchmark posted a small gain.
Currency Exposure, Yield Curve Positioning Weighed on Performance
Within the portfolio, currency exposure was a key detractor, primarily due to hedging costs associated with the fund’s positions in Mexico and South Africa. The higher U.S. dollar drove weakness in other currency positions.
Yield curve positioning in the U.S. and Europe also detracted from relative results. Interest rates were volatile over the reporting period, but broadly speaking, rates rose in the U.S. and remained flat in Europe. Security selection also detracted from portfolio performance. In particular, selections among European sovereigns, primarily in Italy, weighed on results.
Country Positioning and Sector Allocation Added Value
The portfolio’s allocation by region contributed to performance, led by exposure to euro-denominated local issues.
*All fund returns referenced in this commentary are for Investor Class shares. Fund returns would have been lower if a portion of the fees had not been waived. Performance for other share classes will vary due to differences in fee structure; when Investor Class performance exceeds that of the market benchmark, other share classes may not. See page 3 for returns for all share classes.
Our sector allocations also contributed. Out-of-index positions in U.S. high-yield credit were especially positive, as the high-yield sector was one of the few broad fixed-income categories to post positive returns over the reporting period. U.S. corporate earnings were robust, which helped drive gains in the high-yield sector. Our allocation to hard currency emerging markets debt also added to returns, but security selection mitigated the positive allocation effects.
Although security selection was a detractor overall, our choices among non-agency collateralized mortgage obligations and commercial mortgage-backed securities in the U.S. aided portfolio performance.
Positioning for the Future
We expect U.S. Treasury yields to gradually climb higher. In Europe and the U.K., we expect a slow normalization of yields as central banks remove stimulus and/or gradually raise interest rates. In Japan, continued aggressive central bank stimulus still supports low yields. Accordingly, we plan to maintain a neutral to short position in U.S. Treasuries and a short position in European government bonds. We favor long exposure in emerging markets local sovereign rates, given our expectations for rates to decline in select markets.
We continue to favor overweight positions in U.S. securitized bonds, including floating-rate securities that should benefit as interest rates rise, and corporate credit. We also will continue to seek value from out-of-index positions, including high-yield corporates, emerging markets bonds, and select currencies.
|
| |
| OCTOBER 31, 2018 |
| Portfolio at a Glance |
| Average Duration (effective) | 6.5 years |
| Weighted Average Life to Maturity | 9.7 years |
| | |
| Bond Holdings by Country | % of net assets |
| United States | 41.7% |
| Japan | 6.8% |
| Canada | 5.9% |
| United Kingdom | 5.9% |
| Cayman Islands | 5.2% |
| Italy | 4.1% |
| South Africa | 3.0% |
| France | 2.9% |
| Netherlands | 2.9% |
| Germany | 2.5% |
| Other Countries | 17.7% |
| Cash and Equivalents* | 1.4% |
| * Includes temporary cash investments and other assets and liabilities. |
| | |
| Types of Investments in Portfolio | % of net assets |
| Sovereign Governments and Agencies | 37.9% |
| Corporate Bonds | 33.0% |
| Collateralized Mortgage Obligations | 5.9% |
| Asset-Backed Securities | 5.2% |
| Collateralized Loan Obligations | 4.9% |
| Commercial Mortgage-Backed Securities | 4.5% |
| U.S. Government Agency Mortgage-Backed Securities | 4.4% |
| Bank Loan Obligations | 2.4% |
| Municipal Securities | 0.4% |
| Temporary Cash Investments | 0.7% |
| Other Assets and Liabilities | 0.7% |
Fund shareholders may incur two types of costs: (1) transaction costs, including sales charges (loads) on purchase payments and redemption/exchange fees; and (2) ongoing costs, including management fees; distribution and service (12b-1) fees; and other fund expenses. This example is intended to help you understand your ongoing costs (in dollars) of investing in your fund and to compare these costs with the ongoing cost of investing in other mutual funds.
The example is based on an investment of $1,000 made at the beginning of the period and held for the entire period from May 1, 2018 to October 31, 2018.
Actual Expenses
The table provides information about actual account values and actual expenses for each class. You may use the information, together with the amount you invested, to estimate the expenses that you paid over the period. First, identify the share class you own. Then simply divide your account value by $1,000 (for example, an $8,600 account value divided by $1,000 = 8.6), then multiply the result by the number under the heading “Expenses Paid During Period” to estimate the expenses you paid on your account during this period.
If you hold Investor Class shares of any American Century Investments fund, or I Class shares of the American Century Diversified Bond Fund, in an American Century Investments account (i.e., not a financial intermediary or retirement plan account), American Century Investments may charge you a $12.50 semiannual account maintenance fee if the value of those shares is less than $10,000. We will redeem shares automatically in one of your accounts to pay the $12.50 fee. In determining your total eligible investment amount, we will include your investments in all personal accounts (including American Century Investments Brokerage accounts) registered under your Social Security number. Personal accounts include individual accounts, joint accounts, UGMA/UTMA accounts, personal trusts, Coverdell Education Savings Accounts and IRAs (including traditional, Roth, Rollover, SEP-, SARSEP- and SIMPLE-IRAs), and certain other retirement accounts. If you have only business, business retirement, employer-sponsored or American Century Investments Brokerage accounts, you are currently not subject to this fee. If you are subject to the Account Maintenance Fee, your account value could be reduced by the fee amount.
Hypothetical Example for Comparison Purposes
The table also provides information about hypothetical account values and hypothetical expenses based on the actual expense ratio of each class of your fund and an assumed rate of return of 5% per year before expenses, which is not the actual return of a fund’s share class. The hypothetical account values and expenses may not be used to estimate the actual ending account balance or expenses you paid for the period. You may use this information to compare the ongoing costs of investing in your fund and other funds. To do so, compare this 5% hypothetical example with the 5% hypothetical examples that appear in the shareholder reports of the other funds.
Please note that the expenses shown in the table are meant to highlight your ongoing costs only and do not reflect any transactional costs, such as sales charges (loads) or redemption/exchange fees. Therefore, the table is useful in comparing ongoing costs only, and will not help you determine the relative total costs of owning different funds. In addition, if these transactional costs were included, your costs would have been higher.
|
| | | | |
| | Beginning
Account Value
5/1/18 | Ending
Account Value
10/31/18 | Expenses Paid
During Period(1)
5/1/18 - 10/31/18 | Annualized
Expense Ratio(1) |
| Actual | | | | |
| Investor Class | $1,000 | $993.10 | $4.22 | 0.84% |
| I Class | $1,000 | $993.10 | $3.72 | 0.74% |
| Y Class | $1,000 | $993.10 | $3.22 | 0.64% |
| A Class | $1,000 | $991.10 | $5.47 | 1.09% |
| C Class | $1,000 | $988.00 | $9.22 | 1.84% |
| R Class | $1,000 | $990.00 | $6.72 | 1.34% |
| R5 Class | $1,000 | $994.10 | $3.22 | 0.64% |
| R6 Class | $1,000 | $994.10 | $2.97 | 0.59% |
| G Class | $1,000 | $997.00 | $0.05 | 0.01% |
| Hypothetical | | | | |
| Investor Class | $1,000 | $1,020.97 | $4.28 | 0.84% |
| I Class | $1,000 | $1,021.48 | $3.77 | 0.74% |
| Y Class | $1,000 | $1,021.98 | $3.26 | 0.64% |
| A Class | $1,000 | $1,019.71 | $5.55 | 1.09% |
| C Class | $1,000 | $1,015.93 | $9.35 | 1.84% |
| R Class | $1,000 | $1,018.45 | $6.82 | 1.34% |
| R5 Class | $1,000 | $1,021.98 | $3.26 | 0.64% |
| R6 Class | $1,000 | $1,022.23 | $3.01 | 0.59% |
| G Class | $1,000 | $1,025.16 | $0.05 | 0.01% |
| |
| (1) | Expenses are equal to the class's annualized expense ratio listed in the table above, multiplied by the average account value over the period, multiplied by 184, the number of days in the most recent fiscal half-year, divided by 365, to reflect the one-half year period. Annualized expense ratio reflects actual expenses, including any applicable fee waivers or expense reimbursements and excluding any acquired fund fees and expenses. |
OCTOBER 31, 2018
|
| | | | | | | |
| | | Principal Amount | Value |
| SOVEREIGN GOVERNMENTS AND AGENCIES — 37.9% | | | |
| Argentina — 0.1% | | | |
| Argentine Republic Government International Bond, 6.875%, 1/26/27 | | $ | 800,000 |
| $ | 671,700 |
|
| Argentine Republic Government International Bond, 6.625%, 7/6/28 | | $ | 1,700,000 |
| 1,362,975 |
|
| | | | 2,034,675 |
|
| Australia — 1.3% | | | |
| Australia Government Bond, 2.75%, 4/21/24 | AUD | 22,149,000 |
| 16,048,045 |
|
| New South Wales Treasury Corp., 3.00%, 3/20/28 | AUD | 4,100,000 |
| 2,904,008 |
|
| | | | 18,952,053 |
|
| Austria — 0.7% | | | |
Republic of Austria Government Bond, 3.40%, 11/22/22(1) | EUR | 3,395,000 |
| 4,418,132 |
|
Republic of Austria Government Bond, 0.75%, 10/20/26(1) | EUR | 2,934,000 |
| 3,413,703 |
|
Republic of Austria Government Bond, 4.15%, 3/15/37(1) | EUR | 1,610,000 |
| 2,741,609 |
|
| | | | 10,573,444 |
|
| Belgium — 0.5% | | | |
Kingdom of Belgium Government Bond, 4.25%, 3/28/41(1) | EUR | 1,335,000 |
| 2,292,791 |
|
Kingdom of Belgium Government Bond, 1.60%, 6/22/47(1) | EUR | 3,900,000 |
| 4,298,064 |
|
| | | | 6,590,855 |
|
| Brazil — 0.1% | | | |
| Brazilian Government International Bond, 2.625%, 1/5/23 | | $ | 488,000 |
| 452,869 |
|
| Brazilian Government International Bond, 5.625%, 1/7/41 | | $ | 1,000,000 |
| 924,250 |
|
| | | | 1,377,119 |
|
| Canada — 5.4% | | | |
| Canadian Government Bond, 1.00%, 9/1/22 | CAD | 57,800,000 |
| 41,653,583 |
|
| Canadian Government Bond, 4.00%, 6/1/41 | CAD | 4,804,000 |
| 4,559,029 |
|
| Province of British Columbia Canada, 3.25%, 12/18/21 | CAD | 6,970,000 |
| 5,393,497 |
|
| Province of British Columbia Canada, 2.85%, 6/18/25 | CAD | 11,980,000 |
| 9,067,562 |
|
| Province of Quebec Canada, 3.00%, 9/1/23 | CAD | 7,892,000 |
| 6,038,254 |
|
| Province of Quebec Canada, 5.75%, 12/1/36 | CAD | 6,345,000 |
| 6,409,055 |
|
| Province of Quebec Canada, 3.50%, 12/1/48 | CAD | 5,797,000 |
| 4,564,149 |
|
| | | | 77,685,129 |
|
Chile† | | | |
| Chile Government International Bond, 3.25%, 9/14/21 | | $ | 300,000 |
| 298,890 |
|
| Colombia — 0.2% | | | |
| Colombia Government International Bond, 7.375%, 9/18/37 | | $ | 2,100,000 |
| 2,543,625 |
|
| Czech Republic — 0.1% | | | |
| Czech Republic Government Bond, 4.70%, 9/12/22 | CZK | 28,900,000 |
| 1,402,533 |
|
| Denmark — 0.2% | | | |
| Denmark Government Bond, 0.50%, 11/15/27 | DKK | 15,795,000 |
| 2,434,553 |
|
| Denmark Government Bond, 4.50%, 11/15/39 | DKK | 1,705,000 |
| 444,194 |
|
| | | | 2,878,747 |
|
|
| | | | | | | |
| | | Principal Amount | Value |
| Dominican Republic — 0.2% | | | |
| Dominican Republic International Bond, 6.875%, 1/29/26 | | $ | 1,900,000 |
| $ | 1,999,750 |
|
Dominican Republic International Bond, 5.95%, 1/25/27(1) | | $ | 800,000 |
| 799,000 |
|
| Dominican Republic International Bond, 5.95%, 1/25/27 | | $ | 800,000 |
| 799,000 |
|
| | | | 3,597,750 |
|
| Egypt — 0.1% | | | |
| Egypt Government International Bond, 5.75%, 4/29/20 | | $ | 1,000,000 |
| 1,009,040 |
|
Egypt Government International Bond, 7.50%, 1/31/27(1) | | $ | 600,000 |
| 588,164 |
|
| | | | 1,597,204 |
|
| Finland — 0.3% | | | |
Finland Government Bond, 4.00%, 7/4/25(1) | EUR | 3,247,000 |
| 4,598,469 |
|
| France — 1.0% | | | |
| French Republic Government Bond OAT, 5.50%, 4/25/29 | EUR | 3,456,518 |
| 5,799,223 |
|
| French Republic Government Bond OAT, 3.25%, 5/25/45 | EUR | 5,593,000 |
| 8,724,823 |
|
| | | | 14,524,046 |
|
| Germany — 1.3% | | | |
| Bundesrepublik Deutschland Bundesanleihe, 0.50%, 2/15/25 | EUR | 642,000 |
| 751,566 |
|
Bundesrepublik Deutschland Bundesanleihe, 0.00%, 8/15/26(2) | EUR | 9,285,000 |
| 10,396,674 |
|
| Bundesrepublik Deutschland Bundesanleihe, 4.75%, 7/4/40 | EUR | 1,189,000 |
| 2,392,417 |
|
| Bundesrepublik Deutschland Bundesanleihe, 2.50%, 7/4/44 | EUR | 3,067,000 |
| 4,691,325 |
|
| | | | 18,231,982 |
|
| Hungary — 2.0% | | | |
| Hungary Government Bond, 6.75%, 10/22/28 | HUF | 6,372,000,000 |
| 27,763,815 |
|
| Hungary Government International Bond, 7.625%, 3/29/41 | | $ | 500,000 |
| 680,893 |
|
| | | | 28,444,708 |
|
| Indonesia — 0.2% | | | |
Indonesia Government International Bond, 4.75%, 1/8/26(1) | | $ | 1,000,000 |
| 990,487 |
|
| Indonesia Government International Bond, MTN, 6.75%, 1/15/44 | | $ | 1,800,000 |
| 2,075,015 |
|
| | | | 3,065,502 |
|
| Ireland — 0.4% | | | |
| Ireland Government Bond, 3.40%, 3/18/24 | EUR | 4,403,000 |
| 5,830,666 |
|
| Italy — 2.7% | | | |
| Italy Buoni Poliennali Del Tesoro, 2.00%, 12/1/25 | EUR | 16,633,000 |
| 17,596,257 |
|
Italy Buoni Poliennali Del Tesoro, 4.75%, 9/1/44(1) | EUR | 10,193,000 |
| 12,905,303 |
|
Italy Buoni Poliennali Del Tesoro, 3.45%, 3/1/48(1) | EUR | 7,405,000 |
| 7,692,885 |
|
| Republic of Italy Government International Bond, 6.875%, 9/27/23 | | $ | 120,000 |
| 128,907 |
|
| | | | 38,323,352 |
|
| Japan — 6.8% | | | |
| Japan Government Thirty Year Bond, 2.40%, 3/20/37 | JPY | 1,989,750,000 |
| 23,219,510 |
|
| Japan Government Thirty Year Bond, 2.00%, 9/20/41 | JPY | 1,444,800,000 |
| 16,194,795 |
|
| Japan Government Thirty Year Bond, 1.40%, 12/20/45 | JPY | 2,473,750,000 |
| 24,966,689 |
|
| Japan Government Thirty Year Bond, 0.80%, 3/20/48 | JPY | 520,000,000 |
| 4,534,722 |
|
| Japan Government Twenty Year Bond, 2.10%, 12/20/26 | JPY | 2,698,800,000 |
| 27,930,613 |
|
| | | | 96,846,329 |
|
|
| | | | | | | |
| | | Principal Amount | Value |
| Jordan — 0.2% | | | |
| Jordan Government International Bond, 5.75%, 1/31/27 | | $ | 2,000,000 |
| $ | 1,842,198 |
|
| Jordan Government International Bond, 7.375%, 10/10/47 | | $ | 1,200,000 |
| 1,089,828 |
|
| | | | 2,932,026 |
|
| Malaysia — 0.2% | | | |
| Malaysia Government Bond, 3.96%, 9/15/25 | MYR | 13,250,000 |
| 3,142,164 |
|
| Mexico — 1.8% | | | |
| Mexican Bonos, 6.50%, 6/9/22 | MXN | 130,050,000 |
| 5,983,520 |
|
| Mexican Bonos, 8.00%, 12/7/23 | MXN | 229,000,000 |
| 10,966,342 |
|
| Mexican Bonos, 10.00%, 11/20/36 | MXN | 8,740,000 |
| 470,009 |
|
| Mexico Government International Bond, 4.125%, 1/21/26 | | $ | 300,000 |
| 289,972 |
|
| Mexico Government International Bond, 4.15%, 3/28/27 | | $ | 3,900,000 |
| 3,718,162 |
|
| Nacional Financiera SNC, MTN, 0.78%, 3/29/22 | JPY | 500,000,000 |
| 4,459,879 |
|
| | | | 25,887,884 |
|
| Netherlands — 1.0% | | | |
Netherlands Government Bond, 0.00%, 1/15/22(1)(2) | EUR | 4,836,000 |
| 5,546,974 |
|
Netherlands Government Bond, 0.50%, 7/15/26(1) | EUR | 5,616,000 |
| 6,473,388 |
|
Netherlands Government Bond, 2.75%, 1/15/47(1) | EUR | 1,228,000 |
| 1,962,953 |
|
| | | | 13,983,315 |
|
| Norway — 0.3% | | | |
Norway Government Bond, 2.00%, 5/24/23(1) | NOK | 4,725,000 |
| 572,038 |
|
Norway Government Bond, 1.75%, 2/17/27(1) | NOK | 27,700,000 |
| 3,255,731 |
|
| | | | 3,827,769 |
|
| Panama — 0.2% | | | |
| Panama Government International Bond, 6.70%, 1/26/36 | | $ | 2,000,000 |
| 2,405,000 |
|
Paraguay† | | | |
Paraguay Government International Bond, 5.00%, 4/15/26(1) | | $ | 500,000 |
| 501,250 |
|
| Peru — 1.8% | | | |
Peru Government Bond, 6.15%, 8/12/32(1) | PEN | 80,940,000 |
| 23,978,022 |
|
| Peruvian Government International Bond, 4.125%, 8/25/27 | | $ | 1,200,000 |
| 1,210,812 |
|
| Peruvian Government International Bond, 6.55%, 3/14/37 | | $ | 350,000 |
| 427,875 |
|
| | | | 25,616,709 |
|
| Philippines — 0.1% | | | |
| Philippine Government International Bond, 6.375%, 10/23/34 | | $ | 1,000,000 |
| 1,217,669 |
|
| Poland — 0.3% | | | |
| Republic of Poland Government Bond, 4.00%, 10/25/23 | PLN | 11,985,000 |
| 3,347,411 |
|
| Republic of Poland Government International Bond, 4.00%, 1/22/24 | | $ | 500,000 |
| 505,856 |
|
| | | | 3,853,267 |
|
| Russia — 0.4% | | | |
| Russian Federal Bond - OFZ, 7.05%, 1/19/28 | RUB | 77,600,000 |
| 1,076,708 |
|
| Russian Foreign Bond - Eurobond, 12.75%, 6/24/28 | | $ | 1,500,000 |
| 2,379,315 |
|
| Russian Foreign Bond - Eurobond, 5.25%, 6/23/47 | | $ | 2,000,000 |
| 1,855,570 |
|
| | | | 5,311,593 |
|
| Saudi Arabia — 0.1% | | | |
Saudi Government International Bond, 2.375%, 10/26/21(1) | | $ | 1,300,000 |
| 1,243,827 |
|
| Senegal — 0.1% | | | |
Senegal Government International Bond, 6.25%, 5/23/33(1) | | $ | 1,500,000 |
| 1,301,306 |
|
|
| | | | | | | |
| | | Principal Amount | Value |
| Serbia — 0.1% | | | |
Serbia International Bond, 7.25%, 9/28/21(1) | | $ | 800,000 |
| $ | 864,250 |
|
| Singapore — 0.2% | | | |
| Singapore Government Bond, 3.125%, 9/1/22 | SGD | 4,410,000 |
| 3,289,806 |
|
| South Africa — 3.0% | | | |
| Republic of South Africa Government Bond, 7.75%, 2/28/23 | ZAR | 236,000,000 |
| 15,485,887 |
|
| Republic of South Africa Government Bond, 10.50%, 12/21/26 | ZAR | 257,000,000 |
| 18,506,805 |
|
| Republic of South Africa Government Bond, 8.00%, 1/31/30 | ZAR | 160,000,000 |
| 9,537,237 |
|
| Republic of South Africa Government International Bond, 4.67%, 1/17/24 | | $ | 250,000 |
| 239,516 |
|
| | | | 43,769,445 |
|
| Switzerland — 0.5% | | | |
| Swiss Confederation Government Bond, 1.25%, 5/28/26 | CHF | 5,058,000 |
| 5,563,222 |
|
| Swiss Confederation Government Bond, 2.50%, 3/8/36 | CHF | 1,534,000 |
| 2,057,012 |
|
| | | | 7,620,234 |
|
| Thailand — 0.5% | | | |
| Thailand Government Bond, 3.625%, 6/16/23 | THB | 65,000,000 |
| 2,068,014 |
|
| Thailand Government Bond, 3.85%, 12/12/25 | THB | 175,700,000 |
| 5,720,039 |
|
| | | | 7,788,053 |
|
| Tunisia — 0.2% | | | |
| Banque Centrale de Tunisie International Bond, 5.75%, 1/30/25 | | $ | 2,800,000 |
| 2,385,275 |
|
| United Kingdom — 3.3% | | | |
| United Kingdom Gilt, 1.50%, 7/22/26 | GBP | 18,316,000 |
| 23,872,091 |
|
| United Kingdom Gilt, 4.50%, 12/7/42 | GBP | 6,876,000 |
| 13,302,087 |
|
| United Kingdom Gilt, 4.25%, 12/7/49 | GBP | 2,656,000 |
| 5,311,973 |
|
| United Kingdom Gilt, 4.25%, 12/7/55 | GBP | 2,020,000 |
| 4,278,202 |
|
| | | | 46,764,353 |
|
TOTAL SOVEREIGN GOVERNMENTS AND AGENCIES
(Cost $573,008,726) | | | 543,102,273 |
|
| CORPORATE BONDS — 33.0% | | | |
| Aerospace and Defense — 0.1% | | | |
| Lockheed Martin Corp., 3.55%, 1/15/26 | | $ | 570,000 |
| 557,258 |
|
| Lockheed Martin Corp., 3.80%, 3/1/45 | | 240,000 |
| 214,245 |
|
| Rockwell Collins, Inc., 4.35%, 4/15/47 | | 310,000 |
| 288,162 |
|
| United Technologies Corp., 5.70%, 4/15/40 | | 380,000 |
| 416,691 |
|
| | | | 1,476,356 |
|
| Airlines — 0.1% | | | |
| United Continental Holdings, Inc., 4.25%, 10/1/22 | | 1,150,000 |
| 1,129,875 |
|
| Auto Components — 0.3% | | | |
| Goodyear Tire & Rubber Co. (The), 5.125%, 11/15/23 | | 2,650,000 |
| 2,606,275 |
|
| Tenneco, Inc., 5.00%, 7/15/26 | | 1,060,000 |
| 885,100 |
|
ZF North America Capital, Inc., 4.00%, 4/29/20(1) | | 560,000 |
| 560,118 |
|
| | | | 4,051,493 |
|
| Automobiles — 0.5% | | | |
| Ford Motor Co., 4.35%, 12/8/26 | | 370,000 |
| 336,198 |
|
| Ford Motor Credit Co. LLC, 5.875%, 8/2/21 | | 2,710,000 |
| 2,807,545 |
|
| Ford Motor Credit Co. LLC, 2.98%, 8/3/22 | | 450,000 |
| 422,480 |
|
|
| | | | | | | |
| | | Principal Amount | Value |
| General Motors Co., 5.15%, 4/1/38 | | $ | 560,000 |
| $ | 496,266 |
|
| General Motors Financial Co., Inc., 3.20%, 7/6/21 | | 1,860,000 |
| 1,820,805 |
|
| General Motors Financial Co., Inc., 5.25%, 3/1/26 | | 800,000 |
| 800,009 |
|
Jaguar Land Rover Automotive plc, 3.50%, 3/15/20(1) | | 980,000 |
| 964,075 |
|
| | | | 7,647,378 |
|
| Banks — 5.8% | | | |
| Banco de Bogota SA, 6.25%, 5/12/26 | | 1,200,000 |
| 1,221,000 |
|
| Banco Santander SA, MTN, 2.50%, 3/18/25 | EUR | 3,700,000 |
| 4,190,303 |
|
| Bank of America Corp., MTN, 4.20%, 8/26/24 | | $ | 430,000 |
| 427,353 |
|
| Bank of America Corp., MTN, 4.00%, 1/22/25 | | 1,390,000 |
| 1,353,553 |
|
| Bank of America Corp., MTN, 2.30%, 7/25/25 | GBP | 900,000 |
| 1,137,478 |
|
Bank of America Corp., MTN, VRN, 3.82%, 1/20/27(3) | | $ | 2,500,000 |
| 2,399,351 |
|
Bank of America Corp., MTN, VRN, 4.44%, 1/20/47(3) | | 250,000 |
| 238,499 |
|
Bank of America Corp., VRN, 3.42%, 12/20/27(3) | | 120,000 |
| 110,807 |
|
Banque Federative du Credit Mutuel SA, 2.00%, 4/12/19(1) | | 250,000 |
| 248,752 |
|
| Barclays plc, 4.375%, 1/12/26 | | 200,000 |
| 192,157 |
|
| Barclays plc, 4.95%, 1/10/47 | | 400,000 |
| 357,785 |
|
BPCE SA, 3.00%, 5/22/22(1) | | 790,000 |
| 761,679 |
|
BPCE SA, 5.15%, 7/21/24(1) | | 300,000 |
| 302,323 |
|
BPCE SA, VRN, 2.75%, 7/8/21(3) | EUR | 1,700,000 |
| 2,012,038 |
|
CaixaBank SA, MTN, VRN, 2.75%, 7/14/23(3) | EUR | 2,200,000 |
| 2,502,957 |
|
| Capital One Financial Corp., 3.75%, 7/28/26 | | $ | 1,850,000 |
| 1,704,623 |
|
| Citigroup, Inc., 2.90%, 12/8/21 | | 1,100,000 |
| 1,075,374 |
|
| Citigroup, Inc., 2.75%, 4/25/22 | | 1,350,000 |
| 1,305,224 |
|
| Citigroup, Inc., 4.05%, 7/30/22 | | 1,850,000 |
| 1,859,676 |
|
| Citigroup, Inc., 4.45%, 9/29/27 | | 1,760,000 |
| 1,715,003 |
|
Citigroup, Inc., VRN, 3.52%, 10/27/27(3) | | 470,000 |
| 436,393 |
|
Commerzbank AG, 8.125%, 9/19/23(1) | | 280,000 |
| 315,698 |
|
| Commerzbank AG, MTN, 4.00%, 3/23/26 | EUR | 2,450,000 |
| 2,947,290 |
|
| Cooperatieve Rabobank UA, 3.95%, 11/9/22 | | $ | 1,200,000 |
| 1,189,927 |
|
Cooperatieve Rabobank UA, VRN, 2.50%, 5/26/21(3) | EUR | 1,500,000 |
| 1,770,718 |
|
| Credit Agricole Cariparma SpA, MTN, 1.625%, 3/21/29 (Secured) | EUR | 1,200,000 |
| 1,339,660 |
|
| Discover Bank, 3.35%, 2/6/23 | | $ | 500,000 |
| 483,403 |
|
| European Financial Stability Facility, MTN, 2.125%, 2/19/24 | EUR | 4,175,000 |
| 5,201,777 |
|
| European Investment Bank, MTN, 2.25%, 10/14/22 | EUR | 8,050,000 |
| 9,964,609 |
|
| Huntington Bancshares, Inc., 2.30%, 1/14/22 | | $ | 400,000 |
| 382,577 |
|
ING Groep NV, MTN, VRN, 1.625%, 9/26/24(3) | EUR | 3,000,000 |
| 3,287,059 |
|
Intesa Sanpaolo SpA, 3.125%, 7/14/22(1) | | $ | 520,000 |
| 472,796 |
|
Intesa Sanpaolo SpA, 5.02%, 6/26/24(1) | | 680,000 |
| 600,253 |
|
| Intesa Sanpaolo SpA, MTN, 6.625%, 9/13/23 | EUR | 1,200,000 |
| 1,517,443 |
|
| Intesa Sanpaolo SpA, MTN, 3.93%, 9/15/26 | EUR | 1,000,000 |
| 1,090,220 |
|
| JPMorgan Chase & Co., 4.625%, 5/10/21 | | $ | 910,000 |
| 936,194 |
|
| JPMorgan Chase & Co., 3.25%, 9/23/22 | | 500,000 |
| 493,403 |
|
| JPMorgan Chase & Co., 3.875%, 9/10/24 | | 210,000 |
| 206,509 |
|
| JPMorgan Chase & Co., 3.125%, 1/23/25 | | 270,000 |
| 256,244 |
|
|
| | | | | | | |
| | | Principal Amount | Value |
JPMorgan Chase & Co., VRN, 3.54%, 5/1/27(3) | | $ | 600,000 |
| $ | 567,659 |
|
JPMorgan Chase & Co., VRN, 3.88%, 7/24/37(3) | | 800,000 |
| 722,582 |
|
JPMorgan Chase & Co., VRN, 3.96%, 11/15/47(3) | | 150,000 |
| 131,852 |
|
JPMorgan Chase & Co., VRN, 3.90%, 1/23/48(3) | | 550,000 |
| 479,794 |
|
| KeyBank N.A., MTN, 3.40%, 5/20/26 | | 250,000 |
| 235,219 |
|
| Kreditanstalt fuer Wiederaufbau, 4.625%, 1/4/23 | EUR | 3,545,000 |
| 4,801,427 |
|
Liberbank SA, VRN, 6.875%, 3/14/22(3) | EUR | 1,200,000 |
| 1,452,610 |
|
| Lloyds Bank plc, MTN, 7.625%, 4/22/25 | GBP | 970,000 |
| 1,561,830 |
|
| Mediobanca Banca di Credito Finanziario SpA, MTN, 1.25%, 11/24/29 (Secured) | EUR | 2,400,000 |
| 2,539,395 |
|
| PNC Financial Services Group, Inc. (The), 4.375%, 8/11/20 | | $ | 700,000 |
| 711,616 |
|
| QNB Finansbank AS, MTN, 6.25%, 4/30/19 | | 1,850,000 |
| 1,853,792 |
|
| Regions Financial Corp., 2.75%, 8/14/22 | | 610,000 |
| 587,068 |
|
| Santander UK plc, MTN, 5.125%, 4/14/21 (Secured) | GBP | 2,300,000 |
| 3,209,722 |
|
| SunTrust Bank, 3.30%, 5/15/26 | | $ | 200,000 |
| 187,452 |
|
| US Bancorp, MTN, 3.60%, 9/11/24 | | 1,360,000 |
| 1,338,237 |
|
| Wells Fargo & Co., 3.07%, 1/24/23 | | 430,000 |
| 416,752 |
|
| Wells Fargo & Co., MTN, 4.10%, 6/3/26 | | 3,020,000 |
| 2,945,152 |
|
| Wells Fargo & Co., MTN, 4.65%, 11/4/44 | | 250,000 |
| 235,667 |
|
| Wells Fargo & Co., MTN, 4.75%, 12/7/46 | | 200,000 |
| 191,224 |
|
Wells Fargo & Co., MTN, VRN, 3.58%, 5/22/27(3) | | 440,000 |
| 419,174 |
|
| | | | 82,596,332 |
|
| Beverages — 0.2% | | | |
| Anheuser-Busch InBev Finance, Inc., 3.65%, 2/1/26 | | 2,090,000 |
| 1,985,442 |
|
| Anheuser-Busch InBev Finance, Inc., 4.90%, 2/1/46 | | 860,000 |
| 815,057 |
|
| Constellation Brands, Inc., 2.00%, 11/7/19 | | 200,000 |
| 197,842 |
|
| Constellation Brands, Inc., 4.75%, 12/1/25 | | 500,000 |
| 510,303 |
|
| | | | 3,508,644 |
|
| Biotechnology — 0.6% | | | |
| AbbVie, Inc., 2.90%, 11/6/22 | | 1,370,000 |
| 1,327,542 |
|
| AbbVie, Inc., 3.60%, 5/14/25 | | 1,690,000 |
| 1,614,862 |
|
| AbbVie, Inc., 4.70%, 5/14/45 | | 250,000 |
| 226,835 |
|
| Amgen, Inc., 2.65%, 5/11/22 | | 1,030,000 |
| 995,996 |
|
| Amgen, Inc., 4.66%, 6/15/51 | | 474,000 |
| 439,079 |
|
| Celgene Corp., 3.875%, 8/15/25 | | 1,950,000 |
| 1,884,226 |
|
| Celgene Corp., 5.00%, 8/15/45 | | 150,000 |
| 140,750 |
|
| Gilead Sciences, Inc., 3.65%, 3/1/26 | | 1,550,000 |
| 1,502,704 |
|
| Gilead Sciences, Inc., 4.15%, 3/1/47 | | 200,000 |
| 177,723 |
|
| | | | 8,309,717 |
|
| Building Products — 0.1% | | | |
| Masco Corp., 4.45%, 4/1/25 | | 1,000,000 |
| 997,422 |
|
| Capital Markets — 0.4% | | | |
Bank of Scotland plc, VRN, 7.28%, 5/31/26(3) | GBP | 1,000,000 |
| 1,483,725 |
|
| Criteria Caixa SAU, MTN, 1.50%, 5/10/23 | EUR | 3,000,000 |
| 3,365,365 |
|
| Jefferies Group LLC / Jefferies Group Capital Finance, Inc., 4.15%, 1/23/30 | | $ | 650,000 |
| 568,425 |
|
| | | | 5,417,515 |
|
|
| | | | | | | |
| | | Principal Amount | Value |
| Chemicals — 0.2% | | | |
| Ashland LLC, 4.75%, 8/15/22 | | $ | 1,980,000 |
| $ | 1,970,100 |
|
| Dow Chemical Co. (The), 4.375%, 11/15/42 | | 200,000 |
| 177,518 |
|
NOVA Chemicals Corp., 4.875%, 6/1/24(1) | | 1,110,000 |
| 1,023,975 |
|
| | | | 3,171,593 |
|
| Commercial Services and Supplies — 0.2% | | | |
| Covanta Holding Corp., 5.875%, 3/1/24 | | 1,060,000 |
| 1,060,000 |
|
Nielsen Finance LLC / Nielsen Finance Co., 5.00%, 4/15/22(1) | | 820,000 |
| 800,525 |
|
| Republic Services, Inc., 3.55%, 6/1/22 | | 680,000 |
| 678,344 |
|
| | | | 2,538,869 |
|
| Communications Equipment — 0.4% | | | |
CommScope Technologies LLC, 5.00%, 3/15/27(1) | | 3,260,000 |
| 2,934,000 |
|
IHS Netherlands Holdco BV, 9.50%, 10/27/21(1) | | 1,300,000 |
| 1,314,725 |
|
Zayo Group LLC / Zayo Capital, Inc., 5.75%, 1/15/27(1) | | 1,890,000 |
| 1,857,303 |
|
| | | | 6,106,028 |
|
| Consumer Finance — 0.5% | | | |
| American Express Co., 3.00%, 10/30/24 | | 300,000 |
| 283,987 |
|
| CIT Group, Inc., 5.00%, 8/15/22 | | 1,610,000 |
| 1,626,100 |
|
| Discover Bank, 3.45%, 7/27/26 | | 550,000 |
| 507,140 |
|
| Discover Financial Services, 3.75%, 3/4/25 | | 200,000 |
| 189,692 |
|
IHS Markit Ltd., 4.00%, 3/1/26(1) | | 1,906,000 |
| 1,798,597 |
|
| PNC Bank N.A., MTN, 2.30%, 6/1/20 | | 950,000 |
| 935,690 |
|
| Synchrony Financial, 2.60%, 1/15/19 | | 380,000 |
| 379,506 |
|
| Synchrony Financial, 3.00%, 8/15/19 | | 250,000 |
| 249,026 |
|
| Synchrony Financial, 3.95%, 12/1/27 | | 650,000 |
| 574,202 |
|
| | | | 6,543,940 |
|
| Containers and Packaging — 1.0% | | | |
Ardagh Packaging Finance plc / Ardagh Holdings USA, Inc., 6.00%, 2/15/25(1) | | 3,130,000 |
| 2,942,200 |
|
| Ball Corp., 4.00%, 11/15/23 | | 2,090,000 |
| 2,032,525 |
|
| Berry Global, Inc., 5.125%, 7/15/23 | | 2,750,000 |
| 2,746,563 |
|
| Crown Americas LLC / Crown Americas Capital Corp. IV, 4.50%, 1/15/23 | | 2,490,000 |
| 2,446,425 |
|
Crown Americas LLC / Crown Americas Capital Corp. VI, 4.75%, 2/1/26(1) | | 1,180,000 |
| 1,116,575 |
|
Reynolds Group Issuer, Inc. / Reynolds Group Issuer LLC / Reynolds Group Issuer Lu, 5.125%, 7/15/23(1) | | 2,700,000 |
| 2,646,000 |
|
| | | | 13,930,288 |
|
Diversified Consumer Services† | | | |
| Board of Trustees of The Leland Stanford Junior University (The), 3.46%, 5/1/47 | | 200,000 |
| 177,368 |
|
| Catholic Health Initiatives, 2.95%, 11/1/22 | | 10,000 |
| 9,625 |
|
| | | | 186,993 |
|
| Diversified Financial Services — 3.4% | | | |
| Ally Financial, Inc., 4.625%, 3/30/25 | | 3,240,000 |
| 3,183,300 |
|
| Banco Santander SA, 3.50%, 4/11/22 | | 1,000,000 |
| 976,924 |
|
Barclays plc, MTN, VRN, 2.00%, 2/7/23(3) | EUR | 2,100,000 |
| 2,271,245 |
|
Barclays plc, MTN, VRN, 1.375%, 1/24/25(3) | EUR | 2,900,000 |
| 3,118,284 |
|
|
| | | | | | | |
| | | Principal Amount | Value |
BNP Paribas SA, 4.375%, 9/28/25(1) | | $ | 500,000 |
| $ | 484,038 |
|
| Credit Agricole SA, MTN, 7.375%, 12/18/23 | GBP | 1,700,000 |
| 2,686,715 |
|
Credit Suisse Group AG, VRN, 2.125%, 9/12/24(3) | GBP | 5,000,000 |
| 6,124,612 |
|
| Credit Suisse Group Funding Guernsey Ltd., 3.45%, 4/16/21 | | $ | 1,925,000 |
| 1,913,468 |
|
| GE Capital UK Funding Unlimited Co., MTN, 5.125%, 5/24/23 | GBP | 500,000 |
| 715,639 |
|
| Goldman Sachs Group, Inc. (The), 5.50%, 10/12/21 | GBP | 850,000 |
| 1,192,325 |
|
| Goldman Sachs Group, Inc. (The), 3.50%, 1/23/25 | | $ | 1,400,000 |
| 1,341,380 |
|
| Goldman Sachs Group, Inc. (The), 3.50%, 11/16/26 | | 2,300,000 |
| 2,151,485 |
|
| Goldman Sachs Group, Inc. (The), 5.15%, 5/22/45 | | 250,000 |
| 245,291 |
|
| Goldman Sachs Group, Inc. (The), MTN, 4.25%, 1/29/26 | GBP | 1,000,000 |
| 1,396,347 |
|
Goldman Sachs Group, Inc. (The), VRN, 2.88%, 10/31/21(3) | | $ | 330,000 |
| 321,108 |
|
Goldman Sachs Group, Inc. (The), VRN, 3.27%, 9/29/24(3) | | 430,000 |
| 408,010 |
|
| HSBC Holdings plc, 2.95%, 5/25/21 | | 1,600,000 |
| 1,573,643 |
|
| HSBC Holdings plc, 0.84%, 9/26/23 | JPY | 600,000,000 |
| 5,410,273 |
|
| HSBC Holdings plc, 4.30%, 3/8/26 | | $ | 300,000 |
| 296,210 |
|
| HSBC Holdings plc, 4.375%, 11/23/26 | | 2,070,000 |
| 2,010,904 |
|
HSBC Holdings plc, VRN, 3.26%, 3/13/22(3) | | 340,000 |
| 332,195 |
|
| Morgan Stanley, 2.75%, 5/19/22 | | 3,010,000 |
| 2,911,292 |
|
| Morgan Stanley, 4.375%, 1/22/47 | | 350,000 |
| 327,026 |
|
| Morgan Stanley, MTN, 5.625%, 9/23/19 | | 110,000 |
| 112,354 |
|
| Morgan Stanley, MTN, 4.00%, 7/23/25 | | 1,300,000 |
| 1,277,885 |
|
UBS Group Funding Switzerland AG, 3.49%, 5/23/23(1) | | 1,000,000 |
| 977,460 |
|
UBS Group Funding Switzerland AG, 4.125%, 9/24/25(1) | | 200,000 |
| 196,958 |
|
| UniCredit SpA, 0.375%, 10/31/26 (Secured) | EUR | 600,000 |
| 626,759 |
|
UniCredit SpA, MTN, VRN, 5.75%, 10/28/20(3) | EUR | 2,300,000 |
| 2,700,635 |
|
UniCredit SpA, VRN, 5.86%, 6/19/27(1)(3) | | $ | 2,200,000 |
| 1,888,616 |
|
| | | | 49,172,381 |
|
| Diversified Telecommunication Services — 1.3% | | | |
| AT&T, Inc., 3.40%, 5/15/25 | | 2,350,000 |
| 2,209,675 |
|
| AT&T, Inc., 2.60%, 12/17/29 | EUR | 1,800,000 |
| 2,069,264 |
|
| AT&T, Inc., 5.25%, 3/1/37 | | $ | 500,000 |
| 479,650 |
|
AT&T, Inc., 5.15%, 11/15/46(1) | | 272,000 |
| 248,366 |
|
| AT&T, Inc., 5.45%, 3/1/47 | | 350,000 |
| 333,174 |
|
| CenturyLink, Inc., 6.15%, 9/15/19 | | 980,000 |
| 994,700 |
|
Deutsche Telekom International Finance BV, 3.60%, 1/19/27(1) | | 450,000 |
| 420,666 |
|
| Deutsche Telekom International Finance BV, MTN, 1.25%, 10/6/23 | GBP | 1,500,000 |
| 1,861,586 |
|
| Orange SA, 4.125%, 9/14/21 | | $ | 680,000 |
| 693,279 |
|
Orange SA, MTN, VRN, 4.00%, 10/1/21(3) | EUR | 1,600,000 |
| 1,933,416 |
|
| Telefonica Emisiones SAU, 5.46%, 2/16/21 | | $ | 690,000 |
| 717,302 |
|
| Telefonica Emisiones SAU, 5.21%, 3/8/47 | | 300,000 |
| 280,423 |
|
Telefonica Europe BV, VRN, 3.00%, 12/4/23(3) | EUR | 4,500,000 |
| 4,899,548 |
|
| Verizon Communications, Inc., 3.50%, 11/1/24 | | $ | 600,000 |
| 587,635 |
|
| Verizon Communications, Inc., 5.01%, 8/21/54 | | 1,200,000 |
| 1,137,365 |
|
| | | | 18,866,049 |
|
|
| | | | | | | |
| | | Principal Amount | Value |
| Electric Utilities — 0.1% | | | |
NextEra Energy Operating Partners LP, 4.50%, 9/15/27(1) | | $ | 2,000,000 |
| $ | 1,852,500 |
|
| Energy Equipment and Services — 0.1% | | | |
| Halliburton Co., 3.80%, 11/15/25 | | 380,000 |
| 370,250 |
|
| Halliburton Co., 4.85%, 11/15/35 | | 570,000 |
| 572,979 |
|
| | | | 943,229 |
|
| Entertainment — 0.9% | | | |
| 21st Century Fox America, Inc., 4.75%, 9/15/44 | | 640,000 |
| 662,162 |
|
| Activision Blizzard, Inc., 2.30%, 9/15/21 | | 760,000 |
| 736,198 |
|
| CCO Holdings LLC / CCO Holdings Capital Corp., 5.25%, 9/30/22 | | 1,170,000 |
| 1,178,044 |
|
CCO Holdings LLC / CCO Holdings Capital Corp., 5.125%, 5/1/27(1) | | 2,920,000 |
| 2,755,750 |
|
| Charter Communications Operating LLC / Charter Communications Operating Capital, 4.91%, 7/23/25 | | 2,040,000 |
| 2,057,273 |
|
| Charter Communications Operating LLC / Charter Communications Operating Capital, 6.48%, 10/23/45 | | 120,000 |
| 123,038 |
|
CSC Holdings LLC, 5.50%, 4/15/27(1) | | 2,360,000 |
| 2,271,500 |
|
Netflix, Inc., 4.875%, 4/15/28(1) | | 2,500,000 |
| 2,296,875 |
|
| Viacom, Inc., 4.25%, 9/1/23 | | 500,000 |
| 499,811 |
|
| Viacom, Inc., 4.375%, 3/15/43 | | 580,000 |
| 476,345 |
|
| | | | 13,056,996 |
|
| Equity Real Estate Investment Trusts (REITs) — 0.7% | | | |
| American Tower Corp., 3.375%, 10/15/26 | | 870,000 |
| 800,658 |
|
| AvalonBay Communities, Inc., MTN, 3.20%, 1/15/28 | | 240,000 |
| 225,203 |
|
| Boston Properties LP, 3.65%, 2/1/26 | | 860,000 |
| 827,634 |
|
| Crown Castle International Corp., 5.25%, 1/15/23 | | 840,000 |
| 876,885 |
|
| CyrusOne LP / CyrusOne Finance Corp., 5.00%, 3/15/24 | | 2,130,000 |
| 2,135,325 |
|
| Essex Portfolio LP, 3.25%, 5/1/23 | | 550,000 |
| 533,448 |
|
| Hospitality Properties Trust, 4.65%, 3/15/24 | | 220,000 |
| 217,978 |
|
| Kimco Realty Corp., 2.80%, 10/1/26 | | 400,000 |
| 354,705 |
|
| MGM Growth Properties Operating Partnership LP / MGP Finance Co-Issuer, Inc., 4.50%, 9/1/26 | | 2,180,000 |
| 1,983,800 |
|
| Ventas Realty LP, 4.125%, 1/15/26 | | 250,000 |
| 243,881 |
|
| VEREIT Operating Partnership LP, 4.125%, 6/1/21 | | 1,030,000 |
| 1,037,455 |
|
| Welltower, Inc., 3.75%, 3/15/23 | | 300,000 |
| 296,963 |
|
| | | | 9,533,935 |
|
| Food and Staples Retailing — 0.6% | | | |
| Cencosud SA, 4.875%, 1/20/23 | | 1,339,000 |
| 1,311,421 |
|
| CVS Health Corp., 3.50%, 7/20/22 | | 250,000 |
| 247,443 |
|
| CVS Health Corp., 2.75%, 12/1/22 | | 690,000 |
| 660,159 |
|
| Kroger Co. (The), 3.30%, 1/15/21 | | 480,000 |
| 478,054 |
|
| Target Corp., 3.90%, 11/15/47 | | 150,000 |
| 135,240 |
|
| Walmart, Inc., 0.18%, 7/15/22 | JPY | 650,000,000 |
| 5,788,281 |
|
| Walmart, Inc., 4.05%, 6/29/48 | | $ | 500,000 |
| 476,143 |
|
| | | | 9,096,741 |
|
| Food Products — 0.5% | | | |
Arcor SAIC, 6.00%, 7/6/23(1) | | 1,000,000 |
| 982,500 |
|
| Conagra Brands, Inc., 4.60%, 11/1/25 | | 1,290,000 |
| 1,292,912 |
|
|
| | | | | | | |
| | | Principal Amount | Value |
| Kraft Heinz Foods Co., 5.20%, 7/15/45 | | $ | 200,000 |
| $ | 188,449 |
|
| Kraft Heinz Foods Co., 4.375%, 6/1/46 | | 120,000 |
| 100,409 |
|
Lamb Weston Holdings, Inc., 4.625%, 11/1/24(1) | | 2,780,000 |
| 2,733,352 |
|
Post Holdings, Inc., 5.00%, 8/15/26(1) | | 1,900,000 |
| 1,759,875 |
|
| | | | 7,057,497 |
|
| Gas Utilities — 1.1% | | | |
| Andeavor Logistics LP / Tesoro Logistics Finance Corp., 5.50%, 10/15/19 | | 520,000 |
| 530,499 |
|
| Andeavor Logistics LP / Tesoro Logistics Finance Corp., 4.25%, 12/1/27 | | 500,000 |
| 476,819 |
|
| Enbridge Energy Partners LP, 5.20%, 3/15/20 | | 350,000 |
| 357,540 |
|
| Enbridge, Inc., 4.00%, 10/1/23 | | 530,000 |
| 529,808 |
|
| Energy Transfer Operating LP, 4.15%, 10/1/20 | | 20,000 |
| 20,177 |
|
| Energy Transfer Operating LP, 3.60%, 2/1/23 | | 630,000 |
| 614,093 |
|
| Energy Transfer Operating LP, 4.90%, 3/15/35 | | 320,000 |
| 288,682 |
|
| Enterprise Products Operating LLC, 5.20%, 9/1/20 | | 530,000 |
| 546,058 |
|
| Enterprise Products Operating LLC, 4.85%, 3/15/44 | | 900,000 |
| 868,372 |
|
| Kinder Morgan Energy Partners LP, 6.50%, 9/1/39 | | 970,000 |
| 1,060,596 |
|
| Kinder Morgan, Inc., 5.55%, 6/1/45 | | 450,000 |
| 456,186 |
|
| MPLX LP, 4.875%, 6/1/25 | | 450,000 |
| 459,426 |
|
| MPLX LP, 4.50%, 4/15/38 | | 280,000 |
| 250,233 |
|
| MPLX LP, 5.20%, 3/1/47 | | 368,000 |
| 349,195 |
|
| ONEOK, Inc., 4.00%, 7/13/27 | | 460,000 |
| 441,841 |
|
| Plains All American Pipeline LP / PAA Finance Corp., 3.65%, 6/1/22 | | 690,000 |
| 676,868 |
|
| Sabine Pass Liquefaction LLC, 5.625%, 3/1/25 | | 1,620,000 |
| 1,693,558 |
|
| Sunoco Logistics Partners Operations LP, 3.45%, 1/15/23 | | 1,020,000 |
| 985,922 |
|
| Sunoco Logistics Partners Operations LP, 4.00%, 10/1/27 | | 510,000 |
| 472,197 |
|
| Targa Resources Partners LP / Targa Resources Partners Finance Corp., 4.25%, 11/15/23 | | 1,680,000 |
| 1,619,604 |
|
| Targa Resources Partners LP / Targa Resources Partners Finance Corp., 5.00%, 1/15/28 | | 1,020,000 |
| 970,275 |
|
| Williams Cos., Inc. (The), 4.125%, 11/15/20 | | 680,000 |
| 686,494 |
|
| Williams Cos., Inc. (The), 4.55%, 6/24/24 | | 850,000 |
| 856,643 |
|
| Williams Cos., Inc. (The), 5.10%, 9/15/45 | | 300,000 |
| 284,439 |
|
| | | | 15,495,525 |
|
| Health Care Equipment and Supplies — 0.3% | | | |
| Abbott Laboratories, 3.75%, 11/30/26 | | 375,000 |
| 369,879 |
|
| Becton Dickinson and Co., 3.73%, 12/15/24 | | 600,000 |
| 582,431 |
|
| Becton Dickinson and Co., 3.70%, 6/6/27 | | 470,000 |
| 442,236 |
|
| Medtronic, Inc., 3.50%, 3/15/25 | | 720,000 |
| 705,535 |
|
| Medtronic, Inc., 4.375%, 3/15/35 | | 610,000 |
| 608,004 |
|
| Thermo Fisher Scientific, Inc., 3.30%, 2/15/22 | | 213,000 |
| 211,080 |
|
| Thermo Fisher Scientific, Inc., 2.95%, 9/19/26 | | 250,000 |
| 228,717 |
|
| Thermo Fisher Scientific, Inc., 5.30%, 2/1/44 | | 240,000 |
| 255,716 |
|
| Zimmer Biomet Holdings, Inc., 2.70%, 4/1/20 | | 270,000 |
| 267,080 |
|
| | | | 3,670,678 |
|
| Health Care Providers and Services — 1.0% | | | |
| Anthem, Inc., 3.65%, 12/1/27 | | 370,000 |
| 346,572 |
|
|
| | | | | | | |
| | | Principal Amount | Value |
| Anthem, Inc., 4.65%, 1/15/43 | | $ | 460,000 |
| $ | 435,928 |
|
| CVS Health Corp., 4.30%, 3/25/28 | | 900,000 |
| 879,570 |
|
| CVS Health Corp., 4.78%, 3/25/38 | | 270,000 |
| 259,450 |
|
| CVS Health Corp., 5.05%, 3/25/48 | | 410,000 |
| 401,193 |
|
| DaVita, Inc., 5.125%, 7/15/24 | | 3,000,000 |
| 2,872,500 |
|
| Express Scripts Holding Co., 3.40%, 3/1/27 | | 200,000 |
| 184,064 |
|
Fresenius Medical Care US Finance II, Inc., 4.125%, 10/15/20(1) | | 980,000 |
| 985,597 |
|
Halfmoon Parent, Inc., 4.90%, 12/15/48(1) | | 320,000 |
| 304,088 |
|
| HCA, Inc., 5.00%, 3/15/24 | | 710,000 |
| 720,206 |
|
| HCA, Inc., 5.375%, 2/1/25 | | 1,340,000 |
| 1,351,725 |
|
| Northwell Healthcare, Inc., 4.26%, 11/1/47 | | 220,000 |
| 200,409 |
|
| Tenet Healthcare Corp., 4.375%, 10/1/21 | | 750,000 |
| 745,313 |
|
| Tenet Healthcare Corp., 5.125%, 5/1/25 | | 2,200,000 |
| 2,123,000 |
|
| UnitedHealth Group, Inc., 2.875%, 12/15/21 | | 610,000 |
| 601,780 |
|
| UnitedHealth Group, Inc., 3.75%, 7/15/25 | | 710,000 |
| 703,834 |
|
| UnitedHealth Group, Inc., 4.75%, 7/15/45 | | 310,000 |
| 317,077 |
|
Universal Health Services, Inc., 4.75%, 8/1/22(1) | | 980,000 |
| 982,450 |
|
| | | | 14,414,756 |
|
| Hotels, Restaurants and Leisure — 0.8% | | | |
1011778 BC ULC / New Red Finance, Inc., 4.625%, 1/15/22(1) | | 2,200,000 |
| 2,185,975 |
|
Aramark Services, Inc., 5.00%, 4/1/25(1) | | 2,270,000 |
| 2,251,556 |
|
| Hilton Domestic Operating Co., Inc., 4.25%, 9/1/24 | | 2,460,000 |
| 2,368,488 |
|
| InterContinental Hotels Group plc, MTN, 3.75%, 8/14/25 | GBP | 1,400,000 |
| 1,886,273 |
|
International Game Technology plc, 6.25%, 2/15/22(1) | | $ | 1,200,000 |
| 1,245,000 |
|
| McDonald's Corp., MTN, 3.375%, 5/26/25 | | 280,000 |
| 270,177 |
|
| McDonald's Corp., MTN, 4.70%, 12/9/35 | | 460,000 |
| 463,847 |
|
| Royal Caribbean Cruises Ltd., 5.25%, 11/15/22 | | 550,000 |
| 574,740 |
|
| | | | 11,246,056 |
|
| Household Durables — 0.3% | | | |
| Lennar Corp., 4.75%, 4/1/21 | | 1,200,000 |
| 1,210,500 |
|
| Lennar Corp., 4.50%, 4/30/24 | | 1,400,000 |
| 1,341,375 |
|
| Lennar Corp., 4.75%, 11/29/27 | | 850,000 |
| 795,813 |
|
| Newell Brands, Inc., 5.00%, 11/15/23 | | 480,000 |
| 478,949 |
|
| Toll Brothers Finance Corp., 4.35%, 2/15/28 | | 940,000 |
| 834,250 |
|
| | | | 4,660,887 |
|
| Household Products — 0.1% | | | |
| Spectrum Brands, Inc., 5.75%, 7/15/25 | | 1,530,000 |
| 1,491,750 |
|
Industrial Conglomerates† | | | |
| FedEx Corp., 4.40%, 1/15/47 | | 400,000 |
| 359,288 |
|
| Insurance — 2.2% | | | |
| AerCap Ireland Capital DAC / AerCap Global Aviation Trust, 3.75%, 5/15/19 | | 1,450,000 |
| 1,453,018 |
|
Allianz SE, VRN, 3.375%, 9/18/24(3) | EUR | 2,200,000 |
| 2,617,593 |
|
| American International Group, Inc., 4.125%, 2/15/24 | | $ | 1,360,000 |
| 1,353,402 |
|
| American International Group, Inc., 4.50%, 7/16/44 | | 200,000 |
| 178,122 |
|
Assicurazioni Generali SpA, MTN, VRN, 4.60%, 11/21/25(3) | EUR | 3,600,000 |
| 4,005,422 |
|
|
| | | | | | | |
| | | Principal Amount | Value |
AXA SA, MTN, VRN, 6.69%, 7/6/26(3) | GBP | 1,100,000 |
| $ | 1,573,642 |
|
AXA SA, MTN, VRN, 3.375%, 7/6/27(3) | EUR | 3,600,000 |
| 4,149,685 |
|
| Berkshire Hathaway Finance Corp., 3.00%, 5/15/22 | | $ | 680,000 |
| 672,885 |
|
| Berkshire Hathaway, Inc., 4.50%, 2/11/43 | | 460,000 |
| 462,406 |
|
BNP Paribas Cardif SA, VRN, 4.03%, 11/25/25(3) | EUR | 1,800,000 |
| 2,110,990 |
|
| Chubb INA Holdings, Inc., 3.15%, 3/15/25 | | $ | 600,000 |
| 575,418 |
|
| Chubb INA Holdings, Inc., 3.35%, 5/3/26 | | 330,000 |
| 317,752 |
|
CNP Assurances, VRN, 4.00%, 11/18/24(3) | EUR | 2,200,000 |
| 2,597,930 |
|
Credit Agricole Assurances SA, VRN, 4.25%, 1/13/25(3) | EUR | 3,000,000 |
| 3,524,324 |
|
| International Lease Finance Corp., 5.875%, 8/15/22 | | $ | 400,000 |
| 421,638 |
|
Intesa Sanpaolo Vita SpA, VRN, 4.75%, 12/17/24(3) | EUR | 1,600,000 |
| 1,768,620 |
|
| Markel Corp., 4.90%, 7/1/22 | | $ | 290,000 |
| 298,216 |
|
| Markel Corp., 3.50%, 11/1/27 | | 250,000 |
| 231,251 |
|
| MetLife, Inc., 4.875%, 11/13/43 | | 680,000 |
| 686,380 |
|
| Prudential Financial, Inc., 3.94%, 12/7/49 | | 270,000 |
| 234,421 |
|
Prudential Financial, Inc., VRN, 5.875%, 9/15/22(3) | | 1,050,000 |
| 1,093,838 |
|
| Voya Financial, Inc., 5.70%, 7/15/43 | | 435,000 |
| 466,755 |
|
| WR Berkley Corp., 4.625%, 3/15/22 | | 660,000 |
| 675,810 |
|
| | | | 31,469,518 |
|
| IT Services — 0.3% | | | |
| Fidelity National Information Services, Inc., 3.00%, 8/15/26 | | 990,000 |
| 901,619 |
|
First Data Corp., 5.00%, 1/15/24(1) | | 3,160,000 |
| 3,140,250 |
|
| | | | 4,041,869 |
|
| Life Sciences Tools and Services — 0.1% | | | |
IQVIA, Inc., 5.00%, 10/15/26(1) | | 2,000,000 |
| 1,931,860 |
|
| Media — 1.0% | | | |
| AMC Networks, Inc., 4.75%, 8/1/25 | | 1,940,000 |
| 1,808,274 |
|
| CBS Corp., 4.00%, 1/15/26 | | 550,000 |
| 533,154 |
|
| Comcast Corp., 4.40%, 8/15/35 | | 550,000 |
| 524,348 |
|
| Comcast Corp., 4.70%, 10/15/48 | | 790,000 |
| 767,670 |
|
| Discovery Communications LLC, 5.625%, 8/15/19 | | 423,000 |
| 431,362 |
|
Globo Comunicacao e Participacoes SA, 5.125%, 3/31/27(1) | | 1,100,000 |
| 1,024,386 |
|
GTH Finance BV, 7.25%, 4/26/23(1) | | 2,000,000 |
| 2,076,730 |
|
| Lamar Media Corp., 5.375%, 1/15/24 | | 1,840,000 |
| 1,851,500 |
|
Sirius XM Radio, Inc., 5.375%, 4/15/25(1) | | 2,830,000 |
| 2,810,544 |
|
| TEGNA, Inc., 5.125%, 7/15/20 | | 910,000 |
| 911,138 |
|
| Time Warner Cable LLC, 4.50%, 9/15/42 | | 300,000 |
| 243,467 |
|
| Warner Media LLC, 4.70%, 1/15/21 | | 420,000 |
| 430,094 |
|
| Warner Media LLC, 2.95%, 7/15/26 | | 700,000 |
| 620,542 |
|
| Warner Media LLC, 3.80%, 2/15/27 | | 200,000 |
| 187,577 |
|
| Warner Media LLC, 5.35%, 12/15/43 | | 250,000 |
| 236,340 |
|
| | | | 14,457,126 |
|
| Metals and Mining — 0.5% | | | |
Alcoa Nederland Holding BV, 6.75%, 9/30/24(1) | | 800,000 |
| 844,000 |
|
Alcoa Nederland Holding BV, 6.125%, 5/15/28(1) | | 950,000 |
| 950,000 |
|
Constellium NV, 6.625%, 3/1/25(1) | | 650,000 |
| 638,625 |
|
| Freeport-McMoRan, Inc., 3.875%, 3/15/23 | | 1,180,000 |
| 1,094,450 |
|
|
| | | | | | | |
| | | Principal Amount | Value |
| Steel Dynamics, Inc., 4.125%, 9/15/25 | | $ | 1,000,000 |
| $ | 940,000 |
|
| Steel Dynamics, Inc., 5.00%, 12/15/26 | | 880,000 |
| 862,400 |
|
| Vale Overseas Ltd., 6.875%, 11/21/36 | | 2,000,000 |
| 2,230,580 |
|
| | | | 7,560,055 |
|
| Multi-Utilities — 1.6% | | | |
| AES Corp., 4.875%, 5/15/23 | | 1,380,000 |
| 1,369,650 |
|
| AES Corp., 6.00%, 5/15/26 | | 750,000 |
| 770,625 |
|
| AmeriGas Partners LP / AmeriGas Finance Corp., 5.875%, 8/20/26 | | 1,950,000 |
| 1,852,500 |
|
| AmeriGas Partners LP / AmeriGas Finance Corp., 5.75%, 5/20/27 | | 550,000 |
| 512,875 |
|
| Berkshire Hathaway Energy Co., 3.50%, 2/1/25 | | 680,000 |
| 667,636 |
|
| Berkshire Hathaway Energy Co., 3.80%, 7/15/48 | | 700,000 |
| 607,760 |
|
| CenterPoint Energy, Inc., 4.25%, 11/1/28 | | 340,000 |
| 337,397 |
|
Centrica plc, VRN, 5.25%, 4/10/25(3) | GBP | 1,800,000 |
| 2,378,411 |
|
| Dominion Energy, Inc., 3.625%, 12/1/24 | | $ | 1,030,000 |
| 1,010,763 |
|
| Dominion Energy, Inc., 3.90%, 10/1/25 | | 480,000 |
| 469,011 |
|
| Dominion Energy, Inc., 4.90%, 8/1/41 | | 100,000 |
| 99,970 |
|
| Duke Energy Corp., 3.55%, 9/15/21 | | 680,000 |
| 680,044 |
|
| Duke Energy Corp., 2.65%, 9/1/26 | | 300,000 |
| 268,914 |
|
| Duke Energy Progress LLC, 3.25%, 8/15/25 | | 400,000 |
| 388,060 |
|
| Duke Energy Progress LLC, 4.15%, 12/1/44 | | 170,000 |
| 162,249 |
|
| Duke Energy Progress LLC, 3.70%, 10/15/46 | | 450,000 |
| 394,351 |
|
| Exelon Corp., 4.45%, 4/15/46 | | 400,000 |
| 377,675 |
|
| Exelon Generation Co. LLC, 4.25%, 6/15/22 | | 680,000 |
| 688,309 |
|
| FirstEnergy Corp., 4.25%, 3/15/23 | | 900,000 |
| 909,233 |
|
| Florida Power & Light Co., 4.125%, 2/1/42 | | 525,000 |
| 512,526 |
|
| IPALCO Enterprises, Inc., 3.45%, 7/15/20 | | 850,000 |
| 844,106 |
|
| MidAmerican Energy Co., 4.40%, 10/15/44 | | 200,000 |
| 199,728 |
|
| NextEra Energy Capital Holdings, Inc., 3.55%, 5/1/27 | | 650,000 |
| 619,223 |
|
| NiSource, Inc., 5.65%, 2/1/45 | | 410,000 |
| 444,357 |
|
| Pacific Gas & Electric Co., 4.00%, 12/1/46 | | 200,000 |
| 163,422 |
|
| Potomac Electric Power Co., 3.60%, 3/15/24 | | 10,000 |
| 9,979 |
|
RWE AG, VRN, 7.00%, 3/20/19(3) | GBP | 1,000,000 |
| 1,297,400 |
|
| Sempra Energy, 2.875%, 10/1/22 | | $ | 680,000 |
| 656,415 |
|
| Sempra Energy, 3.25%, 6/15/27 | | 500,000 |
| 461,274 |
|
| Sempra Energy, 4.00%, 2/1/48 | | 250,000 |
| 216,897 |
|
| Southern Co. Gas Capital Corp., 3.95%, 10/1/46 | | 400,000 |
| 343,080 |
|
| Southwestern Public Service Co., 3.70%, 8/15/47 | | 350,000 |
| 314,645 |
|
SSE plc, VRN, 2.375%, 4/1/21(3) | EUR | 2,200,000 |
| 2,517,422 |
|
| Xcel Energy, Inc., 3.35%, 12/1/26 | | $ | 150,000 |
| 143,258 |
|
| | | | 22,689,165 |
|
Multiline Retail† | | | |
| Macy's Retail Holdings, Inc., 2.875%, 2/15/23 | | 350,000 |
| 327,216 |
|
| Oil, Gas and Consumable Fuels — 2.7% | | | |
| Anadarko Petroleum Corp., 5.55%, 3/15/26 | | 750,000 |
| 781,514 |
|
| Antero Resources Corp., 5.125%, 12/1/22 | | 2,690,000 |
| 2,678,231 |
|
| Apache Corp., 4.75%, 4/15/43 | | 300,000 |
| 268,326 |
|
|
| | | | | | | |
| | | Principal Amount | Value |
| BP Capital Markets plc, 4.50%, 10/1/20 | | $ | 690,000 |
| $ | 705,244 |
|
| Cenovus Energy, Inc., 4.25%, 4/15/27 | | 570,000 |
| 538,397 |
|
| Cimarex Energy Co., 4.375%, 6/1/24 | | 1,000,000 |
| 996,905 |
|
| CNOOC Nexen Finance 2014 ULC, 4.25%, 4/30/24 | | 1,020,000 |
| 1,024,536 |
|
| Concho Resources, Inc., 4.375%, 1/15/25 | | 710,000 |
| 708,775 |
|
| Concho Resources, Inc., 4.875%, 10/1/47 | | 350,000 |
| 332,045 |
|
| Continental Resources, Inc., 5.00%, 9/15/22 | | 456,000 |
| 460,587 |
|
| Continental Resources, Inc., 3.80%, 6/1/24 | | 2,380,000 |
| 2,301,965 |
|
| Continental Resources, Inc., 4.375%, 1/15/28 | | 300,000 |
| 290,616 |
|
| Diamondback Energy, Inc., 5.375%, 5/31/25 | | 2,440,000 |
| 2,433,900 |
|
| Ecopetrol SA, 5.875%, 5/28/45 | | 1,580,000 |
| 1,510,085 |
|
| Encana Corp., 6.50%, 2/1/38 | | 480,000 |
| 548,213 |
|
| Gazprom OAO Via Gaz Capital SA, MTN, 7.29%, 8/16/37 | | 600,000 |
| 663,547 |
|
| Hess Corp., 6.00%, 1/15/40 | | 670,000 |
| 661,878 |
|
Lukoil International Finance BV, 4.75%, 11/2/26(1) | | 1,300,000 |
| 1,278,534 |
|
| Marathon Oil Corp., 3.85%, 6/1/25 | | 400,000 |
| 384,736 |
|
| Newfield Exploration Co., 5.75%, 1/30/22 | | 2,080,000 |
| 2,155,400 |
|
| Newfield Exploration Co., 5.375%, 1/1/26 | | 500,000 |
| 507,190 |
|
| Noble Energy, Inc., 4.15%, 12/15/21 | | 217,000 |
| 218,715 |
|
| Petrobras Global Finance BV, 5.30%, 1/27/25 | | 1,550,000 |
| 1,482,188 |
|
| Petroleos Mexicanos, 6.625%, 6/15/35 | | 1,720,000 |
| 1,582,400 |
|
| Phillips 66, 4.30%, 4/1/22 | | 350,000 |
| 357,493 |
|
| Range Resources Corp., 4.875%, 5/15/25 | | 3,080,000 |
| 2,864,400 |
|
| Shell International Finance BV, 2.375%, 8/21/22 | | 690,000 |
| 665,587 |
|
| Shell International Finance BV, 3.25%, 5/11/25 | | 230,000 |
| 221,907 |
|
Sinopec Group Overseas Development Ltd., 2.50%, 4/28/20(1) | | 600,000 |
| 590,690 |
|
Sunoco LP / Sunoco Finance Corp., 5.50%, 2/15/26(1) | | 2,640,000 |
| 2,521,200 |
|
| Total Capital Canada Ltd., 2.75%, 7/15/23 | | 680,000 |
| 656,224 |
|
TOTAL SA, MTN, VRN, 2.625%, 2/26/25(3) | EUR | 2,992,000 |
| 3,429,191 |
|
Tullow Oil plc, 7.00%, 3/1/25(1) | | $ | 700,000 |
| 686,945 |
|
| WPX Energy, Inc., 5.25%, 9/15/24 | | 1,380,000 |
| 1,369,650 |
|
YPF SA, 6.95%, 7/21/27(1) | | 1,300,000 |
| 1,103,635 |
|
| | | | 38,980,849 |
|
| Paper and Forest Products — 0.1% | | | |
Georgia-Pacific LLC, 5.40%, 11/1/20(1) | | 710,000 |
| 735,923 |
|
| International Paper Co., 4.40%, 8/15/47 | | 400,000 |
| 346,670 |
|
| | | | 1,082,593 |
|
| Pharmaceuticals — 0.7% | | | |
| Allergan Funding SCS, 3.85%, 6/15/24 | | 1,510,000 |
| 1,484,375 |
|
| Allergan Funding SCS, 4.55%, 3/15/35 | | 140,000 |
| 132,467 |
|
Bausch Health Cos., Inc., 7.00%, 3/15/24(1) | | 1,220,000 |
| 1,280,622 |
|
Bayer AG, VRN, 3.75%, 7/1/24(3) | EUR | 3,100,000 |
| 3,553,298 |
|
| Shire Acquisitions Investments Ireland DAC, 2.40%, 9/23/21 | | $ | 1,300,000 |
| 1,250,248 |
|
| Teva Pharmaceutical Finance Netherlands III BV, 3.15%, 10/1/26 | | 1,970,000 |
| 1,607,658 |
|
| | | | 9,308,668 |
|
|
| | | | | | | |
| | | Principal Amount | Value |
| Real Estate Management and Development — 0.1% | | | |
| Tesco Property Finance 3 plc, 5.74%, 4/13/40 | GBP | 1,067,967 |
| $ | 1,609,280 |
|
| Road and Rail — 0.2% | | | |
| Burlington Northern Santa Fe LLC, 4.15%, 4/1/45 | | $ | 1,235,000 |
| 1,168,753 |
|
| CSX Corp., 3.40%, 8/1/24 | | 690,000 |
| 675,199 |
|
| CSX Corp., 3.25%, 6/1/27 | | 320,000 |
| 298,295 |
|
| Norfolk Southern Corp., 3.15%, 6/1/27 | | 530,000 |
| 497,472 |
|
| Union Pacific Corp., 4.75%, 9/15/41 | | 300,000 |
| 300,388 |
|
| Union Pacific Corp., 4.05%, 11/15/45 | | 200,000 |
| 180,866 |
|
| | | | 3,120,973 |
|
| Semiconductors and Semiconductor Equipment — 0.4% | | | |
| Broadcom Corp. / Broadcom Cayman Finance Ltd., 3.125%, 1/15/25 | | 500,000 |
| 458,033 |
|
| Broadcom Corp. / Broadcom Cayman Finance Ltd., 3.50%, 1/15/28 | | 190,000 |
| 167,592 |
|
NXP BV / NXP Funding LLC, 4.125%, 6/15/20(1) | | 1,000,000 |
| 1,000,000 |
|
NXP BV / NXP Funding LLC, 3.875%, 9/1/22(1) | | 500,000 |
| 483,750 |
|
Sensata Technologies BV, 5.00%, 10/1/25(1) | | 910,000 |
| 882,700 |
|
Sensata Technologies UK Financing Co. plc, 6.25%, 2/15/26(1) | | 2,300,000 |
| 2,351,750 |
|
| | | | 5,343,825 |
|
| Software — 0.3% | | | |
| Microsoft Corp., 2.70%, 2/12/25 | | 1,280,000 |
| 1,215,352 |
|
| Microsoft Corp., 3.125%, 11/3/25 | | 330,000 |
| 320,062 |
|
| Microsoft Corp., 3.45%, 8/8/36 | | 1,200,000 |
| 1,106,687 |
|
| Microsoft Corp., 4.25%, 2/6/47 | | 330,000 |
| 332,656 |
|
| Oracle Corp., 3.625%, 7/15/23 | | 1,010,000 |
| 1,013,755 |
|
| Oracle Corp., 2.65%, 7/15/26 | | 600,000 |
| 549,364 |
|
| | | | 4,537,876 |
|
| Specialty Retail — 0.4% | | | |
Ashtead Capital, Inc., 4.125%, 8/15/25(1) | | 1,650,000 |
| 1,538,625 |
|
| Home Depot, Inc. (The), 3.75%, 2/15/24 | | 750,000 |
| 759,473 |
|
| Home Depot, Inc. (The), 5.95%, 4/1/41 | | 480,000 |
| 574,691 |
|
| Home Depot, Inc. (The), 3.90%, 6/15/47 | | 350,000 |
| 319,234 |
|
| United Rentals North America, Inc., 5.75%, 11/15/24 | | 3,080,000 |
| 3,099,250 |
|
| | | | 6,291,273 |
|
| Technology Hardware, Storage and Peripherals — 0.4% | | | |
| Apple, Inc., 2.75%, 1/13/25 | | 270,000 |
| 256,198 |
|
| Apple, Inc., 2.50%, 2/9/25 | | 520,000 |
| 485,645 |
|
| Apple, Inc., 2.45%, 8/4/26 | | 600,000 |
| 547,081 |
|
| Apple, Inc., 3.20%, 5/11/27 | | 600,000 |
| 571,135 |
|
| Apple, Inc., 2.90%, 9/12/27 | | 770,000 |
| 714,169 |
|
Dell International LLC / EMC Corp., 6.02%, 6/15/26(1) | | 1,580,000 |
| 1,640,785 |
|
| Hewlett Packard Enterprise Co., 3.60%, 10/15/20 | | 780,000 |
| 781,573 |
|
| Seagate HDD Cayman, 4.75%, 6/1/23 | | 450,000 |
| 428,701 |
|
| Seagate HDD Cayman, 4.75%, 1/1/25 | | 1,000,000 |
| 916,354 |
|
| | | | 6,341,641 |
|
|
| | | | | | | |
| | | Principal Amount | Value |
| Textiles, Apparel and Luxury Goods — 0.1% | | | |
Hanesbrands, Inc., 4.625%, 5/15/24(1) | | $ | 700,000 |
| $ | 673,750 |
|
| Wireless Telecommunication Services — 0.3% | | | |
| America Movil SAB de CV, 3.125%, 7/16/22 | | 240,000 |
| 233,796 |
|
| MTN Mauritius Investments Ltd., 4.76%, 11/11/24 | | 1,400,000 |
| 1,259,867 |
|
| Sprint Communications, Inc., 6.00%, 11/15/22 | | 1,200,000 |
| 1,214,250 |
|
| T-Mobile USA, Inc., 4.75%, 2/1/28 | | 2,380,000 |
| 2,207,450 |
|
| | | | 4,915,363 |
|
TOTAL CORPORATE BONDS
(Cost $491,177,966) | | | 473,213,611 |
|
COLLATERALIZED MORTGAGE OBLIGATIONS(4) — 5.9% | | | |
| Private Sponsor Collateralized Mortgage Obligations — 3.9% |
Bear Stearns Adjustable Rate Mortgage Trust, Series 2004-12, Class 2A1, VRN, 3.66%, 11/1/18(5) | | 650,366 |
| 659,674 |
|
Bear Stearns Adjustable Rate Mortgage Trust, Series 2004-8, Class 2A1, VRN, 4.19%, 11/1/18(5) | | 470,886 |
| 461,295 |
|
Bear Stearns Adjustable Rate Mortgage Trust, Series 2005-6, Class 1A1, VRN, 4.43%, 11/1/18(5) | | 1,601,080 |
| 1,472,729 |
|
| Bear Stearns Adjustable Rate Mortgage Trust, Series 2006-1, Class A1, VRN, 3.87%, 11/1/18, resets annually off the 1-year H15T1Y plus 2.25% | | 621,002 |
| 628,438 |
|
Chase Mortgage Finance Trust, Series 2007-A2, Class 6A2 SEQ, VRN, 4.06%, 11/1/18(5) | | 1,847,607 |
| 1,786,039 |
|
Citigroup Mortgage Loan Trust, Inc., Series 2004-UST1, Class A5, VRN, 4.05%, 11/1/18(5) | | 1,130,321 |
| 1,123,233 |
|
Citigroup Mortgage Loan Trust, Inc., Series 2005-4, Class A, VRN, 4.48%, 11/1/18(5) | | 32,893 |
| 33,374 |
|
| Countrywide Home Loan Mortgage Pass-Through Trust, Series 2004-4, Class A19, 5.25%, 5/25/34 | | 3,421 |
| 3,475 |
|
Credit Suisse First Boston Mortgage-Backed Pass-Through Certificates, Series 2005-3, Class 1A1, VRN, 5.42%, 11/1/18(5) | | 693,165 |
| 695,805 |
|
First Horizon Mortgage Pass-Through Trust, Series 2005-AR3, Class 4A1, VRN, 4.39%, 11/1/18(5) | | 2,558 |
| 2,576 |
|
First Horizon Mortgage Pass-Through Trust, Series 2006-AR4, Class 1A2, VRN, 3.72%, 11/1/18(5) | | 407,913 |
| 372,494 |
|
Flagstar Mortgage Trust, Series 2017-1, Class 1A5 SEQ, VRN, 3.50%, 11/1/18(1)(5) | | 7,712,663 |
| 7,571,776 |
|
| GSR Mortgage Loan Trust, Series 2005-6F, Class 1A5 SEQ, 5.25%, 7/25/35 | | 10,442 |
| 10,927 |
|
GSR Mortgage Loan Trust, Series 2005-AR6, Class 2A1, VRN, 4.01%, 11/1/18(5) | | 701,173 |
| 717,524 |
|
GSR Mortgage Loan Trust, Series 2005-AR6, Class 4A5, VRN, 4.44%, 11/1/18(5) | | 506,461 |
| 513,911 |
|
JPMorgan Mortgage Trust, Series 2005-A4, Class 2A1, VRN, 4.18%, 11/1/18(5) | | 470,637 |
| 471,732 |
|
JPMorgan Mortgage Trust, Series 2005-A6, Class 7A1, VRN, 4.37%, 11/1/18(5) | | 631,964 |
| 621,108 |
|
JPMorgan Mortgage Trust, Series 2006-A3, Class 7A1, VRN, 3.88%, 11/1/18(5) | | 6,486 |
| 6,608 |
|
| JPMorgan Mortgage Trust, Series 2006-S1, Class 1A2 SEQ, 6.50%, 4/25/36 | | 356,565 |
| 383,049 |
|
MASTR Adjustable Rate Mortgages Trust, Series 2004-13, Class 3A7, VRN, 4.45%, 11/1/18(5) | | 860,829 |
| 884,624 |
|
Merrill Lynch Mortgage Investors Trust, Series 2005-A2, Class A1, VRN, 3.54%, 11/1/18(5) | | 716,142 |
| 728,135 |
|
|
| | | | | | | |
| | | Principal Amount | Value |
Merrill Lynch Mortgage Investors Trust, Series 2005-A2, Class A2, VRN, 3.54%, 11/1/18(5) | | $ | 363,099 |
| $ | 378,319 |
|
New Residential Mortgage Loan Trust, Series 2017-2A, Class A3, VRN, 4.00%, 11/1/18(1)(5) | | 3,349,123 |
| 3,370,788 |
|
New Residential Mortgage Loan Trust, Series 2017-5A, Class A1, VRN, 3.78%, 11/25/18, resets monthly off the 1-month LIBOR plus 1.50%(1) | | 1,029,006 |
| 1,056,552 |
|
PHHMC Mortgage Pass-Through Certificates, Series 2007-6, Class A1, VRN, 5.83%, 11/1/18(5) | | 4 |
| 4 |
|
| Residential Accredit Loans, Inc., Series 2006-QS17, Class A5, 6.00%, 12/25/36 | | 736,517 |
| 675,854 |
|
Sequoia Mortgage Trust, Series 2018-2, Class A4 SEQ, VRN, 3.50%, 11/1/18(1)(5) | | 2,587,840 |
| 2,551,607 |
|
Sequoia Mortgage Trust, Series 2018-CH2, Class A12 SEQ, VRN, 4.00%, 11/1/18(1)(5) | | 4,479,725 |
| 4,506,342 |
|
Structured Adjustable Rate Mortgage Loan Trust, Series 2004-8, Class 2A1, VRN, 4.31%, 11/1/18(5) | | 1,289,245 |
| 1,298,652 |
|
Thornburg Mortgage Securities Trust, Series 2006-4, Class A2B, VRN, 4.02%, 11/25/18(5) | | 1,901,902 |
| 1,855,752 |
|
WaMu Mortgage Pass-Through Certificates, Series 2005-AR7, Class A3, VRN, 4.08%, 11/1/18(5) | | 668,750 |
| 675,147 |
|
Wells Fargo Mortgage-Backed Securities Trust, Series 2004-A, Class A1, VRN, 3.98%, 11/1/18(5) | | 9,305 |
| 9,679 |
|
Wells Fargo Mortgage-Backed Securities Trust, Series 2004-Z, Class 2A2, VRN, 3.89%, 11/1/18(5) | | 13,587 |
| 13,913 |
|
| Wells Fargo Mortgage-Backed Securities Trust, Series 2005-17, Class 1A1, 5.50%, 1/25/36 | | 441,347 |
| 434,370 |
|
| Wells Fargo Mortgage-Backed Securities Trust, Series 2005-18, Class 1A1, 5.50%, 1/25/36 | | 837,481 |
| 830,582 |
|
Wells Fargo Mortgage-Backed Securities Trust, Series 2005-AR10, Class 1A1, VRN, 4.36%, 11/1/18(5) | | 18,564 |
| 19,631 |
|
Wells Fargo Mortgage-Backed Securities Trust, Series 2005-AR10, Class 2A17, VRN, 4.31%, 11/1/18(5) | | 15,100 |
| 15,617 |
|
Wells Fargo Mortgage-Backed Securities Trust, Series 2005-AR12, Class 2A6, VRN, 4.17%, 11/1/18(5) | | 380,665 |
| 391,216 |
|
Wells Fargo Mortgage-Backed Securities Trust, Series 2005-AR16, Class 3A2, VRN, 4.37%, 11/1/18(5) | | 4,880 |
| 4,971 |
|
Wells Fargo Mortgage-Backed Securities Trust, Series 2005-AR16, Class 4A8, VRN, 4.51%, 11/1/18(5) | | 5,000,000 |
| 5,095,281 |
|
| Wells Fargo Mortgage-Backed Securities Trust, Series 2006-10, Class A4 SEQ, 6.00%, 8/25/36 | | 21,794 |
| 21,756 |
|
| Wells Fargo Mortgage-Backed Securities Trust, Series 2006-13, Class A5, 6.00%, 10/25/36 | | 429,655 |
| 425,305 |
|
| Wells Fargo Mortgage-Backed Securities Trust, Series 2006-4, Class 2A1, 6.00%, 4/25/36 | | 2,172,371 |
| 2,150,814 |
|
| Wells Fargo Mortgage-Backed Securities Trust, Series 2006-8, Class A10 SEQ, 6.00%, 7/25/36 | | 18,014 |
| 18,092 |
|
| Wells Fargo Mortgage-Backed Securities Trust, Series 2006-8, Class A15, 6.00%, 7/25/36 | | 329,295 |
| 330,726 |
|
| Wells Fargo Mortgage-Backed Securities Trust, Series 2006-8, Class A9 SEQ, 6.00%, 7/25/36 | | 14,411 |
| 14,474 |
|
Wells Fargo Mortgage-Backed Securities Trust, Series 2006-AR1, Class 1A1, VRN, 4.07%, 11/1/18(5) | | 30,116 |
| 29,091 |
|
Wells Fargo Mortgage-Backed Securities Trust, Series 2006-AR1, Class 2A5 SEQ, VRN, 3.97%, 11/1/18(5) | | 1,015,565 |
| 996,856 |
|
Wells Fargo Mortgage-Backed Securities Trust, Series 2006-AR10, Class 1A1, VRN, 4.28%, 11/1/18(5) | | 1,271,787 |
| 1,249,399 |
|
|
| | | | | | | |
| | | Principal Amount | Value |
Wells Fargo Mortgage-Backed Securities Trust, Series 2006-AR10, Class 5A6 SEQ, VRN, 4.42%, 11/1/18(5) | | $ | 8,019 |
| $ | 8,163 |
|
Wells Fargo Mortgage-Backed Securities Trust, Series 2006-AR12, Class 1A1, VRN, 4.70%, 11/1/18(5) | | 18,427 |
| 18,593 |
|
Wells Fargo Mortgage-Backed Securities Trust, Series 2006-AR14, Class 1A7 SEQ, VRN, 4.65%, 11/1/18(5) | | 1,908,536 |
| 1,855,790 |
|
Wells Fargo Mortgage-Backed Securities Trust, Series 2006-AR14, Class 2A1, VRN, 4.74%, 11/1/18(5) | | 5,532 |
| 5,522 |
|
Wells Fargo Mortgage-Backed Securities Trust, Series 2006-AR15, Class A1, VRN, 4.73%, 11/1/18(5) | | 4,835 |
| 4,783 |
|
Wells Fargo Mortgage-Backed Securities Trust, Series 2006-AR16, Class A1, VRN, 4.70%, 11/1/18(5) | | 465,769 |
| 460,779 |
|
Wells Fargo Mortgage-Backed Securities Trust, Series 2006-AR19, Class A1, VRN, 4.23%, 11/1/18(5) | | 396,521 |
| 373,840 |
|
Wells Fargo Mortgage-Backed Securities Trust, Series 2006-AR2, Class 2A3, VRN, 4.08%, 11/1/18(5) | | 357,954 |
| 363,537 |
|
Wells Fargo Mortgage-Backed Securities Trust, Series 2006-AR5, Class 2A1, VRN, 4.19%, 11/1/18(5) | | 606,881 |
| 611,727 |
|
Wells Fargo Mortgage-Backed Securities Trust, Series 2006-AR7, Class 2A1, VRN, 4.32%, 11/1/18(5) | | 380,190 |
| 390,325 |
|
| Wells Fargo Mortgage-Backed Securities Trust, Series 2007-11, Class A3 SEQ, 6.00%, 8/25/37 | | 28,774 |
| 28,534 |
|
| Wells Fargo Mortgage-Backed Securities Trust, Series 2007-12, Class A7, 5.50%, 9/25/37 | | 12,469 |
| 12,545 |
|
| Wells Fargo Mortgage-Backed Securities Trust, Series 2007-13, Class A1, 6.00%, 9/25/37 | | 21,403 |
| 21,399 |
|
| Wells Fargo Mortgage-Backed Securities Trust, Series 2007-14, Class 2A2, 5.50%, 10/25/22 | | 4,744 |
| 4,838 |
|
| Wells Fargo Mortgage-Backed Securities Trust, Series 2007-15, Class A1, 6.00%, 11/25/37 | | 399,454 |
| 397,294 |
|
| Wells Fargo Mortgage-Backed Securities Trust, Series 2007-16, Class 1A1, 6.00%, 12/28/37 | | 9,193 |
| 9,199 |
|
| Wells Fargo Mortgage-Backed Securities Trust, Series 2007-8, Class 2A2, 6.00%, 7/25/37 | | 1,839,866 |
| 1,828,037 |
|
Wells Fargo Mortgage-Backed Securities Trust, Series 2007-AR7, Class A1, VRN, 4.68%, 11/1/18(5) | | 1,279,949 |
| 1,257,901 |
|
| Wells Fargo Mortgage-Backed Securities Trust, Series 2008-1, Class 4A1, 5.75%, 2/25/38 | | 8,661 |
| 9,096 |
|
| | | | 55,231,218 |
|
| U.S. Government Agency Collateralized Mortgage Obligations — 2.0% |
| FHLMC, Series 2015-HQ2, Class M3, VRN, 5.54%, 11/25/18, resets monthly off the 1-month LIBOR plus 3.25% | | 4,000,000 |
| 4,450,704 |
|
| FHLMC, Series 2016-HQA3, Class M2, VRN, 3.63%, 11/25/18, resets monthly off the 1-month LIBOR plus 1.35% | | 1,000,000 |
| 1,014,885 |
|
| FHLMC, Series 2017-DNA2, Class M1, VRN, 3.48%, 11/25/18, resets monthly off the 1-month LIBOR plus 1.20% | | 637,886 |
| 644,430 |
|
| FNMA, Series 2014-C02, Class 1M2, VRN, 4.88%, 11/25/18, resets monthly off the 1-month LIBOR plus 2.60% | | 1,525,000 |
| 1,622,106 |
|
| FNMA, Series 2014-C02, Class 2M2, VRN, 4.88%, 11/25/18, resets monthly off the 1-month LIBOR plus 2.60% | | 2,541,272 |
| 2,690,597 |
|
| FNMA, Series 2016-C03, Class 2M2, VRN, 8.18%, 11/25/18, resets monthly off the 1-month LIBOR plus 5.90% | | 1,570,000 |
| 1,803,229 |
|
| FNMA, Series 2017-C03, Class 1M2, VRN, 5.28%, 11/25/18, resets monthly off the 1-month LIBOR plus 3.00% | | 4,000,000 |
| 4,281,832 |
|
| FNMA, Series 2017-C06, Class 2M2, VRN, 5.08%, 11/25/18, resets monthly off the 1-month LIBOR plus 2.80% | | 3,125,000 |
| 3,284,290 |
|
|
| | | | | | | |
| | | Principal Amount | Value |
| FNMA, Series 2017-C07, Class 1M1, VRN, 2.93%, 11/25/18, resets monthly off the 1-month LIBOR plus 0.65% | | $ | 3,963,008 |
| $ | 3,965,909 |
|
| FNMA, Series 2017-C07, Class 1M2, VRN, 4.68%, 11/25/18, resets monthly off the 1-month LIBOR plus 2.40% | | 5,400,000 |
| 5,544,540 |
|
| | | | 29,302,522 |
|
TOTAL COLLATERALIZED MORTGAGE OBLIGATIONS
(Cost $83,257,215) | | | 84,533,740 |
|
ASSET-BACKED SECURITIES(4) — 5.2% | | | |
Avis Budget Rental Car Funding AESOP LLC, Series 2015-2A, Class B, 3.42%, 12/20/21(1) | | 2,000,000 |
| 1,986,590 |
|
BRE Grand Islander Timeshare Issuer LLC, Series 2017-1A, Class A SEQ, 2.94%, 5/25/29(1) | | 1,613,676 |
| 1,575,215 |
|
Colony Starwood Homes, Series 2016-2A, Class A, VRN, 3.53%, 11/17/18, resets monthly off the 1-month LIBOR plus 1.25%(1) | | 4,870,939 |
| 4,874,679 |
|
Goodgreen, Series 2018-1A, Class A, VRN, 3.93%, 11/15/18(1)(5) | | 3,390,469 |
| 3,368,637 |
|
Hertz Fleet Lease Funding LP, Series 2016-1, Class A1, VRN, 3.38%, 11/13/18, resets monthly off the 1-month LIBOR plus 1.10%(1) | | 965,579 |
| 966,636 |
|
Hilton Grand Vacations Trust, Series 2017-AA, Class A SEQ, 2.66%, 12/26/28(1) | | 1,350,001 |
| 1,323,139 |
|
Invitation Homes Trust, Series 2017-SFR2, Class B, VRN, 3.44%, 11/17/18, resets monthly off the 1-month LIBOR plus 1.15%(1) | | 4,175,000 |
| 4,209,347 |
|
Invitation Homes Trust, Series 2018-SFR1, Class B, VRN, 3.24%, 11/17/18, resets monthly off the 1-month LIBOR plus 0.95%(1) | | 3,900,000 |
| 3,889,670 |
|
Invitation Homes Trust, Series 2018-SFR2, Class C, VRN, 3.56%, 11/17/18, resets monthly off the 1-month LIBOR plus 1.28%(1) | | 5,875,000 |
| 5,872,188 |
|
Invitation Homes Trust, Series 2018-SFR3, Class B, VRN, 3.44%, 11/17/18, resets monthly off the 1-month LIBOR plus 1.15%(1) | | 5,925,000 |
| 5,953,717 |
|
Marriott Vacation Club Owner Trust, Series 2012-1A, Class A SEQ, 2.51%, 5/20/30(1) | | 775,806 |
| 769,214 |
|
Mosaic Solar Loan Trust, Series 2018-2GS, Class A SEQ, 4.20%, 2/22/44(1) | | 1,813,158 |
| 1,806,032 |
|
MVW Owner Trust, Series 2014-1A, Class B, 2.70%, 9/22/31(1) | | 57,814 |
| 56,253 |
|
MVW Owner Trust, Series 2015-1A, Class A SEQ, 2.52%, 12/20/32(1) | | 594,508 |
| 581,865 |
|
Progress Residential Trust, Series 2016-SFR2, Class A SEQ, VRN, 3.69%, 11/17/18, resets monthly off the 1-month LIBOR plus 1.40%(1) | | 1,973,054 |
| 1,977,627 |
|
Progress Residential Trust, Series 2017-SFR2, Class A SEQ, 2.90%, 12/17/34(1) | | 8,350,000 |
| 8,057,326 |
|
Progress Residential Trust, Series 2018-SFR1, Class B, 3.48%, 3/17/35(1) | | 3,550,000 |
| 3,486,325 |
|
Progress Residential Trust, Series 2018-SFR1, Class D, 3.88%, 3/17/35(1) | | 2,450,000 |
| 2,384,936 |
|
Sierra Receivables Funding Co. LLC, Series 2017-1A, Class A SEQ, 2.91%, 3/20/34(1) | | 1,301,331 |
| 1,284,948 |
|
Sierra Timeshare Receivables Funding LLC, Series 2015-1A, Class A SEQ, 2.40%, 3/22/32(1) | | 394,785 |
| 391,978 |
|
Sierra Timeshare Receivables Funding LLC, Series 2015-2A, Class A SEQ, 2.43%, 6/20/32(1) | | 806,797 |
| 799,003 |
|
Sierra Timeshare Receivables Funding LLC, Series 2015-3A, Class A SEQ, 2.58%, 9/20/32(1) | | 1,395,310 |
| 1,370,616 |
|
|
| | | | | | | |
| | | Principal Amount | Value |
Sierra Timeshare Receivables Funding LLC, Series 2016-1A, Class A SEQ, 3.08%, 3/21/33(1) | | $ | 984,924 |
| $ | 977,547 |
|
Sierra Timeshare Receivables Funding LLC, Series 2016-2A, Class A SEQ, 2.33%, 7/20/33(1) | | 1,036,917 |
| 1,016,384 |
|
Towd Point Mortgage Trust, Series 2017-3, Class M1, VRN, 3.50%, 11/1/18(1)(5) | | 4,000,000 |
| 3,838,734 |
|
Towd Point Mortgage Trust, Series 2017-4, Class A1, VRN, 2.75%, 11/1/18(1)(5) | | 5,171,902 |
| 5,035,660 |
|
Towd Point Mortgage Trust, Series 2018-4, Class A1, VRN, 3.00%, 11/1/18(1)(5) | | 2,938,798 |
| 2,855,962 |
|
VSE VOI Mortgage LLC, Series 2016-A, Class A SEQ, 2.54%, 7/20/33(1) | | 3,864,687 |
| 3,769,935 |
|
TOTAL ASSET-BACKED SECURITIES
(Cost $75,332,883) | | | 74,480,163 |
|
COLLATERALIZED LOAN OBLIGATIONS(4) — 4.9% | | | |
Ares XXXIIR CLO Ltd., Series 2014-32RA, Class A2A, VRN, 3.86%, 11/15/18, resets quarterly off the 3-month LIBOR plus 1.55%(1) | | 5,000,000 |
| 4,979,725 |
|
Bean Creek CLO Ltd., Series 2015-1A, Class BR, VRN, 3.92%, 1/22/19, resets quarterly off the 3-month LIBOR plus 1.45%(1) | | 3,200,000 |
| 3,168,614 |
|
Carlyle Global Market Strategies CLO, Series 2014-2RA, Class A3, VRN, 3.81%, 11/15/18, resets quarterly off the 3-month LIBOR plus 1.50%(1) | | 4,500,000 |
| 4,453,079 |
|
Carlyle Global Market Strategies CLO, Series 2014-1A, Class A1R2, VRN, 3.42%, 1/17/19, resets quarterly off the 3-month LIBOR plus 0.97%(1) | | 2,000,000 |
| 2,002,963 |
|
CBAM Ltd., Series 2018-5A, Class A, VRN, 3.47%, 1/17/19, resets quarterly off the 3-month LIBOR plus 1.02%(1) | | 2,150,000 |
| 2,138,959 |
|
CBAM Ltd., Series 2018-5A, Class B1, VRN, 3.85%, 1/17/19, resets quarterly off the 3-month LIBOR plus 1.40%(1) | | 2,200,000 |
| 2,177,661 |
|
CIFC Funding Ltd., Series 2013-3RA, Class A1, VRN, 3.33%, 1/24/19, resets quarterly off the 3-month LIBOR plus 0.98%(1) | | 3,175,000 |
| 3,154,151 |
|
CIFC Funding Ltd., Series 2013-3RA, Class A2, VRN, 3.75%, 1/24/19, resets quarterly off the 3-month LIBOR plus 1.40%(1) | | 6,000,000 |
| 5,945,152 |
|
Dryden 41 Senior Loan Fund, Series 2015-41A, Class AR, VRN, 3.41%, 1/15/19, resets quarterly off the 3-month LIBOR plus 0.97%(1) | | 2,125,000 |
| 2,114,007 |
|
Goldentree Loan Management US CLO 3 Ltd., Series 2018-3A, Class B1, VRN, 4.02%, 1/22/19, resets quarterly off the 3-month LIBOR plus 1.55%(1) | | 2,600,000 |
| 2,583,942 |
|
Goldentree Loan Opportunities X Ltd., Series 2015-10A, Class AR, VRN, 3.59%, 1/22/19, resets quarterly off the 3-month LIBOR plus 1.12%(1) | | 1,000,000 |
| 999,260 |
|
KKR CLO Ltd., Series 22A, Class A, VRN, 3.52%, 1/22/19, resets quarterly off the 3-month LIBOR plus 1.15%(1) | | 1,600,000 |
| 1,597,501 |
|
KKR CLO Ltd., Series 22A, Class B, VRN, 3.97%, 1/22/19, resets quarterly off the 3-month LIBOR plus 1.60%(1) | | 4,000,000 |
| 3,989,835 |
|
LCM XIV LP, Series 14A, Class AR, VRN, 3.51%, 1/22/19, resets quarterly off the 3-month LIBOR plus 1.04%(1) | | 1,500,000 |
| 1,498,322 |
|
LCM XIV LP, Series 2014A, Class BR, VRN, 4.05%, 1/22/19, resets quarterly off the 3-month LIBOR plus 1.58%(1) | | 3,500,000 |
| 3,494,273 |
|
LoanCore Issuer Ltd., Series 2018-CRE1, Class AS, VRN, 3.78%, 11/15/18, resets monthly off the 1-month LIBOR plus 1.50%(1) | | 3,668,000 |
| 3,683,399 |
|
|
| | | | | | | |
| | | Principal Amount | Value |
Madison Park Funding XIII Ltd., Series 2014-13A, Class AR2, VRN, 3.40%, 1/22/19, resets quarterly off the 3-month LIBOR plus 0.95%(1) | | $ | 1,600,000 |
| $ | 1,597,427 |
|
Madison Park Funding XIII Ltd., Series 2014-13A, Class BR2, VRN, 3.95%, 1/22/19, resets quarterly off the 3-month LIBOR plus 1.50%(1) | | 4,000,000 |
| 4,000,213 |
|
Magnetite VIII Ltd., Series 2014-8A, Class AR2, VRN, 3.42%, 1/15/19, resets quarterly off the 3-month LIBOR plus 0.98%(1) | | 2,700,000 |
| 2,695,468 |
|
Magnetite VIII Ltd., Series 2014-8A, Class BR2, VRN, 3.94%, 1/15/19, resets quarterly off the 3-month LIBOR plus 1.50%(1) | | 2,500,000 |
| 2,485,443 |
|
Sounds Point CLO IV-R Ltd., Series 2013-3RA, Class A, VRN, 3.59%, 1/18/19, resets quarterly off the 3-month LIBOR plus 1.15%(1) | | 1,600,000 |
| 1,601,759 |
|
Sounds Point CLO IV-R Ltd., Series 2013-3RA, Class B, VRN, 4.19%, 1/18/19, resets quarterly off the 3-month LIBOR plus 1.75%(1) | | 2,500,000 |
| 2,500,580 |
|
Symphony CLO XIX Ltd., Series 2018-19A, Class A, VRN, 3.40%, 1/16/19, resets quarterly off the 3-month LIBOR plus 0.96%(1) | | 5,000,000 |
| 4,969,156 |
|
Voya CLO Ltd., Series 2013-3A, Class A2RR, VRN, 4.14%, 1/18/19, resets quarterly off the 3-month LIBOR plus 1.70%(1) | | 2,000,000 |
| 2,000,000 |
|
TOTAL COLLATERALIZED LOAN OBLIGATIONS
(Cost $70,090,929) | | | 69,830,889 |
|
COMMERCIAL MORTGAGE-BACKED SECURITIES(4) �� 4.5% |
BB-UBS Trust, Series 2012-SHOW, Class A SEQ, 3.43%, 11/5/36(1) | | 4,000,000 |
| 3,913,768 |
|
Commercial Mortgage Pass-Through Certificates, Series 2014-CR15, Class B, VRN, 4.68%, 11/1/18(5) | | 2,105,000 |
| 2,182,384 |
|
Commercial Mortgage Pass-Through Certificates, Series 2016-CR28, Class B, VRN, 4.65%, 11/1/18(5) | | 3,500,000 |
| 3,598,300 |
|
Commercial Mortgage Trust, Series 2014-LC17, Class C, VRN, 4.60%, 11/1/18(5) | | 1,960,000 |
| 1,922,393 |
|
Commercial Mortgage Trust, Series 2015-CR22, Class B, VRN, 3.93%, 11/1/18(5) | | 2,500,000 |
| 2,445,466 |
|
Commercial Mortgage Trust, Series 2017-PANW, Class A SEQ, 3.24%, 10/10/29(1) | | 8,705,000 |
| 8,438,630 |
|
Core Industrial Trust, Series 2015-CALW, Class B, 3.25%, 2/10/34(1) | | 3,500,000 |
| 3,454,728 |
|
Core Industrial Trust, Series 2015-TEXW, Class B, 3.33%, 2/10/34(1) | | 2,825,000 |
| 2,791,696 |
|
Core Industrial Trust, Series 2015-WEST, Class A SEQ, 3.29%, 2/10/37(1) | | 3,533,131 |
| 3,435,875 |
|
CSAIL Commercial Mortgage Trust, Series 2017-CX10, Class AS, VRN, 3.67%, 11/1/18(5) | | 2,925,000 |
| 2,804,078 |
|
DBCG Mortgage Trust, Series 2017-BBG, Class A, VRN, 2.98%, 11/15/18, resets monthly off the 1-month LIBOR plus 0.70%(1) | | 5,000,000 |
| 5,002,515 |
|
| GS Mortgage Securities Trust, Series 2015-GC28, Class AS, 3.76%, 2/10/48 | | 2,000,000 |
| 1,976,591 |
|
GS Mortgage Securities Trust, Series 2016-GS2, Class B, VRN, 3.76%, 11/1/18(5) | | 3,000,000 |
| 2,904,535 |
|
Hudson Yards Mortgage Trust, Series 2016-10HY, Class A SEQ, 2.84%, 8/10/38(1) | | 3,000,000 |
| 2,775,083 |
|
JPMBB Commercial Mortgage Securities Trust, Series 2014-C21, Class B, VRN, 4.34%, 11/1/18(5) | | 2,200,000 |
| 2,204,821 |
|
|
| | | | | | | |
| | | Principal Amount | Value |
| JPMDB Commercial Mortgage Securities Trust, Series 2017-C5, Class A4 SEQ, 3.41%, 3/15/50 | | $ | 6,340,000 |
| $ | 6,118,317 |
|
| JPMorgan Chase Commercial Mortgage Securities Trust, Series 2016-JP2, Class B, 3.46%, 8/15/49 | | 3,000,000 |
| 2,844,122 |
|
Morgan Stanley Capital I Trust, Series 2014-CPT, Class E, VRN, 3.45%, 11/1/18(1)(5) | | 1,960,000 |
| 1,920,399 |
|
| UBS Commercial Mortgage Trust, Series 2017-C1, Class A3 SEQ, 3.20%, 6/15/50 | | 4,200,000 |
| 3,978,630 |
|
TOTAL COMMERCIAL MORTGAGE-BACKED SECURITIES
(Cost $67,712,876) | 64,712,331 |
|
U.S. GOVERNMENT AGENCY MORTGAGE-BACKED SECURITIES(4) — 4.4% |
Adjustable-Rate U.S. Government Agency Mortgage-Backed Securities(5) — 1.0% |
| FHLMC, VRN, 2.36%, 11/15/18 | | 1,237,363 |
| 1,225,832 |
|
| FHLMC, VRN, 3.85%, 11/15/18 | | 3,473 |
| 3,634 |
|
| FHLMC, VRN, 3.89%, 11/15/18 | | 1,618 |
| 1,696 |
|
| FHLMC, VRN, 4.01%, 11/15/18 | | 1,436,922 |
| 1,510,563 |
|
| FNMA, VRN, 3.18%, 11/25/18 | | 2,135,162 |
| 2,111,752 |
|
| FNMA, VRN, 3.19%, 11/25/18 | | 3,973,484 |
| 3,925,089 |
|
| FNMA, VRN, 3.26%, 11/25/18 | | 2,415,002 |
| 2,419,821 |
|
| FNMA, VRN, 3.61%, 11/25/18 | | 4,541 |
| 4,630 |
|
| FNMA, VRN, 3.94%, 11/25/18 | | 5,237 |
| 5,345 |
|
| FNMA, VRN, 4.04%, 11/25/18 | | 1,353,131 |
| 1,399,308 |
|
| FNMA, VRN, 4.06%, 11/25/18 | | 870,416 |
| 901,650 |
|
| FNMA, VRN, 4.06%, 11/25/18 | | 733,007 |
| 757,269 |
|
| | | | 14,266,589 |
|
| Fixed-Rate U.S. Government Agency Mortgage-Backed Securities — 3.4% |
| FHLMC, 6.00%, 2/1/38 | | 2,019 |
| 2,223 |
|
| FHLMC, 4.00%, 12/1/40 | | 5,798 |
| 5,854 |
|
| FNMA, 5.00%, 7/1/31 | | 24,918 |
| 26,035 |
|
| FNMA, 5.50%, 5/1/33 | | 6,471 |
| 6,937 |
|
| FNMA, 5.00%, 9/1/33 | | 986,399 |
| 1,044,072 |
|
| FNMA, 5.00%, 11/1/33 | | 7,227 |
| 7,648 |
|
| FNMA, 5.00%, 9/1/35 | | 17,399 |
| 18,330 |
|
| FNMA, 6.00%, 4/1/37 | | 6,631 |
| 7,159 |
|
| FNMA, 6.00%, 7/1/37 | | 8,405 |
| 9,178 |
|
| FNMA, 6.00%, 8/1/37 | | 6,052 |
| 6,612 |
|
| FNMA, 5.50%, 1/1/39 | | 11,746 |
| 12,587 |
|
| FNMA, 5.50%, 3/1/39 | | 1,381 |
| 1,476 |
|
| FNMA, 4.50%, 5/1/39 | | 1,685,067 |
| 1,745,875 |
|
| FNMA, 5.00%, 8/1/39 | | 3,998 |
| 4,228 |
|
| FNMA, 4.50%, 3/1/40 | | 1,907,451 |
| 1,976,940 |
|
| FNMA, 5.00%, 8/1/40 | | 981,079 |
| 1,038,022 |
|
| FNMA, 3.50%, 10/1/40 | | 2,577,018 |
| 2,532,584 |
|
| FNMA, 3.50%, 12/1/40 | | 33,006 |
| 32,437 |
|
| FNMA, 4.50%, 9/1/41 | | 15,629 |
| 16,170 |
|
| FNMA, 3.50%, 5/1/42 | | 42,328 |
| 41,597 |
|
| FNMA, 3.50%, 6/1/42 | | 25,652 |
| 25,209 |
|
| FNMA, 3.50%, 9/1/42 | | 17,832 |
| 17,524 |
|
| FNMA, 3.00%, 11/1/42 | | 27,856 |
| 26,610 |
|
|
| | | | | | | |
| | | Principal Amount | Value |
| FNMA, 3.00%, 5/1/43 | | $ | 3,459,861 |
| $ | 3,304,010 |
|
| FNMA, 3.50%, 5/1/46 | | 7,146,226 |
| 6,984,796 |
|
| FNMA, 3.50%, 10/1/47 | | 13,346,851 |
| 13,006,613 |
|
GNMA, 2.50%, 11/19/18(6) | | 715,000 |
| 662,892 |
|
GNMA, 3.00%, 11/19/18(6) | | 4,665,000 |
| 4,459,813 |
|
| GNMA, 6.00%, 7/15/33 | | 4,091 |
| 4,452 |
|
| GNMA, 5.00%, 3/20/36 | | 26,868 |
| 28,523 |
|
| GNMA, 5.50%, 1/15/39 | | 3,830 |
| 4,196 |
|
| GNMA, 5.50%, 9/15/39 | | 19,910 |
| 21,489 |
|
| GNMA, 4.50%, 10/15/39 | | 7,652 |
| 7,937 |
|
| GNMA, 5.00%, 10/15/39 | | 12,201 |
| 12,926 |
|
| GNMA, 4.50%, 1/15/40 | | 9,713 |
| 10,061 |
|
| GNMA, 4.00%, 12/15/40 | | 10,204 |
| 10,342 |
|
| GNMA, 4.50%, 12/15/40 | | 35,067 |
| 36,326 |
|
| GNMA, 4.50%, 7/20/41 | | 1,550,661 |
| 1,613,820 |
|
| GNMA, 4.00%, 12/15/41 | | 18,971 |
| 19,229 |
|
| GNMA, 3.50%, 6/20/42 | | 5,947,590 |
| 5,883,250 |
|
| GNMA, 2.50%, 7/20/46 | | 4,765,626 |
| 4,422,852 |
|
| | | | 49,098,834 |
|
TOTAL U.S. GOVERNMENT AGENCY MORTGAGE-BACKED SECURITIES
(Cost $66,497,344) | 63,365,423 |
|
BANK LOAN OBLIGATIONS(7) — 2.4% | | | |
| Diversified Telecommunication Services — 0.7% | | | |
| CenturyLink, Inc., 2017 Term Loan B, 5.05%, 1/31/25, resets monthly off the 1-month LIBOR plus 2.75% | | 2,787,965 |
| 2,761,828 |
|
| Level 3 Financing, Inc., 2017 Term Loan B, 4.53%, 2/22/24, resets monthly off the 1-month LIBOR plus 2.25% | | 2,200,000 |
| 2,204,301 |
|
| Sprint Communications, Inc., 1st Lien Term Loan B, 4.81%, 2/2/24, resets monthly off the 1-month LIBOR plus 2.50% | | 1,595,949 |
| 1,597,194 |
|
| Zayo Group, LLC, 2017 Incremental Term Loan, 4.55%, 1/19/24, resets monthly off the 1-month LIBOR plus 2.25% | | 2,600,000 |
| 2,606,500 |
|
| | | | 9,169,823 |
|
| Entertainment — 0.1% | | | |
| CSC Holdings, LLC, 2017 1st Lien Term Loan, 4.53%, 7/17/25, resets monthly off the 1-month LIBOR plus 2.25% | | 1,496,203 |
| 1,494,871 |
|
| Health Care Providers and Services — 0.2% | | | |
| HCA Inc., 2018 Term Loan B10, 4.30%, 3/13/25, resets monthly off the 1-month LIBOR plus 2.00% | | 3,233,750 |
| 3,251,940 |
|
| Hotels, Restaurants and Leisure — 0.8% | | | |
| 1011778 B.C. Unlimited Liability Company, Term Loan B3, 4.55%, 2/16/24, resets monthly off the 1-month LIBOR plus 2.25% | | 1,982,233 |
| 1,977,029 |
|
| 1011778 B.C. Unlimited Liability Company, Term Loan B3, 4.55%, 2/16/24, resets monthly off the 1-month LIBOR plus 2.25% | | 1,608,634 |
| 1,604,412 |
|
| Caesars Resort Collection, LLC, 2017 1st Lien Term Loan B, 5.05%, 12/22/24, resets monthly off the 1-month LIBOR plus 2.75% | | 1,645,854 |
| 1,648,257 |
|
| Hilton Worldwide Finance, LLC, Term Loan B2, 4.03%, 10/25/23, resets monthly off the 1-month LIBOR plus 1.75% | | 3,700,000 |
| 3,708,103 |
|
|
| | | | | | | |
| | | Principal Amount | Value |
| MGM Growth Properties Operating Partnership LP, 2016 Term Loan B, 4.30%, 3/21/25, resets monthly off the 1-month LIBOR plus 2.00% | | $ | 2,387,755 |
| $ | 2,383,493 |
|
| | | | 11,321,294 |
|
| Pharmaceuticals — 0.3% | | | |
| Catalent Pharma Solutions Inc., USD Term Loan B, 4.55%, 5/20/24, resets monthly off the 1-month LIBOR plus 2.25% | | 1,775,610 |
| 1,785,464 |
|
| Valeant Pharmaceuticals International, Inc., 2018 Term Loan B, 5.27%, 6/1/25, resets monthly off the 1-month LIBOR plus 3.00% | | 2,827,500 |
| 2,832,477 |
|
| | | | 4,617,941 |
|
| Software — 0.1% | | | |
| Dell International LLC, 2017 Term Loan B, 4.31%, 9/7/23, resets monthly off the 1-month LIBOR plus 2.00% | | 1,595,970 |
| 1,596,105 |
|
| Technology Hardware, Storage and Peripherals — 0.2% | | | |
| Western Digital Corporation, 2018 Term Loan B4, 4.04%, 4/29/23, resets monthly off the 1-month LIBOR plus 1.75% | | 2,572,075 |
| 2,560,822 |
|
TOTAL BANK LOAN OBLIGATIONS
(Cost $34,119,042) | 34,012,796 |
|
| MUNICIPAL SECURITIES — 0.4% | | | |
| Bay Area Toll Authority Rev., 6.92%, 4/1/40 | | 365,000 |
| 476,650 |
|
| Chicago GO, 7.05%, 1/1/29 | | 400,000 |
| 422,868 |
|
| Los Angeles Community College District GO, 6.75%, 8/1/49 | | 600,000 |
| 840,942 |
|
| Metropolitan Transportation Authority Rev., 6.69%, 11/15/40 | | 195,000 |
| 250,608 |
|
| Missouri Highway & Transportation Commission Rev., 5.45%, 5/1/33 | | 175,000 |
| 197,078 |
|
| New Jersey Turnpike Authority Rev., 7.10%, 1/1/41 | | 225,000 |
| 304,859 |
|
| Pennsylvania Turnpike Commission Rev., 5.56%, 12/1/49 | | 125,000 |
| 148,183 |
|
| Port Authority of New York & New Jersey Rev., 4.93%, 10/1/51 | | 250,000 |
| 272,970 |
|
| Rutgers The State University of New Jersey Rev., 5.67%, 5/1/40 | | 200,000 |
| 231,398 |
|
| Salt River Project Agricultural Improvement & Power District Rev., 4.84%, 1/1/41 | | 415,000 |
| 454,076 |
|
| San Diego County Water Authority Financing Corp. Rev., 6.14%, 5/1/49 | | 100,000 |
| 126,993 |
|
| San Francisco Public Utilities Commission Water Rev., 6.00%, 11/1/40 | | 195,000 |
| 232,473 |
|
| San Francisco Public Utilities Commission Water Rev., 6.95%, 11/1/50 | | 580,000 |
| 800,934 |
|
| Santa Clara Valley Transportation Authority Rev., 5.88%, 4/1/32 | | 150,000 |
| 171,433 |
|
| State of California GO, 4.60%, 4/1/38 | | 110,000 |
| 111,956 |
|
| State of California GO, 7.55%, 4/1/39 | | 400,000 |
| 569,376 |
|
| State of California GO, 7.30%, 10/1/39 | | 90,000 |
| 122,571 |
|
| State of Illinois GO, 5.10%, 6/1/33 | | 200,000 |
| 189,050 |
|
| University of California Rev., 4.60%, 5/15/31 | | 400,000 |
| 421,344 |
|
TOTAL MUNICIPAL SECURITIES
(Cost $6,530,988) | | | 6,345,762 |
|
|
| | | | | | | |
| | | Principal Amount/Shares | Value |
| TEMPORARY CASH INVESTMENTS — 0.7% | | | |
Repurchase Agreement, BMO Capital Markets Corp., (collateralized by various U.S. Treasury obligations, 1.625% - 4.75%, 1/31/20 - 8/15/45, valued at $1,531,221), in a joint trading account at 2.00%, dated 10/31/18, due 11/1/18 (Delivery value $1,500,215) | | | $ | 1,500,132 |
|
| Repurchase Agreement, Fixed Income Clearing Corp., (collateralized by various U.S. Treasury obligations, 3.00%, 5/15/45, valued at $765,953), at 1.05%, dated 10/31/18, due 11/1/18 (Delivery value $750,022) | | | 750,000 |
|
| State Street Institutional U.S. Government Money Market Fund, Premier Class | | 176,228 |
| 176,228 |
|
U.S. Treasury Bills, 2.34%, 1/24/19(8)(9) | | $ | 8,000,000 |
| 7,957,814 |
|
TOTAL TEMPORARY CASH INVESTMENTS
(Cost $10,383,587) | | | 10,384,174 |
|
TOTAL INVESTMENT SECURITIES — 99.3%
(Cost $1,478,111,556) | | | 1,423,981,162 |
|
| OTHER ASSETS AND LIABILITIES — 0.7% | | | 9,704,638 |
|
| TOTAL NET ASSETS — 100.0% | | | $ | 1,433,685,800 |
|
FORWARD FOREIGN CURRENCY EXCHANGE CONTRACTS |
| | | | | | | | |
| Currency Purchased | Currency Sold | Counterparty | Settlement Date | Unrealized Appreciation
(Depreciation) |
| USD | 19,506,633 | AUD | 27,182,778 | Bank Of America, N.A. | 12/19/18 | $ | 247,271 |
|
| BRL | 13,929,338 | USD | 3,746,460 | Goldman Sachs & Co. | 12/19/18 | (18,285 | ) |
| USD | 772,259 | BRL | 2,904,156 | Goldman Sachs & Co. | 12/19/18 | (5,036 | ) |
| CAD | 9,493,913 | USD | 7,252,023 | Morgan Stanley | 12/19/18 | (33,214 | ) |
| USD | 64,557,653 | CAD | 83,661,554 | Morgan Stanley | 12/19/18 | 944,601 |
|
| USD | 651,931 | CAD | 835,288 | Morgan Stanley | 12/19/18 | 16,810 |
|
| USD | 7,193,902 | CAD | 9,289,414 | Morgan Stanley | 12/19/18 | 130,586 |
|
| USD | 7,418,638 | CAD | 9,645,342 | Morgan Stanley | 12/19/18 | 84,688 |
|
| USD | 7,358,696 | CHF | 7,258,353 | Morgan Stanley | 12/19/18 | 117,773 |
|
| USD | 8,039,194 | CHF | 7,737,644 | UBS AG | 12/19/18 | 320,131 |
|
| USD | 375 | CLP | 259,474 | Goldman Sachs & Co. | 12/19/18 | 2 |
|
| USD | 1,567,715 | CZK | 34,401,935 | Goldman Sachs & Co. | 12/19/18 | 58,934 |
|
| USD | 2,929,623 | DKK | 18,657,892 | Goldman Sachs & Co. | 12/19/18 | 84,322 |
|
| EUR | 976,735 | USD | 1,121,750 | JPMorgan Chase Bank N.A. | 11/14/18 | (14,428 | ) |
| EUR | 928,391 | USD | 1,056,917 | JPMorgan Chase Bank N.A. | 11/14/18 | (4,402 | ) |
| USD | 214,771,743 | EUR | 186,228,501 | JPMorgan Chase Bank N.A. | 11/14/18 | 3,645,012 |
|
| USD | 642,526 | EUR | 553,689 | JPMorgan Chase Bank N.A. | 11/14/18 | 14,810 |
|
| USD | 1,198,531 | EUR | 1,034,185 | JPMorgan Chase Bank N.A. | 11/14/18 | 26,079 |
|
| USD | 657,172 | EUR | 566,519 | JPMorgan Chase Bank N.A. | 11/14/18 | 14,911 |
|
| USD | 657,411 | EUR | 566,363 | JPMorgan Chase Bank N.A. | 11/14/18 | 15,327 |
|
| USD | 692,132 | EUR | 596,426 | JPMorgan Chase Bank N.A. | 11/14/18 | 15,965 |
|
| USD | 714,752 | EUR | 622,210 | JPMorgan Chase Bank N.A. | 11/14/18 | 9,355 |
|
| USD | 1,333,237 | EUR | 1,173,108 | JPMorgan Chase Bank N.A. | 11/14/18 | 3,288 |
|
| GBP | 900,940 | USD | 1,178,993 | Bank Of America, N.A. | 12/19/18 | (24,641 | ) |
| GBP | 1,711,310 | USD | 2,244,063 | Bank Of America, N.A. | 12/19/18 | (51,404 | ) |
| USD | 78,667,587 | GBP | 59,957,309 | Bank Of America, N.A. | 12/19/18 | 1,845,786 |
|
|
| | | | | | | | |
| Currency Purchased | Currency Sold | Counterparty | Settlement Date | Unrealized Appreciation
(Depreciation) |
| USD | 4,047,787 | GBP | 3,065,042 | Bank Of America, N.A. | 12/19/18 | $ | 120,625 |
|
| USD | 804,792 | GBP | 628,625 | Bank Of America, N.A. | 12/19/18 | (649 | ) |
| HUF | 2,139,892,085 | USD | 7,640,016 | UBS AG | 12/19/18 | (148,001 | ) |
| HUF | 233,326,740 | USD | 835,182 | UBS AG | 12/19/18 | (18,278 | ) |
| HUF | 355,083,139 | USD | 1,266,074 | UBS AG | 12/19/18 | (22,886 | ) |
| HUF | 379,683,981 | USD | 1,334,566 | UBS AG | 12/19/18 | (5,247 | ) |
| USD | 38,096,608 | HUF | 10,603,581,415 | UBS AG | 12/19/18 | 972,217 |
|
| USD | 1,522,318 | HUF | 430,237,458 | UBS AG | 12/19/18 | 16,006 |
|
| IDR | 109,246,555,667 | USD | 7,159,014 | Goldman Sachs & Co. | 12/19/18 | (34,146 | ) |
| ILS | 1,006 | USD | 283 | Goldman Sachs & Co. | 12/19/18 | (12 | ) |
| USD | 105,490,745 | JPY | 11,916,867,530 | Bank Of America, N.A. | 11/14/18 | (210,804 | ) |
| USD | 879,693 | KRW | 988,466,801 | Goldman Sachs & Co. | 12/19/18 | 12,490 |
|
| MXN | 14,285,151 | USD | 700,334 | JPMorgan Chase Bank N.A. | 12/19/18 | (2,161 | ) |
| USD | 19,065,281 | MXN | 368,055,250 | JPMorgan Chase Bank N.A. | 12/19/18 | 1,076,929 |
|
| USD | 861,516 | MXN | 16,469,782 | JPMorgan Chase Bank N.A. | 12/19/18 | 56,571 |
|
| MYR | 11,503,040 | USD | 2,771,229 | Goldman Sachs & Co. | 12/19/18 | (25,524 | ) |
| USD | 5,994,902 | MYR | 24,923,806 | Goldman Sachs & Co. | 12/19/18 | 45,743 |
|
| NOK | 81,423,872 | USD | 9,892,222 | Goldman Sachs & Co. | 12/19/18 | (211,991 | ) |
| USD | 792,201 | NOK | 6,493,265 | Goldman Sachs & Co. | 12/19/18 | 20,237 |
|
| NZD | 33,545 | USD | 22,017 | Bank Of America, N.A. | 12/19/18 | (116 | ) |
| USD | 15,082,926 | PEN | 50,049,674 | Goldman Sachs & Co. | 12/19/18 | 263,040 |
|
| USD | 5,014,882 | PEN | 16,646,901 | Goldman Sachs & Co. | 12/19/18 | 85,676 |
|
| USD | 1,397,949 | PEN | 4,673,344 | Goldman Sachs & Co. | 12/19/18 | 14,155 |
|
| USD | 3,596,559 | PEN | 12,030,489 | Goldman Sachs & Co. | 12/19/18 | 34,288 |
|
| USD | 7,353,580 | PHP | 401,446,626 | Goldman Sachs & Co. | 12/19/18 | (150,988 | ) |
| USD | 3,559,641 | PLN | 13,174,587 | Goldman Sachs & Co. | 12/19/18 | 122,143 |
|
| USD | 1,076,644 | RUB | 74,772,903 | Goldman Sachs & Co. | 12/19/18 | (52,080 | ) |
| SEK | 71,972 | USD | 8,065 | Goldman Sachs & Co. | 12/19/18 | (165 | ) |
| SEK | 65,712,187 | USD | 7,341,250 | Goldman Sachs & Co. | 12/19/18 | (127,992 | ) |
| USD | 7,353,508 | SEK | 65,927,872 | Goldman Sachs & Co. | 12/19/18 | 116,574 |
|
| USD | 3,476,959 | SGD | 4,762,071 | Bank Of America, N.A. | 12/19/18 | 35,659 |
|
| THB | 199,096,284 | USD | 6,139,263 | Goldman Sachs & Co. | 12/19/18 | (123,451 | ) |
| USD | 14,101,951 | THB | 460,682,549 | Goldman Sachs & Co. | 12/19/18 | 182,157 |
|
| TRY | 895,208 | USD | 133,468 | Goldman Sachs & Co. | 12/19/18 | 22,148 |
|
| USD | 41,565,945 | ZAR | 629,266,843 | UBS AG | 12/19/18 | (841,546 | ) |
| USD | 1,775,066 | ZAR | 25,734,022 | UBS AG | 12/19/18 | 40,801 |
|
| | | | | | | $ | 8,705,663 |
|
|
| | | | | | | | | | |
| FUTURES CONTRACTS PURCHASED |
| Reference Entity | Contracts | Expiration Date | Notional Amount | Underlying Contract Value | Unrealized Appreciation
(Depreciation) |
| Euro-Bund 10-Year Bonds | 52 | December 2018 | EUR | 5,200,000 | $ | 9,438,964 |
| $ | (28,946 | ) |
| Japanese 10-Year Government Bonds | 11 | December 2018 | JPY | 1,100,000,000 | 14,684,540 |
| 47,671 |
|
| Japanese 10-Year Mini Government Bonds | 460 | December 2018 | JPY | 4,600,000,000 | 61,367,306 |
| 153,162 |
|
Korean Treasury 10-Year Bonds | 142 | December 2018 | KRW | 14,200,000,000 | 15,509,034 |
| 34,642 |
|
U.S. Treasury 5-Year Notes | 219 | December 2018 | USD | 21,900,000 | 24,611,836 |
| (170,739 | ) |
| U.S. Treasury Long Bonds | 177 | December 2018 | USD | 17,700,000 | 24,448,125 |
| (746,859 | ) |
| U.S. Treasury Ultra Bonds | 38 | December 2018 | USD | 3,800,000 | 5,670,313 |
| (364,054 | ) |
| | | | | | $ | 155,730,118 |
| $ | (1,075,123 | ) |
|
| | | | | | | | | | |
| FUTURES CONTRACTS SOLD |
| Reference Entity | Contracts | Expiration Date | Notional Amount | Underlying Contract Value | Unrealized Appreciation
(Depreciation) |
| Euro-Bobl 5-Year Bonds | 716 | December 2018 | EUR | 71,600,000 | $ | 106,594,902 |
| $ | 136,690 |
|
| Euro-OAT 10-Year Bonds | 52 | December 2018 | EUR | 5,200,000 | 8,950,112 |
| 32,308 |
|
| U.K. Gilt 10-Year Bonds | 353 | December 2018 | GBP | 35,300,000 | 55,231,968 |
| (213,914 | ) |
| | | | | | $ | 170,776,982 |
| $ | (44,916 | ) |
|
| | | | | | | | | | | | | | | |
| CENTRALLY CLEARED CREDIT DEFAULT SWAP AGREEMENTS | |
| Reference Entity | Type | Fixed Rate
Received
(Paid) | Termination
Date | Notional
Amount | Premiums
Paid
(Received) | Unrealized
Appreciation
(Depreciation) | Value^ |
| Markit CDX North America High Yield Index Series 30 | Buy | (5.00)% | 6/20/23 | $ | 51,500,000 |
| $ | (3,745,034 | ) | $ | 317,591 |
| $ | (3,427,443 | ) |
| |
| ^ | The value for credit default swap agreements serve as an indicator of the current status of the payment/performance risk and represent the likelihood of an expected liability or profit at the period end. Increasing values in absolute terms when compared to the notional amount of the credit default swap agreement represent a deterioration of the referenced entity's credit soundness and an increased likelihood or risk of a credit event occurring as defined in the agreement. |
|
| | | | | | | | | | | | | | | |
| CENTRALLY CLEARED INTEREST RATE SWAP AGREEMENTS | |
| Floating Rate Index | Pay/Receive Floating
Rate Index | Fixed
Rate | Termination
Date | | Notional
Amount | Premiums Paid (Received) | Unrealized
Appreciation
(Depreciation) | Value |
| MXIBTIIE | Pay | 7.84% | 8/7/23 | MXN | 207,000,000 |
| $ | 552 |
| $ | (401,925 | ) | $ | (401,373 | ) |
| MXIBTIIE | Pay | 7.92% | 8/8/23 | MXN | 210,000,000 |
| 546 |
| (374,123 | ) | (373,577 | ) |
| MXIBTIIE | Pay | 7.99% | 8/10/23 | MXN | 420,000,000 |
| 594 |
| (690,620 | ) | (690,026 | ) |
| MXIBTIIE | Pay | 7.99% | 8/10/23 | MXN | 420,000,000 |
| 594 |
| (690,666 | ) | (690,072 | ) |
| | | | | | | $ | 2,286 |
| $ | (2,157,334 | ) | $ | (2,155,048 | ) |
|
| | | | | | | | | |
| INTEREST RATE SWAP AGREEMENTS |
| Counterparty | Floating
Rate Index | Pay/Receive
Floating Rate
Index | Fixed Rate | Termination
Date | Notional
Amount | Value* |
| Morgan Stanley | BUBOR06M | Receive | 0.97% | 6/21/20 | HUF | 2,885,000,000 | $ | (25,419 | ) |
| |
| * | Amount represents value and unrealized appreciation (depreciation). |
|
| | | | | |
| NOTES TO SCHEDULE OF INVESTMENTS |
| AUD | - | Australian Dollar | MTN | - | Medium Term Note |
| BRL | - | Brazilian Real | MXIBTIIE | - | 28-day Mexico Interbank Equilibrium Interest Rate Index |
| BUBOR06M | - | 6-month Budapest Interbank Offered Rate | MXN | - | Mexican Peso |
| CAD | - | Canadian Dollar | MYR | - | Malaysian Ringgit |
| CDX | - | Credit Derivatives Indexes | NOK | - | Norwegian Krone |
| CHF | - | Swiss Franc | NZD | - | New Zealand Dollar |
| CLP | - | Chilean Peso | PEN | - | Peruvian Sol |
| CZK | - | Czech Koruna | PHP | - | Philippine Peso |
| DKK | - | Danish Krone | PLN | - | Polish Zloty |
| EUR | - | Euro | resets | - | The frequency with which a security's coupon changes, based on current market conditions or an underlying index. |
| FHLMC | - | Federal Home Loan Mortgage Corporation |
| FNMA | - | Federal National Mortgage Association | RUB | - | Russian Ruble |
| GBP | - | British Pound | SEK | - | Swedish Krona |
| GNMA | - | Government National Mortgage Association | SEQ | - | Sequential Payer |
| GO | - | General Obligation | SGD | - | Singapore Dollar |
| H15T1Y | - | Constant Maturity U.S. Treasury Note Yield Curve Rate Index | THB | - | Thai Baht |
| HUF | - | Hungarian Forint | TRY | - | Turkish Lira |
| IDR | - | Indonesian Rupiah | USD | - | United States Dollar |
| ILS | - | Israeli Shekel | VRN | - | Variable Rate Note. Interest reset date is indicated. Rate shown is effective at the period end. |
| JPY | - | Japanese Yen |
| KRW | - | South Korean Won | ZAR | - | South African Rand |
| LIBOR | - | London Interbank Offered Rate | | | |
† Category is less than 0.05% of total net assets.
| |
| (1) | Security was purchased pursuant to Rule 144A under the Securities Act of 1933 and may be sold in transactions exempt from registration, normally to qualified institutional investors. The aggregate value of these securities at the period end was $363,207,177, which represented 25.3% of total net assets. |
| |
| (2) | Security is a zero-coupon bond. |
| |
| (3) | Coupon rate adjusts periodically based upon a predetermined schedule. Interest reset date is indicated. Rate shown is effective at the period end. |
| |
| (4) | Final maturity date indicated, unless otherwise noted. |
| |
| (5) | The interest rate resets periodically based on the weighted average coupons of the underlying mortgage-related or asset-backed obligations. |
| |
| (6) | Forward commitment. Settlement date is indicated. |
| |
| (7) | The interest rate on a bank loan obligation adjusts periodically based on a predetermined schedule. Rate shown is effective at period end. The maturity date on a bank loan obligation may be less than indicated as a result of contractual or optional prepayments. These prepayments cannot be predicted with certainty. Final maturity date is indicated. |
| |
| (8) | Security, or a portion thereof, has been pledged at the custodian bank or with a broker for collateral requirements on forward commitments, forward foreign currency exchange contracts, futures contracts and/or swap agreements. At the period end, the aggregate value of securities pledged was $6,789,697. |
| |
| (9) | The rate indicated is the yield to maturity at purchase. |
See Notes to Financial Statements.
|
|
| Statement of Assets and Liabilities |
|
| | | |
| OCTOBER 31, 2018 |
| Assets |
| Investment securities, at value (cost of $1,478,111,556) | $ | 1,423,981,162 |
|
| Foreign currency holdings, at value (cost of $1,347,193) | 1,288,160 |
|
| Foreign deposits with broker for futures contracts, at value (cost of $1,388,986) | 1,342,378 |
|
| Receivable for investments sold | 366,878 |
|
| Receivable for capital shares sold | 82,505 |
|
| Receivable for variation margin on futures contracts | 225,007 |
|
| Unrealized appreciation on forward foreign currency exchange contracts | 10,833,110 |
|
| Interest receivable | 12,531,193 |
|
| | 1,450,650,393 |
|
| | |
| Liabilities | |
| Disbursements in excess of demand deposit cash | 103,037 |
|
| Payable for investments purchased | 6,447,317 |
|
| Payable for capital shares redeemed | 7,057,063 |
|
| Payable for variation margin on futures contracts | 395,641 |
|
| Payable for variation margin on swap agreements | 566,644 |
|
| Unrealized depreciation on forward foreign currency exchange contracts | 2,127,447 |
|
| Swap agreements, at value | 25,419 |
|
| Accrued management fees | 240,583 |
|
| Distribution and service fees payable | 1,442 |
|
| | 16,964,593 |
|
| | |
| Net Assets | $ | 1,433,685,800 |
|
| | |
| Net Assets Consist of: | |
| Capital paid in | $ | 1,428,749,207 |
|
| Distributable earnings | 4,936,593 |
|
| | $ | 1,433,685,800 |
|
|
| | | | | | |
| | Net Assets | Shares Outstanding | Net Asset Value Per Share |
| Investor Class |
| $299,229,801 |
| 29,838,343 |
| $10.03 |
| I Class |
| $10,569,489 |
| 1,050,909 |
| $10.06 |
| Y Class |
| $7,890,557 |
| 783,212 |
| $10.07 |
| A Class |
| $1,753,478 |
| 175,676 |
| $9.98* |
| C Class |
| $1,195,521 |
| 121,370 |
| $9.85 |
| R Class |
| $96,650 |
| 9,726 |
| $9.94 |
| R5 Class |
| $28,832,403 |
| 2,866,527 |
| $10.06 |
| R6 Class |
| $1,015,038 |
| 100,875 |
| $10.06 |
| G Class |
| $1,083,102,863 |
| 106,955,316 |
| $10.13 |
*Maximum offering price $10.45 (net asset value divided by 0.955).
See Notes to Financial Statements.
|
| | | |
| YEAR ENDED OCTOBER 31, 2018 | |
| Investment Income (Loss) |
| Income: | |
| Interest (net of foreign taxes withheld of $43,967) | $ | 47,571,080 |
|
| | |
| Expenses: | |
| Management fees | 11,083,163 |
|
| Distribution and service fees: | |
| A Class | 4,837 |
|
| C Class | 14,691 |
|
| R Class | 448 |
|
| Trustees' fees and expenses | 96,609 |
|
| Other expenses | 105,265 |
|
| | 11,305,013 |
|
Fees waived(1) | (8,231,741 | ) |
| | 3,073,272 |
|
| | |
| Net investment income (loss) | 44,497,808 |
|
| | |
| Realized and Unrealized Gain (Loss) | |
| Net realized gain (loss) on: | |
| Investment transactions | 2,162,469 |
|
| Forward foreign currency exchange contract transactions | 31,031,828 |
|
| Futures contract transactions | (7,149,467 | ) |
| Swap agreement transactions | 2,848,782 |
|
| Foreign currency translation transactions | (350,070 | ) |
| | 28,543,542 |
|
| | |
| Change in net unrealized appreciation (depreciation) on: | |
| Investments | (80,196,030 | ) |
| Forward foreign currency exchange contracts | (2,512,861 | ) |
| Futures contracts | (71,465 | ) |
| Swap agreements | (392,829 | ) |
| Translation of assets and liabilities in foreign currencies | (321,842 | ) |
| | (83,495,027 | ) |
| | |
| Net realized and unrealized gain (loss) | (54,951,485 | ) |
| | |
| Net Increase (Decrease) in Net Assets Resulting from Operations | $ | (10,453,677 | ) |
| |
| (1) | Amount consists of $271,838, $12,416, $672, $1,783, $1,383, $80, $28,540, $1,041 and $7,913,988 for Investor Class, I Class, Y Class, A Class, C Class, R Class, R5 Class, R6 Class and G Class, respectively. |
See Notes to Financial Statements.
|
|
| Statement of Changes in Net Assets |
|
| | | | | | |
| YEARS ENDED OCTOBER 31, 2018 AND OCTOBER 31, 2017 |
| Increase (Decrease) in Net Assets | October 31, 2018 | October 31, 2017 |
| Operations | | |
| Net investment income (loss) | $ | 44,497,808 |
| $ | 20,568,075 |
|
| Net realized gain (loss) | 28,543,542 |
| 18,905,438 |
|
| Change in net unrealized appreciation (depreciation) | (83,495,027 | ) | (6,100,471 | ) |
| Net increase (decrease) in net assets resulting from operations | (10,453,677 | ) | 33,373,042 |
|
| | | |
| Distributions to Shareholders | | |
From earnings:(1) | | |
| Investor Class | (5,738,404 | ) | (3,710,707 | ) |
| I Class | (247,935 | ) | — |
|
| Y Class | (104 | ) | — |
|
| A Class | (35,060 | ) | (109,776 | ) |
| C Class | (15,599 | ) | (18,759 | ) |
| R Class | (1,861 | ) | (380 | ) |
| R5 Class | (667,330 | ) | (13,547,910 | ) |
| R6 Class | (23,639 | ) | (1,809,993 | ) |
| G Class | (27,388,949 | ) | — |
|
| Decrease in net assets from distributions | (34,118,881 | ) | (19,197,525 | ) |
| | | |
| Capital Share Transactions | | |
| Net increase (decrease) in net assets from capital share transactions (Note 5) | 126,889,276 |
| 131,338,951 |
|
| | | |
| Net increase (decrease) in net assets | 82,316,718 |
| 145,514,468 |
|
| | | |
| Net Assets | | |
| Beginning of period | 1,351,369,082 |
| 1,205,854,614 |
|
| End of period | $ | 1,433,685,800 |
| $ | 1,351,369,082 |
|
| |
| (1) | Prior period presentation has been updated to reflect the current period combination of distributions to shareholders from net investment income and net realized gains. Distributions from net investment income were $(2,968,471), $(83,113), $(6,117), $(263), $(11,175,900) and $(1,505,807) for Investor Class, A Class, C Class, R Class, R5 Class and R6 Class, respectively. Distributions from net realized gains were $(742,236), $(26,663), $(12,642), $(117), $(2,372,010) and $(304,186) for Investor Class, A Class, C Class, R Class, R5 Class and R6 Class, respectively. |
See Notes to Financial Statements.
|
|
| Notes to Financial Statements |
OCTOBER 31, 2018
1. Organization
American Century International Bond Funds (the trust) is registered under the Investment Company Act of 1940, as amended (the 1940 Act), as an open-end management investment company and is organized as a Massachusetts business trust. Global Bond Fund (the fund) is one fund in a series issued by the trust. The fund’s investment objective is to seek long-term total return.
The fund offers the Investor Class, I Class, Y Class, A Class, C Class, R Class, R5 Class, R6 Class and G Class. The A Class may incur an initial sales charge. The A Class and C Class may be subject to a contingent deferred sales charge. Sale of the I Class and Y Class commenced on April 10, 2017 and sale of the G Class commenced on July 28, 2017.
2. Significant Accounting Policies
The following is a summary of significant accounting policies consistently followed by the fund in preparation of its financial statements. The fund is an investment company and follows accounting and reporting guidance in accordance with accounting principles generally accepted in the United States of America. This may require management to make certain estimates and assumptions at the date of the financial statements. Actual results could differ from these estimates. Management evaluated the impact of events or transactions occurring through the date the financial statements were issued that would merit recognition or disclosure.
Investment Valuations — The fund determines the fair value of its investments and computes its net asset value per share at the close of regular trading (usually 4 p.m. Eastern time) on the New York Stock Exchange (NYSE) on each day the NYSE is open. The Board of Trustees has adopted valuation policies and procedures to guide the investment advisor in the fund’s investment valuation process and to provide methodologies for the oversight of the fund’s pricing function.
Fixed income securities are valued at the evaluated mean as provided by independent pricing services or at the mean of the most recent bid and asked prices as provided by investment dealers. Corporate bonds, U.S. Treasury and Government Agency securities, convertible bonds, bank loan obligations, municipal securities, and sovereign governments and agencies are valued using market models that consider trade data, quotations from dealers and active market makers, relevant yield curve and spread data, creditworthiness, trade data or market information on comparable securities, and other relevant security specific information. Mortgage-related and asset-backed securities are valued based on models that consider trade data, prepayment and default projections, benchmark yield and spread data and estimated cash flows of each tranche of the issuer. Collateralized loan obligations are valued based on discounted cash flow models that consider trade and economic data, prepayment assumptions and default projections. Fixed income securities initially expressed in local currencies are translated into U.S. dollars at the mean of the appropriate currency exchange rate at the close of the NYSE as provided by an independent pricing service.
Open-end management investment companies are valued at the reported net asset value per share. Repurchase agreements are valued at cost, which approximates fair value. Exchange-traded futures contracts are valued at the settlement price as provided by the appropriate exchange. Swap agreements are valued at an evaluated mean as provided by independent pricing services or independent brokers. Forward foreign currency exchange contracts are valued at the mean of the appropriate forward exchange rate at the close of the NYSE as provided by an independent pricing service. Investments initially expressed in local currencies are translated into U.S. dollars at the mean of the appropriate currency exchange rate at the close of the NYSE as provided by an independent pricing service.
If the fund determines that the market price for an investment is not readily available or the valuation methods mentioned above do not reflect an investment’s fair value, such investment is valued as determined in good faith by the Board of Trustees or its delegate, in accordance with policies and procedures adopted by the Board of Trustees. In its determination of fair value, the fund may review several factors including, but not limited to, market information regarding the specific investment or comparable investments and correlation with other investment types, futures indices or general market indicators. Circumstances that may cause the fund to use these procedures to value an investment include, but are not limited to: an investment has been declared in default or is distressed; trading in a security has been suspended during the trading day or a
security is not actively trading on its principal exchange; prices received from a regular pricing source are deemed unreliable; or there is a foreign market holiday and no trading occurred.
The fund monitors for significant events occurring after the close of an investment’s primary exchange but before the fund’s net asset value per share is determined. Significant events may include, but are not limited to: corporate announcements and transactions; governmental action and political unrest that could impact a specific investment or an investment sector; or armed conflicts, natural disasters and similar events that could affect investments in a specific country or region.
Security Transactions — Security transactions are accounted for as of the trade date. Net realized gains and losses are determined on the identified cost basis, which is also used for federal income tax purposes.
Investment Income — Interest income less foreign taxes withheld, if any, is recorded on the accrual basis and includes paydown gain (loss) and accretion of discounts and amortization of premiums. Inflation adjustments related to inflation-linked debt securities are reflected as interest income.
Foreign Currency Translations — All assets and liabilities initially expressed in foreign currencies are translated into U.S. dollars at prevailing exchange rates at period end. The fund may enter into spot foreign currency exchange contracts to facilitate transactions denominated in a foreign currency. Purchases and sales of investment securities, dividend and interest income, spot foreign currency exchange contracts, and expenses are translated at the rates of exchange prevailing on the respective dates of such transactions. Net realized and unrealized foreign currency exchange gains or losses related to investment securities are a component of net realized gain (loss) on investment transactions and change in net unrealized appreciation (depreciation) on investments, respectively.
Forward Commitments — The fund may engage in securities transactions on a forward commitment basis. In these transactions, the securities’ prices and yields are fixed on the date of the commitment. The fund may sell a to-be-announced (TBA) security and at the same time make a commitment to purchase the same security at a future date at a specified price. Conversely, the fund may purchase a TBA security and at the same time make a commitment to sell the same security at a future date at a specified price. These types of transactions are known as “TBA roll” transactions and are accounted for as purchases and sales. The fund will segregate cash, cash equivalents or other appropriate liquid securities on its records in amounts sufficient to meet the purchase price.
Repurchase Agreements — The fund may enter into repurchase agreements with institutions that American Century Investment Management, Inc. (ACIM) (the investment advisor) has determined are creditworthy pursuant to criteria adopted by the Board of Trustees. The fund requires that the collateral, represented by securities, received in a repurchase transaction be transferred to the custodian in a manner sufficient to enable the fund to obtain those securities in the event of a default under the repurchase agreement. ACIM monitors, on a daily basis, the securities transferred to ensure the value, including accrued interest, of the securities under each repurchase agreement is equal to or greater than amounts owed to the fund under each repurchase agreement.
Joint Trading Account — Pursuant to an Exemptive Order issued by the Securities and Exchange Commission, the fund, along with certain other funds in the American Century Investments family of funds, may transfer uninvested cash balances into a joint trading account. These balances are invested in one or more repurchase agreements that are collateralized by U.S. Treasury or Agency obligations.
Segregated Assets — In accordance with the 1940 Act, the fund segregates assets on its books and records to cover certain types of investment securities and other financial instruments. ACIM monitors, on a daily basis, the securities segregated to ensure the fund designates a sufficient amount of liquid assets, marked-to-market daily. The fund may also receive assets or be required to pledge assets at the custodian bank or with a broker for collateral requirements.
Income Tax Status — It is the fund’s policy to distribute substantially all net investment income and net realized gains to shareholders and to otherwise qualify as a regulated investment company under provisions of the Internal Revenue Code. Accordingly, no provision has been made for income taxes. The fund files U.S. federal, state, local and non-U.S. tax returns as applicable. The fund's tax returns are subject to examination by the relevant taxing authority until expiration of the applicable statute of limitations, which is generally three years from the date of filing but can be longer in certain jurisdictions. At this time, management believes there are no uncertain tax positions which, based on their technical merit, would not be sustained upon examination and for which it is reasonably possible that the total amounts of unrecognized tax benefits will significantly change in the next twelve months.
Multiple Class — All shares of the fund represent an equal pro rata interest in the net assets of the class to which such shares belong, and have identical voting, dividend, liquidation and other rights and the same terms and conditions, except for class specific expenses and exclusive rights to vote on matters affecting only individual classes. Income, non-class specific expenses, and realized and unrealized capital gains and losses of the fund are allocated to each class of shares based on their relative net assets.
Distributions to Shareholders — Distributions from net investment income, if any, are generally declared and paid quarterly, but may be paid less frequently. Distributions from net realized gains, if any, are generally declared and paid annually.
Indemnifications — Under the trust’s organizational documents, its officers and trustees are indemnified against certain liabilities arising out of the performance of their duties to the fund. In addition, in the normal course of business, the fund enters into contracts that provide general indemnifications. The maximum exposure under these arrangements is unknown as this would involve future claims that may be made against a fund. The risk of material loss from such claims is considered by management to be remote.
3. Fees and Transactions with Related Parties
Certain officers and trustees of the trust are also officers and/or directors of American Century Companies, Inc. (ACC). The trust's investment advisor, ACIM, the trust's distributor, American Century Investment Services, Inc. (ACIS), and the trust's transfer agent, American Century Services, LLC, are wholly owned, directly or indirectly, by ACC. Various funds issued by American Century Asset Allocation Portfolios, Inc. own, in aggregate, 94% of the shares of the fund. Related parties do not invest in the fund for the purpose of exercising management or control.
Management Fees — The trust has entered into a management agreement with ACIM, under which ACIM provides the fund with investment advisory and management services in exchange for a single, unified management fee (the fee) per class. The agreement provides that all expenses of managing and operating the fund, except distribution and service fees, brokerage expenses, taxes, interest, fees and expenses of the independent trustees (including legal counsel fees), and extraordinary expenses, will be paid by ACIM. The fee is computed and accrued daily based on each class's daily net assets and paid monthly in arrears. The difference in the fee among the classes is a result of their separate arrangements for non-Rule 12b-1 shareholder services. It is not the result of any difference in advisory or custodial fees or other expenses related to the management of the fund’s assets, which do not vary by class. From November 1, 2017 through July 31, 2018, the investment advisor agreed to waive 0.12% of the fund's management fee. Effective August 1, 2018, the investment advisor terminated this waiver and decreased the annual management fee by 0.12%. The investment advisor agreed to waive the G Class’s management fee in its entirety. The investment advisor expects this waiver to remain in effect permanently and cannot terminate it without the approval of the Board of Trustees.
The annual management fee and the effective annual management fee before and after waiver for each class for the period ended October 31, 2018 are as follows:
|
| | | |
| | | Effective Annual Management Fee |
| | Annual Management Fee* | Before Waiver | After Waiver |
| Investor Class | 0.83% | 0.92% | 0.83% |
| I Class | 0.73% | 0.82% | 0.73% |
| Y Class | 0.63% | 0.72% | 0.63% |
| A Class | 0.83% | 0.92% | 0.83% |
| C Class | 0.83% | 0.92% | 0.83% |
| R Class | 0.83% | 0.92% | 0.83% |
| R5 Class | 0.63% | 0.72% | 0.63% |
| R6 Class | 0.58% | 0.67% | 0.58% |
| G Class | 0.58% | 0.67% | 0.00% |
*Prior to August 1, 2018, the annual management fee was 0.95% for the Investor Class, A Class, C Class and R Class, 0.85% for the I Class, 0.75% for the Y Class and R5 Class and 0.70% for the R6 Class and G Class.
Distribution and Service Fees — The Board of Trustees has adopted a separate Master Distribution and Individual Shareholder Services Plan for each of the A Class, C Class and R Class (collectively the plans), pursuant to Rule 12b-1 of the 1940 Act. The plans provide that the A Class will pay ACIS an annual distribution and service fee of 0.25%. The plans provide that the C Class will pay ACIS an annual distribution and service fee of 1.00%, of which 0.25% is paid for individual shareholder services and 0.75% is paid for distribution services. The plans provide that the R Class will pay ACIS an annual distribution and service fee of 0.50%. The fees are computed and accrued daily based on each class’s daily net assets and paid monthly in arrears. The fees are used to pay financial intermediaries for distribution and individual shareholder services. Fees incurred under the plans during the period ended October 31, 2018 are detailed in the Statement of Operations.
Trustees’ Fees and Expenses — The Board of Trustees is responsible for overseeing the investment advisor’s management and operations of the fund. The trustees receive detailed information about the fund and its investment advisor regularly throughout the year, and meet at least quarterly with management of the investment advisor to review reports about fund operations. The fund’s officers do not receive compensation from the fund.
Interfund Transactions — The fund may enter into security transactions with other American Century Investments funds and other client accounts of the investment advisor, in accordance with the 1940 Act rules and procedures adopted by the Board of Trustees. The rules and procedures require, among other things, that these transactions be effected at the independent current market price of the security. There were no interfund transactions during the period.
4. Investment Transactions
Purchases of investment securities, excluding short-term investments, for the period ended October 31, 2018 totaled $1,333,145,219, of which $518,378,424 represented U.S. Treasury and Government Agency obligations.
Sales of investment securities, excluding short-term investments, for the period ended October 31, 2018 totaled $1,181,961,705, of which $577,272,832 represented U.S. Treasury and Government Agency obligations.
5. Capital Share Transactions
Transactions in shares of the fund were as follows (unlimited number of shares authorized): |
| | | | | | | | | | |
| | Year ended
October 31, 2018 | Year ended
October 31, 2017(1) |
| | Shares | Amount | Shares | Amount |
| Investor Class | | | | |
| Sold | 3,848,521 |
| $ | 39,284,188 |
| 4,649,418 |
| $ | 47,097,131 |
|
| Issued in reinvestment of distributions | 563,241 |
| 5,735,786 |
| 370,083 |
| 3,700,038 |
|
| Redeemed | (3,013,541 | ) | (30,560,483 | ) | (2,187,286 | ) | (22,281,031 | ) |
| | 1,398,221 |
| 14,459,491 |
| 2,832,215 |
| 28,516,138 |
|
| I Class | | | | |
| Sold | 709,744 |
| 7,212,017 |
| 1,162,741 |
| 11,976,601 |
|
| Issued in reinvestment of distributions | 20,890 |
| 213,129 |
| — |
| — |
|
| Redeemed | (821,550 | ) | (8,298,368 | ) | (20,916 | ) | (217,114 | ) |
| | (90,916 | ) | (873,222 | ) | 1,141,825 |
| 11,759,487 |
|
| Y Class | | | | |
| Sold | 793,074 |
| 8,033,913 |
| 493 |
| 5,000 |
|
| Issued in reinvestment of distributions | 10 |
| 104 |
| — |
| — |
|
| Redeemed | (10,365 | ) | (104,939 | ) | — |
| — |
|
| | 782,719 |
| 7,929,078 |
| 493 |
| 5,000 |
|
| A Class | | | | |
| Sold | 39,634 |
| 401,159 |
| 121,215 |
| 1,227,484 |
|
| Issued in reinvestment of distributions | 3,337 |
| 33,907 |
| 10,936 |
| 109,001 |
|
| Redeemed | (76,502 | ) | (771,125 | ) | (829,922 | ) | (8,392,635 | ) |
| | (33,531 | ) | (336,059 | ) | (697,771 | ) | (7,056,150 | ) |
| C Class | | | | |
| Sold | 15,898 |
| 158,769 |
| 15,173 |
| 151,490 |
|
| Issued in reinvestment of distributions | 1,103 |
| 11,125 |
| 629 |
| 6,215 |
|
| Redeemed | (74,942 | ) | (749,345 | ) | (296,410 | ) | (2,969,427 | ) |
| | (57,941 | ) | (579,451 | ) | (280,608 | ) | (2,811,722 | ) |
| R Class | | | | |
| Sold | 10,666 |
| 107,378 |
| 10,543 |
| 106,699 |
|
| Issued in reinvestment of distributions | 184 |
| 1,861 |
| 38 |
| 380 |
|
| Redeemed | (15,347 | ) | (154,265 | ) | (1,117 | ) | (11,293 | ) |
| | (4,497 | ) | (45,026 | ) | 9,464 |
| 95,786 |
|
| R5 Class | | | | |
| Sold | 268,950 |
| 2,742,437 |
| 9,113,393 |
| 92,123,729 |
|
| Issued in reinvestment of distributions | 65,409 |
| 667,330 |
| 1,353,329 |
| 13,547,910 |
|
| Redeemed | (568,473 | ) | (5,761,524 | ) | (88,213,711 | ) | (906,962,491 | ) |
| | (234,114 | ) | (2,351,757 | ) | (77,746,989 | ) | (801,290,852 | ) |
| R6 Class | | | | |
| Sold | 17,993 |
| 183,840 |
| 3,989,569 |
| 40,436,853 |
|
| Issued in reinvestment of distributions | 2,317 |
| 23,639 |
| 180,819 |
| 1,809,993 |
|
| Redeemed | (62,731 | ) | (647,979 | ) | (13,217,020 | ) | (135,904,020 | ) |
| | (42,421 | ) | (440,500 | ) | (9,046,632 | ) | (93,657,174 | ) |
| G Class | | | | |
| Sold | 26,584,587 |
| 275,961,708 |
| 97,393,395 |
| 1,002,138,851 |
|
| Issued in reinvestment of distributions | 2,681,778 |
| 27,388,949 |
| — |
| — |
|
| Redeemed | (19,088,493 | ) | (194,223,935 | ) | (615,951 | ) | (6,360,413 | ) |
| | 10,177,872 |
| 109,126,722 |
| 96,777,444 |
| 995,778,438 |
|
| Net increase (decrease) | 11,895,392 |
| $ | 126,889,276 |
| 12,989,441 |
| $ | 131,338,951 |
|
| |
| (1) | April 10, 2017 (commencement of sale) through October 31, 2017 for the I Class and Y Class and July 28, 2017 (commencement of sale) through October 31, 2017 for the G Class. |
6. Fair Value Measurements
The fund’s investments valuation process is based on several considerations and may use multiple inputs to determine the fair value of the investments held by the fund. In conformity with accounting principles generally accepted in the United States of America, the inputs used to determine a valuation are classified into three broad levels.
| |
| • | Level 1 valuation inputs consist of unadjusted quoted prices in an active market for identical investments. |
| |
| • | Level 2 valuation inputs consist of direct or indirect observable market data (including quoted prices for comparable investments, evaluations of subsequent market events, interest rates, prepayment speeds, credit risk, etc.). These inputs also consist of quoted prices for identical investments initially expressed in local currencies that are adjusted through translation into U.S. dollars. |
| |
| • | Level 3 valuation inputs consist of unobservable data (including a fund’s own assumptions). |
The level classification is based on the lowest level input that is significant to the fair valuation measurement. The valuation inputs are not necessarily an indication of the risks associated with investing in these securities or other financial instruments.
The following is a summary of the level classifications as of period end. The Schedule of Investments provides additional information on the fund’s portfolio holdings.
|
| | | | | | | | |
| | Level 1 | Level 2 | Level 3 |
| Assets | | | |
| Investment Securities | | | |
| Sovereign Governments and Agencies | — |
| $ | 543,102,273 |
| — |
|
| Corporate Bonds | — |
| 473,213,611 |
| — |
|
| Collateralized Mortgage Obligations | — |
| 84,533,740 |
| — |
|
| Asset-Backed Securities | — |
| 74,480,163 |
| — |
|
| Collateralized Loan Obligations | — |
| 69,830,889 |
| — |
|
| Commercial Mortgage-Backed Securities | — |
| 64,712,331 |
| — |
|
| U.S. Government Agency Mortgage-Backed Securities | — |
| 63,365,423 |
| — |
|
| Bank Loan Obligations | — |
| 34,012,796 |
| — |
|
| Municipal Securities | — |
| 6,345,762 |
| — |
|
| Temporary Cash Investments | $ | 176,228 |
| 10,207,946 |
| — |
|
| | $ | 176,228 |
| $ | 1,423,804,934 |
| — |
|
| Other Financial Instruments | | | |
| Futures Contracts | — |
| $ | 404,473 |
| — |
|
| Forward Foreign Currency Exchange Contracts | — |
| 10,833,110 |
| — |
|
| | — |
| $ | 11,237,583 |
| — |
|
| | | | |
| Liabilities | | | |
| Other Financial Instruments | | | |
| Futures Contracts | $ | 1,281,652 |
| $ | 242,860 |
| — |
|
| Swap Agreements | — |
| 5,607,910 |
| — |
|
| Forward Foreign Currency Exchange Contracts | — |
| 2,127,447 |
| — |
|
| | $ | 1,281,652 |
| $ | 7,978,217 |
| — |
|
7. Derivative Instruments
Credit Risk — The fund is subject to credit risk in the normal course of pursuing its investment objectives. The value of a bond generally declines as the credit quality of its issuer declines. Credit default swap agreements enable a fund to buy/sell protection against a credit event of a specific issuer or index. A fund may attempt to enhance returns by selling protection or attempt to mitigate credit risk by buying protection. The buyer/seller of credit protection against a security or basket of securities may pay/receive an up-front or periodic payment to compensate for/against potential default events. Changes in value, including the periodic amounts of interest to be paid or received on swap agreements, are recorded as unrealized appreciation
(depreciation) on swap agreements. Upon entering into a centrally cleared swap, a fund is required to deposit cash or securities (initial margin) with a financial intermediary in an amount equal to a certain percentage of the notional amount. Subsequent payments (variation margin) are made or received daily, in cash, by a fund. The variation margin is equal to the daily change in the value and is a component of unrealized gains and losses. Realized gain or loss is recorded upon receipt or payment of a periodic settlement or termination of swap agreements. Net realized and unrealized gains or losses occurring during the holding period of swap agreements are a component of net realized gain (loss) on swap agreement transactions and change in net unrealized appreciation (depreciation) on swap agreements, respectively. The risks of entering into swap agreements include the possible lack of liquidity, failure of the counterparty to meet its obligations, and that there may be unfavorable changes in the underlying investments or instruments. The fund's average notional amount held during the period was $56,600,000.
Foreign Currency Risk — The fund is subject to foreign currency exchange rate risk in the normal course of pursuing its investment objectives. The value of foreign investments held by a fund may be significantly affected by changes in foreign currency exchange rates. The dollar value of a foreign security generally decreases when the value of the dollar rises against the foreign currency in which the security is denominated and tends to increase when the value of the dollar declines against such foreign currency. A fund may enter into forward foreign currency exchange contracts to reduce a fund's exposure to foreign currency exchange rate fluctuations or to gain exposure to the fluctuations in the value of foreign currencies. The net U.S. dollar value of foreign currency underlying all contractual commitments held by a fund and the resulting unrealized appreciation or depreciation are determined daily. Realized gain or loss is recorded upon the termination of the contract. Net realized and unrealized gains or losses occurring during the holding period of forward foreign currency exchange contracts are a component of net realized gain (loss) on forward foreign currency exchange contract transactions and change in net unrealized appreciation (depreciation) on forward foreign currency exchange contracts, respectively. A fund bears the risk of an unfavorable change in the foreign currency exchange rate underlying the forward contract. Additionally, losses, up to the fair value, may arise if the counterparties do not perform under the contract terms. The fund's average U.S. dollar exposure to foreign currency risk derivative instruments held during the period was $1,077,498,919.
Interest Rate Risk — The fund is subject to interest rate risk in the normal course of pursuing its investment objectives. A fund may enter into futures contracts or interest rate swap agreements in order to manage its exposure to changes in market conditions. The value of bonds generally declines as interest rates rise. The risks of entering into interest rate risk derivative instruments include the possible lack of liquidity, failure of the counterparty to meet its obligations, and that there may be unfavorable changes in the underlying investments or instruments.
A fund may enter into futures contracts based on a bond index or a specific underlying security. A fund may purchase futures contracts to gain exposure to increases in market value or sell futures contracts to protect against a decline in market value. Upon entering into a futures contract, a fund will segregate cash, cash equivalents or other appropriate liquid securities on its records in amounts sufficient to meet requirements. Subsequent payments (variation margin) are made or received daily, in cash, by a fund. The variation margin is equal to the daily change in the contract value and is recorded as unrealized gains and losses. A fund recognizes a realized gain or loss when the futures contract is closed or expires. Net realized and unrealized gains or losses occurring during the holding period of futures contracts are a component of net realized gain (loss) on futures contract transactions and change in net unrealized appreciation (depreciation) on futures contracts, respectively. The fund's average notional exposure to these interest rate risk derivative instruments held during the period was $125,409,602 futures contracts purchased and $147,710,286 futures contracts sold.
A fund may enter into interest rate swap agreements to gain exposure to declines in interest rates, to protect against increases in interest rates, or to maintain its ability to generate income at prevailing interest rates. A fund will segregate cash, cash equivalents or other appropriate liquid securities on its records in amounts sufficient to meet requirements. Changes in value, including the periodic amounts of interest to be paid or received on swap agreements, are recorded as unrealized appreciation (depreciation) on swap agreements. Upon entering into a centrally cleared swap, a fund is required to deposit cash or securities (initial margin) with a financial intermediary in an amount equal to a certain percentage of the notional amount. Subsequent payments (variation margin) are made or received daily, in cash, by a fund. The variation margin is equal to the daily change in the value and is a component of unrealized gains and losses. Realized gain or loss is recorded upon receipt or payment of a periodic settlement or termination of swap agreements. Net realized and unrealized gains or losses occurring during the holding period of swap agreements are a component of net realized gain (loss) on swap agreement transactions and change in net unrealized appreciation (depreciation) on swap agreements, respectively. The fund's average notional amount on interest rate swap agreements held during the period was $259,130,141.
Other Contracts — A fund may enter into total return swap agreements in order to attempt to obtain or preserve a particular return or spread at a lower cost than obtaining a return or spread through purchases and/or sales of instruments in other markets or gain exposure to certain markets in the most economical way possible. A fund will segregate cash, cash equivalents or other appropriate liquid securities on its records in amounts sufficient to meet requirements. Changes in value, including the periodic amounts of interest to be paid or received on swap agreements, are recorded as unrealized appreciation (depreciation) on swap agreements. Upon entering into a centrally cleared swap, a fund is required to deposit cash or securities (initial margin) with a financial intermediary in an amount equal to a certain percentage of the notional amount. Subsequent payments (variation margin) are made or received daily, in cash, by a fund. The variation margin is equal to the daily change in the value and is a component of unrealized gains and losses. Realized gain or loss is recorded upon receipt or payment of a periodic settlement or termination of swap agreements. Net realized and unrealized gains or losses occurring during the holding period of swap agreements are a component of net realized gain (loss) on swap agreement transactions and change in net unrealized appreciation (depreciation) on swap agreements, respectively. The risks of entering into swap agreements include the possible lack of liquidity, failure of the counterparty to meet its obligations, and that there may be unfavorable changes in the underlying investments or instruments, including inflationary risk. The fund's average notional amount held during the period was $59,955,556.
Value of Derivative Instruments as of October 31, 2018
|
| | | | | | | | |
| | Asset Derivatives | Liability Derivatives |
| Type of Risk Exposure | Location on Statement of Assets and Liabilities | Value | Location on Statement of Assets and Liabilities | Value |
| Credit Risk | Receivable for variation margin on swap agreements* | — |
| Payable for variation margin on swap agreements* | $ | 108,922 |
|
| Foreign Currency Risk | Unrealized appreciation on forward foreign currency exchange contracts | $ | 10,833,110 |
| Unrealized depreciation on forward foreign currency exchange contracts | 2,127,447 |
|
| Interest Rate Risk | Receivable for variation margin on futures contracts* | 225,007 |
| Payable for variation margin on futures contracts* | 395,641 |
|
| Interest Rate Risk | Receivable for variation margin on swap agreements* | — |
| Payable for variation margin on swap agreements* | 457,722 |
|
| Interest Rate Risk | Swap agreements | — |
| Swap agreements | 25,419 |
|
| | | $ | 11,058,117 |
| | $ | 3,115,151 |
|
| |
| * | Included in the unrealized appreciation (depreciation) on futures contracts or centrally cleared swap agreements, as applicable, as reported in the Schedule of Investments. |
Effect of Derivative Instruments on the Statement of Operations for the Year Ended October 31, 2018
|
| | | | | | | | |
| | Net Realized Gain (Loss) | Change in Net Unrealized Appreciation (Depreciation) |
| Type of Risk Exposure | Location on Statement of Operations | Value | Location on Statement of Operations | Value |
| Credit Risk | Net realized gain (loss) on swap agreement transactions | $ | 2,611,754 |
| Change in net unrealized appreciation (depreciation) on swap agreements | $ | (418,274 | ) |
| Foreign Currency Risk | Net realized gain (loss) on forward foreign currency exchange contract transactions | 31,031,828 |
| Change in net unrealized appreciation (depreciation) on forward foreign currency exchange contracts | (2,512,861 | ) |
| Interest Rate Risk | Net realized gain (loss) on futures contract transactions | (7,149,467) |
| Change in net unrealized appreciation (depreciation) on futures contracts | (71,465) |
|
| Interest Rate Risk | Net realized gain (loss) on swap agreement transactions | (359,311 | ) | Change in net unrealized appreciation (depreciation) on swap agreements | (699,699) |
|
| Other Contracts | Net realized gain (loss) on swap agreement transactions | 596,339 |
| Change in net unrealized appreciation (depreciation) on swap agreements | 725,144 |
|
| | | $ | 26,731,143 |
| | $ | (2,977,155 | ) |
8. Risk Factors
There are certain risks involved in investing in foreign securities. These risks include those resulting from future adverse political, social and economic developments, fluctuations in currency exchange rates, the possible imposition of exchange controls, and other foreign laws or restrictions. Investing in emerging markets may accentuate these risks.
The fund’s investment process may result in high portfolio turnover, which could mean high transaction costs, affecting both performance and capital gains tax liabilities to investors.
9. Federal Tax Information
The tax character of distributions paid during the years ended October 31, 2018 and October 31, 2017 were as follows:
|
| | | | | | |
| | 2018 | 2017 |
| Distributions Paid From | | |
| Ordinary income | $ | 33,860,901 |
| $ | 19,197,525 |
|
| Long-term capital gains | $ | 257,980 |
| — |
|
The book-basis character of distributions made during the year from net investment income or net realized gains may differ from their ultimate characterization for federal income tax purposes. These differences reflect the differing character of certain income items and net realized gains and losses for financial statement and tax purposes, and may result in reclassification among certain capital accounts on the financial statements. The reclassifications were primarily due to foreign currency gains and losses.
As of period end, the federal tax cost of investments and the components of distributable earnings on a tax-basis were as follows:
|
| | | |
| Federal tax cost of investments | $ | 1,480,224,412 |
|
| Gross tax appreciation of investments | $ | 13,806,082 |
|
| Gross tax depreciation of investments | (70,049,332 | ) |
| Net tax appreciation (depreciation) of investments | (56,243,250 | ) |
Net tax appreciation (depreciation) on derivatives and translation of assets and liabilities in foreign currencies | (1,190,532 | ) |
| Net tax appreciation (depreciation) | $ | (57,433,782 | ) |
| Other book-to-tax adjustments | $ | (278,969 | ) |
| Undistributed ordinary income | $ | 77,409,213 |
|
| Accumulated short-term capital losses | $ | (7,798,706 | ) |
| Accumulated long-term capital losses | $ | (6,961,163 | ) |
The difference between book-basis and tax-basis unrealized appreciation (depreciation) is attributable primarily to the realization for tax purposes of unrealized gains (losses) on certain foreign currency exchange contracts. Other book-to-tax adjustments are attributable primarily to the tax deferral of losses on straddle positions.
Accumulated capital losses represent net capital loss carryovers that may be used to offset future realized capital gains for federal income tax purposes. The capital loss carryovers may be carried forward for an unlimited period. Future capital loss carryover utilization in any given year may be subject to Internal Revenue Code limitations.
10. Recently Issued Accounting Standards
In March 2017, the Financial Accounting Standards Board (FASB) issued Accounting Standards Update No. 2017-08, “Receivables - Nonrefundable Fees and Other Costs (Subtopic 310-20), Premium Amortization on Purchased Callable Debt Securities” (ASU 2017-08). ASU 2017-08 amends the amortization period for certain purchased callable debt securities held at a premium, shortening such period to the earliest call date. The amendments are effective for fiscal years, and interim periods within those fiscal years, beginning after December 15, 2018. Management is currently evaluating the impact that adopting ASU 2017-08 will have on the financial statements.
|
| | | | | | | | | | | | | | | | | |
| For a Share Outstanding Throughout the Years Ended October 31 (except as noted) |
| Per-Share Data | Ratios and Supplemental Data |
| | | Income From Investment Operations: | Distributions From: | | | Ratio to Average Net Assets of: | | |
| | Net Asset Value, Beginning of Period | Net Investment Income (Loss)(1) | Net Realized and Unrealized Gain (Loss) | Total From Investment Operations | Net Investment Income | Net Realized Gains | Total Distributions | Net Asset Value, End of Period | Total Return(2) | Operating Expenses | Operating Expenses (before expense waiver) | Net Investment Income (Loss) | Net Investment Income (Loss) (before expense waiver) | Portfolio Turnover Rate | Net Assets, End of Period (in thousands) |
| Investor Class |
| 2018 | $10.36 | 0.23 | (0.36) | (0.13) | (0.17) | (0.03) | (0.20) | $10.03 | (1.33)% | 0.84% | 0.93% | 2.26% | 2.17% | 78% |
| $299,230 |
|
| 2017 | $10.28 | 0.13 | 0.09 | 0.22 | (0.11) | (0.03) | (0.14) | $10.36 | 2.23% | 0.84% | 0.96% | 1.32% | 1.20% | 130% |
| $294,535 |
|
| 2016 | $9.86 | 0.12 | 0.34 | 0.46 | (0.04) | — | (0.04) | $10.28 | 4.72% | 0.84% | 0.96% | 1.18% | 1.06% | 106% |
| $263,312 |
|
2015(3) | $9.71 | 0.04 | 0.11 | 0.15 | — | — | — | $9.86 | 1.54% | 0.87%(4) | 0.96%(4) | 1.08%(4) | 0.99%(4) | 37% |
| $224,271 |
|
| 2015 | $9.93 | 0.08 | 0.14(5) | 0.22 | (0.44) | — | (0.44) | $9.71 | 2.18% | 0.95% | 0.95% | 0.73% | 0.73% | 114% |
| $219,606 |
|
| 2014 | $9.98 | 0.16 | 0.25 | 0.41 | (0.42) | (0.04) | (0.46) | $9.93 | 4.25% | 0.96% | 0.96% | 1.64% | 1.64% | 71% |
| $10,704 |
|
| I Class |
| 2018 | $10.38 | 0.24 | (0.35) | (0.11) | (0.18) | (0.03) | (0.21) | $10.06 | (1.16)% | 0.74% | 0.83% | 2.36% | 2.27% | 78% |
| $10,569 |
|
2017(6) | $10.14 | 0.09 | 0.15 | 0.24 | — | — | — | $10.38 | 2.37% | 0.74%(4) | 0.86%(4) | 1.51%(4) | 1.39%(4) | 130%(7) |
| $11,856 |
|
| Y Class |
| 2018 | $10.39 | 0.27 | (0.38) | (0.11) | (0.18) | (0.03) | (0.21) | $10.07 | (1.09)% | 0.64% | 0.73% | 2.46% | 2.37% | 78% |
| $7,891 |
|
2017(6) | $10.14 | 0.09 | 0.16 | 0.25 | — | — | — | $10.39 | 2.47% | 0.64%(4) | 0.76%(4) | 1.59%(4) | 1.47%(4) | 130%(7) |
| $5 |
|
|
| | | | | | | | | | | | | | | | | |
| For a Share Outstanding Throughout the Years Ended October 31 (except as noted) |
| Per-Share Data | Ratios and Supplemental Data |
| | | Income From Investment Operations: | Distributions From: | | | Ratio to Average Net Assets of: | | |
| | Net Asset Value, Beginning of Period | Net Investment Income (Loss)(1) | Net Realized and Unrealized Gain (Loss) | Total From Investment Operations | Net Investment Income | Net Realized Gains | Total Distributions | Net Asset Value, End of Period | Total Return(2) | Operating Expenses | Operating Expenses (before expense waiver) | Net Investment Income (Loss) | Net Investment Income (Loss) (before expense waiver) | Portfolio Turnover Rate | Net Assets, End of Period (in thousands) |
| A Class |
| 2018 | $10.31 | 0.20 | (0.36) | (0.16) | (0.14) | (0.03) | (0.17) | $9.98 | (1.59)% | 1.09% | 1.18% | 2.01% | 1.92% | 78% |
| $1,753 |
|
| 2017 | $10.24 | 0.10 | 0.09 | 0.19 | (0.09) | (0.03) | (0.12) | $10.31 | 1.88% | 1.09% | 1.21% | 1.07% | 0.95% | 130% |
| $2,157 |
|
| 2016 | $9.83 | 0.09 | 0.36 | 0.45 | (0.04) | — | (0.04) | $10.24 | 4.55% | 1.09% | 1.21% | 0.93% | 0.81% | 106% |
| $9,284 |
|
2015(3) | $9.69 | 0.03 | 0.11 | 0.14 | — | — | — | $9.83 | 1.44% | 1.12%(4) | 1.21%(4) | 0.83%(4) | 0.74%(4) | 37% |
| $5,506 |
|
| 2015 | $9.91 | 0.13 | 0.06(5) | 0.19 | (0.41) | — | (0.41) | $9.69 | 1.93% | 1.20% | 1.20% | 0.48% | 0.48% | 114% |
| $3,033 |
|
| 2014 | $9.97 | 0.14 | 0.24 | 0.38 | (0.40) | (0.04) | (0.44) | $9.91 | 3.97% | 1.21% | 1.21% | 1.39% | 1.39% | 71% |
| $7,268 |
|
| C Class |
| 2018 | $10.17 | 0.12 | (0.34) | (0.22) | (0.07) | (0.03) | (0.10) | $9.85 | (2.27)% | 1.84% | 1.93% | 1.26% | 1.17% | 78% |
| $1,196 |
|
| 2017 | $10.10 | 0.03 | 0.08 | 0.11 | (0.01) | (0.03) | (0.04) | $10.17 | 1.13% | 1.84% | 1.96% | 0.32% | 0.20% | 130% |
| $1,824 |
|
| 2016 | $9.75 | 0.02 | 0.34 | 0.36 | (0.01) | — | (0.01) | $10.10 | 3.72% | 1.84% | 1.96% | 0.18% | 0.06% | 106% |
| $4,646 |
|
2015(3) | $9.64 | —(8) | 0.11 | 0.11 | — | — | — | $9.75 | 1.14% | 1.87%(4) | 1.96%(4) | 0.08%(4) | (0.01)%(4) | 37% |
| $549 |
|
| 2015 | $9.85 | 0.07 | 0.06(5) | 0.13 | (0.34) | — | (0.34) | $9.64 | 1.26% | 1.95% | 1.95% | (0.27)% | (0.27)% | 114% |
| $629 |
|
| 2014 | $9.93 | 0.06 | 0.25 | 0.31 | (0.35) | (0.04) | (0.39) | $9.85 | 3.21% | 1.96% | 1.96% | 0.64% | 0.64% | 71% |
| $2,847 |
|
|
| | | | | | | | | | | | | | | | | |
| For a Share Outstanding Throughout the Years Ended October 31 (except as noted) |
| Per-Share Data | Ratios and Supplemental Data |
| | | Income From Investment Operations: | Distributions From: | | | Ratio to Average Net Assets of: | | |
| | Net Asset Value, Beginning of Period | Net Investment Income (Loss)(1) | Net Realized and Unrealized Gain (Loss) | Total From Investment Operations | Net Investment Income | Net Realized Gains | Total Distributions | Net Asset Value, End of Period | Total Return(2) | Operating Expenses | Operating Expenses (before expense waiver) | Net Investment Income (Loss) | Net Investment Income (Loss) (before expense waiver) | Portfolio Turnover Rate | Net Assets, End of Period (in thousands) |
| R Class |
| 2018 | $10.26 | 0.17 | (0.34) | (0.17) | (0.12) | (0.03) | (0.15) | $9.94 | (1.75)% | 1.34% | 1.43% | 1.76% | 1.67% | 78% |
| $97 |
|
| 2017 | $10.19 | 0.09 | 0.07 | 0.16 | (0.06) | (0.03) | (0.09) | $10.26 | 1.63% | 1.34% | 1.46% | 0.82% | 0.70% | 130% |
| $146 |
|
| 2016 | $9.80 | 0.07 | 0.35 | 0.42 | (0.03) | — | (0.03) | $10.19 | 4.28% | 1.34% | 1.46% | 0.68% | 0.56% | 106% |
| $48 |
|
2015(3) | $9.67 | 0.02 | 0.11 | 0.13 | — | — | — | $9.80 | 1.34% | 1.37%(4) | 1.46%(4) | 0.58%(4) | 0.49%(4) | 37% |
| $25 |
|
| 2015 | $9.89 | 0.12 | 0.05(5) | 0.17 | (0.39) | — | (0.39) | $9.67 | 1.67% | 1.45% | 1.45% | 0.23% | 0.23% | 114% |
| $25 |
|
| 2014 | $9.95 | 0.11 | 0.25 | 0.36 | (0.38) | (0.04) | (0.42) | $9.89 | 3.78% | 1.46% | 1.46% | 1.14% | 1.14% | 71% |
| $2,841 |
|
| R5 Class |
| 2018 | $10.39 | 0.25 | (0.36) | (0.11) | (0.19) | (0.03) | (0.22) | $10.06 | (1.13)% | 0.64% | 0.73% | 2.46% | 2.37% | 78% |
| $28,832 |
|
| 2017 | $10.31 | 0.15 | 0.10 | 0.25 | (0.14) | (0.03) | (0.17) | $10.39 | 2.43% | 0.64% | 0.76% | 1.52% | 1.40% | 130% |
| $32,206 |
|
| 2016 | $9.87 | 0.14 | 0.35 | 0.49 | (0.05) | — | (0.05) | $10.31 | 4.98% | 0.64% | 0.76% | 1.38% | 1.26% | 106% |
| $833,757 |
|
2015(3) | $9.72 | 0.04 | 0.12 | 0.16 | (0.01) | — | (0.01) | $9.87 | 1.61% | 0.67%(4) | 0.76%(4) | 1.28%(4) | 1.19%(4) | 37% |
| $720,700 |
|
| 2015 | $9.95 | 0.09 | 0.14(5) | 0.23 | (0.46) | — | (0.46) | $9.72 | 2.28% | 0.75% | 0.75% | 0.93% | 0.93% | 114% |
| $728,768 |
|
| 2014 | $9.99 | 0.18 | 0.25 | 0.43 | (0.43) | (0.04) | (0.47) | $9.95 | 4.50% | 0.76% | 0.76% | 1.84% | 1.84% | 71% |
| $8,091 |
|
|
| | | | | | | | | | | | | | | | | |
| For a Share Outstanding Throughout the Years Ended October 31 (except as noted) |
| Per-Share Data | Ratios and Supplemental Data |
| | | Income From Investment Operations: | Distributions From: | | | Ratio to Average Net Assets of: | | |
| | Net Asset Value, Beginning of Period | Net Investment Income (Loss)(1) | Net Realized and Unrealized Gain (Loss) | Total From Investment Operations | Net Investment Income | Net Realized Gains | Total Distributions | Net Asset Value, End of Period | Total Return(2) | Operating Expenses | Operating Expenses (before expense waiver) | Net Investment Income (Loss) | Net Investment Income (Loss) (before expense waiver) | Portfolio Turnover Rate | Net Assets, End of Period (in thousands) |
| R6 Class |
| 2018 | $10.39 | 0.25 | (0.36) | (0.11) | (0.19) | (0.03) | (0.22) | $10.06 | (1.08)% | 0.59% | 0.68% | 2.51% | 2.42% | 78% |
| $1,015 |
|
| 2017 | $10.32 | 0.16 | 0.08 | 0.24 | (0.14) | (0.03) | (0.17) | $10.39 | 2.38% | 0.59% | 0.71% | 1.57% | 1.45% | 130% |
| $1,489 |
|
| 2016 | $9.87 | 0.14 | 0.36 | 0.50 | (0.05) | — | (0.05) | $10.32 | 5.10% | 0.59% | 0.71% | 1.43% | 1.31% | 106% |
| $94,808 |
|
2015(3) | $9.72 | 0.04 | 0.12 | 0.16 | (0.01) | — | (0.01) | $9.87 | 1.64% | 0.62%(4) | 0.71%(4) | 1.33%(4) | 1.24%(4) | 37% |
| $56,798 |
|
| 2015 | $9.95 | 0.09 | 0.14(5) | 0.23 | (0.46) | — | (0.46) | $9.72 | 2.34% | 0.70% | 0.70% | 0.98% | 0.98% | 114% |
| $53,780 |
|
2014(9) | $10.03 | 0.17 | 0.22 | 0.39 | (0.43) | (0.04) | (0.47) | $9.95 | 4.12% | 0.71%(4) | 0.71%(4) | 1.91%(4) | 1.91%(4) | 71%(10) |
| $26 |
|
| G Class |
| 2018 | $10.41 | 0.32 | (0.37) | (0.05) | (0.20) | (0.03) | (0.23) | $10.13 | (0.49)% | 0.01% | 0.68% | 3.09% | 2.42% | 78% |
| $1,083,103 |
|
2017(11) | $10.29 | 0.06 | 0.06 | 0.12 | — | — | — | $10.41 | 1.17% | 0.01%(4) | 0.71%(4) | 2.27%(4) | 1.57%(4) | 130%(7) |
| $1,007,151 |
|
|
| | | | |
| Notes to Financial Highlights | | |
| |
| (1) | Computed using average shares outstanding throughout the period. |
| |
| (2) | Total returns are calculated based on the net asset value of the last business day and do not reflect applicable sales charges, if any. Total returns for periods less than one year are not annualized. |
| |
| (3) | July 1, 2015 through October 31, 2015. The fund's fiscal year end was changed from June 30 to October 31, resulting in a four-month annual reporting period. For the years before October 31, 2015, the fund's fiscal year end was June 30. |
| |
| (5) | Per-share amount was not in accord with the net realized and unrealized gain (loss) for the period because of the timing of transactions in shares of the fund and the amount and timing of per-share net realized and unrealized gain (loss) on such shares. |
| |
| (6) | April 10, 2017 (commencement of sale) through October 31, 2017. |
| |
| (7) | Portfolio turnover is calculated at the fund level. Percentage indicated was calculated for the year ended October 31, 2017. |
| |
| (8) | Per-share amount was less than $0.005. |
| |
| (9) | July 26, 2013 (commencement of sale) through June 30, 2014. |
| |
| (10) | Portfolio turnover is calculated at the fund level. Percentage indicated was calculated for the year ended June 30, 2014. |
| |
| (11) | July 28, 2017 (commencement of sale) through October 31, 2017. |
See Notes to Financial Statements.
|
|
| Report of Independent Registered Public Accounting Firm |
To the Board of Trustees of American Century International Bond Funds and Shareholders of Global Bond Fund:
Opinion on the Financial Statements
We have audited the accompanying statement of assets and liabilities, including the schedule of investments, of Global Bond Fund (one of the funds constituting American Century International Bond Funds, referred to hereafter as the “Fund”) as of October 31, 2018, the related statement of operations for the year ended October 31, 2018, the statement of changes in net assets for each of the two years in the period ended October 31, 2018, including the related notes, and the financial highlights for each of the periods indicated therein (collectively referred to as the “financial statements”). In our opinion, the financial statements present fairly, in all material respects, the financial position of the Fund as of October 31, 2018, the results of its operations for the year then ended, the changes in its net assets for each of the two years in the period ended October 31, 2018 and the financial highlights for each of the periods indicated therein in conformity with accounting principles generally accepted in the United States of America.
Basis for Opinion
These financial statements are the responsibility of the Fund’s management. Our responsibility is to express an opinion on the Fund’s financial statements based on our audits. We are a public accounting firm registered with the Public Company Accounting Oversight Board (United States) (“PCAOB”) and are required to be independent with respect to the Fund in accordance with the U.S. federal securities laws and the applicable rules and regulations of the Securities and Exchange Commission and the PCAOB.
We conducted our audits of these financial statements in accordance with the standards of the PCAOB. Those standards require that we plan and perform the audit to obtain reasonable assurance about whether the financial statements are free of material misstatement, whether due to error or fraud.
Our audits included performing procedures to assess the risks of material misstatement of the financial statements, whether due to error or fraud, and performing procedures that respond to those risks. Such procedures included examining, on a test basis, evidence regarding the amounts and disclosures in the financial statements. Our audits also included evaluating the accounting principles used and significant estimates made by management, as well as evaluating the overall presentation of the financial statements. Our procedures included confirmation of securities owned as of October 31, 2018 by correspondence with the custodian and brokers; when replies were not received from brokers, we performed other auditing procedures. We believe that our audits provide a reasonable basis for our opinion.
/s/ PricewaterhouseCoopers LLP
Kansas City, Missouri
December 18, 2018
We have served as the auditor of one or more investment companies in American Century Investments since 1997.
Board of Trustees
The individuals listed below serve as trustees of the funds. Each trustee will continue to serve in this capacity until death, retirement, resignation or removal from office. The board has adopted a mandatory retirement age for trustees who are not “interested persons,” as that term is defined in the Investment Company Act (independent trustees). Independent trustees shall retire on December 31 of the year in which they reach their 75th birthday; provided, however, that on or after January 1, 2022, independent trustees shall retire on December 31 of the year in which they reach their 76th birthday.
Mr. Thomas is an “interested person” because he currently serves as President and Chief Executive Officer of American Century Companies, Inc. (ACC), the parent company of American Century Investment Management, Inc. (ACIM or the advisor). The other trustees (more than three-fourths of the total number) are independent. They are not employees, directors or officers of, and have no financial interest in, ACC or any of its wholly owned, direct or indirect, subsidiaries, including ACIM, American Century Investment Services, Inc. (ACIS) and American Century Services, LLC (ACS), and they do not have any other affiliations, positions or relationships that would cause them to be considered “interested persons” under the Investment Company Act. The trustees serve in this capacity for eight (in the case of Jonathan S. Thomas, 16; and Ronald J. Gilson, 9) registered investment companies in the American Century Investments family of funds.
The following table presents additional information about the trustees. The mailing address for each trustee other than Mr. Thomas is 1665 Charleston Road, Mountain View, California 94043. The mailing address for Mr. Thomas is 4500 Main Street, Kansas City, Missouri 64111.
|
| | | | | |
Name
(Year of Birth) | Position(s) Held with Funds | Length of Time Served | Principal Occupation(s) During Past 5 Years | Number of American Century Portfolios Overseen by Trustee | Other Directorships Held During Past 5 Years |
| Independent Trustees |
|
|
Tanya S. Beder
(1955) | Trustee | Since 2011 | Chairman and CEO, SBCC Group Inc. (independent advisory services) (2006 to present) | 45 | CYS Investments, Inc.; Nabors Industries Ltd. |
Jeremy I. Bulow
(1954) | Trustee | Since 2011 | Professor of Economics, Stanford University, Graduate School of Business (1979 to present) | 45 | None |
Anne Casscells
(1958) | Trustee | Since 2016 | Co-Chief Executive Officer and Chief Investment Officer, Aetos Alternatives Management (investment advisory firm) (2001 to present); Lecturer in Accounting, Stanford University, Graduate School of Business (2009 to present) | 45 | None |
Ronald J. Gilson
(1946) | Trustee and Chairman of the Board | Since 1995
(Chairman since 2005) | Charles J. Meyers Professor of Law and Business, Emeritus, Stanford Law School (1979 to present); Marc and Eva Stern Professor of Law and Business, Columbia University School of Law (1992 to present) | 50 | None |
|
| | | | | |
Name
(Year of Birth) | Position(s) Held with Funds | Length of Time Served | Principal Occupation(s) During Past 5 Years | Number of American Century Portfolios Overseen by Trustee | Other Directorships Held During Past 5 Years |
| Independent Trustees |
|
|
Frederick L. A. Grauer
(1946) | Trustee | Since 2008 | Senior Advisor, iShares by BlackRock, Inc. (investment management firm) (2010 to 2011, 2013 to 2015); Senior Advisor, Course Hero (an educational technology company) (2015 to present) | 45 | None |
Jonathan D. Levin
(1972) | Trustee | Since 2016 | Philip H. Knight Professor and Dean, Graduate School of Business, Stanford University (2016 to present); Professor, Stanford University, (2000 to present); Chair, Department of Economics, Stanford University (2011 to 2014) | 45 | None |
Peter F. Pervere
(1947) | Trustee | Since 2007 | Retired | 45 | None |
John B. Shoven
(1947) | Trustee | Since 2002 | Charles R. Schwab Professor of Economics, Stanford University (1973 to present) | 45 | Cadence Design Systems; Exponent; Financial Engines |
| Interested Trustee |
|
|
Jonathan S. Thomas
(1963) | Trustee and President | Since 2007 | President and Chief Executive Officer, ACC (March 2007 to present). Also serves as Chief Executive Officer, ACS; Executive Vice President, ACIM; Director, ACC, ACIM and other ACC subsidiaries | 117 | BioMed Valley Discoveries, Inc. |
The Statement of Additional Information has additional information about the fund's trustees and is available without charge, upon request, by calling 1-800-345-2021.
Officers
The following table presents certain information about the executive officers of the funds. Each officer serves as an officer for 16 (in the case of Robert J. Leach, 15) investment companies in the American Century family of funds. No officer is compensated for his or her service as an officer of the funds. The listed officers are interested persons of the funds and are appointed or re-appointed on an annual basis. The mailing address for each of the officers listed below is 4500 Main Street, Kansas City, Missouri 64111.
|
| | |
Name
(Year of Birth) | Offices with the Funds | Principal Occupation(s) During the Past Five Years |
Jonathan S. Thomas
(1963) | Trustee and President since 2007 | President and Chief Executive Officer, ACC (2007 to present). Also serves as Chief Executive Officer, ACS; Executive Vice President, ACIM; Director, ACC, ACIM and other ACC subsidiaries |
R. Wes Campbell
(1974) | Chief Financial Officer and Treasurer since 2018
| Investment Operations and Investment Accounting, ACS (2000 to present)
|
Amy D. Shelton
(1964) | Chief Compliance Officer and Vice President since 2014 | Chief Compliance Officer, American Century funds, (2014 to present); Chief Compliance Officer, ACIM (2014 to present); Chief Compliance Officer, ACIS (2009 to present); Vice President, Client Interactions and Marketing, ACIS (2013 to 2014). Also serves as Vice President, ACIS |
Charles A. Etherington
(1957) | General Counsel since 2007 and Senior Vice President since 2006 | Attorney, ACC (1994 to present); Vice President, ACC (2005 to present); General Counsel, ACC (2007 to present). Also serves as General Counsel, ACIM, ACS, ACIS and other ACC subsidiaries; and Senior Vice President, ACIM and ACS |
C. Jean Wade
(1964) | Vice President since 2012 | Senior Vice President, ACS (2017 to present); Vice President ACS (2000 to 2017) |
Robert J. Leach
(1966) | Vice President since 2006 | Vice President, ACS (2000 to present) |
David H. Reinmiller
(1963) | Vice President since 2000 | Attorney, ACC (1994 to present). Also serves as Vice President, ACIM and ACS |
Ward D. Stauffer
(1960) | Secretary since 2005 | Attorney, ACC (2003 to present) |
|
|
Approval of Management Agreement
|
At a meeting held on June 19, 2018, the Fund’s Board of Trustees (the "Board") unanimously approved the renewal of the management agreement pursuant to which American Century Investment Management, Inc. (the “Advisor”) acts as the investment advisor for the Fund. Under Section 15(c) of the Investment Company Act, contracts for investment advisory services are required to be reviewed, evaluated, and approved by a majority of a fund’s directors/trustees, including a majority of the independent Trustees, each year. The Board regards this annual evaluation and renewal as one of its most important responsibilities.
The independent Trustees have memorialized a statement regarding the relationship between their ongoing obligations to oversee and evaluate the performance of the Advisor and their annual consideration of renewal of the management agreement. In that statement, the independent Trustees noted that their assessment of the Advisor’s performance is an ongoing process that takes place over the entire year and is informed by all of the extensive information that the Board and its committees receive and consider over time. This information, together with the additional materials provided specifically in connection with the review, are central to the Board’s assessment of the Advisor’s performance and its determination whether to renew the Fund’s management agreement.
Prior to its consideration of the renewal of the management agreement, the Board requested and reviewed extensive data and analysis relating to the proposed renewal. This information and analysis was compiled by the Advisor and certain independent providers of evaluation data concerning the Fund and the services provided to the Fund by the Advisor.
In connection with its consideration of the renewal of the management agreement, the Board’s review and evaluation of the services provided by the Advisor included, but was not limited to, the following:
| |
| • | the nature, extent, and quality of investment management, shareholder services, and other services provided to the Fund; |
| |
| • | the wide range of other programs and services the Advisor provides to the Fund and its shareholders on a routine and non-routine basis; |
| |
| • | the investment performance of the Fund, including data comparing the Fund’s performance to appropriate benchmarks and/or a peer group of other mutual funds with similar investment objectives and strategies; |
| |
| • | the cost of owning the Fund compared to the cost of owning similar funds; |
| |
| • | the Advisor’s compliance policies, procedures, and regulatory experience; |
| |
| • | financial data showing the cost of services provided to the Fund, the profitability of the Fund to the Advisor, and the overall profitability of the Advisor; |
| |
| • | strategic plans of the Advisor; |
| |
| • | any economies of scale associated with the Advisor’s management of the Fund and other accounts; |
| |
| • | services provided and charges to other investment management clients of the Advisor; |
| |
| • | acquired fund fees and expenses; |
| |
| • | payments and practices in connection with financial intermediaries holding shares of the Fund and the services provided by intermediaries in connection therewith; and |
| |
| • | any collateral benefits derived by the Advisor from the management of the Fund. |
In keeping with its practice, the Board held two in-person meetings to review and discuss the information provided in response to their request and held active discussions with the Advisor regarding the renewal of the management agreement. The independent Trustees had the benefit of the advice of their independent counsel throughout the process.
Factors Considered
The Trustees considered all of the information provided by the Advisor, the independent data providers, and the independent Trustees’ independent counsel in connection with the approval. They determined that the information was sufficient for them to evaluate the management agreement for the Fund. In connection with their review, the Trustees did not identify any single factor as being all-important or controlling and each Trustee may have attributed different levels of importance to different factors. In deciding to renew the management agreement, the Board based its decision on a number of factors, including the following:
Nature, Extent and Quality of Services - Generally. Under the management agreement, the Advisor is responsible for providing or arranging for all services necessary for the operation of the Fund. The Board noted that the Advisor provides or arranges at its own expense a wide variety of services including:
| |
| • | constructing and designing the Fund |
| |
| • | portfolio research and security selection |
| |
| • | initial capitalization/funding |
| |
| • | daily valuation of the Fund’s portfolio |
| |
| • | shareholder servicing and transfer agency, including shareholder confirmations, recordkeeping, and communications |
| |
| • | legal services (except the independent Trustees’ counsel) |
| |
| • | regulatory and portfolio compliance |
| |
| • | marketing and distribution (except amounts paid by the Fund under Rule 12b-1 plans) |
The Board noted that many of these services have expanded over time in terms of both quantity and complexity in response to shareholder demands, competition in the industry, changing distribution channels, and the changing regulatory environment.
Investment Management, Shareholder, and Other Services. The nature of the investment management services provided to the Fund is quite complex and allows Fund shareholders access to professional money management, instant diversification of their investments within an asset class, the opportunity to easily diversify among asset classes by investing in or exchanging among various American Century Investments funds, and liquidity. In evaluating investment performance, the Board expects the Advisor to manage the Fund in accordance with its investment objectives and approved strategies. Further, the Trustees recognize that the Advisor has an obligation to seek the best execution of fund trades. In providing these services, the Advisor utilizes teams of investment professionals (portfolio managers, analysts, research assistants, and securities traders) who require extensive information technology, research, training, compliance, and other systems to conduct their business. The Board, directly and through its Portfolio Committee, regularly reviews investment performance information for the Fund, together with comparative information for appropriate benchmarks and/or peer groups of similarly-managed funds, over different time horizons. The Trustees also review detailed performance information during the management agreement approval process. If performance concerns are identified, the Fund receives special reviews until performance improves, during which the Board discusses with the Advisor the reasons for such results (e.g., market conditions, security selection) and any efforts being undertaken to improve performance. The Fund’s performance was above its benchmark for the one-, three-, and five-year periods reviewed by the Board. The Board found the investment management services provided by the Advisor to the Fund to be satisfactory and consistent with the management agreement.
Under the management agreement, the Advisor provides the Fund with a comprehensive package of transfer agency, shareholder, and other services. The Board, directly and through various committees of the Board, regularly reviews reports and evaluations of such services at its regular meetings. These reports include, but are not limited to, information regarding the operational efficiency and accuracy of the shareholder and transfer agency services provided, staffing levels, shareholder satisfaction (as measured by external as well as internal sources), technology support, new products and services offered to Fund shareholders, securities trading activities, portfolio valuation services, auditing services, and legal and operational compliance activities. The Board found the services provided by the Advisor to the Fund under the management agreement to be competitive and of high quality.
Costs of Services and Profitability. The Advisor provides detailed information concerning its cost of providing various services to the Fund, its profitability in managing the Fund, its overall profitability, and its financial condition. The Trustees have reviewed with the Advisor the methodology used to prepare this financial information. This information is considered in evaluating the Advisor’s financial condition, its ability to continue to provide services under the management agreement, and the reasonableness of the current management fee. The Board concluded that the Advisor’s profits were reasonable in light of the services provided to the Fund.
Economies of Scale. The Board also reviewed information provided by the Advisor regarding the possible existence of economies of scale in connection with the management of the Fund. The Board concluded that economies of scale are difficult to measure and predict with precision, especially on a fund-by-fund basis. The Board concluded that the Advisor is appropriately sharing economies of scale through its competitive fee structure, offering competitive fees from fund inception, and through reinvestment in its business to provide shareholders enhanced and expanded services.
Comparison to Other Funds’ Fees. The management agreement provides that the Fund pays the Advisor a single, all-inclusive (or unified) management fee for providing all services necessary for the management and operation of the Fund, other than brokerage expenses, expenses attributable to short sales, taxes, interest, extraordinary expenses, the fees and expenses of the Fund’s independent Trustees (including their independent legal counsel), and expenses incurred in connection with the provision of shareholder services and distribution services under a plan adopted pursuant to Rule 12b-1 under the 1940 Act. Under the unified fee structure, the Advisor is responsible for providing all investment advisory, custody, audit, administrative, compliance, recordkeeping, marketing, and shareholder services, or arranging and supervising third parties to provide such services. By contrast, most other funds are charged a variety of fees, including an investment advisory fee, a transfer agency fee, an administrative fee, distribution charges, and other expenses. Other than their investment advisory fees and any applicable Rule 12b-1 distribution fees, all other components of the total fees charged by these other funds may be increased without shareholder approval. The Board believes the unified fee structure is a benefit to Fund shareholders because it clearly discloses to shareholders the cost of owning Fund shares, and, since the unified fee cannot be increased without a vote of Fund shareholders, it shifts to the Advisor the risk of increased costs of operating the Fund and provides a direct incentive to minimize administrative inefficiencies. Part of the Board’s analysis of fee levels involves reviewing certain evaluative data compiled by an independent provider and comparing the Fund’s unified fee to the total expense ratio of peer funds. The unified fee charged to shareholders of the Fund was below the median of the total expense ratios of the Fund’s peer group. The Board and the Advisor agreed to a permanent change to the fund's fee schedule that should have the effect of lowering the fund's annual unified management fee by approximately 0.12% (e.g., the Investor Class unified fee will be reduced from 0.95% to 0.83%) beginning August 1, 2018. The Board concluded that the management fee paid by the Fund to the Advisor under the management agreement is reasonable in light of the services provided to the Fund.
Comparison to Fees and Services Provided to Other Clients of the Advisor. The Board also requested and received information from the Advisor concerning the nature of the services, fees,
costs, and profitability of its advisory services to advisory clients other than the Fund. They observed that these varying types of client accounts require different services and involve different regulatory and entrepreneurial risks than the management of the Fund. The Board analyzed this information and concluded that the fees charged and services provided to the Fund were reasonable by comparison.
Payments to Intermediaries. The Trustees also requested and received a description of payments made to intermediaries by the Fund and the Advisor and services provided by intermediaries. These payments include various payments made by the Fund or the Advisor to different types of intermediaries and recordkeepers for distribution and service activities provided for the Fund. The Trustees reviewed such information and received representations from the Advisor that all such payments by the Fund were made pursuant to the Fund’s Rule 12b-1 Plan and that all such payments by the Advisor were made from the Advisor’s resources and reasonable profits. The Board found such payments to be reasonable in scope and purpose.
Collateral or “Fall-Out” Benefits Derived by the Advisor. The Board considered the existence of collateral benefits the Advisor may receive as a result of its relationship with the Fund. The Board noted that the Advisor’s primary business is managing mutual funds and it generally does not use fund or shareholder information to generate profits in other lines of business, and therefore does not derive any significant collateral benefits from them. The Board noted that the Advisor may receive proprietary research from broker-dealers that execute fund portfolio transactions. The Board also determined that the Advisor is able to provide investment management services to certain clients other than the Fund, at least in part, due to its existing infrastructure built to serve the fund complex.
Existing Relationship. The Board also considered whether there was any reason for not continuing the existing arrangement with the Advisor. In this regard, the Board was mindful of the potential disruptions of the Fund’s operations and various risks, uncertainties, and other effects that could occur as a result of a decision not to continue such relationship. In particular, the Board recognized that most shareholders have invested in the Fund on the strength of the Advisor’s industry standing and reputation and in the expectation that the Advisor will have a continuing role in providing advisory services to the Fund.
Conclusion of the Trustees. As a result of this process, the Board, including all of the independent Trustees and assisted by the advice of independent legal counsel, taking into account all of the factors discussed above and the information provided by the Advisor and others in connection with its review and throughout the year, concluded that the management agreement between the Fund and the Advisor is fair and reasonable in light of the services provided and should be renewed.
Retirement Account Information
As required by law, distributions you receive from certain retirement accounts are subject to federal income tax withholding, unless you elect not to have withholding apply*. Tax will be withheld on the total amount withdrawn even though you may be receiving amounts that are not subject to withholding, such as nondeductible contributions. In such case, excess amounts of withholding could occur. You may adjust your withholding election so that a greater or lesser amount will be withheld.
If you don’t want us to withhold on this amount, you must notify us to not withhold the federal income tax. You may notify us in writing or in certain situations by telephone or through other electronic means. For systematic withdrawals, your withholding election will remain in effect until revoked or changed by filing a new election. You have the right to revoke your election at any time and change your withholding percentage for future distributions.
Remember, even if you elect not to have income tax withheld, you are liable for paying income tax on the taxable portion of your withdrawal. If you elect not to have income tax withheld or you don’t have enough income tax withheld, you may be responsible for payment of estimated tax. You may incur penalties under the estimated tax rules if your withholding and estimated tax payments are not sufficient. You can reduce or defer the income tax on a distribution by directly or indirectly rolling such distribution over to another IRA or eligible plan. You should consult your tax advisor for additional information.
State tax will be withheld if, at the time of your distribution, your address is within one of the mandatory withholding states and you have federal income tax withheld (or as otherwise required by state law). State taxes will be withheld from your distribution in accordance with the respective state rules.
*Some 403(b), 457 and qualified retirement plan distributions may be subject to 20% mandatory withholding, as they are subject to special tax and withholding rules. Your plan administrator or plan sponsor is required to provide you with a special tax notice explaining those rules at the time you request a distribution. If applicable, federal and/or state taxes may be withheld from your distribution amount.
Proxy Voting Policies
Descriptions of the principles and policies that the fund's investment advisor uses in exercising the voting rights associated with the securities purchased and/or held by the fund are available without charge, upon request, by calling 1-800-345-2021 or visiting the "About Us" page of American Century Investments’ website at americancentury.com. A description of the policies is also available on the Securities and Exchange Commission’s website at sec.gov. Information regarding how the investment advisor voted proxies relating to portfolio securities during the most recent 12-month period ended June 30 is available on the "About Us" page at americancentury.com. It is also available at sec.gov.
Quarterly Portfolio Disclosure
The fund files its complete schedule of portfolio holdings with the Securities and Exchange Commission (SEC) for the first and third quarters of each fiscal year on Form N-Q. The fund’s Forms N-Q are available on the SEC’s website at sec.gov. The fund also makes its complete schedule of portfolio holdings for the most recent quarter of its fiscal year available on its website at americancentury.com and, upon request, by calling 1-800-345-2021.
Other Tax Information
The following information is provided pursuant to provisions of the Internal Revenue Code.
The fund hereby designates $3,675,091 as qualified short-term capital gain distributions for purposes of Internal Revenue Code Section 871 for the fiscal year ended October 31, 2018.
The fund hereby designates $257,980, or up to the maximum amount allowable, as long-term capital gain distributions (20% rate gain distributions) for the fiscal year ended October 31, 2018.
|
| | |
| |
| | | |
| Contact Us | americancentury.com | |
| Automated Information Line | 1-800-345-8765 | |
| Investor Services Representative | 1-800-345-2021
or 816-531-5575 | |
| Investors Using Advisors | 1-800-378-9878 | |
Business, Not-For-Profit, Employer-Sponsored
Retirement Plans | 1-800-345-3533 | |
Banks and Trust Companies, Broker-Dealers,
Financial Professionals, Insurance Companies | 1-800-345-6488 | |
| Telecommunications Relay Service for the Deaf | 711 | |
| | | |
| American Century International Bond Funds | |
| | | |
Investment Advisor: American Century Investment Management, Inc. Kansas City, Missouri | |
| | | |
| This report and the statements it contains are submitted for the general information of our shareholders. The report is not authorized for distribution to prospective investors unless preceded or accompanied by an effective prospectus. | |
| | | |
©2018 American Century Proprietary Holdings, Inc. All rights reserved.
CL-ANN-90984 1812 | |
|
| |
| | |
| | Annual Report |
| | |
| | October 31, 2018 |
| | |
| | International Bond Fund |
| | Investor Class (BEGBX) |
| | I Class (AIBHX) |
| | Y Class (AIBYX) |
| | A Class (AIBDX) |
| | C Class (AIQCX) |
| | R Class (AIBRX) |
| | R5 Class (AIDIX) |
| | R6 Class (AIDDX) |
| | G Class (AIBGX) |
|
| | |
| President’s Letter | 2 |
|
| Performance | 3 |
|
| Portfolio Commentary | |
|
| Fund Characteristics | |
|
| Shareholder Fee Example | |
|
| Schedule of Investments | |
|
| Statement of Assets and Liabilities | |
|
| Statement of Operations | |
|
| Statement of Changes in Net Assets | |
|
| Notes to Financial Statements | |
|
| Financial Highlights | |
|
| Report of Independent Registered Public Accounting Firm | |
|
| Management | |
|
| Approval of Management Agreement | |
|
| Additional Information | |
|
Any opinions expressed in this report reflect those of the author as of the date of the report, and do not necessarily represent the opinions of American Century Investments® or any other person in the American Century Investments organization. Any such opinions are subject to change at any time based upon market or other conditions and American Century Investments disclaims any responsibility to update such opinions. These opinions may not be relied upon as investment advice and, because investment decisions made by American Century Investments funds are based on numerous factors, may not be relied upon as an indication of trading intent on behalf of any American Century Investments fund. Security examples are used for representational purposes only and are not intended as recommendations to purchase or sell securities. Performance information for comparative indices and securities is provided to American Century Investments by third party vendors. To the best of American Century Investments’ knowledge, such information is accurate at the time of printing.
Jonathan Thomas
Dear Investor:
Thank you for reviewing this annual report for the 12 months ended October 31, 2018. Annual reports help convey important information about fund returns, including market factors that affected performance during the reporting period. For additional investment and market insights, we encourage you to visit our website, americancentury.com.
Rising Rates, Heightened Volatility Challenge Investors
U.S. stocks generally delivered gains for the period, but returns were considerably weaker than the robust, double-digit results of the previous fiscal year. Early on, a backdrop of robust corporate earnings results, improving global economic growth, and growth-oriented U.S. tax reform helped drive stock prices higher. The S&P 500 Index returned more than 10% just in the first three months of the reporting period.
Investor sentiment shifted dramatically in early February, as volatility resurfaced after an extended period of relative dormancy. Better-than-expected U.S. economic data triggered expectations for rising inflation, higher interest rates, and a more-hawkish Federal Reserve (Fed). In response, U.S. Treasury yields soared, and stock prices plunged. Although this bout of market unrest quickly subsided, volatility remained a formidable force throughout the rest of the period. Stocks remained resilient, though, and the S&P 500 Index advanced 7.35% for the 12-month period. Growth stocks outpaced value stocks, and large-cap stocks outperformed small-cap stocks. Meanwhile, rising U.S. Treasury yields and Fed rate hikes weighed on interest-rate sensitive assets, including investment-grade bonds and real estate investment trusts.
Outside the U.S., economic growth moderated as the period unfolded, and global bond yields were flat to modestly higher. The U.S. dollar continued to gain ground versus other currencies, which drove down non-U.S. bond returns for unhedged investors. The strong dollar, combined with rising U.S. interest rates, geopolitical tensions, and fiscal challenges in several developing countries, led to negative results for emerging markets bonds.
With global economic growth diverging, Treasury yields rising, and volatility lingering, investors likely will face opportunities and challenges in the months ahead. We believe this scenario underscores the importance of using professionally managed portfolios in pursuit of investment goals. We appreciate your continued trust and confidence in us.
Sincerely,
Jonathan Thomas
President and Chief Executive Officer
American Century Investments
|
| | | | | | |
| Total Returns as of October 31, 2018 |
| | | | Average Annual Returns | |
| | Ticker Symbol | 1 year | 5 years | 10 years | Since Inception | Inception Date |
| Investor Class | BEGBX | -3.98% | -1.55% | 1.52% | — | 1/7/92 |
| Bloomberg Barclays Global Aggregate Bond Index ex-USD (Unhedged) | — | -2.09% | -0.82% | 2.52% | — | — |
| I Class | AIBHX | -3.90% | — | — | 0.90% | 4/10/17 |
| Y Class | AIBYX | -3.81% | — | — | 1.06% | 4/10/17 |
| A Class | AIBDX | | | | | 10/27/98 |
| No sales charge | | -4.18% | -1.79% | 1.27% | — | |
| With sales charge | | -8.46% | -2.69% | 0.80% | — | |
| C Class | AIQCX | -4.92% | -2.54% | 0.51% | — | 9/28/07 |
| R Class | AIBRX | -4.44% | -2.03% | 1.02% | — | 9/28/07 |
| R5 Class | AIDIX | -3.82% | -1.36% | 1.71% | — | 8/2/04 |
| R6 Class | AIDDX | -3.74% | -1.32% | — | -0.79% | 7/26/13 |
| G Class | AIBGX | -3.19% | — | — | -3.13% | 7/28/17 |
Average annual returns since inception are presented when ten years of performance history is not available.
G Class returns would have been lower if a portion of the fees had not been waived.
Sales charges include initial sales charges and contingent deferred sales charges (CDSCs), as applicable. A Class shares have a 4.50% maximum initial sales charge and may be subject to a maximum CDSC of 1.00%. C Class shares redeemed within 12 months of purchase are subject to a maximum CDSC of 1.00%. The SEC requires that mutual funds provide performance information net of maximum sales charges in all cases where charges could be applied.
Data presented reflect past performance. Past performance is no guarantee of future results. Current performance may be higher or lower than the performance shown. Total returns for periods less than one year are not annualized. Investment return and principal value will fluctuate, and redemption value may be more or less than original cost. Data assumes reinvestment of dividends and capital gains, and none of the charts reflect the deduction of taxes that a shareholder would pay on fund distributions or the redemption of fund shares. To obtain performance data current to the most recent month end, please call 1-800-345-2021 or visit americancentury.com. For additional information about the fund, please consult the prospectus.
|
|
| Growth of $10,000 Over 10 Years |
| $10,000 investment made October 31, 2008 |
| Performance for other share classes will vary due to differences in fee structure. |
|
| |
| Value on October 31, 2018 |
| | Investor Class — $11,630 |
| |
| | Bloomberg Barclays Global Aggregate Bond Index ex-USD (Unhedged) — $12,830 |
| |
|
| | | | | | | | |
| Total Annual Fund Operating Expenses | | | | |
| Investor Class | I Class | Y Class | A Class | C Class | R Class | R5 Class | R6 Class | G Class |
| 0.80% | 0.70% | 0.60% | 1.05% | 1.80% | 1.30% | 0.60% | 0.55% | 0.55% |
The total annual fund operating expenses shown is as stated in the fund’s prospectus current as of the date of this report. The prospectus may vary from the expense ratio shown elsewhere in this report because it is based on a different time period, includes acquired fund fees and expenses, and, if applicable, does not include fee waivers or expense reimbursements.
Data presented reflect past performance. Past performance is no guarantee of future results. Current performance may be higher or lower than the performance shown. Total returns for periods less than one year are not annualized. Investment return and principal value will fluctuate, and redemption value may be more or less than original cost. Data assumes reinvestment of dividends and capital gains, and none of the charts reflect the deduction of taxes that a shareholder would pay on fund distributions or the redemption of fund shares. To obtain performance data current to the most recent month end, please call 1-800-345-2021 or visit americancentury.com. For additional information about the fund, please consult the prospectus.
Portfolio Managers: John Lovito, Brian Howell, Simon Chester, and Abdelak Adjriou
Performance Summary
International Bond declined -3.98%* for the fiscal year ended October 31, 2018. By comparison, the Bloomberg Barclays Global Aggregate Bond Index ex-USD (Unhedged) returned -2.09% over the same time period. Portfolio returns reflect operating expenses, while index returns do not.
Market Review
Volatility characterized global bond markets over the reporting period. The economic backdrop was generally positive, though the gap between stronger U.S. growth and slower growth in other developed markets grew more pronounced. U.S. momentum surged after a domestic tax cut at the end of 2017, while growth in other developed markets softened incrementally in the second and third calendar quarters of 2018. The Federal Reserve hiked U.S. rates four times over the period, and U.S. Treasury yields increased across all maturities. Of note, the 10-year U.S. Treasury yield topped 3% for the first time in several years. Elsewhere, the Bank of England enacted two rate hikes, while the European Central Bank (ECB) and Bank of Japan held target rates steady. The ECB began tapering its monthly bond purchases, aiming to end the program by December 2018. Inflation edged modestly higher across developed markets, ending the period at or near central bank targets.
Meanwhile, U.S. dollar strength, global trade tensions, and softening growth in China drove higher volatility in emerging markets. The countries most reliant on external funding came under distress, notably Argentina and Turkey, which helped drive the entire asset class lower. Both countries made progress late in the period, with Argentina securing a financing package from the International Monetary Fund and Turkish assets rallying after central bankers finally enacted a steep rate hike.
In this environment, non-U.S. bonds declined on an unhedged basis, as the U.S. dollar’s strength weighed on non-U.S. bond returns. U.S. bonds also generally declined.
Currency Exposure and Duration Positioning Weighed on Performance
Within the portfolio, currency exposure was a key detractor, primarily due to hedging costs associated with the fund’s out-of-index emerging markets positions in the Mexican peso and South African rand. The higher U.S. dollar drove weakness in other currency positions.
Yield curve positioning in the U.S. and Europe also detracted from relative results. Interest rates were volatile over the reporting period, but broadly speaking, rates rose in the U.S. and remained flat in Europe.
Security selection also detracted from portfolio performance. In particular, selections among European sovereigns, primarily in Italy, weighed on results.
*All fund returns referenced in this commentary are for Investor Class shares. Performance for other share classes will vary due to differences in fee structure; when Investor Class performance exceeds that of the fund's market index, other share classes may not. See page 3 for returns for all share classes.
Country Positioning and Sector Allocation Added Value
The portfolio’s allocation by region contributed to performance, led by exposure to euro-
denominated local issues.
Our sector allocations also contributed. Out-of-index high-yield positions in the U.S. were especially positive, as the sector was one of the few broad fixed-income categories to post positive returns over the reporting period. U.S. corporate earnings were robust, which helped drive gains in the high-yield sector. Our allocation to hard currency emerging markets debt, another out-of-index position, also added to returns, but security selection mitigated the positive allocation effects.
Although security selection was a detractor overall, our choices among out-of-index non-agency collateralized mortgage obligations and commercial mortgage-backed securities in the U.S. aided portfolio performance.
Positioning for the Future
We expect U.S. Treasury yields to gradually climb higher. In Europe and the U.K., we expect a slow normalization of yields as central banks remove stimulus and/or gradually raise rates. In Japan, continued aggressive central bank stimulus still supports low yields. Accordingly, we plan to maintain a neutral to short position in U.S. Treasuries and a short position in European government bonds. We favor long exposure in emerging markets local sovereign rates, given our expectations for rates to decline in select markets.
We continue to favor out-of-index positions in U.S. securitized bonds, including floating-rate securities that should benefit as interest rates rise, and corporate credit. We also will continue to seek value from other out-of-index positions, including high-yield corporates, emerging markets bonds, and select currencies.
|
| |
| OCTOBER 31, 2018 |
| Portfolio at a Glance | |
| Average Duration (effective) | 7.1 years |
| Weighted Average Life to Maturity | 11.1 years |
| | |
| Bond Holdings by Country | % of net assets |
| Japan | 18.1% |
| United States | 17.8% |
| United Kingdom | 7.7% |
| Canada | 7.6% |
| Italy | 6.8% |
| France | 4.2% |
| Cayman Islands | 3.6% |
| Netherlands | 3.3% |
| South Africa | 3.0% |
| Germany | 2.8% |
| Other Countries | 23.3% |
| Cash and Equivalents* | 1.8% |
* Includes temporary cash investments and other assets and liabilities.
| |
| | |
| Types of Investments in Portfolio | % of net assets |
| Sovereign Governments and Agencies | 60.3% |
| Corporate Bonds | 25.9% |
| Asset-Backed Securities | 3.9% |
| Collateralized Loan Obligations | 2.8% |
| Bank Loan Obligations | 2.2% |
| Collateralized Mortgage Obligations | 1.8% |
| Commercial Mortgage-Backed Securities | 1.3% |
| Temporary Cash Investments | 0.8% |
| Other Assets and Liabilities | 1.0% |
Fund shareholders may incur two types of costs: (1) transaction costs, including sales charges (loads) on purchase payments and redemption/exchange fees; and (2) ongoing costs, including management fees; distribution and service (12b-1) fees; and other fund expenses. This example is intended to help you understand your ongoing costs (in dollars) of investing in your fund and to compare these costs with the ongoing cost of investing in other mutual funds.
The example is based on an investment of $1,000 made at the beginning of the period and held for the entire period from May 1, 2018 to October 31, 2018.
Actual Expenses
The table provides information about actual account values and actual expenses for each class. You may use the information, together with the amount you invested, to estimate the expenses that you paid over the period. First, identify the share class you own. Then simply divide your account value by $1,000 (for example, an $8,600 account value divided by $1,000 = 8.6), then multiply the result by the number under the heading “Expenses Paid During Period” to estimate the expenses you paid on your account during this period.
If you hold Investor Class shares of any American Century Investments fund, or I Class shares of the American Century Diversified Bond Fund, in an American Century Investments account (i.e., not a financial intermediary or retirement plan account), American Century Investments may charge you a $12.50 semiannual account maintenance fee if the value of those shares is less than $10,000. We will redeem shares automatically in one of your accounts to pay the $12.50 fee. In determining your total eligible investment amount, we will include your investments in all personal accounts (including American Century Investments Brokerage accounts) registered under your Social Security number. Personal accounts include individual accounts, joint accounts, UGMA/UTMA accounts, personal trusts, Coverdell Education Savings Accounts and IRAs (including traditional, Roth, Rollover, SEP-, SARSEP- and SIMPLE-IRAs), and certain other retirement accounts. If you have only business, business retirement, employer-sponsored or American Century Investments Brokerage accounts, you are currently not subject to this fee. If you are subject to the Account Maintenance Fee, your account value could be reduced by the fee amount.
Hypothetical Example for Comparison Purposes
The table also provides information about hypothetical account values and hypothetical expenses based on the actual expense ratio of each class of your fund and an assumed rate of return of 5% per year before expenses, which is not the actual return of a fund’s share class. The hypothetical account values and expenses may not be used to estimate the actual ending account balance or expenses you paid for the period. You may use this information to compare the ongoing costs of investing in your fund and other funds. To do so, compare this 5% hypothetical example with the 5% hypothetical examples that appear in the shareholder reports of the other funds.
Please note that the expenses shown in the table are meant to highlight your ongoing costs only and do not reflect any transactional costs, such as sales charges (loads) or redemption/exchange fees. Therefore, the table is useful in comparing ongoing costs only, and will not help you determine the relative total costs of owning different funds. In addition, if these transactional costs were included, your costs would have been higher.
|
| | | | |
| | Beginning
Account Value
5/1/18 | Ending
Account Value
10/31/18 | Expenses Paid
During Period(1)
5/1/18 - 10/31/18 |
Annualized
Expense Ratio(1) |
| Actual | | | | |
| Investor Class | $1,000 | $932.30 | $3.90 | 0.80% |
| I Class | $1,000 | $932.50 | $3.41 | 0.70% |
| Y Class | $1,000 | $933.40 | $2.92 | 0.60% |
| A Class | $1,000 | $931.60 | $5.11 | 1.05% |
| C Class | $1,000 | $927.30 | $8.74 | 1.80% |
| R Class | $1,000 | $930.30 | $6.33 | 1.30% |
| R5 Class | $1,000 | $932.60 | $2.92 | 0.60% |
| R6 Class | $1,000 | $933.40 | $2.68 | 0.55% |
| G Class | $1,000 | $935.90 | $0.05 | 0.01% |
| Hypothetical | | | | |
| Investor Class | $1,000 | $1,021.17 | $4.08 | 0.80% |
| I Class | $1,000 | $1,021.68 | $3.57 | 0.70% |
| Y Class | $1,000 | $1,022.18 | $3.06 | 0.60% |
| A Class | $1,000 | $1,019.91 | $5.35 | 1.05% |
| C Class | $1,000 | $1,016.13 | $9.15 | 1.80% |
| R Class | $1,000 | $1,018.65 | $6.61 | 1.30% |
| R5 Class | $1,000 | $1,022.18 | $3.06 | 0.60% |
| R6 Class | $1,000 | $1,022.43 | $2.80 | 0.55% |
| G Class | $1,000 | $1,025.16 | $0.05 | 0.01% |
| |
| (1) | Expenses are equal to the class's annualized expense ratio listed in the table above, multiplied by the average account value over the period, multiplied by 184, the number of days in the most recent fiscal half-year, divided by 365, to reflect the one-half year period. Annualized expense ratio reflects actual expenses, including any applicable fee waivers or expense reimbursements and excluding any acquired fund fees and expenses. |
OCTOBER 31, 2018
|
| | | | | | | |
| | | Principal Amount | Value |
| SOVEREIGN GOVERNMENTS AND AGENCIES — 60.3% | | | |
| Argentina — 0.1% | | | |
| Argentine Republic Government International Bond, 6.875%, 1/26/27 | | $ | 700,000 |
| $ | 587,737 |
|
| Australia — 2.3% | | | |
| Australia Government Bond, 2.75%, 4/21/24 | AUD | 17,772,000 |
| 12,876,693 |
|
| New South Wales Treasury Corp., 3.00%, 3/20/28 | AUD | 3,250,000 |
| 2,301,957 |
|
| | | | 15,178,650 |
|
| Austria — 1.2% | | | |
Republic of Austria Government Bond, 3.40%, 11/22/22(1) | EUR | 2,350,000 |
| 3,058,206 |
|
Republic of Austria Government Bond, 0.75%, 10/20/26(1) | EUR | 2,387,000 |
| 2,777,270 |
|
Republic of Austria Government Bond, 4.15%, 3/15/37(1) | EUR | 1,400,000 |
| 2,384,008 |
|
| | | | 8,219,484 |
|
| Belgium — 0.4% | | | |
Kingdom of Belgium Government Bond, 4.25%, 3/28/41(1) | EUR | 512,000 |
| 879,332 |
|
Kingdom of Belgium Government Bond, 1.60%, 6/22/47(1) | EUR | 1,800,000 |
| 1,983,722 |
|
| | | | 2,863,054 |
|
| Brazil — 0.1% | | | |
| Brazilian Government International Bond, 5.625%, 1/7/41 | | $ | 400,000 |
| 369,700 |
|
| Canada — 7.3% | | | |
| Canadian Government Bond, 1.00%, 9/1/22 | CAD | 24,528,000 |
| 17,676,109 |
|
| Canadian Government Bond, 4.00%, 6/1/41 | CAD | 5,066,000 |
| 4,807,669 |
|
| Province of British Columbia Canada, 3.25%, 12/18/21 | CAD | 1,009,000 |
| 780,780 |
|
| Province of British Columbia Canada, 2.85%, 6/18/25 | CAD | 11,071,000 |
| 8,379,547 |
|
| Province of Ontario Canada, MTN, 1.65%, 6/8/20 | JPY | 100,000,000 |
| 909,625 |
|
| Province of Quebec Canada, 3.00%, 9/1/23 | CAD | 10,086,000 |
| 7,716,907 |
|
| Province of Quebec Canada, 5.75%, 12/1/36 | CAD | 6,140,000 |
| 6,201,985 |
|
| Province of Quebec Canada, 5.00%, 12/1/41 | CAD | 800,000 |
| 771,791 |
|
| Province of Quebec Canada, 3.50%, 12/1/48 | CAD | 720,000 |
| 566,877 |
|
| | | | 47,811,290 |
|
| Colombia — 0.1% | | | |
| Colombia Government International Bond, 7.375%, 9/18/37 | | $ | 300,000 |
| 363,375 |
|
| Czech Republic — 0.3% | | | |
| Czech Republic Government Bond, 4.70%, 9/12/22 | CZK | 37,500,000 |
| 1,819,895 |
|
| Denmark — 0.3% | | | |
| Denmark Government Bond, 0.50%, 11/15/27 | DKK | 5,887,000 |
| 907,389 |
|
| Denmark Government Bond, 4.50%, 11/15/39 | DKK | 4,500,000 |
| 1,172,361 |
|
| | | | 2,079,750 |
|
| Dominican Republic — 0.4% | | | |
| Dominican Republic International Bond, 6.875%, 1/29/26 | | $ | 1,000,000 |
| 1,052,500 |
|
Dominican Republic International Bond, 5.95%, 1/25/27(1) | | $ | 800,000 |
| 799,000 |
|
| Dominican Republic International Bond, 5.95%, 1/25/27 | | $ | 600,000 |
| 599,250 |
|
| | | | 2,450,750 |
|
|
| | | | | | | |
| | | Principal Amount | Value |
| Egypt — 0.1% | | | |
Egypt Government International Bond, 7.50%, 1/31/27(1) | | $ | 400,000 |
| $ | 392,110 |
|
| Finland — 0.6% | | | |
Finland Government Bond, 4.00%, 7/4/25(1) | EUR | 2,727,000 |
| 3,862,034 |
|
| France — 2.0% | | | |
| French Republic Government Bond OAT, 3.25%, 10/25/21 | EUR | 2,060,000 |
| 2,586,745 |
|
| French Republic Government Bond OAT, 1.75%, 11/25/24 | EUR | 2,006,237 |
| 2,490,612 |
|
| French Republic Government Bond OAT, 5.50%, 4/25/29 | EUR | 157,000 |
| 263,409 |
|
| French Republic Government Bond OAT, 3.25%, 5/25/45 | EUR | 4,999,000 |
| 7,798,210 |
|
| | | | 13,138,976 |
|
| Germany — 1.0% | | | |
| Bundesrepublik Deutschland Bundesanleihe, 4.75%, 7/4/40 | EUR | 395,000 |
| 794,789 |
|
| Bundesrepublik Deutschland Bundesanleihe, 2.50%, 7/4/44 | EUR | 3,830,000 |
| 5,858,421 |
|
| | | | 6,653,210 |
|
| Hungary — 2.0% | | | |
| Hungary Government Bond, 6.75%, 10/22/28 | HUF | 2,949,000,000 |
| 12,849,261 |
|
| Ireland — 0.7% | | | |
| Ireland Government Bond, 3.40%, 3/18/24 | EUR | 3,719,000 |
| 4,924,880 |
|
| Italy — 4.9% | | | |
| Italy Buoni Poliennali Del Tesoro, 1.50%, 6/1/25 | EUR | 7,255,000 |
| 7,501,053 |
|
| Italy Buoni Poliennali Del Tesoro, 2.00%, 12/1/25 | EUR | 11,084,000 |
| 11,725,901 |
|
Italy Buoni Poliennali Del Tesoro, 4.75%, 9/1/44(1) | EUR | 7,420,000 |
| 9,394,423 |
|
Italy Buoni Poliennali Del Tesoro, 3.45%, 3/1/48(1) | EUR | 3,617,000 |
| 3,757,618 |
|
| | | | 32,378,995 |
|
| Japan — 18.1% | | | |
| Japan Government Ten Year Bond, 0.80%, 6/20/23 | JPY | 991,350,000 |
| 9,148,210 |
|
| Japan Government Thirty Year Bond, 2.40%, 3/20/37 | JPY | 2,361,650,000 |
| 27,559,420 |
|
| Japan Government Thirty Year Bond, 2.00%, 9/20/41 | JPY | 3,029,300,000 |
| 33,955,490 |
|
| Japan Government Thirty Year Bond, 0.80%, 3/20/48 | JPY | 350,000,000 |
| 3,052,217 |
|
| Japan Government Twenty Year Bond, 2.10%, 12/20/26 | JPY | 4,366,950,000 |
| 45,194,749 |
|
| | | | 118,910,086 |
|
| Jordan — 0.2% | | | |
Jordan Government International Bond, 7.375%, 10/10/47(1) | | $ | 1,500,000 |
| 1,362,285 |
|
| Malaysia — 0.4% | | | |
| Malaysia Government Bond, 3.96%, 9/15/25 | MYR | 12,150,000 |
| 2,881,305 |
|
| Mexico — 2.6% | | | |
| Mexican Bonos, 6.50%, 6/9/22 | MXN | 99,250,000 |
| 4,566,431 |
|
| Mexican Bonos, 8.00%, 12/7/23 | MXN | 105,000,000 |
| 5,028,235 |
|
| Mexican Bonos, 10.00%, 11/20/36 | MXN | 14,890,000 |
| 800,735 |
|
| Mexico Government International Bond, 4.125%, 1/21/26 | | $ | 200,000 |
| 193,315 |
|
| Mexico Government International Bond, 4.15%, 3/28/27 | | $ | 2,800,000 |
| 2,669,450 |
|
| Nacional Financiera SNC, MTN, 0.78%, 3/29/22 | JPY | 400,000,000 |
| 3,567,904 |
|
| | | | 16,826,070 |
|
| Netherlands — 1.4% | | | |
Netherlands Government Bond, 0.50%, 7/15/26(1) | EUR | 6,728,000 |
| 7,755,156 |
|
Netherlands Government Bond, 2.75%, 1/15/47(1) | EUR | 836,000 |
| 1,336,342 |
|
| | | | 9,091,498 |
|
|
| | | | | | | |
| | | Principal Amount | Value |
| Norway — 0.5% | | | |
Norway Government Bond, 2.00%, 5/24/23(1) | NOK | 6,400,000 |
| $ | 774,825 |
|
Norway Government Bond, 1.75%, 2/17/27(1) | NOK | 22,200,000 |
| 2,609,286 |
|
| | | | 3,384,111 |
|
| Peru — 1.6% | | | |
Peru Government Bond, 6.15%, 8/12/32(1) | PEN | 36,430,000 |
| 10,792,183 |
|
| Poland — 0.4% | | | |
| Republic of Poland Government Bond, 4.00%, 10/25/23 | PLN | 10,430,000 |
| 2,913,099 |
|
| Russia — 0.4% | | | |
| Russian Federal Bond - OFZ, 7.05%, 1/19/28 | RUB | 70,300,000 |
| 975,420 |
|
| Russian Foreign Bond - Eurobond, 12.75%, 6/24/28 | | $ | 900,000 |
| 1,427,589 |
|
| | | | 2,403,009 |
|
| Singapore — 0.5% | | | |
| Singapore Government Bond, 3.125%, 9/1/22 | SGD | 4,225,000 |
| 3,151,798 |
|
| South Africa — 3.0% | | | |
| Republic of South Africa Government Bond, 7.75%, 2/28/23 | ZAR | 107,000,000 |
| 7,021,144 |
|
| Republic of South Africa Government Bond, 10.50%, 12/21/26 | ZAR | 114,600,000 |
| 8,252,451 |
|
| Republic of South Africa Government Bond, 8.00%, 1/31/30 | ZAR | 73,000,000 |
| 4,351,364 |
|
| | | | 19,624,959 |
|
| Spain — 1.6% | | | |
Spain Government Bond, 4.40%, 10/31/23(1) | EUR | 2,090,000 |
| 2,807,813 |
|
Spain Government Bond, 1.60%, 4/30/25(1) | EUR | 4,192,000 |
| 4,951,041 |
|
Spain Government Bond, 5.15%, 10/31/28(1) | EUR | 1,268,000 |
| 1,912,363 |
|
Spain Government Bond, 5.15%, 10/31/44(1) | EUR | 354,000 |
| 600,960 |
|
| | | | 10,272,177 |
|
| Switzerland — 0.9% | | | |
| Swiss Confederation Government Bond, 1.25%, 5/28/26 | CHF | 2,908,000 |
| 3,198,468 |
|
| Swiss Confederation Government Bond, 2.50%, 3/8/36 | CHF | 1,965,000 |
| 2,634,959 |
|
| | | | 5,833,427 |
|
| Thailand — 1.0% | | | |
| Thailand Government Bond, 3.625%, 6/16/23 | THB | 50,000,000 |
| 1,590,780 |
|
| Thailand Government Bond, 3.85%, 12/12/25 | THB | 152,200,000 |
| 4,954,980 |
|
| | | | 6,545,760 |
|
| Tunisia — 0.1% | | | |
| Banque Centrale de Tunisie International Bond, 5.75%, 1/30/25 | | $ | 1,200,000 |
| 1,022,261 |
|
| United Kingdom — 3.8% | | | |
| United Kingdom Gilt, 1.50%, 7/22/26 | GBP | 924,000 |
| 1,204,292 |
|
| United Kingdom Gilt, 4.50%, 12/7/42 | GBP | 7,267,000 |
| 14,058,503 |
|
| United Kingdom Gilt, 4.25%, 12/7/49 | GBP | 1,672,000 |
| 3,343,983 |
|
| United Kingdom Gilt, 4.25%, 12/7/55 | GBP | 2,958,000 |
| 6,264,812 |
|
| | | | 24,871,590 |
|
TOTAL SOVEREIGN GOVERNMENTS AND AGENCIES
(Cost $404,847,706) | | | 395,828,769 |
|
| CORPORATE BONDS — 25.9% | | | |
| Belgium — 0.1% | | | |
| Anheuser-Busch InBev SA, MTN, 1.50%, 3/17/25 | EUR | 800,000 |
| 928,278 |
|
|
| | | | | | | |
| | | Principal Amount | Value |
| Brazil — 0.2% | | | |
| Globo Comunicacao e Participacoes SA, 4.84%, 6/8/25 | | $ | 1,300,000 |
| $ | 1,231,750 |
|
| Canada — 0.3% | | | |
1011778 BC ULC / New Red Finance, Inc., 4.625%, 1/15/22(1) | | 1,250,000 |
| 1,242,031 |
|
NOVA Chemicals Corp., 4.875%, 6/1/24(1) | | 730,000 |
| 673,425 |
|
| | | | 1,915,456 |
|
| Cayman Islands — 0.5% | | | |
Braskem Finance Ltd., 5.75%, 4/15/21(1) | | 800,000 |
| 823,008 |
|
CK Hutchison International 17 II Ltd., 2.25%, 9/29/20(1) | | 2,370,000 |
| 2,312,233 |
|
| | | | 3,135,241 |
|
| France — 2.2% | | | |
AXA SA, MTN, VRN, 6.69%, 7/6/26(2) | GBP | 1,200,000 |
| 1,716,700 |
|
AXA SA, MTN, VRN, 3.375%, 7/6/27(2) | EUR | 600,000 |
| 691,614 |
|
BNP Paribas Cardif SA, VRN, 4.03%, 11/25/25(2) | EUR | 800,000 |
| 938,218 |
|
| Carrefour SA, MTN, 0.75%, 4/26/24 | EUR | 2,000,000 |
| 2,214,309 |
|
CNP Assurances, VRN, 4.00%, 11/18/24(2) | EUR | 1,200,000 |
| 1,417,053 |
|
Credit Agricole Assurances SA, VRN, 4.25%, 1/13/25(2) | EUR | 2,000,000 |
| 2,349,549 |
|
| Credit Agricole SA, MTN, 7.375%, 12/18/23 | GBP | 1,500,000 |
| 2,370,631 |
|
Orange SA, MTN, VRN, 4.00%, 10/1/21(2) | EUR | 960,000 |
| 1,160,049 |
|
TOTAL SA, MTN, VRN, 2.625%, 2/26/25(2) | EUR | 1,200,000 |
| 1,375,344 |
|
| | | | 14,233,467 |
|
| Germany — 1.8% | | | |
Allianz SE, VRN, 3.375%, 9/18/24(2) | EUR | 1,000,000 |
| 1,189,815 |
|
Bayer AG, VRN, 3.75%, 7/1/24(2) | EUR | 1,300,000 |
| 1,490,093 |
|
| Commerzbank AG, MTN, 4.00%, 3/23/26 | EUR | 2,000,000 |
| 2,405,951 |
|
| Daimler AG, MTN, 0.85%, 2/28/25 | EUR | 900,000 |
| 996,080 |
|
| Kreditanstalt fuer Wiederaufbau, 4.625%, 1/4/23 | EUR | 3,165,000 |
| 4,286,746 |
|
RWE AG, VRN, 7.00%, 3/20/19(2) | GBP | 1,000,000 |
| 1,297,400 |
|
| | | | 11,666,085 |
|
| Ireland — 0.9% | | | |
Ardagh Packaging Finance plc / Ardagh Holdings USA, Inc., 6.00%, 2/15/25(1) | | $ | 1,530,000 |
| 1,438,200 |
|
| GE Capital European Funding Unlimited. Co., MTN, 5.375%, 1/23/20 | EUR | 3,960,000 |
| 4,773,816 |
|
| | | | 6,212,016 |
|
| Italy — 1.9% | | | |
Assicurazioni Generali SpA, MTN, VRN, 4.60%, 11/21/25(2) | EUR | 2,000,000 |
| 2,225,235 |
|
| Credit Agricole Cariparma SpA, MTN, 1.625%, 3/21/29 (Secured) | EUR | 600,000 |
| 669,830 |
|
| Eni SpA, MTN, 1.75%, 1/18/24 | EUR | 1,100,000 |
| 1,295,335 |
|
| Intesa Sanpaolo SpA, MTN, 6.625%, 9/13/23 | EUR | 2,000,000 |
| 2,529,072 |
|
Intesa Sanpaolo Vita SpA, VRN, 4.75%, 12/17/24(2) | EUR | 1,500,000 |
| 1,658,081 |
|
| Mediobanca Banca di Credito Finanziario SpA, MTN, 1.25%, 11/24/29 (Secured) | EUR | 1,100,000 |
| 1,163,889 |
|
| UniCredit SpA, 0.375%, 10/31/26 (Secured) | EUR | 300,000 |
| 313,380 |
|
UniCredit SpA, MTN, VRN, 5.75%, 10/28/20(2) | EUR | 1,000,000 |
| 1,174,189 |
|
UniCredit SpA, VRN, 5.86%, 6/19/27(1)(2) | | $ | 1,340,000 |
| 1,150,339 |
|
| | | | 12,179,350 |
|
|
| | | | | | | |
| | | Principal Amount | Value |
| Kazakhstan — 0.1% | | | |
KazTransGas JSC, 4.375%, 9/26/27(1) | | $ | 800,000 |
| $ | 757,306 |
|
| Luxembourg — 1.5% | | | |
| European Financial Stability Facility, MTN, 2.125%, 2/19/24 | EUR | 5,605,000 |
| 6,983,464 |
|
| European Financial Stability Facility, MTN, 2.35%, 7/29/44 | EUR | 1,830,000 |
| 2,435,301 |
|
| Gazprom OAO Via Gaz Capital SA, MTN, 7.29%, 8/16/37 | | $ | 600,000 |
| 663,546 |
|
| | | | 10,082,311 |
|
| Netherlands — 1.9% | | | |
Alcoa Nederland Holding BV, 6.125%, 5/15/28(1) | | 520,000 |
| 520,000 |
|
| BMW Finance NV, MTN, 1.00%, 2/15/22 | EUR | 1,000,000 |
| 1,160,096 |
|
| BMW Finance NV, MTN, 0.875%, 4/3/25 | EUR | 800,000 |
| 894,758 |
|
Constellium NV, 6.625%, 3/1/25(1) | | $ | 400,000 |
| 393,000 |
|
| Deutsche Telekom International Finance BV, MTN, 1.25%, 10/6/23 | GBP | 1,150,000 |
| 1,427,216 |
|
| Deutsche Telekom International Finance BV, MTN, 0.875%, 1/30/24 | EUR | 820,000 |
| 936,779 |
|
ING Groep NV, MTN, VRN, 1.625%, 9/26/24(2) | EUR | 1,300,000 |
| 1,424,392 |
|
NXP BV / NXP Funding LLC, 4.125%, 6/15/20(1) | | $ | 750,000 |
| 750,000 |
|
| Petrobras Global Finance BV, 5.30%, 1/27/25 | | 1,350,000 |
| 1,290,938 |
|
Sensata Technologies BV, 5.00%, 10/1/25(1) | | 680,000 |
| 659,600 |
|
Telefonica Europe BV, VRN, 3.00%, 12/4/23(2) | EUR | 1,900,000 |
| 2,068,698 |
|
| Teva Pharmaceutical Finance Netherlands III BV, 3.15%, 10/1/26 | | $ | 800,000 |
| 652,856 |
|
| | | | 12,178,333 |
|
| Norway — 0.3% | | | |
| Equinor ASA, MTN, 0.875%, 2/17/23 | EUR | 1,700,000 |
| 1,969,833 |
|
| Spain — 0.9% | | | |
| Banco Santander SA, MTN, 2.50%, 3/18/25 | EUR | 2,200,000 |
| 2,491,532 |
|
CaixaBank SA, MTN, VRN, 2.75%, 7/14/23(2) | EUR | 800,000 |
| 910,166 |
|
| Criteria Caixa SAU, MTN, 1.50%, 5/10/23 | EUR | 1,500,000 |
| 1,682,682 |
|
Liberbank SA, VRN, 6.875%, 3/14/22(2) | EUR | 700,000 |
| 847,356 |
|
| | | | 5,931,736 |
|
| Switzerland — 0.5% | | | |
Credit Suisse Group AG, VRN, 2.125%, 9/12/24(2) | GBP | 2,900,000 |
| 3,552,275 |
|
| United Kingdom — 3.9% | | | |
Barclays plc, MTN, VRN, 2.00%, 2/7/23(2) | EUR | 1,600,000 |
| 1,730,472 |
|
Barclays plc, MTN, VRN, 1.375%, 1/24/25(2) | EUR | 1,200,000 |
| 1,290,324 |
|
Centrica plc, VRN, 5.25%, 4/10/25(2) | GBP | 1,500,000 |
| 1,982,009 |
|
| Co-Operative Bank plc (The), 4.75%, 11/11/21 (Secured) | GBP | 2,640,000 |
| 3,613,933 |
|
| HSBC Holdings plc, 0.84%, 9/26/23 | JPY | 400,000,000 |
| 3,606,849 |
|
| HSBC Holdings plc, 2.625%, 8/16/28 | GBP | 1,000,000 |
| 1,234,582 |
|
| InterContinental Hotels Group plc, MTN, 3.75%, 8/14/25 | GBP | 1,100,000 |
| 1,482,072 |
|
International Game Technology plc, 6.25%, 2/15/22(1) | | $ | 800,000 |
| 830,000 |
|
| Lloyds Bank plc, MTN, 7.625%, 4/22/25 | GBP | 1,500,000 |
| 2,415,200 |
|
| Santander UK plc, MTN, 5.125%, 4/14/21 (Secured) | GBP | 1,940,000 |
| 2,707,331 |
|
Sensata Technologies UK Financing Co. plc, 6.25%, 2/15/26(1) | | $ | 700,000 |
| 715,750 |
|
SSE plc, VRN, 2.375%, 4/1/21(2) | EUR | 1,400,000 |
| 1,601,996 |
|
| Tesco Corporate Treasury Services plc, MTN, 2.50%, 7/1/24 | EUR | 700,000 |
| 831,114 |
|
|
| | | | | | | |
| | | Principal Amount | Value |
| Tesco plc, MTN, 5.00%, 3/24/23 | GBP | 1,000,000 |
| $ | 1,419,920 |
|
| | | | 25,461,552 |
|
| United States — 8.9% | | | |
| AES Corp., 4.875%, 5/15/23 | | $ | 940,000 |
| 932,950 |
|
| Ally Financial, Inc., 4.625%, 3/30/25 | | 1,500,000 |
| 1,473,750 |
|
| AMC Networks, Inc., 4.75%, 8/1/25 | | 1,340,000 |
| 1,249,014 |
|
| Antero Resources Corp., 5.125%, 12/1/22 | | 1,100,000 |
| 1,095,187 |
|
Aramark Services, Inc., 5.00%, 4/1/25(1) | | 1,030,000 |
| 1,021,631 |
|
| Ashland LLC, 4.75%, 8/15/22 | | 900,000 |
| 895,500 |
|
| AT&T, Inc., 3.375%, 3/15/34 | EUR | 1,000,000 |
| 1,166,642 |
|
| Ball Corp., 4.00%, 11/15/23 | | $ | 940,000 |
| 914,150 |
|
| Bank of America Corp., MTN, 2.30%, 7/25/25 | GBP | 700,000 |
| 884,705 |
|
| CCO Holdings LLC / CCO Holdings Capital Corp., 5.25%, 9/30/22 | | $ | 1,240,000 |
| 1,248,525 |
|
CCO Holdings LLC / CCO Holdings Capital Corp., 5.125%, 5/1/27(1) | | 1,050,000 |
| 990,938 |
|
| CIT Group, Inc., 5.00%, 8/15/22 | | 860,000 |
| 868,600 |
|
CommScope Technologies LLC, 5.00%, 3/15/27(1) | | 1,640,000 |
| 1,476,000 |
|
| Continental Resources, Inc., 3.80%, 6/1/24 | | 1,500,000 |
| 1,450,818 |
|
| Crown Americas LLC / Crown Americas Capital Corp. IV, 4.50%, 1/15/23 | | 1,360,000 |
| 1,336,200 |
|
Crown Americas LLC / Crown Americas Capital Corp. VI, 4.75%, 2/1/26(1) | | 410,000 |
| 387,963 |
|
CSC Holdings LLC, 5.50%, 4/15/27(1) | | 1,040,000 |
| 1,001,000 |
|
| CyrusOne LP / CyrusOne Finance Corp., 5.00%, 3/15/24 | | 140,000 |
| 140,350 |
|
| DaVita, Inc., 5.125%, 7/15/24 | | 1,500,000 |
| 1,436,250 |
|
| Diamondback Energy, Inc., 5.375%, 5/31/25 | | 1,070,000 |
| 1,067,325 |
|
| Discovery Communications LLC, 2.50%, 9/20/24 | GBP | 1,800,000 |
| 2,260,451 |
|
First Data Corp., 5.00%, 1/15/24(1) | | $ | 1,600,000 |
| 1,590,000 |
|
| Goldman Sachs Group, Inc. (The), 5.50%, 10/12/21 | GBP | 850,000 |
| 1,192,325 |
|
| Goldman Sachs Group, Inc. (The), MTN, 4.25%, 1/29/26 | GBP | 800,000 |
| 1,117,078 |
|
| Goodyear Tire & Rubber Co. (The), 5.125%, 11/15/23 | | $ | 1,300,000 |
| 1,278,550 |
|
Hanesbrands, Inc., 4.625%, 5/15/24(1) | | 500,000 |
| 481,250 |
|
| HCA, Inc., 5.00%, 3/15/24 | | 250,000 |
| 253,594 |
|
| Hilton Domestic Operating Co., Inc., 4.25%, 9/1/24 | | 1,150,000 |
| 1,107,220 |
|
| International Business Machines Corp., 1.75%, 3/7/28 | EUR | 1,000,000 |
| 1,166,131 |
|
IQVIA, Inc., 5.00%, 10/15/26(1) | | $ | 1,000,000 |
| 965,930 |
|
| Lamar Media Corp., 5.375%, 1/15/24 | | 800,000 |
| 805,000 |
|
Lamb Weston Holdings, Inc., 4.625%, 11/1/24(1) | | 1,340,000 |
| 1,317,515 |
|
| Lennar Corp., 4.75%, 4/1/21 | | 780,000 |
| 786,825 |
|
| Lennar Corp., 4.50%, 4/30/24 | | 400,000 |
| 383,250 |
|
Netflix, Inc., 4.875%, 4/15/28(1) | | 1,500,000 |
| 1,378,125 |
|
| Newfield Exploration Co., 5.75%, 1/30/22 | | 1,360,000 |
| 1,409,300 |
|
NextEra Energy Operating Partners LP, 4.50%, 9/15/27(1) | | 1,410,000 |
| 1,306,012 |
|
Post Holdings, Inc., 5.00%, 8/15/26(1) | | 1,080,000 |
| 1,000,350 |
|
| Range Resources Corp., 4.875%, 5/15/25 | | 950,000 |
| 883,500 |
|
Reynolds Group Issuer, Inc. / Reynolds Group Issuer LLC / Reynolds Group Issuer Lu, 5.125%, 7/15/23(1) | | 1,010,000 |
| 989,800 |
|
Sirius XM Radio, Inc., 5.375%, 4/15/25(1) | | 1,350,000 |
| 1,340,719 |
|
|
| | | | | | | |
| | | Principal Amount | Value |
| Spectrum Brands, Inc., 5.75%, 7/15/25 | | $ | 630,000 |
| $ | 614,250 |
|
| Sprint Communications, Inc., 6.00%, 11/15/22 | | 750,000 |
| 758,906 |
|
| Steel Dynamics, Inc., 5.00%, 12/15/26 | | 1,180,000 |
| 1,156,400 |
|
Sunoco LP / Sunoco Finance Corp., 5.50%, 2/15/26(1) | | 1,190,000 |
| 1,136,450 |
|
| T-Mobile USA, Inc., 4.75%, 2/1/28 | | 1,060,000 |
| 983,150 |
|
| Targa Resources Partners LP / Targa Resources Partners Finance Corp., 5.00%, 1/15/28 | | 910,000 |
| 865,638 |
|
| Tenet Healthcare Corp., 4.375%, 10/1/21 | | 400,000 |
| 397,500 |
|
| Tenet Healthcare Corp., 5.125%, 5/1/25 | | 900,000 |
| 868,500 |
|
| Tenneco, Inc., 5.00%, 7/15/26 | | 870,000 |
| 726,450 |
|
| United Rentals North America, Inc., 5.75%, 11/15/24 | | 480,000 |
| 483,000 |
|
Universal Health Services, Inc., 4.75%, 8/1/22(1) | | 940,000 |
| 942,350 |
|
| Walmart, Inc., 0.18%, 7/15/22 | JPY | 450,000,000 |
| 4,007,271 |
|
Zayo Group LLC / Zayo Capital, Inc., 5.75%, 1/15/27(1) | | $ | 1,000,000 |
| 982,700 |
|
ZF North America Capital, Inc., 4.00%, 4/29/20(1) | | 762,000 |
| 762,160 |
|
| | | | 58,735,148 |
|
TOTAL CORPORATE BONDS
(Cost $178,220,047) | | | 170,170,137 |
|
ASSET-BACKED SECURITIES(3) — 3.9% | | | |
Goodgreen, Series 2018-1A, Class A, VRN, 3.93%, 11/15/18(1)(4) | | 1,606,012 |
| 1,595,670 |
|
Invitation Homes Trust, Series 2018-SFR1, Class A, VRN, 2.99%, 11/17/18, resets monthly off the 1-month LIBOR plus 0.70%(1) | | 3,945,947 |
| 3,945,997 |
|
Invitation Homes Trust, Series 2018-SFR2, Class B, VRN, 3.36%, 11/17/18, resets monthly off the 1-month LIBOR plus 1.08%(1) | | 2,550,000 |
| 2,563,761 |
|
Invitation Homes Trust, Series 2018-SFR2, Class C, VRN, 3.56%, 11/17/18, resets monthly off the 1-month LIBOR plus 1.28%(1) | | 2,775,000 |
| 2,773,672 |
|
Invitation Homes Trust, Series 2018-SFR3, Class B, VRN, 3.44%, 11/17/18, resets monthly off the 1-month LIBOR plus 1.15%(1) | | 2,700,000 |
| 2,713,086 |
|
Mosaic Solar Loan Trust, Series 2018-2GS, Class A SEQ, 4.20%, 2/22/44(1) | | 824,163 |
| 820,924 |
|
MVW Owner Trust, Series 2017-1A, Class A SEQ, 2.42%, 12/20/34(1) | | 2,272,705 |
| 2,197,089 |
|
Progress Residential Trust, Series 2017-SFR1, Class A SEQ, 2.77%, 8/17/34(1) | | 2,815,954 |
| 2,712,988 |
|
Towd Point Mortgage Trust, Series 2017-4, Class A1, VRN, 2.75%, 11/1/18(1)(4) | | 3,596,461 |
| 3,501,720 |
|
VSE VOI Mortgage LLC, Series 2016-A, Class A SEQ, 2.54%, 7/20/33(1) | | 116,466 |
| 113,610 |
|
VSE VOI Mortgage LLC, Series 2017-A, Class A SEQ, 2.33%, 3/20/35(1) | | 2,368,841 |
| 2,284,193 |
|
TOTAL ASSET-BACKED SECURITIES
(Cost $25,598,478) | | | 25,222,710 |
|
COLLATERALIZED LOAN OBLIGATIONS(3) — 2.8% | | | |
Carlyle Global Market Strategies CLO, Series 2014-2RA, Class A3, VRN, 3.81%, 11/15/18, resets quarterly off the 3-month LIBOR plus 1.50%(1) | | 3,000,000 |
| 2,968,719 |
|
Goldentree Loan Management US CLO 3 Ltd., Series 2018-3A, Class B1, VRN, 4.02%, 1/22/19, resets quarterly off the 3-month LIBOR plus 1.55%(1) | | 1,800,000 |
| 1,788,883 |
|
|
| | | | | | | |
| | | Principal Amount | Value |
Goldentree Loan Opportunities X Ltd., Series 2015-10A, Class AR, VRN, 3.59%, 1/22/19, resets quarterly off the 3-month LIBOR plus 1.12%(1) | | $ | 500,000 |
| $ | 499,630 |
|
KKR CLO Ltd., Series 22A, Class A, VRN, 3.52%, 1/22/19, resets quarterly off the 3-month LIBOR plus 1.15%(1) | | 750,000 |
| 748,829 |
|
KKR CLO Ltd., Series 22A, Class B, VRN, 3.97%, 1/22/19, resets quarterly off the 3-month LIBOR plus 1.60%(1) | | 1,500,000 |
| 1,496,188 |
|
LCM XIV LP, Series 2014A, Class BR, VRN, 4.05%, 1/22/19, resets quarterly off the 3-month LIBOR plus 1.58%(1) | | 2,375,000 |
| 2,371,114 |
|
LoanCore Issuer Ltd., Series 2018-CRE1, Class AS, VRN, 3.78%, 11/15/18, resets monthly off the 1-month LIBOR plus 1.50%(1) | | 1,701,000 |
| 1,708,141 |
|
Magnetite VIII Ltd., Series 2014-8A, Class AR2, VRN, 3.42%, 1/15/19, resets quarterly off the 3-month LIBOR plus 0.98%(1) | | 2,300,000 |
| 2,296,139 |
|
Magnetite VIII Ltd., Series 2014-8A, Class BR2, VRN, 3.94%, 1/15/19, resets quarterly off the 3-month LIBOR plus 1.50%(1) | | 1,750,000 |
| 1,739,810 |
|
Sounds Point CLO IV-R Ltd., Series 2013-3RA, Class A, VRN, 3.59%, 1/18/19, resets quarterly off the 3-month LIBOR plus 1.15%(1) | | 1,000,000 |
| 1,001,100 |
|
Sounds Point CLO IV-R Ltd., Series 2013-3RA, Class B, VRN, 4.19%, 1/18/19, resets quarterly off the 3-month LIBOR plus 1.75%(1) | | 1,750,000 |
| 1,750,406 |
|
TOTAL COLLATERALIZED LOAN OBLIGATIONS
(Cost $18,415,848) | | | 18,368,959 |
|
BANK LOAN OBLIGATIONS(5) — 2.2% | | | |
| 1011778 B.C. Unlimited Liability Company, Term Loan B3, 4.55%, 2/16/24, resets monthly off the 1-month LIBOR plus 2.25% | | 798,399 |
| 796,304 |
|
| 1011778 B.C. Unlimited Liability Company, Term Loan B3, 4.55%, 2/16/24, resets monthly off the 1-month LIBOR plus 2.25% | | 647,922 |
| 646,221 |
|
| Caesars Resort Collection, LLC, 2017 1st Lien Term Loan B, 5.05%, 12/22/24, resets monthly off the 1-month LIBOR plus 2.75% | | 748,116 |
| 749,208 |
|
| Catalent Pharma Solutions Inc., USD Term Loan B, 4.55%, 5/20/24, resets monthly off the 1-month LIBOR plus 2.25% | | 824,390 |
| 828,966 |
|
| CenturyLink, Inc., 2017 Term Loan B, 5.05%, 1/31/25, resets monthly off the 1-month LIBOR plus 2.75% | | 1,015,687 |
| 1,006,165 |
|
| CSC Holdings, LLC, 2017 1st Lien Term Loan, 4.53%, 7/17/25, resets monthly off the 1-month LIBOR plus 2.25% | | 748,101 |
| 747,435 |
|
| Dell International LLC, 2017 Term Loan B, 4.31%, 9/7/23, resets monthly off the 1-month LIBOR plus 2.00% | | 598,489 |
| 598,540 |
|
| HCA Inc., 2018 Term Loan B10, 4.30%, 3/13/25, resets monthly off the 1-month LIBOR plus 2.00% | | 1,467,625 |
| 1,475,880 |
|
| Hilton Worldwide Finance, LLC, Term Loan B2, 4.03%, 10/25/23, resets monthly off the 1-month LIBOR plus 1.75% | | 1,600,000 |
| 1,603,504 |
|
| Level 3 Financing Inc., 2017 Term Loan B, 4.53%, 2/22/24, resets monthly off the 1-month LIBOR plus 2.25% | | 900,000 |
| 901,759 |
|
| MGM Growth Properties Operating Partnership LP, 2016 Term Loan B, 4.30%, 3/21/25, resets monthly off the 1-month LIBOR plus 2.00% | | 994,898 |
| 993,122 |
|
| Sprint Communications, Inc., 1st Lien Term Loan B, 4.81%, 2/2/24, resets monthly off the 1-month LIBOR plus 2.50% | | 528,658 |
| 529,071 |
|
| Valeant Pharmaceuticals International, Inc., 2018 Term Loan B, 5.27%, 6/1/25, resets monthly off the 1-month LIBOR plus 3.00% | | 1,514,953 |
| 1,517,619 |
|
|
| | | | | | | |
| | | Shares/
Principal Amount | Value |
| Western Digital Corporation, 2018 Term Loan B4, 4.04%, 4/29/23, resets monthly off the 1-month LIBOR plus 1.75% | | $ | 1,129,325 |
| $ | 1,124,384 |
|
| Zayo Group, LLC, 2017 Incremental Term Loan, 4.55%, 1/19/24, resets monthly off the 1-month LIBOR plus 2.25% | | 1,100,000 |
| 1,102,750 |
|
TOTAL BANK LOAN OBLIGATIONS
(Cost $14,667,412) | | | 14,620,928 |
|
COLLATERALIZED MORTGAGE OBLIGATIONS(3) — 1.8% | | | |
| Private Sponsor Collateralized Mortgage Obligations — 0.8% |
Agate Bay Mortgage Trust, Series 2016-1, Class A5 SEQ, VRN, 3.50%, 11/1/18(1)(4) | | 2,967,105 |
| 2,938,868 |
|
Credit Suisse Mortgage Trust, Series 2017-HL1, Class A3 SEQ, VRN, 3.50%, 11/1/18(1)(4) | | 2,216,897 |
| 2,180,232 |
|
| | | | 5,119,100 |
|
| U.S. Government Agency Collateralized Mortgage Obligations — 1.0% |
| FHLMC, Series 2017-DNA2, Class M1, VRN, 3.48%, 11/25/18, resets monthly off the 1-month LIBOR plus 1.20% | | 3,645,061 |
| 3,682,455 |
|
| FHLMC, Series 2017-HQA2, Class M1, VRN, 3.08%, 11/25/18, resets monthly off the 1-month LIBOR plus 0.80% | | 3,122,486 |
| 3,130,296 |
|
| | | | 6,812,751 |
|
TOTAL COLLATERALIZED MORTGAGE OBLIGATIONS
(Cost $12,119,030) | | | 11,931,851 |
|
COMMERCIAL MORTGAGE-BACKED SECURITIES(3) — 1.3% |
Core Industrial Trust, Series 2015-CALW, Class C, 3.56%, 2/10/34(1) | | 2,000,000 |
| 1,983,580 |
|
| JPMorgan Chase Commercial Mortgage Securities Trust, Series 2016-JP2, Class AS, 3.06%, 8/15/49 | | 2,600,000 |
| 2,422,240 |
|
| Morgan Stanley Bank of America Merrill Lynch Trust, Series 2017-C34, Class A3 SEQ, 3.28%, 11/15/52 | | 2,000,000 |
| 1,899,346 |
|
| UBS Commercial Mortgage Trust, Series 2017-C1, Class A3 SEQ, 3.20%, 6/15/50 | | 2,300,000 |
| 2,178,773 |
|
TOTAL COMMERCIAL MORTGAGE-BACKED SECURITIES
(Cost $8,950,251) | 8,483,939 |
|
| TEMPORARY CASH INVESTMENTS — 0.8% | | | |
| State Street Institutional U.S. Government Money Market Fund, Premier Class | | 17,296 |
| 17,296 |
|
U.S. Treasury Bills 2.34%, 1/24/19(6)(7) | | $ | 5,000,000 |
| 4,973,634 |
|
TOTAL TEMPORARY CASH INVESTMENTS
(Cost $4,990,563) | | | 4,990,930 |
|
TOTAL INVESTMENT SECURITIES — 99.0%
(Cost $667,809,335) | | | 649,618,223 |
|
| OTHER ASSETS AND LIABILITIES — 1.0% | | | 6,481,500 |
|
| TOTAL NET ASSETS — 100.0% | | | $ | 656,099,723 |
|
FORWARD FOREIGN CURRENCY EXCHANGE CONTRACTS
|
| | | | | | | | | | |
| Currency Purchased | Currency Sold | Counterparty | Settlement Date | Unrealized Appreciation
(Depreciation) |
| AUD | 5,064,571 |
| USD | 3,634,387 |
| Bank of America, N.A. | 12/19/18 | $ | (46,070 | ) |
| AUD | 491,457 |
| USD | 351,185 |
| Bank of America, N.A. | 12/19/18 | (2,981 | ) |
| USD | 358,436 |
| AUD | 505,504 |
| Bank of America, N.A. | 12/19/18 | 279 |
|
| BRL | 6,232,513 |
| USD | 1,676,308 |
| Goldman Sachs & Co. | 12/19/18 | (8,181 | ) |
| USD | 344,638 |
| BRL | 1,296,045 |
| Goldman Sachs & Co. | 12/19/18 | (2,248 | ) |
| CAD | 460,272 |
| USD | 355,412 |
| Morgan Stanley | 12/19/18 | (5,439 | ) |
| CAD | 4,310,516 |
| USD | 3,292,632 |
| Morgan Stanley | 12/19/18 | (15,080 | ) |
| USD | 8,170,502 |
| CAD | 10,588,317 |
| Morgan Stanley | 12/19/18 | 119,550 |
|
| USD | 248,212 |
| CAD | 318,022 |
| Morgan Stanley | 12/19/18 | 6,400 |
|
| USD | 3,287,561 |
| CAD | 4,245,194 |
| Morgan Stanley | 12/19/18 | 59,677 |
|
| USD | 3,440,153 |
| CAD | 4,472,715 |
| Morgan Stanley | 12/19/18 | 39,271 |
|
| CHF | 1,165,528 |
| USD | 1,210,951 |
| UBS AG | 12/19/18 | (48,222 | ) |
| USD | 3,281,723 |
| CHF | 3,236,973 |
| Bank of America, N.A. | 12/19/18 | 52,523 |
|
| CLP | 72,611,130 |
| USD | 104,945 |
| Goldman Sachs & Co. | 12/19/18 | (554 | ) |
| COP | 10,443,958,913 |
| USD | 3,396,122 |
| Goldman Sachs & Co. | 12/19/18 | (158,642 | ) |
| USD | 856,159 |
| CZK | 18,787,555 |
| Goldman Sachs & Co. | 12/19/18 | 32,185 |
|
| DKK | 6,693,563 |
| USD | 1,051,009 |
| Goldman Sachs & Co. | 12/19/18 | (30,251 | ) |
| EUR | 119,903,581 |
| USD | 138,281,203 |
| JPMorgan Chase Bank N.A. | 11/14/18 | (2,346,848 | ) |
| EUR | 255,836 |
| USD | 293,820 |
| JPMorgan Chase Bank N.A. | 11/14/18 | (3,779 | ) |
| USD | 321,263 |
| EUR | 276,845 |
| JPMorgan Chase Bank N.A. | 11/14/18 | 7,405 |
|
| USD | 599,266 |
| EUR | 517,092 |
| JPMorgan Chase Bank N.A. | 11/14/18 | 13,039 |
|
| USD | 328,586 |
| EUR | 283,260 |
| JPMorgan Chase Bank N.A. | 11/14/18 | 7,456 |
|
| USD | 328,706 |
| EUR | 283,182 |
| JPMorgan Chase Bank N.A. | 11/14/18 | 7,663 |
|
| USD | 346,066 |
| EUR | 298,213 |
| JPMorgan Chase Bank N.A. | 11/14/18 | 7,982 |
|
| USD | 238,251 |
| EUR | 207,403 |
| JPMorgan Chase Bank N.A. | 11/14/18 | 3,118 |
|
| USD | 534,710 |
| EUR | 468,519 |
| JPMorgan Chase Bank N.A. | 11/14/18 | 3,551 |
|
| USD | 844,955 |
| EUR | 741,101 |
| JPMorgan Chase Bank N.A. | 11/14/18 | 4,770 |
|
| USD | 558,479 |
| EUR | 491,403 |
| JPMorgan Chase Bank N.A. | 11/14/18 | 1,377 |
|
| USD | 2,643,234 |
| EUR | 2,330,820 |
| JPMorgan Chase Bank N.A. | 11/14/18 | 790 |
|
| GBP | 2,889,069 |
| USD | 3,790,632 |
| Bank of America, N.A. | 12/19/18 | (88,940 | ) |
| GBP | 285,505 |
| USD | 369,595 |
| Bank of America, N.A. | 12/19/18 | (3,784 | ) |
| GBP | 338,790 |
| USD | 433,733 |
| Bank of America, N.A. | 12/19/18 | 350 |
|
| USD | 1,770,907 |
| GBP | 1,340,956 |
| Bank of America, N.A. | 12/19/18 | 52,773 |
|
| USD | 376,912 |
| GBP | 289,380 |
| Bank of America, N.A. | 12/19/18 | 6,136 |
|
| USD | 344,422 |
| GBP | 259,591 |
| Bank of America, N.A. | 12/19/18 | 11,814 |
|
| HKD | 1,526,317 |
| USD | 194,706 |
| Goldman Sachs & Co. | 12/19/18 | 196 |
|
| HUF | 956,548,647 |
| USD | 3,415,147 |
| UBS AG | 12/19/18 | (66,158 | ) |
| HUF | 106,046,596 |
| USD | 379,589 |
| UBS AG | 12/19/18 | (8,307 | ) |
| HUF | 163,363,205 |
| USD | 582,483 |
| UBS AG | 12/19/18 | (10,529 | ) |
| HUF | 175,584,748 |
| USD | 617,170 |
| UBS AG | 12/19/18 | (2,427 | ) |
| USD | 16,515,939 |
| HUF | 4,596,947,352 |
| UBS AG | 12/19/18 | 421,483 |
|
| USD | 701,896 |
| HUF | 198,369,939 |
| UBS AG | 12/19/18 | 7,380 |
|
| IDR | 145,376,249,774 |
| USD | 9,526,622 |
| Goldman Sachs & Co. | 12/19/18 | (45,438 | ) |
| IDR | 4,433,829,858 |
| USD | 294,372 |
| Goldman Sachs & Co. | 12/19/18 | (5,205 | ) |
| ILS | 5,029,365 |
| USD | 1,414,531 |
| Goldman Sachs & Co. | 12/19/18 | (57,496 | ) |
|
| | | | | | | | | | |
| Currency Purchased | Currency Sold | Counterparty | Settlement Date | Unrealized Appreciation
(Depreciation) |
| JPY | 7,891,341,828 |
| USD | 69,855,902 |
| Bank of America, N.A. | 11/14/18 | $ | 139,594 |
|
| JPY | 152,903,922 |
| USD | 1,356,045 |
| Bank of America, N.A. | 11/14/18 | 200 |
|
| USD | 359,805 |
| JPY | 40,500,058 |
| Bank of America, N.A. | 11/14/18 | 573 |
|
| USD | 569,388 |
| JPY | 63,740,069 |
| Bank of America, N.A. | 11/14/18 | 4,020 |
|
| KRW | 16,375,528,444 |
| USD | 14,573,514 |
| Goldman Sachs & Co. | 12/19/18 | (206,914 | ) |
| MXN | 7,041,101 |
| USD | 345,192 |
| JPMorgan Chase Bank N.A. | 12/19/18 | (1,065 | ) |
| USD | 7,878,239 |
| MXN | 152,089,404 |
| JPMorgan Chase Bank N.A. | 12/19/18 | 445,013 |
|
| USD | 351,565 |
| MXN | 6,720,946 |
| JPMorgan Chase Bank N.A. | 12/19/18 | 23,086 |
|
| MYR | 14,083,798 |
| USD | 3,392,967 |
| Goldman Sachs & Co. | 12/19/18 | (31,251 | ) |
| USD | 2,783,950 |
| MYR | 11,574,272 |
| Goldman Sachs & Co. | 12/19/18 | 21,242 |
|
| NOK | 32,141,466 |
| USD | 3,904,881 |
| Goldman Sachs & Co. | 12/19/18 | (83,682 | ) |
| NZD | 7,148,233 |
| USD | 4,691,650 |
| Bank of America, N.A. | 12/19/18 | (24,754 | ) |
| USD | 6,747,262 |
| PEN | 22,389,441 |
| Goldman Sachs & Co. | 12/19/18 | 117,670 |
|
| USD | 2,196,778 |
| PEN | 7,292,206 |
| Goldman Sachs & Co. | 12/19/18 | 37,530 |
|
| USD | 653,139 |
| PEN | 2,183,443 |
| Goldman Sachs & Co. | 12/19/18 | 6,614 |
|
| USD | 1,727,913 |
| PEN | 5,769,502 |
| Goldman Sachs & Co. | 12/19/18 | 19,543 |
|
| USD | 3,282,927 |
| PHP | 179,221,528 |
| Goldman Sachs & Co. | 12/19/18 | (67,407 | ) |
| PLN | 10,963,382 |
| USD | 2,962,196 |
| Goldman Sachs & Co. | 12/19/18 | (101,643 | ) |
| RUB | 43,994,055 |
| USD | 633,464 |
| Goldman Sachs & Co. | 12/19/18 | 30,642 |
|
| SEK | 45,121,672 |
| USD | 5,056,499 |
| Goldman Sachs & Co. | 12/19/18 | (103,472 | ) |
| SEK | 31,414,537 |
| USD | 3,509,577 |
| Goldman Sachs & Co. | 12/19/18 | (61,188 | ) |
| USD | 3,377,714 |
| SEK | 30,282,895 |
| Goldman Sachs & Co. | 12/19/18 | 53,547 |
|
| USD | 865,291 |
| SGD | 1,185,109 |
| Bank of America, N.A. | 12/19/18 | 8,874 |
|
| THB | 86,712,923 |
| USD | 2,673,849 |
| Goldman Sachs & Co. | 12/19/18 | (53,767 | ) |
| USD | 5,693,916 |
| THB | 186,008,851 |
| Goldman Sachs & Co. | 12/19/18 | 73,549 |
|
| TRY | 402,537 |
| USD | 60,015 |
| Goldman Sachs & Co. | 12/19/18 | 9,959 |
|
| USD | 18,424,102 |
| ZAR | 278,922,478 |
| UBS AG | 12/19/18 | (373,015 | ) |
| USD | 1,132,370 |
| ZAR | 16,416,531 |
| UBS AG | 12/19/18 | 26,028 |
|
| | | | | | | $ | (2,179,885 | ) |
|
| | | | | | | | | | | |
| FUTURES CONTRACTS PURCHASED |
| Reference Entity | Contracts | Expiration
Date | Notional
Amount | Underlying
Contract
Value | Unrealized
Appreciation
(Depreciation) |
| Euro-Bund 10-Year Bonds | 44 | December 2018 | EUR | 4,400,000 |
| $ | 7,986,816 |
| $ | (21,638 | ) |
| Euro-OAT 10-Year Bonds | 74 | December 2018 | EUR | 7,400,000 |
| 12,736,698 |
| (47,059 | ) |
| Japanese 10-Year Government Bonds | 13 | December 2018 | JPY | 1,300,000,000 |
| 17,354,456 |
| 56,339 |
|
| Japanese 10-Year Mini Government Bonds | 107 | December 2018 | JPY | 1,070,000,000 |
| 14,274,569 |
| 35,773 |
|
| Korean Treasury 10-Year Bonds | 119 | December 2018 | KRW | 11,900,000,000 |
| 12,997,007 |
| 31,576 |
|
| | | | | | $ | 65,349,546 |
| $ | 54,991 |
|
|
| | | | | | | | | | | |
| FUTURES CONTRACTS SOLD |
| Reference Entity | Contracts | Expiration
Date | Notional
Amount | Underlying
Contract
Value | Unrealized
Appreciation
(Depreciation) |
| Euro-Bobl 5-Year Bonds | 302 | December 2018 | EUR | 30,200,000 |
| $ | 44,960,419 |
| $ | 57,654 |
|
| U.K. Gilt 10-Year Bonds | 117 | December 2018 | GBP | 11,700,000 |
| 18,306,346 |
| (72,646 | ) |
| U.S. Treasury 2-Year Notes | 80 | December 2018 | USD | 16,000,000 |
| 16,852,500 |
| 41,070 |
|
| U.S. Treasury 5-Year Notes | 284 | December 2018 | USD | 28,400,000 |
| 31,916,719 |
| 223,876 |
|
| U.S. Treasury 10-Year Ultra Notes | 223 | December 2018 | USD | 22,300,000 |
| 27,899,391 |
| 543,061 |
|
| U.S. Treasury Long Bonds | 78 | December 2018 | USD | 7,800,000 |
| 10,773,750 |
| 428,825 |
|
| | | | | | $ | 150,709,125 |
| $ | 1,221,840 |
|
|
| | | | | | | | | | | | | | | |
| CENTRALLY CLEARED CREDIT DEFAULT SWAP AGREEMENTS |
| Reference Entity | Type | Fixed Rate
Received
(Paid) | Termination
Date | Notional
Amount | Premiums
Paid
(Received) | Unrealized
Appreciation
(Depreciation) | Value^ |
| Markit CDX North America High Yield Index Series 30 | Buy | (5.00%) | 6/20/23 | $ | 16,500,000 |
| $ | (1,199,533 | ) | $ | 101,420 |
| $ | (1,098,113 | ) |
^The value for credit default swap agreements serve as an indicator of the current status of the
payment/performance risk and represent the likelihood of an expected liability or profit at the period end. Increasing values in absolute terms when compared to the notional amount of the credit default swap agreement represent a deterioration of the referenced entity's credit soundness and an increased likelihood or risk of a credit event occurring as defined in the agreement.
|
| | | | | | | | | | | | | | | |
| CENTRALLY CLEARED INTEREST RATE SWAP AGREEMENTS |
| Floating Rate Index | Pay/Receive Floating Rate Index | Fixed Rate | Termination Date | Notional Amount | Premiums
Paid
(Received) | Unrealized Appreciation (Depreciation) | Value |
| MXIBTIIE | Pay | 7.84% | 8/7/23 | MXN | 93,000,000 |
| $ | 526 |
| $ | (180,853 | ) | $ | (180,327 | ) |
| MXIBTIIE | Pay | 7.92% | 8/8/23 | MXN | 90,000,000 |
| 519 |
| (160,624 | ) | (160,105 | ) |
| MXIBTIIE | Pay | 7.99% | 8/10/23 | MXN | 185,000,000 |
| 541 |
| (304,501 | ) | (303,960 | ) |
| MXIBTIIE | Pay | 7.99% | 8/10/23 | MXN | 185,000,000 |
| 541 |
| (304,501 | ) | (303,960 | ) |
| | $ | 2,127 |
| $ | (950,479 | ) | $ | (948,352 | ) |
|
| | | | | | | | | | |
| INTEREST RATE SWAP AGREEMENTS |
| Counterparty | Floating
Rate Index | Pay/Receive
Floating Rate
Index | Fixed Rate | Termination
Date | Notional
Amount | Value* |
| Morgan Stanley | BUBOR06M | Receive | 0.97% | 6/21/20 | HUF | 1,343,000,000 |
| $ | (11,842 | ) |
* Amount represents value and unrealized appreciation (depreciation).
|
| | | | | |
| NOTES TO SCHEDULE OF INVESTMENTS | | | |
| AUD | - | Australian Dollar | MXIBTIIE | - | 28-day Mexico Interbank Equilibrium Interest Rate Index |
| BRL | - | Brazilian Real | MXN | - | Mexican Peso |
| BUBOR06M | - | 6-month Budapest Interbank Offered Rate | MYR | - | Malaysian Ringgit |
| CAD | - | Canadian Dollar | NOK | - | Norwegian Krone |
| CDX | - | Credit Derivatives Indexes | NZD | - | New Zealand Dollar |
| CHF | - | Swiss Franc | PEN | - | Peruvian Sol |
| CLP | - | Chilean Peso | PHP | - | Philippine Peso |
| COP | - | Colombian Peso | PLN | - | Polish Zloty |
| CZK | - | Czech Koruna | resets | - | The frequency with which a security's coupon changes, based on current market conditions or an underlying index. |
| DKK | - | Danish Krone |
| EUR | - | Euro | RUB | - | Russian Ruble |
| FHLMC | - | Federal Home Loan Mortgage Corporation | SEK | - | Swedish Krona |
| GBP | - | British Pound | SEQ | - | Sequential Payer |
| HKD | - | Hong Kong Dollar | SGD | - | Singapore Dollar |
| HUF | - | Hungarian Forint | THB | - | Thai Baht |
| IDR | - | Indonesian Rupiah | TRY | - | Turkish Lira |
| ILS | - | Israeli Shekel | USD | - | United States Dollar |
| JPY | - | Japanese Yen | VRN | - | Variable Rate Note. Interest reset date is indicated. Rate shown is effective at the period end. |
| KRW | - | South Korean Won |
| LIBOR | - | London Interbank Offered Rate | ZAR | - | South African Rand |
| MTN | - | Medium Term Note | | | |
| |
| (1) | Security was purchased pursuant to Rule 144A under the Securities Act of 1933 and may be sold in transactions exempt from registration, normally to qualified institutional investors. The aggregate value of these securities at the period end was $146,220,111, which represented 22.3% of total net assets. |
| |
| (2) | Coupon rate adjusts periodically based upon a predetermined schedule. Interest reset date is indicated. Rate shown is effective at the period end. |
| |
| (3) | Final maturity date indicated, unless otherwise noted. |
| |
| (4) | The interest rate resets periodically based on the weighted average coupons of the underlying mortgage-related or asset-backed obligations. |
| |
| (5) | The interest rate on a bank loan obligation adjusts periodically based on a predetermined schedule. Rate shown is effective at period end. The maturity date on a bank loan obligation may be less than indicated as a result of contractual or optional prepayments. These prepayments cannot be predicted with certainty. Final maturity date is indicated. |
| |
| (6) | Security, or a portion thereof, has been pledged at the custodian bank or with a broker for collateral requirements on forward foreign currency exchange contracts, futures contracts and/or swap agreements. At the period end, the aggregate value of securities pledged was $3,036,763. |
| |
| (7) | The rate indicated is the yield to maturity at purchase. |
See Notes to Financial Statements.
|
|
| Statement of Assets and Liabilities |
|
| | | |
| OCTOBER 31, 2018 | |
| Assets | |
| Investment securities, at value (cost of $667,809,335) | $ | 649,618,223 |
|
| Foreign currency holdings, at value (cost of $884,049) | 824,916 |
|
| Foreign deposits with broker for futures contracts, at value (cost of $1,152,284) | 1,121,475 |
|
| Receivable for investments sold | 697,071 |
|
| Receivable for capital shares sold | 730,653 |
|
| Receivable for variation margin on futures contracts | 305,144 |
|
| Unrealized appreciation on forward foreign currency exchange contracts | 1,884,852 |
|
| Interest receivable | 6,232,293 |
|
| | 661,414,627 |
|
| | |
| Liabilities | |
| Disbursements in excess of demand deposit cash | 34,312 |
|
| Payable for investments purchased | 549,853 |
|
| Payable for capital shares redeemed | 39,613 |
|
| Payable for variation margin on futures contracts | 74,320 |
|
| Payable for variation margin on swap agreements | 236,265 |
|
| Unrealized depreciation on forward foreign currency exchange contracts | 4,064,737 |
|
| Swap agreements, at value | 11,842 |
|
| Accrued management fees | 301,489 |
|
| Distribution and service fees payable | 2,473 |
|
| | 5,314,904 |
|
| | |
| Net Assets | $ | 656,099,723 |
|
| | |
| Net Assets Consist of: | |
| Capital paid in | $ | 666,881,372 |
|
| Distributable earnings | (10,781,649 | ) |
| | $ | 656,099,723 |
|
|
| | | | | | |
| | Net Assets | Shares Outstanding | Net Asset Value Per Share |
| Investor Class |
| $407,913,028 |
| 32,895,681 |
| $12.40 |
| I Class |
| $18,592,024 |
| 1,494,217 |
| $12.44 |
| Y Class |
| $3,766,496 |
| 302,108 |
| $12.47 |
| A Class |
| $9,192,396 |
| 750,517 |
| $12.25* |
| C Class |
| $481,906 |
| 40,624 |
| $11.86 |
| R Class |
| $67,888 |
| 5,588 |
| $12.15 |
| R5 Class |
| $5,607,681 |
| 449,929 |
| $12.46 |
| R6 Class |
| $2,691,026 |
| 215,751 |
| $12.47 |
| G Class |
| $207,787,278 |
| 16,546,210 |
| $12.56 |
*Maximum offering price $12.83 (net asset value divided by 0.955).
See Notes to Financial Statements.
|
| | | |
| YEAR ENDED OCTOBER 31, 2018 | |
| Investment Income (Loss) | |
| Income: | |
| Interest (net of foreign taxes withheld of $19,960) | $ | 18,408,527 |
|
| | |
| Expenses: | |
| Management fees | 5,029,823 |
|
| Distribution and service fees: | |
| A Class | 27,358 |
|
| C Class | 6,509 |
|
| R Class | 556 |
|
| Trustees' fees and expenses | 45,629 |
|
| Other expenses | 61,451 |
|
| | 5,171,326 |
|
| Fees waived - G Class | (1,268,405 | ) |
| | 3,902,921 |
|
| | |
| Net investment income (loss) | 14,505,606 |
|
| | |
| Realized and Unrealized Gain (Loss) | |
| Net realized gain (loss) on: | |
| Investment transactions | 4,376,197 |
|
| Forward foreign currency exchange contract transactions | (4,356,964 | ) |
| Futures contract transactions | (1,647,719 | ) |
| Swap agreement transactions | 624,544 |
|
| Foreign currency translation transactions | 5,777 |
|
| | (998,165 | ) |
| | |
| Change in net unrealized appreciation (depreciation) on: | |
| Investments | (36,639,921 | ) |
| Forward foreign currency exchange contracts | (1,372,547 | ) |
| Futures contracts | 1,759,341 |
|
| Swap agreements | 234,385 |
|
| Translation of assets and liabilities in foreign currencies | (267,083 | ) |
| | (36,285,825 | ) |
| | |
| Net realized and unrealized gain (loss) | (37,283,990 | ) |
| | |
| Net Increase (Decrease) in Net Assets Resulting from Operations | $ | (22,778,384 | ) |
See Notes to Financial Statements.
|
|
| Statement of Changes in Net Assets |
|
| | | | | | |
| YEARS ENDED OCTOBER 31, 2018 AND OCTOBER 31, 2017 |
| Increase (Decrease) in Net Assets | October 31, 2018 | October 31, 2017 |
| Operations | | |
| Net investment income (loss) | $ | 14,505,606 |
| $ | 8,381,058 |
|
| Net realized gain (loss) | (998,165 | ) | (14,232,083 | ) |
| Change in net unrealized appreciation (depreciation) | (36,285,825 | ) | 22,755,206 |
|
| Net increase (decrease) in net assets resulting from operations | (22,778,384 | ) | 16,904,181 |
|
| | | |
| Distributions to Shareholders | | |
| From earnings: | | |
| Investor Class | (1,552,619 | ) | — |
|
| I Class | (73,143 | ) | — |
|
| Y Class | (19 | ) | — |
|
| A Class | (37,161 | ) | — |
|
| C Class | (2,955 | ) | — |
|
| R Class | (562 | ) | — |
|
| R5 Class | (21,375 | ) | — |
|
| R6 Class | (13,173 | ) | — |
|
| G Class | (795,266 | ) | — |
|
| Decrease in net assets from distributions | (2,496,273 | ) | — |
|
| | | |
| Capital Share Transactions | | |
| Net increase (decrease) in net assets from capital share transactions (Note 5) | (268,520,182 | ) | 57,417,033 |
|
| | | |
| Net increase (decrease) in net assets | (293,794,839 | ) | 74,321,214 |
|
| | | |
| Net Assets | | |
| Beginning of period | 949,894,562 |
| 875,573,348 |
|
| End of period | $ | 656,099,723 |
| $ | 949,894,562 |
|
See Notes to Financial Statements.
|
|
| Notes to Financial Statements |
OCTOBER 31, 2018
1. Organization
American Century International Bond Funds (the trust) is registered under the Investment Company Act of 1940, as amended (the 1940 Act), as an open-end management investment company and is organized as a Massachusetts business trust. International Bond Fund (the fund) is one fund in a series issued by the trust. The fund’s investment objective is to seek total return.
The fund offers the Investor Class, I Class, Y Class, A Class, C Class, R Class, R5 Class, R6 Class and G Class. The A Class may incur an initial sales charge. The A Class and C Class may be subject to a contingent deferred sales charge. Sale of the I Class and Y Class commenced on April 10, 2017 and sale of the G Class commenced on July 28, 2017.
2. Significant Accounting Policies
The following is a summary of significant accounting policies consistently followed by the fund in preparation of its financial statements. The fund is an investment company and follows accounting and reporting guidance in accordance with accounting principles generally accepted in the United States of America. This may require management to make certain estimates and assumptions at the date of the financial statements. Actual results could differ from these estimates. Management evaluated the impact of events or transactions occurring through the date the financial statements were issued that would merit recognition or disclosure.
Investment Valuations — The fund determines the fair value of its investments and computes its net asset value per share at the close of regular trading (usually 4 p.m. Eastern time) on the New York Stock Exchange (NYSE) on each day the NYSE is open. The Board of Trustees has adopted valuation policies and procedures to guide the investment advisor in the fund’s investment valuation process and to provide methodologies for the oversight of the fund’s pricing function.
Fixed income securities are valued at the evaluated mean as provided by independent pricing services or at the mean of the most recent bid and asked prices as provided by investment dealers. Sovereign governments and agencies, corporate bonds, bank loan obligations, and U.S. Treasury and Government Agency securities are valued using market models that consider trade data, quotations from dealers and active market makers, relevant yield curve and spread data, creditworthiness, trade data or market information on comparable securities, and other relevant security specific information. Mortgage-related and asset-backed securities are valued based on models that consider trade data, prepayment and default projections, benchmark yield and spread data and estimated cash flows of each tranche of the issuer. Collateralized loan obligations are valued based on discounted cash flow models that consider trade and economic data, prepayment assumptions and default projections. Fixed income securities initially expressed in local currencies are translated into U.S. dollars at the mean of the appropriate currency exchange rate at the close of the NYSE as provided by an independent pricing service.
Open-end management investment companies are valued at the reported net asset value per share. Repurchase agreements are valued at cost, which approximates fair value. Exchange-traded futures contracts are valued at the settlement price as provided by the appropriate exchange. Swap agreements are valued at an evaluated mean as provided by independent pricing services or independent brokers. Forward foreign currency exchange contracts are valued at the mean of the appropriate forward exchange rate at the close of the NYSE as provided by an independent pricing service. Investments initially expressed in local currencies are translated into U.S. dollars at the mean of the appropriate currency exchange rate at the close of the NYSE as provided by an independent pricing service.
If the fund determines that the market price for an investment is not readily available or the valuation methods mentioned above do not reflect an investment’s fair value, such investment is valued as determined in good faith by the Board of Trustees or its delegate, in accordance with policies and procedures adopted by the Board of Trustees. In its determination of fair value, the fund may review several factors including, but not limited to, market information regarding the specific investment or comparable investments and correlation with other investment types, futures indices or general market indicators. Circumstances that may cause the fund to use these procedures to value an investment include, but are not limited to: an investment has been declared in default or is distressed; trading in a security has been suspended during the trading day or a security is not actively trading on its principal exchange; prices received from a regular pricing source are deemed unreliable; or there is a foreign market holiday and no trading occurred.
The fund monitors for significant events occurring after the close of an investment’s primary exchange but before the fund’s net asset value per share is determined. Significant events may include, but are not limited to: corporate announcements and transactions; governmental action and political unrest that could impact a specific investment or an investment sector; or armed conflicts, natural disasters and similar events that could affect investments in a specific country or region.
Security Transactions — Security transactions are accounted for as of the trade date. Net realized gains and losses are determined on the identified cost basis, which is also used for federal income tax purposes.
Investment Income — Interest income less foreign taxes withheld, if any, is recorded on the accrual basis and includes paydown gain (loss) and accretion of discounts and amortization of premiums. Inflation adjustments related to inflation-linked debt securities are reflected as interest income.
Foreign Currency Translations — All assets and liabilities initially expressed in foreign currencies are translated into U.S. dollars at prevailing exchange rates at period end. The fund may enter into spot foreign currency exchange contracts to facilitate transactions denominated in a foreign currency. Purchases and sales of investment securities, dividend and interest income, spot foreign currency exchange contracts, and expenses are translated at the rates of exchange prevailing on the respective dates of such transactions. Net realized and unrealized foreign currency exchange gains or losses related to investment securities are a component of net realized gain (loss) on investment transactions and change in net unrealized appreciation (depreciation) on investments, respectively.
Repurchase Agreements — The fund may enter into repurchase agreements with institutions that American Century Investment Management, Inc. (ACIM) (the investment advisor) has determined are creditworthy pursuant to criteria adopted by the Board of Trustees. The fund requires that the collateral, represented by securities, received in a repurchase transaction be transferred to the custodian in a manner sufficient to enable the fund to obtain those securities in the event of a default under the repurchase agreement. ACIM monitors, on a daily basis, the securities transferred to ensure the value, including accrued interest, of the securities under each repurchase agreement is equal to or greater than amounts owed to the fund under each repurchase agreement.
Joint Trading Account — Pursuant to an Exemptive Order issued by the Securities and Exchange Commission, the fund, along with certain other funds in the American Century Investments family of funds, may transfer uninvested cash balances into a joint trading account. These balances are invested in one or more repurchase agreements that are collateralized by U.S. Treasury or Agency obligations.
Segregated Assets — In accordance with the 1940 Act, the fund segregates assets on its books and records to cover certain types of investment securities and other financial instruments. ACIM monitors, on a daily basis, the securities segregated to ensure the fund designates a sufficient amount of liquid assets, marked-to-market daily. The fund may also receive assets or be required to pledge assets at the custodian bank or with a broker for collateral requirements.
Income Tax Status — It is the fund’s policy to distribute substantially all net investment income and net realized gains to shareholders and to otherwise qualify as a regulated investment company under provisions of the Internal Revenue Code. Accordingly, no provision has been made for income taxes. The fund files U.S. federal, state, local and non-U.S. tax returns as applicable. The fund's tax returns are subject to examination by the relevant taxing authority until expiration of the applicable statute of limitations, which is generally three years from the date of filing but can be longer in certain jurisdictions. At this time, management believes there are no uncertain tax positions which, based on their technical merit, would not be sustained upon examination and for which it is reasonably possible that the total amounts of unrecognized tax benefits will significantly change in the next twelve months.
Multiple Class — All shares of the fund represent an equal pro rata interest in the net assets of the class to which such shares belong, and have identical voting, dividend, liquidation and other rights and the same terms and conditions, except for class specific expenses and exclusive rights to vote on matters affecting only individual classes. Income, non-class specific expenses, and realized and unrealized capital gains and losses of the fund are allocated to each class of shares based on their relative net assets.
Distributions to Shareholders — Distributions from net investment income, if any, are generally declared and paid quarterly, but may be paid less frequently. Distributions from net realized gains, if any, are generally declared and paid annually.
Indemnifications — Under the trust’s organizational documents, its officers and trustees are indemnified against certain liabilities arising out of the performance of their duties to the fund. In addition, in the normal course of business, the fund enters into contracts that provide general indemnifications. The maximum exposure under these arrangements is unknown as this would involve future claims that may be made against a fund. The risk of material loss from such claims is considered by management to be remote.
3. Fees and Transactions with Related Parties
Certain officers and trustees of the trust are also officers and/or directors of American Century Companies, Inc. (ACC). The trust's investment advisor, ACIM, the trust's distributor, American Century Investment Services, Inc. (ACIS), and the trust's transfer agent, American Century Services, LLC, are wholly owned, directly or indirectly, by ACC. Various funds issued by American Century Asset Allocation Portfolios, Inc. own, in aggregate, 52% of the shares of the fund. Related parties do not invest in the fund for the purpose of exercising management or control.
Management Fees — The trust has entered into a management agreement with ACIM, under which ACIM provides the fund with investment advisory and management services in exchange for a single, unified management fee (the fee) per class. The agreement provides that all expenses of managing and operating the fund, except distribution and service fees, brokerage expenses, taxes, interest, fees and expenses of the independent trustees (including legal counsel fees), and extraordinary expenses, will be paid by ACIM. The fee is computed and accrued daily based on each class's daily net assets and paid monthly in arrears. The difference in the fee among the classes is a result of their separate arrangements for non-Rule 12b-1 shareholder services. It is not the result of any difference in advisory or custodial fees or other expenses related to the management of the fund’s assets, which do not vary by class. The fee consists of (1) an Investment Category Fee based on the daily net assets of the fund and certain other accounts managed by the investment advisor that are in the same broad investment category as the fund and (2) a Complex Fee based on the assets of all the funds in the American Century Investments family of funds. The investment advisor agreed to waive the G Class’s management fee in its entirety. The investment advisor expects this waiver to remain in effect permanently and cannot terminate it without the approval of the Board of Trustees.
The Investment Category Fee range, the Complex Fee range and the effective annual management fee for each class for the period ended October 31, 2018 are as follows:
|
| | | |
| | Investment Category Fee Range | Complex Fee Range | Effective Annual Management Fee |
| Investor Class | 0.4925%
to 0.6100% | 0.2500% to 0.3100% | 0.79% |
| I Class | 0.1500% to 0.2100% | 0.69% |
| Y Class | 0.0500% to 0.1100% | 0.59% |
| A Class | 0.2500% to 0.3100% | 0.79% |
| C Class | 0.2500% to 0.3100% | 0.79% |
| R Class | 0.2500% to 0.3100% | 0.79% |
| R5 Class | 0.0500% to 0.1100% | 0.59% |
| R6 Class | 0.0000% to 0.0600% | 0.54% |
| G Class | 0.0000% to 0.0600% | 0.00%(1) |
| |
| (1) | Effective annual management fee before waiver was 0.54%. |
Distribution and Service Fees — The Board of Trustees has adopted a separate Master Distribution and Individual Shareholder Services Plan for each of the A Class, C Class and R Class (collectively the plans), pursuant to Rule 12b-1 of the 1940 Act. The plans provide that the A Class will pay ACIS an annual distribution and service fee of 0.25%. The plans provide that the C Class will pay ACIS an annual distribution and service fee of 1.00%, of which 0.25% is paid for individual shareholder services and 0.75% is paid for distribution services. The plans provide that the R Class will pay ACIS an annual distribution and service fee of 0.50%. The fees are computed and accrued daily based on each class’s daily net assets and paid monthly in arrears. The fees are used to pay financial intermediaries for distribution and individual shareholder services. Fees incurred under the plans during the period ended October 31, 2018 are detailed in the Statement of Operations.
Trustees’ Fees and Expenses — The Board of Trustees is responsible for overseeing the investment advisor’s management and operations of the fund. The trustees receive detailed information about the fund and its investment advisor regularly throughout the year, and meet at least quarterly with management of the investment advisor to review reports about fund operations. The fund’s officers do not receive compensation from the fund.
Interfund Transactions — The fund may enter into security transactions with other American Century Investments funds and other client accounts of the investment advisor, in accordance with the 1940 Act rules and procedures adopted by the Board of Trustees. The rules and procedures require, among other things, that these transactions be effected at the independent current market price of the security. There were no interfund transactions during the period.
4. Investment Transactions
Purchases of investment securities, excluding short-term investments, for the period ended October 31, 2018 totaled $280,654,927, none of which were U.S. Treasury and Government Agency obligations.
Sales of investment securities, excluding short-term investments, for the period ended October 31, 2018 totaled $512,789,531, of which $8,679,819 represented U.S. Treasury and Government Agency obligations.
5. Capital Share Transactions
Transactions in shares of the fund were as follows (unlimited number of shares authorized):
|
| | | | | | | | | | |
| | Year ended
October 31, 2018 | Year ended October 31, 2017(1) |
| | Shares | Amount | Shares | Amount |
| Investor Class | | | | |
| Sold | 4,270,722 |
| $ | 55,915,494 |
| 10,099,436 |
| $ | 127,117,045 |
|
| Issued in reinvestment of distributions | 117,358 |
| 1,533,870 |
| — |
| — |
|
| Redeemed | (6,409,733 | ) | (83,634,807 | ) | (9,083,786 | ) | (115,424,782 | ) |
| | (2,021,653 | ) | (26,185,443 | ) | 1,015,650 |
| 11,692,263 |
|
| I Class | | | | |
| Sold | 891,721 |
| 11,765,128 |
| 1,887,749 |
| 24,258,234 |
|
| Issued in reinvestment of distributions | 5,465 |
| 71,595 |
| — |
| — |
|
| Redeemed | (1,002,846 | ) | (12,995,408 | ) | (287,872 | ) | (3,721,861 | ) |
| | (105,660 | ) | (1,158,685 | ) | 1,599,877 |
| 20,536,373 |
|
| Y Class | | | | |
| Sold | 305,051 |
| 3,932,168 |
| 406 |
| 5,000 |
|
| Issued in reinvestment of distributions | 1 |
| 19 |
| — |
| — |
|
| Redeemed | (3,350 | ) | (42,863 | ) | — |
| — |
|
| | 301,702 |
| 3,889,324 |
| 406 |
| 5,000 |
|
| A Class | | | | |
| Sold | 371,109 |
| 4,820,015 |
| 1,251,508 |
| 15,802,156 |
|
| Issued in reinvestment of distributions | 2,844 |
| 36,795 |
| — |
| — |
|
| Redeemed | (483,020 | ) | (6,144,144 | ) | (1,818,672 | ) | (23,026,030 | ) |
| | (109,067 | ) | (1,287,334 | ) | (567,164 | ) | (7,223,874 | ) |
| C Class | | | | |
| Sold | 1,359 |
| 17,637 |
| 16,047 |
| 197,701 |
|
| Issued in reinvestment of distributions | 184 |
| 2,316 |
| — |
| — |
|
| Redeemed | (25,739 | ) | (327,652 | ) | (33,850 | ) | (415,463 | ) |
| | (24,196 | ) | (307,699 | ) | (17,803 | ) | (217,762 | ) |
| R Class | | | | |
| Sold | 4,917 |
| 63,023 |
| 1,802 |
| 22,251 |
|
| Issued in reinvestment of distributions | 39 |
| 507 |
| — |
| — |
|
| Redeemed | (11,183 | ) | (143,842 | ) | (523 | ) | (6,296 | ) |
| | (6,227 | ) | (80,312 | ) | 1,279 |
| 15,955 |
|
| R5 Class | | | | |
| Sold | 10,885 |
| 143,638 |
| 5,348,925 |
| 65,207,407 |
|
| Issued in reinvestment of distributions | 1,629 |
| 21,362 |
| — |
| — |
|
| Redeemed | (24,543 | ) | (326,158 | ) | (33,952,869 | ) | (443,824,947 | ) |
| | (12,029 | ) | (161,158 | ) | (28,603,944 | ) | (378,617,540 | ) |
| R6 Class | | | | |
| Sold | 54,471 |
| 716,330 |
| 1,702,694 |
| 20,846,709 |
|
| Issued in reinvestment of distributions | 1,004 |
| 13,173 |
| — |
| — |
|
| Redeemed | (131,949 | ) | (1,692,580 | ) | (5,196,446 | ) | (67,726,783 | ) |
| | (76,474 | ) | (963,077 | ) | (3,493,752 | ) | (46,880,074 | ) |
| G Class | | | | |
| Sold | 988,356 |
| 12,888,893 |
| 35,641,483 |
| 467,666,876 |
|
| Issued in reinvestment of distributions | 60,477 |
| 795,266 |
| — |
| — |
|
| Redeemed | (19,423,363 | ) | (255,949,957 | ) | (720,743 | ) | (9,560,184 | ) |
| | (18,374,530 | ) | (242,265,798 | ) | 34,920,740 |
| 458,106,692 |
|
| Net increase (decrease) | (20,428,134 | ) | $ | (268,520,182 | ) | 4,855,289 |
| $ | 57,417,033 |
|
| |
| (1) | April 10, 2017 (commencement of sale) through October 31, 2017 for the I Class and Y Class and |
July 28, 2017 (commencement of sale) through October 31, 2017 for the G Class.
6. Fair Value Measurements
The fund’s investments valuation process is based on several considerations and may use multiple inputs to determine the fair value of the investments held by the fund. In conformity with accounting principles generally accepted in the United States of America, the inputs used to determine a valuation are classified into three broad levels.
| |
| • | Level 1 valuation inputs consist of unadjusted quoted prices in an active market for identical investments. |
| |
| • | Level 2 valuation inputs consist of direct or indirect observable market data (including quoted prices for comparable investments, evaluations of subsequent market events, interest rates, prepayment speeds, credit risk, etc.). These inputs also consist of quoted prices for identical investments initially expressed in local currencies that are adjusted through translation into U.S. dollars. |
| |
| • | Level 3 valuation inputs consist of unobservable data (including a fund’s own assumptions). |
The level classification is based on the lowest level input that is significant to the fair valuation measurement. The valuation inputs are not necessarily an indication of the risks associated with investing in these securities or other financial instruments.
The following is a summary of the level classifications as of period end. The Schedule of Investments provides additional information on the fund’s portfolio holdings.
|
| | | | | | | | |
| | Level 1 | Level 2 | Level 3 |
| Assets | | | |
| Investment Securities | | | |
| Sovereign Governments and Agencies | — |
| $ | 395,828,769 |
| — |
|
| Corporate Bonds | — |
| 170,170,137 |
| — |
|
| Asset-Backed Securities | — |
| 25,222,710 |
| — |
|
| Collateralized Loan Obligations | — |
| 18,368,959 |
| — |
|
| Bank Loan Obligations | — |
| 14,620,928 |
| — |
|
| Collateralized Mortgage Obligations | — |
| 11,931,851 |
| — |
|
| Commercial Mortgage-Backed Securities | — |
| 8,483,939 |
| — |
|
| Temporary Cash Investments | $ | 17,296 |
| 4,973,634 |
| — |
|
| | $ | 17,296 |
| $ | 649,600,927 |
| — |
|
| Other Financial Instruments | | | |
| Futures Contracts | $ | 1,236,832 |
| $ | 181,342 |
| — |
|
| Forward Foreign Currency Exchange Contracts | — |
| 1,884,852 |
| — |
|
| | $ | 1,236,832 |
| $ | 2,066,194 |
| — |
|
| | | | |
| Liabilities | | | |
| Other Financial Instruments | | | |
| Futures Contracts | — |
| $ | 141,343 |
| — |
|
| Swap Agreements | — |
| 2,058,307 |
| — |
|
| Forward Foreign Currency Exchange Contracts | — |
| 4,064,737 |
| — |
|
| | — |
| $ | 6,264,387 |
| — |
|
7. Derivative Instruments
Credit Risk — The fund is subject to credit risk in the normal course of pursuing its investment objectives. The value of a bond generally declines as the credit quality of its issuer declines. Credit default swap agreements enable a fund to buy/sell protection against a credit event of a specific issuer or index. A fund may attempt to enhance returns by selling protection or attempt to mitigate credit risk by buying protection. The buyer/seller of credit protection against a security or basket of securities may pay/receive an up-front or periodic payment to compensate for/against potential default events. Changes in value, including the periodic amounts of interest to be paid or received on swap agreements, are recorded as unrealized appreciation (depreciation) on swap agreements. Upon entering into a centrally cleared swap, a fund is required to deposit cash or securities (initial margin) with a financial intermediary in an amount equal to a certain percentage of the notional amount. Subsequent payments (variation margin) are made or received daily, in cash, by a fund. The variation margin is equal to the daily change in the value and is a component of unrealized gains and losses. Realized gain or loss is recorded upon receipt or payment of a periodic settlement or termination of swap agreements. Net realized and unrealized gains or losses occurring during the holding period of swap agreements are a component of net realized gain (loss) on swap agreement transactions and change in net unrealized appreciation (depreciation) on swap agreements, respectively. The risks of entering into swap agreements include the possible lack of liquidity, failure of the counterparty to meet its obligations, and that there may be unfavorable changes in the underlying investments or instruments. The fund's average notional amount held during the period was $21,275,000.
Foreign Currency Risk — The fund is subject to foreign currency exchange rate risk in the normal course of pursuing its investment objectives. The value of foreign investments held by a fund may be significantly affected by changes in foreign currency exchange rates. The dollar value of a foreign security generally decreases when the value of the dollar rises against the foreign currency in which the security is denominated and tends to increase when the value of the dollar declines against such foreign currency. A fund may enter into forward foreign currency exchange contracts to reduce a fund's exposure to foreign currency exchange rate fluctuations or to gain exposure to the fluctuations in the value of foreign currencies. The net U.S. dollar value of foreign currency underlying all contractual commitments held by a fund and the resulting unrealized appreciation or depreciation are determined daily. Realized gain or loss is recorded upon the termination of the contract. Net realized and unrealized gains or losses occurring during the holding period of forward foreign currency exchange contracts are a component of net realized gain (loss) on forward foreign currency exchange contract transactions and change in net unrealized appreciation (depreciation) on forward foreign currency exchange contracts, respectively. A fund bears the risk of an unfavorable change in the foreign currency exchange rate underlying the forward contract. Additionally, losses, up to the fair value, may arise if the counterparties do not perform under the contract terms. The fund's average U.S. dollar exposure to foreign currency risk derivative instruments held during the period was $551,309,384.
Interest Rate Risk — The fund is subject to interest rate risk in the normal course of pursuing its investment objectives. A fund may enter into futures contracts or interest rate swap agreements in order to manage its exposure to changes in market conditions. The value of bonds generally declines as interest rates rise. The risks of entering into interest rate risk derivative instruments include the possible lack of liquidity, failure of the counterparty to meet its obligations, and that there may be unfavorable changes in the underlying investments or instruments.
A fund may enter into futures contracts based on a bond index or a specific underlying security. A fund may purchase futures contracts to gain exposure to increases in market value or sell futures contracts to protect against a decline in market value. Upon entering into a futures contract, a fund will segregate cash, cash equivalents or other appropriate liquid securities on its records in amounts sufficient to meet requirements. Subsequent payments (variation margin) are made or received daily, in cash, by a fund. The variation margin is equal to the daily change in the contract value and is recorded as unrealized gains and losses. A fund recognizes a realized gain or loss when the futures contract is closed or expires. Net realized and unrealized gains or losses occurring during the holding period of futures contracts are a component of net realized gain (loss) on futures contract transactions and change in net unrealized appreciation (depreciation) on futures contracts, respectively. The fund's average notional exposure to these interest rate risk derivative instruments held during the period was $46,556,641 futures contracts purchased and $98,447,425 futures contracts sold.
A fund may enter into interest rate swap agreements to gain exposure to declines in interest rates, to protect against increases in interest rates, or to maintain its ability to generate income at prevailing interest rates. A fund will segregate cash, cash equivalents or other appropriate liquid securities on its records in amounts sufficient to meet requirements. Changes in value, including the periodic amounts of interest to be paid or received on swap agreements, are recorded as unrealized appreciation (depreciation) on swap agreements. Upon entering into a centrally cleared swap, a fund is required to deposit cash or securities (initial margin) with a financial intermediary in an amount equal to a certain percentage of the notional amount. Subsequent payments (variation margin) are made or received daily, in cash, by a fund. The variation margin is equal to the daily change in the value and is a component of unrealized gains and losses. Realized gain or loss is recorded upon receipt or payment of a periodic settlement or termination of swap agreements. Net realized and unrealized gains or losses occurring during the holding period of swap agreements are a component of net realized gain (loss) on swap agreement transactions and change in net unrealized appreciation (depreciation) on swap agreements, respectively. The fund's average notional amount on interest rate swap agreements held during the period was $140,885,299.
Other Contracts — A fund may enter into total return swap agreements in order to attempt to obtain or preserve a particular return or spread at a lower cost than obtaining a return or spread through purchases and/or sales of instruments in other markets or gain exposure to certain markets in the most economical way possible. A fund will segregate cash, cash equivalents or other appropriate liquid securities on its records in amounts sufficient to meet requirements. Changes in value, including the periodic amounts of interest to be paid or received on swap agreements, are recorded as unrealized appreciation (depreciation) on swap agreements. Upon entering into a centrally cleared swap, a fund is required to deposit cash or securities (initial margin) with a financial intermediary in an amount equal to a certain percentage of the notional amount. Subsequent payments (variation margin) are made or received daily, in cash, by a fund. The variation margin is equal to the daily change in the value and is a component of unrealized gains and losses. Realized gain or loss is recorded upon receipt or payment of a periodic settlement or termination of swap agreements. Net realized and unrealized gains or losses occurring during the holding period of swap agreements are a component of net realized gain (loss) on swap agreement transactions and change in net unrealized appreciation (depreciation) on swap agreements, respectively. The risks of entering into swap agreements include the possible lack of liquidity, failure of the counterparty to meet its obligations, and that there may be unfavorable changes in the underlying investments or instruments, including inflationary risk. The fund's average notional amount held during the period was $28,944,444.
Value of Derivative Instruments as of October 31, 2018
|
| | | | | | | | |
| | Asset Derivatives | Liability Derivatives |
| Type of Risk Exposure | Location on Statement of Assets and Liabilities | Value | Location on Statement of Assets and Liabilities | Value |
| Credit Risk | Receivable for variation margin on swap agreements* | — |
| Payable for variation margin on swap agreements* | $ | 34,898 |
|
| Foreign Currency Risk | Unrealized appreciation on forward foreign currency exchange contracts | $ | 1,884,852 |
| Unrealized depreciation on forward foreign currency exchange contracts | 4,064,737 |
|
| Interest Rate Risk | Receivable for variation margin on futures contracts* | 305,144 |
| Payable for variation margin on futures contracts* | 74,320 |
|
| Interest Rate Risk | Receivable for variation margin on swap agreements* | — |
| Payable for variation margin on swap agreements* | 201,367 |
|
| Interest Rate Risk | Swap agreements | — |
| Swap agreements | 11,842 |
|
| | | $ | 2,189,996 |
| | $ | 4,387,164 |
|
*Included in the unrealized appreciation (depreciation) on centrally cleared swap agreements or futures contracts, as applicable, as reported in the Schedule of Investments.
Effect of Derivative Instruments on the Statement of Operations for the Year Ended October 31, 2018
|
| | | | | | | | |
| | Net Realized Gain (Loss) | Change in Net Unrealized Appreciation (Depreciation) |
| Type of Risk Exposure | Location on Statement of Operations | Value | Location on Statement of Operations | Value |
| Credit Risk | Net realized gain (loss) on swap agreement transactions | $ | 1,385,064 |
| Change in net unrealized appreciation (depreciation) on swap agreements | $ | (395,424 | ) |
| Foreign Currency Risk | Net realized gain (loss) on forward foreign currency exchange contract transactions | (4,356,964 | ) | Change in net unrealized appreciation (depreciation) on forward foreign currency exchange contracts | (1,372,547 | ) |
| Interest Rate Risk | Net realized gain (loss) on futures contract transactions | (1,647,719 | ) | Change in net unrealized appreciation (depreciation) on futures contracts | 1,759,341 |
|
| Interest Rate Risk | Net realized gain (loss) on swap agreement transactions | (914,971 | ) | Change in net unrealized appreciation (depreciation) on swap agreements | 125,597 |
|
| Other Contracts | Net realized gain (loss) on swap agreement transactions | 154,451 |
| Change in net unrealized appreciation (depreciation) on swap agreements | 504,212 |
|
| | | $ | (5,380,139 | ) | | $ | 621,179 |
|
8. Risk Factors
There are certain risks involved in investing in foreign securities. These risks include those resulting from future adverse political, social and economic developments, fluctuations in currency exchange rates, the possible imposition of exchange controls, and other foreign laws or restrictions. Investing in emerging markets may accentuate these risks.
9. Federal Tax Information
The tax character of distributions paid during the years ended October 31, 2018 and October 31, 2017 were as follows:
|
| | | | | |
| | 2018 | 2017 |
| Distributions Paid From | | |
| Ordinary income | $ | 1,439 |
| — |
|
| Long-term capital gains | $ | 2,494,834 |
| — |
|
The book-basis character of distributions made during the year from net investment income or net realized gains may differ from their ultimate characterization for federal income tax purposes. These differences reflect the differing character of certain income items and net realized gains and losses for financial statement and tax purposes, and may result in reclassification among certain capital accounts on the financial statements.
As of period end, the federal tax cost of investments and the components of distributable earnings on a tax-basis were as follows:
|
| | | |
| Federal tax cost of investments | $ | 668,454,607 |
|
| Gross tax appreciation of investments | $ | 13,181,276 |
|
| Gross tax depreciation of investments | (32,017,660 | ) |
| Net tax appreciation (depreciation) of investments | (18,836,384 | ) |
Net tax appreciation (depreciation) on derivatives and translation of assets and liabilities in foreign currencies | (819,171 | ) |
| Net tax appreciation (depreciation) | $ | (19,655,555 | ) |
| Other book-to-tax adjustments | $ | (1,110,850 | ) |
| Undistributed ordinary income | $ | 10,374,449 |
|
| Accumulated short-term capital losses | $ | (339,232 | ) |
| Accumulated long-term capital losses | $ | (50,461 | ) |
The difference between book-basis and tax-basis unrealized appreciation (depreciation) is attributable primarily to the tax deferral of losses on wash sales and realization for tax purposes of unrealized gains (losses) on certain foreign currency exchange contracts and futures contracts. Other book-to-tax adjustments are attributable primarily to the tax deferral of losses on straddle positions.
Accumulated capital losses represent net capital loss carryovers that may be used to offset future realized capital gains for federal income tax purposes. The capital loss carryovers may be carried forward for an unlimited period. Future capital loss carryover utilization in any given year may be subject to Internal Revenue Code limitations.
10. Recently Issued Accounting Standards
In March 2017, the Financial Accounting Standards Board (FASB) issued Accounting Standards Update No. 2017-08, “Receivables - Nonrefundable Fees and Other Costs (Subtopic 310-20), Premium Amortization on Purchased Callable Debt Securities” (ASU 2017-08). ASU 2017-08 amends the amortization period for certain purchased callable debt securities held at a premium, shortening such period to the earliest call date. The amendments are effective for fiscal years, and interim periods within those fiscal years, beginning after December 15, 2018. Management is currently evaluating the impact that adopting ASU 2017-08 will have on the financial statements.
|
| | | | | | | | | | | | | | | | |
| For a Share Outstanding Throughout the Years Ended October 31 (except as noted) |
| Per-Share Data | Ratios and Supplemental Data |
| | | Income From Investment Operations: | Distributions From: | | | Ratio to Average Net Assets of: | | |
| | Net Asset Value, Beginning of Period | Net Investment Income (Loss)(1) | Net Realized and Unrealized Gain (Loss) | Total From Investment Operations | Net Investment Income | Net Realized Gains | Tax Return of Capital | Total Distributions | Net Asset Value, End of Period | Total Return(2) | Operating Expenses | Net Investment Income (Loss) | Portfolio Turnover Rate | Net Assets, End of Period (in thousands) |
| Investor Class |
| 2018 | $12.96 | 0.23 | (0.74) | (0.51) | — | (0.05) | — | (0.05) | $12.40 | (3.98)% | 0.81% | 1.76% | 40% |
| $407,913 |
|
| 2017 | $12.82 | 0.09 | 0.05 | 0.14 | — | — | — | — | $12.96 | 1.09% | 0.80% | 0.74% | 87% |
| $452,514 |
|
| 2016 | $12.39 | 0.11 | 0.58 | 0.69 | — | (0.25) | (0.01) | (0.26) | $12.82 | 5.57% | 0.80% | 0.85% | 40% |
| $434,618 |
|
2015(3) | $12.35 | 0.04 | —(4) | 0.04 | — | — | — | — | $12.39 | 0.40% | 0.81%(5) | 0.95%(5) | 7% |
| $469,820 |
|
| 2015 | $14.50 | 0.14 | (1.98) | (1.84) | (0.21) | (0.10) | — | (0.31) | $12.35 | (12.85)% | 0.80% | 1.05% | 67% |
| $494,676 |
|
| 2014 | $13.50 | 0.17 | 0.86 | 1.03 | (0.03) | — | — | (0.03) | $14.50 | 7.66% | 0.80% | 1.24% | 35% |
| $600,026 |
|
| I Class |
| 2018 | $12.99 | 0.25 | (0.75) | (0.50) | — | (0.05) | — | (0.05) | $12.44 | (3.90)% | 0.71% | 1.86% | 40% |
| $18,592 |
|
2017(6) | $12.31 | 0.06 | 0.62 | 0.68 | — | — | — | — | $12.99 | 5.52% | 0.70%(5) | 0.88%(5) | 87%(7) |
| $20,782 |
|
| Y Class |
| 2018 | $13.01 | 0.28 | (0.77) | (0.49) | — | (0.05) | — | (0.05) | $12.47 | (3.81)% | 0.61% | 1.96% | 40% |
| $3,766 |
|
2017(6) | $12.31 | 0.07 | 0.63 | 0.70 | — | — | — | — | $13.01 | 5.69% | 0.60%(5) | 0.96%(5) | 87%(7) |
| $5 |
|
|
| | | | | | | | | | | | | | | | |
| For a Share Outstanding Throughout the Years Ended October 31 (except as noted) |
| Per-Share Data | Ratios and Supplemental Data |
| | | Income From Investment Operations: | Distributions From: | | | Ratio to Average Net Assets of: | | |
| | Net Asset Value, Beginning of Period | Net Investment Income (Loss)(1) | Net Realized and Unrealized Gain (Loss) | Total From Investment Operations | Net Investment Income | Net Realized Gains | Tax Return of Capital | Total Distributions | Net Asset Value, End of Period | Total Return(2) | Operating Expenses | Net Investment Income (Loss) | Portfolio Turnover Rate | Net Assets, End of Period (in thousands) |
| A Class |
| 2018 | $12.83 | 0.20 | (0.73) | (0.53) | — | (0.05) | — | (0.05) | $12.25 | (4.18)% | 1.06% | 1.51% | 40% |
| $9,192 |
|
| 2017 | $12.73 | 0.06 | 0.04 | 0.10 | — | — | — | — | $12.83 | 0.79% | 1.05% | 0.49% | 87% |
| $11,031 |
|
| 2016 | $12.33 | 0.08 | 0.57 | 0.65 | — | (0.25) | — | (0.25) | $12.73 | 5.38% | 1.05% | 0.60% | 40% |
| $18,161 |
|
2015(3) | $12.30 | 0.03 | —(4) | 0.03 | — | — | — | — | $12.33 | 0.24% | 1.06%(5) | 0.70%(5) | 7% |
| $18,899 |
|
| 2015 | $14.44 | 0.10 | (1.96) | (1.86) | (0.18) | (0.10) | — | (0.28) | $12.30 | (13.06)% | 1.05% | 0.80% | 67% |
| $19,392 |
|
| 2014 | $13.44 | 0.14 | 0.86 | 1.00 | — | — | — | — | $14.44 | 7.44% | 1.05% | 0.99% | 35% |
| $96,081 |
|
| C Class |
| 2018 | $12.52 | 0.09 | (0.70) | (0.61) | — | (0.05) | — | (0.05) | $11.86 | (4.92)% | 1.81% | 0.76% | 40% |
| $482 |
|
| 2017 | $12.51 | (0.03) | 0.04 | 0.01 | — | — | — | — | $12.52 | 0.08% | 1.80% | (0.26)% | 87% |
| $812 |
|
| 2016 | $12.22 | (0.02) | 0.56 | 0.54 | — | (0.25) | — | (0.25) | $12.51 | 4.52% | 1.80% | (0.15)% | 40% |
| $1,034 |
|
2015(3) | $12.22 | —(4) | —(4) | —(4) | — | — | — | — | $12.22 | 0.00% | 1.81%(5) | (0.05)%(5) | 7% |
| $1,211 |
|
| 2015 | $14.34 | 0.01 | (1.96) | (1.95) | (0.07) | (0.10) | — | (0.17) | $12.22 | (13.67)% | 1.80% | 0.05% | 67% |
| $1,580 |
|
| 2014 | $13.45 | 0.03 | 0.86 | 0.89 | — | — | — | — | $14.34 | 6.62% | 1.80% | 0.24% | 35% |
| $3,352 |
|
| R Class |
| 2018 | $12.76 | 0.16 | (0.72) | (0.56) | — | (0.05) | — | (0.05) | $12.15 | (4.44)% | 1.31% | 1.26% | 40% |
| $68 |
|
| 2017 | $12.68 | 0.03 | 0.05 | 0.08 | — | — | — | — | $12.76 | 0.63% | 1.30% | 0.24% | 87% |
| $151 |
|
| 2016 | $12.32 | 0.04 | 0.57 | 0.61 | — | (0.25) | — | (0.25) | $12.68 | 5.06% | 1.30% | 0.35% | 40% |
| $134 |
|
2015(3) | $12.30 | 0.02 | —(4) | 0.02 | — | — | — | — | $12.32 | 0.16% | 1.31%(5) | 0.45%(5) | 7% |
| $157 |
|
| 2015 | $14.44 | 0.07 | (1.97) | (1.90) | (0.14) | (0.10) | — | (0.24) | $12.30 | (13.28)% | 1.30% | 0.55% | 67% |
| $179 |
|
| 2014 | $13.47 | 0.10 | 0.87 | 0.97 | — | — | — | — | $14.44 | 7.20% | 1.30% | 0.74% | 35% |
| $231 |
|
|
| | | | | | | | | | | | | | | | |
| For a Share Outstanding Throughout the Years Ended October 31 (except as noted) |
| Per-Share Data | Ratios and Supplemental Data |
| | | Income From Investment Operations: | Distributions From: | | | Ratio to Average Net Assets of: | | |
| | Net Asset Value, Beginning of Period | Net Investment Income (Loss)(1) | Net Realized and Unrealized Gain (Loss) | Total From Investment Operations | Net Investment Income | Net Realized Gains | Tax Return of Capital | Total Distributions | Net Asset Value, End of Period | Total Return(2) | Operating Expenses | Net Investment Income (Loss) | Portfolio Turnover Rate | Net Assets, End of Period (in thousands) |
| R5 Class |
| 2018 | $13.00 | 0.26 | (0.75) | (0.49) | — | (0.05) | — | (0.05) | $12.46 | (3.82)% | 0.61% | 1.96% | 40% |
| $5,608 |
|
| 2017 | $12.83 | 0.11 | 0.06 | 0.17 | — | — | — | — | $13.00 | 1.33% | 0.60% | 0.94% | 87% |
| $6,005 |
|
| 2016 | $12.41 | 0.13 | 0.57 | 0.70 | — | (0.25) | (0.03) | (0.28) | $12.83 | 5.78% | 0.60% | 1.05% | 40% |
| $373,045 |
|
2015(3) | $12.36 | 0.05 | –(4) | 0.05 | — | — | — | — | $12.41 | 0.40% | 0.61%(5) | 1.15%(5) | 7% |
| $332,434 |
|
| 2015 | $14.51 | 0.16 | (1.97) | (1.81) | (0.24) | (0.10) | — | (0.34) | $12.36 | (12.67)% | 0.60% | 1.25% | 67% |
| $339,993 |
|
| 2014 | $13.50 | 0.20 | 0.87 | 1.07 | (0.06) | — | — | (0.06) | $14.51 | 7.95% | 0.60% | 1.44% | 35% |
| $424,158 |
|
| R6 Class | | | | | | | | | | | | | |
| 2018 | $13.00 | 0.27 | (0.75) | (0.48) | — | (0.05) | — | (0.05) | $12.47 | (3.74)% | 0.56% | 2.01% | 40% |
| $2,691 |
|
| 2017 | $12.83 | 0.12 | 0.05 | 0.17 | — | — | — | — | $13.00 | 1.33% | 0.55% | 0.99% | 87% |
| $3,800 |
|
| 2016 | $12.41 | 0.14 | 0.57 | 0.71 | — | (0.25) | (0.04) | (0.29) | $12.83 | 5.83% | 0.55% | 1.10% | 40% |
| $48,582 |
|
2015(3) | $12.35 | 0.05 | 0.01 | 0.06 | — | — | — | — | $12.41 | 0.49% | 0.56%(5) | 1.20%(5) | 7% |
| $31,370 |
|
| 2015 | $14.50 | 0.16 | (1.97) | (1.81) | (0.24) | (0.10) | — | (0.34) | $12.35 | (12.63)% | 0.55% | 1.30% | 67% |
| $30,516 |
|
2014(8) | $13.77 | 0.19 | 0.61 | 0.80 | (0.07) | — | — | (0.07) | $14.50 | 5.81% | 0.55%(5) | 1.45%(5) | 35%(9) |
| $7,614 |
|
| G Class | | | | | | | | | | | | | |
| 2018 | $13.02 | 0.33 | (0.74) | (0.41) | — | (0.05) | — | (0.05) | $12.56 | (3.19)% | 0.02%(10) | 2.55%(10) | 40% |
| $207,787 |
|
2017(11) | $13.12 | 0.06 | (0.16) | (0.10) | — | — | — | — | $13.02 | (0.76)% | 0.01%(5)(12) | 1.66%(5)(12) | 87%(7) |
| $454,794 |
|
|
|
| Notes to Financial Highlights |
| |
| (1) | Computed using average shares outstanding throughout the period. |
| |
| (2) | Total returns are calculated based on the net asset value of the last business day and do not reflect applicable sales charges, if any. Total returns for periods less than one year are not annualized. |
| |
| (3) | July 1, 2015 through October 31, 2015. The fund's fiscal year end was changed from June 30 to October 31, resulting in a four-month annual reporting period. For the years before October 31, 2015, the fund's fiscal year end was June 30. |
| |
| (4) | Per-share amount was less than $0.005. |
| |
| (6) | April 10, 2017 (commencement of sale) through October 31, 2017. |
| |
| (7) | Portfolio turnover is calculated at the fund level. Percentage indicated was calculated for the year ended October 31, 2017. |
| |
| (8) | July 26, 2013 (commencement of sale) through June 30, 2014. |
| |
| (9) | Portfolio turnover is calculated at the fund level. Percentage indicated was calculated for the year ended June 30, 2014. |
| |
| (10) | The ratio of operating expenses to average net assets before expense waiver and the ratio of net investment income (loss) to average net assets before expense waiver was 0.56% and 2.01%, respectively. |
| |
| (11) | July 28, 2017 (commencement of sale) through October 31, 2017. |
| |
| (12) | The annualized ratio of operating expenses to average net assets before expense waiver and the annualized ratio of net investment income (loss) to average net assets before expense waiver was 0.55% and 1.12%, respectively. |
See Notes to Financial Statements.
|
|
| Report of Independent Registered Public Accounting Firm |
To the Board of Trustees of American Century International Bond Funds and Shareholders of International Bond Fund:
Opinion on the Financial Statements
We have audited the accompanying statement of assets and liabilities, including the schedule of investments, of International Bond Fund (one of the funds constituting American Century International Bond Funds, referred to hereafter as the “Fund”) as of October 31, 2018, the related statement of operations for the year ended October 31, 2018, the statement of changes in net assets for each of the two years in the period ended October 31, 2018, including the related notes, and the financial highlights for each of the periods indicated therein (collectively referred to as the “financial statements”). In our opinion, the financial statements present fairly, in all material respects, the financial position of the Fund as of October 31, 2018, the results of its operations for the year then ended, the changes in its net assets for each of the two years in the period ended October 31, 2018 and the financial highlights for each of the periods indicated therein in conformity with accounting principles generally accepted in the United States of America.
Basis for Opinion
These financial statements are the responsibility of the Fund’s management. Our responsibility is to express an opinion on the Fund’s financial statements based on our audits. We are a public accounting firm registered with the Public Company Accounting Oversight Board (United States) (“PCAOB”) and are required to be independent with respect to the Fund in accordance with the U.S. federal securities laws and the applicable rules and regulations of the Securities and Exchange Commission and the PCAOB.
We conducted our audits of these financial statements in accordance with the standards of the PCAOB. Those standards require that we plan and perform the audit to obtain reasonable assurance about whether the financial statements are free of material misstatement, whether due to error or fraud.
Our audits included performing procedures to assess the risks of material misstatement of the financial statements, whether due to error or fraud, and performing procedures that respond to those risks. Such procedures included examining, on a test basis, evidence regarding the amounts and disclosures in the financial statements. Our audits also included evaluating the accounting principles used and significant estimates made by management, as well as evaluating the overall presentation of the financial statements. Our procedures included confirmation of securities owned as of October 31, 2018 by correspondence with the custodian and brokers; when replies were not received from brokers, we performed other auditing procedures. We believe that our audits provide a reasonable basis for our opinion.
/s/ PricewaterhouseCoopers LLP
Kansas City, Missouri
December 18, 2018
We have served as the auditor of one or more investment companies in American Century Investments since 1997.
Board of Trustees
The individuals listed below serve as trustees of the funds. Each trustee will continue to serve in this capacity until death, retirement, resignation or removal from office. The board has adopted a mandatory retirement age for trustees who are not “interested persons,” as that term is defined in the Investment Company Act (independent trustees). Independent trustees shall retire on December 31 of the year in which they reach their 75th birthday; provided, however, that on or after January 1, 2022, independent trustees shall retire on December 31 of the year in which they reach their 76th birthday.
Mr. Thomas is an “interested person” because he currently serves as President and Chief Executive Officer of American Century Companies, Inc. (ACC), the parent company of American Century Investment Management, Inc. (ACIM or the advisor). The other trustees (more than three-fourths of the total number) are independent. They are not employees, directors or officers of, and have no financial interest in, ACC or any of its wholly owned, direct or indirect, subsidiaries, including ACIM, American Century Investment Services, Inc. (ACIS) and American Century Services, LLC (ACS), and they do not have any other affiliations, positions or relationships that would cause them to be considered “interested persons” under the Investment Company Act. The trustees serve in this capacity for eight (in the case of Jonathan S. Thomas, 16; and Ronald J. Gilson, 9) registered investment companies in the American Century Investments family of funds.
The following table presents additional information about the trustees. The mailing address for each trustee other than Mr. Thomas is 1665 Charleston Road, Mountain View, California 94043. The mailing address for Mr. Thomas is 4500 Main Street, Kansas City, Missouri 64111.
|
| | | | | |
Name
(Year of Birth) | Position(s) Held with Funds | Length of Time Served | Principal Occupation(s) During Past 5 Years | Number of American Century Portfolios Overseen by Trustee | Other Directorships Held During Past 5 Years |
| Independent Trustees |
|
|
Tanya S. Beder
(1955) | Trustee | Since 2011 | Chairman and CEO, SBCC Group Inc. (independent advisory services) (2006 to present) | 45 | CYS Investments, Inc.; Nabors Industries Ltd. |
Jeremy I. Bulow
(1954) | Trustee | Since 2011 | Professor of Economics, Stanford University, Graduate School of Business (1979 to present) | 45 | None |
Anne Casscells
(1958) | Trustee | Since 2016 | Co-Chief Executive Officer and Chief Investment Officer, Aetos Alternatives Management (investment advisory firm) (2001 to present); Lecturer in Accounting, Stanford University, Graduate School of Business (2009 to present) | 45 | None |
Ronald J. Gilson
(1946) | Trustee and Chairman of the Board | Since 1995
(Chairman since 2005) | Charles J. Meyers Professor of Law and Business, Emeritus, Stanford Law School (1979 to present); Marc and Eva Stern Professor of Law and Business, Columbia University School of Law (1992 to present) | 50 | None |
|
| | | | | |
Name
(Year of Birth) | Position(s) Held with Funds | Length of Time Served | Principal Occupation(s) During Past 5 Years | Number of American Century Portfolios Overseen by Trustee | Other Directorships Held During Past 5 Years |
| Independent Trustees |
|
|
Frederick L. A. Grauer
(1946) | Trustee | Since 2008 | Senior Advisor, iShares by BlackRock, Inc. (investment management firm) (2010 to 2011, 2013 to 2015); Senior Advisor, Course Hero (an educational technology company) (2015 to present) | 45 | None |
Jonathan D. Levin
(1972) | Trustee | Since 2016 | Philip H. Knight Professor and Dean, Graduate School of Business, Stanford University (2016 to present); Professor, Stanford University, (2000 to present); Chair, Department of Economics, Stanford University (2011 to 2014) | 45 | None |
Peter F. Pervere
(1947) | Trustee | Since 2007 | Retired | 45 | None |
John B. Shoven
(1947) | Trustee | Since 2002 | Charles R. Schwab Professor of Economics, Stanford University (1973 to present) | 45 | Cadence Design Systems; Exponent; Financial Engines |
| Interested Trustee |
|
|
Jonathan S. Thomas
(1963) | Trustee and President | Since 2007 | President and Chief Executive Officer, ACC (March 2007 to present). Also serves as Chief Executive Officer, ACS; Executive Vice President, ACIM; Director, ACC, ACIM and other ACC subsidiaries | 117 | BioMed Valley Discoveries, Inc. |
The Statement of Additional Information has additional information about the fund's trustees and is available without charge, upon request, by calling 1-800-345-2021.
Officers
The following table presents certain information about the executive officers of the funds. Each officer serves as an officer for 16 (in the case of Robert J. Leach, 15) investment companies in the American Century family of funds. No officer is compensated for his or her service as an officer of the funds. The listed officers are interested persons of the funds and are appointed or re-appointed on an annual basis. The mailing address for each of the officers listed below is 4500 Main Street, Kansas City, Missouri 64111.
|
| | |
Name
(Year of Birth) | Offices with the Funds | Principal Occupation(s) During the Past Five Years |
Jonathan S. Thomas
(1963) | Trustee and President since 2007 | President and Chief Executive Officer, ACC (2007 to present). Also serves as Chief Executive Officer, ACS; Executive Vice President, ACIM; Director, ACC, ACIM and other ACC subsidiaries |
R. Wes Campbell
(1974) | Chief Financial Officer and Treasurer since 2018
| Investment Operations and Investment Accounting, ACS (2000 to present)
|
Amy D. Shelton
(1964) | Chief Compliance Officer and Vice President since 2014 | Chief Compliance Officer, American Century funds, (2014 to present); Chief Compliance Officer, ACIM (2014 to present); Chief Compliance Officer, ACIS (2009 to present); Vice President, Client Interactions and Marketing, ACIS (2013 to 2014). Also serves as Vice President, ACIS |
Charles A. Etherington
(1957) | General Counsel since 2007 and Senior Vice President since 2006 | Attorney, ACC (1994 to present); Vice President, ACC (2005 to present); General Counsel, ACC (2007 to present). Also serves as General Counsel, ACIM, ACS, ACIS and other ACC subsidiaries; and Senior Vice President, ACIM and ACS |
C. Jean Wade
(1964) | Vice President since 2012 | Senior Vice President, ACS (2017 to present); Vice President ACS (2000 to 2017) |
Robert J. Leach
(1966) | Vice President since 2006 | Vice President, ACS (2000 to present) |
David H. Reinmiller
(1963) | Vice President since 2000 | Attorney, ACC (1994 to present). Also serves as Vice President, ACIM and ACS |
Ward D. Stauffer
(1960) | Secretary since 2005 | Attorney, ACC (2003 to present) |
|
|
Approval of Management Agreement
|
At a meeting held on June 19, 2018, the Fund’s Board of Trustees (the "Board") unanimously approved the renewal of the management agreement pursuant to which American Century Investment Management, Inc. (the “Advisor”) acts as the investment advisor for the Fund. Under Section 15(c) of the Investment Company Act, contracts for investment advisory services are required to be reviewed, evaluated, and approved by a majority of a fund’s directors/trustees, including a majority of the independent Trustees, each year. The Board regards this annual evaluation and renewal as one of its most important responsibilities.
The independent Trustees have memorialized a statement regarding the relationship between their ongoing obligations to oversee and evaluate the performance of the Advisor and their annual consideration of renewal of the management agreement. In that statement, the independent Trustees noted that their assessment of the Advisor’s performance is an ongoing process that takes place over the entire year and is informed by all of the extensive information that the Board and its committees receive and consider over time. This information, together with the additional materials provided specifically in connection with the review, are central to the Board’s assessment of the Advisor’s performance and its determination whether to renew the Fund’s management agreement.
Prior to its consideration of the renewal of the management agreement, the Board requested and reviewed extensive data and analysis relating to the proposed renewal. This information and analysis was compiled by the Advisor and certain independent providers of evaluation data concerning the Fund and the services provided to the Fund by the Advisor.
In connection with its consideration of the renewal of the management agreement, the Board’s review and evaluation of the services provided by the Advisor included, but was not limited to, the following:
| |
| • | the nature, extent, and quality of investment management, shareholder services, and other services provided to the Fund; |
| |
| • | the wide range of other programs and services the Advisor provides to the Fund and its shareholders on a routine and non-routine basis; |
| |
| • | the investment performance of the Fund, including data comparing the Fund’s performance to appropriate benchmarks and/or a peer group of other mutual funds with similar investment objectives and strategies; |
| |
| • | the cost of owning the Fund compared to the cost of owning similar funds; |
| |
| • | the Advisor’s compliance policies, procedures, and regulatory experience; |
| |
| • | financial data showing the cost of services provided to the Fund, the profitability of the Fund to the Advisor, and the overall profitability of the Advisor; |
| |
| • | strategic plans of the Advisor; |
| |
| • | any economies of scale associated with the Advisor’s management of the Fund and other accounts; |
| |
| • | services provided and charges to other investment management clients of the Advisor; |
| |
| • | acquired fund fees and expenses; |
| |
| • | payments and practices in connection with financial intermediaries holding shares of the Fund and the services provided by intermediaries in connection therewith; and |
| |
| • | any collateral benefits derived by the Advisor from the management of the Fund. |
In keeping with its practice, the Board held two in-person meetings to review and discuss the information provided in response to their request and held active discussions with the Advisor regarding the renewal of the management agreement. The independent Trustees had the benefit of the advice of their independent counsel throughout the process.
Factors Considered
The Trustees considered all of the information provided by the Advisor, the independent data providers, and the independent Trustees’ independent counsel in connection with the approval. They determined that the information was sufficient for them to evaluate the management agreement for the Fund. In connection with their review, the Trustees did not identify any single factor as being all-important or controlling and each Trustee may have attributed different levels of importance to different factors. In deciding to renew the management agreement, the Board based its decision on a number of factors, including the following:
Nature, Extent and Quality of Services - Generally. Under the management agreement, the Advisor is responsible for providing or arranging for all services necessary for the operation of the Fund. The Board noted that the Advisor provides or arranges at its own expense a wide variety of services including:
| |
| • | constructing and designing the Fund |
| |
| • | portfolio research and security selection |
| |
| • | initial capitalization/funding |
| |
| • | daily valuation of the Fund’s portfolio |
| |
| • | shareholder servicing and transfer agency, including shareholder confirmations, recordkeeping, and communications |
| |
| • | legal services (except the independent Trustees’ counsel) |
| |
| • | regulatory and portfolio compliance |
| |
| • | marketing and distribution (except amounts paid by the Fund under Rule 12b-1 plans) |
The Board noted that many of these services have expanded over time in terms of both quantity and complexity in response to shareholder demands, competition in the industry, changing distribution channels, and the changing regulatory environment.
Investment Management, Shareholder, and Other Services. The nature of the investment management services provided to the Fund is quite complex and allows Fund shareholders access to professional money management, instant diversification of their investments within an asset class, the opportunity to easily diversify among asset classes by investing in or exchanging among various American Century Investments funds, and liquidity. In evaluating investment performance, the Board expects the Advisor to manage the Fund in accordance with its investment objectives and approved strategies. Further, the Trustees recognize that the Advisor has an obligation to seek the best execution of fund trades. In providing these services, the Advisor utilizes teams of investment professionals (portfolio managers, analysts, research assistants, and securities traders) who require extensive information technology, research, training, compliance, and other systems to conduct their business. The Board, directly and through its Portfolio Committee, regularly reviews investment performance information for the Fund, together with comparative information for appropriate benchmarks and/or peer groups of similarly-managed funds, over different time horizons. The Trustees also review detailed performance information during the management agreement approval process. If performance concerns are identified, the Fund receives special reviews until performance improves, during which the Board discusses with the Advisor the reasons for such results (e.g., market conditions, security selection) and any efforts being undertaken to improve performance. The Fund’s performance was above its benchmark for the one- and three-year periods and below its benchmark for the five- and ten-year periods reviewed by the Board. The Board discussed the Fund’s performance with the Advisor and was satisfied with the efforts being undertaken by the Advisor. The Board found the investment management services provided by the Advisor to the Fund to be satisfactory and consistent with the management agreement.
Under the management agreement, the Advisor provides the Fund with a comprehensive package of transfer agency, shareholder, and other services. The Board, directly and through various committees of the Board, regularly reviews reports and evaluations of such services at its regular meetings. These reports include, but are not limited to, information regarding the operational efficiency and accuracy of the shareholder and transfer agency services provided, staffing levels, shareholder satisfaction (as measured by external as well as internal sources), technology support, new products and services offered to Fund shareholders, securities trading activities, portfolio valuation services, auditing services, and legal and operational compliance activities. The Board found the services provided by the Advisor to the Fund under the management agreement to be competitive and of high quality.
Costs of Services and Profitability. The Advisor provides detailed information concerning its cost of providing various services to the Fund, its profitability in managing the Fund, its overall profitability, and its financial condition. The Trustees have reviewed with the Advisor the methodology used to prepare this financial information. This information is considered in evaluating the Advisor’s financial condition, its ability to continue to provide services under the management agreement, and the reasonableness of the current management fee. The Board concluded that the Advisor’s profits were reasonable in light of the services provided to the Fund.
Economies of Scale. The Board also reviewed information provided by the Advisor regarding the possible existence of economies of scale in connection with the management of the Fund. The Board concluded that economies of scale are difficult to measure and predict with precision, especially on a fund-by-fund basis. The Board concluded that the Advisor is appropriately sharing economies of scale through its competitive fee structure, offering competitive fees from fund inception, and through reinvestment in its business to provide shareholders enhanced and expanded services.
Comparison to Other Funds’ Fees. The management agreement provides that the Fund pays the Advisor a single, all-inclusive (or unified) management fee for providing all services necessary for the management and operation of the Fund, other than brokerage expenses, expenses attributable to short sales, taxes, interest, extraordinary expenses, the fees and expenses of the Fund’s independent Trustees (including their independent legal counsel), and expenses incurred in connection with the provision of shareholder services and distribution services under a plan adopted pursuant to Rule 12b-1 under the 1940 Act. Under the unified fee structure, the Advisor is responsible for providing all investment advisory, custody, audit, administrative, compliance, recordkeeping, marketing, and shareholder services, or arranging and supervising third parties to provide such services. By contrast, most other funds are charged a variety of fees, including an investment advisory fee, a transfer agency fee, an administrative fee, distribution charges, and other expenses. Other than their investment advisory fees and any applicable Rule 12b-1 distribution fees, all other components of the total fees charged by these other funds may be increased without shareholder approval. The Board believes the unified fee structure is a benefit to Fund shareholders because it clearly discloses to shareholders the cost of owning Fund shares, and, since the unified fee cannot be increased without a vote of Fund shareholders, it shifts to the Advisor the risk of increased costs of operating the Fund and provides a direct incentive to minimize administrative inefficiencies. Part of the Board’s analysis of fee levels involves reviewing certain evaluative data compiled by an independent provider and comparing the Fund’s unified fee to the total expense ratio of peer funds. The unified fee charged to shareholders of the Fund was below the median of the total expense ratios of the Fund’s peer group. The Board concluded that the management fee paid by the Fund to the Advisor under the management agreement is reasonable in light of the services provided to the Fund.
Comparison to Fees and Services Provided to Other Clients of the Advisor. The Board also requested and received information from the Advisor concerning the nature of the services, fees, costs, and profitability of its advisory services to advisory clients other than the Fund. They observed that these varying types of client accounts require different services and involve different
regulatory and entrepreneurial risks than the management of the Fund. The Board analyzed this information and concluded that the fees charged and services provided to the Fund were reasonable by comparison.
Payments to Intermediaries. The Trustees also requested and received a description of payments made to intermediaries by the Fund and the Advisor and services provided by intermediaries. These payments include various payments made by the Fund or the Advisor to different types of intermediaries and recordkeepers for distribution and service activities provided for the Fund. The Trustees reviewed such information and received representations from the Advisor that all such payments by the Fund were made pursuant to the Fund’s Rule 12b-1 Plan and that all such payments by the Advisor were made from the Advisor’s resources and reasonable profits. The Board found such payments to be reasonable in scope and purpose.
Collateral or “Fall-Out” Benefits Derived by the Advisor. The Board considered the existence of collateral benefits the Advisor may receive as a result of its relationship with the Fund. The Board noted that the Advisor’s primary business is managing mutual funds and it generally does not use fund or shareholder information to generate profits in other lines of business, and therefore does not derive any significant collateral benefits from them. The Board noted that the Advisor may receive proprietary research from broker-dealers that execute fund portfolio transactions. The Board also determined that the Advisor is able to provide investment management services to certain clients other than the Fund, at least in part, due to its existing infrastructure built to serve the fund complex. The Board noted that the assets of those other accounts are, where applicable, included with the assets of the Fund to determine breakpoints in the management fee schedule.
Existing Relationship. The Board also considered whether there was any reason for not continuing the existing arrangement with the Advisor. In this regard, the Board was mindful of the potential disruptions of the Fund’s operations and various risks, uncertainties, and other effects that could occur as a result of a decision not to continue such relationship. In particular, the Board recognized that most shareholders have invested in the Fund on the strength of the Advisor’s industry standing and reputation and in the expectation that the Advisor will have a continuing role in providing advisory services to the Fund.
Conclusion of the Trustees. As a result of this process, the Board, including all of the independent Trustees and assisted by the advice of independent legal counsel, taking into account all of the factors discussed above and the information provided by the Advisor and others in connection with its review and throughout the year, concluded that the management agreement between the Fund and the Advisor is fair and reasonable in light of the services provided and should be renewed.
Retirement Account Information
As required by law, distributions you receive from certain retirement accounts are subject to federal income tax withholding, unless you elect not to have withholding apply*. Tax will be withheld on the total amount withdrawn even though you may be receiving amounts that are not subject to withholding, such as nondeductible contributions. In such case, excess amounts of withholding could occur. You may adjust your withholding election so that a greater or lesser amount will be withheld.
If you don’t want us to withhold on this amount, you must notify us to not withhold the federal income tax. You may notify us in writing or in certain situations by telephone or through other electronic means. For systematic withdrawals, your withholding election will remain in effect until revoked or changed by filing a new election. You have the right to revoke your election at any time and change your withholding percentage for future distributions.
Remember, even if you elect not to have income tax withheld, you are liable for paying income tax on the taxable portion of your withdrawal. If you elect not to have income tax withheld or you don’t have enough income tax withheld, you may be responsible for payment of estimated tax. You may incur penalties under the estimated tax rules if your withholding and estimated tax payments are not sufficient. You can reduce or defer the income tax on a distribution by directly or indirectly rolling such distribution over to another IRA or eligible plan. You should consult your tax advisor for additional information.
State tax will be withheld if, at the time of your distribution, your address is within one of the mandatory withholding states and you have federal income tax withheld (or as otherwise required by state law). State taxes will be withheld from your distribution in accordance with the respective state rules.
*Some 403(b), 457 and qualified retirement plan distributions may be subject to 20% mandatory withholding, as they are subject to special tax and withholding rules. Your plan administrator or plan sponsor is required to provide you with a special tax notice explaining those rules at the time you request a distribution. If applicable, federal and/or state taxes may be withheld from your distribution amount.
Proxy Voting Policies
Descriptions of the principles and policies that the fund's investment advisor uses in exercising the voting rights associated with the securities purchased and/or held by the fund are available without charge, upon request, by calling 1-800-345-2021 or visiting the "About Us" page of American Century Investments’ website at americancentury.com. A description of the policies is also available on the Securities and Exchange Commission’s website at sec.gov. Information regarding how the investment advisor voted proxies relating to portfolio securities during the most recent 12-month period ended June 30 is available on the "About Us" page at americancentury.com. It is also available at sec.gov.
Quarterly Portfolio Disclosure
The fund files its complete schedule of portfolio holdings with the Securities and Exchange Commission (SEC) for the first and third quarters of each fiscal year on Form N-Q. The fund’s Forms N-Q are available on the SEC’s website at sec.gov. The fund also makes its complete schedule of portfolio holdings for the most recent quarter of its fiscal year available on its website at americancentury.com and, upon request, by calling 1-800-345-2021.
Other Tax Information
The following information is provided pursuant to provisions of the Internal Revenue Code.
The fund hereby designates $2,494,834, or up to the maximum amount allowable, as long-term capital gain distributions (20% rate gain distributions) for the fiscal year ended October 31, 2018.
|
| | |
| |
| | | |
| Contact Us | americancentury.com | |
| Automated Information Line | 1-800-345-8765 | |
| Investor Services Representative | 1-800-345-2021
or 816-531-5575 | |
| Investors Using Advisors | 1-800-378-9878 | |
Business, Not-For-Profit, Employer-Sponsored
Retirement Plans | 1-800-345-3533 | |
Banks and Trust Companies, Broker-Dealers,
Financial Professionals, Insurance Companies | 1-800-345-6488 | |
| Telecommunications Relay Service for the Deaf | 711 | |
| | | |
| American Century International Bond Funds | |
| | | |
Investment Advisor: American Century Investment Management, Inc. Kansas City, Missouri | |
| | | |
| This report and the statements it contains are submitted for the general information of our shareholders. The report is not authorized for distribution to prospective investors unless preceded or accompanied by an effective prospectus. | |
| | | |
©2018 American Century Proprietary Holdings, Inc. All rights reserved.
CL-ANN-90983 1812 | |
ITEM 2. CODE OF ETHICS.
| |
| (a) | The registrant has adopted a Code of Ethics for Senior Financial Officers that applies to the registrant’s principal executive officer, principal financial officer, principal accounting officer, and persons performing similar functions. |
| |
| (f) | The registrant’s Code of Ethics for Senior Financial Officers was filed as Exhibit 12 (a)(1) to American Century Asset Allocation Portfolios, Inc.’s Annual Certified Shareholder Report on Form N-CSR, File No. 811-21591, on September 29, 2005, and is incorporated herein by reference. |
ITEM 3. AUDIT COMMITTEE FINANCIAL EXPERT.
| |
| (a)(1) | The registrant's board has determined that the registrant has at least one audit committee financial expert serving on its audit committee. |
| |
| (a)(2) | Tanya S. Beder, Anne Casscells, Peter F. Pervere and Ronald J. Gilson are the registrant's designated audit committee financial experts. They are "independent" as defined in Item 3 of Form N-CSR. |
ITEM 4. PRINCIPAL ACCOUNTANT FEES AND SERVICES.
The aggregate fees billed for each of the last two fiscal years for professional services rendered by the principal accountant for the audit of the registrant’s annual financial statements or services that are normally provided by the accountant in connection with statutory and regulatory filings or engagements for those fiscal years were as follows:
FY 2017: $127,917
FY 2018: $116,815
The aggregate fees billed in each of the last two fiscal years for assurance and related services by the principal accountant that are reasonably related to the performance of the audit of the registrant’s financial statements and are not reported under paragraph (a) of this Item were as follows:
For services rendered to the registrant:
FY 2017:$0
FY 2018:$0
Fees required to be approved pursuant to paragraph (c)(7)(ii) of Rule 2-01 of Regulation S-X (relating to certain engagements for non-audit services with the registrant’s investment adviser and its affiliates):
FY 2017:$0
FY 2018:$0
The aggregate fees billed in each of the last two fiscal years for professional services rendered by the principal accountant for tax compliance, tax advice, and tax planning were as follows:
For services rendered to the registrant:
FY 2017: $0
FY 2018: $0
Fees required to be approved pursuant to paragraph (c)(7)(ii) of Rule 2-01 of Regulation S-X (relating to certain engagements for non-audit services with the registrant’s investment adviser and its affiliates):
FY 2017: $0
FY 2018: $0
The aggregate fees billed in each of the last two fiscal years for products and services provided by the principal accountant, other than the services reported in paragraphs (a) through (c) of this Item were as follows:
For services rendered to the registrant:
FY 2017:$0
FY 2018:$0
Fees required to be approved pursuant to paragraph (c)(7)(ii) of Rule 2-01 of Regulation S-X (relating to certain engagements for non-audit services with the registrant’s investment adviser and its affiliates):
FY 2017:$0
FY 2018:$0
| |
| (e)(1) | In accordance with paragraph (c)(7)(i)(A) of Rule 2-01 of Regulation S-X, before the accountant is engaged by the registrant to render audit or non-audit services, the engagement is approved by the registrant’s audit committee. Pursuant to paragraph (c)(7)(ii) of Rule 2-01 of Regulation S-X, the registrant’s audit committee also pre-approves its accountant’s engagements for non-audit services with the registrant’s investment adviser, its parent company, and any entity controlled by, or under common control with the investment adviser that provides ongoing services to the registrant, if the engagement relates directly to the operations and financial reporting of the registrant. |
| |
| (e)(2) | All services described in each of paragraphs (b) through (d) of this Item were pre-approved before the engagement by the registrant’s audit committee pursuant to paragraph (c)(7)(i)(A) of Rule 2-01 of Regulation S-X. Consequently, none of such services were required to be approved by the audit committee pursuant to paragraph (c)(7)(i)(C). |
| |
| (f) | The percentage of hours expended on the principal accountant’s engagement to audit the registrant’s financial statements for the most recent fiscal year that were attributed to work performed by persons other than the principal accountant’s full-time, permanent employees was less than 50%. |
| |
| (g) | The aggregate non-audit fees billed by the registrant’s accountant for services rendered to the registrant, and rendered to the registrant’s investment adviser (not including any sub-adviser whose role is primarily portfolio management and is subcontracted with or overseen by another investment adviser), and any entity controlling, controlled by, or under common control with the adviser that provides ongoing services to the registrant for each of the last two fiscal years of the registrant were as follows: |
FY 2017: $145,111
FY 2018: $130,738
| |
| (h) | The registrant’s investment adviser and accountant have notified the registrant’s audit committee of all non-audit services that were rendered by the registrant’s accountant to the registrant’s investment adviser, its parent company, and any entity controlled by, or under common control with the investment adviser that provides services to the registrant, which services were not required to be pre-approved pursuant to paragraph (c)(7)(ii) of Rule 2-01 of Regulation S-X. The notification provided to the registrant’s audit committee included sufficient details regarding such services to allow the registrant’s audit committee to consider the continuing independence of its principal accountant. |
ITEM 5. AUDIT COMMITTEE OF LISTED REGISTRANTS.
Not applicable.
ITEM 6. INVESTMENTS.
| |
| (a) | The schedule of investments is included as part of the report to stockholders filed under Item 1 of this Form. |
ITEM 7. DISCLOSURE OF PROXY VOTING POLICIES AND PROCEDURES FOR CLOSED-END MANAGEMENT INVESTMENT COMPANIES.
Not applicable.
ITEM 8. PORTFOLIO MANAGERS OF CLOSED-END MANAGEMENT INVESTMENT COMPANIES.
Not applicable.
ITEM 9. PURCHASES OF EQUITY SECURITIES BY CLOSED-END MANAGEMENT INVESTMENT COMPANY AND AFFILIATED PURCHASERS.
Not applicable.
ITEM 10. SUBMISSION OF MATTERS TO A VOTE OF SECURITY HOLDERS.
During the reporting period, there were no material changes to the procedures by which shareholders may recommend nominees to the registrant’s board.
ITEM 11. CONTROLS AND PROCEDURES.
| |
| (a) | The registrant's principal executive officer and principal financial officer have concluded that the registrant's disclosure controls and procedures (as defined in Rule 30a-3(c) under the Investment Company Act of 1940) are effective based on their evaluation of these controls and procedures as of a date within 90 days of the filing date of this report. |
| |
| (b) | There were no changes in the registrant's internal control over financial reporting (as defined in Rule 30a-3(d) under the Investment Company Act of 1940) that occurred during the period covered by this report that have materially affected, or are reasonably likely to materially affect, the registrant's internal control over financial reporting. |
ITEM 12. DISCLOSURE OF SECURITIES LENDING ACTIVITIES FOR CLOSED-END MANAGEMENT INVESTMENT COMPANIES.
Not applicable.
ITEM 13. EXHIBITS.
| |
| (a)(1) | Registrant’s Code of Ethics for Senior Financial Officers, which is the subject of the disclosure required by Item 2 of Form N-CSR, was filed as Exhibit 12(a)(1) to American Century Asset Allocation Portfolios, Inc.’s Certified Shareholder Report on Form N-CSR, File No. 811-21591, on September 29, 2005. |
| |
| (a)(2) | Separate certifications by the registrant’s principal executive officer and principal financial officer, pursuant to Section 302 of the Sarbanes-Oxley Act of 2002 and Rule 30a-2(a) under the Investment Company Act of 1940, are filed and attached hereto as EX-99.CERT. |
(b) A certification by the registrant’s chief executive officer and chief financial officer, pursuant to Section 906 of the Sarbanes-Oxley Act of 2002, is furnished and attached hereto as EX-99.906CERT.
SIGNATURES
Pursuant to the requirements of the Securities Exchange Act of 1934 and the Investment Company Act of 1940, the registrant has duly caused this report to be signed on its behalf by the undersigned, thereunto duly authorized.
|
| | | | |
| Registrant: | American Century International Bond Funds |
| | | | |
| By: | /s/ Jonathan S. Thomas | |
| | Name: | Jonathan S. Thomas | |
| | Title: | President | |
| | | | |
| Date: | December 28, 2018 | |
Pursuant to the requirements of the Securities Exchange Act of 1934 and the Investment Company Act of 1940, this report has been signed below by the following persons on behalf of the registrant and in the capacities and on the dates indicated.
|
| | | |
| By: | /s/ Jonathan S. Thomas | |
| | Name: | Jonathan S. Thomas | |
| | Title: | President | |
| | | (principal executive officer) | |
| | | | |
| Date: | December 28, 2018 | |
|
| | | |
| By: | /s/ R. Wes Campbell | |
| | Name: | R. Wes Campbell | |
| | Title: | Treasurer and | |
| | | Chief Financial Officer | |
| | | (principal financial officer) | |
| | | | |
| Date: | December 28, 2018 | |