UNITED STATES
SECURITIES AND EXCHANGE COMMISSION
Washington, D.C. 20549
FORM N-CSR
CERTIFIED SHAREHOLDER REPORT OF REGISTERED
MANAGEMENT INVESTMENT COMPANIES
|
| | | | | | |
| Investment Company Act file number | 811-06441
|
| | |
| AMERICAN CENTURY INTERNATIONAL BOND FUNDS |
| (Exact name of registrant as specified in charter) |
| | |
| 4500 MAIN STREET, KANSAS CITY, MISSOURI | 64111 |
| (Address of principal executive offices) | (Zip Code) |
| | |
CHARLES A. ETHERINGTON 4500 MAIN STREET, KANSAS CITY, MISSOURI 64111 |
| (Name and address of agent for service) |
| | |
| Registrant’s telephone number, including area code: | 816-531-5575 |
| | |
| Date of fiscal year end: | 10-31 |
| | |
| Date of reporting period: | 10-31-2017 |
ITEM 1. REPORTS TO STOCKHOLDERS.
|
| |
| | |
| | Annual Report |
| | |
| | October 31, 2017 |
| | |
| | Emerging Markets Debt Fund |
|
| | |
| President’s Letter | 2 |
|
| Performance | 3 |
|
| Portfolio Commentary | |
|
| Fund Characteristics | |
|
| Shareholder Fee Example | |
|
| Schedule of Investments | |
|
| Statement of Assets and Liabilities | |
|
| Statement of Operations | |
|
| Statement of Changes in Net Assets | |
|
| Notes to Financial Statements | |
|
| Financial Highlights | |
|
| Report of Independent Registered Public Accounting Firm | |
|
| Management | |
|
| Approval of Management Agreement | |
|
| Additional Information | |
|
Any opinions expressed in this report reflect those of the author as of the date of the report, and do not necessarily represent the opinions of American Century Investments® or any other person in the American Century Investments organization. Any such opinions are subject to change at any time based upon market or other conditions and American Century Investments disclaims any responsibility to update such opinions. These opinions may not be relied upon as investment advice and, because investment decisions made by American Century Investments funds are based on numerous factors, may not be relied upon as an indication of trading intent on behalf of any American Century Investments fund. Security examples are used for representational purposes only and are not intended as recommendations to purchase or sell securities. Performance information for comparative indices and securities is provided to American Century Investments by third party vendors. To the best of American Century Investments’ knowledge, such information is accurate at the time of printing.
 Jonathan Thomas
Dear Investor:
Thank you for reviewing this annual report for the period ended October 31, 2017. Annual reports help convey important information about fund returns, including market factors that affected performance during the reporting period. For additional, updated investment and market insights, we encourage you to visit our website, americancentury.com.
‘Risk-On’ Sentiment Sparked Strong Gains Among Stocks
U.S. stocks delivered robust double-digit gains for the reporting period. The “risk-on” rally began early in the period, following Donald Trump’s election victory in November 2016. Investor expectations for President Trump’s administration to usher in pro-growth policies and reforms drove stock prices higher. In addition, healthy corporate earnings growth and improving gross domestic product (GDP) and other economic data provided additional support for stocks. Against this backdrop, the S&P 500 Index reached several milestone levels during the period and returned 23.63%. In terms of equity styles, riskier and economically sensitive stocks generally remained in favor. For example, small-cap stocks generally outperformed their mid- and large-cap peers, while growth stocks broadly outperformed their value counterparts across the capitalization spectrum. Real estate investment trusts (REITs) advanced, but global property stocks significantly underperformed the broader stock market as interest rates increased, most notably in the U.S., where the Federal Reserve (Fed) raised rates three times during the period.
As stocks soared in the post-election environment, global bonds sold off sharply. President Trump’s policy agenda fueled inflation fears that sent global bond yields sharply higher in late 2016. However, broad bond market performance generally recovered beginning in early 2017, advancing on subdued inflation and continued central bank accommodation to post modest gains for the entire reporting period. Investor preferences for risk also extended to the global fixed-income market, where high-yield corporate and emerging markets bonds were top performers.
As Congress considers tax cuts and other pro-growth reforms and the Fed and other central banks pursue policy normalization, investors likely will face new opportunities and challenges in the months ahead. We continue to believe in a disciplined, diversified, and risk-aware approach, using professionally managed portfolios in pursuit of investment goals. We appreciate your continued trust in us.
Sincerely,
Jonathan Thomas
President and Chief Executive Officer
American Century Investments
|
| | | | |
| Total Returns as of October 31, 2017 |
| | | | Average
Annual Returns | |
| | Ticker Symbol | 1 year | Since Inception | Inception Date |
| Investor Class | AEDVX | 5.11% | 4.96% | 7/29/14 |
| JPMorgan Corporate Emerging Market Bond (CEMBI) Broad Diversified Index | — | 6.18% | 5.14% | — |
| I Class | AEHDX | — | 3.28% | 4/10/17 |
| Y Class | AEYDX | — | 3.33% | 4/10/17 |
| A Class | AEDQX | | | 7/29/14 |
| No sales charge | | 4.84% | 4.72% | |
| With sales charge | | 0.09% | 3.25% | |
| C Class | AEDHX | 4.07% | 3.94% | 7/29/14 |
| R Class | AEDWX | 4.58% | 4.45% | 7/29/14 |
| R5 Class | AEDJX | 5.31% | 5.17% | 7/29/14 |
| R6 Class | AEXDX | 5.37% | 5.25% | 7/29/14 |
Prior to April 10, 2017, the R5 Class was referred to as the Institutional Class.
Sales charges include initial sales charges and contingent deferred sales charges (CDSCs), as applicable. A Class shares have a 4.50% maximum initial sales charge and may be subject to a maximum CDSC of 1.00%. C Class shares redeemed within 12 months of purchase are subject to a maximum CDSC of 1.00%. The SEC requires that mutual funds provide performance information net of maximum sales charges in all cases where charges could be applied.
Data presented reflect past performance. Past performance is no guarantee of future results. Current performance may be higher or lower than the performance shown. Total returns for periods less than one year are not annualized. Investment return and principal value will fluctuate, and redemption value may be more or less than original cost. Data assumes reinvestment of dividends and capital gains, and none of the charts reflect the deduction of taxes that a shareholder would pay on fund distributions or the redemption of fund shares. To obtain performance data current to the most recent month end, please call 1-800-345-2021 or visit americancentury.com. For additional information about the fund, please consult the prospectus.
|
|
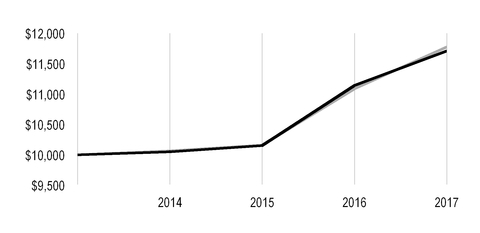
| Growth of $10,000 Over Life of Class |
| $10,000 investment made July 29, 2014 |
| Performance for other share classes will vary due to differences in fee structure. |
|
| |
| Value on October 31, 2017 |
| | Investor Class — $11,710 |
| |
| | JPMorgan CEMBI Broad Diversified Index — $11,776 |
| |
|
| | | | | | | |
| Total Annual Fund Operating Expenses |
| Investor Class | I Class | Y Class | A Class | C Class | R Class | R5 Class | R6 Class |
| 0.97% | 0.87% | 0.77% | 1.22% | 1.97% | 1.47% | 0.77% | 0.72% |
The total annual fund operating expenses shown is as stated in the fund’s prospectus current as of the date of this report. The prospectus may vary from the expense ratio shown elsewhere in this report because it is based on a different time period, includes acquired fund fees and expenses, and, if applicable, does not include fee waivers or expense reimbursements.
Data presented reflect past performance. Past performance is no guarantee of future results. Current performance may be higher or lower than the performance shown. Total returns for periods less than one year are not annualized. Investment return and principal value will fluctuate, and redemption value may be more or less than original cost. Data assumes reinvestment of dividends and capital gains, and none of the charts reflect the deduction of taxes that a shareholder would pay on fund distributions or the redemption of fund shares. To obtain performance data current to the most recent month end, please call 1-800-345-2021 or visit americancentury.com. For additional information about the fund, please consult the prospectus.
Portfolio Managers: Margé Karner, Kevin Akioka, John Lovito, and Brian Howell
Performance Summary
Emerging Markets Debt returned 5.11%* for the fiscal year ended October 31, 2017. By comparison, the fund’s benchmark, the JPMorgan Corporate Emerging Market Bond (CEMBI) Broad Diversified Index, returned 6.18% over the same time period. (Portfolio returns reflect operating expenses, while index returns do not.)
Market Review
Emerging markets debt advanced for the reporting period, boosted by synchronized global growth, firming commodity prices, and gradually rising interest rates. Record inflows, driven primarily by strong investor demand for yield, contributed to narrowing emerging market spreads. Strong technical support from investor inflows and a benign global backdrop resulted in resilience of the asset class, despite heightened political risks in some large markets (such as Brazil and South Africa), increased tensions in the Middle East and North Korea, and uncertainty related to monetary policy normalization in the U.S. and in Europe. Positive factors influencing emerging markets debt performance included a rebound in commodity prices (particularly oil and copper), U.S. dollar weakness, and continued strong economic data from China. The outcome of France’s presidential election, where victory for Emmanuel Macron eased market concerns about nationalist populism in Europe, along with growth momentum in developed markets were also positive influences.
In this environment, lower-quality bonds generally outpaced investment-grade securities, as investors gravitated to higher-yielding segments of the market and emerging markets debt. Boosted by appreciating currencies and falling inflation, local sovereign debt generated strong returns. Among U.S. dollar-denominated emerging markets debt, the frontier markets were top performers, and the lowest-rated corporate issuers (B and below) generated more than double the returns compared with investment-grade issuers. Latin America, Argentina, and Brazil were also strong performers, while higher-rated Asian and European countries underperformed.
Defensive Positioning Detracted from Results
As the reporting period progressed, we positioned the portfolio more defensively, lowering risk as valuations became less attractive. We believed the credit spreads of most lower-quality bonds did not appropriately reflect idiosyncratic credit risks and prevailing market risks. This positioning weighed on portfolio performance, as lower-quality debt significantly outperformed investment-grade credit. However, our positioning provided some upside by helping the portfolio avoid problematic debt represented in the index. There were no defaults, distressed exchanges, or bonds trading at distressed levels in the portfolio.
Country Allocations Added Value
The portfolio experienced positive performance from country allocation as well as security selection in several countries. Overweight positions and security selection in Argentina and Mexico were top contributors to the portfolio, while underweight allocations and security selection in South Korea, Hong Kong, and Israel also added to performance. On the negative side, our lack of exposure to
*All fund returns referenced in this commentary are for Investor Class shares. Performance for other share classes will vary due to differences in fee structure; when Investor Class performance exceeds that of the fund's benchmark, other share classes may not. See page 3 returns for all share classes.
strong-performing frontier countries weighed on relative results. Security selection in Brazil and Turkey, where we focused on higher quality issuers due to challenging macroeconomic environments and heightened political risks in those countries, also detracted from relative performance.
Sector Positioning Delivered Mixed Results
An underweight position in the top-performing metals and mining sector detracted from relative results, but security selection within the sector helped offset some of the negative allocation effect. On the positive side, an underweight position and security selection in the consumer sector contributed to performance. This was partly due to not having exposure to certain companies in the index with problematic debt. Underweight positions in the utilities and financials sectors and security selection in the industrials sector contributed to performance. In addition, overweight positions in the oil and gas sector and in sovereign debt helped.
Positioning for the Future
Looking ahead, we believe the extended strong rally in the emerging markets debt asset class combined with Federal Reserve normalization, European Central Bank tapering, U.S. trade policy, and increased geopolitical tension warrant a cautious approach. Although emerging markets fundamentals have improved, we believe valuations in external corporate debt, particularly in the lowest-quality segments, have run ahead of fundamentals. However, we are beginning to see some adjustment, particularly in the high-yield corporate debt sector. We continue to remain selective and limit the exposure to countries and issuers with solid or improving fundamentals that offer an attractive risk/reward profile to investors.
|
| |
| OCTOBER 31, 2017 |
| Portfolio at a Glance |
| Average Duration (effective) | 4.7 years |
| Weighted Average Life | 6.3 years |
| | |
| Holdings by Country | % of net assets |
| Turkey | 12.6% |
| China | 10.7% |
| Russia | 9.2% |
| Brazil | 8.1% |
| Colombia | 5.4% |
| India | 4.3% |
| Hong Kong | 4.3% |
| Qatar | 4.1% |
| Argentina | 4.1% |
| Mexico | 4.0% |
| Other Countries | 28.8% |
| Cash and Equivalents* | 4.4% |
| *Includes temporary cash investments and other assets and liabilities. |
| | |
| Types of Investments in Portfolio | % of net assets |
| Corporate Bonds | 88.8% |
| Sovereign Governments and Agencies | 6.7% |
| Common Stocks | 0.1% |
| U.S. Treasury Securities | —** |
| Temporary Cash Investments | 2.8% |
| Other Assets and Liabilities | 1.6% |
**Category is less than 0.05% of total net assets.
Fund shareholders may incur two types of costs: (1) transaction costs, including sales charges (loads) on purchase payments and redemption/exchange fees; and (2) ongoing costs, including management fees; distribution and service (12b-1) fees; and other fund expenses. This example is intended to help you understand your ongoing costs (in dollars) of investing in your fund and to compare these costs with the ongoing cost of investing in other mutual funds.
The example is based on an investment of $1,000 made at the beginning of the period and held for the entire period from May 1, 2017 to October 31, 2017.
Actual Expenses
The table provides information about actual account values and actual expenses for each class. You may use the information, together with the amount you invested, to estimate the expenses that you paid over the period. First, identify the share class you own. Then simply divide your account value by $1,000 (for example, an $8,600 account value divided by $1,000 = 8.6), then multiply the result by the number under the heading “Expenses Paid During Period” to estimate the expenses you paid on your account during this period.
If you hold Investor Class shares of any American Century Investments fund, or I Class shares of the American Century Diversified Bond Fund, in an American Century Investments account (i.e., not a financial intermediary or retirement plan account), American Century Investments may charge you a $12.50 semiannual account maintenance fee if the value of those shares is less than $10,000. We will redeem shares automatically in one of your accounts to pay the $12.50 fee. In determining your total eligible investment amount, we will include your investments in all personal accounts (including American Century Investments Brokerage accounts) registered under your Social Security number. Personal accounts include individual accounts, joint accounts, UGMA/UTMA accounts, personal trusts, Coverdell Education Savings Accounts and IRAs (including traditional, Roth, Rollover, SEP-, SARSEP- and SIMPLE-IRAs), and certain other retirement accounts. If you have only business, business retirement, employer-sponsored or American Century Investments Brokerage accounts, you are currently not subject to this fee. If you are subject to the Account Maintenance Fee, your account value could be reduced by the fee amount.
Hypothetical Example for Comparison Purposes
The table also provides information about hypothetical account values and hypothetical expenses based on the actual expense ratio of each class of your fund and an assumed rate of return of 5% per year before expenses, which is not the actual return of a fund’s share class. The hypothetical account values and expenses may not be used to estimate the actual ending account balance or expenses you paid for the period. You may use this information to compare the ongoing costs of investing in your fund and other funds. To do so, compare this 5% hypothetical example with the 5% hypothetical examples that appear in the shareholder reports of the other funds.
Please note that the expenses shown in the table are meant to highlight your ongoing costs only and do not reflect any transactional costs, such as sales charges (loads) or redemption/exchange fees. Therefore, the table is useful in comparing ongoing costs only, and will not help you determine the relative total costs of owning different funds. In addition, if these transactional costs were included, your costs would have been higher.
|
| | | | |
| | Beginning
Account Value
5/1/17 | Ending
Account Value
10/31/17 | Expenses Paid
During Period(1)
5/1/17 - 10/31/17 |
Annualized
Expense Ratio(1) |
| Actual | | | | |
| Investor Class | $1,000 | $1,022.30 | $4.94 | 0.97% |
| I Class | $1,000 | $1,023.80 | $4.44 | 0.87% |
| Y Class | $1,000 | $1,024.20 | $3.93 | 0.77% |
| A Class | $1,000 | $1,022.00 | $6.22 | 1.22% |
| C Class | $1,000 | $1,018.10 | $10.02 | 1.97% |
| R Class | $1,000 | $1,019.70 | $7.48 | 1.47% |
| R5 Class | $1,000 | $1,023.30 | $3.93 | 0.77% |
| R6 Class | $1,000 | $1,024.50 | $3.67 | 0.72% |
| Hypothetical | | | | |
| Investor Class | $1,000 | $1,020.32 | $4.94 | 0.97% |
| I Class | $1,000 | $1,020.82 | $4.43 | 0.87% |
| Y Class | $1,000 | $1,021.32 | $3.92 | 0.77% |
| A Class | $1,000 | $1,019.06 | $6.21 | 1.22% |
| C Class | $1,000 | $1,015.28 | $10.01 | 1.97% |
| R Class | $1,000 | $1,017.80 | $7.48 | 1.47% |
| R5 Class | $1,000 | $1,021.32 | $3.92 | 0.77% |
| R6 Class | $1,000 | $1,021.58 | $3.67 | 0.72% |
| |
| (1) | Expenses are equal to the class's annualized expense ratio listed in the table above, multiplied by the average account value over the period, multiplied by 184, the number of days in the most recent fiscal half-year, divided by 365, to reflect the one-half year period. Annualized expense ratio reflects actual expenses, including any applicable fee waivers or expense reimbursements and excluding any acquired fund fees and expenses. |
OCTOBER 31, 2017
|
| | | | | | | |
| | | Principal Amount | Value |
| CORPORATE BONDS — 88.8% | | | |
| Algeria — 0.6% | | | |
GTH Finance BV, 7.25%, 4/26/23(1) | | $ | 200,000 |
| $ | 226,971 |
|
| Argentina — 3.2% | | | |
Banco Macro SA, VRN, 6.75%, 11/4/21(2) | | 300,000 |
| 317,100 |
|
| Pampa Energia SA, 7.50%, 1/24/27 | | 200,000 |
| 219,160 |
|
| YPF SA, 6.95%, 7/21/27 | | 300,000 |
| 321,375 |
|
| YPF SA, 8.50%, 7/28/25 | | 300,000 |
| 349,800 |
|
| | | | 1,207,435 |
|
| Brazil — 8.1% | | | |
Azul Investments LLP, 5.875%, 10/26/24(1) | | 300,000 |
| 300,450 |
|
Braskem Netherlands Finance BV, 4.50%, 1/10/28(1) | | 400,000 |
| 398,260 |
|
Globo Comunicacao e Participacoes SA, 5.125%, 3/31/27(1) | | 200,000 |
| 204,500 |
|
| Minerva Luxembourg SA, 6.50%, 9/20/26 | | 300,000 |
| 311,715 |
|
| Petrobras Global Finance BV, 3.00%, 1/15/19 | | 1,000,000 |
| 1,001,790 |
|
| Petrobras Global Finance BV, 7.25%, 3/17/44 | | 300,000 |
| 315,375 |
|
| Petrobras Global Finance BV, 8.75%, 5/23/26 | | 200,000 |
| 242,750 |
|
Suzano Austria GmbH, 5.75%, 7/14/26(1) | | 300,000 |
| 323,850 |
|
| | | | 3,098,690 |
|
| Chile — 2.9% | | | |
| Cencosud SA, 6.625%, 2/12/45 | | 300,000 |
| 328,109 |
|
Colbun SA, 3.95%, 10/11/27(1) | | 200,000 |
| 200,175 |
|
SACI Falabella, 3.75%, 10/30/27(1) | | 300,000 |
| 294,000 |
|
| Transelec SA, 3.875%, 1/12/29 | | 300,000 |
| 299,250 |
|
| | | | 1,121,534 |
|
| China — 9.9% | | | |
| Baidu, Inc., 2.75%, 6/9/19 | | 200,000 |
| 202,163 |
|
| Baidu, Inc., 3.625%, 7/6/27 | | 400,000 |
| 402,912 |
|
| China Overseas Finance Cayman III Ltd., 3.375%, 10/29/18 | | 500,000 |
| 505,843 |
|
| China Overseas Finance Cayman V Ltd., 3.95%, 11/15/22 | | 200,000 |
| 208,377 |
|
| CITIC Ltd., MTN, 6.80%, 1/17/23 | | 200,000 |
| 234,586 |
|
| CNOOC Finance 2013 Ltd., 3.00%, 5/9/23 | | 300,000 |
| 301,842 |
|
| CNPC General Capital Ltd., 2.75%, 5/14/19 | | 400,000 |
| 402,684 |
|
| CRCC Yuxiang Ltd., 3.50%, 5/16/23 | | 200,000 |
| 205,890 |
|
| Sinopec Group Overseas Development 2016 Ltd., 2.125%, 5/3/19 | | 400,000 |
| 398,954 |
|
Sinopec Group Overseas Development Ltd., 2.50%, 4/28/20(1) | | 200,000 |
| 200,317 |
|
Sinopec Group Overseas Development Ltd., 2.25%, 9/13/20(1) | | 500,000 |
| 497,517 |
|
State Grid Overseas Investment 2016 Ltd., 3.50%, 5/4/27(1) | | 200,000 |
| 204,362 |
|
| | | | 3,765,447 |
|
| Colombia — 5.3% | | | |
| Bancolombia SA, 5.125%, 9/11/22 | | 130,000 |
| 137,033 |
|
Bancolombia SA, VRN, 4.875%, 10/18/22(2) | | 400,000 |
| 400,300 |
|
|
| | | | | | | |
| | | Principal Amount | Value |
| Colombia Telecomunicaciones SA, 8.50%, 12/29/49 | | $ | 100,000 |
| $ | 107,250 |
|
| Ecopetrol SA, 5.875%, 5/28/45 | | 300,000 |
| 297,750 |
|
| Grupo Aval Ltd., 4.75%, 9/26/22 | | 250,000 |
| 255,625 |
|
Millicom International Cellular SA, 5.125%, 1/15/28(1) | | 500,000 |
| 505,000 |
|
| SUAM Finance BV, 4.875%, 4/17/24 | | 300,000 |
| 322,950 |
|
| | | | 2,025,908 |
|
| Dominican Republic — 0.9% | | | |
Aeropuertos Dominicanos Siglo XXI SA, 6.75%, 3/30/29(1) | | 300,000 |
| 326,625 |
|
| Guatemala — 0.6% | | | |
| Comcel Trust via Comunicaciones Celulares SA, 6.875%, 2/6/24 | | 200,000 |
| 212,000 |
|
| Hong Kong — 4.3% | | | |
Bank of East Asia Ltd. (The), MTN, VRN, 4.25%, 11/20/19(2) | | 200,000 |
| 204,074 |
|
| China CITIC Bank International Ltd., MTN, 6.875%, 6/24/20 | | 200,000 |
| 217,909 |
|
CK Hutchison International 17 II Ltd., 2.25%, 9/29/20(1) | | 500,000 |
| 498,454 |
|
| CK Hutchison International 17 Ltd., 3.50%, 4/5/27 | | 600,000 |
| 605,149 |
|
| Hutchison Whampoa International 09 Ltd., 7.625%, 4/9/19 | | 100,000 |
| 107,593 |
|
| | | | 1,633,179 |
|
| India — 4.3% | | | |
| Bharti Airtel International (Netherlands) BV, 5.125%, 3/11/23 | | 600,000 |
| 643,788 |
|
| ICICI Bank Ltd., 5.75%, 11/16/20 | | 200,000 |
| 217,556 |
|
| ONGC Videsh Ltd., 4.625%, 7/15/24 | | 200,000 |
| 214,905 |
|
| Reliance Industries Ltd., 4.125%, 1/28/25 | | 250,000 |
| 260,883 |
|
Vedanta Resources plc, 6.125%, 8/9/24(1) | | 300,000 |
| 306,825 |
|
| | | | 1,643,957 |
|
| Indonesia — 1.9% | | | |
Minejesa Capital BV, 4.625%, 8/10/30(1) | | 300,000 |
| 306,751 |
|
| TBG Global Pte Ltd., 5.25%, 2/10/22 | | 400,000 |
| 412,909 |
|
| | | | 719,660 |
|
| Ireland — 0.8% | | | |
C&W Senior Financing Designated Activity Co., 6.875%, 9/15/27(1) | | 300,000 |
| 314,250 |
|
| Israel — 1.5% | | | |
Israel Electric Corp. Ltd., 5.00%, 11/12/24(1) | | 200,000 |
| 215,612 |
|
| Teva Pharmaceutical Finance Netherlands III BV, 2.80%, 7/21/23 | | 400,000 |
| 368,424 |
|
| | | | 584,036 |
|
| Kazakhstan — 0.5% | | | |
KazTransGas JSC, 4.375%, 9/26/27(1) | | 200,000 |
| 197,984 |
|
| Kuwait — 0.8% | | | |
| Kuwait Projects Co. SPC Ltd., 5.00%, 3/15/23 | | 300,000 |
| 318,384 |
|
| Mexico — 4.0% | | | |
Banco Inbursa SA Institucion de Banca Multiple, 4.375%, 4/11/27(1) | | 300,000 |
| 298,500 |
|
Banco Mercantil del Norte SA, VRN, 5.75%, 10/4/26(2) | | 300,000 |
| 306,000 |
|
| Mexichem SAB de CV, 5.875%, 9/17/44 | | 400,000 |
| 415,100 |
|
| Petroleos Mexicanos, 6.50%, 3/13/27 | | 200,000 |
| 218,530 |
|
| Southern Copper Corp., 7.50%, 7/27/35 | | 200,000 |
| 264,849 |
|
| | | | 1,502,979 |
|
|
| | | | | | | |
| | | Principal Amount | Value |
| Nigeria — 1.7% | | | |
| Guaranty Trust Bank plc, MTN, 6.00%, 11/8/18 | | $ | 200,000 |
| $ | 203,144 |
|
IHS Netherlands Holdco BV, 9.50%, 10/27/21(1) | | 400,000 |
| 425,938 |
|
| | | | 629,082 |
|
| Panama — 1.3% | | | |
Banco General SA, 4.125%, 8/7/27(1) | | 300,000 |
| 298,650 |
|
Banistmo SA, 3.65%, 9/19/22(1) | | 200,000 |
| 200,380 |
|
| | | | 499,030 |
|
| Peru — 3.8% | | | |
Banco de Credito del Peru, 2.25%, 10/25/19(1) | | 200,000 |
| 200,500 |
|
Banco Internacional del Peru SAA Interbank, VRN, 6.625%, 3/19/24(2) | | 200,000 |
| 227,000 |
|
Intercorp Financial Services, Inc., 4.125%, 10/19/27(1) | | 300,000 |
| 296,625 |
|
SAN Miguel Industrias Pet SA, 4.50%, 9/18/22(1) | | 300,000 |
| 304,170 |
|
| Transportadora de Gas del Peru SA, 4.25%, 4/30/28 | | 400,000 |
| 414,500 |
|
| | | | 1,442,795 |
|
| Philippines — 0.3% | | | |
| FPT Finance Ltd., 6.375%, 9/28/20 | | 100,000 |
| 109,500 |
|
| Qatar — 4.1% | | | |
| Nakilat, Inc., 6.27%, 12/31/33 | | 208,550 |
| 245,046 |
|
| Ooredoo Tamweel Ltd., 3.04%, 12/3/18 | | 600,000 |
| 604,935 |
|
| Ras Laffan Liquefied Natural Gas Co. Ltd. III, 6.75%, 9/30/19 | | 400,000 |
| 429,975 |
|
| Ras Laffan Liquefied Natural Gas Co. Ltd. III, 6.33%, 9/30/27 | | 250,000 |
| 288,500 |
|
| | | | 1,568,456 |
|
| Republic of Korea — 1.6% | | | |
| Hyundai Capital America, 2.55%, 2/6/19 | | 200,000 |
| 200,406 |
|
| KEB Hana Bank, MTN, 4.375%, 9/30/24 | | 200,000 |
| 209,140 |
|
| Woori Bank, MTN, 4.75%, 4/30/24 | | 200,000 |
| 210,127 |
|
| | | | 619,673 |
|
| Russia — 8.1% | | | |
| Credit Bank of Moscow Via CBOM Finance plc, 7.70%, 2/1/18 | | 400,000 |
| 402,951 |
|
| Gazprom OAO Via Gaz Capital SA, 9.25%, 4/23/19 | | 500,000 |
| 545,518 |
|
| Gazprom OAO Via Gaz Capital SA, 6.51%, 3/7/22 | | 200,000 |
| 221,917 |
|
| Gazprom OAO Via Gaz Capital SA, MTN, 7.29%, 8/16/37 | | 200,000 |
| 243,462 |
|
| Lukoil International Finance BV, 6.125%, 11/9/20 | | 200,000 |
| 217,713 |
|
Lukoil International Finance BV, 4.75%, 11/2/26(1) | | 300,000 |
| 315,778 |
|
| Novolipetsk Steel via Steel Funding DAC, 4.50%, 6/15/23 | | 200,000 |
| 207,437 |
|
| Sberbank of Russia Via SB Capital SA, 5.18%, 6/28/19 | | 400,000 |
| 415,851 |
|
| Sberbank of Russia Via SB Capital SA, 5.125%, 10/29/22 | | 300,000 |
| 313,981 |
|
| VEON Holdings BV, 5.20%, 2/13/19 | | 200,000 |
| 206,200 |
|
| | | | 3,090,808 |
|
| Singapore — 1.1% | | | |
Oversea-Chinese Banking Corp. Ltd., MTN, VRN, 4.00%, 10/15/19(2) | | 200,000 |
| 205,048 |
|
United Overseas Bank Ltd., MTN, VRN, 3.75%, 9/19/19(2) | | 200,000 |
| 204,565 |
|
| | | | 409,613 |
|
| South Africa — 1.1% | | | |
MTN Mauritius Investment Ltd., 6.50%, 10/13/26(1) | | 400,000 |
| 433,300 |
|
|
| | | | | | | |
| | | Principal Amount | Value |
| Thailand — 1.1% | | | |
| Bangkok Bank PCL, 3.875%, 9/27/22 | | $ | 200,000 |
| $ | 210,126 |
|
| Siam Commercial Bank PCL, MTN, 3.50%, 4/7/19 | | 200,000 |
| 203,288 |
|
| | | | 413,414 |
|
| Turkey — 11.8% | | | |
Finansbank AS, 4.875%, 5/19/22(1) | | 200,000 |
| 197,858 |
|
| Finansbank AS, MTN, 6.25%, 4/30/19 | | 200,000 |
| 206,699 |
|
| Tupras Turkiye Petrol Rafinerileri AS, 4.125%, 5/2/18 | | 800,000 |
| 804,839 |
|
Tupras Turkiye Petrol Rafinerileri AS, 4.50%, 10/18/24(1) | | 500,000 |
| 490,063 |
|
| Turk Telekomunikasyon AS, 4.875%, 6/19/24 | | 500,000 |
| 507,002 |
|
| Turk Telekomunikasyon AS, 3.75%, 6/19/19 | | 300,000 |
| 303,406 |
|
| Turkiye Garanti Bankasi AS, MTN, 4.75%, 10/17/19 | | 400,000 |
| 407,435 |
|
Turkiye Garanti Bankasi AS, VRN, 6.125%, 5/24/22(1)(2) | | 600,000 |
| 594,300 |
|
| Turkiye Is Bankasi, 3.75%, 10/10/18 | | 200,000 |
| 200,204 |
|
Turkiye Is Bankasi, 6.125%, 4/25/24(1) | | 300,000 |
| 299,792 |
|
| Yapi ve Kredi Bankasi AS, 5.25%, 12/3/18 | | 200,000 |
| 203,337 |
|
Yapi ve Kredi Bankasi AS, 5.85%, 6/21/24(1) | | 300,000 |
| 296,540 |
|
| | | | 4,511,475 |
|
| Ukraine — 0.6% | | | |
| MHP SE, 8.25%, 4/2/20 | | 200,000 |
| 216,677 |
|
| United Arab Emirates — 2.6% | | | |
| Abu Dhabi National Energy Co. PJSC, 3.625%, 1/12/23 | | 200,000 |
| 203,000 |
|
| Abu Dhabi National Energy Co. PJSC, MTN, 5.875%, 12/13/21 | | 300,000 |
| 331,860 |
|
| ADCB Finance Cayman Ltd., MTN, 4.50%, 3/6/23 | | 200,000 |
| 210,605 |
|
| DP World Ltd., MTN, 6.85%, 7/2/37 | | 200,000 |
| 248,123 |
|
| | | | 993,588 |
|
TOTAL CORPORATE BONDS
(Cost $33,243,526) | | | 33,836,450 |
|
| SOVEREIGN GOVERNMENTS AND AGENCIES — 6.7% | | | |
| Argentina — 0.9% | | | |
| Provincia de Buenos Aires, 7.875%, 6/15/27 | | 300,000 |
| 333,300 |
|
| China — 0.8% | | | |
| Avi Funding Co. Ltd., MTN, 3.80%, 9/16/25 | | 300,000 |
| 309,515 |
|
| Greece — 2.1% | | | |
Hellenic Republic Government Bond, 4.375%, 8/1/22(1) | EUR | 700,000 |
| 814,446 |
|
| Jordan — 0.5% | | | |
Jordan Government International Bond, 7.375%, 10/10/47(1) | | $ | 200,000 |
| 209,935 |
|
| Russia — 1.1% | | | |
| Russian Foreign Bond - Eurobond, 4.25%, 6/23/27 | | 200,000 |
| 204,181 |
|
| Russian Foreign Bond - Eurobond, 5.00%, 4/29/20 | | 200,000 |
| 211,844 |
|
| | | | 416,025 |
|
| Saudi Arabia — 0.5% | | | |
Saudi Government International Bond, 2.375%, 10/26/21(1) | | 200,000 |
| 196,803 |
|
| Turkey — 0.8% | | | |
| Turkey Government International Bond, 4.875%, 10/9/26 | | 300,000 |
| 293,495 |
|
TOTAL SOVEREIGN GOVERNMENTS AND AGENCIES
(Cost $2,543,286) | | | 2,573,519 |
|
|
| | | | | | | |
| | | Shares/Principal Amount | Value |
| COMMON STOCKS — 0.1% | | | |
| Colombia — 0.1% | | | |
Frontera Energy Corp.(3)
(Cost $202,817) | | 1,039 |
| $ | 31,064 |
|
U.S. TREASURY SECURITIES† | | | |
United States† | | | |
U.S. Treasury Notes, 2.25%, 8/15/27
(Cost $9,891) | | $ | 10,000 |
| 9,891 |
|
| TEMPORARY CASH INVESTMENTS — 2.8% | | | |
| Repurchase Agreement, BMO Capital Markets Corp., (collateralized by various U.S. Treasury obligations, 0.375% - 1.375%, 1/15/27 - 2/15/45, valued at $364,754), in a joint trading account at 0.88%, dated 10/31/17, due 11/1/17 (Delivery value $356,792) | | | 356,783 |
|
| Repurchase Agreement, Fixed Income Clearing Corp., (collateralized by various U.S. Treasury obligations, 2.50%, 5/15/46, valued at $304,464), at 0.34%, dated 10/31/17, due 11/1/17 (Delivery value $297,003) | | | 297,000 |
|
| State Street Institutional U.S. Government Money Market Fund, Premier Class | | 326,837 |
| 326,837 |
|
U.S. Treasury Bills 1.05%, 11/9/17(4)(5) | | $ | 100,000 |
| 99,979 |
|
TOTAL TEMPORARY CASH INVESTMENTS
(Cost $1,080,598) | | | 1,080,599 |
|
TOTAL INVESTMENT SECURITIES — 98.4%
(Cost $37,080,118) | | | 37,531,523 |
|
| OTHER ASSETS AND LIABILITIES — 1.6% | | | 592,578 |
|
| TOTAL NET ASSETS — 100.0% | | | $ | 38,124,101 |
|
|
| | | | | | | | | | |
| FORWARD FOREIGN CURRENCY EXCHANGE CONTRACTS |
| Currency Purchased | Currency Sold | Counterparty | Settlement Date | Unrealized Appreciation
(Depreciation) |
| USD | 806,871 |
| EUR | 684,361 |
| JPMorgan Chase Bank N.A. | 12/20/17 | $ | 7,501 |
|
| USD | 2,269,745 |
| MXN | 40,813,647 |
| JPMorgan Chase Bank N.A. | 12/20/17 | 158,219 |
|
| MXN | 40,813,647 |
| USD | 2,157,740 |
| JPMorgan Chase Bank N.A. | 12/20/17 | (46,214 | ) |
| | | | | | | $ | 119,506 |
|
|
| | | | | | | | | | | | |
| FUTURES CONTRACTS PURCHASED |
| Reference Entity | Contracts | Expiration
Date | Notional
Amount | Underlying
Contract
Value | Unrealized
Appreciation
(Depreciation) |
| U.S. Treasury 5-Year Notes | 41 | December 2017 | | $ | 4,100,000 |
| $ | 4,804,688 |
| $ | (54,225 | ) |
| U.S. Treasury Long Bonds | 4 | December 2017 | | $ | 400,000 |
| 609,875 |
| (11,572 | ) |
| | | | | | $ | 5,414,563 |
| $ | (65,797 | ) |
|
| | | | | | | | | | | | |
| FUTURES CONTRACTS SOLD |
| Reference Entity | Contracts | Expiration
Date | Notional
Amount | Underlying
Contract
Value | Unrealized
Appreciation
(Depreciation) |
| U.S. Treasury 10-Year Ultra Notes | 26 | December 2017 | | $ | 2,600,000 |
| $ | 3,481,969 |
| $ | 30,973 |
|
|
| | | | | | | | | | | | | | | |
| CREDIT DEFAULT SWAP AGREEMENTS |
| Counterparty/Reference Entity | Type | Fixed Rate
Received
(Paid) | Termination
Date | Notional
Amount | Premiums Paid (Received) | Unrealized
Appreciation
(Depreciation) | Value* |
| Bank of America N.A. / Colombia Government International Bond | Buy | (1.00)% | 12/20/21 | $ | 500,000 |
| $ | 10,339 |
| $ | (14,405 | ) | $ | (4,066 | ) |
| Bank of America N.A. / Markit CDX Emerging Markets Index Series 28 | Buy | (1.00)% | 12/20/22 | $ | 1,500,000 |
| 62,517 |
| (12,333 | ) | 50,184 |
|
| Bank of America N.A. / Republic of Chile | Buy | (1.00)% | 12/20/22 | $ | 1,500,000 |
| (32,148 | ) | (5,751 | ) | (37,899 | ) |
| Morgan Stanley / Republic of Turkey | Buy | (1.00)% | 12/20/22 | $ | 1,300,000 |
| 49,652 |
| 334 |
| 49,986 |
|
| | | | | | $ | 90,360 |
| $ | (32,155 | ) | $ | 58,205 |
|
*The value for credit default swap agreements serve as an indicator of the current status of the payment/performance risk and represent the likelihood of an expected liability or profit at the period end. Increasing values in absolute terms when compared to the notional amount of the credit default swap agreement represent a deterioration of the referenced entity's credit soundness and an increased likelihood or risk of a credit event occurring as defined in the agreement.
|
| | |
| NOTES TO SCHEDULE OF INVESTMENTS |
| CDX | - | Credit Derivatives Indexes |
| EUR | - | Euro |
| MTN | - | Medium Term Note |
| MXN | - | Mexican Peso |
| USD | - | United States Dollar |
| VRN | - | Variable Rate Note. Interest reset date is indicated. Rate shown is effective at the period end. |
| |
| † | Category is less than 0.05% of total net assets. |
| |
| (1) | Security was purchased pursuant to Rule 144A under the Securities Act of 1933 and may be sold in transactions exempt from registration, normally to qualified institutional investors. The aggregate value of these securities at the period end was $11,395,481, which represented 29.9% of total net assets. |
| |
| (2) | Coupon rate adjusts periodically based upon a predetermined schedule. Interest reset date is indicated. Rate shown is effective at the period end. |
| |
| (4) | The rate indicated is the yield to maturity at purchase. |
| |
| (5) | Security, or a portion thereof, has been pledged at the custodian bank or with a broker for margin requirements on forward foreign currency exchange contracts, futures contracts and/or swap agreements. At the period end, the aggregate value of securities pledged was $17,996. |
See Notes to Financial Statements.
|
|
| Statement of Assets and Liabilities |
|
| | | |
| OCTOBER 31, 2017 | |
| Assets | |
| Investment securities, at value (cost of $37,080,118) | $ | 37,531,523 |
|
| Receivable for capital shares sold | 86,310 |
|
| Unrealized appreciation on forward foreign currency exchange contracts | 165,720 |
|
| Swap agreements, at value (including net premiums paid (received) of $112,169) | 100,170 |
|
| Interest receivable | 370,590 |
|
| | 38,254,313 |
|
| | |
| Liabilities | |
| Payable for investments purchased | 9,939 |
|
| Payable for capital shares redeemed | 996 |
|
| Payable for variation margin on futures contracts | 1,289 |
|
| Unrealized depreciation on forward foreign currency exchange contracts | 46,214 |
|
| Swap agreements, at value (including net premiums paid (received) of $(21,809)) | 41,965 |
|
| Accrued management fees | 26,462 |
|
| Distribution and service fees payable | 2,870 |
|
| Dividends payable | 477 |
|
| | 130,212 |
|
| | |
| Net Assets | $ | 38,124,101 |
|
| | |
| Net Assets Consist of: | |
| Capital paid in | $ | 36,709,118 |
|
| Undistributed net investment income | 22,630 |
|
| Undistributed net realized gain | 888,494 |
|
| Net unrealized appreciation | 503,859 |
|
| | $ | 38,124,101 |
|
|
| | | | | | |
| | Net Assets | Shares Outstanding | Net Asset Value Per Share |
| Investor Class |
| $6,634,232 |
| 635,800 |
| $10.43 |
| I Class |
| $38,195 |
| 3,660 |
| $10.44 |
| Y Class |
| $5,166 |
| 495 |
| $10.44 |
| A Class |
| $6,618,778 |
| 634,640 |
| $10.43* |
| C Class |
| $1,144,374 |
| 109,919 |
| $10.41 |
| R Class |
| $1,205,251 |
| 115,638 |
| $10.42 |
| R5 Class |
| $5,985,762 |
| 573,627 |
| $10.43 |
| R6 Class |
| $16,492,343 |
| 1,579,852 |
| $10.44 |
*Maximum offering price $10.92 (net asset value divided by 0.955).
See Notes to Financial Statements.
|
| | | |
| YEAR ENDED OCTOBER 31, 2017 |
| Investment Income (Loss) | |
| Income: | |
| Interest | $ | 1,585,865 |
|
| | |
| Expenses: | |
| Management fees | 292,680 |
|
| Distribution and service fees: | |
| A Class | 15,896 |
|
| C Class | 11,166 |
|
| R Class | 5,781 |
|
| Trustees' fees and expenses | 2,236 |
|
| Other expenses | 1,260 |
|
| | 329,019 |
|
| | |
| Net investment income (loss) | 1,256,846 |
|
| | |
| Realized and Unrealized Gain (Loss) | |
| Net realized gain (loss) on: | |
| Investment transactions | 993,500 |
|
| Forward foreign currency exchange contract transactions | (185,138 | ) |
| Futures contract transactions | 133,547 |
|
| Swap agreement transactions | (39,674 | ) |
| Foreign currency translation transactions | 15,481 |
|
| | 917,716 |
|
| | |
| Change in net unrealized appreciation (depreciation) on: | |
| Investments | (308,439 | ) |
| Forward foreign currency exchange contracts | 119,506 |
|
| Futures contracts | (50,513 | ) |
| Swap agreements | (32,155 | ) |
| Translation of assets and liabilities in foreign currencies | (73 | ) |
| | (271,674 | ) |
| | |
| Net realized and unrealized gain (loss) | 646,042 |
|
| | |
| Net Increase (Decrease) in Net Assets Resulting from Operations | $ | 1,902,888 |
|
See Notes to Financial Statements.
|
|
| Statement of Changes in Net Assets |
|
| | | | | | |
| YEARS ENDED OCTOBER 31, 2017 AND OCTOBER 31, 2016 |
| Increase (Decrease) in Net Assets | October 31, 2017 | October 31, 2016 |
| Operations | | |
| Net investment income (loss) | $ | 1,256,846 |
| $ | 1,046,093 |
|
| Net realized gain (loss) | 917,716 |
| 427,241 |
|
| Change in net unrealized appreciation (depreciation) | (271,674 | ) | 1,232,877 |
|
| Net increase (decrease) in net assets resulting from operations | 1,902,888 |
| 2,706,211 |
|
| | | |
| Distributions to Shareholders | | |
| From net investment income: | | |
| Investor Class | (136,419 | ) | (85,827 | ) |
| I Class | (429 | ) | — |
|
| Y Class | (98 | ) | — |
|
| A Class | (195,891 | ) | (202,338 | ) |
| C Class | (26,040 | ) | (27,956 | ) |
| R Class | (32,720 | ) | (33,205 | ) |
| R5 Class | (204,399 | ) | (207,030 | ) |
| R6 Class | (635,782 | ) | (507,314 | ) |
| From net realized gains: | | |
| Investor Class | (18,280 | ) | — |
|
| A Class | (36,596 | ) | — |
|
| C Class | (6,473 | ) | — |
|
| R Class | (6,555 | ) | — |
|
| R5 Class | (33,080 | ) | — |
|
| R6 Class | (99,926 | ) | — |
|
| Decrease in net assets from distributions | (1,432,688 | ) | (1,063,670 | ) |
| | | |
| Capital Share Transactions | | |
| Net increase (decrease) in net assets from capital share transactions (Note 5) | 4,094,966 |
| 4,891,529 |
|
| | | |
| Net increase (decrease) in net assets | 4,565,166 |
| 6,534,070 |
|
| | | |
| Net Assets | | |
| Beginning of period | 33,558,935 |
| 27,024,865 |
|
| End of period | $ | 38,124,101 |
| $ | 33,558,935 |
|
| | | |
| Undsitributed net investment income | $ | 22,630 |
| — |
|
See Notes to Financial Statements.
|
|
| Notes to Financial Statements |
OCTOBER 31, 2017
1. Organization
American Century International Bond Funds (the trust) is registered under the Investment Company Act of 1940, as amended (the 1940 Act), as an open-end management investment company and is organized as a Massachusetts business trust. Emerging Markets Debt Fund (the fund) is one fund in a series issued by the trust. The fund’s investment objective is to seek total return.
The fund offers the Investor Class, I Class, Y Class, A Class, C Class, R Class, R5 Class (formerly Institutional Class) and R6 Class. The A Class may incur an initial sales charge. The A Class and C Class may be subject to a contingent deferred sales charge. Sale of the I Class and Y Class commenced on April 10, 2017.
2. Significant Accounting Policies
The following is a summary of significant accounting policies consistently followed by the fund in preparation of its financial statements. The fund is an investment company and follows accounting and reporting guidance in accordance with accounting principles generally accepted in the United States of America. This may require management to make certain estimates and assumptions at the date of the financial statements. Actual results could differ from these estimates. Management evaluated the impact of events or transactions occurring through the date the financial statements were issued that would merit recognition or disclosure.
Investment Valuations — The fund determines the fair value of its investments and computes its net asset value per share at the close of regular trading (usually 4 p.m. Eastern time) on the New York Stock Exchange (NYSE) on each day the NYSE is open. The Board of Trustees has adopted valuation policies and procedures to guide the investment advisor in the fund’s investment valuation process and to provide methodologies for the oversight of the fund’s pricing function.
Fixed income securities are valued at the evaluated mean as provided by independent pricing services or at the mean of the most recent bid and asked prices as provided by investment dealers. Sovereign governments and agencies, corporate bonds, and U.S. Treasury and Government Agency securities are valued using market models that consider trade data, quotations from dealers and active market makers, relevant yield curve and spread data, creditworthiness, trade data or market information on comparable securities, and other relevant security specific information. Fixed income securities initially expressed in local currencies are translated into U.S. dollars at the mean of the appropriate currency exchange rate at the close of the NYSE as provided by an independent pricing service.
Equity securities that are listed or traded on a domestic securities exchange are valued at the last reported sales price or at the official closing price as provided by the exchange. Equity securities traded on foreign securities exchanges are generally valued at the closing price of such securities on the exchange where primarily traded or at the close of the NYSE, if that is earlier. If no last sales price is reported, or if local convention or regulation so provides, the mean of the latest bid and asked prices may be used. Securities traded over-the-counter are valued at the mean of the latest bid and asked prices, the last sales price, or the official closing price. Equity securities initially expressed in local currencies are translated into U.S. dollars at the mean of the appropriate currency exchange rate at the close of the NYSE as provided by an independent pricing service.
Open-end management investment companies are valued at the reported net asset value per share. Repurchase agreements are valued at cost, which approximates fair value. Exchange-traded futures contracts are valued at the settlement price as provided by the appropriate clearing corporation. Swap agreements are valued at an evaluated mean as provided by independent pricing services or independent brokers. Forward foreign currency exchange contracts are valued at the mean of the appropriate forward exchange rate at the close of the NYSE as provided by an independent pricing service.
If the fund determines that the market price for an investment is not readily available or the valuation methods mentioned above do not reflect an investment’s fair value, such investment is valued as determined in good faith by the Board of Trustees or its delegate, in accordance with policies and procedures adopted by the Board of Trustees. In its determination of fair value, the fund may review several factors including, but not limited to, market information regarding the specific investment or comparable investments and correlation
with other investment types, futures indices or general market indicators. Circumstances that may cause the fund to use these procedures to value an investment include, but are not limited to: an investment has been declared in default or is distressed; trading in a security has been suspended during the trading day or a security is not actively trading on its principal exchange; prices received from a regular pricing source are deemed unreliable; or there is a foreign market holiday and no trading occurred.
The fund monitors for significant events occurring after the close of an investment’s primary exchange but before the fund’s net asset value per share is determined. Significant events may include, but are not limited to: corporate announcements and transactions; governmental action and political unrest that could impact a specific investment or an investment sector; or armed conflicts, natural disasters and similar events that could affect investments in a specific country or region. The fund also monitors for significant fluctuations between domestic and foreign markets, as evidenced by the U.S. market or such other indicators that the Board of Trustees, or its delegate, deems appropriate. If significant fluctuations in foreign markets are identified, the fund may apply a model-derived factor to the closing price of equity securities traded on foreign securities exchanges. The factor is based on observable market data as provided by an independent pricing service.
Security Transactions — Security transactions are accounted for as of the trade date. Net realized gains and losses are determined on the identified cost basis, which is also used for federal income tax purposes.
Investment Income — Interest income is recorded on the accrual basis and includes accretion of discounts and amortization of premiums. Inflation adjustments related to inflation-linked debt securities are reflected as interest income.
Foreign Currency Translations — All assets and liabilities initially expressed in foreign currencies are translated into U.S. dollars at prevailing exchange rates at period end. The fund may enter into spot foreign currency exchange contracts to facilitate transactions denominated in a foreign currency. Purchases and sales of investment securities, dividend and interest income, spot foreign currency exchange contracts, and expenses are translated at the rates of exchange prevailing on the respective dates of such transactions. Net realized and unrealized foreign currency exchange gains or losses related to investment securities are a component of net realized gain (loss) on investment transactions and change in net unrealized appreciation (depreciation) on investments, respectively.
Repurchase Agreements — The fund may enter into repurchase agreements with institutions that American Century Investment Management, Inc. (ACIM) (the investment advisor) has determined are creditworthy pursuant to criteria adopted by the Board of Trustees. The fund requires that the collateral, represented by securities, received in a repurchase transaction be transferred to the custodian in a manner sufficient to enable the fund to obtain those securities in the event of a default under the repurchase agreement. ACIM monitors, on a daily basis, the securities transferred to ensure the value, including accrued interest, of the securities under each repurchase agreement is equal to or greater than amounts owed to the fund under each repurchase agreement.
Joint Trading Account — Pursuant to an Exemptive Order issued by the Securities and Exchange Commission, the fund, along with certain other funds in the American Century Investments family of funds, may transfer uninvested cash balances into a joint trading account. These balances are invested in one or more repurchase agreements that are collateralized by U.S. Treasury or Agency obligations.
Segregated Assets — In accordance with the 1940 Act, the fund segregates assets on its books and records to cover certain types of investments, including, but not limited to, futures contracts, forward commitments, when-issued securities, swap agreements and certain forward foreign currency exchange contracts. ACIM monitors, on a daily basis, the securities segregated to ensure the fund designates a sufficient amount of liquid assets, marked-to-market daily. The fund may also receive assets or be required to pledge assets at the custodian bank or with a broker for margin requirements on futures contracts, forward commitments, swap agreements and certain forward foreign currency exchange contracts.
Income Tax Status — It is the fund’s policy to distribute substantially all net investment income and net realized gains to shareholders and to otherwise qualify as a regulated investment company under provisions of the Internal Revenue Code. Accordingly, no provision has been made for income taxes. The fund files U.S. federal, state, local and non-U.S. tax returns as applicable. The fund's tax returns are subject to examination by the relevant taxing authority until expiration of the applicable statute of limitations, which is generally three years from the date of filing but can be longer in certain jurisdictions. At this time, management believes there are no uncertain tax positions which, based on their technical merit, would not be sustained upon examination and for which it is reasonably possible that the total amounts of unrecognized tax benefits will significantly change in the next twelve months.
Multiple Class — All shares of the fund represent an equal pro rata interest in the net assets of the class to which such shares belong, and have identical voting, dividend, liquidation and other rights and the same terms and conditions, except for class specific expenses and exclusive rights to vote on matters affecting only individual classes. Income, non-class specific expenses, and realized and unrealized capital gains and losses of the fund are allocated to each class of shares based on their relative net assets.
Distributions to Shareholders — Distributions from net investment income, if any, are declared daily and paid monthly. Distributions from net realized gains, if any, are generally declared and paid annually.
Indemnifications — Under the trust’s organizational documents, its officers and trustees are indemnified against certain liabilities arising out of the performance of their duties to the fund. In addition, in the normal course of business, the fund enters into contracts that provide general indemnifications. The maximum exposure under these arrangements is unknown as this would involve future claims that may be made against a fund. The risk of material loss from such claims is considered by management to be remote.
3. Fees and Transactions with Related Parties
Certain officers and trustees of the trust are also officers and/or directors of American Century Companies, Inc. (ACC). The trust's investment advisor, ACIM, the trust's distributor, American Century Investment Services, Inc. (ACIS), and the trust's transfer agent, American Century Services, LLC, are wholly owned, directly or indirectly, by ACC. ACIM owns 45% of the shares of the fund. Various funds issued by American Century Investment Trust and American Century Strategic Asset Allocations, Inc. own, in aggregate, 41% of the shares of the fund. Related parties do not invest in the fund for the purpose of exercising management or control.
Management Fees — The trust has entered into a management agreement with ACIM, under which ACIM provides the fund with investment advisory and management services in exchange for a single, unified management fee (the fee) per class. The agreement provides that all expenses of managing and operating the fund, except distribution and service fees, brokerage expenses, taxes, interest, fees and expenses of the independent trustees (including legal counsel fees), and extraordinary expenses, will be paid by ACIM. The fee is computed and accrued daily based on each class's daily net assets and paid monthly in arrears. The difference in the fee among the classes is a result of their separate arrangements for non-Rule 12b-1 shareholder services. It is not the result of any difference in advisory or custodial fees or other expenses related to the management of the fund’s assets, which do not vary by class.
The annual management fee for each class is as follows:
|
| | | | | | | |
| Investor Class | I Class | Y Class | A Class | C Class | R Class | R5 Class | R6 Class |
| 0.96% | 0.86% | 0.76% | 0.96% | 0.96% | 0.96% | 0.76% | 0.71% |
Distribution and Service Fees — The Board of Trustees has adopted a separate Master Distribution and Individual Shareholder Services Plan for each of the A Class, C Class and R Class (collectively the plans), pursuant to Rule 12b-1 of the 1940 Act. The plans provide that the A Class will pay ACIS an annual distribution and service fee of 0.25%. The plans provide that the C Class will pay ACIS an annual distribution and service fee of 1.00%, of which 0.25% is paid for individual shareholder services and 0.75% is paid for distribution services. The plans provide that the R Class will pay ACIS an annual distribution and service fee of 0.50%. The fees are computed and accrued daily based on each class’s daily net assets and paid monthly in arrears. The fees are used to pay financial intermediaries for distribution and individual shareholder services. Fees incurred under the plans during the period ended October 31, 2017 are detailed in the Statement of Operations.
Trustees’ Fees and Expenses — The Board of Trustees is responsible for overseeing the investment advisor’s management and operations of the fund. The trustees receive detailed information about the fund and its investment advisor regularly throughout the year, and meet at least quarterly with management of the investment advisor to review reports about fund operations. The fund’s officers do not receive compensation from the fund.
4. Investment Transactions
Purchases of investment securities, excluding short-term investments, for the period ended October 31, 2017 totaled $51,862,711, of which $936,083 represented U.S. Treasury and Government Agency obligations.
Sales of investment securities, excluding short-term investments, for the period ended October 31, 2017 totaled $46,087,146, of which $925,976 represented U.S. Treasury and Government Agency obligations.
5. Capital Share Transactions
Transactions in shares of the fund were as follows (unlimited number of shares authorized):
|
| | | | | | | | | | |
| | Year ended
October 31, 2017(1) | Year ended
October 31, 2016 |
| | Shares | Amount | Shares | Amount |
| Investor Class | | | | |
| Sold | 582,422 |
| $ | 6,023,796 |
| 274,466 |
| $ | 2,798,069 |
|
| Issued in reinvestment of distributions | 14,657 |
| 150,735 |
| 8,240 |
| 82,673 |
|
| Redeemed | (338,952 | ) | (3,465,672 | ) | (97,759 | ) | (978,196 | ) |
| | 258,127 |
| 2,708,859 |
| 184,947 |
| 1,902,546 |
|
| I Class | | | N/A |
| |
| Sold | 3,639 |
| 37,719 |
| | |
| Issued in reinvestment of distributions | 41 |
| 429 |
| | |
| Redeemed | (20 | ) | (204 | ) | | |
| | 3,660 |
| 37,944 |
| | |
| Y Class | | | N/A |
| |
| Sold | 485 |
| 5,000 |
| | |
| Issued in reinvestment of distributions | 10 |
| 98 |
| | |
| | 495 |
| 5,098 |
| | |
| A Class | | | | |
| Sold | 11,352 |
| 118,176 |
| 6,539 |
| 63,694 |
|
| Issued in reinvestment of distributions | 22,681 |
| 232,487 |
| 20,228 |
| 201,870 |
|
| Redeemed | (8,319 | ) | (86,038 | ) | — |
| — |
|
| | 25,714 |
| 264,625 |
| 26,767 |
| 265,564 |
|
| C Class | | | | |
| Sold | 962 |
| 10,000 |
| 847 |
| 8,260 |
|
| Issued in reinvestment of distributions | 3,180 |
| 32,497 |
| 2,801 |
| 27,893 |
|
| Redeemed | (2,044 | ) | (21,053 | ) | (44 | ) | (446 | ) |
| | 2,098 |
| 21,444 |
| 3,604 |
| 35,707 |
|
| R Class | | | | |
| Sold | 4,099 |
| 42,218 |
| 1,674 |
| 16,835 |
|
| Issued in reinvestment of distributions | 3,835 |
| 39,275 |
| 3,322 |
| 33,128 |
|
| Redeemed | (951 | ) | (9,915 | ) | — |
| — |
|
| | 6,983 |
| 71,578 |
| 4,996 |
| 49,963 |
|
| R5 Class | | | | |
| Issued in reinvestment of distributions | 23,143 |
| 237,479 |
| 20,682 |
| 206,541 |
|
| R6 Class | | | | |
| Sold | 349,756 |
| 3,540,873 |
| 353,521 |
| 3,601,101 |
|
| Issued in reinvestment of distributions | 71,619 |
| 735,307 |
| 50,626 |
| 506,132 |
|
| Redeemed | (339,248 | ) | (3,528,241 | ) | (166,923 | ) | (1,676,025 | ) |
| | 82,127 |
| 747,939 |
| 237,224 |
| 2,431,208 |
|
| Net increase (decrease) | 402,347 |
| $ | 4,094,966 |
| 478,220 |
| $ | 4,891,529 |
|
| |
| (1) | April 10, 2017 (commencement of sale) through October 31, 2017 for the I Class and Y Class. |
6. Fair Value Measurements
The fund’s investments valuation process is based on several considerations and may use multiple inputs to determine the fair value of the investments held by the fund. In conformity with accounting principles generally accepted in the United States of America, the inputs used to determine a valuation are classified into three broad levels.
| |
| • | Level 1 valuation inputs consist of unadjusted quoted prices in an active market for identical investments. |
| |
| • | Level 2 valuation inputs consist of direct or indirect observable market data (including quoted prices for comparable investments, evaluations of subsequent market events, interest rates, prepayment speeds, credit risk, etc.). These inputs also consist of quoted prices for identical investments initially expressed in local currencies that are adjusted through translation into U.S. dollars. |
| |
| • | Level 3 valuation inputs consist of unobservable data (including a fund’s own assumptions). |
The level classification is based on the lowest level input that is significant to the fair valuation measurement. The valuation inputs are not necessarily an indication of the risks associated with investing in these securities or other financial instruments. There were no significant transfers between levels during the period.
The following is a summary of the level classifications as of period end. The Schedule of Investments provides additional information on the fund’s portfolio holdings.
|
| | | | | | | | |
| | Level 1 | Level 2 | Level 3 |
| Assets | | | |
| Investment Securities | | | |
| Corporate Bonds | — |
| $ | 33,836,450 |
| — |
|
| Sovereign Governments and Agencies | — |
| 2,573,519 |
| — |
|
| Common Stocks | $ | 31,064 |
| — |
| — |
|
| U.S. Treasury Securities | — |
| 9,891 |
| — |
|
| Temporary Cash Investments | 326,837 |
| 753,762 |
| — |
|
| | $ | 357,901 |
| $ | 37,173,622 |
| — |
|
| Other Financial Instruments | | | |
| Futures Contracts | $ | 30,973 |
| — |
| — |
|
| Swap Agreements | — |
| $ | 100,170 |
| — |
|
| Forward Foreign Currency Exchange Contracts | — |
| 165,720 |
| — |
|
| | $ | 30,973 |
| $ | 265,890 |
| — |
|
| �� | | | |
| Liabilities | | | |
| Other Financial Instruments | | | |
| Futures Contracts | $ | 65,797 |
| — |
| — |
|
| Swap Agreements | — |
| $ | 41,965 |
| — |
|
| Forward Foreign Currency Exchange Contracts | — |
| 46,214 |
| — |
|
| | $ | 65,797 |
| $ | 88,179 |
| — |
|
7. Derivative Instruments
Credit Risk — The fund is subject to credit risk in the normal course of pursuing its investment objectives. The value of a bond generally declines as the credit quality of its issuer declines. Credit default swap agreements enable a fund to buy/sell protection against a credit event of a specific issuer or index. A fund may attempt to enhance returns by selling protection or attempt to mitigate credit risk by buying protection. The buyer/seller of credit protection against a security or basket of securities may pay/receive an up-front or periodic payment to compensate for/against potential default events. A fund will segregate cash, cash equivalents or other appropriate liquid securities on its records in amounts sufficient to meet requirements. Changes in value, including the periodic amounts of interest to be paid or received on swap agreements, are recorded as unrealized appreciation (depreciation) on swap agreements. Upon entering into a centrally cleared swap, a fund is required to deposit cash or securities (initial margin) with a financial intermediary in an
amount equal to a certain percentage of the notional amount. Subsequent payments (variation margin) are made or received daily, in cash, by a fund. The variation margin is equal to the daily change in the value and is a component of unrealized gains and losses. Realized gain or loss is recorded upon receipt or payment of a periodic settlement or termination of swap agreements. Net realized and unrealized gains or losses occurring during the holding period of swap agreements are a component of net realized gain (loss) on swap agreement transactions and change in net unrealized appreciation (depreciation) on swap agreements, respectively. The risks of entering into swap agreements include the possible lack of liquidity, failure of the counterparty to meet its obligations, and that there may be unfavorable changes in the underlying investments or instruments. The fund's average notional amount held during the period was $2,350,000.
Foreign Currency Risk — The fund is subject to foreign currency exchange rate risk in the normal course of pursuing its investment objectives. The value of foreign investments held by a fund may be significantly affected by changes in foreign currency exchange rates. The dollar value of a foreign security generally decreases when the value of the dollar rises against the foreign currency in which the security is denominated and tends to increase when the value of the dollar declines against such foreign currency. A fund may enter into forward foreign currency exchange contracts to reduce a fund's exposure to foreign currency exchange rate fluctuations or to gain exposure to the fluctuations in the value of foreign currencies. The net U.S. dollar value of foreign currency underlying all contractual commitments held by a fund and the resulting unrealized appreciation or depreciation are determined daily. Realized gain or loss is recorded upon the termination of the contract. Net realized and unrealized gains or losses occurring during the holding period of forward foreign currency exchange contracts are a component of net realized gain (loss) on forward foreign currency exchange contract transactions and change in net unrealized appreciation (depreciation) on forward foreign currency exchange contracts, respectively. A fund bears the risk of an unfavorable change in the foreign currency exchange rate underlying the forward contract. Additionally, losses, up to the fair value, may arise if the counterparties do not perform under the contract terms. The fund's average U.S. dollar exposure to foreign currency risk derivative instruments held during the period was $2,629,004.
Interest Rate Risk — The fund is subject to interest rate risk in the normal course of pursuing its investment objectives. The value of bonds generally declines as interest rates rise. A fund may enter into futures contracts based on a bond index or a specific underlying security. A fund may purchase futures contracts to gain exposure to increases in market value or sell futures contracts to protect against a decline in market value. Upon entering into a futures contract, a fund will segregate cash, cash equivalents or other appropriate liquid securities on its records in amounts sufficient to meet requirements. Subsequent payments (variation margin) are made or received daily, in cash, by a fund. The variation margin is equal to the daily change in the contract value and is recorded as unrealized gains and losses. A fund recognizes a realized gain or loss when the futures contract is closed or expires. Net realized and unrealized gains or losses occurring during the holding period of futures contracts are a component of net realized gain (loss) on futures contract transactions and change in net unrealized appreciation (depreciation) on futures contracts, respectively. One of the risks of entering into futures contracts is the possibility that the change in value of the contract may not correlate with the changes in value of the underlying securities. The fund's average notional exposure to these interest rate risk derivative instruments held during the period was $7,450,000 futures contracts purchased and $983,333 future contracts sold.
Value of Derivative Instruments as of October 31, 2017
|
| | | | | | | | |
| | Asset Derivatives | Liability Derivatives |
| Type of Risk Exposure | Location on Statement of Assets and Liabilities | Value | Location on Statement of Assets and Liabilities | Value |
| Credit Risk | Swap agreements | $ | 100,170 |
| Swap agreements | $ | 41,965 |
|
| Foreign Currency Risk | Unrealized appreciation on forward foreign currency exchange contracts | 165,720 |
| Unrealized depreciation on forward foreign currency exchange contracts | 46,214 |
|
| Interest Rate Risk | Receivable for variation margin on futures contracts* | — |
| Payable for variation margin on futures contracts* | 1,289 |
|
| | | $ | 265,890 |
| | $ | 89,468 |
|
| |
| * | Included in the unrealized appreciation (depreciation) on futures contracts as reported in the Schedule of Investments. |
Effect of Derivative Instruments on the Statement of Operations for the Year Ended October 31, 2017
|
| | | | | | | | |
| | Net Realized Gain (Loss) | Change in Net Unrealized Appreciation (Depreciation) |
| Type of Risk Exposure | Location on Statement of Operations | Value | Location on Statement of Operations | Value |
| Credit Risk | Net realized gain (loss) on swap agreement transactions | $ | (39,674 | ) | Change in net unrealized appreciation (depreciation) on swap agreements | $ | (32,155 | ) |
| Foreign Currency Risk | Net realized gain (loss) on forward foreign currency exchange contract transactions | (185,138 | ) | Change in net unrealized appreciation (depreciation) on forward foreign currency exchange contracts | 119,506 |
|
| Interest Rate Risk | Net realized gain (loss) on futures contract transactions | 133,547 |
| Change in net unrealized appreciation (depreciation) on futures contracts | (50,513 | ) |
| | | $ | (91,265 | ) | | $ | 36,838 |
|
8. Risk Factors
There are certain risks involved in investing in foreign securities. These risks include those resulting from future adverse political, social and economic developments, fluctuations in currency exchange rates, the possible imposition of exchange controls, and other foreign laws or restrictions. Investing in emerging markets may accentuate these risks.
The fund may invest in lower-rated debt securities, which are subject to substantial risks including liquidity risk and credit risk.
The fund’s investment process may result in high portfolio turnover, which could mean high transaction costs, affecting both performance and capital gains tax liabilities to investors.
9. Federal Tax Information
The tax character of distributions paid during the years ended October 31, 2017 and October 31, 2016 were as follows:
|
| | | | | | |
| | 2017 | 2016 |
| Distributions Paid From | | |
| Ordinary income | $ | 1,432,688 |
| $ | 1,063,670 |
|
| Long-term capital gains | — |
| — |
|
The book-basis character of distributions made during the year from net investment income or net realized gains may differ from their ultimate characterization for federal income tax purposes. These differences reflect the differing character of certain income items and net realized gains and losses for financial statement and tax purposes, and may result in reclassification among certain capital accounts on the financial statements.
As of period end, the federal tax cost of investments and the components of distributable earnings on a tax-basis were as follows:
|
| | | |
| Federal tax cost of investments | $ | 37,080,118 |
|
| Gross tax appreciation of investments | $ | 684,134 |
|
| Gross tax depreciation of investments | (232,729 | ) |
| Net tax appreciation (depreciation) of investments | 451,405 |
|
Net tax appreciation (depreciation) on derivatives and translation of assets and liabilities in foreign currencies | (26,628 | ) |
| Net tax appreciation (depreciation) | $ | 424,777 |
|
| Undistributed ordinary income | $ | 668,411 |
|
Accumulated long-term gains
| $ | 321,795 |
|
The difference between book-basis and tax-basis unrealized appreciation (depreciation) is attributable primarily to the realization for tax purposes of unrealized gains (losses) on certain foreign currency exchange contracts.
10. Recently Issued Accounting Standards
In March 2017, the Financial Accounting Standards Board (FASB) issued Accounting Standards Update No.2017-08, “Receivables - Nonrefundable Fees and Other Costs (Subtopic 310-20), Premium Amortization on Purchased Callable Debt Securities” (ASU 2017-08). ASU 2017-08 amends the amortization period for certain purchased callable debt securities held at a premium, shortening such period to the earliest call date. The amendments are effective for fiscal years, and interim periods within those fiscal years, beginning after December 15, 2018. Management is currently evaluating the impact that adopting ASU 2017-08 will have on
the financial statements.
|
| | | | | | | | | | | | | | | |
| For a Share Outstanding Throughout the Years Ended October 31 (except as noted) |
| Per-Share Data | Ratios and Supplemental Data |
| | | Income From Investment Operations: | Distributions From: | | | Ratio to Average Net Assets of: | | |
| | Net Asset Value, Beginning of Period | Net Investment Income (Loss)(1) | Net Realized and Unrealized Gain (Loss) | Total From Investment Operations | Net
Investment
Income | Net
Realized
Gains | Total Distributions | Net Asset Value, End of Period | Total Return(2) | Operating Expenses | Net Investment Income (Loss) | Portfolio Turnover Rate | Net Assets, End of Period (in thousands) |
| Investor Class |
| 2017 | $10.32 | 0.35 | 0.16 | 0.51 | (0.34) | (0.06) | (0.40) | $10.43 | 5.11% | 0.97% | 3.39% | 154% |
| $6,634 |
|
| 2016 | $9.75 | 0.36 | 0.57 | 0.93 | (0.36) | — | (0.36) | $10.32 | 9.77% | 0.97% | 3.59% | 97% |
| $3,898 |
|
2015(3) | $9.88 | 0.11 | (0.13) | (0.02) | (0.11) | — | (0.11) | $9.75 | (0.22)% | 0.97%(4) | 3.19%(4) | 35% |
| $1,878 |
|
2015(5) | $10.00 | 0.28 | (0.11) | 0.17 | (0.29) | — | (0.29) | $9.88 | 1.72% | 0.97%(4) | 3.18%(4) | 46% |
| $3,312 |
|
| I Class |
2017(6) | $10.30 | 0.20 | 0.14 | 0.34 | (0.20) | — | (0.20) | $10.44 | 3.28% | 0.87%(4) | 3.38%(4) | 154%(7) |
| $38 |
|
| Y Class |
2017(6) | $10.30 | 0.21 | 0.13 | 0.34 | (0.20) | — | (0.20) | $10.44 | 3.33% | 0.77%(4) | 3.52%(4) | 154%(7) |
| $5 |
|
| A Class |
| 2017 | $10.32 | 0.32 | 0.17 | 0.49 | (0.32) | (0.06) | (0.38) | $10.43 | 4.84% | 1.22% | 3.14% | 154% |
| $6,619 |
|
| 2016 | $9.74 | 0.33 | 0.59 | 0.92 | (0.34) | — | (0.34) | $10.32 | 9.61% | 1.22% | 3.34% | 97% |
| $6,282 |
|
2015(3) | $9.87 | 0.10 | (0.13) | (0.03) | (0.10) | — | (0.10) | $9.74 | (0.31)% | 1.22%(4) | 2.94%(4) | 35% |
| $5,671 |
|
2015(5) | $10.00 | 0.27 | (0.13) | 0.14 | (0.27) | — | (0.27) | $9.87 | 1.45% | 1.22%(4) | 2.93%(4) | 46% |
| $6,660 |
|
|
| | | | | | | | | | | | | | | |
| For a Share Outstanding Throughout the Years Ended October 31 (except as noted) |
| Per-Share Data | Ratios and Supplemental Data |
| | | Income From Investment Operations: | Distributions From: | | | Ratio to Average Net Assets of: | | |
| | Net Asset Value, Beginning of Period | Net Investment Income (Loss)(1) | Net Realized and Unrealized Gain (Loss) | Total From Investment Operations | Net
Investment
Income | Net
Realized
Gains | Total Distributions | Net Asset Value, End of Period | Total Return(2) | Operating Expenses | Net Investment Income (Loss) | Portfolio Turnover Rate | Net Assets, End of Period (in thousands) |
| C Class |
| 2017 | $10.30 | 0.25 | 0.16 | 0.41 | (0.24) | (0.06) | (0.30) | $10.41 | 4.07% | 1.97% | 2.39% | 154% |
| $1,144 |
|
| 2016 | $9.72 | 0.26 | 0.58 | 0.84 | (0.26) | — | (0.26) | $10.30 | 8.81% | 1.97% | 2.59% | 97% |
| $1,110 |
|
2015(3) | $9.85 | 0.07 | (0.13) | (0.06) | (0.07) | — | (0.07) | $9.72 | (0.57)% | 1.97%(4) | 2.19%(4) | 35% |
| $1,013 |
|
2015(5) | $10.00 | 0.20 | (0.13) | 0.07 | (0.22) | — | (0.22) | $9.85 | 0.74% | 1.97%(4) | 2.18%(4) | 46% |
| $1,019 |
|
| R Class |
| 2017 | $10.31 | 0.30 | 0.16 | 0.46 | (0.29) | (0.06) | (0.35) | $10.42 | 4.58% | 1.47% | 2.89% | 154% |
| $1,205 |
|
| 2016 | $9.73 | 0.31 | 0.58 | 0.89 | (0.31) | — | (0.31) | $10.31 | 9.34% | 1.47% | 3.09% | 97% |
| $1,120 |
|
2015(3) | $9.86 | 0.09 | (0.13) | (0.04) | (0.09) | — | (0.09) | $9.73 | (0.40)% | 1.47%(4) | 2.69%(4) | 35% |
| $1,009 |
|
2015(5) | $10.00 | 0.24 | (0.12) | 0.12 | (0.26) | — | (0.26) | $9.86 | 1.18% | 1.47%(4) | 2.68%(4) | 46% |
| $1,012 |
|
R5 Class(8) |
| 2017 | $10.32 | 0.37 | 0.16 | 0.53 | (0.36) | (0.06) | (0.42) | $10.43 | 5.31% | 0.77% | 3.59% | 154% |
| $5,986 |
|
| 2016 | $9.75 | 0.38 | 0.57 | 0.95 | (0.38) | — | (0.38) | $10.32 | 9.99% | 0.77% | 3.79% | 97% |
| $5,682 |
|
2015(3) | $9.87 | 0.11 | (0.12) | (0.01) | (0.11) | — | (0.11) | $9.75 | (0.16)% | 0.77%(4) | 3.39%(4) | 35% |
| $5,164 |
|
2015(5) | $10.00 | 0.31 | (0.13) | 0.18 | (0.31) | — | (0.31) | $9.87 | 1.91% | 0.77%(4) | 3.38%(4) | 46% |
| $6,671 |
|
| R6 Class | | | | | | | | | | | | | |
| 2017 | $10.33 | 0.38 | 0.16 | 0.54 | (0.37) | (0.06) | (0.43) | $10.44 | 5.37% | 0.72% | 3.64% | 154% |
| $16,492 |
|
| 2016 | $9.75 | 0.38 | 0.59 | 0.97 | (0.39) | — | (0.39) | $10.33 | 10.15% | 0.72% | 3.84% | 97% |
| $15,465 |
|
2015(3) | $9.88 | 0.11 | (0.12) | (0.01) | (0.12) | — | (0.12) | $9.75 | (0.14)% | 0.72%(4) | 3.44%(4) | 35% |
| $12,290 |
|
2015(5) | $10.00 | 0.32 | (0.13) | 0.19 | (0.31) | — | (0.31) | $9.88 | 1.96% | 0.72%(4) | 3.43%(4) | 46% |
| $8,699 |
|
|
|
| Notes to Financial Highlights |
| |
| (1) | Computed using average shares outstanding throughout the period. |
| |
| (2) | Total returns are calculated based on the net asset value of the last business day and do not reflect applicable sales charges, if any. Total returns for periods less than one year are not annualized. |
| |
| (3) | July 1, 2015 through October 31, 2015. The fund's fiscal year end was changed from June 30 to October 31, resulting in a four-month annual reporting period. |
| |
| (5) | July 29, 2014 (fund inception) through June 30, 2015. |
| |
| (6) | April 10, 2017 (commencement of sale) through October 31, 2017. |
| |
| (7) | Portfolio turnover is calculated at the fund level. Percentage indicated was calculated for the year ended October 31, 2017. |
| |
| (8) | Prior to April 10, 2017, the R5 Class was referred to as the Institutional Class. |
See Notes to Financial Statements.
|
|
| Report of Independent Registered Public Accounting Firm |
To the Board of Trustees of the American Century International Bond Funds and Shareholders of the Emerging Markets Debt Fund:
In our opinion, the accompanying statement of assets and liabilities, including the schedule of investments, and the related statements of operations and of changes in net assets and the financial highlights present fairly, in all material respects, the financial position of the Emerging Markets Debt Fund (one of the three funds constituting the American Century International Bond Funds, hereafter referred to as the "Fund") as of October 31, 2017, the results of its operations for the year then ended, the changes in its net assets for each of the two years in the period then ended and the financial highlights for each of the periods indicated, in conformity with accounting principles generally accepted in the United States of America. These financial statements and financial highlights (hereafter referred to as "financial statements") are the responsibility of the Fund's management. Our responsibility is to express an opinion on these financial statements based on our audits. We conducted our audits of these financial statements in accordance with the standards of the Public Company Accounting Oversight Board (United States). Those standards require that we plan and perform the audit to obtain reasonable assurance about whether the financial statements are free of material misstatement. An audit includes examining, on a test basis, evidence supporting the amounts and disclosures in the financial statements, assessing the accounting principles used and significant estimates made by management, and evaluating the overall financial statement presentation. We believe that our audits, which included confirmation of securities as of October 31, 2017 by correspondence with the custodian and brokers, provide a reasonable basis for our opinion.
/s/ PricewaterhouseCoopers LLP
Kansas City, Missouri
December 18, 2017
Board of Trustees
The individuals listed below serve as trustees of the funds. Each trustee will continue to serve in this capacity until death, retirement, resignation or removal from office. The board has adopted a mandatory retirement age for trustees who are not “interested persons,” as that term is defined in the Investment Company Act (independent trustees). Independent trustees shall retire on December 31 of the year in which they reach their 75th birthday; provided, however, that on or after January 1, 2022, independent trustees shall retire on December 31 of the year in which they reach their 76th birthday.
Mr. Thomas is an “interested person” because he currently serves as President and Chief Executive Officer of American Century Companies, Inc. (ACC), the parent company of American Century Investment Management, Inc. (ACIM or the advisor). The other trustees (more than three-fourths of the total number) are independent. They are not employees, directors or officers of, and have no financial interest in, ACC or any of its wholly owned, direct or indirect, subsidiaries, including ACIM, American Century Investment Services, Inc. (ACIS) and American Century Services, LLC (ACS), and they do not have any other affiliations, positions or relationships that would cause them to be considered “interested persons” under the Investment Company Act. The trustees serve in this capacity for eight (in the case of Mr. Thomas, 15) registered investment companies in the American Century Investments family of funds.
The following table presents additional information about the trustees. The mailing address for each trustee other than Mr. Thomas is 1665 Charleston Road, Mountain View, California 94043. The mailing address for Mr. Thomas is 4500 Main Street, Kansas City, Missouri 64111.
|
| | | | | |
Name
(Year of Birth) | Position(s) Held with Funds | Length of Time Served | Principal Occupation(s) During Past 5 Years | Number of American Century Portfolios Overseen by Trustee | Other Directorships Held During Past 5 Years |
| Independent Trustees |
|
|
Tanya S. Beder
(1955) | Trustee | Since 2011 | Chairman and CEO, SBCC Group Inc. (independent advisory services) (2006 to present) | 45 | CYS Investments, Inc.; Nabors Industries Ltd. |
Jeremy I. Bulow
(1954) | Trustee | Since 2011 | Professor of Economics, Stanford University, Graduate School of Business (1979 to present) | 45 | None |
Anne Casscells
(1958) | Trustee | Since 2016 | Co-Chief Executive Officer and Chief Investment Officer, Aetos Alternatives Management (investment advisory firm) (2001 to present); Lecturer in Accounting, Stanford University, Graduate School of Business (2009 to present) | 45 | None |
Ronald J. Gilson
(1946) | Trustee and Chairman of the Board | Since 1995
(Chairman since 2005) | Charles J. Meyers Professor of Law and Business, Emeritus, Stanford Law School (1979 to present); Marc and Eva Stern Professor of Law and Business, Columbia University School of Law (1992 to present) | 45 | None |
|
| | | | | |
Name
(Year of Birth) | Position(s) Held with Funds | Length of Time Served | Principal Occupation(s) During Past 5 Years | Number of American Century Portfolios Overseen by Trustee | Other Directorships Held During Past 5 Years |
| Independent Trustees |
|
|
Frederick L. A. Grauer
(1946) | Trustee | Since 2008 | Senior Advisor, iShares by BlackRock, Inc. (investment management firm) (2010 to 2011, 2013 to 2015); Senior Advisor, Course Hero (an educational technology company) (2015 to present) | 45 | None |
Jonathan D. Levin
(1972) | Trustee | Since 2016 | Philip H. Knight Professor and Dean, Graduate School of Business, Stanford University (2016 to present); Professor, Stanford University, (2000 to present); Chair, Department of Economics, Stanford University (2011 to 2014) | 45 | None |
Peter F. Pervere
(1947) | Trustee | Since 2007 | Retired | 45 | None |
John B. Shoven
(1947) | Trustee | Since 2002 | Charles R. Schwab Professor of Economics, Stanford University (1973 to present) | 45 | Cadence Design Systems; Exponent; Financial Engines |
| Interested Trustee |
|
|
Jonathan S. Thomas
(1963) | Trustee and President | Since 2007 | President and Chief Executive Officer, ACC (March 2007 to present). Also serves as Chief Executive Officer, ACS; Executive Vice President, ACIM; Director, ACC, ACIM and other ACC subsidiaries | 114 | BioMed Valley Discoveries, Inc. |
The Statement of Additional Information has additional information about the fund's trustees and is available without charge, upon request, by calling 1-800-345-2021.
Officers
The following table presents certain information about the executive officers of the funds. Each officer serves as an officer for each of the 15 investment companies in the American Century family of funds, unless otherwise noted. No officer is compensated for his or her service as an officer of the funds. The listed officers are interested persons of the funds and are appointed or re-appointed on an annual basis. The mailing address for each of the officers listed below is 4500 Main Street, Kansas City, Missouri 64111.
|
| | |
Name
(Year of Birth) | Offices with the Funds | Principal Occupation(s) During the Past Five Years |
Jonathan S. Thomas
(1963) | Trustee and President since 2007 | President and Chief Executive Officer, ACC (2007 to present). Also serves as Chief Executive Officer, ACS; Executive Vice President, ACIM; Director, ACC, ACIM and other ACC subsidiaries |
Amy D. Shelton
(1964) | Chief Compliance Officer and Vice President since 2014 | Chief Compliance Officer, American Century funds, (2014 to present); Chief Compliance Officer, ACIM (2014 to present); Chief Compliance Officer, ACIS (2009 to present); Vice President, Client Interactions and Marketing, ACIS (2013 to 2014); Director, Client Interactions and Marketing, ACIS (2007 to 2013). Also serves as Vice President, ACIS |
Charles A. Etherington
(1957) | General Counsel since 2007 and Senior Vice President since 2006 | Attorney, ACC (1994 to present); Vice President, ACC (2005 to present); General Counsel, ACC (2007 to present). Also serves as General Counsel, ACIM, ACS, ACIS and other ACC subsidiaries; and Senior Vice President, ACIM and ACS |
C. Jean Wade
(1964) | Vice President, Treasurer and Chief Financial Officer since 2012 | Vice President, ACS (2000 to present) |
Robert J. Leach
(1966) | Vice President since 2006 and Assistant Treasurer since 2012 | Vice President, ACS (2000 to present) |
David H. Reinmiller
(1963) | Vice President since 2000 | Attorney, ACC (1994 to present); Associate General Counsel, ACC (2001 to present). Also serves as Vice President, ACIM and ACS |
Ward D. Stauffer
(1960) | Secretary since 2005 | Attorney, ACC (2003 to present) |
|
|
| Approval of Management Agreement |
At a meeting held on June 14, 2017, the Fund’s Board of Trustees (the "Board") unanimously approved the renewal of the management agreement pursuant to which American Century Investment Management, Inc. (the “Advisor”) acts as the investment advisor for the Fund. Under Section 15(c) of the Investment Company Act, contracts for investment advisory services are required to be reviewed, evaluated, and approved by a majority of a fund’s directors/trustees, including a majority of the independent Trustees, each year. The Board regards this annual evaluation and renewal as one of its most important responsibilities.
The independent Trustees have memorialized a statement regarding the relationship between their ongoing obligations to oversee and evaluate the performance of the Advisor and their annual consideration of renewal of the management agreement. In that statement, the independent Trustees noted that their assessment of the Advisor’s performance is an ongoing process that takes place over the entire year and is informed by all of the extensive information that the Board and its committees receive and consider over time. This information, together with the additional materials provided specifically in connection with the review, are central to the Board’s assessment of the Advisor’s performance and its determination whether to renew the Fund’s management agreement.
Prior to its consideration of the renewal of the management agreement, the Board requested and reviewed extensive data and analysis relating to the proposed renewal. This information and analysis was compiled by the Advisor and certain independent providers of evaluation data concerning the Fund and the services provided to the Fund by the Advisor.
In connection with its consideration of the renewal of the management agreement, the Board’s review and evaluation of the services provided by the Advisor included, but was not limited to, the following:
| |
| • | the nature, extent, and quality of investment management, shareholder services, and other services provided by the Advisor to the Fund; |
| |
| • | the wide range of other programs and services the Advisor provides to the Fund and its shareholders on a routine and non-routine basis; |
| |
| • | the investment performance of the Fund, including data comparing the Fund’s performance to appropriate benchmarks and/or a peer group of other mutual funds with similar investment objectives and strategies; |
| |
| • | the cost of owning the Fund compared to the cost of owning similar funds; |
| |
| • | the compliance policies, procedures, and regulatory experience of the Advisor and the Fund's service providers; |
| |
| • | financial data showing the cost of services provided to the Fund, the profitability of the Fund to the Advisor, and the overall profitability of the Advisor; |
| |
| • | strategic plans of the Advisor; |
| |
| • | possible economies of scale associated with the Advisor’s management of the Fund and other accounts under its management; |
| |
| • | data comparing services provided and charges to the Advisor's other investment management clients; |
| |
| • | acquired fund fees and expenses; |
| |
| • | payments and practices by the Fund and the Advisor regarding financial intermediaries whose clients are investors in the Fund, the nature of services provided by intermediaries, and the terms of share classes utilized; and |
| |
| • | any collateral benefits derived by the Advisor from the management of the Fund. |
In keeping with its practice, the Board held two in-person meetings to review and discuss the information provided in response to their request and held active discussions with the Advisor regarding the renewal of the management agreement. The independent Trustees had the benefit of the advice of their independent counsel throughout the process.
Factors Considered
The Trustees considered all of the information provided by the Advisor, the independent data providers, and the independent Trustees’ independent counsel in connection with the approval. They determined that the information was sufficient for them to evaluate the management agreement for the Fund. In connection with their review, the Trustees did not identify any single factor as being all-important or controlling and each Trustee may have attributed different levels of importance to different factors. In deciding to renew the management agreement, the Board based its decision on a number of factors, including without limitation the following:
Nature, Extent and Quality of Services - Generally. Under the management agreement, the Advisor is responsible for providing or arranging for all services necessary for the operation of the Fund. The Board noted that the Advisor provides or arranges at its own expense a wide variety of services including without limitation the following:
| |
| • | constructing and designing the Fund |
| |
| • | portfolio research and security selection |
| |
| • | initial capitalization/funding |
| |
| • | daily valuation of the Fund’s portfolio |
| |
| • | shareholder servicing and transfer agency, including shareholder confirmations, recordkeeping, and communications |
| |
| • | legal services (except the independent Trustees’ counsel) |
| |
| • | regulatory and portfolio compliance |
| |
| • | marketing and distribution (except amounts paid by the Fund under Rule 12b-1 plans) |
The Board noted that many of these services have expanded over time in terms of both quantity and complexity in response to shareholder demands, competition in the industry, changing distribution channels, and the changing regulatory environment.
Investment Management, Shareholder, and Other Services. The nature of the investment management services provided to the Fund is quite complex and allows Fund shareholders access to professional money management, instant diversification of their investments within an asset class, the opportunity to easily diversify among asset classes by investing in or exchanging among various American Century Investments funds, and liquidity. In evaluating investment performance, the Board expects the Advisor to manage the Fund in accordance with its investment objectives and approved strategies. Further, the Trustees recognize that the Advisor has an obligation to seek the best execution of fund trades. In providing these services, the Advisor utilizes teams of investment professionals (portfolio managers, analysts, research assistants, and securities traders) who require extensive information technology, research, training, compliance, and other systems to conduct their business. The Board, directly and through its Portfolio Committee, regularly reviews investment performance information for the Fund, together with comparative information for appropriate benchmarks and/or peer groups of similarly-managed funds, over different time horizons. The Trustees also review detailed performance information provided by the Advisor during the management agreement approval process. If performance concerns are identified, the Fund receives special reviews until performance improves, during which the Board discusses with the Advisor the reasons for such results (e.g., market conditions, security selection) and any efforts being undertaken to improve performance. The Fund’s performance was above its benchmark for
the one-year period reviewed by the Board. The Board found the investment management services provided by the Advisor to the Fund to be satisfactory and consistent with the management agreement.
Under the management agreement, the Advisor provides the Fund with a comprehensive package of transfer agency, shareholder, and other services. The Board, directly and through various committees of the Board, regularly reviews reports and evaluations of such services at its regular meetings. These reports include, but are not limited to, information regarding the operational efficiency and accuracy of the shareholder and transfer agency services provided, staffing levels, shareholder satisfaction (as measured by external as well as internal sources), technology support, new products and services offered to Fund shareholders, securities trading activities, portfolio valuation services, auditing services, and legal and operational compliance activities. Certain aspects of shareholder and transfer agency service level efficiency and the quality of securities trading activities are measured by independent third party providers and are presented in comparison to other fund groups not managed by the Advisor.
The Board found the services provided by the Advisor to the Fund under the management agreement to be competitive and of high quality.
Costs of Services and Profitability. The Advisor provides detailed information concerning its cost of providing various services to the Fund, its profitability in managing the Fund, its overall profitability, and its financial condition. The Trustees have reviewed with the Advisor the methodology used to prepare this financial information. This information is considered in evaluating the Advisor’s financial condition, its ability to continue to provide services under the management agreement, and the reasonableness of the current management fee. The Board concluded that the Advisor’s profits were reasonable in light of the services provided to the Fund.
Economies of Scale. The Board also reviewed information provided by the Advisor regarding the possible existence of economies of scale in connection with the management of the Fund. The Board concluded that economies of scale are difficult to measure and predict with precision, especially on a fund-by-fund basis. The Board concluded that the Advisor is appropriately sharing economies of scale through its competitive fee structure, offering competitive fees from fund inception, and through reinvestment in its business to provide shareholders enhanced and expanded services.
Comparison to Other Funds’ Fees. The management agreement provides that the Fund pays the Advisor a single, all-inclusive (or unified) management fee for providing all services necessary for the management and operation of the Fund, other than brokerage expenses, expenses attributable to short sales, taxes, interest, extraordinary expenses, the fees and expenses of the Fund’s independent Trustees (including their independent legal counsel), and expenses incurred in connection with the provision of shareholder services and distribution services under a plan adopted pursuant to Rule 12b-1 under the 1940 Act. Under the unified fee structure, the Advisor is responsible for providing all investment advisory, custody, audit, administrative, compliance, recordkeeping, marketing, and shareholder services, or arranging and supervising third parties to provide such services. By contrast, most other funds are charged a variety of fees, including an investment advisory fee, a transfer agency fee, an administrative fee, distribution charges, and other expenses. Other than their investment advisory fees and any applicable Rule 12b-1 distribution fees, all other components of the total fees charged by these other funds may be increased without shareholder approval. The Board believes the unified fee structure is a benefit to Fund shareholders because it clearly discloses to shareholders the cost of owning Fund shares, and, since the unified fee cannot be increased without a vote of Fund shareholders, it shifts to the Advisor the risk of increased costs of operating the Fund and provides a direct incentive to minimize administrative inefficiencies. Part of the Board’s analysis of fee levels involves reviewing certain evaluative data compiled by an independent provider and comparing the Fund’s unified fee to the total expense ratio of peer funds. The unified fee charged to shareholders of the Fund was below the median of the total expense ratios of the Fund’s peer universe. The Board concluded
that the management fee paid by the Fund to the Advisor under the management agreement is reasonable in light of the services provided to the Fund.
Comparison to Fees and Services Provided to Other Clients of the Advisor. The Board also requested and received information from the Advisor concerning the nature of the services, fees, costs, and profitability of its advisory services to advisory clients other than the Fund. They observed that these varying types of client accounts require different services and involve different regulatory and entrepreneurial risks than the management of the Fund. The Board analyzed this information and concluded that the fees charged and services provided to the Fund were reasonable by comparison.
Payments to Intermediaries. The Trustees also requested and received a description of payments made to intermediaries by the Fund and the Advisor and services provided by intermediaries. These payments include various payments made by the Fund or the Advisor to different types of intermediaries and recordkeepers for distribution and service activities provided for the Fund. The Trustees reviewed such information and received representations from the Advisor that all such payments by the Fund were made pursuant to the Fund's Rule 12b-1 Plan and that all such payments by the Advisor were made from the Advisor's resources and reasonable profits. The Board found the payments to be reasonable in scope and purpose.
Collateral or “Fall-Out” Benefits Derived by the Advisor. The Board considered the existence of collateral benefits the Advisor may receive as a result of its relationship with the Fund. The Board noted that the Advisor’s primary business is managing mutual funds and it generally does not use fund or shareholder information to generate profits in other lines of business, and therefore does not derive any significant collateral benefits from them. The Board noted that the Advisor receives proprietary research from broker-dealers that execute fund portfolio transactions. The Board also determined that the Advisor is able to provide investment management services to certain clients other than the Fund, at least in part, due to its existing infrastructure built to serve the fund complex.
Existing Relationship. The Board also considered whether there was any reason for not continuing the existing arrangement with the Advisor. In this regard, the Board was mindful of the potential disruptions of the Fund’s operations and various risks, uncertainties, and other effects that could occur as a result of a decision not to continue such relationship. In particular, the Board recognized that most shareholders have invested in the Fund on the strength of the Advisor’s industry standing and reputation and in the expectation that the Advisor will have a continuing role in providing advisory services to the Fund.
Conclusion of the Trustees. As a result of this process, the Board, including all of the independent Trustees and assisted by the advice of independent legal counsel, taking into account all of the factors discussed above and the information provided by the Advisor and others in connection with its review and throughout the year, concluded that the management agreement between the Fund and the Advisor is fair and reasonable in light of the services provided and should be renewed.
Retirement Account Information
As required by law, distributions you receive from certain retirement accounts are subject to federal income tax withholding, unless you elect not to have withholding apply*. Tax will be withheld on the total amount withdrawn even though you may be receiving amounts that are not subject to withholding, such as nondeductible contributions. In such case, excess amounts of withholding could occur. You may adjust your withholding election so that a greater or lesser amount will be withheld.
If you don’t want us to withhold on this amount, you must notify us to not withhold the federal income tax. You may notify us in writing or in certain situations by telephone or through other electronic means. For systematic withdrawals, your withholding election will remain in effect until revoked or changed by filing a new election. You have the right to revoke your election at any time and change your withholding percentage for future distributions.
Remember, even if you elect not to have income tax withheld, you are liable for paying income tax on the taxable portion of your withdrawal. If you elect not to have income tax withheld or you don’t have enough income tax withheld, you may be responsible for payment of estimated tax. You may incur penalties under the estimated tax rules if your withholding and estimated tax payments are not sufficient. You can reduce or defer the income tax on a distribution by directly or indirectly rolling such distribution over to another IRA or eligible plan. You should consult your tax advisor for additional information.
State tax will be withheld if, at the time of your distribution, your address is within one of the mandatory withholding states and you have federal income tax withheld (or as otherwise required by state law). State taxes will be withheld from your distribution in accordance with the respective state rules.
*Some 403(b), 457 and qualified retirement plan distributions may be subject to 20% mandatory withholding, as they are subject to special tax and withholding rules. Your plan administrator or plan sponsor is required to provide you with a special tax notice explaining those rules at the time you request a distribution. If applicable, federal and/or state taxes may be withheld from your distribution amount.
Proxy Voting Policies
Descriptions of the principles and policies that the fund's investment advisor uses in exercising the voting rights associated with the securities purchased and/or held by the fund are available without charge, upon request, by calling 1-800-345-2021 or visiting the "About Us" page of American Century Investments’ website at americancentury.com. A description of the policies is also available on the Securities and Exchange Commission’s website at sec.gov. Information regarding how the investment advisor voted proxies relating to portfolio securities during the most recent 12-month period ended June 30 is available on the "About Us" page at americancentury.com. It is also available at sec.gov.
Quarterly Portfolio Disclosure
The fund files its complete schedule of portfolio holdings with the Securities and Exchange Commission (SEC) for the first and third quarters of each fiscal year on Form N-Q. The fund’s Forms N-Q are available on the SEC’s website at sec.gov, and may be reviewed and copied at the SEC’s Public Reference Room in Washington, DC. Information on the operation of the Public Reference Room may be obtained by calling 1-800-SEC-0330. The fund also makes its complete schedule of portfolio holdings for the most recent quarter of its fiscal year available on its website at americancentury.com and, upon request, by calling 1-800-345-2021.
Other Tax Information
The following information is provided pursuant to provisions of the Internal Revenue Code.
The fund hereby designates $200,910 as qualified short-term capital gain distributions for purposes of Internal Revenue Code Section 871 for the fiscal year ended October 31, 2017.
|
| | |
| |
| | | |
| Contact Us | americancentury.com | |
| Automated Information Line | 1-800-345-8765 | |
| Investor Services Representative | 1-800-345-2021
or 816-531-5575 | |
| Investors Using Advisors | 1-800-378-9878 | |
Business, Not-For-Profit, Employer-Sponsored
Retirement Plans | 1-800-345-3533 | |
Banks and Trust Companies, Broker-Dealers,
Financial Professionals, Insurance Companies | 1-800-345-6488 | |
| Telecommunications Relay Service for the Deaf | 711 | |
| | | |
| American Century International Bond Funds | |
| | | |
Investment Advisor: American Century Investment Management, Inc. Kansas City, Missouri | |
| | | |
| This report and the statements it contains are submitted for the general information of our shareholders. The report is not authorized for distribution to prospective investors unless preceded or accompanied by an effective prospectus. | |
| | | |
©2017 American Century Proprietary Holdings, Inc. All rights reserved.
CL-ANN-90985 1712 | |
|
| |
| | |
| | Annual Report |
| | |
| | October 31, 2017 |
| | |
| | Global Bond Fund |
|
| | |
| President’s Letter | 2 |
|
| Performance | 3 |
|
| Portfolio Commentary | |
|
| Fund Characteristics | |
|
| Shareholder Fee Example | |
|
| Schedule of Investments | |
|
| Statement of Assets and Liabilities | |
|
| Statement of Operations | |
|
| Statement of Changes in Net Assets | |
|
| Notes to Financial Statements | |
|
| Financial Highlights | |
|
| Report of Independent Registered Public Accounting Firm | |
|
| Management | |
|
| Approval of Management Agreement | |
|
| Additional Information | |
|
Any opinions expressed in this report reflect those of the author as of the date of the report, and do not necessarily represent the opinions of American Century Investments® or any other person in the American Century Investments organization. Any such opinions are subject to change at any time based upon market or other conditions and American Century Investments disclaims any responsibility to update such opinions. These opinions may not be relied upon as investment advice and, because investment decisions made by American Century Investments funds are based on numerous factors, may not be relied upon as an indication of trading intent on behalf of any American Century Investments fund. Security examples are used for representational purposes only and are not intended as recommendations to purchase or sell securities. Performance information for comparative indices and securities is provided to American Century Investments by third party vendors. To the best of American Century Investments’ knowledge, such information is accurate at the time of printing.
Jonathan Thomas
Dear Investor:
Thank you for reviewing this annual report for the period ended October 31, 2017. Annual reports help convey important information about fund returns, including market factors that affected performance during the reporting period. For additional, updated investment and market insights, we encourage you to visit our website, americancentury.com.
‘Risk-On’ Sentiment Sparked Strong Gains Among Stocks
U.S. stocks delivered robust double-digit gains for the reporting period. The “risk-on” rally began early in the period, following Donald Trump’s election victory in November 2016. Investor expectations for President Trump’s administration to usher in pro-growth policies and reforms drove stock prices higher. In addition, healthy corporate earnings growth and improving gross domestic product (GDP) and other economic data provided additional support for stocks. Against this backdrop, the S&P 500 Index reached several milestone levels during the period and returned 23.63%. In terms of equity styles, riskier and economically sensitive stocks generally remained in favor. For example, small-cap stocks generally outperformed their mid- and large-cap peers, while growth stocks broadly outperformed their value counterparts across the capitalization spectrum. Real estate investment trusts (REITs) advanced, but global property stocks significantly underperformed the broader stock market as interest rates increased, most notably in the U.S., where the Federal Reserve (Fed) raised rates three times during the period.
As stocks soared in the post-election environment, global bonds sold off sharply. President Trump’s policy agenda fueled inflation fears that sent global bond yields sharply higher in late 2016. However, broad bond market performance generally recovered beginning in early 2017, advancing on subdued inflation and continued central bank accommodation to post modest gains for the entire reporting period. Investor preferences for risk also extended to the global fixed-income market, where high-yield corporate and emerging markets bonds were top performers.
As Congress considers tax cuts and other pro-growth reforms and the Fed and other central banks pursue policy normalization, investors likely will face new opportunities and challenges in the months ahead. We continue to believe in a disciplined, diversified, and risk-aware approach, using professionally managed portfolios in pursuit of investment goals. We appreciate your continued trust in us.
Sincerely,
Jonathan Thomas
President and Chief Executive Officer
American Century Investments
|
| | | | | |
| Total Returns as of October 31, 2017 |
| | | | Average Annual Returns | |
| | Ticker Symbol | 1 year | 5 years | Since Inception | Inception Date |
| Investor Class | AGBVX | 2.23% | 2.74% | 3.16% | 1/31/12 |
| Bloomberg Barclays Global Aggregate Bond Index (USD, Hedged) | — | 1.23% | 3.10% | 3.40% | — |
| I Class | AGBHX | — | — | 2.37% | 4/10/17 |
| Y Class | AGBWX | — | — | 2.47% | 4/10/17 |
| A Class | AGBAX | | | | 1/31/12 |
| No sales charge | | 1.88% | 2.50% | 2.90% | |
| With sales charge | | -2.68% | 1.56% | 2.08% | |
| C Class | AGBTX | 1.13% | 1.71% | 2.13% | 1/31/12 |
| R Class | AGBRX | 1.63% | 2.23% | 2.64% | 1/31/12 |
| R5 Class | AGBNX | 2.43% | 2.95% | 3.36% | 1/31/12 |
| R6 Class | AGBDX | 2.38% | — | 3.65% | 7/26/13 |
| G Class | AGBGX | — | — | 1.17% | 7/28/17 |
Fund returns would have been lower if a portion of the fees had not been waived. Prior to April 10, 2017, the R5 Class was referred to as the Institutional Class.
Sales charges include initial sales charges and contingent deferred sales charges (CDSCs), as applicable. A Class shares have a 4.50% maximum initial sales charge and may be subject to a maximum CDSC of 1.00%. C Class shares redeemed within 12 months of purchase are subject to a maximum CDSC of 1.00%. The SEC requires that mutual funds provide performance information net of maximum sales charges in all cases where charges could be applied.
Data presented reflect past performance. Past performance is no guarantee of future results. Current performance may be higher or lower than the performance shown. Total returns for periods less than one year are not annualized. Investment return and principal value will fluctuate, and redemption value may be more or less than original cost. Data assumes reinvestment of dividends and capital gains, and none of the charts reflect the deduction of taxes that a shareholder would pay on fund distributions or the redemption of fund shares. To obtain performance data current to the most recent month end, please call 1-800-345-2021 or visit americancentury.com. For additional information about the fund, please consult the prospectus.
|
|
| Growth of $10,000 Over Life of Class |
| $10,000 investment made January 31, 2012 |
| Performance for other share classes will vary due to differences in fee structure. |
|
| |
| Value on October 31, 2017 |
| | Investor Class — $11,959 |
| |
| | Bloomberg Barclays Global Aggregate Bond Index (USD, Hedged) — $12,122 |
| |
Ending value of Investor Class would have been lower if a portion of the fees had not been waived.
|
| | | | | | | | |
| Total Annual Fund Operating Expenses | | | |
| Investor Class | I Class | Y Class | A Class | C Class | R Class | R5 Class | R6 Class | G Class |
| 0.96% | 0.86% | 0.76% | 1.21% | 1.96% | 1.46% | 0.76% | 0.71% | 0.71% |
The total annual fund operating expenses shown is as stated in the fund’s prospectus current as of the date of this report. The prospectus may vary from the expense ratio shown elsewhere in this report because it is based on a different time period, includes acquired fund fees and expenses, and, if applicable, does not include fee waivers or expense reimbursements.
Data presented reflect past performance. Past performance is no guarantee of future results. Current performance may be higher or lower than the performance shown. Total returns for periods less than one year are not annualized. Investment return and principal value will fluctuate, and redemption value may be more or less than original cost. Data assumes reinvestment of dividends and capital gains, and none of the charts reflect the deduction of taxes that a shareholder would pay on fund distributions or the redemption of fund shares. To obtain performance data current to the most recent month end, please call 1-800-345-2021 or visit americancentury.com. For additional information about the fund, please consult the prospectus.
Portfolio Managers: John Lovito, Simon Chester, Robert Gahagan, and Abdelak Adjriou
In June 2017, portfolio manager Edward Boyle left the fund’s management team.
Performance Summary
Global Bond returned 2.23%* for the fiscal year ended October 31, 2017. By comparison, the fund’s benchmark, the Bloomberg Barclays Global Aggregate Bond Index (USD, hedged) returned 1.23% over the same time period. (Portfolio returns reflect operating expenses, while index returns do not.)
Market Review
Against a backdrop of synchronized global growth, low volatility, stable inflation, higher commodity prices, and gradually rising interest rates, global bonds (hedged to remove the effects of currency fluctuations) advanced modestly. Global bonds sold off sharply early in the reporting period on expectations for President Trump’s policy agenda to deliver faster growth and higher inflation. However, investors scaled back those expectations on some early setbacks for President Trump’s pro-growth reforms, and global fixed-income markets rebounded in early 2017. Geopolitical risks, including unrest in Iran and Syria and mounting tensions with North Korea, triggered periodic bouts of market volatility, but these events had minimal impact on overall returns.
Positive performance generally prevailed through the end of the reporting period, but the effects of the late 2016 sell-off held back performance from a 12-month perspective. Meanwhile, global inflation remained muted, which supported bonds, and central banks generally remained accommodative, as they slowly pursued monetary policy normalization. The U.S. Federal Reserve (the Fed) raised short-term interest rates three times during the period to a range of 1.00%-1.25% and began gradually cutting its balance sheet late in the period. The European Central Bank held its benchmark interest rate at zero, but it announced plans to begin tapering its quantitative easing in January 2018. The Bank of England also held rates steady, but rising inflation led to expectations for a near-term rate hike (which did occur in early November 2017). Higher-than-expected growth in Canada prompted the Bank of Canada to lift rates twice during the period.
In this environment, yields on government securities remained relatively low, fueling demand for riskier and higher-yielding assets . Emerging markets debt and high-yield bonds were among the best performers during the reporting period.
Country Positioning Added Value
Early in the reporting period, we initiated a long position in U.S. Treasuries and corresponding short positions in government bonds in the U.K. and Germany. We believed market expectations were too optimistic regarding U.S. stimulus and too complacent regarding the continuation of accommodative monetary policy in Europe. As the bond market began recovering in early 2017, our market assumptions proved true, and this trade was a key contributor to performance.
*All fund returns referenced in this commentary are for Investor Class shares. Fund returns would have been lower if a portion of the fees had not been waived. Performance for other share classes will vary due to differences in fee structure; when Investor Class performance exceeds that of the fund’s benchmark, other share classes may not. See page 3 returns for all share classes.
Another key contributor was an overweight position in Portugal bonds relative to Germany. After underperforming in 2016 on slowing growth and credit concerns, Portugal rallied in 2016 on improving growth and budget and pension reforms, which helped the country maintain its investment-grade credit rating. We exited our position in Portugal during the reporting period. Similarly, an overweight position in Italy relative to Spain also contributed, as Italy resolved its banking sector issues and Spain underperformed on valuation concerns and the Catalonia uprising. Another positive contributor was an overweight position in Norway and an underweight position in the U.K. Norway bonds rallied as tightening fears eased.
Sector Allocation Aided Performance
Our positions in the U.S. high-yield bond sector and European financials contributed to performance. In addition, overweight positions in external emerging markets debt, including sovereign, quasi-sovereign, and corporate bonds, lifted results. Security selection and an overweight position in U.S. securitized debt and underweight positions in government sectors (U.S. Treasuries, German bunds, and U.K. gilts) also contributed.
Currency Positioning and Duration Strategy Detracted Slightly
Despite a modest rebound at the end of the period, the U.S. dollar weakened overall and lagged most of its major trading partners. The portfolio’s currency positions slightly weighed on relative performance, largely due to weakness among emerging markets currencies, particularly the Mexican peso, following the U.S. presidential election. On the positive side, overweight positions in the Malaysian ringgit and the Philippine peso and an underweight position in the Thai baht aided performance. Overweight positions in oil-related currencies, such as the Colombian peso and Russian ruble, also helped.
The portfolio’s duration position (price sensitivity to interest rate changes) detracted slightly from performance. Early in the period, the portfolio’s duration was slightly longer than the benchmark’s duration, which weighed on relative results as yields increased in response to President Trump’s policy agenda. In early 2017, we reduced the portfolio’s duration to a neutral position relative to the benchmark.
Positioning for the Future
We expect the environment of moderate global growth, stable inflation, gradual rate increases, and low market volatility to continue. This backdrop should lead to a continuation of monetary policy normalization in the U.S., U.K., and Europe. These influences should continue to support high-yield, securitized, and emerging markets securities. Although credit spreads remain tight, we continue to favor these sectors for their yield advantages. From a country standpoint, we expect continued stability and outperformance from peripheral markets in Europe and select emerging markets.
We believe the U.S. dollar will go through two phases going forward. Initially, we believe the dollar may appreciate in response to U.S. tax reform. In addition, the Fed is likely to increase interest rates at a faster pace than other central banks, providing support for the dollar. Longer term, we expect the dollar to depreciate modestly relative to other currencies as global yields converge. Furthermore, if volatility remains low, we expect investors to favor riskier currencies over the dollar, contributing to dollar weakness.
|
| |
| OCTOBER 31, 2017 |
| Portfolio at a Glance |
| Average Duration (effective) | 7.2 years |
| Weighted Average Life | 8.7 years |
| | |
| Bond Holdings by Country | % of net assets |
| United States | 45.6% |
| Japan | 12.7% |
| United Kingdom | 5.4% |
| Italy | 4.6% |
| Germany | 4.2% |
| France | 3.7% |
| Netherlands | 3.0% |
| Canada | 2.7% |
| Mexico | 1.4% |
| Chile | 1.4% |
| Other Countries | 15.0% |
Cash and Equivalents* | 0.3% |
| * Includes temporary cash investments and other assets and liabilities. |
| | |
| Types of Investments in Portfolio | % of net assets |
| Sovereign Governments and Agencies | 40.0% |
| Corporate Bonds | 34.5% |
| U.S. Government Agency Mortgage-Backed Securities | 9.1% |
| Collateralized Mortgage Obligations | 5.9% |
| Commercial Mortgage-Backed Securities | 5.2% |
| Asset-Backed Securities | 3.8% |
| U.S. Treasury Securities | 0.7% |
| Municipal Securities | 0.5% |
| Temporary Cash Investments | 4.3% |
| Other Assets and Liabilities | (4.0)% |
Fund shareholders may incur two types of costs: (1) transaction costs, including sales charges (loads) on purchase payments and redemption/exchange fees; and (2) ongoing costs, including management fees; distribution and service (12b-1) fees; and other fund expenses. This example is intended to help you understand your ongoing costs (in dollars) of investing in your fund and to compare these costs with the ongoing cost of investing in other mutual funds.
The example is based on an investment of $1,000 made at the beginning of the period and held for the entire period from May 1, 2017 to October 31, 2017 (except as noted).
Actual Expenses
The table provides information about actual account values and actual expenses for each class. You may use the information, together with the amount you invested, to estimate the expenses that you paid over the period. First, identify the share class you own. Then simply divide your account value by $1,000 (for example, an $8,600 account value divided by $1,000 = 8.6), then multiply the result by the number under the heading “Expenses Paid During Period” to estimate the expenses you paid on your account during this period.
If you hold Investor Class shares of any American Century Investments fund, or I Class shares of the American Century Diversified Bond Fund, in an American Century Investments account (i.e., not a financial intermediary or retirement plan account), American Century Investments may charge you a $12.50 semiannual account maintenance fee if the value of those shares is less than $10,000. We will redeem shares automatically in one of your accounts to pay the $12.50 fee. In determining your total eligible investment amount, we will include your investments in all personal accounts (including American Century Investments Brokerage accounts) registered under your Social Security number. Personal accounts include individual accounts, joint accounts, UGMA/UTMA accounts, personal trusts, Coverdell Education Savings Accounts and IRAs (including traditional, Roth, Rollover, SEP-, SARSEP- and SIMPLE-IRAs), and certain other retirement accounts. If you have only business, business retirement, employer-sponsored or American Century Investments Brokerage accounts, you are currently not subject to this fee. If you are subject to the Account Maintenance Fee, your account value could be reduced by the fee amount.
Hypothetical Example for Comparison Purposes
The table also provides information about hypothetical account values and hypothetical expenses based on the actual expense ratio of each class of your fund and an assumed rate of return of 5% per year before expenses, which is not the actual return of a fund’s share class. The hypothetical account values and expenses may not be used to estimate the actual ending account balance or expenses you paid for the period. You may use this information to compare the ongoing costs of investing in your fund and other funds. To do so, compare this 5% hypothetical example with the 5% hypothetical examples that appear in the shareholder reports of the other funds.
Please note that the expenses shown in the table are meant to highlight your ongoing costs only and do not reflect any transactional costs, such as sales charges (loads) or redemption/exchange fees. Therefore, the table is useful in comparing ongoing costs only, and will not help you determine the relative total costs of owning different funds. In addition, if these transactional costs were included, your costs would have been higher.
|
| | | | |
| | Beginning
Account Value
5/1/17 | Ending
Account Value
10/31/17 | Expenses Paid
During Period(1)
5/1/17 - 10/31/17 | Annualized
Expense Ratio(1) |
| Actual | | | | |
| Investor Class | $1,000 | $1,017.70 | $4.27 | 0.84% |
| I Class | $1,000 | $1,017.60 | $3.76 | 0.74% |
| Y Class | $1,000 | $1,018.60 | $3.26 | 0.64% |
| A Class | $1,000 | $1,015.80 | $5.54 | 1.09% |
| C Class | $1,000 | $1,011.90 | $9.33 | 1.84% |
| R Class | $1,000 | $1,014.80 | $6.81 | 1.34% |
| R5 Class | $1,000 | $1,018.60 | $3.26 | 0.64% |
| R6 Class | $1,000 | $1,018.60 | $3.00 | 0.59% |
| G Class | $1,000 | $1,011.70(2) | $0.03(3) | 0.01% |
| Hypothetical | | | | |
| Investor Class | $1,000 | $1,020.97 | $4.28 | 0.84% |
| I Class | $1,000 | $1,021.48 | $3.77 | 0.74% |
| Y Class | $1,000 | $1,021.98 | $3.26 | 0.64% |
| A Class | $1,000 | $1,019.71 | $5.55 | 1.09% |
| C Class | $1,000 | $1,015.93 | $9.35 | 1.84% |
| R Class | $1,000 | $1,018.45 | $6.82 | 1.34% |
| R5 Class | $1,000 | $1,021.98 | $3.26 | 0.64% |
| R6 Class | $1,000 | $1,022.23 | $3.01 | 0.59% |
| G Class | $1,000 | $1,025.16(4) | $0.05(4) | 0.01% |
| |
| (1) | Expenses are equal to the class's annualized expense ratio listed in the table above, multiplied by the average account value over the period, multiplied by 184, the number of days in the most recent fiscal half-year, divided by 365, to reflect the one-half year period. Annualized expense ratio reflects actual expenses, including any applicable fee waivers or expense reimbursements and excluding any acquired fund fees and expenses. |
| |
| (2) | Ending account value based on actual return from July 28, 2017 (commencement of sale) through October 31, 2017. |
| |
| (3) | Expenses are equal to the class's annualized expense ratio listed in the table above, multiplied by the average account value over the period, multiplied by 96, the number of days in the period from July 28, 2017 (commencement of sale) through October 31, 2017, divided by 365, to reflect the period. Had the class been available for the full period, the expenses paid during the period would have been higher. |
| |
| (4) | Ending account value and expenses paid during the period assumes the class had been available throughout the entire period and are calculated using the class’s annualized expense ratio listed in the table above. |
OCTOBER 31, 2017
|
| | | | | | | |
| | | Principal Amount | Value |
| SOVEREIGN GOVERNMENTS AND AGENCIES — 40.0% | | |
| Argentina — 0.2% | | | |
| Argentine Republic Government International Bond, 7.50%, 4/22/26 | | $ | 550,000 |
| $ | 622,875 |
|
| Argentine Republic Government International Bond, 6.875%, 1/26/27 | | $ | 800,000 |
| 873,600 |
|
| Argentine Republic Government International Bond, 6.625%, 7/6/28 | | $ | 1,700,000 |
| 1,808,800 |
|
| | | | 3,305,275 |
|
| Australia — 1.1% | | | |
| Australia Government Bond, 2.75%, 4/21/24 | AUD | 15,726,000 |
| 12,279,968 |
|
| New South Wales Treasury Corp., 3.00%, 3/20/28 | AUD | 4,100,000 |
| 3,115,645 |
|
| | | | 15,395,613 |
|
| Austria — 0.7% | | | |
Republic of Austria Government Bond, 3.40%, 11/22/22(1) | EUR | 3,395,000 |
| 4,688,772 |
|
Republic of Austria Government Bond, 0.75%, 10/20/26(1) | EUR | 1,989,000 |
| 2,379,634 |
|
Republic of Austria Government Bond, 4.15%, 3/15/37(1) | EUR | 1,270,000 |
| 2,255,019 |
|
| | | | 9,323,425 |
|
| Belgium — 0.5% | | | |
| Kingdom of Belgium Government Bond, 2.25%, 6/22/23 | EUR | 3,547,000 |
| 4,690,111 |
|
Kingdom of Belgium Government Bond, 4.25%, 3/28/41(1) | EUR | 1,155,000 |
| 2,102,224 |
|
| | | | 6,792,335 |
|
| Brazil — 0.1% | | | |
| Brazilian Government International Bond, 2.625%, 1/5/23 | | $ | 488,000 |
| 473,116 |
|
| Brazilian Government International Bond, 5.625%, 1/7/41 | | $ | 1,000,000 |
| 1,016,000 |
|
| | | | 1,489,116 |
|
| Canada — 2.1% | | | |
| Canadian Government Bond, 4.00%, 6/1/41 | CAD | 4,150,000 |
| 4,196,032 |
|
| Province of British Columbia Canada, 3.25%, 12/18/21 | CAD | 5,470,000 |
| 4,465,294 |
|
| Province of British Columbia Canada, 2.85%, 6/18/25 | CAD | 9,780,000 |
| 7,836,433 |
|
| Province of Quebec Canada, 3.00%, 9/1/23 | CAD | 6,672,000 |
| 5,401,574 |
|
| Province of Quebec Canada, 5.75%, 12/1/36 | CAD | 3,900,000 |
| 4,226,758 |
|
| Province of Quebec Canada, 3.50%, 12/1/48 | CAD | 2,424,000 |
| 2,046,750 |
|
| | | | 28,172,841 |
|
| Chile — 1.3% | | | |
| Bonos de la Tesoreria de la Republica en pesos, 4.50%, 3/1/26 | CLP | 10,850,000,000 |
| 17,270,159 |
|
| Chile Government International Bond, 3.25%, 9/14/21 | | $ | 300,000 |
| 312,450 |
|
| | | | 17,582,609 |
|
| Colombia — 0.2% | | | |
| Colombia Government International Bond, 7.375%, 9/18/37 | | $ | 2,100,000 |
| 2,782,500 |
|
| Czech — 0.1% | | | |
| Czech Republic Government Bond, 4.70%, 9/12/22 | CZK | 28,900,000 |
| 1,564,305 |
|
| Denmark — 0.2% | | | |
| Denmark Government Bond, 0.50%, 11/15/27 | DKK | 15,545,000 |
| 2,451,991 |
|
|
| | | | | | | |
| | | Principal Amount | Value |
| Denmark Government Bond, 4.50%, 11/15/39 | DKK | 1,705,000 |
| $ | 453,226 |
|
| | | | 2,905,217 |
|
| Dominican Republic — 0.3% | | | |
| Dominican Republic International Bond, 6.875%, 1/29/26 | | $ | 1,900,000 |
| 2,176,127 |
|
Dominican Republic International Bond, 5.95%, 1/25/27(1) | | $ | 800,000 |
| 863,200 |
|
| Dominican Republic International Bond, 5.95%, 1/25/27 | | $ | 800,000 |
| 863,200 |
|
| | | | 3,902,527 |
|
| Egypt — 0.2% | | | |
| Egypt Government International Bond, 5.75%, 4/29/20 | | $ | 1,000,000 |
| 1,040,891 |
|
Egypt Government International Bond, 6.125%, 1/31/22(1) | | $ | 600,000 |
| 626,944 |
|
Egypt Government International Bond, 7.50%, 1/31/27(1) | | $ | 600,000 |
| 666,327 |
|
| | | | 2,334,162 |
|
| Finland — 0.3% | | | |
Finland Government Bond, 4.00%, 7/4/25(1) | EUR | 2,667,000 |
| 4,012,691 |
|
| France — 2.2% | | | |
| French Republic Government Bond OAT, 1.75%, 11/25/24 | EUR | 7,742,000 |
| 10,032,747 |
|
| French Republic Government Bond OAT, 5.50%, 4/25/29 | EUR | 6,014,000 |
| 10,656,265 |
|
| French Republic Government Bond OAT, 3.25%, 5/25/45 | EUR | 5,401,000 |
| 8,552,609 |
|
| | | | 29,241,621 |
|
| Germany — 3.5% | | | |
| Bundesrepublik Deutschland, 0.50%, 2/15/25 | EUR | 2,027,000 |
| 2,450,371 |
|
Bundesrepublik Deutschland, 0.00%, 8/15/26(2) | EUR | 16,860,000 |
| 19,293,553 |
|
| Bundesrepublik Deutschland, 0.25%, 2/15/27 | EUR | 10,768,000 |
| 12,505,257 |
|
| Bundesrepublik Deutschland, 4.75%, 7/4/28 | EUR | 3,170,000 |
| 5,368,070 |
|
| Bundesrepublik Deutschland, 4.75%, 7/4/40 | EUR | 1,189,000 |
| 2,442,033 |
|
| Bundesrepublik Deutschland, 2.50%, 7/4/44 | EUR | 2,981,000 |
| 4,560,651 |
|
| | | | 46,619,935 |
|
| Greece — 0.5% | | | |
Hellenic Republic Government Bond, 4.375%, 8/1/22(1) | EUR | 5,300,000 |
| 6,166,516 |
|
| Hungary — 0.1% | | | |
| Hungary Government Bond, 6.75%, 10/22/28 | HUF | 126,000,000 |
| 655,882 |
|
| Hungary Government International Bond, 7.625%, 3/29/41 | | $ | 500,000 |
| 772,375 |
|
| | | | 1,428,257 |
|
| Indonesia — 0.1% | | | |
Indonesia Government International Bond, 4.75%, 1/8/26(1) | | $ | 1,000,000 |
| 1,092,694 |
|
| Ireland — 0.4% | | | |
| Ireland Government Bond, 3.40%, 3/18/24 | EUR | 3,473,000 |
| 4,883,799 |
|
| Italy — 4.1% | | | |
| Italy Buoni Poliennali Del Tesoro, 1.50%, 6/1/25 | EUR | 21,748,000 |
| 25,517,952 |
|
| Italy Buoni Poliennali Del Tesoro, 2.00%, 12/1/25 | EUR | 13,828,000 |
| 16,722,783 |
|
Italy Buoni Poliennali Del Tesoro, 4.75%, 9/1/44(1) | EUR | 8,644,000 |
| 13,454,445 |
|
| Republic of Italy Government International Bond, 6.875%, 9/27/23 | | $ | 120,000 |
| 143,298 |
|
| | | | 55,838,478 |
|
| Japan — 12.7% | | | |
| Japan Government Ten Year Bond, 1.00%, 12/20/21 | JPY | 3,262,950,000 |
| 30,004,189 |
|
| Japan Government Ten Year Bond, 0.80%, 6/20/23 | JPY | 2,690,100,000 |
| 24,818,760 |
|
| Japan Government Thirty Year Bond, 2.40%, 3/20/37 | JPY | 2,199,350,000 |
| 25,817,512 |
|
|
| | | | | | | |
| | | Principal Amount | Value |
| Japan Government Thirty Year Bond, 2.00%, 9/20/41 | JPY | 1,185,900,000 |
| $ | 13,310,647 |
|
| Japan Government Thirty Year Bond, 1.40%, 12/20/45 | JPY | 1,840,550,000 |
| 18,521,740 |
|
| Japan Government Twenty Year Bond, 2.10%, 12/20/26 | JPY | 5,713,500,000 |
| 59,682,747 |
|
| | | | 172,155,595 |
|
| Malaysia — 0.2% | | | |
| Malaysia Government Bond, 3.96%, 9/15/25 | MYR | 13,250,000 |
| 3,085,834 |
|
| Mexico — 1.0% | | | |
| Mexican Bonos, 6.50%, 6/9/22 | MXN | 105,050,000 |
| 5,365,335 |
|
| Mexico Government International Bond, 4.125%, 1/21/26 | | $ | 300,000 |
| 312,975 |
|
| Mexico Government International Bond, 4.15%, 3/28/27 | | $ | 3,900,000 |
| 4,058,925 |
|
| Nacional Financiera SNC, MTN, 0.78%, 3/29/22 | JPY | 500,000,000 |
| 4,434,721 |
|
| | | | 14,171,956 |
|
| Namibia — 0.1% | | | |
| Namibia International Bonds, 5.25%, 10/29/25 | | $ | 1,500,000 |
| 1,527,285 |
|
| Netherlands — 1.0% | | | |
Netherlands Government Bond, 0.00%, 1/15/22(1)(2) | EUR | 4,836,000 |
| 5,728,915 |
|
Netherlands Government Bond, 0.50%, 7/15/26(1) | EUR | 4,686,000 |
| 5,547,300 |
|
Netherlands Government Bond, 2.75%, 1/15/47(1) | EUR | 1,338,000 |
| 2,131,648 |
|
| | | | 13,407,863 |
|
| New Zealand — 0.6% | | | |
| New Zealand Government Bond, 5.00%, 3/15/19 | NZD | 11,375,000 |
| 8,102,417 |
|
| Panama — 0.2% | | | |
| Panama Government International Bond, 6.70%, 1/26/36 | | $ | 2,000,000 |
| 2,650,000 |
|
Paraguay† | | | |
Paraguay Government International Bond, 5.00%, 4/15/26(1) | | $ | 500,000 |
| 540,000 |
|
| Peru — 0.1% | | | |
| Peruvian Government International Bond, 4.125%, 8/25/27 | | $ | 1,200,000 |
| 1,318,200 |
|
| Peruvian Government International Bond, 6.55%, 3/14/37 | | $ | 350,000 |
| 472,500 |
|
| | | | 1,790,700 |
|
| Philippines — 0.1% | | | |
| Philippine Government International Bond, 6.375%, 10/23/34 | | $ | 1,000,000 |
| 1,342,016 |
|
| Poland — 0.2% | | | |
| Republic of Poland Government Bond, 4.00%, 10/25/23 | PLN | 8,110,000 |
| 2,359,309 |
|
| Republic of Poland Government International Bond, 4.00%, 1/22/24 | | $ | 500,000 |
| 536,556 |
|
| | | | 2,895,865 |
|
| Russia — 0.2% | | | |
| Russian Foreign Bond - Eurobond, 12.75%, 6/24/28 | | $ | 1,500,000 |
| 2,635,492 |
|
| Saudi Arabia — 0.1% | | | |
Saudi Government International Bond, 2.375%, 10/26/21(1) | | $ | 1,300,000 |
| 1,279,221 |
|
| Senegal — 0.1% | | | |
Senegal Government International Bond, 6.25%, 5/23/33(1) | | $ | 1,500,000 |
| 1,554,975 |
|
| Serbia — 0.1% | | | |
Serbia International Bond, 7.25%, 9/28/21(1) | | $ | 800,000 |
| 921,458 |
|
| Singapore — 0.3% | | | |
| Singapore Government Bond, 3.125%, 9/1/22 | SGD | 4,410,000 |
| 3,442,518 |
|
|
| | | | | | | |
| | | Principal Amount | Value |
| South Africa — 0.5% | | | |
| Republic of South Africa Government Bond, 10.50%, 12/21/26 | ZAR | 90,865,000 |
| $ | 6,968,265 |
|
| Republic of South Africa Government International Bond, 4.67%, 1/17/24 | | $ | 250,000 |
| 253,793 |
|
| | | | 7,222,058 |
|
| Sweden — 0.3% | | | |
| Sweden Government Bond, 2.50%, 5/12/25 | SEK | 25,885,000 |
| 3,592,634 |
|
| Switzerland — 0.5% | | | |
| Swiss Confederation Government Bond, 1.25%, 5/28/26 | CHF | 5,058,000 |
| 5,687,450 |
|
| Swiss Confederation Government Bond, 2.50%, 3/8/36 | CHF | 690,000 |
| 968,392 |
|
| | | | 6,655,842 |
|
| Thailand — 0.3% | | | |
| Thailand Government Bond, 3.85%, 12/12/25 | THB | 116,600,000 |
| 3,920,178 |
|
| Turkey — 0.3% | | | |
| Turkey Government International Bond, 3.25%, 3/23/23 | | $ | 180,000 |
| 170,042 |
|
| Turkey Government International Bond, 4.25%, 4/14/26 | | $ | 2,500,000 |
| 2,367,058 |
|
| Turkey Government International Bond, 6.00%, 3/25/27 | | $ | 1,200,000 |
| 1,266,396 |
|
| | | | 3,803,496 |
|
| United Kingdom — 2.9% | | | |
| United Kingdom Gilt, 1.50%, 7/22/26 | GBP | 11,654,000 |
| 15,814,464 |
|
| United Kingdom Gilt, 4.50%, 12/7/42 | GBP | 8,026,000 |
| 16,121,917 |
|
| United Kingdom Gilt, 4.25%, 12/7/49 | GBP | 2,225,000 |
| 4,655,813 |
|
| United Kingdom Gilt, 4.25%, 12/7/55 | GBP | 1,095,000 |
| 2,453,569 |
|
| | | | 39,045,763 |
|
TOTAL SOVEREIGN GOVERNMENTS AND AGENCIES
(Cost $528,718,964) | | | 540,577,082 |
|
| CORPORATE BONDS — 34.5% | | | |
| Aerospace and Defense — 0.2% | | | |
| Boeing Co. (The), 2.20%, 10/30/22 | | $ | 330,000 |
| 328,165 |
|
| Lockheed Martin Corp., 3.55%, 1/15/26 | | 670,000 |
| 698,070 |
|
| Lockheed Martin Corp., 3.80%, 3/1/45 | | 240,000 |
| 237,033 |
|
| Rockwell Collins, Inc., 4.35%, 4/15/47 | | 310,000 |
| 333,515 |
|
| United Technologies Corp., 3.125%, 5/4/27 | | 200,000 |
| 200,438 |
|
| United Technologies Corp., 5.70%, 4/15/40 | | 380,000 |
| 476,891 |
|
| United Technologies Corp., 3.75%, 11/1/46 | | 100,000 |
| 97,688 |
|
| | | | 2,371,800 |
|
| Airlines — 0.1% | | | |
| United Continental Holdings, Inc., 4.25%, 10/1/22 | | 1,150,000 |
| 1,157,188 |
|
| Auto Components — 0.3% | | | |
| Goodyear Tire & Rubber Co. (The), 5.125%, 11/15/23 | | 1,800,000 |
| 1,860,750 |
|
| Tenneco, Inc., 5.00%, 7/15/26 | | 1,520,000 |
| 1,565,600 |
|
ZF North America Capital, Inc., 4.00%, 4/29/20(1) | | 1,000,000 |
| 1,036,250 |
|
| | | | 4,462,600 |
|
| Automobiles — 0.5% | | | |
| Ford Motor Co., 4.35%, 12/8/26 | | 370,000 |
| 386,242 |
|
| Ford Motor Credit Co. LLC, 5.00%, 5/15/18 | | 210,000 |
| 213,648 |
|
| Ford Motor Credit Co. LLC, 5.875%, 8/2/21 | | 1,360,000 |
| 1,515,090 |
|
|
| | | | | | | |
| | | Principal Amount | Value |
| Ford Motor Credit Co. LLC, 2.98%, 8/3/22 | | $ | 450,000 |
| $ | 451,727 |
|
| General Motors Co., 5.15%, 4/1/38 | | 310,000 |
| 323,232 |
|
| General Motors Financial Co., Inc., 3.25%, 5/15/18 | | 1,210,000 |
| 1,219,474 |
|
| General Motors Financial Co., Inc., 3.20%, 7/6/21 | | 510,000 |
| 520,753 |
|
| General Motors Financial Co., Inc., 5.25%, 3/1/26 | | 800,000 |
| 875,344 |
|
Jaguar Land Rover Automotive plc, 4.125%, 12/15/18(1) | | 20,000 |
| 20,475 |
|
Jaguar Land Rover Automotive plc, 3.50%, 3/15/20(1) | | 980,000 |
| 991,025 |
|
| | | | 6,517,010 |
|
| Banks — 6.6% | | | |
Banco General SA, 4.125%, 8/7/27(1) | | 2,300,000 |
| 2,289,650 |
|
Banco Inbursa SA Institucion de Banca Multiple, 4.375%, 4/11/27(1) | | 2,500,000 |
| 2,487,500 |
|
Bancolombia SA, VRN, 4.875%, 10/18/22(3) | | 2,500,000 |
| 2,501,875 |
|
| Bank of America Corp., MTN, 5.625%, 7/1/20 | | 3,000,000 |
| 3,256,024 |
|
| Bank of America Corp., MTN, 4.00%, 4/1/24 | | 250,000 |
| 265,092 |
|
| Bank of America Corp., MTN, 4.20%, 8/26/24 | | 300,000 |
| 317,068 |
|
| Bank of America Corp., MTN, 4.00%, 1/22/25 | | 1,390,000 |
| 1,440,391 |
|
Bank of America Corp., MTN, VRN, 3.82%, 1/20/27(3) | | 500,000 |
| 515,383 |
|
Bank of America Corp., MTN, VRN, 4.44%, 1/20/47(3) | | 250,000 |
| 271,584 |
|
Banque Federative du Credit Mutuel SA, 2.00%, 4/12/19(1) | | 250,000 |
| 250,074 |
|
| Barclays plc, 4.375%, 1/12/26 | | 200,000 |
| 209,959 |
|
| Barclays plc, 4.95%, 1/10/47 | | 400,000 |
| 439,810 |
|
Barclays plc, MTN, VRN, 2.625%, 11/11/20(3) | EUR | 2,000,000 |
| 2,428,781 |
|
BPCE SA, 3.00%, 5/22/22(1) | | $ | 790,000 |
| 794,733 |
|
BPCE SA, 5.15%, 7/21/24(1) | | 300,000 |
| 327,175 |
|
BPCE SA, VRN, 2.75%, 7/8/21(3) | EUR | 1,700,000 |
| 2,118,538 |
|
| Branch Banking & Trust Co., 3.625%, 9/16/25 | | $ | 337,000 |
| 351,169 |
|
| Branch Banking & Trust Co., 3.80%, 10/30/26 | | 10,000 |
| 10,538 |
|
CaixaBank SA, MTN, VRN, 2.75%, 7/14/23(3) | EUR | 1,200,000 |
| 1,431,177 |
|
| Capital One Financial Corp., 4.20%, 10/29/25 | | $ | 1,850,000 |
| 1,910,524 |
|
| Citigroup, Inc., 2.90%, 12/8/21 | | 1,100,000 |
| 1,113,217 |
|
| Citigroup, Inc., 2.75%, 4/25/22 | | 1,350,000 |
| 1,355,430 |
|
| Citigroup, Inc., 4.05%, 7/30/22 | | 1,850,000 |
| 1,945,833 |
|
| Citigroup, Inc., 4.45%, 9/29/27 | | 810,000 |
| 857,107 |
|
Citigroup, Inc., VRN, 3.52%, 10/27/27(3) | | 470,000 |
| 470,136 |
|
Commerzbank AG, 8.125%, 9/19/23(1) | | 280,000 |
| 340,701 |
|
| Commerzbank AG, MTN, 4.00%, 3/23/26 | EUR | 1,550,000 |
| 2,085,341 |
|
| Cooperatieve Rabobank UA, 3.875%, 2/8/22 | | $ | 680,000 |
| 722,108 |
|
| Cooperatieve Rabobank UA, 3.95%, 11/9/22 | | 500,000 |
| 527,906 |
|
Cooperatieve Rabobank UA, VRN, 2.50%, 5/26/21(3) | EUR | 1,500,000 |
| 1,858,824 |
|
| European Financial Stability Facility, MTN, 2.125%, 2/19/24 | EUR | 4,175,000 |
| 5,485,927 |
|
| European Investment Bank, MTN, 2.25%, 10/14/22 | EUR | 8,050,000 |
| 10,546,093 |
|
Finansbank AS, 4.875%, 5/19/22(1) | | $ | 2,000,000 |
| 1,978,578 |
|
| Finansbank AS, MTN, 6.25%, 4/30/19 | | 1,850,000 |
| 1,911,964 |
|
HBOS plc, MTN, 6.75%, 5/21/18(1) | | 400,000 |
| 410,375 |
|
| Huntington Bancshares, Inc., 2.30%, 1/14/22 | | 400,000 |
| 395,311 |
|
Ibercaja Banco SA, VRN, 5.00%, 7/28/20(3) | EUR | 2,200,000 |
| 2,640,484 |
|
Intesa Sanpaolo SpA, 3.125%, 7/14/22(1) | | $ | 520,000 |
| 521,852 |
|
|
| | | | | | | |
| | | Principal Amount | Value |
Intesa Sanpaolo SpA, 5.02%, 6/26/24(1) | | $ | 680,000 |
| $ | 696,782 |
|
| Intesa Sanpaolo SpA, MTN, 6.625%, 9/13/23 | EUR | 1,200,000 |
| 1,770,400 |
|
| JPMorgan Chase & Co., 4.625%, 5/10/21 | | $ | 3,230,000 |
| 3,474,771 |
|
| JPMorgan Chase & Co., 3.25%, 9/23/22 | | 500,000 |
| 514,828 |
|
| JPMorgan Chase & Co., 3.875%, 9/10/24 | | 210,000 |
| 219,382 |
|
| JPMorgan Chase & Co., 3.125%, 1/23/25 | | 270,000 |
| 271,821 |
|
| JPMorgan Chase & Co., 4.95%, 6/1/45 | | 150,000 |
| 171,173 |
|
JPMorgan Chase & Co., VRN, 3.54%, 5/1/27(3) | | 1,000,000 |
| 1,012,754 |
|
JPMorgan Chase & Co., VRN, 3.88%, 7/24/37(3) | | 800,000 |
| 809,005 |
|
| KeyBank N.A., MTN, 3.40%, 5/20/26 | | 250,000 |
| 249,442 |
|
| Kreditanstalt fuer Wiederaufbau, 4.625%, 1/4/23 | EUR | 3,545,000 |
| 5,153,873 |
|
| Lloyds Bank plc, MTN, 7.625%, 4/22/25 | GBP | 970,000 |
| 1,724,284 |
|
| PNC Financial Services Group, Inc. (The), 4.375%, 8/11/20 | | $ | 700,000 |
| 741,582 |
|
| Regions Financial Corp., 2.75%, 8/14/22 | | 610,000 |
| 611,620 |
|
| Santander Issuances SAU, MTN, 2.50%, 3/18/25 | EUR | 2,900,000 |
| 3,573,197 |
|
| Santander UK plc, MTN, 5.125%, 4/14/21 (Secured) | GBP | 2,300,000 |
| 3,475,099 |
|
| SunTrust Bank, 3.30%, 5/15/26 | | $ | 200,000 |
| 198,334 |
|
Turkiye Garanti Bankasi AS, 5.875%, 3/16/23(1) | | 1,500,000 |
| 1,547,387 |
|
| U.S. Bancorp, MTN, 3.60%, 9/11/24 | | 1,360,000 |
| 1,415,395 |
|
| Wells Fargo & Co., 3.07%, 1/24/23 | | 430,000 |
| 435,939 |
|
| Wells Fargo & Co., MTN, 4.10%, 6/3/26 | | 1,570,000 |
| 1,636,190 |
|
| Wells Fargo & Co., MTN, 4.65%, 11/4/44 | | 250,000 |
| 268,950 |
|
| Wells Fargo & Co., MTN, 4.75%, 12/7/46 | | 350,000 |
| 382,540 |
|
Wells Fargo & Co., MTN, VRN, 3.58%, 5/22/27(3) | | 440,000 |
| 445,547 |
|
| | | | 89,584,527 |
|
| Beverages — 0.4% | | | |
| Anheuser-Busch InBev Finance, Inc., 3.30%, 2/1/23 | | 590,000 |
| 609,314 |
|
| Anheuser-Busch InBev Finance, Inc., 3.65%, 2/1/26 | | 2,090,000 |
| 2,160,013 |
|
| Anheuser-Busch InBev Finance, Inc., 4.90%, 2/1/46 | | 1,010,000 |
| 1,138,130 |
|
| Constellation Brands, Inc., 3.875%, 11/15/19 | | 980,000 |
| 1,014,067 |
|
| Constellation Brands, Inc., 4.75%, 12/1/25 | | 500,000 |
| 552,910 |
|
| Molson Coors Brewing Co., 3.00%, 7/15/26 | | 470,000 |
| 458,560 |
|
| | | | 5,932,994 |
|
| Biotechnology — 0.7% | | | |
| AbbVie, Inc., 2.90%, 11/6/22 | | 1,370,000 |
| 1,385,831 |
|
| AbbVie, Inc., 3.60%, 5/14/25 | | 290,000 |
| 298,565 |
|
| Amgen, Inc., 2.65%, 5/11/22 | | 1,030,000 |
| 1,034,761 |
|
| Amgen, Inc., 4.66%, 6/15/51 | | 474,000 |
| 514,628 |
|
| Biogen, Inc., 3.625%, 9/15/22 | | 980,000 |
| 1,027,019 |
|
| Celgene Corp., 3.875%, 8/15/25 | | 1,950,000 |
| 2,030,638 |
|
| Celgene Corp., 5.00%, 8/15/45 | | 150,000 |
| 165,591 |
|
| Gilead Sciences, Inc., 4.40%, 12/1/21 | | 1,020,000 |
| 1,100,745 |
|
| Gilead Sciences, Inc., 3.65%, 3/1/26 | | 1,050,000 |
| 1,093,999 |
|
| Gilead Sciences, Inc., 4.15%, 3/1/47 | | 200,000 |
| 205,244 |
|
| | | | 8,857,021 |
|
| Building Products — 0.1% | | | |
| Masco Corp., 4.45%, 4/1/25 | | 1,000,000 |
| 1,074,040 |
|
|
| | | | | | | |
| | | Principal Amount | Value |
| Masco Corp., 4.375%, 4/1/26 | | $ | 200,000 |
| $ | 213,662 |
|
| | | | 1,287,702 |
|
| Capital Markets — 0.2% | | | |
| Criteria Caixa SAU, MTN, 1.50%, 5/10/23 | EUR | 2,000,000 |
| 2,371,703 |
|
| Jefferies Group LLC, 4.85%, 1/15/27 | | $ | 550,000 |
| 585,557 |
|
| | | | 2,957,260 |
|
| Chemicals — 0.2% | | | |
| Ashland LLC, 4.75%, 8/15/22 | | 1,140,000 |
| 1,205,778 |
|
| Dow Chemical Co. (The), 4.375%, 11/15/42 | | 200,000 |
| 208,730 |
|
| Ecolab, Inc., 4.35%, 12/8/21 | | 235,000 |
| 253,223 |
|
NOVA Chemicals Corp., 4.875%, 6/1/24(1) | | 1,110,000 |
| 1,133,587 |
|
| Sherwin-Williams Co. (The), 3.45%, 6/1/27 | | 540,000 |
| 549,610 |
|
| | | | 3,350,928 |
|
| Commercial Services and Supplies — 0.2% | | | |
| Covanta Holding Corp., 5.875%, 3/1/24 | | 1,060,000 |
| 1,065,300 |
|
| Republic Services, Inc., 3.55%, 6/1/22 | | 680,000 |
| 707,792 |
|
| Waste Management, Inc., 4.10%, 3/1/45 | | 310,000 |
| 327,872 |
|
| | | | 2,100,964 |
|
| Communications Equipment — 0.4% | | | |
| Cisco Systems, Inc., 3.00%, 6/15/22 | | 450,000 |
| 463,933 |
|
CommScope Technologies LLC, 5.00%, 3/15/27(1) | | 1,850,000 |
| 1,806,063 |
|
IHS Netherlands Holdco BV, 9.50%, 10/27/21(1) | | 1,500,000 |
| 1,597,266 |
|
Zayo Group LLC / Zayo Capital, Inc., 5.75%, 1/15/27(1) | | 1,620,000 |
| 1,711,125 |
|
| | | | 5,578,387 |
|
| Consumer Discretionary — 0.2% | | | |
Netflix, Inc., 4.875%, 4/15/28(1) | | 2,100,000 |
| 2,089,920 |
|
| Consumer Finance — 0.5% | | | |
| American Express Credit Corp., MTN, 2.60%, 9/14/20 | | 335,000 |
| 339,315 |
|
| American Express Credit Corp., MTN, 2.25%, 5/5/21 | | 1,350,000 |
| 1,351,599 |
|
| American Express Credit Corp., MTN, 3.30%, 5/3/27 | | 300,000 |
| 303,646 |
|
| CIT Group, Inc., 5.00%, 8/15/22 | | 810,000 |
| 872,775 |
|
| Discover Bank, 3.45%, 7/27/26 | | 550,000 |
| 543,333 |
|
| Discover Financial Services, 3.75%, 3/4/25 | | 200,000 |
| 202,580 |
|
| GLP Capital LP / GLP Financing II, Inc., 4.875%, 11/1/20 | | 620,000 |
| 658,672 |
|
| PNC Bank N.A., 1.95%, 3/4/19 | | 1,100,000 |
| 1,100,965 |
|
| Synchrony Financial, 2.60%, 1/15/19 | | 380,000 |
| 382,316 |
|
| Synchrony Financial, 3.00%, 8/15/19 | | 250,000 |
| 253,659 |
|
| Visa, Inc., 2.75%, 9/15/27 | | 400,000 |
| 392,856 |
|
| | | | 6,401,716 |
|
| Containers and Packaging — 0.6% | | | |
Ardagh Packaging Finance plc / Ardagh Holdings USA, Inc., 6.00%, 2/15/25(1) | | 2,430,000 |
| 2,584,912 |
|
| Ball Corp., 4.00%, 11/15/23 | | 1,090,000 |
| 1,124,063 |
|
| Berry Global, Inc., 5.125%, 7/15/23 | | 900,000 |
| 948,375 |
|
| Crown Americas LLC / Crown Americas Capital Corp. IV, 4.50%, 1/15/23 | | 1,740,000 |
| 1,815,864 |
|
Reynolds Group Issuer, Inc. / Reynolds Group Issuer LLC / Reynolds Group Issuer Lu, 5.125%, 7/15/23(1) | | 1,410,000 |
| 1,469,925 |
|
|
| | | | | | | |
| | | Principal Amount | Value |
| WestRock RKT Co., 4.00%, 3/1/23 | | $ | 120,000 |
| $ | 125,639 |
|
| | | | 8,068,778 |
|
Diversified Consumer Services† | | | |
| Board of Trustees of The Leland Stanford Junior University (The), 3.46%, 5/1/47 | | 200,000 |
| 198,912 |
|
| Catholic Health Initiatives, 2.95%, 11/1/22 | | 10,000 |
| 10,031 |
|
| | | | 208,943 |
|
| Diversified Financial Services — 3.3% | | | |
| Ally Financial, Inc., 3.50%, 1/27/19 | | 550,000 |
| 558,085 |
|
| Ally Financial, Inc., 4.625%, 3/30/25 | | 1,390,000 |
| 1,483,825 |
|
| Banco Santander SA, 3.50%, 4/11/22 | | 1,000,000 |
| 1,025,543 |
|
| Bank of America Corp., MTN, 2.30%, 7/25/25 | GBP | 900,000 |
| 1,201,254 |
|
BNP Paribas SA, 4.375%, 9/28/25(1) | | $ | 500,000 |
| 526,153 |
|
| Credit Agricole SA, MTN, 7.375%, 12/18/23 | GBP | 1,700,000 |
| 2,927,156 |
|
Credit Suisse Group AG, VRN, 2.125%, 9/12/24(3) | GBP | 1,800,000 |
| 2,360,617 |
|
| Credit Suisse Group Funding Guernsey Ltd., 3.45%, 4/16/21 | | $ | 1,000,000 |
| 1,028,614 |
|
| GE Capital International Funding Co. Unlimited Co., 2.34%, 11/15/20 | | 1,841,000 |
| 1,850,536 |
|
| GE Capital UK Funding Unlimited Co., MTN, 5.125%, 5/24/23 | GBP | 500,000 |
| 787,922 |
|
| Goldman Sachs Group, Inc. (The), 2.30%, 12/13/19 | | $ | 2,340,000 |
| 2,347,736 |
|
| Goldman Sachs Group, Inc. (The), 5.375%, 3/15/20 | | 1,415,000 |
| 1,515,095 |
|
| Goldman Sachs Group, Inc. (The), 5.50%, 10/12/21 | GBP | 850,000 |
| 1,287,597 |
|
| Goldman Sachs Group, Inc. (The), 3.50%, 1/23/25 | | $ | 1,400,000 |
| 1,423,038 |
|
| Goldman Sachs Group, Inc. (The), 3.50%, 11/16/26 | | 1,300,000 |
| 1,304,114 |
|
| Goldman Sachs Group, Inc. (The), 5.15%, 5/22/45 | | 250,000 |
| 285,235 |
|
Goldman Sachs Group, Inc. (The), VRN, 2.88%, 10/31/21(3) | | 330,000 |
| 330,692 |
|
Goldman Sachs Group, Inc. (The), VRN, 3.27%, 9/29/24(3) | | 430,000 |
| 429,114 |
|
| HSBC Holdings plc, 2.95%, 5/25/21 | | 1,600,000 |
| 1,627,954 |
|
| HSBC Holdings plc, 0.84%, 9/26/23 | JPY | 600,000,000 |
| 5,398,829 |
|
| HSBC Holdings plc, 4.30%, 3/8/26 | | $ | 300,000 |
| 322,322 |
|
| HSBC Holdings plc, 4.375%, 11/23/26 | | 570,000 |
| 600,509 |
|
HSBC Holdings plc, VRN, 3.26%, 3/13/22(3) | | 340,000 |
| 347,634 |
|
| Morgan Stanley, 2.75%, 5/19/22 | | 6,210,000 |
| 6,225,481 |
|
| Morgan Stanley, 4.375%, 1/22/47 | | 350,000 |
| 373,457 |
|
| Morgan Stanley, MTN, 5.625%, 9/23/19 | | 110,000 |
| 117,012 |
|
| Morgan Stanley, MTN, 4.00%, 7/23/25 | | 1,300,000 |
| 1,368,352 |
|
| S&P Global, Inc., 3.30%, 8/14/20 | | 250,000 |
| 256,483 |
|
UBS Group Funding Switzerland AG, 3.49%, 5/23/23(1) | | 1,000,000 |
| 1,025,819 |
|
UBS Group Funding Switzerland AG, 4.125%, 9/24/25(1) | | 200,000 |
| 211,139 |
|
UniCredit SpA, MTN, VRN, 5.75%, 10/28/20(3) | EUR | 1,000,000 |
| 1,309,774 |
|
UniCredit SpA, VRN, 5.86%, 6/19/27(1)(3) | | $ | 2,970,000 |
| 3,178,553 |
|
| | | | 45,035,644 |
|
| Diversified Telecommunication Services — 1.6% | | | |
| AT&T, Inc., 3.60%, 2/17/23 | | 500,000 |
| 517,499 |
|
| AT&T, Inc., 3.40%, 5/15/25 | | 2,350,000 |
| 2,326,923 |
|
| AT&T, Inc., 3.90%, 8/14/27 | | 1,650,000 |
| 1,645,775 |
|
|
| | | | | | | |
| | | Principal Amount | Value |
| AT&T, Inc., 2.60%, 12/17/29 | EUR | 1,800,000 |
| $ | 2,231,842 |
|
| AT&T, Inc., 6.55%, 2/15/39 | | $ | 271,000 |
| 327,474 |
|
| AT&T, Inc., 5.45%, 3/1/47 | | 350,000 |
| 366,641 |
|
| AT&T, Inc., 5.15%, 2/14/50 | | 500,000 |
| 494,945 |
|
| British Telecommunications plc, 5.95%, 1/15/18 | | 500,000 |
| 504,528 |
|
| CenturyLink, Inc., 6.15%, 9/15/19 | | 980,000 |
| 1,030,225 |
|
| Deutsche Telekom International Finance BV, 1.25%, 10/6/23 | GBP | 1,500,000 |
| 1,950,922 |
|
Deutsche Telekom International Finance BV, 3.60%, 1/19/27(1) | | $ | 600,000 |
| 610,495 |
|
| Frontier Communications Corp., 8.50%, 4/15/20 | | 394,000 |
| 390,553 |
|
| Orange SA, 4.125%, 9/14/21 | | 680,000 |
| 727,651 |
|
Orange SA, MTN, VRN, 4.00%, 10/1/21(3) | EUR | 1,600,000 |
| 2,065,766 |
|
| Telefonica Emisiones SAU, 5.46%, 2/16/21 | | $ | 690,000 |
| 754,845 |
|
| Telefonica Emisiones SAU, 5.21%, 3/8/47 | | 300,000 |
| 331,384 |
|
Telefonica Europe BV, VRN, 5.875%, 3/31/24(3) | EUR | 1,500,000 |
| 2,056,542 |
|
| Verizon Communications, Inc., 2.45%, 11/1/22 | | $ | 1,510,000 |
| 1,502,062 |
|
| Verizon Communications, Inc., 4.125%, 3/16/27 | | 300,000 |
| 313,680 |
|
| Verizon Communications, Inc., 4.86%, 8/21/46 | | 1,510,000 |
| 1,528,472 |
|
| | | | 21,678,224 |
|
| Electric Utilities — 0.1% | | | |
NextEra Energy Operating Partners LP, 4.50%, 9/15/27(1) | | 2,000,000 |
| 2,017,500 |
|
| Electronic Equipment, Instruments and Components — 0.1% | | |
Sanmina Corp., 4.375%, 6/1/19(1) | | 980,000 |
| 1,008,988 |
|
| Energy Equipment and Services — 0.1% | | | |
| Ensco plc, 5.20%, 3/15/25 | | 160,000 |
| 135,600 |
|
| Halliburton Co., 3.80%, 11/15/25 | | 380,000 |
| 395,087 |
|
| Noble Holding International Ltd., 7.75%, 1/15/24 | | 690,000 |
| 621,000 |
|
| | | | 1,151,687 |
|
| Equity Real Estate Investment Trusts (REITs) — 0.5% | | | |
| American Tower Corp., 3.375%, 10/15/26 | | 870,000 |
| 861,043 |
|
| AvalonBay Communities, Inc., MTN, 3.35%, 5/15/27 | | 200,000 |
| 203,029 |
|
| Boston Properties LP, 3.65%, 2/1/26 | | 400,000 |
| 407,911 |
|
| Crown Castle International Corp., 5.25%, 1/15/23 | | 590,000 |
| 652,531 |
|
| DDR Corp., 3.90%, 8/15/24 | | 1,040,000 |
| 1,050,217 |
|
| Essex Portfolio LP, 3.25%, 5/1/23 | | 550,000 |
| 558,966 |
|
| Hospitality Properties Trust, 4.65%, 3/15/24 | | 220,000 |
| 232,682 |
|
| Kilroy Realty LP, 4.375%, 10/1/25 | | 400,000 |
| 420,810 |
|
| MGM Growth Properties Operating Partnership LP / MGP Finance Co-Issuer, Inc., 4.50%, 9/1/26 | | 1,340,000 |
| 1,351,725 |
|
| Ventas Realty LP, 4.125%, 1/15/26 | | 250,000 |
| 260,464 |
|
| VEREIT Operating Partnership LP, 4.125%, 6/1/21 | | 1,030,000 |
| 1,076,949 |
|
| Welltower, Inc., 3.75%, 3/15/23 | | 300,000 |
| 311,885 |
|
| | | | 7,388,212 |
|
| Financial Services — 0.1% | | | |
GrupoSura Finance SA, 5.50%, 4/29/26(1) | | 1,200,000 |
| 1,308,000 |
|
| Food and Staples Retailing — 1.0% | | | |
| Cencosud SA, 4.875%, 1/20/23 | | 1,339,000 |
| 1,419,697 |
|
|
| | | | | | | |
| | | Principal Amount | Value |
CK Hutchison International 17 II Ltd., 2.25%, 9/29/20(1) | | $ | 3,240,000 |
| $ | 3,229,981 |
|
| CVS Health Corp., 3.50%, 7/20/22 | | 250,000 |
| 257,728 |
|
| CVS Health Corp., 2.75%, 12/1/22 | | 690,000 |
| 687,700 |
|
| CVS Health Corp., 5.125%, 7/20/45 | | 100,000 |
| 112,092 |
|
| Kroger Co. (The), 3.30%, 1/15/21 | | 480,000 |
| 492,437 |
|
| Kroger Co. (The), 3.70%, 8/1/27 | | 400,000 |
| 398,347 |
|
| Target Corp., 2.50%, 4/15/26 | | 710,000 |
| 683,062 |
|
| Wal-Mart Stores, Inc., 0.18%, 7/15/22 | JPY | 650,000,000 |
| 5,707,349 |
|
| Wal-Mart Stores, Inc., 3.625%, 12/15/47 | | $ | 200,000 |
| 204,040 |
|
| | | | 13,192,433 |
|
| Food Products — 0.4% | | | |
Arcor SAIC, 6.00%, 7/6/23(1) | | 1,000,000 |
| 1,078,500 |
|
| Kraft Heinz Foods Co., 5.20%, 7/15/45 | | 200,000 |
| 218,754 |
|
| Kraft Heinz Foods Co., 4.375%, 6/1/46 | | 120,000 |
| 117,562 |
|
Lamb Weston Holdings, Inc., 4.625%, 11/1/24(1) | | 1,930,000 |
| 2,026,500 |
|
Post Holdings, Inc., 5.00%, 8/15/26(1) | | 1,400,000 |
| 1,410,500 |
|
| | | | 4,851,816 |
|
| Gas Utilities — 1.1% | | | |
| Andeavor Logistics LP / Tesoro Logistics Finance Corp., 5.50%, 10/15/19 | | 520,000 |
| 549,900 |
|
| Boardwalk Pipelines LP, 4.45%, 7/15/27 | | 280,000 |
| 287,615 |
|
| Enbridge Energy Partners LP, 5.20%, 3/15/20 | | 350,000 |
| 371,986 |
|
| Enbridge, Inc., 4.00%, 10/1/23 | | 530,000 |
| 554,549 |
|
| Energy Transfer Equity LP, 7.50%, 10/15/20 | | 20,000 |
| 22,600 |
|
| Energy Transfer LP, 4.15%, 10/1/20 | | 20,000 |
| 20,891 |
|
| Energy Transfer LP, 3.60%, 2/1/23 | | 1,000,000 |
| 1,020,355 |
|
| Energy Transfer LP, 4.90%, 3/15/35 | | 320,000 |
| 317,487 |
|
| Enterprise Products Operating LLC, 5.20%, 9/1/20 | | 530,000 |
| 573,193 |
|
| Enterprise Products Operating LLC, 4.85%, 3/15/44 | | 900,000 |
| 979,022 |
|
| Kinder Morgan Energy Partners LP, 6.50%, 9/1/39 | | 970,000 |
| 1,125,953 |
|
| Kinder Morgan, Inc., 5.55%, 6/1/45 | | 450,000 |
| 490,546 |
|
| MPLX LP, 4.875%, 6/1/25 | | 450,000 |
| 488,118 |
|
| MPLX LP, 5.20%, 3/1/47 | | 368,000 |
| 395,232 |
|
| ONEOK, Inc., 4.00%, 7/13/27 | | 460,000 |
| 468,986 |
|
| Plains All American Pipeline LP / PAA Finance Corp., 3.65%, 6/1/22 | | 690,000 |
| 698,154 |
|
| Sabine Pass Liquefaction LLC, 5.625%, 3/1/25 | | 1,620,000 |
| 1,802,327 |
|
| Sunoco Logistics Partners Operations LP, 3.45%, 1/15/23 | | 1,020,000 |
| 1,031,987 |
|
| Sunoco Logistics Partners Operations LP, 4.00%, 10/1/27 | | 210,000 |
| 209,277 |
|
| Targa Resources Partners LP / Targa Resources Partners Finance Corp., 4.25%, 11/15/23 | | 980,000 |
| 980,000 |
|
Targa Resources Partners LP / Targa Resources Partners Finance Corp., 5.00%, 1/15/28(1) | | 1,020,000 |
| 1,027,650 |
|
| Williams Cos., Inc. (The), 3.70%, 1/15/23 | | 850,000 |
| 861,688 |
|
| Williams Partners LP, 4.125%, 11/15/20 | | 680,000 |
| 709,821 |
|
| Williams Partners LP, 5.10%, 9/15/45 | | 300,000 |
| 323,076 |
|
| | | | 15,310,413 |
|
| Health Care Equipment and Supplies — 0.5% | | | |
| Abbott Laboratories, 2.00%, 9/15/18 | | 160,000 |
| 160,251 |
|
|
| | | | | | | |
| | | Principal Amount | Value |
| Abbott Laboratories, 3.75%, 11/30/26 | | $ | 1,452,000 |
| $ | 1,500,438 |
|
| Becton Dickinson and Co., 3.73%, 12/15/24 | | 600,000 |
| 617,528 |
|
| Becton Dickinson and Co., 3.70%, 6/6/27 | | 470,000 |
| 473,687 |
|
| Mallinckrodt International Finance SA, 3.50%, 4/15/18 | | 980,000 |
| 983,675 |
|
| Medtronic, Inc., 2.50%, 3/15/20 | | 610,000 |
| 618,483 |
|
| Medtronic, Inc., 3.50%, 3/15/25 | | 720,000 |
| 748,333 |
|
| Medtronic, Inc., 4.375%, 3/15/35 | | 610,000 |
| 674,686 |
|
| Thermo Fisher Scientific, Inc., 3.30%, 2/15/22 | | 213,000 |
| 219,868 |
|
| Thermo Fisher Scientific, Inc., 2.95%, 9/19/26 | | 250,000 |
| 245,161 |
|
| Thermo Fisher Scientific, Inc., 5.30%, 2/1/44 | | 240,000 |
| 285,820 |
|
| Zimmer Biomet Holdings, Inc., 2.70%, 4/1/20 | | 270,000 |
| 272,416 |
|
| | | | 6,800,346 |
|
| Health Care Providers and Services — 1.1% | | | |
| Anthem, Inc., 4.65%, 1/15/43 | | 300,000 |
| 325,613 |
|
| CHS / Community Health Systems, Inc., 6.25%, 3/31/23 | | 750,000 |
| 722,813 |
|
| DaVita, Inc., 5.75%, 8/15/22 | | 480,000 |
| 495,300 |
|
| DaVita, Inc., 5.125%, 7/15/24 | | 3,000,000 |
| 3,013,125 |
|
| Express Scripts Holding Co., 3.40%, 3/1/27 | | 200,000 |
| 196,823 |
|
Fresenius Medical Care US Finance II, Inc., 4.125%, 10/15/20(1) | | 980,000 |
| 1,020,843 |
|
| HCA, Inc., 3.75%, 3/15/19 | | 530,000 |
| 539,275 |
|
| HCA, Inc., 5.00%, 3/15/24 | | 1,480,000 |
| 1,560,941 |
|
| HCA, Inc., 5.375%, 2/1/25 | | 1,340,000 |
| 1,381,460 |
|
| Mylan NV, 3.95%, 6/15/26 | | 160,000 |
| 160,090 |
|
| Northwell Healthcare, Inc., 4.26%, 11/1/47 | | 220,000 |
| 220,333 |
|
Tenet Healthcare Corp., 5.125%, 5/1/25(1) | | 2,200,000 |
| 2,150,500 |
|
| UnitedHealth Group, Inc., 2.875%, 12/15/21 | | 610,000 |
| 624,187 |
|
| UnitedHealth Group, Inc., 3.75%, 7/15/25 | | 710,000 |
| 751,749 |
|
| UnitedHealth Group, Inc., 4.75%, 7/15/45 | | 310,000 |
| 359,370 |
|
| UnitedHealth Group, Inc., 3.75%, 10/15/47 | | 420,000 |
| 412,547 |
|
Universal Health Services, Inc., 4.75%, 8/1/22(1) | | 980,000 |
| 1,014,300 |
|
| | | | 14,949,269 |
|
| Hotels, Restaurants and Leisure — 0.8% | | | |
1011778 BC ULC / New Red Finance, Inc., 4.625%, 1/15/22(1) | | 2,200,000 |
| 2,256,760 |
|
Aramark Services, Inc., 5.00%, 4/1/25(1) | | 740,000 |
| 792,725 |
|
| Hilton Domestic Operating Co., Inc., 4.25%, 9/1/24 | | 1,760,000 |
| 1,801,800 |
|
| InterContinental Hotels Group plc, MTN, 3.75%, 8/14/25 | GBP | 1,400,000 |
| 2,020,682 |
|
International Game Technology plc, 6.25%, 2/15/22(1) | | $ | 1,880,000 |
| 2,076,836 |
|
| McDonald's Corp., MTN, 3.375%, 5/26/25 | | 280,000 |
| 288,192 |
|
| McDonald's Corp., MTN, 4.70%, 12/9/35 | | 460,000 |
| 511,752 |
|
| Royal Caribbean Cruises Ltd., 5.25%, 11/15/22 | | 550,000 |
| 609,290 |
|
| | | | 10,358,037 |
|
| Household Durables — 0.4% | | | |
| D.R. Horton, Inc., 5.75%, 8/15/23 | | 20,000 |
| 22,679 |
|
| Lennar Corp., 4.75%, 12/15/17 | | 43,000 |
| 43,129 |
|
| Lennar Corp., 4.75%, 4/1/21 | | 1,760,000 |
| 1,850,200 |
|
| Lennar Corp., 4.50%, 4/30/24 | | 1,400,000 |
| 1,445,500 |
|
|
| | | | | | | |
| | | Principal Amount | Value |
| Newell Brands, Inc., 5.00%, 11/15/23 | | $ | 480,000 |
| $ | 511,349 |
|
| Newell Brands, Inc., 4.20%, 4/1/26 | | 350,000 |
| 369,204 |
|
| Newell Brands, Inc., 5.50%, 4/1/46 | | 300,000 |
| 356,651 |
|
| Toll Brothers Finance Corp., 4.00%, 12/31/18 | | 45,000 |
| 45,787 |
|
| TRI Pointe Group, Inc. / TRI Pointe Homes, Inc., 4.375%, 6/15/19 | | 990,000 |
| 1,020,937 |
|
| | | | 5,665,436 |
|
| Household Products — 0.1% | | | |
| Spectrum Brands, Inc., 5.75%, 7/15/25 | | 780,000 |
| 832,400 |
|
| Industrial Conglomerates — 0.2% | | | |
| FedEx Corp., 4.40%, 1/15/47 | | 400,000 |
| 417,434 |
|
| General Electric Co., 2.70%, 10/9/22 | | 1,020,000 |
| 1,034,494 |
|
| General Electric Co., MTN, 2.20%, 1/9/20 | | 716,000 |
| 719,743 |
|
| | | | 2,171,671 |
|
| Insurance — 1.6% | | | |
| AerCap Ireland Capital DAC / AerCap Global Aviation Trust, 3.75%, 5/15/19 | | 1,450,000 |
| 1,483,606 |
|
| American International Group, Inc., 4.125%, 2/15/24 | | 1,360,000 |
| 1,448,484 |
|
| American International Group, Inc., 4.50%, 7/16/44 | | 200,000 |
| 208,511 |
|
AXA SA, MTN, VRN, 6.69%, 7/6/26(3) | GBP | 1,100,000 |
| 1,756,743 |
|
AXA SA, MTN, VRN, 3.375%, 7/6/27(3) | EUR | 2,000,000 |
| 2,619,877 |
|
| Berkshire Hathaway Finance Corp., 3.00%, 5/15/22 | | $ | 680,000 |
| 701,608 |
|
| Berkshire Hathaway, Inc., 4.50%, 2/11/43 | | 460,000 |
| 520,789 |
|
| Chubb INA Holdings, Inc., 3.15%, 3/15/25 | | 600,000 |
| 610,974 |
|
| Chubb INA Holdings, Inc., 3.35%, 5/3/26 | | 330,000 |
| 338,616 |
|
CNP Assurances, VRN, 4.00%, 11/18/24(3) | EUR | 1,500,000 |
| 1,941,161 |
|
Credit Agricole Assurances SA, VRN, 4.25%, 1/13/25(3) | EUR | 2,200,000 |
| 2,891,951 |
|
Generali Finance BV, MTN, VRN, 4.60%, 11/21/25(3) | EUR | 1,500,000 |
| 1,925,112 |
|
| International Lease Finance Corp., 6.25%, 5/15/19 | | $ | 400,000 |
| 424,286 |
|
| Markel Corp., 4.90%, 7/1/22 | | 290,000 |
| 315,809 |
|
Markel Corp., 3.50%, 11/1/27(4) | | 250,000 |
| 249,784 |
|
| MetLife, Inc., 4.875%, 11/13/43 | | 680,000 |
| 781,137 |
|
| Prudential Financial, Inc., MTN, 5.375%, 6/21/20 | | 1,360,000 |
| 1,473,997 |
|
Prudential Financial, Inc., VRN, 5.875%, 9/15/22(3) | | 1,050,000 |
| 1,159,462 |
|
| Voya Financial, Inc., 5.70%, 7/15/43 | | 435,000 |
| 517,037 |
|
| WR Berkley Corp., 4.625%, 3/15/22 | | 660,000 |
| 709,028 |
|
| | | | 22,077,972 |
|
| Internet and Direct Marketing Retail — 0.1% | | | |
Amazon.com, Inc., 3.15%, 8/22/27(1) | | 830,000 |
| 836,619 |
|
Amazon.com, Inc., 3.875%, 8/22/37(1) | | 300,000 |
| 311,192 |
|
| | | | 1,147,811 |
|
| Internet Software and Services — 0.4% | | | |
| Netflix, Inc., 5.375%, 2/1/21 | | 630,000 |
| 676,778 |
|
| Symantec Corp., 4.20%, 9/15/20 | | 1,770,000 |
| 1,836,375 |
|
Tencent Holdings Ltd., 3.375%, 5/2/19(1) | | 3,000,000 |
| 3,053,802 |
|
| | | | 5,566,955 |
|
| IT Services — 0.3% | | | |
| Fidelity National Information Services, Inc., 3.00%, 8/15/26 | | 340,000 |
| 330,530 |
|
|
| | | | | | | |
| | | Principal Amount | Value |
First Data Corp., 5.00%, 1/15/24(1) | | $ | 2,310,000 |
| $ | 2,408,175 |
|
| Hewlett Packard Enterprise Co., 3.60%, 10/15/20 | | 780,000 |
| 807,136 |
|
| Hewlett Packard Enterprise Co., 4.90%, 10/15/25 | | 140,000 |
| 149,085 |
|
| | | | 3,694,926 |
|
| Machinery — 0.1% | | | |
| Caterpillar Financial Services Corp., MTN, 2.85%, 6/1/22 | | 1,010,000 |
| 1,032,597 |
|
| Oshkosh Corp., 5.375%, 3/1/22 | | 20,000 |
| 20,825 |
|
| | | | 1,053,422 |
|
| Media — 2.0% | | | |
| 21st Century Fox America, Inc., 3.70%, 10/15/25 | | 220,000 |
| 226,815 |
|
| 21st Century Fox America, Inc., 4.75%, 9/15/44 | | 390,000 |
| 417,077 |
|
| AMC Networks, Inc., 4.75%, 8/1/25 | | 1,550,000 |
| 1,551,937 |
|
| CBS Corp., 3.50%, 1/15/25 | | 500,000 |
| 508,369 |
|
| CCO Holdings LLC / CCO Holdings Capital Corp., 5.25%, 9/30/22 | | 1,170,000 |
| 1,207,294 |
|
CCO Holdings LLC / CCO Holdings Capital Corp., 5.125%, 5/1/27(1) | | 2,080,000 |
| 2,103,400 |
|
| Charter Communications Operating LLC / Charter Communications Operating Capital, 4.91%, 7/23/25 | | 2,040,000 |
| 2,173,470 |
|
| Charter Communications Operating LLC / Charter Communications Operating Capital, 6.48%, 10/23/45 | | 120,000 |
| 138,822 |
|
| Comcast Corp., 3.15%, 3/1/26 | | 370,000 |
| 372,844 |
|
| Comcast Corp., 4.40%, 8/15/35 | | 900,000 |
| 977,726 |
|
| Comcast Corp., 6.40%, 5/15/38 | | 530,000 |
| 712,319 |
|
CSC Holdings LLC, 5.50%, 4/15/27(1) | | 1,510,000 |
| 1,559,075 |
|
| Discovery Communications LLC, 5.625%, 8/15/19 | | 423,000 |
| 448,704 |
|
| Discovery Communications LLC, 3.95%, 3/20/28 | | 1,110,000 |
| 1,103,155 |
|
| DISH DBS Corp., 6.75%, 6/1/21 | | 50,000 |
| 52,625 |
|
Globo Comunicacao e Participacoes SA, 5.125%, 3/31/27(1) | | 1,100,000 |
| 1,124,750 |
|
GTH Finance BV, 7.25%, 4/26/23(1) | | 2,000,000 |
| 2,269,710 |
|
| Lamar Media Corp., 5.375%, 1/15/24 | | 1,840,000 |
| 1,941,200 |
|
| NBCUniversal Media LLC, 2.875%, 1/15/23 | | 625,000 |
| 635,376 |
|
Nielsen Finance LLC / Nielsen Finance Co., 5.00%, 4/15/22(1) | | 810,000 |
| 836,224 |
|
| Omnicom Group, Inc., 3.60%, 4/15/26 | | 500,000 |
| 507,788 |
|
Sirius XM Radio, Inc., 5.375%, 4/15/25(1) | | 980,000 |
| 1,035,125 |
|
| TEGNA, Inc., 5.125%, 7/15/20 | | 910,000 |
| 933,887 |
|
| Time Warner Cable LLC, 6.75%, 7/1/18 | | 310,000 |
| 319,912 |
|
| Time Warner Cable LLC, 4.50%, 9/15/42 | | 300,000 |
| 277,074 |
|
| Time Warner, Inc., 4.70%, 1/15/21 | | 420,000 |
| 448,369 |
|
| Time Warner, Inc., 3.60%, 7/15/25 | | 700,000 |
| 701,478 |
|
| Time Warner, Inc., 3.80%, 2/15/27 | | 200,000 |
| 200,335 |
|
| Time Warner, Inc., 5.35%, 12/15/43 | | 250,000 |
| 267,503 |
|
| Viacom, Inc., 4.25%, 9/1/23 | | 500,000 |
| 515,381 |
|
Virgin Media Secured Finance plc, 5.25%, 1/15/26(1) | | 1,550,000 |
| 1,614,247 |
|
| Walt Disney Co. (The), MTN, 4.125%, 6/1/44 | | 220,000 |
| 234,187 |
|
| | | | 27,416,178 |
|
|
| | | | | | | |
| | | Principal Amount | Value |
| Metals and Mining — 0.5% | | | |
Constellium NV, 6.625%, 3/1/25(1) | | $ | 650,000 |
| $ | 676,000 |
|
| Freeport-McMoRan, Inc., 3.875%, 3/15/23 | | 430,000 |
| 426,238 |
|
Glencore Finance Canada Ltd., 4.95%, 11/15/21(1) | | 10,000 |
| 10,820 |
|
Novolipetsk Steel via Steel Funding DAC, 4.00%, 9/21/24(1) | | 1,100,000 |
| 1,101,412 |
|
Steel Dynamics, Inc., 4.125%, 9/15/25(1) | | 1,000,000 |
| 1,005,000 |
|
| Steel Dynamics, Inc., 5.00%, 12/15/26 | | 880,000 |
| 932,800 |
|
| Vale Overseas Ltd., 6.875%, 11/21/36 | | 2,000,000 |
| 2,406,000 |
|
| | | | 6,558,270 |
|
| Multi-Utilities — 1.8% | | | |
| AES Corp., 4.875%, 5/15/23 | | 980,000 |
| 1,006,950 |
|
| AES Corp., 6.00%, 5/15/26 | | 750,000 |
| 811,875 |
|
| AmeriGas Partners LP / AmeriGas Finance Corp., 5.875%, 8/20/26 | | 1,400,000 |
| 1,463,000 |
|
| AmeriGas Partners LP / AmeriGas Finance Corp., 5.75%, 5/20/27 | | 550,000 |
| 564,437 |
|
| Berkshire Hathaway Energy Co., 3.50%, 2/1/25 | | 680,000 |
| 707,312 |
|
Calpine Corp., 5.875%, 1/15/24(1) | | 490,000 |
| 509,600 |
|
Centrica plc, VRN, 5.25%, 4/10/25(3) | GBP | 1,800,000 |
| 2,552,040 |
|
| CMS Energy Corp., 8.75%, 6/15/19 | | $ | 500,000 |
| 551,794 |
|
| Dominion Energy, Inc., 3.625%, 12/1/24 | | 1,030,000 |
| 1,067,405 |
|
| Dominion Energy, Inc., 3.90%, 10/1/25 | | 480,000 |
| 503,262 |
|
| Dominion Energy, Inc., 4.90%, 8/1/41 | | 100,000 |
| 111,348 |
|
| Duke Energy Corp., 3.55%, 9/15/21 | | 680,000 |
| 708,763 |
|
| Duke Energy Corp., 2.65%, 9/1/26 | | 300,000 |
| 288,442 |
|
| Duke Energy Progress LLC, 3.25%, 8/15/25 | | 400,000 |
| 409,825 |
|
| Duke Energy Progress LLC, 4.15%, 12/1/44 | | 170,000 |
| 182,669 |
|
| Duke Energy Progress LLC, 3.70%, 10/15/46 | | 450,000 |
| 453,848 |
|
Enel Finance International NV, 2.875%, 5/25/22(1) | | 1,130,000 |
| 1,137,765 |
|
| Exelon Corp., 4.45%, 4/15/46 | | 400,000 |
| 425,196 |
|
| Exelon Generation Co. LLC, 4.25%, 6/15/22 | | 680,000 |
| 723,416 |
|
| FirstEnergy Corp., 4.25%, 3/15/23 | | 900,000 |
| 953,456 |
|
| Florida Power & Light Co., 4.125%, 2/1/42 | | 525,000 |
| 569,654 |
|
| IPALCO Enterprises, Inc., 3.45%, 7/15/20 | | 850,000 |
| 865,937 |
|
KazTransGas JSC, 4.375%, 9/26/27(1) | | 1,000,000 |
| 989,920 |
|
| MidAmerican Energy Co., 4.40%, 10/15/44 | | 200,000 |
| 224,797 |
|
| NiSource Finance Corp., 5.65%, 2/1/45 | | 410,000 |
| 508,546 |
|
| Pacific Gas & Electric Co., 4.00%, 12/1/46 | | 505,000 |
| 506,568 |
|
| Potomac Electric Power Co., 3.60%, 3/15/24 | | 10,000 |
| 10,506 |
|
RWE AG, VRN, 7.00%, 3/20/19(3) | GBP | 1,000,000 |
| 1,417,813 |
|
| Sempra Energy, 2.875%, 10/1/22 | | $ | 680,000 |
| 686,373 |
|
| Sempra Energy, 3.25%, 6/15/27 | | 500,000 |
| 497,724 |
|
SSE plc, VRN, 2.375%, 4/1/21(3) | EUR | 2,200,000 |
| 2,659,346 |
|
| Xcel Energy, Inc., 3.35%, 12/1/26 | | $ | 150,000 |
| 152,265 |
|
| | | | 24,221,852 |
|
Multiline Retail† | | | |
| Macy's Retail Holdings, Inc., 2.875%, 2/15/23 | | 350,000 |
| 320,697 |
|
|
| | | | | | | |
| | | Principal Amount | Value |
| Oil, Gas and Consumable Fuels — 2.0% | | | |
| Anadarko Petroleum Corp., 3.45%, 7/15/24 | | $ | 300,000 |
| $ | 299,410 |
|
| Anadarko Petroleum Corp., 5.55%, 3/15/26 | | 350,000 |
| 394,432 |
|
| Andeavor, 5.375%, 10/1/22 | | 490,000 |
| 503,475 |
|
| Antero Resources Corp., 5.125%, 12/1/22 | | 1,440,000 |
| 1,486,800 |
|
| Apache Corp., 4.75%, 4/15/43 | | 300,000 |
| 306,870 |
|
| BP Capital Markets plc, 4.50%, 10/1/20 | | 690,000 |
| 736,009 |
|
Cenovus Energy, Inc., 4.25%, 4/15/27(1) | | 300,000 |
| 301,571 |
|
| Chevron Corp., 2.10%, 5/16/21 | | 470,000 |
| 469,967 |
|
| Cimarex Energy Co., 4.375%, 6/1/24 | | 1,000,000 |
| 1,067,338 |
|
| CNOOC Nexen Finance 2014 ULC, 4.25%, 4/30/24 | | 1,020,000 |
| 1,089,073 |
|
| Concho Resources, Inc., 4.375%, 1/15/25 | | 710,000 |
| 750,939 |
|
| ConocoPhillips Holding Co., 6.95%, 4/15/29 | | 10,000 |
| 13,099 |
|
| Continental Resources, Inc., 5.00%, 9/15/22 | | 570,000 |
| 578,550 |
|
| Continental Resources, Inc., 3.80%, 6/1/24 | | 1,080,000 |
| 1,054,350 |
|
| Ecopetrol SA, 5.875%, 5/28/45 | | 1,580,000 |
| 1,568,150 |
|
| Encana Corp., 6.50%, 2/1/38 | | 480,000 |
| 598,451 |
|
| Exxon Mobil Corp., 2.71%, 3/6/25 | | 1,030,000 |
| 1,037,902 |
|
| Hess Corp., 6.00%, 1/15/40 | | 320,000 |
| 349,317 |
|
Lukoil International Finance BV, 4.75%, 11/2/26(1) | | 2,000,000 |
| 2,105,184 |
|
| Marathon Oil Corp., 3.85%, 6/1/25 | | 400,000 |
| 404,324 |
|
| Marathon Oil Corp., 5.20%, 6/1/45 | | 200,000 |
| 208,663 |
|
| Newfield Exploration Co., 5.75%, 1/30/22 | | 1,230,000 |
| 1,328,400 |
|
| Newfield Exploration Co., 5.375%, 1/1/26 | | 500,000 |
| 533,750 |
|
| Noble Energy, Inc., 4.15%, 12/15/21 | | 217,000 |
| 229,088 |
|
| Occidental Petroleum Corp., 4.625%, 6/15/45 | | 460,000 |
| 511,140 |
|
Petrobras Global Finance BV, 5.30%, 1/27/25(1) | | 2,400,000 |
| 2,410,800 |
|
| Petroleos Mexicanos, 6.625%, 6/15/35 | | 2,720,000 |
| 2,882,520 |
|
| Phillips 66, 4.30%, 4/1/22 | | 350,000 |
| 375,232 |
|
| Shell International Finance BV, 2.375%, 8/21/22 | | 690,000 |
| 691,947 |
|
| Shell International Finance BV, 3.25%, 5/11/25 | | 230,000 |
| 236,849 |
|
Sinopec Group Overseas Development Ltd., 2.50%, 4/28/20(1) | | 600,000 |
| 600,951 |
|
| Statoil ASA, 3.95%, 5/15/43 | | 500,000 |
| 512,993 |
|
| Suburban Propane Partners LP / Suburban Energy Finance Corp., 5.75%, 3/1/25 | | 10,000 |
| 10,075 |
|
| Suncor Energy, Inc., 6.50%, 6/15/38 | | 280,000 |
| 372,719 |
|
| Total Capital Canada Ltd., 2.75%, 7/15/23 | | 680,000 |
| 689,005 |
|
| Whiting Petroleum Corp., 5.75%, 3/15/21 | | 440,000 |
| 444,400 |
|
| | | | 27,153,743 |
|
| Paper and Forest Products — 0.1% | | | |
Georgia-Pacific LLC, 5.40%, 11/1/20(1) | | 710,000 |
| 775,452 |
|
| International Paper Co., 4.40%, 8/15/47 | | 400,000 |
| 414,943 |
|
| | | | 1,190,395 |
|
| Pharmaceuticals — 0.4% | | | |
| AbbVie, Inc., 4.70%, 5/14/45 | | 250,000 |
| 272,102 |
|
| Allergan Funding SCS, 3.85%, 6/15/24 | | 1,510,000 |
| 1,570,013 |
|
| Allergan Funding SCS, 4.55%, 3/15/35 | | 140,000 |
| 147,583 |
|
|
| | | | | | | |
| | | Principal Amount | Value |
| Baxalta, Inc., 4.00%, 6/23/25 | | $ | 650,000 |
| $ | 682,151 |
|
| Shire Acquisitions Investments Ireland DAC, 2.40%, 9/23/21 | | 1,300,000 |
| 1,292,270 |
|
| Teva Pharmaceutical Finance Netherlands III BV, 3.15%, 10/1/26 | | 650,000 |
| 577,070 |
|
| Zoetis, Inc., 3.00%, 9/12/27 | | 250,000 |
| 245,250 |
|
| | | | 4,786,439 |
|
| Real Estate Management and Development — 0.1% | | | |
| Tesco Property Finance 3 plc, 5.74%, 4/13/40 | GBP | 1,072,814 |
| 1,688,475 |
|
| Road and Rail — 0.2% | | | |
| Burlington Northern Santa Fe LLC, 3.60%, 9/1/20 | | $ | 20,000 |
| 20,784 |
|
| Burlington Northern Santa Fe LLC, 4.15%, 4/1/45 | | 820,000 |
| 875,485 |
|
| CSX Corp., 3.40%, 8/1/24 | | 690,000 |
| 713,263 |
|
| CSX Corp., 3.25%, 6/1/27 | | 320,000 |
| 320,939 |
|
| Norfolk Southern Corp., 3.15%, 6/1/27 | | 530,000 |
| 532,889 |
|
| Union Pacific Corp., 4.00%, 2/1/21 | | 310,000 |
| 327,291 |
|
| Union Pacific Corp., 4.75%, 9/15/41 | | 300,000 |
| 344,987 |
|
| Union Pacific Corp., 4.05%, 11/15/45 | | 200,000 |
| 210,484 |
|
| | | | 3,346,122 |
|
| Semiconductors and Semiconductor Equipment — 0.4% | | |
Broadcom Corp. / Broadcom Cayman Finance Ltd., 3.125%, 1/15/25(1) | | 500,000 |
| 496,600 |
|
Broadcom Corp. / Broadcom Cayman Finance Ltd., 3.50%, 1/15/28(1) | | 190,000 |
| 189,373 |
|
| Intel Corp., 3.15%, 5/11/27 | | 740,000 |
| 752,161 |
|
NXP BV / NXP Funding LLC, 4.125%, 6/15/20(1) | | 1,000,000 |
| 1,043,750 |
|
NXP BV / NXP Funding LLC, 3.875%, 9/1/22(1) | | 500,000 |
| 520,625 |
|
| QUALCOMM, Inc., 3.25%, 5/20/27 | | 670,000 |
| 669,892 |
|
Sensata Technologies BV, 5.00%, 10/1/25(1) | | 910,000 |
| 973,700 |
|
Sensata Technologies UK Financing Co. plc, 6.25%, 2/15/26(1) | | 1,000,000 |
| 1,102,500 |
|
| | | | 5,748,601 |
|
| Software — 0.6% | | | |
| Activision Blizzard, Inc., 2.30%, 9/15/21 | | 760,000 |
| 756,271 |
|
| Microsoft Corp., 2.70%, 2/12/25 | | 1,280,000 |
| 1,287,067 |
|
| Microsoft Corp., 3.125%, 11/3/25 | | 330,000 |
| 339,374 |
|
| Microsoft Corp., 3.45%, 8/8/36 | | 1,200,000 |
| 1,214,116 |
|
| Microsoft Corp., 4.25%, 2/6/47 | | 330,000 |
| 365,146 |
|
| Oracle Corp., 3.625%, 7/15/23 | | 1,010,000 |
| 1,073,462 |
|
| Oracle Corp., 2.65%, 7/15/26 | | 600,000 |
| 588,435 |
|
| Oracle Corp., 4.00%, 7/15/46 | | 280,000 |
| 290,672 |
|
Quintiles IMS, Inc., 5.00%, 10/15/26(1) | | 2,000,000 |
| 2,130,000 |
|
| | | | 8,044,543 |
|
| Specialty Retail — 0.5% | | | |
Ashtead Capital, Inc., 4.125%, 8/15/25(1) | | 1,300,000 |
| 1,311,375 |
|
| Home Depot, Inc. (The), 3.75%, 2/15/24 | | 750,000 |
| 796,604 |
|
| Home Depot, Inc. (The), 5.95%, 4/1/41 | | 680,000 |
| 900,706 |
|
| Lowe's Cos., Inc., 3.10%, 5/3/27 | | 500,000 |
| 500,537 |
|
| Sally Holdings LLC / Sally Capital, Inc., 5.625%, 12/1/25 | | 730,000 |
| 728,175 |
|
|
| | | | | | | |
| | | Principal Amount | Value |
| United Rentals North America, Inc., 4.625%, 7/15/23 | | $ | 190,000 |
| $ | 199,381 |
|
| United Rentals North America, Inc., 5.75%, 11/15/24 | | 2,230,000 |
| 2,372,162 |
|
| | | | 6,808,940 |
|
| Technology Hardware, Storage and Peripherals — 0.4% | | | |
| Apple, Inc., 2.85%, 5/6/21 | | 1,020,000 |
| 1,045,664 |
|
| Apple, Inc., 2.50%, 2/9/25 | | 520,000 |
| 512,649 |
|
| Apple, Inc., 3.20%, 5/11/27 | | 600,000 |
| 609,866 |
|
| Apple, Inc., 2.90%, 9/12/27 | | 450,000 |
| 445,787 |
|
Dell International LLC / EMC Corp., 6.02%, 6/15/26(1) | | 1,280,000 |
| 1,431,239 |
|
| Seagate HDD Cayman, 4.75%, 6/1/23 | | 450,000 |
| 463,219 |
|
| Seagate HDD Cayman, 4.75%, 1/1/25 | | 300,000 |
| 297,739 |
|
Western Digital Corp., 7.375%, 4/1/23(1) | | 500,000 |
| 548,750 |
|
| | | | 5,354,913 |
|
| Textiles, Apparel and Luxury Goods — 0.1% | | | |
Hanesbrands, Inc., 4.625%, 5/15/24(1) | | 700,000 |
| 723,625 |
|
| L Brands, Inc., 6.625%, 4/1/21 | | 40,000 |
| 44,250 |
|
| PVH Corp., 4.50%, 12/15/22 | | 420,000 |
| 428,400 |
|
| | | | 1,196,275 |
|
| Wireless Telecommunication Services — 0.3% | | | |
| America Movil SAB de CV, 3.125%, 7/16/22 | | 240,000 |
| 244,964 |
|
MTN Mauritius Investment Ltd., 6.50%, 10/13/26(1) | | 1,400,000 |
| 1,516,550 |
|
Sprint Communications, Inc., 9.00%, 11/15/18(1) | | 367,000 |
| 389,479 |
|
| Sprint Communications, Inc., 6.00%, 11/15/22 | | 1,000,000 |
| 1,052,500 |
|
| T-Mobile USA, Inc., 6.625%, 4/1/23 | | 590,000 |
| 620,975 |
|
| | | | 3,824,468 |
|
TOTAL CORPORATE BONDS
(Cost $452,546,018) | | | 465,848,811 |
|
U.S. GOVERNMENT AGENCY MORTGAGE-BACKED SECURITIES(5) — 9.1% | |
Adjustable-Rate U.S. Government Agency Mortgage-Backed Securities(6) — 1.4% | |
| FHLMC, VRN, 2.37%, 11/15/17 | | 1,544,599 |
| 1,562,872 |
|
| FHLMC, VRN, 3.09%, 11/15/17 | | 1,985,740 |
| 2,095,134 |
|
| FHLMC, VRN, 3.49%, 11/15/17 | | 2,219 |
| 2,324 |
|
| FHLMC, VRN, 3.53%, 11/15/17 | | 5,113 |
| 5,372 |
|
| FNMA, VRN, 2.94%, 11/25/17 | | 1,325,431 |
| 1,377,217 |
|
| FNMA, VRN, 2.94%, 11/25/17 | | 1,126,107 |
| 1,171,498 |
|
| FNMA, VRN, 3.01%, 11/25/17 | | 2,006,040 |
| 2,082,459 |
|
| FNMA, VRN, 3.18%, 11/25/17 | | 2,449,745 |
| 2,509,670 |
|
| FNMA, VRN, 3.20%, 11/25/17 | | 4,752,737 |
| 4,858,042 |
|
| FNMA, VRN, 3.26%, 11/25/17 | | 2,916,068 |
| 3,013,257 |
|
| FNMA, VRN, 3.53%, 11/25/17 | | 5,107 |
| 5,312 |
|
| FNMA, VRN, 3.93%, 11/25/17 | | 7,782 |
| 8,068 |
|
| | | | 18,691,225 |
|
| Fixed-Rate U.S. Government Agency Mortgage-Backed Securities — 7.7% | |
| FHLMC, 6.00%, 2/1/38 | | 2,497 |
| 2,832 |
|
| FHLMC, 4.00%, 12/1/40 | | 6,606 |
| 7,014 |
|
FNMA, 3.00%, 11/13/17(7) | | 13,715,000 |
| 13,721,965 |
|
FNMA, 3.50%, 11/13/17(7) | | 6,721,000 |
| 6,907,928 |
|
FNMA, 4.00%, 11/13/17(7) | | 25,610,000 |
| 26,874,494 |
|
|
| | | | | | | |
| | | Principal Amount | Value |
FNMA, 4.50%, 11/13/17(7) | | $ | 4,377,500 |
| $ | 4,679,650 |
|
| FNMA, 5.00%, 7/1/31 | | 32,334 |
| 35,132 |
|
| FNMA, 5.50%, 5/1/33 | | 7,932 |
| 8,855 |
|
| FNMA, 5.00%, 9/1/33 | | 1,200,944 |
| 1,317,893 |
|
| FNMA, 5.00%, 11/1/33 | | 8,799 |
| 9,654 |
|
| FNMA, 5.00%, 9/1/35 | | 23,311 |
| 25,560 |
|
| FNMA, 6.00%, 4/1/37 | | 9,644 |
| 10,959 |
|
| FNMA, 6.00%, 7/1/37 | | 10,997 |
| 12,446 |
|
| FNMA, 6.00%, 8/1/37 | | 6,553 |
| 7,398 |
|
| FNMA, 5.50%, 1/1/39 | | 15,248 |
| 16,991 |
|
| FNMA, 5.50%, 3/1/39 | | 1,894 |
| 2,108 |
|
| FNMA, 4.50%, 5/1/39 | | 1,978,533 |
| 2,138,219 |
|
| FNMA, 5.00%, 8/1/39 | | 4,678 |
| 5,158 |
|
| FNMA, 4.50%, 3/1/40 | | 2,197,535 |
| 2,365,311 |
|
| FNMA, 5.00%, 8/1/40 | | 1,194,208 |
| 1,296,706 |
|
| FNMA, 3.50%, 10/1/40 | | 2,977,470 |
| 3,076,927 |
|
| FNMA, 3.50%, 12/1/40 | | 37,501 |
| 38,758 |
|
| FNMA, 4.50%, 9/1/41 | | 18,257 |
| 19,645 |
|
| FNMA, 3.50%, 5/1/42 | | 49,107 |
| 50,729 |
|
| FNMA, 3.50%, 6/1/42 | | 29,447 |
| 30,478 |
|
| FNMA, 3.50%, 9/1/42 | | 22,987 |
| 23,740 |
|
| FNMA, 3.00%, 11/1/42 | | 31,734 |
| 31,929 |
|
| FNMA, 3.00%, 5/1/43 | | 3,910,964 |
| 3,935,139 |
|
| FNMA, 3.50%, 5/1/46 | | 8,547,985 |
| 8,793,679 |
|
GNMA, 2.50%, 11/20/17(7) | | 715,000 |
| 699,309 |
|
GNMA, 3.00%, 11/20/17(7) | | 4,665,000 |
| 4,719,668 |
|
GNMA, 3.50%, 11/20/17(7) | | 3,907,500 |
| 4,053,268 |
|
GNMA, 4.00%, 11/20/17(7) | | 3,712,000 |
| 3,897,745 |
|
| GNMA, 6.00%, 7/15/33 | | 4,841 |
| 5,625 |
|
| GNMA, 5.00%, 3/20/36 | | 31,857 |
| 34,883 |
|
| GNMA, 5.50%, 1/15/39 | | 4,419 |
| 5,057 |
|
| GNMA, 5.50%, 9/15/39 | | 25,428 |
| 28,571 |
|
| GNMA, 4.50%, 10/15/39 | | 9,456 |
| 10,222 |
|
| GNMA, 5.00%, 10/15/39 | | 15,048 |
| 16,598 |
|
| GNMA, 4.50%, 1/15/40 | | 12,586 |
| 13,438 |
|
| GNMA, 4.00%, 12/15/40 | | 12,190 |
| 12,883 |
|
| GNMA, 4.50%, 12/15/40 | | 42,704 |
| 46,113 |
|
| GNMA, 4.50%, 7/20/41 | | 1,906,520 |
| 2,049,785 |
|
| GNMA, 4.00%, 12/15/41 | | 23,004 |
| 24,295 |
|
| GNMA, 3.50%, 6/20/42 | | 7,151,960 |
| 7,466,570 |
|
| GNMA, 2.50%, 7/20/46 | | 5,268,990 |
| 5,158,543 |
|
| | | | 103,689,870 |
|
TOTAL U.S. GOVERNMENT AGENCY MORTGAGE-BACKED SECURITIES
(Cost $123,196,419) | 122,381,095 |
|
COLLATERALIZED MORTGAGE OBLIGATIONS(5) — 5.9% | | |
| Private Sponsor Collateralized Mortgage Obligations — 4.1% | | |
Bear Stearns Adjustable Rate Mortgage Trust, Series 2004-12, Class 2A1, VRN, 3.47%, 11/1/17(6) | | 847,168 |
| 849,317 |
|
|
| | | | | | | |
| | | Principal Amount | Value |
Bear Stearns Adjustable Rate Mortgage Trust, Series 2004-8, Class 2A1, VRN, 3.61%, 11/1/17(6) | | $ | 642,065 |
| $ | 627,517 |
|
Bear Stearns Adjustable Rate Mortgage Trust, Series 2005-6, Class 1A1, VRN, 3.64%, 11/1/17(6) | | 2,200,553 |
| 2,175,479 |
|
| Bear Stearns Adjustable Rate Mortgage Trust, Series 2006-1, Class A1, VRN, 3.04%, 11/1/17, resets annually off the 1-year H15T1Y plus 2.25% | | 922,572 |
| 926,697 |
|
Chase Mortgage Finance Trust, Series 2007-A2, Class 6A2 SEQ, VRN, 3.50%, 11/1/17(6) | | 2,230,177 |
| 2,160,899 |
|
Citigroup Mortgage Loan Trust, Inc., Series 2004-UST1, Class A5, VRN, 3.08%, 11/1/17(6) | | 1,654,203 |
| 1,640,435 |
|
Citigroup Mortgage Loan Trust, Inc., Series 2005-4, Class A, VRN, 3.55%, 11/1/17(6) | | 45,738 |
| 45,440 |
|
| Countrywide Home Loan Mortgage Pass-Through Trust, Series 2004-4, Class A19, 5.25%, 5/25/34 | | 4,276 |
| 4,367 |
|
Credit Suisse First Boston Mortgage-Backed Pass-Through Certificates, Series 2005-3, Class 1A1, VRN, 5.41%, 11/1/17(6) | | 795,888 |
| 762,828 |
|
CSMC 2017-HL2 Trust, Series 2017-HL2, Class A3 SEQ, VRN, 3.50%, 11/1/17(1)(6) | | 2,100,000 |
| 2,134,125 |
|
First Horizon Mortgage Pass-Through Trust, Series 2005-AR3, Class 4A1, VRN, 3.34%, 11/1/17(6) | | 3,608 |
| 3,576 |
|
First Horizon Mortgage Pass-Through Trust, Series 2006-AR4, Class 1A2, VRN, 3.06%, 11/1/17(6) | | 513,583 |
| 459,290 |
|
Flagstar Mortgage Trust 2017-2, Series 2017-2, Class A5 SEQ, VRN, 3.50%, 11/1/17(1)(6) | | 2,100,000 |
| 2,134,125 |
|
| GSR Mortgage Loan Trust, Series 2005-6F, Class 1A5 SEQ, 5.25%, 7/25/35 | | 14,193 |
| 14,808 |
|
GSR Mortgage Loan Trust, Series 2005-AR6, Class 2A1, VRN, 3.28%, 11/1/17(6) | | 994,538 |
| 1,017,342 |
|
GSR Mortgage Loan Trust, Series 2005-AR6, Class 4A5, VRN, 3.51%, 11/1/17(6) | | 836,162 |
| 844,324 |
|
JPMorgan Mortgage Trust, Series 2005-A4, Class 2A1, VRN, 3.67%, 11/1/17(6) | | 617,781 |
| 618,954 |
|
JPMorgan Mortgage Trust, Series 2005-A6, Class 7A1, VRN, 3.61%, 11/1/17(6) | | 820,048 |
| 800,082 |
|
JPMorgan Mortgage Trust, Series 2006-A3, Class 7A1, VRN, 3.61%, 11/1/17(6) | | 8,492 |
| 8,616 |
|
| JPMorgan Mortgage Trust, Series 2006-S1, Class 1A2 SEQ, 6.50%, 4/25/36 | | 427,802 |
| 447,990 |
|
MASTR Adjustable Rate Mortgages Trust, Series 2004-13, Class 3A7, VRN, 3.47%, 11/1/17(6) | | 1,256,512 |
| 1,291,766 |
|
Merrill Lynch Mortgage Investors Trust, Series 2005-A2, Class A1, VRN, 2.97%, 11/1/17(6) | | 979,310 |
| 970,800 |
|
Merrill Lynch Mortgage Investors Trust, Series 2005-A2, Class A2, VRN, 2.97%, 11/1/17(6) | | 496,531 |
| 508,681 |
|
New Residential Mortgage Loan Trust, Series 2017-2A, Class A3, VRN, 4.00%, 11/1/17(1)(6) | | 2,143,561 |
| 2,232,722 |
|
PHHMC Mortgage Pass-Through Certificates, Series 2007-6, Class A1, VRN, 5.82%, 11/1/17(6) | | 427 |
| 441 |
|
| Residential Accredit Loans, Inc., Series 2006-QS17, Class A5, 6.00%, 12/25/36 | | 896,028 |
| 787,361 |
|
Sequoia Mortgage Trust, Series 2017-5, Class A4 SEQ, VRN, 3.50%, 11/1/17(1)(6) | | 4,317,905 |
| 4,416,851 |
|
Structured Adjustable Rate Mortgage Loan Trust, Series 2004-8, Class 2A1, VRN, 3.33%, 11/1/17(6) | | 1,837,948 |
| 1,848,281 |
|
Thornburg Mortgage Securities Trust, Series 2006-4, Class A2B, VRN, 3.30%, 11/27/17(6) | | 2,343,362 |
| 2,294,725 |
|
|
| | | | | | | |
| | | Principal Amount | Value |
WaMu Mortgage Pass-Through Certificates, Series 2005-AR7, Class A3, VRN, 3.22%, 11/1/17(6) | | $ | 897,036 |
| $ | 904,287 |
|
Wells Fargo Mortgage-Backed Securities Trust, Series 2004-A, Class A1, VRN, 3.22%, 11/1/17(6) | | 11,911 |
| 12,317 |
|
Wells Fargo Mortgage-Backed Securities Trust, Series 2004-Z, Class 2A2, VRN, 3.08%, 11/1/17(6) | | 22,237 |
| 22,700 |
|
| Wells Fargo Mortgage-Backed Securities Trust, Series 2005-17, Class 1A1, 5.50%, 1/25/36 | | 572,502 |
| 566,210 |
|
| Wells Fargo Mortgage-Backed Securities Trust, Series 2005-18, Class 1A1, 5.50%, 1/25/36 | | 1,253,174 |
| 1,246,557 |
|
Wells Fargo Mortgage-Backed Securities Trust, Series 2005-AR10, Class 1A1, VRN, 3.38%, 11/1/17(6) | | 25,374 |
| 26,707 |
|
Wells Fargo Mortgage-Backed Securities Trust, Series 2005-AR10, Class 2A17, VRN, 3.37%, 11/1/17(6) | | 21,157 |
| 21,751 |
|
Wells Fargo Mortgage-Backed Securities Trust, Series 2005-AR12, Class 2A6, VRN, 3.29%, 11/1/17(6) | | 543,872 |
| 550,608 |
|
Wells Fargo Mortgage-Backed Securities Trust, Series 2005-AR16, Class 3A2, VRN, 3.45%, 11/1/17(6) | | 6,381 |
| 6,461 |
|
Wells Fargo Mortgage-Backed Securities Trust, Series 2005-AR16, Class 4A8, VRN, 3.46%, 11/1/17(6) | | 5,000,000 |
| 5,102,890 |
|
| Wells Fargo Mortgage-Backed Securities Trust, Series 2006-10, Class A4 SEQ, 6.00%, 8/25/36 | | 29,340 |
| 29,375 |
|
| Wells Fargo Mortgage-Backed Securities Trust, Series 2006-13, Class A5, 6.00%, 10/25/36 | | 586,535 |
| 582,516 |
|
| Wells Fargo Mortgage-Backed Securities Trust, Series 2006-4, Class 2A1, 6.00%, 4/25/36 | | 3,007,887 |
| 2,988,015 |
|
| Wells Fargo Mortgage-Backed Securities Trust, Series 2006-8, Class A10 SEQ, 6.00%, 7/25/36 | | 24,940 |
| 25,174 |
|
| Wells Fargo Mortgage-Backed Securities Trust, Series 2006-8, Class A15, 6.00%, 7/25/36 | | 455,757 |
| 460,030 |
|
| Wells Fargo Mortgage-Backed Securities Trust, Series 2006-8, Class A9 SEQ, 6.00%, 7/25/36 | | 19,952 |
| 20,139 |
|
Wells Fargo Mortgage-Backed Securities Trust, Series 2006-AR1, Class 1A1, VRN, 3.27%, 11/1/17(6) | | 37,374 |
| 35,793 |
|
Wells Fargo Mortgage-Backed Securities Trust, Series 2006-AR1, Class 2A5 SEQ, VRN, 3.21%, 11/1/17(6) | | 1,348,344 |
| 1,312,754 |
|
Wells Fargo Mortgage-Backed Securities Trust, Series 2006-AR10, Class 1A1, VRN, 3.32%, 11/1/17(6) | | 1,717,648 |
| 1,676,240 |
|
Wells Fargo Mortgage-Backed Securities Trust, Series 2006-AR10, Class 5A6 SEQ, VRN, 3.38%, 11/1/17(6) | | 11,097 |
| 11,199 |
|
Wells Fargo Mortgage-Backed Securities Trust, Series 2006-AR12, Class 1A1, VRN, 3.75%, 11/1/17(6) | | 24,054 |
| 24,074 |
|
Wells Fargo Mortgage-Backed Securities Trust, Series 2006-AR14, Class 1A7 SEQ, VRN, 3.57%, 11/1/17(6) | | 2,446,022 |
| 2,339,053 |
|
Wells Fargo Mortgage-Backed Securities Trust, Series 2006-AR14, Class 2A1, VRN, 3.62%, 11/1/17(6) | | 8,024 |
| 7,919 |
|
Wells Fargo Mortgage-Backed Securities Trust, Series 2006-AR15, Class A1, VRN, 3.60%, 11/1/17(6) | | 6,549 |
| 6,429 |
|
Wells Fargo Mortgage-Backed Securities Trust, Series 2006-AR16, Class A1, VRN, 3.72%, 11/1/17(6) | | 703,110 |
| 688,829 |
|
Wells Fargo Mortgage-Backed Securities Trust, Series 2006-AR19, Class A1, VRN, 3.36%, 11/1/17(6) | | 549,448 |
| 512,330 |
|
Wells Fargo Mortgage-Backed Securities Trust, Series 2006-AR2, Class 2A3, VRN, 3.26%, 11/1/17(6) | | 504,891 |
| 509,671 |
|
Wells Fargo Mortgage-Backed Securities Trust, Series 2006-AR5, Class 2A1, VRN, 3.33%, 11/1/17(6) | | 869,417 |
| 827,376 |
|
Wells Fargo Mortgage-Backed Securities Trust, Series 2006-AR7, Class 2A1, VRN, 3.33%, 11/1/17(6) | | 542,889 |
| 524,363 |
|
|
| | | | | | | |
| | | Principal Amount | Value |
| Wells Fargo Mortgage-Backed Securities Trust, Series 2007-11, Class A3 SEQ, 6.00%, 8/25/37 | | $ | 40,407 |
| $ | 40,511 |
|
| Wells Fargo Mortgage-Backed Securities Trust, Series 2007-12, Class A7, 5.50%, 9/25/37 | | 17,105 |
| 17,230 |
|
| Wells Fargo Mortgage-Backed Securities Trust, Series 2007-13, Class A1, 6.00%, 9/25/37 | | 31,083 |
| 31,383 |
|
| Wells Fargo Mortgage-Backed Securities Trust, Series 2007-14, Class 2A2, 5.50%, 10/25/22 | | 9,110 |
| 9,343 |
|
| Wells Fargo Mortgage-Backed Securities Trust, Series 2007-15, Class A1, 6.00%, 11/25/37 | | 553,002 |
| 550,912 |
|
| Wells Fargo Mortgage-Backed Securities Trust, Series 2007-16, Class 1A1, 6.00%, 12/28/37 | | 13,826 |
| 14,484 |
|
| Wells Fargo Mortgage-Backed Securities Trust, Series 2007-8, Class 2A2, 6.00%, 7/25/37 | | 244,231 |
| 245,891 |
|
Wells Fargo Mortgage-Backed Securities Trust, Series 2007-AR7, Class A1, VRN, 3.66%, 11/1/17(6) | | 1,861,784 |
| 1,812,343 |
|
| Wells Fargo Mortgage-Backed Securities Trust, Series 2008-1, Class 4A1, 5.75%, 2/25/38 | | 12,664 |
| 13,365 |
|
| | | | 55,805,068 |
|
| U.S. Government Agency Collateralized Mortgage Obligations — 1.8% | |
| FHLMC, Series 2015-HQ2, Class M3, VRN, 4.49%, 11/27/17, resets monthly off the 1-month LIBOR plus 3.25% | | 4,000,000 |
| 4,479,174 |
|
| FHLMC, Series 2016-HQA3, Class M2, VRN, 2.59%, 11/27/17, resets monthly off the 1-month LIBOR plus 1.35% | | 1,000,000 |
| 1,012,355 |
|
| FHLMC, Series 2017-DNA2, Class M1, VRN, 2.44%, 11/27/17, resets monthly off the 1-month LIBOR plus 1.20% | | 681,349 |
| 690,474 |
|
| FHLMC, Series 2017-HQA2, Class M1, VRN, 2.04%, 11/27/17, resets monthly off the 1-month LIBOR plus 0.80% | | 3,414,312 |
| 3,425,682 |
|
| FNMA, Series 2014-C02, Class 1M2, VRN, 3.84%, 11/27/17, resets monthly off the 1-month LIBOR plus 2.60% | | 1,525,000 |
| 1,600,594 |
|
| FNMA, Series 2014-C02, Class 2M2, VRN, 3.84%, 11/27/17, resets monthly off the 1-month LIBOR plus 2.60% | | 3,000,000 |
| 3,123,660 |
|
| FNMA, Series 2016-C03, Class 2M2, VRN, 7.14%, 11/27/17, resets monthly off the 1-month LIBOR plus 5.90% | | 1,570,000 |
| 1,803,635 |
|
| FNMA, Series 2016-C04, Class 1M2, VRN, 5.49%, 11/27/17, resets monthly off the 1-month LIBOR plus 4.25% | | 2,000,000 |
| 2,230,597 |
|
| FNMA, Series 2017-C03, Class 1M2, VRN, 4.24%, 11/27/17, resets monthly off the 1-month LIBOR plus 3.00% | | 4,000,000 |
| 4,143,345 |
|
| FNMA, Series 2017-C05, Class 1M2, VRN, 3.44%, 11/27/17, resets monthly off the 1-month LIBOR plus 2.20% | | 2,000,000 |
| 1,986,852 |
|
| | | | 24,496,368 |
|
TOTAL COLLATERALIZED MORTGAGE OBLIGATIONS
(Cost $78,728,242) | | | 80,301,436 |
|
COMMERCIAL MORTGAGE-BACKED SECURITIES(5) — 5.2% | | |
Bank of America Merrill Lynch Commercial Mortgage Securities Trust, Series 2014-ICTS, Class A, VRN, 2.04%, 11/15/17, resets monthly off the 1-month LIBOR plus 0.80%(1) | | 3,525,000 |
| 3,530,510 |
|
|
| | | | | | | |
| | | Principal Amount | Value |
Bank of America Merrill Lynch Commercial Mortgage Securities Trust, Series 2015-200P, Class B, 3.49%, 4/14/33(1) | | $ | 3,500,000 |
| $ | 3,567,620 |
|
BB-UBS Trust, Series 2012-SHOW, Class A SEQ, 3.43%, 11/5/36(1) | | 5,000,000 |
| 5,109,043 |
|
Commercial Mortgage Pass-Through Certificates, Series 2014-CR15, Class B, VRN, 4.71%, 11/1/17(6) | | 2,105,000 |
| 2,272,759 |
|
Commercial Mortgage Pass-Through Certificates, Series 2016-CR28, Class B, VRN, 4.65%, 11/1/17(6) | | 3,500,000 |
| 3,770,779 |
|
Commercial Mortgage Trust, Series 2014-LC17, Class C, VRN, 4.56%, 11/1/17(6) | | 1,960,000 |
| 1,945,486 |
|
Commercial Mortgage Trust, Series 2015-CR22, Class B, VRN, 3.93%, 11/1/17(6) | | 2,500,000 |
| 2,537,806 |
|
Core Industrial Trust, Series 2015-CALW, Class B, 3.25%, 2/10/34(1) | | 3,500,000 |
| 3,560,604 |
|
Core Industrial Trust, Series 2015-TEXW, Class B, 3.33%, 2/10/34(1) | | 2,825,000 |
| 2,867,876 |
|
Core Industrial Trust, Series 2015-WEST, Class A SEQ, 3.29%, 2/10/37(1) | | 3,600,000 |
| 3,679,434 |
|
DBCG Mortgage Trust, Series 2017-BBG, Class A, VRN, 1.94%, 11/15/17, resets monthly off the 1-month LIBOR plus 0.70%(1) | | 5,000,000 |
| 5,030,379 |
|
| GS Mortgage Securities Corp. II, Series 2015-GC28, Class AS, 3.76%, 2/10/48 | | 2,000,000 |
| 2,041,054 |
|
GS Mortgage Securities Corp. II, Series 2016-GS2, Class B, VRN, 3.76%, 11/1/17(6) | | 3,000,000 |
| 3,076,023 |
|
Hudson Yards Mortgage Trust, Series 2016-10HY, Class A SEQ, 2.84%, 8/10/38(1) | | 3,000,000 |
| 2,937,238 |
|
Irvine Core Office Trust, Series 2013-IRV, Class A2 SEQ, VRN, 3.17%, 11/10/17(1)(6) | | 3,690,000 |
| 3,782,175 |
|
JPMBB Commercial Mortgage Securities Trust, Series 2014-C21, Class B, VRN, 4.34%, 11/1/17(6) | | 2,200,000 |
| 2,278,176 |
|
| JPMDB Commercial Mortgage Securities Trust, Series 2017-C5, Class A4, 3.41%, 3/15/50 | | 6,340,000 |
| 6,543,387 |
|
JPMorgan Chase Commercial Mortgage Securities Trust, Series 2014-CBM, Class A, VRN, 2.14%, 11/15/17, resets monthly off the 1-month LIBOR plus 0.90%(1) | | 2,950,000 |
| 2,952,100 |
|
| JPMorgan Chase Commercial Mortgage Securities Trust, Series 2016-JP2, Class B, 3.46%, 8/15/49 | | 3,000,000 |
| 2,971,305 |
|
Morgan Stanley Capital I Trust, Series 2014-CPT, Class E, VRN, 3.45%, 11/1/17(1)(6) | | 1,960,000 |
| 1,971,461 |
|
| UBS Commercial Mortgage Trust, Series 2017-C1, Class A3, 3.20%, 6/15/50 | | 4,200,000 |
| 4,254,512 |
|
TOTAL COMMERCIAL MORTGAGE-BACKED SECURITIES
(Cost $70,899,548) | | 70,679,727 |
|
ASSET-BACKED SECURITIES(5) — 3.8% | | | |
Avis Budget Rental Car Funding AESOP LLC, Series 2014-1A, Class A SEQ, 2.46%, 7/20/20(1) | | 5,000,000 |
| 5,021,286 |
|
Avis Budget Rental Car Funding AESOP LLC, Series 2015-2A, Class B, 3.42%, 12/20/21(1) | | 2,000,000 |
| 2,020,600 |
|
BRE Grand Islander Timeshare Issuer LLC, Series 2017-1A, Class A SEQ, 2.94%, 5/25/29(1) | | 2,114,321 |
| 2,114,735 |
|
Colony Starwood Homes, Series 2016-2A, Class A, VRN, 2.49%, 11/17/17, resets monthly off the 1-month LIBOR plus 1.25%(1) | | 4,975,985 |
| 5,022,462 |
|
Enterprise Fleet Financing LLC, Series 2015-2, Class A2 SEQ, 1.59%, 2/22/21(1) | | 966,725 |
| 966,583 |
|
|
| | | | | | | |
| | | Principal Amount | Value |
Hertz Fleet Lease Funding LP, Series 2016-1, Class A1, VRN, 2.34%, 11/10/17, resets monthly off the 1-month USD LIBOR plus 1.10%(1) | | $ | 1,939,526 |
| $ | 1,945,688 |
|
Hertz Vehicle Financing LLC, Series 2013-1A, Class A2 SEQ, 1.83%, 8/25/19(1) | | 3,775,000 |
| 3,772,748 |
|
Hertz Vehicle Financing LLC, Series 2013-1A, Class B2, 2.48%, 8/25/19(1) | | 2,625,000 |
| 2,614,249 |
|
Hilton Grand Vacations Trust, Series 2017-AA, Class A SEQ, 2.66%, 12/26/28(1) | | 1,869,064 |
| 1,867,822 |
|
| Honda Auto Receivables Owner Trust, Series 2017-1, Class A2 SEQ, 1.42%, 7/22/19 | | 2,690,885 |
| 2,689,479 |
|
| Hyundai Auto Receivables Trust, Series 2017-A, Class A2A SEQ, 1.48%, 2/18/20 | | 3,600,000 |
| 3,602,067 |
|
Invitation Homes Trust, Series 2014-SFR3, Class A, VRN, 2.44%, 11/17/17, resets monthly off the 1-month LIBOR plus 1.20%(1) | | 517,762 |
| 518,163 |
|
Marriott Vacation Club Owner Trust, Series 2012-1A, Class A SEQ, 2.51%, 5/20/30(1) | | 1,236,511 |
| 1,236,495 |
|
MVW Owner Trust, Series 2014-1A, Class B, 2.70%, 9/22/31(1) | | 82,085 |
| 81,212 |
|
MVW Owner Trust, Series 2015-1A, Class A SEQ, 2.52%, 12/20/32(1) | | 913,107 |
| 913,579 |
|
Progress Residential Trust, Series 2016-SFR2, Class A, VRN, 2.64%, 11/17/17, resets monthly off the 1-month LIBOR plus 1.40%(1) | | 1,975,000 |
| 1,996,798 |
|
Sierra Receivables Funding Co. LLC, Series 2017-1A, Class A SEQ, 2.91%, 3/20/34(1) | | 2,302,929 |
| 2,312,461 |
|
Sierra Timeshare Receivables Funding LLC, Series 2013-1A, Class A SEQ, 1.59%, 11/20/29(1) | | 821,743 |
| 821,050 |
|
Sierra Timeshare Receivables Funding LLC, Series 2013-2A, Class A SEQ, VRN, 2.28%, 11/20/17(1)(6) | | 597,125 |
| 597,217 |
|
Sierra Timeshare Receivables Funding LLC, Series 2014-1A, Class A SEQ, 2.07%, 3/20/30(1) | | 1,026,615 |
| 1,025,052 |
|
Sierra Timeshare Receivables Funding LLC, Series 2015-1A, Class A, 2.40%, 3/22/32(1) | | 626,005 |
| 625,326 |
|
Sierra Timeshare Receivables Funding LLC, Series 2015-2A, Class A, 2.43%, 6/20/32(1) | | 1,256,170 |
| 1,253,127 |
|
Sierra Timeshare Receivables Funding LLC, Series 2015-3A, Class A SEQ, 2.58%, 9/20/32(1) | | 2,204,392 |
| 2,210,685 |
|
Sierra Timeshare Receivables Funding LLC, Series 2016-1A, Class A SEQ, 3.08%, 3/21/33(1) | | 1,627,254 |
| 1,639,454 |
|
Sierra Timeshare Receivables Funding LLC, Series 2016-2A, Class A SEQ, 2.33%, 7/20/33(1) | | 1,723,611 |
| 1,719,385 |
|
VSE VOI Mortgage LLC, Series 2016-A, Class A SEQ, 2.54%, 7/20/33(1) | | 2,761,547 |
| 2,750,394 |
|
TOTAL ASSET-BACKED SECURITIES
(Cost $51,240,244) | | | 51,338,117 |
|
| U.S. TREASURY SECURITIES — 0.7% | | | |
U.S. Treasury Notes, 1.00%, 3/15/18(8)
(Cost $9,001,420) | | 9,000,000 |
| 8,991,158 |
|
| MUNICIPAL SECURITIES — 0.5% | | | |
| Bay Area Toll Authority Rev., 6.92%, 4/1/40 | | 365,000 |
| 519,508 |
|
| Chicago GO, 7.05%, 1/1/29 | | 400,000 |
| 443,816 |
|
| Los Angeles Community College District GO, 6.75%, 8/1/49 | | 600,000 |
| 914,496 |
|
| Metropolitan Transportation Authority Rev., 6.69%, 11/15/40 | | 195,000 |
| 273,556 |
|
|
| | | | | | | |
| | | Principal Amount | Value |
| Missouri Highway & Transportation Commission Rev., 5.45%, 5/1/33 | | $ | 175,000 |
| $ | 204,745 |
|
| New Jersey Turnpike Authority Rev., 7.10%, 1/1/41 | | 225,000 |
| 332,687 |
|
| Pennsylvania Turnpike Commission Rev., 5.56%, 12/1/49 | | 125,000 |
| 164,691 |
|
| Port Authority of New York & New Jersey Rev., 4.93%, 10/1/51 | | 250,000 |
| 301,900 |
|
| Rutgers The State University of New Jersey Rev., 5.67%, 5/1/40 | | 200,000 |
| 243,194 |
|
| Salt River Project Agricultural Improvement & Power District Rev., 4.84%, 1/1/41 | | 415,000 |
| 492,945 |
|
| San Diego County Water Authority Financing Corp. Rev., 6.14%, 5/1/49 | | 100,000 |
| 139,209 |
|
| San Francisco Public Utilities Commission Water Rev., 6.00%, 11/1/40 | | 195,000 |
| 248,073 |
|
| San Francisco Public Utilities Commission Water Rev., 6.95%, 11/1/50 | | 580,000 |
| 853,743 |
|
| Santa Clara Valley Transportation Authority Rev., 5.88%, 4/1/32 | | 150,000 |
| 182,586 |
|
| State of California GO, 7.55%, 4/1/39 | | 400,000 |
| 618,200 |
|
| State of California GO, 7.30%, 10/1/39 | | 170,000 |
| 251,427 |
|
| State of Illinois GO, 5.10%, 6/1/33 | | 200,000 |
| 202,006 |
|
| University of California Rev., 4.60%, 5/15/31 | | 400,000 |
| 450,408 |
|
TOTAL MUNICIPAL SECURITIES
(Cost $6,558,325) | | | 6,837,190 |
|
TEMPORARY CASH INVESTMENTS(9) — 4.3% | | | |
| Repurchase Agreement, BMO Capital Markets Corp., (collateralized by various U.S. Treasury obligations, 0.375% - 1.375%, 1/15/27 - 2/15/45, valued at $24,222,446), in a joint trading account at 0.88%, dated 10/31/17, due 11/1/17 (Delivery value $23,693,680) | | | 23,693,101 |
|
| Repurchase Agreement, Fixed Income Clearing Corp., (collateralized by various U.S. Treasury obligations, 2.50%, 5/15/46, valued at $20,150,826), at 0.34%, dated 10/31/17, due 11/1/17 (Delivery value $19,752,187) | | | 19,752,000 |
|
U.S. Treasury Bills, 1.04%, 11/9/17(8)(10) | | 14,650,000 |
| 14,646,887 |
|
TOTAL TEMPORARY CASH INVESTMENTS
(Cost $58,091,788) | | | 58,091,988 |
|
TOTAL INVESTMENT SECURITIES — 104.0%
(Cost $1,378,980,968) | | | 1,405,046,604 |
|
| OTHER ASSETS AND LIABILITIES — (4.0)% | | | (53,677,522 | ) |
| TOTAL NET ASSETS — 100.0% | | | $ | 1,351,369,082 |
|
FORWARD FOREIGN CURRENCY EXCHANGE CONTRACTS |
| | | | | | | | |
| Currency Purchased | Currency Sold | Counterparty | Settlement Date | Unrealized Appreciation
(Depreciation) |
| ARS | 22,663,234 | USD | 1,259,593 | Goldman Sachs & Co. | 12/20/17 | $ | (12,206 | ) |
| AUD | 169,547 | USD | 133,205 | JPMorgan Chase Bank N.A. | 12/20/17 | (3,502 | ) |
| AUD | 340,294 | USD | 266,778 | JPMorgan Chase Bank N.A. | 12/20/17 | (6,454 | ) |
| AUD | 341,106 | USD | 268,142 | JPMorgan Chase Bank N.A. | 12/20/17 | (7,197 | ) |
| BRL | 827,264 | USD | 261,296 | Morgan Stanley | 12/20/17 | (9,898 | ) |
| BRL | 1,250,674 | USD | 393,158 | Morgan Stanley | 12/20/17 | (13,088 | ) |
| BRL | 1,277,864 | USD | 398,573 | Morgan Stanley | 12/20/17 | (10,241 | ) |
| BRL | 5,335,167 | USD | 1,635,300 | Morgan Stanley | 12/20/17 | (13,988 | ) |
|
| | | | | | | | |
| Currency Purchased | Currency Sold | Counterparty | Settlement Date | Unrealized Appreciation
(Depreciation) |
| BRL | 6,147,056 | USD | 1,884,906 | Morgan Stanley | 12/20/17 | $ | (16,867 | ) |
| BRL | 1,323,045 | USD | 403,983 | Morgan Stanley | 12/20/17 | (1,921 | ) |
| CAD | 162,792 | USD | 134,015 | JPMorgan Chase Bank N.A. | 12/20/17 | (7,767 | ) |
| CAD | 161,750 | USD | 133,206 | JPMorgan Chase Bank N.A. | 12/20/17 | (7,766 | ) |
| CAD | 165,736 | USD | 134,042 | JPMorgan Chase Bank N.A. | 12/20/17 | (5,511 | ) |
| CAD | 665,125 | USD | 532,112 | JPMorgan Chase Bank N.A. | 12/20/17 | (16,297 | ) |
| CAD | 39,820,856 | USD | 31,687,045 | JPMorgan Chase Bank N.A. | 12/20/17 | (805,364 | ) |
| CAD | 334,261 | USD | 266,717 | JPMorgan Chase Bank N.A. | 12/20/17 | (7,493 | ) |
| CAD | 1,717,672 | USD | 1,374,309 | JPMorgan Chase Bank N.A. | 12/20/17 | (42,228 | ) |
| CAD | 170,400 | USD | 134,820 | JPMorgan Chase Bank N.A. | 12/20/17 | (2,672 | ) |
| CLP | 1,705,067,043 | USD | 2,654,503 | JPMorgan Chase Bank N.A. | 12/20/17 | 23,007 |
|
| COP | 11,773,440,328 | USD | 3,993,366 | Goldman Sachs & Co. | 12/20/17 | (140,448 | ) |
| DKK | 4,221,357 | USD | 674,087 | JPMorgan Chase Bank N.A. | 12/20/17 | (11,357 | ) |
| EUR | 340,452 | USD | 404,124 | JPMorgan Chase Bank N.A. | 11/15/17 | (7,283 | ) |
| EUR | 1,104,740 | USD | 1,305,801 | JPMorgan Chase Bank N.A. | 11/15/17 | (18,081 | ) |
| EUR | 341,026 | USD | 402,962 | JPMorgan Chase Bank N.A. | 11/15/17 | (5,452 | ) |
| EUR | 1,310,882 | USD | 1,546,136 | JPMorgan Chase Bank N.A. | 11/15/17 | (18,130 | ) |
| EUR | 10,328,480 | USD | 12,248,896 | JPMorgan Chase Bank N.A. | 11/15/17 | (209,694 | ) |
| EUR | 684,526 | USD | 804,265 | JPMorgan Chase Bank N.A. | 11/15/17 | (6,360 | ) |
| EUR | 3,422,587 | USD | 4,035,103 | JPMorgan Chase Bank N.A. | 11/15/17 | (45,628 | ) |
| EUR | 682,973 | USD | 803,123 | JPMorgan Chase Bank N.A. | 11/15/17 | (7,028 | ) |
| GBP | 2,047,209 | USD | 2,711,915 | Credit Suisse AG | 12/20/17 | 11,142 |
|
| GBP | 101,263 | USD | 133,871 | Credit Suisse AG | 12/20/17 | 822 |
|
| GBP | 401,345 | USD | 533,538 | Credit Suisse AG | 12/20/17 | 304 |
|
| GBP | 196,048 | USD | 265,819 | Credit Suisse AG | 12/20/17 | (5,049 | ) |
| GBP | 98,257 | USD | 133,625 | Credit Suisse AG | 12/20/17 | (2,930 | ) |
| GBP | 775,057 | USD | 1,041,769 | Credit Suisse AG | 12/20/17 | (10,842 | ) |
| GBP | 99,500 | USD | 134,088 | Credit Suisse AG | 12/20/17 | (1,739 | ) |
| GBP | 1,388,131 | USD | 1,866,553 | Credit Suisse AG | 12/20/17 | (20,156 | ) |
| GBP | 647,031 | USD | 850,089 | Credit Suisse AG | 12/20/17 | 10,546 |
|
| GBP | 101,603 | USD | 133,783 | Credit Suisse AG | 12/20/17 | 1,362 |
|
| GBP | 1,228,268 | USD | 1,637,250 | Credit Suisse AG | 12/20/17 | (3,492 | ) |
| GBP | 407,840 | USD | 538,677 | Credit Suisse AG | 12/20/17 | 3,804 |
|
| GBP | 405,803 | USD | 536,748 | Credit Suisse AG | 12/20/17 | 3,024 |
|
| GBP | 4,697,928 | USD | 6,176,835 | Credit Suisse AG | 12/20/17 | 72,027 |
|
| JPY | 30,673,025 | USD | 272,334 | Credit Suisse AG | 11/15/17 | (2,432 | ) |
| JPY | 90,609,762 | USD | 805,456 | Credit Suisse AG | 11/15/17 | (8,150 | ) |
| JPY | 48,856,702 | USD | 435,412 | Credit Suisse AG | 11/15/17 | (5,505 | ) |
| JPY | 15,059,124 | USD | 134,841 | Credit Suisse AG | 11/15/17 | (2,331 | ) |
| JPY | 15,135,559 | USD | 134,097 | Credit Suisse AG | 11/15/17 | (914 | ) |
| JPY | 753,982,250 | USD | 6,681,870 | Credit Suisse AG | 11/15/17 | (47,326 | ) |
| JPY | 45,760,568 | USD | 402,546 | Credit Suisse AG | 11/15/17 | 117 |
|
| KRW | 4,597,156,746 | USD | 4,010,501 | Morgan Stanley | 12/21/17 | 101,954 |
|
| KRW | 758,754,272 | USD | 670,633 | Morgan Stanley | 12/21/17 | 8,122 |
|
| MXN | 2,358,861 | USD | 130,849 | JPMorgan Chase Bank N.A. | 12/20/17 | (8,811 | ) |
| MYR | 99,379,129 | USD | 23,712,510 | Goldman Sachs & Co. | 12/20/17 | (209,909 | ) |
|
| | | | | | | | |
| Currency Purchased | Currency Sold | Counterparty | Settlement Date | Unrealized Appreciation
(Depreciation) |
| MYR | 1,124,756 | USD | 266,265 | Goldman Sachs & Co. | 12/20/17 | $ | (266 | ) |
| MYR | 564,102 | USD | 133,579 | Goldman Sachs & Co. | 12/20/17 | (172 | ) |
| MYR | 1,134,717 | USD | 268,967 | Goldman Sachs & Co. | 12/20/17 | (613 | ) |
| NOK | 619,068,104 | USD | 79,080,279 | JPMorgan Chase Bank N.A. | 12/20/17 | (3,194,891 | ) |
| NOK | 3,116,239 | USD | 399,614 | JPMorgan Chase Bank N.A. | 12/20/17 | (17,626 | ) |
| NOK | 1,103,437 | USD | 135,163 | JPMorgan Chase Bank N.A. | 12/20/17 | 96 |
|
| NZD | 360,530 | USD | 263,430 | JPMorgan Chase Bank N.A. | 12/20/17 | (16,929 | ) |
| NZD | 3,841,379 | USD | 2,636,792 | JPMorgan Chase Bank N.A. | 12/20/17 | (10,369 | ) |
| PEN | 12,855,818 | USD | 3,952,960 | Morgan Stanley | 12/20/17 | (6,532 | ) |
| PEN | 435,711 | USD | 132,960 | Morgan Stanley | 12/20/17 | 793 |
|
| PHP | 1,019,009,435 | USD | 19,894,757 | Goldman Sachs & Co. | 12/20/17 | (262,807 | ) |
| PHP | 13,585,062 | USD | 264,558 | Goldman Sachs & Co. | 12/20/17 | (2,832 | ) |
| PHP | 13,733,069 | USD | 264,831 | Goldman Sachs & Co. | 12/20/17 | (253 | ) |
| PHP | 6,914,463 | USD | 133,577 | Goldman Sachs & Co. | 12/20/17 | (365 | ) |
| PHP | 6,939,351 | USD | 134,001 | Goldman Sachs & Co. | 12/20/17 | (309 | ) |
| PLN | 884,520 | USD | 247,363 | Goldman Sachs & Co. | 12/20/17 | (4,307 | ) |
| PLN | 14,873,202 | USD | 4,079,320 | Goldman Sachs & Co. | 12/20/17 | 7,669 |
|
| RUB | 157,998,246 | USD | 2,734,717 | Morgan Stanley | 12/20/17 | (47,515 | ) |
| SEK | 21,775,467 | USD | 2,677,726 | JPMorgan Chase Bank N.A. | 12/20/17 | (68,903 | ) |
| SEK | 1,079,918 | USD | 133,868 | JPMorgan Chase Bank N.A. | 12/20/17 | (4,488 | ) |
| TRY | 4,552,142 | USD | 1,294,473 | Goldman Sachs & Co. | 12/20/17 | (111,552 | ) |
| TRY | 474,644 | USD | 130,447 | Goldman Sachs & Co. | 12/20/17 | (7,106 | ) |
| TRY | 9,486,941 | USD | 2,596,388 | Goldman Sachs & Co. | 12/20/17 | (131,109 | ) |
| TRY | 492,438 | USD | 132,031 | Goldman Sachs & Co. | 12/20/17 | (4,066 | ) |
| TRY | 15,171,420 | USD | 4,007,878 | Goldman Sachs & Co. | 12/20/17 | (65,429 | ) |
| TWD | 242,694,536 | USD | 7,998,106 | JPMorgan Chase Bank N.A. | 12/20/17 | 78,478 |
|
| USD | 1,276,564 | ARS | 23,166,454 | Goldman Sachs & Co. | 12/20/17 | 1,480 |
|
| USD | 15,235,289 | AUD | 19,009,775 | JPMorgan Chase Bank N.A. | 12/20/17 | 692,906 |
|
| USD | 222,485 | AUD | 278,180 | JPMorgan Chase Bank N.A. | 12/20/17 | 9,679 |
|
| USD | 134,241 | AUD | 166,496 | JPMorgan Chase Bank N.A. | 12/20/17 | 6,873 |
|
| USD | 225,044 | AUD | 286,376 | JPMorgan Chase Bank N.A. | 12/20/17 | 5,968 |
|
| USD | 454,957 | AUD | 594,251 | JPMorgan Chase Bank N.A. | 12/20/17 | 358 |
|
| USD | 223,894 | AUD | 285,197 | JPMorgan Chase Bank N.A. | 12/20/17 | 5,720 |
|
| USD | 134,143 | AUD | 170,928 | JPMorgan Chase Bank N.A. | 12/20/17 | 3,384 |
|
| USD | 134,468 | AUD | 172,319 | JPMorgan Chase Bank N.A. | 12/20/17 | 2,645 |
|
| USD | 134,718 | AUD | 172,055 | JPMorgan Chase Bank N.A. | 12/20/17 | 3,097 |
|
| USD | 3,638,929 | BRL | 11,369,106 | Morgan Stanley | 12/20/17 | 183,953 |
|
| USD | 527,344 | BRL | 1,650,799 | Morgan Stanley | 12/20/17 | 25,680 |
|
| USD | 63,071,558 | CAD | 76,689,023 | JPMorgan Chase Bank N.A. | 12/20/17 | 3,598,052 |
|
| USD | 784,579 | CAD | 963,047 | JPMorgan Chase Bank N.A. | 12/20/17 | 37,722 |
|
| USD | 271,080 | CAD | 337,603 | JPMorgan Chase Bank N.A. | 12/20/17 | 9,264 |
|
| USD | 209,001 | CAD | 269,390 | JPMorgan Chase Bank N.A. | 12/20/17 | 85 |
|
| USD | 193,727 | CAD | 240,588 | JPMorgan Chase Bank N.A. | 12/20/17 | 7,148 |
|
| USD | 193,142 | CAD | 241,663 | JPMorgan Chase Bank N.A. | 12/20/17 | 5,728 |
|
| USD | 70,935 | CAD | 88,644 | JPMorgan Chase Bank N.A. | 12/20/17 | 2,190 |
|
| USD | 807,063 | CAD | 1,040,007 | JPMorgan Chase Bank N.A. | 12/20/17 | 522 |
|
|
| | | | | | | | |
| Currency Purchased | Currency Sold | Counterparty | Settlement Date | Unrealized Appreciation
(Depreciation) |
| USD | 7,013,382 | CHF | 6,643,847 | Credit Suisse AG | 12/20/17 | $ | 331,748 |
|
| USD | 2,672,635 | CHF | 2,514,920 | Credit Suisse AG | 12/20/17 | 143,411 |
|
| USD | 135,025 | CHF | 127,176 | Credit Suisse AG | 12/20/17 | 7,126 |
|
| USD | 4,024,267 | CHF | 3,842,744 | Credit Suisse AG | 12/20/17 | 159,667 |
|
| USD | 6,782,987 | CHF | 6,639,866 | Credit Suisse AG | 12/20/17 | 105,357 |
|
| USD | 2,695,585 | CLP | 1,665,871,749 | JPMorgan Chase Bank N.A. | 12/20/17 | 79,625 |
|
| USD | 132,569 | CLP | 84,918,534 | JPMorgan Chase Bank N.A. | 12/20/17 | (781 | ) |
| USD | 17,298,154 | CLP | 10,967,029,488 | JPMorgan Chase Bank N.A. | 12/20/17 | 76,348 |
|
| USD | 134,261 | CLP | 84,053,971 | JPMorgan Chase Bank N.A. | 12/20/17 | 2,269 |
|
| USD | 3,956,240 | COP | 11,787,341,100 | Goldman Sachs & Co. | 12/20/17 | 98,774 |
|
| USD | 1,727,261 | CZK | 37,376,194 | Goldman Sachs & Co. | 12/20/17 | 25,430 |
|
| USD | 3,135,544 | DKK | 19,296,508 | JPMorgan Chase Bank N.A. | 12/20/17 | 106,098 |
|
| USD | 269,813 | DKK | 1,702,932 | JPMorgan Chase Bank N.A. | 12/20/17 | 2,462 |
|
| USD | 269,714 | DKK | 1,701,651 | JPMorgan Chase Bank N.A. | 12/20/17 | 2,564 |
|
| USD | 241,589,670 | EUR | 204,776,055 | JPMorgan Chase Bank N.A. | 11/15/17 | 2,896,241 |
|
| USD | 3,049,439 | EUR | 2,600,703 | JPMorgan Chase Bank N.A. | 11/15/17 | 17,977 |
|
| USD | 404,648 | EUR | 342,511 | JPMorgan Chase Bank N.A. | 11/15/17 | 5,406 |
|
| USD | 3,396,964 | EUR | 2,872,145 | JPMorgan Chase Bank N.A. | 11/15/17 | 49,101 |
|
| USD | 150,837 | EUR | 127,039 | JPMorgan Chase Bank N.A. | 11/15/17 | 2,757 |
|
| USD | 1,450,062 | EUR | 1,222,299 | JPMorgan Chase Bank N.A. | 11/15/17 | 25,312 |
|
| USD | 538,973 | EUR | 453,497 | JPMorgan Chase Bank N.A. | 11/15/17 | 10,363 |
|
| USD | 1,101,620 | EUR | 931,485 | JPMorgan Chase Bank N.A. | 11/15/17 | 15,852 |
|
| USD | 135,189 | EUR | 114,649 | JPMorgan Chase Bank N.A. | 11/15/17 | 1,551 |
|
| USD | 1,485,671 | EUR | 1,262,145 | JPMorgan Chase Bank N.A. | 11/15/17 | 14,475 |
|
| USD | 328,568 | EUR | 279,084 | JPMorgan Chase Bank N.A. | 11/15/17 | 3,259 |
|
| USD | 1,574,052 | EUR | 1,352,846 | JPMorgan Chase Bank N.A. | 11/15/17 | (2,867 | ) |
| USD | 135,232 | EUR | 116,335 | JPMorgan Chase Bank N.A. | 11/15/17 | (372 | ) |
| USD | 3,655,570 | EUR | 3,136,054 | JPMorgan Chase Bank N.A. | 11/15/17 | 86 |
|
| USD | 783,032 | EUR | 671,514 | JPMorgan Chase Bank N.A. | 11/15/17 | 294 |
|
| USD | 44,229,280 | GBP | 33,627,529 | Credit Suisse AG | 12/20/17 | (499,761 | ) |
| USD | 403,947 | GBP | 305,469 | Credit Suisse AG | 12/20/17 | (2,367 | ) |
| USD | 404,327 | GBP | 301,984 | Credit Suisse AG | 12/20/17 | 2,648 |
|
| USD | 167,940 | GBP | 125,102 | Credit Suisse AG | 12/20/17 | 1,538 |
|
| USD | 22,247,438 | GBP | 16,465,923 | Credit Suisse AG | 12/20/17 | 345,592 |
|
| USD | 158,526 | GBP | 116,970 | Credit Suisse AG | 12/20/17 | 2,940 |
|
| USD | 561,507 | GBP | 416,672 | Credit Suisse AG | 12/20/17 | 7,279 |
|
| USD | 2,647,919 | GBP | 1,988,442 | Credit Suisse AG | 12/20/17 | 3,029 |
|
| USD | 163,107 | GBP | 122,864 | Credit Suisse AG | 12/20/17 | (318 | ) |
| USD | 268,810 | GBP | 201,962 | Credit Suisse AG | 12/20/17 | 174 |
|
| USD | 135,171 | GBP | 102,526 | Credit Suisse AG | 12/20/17 | (1,202 | ) |
| USD | 2,531,003 | GBP | 1,912,379 | Credit Suisse AG | 12/20/17 | (12,713 | ) |
| USD | 403,913 | GBP | 306,086 | Credit Suisse AG | 12/20/17 | (3,222 | ) |
| USD | 353,080 | GBP | 268,603 | Credit Suisse AG | 12/20/17 | (4,197 | ) |
| USD | 404,255 | GBP | 306,591 | Credit Suisse AG | 12/20/17 | (3,551 | ) |
| USD | 2,345,765 | GBP | 1,781,373 | Credit Suisse AG | 12/20/17 | (23,695 | ) |
| USD | 1,199,297 | GBP | 904,035 | Credit Suisse AG | 12/20/17 | (3,188 | ) |
|
| | | | | | | | |
| Currency Purchased | Currency Sold | Counterparty | Settlement Date | Unrealized Appreciation
(Depreciation) |
| USD | 2,012,984 | GBP | 1,526,155 | Credit Suisse AG | 12/20/17 | $ | (17,004 | ) |
| USD | 271,402 | GBP | 205,530 | Credit Suisse AG | 12/20/17 | (1,980 | ) |
| USD | 236,301 | GBP | 177,613 | Credit Suisse AG | 12/20/17 | 52 |
|
| USD | 695,103 | HUF | 176,271,995 | JPMorgan Chase Bank N.A. | 12/20/17 | 34,250 |
|
| USD | 3,980,890 | HUF | 1,052,627,012 | JPMorgan Chase Bank N.A. | 12/20/17 | 34,534 |
|
| USD | 135,450 | HUF | 35,610,842 | JPMorgan Chase Bank N.A. | 12/20/17 | 1,943 |
|
| USD | 3,938,450 | INR | 254,226,924 | Goldman Sachs & Co. | 12/20/17 | 29,122 |
|
| USD | 132,496 | INR | 8,735,478 | Goldman Sachs & Co. | 12/20/17 | (1,832 | ) |
| USD | 177,420,693 | JPY | 19,932,966,523 | Credit Suisse AG | 11/15/17 | 2,023,789 |
|
| USD | 403,007 | JPY | 45,307,951 | Credit Suisse AG | 11/15/17 | 4,327 |
|
| USD | 269,062 | JPY | 30,199,888 | Credit Suisse AG | 11/15/17 | 3,323 |
|
| USD | 544,330 | JPY | 60,968,934 | Credit Suisse AG | 11/15/17 | 7,843 |
|
| USD | 135,148 | JPY | 15,082,244 | Credit Suisse AG | 11/15/17 | 2,435 |
|
| USD | 437,007 | JPY | 48,759,091 | Credit Suisse AG | 11/15/17 | 7,959 |
|
| USD | 109,503 | JPY | 12,278,903 | Credit Suisse AG | 11/15/17 | 1,456 |
|
| USD | 219,118 | JPY | 24,719,244 | Credit Suisse AG | 11/15/17 | 1,605 |
|
| USD | 269,270 | JPY | 30,645,078 | Credit Suisse AG | 11/15/17 | (386 | ) |
| USD | 328,253 | JPY | 37,344,819 | Credit Suisse AG | 11/15/17 | (357 | ) |
| USD | 3,904,734 | JPY | 443,491,044 | Credit Suisse AG | 11/15/17 | 2,306 |
|
| USD | 494,195 | JPY | 56,145,770 | Credit Suisse AG | 11/15/17 | 150 |
|
| USD | 4,799,534 | KRW | 5,416,514,187 | Morgan Stanley | 12/21/17 | (45,889 | ) |
| USD | 133,175 | KRW | 150,221,685 | Morgan Stanley | 12/21/17 | (1,208 | ) |
| USD | 679,649 | KRW | 759,440,178 | Morgan Stanley | 12/21/17 | 281 |
|
| USD | 5,260,350 | MXN | 94,589,506 | JPMorgan Chase Bank N.A. | 12/20/17 | 366,688 |
|
| USD | 131,204 | MXN | 2,365,176 | JPMorgan Chase Bank N.A. | 12/20/17 | 8,839 |
|
| USD | 130,592 | MXN | 2,366,500 | JPMorgan Chase Bank N.A. | 12/20/17 | 8,159 |
|
| USD | 671,816 | MXN | 12,340,068 | JPMorgan Chase Bank N.A. | 12/20/17 | 33,393 |
|
| USD | 132,871 | MYR | 557,792 | Goldman Sachs & Co. | 12/20/17 | 956 |
|
| USD | 75,022,691 | NOK | 579,733,524 | JPMorgan Chase Bank N.A. | 12/20/17 | 3,958,937 |
|
| USD | 401,097 | NOK | 3,100,963 | JPMorgan Chase Bank N.A. | 12/20/17 | 20,981 |
|
| USD | 2,295,306 | NOK | 18,098,928 | JPMorgan Chase Bank N.A. | 12/20/17 | 76,739 |
|
| USD | 9,372,859 | NZD | 12,993,857 | JPMorgan Chase Bank N.A. | 12/20/17 | 488,715 |
|
| USD | 133,889 | NZD | 184,710 | JPMorgan Chase Bank N.A. | 12/20/17 | 7,599 |
|
| USD | 903,131 | NZD | 1,256,090 | JPMorgan Chase Bank N.A. | 12/20/17 | 44,319 |
|
| USD | 133,744 | NZD | 186,972 | JPMorgan Chase Bank N.A. | 12/20/17 | 5,908 |
|
| USD | 1,018,613 | NZD | 1,489,486 | JPMorgan Chase Bank N.A. | 12/20/17 | 224 |
|
| USD | 3,980,972 | PEN | 13,071,523 | Morgan Stanley | 12/20/17 | (31,672 | ) |
| USD | 131,668 | PHP | 6,775,617 | Goldman Sachs & Co. | 12/20/17 | 1,131 |
|
| USD | 2,774,737 | PLN | 9,821,291 | Goldman Sachs & Co. | 12/20/17 | 75,957 |
|
| USD | 4,022,554 | PLN | 14,531,478 | Goldman Sachs & Co. | 12/20/17 | 29,467 |
|
| USD | 2,618,814 | RUB | 153,551,541 | Morgan Stanley | 12/20/17 | 7,241 |
|
| USD | 3,978,656 | SEK | 31,471,170 | JPMorgan Chase Bank N.A. | 12/20/17 | 208,233 |
|
| USD | 3,265,841 | SEK | 25,752,091 | JPMorgan Chase Bank N.A. | 12/20/17 | 180,595 |
|
| USD | 189,648 | SEK | 1,502,706 | JPMorgan Chase Bank N.A. | 12/20/17 | 9,615 |
|
| USD | 133,493 | SEK | 1,085,044 | JPMorgan Chase Bank N.A. | 12/20/17 | 3,498 |
|
| USD | 190,679 | SEK | 1,529,716 | JPMorgan Chase Bank N.A. | 12/20/17 | 7,410 |
|
|
| | | | | | | | |
| Currency Purchased | Currency Sold | Counterparty | Settlement Date | Unrealized Appreciation
(Depreciation) |
| USD | 2,690,098 | SEK | 22,455,080 | JPMorgan Chase Bank N.A. | 12/20/17 | $ | (147 | ) |
| USD | 208,017 | SEK | 1,735,737 | JPMorgan Chase Bank N.A. | 12/20/17 | 66 |
|
| USD | 1,545,664 | SGD | 2,073,515 | JPMorgan Chase Bank N.A. | 12/20/17 | 23,865 |
|
| USD | 1,998,697 | SGD | 2,688,556 | JPMorgan Chase Bank N.A. | 12/20/17 | 25,506 |
|
| USD | 50,981,420 | THB | 1,686,210,471 | Goldman Sachs & Co. | 12/20/17 | 240,804 |
|
| USD | 400,903 | THB | 13,357,672 | Goldman Sachs & Co. | 12/20/17 | (1,050 | ) |
| USD | 134,487 | THB | 4,473,030 | Goldman Sachs & Co. | 12/20/17 | (113 | ) |
| USD | 3,905,115 | TRY | 15,092,096 | Goldman Sachs & Co. | 12/20/17 | (16,721 | ) |
| USD | 3,911,198 | TRY | 15,085,489 | Goldman Sachs & Co. | 12/20/17 | (8,921 | ) |
| USD | 3,977,577 | TWD | 120,719,449 | JPMorgan Chase Bank N.A. | 12/20/17 | (39,823 | ) |
| USD | 2,605,519 | ZAR | 33,933,501 | Goldman Sachs & Co. | 12/20/17 | 225,134 |
|
| USD | 953,459 | ZAR | 12,590,141 | Goldman Sachs & Co. | 12/20/17 | 70,280 |
|
| USD | 3,939,737 | ZAR | 55,447,068 | Goldman Sachs & Co. | 12/20/17 | 50,207 |
|
| USD | 3,990,544 | ZAR | 57,030,854 | Goldman Sachs & Co. | 12/20/17 | (10,086 | ) |
| USD | 269,335 | ZAR | 3,820,545 | Goldman Sachs & Co. | 12/20/17 | 1,329 |
|
| ZAR | 57,236,833 | USD | 4,122,830 | Goldman Sachs & Co. | 12/20/17 | (107,751 | ) |
| | | | | | | $ | 11,218,524 |
|
|
| | | | | | | | | | |
| FUTURES CONTRACTS PURCHASED |
| Reference Entity | Contracts | Expiration Date | Notional Amount | Underlying Contract Value | Unrealized Appreciation
(Depreciation) |
| Euro-OAT 10-Year Bonds | 73 | December 2017 | EUR | 7,300,000 | $ | 13,389,456 |
| $ | 173,937 |
|
Euro-Schatz 2-Year Bonds | 299 | December 2017 | EUR | 29,900,000 | 39,100,777 |
| 39,548 |
|
| Korean Treasury 10-Year Bonds | 113 | December 2017 | KRW | 11,300,000,000 | 12,191,110 |
| (340,104 | ) |
U.S. Treasury 2-Year Notes | 90 | December 2017 | USD | 18,000,000 | 19,382,344 |
| (91,609 | ) |
U.S. Treasury 5-Year Notes | 579 | December 2017 | USD | 57,900,000 | 67,851,562 |
| (663,076 | ) |
U.S. Treasury 10-Year Notes | 80 | December 2017 | USD | 8,000,000 | 9,995,000 |
| (172,055 | ) |
U.S. Treasury 10-Year Ultra Notes | 22 | December 2017 | USD | 2,200,000 | 2,946,281 |
| (61,925 | ) |
| U.S. Treasury Long Bonds | 22 | December 2017 | USD | 2,200,000 | 3,354,312 |
| (87,362 | ) |
| U.S. Treasury Ultra Bonds | 151 | December 2017 | USD | 15,100,000 | 24,881,969 |
| (476,616 | ) |
| | | | | | $ | 193,092,811 |
| $ | (1,679,262 | ) |
|
| | | | | | | | | | |
| FUTURES CONTRACTS SOLD |
| Reference Entity | Contracts | Expiration Date | Notional Amount | Underlying Contract Value | Unrealized Appreciation
(Depreciation) |
| Euro-Bobl 5-Year Bonds | 419 | December 2017 | EUR | 41,900,000 | $ | 64,318,120 |
| $ | (128,819 | ) |
Euro-Bund 10-Year Bonds | 86 | December 2017 | EUR | 8,600,000 | 16,303,816 |
| (93,030 | ) |
| U.K. Gilt 10-Year Bonds | 219 | December 2017 | GBP | 21,900,000 | 36,163,227 |
| 852,537 |
|
| | | | | | $ | 116,785,163 |
| $ | 630,688 |
|
|
| | | | | | | | | | | | | | | |
| CENTRALLY CLEARED CREDIT DEFAULT SWAP AGREEMENTS | |
| Reference Entity | Type* | Fixed Rate
Received
(Paid) | Termination
Date | Notional
Amount | Premiums
Paid
(Received) | Unrealized
Appreciation
(Depreciation) | Value** |
| Markit CDX North America High Yield Index Series 29 | Sell | 5.00% | 12/20/22 | $ | 65,970,000 |
| $ | 5,233,283 |
| $ | 679,225 |
| $ | 5,912,508 |
|
| Markit CDX North America Investment Grade Index Series 29 | Sell | 1.00% | 12/20/22 | $ | 12,000,000 |
| 233,322 |
| 56,640 |
| 289,962 |
|
| | | | | | $ | 5,466,605 |
| $ | 735,865 |
| $ | 6,202,470 |
|
| |
| * | The maximum potential amount the fund could be required to deliver as a seller of credit protection if a credit event occurs as defined under the terms of the agreement is the notational amount. The maximum potential amount may be partially offset by any recovery values of the reference entities and upfront payments received upon entering into the agreement. |
| |
| ** | The value for credit default swap agreements serve as an indicator of the current status of the payment/performance risk and represent the likelihood of an expected liability or profit at the period end. Increasing values in absolute terms when compared to the notational amount of the credit default swap agreement represent a deterioration of the referenced entity's credit soundness and an increased likelihood or risk of a credit event occurring as defined in the agreement. |
|
| | | | | | | | | | | | | | | |
| CENTRALLY CLEARED TOTAL RETURN SWAP AGREEMENTS | |
| Floating Rate Index | Pay/Receive Floating
Rate Index | Fixed
Rate | Termination
Date | Notional
Amount | Premiums Paid (Received) | Unrealized
Appreciation
(Depreciation) | Value |
| CPURNSA | Receive | 2.24% | 11/15/26 | $ | 3,000,000 |
| $ | 532 |
| $ | (39,501 | ) | $ | (38,969 | ) |
| CPURNSA | Receive | 2.28% | 11/16/26 | $ | 3,000,000 |
| 532 |
| (49,471 | ) | (48,939 | ) |
| CPURNSA | Receive | 2.27% | 11/21/26 | $ | 3,000,000 |
| 532 |
| (48,239 | ) | (47,707 | ) |
| CPURNSA | Receive | 2.17% | 5/10/27 | $ | 16,400,000 |
| 645 |
| (112,127 | ) | (111,482 | ) |
| | | | | | $ | 2,241 |
| $ | (249,338 | ) | $ | (247,097 | ) |
|
| | | | | | | | |
| TOTAL RETURN SWAP AGREEMENTS |
| Counterparty | Floating
Rate Index | Pay/Receive
Floating Rate
Index | Fixed Rate | Termination
Date | Notional
Amount | Value* |
| Bank of America N.A. | CPURNSA | Receive | 2.26% | 11/15/26 | $3,000,000 | $ | (44,146 | ) |
| Bank of America N.A. | CPURNSA | Receive | 2.29% | 11/16/26 | $3,000,000 | (52,024 | ) |
| Bank of America N.A. | CPURNSA | Receive | 2.28% | 11/21/26 | $3,000,000 | (48,879 | ) |
| Bank of America N.A. | CPURNSA | Receive | 2.22% | 4/13/27 | $4,000,000 | (54,538 | ) |
| Barclays Bank plc | CPURNSA | Receive | 2.25% | 11/15/26 | $3,000,000 | (40,488 | ) |
| Barclays Bank plc | CPURNSA | Receive | 2.28% | 11/16/26 | $3,000,000 | (50,191 | ) |
| Barclays Bank plc | CPURNSA | Receive | 2.26% | 11/21/26 | $3,000,000 | (45,065 | ) |
| Goldman Sachs & Co. | CPURNSA | Receive | 2.25% | 11/15/26 | $3,000,000 | (39,574 | ) |
| Goldman Sachs & Co. | CPURNSA | Receive | 2.28% | 11/16/26 | $3,000,000 | (50,496 | ) |
| Goldman Sachs & Co. | CPURNSA | Receive | 2.28% | 11/21/26 | $3,000,000 | (50,405 | ) |
| | | | | | | $ | (475,806 | ) |
| |
| * | Amount represents value and unrealized appreciation (depreciation). |
|
| | | | | | | | | |
| INTEREST RATE SWAP AGREEMENTS |
| Counterparty | Floating
Rate Index | Pay/Receive
Floating Rate
Index | Fixed Rate | Termination
Date | Notional
Amount | Value* |
| Bank of America N.A | BZDIOVRA | Receive | 9.60% | 1/2/19 | BRL | 295,581,614 | $ | (2,528,422 | ) |
| Bank of America N.A. | BZDIOVRA | Pay | 10.78% | 1/2/23 | BRL | 87,539,414 | 1,783,513 |
|
| Barclays Bank plc | BZDIOVRA | Receive | 7.29% | 1/2/19 | BRL | 521,175,808 | 13,158 |
|
| Barclays Bank plc | BZDIOVRA | Pay | 9.51% | 1/2/23 | BRL | 91,485,315 | (207,917 | ) |
| Morgan Stanley | BZDIOVRA | Receive | 8.71% | 1/2/19 | BRL | 159,476,942 | (772,385 | ) |
| Morgan Stanley | BZDIOVRA | Pay | 10.24% | 1/2/23 | BRL | 43,765,238 | 462,785 |
|
| Morgan Stanley | BZDIOVRA | Receive | 7.51% | 1/2/19 | BRL | 381,058,977 | (233,786 | ) |
| | | | | | | | $ | (1,483,054 | ) |
| |
| * | Amount represents value and unrealized appreciation (depreciation). |
|
| | | | | |
| NOTES TO SCHEDULE OF INVESTMENTS | | | |
| ARS | - | Argentine Peso | LIBOR | - | London Interbank Offered Rate |
| AUD | - | Australian Dollar | MTN | - | Medium Term Note |
| BRL | - | Brazilian Real | MXN | - | Mexican Peso |
| BZDIOVRA | - | Brazil Interbank Deposit Rate | MYR | - | Malaysian Ringgit |
| CAD | - | Canadian Dollar | NOK | - | Norwegian Krone |
| CDX | - | Credit Derivatives Indexes | NZD | - | New Zealand Dollar |
| CHF | - | Swiss Franc | PEN | - | Peruvian Sol |
| CLP | - | Chilean Peso | PHP | - | Philippine Peso |
| COP | - | Colombian Peso | PLN | - | Polish Zloty |
| CPURNSA | - | U.S. Consumer Price Index Urban Consumers Not Seasonally Adjusted Index | resets | - | The frequency with which a security's coupon changes, based on current market conditions or an underlying index. |
| CZK | - | Czech Koruna | RUB | - | Russian Ruble |
| DKK | - | Danish Krone | SEK | - | Swedish Krona |
| EUR | - | Euro | SEQ | - | Sequential Payer |
| FHLMC | - | Federal Home Loan Mortgage Corporation | SGD | - | Singapore Dollar |
| FNMA | - | Federal National Mortgage Association | THB | - | Thai Baht |
| GBP | - | British Pound | TRY | - | Turkish Lira |
| GNMA | - | Government National Mortgage Association | TWD | - | Taiwanese Dollar |
| GO | - | General Obligation | USD | - | United States Dollar |
| H15T1Y | - | Constant Maturity U.S. Treasury Note Yield Curve Rate Index | VRN | - | Variable Rate Note. Interest reset date is indicated. Rate shown is effective at the period end. |
| HUF | - | Hungarian Forint | ZAR | - | South African Rand |
| INR | - | Indian Rupee | | | |
| JPY | - | Japanese Yen | | | |
| KRW | - | South Korean Won | | | |
† Category is less than 0.05% of total net assets.
| |
| (1) | Security was purchased pursuant to Rule 144A under the Securities Act of 1933 and may be sold in transactions exempt from registration, normally to qualified institutional investors. The aggregate value of these securities at the period end was $246,176,274, which represented 18.2% of total net assets. |
| |
| (2) | Security is a zero-coupon bond. |
| |
| (3) | Coupon rate adjusts periodically based upon a predetermined schedule. Interest reset date is indicated. Rate shown is effective at the period end. |
| |
| (4) | When-issued security. The issue price and yield are fixed on the date of the commitment, but payment and delivery are scheduled for a future date. |
| |
| (5) | Final maturity date indicated, unless otherwise noted. |
| |
| (6) | The interest rate resets periodically based on the weighted average coupons of the underlying mortgage-related or asset-backed obligations. |
| |
| (7) | Forward commitment. Settlement date is indicated. |
| |
| (8) | Security, or a portion thereof, has been pledged at the custodian bank or with a broker for margin requirements on forward commitments, forward foreign currency exchange contracts, futures contracts and/or swap agreements. At the period end, the aggregate value of securities pledged was $9,458,281. |
| |
| (9) | Category includes collateral received at the custodian bank for margin requirements on forward foreign currency exchange contracts. At the period end, the aggregate value of cash deposits received was $270,000. |
| |
| (10) | The rate indicated is the yield to maturity at purchase. |
See Notes to Financial Statements.
|
|
| Statement of Assets and Liabilities |
|
| | | |
| OCTOBER 31, 2017 |
| Assets |
| Investment securities, at value (cost of $1,378,980,968) | $ | 1,405,046,604 |
|
| Cash | 291,977 |
|
| Foreign deposits with broker for futures contracts, at value (cost of $398,948) | 413,109 |
|
| Receivable for investments sold | 119,033 |
|
| Receivable for capital shares sold | 430,813 |
|
| Receivable for variation margin on futures contracts | 39,030 |
|
| Receivable for variation margin on swap agreements | 113,481 |
|
| Unrealized appreciation on forward foreign currency exchange contracts | 17,809,644 |
|
| Swap agreements, at value | 2,259,456 |
|
| Interest receivable | 10,042,788 |
|
| | 1,436,565,935 |
|
| | |
| Liabilities | |
| Foreign currency overdraft payable, at value (cost of $102,232) | 102,671 |
|
| Payable for collateral received for forward foreign currency exchange contracts | 270,000 |
|
| Payable for investments purchased | 73,500,547 |
|
| Payable for capital shares redeemed | 202,196 |
|
| Payable for variation margin on futures contracts | 75,792 |
|
| Unrealized depreciation on forward foreign currency exchange contracts | 6,591,120 |
|
| Swap agreements, at value | 4,218,316 |
|
| Accrued management fees | 234,051 |
|
| Distribution and service fees payable | 2,160 |
|
| | 85,196,853 |
|
| | |
| Net Assets | $ | 1,351,369,082 |
|
| | |
| Net Assets Consist of: | |
| Capital paid in | $ | 1,301,859,931 |
|
| Undistributed net investment income | 11,206,954 |
|
| Undistributed net realized gain | 3,522,945 |
|
| Net unrealized appreciation | 34,779,252 |
|
| | $ | 1,351,369,082 |
|
|
| | | | | | |
| | Net Assets | Shares Outstanding | Net Asset Value Per Share |
| Investor Class |
| $294,534,819 |
| 28,440,122 |
| $10.36 |
| I Class |
| $11,856,407 |
| 1,141,825 |
| $10.38 |
| Y Class |
| $5,124 |
| 493 |
| $10.39 |
| A Class |
| $2,156,716 |
| 209,207 |
| $10.31* |
| C Class |
| $1,824,159 |
| 179,311 |
| $10.17 |
| R Class |
| $145,953 |
| 14,223 |
| $10.26 |
| R5 Class |
| $32,206,467 |
| 3,100,641 |
| $10.39 |
| R6 Class |
| $1,488,934 |
| 143,296 |
| $10.39 |
| G Class |
| $1,007,150,503 |
| 96,777,444 |
| $10.41 |
*Maximum offering price $10.80 (net asset value divided by 0.955).
See Notes to Financial Statements.
|
| | | |
| YEAR ENDED OCTOBER 31, 2017 | |
| Investment Income (Loss) |
| Income: | |
| Interest | $ | 27,760,986 |
|
| | |
| Expenses: | |
| Management fees | 10,040,175 |
|
| Distribution and service fees: | |
| A Class | 13,955 |
|
| C Class | 32,203 |
|
| R Class | 428 |
|
| Trustees' fees and expenses | 79,091 |
|
| Other expenses | 33,355 |
|
| | 10,199,207 |
|
Fees waived(1) | (3,006,296 | ) |
| | 7,192,911 |
|
| | |
| Net investment income (loss) | 20,568,075 |
|
| | |
| Realized and Unrealized Gain (Loss) | |
| Net realized gain (loss) on: | |
| Investment transactions | 10,074,941 |
|
| Forward foreign currency exchange contract transactions | 5,724,793 |
|
| Futures contract transactions | 2,224,943 |
|
| Swap agreement transactions | 954,863 |
|
| Foreign currency translation transactions | (74,102 | ) |
| | 18,905,438 |
|
| | |
| Change in net unrealized appreciation (depreciation) on: | |
| Investments | 6,415,743 |
|
| Forward foreign currency exchange contracts | (9,595,144 | ) |
| Futures contracts | (1,388,195 | ) |
| Swap agreements | (1,702,927 | ) |
| Translation of assets and liabilities in foreign currencies | 170,052 |
|
| | (6,100,471 | ) |
| | |
| Net realized and unrealized gain (loss) | 12,804,967 |
|
| | |
| Net Increase (Decrease) in Net Assets Resulting from Operations | $ | 33,373,042 |
|
| |
| (1) | Amount consists of $335,211, $3,828, $4, $6,698, $3,865, $103, $785,922, $101,828 and $1,768,837 for Investor Class, I Class, Y Class, A Class, C Class, R Class, R5 Class, R6 Class and G Class, respectively. |
See Notes to Financial Statements.
|
|
| Statement of Changes in Net Assets |
|
| | | | | | |
| YEARS ENDED OCTOBER 31, 2017 AND OCTOBER 31, 2016 |
| Increase (Decrease) in Net Assets | October 31, 2017 | October 31, 2016 |
| Operations | | |
| Net investment income (loss) | $ | 20,568,075 |
| $ | 14,706,886 |
|
| Net realized gain (loss) | 18,905,438 |
| (11,172,998 | ) |
| Change in net unrealized appreciation (depreciation) | (6,100,471 | ) | 48,440,736 |
|
| Net increase (decrease) in net assets resulting from operations | 33,373,042 |
| 51,974,624 |
|
| | | |
| Distributions to Shareholders | | |
| From net investment income: | | |
| Investor Class | (2,968,471 | ) | (994,718 | ) |
| A Class | (83,113 | ) | (24,034 | ) |
| C Class | (6,117 | ) | (1,212 | ) |
| R Class | (263 | ) | (72 | ) |
| R5 Class | (11,175,900 | ) | (3,641,614 | ) |
| R6 Class | (1,505,807 | ) | (321,334 | ) |
| From net realized gains: | | |
| Investor Class | (742,236 | ) | — |
|
| A Class | (26,663 | ) | — |
|
| C Class | (12,642 | ) | — |
|
| R Class | (117 | ) | — |
|
| R5 Class | (2,372,010 | ) | — |
|
| R6 Class | (304,186 | ) | — |
|
| Decrease in net assets from distributions | (19,197,525 | ) | (4,982,984 | ) |
| | | |
| Capital Share Transactions | | |
| Net increase (decrease) in net assets from capital share transactions (Note 5) | 131,338,951 |
| 151,014,125 |
|
| | | |
| Net increase (decrease) in net assets | 145,514,468 |
| 198,005,765 |
|
| | | |
| Net Assets | | |
| Beginning of period | 1,205,854,614 |
| 1,007,848,849 |
|
| End of period | $ | 1,351,369,082 |
| $ | 1,205,854,614 |
|
| | | |
| Undistributed (distributions in excess of) net investment income | $ | 11,206,954 |
| $ | (8,196,568 | ) |
See Notes to Financial Statements.
|
|
| Notes to Financial Statements |
OCTOBER 31, 2017
1. Organization
American Century International Bond Funds (the trust) is registered under the Investment Company Act of 1940, as amended (the 1940 Act), as an open-end management investment company and is organized as a Massachusetts business trust. Global Bond Fund (the fund) is one fund in a series issued by the trust. The fund’s investment objective is to seek long-term total return.
The fund offers the Investor Class, I Class, Y Class, A Class, C Class, R Class, R5 Class (formerly Institutional Class), R6 Class and G Class. The A Class may incur an initial sales charge. The A Class and C Class may be subject to a contingent deferred sales charge. Sale of the I Class and Y Class commenced on April 10, 2017 and sale of the G class commenced on July 28, 2017.
2. Significant Accounting Policies
The following is a summary of significant accounting policies consistently followed by the fund in preparation of its financial statements. The fund is an investment company and follows accounting and reporting guidance in accordance with accounting principles generally accepted in the United States of America. This may require management to make certain estimates and assumptions at the date of the financial statements. Actual results could differ from these estimates. Management evaluated the impact of events or transactions occurring through the date the financial statements were issued that would merit recognition or disclosure.
Investment Valuations — The fund determines the fair value of its investments and computes its net asset value per share at the close of regular trading (usually 4 p.m. Eastern time) on the New York Stock Exchange (NYSE) on each day the NYSE is open. The Board of Trustees has adopted valuation policies and procedures to guide the investment advisor in the fund’s investment valuation process and to provide methodologies for the oversight of the fund’s pricing function.
Fixed income securities are valued at the evaluated mean as provided by independent pricing services or at the mean of the most recent bid and asked prices as provided by investment dealers. Corporate bonds, U.S. Treasury and Government Agency securities, convertible bonds, municipal securities, and sovereign governments and agencies are valued using market models that consider trade data, quotations from dealers and active market makers, relevant yield curve and spread data, creditworthiness, trade data or market information on comparable securities, and other relevant security specific information. Mortgage-related and asset-backed securities are valued based on models that consider trade data, prepayment and default projections, benchmark yield and spread data and estimated cash flows of each tranche of the issuer. Fixed income securities initially expressed in local currencies are translated into U.S. dollars at the mean of the appropriate currency exchange rate at the close of the NYSE as provided by an independent pricing service.
Open-end management investment companies are valued at the reported net asset value per share. Repurchase agreements are valued at cost, which approximates fair value. Exchange-traded futures contracts are valued at the settlement price as provided by the appropriate clearing corporation. Swap agreements are valued at an evaluated mean as provided by independent pricing services or independent brokers. Forward foreign currency exchange contracts are valued at the mean of the appropriate forward exchange rate at the close of the NYSE as provided by an independent pricing service. Investments initially expressed in local currencies are translated into U.S. dollars at the mean of the appropriate currency exchange rate at the close of the NYSE as provided by an independent pricing service.
If the fund determines that the market price for an investment is not readily available or the valuation methods mentioned above do not reflect an investment’s fair value, such investment is valued as determined in good faith by the Board of Trustees or its delegate, in accordance with policies and procedures adopted by the Board of Trustees. In its determination of fair value, the fund may review several factors including, but not limited to, market information regarding the specific investment or comparable investments and correlation with other investment types, futures indices or general market indicators. Circumstances that may cause the fund to use these procedures to value an investment include, but are not limited to: an investment has been declared in default or is distressed; trading in a security has been suspended during the trading day or a security is not actively trading on its principal exchange; prices received from a regular pricing source are deemed unreliable; or there is a foreign market holiday and no trading occurred.
The fund monitors for significant events occurring after the close of an investment’s primary exchange but before the fund’s net asset value per share is determined. Significant events may include, but are not limited to: corporate announcements and transactions; governmental action and political unrest that could impact a specific investment or an investment sector; or armed conflicts, natural disasters and similar events that could affect investments in a specific country or region.
Security Transactions — Security transactions are accounted for as of the trade date. Net realized gains and losses are determined on the identified cost basis, which is also used for federal income tax purposes.
Investment Income — Interest income is recorded on the accrual basis and includes paydown gain (loss) and accretion of discounts and amortization of premiums. Inflation adjustments related to inflation-linked debt securities are reflected as interest income.
Foreign Currency Translations — All assets and liabilities initially expressed in foreign currencies are translated into U.S. dollars at prevailing exchange rates at period end. The fund may enter into spot foreign currency exchange contracts to facilitate transactions denominated in a foreign currency. Purchases and sales of investment securities, dividend and interest income, spot foreign currency exchange contracts, and expenses are translated at the rates of exchange prevailing on the respective dates of such transactions. Net realized and unrealized foreign currency exchange gains or losses related to investment securities are a component of net realized gain (loss) on investment transactions and change in net unrealized appreciation (depreciation) on investments, respectively.
Forward Commitments — The fund may engage in securities transactions on a forward commitment basis. In these transactions, the securities’ prices and yields are fixed on the date of the commitment. The fund may sell a to-be-announced (TBA) security and at the same time make a commitment to purchase the same security at a future date at a specified price. Conversely, the fund may purchase a TBA security and at the same time make a commitment to sell the same security at a future date at a specified price. These types of transactions are known as “TBA roll” transactions and are accounted for as purchases and sales. The fund will segregate cash, cash equivalents or other appropriate liquid securities on its records in amounts sufficient to meet the purchase price.
Repurchase Agreements — The fund may enter into repurchase agreements with institutions that American Century Investment Management, Inc. (ACIM) (the investment advisor) has determined are creditworthy pursuant to criteria adopted by the Board of Trustees. The fund requires that the collateral, represented by securities, received in a repurchase transaction be transferred to the custodian in a manner sufficient to enable the fund to obtain those securities in the event of a default under the repurchase agreement. ACIM monitors, on a daily basis, the securities transferred to ensure the value, including accrued interest, of the securities under each repurchase agreement is equal to or greater than amounts owed to the fund under each repurchase agreement.
Joint Trading Account — Pursuant to an Exemptive Order issued by the Securities and Exchange Commission, the fund, along with certain other funds in the American Century Investments family of funds, may transfer uninvested cash balances into a joint trading account. These balances are invested in one or more repurchase agreements that are collateralized by U.S. Treasury or Agency obligations.
Segregated Assets — In accordance with the 1940 Act, the fund segregates assets on its books and records to cover certain types of investments, including, but not limited to, futures contracts, forward commitments, when-issued securities, swap agreements and certain forward foreign currency exchange contracts. ACIM monitors, on a daily basis, the securities segregated to ensure the fund designates a sufficient amount of liquid assets, marked-to-market daily. The fund may also receive assets or be required to pledge assets at the custodian bank or with a broker for margin requirements on futures contracts, forward commitments, swap agreements and certain forward foreign currency exchange contracts.
Income Tax Status — It is the fund’s policy to distribute substantially all net investment income and net realized gains to shareholders and to otherwise qualify as a regulated investment company under provisions of the Internal Revenue Code. Accordingly, no provision has been made for income taxes. The fund files U.S. federal, state, local and non-U.S. tax returns as applicable. The fund's tax returns are subject to examination by the relevant taxing authority until expiration of the applicable statute of limitations, which is generally three years from the date of filing but can be longer in certain jurisdictions. At this time, management believes there are no uncertain tax positions which, based on their technical merit, would not be sustained upon examination and for which it is reasonably possible that the total amounts of unrecognized tax benefits will significantly change in the next twelve months.
Multiple Class — All shares of the fund represent an equal pro rata interest in the net assets of the class to which such shares belong, and have identical voting, dividend, liquidation and other rights and the same terms and conditions, except for class specific expenses and exclusive rights to vote on matters affecting only individual classes. Income, non-class specific expenses, and realized and unrealized capital gains and losses of the fund are allocated to each class of shares based on their relative net assets.
Distributions to Shareholders — Distributions from net investment income, if any, are generally declared and paid quarterly, but may be paid less frequently. Distributions from net realized gains, if any, are generally declared and paid annually.
Indemnifications — Under the trust’s organizational documents, its officers and trustees are indemnified against certain liabilities arising out of the performance of their duties to the fund. In addition, in the normal course of business, the fund enters into contracts that provide general indemnifications. The maximum exposure under these arrangements is unknown as this would involve future claims that may be made against a fund. The risk of material loss from such claims is considered by management to be remote.
3. Fees and Transactions with Related Parties
Certain officers and trustees of the trust are also officers and/or directors of American Century Companies, Inc. (ACC). The trust's investment advisor, ACIM, the trust's distributor, American Century Investment Services, Inc. (ACIS), and the trust's transfer agent, American Century Services, LLC, are wholly owned, directly or indirectly, by ACC. Various funds issued by American Century Asset Allocation Portfolios, Inc. own, in aggregate, 93% of the shares of the fund. Related parties do not invest in the fund for the purpose of exercising management or control.
Management Fees — The trust has entered into a management agreement with ACIM, under which ACIM provides the fund with investment advisory and management services in exchange for a single, unified management fee (the fee) per class. The agreement provides that all expenses of managing and operating the fund, except distribution and service fees, brokerage expenses, taxes, interest, fees and expenses of the independent trustees (including legal counsel fees), and extraordinary expenses, will be paid by ACIM. The fee is computed and accrued daily based on each class's daily net assets and paid monthly in arrears. The difference in the fee among the classes is a result of their separate arrangements for non-Rule 12b-1 shareholder services. It is not the result of any difference in advisory or custodial fees or other expenses related to the management of the fund’s assets, which do not vary by class. During the period ended October 31, 2017, the investment advisor agreed to waive 0.12% of the fund's management fee. The investment advisor expects this waiver to continue until July 31, 2018 and cannot terminate it prior to such date without the approval of the Board of Trustees. Effective July 28, 2017, the investment advisor agreed to waive the G Class’s management fee in its entirety. The investment advisor expects this waiver to remain in effect permanently and cannot terminate it without the approval of the Board of Trustees.
The annual management fee and the effective annual management fee after waiver for each class for the period ended October 31, 2017 are as follows:
|
| | |
| | Annual Management Fee | Effective Annual Management Fee After Waiver |
| Investor Class | 0.95% | 0.83% |
| I Class | 0.85% | 0.73% |
| Y Class | 0.75% | 0.63% |
| A Class | 0.95% | 0.83% |
| C Class | 0.95% | 0.83% |
| R Class | 0.95% | 0.83% |
| R5 Class | 0.75% | 0.63% |
| R6 Class | 0.70% | 0.58% |
| G Class | 0.70% | 0.00% |
Distribution and Service Fees — The Board of Trustees has adopted a separate Master Distribution and Individual Shareholder Services Plan for each of the A Class, C Class and R Class (collectively the plans), pursuant to Rule 12b-1 of the 1940 Act. The plans provide that the A Class will pay ACIS an annual distribution and service fee of 0.25%. The plans provide that the C Class will pay ACIS an annual distribution and service fee of 1.00%, of which 0.25% is paid for individual shareholder services and 0.75% is paid for distribution services. The plans provide that the R Class will pay ACIS an annual distribution and service fee of 0.50%. The fees are computed and accrued daily based on each class’s daily net assets and paid monthly in arrears. The fees are used to pay financial intermediaries for distribution and individual shareholder services. Fees incurred under the plans during the period ended October 31, 2017 are detailed in the Statement of Operations.
Trustees’ Fees and Expenses — The Board of Trustees is responsible for overseeing the investment advisor’s management and operations of the fund. The trustees receive detailed information about the fund and its investment advisor regularly throughout the year, and meet at least quarterly with management of the investment advisor to review reports about fund operations. The fund’s officers do not receive compensation from the fund.
Interfund Transactions — The fund may enter into security transactions with other American Century Investments funds and other client accounts of the investment advisor, in accordance with the 1940 Act rules and procedures adopted by the Board of Trustees. The rules and procedures require, among other things, that these transactions be effected at the independent current market price of the security. There were no interfund transactions during the period.
4. Investment Transactions
Purchases of investment securities, excluding short-term investments, for the period ended October 31, 2017 totaled $1,817,360,054, of which $871,036,830 represented U.S. Treasury and Government Agency obligations.
Sales of investment securities, excluding short-term investments, for the period ended October 31, 2017 totaled $1,706,421,831, of which $870,662,434 represented U.S. Treasury and Government Agency obligations.
5. Capital Share Transactions
Transactions in shares of the fund were as follows (unlimited number of shares authorized):
|
| | | | | | | | | | |
| | Year ended October 31, 2017(1) | Year ended
October 31, 2016 |
| | Shares | Amount | Shares | Amount |
| Investor Class | | | | |
| Sold | 4,649,418 |
| $ | 47,097,131 |
| 4,224,794 |
| $ | 42,509,590 |
|
| Issued in reinvestment of distributions | 370,083 |
| 3,700,038 |
| 101,891 |
| 994,455 |
|
| Redeemed | (2,187,286 | ) | (22,281,031 | ) | (1,475,601 | ) | (14,719,308 | ) |
| | 2,832,215 |
| 28,516,138 |
| 2,851,084 |
| 28,784,737 |
|
| I Class | | | N/A |
| |
| Sold | 1,162,741 |
| 11,976,601 |
| | |
| Redeemed | (20,916 | ) | (217,114 | ) | | |
| | 1,141,825 |
| 11,759,487 |
| | |
| Y Class | | | N/A |
| |
| Sold | 493 |
| 5,000 |
| | |
| A Class | | | | |
| Sold | 121,215 |
| 1,227,484 |
| 787,899 |
| 7,881,459 |
|
| Issued in reinvestment of distributions | 10,936 |
| 109,001 |
| 2,435 |
| 23,721 |
|
| Redeemed | (829,922 | ) | (8,392,635 | ) | (443,590 | ) | (4,465,296 | ) |
| | (697,771 | ) | (7,056,150 | ) | 346,744 |
| 3,439,884 |
|
| C Class | | | | |
| Sold | 15,173 |
| 151,490 |
| 430,034 |
| 4,242,958 |
|
| Issued in reinvestment of distributions | 629 |
| 6,215 |
| 93 |
| 901 |
|
| Redeemed | (296,410 | ) | (2,969,427 | ) | (26,572 | ) | (267,430 | ) |
| | (280,608 | ) | (2,811,722 | ) | 403,555 |
| 3,976,429 |
|
| R Class | | | | |
| Sold | 10,543 |
| 106,699 |
| 2,462 |
| 24,873 |
|
| Issued in reinvestment of distributions | 38 |
| 380 |
| 8 |
| 72 |
|
| Redeemed | (1,117 | ) | (11,293 | ) | (299 | ) | (3,048 | ) |
| | 9,464 |
| 95,786 |
| 2,171 |
| 21,897 |
|
| R5 Class | | | | |
| Sold | 9,113,393 |
| 92,123,729 |
| 13,580,611 |
| 137,428,131 |
|
| Issued in reinvestment of distributions | 1,353,329 |
| 13,547,910 |
| 372,734 |
| 3,641,614 |
|
| Redeemed | (88,213,711 | ) | (906,962,491 | ) | (6,122,727 | ) | (61,067,438 | ) |
| | (77,746,989 | ) | (801,290,852 | ) | 7,830,618 |
| 80,002,307 |
|
| R6 Class | | | | |
| Sold | 3,989,569 |
| 40,436,853 |
| 3,905,996 |
| 39,511,355 |
|
| Issued in reinvestment of distributions | 180,819 |
| 1,809,993 |
| 32,890 |
| 321,334 |
|
| Redeemed | (13,217,020 | ) | (135,904,020 | ) | (503,190 | ) | (5,043,818 | ) |
| | (9,046,632 | ) | (93,657,174 | ) | 3,435,696 |
| 34,788,871 |
|
| G Class | | | N/A |
| |
| Sold | 97,393,395 |
| 1,002,138,851 |
| | |
| Redeemed | (615,951 | ) | (6,360,413 | ) | | |
| | 96,777,444 |
| 995,778,438 |
| | |
| Net increase (decrease) | 12,989,441 |
| $ | 131,338,951 |
| 14,869,868 |
| $ | 151,014,125 |
|
| |
| (1) | April 10, 2017 (commencement of sale) through October 31, 2017 for the I Class and Y Class and July 28, 2017 (commencement of sale) through October 31, 2017 for the G Class. |
6. Fair Value Measurements
The fund’s investments valuation process is based on several considerations and may use multiple inputs to determine the fair value of the investments held by the fund. In conformity with accounting principles generally accepted in the United States of America, the inputs used to determine a valuation are classified into three broad levels.
| |
| • | Level 1 valuation inputs consist of unadjusted quoted prices in an active market for identical investments. |
| |
| • | Level 2 valuation inputs consist of direct or indirect observable market data (including quoted prices for comparable investments, evaluations of subsequent market events, interest rates, prepayment speeds, credit risk, etc.). These inputs also consist of quoted prices for identical investments initially expressed in local currencies that are adjusted through translation into U.S. dollars. |
| |
| • | Level 3 valuation inputs consist of unobservable data (including a fund’s own assumptions). |
The level classification is based on the lowest level input that is significant to the fair valuation measurement. The valuation inputs are not necessarily an indication of the risks associated with investing in these securities or other financial instruments. There were no significant transfers between levels during the period.
The following is a summary of the level classifications as of period end. The Schedule of Investments provides additional information on the fund’s portfolio holdings.
|
| | | | | | | | |
| | Level 1 | Level 2 | Level 3 |
| Assets | | | |
| Investment Securities | | | |
| Sovereign Governments and Agencies | — |
| $ | 540,577,082 |
| — |
|
| Corporate Bonds | — |
| 465,848,811 |
| — |
|
| U.S. Government Agency Mortgage-Backed Securities | — |
| 122,381,095 |
| — |
|
| Collateralized Mortgage Obligations | — |
| 80,301,436 |
| — |
|
| Commercial Mortgage-Backed Securities | — |
| 70,679,727 |
| — |
|
| Asset-Backed Securities | — |
| 51,338,117 |
| — |
|
| U.S. Treasury Securities | — |
| 8,991,158 |
| — |
|
| Municipal Securities | — |
| 6,837,190 |
| — |
|
| Temporary Cash Investments | — |
| 58,091,988 |
| — |
|
| | — |
| $ | 1,405,046,604 |
| — |
|
| Other Financial Instruments | | | |
| Futures Contracts | — |
| $ | 1,066,022 |
| — |
|
| Swap Agreements | — |
| 8,461,926 |
| — |
|
| Forward Foreign Currency Exchange Contracts | — |
| 17,809,644 |
| — |
|
| | — |
| $ | 27,337,592 |
| — |
|
| | | | |
| Liabilities | | | |
| Other Financial Instruments | | | |
| Futures Contracts | $ | 1,552,643 |
| $ | 561,953 |
| — |
|
| Swap Agreements | — |
| 4,465,413 |
| — |
|
| Forward Foreign Currency Exchange Contracts | — |
| 6,591,120 |
| — |
|
| | $ | 1,552,643 |
| $ | 11,618,486 |
| — |
|
7. Derivative Instruments
Credit Risk — The fund is subject to credit risk in the normal course of pursuing its investment objectives. The value of a bond generally declines as the credit quality of its issuer declines. Credit default swap agreements enable a fund to buy/sell protection against a credit event of a specific issuer or index. A fund may attempt to enhance returns by selling protection or attempt to mitigate credit risk by buying protection. The buyer/seller of credit protection against a security or basket of securities may pay/receive an up-front or periodic payment to compensate for/against potential default events. Changes in value, including the periodic amounts of interest to be paid or received on swap agreements, are recorded as unrealized appreciation
(depreciation) on swap agreements. Upon entering into a centrally cleared swap, a fund is required to deposit cash or securities (initial margin) with a financial intermediary in an amount equal to a certain percentage of the notional amount. Subsequent payments (variation margin) are made or received daily, in cash, by a fund. The variation margin is equal to the daily change in the value and is a component of unrealized gains and losses. Realized gain or loss is recorded upon receipt or payment of a periodic settlement or termination of swap agreements. Net realized and unrealized gains or losses occurring during the holding period of swap agreements are a component of net realized gain (loss) on swap agreement transactions and change in net unrealized appreciation (depreciation) on swap agreements, respectively. The risks of entering into swap agreements include the possible lack of liquidity, failure of the counterparty to meet its obligations, and that there may be unfavorable changes in the underlying investments or instruments. The fund's average notional amount held during the period was $25,272,200.
Foreign Currency Risk — The fund is subject to foreign currency exchange rate risk in the normal course of pursuing its investment objectives. The value of foreign investments held by a fund may be significantly affected by changes in foreign currency exchange rates. The dollar value of a foreign security generally decreases when the value of the dollar rises against the foreign currency in which the security is denominated and tends to increase when the value of the dollar declines against such foreign currency. A fund may enter into forward foreign currency exchange contracts to reduce a fund's exposure to foreign currency exchange rate fluctuations or to gain exposure to the fluctuations in the value of foreign currencies. The net U.S. dollar value of foreign currency underlying all contractual commitments held by a fund and the resulting unrealized appreciation or depreciation are determined daily. Realized gain or loss is recorded upon the termination of the contract. Net realized and unrealized gains or losses occurring during the holding period of forward foreign currency exchange contracts are a component of net realized gain (loss) on forward foreign currency exchange contract transactions and change in net unrealized appreciation (depreciation) on forward foreign currency exchange contracts, respectively. A fund bears the risk of an unfavorable change in the foreign currency exchange rate underlying the forward contract. Additionally, losses, up to the fair value, may arise if the counterparties do not perform under the contract terms. The fund's average U.S. dollar exposure to foreign currency risk derivative instruments held during the period was $968,338,804.
Interest Rate Risk — The fund is subject to interest rate risk in the normal course of pursuing its investment objectives. A fund may enter into futures contracts or interest rate swap agreements in order to manage its exposure to changes in market conditions. The value of bonds generally declines as interest rates rise. The risks of entering into interest rate risk derivative instruments include the possible lack of liquidity, failure of the counterparty to meet its obligations, and that there may be unfavorable changes in the underlying investments or instruments.
A fund may enter into futures contracts based on a bond index or a specific underlying security. A fund may purchase futures contracts to gain exposure to increases in market value or sell futures contracts to protect against a decline in market value. Upon entering into a futures contract, a fund will segregate cash, cash equivalents or other appropriate liquid securities on its records in amounts sufficient to meet requirements. Subsequent payments (variation margin) are made or received daily, in cash, by a fund. The variation margin is equal to the daily change in the contract value and is recorded as unrealized gains and losses. A fund recognizes a realized gain or loss when the futures contract is closed or expires. Net realized and unrealized gains or losses occurring during the holding period of futures contracts are a component of net realized gain (loss) on futures contract transactions and change in net unrealized appreciation (depreciation) on futures contracts, respectively. The fund's average notional exposure to these interest rate risk derivative instruments held during the period was $143,148,036 futures contracts purchased and $68,956,781 futures contracts sold.
A fund may enter into interest rate swap agreements to gain exposure to declines in interest rates, to protect against increases in interest rates, or to maintain its ability to generate income at prevailing interest rates. A fund will segregate cash, cash equivalents or other appropriate liquid securities on its records in amounts sufficient to meet requirements. Changes in value, including the periodic amounts of interest to be paid or received on swap agreements, are recorded as unrealized appreciation (depreciation) on swap agreements. Realized gain or loss is recorded upon receipt or payment of a periodic settlement or termination of swap agreements. Net realized and unrealized gains or losses occurring during the holding period of swap agreements are a component of net realized gain (loss) on swap agreement transactions and change in net unrealized appreciation (depreciation) on swap agreements, respectively. The fund's average notional amount on interest rate swap agreements during the period was $195,430,212.
Other Contracts — A fund may enter into total return swap agreements in order to attempt to obtain or preserve a particular return or spread at a lower cost than obtaining a return or spread through purchases and/or sales of instruments in other markets or gain exposure to certain markets in the most economical way possible. A fund will segregate cash, cash equivalents or other appropriate liquid securities on its records in amounts sufficient to meet requirements. Changes in value, including the periodic amounts of interest to be paid or received on swap agreements, are recorded as unrealized appreciation (depreciation) on swap agreements. Upon entering into a centrally cleared swap, a fund is required to deposit cash or securities (initial margin) with a financial intermediary in an amount equal to a certain percentage of the notional amount. Subsequent payments (variation margin) are made or received daily, in cash, by a fund. The variation margin is equal to the daily change in the value and is a component of unrealized gains and losses. Realized gain or loss is recorded upon receipt or payment of a periodic settlement or termination of swap agreements. Net realized and unrealized gains or losses occurring during the holding period of swap agreements are a component of net realized gain (loss) on swap agreement transactions and change in net unrealized appreciation (depreciation) on swap agreements, respectively. The risks of entering into swap agreements include the possible lack of liquidity, failure of the counterparty to meet its obligations, and that there may be unfavorable changes in the underlying investments or instruments, including inflationary risk. The fund's average notional amount held during the period was $46,533,333.
Value of Derivative Instruments as of October 31, 2017
|
| | | | | | | | |
| | Asset Derivatives | Liability Derivatives |
| Type of Risk Exposure | Location on Statement of Assets and Liabilities | Value | Location on Statement of Assets and Liabilities | Value |
| Credit Risk | Receivable for variation margin on swap agreements* | $ | 104,414 |
| Payable for variation margin on swap agreements* | — |
|
| Foreign Currency Risk | Unrealized appreciation on forward foreign currency exchange contracts | 17,809,644 |
| Unrealized depreciation on forward foreign currency exchange contracts | $ | 6,591,120 |
|
| Interest Rate Risk | Receivable for variation margin on futures contracts* | 39,030 |
| Payable for variation margin on futures contracts* | 75,792 |
|
| Interest Rate Risk | Swap agreements | 2,259,456 |
| Swap agreements | 3,742,510 |
|
| Other Contracts | Receivable for variation margin on swap agreements* | 9,067 |
| Payable for variation margin on swap agreements* | — |
|
| Other Contracts | Swap agreements | — |
| Swap agreements | 475,806 |
|
| | | $ | 20,221,611 |
| | $ | 10,885,228 |
|
| |
| * | Included in the unrealized appreciation (depreciation) on centrally cleared swap agreements and futures contracts, as applicable, as reported in the Schedule of Investments. |
Effect of Derivative Instruments on the Statement of Operations for the Year Ended October 31, 2017
|
| | | | | | | | |
| | Net Realized Gain (Loss) | Change in Net Unrealized Appreciation (Depreciation) |
| Type of Risk Exposure | Location on Statement of Operations | Value | Location on Statement of Operations | Value |
| Credit Risk | Net realized gain (loss) on swap agreement transactions | $ | 1,469,715 |
| Change in net unrealized appreciation (depreciation) on swap agreements | $ | 505,271 |
|
| Foreign Currency Risk | Net realized gain (loss) on forward foreign currency exchange contract transactions | 5,724,793 |
| Change in net unrealized appreciation (depreciation) on forward foreign currency exchange contracts | (9,595,144 | ) |
| Interest Rate Risk | Net realized gain (loss) on futures contract transactions | 2,224,943 |
| Change in net unrealized appreciation (depreciation) on futures contracts | (1,388,195) |
|
| Interest Rate Risk | Net realized gain (loss) on swap agreement transactions | (514,852 | ) | Change in net unrealized appreciation (depreciation) on swap agreements | (1,483,054) |
|
| Other Contracts | Net realized gain (loss) on swap agreement transactions | — |
| Change in net unrealized appreciation (depreciation) on swap agreements | (725,144) |
|
| | | $ | 8,904,599 |
| | $ | (12,686,266 | ) |
Counterparty Risk — The fund is subject to counterparty risk, or the risk that an institution will fail to perform its obligations to the fund. The investment advisor attempts to minimize counterparty risk prior to entering into transactions by performing extensive reviews of the creditworthiness of all potential counterparties. The fund may also enter into agreements that provide provisions for legally enforceable master netting arrangements to manage the credit risk between counterparties related to forward foreign currency exchange contracts and/or over-the-counter swap agreements. A master netting arrangement provides for the net settlement of multiple contracts with a single counterparty through a single payment in the event of default or termination of any one contract. To mitigate counterparty risk, the fund may receive assets or be required to pledge assets at the custodian bank or with a broker as designated under prescribed collateral provisions.
The fund does not offset assets and liabilities subject to master netting arrangements on the Statement of Assets and Liabilities for financial reporting purposes. The fund’s asset derivatives and liability derivatives that are subject to legally enforceable offsetting arrangements as of period end were as follows:
|
| | | | | | | | | | | | |
| Counterparty | Gross Amount
on Statement
of Assets
and Liabilities | Amount
Eligible
for Offset | Collateral | Net
Exposure* |
| Assets | | | | |
| Bank of America N.A | $ | 1,783,513 |
| $ | (1,783,513 | ) | — |
| — |
|
| Barclays Bank plc | 13,158 |
| (13,158 | ) | — |
| — |
|
| Credit Suisse AG | 3,268,902 |
| (684,807 | ) | — |
| $ | 2,584,095 |
|
| Goldman Sachs & Co. | 857,740 |
| (857,740 | ) | — |
| — |
|
| JPMorgan Chase Bank N.A. | 13,354,978 |
| (4,607,271 | ) | $ | (270,000 | ) | 8,477,707 |
|
| Morgan Stanley | 790,809 |
| (790,809 | ) | — |
| — |
|
| | $ | 20,069,100 |
| $ | (8,737,298 | ) | $ | (270,000 | ) | $ | 11,061,802 |
|
| | | | | |
| Liabilities | | | | |
| Bank of America N.A | $ | 2,728,009 |
| $ | (1,783,513 | ) | $ | (907,009 | ) | $ | 37,487 |
|
| Barclays Bank plc | 343,661 |
| (13,158 | ) | — |
| 330,503 |
|
| Credit Suisse AG | 684,807 |
| (684,807 | ) | — |
| — |
|
| Goldman Sachs & Co. | 1,240,698 |
| (857,740 | ) | — |
| 382,958 |
|
| JPMorgan Chase Bank N.A. | 4,607,271 |
| (4,607,271 | ) | — |
| — |
|
| Morgan Stanley | 1,204,990 |
| (790,809 | ) | (414,181 | ) | — |
|
| | $ | 10,809,436 |
| $ | (8,737,298 | ) | $ | (1,321,190 | ) | $ | 750,948 |
|
*The net exposure represents the amount receivable from the counterparty or amount payable to the counterparty in the event of default or termination.
8. Risk Factors
There are certain risks involved in investing in foreign securities. These risks include those resulting from future adverse political, social and economic developments, fluctuations in currency exchange rates, the possible imposition of exchange controls, and other foreign laws or restrictions. Investing in emerging markets may accentuate these risks.
The fund’s investment process may result in high portfolio turnover, which could mean high transaction costs, affecting both performance and capital gains tax liabilities to investors.
9. Federal Tax Information
The tax character of distributions paid during the years ended October 31, 2017 and October 31, 2016 were as follows:
|
| | | | | | |
| | 2017 | 2016 |
| Distributions Paid From | | |
| Ordinary income | $ | 19,197,525 |
| $ | 4,982,984 |
|
| Long-term capital gains | — |
| — |
|
The book-basis character of distributions made during the year from net investment income or net realized gains may differ from their ultimate characterization for federal income tax purposes. These differences reflect the differing character of certain income items and net realized gains and losses for financial statement and tax purposes, and may result in reclassification among certain capital accounts on the financial statements.
The reclassifications, which are primarily due to foreign currency gains and losses, were made to undistributed net investment income $14,575,118 and undistributed net realized gain $(14,575,118).
As of period end, the federal tax cost of investments and the components of distributable earnings on a tax-basis were as follows:
|
| | | |
| Federal tax cost of investments | $ | 1,381,133,684 |
|
| Gross tax appreciation of investments | $ | 33,648,592 |
|
| Gross tax depreciation of investments | (9,735,672 | ) |
| Net tax appreciation (depreciation) of investments | 23,912,920 |
|
Net tax appreciation (depreciation) on derivatives and translation of assets and liabilities in foreign currencies | $ | (2,291,406 | ) |
| Net tax appreciation (depreciation) | $ | 21,621,514 |
|
| Other book-to-tax adjustments | $ | (250,522 | ) |
| Undistributed ordinary income | $ | 27,913,474 |
|
| Accumulated long-term gains | $ | 224,685 |
|
The difference between book-basis and tax-basis unrealized appreciation (depreciation) is attributable primarily to the realization for tax purposes of unrealized gains (losses) on certain foreign currency exchange contracts. Other book-to-tax adjustments are attributable primarily to the tax deferral of losses on straddle positions.
10. Recently Issued Accounting Standards
In March 2017, the Financial Accounting Standards Board (FASB) issued Accounting Standards Update No.2017-08, “Receivables - Nonrefundable Fees and Other Costs (Subtopic 310-20), Premium Amortization on Purchased Callable Debt Securities” (ASU 2017-08). ASU 2017-08 amends the amortization period for certain purchased callable debt securities held at a premium, shortening such period to the earliest call date. The amendments are effective for fiscal years, and interim periods within those fiscal years, beginning after December 15, 2018. Management is currently evaluating the impact that adopting ASU 2017-08 will have on
the financial statements.
|
| | | | | | | | | | | | | | | | | |
| For a Share Outstanding Throughout the Years Ended October 31 (except as noted) |
| Per-Share Data | Ratios and Supplemental Data |
| | | Income From Investment Operations: | Distributions From: | | | Ratio to Average Net Assets of: | | |
| | Net Asset Value, Beginning of Period | Net Investment Income (Loss)(1) | Net Realized and Unrealized Gain (Loss) | Total From Investment Operations | Net Investment Income | Net Realized Gains | Total Distributions | Net Asset Value, End of Period | Total Return(2) | Operating Expenses | Operating Expenses (before expense waiver) | Net Investment Income (Loss) | Net Investment Income (Loss) (before expense waiver) | Portfolio Turnover Rate | Net Assets, End of Period (in thousands) |
| Investor Class |
| 2017 | $10.28 | 0.13 | 0.09 | 0.22 | (0.11) | (0.03) | (0.14) | $10.36 | 2.23% | 0.84% | 0.96% | 1.32% | 1.20% | 130% |
| $294,535 |
|
| 2016 | $9.86 | 0.12 | 0.34 | 0.46 | (0.04) | — | (0.04) | $10.28 | 4.72% | 0.84% | 0.96% | 1.18% | 1.06% | 106% |
| $263,312 |
|
2015(3) | $9.71 | 0.04 | 0.11 | 0.15 | — | — | — | $9.86 | 1.54% | 0.87%(4) | 0.96%(4) | 1.08%(4) | 0.99%(4) | 37% |
| $224,271 |
|
| 2015 | $9.93 | 0.08 | 0.14(5) | 0.22 | (0.44) | — | (0.44) | $9.71 | 2.18% | 0.95% | 0.95% | 0.73% | 0.73% | 114% |
| $219,606 |
|
| 2014 | $9.98 | 0.16 | 0.25 | 0.41 | (0.42) | (0.04) | (0.46) | $9.93 | 4.25% | 0.96% | 0.96% | 1.64% | 1.64% | 71% |
| $10,704 |
|
| 2013 | $10.19 | 0.13 | 0.01 | 0.14 | (0.34) | (0.01) | (0.35) | $9.98 | 1.34% | 0.96% | 0.96% | 1.31% | 1.31% | 68% |
| $9,590 |
|
| I Class |
2017(6) | $10.14 | 0.09 | 0.15 | 0.24 | — | — | — | $10.38 | 2.37% | 0.74%(4) | 0.86%(4) | 1.51%(4) | 1.39%(4) | 130%(7) |
| $11,856 |
|
| Y Class |
2017(6) | $10.14 | 0.09 | 0.16 | 0.25 | — | — | — | $10.39 | 2.47% | 0.64%(4) | 0.76%(4) | 1.59%(4) | 1.47%(4) | 130%(7) |
| $5 |
|
|
| | | | | | | | | | | | | | | | | |
| For a Share Outstanding Throughout the Years Ended October 31 (except as noted) |
| Per-Share Data | Ratios and Supplemental Data |
| | | Income From Investment Operations: | Distributions From: | | | Ratio to Average Net Assets of: | | |
| | Net Asset Value, Beginning of Period | Net Investment Income (Loss)(1) | Net Realized and Unrealized Gain (Loss) | Total From Investment Operations | Net Investment Income | Net Realized Gains | Total Distributions | Net Asset Value, End of Period | Total Return(2) | Operating Expenses | Operating Expenses (before expense waiver) | Net Investment Income (Loss) | Net Investment Income (Loss) (before expense waiver) | Portfolio Turnover Rate | Net Assets, End of Period (in thousands) |
| A Class |
| 2017 | $10.24 | 0.10 | 0.09 | 0.19 | (0.09) | (0.03) | (0.12) | $10.31 | 1.88% | 1.09% | 1.21% | 1.07% | 0.95% | 130% |
| $2,157 |
|
| 2016 | $9.83 | 0.09 | 0.36 | 0.45 | (0.04) | — | (0.04) | $10.24 | 4.55% | 1.09% | 1.21% | 0.93% | 0.81% | 106% |
| $9,284 |
|
2015(3) | $9.69 | 0.03 | 0.11 | 0.14 | — | — | — | $9.83 | 1.44% | 1.12%(4) | 1.21%(4) | 0.83%(4) | 0.74%(4) | 37% |
| $5,506 |
|
| 2015 | $9.91 | 0.13 | 0.06(5) | 0.19 | (0.41) | — | (0.41) | $9.69 | 1.93% | 1.20% | 1.20% | 0.48% | 0.48% | 114% |
| $3,033 |
|
| 2014 | $9.97 | 0.14 | 0.24 | 0.38 | (0.40) | (0.04) | (0.44) | $9.91 | 3.97% | 1.21% | 1.21% | 1.39% | 1.39% | 71% |
| $7,268 |
|
| 2013 | $10.18 | 0.11 | —(8) | 0.11 | (0.31) | (0.01) | (0.32) | $9.97 | 1.11% | 1.21% | 1.21% | 1.06% | 1.06% | 68% |
| $6,729 |
|
| C Class |
| 2017 | $10.10 | 0.03 | 0.08 | 0.11 | (0.01) | (0.03) | (0.04) | $10.17 | 1.13% | 1.84% | 1.96% | 0.32% | 0.20% | 130% |
| $1,824 |
|
| 2016 | $9.75 | 0.02 | 0.34 | 0.36 | (0.01) | — | (0.01) | $10.10 | 3.72% | 1.84% | 1.96% | 0.18% | 0.06% | 106% |
| $4,646 |
|
2015(3) | $9.64 | —(8) | 0.11 | 0.11 | — | — | — | $9.75 | 1.14% | 1.87%(4) | 1.96%(4) | 0.08%(4) | (0.01)%(4) | 37% |
| $549 |
|
| 2015 | $9.85 | 0.07 | 0.06(5) | 0.13 | (0.34) | — | (0.34) | $9.64 | 1.26% | 1.95% | 1.95% | (0.27)% | (0.27)% | 114% |
| $629 |
|
| 2014 | $9.93 | 0.06 | 0.25 | 0.31 | (0.35) | (0.04) | (0.39) | $9.85 | 3.21% | 1.96% | 1.96% | 0.64% | 0.64% | 71% |
| $2,847 |
|
| 2013 | $10.15 | 0.03 | —(8) | 0.03 | (0.24) | (0.01) | (0.25) | $9.93 | 0.32% | 1.96% | 1.96% | 0.31% | 0.31% | 68% |
| $2,781 |
|
|
| | | | | | | | | | | | | | | | | |
| For a Share Outstanding Throughout the Years Ended October 31 (except as noted) |
| Per-Share Data | Ratios and Supplemental Data |
| | | Income From Investment Operations: | Distributions From: | | | Ratio to Average Net Assets of: | | |
| | Net Asset Value, Beginning of Period | Net Investment Income (Loss)(1) | Net Realized and Unrealized Gain (Loss) | Total From Investment Operations | Net Investment Income | Net Realized Gains | Total Distributions | Net Asset Value, End of Period | Total Return(2) | Operating Expenses | Operating Expenses (before expense waiver) | Net Investment Income (Loss) | Net Investment Income (Loss) (before expense waiver) | Portfolio Turnover Rate | Net Assets, End of Period (in thousands) |
| R Class |
| 2017 | $10.19 | 0.09 | 0.07 | 0.16 | (0.06) | (0.03) | (0.09) | $10.26 | 1.63% | 1.34% | 1.46% | 0.82% | 0.70% | 130% |
| $146 |
|
| 2016 | $9.80 | 0.07 | 0.35 | 0.42 | (0.03) | — | (0.03) | $10.19 | 4.28% | 1.34% | 1.46% | 0.68% | 0.56% | 106% |
| $48 |
|
2015(3) | $9.67 | 0.02 | 0.11 | 0.13 | — | — | — | $9.80 | 1.34% | 1.37%(4) | 1.46%(4) | 0.58%(4) | 0.49%(4) | 37% |
| $25 |
|
| 2015 | $9.89 | 0.12 | 0.05(5) | 0.17 | (0.39) | — | (0.39) | $9.67 | 1.67% | 1.45% | 1.45% | 0.23% | 0.23% | 114% |
| $25 |
|
| 2014 | $9.95 | 0.11 | 0.25 | 0.36 | (0.38) | (0.04) | (0.42) | $9.89 | 3.78% | 1.46% | 1.46% | 1.14% | 1.14% | 71% |
| $2,841 |
|
| 2013 | $10.17 | 0.08 | —(8) | 0.08 | (0.29) | (0.01) | (0.30) | $9.95 | 0.78% | 1.46% | 1.46% | 0.81% | 0.81% | 68% |
| $2,739 |
|
R5 Class(9) |
| 2017 | $10.31 | 0.15 | 0.10 | 0.25 | (0.14) | (0.03) | (0.17) | $10.39 | 2.43% | 0.64% | 0.76% | 1.52% | 1.40% | 130% |
| $32,206 |
|
| 2016 | $9.87 | 0.14 | 0.35 | 0.49 | (0.05) | — | (0.05) | $10.31 | 4.98% | 0.64% | 0.76% | 1.38% | 1.26% | 106% |
| $833,757 |
|
2015(3) | $9.72 | 0.04 | 0.12 | 0.16 | (0.01) | — | (0.01) | $9.87 | 1.61% | 0.67%(4) | 0.76%(4) | 1.28%(4) | 1.19%(4) | 37% |
| $720,700 |
|
| 2015 | $9.95 | 0.09 | 0.14(5) | 0.23 | (0.46) | — | (0.46) | $9.72 | 2.28% | 0.75% | 0.75% | 0.93% | 0.93% | 114% |
| $728,768 |
|
| 2014 | $9.99 | 0.18 | 0.25 | 0.43 | (0.43) | (0.04) | (0.47) | $9.95 | 4.50% | 0.76% | 0.76% | 1.84% | 1.84% | 71% |
| $8,091 |
|
| 2013 | $10.20 | 0.15 | 0.01 | 0.16 | (0.36) | (0.01) | (0.37) | $9.99 | 1.53% | 0.76% | 0.76% | 1.51% | 1.51% | 68% |
| $7,745 |
|
|
| | | | | | | | | | | | | | | | | |
| For a Share Outstanding Throughout the Years Ended October 31 (except as noted) |
| Per-Share Data | Ratios and Supplemental Data |
| | | Income From Investment Operations: | Distributions From: | | | Ratio to Average Net Assets of: | | |
| | Net Asset Value, Beginning of Period | Net Investment Income (Loss)(1) | Net Realized and Unrealized Gain (Loss) | Total From Investment Operations | Net Investment Income | Net Realized Gains | Total Distributions | Net Asset Value, End of Period | Total Return(2) | Operating Expenses | Operating Expenses (before expense waiver) | Net Investment Income (Loss) | Net Investment Income (Loss) (before expense waiver) | Portfolio Turnover Rate | Net Assets, End of Period (in thousands) |
| R6 Class |
| 2017 | $10.32 | 0.16 | 0.08 | 0.24 | (0.14) | (0.03) | (0.17) | $10.39 | 2.38% | 0.59% | 0.71% | 1.57% | 1.45% | 130% |
| $1,489 |
|
| 2016 | $9.87 | 0.14 | 0.36 | 0.50 | (0.05) | — | (0.05) | $10.32 | 5.10% | 0.59% | 0.71% | 1.43% | 1.31% | 106% |
| $94,808 |
|
2015(3) | $9.72 | 0.04 | 0.12 | 0.16 | (0.01) | — | (0.01) | $9.87 | 1.64% | 0.62%(4) | 0.71%(4) | 1.33%(4) | 1.24%(4) | 37% |
| $56,798 |
|
| 2015 | $9.95 | 0.09 | 0.14(5) | 0.23 | (0.46) | — | (0.46) | $9.72 | 2.34% | 0.70% | 0.70% | 0.98% | 0.98% | 114% |
| $53,780 |
|
2014(10) | $10.03 | 0.17 | 0.22 | 0.39 | (0.43) | (0.04) | (0.47) | $9.95 | 4.12% | 0.71%(4) | 0.71%(4) | 1.91%(4) | 1.91%(4) | 71%(11) |
| $26 |
|
| G Class |
2017(12) | $10.29 | 0.06 | 0.06 | 0.12 | — | — | — | $10.41 | 1.17% | 0.01%(4) | 0.71%(4) | 2.27%(4) | 1.57%(4) | 130%(7) |
| $1,007,151 |
|
|
| | | | |
| Notes to Financial Highlights | | |
| |
| (1) | Computed using average shares outstanding throughout the period. |
| |
| (2) | Total returns are calculated based on the net asset value of the last business day and do not reflect applicable sales charges, if any. Total returns for periods less than one year are not annualized. |
| |
| (3) | July 1, 2015 through October 31, 2015. The fund's fiscal year end was changed from June 30 to October 31, resulting in a four-month annual reporting period. For the years before October 31, 2015, the fund's fiscal year end was June 30. |
| |
| (5) | Per-share amount was not in accord with the net realized and unrealized gain (loss) for the period because of the timing of transactions in shares of the fund and the amount and timing of per-share net realized and unrealized gain (loss) on such shares. |
| |
| (6) | April 10, 2017 (commencement of sale) through October 31, 2017. |
| |
| (7) | Portfolio turnover is calculated at the fund level. Percentage indicated was calculated for the year ended October 31, 2017. |
| |
| (8) | Per-share amount was less than $0.005. |
| |
| (9) | Prior to April 10, 2017, the R5 Class was referred to as the Institutional Class. |
| |
| (10) | July 26, 2013 (commencement of sale) through June 30, 2014. |
| |
| (11) | Portfolio turnover is calculated at the fund level. Percentage indicated was calculated for the year ended June 30, 2014. |
| |
| (12) | July 28, 2017 (commencement of sale) through October 31, 2017. |
See Notes to Financial Statements.
|
|
| Report of Independent Registered Public Accounting Firm |
To the Board of Trustees of the American Century International Bond Funds and Shareholders of the Global Bond Fund:
In our opinion, the accompanying statement of assets and liabilities, including the schedule of investments, and the related statements of operations and of changes in net assets and the financial highlights present fairly, in all material respects, the financial position of the Global Bond Fund (one of the three funds constituting the American Century International Bond Funds, hereafter referred to as the "Fund") as of October 31, 2017, the results of its operations for the year then ended, the changes in its net assets for each of the two years in the period then ended and the financial highlights for each of the periods indicated, in conformity with accounting principles generally accepted in the United States of America. These financial statements and financial highlights (hereafter referred to as "financial statements") are the responsibility of the Fund's management. Our responsibility is to express an opinion on these financial statements based on our audits. We conducted our audits of these financial statements in accordance with the standards of the Public Company Accounting Oversight Board (United States). Those standards require that we plan and perform the audit to obtain reasonable assurance about whether the financial statements are free of material misstatement. An audit includes examining, on a test basis, evidence supporting the amounts and disclosures in the financial statements, assessing the accounting principles used and significant estimates made by management, and evaluating the overall financial statement presentation. We believe that our audits, which included confirmation of securities as of October 31, 2017 by correspondence with the custodian and brokers, provide a reasonable basis for our opinion.
/s/ PricewaterhouseCoopers LLP
Kansas City, Missouri
December 18, 2017
Board of Trustees
The individuals listed below serve as trustees of the funds. Each trustee will continue to serve in this capacity until death, retirement, resignation or removal from office. The board has adopted a mandatory retirement age for trustees who are not “interested persons,” as that term is defined in the Investment Company Act (independent trustees). Independent trustees shall retire on December 31 of the year in which they reach their 75th birthday; provided, however, that on or after January 1, 2022, independent trustees shall retire on December 31 of the year in which they reach their 76th birthday.
Mr. Thomas is an “interested person” because he currently serves as President and Chief Executive Officer of American Century Companies, Inc. (ACC), the parent company of American Century Investment Management, Inc. (ACIM or the advisor). The other trustees (more than three-fourths of the total number) are independent. They are not employees, directors or officers of, and have no financial interest in, ACC or any of its wholly owned, direct or indirect, subsidiaries, including ACIM, American Century Investment Services, Inc. (ACIS) and American Century Services, LLC (ACS), and they do not have any other affiliations, positions or relationships that would cause them to be considered “interested persons” under the Investment Company Act. The trustees serve in this capacity for eight (in the case of Mr. Thomas, 15) registered investment companies in the American Century Investments family of funds.
The following table presents additional information about the trustees. The mailing address for each trustee other than Mr. Thomas is 1665 Charleston Road, Mountain View, California 94043. The mailing address for Mr. Thomas is 4500 Main Street, Kansas City, Missouri 64111.
|
| | | | | |
Name
(Year of Birth) | Position(s) Held with Funds | Length of Time Served | Principal Occupation(s) During Past 5 Years | Number of American Century Portfolios Overseen by Trustee | Other Directorships Held During Past 5 Years |
| Independent Trustees |
|
|
Tanya S. Beder
(1955) | Trustee | Since 2011 | Chairman and CEO, SBCC Group Inc. (independent advisory services) (2006 to present) | 45 | CYS Investments, Inc.; Nabors Industries Ltd. |
Jeremy I. Bulow
(1954) | Trustee | Since 2011 | Professor of Economics, Stanford University, Graduate School of Business (1979 to present) | 45 | None |
Anne Casscells
(1958) | Trustee | Since 2016 | Co-Chief Executive Officer and Chief Investment Officer, Aetos Alternatives Management (investment advisory firm) (2001 to present); Lecturer in Accounting, Stanford University, Graduate School of Business (2009 to present) | 45 | None |
Ronald J. Gilson
(1946) | Trustee and Chairman of the Board | Since 1995
(Chairman since 2005) | Charles J. Meyers Professor of Law and Business, Emeritus, Stanford Law School (1979 to present); Marc and Eva Stern Professor of Law and Business, Columbia University School of Law (1992 to present) | 45 | None |
|
| | | | | |
Name
(Year of Birth) | Position(s) Held with Funds | Length of Time Served | Principal Occupation(s) During Past 5 Years | Number of American Century Portfolios Overseen by Trustee | Other Directorships Held During Past 5 Years |
| Independent Trustees |
|
|
Frederick L. A. Grauer
(1946) | Trustee | Since 2008 | Senior Advisor, iShares by BlackRock, Inc. (investment management firm) (2010 to 2011, 2013 to 2015); Senior Advisor, Course Hero (an educational technology company) (2015 to present) | 45 | None |
Jonathan D. Levin
(1972) | Trustee | Since 2016 | Philip H. Knight Professor and Dean, Graduate School of Business, Stanford University (2016 to present); Professor, Stanford University, (2000 to present); Chair, Department of Economics, Stanford University (2011 to 2014) | 45 | None |
Peter F. Pervere
(1947) | Trustee | Since 2007 | Retired | 45 | None |
John B. Shoven
(1947) | Trustee | Since 2002 | Charles R. Schwab Professor of Economics, Stanford University (1973 to present) | 45 | Cadence Design Systems; Exponent; Financial Engines |
| Interested Trustee |
|
|
Jonathan S. Thomas
(1963) | Trustee and President | Since 2007 | President and Chief Executive Officer, ACC (March 2007 to present). Also serves as Chief Executive Officer, ACS; Executive Vice President, ACIM; Director, ACC, ACIM and other ACC subsidiaries | 114 | BioMed Valley Discoveries, Inc. |
The Statement of Additional Information has additional information about the fund's trustees and is available without charge, upon request, by calling 1-800-345-2021.
Officers
The following table presents certain information about the executive officers of the funds. Each officer serves as an officer for each of the 15 investment companies in the American Century family of funds, unless otherwise noted. No officer is compensated for his or her service as an officer of the funds. The listed officers are interested persons of the funds and are appointed or re-appointed on an annual basis. The mailing address for each of the officers listed below is 4500 Main Street, Kansas City, Missouri 64111.
|
| | |
Name
(Year of Birth) | Offices with the Funds | Principal Occupation(s) During the Past Five Years |
Jonathan S. Thomas
(1963) | Trustee and President since 2007 | President and Chief Executive Officer, ACC (2007 to present). Also serves as Chief Executive Officer, ACS; Executive Vice President, ACIM; Director, ACC, ACIM and other ACC subsidiaries |
Amy D. Shelton
(1964) | Chief Compliance Officer and Vice President since 2014 | Chief Compliance Officer, American Century funds, (2014 to present); Chief Compliance Officer, ACIM (2014 to present); Chief Compliance Officer, ACIS (2009 to present); Vice President, Client Interactions and Marketing, ACIS (2013 to 2014); Director, Client Interactions and Marketing, ACIS (2007 to 2013). Also serves as Vice President, ACIS |
Charles A. Etherington
(1957) | General Counsel since 2007 and Senior Vice President since 2006 | Attorney, ACC (1994 to present); Vice President, ACC (2005 to present); General Counsel, ACC (2007 to present). Also serves as General Counsel, ACIM, ACS, ACIS and other ACC subsidiaries; and Senior Vice President, ACIM and ACS |
C. Jean Wade
(1964) | Vice President, Treasurer and Chief Financial Officer since 2012 | Vice President, ACS (2000 to present) |
Robert J. Leach
(1966) | Vice President since 2006 and Assistant Treasurer since 2012 | Vice President, ACS (2000 to present) |
David H. Reinmiller
(1963) | Vice President since 2000 | Attorney, ACC (1994 to present); Associate General Counsel, ACC (2001 to present). Also serves as Vice President, ACIM and ACS |
Ward D. Stauffer
(1960) | Secretary since 2005 | Attorney, ACC (2003 to present) |
|
|
| Approval of Management Agreement |
At a meeting held on June 14, 2017, the Fund’s Board of Trustees (the "Board") unanimously approved the renewal of the management agreement pursuant to which American Century Investment Management, Inc. (the “Advisor”) acts as the investment advisor for the Fund. Under Section 15(c) of the Investment Company Act, contracts for investment advisory services are required to be reviewed, evaluated, and approved by a majority of a fund’s directors/trustees, including a majority of the independent Trustees, each year. The Board regards this annual evaluation and renewal as one of its most important responsibilities.
The independent Trustees have memorialized a statement regarding the relationship between their ongoing obligations to oversee and evaluate the performance of the Advisor and their annual consideration of renewal of the management agreement. In that statement, the independent Trustees noted that their assessment of the Advisor’s performance is an ongoing process that takes place over the entire year and is informed by all of the extensive information that the Board and its committees receive and consider over time. This information, together with the additional materials provided specifically in connection with the review, are central to the Board’s assessment of the Advisor’s performance and its determination whether to renew the Fund’s management agreement.
Prior to its consideration of the renewal of the management agreement, the Board requested and reviewed extensive data and analysis relating to the proposed renewal. This information and analysis was compiled by the Advisor and certain independent providers of evaluation data concerning the Fund and the services provided to the Fund by the Advisor.
In connection with its consideration of the renewal of the management agreement, the Board’s review and evaluation of the services provided by the Advisor included, but was not limited to, the following:
| |
| • | the nature, extent, and quality of investment management, shareholder services, and other services provided by the Advisor to the Fund; |
| |
| • | the wide range of other programs and services the Advisor provides to the Fund and its shareholders on a routine and non-routine basis; |
| |
| • | the investment performance of the Fund, including data comparing the Fund’s performance to appropriate benchmarks and/or a peer group of other mutual funds with similar investment objectives and strategies; |
| |
| • | the cost of owning the Fund compared to the cost of owning similar funds; |
| |
| • | the compliance policies, procedures, and regulatory experience of the Advisor and the Fund's service providers; |
| |
| • | financial data showing the cost of services provided to the Fund, the profitability of the Fund to the Advisor, and the overall profitability of the Advisor; |
| |
| • | strategic plans of the Advisor; |
| |
| • | possible economies of scale associated with the Advisor’s management of the Fund and other accounts under its management; |
| |
| • | data comparing services provided and charges to the Advisor's other investment management clients; |
| |
| • | acquired fund fees and expenses; |
| |
| • | payments and practices by the Fund and the Advisor regarding financial intermediaries whose clients are investors in the Fund, the nature of services provided by intermediaries, and the terms of share classes utilized; and |
| |
| • | any collateral benefits derived by the Advisor from the management of the Fund. |
In keeping with its practice, the Board held two in-person meetings to review and discuss the information provided in response to their request and held active discussions with the Advisor regarding the renewal of the management agreement. The independent Trustees had the benefit of the advice of their independent counsel throughout the process.
Factors Considered
The Trustees considered all of the information provided by the Advisor, the independent data providers, and the independent Trustees’ independent counsel in connection with the approval. They determined that the information was sufficient for them to evaluate the management agreement for the Fund. In connection with their review, the Trustees did not identify any single factor as being all-important or controlling and each Trustee may have attributed different levels of importance to different factors. In deciding to renew the management agreement, the Board based its decision on a number of factors, including without limitation the following:
Nature, Extent and Quality of Services - Generally. Under the management agreement, the Advisor is responsible for providing or arranging for all services necessary for the operation of the Fund. The Board noted that the Advisor provides or arranges at its own expense a wide variety of services including without limitation the following:
| |
| • | constructing and designing the Fund |
| |
| • | portfolio research and security selection |
| |
| • | initial capitalization/funding |
| |
| • | daily valuation of the Fund’s portfolio |
| |
| • | shareholder servicing and transfer agency, including shareholder confirmations, recordkeeping, and communications |
| |
| • | legal services (except the independent Trustees’ counsel) |
| |
| • | regulatory and portfolio compliance |
| |
| • | marketing and distribution (except amounts paid by the Fund under Rule 12b-1 plans) |
The Board noted that many of these services have expanded over time in terms of both quantity and complexity in response to shareholder demands, competition in the industry, changing distribution channels, and the changing regulatory environment.
Investment Management, Shareholder, and Other Services. The nature of the investment management services provided to the Fund is quite complex and allows Fund shareholders access to professional money management, instant diversification of their investments within an asset class, the opportunity to easily diversify among asset classes by investing in or exchanging among various American Century Investments funds, and liquidity. In evaluating investment performance, the Board expects the Advisor to manage the Fund in accordance with its investment objectives and approved strategies. Further, the Trustees recognize that the Advisor has an obligation to seek the best execution of fund trades. In providing these services, the Advisor utilizes teams of investment professionals (portfolio managers, analysts, research assistants, and securities traders) who require extensive information technology, research, training, compliance, and other systems to conduct their business. The Board, directly and through its Portfolio Committee, regularly reviews investment performance information for the Fund, together with comparative information for appropriate benchmarks and/or peer groups of similarly-managed funds, over different time horizons. The Trustees also review detailed performance information provided by the Advisor during the management agreement approval process. If performance concerns are identified, the Fund receives special reviews until performance improves, during which the Board discusses with the Advisor the reasons for such results (e.g., market conditions, security selection) and any efforts being undertaken to improve performance. The Fund’s performance was above its benchmark for
the one- and three-year periods reviewed by the Board. The Board found the investment management services provided by the Advisor to the Fund to be satisfactory and consistent with the management agreement.
Under the management agreement, the Advisor provides the Fund with a comprehensive package of transfer agency, shareholder, and other services. The Board, directly and through various committees of the Board, regularly reviews reports and evaluations of such services at its regular meetings. These reports include, but are not limited to, information regarding the operational efficiency and accuracy of the shareholder and transfer agency services provided, staffing levels, shareholder satisfaction (as measured by external as well as internal sources), technology support, new products and services offered to Fund shareholders, securities trading activities, portfolio valuation services, auditing services, and legal and operational compliance activities. Certain aspects of shareholder and transfer agency service level efficiency and the quality of securities trading activities are measured by independent third party providers and are presented in comparison to other fund groups not managed by the Advisor.
The Board found the services provided by the Advisor to the Fund under the management agreement to be competitive and of high quality.
Costs of Services and Profitability. The Advisor provides detailed information concerning its cost of providing various services to the Fund, its profitability in managing the Fund, its overall profitability, and its financial condition. The Trustees have reviewed with the Advisor the methodology used to prepare this financial information. This information is considered in evaluating the Advisor’s financial condition, its ability to continue to provide services under the management agreement, and the reasonableness of the current management fee. The Board concluded that the Advisor’s profits were reasonable in light of the services provided to the Fund.
Economies of Scale. The Board also reviewed information provided by the Advisor regarding the possible existence of economies of scale in connection with the management of the Fund. The Board concluded that economies of scale are difficult to measure and predict with precision, especially on a fund-by-fund basis. The Board concluded that the Advisor is appropriately sharing economies of scale through its competitive fee structure, offering competitive fees from fund inception, and through reinvestment in its business to provide shareholders enhanced and expanded services.
Comparison to Other Funds’ Fees. The management agreement provides that the Fund pays the Advisor a single, all-inclusive (or unified) management fee for providing all services necessary for the management and operation of the Fund, other than brokerage expenses, expenses attributable to short sales, taxes, interest, extraordinary expenses, the fees and expenses of the Fund’s independent Trustees (including their independent legal counsel), and expenses incurred in connection with the provision of shareholder services and distribution services under a plan adopted pursuant to Rule 12b-1 under the 1940 Act. Under the unified fee structure, the Advisor is responsible for providing all investment advisory, custody, audit, administrative, compliance, recordkeeping, marketing, and shareholder services, or arranging and supervising third parties to provide such services. By contrast, most other funds are charged a variety of fees, including an investment advisory fee, a transfer agency fee, an administrative fee, distribution charges, and other expenses. Other than their investment advisory fees and any applicable Rule 12b-1 distribution fees, all other components of the total fees charged by these other funds may be increased without shareholder approval. The Board believes the unified fee structure is a benefit to Fund shareholders because it clearly discloses to shareholders the cost of owning Fund shares, and, since the unified fee cannot be increased without a vote of Fund shareholders, it shifts to the Advisor the risk of increased costs of operating the Fund and provides a direct incentive to minimize administrative inefficiencies. Part of the Board’s analysis of fee levels involves reviewing certain evaluative data compiled by an independent provider and comparing the Fund’s unified fee to the total expense ratio of peer funds. The unified fee charged to shareholders of the Fund was below the median of the total expense ratios of the Fund’s peer group. The Board concluded that
the management fee paid by the Fund to the Advisor under the management agreement is reasonable in light of the services provided to the Fund.
Comparison to Fees and Services Provided to Other Clients of the Advisor. The Board also requested and received information from the Advisor concerning the nature of the services, fees, costs, and profitability of its advisory services to advisory clients other than the Fund. They observed that these varying types of client accounts require different services and involve different regulatory and entrepreneurial risks than the management of the Fund. The Board analyzed this information and concluded that the fees charged and services provided to the Fund were reasonable by comparison.
Payments to Intermediaries. The Trustees also requested and received a description of payments made to intermediaries by the Fund and the Advisor and services provided by intermediaries. These payments include various payments made by the Fund or the Advisor to different types of intermediaries and recordkeepers for distribution and service activities provided for the Fund. The Trustees reviewed such information and received representations from the Advisor that all such payments by the Fund were made pursuant to the Fund's Rule 12b-1 Plan and that all such payments by the Advisor were made from the Advisor's resources and reasonable profits. The Board found the payments to be reasonable in scope and purpose.
Collateral or “Fall-Out” Benefits Derived by the Advisor. The Board considered the existence of collateral benefits the Advisor may receive as a result of its relationship with the Fund. The Board noted that the Advisor’s primary business is managing mutual funds and it generally does not use fund or shareholder information to generate profits in other lines of business, and therefore does not derive any significant collateral benefits from them. The Board noted that the Advisor receives proprietary research from broker-dealers that execute fund portfolio transactions. The Board also determined that the Advisor is able to provide investment management services to certain clients other than the Fund, at least in part, due to its existing infrastructure built to serve the fund complex.
Existing Relationship. The Board also considered whether there was any reason for not continuing the existing arrangement with the Advisor. In this regard, the Board was mindful of the potential disruptions of the Fund’s operations and various risks, uncertainties, and other effects that could occur as a result of a decision not to continue such relationship. In particular, the Board recognized that most shareholders have invested in the Fund on the strength of the Advisor’s industry standing and reputation and in the expectation that the Advisor will have a continuing role in providing advisory services to the Fund.
Conclusion of the Trustees. As a result of this process, the Board, including all of the independent Trustees and assisted by the advice of independent legal counsel, taking into account all of the factors discussed above and the information provided by the Advisor and others in connection with its review and throughout the year, concluded that the management agreement between the Fund and the Advisor is fair and reasonable in light of the services provided and should be renewed.
Retirement Account Information
As required by law, distributions you receive from certain retirement accounts are subject to federal income tax withholding, unless you elect not to have withholding apply*. Tax will be withheld on the total amount withdrawn even though you may be receiving amounts that are not subject to withholding, such as nondeductible contributions. In such case, excess amounts of withholding could occur. You may adjust your withholding election so that a greater or lesser amount will be withheld.
If you don’t want us to withhold on this amount, you must notify us to not withhold the federal income tax. You may notify us in writing or in certain situations by telephone or through other electronic means. For systematic withdrawals, your withholding election will remain in effect until revoked or changed by filing a new election. You have the right to revoke your election at any time and change your withholding percentage for future distributions.
Remember, even if you elect not to have income tax withheld, you are liable for paying income tax on the taxable portion of your withdrawal. If you elect not to have income tax withheld or you don’t have enough income tax withheld, you may be responsible for payment of estimated tax. You may incur penalties under the estimated tax rules if your withholding and estimated tax payments are not sufficient. You can reduce or defer the income tax on a distribution by directly or indirectly rolling such distribution over to another IRA or eligible plan. You should consult your tax advisor for additional information.
State tax will be withheld if, at the time of your distribution, your address is within one of the mandatory withholding states and you have federal income tax withheld (or as otherwise required by state law). State taxes will be withheld from your distribution in accordance with the respective state rules.
*Some 403(b), 457 and qualified retirement plan distributions may be subject to 20% mandatory withholding, as they are subject to special tax and withholding rules. Your plan administrator or plan sponsor is required to provide you with a special tax notice explaining those rules at the time you request a distribution. If applicable, federal and/or state taxes may be withheld from your distribution amount.
Proxy Voting Policies
Descriptions of the principles and policies that the fund's investment advisor uses in exercising the voting rights associated with the securities purchased and/or held by the fund are available without charge, upon request, by calling 1-800-345-2021 or visiting the "About Us" page of American Century Investments’ website at americancentury.com. A description of the policies is also available on the Securities and Exchange Commission’s website at sec.gov. Information regarding how the investment advisor voted proxies relating to portfolio securities during the most recent 12-month period ended June 30 is available on the "About Us" page at americancentury.com. It is also available at sec.gov.
Quarterly Portfolio Disclosure
The fund files its complete schedule of portfolio holdings with the Securities and Exchange Commission (SEC) for the first and third quarters of each fiscal year on Form N-Q. The fund’s Forms N-Q are available on the SEC’s website at sec.gov, and may be reviewed and copied at the SEC’s Public Reference Room in Washington, DC. Information on the operation of the Public Reference Room may be obtained by calling 1-800-SEC-0330. The fund also makes its complete schedule of portfolio holdings for the most recent quarter of its fiscal year available on its website at americancentury.com and, upon request, by calling 1-800-345-2021.
Other Tax Information
The following information is provided pursuant to provisions of the Internal Revenue Code.
The fund hereby designates $3,500,381 as qualified short-term capital gain distributions for purposes of Internal Revenue Code Section 871 for the fiscal year ended October 31, 2017.
|
| | |
| |
| | | |
| Contact Us | americancentury.com | |
| Automated Information Line | 1-800-345-8765 | |
| Investor Services Representative | 1-800-345-2021
or 816-531-5575 | |
| Investors Using Advisors | 1-800-378-9878 | |
Business, Not-For-Profit, Employer-Sponsored
Retirement Plans | 1-800-345-3533 | |
Banks and Trust Companies, Broker-Dealers,
Financial Professionals, Insurance Companies | 1-800-345-6488 | |
| Telecommunications Relay Service for the Deaf | 711 | |
| | | |
| American Century International Bond Funds | |
| | | |
Investment Advisor: American Century Investment Management, Inc. Kansas City, Missouri | |
| | | |
| This report and the statements it contains are submitted for the general information of our shareholders. The report is not authorized for distribution to prospective investors unless preceded or accompanied by an effective prospectus. | |
| | | |
©2017 American Century Proprietary Holdings, Inc. All rights reserved.
CL-ANN-90984 1712 | |
|
| |
| | |
| | Annual Report |
| | |
| | October 31, 2017 |
| | |
| | International Bond Fund |
|
| | |
| President’s Letter | 2 |
|
| Performance | 3 |
|
| Portfolio Commentary | |
|
| Fund Characteristics | |
|
| Shareholder Fee Example | |
|
| Schedule of Investments | |
|
| Statement of Assets and Liabilities | |
|
| Statement of Operations | |
|
| Statement of Changes in Net Assets | |
|
| Notes to Financial Statements | |
|
| Financial Highlights | |
|
| Report of Independent Registered Public Accounting Firm | |
|
| Management | |
|
| Approval of Management Agreement | |
|
| Additional Information | |
|
Any opinions expressed in this report reflect those of the author as of the date of the report, and do not necessarily represent the opinions of American Century Investments® or any other person in the American Century Investments organization. Any such opinions are subject to change at any time based upon market or other conditions and American Century Investments disclaims any responsibility to update such opinions. These opinions may not be relied upon as investment advice and, because investment decisions made by American Century Investments funds are based on numerous factors, may not be relied upon as an indication of trading intent on behalf of any American Century Investments fund. Security examples are used for representational purposes only and are not intended as recommendations to purchase or sell securities. Performance information for comparative indices and securities is provided to American Century Investments by third party vendors. To the best of American Century Investments’ knowledge, such information is accurate at the time of printing.
Jonathan Thomas
Dear Investor:
Thank you for reviewing this annual report for the period ended October 31, 2017. Annual reports help convey important information about fund returns, including market factors that affected performance during the reporting period. For additional, updated investment and market insights, we encourage you to visit our website, americancentury.com.
‘Risk-On’ Sentiment Sparked Strong Gains Among Stocks
U.S. stocks delivered robust double-digit gains for the reporting period. The “risk-on” rally began early in the period, following Donald Trump’s election victory in November 2016. Investor expectations for President Trump’s administration to usher in pro-growth policies and reforms drove stock prices higher. In addition, healthy corporate earnings growth and improving gross domestic product (GDP) and other economic data provided additional support for stocks. Against this backdrop, the S&P 500 Index reached several milestone levels during the period and returned 23.63%. In terms of equity styles, riskier and economically sensitive stocks generally remained in favor. For example, small-cap stocks generally outperformed their mid- and large-cap peers, while growth stocks broadly outperformed their value counterparts across the capitalization spectrum. Real estate investment trusts (REITs) advanced, but global property stocks significantly underperformed the broader stock market as interest rates increased, most notably in the U.S., where the Federal Reserve (Fed) raised rates three times during the period.
As stocks soared in the post-election environment, global bonds sold off sharply. President Trump’s policy agenda fueled inflation fears that sent global bond yields sharply higher in late 2016. However, broad bond market performance generally recovered beginning in early 2017, advancing on subdued inflation and continued central bank accommodation to post modest gains for the entire reporting period. Investor preferences for risk also extended to the global fixed-income market, where high-yield corporate and emerging markets bonds were top performers.
As Congress considers tax cuts and other pro-growth reforms and the Fed and other central banks pursue policy normalization, investors likely will face new opportunities and challenges in the months ahead. We continue to believe in a disciplined, diversified, and risk-aware approach, using professionally managed portfolios in pursuit of investment goals. We appreciate your continued trust in us.
Sincerely,
Jonathan Thomas
President and Chief Executive Officer
American Century Investments
|
| | | | | | |
| Total Returns as of October 31, 2017 |
| | | | Average Annual Returns | |
| | Ticker Symbol | 1 year | 5 years | 10 years | Since Inception | Inception Date |
| Investor Class | BEGBX | 1.09% | -1.48% | 1.22% | — | 1/7/92 |
| Bloomberg Barclays Global Aggregate Bond Index ex-USD (Unhedged) | — | 1.26% | -0.79% | 2.28% | — | — |
| I Class | AIBHX | — | — | — | 5.52% | 4/10/17 |
| Y Class | AIBYX | — | — | — | 5.69% | 4/10/17 |
| A Class | AIBDX | | | | | 10/27/98 |
| No sales charge | | 0.79% | -1.73% | 0.94% | — | |
| With sales charge | | -3.75% | -2.63% | 0.47% | — | |
| C Class | AIQCX | 0.08% | -2.47% | 0.21% | — | 9/28/07 |
| R Class | AIBRX | 0.63% | -1.97% | 0.71% | — | 9/28/07 |
| R5 Class | AIDIX | 1.33% | -1.28% | 1.42% | — | 8/2/04 |
| R6 Class | AIDDX | 1.33% | — | — | -0.09% | 7/26/13 |
| G Class | AIBGX | — | — | — | -0.76% | 7/28/17 |
Average annual returns since inception are presented when ten years of performance history is not available. G Class returns would have been lower if a portion of the fees had not been waived. Prior to April 10, 2017, the R5 Class was referred to as the Institutional Class.
Sales charges include initial sales charges and contingent deferred sales charges (CDSCs), as applicable. A Class shares have a 4.50% maximum initial sales charge and may be subject to a maximum CDSC of 1.00%. C Class shares redeemed within 12 months of purchase are subject to a maximum CDSC of 1.00%. The SEC requires that mutual funds provide performance information net of maximum sales charges in all cases where charges could be applied.
Data presented reflect past performance. Past performance is no guarantee of future results. Current performance may be higher or lower than the performance shown. Total returns for periods less than one year are not annualized. Investment return and principal value will fluctuate, and redemption value may be more or less than original cost. Data assumes reinvestment of dividends and capital gains, and none of the charts reflect the deduction of taxes that a shareholder would pay on fund distributions or the redemption of fund shares. To obtain performance data current to the most recent month end, please call 1-800-345-2021 or visit americancentury.com. For additional information about the fund, please consult the prospectus.
|
|
| Growth of $10,000 Over 10 Years |
| $10,000 investment made October 31, 2007 |
| Performance for other share classes will vary due to differences in fee structure. |
|
| |
| Value on October 31, 2017 |
| | Investor Class — $11,290 |
| |
| | Bloomberg Barclays Global Aggregate Bond Index ex-USD (Unhedged) — $12,534 |
| |
|
| | | | | | | | |
| Total Annual Fund Operating Expenses | | | | |
| Investor Class | I Class | Y Class | A Class | C Class | R Class | R5 Class | R6 Class | G Class |
| 0.80% | 0.70% | 0.60% | 1.05% | 1.80% | 1.30% | 0.60% | 0.55% | 0.55% |
The total annual fund operating expenses shown is as stated in the fund’s prospectus current as of the date of this report. The prospectus may vary from the expense ratio shown elsewhere in this report because it is based on a different time period, includes acquired fund fees and expenses, and, if applicable, does not include fee waivers or expense reimbursements.
Data presented reflect past performance. Past performance is no guarantee of future results. Current performance may be higher or lower than the performance shown. Total returns for periods less than one year are not annualized. Investment return and principal value will fluctuate, and redemption value may be more or less than original cost. Data assumes reinvestment of dividends and capital gains, and none of the charts reflect the deduction of taxes that a shareholder would pay on fund distributions or the redemption of fund shares. To obtain performance data current to the most recent month end, please call 1-800-345-2021 or visit americancentury.com. For additional information about the fund, please consult the prospectus.
Portfolio Managers: John Lovito, Brian Howell, Simon Chester, and Abdelak Adjriou
In June 2017, portfolio manager Edward Boyle left the fund’s management team.
Performance Summary
International Bond returned 1.09%* for the fiscal year ended October 31, 2017. By comparison, the fund’s benchmark, the Bloomberg Barclays Global Aggregate Bond Index ex-USD (Unhedged), returned 1.26% over the same time period. (Portfolio returns reflect operating expenses, while index returns do not.)
Market Review
Against a backdrop of synchronized global growth, low volatility, stable inflation, higher commodity prices, and gradually rising interest rates, global bonds (hedged to remove the effects of currency fluctuations) advanced modestly. Global bonds sold off sharply early in the reporting period on expectations for President Trump’s policy agenda to deliver faster growth and higher inflation. However, investors scaled back those expectations on some early setbacks for President Trump’s pro-growth reforms, and global fixed-income markets rebounded in early 2017. Geopolitical risks, including unrest in Iran and Syria and mounting tensions with North Korea, triggered periodic bouts of market volatility, but these events had minimal impact on overall returns.
Positive performance generally prevailed through the end of the reporting period, but the effects of the late 2016 sell-off held back performance from a 12-month perspective. Meanwhile, global inflation remained muted, which supported bonds, and central banks generally remained accommodative, as they slowly pursued monetary policy normalization. The U.S. Federal Reserve (the Fed) raised short-term interest rates three times during the period to a range of 1.00%-1.25% and began gradually cutting its balance sheet late in the period. The European Central Bank held its benchmark interest rate at zero, but it announced plans to begin tapering its quantitative easing in January 2018. The Bank of England also held rates steady, but rising inflation led to expectations for a near-term rate hike (which did occur in early November 2017). Higher-than-expected growth in Canada prompted the Bank of Canada to lift rates twice during the period.
In this environment, yields on government securities remained relatively low, fueling demand for riskier and higher-yielding assets. Emerging markets debt and high-yield bonds were among the best performers during the reporting period.
Currency Positioning and Bond Duration Detracted
Despite a modest rebound at the end of the reporting period, the U.S. dollar weakened overall and lagged most of its major trading partners. The portfolio’s currency positions modestly detracted from performance. Most of the underperformance occurred early in the reporting period, as rising post-election U.S. interest rates and protectionist rhetoric from the new presidential administration hurt some emerging markets currencies. In particular, an overweight position in the Mexican peso weighed on performance.
*All fund returns referenced in this commentary are for Investor Class shares. Performance for other share classes will vary due to differences in fee structure; when Investor Class performance exceeds that of the fund's benchmark, other share classes may not. See page 3 returns for all share classes.
Conversely, positions in select Asian currencies, notably overweight positions in the Malaysian ringgit and the Philippine peso and an underweight position in the Thai baht, aided portfolio performance. In addition, overweight positions in oil-related currencies, such as the Colombian peso and Russian ruble, lifted results.
The portfolio’s duration position (price sensitivity to interest rate changes) detracted slightly from performance. Early in the period, the portfolio’s duration was slightly longer than the benchmark’s duration. This strategy weighed on relative results as global bond yields increased in response to the U.S. presidential election results. In early 2017, we reduced the portfolio’s duration to a neutral position relative to the benchmark.
Country Positioning Added Value
Early in the reporting period, we initiated a long position in U.S. Treasuries and corresponding short positions in government bonds in the U.K. and Germany. We believed market expectations were too optimistic regarding U.S. stimulus and too complacent regarding the continuation of accommodative monetary policy in Europe. As the bond market began recovering in early 2017, our market assumptions proved true, and this trade was a key contributor to performance.
Another key contributor was an overweight position in Portugal bonds relative to Germany. After underperforming in 2016 on slowing growth and credit concerns, Portugal rallied in 2016 on improving growth and budget and pension reforms, which helped the country maintain its investment-grade credit rating. We exited the position in Portugal bonds during the reporting period. Similarly, an overweight position in Italy relative to Spain also contributed, as Italy resolved its banking sector issues and Spain underperformed on valuation concerns and the Catalonia uprising. Another positive contributor was an overweight position in Norway and an underweight position in the U.K. Norway bonds rallied as tightening fears eased.
Sector Allocation Key Contributor to Performance
Our positions in the high-yield corporate bond sector and European financials contributed to performance. In addition, overweight positions in external emerging markets debt, including sovereign, quasi-sovereign, and corporate bonds, lifted results. Security selection and an underweight position in government sectors (German bunds and U.K. gilts) also helped.
Positioning for the Future
We expect the environment of moderate global growth, stable inflation, gradual rate increases, and low market volatility to continue. This backdrop should lead to a continuation of monetary policy normalization in the U.S., U.K., and Europe. These influences should continue to support higher-yielding and riskier securities. Although credit spreads remain tight, we continue to favor these sectors for their yield advantages. From a country standpoint, we expect continued stability and outperformance from peripheral markets in Europe and select emerging markets.
We believe the U.S. dollar will go through two phases going forward. Initially, we believe the dollar may appreciate in response to U.S. tax reform. In addition, the Fed is likely to increase interest rates at a faster pace than other central banks, providing support for the dollar. Longer term, we expect the dollar to depreciate modestly relative to other currencies as global yields converge. Furthermore, if volatility remains low, we expect investors to favor riskier currencies over the dollar, contributing to dollar weakness.
|
| |
| OCTOBER 31, 2017 |
| Portfolio at a Glance | |
| Average Duration (effective) | 8.1 years |
| Weighted Average Life | 9.8 years |
| | |
| Bond Holdings by Country | % of net assets |
| Japan | 23.3% |
| United States | 14.5% |
| United Kingdom | 8.0% |
| Italy | 7.7% |
| France | 7.2% |
| Germany | 5.4% |
| Canada | 4.1% |
| Netherlands | 2.7% |
| Spain | 2.2% |
| Australia | 2.1% |
| Other Countries | 18.9% |
| Cash and Equivalents* | 3.9% |
| * Includes temporary cash investments and other assets and liabilities. | |
| | |
| Types of Investments in Portfolio | % of net assets |
| Sovereign Governments and Agencies | 67.1% |
| Corporate Bonds | 21.9% |
| Collateralized Mortgage Obligations | 3.3% |
| Commercial Mortgage-Backed Securities | 2.0% |
| Asset-Backed Securities | 1.8% |
| Temporary Cash Investments | 4.1% |
| Other Assets and Liabilities | (0.2)% |
Fund shareholders may incur two types of costs: (1) transaction costs, including sales charges (loads) on purchase payments and redemption/exchange fees; and (2) ongoing costs, including management fees; distribution and service (12b-1) fees; and other fund expenses. This example is intended to help you understand your ongoing costs (in dollars) of investing in your fund and to compare these costs with the ongoing cost of investing in other mutual funds.
The example is based on an investment of $1,000 made at the beginning of the period and held for the entire period from May 1, 2017 to October 31, 2017 (except as noted).
Actual Expenses
The table provides information about actual account values and actual expenses for each class. You may use the information, together with the amount you invested, to estimate the expenses that you paid over the period. First, identify the share class you own. Then simply divide your account value by $1,000 (for example, an $8,600 account value divided by $1,000 = 8.6), then multiply the result by the number under the heading “Expenses Paid During Period” to estimate the expenses you paid on your account during this period.
If you hold Investor Class shares of any American Century Investments fund, or I Class shares of the American Century Diversified Bond Fund, in an American Century Investments account (i.e., not a financial intermediary or retirement plan account), American Century Investments may charge you a $12.50 semiannual account maintenance fee if the value of those shares is less than $10,000. We will redeem shares automatically in one of your accounts to pay the $12.50 fee. In determining your total eligible investment amount, we will include your investments in all personal accounts (including American Century Investments Brokerage accounts) registered under your Social Security number. Personal accounts include individual accounts, joint accounts, UGMA/UTMA accounts, personal trusts, Coverdell Education Savings Accounts and IRAs (including traditional, Roth, Rollover, SEP-, SARSEP- and SIMPLE-IRAs), and certain other retirement accounts. If you have only business, business retirement, employer-sponsored or American Century Investments Brokerage accounts, you are currently not subject to this fee. If you are subject to the Account Maintenance Fee, your account value could be reduced by the fee amount.
Hypothetical Example for Comparison Purposes
The table also provides information about hypothetical account values and hypothetical expenses based on the actual expense ratio of each class of your fund and an assumed rate of return of 5% per year before expenses, which is not the actual return of a fund’s share class. The hypothetical account values and expenses may not be used to estimate the actual ending account balance or expenses you paid for the period. You may use this information to compare the ongoing costs of investing in your fund and other funds. To do so, compare this 5% hypothetical example with the 5% hypothetical examples that appear in the shareholder reports of the other funds.
Please note that the expenses shown in the table are meant to highlight your ongoing costs only and do not reflect any transactional costs, such as sales charges (loads) or redemption/exchange fees. Therefore, the table is useful in comparing ongoing costs only, and will not help you determine the relative total costs of owning different funds. In addition, if these transactional costs were included, your costs would have been higher.
|
| | | | |
| | Beginning
Account Value
5/1/17 | Ending
Account Value
10/31/17 | Expenses Paid
During Period(1)
5/1/17 - 10/31/17 | Annualized
Expense Ratio(1) |
| Actual | | | | |
| Investor Class | $1,000 | $1,036.00 | $4.11 | 0.80% |
| I Class | $1,000 | $1,036.7 | $3.59 | 0.70% |
| Y Class | $1,000 | $1,038.3 | $3.08 | 0.60% |
| A Class | $1,000 | $1,034.70 | $5.38 | 1.05% |
| C Class | $1,000 | $1,030.50 | $9.21 | 1.80% |
| R Class | $1,000 | $1,033.20 | $6.66 | 1.30% |
| R5 Class | $1,000 | $1,037.50 | $3.08 | 0.60% |
| R6 Class | $1,000 | $1,036.70 | $2.82 | 0.55% |
| G Class | $1,000 | $992.40(2) | $0.03(3) | 0.01% |
| Hypothetical | | | | |
| Investor Class | $1,000 | $1,021.17 | $4.08 | 0.80% |
| I Class | $1,000 | $1,021.68 | $3.57 | 0.70% |
| Y Class | $1,000 | $1,022.18 | $3.06 | 0.60% |
| A Class | $1,000 | $1,019.91 | $5.35 | 1.05% |
| C Class | $1,000 | $1,016.13 | $9.15 | 1.80% |
| R Class | $1,000 | $1,018.65 | $6.61 | 1.30% |
| R5 Class | $1,000 | $1,022.18 | $3.06 | 0.60% |
| R6 Class | $1,000 | $1,022.43 | $2.80 | 0.55% |
| G Class | $1,000 | $1,025.16(4) | $0.05(4) | 0.01% |
| |
| (1) | Expenses are equal to the class's annualized expense ratio listed in the table above, multiplied by the average account value over the period, multiplied by 184, the number of days in the most recent fiscal half-year, divided by 365, to reflect the one-half year period. Annualized expense ratio reflects actual expenses, including any applicable fee waivers or expense reimbursements and excluding any acquired fund fees and expenses. |
| |
| (2) | Ending account value based on actual return from July 28, 2017 (commencement of sale) through October 31, 2017. |
| |
| (3) | Expenses are equal to the class's annualized expense ratio listed in the table above, multiplied by the average account value over the period, multiplied by 96, the number of days in the period from July 28, 2017 (commencement of sale) through October 31, 2017, divided by 365, to reflect the period. Had the class been available for the full period, the expenses paid during the period would have been higher. |
| |
| (4) | Ending account value and expenses paid during the period assumes the class had been available throughout the entire period and are calculated using the class's annualized expense ratio listed in the table above. |
OCTOBER 31, 2017
|
| | | | | | | |
| | | Principal Amount | Value |
| SOVEREIGN GOVERNMENTS AND AGENCIES — 67.1% | | | |
| Argentina — 0.1% | | | |
| Argentine Republic Government International Bond, 6.875%, 1/26/27 | | $ | 700,000 |
| $ | 764,400 |
|
| Australia — 2.1% | | | |
| Australia Government Bond, 2.75%, 4/21/24 | AUD | 22,908,000 |
| 17,888,179 |
|
| New South Wales Treasury Corp., 3.00%, 3/20/28 | AUD | 3,250,000 |
| 2,469,719 |
|
| | | | 20,357,898 |
|
| Austria — 1.1% | | | |
Republic of Austria Government Bond, 3.40%, 11/22/22(1) | EUR | 2,680,000 |
| 3,701,299 |
|
Republic of Austria Government Bond, 0.75%, 10/20/26(1) | EUR | 2,939,000 |
| 3,516,211 |
|
Republic of Austria Government Bond, 4.15%, 3/15/37(1) | EUR | 1,860,000 |
| 3,302,627 |
|
| | | | 10,520,137 |
|
| Belgium — 1.8% | | | |
| Kingdom of Belgium Government Bond, 2.25%, 6/22/23 | EUR | 11,324,000 |
| 14,973,447 |
|
Kingdom of Belgium Government Bond, 4.25%, 3/28/41(1) | EUR | 902,000 |
| 1,641,737 |
|
| | | | 16,615,184 |
|
Brazil† | | | |
| Brazilian Government International Bond, 5.625%, 1/7/41 | | $ | 400,000 |
| 406,400 |
|
| Canada — 3.9% | | | |
| Canadian Government Bond, 4.00%, 6/1/41 | CAD | 5,010,000 |
| 5,065,572 |
|
| Province of British Columbia Canada, 3.25%, 12/18/21 | CAD | 6,309,000 |
| 5,150,190 |
|
| Province of British Columbia Canada, 2.85%, 6/18/25 | CAD | 13,219,000 |
| 10,592,004 |
|
| Province of Ontario Canada, MTN, 1.65%, 6/8/20 | JPY | 100,000,000 |
| 917,909 |
|
| Province of Quebec Canada, 3.00%, 9/1/23 | CAD | 8,826,000 |
| 7,145,427 |
|
| Province of Quebec Canada, 5.75%, 12/1/36 | CAD | 4,925,000 |
| 5,337,637 |
|
| Province of Quebec Canada, 5.00%, 12/1/41 | CAD | 800,000 |
| 823,794 |
|
| Province of Quebec Canada, 3.50%, 12/1/48 | CAD | 2,387,000 |
| 2,015,508 |
|
| | | | 37,048,041 |
|
| Chile — 1.3% | | | |
| Bonos de la Tesoreria de la Republica en pesos, 4.50%, 3/1/26 | CLP | 7,945,000,000 |
| 12,646,213 |
|
Colombia† | | | |
| Colombia Government International Bond, 7.375%, 9/18/37 | | $ | 300,000 |
| 397,500 |
|
| Czech — 0.2% | | | |
| Czech Republic Government Bond, 4.70%, 9/12/22 | CZK | 37,500,000 |
| 2,029,808 |
|
| Denmark — 0.4% | | | |
| Denmark Government Bond, 0.50%, 11/15/27 | DKK | 12,517,000 |
| 1,974,370 |
|
| Denmark Government Bond, 4.50%, 11/15/39 | DKK | 5,100,000 |
| 1,355,689 |
|
| | | | 3,330,059 |
|
| Dominican Republic — 0.3% | | | |
| Dominican Republic International Bond, 6.875%, 1/29/26 | | $ | 1,000,000 |
| 1,145,330 |
|
Dominican Republic International Bond, 5.95%, 1/25/27(1) | | $ | 800,000 |
| 863,200 |
|
| | | | |
|
| | | | | | | |
| | | Principal Amount | Value |
| Dominican Republic International Bond, 5.95%, 1/25/27 | | $ | 600,000 |
| $ | 647,400 |
|
| | | | 2,655,930 |
|
| Egypt — 0.1% | | | |
Egypt Government International Bond, 6.125%, 1/31/22(1) | | $ | 400,000 |
| $ | 417,963 |
|
Egypt Government International Bond, 7.50%, 1/31/27(1) | | $ | 400,000 |
| 444,218 |
|
| | | | 862,181 |
|
| Finland — 0.5% | | | |
Finland Government Bond, 4.00%, 7/4/25(1) | EUR | 3,437,000 |
| 5,171,210 |
|
| France — 5.8% | | | |
| French Republic Government Bond OAT, 3.25%, 10/25/21 | EUR | 5,065,000 |
| 6,762,968 |
|
| French Republic Government Bond OAT, 1.75%, 11/25/24 | EUR | 20,351,000 |
| 26,372,571 |
|
| French Republic Government Bond OAT, 5.50%, 4/25/29 | EUR | 6,695,000 |
| 11,862,935 |
|
| French Republic Government Bond OAT, 3.25%, 5/25/45 | EUR | 6,310,000 |
| 9,992,031 |
|
| | | | 54,990,505 |
|
| Germany — 4.2% | | | |
Bundesrepublik Deutschland, 0.00%, 8/15/26(2) | EUR | 15,275,000 |
| 17,479,776 |
|
| Bundesrepublik Deutschland, 0.25%, 2/15/27 | EUR | 8,335,000 |
| 9,679,729 |
|
| Bundesrepublik Deutschland, 4.75%, 7/4/28 | EUR | 220,000 |
| 372,547 |
|
| Bundesrepublik Deutschland, 4.75%, 7/4/40 | EUR | 2,018,000 |
| 4,144,678 |
|
| Bundesrepublik Deutschland, 2.50%, 7/4/44 | EUR | 5,330,000 |
| 8,154,401 |
|
| | | | 39,831,131 |
|
| Greece — 0.5% | | | |
Hellenic Republic Government Bond, 4.375%, 8/1/22(1) | EUR | 3,820,000 |
| 4,444,546 |
|
| Hungary — 0.1% | | | |
| Hungary Government Bond, 6.75%, 10/22/28 | HUF | 149,000,000 |
| 775,607 |
|
| Ireland — 0.7% | | | |
| Ireland Government Bond, 3.40%, 3/18/24 | EUR | 4,399,000 |
| 6,185,958 |
|
| Italy — 6.6% | | | |
| Italy Buoni Poliennali Del Tesoro, 1.50%, 6/1/25 | EUR | 19,829,000 |
| 23,266,299 |
|
| Italy Buoni Poliennali Del Tesoro, 2.00%, 12/1/25 | EUR | 21,989,000 |
| 26,592,223 |
|
Italy Buoni Poliennali Del Tesoro, 4.75%, 9/1/44(1) | EUR | 8,341,000 |
| 12,982,824 |
|
| | | | 62,841,346 |
|
| Japan — 23.3% | | | |
| Japan Government Ten Year Bond, 1.00%, 12/20/21 | JPY | 3,753,900,000 |
| 34,518,679 |
|
| Japan Government Ten Year Bond, 0.80%, 6/20/23 | JPY | 4,849,200,000 |
| 44,738,535 |
|
| Japan Government Thirty Year Bond, 2.40%, 3/20/37 | JPY | 2,060,350,000 |
| 24,185,833 |
|
| Japan Government Thirty Year Bond, 2.00%, 9/20/41 | JPY | 2,948,500,000 |
| 33,094,225 |
|
| Japan Government Thirty Year Bond, 1.40%, 12/20/45 | JPY | 1,458,100,000 |
| 14,673,086 |
|
| Japan Government Twenty Year Bond, 2.10%, 12/20/26 | JPY | 6,680,150,000 |
| 69,780,293 |
|
| | | | 220,990,651 |
|
| Jordan — 0.2% | | | |
Jordan Government International Bond, 7.375%, 10/10/47(1) | | $ | 1,500,000 |
| 1,574,512 |
|
| Malaysia — 0.4% | | | |
| Malaysia Government Bond, 3.96%, 9/15/25 | MYR | 16,095,000 |
| 3,748,415 |
|
| Mexico — 1.4% | | | |
| Mexican Bonos, 6.50%, 6/9/22 | MXN | 131,490,000 |
| 6,715,734 |
|
| Mexico Government International Bond, 4.125%, 1/21/26 | | $ | 200,000 |
| 208,650 |
|
|
| | | | | | | |
| | | Principal Amount | Value |
| Mexico Government International Bond, 4.15%, 3/28/27 | | $ | 2,800,000 |
| $ | 2,914,100 |
|
| Nacional Financiera SNC, MTN, 0.78%, 3/29/22 | JPY | 400,000,000 |
| 3,547,777 |
|
| | | | 13,386,261 |
|
| Netherlands — 1.3% | | | |
Netherlands Government Bond, 0.50%, 7/15/26(1) | EUR | 8,956,000 |
| 10,602,137 |
|
Netherlands Government Bond, 2.75%, 1/15/47(1) | EUR | 1,086,000 |
| 1,730,172 |
|
| | | | 12,332,309 |
|
| New Zealand — 1.1% | | | |
| New Zealand Government Bond, 5.00%, 3/15/19 | NZD | 15,140,000 |
| 10,784,227 |
|
| Poland — 0.3% | | | |
| Republic of Poland Government Bond, 4.00%, 10/25/23 | PLN | 10,430,000 |
| 3,034,229 |
|
| Russia — 0.2% | | | |
| Russian Foreign Bond - Eurobond, 12.75%, 6/24/28 | | $ | 900,000 |
| 1,581,295 |
|
| Singapore — 0.5% | | | |
| Singapore Government Bond, 3.125%, 9/1/22 | SGD | 5,845,000 |
| 4,562,702 |
|
| South Africa — 0.7% | | | |
| Republic of South Africa Government Bond, 10.50%, 12/21/26 | ZAR | 87,250,000 |
| 6,691,037 |
|
| Spain — 1.4% | | | |
Spain Government Bond, 4.40%, 10/31/23(1) | EUR | 3,253,000 |
| 4,645,301 |
|
Spain Government Bond, 1.60%, 4/30/25(1) | EUR | 3,553,000 |
| 4,343,775 |
|
Spain Government Bond, 5.15%, 10/31/28(1) | EUR | 2,448,000 |
| 3,878,270 |
|
Spain Government Bond, 5.15%, 10/31/44(1) | EUR | 260,000 |
| 448,620 |
|
| | | | 13,315,966 |
|
| Sweden — 0.5% | | | |
| Sweden Government Bond, 2.50%, 5/12/25 | SEK | 32,850,000 |
| 4,559,321 |
|
| Switzerland — 0.7% | | | |
| Swiss Confederation Government Bond, 1.25%, 5/28/26 | CHF | 3,358,000 |
| 3,775,891 |
|
| Swiss Confederation Government Bond, 2.50%, 3/8/36 | CHF | 2,265,000 |
| 3,178,853 |
|
| | | | 6,954,744 |
|
| Thailand — 0.5% | | | |
| Thailand Government Bond, 3.85%, 12/12/25 | THB | 152,200,000 |
| 5,117,077 |
|
| Turkey — 0.2% | | | |
| Turkey Government International Bond, 4.25%, 4/14/26 | | $ | 1,000,000 |
| 946,823 |
|
| Turkey Government International Bond, 6.00%, 3/25/27 | | $ | 800,000 |
| 844,264 |
|
| | | | 1,791,087 |
|
| United Kingdom — 4.7% | | | |
| United Kingdom Gilt, 1.75%, 9/7/22 | GBP | 1,007,000 |
| 1,399,299 |
|
| United Kingdom Gilt, 1.50%, 7/22/26 | GBP | 8,559,000 |
| 11,614,552 |
|
| United Kingdom Gilt, 4.50%, 12/7/42 | GBP | 7,152,000 |
| 14,366,303 |
|
| United Kingdom Gilt, 4.25%, 12/7/49 | GBP | 1,672,000 |
| 3,498,661 |
|
| United Kingdom Gilt, 4.25%, 12/7/55 | GBP | 6,339,000 |
| 14,203,810 |
|
| | | | 45,082,625 |
|
TOTAL SOVEREIGN GOVERNMENTS AND AGENCIES
(Cost $622,716,453) | | | 637,380,512 |
|
| CORPORATE BONDS — 21.9% | | | |
| Belgium — 0.1% | | | |
| Anheuser-Busch InBev SA, MTN, 1.50%, 3/17/25 | EUR | 800,000 |
| 993,586 |
|
|
| | | | | | | |
| | | Principal Amount | Value |
| Brazil — 0.1% | | | |
| Globo Comunicacao e Participacoes SA, 4.84%, 6/8/25 | | $ | 1,300,000 |
| $ | 1,342,250 |
|
| Canada — 0.2% | | | |
1011778 BC ULC / New Red Finance, Inc., 4.625%, 1/15/22(1) | | 1,250,000 |
| 1,282,250 |
|
NOVA Chemicals Corp., 4.875%, 6/1/24(1) | | 730,000 |
| 745,512 |
|
| | | | 2,027,762 |
|
| Cayman Islands — 0.5% | | | |
Braskem Finance Ltd., 5.75%, 4/15/21(1) | | 800,000 |
| 869,200 |
|
CK Hutchison International 17 II Ltd., 2.25%, 9/29/20(1) | | 2,370,000 |
| 2,362,671 |
|
| Vale Overseas Ltd., 6.25%, 8/10/26 | | 1,000,000 |
| 1,154,520 |
|
| | | | 4,386,391 |
|
| Chile — 0.1% | | | |
Colbun SA, 3.95%, 10/11/27(1) | | 800,000 |
| 800,700 |
|
| Colombia — 0.2% | | | |
Bancolombia SA, VRN, 4.875%, 10/18/22(3) | | 1,700,000 |
| 1,701,275 |
|
| France — 1.4% | | | |
AXA SA, MTN, VRN, 6.69%, 7/6/26(3) | GBP | 1,200,000 |
| 1,916,447 |
|
AXA SA, MTN, VRN, 3.375%, 7/6/27(3) | EUR | 1,800,000 |
| 2,357,889 |
|
CNP Assurances, VRN, 4.00%, 11/18/24(3) | EUR | 1,200,000 |
| 1,552,929 |
|
Credit Agricole Assurances SA, VRN, 4.25%, 1/13/25(3) | EUR | 2,000,000 |
| 2,629,047 |
|
| Credit Agricole SA, MTN, 7.375%, 12/18/23 | GBP | 1,500,000 |
| 2,582,784 |
|
Orange SA, MTN, VRN, 4.00%, 10/1/21(3) | EUR | 960,000 |
| 1,239,460 |
|
| Total Capital International SA, 2.50%, 3/25/26 | EUR | 900,000 |
| 1,204,558 |
|
| | | | 13,483,114 |
|
| Germany — 1.2% | | | |
| Commerzbank AG, MTN, 4.00%, 3/23/26 | EUR | 2,000,000 |
| 2,690,763 |
|
| Daimler AG, MTN, 0.85%, 2/28/25 | EUR | 900,000 |
| 1,068,770 |
|
| Kreditanstalt fuer Wiederaufbau, 4.625%, 1/4/23 | EUR | 4,415,000 |
| 6,418,716 |
|
RWE AG, VRN, 7.00%, 3/20/19(3) | GBP | 1,000,000 |
| 1,417,813 |
|
| | | | 11,596,062 |
|
| Ireland — 0.8% | | | |
Ardagh Packaging Finance plc / Ardagh Holdings USA, Inc., 6.00%, 2/15/25(1) | | $ | 1,530,000 |
| 1,627,537 |
|
| GE Capital European Funding Unlimited. Co., MTN, 5.375%, 1/23/20 | EUR | 3,960,000 |
| 5,185,115 |
|
Novolipetsk Steel via Steel Funding DAC, 4.00%, 9/21/24(1) | | $ | 700,000 |
| 700,899 |
|
| | | | 7,513,551 |
|
| Italy — 1.1% | | | |
| Assicurazioni Generali SpA, MTN, 4.125%, 5/4/26 | EUR | 2,000,000 |
| 2,704,587 |
|
| Eni SpA, MTN, 1.75%, 1/18/24 | EUR | 1,100,000 |
| 1,369,578 |
|
| Intesa Sanpaolo SpA, MTN, 6.625%, 9/13/23 | EUR | 2,000,000 |
| 2,950,666 |
|
UniCredit SpA, MTN, VRN, 5.75%, 10/28/20(3) | EUR | 1,000,000 |
| 1,309,774 |
|
UniCredit SpA, VRN, 5.86%, 6/19/27(1)(3) | | $ | 2,100,000 |
| 2,247,462 |
|
| | | | 10,582,067 |
|
| Kazakhstan — 0.1% | | | |
KazTransGas JSC, 4.375%, 9/26/27(1) | | 1,200,000 |
| 1,187,904 |
|
|
| | | | | | | |
| | | Principal Amount | Value |
| Luxembourg — 1.2% | | | |
| European Financial Stability Facility, MTN, 2.125%, 2/19/24 | EUR | 6,505,000 |
| $ | 8,547,534 |
|
| European Financial Stability Facility, MTN, 2.35%, 7/29/44 | EUR | 2,130,000 |
| 3,013,617 |
|
| | | | 11,561,151 |
|
| Mexico — 0.2% | | | |
Banco Inbursa SA Institucion de Banca Multiple, 4.375%, 4/11/27(1) | | $ | 1,700,000 |
| 1,691,500 |
|
| Netherlands — 1.4% | | | |
| BMW Finance NV, MTN, 1.00%, 2/15/22 | EUR | 1,000,000 |
| 1,214,719 |
|
| BMW Finance NV, MTN, 0.875%, 4/3/25 | EUR | 800,000 |
| 953,069 |
|
Constellium NV, 6.625%, 3/1/25(1) | | $ | 400,000 |
| 416,000 |
|
| Cooperatieve Rabobank UA, MTN, 4.375%, 6/7/21 | EUR | 3,000,000 |
| 4,050,622 |
|
| Deutsche Telekom International Finance BV, 1.25%, 10/6/23 | GBP | 1,150,000 |
| 1,495,707 |
|
| Deutsche Telekom International Finance BV, MTN, 0.875%, 1/30/24 | EUR | 820,000 |
| 981,044 |
|
NXP BV / NXP Funding LLC, 4.125%, 6/15/20(1) | | $ | 750,000 |
| 782,812 |
|
Petrobras Global Finance BV, 5.30%, 1/27/25(1) | | 1,700,000 |
| 1,707,650 |
|
Sensata Technologies BV, 5.00%, 10/1/25(1) | | 680,000 |
| 727,600 |
|
Telefonica Europe BV, VRN, 5.875%, 3/31/24(3) | EUR | 1,000,000 |
| 1,371,028 |
|
| | | | 13,700,251 |
|
| Norway — 0.2% | | | |
| Statoil ASA, MTN, 0.875%, 2/17/23 | EUR | 1,700,000 |
| 2,045,248 |
|
| Panama — 0.2% | | | |
Banco General SA, 4.125%, 8/7/27(1) | | $ | 1,600,000 |
| 1,592,800 |
|
| Spain — 0.8% | | | |
CaixaBank SA, MTN, VRN, 2.75%, 7/14/23(3) | EUR | 800,000 |
| 954,118 |
|
| Criteria Caixa SAU, MTN, 1.50%, 5/10/23 | EUR | 1,500,000 |
| 1,778,778 |
|
Ibercaja Banco SA, VRN, 5.00%, 7/28/20(3) | EUR | 1,700,000 |
| 2,040,374 |
|
| Santander Issuances SAU, MTN, 2.50%, 3/18/25 | EUR | 2,200,000 |
| 2,710,701 |
|
| | | | 7,483,971 |
|
| Supranational — 0.9% | | | |
| Asian Development Bank, MTN, 2.35%, 6/21/27 | JPY | 830,000,000 |
| 8,916,290 |
|
| Switzerland — 0.2% | | | |
Credit Suisse Group AG, VRN, 2.125%, 9/12/24(3) | GBP | 1,500,000 |
| 1,967,181 |
|
| Turkey — 0.3% | | | |
Finansbank AS, 4.875%, 5/19/22(1) | | $ | 1,400,000 |
| 1,385,005 |
|
Turkiye Garanti Bankasi AS, 5.875%, 3/16/23(1) | | 1,000,000 |
| 1,031,591 |
|
| | | | 2,416,596 |
|
| United Kingdom — 3.3% | | | |
Barclays plc, MTN, VRN, 2.625%, 11/11/20(3) | EUR | 1,600,000 |
| 1,943,025 |
|
Centrica plc, VRN, 5.25%, 4/10/25(3) | GBP | 1,500,000 |
| 2,126,700 |
|
| Co-Operative Bank plc, 4.75%, 11/11/21 (Secured) | GBP | 2,640,000 |
| 3,857,098 |
|
| HSBC Holdings plc, 0.84%, 9/26/23 | JPY | 400,000,000 |
| 3,599,219 |
|
| HSBC Holdings plc, 2.625%, 8/16/28 | GBP | 1,600,000 |
| 2,152,141 |
|
| InterContinental Hotels Group plc, MTN, 3.75%, 8/14/25 | GBP | 1,100,000 |
| 1,587,679 |
|
International Game Technology plc, 6.25%, 2/15/22(1) | | $ | 1,200,000 |
| 1,325,640 |
|
| Lloyds Bank plc, MTN, 7.625%, 4/22/25 | GBP | 1,500,000 |
| 2,666,418 |
|
| Santander UK plc, MTN, 5.125%, 4/14/21 (Secured) | GBP | 1,940,000 |
| 2,931,171 |
|
|
| | | | | | | |
| | | Principal Amount | Value |
Sensata Technologies UK Financing Co. plc, 6.25%, 2/15/26(1) | | $ | 700,000 |
| $ | 771,750 |
|
SSE plc, VRN, 2.375%, 4/1/21(3) | EUR | 1,400,000 |
| 1,692,311 |
|
| Tesco Corporate Treasury Services plc, MTN, 2.50%, 7/1/24 | EUR | 1,940,000 |
| 2,441,786 |
|
| Tesco plc, MTN, 5.00%, 3/24/23 | GBP | 1,000,000 |
| 1,503,140 |
|
Virgin Media Secured Finance plc, 5.25%, 1/15/26(1) | | $ | 1,360,000 |
| 1,416,372 |
|
| WPP Finance 2013, MTN, 3.00%, 11/20/23 | EUR | 700,000 |
| 925,117 |
|
| | | | 30,939,567 |
|
| United States — 7.4% | | | |
| AES Corp., 4.875%, 5/15/23 | | $ | 940,000 |
| 965,850 |
|
| Ally Financial, Inc., 4.625%, 3/30/25 | | 1,000,000 |
| 1,067,500 |
|
| AMC Networks, Inc., 4.75%, 8/1/25 | | 1,070,000 |
| 1,071,338 |
|
| Andeavor Logistics LP / Tesoro Logistics Finance Corp., 5.50%, 10/15/19 | | 1,360,000 |
| 1,438,200 |
|
| Antero Resources Corp., 5.125%, 12/1/22 | | 1,100,000 |
| 1,135,750 |
|
Aramark Services, Inc., 5.00%, 4/1/25(1) | | 560,000 |
| 599,900 |
|
| Ashland LLC, 4.75%, 8/15/22 | | 900,000 |
| 951,930 |
|
| AT&T, Inc., 3.375%, 3/15/34 | EUR | 1,000,000 |
| 1,290,021 |
|
| Ball Corp., 4.00%, 11/15/23 | | $ | 940,000 |
| 969,375 |
|
| Bank of America Corp., MTN, 2.30%, 7/25/25 | GBP | 700,000 |
| 934,309 |
|
Calpine Corp., 5.875%, 1/15/24(1) | | $ | 940,000 |
| 977,600 |
|
| CCO Holdings LLC / CCO Holdings Capital Corp., 5.25%, 9/30/22 | | 1,240,000 |
| 1,279,525 |
|
CCO Holdings LLC / CCO Holdings Capital Corp., 5.125%, 5/1/27(1) | | 1,050,000 |
| 1,061,813 |
|
| CIT Group, Inc., 5.00%, 8/15/22 | | 1,360,000 |
| 1,465,400 |
|
CommScope Technologies LLC, 5.00%, 3/15/27(1) | | 1,360,000 |
| 1,327,700 |
|
| Concho Resources, Inc., 4.375%, 1/15/25 | | 300,000 |
| 317,298 |
|
| Continental Resources, Inc., 3.80%, 6/1/24 | | 900,000 |
| 878,625 |
|
| Crown Americas LLC / Crown Americas Capital Corp. IV, 4.50%, 1/15/23 | | 1,360,000 |
| 1,419,296 |
|
CSC Holdings LLC, 5.50%, 4/15/27(1) | | 1,040,000 |
| 1,073,800 |
|
| DaVita, Inc., 5.75%, 8/15/22 | | 300,000 |
| 309,563 |
|
| DaVita, Inc., 5.125%, 7/15/24 | | 2,010,000 |
| 2,018,794 |
|
Dell International LLC / EMC Corp., 7.125%, 6/15/24(1) | | 500,000 |
| 552,079 |
|
| Discovery Communications LLC, 2.50%, 9/20/24 | GBP | 1,800,000 |
| 2,348,090 |
|
First Data Corp., 5.00%, 1/15/24(1) | | $ | 1,600,000 |
| 1,668,000 |
|
| Frontier Communications Corp., 8.50%, 4/15/20 | | 197,000 |
| 195,276 |
|
| General Motors Co., 5.00%, 4/1/35 | | 1,360,000 |
| 1,412,003 |
|
| General Motors Financial Co., Inc., 3.25%, 5/15/18 | | 1,360,000 |
| 1,370,649 |
|
| Goldman Sachs Group, Inc. (The), 5.50%, 10/12/21 | GBP | 850,000 |
| 1,287,597 |
|
| Goldman Sachs Group, Inc. (The), MTN, 4.25%, 1/29/26 | GBP | 800,000 |
| 1,197,297 |
|
| Goodyear Tire & Rubber Co. (The), 5.125%, 11/15/23 | | $ | 1,300,000 |
| 1,343,875 |
|
Hanesbrands, Inc., 4.625%, 5/15/24(1) | | 500,000 |
| 516,875 |
|
| HCA, Inc., 3.75%, 3/15/19 | | 1,410,000 |
| 1,434,675 |
|
| HCA, Inc., 5.00%, 3/15/24 | | 1,000,000 |
| 1,054,690 |
|
| Hilton Domestic Operating Co., Inc., 4.25%, 9/1/24 | | 1,150,000 |
| 1,177,313 |
|
| International Business Machines Corp., 1.75%, 3/7/28 | EUR | 2,000,000 |
| 2,483,762 |
|
| International Lease Finance Corp., 6.25%, 5/15/19 | | $ | 549,000 |
| 582,333 |
|
|
| | | | | | | |
| | | Principal Amount | Value |
| Lamar Media Corp., 5.375%, 1/15/24 | | $ | 1,300,000 |
| $ | 1,371,500 |
|
Lamb Weston Holdings, Inc., 4.625%, 11/1/24(1) | | 1,340,000 |
| 1,407,000 |
|
| Lennar Corp., 4.75%, 4/1/21 | | 1,910,000 |
| 2,007,887 |
|
| Lennar Corp., 4.50%, 4/30/24 | | 400,000 |
| 413,000 |
|
Netflix, Inc., 4.875%, 4/15/28(1) | | 2,000,000 |
| 1,990,400 |
|
| Newfield Exploration Co., 5.75%, 1/30/22 | | 1,360,000 |
| 1,468,800 |
|
NextEra Energy Operating Partners LP, 4.50%, 9/15/27(1) | | 1,410,000 |
| 1,422,337 |
|
Post Holdings, Inc., 5.00%, 8/15/26(1) | | 1,080,000 |
| 1,088,100 |
|
Quintiles IMS, Inc., 5.00%, 10/15/26(1) | | 1,000,000 |
| 1,065,000 |
|
Reynolds Group Issuer, Inc. / Reynolds Group Issuer LLC / Reynolds Group Issuer Lu, 5.125%, 7/15/23(1) | | 1,010,000 |
| 1,052,925 |
|
| Spectrum Brands, Inc., 5.75%, 7/15/25 | | 630,000 |
| 672,323 |
|
Sprint Communications, Inc., 9.00%, 11/15/18(1) | | 349,000 |
| 370,376 |
|
| Sprint Communications, Inc., 6.00%, 11/15/22 | | 250,000 |
| 263,125 |
|
| Steel Dynamics, Inc., 5.00%, 12/15/26 | | 1,180,000 |
| 1,250,800 |
|
Targa Resources Partners LP / Targa Resources Partners Finance Corp., 5.00%, 1/15/28(1) | | 910,000 |
| 916,825 |
|
| Tenet Healthcare Corp., 4.375%, 10/1/21 | | 400,000 |
| 400,600 |
|
Tenet Healthcare Corp., 5.125%, 5/1/25(1) | | 900,000 |
| 879,750 |
|
| Tenneco, Inc., 5.00%, 7/15/26 | | 1,080,000 |
| 1,112,400 |
|
| United Rentals North America, Inc., 4.625%, 7/15/23 | | 1,360,000 |
| 1,427,150 |
|
| United Rentals North America, Inc., 5.75%, 11/15/24 | | 480,000 |
| 510,600 |
|
Universal Health Services, Inc., 4.75%, 8/1/22(1) | | 940,000 |
| 972,900 |
|
| Wal-Mart Stores, Inc., 0.18%, 7/15/22 | JPY | 450,000,000 |
| 3,951,242 |
|
Western Digital Corp., 7.375%, 4/1/23(1) | | $ | 500,000 |
| 548,750 |
|
Zayo Group LLC / Zayo Capital, Inc., 5.75%, 1/15/27(1) | | 1,000,000 |
| 1,056,250 |
|
ZF North America Capital, Inc., 4.00%, 4/29/20(1) | | 1,360,000 |
| 1,409,300 |
|
| | | | 70,207,441 |
|
TOTAL CORPORATE BONDS
(Cost $204,381,902) | | | 208,136,658 |
|
COLLATERALIZED MORTGAGE OBLIGATIONS(4) — 3.3% | | | |
| Private Sponsor Collateralized Mortgage Obligations — 1.6% | | |
Agate Bay Mortgage Trust, Series 2016-1, Class A5 SEQ, VRN, 3.50%, 11/1/17(1)(7) | | 3,887,760 |
| 3,990,517 |
|
Credit Suisse Mortgage Trust, Series 2017-HL1, Class A3 SEQ, VRN, 3.50%, 11/1/17(1)(7) | | 3,351,916 |
| 3,425,842 |
|
Flagstar Mortgage Trust, Series 2017-1, Class 1A5 SEQ, VRN, 3.50%, 11/1/17(1)(7) | | 3,782,140 |
| 3,866,150 |
|
Sequoia Mortgage Trust, Series 2017-5, Class A4 SEQ, VRN, 3.50%, 11/1/17(1)(7) | | 3,838,138 |
| 3,926,090 |
|
| | | | 15,208,599 |
|
| U.S. Government Agency Collateralized Mortgage Obligations — 1.7% | |
| FHLMC, Series 2017-DNA2, Class M1, VRN, 2.44%, 11/27/17, resets monthly off the 1-month USD LIBOR plus 1.20% | | 3,893,422 |
| 3,945,568 |
|
| FHLMC, Series 2017-HQA2, Class M1, VRN, 2.04%, 11/27/17, resets monthly off the 1-month USD LIBOR plus 0.80% | | 3,902,071 |
| 3,915,066 |
|
| FNMA, Series 2017-C06, Class 1M1, VRN, 1.99%, 11/27/17, resets monthly off the 1-month USD LIBOR plus 2.10% | | 3,703,086 |
| 3,713,742 |
|
|
| | | | | | | |
| | | Principal Amount | Value |
| FNMA, Series 2017-C06, Class 2M1, VRN, 1.99%, 11/27/17, resets monthly off the 1-month USD LIBOR plus 0.75% | | $ | 3,940,664 |
| $ | 3,949,196 |
|
| | | | 15,523,572 |
|
TOTAL COLLATERALIZED MORTGAGE OBLIGATIONS
(Cost $30,698,105) | | | 30,732,171 |
|
COMMERCIAL MORTGAGE-BACKED SECURITIES(4) — 2.0% | | |
Bank of America Merrill Lynch Commercial Mortgage Securities Trust, Series 2015-200P, Class B, 3.49%, 4/14/33(1) | | 2,750,000 |
| 2,803,130 |
|
COMM Mortgage Trust, Series 2017-PANW, Class A, 3.24%, 11/10/34(1) | | 2,300,000 |
| 2,327,223 |
|
Core Industrial Trust, Series 2015-CALW, Class C, 3.56%, 2/10/34(1) | | 2,000,000 |
| 2,042,762 |
|
| GS Mortgage Securities Trust, Series 2016-GS2, Class A3 SEQ, 2.79%, 5/10/49 | | 3,775,000 |
| 3,737,446 |
|
| JPMorgan Chase Commercial Mortgage Securities Trust, Series 2016-JP2, Class AS SEQ, 3.06%, 8/15/49 | | 2,600,000 |
| 2,550,232 |
|
| Morgan Stanley Bank of America Merrill Lynch Trust, Series 2017-C34, Class A3 SEQ, 3.28%, 11/15/52 | | 3,300,000 |
| 3,375,357 |
|
| UBS Commercial Mortgage Trust, Series 2017-C1, Class A3, 3.20%, 6/15/50 | | 2,300,000 |
| 2,329,852 |
|
TOTAL COMMERCIAL MORTGAGE-BACKED SECURITIES
(Cost $19,110,426) | | 19,166,002 |
|
ASSET-BACKED SECURITIES(4) — 1.8% | | | |
MVW Owner Trust, Series 2017-1A, Class A SEQ, 2.42%, 12/20/34(1) | | 2,922,120 |
| 2,911,188 |
|
Progress Residential Trust, Series 2017-SFR1, Class A, 2.77%, 8/17/34(1) | | 2,822,456 |
| 2,813,154 |
|
Towd Point Mortgage Trust, Series 2017-4, Class A1, VRN, 2.75%, 11/1/17(1)(7) | | 4,380,897 |
| 4,401,554 |
|
VSE VOI Mortgage LLC, Series 2016-A, Class A SEQ, 2.54%, 7/20/33(1) | | 4,176,841 |
| 4,159,972 |
|
VSE VOI Mortgage LLC, Series 2017-A, Class A SEQ, 2.33%, 3/20/35(1) | | 3,144,278 |
| 3,121,907 |
|
TOTAL ASSET-BACKED SECURITIES
(Cost $17,467,495) | | | 17,407,775 |
|
| TEMPORARY CASH INVESTMENTS — 4.1% | | | |
Repurchase Agreement, BMO Capital Markets Corp.,(collateralized by various U.S. Treasury obligations, 0.375% - 1.375%, 1/15/27 - 2/15/45, valued at $18,011,019),in a joint trading account at 0.88%, dated 10/31/17, due 11/1/17 (Delivery value $17,617,846) | | | 17,617,415 |
|
| Repurchase Agreement, Fixed Income Clearing Corp.,(collateralized by various U.S. Treasury obligations, 2.50%, 5/15/46, valued at $14,984,308),at 0.34%, dated 10/31/17, due 11/1/17 (Delivery value $14,687,139) | | | 14,687,000 |
|
U.S. Treasury Bills, 1.02%,11/9/17(5)(6) | | 6,870,000 |
| 6,868,540 |
|
TOTAL TEMPORARY CASH INVESTMENTS
(Cost $39,172,883) | | | 39,172,955 |
|
TOTAL INVESTMENT SECURITIES — 100.2%
(Cost $933,547,264) | | | 951,996,073 |
|
| OTHER ASSETS AND LIABILITIES — (0.2)% | | | (2,101,511 | ) |
| TOTAL NET ASSETS — 100.0% | | | $ | 949,894,562 |
|
FORWARD FOREIGN CURRENCY EXCHANGE CONTRACTS
|
| | | | | | | | | | |
| Currency Purchased | Currency Sold | Counterparty | Settlement Date | Unrealized Appreciation
(Depreciation) |
| ARS | 16,532,516 |
| USD | 918,856 |
| Goldman Sachs & Co. | 12/20/17 | $ | (8,904 | ) |
| USD | 916,475 |
| ARS | 16,631,730 |
| Goldman Sachs & Co. | 12/20/17 | 1,062 |
|
| AUD | 168,420 |
| USD | 133,661 |
| JPMorgan Chase Bank N.A. | 12/20/17 | (4,821 | ) |
| AUD | 201,761 |
| USD | 160,134 |
| JPMorgan Chase Bank N.A. | 12/20/17 | (5,788 | ) |
| AUD | 326,264 |
| USD | 255,779 |
| JPMorgan Chase Bank N.A. | 12/20/17 | (6,188 | ) |
| AUD | 179,858 |
| USD | 140,614 |
| JPMorgan Chase Bank N.A. | 12/20/17 | (3,024 | ) |
| AUD | 190,747 |
| USD | 148,749 |
| JPMorgan Chase Bank N.A. | 12/20/17 | (2,829 | ) |
| AUD | 357,218 |
| USD | 280,807 |
| JPMorgan Chase Bank N.A. | 12/20/17 | (7,537 | ) |
| AUD | 4,856,769 |
| USD | 3,892,433 |
| JPMorgan Chase Bank N.A. | 12/20/17 | (177,029 | ) |
| USD | 161,956 |
| AUD | 202,499 |
| JPMorgan Chase Bank N.A. | 12/20/17 | 7,046 |
|
| USD | 140,967 |
| AUD | 179,623 |
| JPMorgan Chase Bank N.A. | 12/20/17 | 3,556 |
|
| USD | 102,979 |
| AUD | 132,797 |
| JPMorgan Chase Bank N.A. | 12/20/17 | 1,390 |
|
| USD | 322,206 |
| AUD | 414,088 |
| JPMorgan Chase Bank N.A. | 12/20/17 | 5,431 |
|
| USD | 159,756 |
| AUD | 203,872 |
| JPMorgan Chase Bank N.A. | 12/20/17 | 3,795 |
|
| USD | 231,903 |
| AUD | 296,175 |
| JPMorgan Chase Bank N.A. | 12/20/17 | 5,331 |
|
| USD | 319,721 |
| AUD | 417,609 |
| JPMorgan Chase Bank N.A. | 12/20/17 | 252 |
|
| BRL | 603,890 |
| USD | 190,742 |
| Morgan Stanley | 12/20/17 | (7,225 | ) |
| BRL | 906,823 |
| USD | 285,066 |
| Morgan Stanley | 12/20/17 | (9,490 | ) |
| BRL | 304,297 |
| USD | 95,212 |
| Morgan Stanley | 12/20/17 | (2,739 | ) |
| BRL | 917,716 |
| USD | 286,241 |
| Morgan Stanley | 12/20/17 | (7,354 | ) |
| BRL | 3,747,120 |
| USD | 1,148,543 |
| Morgan Stanley | 12/20/17 | (9,824 | ) |
| BRL | 4,645,745 |
| USD | 1,424,551 |
| Morgan Stanley | 12/20/17 | (12,748 | ) |
| BRL | 617,048 |
| USD | 188,412 |
| Morgan Stanley | 12/20/17 | (896 | ) |
| USD | 95,381 |
| BRL | 302,425 |
| JPMorgan Chase Bank N.A. | 12/20/17 | 3,477 |
|
| USD | 2,565,681 |
| BRL | 8,015,957 |
| Morgan Stanley | 12/20/17 | 129,699 |
|
| USD | 388,562 |
| BRL | 1,216,353 |
| Morgan Stanley | 12/20/17 | 18,922 |
|
| CAD | 126,439 |
| USD | 104,126 |
| JPMorgan Chase Bank N.A. | 12/20/17 | (6,071 | ) |
| CAD | 62,858 |
| USD | 50,997 |
| JPMorgan Chase Bank N.A. | 12/20/17 | (2,250 | ) |
| CAD | 135,246 |
| USD | 109,383 |
| JPMorgan Chase Bank N.A. | 12/20/17 | (4,497 | ) |
| CAD | 119,767 |
| USD | 95,858 |
| JPMorgan Chase Bank N.A. | 12/20/17 | (2,977 | ) |
| CAD | 143,333 |
| USD | 114,709 |
| JPMorgan Chase Bank N.A. | 12/20/17 | (3,553 | ) |
| CAD | 32,330,282 |
| USD | 25,726,496 |
| JPMorgan Chase Bank N.A. | 12/20/17 | (653,870 | ) |
| CAD | 333,828 |
| USD | 266,372 |
| JPMorgan Chase Bank N.A. | 12/20/17 | (7,483 | ) |
| CAD | 919,615 |
| USD | 735,784 |
| JPMorgan Chase Bank N.A. | 12/20/17 | (22,608 | ) |
| CAD | 135,894 |
| USD | 108,434 |
| JPMorgan Chase Bank N.A. | 12/20/17 | (3,046 | ) |
| CAD | 312,489 |
| USD | 248,639 |
| JPMorgan Chase Bank N.A. | 12/20/17 | (6,299 | ) |
| CAD | 628,747 |
| USD | 489,399 |
| JPMorgan Chase Bank N.A. | 12/20/17 | (1,796 | ) |
| CAD | 243,545 |
| USD | 188,995 |
| JPMorgan Chase Bank N.A. | 12/20/17 | (122 | ) |
| CAD | 508,831 |
| USD | 418,884 |
| JPMorgan Chase Bank N.A. | 12/20/17 | (24,278 | ) |
| USD | 19,558,482 |
| CAD | 23,781,256 |
| JPMorgan Chase Bank N.A. | 12/20/17 | 1,115,756 |
|
| USD | 102,883 |
| CAD | 124,800 |
| JPMorgan Chase Bank N.A. | 12/20/17 | 6,098 |
|
| USD | 553,946 |
| CAD | 693,111 |
| JPMorgan Chase Bank N.A. | 12/20/17 | 16,428 |
|
| USD | 95,301 |
| CAD | 119,123 |
| JPMorgan Chase Bank N.A. | 12/20/17 | 2,919 |
|
| USD | 148,625 |
| CAD | 185,730 |
| JPMorgan Chase Bank N.A. | 12/20/17 | 4,588 |
|
| USD | 197,726 |
| CAD | 246,555 |
| JPMorgan Chase Bank N.A. | 12/20/17 | 6,519 |
|
|
| | | | | | | | | | |
| Currency Purchased | Currency Sold | Counterparty | Settlement Date | Unrealized Appreciation
(Depreciation) |
| USD | 201,763 |
| CAD | 252,896 |
| JPMorgan Chase Bank N.A. | 12/20/17 | $ | 5,639 |
|
| USD | 50,201 |
| CAD | 62,602 |
| JPMorgan Chase Bank N.A. | 12/20/17 | 1,653 |
|
| USD | 210,360 |
| CAD | 262,387 |
| JPMorgan Chase Bank N.A. | 12/20/17 | 6,875 |
|
| USD | 196,152 |
| CAD | 252,829 |
| JPMorgan Chase Bank N.A. | 12/20/17 | 80 |
|
| CHF | 3,519,437 |
| USD | 3,715,190 |
| Credit Suisse AG | 12/20/17 | (175,737 | ) |
| USD | 1,946,452 |
| CHF | 1,831,590 |
| Credit Suisse AG | 12/20/17 | 104,445 |
|
| USD | 2,917,638 |
| CHF | 2,786,032 |
| Credit Suisse AG | 12/20/17 | 115,760 |
|
| USD | 125,330 |
| CHF | 121,528 |
| Credit Suisse AG | 12/20/17 | 3,111 |
|
| USD | 4,769,681 |
| CHF | 4,669,041 |
| Credit Suisse AG | 12/20/17 | 74,085 |
|
| USD | 108,377 |
| CHF | 105,386 |
| Credit Suisse AG | 12/20/17 | 2,392 |
|
| CLP | 1,208,621,840 |
| USD | 1,881,621 |
| JPMorgan Chase Bank N.A. | 12/20/17 | 16,308 |
|
| USD | 1,799,786 |
| CLP | 1,112,267,633 |
| JPMorgan Chase Bank N.A. | 12/20/17 | 53,164 |
|
| USD | 12,702,449 |
| CLP | 8,053,352,847 |
| JPMorgan Chase Bank N.A. | 12/20/17 | 56,064 |
|
| USD | 117,699 |
| CLP | 74,168,142 |
| JPMorgan Chase Bank N.A. | 12/20/17 | 1,231 |
|
| COP | 8,529,010,462 |
| USD | 2,892,906 |
| Goldman Sachs & Co. | 12/20/17 | (101,744 | ) |
| USD | 2,839,022 |
| COP | 8,458,666,472 |
| Goldman Sachs & Co. | 12/20/17 | 70,880 |
|
| CZK | 4,221,892 |
| USD | 192,855 |
| Goldman Sachs & Co. | 12/20/17 | (622 | ) |
| USD | 613,801 |
| CZK | 13,282,039 |
| Goldman Sachs & Co. | 12/20/17 | 9,037 |
|
| DKK | 631,736 |
| USD | 100,818 |
| JPMorgan Chase Bank N.A. | 12/20/17 | (1,639 | ) |
| DKK | 6,030,510 |
| USD | 962,981 |
| JPMorgan Chase Bank N.A. | 12/20/17 | (16,224 | ) |
| DKK | 11,229,868 |
| USD | 1,824,773 |
| JPMorgan Chase Bank N.A. | 12/20/17 | (61,745 | ) |
| USD | 95,228 |
| DKK | 601,035 |
| JPMorgan Chase Bank N.A. | 12/20/17 | 869 |
|
| USD | 95,558 |
| DKK | 597,837 |
| JPMorgan Chase Bank N.A. | 12/20/17 | 1,701 |
|
| USD | 475,361 |
| DKK | 2,999,098 |
| JPMorgan Chase Bank N.A. | 12/20/17 | 4,519 |
|
| EUR | 98,439,944 |
| USD | 116,136,985 |
| JPMorgan Chase Bank N.A. | 11/15/17 | (1,392,281 | ) |
| EUR | 1,811,359 |
| USD | 2,127,785 |
| JPMorgan Chase Bank N.A. | 11/15/17 | (16,408 | ) |
| EUR | 685,749 |
| USD | 810,154 |
| JPMorgan Chase Bank N.A. | 11/15/17 | (10,823 | ) |
| EUR | 942,745 |
| USD | 1,119,350 |
| JPMorgan Chase Bank N.A. | 11/15/17 | (20,456 | ) |
| EUR | 3,393,657 |
| USD | 4,025,862 |
| JPMorgan Chase Bank N.A. | 11/15/17 | (70,108 | ) |
| EUR | 368,920 |
| USD | 436,063 |
| JPMorgan Chase Bank N.A. | 11/15/17 | (6,038 | ) |
| EUR | 1,736,399 |
| USD | 2,043,554 |
| JPMorgan Chase Bank N.A. | 11/15/17 | (19,553 | ) |
| EUR | 5,091,751 |
| USD | 6,005,527 |
| JPMorgan Chase Bank N.A. | 11/15/17 | (70,421 | ) |
| EUR | 12,012,246 |
| USD | 14,245,731 |
| JPMorgan Chase Bank N.A. | 11/15/17 | (243,878 | ) |
| EUR | 195,357 |
| USD | 230,863 |
| JPMorgan Chase Bank N.A. | 11/15/17 | (3,149 | ) |
| EUR | 2,427,467 |
| USD | 2,861,894 |
| JPMorgan Chase Bank N.A. | 11/15/17 | (32,362 | ) |
| EUR | 870,368 |
| USD | 1,011,827 |
| JPMorgan Chase Bank N.A. | 11/15/17 | 2,702 |
|
| USD | 1,786,568 |
| EUR | 1,515,968 |
| JPMorgan Chase Bank N.A. | 11/15/17 | 19,508 |
|
| USD | 285,239 |
| EUR | 242,281 |
| JPMorgan Chase Bank N.A. | 11/15/17 | 2,828 |
|
| USD | 721,241 |
| EUR | 615,108 |
| JPMorgan Chase Bank N.A. | 11/15/17 | 4,252 |
|
| USD | 2,151,959 |
| EUR | 1,830,889 |
| JPMorgan Chase Bank N.A. | 11/15/17 | 17,817 |
|
| USD | 101,511 |
| EUR | 86,329 |
| JPMorgan Chase Bank N.A. | 11/15/17 | 883 |
|
| USD | 2,633,105 |
| EUR | 2,226,300 |
| JPMorgan Chase Bank N.A. | 11/15/17 | 38,060 |
|
| USD | 966,708 |
| EUR | 814,866 |
| JPMorgan Chase Bank N.A. | 11/15/17 | 16,875 |
|
| USD | 95,960 |
| EUR | 80,898 |
| JPMorgan Chase Bank N.A. | 11/15/17 | 1,663 |
|
| USD | 979,218 |
| EUR | 827,986 |
| JPMorgan Chase Bank N.A. | 11/15/17 | 14,091 |
|
| USD | 937,676 |
| EUR | 796,104 |
| JPMorgan Chase Bank N.A. | 11/15/17 | 9,713 |
|
|
| | | | | | | | | | |
| Currency Purchased | Currency Sold | Counterparty | Settlement Date | Unrealized Appreciation
(Depreciation) |
| USD | 2,418,011 |
| EUR | 2,050,629 |
| JPMorgan Chase Bank N.A. | 11/15/17 | $ | 27,734 |
|
| USD | 342,085 |
| EUR | 290,617 |
| JPMorgan Chase Bank N.A. | 11/15/17 | 3,333 |
|
| USD | 1,089,729 |
| EUR | 936,586 |
| JPMorgan Chase Bank N.A. | 11/15/17 | (1,985 | ) |
| USD | 1,677,541 |
| EUR | 1,443,128 |
| JPMorgan Chase Bank N.A. | 11/15/17 | (4,614 | ) |
| USD | 1,206,268 |
| EUR | 1,034,838 |
| JPMorgan Chase Bank N.A. | 11/15/17 | 28 |
|
| USD | 2,425,692 |
| EUR | 2,080,231 |
| JPMorgan Chase Bank N.A. | 11/15/17 | 910 |
|
| GBP | 378,894 |
| USD | 513,994 |
| Credit Suisse AG | 12/20/17 | (10,015 | ) |
| GBP | 103,097 |
| USD | 139,658 |
| Credit Suisse AG | 12/20/17 | (2,526 | ) |
| GBP | 92,806 |
| USD | 125,200 |
| Credit Suisse AG | 12/20/17 | (1,756 | ) |
| GBP | 1,109,037 |
| USD | 1,490,679 |
| Credit Suisse AG | 12/20/17 | (15,514 | ) |
| GBP | 506,062 |
| USD | 680,477 |
| Credit Suisse AG | 12/20/17 | (7,348 | ) |
| GBP | 172,508 |
| USD | 229,435 |
| Credit Suisse AG | 12/20/17 | 23 |
|
| GBP | 1,838,322 |
| USD | 2,415,246 |
| Credit Suisse AG | 12/20/17 | 29,964 |
|
| GBP | 289,521 |
| USD | 381,285 |
| Credit Suisse AG | 12/20/17 | 3,816 |
|
| GBP | 218,225 |
| USD | 288,564 |
| Credit Suisse AG | 12/20/17 | 1,704 |
|
| GBP | 814,619 |
| USD | 1,085,867 |
| Credit Suisse AG | 12/20/17 | (2,316 | ) |
| GBP | 319,098 |
| USD | 420,967 |
| Credit Suisse AG | 12/20/17 | 3,475 |
|
| GBP | 79,262 |
| USD | 104,511 |
| Credit Suisse AG | 12/20/17 | 918 |
|
| GBP | 3,998,884 |
| USD | 5,257,732 |
| Credit Suisse AG | 12/20/17 | 61,310 |
|
| GBP | 91,203 |
| USD | 119,536 |
| Credit Suisse AG | 12/20/17 | 1,776 |
|
| GBP | 348,924 |
| USD | 461,042 |
| Credit Suisse AG | 12/20/17 | 3,073 |
|
| GBP | 582,743 |
| USD | 774,936 |
| Credit Suisse AG | 12/20/17 | 189 |
|
| GBP | 19,317,162 |
| USD | 25,407,284 |
| Credit Suisse AG | 12/20/17 | 287,085 |
|
| GBP | 1,526,921 |
| USD | 2,022,695 |
| Credit Suisse AG | 12/20/17 | 8,310 |
|
| USD | 231,805 |
| GBP | 175,342 |
| Credit Suisse AG | 12/20/17 | (1,423 | ) |
| USD | 264,161 |
| GBP | 198,711 |
| Credit Suisse AG | 12/20/17 | (151 | ) |
| USD | 285,269 |
| GBP | 212,503 |
| Credit Suisse AG | 12/20/17 | 2,612 |
|
| USD | 16,185,504 |
| GBP | 11,979,324 |
| Credit Suisse AG | 12/20/17 | 251,426 |
|
| USD | 118,199 |
| GBP | 87,215 |
| Credit Suisse AG | 12/20/17 | 2,192 |
|
| USD | 105,041 |
| GBP | 77,250 |
| Credit Suisse AG | 12/20/17 | 2,288 |
|
| USD | 117,333 |
| GBP | 87,122 |
| Credit Suisse AG | 12/20/17 | 1,450 |
|
| USD | 585,242 |
| GBP | 435,855 |
| Credit Suisse AG | 12/20/17 | 5,497 |
|
| USD | 1,845,683 |
| GBP | 1,386,007 |
| Credit Suisse AG | 12/20/17 | 2,111 |
|
| USD | 2,348,245 |
| GBP | 1,765,603 |
| Credit Suisse AG | 12/20/17 | (240 | ) |
| USD | 447,924 |
| GBP | 336,534 |
| Credit Suisse AG | 12/20/17 | 289 |
|
| USD | 483,826 |
| GBP | 369,841 |
| Credit Suisse AG | 12/20/17 | (8,111 | ) |
| USD | 2,109,169 |
| GBP | 1,593,649 |
| Credit Suisse AG | 12/20/17 | (10,594 | ) |
| USD | 715,500 |
| GBP | 541,592 |
| Credit Suisse AG | 12/20/17 | (4,889 | ) |
| USD | 1,954,804 |
| GBP | 1,484,477 |
| Credit Suisse AG | 12/20/17 | (19,746 | ) |
| USD | 932,787 |
| GBP | 703,138 |
| Credit Suisse AG | 12/20/17 | (2,480 | ) |
| USD | 1,581,630 |
| GBP | 1,199,122 |
| Credit Suisse AG | 12/20/17 | (13,360 | ) |
| USD | 429,478 |
| GBP | 325,239 |
| Credit Suisse AG | 12/20/17 | (3,133 | ) |
| USD | 161,321 |
| GBP | 121,255 |
| Credit Suisse AG | 12/20/17 | 36 |
|
| HKD | 2,269,856 |
| USD | 291,286 |
| Credit Suisse AG | 12/20/17 | (110 | ) |
| HUF | 161,316,624 |
| USD | 636,129 |
| JPMorgan Chase Bank N.A. | 12/20/17 | (31,344 | ) |
| USD | 2,822,172 |
| HUF | 746,238,837 |
| JPMorgan Chase Bank N.A. | 12/20/17 | 24,482 |
|
|
| | | | | | | | | | |
| Currency Purchased | Currency Sold | Counterparty | Settlement Date | Unrealized Appreciation
(Depreciation) |
| ILS | 360,729 |
| USD | 103,053 |
| Goldman Sachs & Co. | 12/20/17 | $ | (447 | ) |
| ILS | 7,907,462 |
| USD | 2,252,389 |
| Goldman Sachs & Co. | 12/20/17 | (3,188 | ) |
| USD | 2,861,733 |
| INR | 184,724,889 |
| Goldman Sachs & Co. | 12/20/17 | 21,161 |
|
| JPY | 4,789,884,185 |
| USD | 42,634,124 |
| Credit Suisse AG | 11/15/17 | (486,316 | ) |
| JPY | 13,211,228 |
| USD | 117,298 |
| Credit Suisse AG | 11/15/17 | (1,048 | ) |
| JPY | 160,868,118 |
| USD | 1,430,897 |
| Credit Suisse AG | 11/15/17 | (15,364 | ) |
| JPY | 72,213,489 |
| USD | 643,377 |
| Credit Suisse AG | 11/15/17 | (7,946 | ) |
| JPY | 43,581,096 |
| USD | 388,396 |
| Credit Suisse AG | 11/15/17 | (4,911 | ) |
| JPY | 21,357,753 |
| USD | 191,240 |
| Credit Suisse AG | 11/15/17 | (3,306 | ) |
| JPY | 157,673,174 |
| USD | 1,405,322 |
| Credit Suisse AG | 11/15/17 | (17,902 | ) |
| JPY | 395,959,842 |
| USD | 3,509,893 |
| Credit Suisse AG | 11/15/17 | (25,709 | ) |
| JPY | 534,771,978 |
| USD | 4,739,206 |
| Credit Suisse AG | 11/15/17 | (33,567 | ) |
| JPY | 31,028,568 |
| USD | 272,951 |
| Credit Suisse AG | 11/15/17 | 79 |
|
| JPY | 75,028,161 |
| USD | 658,965 |
| Credit Suisse AG | 11/15/17 | 1,233 |
|
| JPY | 23,138,110 |
| USD | 202,705 |
| Credit Suisse AG | 11/15/17 | 895 |
|
| JPY | 79,136,162 |
| USD | 697,853 |
| Credit Suisse AG | 11/15/17 | (1,507 | ) |
| JPY | 365,412,710 |
| USD | 3,217,290 |
| Credit Suisse AG | 11/15/17 | (1,900 | ) |
| USD | 1,151,208 |
| JPY | 129,553,489 |
| Credit Suisse AG | 11/15/17 | 11,223 |
|
| USD | 1,465,392 |
| JPY | 165,091,080 |
| Credit Suisse AG | 11/15/17 | 12,700 |
|
| USD | 146,967 |
| JPY | 16,463,078 |
| Credit Suisse AG | 11/15/17 | 2,103 |
|
| USD | 937,765 |
| JPY | 104,631,273 |
| Credit Suisse AG | 11/15/17 | 17,080 |
|
| USD | 469,735 |
| JPY | 52,673,054 |
| Credit Suisse AG | 11/15/17 | 6,247 |
|
| USD | 1,463,505 |
| JPY | 165,186,706 |
| Credit Suisse AG | 11/15/17 | 9,972 |
|
| USD | 542,247 |
| JPY | 61,711,967 |
| Credit Suisse AG | 11/15/17 | (777 | ) |
| USD | 345,423 |
| JPY | 39,298,240 |
| Credit Suisse AG | 11/15/17 | (375 | ) |
| USD | 1,240,599 |
| JPY | 140,700,015 |
| Credit Suisse AG | 11/15/17 | 2,532 |
|
| USD | 2,790,276 |
| JPY | 317,004,703 |
| Credit Suisse AG | 11/15/17 | 845 |
|
| KRW | 3,339,304,301 |
| USD | 2,913,166 |
| Morgan Stanley | 12/21/17 | 74,058 |
|
| KRW | 20,254,782,931 |
| USD | 17,947,617 |
| Morgan Stanley | 12/21/17 | 171,598 |
|
| USD | 772,048 |
| KRW | 883,531,905 |
| Morgan Stanley | 12/21/17 | (18,328 | ) |
| USD | 260,892 |
| KRW | 291,520,354 |
| Morgan Stanley | 12/21/17 | 108 |
|
| USD | 983,447 |
| MXN | 17,683,945 |
| JPMorgan Chase Bank N.A. | 12/20/17 | 68,554 |
|
| USD | 961,630 |
| MXN | 17,663,433 |
| JPMorgan Chase Bank N.A. | 12/20/17 | 47,798 |
|
| MYR | 545,214 |
| USD | 129,268 |
| Goldman Sachs & Co. | 12/20/17 | (328 | ) |
| MYR | 504,431 |
| USD | 119,567 |
| Goldman Sachs & Co. | 12/20/17 | (272 | ) |
| MYR | 86,147,631 |
| USD | 20,555,388 |
| Goldman Sachs & Co. | 12/20/17 | (181,961 | ) |
| MYR | 440,994 |
| USD | 104,874 |
| Goldman Sachs & Co. | 12/20/17 | (581 | ) |
| USD | 226,227 |
| MYR | 945,855 |
| Goldman Sachs & Co. | 12/20/17 | 2,538 |
|
| USD | 141,297 |
| MYR | 597,870 |
| Goldman Sachs & Co. | 12/20/17 | (96 | ) |
| USD | 241,678 |
| MYR | 1,022,782 |
| Goldman Sachs & Co. | 12/20/17 | (204 | ) |
| NOK | 199,651,292 |
| USD | 25,503,624 |
| JPMorgan Chase Bank N.A. | 12/20/17 | (1,030,362 | ) |
| NOK | 1,640,539 |
| USD | 210,376 |
| JPMorgan Chase Bank N.A. | 12/20/17 | (9,279 | ) |
| USD | 21,247,505 |
| NOK | 164,188,874 |
| JPMorgan Chase Bank N.A. | 12/20/17 | 1,121,228 |
|
| USD | 606,188 |
| NOK | 4,779,906 |
| JPMorgan Chase Bank N.A. | 12/20/17 | 20,267 |
|
| NZD | 292,051 |
| USD | 213,394 |
| JPMorgan Chase Bank N.A. | 12/20/17 | (13,713 | ) |
| NZD | 2,665,796 |
| USD | 1,829,850 |
| JPMorgan Chase Bank N.A. | 12/20/17 | (7,196 | ) |
|
| | | | | | | | | | |
| Currency Purchased | Currency Sold | Counterparty | Settlement Date | Unrealized Appreciation
(Depreciation) |
| USD | 8,177,553 |
| NZD | 11,336,771 |
| JPMorgan Chase Bank N.A. | 12/20/17 | $ | 426,390 |
|
| USD | 238,553 |
| NZD | 329,102 |
| JPMorgan Chase Bank N.A. | 12/20/17 | 13,540 |
|
| USD | 1,354,697 |
| NZD | 1,884,135 |
| JPMorgan Chase Bank N.A. | 12/20/17 | 66,478 |
|
| USD | 1,434,666 |
| NZD | 2,097,867 |
| JPMorgan Chase Bank N.A. | 12/20/17 | 315 |
|
| PEN | 9,341,220 |
| USD | 2,872,277 |
| Morgan Stanley | 12/20/17 | (4,747 | ) |
| USD | 2,858,031 |
| PEN | 9,384,346 |
| Morgan Stanley | 12/20/17 | (22,738 | ) |
| PHP | 14,897,159 |
| USD | 287,790 |
| Goldman Sachs & Co. | 12/20/17 | (785 | ) |
| PHP | 744,433,152 |
| USD | 14,534,033 |
| Goldman Sachs & Co. | 12/20/17 | (191,993 | ) |
| PHP | 9,957,116 |
| USD | 193,907 |
| Goldman Sachs & Co. | 12/20/17 | (2,076 | ) |
| USD | 96,115 |
| PHP | 4,946,094 |
| Goldman Sachs & Co. | 12/20/17 | 825 |
|
| USD | 96,066 |
| PHP | 4,904,175 |
| Goldman Sachs & Co. | 12/20/17 | 1,584 |
|
| USD | 95,263 |
| PHP | 4,871,741 |
| Goldman Sachs & Co. | 12/20/17 | 1,405 |
|
| USD | 281,684 |
| PHP | 14,637,433 |
| Goldman Sachs & Co. | 12/20/17 | (317 | ) |
| PLN | 473,301 |
| USD | 129,883 |
| Goldman Sachs & Co. | 12/20/17 | 175 |
|
| PLN | 10,688,180 |
| USD | 2,931,481 |
| Goldman Sachs & Co. | 12/20/17 | 5,511 |
|
| PLN | 2,643,603 |
| USD | 746,878 |
| Goldman Sachs & Co. | 12/20/17 | (20,445 | ) |
| USD | 2,876,744 |
| PLN | 10,392,239 |
| Goldman Sachs & Co. | 12/20/17 | 21,074 |
|
| RUB | 6,432,875 |
| USD | 109,589 |
| Morgan Stanley | 12/20/17 | (180 | ) |
| RUB | 233,087,752 |
| USD | 4,034,405 |
| Morgan Stanley | 12/20/17 | (70,096 | ) |
| USD | 1,814,961 |
| RUB | 106,418,425 |
| Morgan Stanley | 12/20/17 | 5,018 |
|
| SEK | 15,400,956 |
| USD | 1,893,853 |
| JPMorgan Chase Bank N.A. | 12/20/17 | (48,732 | ) |
| SEK | 4,015,294 |
| USD | 480,917 |
| JPMorgan Chase Bank N.A. | 12/20/17 | 138 |
|
| SEK | 27,216,203 |
| USD | 3,451,517 |
| JPMorgan Chase Bank N.A. | 12/20/17 | (190,863 | ) |
| USD | 2,897,201 |
| SEK | 22,916,859 |
| JPMorgan Chase Bank N.A. | 12/20/17 | 151,632 |
|
| USD | 138,193 |
| SEK | 1,094,995 |
| JPMorgan Chase Bank N.A. | 12/20/17 | 7,006 |
|
| USD | 179,806 |
| SEK | 1,461,489 |
| JPMorgan Chase Bank N.A. | 12/20/17 | 4,712 |
|
| USD | 1,887,780 |
| SEK | 15,757,883 |
| JPMorgan Chase Bank N.A. | 12/20/17 | (103 | ) |
| USD | 407,601 |
| SEK | 3,401,107 |
| JPMorgan Chase Bank N.A. | 12/20/17 | 129 |
|
| USD | 63,216 |
| SGD | 84,804 |
| JPMorgan Chase Bank N.A. | 12/20/17 | 976 |
|
| USD | 1,299,153 |
| SGD | 1,747,561 |
| JPMorgan Chase Bank N.A. | 12/20/17 | 16,579 |
|
| USD | 134,003 |
| SGD | 181,822 |
| JPMorgan Chase Bank N.A. | 12/20/17 | 560 |
|
| THB | 20,194,061 |
| USD | 610,277 |
| Goldman Sachs & Co. | 12/20/17 | (2,607 | ) |
| THB | 12,263,324 |
| USD | 366,979 |
| Goldman Sachs & Co. | 12/20/17 | 2,043 |
|
| THB | 16,666,906 |
| USD | 500,207 |
| Goldman Sachs & Co. | 12/20/17 | 1,325 |
|
| USD | 34,971,990 |
| THB | 1,156,698,578 |
| Goldman Sachs & Co. | 12/20/17 | 165,185 |
|
| USD | 231,774 |
| THB | 7,657,121 |
| Goldman Sachs & Co. | 12/20/17 | 1,360 |
|
| USD | 138,038 |
| THB | 4,562,146 |
| Goldman Sachs & Co. | 12/20/17 | 756 |
|
| USD | 242,072 |
| THB | 8,065,589 |
| Goldman Sachs & Co. | 12/20/17 | (634 | ) |
| TRY | 337,946 |
| USD | 93,072 |
| Goldman Sachs & Co. | 12/20/17 | (5,253 | ) |
| TRY | 6,810,893 |
| USD | 1,864,006 |
| Goldman Sachs & Co. | 12/20/17 | (94,126 | ) |
| TRY | 351,738 |
| USD | 94,307 |
| Goldman Sachs & Co. | 12/20/17 | (2,904 | ) |
| TRY | 10,486,252 |
| USD | 2,770,183 |
| Goldman Sachs & Co. | 12/20/17 | (45,223 | ) |
| TRY | 3,299,928 |
| USD | 938,386 |
| Goldman Sachs & Co. | 12/20/17 | (80,866 | ) |
| USD | 2,759,353 |
| TRY | 10,642,823 |
| Goldman Sachs & Co. | 12/20/17 | (6,294 | ) |
| USD | 2,754,142 |
| TRY | 10,643,934 |
| Goldman Sachs & Co. | 12/20/17 | (11,793 | ) |
| TWD | 174,235,981 |
| USD | 5,742,024 |
| JPMorgan Chase Bank N.A. | 12/20/17 | 56,341 |
|
|
| | | | | | | | | | |
| Currency Purchased | Currency Sold | Counterparty | Settlement Date | Unrealized Appreciation
(Depreciation) |
| USD | 2,871,227 |
| TWD | 87,141,740 |
| JPMorgan Chase Bank N.A. | 12/20/17 | $ | (28,746 | ) |
| ZAR | 2,224,616 |
| USD | 168,346 |
| Goldman Sachs & Co. | 12/20/17 | (12,293 | ) |
| ZAR | 1,871,509 |
| USD | 136,891 |
| Goldman Sachs & Co. | 12/20/17 | (5,608 | ) |
| ZAR | 38,928,525 |
| USD | 2,804,063 |
| Goldman Sachs & Co. | 12/20/17 | (73,285 | ) |
| ZAR | 7,881,383 |
| USD | 596,862 |
| Goldman Sachs & Co. | 12/20/17 | (43,995 | ) |
| USD | 1,505,642 |
| ZAR | 19,609,034 |
| Goldman Sachs & Co. | 12/20/17 | 130,098 |
|
| USD | 2,777,313 |
| ZAR | 39,087,350 |
| Goldman Sachs & Co. | 12/20/17 | 35,394 |
|
| USD | 2,863,379 |
| ZAR | 40,921,974 |
| Goldman Sachs & Co. | 12/20/17 | (7,237 | ) |
| | | | | | | $ | (807,338 | ) |
|
| | | | | | | | | | | |
| FUTURES CONTRACTS PURCHASED |
| Reference Entity | Contracts | Expiration
Date | Notional
Amount | Underlying
Contract
Value | Unrealized
Appreciation
(Depreciation) |
Euro-OAT 10-Year Bonds | 60 | December 2017 | EUR | 6,000,000 |
| $ | 11,005,032 |
| $ | 142,962 |
|
Euro-Schatz 2-Year Bonds | 228 | December 2017 | EUR | 22,800,000 |
| 29,815,977 |
| 28,899 |
|
Korean Treasury 10-Year Bonds | 147 | December 2017 | KRW | 14,700,000,000 |
| 15,859,232 |
| (442,436 | ) |
U.S. Treasury 10-Year Notes | 254 | December 2017 | USD | 25,400,000 |
| 31,734,125 |
| (546,275 | ) |
U.S. Treasury 5-Year Notes | 150 | December 2017 | USD | 15,000,000 |
| 17,578,125 |
| (159,197 | ) |
| | | | | | $ | 105,992,491 |
| $ | (976,047 | ) |
| FUTURES CONTRACTS SOLD |
| Reference Entity | Contracts | Expiration
Date | Notional
Amount | Underlying
Contract
Value | Unrealized
Appreciation
(Depreciation) |
| Euro-Bobl 5-Year Bonds | 427 | December 2017 | EUR | 42,700,000 |
| $ | 65,546,151 |
| $ | (116,551 | ) |
Euro-Bund 10-Year Bonds | 62 | December 2017 | EUR | 6,200,000 |
| 11,753,914 |
| (67,992 | ) |
| U.K. Gilt 10-Year Bonds | 166 | December 2017 | GBP | 16,600,000 |
| 27,411,396 |
| 646,848 |
|
| U.S. Treasury Long Bonds | 8 | December 2017 | USD | 800,000 |
| 1,219,750 |
| 31,232 |
|
| | | | | | $ | 105,931,211 |
| $ | 493,537 |
|
|
| | | | | | | | | | | | | | | |
| CENTRALLY CLEARED CREDIT DEFAULT SWAP AGREEMENTS |
| Reference Entity | Type* | Fixed Rate Received (Paid) | Termination Date | Notional Amount | Premiums
Paid
(Received) | Unrealized Appreciation (Depreciation) | Value** |
| Markit CDX North America High Yield Index Series 29 | Sell | 5.00% | 12/20/22 | $ | 48,280,000 |
| $ | 3,830,212 |
| $ | 496,844 |
| $ | 4,327,056 |
|
*The maximum potential amount the fund could be required to deliver as a seller of credit protection if a credit event occurs as defined under the terms of the agreement is the notional amount. The maximum potential amount may be partially offset by any recovery values of the reference entities and upfront payments received upon entering into the agreement.
**The value for credit default swap agreements serve as an indicator of the current status of the payment/performance risk and represent the likelihood of an expected liability or profit at the period end. Increasing values in absolute terms when compared to the notional amount of the credit default swap agreement represent a deterioration of the referenced entity's credit soundness and an increased likelihood or risk of a credit event occurring as defined in the agreement.
|
| | | | | | | | | | |
| INTEREST RATE SWAP AGREEMENTS |
| Counterparty | Floating
Rate Index | Pay/Receive
Floating Rate
Index | Fixed Rate | Termination
Date | Notional
Amount | Value* |
| Bank of America N.A | BZDIOVRA | Receive | 9.60% | 1/2/19 | BRL | 212,611,000 |
| $ | (1,818,687 | ) |
| Bank of America N.A. | BZDIOVRA | Pay | 10.78% | 1/2/23 | BRL | 62,124,000 |
| 1,265,704 |
|
| Barclays Bank plc | BZDIOVRA | Receive | 7.29% | 1/2/19 | BRL | 362,250,000 |
| 9,145 |
|
| Barclays Bank plc | BZDIOVRA | Pay | 9.51% | 1/2/23 | BRL | 65,400,000 |
| (148,633 | ) |
| Morgan Stanley | BZDIOVRA | Receive | 8.71% | 1/2/19 | BRL | 114,292,000 |
| (553,543 | ) |
| Morgan Stanley | BZDIOVRA | Receive | 7.51% | 1/2/19 | BRL | 278,957,000 |
| (171,145 | ) |
| Morgan Stanley | BZDIOVRA | Pay | 10.24% | 1/2/23 | BRL | 31,136,000 |
| 329,241 |
|
| | | | | | | | $ | (1,087,918 | ) |
* Amount represents value and unrealized appreciation (depreciation).
|
| | | | | | | | | | | | | | | |
| CENTRALLY CLEARED TOTAL RETURN SWAP AGREEMENTS |
| Floating Rate Index | Pay/Receive Floating Rate Index | Fixed Rate | Termination Date | Notional Amount | Premiums
Paid
(Received) | Unrealized Appreciation (Depreciation) | Value |
| CPURNSA | Receive | 2.24% | 11/15/26 | $ | 2,200,000 |
| $ | 524 |
| $ | (29,101 | ) | $ | (28,577 | ) |
| CPURNSA | Receive | 2.28% | 11/16/26 | $ | 2,200,000 |
| 524 |
| (36,412 | ) | (35,888 | ) |
| CPURNSA | Receive | 2.27% | 11/21/26 | $ | 2,200,000 |
| 523 |
| (35,508 | ) | (34,985 | ) |
| CPURNSA | Receive | 2.17% | 5/10/27 | $ | 11,500,000 |
| 594 |
| (78,768 | ) | (78,174 | ) |
| | $ | 2,165 |
| $ | (179,789 | ) | $ | (177,624 | ) |
|
| | | | | | | | | | |
| TOTAL RETURN SWAP AGREEMENTS |
| Counterparty | Floating
Rate Index | Pay/Receive
Floating Rate
Index | Fixed Rate | Termination
Date | Notional
Amount | Value* |
| Bank of America N.A. | CPURNSA | Receive | 2.26% | 11/15/26 | $ | 2,200,000 |
| $ | (32,374 | ) |
| Bank of America N.A. | CPURNSA | Receive | 2.29% | 11/16/26 | $ | 2,200,000 |
| (38,151 | ) |
| Bank of America N.A. | CPURNSA | Receive | 2.28% | 11/21/26 | $ | 2,200,000 |
| (35,844 | ) |
| Bank of America N.A. | CPURNSA | Receive | 2.22% | 4/13/27 | $ | 1,800,000 |
| (24,542 | ) |
| Barclays Bank plc | CPURNSA | Receive | 2.25% | 11/15/26 | $ | 2,000,000 |
| (26,992 | ) |
| Barclays Bank plc | CPURNSA | Receive | 2.28% | 11/16/26 | $ | 2,000,000 |
| (33,461 | ) |
| Barclays Bank plc | CPURNSA | Receive | 2.26% | 11/21/26 | $ | 2,000,000 |
| (30,043 | ) |
| Goldman Sachs & Co. | CPURNSA | Receive | 2.25% | 11/15/26 | $ | 2,200,000 |
| (29,021 | ) |
| Goldman Sachs & Co. | CPURNSA | Receive | 2.28% | 11/16/26 | $ | 2,200,000 |
| (37,031 | ) |
| Goldman Sachs & Co. | CPURNSA | Receive | 2.28% | 11/21/26 | $ | 2,200,000 |
| (36,964 | ) |
| | | | | | | $ | (324,423 | ) |
* Amount represents value and unrealized appreciation (depreciation).
|
| | | | | |
| NOTES TO SCHEDULE OF INVESTMENTS | | | |
| ARS | - | Argentine Peso | KRW | - | South Korean Won |
| AUD | - | Australian Dollar | LIBOR | - | London Interbank Offered Rate |
| BRL | - | Brazilian Real | MTN | - | Medium Term Note |
| BZDIOVRA | - | Brazil Interbank Deposit Rate | MXN | - | Mexican Peso |
| CAD | - | Canadian Dollar | MYR | - | Malaysian Ringgit |
| CDX | - | Credit Derivatives Indexes | NOK | - | Norwegian Krone |
| CHF | - | Swiss Franc | NZD | - | New Zealand Dollar |
| CLP | - | Chilean Peso | PEN | - | Peruvian Sol |
| COP | - | Colombian Peso | PHP | - | Philippine Peso |
| CPURNSA | - | U.S. Consumer Price Index Urban Consumers Not Seasonally Adjusted Index | PLN | - | Polish Zloty |
| CZK | - | Czech Koruna | resets | | The frequency with which a security's coupon changes, based on current market conditions or an underlying index. |
| DKK | - | Danish Krone | RUB | - | Russian Ruble |
| EUR | - | Euro | SEK | - | Swedish Krona |
| FHLMC | - | Federal Home Loan Mortgage Corporation | SEQ | - | Sequential Payer |
| FNMA | - | Federal National Mortgage Association | SGD | - | Singapore Dollar |
| GBP | - | British Pound | THB | - | Thai Baht |
| HKD | - | Hong Kong Dollar | TRY | - | Turkish Lira |
| HUF | - | Hungarian Forint | TWD | - | Taiwanese Dollar |
| ILS | - | Israeli Shekel | USD | - | United States Dollar |
| INR | - | Indian Rupee | VRN | - | Variable Rate Note. Interest reset date is indicated. Rate shown is effective at the period end. |
| JPY | - | Japanese Yen | ZAR | - | South African Rand |
| | | | | | |
| |
| † | Category is less than 0.05% of total net assets. |
| |
| (1) | Security was purchased pursuant to Rule 144A under the Securities Act of 1933 and may be sold in transactions exempt from registration, normally to qualified institutional investors. The aggregate value of these securities at the period end was $150,128,646, which represented 15.8% of total net assets. |
| |
| (2) | Security is a zero-coupon bond. |
| |
| (3) | Coupon rate adjusts periodically based upon a predetermined schedule. Interest reset date is indicated. Rate shown is effective at the period end. |
| |
| (4) | Final maturity date indicated, unless otherwise noted. |
| |
| (5) | The rate indicated is the yield to maturity at purchase. |
| |
| (6) | Security, or a portion thereof, has been pledged at the custodian bank or with a broker for margin requirements on forward foreign currency exchange contracts, futures contracts and/or swap agreements. At the period end, the aggregate value of securities pledged was $6,515,564. |
| |
| (7) | The interest rate resets periodically based on the weighted average coupons of the underlying mortgage-related or asset-backed obligations. |
See Notes to Financial Statements.
|
|
| Statement of Assets and Liabilities |
|
| | | |
| OCTOBER 31, 2017 | |
| Assets | |
| Investment securities, at value (cost of $933,547,264) | $ | 951,996,073 |
|
| Cash | 16,283 |
|
| Foreign currency holdings, at value (cost of $365,290) | 364,443 |
|
| Foreign deposits with broker for futures contracts, at value (cost of $520,045) | 538,536 |
|
| Receivable for investments sold | 5,670,323 |
|
| Receivable for capital shares sold | 161,040 |
|
| Receivable for variation margin on futures contracts | 34,305 |
|
| Receivable for variation margin on swap agreements | 79,611 |
|
| Unrealized appreciation on forward foreign currency exchange contracts | 5,423,273 |
|
| Swap agreements, at value | 1,604,090 |
|
| Interest receivable | 7,495,503 |
|
| | 973,383,480 |
|
| | |
| Liabilities | |
| Payable for investments purchased | 13,333,212 |
|
| Payable for capital shares redeemed | 464,576 |
|
| Payable for variation margin on futures contracts | 109,950 |
|
| Unrealized depreciation on forward foreign currency exchange contracts | 6,230,611 |
|
| Swap agreements, at value | 3,016,431 |
|
| Accrued management fees | 330,740 |
|
| Distribution and service fees payable | 3,398 |
|
| | 23,488,918 |
|
| | |
| Net Assets | $ | 949,894,562 |
|
| | |
| Net Assets Consist of: | |
| Capital paid in | $ | 935,401,554 |
|
| Accumulated net investment loss | (2,530,175 | ) |
| Undistributed net realized gain | 938,080 |
|
| Net unrealized appreciation | 16,085,103 |
|
| | $ | 949,894,562 |
|
|
| | | | | | |
| | Net Assets | Shares Outstanding | Net Asset Value Per Share |
| Investor Class |
| $452,514,443 |
| 34,917,334 |
| $12.96 |
| I Class |
| $20,782,169 |
| 1,599,877 |
| $12.99 |
| Y Class |
| $5,284 |
| 406 |
| $13.01 |
| A Class |
| $11,031,046 |
| 859,584 |
| $12.83* |
| C Class |
| $811,773 |
| 64,820 |
| $12.52 |
| R Class |
| $150,750 |
| 11,815 |
| $12.76 |
| R5 Class |
| $6,005,170 |
| 461,958 |
| $13.00 |
| R6 Class |
| $3,800,118 |
| 292,225 |
| $13.00 |
| G Class |
| $454,793,809 |
| 34,920,740 |
| $13.02 |
*Maximum offering price $13.43 (net asset value divided by 0.955).
See Notes to Financial Statements.
|
| | | |
| YEAR ENDED OCTOBER 31, 2017 | |
| Investment Income (Loss) | |
| Income: | |
| Interest | $ | 14,164,646 |
|
| | |
| Expenses: | |
| Management fees | 6,275,991 |
|
| Distribution and service fees: | |
| A Class | 41,765 |
|
| C Class | 9,313 |
|
| R Class | 689 |
|
| Trustees' fees and expenses | 56,678 |
|
| Other expenses | 28,295 |
|
| | 6,412,731 |
|
| Fees waived - G Class | (629,143 | ) |
| | 5,783,588 |
|
| | |
| Net investment income (loss) | 8,381,058 |
|
| | |
| Realized and Unrealized Gain (Loss) | |
| Net realized gain (loss) on: | |
| Investment transactions | (6,483,410 | ) |
| Forward foreign currency exchange contract transactions | (8,565,054 | ) |
| Futures contract transactions | 211,651 |
|
| Swap agreement transactions | 487,981 |
|
| Foreign currency translation transactions | 116,749 |
|
| | (14,232,083 | ) |
| | |
| Change in net unrealized appreciation (depreciation) on: | |
| Investments | 21,213,481 |
|
| Forward foreign currency exchange contracts | 3,195,736 |
|
| Futures contracts | (739,073 | ) |
| Swap agreements | (1,181,943 | ) |
| Translation of assets and liabilities in foreign currencies | 267,005 |
|
| | 22,755,206 |
|
| | |
| Net realized and unrealized gain (loss) | 8,523,123 |
|
| | |
| Net Increase (Decrease) in Net Assets Resulting from Operations | $ | 16,904,181 |
|
See Notes to Financial Statements.
|
|
| Statement of Changes in Net Assets |
|
| | | | | | |
| YEARS ENDED OCTOBER 31, 2017 AND OCTOBER 31, 2016 |
| Increase (Decrease) in Net Assets | October 31, 2017 | October 31, 2016 |
| Operations | | |
| Net investment income (loss) | $ | 8,381,058 |
| $ | 8,095,439 |
|
| Net realized gain (loss) | (14,232,083 | ) | (16,426,920 | ) |
| Change in net unrealized appreciation (depreciation) | 22,755,206 |
| 55,454,116 |
|
| Net increase (decrease) in net assets resulting from operations | 16,904,181 |
| 47,122,635 |
|
| | | |
| Distributions to Shareholders | | |
| From net realized gains: | | |
| Investor Class | — |
| (9,015,238 | ) |
| A Class | — |
| (370,206 | ) |
| C Class | — |
| (24,358 | ) |
| R Class | — |
| (3,117 | ) |
| R5 Class | — |
| (7,001,393 | ) |
| R6 Class | — |
| (647,152 | ) |
| From tax return of capital: | | |
| Investor Class | — |
| (236,722 | ) |
| R5 Class | — |
| (866,572 | ) |
| R6 Class | — |
| (100,098 | ) |
| Decrease in net assets from distributions | — |
| (18,264,856 | ) |
| | | |
| Capital Share Transactions | | |
Net increase (decrease) in net assets from capital share transactions (Note 5) | 57,417,033 |
| (7,175,296 | ) |
| | | |
| Net increase (decrease) in net assets | 74,321,214 |
| 21,682,483 |
|
| | | |
| Net Assets | | |
| Beginning of period | 875,573,348 |
| 853,890,865 |
|
| End of period | $ | 949,894,562 |
| $ | 875,573,348 |
|
| | | |
Accumulated net investment loss/undistributed net investment income | $ | (2,530,175 | ) | $ | 1,585,668 |
|
See Notes to Financial Statements.
|
|
| Notes to Financial Statements |
OCTOBER 31, 2017
1. Organization
American Century International Bond Funds (the trust) is registered under the Investment Company Act of 1940, as amended (the 1940 Act), as an open-end management investment company and is organized as a Massachusetts business trust. International Bond Fund (the fund) is one fund in a series issued by the trust. The fund’s investment objective is to seek total return.
The fund offers the Investor Class, I Class, Y Class, A Class, C Class, R Class, R5 Class (formerly Institutional Class), R6 Class and G Class. The A Class may incur an initial sales charge. The A Class and C Class may be subject to a contingent deferred sales charge. Sale of the I Class and Y Class commenced on April 10, 2017 and sale of the G Class commenced on July 28, 2017.
2. Significant Accounting Policies
The following is a summary of significant accounting policies consistently followed by the fund in preparation of its financial statements. The fund is an investment company and follows accounting and reporting guidance in accordance with accounting principles generally accepted in the United States of America. This may require management to make certain estimates and assumptions at the date of the financial statements. Actual results could differ from these estimates. Management evaluated the impact of events or transactions occurring through the date the financial statements were issued that would merit recognition or disclosure.
Investment Valuations — The fund determines the fair value of its investments and computes its net asset value per share at the close of regular trading (usually 4 p.m. Eastern time) on the New York Stock Exchange (NYSE) on each day the NYSE is open. The Board of Trustees has adopted valuation policies and procedures to guide the investment advisor in the fund’s investment valuation process and to provide methodologies for the oversight of the fund’s pricing function.
Fixed income securities are valued at the evaluated mean as provided by independent pricing services or at the mean of the most recent bid and asked prices as provided by investment dealers. Sovereign governments and agencies, corporate bonds, and U.S. Treasury and Government Agency securities are valued using market models that consider trade data, quotations from dealers and active market makers, relevant yield curve and spread data, creditworthiness, trade data or market information on comparable securities, and other relevant security specific information. Mortgage-related and asset-backed securities are valued based on models that consider trade data, prepayment and default projections, benchmark yield and spread data and estimated cash flows of each tranche of the issuer. Fixed income securities initially expressed in local currencies are translated into U.S. dollars at the mean of the appropriate currency exchange rate at the close of the NYSE as provided by an independent pricing service.
Open-end management investment companies are valued at the reported net asset value per share. Repurchase agreements are valued at cost, which approximates fair value. Exchange-traded futures contracts are valued at the settlement price as provided by the appropriate clearing corporation. Swap agreements are valued at an evaluated mean as provided by independent pricing services or independent brokers. Forward foreign currency exchange contracts are valued at the mean of the appropriate forward exchange rate at the close of the NYSE as provided by an independent pricing service. Investments initially expressed in local currencies are translated into U.S. dollars at the mean of the appropriate currency exchange rate at the close of the NYSE as provided by an independent pricing service.
If the fund determines that the market price for an investment is not readily available or the valuation methods mentioned above do not reflect an investment’s fair value, such investment is valued as determined in good faith by the Board of Trustees or its delegate, in accordance with policies and procedures adopted by the Board of Trustees. In its determination of fair value, the fund may review several factors including, but not limited to, market information regarding the specific investment or comparable investments and correlation with other investment types, futures indices or general market indicators. Circumstances that may cause the fund to use these procedures to value an investment include, but are not limited to: an investment has been declared in default or is distressed; trading in a security has been suspended during the trading day or a security is not actively trading on its principal exchange; prices received from a regular pricing source are deemed unreliable; or there is a foreign market holiday and no trading occurred.
The fund monitors for significant events occurring after the close of an investment’s primary exchange but before the fund’s net asset value per share is determined. Significant events may include, but are not limited to: corporate announcements and transactions; governmental action and political unrest that could impact a specific investment or an investment sector; or armed conflicts, natural disasters and similar events that could affect investments in a specific country or region.
Security Transactions — Security transactions are accounted for as of the trade date. Net realized gains and losses are determined on the identified cost basis, which is also used for federal income tax purposes.
Investment Income — Interest income is recorded on the accrual basis and includes paydown gain (loss) and accretion of discounts and amortization of premiums. Inflation adjustments related to inflation-linked debt securities are reflected as interest income.
Foreign Currency Translations — All assets and liabilities initially expressed in foreign currencies are translated into U.S. dollars at prevailing exchange rates at period end. The fund may enter into spot foreign currency exchange contracts to facilitate transactions denominated in a foreign currency. Purchases and sales of investment securities, dividend and interest income, spot foreign currency exchange contracts, and expenses are translated at the rates of exchange prevailing on the respective dates of such transactions. Net realized and unrealized foreign currency exchange gains or losses related to investment securities are a component of net realized gain (loss) on investment transactions and change in net unrealized appreciation (depreciation) on investments, respectively.
Repurchase Agreements — The fund may enter into repurchase agreements with institutions that American Century Investment Management, Inc. (ACIM) (the investment advisor) has determined are creditworthy pursuant to criteria adopted by the Board of Trustees. The fund requires that the collateral, represented by securities, received in a repurchase transaction be transferred to the custodian in a manner sufficient to enable the fund to obtain those securities in the event of a default under the repurchase agreement. ACIM monitors, on a daily basis, the securities transferred to ensure the value, including accrued interest, of the securities under each repurchase agreement is equal to or greater than amounts owed to the fund under each repurchase agreement.
Joint Trading Account — Pursuant to an Exemptive Order issued by the Securities and Exchange Commission, the fund, along with certain other funds in the American Century Investments family of funds, may transfer uninvested cash balances into a joint trading account. These balances are invested in one or more repurchase agreements that are collateralized by U.S. Treasury or Agency obligations.
Segregated Assets — In accordance with the 1940 Act, the fund segregates assets on its books and records to cover certain types of investments, including, but not limited to, futures contracts, forward commitments, when-issued securities, swap agreements and certain forward foreign currency exchange contracts. ACIM monitors, on a daily basis, the securities segregated to ensure the fund designates a sufficient amount of liquid assets, marked-to-market daily. The fund may also receive assets or be required to pledge assets at the custodian bank or with a broker for margin requirements on futures contracts, forward commitments, swap agreements and certain forward foreign currency exchange contracts.
Income Tax Status — It is the fund’s policy to distribute substantially all net investment income and net realized gains to shareholders and to otherwise qualify as a regulated investment company under provisions of the Internal Revenue Code. Accordingly, no provision has been made for income taxes. The fund files U.S. federal, state, local and non-U.S. tax returns as applicable. The fund's tax returns are subject to examination by the relevant taxing authority until expiration of the applicable statute of limitations, which is generally three years from the date of filing but can be longer in certain jurisdictions. At this time, management believes there are no uncertain tax positions which, based on their technical merit, would not be sustained upon examination and for which it is reasonably possible that the total amounts of unrecognized tax benefits will significantly change in the next twelve months.
Multiple Class — All shares of the fund represent an equal pro rata interest in the net assets of the class to which such shares belong, and have identical voting, dividend, liquidation and other rights and the same terms and conditions, except for class specific expenses and exclusive rights to vote on matters affecting only individual classes. Income, non-class specific expenses, and realized and unrealized capital gains and losses of the fund are allocated to each class of shares based on their relative net assets.
Distributions to Shareholders — Distributions from net investment income, if any, are generally declared and paid quarterly, but may be paid less frequently. Distributions from net realized gains, if any, are generally declared and paid annually.
Indemnifications — Under the trust’s organizational documents, its officers and trustees are indemnified against certain liabilities arising out of the performance of their duties to the fund. In addition, in the normal course of business, the fund enters into contracts that provide general indemnifications. The maximum exposure under these arrangements is unknown as this would involve future claims that may be made against a fund. The risk of material loss from such claims is considered by management to be remote.
3. Fees and Transactions with Related Parties
Certain officers and trustees of the trust are also officers and/or directors of American Century Companies, Inc. (ACC). The trust's investment advisor, ACIM, the trust's distributor, American Century Investment Services, Inc. (ACIS), and the trust's transfer agent, American Century Services, LLC, are wholly owned, directly or indirectly, by ACC. Various funds issued by American Century Asset Allocation Portfolios, Inc. and American Century Strategic Asset Allocations, Inc. own, in aggregate, 64% of the shares of the fund. Related parties do not invest in the fund for the purpose of exercising management or control.
Management Fees — The trust has entered into a management agreement with ACIM, under which ACIM provides the fund with investment advisory and management services in exchange for a single, unified management fee (the fee) per class. The agreement provides that all expenses of managing and operating the fund, except distribution and service fees, brokerage expenses, taxes, interest, fees and expenses of the independent trustees (including legal counsel fees), and extraordinary expenses, will be paid by ACIM. The fee is computed and accrued daily based on each class's daily net assets and paid monthly in arrears. The difference in the fee among the classes is a result of their separate arrangements for non-Rule 12b-1 shareholder services. It is not the result of any difference in advisory or custodial fees or other expenses related to the management of the fund’s assets, which do not vary by class. The fee consists of (1) an Investment Category Fee based on the daily net assets of the fund and certain other accounts managed by the investment advisor that are in the same broad investment category as the fund and (2) a Complex Fee based on the assets of all the funds in the American Century Investments family of funds. Effective July 28, 2017, the investment advisor agreed to waive the G Class’s management fee in its entirety. The investment advisor expects this waiver to remain in effect permanently and cannot terminate it without the approval of the Board of Trustees.
The Investment Category Fee range, the Complex Fee range and the effective annual management fee for each class for the period ended October 31, 2017 are as follows:
|
| | | |
| | Investment Category Fee Range | Complex Fee Range | Effective Annual Management Fee |
| Investor Class | 0.4925%
to 0.6100% | 0.2500% to 0.3100% | 0.79% |
| I Class | 0.1500% to 0.2100% | 0.69% |
| Y Class | 0.0500% to 0.1100% | 0.59% |
| A Class | 0.2500% to 0.3100% | 0.79% |
| C Class | 0.2500% to 0.3100% | 0.79% |
| R Class | 0.2500% to 0.3100% | 0.79% |
| R5 Class | 0.0500% to 0.1100% | 0.59% |
| R6 Class | 0.0000% to 0.0600% | 0.54% |
| G Class | 0.0000% to 0.0600% | 0.00%(1) |
| |
| (1) | Effective annual management fee before waiver was 0.54%. |
Distribution and Service Fees — The Board of Trustees has adopted a separate Master Distribution and Individual Shareholder Services Plan for each of the A Class, C Class and R Class (collectively the plans), pursuant to Rule 12b-1 of the 1940 Act. The plans provide that the A Class will pay ACIS an annual distribution and service fee of 0.25%. The plans provide that the C Class will pay ACIS an annual distribution and service fee of 1.00%, of which 0.25% is paid for individual shareholder services and 0.75% is paid for distribution services. The plans provide that the R Class will pay ACIS an annual distribution and service fee of 0.50%. The fees are computed and accrued daily based on each class’s daily net assets and paid monthly in arrears. The fees are used to pay financial intermediaries for distribution and individual shareholder services. Fees incurred under the plans during the period ended October 31, 2017 are detailed in the Statement of Operations.
Trustees’ Fees and Expenses — The Board of Trustees is responsible for overseeing the investment advisor’s management and operations of the fund. The trustees receive detailed information about the fund and its investment advisor regularly throughout the year, and meet at least quarterly with management of the investment advisor to review reports about fund operations. The fund’s officers do not receive compensation from the fund.
Interfund Transactions — The fund may enter into security transactions with other American Century Investments funds and other client accounts of the investment advisor, in accordance with the 1940 Act rules and procedures adopted by the Board of Trustees. The rules and procedures require, among other things, that these transactions be effected at the independent current market price of the security. There were no interfund transactions during the period.
4. Investment Transactions
Purchases of investment securities, excluding short-term investments, for the period ended October 31, 2017 totaled $864,640,934, of which $30,682,304 represented U.S. Treasury and Government Agency obligations.
Sales of investment securities, excluding short-term investments, for the period ended October 31, 2017 totaled $771,362,868, of which $15,523,007 represented U.S. Treasury and Government Agency obligations.
5. Capital Share Transactions
Transactions in shares of the fund were as follows (unlimited number of shares authorized):
|
| | | | | | | | | | |
| | Year ended October 31, 2017(1) | Year ended
October 31, 2016 |
| | Shares | Amount | Shares | Amount |
| Investor Class | | | | |
| Sold | 10,099,436 |
| $ | 127,117,045 |
| 4,463,718 |
| $ | 57,088,670 |
|
| Issued in reinvestment of distributions | — |
| — |
| 754,933 |
| 9,022,604 |
|
| Redeemed | (9,083,786 | ) | (115,424,782 | ) | (9,221,561 | ) | (116,841,658 | ) |
| | 1,015,650 |
| 11,692,263 |
| (4,002,910 | ) | (50,730,384 | ) |
| I Class | | | N/A |
| |
| Sold | 1,887,749 |
| 24,258,234 |
| | |
| Redeemed | (287,872 | ) | (3,721,861 | ) | | |
| | 1,599,877 |
| 20,536,373 |
| | |
| Y Class | | | N/A |
| |
| Sold | 406 |
| 5,000 |
| | |
| A Class | | | | |
| Sold | 1,251,508 |
| 15,802,156 |
| 818,041 |
| 10,292,948 |
|
| Issued in reinvestment of distributions | — |
| — |
| 30,489 |
| 362,204 |
|
| Redeemed | (1,818,672 | ) | (23,026,030 | ) | (954,290 | ) | (12,213,403 | ) |
| | (567,164 | ) | (7,223,874 | ) | (105,760 | ) | (1,558,251 | ) |
| C Class | | | | |
| Sold | 16,047 |
| 197,701 |
| 2,180 |
| 27,360 |
|
| Issued in reinvestment of distributions | — |
| — |
| 1,511 |
| 17,773 |
|
| Redeemed | (33,850 | ) | (415,463 | ) | (20,221 | ) | (248,330 | ) |
| | (17,803 | ) | (217,762 | ) | (16,530 | ) | (203,197 | ) |
| R Class | | | | |
| Sold | 1,802 |
| 22,251 |
| 2,457 |
| 30,961 |
|
| Issued in reinvestment of distributions | — |
| — |
| 254 |
| 3,011 |
|
| Redeemed | (523 | ) | (6,296 | ) | (4,887 | ) | (62,306 | ) |
| | 1,279 |
| 15,955 |
| (2,176 | ) | (28,334 | ) |
| R5 Class | | | | |
| Sold | 5,348,925 |
| 65,207,407 |
| 5,155,669 |
| 65,467,070 |
|
| Issued in reinvestment of distributions | — |
| — |
| 647,103 |
| 7,742,905 |
|
| Redeemed | (33,952,869 | ) | (443,824,947 | ) | (3,529,100 | ) | (43,900,313 | ) |
| | (28,603,944 | ) | (378,617,540 | ) | 2,273,672 |
| 29,309,662 |
|
| R6 Class | | | | |
| Sold | 1,702,694 |
| 20,846,709 |
| 1,697,366 |
| 21,638,355 |
|
| Issued in reinvestment of distributions | — |
| — |
| 62,451 |
| 747,250 |
|
| Redeemed | (5,196,446 | ) | (67,726,783 | ) | (502,512 | ) | (6,350,397 | ) |
| | (3,493,752 | ) | (46,880,074 | ) | 1,257,305 |
| 16,035,208 |
|
| G Class | | | N/A |
| |
| Sold | 35,641,483 |
| 467,666,876 |
| | |
| Redeemed | (720,743 | ) | (9,560,184 | ) | | |
| | 34,920,740 |
| 458,106,692 |
| | |
| Net increase (decrease) | 4,855,289 |
| $ | 57,417,033 |
| (596,399 | ) | $ | (7,175,296 | ) |
| |
| (1) | April 10, 2017 (commencement of sale) through October 31, 2017 for the I Class and Y Class and July 28, 2017 (commencement of sale) through October 31, 2017 for the G Class. |
6. Fair Value Measurements
The fund’s investments valuation process is based on several considerations and may use multiple inputs to determine the fair value of the investments held by the fund. In conformity with accounting principles generally accepted in the United States of America, the inputs used to determine a valuation are classified into three broad levels.
| |
| • | Level 1 valuation inputs consist of unadjusted quoted prices in an active market for identical investments. |
| |
| • | Level 2 valuation inputs consist of direct or indirect observable market data (including quoted prices for comparable investments, evaluations of subsequent market events, interest rates, prepayment speeds, credit risk, etc.). These inputs also consist of quoted prices for identical investments initially expressed in local currencies that are adjusted through translation into U.S. dollars. |
| |
| • | Level 3 valuation inputs consist of unobservable data (including a fund’s own assumptions). |
The level classification is based on the lowest level input that is significant to the fair valuation measurement. The valuation inputs are not necessarily an indication of the risks associated with investing in these securities or other financial instruments. There were no significant transfers between levels during the period.
The following is a summary of the level classifications as of period end. The Schedule of Investments provides additional information on the fund’s portfolio holdings.
|
| | | | | | | | |
| | Level 1 | Level 2 | Level 3 |
| Assets | | | |
| Investment Securities | | | |
| Sovereign Governments and Agencies | — |
| $ | 637,380,512 |
| — |
|
| Corporate Bonds | — |
| 208,136,658 |
| — |
|
| Collateralized Mortgage Obligations | — |
| 30,732,171 |
| — |
|
| Commercial Mortgage-Backed Securities | — |
| 19,166,002 |
| — |
|
| Asset-Backed Securities | — |
| 17,407,775 |
| — |
|
| Temporary Cash Investments | — |
| 39,172,955 |
| — |
|
| | — |
| $ | 951,996,073 |
| — |
|
| Other Financial Instruments | | | |
| Futures Contracts | $ | 31,232 |
| $ | 818,709 |
| — |
|
| Swap Agreements | — |
| 5,931,146 |
| — |
|
| Forward Foreign Currency Exchange Contracts | — |
| 5,423,273 |
| — |
|
| | $ | 31,232 |
| $ | 12,173,128 |
| — |
|
| | | | |
| Liabilities | | | |
| Other Financial Instruments | | | |
| Futures Contracts | $ | 705,472 |
| $ | 626,979 |
| — |
|
| Swap Agreements | — |
| 3,194,055 |
| — |
|
| Forward Foreign Currency Exchange Contracts | — |
| 6,230,611 |
| — |
|
| | $ | 705,472 |
| $ | 10,051,645 |
| — |
|
7. Derivative Instruments
Credit Risk — The fund is subject to credit risk in the normal course of pursuing its investment objectives. The value of a bond generally declines as the credit quality of its issuer declines. Credit default swap agreements enable a fund to buy/sell protection against a credit event of a specific issuer or index. A fund may attempt to enhance returns by selling protection or attempt to mitigate credit risk by buying protection. Upon entering into a centrally cleared swap, a fund is required to deposit cash or securities (initial margin) with a financial intermediary in an amount equal to a certain percentage of the notional amount. Subsequent payments (variation margin) are made or received daily, in cash, by a fund. The variation margin is equal to the daily change in the value and is a component of unrealized gains and losses. Realized gain or loss is recorded upon receipt or payment of a periodic settlement or termination of swap agreements. Net realized and unrealized gains or losses occurring during the holding period of swap agreements are a component of net realized gain (loss) on swap agreement transactions and change in net unrealized appreciation (depreciation) on swap agreements, respectively. The risks of entering into swap agreements include the possible lack of liquidity, failure of the counterparty to meet its obligations, and that there may be unfavorable changes in the underlying investments or instruments. The fund's average notional amount held during the period was $12,212,633.
Foreign Currency Risk — The fund is subject to foreign currency exchange rate risk in the normal course of pursuing its investment objectives. The value of foreign investments held by a fund may be significantly affected by changes in foreign currency exchange rates. The dollar value of a foreign security generally decreases when the value of the dollar rises against the foreign currency in which the security is denominated and tends to increase when the value of the dollar declines against such foreign currency. A fund may enter into forward foreign currency exchange contracts to reduce a fund's exposure to foreign currency exchange rate fluctuations or to gain exposure to the fluctuations in the value of foreign currencies. The net U.S. dollar value of foreign currency underlying all contractual commitments held by a fund and the resulting unrealized appreciation or depreciation are determined daily. Realized gain or loss is recorded upon the termination of the contract. Net realized and unrealized gains or losses occurring during the holding period of forward foreign currency exchange contracts are a component of net realized gain (loss) on forward foreign currency exchange contract transactions and change in net unrealized appreciation (depreciation) on forward foreign currency exchange contracts, respectively. A fund bears the risk of an unfavorable change in the foreign currency exchange rate underlying the forward contract. Additionally, losses, up to the fair value, may arise if the counterparties do not perform under the contract terms. The fund's average U.S. dollar exposure to foreign currency risk derivative instruments held during the period was $466,258,368.
Interest Rate Risk — The fund is subject to interest rate risk in the normal course of pursuing its investment objectives. A fund may enter into futures contracts or interest rate swap agreements in order to manage its exposure to changes in market conditions. The value of bonds generally declines as interest rates rise. The risks of entering into interest rate risk derivative instruments include the possible lack of liquidity, failure of the counterparty to meet its obligations, and that there may be unfavorable changes in the underlying investments or instruments.
A fund may enter into futures contracts based on a bond index or a specific underlying security. A fund may purchase futures contracts to gain exposure to increases in market value or sell futures contracts to protect against a decline in market value. Upon entering into a futures contract, a fund will segregate cash, cash equivalents or other appropriate liquid securities on its records in amounts sufficient to meet requirements. Subsequent payments (variation margin) are made or received daily, in cash, by a fund. The variation margin is equal to the daily change in the contract value and is recorded as unrealized gains and losses. A fund recognizes a realized gain or loss when the futures contract is closed or expires. Net realized and unrealized gains or losses occurring during the holding period of futures contracts are a component of net realized gain (loss) on futures contract transactions and change in net unrealized appreciation (depreciation) on futures contracts, respectively. The fund's average notional exposure to these interest rate risk derivative instruments held during the period was $62,393,749 futures contracts purchased and $63,648,762 futures contracts sold.
A fund may enter into interest rate swap agreements to gain exposure to declines in interest rates, to protect against increases in interest rates, or to maintain its ability to generate income at prevailing interest rates. A fund will segregate cash, cash equivalents or other appropriate liquid securities on its records in amounts sufficient to meet requirements. Changes in value, including the periodic amounts of interest to be paid or received on swap agreements, are recorded as unrealized appreciation (depreciation) on swap agreements. Realized gain or loss is recorded upon receipt or payment of a periodic settlement or termination of swap agreements. Net realized and unrealized gains or losses occurring during the holding period of swap agreements are a component of net realized gain (loss) on swap agreement transactions and change in net unrealized appreciation (depreciation) on swap agreements, respectively. The fund's average notional amount on interest rate swap agreements during the period was $139,831,940.
Other Contracts — A fund may enter into total return swap agreements in order to attempt to obtain or preserve a particular return or spread at a lower cost than obtaining a return or spread through purchases and/or sales of instruments in other markets or gain exposure to certain markets in the most economical way possible. A fund will segregate cash, cash equivalents or other appropriate liquid securities on its records in amounts sufficient to meet requirements. Changes in value, including the periodic amounts of interest to be paid or received on swap agreements, are recorded as unrealized appreciation (depreciation) on swap agreements. Upon entering into a centrally cleared swap, a fund is required to deposit cash or securities (initial margin) with a financial intermediary in an amount equal to a certain percentage of the notional amount. Subsequent payments (variation margin) are made or received daily, in cash, by a fund. The variation margin is equal to the daily change in the value and is a component of unrealized gains and losses. Realized gain or loss is recorded upon receipt or payment of a periodic settlement or termination of swap agreements. Net realized and unrealized gains or losses occurring during the holding period of swap agreements are a component of net realized gain (loss) on swap agreement transactions and change in net unrealized appreciation (depreciation) on swap agreements, respectively. The risks of entering into swap agreements include the possible lack of liquidity, failure of the counterparty to meet its obligations, and that there may be unfavorable changes in the underlying investments or instruments, including inflationary risk. The fund's average notional amount held during the period was $32,600,000.
Value of Derivative Instruments as of October 31, 2017
|
| | | | | | | | |
| | Asset Derivatives | Liability Derivatives |
| Type of Risk Exposure | Location on Statement of Assets and Liabilities | Value | Location on Statement of Assets and Liabilities | Value |
| Credit Risk | Receivable for variation margin on swap agreements* | $ | 73,131 |
| Payable for variation margin on swap agreements* | — |
|
| Foreign Currency Risk | Unrealized appreciation on forward foreign currency exchange contracts | 5,423,273 |
| Unrealized depreciation on forward foreign currency exchange contracts | $ | 6,230,611 |
|
| Interest Rate Risk | Receivable for variation margin on futures contracts* | 34,305 |
| Payable for variation margin on futures contracts* | 109,950 |
|
| Interest Rate Risk | Swap agreements | 1,604,090 |
| Swap agreements | 2,692,008 |
|
| Other Contracts | Swap agreements | — |
| Swap agreements | 324,423 |
|
| Other Contracts | Receivable for variation margin on swap agreements* | 6,480 |
| Payable for variation margin on swap agreements* | — |
|
| | | $ | 7,141,279 |
| | $ | 9,356,992 |
|
| |
| * | Included in the unrealized appreciation (depreciation) on futures contracts or centrally cleared swap agreements, as applicable, as reported in the Schedule of Investments. |
Effect of Derivative Instruments on the Statement of Operations for the Year Ended October 31, 2017
|
| | | | | | | | |
| | Net Realized Gain (Loss) | Change in Net Unrealized Appreciation (Depreciation) |
| Type of Risk Exposure | Location on Statement of Operations | Value | Location on Statement of Operations | Value |
| Credit Risk | Net realized gain (loss) on swap agreement transactions | $ | 850,043 |
| Change in net unrealized appreciation (depreciation) on swap agreements | $ | 410,187 |
|
| Foreign Currency Risk | Net realized gain (loss) on forward foreign currency exchange contract transactions | (8,565,054 | ) | Change in net unrealized appreciation (depreciation) on forward foreign currency exchange contracts | 3,195,736 |
|
| Interest Rate Risk | Net realized gain (loss) on futures contract transactions | 211,651 |
| Change in net unrealized appreciation (depreciation) on futures contracts | (739,073 | ) |
| Interest Rate Risk | Net realized gain (loss) on swap agreement transactions | (362,062 | ) | Change in net unrealized appreciation (depreciation) on swap agreements | (1,087,918) |
|
| Other Contracts | Net realized gain (loss) on swap agreement transactions | — |
| Change in net unrealized appreciation (depreciation) on swap agreements | (504,212) |
|
| | | $ | (7,865,422 | ) | | $ | 1,274,720 |
|
8. Risk Factors
There are certain risks involved in investing in foreign securities. These risks include those resulting from future adverse political, social and economic developments, fluctuations in currency exchange rates, the possible imposition of exchange controls, and other foreign laws or restrictions. Investing in emerging markets may accentuate these risks.
9. Federal Tax Information
The tax character of distributions paid during the years ended October 31, 2017 and October 31, 2016 were as follows:
|
| | | | | |
| | 2017 | 2016 |
| Distributions Paid From | | |
| Ordinary income | — |
| — |
|
| Long-term capital gains | — |
| $ | 17,061,464 |
|
| Tax return of capital | — |
| $ | 1,203,392 |
|
The book-basis character of distributions made during the year from net investment income or net realized gains may differ from their ultimate characterization for federal income tax purposes. These differences reflect the differing character of certain income items and net realized gains and losses for financial statement and tax purposes, and may result in reclassification among certain capital accounts on the financial statements.
The reclassifications, which are primarily due to foreign currency gains and losses and net operating losses, were made to capital paid in $(4,862,833), accumulated net investment loss $(12,496,901), and undistributed net realized gain $17,359,734.
As of period end, the federal tax cost of investments and the components of distributable earnings on a tax-basis were as follows:
|
| | | |
| Federal tax cost of investments | $ | 936,367,792 |
|
| Gross tax appreciation of investments | $ | 25,909,357 |
|
| Gross tax depreciation of investments | (10,281,076 | ) |
| Net tax appreciation (depreciation) of investments | 15,628,281 |
|
Net tax appreciation (depreciation) on derivatives and translation of assets and liabilities in foreign currencies | (2,065,006 | ) |
| Net tax appreciation (depreciation) | $ | 13,563,275 |
|
| Other book-to-tax adjustments | $ | (1,565,101 | ) |
| Undistributed ordinary income | — |
|
| Accumulated long-term gains | $ | 2,494,834 |
|
The difference between book-basis and tax-basis unrealized appreciation (depreciation) is attributable primarily to the tax deferral of losses on wash sales. Other book-to-tax adjustments are attributable primarily to the tax deferral of losses on straddle positions.
10. Recently Issued Accounting Standards
In March 2017, the Financial Accounting Standards Board (FASB) issued Accounting Standards Update No.2017-08, “Receivables - Nonrefundable Fees and Other Costs (Subtopic 310-20), Premium Amortization on Purchased Callable Debt Securities” (ASU 2017-08). ASU 2017-08 amends the amortization period for certain purchased callable debt securities held at a premium, shortening such period to the earliest call date. The amendments are effective for fiscal years, and interim periods within those fiscal years, beginning after December 15, 2018. Management is currently evaluating the impact that adopting ASU 2017-08 will have on
the financial statements.
|
| | | | | | | | | | | | | | | | |
| For a Share Outstanding Throughout the Years Ended October 31 (except as noted) |
| Per-Share Data | Ratios and Supplemental Data |
| | | Income From Investment Operations: | Distributions From: | | | Ratio to Average Net Assets of: | | |
| | Net Asset Value, Beginning of Period | Net Investment Income (Loss)(1) | Net Realized and Unrealized Gain (Loss) | Total From Investment Operations | Net Investment Income | Net Realized Gains | Tax Return of Capital | Total Distributions | Net Asset Value, End of Period | Total Return(2) | Operating Expenses | Net Investment Income (Loss) | Portfolio Turnover Rate | Net Assets, End of Period (in thousands) |
| Investor Class |
| 2017 | $12.82 | 0.09 | 0.05 | 0.14 | — | — | — | — | $12.96 | 1.09% | 0.80% | 0.74% | 87% |
| $452,514 |
|
| 2016 | $12.39 | 0.11 | 0.58 | 0.69 | — | (0.25) | (0.01) | (0.26) | $12.82 | 5.57% | 0.80% | 0.85% | 40% |
| $434,618 |
|
2015(3) | $12.35 | 0.04 | —(4) | 0.04 | — | — | — | — | $12.39 | 0.40% | 0.81%(5) | 0.95%(5) | 7% |
| $469,820 |
|
| 2015 | $14.50 | 0.14 | (1.98) | (1.84) | (0.21) | (0.10) | — | (0.31) | $12.35 | (12.85)% | 0.80% | 1.05% | 67% |
| $494,676 |
|
| 2014 | $13.50 | 0.17 | 0.86 | 1.03 | (0.03) | — | — | (0.03) | $14.50 | 7.66% | 0.80% | 1.24% | 35% |
| $600,026 |
|
| 2013 | $14.39 | 0.19 | (0.82) | (0.63) | (0.26) | — | — | (0.26) | $13.50 | (4.55)% | 0.80% | 1.35% | 21% |
| $655,032 |
|
| I Class |
2017(6) | $12.31 | 0.06 | 0.62 | 0.68 | — | — | — | — | $12.99 | 5.52% | 0.70%(5) | 0.88%(5) | 87%(7) |
| $20,782 |
|
| Y Class |
2017(6) | $12.31 | 0.07 | 0.63 | 0.70 | — | — | — | — | $13.01 | 5.69% | 0.60%(5) | 0.96%(5) | 87%(7) |
| $5 |
|
|
| | | | | | | | | | | | | | | | |
| For a Share Outstanding Throughout the Years Ended October 31 (except as noted) |
| Per-Share Data | Ratios and Supplemental Data |
| | | Income From Investment Operations: | Distributions From: | | | Ratio to Average Net Assets of: | | |
| | Net Asset Value, Beginning of Period | Net Investment Income (Loss)(1) | Net Realized and Unrealized Gain (Loss) | Total From Investment Operations | Net Investment Income | Net Realized Gains | Tax Return of Capital | Total Distributions | Net Asset Value, End of Period | Total Return(2) | Operating Expenses | Net Investment Income (Loss) | Portfolio Turnover Rate | Net Assets, End of Period (in thousands) |
| A Class |
| 2017 | $12.73 | 0.06 | 0.04 | 0.10 | — | — | — | — | $12.83 | 0.79% | 1.05% | 0.49% | 87% |
| $11,031 |
|
| 2016 | $12.33 | 0.08 | 0.57 | 0.65 | — | (0.25) | — | (0.25) | $12.73 | 5.38% | 1.05% | 0.60% | 40% |
| $18,161 |
|
2015(3) | $12.30 | 0.03 | —(4) | 0.03 | — | — | — | — | $12.33 | 0.24% | 1.06%(5) | 0.70%(5) | 7% |
| $18,899 |
|
| 2015 | $14.44 | 0.10 | (1.96) | (1.86) | (0.18) | (0.10) | — | (0.28) | $12.30 | (13.06)% | 1.05% | 0.80% | 67% |
| $19,392 |
|
| 2014 | $13.44 | 0.14 | 0.86 | 1.00 | — | — | — | — | $14.44 | 7.44% | 1.05% | 0.99% | 35% |
| $96,081 |
|
| 2013 | $14.33 | 0.16 | (0.83) | (0.67) | (0.22) | — | — | (0.22) | $13.44 | (4.81)% | 1.05% | 1.10% | 21% |
| $89,103 |
|
| C Class |
| 2017 | $12.51 | (0.03) | 0.04 | 0.01 | — | — | — | — | $12.52 | 0.08% | 1.80% | (0.26)% | 87% |
| $812 |
|
| 2016 | $12.22 | (0.02) | 0.56 | 0.54 | — | (0.25) | — | (0.25) | $12.51 | 4.52% | 1.80% | (0.15)% | 40% |
| $1,034 |
|
2015(3) | $12.22 | —(4) | —(4) | —(4) | — | — | — | — | $12.22 | —% | 1.81%(5) | (0.05)%(5) | 7% |
| $1,211 |
|
| 2015 | $14.34 | 0.01 | (1.96) | (1.95) | (0.07) | (0.10) | — | (0.17) | $12.22 | (13.67)% | 1.80% | 0.05% | 67% |
| $1,580 |
|
| 2014 | $13.45 | 0.03 | 0.86 | 0.89 | — | — | — | — | $14.34 | 6.62% | 1.80% | 0.24% | 35% |
| $3,352 |
|
| 2013 | $14.34 | 0.05 | (0.83) | (0.78) | (0.11) | — | — | (0.11) | $13.45 | (5.51)% | 1.80% | 0.35% | 21% |
| $5,051 |
|
|
| | | | | | | | | | | | | | | | |
| For a Share Outstanding Throughout the Years Ended October 31 (except as noted) |
| Per-Share Data | Ratios and Supplemental Data |
| | | Income From Investment Operations: | Distributions From: | | | Ratio to Average Net Assets of: | | |
| | Net Asset Value, Beginning of Period | Net Investment Income (Loss)(1) | Net Realized and Unrealized Gain (Loss) | Total From Investment Operations | Net Investment Income | Net Realized Gains | Tax Return of Capital | Total Distributions | Net Asset Value, End of Period | Total Return(2) | Operating Expenses | Net Investment Income (Loss) | Portfolio Turnover Rate | Net Assets, End of Period (in thousands) |
| R Class |
| 2017 | $12.68 | 0.03 | 0.05 | 0.08 | — | — | — | — | $12.76 | 0.63% | 1.30% | 0.24% | 87% |
| $151 |
|
| 2016 | $12.32 | 0.04 | 0.57 | 0.61 | — | (0.25) | — | (0.25) | $12.68 | 5.06% | 1.30% | 0.35% | 40% |
| $134 |
|
2015(3) | $12.30 | 0.02 | —(4) | 0.02 | — | — | — | — | $12.32 | 0.16% | 1.31%(5) | 0.45%(5) | 7% |
| $157 |
|
| 2015 | $14.44 | 0.07 | (1.97) | (1.90) | (0.14) | (0.10) | — | (0.24) | $12.30 | (13.28)% | 1.30% | 0.55% | 67% |
| $179 |
|
| 2014 | $13.47 | 0.10 | 0.87 | 0.97 | — | — | — | — | $14.44 | 7.20% | 1.30% | 0.74% | 35% |
| $231 |
|
| 2013 | $14.36 | 0.12 | (0.83) | (0.71) | (0.18) | — | — | (0.18) | $13.47 | (5.03)% | 1.30% | 0.85% | 21% |
| $200 |
|
R5 Class(8) |
| 2017 | $12.83 | 0.11 | 0.06 | 0.17 | — | — | — | — | $13.00 | 1.33% | 0.60% | 0.94% | 87% |
| $6,005 |
|
| 2016 | $12.41 | 0.13 | 0.57 | 0.70 | — | (0.25) | (0.03) | (0.28) | $12.83 | 5.78% | 0.60% | 1.05% | 40% |
| $373,045 |
|
2015(3) | $12.36 | 0.05 | —(4) | 0.05 | — | — | — | — | $12.41 | 0.40% | 0.61%(5) | 1.15%(5) | 7% |
| $332,434 |
|
| 2015 | $14.51 | 0.16 | (1.97) | (1.81) | (0.24) | (0.10) | — | (0.34) | $12.36 | (12.67)% | 0.60% | 1.25% | 67% |
| $339,993 |
|
| 2014 | $13.50 | 0.20 | 0.87 | 1.07 | (0.06) | — | — | (0.06) | $14.51 | 7.95% | 0.60% | 1.44% | 35% |
| $424,158 |
|
| 2013 | $14.39 | 0.22 | (0.83) | (0.61) | (0.28) | — | — | (0.28) | $13.50 | (4.36)% | 0.60% | 1.55% | 21% |
| $346,695 |
|
| R6 Class | | | | | | | | | | | | | |
| 2017 | $12.83 | 0.12 | 0.05 | 0.17 | — | — | — | — | $13.00 | 1.33% | 0.55% | 0.99% | 87% |
| $3,800 |
|
| 2016 | $12.41 | 0.14 | 0.57 | 0.71 | — | (0.25) | (0.04) | (0.29) | $12.83 | 5.83% | 0.55% | 1.10% | 40% |
| $48,582 |
|
2015(3) | $12.35 | 0.05 | 0.01 | 0.06 | — | — | — | — | $12.41 | 0.49% | 0.56%(5) | 1.20%(5) | 7% |
| $31,370 |
|
| 2015 | $14.50 | 0.16 | (1.97) | (1.81) | (0.24) | (0.10) | — | (0.34) | $12.35 | (12.63)% | 0.55% | 1.30% | 67% |
| $30,516 |
|
2014(9) | $13.77 | 0.19 | 0.61 | 0.80 | (0.07) | — | — | (0.07) | $14.50 | 5.81% | 0.55%(5) | 1.45%(5) | 35%(10) |
| $7,614 |
|
| G Class | | | | | | | | | | | | | |
2017(11) | $13.12 | 0.06 | (0.16) | (0.10) | — | — | — | — | $13.02 | (0.76)% | 0.01%(5)(12) | 1.66%(5)(12) | 87%(7) |
| $454,794 |
|
|
|
| Notes to Financial Highlights |
| |
| (1) | Computed using average shares outstanding throughout the period. |
| |
| (2) | Total returns are calculated based on the net asset value of the last business day and do not reflect applicable sales charges, if any. Total returns for periods less than one year are not annualized. |
| |
| (3) | July 1, 2015 through October 31, 2015. The fund's fiscal year end was changed from June 30 to October 31, resulting in a four-month annual reporting period. For the years before October 31, 2015, the fund's fiscal year end was June 30. |
| |
| (4) | Per-share amount was less than $0.005. |
| |
| (6) | April 10, 2017 (commencement of sale) through October 31, 2017. |
| |
| (7) | Portfolio turnover is calculated at the fund level. Percentage indicated was calculated for the year ended October 31, 2017. |
| |
| (8) | Prior to April 10, 2017, the R5 Class was referred to as the Institutional Class. |
| |
| (9) | July 26, 2013 (commencement of sale) through June 30, 2014. |
| |
| (10) | Portfolio turnover is calculated at the fund level. Percentage indicated was calculated for the year ended June 30, 2014. |
| |
| (11) | July 28, 2017 (commencement of sale) through October 31, 2017 for the G Class. |
| |
| (12) | The annualized ratio of operating expenses to average net assets before expense waiver and the annualized ratio of net investment income (loss) to average net assets before expense waiver was 0.55% and 1.12%, respectively. |
See Notes to Financial Statements.
|
|
| Report of Independent Registered Public Accounting Firm |
To the Board of Trustees of the American Century International Bond Funds and Shareholders of the International Bond Fund:
In our opinion, the accompanying statement of assets and liabilities, including the schedule of investments, and the related statements of operations and of changes in net assets and the financial highlights present fairly, in all material respects, the financial position of the International Bond Fund (one of the three funds constituting the American Century International Bond Funds, hereafter referred to as the "Fund") as of October 31, 2017, the results of its operations for the year then ended, the changes in its net assets for each of the two years in the period then ended and the financial highlights for each of the periods indicated, in conformity with accounting principles generally accepted in the United States of America. These financial statements and financial highlights (hereafter referred to as "financial statements") are the responsibility of the Fund's management. Our responsibility is to express an opinion on these financial statements based on our audits. We conducted our audits of these financial statements in accordance with the standards of the Public Company Accounting Oversight Board (United States). Those standards require that we plan and perform the audit to obtain reasonable assurance about whether the financial statements are free of material misstatement. An audit includes examining, on a test basis, evidence supporting the amounts and disclosures in the financial statements, assessing the accounting principles used and significant estimates made by management, and evaluating the overall financial statement presentation. We believe that our audits, which included confirmation of securities as of October 31, 2017 by correspondence with the custodian and brokers, provide a reasonable basis for our opinion.
/s/ PricewaterhouseCoopers LLP
Kansas City, Missouri
December 18, 2017
Board of Trustees
The individuals listed below serve as trustees of the funds. Each trustee will continue to serve in this capacity until death, retirement, resignation or removal from office. The board has adopted a mandatory retirement age for trustees who are not “interested persons,” as that term is defined in the Investment Company Act (independent trustees). Independent trustees shall retire on December 31 of the year in which they reach their 75th birthday; provided, however, that on or after January 1, 2022, independent trustees shall retire on December 31 of the year in which they reach their 76th birthday.
Mr. Thomas is an “interested person” because he currently serves as President and Chief Executive Officer of American Century Companies, Inc. (ACC), the parent company of American Century Investment Management, Inc. (ACIM or the advisor). The other trustees (more than three-fourths of the total number) are independent. They are not employees, directors or officers of, and have no financial interest in, ACC or any of its wholly owned, direct or indirect, subsidiaries, including ACIM, American Century Investment Services, Inc. (ACIS) and American Century Services, LLC (ACS), and they do not have any other affiliations, positions or relationships that would cause them to be considered “interested persons” under the Investment Company Act. The trustees serve in this capacity for eight (in the case of Mr. Thomas, 15) registered investment companies in the American Century Investments family of funds.
The following table presents additional information about the trustees. The mailing address for each trustee other than Mr. Thomas is 1665 Charleston Road, Mountain View, California 94043. The mailing address for Mr. Thomas is 4500 Main Street, Kansas City, Missouri 64111.
|
| | | | | |
Name
(Year of Birth) | Position(s) Held with Funds | Length of Time Served | Principal Occupation(s) During Past 5 Years | Number of American Century Portfolios Overseen by Trustee | Other Directorships Held During Past 5 Years |
| Independent Trustees |
|
|
Tanya S. Beder
(1955) | Trustee | Since 2011 | Chairman and CEO, SBCC Group Inc. (independent advisory services) (2006 to present) | 45 | CYS Investments, Inc.; Nabors Industries Ltd. |
Jeremy I. Bulow
(1954) | Trustee | Since 2011 | Professor of Economics, Stanford University, Graduate School of Business (1979 to present) | 45 | None |
Anne Casscells
(1958) | Trustee | Since 2016 | Co-Chief Executive Officer and Chief Investment Officer, Aetos Alternatives Management (investment advisory firm) (2001 to present); Lecturer in Accounting, Stanford University, Graduate School of Business (2009 to present) | 45 | None |
Ronald J. Gilson
(1946) | Trustee and Chairman of the Board | Since 1995
(Chairman since 2005) | Charles J. Meyers Professor of Law and Business, Emeritus, Stanford Law School (1979 to present); Marc and Eva Stern Professor of Law and Business, Columbia University School of Law (1992 to present) | 45 | None |
|
| | | | | |
Name
(Year of Birth) | Position(s) Held with Funds | Length of Time Served | Principal Occupation(s) During Past 5 Years | Number of American Century Portfolios Overseen by Trustee | Other Directorships Held During Past 5 Years |
| Independent Trustees |
|
|
Frederick L. A. Grauer
(1946) | Trustee | Since 2008 | Senior Advisor, iShares by BlackRock, Inc. (investment management firm) (2010 to 2011, 2013 to 2015); Senior Advisor, Course Hero (an educational technology company) (2015 to present) | 45 | None |
Jonathan D. Levin
(1972) | Trustee | Since 2016 | Philip H. Knight Professor and Dean, Graduate School of Business, Stanford University (2016 to present); Professor, Stanford University, (2000 to present); Chair, Department of Economics, Stanford University (2011 to 2014) | 45 | None |
Peter F. Pervere
(1947) | Trustee | Since 2007 | Retired | 45 | None |
John B. Shoven
(1947) | Trustee | Since 2002 | Charles R. Schwab Professor of Economics, Stanford University (1973 to present) | 45 | Cadence Design Systems; Exponent; Financial Engines |
| Interested Trustee |
|
|
Jonathan S. Thomas
(1963) | Trustee and President | Since 2007 | President and Chief Executive Officer, ACC (March 2007 to present). Also serves as Chief Executive Officer, ACS; Executive Vice President, ACIM; Director, ACC, ACIM and other ACC subsidiaries | 114 | BioMed Valley Discoveries, Inc. |
The Statement of Additional Information has additional information about the fund's trustees and is available without charge, upon request, by calling 1-800-345-2021.
Officers
The following table presents certain information about the executive officers of the funds. Each officer serves as an officer for each of the 15 investment companies in the American Century family of funds, unless otherwise noted. No officer is compensated for his or her service as an officer of the funds. The listed officers are interested persons of the funds and are appointed or re-appointed on an annual basis. The mailing address for each of the officers listed below is 4500 Main Street, Kansas City, Missouri 64111.
|
| | |
Name
(Year of Birth) | Offices with the Funds | Principal Occupation(s) During the Past Five Years |
Jonathan S. Thomas
(1963) | Trustee and President since 2007 | President and Chief Executive Officer, ACC (2007 to present). Also serves as Chief Executive Officer, ACS; Executive Vice President, ACIM; Director, ACC, ACIM and other ACC subsidiaries |
Amy D. Shelton
(1964) | Chief Compliance Officer and Vice President since 2014 | Chief Compliance Officer, American Century funds, (2014 to present); Chief Compliance Officer, ACIM (2014 to present); Chief Compliance Officer, ACIS (2009 to present); Vice President, Client Interactions and Marketing, ACIS (2013 to 2014); Director, Client Interactions and Marketing, ACIS (2007 to 2013). Also serves as Vice President, ACIS |
Charles A. Etherington
(1957) | General Counsel since 2007 and Senior Vice President since 2006 | Attorney, ACC (1994 to present); Vice President, ACC (2005 to present); General Counsel, ACC (2007 to present). Also serves as General Counsel, ACIM, ACS, ACIS and other ACC subsidiaries; and Senior Vice President, ACIM and ACS |
C. Jean Wade
(1964) | Vice President, Treasurer and Chief Financial Officer since 2012 | Vice President, ACS (2000 to present) |
Robert J. Leach
(1966) | Vice President since 2006 and Assistant Treasurer since 2012 | Vice President, ACS (2000 to present) |
David H. Reinmiller
(1963) | Vice President since 2000 | Attorney, ACC (1994 to present); Associate General Counsel, ACC (2001 to present). Also serves as Vice President, ACIM and ACS |
Ward D. Stauffer
(1960) | Secretary since 2005 | Attorney, ACC (2003 to present) |
|
|
| Approval of Management Agreement |
At a meeting held on June 14, 2017, the Fund’s Board of Trustees (the "Board") unanimously approved the renewal of the management agreement pursuant to which American Century Investment Management, Inc. (the “Advisor”) acts as the investment advisor for the Fund. Under Section 15(c) of the Investment Company Act, contracts for investment advisory services are required to be reviewed, evaluated, and approved by a majority of a fund’s directors/trustees, including a majority of the independent Trustees, each year. The Board regards this annual evaluation and renewal as one of its most important responsibilities.
The independent Trustees have memorialized a statement regarding the relationship between their ongoing obligations to oversee and evaluate the performance of the Advisor and their annual consideration of renewal of the management agreement. In that statement, the independent Trustees noted that their assessment of the Advisor’s performance is an ongoing process that takes place over the entire year and is informed by all of the extensive information that the Board and its committees receive and consider over time. This information, together with the additional materials provided specifically in connection with the review, are central to the Board’s assessment of the Advisor’s performance and its determination whether to renew the Fund’s management agreement.
Prior to its consideration of the renewal of the management agreement, the Board requested and reviewed extensive data and analysis relating to the proposed renewal. This information and analysis was compiled by the Advisor and certain independent providers of evaluation data concerning the Fund and the services provided to the Fund by the Advisor.
In connection with its consideration of the renewal of the management agreement, the Board’s review and evaluation of the services provided by the Advisor included, but was not limited to, the following:
| |
| • | the nature, extent, and quality of investment management, shareholder services, and other services provided by the Advisor to the Fund; |
| |
| • | the wide range of other programs and services the Advisor provides to the Fund and its shareholders on a routine and non-routine basis; |
| |
| • | the investment performance of the Fund, including data comparing the Fund’s performance to appropriate benchmarks and/or a peer group of other mutual funds with similar investment objectives and strategies; |
| |
| • | the cost of owning the Fund compared to the cost of owning similar funds; |
| |
| • | the compliance policies, procedures, and regulatory experience of the Advisor and the Fund's service providers; |
| |
| • | financial data showing the cost of services provided to the Fund, the profitability of the Fund to the Advisor, and the overall profitability of the Advisor; |
| |
| • | strategic plans of the Advisor; |
| |
| • | possible economies of scale associated with the Advisor’s management of the Fund and other accounts under its management; |
| |
| • | data comparing services provided and charges to the Advisor's other investment management clients; |
| |
| • | acquired fund fees and expenses; |
| |
| • | payments and practices by the Fund and the Advisor regarding financial intermediaries whose clients are investors in the Fund, the nature of services provided by intermediaries, and the terms of share classes utilized; and |
| |
| • | any collateral benefits derived by the Advisor from the management of the Fund. |
In keeping with its practice, the Board held two in-person meetings to review and discuss the information provided in response to their request and held active discussions with the Advisor regarding the renewal of the management agreement. The independent Trustees had the benefit of the advice of their independent counsel throughout the process.
Factors Considered
The Trustees considered all of the information provided by the Advisor, the independent data providers, and the independent Trustees’ independent counsel in connection with the approval. They determined that the information was sufficient for them to evaluate the management agreement for the Fund. In connection with their review, the Trustees did not identify any single factor as being all-important or controlling and each Trustee may have attributed different levels of importance to different factors. In deciding to renew the management agreement, the Board based its decision on a number of factors, including without limitation the following:
Nature, Extent and Quality of Services - Generally. Under the management agreement, the Advisor is responsible for providing or arranging for all services necessary for the operation of the Fund. The Board noted that the Advisor provides or arranges at its own expense a wide variety of services including without limitation the following:
| |
| • | constructing and designing the Fund |
| |
| • | portfolio research and security selection |
| |
| • | initial capitalization/funding |
| |
| • | daily valuation of the Fund’s portfolio |
| |
| • | shareholder servicing and transfer agency, including shareholder confirmations, recordkeeping, and communications |
| |
| • | legal services (except the independent Trustees’ counsel) |
| |
| • | regulatory and portfolio compliance |
| |
| • | marketing and distribution (except amounts paid by the Fund under Rule 12b-1 plans) |
The Board noted that many of these services have expanded over time in terms of both quantity and complexity in response to shareholder demands, competition in the industry, changing distribution channels, and the changing regulatory environment.
Investment Management, Shareholder, and Other Services. The nature of the investment management services provided to the Fund is quite complex and allows Fund shareholders access to professional money management, instant diversification of their investments within an asset class, the opportunity to easily diversify among asset classes by investing in or exchanging among various American Century Investments funds, and liquidity. In evaluating investment performance, the Board expects the Advisor to manage the Fund in accordance with its investment objectives and approved strategies. Further, the Trustees recognize that the Advisor has an obligation to seek the best execution of fund trades. In providing these services, the Advisor utilizes teams of investment professionals (portfolio managers, analysts, research assistants, and securities traders) who require extensive information technology, research, training, compliance, and other systems to conduct their business. The Board, directly and through its Portfolio Committee, regularly reviews investment performance information for the Fund, together with comparative information for appropriate benchmarks and/or peer groups of similarly-managed funds, over different time horizons. The Trustees also review detailed performance information provided by the Advisor during the management agreement approval process. If performance concerns are identified, the Fund receives special reviews until performance improves, during which the Board discusses with the Advisor the reasons for such results (e.g., market conditions, security selection) and any efforts being undertaken to improve performance. The Fund’s performance was below its benchmark for
the one-, three-, five-, and ten-year periods reviewed by the Board. The Board discussed the Fund’s performance with the Advisor and was satisfied with the efforts being undertaken by the Advisor. The Board found the investment management services provided by the Advisor to the Fund to be satisfactory and consistent with the management agreement.
Under the management agreement, the Advisor provides the Fund with a comprehensive package of transfer agency, shareholder, and other services. The Board, directly and through various committees of the Board, regularly reviews reports and evaluations of such services at its regular meetings. These reports include, but are not limited to, information regarding the operational efficiency and accuracy of the shareholder and transfer agency services provided, staffing levels, shareholder satisfaction (as measured by external as well as internal sources), technology support, new products and services offered to Fund shareholders, securities trading activities, portfolio valuation services, auditing services, and legal and operational compliance activities. Certain aspects of shareholder and transfer agency service level efficiency and the quality of securities trading activities are measured by independent third party providers and are presented in comparison to other fund groups not managed by the Advisor.
The Board found the services provided by the Advisor to the Fund under the management agreement to be competitive and of high quality.
Costs of Services and Profitability. The Advisor provides detailed information concerning its cost of providing various services to the Fund, its profitability in managing the Fund, its overall profitability, and its financial condition. The Trustees have reviewed with the Advisor the methodology used to prepare this financial information. This information is considered in evaluating the Advisor’s financial condition, its ability to continue to provide services under the management agreement, and the reasonableness of the current management fee. The Board concluded that the Advisor’s profits were reasonable in light of the services provided to the Fund.
Economies of Scale. The Board also reviewed information provided by the Advisor regarding the possible existence of economies of scale in connection with the management of the Fund. The Board concluded that economies of scale are difficult to measure and predict with precision, especially on a fund-by-fund basis. The Board concluded that the Advisor is appropriately sharing economies of scale through its competitive fee structure, offering competitive fees from fund inception, and through reinvestment in its business to provide shareholders enhanced and expanded services.
Comparison to Other Funds’ Fees. The management agreement provides that the Fund pays the Advisor a single, all-inclusive (or unified) management fee for providing all services necessary for the management and operation of the Fund, other than brokerage expenses, expenses attributable to short sales, taxes, interest, extraordinary expenses, the fees and expenses of the Fund’s independent Trustees (including their independent legal counsel), and expenses incurred in connection with the provision of shareholder services and distribution services under a plan adopted pursuant to Rule 12b-1 under the 1940 Act. Under the unified fee structure, the Advisor is responsible for providing all investment advisory, custody, audit, administrative, compliance, recordkeeping, marketing, and shareholder services, or arranging and supervising third parties to provide such services. By contrast, most other funds are charged a variety of fees, including an investment advisory fee, a transfer agency fee, an administrative fee, distribution charges, and other expenses. Other than their investment advisory fees and any applicable Rule 12b-1 distribution fees, all other components of the total fees charged by these other funds may be increased without shareholder approval. The Board believes the unified fee structure is a benefit to Fund shareholders because it clearly discloses to shareholders the cost of owning Fund shares, and, since the unified fee cannot be increased without a vote of Fund shareholders, it shifts to the Advisor the risk of increased costs of operating the Fund and provides a direct incentive to minimize administrative inefficiencies. Part of the Board’s analysis of fee levels involves reviewing certain evaluative data compiled by an independent provider and comparing the Fund’s unified fee to the total expense ratio of peer funds. The unified fee charged to shareholders of the Fund was
below the median of the total expense ratios of the Fund’s peer group. The Board concluded that the management fee paid by the Fund to the Advisor under the management agreement is reasonable in light of the services provided to the Fund.
Comparison to Fees and Services Provided to Other Clients of the Advisor. The Board also requested and received information from the Advisor concerning the nature of the services, fees, costs, and profitability of its advisory services to advisory clients other than the Fund. They observed that these varying types of client accounts require different services and involve different regulatory and entrepreneurial risks than the management of the Fund. The Board analyzed this information and concluded that the fees charged and services provided to the Fund were reasonable by comparison.
Payments to Intermediaries. The Trustees also requested and received a description of payments made to intermediaries by the Fund and the Advisor and services provided by intermediaries. These payments include various payments made by the Fund or the Advisor to different types of intermediaries and recordkeepers for distribution and service activities provided for the Fund. The Trustees reviewed such information and received representations from the Advisor that all such payments by the Fund were made pursuant to the Fund's Rule 12b-1 Plan and that all such payments by the Advisor were made from the Advisor's resources and reasonable profits. The Board found the payments to be reasonable in scope and purpose.
Collateral or “Fall-Out” Benefits Derived by the Advisor. The Board considered the existence of collateral benefits the Advisor may receive as a result of its relationship with the Fund. The Board noted that the Advisor’s primary business is managing mutual funds and it generally does not use fund or shareholder information to generate profits in other lines of business, and therefore does not derive any significant collateral benefits from them. The Board noted that the Advisor receives proprietary research from broker-dealers that execute fund portfolio transactions. The Board also determined that the Advisor is able to provide investment management services to certain clients other than the Fund, at least in part, due to its existing infrastructure built to serve the fund complex. The Board noted that the assets of those other accounts are, where applicable, included with the assets of the Fund to determine breakpoints in the management fee schedule.
Existing Relationship. The Board also considered whether there was any reason for not continuing the existing arrangement with the Advisor. In this regard, the Board was mindful of the potential disruptions of the Fund’s operations and various risks, uncertainties, and other effects that could occur as a result of a decision not to continue such relationship. In particular, the Board recognized that most shareholders have invested in the Fund on the strength of the Advisor’s industry standing and reputation and in the expectation that the Advisor will have a continuing role in providing advisory services to the Fund.
Conclusion of the Trustees. As a result of this process, the Board, including all of the independent Trustees and assisted by the advice of independent legal counsel, taking into account all of the factors discussed above and the information provided by the Advisor and others in connection with its review and throughout the year, concluded that the management agreement between the Fund and the Advisor is fair and reasonable in light of the services provided and should be renewed.
Retirement Account Information
As required by law, distributions you receive from certain retirement accounts are subject to federal income tax withholding, unless you elect not to have withholding apply*. Tax will be withheld on the total amount withdrawn even though you may be receiving amounts that are not subject to withholding, such as nondeductible contributions. In such case, excess amounts of withholding could occur. You may adjust your withholding election so that a greater or lesser amount will be withheld.
If you don’t want us to withhold on this amount, you must notify us to not withhold the federal income tax. You may notify us in writing or in certain situations by telephone or through other electronic means. For systematic withdrawals, your withholding election will remain in effect until revoked or changed by filing a new election. You have the right to revoke your election at any time and change your withholding percentage for future distributions.
Remember, even if you elect not to have income tax withheld, you are liable for paying income tax on the taxable portion of your withdrawal. If you elect not to have income tax withheld or you don’t have enough income tax withheld, you may be responsible for payment of estimated tax. You may incur penalties under the estimated tax rules if your withholding and estimated tax payments are not sufficient. You can reduce or defer the income tax on a distribution by directly or indirectly rolling such distribution over to another IRA or eligible plan. You should consult your tax advisor for additional information.
State tax will be withheld if, at the time of your distribution, your address is within one of the mandatory withholding states and you have federal income tax withheld (or as otherwise required by state law). State taxes will be withheld from your distribution in accordance with the respective state rules.
*Some 403(b), 457 and qualified retirement plan distributions may be subject to 20% mandatory withholding, as they are subject to special tax and withholding rules. Your plan administrator or plan sponsor is required to provide you with a special tax notice explaining those rules at the time you request a distribution. If applicable, federal and/or state taxes may be withheld from your distribution amount.
Proxy Voting Policies
Descriptions of the principles and policies that the fund's investment advisor uses in exercising the voting rights associated with the securities purchased and/or held by the fund are available without charge, upon request, by calling 1-800-345-2021 or visiting the "About Us" page of American Century Investments’ website at americancentury.com. A description of the policies is also available on the Securities and Exchange Commission’s website at sec.gov. Information regarding how the investment advisor voted proxies relating to portfolio securities during the most recent 12-month period ended June 30 is available on the "About Us" page at americancentury.com. It is also available at sec.gov.
Quarterly Portfolio Disclosure
The fund files its complete schedule of portfolio holdings with the Securities and Exchange Commission (SEC) for the first and third quarters of each fiscal year on Form N-Q. The fund’s Forms N-Q are available on the SEC’s website at sec.gov, and may be reviewed and copied at the SEC’s Public Reference Room in Washington, DC. Information on the operation of the Public Reference Room may be obtained by calling 1-800-SEC-0330. The fund also makes its complete schedule of portfolio holdings for the most recent quarter of its fiscal year available on its website at americancentury.com and, upon request, by calling 1-800-345-2021.
|
| | |
| |
| | | |
| Contact Us | americancentury.com | |
| Automated Information Line | 1-800-345-8765 | |
| Investor Services Representative | 1-800-345-2021
or 816-531-5575 | |
| Investors Using Advisors | 1-800-378-9878 | |
Business, Not-For-Profit, Employer-Sponsored
Retirement Plans | 1-800-345-3533 | |
Banks and Trust Companies, Broker-Dealers,
Financial Professionals, Insurance Companies | 1-800-345-6488 | |
| Telecommunications Relay Service for the Deaf | 711 | |
| | | |
| American Century International Bond Funds | |
| | | |
Investment Advisor: American Century Investment Management, Inc. Kansas City, Missouri | |
| | | |
| This report and the statements it contains are submitted for the general information of our shareholders. The report is not authorized for distribution to prospective investors unless preceded or accompanied by an effective prospectus. | |
| | | |
©2017 American Century Proprietary Holdings, Inc. All rights reserved.
CL-ANN-90983 1712 | |
ITEM 2. CODE OF ETHICS.
| |
| (a) | The registrant has adopted a Code of Ethics for Senior Financial Officers that applies to the registrant’s principal executive officer, principal financial officer, principal accounting officer, and persons performing similar functions. |
| |
| (f) | The registrant’s Code of Ethics for Senior Financial Officers was filed as Exhibit 12 (a)(1) to American Century Asset Allocation Portfolios, Inc.’s Annual Certified Shareholder Report on Form N-CSR, File No. 811-21591, on September 29, 2005, and is incorporated herein by reference. |
ITEM 3. AUDIT COMMITTEE FINANCIAL EXPERT.
| |
| (a)(1) | The registrant's board has determined that the registrant has at least one audit committee financial expert serving on its audit committee. |
| |
| (a)(2) | Tanya S. Beder, Anne Casscells, Peter F. Pervere and Ronald J. Gilson are the registrant's designated audit committee financial experts. They are "independent" as defined in Item 3 of Form N-CSR. |
ITEM 4. PRINCIPAL ACCOUNTANT FEES AND SERVICES.
The aggregate fees billed for each of the last two fiscal years for professional services rendered by the principal accountant for the audit of the registrant’s annual financial statements or services that are normally provided by the accountant in connection with statutory and regulatory filings or engagements for those fiscal years were as follows:
FY 2016: $101,490
FY 2017: $127,917
The aggregate fees billed in each of the last two fiscal years for assurance and related services by the principal accountant that are reasonably related to the performance of the audit of the registrant’s financial statements and are not reported under paragraph (a) of this Item were as follows:
For services rendered to the registrant:
Fees required to be approved pursuant to paragraph (c)(7)(ii) of Rule 2-01 of Regulation S-X (relating to certain engagements for non-audit services with the registrant’s investment adviser and its affiliates):
The aggregate fees billed in each of the last two fiscal years for professional services rendered by the principal accountant for tax compliance, tax advice, and tax planning were as follows:
For services rendered to the registrant:
FY 2016: $0
FY 2017: $0
Fees required to be approved pursuant to paragraph (c)(7)(ii) of Rule 2-01 of Regulation S-X (relating to certain engagements for non-audit services with the registrant’s investment adviser and its affiliates):
FY 2016: $0
FY 2017: $0
The aggregate fees billed in each of the last two fiscal years for products and services provided by the principal accountant, other than the services reported in paragraphs (a) through (c) of this Item were as follows:
For services rendered to the registrant:
Fees required to be approved pursuant to paragraph (c)(7)(ii) of Rule 2-01 of Regulation S-X (relating to certain engagements for non-audit services with the registrant’s investment adviser and its affiliates):
| |
| (e)(1) | In accordance with paragraph (c)(7)(i)(A) of Rule 2-01 of Regulation S-X, before the accountant is engaged by the registrant to render audit or non-audit services, the engagement is approved by the registrant’s audit committee. Pursuant to paragraph (c)(7)(ii) of Rule 2-01 of Regulation S-X, the registrant’s audit committee also pre-approves its accountant’s engagements for non-audit services with the registrant’s investment adviser, its parent company, and any entity controlled by, or under common control with the investment adviser that provides ongoing services to the registrant, if the engagement relates directly to the operations and financial reporting of the registrant. |
| |
| (e)(2) | All services described in each of paragraphs (b) through (d) of this Item were pre-approved before the engagement by the registrant’s audit committee pursuant to paragraph (c)(7)(i)(A) of Rule 2-01 of Regulation S-X. Consequently, none of such services were required to be approved by the audit committee pursuant to paragraph (c)(7)(i)(C). |
| |
| (f) | The percentage of hours expended on the principal accountant’s engagement to audit the registrant’s financial statements for the most recent fiscal year that were attributed to work performed by persons other than the principal accountant’s full-time, permanent employees was less than 50%. |
| |
| (g) | The aggregate non-audit fees billed by the registrant’s accountant for services rendered to the registrant, and rendered to the registrant’s investment adviser (not including any sub-adviser whose role is primarily portfolio management and is subcontracted with or overseen by another investment adviser), and any entity controlling, controlled by, or under common control with the adviser that provides ongoing services to the registrant for each of the last two fiscal years of the registrant were as follows: |
FY 2016: $167,395
FY 2017: $145,111
| |
| (h) | The registrant’s investment adviser and accountant have notified the registrant’s audit committee of all non-audit services that were rendered by the registrant’s accountant to the registrant’s investment adviser, its parent company, and any entity controlled by, or under common control with the investment adviser that provides services to the registrant, which services were not required to be pre-approved pursuant to paragraph (c)(7)(ii) of Rule 2-01 of Regulation S-X. The notification provided to the registrant’s audit committee included sufficient details regarding such services to allow the registrant’s audit committee to consider the continuing independence of its principal accountant. |
ITEM 5. AUDIT COMMITTEE OF LISTED REGISTRANTS.
Not applicable.
ITEM 6. INVESTMENTS.
| |
| (a) | The schedule of investments is included as part of the report to stockholders filed under Item 1 of this Form. |
ITEM 7. DISCLOSURE OF PROXY VOTING POLICIES AND PROCEDURES FOR CLOSED-END MANAGEMENT INVESTMENT COMPANIES.
Not applicable.
ITEM 8. PORTFOLIO MANAGERS OF CLOSED-END MANAGEMENT INVESTMENT COMPANIES.
Not applicable.
ITEM 9. PURCHASES OF EQUITY SECURITIES BY CLOSED-END MANAGEMENT INVESTMENT COMPANY AND AFFILIATED PURCHASERS.
Not applicable.
ITEM 10. SUBMISSION OF MATTERS TO A VOTE OF SECURITY HOLDERS.
During the reporting period, there were no material changes to the procedures by which shareholders may recommend nominees to the registrant’s board.
ITEM 11. CONTROLS AND PROCEDURES.
| |
| (a) | The registrant's principal executive officer and principal financial officer have concluded that the registrant's disclosure controls and procedures (as defined in Rule 30a-3(c) under the Investment Company Act of 1940) are effective based on their evaluation of these controls and procedures as of a date within 90 days of the filing date of this report. |
| |
| (b) | There were no changes in the registrant's internal control over financial reporting (as defined in Rule 30a-3(d) under the Investment Company Act of 1940) that occurred during the registrant's second fiscal quarter of the period covered by this report that have materially affected, or are reasonably likely to materially affect, the registrant's internal control over financial reporting. |
ITEM 12. EXHIBITS.
| |
| (a)(1) | Registrant’s Code of Ethics for Senior Financial Officers, which is the subject of the disclosure required by Item 2 of Form N-CSR, was filed as Exhibit 12(a)(1) to American Century Asset Allocation Portfolios, Inc.’s Certified Shareholder Report on Form N-CSR, File No. 811-21591, on September 29, 2005. |
| |
| (a)(2) | Separate certifications by the registrant’s principal executive officer and principal financial officer, pursuant to Section 302 of the Sarbanes-Oxley Act of 2002 and Rule 30a-2(a) under the Investment Company Act of 1940, are filed and attached hereto as EX-99.CERT. |
| |
| (b) | A certification by the registrant’s chief executive officer and chief financial officer, pursuant to Section 906 of the Sarbanes-Oxley Act of 2002, is furnished and attached hereto as EX-99.906CERT. |
SIGNATURES
Pursuant to the requirements of the Securities Exchange Act of 1934 and the Investment Company Act of 1940, the registrant has duly caused this report to be signed on its behalf by the undersigned, thereunto duly authorized.
|
| | | | |
| Registrant: | American Century International Bond Funds |
| | | | |
| By: | /s/ Jonathan S. Thomas | |
| | Name: | Jonathan S. Thomas | |
| | Title: | President | |
| | | | |
| Date: | December 28, 2017 | |
Pursuant to the requirements of the Securities Exchange Act of 1934 and the Investment Company Act of 1940, this report has been signed below by the following persons on behalf of the registrant and in the capacities and on the dates indicated.
|
| | | |
| By: | /s/ Jonathan S. Thomas | |
| | Name: | Jonathan S. Thomas | |
| | Title: | President | |
| | | (principal executive officer) | |
| | | | |
| Date: | December 28, 2017 | |
|
| | | |
| By: | /s/ C. Jean Wade | |
| | Name: | C. Jean Wade | |
| | Title: | Vice President, Treasurer, and | |
| | | Chief Financial Officer | |
| | | (principal financial officer) | |
| | | | |
| Date: | December 28, 2017 | |