UNITED STATES
SECURITIES AND EXCHANGE COMMISSION
Washington, D.C. 20549
FORM N-CSR
CERTIFIED SHAREHOLDER REPORT OF REGISTERED
MANAGEMENT INVESTMENT COMPANIES
|
| | | | | | |
| Investment Company Act file number | 811-06441 |
| | |
| AMERICAN CENTURY INTERNATIONAL BOND FUNDS |
| (Exact name of registrant as specified in charter) |
| | |
| 4500 MAIN STREET, KANSAS CITY, MISSOURI | 64111 |
| (Address of principal executive offices) | (Zip Code) |
| | |
CHARLES A. ETHERINGTON 4500 MAIN STREET, KANSAS CITY, MISSOURI 64111 |
| (Name and address of agent for service) |
| | |
| Registrant’s telephone number, including area code: | 816-531-5575 |
| | |
| Date of fiscal year end: | 06-30 |
| | |
| Date of reporting period: | 06-30-15 |
ITEM 1. REPORTS TO STOCKHOLDERS.
|
| |
| ANNUAL REPORT | JUNE 30, 2015 |
Emerging Markets Debt Fund
|
| | |
| President’s Letter | 2 |
|
| Performance | 3 |
|
| Portfolio Commentary | |
|
| Fund Characteristics | |
|
| Shareholder Fee Example | |
|
| Schedule of Investments | |
|
| Statement of Assets and Liabilities | |
|
| Statement of Operations | |
|
| Statement of Changes in Net Assets | |
|
| Notes to Financial Statements | |
|
| Financial Highlights | |
|
| Report of Independent Registered Public Accounting Firm | |
|
| Management | |
|
| Approval of Management Agreement | |
|
| Additional Information | |
|
Any opinions expressed in this report reflect those of the author as of the date of the report, and do not necessarily represent the opinions of American Century Investments® or any other person in the American Century Investments organization. Any such opinions are subject to change at any time based upon market or other conditions and American Century Investments disclaims any responsibility to update such opinions. These opinions may not be relied upon as investment advice and, because investment decisions made by American Century Investments funds are based on numerous factors, may not be relied upon as an indication of trading intent on behalf of any American Century Investments fund. Security examples are used for representational purposes only and are not intended as recommendations to purchase or sell securities. Performance information for comparative indices and securities is provided to American Century Investments by third party vendors. To the best of American Century Investments’ knowledge, such information is accurate at the time of printing.
|
| |
| Dear Investor:
Thank you for reviewing this annual report for the 11 months from the fund’s inception July 29, 2014 to June 30, 2015. It provides investment performance and portfolio information for the reporting period.
Annual reports remain important vehicles for conveying information about fund returns, including market and economic factors that affected performance during the reporting period. For additional, updated investment and market insights, we encourage you to visit our website, americancentury.com. |
| Jonathan Thomas |
Global Divergence Favored U.S. Assets
“Global divergence” between the U.S. and the rest of the world emerged as a prevalent theme during the reporting period. This theme embraced not only the relatively stronger economic growth enjoyed by the U.S. compared with most of the world, but also the related contrast between the U.S. Federal Reserve’s unwinding of monetary stimulus compared with the continuation and expansion of stimulus by other major central banks. Low inflation also prevailed, after crude oil prices plunged over 40% amid muted demand for commodities in general. In this environment, the U.S. dollar, U.S. growth stocks, and longer-maturity U.S. Treasuries generally benefited from “flight to quality” capital flows, reinforced by geopolitical and financial turmoil, particularly in Greece, Russia/Ukraine, China, and the Middle East.
For the reporting period, the U.S. Dollar Index, the S&P 500 Index, and the Barclays U.S. Aggregate Bond Index returned 17.36%, 6.78%, and 1.69%, respectively. By contrast, the MSCI EAFE Index, the MSCI Emerging Markets Index, and the Barclays Global Aggregate Bond ex-USD (Unhedged) Index returned -3.71%, -8.18%, and -12.57%, respectively, for U.S. investors unhedged for the strong dollar’s impact on non-dollar-denominated returns. Corporate emerging market debt was a notable exception to the broader divergence, rebounding to post a 2.19% return (according to the JPMorgan Corporate Emerging Market Bond (CEMBI) Broad Diversified Index) for the full reporting period after struggling in the last half of 2014.
We expect more monetary policy divergence between the U.S. and other major developed economies in the coming months, accompanied by continued market volatility. This could present both challenges and opportunities for active investment managers. Upward pressures on inflation and interest rates could develop as the massive amount of global monetary stimulus in progress takes hold and economies improve. In this environment, we continue to believe in a disciplined, diversified, long-term investment approach, using professionally managed stock and bond portfolios to meet financial goals. We appreciate your continued trust in us.
Sincerely,
Jonathan Thomas
President and Chief Executive Officer
American Century Investments
|
| | | |
| Total Returns as of June 30, 2015 |
| | Ticker Symbol | Since Inception(1) | Inception Date |
| Investor Class | AEDVX | 1.72% | 7/29/14 |
| JPMorgan Corporate Emerging Market Bond (CEMBI) Broad Diversified Index | — | 2.19% | — |
| Institutional Class | AEDJX | 1.91% | 7/29/14 |
| A Class | AEDQX | | 7/29/14 |
| No sales charge* | | 1.45% | |
| With sales charge* | | -3.11% | |
| C Class | AEDHX | | 7/29/14 |
| No sales charge* | | 0.74% | |
| With sales charge* | | -0.25% | |
| R Class | AEDWX | 1.18% | 7/29/14 |
| R6 Class | AEXDX | 1.96% | 7/29/14 |
| |
| * | Sales charges include initial sales charges and contingent deferred sales charges (CDSCs), as applicable. A Class shares have a 4.50% maximum initial sales charge and may be subject to a maximum CDSC of 1.00%. C Class shares redeemed within 12 months of purchase are subject to a maximum CDSC of 1.00%. The SEC requires that mutual funds provide performance information net of maximum sales charges in all cases where charges could be applied. |
| |
| (1) | Total returns for periods less than one year are not annualized. |
Data presented reflect past performance. Past performance is no guarantee of future results. Current performance may be higher or lower than the performance shown. Investment return and principal value will fluctuate, and redemption value may be more or less than original cost. Data assumes reinvestment of dividends and capital gains, and none of the charts reflect the deduction of taxes that a shareholder would pay on fund distributions or the redemption of fund shares. To obtain performance data current to the most recent month end, please call 1-800-345-2021 or visit americancentury.com. For additional information about the fund, please consult the prospectus.
|
|
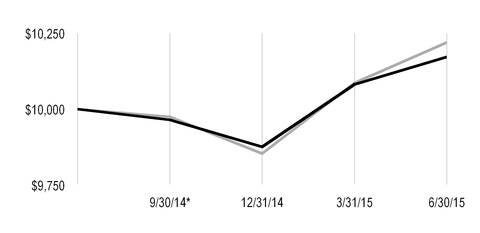
| Growth of $10,000 Over Life of Class |
| $10,000 investment made July 29, 2014 |
| Performance for other share classes will vary due to differences in fee structure. |
|
| |
| Value on June 30, 2015 |
| | Investor Class — $10,172 |
| |
| | JPMorgan CEMBI Broad Diversified Index — $10,219 |
| |
*From July 29, 2014, the Investor Class's inception date. Not annualized.
|
| | | | | |
| Total Annual Fund Operating Expenses | |
| Investor Class | Institutional Class | A Class | C Class | R Class | R6 Class |
| 0.97% | 0.77% | 1.22% | 1.97% | 1.47% | 0.72% |
The total annual fund operating expenses shown is as stated in the fund’s prospectus current as of the date of this report. The prospectus may vary from the expense ratio shown elsewhere in this report because it is based on a different time period, includes acquired fund fees and expenses, and, if applicable, does not include fee waivers or expense reimbursements.
Data presented reflect past performance. Past performance is no guarantee of future results. Current performance may be higher or lower than the performance shown. Investment return and principal value will fluctuate, and redemption value may be more or less than original cost. Data assumes reinvestment of dividends and capital gains, and none of the charts reflect the deduction of taxes that a shareholder would pay on fund distributions or the redemption of fund shares. To obtain performance data current to the most recent month end, please call 1-800-345-2021 or visit americancentury.com. For additional information about the fund, please consult the prospectus.
Portfolio Managers: Margé Karner, Kevin Akioka, John Lovito, and Brian Howell
Phil Yuhn joined the portfolio management team shortly after the end of the reporting period, in
July 2015.
Performance Summary
From its inception on July 29, 2014 through June 30, 2015, Emerging Markets Debt returned 1.72%,* compared with the 2.19% return of its benchmark, the JPMorgan Corporate Emerging Market Bond (CEMBI) Broad Diversified Index. Portfolio returns reflect operating expenses, while index returns do not.
Market Review
Emerging markets corporate bonds posted positive returns for the reporting period. The main drivers of performance during the period were commodity price fluctuations, geopolitical tensions, a heavy elections calendar in many developing countries, and interest rate policy expectations for the U.S. Federal Reserve (the Fed). From a commodity perspective, a sharp decline in the price of oil during the latter part of 2014—driven by increased energy production in the U.S. and slowing global energy demand—put downward pressure on emerging markets bonds. However, as energy prices stabilized and gradually recovered in the first half of 2015, emerging markets bonds rebounded, more than offsetting the negative performance from the first half of the period.
The economic environment was challenging as many of the largest emerging economies experienced slower growth during the reporting period. Although China remained one of the fastest-growing economies in the world, its growth rate slowed, particularly in the first half of 2015. Two other large emerging economies, Brazil and Russia, experienced a recessionary trend during the reporting period, along with a high level of political uncertainty.
Emerging markets bonds were also buffeted by geopolitical conflicts in Ukraine and the Middle East, resurfacing sovereign debt problems in Greece, and elections in countries such as Indonesia, Brazil, and Turkey. In addition, expectations of an interest rate increase by the Fed sometime in 2015 contributed to increased volatility as investors struggled to assess the timing and pace of the Fed’s actions and the potential impact on emerging markets bonds.
Portfolio Positioning
At inception, the portfolio was positioned defensively, with an emphasis on higher-quality corporate securities in stable emerging countries and an overweight in cash. We established this cautious positioning in anticipation of increasing risks that, in our view, were not reflected in market pricing. We maintained this positioning through the end of 2014, and it aided performance as emerging markets bonds experienced price declines during the latter part of 2014.
The sell-off in emerging markets bonds created pockets of value, and we took advantage of these opportunities to reduce some of the portfolio’s underweight positions and increase its exposure to select countries and securities that had significantly underperformed.
On average, the portfolio was underweight lower-quality securities and overweight in higher-quality bonds during the period, and this positioning was generally positive for overall performance.
| |
| * | All fund returns referenced in this commentary are for Investor Class shares. Total returns for periods less |
than one year are not annualized. Performance for other share classes will vary due to differences in fee
structure; when Investor Class performance exceeds that of the fund’s benchmark, other share classes may
not. See page 3 for returns for all share classes.
Shorter Duration Detracted
The portfolio’s duration positioning was the main factor behind the fund’s underperformance of its benchmark for the reporting period. The portfolio’s duration (a measure of the portfolio’s price sensitivity to interest rate changes) was shorter than that of the benchmark throughout the reporting period, which detracted overall from relative results. By the end of the reporting period, we had shifted the portfolio’s duration back to a relatively neutral position compared with the benchmark.
Sector Allocation and Country Positioning Added Value
The portfolio’s sector allocation and country weightings contributed positively to performance during the period. Underweight positions in commodity-oriented sectors, especially energy and metals and mining, aided relative results. In the energy sector, we focused on securities issued by low-cost producers with limited leverage that would still be profitable in an environment of lower energy prices. On the downside, an underweight position in the financials sector detracted from performance versus the benchmark as this sector outperformed.
From a country perspective, an underweight position in Ukraine added value during the period. Russia, the portfolio’s second-largest country weighting, began the period as an underweight, but moved to an overweight position by the end of the period. The net overweight in Russia had a positive impact on overall results. Overweight positions in Indonesia and Colombia detracted from relative performance. As of the end of the period, the portfolio was overweight in Latin America, with a focus on Mexican companies that had recently underperformed, and underweight in the Asia/Pacific region (with the exception of China) because of unattractive valuations.
Positioning for the Future
We believe commodity prices and Fed interest rate policy are likely to have the biggest impact on emerging markets corporate bond performance in the coming months. The Fed is expected to start raising its short-term interest rate target by year-end, which could have implications for emerging markets countries with substantial budget deficits and/or near-term financing needs. On the commodity front, we do not expect a near-term reversal of the negative trend in commodity prices due to a sluggish outlook for global growth and the continued transition to a more consumption-driven economic model in China.
We have reduced the portfolio’s overall risk profile in the recent months, maintaining a focus on more defensive sectors and countries, as well as select high-yield corporate securities where we see attractive relative values. We expect higher market volatility in the near term, and we will look for opportunities to take advantage of market fluctuations in countries and companies where we are comfortable with the economic and credit-specific fundamentals, and where valuations adequately reflect the risks as we see them.
|
| |
| JUNE 30, 2015 |
| Portfolio at a Glance |
| Average Duration (effective) | 4.6 years |
| Weighted Average Life | 5.4 years |
| | |
| Bond Holdings by Country | % of net assets |
| China | 9.9% |
| Russia | 5.9% |
| Mexico | 5.4% |
| Brazil | 5.1% |
| India | 4.7% |
| Hong Kong | 4.7% |
| Chile | 4.5% |
| Colombia | 4.4% |
| South Africa | 3.8% |
| Thailand | 3.6% |
| Other Countries | 35.3% |
Cash and Equivalents(1) | 12.7% |
| (1) Includes temporary cash investments and other assets and liabilities. |
| | |
| Types of Investments in Portfolio | % of net assets |
| Corporate Bonds | 86.0% |
| U.S. Treasury Securities | 1.3% |
| Temporary Cash Investments | 11.7% |
| Other Assets and Liabilities | 1.0% |
Fund shareholders may incur two types of costs: (1) transaction costs, including sales charges (loads) on purchase payments and redemption/exchange fees; and (2) ongoing costs, including management fees; distribution and service (12b-1) fees; and other fund expenses. This example is intended to help you understand your ongoing costs (in dollars) of investing in your fund and to compare these costs with the ongoing cost of investing in other mutual funds.
The example is based on an investment of $1,000 made at the beginning of the period and held for the entire period from January 1, 2015 to June 30, 2015.
Actual Expenses
The table provides information about actual account values and actual expenses for each class. You may use the information, together with the amount you invested, to estimate the expenses that you paid over the period. First, identify the share class you own. Then simply divide your account value by $1,000 (for example, an $8,600 account value divided by $1,000 = 8.6), then multiply the result by the number under the heading “Expenses Paid During Period” to estimate the expenses you paid on your account during this period.
If you hold Investor Class shares of any American Century Investments fund, or Institutional Class shares of the American Century Diversified Bond Fund, in an American Century Investments account (i.e., not a financial intermediary or retirement plan account), American Century Investments may charge you a $12.50 semiannual account maintenance fee if the value of those shares is less than $10,000. We will redeem shares automatically in one of your accounts to pay the $12.50 fee. In determining your total eligible investment amount, we will include your investments in all personal accounts (including American Century Investments Brokerage accounts) registered under your Social Security number. Personal accounts include individual accounts, joint accounts, UGMA/UTMA accounts, personal trusts, Coverdell Education Savings Accounts and IRAs (including traditional, Roth, Rollover, SEP-, SARSEP- and SIMPLE-IRAs), and certain other retirement accounts. If you have only business, business retirement, employer-sponsored or American Century Investments Brokerage accounts, you are currently not subject to this fee. If you are subject to the Account Maintenance Fee, your account value could be reduced by the fee amount.
Hypothetical Example for Comparison Purposes
The table also provides information about hypothetical account values and hypothetical expenses based on the actual expense ratio of each class of your fund and an assumed rate of return of 5% per year before expenses, which is not the actual return of a fund’s share class. The hypothetical account values and expenses may not be used to estimate the actual ending account balance or expenses you paid for the period. You may use this information to compare the ongoing costs of investing in your fund and other funds. To do so, compare this 5% hypothetical example with the 5% hypothetical examples that appear in the shareholder reports of the other funds.
Please note that the expenses shown in the table are meant to highlight your ongoing costs only and do not reflect any transactional costs, such as sales charges (loads) or redemption/exchange fees. Therefore, the table is useful in comparing ongoing costs only, and will not help you determine the relative total costs of owning different funds. In addition, if these transactional costs were included, your costs would have been higher.
|
| | | | |
| | Beginning
Account Value
1/1/15 | Ending
Account Value
6/30/15 | Expenses Paid
During Period(1)1/1/15 - 6/30/15 | Annualized Expense Ratio(1) |
| Actual | | | | |
| Investor Class | $1,000 | $1,029.90 | $4.83 | 0.96% |
| Institutional Class | $1,000 | $1,030.90 | $3.83 | 0.76% |
| A Class | $1,000 | $1,028.70 | $6.09 | 1.21% |
| C Class | $1,000 | $1,024.90 | $9.84 | 1.96% |
| R Class | $1,000 | $1,027.40 | $7.34 | 1.46% |
| R6 Class | $1,000 | $1,031.20 | $3.58 | 0.71% |
| Hypothetical | | | | |
| Investor Class | $1,000 | $1,020.03 | $4.81 | 0.96% |
| Institutional Class | $1,000 | $1,021.03 | $3.81 | 0.76% |
| A Class | $1,000 | $1,018.79 | $6.06 | 1.21% |
| C Class | $1,000 | $1,015.08 | $9.79 | 1.96% |
| R Class | $1,000 | $1,017.56 | $7.30 | 1.46% |
| R6 Class | $1,000 | $1,021.27 | $3.56 | 0.71% |
| |
| (1) | Expenses are equal to the class's annualized expense ratio listed in the table above, multiplied by the average account value over the period, multiplied by 181, the number of days in the most recent fiscal half-year, divided by 365, to reflect the one-half year period. |
JUNE 30, 2015
|
| | | | | | |
| | Principal Amount | Value |
| CORPORATE BONDS — 86.0% | | |
| Brazil — 5.1% | | |
| Banco ABC Brasil SA, 7.875%, 4/8/20 | $ | 200,000 |
| $ | 208,250 |
|
| BRF SA, 3.95%, 5/22/23 | 200,000 |
| 190,625 |
|
| ESAL GmbH, 6.25%, 2/5/23 | 200,000 |
| 197,500 |
|
| Itau Unibanco Holding SA, 6.20%, 12/21/21 | 200,000 |
| 212,350 |
|
| Petrobras Global Finance BV, 7.875%, 3/15/19 | 100,000 |
| 106,443 |
|
| Petrobras Global Finance Co., 4.875%, 3/17/20 | 400,000 |
| 381,336 |
|
| Vale Overseas Ltd., 6.875%, 11/21/36 | 100,000 |
| 96,944 |
|
| | | 1,393,448 |
|
| Chile — 4.5% | | |
| Banco del Estado de Chile, 4.125%, 10/7/20 | 200,000 |
| 212,189 |
|
| Banco Santander Chile, 3.875%, 9/20/22 | 200,000 |
| 202,562 |
|
| Cencosud SA, 5.50%, 1/20/21 | 150,000 |
| 157,832 |
|
Corpbanca SA, 3.875%, 9/22/19(1) | 250,000 |
| 254,189 |
|
| Telefonica Chile SA, 3.875%, 10/12/22 | 200,000 |
| 196,442 |
|
| VTR Finance BV, 6.875%, 1/15/24 | 200,000 |
| 204,870 |
|
| | | 1,228,084 |
|
| China — 9.9% | | |
| Agile Property Holdings Ltd., 8.875%, 4/28/17 | 200,000 |
| 202,700 |
|
| China Overseas Finance Cayman V Ltd., 3.95%, 11/15/22 | 200,000 |
| 195,137 |
|
| CITIC Ltd., 6.80%, 1/17/23 | 200,000 |
| 232,112 |
|
| CNOOC Finance 2013 Ltd., 3.00%, 5/9/23 | 300,000 |
| 284,329 |
|
| Country Garden Holdings Co. Ltd., 7.50%, 3/9/20 | 200,000 |
| 207,201 |
|
| CRCC Yuxiang Ltd., 3.50%, 5/16/23 | 200,000 |
| 194,875 |
|
| ENN Energy Holdings Ltd., 6.00%, 5/13/21 | 200,000 |
| 221,268 |
|
| KWG Property Holding Ltd., 8.98%, 1/14/19 | 400,000 |
| 410,904 |
|
| MIE Holdings Corp., 7.50%, 4/25/19 | 200,000 |
| 153,000 |
|
| Shimao Property Holdings Ltd., 8.125%, 1/22/21 | 200,000 |
| 209,750 |
|
Sinopec Group Overseas Development 2015 Ltd., 2.50%, 4/28/20(1) | 200,000 |
| 197,924 |
|
Tencent Holdings Ltd., 3.80%, 2/11/25(1) | 200,000 |
| 194,107 |
|
| | | 2,703,307 |
|
| Colombia — 4.4% | | |
| Banco Davivienda SA, 5.875%, 7/9/22 | 200,000 |
| 203,250 |
|
| Ecopetrol SA, 5.875%, 9/18/23 | 200,000 |
| 210,500 |
|
| Empresa de Energia de Bogota SA ESP, 6.125%, 11/10/21 | 200,000 |
| 212,000 |
|
| GrupoSura Finance SA, 5.70%, 5/18/21 | 200,000 |
| 213,940 |
|
| Millicom International Cellular SA, 6.625%, 10/15/21 | 200,000 |
| 205,500 |
|
| Pacific Rubiales Energy Corp., 5.375%, 1/26/19 | 100,000 |
| 82,400 |
|
| Pacific Rubiales Energy Corp., 7.25%, 12/12/21 | 100,000 |
| 82,500 |
|
| | | 1,210,090 |
|
| Guatemala — 0.8% | | |
| Comcel Trust, 6.875%, 2/6/24 | 200,000 |
| 211,000 |
|
| Hong Kong — 4.7% | | |
| Bank of East Asia Ltd. (The), MTN, VRN, 4.25%, 11/20/19 | 200,000 |
| 200,959 |
|
| China CITIC Bank International Ltd., MTN, 6.875%, 6/24/20 | 200,000 |
| 223,963 |
|
| Hutchison Whampoa International 09 Ltd., 7.625%, 4/9/19 | 100,000 |
| 118,218 |
|
|
| | | | | | |
| | Principal Amount | Value |
| Hutchison Whampoa International 12 Ltd., VRN, 6.00%, 5/7/17 | $ | 100,000 |
| $ | 106,404 |
|
| LS Finance 2017 Ltd., 5.25%, 1/26/17 | 200,000 |
| 209,327 |
|
| PCCW Capital No 4 Ltd., 5.75%, 4/17/22 | 200,000 |
| 215,355 |
|
| Sun Hung Kai Properties Capital Market Ltd., 4.50%, 2/14/22 | 200,000 |
| 212,796 |
|
| | | 1,287,022 |
|
| Hungary — 0.8% | | |
| MOL Group Finance SA, 6.25%, 9/26/19 | 200,000 |
| 218,500 |
|
| India — 4.7% | | |
| Axis Bank Ltd. (Dubai), MTN, 5.125%, 9/5/17 | 200,000 |
| 211,563 |
|
| Bharti Airtel International (Netherlands) BV, 5.125%, 3/11/23 | 200,000 |
| 209,800 |
|
| ICICI Bank Ltd., 5.75%, 11/16/20 | 200,000 |
| 221,852 |
|
| Indian Oil Corp. Ltd., 5.625%, 8/2/21 | 200,000 |
| 219,222 |
|
| Reliance Industries Ltd., 4.125%, 1/28/25 | 250,000 |
| 244,001 |
|
| Vedanta Resources plc, 6.00%, 1/31/19 | 200,000 |
| 194,500 |
|
| | | 1,300,938 |
|
| Indonesia — 2.9% | | |
| Indosat Palapa Co. BV, 7.375%, 7/29/20 | 200,000 |
| 207,750 |
|
| Listrindo Capital BV, 6.95%, 2/21/19 | 200,000 |
| 209,500 |
|
| Star Energy Geothermal Wayang Windu Ltd., 6.125%, 3/27/20 | 200,000 |
| 192,000 |
|
| TBG Global Pte. Ltd., 4.625%, 4/3/18 | 200,000 |
| 199,614 |
|
| | | 808,864 |
|
| Israel — 3.4% | | |
| Altice Financing SA, 6.50%, 1/15/22 | 200,000 |
| 200,500 |
|
B Communications Ltd., 7.375%, 2/15/21(1) | 100,000 |
| 107,062 |
|
| Israel Electric Corp. Ltd., 5.625%, 6/21/18 | 200,000 |
| 213,624 |
|
Israel Electric Corp. Ltd., 5.00%, 11/12/24(1) | 400,000 |
| 407,532 |
|
| | | 928,718 |
|
| Jamaica — 0.9% | | |
| Digicel Group Ltd., 8.25%, 9/30/20 | 250,000 |
| 251,250 |
|
| Kazakhstan — 1.5% | | |
| Halyk Savings Bank of Kazakhstan JSC, 7.25%, 1/28/21 | 200,000 |
| 208,062 |
|
| Halyk Savings Bank of Kazakhstan JSC, 7.25%, 5/3/17 | 200,000 |
| 207,250 |
|
| | | 415,312 |
|
| Kuwait — 1.1% | | |
| Kuwait Projects Co., 4.80%, 2/5/19 | 300,000 |
| 315,402 |
|
| Macau — 0.7% | | |
MCE Finance Ltd., 5.00%, 2/15/21(1) | 200,000 |
| 191,000 |
|
| Malaysia — 0.7% | | |
| Malayan Banking Bhd, MTN, VRN, 3.25%, 9/20/17 | 200,000 |
| 202,053 |
|
| Mexico — 5.4% | | |
| America Movil SAB de CV, 6.375%, 3/1/35 | 100,000 |
| 117,070 |
|
| BBVA Bancomer SA, 6.75%, 9/30/22 | 150,000 |
| 165,562 |
|
| BBVA Bancomer SA, 4.375%, 4/10/24 | 150,000 |
| 152,175 |
|
| Cemex SAB de CV, 7.25%, 1/15/21 | 200,000 |
| 211,540 |
|
| Mexichem SAB de CV, 5.875%, 9/17/44 | 200,000 |
| 184,750 |
|
| Sixsigma Networks Mexico SA de CV, 8.25%, 11/7/21 | 200,000 |
| 207,240 |
|
| Southern Copper Corp., 7.50%, 7/27/35 | 200,000 |
| 224,988 |
|
| Tenedora Nemak SA de CV, 5.50%, 2/28/23 | 200,000 |
| 206,250 |
|
| | | 1,469,575 |
|
| Morocco — 1.5% | | |
| OCP SA, 4.50%, 10/22/25 | 200,000 |
| 191,250 |
|
|
| | | | | | |
| | Principal Amount | Value |
| OCP SA, 5.625%, 4/25/24 | $ | 200,000 |
| $ | 209,250 |
|
| | | 400,500 |
|
| Netherlands — 0.6% | | |
| Helios Towers Finance Netherlands BV, 8.375%, 7/15/19 | 200,000 |
| 172,167 |
|
| Nigeria — 0.7% | | |
| GTB Finance BV, 6.00%, 11/8/18 | 200,000 |
| 191,917 |
|
| Peru — 3.1% | | |
| Banco de Credito del Peru, VRN, 6.875%, 9/16/21 | 200,000 |
| 224,000 |
|
| Banco Internacional del Peru SAA Interbank, VRN, 6.625%, 3/19/24 | 100,000 |
| 106,950 |
|
| BBVA Banco Continental SA, 5.00%, 8/26/22 | 200,000 |
| 208,140 |
|
| BBVA Banco Continental SA, VRN, 5.25%, 9/22/24 | 100,000 |
| 101,875 |
|
| InRetail Consumer, 5.25%, 10/10/21 | 100,000 |
| 103,375 |
|
| Intercorp Peru Ltd., 5.875%, 2/12/25 | 100,000 |
| 100,590 |
|
| | | 844,930 |
|
| Philippines — 2.3% | | |
| Alliance Global Group Inc/Cayman, 6.50%, 8/18/17 | 100,000 |
| 106,663 |
|
| BDO Unibank, Inc., 3.875%, 4/22/16 | 200,000 |
| 202,121 |
|
| FPT Finance Ltd., 6.375%, 9/28/20 | 100,000 |
| 110,149 |
|
| SM Investments Corp., 4.875%, 6/10/24 | 200,000 |
| 200,893 |
|
| | | 619,826 |
|
| Poland — 0.8% | | |
| Powszechna Kasa Oszczednosci Bank Polski SA, 4.63%, 9/26/22 | 200,000 |
| 208,000 |
|
| Qatar — 1.7% | | |
| Nakilat, Inc., 6.27%, 12/31/33 | 225,433 |
| 262,348 |
|
| Ooredoo International Finance Ltd., 3.25%, 2/21/23 | 200,000 |
| 193,790 |
|
| | | 456,138 |
|
| Republic of Korea — 2.2% | | |
| Korea Exchange Bank, 2.00%, 4/2/18 | 200,000 |
| 199,585 |
|
| Korea Gas Corp., 2.875%, 7/29/18 | 200,000 |
| 205,972 |
|
| Korea National Oil Corp., 2.75%, 1/23/19 | 200,000 |
| 202,909 |
|
| | | 608,466 |
|
| Russia — 5.9% | | |
| ALROSA Finance SA, 7.75%, 11/3/20 | 200,000 |
| 209,000 |
|
| Gazprom Neft OAO Via GPN Capital SA, 4.375%, 9/19/22 | 200,000 |
| 170,534 |
|
| Gazprom OAO Via Gaz Capital SA, 9.25%, 4/23/19 | 100,000 |
| 111,404 |
|
| Gazprom OAO Via Gaz Capital SA, 6.21%, 11/22/16 | 200,000 |
| 208,250 |
|
| Gazprom OAO Via Gaz Capital SA, MTN, 8.15%, 4/11/18 | 100,000 |
| 107,241 |
|
| Lukoil International Finance BV, 3.42%, 4/24/18 | 250,000 |
| 239,750 |
|
| Mobile Telesystems OJSC Via MTS International Funding Ltd., 8.625%, 6/22/20 | 100,000 |
| 108,050 |
|
| Rosneft Finance SA, 7.25%, 2/2/20 | 100,000 |
| 101,875 |
|
| Sberbank of Russia Via SB Capital SA, VRN, 5.50%, 2/26/19 | 200,000 |
| 166,500 |
|
| Vimpel Communications Via VIP Finance Ireland Ltd. OJSC, 7.75%, 2/2/21 | 200,000 |
| 201,421 |
|
| | | 1,624,025 |
|
| Singapore — 2.6% | | |
| DBS Bank Ltd., VRN, 3.625%, 9/21/17 | 300,000 |
| 309,927 |
|
| Oversea-Chinese Banking Corp. Ltd., MTN, VRN, 4.00%, 10/15/19 | 200,000 |
| 204,890 |
|
| United Overseas Bank Ltd., MTN, VRN, 3.75%, 9/19/19 | 200,000 |
| 204,465 |
|
| | | 719,282 |
|
|
| | | | | | |
| | Principal Amount/Shares | Value |
| South Africa — 3.8% | | |
| AngloGold Ashanti Holdings plc, 8.50%, 7/30/20 | $ | 200,000 |
| $ | 220,750 |
|
| FirstRand Bank Ltd., MTN, 4.25%, 4/30/20 | 200,000 |
| 202,364 |
|
| Gold Fields Orogen Holdings BVI Ltd., 4.875%, 10/7/20 | 200,000 |
| 181,500 |
|
| Myriad International Holdings BV, 6.00%, 7/18/20 | 200,000 |
| 218,850 |
|
| Sappi Papier Holding GmbH, 6.625%, 4/15/21 | 200,000 |
| 208,500 |
|
| | | 1,031,964 |
|
| Thailand — 3.6% | | |
| Bangkok Bank PCL, 3.875%, 9/27/22 | 200,000 |
| 203,830 |
|
| PTT PCL, 3.375%, 10/25/22 | 200,000 |
| 195,805 |
|
| PTT PCL, 4.50%, 10/25/42 | 200,000 |
| 178,973 |
|
| Siam Commercial Bank PCL, MTN, 3.50%, 4/7/19 | 200,000 |
| 205,732 |
|
| Thai Oil PCL, 3.625%, 1/23/23 | 200,000 |
| 197,250 |
|
| | | 981,590 |
|
| Trinidad and Tobago — 0.8% | | |
| Columbus International, Inc., 7.375%, 3/30/21 | 200,000 |
| 215,750 |
|
| Turkey — 2.2% | | |
Akbank TAS, 4.00%, 1/24/20(1) | 200,000 |
| 195,308 |
|
| Finansbank AS, 6.25%, 4/30/19 | 200,000 |
| 201,180 |
|
| Turkiye Is Bankasi, 6.00%, 10/24/22 | 200,000 |
| 199,205 |
|
| | | 595,693 |
|
| United Arab Emirates — 2.7% | | |
| Abu Dhabi National Energy Co. PJSC, 3.625%, 1/12/23 | 200,000 |
| 198,974 |
|
| DP World Ltd., MTN, 6.85%, 7/2/37 | 200,000 |
| 217,850 |
|
| DP World Sukuk Ltd., 6.25%, 7/2/17 | 100,000 |
| 107,720 |
|
| Emaar Sukuk Ltd., 6.40%, 7/18/19 | 200,000 |
| 225,524 |
|
| | | 750,068 |
|
TOTAL CORPORATE BONDS (Cost $23,696,059) | | 23,554,879 |
|
| U.S. TREASURY SECURITIES — 1.3% | | |
U.S. Treasury Bills, 0.08%, 11/12/15(2)(3) | 50,000 |
| 49,994 |
|
| U.S. Treasury Notes, 2.125%, 5/15/25 | 300,000 |
| 294,094 |
|
TOTAL U.S. TREASURY SECURITIES (Cost $344,916) | | 344,088 |
|
| TEMPORARY CASH INVESTMENTS — 11.7% | | |
| Repurchase Agreement, Bank of America Merrill Lynch, (collateralized by various U.S. Treasury obligations, 1.50%, 1/31/19 - 11/30/19, valued at $564,075), in a joint trading account at 0.10%, dated 6/30/15, due 7/1/15 (Delivery value $552,821) | | 552,819 |
|
| Repurchase Agreement, Fixed Income Clearing Corp., (collateralized by various U.S. Treasury obligations, 2.375%, 8/15/24, valued at $2,258,412), at 0.01%, dated 6/30/15, due 7/1/15 (Delivery value $2,212,001) | | 2,212,000 |
|
| SSgA U.S. Government Money Market Fund, Class N | 431,530 |
| 431,530 |
|
TOTAL TEMPORARY CASH INVESTMENTS (Cost $3,196,349) | | 3,196,349 |
|
TOTAL INVESTMENT SECURITIES — 99.0% (Cost $27,237,324) | | 27,095,316 |
|
| OTHER ASSETS AND LIABILITIES — 1.0% | | 278,481 |
|
| TOTAL NET ASSETS — 100.0% | | $ | 27,373,797 |
|
|
| | | | | | | | | |
| FUTURES CONTRACTS |
| Contracts Purchased | Expiration Date | Underlying Face
Amount at Value | | Unrealized Appreciation
(Depreciation) |
| 2 | U.S. Treasury Long Bonds | September 2015 | $ | 301,688 |
| | $ | (7,161 | ) |
|
| | |
| NOTES TO SCHEDULE OF INVESTMENTS |
| JSC | - | Joint Stock Company |
| MTN | - | Medium Term Note |
| OJSC | - | Open Joint Stock Company |
| PJSC | - | Public Joint Stock Company |
| VRN | - | Variable Rate Note. Interest reset date is indicated. Rate shown is effective at the period end. |
| |
| (1) | Restricted security exempt from registration pursuant to Rule 144A under the Securities Act of 1933. These securities may be sold without restriction to qualified institutional investors and have been deemed liquid under policies approved by the Board of Trustees. The aggregate value of these securities at the period end was $1,547,122, which represented 5.7% of total net assets. |
| |
| (2) | The rate indicated is the yield to maturity at purchase. |
| |
| (3) | Security, or a portion thereof, has been pledged at the custodian bank or with a broker for margin requirements on futures contracts. At the period end, the aggregate value of securities pledged was $7,999. |
See Notes to Financial Statements.
|
|
| Statement of Assets and Liabilities |
|
| | | |
| JUNE 30, 2015 | |
| Assets | |
| Investment securities, at value (cost of $27,237,324) | $ | 27,095,316 |
|
| Cash | 125,639 |
|
| Receivable for investments sold | 220,391 |
|
| Receivable for capital shares sold | 300 |
|
| Interest receivable | 362,181 |
|
| | 27,803,827 |
|
| | |
| Liabilities | |
| Payable for investments purchased | 408,460 |
|
| Payable for capital shares redeemed | 72 |
|
| Payable for variation margin on futures contracts | 125 |
|
| Accrued management fees | 18,747 |
|
| Distribution and service fees payable | 2,626 |
|
| | 430,030 |
|
| | |
| Net Assets | $ | 27,373,797 |
|
| | |
| Net Assets Consist of: | |
| Capital paid in | $ | 27,698,219 |
|
| Undistributed net investment income | 750 |
|
| Accumulated net realized loss | (176,003 | ) |
| Net unrealized depreciation | (149,169 | ) |
| | $ | 27,373,797 |
|
|
| | | | | | |
| | Net Assets | Shares Outstanding | Net Asset Value Per Share |
| Investor Class |
| $3,312,198 |
| 335,386 |
| $9.88 |
| Institutional Class |
| $6,671,446 |
| 675,591 |
| $9.87 |
| A Class |
| $6,660,180 |
| 674,872 |
| $9.87* |
| C Class |
| $1,018,834 |
| 103,429 |
| $9.85 |
| R Class |
| $1,012,063 |
| 102,613 |
| $9.86 |
| R6 Class |
| $8,699,076 |
| 880,617 |
| $9.88 |
*Maximum offering price $10.34 (net asset value divided by 0.955).
See Notes to Financial Statements.
|
| | | |
FOR THE PERIOD ENDED JUNE 30, 2015(1) |
| Investment Income (Loss) | |
| Income: | |
| Interest | $ | 992,615 |
|
| | |
| Expenses: | |
| Management fees | 205,520 |
|
| Distribution and service fees: | |
| A Class | 15,139 |
|
| C Class | 9,254 |
|
| R Class | 4,609 |
|
| Trustees' fees and expenses | 1,139 |
|
| Other expenses | 33 |
|
| | 235,694 |
|
| | |
| Net investment income (loss) | 756,921 |
|
| | |
| Realized and Unrealized Gain (Loss) | |
| Net realized gain (loss) on: | |
| Investment transactions | (188,935 | ) |
| Futures contract transactions | 12,932 |
|
| | (176,003 | ) |
| | |
| Change in net unrealized appreciation (depreciation) on: | |
| Investments | (142,008 | ) |
| Futures contracts | (7,161 | ) |
| | (149,169 | ) |
| | |
| Net realized and unrealized gain (loss) | (325,172 | ) |
| | |
| Net Increase (Decrease) in Net Assets Resulting from Operations | $ | 431,749 |
|
| |
| (1) | July 29, 2014 (fund inception) through June 30, 2015. |
See Notes to Financial Statements.
|
|
| Statement of Changes in Net Assets |
|
| | | |
PERIOD ENDED JUNE 30, 2015(1) |
| Increase (Decrease) in Net Assets | |
| Operations | |
| Net investment income (loss) | $ | 756,921 |
|
| Net realized gain (loss) | (176,003 | ) |
| Change in net unrealized appreciation (depreciation) | (149,169 | ) |
| Net increase (decrease) in net assets resulting from operations | 431,749 |
|
| | |
| Distributions to Shareholders | |
| From net investment income: | |
| Investor Class | (160,059 | ) |
| Institutional Class | (204,283 | ) |
| A Class | (181,010 | ) |
| C Class | (22,588 | ) |
| R Class | (25,873 | ) |
| R6 Class | (170,103 | ) |
| Decrease in net assets from distributions | (763,916 | ) |
| | |
| Capital Share Transactions | |
| Net increase (decrease) in net assets from capital share transactions (Note 5) | 27,705,964 |
|
| | |
| Net increase (decrease) in net assets | 27,373,797 |
|
| | |
| Net Assets | |
| End of period | $ | 27,373,797 |
|
| | |
| Undistributed net investment income | $ | 750 |
|
| |
| (1) | July 29, 2014 (fund inception) through June 30, 2015. |
See Notes to Financial Statements.
|
|
| Notes to Financial Statements |
JUNE 30, 2015
1. Organization
American Century International Bond Funds (the trust) is registered under the Investment Company Act of 1940, as amended (the 1940 Act), as an open-end management investment company and is organized as a Massachusetts business trust. Emerging Markets Debt Fund (the fund) is one fund in a series issued by the trust. The fund is nondiversified as defined under the 1940 Act. The fund’s investment objective is to seek total return.
The fund offers the Investor Class, the Institutional Class, the A Class, the C Class, the R Class and the R6 Class. The A Class may incur an initial sales charge. The A Class and C Class may be subject to a contingent deferred sales charge. The share classes differ principally in their respective sales charges and distribution and shareholder servicing expenses and arrangements. The Institutional Class and R6 Class shareholders do not require the same level of shareholder and administrative services from American Century Investment Management, Inc. (ACIM) (the investment advisor) as shareholders of other classes. In addition, financial intermediaries do not receive any service, distribution or administrative fees for the R6 Class. As a result, the Institutional Class and R6 Class are charged lower unified management fees. All classes of the fund commenced sale on July 29, 2014, the fund's inception date.
2. Significant Accounting Policies
The following is a summary of significant accounting policies consistently followed by the fund in preparation of its financial statements. The fund is an investment company and follows accounting and reporting guidance in accordance with accounting principles generally accepted in the United States of America. This may require management to make certain estimates and assumptions at the date of the financial statements. Actual results could differ from these estimates. Management evaluated the impact of events or transactions occurring through the date the financial statements were issued that would merit recognition or disclosure.
Investment Valuations — The fund determines the fair value of its investments and computes its net asset value per share at the close of regular trading (usually 4 p.m. Eastern time) on the New York Stock Exchange (NYSE) on each day the NYSE is open. The Board of Trustees has adopted valuation policies and procedures to guide the investment advisor in the fund’s investment valuation process and to provide methodologies for the oversight of the fund’s pricing function.
Fixed income securities maturing in greater than 60 days at the time of purchase are valued at the evaluated mean as provided by independent pricing services or at the mean of the most recent bid and asked prices as provided by investment dealers. Fixed income securities maturing within 60 days at the time of purchase may be valued at cost, plus or minus any amortized discount or premium or at the evaluated mean as provided by an independent pricing service. Evaluated mean prices are commonly derived through utilization of market models, which may consider, among other factors: trade data, quotations from dealers and active market makers, relevant yield curve and spread data, related sector levels, creditworthiness, trade data or market information on comparable securities, and other relevant security specific information. Fixed income securities initially expressed in local currencies are translated into U.S. dollars at the mean of the appropriate currency exchange rate at the close of the NYSE as provided by an independent pricing service.
Open-end management investment companies are valued at the reported net asset value per share. Repurchase agreements are valued at cost, which approximates fair value. Exchange-traded futures contracts are valued at the settlement price as provided by the appropriate clearing corporation.
If the fund determines that the market price for an investment is not readily available or the valuation methods mentioned above do not reflect an investment’s fair value, such investment is valued as determined in good faith by the Board of Trustees or its delegate, in accordance with policies and procedures adopted by the Board of Trustees. In its determination of fair value, the fund may review several factors including, but not limited to, market information regarding the specific investment or comparable investments and correlation with other investment types, futures indices or general market indicators. Circumstances that may cause the fund to use these procedures to value an investment include, but are not limited to: an investment has been declared in default or is distressed; trading in a security has been suspended during the trading day or a security is not actively trading on its principal exchange; prices received from a regular pricing source are deemed unreliable; or there is a foreign market holiday and no trading occurred.
The fund monitors for significant events occurring after the close of an investment’s primary exchange but before the fund’s net asset value per share is determined. Significant events may include, but are not limited to: corporate announcements and transactions; governmental action and political unrest that could impact a specific investment or an investment sector; or armed conflicts, natural disasters and similar events that could affect investments in a specific country or region.
Security Transactions — Security transactions are accounted for as of the trade date. Net realized gains and losses are determined on the identified cost basis, which is also used for federal income tax purposes.
Investment Income — Interest income is recorded on the accrual basis and includes accretion of discounts and amortization of premiums.
Segregated Assets — In accordance with the 1940 Act, the fund segregates assets on its books and records to cover certain types of investments, including, but not limited to, futures contracts, forward commitments, when-issued securities, swap agreements and certain forward foreign currency exchange contracts. ACIM monitors, on a daily basis, the securities segregated to ensure the fund designates a sufficient amount of liquid assets, marked-to-market daily. The fund may also receive assets or be required to pledge assets at the custodian bank or with a broker for margin requirements on futures contracts, forward commitments and swap agreements.
Foreign Currency Translations — All assets and liabilities initially expressed in foreign currencies are translated into U.S. dollars at prevailing exchange rates at period end. The fund may enter into spot foreign currency exchange contracts to facilitate transactions denominated in a foreign currency. Purchases and sales of investment securities, dividend and interest income, spot foreign currency exchange contracts, and expenses are translated at the rates of exchange prevailing on the respective dates of such transactions. Net realized and unrealized foreign currency exchange gains or losses related to investment securities are a component of net realized gain (loss) on investment transactions and change in net unrealized appreciation (depreciation) on investments, respectively.
Repurchase Agreements — The fund may enter into repurchase agreements with institutions that ACIM has determined are creditworthy pursuant to criteria adopted by the Board of Trustees. The fund requires that the collateral, represented by securities, received in a repurchase transaction be transferred to the custodian in a manner sufficient to enable the fund to obtain those securities in the event of a default under the repurchase agreement. ACIM monitors, on a daily basis, the securities transferred to ensure the value, including accrued interest, of the securities under each repurchase agreement is equal to or greater than amounts owed to the fund under each repurchase agreement.
Joint Trading Account — Pursuant to an Exemptive Order issued by the Securities and Exchange Commission, the fund, along with certain other funds in the American Century Investments family of funds, may transfer uninvested cash balances into a joint trading account. These balances are invested in one or more repurchase agreements that are collateralized by U.S. Treasury or Agency obligations.
Income Tax Status — It is the fund’s policy to distribute substantially all net investment income and net realized gains to shareholders and to otherwise qualify as a regulated investment company under provisions of the Internal Revenue Code. Accordingly, no provision has been made for income taxes. The fund files U.S. federal, state, local and non-U.S. tax returns as applicable. The fund's tax returns are subject to examination by the relevant taxing authority until expiration of the applicable statute of limitations, which is generally three years from the date of filing but can be longer in certain jurisdictions. At this time, management believes there are no uncertain tax positions which, based on their technical merit, would not be sustained upon examination and for which it is reasonably possible that the total amounts of unrecognized tax benefits will significantly change in the next twelve months.
Multiple Class — All shares of the fund represent an equal pro rata interest in the net assets of the class to which such shares belong, and have identical voting, dividend, liquidation and other rights and the same terms and conditions, except for class specific expenses and exclusive rights to vote on matters affecting only individual classes. Income, non-class specific expenses, and realized and unrealized capital gains and losses of the fund are allocated to each class of shares based on their relative net assets.
Distributions to Shareholders — Distributions from net investment income, if any, are declared daily and paid monthly. Distributions from net realized gains, if any, are generally declared and paid annually.
Indemnifications — Under the trust’s organizational documents, its officers and trustees are indemnified against certain liabilities arising out of the performance of their duties to the fund. In addition, in the normal course of business, the fund enters into contracts that provide general indemnifications. The maximum exposure under these arrangements is unknown as this would involve future claims that may be made against a fund. The risk of material loss from such claims is considered by management to be remote.
3. Fees and Transactions with Related Parties
Certain officers and trustees of the trust are also officers and/or directors of American Century Companies, Inc. (ACC). The trust's investment advisor, ACIM, the trust's distributor, American Century Investment Services, Inc. (ACIS), and the trust's transfer agent, American Century Services, LLC, are wholly owned, directly or indirectly, by ACC. ACIM owns 69% of the shares of the fund. Various funds issued by American Century Investment Trust and American Century Strategic Asset Allocations, Inc. own, in aggregate, 29% of the shares of the fund. Related parties do not invest in the fund for the purpose of exercising management or control.
Management Fees — The trust has entered into a management agreement with ACIM, under which ACIM provides the fund with investment advisory and management services in exchange for a single, unified management fee (the fee) per class. The agreement provides that all expenses of managing and operating the fund, except distribution and service fees, brokerage expenses, taxes, interest, fees and expenses of the independent trustees (including legal counsel fees), and extraordinary expenses, will be paid by ACIM. The fee is computed and accrued daily based on each class’s daily net assets and paid monthly in arrears. The annual management fee is 0.96% for the Investor Class, A Class, C Class and R Class, 0.76% for the Institutional Class and 0.71% for the R6 Class.
Distribution and Service Fees — The Board of Trustees has adopted a separate Master Distribution and Individual Shareholder Services Plan for each of the A Class, C Class and R Class (collectively the plans), pursuant to Rule 12b-1 of the 1940 Act. The plans provide that the A Class will pay ACIS an annual distribution and service fee of 0.25%. The plans provide that the C Class will pay ACIS an annual distribution and service fee of 1.00%, of which 0.25% is paid for individual shareholder services and 0.75% is paid for distribution services. The plans provide that the R Class will pay ACIS an annual distribution and service fee of 0.50%. The fees are computed and accrued daily based on each class’s daily net assets and paid monthly in arrears. The fees are used to pay financial intermediaries for distribution and individual shareholder services. Fees incurred under the plans during the period July 29, 2014 (fund inception) through June 30, 2015 are detailed in the Statement of Operations.
Trustees’ Fees and Expenses — The Board of Trustees is responsible for overseeing the investment advisor’s management and operations of the fund. The trustees receive detailed information about the fund and its investment advisor regularly throughout the year, and meet at least quarterly with management of the investment advisor to review reports about fund operations. The fund’s officers do not receive compensation from the fund.
4. Investment Transactions
Purchases of investment securities, excluding short-term investments, for the period July 29, 2014 (fund inception) through June 30, 2015 totaled $33,957,651, of which $294,914 represented U.S. Treasury and Government Agency obligations.
Sales of investment securities, excluding short-term investments, for the period July 29, 2014 (fund inception) through June 30, 2015 totaled $9,727,843, none of which were U.S. Treasury and Government Agency obligations.
5. Capital Share Transactions
Transactions in shares of the fund were as follows (unlimited number of shares authorized):
|
| | | | | |
| | Period ended June 30, 2015(1) |
| | Shares | Amount |
| Investor Class | | |
| Sold | 833,039 |
| $ | 8,320,778 |
|
| Issued in reinvestment of distributions | 16,132 |
| 160,044 |
|
| Redeemed | (513,785 | ) | (5,084,279 | ) |
| | 335,386 |
| 3,396,543 |
|
| Institutional Class | | |
| Sold | 730,000 |
| 7,300,000 |
|
| Issued in reinvestment of distributions | 20,591 |
| 204,283 |
|
| Redeemed | (75,000 | ) | (750,000 | ) |
| | 675,591 |
| 6,754,283 |
|
| A Class | | |
| Sold | 732,269 |
| 7,322,515 |
|
| Issued in reinvestment of distributions | 18,264 |
| 181,010 |
|
| Redeemed | (75,661 | ) | (756,585 | ) |
| | 674,872 |
| 6,746,940 |
|
| C Class | | |
| Sold | 101,157 |
| 1,011,257 |
|
| Issued in reinvestment of distributions | 2,286 |
| 22,588 |
|
| Redeemed | (14 | ) | (141 | ) |
| | 103,429 |
| 1,033,704 |
|
| R Class | | |
| Sold | 100,000 |
| 1,000,000 |
|
| Issued in reinvestment of distributions | 2,613 |
| 25,873 |
|
| | 102,613 |
| 1,025,873 |
|
| R6 Class | | |
| Sold | 925,434 |
| 9,190,982 |
|
| Issued in reinvestment of distributions | 17,149 |
| 170,103 |
|
| Redeemed | (61,966 | ) | (612,464 | ) |
| | 880,617 |
| 8,748,621 |
|
| Net increase (decrease) | 2,772,508 |
| $ | 27,705,964 |
|
(1) July 29, 2014 (fund inception) through June 30, 2015.
6. Fair Value Measurements
The fund’s investments valuation process is based on several considerations and may use multiple inputs to determine the fair value of the investments held by the fund. In conformity with accounting principles generally accepted in the United States of America, the inputs used to determine a valuation are classified into three broad levels.
| |
| • | Level 1 valuation inputs consist of unadjusted quoted prices in an active market for identical investments. |
| |
| • | Level 2 valuation inputs consist of direct or indirect observable market data (including quoted prices for comparable investments, evaluations of subsequent market events, interest rates, prepayment speeds, credit risk, etc.). These inputs also consist of quoted prices for identical investments initially expressed in local currencies that are adjusted through translation into U.S. dollars. |
| |
| • | Level 3 valuation inputs consist of unobservable data (including a fund’s own assumptions). |
The level classification is based on the lowest level input that is significant to the fair valuation measurement. The valuation inputs are not necessarily an indication of the risks associated with investing in these securities or other financial instruments. There were no significant transfers between levels during the period.
The following is a summary of the level classifications as of period end. The Schedule of Investments provides additional information on the fund’s portfolio holdings.
|
| | | | | | | | |
| | Level 1 | Level 2 | Level 3 |
| Assets | | | |
| Investment Securities | | | |
| Corporate Bonds | — |
| $ | 23,554,879 |
| — |
|
| U.S. Treasury Securities | — |
| 344,088 |
| — |
|
| Temporary Cash Investments | $ | 431,530 |
| 2,764,819 |
| — |
|
| | $ | 431,530 |
| $ | 26,663,786 |
| — |
|
| | | | |
| Liabilities | | | |
| Other Financial Instruments | | | |
| Futures Contracts | $ | (7,161 | ) | — |
| — |
|
7. Derivative Instruments
Interest Rate Risk — The fund is subject to interest rate risk in the normal course of pursuing its investment objectives. The value of bonds generally declines as interest rates rise. A fund may enter into futures contracts based on a bond index or a specific underlying security. A fund may purchase futures contracts to gain exposure to increases in market value or sell futures contracts to protect against a decline in market value. Upon entering into a futures contract, a fund will segregate cash, cash equivalents or other appropriate liquid securities on its records in amounts sufficient to meet requirements. Subsequent payments (variation margin) are made or received daily, in cash, by a fund. The variation margin is equal to the daily change in the contract value and is recorded as unrealized gains and losses. A fund recognizes a realized gain or loss when the futures contract is closed or expires. Net realized and unrealized gains or losses occurring during the holding period of futures contracts are a component of net realized gain (loss) on futures contract transactions and change in net unrealized appreciation (depreciation) on futures contracts, respectively. One of the risks of entering into futures contracts is the possibility that the change in value of the contract may not correlate with the changes in value of the underlying securities. The fund's average exposure to interest rate risk derivative instruments held during the period was 8 contracts.
The value of interest rate risk derivative instruments as of June 30, 2015, is disclosed on the Statement of Assets and Liabilities as a liability of $125 in payable for variation margin on futures contracts.* For the period July 29, 2014 (fund inception) through June 30, 2015, the effect of interest rate risk derivative instruments on the Statement of Operations was $12,932 in net realized gain (loss) on futures contract transactions and $(7,161) in change in net unrealized appreciation (depreciation) on futures contracts.
* Included in the unrealized appreciation (depreciation) on futures contracts as reported in the Schedule of Investments.
8. Risk Factors
There are certain risks involved in investing in foreign securities. These risks include those resulting from future adverse political, social and economic developments, fluctuations in currency exchange rates, the possible imposition of exchange controls, and other foreign laws or restrictions. Investing in emerging markets may accentuate these risks.
The fund invests in lower-rated debt securities, which are subject to substantial risks including liquidity risk and credit risk.
9. Federal Tax Information
The tax character of distributions paid during the period July 29, 2014 (fund inception) through June 30, 2015 was as follows:
|
| | | |
| | |
| Distributions Paid From | |
| Ordinary income | $ | 763,916 |
|
| Long-term capital gains | — |
|
The book-basis character of distributions made during the year from net investment income or net realized gains may differ from their ultimate characterization for federal income tax purposes. These differences reflect the differing character of certain income items and net realized gains and losses for financial statement and tax purposes, and may result in reclassification among certain capital accounts on the financial statements.
As of June 30, 2015, the federal tax cost of investments and the components of distributable earnings on a tax-basis were as follows:
|
| | | |
| Federal tax cost of investments | $ | 27,237,324 |
|
| Gross tax appreciation of investments | $ | 195,987 |
|
| Gross tax depreciation of investments | (337,995 | ) |
| Net tax appreciation (depreciation) of investments | (142,008 | ) |
| Net tax appreciation (depreciation) on derivatives | — |
|
| Net tax appreciation (depreciation) | $ | (142,008 | ) |
| Undistributed ordinary income | $ | 750 |
|
| Accumulated short-term capital losses | $ | (183,164 | ) |
The cost of investments for federal income tax purposes was the same as the cost for financial reporting purposes. The difference between book-basis and tax-basis unrealized appreciation (depreciation) is attributable primarily to the realization for tax purposes of unrealized gains (losses) on futures contracts.
Accumulated capital losses represent net capital loss carryovers that may be used to offset future realized capital gains for federal income tax purposes. The capital loss carryovers may be carried forward for an unlimited period. Future capital loss carryover utilization in any given year may be subject to Internal Revenue Code limitations.
|
| | | | | | | | | | | | | |
| For a Share Outstanding Throughout the Period Indicated |
| Per-Share Data | Ratios and Supplemental Data |
| | | Income From Investment Operations: | | | | Ratio to Average Net Assets of: | | |
| | Net Asset Value, Beginning of Period | Net Investment Income (Loss)(1) | Net Realized and Unrealized Gain (Loss) | Total From Investment Operations | Distributions From Net Investment Income | Net Asset Value, End of Period | Total Return(2) | Operating Expenses | Net Investment Income (Loss) | Portfolio Turnover Rate | Net Assets, End of Period (in thousands) |
| Investor Class |
2015(3) | $10.00 | 0.28 | (0.11) | 0.17 | (0.29) | $9.88 | 1.72% | 0.97%(4) | 3.18%(4) | 46% |
| $3,312 |
|
| Institutional Class |
2015(3) | $10.00 | 0.31 | (0.13) | 0.18 | (0.31) | $9.87 | 1.91% | 0.77%(4) | 3.38%(4) | 46% |
| $6,671 |
|
| A Class |
2015(3) | $10.00 | 0.27 | (0.13) | 0.14 | (0.27) | $9.87 | 1.45% | 1.22%(4) | 2.93%(4) | 46% |
| $6,660 |
|
| C Class |
2015(3) | $10.00 | 0.20 | (0.13) | 0.07 | (0.22) | $9.85 | 0.74% | 1.97%(4) | 2.18%(4) | 46% |
| $1,019 |
|
| R Class |
2015(3) | $10.00 | 0.24 | (0.12) | 0.12 | (0.26) | $9.86 | 1.18% | 1.47%(4) | 2.68%(4) | 46% |
| $1,012 |
|
| R6 Class | | | | | | | | | | | |
2015(3) | $10.00 | 0.32 | (0.13) | 0.19 | (0.31) | $9.88 | 1.96% | 0.72%(4) | 3.43%(4) | 46% |
| $8,699 |
|
|
|
| Notes to Financial Highlights |
| |
| (1) | Computed using average shares outstanding throughout the period. |
| |
| (2) | Total returns are calculated based on the net asset value of the last business day and do not reflect applicable sales charges, if any. Total returns for periods less than one year are not annualized. |
| |
| (3) | July 29, 2014 (fund inception) through June 30, 2015. |
See Notes to Financial Statements.
|
|
| Report of Independent Registered Public Accounting Firm |
To the Trustees of the American Century International Bond Funds and Shareholders of the Emerging Markets Debt Fund:
In our opinion, the accompanying statement of assets and liabilities, including the schedule of investments, and the related statements of operations and of changes in net assets and the financial highlights present fairly, in all material respects, the financial position of the Emerging Markets Debt Fund (one of the three funds comprising the American Century International Bond Funds, hereafter referred to as the “Fund”) at June 30, 2015, and the results of its operations, the changes in its net assets and the financial highlights for the period July 29, 2014 (commencement of operations) through June 30, 2015, in conformity with accounting principles generally accepted in the United States of America. These financial statements and financial highlights (hereafter referred to as "financial statements") are the responsibility of the Fund's management. Our responsibility is to express an opinion on these financial statements based on our audit. We conducted our audit of these financial statements in accordance with the standards of the Public Company Accounting Oversight Board (United States). Those standards require that we plan and perform the audit to obtain reasonable assurance about whether the financial statements are free of material misstatement. An audit includes examining, on a test basis, evidence supporting the amounts and disclosures in the financial statements, assessing the accounting principles used and significant estimates made by management, and evaluating the overall financial statement presentation. We believe that our audit, which included confirmation of securities at June 30, 2015 by correspondence with the custodian and brokers, provides a reasonable basis for our opinion.
PricewaterhouseCoopers LLP
Kansas City, Missouri
August 21, 2015
Board of Trustees
The individuals listed below serve as trustees of the funds. Each trustee will continue to serve in this capacity until death, retirement, resignation or removal from office. The board has adopted a mandatory retirement age for trustees who are not “interested persons,” as that term is defined in the Investment Company Act (independent trustees). Independent trustees shall retire on December 31 of the year in which they reach their 75th birthday; provided, however, that on or after January 1, 2022, independent trustees shall retire on December 31 of the year in which they reach their 76th birthday.
Mr. Thomas is an “interested person” because he currently serves as President and Chief Executive Officer of American Century Companies, Inc. (ACC), the parent company of American Century Investment Management, Inc. (ACIM or the advisor). The other trustees (more than three-fourths of the total number) are independent. They are not employees, directors or officers of, and have no financial interest in, ACC or any of its wholly owned, direct or indirect, subsidiaries, including ACIM, American Century Investment Services, Inc. (ACIS) and American Century Services, LLC (ACS), and they do not have any other affiliations, positions or relationships that would cause them to be considered “interested persons” under the Investment Company Act. The trustees serve in this capacity for eight (in the case of Mr. Thomas, 15) registered investment companies in the American Century Investments family of funds.
The following table presents additional information about the trustees. The mailing address for each trustee other than Mr. Thomas is 1665 Charleston Road, Mountain View, California 94043. The mailing address for Mr. Thomas is 4500 Main Street, Kansas City, Missouri 64111.
|
| | | | | |
Name (Year of Birth) | Position(s) Held with Funds | Length of Time Served | Principal Occupation(s) During Past 5 Years | Number of American Century Portfolios Overseen by Trustee | Other Directorships Held During Past 5 Years |
| Independent Trustees | | |
Tanya S. Beder
(1955) | Trustee | Since 2011 | Chairman and CEO, SBCC Group Inc. (independent advisory services) (2006 to present) | 46 | CYS Investments, Inc. (NYSE mortgage arbitrage REIT) |
Jeremy I. Bulow
(1954) | Trustee | Since 2011 | Professor of Economics, Stanford University, Graduate School of Business (1979 to present) | 46 | None |
Ronald J. Gilson
(1946) | Trustee and Chairman of the Board | Since 1995
(Chairman since 2005) | Charles J. Meyers Professor of Law and Business, Stanford Law School (1979 to present); Marc and Eva Stern Professor of Law and Business, Columbia University School of Law (1992 to present) | 46 | None |
Frederick L. A. Grauer
(1946) | Trustee | Since 2008 | Senior Advisor, BlackRock, Inc. (investment management firm) (2010 to 2011, 2013 to present) | 46 | None |
Peter F. Pervere
(1947) | Trustee | Since 2007 | Retired | 46 | None |
|
| | | | | |
Name
(Year of Birth) | Position(s) Held with Funds | Length of Time Served | Principal Occupation(s) During Past 5 Years | Number of American Century Portfolios Overseen by Trustee | Other Directorships Held During Past 5 Years |
| Independent Trustees | | |
John B. Shoven
(1947) | Trustee | Since 2002 | Professor of Economics, Stanford University (1973 to present) | 46 | Cadence Design Systems; Exponent; Financial Engines |
| Interested Trustee | | |
Jonathan S. Thomas
(1963) | Trustee and President | Since 2007 | President and Chief Executive Officer, ACC (March 2007 to present). Also serves as Chief Executive Officer, ACS; Executive Vice President, ACIM; trustee, ACC, ACIM and other ACC subsidiaries | 124 | BioMed Valley Discoveries, Inc. |
The Statement of Additional Information has additional information about the fund's trustees and is available without charge, upon request, by calling 1-800-345-2021.
Officers
The following table presents certain information about the executive officers of the funds. Each officer serves as an officer for each of the 15 investment companies in the American Century family of funds, unless otherwise noted. No officer is compensated for his or her service as an officer of the funds. The listed officers are interested persons of the funds and are appointed or re-appointed on an annual basis. The mailing address for each of the officers listed below is 4500 Main Street, Kansas City, Missouri 64111.
|
| | |
Name (Year of Birth) | Offices with the Funds | Principal Occupation(s) During the Past Five Years |
Jonathan S.
Thomas
(1963) | Trustee and President
since 2007 | President and Chief Executive Officer, ACC (March 2007 to present). Also serves as Chief Executive Officer, ACS; Executive Vice President, ACIM; Director, ACC, ACIM and other ACC subsidiaries |
Amy D. Shelton
(1964) | Chief Compliance Officer and Vice President since 2014 | Chief Compliance Officer, American Century funds, (March 2014 to present); Chief Compliance Officer, ACIM (February 2014 to present); Chief Compliance Officer, ACIS (October 2009 to present); Vice President, Client Interactions and Marketing, ACIS (February 2013 to January 2014); Director, Client Interactions and Marketing, ACIS (June 2007 to January 2013). Also serves as Vice President, ACIS |
Charles A. Etherington
(1957) | General Counsel since 2007 and Senior Vice President since 2006 | Attorney, ACC (February 1994 to present); Vice President, ACC (November 2005 to present); General Counsel, ACC (March 2007 to present). Also serves as General Counsel, ACIM, ACS, ACIS and other ACC subsidiaries; and Senior Vice President, ACIM and ACS |
C. Jean Wade
(1964) | Vice President, Treasurer and Chief Financial Officer since 2012 | Vice President, ACS (February 2000 to present) |
Robert J. Leach
(1966) | Vice President since 2006 and Assistant Treasurer since 2012 | Vice President, ACS (February 2000 to present) |
David H. Reinmiller
(1963) | Vice President since 2001 | Attorney, ACC (January 1994 to present); Associate General Counsel, ACC (January 2001 to present). Also serves as Vice President, ACIM and ACS |
Ward D. Stauffer
(1960) | Secretary since 2005 | Attorney, ACC (June 2003 to present) |
|
|
| Approval of Management Agreement |
At a meeting held on June 16, 2015, the Fund’s Board of Trustees unanimously approved the renewal of the management agreement pursuant to which American Century Investment Management, Inc. (the “Advisor”) acts as the investment advisor for the Fund. Under Section 15(c) of the Investment Company Act, contracts for investment advisory services are required to be reviewed, evaluated, and approved by a majority of a fund’s directors/trustees, including a majority of the independent Trustees, each year. The Board regards this annual evaluation and renewal as one of its most important responsibilities.
The independent Trustees have memorialized a statement regarding the relationship between their ongoing obligations to oversee and evaluate the performance of the Advisor and their annual consideration of renewal of the management agreement. In that statement, the independent Trustees noted that their assessment of the Advisor’s performance is an ongoing process that takes place over the entire year and is informed by all of the extensive information that the Board and its committees receive and consider over time. This information, together with the materials provided in connection with the review, are central to the Board’s assessment of the Advisor’s performance and its determination whether to renew the Fund’s management agreement.
Prior to its consideration of the renewal of the management agreement, the Board requested and reviewed extensive data and analysis relating to the proposed renewal. This information and analysis was compiled by the Advisor and certain independent providers of evaluation data concerning the Fund and the services provided to the Fund by the Advisor.
In connection with its consideration of the renewal of the management agreement, the Board’s review and evaluation of the services provided by the Advisor included, but was not limited to, the following:
| |
| • | the nature, extent, and quality of investment management, shareholder services, and other services provided by the Advisor to the Fund; |
| |
| • | the wide range of other programs and services the Advisor provides to the Fund and its shareholders on a routine and non-routine basis; |
| |
| • | the investment performance of the Fund, including data comparing the Fund’s performance to appropriate benchmarks and/or a peer group of other mutual funds with similar investment objectives and strategies; |
| |
| • | the cost of owning the Fund compared to the cost of owning similar funds; |
| |
| • | the Advisor’s compliance policies, procedures, and regulatory experience; |
| |
| • | financial data showing the cost of services provided to the Fund, the profitability of the Fund to the Advisor, and the overall profitability of the Advisor; |
| |
| • | possible economies of scale associated with the Advisor’s management of the Fund and other accounts under its management; |
| |
| • | data comparing services provided and charges to other investment management clients of the Advisor; |
| |
| • | acquired fund fees and expenses; |
| |
| • | payments by the Fund and the Advisor to financial intermediaries whose clients are investors in the Fund; and |
| |
| • | any collateral benefits derived by the Advisor from the management of the Fund. |
In keeping with its practice, the Board held two in-person meetings to review and discuss the information provided in response to their request. The independent Trustees also had the benefit of the advice of their independent counsel throughout the process.
Factors Considered
The Trustees considered all of the information provided by the Advisor, the independent data providers, and the independent Trustees’ independent counsel in connection with the review, and evaluated such information for the Fund. In connection with their review, the Trustees did not identify any single factor as being all-important or controlling and each Trustee may have attributed different levels of importance to different factors. In deciding to renew the management agreement, the Board based its decision on a number of factors, including the following:
Nature, Extent and Quality of Services - Generally. Under the management agreement, the Advisor is responsible for providing or arranging for all services necessary for the operation of the Fund. The Board noted that under the management agreement, the Advisor provides or arranges at its own expense a wide variety of services including:
| |
| • | constructing and designing the Fund |
| |
| • | portfolio research and security selection |
| |
| • | initial capitalization/funding |
| |
| • | daily valuation of the Fund’s portfolio |
| |
| • | shareholder servicing and transfer agency, including shareholder confirmations, recordkeeping, and communications |
| |
| • | legal services (except the independent Trustees’ counsel) |
| |
| • | regulatory and portfolio compliance |
| |
| • | marketing and distribution (except amounts paid by the Fund under Rule 12b-1 plans) |
The Board noted that many of these services have expanded over time both in terms of quantity and complexity in response to shareholder demands, competition in the industry, changing distribution channels, and the changing regulatory environment.
Investment Management, Shareholder, and Other Services. The nature of the investment management services provided to the Fund is quite complex and allows Fund shareholders access to professional money management, instant diversification of their investments within an asset class, the opportunity to easily diversify among asset classes by investing in or exchanging among various American Century Investments funds, and liquidity. In evaluating investment performance, the Board expects the Advisor to manage the Fund in accordance with its investment objectives and approved strategies. Further, the Trustees recognize that the Advisor has an obligation to seek the best execution of fund trades. In providing these services, the Advisor utilizes teams of investment professionals (portfolio managers, analysts, research assistants, and securities traders) who require extensive information technology, research, training, compliance, and other systems to conduct their business. The Board, directly and through its Portfolio Committee, regularly reviews investment performance information for the Fund, together with comparative information for appropriate benchmarks and/or peer groups of similarly-managed funds, over different time horizons. The Trustees also review detailed performance information during the management agreement approval process. If performance concerns are identified, the Fund receives special reviews until performance improves, during which the Board discusses with the Advisor the reasons for such results (e.g., market conditions, security selection) and any efforts being undertaken to improve performance. The Fund has less than one year of performance history. The Board found the investment management services provided by the Advisor to the Fund to be satisfactory and consistent with the management agreement.
Under the management agreement, the Advisor provides the Fund with a comprehensive package of transfer agency, shareholder, and other services. The Board, directly and through various committees of the Board, regularly reviews reports and evaluations of such services at its regular meetings. These reports include, but are not limited to, information regarding the operational
efficiency and accuracy of the shareholder and transfer agency services provided, staffing levels, shareholder satisfaction (as measured by external as well as internal sources), technology support, new products and services offered to Fund shareholders, securities trading activities, portfolio valuation services, auditing services, and legal and operational compliance activities.
Certain aspects of shareholder and transfer agency service level efficiency and the quality of securities trading activities are measured by independent third party providers and are presented in comparison to other fund groups not managed by the Advisor. The Board found the services provided by the Advisor to the Fund under the management agreement to be competitive and of high quality.
Costs of Services and Profitability. The Advisor provides detailed information concerning its cost of providing various services to the Fund, its profitability in managing the Fund, its overall profitability, and its financial condition. The Trustees have reviewed with the Advisor the methodology used to prepare this financial information. This information is considered in evaluating the Advisor’s financial condition, its ability to continue to provide services under the management agreement, and the reasonableness of the current management fee. The Board concluded that the Advisor’s profits were reasonable in light of the services provided to the Fund.
Ethics. The Board generally considers the Advisor’s commitment to providing quality services to shareholders and to conducting its business ethically. They noted that the Advisor’s practices generally meet or exceed industry best practices.
Economies of Scale. The Board also reviewed information provided by the Advisor regarding the possible existence of economies of scale in connection with the management of the Fund. The Board concluded that economies of scale are difficult to measure and predict with precision, especially on a fund-by-fund basis. The Board concluded that the Advisor is appropriately sharing economies of scale through its competitive fee structure, offering competitive fees from fund inception, and through reinvestment in its business to provide shareholders enhanced and expanded services.
Comparison to Other Funds’ Fees. The management agreement provides that the Fund pays the Advisor a single, all-inclusive (or unified) management fee for providing all services necessary for the management and operation of the Fund, other than brokerage expenses, taxes, interest, extraordinary expenses, the fees and expenses of the Fund’s independent Trustees (including their independent legal counsel), and expenses incurred in connection with the provision of shareholder services and distribution services under a plan adopted pursuant to Rule 12b-1 under the 1940 Act. Under the unified fee structure, the Advisor is responsible for providing all investment advisory, custody, audit, administrative, compliance, recordkeeping, marketing, and shareholder services, or arranging and supervising third parties to provide such services. By contrast, most other funds are charged a variety of fees, including an investment advisory fee, a transfer agency fee, an administrative fee, distribution charges, and other expenses. Other than their investment advisory fees and any applicable Rule 12b-1 fees, all other components of the total fees charged by these other funds may be increased without shareholder approval. The Board believes the unified fee structure is a benefit to Fund shareholders because it clearly discloses to shareholders the cost of owning Fund shares, and, since the unified fee cannot be increased without a vote of Fund shareholders, it shifts to the Advisor the risk of increased costs of operating the Fund and provides a direct incentive to minimize administrative inefficiencies. Part of the Board’s analysis of fee levels involves reviewing certain evaluative data compiled by an independent provider and comparing the Fund’s unified fee to the total expense ratio of peer funds. The unified fee charged to shareholders of the Fund was slightly above the median of the total expense ratios of the Fund’s peer universe. The Board concluded that the management fee paid by the Fund to the Advisor under the management agreement is reasonable in light of the services provided to the Fund.
Comparison to Fees and Services Provided to Other Clients of the Advisor. The Board also requested and received information from the Advisor concerning the nature of the services, fees, costs, and profitability of its advisory services to advisory clients other than the Fund. They
observed that these varying types of client accounts require different services and involve different regulatory and entrepreneurial risks than the management of the Fund. The Board analyzed this information and concluded that the fees charged and services provided to the Fund were reasonable by comparison.
Payments to Intermediaries. The Trustees also requested and received a description of payments made to intermediaries by the Fund and the Advisor. These payments include various payments made by the Fund or the Advisor to different types of intermediaries and recordkeepers for distribution and service activities provided for the Fund.
Collateral or “Fall-Out” Benefits Derived by the Advisor. The Board considered the existence of collateral benefits the Advisor may receive as a result of its relationship with the Fund. The Board noted that the Advisor’s primary business is managing mutual funds and it generally does not use fund or shareholder information to generate profits in other lines of business, and therefore does not derive any significant collateral benefits from them. The Board noted that the Advisor receives proprietary research from broker-dealers that execute fund portfolio transactions. The Board also determined that the Advisor is able to provide investment management services to certain clients other than the Fund, at least in part, due to its existing infrastructure built to serve the fund complex.
Existing Relationship. The Board also considered whether there was any reason for not continuing the existing arrangement with the Advisor. In this regard, the Board was mindful of the potential disruptions of the Fund’s operations and various risks, uncertainties, and other effects that could occur as a result of a decision not to continue such relationship. In particular, the Board recognized that most shareholders have invested in the Fund on the strength of the Advisor’s industry standing and reputation and in the expectation that the Advisor will have a continuing role in providing advisory services to the Fund.
Conclusion of the Trustees. As a result of this process, the Board, including all of the independent Trustees and assisted by the advice of independent legal counsel, taking into account all of the factors discussed above and the information provided by the Advisor and others in connection with its review and throughout the year, concluded that the management agreement between the Fund and the Advisor is fair and reasonable in light of the services provided and should be renewed.
Retirement Account Information
As required by law, distributions you receive from certain IRAs are subject to federal income tax withholding, unless you elect not to have withholding apply. Tax will be withheld on the total amount withdrawn even though you may be receiving amounts that are not subject to withholding, such as nondeductible contributions. In such case, excess amounts of withholding could occur. You may adjust your withholding election so that a greater or lesser amount will be withheld.
If you don’t want us to withhold on this amount, you must notify us to not withhold the federal income tax. You may notify us in writing or in certain situations by telephone or through other electronic means. For systematic withdrawals, your withholding election will remain in effect until revoked or changed by filing a new election. You have the right to revoke your election at any time.
Remember, even if you elect not to have income tax withheld, you are liable for paying income tax on the taxable portion of your withdrawal. If you elect not to have income tax withheld or you don’t have enough income tax withheld, you may be responsible for payment of estimated tax. You may incur penalties under the estimated tax rules if your withholding and estimated tax payments are not sufficient. You can reduce or defer the income tax on a distribution by directly or indirectly rolling such distribution over to another IRA or eligible plan. You should consult your tax advisor for additional information.
State tax will be withheld if, at the time of your distribution, your address is within one of the mandatory withholding states and you have federal income tax withheld (or as otherwise required by state law). State taxes will be withheld from your distribution in accordance with the respective state rules.
Distributions you receive from 403(b), 457 and qualified plans are subject to special tax and withholding rules. Your plan administrator or plan sponsor is required to provide you with a special tax notice explaining those rules at the time you request a distribution. If applicable, federal and/or state taxes may be withheld from your distribution amount.
Proxy Voting Policies
Descriptions of the principles and policies that the fund's investment advisor uses in exercising the voting rights associated with the securities purchased and/or held by the fund are available without charge, upon request, by calling 1-800-345-2021 or visiting the "About Us" page of American Century Investments’ website at americancentury.com. A description of the policies is also available on the Securities and Exchange Commission’s website at sec.gov. Information regarding how the investment advisor voted proxies relating to portfolio securities during the most recent 12-month period ended June 30 is available on the "About Us" page at americancentury.com. It is also available at sec.gov.
Quarterly Portfolio Disclosure
The fund files its complete schedule of portfolio holdings with the Securities and Exchange Commission (SEC) for the first and third quarters of each fiscal year on Form N-Q. The fund’s Forms N-Q are available on the SEC’s website at sec.gov, and may be reviewed and copied at the SEC’s Public Reference Room in Washington, DC. Information on the operation of the Public Reference Room may be obtained by calling 1-800-SEC-0330. The fund also makes its complete schedule of portfolio holdings for the most recent quarter of its fiscal year available on its website at americancentury.com and, upon request, by calling 1-800-345-2021.
|
| | |
| |
| | | |
| Contact Us | americancentury.com | |
| Automated Information Line | 1-800-345-8765 | |
| Investor Services Representative | 1-800-345-2021
or 816-531-5575 | |
| Investors Using Advisors | 1-800-378-9878 | |
Business, Not-For-Profit, Employer-Sponsored
Retirement Plans | 1-800-345-3533 | |
Banks and Trust Companies, Broker-Dealers,
Financial Professionals, Insurance Companies | 1-800-345-6488 | |
| Telecommunications Relay Service for the Deaf | 711 | |
| | | |
| American Century International Bond Funds | |
| | | |
Investment Advisor: American Century Investment Management, Inc. Kansas City, Missouri | |
| | | |
| This report and the statements it contains are submitted for the general information of our shareholders. The report is not authorized for distribution to prospective investors unless preceded or accompanied by an effective prospectus. | |
| | | |
©2015 American Century Proprietary Holdings, Inc. All rights reserved.
CL-ANN-86513 1508 | |
|
| |
| ANNUAL REPORT | JUNE 30, 2015 |
Global Bond Fund
|
| | |
| President’s Letter | 2 |
|
| Performance | 3 |
|
| Portfolio Commentary | |
|
| Fund Characteristics | |
|
| Shareholder Fee Example | |
|
| Schedule of Investments | |
|
| Statement of Assets and Liabilities | |
|
| Statement of Operations | |
|
| Statement of Changes in Net Assets | |
|
| Notes to Financial Statements | |
|
| Financial Highlights | |
|
| Report of Independent Registered Public Accounting Firm | |
|
| Management | |
|
| Approval of Management Agreement | |
|
| Additional Information | |
|
Any opinions expressed in this report reflect those of the author as of the date of the report, and do not necessarily represent the opinions of American Century Investments® or any other person in the American Century Investments organization. Any such opinions are subject to change at any time based upon market or other conditions and American Century Investments disclaims any responsibility to update such opinions. These opinions may not be relied upon as investment advice and, because investment decisions made by American Century Investments funds are based on numerous factors, may not be relied upon as an indication of trading intent on behalf of any American Century Investments fund. Security examples are used for representational purposes only and are not intended as recommendations to purchase or sell securities. Performance information for comparative indices and securities is provided to American Century Investments by third party vendors. To the best of American Century Investments’ knowledge, such information is accurate at the time of printing.
|
| |
| Dear Investor:
Thank you for reviewing this annual report for the 12 months ended June 30, 2015. It provides investment performance and portfolio information for the reporting period, plus longer-term historical performance data.
Annual reports remain important vehicles for conveying information about fund returns, including market and economic factors that affected performance during the reporting period. For additional, updated investment and market insights, we encourage you to visit our website, americancentury.com. |
| Jonathan Thomas |
Global Divergence Favored U.S. Assets
“Global divergence” between the U.S. and the rest of the world emerged as a prevalent theme during the reporting period. This theme embraced not only the relatively stronger economic growth enjoyed by the U.S. compared with most of the world, but also the related contrast between the U.S. Federal Reserve’s unwinding of monetary stimulus compared with the continuation and expansion of stimulus by other major central banks. Low inflation also prevailed, after crude oil prices plunged over 40% amid muted demand for commodities in general. In this environment, the U.S. dollar, U.S. growth stocks, and longer-maturity U.S. Treasuries generally benefited from “flight to quality” capital flows, reinforced by geopolitical and financial turmoil, particularly in Greece, Russia/Ukraine, China, and the Middle East.
Strong global capital flows into U.S. assets generated a global divergence between investment returns for U.S. and non-U.S. markets, especially for U.S. investors who realized their returns in dollar terms. For the reporting period, the U.S. Dollar Index, the S&P 500 Index, and the Barclays U.S. Aggregate Bond Index returned 19.74%, 7.42%, and 1.86%, respectively. By contrast, the MSCI EAFE Index, the MSCI Emerging Markets Index, and the Barclays Global Aggregate Bond ex-USD (Unhedged) Index returned -4.22%, -5.12%, and -13.19%, respectively, for U.S. investors unhedged for the strong dollar’s impact on non-dollar-denominated returns.
We expect more monetary policy divergence between the U.S. and other major developed economies in the coming months, accompanied by continued market volatility. This could present both challenges and opportunities for active investment managers. Upward pressures on inflation and interest rates could develop as the massive amount of global monetary stimulus in progress takes hold and economies improve. In this environment, we continue to believe in a disciplined, diversified, long-term investment approach, using professionally managed stock and bond portfolios to meet financial goals. We appreciate your continued trust in us.
Sincerely,
Jonathan Thomas
President and Chief Executive Officer
American Century Investments
|
| | | | |
| Total Returns as of June 30, 2015 |
| | | | Average Annual Returns | |
| | Ticker Symbol | 1 year | Since Inception | Inception Date |
| Investor Class | AGBVX | 2.18% | 2.83% | 1/31/12 |
Barclays Global Aggregate Bond Index (USD, hedged) | — | 2.96% | 3.38% | — |
| Institutional Class | AGBNX | 2.28% | 3.02% | 1/31/12 |
| A Class | AGBAX | | | 1/31/12 |
| No sales charge* | | 1.93% | 2.58% | |
| With sales charge* | | -2.69% | 1.21% | |
| C Class | AGBTX | 1.26% | 1.84% | 1/31/12 |
| R Class | AGBRX | 1.67% | 2.32% | 1/31/12 |
| R6 Class | AGBDX | 2.34% | 3.35% | 7/26/13 |
| |
| * | Sales charges include initial sales charges and contingent deferred sales charges (CDSCs), as applicable. A Class shares have a 4.50% maximum initial sales charge and may be subject to a maximum CDSC of 1.00%. C Class shares redeemed within 12 months of purchase are subject to a maximum CDSC of 1.00%. The SEC requires that mutual funds provide performance information net of maximum sales charges in all cases where charges could be applied. |
Data presented reflect past performance. Past performance is no guarantee of future results. Current performance may be higher or lower than the performance shown. Investment return and principal value will fluctuate, and redemption value may be more or less than original cost. Data assumes reinvestment of dividends and capital gains, and none of the charts reflect the deduction of taxes that a shareholder would pay on fund distributions or the redemption of fund shares. To obtain performance data current to the most recent month end, please call 1-800-345-2021 or visit americancentury.com. For additional information about the fund, please consult the prospectus.
|
|
| Growth of $10,000 Over Life of Class |
| $10,000 investment made January 31, 2012 |
| Performance for other share classes will vary due to differences in fee structure. |
|
| |
| Value on June 30, 2015 |
| | Investor Class — $11,001 |
| |
| | Barclays Global Aggregate Bond Index (USD, hedged) — $11,203 |
| |
*From January 31, 2012, the Investor Class’s inception date. Not annualized.
|
| | | | | |
| Total Annual Fund Operating Expenses | |
| Investor Class | Institutional Class | A Class | C Class | R Class | R6 Class |
| 0.96% | 0.76% | 1.21% | 1.96% | 1.46% | 0.71% |
The total annual fund operating expenses shown is as stated in the fund’s prospectus current as of the date of this report. The prospectus may vary from the expense ratio shown elsewhere in this report because it is based on a different time period, includes acquired fund fees and expenses, and, if applicable, does not include fee waivers or expense reimbursements.
Data presented reflect past performance. Past performance is no guarantee of future results. Current performance may be higher or lower than the performance shown. Investment return and principal value will fluctuate, and redemption value may be more or less than original cost. Data assumes reinvestment of dividends and capital gains, and none of the charts reflect the deduction of taxes that a shareholder would pay on fund distributions or the redemption of fund shares. To obtain performance data current to the most recent month end, please call 1-800-345-2021 or visit americancentury.com. For additional information about the fund, please consult the prospectus.
Portfolio Managers: John Lovito, Simon Chester, Edward Boyle, Robert Gahagan, and David MacEwen
Performance Summary
Global Bond returned 2.18%* for the fiscal year ended June 30, 2015, compared with the 2.96% return of the fund’s benchmark, the Barclays Global Aggregate Bond Index (USD, hedged). Portfolio returns reflect operating expenses, while index returns do not.
Market Review
Global bonds (hedged to remove the effects of currency fluctuations) posted positive returns for the one-year period. One factor influencing global bond market performance was a continued divergence in economic conditions and central bank policy between the U.S. and the rest of the world. Despite a slowdown in early 2015, the U.S. economy remained among the strongest in the developed world, leading the U.S. Federal Reserve (the Fed) to end its quantitative easing program in late 2014 and signal its intention to raise short-term interest rates in 2015. In contrast, Europe faced slowing growth and the threat of deflation, Japan slipped into recession, and many emerging economies experienced a continued deceleration in growth. As a result, central banks around the world responded with aggressive stimulus actions, including quantitative easing efforts from the Bank of Japan and the European Central Bank.
In this environment, bond yields fell around the globe. European bond markets delivered the best returns as their yields fell the most, led by the U.K. and peripheral markets such as Italy and Spain. Yields tumbled in most Asia/Pacific bond markets as well, with the exception of Japan, where yield movements were more muted. U.S. yields were mixed, as short-term bond yields rose slightly, while longer-term bond yields declined.
A meaningfully stronger U.S. dollar significantly reduced non-U.S. bond returns for unhedged U.S. investors. For the 12-month period, the dollar appreciated by 23% against the euro, 22% versus the Australian dollar, 21% against the Japanese yen, 17% versus the Canadian dollar, and 9% against the British pound.
Duration and Sector Positioning Detracted
The fund’s duration positioning contributed to the fund’s underperformance of its benchmark during the one-year period. The fund’s duration (a measure of interest-rate sensitivity) was shorter than that of the benchmark throughout the reporting period, primarily in the U.S. bond market. This positioning detracted from relative results as the shorter duration limited the positive impact of declining bond yields on fund performance. By the end of the reporting period, however, we had shifted back to a relatively neutral duration compared with the benchmark.
| |
| * | All fund returns referenced in this commentary are for Investor Class shares. Performance for other share classes will vary due to differences in fee structure; when Investor Class performance exceeds that of the fund's benchmark, other share classes may not. See page 3 for returns for all share classes. |
Sector allocation was mixed but slightly negative for performance. The fund’s corporate bond holdings detracted from relative results, especially an overweight position in U.S. high-yield corporate securities and lower-rated corporate bonds issued by European financial companies. On the positive side, an overweight position in the securitized sector—which included residential and commercial mortgage-backed securities, as well as asset-backed bonds—aided performance as this sector outperformed during the period.
Country Allocation Mixed
Country allocation within the portfolio produced mixed results for the reporting period. Overweight positions in peripheral European bond markets such as Italy and Spain contributed positively to performance, as did an overweight position in Norwegian bonds. However, an underweight position in the U.K. detracted from performance as the U.K. was one of the best-performing bond markets on a global basis. In addition, an overweight position in the U.S. bond market weighed on relative results as U.S. bonds underperformed.
Currency Positioning Added Value
The portfolio generally hedges its foreign currency exposure, and this proved valuable over the past year as a stronger U.S. dollar significantly reduced returns on non-U.S. bonds for unhedged investors. However, we take modest tactical currency positions in an effort to enhance performance, and these currency positions boosted fund results during the reporting period. In particular, an overweight position in the U.S. dollar throughout the reporting period added value. Underweight positions in the euro and Japanese yen also contributed favorably to relative performance.
Positioning for the Future
We expect global economic conditions to improve during the second half of the year. The U.S. is likely to remain one of the stronger economies in the world, but growth also appears to be firming in Europe and selected countries in the Asia/Pacific region thanks to accommodative central bank policies. This environment will most likely result in a short-term interest rate increase by the Fed before year-end.
In recent months, we have been reducing the fund’s overall risk profile and sharpening its focus on areas such as U.S. high-yield bonds, European financial securities, and peripheral European bond markets. In addition, the fund’s currency overlay remains overweight the U.S. dollar given the likelihood of an impending Fed rate hike. We expect to see greater volatility in the global fixed-income and currency markets in the coming months, and will seek to take advantage of opportunities resulting from these market fluctuations.
|
| |
| JUNE 30, 2015 |
| Portfolio at a Glance |
| Average Duration (effective) | 6.3 years |
| Weighted Average Life | 8.3 years |
| | |
| Bond Holdings by Country | % of net assets |
| United States | 49.4% |
| Japan | 11.5% |
| United Kingdom | 6.2% |
Germany(1) | 4.3% |
France(1) | 4.0% |
Italy(1) | 3.8% |
Spain(1) | 3.3% |
Netherlands(1) | 3.0% |
| Canada | 2.7% |
| Supranational | 1.9% |
| Other Countries | 9.5% |
Cash and Equivalents(2) | 0.4% |
| (1) These countries are members of the eurozone. |
| (2) Includes temporary cash investments and other assets and liabilities. |
| | |
| Types of Investments in Portfolio | % of net assets |
| Sovereign Governments and Agencies | 37.0% |
| Corporate Bonds | 27.8% |
| U.S. Treasury Securities | 11.8% |
| U.S. Government Agency Mortgage-Backed Securities | 11.2% |
| Collateralized Mortgage Obligations | 5.5% |
| Commercial Mortgage-Backed Securities | 4.5% |
| Asset-Backed Securities | 1.4% |
| Municipal Securities | 0.4% |
| Temporary Cash Investments | 3.5% |
| Other Assets and Liabilities | (3.1)% |
Fund shareholders may incur two types of costs: (1) transaction costs, including sales charges (loads) on purchase payments and redemption/exchange fees; and (2) ongoing costs, including management fees; distribution and service (12b-1) fees; and other fund expenses. This example is intended to help you understand your ongoing costs (in dollars) of investing in your fund and to compare these costs with the ongoing cost of investing in other mutual funds.
The example is based on an investment of $1,000 made at the beginning of the period and held for the entire period from January 1, 2015 to June 30, 2015.
Actual Expenses
The table provides information about actual account values and actual expenses for each class. You may use the information, together with the amount you invested, to estimate the expenses that you paid over the period. First, identify the share class you own. Then simply divide your account value by $1,000 (for example, an $8,600 account value divided by $1,000 = 8.6), then multiply the result by the number under the heading “Expenses Paid During Period” to estimate the expenses you paid on your account during this period.
If you hold Investor Class shares of any American Century Investments fund, or Institutional Class shares of the American Century Diversified Bond Fund, in an American Century Investments account (i.e., not a financial intermediary or retirement plan account), American Century Investments may charge you a $12.50 semiannual account maintenance fee if the value of those shares is less than $10,000. We will redeem shares automatically in one of your accounts to pay the $12.50 fee. In determining your total eligible investment amount, we will include your investments in all personal accounts (including American Century Investments Brokerage accounts) registered under your Social Security number. Personal accounts include individual accounts, joint accounts, UGMA/UTMA accounts, personal trusts, Coverdell Education Savings Accounts and IRAs (including traditional, Roth, Rollover, SEP-, SARSEP- and SIMPLE-IRAs), and certain other retirement accounts. If you have only business, business retirement, employer-sponsored or American Century Investments Brokerage accounts, you are currently not subject to this fee. If you are subject to the Account Maintenance Fee, your account value could be reduced by the fee amount.
Hypothetical Example for Comparison Purposes
The table also provides information about hypothetical account values and hypothetical expenses based on the actual expense ratio of each class of your fund and an assumed rate of return of 5% per year before expenses, which is not the actual return of a fund’s share class. The hypothetical account values and expenses may not be used to estimate the actual ending account balance or expenses you paid for the period. You may use this information to compare the ongoing costs of investing in your fund and other funds. To do so, compare this 5% hypothetical example with the 5% hypothetical examples that appear in the shareholder reports of the other funds.
Please note that the expenses shown in the table are meant to highlight your ongoing costs only and do not reflect any transactional costs, such as sales charges (loads) or redemption/exchange fees. Therefore, the table is useful in comparing ongoing costs only, and will not help you determine the relative total costs of owning different funds. In addition, if these transactional costs were included, your costs would have been higher.
|
| | | | |
| | Beginning
Account Value
1/1/15 | Ending
Account Value
6/30/15 | Expenses Paid
During Period(1)1/1/15 - 6/30/15 | Annualized Expense Ratio(1) |
| Actual | | | | |
| Investor Class | $1,000 | $990.80 | $4.69 | 0.95% |
| Institutional Class | $1,000 | $991.80 | $3.70 | 0.75% |
| A Class | $1,000 | $989.80 | $5.92 | 1.20% |
| C Class | $1,000 | $986.70 | $9.61 | 1.95% |
| R Class | $1,000 | $988.80 | $7.15 | 1.45% |
| R6 Class | $1,000 | $991.80 | $3.46 | 0.70% |
| Hypothetical | | | | |
| Investor Class | $1,000 | $1,020.08 | $4.76 | 0.95% |
| Institutional Class | $1,000 | $1,021.08 | $3.76 | 0.75% |
| A Class | $1,000 | $1,018.84 | $6.01 | 1.20% |
| C Class | $1,000 | $1,015.13 | $9.74 | 1.95% |
| R Class | $1,000 | $1,017.60 | $7.25 | 1.45% |
| R6 Class | $1,000 | $1,021.32 | $3.51 | 0.70% |
| |
| (1) | Expenses are equal to the class's annualized expense ratio listed in the table above, multiplied by the average account value over the period, multiplied by 181, the number of days in the most recent fiscal half-year, divided by 365, to reflect the one-half year period. |
JUNE 30, 2015
|
| | | | | | | |
| | | Principal Amount | Value |
| SOVEREIGN GOVERNMENTS AND AGENCIES — 37.0% | | | |
| Australia — 1.2% | | | |
| Australia Government Bond, 4.50%, 4/15/20 | AUD | 2,535,000 |
| $ | 2,150,725 |
|
| Australia Government Bond, 2.75%, 4/21/24 | AUD | 8,680,000 |
| 6,607,348 |
|
| New South Wales Treasury Corp., 4.00%, 2/20/17 | AUD | 4,485,000 |
| 3,568,207 |
|
| New South Wales Treasury Corp., 5.50%, 3/1/17 | AUD | 145,000 |
| 118,137 |
|
| | | | 12,444,417 |
|
| Austria — 0.7% | | | |
Austria Government Bond, 4.35%, 3/15/19(1) | EUR | 2,325,000 |
| 3,003,594 |
|
Austria Government Bond, 3.90%, 7/15/20(1) | EUR | 1,240,000 |
| 1,632,366 |
|
Austria Government Bond, 1.65%, 10/21/24(1) | EUR | 1,550,000 |
| 1,824,460 |
|
Austria Government Bond, 4.15%, 3/15/37(1) | EUR | 620,000 |
| 1,000,411 |
|
| | | | 7,460,831 |
|
| Belgium — 1.7% | | | |
| Belgium Government Bond, 4.25%, 9/28/22 | EUR | 4,650,000 |
| 6,473,634 |
|
| Belgium Government Bond, 2.25%, 6/22/23 | EUR | 5,030,000 |
| 6,195,976 |
|
Belgium Government Bond, 5.00%, 3/28/35(1) | EUR | 2,015,000 |
| 3,408,393 |
|
Belgium Government Bond, 4.25%, 3/28/41(1) | EUR | 620,000 |
| 1,002,100 |
|
| | | | 17,080,103 |
|
Brazil† | | | |
| Brazilian Government International Bond, 5.875%, 1/15/19 | | $ | 10,000 |
| 11,125 |
|
| Brazilian Government International Bond, 2.625%, 1/5/23 | | $ | 488,000 |
| 433,100 |
|
| | | | 444,225 |
|
| Canada — 2.5% | | | |
| Canadian Government Bond, 4.00%, 6/1/17 | CAD | 7,935,000 |
| 6,781,789 |
|
| Canadian Government Bond, 3.25%, 6/1/21 | CAD | 9,579,000 |
| 8,636,515 |
|
| Canadian Government Bond, 4.00%, 6/1/41 | CAD | 3,920,000 |
| 4,165,086 |
|
| Province of British Columbia, 2.85%, 6/18/25 | CAD | 2,325,000 |
| 1,940,522 |
|
| Province of Ontario Canada, 4.65%, 6/2/41 | CAD | 2,170,000 |
| 2,174,265 |
|
| Province of Quebec Canada, 3.00%, 9/1/23 | CAD | 1,395,000 |
| 1,182,055 |
|
| Province of Quebec Canada, 5.00%, 12/1/41 | CAD | 465,000 |
| 487,440 |
|
| | | | 25,367,672 |
|
| Colombia — 0.1% | | | |
| Colombia Government International Bond, 4.375%, 7/12/21 | | $ | 697,000 |
| 730,804 |
|
| Czech — 0.2% | | | |
| Czech Republic Government Bond, 4.70%, 9/12/22 | CZK | 29,000,000 |
| 1,509,290 |
|
| Denmark — 0.1% | | | |
| Denmark Government Bond, 4.00%, 11/15/19 | DKK | 350,000 |
| 61,492 |
|
| Denmark Government Bond, 7.00%, 11/10/24 | DKK | 4,030,000 |
| 939,528 |
|
| Denmark Government Bond, 4.50%, 11/15/39 | DKK | 1,705,000 |
| 403,205 |
|
| | | | 1,404,225 |
|
| Finland — 0.2% | | | |
Finland Government Bond, 1.625%, 9/15/22(1) | EUR | 1,395,000 |
| 1,661,401 |
|
|
| | | | | | | |
| | | Principal Amount | Value |
| France — 2.6% | | | |
| France Government Bond OAT, 3.25%, 10/25/21 | EUR | 10,745,000 |
| $ | 13,988,887 |
|
| France Government Bond OAT, 5.50%, 4/25/29 | EUR | 3,260,000 |
| 5,404,474 |
|
| France Government Bond OAT, 3.25%, 5/25/45 | EUR | 4,960,000 |
| 6,821,496 |
|
| | | | 26,214,857 |
|
| Germany — 2.7% | | | |
| Bundesrepublik Deutschland, 3.00%, 7/4/20 | EUR | 13,970,000 |
| 17,817,720 |
|
| Bundesrepublik Deutschland, 1.75%, 2/15/24 | EUR | 3,090,000 |
| 3,774,845 |
|
| Bundesrepublik Deutschland, 2.50%, 7/4/44 | EUR | 3,720,000 |
| 5,077,726 |
|
| | | | 26,670,291 |
|
| Ireland — 0.2% | | | |
| Ireland Government Bond, 5.90%, 10/18/19 | EUR | 1,085,000 |
| 1,484,666 |
|
| Ireland Government Bond, 3.40%, 3/18/24 | EUR | 713,000 |
| 918,781 |
|
| | | | 2,403,447 |
|
| Italy — 3.2% | | | |
| Italy Buoni Poliennali Del Tesoro, 3.50%, 11/1/17 | EUR | 1,990,000 |
| 2,371,458 |
|
| Italy Buoni Poliennali Del Tesoro, 1.50%, 8/1/19 | EUR | 17,975,000 |
| 20,462,557 |
|
| Italy Buoni Poliennali Del Tesoro, 4.00%, 2/1/37 | EUR | 7,575,000 |
| 9,464,719 |
|
| Italy Government International Bond, 6.875%, 9/27/23 | | $ | 120,000 |
| 149,997 |
|
| | | | 32,448,731 |
|
| Japan — 11.5% | | | |
| Japan Government Five Year Bond, 0.30%, 9/20/18 | JPY | 1,504,300,000 |
| 12,403,119 |
|
| Japan Government Ten Year Bond, 1.00%, 12/20/21 | JPY | 5,402,050,000 |
| 46,469,618 |
|
| Japan Government Thirty Year Bond, 2.40%, 3/20/37 | JPY | 3,323,050,000 |
| 32,995,102 |
|
| Japan Government Thirty Year Bond, 2.00%, 9/20/41 | JPY | 632,800,000 |
| 5,867,863 |
|
| Japan Government Twenty Year Bond, 2.10%, 12/20/26 | JPY | 1,876,600,000 |
| 17,957,847 |
|
| | | | 115,693,549 |
|
| Malaysia — 0.2% | | | |
| Malaysia Government Bond, 3.96%, 9/15/25 | MYR | 8,000,000 |
| 2,102,947 |
|
| Mexico — 0.4% | | | |
| Mexican Bonos, 6.50%, 6/9/22 | MXN | 48,980,000 |
| 3,229,402 |
|
| Mexico Government International Bond, MTN, 5.95%, 3/19/19 | | $ | 30,000 |
| 33,720 |
|
| Mexico Government International Bond, 4.00%, 10/2/23 | | $ | 20,000 |
| 20,580 |
|
| Mexico Government International Bond, 3.60%, 1/30/25 | | $ | 700,000 |
| 691,950 |
|
| Mexico Government International Bond, 6.05%, 1/11/40 | | $ | 10,000 |
| 11,425 |
|
| Mexico Government International Bond, MTN, 4.75%, 3/8/44 | | $ | 370,000 |
| 355,200 |
|
| | | | 4,342,277 |
|
| Netherlands — 1.1% | | | |
Netherlands Government Bond, 3.50%, 7/15/20(1) | EUR | 7,750,000 |
| 10,049,627 |
|
| Netherlands Government Bond, 2.75%, 1/15/47 | EUR | 930,000 |
| 1,297,893 |
|
| | | | 11,347,520 |
|
| New Zealand — 0.1% | | | |
| New Zealand Government Bond, 5.00%, 3/15/19 | NZD | 1,550,000 |
| 1,126,403 |
|
| Norway — 0.2% | | | |
Norway Government Bond, 3.75%, 5/25/21(1) | NOK | 13,188,000 |
| 1,907,309 |
|
|
| | | | | | | |
| | | Principal Amount | Value |
Peru† | | | |
| Peruvian Government International Bond, 6.55%, 3/14/37 | | $ | 350,000 |
| $ | 437,500 |
|
| Philippines — 0.1% | | | |
| Philippine Government International Bond, 4.00%, 1/15/21 | | $ | 750,000 |
| 812,850 |
|
| Poland — 0.1% | | | |
| Poland Government Bond, 4.00%, 10/25/23 | PLN | 4,410,000 |
| 1,238,704 |
|
| Poland Government International Bond, 3.00%, 3/17/23 | | $ | 10,000 |
| 9,843 |
|
| | | | 1,248,547 |
|
| Singapore — 0.2% | | | |
| Singapore Government Bond, 3.125%, 9/1/22 | SGD | 1,910,000 |
| 1,483,256 |
|
| South Africa — 0.3% | | | |
| South Africa Government Bond, 7.75%, 2/28/23 | ZAR | 32,700,000 |
| 2,625,464 |
|
South Korea† | | | |
| Korea Development Bank (The), 3.25%, 3/9/16 | | $ | 40,000 |
| 40,594 |
|
| Spain — 2.5% | | | |
Spain Government Bond, 4.30%, 10/31/19(1) | EUR | 3,500,000 |
| 4,441,386 |
|
Spain Government Bond, 5.85%, 1/31/22(1) | EUR | 310,000 |
| 434,510 |
|
Spain Government Bond, 4.40%, 10/31/23(1) | EUR | 5,735,000 |
| 7,522,474 |
|
Spain Government Bond, 1.60%, 4/30/25(1) | EUR | 9,720,000 |
| 10,205,485 |
|
Spain Government Bond, 5.15%, 10/31/44(1) | EUR | 1,550,000 |
| 2,316,123 |
|
| | | | 24,919,978 |
|
| Sweden — 0.3% | | | |
| Sweden Government Bond, 3.50%, 6/1/22 | SEK | 24,025,000 |
| 3,460,353 |
|
| Switzerland — 0.7% | | | |
| Switzerland Government Bond, 2.00%, 4/28/21 | CHF | 5,535,000 |
| 6,757,499 |
|
| Thailand — 0.2% | | | |
| Thailand Government Bond, 3.85%, 12/12/25 | THB | 63,300,000 |
| 2,023,341 |
|
| Turkey — 0.1% | | | |
| Turkey Government International Bond, 3.25%, 3/23/23 | | $ | 380,000 |
| 354,825 |
|
| Turkey Government International Bond, 4.25%, 4/14/26 | | $ | 270,000 |
| 258,644 |
|
| | | | 613,469 |
|
| United Kingdom — 3.6% | | | |
| United Kingdom Gilt, 5.00%, 3/7/18 | GBP | 3,720,000 |
| 6,500,358 |
|
| United Kingdom Gilt, 5.00%, 3/7/25 | GBP | 3,040,000 |
| 6,025,342 |
|
| United Kingdom Gilt, 4.25%, 3/7/36 | GBP | 2,615,000 |
| 5,186,209 |
|
| United Kingdom Gilt, 4.50%, 12/7/42 | GBP | 8,119,000 |
| 17,321,981 |
|
| United Kingdom Gilt, 4.25%, 12/7/55 | GBP | 310,000 |
| 690,394 |
|
| | | | 35,724,284 |
|
Uruguay† | | | |
| Uruguay Government International Bond, 4.125%, 11/20/45 | | $ | 140,000 |
| 120,050 |
|
TOTAL SOVEREIGN GOVERNMENTS AND AGENCIES (Cost $380,458,748) | | | 372,627,484 |
|
| CORPORATE BONDS — 27.8% | | | |
| Aerospace and Defense — 0.1% | | | |
Bombardier, Inc., 7.50%, 3/15/18(1) | | 40,000 |
| 42,000 |
|
| Harris Corp., 2.70%, 4/27/20 | | 240,000 |
| 236,991 |
|
| Lockheed Martin Corp., 3.80%, 3/1/45 | | 100,000 |
| 89,170 |
|
|
| | | | | | | |
| | | Principal Amount | Value |
| United Technologies Corp., 5.70%, 4/15/40 | | $ | 680,000 |
| $ | 793,548 |
|
| United Technologies Corp., 4.50%, 6/1/42 | | 10,000 |
| 10,146 |
|
| | | | 1,171,855 |
|
| Auto Components — 0.3% | | | |
Schaeffler Finance BV, 4.25%, 5/15/21(1) | | 1,000,000 |
| 980,000 |
|
| Tenneco, Inc., 6.875%, 12/15/20 | | 990,000 |
| 1,039,500 |
|
ZF North America Capital, Inc., 4.00%, 4/29/20(1) | | 1,000,000 |
| 1,002,500 |
|
| | | | 3,022,000 |
|
| Automobiles — 0.6% | | | |
| American Honda Finance Corp., 2.125%, 10/10/18 | | 20,000 |
| 20,300 |
|
| Ford Motor Credit Co. LLC, 5.875%, 8/2/21 | | 1,360,000 |
| 1,548,730 |
|
| General Motors Co., 5.00%, 4/1/35 | | 310,000 |
| 305,319 |
|
| General Motors Financial Co., Inc., 3.25%, 5/15/18 | | 1,210,000 |
| 1,239,247 |
|
Jaguar Land Rover Automotive plc, 4.125%, 12/15/18(1) | | 20,000 |
| 20,325 |
|
Jaguar Land Rover Automotive plc, 3.50%, 3/15/20(1) | | 980,000 |
| 965,300 |
|
| Volkswagen International Finance NV, VRN, 3.75%, 3/24/21 | EUR | 1,500,000 |
| 1,726,113 |
|
| | | | 5,825,334 |
|
| Banks — 8.5% | | | |
Abbey National Treasury Services plc, MTN, 5.125%, 4/14/21 (Secured) | GBP | 2,300,000 |
| 4,203,326 |
|
Banco Bilbao Vizcaya Argentaria SA, 3.625%, 1/18/17 (Secured) | EUR | 2,250,000 |
| 2,645,602 |
|
| Bank of America Corp., 6.50%, 8/1/16 | | $ | 10,000 |
| 10,551 |
|
| Bank of America Corp., 5.75%, 12/1/17 | | 20,000 |
| 21,796 |
|
| Bank of America Corp., 5.625%, 7/1/20 | | 3,000,000 |
| 3,381,231 |
|
| Bank of America Corp., 5.70%, 1/24/22 | | 10,000 |
| 11,358 |
|
| Bank of America Corp., MTN, 4.75%, 4/3/17 | EUR | 1,550,000 |
| 1,859,274 |
|
| Bank of America Corp., MTN, 4.20%, 8/26/24 | | $ | 50,000 |
| 49,902 |
|
| Bank of America Corp., MTN, 4.00%, 1/22/25 | | 930,000 |
| 906,526 |
|
| Bank of America N.A., 5.30%, 3/15/17 | | 50,000 |
| 52,964 |
|
| Bank of Nova Scotia, 2.55%, 1/12/17 | | 20,000 |
| 20,433 |
|
Bankia SA, 3.625%, 10/5/16 (Secured) | EUR | 2,050,000 |
| 2,382,101 |
|
| Barclays Bank plc, MTN, 6.00%, 1/14/21 | EUR | 50,000 |
| 66,055 |
|
| Barclays Bank plc, MTN, 6.625%, 3/30/22 | EUR | 1,500,000 |
| 2,076,079 |
|
| BB&T Corp., MTN, 2.05%, 6/19/18 | | $ | 10,000 |
| 10,109 |
|
| BPCE SA, 4.625%, 7/18/23 | EUR | 100,000 |
| 126,325 |
|
BPCE SA, 5.15%, 7/21/24(1) | | $ | 300,000 |
| 304,425 |
|
| BPCE SA, VRN, 2.75%, 7/8/21 | EUR | 1,700,000 |
| 1,900,302 |
|
| Branch Banking & Trust Co., 3.80%, 10/30/26 | | $ | 10,000 |
| 10,095 |
|
| Capital One Financial Corp., 3.20%, 2/5/25 | | 1,380,000 |
| 1,303,850 |
|
| Citigroup, Inc., 1.75%, 5/1/18 | | 30,000 |
| 29,869 |
|
| Citigroup, Inc., 4.50%, 1/14/22 | | 1,350,000 |
| 1,450,233 |
|
| Citigroup, Inc., 4.05%, 7/30/22 | | 1,350,000 |
| 1,382,886 |
|
| Citigroup, Inc., 3.30%, 4/27/25 | | 20,000 |
| 19,242 |
|
Commerzbank AG, 8.125%, 9/19/23(1) | | 490,000 |
| 573,344 |
|
| Commerzbank AG, MTN, 6.375%, 3/22/19 | EUR | 1,950,000 |
| 2,444,220 |
|
| Commerzbank AG, MTN, 7.75%, 3/16/21 | EUR | 100,000 |
| 133,633 |
|
|
| | | | | | | |
| | | Principal Amount | Value |
| Cooperatieve Centrale Raiffeisen-Boerenleenbank BA, 3.875%, 2/8/22 | | $ | 680,000 |
| $ | 707,658 |
|
| Cooperatieve Centrale Raiffeisen-Boerenleenbank BA, MTN, 3.75%, 11/9/20 | EUR | 70,000 |
| 84,929 |
|
| Cooperatieve Centrale Raiffeisen-Boerenleenbank BA, VRN, 2.50%, 5/26/21 | EUR | 1,500,000 |
| 1,664,242 |
|
| Credit Suisse AG, VRN, 5.75%, 9/18/20 | EUR | 2,000,000 |
| 2,483,853 |
|
Credit Suisse Group Funding Guernsey Ltd., 2.75%, 3/26/20(1) | | $ | 500,000 |
| 494,169 |
|
| European Financial Stability Facility, MTN, 2.125%, 2/19/24 | EUR | 3,100,000 |
| 3,814,993 |
|
| European Investment Bank, MTN, 3.625%, 1/15/21 | EUR | 1,550,000 |
| 2,036,133 |
|
| European Investment Bank, MTN, 4.25%, 12/7/21 | GBP | 3,410,000 |
| 6,112,572 |
|
| European Investment Bank, MTN, 2.25%, 10/14/22 | EUR | 6,200,000 |
| 7,712,070 |
|
| Fifth Third Bancorp, 4.30%, 1/16/24 | | $ | 10,000 |
| 10,267 |
|
HBOS plc, MTN, 6.75%, 5/21/18(1) | | 400,000 |
| 444,282 |
|
| HSBC Holdings plc, 5.10%, 4/5/21 | | 1,030,000 |
| 1,147,892 |
|
| HSBC Holdings plc, MTN, 6.00%, 6/10/19 | EUR | 1,550,000 |
| 2,025,170 |
|
| ING Bank NV, MTN, VRN, 3.625%, 2/25/21 | EUR | 1,500,000 |
| 1,771,637 |
|
| International Bank for Reconstruction & Development, MTN, 3.875%, 5/20/19 | EUR | 2,635,000 |
| 3,364,473 |
|
Intesa Sanpaolo SpA, 5.02%, 6/26/24(1) | | $ | 980,000 |
| 952,526 |
|
| Intesa Sanpaolo SpA, MTN, 5.00%, 9/23/19 | EUR | 50,000 |
| 60,506 |
|
| Intesa Sanpaolo SpA, MTN, 6.625%, 9/13/23 | EUR | 1,200,000 |
| 1,590,521 |
|
| JPMorgan Chase & Co., 6.00%, 1/15/18 | | $ | 40,000 |
| 44,056 |
|
| JPMorgan Chase & Co., 4.625%, 5/10/21 | | 3,020,000 |
| 3,265,819 |
|
| JPMorgan Chase & Co., 3.25%, 9/23/22 | | 20,000 |
| 19,865 |
|
| JPMorgan Chase & Co., 3.875%, 9/10/24 | | 10,000 |
| 9,821 |
|
| JPMorgan Chase & Co., 3.125%, 1/23/25 | | 20,000 |
| 19,089 |
|
| JPMorgan Chase & Co., 4.95%, 6/1/45 | | 150,000 |
| 145,845 |
|
| KeyCorp, MTN, 2.30%, 12/13/18 | | 10,000 |
| 10,090 |
|
| KFW, 3.875%, 1/21/19 | EUR | 2,170,000 |
| 2,748,677 |
|
| KFW, MTN, 4.625%, 1/4/23 | EUR | 2,170,000 |
| 3,135,847 |
|
| Lloyds Bank plc, MTN, 7.625%, 4/22/25 | GBP | 970,000 |
| 1,931,762 |
|
| Royal Bank of Scotland Group plc, 6.125%, 12/15/22 | | $ | 990,000 |
| 1,066,404 |
|
| Royal Bank of Scotland Group plc, MTN, VRN, 3.625%, 3/25/19 | EUR | 1,500,000 |
| 1,704,622 |
|
| Santander Issuances SAU, MTN, 2.50%, 3/18/25 | EUR | 1,800,000 |
| 1,891,853 |
|
| Standard Chartered plc, MTN, 3.625%, 11/23/22 | EUR | 100,000 |
| 116,358 |
|
| Standard Chartered plc, MTN, VRN, 4.00%, 10/21/20 | EUR | 1,500,000 |
| 1,769,752 |
|
| U.S. Bancorp, MTN, 3.60%, 9/11/24 | | $ | 1,360,000 |
| 1,366,759 |
|
| Wells Fargo & Co., 4.125%, 8/15/23 | | 20,000 |
| 20,760 |
|
| Wells Fargo & Co., MTN, 2.10%, 5/8/17 | | 1,370,000 |
| 1,393,415 |
|
| Wells Fargo & Co., MTN, 4.10%, 6/3/26 | | 1,360,000 |
| 1,365,266 |
|
| | | | 85,879,684 |
|
| Beverages — 0.1% | | | |
| Anheuser-Busch InBev Worldwide, Inc., 7.75%, 1/15/19 | | 20,000 |
| 23,735 |
|
| Constellation Brands, Inc., 3.875%, 11/15/19 | | 980,000 |
| 997,150 |
|
| | | | 1,020,885 |
|
|
| | | | | | | |
| | | Principal Amount | Value |
| Biotechnology — 0.2% | | | |
| Amgen, Inc., 2.125%, 5/15/17 | | $ | 20,000 |
| $ | 20,322 |
|
| Amgen, Inc., 4.10%, 6/15/21 | | 510,000 |
| 543,402 |
|
| Amgen, Inc., 5.375%, 5/15/43 | | 410,000 |
| 435,180 |
|
| Gilead Sciences, Inc., 4.40%, 12/1/21 | | 1,020,000 |
| 1,113,732 |
|
| | | | 2,112,636 |
|
| Building Products — 0.1% | | | |
| Masco Corp., 4.45%, 4/1/25 | | 1,000,000 |
| 1,005,000 |
|
| Capital Markets — 0.2% | | | |
| ABN AMRO Bank NV, MTN, 7.125%, 7/6/22 | EUR | 1,500,000 |
| 2,136,801 |
|
| Ameriprise Financial, Inc., 4.00%, 10/15/23 | | $ | 20,000 |
| 20,880 |
|
| Fidelity International Ltd., MTN, 6.75%, 10/19/20 | GBP | 50,000 |
| 91,531 |
|
| Jefferies Group, Inc., 5.125%, 4/13/18 | | $ | 10,000 |
| 10,627 |
|
| | | | 2,259,839 |
|
| Chemicals — 0.3% | | | |
| Ashland, Inc., 4.75%, 8/15/22 | | 990,000 |
| 975,150 |
|
| Eastman Chemical Co., 2.70%, 1/15/20 | | 1,020,000 |
| 1,018,644 |
|
| Eastman Chemical Co., 3.60%, 8/15/22 | | 10,000 |
| 10,112 |
|
| Ecolab, Inc., 4.35%, 12/8/21 | | 235,000 |
| 253,605 |
|
| Mosaic Co. (The), 4.25%, 11/15/23 | | 1,000,000 |
| 1,028,657 |
|
| Mosaic Co. (The), 5.625%, 11/15/43 | | 10,000 |
| 10,657 |
|
| | | | 3,296,825 |
|
| Commercial Services and Supplies — 0.1% | | | |
| Clean Harbors, Inc., 5.25%, 8/1/20 | | 10,000 |
| 10,200 |
|
| Covanta Holding Corp., 5.875%, 3/1/24 | | 10,000 |
| 10,025 |
|
| Pitney Bowes, Inc., 4.625%, 3/15/24 | | 10,000 |
| 10,090 |
|
| Republic Services, Inc., 3.55%, 6/1/22 | | 680,000 |
| 689,193 |
|
| Waste Management, Inc., 4.10%, 3/1/45 | | 310,000 |
| 282,845 |
|
| | | | 1,002,353 |
|
| Communications Equipment — 0.2% | | | |
| CC Holdings GS V LLC / Crown Castle GS III Corp., 3.85%, 4/15/23 | | 10,000 |
| 9,824 |
|
| Cisco Systems, Inc., 3.00%, 6/15/22 | | 450,000 |
| 446,222 |
|
CommScope, Inc., 4.375%, 6/15/20(1) | | 800,000 |
| 810,000 |
|
| Crown Castle International Corp., 5.25%, 1/15/23 | | 590,000 |
| 596,490 |
|
| | | | 1,862,536 |
|
Construction Materials† | | | |
| Owens Corning, 4.20%, 12/15/22 | | 10,000 |
| 10,139 |
|
| Consumer Finance — 0.2% | | | |
| CIT Group, Inc., 5.00%, 5/15/17 | | 50,000 |
| 51,685 |
|
| CIT Group, Inc., 4.25%, 8/15/17 | | 1,460,000 |
| 1,485,550 |
|
| CIT Group, Inc., 5.00%, 8/15/22 | | 10,000 |
| 9,925 |
|
| Discover Financial Services, 3.75%, 3/4/25 | | 200,000 |
| 191,058 |
|
| Equifax, Inc., 3.30%, 12/15/22 | | 10,000 |
| 9,951 |
|
| GLP Capital LP / GLP Financing II, Inc., 4.875%, 11/1/20 | | 620,000 |
| 633,950 |
|
| | | | 2,382,119 |
|
|
| | | | | | | |
| | | Principal Amount | Value |
| Containers and Packaging — 0.2% | | | |
| Ball Corp., 4.00%, 11/15/23 | | $ | 590,000 |
| $ | 550,175 |
|
| Berry Plastics Corp., 5.125%, 7/15/23 | | 500,000 |
| 488,750 |
|
| Crown Americas LLC / Crown Americas Capital Corp. III, 6.25%, 2/1/21 | | 39,000 |
| 40,853 |
|
| Crown Americas LLC / Crown Americas Capital Corp. IV, 4.50%, 1/15/23 | | 980,000 |
| 930,392 |
|
| Rock-Tenn Co., 4.00%, 3/1/23 | | 20,000 |
| 20,339 |
|
| | | | 2,030,509 |
|
Diversified Consumer Services† | | | |
| Board of Trustees of The Leland Stanford Junior University (The), 3.46%, 5/1/47 | | 200,000 |
| 178,601 |
|
| Catholic Health Initiatives, 2.95%, 11/1/22 | | 10,000 |
| 9,751 |
|
| | | | 188,352 |
|
| Diversified Financial Services — 2.2% | | | |
| Ally Financial, Inc., 2.75%, 1/30/17 | | 1,480,000 |
| 1,477,040 |
|
| BNP Paribas SA, MTN, 2.375%, 2/17/25 | EUR | 1,200,000 |
| 1,261,108 |
|
| Credit Agricole SA, MTN, 7.375%, 12/18/23 | GBP | 1,200,000 |
| 2,349,140 |
|
Denali Borrower LLC / Denali Finance Corp., 5.625%, 10/15/20(1) | | $ | 250,000 |
| 263,438 |
|
| Deutsche Bank AG, MTN, 2.75%, 2/17/25 | EUR | 2,400,000 |
| 2,520,435 |
|
| GE Capital UK Funding, MTN, 5.125%, 5/24/23 | GBP | 1,000,000 |
| 1,813,968 |
|
| General Electric Capital Corp., MTN, 2.20%, 1/9/20 | | $ | 2,500,000 |
| 2,498,798 |
|
| Goldman Sachs Group, Inc. (The), 2.375%, 1/22/18 | | 200,000 |
| 203,023 |
|
| Goldman Sachs Group, Inc. (The), 2.90%, 7/19/18 | | 2,140,000 |
| 2,193,924 |
|
| Goldman Sachs Group, Inc. (The), 5.375%, 3/15/20 | | 430,000 |
| 478,721 |
|
| Goldman Sachs Group, Inc. (The), 5.75%, 1/24/22 | | 40,000 |
| 45,489 |
|
| Goldman Sachs Group, Inc. (The), 4.00%, 3/3/24 | | 30,000 |
| 30,382 |
|
| Goldman Sachs Group, Inc. (The), 3.50%, 1/23/25 | | 1,000,000 |
| 969,490 |
|
| Goldman Sachs Group, Inc. (The), 5.15%, 5/22/45 | | 180,000 |
| 173,691 |
|
| Icahn Enterprises LP / Icahn Enterprises Finance Corp., 3.50%, 3/15/17 | | 20,000 |
| 20,175 |
|
| Morgan Stanley, 2.65%, 1/27/20 | | 3,010,000 |
| 3,004,037 |
|
| Morgan Stanley, 5.00%, 11/24/25 | | 550,000 |
| 576,056 |
|
| Morgan Stanley, MTN, 6.625%, 4/1/18 | | 30,000 |
| 33,658 |
|
| Morgan Stanley, MTN, 5.625%, 9/23/19 | | 10,000 |
| 11,204 |
|
| Morgan Stanley, MTN, 3.70%, 10/23/24 | | 20,000 |
| 19,913 |
|
| Nationwide Building Society, MTN, 6.75%, 7/22/20 | EUR | 1,600,000 |
| 2,171,811 |
|
| | | | 22,115,501 |
|
| Diversified Telecommunication Services — 1.9% | | | |
| AT&T, Inc., 2.625%, 12/1/22 | | $ | 1,000,000 |
| 940,828 |
|
| AT&T, Inc., 3.40%, 5/15/25 | | 900,000 |
| 856,292 |
|
| AT&T, Inc., 2.60%, 12/17/29 | EUR | 1,800,000 |
| 1,913,002 |
|
| AT&T, Inc., 6.55%, 2/15/39 | | $ | 21,000 |
| 24,132 |
|
| AT&T, Inc., 4.30%, 12/15/42 | | 10,000 |
| 8,572 |
|
| British Telecommunications plc, 5.95%, 1/15/18 | | 500,000 |
| 552,173 |
|
| CenturyLink, Inc., 6.00%, 4/1/17 | | 20,000 |
| 20,925 |
|
| CenturyLink, Inc., Series Q, 6.15%, 9/15/19 | | 980,000 |
| 1,036,350 |
|
| Deutsche Telekom International Finance BV, 6.75%, 8/20/18 | | 530,000 |
| 608,077 |
|
|
| | | | | | | |
| | | Principal Amount | Value |
| Frontier Communications Corp., 8.25%, 4/15/17 | | $ | 980,000 |
| $ | 1,057,175 |
|
| Frontier Communications Corp., 7.125%, 3/15/19 | | 25,000 |
| 25,938 |
|
| Frontier Communications Corp., 8.50%, 4/15/20 | | 500,000 |
| 524,000 |
|
| Orange SA, 4.125%, 9/14/21 | | 680,000 |
| 719,492 |
|
| Orange SA, MTN, VRN, 4.00%, 10/1/21 | EUR | 1,600,000 |
| 1,817,598 |
|
| Telecom Italia Capital SA, 7.00%, 6/4/18 | | $ | 20,000 |
| 22,099 |
|
| Telecom Italia Capital SA, 6.00%, 9/30/34 | | 10,000 |
| 9,725 |
|
Telecom Italia SpA, 5.30%, 5/30/24(1) | | 1,000,000 |
| 1,000,000 |
|
| Telecom Italia SpA, MTN, 5.875%, 5/19/23 | GBP | 1,350,000 |
| 2,238,287 |
|
| Telefonica Emisiones SAU, 5.46%, 2/16/21 | | $ | 690,000 |
| 763,166 |
|
| Telefonica Europe BV, VRN, 5.875%, 3/31/24 | EUR | 1,600,000 |
| 1,894,920 |
|
| Verizon Communications, Inc., 3.65%, 9/14/18 | | $ | 50,000 |
| 52,560 |
|
| Verizon Communications, Inc., 3.50%, 11/1/21 | | 1,510,000 |
| 1,529,526 |
|
| Verizon Communications, Inc., 5.05%, 3/15/34 | | 50,000 |
| 50,346 |
|
| Verizon Communications, Inc., 4.86%, 8/21/46 | | 1,510,000 |
| 1,413,571 |
|
| Verizon Communications, Inc., 5.01%, 8/21/54 | | 5,000 |
| 4,589 |
|
| Windstream Services LLC, 7.875%, 11/1/17 | | 40,000 |
| 42,650 |
|
| | | | 19,125,993 |
|
| Electric Utilities — 0.1% | | | |
| AES Corp. (The), 4.875%, 5/15/23 | | 980,000 |
| 926,100 |
|
| Electrical Equipment — 0.1% | | | |
Belden, Inc., 5.25%, 7/15/24(1) | | 600,000 |
| 585,000 |
|
| Electronic Equipment, Instruments and Components — 0.1% | |
| Jabil Circuit, Inc., 7.75%, 7/15/16 | | 20,000 |
| 21,000 |
|
| Jabil Circuit, Inc., 5.625%, 12/15/20 | | 10,000 |
| 10,725 |
|
Sanmina Corp., 4.375%, 6/1/19(1) | | 980,000 |
| 980,000 |
|
| | | | 1,011,725 |
|
| Energy Equipment and Services — 0.1% | | | |
| Ensco plc, 4.70%, 3/15/21 | | 10,000 |
| 10,189 |
|
| Ensco plc, 5.20%, 3/15/25 | | 130,000 |
| 128,767 |
|
| Noble Holding International Ltd., 5.95%, 4/1/25 | | 210,000 |
| 207,147 |
|
| Schlumberger Investment SA, 3.65%, 12/1/23 | | 210,000 |
| 217,111 |
|
| Weatherford International Ltd., 4.50%, 4/15/22 | | 10,000 |
| 9,394 |
|
| | | | 572,608 |
|
| Food and Staples Retailing — 0.2% | | | |
| CVS Health Corp., 2.75%, 12/1/22 | | 690,000 |
| 665,446 |
|
| Delhaize Group SA, 5.70%, 10/1/40 | | 70,000 |
| 71,058 |
|
| Dollar General Corp., 3.25%, 4/15/23 | | 160,000 |
| 152,503 |
|
| Kroger Co. (The), 3.30%, 1/15/21 | | 480,000 |
| 490,061 |
|
| Wal-Mart Stores, Inc., 5.625%, 4/15/41 | | 1,020,000 |
| 1,202,306 |
|
| | | | 2,581,374 |
|
| Food Products — 0.2% | | | |
| Kraft Foods Group, Inc., 5.00%, 6/4/42 | | 310,000 |
| 308,992 |
|
Kraft Heinz Food Co., 4.875%, 2/15/25(1) | | 618,000 |
| 674,393 |
|
Kraft Heinz Food Co., 5.20%, 7/15/45(1)(2) | | 200,000 |
| 205,438 |
|
| Mondelez International, Inc., 4.00%, 2/1/24 | | 510,000 |
| 528,446 |
|
| Tyson Foods, Inc., 4.50%, 6/15/22 | | 20,000 |
| 21,256 |
|
| | | | 1,738,525 |
|
|
| | | | | | | |
| | | Principal Amount | Value |
| Gas Utilities — 0.8% | | | |
Columbia Pipeline Group, Inc., 4.50%, 6/1/25(1) | | $ | 280,000 |
| $ | 276,344 |
|
| Enbridge, Inc., 4.50%, 6/10/44 | | 10,000 |
| 8,221 |
|
| Energy Transfer Equity LP, 7.50%, 10/15/20 | | 20,000 |
| 22,650 |
|
| Energy Transfer Partners LP, 4.15%, 10/1/20 | | 20,000 |
| 20,560 |
|
| Energy Transfer Partners LP, 3.60%, 2/1/23 | | 1,000,000 |
| 947,376 |
|
| Energy Transfer Partners LP, 6.50%, 2/1/42 | | 10,000 |
| 10,303 |
|
| Enterprise Products Operating LLC, 5.20%, 9/1/20 | | 30,000 |
| 33,399 |
|
| Enterprise Products Operating LLC, 3.70%, 2/15/26 | | 400,000 |
| 389,529 |
|
| Enterprise Products Operating LLC, 4.85%, 3/15/44 | | 300,000 |
| 282,210 |
|
| Kinder Morgan Energy Partners LP, 6.50%, 4/1/20 | | 10,000 |
| 11,390 |
|
| Kinder Morgan Energy Partners LP, 6.50%, 9/1/39 | | 20,000 |
| 20,511 |
|
| Kinder Morgan, Inc., 7.25%, 6/1/18 | | 20,000 |
| 22,560 |
|
| Kinder Morgan, Inc., 4.30%, 6/1/25 | | 490,000 |
| 475,912 |
|
| Kinder Morgan, Inc., 5.55%, 6/1/45 | | 300,000 |
| 277,345 |
|
| MarkWest Energy Partners LP / MarkWest Energy Finance Corp., 4.875%, 12/1/24 | | 990,000 |
| 972,675 |
|
| Plains All American Pipeline LP / PAA Finance Corp., 3.65%, 6/1/22 | | 690,000 |
| 694,910 |
|
| Sunoco Logistics Partners Operations LP, 3.45%, 1/15/23 | | 1,020,000 |
| 965,675 |
|
| Targa Resources Partners LP / Targa Resources Partners Finance Corp., 4.25%, 11/15/23 | | 980,000 |
| 911,400 |
|
Tesoro Logistics LP / Tesoro Logistics Finance Corp., 5.50%, 10/15/19(1) | | 520,000 |
| 542,100 |
|
| TransCanada PipeLines Ltd., 2.50%, 8/1/22 | | 20,000 |
| 18,979 |
|
| Williams Cos., Inc. (The), 5.75%, 6/24/44 | | 10,000 |
| 9,282 |
|
| Williams Partners LP, 4.125%, 11/15/20 | | 680,000 |
| 705,487 |
|
| Williams Partners LP, 5.40%, 3/4/44 | | 20,000 |
| 18,285 |
|
| | | | 7,637,103 |
|
| Health Care Equipment and Supplies — 0.3% | | | |
| Becton Dickinson and Co., 3.73%, 12/15/24 | | 330,000 |
| 329,048 |
|
| Mallinckrodt International Finance SA, 3.50%, 4/15/18 | | 980,000 |
| 987,350 |
|
Medtronic, Inc., 2.50%, 3/15/20(1) | | 610,000 |
| 610,894 |
|
| Medtronic, Inc., 2.75%, 4/1/23 | | 10,000 |
| 9,676 |
|
Medtronic, Inc., 3.50%, 3/15/25(1) | | 20,000 |
| 19,958 |
|
Medtronic, Inc., 4.375%, 3/15/35(1) | | 610,000 |
| 604,650 |
|
| Zimmer Biomet Holdings, Inc., 2.70%, 4/1/20 | | 270,000 |
| 268,669 |
|
| | | | 2,830,245 |
|
| Health Care Providers and Services — 0.7% | | | |
| Aetna, Inc., 2.75%, 11/15/22 | | 10,000 |
| 9,433 |
|
| CHS / Community Health Systems, Inc., 5.125%, 8/15/18 | | 1,023,000 |
| 1,051,644 |
|
| DaVita HealthCare Partners, Inc., 5.75%, 8/15/22 | | 50,000 |
| 53,187 |
|
| DaVita HealthCare Partners, Inc., 5.125%, 7/15/24 | | 1,300,000 |
| 1,280,500 |
|
Fresenius Medical Care US Finance II, Inc., 4.125%, 10/15/20(1) | | 980,000 |
| 988,575 |
|
| HCA, Inc., 3.75%, 3/15/19 | | 530,000 |
| 535,300 |
|
| HCA, Inc., 4.25%, 10/15/19 | | 980,000 |
| 1,004,500 |
|
| HCA, Inc., 5.375%, 2/1/25 | | 940,000 |
| 951,750 |
|
| Tenet Healthcare Corp., 6.25%, 11/1/18 | | 40,000 |
| 43,550 |
|
|
| | | | | | | |
| | | Principal Amount | Value |
| UnitedHealth Group, Inc., 2.875%, 12/15/21 | | $ | 610,000 |
| $ | 609,769 |
|
Universal Health Services, Inc., 4.75%, 8/1/22(1) | | 980,000 |
| 1,011,237 |
|
| | | | 7,539,445 |
|
| Hotels, Restaurants and Leisure — 0.1% | | | |
1011778 BC ULC / New Red Finance, Inc., 4.625%, 1/15/22(1) | | 500,000 |
| 493,750 |
|
| McDonald's Corp., MTN, 4.60%, 5/26/45 | | 90,000 |
| 87,827 |
|
| Royal Caribbean Cruises Ltd., 5.25%, 11/15/22 | | 610,000 |
| 633,977 |
|
| Wyndham Worldwide Corp., 2.95%, 3/1/17 | | 20,000 |
| 20,307 |
|
| | | | 1,235,861 |
|
| Household Durables — 0.3% | | | |
| D.R. Horton, Inc., 3.625%, 2/15/18 | | 1,025,000 |
| 1,048,063 |
|
| D.R. Horton, Inc., 5.75%, 8/15/23 | | 20,000 |
| 21,250 |
|
| Lennar Corp., 4.75%, 12/15/17 | | 43,000 |
| 44,935 |
|
| Lennar Corp., 4.50%, 6/15/19 | | 850,000 |
| 871,250 |
|
| MDC Holdings, Inc., 5.50%, 1/15/24 | | 10,000 |
| 9,875 |
|
| Toll Brothers Finance Corp., 4.00%, 12/31/18 | | 45,000 |
| 46,406 |
|
| TRI Pointe Holdings, Inc., 4.375%, 6/15/19 | | 890,000 |
| 876,650 |
|
| TRI Pointe Holdings, Inc., 5.875%, 6/15/24 | | 20,000 |
| 19,700 |
|
| | | | 2,938,129 |
|
| Household Products — 0.1% | | | |
Spectrum Brands, Inc., 5.75%, 7/15/25(1) | | 500,000 |
| 510,000 |
|
| Industrial Conglomerates — 0.1% | | | |
| General Electric Co., 2.70%, 10/9/22 | | 670,000 |
| 655,444 |
|
| General Electric Co., 4.125%, 10/9/42 | | 10,000 |
| 9,608 |
|
| Ingersoll-Rand Luxembourg Finance SA, 3.55%, 11/1/24 | | 20,000 |
| 19,579 |
|
| | | | 684,631 |
|
| Insurance — 1.8% | | | |
| ACE INA Holdings, Inc., 3.15%, 3/15/25 | | 400,000 |
| 390,645 |
|
AerCap Ireland Capital Ltd. / AerCap Global Aviation Trust, 3.75%, 5/15/19(1) | | 800,000 |
| 793,000 |
|
| Allianz Finance II BV, MTN, 4.75%, 7/22/19 | EUR | 1,500,000 |
| 1,951,072 |
|
| Allianz SE, MTN, VRN, 4.75%, 10/24/23 | EUR | 1,100,000 |
| 1,322,072 |
|
| American International Group, Inc., 4.875%, 6/1/22 | | $ | 1,360,000 |
| 1,492,975 |
|
| American International Group, Inc., MTN, 5.85%, 1/16/18 | | 20,000 |
| 22,053 |
|
| Aquarius and Investments plc for Zurich Insurance Co. Ltd., MTN, VRN, 4.25%, 10/2/23 | EUR | 1,200,000 |
| 1,475,284 |
|
| AXA SA, 7.125%, 12/15/20 | GBP | 1,800,000 |
| 3,334,470 |
|
| Berkshire Hathaway Finance Corp., 3.00%, 5/15/22 | | $ | 680,000 |
| 686,451 |
|
| Berkshire Hathaway, Inc., 4.50%, 2/11/43 | | 10,000 |
| 10,013 |
|
| CNP Assurances, VRN, 4.00%, 11/18/24 | EUR | 1,500,000 |
| 1,634,978 |
|
| Generali Finance BV, MTN, VRN, 4.60%, 11/21/25 | EUR | 1,500,000 |
| 1,599,230 |
|
| Generali Finance BV, VRN, 6.21%, 6/16/16 | GBP | 50,000 |
| 79,209 |
|
| International Lease Finance Corp., 6.25%, 5/15/19 | | $ | 400,000 |
| 433,500 |
|
Liberty Mutual Group, Inc., 4.95%, 5/1/22(1) | | 10,000 |
| 10,756 |
|
Liberty Mutual Group, Inc., 4.85%, 8/1/44(1) | | 400,000 |
| 386,568 |
|
| Lincoln National Corp., 6.25%, 2/15/20 | | 20,000 |
| 23,146 |
|
| Markel Corp., 4.90%, 7/1/22 | | 290,000 |
| 310,782 |
|
|
| | | | | | | |
| | | Principal Amount | Value |
| MetLife, Inc., 4.875%, 11/13/43 | | $ | 680,000 |
| $ | 704,817 |
|
| Prudential Financial, Inc., MTN, 5.375%, 6/21/20 | | 1,360,000 |
| 1,534,742 |
|
| QBE Insurance Group Ltd., MTN, 6.125%, 9/28/15 | GBP | 50,000 |
| 79,450 |
|
TIAA Asset Management Finance Co. LLC, 4.125%, 11/1/24(1) | | $ | 10,000 |
| 10,076 |
|
| Voya Financial, Inc., 5.70%, 7/15/43 | | 10,000 |
| 11,209 |
|
| WR Berkley Corp., 4.625%, 3/15/22 | | 10,000 |
| 10,638 |
|
| XLIT Ltd., 4.45%, 3/31/25 | | 50,000 |
| 49,586 |
|
| | | | 18,356,722 |
|
| Internet Software and Services — 0.1% | | | |
| Netflix, Inc., 5.375%, 2/1/21 | | 630,000 |
| 656,775 |
|
IT Services† | | | |
| Fidelity National Information Services, Inc., 5.00%, 3/15/22 | | 10,000 |
| 10,562 |
|
| Life Sciences Tools and Services — 0.1% | | | |
| Thermo Fisher Scientific, Inc., 3.60%, 8/15/21 | | 10,000 |
| 10,182 |
|
| Thermo Fisher Scientific, Inc., 3.30%, 2/15/22 | | 10,000 |
| 9,885 |
|
| Thermo Fisher Scientific, Inc., 4.15%, 2/1/24 | | 490,000 |
| 499,498 |
|
| Thermo Fisher Scientific, Inc., 5.30%, 2/1/44 | | 320,000 |
| 338,294 |
|
| | | | 857,859 |
|
| Machinery — 0.1% | | | |
| Caterpillar Financial Services Corp., MTN, 2.85%, 6/1/22 | | 1,010,000 |
| 1,007,175 |
|
| Oshkosh Corp., 5.375%, 3/1/22 | | 20,000 |
| 20,550 |
|
| Terex Corp., 6.50%, 4/1/20 | | 20,000 |
| 21,050 |
|
| | | | 1,048,775 |
|
| Media — 1.4% | | | |
| 21st Century Fox America, Inc., 3.00%, 9/15/22 | | 320,000 |
| 312,778 |
|
| 21st Century Fox America, Inc., 4.75%, 9/15/44 | | 410,000 |
| 400,983 |
|
| CBS Corp., 3.50%, 1/15/25 | | 320,000 |
| 306,315 |
|
| CCO Holdings LLC / CCO Holdings Capital Corp., 5.25%, 9/30/22 | | 1,170,000 |
| 1,155,375 |
|
| Comcast Corp., 4.40%, 8/15/35 | | 100,000 |
| 99,186 |
|
| Comcast Corp., 6.40%, 5/15/38 | | 530,000 |
| 644,213 |
|
| Comcast Corp., 4.75%, 3/1/44 | | 10,000 |
| 10,138 |
|
| DIRECTV Holdings LLC / DIRECTV Financing Co., Inc., 5.00%, 3/1/21 | | 10,000 |
| 10,832 |
|
| DIRECTV Holdings LLC / DIRECTV Financing Co., Inc., 4.45%, 4/1/24 | | 510,000 |
| 521,378 |
|
| Discovery Communications LLC, 5.625%, 8/15/19 | | 690,000 |
| 771,682 |
|
| DISH DBS Corp., 7.125%, 2/1/16 | | 40,000 |
| 41,100 |
|
| DISH DBS Corp., 4.625%, 7/15/17 | | 980,000 |
| 1,011,850 |
|
| DISH DBS Corp., 6.75%, 6/1/21 | | 50,000 |
| 52,250 |
|
| Embarq Corp., 8.00%, 6/1/36 | | 10,000 |
| 11,112 |
|
| Interpublic Group of Cos., Inc. (The), 4.00%, 3/15/22 | | 10,000 |
| 10,232 |
|
| Lamar Media Corp., 5.375%, 1/15/24 | | 1,000,000 |
| 1,018,750 |
|
| NBCUniversal Media LLC, 5.15%, 4/30/20 | | 1,100,000 |
| 1,235,122 |
|
| NBCUniversal Media LLC, 2.875%, 1/15/23 | | 625,000 |
| 607,206 |
|
Nielsen Finance LLC / Nielsen Finance Co., 5.00%, 4/15/22(1) | | 610,000 |
| 601,613 |
|
| Scripps Networks Interactive, Inc., 2.80%, 6/15/20 | | 200,000 |
| 197,074 |
|
Sirius XM Radio, Inc., 5.375%, 4/15/25(1) | | 980,000 |
| 950,600 |
|
|
| | | | | | | |
| | | Principal Amount | Value |
| TEGNA, Inc., 5.125%, 7/15/20 | | $ | 610,000 |
| $ | 627,538 |
|
| Time Warner Cable, Inc., 6.75%, 7/1/18 | | 310,000 |
| 345,694 |
|
| Time Warner Cable, Inc., 4.50%, 9/15/42 | | 300,000 |
| 246,698 |
|
| Time Warner, Inc., 4.70%, 1/15/21 | | 420,000 |
| 453,975 |
|
| Time Warner, Inc., 3.60%, 7/15/25 | | 200,000 |
| 194,635 |
|
| Time Warner, Inc., 5.375%, 10/15/41 | | 10,000 |
| 10,260 |
|
| Time Warner, Inc., 5.35%, 12/15/43 | | 400,000 |
| 409,936 |
|
Virgin Media Secured Finance plc, 5.375%, 4/15/21(1) | | 810,000 |
| 837,844 |
|
Virgin Media Secured Finance plc, 5.25%, 1/15/26(1) | | 200,000 |
| 193,750 |
|
| Walt Disney Co. (The), MTN, 4.125%, 6/1/44 | | 680,000 |
| 668,483 |
|
| | | | 13,958,602 |
|
| Metals and Mining — 0.6% | | | |
| Alcoa, Inc., 5.125%, 10/1/24 | | 980,000 |
| 997,150 |
|
| ArcelorMittal, 6.00%, 8/5/20 | | 1,080,000 |
| 1,132,650 |
|
| Barrick Gold Corp., 4.10%, 5/1/23 | | 340,000 |
| 330,764 |
|
| Freeport-McMoRan, Inc., 4.55%, 11/14/24 | | 310,000 |
| 288,980 |
|
Glencore Finance Canada Ltd., 4.95%, 11/15/21(1) | | 10,000 |
| 10,505 |
|
| Glencore Finance Europe SA, MTN, 1.625%, 1/18/22 | EUR | 1,500,000 |
| 1,635,184 |
|
| Rio Tinto Finance USA Ltd., 3.75%, 6/15/25 | | $ | 200,000 |
| 197,294 |
|
| Steel Dynamics, Inc., 6.125%, 8/15/19 | | 980,000 |
| 1,036,350 |
|
| Vale Overseas Ltd., 5.625%, 9/15/19 | | 550,000 |
| 596,222 |
|
| | | | 6,225,099 |
|
| Multi-Utilities — 1.6% | | | |
| Berkshire Hathaway Energy Co., 3.50%, 2/1/25 | | 680,000 |
| 677,493 |
|
Calpine Corp., 5.875%, 1/15/24(1) | | 490,000 |
| 520,625 |
|
| Calpine Corp., 5.75%, 1/15/25 | | 490,000 |
| 478,362 |
|
| Consolidated Edison Co. of New York, Inc., 3.95%, 3/1/43 | | 10,000 |
| 9,117 |
|
| Constellation Energy Group, Inc., 5.15%, 12/1/20 | | 10,000 |
| 11,068 |
|
| Consumers Energy Co., 2.85%, 5/15/22 | | 10,000 |
| 10,026 |
|
| Dominion Resources, Inc., 2.75%, 9/15/22 | | 10,000 |
| 9,666 |
|
| Dominion Resources, Inc., 3.625%, 12/1/24 | | 680,000 |
| 674,610 |
|
| Dominion Resources, Inc., 4.90%, 8/1/41 | | 10,000 |
| 10,188 |
|
| Duke Energy Corp., 1.625%, 8/15/17 | | 20,000 |
| 20,082 |
|
| Duke Energy Corp., 3.55%, 9/15/21 | | 680,000 |
| 705,799 |
|
| Duke Energy Florida, Inc., 3.85%, 11/15/42 | | 10,000 |
| 9,232 |
|
| Exelon Generation Co. LLC, 4.25%, 6/15/22 | | 680,000 |
| 696,342 |
|
| Exelon Generation Co. LLC, 5.60%, 6/15/42 | | 10,000 |
| 10,192 |
|
| FirstEnergy Corp., 4.25%, 3/15/23 | | 1,180,000 |
| 1,187,823 |
|
| Florida Power & Light Co., 4.125%, 2/1/42 | | 250,000 |
| 246,533 |
|
| GDF Suez, VRN, 4.75%, 7/10/21 | EUR | 1,600,000 |
| 1,940,094 |
|
| GenOn Energy, Inc., 7.875%, 6/15/17 | | $ | 45,000 |
| 45,563 |
|
| IPALCO Enterprises, Inc., 5.00%, 5/1/18 | | 30,000 |
| 31,800 |
|
IPALCO Enterprises, Inc., 3.45%, 7/15/20(1) | | 600,000 |
| 600,000 |
|
| MidAmerican Energy Co., 4.40%, 10/15/44 | | 200,000 |
| 199,928 |
|
| NextEra Energy Capital Holdings, Inc., VRN, 7.30%, 9/1/17 | | 20,000 |
| 20,773 |
|
| Nisource Finance Corp., 5.65%, 2/1/45 | | 310,000 |
| 350,430 |
|
| NRG Energy, Inc., 7.625%, 1/15/18 | | 40,000 |
| 43,950 |
|
|
| | | | | | | |
| | | Principal Amount | Value |
| Potomac Electric Power Co., 3.60%, 3/15/24 | | $ | 10,000 |
| $ | 10,223 |
|
| Progress Energy, Inc., 3.15%, 4/1/22 | | 10,000 |
| 10,002 |
|
| RWE AG, VRN, 7.00%, 3/20/19 | GBP | 2,200,000 |
| 3,618,283 |
|
| San Diego Gas & Electric Co., 3.00%, 8/15/21 | | $ | 10,000 |
| 10,252 |
|
| Sempra Energy, 2.40%, 3/15/20 | | 20,000 |
| 19,849 |
|
| Sempra Energy, 2.875%, 10/1/22 | | 680,000 |
| 659,573 |
|
| SSE plc, VRN, 2.375%, 4/1/21 | EUR | 2,200,000 |
| 2,336,664 |
|
| Xcel Energy, Inc., 4.80%, 9/15/41 | | $ | 680,000 |
| 705,363 |
|
| | | | 15,879,905 |
|
| Multiline Retail — 0.1% | | | |
| Macy's Retail Holdings, Inc., 3.625%, 6/1/24 | | 690,000 |
| 688,402 |
|
| Target Corp., 4.00%, 7/1/42 | | 250,000 |
| 235,921 |
|
| | | | 924,323 |
|
| Oil, Gas and Consumable Fuels — 1.2% | | | |
| AmeriGas Partners LP / AmeriGas Finance Corp., 6.25%, 8/20/19 | | 10,000 |
| 10,225 |
|
| Anadarko Petroleum Corp., 5.95%, 9/15/16 | | 20,000 |
| 21,088 |
|
| BP Capital Markets plc, 4.50%, 10/1/20 | | 690,000 |
| 754,607 |
|
| California Resources Corp., 5.50%, 9/15/21 | | 980,000 |
| 853,825 |
|
| Chesapeake Energy Corp., 4.875%, 4/15/22 | | 980,000 |
| 857,500 |
|
| Cimarex Energy Co., 4.375%, 6/1/24 | | 1,000,000 |
| 996,960 |
|
| CNOOC Nexen Finance 2014 ULC, 4.25%, 4/30/24 | | 20,000 |
| 20,434 |
|
| Concho Resources, Inc., 7.00%, 1/15/21 | | 590,000 |
| 620,238 |
|
| ConocoPhillips Holding Co., 6.95%, 4/15/29 | | 10,000 |
| 12,786 |
|
| Continental Resources, Inc., 5.00%, 9/15/22 | | 20,000 |
| 19,638 |
|
| EOG Resources, Inc., 4.10%, 2/1/21 | | 10,000 |
| 10,743 |
|
| Exxon Mobil Corp., 2.71%, 3/6/25 | | 1,030,000 |
| 999,889 |
|
| Hess Corp., 6.00%, 1/15/40 | | 10,000 |
| 10,680 |
|
| Marathon Petroleum Corp., 3.50%, 3/1/16 | | 20,000 |
| 20,340 |
|
| Newfield Exploration Co., 5.75%, 1/30/22 | | 1,230,000 |
| 1,260,750 |
|
| Newfield Exploration Co., 5.625%, 7/1/24 | | 50,000 |
| 50,750 |
|
| Noble Energy, Inc., 4.15%, 12/15/21 | | 217,000 |
| 226,130 |
|
| Occidental Petroleum Corp., 4.625%, 6/15/45 | | 960,000 |
| 954,314 |
|
| Peabody Energy Corp., 6.50%, 9/15/20 | | 25,000 |
| 8,625 |
|
| Pemex Project Funding Master Trust, 6.625%, 6/15/35 | | 720,000 |
| 772,200 |
|
| Petrobras Global Finance BV, 5.75%, 1/20/20 | | 10,000 |
| 9,933 |
|
| Petrobras Global Finance BV, 5.375%, 1/27/21 | | 20,000 |
| 19,296 |
|
| Petrobras Global Finance BV, 6.25%, 3/17/24 | | 240,000 |
| 232,313 |
|
| Phillips 66, 4.30%, 4/1/22 | | 10,000 |
| 10,500 |
|
| Phillips 66, 4.65%, 11/15/34 | | 520,000 |
| 508,806 |
|
| Shell International Finance BV, 2.375%, 8/21/22 | | 690,000 |
| 667,238 |
|
| Shell International Finance BV, 3.25%, 5/11/25 | | 230,000 |
| 227,880 |
|
Sinopec Group Overseas Development 2015 Ltd., 2.50%, 4/28/20(1) | | 600,000 |
| 593,772 |
|
| Statoil ASA, 2.45%, 1/17/23 | | 10,000 |
| 9,589 |
|
| Suburban Propane Partners LP / Suburban Energy Finance Corp., 5.75%, 3/1/25 | | 10,000 |
| 10,025 |
|
| Talisman Energy, Inc., 7.75%, 6/1/19 | | 10,000 |
| 11,470 |
|
|
| | | | | | | |
| | | Principal Amount | Value |
| Tesoro Corp., 5.375%, 10/1/22 | | $ | 490,000 |
| $ | 499,800 |
|
| Total Capital Canada Ltd., 2.75%, 7/15/23 | | 680,000 |
| 656,832 |
|
| Whiting Petroleum Corp., 5.00%, 3/15/19 | | 620,000 |
| 612,250 |
|
| | | | 12,551,426 |
|
| Paper and Forest Products — 0.1% | | | |
Georgia-Pacific LLC, 2.54%, 11/15/19(1) | | 20,000 |
| 19,985 |
|
Georgia-Pacific LLC, 5.40%, 11/1/20(1) | | 710,000 |
| 792,758 |
|
| International Paper Co., 6.00%, 11/15/41 | | 210,000 |
| 226,454 |
|
| | | | 1,039,197 |
|
| Pharmaceuticals — 0.4% | | | |
| AbbVie, Inc., 1.75%, 11/6/17 | | 20,000 |
| 20,069 |
|
| AbbVie, Inc., 2.90%, 11/6/22 | | 1,020,000 |
| 988,382 |
|
| AbbVie, Inc., 3.60%, 5/14/25 | | 290,000 |
| 286,778 |
|
| Actavis Funding SCS, 3.85%, 6/15/24 | | 1,360,000 |
| 1,344,223 |
|
| Actavis Funding SCS, 4.55%, 3/15/35 | | 10,000 |
| 9,510 |
|
| Actavis, Inc., 1.875%, 10/1/17 | | 20,000 |
| 20,031 |
|
Baxalta, Inc., 4.00%, 6/23/25(1) | | 650,000 |
| 647,065 |
|
Forest Laboratories LLC, 4.875%, 2/15/21(1) | | 20,000 |
| 21,690 |
|
Roche Holdings, Inc., 3.35%, 9/30/24(1) | | 10,000 |
| 10,093 |
|
Valeant Pharmaceuticals International, Inc., 6.75%, 8/15/18(1) | | 980,000 |
| 1,029,612 |
|
Valeant Pharmaceuticals International, Inc., 6.125%, 4/15/25(1) | | 230,000 |
| 237,475 |
|
| | | | 4,614,928 |
|
| Real Estate Investment Trusts (REITs) — 0.2% | | | |
| American Tower Corp., 5.05%, 9/1/20 | | 10,000 |
| 10,869 |
|
| DDR Corp., 4.75%, 4/15/18 | | 10,000 |
| 10,671 |
|
| DDR Corp., 3.625%, 2/1/25 | | 50,000 |
| 48,037 |
|
| Essex Portfolio LP, 3.625%, 8/15/22 | | 10,000 |
| 10,030 |
|
| Health Care REIT, Inc., 3.75%, 3/15/23 | | 10,000 |
| 9,904 |
|
| Hospitality Properties Trust, 4.65%, 3/15/24 | | 20,000 |
| 19,963 |
|
| Hospitality Properties Trust, 4.50%, 3/15/25 | | 710,000 |
| 698,712 |
|
| Host Hotels & Resorts LP, 3.75%, 10/15/23 | | 410,000 |
| 402,385 |
|
| Kilroy Realty LP, 3.80%, 1/15/23 | | 10,000 |
| 9,977 |
|
| Realty Income Corp., 4.125%, 10/15/26 | | 680,000 |
| 684,765 |
|
| Senior Housing Properties Trust, 4.75%, 5/1/24 | | 10,000 |
| 10,050 |
|
| Ventas Realty LP / Ventas Capital Corp., 4.75%, 6/1/21 | | 10,000 |
| 10,839 |
|
| | | | 1,926,202 |
|
| Real Estate Management and Development — 0.2% | | | |
| Tesco Property Finance 3 plc, 5.74%, 4/13/40 | GBP | 1,083,789 |
| 1,640,803 |
|
| Road and Rail — 0.2% | | | |
| Burlington Northern Santa Fe LLC, 3.60%, 9/1/20 | | $ | 20,000 |
| 20,918 |
|
| Burlington Northern Santa Fe LLC, 4.45%, 3/15/43 | | 10,000 |
| 9,702 |
|
| Burlington Northern Santa Fe LLC, 4.15%, 4/1/45 | | 500,000 |
| 462,790 |
|
| CSX Corp., 4.25%, 6/1/21 | | 10,000 |
| 10,820 |
|
| CSX Corp., 3.40%, 8/1/24 | | 690,000 |
| 690,771 |
|
| Union Pacific Corp., 4.00%, 2/1/21 | | 310,000 |
| 334,607 |
|
| Union Pacific Corp., 4.75%, 9/15/41 | | 300,000 |
| 311,715 |
|
| | | | 1,841,323 |
|
|
| | | | | | | |
| | | Principal Amount | Value |
| Semiconductors and Semiconductor Equipment — 0.1% | | | |
| Intel Corp., 1.35%, 12/15/17 | | $ | 20,000 |
| $ | 20,001 |
|
NXP BV / NXP Funding LLC, 3.50%, 9/15/16(1) | | 45,000 |
| 45,563 |
|
NXP BV / NXP Funding LLC, 4.125%, 6/15/20(1) | | 500,000 |
| 505,000 |
|
| | | | 570,564 |
|
| Software — 0.4% | | | |
Activision Blizzard, Inc., 5.625%, 9/15/21(1) | | 980,000 |
| 1,029,000 |
|
| Microsoft Corp., 2.70%, 2/12/25 | | 1,360,000 |
| 1,310,122 |
|
| Oracle Corp., 3.625%, 7/15/23 | | 1,010,000 |
| 1,038,332 |
|
| Oracle Corp., 2.95%, 5/15/25 | | 600,000 |
| 577,749 |
|
| | | | 3,955,203 |
|
| Specialty Retail — 0.3% | | | |
| Home Depot, Inc. (The), 5.95%, 4/1/41 | | 680,000 |
| 826,760 |
|
| Sally Holdings LLC / Sally Capital, Inc., 6.875%, 11/15/19 | | 980,000 |
| 1,029,000 |
|
| Sonic Automotive, Inc., 7.00%, 7/15/22 | | 50,000 |
| 54,375 |
|
| United Rentals North America, Inc., 5.75%, 11/15/24 | | 980,000 |
| 970,200 |
|
| | | | 2,880,335 |
|
| Technology Hardware, Storage and Peripherals — 0.2% | | | |
| Apple, Inc., 2.85%, 5/6/21 | | 1,020,000 |
| 1,034,736 |
|
| Apple, Inc., 3.20%, 5/13/25 | | 530,000 |
| 527,087 |
|
| Dell, Inc., 2.30%, 9/10/15 | | 45,000 |
| 45,056 |
|
| Dell, Inc., 3.10%, 4/1/16 | | 45,000 |
| 45,112 |
|
| Hewlett-Packard Co., 4.30%, 6/1/21 | | 20,000 |
| 20,780 |
|
| Seagate HDD Cayman, 4.75%, 6/1/23 | | 530,000 |
| 540,285 |
|
| | | | 2,213,056 |
|
Textiles, Apparel and Luxury Goods† | | | |
| Hanesbrands, Inc., 6.375%, 12/15/20 | | 41,000 |
| 43,050 |
|
| L Brands, Inc., 6.625%, 4/1/21 | | 40,000 |
| 44,175 |
|
| | | | 87,225 |
|
| Wireless Telecommunication Services — 0.3% | | | |
| America Movil SAB de CV, 3.125%, 7/16/22 | | 240,000 |
| 237,394 |
|
| Sprint Communications, 6.00%, 12/1/16 | | 1,020,000 |
| 1,058,887 |
|
Sprint Communications, 9.00%, 11/15/18(1) | | 990,000 |
| 1,120,442 |
|
| T-Mobile USA, Inc., 6.625%, 4/1/23 | | 590,000 |
| 614,338 |
|
| | | | 3,031,061 |
|
TOTAL CORPORATE BONDS (Cost $284,051,797) | | | 279,372,251 |
|
| U.S. TREASURY SECURITIES — 11.8% | | | |
| U.S. Treasury Bonds, 3.50%, 2/15/39 | | 3,600,000 |
| 3,864,938 |
|
| U.S. Treasury Bonds, 2.875%, 5/15/43 | | 750,000 |
| 711,446 |
|
| U.S. Treasury Bonds, 2.50%, 2/15/45 | | 7,050,000 |
| 6,176,463 |
|
U.S. Treasury Notes, 0.50%, 2/28/17(3) | | 78,000,000 |
| 77,926,836 |
|
| U.S. Treasury Notes, 1.00%, 3/15/18 | | 25,000,000 |
| 25,046,875 |
|
| U.S. Treasury Notes, 1.50%, 5/31/20 | | 5,000,000 |
| 4,967,970 |
|
TOTAL U.S. TREASURY SECURITIES (Cost $119,301,498) | | | 118,694,528 |
|
|
| | | | | | | |
| | | Principal Amount | Value |
U.S. GOVERNMENT AGENCY MORTGAGE-BACKED SECURITIES(4) — 11.2% | |
| Adjustable-Rate U.S. Government Agency Mortgage-Backed Securities — 2.0% | |
| FHLMC, VRN, 1.75%, 7/15/15 | | $ | 74,015 |
| $ | 75,873 |
|
| FHLMC, VRN, 1.84%, 7/15/15 | | 92,932 |
| 95,529 |
|
| FHLMC, VRN, 1.96%, 7/15/15 | | 54,940 |
| 56,796 |
|
| FHLMC, VRN, 1.98%, 7/15/15 | | 39,673 |
| 40,912 |
|
| FHLMC, VRN, 2.07%, 7/15/15 | | 24,507 |
| 24,918 |
|
| FHLMC, VRN, 2.26%, 7/15/15 | | 21,933 |
| 23,458 |
|
| FHLMC, VRN, 2.33%, 7/15/15 | | 86,927 |
| 87,864 |
|
| FHLMC, VRN, 2.40%, 7/15/15 | | 19,917 |
| 21,314 |
|
| FHLMC, VRN, 2.42%, 7/15/15 | | 3,902,816 |
| 4,169,906 |
|
| FHLMC, VRN, 2.87%, 7/15/15 | | 37,478 |
| 38,545 |
|
| FHLMC, VRN, 3.01%, 7/15/15 | | 18,324 |
| 19,527 |
|
| FHLMC, VRN, 3.24%, 7/15/15 | | 4,494 |
| 4,796 |
|
| FHLMC, VRN, 3.29%, 7/15/15 | | 41,540 |
| 44,153 |
|
| FHLMC, VRN, 3.73%, 7/15/15 | | 8,432 |
| 8,812 |
|
| FHLMC, VRN, 4.20%, 7/15/15 | | 67,809 |
| 71,363 |
|
| FHLMC, VRN, 4.74%, 7/15/15 | | 3,607 |
| 3,804 |
|
| FHLMC, VRN, 5.13%, 7/15/15 | | 5,631 |
| 5,999 |
|
| FHLMC, VRN, 5.78%, 7/15/15 | | 13,305 |
| 14,230 |
|
| FHLMC, VRN, 5.93%, 7/15/15 | | 7,816 |
| 8,333 |
|
| FHLMC, VRN, 6.12%, 7/15/15 | | 5,720 |
| 6,138 |
|
| FNMA, VRN, 1.89%, 7/25/15 | | 2,797,382 |
| 2,936,105 |
|
| FNMA, VRN, 1.92%, 7/25/15 | | 5,392,173 |
| 5,671,027 |
|
| FNMA, VRN, 1.94%, 7/25/15 | | 3,494,506 |
| 3,679,736 |
|
| FNMA, VRN, 1.94%, 7/25/15 | | 2,741,915 |
| 2,887,253 |
|
| FNMA, VRN, 2.34%, 7/25/15 | | 50,409 |
| 53,723 |
|
| FNMA, VRN, 2.71%, 7/25/15 | | 19,116 |
| 19,588 |
|
| FNMA, VRN, 3.68%, 7/25/15 | | 8,536 |
| 8,954 |
|
| FNMA, VRN, 3.92%, 7/25/15 | | 10,695 |
| 11,307 |
|
| FNMA, VRN, 5.06%, 7/25/15 | | 7,391 |
| 7,944 |
|
| FNMA, VRN, 6.05%, 7/25/15 | | 10,442 |
| 11,262 |
|
| | | | 20,109,169 |
|
| Fixed-Rate U.S. Government Agency Mortgage-Backed Securities — 9.2% | |
| FHLMC, 6.00%, 2/1/38 | | 4,772 |
| 5,404 |
|
| FHLMC, 4.00%, 12/1/40 | | 9,683 |
| 10,290 |
|
FNMA, 3.00%, 7/14/15(5) | | 3,715,000 |
| 3,692,651 |
|
FNMA, 3.50%, 7/14/15(5) | | 6,721,000 |
| 6,913,572 |
|
FNMA, 4.00%, 7/14/15(5) | | 14,355,000 |
| 15,190,226 |
|
FNMA, 4.50%, 7/14/15(5) | | 4,377,500 |
| 4,729,752 |
|
FNMA, 5.00%, 7/14/15(5) | | 2,257,500 |
| 2,493,687 |
|
FNMA, 5.50%, 7/14/15(5) | | 3,712,000 |
| 4,168,808 |
|
| FNMA, 6.625%, 11/15/30 | | 2,500,000 |
| 3,530,760 |
|
| FNMA, 5.00%, 7/1/31 | | 55,880 |
| 61,984 |
|
| FNMA, 5.50%, 5/1/33 | | 14,234 |
| 16,056 |
|
| FNMA, 5.00%, 9/1/33 | | 2,135,075 |
| 2,365,152 |
|
| FNMA, 5.00%, 11/1/33 | | 12,425 |
| 13,772 |
|
|
| | | | | | | |
| | | Principal Amount | Value |
| FNMA, 5.00%, 9/1/35 | | $ | 45,133 |
| $ | 49,882 |
|
| FNMA, 6.00%, 4/1/37 | | 14,206 |
| 16,246 |
|
| FNMA, 6.00%, 7/1/37 | | 17,579 |
| 20,187 |
|
| FNMA, 6.00%, 8/1/37 | | 13,301 |
| 15,195 |
|
| FNMA, 5.50%, 1/1/39 | | 31,503 |
| 35,336 |
|
| FNMA, 5.50%, 3/1/39 | | 3,930 |
| 4,411 |
|
| FNMA, 4.50%, 5/1/39 | | 3,307,565 |
| 3,599,624 |
|
| FNMA, 5.00%, 8/1/39 | | 7,969 |
| 8,881 |
|
| FNMA, 4.50%, 3/1/40 | | 3,903,218 |
| 4,229,716 |
|
| FNMA, 5.00%, 8/1/40 | | 2,431,466 |
| 2,691,576 |
|
| FNMA, 3.50%, 10/1/40 | | 4,630,182 |
| 4,775,889 |
|
| FNMA, 3.50%, 12/1/40 | | 57,318 |
| 59,126 |
|
| FNMA, 4.50%, 9/1/41 | | 29,971 |
| 32,509 |
|
| FNMA, 3.50%, 5/1/42 | | 72,877 |
| 75,210 |
|
| FNMA, 3.50%, 6/1/42 | | 40,410 |
| 41,711 |
|
| FNMA, 3.50%, 9/1/42 | | 36,846 |
| 38,036 |
|
| FNMA, 3.00%, 11/1/42 | | 42,227 |
| 42,211 |
|
| FNMA, 3.00%, 5/1/43 | | 5,629,548 |
| 5,623,952 |
|
GNMA, 3.00%, 7/20/15(5) | | 4,665,000 |
| 4,700,808 |
|
GNMA, 3.50%, 7/20/15(5) | | 3,907,500 |
| 4,048,077 |
|
GNMA, 4.00%, 7/20/15(5) | | 9,635,000 |
| 10,199,551 |
|
GNMA, 4.50%, 7/20/15(5) | | 1,620,000 |
| 1,746,816 |
|
| GNMA, 6.00%, 7/15/33 | | 7,000 |
| 8,185 |
|
| GNMA, 5.00%, 3/20/36 | | 59,604 |
| 66,572 |
|
| GNMA, 5.50%, 1/15/39 | | 6,267 |
| 7,243 |
|
| GNMA, 5.50%, 9/15/39 | | 43,950 |
| 50,228 |
|
| GNMA, 4.50%, 10/15/39 | | 17,894 |
| 19,655 |
|
| GNMA, 5.00%, 10/15/39 | | 26,888 |
| 30,307 |
|
| GNMA, 4.50%, 1/15/40 | | 25,055 |
| 27,221 |
|
| GNMA, 4.00%, 12/15/40 | | 23,932 |
| 25,490 |
|
| GNMA, 4.50%, 12/15/40 | | 73,483 |
| 80,690 |
|
| GNMA, 4.50%, 7/20/41 | | 3,589,599 |
| 3,918,005 |
|
| GNMA, 4.00%, 12/15/41 | | 39,330 |
| 41,870 |
|
| GNMA, 3.50%, 6/20/42 | | 3,270,875 |
| 3,399,502 |
|
| | | | 92,922,032 |
|
TOTAL U.S. GOVERNMENT AGENCY MORTGAGE-BACKED SECURITIES (Cost $113,895,067) | 113,031,201 |
|
COLLATERALIZED MORTGAGE OBLIGATIONS(4) — 5.5% | | | |
| Banc of America Funding Corp., Series 2004-2, Class 3A1, 5.50%, 9/20/34 | | 12,088 |
| 12,522 |
|
| Banc of America Mortgage Securities, Inc., Series 2005-1, Class 1A15, 5.50%, 2/25/35 | | 5,611 |
| 5,877 |
|
| Banc of America Mortgage Securities, Inc., Series 2007-1, Class 1A16, 5.625%, 3/25/37 | | 55,371 |
| 50,135 |
|
| Banc of America Mortgage Trust, Series 2006-A, Class 2A1, VRN, 2.64%, 7/1/15 | | 3,584,712 |
| 3,233,661 |
|
| Bear Stearns Adjustable Rate Mortgage Trust, Series 2004-12, Class 2A1, VRN, 2.70%, 7/1/15 | | 7,420 |
| 7,429 |
|
| Bear Stearns Adjustable Rate Mortgage Trust, Series 2005-6, Class 1A1, VRN, 2.60%, 7/1/15 | | 3,779,422 |
| 3,408,801 |
|
|
| | | | | | | |
| | | Principal Amount | Value |
| Chase Mortgage Finance Trust, Series 2007-A2, Class 6A2 SEQ, VRN, 2.52%, 7/1/15 | | $ | 3,766,015 |
| $ | 3,344,059 |
|
| Citigroup Mortgage Loan Trust, Inc., Series 2004-UST1, Class A5, VRN, 1.98%, 7/1/15 | | 2,593,707 |
| 2,557,469 |
|
| Citigroup Mortgage Loan Trust, Inc., Series 2005-4, Class A, VRN, 5.11%, 7/1/15 | | 88,860 |
| 87,855 |
|
| Countrywide Home Loan Mortgage Pass-Through Trust, Series 2004-4, Class A19, 5.25%, 5/25/34 | | 8,021 |
| 8,495 |
|
| First Horizon Mortgage Pass-Through Trust, Series 2005-AR3, Class 4A1, VRN, 3.94%, 7/1/15 | | 6,653 |
| 6,369 |
|
| First Horizon Mortgage Pass-Through Trust, Series 2006-AR4, Class 1A2, VRN, 2.55%, 7/1/15 | | 984,747 |
| 878,230 |
|
| GSR Mortgage Loan Trust, Series 2005-6F, Class 1A5 SEQ, 5.25%, 7/25/35 | | 28,850 |
| 29,922 |
|
| GSR Mortgage Loan Trust, Series 2005-AR6, Class 2A1, VRN, 2.68%, 7/1/15 | | 1,900,767 |
| 1,909,573 |
|
| GSR Mortgage Loan Trust, Series 2005-AR6, Class 4A5, VRN, 2.72%, 7/1/15 | | 1,723,221 |
| 1,740,200 |
|
| JPMorgan Mortgage Trust, Series 2005-A4, Class 2A1, VRN, 2.67%, 7/1/15 | | 1,258,024 |
| 1,253,247 |
|
| JPMorgan Mortgage Trust, Series 2005-A6, Class 7A1, VRN, 2.53%, 7/1/15 | | 1,525,889 |
| 1,451,328 |
|
| JPMorgan Mortgage Trust, Series 2006-A3, Class 7A1, VRN, 2.61%, 7/1/15 | | 18,345 |
| 18,512 |
|
| JPMorgan Mortgage Trust, Series 2006-S1, Class 1A2, VRN, 6.50%, 7/1/15 | | 603,698 |
| 640,776 |
|
| MASTR Adjustable Rate Mortgages Trust, Series 2004-13, Class 3A7, VRN, 2.70%, 7/1/15 | | 2,376,705 |
| 2,440,839 |
|
| Merrill Lynch Mortgage Investors Trust, Series 2005-A2, Class A1, VRN, 2.46%, 7/1/15 | | 1,812,026 |
| 1,783,680 |
|
| Merrill Lynch Mortgage Investors Trust, Series 2005-A2, Class A2, VRN, 2.46%, 7/1/15 | | 918,735 |
| 925,823 |
|
| PHHMC Mortgage Pass-Through Certificates, Series 2007-6, Class A1, VRN, 5.36%, 7/1/15 | | 3,488 |
| 3,476 |
|
| Structured Adjustable Rate Mortgage Loan Trust, Series 2004-8, Class 2A1, VRN, 2.42%, 7/1/15 | | 3,740,075 |
| 3,741,657 |
|
| WaMu Mortgage Pass-Through Certificates, Series 2005-AR4, Class A5, VRN, 2.46%, 7/1/15 | | 2,775,443 |
| 2,733,369 |
|
| Wells Fargo Mortgage-Backed Securities Trust, Series 2004-A, Class A1, VRN, 2.64%, 7/1/15 | | 17,930 |
| 17,985 |
|
| Wells Fargo Mortgage-Backed Securities Trust, Series 2004-K, Class 2A6, VRN, 2.73%, 7/1/15 | | 43,769 |
| 44,128 |
|
| Wells Fargo Mortgage-Backed Securities Trust, Series 2004-Z, Class 2A2, VRN, 2.61%, 7/1/15 | | 47,810 |
| 48,156 |
|
| Wells Fargo Mortgage-Backed Securities Trust, Series 2005-17, Class 1A1, 5.50%, 1/25/36 | | 22,155 |
| 22,754 |
|
| Wells Fargo Mortgage-Backed Securities Trust, Series 2005-18, Class 1A1, 5.50%, 1/25/36 | | 57,246 |
| 55,633 |
|
| Wells Fargo Mortgage-Backed Securities Trust, Series 2005-AR10, Class 1A1, VRN, 2.66%, 7/1/15 | | 44,633 |
| 45,726 |
|
| Wells Fargo Mortgage-Backed Securities Trust, Series 2005-AR10, Class 2A17, VRN, 2.65%, 7/1/15 | | 38,949 |
| 39,769 |
|
| Wells Fargo Mortgage-Backed Securities Trust, Series 2005-AR12, Class 2A6, VRN, 2.65%, 7/1/15 | | 1,070,934 |
| 1,098,918 |
|
| Wells Fargo Mortgage-Backed Securities Trust, Series 2005-AR16, Class 3A2, VRN, 2.64%, 7/1/15 | | 11,947 |
| 12,068 |
|
|
| | | | | | | |
| | | Principal Amount | Value |
| Wells Fargo Mortgage-Backed Securities Trust, Series 2005-AR16, Class 4A8, VRN, 2.69%, 7/1/15 | | $ | 5,000,000 |
| $ | 4,836,400 |
|
| Wells Fargo Mortgage-Backed Securities Trust, Series 2005-AR2, Class 3A1, VRN, 2.61%, 7/1/15 | | 59,222 |
| 60,101 |
|
| Wells Fargo Mortgage-Backed Securities Trust, Series 2006-10, Class A4 SEQ, 6.00%, 8/25/36 | | 56,718 |
| 58,362 |
|
| Wells Fargo Mortgage-Backed Securities Trust, Series 2006-11, Class A9 SEQ, 6.50%, 9/25/36 | | 67,059 |
| 65,454 |
|
| Wells Fargo Mortgage-Backed Securities Trust, Series 2006-13, Class A5, 6.00%, 10/25/36 | | 946,224 |
| 985,195 |
|
| Wells Fargo Mortgage-Backed Securities Trust, Series 2006-14, Class A1, 6.00%, 10/25/36 | | 64,906 |
| 65,091 |
|
| Wells Fargo Mortgage-Backed Securities Trust, Series 2006-8, Class A10 SEQ, 6.00%, 7/25/36 | | 56,691 |
| 57,376 |
|
| Wells Fargo Mortgage-Backed Securities Trust, Series 2006-8, Class A9 SEQ, 6.00%, 7/25/36 | | 45,352 |
| 45,901 |
|
| Wells Fargo Mortgage-Backed Securities Trust, Series 2006-AR1, Class 1A1, VRN, 5.60%, 7/1/15 | | 70,548 |
| 68,014 |
|
| Wells Fargo Mortgage-Backed Securities Trust, Series 2006-AR10, Class 1A1, VRN, 2.68%, 7/1/15 | | 2,972,593 |
| 2,931,623 |
|
| Wells Fargo Mortgage-Backed Securities Trust, Series 2006-AR10, Class 5A1, VRN, 2.72%, 7/1/15 | | 3,125,770 |
| 3,036,270 |
|
| Wells Fargo Mortgage-Backed Securities Trust, Series 2006-AR10, Class 5A4 SEQ, VRN, 2.72%, 7/1/15 | | 23,568 |
| 22,893 |
|
| Wells Fargo Mortgage-Backed Securities Trust, Series 2006-AR10, Class 5A5 SEQ, VRN, 2.72%, 7/1/15 | | 23,568 |
| 22,893 |
|
| Wells Fargo Mortgage-Backed Securities Trust, Series 2006-AR10, Class 5A6 SEQ, VRN, 2.72%, 7/1/15 | | 22,527 |
| 21,882 |
|
| Wells Fargo Mortgage-Backed Securities Trust, Series 2006-AR12, Class 1A1, VRN, 2.50%, 7/1/15 | | 47,308 |
| 44,363 |
|
| Wells Fargo Mortgage-Backed Securities Trust, Series 2006-AR14, Class 1A7 SEQ, VRN, 5.81%, 7/1/15 | | 4,850,833 |
| 4,738,827 |
|
| Wells Fargo Mortgage-Backed Securities Trust, Series 2006-AR14, Class 2A1, VRN, 2.63%, 7/1/15 | | 16,023 |
| 14,975 |
|
| Wells Fargo Mortgage-Backed Securities Trust, Series 2006-AR15, Class A1, VRN, 2.62%, 7/1/15 | | 12,288 |
| 11,400 |
|
| Wells Fargo Mortgage-Backed Securities Trust, Series 2006-AR16, Class A1, VRN, 2.53%, 7/1/15 | | 40,008 |
| 37,572 |
|
| Wells Fargo Mortgage-Backed Securities Trust, Series 2006-AR19, Class A1, VRN, 5.59%, 7/1/15 | | 941,330 |
| 914,216 |
|
| Wells Fargo Mortgage-Backed Securities Trust, Series 2006-AR2, Class 2A3, VRN, 2.62%, 7/1/15 | | 63,345 |
| 62,700 |
|
| Wells Fargo Mortgage-Backed Securities Trust, Series 2006-AR5, Class 2A1, VRN, 2.71%, 7/1/15 | | 92,051 |
| 87,114 |
|
| Wells Fargo Mortgage-Backed Securities Trust, Series 2007-10, Class 1A5, 6.00%, 7/25/37 | | 64,242 |
| 64,311 |
|
| Wells Fargo Mortgage-Backed Securities Trust, Series 2007-11, Class A3 SEQ, 6.00%, 8/25/37 | | 84,831 |
| 83,937 |
|
| Wells Fargo Mortgage-Backed Securities Trust, Series 2007-12, Class A7, 5.50%, 9/25/37 | | 41,718 |
| 43,090 |
|
| Wells Fargo Mortgage-Backed Securities Trust, Series 2007-13, Class A1, 6.00%, 9/25/37 | | 65,087 |
| 67,668 |
|
| Wells Fargo Mortgage-Backed Securities Trust, Series 2007-14, Class 2A2, 5.50%, 10/25/22 | | 25,281 |
| 26,161 |
|
| Wells Fargo Mortgage-Backed Securities Trust, Series 2007-15, Class A1, 6.00%, 11/25/37 | | 23,676 |
| 23,495 |
|
|
| | | | | | | |
| | | Principal Amount | Value |
| Wells Fargo Mortgage-Backed Securities Trust, Series 2007-16, Class 1A1, 6.00%, 12/28/37 | | $ | 37,636 |
| $ | 38,978 |
|
| Wells Fargo Mortgage-Backed Securities Trust, Series 2007-3, Class 3A1, 5.50%, 4/25/22 | | 1,898 |
| 1,963 |
|
| Wells Fargo Mortgage-Backed Securities Trust, Series 2007-8, Class 2A2, 6.00%, 7/25/37 | | 41,696 |
| 41,141 |
|
| Wells Fargo Mortgage-Backed Securities Trust, Series 2007-AR7, Class A1, VRN, 2.58%, 7/1/15 | | 3,119,807 |
| 2,902,574 |
|
| Wells Fargo Mortgage-Backed Securities Trust, Series 2008-1, Class 4A1, 5.75%, 2/25/38 | | 29,583 |
| 31,281 |
|
TOTAL COLLATERALIZED MORTGAGE OBLIGATIONS (Cost $55,228,245) | | | 55,171,662 |
|
COMMERCIAL MORTGAGE-BACKED SECURITIES(4) — 4.5% | |
Bank of America Merrill Lynch Commercial Mortgage Securities Trust, Series 2014-ICTS, Class A, VRN, 0.99%, 7/15/15(1) | | 3,525,000 |
| 3,518,244 |
|
Bank of America Merrill Lynch Commercial Mortgage Securities Trust, Series 2015-200P, Class B, VRN, 3.49%, 7/1/15(1) | | 3,500,000 |
| 3,447,323 |
|
BB-UBS Trust, Series 2012-SHOW, Class A SEQ, 3.43%, 11/5/36(1) | | 3,000,000 |
| 2,992,808 |
|
BLCP Hotel Trust, Series 2014-CLRN, Class A, VRN, 1.14%, 7/15/15(1) | | 1,125,000 |
| 1,125,057 |
|
Commercial Mortgage Pass-Through Certificates, Series 2014-BBG, Class A, VRN, 0.99%, 7/15/15(1) | | 1,100,000 |
| 1,099,560 |
|
| Commercial Mortgage Pass-Through Certificates, Series 2014-CR15, Class B, VRN, 4.87%, 7/1/15 | | 2,105,000 |
| 2,309,207 |
|
| Commercial Mortgage Pass-Through Certificates, Series 2014-LC17, Class B, VRN, 4.49%, 7/1/15 | | 100,000 |
| 104,794 |
|
| Commercial Mortgage Pass-Through Certificates, Series 2015-CR22, Class AM, 3.60%, 3/10/48 | | 1,000,000 |
| 998,182 |
|
| Commercial Mortgage Trust, Series 2014-LC17, Class C, VRN, 4.72%, 7/1/15 | | 1,960,000 |
| 1,985,938 |
|
| Commercial Mortgage Trust, Series 2014-UBS5, Class C, VRN, 4.77%, 7/1/15 | | 3,150,000 |
| 3,173,272 |
|
| Commercial Mortgage Trust, Series 2015-CR22, Class B, 3.93%, 3/10/48 | | 2,500,000 |
| 2,480,100 |
|
Core Industrial Trust, Series 2015-CALW, Class B, 3.25%, 2/10/34(1) | | 3,500,000 |
| 3,497,354 |
|
Core Industrial Trust, Series 2015-TEXW, Class B, 3.33%, 2/10/34(1) | | 2,825,000 |
| 2,819,603 |
|
Core Industrial Trust, Series 2015-WEST, Class A, 3.29%, 2/10/37(1) | | 3,600,000 |
| 3,550,806 |
|
| GS Mortgage Securities Corp. II, Series 2015-GC28, Class AS, 3.76%, 2/10/48 | | 2,000,000 |
| 2,005,810 |
|
Irvine Core Office Trust, Series 2013-IRV, Class A2 SEQ, VRN, 3.28%, 7/10/15(1) | | 3,690,000 |
| 3,719,634 |
|
| JPMBB Commercial Mortgage Securities Trust, Series 2014-C21, Class B, VRN, 4.34%, 7/1/15 | | 1,050,000 |
| 1,088,397 |
|
JPMorgan Chase Commercial Mortgage Securities Corp., Series 2014-CBM, Class A, VRN, 1.09%, 7/15/15(1) | | 2,950,000 |
| 2,937,606 |
|
| JPMorgan Chase Commercial Mortgage Securities Trust, Series 2013-C16, Class AS, 4.52%, 12/15/46 | | 50,000 |
| 54,195 |
|
Morgan Stanley Capital I Trust, Series 2014-CPT, Class C, VRN, 3.56%, 7/1/15(1) | | 75,000 |
| 75,299 |
|
Morgan Stanley Capital I Trust, Series 2014-CPT, Class E, VRN, 3.56%, 7/1/15(1) | | 1,960,000 |
| 1,937,197 |
|
TOTAL COMMERCIAL MORTGAGE-BACKED SECURITIES (Cost $46,253,769) | 44,920,386 |
|
|
| | | | | | | |
| | | Principal Amount | Value |
ASSET-BACKED SECURITIES(4) — 1.4% | | | |
Avis Budget Rental Car Funding AESOP LLC, Series 2012-2A, Class A SEQ, 2.80%, 5/20/18(1) | | $ | 2,100,000 |
| $ | 2,150,016 |
|
Avis Budget Rental Car Funding AESOP LLC, Series 2013-1A, Class B, 2.62%, 9/20/19(1) | | 75,000 |
| 75,289 |
|
Avis Budget Rental Car Funding AESOP LLC, Series 2015-2A, Class B, 3.42%, 12/20/21(1) | | 2,000,000 |
| 1,995,788 |
|
| Chase Issuance Trust, Series 2007-B1, Class B1, VRN, 0.44%, 7/15/15 | | 2,600,000 |
| 2,585,014 |
|
Hertz Fleet Lease Funding LP, Series 2014-1, Class A, VRN, 0.59%, 7/10/15(1) | | 90,965 |
| 90,867 |
|
Hilton Grand Vacations Trust, Series 2014-AA, Class A SEQ, 1.77%, 11/25/26(1) | | 77,255 |
| 76,673 |
|
| John Deere Owner Trust, Series 2014-A, Class A3 SEQ, 0.92%, 4/16/18 | | 75,000 |
| 75,069 |
|
Marriott Vacation Club Owner Trust, Series 2012-1A, Class A SEQ, 2.51%, 5/20/30(1) | | 2,637,977 |
| 2,666,836 |
|
MVW Owner Trust, Series 2014-1A, Class B, 2.70%, 9/22/31(1) | | 168,454 |
| 167,345 |
|
Sierra Timeshare Receivables Funding LLC, Series 2013-1A, Class A SEQ, 1.59%, 11/20/29(1) | | 2,279,876 |
| 2,262,336 |
|
Sierra Timeshare Receivables Funding LLC, Series 2013-2A, Class A SEQ, 2.28%, 11/20/25(1) | | 1,947,695 |
| 1,969,056 |
|
Sierra Timeshare Receivables Funding LLC, Series 2015-1A, Class A, 2.40%, 3/22/32(1) | | 65,608 |
| 65,675 |
|
TOTAL ASSET-BACKED SECURITIES (Cost $14,203,116) | | | 14,179,964 |
|
| MUNICIPAL SECURITIES — 0.4% | | | |
| Bay Area Toll Authority Toll Bridge Rev., Series 2010 S-1, (Building Bonds), 6.92%, 4/1/40 | | 220,000 |
| 283,859 |
|
| California GO, (Building Bonds), 7.55%, 4/1/39 | | 400,000 |
| 579,892 |
|
| California GO, (Building Bonds), 7.30%, 10/1/39 | | 20,000 |
| 27,851 |
|
| Illinois GO, (Taxable Pension), 5.10%, 6/1/33 | | 400,000 |
| 372,576 |
|
| Illinois GO, Series 2010-3, (Building Bonds), 6.73%, 4/1/35 | | 20,000 |
| 20,823 |
|
| Los Angeles Community College District GO, (Building Bonds), 6.75%, 8/1/49 | | 100,000 |
| 138,712 |
|
| Maryland State Transportation Authority Rev., (Building Bonds), 5.75%, 7/1/41 | | 30,000 |
| 35,590 |
|
| Metropolitan Transportation Authority Rev., Series 2010 C-1, (Building Bonds), 6.69%, 11/15/40 | | 195,000 |
| 252,613 |
|
| Missouri Highways & Transportation Commission Rev., (Building Bonds), 5.45%, 5/1/33 | | 175,000 |
| 204,286 |
|
| New Jersey State Turnpike Authority Rev., Series 2010 A, (Building Bonds), 7.10%, 1/1/41 | | 225,000 |
| 303,019 |
|
| Pennsylvania Turnpike Commission Rev., Series 2010 B, (Building Bonds), 5.56%, 12/1/49 | | 125,000 |
| 143,151 |
|
| Port Authority of New York & New Jersey Rev., 4.93%, 10/1/51 | | 250,000 |
| 263,507 |
|
| Rutgers State University Rev., Series 2010 H, (Building Bonds), 5.67%, 5/1/40 | | 200,000 |
| 231,448 |
|
| Salt River Agricultural Improvement & Power District Electric Rev., Series 2010 A, (Building Bonds), 4.84%, 1/1/41 | | 215,000 |
| 238,362 |
|
| San Diego County Water Authority Rev., Series 2010 B, (Building Bonds), 6.14%, 5/1/49 | | 100,000 |
| 125,274 |
|
| San Francisco City & County Public Utilities Water Commission Rev., Series 2010 B, (Building Bonds), 6.00%, 11/1/40 | | 195,000 |
| 232,846 |
|
|
| | | | | | | |
| | | Principal Amount/Shares | Value |
| San Francisco City & County Public Utilities Water Commission Rev., Series 2010 FG, (Building Bonds), 6.95%, 11/1/50 | | $ | 80,000 |
| $ | 107,806 |
|
| Santa Clara Valley Transportation Authority Sales Tax Rev., Series 2010 A, (Building Bonds), 5.88%, 4/1/32 | | 150,000 |
| 179,020 |
|
TOTAL MUNICIPAL SECURITIES (Cost $4,071,123) | | | 3,740,635 |
|
| TEMPORARY CASH INVESTMENTS — 3.5% | | | |
| Repurchase Agreement, Bank of America Merrill Lynch, (collateralized by various U.S. Treasury obligations, 1.50%, 1/31/19 - 11/30/19, valued at $6,020,515), in a joint trading account at 0.10%, dated 6/30/15, due 7/1/15 (Delivery value $5,900,392) | | | 5,900,376 |
|
| Repurchase Agreement, Fixed Income Clearing Corp., (collateralized by various U.S. Treasury obligations, 1.625%, 8/15/22, valued at $24,080,218), at 0.01%, dated 6/30/15, due 7/1/15 (Delivery value $23,605,007) | | | 23,605,000 |
|
| SSgA U.S. Government Money Market Fund, Class N | | 5,867,616 |
| 5,867,616 |
|
TOTAL TEMPORARY CASH INVESTMENTS (Cost $35,372,992) | | | 35,372,992 |
|
TOTAL INVESTMENT SECURITIES — 103.1% (Cost $1,052,836,355) | | | 1,037,111,103 |
|
| OTHER ASSETS AND LIABILITIES — (3.1)% | | | (31,270,109) |
|
| TOTAL NET ASSETS — 100.0% | | | $ | 1,005,840,994 |
|
FORWARD FOREIGN CURRENCY EXCHANGE CONTRACTS
|
| | | | | | | | |
| Currency Purchased | Currency Sold | Counterparty | Settlement Date | Unrealized Appreciation
(Depreciation) |
| USD | 12,751,376 | AUD | 16,702,285 | Barclays Bank plc | 9/16/15 | $ | (82,342 | ) |
| BRL | 66,220 | USD | 20,681 | UBS AG | 9/16/15 | 46 |
|
| CAD | 3,211,419 | USD | 2,590,000 | Barclays Bank plc | 9/16/15 | (21,408 | ) |
| USD | 25,808,474 | CAD | 31,872,897 | Barclays Bank plc | 9/16/15 | 315,540 |
|
| USD | 178,400 | CAD | 221,753 | JPMorgan Chase Bank N.A. | 9/16/15 | 1,035 |
|
| USD | 6,825,344 | CHF | 6,330,206 | UBS AG | 9/16/15 | 34,720 |
|
| CLP | 2,853,458,588 | USD | 4,477,769 | UBS AG | 9/16/15 | (45,587 | ) |
| USD | 2,500,000 | CLP | 1,606,250,000 | UBS AG | 9/16/15 | 5,065 |
|
| CNY | 13,428,434 | USD | 2,183,308 | UBS AG | 9/16/15 | 4,153 |
|
| CZK | 32,724,523 | USD | 1,350,000 | Barclays Bank plc | 9/16/15 | (10,745 | ) |
| USD | 2,875,061 | CZK | 69,694,746 | Deutsche Bank | 9/16/15 | 22,795 |
|
| USD | 1,582,864 | DKK | 10,435,846 | Barclays Bank plc | 9/16/15 | 19,933 |
|
| EUR | 680,000 | USD | 759,968 | Barclays Bank plc | 9/16/15 | (1,066 | ) |
| EUR | 680,000 | USD | 759,968 | Barclays Bank plc | 9/16/15 | (1,066 | ) |
| EUR | 6,150,000 | USD | 6,860,633 | Westpac Group | 9/16/15 | 2,970 |
|
| USD | 249,035,160 | EUR | 219,755,391 | Barclays Bank plc | 9/16/15 | 3,780,924 |
|
| USD | 960,952 | EUR | 860,000 | Deutsche Bank | 9/16/15 | 1,164 |
|
| USD | 1,174,526 | EUR | 1,029,510 | JPMorgan Chase Bank N.A. | 9/16/15 | 25,559 |
|
| USD | 2,259,519 | EUR | 2,019,994 | JPMorgan Chase Bank N.A. | 9/16/15 | 5,139 |
|
| USD | 2,241,396 | EUR | 2,008,430 | JPMorgan Chase Bank N.A. | 9/16/15 | (78 | ) |
| GBP | 1,130,000 | USD | 1,776,439 | Westpac Group | 9/16/15 | (1,896 | ) |
| USD | 241,025 | GBP | 157,226 | Barclays Bank plc | 9/16/15 | (5,882 | ) |
| USD | 1,766,143 | GBP | 1,130,000 | Barclays Bank plc | 9/16/15 | (8,400 | ) |
| USD | 54,528,300 | GBP | 35,466,322 | Deutsche Bank | 9/16/15 | (1,167,724 | ) |
| USD | 850,901 | GBP | 535,238 | JPMorgan Chase Bank N.A. | 9/16/15 | 10,368 |
|
| USD | 1,974,953 | GBP | 1,248,240 | UBS AG | 9/16/15 | 14,727 |
|
|
| | | | | | | | |
| Currency Purchased | Currency Sold | Counterparty | Settlement Date | Unrealized Appreciation
(Depreciation) |
| USD | 6,770 | HUF | 1,878,117 | Deutsche Bank | 9/16/15 | $ | 140 |
|
| USD | 123,848,877 | JPY | 15,386,652,578 | Deutsche Bank | 9/16/15 | (1,997,671 | ) |
| KRW | 2,526,739,005 | USD | 2,268,779 | Westpac Group | 9/16/15 | (16,235 | ) |
| MXN | 39,121,238 | USD | 2,540,000 | Barclays Bank plc | 9/17/15 | (64,360 | ) |
| USD | 5,986,511 | MXN | 93,758,219 | Barclays Bank plc | 9/17/15 | 53,376 |
|
| USD | 2,380,000 | MYR | 8,990,450 | Westpac Group | 9/17/15 | 220 |
|
| USD | 2,000,000 | MYR | 7,542,600 | Westpac Group | 9/17/15 | 3,468 |
|
| USD | 2,010,481 | NOK | 15,552,247 | Deutsche Bank | 9/16/15 | 30,378 |
|
| USD | 4,143,012 | NZD | 5,855,632 | Barclays Bank plc | 9/16/15 | 200,452 |
|
| USD | 1,010,544 | NZD | 1,480,000 | Barclays Bank plc | 9/16/15 | 14,069 |
|
| USD | 2,845,121 | NZD | 4,160,000 | Barclays Bank plc | 9/16/15 | 44,220 |
|
| USD | 1,214,994 | PLN | 4,507,524 | Deutsche Bank | 9/16/15 | 18,612 |
|
| SEK | 21,507,614 | USD | 2,630,000 | Barclays Bank plc | 9/16/15 | (31,448 | ) |
| USD | 3,569,671 | SEK | 29,257,737 | JPMorgan Chase Bank N.A. | 9/16/15 | 34,747 |
|
| USD | 1,482,285 | SGD | 2,007,809 | Barclays Bank plc | 9/16/15 | (6,850 | ) |
| THB | 70,672,611 | USD | 2,083,509 | Westpac Group | 9/16/15 | 3,769 |
|
| THB | 27,459,810 | USD | 810,000 | Westpac Group | 9/16/15 | 1,011 |
|
| USD | 2,912,053 | THB | 98,741,892 | Westpac Group | 9/16/15 | (4,236 | ) |
| USD | 2,160,000 | THB | 73,148,400 | Westpac Group | 9/16/15 | (399 | ) |
| TRY | 4,225,340 | USD | 1,500,378 | Deutsche Bank | 9/16/15 | 42,224 |
|
| USD | 1,650,000 | TRY | 4,584,525 | Barclays Bank plc | 9/16/15 | (23,734 | ) |
| TWD | 103,444,900 | USD | 3,380,000 | Westpac Group | 9/16/15 | (27,343 | ) |
| USD | 3,220,062 | TWD | 99,419,400 | UBS AG | 9/16/15 | (2,129 | ) |
| ZAR | 36,025,638 | USD | 2,873,392 | Barclays Bank plc | 9/16/15 | 48,907 |
|
| USD | 5,354,393 | ZAR | 67,724,285 | Deutsche Bank | 9/16/15 | (139,212 | ) |
| | | | | | | $ | 1,079,920 |
|
|
| | | | | | | | | |
| FUTURES CONTRACTS |
| Contracts Purchased | Expiration Date | Underlying Face
Amount at Value | Unrealized Appreciation
(Depreciation) |
| 11 |
| Korean Treasury 10-Year Bonds | September 2015 | $ | 1,207,145 |
| $ | 9,815 |
|
| | | | | |
| Contracts Sold | Expiration Date | Underlying Face
Amount at Value | Unrealized Appreciation
(Depreciation) |
| 144 |
| U.S. Treasury 10-Year Notes | September 2015 | $ | 18,168,750 |
| $ | 139,176 |
|
|
| | | | | | | | | | | | | |
| CENTRALLY CLEARED CREDIT DEFAULT SWAP AGREEMENTS | |
| Reference Entity | Notional
Amount | Buy/Sell*
Protection | Interest
Rate | Termination
Date | Implied Credit Spread** | Unrealized Appreciation
(Depreciation) | Value |
| CDX North America High Yield 24 Index | $ | 10,494,000 |
| Sell | 5.00% | 6/20/20 | 3.56% | $ | (40,110 | ) | $ | 665,396 |
|
| CDX North America Investment Grade 24 Index | 15,000,000 |
| Sell | 1.00 | 6/20/20 | 0.70 | (54,883 | ) | 214,061 |
|
| | | | | | | $ | (94,993 | ) | $ | 879,457 |
|
* The maximum potential amount the fund could be required to deliver as a seller of credit protection if a credit event occurs as defined under the terms of the agreement is the notional amount. The maximum potential amount may be partially offset by any recovery values of the reference entities and upfront payments received upon entering into the agreement.
**Implied credit spreads for centrally cleared credit default swap agreements are linked to the weighted average spread across the underlying reference entities included in a particular index. Implied credit spreads serve as an indication of the seller’s performance risk related to the likelihood of a credit event occurring as defined in the agreement. Implied credit spreads are used to determine the value of swap agreements and reflect the cost of buying/selling protection, which may include upfront payments made/received upon entering the agreement. Therefore, higher spreads would indicate a greater likelihood that a seller will be obligated to perform under the contract terms. Increasing values, in absolute terms and relative to notional amounts, are also indicative of greater performance risk.
|
| | |
| NOTES TO SCHEDULE OF INVESTMENTS |
| AUD | - | Australian Dollar |
| BRL | - | Brazilian Real |
| CAD | - | Canadian Dollar |
| CDX | - | Credit Derivatives Indexes |
| CHF | - | Swiss Franc |
| CLP | - | Chilean Peso |
| CNY | - | Chinese Yuan |
| CZK | - | Czech Koruna |
| DKK | - | Danish Krone |
| EUR | - | Euro |
| FHLMC | - | Federal Home Loan Mortgage Corporation |
| FNMA | - | Federal National Mortgage Association |
| GBP | - | British Pound |
| GNMA | - | Government National Mortgage Association |
| GO | - | General Obligation |
| HUF | - | Hungarian Forint |
| JPY | - | Japanese Yen |
| KRW | - | South Korea Won |
| MTN | - | Medium Term Note |
| MXN | - | Mexican Peso |
| MYR | - | Malaysian Ringgit |
| NOK | - | Norwegian Krone |
| NZD | - | New Zealand Dollar |
| PLN | - | Polish Zloty |
| SEK | - | Swedish Krona |
| SEQ | - | Sequential Payer |
| SGD | - | Singapore Dollar |
| THB | - | Thai Baht |
| TRY | - | Turkish Lira |
| TWD | - | Taiwanese Dollar |
| USD | - | United States Dollar |
| VRN | - | Variable Rate Note. Interest reset date is indicated. Rate shown is effective at the period end. |
| ZAR | - | South African Rand |
| |
| † | Category is less than 0.05% of total net assets. |
| |
| (1) | Restricted security exempt from registration pursuant to Rule 144A under the Securities Act of 1933. These securities may be sold without restriction to qualified institutional investors and have been deemed liquid under policies approved by the Board of Trustees. The aggregate value of these securities at the period end was $118,972,451, which represented 11.8% of total net assets. |
| |
| (2) | When-issued security. The issue price and yield are fixed on the date of the commitment, but payment and delivery are scheduled for a future date. |
| |
| (3) | Security, or a portion thereof, has been pledged at the custodian bank or with a broker for margin requirements on futures contracts, swap agreements and/or forward commitments. At the period end, the aggregate value of securities pledged was $1,477,582. |
| |
| (4) | Final maturity date indicated, unless otherwise noted. |
| |
| (5) | Forward commitment. Settlement date is indicated. |
See Notes to Financial Statements.
|
|
| Statement of Assets and Liabilities |
|
| | | |
| JUNE 30, 2015 |
| Assets |
| Investment securities, at value (cost of $1,052,836,355) | $ | 1,037,111,103 |
|
| Cash | 33,032 |
|
| Foreign currency holdings, at value (cost of $790,022) | 787,977 |
|
| Foreign deposits with broker for futures contracts, at value (cost of $285,223) | 278,213 |
|
| Receivable for investments sold | 30,715,111 |
|
| Receivable for capital shares sold | 307,696 |
|
| Receivable for variation margin on futures contracts | 4,500 |
|
| Receivable for variation margin on swap agreements | 67,972 |
|
| Unrealized appreciation on forward foreign currency exchange contracts | 4,739,731 |
|
| Interest receivable | 8,214,417 |
|
| | 1,082,259,752 |
|
| | |
| Liabilities | |
| Payable for investments purchased | 71,175,640 |
|
| Payable for capital shares redeemed | 932,384 |
|
| Payable for variation margin on futures contracts | 402 |
|
| Unrealized depreciation on forward foreign currency exchange contracts | 3,659,811 |
|
| Accrued management fees | 649,461 |
|
| Distribution and service fees payable | 1,060 |
|
| | 76,418,758 |
|
| | |
| Net Assets | $ | 1,005,840,994 |
|
| | |
| Net Assets Consist of: | |
| Capital paid in | $ | 1,032,575,112 |
|
| Distributions in excess of net investment income | (11,926,536 | ) |
| Accumulated net realized loss | (315,386 | ) |
| Net unrealized depreciation | (14,492,196 | ) |
| | $ | 1,005,840,994 |
|
|
| | | | | | |
| | Net Assets | Shares Outstanding | Net Asset Value Per Share |
| Investor Class |
| $219,605,934 |
| 22,619,413 |
| $9.71 |
| Institutional Class |
| $728,768,209 |
| 74,945,759 |
| $9.72 |
| A Class |
| $3,033,233 |
| 313,020 |
| $9.69* |
| C Class |
| $628,820 |
| 65,255 |
| $9.64 |
| R Class |
| $24,780 |
| 2,563 |
| $9.67 |
| R6 Class |
| $53,780,018 |
| 5,530,266 |
| $9.72 |
*Maximum offering price $10.15 (net asset value divided by 0.955).
See Notes to Financial Statements.
|
| | | |
| YEAR ENDED JUNE 30, 2015 |
| Investment Income (Loss) |
| Income: | |
| Interest | $ | 5,027,584 |
|
| | |
| Expenses: | |
| Management fees | 2,389,594 |
|
| Distribution and service fees: | |
| A Class | 13,461 |
|
| C Class | 16,377 |
|
| R Class | 7,412 |
|
| Trustees' fees and expenses | 8,890 |
|
| Other expenses | 1,133 |
|
| | 2,436,867 |
|
| | |
| Net investment income (loss) | 2,590,717 |
|
| | |
| Realized and Unrealized Gain (Loss) | |
| Net realized gain (loss) on: | |
| Investment transactions | 2,306,610 |
|
| Futures contract transactions | 205,757 |
|
| Swap agreement transactions | (17,582 | ) |
| Foreign currency transactions | (15,601,450 | ) |
| | (13,106,665 | ) |
| | |
| Change in net unrealized appreciation (depreciation) on: | |
| Investments | (16,142,798 | ) |
| Futures contracts | 131,228 |
|
| Swap agreements | (94,993 | ) |
| Translation of assets and liabilities in foreign currencies | 1,333,081 |
|
| | (14,773,482 | ) |
| | |
| Net realized and unrealized gain (loss) | (27,880,147 | ) |
| | |
| Net Increase (Decrease) in Net Assets Resulting from Operations | $ | (25,289,430 | ) |
See Notes to Financial Statements.
|
|
| Statement of Changes in Net Assets |
|
| | | | | | |
| YEARS ENDED JUNE 30, 2015 AND JUNE 30, 2014 |
| Increase (Decrease) in Net Assets | June 30, 2015 | June 30, 2014 |
| Operations |
| Net investment income (loss) | $ | 2,590,717 |
| $ | 457,150 |
|
| Net realized gain (loss) | (13,106,665 | ) | (369,761 | ) |
| Change in net unrealized appreciation (depreciation) | (14,773,482 | ) | 1,154,958 |
|
| Net increase (decrease) in net assets resulting from operations | (25,289,430 | ) | 1,242,347 |
|
| | | |
| Distributions to Shareholders | | |
| From net investment income: | | |
| Investor Class | (484,254 | ) | (402,018 | ) |
| Institutional Class | (373,932 | ) | (332,588 | ) |
| A Class | (252,933 | ) | (269,093 | ) |
| C Class | (66,657 | ) | (96,479 | ) |
| R Class | (76,334 | ) | (104,769 | ) |
| R6 Class | (1,216 | ) | (1,078 | ) |
| From net realized gains: | | |
| Investor Class | — |
| (37,587 | ) |
| Institutional Class | — |
| (29,658 | ) |
| A Class | — |
| (26,435 | ) |
| C Class | — |
| (10,558 | ) |
| R Class | — |
| (10,476 | ) |
| R6 Class | — |
| (95 | ) |
| Decrease in net assets from distributions | (1,255,326 | ) | (1,320,834 | ) |
| | | |
| Capital Share Transactions | | |
Net increase (decrease) in net assets from capital share transactions (Note 5) | 1,000,608,600 |
| 2,271,444 |
|
| | | |
| Net increase (decrease) in net assets | 974,063,844 |
| 2,192,957 |
|
| | | |
| Net Assets | | |
| Beginning of period | 31,777,150 |
| 29,584,193 |
|
| End of period | $ | 1,005,840,994 |
| $ | 31,777,150 |
|
| | | |
| Distributions in excess of net investment income | $ | (11,926,536 | ) | $ | (350,861 | ) |
See Notes to Financial Statements.
|
|
| Notes to Financial Statements |
JUNE 30, 2015
1. Organization
American Century International Bond Funds (the trust) is registered under the Investment Company Act of 1940, as amended (the 1940 Act), as an open-end management investment company and is organized as a Massachusetts business trust. Global Bond Fund (the fund) is one fund in a series issued by the trust. The fund is nondiversified as defined under the 1940 Act. The fund’s investment objective is to seek long-term total return.
The fund offers the Investor Class, the Institutional Class, the A Class, the C Class, the R Class and the R6 Class. The A Class may incur an initial sales charge. The A Class and C Class may be subject to a contingent deferred sales charge. The share classes differ principally in their respective sales charges and distribution and shareholder servicing expenses and arrangements. The Institutional Class and R6 Class shareholders do not require the same level of shareholder and administrative services from American Century Investment Management, Inc. (ACIM) (the investment advisor) as shareholders of other classes. In addition, financial intermediaries do not receive any service, distribution or administrative fees for the R6 Class. As a result, the Institutional Class and R6 Class are charged lower unified management fees. Sale of the R6 Class commenced on July 26, 2013.
2. Significant Accounting Policies
The following is a summary of significant accounting policies consistently followed by the fund in preparation of its financial statements. The fund is an investment company and follows accounting and reporting guidance in accordance with accounting principles generally accepted in the United States of America. This may require management to make certain estimates and assumptions at the date of the financial statements. Actual results could differ from these estimates. Management evaluated the impact of events or transactions occurring through the date the financial statements were issued that would merit recognition or disclosure.
Investment Valuations — The fund determines the fair value of its investments and computes its net asset value per share at the close of regular trading (usually 4 p.m. Eastern time) on the New York Stock Exchange (NYSE) on each day the NYSE is open. The Board of Trustees has adopted valuation policies and procedures to guide the investment advisor in the fund’s investment valuation process and to provide methodologies for the oversight of the fund’s pricing function.
Fixed income securities maturing in greater than 60 days at the time of purchase are valued at the evaluated mean as provided by independent pricing services or at the mean of the most recent bid and asked prices as provided by investment dealers. Fixed income securities maturing within 60 days at the time of purchase may be valued at cost, plus or minus any amortized discount or premium or at the evaluated mean as provided by an independent pricing service. Evaluated mean prices are commonly derived through utilization of market models, which may consider, among other factors: trade data, quotations from dealers and active market makers, relevant yield curve and spread data, related sector levels, creditworthiness, trade data or market information on comparable securities, and other relevant security specific information. Fixed income securities initially expressed in local currencies are translated into U.S. dollars at the mean of the appropriate currency exchange rate at the close of the NYSE as provided by an independent pricing service.
Open-end management investment companies are valued at the reported net asset value per share. Repurchase agreements are valued at cost, which approximates fair value. Exchange-traded futures contracts are valued at the settlement price as provided by the appropriate clearing corporation. Swap agreements are valued at an evaluated price as provided by independent pricing services or independent brokers. Forward foreign currency exchange contracts are valued at the mean of the appropriate forward exchange rate at the close of the NYSE as provided by an independent pricing service. Investments initially expressed in local currencies are translated into U.S. dollars at the mean of the appropriate currency exchange rate at the close of the NYSE as provided by an independent pricing service.
If the fund determines that the market price for an investment is not readily available or the valuation methods mentioned above do not reflect an investment’s fair value, such investment is valued as determined in good faith by the Board of Trustees or its delegate, in accordance with policies and procedures adopted by the Board of Trustees. In its determination of fair value, the fund may review several factors including, but not limited to, market information regarding the specific investment or comparable investments and correlation
with other investment types, futures indices or general market indicators. Circumstances that may cause the fund to use these procedures to value an investment include, but are not limited to: an investment has been declared in default or is distressed; trading in a security has been suspended during the trading day or a security is not actively trading on its principal exchange; prices received from a regular pricing source are deemed unreliable; or there is a foreign market holiday and no trading occurred.
The fund monitors for significant events occurring after the close of an investment’s primary exchange but before the fund’s net asset value per share is determined. Significant events may include, but are not limited to: corporate announcements and transactions; governmental action and political unrest that could impact a specific investment or an investment sector; or armed conflicts, natural disasters and similar events that could affect investments in a specific country or region.
Security Transactions — Security transactions are accounted for as of the trade date. Net realized gains and losses are determined on the identified cost basis, which is also used for federal income tax purposes.
Investment Income — Interest income is recorded on the accrual basis and includes paydown gain (loss) and accretion of discounts and amortization of premiums. Inflation adjustments related to inflation-linked debt securities are reflected as interest income.
Foreign Currency Translations — All assets and liabilities initially expressed in foreign currencies are translated into U.S. dollars at prevailing exchange rates at period end. The fund may enter into spot foreign currency exchange contracts to facilitate transactions denominated in a foreign currency. Purchases and sales of investment securities, dividend and interest income, spot foreign currency exchange contracts, and expenses are translated at the rates of exchange prevailing on the respective dates of such transactions. Net realized and unrealized foreign currency exchange gains or losses related to investment securities are a component of net realized gain (loss) on investment transactions and change in net unrealized appreciation (depreciation) on investments, respectively.
Forward Commitments — The fund may engage in securities transactions on a forward commitment basis. In these transactions, the securities’ prices and yields are fixed on the date of the commitment. The fund may sell a to-be-announced (TBA) security and at the same time make a commitment to purchase the same security at a future date at a specified price. Conversely, the fund may purchase a TBA security and at the same time make a commitment to sell the same security at a future date at a specified price. These types of transactions are known as “TBA roll” transactions and are accounted for as purchases and sales. The fund will segregate cash, cash equivalents or other appropriate liquid securities on its records in amounts sufficient to meet the purchase price.
Repurchase Agreements — The fund may enter into repurchase agreements with institutions that ACIM has determined are creditworthy pursuant to criteria adopted by the Board of Trustees. The fund requires that the collateral, represented by securities, received in a repurchase transaction be transferred to the custodian in a manner sufficient to enable the fund to obtain those securities in the event of a default under the repurchase agreement. ACIM monitors, on a daily basis, the securities transferred to ensure the value, including accrued interest, of the securities under each repurchase agreement is equal to or greater than amounts owed to the fund under each repurchase agreement.
Joint Trading Account — Pursuant to an Exemptive Order issued by the Securities and Exchange Commission, the fund, along with certain other funds in the American Century Investments family of funds, may transfer uninvested cash balances into a joint trading account. These balances are invested in one or more repurchase agreements that are collateralized by U.S. Treasury or Agency obligations.
Segregated Assets — In accordance with the 1940 Act, the fund segregates assets on its books and records to cover certain types of investments, including, but not limited to, futures contracts, forward commitments, when-issued securities, swap agreements and certain forward foreign currency exchange contracts. ACIM monitors, on a daily basis, the securities segregated to ensure the fund designates a sufficient amount of liquid assets, marked-to-market daily. The fund may also receive assets or be required to pledge assets at the custodian bank or with a broker for margin requirements on futures contracts, forward commitments and swap agreements.
Income Tax Status — It is the fund’s policy to distribute substantially all net investment income and net realized gains to shareholders and to otherwise qualify as a regulated investment company under provisions of the Internal Revenue Code. Accordingly, no provision has been made for income taxes. The fund files U.S. federal, state, local and non-U.S. tax returns as applicable. The fund's tax returns are subject to examination by the relevant taxing authority until expiration of the applicable statute of limitations, which is generally three years from the date of filing but can be longer in certain jurisdictions. At this time, management believes there are no uncertain tax positions which, based on their technical merit, would not be sustained upon examination and for which it is reasonably possible that the total amounts of unrecognized tax benefits will significantly change in the next twelve months.
Multiple Class — All shares of the fund represent an equal pro rata interest in the net assets of the class to which such shares belong, and have identical voting, dividend, liquidation and other rights and the same terms and conditions, except for class specific expenses and exclusive rights to vote on matters affecting only individual classes. Income, non-class specific expenses, and realized and unrealized capital gains and losses of the fund are allocated to each class of shares based on their relative net assets.
Distributions to Shareholders — Distributions from net investment income, if any, are generally declared and paid quarterly, but may be paid less frequently. Distributions from net realized gains, if any, are generally declared and paid annually.
Indemnifications — Under the trust’s organizational documents, its officers and trustees are indemnified against certain liabilities arising out of the performance of their duties to the fund. In addition, in the normal course of business, the fund enters into contracts that provide general indemnifications. The maximum exposure under these arrangements is unknown as this would involve future claims that may be made against a fund. The risk of material loss from such claims is considered by management to be remote.
3. Fees and Transactions with Related Parties
Certain officers and trustees of the trust are also officers and/or directors of American Century Companies, Inc. (ACC). The trust's investment advisor, ACIM, the trust's distributor, American Century Investment Services, Inc. (ACIS), and the trust's transfer agent, American Century Services, LLC, are wholly owned, directly or indirectly, by ACC. Various funds issued by American Century Asset Allocation Portfolios, Inc. own, in aggregate, 97% of the shares of the fund. Related parties do not invest in the fund for the purpose of exercising management or control.
Management Fees — The trust has entered into a management agreement with ACIM, under which ACIM provides the fund with investment advisory and management services in exchange for a single, unified management fee (the fee) per class. The agreement provides that all expenses of managing and operating the fund, except distribution and service fees, brokerage expenses, taxes, interest, fees and expenses of the independent trustees (including legal counsel fees), and extraordinary expenses, will be paid by ACIM. The fee is computed and accrued daily based on each class's daily net assets and paid monthly in arrears. The annual management fee is 0.95% for the Investor Class, A Class, C Class and R Class, 0.75% for the Institutional Class and 0.70% for the R6 Class.
Distribution and Service Fees — The Board of Trustees has adopted a separate Master Distribution and Individual Shareholder Services Plan for each of the A Class, C Class and R Class (collectively the plans), pursuant to Rule 12b-1 of the 1940 Act. The plans provide that the A Class will pay ACIS an annual distribution and service fee of 0.25%. The plans provide that the C Class will pay ACIS an annual distribution and service fee of 1.00%, of which 0.25% is paid for individual shareholder services and 0.75% is paid for distribution services. The plans provide that the R Class will pay ACIS an annual distribution and service fee of 0.50%. The fees are computed and accrued daily based on each class’s daily net assets and paid monthly in arrears. The fees are used to pay financial intermediaries for distribution and individual shareholder services. Fees incurred under the plans during the year ended June 30, 2015 are detailed in the Statement of Operations.
Trustees’ Fees and Expenses — The Board of Trustees is responsible for overseeing the investment advisor’s management and operations of the fund. The trustees receive detailed information about the fund and its investment advisor regularly throughout the year, and meet at least quarterly with management of the investment advisor to review reports about fund operations. The fund’s officers do not receive compensation from the fund.
4. Investment Transactions
Purchases of investment securities, excluding short-term investments, for the year ended June 30, 2015 totaled $1,349,250,173, of which $463,813,666 represented U.S. Treasury and Government Agency obligations.
Sales of investment securities, excluding short-term investments, for the year ended June 30, 2015 totaled $363,056,498, of which $234,110,910 represented U.S. Treasury and Government Agency obligations.
5. Capital Share Transactions
Transactions in shares of the fund were as follows (unlimited number of shares authorized):
|
| | | | | | | | | | |
| | Year ended
June 30, 2015 | Year ended June 30, 2014(1) |
| | Shares | Amount | Shares | Amount |
| Investor Class | | | | |
| Sold | 22,519,611 |
| $ | 224,687,713 |
| 122,195 |
| $ | 1,193,644 |
|
| Issued in reinvestment of distributions | 49,450 |
| 482,635 |
| 46,035 |
| 436,956 |
|
| Redeemed | (1,027,404 | ) | (10,234,647 | ) | (51,395 | ) | (501,760 | ) |
| | 21,541,657 |
| 214,935,701 |
| 116,835 |
| 1,128,840 |
|
| Institutional Class | | | | |
| Sold | 76,618,522 |
| 764,553,101 |
| — |
| — |
|
| Issued in reinvestment of distributions | 38,274 |
| 373,932 |
| 38,163 |
| 362,246 |
|
| Redeemed | (2,524,464 | ) | (25,164,854 | ) | — |
| — |
|
| | 74,132,332 |
| 739,762,179 |
| 38,163 |
| 362,246 |
|
| A Class | | | | |
| Sold | 370,055 |
| 3,654,518 |
| 35,254 |
| 339,771 |
|
| Issued in reinvestment of distributions | 25,659 |
| 250,177 |
| 31,111 |
| 295,287 |
|
| Redeemed | (815,977 | ) | (8,126,387 | ) | (8,253 | ) | (79,705 | ) |
| | (420,263 | ) | (4,221,692 | ) | 58,112 |
| 555,353 |
|
| C Class | | | | |
| Sold | 85,357 |
| 838,772 |
| 980 |
| 9,600 |
|
| Issued in reinvestment of distributions | 6,844 |
| 66,657 |
| 11,277 |
| 107,037 |
|
| Redeemed | (315,937 | ) | (3,133,594 | ) | (3,367 | ) | (33,047 | ) |
| | (223,736 | ) | (2,228,165 | ) | 8,890 |
| 83,590 |
|
| R Class | | | | |
| Issued in reinvestment of distributions | 7,829 |
| 76,334 |
| 12,141 |
| 115,242 |
|
| Redeemed | (292,535 | ) | (2,909,474 | ) | — |
| — |
|
| | (284,706 | ) | (2,833,140 | ) | 12,141 |
| 115,242 |
|
| R6 Class | | | | |
| Sold | 5,646,706 |
| 56,374,266 |
| 2,493 |
| 25,000 |
|
| Issued in reinvestment of distributions | 124 |
| 1,216 |
| 123 |
| 1,173 |
|
| Redeemed | (119,180 | ) | (1,181,765 | ) | — |
| — |
|
| | 5,527,650 |
| 55,193,717 |
| 2,616 |
| 26,173 |
|
| Net increase (decrease) | 100,272,934 |
| $ | 1,000,608,600 |
| 236,757 |
| $ | 2,271,444 |
|
(1) July 26, 2013 (commencement of sale) through June 30, 2014 for the R6 Class.
6. Fair Value Measurements
The fund’s investments valuation process is based on several considerations and may use multiple inputs to determine the fair value of the investments held by the fund. In conformity with accounting principles generally accepted in the United States of America, the inputs used to determine a valuation are classified into three broad levels.
| |
| • | Level 1 valuation inputs consist of unadjusted quoted prices in an active market for identical investments. |
| |
| • | Level 2 valuation inputs consist of direct or indirect observable market data (including quoted prices for comparable investments, evaluations of subsequent market events, interest rates, prepayment speeds, credit risk, etc.). These inputs also consist of quoted prices for identical investments initially expressed in local currencies that are adjusted through translation into U.S. dollars. |
| |
| • | Level 3 valuation inputs consist of unobservable data (including a fund’s own assumptions). |
The level classification is based on the lowest level input that is significant to the fair valuation measurement. The valuation inputs are not necessarily an indication of the risks associated with investing in these securities or other financial instruments. There were no significant transfers between levels during the period.
The following is a summary of the level classifications as of period end. The Schedule of Investments provides additional information on the fund’s portfolio holdings.
|
| | | | | | | | |
| | Level 1 | Level 2 | Level 3 |
| Assets | | | |
| Investment Securities | | | |
| Sovereign Governments and Agencies | — |
| $ | 372,627,484 |
| — |
|
| Corporate Bonds | — |
| 279,372,251 |
| — |
|
| U.S. Treasury Securities | — |
| 118,694,528 |
| — |
|
| U.S. Government Agency Mortgage-Backed Securities | — |
| 113,031,201 |
| — |
|
| Collateralized Mortgage Obligations | — |
| 55,171,662 |
| — |
|
| Commercial Mortgage-Backed Securities | — |
| 44,920,386 |
| — |
|
| Asset-Backed Securities | — |
| 14,179,964 |
| — |
|
| Municipal Securities | — |
| 3,740,635 |
| — |
|
| Temporary Cash Investments | $ | 5,867,616 |
| 29,505,376 |
| — |
|
| | $ | 5,867,616 |
| $ | 1,031,243,487 |
| — |
|
| Other Financial Instruments | | | |
| Futures Contracts | $ | 139,176 |
| $ | 9,815 |
| — |
|
| Forward Foreign Currency Exchange Contracts | — |
| 4,739,731 |
| — |
|
| | $ | 139,176 |
| $ | 4,749,546 |
| — |
|
| | | | |
| Liabilities | | | |
| Other Financial Instruments | | | |
| Swap Agreements | — |
| $ | (94,993 | ) | — |
|
| Forward Foreign Currency Exchange Contracts | — |
| (3,659,811 | ) | — |
|
| | — |
| $ | (3,754,804 | ) | — |
|
7. Derivative Instruments
Credit Risk — The fund is subject to credit risk in the normal course of pursuing its investment objectives. The value of a bond generally declines as the credit quality of its issuer declines. Credit default swap agreements enable a fund to buy/sell protection against a credit event of a specific issuer or index. A fund may attempt to enhance returns by selling protection or attempt to mitigate credit risk by buying protection. Upon entering into a centrally cleared swap, a fund is required to deposit cash or securities (initial margin) with a financial intermediary in an amount equal to a certain percentage of the notional amount. Subsequent payments (variation margin) are made or received daily, in cash, by a fund. The variation margin is equal to the daily change in the value and is a component of unrealized gains and losses. Realized gain or loss is recorded upon receipt or payment of a periodic settlement or termination of swap agreements. Net realized
and unrealized gains or losses occurring during the holding period of swap agreements are a component of net realized gain (loss) on swap agreement transactions and change in net unrealized appreciation (depreciation) on swap agreements, respectively. The risks of entering into swap agreements include the possible lack of liquidity, failure of the counterparty to meet its obligations, and that there may be unfavorable changes in the underlying investments or instruments. The fund's average notional amount held during the period was $7,806,444.
Foreign Currency Risk — The fund is subject to foreign currency exchange rate risk in the normal course of pursuing its investment objectives. The value of foreign investments held by a fund may be significantly affected by changes in foreign currency exchange rates. The dollar value of a foreign security generally decreases when the value of the dollar rises against the foreign currency in which the security is denominated and tends to increase when the value of the dollar declines against such foreign currency. A fund may enter into forward foreign currency exchange contracts to reduce a fund's exposure to foreign currency exchange rate fluctuations or to gain exposure to the fluctuations in the value of foreign currencies. The net U.S. dollar value of foreign currency underlying all contractual commitments held by a fund and the resulting unrealized appreciation or depreciation are determined daily. Realized gain or loss is recorded upon the termination of the contract. Net realized and unrealized gains or losses occurring during the holding period of forward foreign currency exchange contracts are a component of net realized gain (loss) on foreign currency transactions and change in net unrealized appreciation (depreciation) on translation of assets and liabilities in foreign currencies, respectively. A fund bears the risk of an unfavorable change in the foreign currency exchange rate underlying the forward contract. Additionally, losses, up to the fair value, may arise if the counterparties do not perform under the contract terms. The fund's average U.S. dollar exposure to foreign currency risk derivative instruments held during the period was $229,221,001.
Interest Rate Risk — The fund is subject to interest rate risk in the normal course of pursuing its investment objectives. The value of bonds generally declines as interest rates rise. A fund may enter into futures contracts based on a bond index or a specific underlying security. A fund may purchase futures contracts to gain exposure to increases in market value or sell futures contracts to protect against a decline in market value. Upon entering into a futures contract, a fund will segregate cash, cash equivalents or other appropriate liquid securities on its records in amounts sufficient to meet requirements. Subsequent payments (variation margin) are made or received daily, in cash, by a fund. The variation margin is equal to the daily change in the contract value and is recorded as unrealized gains and losses. A fund recognizes a realized gain or loss when the futures contract is closed or expires. Net realized and unrealized gains or losses occurring during the holding period of futures contracts are a component of net realized gain (loss) on futures contract transactions and change in net unrealized appreciation (depreciation) on futures contracts, respectively. One of the risks of entering into futures contracts is the possibility that the change in value of the contract may not correlate with the changes in value of the underlying securities. The fund's average exposure to interest rate risk derivative instruments held during the period was 68 contracts.
Value of Derivative Instruments as of June 30, 2015
|
| | | | | | | | |
| | Asset Derivatives | Liability Derivatives |
| Type of Risk Exposure | Location on Statement of Assets and Liabilities | Value | Location on Statement of Assets and Liabilities | Value |
| Credit Risk | Receivable for variation margin on swap agreements* | $ | 67,972 |
| Payable for variation margin on swap agreements* | — |
|
| Foreign Currency Risk | Unrealized appreciation on forward foreign currency exchange contracts | 4,739,731 |
| Unrealized depreciation on forward foreign currency exchange contracts | $ | 3,659,811 |
|
| Interest Rate Risk | Receivable for variation margin on futures contracts* | 4,500 |
| Payable for variation margin on futures contracts* | 402 |
|
| | | $ | 4,812,203 |
| | $ | 3,660,213 |
|
| |
| * | Included in the unrealized appreciation (depreciation) on centrally cleared credit default swap agreements or futures contracts, as applicable, as reported in the Schedule of Investments. |
Effect of Derivative Instruments on the Statement of Operations for the Year Ended June 30, 2015
|
| | | | | | | | |
| | Net Realized Gain (Loss) | Change in Net Unrealized Appreciation (Depreciation) |
| Type of Risk Exposure | Location on Statement of Operations | Value | Location on Statement of Operations | Value |
| Credit Risk | Net realized gain (loss) on swap agreement transactions | $ | (17,582 | ) | Change in net unrealized appreciation (depreciation) on swap agreements | $ | (94,993 | ) |
| Foreign Currency Risk | Net realized gain (loss) on foreign currency transactions | (15,865,374 | ) | Change in net unrealized appreciation (depreciation) on translation of assets and liabilities in foreign currencies | 1,234,688 |
|
| Interest Rate Risk | Net realized gain (loss) on futures contract transactions | 205,757 |
| Change in net unrealized appreciation (depreciation) on futures contracts | 131,228 |
|
| | | $ | (15,677,199 | ) | | $ | 1,270,923 |
|
8. Risk Factors
There are certain risks involved in investing in foreign securities. These risks include those resulting from future adverse political, social and economic developments, fluctuations in currency exchange rates, the possible imposition of exchange controls, and other foreign laws or restrictions. Investing in emerging markets may accentuate these risks.
The fund’s investment process may result in high portfolio turnover, which could mean high transaction costs, affecting both performance and capital gains tax liabilities to investors.
9. Federal Tax Information
The tax character of distributions paid during the years ended June 30, 2015 and June 30, 2014 were as follows:
|
| | | | | | |
| | 2015 | 2014 |
| Distributions Paid From | | |
| Ordinary income | $ | 1,255,326 |
| $ | 1,282,068 |
|
| Long-term capital gains | — |
| $ | 38,766 |
|
The book-basis character of distributions made during the year from net investment income or net realized gains may differ from their ultimate characterization for federal income tax purposes. These differences reflect the differing character of certain income items and net realized gains and losses for financial statement and tax purposes, and may result in reclassification among certain capital accounts on the financial statements.
The reclassifications, which are primarily due to foreign currency gains and losses, were made to distributions in excess of net investment income $(12,911,066), and accumulated net realized loss $12,911,066.
As of June 30, 2015, the federal tax cost of investments and the components of distributable earnings on a tax-basis were as follows:
|
| | | |
| Federal tax cost of investments | $ | 1,053,089,096 |
|
| Gross tax appreciation of investments | $ | 4,848,953 |
|
| Gross tax depreciation of investments | (20,826,946 | ) |
| Net tax appreciation (depreciation) of investments | (15,977,993 | ) |
Net tax appreciation (depreciation) on derivatives and translation of assets and liabilities in foreign currencies | (45,212 | ) |
| Net tax appreciation (depreciation) | $ | (16,023,205 | ) |
| Other book-to-tax adjustments | $ | (2,720,388 | ) |
| Undistributed ordinary income | $ | 557,059 |
|
| Late-year ordinary loss deferral | $ | (8,547,584 | ) |
The difference between book-basis and tax-basis unrealized appreciation (depreciation) is attributable primarily to the realization for tax purposes of unrealized gains (losses) on certain foreign currency exchange contracts. Other book-to-tax adjustments are attributable primarily to the tax deferral of losses on straddle positions.
Loss deferrals represent certain qualified losses that the fund has elected to treat as having been incurred in the following fiscal year for federal income tax purposes.
|
| | | | | | | | | | | | | | | |
| For a Share Outstanding Throughout the Years Ended June 30 (except as noted) |
| Per-Share Data | Ratios and Supplemental Data |
| | | Income From Investment Operations: | Distributions From: | | | Ratio to Average Net Assets of: | | |
| | Net Asset Value, Beginning of Period | Net Investment Income (Loss)(1) | Net Realized and Unrealized Gain (Loss) | Total From Investment Operations | Net Investment Income | Net Realized Gains | Total Distributions | Net Asset Value, End of Period | Total Return(2) | Operating Expenses | Net Investment Income (Loss) | Portfolio Turnover Rate | Net Assets, End of Period (in thousands) |
| Investor Class |
| 2015 | $9.93 | 0.08 | 0.14(8) | 0.22 | (0.44) | — | (0.44) | $9.71 | 2.18% | 0.95% | 0.73% | 114% |
| $219,606 |
|
| 2014 | $9.98 | 0.16 | 0.25 | 0.41 | (0.42) | (0.04) | (0.46) | $9.93 | 4.25% | 0.96% | 1.64% | 71% |
| $10,704 |
|
| 2013 | $10.19 | 0.13 | 0.01 | 0.14 | (0.34) | (0.01) | (0.35) | $9.98 | 1.34% | 0.96% | 1.31% | 68% |
| $9,590 |
|
2012(3) | $10.00 | 0.06 | 0.13 | 0.19 | — | — | — | $10.19 | 1.90% | 0.96%(4) | 1.44%(4) | 29% |
| $8,514 |
|
| Institutional Class |
| 2015 | $9.95 | 0.09 | 0.14(8) | 0.23 | (0.46) | — | (0.46) | $9.72 | 2.28% | 0.75% | 0.93% | 114% |
| $728,768 |
|
| 2014 | $9.99 | 0.18 | 0.25 | 0.43 | (0.43) | (0.04) | (0.47) | $9.95 | 4.50% | 0.76% | 1.84% | 71% |
| $8,091 |
|
| 2013 | $10.20 | 0.15 | 0.01 | 0.16 | (0.36) | (0.01) | (0.37) | $9.99 | 1.53% | 0.76% | 1.51% | 68% |
| $7,745 |
|
2012(3) | $10.00 | 0.07 | 0.13 | 0.20 | — | — | — | $10.20 | 2.00% | 0.76%(4) | 1.64%(4) | 29% |
| $7,627 |
|
| A Class |
| 2015 | $9.91 | 0.13 | 0.06(8) | 0.19 | (0.41) | — | (0.41) | $9.69 | 1.93% | 1.20% | 0.48% | 114% |
| $3,033 |
|
| 2014 | $9.97 | 0.14 | 0.24 | 0.38 | (0.40) | (0.04) | (0.44) | $9.91 | 3.97% | 1.21% | 1.39% | 71% |
| $7,268 |
|
| 2013 | $10.18 | 0.11 | —(5) | 0.11 | (0.31) | (0.01) | (0.32) | $9.97 | 1.11% | 1.21% | 1.06% | 68% |
| $6,729 |
|
2012(3) | $10.00 | 0.05 | 0.13 | 0.18 | — | — | — | $10.18 | 1.80% | 1.21%(4) | 1.19%(4) | 29% |
| $6,563 |
|
|
| | | | | | | | | | | | | | | |
| For a Share Outstanding Throughout the Years Ended June 30 (except as noted) |
| Per-Share Data | Ratios and Supplemental Data |
| | | Income From Investment Operations: | Distributions From: | | | Ratio to Average Net Assets of: | | |
| | Net Asset Value, Beginning of Period | Net Investment Income (Loss)(1) | Net Realized and Unrealized Gain (Loss) | Total From Investment Operations | Net Investment Income | Net Realized Gains | Total Distributions | Net Asset Value, End of Period | Total Return(2) | Operating Expenses | Net Investment Income (Loss) | Portfolio Turnover Rate | Net Assets, End of Period (in thousands) |
| C Class |
| 2015 | $9.85 | 0.07 | 0.06(8) | 0.13 | (0.34) | — | (0.34) | $9.64 | 1.26% | 1.95% | (0.27)% | 114% |
| $629 |
|
| 2014 | $9.93 | 0.06 | 0.25 | 0.31 | (0.35) | (0.04) | (0.39) | $9.85 | 3.21% | 1.96% | 0.64% | 71% |
| $2,847 |
|
| 2013 | $10.15 | 0.03 | —(5) | 0.03 | (0.24) | (0.01) | (0.25) | $9.93 | 0.32% | 1.96% | 0.31% | 68% |
| $2,781 |
|
2012(3) | $10.00 | 0.02 | 0.13 | 0.15 | — | — | — | $10.15 | 1.50% | 1.96%(4) | 0.44%(4) | 29% |
| $2,710 |
|
| R Class |
| 2015 | $9.89 | 0.12 | 0.05(8) | 0.17 | (0.39) | — | (0.39) | $9.67 | 1.67% | 1.45% | 0.23% | 114% |
| $25 |
|
| 2014 | $9.95 | 0.11 | 0.25 | 0.36 | (0.38) | (0.04) | (0.42) | $9.89 | 3.78% | 1.46% | 1.14% | 71% |
| $2,841 |
|
| 2013 | $10.17 | 0.08 | —(5) | 0.08 | (0.29) | (0.01) | (0.30) | $9.95 | 0.78% | 1.46% | 0.81% | 68% |
| $2,739 |
|
2012(3) | $10.00 | 0.04 | 0.13 | 0.17 | — | — | — | $10.17 | 1.70% | 1.46%(4) | 0.94%(4) | 29% |
| $2,716 |
|
| R6 Class |
| 2015 | $9.95 | 0.09 | 0.14(8) | 0.23 | (0.46) | — | (0.46) | $9.72 | 2.34% | 0.70% | 0.98% | 114% |
| $53,780 |
|
2014(6) | $10.03 | 0.17 | 0.22 | 0.39 | (0.43) | (0.04) | (0.47) | $9.95 | 4.12% | 0.71%(4) | 1.91%(4) | 71%(7) |
| $26 |
|
|
| | | | |
| Notes to Financial Highlights | | |
| |
| (1) | Computed using average shares outstanding throughout the period. |
| |
| (2) | Total returns are calculated based on the net asset value of the last business day and do not reflect applicable sales charges, if any. Total returns for periods less than one year are not annualized. |
| |
| (3) | January 31, 2012 (fund inception) through June 30, 2012. |
| |
| (5) | Per-share amount was less than $0.005. |
| |
| (6) | July 26, 2013 (commencement of sale) through June 30, 2014. |
| |
| (7) | Portfolio turnover is calculated at the fund level. Percentage indicated was calculated for the year ended June 30, 2014. |
| |
| (8) | Per-share amount was not in accord with the net realized and unrealized gain (loss) for the period because of the timing of transactions in shares of the fund and the amount and timing of per-share net realized and unrealized gain (loss) on such shares. |
See Notes to Financial Statements.
|
|
| Report of Independent Registered Public Accounting Firm |
To the Trustees of the American Century International Bond Funds and Shareholders of the Global Bond Fund:
In our opinion, the accompanying statement of assets and liabilities, including the schedule of investments, and the related statements of operations and of changes in net assets and the financial highlights present fairly, in all material respects, the financial position of the Global Bond Fund (one of the three funds comprising the American Century International Bond Funds, hereafter referred to as the “Fund”) at June 30, 2015, the results of its operations for the year then ended, the changes in its net assets for each of the two years in the period then ended and the financial highlights for each of the periods presented, in conformity with accounting principles generally accepted in the United States of America. These financial statements and financial highlights (hereafter referred to as "financial statements") are the responsibility of the Fund's management. Our responsibility is to express an opinion on these financial statements based on our audits. We conducted our audits of these financial statements in accordance with the standards of the Public Company Accounting Oversight Board (United States). Those standards require that we plan and perform the audit to obtain reasonable assurance about whether the financial statements are free of material misstatement. An audit includes examining, on a test basis, evidence supporting the amounts and disclosures in the financial statements, assessing the accounting principles used and significant estimates made by management, and evaluating the overall financial statement presentation. We believe that our audits, which included confirmation of securities at June 30, 2015 by correspondence with the custodian and brokers, provide a reasonable basis for our opinion.
PricewaterhouseCoopers LLP
Kansas City, Missouri
August 21, 2015
Board of Trustees
The individuals listed below serve as trustees of the funds. Each trustee will continue to serve in this capacity until death, retirement, resignation or removal from office. The board has adopted a mandatory retirement age for trustees who are not “interested persons,” as that term is defined in the Investment Company Act (independent trustees). Independent trustees shall retire on December 31 of the year in which they reach their 75th birthday; provided, however, that on or after January 1, 2022, independent trustees shall retire on December 31 of the year in which they reach their 76th birthday.
Mr. Thomas is an “interested person” because he currently serves as President and Chief Executive Officer of American Century Companies, Inc. (ACC), the parent company of American Century Investment Management, Inc. (ACIM or the advisor). The other trustees (more than three-fourths of the total number) are independent. They are not employees, directors or officers of, and have no financial interest in, ACC or any of its wholly owned, direct or indirect, subsidiaries, including ACIM, American Century Investment Services, Inc. (ACIS) and American Century Services, LLC (ACS), and they do not have any other affiliations, positions or relationships that would cause them to be considered “interested persons” under the Investment Company Act. The trustees serve in this capacity for eight (in the case of Mr. Thomas, 15) registered investment companies in the American Century Investments family of funds.
The following table presents additional information about the trustees. The mailing address for each trustee other than Mr. Thomas is 1665 Charleston Road, Mountain View, California 94043. The mailing address for Mr. Thomas is 4500 Main Street, Kansas City, Missouri 64111.
|
| | | | | |
Name (Year of Birth) | Position(s) Held with Funds | Length of Time Served | Principal Occupation(s) During Past 5 Years | Number of American Century Portfolios Overseen by Trustee | Other Directorships Held During Past 5 Years |
| Independent Trustees | | |
Tanya S. Beder
(1955) | Trustee | Since 2011 | Chairman and CEO, SBCC Group Inc. (independent advisory services) (2006 to present) | 46 | CYS Investments, Inc. (NYSE mortgage arbitrage REIT) |
Jeremy I. Bulow
(1954) | Trustee | Since 2011 | Professor of Economics, Stanford University, Graduate School of Business (1979 to present) | 46 | None |
Ronald J. Gilson
(1946) | Trustee and Chairman of the Board | Since 1995
(Chairman since 2005) | Charles J. Meyers Professor of Law and Business, Stanford Law School (1979 to present); Marc and Eva Stern Professor of Law and Business, Columbia University School of Law (1992 to present) | 46 | None |
Frederick L. A. Grauer
(1946) | Trustee | Since 2008 | Senior Advisor, BlackRock, Inc. (investment management firm) (2010 to 2011, 2013 to present) | 46 | None |
Peter F. Pervere
(1947) | Trustee | Since 2007 | Retired | 46 | None |
|
| | | | | |
Name
(Year of Birth) | Position(s) Held with Funds | Length of Time Served | Principal Occupation(s) During Past 5 Years | Number of American Century Portfolios Overseen by Trustee | Other Directorships Held During Past 5 Years |
| Independent Trustees | | |
John B. Shoven
(1947) | Trustee | Since 2002 | Professor of Economics, Stanford University (1973 to present) | 46 | Cadence Design Systems; Exponent; Financial Engines |
| Interested Trustee | | |
Jonathan S. Thomas
(1963) | Trustee and President | Since 2007 | President and Chief Executive Officer, ACC (March 2007 to present). Also serves as Chief Executive Officer, ACS; Executive Vice President, ACIM; trustee, ACC, ACIM and other ACC subsidiaries | 124 | BioMed Valley Discoveries, Inc. |
The Statement of Additional Information has additional information about the fund's trustees and is available without charge, upon request, by calling 1-800-345-2021.
Officers
The following table presents certain information about the executive officers of the funds. Each officer serves as an officer for each of the 15 investment companies in the American Century family of funds, unless otherwise noted. No officer is compensated for his or her service as an officer of the funds. The listed officers are interested persons of the funds and are appointed or re-appointed on an annual basis. The mailing address for each of the officers listed below is 4500 Main Street, Kansas City, Missouri 64111.
|
| | |
Name (Year of Birth) | Offices with
the Funds | Principal Occupation(s) During the Past Five Years |
Jonathan S.
Thomas
(1963) | Trustee and President
since 2007 | President and Chief Executive Officer, ACC (March 2007 to present). Also serves as Chief Executive Officer, ACS; Executive Vice President, ACIM; Director, ACC, ACIM and other ACC subsidiaries |
Amy D. Shelton
(1964) | Chief Compliance Officer and Vice President since 2014 | Chief Compliance Officer, American Century funds, (March 2014 to present); Chief Compliance Officer, ACIM (February 2014 to present); Chief Compliance Officer, ACIS (October 2009 to present); Vice President, Client Interactions and Marketing, ACIS (February 2013 to January 2014); Director, Client Interactions and Marketing, ACIS (June 2007 to January 2013). Also serves as Vice President, ACIS |
Charles A. Etherington
(1957) | General Counsel since 2007 and Senior Vice President since 2006 | Attorney, ACC (February 1994 to present); Vice President, ACC (November 2005 to present); General Counsel, ACC (March 2007 to present). Also serves as General Counsel, ACIM, ACS, ACIS and other ACC subsidiaries; and Senior Vice President, ACIM and ACS |
C. Jean Wade
(1964) | Vice President,
Treasurer and
Chief Financial
Officer since 2012 | Vice President, ACS (February 2000 to present) |
Robert J. Leach
(1966) | Vice President
since 2006 and
Assistant Treasurer
since 2012 | Vice President, ACS (February 2000 to present) |
David H. Reinmiller
(1963) | Vice President since 2001 | Attorney, ACC (January 1994 to present); Associate General Counsel, ACC (January 2001 to present). Also serves as Vice President, ACIM and ACS |
Ward D. Stauffer
(1960) | Secretary since 2005 | Attorney, ACC (June 2003 to present) |
|
|
| Approval of Management Agreement |
At a meeting held on June 16, 2015, the Fund’s Board of Trustees unanimously approved the renewal of the management agreement pursuant to which American Century Investment Management, Inc. (the “Advisor”) acts as the investment advisor for the Fund. Under Section 15(c) of the Investment Company Act, contracts for investment advisory services are required to be reviewed, evaluated, and approved by a majority of a fund’s directors/trustees, including a majority of the independent Trustees, each year. The Board regards this annual evaluation and renewal as one of its most important responsibilities.
The independent Trustees have memorialized a statement regarding the relationship between their ongoing obligations to oversee and evaluate the performance of the Advisor and their annual consideration of renewal of the management agreement. In that statement, the independent Trustees noted that their assessment of the Advisor’s performance is an ongoing process that takes place over the entire year and is informed by all of the extensive information that the Board and its committees receive and consider over time. This information, together with the materials provided in connection with the review, are central to the Board’s assessment of the Advisor’s performance and its determination whether to renew the Fund’s management agreement.
Prior to its consideration of the renewal of the management agreement, the Board requested and reviewed extensive data and analysis relating to the proposed renewal. This information and analysis was compiled by the Advisor and certain independent providers of evaluation data concerning the Fund and the services provided to the Fund by the Advisor.
In connection with its consideration of the renewal of the management agreement, the Board’s review and evaluation of the services provided by the Advisor included, but was not limited to, the following:
| |
| • | the nature, extent, and quality of investment management, shareholder services, and other services provided by the Advisor to the Fund; |
| |
| • | the wide range of other programs and services the Advisor provides to the Fund and its shareholders on a routine and non-routine basis; |
| |
| • | the investment performance of the Fund, including data comparing the Fund’s performance to appropriate benchmarks and/or a peer group of other mutual funds with similar investment objectives and strategies; |
| |
| • | the cost of owning the Fund compared to the cost of owning similar funds; |
| |
| • | the Advisor’s compliance policies, procedures, and regulatory experience; |
| |
| • | financial data showing the cost of services provided to the Fund, the profitability of the Fund to the Advisor, and the overall profitability of the Advisor; |
| |
| • | possible economies of scale associated with the Advisor’s management of the Fund and other accounts under its management; |
| |
| • | data comparing services provided and charges to other investment management clients of the Advisor; |
| |
| • | acquired fund fees and expenses; |
| |
| • | payments by the Fund and the Advisor to financial intermediaries whose clients are investors in the Fund; and |
| |
| • | any collateral benefits derived by the Advisor from the management of the Fund. |
In keeping with its practice, the Board held two in-person meetings to review and discuss the information provided in response to their request. The independent Trustees also had the benefit of the advice of their independent counsel throughout the process.
Factors Considered
The Trustees considered all of the information provided by the Advisor, the independent data providers, and the independent Trustees’ independent counsel in connection with the review, and evaluated such information for the Fund. In connection with their review, the Trustees did not identify any single factor as being all-important or controlling and each Trustee may have attributed different levels of importance to different factors. In deciding to renew the management agreement, the Board based its decision on a number of factors, including the following:
Nature, Extent and Quality of Services - Generally. Under the management agreement, the Advisor is responsible for providing or arranging for all services necessary for the operation of the Fund. The Board noted that under the management agreement, the Advisor provides or arranges at its own expense a wide variety of services including:
| |
| • | constructing and designing the Fund |
| |
| • | portfolio research and security selection |
| |
| • | initial capitalization/funding |
| |
| • | daily valuation of the Fund’s portfolio |
| |
| • | shareholder servicing and transfer agency, including shareholder confirmations, recordkeeping, and communications |
| |
| • | legal services (except the independent Trustees’ counsel) |
| |
| • | regulatory and portfolio compliance |
| |
| • | marketing and distribution (except amounts paid by the Fund under Rule 12b-1 plans) |
The Board noted that many of these services have expanded over time both in terms of quantity and complexity in response to shareholder demands, competition in the industry, changing distribution channels, and the changing regulatory environment.
Investment Management, Shareholder, and Other Services. The nature of the investment management services provided to the Fund is quite complex and allows Fund shareholders access to professional money management, instant diversification of their investments within an asset class, the opportunity to easily diversify among asset classes by investing in or exchanging among various American Century Investments funds, and liquidity. In evaluating investment performance, the Board expects the Advisor to manage the Fund in accordance with its investment objectives and approved strategies. Further, the Trustees recognize that the Advisor has an obligation to seek the best execution of fund trades. In providing these services, the Advisor utilizes teams of investment professionals (portfolio managers, analysts, research assistants, and securities traders) who require extensive information technology, research, training, compliance, and other systems to conduct their business. The Board, directly and through its Portfolio Committee, regularly reviews investment performance information for the Fund, together with comparative information for appropriate benchmarks and/or peer groups of similarly-managed funds, over different time horizons. The Trustees also review detailed performance information during the management agreement approval process. If performance concerns are identified, the Fund receives special reviews until performance improves, during which the Board discusses with the Advisor the reasons for such results (e.g., market conditions, security selection) and any efforts being undertaken to improve performance. The Fund’s performance was above its benchmark for the one-year period reviewed by the Board. The Board found the investment management services provided by the Advisor to the Fund to be satisfactory and consistent with the management agreement.
Under the management agreement, the Advisor provides the Fund with a comprehensive package of transfer agency, shareholder, and other services. The Board, directly and through various committees of the Board, regularly reviews reports and evaluations of such services at its regular
meetings. These reports include, but are not limited to, information regarding the operational efficiency and accuracy of the shareholder and transfer agency services provided, staffing levels, shareholder satisfaction (as measured by external as well as internal sources), technology support, new products and services offered to Fund shareholders, securities trading activities, portfolio valuation services, auditing services, and legal and operational compliance activities.
Certain aspects of shareholder and transfer agency service level efficiency and the quality of securities trading activities are measured by independent third party providers and are presented in comparison to other fund groups not managed by the Advisor. The Board found the services provided by the Advisor to the Fund under the management agreement to be competitive and of high quality.
Costs of Services and Profitability. The Advisor provides detailed information concerning its cost of providing various services to the Fund, its profitability in managing the Fund, its overall profitability, and its financial condition. The Trustees have reviewed with the Advisor the methodology used to prepare this financial information. This information is considered in evaluating the Advisor’s financial condition, its ability to continue to provide services under the management agreement, and the reasonableness of the current management fee. The Board concluded that the Advisor’s profits were reasonable in light of the services provided to the Fund.
Ethics. The Board generally considers the Advisor’s commitment to providing quality services to shareholders and to conducting its business ethically. They noted that the Advisor’s practices generally meet or exceed industry best practices.
Economies of Scale. The Board also reviewed information provided by the Advisor regarding the possible existence of economies of scale in connection with the management of the Fund. The Board concluded that economies of scale are difficult to measure and predict with precision, especially on a fund-by-fund basis. The Board concluded that the Advisor is appropriately sharing economies of scale through its competitive fee structure, offering competitive fees from fund inception, and through reinvestment in its business to provide shareholders enhanced and expanded services.
Comparison to Other Funds’ Fees. The management agreement provides that the Fund pays the Advisor a single, all-inclusive (or unified) management fee for providing all services necessary for the management and operation of the Fund, other than brokerage expenses, taxes, interest, extraordinary expenses, the fees and expenses of the Fund’s independent Trustees (including their independent legal counsel), and expenses incurred in connection with the provision of shareholder services and distribution services under a plan adopted pursuant to Rule 12b-1 under the 1940 Act. Under the unified fee structure, the Advisor is responsible for providing all investment advisory, custody, audit, administrative, compliance, recordkeeping, marketing, and shareholder services, or arranging and supervising third parties to provide such services. By contrast, most other funds are charged a variety of fees, including an investment advisory fee, a transfer agency fee, an administrative fee, distribution charges, and other expenses. Other than their investment advisory fees and any applicable Rule 12b-1 fees, all other components of the total fees charged by these other funds may be increased without shareholder approval. The Board believes the unified fee structure is a benefit to Fund shareholders because it clearly discloses to shareholders the cost of owning Fund shares, and, since the unified fee cannot be increased without a vote of Fund shareholders, it shifts to the Advisor the risk of increased costs of operating the Fund and provides a direct incentive to minimize administrative inefficiencies. Part of the Board’s analysis of fee levels involves reviewing certain evaluative data compiled by an independent provider and comparing the Fund’s unified fee to the total expense ratio of peer funds. The unified fee charged to shareholders of the Fund was above the median of the total expense ratios of the Fund’s peer universe. The Board concluded that the management fee paid by the Fund to the Advisor under the management agreement is reasonable in light of the nature and quality of services provided to the Fund.
Comparison to Fees and Services Provided to Other Clients of the Advisor. The Board also requested and received information from the Advisor concerning the nature of the services, fees, costs, and profitability of its advisory services to advisory clients other than the Fund. They observed that these varying types of client accounts require different services and involve different regulatory and entrepreneurial risks than the management of the Fund. The Board analyzed this information and concluded that the fees charged and services provided to the Fund were reasonable by comparison.
Payments to Intermediaries. The Trustees also requested and received a description of payments made to intermediaries by the Fund and the Advisor. These payments include various payments made by the Fund or the Advisor to different types of intermediaries and recordkeepers for distribution and service activities provided for the Fund.
Collateral or “Fall-Out” Benefits Derived by the Advisor. The Board considered the existence of collateral benefits the Advisor may receive as a result of its relationship with the Fund. The Board noted that the Advisor’s primary business is managing mutual funds and it generally does not use fund or shareholder information to generate profits in other lines of business, and therefore does not derive any significant collateral benefits from them. The Board noted that the Advisor receives proprietary research from broker-dealers that execute fund portfolio transactions. The Board also determined that the Advisor is able to provide investment management services to certain clients other than the Fund, at least in part, due to its existing infrastructure built to serve the fund complex.
Existing Relationship. The Board also considered whether there was any reason for not continuing the existing arrangement with the Advisor. In this regard, the Board was mindful of the potential disruptions of the Fund’s operations and various risks, uncertainties, and other effects that could occur as a result of a decision not to continue such relationship. In particular, the Board recognized that most shareholders have invested in the Fund on the strength of the Advisor’s industry standing and reputation and in the expectation that the Advisor will have a continuing role in providing advisory services to the Fund.
Conclusion of the Trustees. As a result of this process, the Board, including all of the independent Trustees and assisted by the advice of independent legal counsel, taking into account all of the factors discussed above and the information provided by the Advisor and others in connection with its review and throughout the year, concluded that the management agreement between the Fund and the Advisor is fair and reasonable in light of the services provided and should be renewed.
Retirement Account Information
As required by law, distributions you receive from certain IRAs are subject to federal income tax withholding, unless you elect not to have withholding apply. Tax will be withheld on the total amount withdrawn even though you may be receiving amounts that are not subject to withholding, such as nondeductible contributions. In such case, excess amounts of withholding could occur. You may adjust your withholding election so that a greater or lesser amount will be withheld.
If you don’t want us to withhold on this amount, you must notify us to not withhold the federal income tax. You may notify us in writing or in certain situations by telephone or through other electronic means. For systematic withdrawals, your withholding election will remain in effect until revoked or changed by filing a new election. You have the right to revoke your election at any time.
Remember, even if you elect not to have income tax withheld, you are liable for paying income tax on the taxable portion of your withdrawal. If you elect not to have income tax withheld or you don’t have enough income tax withheld, you may be responsible for payment of estimated tax. You may incur penalties under the estimated tax rules if your withholding and estimated tax payments are not sufficient. You can reduce or defer the income tax on a distribution by directly or indirectly rolling such distribution over to another IRA or eligible plan. You should consult your tax advisor for additional information.
State tax will be withheld if, at the time of your distribution, your address is within one of the mandatory withholding states and you have federal income tax withheld (or as otherwise required by state law). State taxes will be withheld from your distribution in accordance with the respective state rules.
Distributions you receive from 403(b), 457 and qualified plans are subject to special tax and withholding rules. Your plan administrator or plan sponsor is required to provide you with a special tax notice explaining those rules at the time you request a distribution. If applicable, federal and/or state taxes may be withheld from your distribution amount.
Proxy Voting Policies
Descriptions of the principles and policies that the fund's investment advisor uses in exercising the voting rights associated with the securities purchased and/or held by the fund are available without charge, upon request, by calling 1-800-345-2021 or visiting the "About Us" page of American Century Investments’ website at americancentury.com. A description of the policies is also available on the Securities and Exchange Commission’s website at sec.gov. Information regarding how the investment advisor voted proxies relating to portfolio securities during the most recent 12-month period ended June 30 is available on the "About Us" page at americancentury.com. It is also available at sec.gov.
Quarterly Portfolio Disclosure
The fund files its complete schedule of portfolio holdings with the Securities and Exchange Commission (SEC) for the first and third quarters of each fiscal year on Form N-Q. The fund’s Forms N-Q are available on the SEC’s website at sec.gov, and may be reviewed and copied at the SEC’s Public Reference Room in Washington, DC. Information on the operation of the Public Reference Room may be obtained by calling 1-800-SEC-0330. The fund also makes its complete schedule of portfolio holdings for the most recent quarter of its fiscal year available on its website at americancentury.com and, upon request, by calling 1-800-345-2021.
Other Tax Information
The following information is provided pursuant to provisions of the Internal Revenue Code.
The fund hereby designates $229,985 as qualified short-term capital gain distributions for purposes of Internal Revenue Code Section 871 for the fiscal year ended June 30, 2015.
|
| | |
| |
| | | |
| Contact Us | americancentury.com | |
| Automated Information Line | 1-800-345-8765 | |
| Investor Services Representative | 1-800-345-2021
or 816-531-5575 | |
| Investors Using Advisors | 1-800-378-9878 | |
Business, Not-For-Profit, Employer-Sponsored
Retirement Plans | 1-800-345-3533 | |
Banks and Trust Companies, Broker-Dealers,
Financial Professionals, Insurance Companies | 1-800-345-6488 | |
| Telecommunications Relay Service for the Deaf | 711 | |
| | | |
| American Century International Bond Funds | |
| | | |
Investment Advisor: American Century Investment Management, Inc. Kansas City, Missouri | |
| | | |
| This report and the statements it contains are submitted for the general information of our shareholders. The report is not authorized for distribution to prospective investors unless preceded or accompanied by an effective prospectus. | |
| | | |
©2015 American Century Proprietary Holdings, Inc. All rights reserved.
CL-ANN-86511 1508 | |
|
| |
| ANNUAL REPORT | JUNE 30, 2015 |
International Bond Fund
|
| | |
| President’s Letter | 2 |
|
| Performance | 3 |
|
| Portfolio Commentary | |
|
| Fund Characteristics | |
|
| Shareholder Fee Example | |
|
| Schedule of Investments | |
|
| Statement of Assets and Liabilities | |
|
| Statement of Operations | |
|
| Statement of Changes in Net Assets | |
|
| Notes to Financial Statements | |
|
| Financial Highlights | |
|
| Report of Independent Registered Public Accounting Firm | |
|
| Management | |
|
| Approval of Management Agreement | |
|
| Proxy Voting Results | |
|
| Additional Information | |
|
Any opinions expressed in this report reflect those of the author as of the date of the report, and do not necessarily represent the opinions of American Century Investments® or any other person in the American Century Investments organization. Any such opinions are subject to change at any time based upon market or other conditions and American Century Investments disclaims any responsibility to update such opinions. These opinions may not be relied upon as investment advice and, because investment decisions made by American Century Investments funds are based on numerous factors, may not be relied upon as an indication of trading intent on behalf of any American Century Investments fund. Security examples are used for representational purposes only and are not intended as recommendations to purchase or sell securities. Performance information for comparative indices and securities is provided to American Century Investments by third party vendors. To the best of American Century Investments’ knowledge, such information is accurate at the time of printing.
|
| |
| Dear Investor:
Thank you for reviewing this annual report for the 12 months ended June 30, 2015. It provides investment performance and portfolio information for the reporting period, plus longer-term historical performance data.
Annual reports remain important vehicles for conveying information about fund returns, including market and economic factors that affected performance during the reporting period. For additional, updated investment and market insights, we encourage you to visit our website, americancentury.com. |
| Jonathan Thomas |
Global Divergence Favored U.S. Assets
“Global divergence” between the U.S. and the rest of the world emerged as a prevalent theme during the reporting period. This theme embraced not only the relatively stronger economic growth enjoyed by the U.S. compared with most of the world, but also the related contrast between the U.S. Federal Reserve’s unwinding of monetary stimulus compared with the continuation and expansion of stimulus by other major central banks. Low inflation also prevailed, after crude oil prices plunged over 40% amid muted demand for commodities in general. In this environment, the U.S. dollar, U.S. growth stocks, and longer-maturity U.S. Treasuries generally benefited from “flight to quality” capital flows, reinforced by geopolitical and financial turmoil, particularly in Greece, Russia/Ukraine, China, and the Middle East.
Strong global capital flows into U.S. assets generated a global divergence between investment returns for U.S. and non-U.S. markets, especially for U.S. investors who realized their returns in dollar terms. For the reporting period, the U.S. Dollar Index, the S&P 500 Index, and the Barclays U.S. Aggregate Bond Index returned 19.74%, 7.42%, and 1.86%, respectively. By contrast, the MSCI EAFE Index, the MSCI Emerging Markets Index, and the Barclays Global Aggregate Bond ex-USD (Unhedged) Index returned -4.22%, -5.12%, and -13.19%, respectively, for U.S. investors unhedged for the strong dollar’s impact on non-dollar-denominated returns.
We expect more monetary policy divergence between the U.S. and other major developed economies in the coming months, accompanied by continued market volatility. This could present both challenges and opportunities for active investment managers. Upward pressures on inflation and interest rates could develop as the massive amount of global monetary stimulus in progress takes hold and economies improve. In this environment, we continue to believe in a disciplined, diversified, long-term investment approach, using professionally managed stock and bond portfolios to meet financial goals. We appreciate your continued trust in us.
Sincerely,
Jonathan Thomas
President and Chief Executive Officer
American Century Investments
|
| | | | | | |
| Total Returns as of June 30, 2015 |
| | | | Average Annual Returns | |
| | Ticker Symbol | 1 year | 5 years | 10 years | Since Inception | Inception Date |
| Investor Class | BEGBX | -12.85% | 0.50% | 1.91% | 4.74% | 1/7/92 |
Barclays Global Aggregate Bond Index ex-USD (Unhedged)(1) | — | -13.19% | 1.08% | 2.82% | 5.00%(2) | — |
Barclays Global Treasury ex-U.S. Bond Index | — | -12.94% | 0.48% | 2.72% | 5.02%(2) | — |
| Institutional Class | AIDIX | -12.67% | 0.70% | 2.12% | 2.74% | 8/2/04 |
A Class(3) | AIBDX | | | | | 10/27/98 |
| No sales charge* | | -13.06% | 0.25% | 1.64% | 2.97% | |
| With sales charge* | | -16.97% | -0.67% | 1.17% | 2.68% | |
| C Class | AIQCX | -13.67% | -0.50% | — | -0.07% | 9/28/07 |
| R Class | AIBRX | -13.28% | 0.00% | — | 0.42% | 9/28/07 |
| R6 Class | AIDDX | -12.63% | — | — | -3.99% | 7/26/13 |
* Sales charges include initial sales charges and contingent deferred sales charges (CDSCs), as applicable. A Class shares have a 4.50% maximum initial sales charge and may be subject to a maximum CDSC of 1.00%. C Class shares redeemed within 12 months of purchase are subject to a maximum CDSC of 1.00%. The SEC requires that mutual funds provide performance information net of maximum sales charges in all cases where charges could be applied.
| |
| (1) | Effective November 2014, the fund’s benchmark changed from the Barclays Global Treasury ex-U.S. Bond Index to the Barclays Global Aggregate Bond Index ex-USD (Unhedged). The fund’s investment advisor believes that the Barclays Global Aggregate Bond Index ex-USD (Unhedged) better represents the fund's portfolio composition given the increased investments in corporate bonds. |
| |
| (2) | Since December 31, 1991, the date nearest the Investor Class’s inception for which data are available. |
| |
| (3) | Prior to September 4, 2007, the A Class was referred to as the Advisor Class and did not have a front-end sales charge. Performance prior to that date has been adjusted to reflect this charge. |
Data presented reflect past performance. Past performance is no guarantee of future results. Current performance may be higher or lower than the performance shown. Investment return and principal value will fluctuate, and redemption value may be more or less than original cost. Data assumes reinvestment of dividends and capital gains, and none of the charts reflect the deduction of taxes that a shareholder would pay on fund distributions or the redemption of fund shares. To obtain performance data current to the most recent month end, please call 1-800-345-2021 or visit americancentury.com. For additional information about the fund, please consult the prospectus.
|
|
| Growth of $10,000 Over 10 Years |
| $10,000 investment made June 30, 2005 |
| Performance for other share classes will vary due to differences in fee structure. |
|
| |
| Value on June 30, 2015 |
| | Investor Class — $12,087 |
| |
| | Barclays Global Aggregate Bond Index ex-USD (Unhedged) — $13,213 |
| |
| | Barclays Global Treasury ex-U.S. Bond Index — $13,083 |
| |
|
| | | | | |
| Total Annual Fund Operating Expenses | |
| Investor Class | Institutional Class | A Class | C Class | R Class | R6 Class |
| 0.80% | 0.60% | 1.05% | 1.80% | 1.30% | 0.55% |
The total annual fund operating expenses shown is as stated in the fund’s prospectus current as of the date of this report. The prospectus may vary from the expense ratio shown elsewhere in this report because it is based on a different time period, includes acquired fund fees and expenses, and, if applicable, does not include fee waivers or expense reimbursements.
Data presented reflect past performance. Past performance is no guarantee of future results. Current performance may be higher or lower than the performance shown. Investment return and principal value will fluctuate, and redemption value may be more or less than original cost. Data assumes reinvestment of dividends and capital gains, and none of the charts reflect the deduction of taxes that a shareholder would pay on fund distributions or the redemption of fund shares. To obtain performance data current to the most recent month end, please call 1-800-345-2021 or visit americancentury.com. For additional information about the fund, please consult the prospectus.
Portfolio Managers: John Lovito, Simon Chester, Edward Boyle, Margé Karner, and Brian Howell
Performance Summary
International Bond returned -12.85%* for the fiscal year ended June 30, 2015, compared with the -12.94% return of its old benchmark, the Barclays Global Treasury ex-U.S. Bond Index, and the -13.19% return of its new benchmark, the Barclays Global Aggregate Bond Index ex-USD (Unhedged). Portfolio returns reflect operating expenses, while index returns do not.
The fund’s new benchmark took effect on November 1, 2014, as part of some changes to the fund’s investment policies. The changes included easing the fund’s credit-quality restrictions (which broadened the fund’s investment universe in terms of both countries and foreign currencies) and increasing its exposure to non-government securities.
Market Review
Non-U.S. bonds posted positive returns in local currencies but declined sharply in U.S. dollar terms during the one-year period. A meaningfully stronger U.S. dollar significantly reduced non-U.S. bond returns for U.S. investors. For the 12-month period, the dollar appreciated by 23% against the euro, 22% versus the Australian dollar, 21% against the Japanese yen, 17% versus the Canadian dollar, and 9% against the British pound.
The primary factor behind the stronger dollar was a divergence in economic conditions and central bank policy between the U.S. and the rest of the world. Despite a slowdown in early 2015, the U.S. economy remained among the strongest in the developed world, leading the U.S. Federal Reserve (the Fed) to end its quantitative easing program in late 2014 and signal its intention to raise short-term interest rates in 2015. In contrast, Europe faced slowing growth and the threat of deflation, Japan slipped into recession, and many emerging economies experienced a continued deceleration in growth. As a result, central banks around the world responded with aggressive stimulus actions, including quantitative easing efforts from the Bank of Japan and the European Central Bank.
This divergence also drove global bond performance and yield movements during the one-year period. European bond markets delivered the best returns as their yields fell the most, led by the U.K. and peripheral markets such as Italy and Spain. Yields tumbled in most Asia/Pacific bond markets as well, with the exception of Japan, where yield movements were more muted.
Currency Positioning Aided Performance
The fund’s outperformance of its benchmark during the one-year period was driven in part by currency positioning. In particular, an overweight position in the U.S. dollar throughout the reporting period added value as the dollar appreciated substantially against most foreign currencies. Underweight positions in the euro and Japanese yen also contributed favorably to relative performance.
| |
| * | All fund returns referenced in this commentary are for Investor Class shares. Performance for other share classes will vary due to differences in fee structure; when Investor Class performance exceeds that of the fund's benchmark, other share classes may not. See page 3 for returns for all share classes. |
Sector and Country Allocation Also Added Value
For most of the period, the fund held an overweight position in non-government bonds, and these securities generally outperformed, aiding overall performance.
The fund’s new benchmark has a non-government bond component comprising approximately 20% of the index, whereas the old benchmark had no non-government securities. Consequently, we increased the fund’s exposure to non-government bonds during the period, from less than 10% to more than 20% of the portfolio. As of the end of the period, the bulk of the fund’s non-government holdings were lower-rated corporate bonds issued by European financial companies, which we believe offer attractive yields and relative values. The fund also held small positions in supranational bonds and U.S. high-yield corporate bonds.
Country allocation within the portfolio was mixed but slightly positive overall. Following the changes in the fund’s investment policies, we established positions in peripheral European bond markets such as Italy and Spain, which together comprised approximately 14% of the portfolio at the end of the period. These holdings contributed positively to performance. An overweight position in Norwegian bonds also added value during the period. However, an underweight position in the U.K. detracted from performance as the U.K. was one of the best-performing bond markets on a global basis.
Shorter Duration Detracted
The fund’s duration (a measure of interest-rate sensitivity) was shorter than that of the benchmark throughout the reporting period. This positioning detracted from relative results as the shorter duration limited the positive impact of declining bond yields on fund performance. By the end of the reporting period, however, we had shifted back to a relatively neutral duration compared with the benchmark.
Positioning for the Future
We expect global economic conditions to improve during the second half of the year. The U.S. is likely to remain one of the stronger economies in the world, but growth also appears to be firming in Europe and selected countries in the Asia/Pacific region thanks to accommodative central bank policies. This environment will most likely result in a short-term interest rate increase by the Fed before year-end.
In recent months, we have been reducing the fund’s overall risk profile and sharpening its focus on areas such as U.S. high-yield bonds, European financial securities, and peripheral European bond markets. In addition, the fund remains overweight the U.S. dollar given the likelihood of an impending Fed rate hike. We expect to see greater volatility in the fixed-income and currency markets in the coming months, and will seek to take advantage of opportunities resulting from these market fluctuations.
|
| |
| JUNE 30, 2015 |
| Portfolio at a Glance | |
| Average Duration (effective) | 7.0 years |
| Weighted Average Life | 8.8 years |
| | |
| Bond Holdings by Country | % of net assets |
| Japan | 23.4% |
| United Kingdom | 10.3% |
Italy(1) | 7.6% |
France(1) | 7.2% |
Spain(1) | 5.9% |
Germany(1) | 5.6% |
| Canada | 5.2% |
| Supranational | 4.6% |
| United States | 4.1% |
Netherlands(1) | 2.9% |
| Other Countries | 15.8% |
Cash and Equivalents(2) | 7.4% |
| (1) These countries are members of the eurozone. | |
| (2) Includes temporary cash investments and other assets and liabilities. | |
| | |
| Types of Investments in Portfolio | % of net assets |
| Sovereign Governments and Agencies | 69.7% |
| Corporate Bonds | 22.9% |
| Temporary Cash Investments | 3.0% |
| Other Assets and Liabilities | 4.4% |
Fund shareholders may incur two types of costs: (1) transaction costs, including sales charges (loads) on purchase payments and redemption/exchange fees; and (2) ongoing costs, including management fees; distribution and service (12b-1) fees; and other fund expenses. This example is intended to help you understand your ongoing costs (in dollars) of investing in your fund and to compare these costs with the ongoing cost of investing in other mutual funds.
The example is based on an investment of $1,000 made at the beginning of the period and held for the entire period from January 1, 2015 to June 30, 2015.
Actual Expenses
The table provides information about actual account values and actual expenses for each class. You may use the information, together with the amount you invested, to estimate the expenses that you paid over the period. First, identify the share class you own. Then simply divide your account value by $1,000 (for example, an $8,600 account value divided by $1,000 = 8.6), then multiply the result by the number under the heading “Expenses Paid During Period” to estimate the expenses you paid on your account during this period.
If you hold Investor Class shares of any American Century Investments fund, or Institutional Class shares of the American Century Diversified Bond Fund, in an American Century Investments account (i.e., not a financial intermediary or retirement plan account), American Century Investments may charge you a $12.50 semiannual account maintenance fee if the value of those shares is less than $10,000. We will redeem shares automatically in one of your accounts to pay the $12.50 fee. In determining your total eligible investment amount, we will include your investments in all personal accounts (including American Century Investments Brokerage accounts) registered under your Social Security number. Personal accounts include individual accounts, joint accounts, UGMA/UTMA accounts, personal trusts, Coverdell Education Savings Accounts and IRAs (including traditional, Roth, Rollover, SEP-, SARSEP- and SIMPLE-IRAs), and certain other retirement accounts. If you have only business, business retirement, employer-sponsored or American Century Investments Brokerage accounts, you are currently not subject to this fee. If you are subject to the Account Maintenance Fee, your account value could be reduced by the fee amount.
Hypothetical Example for Comparison Purposes
The table also provides information about hypothetical account values and hypothetical expenses based on the actual expense ratio of each class of your fund and an assumed rate of return of 5% per year before expenses, which is not the actual return of a fund’s share class. The hypothetical account values and expenses may not be used to estimate the actual ending account balance or expenses you paid for the period. You may use this information to compare the ongoing costs of investing in your fund and other funds. To do so, compare this 5% hypothetical example with the 5% hypothetical examples that appear in the shareholder reports of the other funds.
Please note that the expenses shown in the table are meant to highlight your ongoing costs only and do not reflect any transactional costs, such as sales charges (loads) or redemption/exchange fees. Therefore, the table is useful in comparing ongoing costs only, and will not help you determine the relative total costs of owning different funds. In addition, if these transactional costs were included, your costs would have been higher.
|
| | | | |
| | Beginning
Account Value
1/1/15 | Ending
Account Value
6/30/15 | Expenses Paid
During Period(1)1/1/15 - 6/30/15 | Annualized Expense Ratio(1) |
| Actual |
| Investor Class | $1,000 | $942.00 | $3.85 | 0.80% |
| Institutional Class | $1,000 | $942.80 | $2.89 | 0.60% |
| A Class | $1,000 | $940.40 | $5.05 | 1.05% |
| C Class | $1,000 | $937.80 | $8.65 | 1.80% |
| R Class | $1,000 | $939.60 | $6.25 | 1.30% |
| R6 Class | $1,000 | $942.70 | $2.65 | 0.55% |
| Hypothetical | | | | |
| Investor Class | $1,000 | $1,020.83 | $4.01 | 0.80% |
| Institutional Class | $1,000 | $1,021.82 | $3.01 | 0.60% |
| A Class | $1,000 | $1,019.59 | $5.26 | 1.05% |
| C Class | $1,000 | $1,015.87 | $9.00 | 1.80% |
| R Class | $1,000 | $1,018.35 | $6.51 | 1.30% |
| R6 Class | $1,000 | $1,022.07 | $2.76 | 0.55% |
| |
| (1) | Expenses are equal to the class's annualized expense ratio listed in the table above, multiplied by the average account value over the period, multiplied by 181, the number of days in the most recent fiscal half-year, divided by 365, to reflect the one-half year period. |
JUNE 30, 2015
|
| | | | | | | |
| | | Principal Amount | Value |
| SOVEREIGN GOVERNMENTS AND AGENCIES — 69.7% | | | |
| Australia — 2.3% | | | |
| Australia Government Bond, 2.75%, 4/21/24 | AUD | 15,320,000 |
| $ | 11,661,818 |
|
| New South Wales Treasury Corp., 5.50%, 3/1/17 | AUD | 10,650,000 |
| 8,676,977 |
|
| | | | 20,338,795 |
|
| Austria — 1.3% | | | |
Austria Government Bond, 4.35%, 3/15/19(1) | EUR | 4,740,000 |
| 6,123,457 |
|
Austria Government Bond, 3.40%, 11/22/22(1) | EUR | 2,525,000 |
| 3,361,393 |
|
Austria Government Bond, 4.15%, 3/15/37(1) | EUR | 1,485,000 |
| 2,396,146 |
|
| | | | 11,880,996 |
|
| Belgium — 2.1% | | | |
Belgium Government Bond, 4.00%, 3/28/18(1) | EUR | 7,655,000 |
| 9,495,316 |
|
| Belgium Government Bond, 2.25%, 6/22/23 | EUR | 4,585,000 |
| 5,647,822 |
|
Belgium Government Bond, 4.25%, 3/28/41(1) | EUR | 2,115,000 |
| 3,418,453 |
|
| | | | 18,561,591 |
|
| Canada — 4.8% | | | |
| Canadian Government Bond, 1.50%, 3/1/17 | CAD | 10,560,000 |
| 8,601,539 |
|
| Canadian Government Bond, 4.00%, 6/1/41 | CAD | 6,085,000 |
| 6,465,446 |
|
| Province of British Columbia, 3.25%, 12/18/21 | CAD | 6,970,000 |
| 6,097,781 |
|
| Province of British Columbia, 2.85%, 6/18/25 | CAD | 4,680,000 |
| 3,906,083 |
|
| Province of Ontario Canada, 4.40%, 6/2/19 | CAD | 11,115,000 |
| 9,989,533 |
|
| Province of Ontario Canada, 4.65%, 6/2/41 | CAD | 3,170,000 |
| 3,176,230 |
|
| Province of Quebec Canada, 3.00%, 9/1/23 | CAD | 4,100,000 |
| 3,474,141 |
|
| Province of Quebec Canada, 5.00%, 12/1/41 | CAD | 800,000 |
| 838,606 |
|
| | | | 42,549,359 |
|
| Czech — 0.4% | | | |
| Czech Republic Government Bond, 4.70%, 9/12/22 | CZK | 59,900,000 |
| 3,117,465 |
|
| Denmark — 0.4% | | | |
| Denmark Government Bond, 7.00%, 11/10/24 | DKK | 8,270,000 |
| 1,928,013 |
|
| Denmark Government Bond, 4.50%, 11/15/39 | DKK | 5,100,000 |
| 1,206,067 |
|
| | | | 3,134,080 |
|
| Finland — 0.3% | | | |
Finland Government Bond, 4.00%, 7/4/25(1) | EUR | 1,960,000 |
| 2,803,222 |
|
| France — 5.1% | | | |
| France Government Bond OAT, 3.25%, 10/25/21 | EUR | 17,205,000 |
| 22,399,145 |
|
| France Government Bond OAT, 1.75%, 11/25/24 | EUR | 13,370,000 |
| 15,778,406 |
|
| France Government Bond OAT, 3.25%, 5/25/45 | EUR | 5,390,000 |
| 7,412,875 |
|
| | | | 45,590,426 |
|
| Germany — 3.3% | | | |
| Bundesrepublik Deutschland, 3.00%, 7/4/20 | EUR | 13,500,000 |
| 17,218,270 |
|
| Bundesrepublik Deutschland, 1.75%, 2/15/24 | EUR | 5,300,000 |
| 6,474,653 |
|
| Bundesrepublik Deutschland, 2.50%, 7/4/44 | EUR | 4,085,000 |
| 5,575,943 |
|
| | | | 29,268,866 |
|
| Ireland — 0.5% | | | |
| Ireland Government Bond, 5.90%, 10/18/19 | EUR | 1,410,000 |
| 1,929,382 |
|
| Ireland Government Bond, 3.40%, 3/18/24 | EUR | 1,620,000 |
| 2,087,552 |
|
| | | | 4,016,934 |
|
|
| | | | | | | |
| | | Principal Amount | Value |
| Italy — 6.5% | | | |
| Italy Buoni Poliennali Del Tesoro, 3.50%, 11/1/17 | EUR | 14,520,000 |
| $ | 17,303,304 |
|
| Italy Buoni Poliennali Del Tesoro, 1.50%, 8/1/19 | EUR | 15,775,000 |
| 17,958,099 |
|
| Italy Buoni Poliennali Del Tesoro, 2.50%, 12/1/24 | EUR | 13,655,000 |
| 15,512,937 |
|
Italy Buoni Poliennali Del Tesoro, 4.75%, 9/1/44(1) | EUR | 4,650,000 |
| 6,519,806 |
|
| | | | 57,294,146 |
|
| Japan — 23.4% | | | |
| Japan Government Five Year Bond, 0.30%, 9/20/18 | JPY | 7,381,800,000 |
| 60,863,754 |
|
| Japan Government Ten Year Bond, 1.00%, 12/20/21 | JPY | 6,483,400,000 |
| 55,771,628 |
|
| Japan Government Thirty Year Bond, 2.40%, 3/20/37 | JPY | 2,504,650,000 |
| 24,869,076 |
|
| Japan Government Thirty Year Bond, 2.00%, 9/20/41 | JPY | 2,046,150,000 |
| 18,973,653 |
|
| Japan Government Twenty Year Bond, 2.10%, 12/20/26 | JPY | 4,929,850,000 |
| 47,175,472 |
|
| | | | 207,653,583 |
|
| Malaysia — 0.3% | | | |
| Malaysia Government Bond, 3.96%, 9/15/25 | MYR | 11,300,000 |
| 2,970,413 |
|
| Mexico — 0.7% | | | |
| Mexican Bonos, 6.50%, 6/9/22 | MXN | 93,500,000 |
| 6,164,743 |
|
| Netherlands — 0.8% | | | |
Netherlands Government Bond, 2.25%, 7/15/22(1) | EUR | 3,260,000 |
| 4,053,508 |
|
Netherlands Government Bond, 3.75%, 1/15/42(1) | EUR | 1,725,000 |
| 2,816,898 |
|
| | | | 6,870,406 |
|
| New Zealand — 0.6% | | | |
| New Zealand Government Bond, 5.00%, 3/15/19 | NZD | 6,860,000 |
| 4,985,243 |
|
| Norway — 0.6% | | | |
Norway Government Bond, 4.25%, 5/19/17(1) | NOK | 24,590,000 |
| 3,340,584 |
|
Norway Government Bond, 3.75%, 5/25/21(1) | NOK | 15,080,000 |
| 2,180,938 |
|
| | | | 5,521,522 |
|
| Poland — 0.2% | | | |
| Poland Government Bond, 4.00%, 10/25/23 | PLN | 7,730,000 |
| 2,171,244 |
|
| Singapore — 0.9% | | | |
| Singapore Government Bond, 2.375%, 4/1/17 | SGD | 6,150,000 |
| 4,684,104 |
|
| Singapore Government Bond, 3.125%, 9/1/22 | SGD | 4,220,000 |
| 3,277,142 |
|
| | | | 7,961,246 |
|
| South Africa — 0.4% | | | |
| South Africa Government Bond, 7.75%, 2/28/23 | ZAR | 45,736,000 |
| 3,672,117 |
|
| Spain — 5.7% | | | |
Spain Government Bond, 5.50%, 7/30/17(1) | EUR | 10,030,000 |
| 12,355,713 |
|
Spain Government Bond, 4.30%, 10/31/19(1) | EUR | 11,260,000 |
| 14,288,573 |
|
Spain Government Bond, 4.40%, 10/31/23(1) | EUR | 7,920,000 |
| 10,388,491 |
|
Spain Government Bond, 1.60%, 4/30/25(1) | EUR | 8,840,000 |
| 9,281,532 |
|
Spain Government Bond, 5.15%, 10/31/44(1) | EUR | 2,560,000 |
| 3,825,339 |
|
| | | | 50,139,648 |
|
| Sweden — 0.9% | | | |
| Sweden Government Bond, 4.25%, 3/12/19 | SEK | 28,800,000 |
| 4,017,067 |
|
| Sweden Government Bond, 3.50%, 6/1/22 | SEK | 25,100,000 |
| 3,615,186 |
|
| | | | 7,632,253 |
|
| Switzerland — 0.9% | | | |
| Switzerland Government Bond, 2.00%, 4/28/21 | CHF | 4,050,000 |
| 4,944,511 |
|
| Switzerland Government Bond, 2.50%, 3/8/36 | CHF | 2,265,000 |
| 3,359,192 |
|
| | | | 8,303,703 |
|
|
| | | | | | | |
| | | Principal Amount | Value |
| Thailand — 0.3% | | | |
| Thailand Government Bond, 3.85%, 12/12/25 | THB | 90,200,000 |
| $ | 2,883,181 |
|
| United Kingdom — 7.0% | | | |
| United Kingdom Gilt, 4.00%, 9/7/16 | GBP | 3,065,000 |
| 5,013,935 |
|
| United Kingdom Gilt, 4.50%, 3/7/19 | GBP | 6,245,000 |
| 11,014,523 |
|
| United Kingdom Gilt, 5.00%, 3/7/25 | GBP | 5,700,000 |
| 11,297,517 |
|
| United Kingdom Gilt, 4.25%, 3/7/36 | GBP | 7,575,000 |
| 15,023,149 |
|
| United Kingdom Gilt, 4.50%, 12/7/42 | GBP | 3,660,000 |
| 7,808,653 |
|
| United Kingdom Gilt, 4.25%, 12/7/55 | GBP | 5,335,000 |
| 11,881,450 |
|
| | | | 62,039,227 |
|
TOTAL SOVEREIGN GOVERNMENTS AND AGENCIES (Cost $676,051,330) | | | 617,524,409 |
|
| CORPORATE BONDS — 22.9% | | | |
| Canada — 0.4% | | | |
1011778 BC ULC / New Red Finance, Inc., 4.625%, 1/15/22(1) | | $ | 650,000 |
| 641,875 |
|
| Total Capital Canada Ltd., MTN, 2.125%, 9/18/29 | EUR | 1,500,000 |
| 1,673,390 |
|
Valeant Pharmaceuticals International, Inc., 6.75%, 8/15/18(1) | | $ | 1,360,000 |
| 1,428,850 |
|
| | | | 3,744,115 |
|
| France — 2.1% | | | |
| AXA SA, 7.125%, 12/15/20 | GBP | 2,000,000 |
| 3,704,966 |
|
| BNP Paribas SA, MTN, 2.375%, 2/17/25 | EUR | 2,900,000 |
| 3,047,678 |
|
| BPCE SA, 4.625%, 7/18/23 | EUR | 2,000,000 |
| 2,526,493 |
|
| CNP Assurances, VRN, 4.00%, 11/18/24 | EUR | 2,000,000 |
| 2,179,971 |
|
| Credit Agricole SA, MTN, 7.375%, 12/18/23 | GBP | 1,500,000 |
| 2,936,425 |
|
| GDF Suez, VRN, 4.75%, 7/10/21 | EUR | 1,700,000 |
| 2,061,350 |
|
| Orange SA, MTN, VRN, 4.00%, 10/1/21 | EUR | 1,760,000 |
| 1,999,358 |
|
| | | | 18,456,241 |
|
| Germany — 2.3% | | | |
| Allianz SE, MTN, VRN, 4.75%, 10/24/23 | EUR | 2,200,000 |
| 2,644,145 |
|
| Commerzbank AG, MTN, 7.75%, 3/16/21 | EUR | 2,500,000 |
| 3,340,822 |
|
| Deutsche Bank AG, MTN, 2.75%, 2/17/25 | EUR | 2,874,000 |
| 3,018,221 |
|
| KFW, 3.875%, 1/21/19 | EUR | 2,890,000 |
| 3,660,680 |
|
| KFW, MTN, 4.625%, 1/4/23 | EUR | 3,340,000 |
| 4,826,603 |
|
| RWE AG, VRN, 7.00%, 3/20/19 | GBP | 2,000,000 |
| 3,289,348 |
|
| | | | 20,779,819 |
|
| Ireland — 0.8% | | | |
| Aquarius and Investments plc for Zurich Insurance Co. Ltd., MTN, VRN, 4.25%, 10/2/23 | EUR | 1,200,000 |
| 1,475,284 |
|
| GE Capital European Funding, MTN, 5.375%, 1/23/20 | EUR | 3,960,000 |
| 5,315,460 |
|
| | | | 6,790,744 |
|
| Italy — 1.1% | | | |
| Assicurazioni Generali SpA, MTN, 4.125%, 5/4/26 | EUR | 2,000,000 |
| 2,334,763 |
|
| Intesa Sanpaolo SpA, MTN, 6.625%, 9/13/23 | EUR | 2,000,000 |
| 2,650,868 |
|
| Telecom Italia SpA, MTN, 5.875%, 5/19/23 | GBP | 1,350,000 |
| 2,238,287 |
|
| Terna Rete Elettrica Nazionale SpA, MTN, 2.875%, 2/16/18 | EUR | 1,940,000 |
| 2,284,322 |
|
| | | | 9,508,240 |
|
| Luxembourg — 1.6% | | | |
| European Financial Stability Facility, MTN, 1.875%, 5/23/23 | EUR | 5,190,000 |
| 6,282,598 |
|
| European Financial Stability Facility, MTN, 2.125%, 2/19/24 | EUR | 3,260,000 |
| 4,011,896 |
|
| European Financial Stability Facility, MTN, 2.35%, 7/29/44 | EUR | 1,830,000 |
| 2,285,383 |
|
|
| | | | | | | |
| | | Principal Amount | Value |
| Glencore Finance Europe SA, MTN, 1.625%, 1/18/22 | EUR | 1,760,000 |
| $ | 1,918,616 |
|
| | | | 14,498,493 |
|
| Netherlands — 2.1% | | | |
| ABN AMRO Bank NV, MTN, 7.125%, 7/6/22 | EUR | 1,500,000 |
| 2,136,801 |
|
| Allianz Finance II BV, MTN, 4.75%, 7/22/19 | EUR | 2,600,000 |
| 3,381,859 |
|
| Cooperatieve Centrale Raiffeisen-Boerenleenbank BA, MTN, 4.375%, 6/7/21 | EUR | 4,000,000 |
| 5,301,951 |
|
| ING Bank NV, MTN, VRN, 3.625%, 2/25/21 | EUR | 2,000,000 |
| 2,362,183 |
|
NXP BV / NXP Funding LLC, 4.125%, 6/15/20(1) | | $ | 500,000 |
| 505,000 |
|
| Shell International Finance BV, MTN, 1.625%, 1/20/27 | EUR | 1,580,000 |
| 1,702,692 |
|
| Telefonica Europe BV, VRN, 5.875%, 3/31/24 | EUR | 1,500,000 |
| 1,776,487 |
|
| Volkswagen International Finance NV, VRN, 3.75%, 3/24/21 | EUR | 1,760,000 |
| 2,025,306 |
|
| | | | 19,192,279 |
|
| Spain — 0.2% | | | |
| Santander Issuances SAU, MTN, 2.50%, 3/18/25 | EUR | 1,700,000 |
| 1,786,750 |
|
| Supranational — 4.6% | | | |
| Asian Development Bank, MTN, 2.35%, 6/21/27 | JPY | 830,000,000 |
| 8,238,336 |
|
| European Investment Bank, 2.50%, 7/15/15 | EUR | 6,450,000 |
| 7,197,610 |
|
| European Investment Bank, MTN, 3.625%, 1/15/21 | EUR | 5,100,000 |
| 6,699,534 |
|
| European Investment Bank, MTN, 4.25%, 12/7/21 | GBP | 4,950,000 |
| 8,873,089 |
|
| International Bank for Reconstruction & Development, MTN, 3.875%, 5/20/19 | EUR | 7,480,000 |
| 9,550,761 |
|
| | | | 40,559,330 |
|
| Switzerland — 0.3% | | | |
| Credit Suisse AG, VRN, 5.75%, 9/18/20 | EUR | 2,000,000 |
| 2,483,853 |
|
| United Kingdom — 3.3% | | | |
Abbey National Treasury Services plc, MTN, 5.125%, 4/14/21 (Secured) | GBP | 1,940,000 |
| 3,545,414 |
|
| Barclays Bank plc, MTN, 6.625%, 3/30/22 | EUR | 1,250,000 |
| 1,730,066 |
|
Co-Operative Bank plc, 4.75%, 11/11/21 (Secured) | GBP | 2,640,000 |
| 4,604,382 |
|
| HSBC Bank plc, MTN, 6.50%, 7/7/23 | GBP | 2,000,000 |
| 3,695,095 |
|
| Lloyds Bank plc, MTN, 7.625%, 4/22/25 | GBP | 1,500,000 |
| 2,987,261 |
|
| Nationwide Building Society, MTN, 6.75%, 7/22/20 | EUR | 2,000,000 |
| 2,714,764 |
|
| Royal Bank of Scotland Group plc, MTN, VRN, 3.625%, 3/25/19 | EUR | 1,500,000 |
| 1,704,622 |
|
| SSE plc, VRN, 2.375%, 4/1/21 | EUR | 2,200,000 |
| 2,336,664 |
|
| Standard Chartered plc, MTN, 3.625%, 11/23/22 | EUR | 2,000,000 |
| 2,327,169 |
|
| Tesco Corporate Treasury Services plc, MTN, 2.50%, 7/1/24 | EUR | 1,940,000 |
| 2,039,864 |
|
Virgin Media Secured Finance plc, 5.25%, 1/15/26(1) | | $ | 1,360,000 |
| 1,317,500 |
|
| | | | 29,002,801 |
|
| United States — 4.1% | | | |
| AES Corp. (The), 4.875%, 5/15/23 | | 940,000 |
| 888,300 |
|
| Ally Financial, Inc., 2.75%, 1/30/17 | | 1,360,000 |
| 1,357,280 |
|
| Ashland, Inc., 4.75%, 8/15/22 | | 1,360,000 |
| 1,339,600 |
|
| AT&T, Inc., 3.375%, 3/15/34 | EUR | 1,000,000 |
| 1,117,488 |
|
| Ball Corp., 4.00%, 11/15/23 | | $ | 940,000 |
| 876,550 |
|
Calpine Corp., 5.875%, 1/15/24(1) | | 940,000 |
| 998,750 |
|
| Calpine Corp., 5.75%, 1/15/25 | | 940,000 |
| 917,675 |
|
| CCO Holdings LLC / CCO Holdings Capital Corp., 5.25%, 9/30/22 | | 940,000 |
| 928,250 |
|
| Chesapeake Energy Corp., 4.875%, 4/15/22 | | 940,000 |
| 822,500 |
|
| CIT Group, Inc., 5.00%, 8/15/22 | | 1,360,000 |
| 1,349,800 |
|
|
| | | | | | | |
| | | Principal Amount/Shares | Value |
| Constellation Brands, Inc., 3.875%, 11/15/19 | | $ | 1,360,000 |
| $ | 1,383,800 |
|
| Crown Americas LLC / Crown Americas Capital Corp. IV, 4.50%, 1/15/23 | | 1,360,000 |
| 1,291,157 |
|
| DaVita HealthCare Partners, Inc., 5.125%, 7/15/24 | | 1,360,000 |
| 1,339,600 |
|
Denali Borrower LLC / Denali Finance Corp., 5.625%, 10/15/20(1) | | 450,000 |
| 474,187 |
|
| General Motors Co., 5.00%, 4/1/35 | | 1,360,000 |
| 1,339,463 |
|
| General Motors Financial Co., Inc., 3.25%, 5/15/18 | | 1,360,000 |
| 1,392,873 |
|
| HCA, Inc., 3.75%, 3/15/19 | | 1,410,000 |
| 1,424,100 |
|
| International Lease Finance Corp., 6.25%, 5/15/19 | | 1,360,000 |
| 1,473,900 |
|
Kraft Heinz Food Co., 4.875%, 2/15/25(1) | | 564,000 |
| 615,465 |
|
| Lennar Corp., 4.50%, 6/15/19 | | 950,000 |
| 973,750 |
|
| MarkWest Energy Partners LP / MarkWest Energy Finance Corp., 4.875%, 12/1/24 | | 1,360,000 |
| 1,336,200 |
|
| Newfield Exploration Co., 5.75%, 1/30/22 | | 1,360,000 |
| 1,394,000 |
|
Sprint Communications, 9.00%, 11/15/18(1) | | 940,000 |
| 1,063,854 |
|
| Steel Dynamics, Inc., 6.125%, 8/15/19 | | 1,360,000 |
| 1,438,200 |
|
| Tenet Healthcare Corp., 4.375%, 10/1/21 | | 400,000 |
| 393,000 |
|
| Tenneco, Inc., 6.875%, 12/15/20 | | 940,000 |
| 987,000 |
|
Tesoro Logistics LP / Tesoro Logistics Finance Corp., 5.50%, 10/15/19(1) | | 1,360,000 |
| 1,417,800 |
|
| United Rentals North America, Inc., 4.625%, 7/15/23 | | 1,360,000 |
| 1,338,716 |
|
Universal Health Services, Inc., 4.75%, 8/1/22(1) | | 940,000 |
| 969,962 |
|
| Wells Fargo & Co., MTN, 2.25%, 9/3/20 | EUR | 1,800,000 |
| 2,134,220 |
|
ZF North America Capital, Inc., 4.00%, 4/29/20(1) | | $ | 1,360,000 |
| 1,363,400 |
|
| | | | 36,140,840 |
|
TOTAL CORPORATE BONDS (Cost $215,414,427) | | | 202,943,505 |
|
| TEMPORARY CASH INVESTMENTS — 3.0% | | | |
| Repurchase Agreement, Bank of America Merrill Lynch, (collateralized by various U.S. Treasury obligations, 1.50%, 1/31/19 - 11/30/19, valued at $4,365,088), in a joint trading account at 0.10%, dated 6/30/15, due 7/1/15 (Delivery value $4,277,994) | | | 4,277,982 |
|
| Repurchase Agreement, Fixed Income Clearing Corp., (collateralized by various U.S. Treasury obligations, 2.125%, 6/30/22, valued at $17,460,231), at 0.01%, dated 6/30/15, due 7/1/15 (Delivery value $17,114,005) | | | 17,114,000 |
|
| SSgA U.S. Government Money Market Fund, Class N | | 4,254,696 |
| 4,254,696 |
|
U.S. Treasury Bills, 0.08%, 11/12/15(2)(3) | | $ | 1,200,000 |
| 1,199,855 |
|
TOTAL TEMPORARY CASH INVESTMENTS (Cost $26,846,316) | | | 26,846,533 |
|
TOTAL INVESTMENT SECURITIES — 95.6% (Cost $918,312,073) | | | 847,314,447 |
|
| OTHER ASSETS AND LIABILITIES — 4.4% | | | 39,021,613 |
|
| TOTAL NET ASSETS — 100.0% | | | $ | 886,336,060 |
|
|
| | | | | | | | |
| FORWARD FOREIGN CURRENCY EXCHANGE CONTRACTS |
| Currency Purchased | Currency Sold | Counterparty | Settlement Date | Unrealized Appreciation
(Depreciation) |
| AUD | 1,153,987 | USD | 881,013 | Barclays Bank plc | 9/16/15 | $ | 5,689 |
|
| BRL | 138,450 | USD | 43,239 | UBS AG | 9/16/15 | 96 |
|
| CAD | 3,285,815 | USD | 2,650,000 | Barclays Bank plc | 9/16/15 | (21,903 | ) |
| USD | 97,534 | CAD | 120,452 | Barclays Bank plc | 9/16/15 | 1,192 |
|
| CHF | 4,424,680 | USD | 4,770,771 | UBS AG | 9/16/15 | (24,268 | ) |
| CLP | 2,936,994,780 | USD | 4,608,858 | UBS AG | 9/16/15 | (46,921 | ) |
| USD | 2,450,000 | CLP | 1,574,125,000 | UBS AG | 9/16/15 | 4,964 |
|
| CNY | 13,037,555 | USD | 2,119,755 | UBS AG | 9/16/15 | 4,032 |
|
| CZK | 27,876,445 | USD | 1,150,000 | Barclays Bank plc | 9/16/15 | (9,153 | ) |
| USD | 2,913,006 | CZK | 70,614,576 | Deutsche Bank | 9/16/15 | 23,096 |
|
| DKK | 7,931,086 | USD | 1,202,952 | Barclays Bank plc | 9/16/15 | (15,149 | ) |
| EUR | 5,250,000 | USD | 5,867,400 | Barclays Bank plc | 9/16/15 | (8,228 | ) |
| EUR | 3,700,000 | USD | 4,135,120 | Barclays Bank plc | 9/16/15 | (5,799 | ) |
| EUR | 4,720,199 | USD | 5,303,568 | JPMorgan Chase Bank N.A. | 9/16/15 | (35,671 | ) |
| USD | 13,349,334 | EUR | 11,781,936 | Barclays Bank plc | 9/16/15 | 200,306 |
|
| USD | 1,404,488 | EUR | 1,250,000 | JPMorgan Chase Bank N.A. | 9/16/15 | 9,446 |
|
| USD | 3,102,748 | EUR | 2,750,000 | UBS AG | 9/16/15 | 33,658 |
|
| GBP | 4,268,090 | USD | 6,562,048 | Deutsche Bank | 9/16/15 | 140,526 |
|
| USD | 850,903 | GBP | 535,239 | JPMorgan Chase Bank N.A. | 9/16/15 | 10,368 |
|
| HKD | 2,067,261 | USD | 266,611 | Deutsche Bank | 9/16/15 | 58 |
|
| USD | 21,474 | HUF | 5,957,365 | Deutsche Bank | 9/16/15 | 445 |
|
| ILS | 8,427,167 | USD | 2,205,866 | Barclays Bank plc | 9/16/15 | 27,877 |
|
| JPY | 2,741,228,346 | USD | 22,064,452 | Deutsche Bank | 9/16/15 | 355,898 |
|
| USD | 1,700,000 | JPY | 207,872,600 | Westpac Group | 9/16/15 | (178 | ) |
| KRW | 23,817,163,502 | USD | 21,385,619 | Westpac Group | 9/16/15 | (153,028 | ) |
| KRW | 785,848,000 | USD | 700,000 | Westpac Group | 9/16/15 | 570 |
|
| USD | 1,100,000 | KRW | 1,231,560,000 | Westpac Group | 9/16/15 | 2,085 |
|
| MXN | 40,045,362 | USD | 2,600,000 | Barclays Bank plc | 9/17/15 | (65,880 | ) |
| USD | 2,820,682 | MXN | 44,176,337 | Barclays Bank plc | 9/17/15 | 25,149 |
|
| MYR | 6,293,198 | USD | 1,670,169 | Westpac Group | 9/17/15 | (4,355 | ) |
| USD | 2,800,000 | MYR | 10,559,640 | Westpac Group | 9/17/15 | 4,855 |
|
| USD | 3,586,837 | NOK | 27,746,285 | Deutsche Bank | 9/16/15 | 54,197 |
|
| USD | 5,605,480 | NZD | 7,922,649 | Barclays Bank plc | 9/16/15 | 271,211 |
|
| USD | 1,126,620 | NZD | 1,650,000 | Barclays Bank plc | 9/16/15 | 15,685 |
|
| USD | 2,598,909 | NZD | 3,800,000 | Barclays Bank plc | 9/16/15 | 40,393 |
|
| PLN | 3,966,661 | USD | 1,069,205 | Deutsche Bank | 9/16/15 | (16,379 | ) |
| RUB | 74,036,226 | USD | 1,317,371 | UBS AG | 9/16/15 | (10,888 | ) |
| SEK | 20,444,500 | USD | 2,500,000 | Barclays Bank plc | 9/16/15 | (29,893 | ) |
| SEK | 1,381,979 | USD | 168,612 | JPMorgan Chase Bank N.A. | 9/16/15 | (1,641 | ) |
| USD | 750,000 | SEK | 6,215,044 | Westpac Group | 9/16/15 | (902 | ) |
| USD | 5,339,830 | SGD | 7,232,992 | Barclays Bank plc | 9/16/15 | (24,676 | ) |
| THB | 52,382,864 | USD | 1,544,853 | Westpac Group | 9/16/15 | 2,247 |
|
| THB | 100,705,680 | USD | 2,968,917 | Westpac Group | 9/16/15 | 5,371 |
|
| USD | 3,200,000 | THB | 108,368,000 | Westpac Group | 9/16/15 | (591 | ) |
| TRY | 11,024,737 | USD | 3,914,779 | Deutsche Bank | 9/16/15 | 110,170 |
|
| USD | 1,500,000 | TRY | 4,167,750 | Barclays Bank plc | 9/16/15 | (21,576 | ) |
| TWD | 96,405,750 | USD | 3,150,000 | Westpac Group | 9/16/15 | (25,482 | ) |
| USD | 2,990,769 | TWD | 92,340,000 | UBS AG | 9/16/15 | (1,977 | ) |
| ZAR | 32,000,971 | USD | 2,552,386 | Barclays Bank plc | 9/16/15 | 43,443 |
|
| USD | 2,626,063 | ZAR | 33,215,382 | Deutsche Bank | 9/16/15 | (68,277 | ) |
| | | | | | | $ | 800,212 |
|
|
| | | | | | | | |
| FUTURES CONTRACTS |
| Contracts Purchased | Expiration Date | Underlying Face
Amount at Value | Unrealized Appreciation
(Depreciation) |
| 10 | Korean Treasury 10-Year Bonds | September 2015 | $ | 1,097,405 |
| $ | 9,037 |
|
| | | | | |
| Contracts Sold | Expiration Date | Underlying Face
Amount at Value | Unrealized Appreciation
(Depreciation) |
| 106 | U.S. Treasury 10-Year Notes | September 2015 | $ | 13,374,219 |
| $ | (38,333 | ) |
| 136 | U.S. Treasury 5-Year Notes | September 2015 | 16,219,063 |
| (68,306 | ) |
| 14 | U.S. Treasury Long Bonds | September 2015 | 2,111,812 |
| 50,278 |
|
| | | | $ | 31,705,094 |
| $ | (56,361 | ) |
|
| | | | | | | | | | | | | |
| CENTRALLY CLEARED CREDIT DEFAULT SWAP AGREEMENTS | |
| Reference Entity | Notional
Amount | Buy/Sell*
Protection | Interest
Rate | Termination
Date | Implied Credit Spread** | Unrealized Appreciation
(Depreciation) | Value |
| CDX North America High Yield 24 Index | $ | 8,415,000 |
| Sell | 5.00% | 6/20/20 | 3.56% | $ | (32,577 | ) | $ | 533,456 |
|
| |
| * | The maximum potential amount the fund could be required to deliver as a seller of credit protection if a credit event occurs as defined under the terms of the agreement is the notional amount. The maximum potential amount may be partially offset by any recovery values of the reference entities and upfront payments received upon entering into the agreement. |
**Implied credit spreads for centrally cleared credit default swap agreements are linked to the weighted average spread across the underlying reference entities included in a particular index. Implied credit spreads serve as an indication of the seller’s performance risk related to the likelihood of a credit event occurring as defined in the agreement. Implied credit spreads are used to determine the value of swap agreements and reflect the cost of buying/selling protection, which may include upfront payments made/received upon entering the agreement. Therefore, higher spreads would indicate a greater likelihood that a seller will be obligated to perform under the contract terms. Increasing values, in absolute terms and relative to notional amounts, are also indicative of greater performance risk.
|
| | |
| NOTES TO SCHEDULE OF INVESTMENTS |
| AUD | - | Australian Dollar |
| BRL | - | Brazilian Real |
| CAD | - | Canadian Dollar |
| CDX | - | Credit Derivatives Indexes |
| CHF | - | Swiss Franc |
| CLP | - | Chilean Peso |
| CNY | - | Chinese Yuan |
| CZK | - | Czech Koruna |
| DKK | - | Danish Krone |
| EUR | - | Euro |
| GBP | - | British Pound |
| HKD | - | Hong Kong Dollar |
| HUF | - | Hungarian Forint |
| ILS | - | Israeli Shekel |
| JPY | - | Japanese Yen |
| KRW | - | South Korea Won |
| MTN | - | Medium Term Note |
| MXN | - | Mexican Peso |
| MYR | - | Malaysian Ringgit |
| NOK | - | Norwegian Krone |
| NZD | - | New Zealand Dollar |
| PLN | - | Polish Zloty |
| RUB | - | Russian Ruble |
| SEK | - | Swedish Krona |
| SGD | - | Singapore Dollar |
| THB | - | Thai Baht |
| TRY | - | Turkish Lira |
| TWD | - | Taiwanese Dollar |
| USD | - | United States Dollar |
| VRN | - | Variable Rate Note. Interest reset date is indicated. Rate shown is effective at the period end. |
| ZAR | - | South African Rand |
| |
| (1) | Restricted security exempt from registration pursuant to Rule 144A under the Securities Act of 1933. These securities may be sold without restriction to qualified institutional investors and have been deemed liquid under policies approved by the Board of Trustees. The aggregate value of these securities at the period end was $107,446,012, which represented 12.1% of total net assets. |
| |
| (2) | Security, or a portion thereof, has been pledged at the custodian bank or with a broker for margin requirements on futures contracts and/or swap agreements. At the period end, the aggregate value of securities pledged was $806,947. |
| |
| (3) | The rate indicated is the yield to maturity at purchase. |
See Notes to Financial Statements.
|
|
| Statement of Assets and Liabilities |
|
| | | |
| JUNE 30, 2015 | |
| Assets | |
| Investment securities, at value (cost of $918,312,073) | $ | 847,314,447 |
|
| Foreign currency holdings, at value (cost of $18,284,467) | 18,580,122 |
|
| Foreign deposits with broker for futures contracts, at value (cost of $444,427) | 433,361 |
|
| Receivable for investments sold | 22,763,092 |
|
| Receivable for capital shares sold | 122,087 |
|
| Receivable for variation margin on futures contracts | 9,501 |
|
| Receivable for variation margin on swap agreements | 42,566 |
|
| Unrealized appreciation on forward foreign currency exchange contracts | 1,393,027 |
|
| Interest receivable | 8,916,950 |
|
| | 899,575,153 |
|
| | |
| Liabilities | |
| Payable for investments purchased | 11,443,366 |
|
| Payable for capital shares redeemed | 670,615 |
|
| Payable for variation margin on futures contracts | 365 |
|
| Unrealized depreciation on forward foreign currency exchange contracts | 592,815 |
|
| Accrued management fees | 517,027 |
|
| Distribution and service fees payable | 14,905 |
|
| | 13,239,093 |
|
| | |
| Net Assets | $ | 886,336,060 |
|
| | |
| Net Assets Consist of: | |
| Capital paid in | $ | 986,338,382 |
|
| Distributions in excess of net investment income | (46,262,508 | ) |
| Undistributed net realized gain | 16,411,232 |
|
| Net unrealized depreciation | (70,151,046 | ) |
| | $ | 886,336,060 |
|
|
| | | | | | |
| | Net Assets | Shares Outstanding | Net Asset Value Per Share |
| Investor Class |
| $494,676,170 |
| 40,048,048 |
| $12.35 |
| Institutional Class |
| $339,993,311 |
| 27,515,120 |
| $12.36 |
| A Class |
| $19,391,542 |
| 1,576,529 |
| $12.30* |
| C Class |
| $1,579,792 |
| 129,322 |
| $12.22 |
| R Class |
| $178,782 |
| 14,535 |
| $12.30 |
| R6 Class |
| $30,516,463 |
| 2,470,481 |
| $12.35 |
*Maximum offering price $12.88 (net asset value divided by 0.955).
See Notes to Financial Statements.
|
| | | |
| YEAR ENDED JUNE 30, 2015 | |
| Investment Income (Loss) | |
| Income: | |
| Interest | $ | 18,871,009 |
|
| | |
| Expenses: | |
| Management fees | 7,306,551 |
|
| Distribution and service fees: | |
| A Class | 215,983 |
|
| C Class | 24,121 |
|
| R Class | 1,003 |
|
| Trustees' fees and expenses | 52,567 |
|
| Other expenses | 8,257 |
|
| | 7,608,482 |
|
| | |
| Net investment income (loss) | 11,262,527 |
|
| | |
| Realized and Unrealized Gain (Loss) | |
| Net realized gain (loss) on: | |
| Investment transactions | (25,109,621 | ) |
| Futures contract transactions | (405,370 | ) |
| Swap agreement transactions | (38,149 | ) |
| Foreign currency transactions | (1,447,795 | ) |
| | (27,000,935 | ) |
| | |
| Change in net unrealized appreciation (depreciation) on: | |
| Investments | (126,477,774 | ) |
| Futures contracts | (448,239 | ) |
| Swap agreements | (32,577 | ) |
| Translation of assets and liabilities in foreign currencies | (1,274,276 | ) |
| | (128,232,866 | ) |
| | |
| Net realized and unrealized gain (loss) | (155,233,801 | ) |
| | |
| Net Increase (Decrease) in Net Assets Resulting from Operations | $ | (143,971,274 | ) |
See Notes to Financial Statements.
|
|
| Statement of Changes in Net Assets |
|
| | | | | | |
| YEARS ENDED JUNE 30, 2015 AND JUNE 30, 2014 |
| Increase (Decrease) in Net Assets | June 30, 2015 | June 30, 2014 |
| Operations | | |
| Net investment income (loss) | $ | 11,262,527 |
| $ | 14,630,394 |
|
| Net realized gain (loss) | (27,000,935 | ) | 7,953,638 |
|
| Change in net unrealized appreciation (depreciation) | (128,232,866 | ) | 62,762,221 |
|
| Net increase (decrease) in net assets resulting from operations | (143,971,274 | ) | 85,346,253 |
|
| | | |
| Distributions to Shareholders | | |
| From net investment income: | | |
| Investor Class | (8,594,590 | ) | (1,401,580 | ) |
| Institutional Class | (6,999,495 | ) | (1,769,742 | ) |
| A Class | (1,147,782 | ) | — |
|
| C Class | (15,739 | ) | — |
|
| R Class | (2,212 | ) | — |
|
| R6 Class | (263,072 | ) | (13,259 | ) |
| From net realized gains: | | |
| Investor Class | (3,986,298 | ) | — |
|
| Institutional Class | (3,076,826 | ) | — |
|
| A Class | (648,335 | ) | — |
|
| C Class | (20,716 | ) | — |
|
| R Class | (1,421 | ) | — |
|
| R6 Class | (116,477 | ) | — |
|
| Decrease in net assets from distributions | (24,872,963 | ) | (3,184,581 | ) |
| | | |
| Capital Share Transactions | | |
Net increase (decrease) in net assets from capital share transactions (Note 5) | (76,281,317 | ) | (46,781,589 | ) |
| | | |
| Net increase (decrease) in net assets | (245,125,554 | ) | 35,380,083 |
|
| | | |
| Net Assets | | |
| Beginning of period | 1,131,461,614 |
| 1,096,081,531 |
|
| End of period | $ | 886,336,060 |
| $ | 1,131,461,614 |
|
| | | |
| Undistributed (distributions in excess of) net investment income | $ | (46,262,508 | ) | $ | 4,036,503 |
|
See Notes to Financial Statements.
|
|
| Notes to Financial Statements |
JUNE 30, 2015
1. Organization
American Century International Bond Funds (the trust) is registered under the Investment Company Act of 1940, as amended (the 1940 Act), as an open-end management investment company and is organized as a Massachusetts business trust. International Bond Fund (the fund) is one fund in a series issued by the trust. The fund is nondiversified as defined under the 1940 Act. The fund’s investment objective is to seek total return.
The fund offers the Investor Class, the Institutional Class, the A Class, the C Class, the R Class and the R6 Class. The A Class may incur an initial sales charge. The A Class and C Class may be subject to a contingent deferred sales charge. The share classes differ principally in their respective sales charges and distribution and shareholder servicing expenses and arrangements. The Institutional Class and R6 Class shareholders do not require the same level of shareholder and administrative services from American Century Investment Management, Inc. (ACIM) (the investment advisor) as shareholders of other classes. In addition, financial intermediaries do not receive any service, distribution or administrative fees for the R6 Class. As a result, the Institutional Class and R6 Class are charged lower unified management fees. Sale of the R6 Class commenced on July 26, 2013.
2. Significant Accounting Policies
The following is a summary of significant accounting policies consistently followed by the fund in preparation of its financial statements. The fund is an investment company and follows accounting and reporting guidance in accordance with accounting principles generally accepted in the United States of America. This may require management to make certain estimates and assumptions at the date of the financial statements. Actual results could differ from these estimates. Management evaluated the impact of events or transactions occurring through the date the financial statements were issued that would merit recognition or disclosure.
Investment Valuations — The fund determines the fair value of its investments and computes its net asset value per share at the close of regular trading (usually 4 p.m. Eastern time) on the New York Stock Exchange (NYSE) on each day the NYSE is open. The Board of Trustees has adopted valuation policies and procedures to guide the investment advisor in the fund’s investment valuation process and to provide methodologies for the oversight of the fund’s pricing function.
Fixed income securities maturing in greater than 60 days at the time of purchase are valued at the evaluated mean as provided by independent pricing services or at the mean of the most recent bid and asked prices as provided by investment dealers. Fixed income securities maturing within 60 days at the time of purchase may be valued at cost, plus or minus any amortized discount or premium or at the evaluated mean as provided by an independent pricing service. Evaluated mean prices are commonly derived through utilization of market models, which may consider, among other factors: trade data, quotations from dealers and active market makers, relevant yield curve and spread data, related sector levels, creditworthiness, trade data or market information on comparable securities, and other relevant security specific information. Fixed income securities initially expressed in local currencies are translated into U.S. dollars at the mean of the appropriate currency exchange rate at the close of the NYSE as provided by an independent pricing service.
Open-end management investment companies are valued at the reported net asset value per share. Repurchase agreements are valued at cost, which approximates fair value. Exchange-traded futures contracts are valued at the settlement price as provided by the appropriate clearing corporation. Swap agreements are valued at an evaluated price as provided by independent pricing services or independent brokers. Forward foreign currency exchange contracts are valued at the mean of the appropriate forward exchange rate at the close of the NYSE as provided by an independent pricing service. Investments initially expressed in local currencies are translated into U.S. dollars at the mean of the appropriate currency exchange rate at the close of the NYSE as provided by an independent pricing service.
If the fund determines that the market price for an investment is not readily available or the valuation methods mentioned above do not reflect an investment’s fair value, such investment is valued as determined in good faith by the Board of Trustees or its delegate, in accordance with policies and procedures adopted by the Board of Trustees. In its determination of fair value, the fund may review several factors including, but not
limited to, market information regarding the specific investment or comparable investments and correlation with other investment types, futures indices or general market indicators. Circumstances that may cause the fund to use these procedures to value an investment include, but are not limited to: an investment has been declared in default or is distressed; trading in a security has been suspended during the trading day or a security is not actively trading on its principal exchange; prices received from a regular pricing source are deemed unreliable; or there is a foreign market holiday and no trading occurred.
The fund monitors for significant events occurring after the close of an investment’s primary exchange but before the fund’s net asset value per share is determined. Significant events may include, but are not limited to: corporate announcements and transactions; governmental action and political unrest that could impact a specific investment or an investment sector; or armed conflicts, natural disasters and similar events that could affect investments in a specific country or region.
Security Transactions — Security transactions are accounted for as of the trade date. Net realized gains and losses are determined on the identified cost basis, which is also used for federal income tax purposes.
Investment Income — Interest income is recorded on the accrual basis and includes accretion of discounts and amortization of premiums. Inflation adjustments related to inflation-linked debt securities are reflected as interest income.
Foreign Currency Translations — All assets and liabilities initially expressed in foreign currencies are translated into U.S. dollars at prevailing exchange rates at period end. The fund may enter into spot foreign currency exchange contracts to facilitate transactions denominated in a foreign currency. Purchases and sales of investment securities, dividend and interest income, spot foreign currency exchange contracts, and expenses are translated at the rates of exchange prevailing on the respective dates of such transactions. Net realized and unrealized foreign currency exchange gains or losses related to investment securities are a component of net realized gain (loss) on investment transactions and change in net unrealized appreciation (depreciation) on investments, respectively.
Repurchase Agreements — The fund may enter into repurchase agreements with institutions that ACIM has determined are creditworthy pursuant to criteria adopted by the Board of Trustees. The fund requires that the collateral, represented by securities, received in a repurchase transaction be transferred to the custodian in a manner sufficient to enable the fund to obtain those securities in the event of a default under the repurchase agreement. ACIM monitors, on a daily basis, the securities transferred to ensure the value, including accrued interest, of the securities under each repurchase agreement is equal to or greater than amounts owed to the fund under each repurchase agreement.
Joint Trading Account — Pursuant to an Exemptive Order issued by the Securities and Exchange Commission, the fund, along with certain other funds in the American Century Investments family of funds, may transfer uninvested cash balances into a joint trading account. These balances are invested in one or more repurchase agreements that are collateralized by U.S. Treasury or Agency obligations.
Segregated Assets — In accordance with the 1940 Act, the fund segregates assets on its books and records to cover certain types of investments, including, but not limited to, futures contracts, forward commitments, when-issued securities, swap agreements and certain forward foreign currency exchange contracts. ACIM monitors, on a daily basis, the securities segregated to ensure the fund designates a sufficient amount of liquid assets, marked-to-market daily. The fund may also receive assets or be required to pledge assets at the custodian bank or with a broker for margin requirements on futures contracts, forward commitments and swap agreements.
Income Tax Status — It is the fund’s policy to distribute substantially all net investment income and net realized gains to shareholders and to otherwise qualify as a regulated investment company under provisions of the Internal Revenue Code. Accordingly, no provision has been made for income taxes. The fund files U.S. federal, state, local and non-U.S. tax returns as applicable. The fund's tax returns are subject to examination by the relevant taxing authority until expiration of the applicable statute of limitations, which is generally three years from the date of filing but can be longer in certain jurisdictions. At this time, management believes there are no uncertain tax positions which, based on their technical merit, would not be sustained upon examination and for which it is reasonably possible that the total amounts of unrecognized tax benefits will significantly change in the next twelve months.
Multiple Class — All shares of the fund represent an equal pro rata interest in the net assets of the class to which such shares belong, and have identical voting, dividend, liquidation and other rights and the same terms and conditions, except for class specific expenses and exclusive rights to vote on matters affecting only individual classes. Income, non-class specific expenses, and realized and unrealized capital gains and losses of the fund are allocated to each class of shares based on their relative net assets.
Distributions to Shareholders — Distributions from net investment income, if any, are generally declared and paid quarterly, but may be paid less frequently. Distributions from net realized gains, if any, are generally declared and paid annually.
Indemnifications — Under the trust’s organizational documents, its officers and trustees are indemnified against certain liabilities arising out of the performance of their duties to the fund. In addition, in the normal course of business, the fund enters into contracts that provide general indemnifications. The maximum exposure under these arrangements is unknown as this would involve future claims that may be made against a fund. The risk of material loss from such claims is considered by management to be remote.
3. Fees and Transactions with Related Parties
Certain officers and trustees of the trust are also officers and/or directors of American Century Companies, Inc. (ACC). The trust's investment advisor, ACIM, the trust's distributor, American Century Investment Services, Inc. (ACIS), and the trust's transfer agent, American Century Services, LLC, are wholly owned, directly or indirectly, by ACC. Various funds issued by American Century Asset Allocation Portfolios, Inc. and American Century Strategic Asset Allocations, Inc. own, in aggregate, 53% of the shares of the fund. Related parties do not invest in the fund for the purpose of exercising management or control.
Management Fees — The trust has entered into a management agreement with ACIM, under which ACIM provides the fund with investment advisory and management services in exchange for a single, unified management fee (the fee) per class. The agreement provides that all expenses of managing and operating the fund, except distribution and service fees, brokerage expenses, taxes, interest, fees and expenses of the independent trustees (including legal counsel fees), and extraordinary expenses, will be paid by ACIM. The fee is computed and accrued daily based on each class’s daily net assets and paid monthly in arrears. The fee consists of (1) an Investment Category Fee based on the daily net assets of the fund and certain other accounts managed by the investment advisor that are in the same broad investment category as the fund and (2) a Complex Fee based on the assets of all the funds in the American Century Investments family of funds. The rates for the Investment Category Fee range from 0.4925% to 0.6100%. The rates for the Complex Fee range from 0.2500% to 0.3100% for the Investor Class, A Class, C Class and R Class. The rates for the Complex Fee range from 0.0500% to 0.1100% for the Institutional Class and 0.0000% to 0.0600% for the R6 Class. The effective annual management fee for each class for the year ended June 30, 2015 was 0.80% for the Investor Class, A Class, C Class and R Class and 0.60% for the Institutional Class and 0.55% for the R6 Class.
Distribution and Service Fees — The Board of Trustees has adopted a separate Master Distribution and Individual Shareholder Services Plan for each of the A Class, C Class and R Class (collectively the plans), pursuant to Rule 12b-1 of the 1940 Act. The plans provide that the A Class will pay ACIS an annual distribution and service fee of 0.25%. The plans provide that the C Class will pay ACIS an annual distribution and service fee of 1.00%, of which 0.25% is paid for individual shareholder services and 0.75% is paid for distribution services. The plans provide that the R Class will pay ACIS an annual distribution and service fee of 0.50%. The fees are computed and accrued daily based on each class’s daily net assets and paid monthly in arrears. The fees are used to pay financial intermediaries for distribution and individual shareholder services. Fees incurred under the plans during the year ended June 30, 2015 are detailed in the Statement of Operations.
Trustees’ Fees and Expenses — The Board of Trustees is responsible for overseeing the investment advisor’s management and operations of the fund. The trustees receive detailed information about the fund and its investment advisor regularly throughout the year, and meet at least quarterly with management of the investment advisor to review reports about fund operations. The fund’s officers do not receive compensation from the fund.
4. Investment Transactions
Purchases and sales of investment securities, excluding short-term investments, for the year ended June 30, 2015 were $642,853,179 and $735,020,763, respectively.
5. Capital Share Transactions
Transactions in shares of the fund were as follows (unlimited number of shares authorized):
|
| | | | | | | | | | |
| | Year ended
June 30, 2015 | Year ended June 30, 2014(1) |
| | Shares | Amount | Shares | Amount |
| Investor Class | | | | |
| Sold | 13,230,317 |
| $ | 171,102,730 |
| 5,743,649 |
| $ | 79,751,278 |
|
| Issued in reinvestment of distributions | 904,725 |
| 12,179,259 |
| 97,291 |
| 1,345,534 |
|
| Redeemed | (15,471,042 | ) | (200,938,611 | ) | (12,992,502 | ) | (181,244,312 | ) |
| | (1,336,000 | ) | (17,656,622 | ) | (7,151,562 | ) | (100,147,500 | ) |
| Institutional Class | | | | |
| Sold | 11,382,543 |
| 148,212,279 |
| 14,760,327 |
| 206,281,486 |
|
| Issued in reinvestment of distributions | 720,123 |
| 9,683,159 |
| 126,210 |
| 1,744,224 |
|
| Redeemed | (13,829,014 | ) | (177,477,602 | ) | (11,321,879 | ) | (160,430,998 | ) |
| | (1,726,348 | ) | (19,582,164 | ) | 3,564,658 |
| 47,594,712 |
|
| A Class | | | | |
| Sold | 1,487,574 |
| 19,464,326 |
| 1,211,172 |
| 16,789,934 |
|
| Issued in reinvestment of distributions | 133,438 |
| 1,788,449 |
| — |
| — |
|
| Redeemed | (6,698,969 | ) | (84,649,731 | ) | (1,185,289 | ) | (16,482,826 | ) |
| | (5,077,957 | ) | (63,396,956 | ) | 25,883 |
| 307,108 |
|
| C Class | | | | |
| Sold | 5,736 |
| 74,141 |
| 10,832 |
| 151,016 |
|
| Issued in reinvestment of distributions | 2,314 |
| 30,676 |
| — |
| — |
|
| Redeemed | (112,439 | ) | (1,465,840 | ) | (152,638 | ) | (2,125,172 | ) |
| | (104,389 | ) | (1,361,023 | ) | (141,806 | ) | (1,974,156 | ) |
| R Class | | | | |
| Sold | 1,854 |
| 24,953 |
| 1,991 |
| 27,763 |
|
| Issued in reinvestment of distributions | 271 |
| 3,633 |
| — |
| — |
|
| Redeemed | (3,560 | ) | (47,332 | ) | (851 | ) | (11,925 | ) |
| | (1,435 | ) | (18,746 | ) | 1,140 |
| 15,838 |
|
| R6 Class | | | | |
| Sold | 2,806,246 |
| 36,543,008 |
| 598,583 |
| 8,455,028 |
|
| Issued in reinvestment of distributions | 28,238 |
| 379,549 |
| 960 |
| 13,259 |
|
| Redeemed | (889,012 | ) | (11,188,363 | ) | (74,534 | ) | (1,045,878 | ) |
| | 1,945,472 |
| 25,734,194 |
| 525,009 |
| 7,422,409 |
|
| Net increase (decrease) | (6,300,657 | ) | $ | (76,281,317 | ) | (3,176,678 | ) | $ | (46,781,589 | ) |
(1) July 26, 2013 (commencement of sale) through June 30, 2014 for the R6 Class.
6. Fair Value Measurements
The fund’s investments valuation process is based on several considerations and may use multiple inputs to determine the fair value of the investments held by the fund. In conformity with accounting principles generally accepted in the United States of America, the inputs used to determine a valuation are classified into three broad levels.
| |
| • | Level 1 valuation inputs consist of unadjusted quoted prices in an active market for identical investments. |
| |
| • | Level 2 valuation inputs consist of direct or indirect observable market data (including quoted prices for comparable investments, evaluations of subsequent market events, interest rates, prepayment speeds, credit risk, etc.). These inputs also consist of quoted prices for identical investments initially expressed in local currencies that are adjusted through translation into U.S. dollars. |
| |
| • | Level 3 valuation inputs consist of unobservable data (including a fund’s own assumptions). |
The level classification is based on the lowest level input that is significant to the fair valuation measurement. The valuation inputs are not necessarily an indication of the risks associated with investing in these securities or other financial instruments. There were no significant transfers between levels during the period.
The following is a summary of the level classifications as of period end. The Schedule of Investments provides additional information on the fund’s portfolio holdings.
|
| | | | | | | | |
| | Level 1 | Level 2 | Level 3 |
| Assets | | | |
| Investment Securities | | | |
| Sovereign Governments and Agencies | — |
| $ | 617,524,409 |
| — |
|
| Corporate Bonds | — |
| 202,943,505 |
| — |
|
| Temporary Cash Investments | $ | 4,254,696 |
| 22,591,837 |
| — |
|
| | $ | 4,254,696 |
| $ | 843,059,751 |
| — |
|
| Other Financial Instruments | | | |
| Futures Contracts | $ | 50,278 |
| $ | 9,037 |
| — |
|
| Forward Foreign Currency Exchange Contracts | — |
| 1,393,027 |
| — |
|
| | $ | 50,278 |
| $ | 1,402,064 |
| — |
|
| | | | |
| Liabilities | | | |
| Other Financial Instruments | | | |
| Futures Contracts | $ | (106,639 | ) | — |
| — |
|
| Swap Agreements | — |
| $ | (32,577 | ) | |
| Forward Foreign Currency Exchange Contracts | — |
| (592,815 | ) | — |
|
| | $ | (106,639 | ) | $ | (625,392 | ) | — |
|
7. Derivative Instruments
Credit Risk — The fund is subject to credit risk in the normal course of pursuing its investment objectives. The value of a bond generally declines as the credit quality of its issuer declines. Credit default swap agreements enable a fund to buy/sell protection against a credit event of a specific issuer or index. A fund may attempt to enhance returns by selling protection or attempt to mitigate credit risk by buying protection. Upon entering into a centrally cleared swap, a fund is required to deposit cash or securities (initial margin) with a financial intermediary in an amount equal to a certain percentage of the notional amount. Subsequent payments (variation margin) are made or received daily, in cash, by a fund. The variation margin is equal to the daily change in the value and is a component of unrealized gains and losses. Realized gain or loss is recorded upon receipt or payment of a periodic settlement or termination of swap agreements. Net realized and unrealized gains or losses occurring during the holding period of swap agreements are a component of net realized gain (loss) on swap agreement transactions and change in net unrealized appreciation (depreciation) on swap agreements, respectively. The risks of entering into swap agreements include the possible lack of liquidity, failure of the counterparty to meet its obligations, and that there may be unfavorable changes in the underlying investments or instruments. The fund's average notional amount held during the period was $8,457,500.
Foreign Currency Risk — The fund is subject to foreign currency exchange rate risk in the normal course of pursuing its investment objectives. The value of foreign investments held by a fund may be significantly affected by changes in foreign currency exchange rates. The dollar value of a foreign security generally decreases when the value of the dollar rises against the foreign currency in which the security is denominated and tends to increase when the value of the dollar declines against such foreign currency. A fund may enter into forward foreign currency exchange contracts to reduce a fund's exposure to foreign currency exchange rate fluctuations or to gain exposure to the fluctuations in the value of foreign currencies. The net U.S. dollar value of foreign currency underlying all contractual commitments held by a fund and the resulting unrealized appreciation or depreciation are determined daily. Realized gain or loss is recorded upon the termination of the contract. Net realized and unrealized gains or losses occurring during the holding period of forward foreign currency exchange contracts are a component of net realized gain (loss) on foreign currency transactions and
change in net unrealized appreciation (depreciation) on translation of assets and liabilities in foreign currencies, respectively. A fund bears the risk of an unfavorable change in the foreign currency exchange rate underlying the forward contract. Additionally, losses, up to the fair value, may arise if the counterparties do not perform under the contract terms. The fund's average U.S. dollar exposure to foreign currency risk derivative instruments held during the period was $522,340,724.
Interest Rate Risk — The fund is subject to interest rate risk in the normal course of pursuing its investment objectives. The value of bonds generally declines as interest rates rise. A fund may enter into futures contracts based on a bond index or a specific underlying security. A fund may purchase futures contracts to gain exposure to increases in market value or sell futures contracts to protect against a decline in market value. Upon entering into a futures contract, a fund will segregate cash, cash equivalents or other appropriate liquid securities on its records in amounts sufficient to meet requirements. Subsequent payments (variation margin) are made or received daily, in cash, by a fund. The variation margin is equal to the daily change in the contract value and is recorded as unrealized gains and losses. A fund recognizes a realized gain or loss when the futures contract is closed or expires. Net realized and unrealized gains or losses occurring during the holding period of futures contracts are a component of net realized gain (loss) on futures contract transactions and change in net unrealized appreciation (depreciation) on futures contracts, respectively. One of the risks of entering into futures contracts is the possibility that the change in value of the contract may not correlate with the changes in value of the underlying securities. The fund's average exposure to interest rate risk derivative instruments held during the period was 391 contracts.
Value of Derivative Instruments as of June 30, 2015
|
| | | | | | | | |
| | Asset Derivatives | Liability Derivatives |
| Type of Risk Exposure | Location on Statement of Assets and Liabilities | Value | Location on Statement of Assets and Liabilities | Value |
| Credit Risk | Receivable for variation margin on swap agreements* | $ | 42,566 |
| Payable for variation margin on swap agreements* | — |
|
| Foreign Currency Risk | Unrealized appreciation on forward foreign currency exchange contracts | 1,393,027 |
| Unrealized depreciation on forward foreign currency exchange contracts | $ | 592,815 |
|
| Interest Rate Risk | Receivable for variation margin on futures contracts* | 9,501 |
| Payable for variation margin on futures contracts* | 365 |
|
| | | $ | 1,445,094 |
| | $ | 593,180 |
|
| |
| * | Included in the unrealized appreciation (depreciation) on centrally cleared credit default swap agreements or futures contracts, as applicable, as reported in the Schedule of Investments. |
Effect of Derivative Instruments on the Statement of Operations for the Year Ended June 30, 2015
|
| | | | | | | | |
| | Net Realized Gain (Loss) | Change in Net Unrealized Appreciation (Depreciation) |
| Type of Risk Exposure | Location on Statement of Operations | Value | Location on Statement of Operations | Value |
| Credit Risk | Net realized gain (loss) on swap agreement transactions | $ | (38,149 | ) | Change in net unrealized appreciation (depreciation) on swap agreements | $ | (32,577 | ) |
| Foreign Currency Risk | Net realized gain (loss) on foreign currency transactions | 1,582,964 |
| Change in net unrealized appreciation (depreciation) on translation of assets and liabilities in foreign currencies | (1,325,119 | ) |
| Interest Rate Risk | Net realized gain (loss) on futures contract transactions | (405,370) |
| Change in net unrealized appreciation (depreciation) on futures contracts | (448,239) |
|
| | | $ | 1,139,445 |
| | $ | (1,805,935 | ) |
8. Risk Factors
There are certain risks involved in investing in foreign securities. These risks include those resulting from future adverse political, social and economic developments, fluctuations in currency exchange rates, the possible imposition of exchange controls, and other foreign laws or restrictions. Investing in emerging markets may accentuate these risks.
9. Federal Tax Information
The tax character of distributions paid during the years ended June 30, 2015 and June 30, 2014 were as follows:
|
| | | | | | |
| | 2015 | 2014 |
| Distributions Paid From | | |
| Ordinary income | $ | 17,022,890 |
| $ | 3,184,581 |
|
| Long-term capital gains | $ | 7,850,073 |
| — |
|
The book-basis character of distributions made during the year from net investment income or net realized gains may differ from their ultimate characterization for federal income tax purposes. These differences reflect the differing character of certain income items and net realized gains and losses for financial statement and tax purposes, and may result in reclassification among certain capital accounts on the financial statements.
The reclassifications, which are primarily due to foreign currency gains and losses, were made to distributions in excess of net investment income $(44,538,648) and undistributed net realized gain $44,538,648.
As of June 30, 2015, the federal tax cost of investments and the components of distributable earnings on a tax-basis were as follows:
|
| | | |
| Federal tax cost of investments | $ | 919,369,346 |
|
| Gross tax appreciation of investments | $ | 9,351,304 |
|
| Gross tax depreciation of investments | (81,406,203 | ) |
| Net tax appreciation (depreciation) of investments | (72,054,899 | ) |
Net tax appreciation (depreciation) on derivatives and translation of assets and liabilities in foreign currencies | 38,738 |
|
| Net tax appreciation (depreciation) | $ | (72,016,161 | ) |
| Other book-to-tax adjustments | $ | (2,792,120 | ) |
| Undistributed ordinary income | — |
|
| Accumulated long-term gains | $ | 17,056,869 |
|
Late-year ordinary loss deferral
| $ | (42,250,910 | ) |
The difference between book-basis and tax-basis unrealized appreciation (depreciation) is attributable primarily to the tax deferral of losses on wash sales. Other book-to-tax adjustments are attributable primarily to the tax deferral of losses on straddle positions.
Loss deferrals represent certain qualified losses that the fund has elected to treat as having been incurred in the following fiscal year for federal income tax purposes.
|
| | | | | | | | | | | | | | | |
| For a Share Outstanding Throughout the Years Ended June 30 (except as noted) |
| Per-Share Data | Ratios and Supplemental Data |
| | | Income From Investment Operations: | Distributions From: | | | Ratio to Average Net Assets of: | | |
| | Net Asset Value, Beginning of Period | Net Investment Income (Loss)(1) | Net Realized and Unrealized Gain (Loss) | Total From Investment Operations | Net Investment Income | Net Realized Gains | Total Distributions | Net Asset Value, End of Period | Total Return(2) | Operating Expenses | Net Investment Income (Loss) | Portfolio Turnover Rate | Net Assets, End of Period (in thousands) |
| Investor Class |
| 2015 | $14.50 | 0.14 | (1.98) | (1.84) | (0.21) | (0.10) | (0.31) | $12.35 | (12.85)% | 0.80% | 1.05% | 67% |
| $494,676 |
|
| 2014 | $13.50 | 0.17 | 0.86 | 1.03 | (0.03) | — | (0.03) | $14.50 | 7.66% | 0.80% | 1.24% | 35% |
| $600,026 |
|
| 2013 | $14.39 | 0.19 | (0.82) | (0.63) | (0.26) | — | (0.26) | $13.50 | (4.55)% | 0.80% | 1.35% | 21% |
| $655,032 |
|
| 2012 | $14.65 | 0.24 | (0.18) | 0.06 | (0.32) | — | (0.32) | $14.39 | 0.36% | 0.81% | 1.68% | 50% |
| $894,450 |
|
| 2011 | $13.45 | 0.31 | 1.53 | 1.84 | (0.56) | (0.08) | (0.64) | $14.65 | 14.07% | 0.81% | 2.19% | 44% |
| $951,100 |
|
| Institutional Class |
| 2015 | $14.51 | 0.16 | (1.97) | (1.81) | (0.24) | (0.10) | (0.34) | $12.36 | (12.67)% | 0.60% | 1.25% | 67% |
| $339,993 |
|
| 2014 | $13.50 | 0.20 | 0.87 | 1.07 | (0.06) | — | (0.06) | $14.51 | 7.95% | 0.60% | 1.44% | 35% |
| $424,158 |
|
| 2013 | $14.39 | 0.22 | (0.83) | (0.61) | (0.28) | — | (0.28) | $13.50 | (4.36)% | 0.60% | 1.55% | 21% |
| $346,695 |
|
| 2012 | $14.66 | 0.27 | (0.20) | 0.07 | (0.34) | — | (0.34) | $14.39 | 0.49% | 0.61% | 1.88% | 50% |
| $349,782 |
|
| 2011 | $13.46 | 0.34 | 1.53 | 1.87 | (0.59) | (0.08) | (0.67) | $14.66 | 14.29% | 0.61% | 2.39% | 44% |
| $285,697 |
|
| A Class |
| 2015 | $14.44 | 0.10 | (1.96) | (1.86) | (0.18) | (0.10) | (0.28) | $12.30 | (13.06)% | 1.05% | 0.80% | 67% |
| $19,392 |
|
| 2014 | $13.44 | 0.14 | 0.86 | 1.00 | — | — | — | $14.44 | 7.44% | 1.05% | 0.99% | 35% |
| $96,081 |
|
| 2013 | $14.33 | 0.16 | (0.83) | (0.67) | (0.22) | — | (0.22) | $13.44 | (4.81)% | 1.05% | 1.10% | 21% |
| $89,103 |
|
| 2012 | $14.60 | 0.21 | (0.20) | 0.01 | (0.28) | — | (0.28) | $14.33 | 0.03% | 1.06% | 1.43% | 50% |
| $96,335 |
|
| 2011 | $13.40 | 0.27 | 1.54 | 1.81 | (0.53) | (0.08) | (0.61) | $14.60 | 13.84% | 1.06% | 1.94% | 44% |
| $106,044 |
|
|
| | | | | | | | | | | | | | | |
| For a Share Outstanding Throughout the Years Ended June 30 (except as noted) |
| Per-Share Data | Ratios and Supplemental Data |
| | | Income From Investment Operations: | Distributions From: | | | Ratio to Average Net Assets of: | | |
| | Net Asset Value, Beginning of Period | Net Investment Income (Loss)(1) | Net Realized and Unrealized Gain (Loss) | Total From Investment Operations | Net Investment Income | Net Realized Gains | Total Distributions | Net Asset Value, End of Period | Total Return(2) | Operating Expenses | Net Investment Income (Loss) | Portfolio Turnover Rate | Net Assets, End of Period (in thousands) |
| C Class |
| 2015 | $14.34 | 0.01 | (1.96) | (1.95) | (0.07) | (0.10) | (0.17) | $12.22 | (13.67)% | 1.80% | 0.05% | 67% |
| $1,580 |
|
| 2014 | $13.45 | 0.03 | 0.86 | 0.89 | — | — | — | $14.34 | 6.62% | 1.80% | 0.24% | 35% |
| $3,352 |
|
| 2013 | $14.34 | 0.05 | (0.83) | (0.78) | (0.11) | — | (0.11) | $13.45 | (5.51)% | 1.80% | 0.35% | 21% |
| $5,051 |
|
| 2012 | $14.61 | 0.10 | (0.20) | (0.10) | (0.17) | — | (0.17) | $14.34 | (0.73)% | 1.81% | 0.68% | 50% |
| $7,692 |
|
| 2011 | $13.41 | 0.17 | 1.53 | 1.70 | (0.42) | (0.08) | (0.50) | $14.61 | 12.96% | 1.81% | 1.19% | 44% |
| $6,603 |
|
| R Class |
| 2015 | $14.44 | 0.07 | (1.97) | (1.90) | (0.14) | (0.10) | (0.24) | $12.30 | (13.28)% | 1.30% | 0.55% | 67% |
| $179 |
|
| 2014 | $13.47 | 0.10 | 0.87 | 0.97 | — | — | — | $14.44 | 7.20% | 1.30% | 0.74% | 35% |
| $231 |
|
| 2013 | $14.36 | 0.12 | (0.83) | (0.71) | (0.18) | — | (0.18) | $13.47 | (5.03)% | 1.30% | 0.85% | 21% |
| $200 |
|
| 2012 | $14.63 | 0.17 | (0.20) | (0.03) | (0.24) | — | (0.24) | $14.36 | (0.22)% | 1.31% | 1.18% | 50% |
| $246 |
|
| 2011 | $13.43 | 0.24 | 1.53 | 1.77 | (0.49) | (0.08) | (0.57) | $14.63 | 13.52% | 1.31% | 1.69% | 44% |
| $208 |
|
| R6 Class | | | | | | | | | | | | | |
| 2015 | $14.50 | 0.16 | (1.97) | (1.81) | (0.24) | (0.10) | (0.34) | $12.35 | (12.63)% | 0.55% | 1.30% | 67% |
| $30,516 |
|
2014(3) | $13.77 | 0.19 | 0.61 | 0.80 | (0.07) | — | (0.07) | $14.50 | 5.81% | 0.55%(4) | 1.45%(4) | 35%(5) |
| $7,614 |
|
|
|
| Notes to Financial Highlights |
| |
| (1) | Computed using average shares outstanding throughout the period. |
| |
| (2) | Total returns are calculated based on the net asset value of the last business day and do not reflect applicable sales charges, if any. Total returns for periods less than one year are not annualized. |
| |
| (3) | July 26, 2013 (commencement of sale) through June 30, 2014. |
| |
| (5) | Portfolio turnover is calculated at the fund level. Percentage indicated was calculated for the year ended June 30, 2014. |
See Notes to Financial Statements.
|
|
| Report of Independent Registered Public Accounting Firm |
To the Trustees of the American Century International Bond Funds and Shareholders of the International Bond Fund:
In our opinion, the accompanying statement of assets and liabilities, including the schedule of investments, and the related statements of operations and of changes in net assets and the financial highlights present fairly, in all material respects, the financial position of the International Bond Fund (one of the three funds comprising the American Century International Bond Funds, hereafter referred to as the “Fund”) at June 30, 2015, the results of its operations for the year then ended, the changes in its net assets for each of the two years in the period then ended and the financial highlights for each of the five years in the period then ended, in conformity with accounting principles generally accepted in the United States of America. These financial statements and financial highlights (hereafter referred to as "financial statements") are the responsibility of the Fund's management. Our responsibility is to express an opinion on these financial statements based on our audits. We conducted our audits of these financial statements in accordance with the standards of the Public Company Accounting Oversight Board (United States). Those standards require that we plan and perform the audit to obtain reasonable assurance about whether the financial statements are free of material misstatement. An audit includes examining, on a test basis, evidence supporting the amounts and disclosures in the financial statements, assessing the accounting principles used and significant estimates made by management, and evaluating the overall financial statement presentation. We believe that our audits, which included confirmation of securities at June 30, 2015 by correspondence with the custodian and brokers, provide a reasonable basis for our opinion.
PricewaterhouseCoopers LLP
Kansas City, Missouri
August 21, 2015
Board of Trustees
The individuals listed below serve as trustees of the funds. Each trustee will continue to serve in this capacity until death, retirement, resignation or removal from office. The board has adopted a mandatory retirement age for trustees who are not “interested persons,” as that term is defined in the Investment Company Act (independent trustees). Independent trustees shall retire on December 31 of the year in which they reach their 75th birthday; provided, however, that on or after January 1, 2022, independent trustees shall retire on December 31 of the year in which they reach their 76th birthday.
Mr. Thomas is an “interested person” because he currently serves as President and Chief Executive Officer of American Century Companies, Inc. (ACC), the parent company of American Century Investment Management, Inc. (ACIM or the advisor). The other trustees (more than three-fourths of the total number) are independent. They are not employees, directors or officers of, and have no financial interest in, ACC or any of its wholly owned, direct or indirect, subsidiaries, including ACIM, American Century Investment Services, Inc. (ACIS) and American Century Services, LLC (ACS), and they do not have any other affiliations, positions or relationships that would cause them to be considered “interested persons” under the Investment Company Act. The trustees serve in this capacity for eight (in the case of Mr. Thomas, 15) registered investment companies in the American Century Investments family of funds.
The following table presents additional information about the trustees. The mailing address for each trustee other than Mr. Thomas is 1665 Charleston Road, Mountain View, California 94043. The mailing address for Mr. Thomas is 4500 Main Street, Kansas City, Missouri 64111.
|
| | | | | |
Name (Year of Birth) | Position(s) Held with Funds | Length of Time Served | Principal Occupation(s) During Past 5 Years | Number of American Century Portfolios Overseen by Trustee | Other Directorships Held During Past 5 Years |
| Independent Trustees | | |
Tanya S. Beder
(1955) | Trustee | Since 2011 | Chairman and CEO, SBCC Group Inc. (independent advisory services) (2006 to present) | 46 | CYS Investments, Inc. (NYSE mortgage arbitrage REIT) |
Jeremy I. Bulow
(1954) | Trustee | Since 2011 | Professor of Economics, Stanford University, Graduate School of Business (1979 to present) | 46 | None |
Ronald J. Gilson
(1946) | Trustee and Chairman of the Board | Since 1995
(Chairman since 2005) | Charles J. Meyers Professor of Law and Business, Stanford Law School (1979 to present); Marc and Eva Stern Professor of Law and Business, Columbia University School of Law (1992 to present) | 46 | None |
Frederick L. A. Grauer
(1946) | Trustee | Since 2008 | Senior Advisor, BlackRock, Inc. (investment management firm) (2010 to 2011, 2013 to present) | 46 | None |
Peter F. Pervere
(1947) | Trustee | Since 2007 | Retired | 46 | None |
|
| | | | | |
Name
(Year of Birth) | Position(s) Held with Funds | Length of Time Served | Principal Occupation(s) During Past 5 Years | Number of American Century Portfolios Overseen by Trustee | Other Directorships Held During Past 5 Years |
| Independent Trustees | | |
John B. Shoven
(1947) | Trustee | Since 2002 | Professor of Economics, Stanford University (1973 to present) | 46 | Cadence Design Systems; Exponent; Financial Engines |
| Interested Trustee | | |
Jonathan S. Thomas
(1963) | Trustee and President | Since 2007 | President and Chief Executive Officer, ACC (March 2007 to present). Also serves as Chief Executive Officer, ACS; Executive Vice President, ACIM; trustee, ACC, ACIM and other ACC subsidiaries | 124 | BioMed Valley Discoveries, Inc. |
The Statement of Additional Information has additional information about the fund's trustees and is available without charge, upon request, by calling 1-800-345-2021.
Officers
The following table presents certain information about the executive officers of the funds. Each officer serves as an officer for each of the 15 investment companies in the American Century family of funds, unless otherwise noted. No officer is compensated for his or her service as an officer of the funds. The listed officers are interested persons of the funds and are appointed or re-appointed on an annual basis. The mailing address for each of the officers listed below is 4500 Main Street, Kansas City, Missouri 64111.
|
| | |
Name (Year of Birth) | Offices with
the Funds | Principal Occupation(s) During the Past Five Years |
Jonathan S.
Thomas
(1963) | Trustee and President
since 2007 | President and Chief Executive Officer, ACC (March 2007 to present). Also serves as Chief Executive Officer, ACS; Executive Vice President, ACIM; Director, ACC, ACIM and other ACC subsidiaries |
Amy D. Shelton
(1964) | Chief Compliance Officer and Vice President since 2014 | Chief Compliance Officer, American Century funds, (March 2014 to present); Chief Compliance Officer, ACIM (February 2014 to present); Chief Compliance Officer, ACIS (October 2009 to present); Vice President, Client Interactions and Marketing, ACIS (February 2013 to January 2014); Director, Client Interactions and Marketing, ACIS (June 2007 to January 2013). Also serves as Vice President, ACIS |
Charles A. Etherington
(1957) | General Counsel since 2007 and Senior Vice President since 2006 | Attorney, ACC (February 1994 to present); Vice President, ACC (November 2005 to present); General Counsel, ACC (March 2007 to present). Also serves as General Counsel, ACIM, ACS, ACIS and other ACC subsidiaries; and Senior Vice President, ACIM and ACS |
C. Jean Wade
(1964) | Vice President,
Treasurer and
Chief Financial
Officer since 2012 | Vice President, ACS (February 2000 to present) |
Robert J. Leach
(1966) | Vice President
since 2006 and
Assistant Treasurer
since 2012 | Vice President, ACS (February 2000 to present) |
David H. Reinmiller
(1963) | Vice President since 2001 | Attorney, ACC (January 1994 to present); Associate General Counsel, ACC (January 2001 to present). Also serves as Vice President, ACIM and ACS |
Ward D. Stauffer
(1960) | Secretary since 2005 | Attorney, ACC (June 2003 to present) |
|
|
| Approval of Management Agreement |
At a meeting held on June 16, 2015, the Fund’s Board of Trustees unanimously approved the renewal of the management agreement pursuant to which American Century Investment Management, Inc. (the “Advisor”) acts as the investment advisor for the Fund. Under Section 15(c) of the Investment Company Act, contracts for investment advisory services are required to be reviewed, evaluated, and approved by a majority of a fund’s directors/trustees, including a majority of the independent Trustees, each year. The Board regards this annual evaluation and renewal as one of its most important responsibilities.
The independent Trustees have memorialized a statement regarding the relationship between their ongoing obligations to oversee and evaluate the performance of the Advisor and their annual consideration of renewal of the management agreement. In that statement, the independent Trustees noted that their assessment of the Advisor’s performance is an ongoing process that takes place over the entire year and is informed by all of the extensive information that the Board and its committees receive and consider over time. This information, together with the materials provided in connection with the review, are central to the Board’s assessment of the Advisor’s performance and its determination whether to renew the Fund’s management agreement.
Prior to its consideration of the renewal of the management agreement, the Board requested and reviewed extensive data and analysis relating to the proposed renewal. This information and analysis was compiled by the Advisor and certain independent providers of evaluation data concerning the Fund and the services provided to the Fund by the Advisor.
In connection with its consideration of the renewal of the management agreement, the Board’s review and evaluation of the services provided by the Advisor included, but was not limited to, the following:
| |
| • | the nature, extent, and quality of investment management, shareholder services, and other services provided by the Advisor to the Fund; |
| |
| • | the wide range of other programs and services the Advisor provides to the Fund and its shareholders on a routine and non-routine basis; |
| |
| • | the investment performance of the Fund, including data comparing the Fund’s performance to appropriate benchmarks and/or a peer group of other mutual funds with similar investment objectives and strategies; |
| |
| • | the cost of owning the Fund compared to the cost of owning similar funds; |
| |
| • | the Advisor’s compliance policies, procedures, and regulatory experience; |
| |
| • | financial data showing the cost of services provided to the Fund, the profitability of the Fund to the Advisor, and the overall profitability of the Advisor; |
| |
| • | possible economies of scale associated with the Advisor’s management of the Fund and other accounts under its management; |
| |
| • | data comparing services provided and charges to other investment management clients of the Advisor; |
| |
| • | acquired fund fees and expenses; |
| |
| • | payments by the Fund and the Advisor to financial intermediaries whose clients are investors in the Fund; and |
| |
| • | any collateral benefits derived by the Advisor from the management of the Fund. |
In keeping with its practice, the Board held two in-person meetings to review and discuss the information provided in response to their request. The independent Trustees also had the benefit of the advice of their independent counsel throughout the process.
Factors Considered
The Trustees considered all of the information provided by the Advisor, the independent data providers, and the independent Trustees’ independent counsel in connection with the review, and evaluated such information for the Fund. In connection with their review, the Trustees did not identify any single factor as being all-important or controlling and each Trustee may have attributed different levels of importance to different factors. In deciding to renew the management agreement, the Board based its decision on a number of factors, including the following:
Nature, Extent and Quality of Services - Generally. Under the management agreement, the Advisor is responsible for providing or arranging for all services necessary for the operation of the Fund. The Board noted that under the management agreement, the Advisor provides or arranges at its own expense a wide variety of services including:
| |
| • | constructing and designing the Fund |
| |
| • | portfolio research and security selection |
| |
| • | initial capitalization/funding |
| |
| • | daily valuation of the Fund’s portfolio |
| |
| • | shareholder servicing and transfer agency, including shareholder confirmations, recordkeeping, and communications |
| |
| • | legal services (except the independent Trustees’ counsel) |
| |
| • | regulatory and portfolio compliance |
| |
| • | marketing and distribution (except amounts paid by the Fund under Rule 12b-1 plans) |
The Board noted that many of these services have expanded over time both in terms of quantity and complexity in response to shareholder demands, competition in the industry, changing distribution channels, and the changing regulatory environment.
Investment Management, Shareholder, and Other Services. The nature of the investment management services provided to the Fund is quite complex and allows Fund shareholders access to professional money management, instant diversification of their investments within an asset class, the opportunity to easily diversify among asset classes by investing in or exchanging among various American Century Investments funds, and liquidity. In evaluating investment performance, the Board expects the Advisor to manage the Fund in accordance with its investment objectives and approved strategies. Further, the Trustees recognize that the Advisor has an obligation to seek the best execution of fund trades. In providing these services, the Advisor utilizes teams of investment professionals (portfolio managers, analysts, research assistants, and securities traders) who require extensive information technology, research, training, compliance, and other systems to conduct their business. The Board, directly and through its Portfolio Committee, regularly reviews investment performance information for the Fund, together with comparative information for appropriate benchmarks and/or peer groups of similarly-managed funds, over different time horizons. The Trustees also review detailed performance information during the management agreement approval process. If performance concerns are identified, the Fund receives special reviews until performance improves, during which the Board discusses with the Advisor the reasons for such results (e.g., market conditions, security selection) and any efforts being undertaken to improve performance. The Fund’s performance was below its benchmark for the one-, three-, five-, and ten-year periods reviewed by the Board. The Board discussed the Fund’s performance with the Advisor and was satisfied with the efforts being undertaken by the Advisor. The Board found the investment management services provided by the Advisor to the Fund to be satisfactory and consistent with the management agreement.
Under the management agreement, the Advisor provides the Fund with a comprehensive package of transfer agency, shareholder, and other services. The Board, directly and through various
committees of the Board, regularly reviews reports and evaluations of such services at its regular meetings. These reports include, but are not limited to, information regarding the operational efficiency and accuracy of the shareholder and transfer agency services provided, staffing levels, shareholder satisfaction (as measured by external as well as internal sources), technology support, new products and services offered to Fund shareholders, securities trading activities, portfolio valuation services, auditing services, and legal and operational compliance activities.
Certain aspects of shareholder and transfer agency service level efficiency and the quality of securities trading activities are measured by independent third party providers and are presented in comparison to other fund groups not managed by the Advisor. The Board found the services provided by the Advisor to the Fund under the management agreement to be competitive and of high quality.
Costs of Services and Profitability. The Advisor provides detailed information concerning its cost of providing various services to the Fund, its profitability in managing the Fund, its overall profitability, and its financial condition. The Trustees have reviewed with the Advisor the methodology used to prepare this financial information. This information is considered in evaluating the Advisor’s financial condition, its ability to continue to provide services under the management agreement, and the reasonableness of the current management fee. The Board concluded that the Advisor’s profits were reasonable in light of the services provided to the Fund.
Ethics. The Board generally considers the Advisor’s commitment to providing quality services to shareholders and to conducting its business ethically. They noted that the Advisor’s practices generally meet or exceed industry best practices.
Economies of Scale. The Board also reviewed information provided by the Advisor regarding the possible existence of economies of scale in connection with the management of the Fund. The Board concluded that economies of scale are difficult to measure and predict with precision, especially on a fund-by-fund basis. The Board concluded that the Advisor is appropriately sharing economies of scale through its competitive fee structure, offering competitive fees from fund inception, and through reinvestment in its business to provide shareholders enhanced and expanded services.
Comparison to Other Funds’ Fees. The management agreement provides that the Fund pays the Advisor a single, all-inclusive (or unified) management fee for providing all services necessary for the management and operation of the Fund, other than brokerage expenses, taxes, interest, extraordinary expenses, the fees and expenses of the Fund’s independent Trustees (including their independent legal counsel), and expenses incurred in connection with the provision of shareholder services and distribution services under a plan adopted pursuant to Rule 12b-1 under the 1940 Act. Under the unified fee structure, the Advisor is responsible for providing all investment advisory, custody, audit, administrative, compliance, recordkeeping, marketing, and shareholder services, or arranging and supervising third parties to provide such services. By contrast, most other funds are charged a variety of fees, including an investment advisory fee, a transfer agency fee, an administrative fee, distribution charges, and other expenses. Other than their investment advisory fees and any applicable Rule 12b-1 fees, all other components of the total fees charged by these other funds may be increased without shareholder approval. The Board believes the unified fee structure is a benefit to Fund shareholders because it clearly discloses to shareholders the cost of owning Fund shares, and, since the unified fee cannot be increased without a vote of Fund shareholders, it shifts to the Advisor the risk of increased costs of operating the Fund and provides a direct incentive to minimize administrative inefficiencies. Part of the Board’s analysis of fee levels involves reviewing certain evaluative data compiled by an independent provider and comparing the Fund’s unified fee to the total expense ratio of peer funds. The unified fee charged to shareholders of the Fund was below the median of the total expense ratios of the Fund’s peer group. The Board concluded that the management fee paid by the Fund to the Advisor under the management agreement is reasonable in light of the services provided to the Fund.
Comparison to Fees and Services Provided to Other Clients of the Advisor. The Board also requested and received information from the Advisor concerning the nature of the services, fees, costs, and profitability of its advisory services to advisory clients other than the Fund. They observed that these varying types of client accounts require different services and involve different regulatory and entrepreneurial risks than the management of the Fund. The Board analyzed this information and concluded that the fees charged and services provided to the Fund were reasonable by comparison.
Payments to Intermediaries. The Trustees also requested and received a description of payments made to intermediaries by the Fund and the Advisor. These payments include various payments made by the Fund or the Advisor to different types of intermediaries and recordkeepers for distribution and service activities provided for the Fund.
Collateral or “Fall-Out” Benefits Derived by the Advisor. The Board considered the existence of collateral benefits the Advisor may receive as a result of its relationship with the Fund. The Board noted that the Advisor’s primary business is managing mutual funds and it generally does not use fund or shareholder information to generate profits in other lines of business, and therefore does not derive any significant collateral benefits from them. The Board noted that the Advisor receives proprietary research from broker-dealers that execute fund portfolio transactions. The Board also determined that the Advisor is able to provide investment management services to certain clients other than the Fund, at least in part, due to its existing infrastructure built to serve the fund complex.
Existing Relationship. The Board also considered whether there was any reason for not continuing the existing arrangement with the Advisor. In this regard, the Board was mindful of the potential disruptions of the Fund’s operations and various risks, uncertainties, and other effects that could occur as a result of a decision not to continue such relationship. In particular, the Board recognized that most shareholders have invested in the Fund on the strength of the Advisor’s industry standing and reputation and in the expectation that the Advisor will have a continuing role in providing advisory services to the Fund.
Conclusion of the Trustees. As a result of this process, the Board, including all of the independent Trustees and assisted by the advice of independent legal counsel, taking into account all of the factors discussed above and the information provided by the Advisor and others in connection with its review and throughout the year, concluded that the management agreement between the Fund and the Advisor is fair and reasonable in light of the services provided and should be renewed.
A special meeting of shareholders was held on September 15, 2014, to vote on the following proposals. Each proposal received the required number of votes and was adopted. A summary of voting results is listed below each proposal.
Proposal 1:
To approve a change in the fund’s investment objective from seeking “high total return by investing in high-quality non-dollar-denominated government and corporate debt securities outside the US” to seeking “total return.”
|
| | | | | |
| | For: | $ | 743,366,733 |
| |
| | Against: | $ | 62,032,057 |
| |
| | Abstain: | $ | 10,063,770 |
| |
| | Broker non-votes: | N/A |
| |
Proposal 2:
To approve re-classifying the fund’s investment objective from “fundamental” to “non-fundamental.”
|
| | | | | |
| | For: | $ | 580,128,497 |
| |
| | Against: | $ | 223,522,646 |
| |
| | Abstain: | $ | 118,411,417 |
| |
| | Broker non-votes: | N/A |
| |
Retirement Account Information
As required by law, distributions you receive from certain IRAs are subject to federal income tax withholding, unless you elect not to have withholding apply. Tax will be withheld on the total amount withdrawn even though you may be receiving amounts that are not subject to withholding, such as nondeductible contributions. In such case, excess amounts of withholding could occur. You may adjust your withholding election so that a greater or lesser amount will be withheld.
If you don’t want us to withhold on this amount, you must notify us to not withhold the federal income tax. You may notify us in writing or in certain situations by telephone or through other electronic means. For systematic withdrawals, your withholding election will remain in effect until revoked or changed by filing a new election. You have the right to revoke your election at any time.
Remember, even if you elect not to have income tax withheld, you are liable for paying income tax on the taxable portion of your withdrawal. If you elect not to have income tax withheld or you don’t have enough income tax withheld, you may be responsible for payment of estimated tax. You may incur penalties under the estimated tax rules if your withholding and estimated tax payments are not sufficient. You can reduce or defer the income tax on a distribution by directly or indirectly rolling such distribution over to another IRA or eligible plan. You should consult your tax advisor for additional information.
State tax will be withheld if, at the time of your distribution, your address is within one of the mandatory withholding states and you have federal income tax withheld (or as otherwise required by state law). State taxes will be withheld from your distribution in accordance with the respective state rules.
Distributions you receive from 403(b), 457 and qualified plans are subject to special tax and withholding rules. Your plan administrator or plan sponsor is required to provide you with a special tax notice explaining those rules at the time you request a distribution. If applicable, federal and/or state taxes may be withheld from your distribution amount.
Proxy Voting Policies
Descriptions of the principles and policies that the fund's investment advisor uses in exercising the voting rights associated with the securities purchased and/or held by the fund are available without charge, upon request, by calling 1-800-345-2021 or visiting the "About Us" page of American Century Investments’ website at americancentury.com. A description of the policies is also available on the Securities and Exchange Commission’s website at sec.gov. Information regarding how the investment advisor voted proxies relating to portfolio securities during the most recent 12-month period ended June 30 is available on the "About Us" page at americancentury.com. It is also available at sec.gov.
Quarterly Portfolio Disclosure
The fund files its complete schedule of portfolio holdings with the Securities and Exchange Commission (SEC) for the first and third quarters of each fiscal year on Form N-Q. The fund’s Forms N-Q are available on the SEC’s website at sec.gov, and may be reviewed and copied at the SEC’s Public Reference Room in Washington, DC. Information on the operation of the Public Reference Room may be obtained by calling 1-800-SEC-0330. The fund also makes its complete schedule of portfolio holdings for the most recent quarter of its fiscal year available on its website at americancentury.com and, upon request, by calling 1-800-345-2021.
Other Tax Information
The following information is provided pursuant to provisions of the Internal Revenue Code.
The fund hereby designates $6,829,692 as qualified short-term capital gain distributions for purposes of Internal Revenue Code Section 871 for the fiscal year ended June 30, 2015.
The fund hereby designates $7,850,073, or up to the maximum amount allowable, as long-term capital gain distributions for the fiscal year ended June 30, 2015.
|
| | |
| |
| | | |
| Contact Us | americancentury.com | |
| Automated Information Line | 1-800-345-8765 | |
| Investor Services Representative | 1-800-345-2021
or 816-531-5575 | |
| Investors Using Advisors | 1-800-378-9878 | |
Business, Not-For-Profit, Employer-Sponsored
Retirement Plans | 1-800-345-3533 | |
Banks and Trust Companies, Broker-Dealers,
Financial Professionals, Insurance Companies | 1-800-345-6488 | |
| Telecommunications Relay Service for the Deaf | 711 | |
| | | |
| American Century International Bond Funds | |
| | | |
Investment Advisor: American Century Investment Management, Inc. Kansas City, Missouri | |
| | | |
| This report and the statements it contains are submitted for the general information of our shareholders. The report is not authorized for distribution to prospective investors unless preceded or accompanied by an effective prospectus. | |
| | | |
©2015 American Century Proprietary Holdings, Inc. All rights reserved.
CL-ANN-86506 1508 | |
ITEM 2. CODE OF ETHICS.
| |
| (a) | The registrant has adopted a Code of Ethics for Senior Financial Officers that applies to the registrant’s principal executive officer, principal financial officer, principal accounting officer, and persons performing similar functions. |
| |
| (f) | The registrant’s Code of Ethics for Senior Financial Officers was filed as Exhibit 12 (a)(1) to American Century Asset Allocation Portfolios, Inc.’s Annual Certified Shareholder Report on Form N-CSR, File No. 811-21591, on September 29, 2005, and is incorporated herein by reference. |
ITEM 3. AUDIT COMMITTEE FINANCIAL EXPERT.
| |
| (a)(1) | The registrant's board has determined that the registrant has at least one audit committee financial expert serving on its audit committee. |
| |
| (a)(2) | Tanya S. Beder, Peter F. Pervere and Ronald J. Gilson are the registrant's designated audit committee financial experts. They are "independent" as defined in Item 3 of Form N-CSR. |
ITEM 4. PRINCIPAL ACCOUNTANT FEES AND SERVICES.
The aggregate fees billed for each of the last two fiscal years for professional services rendered by the principal accountant for the audit of the registrant’s annual financial statements or services that are normally provided by the accountant in connection with statutory and regulatory filings or engagements for those fiscal years were as follows:
FY 2014: $62,147
FY 2015: $97,228
The aggregate fees billed in each of the last two fiscal years for assurance and related services by the principal accountant that are reasonably related to the performance of the audit of the registrant’s financial statements and are not reported under paragraph (a) of this Item were as follows:
For services rendered to the registrant:
FY 2014: $0
FY 2015: $0
Fees required to be approved pursuant to paragraph (c)(7)(ii) of Rule 2-01 of Regulation S-X (relating to certain engagements for non-audit services with the registrant’s investment adviser and its affiliates):
FY 2014: $0
FY 2015: $0
The aggregate fees billed in each of the last two fiscal years for professional services rendered by the principal accountant for tax compliance, tax advice, and tax planning were as follows:
For services rendered to the registrant:
FY 2014: $0
FY 2015: $0
Fees required to be approved pursuant to paragraph (c)(7)(ii) of Rule 2-01 of Regulation S-X (relating to certain engagements for non-audit services with the registrant’s investment adviser and its affiliates):
FY 2014: $0
FY 2015: $0
The aggregate fees billed in each of the last two fiscal years for products and services provided by the principal accountant, other than the services reported in paragraphs (a) through (c) of this Item were as follows:
For services rendered to the registrant:
FY 2014: $0
FY 2015: $0
Fees required to be approved pursuant to paragraph (c)(7)(ii) of Rule 2-01 of Regulation S-X (relating to certain engagements for non-audit services with the registrant’s investment adviser and its affiliates):
FY 2014: $0
FY 2015: $0
| |
| (e)(1) | In accordance with paragraph (c)(7)(i)(A) of Rule 2-01 of Regulation S-X, before the accountant is engaged by the registrant to render audit or non-audit services, the engagement is approved by the registrant’s audit committee. Pursuant to paragraph (c)(7)(ii) of Rule 2-01 of Regulation S-X, the registrant’s audit committee also pre-approves its accountant’s engagements for non-audit services with the registrant’s investment adviser, its parent company, and any entity controlled by, or under common control with the investment adviser that provides ongoing services to the registrant, if the engagement relates directly to the operations and financial reporting of the registrant. |
| |
| (e)(2) | All services described in each of paragraphs (b) through (d) of this Item were pre-approved before the engagement by the registrant’s audit committee pursuant to paragraph (c)(7)(i)(A) of Rule 2-01 of Regulation S-X. Consequently, none of such services were required to be approved by the audit committee pursuant to paragraph (c)(7)(i)(C). |
| |
| (f) | The percentage of hours expended on the principal accountant’s engagement to audit the registrant’s financial statements for the most recent fiscal year that were attributed to work performed by persons other than the principal accountant’s full-time, permanent employees was less than 50%. |
| |
| (g) | The aggregate non-audit fees billed by the registrant’s accountant for services rendered to the registrant, and rendered to the registrant’s investment adviser (not including any sub-adviser whose role is primarily portfolio management and is subcontracted with or overseen by another investment adviser), and any entity controlling, controlled by, or under common control with the adviser that provides ongoing services to the registrant for each of the last two fiscal years of the registrant were as follows: |
FY 2014: $ 71,500
FY 2015: $310,094
| |
| (h) | The registrant’s investment adviser and accountant have notified the registrant’s audit committee of all non-audit services that were rendered by the registrant’s accountant to the registrant’s investment adviser, its parent company, and any entity controlled by, or under common control with the investment adviser that provides services to the registrant, which services were not required to be pre-approved pursuant to paragraph (c)(7)(ii) of Rule 2-01 of Regulation S-X. The notification provided to the registrant’s audit committee included sufficient details regarding such services to allow the registrant’s audit committee to consider the continuing independence of its principal accountant. |
ITEM 5. AUDIT COMMITTEE OF LISTED REGISTRANTS.
Not applicable.
ITEM 6. INVESTMENTS.
| |
| (a) | The schedule of investments is included as part of the report to stockholders filed under Item 1 of this Form. |
ITEM 7. DISCLOSURE OF PROXY VOTING POLICIES AND PROCEDURES FOR CLOSED-END MANAGEMENT INVESTMENT COMPANIES.
Not applicable.
ITEM 8. PORTFOLIO MANAGERS OF CLOSED-END MANAGEMENT INVESTMENT COMPANIES.
Not applicable.
ITEM 9. PURCHASES OF EQUITY SECURITIES BY CLOSED-END MANAGEMENT INVESTMENT COMPANY AND AFFILIATED PURCHASERS.
Not applicable.
ITEM 10. SUBMISSION OF MATTERS TO A VOTE OF SECURITY HOLDERS.
During the reporting period, there were no material changes to the procedures by which shareholders may recommend nominees to the registrant’s board.
ITEM 11. CONTROLS AND PROCEDURES.
| |
| (a) | The registrant's principal executive officer and principal financial officer have concluded that the registrant's disclosure controls and procedures (as defined in Rule 30a-3(c) under the Investment Company Act of 1940) are effective based on their evaluation of these controls and procedures as of a date within 90 days of the filing date of this report. |
| |
| (b) | There were no changes in the registrant's internal control over financial reporting (as defined in Rule 30a-3(d) under the Investment Company Act of 1940) that occurred during the registrant's second fiscal quarter of the period covered by this report that have materially affected, or are reasonably likely to materially affect, the registrant's internal control over financial reporting. |
ITEM 12. EXHIBITS.
| |
| (a)(1) | Registrant’s Code of Ethics for Senior Financial Officers, which is the subject of the disclosure required by Item 2 of Form N-CSR, was filed as Exhibit 12(a)(1) to American Century Asset Allocation Portfolios, Inc.’s Certified Shareholder Report on Form N-CSR, File No. 811-21591, on September 29, 2005. |
| |
| (a)(2) | Separate certifications by the registrant’s principal executive officer and principal financial officer, pursuant to Section 302 of the Sarbanes-Oxley Act of 2002 and Rule 30a-2(a) under the Investment Company Act of 1940, are filed and attached hereto as EX-99.CERT. |
| |
| (b) | A certification by the registrant’s chief executive officer and chief financial officer, pursuant to Section 906 of the Sarbanes-Oxley Act of 2002, is furnished and attached hereto as EX-99.906CERT. |
SIGNATURES
Pursuant to the requirements of the Securities Exchange Act of 1934 and the Investment Company Act of 1940, the registrant has duly caused this report to be signed on its behalf by the undersigned, thereunto duly authorized.
|
| | | | |
| Registrant: | American Century International Bond Funds | |
| | | | |
| By: | /s/ Jonathan S. Thomas | |
| | Name: | Jonathan S. Thomas | |
| | Title: | President | |
| | | | |
| Date: | August 27, 2015 | |
Pursuant to the requirements of the Securities Exchange Act of 1934 and the Investment Company Act of 1940, this report has been signed below by the following persons on behalf of the registrant and in the capacities and on the dates indicated.
|
| | | |
| By: | /s/ Jonathan S. Thomas | |
| | Name: | Jonathan S. Thomas | |
| | Title: | President | |
| | | (principal executive officer) | |
| | | | |
| Date: | August 27, 2015 | |
|
| | | |
| By: | /s/ C. Jean Wade | |
| | Name: | C. Jean Wade | |
| | Title: | Vice President, Treasurer, and | |
| | | Chief Financial Officer | |
| | | (principal financial officer) | |
| | | | |
| Date: | August 27, 2015 | |