Washington, D.C. 20549
ITEM 1. REPORTS TO STOCKHOLDERS.
ANNUAL REPORT JUNE 30, 2012
| President’s Letter | 2 |
| Market Perspective | 3 |
| Performance | 4 |
| Portfolio Commentary | 5 |
| Fund Characteristics | 7 |
| Shareholder Fee Example | 8 |
| Schedule of Investments | 10 |
| Statement of Assets and Liabilities | 22 |
| Statement of Operations | 23 |
| Statement of Changes in Net Assets | 24 |
| Notes to Financial Statements | 25 |
| Financial Highlights | 32 |
| Report of Independent Registered Public Accounting Firm | 33 |
| Management | 34 |
| Approval of Management Agreement | 37 |
| Additional Information | 39 |
Any opinions expressed in this report reflect those of the author as of the date of the report, and do not necessarily represent the opinions of American Century Investments® or any other person in the American Century Investments organization. Any such opinions are subject to change at any time based upon market or other conditions and American Century Investments disclaims any responsibility to update such opinions. These opinions may not be relied upon as investment advice and, because investment decisions made by American Century Investments funds are based on numerous factors, may not be relied upon as an indication of trading intent on behalf of any American Century Investments fund. Security examples are used for representational purposes only and are not intended as recommendations to purchase or sell securities. Performance information for comparative indices and securities is provided to American Century Investments by third party vendors. To the best of American Century Investments’ knowledge, such information is accurate at the time of printing.
Dear Investor:
Thank you for reviewing this annual report for the shortened reporting period from the fund’s inception on January 31, 2012, to June 30, 2012. Our report offers investment performance and portfolio information, presented with the expert perspective of our portfolio management team.
This report remains one of our most important vehicles for conveying information about fund returns, as well as market factors and strategies that affected fund performance. For additional, updated information, we encourage you to visit our website, americancentury.com. Click on the “Fund Performance” and “Insights & News” headings at the top of our Individual Investors site.
Economic and Financial Uncertainties Resurfaced
The global economy and financial markets struggled to move beyond the lingering aftereffects of the 2008 Financial Crisis and Great Recession during the first half of 2012. Global economic fundamentals have improved since 2008, but weakened since 2010, with increased uncertainty surrounding near-term economic growth levels in major developed economies such as the U.S., Japan, and Europe. There were also questions about near-term growth levels in influential emerging economies such as China.
Some of these near-term uncertainties manifested themselves in relative asset returns for the five months ended June 30, 2012. Commodity prices plunged as global economic growth slowed, and assets perceived to be “safe-haven” investments rallied, including the U.S. dollar. The dollar’s strength negatively affected the returns of foreign investments—including international bonds—that had to be converted from weaker currencies, such as the euro, to the stronger dollar for the portfolios of U.S. investors.
Unfortunately, the instability that helped trigger flight-to-quality trading in the first half of 2012 remains largely in place, and the coming months may bring additional uncertainties about the U.S. presidential election and what might happen when various U.S. tax cuts and other stimulative measures expire in 2013 (the so-called “Fiscal Cliff”). In this uncertain, unstable environment, we continue to believe in a disciplined, diversified, long-term investment approach, using both stocks and bonds, as appropriate. We appreciate your continued trust in us during these unsettled times.
Sincerely,
Jonathan Thomas
President and Chief Executive Officer
American Century Investments
By David MacEwen, Chief Investment Officer, Fixed Income
Global bonds advanced for the period from January 31 to June 30, 2012. The broad Barclays Global Aggregate Bond Index, hedged to remove the effects of currency fluctuations, gained nearly 2% for the reporting period.
Developments in Europe’s sovereign debt crisis had an impact on global bond market performance. As the reporting period began, efforts by the European Central Bank to provide long-term debt financing and other support helped ease the growing stress on the Continent’s debt markets and banking sector. This positive news was short-lived, however, as political turmoil in Greece and faltering banks in Spain led to growing concerns about the sustainability of the euro. These concerns eased in June amid favorable elections in Greece, a recapitalization program for Spanish banks, and talk of a single European banking authority.
Another factor impacting bond markets worldwide was a broad slowdown in economic growth during the period. A number of European countries faced recessions, brought on in part by austerity measures intended to bring fiscal deficits under control. The economic weakness in Europe also impacted fast-growing emerging markets such as China, where exports to Europe and other developed countries are a meaningful component of the economy. Even the U.S. economy, which appeared to pick up steam in early 2012, slowed appreciably by the end of the reporting period.
In this environment, bond yields generally declined around the globe, with yields in many countries approaching record lows. Peripheral European bond markets generated the best returns, while bond markets in Germany, the U.S., and Japan lagged. From a sector perspective, corporate bonds and other non-government securities outperformed government bonds on a global basis during the reporting period.
| Major Currency and Global Bond Market Returns |
| From January 31, 2012 through June 30, 2012* |
| Currency Returns** |
| U.S. Dollar vs. Euro | 3.36% |
| U.S. Dollar vs. Japanese Yen | 4.88% |
| International Bond Market Return (in dollars) |
| Barclays Global Aggregate Bond Index (USD, hedged) | 1.72% |
| Barclays Global Treasury ex-U.S. Bond Index | -1.76% |
| * | Total returns for periods less than one year are not annualized. |
| ** | All percentage changes in foreign exchange rates are calculated on the basis of that currency per one U.S. dollar. |
| Total Returns as of June 30, 2012 |
| | Ticker Symbol | Since Inception(1) | Inception Date |
| Investor Class | AGBVX | 1.90% | 1/31/12 |
Barclays Global Aggregate Bond Index (USD, hedged) | — | 1.72% | — |
| Institutional Class | AGBNX | 2.00% | 1/31/12 |
A Class No sales charge* With sales charge* | AGBAX | 1.80% -2.77% | 1/31/12 |
C Class No sales charge* With sales charge* | AGBTX | 1.50% 0.50% | 1/31/12 |
| R Class | AGBRX | 1.70% | 1/31/12 |
| * | Sales charges include initial sales charges and contingent deferred sales charges (CDSCs), as applicable. A Class shares have a 4.50% maximum initial sales charge and may be subject to a maximum CDSC of 1.00%. C Class shares redeemed within 12 months of purchase are subject to a maximum CDSC of 1.00%. The SEC requires that mutual funds provide performance information net of maximum sales charges in all cases where charges could be applied. |
| (1) | Total returns for periods less than one year are not annualized. |
| Total Annual Fund Operating Expenses |
| Investor Class | Institutional Class | A Class | C Class | R Class |
| 0.96% | 0.76% | 1.21% | 1.96% | 1.46% |
The total annual fund operating expenses shown is as stated in the fund’s prospectus current as of the date of this report. The prospectus may vary from the expense ratio shown elsewhere in this report because it is based on a different time period, includes acquired fund fees and expenses, and, if applicable, does not include fee waivers or expense reimbursements.
Data presented reflect past performance. Past performance is no guarantee of future results. Current performance may be higher or lower than the performance shown. Investment return and principal value will fluctuate, and redemption value may be more or less than original cost. To obtain performance data current to the most recent month end, please call 1-800-345-2021 or visit americancentury.com. As interest rates rise, bond values will decline. International investing involves special risks, such as political instability and currency fluctuations. Investing in emerging markets may accentuate these risks.
Unless otherwise indicated, performance reflects Investor Class shares; performance for other share classes will vary due to differences in fee structure. For information about other share classes available, please consult the prospectus. Data assumes reinvestment of dividends and capital gains, and none of the charts reflect the deduction of taxes that a shareholder would pay on fund distributions or the redemption of fund shares. Returns for the index are provided for comparison. The fund’s total returns include operating expenses (such as transaction costs and management fees) that reduce returns, while the total returns of the index do not.
Portfolio Managers: John Lovito, Federico Garcia Zamora, Simon Chester, Robert Gahagan, and David MacEwen
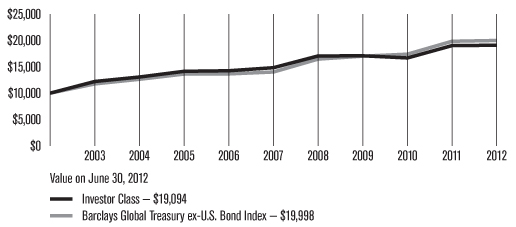
Performance Summary
Global Bond returned 1.90%* from its inception on January 31, 2012, to June 30, 2012. By comparison, the fund’s benchmark index, the Barclays Global Aggregate Bond Index (USD, hedged), returned 1.72%. The fund’s results reflected operating expenses, while the benchmark’s return did not.
The positive performance for both Global Bond and its benchmark index, which is hedged to remove the effects of currency fluctuations, reflected the rally in international bond markets during the reporting period (see page 3 for more details). The fund’s outperformance of its benchmark for the period was driven primarily by sector allocation, particularly in the U.S. portion of the portfolio.
High-Quality Focus in International Component
The fund’s international bond holdings, which comprised approximately 60% of the portfolio throughout the reporting period, emphasized high-quality bonds (those rated AA or higher). In particular, the fund was defensively positioned in Europe, with overweight positions in the U.K. and Germany and limited exposure to peripheral European markets. The fund also held underweight positions in Asian bond markets, including Japan and South Korea. Overall, the fund’s country weightings detracted modestly from performance as underweight positions in core European bond markets other than Germany (most notably France and Belgium) weighed on relative results during the reporting period.
Exposure to non-government bonds outside the U.S. added value during the period as non-government securities generally outperformed government bonds. The fund’s international non-government holdings included selected corporate bonds, supra-national securities (such as those issued by the European Investment Bank), and covered bonds, which are typically backed by a pool of mortgages or other debt.
Sector Allocation Boosted Results in the U.S.
In the U.S. portion of the portfolio, overweight positions in corporate bonds, both investment-grade and high-yield, contributed favorably to performance as corporate securities were among the top performers in the domestic bond market for the reporting period. An overweight position in commercial mortgage-backed securities and an underweight position in Treasury bonds also added value versus the benchmark index.
After a meaningful rally in corporate bonds during the first quarter of 2012, we lowered the fund’s risk profile by reducing its overweight in U.S. corporate securities. This proved to be a favorable decision as corporate bonds underperformed over the final three months of the period. Individual security selection among corporate securities also contributed positively to performance.
Toward the end of the period, we added small positions in Treasury inflation-protected securities and municipal bonds, taking advantage of attractive relative values.
*All fund returns referenced in this commentary are for Investor Class shares. Total returns for periods less than one year are not annualized.
Currency Positioning Mixed But Positive Overall
Although the portfolio typically hedges its foreign currency exposure, we take modest tactical currency positions in an effort to add value to performance. During the reporting period, the fund emphasized currencies in economically sensitive countries with commodity-based economies, strong fiscal positions, robust banking sectors, and exposure to fast-growing emerging markets. These included overweight positions in the Australian dollar, New Zealand dollar, Canadian dollar, and Norwegian krone. At the same time, the fund held underweight positions in the U.S. dollar, the euro, and the Japanese yen.
The fund’s currency positioning produced mixed but generally positive results for the reporting period. The fund’s underweight position in the U.S. dollar detracted from results as the dollar strengthened against most major currencies, but underweight positions in the Japanese yen and euro contributed positively to performance. The economically sensitive currencies fared well early in the period, then gave back much of the gains over the last three months.
A Look Ahead
The themes that have dominated the global bond markets over the last 12–24 months are likely to continue as we move into the second half of 2012. We expect to see modest global economic growth, at an annual rate of 1–3%, over the next six to 12 months. We also expect interest rates to remain low around the world as central banks maintain their accommodative policies to stimulate economic activity. Even central banks in China and other emerging markets are becoming more accommodative, which should bode well for the economically sensitive currencies we favor in the portfolio.
We expect the situation in Europe to remain volatile and will likely continue to be the main factor influencing international bond performance in the coming months. At the European Union summit at the end of June, the EU made some decisions—such as creating a unified banking regulator and a new bank recapitalization fund—that took the markets by surprise. We believe that Europe will eventually move toward greater fiscal integration and debt mutualization, but these developments will happen over an extended period of time.
| JUNE 30, 2012 |
| Portfolio at a Glance |
| Average Duration (effective) | 5.7 years |
| Weighted Average Life | 8.4 years |
| | |
| Bond Holdings by Country | % of net assets |
| United States | 38.2% |
| Japan | 17.2% |
| United Kingdom | 10.5% |
Germany(1) | 4.7% |
Italy(1) | 3.3% |
France(1) | 3.3% |
| Canada | 2.9% |
Netherlands(1) | 2.2% |
| Australia | 1.7% |
| Multi-National | 1.3% |
Spain(1) | 1.1% |
| Other Countries | 6.0% |
Cash and Equivalents(2) | 7.6% |
(1)These countries are members of the eurozone. (2)Includes temporary cash investments and other assets and liabilities. |
| | |
| Types of Investments in Portfolio | % of net assets |
| Sovereign Governments and Agencies | 44.0% |
| Corporate Bonds | 25.1% |
| U.S. Government Agency Mortgage-Backed Securities | 12.2% |
| Municipal Securities | 3.7% |
| U.S. Treasury Securities | 3.6% |
| Commercial Mortgage-Backed Securities | 2.2% |
| Collateralized Mortgage Obligations | 1.2% |
| U.S. Government Agency Securities | 0.4% |
| Temporary Cash Investments | 1.1% |
| Other Assets and Liabilities | 6.5%* |
| *Amount relates primarily to foreign currency holdings at period end. | |
Fund shareholders may incur two types of costs: (1) transaction costs, including sales charges (loads) on purchase payments and redemption/exchange fees; and (2) ongoing costs, including management fees; distribution and service (12b-1) fees; and other fund expenses. This example is intended to help you understand your ongoing costs (in dollars) of investing in your fund and to compare these costs with the ongoing cost of investing in other mutual funds.
The example is based on an investment of $1,000 made at the beginning of the period and held for the entire period from January 1, 2012 to June 30, 2012 (except as noted).
Actual Expenses
The table provides information about actual account values and actual expenses for each class. You may use the information, together with the amount you invested, to estimate the expenses that you paid over the period. First, identify the share class you own. Then simply divide your account value by $1,000 (for example, an $8,600 account value divided by $1,000 = 8.6), then multiply the result by the number under the heading “Expenses Paid During Period” to estimate the expenses you paid on your account during this period.
If you hold Investor Class shares of any American Century Investments fund, or Institutional Class shares of the American Century Diversified Bond Fund, in an American Century Investments account (i.e., not a financial intermediary or retirement plan account), American Century Investments may charge you a $12.50 semiannual account maintenance fee if the value of those shares is less than $10,000. We will redeem shares automatically in one of your accounts to pay the $12.50 fee. In determining your total eligible investment amount, we will include your investments in all personal accounts (including American Century Investments Brokerage accounts) registered under your Social Security number. Personal accounts include individual accounts, joint accounts, UGMA/UTMA accounts, personal trusts, Coverdell Education Savings Accounts and IRAs (including traditional, Roth, Rollover, SEP-, SARSEP- and SIMPLE-IRAs), and certain other retirement accounts. If you have only business, business retirement, employer-sponsored or American Century Investments Brokerage accounts, you are currently not subject to this fee. If you are subject to the Account Maintenance Fee, your account value could be reduced by the fee amount.
Hypothetical Example for Comparison Purposes
The table also provides information about hypothetical account values and hypothetical expenses based on the actual expense ratio of each class of your fund and an assumed rate of return of 5% per year before expenses, which is not the actual return of a fund’s share class. The hypothetical account values and expenses may not be used to estimate the actual ending account balance or expenses you paid for the period. You may use this information to compare the ongoing costs of investing in your fund and other funds. To do so, compare this 5% hypothetical example with the 5% hypothetical examples that appear in the shareholder reports of the other funds.
Please note that the expenses shown in the table are meant to highlight your ongoing costs only and do not reflect any transactional costs, such as sales charges (loads) or redemption/exchange fees. Therefore, the table is useful in comparing ongoing costs only, and will not help you determine the relative total costs of owning different funds. In addition, if these transactional costs were included, your costs would have been higher.
| | | | | |
| | Beginning Account Value 1/1/12 | Ending Account Value 6/30/12 | Expenses Paid During Period(1) 1/1/12 – 6/30/12 | Annualized Expense Ratio(1) |
| Actual |
| Investor Class | $1,000 | $1,019.00(2) | $4.00(3) | 0.96% |
| Institutional Class | $1,000 | $1,020.00(2) | $3.17(3) | 0.76% |
| A Class | $1,000 | $1,018.00(2) | $5.04(3) | 1.21% |
| C Class | $1,000 | $1,015.00(2) | $8.15(3) | 1.96% |
| R Class | $1,000 | $1,017.00(2) | $6.07(3) | 1.46% |
| Hypothetical | | | | |
| Investor Class | $1,000 | $1,020.09(4) | $4.82(4) | 0.96% |
| Institutional Class | $1,000 | $1,021.08(4) | $3.82(4) | 0.76% |
| A Class | $1,000 | $1,018.85(4) | $6.07(4) | 1.21% |
| C Class | $1,000 | $1,015.12(4) | $9.82(4) | 1.96% |
| R Class | $1,000 | $1,017.60(4) | $7.32(4) | 1.46% |
| (1) | Expenses are equal to the class’s annualized expense ratio listed in the table above, multiplied by the average account value over the period, multiplied by 182, the number of days in the most recent fiscal half-year, divided by 366, to reflect the one-half year period. |
| (2) | Ending account value based on actual return from January 31, 2012 (fund inception) through June 30, 2012. |
| (3) | Expenses are equal to the class’s annualized expense ratio listed in the table above, multiplied by the average account value over the period, multiplied by 151, the number of days in the period from January 31, 2012 (fund inception) through June 30, 2012, divided by 366 to reflect the period. Had the class been available for the full period, the expenses paid during the period would have been higher. |
| (4) | Ending account value and expenses paid during the period assumes the class had been available throughout the entire period and are calculated using the class’s annualized expense ratio listed in the table above. |
| | | | Principal Amount | | | Value | |
| Sovereign Governments and Agencies — 44.0% | |
| AUSTRALIA — 1.7% | |
| Government of Australia, 6.50%, 5/15/13 | AUD | | | 220,000 | | | | $232,195 | |
| Government of Australia, 5.75%, 7/15/22 | AUD | | | 60,000 | | | | 75,751 | |
| New South Wales Treasury Corp., 5.50%, 3/1/17 | AUD | | | 145,000 | | | | 163,271 | |
| | | | | | | | | 471,217 | |
| AUSTRIA — 0.9% | |
Republic of Austria, 3.40%, 10/20/14(1) | EUR | | | 100,000 | | | | 134,829 | |
Republic of Austria, 4.35%, 3/15/19(1) | EUR | | | 75,000 | | | | 109,077 | |
Republic of Austria, 4.15%, 3/15/37(1) | EUR | | | 10,000 | | | | 14,638 | |
| | | | | | | | | 258,544 | |
| BELGIUM — 0.8% | |
| Kingdom of Belgium, 4.00%, 3/28/14 | EUR | | | 60,000 | | | | 80,013 | |
| Kingdom of Belgium, 4.00%, 3/28/18 | EUR | | | 30,000 | | | | 41,327 | |
| Kingdom of Belgium, 3.75%, 9/28/20 | EUR | | | 25,000 | | | | 33,564 | |
| Kingdom of Belgium, 5.00%, 3/28/35 | EUR | | | 55,000 | | | | 81,869 | |
| | | | | | | | | 236,773 | |
| BRAZIL — 0.4% | |
| Brazilian Government International Bond, 5.875%, 1/15/19 | | | | 100,000 | | | | 121,200 | |
| CANADA — 2.6% | |
| Government of Canada, 5.00%, 6/1/14 | CAD | | | 75,000 | | | | 79,194 | |
| Government of Canada, 4.00%, 6/1/17 | CAD | | | 170,000 | | | | 188,518 | |
| Government of Canada, 3.75%, 6/1/19 | CAD | | | 65,000 | | | | 73,426 | |
| Government of Canada, 3.25%, 6/1/21 | CAD | | | 85,000 | | | | 94,655 | |
| Government of Canada, 5.75%, 6/1/33 | CAD | | | 40,000 | | | | 61,668 | |
| Government of Canada, 4.00%, 6/1/41 | CAD | | | 30,000 | | | | 39,765 | |
| Province of British Columbia Canada, 4.10%, 12/18/19 | CAD | | | 65,000 | | | | 71,921 | |
| Province of Ontario Canada, 1.60%, 9/21/16 | | | $ | 40,000 | | | $ | 40,779 | |
| Province of Ontario Canada, 4.65%, 6/2/41 | CAD | | | 70,000 | | | | 84,171 | |
| | | | | | | | | 734,097 | |
| DENMARK — 0.3% | |
| Kingdom of Denmark, 4.00%, 11/15/19 | DKK | | | 350,000 | | | | 72,045 | |
| Kingdom of Denmark, 4.50%, 11/15/39 | DKK | | | 55,000 | | | | 13,800 | |
| | | | | | | | | 85,845 | |
| FINLAND — 0.3% | |
| Government of Finland, 3.375%, 4/15/20 | EUR | | | 50,000 | | | | 70,669 | |
| FRANCE — 0.7% | |
| Government of France, 4.00%, 4/25/14 | EUR | | | 55,000 | | | | 74,134 | |
| Government of France, 5.50%, 4/25/29 | EUR | | | 75,000 | | | | 120,735 | |
| | | | | | | | | 194,869 | |
| GERMANY — 3.4% | |
| German Federal Republic, 2.00%, 2/26/16 | EUR | | | 90,000 | | | | 120,699 | |
| German Federal Republic, 2.25%, 9/4/20 | EUR | | | 485,000 | | | | 658,447 | |
| German Federal Republic, 4.25%, 7/4/39 | EUR | | | 95,000 | | | | 166,520 | |
| | | | | | | | | 945,666 | |
| IRELAND — 0.5% | |
| Ireland Government Bond, 4.00%, 1/15/14 | EUR | | | 70,000 | | | | 87,441 | |
| Ireland Government Bond, 5.90%, 10/18/19 | EUR | | | 35,000 | | | | 43,469 | |
| | | | | | | | | 130,910 | |
| ITALY — 2.5% | |
| Republic of Italy, 3.75%, 8/1/15 | EUR | | | 185,000 | | | | 231,243 | |
| Republic of Italy, 5.25%, 8/1/17 | EUR | | | 140,000 | | | | 179,203 | |
| Republic of Italy, 4.75%, 8/1/23 | EUR | | | 130,000 | | | | 152,713 | |
| Republic of Italy, 4.00%, 2/1/37 | EUR | | | 135,000 | | | | 131,251 | |
| | | | | | | | | 694,410 | |
| JAPAN — 17.2% | |
| Government of Japan, 0.60%, 9/20/14 | JPY | | | $50,200,000 | | | | $635,045 | |
| Government of Japan, 1.20%, 6/20/15 | JPY | | | 78,300,000 | | | | 1,011,185 | |
| Government of Japan, 1.50%, 9/20/18 | JPY | | | 141,000,000 | | | | 1,886,865 | |
| Government of Japan, 1.00%, 12/20/21 | JPY | | | 29,400,000 | | | | 375,333 | |
| Government of Japan, 2.40%, 3/20/37 | JPY | | | 66,300,000 | | | | 925,807 | |
| | | | | | | | | 4,834,235 | |
| MEXICO — 0.2% | |
| United Mexican States, MTN, 5.95%, 3/19/19 | $ | | | 30,000 | | | | 36,720 | |
| United Mexican States, 6.05%, 1/11/40 | $ | | | 20,000 | | | | 25,900 | |
| | | | | | | | | 62,620 | |
| MULTI-NATIONAL — 1.3% | |
| European Investment Bank, 2.50%, 7/15/15 | EUR | | | 130,000 | | | | 172,033 | |
| European Investment Bank, MTN, 3.625%, 1/15/21 | EUR | | | 50,000 | | | | 68,993 | |
| International Bank for Reconstruction & Development, MTN, 3.875%, 5/20/19 | EUR | | | 85,000 | | | | 124,287 | |
| | | | | | | | | 365,313 | |
| NETHERLANDS — 1.3% | |
| Kingdom of Netherlands, 4.00%, 7/15/16 | EUR | | | 140,000 | | | | 198,769 | |
| Kingdom of Netherlands, 3.50%, 7/15/20 | EUR | | | 90,000 | | | | 127,903 | |
| Kingdom of Netherlands, 4.00%, 1/15/37 | EUR | | | 20,000 | | | | 31,620 | |
| | | | | | | | | 358,292 | |
| NEW ZEALAND — 0.2% | |
| New Zealand Government Bond, 5.00%, 3/15/19 | NZD | | | 50,000 | | | | 44,467 | |
| NORWAY — 0.2% | |
| Government of Norway, 4.25%, 5/19/17 | NOK | | | 250,000 | | | | 47,494 | |
PERU† | |
| Republic of Peru, 6.55%, 3/14/37 | $ | | | 10,000 | | | | 13,660 | |
| SOUTH KOREA — 0.1% | |
| Korea Development Bank, 3.25%, 3/9/16 | $ | | | 40,000 | | | | 41,503 | |
| SPAIN — 0.7% | |
| Government of Spain, 5.85%, 1/31/22 | EUR | | | 165,000 | | | | 201,184 | |
| SWEDEN — 0.8% | |
| Government of Sweden, 6.75%, 5/5/14 | SEK | | | 1,000,000 | | | | 159,624 | |
| Government of Sweden, 4.25%, 3/12/19 | SEK | | | 450,000 | | | | 77,213 | |
| | | | | | | | | 236,837 | |
| SWITZERLAND — 0.2% | |
| Switzerland Government Bond, 2.00%, 4/28/21 | CHF | | | 55,000 | | | | 65,204 | |
| UNITED KINGDOM — 7.7% | |
| Government of United Kingdom, 5.00%, 9/7/14 | GBP | | | 85,000 | | | | 146,804 | |
| Government of United Kingdom, 4.00%, 9/7/16 | GBP | | | 210,000 | | | | 374,608 | |
| Government of United Kingdom, 3.75%, 9/7/21 | GBP | | | 455,000 | | | | 839,132 | |
| Government of United Kingdom, 4.50%, 12/7/42 | GBP | | | 335,000 | | | | 676,327 | |
| United Kingdom Gilt, 4.25%, 12/7/55 | GBP | | | 60,000 | | | | 118,456 | |
| | | | | | | | | 2,155,327 | |
TOTAL SOVEREIGN GOVERNMENTS AND AGENCIES (Cost $12,540,518) | | | | 12,370,336 | |
| Corporate Bonds — 25.1% | |
| AEROSPACE AND DEFENSE — 0.4% | |
| Lockheed Martin Corp., 4.25%, 11/15/19 | | | $ | 40,000 | | | | 44,779 | |
| Raytheon Co., 4.40%, 2/15/20 | | | | 20,000 | | | | 22,759 | |
| United Technologies Corp., 5.70%, 4/15/40 | | | | 10,000 | | | | 12,750 | |
| United Technologies Corp., 4.50%, 6/1/42 | | | | 20,000 | | | | 22,096 | |
| | | | | | | | | 102,384 | |
| AUTOMOBILES — 0.4% | |
| Ford Motor Credit Co. LLC, 5.875%, 8/2/21 | | | | 20,000 | | | | 22,306 | |
Nissan Motor Acceptance Corp., 3.25%, 1/30/13(1) | | | | 100,000 | | | | 100,979 | |
| | | | | | | | | 123,285 | |
| BEVERAGES — 0.4% | |
| Anheuser-Busch InBev Worldwide, Inc., 7.75%, 1/15/19 | | | | $40,000 | | | | $52,930 | |
| Coca-Cola Co. (The), 1.80%, 9/1/16 | | | | 30,000 | | | | 30,855 | |
SABMiller Holdings, Inc., 2.45%, 1/15/17(1) | | | | 20,000 | | | | 20,646 | |
SABMiller Holdings, Inc., 3.75%, 1/15/22(1) | | | | 10,000 | | | | 10,664 | |
| | | | | | | | | 115,095 | |
| BIOTECHNOLOGY — 0.2% | |
| Amgen, Inc., 2.125%, 5/15/17 | | | | 30,000 | | | | 30,401 | |
| Gilead Sciences, Inc., 4.40%, 12/1/21 | | | | 20,000 | | | | 22,135 | |
| | | | | | | | | 52,536 | |
| CAPITAL MARKETS — 0.9% | |
| Cooperatieve Centrale Raiffeisen-Boerenleenbank BA, 3.375%, 1/19/17 | | | | 50,000 | | | | 51,535 | |
| Cooperatieve Centrale Raiffeisen-Boerenleenbank BA, 3.875%, 2/8/22 | | | | 10,000 | | | | 10,201 | |
| Fidelity International Ltd., MTN, 6.875%, 2/24/17 | EUR | | | 50,000 | | | | 69,185 | |
| Jefferies Group, Inc., 5.125%, 4/13/18 | $ | | | 10,000 | | | | 9,800 | |
| Northern Trust Corp., 4.625%, 5/1/14 | | | | 30,000 | | | | 32,119 | |
| UBS AG, MTN, 6.625%, 4/11/18 | GBP | | | 50,000 | | | | 90,658 | |
| | | | | | | | | 263,498 | |
| CHEMICALS — 0.5% | |
| CF Industries, Inc., 7.125%, 5/1/20 | $ | | | 30,000 | | | | 36,600 | |
| Dow Chemical Co. (The), 5.90%, 2/15/15 | | | | 50,000 | | | | 55,797 | |
| Eastman Chemical Co., 3.60%, 8/15/22 | | | | 20,000 | | | | 20,458 | |
| Ecolab, Inc., 4.35%, 12/8/21 | | | | 20,000 | | | | 22,228 | |
| | | | | | | | | 135,083 | |
| COMMERCIAL BANKS — 3.0% | |
| Abbey National Treasury Services plc, MTN, 5.125%, 4/14/22 | GBP | | | 100,000 | | | | 168,594 | |
| Banca Monte dei Paschi di Siena SpA, 4.875%, 9/15/16 | EUR | | | 100,000 | | | | 126,650 | |
| Bank of America N.A., 5.30%, 3/15/17 | $ | | | 50,000 | | | | 52,132 | |
| Bank of Nova Scotia, 2.55%, 1/12/17 | | | | 20,000 | | | | 20,811 | |
| Barclays Bank plc, MTN, 4.875%, 12/29/49 | EUR | | | 40,000 | | | | 28,221 | |
| Capital One Financial Corp., 2.15%, 3/23/15 | $ | | | 10,000 | | | | 10,086 | |
HSBC Bank plc, 3.50%, 6/28/15(1) | | | | 20,000 | | | | 20,932 | |
| Kreditanstalt fuer Wiederaufbau, 2.00%, 6/1/16 | | | | 50,000 | | | | 52,100 | |
| Kreditanstalt fuer Wiederaufbau, 3.875%, 1/21/19 | EUR | | | 70,000 | | | | 101,743 | |
| Kreditanstalt fuer Wiederaufbau, MTN, 4.625%, 1/4/23 | EUR | | | 70,000 | | | | 109,562 | |
| PNC Funding Corp., 3.625%, 2/8/15 | $ | | | 40,000 | | | | 42,516 | |
| Royal Bank of Scotland plc (The), 4.375%, 3/16/16 | | | | 40,000 | | | | 41,040 | |
| Wells Fargo & Co., 2.10%, 5/8/17 | | | | 30,000 | | | | 30,115 | |
| Wells Fargo & Co., 5.625%, 12/11/17 | | | | 20,000 | | | | 23,394 | |
| Wells Fargo & Co., MTN, 3.50%, 3/8/22 | | | | 10,000 | | | | 10,319 | |
| | | | | | | | | 838,215 | |
| COMMERCIAL SERVICES AND SUPPLIES — 0.1% | |
| Republic Services, Inc., 5.50%, 9/15/19 | | | | 10,000 | | | | 11,596 | |
| Republic Services, Inc., 3.55%, 6/1/22 | | | | 10,000 | | | | 10,137 | |
| Waste Management, Inc., 2.60%, 9/1/16 | | | | 20,000 | | | | 20,552 | |
| | | | | | | | | 42,285 | |
| COMPUTERS AND PERIPHERALS — 0.1% | |
| Hewlett-Packard Co., 2.60%, 9/15/17 | | | | 30,000 | | | | 30,165 | |
| CONSTRUCTION MATERIALS — 0.2% | |
| Cie de St-Gobain, MTN, 4.75%, 4/11/17 | EUR | | | 50,000 | | | | 69,353 | |
| CONSUMER FINANCE — 0.5% | |
| American Express Credit Corp., MTN, 2.75%, 9/15/15 | $ | | | 70,000 | | | | 73,112 | |
| American Express Credit Corp., MTN, 2.375%, 3/24/17 | | | | 10,000 | | | | 10,265 | |
| Credit Suisse (New York), 5.50%, 5/1/14 | | | | $40,000 | | | | $42,428 | |
| SLM Corp., 6.25%, 1/25/16 | | | | 20,000 | | | | 21,100 | |
| | | | | | | | | 146,905 | |
| DIVERSIFIED FINANCIAL SERVICES — 3.5% | |
| Ally Financial, Inc., 8.30%, 2/12/15 | | | | 40,000 | | | | 43,700 | |
| Bank of America Corp., 4.50%, 4/1/15 | | | | 10,000 | | | | 10,316 | |
| Bank of America Corp., 6.50%, 8/1/16 | | | | 10,000 | | | | 10,995 | |
| Bank of America Corp., 3.875%, 3/22/17 | | | | 40,000 | | | | 40,809 | |
| Bank of America Corp., 5.70%, 1/24/22 | | | | 10,000 | | | | 11,042 | |
| Citigroup, Inc., 6.01%, 1/15/15 | | | | 30,000 | | | | 32,255 | |
| Citigroup, Inc., 6.125%, 5/15/18 | | | | 60,000 | | | | 67,111 | |
| Citigroup, Inc., 4.50%, 1/14/22 | | | | 10,000 | | | | 10,356 | |
| General Electric Capital Corp., 4.375%, 9/16/20 | | | | 50,000 | | | | 54,223 | |
| General Electric Capital Corp., MTN, 6.00%, 8/7/19 | | | | 70,000 | | | | 82,074 | |
| Goldman Sachs Group, Inc. (The), 3.625%, 2/7/16 | | | | 50,000 | | | | 50,064 | |
| Goldman Sachs Group, Inc. (The), 5.75%, 1/24/22 | | | | 40,000 | | | | 42,333 | |
| HSBC Holdings plc, 5.10%, 4/5/21 | | | | 30,000 | | | | 33,577 | |
| HSBC Holdings plc, MTN, 3.875%, 3/16/16 | EUR | | | 100,000 | | | | 135,868 | |
| JP Morgan Chase Capital XXV, Series Y, 6.80%, 10/1/37 | $ | | | 10,000 | | | | 10,025 | |
| JPMorgan Chase & Co., 3.45%, 3/1/16 | | | | 10,000 | | | | 10,377 | |
| JPMorgan Chase & Co., 6.00%, 1/15/18 | | | | 70,000 | | | | 80,485 | |
| Merck Financial Services GmbH, MTN, 4.50%, 3/24/20 | EUR | | | 50,000 | | | | 71,607 | |
| Morgan Stanley, 5.50%, 7/24/20 | $ | | | 30,000 | | | | 29,417 | |
| Nationwide Building Society, MTN, 6.75%, 7/22/20 | EUR | | | 50,000 | | | | 60,087 | |
| Societe Generale SA, 2.50%, 1/15/14 | $ | | | 100,000 | | | | 98,725 | |
| Syngenta Finance NV, 3.125%, 3/28/22 | | | | 10,000 | | | | 10,179 | |
| | | | | | | | | 995,625 | |
| DIVERSIFIED TELECOMMUNICATION SERVICES — 2.0% | |
| AT&T, Inc., 6.55%, 2/15/39 | | | | 50,000 | | | | 64,662 | |
| CenturyLink, Inc., 5.80%, 3/15/22 | | | | 10,000 | | | | 9,981 | |
| Deutsche Telekom International Finance BV, 6.75%, 8/20/18 | | | | 50,000 | | | | 60,306 | |
| France Telecom SA, MTN, 3.875%, 4/9/20 | EUR | | | 50,000 | | | | 67,940 | |
| Frontier Communications Corp., 7.125%, 3/15/19 | $ | | | 25,000 | | | | 25,375 | |
| Koninklijke KPN NV, MTN, 4.75%, 1/17/17 | EUR | | | 50,000 | | | | 69,484 | |
| Telecom Italia SpA, MTN, 5.875%, 5/19/23 | GBP | | | 50,000 | | | | 65,542 | |
| Telefonica Emisiones SAU, 5.46%, 2/16/21 | $ | | | 20,000 | | | | 17,456 | |
| Telefonica Emisiones SAU, MTN, 5.375%, 2/2/18 | GBP | | | 50,000 | | | | 71,327 | |
| Verizon Communications, Inc., 4.60%, 4/1/21 | $ | | | 40,000 | | | | 45,964 | |
| Virgin Media Finance plc, 8.375%, 10/15/19 | | | | 45,000 | | | | 50,794 | |
| | | | | | | | | 548,831 | |
| ELECTRIC UTILITIES — 0.1% | |
| AES Corp. (The), 9.75%, 4/15/16 | | | | 20,000 | | | | 23,800 | |
| ELECTRONIC EQUIPMENT, INSTRUMENTS AND COMPONENTS — 0.1% | |
| Jabil Circuit, Inc., 7.75%, 7/15/16 | | | | 20,000 | | | | 22,900 | |
| Jabil Circuit, Inc., 5.625%, 12/15/20 | | | | 10,000 | | | | 10,625 | |
| | | | | | | | | 33,525 | |
| ENERGY EQUIPMENT AND SERVICES — 0.2% | |
| Ensco plc, 3.25%, 3/15/16 | | | | 20,000 | | | | 21,027 | |
| Noble Holding International Ltd., 3.95%, 3/15/22 | | | | 10,000 | | | | 10,140 | |
| Transocean, Inc., 6.375%, 12/15/21 | | | | 10,000 | | | | 11,467 | |
| | | | | | | | | 42,634 | |
| FOOD AND STAPLES RETAILING — 0.3% | |
| CVS Caremark Corp., 6.60%, 3/15/19 | | | | $30,000 | | | | $37,485 | |
| Safeway, Inc., 4.75%, 12/1/21 | | | | 10,000 | | | | 9,944 | |
| Wal-Mart Stores, Inc., 5.625%, 4/15/41 | | | | 30,000 | | | | 39,257 | |
| | | | | | | | | 86,686 | |
| FOOD PRODUCTS — 0.3% | |
| Kraft Foods, Inc., 6.50%, 2/9/40 | | | | 10,000 | | | | 12,909 | |
Kraft Foods, Inc., 5.00%, 6/4/42(1) | | | | 10,000 | | | | 10,641 | |
| TreeHouse Foods, Inc., 7.75%, 3/1/18 | | | | 45,000 | | | | 48,882 | |
| | | | | | | | | 72,432 | |
| GAS UTILITIES — 0.5% | |
| El Paso Corp., 7.25%, 6/1/18 | | | | 40,000 | | | | 46,362 | |
| El Paso Pipeline Partners Operating Co. LLC, 6.50%, 4/1/20 | | | | 10,000 | | | | 11,663 | |
| Enterprise Products Operating LLC, 5.20%, 9/1/20 | | | | 30,000 | | | | 34,403 | |
| Kinder Morgan Energy Partners LP, 6.50%, 9/1/39 | | | | 20,000 | | | | 22,947 | |
| Plains All American Pipeline LP / PAA Finance Corp., 3.65%, 6/1/22 | | | | 10,000 | | | | 10,241 | |
| Williams Partners LP, 4.125%, 11/15/20 | | | | 10,000 | | | | 10,490 | |
| | | | | | | | | 136,106 | |
| HEALTH CARE EQUIPMENT AND SUPPLIES — 0.1% | |
| Covidien International Finance SA, 3.20%, 6/15/22 | | | | 20,000 | | | | 20,681 | |
| HEALTH CARE PROVIDERS AND SERVICES — 0.6% | |
| Express Scripts, Inc., 6.25%, 6/15/14 | | | | 50,000 | | | | 54,700 | |
Express Scripts, Inc., 2.65%, 2/15/17(1) | | | | 40,000 | | | | 40,756 | |
| HCA, Inc., 7.875%, 2/15/20 | | | | 30,000 | | | | 33,450 | |
| Healthsouth Corp., 8.125%, 2/15/20 | | | | 40,000 | | | | 43,900 | |
| WellPoint, Inc., 3.125%, 5/15/22 | | | | 10,000 | | | | 10,110 | |
| | | | | | | | | 182,916 | |
| HOTELS, RESTAURANTS AND LEISURE — 0.1% | |
| Wyndham Worldwide Corp., 2.95%, 3/1/17 | | | | 20,000 | | | | 19,925 | |
| HOUSEHOLD PRODUCTS — 0.2% | |
| Jarden Corp., 8.00%, 5/1/16 | | | | 45,000 | | | | 49,275 | |
| INSURANCE �� 1.3% | |
| American International Group, Inc., 5.85%, 1/16/18 | | | | 40,000 | | | | 44,347 | |
| Aviva plc, 4.73%, 11/29/49 | EUR | | | 50,000 | | | | 47,773 | |
| AXA SA, MTN, 6.21%, 10/29/49 | EUR | | | 50,000 | | | | 47,396 | |
| CNP Assurances, 6.00%, 9/14/40 | EUR | | | 50,000 | | | | 44,546 | |
| Genworth Financial, Inc., 7.625%, 9/24/21 | $ | | | 10,000 | | | | 9,470 | |
| Hartford Financial Services Group, Inc., 6.30%, 3/15/18 | | | | 20,000 | | | | 21,909 | |
| International Lease Finance Corp., 5.75%, 5/15/16 | | | | 10,000 | | | | 10,158 | |
| Lincoln National Corp., 6.25%, 2/15/20 | | | | 20,000 | | | | 22,681 | |
| MetLife, Inc., 6.75%, 6/1/16 | | | | 30,000 | | | | 35,221 | |
| Prudential Financial, Inc., 5.375%, 6/21/20 | | | | 20,000 | | | | 22,182 | |
| Swiss Reinsurance Co. via ELM BV, 5.25%, 5/29/49 | EUR | | | 50,000 | | | | 54,733 | |
| | | | | | | | | 360,416 | |
| IT SERVICES — 0.1% | |
Fidelity National Information Services, Inc., 5.00%, 3/15/22(1) | $ | | | 10,000 | | | | 10,225 | |
| International Business Machines Corp., 1.95%, 7/22/16 | | | | 30,000 | | | | 30,903 | |
| | | | | | | | | 41,128 | |
| MACHINERY — 0.1% | |
| Caterpillar Financial Services Corp., MTN, 2.85%, 6/1/22 | | | | 20,000 | | | | 20,146 | |
| Caterpillar, Inc., 2.60%, 6/26/22 | | | | 10,000 | | | | 10,004 | |
| Deere & Co., 3.90%, 6/9/42 | | | | 10,000 | | | | 9,995 | |
| | | | | | | | | 40,145 | |
| MEDIA — 1.8% | |
| Comcast Corp., 5.90%, 3/15/16 | | | | $30,000 | | | | $34,590 | |
| Comcast Corp., 6.50%, 11/15/35 | | | | 10,000 | | | | 12,222 | |
| Comcast Corp., 6.40%, 5/15/38 | | | | 30,000 | | | | 36,743 | |
| DirecTV Holdings LLC / DirecTV Financing Co., Inc., 3.55%, 3/15/15 | | | | 80,000 | | | | 84,305 | |
| Discovery Communications LLC, 5.625%, 8/15/19 | | | | 20,000 | | | | 23,458 | |
| DISH DBS Corp., 6.75%, 6/1/21 | | | | 50,000 | | | | 54,250 | |
| Interpublic Group of Cos., Inc. (The), 4.00%, 3/15/22 | | | | 10,000 | | | | 10,181 | |
| Lamar Media Corp., 7.875%, 4/15/18 | | | | 70,000 | | | | 77,350 | |
| News America, Inc., 4.50%, 2/15/21 | | | | 20,000 | | | | 21,982 | |
| Time Warner Cable, Inc., 6.75%, 7/1/18 | | | | 40,000 | | | | 48,814 | |
| Time Warner, Inc., 4.875%, 3/15/20 | | | | 20,000 | | | | 22,566 | |
| Time Warner, Inc., 4.90%, 6/15/42 | | | | 10,000 | | | | 10,201 | |
Univision Communications, Inc., 6.875%, 5/15/19(1) | | | | 30,000 | | | | 31,050 | |
| Viacom, Inc., 4.375%, 9/15/14 | | | | 30,000 | | | | 32,133 | |
| | | | | | | | | 499,845 | |
| METALS AND MINING — 0.2% | |
| ArcelorMittal, 6.25%, 2/25/22 | | | | 10,000 | | | | 9,819 | |
| Newmont Mining Corp., 3.50%, 3/15/22 | | | | 10,000 | | | | 9,898 | |
| Vale Overseas Ltd., 5.625%, 9/15/19 | | | | 30,000 | | | | 33,427 | |
| | | | | | | | | 53,144 | |
| MULTI-UTILITIES — 1.2% | |
| Consumers Energy Co., 2.85%, 5/15/22 | | | | 10,000 | | | | 10,203 | |
| Dominion Resources, Inc., 4.90%, 8/1/41 | | | | 30,000 | | | | 34,093 | |
| Duke Energy Corp., 6.30%, 2/1/14 | | | | 50,000 | | | | 54,135 | |
| Enel SpA, MTN, 5.25%, 6/20/17 | EUR | | | 50,000 | | | | 63,041 | |
| FirstEnergy Solutions Corp., 6.05%, 8/15/21 | $ | | | 20,000 | | | | 22,020 | |
| GDF Suez, MTN, 5.625%, 1/18/16 | EUR | | | 30,000 | | | | 43,453 | |
| GDF Suez, MTN, 2.75%, 10/18/17 | EUR | | | 40,000 | | | | 53,013 | |
| Ipalco Enterprises, Inc., 5.00%, 5/1/18 | $ | | | 10,000 | | | | 10,175 | |
| Pacific Gas & Electric Co., 5.80%, 3/1/37 | | | | 10,000 | | | | 12,490 | |
| Progress Energy, Inc., 3.15%, 4/1/22 | | | | 10,000 | | | | 10,121 | |
| San Diego Gas & Electric Co., 3.00%, 8/15/21 | | | | 20,000 | | | | 21,187 | |
| | | | | | | | | 333,931 | |
| OIL, GAS AND CONSUMABLE FUELS — 2.2% | |
| Alpha Natural Resources, Inc., 6.00%, 6/1/19 | | | | 50,000 | | | | 42,875 | |
| Anadarko Petroleum Corp., 5.95%, 9/15/16 | | | | 20,000 | | | | 22,725 | |
| Apache Corp., 4.75%, 4/15/43 | | | | 20,000 | | | | 22,342 | |
| BP Capital Markets plc, 4.50%, 10/1/20 | | | | 20,000 | | | | 22,572 | |
| BP Capital Markets plc, MTN, 3.83%, 10/6/17 | EUR | | | 50,000 | | | | 68,966 | |
| ConocoPhillips Holding Co., 6.95%, 4/15/29 | $ | | | 20,000 | | | | 27,540 | |
| Devon Energy Corp., 5.60%, 7/15/41 | | | | 10,000 | | | | 11,663 | |
| Marathon Petroleum Corp., 3.50%, 3/1/16 | | | | 20,000 | | | | 20,990 | |
| Marathon Petroleum Corp., 5.125%, 3/1/21 | | | | 10,000 | | | | 11,224 | |
| Newfield Exploration Co., 5.625%, 7/1/24 | | | | 50,000 | | | | 51,188 | |
| Nexen, Inc., 5.875%, 3/10/35 | | | | 10,000 | | | | 10,064 | |
| Noble Energy, Inc., 4.15%, 12/15/21 | | | | 20,000 | | | | 21,087 | |
| Occidental Petroleum Corp., 2.70%, 2/15/23 | | | | 20,000 | | | | 20,189 | |
| Peabody Energy Corp., 6.50%, 9/15/20 | | | | 55,000 | | | | 55,963 | |
| Pemex Project Funding Master Trust, 6.625%, 6/15/35 | | | | 30,000 | | | | 35,850 | |
| Petrobras International Finance Co. - Pifco, 5.75%, 1/20/20 | | | | 10,000 | | | | 10,996 | |
| Petrobras International Finance Co. - Pifco, 5.375%, 1/27/21 | | | | 30,000 | | | | 32,505 | |
Phillips 66, 4.30%, 4/1/22(1) | | | | $10,000 | | | | $10,549 | |
| Pioneer Natural Resources Co., 3.95%, 7/15/22 | | | | 10,000 | | | | 10,052 | |
| SandRidge Energy, Inc., 8.75%, 1/15/20 | | | | 40,000 | | | | 41,900 | |
| Suncor Energy, Inc., 6.10%, 6/1/18 | | | | 20,000 | | | | 23,729 | |
| Talisman Energy, Inc., 7.75%, 6/1/19 | | | | 20,000 | | | | 24,587 | |
| Total Capital International SA, 1.55%, 6/28/17 | | | | 10,000 | | | | 10,040 | |
| | | | | | | | | 609,596 | |
| PAPER AND FOREST PRODUCTS — 0.2% | |
Georgia-Pacific LLC, 5.40%, 11/1/20(1) | | | | 30,000 | | | | 34,894 | |
| International Paper Co., 4.75%, 2/15/22 | | | | 20,000 | | | | 21,889 | |
| | | | | | | | | 56,783 | |
| PHARMACEUTICALS — 0.2% | |
| GlaxoSmithKline Capital plc, 2.85%, 5/8/22 | | | | 20,000 | | | | 20,405 | |
Roche Holdings, Inc., 6.00%, 3/1/19(1) | | | | 30,000 | | | | 37,389 | |
| | | | | | | | | 57,794 | |
| REAL ESTATE INVESTMENT TRUSTS (REITs) — 0.9% | |
| American Tower Corp., 4.625%, 4/1/15 | | | | 50,000 | | | | 52,966 | |
| American Tower Corp., 4.70%, 3/15/22 | | | | 10,000 | | | | 10,294 | |
| Boston Properties LP, 3.85%, 2/1/23 | | | | 10,000 | | | | 10,124 | |
| Developers Diversified Realty Corp., 4.75%, 4/15/18 | | | | 20,000 | | | | 20,780 | |
| HCP, Inc., 3.75%, 2/1/16 | | | | 40,000 | | | | 41,648 | |
| Reckson Operating Partnership LP, 6.00%, 3/31/16 | | | | 20,000 | | | | 21,279 | |
| Simon Property Group LP, 5.10%, 6/15/15 | | | | 60,000 | | | | 65,339 | |
| Ventas Realty LP/Ventas Capital Corp., 4.00%, 4/30/19 | | | | 10,000 | | | | 10,275 | |
| Ventas Realty LP/Ventas Capital Corp., 4.75%, 6/1/21 | | | | 10,000 | | | | 10,414 | |
| | | | | | | | | 243,119 | |
| ROAD AND RAIL — 0.2% | |
| Burlington Northern Santa Fe LLC, 3.60%, 9/1/20 | | | | 20,000 | | | | 21,226 | |
| CSX Corp., 4.25%, 6/1/21 | | | | 10,000 | | | | 10,950 | |
| Firstgroup plc, 6.125%, 1/18/19 | GBP | | | 10,000 | | | | 16,529 | |
| | | | | | | | | 48,705 | |
| SOFTWARE — 0.1% | |
| Oracle Corp., 6.125%, 7/8/39 | $ | | | 30,000 | | | | 39,433 | |
| SPECIALTY RETAIL — 0.3% | |
| Home Depot, Inc. (The), 5.95%, 4/1/41 | | | | 10,000 | | | | 13,079 | |
| Lowe’s Cos., Inc., 1.625%, 4/15/17 | | | | 10,000 | | | | 10,090 | |
Sonic Automotive, Inc., 7.00%, 7/15/22(1) | | | | 50,000 | | | | 52,000 | |
| | | | | | | | | 75,169 | |
| TEXTILES, APPAREL AND LUXURY GOODS — 0.2% | |
| Gap, Inc. (The), 5.95%, 4/12/21 | | | | 10,000 | | | | 10,390 | |
| Ltd. Brands, Inc., 6.625%, 4/1/21 | | | | 40,000 | | | | 43,900 | |
| | | | | | | | | 54,290 | |
| THRIFTS AND MORTGAGE FINANCE — 1.0% | |
| Cie de Financement Foncier, 4.375%, 4/25/19 | EUR | | | 100,000 | | | | 138,832 | |
| Cie de Financement Foncier, MTN, 4.50%, 5/16/18 | EUR | | | 110,000 | | | | 154,084 | |
| | | | | | | | | 292,916 | |
| TOBACCO — 0.2% | |
| Altria Group, Inc., 9.25%, 8/6/19 | $ | | | 30,000 | | | | 41,760 | |
| Philip Morris International, Inc., 4.125%, 5/17/21 | | | | 20,000 | | | | 22,359 | |
| | | | | | | | | 64,119 | |
| WIRELESS TELECOMMUNICATION SERVICES — 0.2% | |
| Cellco Partnership / Verizon Wireless Capital LLC, 8.50%, 11/15/18 | | | | 50,000 | | | | 68,544 | |
TOTAL CORPORATE BONDS (Cost $7,052,973) | | | | 7,070,317 | |
U.S. Government Agency Mortgage-Backed Securities(2) — 12.2% | |
| ADJUSTABLE-RATE U.S. GOVERNMENT AGENCY MORTGAGE-BACKED SECURITIES — 0.8% | |
| FHLMC, VRN, 2.90%, 7/15/12 | | | | $49,614 | | | | $51,867 | |
| FHLMC, VRN, 3.30%, 7/15/12 | | | | 15,298 | | | | 16,032 | |
| FHLMC, VRN, 6.15%, 7/15/12 | | | | 22,280 | | | | 24,172 | |
| FNMA, VRN, 2.73%, 7/25/12 | | | | 29,569 | | | | 30,696 | |
| FNMA, VRN, 3.90%, 7/25/12 | | | | 29,294 | | | | 31,016 | |
| FNMA, VRN, 3.90%, 7/25/12 | | | | 22,718 | | | | 24,077 | |
| FNMA, VRN, 5.98%, 7/25/12 | | | | 49,312 | | | | 54,098 | |
| | | | | | | | | 231,958 | |
| FIXED-RATE U.S. GOVERNMENT AGENCY MORTGAGE-BACKED SECURITIES — 11.4% | |
| FHLMC, 6.00%, 2/1/38 | | | | 19,343 | | | | 21,237 | |
| FHLMC, 4.00%, 12/1/40 | | | | 13,692 | | | | 14,749 | |
| FHLMC, 4.00%, 4/1/41 | | | | 65,178 | | | | 70,538 | |
| FNMA, 5.00%, 7/1/31 | | | | 101,300 | | | | 109,899 | |
| FNMA, 5.50%, 5/1/33 | | | | 43,274 | | | | 47,581 | |
| FNMA, 5.00%, 11/1/33 | | | | 35,398 | | | | 38,530 | |
| FNMA, 5.00%, 9/1/35 | | | | 189,741 | | | | 205,936 | |
| FNMA, 6.00%, 4/1/37 | | | | 41,183 | | | | 45,892 | |
| FNMA, 6.00%, 7/1/37 | | | | 63,451 | | | | 70,706 | |
| FNMA, 6.00%, 8/1/37 | | | | 59,899 | | | | 66,749 | |
| FNMA, 5.50%, 1/1/39 | | | | 143,950 | | | | 157,109 | |
| FNMA, 5.50%, 3/1/39 | | | | 21,139 | | | | 23,071 | |
| FNMA, 4.50%, 6/1/39 | | | | 185,749 | | | | 204,064 | |
| FNMA, 5.00%, 8/1/39 | | | | 16,619 | | | | 18,344 | |
| FNMA, 4.50%, 3/1/40 | | | | 302,568 | | | | 332,117 | |
| FNMA, 3.50%, 12/1/40 | | | | 99,118 | | | | 104,334 | |
| FNMA, 4.00%, 12/1/40 | | | | 73,033 | | | | 78,559 | |
| FNMA, 4.00%, 5/1/41 | | | | 129,646 | | | | 138,282 | |
| FNMA, 4.50%, 7/1/41 | | | | 111,126 | | | | 121,423 | |
| FNMA, 4.50%, 9/1/41 | | | | 64,252 | | | | 69,781 | |
| FNMA, 4.00%, 12/1/41 | | | | 121,712 | | | | 131,417 | |
| FNMA, 4.00%, 1/1/42 | | | | 95,180 | | | | 101,550 | |
| FNMA, 4.00%, 1/1/42 | | | | 73,551 | | | | 79,156 | |
| GNMA, 6.00%, 7/15/33 | | | | 12,891 | | | | 14,655 | |
| GNMA, 5.00%, 3/20/36 | | | | 167,883 | | | | 186,559 | |
| GNMA, 5.50%, 1/15/39 | | | | 10,063 | | | | 11,272 | |
| GNMA, 5.50%, 9/15/39 | | | | 85,272 | | | | 95,145 | |
| GNMA, 4.50%, 10/15/39 | | | | 33,890 | | | | 37,433 | |
| GNMA, 5.00%, 10/15/39 | | | | 50,834 | | | | 56,408 | |
| GNMA, 4.50%, 1/15/40 | | | | 61,786 | | | | 67,800 | |
| GNMA, 4.00%, 12/15/40 | | | | 38,114 | | | | 41,773 | |
| GNMA, 4.50%, 12/15/40 | | | | 115,960 | | | | 128,081 | |
| GNMA, 4.00%, 1/20/41 | | | | 176,348 | | | | 193,044 | |
| GNMA, 4.00%, 12/15/41 | | | | 94,477 | | | | 103,400 | |
| | | | | | | | | 3,186,594 | |
TOTAL U.S. GOVERNMENT AGENCY MORTGAGE-BACKED SECURITIES (Cost $3,386,958) | | | | 3,418,552 | |
| Municipal Securities — 3.7% | |
| California GO, (Building Bonds), 7.30%, 10/1/39 | | | | 20,000 | | | | 25,085 | |
| Georgia Road & Tollway Authority Rev., Series 2011 A, 5.00%, 3/1/21 | | | | 315,000 | | | | 397,584 | |
| Illinois GO, Series 2010-3, (Building Bonds), 6.73%, 4/1/35 | | | | 20,000 | | | | 21,954 | |
| Maryland State Transportation Authority Rev., (Building Bonds), 5.75%, 7/1/41 | | | | 30,000 | | | | 39,295 | |
| Missouri Highways & Transportation Commission Rev., (Building Bonds), 5.45%, 5/1/33 | | | | 25,000 | | | | 30,964 | |
| New Jersey State Turnpike Auth. Rev., Series 2009 F, (Building Bonds), 7.41%, 1/1/40 | | | | 25,000 | | | | 36,741 | |
| New Jersey State Turnpike Auth. Rev., Series 2010 A, (Building Bonds), 7.10%, 1/1/41 | | | | 25,000 | | | | 35,442 | |
| Ohio State University (The) Rev., (Building Bonds), 4.91%, 6/1/40 | | | | 25,000 | | | | 30,307 | |
| Pennsylvania Turnpike Commission Rev., Series 2010 B, (Building Bonds), 5.56%, 12/1/49 | | | | 25,000 | | | | 30,148 | |
| Washington GO, Series 2012 R 5.00%, 7/1/23 | | | | 320,000 | | | | 396,182 | |
TOTAL MUNICIPAL SECURITIES(Cost $1,041,114) | | | | 1,043,702 | |
| U.S. Treasury Securities — 3.6% | |
| U.S. Treasury Bonds, 5.50%, 8/15/28 | | | | 50,000 | | | | 72,039 | |
| U.S. Treasury Bonds, 3.00%, 5/15/42 | | | | 75,000 | | | | 78,738 | |
| U.S. Treasury Inflation Indexed Notes, 1.25%, 4/15/14 | | | | 195,687 | | | | 202,185 | |
| U.S. Treasury Inflation Indexed Notes, 1.875%, 7/15/15 | | | | $177,428 | | | | $193,160 | |
| U.S. Treasury Notes, 2.375%, 7/31/17 | | | | 250,000 | | | | 270,137 | |
U.S. Treasury Notes, 1.875%, 10/31/17(3) | | | | 150,000 | | | | 158,356 | |
| U.S. Treasury Notes, 2.625%, 4/30/18 | | | | 45,000 | | | | 49,419 | |
TOTAL U.S. TREASURY SECURITIES (Cost $1,021,597) | | | | 1,024,034 | |
Commercial Mortgage-Backed Securities(2) — 2.2% | |
| Banc of America Commercial Mortgage, Inc., Series 2004-1, Class A4 SEQ, 4.76%, 11/10/39 | | | | 50,000 | | | | 52,253 | |
| Banc of America Merrill Lynch Commercial Mortgage, Inc., Series 2004-2, Class A5 SEQ, 4.58%, 11/10/38 | | | | 50,000 | | | | 52,210 | |
| Citigroup/Deutsche Bank Commercial Mortgage Trust, Series 2005-CD1, Class AM, VRN, 5.39%, 7/15/12 | | | | 25,000 | | | | 27,069 | |
| GE Capital Commercial Mortgage Corp., Series 2005-C3, Class A5, VRN, 4.98%, 7/1/12 | | | | 50,000 | | | | 49,955 | |
| Greenwich Capital Commercial Funding Corp., Series 2005-GG3, Class A3 SEQ, 4.57%, 8/10/42 | | | | 57,411 | | | | 58,155 | |
| Greenwich Capital Commercial Funding Corp., Series 2005-GG3, Class A4, VRN, 4.80%, 7/1/12 | | | | 50,000 | | | | 53,994 | |
| GS Mortgage Securities Corp. II, Series 2004-GG2, Class A6 SEQ, VRN, 5.40%, 7/1/12 | | | | 50,000 | | | | 53,632 | |
| GS Mortgage Securities Corp. II, Series 2005-GG4, Class A4A SEQ, 4.75%, 7/10/39 | | | | 75,000 | | | | 81,173 | |
GS Mortgage Securities Corp. II, Series 2012-ALOH, Class A SEQ, 3.55%, 4/10/34(1) | | | | 25,000 | | | | 26,038 | |
| LB-UBS Commercial Mortgage Trust, Series 2005-C5, Class AM, VRN, 5.02%, 7/11/12 | | | | 35,000 | | | | 37,655 | |
| Wachovia Bank Commercial Mortgage Trust, Series 2004-C15, Class A3 SEQ, 4.50%, 10/15/41 | | | | 21,489 | | | | 21,721 | |
| Wachovia Bank Commercial Mortgage Trust, Series 2004-C15, Class A4 SEQ, 4.80%, 10/15/41 | | | | 100,000 | | | | 107,506 | |
TOTAL COMMERCIAL MORTGAGE-BACKED SECURITIES(Cost $623,240) | | | | 621,361 | |
Collateralized Mortgage Obligations(2) — 1.2% | |
| Banc of America Funding Corp., Series 2004-2, Class 3A1, 5.50%, 9/20/34 | | | | 33,510 | | | | 35,486 | |
| Bear Stearns Adjustable Rate Mortgage Trust, Series 2006-1, Class A1, VRN, 2.52%, 7/1/12 | | | | 30,719 | | | | 26,522 | |
| MASTR Adjustable Rate Mortgages Trust, Series 2004-13, Class 3A7, VRN, 2.66%, 7/1/12 | | | | 30,000 | | | | 29,792 | |
| PHHMC Mortgage Pass-Through Certificates, Series 2007-6, Class A1, VRN, 6.00%, 7/1/12 | | | | 15,819 | | | | 16,512 | |
| Wells Fargo Mortgage-Backed Securities Trust, Series 2005-17, Class 1A1, 5.50%, 1/25/36 | | | | 48,599 | | | | 48,154 | |
| Wells Fargo Mortgage-Backed Securities Trust, Series 2005-2, Class 1A1 SEQ, 5.50%, 4/25/35 | | | | 7,115 | | | | 7,115 | |
| Wells Fargo Mortgage-Backed Securities Trust, Series 2005-5, Class 1A1, 5.00%, 5/25/20 | | | | 11,392 | | | | 11,561 | |
| Wells Fargo Mortgage-Backed Securities Trust, Series 2005-6, Class A1 SEQ, 5.25%, 8/25/35 | | | | 6,663 | | | | 6,681 | |
| Wells Fargo Mortgage-Backed Securities Trust, Series 2006-10, Class A19 SEQ, 6.00%, 8/25/36 | | | | 15,189 | | | | 15,296 | |
| Wells Fargo Mortgage-Backed Securities Trust, Series 2006-10, Class A4 SEQ, 6.00%, 8/25/36 | | | | $22,587 | | | | $22,416 | |
| Wells Fargo Mortgage-Backed Securities Trust, Series 2006-13, Class A5, 6.00%, 10/25/36 | | | | 33,076 | | | | 32,469 | |
| Wells Fargo Mortgage-Backed Securities Trust, Series 2006-AR15, Class A1, VRN, 5.28%, 7/1/12 | | | | 19,400 | | | | 16,565 | |
| Wells Fargo Mortgage-Backed Securities Trust, Series 2006-AR2, Class 2A3, VRN, 2.62%, 7/1/12 | | | | 10,526 | | | | 9,141 | |
| Wells Fargo Mortgage-Backed Securities Trust, Series 2007-13, Class A1, 6.00%, 9/25/37 | | | | 53,215 | | | | 53,179 | |
| Wells Fargo Mortgage-Backed Securities Trust, Series 2007-3, Class 3A1, 5.50%, 4/25/22 | | | | 12,360 | | | | 12,838 | |
TOTAL COLLATERALIZED MORTGAGE OBLIGATIONS(Cost $337,979) | | | | 343,727 | |
| U.S. Government Agency Securities — 0.4% | |
| FHLMC, 5.00%, 2/16/17 (Cost $117,696) | | | | 100,000 | | | | 118,897 | |
| | | Shares | | | Value | |
| Temporary Cash Investments — 1.1% | |
Repurchase Agreement, Bank of America Merrill Lynch, (collateralized by various U.S. Treasury obligations, 1.50% - 4.00%, 2/15/15 - 6/30/16, valued at $97,246), in a joint trading account at 0.10%, dated 6/29/12, due 7/2/12 (Delivery value $95,394) | | | | $95,393 | |
Repurchase Agreement, Credit Suisse First Boston, Inc., (collateralized by various U.S. Treasury obligations, 3.75%, 8/15/41, valued at $97,548), in a joint trading account at 0.10%, dated 6/29/12, due 7/2/12 (Delivery value $95,393) | | | | 95,392 | |
Repurchase Agreement, Goldman Sachs & Co., (collateralized by various U.S. Treasury obligations, 4.375%, 5/15/40, valued at $24,293), in a joint trading account at 0.06%, dated 6/29/12, due 7/2/12 (Delivery value $23,848) | | | | 23,848 | |
| SSgA U.S. Government Money Market Fund | | | 85,257 | | | | 85,257 | |
TOTAL TEMPORARY CASH INVESTMENTS (Cost $299,890) | | | | 299,890 | |
TOTAL INVESTMENT SECURITIES — 93.5% (Cost $26,421,965) | | | | 26,310,816 | |
OTHER ASSETS AND LIABILITIES — 6.5%(4) | | | | 1,819,734 | |
| TOTAL NET ASSETS — 100.0% | | | | $28,130,550 | |
Forward Foreign Currency Exchange Contracts
| Contracts to Buy | Counterparty | Settlement Date | | Value | | | Unrealized Gain (Loss) | |
| | 193,800 | | CHF for EUR | UBS AG | 7/27/12 | | | $204,294 | | | | $(2,823 | ) |
| | 50,980 | | EUR for CHF | Deutsche Bank | 7/27/12 | | | 64,527 | | | | 412 | |
| | 84,784 | | EUR for SEK | UBS AG | 7/27/12 | | | 107,314 | | | | 775 | |
| | 84,934 | | EUR for SEK | Deutsche Bank | 7/27/12 | | | 107,504 | | | | 1,787 | |
| | 771,500 | | SEK for EUR | UBS AG | 7/27/12 | | | 111,431 | | | | 4,419 | |
| | 300 | | AUD for USD | Barclays Bank plc | 7/27/12 | | | 306 | | | | 5 | |
| | 600 | | CAD for USD | Barclays Bank plc | 7/27/12 | | | 589 | | | | 4 | |
| | 400 | | CAD for USD | HSBC Holdings plc | 7/27/12 | | | 393 | | | | (13 | ) |
| | 6,000 | | CAD for USD | Westpac Group | 7/27/12 | | | 5,890 | | | | 35 | |
| | 100 | | CHF for USD | Barclays Bank plc | 7/27/12 | | | 105 | | | | 2 | |
| | 133,340 | | CHF for USD | UBS AG | 7/27/12 | | | 140,560 | | | | 2,433 | |
| | 3,400 | | EUR for USD | Barclays Bank plc | 7/27/12 | | | 4,304 | | | | 62 | |
| | 14,200 | | GBP for USD | Westpac Group | 7/27/12 | | | 22,238 | | | | 72 | |
| | 151,931,005 | | KRW for USD | HSBC Holdings plc | 7/27/12 | | | 132,503 | | | | (438 | ) |
| Contracts to Buy | Counterparty | Settlement Date | | Value | | | Unrealized Gain (Loss) | |
| | 49,500 | | NOK for USD | Barclays Bank plc | 7/27/12 | | | $8,314 | | | | $195 | |
| | 394,572 | | NOK for USD | Deutsche Bank | 7/27/12 | | | 66,273 | | | | (2,253 | ) |
| | 13,100 | | NOK for USD | HSBC Holdings plc | 7/27/12 | | | 2,200 | | | | (84 | ) |
| | 48,200 | | SEK for USD | Barclays Bank plc | 7/27/12 | | | 6,962 | | | | 260 | |
| | 17,500 | | SEK for USD | HSBC Holdings plc | 7/27/12 | | | 2,528 | | | | (66 | ) |
| | 77,400 | | SGD for USD | HSBC Holdings plc | 7/27/12 | | | 61,101 | | | | (819 | ) |
| | 1,192,900 | | TWD for USD | HSBC Holdings plc | 7/27/12 | | | 40,004 | | | | (557 | ) |
| | | | | | | | | $1,089,340 | | | | $3,408 | |
(Value on Settlement Date $1,085,932)
| Contracts to Sell | Counterparty | Settlement Date | | Value | | | Unrealized Gain (Loss) | |
| | 161,454 | | EUR for CHF | UBS AG | 7/27/12 | | | $204,359 | | | | $2,759 | |
| | 61,200 | | CHF for EUR | Deutsche Bank | 7/27/12 | | | 64,514 | | | | (400 | ) |
| | 758,900 | | SEK for EUR | UBS AG | 7/27/12 | | | 109,611 | | | | (3,071 | ) |
| | 744,700 | | SEK for EUR | Deutsche Bank | 7/27/12 | | | 107,560 | | | | (1,843 | ) |
| | 85,419 | | EUR for SEK | UBS AG | 7/27/12 | | | 108,118 | | | | (1,106 | ) |
| | 8,100 | | AUD for USD | Barclays Bank plc | 7/27/12 | | | 8,272 | | | | (428 | ) |
| | 9,100 | | AUD for USD | HSBC Holdings plc | 7/27/12 | | | 9,293 | | | | 34 | |
| | 435,345 | | AUD for USD | Westpac Group | 7/27/12 | | | 444,564 | | | | 2,144 | |
| | 11,200 | | CAD for USD | Barclays Bank plc | 7/27/12 | | | 10,995 | | | | (241 | ) |
| | 603,439 | | CAD for USD | Barclays Bank plc | 7/27/12 | | | 592,400 | | | | 17,621 | |
| | 3,400 | | CHF for USD | HSBC Holdings plc | 7/27/12 | | | 3,584 | | | | 165 | |
| | 296,089 | | CHF for USD | UBS AG | 7/27/12 | | | 312,122 | | | | 11,251 | |
| | 35,000 | | DKK for USD | Barclays Bank plc | 7/27/12 | | | 5,961 | | | | (72 | ) |
| | 495,933 | | DKK for USD | UBS AG | 7/27/12 | | | 84,469 | | | | 3,296 | |
| | 4,363,180 | | EUR for USD | Barclays Bank plc | 7/27/12 | | | 5,522,648 | | | | 206,862 | |
| | 63,000 | | EUR for USD | Barclays Bank plc | 7/27/12 | | | 79,742 | | | | (996 | ) |
| | 29,800 | | EUR for USD | HSBC Holdings plc | 7/27/12 | | | 37,719 | | | | 1,741 | |
| | 20,500 | | EUR for USD | Westpac Group | 7/27/12 | | | 25,948 | | | | (81 | ) |
| | 72,800 | | GBP for USD | Barclays Bank plc | 7/27/12 | | | 114,009 | | | | (1,959 | ) |
| | 1,600 | | GBP for USD | Barclays Bank plc | 7/27/12 | | | 2,506 | | | | (14 | ) |
| | 1,565,981 | | GBP for USD | Deutsche Bank | 7/27/12 | | | 2,452,417 | | | | 41,141 | |
| | 4,700 | | GBP for USD | HSBC Holdings plc | 7/27/12 | | | 7,360 | | | | 260 | |
| | 228,041 | | GBP for USD | UBS AG | 7/27/12 | | | 357,125 | | | | 9,763 | |
| | 27,521 | | GBP for USD | Westpac Group | 7/27/12 | | | 43,099 | | | | (64 | ) |
| | 1,531,800 | | JPY for USD | Barclays Bank plc | 7/27/12 | | | 19,170 | | | | 426 | |
| | 199,500 | | JPY for USD | Barclays Bank plc | 7/27/12 | | | 2,497 | | | | 6 | |
| | 442,665,884 | | JPY for USD | Barclays Bank plc | 7/27/12 | | | 5,539,720 | | | | (50,039 | ) |
| | 11,621,854 | | JPY for USD | Deutsche Bank | 7/27/12 | | | 145,441 | | | | 578 | |
| | 2,184,600 | | JPY for USD | HSBC Holdings plc | 7/27/12 | | | 27,339 | | | | (77 | ) |
| | 5,100,600 | | JPY for USD | Westpac Group | 7/27/12 | | | 63,831 | | | | 979 | |
| | 5,200 | | NOK for USD | Barclays Bank plc | 7/27/12 | | | 873 | | | | (14 | ) |
| | 700 | | NZD for USD | Barclays Bank plc | 7/27/12 | | | 559 | | | | (6 | ) |
| | 19,594 | | NZD for USD | Westpac Group | 7/27/12 | | | 15,659 | | | | 352 | |
| | 21,800 | | SEK for USD | Barclays Bank plc | 7/27/12 | | | 3,149 | | | | (59 | ) |
| | 767,039 | | SEK for USD | Barclays Bank plc | 7/27/12 | | | 110,786 | | | | 2,328 | |
| | | | | | | | | $16,637,419 | | | | $241,236 | |
(Value on Settlement Date $16,878,655)
| Futures Contracts |
| Contracts Sold | Expiration Date | Underlying Face Amount at Value | Unrealized Gain (Loss) |
| 9 | U.S. Treasury 10-Year Notes | September 2012 | $1,200,375 | $(4,942) |
Notes to Schedule of Investments
AUD = Australian Dollar
CAD = Canadian Dollar
CHF = Swiss Franc
DKK = Danish Krone
EUR = Euro
FHLMC = Federal Home Loan Mortgage Corporation
FNMA = Federal National Mortgage Association
GBP = British Pound
GNMA = Government National Mortgage Association
GO = General Obligation
JPY = Japanese Yen
KRW = Korea Won
LB-UBS = Lehman Brothers, Inc. - UBS AG
MASTR = Mortgage Asset Securitization Transactions, Inc.
MTN = Medium Term Note
NOK = Norwegian Krone
NZD = New Zealand Dollar
PHHMC = PHH Mortgage Corporation
SEK = Swedish Krona
SEQ = Sequential Payer
SGD = Singapore Dollar
TWD = Taiwanese Dollar
USD = United States Dollar
VRN = Variable Rate Note. Interest reset date is indicated. Rate shown is effective at the period end.
| † | Category is less than 0.05% of total net assets. |
| (1) | Security was purchased under Rule 144A of the Securities Act of 1933 or is a private placement and, unless registered under the Act or exempted from registration, may only be sold to qualified institutional investors. The aggregate value of these securities at the period end was $665,307, which represented 2.4% of total net assets. |
| (2) | Final maturity date indicated, unless otherwise noted. |
| (3) | Security, or a portion thereof, has been pledged at the custodian bank or with a broker for margin requirements on futures contracts. At the period end, the aggregate value of securities pledged was $21,114. |
| (4) | Amount relates primarily to foreign currency holdings at period end. |
See Notes to Financial Statements.
Statement of Assets and Liabilities |
| JUNE 30, 2012 | |
| Assets | |
| Investment securities, at value (cost of $26,421,965) | | | $26,310,816 | |
| Foreign currency holdings, at value (cost of $1,502,092) | | | 1,501,928 | |
| Receivable for investments sold | | | 198,656 | |
| Receivable for capital shares sold | | | 234 | |
| Receivable for variation margin on futures contracts | | | 4,922 | |
| Unrealized gain on forward foreign currency exchange contracts | | | 312,167 | |
| Interest receivable | | | 264,699 | |
| | | | 28,593,422 | |
| | | | | |
| Liabilities | | | | |
| Payable for investments purchased | | | 370,073 | |
| Unrealized loss on forward foreign currency exchange contracts | | | 67,523 | |
| Accrued management fees | | | 20,602 | |
| Distribution and service fees payable | | | 4,674 | |
| | | | 462,872 | |
| | | | | |
| Net Assets | | | $28,130,550 | |
| | | | | |
| Net Assets Consist of: | | | | |
| Capital paid in | | | $27,615,447 | |
| Undistributed net investment income | | | 388,131 | |
| Undistributed net realized gain | | | 3,939 | |
| Net unrealized appreciation | | | 123,033 | |
| | | | $28,130,550 | |
| | Net assets | Shares outstanding | Net asset value per share |
| Investor Class | $8,514,107 | 835,520 | $10.19 |
| Institutional Class | $7,626,998 | 747,869 | $10.20 |
| A Class | $6,562,891 | 644,722 | $10.18* |
| C Class | $2,710,480 | 267,096 | $10.15 |
| R Class | $2,716,074 | 267,096 | $10.17 |
*Maximum offering price $10.66 (net asset value divided by 0.955)
See Notes to Financial Statements.
FOR THE PERIOD ENDED JUNE 30, 2012(1) | |
| Investment Income (Loss) | |
| Income: | | | |
| Interest (net of foreign taxes withheld of $174) | | | $273,265 | |
| | | | | |
| Expenses: | | | | |
| Management fees | | | 101,868 | |
| Distribution and service fees: | | | | |
| A Class | | | 6,683 | |
| C Class | | | 11,108 | |
| R Class | | | 5,560 | |
| Trustees’ fees and expenses | | | 630 | |
| | | | 125,849 | |
| | | | | |
| Net investment income (loss) | | | 147,416 | |
| | | | | |
| Realized and Unrealized Gain (Loss) | | | | |
| Net realized gain (loss) on: | | | | |
| Investment transactions | | | (40,170 | ) |
| Futures contract transactions | | | (16,815 | ) |
| Foreign currency transactions | | | 287,776 | |
| | | | 230,791 | |
| | | | | |
| Change in net unrealized appreciation (depreciation) on: | | | | |
| Investments | | | (111,149 | ) |
| Futures contracts | | | (4,942 | ) |
| Translation of assets and liabilities in foreign currencies | | | 239,124 | |
| | | | 123,033 | |
| | | | | |
| Net realized and unrealized gain (loss) | | | 353,824 | |
| | | | | |
| Net Increase (Decrease) in Net Assets Resulting from Operations | | | $501,240 | |
(1) January 31, 2012 (fund inception) through June 30, 2012.
See Notes to Financial Statements.
Statement of Changes in Net Assets |
PERIOD ENDED JUNE 30, 2012(1) | |
| Increase (Decrease) in Net Assets | |
| Operations | |
| Net investment income (loss) | | | $147,416 | |
| Net realized gain (loss) | | | 230,791 | |
| Change in net unrealized appreciation (depreciation) | | | 123,033 | |
| Net increase (decrease) in net assets resulting from operations | | | 501,240 | |
| | | | | |
| Capital Share Transactions | | | | |
| Net increase (decrease) in net assets from capital share transactions | | | 27,629,310 | |
| | | | | |
| Net increase (decrease) in net assets | | | 28,130,550 | |
| | | | | |
| Net Assets | | | | |
| End of period | | | $28,130,550 | |
| | | | | |
| Undistributed net investment income | | | $388,131 | |
(1) January 31, 2012 (fund inception) through June 30, 2012.
See Notes to Financial Statements.
Notes to Financial Statements |
JUNE 30, 2012
1. Organization
American Century International Bond Funds (the trust) is registered under the Investment Company Act of 1940, as amended (the 1940 Act), as an open-end management investment company and is organized as a Massachusetts business trust. Global Bond Fund (the fund) is one fund in a series issued by the trust. The fund is nondiversified as defined under the 1940 Act. The fund’s investment objective is to seek long-term total return. The fund pursues its objective by investing primarily in non-money market debt securities of issuers located in developed countries world-wide (including the United States) and may invest up to 35% of its assets in high-yield and/or emerging markets debt securities.
The fund offers the Investor Class, the Institutional Class, the A Class, the C Class and the R Class. The A Class may incur an initial sales charge. The A Class and C Class may be subject to a contingent deferred sales charge. The share classes differ principally in their respective sales charges and distribution and shareholder servicing expenses and arrangements. The Institutional Class is made available to institutional shareholders or through financial intermediaries whose clients do not require the same level of shareholder and administrative services as shareholders of other classes. As a result, the Institutional Class is charged a lower unified management fee. All classes of the fund commenced sale on January 31, 2012, the fund’s inception date.
2. Significant Accounting Policies
The following is a summary of significant accounting policies consistently followed by the fund in preparation of its financial statements. The financial statements are prepared in conformity with accounting principles generally accepted in the United States of America, which may require management to make certain estimates and assumptions at the date of the financial statements. Actual results could differ from these estimates.
Investment Valuations — The fund determines the fair value of its investments and computes its net asset value per share as of the close of regular trading (usually 4 p.m. Eastern time) on the New York Stock Exchange (NYSE) on each day the NYSE is open.
Debt securities maturing in greater than 60 days at the time of purchase are valued at the evaluated mean as provided by independent pricing services or at the mean of the most recent bid and asked prices as provided by investment dealers. Debt securities maturing within 60 days at the time of purchase may be valued at cost, plus or minus any amortized discount or premium or at the evaluated mean as provided by an independent pricing service. Evaluated mean prices are commonly derived through utilization of market models, which may consider, among other factors, trade data, quotations from dealers and active market makers, relevant yield curve and spread data, related sector levels, creditworthiness, and other relevant market information on the same or comparable securities.
Investments in open-end management investment companies are valued at the reported net asset value per share. Repurchase agreements are valued at cost. Exchange-traded futures contracts are valued at the settlement price as provided by the appropriate clearing corporation. Forward foreign currency exchange contracts are valued at the mean of the latest bid and asked prices of the forward currency rates as provided by an independent pricing service.
The value of investments initially expressed in foreign currencies is translated into U.S. dollars at prevailing exchange rates.
If the fund determines that the market price for a portfolio security is not readily available or the valuation methods mentioned above do not reflect a security’s fair value, such security is valued as determined in good faith by the Board of Trustees or its designee, in accordance with procedures adopted by the Board of Trustees. Circumstances that may cause the fund to use these procedures to value a security include, but are not limited to: a security has been declared in default; trading in a security has been halted during the trading day; there is a foreign market holiday and no trading occurred; or an event occurred between the close of a foreign exchange and the NYSE that may affect the value of a security.
Security Transactions — Security transactions are accounted for as of the trade date. Net realized gains and losses are determined on the identified cost basis, which is also used for federal income tax purposes.
Investment Income — Interest income less foreign taxes withheld, if any, is recorded on the accrual basis and includes paydown gain (loss) and accretion of discounts and amortization of premiums. Inflation adjustments related to inflation-linked debt securities are reflected as interest income.
Foreign Currency Translations — All assets and liabilities initially expressed in foreign currencies are translated into U.S. dollars at prevailing exchange rates at period end. The fund may enter into spot foreign currency exchange contracts to facilitate transactions denominated in a foreign currency. Purchases and sales of investment securities, dividend and interest income, spot foreign currency exchange contracts, and expenses are translated at the rates of exchange prevailing on the respective dates of such transactions. Net realized and unrealized foreign currency exchange gains or losses related to investment securities are a component of net realized gain (loss) on investment transactions and change in net unrealized appreciation (depreciation) on investments, respectively.
Repurchase Agreements — The fund may enter into repurchase agreements with institutions that American Century Investment Management, Inc. (ACIM) (the investment advisor) has determined are creditworthy pursuant to criteria adopted by the Board of Trustees. The fund requires that the collateral, represented by securities, received in a repurchase transaction be transferred to the custodian in a manner sufficient to enable the fund to obtain those securities in the event of a default under the repurchase agreement. ACIM monitors, on a daily basis, the securities transferred to ensure the value, including accrued interest, of the securities under each repurchase agreement is equal to or greater than amounts owed to the fund under each repurchase agreement.
Joint Trading Account — Pursuant to an Exemptive Order issued by the Securities and Exchange Commission, the fund, along with certain other funds in the American Century Investments family of funds, may transfer uninvested cash balances into a joint trading account. These balances are invested in one or more repurchase agreements that are collateralized by U.S. Treasury or Agency obligations.
Segregated Assets — In accordance with the 1940 Act, the fund segregates assets on its books and records to cover certain types of investments, including, but not limited to, futures contracts, forward commitments, when-issued securities, swap agreements and certain forward foreign currency exchange contracts. ACIM monitors, on a daily basis, the securities segregated to ensure the fund designates a sufficient amount of liquid assets, marked-to-market daily. The fund may also receive assets or be required to pledge assets at the custodian bank or with a broker for margin requirements on futures contracts and swap agreements.
Income Tax Status — It is the fund’s policy to distribute substantially all net investment income and net realized gains to shareholders and to otherwise qualify as a regulated investment company under provisions of the Internal Revenue Code. All tax years for the fund remain subject to examination by tax authorities. At this time, management believes there are no uncertain tax positions which, based on their technical merit, would not be sustained upon examination and for which it is reasonably possible that the total amounts of unrecognized tax benefits will significantly change in the next twelve months. Accordingly, no provision has been made for federal or state income taxes.
Multiple Class — All shares of the fund represent an equal pro rata interest in the net assets of the class to which such shares belong, and have identical voting, dividend, liquidation and other rights and the same terms and conditions, except for class specific expenses and exclusive rights to vote on matters affecting only individual classes. Income, non-class specific expenses, and realized and unrealized capital gains and losses of the fund are allocated to each class of shares based on their relative net assets.
Distributions to Shareholders — Distributions from net investment income, if any, are generally declared and paid quarterly, but may be paid less frequently. Distributions from net realized gains, if any, are generally declared and paid annually.
Indemnifications — Under the trust’s organizational documents, its officers and trustees are indemnified against certain liabilities arising out of the performance of their duties to the fund. In addition, in the normal course of business, the fund enters into contracts that provide general indemnifications. The maximum exposure under these arrangements is unknown as this would involve future claims that may be made against a fund. The risk of material loss from such claims is considered by management to be remote.
3. Fees and Transactions with Related Parties
Management Fees — The trust has entered into a management agreement with ACIM, under which ACIM provides the fund with investment advisory and management services in exchange for a single, unified management fee (the fee) per class. The agreement provides that all expenses of managing and operating the fund, except distribution and service fees, brokerage expenses, taxes, interest, fees and expenses of the independent trustees (including legal counsel fees), and extraordinary expenses, will be paid by ACIM. The fee is computed and accrued daily based on each class’s daily net assets and paid monthly in arrears. The annual management fee is 0.95% for the Investor Class, A Class, C Class and R Class and 0.75% for the Institutional Class.
Distribution and Service Fees — The Board of Trustees has adopted a separate Master Distribution and Individual Shareholder Services Plan for each of the A Class, C Class and R Class (collectively the plans), pursuant to Rule 12b-1 of the 1940 Act. The plans provide that the A Class will pay American Century Investment Services, Inc. (ACIS) an annual distribution and service fee of 0.25%. The plans provide that the C Class will pay ACIS an annual distribution and service fee of 1.00%, of which 0.25% is paid for individual shareholder services and 0.75% is paid for distribution services. The plans provide that the R Class will pay ACIS an annual distribution and service fee of 0.50%. The fees are computed and accrued daily based on each class’s daily net assets and paid monthly in arrears. The fees are used to pay financial intermediaries for distribution and individual shareholder services. Fees incurred under the plans during the period January 31, 2012 (fund inception) through June 30, 2012 are detailed in the Statement of Operations.
Related Parties — Certain officers and trustees of the trust are also officers and/or directors of American Century Companies, Inc., the parent of the trust’s investment advisor, ACIM, the distributor of the trust, ACIS, and the trust’s transfer agent, American Century Services, LLC. ACIM owns 97% of the outstanding shares of the fund. ACIM does not invest in the fund for the purpose of exercising management or control.
4. Investment Transactions
Purchases of investment securities, excluding short-term investments, for the period January 31, 2012 (fund inception) through June 30, 2012 totaled $34,193,042, of which $5,776,218 represented U.S. Treasury and Government Agency obligations.
Sales of investment securities, excluding short-term investments, for the period January 31, 2012 (fund inception) through June 30, 2012 totaled $7,442,861, of which $1,243,522 represented U.S. Treasury and Government Agency obligations.
On January 31, 2012, the fund incurred a purchase in kind of debt securities valued at $26,256,132. A purchase in kind occurs when a fund receives securities into its portfolio in lieu of cash as payment from a purchasing shareholder.
5. Capital Share Transactions
Transactions in shares of the fund were as follows (unlimited number of shares authorized):
| | | |
| | Period ended June 30, 2012(1) | |
| | Shares | | | Amount | |
| Investor Class | | | | | |
| Sold | | 843,948 | | | | $8,445,480 | |
| Redeemed | | (8,428 | ) | | | (84,573 | ) |
| | | 835,520 | | | | 8,360,907 | |
| Institutional Class | | | | | | | |
| Sold | | 747,869 | | | | 7,478,686 | |
| A Class | | | | | | | |
| Sold | | 645,054 | | | | 6,451,146 | |
| Redeemed | | (332 | ) | | | (3,347 | ) |
| | | 644,722 | | | | 6,447,799 | |
| C Class | | | | | | | |
| Sold | | 267,096 | | | | 2,670,959 | |
| R Class | | | | | | | |
| Sold | | 267,096 | | | | 2,670,959 | |
| Net increase (decrease) | | 2,762,303 | | | | $27,629,310 | |
(1) January 31, 2012 (fund inception) through June 30, 2012.
6. Fair Value Measurements
The fund’s securities valuation process is based on several considerations and may use multiple inputs to determine the fair value of the positions held by the fund. In conformity with accounting principles generally accepted in the United States of America, the inputs used to determine a valuation are classified into three broad levels as follows:
| • | Level 1 valuation inputs consist of unadjusted quoted prices in an active market for identical securities; |
| • | Level 2 valuation inputs consist of direct or indirect observable market data (including quoted prices for similar securities, evaluations of subsequent market events, interest rates, prepayment speeds, credit risk, etc.); or |
| • | Level 3 valuation inputs consist of unobservable data (including a fund’s own assumptions). |
The level classification is based on the lowest level input that is significant to the fair valuation measurement. The valuation inputs are not necessarily an indication of the risks associated with investing in these securities or other financial instruments.
The following is a summary of the level classifications as of period end. The Schedule of Investments provides additional information on the fund’s portfolio holdings.
| | | | | | | | | |
| | Level 1 | | | Level 2 | | | Level 3 | |
| Investment Securities | |
| Sovereign Governments and Agencies | | — | | | | $12,370,336 | | | | — | |
| Corporate Bonds | | — | | | | 7,070,317 | | | | — | |
| U.S. Government Agency Mortgage-Backed Securities | | — | | | | 3,418,552 | | | | — | |
| Municipal Securities | | — | | | | 1,043,702 | | | | — | |
| U.S. Treasury Securities | | — | | | | 1,024,034 | | | | — | |
| Commercial Mortgage-Backed Securities | | — | | | | 621,361 | | | | — | |
| Collateralized Mortgage Obligations | | — | | | | 343,727 | | | | — | |
| U.S. Government Agency Securities | | — | | | | 118,897 | | | | — | |
| Temporary Cash Investments | | $85,257 | | | | 214,633 | | | | — | |
| Total Value of Investment Securities | | $85,257 | | | | $26,225,559 | | | | — | |
| | | | | | | | | | | | |
| Other Financial Instruments | | | | | | | | | | | |
| Forward Foreign Currency Exchange Contracts | | — | | | | $244,644 | | | | — | |
| Futures Contracts | | $(4,942 | ) | | | — | | | | — | |
| Total Unrealized Gain (Loss) on Other Financial Instruments | | $(4,942 | ) | | | $244,644 | | | | — | |
7. Derivative Instruments
Foreign Currency Risk — The fund is subject to foreign currency exchange rate risk in the normal course of pursuing its investment objectives. The value of foreign investments held by a fund may be significantly affected by changes in foreign currency exchange rates. The dollar value of a foreign security generally decreases when the value of the dollar rises against the foreign currency in which the security is denominated and tends to increase when the value of the dollar declines against such foreign currency. A fund may enter into forward foreign currency exchange contracts to reduce a fund’s exposure to foreign currency exchange rate fluctuations, or to shift exposure to the fluctuations in the value of foreign currencies from one foreign currency to another foreign currency. The net U.S. dollar value of foreign currency underlying all contractual commitments held by a fund and the resulting unrealized appreciation or depreciation are determined daily. Realized gain or loss is recorded upon the termination of the contract. Net realized and unrealized gains or losses occurring during the holding period of forward foreign currency exchange contracts are a component of net realized gain (loss) on foreign currency transactions and change in net unrealized appreciation (depreciation) on translation of assets and liabilities in foreign currencies, respectively. A fund bears the risk of an unfavorable change in the foreign currency exchange rate underlying the forward contract. Additionally, losses, up to the fair value, may arise if the counterparties do not perform under the contract terms. The foreign currency risk derivative instruments held at period end as disclosed on the Schedule of Investments are indicative of the fund’s typical volume during the period.
Interest Rate Risk — The fund is subject to interest rate risk in the normal course of pursuing its investment objectives. The value of bonds generally declines as interest rates rise. A fund may enter into futures contracts based on a bond index or a specific underlying security. A fund may purchase futures contracts to gain exposure to increases in market value or sell futures contracts to protect against a decline in market value. Upon entering into a futures contract, a fund will segregate cash, cash equivalents or other appropriate liquid securities on its records in amounts sufficient to meet requirements. Subsequent payments (variation margin) are made or received daily, in cash, by a fund. The variation margin is equal to the daily change in the contract value and is recorded as unrealized gains and losses. A fund recognizes a realized gain or loss when the futures contract is closed or expires. Net realized and unrealized gains or losses occurring during the holding period of futures contracts are a component of net realized gain (loss) on futures contract transactions and change in net unrealized appreciation (depreciation) on futures contracts, respectively. One of the risks of entering into futures contracts is the possibility
that the change in value of the contract may not correlate with the changes in value of the underlying securities. The interest rate risk derivative instruments held at period end as disclosed on the Schedule of Investments are indicative of the fund’s typical volume during the period.
| Value of Derivative Instruments as of June 30, 2012 | |
| | Asset Derivatives | | | Liability Derivatives | |
| Type of Risk Exposure | Location on Statement of Assets and Liabilities | | Value | | | Location on Statement of Assets and Liabilities | | Value | |
| Foreign Currency Risk | Unrealized gain on forward foreign currency exchange contracts | | | $312,167 | | | Unrealized loss on forward foreign currency exchange contracts | | | $67,523 | |
| Interest Rate Risk | Receivable for variation margin on futures contracts* | | | 4,922 | | | Payable for variation margin on futures agreements* | | | — | |
| | | | | $317,089 | | | | | | $67,523 | |
| *Included in the unrealized gain (loss) on futures contracts as reported in the Schedule of Investments. | |
| | |
| Effect of Derivative Instruments on the Statement of Operations for the Period January 31, 2012 (fund inception) through June 30, 2012 | |
| | Net Realized Gain (Loss) | | | Change in Net Unrealized Appreciation (Depreciation) | |
| Type of Risk Exposure | Location on Statement of Operations | | Value | | | Location on Statement of Operations | | Value | |
| Foreign Currency Risk | Net realized gain (loss) on foreign currency transactions | | | $289,674 | | | Change in net unrealized appreciation (depreciation) on translation of assets and liabilities in foreign currencies | | | $244,644 | |
| Interest Rate Risk | Net realized gain (loss) on futures contract transactions | | | (16,815 | ) | | Change in net unrealized appreciation (depreciation) on futures contracts | | | (4,942 | ) |
| | | | | $272,859 | | | | | | $239,702 | |
8. Risk Factors
There are certain risks involved in investing in foreign securities. These risks include those resulting from future adverse political, social and economic developments, fluctuations in currency exchange rates, the possible imposition of exchange controls, and other foreign laws or restrictions. Investing in emerging markets may accentuate these risks.
9. Federal Tax Information
The book-basis character of distributions made during the year from net investment income or net realized gains may differ from their ultimate characterization for federal income tax purposes. These differences reflect the differing character of certain income items and net realized gains and losses for financial statement and tax purposes, and may result in reclassification among certain capital accounts on the financial statements. There were no distributions paid by the fund during the period January 31, 2012 (fund inception) through June 30, 2012.
As of June 30, 2012, the federal tax cost of investments and the components of distributable earnings on a tax-basis were as follows:
| | | | | |
| Federal tax cost of investments | | | $26,423,366 | |
| Gross tax appreciation of investments | | | $191,177 | |
| Gross tax depreciation of investments | | | (303,727 | ) |
| Net tax appreciation (depreciation) of investments | | | $(112,550 | ) |
Net tax appreciation (depreciation) on derivatives and translation of assets and liabilities in foreign currencies | | | $(3,671 | ) |
| Other book-to-tax adjustments | | | (15,215 | ) |
| Net tax appreciation (depreciation) | | | $(131,436 | ) |
| Undistributed ordinary income | | | $647,024 | |
| Accumulated long-term capital losses | | | $(485 | ) |
The difference between book-basis and tax-basis cost and unrealized appreciation (depreciation) is attributable primarily to the tax deferral of losses on wash sales and the realization for tax purposes of unrealized gains (losses) on certain foreign currency exchange contracts and futures contracts. Other book-to-tax adjustments are attributable primarily to the tax deferral of losses on straddle positions.
The accumulated capital losses represent net capital loss carryovers that may be used to offset future realized capital gains for federal income tax purposes. The capital loss carryovers may be carried forward for an unlimited period. Future capital loss carryover utilization in any given year may be subject to Internal Revenue Code limitations.
| For a Share Outstanding Throughout the Period Indicated |
| Per-Share Data | Ratios and Supplemental Data |
| | | Income From Investment Operations: | | | Ratio to Average Net Assets of: | | |
| | Net Asset Value, Beginning of Period | Net Investment Income (Loss)(1) | Net Realized and Unrealized Gain (Loss) | Total From Investment Operations | Net Asset Value, End of Period | Total Return(2) | Operating Expenses | Net Investment Income (Loss) | Portfolio Turnover Rate | Net Assets, End of Period (in thousands) |
| Investor Class |
2012(3) | $10.00 | 0.06 | 0.13 | 0.19 | $10.19 | 1.90% | 0.96%(4) | 1.44%(4) | 29% | $8,514 |
| Institutional Class | | | | | | | | | | |
2012(3) | $10.00 | 0.07 | 0.13 | 0.20 | $10.20 | 2.00% | 0.76%(4) | 1.64%(4) | 29% | $7,627 |
| A Class | | | | | | | | | | |
2012(3) | $10.00 | 0.05 | 0.13 | 0.18 | $10.18 | 1.80% | 1.21%(4) | 1.19%(4) | 29% | $6,563 |
| C Class | | | | | | | | | | |
2012(3) | $10.00 | 0.02 | 0.13 | 0.15 | $10.15 | 1.50% | 1.96%(4) | 0.44%(4) | 29% | $2,710 |
| R Class | | | | | | | | | | |
2012(3) | $10.00 | 0.04 | 0.13 | 0.17 | $10.17 | 1.70% | 1.46%(4) | 0.94%(4) | 29% | $2,716 |
Notes to Financial Highlights
| (1) | Computed using average shares outstanding throughout the period. |
| (2) | Total returns are calculated based on the net asset value of the last business day and do not reflect applicable sales charges, if any. Total returns for periods less than one year are not annualized. |
| (3) | January 31, 2012 (fund inception) through June 30, 2012. |
See Notes to Financial Statements.
Report of Independent Registered Public Accounting Firm |
To the Trustees of the American Century International Bond Funds
and Shareholders of the Global Bond Fund:
In our opinion, the accompanying statement of assets and liabilities, including the schedule of investments, and the related statements of operations and of changes in net assets and the financial highlights present fairly, in all material respects, the financial position of the Global Bond Fund (one of the two funds comprising the American Century International Bond Funds, hereafter referred to as the “Fund”) at June 30, 2012, the results of its operations, the changes in its net assets and the financial highlights for the period January 31, 2012 (commencement of operations) through June 30, 2012, in conformity with accounting principles generally accepted in the United States of America. These financial statements and financial highlights (hereafter referred to as “financial statements”) are the responsibility of the Fund’s management; our responsibility is to express an opinion on these financial statements based on our audit. We conducted our audit of these financial statements in accordance with the standards of the Public Company Accounting Oversight Board (United States). Those standards require that we plan and perform the audit to obtain reasonable assurance about whether the financial statements are free of material misstatement. An audit includes examining, on a test basis, evidence supporting the amounts and disclosures in the financial statements, assessing the accounting principles used and significant estimates made by management, and evaluating the overall financial statement presentation. We believe that our audit, which included confirmation of securities at June 30, 2012 by correspondence with the custodian and brokers, provides a reasonable basis for our opinion.
PricewaterhouseCoopers LLP
Kansas City, Missouri
August 21, 2012
Board of Trustees
The individuals listed below serve as trustees of the funds. Each trustee will continue to serve in this capacity until death, retirement, resignation or removal from office. The mandatory retirement age for trustees who are not “interested persons,” as that term is defined in the Investment Company Act (independent trustees), is 73. However, the mandatory retirement age may be extended for a period not to exceed two years with the approval of the remaining independent trustees.
Mr. Thomas is the only trustee who is an “interested person” because he currently serves as President and Chief Executive Officer of American Century Companies, Inc. (ACC), the parent company of American Century Investment Management, Inc. (ACIM or the advisor).
The other trustees (more than three-fourths of the total number) are independent; that is, they have never been employees, directors or officers of, and have no financial interest in, ACC or any of its wholly owned, direct or indirect, subsidiaries, including ACIM, American Century Investment Services, Inc. (ACIS) and American Century Services, LLC (ACS). The trustees serve in this capacity for eight (in the case of Mr. Thomas, 15) registered investment companies in the American Century Investments family of funds.
The following table presents additional information about the trustees. The mailing address for each trustee other than Mr. Thomas is 1665 Charleston Road, Mountain View, California 94043. The mailing address for Mr. Thomas is 4500 Main Street, Kansas City, Missouri 64111.
Name (Year of Birth) | Position(s) Held with Funds | Length of Time Served | | Principal Occupation(s) During Past 5 Years | | Number of American Century Portfolios Overseen by Trustee | Other Directorships Held During Past 5 Years |
| Independent Trustees |
Tanya S. Beder (1955) | Trustee | Since 2011 | | Chairman, SBCC Group Inc. (investment advisory services)(2006 to present); Fellow in Practice, International Center for Finance, Yale University School of Management (1985 to present) | | 42 | CYS Investments, Inc. (specialty finance company) |
Jeremy I. Bulow (1954) | Trustee | Since 2011 | | Professor of Economics, Stanford University, Graduate School of Business (1979 to present) | | 42 | None |
Ronald J. Gilson (1946) | Trustee and Chairman of the Board | Since 1995 | | Charles J. Meyers Professor of Law and Business, Stanford Law School (1979 to present); Marc and Eva Stern Professor of Law and Business, Columbia University School of Law (1992 to present) | | 42 | None |
Name (Year of Birth) | Position(s) Held with Funds | Length of Time Served | | Principal Occupation(s) During Past 5 Years | | Number of American Century Portfolios Overseen by Trustee | Other Directorships Held During Past 5 Years |
| Independent Trustees |
Frederick L. A. Grauer (1946) | Trustee | Since 2008 | | Senior Advisor, BlackRock, Inc. (investment management firm) (2010 to 2011); Senior Advisor, Barclays Global Investors (investment management firm) (2003 to 2009) | | 42 | None |
Peter F. Pervere (1947) | Trustee | Since 2007 | | Retired | | 42 | Intraware, Inc. (2003 to 2009) |
Myron S. Scholes (1941) | Trustee | Since 1980 | | Chairman, Platinum Grove Asset Management, L.P. (asset manager) (1999 to 2009); Frank E. Buck Professor of Finance-Emeritus, Stanford Graduate School of Business (1996 to present) | | 42 | Dimensional Fund Advisors (investment advisor); CME Group, Inc. (futures and options exchange) |
John B. Shoven (1947) | Trustee | Since 2002 | | Professor of Economics, Stanford University (1973 to present) | | 42 | Cadence Design Systems; Exponent; Financial Engines |
| |
| Interested Trustee |
Jonathan S. Thomas (1963) | Trustee and President | Since 2007 | | President and Chief Executive Officer, ACC (March 2007 to present); Chief Administrative Officer, ACC (February 2006 to February 2007); Executive Vice President, ACC (November 2005 to February 2007). Also serves as Chief Executive Officer and Manager, ACS; Executive Vice President, ACIM; Director, ACC, ACIM and other ACC subsidiaries | | 108 | None |
Officers
The following table presents certain information about the executive officers of the funds. Each officer serves as an officer for each of the 15 investment companies in the American Century family of funds, unless otherwise noted. No officer is compensated for his or her service as an officer of the funds. The listed officers are interested persons of the funds and are appointed or re-appointed on an annual basis. The mailing address for each of the officers listed below is 4500 Main Street, Kansas City, Missouri 64111.
Name (Year of Birth) | Offices with the Funds | Principal Occupation(s) During the Past Five Years |
Jonathan S. Thomas (1963) | Trustee and President since 2007 | President and Chief Executive Officer, ACC (March 2007 to present); Chief Administrative Officer, ACC (February 2006 to February 2007); Executive Vice President, ACC (November 2005 to February 2007). Also serves as Chief Executive Officer and Manager, ACS; Executive Vice President, ACIM; Director, ACC, ACIM and other ACC subsidiaries |
Barry Fink (1955) | Executive Vice President since 2007 | Chief Operating Officer and Executive Vice President, ACC (September 2007 to present); President, ACS (October 2007 to present); Managing Director, Morgan Stanley (2000 to 2007). Also serves as Manager, ACS and Director, ACC and certain ACC subsidiaries |
Maryanne L. Roepke (1956) | Chief Compliance Office since 2006 and Senior Vice President since 2000 | Chief Compliance Officer, American Century funds, ACIM and ACS (August 2006 to present). Also serves as Senior Vice President, ACS |
Charles A. Etherington (1957) | General Counsel since 2007 and Senior Vice President since 2006 | Attorney, ACC (February 1994 to present); Vice President, ACC (November 2005 to present), General Counsel, ACC (March 2007 to present); Also serves as General Counsel, ACIM, ACS, ACIS and other ACC subsidiaries; and Senior Vice President, ACIM and ACS |
C. Jean Wade (1964) | Vice President, Treasurer and Chief Financial Officer since 2012 | Vice President, ACS (February 2000 to present) |
Robert J. Leach (1966) | Vice President since 2006 and Assistant Treasurer since 2012 | Vice President, ACS (February 2000 to present) |
David H. Reinmiller (1963) | Vice President since 2001 | Attorney, ACC (January 1994 to present); Associate General Counsel, ACC (January 2001 to present); Also serves as Vice President, ACIM and ACS |
Ward D. Stauffer (1960) | Secretary since 2005 | Attorney, ACC (June 2003 to present) |
The Statement of Additional Information has additional information about the fund’s trustees and is available without charge, upon request, by calling 1-800-345-2021.
Approval of Management Agreement |
At a meeting held on September 28, 2011, the Fund’s Board of Trustees unanimously approved the initial management agreement pursuant to which American Century Investment Management, Inc. (the “Advisor”) acts as the investment advisor for the Fund. Under Section 15(c) of the Investment Company Act, new contracts for investment advisory services are required to be approved by a majority of a fund’s independent trustees (the “Trustees”) each year and to be evaluated on an annual basis thereafter.
In advance of the Board’s consideration, the Advisor provided information concerning the fund. The materials circulated in advance of the meeting and the discussions held at the meeting detailed the investment objective and strategy proposed to be utilized by the Advisor, the Fund’s characteristics and key attributes, the rationale for launching the Fund, the experience of the staff designated to manage the Fund, the proposed pricing, and the markets in which the Fund would be sold. The information considered and the discussions held included, but were not limited to:
| • | the nature, extent, and quality of investment management, shareholder services, and other services to be provided by the Advisor to the Fund; |
| • | the wide range of other programs and services the Advisor would provide to the Fund and its shareholders on a routine and non-routine basis; |
| • | the Fund’s proposed investment objective and strategy, including a discussion of the Fund’s anticipated investment performance and proposed benchmark; |
| • | data comparing the cost of owning the Fund to the cost of owning similar funds; |
| • | the Advisor’s compliance policies, procedures, and regulatory experience; |
| • | data comparing services provided and charges to other investment management clients of the Advisor; and |
| • | consideration of collateral benefits derived by the Advisor from the management of the Fund and any potential economies of scale relating thereto. |
American Century Investments’ funds utilize a unified management fee structure. Under the unified fee structure, the Advisor is responsible for providing all investment advisory, custody, audit, administrative, compliance, recordkeeping, marketing and shareholder services, or arranging and supervising third parties to provide such services. By contrast, most other funds are charged a variety of fees, including an investment advisory fee, a transfer agency fee, an administrative fee, distribution charges and other expenses. Other than their investment advisory fees and Rule 12b-1 distribution fees, all other components of the total fees charged by these other funds may be increased without shareholder approval. The Advisor and Board believe the unified fee structure is a benefit to fund shareholders because it clearly discloses to shareholders the cost of owning fund shares, and, because the unified fee cannot be increased without a vote of Fund shareholders, it shifts to the Advisor the risk of increased costs of operating the Fund and provides a direct incentive to minimize administrative inefficiencies.
When considering the approval of the management agreement for the Fund, the Board considered the entrepreneurial risk that the Advisor assumes in launching a new fund. In particular, they considered the effect of the unified management fee structure and the fact that the Advisor will assume a substantial part of the start-up costs of the Fund and the risk that the Fund will grow to a level that will become profitable to the Advisor. The Board considered the position that the Fund would take in the lineup of the American Century Investments’ family of funds and the benefits to shareholders of existing funds of the broadened product offering. Finally, while not specifically discussed, but important in the decision to approve the management agreement, is the Trustees’ familiarity with the Advisor. The Board oversees and evaluates on a continuous basis the nature and quality of all services the Advisor performs for other funds within the American Century Investments’ complex. As such, the Trustees have confidence in the Advisor’s integrity and competence in providing services to the Fund.
In their deliberations, the Board did not identify any particular information that was all-important or controlling, and each Trustee attributed different weights to various factors. However, based on their evaluation of all material factors and assisted by the advice of independent legal counsel, the Trustees, concluded that the overall arrangements between the Fund and the Advisor, as provided in the management agreement, were fair and reasonable in light of the services to be performed and should be approved.
Retirement Account Information
As required by law, distributions you receive from certain IRAs, or 403(b), 457 and qualified plans are subject to federal income tax withholding, unless you elect not to have withholding apply. Tax will be withheld on the total amount withdrawn even though you may be receiving amounts that are not subject to withholding, such as nondeductible contributions. In such case, excess amounts of withholding could occur. You may adjust your withholding election so that a greater or lesser amount will be withheld.
If you don’t want us to withhold on this amount, you must notify us to not withhold the federal income tax. You may notify us in writing or in certain situations by telephone or through other electronic means. You have the right to revoke your withholding election at any time and any election you make may remain in effect until revoked by filing a new election.
Remember, even if you elect not to have income tax withheld, you are liable for paying income tax on the taxable portion of your withdrawal. If you elect not to have income tax withheld or you don’t have enough income tax withheld, you may be responsible for payment of estimated tax. You may incur penalties under the estimated tax rules if your withholding and estimated tax payments are not sufficient. You can reduce or defer the income tax on a distribution by directly or indirectly rolling such distribution over to another IRA or eligible plan. You should consult your tax advisor for additional information.
State tax will be withheld if, at the time of your distribution, your address is within one of the mandatory withholding states and you have federal income tax withheld. State taxes will be withheld from your distribution in accordance with the respective state rules.
Proxy Voting Guidelines
American Century Investment Management, Inc., the fund’s investment advisor, is responsible for exercising the voting rights associated with the securities purchased and/or held by the fund. A description of the policies and procedures the advisor uses in fulfilling this responsibility is available without charge, upon request, by calling 1-800-345-2021. It is also available on American Century Investments’ website at americancentury.com and on the Securities and Exchange Commission’s website at sec.gov. Information regarding how the investment advisor voted proxies relating to portfolio securities during the most recent 12-month period ended June 30 is available on the “About Us” page at americancentury.com. It is also available at sec.gov.
Quarterly Portfolio Disclosure
The fund files its complete schedule of portfolio holdings with the Securities and Exchange Commission (SEC) for the first and third quarters of each fiscal year on Form N-Q. The fund’s Forms N-Q are available on the SEC’s website at sec.gov, and may be reviewed and copied at the SEC’s Public Reference Room in Washington, DC. Information on the operation of the Public Reference Room may be obtained by calling 1-800-SEC-0330. The fund also makes its complete schedule of portfolio holdings for the most recent quarter of its fiscal year available on its website at americancentury.com and, upon request, by calling 1-800-345-2021.
| Contact Us | americancentury.com |
| Automated Information Line | 1-800-345-8765 |
| Investor Services Representative | 1-800-345-2021 or 816-531-5575 |
| Investors Using Advisors | 1-800-378-9878 |
| Business, Not-For-Profit, Employer-Sponsored Retirement Plans | 1-800-345-3533 |
| Banks and Trust Companies, Broker-Dealers, Financial Professionals, Insurance Companies | 1-800-345-6488 |
| Telecommunications Device for the Deaf | 1-800-634-4113 |
American Century International Bond Funds
Investment Advisor:
American Century Investment Management, Inc.
Kansas City, Missouri
This report and the statements it contains are submitted for the general information of our shareholders. The report is not authorized for distribution to prospective investors unless preceded or accompanied by an effective prospectus.
©2012 American Century Proprietary Holdings, Inc. All rights reserved.
CL-ANN-75880 1208
ANNUAL REPORT JUNE 30, 2012


| President’s Letter | 2 |
| Market Perspective | 3 |
| Performance | 4 |
| Portfolio Commentary | 6 |
| Fund Characteristics | 8 |
| Shareholder Fee Example | 9 |
| Schedule of Investments | 11 |
| Statement of Assets and Liabilities | 17 |
| Statement of Operations | 18 |
| Statement of Changes in Net Assets | 19 |
| Notes to Financial Statements | 20 |
| Financial Highlights | 27 |
| Report of Independent Registered Public Accounting Firm | 29 |
| Management | 30 |
| Approval of Management Agreement | 33 |
| Additional Information | 38 |
Any opinions expressed in this report reflect those of the author as of the date of the report, and do not necessarily represent the opinions of American Century Investments® or any other person in the American Century Investments organization. Any such opinions are subject to change at any time based upon market or other conditions and American Century Investments disclaims any responsibility to update such opinions. These opinions may not be relied upon as investment advice and, because investment decisions made by American Century Investments funds are based on numerous factors, may not be relied upon as an indication of trading intent on behalf of any American Century Investments fund. Security examples are used for representational purposes only and are not intended as recommendations to purchase or sell securities. Performance information for comparative indices and securities is provided to American Century Investments by third party vendors. To the best of American Century Investments’ knowledge, such information is accurate at the time of printing.
Dear Investor:
Thank you for reviewing this annual report for the period ended June 30, 2012. Our report offers investment performance and portfolio information, presented with the expert perspective of our portfolio management team.
This report remains one of our most important vehicles for conveying information about fund returns, as well as market factors and strategies that affected fund performance. For additional, updated information, we encourage you to visit our website, americancentury.com. Click on the “Fund Performance” and “Insights & News” headings at the top of our Individual Investors site.
Flight to Quality as Economic and Financial Uncertainties Resurfaced
During the second half of 2011 and the first half of 2012, the global economy and financial markets struggled to move beyond the lingering aftereffects of the 2008 Financial Crisis and Great Recession. Global economic fundamentals have improved since 2008, but weakened since 2010, with increased uncertainty surrounding near-term economic growth levels in major developed economies such as the U.S., Japan, and Europe. There were also questions about near-term growth levels in influential emerging economies such as China.
These near-term uncertainties manifested themselves in asset returns for the 12 months ended June 30, 2012. Assets perceived to be “safe-haven” investments rallied—the 30-year U.S. Treasury bond posted a 39% total return. At the other end of the spectrum, international stock returns for U.S. investors were undermined by a combination of risk-averse investing attitudes, weakening global economic growth, and a stronger U.S. dollar versus the euro and currencies of other struggling economies. Commodity prices also plunged during the period.
Unfortunately, the instability that triggered much of this flight-to-quality trading remains largely in place, and the coming months may bring additional uncertainties about the U.S. presidential election and what might happen when various U.S. tax cuts and other stimulative measures expire in 2013 (the so-called “Fiscal Cliff”). In this uncertain, unstable environment, we continue to believe in a disciplined, diversified, long-term investment approach, using both stocks and bonds, as appropriate. We appreciate your continued trust in us during these unsettled times.
Sincerely,
Jonathan Thomas
President and Chief Executive Officer
American Century Investments
By David MacEwen, Chief Investment Officer, Fixed Income
International bonds posted solid gains for the 12 months ended June 30, 2012. For U.S. investors, however, a stronger U.S. dollar erased a significant portion of these gains, leaving a return of less than 1% for unhedged international bonds (see the table below).
One factor contributing to the rally in international bonds was a worsening sovereign debt crisis in Europe. Greece was at the forefront of the crisis, staving off a potential default on its sovereign debt with a restructuring agreement, and then facing election turmoil that could lead the country to leave the eurozone. Troubles also spread to larger, fiscally troubled countries such as Italy and Spain, where a faltering banking sector rekindled fears of a financial crisis in Europe. Fortunately, an emphasis on high credit quality (AA or higher) in our international bond portfolios prevented them from having direct exposure to the weakest sovereign debt markets as these events unfolded.
Another factor impacting international bond market performance was a broad slowdown in global economic growth during the period. A number of European countries faced recessions, brought on in part by austerity measures intended to bring fiscal deficits under control. The economic weakness in Europe also impacted fast-growing emerging markets such as China, where exports to Europe and other developed countries are a meaningful component of the economy. Even the U.S. economy, which appeared to pick up steam in late 2011 and early 2012, slowed appreciably by the end of the reporting period.
In this environment, bond yields fell around the globe, with yields in many countries approaching record lows. The main exceptions were peripheral European countries, where concerns about fiscal deficits led to higher bond yields.
On the currency side, the U.S. dollar strengthened against most major currencies, reducing international bond returns for U.S. investors. The dollar appreciated by more than 14% versus the euro, 5% against the Australian dollar, and 2% against the British pound. The main exception was the Japanese yen; the dollar declined by about 1% versus the yen for the 12 months.
| Major Currency and Global Bond Market Returns |
| For the 12 months ended June 30, 2012 |
| Currency Returns* |
| U.S. Dollar vs. Euro | 14.60% |
| U.S. Dollar vs. Japanese Yen | -0.71% |
| International Bond Market Return (in dollars) |
| Barclays Global Treasury ex-U.S. Bond Index | 0.73% |
| Barclays Global Aggregate Bond Index (USD, hedged) | 6.70% |
*All percentage changes in foreign exchange rates are calculated on the basis of that currency per one U.S. dollar.
| Total Returns as of June 30, 2012 |
| | | | Average Annual Returns | |
| | Ticker Symbol | 1 year | 5 years | 10 years | Since Inception | Inception Date |
| Investor Class | BEGBX | 0.36% | 5.18% | 6.68% | 6.02% | 1/7/92 |
| Barclays Global Treasury ex-U.S. Bond Index | — | 0.73% | 7.37% | 7.18% | 6.38%(1) | — |
| Institutional Class | AIDIX | 0.49% | 5.37% | — | 5.16% | 8/2/04 |
A Class(2) No sales charge* With sales charge* | AIBDX | 0.03% -4.48% | 4.86% 3.91% | 6.40% 5.91% | 4.52% 4.17% | 10/27/98 |
| C Class | AIQCX | -0.73% | — | — | 2.85% | 9/28/07 |
| R Class | AIBRX | -0.22% | — | — | 3.36% | 9/28/07 |
| * | Sales charges include initial sales charges and contingent deferred sales charges (CDSCs), as applicable. A Class shares have a 4.50% maximum initial sales charge and may be subject to a maximum CDSC of 1.00%. C Class shares redeemed within 12 months of purchase are subject to a maximum CDSC of 1.00%. The SEC requires that mutual funds provide performance information net of maximum sales charges in all cases where charges could be applied. |
| (1) | Since 12/31/91, the date nearest the Investor Class’s inception for which data are available. |
| (2) | Prior to September 4, 2007, the A Class was referred to as the Advisor Class and did not have a front-end sales charge. Performance prior to that date has been adjusted to reflect this charge. |
Data presented reflect past performance. Past performance is no guarantee of future results. Current performance may be higher or lower than the performance shown. Investment return and principal value will fluctuate, and redemption value may be more or less than original cost. To obtain performance data current to the most recent month end, please call 1-800-345-2021 or visit americancentury.com. As interest rates rise, bond values will decline. International investing involves special risks, such as political instability and currency fluctuations.
Unless otherwise indicated, performance reflects Investor Class shares; performance for other share classes will vary due to differences in fee structure. For information about other share classes available, please consult the prospectus. Data assumes reinvestment of dividends and capital gains, and none of the charts reflect the deduction of taxes that a shareholder would pay on fund distributions or the redemption of fund shares. Returns for the index are provided for comparison. The fund’s total returns include operating expenses (such as transaction costs and management fees) that reduce returns, while the total returns of the index do not.
| Growth of $10,000 Over 10 Years |
| $10,000 investment made June 30, 2002 |
| Total Annual Fund Operating Expenses |
| Investor Class | Institutional Class | A Class | C Class | R Class |
| 0.81% | 0.61% | 1.06% | 1.81% | 1.31% |
The total annual fund operating expenses shown is as stated in the fund’s prospectus current as of the date of this report. The prospectus may vary from the expense ratio shown elsewhere in this report because it is based on a different time period, includes acquired fund fees and expenses, and, if applicable, does not include fee waivers or expense reimbursements.
Data presented reflect past performance. Past performance is no guarantee of future results. Current performance may be higher or lower than the performance shown. Investment return and principal value will fluctuate, and redemption value may be more or less than original cost. To obtain performance data current to the most recent month end, please call 1-800-345-2021 or visit americancentury.com. As interest rates rise, bond values will decline. International investing involves special risks, such as political instability and currency fluctuations.
Unless otherwise indicated, performance reflects Investor Class shares; performance for other share classes will vary due to differences in fee structure. For information about other share classes available, please consult the prospectus. Data assumes reinvestment of dividends and capital gains, and none of the charts reflect the deduction of taxes that a shareholder would pay on fund distributions or the redemption of fund shares. Returns for the index are provided for comparison. The fund’s total returns include operating expenses (such as transaction costs and management fees) that reduce returns, while the total returns of the index do not.
Portfolio Managers: John Lovito, Federico Garcia Zamora, and Simon Chester
Performance Summary
International Bond returned 0.36%* for the fiscal year ended June 30, 2012, compared with the 0.73% return of its benchmark, the Barclays Global Treasury ex-U.S. Bond Index.
The modest gains for both International Bond and its benchmark index reflected the broad rally in international bond markets, tempered by the mitigating impact of the stronger U.S. dollar (see page 3 for more details). The fund’s underperformance of its benchmark during the 12-month period was driven primarily by currency positioning and exposure to non-government bonds.
It’s also worth noting that the return for the benchmark was calculated as of 4:00 pm London time (11:00 am Eastern U.S. time) on the last day of the period, while the fund’s return was calculated as of 4:00 pm Eastern U.S. time. Currency fluctuations in between these times can have an impact on relative performance. In addition, the fund’s results reflected operating expenses, while the benchmark’s returns did not.
Defensive Positioning Added Value
The fund’s mandate to focus on high-quality bonds (those rated AA or higher) contributed positively to performance for the 12-month period as higher-quality securities outperformed. In addition, the fund was defensively positioned in Europe, with overweight positions in high-quality core European countries such as Germany and the Netherlands, and limited exposure to peripheral European countries such as Italy and Spain.
We further reduced the fund’s holdings of peripheral European bonds during the reporting period by eliminating Italy and Spain from the portfolio when their sovereign debt was downgraded and no longer met the credit-quality standards of the portfolio. (The fund had no exposure to Greece or Portugal, which also do not meet the fund’s credit-quality requirements.) We also increased the fund’s exposure to the U.K., shifting from an underweight position at the beginning of the period to one of the fund’s largest overweight positions by the end of the period. This shift paid off as the U.K. bond market posted strong returns for the 12 months.
On the downside, underweight positions in Japan and South Korea hurt results as these bond markets outperformed during the fiscal year. Positioning for a flatter yield curve (a narrower gap between long- and short-term interest rates) in the U.K. bond market also weighed on results.
Sector Allocation Detracted
International Bond’s exposure to non-government securities had a modestly negative impact on relative performance as government bonds outperformed non-government bonds throughout much of the period. The fund’s non-government holdings included selected corporate bonds, supra-national securities (such as those issued by the European Investment Bank), and covered bonds, which are typically backed by a pool of mortgages or other debt.
*All fund returns referenced in this commentary are for Investor Class shares.
We meaningfully reduced the fund’s non-government holdings during the period, taking profits and lowering the fund’s risk profile after a period of outperformance in late 2011 and early 2012. We reduced the fund’s non-government exposure from a peak of approximately 12% of the portfolio to 7% by the end of the reporting period.
Currency Positioning Weighed on Performance
The fund’s currency positioning was little changed throughout the fiscal year. The fund had an emphasis on currencies in economically sensitive countries with commodity-based economies, strong fiscal positions, robust banking sectors, and exposure to fast-growing emerging markets. These included overweight positions in the Australian dollar, New Zealand dollar, Canadian dollar, and Norwegian krone. At the same time, the fund held underweight positions in the U.S. dollar, the euro, and the Japanese yen.
Overall, the fund’s currency positioning detracted from performance as the U.S. dollar and Japanese yen strengthened versus other currencies, while the economically sensitive currencies were held in check by the broad slowdown in global economic growth.
A Look Ahead
The themes that have dominated the global bond markets over the last 12–24 months are likely to continue as we move into the second half of 2012. We expect to see modest global economic growth, at an annual rate of 1–3%, over the next six to 12 months. We also expect interest rates to remain low around the world as central banks maintain their accommodative policies to stimulate economic activity. Even central banks in China and other emerging markets are becoming more accommodative, which should bode well for the economically sensitive currencies we favor in the portfolio.
We expect the situation in Europe to remain volatile and will likely continue to be the main factor influencing international bond performance in the coming months. At the European Union summit at the end of June, the EU made some decisions—such as creating a unified banking regulator and a new bank recapitalization fund—that took the markets by surprise. We believe that Europe will eventually move toward greater fiscal integration and debt mutualization, but these developments will happen over an extended period of time.
Within the portfolio, we intend to maintain our defensive positioning, with a continued focus on high-quality bonds and fiscally strong currencies.
| JUNE 30, 2012 |
| Portfolio at a Glance |
| Average Duration (effective) | 7.1 years |
| Weighted Average Life | 10.2 years |
| | |
| Bond Holdings by Country | % of net assets |
| United Kingdom | 20.5% |
| Japan | 20.5% |
Germany(1) | 8.6% |
Austria(1) | 4.8% |
Finland(1) | 4.7% |
France(1) | 4.7% |
Netherlands(1) | 4.7% |
| Canada | 4.4% |
Belgium(1) | 3.9% |
| Denmark | 3.4% |
| Multi-National | 3.1% |
| Australia | 2.6% |
| Sweden | 1.2% |
| Switzerland | 0.5% |
| Norway | 0.4% |
| New Zealand | 0.3% |
Cash and Equivalents(2) | 11.7% |
(1)These countries are members of the eurozone. (2)Includes temporary cash investments and other assets and liabilities. |
| | |
| Types of Investments in Portfolio | % of net assets |
| Government Bonds | 81.3% |
| Credit | 7.0% |
| Temporary Cash Investments | 5.7% |
| Other Assets and Liabilities | 6.0%* |
| *Amount relates primarily to foreign currency holdings at period end. |
Fund shareholders may incur two types of costs: (1) transaction costs, including sales charges (loads) on purchase payments and redemption/exchange fees; and (2) ongoing costs, including management fees; distribution and service (12b-1) fees; and other fund expenses. This example is intended to help you understand your ongoing costs (in dollars) of investing in your fund and to compare these costs with the ongoing cost of investing in other mutual funds.
The example is based on an investment of $1,000 made at the beginning of the period and held for the entire period from January 1, 2012 to June 30, 2012.
Actual Expenses
The table provides information about actual account values and actual expenses for each class. You may use the information, together with the amount you invested, to estimate the expenses that you paid over the period. First, identify the share class you own. Then simply divide your account value by $1,000 (for example, an $8,600 account value divided by $1,000 = 8.6), then multiply the result by the number under the heading “Expenses Paid During Period” to estimate the expenses you paid on your account during this period.
If you hold Investor Class shares of any American Century Investments fund, or Institutional Class shares of the American Century Diversified Bond Fund, in an American Century Investments account (i.e., not a financial intermediary or retirement plan account), American Century Investments may charge you a $12.50 semiannual account maintenance fee if the value of those shares is less than $10,000. We will redeem shares automatically in one of your accounts to pay the $12.50 fee. In determining your total eligible investment amount, we will include your investments in all personal accounts (including American Century Investments Brokerage accounts) registered under your Social Security number. Personal accounts include individual accounts, joint accounts, UGMA/UTMA accounts, personal trusts, Coverdell Education Savings Accounts and IRAs (including traditional, Roth, Rollover, SEP-, SARSEP- and SIMPLE-IRAs), and certain other retirement accounts. If you have only business, business retirement, employer-sponsored or American Century Investments Brokerage accounts, you are currently not subject to this fee. If you are subject to the Account Maintenance Fee, your account value could be reduced by the fee amount.
Hypothetical Example for Comparison Purposes
The table also provides information about hypothetical account values and hypothetical expenses based on the actual expense ratio of each class of your fund and an assumed rate of return of 5% per year before expenses, which is not the actual return of a fund’s share class. The hypothetical account values and expenses may not be used to estimate the actual ending account balance or expenses you paid for the period. You may use this information to compare the ongoing costs of investing in your fund and other funds. To do so, compare this 5% hypothetical example with the 5% hypothetical examples that appear in the shareholder reports of the other funds.
Please note that the expenses shown in the table are meant to highlight your ongoing costs only and do not reflect any transactional costs, such as sales charges (loads) or redemption/exchange fees. Therefore, the table is useful in comparing ongoing costs only, and will not help you determine the relative total costs of owning different funds. In addition, if these transactional costs were included, your costs would have been higher.
| | Beginning Account Value 1/1/12 | Ending Account Value 6/30/12 | Expenses Paid During Period(1) 1/1/12 – 6/30/12 | Annualized Expense Ratio(1) |
| Actual |
| Investor Class | $1,000 | $1,007.70 | $3.99 | 0.80% |
| Institutional Class | $1,000 | $1,008.40 | $3.00 | 0.60% |
| A Class | $1,000 | $1,006.30 | $5.24 | 1.05% |
| C Class | $1,000 | $1,002.80 | $8.96 | 1.80% |
| R Class | $1,000 | $1,004.90 | $6.48 | 1.30% |
| Hypothetical | | | | |
| Investor Class | $1,000 | $1,020.89 | $4.02 | 0.80% |
| Institutional Class | $1,000 | $1,021.88 | $3.02 | 0.60% |
| A Class | $1,000 | $1,019.64 | $5.27 | 1.05% |
| C Class | $1,000 | $1,015.91 | $9.02 | 1.80% |
| R Class | $1,000 | $1,018.40 | $6.52 | 1.30% |
| (1) | Expenses are equal to the class’s annualized expense ratio listed in the table above, multiplied by the average account value over the period, multiplied by 182, the number of days in the most recent fiscal half-year, divided by 366, to reflect the one-half year period. |
| | | | Principal Amount | | | Value | |
| Government Bonds — 81.3% | |
| AUSTRALIA — 2.6% | |
| Government of Australia, 6.50%, 5/15/13 | AUD | | | 12,450,000 | | | | $13,140,099 | |
| Government of Australia, 5.75%, 7/15/22 | AUD | | | 6,440,000 | | | | 8,130,573 | |
| New South Wales Treasury Corp., 5.50%, 3/1/17 | AUD | | | 12,100,000 | | | | 13,624,723 | |
| | | | | | | | | 34,895,395 | |
| AUSTRIA — 4.8% | |
Republic of Austria, 3.40%, 10/20/14(1) | EUR | | | 16,280,000 | | | | 21,950,111 | |
Republic of Austria, 4.35%, 3/15/19(1) | EUR | | | 10,780,000 | | | | 15,678,012 | |
Republic of Austria, 3.90%, 7/15/20(1) | EUR | | | 11,590,000 | | | | 16,506,864 | |
Republic of Austria, 4.15%, 3/15/37(1) | EUR | | | 7,285,000 | | | | 10,663,970 | |
| | | | | | | | | 64,798,957 | |
| BELGIUM — 3.9% | |
| Kingdom of Belgium, 4.00%, 3/28/14 | EUR | | | 10,100,000 | | | | 13,468,920 | |
| Kingdom of Belgium, 4.00%, 3/28/18 | EUR | | | 12,195,000 | | | | 16,799,488 | |
| Kingdom of Belgium, 3.75%, 9/28/20 | EUR | | | 8,370,000 | | | | 11,237,041 | |
| Kingdom of Belgium, 5.00%, 3/28/35 | EUR | | | 7,800,000 | | | | 11,610,481 | |
| | | | | | | | | 53,115,930 | |
| CANADA — 4.4% | |
| Government of Canada, 5.00%, 6/1/14 | CAD | | | 20,090,000 | | | | 21,213,390 | |
| Government of Canada, 1.50%, 3/1/17 | CAD | | | 3,000,000 | | | | 2,980,847 | |
| Government of Canada, 5.75%, 6/1/33 | CAD | | | 10,240,000 | | | | 15,787,061 | |
| Province of British Columbia Canada, 3.25%, 12/18/21 | CAD | | | 7,920,000 | | | | 8,237,469 | |
| Province of Ontario Canada, 4.40%, 6/2/19 | CAD | | | 9,500,000 | | | | 10,579,142 | |
| | | | | | | | | 58,797,909 | |
| DENMARK — 3.4% | |
| Kingdom of Denmark, 4.00%, 11/15/17 | DKK | | | 75,000,000 | | | | 15,027,064 | |
| Kingdom of Denmark, 4.00%, 11/15/19 | DKK | | | 8,300,000 | | | | 1,708,487 | |
| Kingdom of Denmark, 7.00%, 11/10/24 | DKK | | | 51,900,000 | | | | 14,029,326 | |
| Kingdom of Denmark, 4.50%, 11/15/39 | DKK | | | 60,760,000 | | | | 15,245,590 | |
| | | | | | | | | 46,010,467 | |
| FINLAND — 4.7% | |
| Government of Finland, 3.125%, 9/15/14 | EUR | | | 11,440,000 | | | | 15,384,314 | |
| Government of Finland, 3.875%, 9/15/17 | EUR | | | 13,290,000 | | | | 19,127,494 | |
| Government of Finland, 4.375%, 7/4/19 | EUR | | | 2,725,000 | | | | 4,075,006 | |
| Government of Finland, 3.375%, 4/15/20 | EUR | | | 10,380,000 | | | | 14,670,810 | |
| Government of Finland, 4.00%, 7/4/25 | EUR | | | 7,070,000 | | | | 10,540,179 | |
| | | | | | | | | 63,797,803 | |
| FRANCE — 3.6% | |
| French Treasury Note, 2.25%, 2/25/16 | EUR | | | 18,980,000 | | | | 25,028,917 | |
| Government of France, 4.00%, 4/25/14 | EUR | | | 4,370,000 | | | | 5,890,283 | |
| Government of France, 3.25%, 10/25/21 | EUR | | | 2,440,000 | | | | 3,259,775 | |
| Government of France, 5.50%, 4/25/29 | EUR | | | 3,580,000 | | | | 5,763,065 | |
| Government of France, 4.75%, 4/25/35 | EUR | | | 5,590,000 | | | | 8,453,145 | |
| | | | | | | | | 48,395,185 | |
| GERMANY — 7.0% | |
| German Federal Republic, 0.25%, 3/14/14 | EUR | | | 17,660,000 | | | | 22,402,554 | |
| German Federal Republic, 2.00%, 2/26/16 | EUR | | | 19,300,000 | | | | 25,883,184 | |
| German Federal Republic, 4.00%, 1/4/18 | EUR | | | 9,100,000 | | | | $13,518,878 | |
| German Federal Republic, 1.75%, 7/4/22 | EUR | | | 10,010,000 | | | | 12,859,587 | |
| German Federal Republic, 4.75%, 7/4/34 | EUR | | | 10,910,000 | | | | 19,531,101 | |
| German Federal Republic, 4.25%, 7/4/39 | EUR | | | 400,000 | | | | 701,137 | |
| | | | | | | | | 94,896,441 | |
| JAPAN — 20.5% | |
| Government of Japan, 0.60%, 9/20/14 | JPY | | | 3,072,600,000 | | | | 38,869,284 | |
| Government of Japan, 1.20%, 6/20/15 | JPY | | | 3,530,000,000 | | | | 45,587,277 | |
| Government of Japan, 1.50%, 9/20/18 | JPY | | | 4,338,000,000 | | | | 58,051,215 | |
| Government of Japan, 1.00%, 12/20/21 | JPY | | | 3,489,300,000 | | | | 44,545,923 | |
| Government of Japan, 2.10%, 12/20/26 | JPY | | | 3,689,850,000 | | | | 51,023,053 | |
| Government of Japan, 2.40%, 3/20/37 | JPY | | | 1,803,000,000 | | | | 25,176,926 | |
| Government of Japan, 2.00%, 9/20/41 | JPY | | | 984,300,000 | | | | 12,602,389 | |
| | | | | | | | | 275,856,067 | |
| NETHERLANDS — 4.7% | |
| Kingdom of Netherlands, 4.25%, 7/15/13 | EUR | | | 7,600,000 | | | | 10,022,261 | |
| Kingdom of Netherlands, 4.00%, 7/15/16 | EUR | | | 13,850,000 | | | | 19,663,935 | |
| Kingdom of Netherlands, 3.50%, 7/15/20 | EUR | | | 15,510,000 | | | | 22,041,868 | |
| Kingdom of Netherlands, 4.00%, 1/15/37 | EUR | | | 7,140,000 | | | | 11,288,364 | |
| | | | | | | | | 63,016,428 | |
| NEW ZEALAND — 0.3% | |
| New Zealand Government Bond, 5.00%, 3/15/19 | NZD | | | 5,200,000 | | | | 4,624,548 | |
| NORWAY — 0.4% | |
| Government of Norway, 4.25%, 5/19/17 | NOK | | | 28,000,000 | | | | 5,319,325 | |
| SWEDEN — 1.2% | |
| Government of Sweden, 6.75%, 5/5/14 | SEK | | | 26,200,000 | | | | 4,182,160 | |
| Government of Sweden, 4.25%, 3/12/19 | SEK | | | 47,530,000 | | | | 8,155,390 | |
| Government of Sweden, 3.50%, 6/1/22 | SEK | | | 18,500,000 | | | | 3,139,080 | |
| | | | | | | | | 15,476,630 | |
| SWITZERLAND — 0.5% | |
| Switzerland Government Bond, 2.00%, 4/28/21 | CHF | | | 4,600,000 | | | | 5,453,458 | |
| Switzerland Government Bond, 2.50%, 3/8/36 | CHF | | | 1,030,000 | | | | 1,428,967 | |
| | | | | | | | | 6,882,425 | |
| UNITED KINGDOM — 19.3% | |
| Government of United Kingdom, 5.00%, 9/7/14 | GBP | | | 19,600,000 | | | | 33,851,278 | |
| Government of United Kingdom, 4.00%, 9/7/16 | GBP | | | 23,240,000 | | | | 41,456,656 | |
| Government of United Kingdom, 4.50%, 3/7/19 | GBP | | | 16,475,000 | | | | 31,370,458 | |
| Government of United Kingdom, 3.75%, 9/7/21 | GBP | | | 21,900,000 | | | | 40,388,993 | |
| Government of United Kingdom, 4.25%, 3/7/36 | GBP | | | 29,825,000 | | | | 57,635,004 | |
| Government of United Kingdom, 4.50%, 12/7/42 | GBP | | | 19,610,000 | | | | 39,590,359 | |
| Government of United Kingdom, 4.25%, 12/7/55 | GBP | | | 7,900,000 | | | | 15,596,632 | |
| | | | | | | | | 259,889,380 | |
TOTAL GOVERNMENT BONDS (Cost $1,036,383,251) | | | | 1,095,772,890 | |
| Credit — 7.0% | |
| FRANCE — 1.1% | |
| Cie de Financement Foncier MTN, 4.50%, 5/16/18 | EUR | | | 5,240,000 | | | | 7,339,973 | |
| Cie de Financement Foncier, 4.375%, 4/25/19 | EUR | | | 5,500,000 | | | | 7,635,779 | |
| | | | | | | | | 14,975,752 | |
| | |
| | | | | Principal Amount | | | | Value | |
| GERMANY — 1.6% | | | | | | | | | |
| Kreditanstalt fuer Wiederaufbau, 3.875%, 1/21/19 | EUR | | | 10,390,000 | | | | $15,101,647 | |
| Kreditanstalt fuer Wiederaufbau MTN, 4.625%, 1/4/23 | EUR | | | 3,790,000 | | | | 5,931,992 | |
| | | | | | | | | 21,033,639 | |
| MULTI-NATIONAL — 3.1% | |
| European Investment Bank MTN, 2.50%, 7/15/15 | EUR | | | 12,850,000 | | | | 17,004,807 | |
| European Investment Bank MTN, 3.625%, 1/15/21 | EUR | | | 8,900,000 | | | | 12,280,854 | |
| International Bank for Reconstruction & Development MTN, 3.875%, 5/20/19 | EUR | | | 8,500,000 | | | | 12,428,685 | |
| | | | | | | | | 41,714,346 | |
| UNITED KINGDOM — 1.2% | |
Abbey National Treasury Services plc MTN, 5.125%, 4/14/22 | GBP | | | 2,200,000 | | | | 3,709,071 | |
| Bank of Scotland plc MTN, 3.25%, 1/25/13 | EUR | | | 10,000,000 | | | | 12,838,768 | |
| | | | | | | | | 16,547,839 | |
TOTAL CREDIT (Cost $96,486,564) | | | | 94,271,576 | |
| | | Shares/ Principal Amount | | | Value | |
| Temporary Cash Investments — 5.7% | |
Repurchase Agreement, Bank of America Merrill Lynch, (collateralized by various U.S. Treasury obligations, 1.50% - 4.00%, 2/15/15 - 6/30/16, valued at $24,935,656), in a joint trading account at 0.10%, dated 6/29/12, due 7/2/12 (Delivery value $24,460,758) | | | | $24,460,554 | |
Repurchase Agreement, Credit Suisse First Boston, Inc., (collateralized by various U.S. Treasury obligations, 3.75%, 8/15/41, valued at $25,013,170), in a joint trading account at 0.10%, dated 6/29/12, due 7/2/12 (Delivery value $24,460,758) | | | | 24,460,554 | |
Repurchase Agreement, Goldman Sachs & Co., (collateralized by various U.S. Treasury obligations, 4.375%, 5/15/40, valued at $6,229,096), in a joint trading account at 0.06%, dated 6/29/12, due 7/2/12 (Delivery value $6,115,169) | | | | 6,115,138 | |
| SSgA U.S. Government Money Market Fund | | | 21,861,498 | | | | 21,861,498 | |
U.S. Treasury Bill, 0.08%, 8/23/12(2) | | | $300,000 | | | | 299,982 | |
TOTAL TEMPORARY CASH INVESTMENTS (Cost $77,197,709) | | | | 77,197,726 | |
TOTAL INVESTMENT SECURITIES — 94.0% (Cost $1,210,067,524) | | | | 1,267,242,192 | |
OTHER ASSETS AND LIABILITIES(3) — 6.0% | | | | 81,262,603 | |
| TOTAL NET ASSETS — 100.0% | | | | $1,348,504,795 | |
Forward Foreign Currency Exchange Contracts
| Contracts to Buy | Counterparty | Settlement Date | | Value | | | Unrealized Gain (Loss) | |
| | 6,370,000 | | CHF for EUR | UBS AG | 7/27/12 | | | $6,714,938 | | | | $(92,800 | ) |
| | 1,724,310 | | EUR for CHF | Deutsche Bank | 7/27/12 | | | 2,182,527 | | | | 13,949 | |
| | 3,178,405 | | EUR for JPY | Deutsche Bank | 7/27/12 | | | 4,023,032 | | | | (184,541 | ) |
| | 6,647,733 | | EUR for JPY | UBS AG | 7/27/12 | | | 8,414,296 | | | | 192,378 | |
| | 2,720,119 | | EUR for SEK | Deutsche Bank | 7/27/12 | | | 3,442,961 | | | | 57,227 | |
| | 2,845,492 | | EUR for SEK | UBS AG | 7/27/12 | | | 3,601,651 | | | | 26,005 | |
| | 3,562,163 | | GBP for JPY | HSBC Holdings plc | 7/27/12 | | | 5,578,555 | | | | 65,036 | |
| | 1,728,858 | | GBP for JPY | UBS AG | 7/27/12 | | | 2,707,493 | | | | (103,111 | ) |
| | 429,428,000 | | JPY for EUR | UBS AG | 7/27/12 | | | 5,374,055 | | | | (31,295 | ) |
| | 245,802,521 | | JPY for SEK | Deutsche Bank | 7/27/12 | | | 3,076,083 | | | | (16,356 | ) |
| | 24,640,000 | | SEK for EUR | UBS AG | 7/27/12 | | | 3,558,848 | | | | 141,135 | |
| | 450,000 | | AUD for USD | HSBC Holdings plc | 7/27/12 | | | 459,529 | | | | (1,667 | ) |
| Contracts to Buy | Counterparty | Settlement Date | | Value | | | Unrealized Gain (Loss) | |
| | 990,000 | | CAD for USD | Barclays Bank plc | 7/27/12 | | | $971,890 | | | | $21,305 | |
| | 13,961,261 | | CAD for USD | Barclays Bank plc | 7/27/12 | | | 13,705,863 | | | | (407,683 | ) |
| | 1,340,000 | | CAD for USD | HSBC Holdings plc | 7/27/12 | | | 1,315,487 | | | | (41,871 | ) |
| | 120,000 | | CHF for USD | Barclays Bank plc | 7/27/12 | | | 126,498 | | | | 1,492 | |
| | 370,000 | | CHF for USD | HSBC Holdings plc | 7/27/12 | | | 390,036 | | | | (17,958 | ) |
| | 145,330,000 | | CZK for USD | Deutsche Bank | 7/27/12 | | | 7,205,861 | | | | (506,408 | ) |
| | 3,010,000 | | DKK for USD | HSBC Holdings plc | 7/27/12 | | | 512,673 | | | | (23,318 | ) |
| | 123,219,133 | | DKK for USD | UBS AG | 7/27/12 | | | 20,987,102 | | | | (818,893 | ) |
| | 4,330,000 | | EUR for USD | Barclays Bank plc | 7/27/12 | | | 5,480,651 | | | | 68,476 | |
| | 17,037,878 | | EUR for USD | Barclays Bank plc | 7/27/12 | | | 21,565,510 | | | | (807,780 | ) |
| | 1,760,000 | | GBP for USD | HSBC Holdings plc | 7/27/12 | | | 2,756,262 | | | | (97,437 | ) |
| | 40,000 | | GBP for USD | Westpac Group | 7/27/12 | | | 62,642 | | | | 202 | |
| | 3,910,000 | | HKD for USD | Westpac Group | 7/27/12 | | | 504,035 | | | | (56 | ) |
| | 3,300,783,445 | | JPY for USD | Barclays Bank plc | 7/27/12 | | | 41,307,487 | | | | 373,122 | |
| | 47,076,989,996 | | KRW for USD | HSBC Holdings plc | 7/27/12 | | | 41,056,920 | | | | (135,704 | ) |
| | 170,000 | | NOK for USD | Barclays Bank plc | 7/27/12 | | | 28,553 | | | | (1,015 | ) |
| | 33,957,086 | | NOK for USD | Deutsche Bank | 7/27/12 | | | 5,703,469 | | | | (193,906 | ) |
| | 40,000 | | NZD for USD | Barclays Bank plc | 7/27/12 | | | 31,968 | | | | (598 | ) |
| | 200,000 | | NZD for USD | Barclays Bank plc | 7/27/12 | | | 159,838 | | | | 8,795 | |
| | 5,457,340 | | NZD for USD | Westpac Group | 7/27/12 | | | 4,361,439 | | | | (98,005 | ) |
| | 630,000 | | SEK for USD | Barclays Bank plc | 7/27/12 | | | 90,993 | | | | (2,412 | ) |
| | 1,760,000 | | SEK for USD | Barclays Bank plc | 7/27/12 | | | 254,203 | | | | 9,500 | |
| | 37,097,739 | | SEK for USD | Barclays Bank plc | 7/27/12 | | | 5,358,166 | | | | (112,590 | ) |
| | 14,210,000 | | SGD for USD | HSBC Holdings plc | 7/27/12 | | | 11,217,614 | | | | (150,385 | ) |
| | 40,940,000 | | TWD for USD | HSBC Holdings plc | 7/27/12 | | | 1,372,941 | | | | (19,102 | ) |
| | | | | | | | | $235,662,069 | | | | $(2,886,269 | ) |
(Value on Settlement Date $238,548,338)
| Contracts to Sell | Counterparty | Settlement Date | | Value | | | Unrealized Gain (Loss) | |
| | 5,306,830 | | EUR for CHF | UBS AG | 7/27/12 | | | $6,717,062 | | | | $90,675 | |
| | 2,070,000 | | CHF for EUR | Deutsche Bank | 7/27/12 | | | 2,182,091 | | | | (13,513 | ) |
| | 335,789,000 | | JPY for EUR | Deutsche Bank | 7/27/12 | | | 4,202,214 | | | | 5,359 | |
| | 644,406,000 | | JPY for EUR | UBS AG | 7/27/12 | | | 8,064,386 | | | | 157,532 | |
| | 23,850,000 | | SEK for EUR | Deutsche Bank | 7/27/12 | | | 3,444,745 | | | | (59,011 | ) |
| | 25,470,000 | | SEK for EUR | UBS AG | 7/27/12 | | | 3,678,728 | | | | (103,081 | ) |
| | 429,604,000 | | JPY for GBP | HSBC Holdings plc | 7/27/12 | | | 5,376,257 | | | | 137,261 | |
| | 223,860,000 | | JPY for GBP | UBS AG | 7/27/12 | | | 2,801,485 | | | | 9,119 | |
| | 4,241,685 | | EUR for JPY | UBS AG | 7/27/12 | | | 5,368,867 | | | | 36,482 | |
| | 21,805,502 | | SEK for JPY | Deutsche Bank | 7/27/12 | | | 3,149,451 | | | | (57,011 | ) |
| | 2,728,078 | | EUR for SEK | UBS AG | 7/27/12 | | | 3,453,035 | | | | (35,322 | ) |
| | 1,780,000 | | AUD for USD | Barclays Bank plc | 7/27/12 | | | 1,817,692 | | | | (94,120 | ) |
| | 150,000 | | AUD for USD | Barclays Bank plc | 7/27/12 | | | 153,176 | | | | 2,026 | |
| | 120,000 | | AUD for USD | Barclays Bank plc | 7/27/12 | | | 122,541 | | | | (1,952 | ) |
| | 1,011,753 | | AUD for USD | Westpac Group | 7/27/12 | | | 1,033,177 | | | | 4,982 | |
| | 110,000 | | AUD for USD | Westpac Group | 7/27/12 | | | 112,329 | | | | (2,274 | ) |
| | 240,000 | | CAD for USD | Barclays Bank plc | 7/27/12 | | | 235,610 | | | | (1,726 | ) |
| | 180,000 | | CAD for USD | Barclays Bank plc | 7/27/12 | | | 176,707 | | | | 6,367 | |
| Contracts to Sell | Counterparty | Settlement Date | | Value | | | Unrealized Gain (Loss) | |
| | 3,041,236 | | CAD for USD | Deutsche Bank | 7/27/12 | | | $2,985,602 | | | | $(22,329 | ) |
| | 400,000 | | CAD for USD | Deutsche Bank | 7/27/12 | | | 392,683 | | | | (3,551 | ) |
| | 20,000 | | CAD for USD | Westpac Group | 7/27/12 | | | 19,634 | | | | (116 | ) |
| | 60,000 | | CHF for USD | Barclays Bank plc | 7/27/12 | | | 63,249 | | | | (920 | ) |
| | 40,000 | | CHF for USD | Barclays Bank plc | 7/27/12 | | | 42,166 | | | | 2,022 | |
| | 7,750,941 | | CHF for USD | UBS AG | 7/27/12 | | | 8,170,657 | | | | 294,534 | |
| | 3,360,000 | | DKK for USD | Barclays Bank plc | 7/27/12 | | | 572,287 | | | | (6,875 | ) |
| | 5,740,000 | | DKK for USD | HSBC Holdings plc | 7/27/12 | | | 977,656 | | | | (11,365 | ) |
| | 1,780,000 | | EUR for USD | Barclays Bank plc | 7/27/12 | | | 2,253,016 | | | | 106,748 | |
| | 1,050,000 | | EUR for USD | Barclays Bank plc | 7/27/12 | | | 1,329,026 | | | | (5,144 | ) |
| | 500,000 | | EUR for USD | Barclays Bank plc | 7/27/12 | | | 632,870 | | | | (9,125 | ) |
| | 4,000,000 | | EUR for USD | HSBC Holdings plc | 7/27/12 | | | 5,062,957 | | | | 233,643 | |
| | 1,070,000 | | EUR for USD | HSBC Holdings plc | 7/27/12 | | | 1,354,341 | | | | 13,365 | |
| | 930,000 | | EUR for USD | HSBC Holdings plc | 7/27/12 | | | 1,177,137 | | | | 34,215 | |
| | 1,910,000 | | EUR for USD | Westpac Group | 7/27/12 | | | 2,417,562 | | | | (7,581 | ) |
| | 3,610,000 | | GBP for USD | Barclays Bank plc | 7/27/12 | | | 5,653,470 | | | | (97,139 | ) |
| | 600,000 | | GBP for USD | Barclays Bank plc | 7/27/12 | | | 939,635 | | | | 34,435 | |
| | 524,049 | | GBP for USD | Barclays Bank plc | 7/27/12 | | | 820,691 | | | | (12,454 | ) |
| | 240,000 | | GBP for USD | Barclays Bank plc | 7/27/12 | | | 375,854 | | | | (2,155 | ) |
| | 17,806,912 | | GBP for USD | Deutsche Bank | 7/27/12 | | | 27,886,660 | | | | 467,820 | |
| | 4,000,000 | | GBP for USD | HSBC Holdings plc | 7/27/12 | | | 6,264,233 | | | | 111,567 | |
| | 360,000 | | GBP for USD | HSBC Holdings plc | 7/27/12 | | | 563,781 | | | | 17,587 | |
| | 4,821,892 | | GBP for USD | UBS AG | 7/27/12 | | | 7,551,363 | | | | 249,976 | |
| | 2,551,239 | | GBP for USD | Westpac Group | 7/27/12 | | | 3,995,389 | | | | (5,927 | ) |
| | 137,360,000 | | JPY for USD | Barclays Bank plc | 7/27/12 | | | 1,718,985 | | | | (10,357 | ) |
| | 107,820,000 | | JPY for USD | Barclays Bank plc | 7/27/12 | | | 1,349,308 | | | | 8,439 | |
| | 70,430,000 | | JPY for USD | Barclays Bank plc | 7/27/12 | | | 881,393 | | | | 2,089 | |
| | 38,060,000 | | JPY for USD | Barclays Bank plc | 7/27/12 | | | 476,300 | | | | 10,577 | |
| | 590,573,730 | | JPY for USD | Deutsche Bank | 7/27/12 | | | 7,390,705 | | | | 29,402 | |
| | 46,250,000 | | JPY for USD | HSBC Holdings plc | 7/27/12 | | | 578,793 | | | | (1,628 | ) |
| | 184,880,000 | | JPY for USD | Westpac Group | 7/27/12 | | | 2,313,671 | | | | 35,500 | |
| | 10,760,000 | | NOK for USD | Barclays Bank plc | 7/27/12 | | | 1,807,261 | | | | (42,464 | ) |
| | 270,000 | | NOK for USD | Barclays Bank plc | 7/27/12 | | | 45,350 | | | | (712 | ) |
| | 930,000 | | NOK for USD | HSBC Holdings plc | 7/27/12 | | | 156,204 | | | | 5,933 | |
| | 80,000 | | NZD for USD | Barclays Bank plc | 7/27/12 | | | 63,935 | | | | (727 | ) |
| | 170,000 | | NZD for USD | Deutsche Bank | 7/27/12 | | | 135,862 | | | | (5,200 | ) |
| | 1,640,000 | | NZD for USD | HSBC Holdings plc | 7/27/12 | | | 1,310,668 | | | | 19,503 | |
| | 1,470,000 | | SEK for USD | Barclays Bank plc | 7/27/12 | | | 212,318 | | | | (3,963 | ) |
| | 1,420,000 | | SEK for USD | HSBC Holdings plc | 7/27/12 | | | 205,096 | | | | 5,393 | |
| | | | | | | | | $152,237,321 | | | | $1,514,809 | |
(Value on Settlement Date $153,752,130)
Notes to Schedule of Investments
AUD = Australian Dollar
CAD = Canadian Dollar
CHF = Swiss Franc
CZK = Czech Koruna
DKK = Danish Krone
EUR = Euro
GBP = British Pound
HKD = Hong Kong Dollar
JPY = Japanese Yen
KRW = Korea Won
MTN = Medium Term Note
NOK = Norwegian Krone
NZD = New Zealand Dollar
SEK = Swedish Krona
SGD = Singapore Dollar
TWD = Taiwanese Dollar
USD = United States Dollar
| † | Category is less than 0.05% of total net assets. |
| (1) | Security was purchased under Rule 144A of the Securities Act of 1933 or is a private placement and, unless registered under the Act or exempted from registration, may only be sold to qualified institutional investors. The aggregate value of these securities at the period end was $64,798,957, which represented 4.8% of total net assets. |
| (2) | The rate indicated is the yield to maturity at purchase. |
| (3) | Amount relates primarily to foreign currency holdings at period end. |
See Notes to Financial Statements.
Statement of Assets and Liabilities |
| JUNE 30, 2012 | |
| Assets | |
| Investment securities, at value (cost of $1,210,067,524) | | | $1,267,242,192 | |
| Foreign currency holdings, at value (cost of $75,712,885) | | | 75,938,124 | |
| Receivable for investments sold | | | 8,588,006 | |
| Receivable for capital shares sold | | | 583,613 | |
| Unrealized gain on forward foreign currency exchange contracts | | | 3,111,173 | |
| Interest receivable | | | 13,456,193 | |
| | | | 1,368,919,301 | |
| | | | | |
| Liabilities | | | | |
| Payable for investments purchased | | | 13,989,165 | |
| Payable for capital shares redeemed | | | 1,087,095 | |
| Unrealized loss on forward foreign currency exchange contracts | | | 4,482,633 | |
| Accrued management fees | | | 829,350 | |
| Distribution and service fees payable | | | 26,263 | |
| | | | 20,414,506 | |
| | | | | |
| Net Assets | | | $1,348,504,795 | |
| | | | | |
| Net Assets Consist of: | | | | |
| Capital paid in | | | $1,288,962,305 | |
| Undistributed net investment income | | | 13,203,138 | |
| Accumulated net realized loss | | | (9,294,255 | ) |
| Net unrealized appreciation | | | 55,633,607 | |
| | | | $1,348,504,795 | |
| | Net assets | Shares outstanding | Net asset value per share |
| Investor Class | $894,449,592 | 62,174,352 | $14.39 |
| Institutional Class | $349,782,206 | 24,302,568 | $14.39 |
| A Class | $96,334,508 | 6,722,581 | $14.33* |
| C Class | $7,692,372 | 536,428 | $14.34 |
| R Class | $246,117 | 17,135 | $14.36 |
*Maximum offering price $15.01 (net asset value divided by 0.955)
See Notes to Financial Statements.
| YEAR ENDED JUNE 30, 2012 | |
| Investment Income (Loss) | |
| Income: | | | |
| Interest | | | $34,029,095 | |
| | | | | |
| Expenses: | | | | |
| Management fees | | | 10,289,561 | |
| Distribution and service fees: | | | | |
| A Class | | | 250,383 | |
| B Class | | | 951 | |
| C Class | | | 85,201 | |
| R Class | | | 1,182 | |
| Trustees’ fees and expenses | | | 75,972 | |
| Other expenses | | | 452 | |
| | | | 10,703,702 | |
| | | | | |
| Net investment income (loss) | | | 23,325,393 | |
| | | | | |
| Realized and Unrealized Gain (Loss) | | | | |
| Net realized gain (loss) on: | | | | |
| Investment transactions | | | 6,272,056 | |
| Futures contract transactions | | | 1,393,581 | |
| Foreign currency transactions | | | (1,196,898 | ) |
| | | | 6,468,739 | |
| | | | | |
| Change in net unrealized appreciation (depreciation) on: | | | | |
| Investments | | | (19,616,498 | ) |
| Futures contracts | | | 554,443 | |
| Translation of assets and liabilities in foreign currencies | | | (4,964,160 | ) |
| | | | (24,026,215 | ) |
| | | | | |
| Net realized and unrealized gain (loss) | | | (17,557,476 | ) |
| | | | | |
| Net Increase (Decrease) in Net Assets Resulting from Operations | | | $5,767,917 | |
See Notes to Financial Statements.
Statement of Changes in Net Assets |
| YEARS ENDED JUNE 30, 2012 AND JUNE 30, 2011 | |
| Increase (Decrease) in Net Assets | June 30, 2012 | | | June 30, 2011 | |
| Operations | |
| Net investment income (loss) | | $23,325,393 | | | | $32,754,647 | |
| Net realized gain (loss) | | 6,468,739 | | | | 7,032,240 | |
| Change in net unrealized appreciation (depreciation) | | (24,026,215 | ) | | | 161,842,474 | |
| Net increase (decrease) in net assets resulting from operations | | 5,767,917 | | | | 201,629,361 | |
| | | | | | | | |
| Distributions to Shareholders | | | | | | | |
| From net investment income: | | | | | | | |
| Investor Class | | (19,770,208 | ) | | | (43,376,216 | ) |
| Institutional Class | | (6,764,758 | ) | | | (12,130,923 | ) |
| A Class | | (2,003,488 | ) | | | (3,841,019 | ) |
| B Class | | (3,389 | ) | | | (9,327 | ) |
| C Class | | (99,603 | ) | | | (218,775 | ) |
| R Class | | (3,476 | ) | | | (6,411 | ) |
| From net realized gains: | | | | | | | |
| Investor Class | | — | | | | (6,394,839 | ) |
| Institutional Class | | — | | | | (1,666,487 | ) |
| A Class | | — | | | | (599,295 | ) |
| B Class | | — | | | | (1,902 | ) |
| C Class | | — | | | | (42,714 | ) |
| R Class | | — | | | | (1,125 | ) |
| Decrease in net assets from distributions | | (28,644,922 | ) | | | (68,289,033 | ) |
| | | | | | | | |
| Capital Share Transactions | | | | | | | |
| Net increase (decrease) in net assets from capital share transactions | | 21,433,031 | | | | (291,241,383 | ) |
| | | | | | | | |
| Net increase (decrease) in net assets | | (1,443,974 | ) | | | (157,901,055 | ) |
| | | | | | | | |
| Net Assets | | | | | | | |
| Beginning of period | | 1,349,948,769 | | | | 1,507,849,824 | |
| End of period | | $1,348,504,795 | | | | $1,349,948,769 | |
| | | | | | | | |
| Undistributed net investment income | | $13,203,138 | | | | $18,082,238 | |
See Notes to Financial Statements.
Notes to Financial Statements |
JUNE 30, 2012
1. Organization
American Century International Bond Funds (the trust) is registered under the Investment Company Act of 1940, as amended (the 1940 Act), as an open-end management investment company and is organized as a Massachusetts business trust. International Bond Fund (the fund) is one fund in a series issued by the trust. The fund is nondiversified as defined under the 1940 Act. The fund’s investment objective is to seek high total return. The fund pursues its objective by investing in high-quality, non-dollar-denominated government and corporate debt securities issued outside the United States.
The fund offers the Investor Class, the Institutional Class, the A Class, the C Class and the R Class. The A Class may incur an initial sales charge. The A Class and C Class may be subject to a contingent deferred sales charge. The share classes differ principally in their respective sales charges and distribution and shareholder servicing expenses and arrangements. The Institutional Class is made available to institutional shareholders or through financial intermediaries whose clients do not require the same level of shareholder and administrative services as shareholders of other classes. As a result, the Institutional Class is charged a lower unified management fee. On October 21, 2011, all outstanding B Class shares were converted to A Class shares and the fund discontinued offering the B Class.
2. Significant Accounting Policies
The following is a summary of significant accounting policies consistently followed by the fund in preparation of its financial statements. The financial statements are prepared in conformity with accounting principles generally accepted in the United States of America, which may require management to make certain estimates and assumptions at the date of the financial statements. Actual results could differ from these estimates.
Investment Valuations — The fund determines the fair value of its investments and computes its net asset value per share as of the close of regular trading (usually 4 p.m. Eastern time) on the New York Stock Exchange (NYSE) on each day the NYSE is open.
Debt securities maturing in greater than 60 days at the time of purchase are valued at the evaluated mean as provided by independent pricing services or at the mean of the most recent bid and asked prices as provided by investment dealers. Debt securities maturing within 60 days at the time of purchase may be valued at cost, plus or minus any amortized discount or premium or at the evaluated mean as provided by an independent pricing service. Evaluated mean prices are commonly derived through utilization of market models, which may consider, among other factors, trade data, quotations from dealers and active market makers, relevant yield curve and spread data, related sector levels, creditworthiness, and other relevant market information on the same or comparable securities.
Investments in open-end management investment companies are valued at the reported net asset value per share. Repurchase agreements are valued at cost. Exchange-traded futures contracts are valued at the settlement price as provided by the appropriate clearing corporation. Forward foreign currency exchange contracts are valued at the mean of the latest bid and asked prices of the forward currency rates as provided by an independent pricing service.
The value of investments initially expressed in foreign currencies is translated into U.S. dollars at prevailing exchange rates.
If the fund determines that the market price for a portfolio security is not readily available or the valuation methods mentioned above do not reflect a security’s fair value, such security is valued as determined in good faith by the Board of Trustees or its designee, in accordance with procedures adopted by the Board of Trustees. Circumstances that may cause the fund to use these procedures to value a security include, but are not limited to: a security has been declared in default; trading in a security has been halted during the trading day; there is a foreign market holiday and no trading occurred; or an event occurred between the close of a foreign exchange and the NYSE that may affect the value of a security.
Security Transactions — Security transactions are accounted for as of the trade date. Net realized gains and losses are determined on the identified cost basis, which is also used for federal income tax purposes.
Investment Income — Interest income less foreign taxes withheld, if any, is recorded on the accrual basis and includes accretion of discounts and amortization of premiums.
Foreign Currency Translations — All assets and liabilities initially expressed in foreign currencies are translated into U.S. dollars at prevailing exchange rates at period end. The fund may enter into spot foreign currency exchange contracts to facilitate transactions denominated in a foreign currency. Purchases and sales of investment securities, dividend and interest income, spot foreign currency exchange contracts, and expenses are translated at the rates of exchange prevailing on the respective dates of such transactions. Net realized and unrealized foreign currency exchange gains or losses related to investment securities are a component of net realized gain (loss) on investment transactions and change in net unrealized appreciation (depreciation) on investments, respectively.
Repurchase Agreements — The fund may enter into repurchase agreements with institutions that American Century Investment Management, Inc. (ACIM) (the investment advisor) has determined are creditworthy pursuant to criteria adopted by the Board of Trustees. The fund requires that the collateral, represented by securities, received in a repurchase transaction be transferred to the custodian in a manner sufficient to enable the fund to obtain those securities in the event of a default under the repurchase agreement. ACIM monitors, on a daily basis, the securities transferred to ensure the value, including accrued interest, of the securities under each repurchase agreement is equal to or greater than amounts owed to the fund under each repurchase agreement.
Joint Trading Account — Pursuant to an Exemptive Order issued by the Securities and Exchange Commission, the fund, along with certain other funds in the American Century Investments family of funds, may transfer uninvested cash balances into a joint trading account. These balances are invested in one or more repurchase agreements that are collateralized by U.S. Treasury or Agency obligations.
Segregated Assets — In accordance with the 1940 Act, the fund segregates assets on its books and records to cover certain types of investments, including, but not limited to, futures contracts, forward commitments, when-issued securities, swap agreements and certain forward foreign currency exchange contracts. ACIM monitors, on a daily basis, the securities segregated to ensure the fund designates a sufficient amount of liquid assets, marked-to-market daily. The fund may also receive assets or be required to pledge assets at the custodian bank or with a broker for margin requirements on futures contracts and swap agreements.
Income Tax Status — It is the fund’s policy to distribute substantially all net investment income and net realized gains to shareholders and to otherwise qualify as a regulated investment company under provisions of the Internal Revenue Code. The fund is no longer subject to examination by tax authorities for years prior to 2009. At this time, management believes there are no uncertain tax positions which, based on their technical merit, would not be sustained upon examination and for which it is reasonably possible that the total amounts of unrecognized tax benefits will significantly change in the next twelve months. Accordingly, no provision has been made for federal or state income taxes.
Multiple Class — All shares of the fund represent an equal pro rata interest in the net assets of the class to which such shares belong, and have identical voting, dividend, liquidation and other rights and the same terms and conditions, except for class specific expenses and exclusive rights to vote on matters affecting only individual classes. Income, non-class specific expenses, and realized and unrealized capital gains and losses of the fund are allocated to each class of shares based on their relative net assets.
Distributions to Shareholders — Distributions from net investment income, if any, are generally declared and paid quarterly, but may be paid less frequently. Distributions from net realized gains, if any, are generally declared and paid annually.
Indemnifications — Under the trust’s organizational documents, its officers and trustees are indemnified against certain liabilities arising out of the performance of their duties to the fund. In addition, in the normal course of business, the fund enters into contracts that provide general indemnifications. The maximum exposure under these arrangements is unknown as this would involve future claims that may be made against a fund. The risk of material loss from such claims is considered by management to be remote.
3. Fees and Transactions with Related Parties
Management Fees — The trust has entered into a management agreement with ACIM, under which ACIM provides the fund with investment advisory and management services in exchange for a single, unified management fee (the fee) per class. The agreement provides that all expenses of managing and operating the fund, except distribution and service fees, brokerage expenses, taxes, interest, fees and expenses of the independent trustees (including legal counsel fees), and extraordinary expenses, will be paid by ACIM. The fee is computed and accrued daily based on each class’s daily net assets and paid monthly in arrears. The fee consists of (1) an Investment Category Fee based on the daily net assets of the fund and certain other accounts managed by the investment advisor that are in the same broad investment category as the fund and (2) a Complex Fee based on the assets of all the funds in the American Century Investments family of funds. The rates for the Investment Category Fee range from 0.4925% to 0.6100%. The rates for the Complex Fee range from 0.2500% to 0.3100% for the Investor Class, A Class, B Class, C Class and R Class. The Institutional Class is 0.2000% less at each point within the Complex Fee range. The effective annual management fee for each class for the year ended June 30, 2012 was 0.80% for the Investor Class, A Class, C Class and R Class and 0.60% for the Institutional Class.
Distribution and Service Fees — The Board of Trustees has adopted a separate Master Distribution and Individual Shareholder Services Plan for each of the A Class, B Class, C Class and R Class (collectively the plans), pursuant to Rule 12b-1 of the 1940 Act. The plans provide that the A Class will pay American Century Investment Services, Inc. (ACIS) an annual distribution and service fee of 0.25%. The plans provide that the B Class and C Class will each pay ACIS an annual distribution and service fee of 1.00%, of which 0.25% is paid for individual shareholder services and 0.75% is paid for distribution services. The plans provide that the R Class will pay ACIS an annual distribution and service fee of 0.50%. The fees are computed and accrued daily based on each class’s daily net assets and paid monthly in arrears. The fees are used to pay financial intermediaries for distribution and individual shareholder services. Fees incurred under the plans during the year ended June 30, 2012 are detailed in the Statement of Operations.
Related Parties — Certain officers and trustees of the trust are also officers and/or directors of American Century Companies, Inc., the parent of the trust’s investment advisor, ACIM, the distributor of the trust, ACIS, and the trust’s transfer agent, American Century Services, LLC. Various funds in a series issued by American Century Asset Allocation Portfolios, Inc. (ACAAP) own, in aggregate, 20% of the shares of the fund. ACAAP does not invest in the fund for the purpose of exercising management or control.
4. Investment Transactions
Purchases and sales of investment securities, excluding short-term investments, for the year ended June 30, 2012 were $617,388,131 and $649,018,427, respectively.
5. Capital Share Transactions
Transactions in shares of the fund were as follows (unlimited number of shares authorized):
| | Year ended June 30, 2012 | | | Year ended June 30, 2011 | |
| | Shares | | | Amount | | | Shares | | | Amount | |
| Investor Class | | | | | | | | | | | |
| Sold | | 15,469,033 | | | | $224,119,401 | | | | 17,803,842 | | | | $251,343,037 | |
| Issued in reinvestment of distributions | | 1,253,548 | | | | 18,242,762 | | | | 3,083,942 | | | | 42,785,732 | |
| Redeemed | | (19,452,664 | ) | | | (282,884,524 | ) | | | (40,414,216 | ) | | | (576,194,110 | ) |
| | | (2,730,083 | ) | | | (40,522,361 | ) | | | (19,526,432 | ) | | | (282,065,341 | ) |
| Institutional Class | | | | | | | | | | | | | | | |
| Sold | | 10,419,634 | | | | 150,680,694 | | | | 8,452,326 | | | | 119,853,819 | |
| Issued in reinvestment of distributions | | 453,592 | | | | 6,593,422 | | | | 946,397 | | | | 13,114,198 | |
| Redeemed | | (6,058,933 | ) | | | (88,448,328 | ) | | | (11,223,555 | ) | | | (160,567,482 | ) |
| | | 4,814,293 | | | | 68,825,788 | | | | (1,824,832 | ) | | | (27,599,465 | ) |
| A Class | | | | | | | | | | | | | | | |
| Sold | | 1,820,942 | | | | 26,447,490 | | | | 4,355,055 | | | | 60,735,611 | |
| Issued in reinvestment of distributions | | 132,803 | | | | 1,928,939 | | | | 208,547 | | | | 2,884,728 | |
| Redeemed | | (2,496,046 | ) | | | (36,286,186 | ) | | | (3,049,566 | ) | | | (43,424,562 | ) |
| | | (542,301 | ) | | | (7,909,757 | ) | | | 1,514,036 | | | | 20,195,777 | |
| B Class | | | | | | | | | | | | | | | |
| Sold | | 660 | | | | 10,006 | | | | 2,612 | | | | 37,930 | |
| Issued in reinvestment of distributions | | 110 | | | | 1,615 | | | | 407 | | | | 5,637 | |
| Redeemed | | (21,173 | ) | | | (310,092 | ) | | | (4,757 | ) | | | (68,161 | ) |
| | | (20,403 | ) | | | (298,471 | ) | | | (1,738 | ) | | | (24,594 | ) |
| C Class | | | | | | | | | | | | | | | |
| Sold | | 292,303 | | | | 4,307,677 | | | | 83,433 | | | | 1,183,080 | |
| Issued in reinvestment of distributions | | 4,297 | | | | 62,816 | | | | 8,351 | | | | 115,785 | |
| Redeemed | | (212,241 | ) | | | (3,075,872 | ) | | | (211,483 | ) | | | (3,000,921 | ) |
| | | 84,359 | | | | 1,294,621 | | | | (119,699 | ) | | | (1,702,056 | ) |
| R Class | | | | | | | | | | | | | | | |
| Sold | | 8,560 | | | | 124,230 | | | | 27,756 | | | | 401,493 | |
| Issued in reinvestment of distributions | | 238 | | | | 3,476 | | | | 545 | | | | 7,536 | |
| Redeemed | | (5,861 | ) | | | (84,495 | ) | | | (31,480 | ) | | | (454,733 | ) |
| | | 2,937 | | | | 43,211 | | | | (3,179 | ) | | | (45,704 | ) |
| Net increase (decrease) | | 1,608,802 | | | | $21,433,031 | | | | (19,961,844 | ) | | | $(291,241,383 | ) |
6. Fair Value Measurements
The fund’s securities valuation process is based on several considerations and may use multiple inputs to determine the fair value of the positions held by the fund. In conformity with accounting principles generally accepted in the United States of America, the inputs used to determine a valuation are classified into three broad levels as follows:
| • | Level 1 valuation inputs consist of unadjusted quoted prices in an active market for identical securities; |
| • | Level 2 valuation inputs consist of direct or indirect observable market data (including quoted prices for similar securities, evaluations of subsequent market events, interest rates, prepayment speeds, credit risk, etc.); or |
| • | Level 3 valuation inputs consist of unobservable data (including a fund’s own assumptions). |
The level classification is based on the lowest level input that is significant to the fair valuation measurement. The valuation inputs are not necessarily an indication of the risks associated with investing in these securities or other financial instruments.
The following is a summary of the level classifications as of period end. The Schedule of Investments provides additional information on the fund’s portfolio holdings.
| | | | | | | | | |
| | Level 1 | | | Level 2 | | | Level 3 | |
| Investment Securities | |
| Government Bonds | | — | | | | $1,095,772,890 | | | | — | |
| Credit | | — | | | | 94,271,576 | | | | — | |
| Temporary Cash Investments | | $21,861,498 | | | | 55,336,228 | | | | — | |
| Total Value of Investment Securities | | $21,861,498 | | | | $1,245,380,694 | | | | — | |
| | | | | | | | | | | | |
| Other Financial Instruments | | | | | | | | | | | |
| Total Unrealized Gain (Loss) on Forward Foreign Currency Exchange Contracts | | — | | | | $(1,371,460 | ) | | | — | |
7. Derivative Instruments
Foreign Currency Risk — The fund is subject to foreign currency exchange rate risk in the normal course of pursuing its investment objectives. The value of foreign investments held by a fund may be significantly affected by changes in foreign currency exchange rates. The dollar value of a foreign security generally decreases when the value of the dollar rises against the foreign currency in which the security is denominated and tends to increase when the value of the dollar declines against such foreign currency. A fund may enter into forward foreign currency exchange contracts to reduce a fund’s exposure to foreign currency exchange rate fluctuations, or to shift exposure to the fluctuations in the value of foreign currencies from one foreign currency to another foreign currency. The net U.S. dollar value of foreign currency underlying all contractual commitments held by a fund and the resulting unrealized appreciation or depreciation are determined daily. Realized gain or loss is recorded upon the termination of the contract. Net realized and unrealized gains or losses occurring during the holding period of forward foreign currency exchange contracts are a component of net realized gain (loss) on foreign currency transactions and change in net unrealized appreciation (depreciation) on translation of assets and liabilities in foreign currencies, respectively. A fund bears the risk of an unfavorable change in the foreign currency exchange rate underlying the forward contract. Additionally, losses, up to the fair value, may arise if the counterparties do not perform under the contract terms. The foreign currency risk derivative instruments held at period end as disclosed on the Schedule of Investments are indicative of the fund’s typical volume during the period.
Interest Rate Risk — The fund is subject to interest rate risk in the normal course of pursuing its investment objectives. The value of bonds generally declines as interest rates rise. A fund may enter into futures contracts based on a bond index or a specific underlying security. A fund may purchase futures contracts to gain exposure to increases in market value or sell futures contracts to protect against a decline in market value. Upon entering into a futures contract, a fund will segregate cash, cash equivalents or other appropriate liquid securities on its records in amounts sufficient to meet requirements. Subsequent payments (variation margin) are made or received daily, in cash, by a fund. The variation margin is equal to the daily change in the contract value and is recorded as unrealized gains and losses. A fund recognizes a realized gain or loss when the futures contract is closed or expires. Net realized and unrealized gains or losses occurring during the holding period of futures contracts are a component of net realized gain (loss) on futures contract transactions and change in net unrealized appreciation (depreciation) on futures contracts, respectively. One of the risks of entering into futures contracts is the possibility that the change in value of the contract may not correlate with the changes in value of the underlying securities. The fund regularly purchased and sold interest rate risk derivative instruments during the first two months of the period.
| Value of Derivative Instruments as of June 30, 2012 | |
| | Asset Derivatives | | | Liability Derivatives | |
| Type of Risk Exposure | Location on Statement of Assets and Liabilities | | Value | | | Location on Statement of Assets and Liabilities | | Value | |
| Foreign Currency Risk | Unrealized gain on forward foreign currency exchange contracts | | | $3,111,173 | | | Unrealized loss on forward foreign currency exchange contracts | | | $4,482,633 | |
| | |
Effect of Derivative Instruments on the Statement of Operations for the Year Ended June 30, 2012 | |
| | Net Realized Gain (Loss) | | | Change in Net Unrealized Appreciation (Depreciation) | |
| Type of Risk Exposure | Location on Statement of Operations | | Value | | | Location on Statement of Operations | | Value | |
| Foreign Currency Risk | Net realized gain (loss) on foreign currency transactions | | | $252,133 | | | Change in net unrealized appreciation (depreciation) on translation of assets and liabilities in foreign currencies | | | $(1,976,167 | ) |
| Interest Rate Risk | Net realized gain (loss) on futures contract transactions | | | 1,393,581 | | | Change in net unrealized appreciation (depreciation) on futures contracts | | | 554,443 | |
| | | | | $1,645,714 | | | | | | $(1,421,724 | ) |
8. Risk Factors
There are certain risks involved in investing in foreign securities. These risks include those resulting from future adverse political, social and economic developments, fluctuations in currency exchange rates, the possible imposition of exchange controls, and other foreign laws or restrictions.
9. Federal Tax Information
The tax character of distributions paid during the years ended June 30, 2012 and June 30, 2011 were as follows:
| | | | | | | |
| | | 2012 | | | 2011 | |
| Distributions Paid From | |
| Ordinary income | | | $28,644,922 | | | | $60,479,201 | |
| Long-term capital gains | | | — | | | | $7,809,832 | |
The book-basis character of distributions made during the year from net investment income or net realized gains may differ from their ultimate characterization for federal income tax purposes. These differences reflect the differing character of certain income items and net realized gains and losses for financial statement and tax purposes, and may result in reclassification among certain capital accounts on the financial statements.
As of June 30, 2012, the federal tax cost of investments and the components of distributable earnings on a tax-basis were as follows:
| | | | | |
| Federal tax cost of investments | | | $1,210,985,056 | |
| Gross tax appreciation of investments | | | $76,146,301 | |
| Gross tax depreciation of investments | | | (19,889,165 | ) |
| Net tax appreciation (depreciation) of investments | | | $56,257,136 | |
Net tax appreciation (depreciation) on derivatives and translation of assets and liabilities in foreign currencies | | | $(1,199,596 | ) |
| Other book-to-tax adjustments | | | (1,613,169 | ) |
| Net tax appreciation (depreciation) | | | $53,444,371 | |
| Undistributed ordinary income | | | $14,323,409 | |
| Accumulated short-term capital losses | | | $(8,225,290 | ) |
The difference between book-basis and tax-basis cost and unrealized appreciation (depreciation) is attributable primarily to the tax deferral of losses on wash sales and the realization for tax purposes of unrealized gains (losses) on certain foreign currency exchange contracts. Other book-to-tax adjustments are attributable primarily to the tax deferral of losses on straddle positions.
The accumulated capital losses represent net capital loss carryovers that may be used to offset future realized capital gains for federal income tax purposes. The capital loss carryovers may be carried forward for an unlimited period. Future capital loss carryover utilization in any given year may be subject to Internal Revenue Code limitations.
| For a Share Outstanding Throughout the Years Ended June 30 (except as noted) |
| Per-Share Data | Ratios and Supplemental Data |
| | | Income From Investment Operations: | Distributions From: | | | Ratio to Average Net Assets of: | | |
| | Net Asset Value, Beginning of Period | Net Investment Income (Loss)(1) | Net Realized and Unrealized Gain (Loss) | Total From Investment Operations | Net Investment Income | Net Realized Gains | Total Distributions | Net Asset Value, End of Period | Total Return(2) | Operating Expenses | Net Investment Income (Loss) | Portfolio Turnover Rate | Net Assets, End of Period (in thousands) |
| Investor Class |
| 2012 | $14.65 | 0.24 | (0.18) | 0.06 | (0.32) | — | (0.32) | $14.39 | 0.36% | 0.81% | 1.68% | 50% | $894,450 |
| 2011 | $13.45 | 0.31 | 1.53 | 1.84 | (0.56) | (0.08) | (0.64) | $14.65 | 14.07% | 0.81% | 2.19% | 44% | $951,100 |
| 2010 | $14.38 | 0.35 | (0.64) | (0.29) | (0.64) | — | (0.64) | $13.45 | (2.39)% | 0.82% | 2.44% | 64% | $1,135,772 |
| 2009 | $15.13 | 0.43 | (0.43) | —(3) | (0.54) | (0.21) | (0.75) | $14.38 | 0.16% | 0.83% | 3.05% | 64% | $1,343,268 |
| 2008 | $13.69 | 0.45 | 1.58 | 2.03 | (0.59) | — | (0.59) | $15.13 | 15.03% | 0.82% | 3.01% | 74% | $1,811,299 |
| Institutional Class |
| 2012 | $14.66 | 0.27 | (0.20) | 0.07 | (0.34) | — | (0.34) | $14.39 | 0.49% | 0.61% | 1.88% | 50% | $349,782 |
| 2011 | $13.46 | 0.34 | 1.53 | 1.87 | (0.59) | (0.08) | (0.67) | $14.66 | 14.29% | 0.61% | 2.39% | 44% | $285,697 |
| 2010 | $14.39 | 0.38 | (0.64) | (0.26) | (0.67) | — | (0.67) | $13.46 | (2.19)% | 0.62% | 2.64% | 64% | $286,817 |
| 2009 | $15.15 | 0.46 | (0.44) | 0.02 | (0.57) | (0.21) | (0.78) | $14.39 | 0.34% | 0.63% | 3.25% | 64% | $228,895 |
| 2008 | $13.70 | 0.48 | 1.58 | 2.06 | (0.61) | — | (0.61) | $15.15 | 15.29% | 0.62% | 3.21% | 74% | $250,179 |
A Class(7) |
| 2012 | $14.60 | 0.21 | (0.20) | 0.01 | (0.28) | — | (0.28) | $14.33 | 0.03% | 1.06% | 1.43% | 50% | $96,335 |
| 2011 | $13.40 | 0.27 | 1.54 | 1.81 | (0.53) | (0.08) | (0.61) | $14.60 | 13.84% | 1.06% | 1.94% | 44% | $106,044 |
| 2010 | $14.33 | 0.32 | (0.65) | (0.33) | (0.60) | — | (0.60) | $13.40 | (2.65)% | 1.07% | 2.19% | 64% | $77,065 |
| 2009 | $15.07 | 0.39 | (0.43) | (0.04) | (0.49) | (0.21) | (0.70) | $14.33 | (0.08)% | 1.08% | 2.80% | 64% | $92,778 |
| 2008 | $13.67 | 0.41 | 1.54 | 1.95 | (0.55) | — | (0.55) | $15.07 | 14.50% | 1.07% | 2.76% | 74% | $124,844 |
| For a Share Outstanding Throughout the Years Ended June 30 (except as noted) |
| Per-Share Data | Ratios and Supplemental Data |
| | | Income From Investment Operations: | Distributions From: | | | Ratio to Average Net Assets of: | | |
| | Net Asset Value, Beginning of Period | Net Investment Income (Loss)(1) | Net Realized and Unrealized Gain (Loss) | Total From Investment Operations | Net Investment Income | Net Realized Gains | Total Distributions | Net Asset Value, End of Period | Total Return(2) | Operating Expenses | Net Investment Income (Loss) | Portfolio Turnover Rate | Net Assets, End of Period (in thousands) |
| C Class |
| 2012 | $14.61 | 0.10 | (0.20) | (0.10) | (0.17) | — | (0.17) | $14.34 | (0.73)% | 1.81% | 0.68% | 50% | $7,692 |
| 2011 | $13.41 | 0.17 | 1.53 | 1.70 | (0.42) | (0.08) | (0.50) | $14.61 | 12.96% | 1.81% | 1.19% | 44% | $6,603 |
| 2010 | $14.33 | 0.20 | (0.63) | (0.43) | (0.49) | — | (0.49) | $13.41 | (3.32)% | 1.82% | 1.44% | 64% | $7,666 |
| 2009 | $15.05 | 0.28 | (0.43) | (0.15) | (0.36) | (0.21) | (0.57) | $14.33 | (0.88)% | 1.83% | 2.05% | 64% | $2,806 |
2008(4) | $14.55 | 0.22 | 0.69 | 0.91 | (0.41) | — | (0.41) | $15.05 | 6.38% | 1.82%(5) | 1.93%(5) | 74%(6) | $1,497 |
| R Class |
| 2012 | $14.63 | 0.17 | (0.20) | (0.03) | (0.24) | — | (0.24) | $14.36 | (0.22)% | 1.31% | 1.18% | 50% | $246 |
| 2011 | $13.43 | 0.24 | 1.53 | 1.77 | (0.49) | (0.08) | (0.57) | $14.63 | 13.52% | 1.31% | 1.69% | 44% | $208 |
| 2010 | $14.35 | 0.27 | (0.63) | (0.36) | (0.56) | — | (0.56) | $13.43 | (2.82)% | 1.32% | 1.94% | 64% | $233 |
| 2009 | $15.09 | 0.34 | (0.42) | (0.08) | (0.45) | (0.21) | (0.66) | $14.35 | (0.40)% | 1.33% | 2.55% | 64% | $102 |
2008(4) | $14.55 | 0.28 | 0.69 | 0.97 | (0.43) | — | (0.43) | $15.09 | 6.76% | 1.32%(5) | 2.45%(5) | 74%(6) | $28 |
Notes to Financial Highlights
| (1) | Computed using average shares outstanding throughout the period. |
| (2) | Total returns are calculated based on the net asset value of the last business day and do not reflect applicable sales charges, if any. Total returns for periods less than one year are not annualized. |
| (3) | Per-share amount was less than $0.005. |
| (4) | September 28, 2007 (commencement of sale) through June 30, 2008. |
| (6) | Portfolio turnover is calculated at the fund level. Percentage indicated was calculated for the year ended June 30, 2008. |
| (7) | Prior to September 4, 2007, the A Class was referred to as the Advisor Class. |
See Notes to Financial Statements.
Report of Independent Registered Public Accounting Firm |
To the Trustees of the American Century International Bond Funds and
Shareholders of the International Bond Fund:
In our opinion, the accompanying statement of assets and liabilities, including the schedule of investments, and the related statements of operations and of changes in net assets and the financial highlights present fairly, in all material respects, the financial position of the International Bond Fund (one of the two funds comprising the American Century International Bond Funds, hereafter referred to as the “Fund”) at June 30, 2012, the results of its operations for the year then ended, the changes in its net assets for each of the two years in the period then ended and the financial highlights for each of the periods presented, in conformity with accounting principles generally accepted in the United States of America. These financial statements and financial highlights (hereafter referred to as “financial statements”) are the responsibility of the Fund’s management; our responsibility is to express an opinion on these financial statements based on our audits. We conducted our audits of these financial statements in accordance with the standards of the Public Company Accounting Oversight Board (United States). Those standards require that we plan and perform the audit to obtain reasonable assurance about whether the financial statements are free of material misstatement. An audit includes examining, on a test basis, evidence supporting the amounts and disclosures in the financial statements, assessing the accounting principles used and significant estimates made by management, and evaluating the overall financial statement presentation. We believe that our audits, which included confirmation of securities at June 30, 2012 by correspondence with the custodian and brokers, provide a reasonable basis for our opinion.
PricewaterhouseCoopers LLP
Kansas City, Missouri
August 21, 2012
Board of Trustees
The individuals listed below serve as trustees of the funds. Each trustee will continue to serve in this capacity until death, retirement, resignation or removal from office. The mandatory retirement age for trustees who are not “interested persons,” as that term is defined in the Investment Company Act (independent trustees), is 73. However, the mandatory retirement age may be extended for a period not to exceed two years with the approval of the remaining independent trustees.
Mr. Thomas is the only trustee who is an “interested person” because he currently serves as President and Chief Executive Officer of American Century Companies, Inc. (ACC), the parent company of American Century Investment Management, Inc. (ACIM or the advisor).
The other trustees (more than three-fourths of the total number) are independent; that is, they have never been employees, directors or officers of, and have no financial interest in, ACC or any of its wholly owned, direct or indirect, subsidiaries, including ACIM, American Century Investment Services, Inc. (ACIS) and American Century Services, LLC (ACS). The trustees serve in this capacity for eight (in the case of Mr. Thomas, 15) registered investment companies in the American Century Investments family of funds.
The following table presents additional information about the trustees. The mailing address for each trustee other than Mr. Thomas is 1665 Charleston Road, Mountain View, California 94043. The mailing address for Mr. Thomas is 4500 Main Street, Kansas City, Missouri 64111.
Name (Year of Birth) | Position(s) Held with Funds | Length of Time Served | | Principal Occupation(s) During Past 5 Years | | Number of American Century Portfolios Overseen by Trustee | Other Directorships Held During Past 5 Years |
| Independent Trustees |
Tanya S. Beder (1955) | Trustee | Since 2011 | | Chairman, SBCC Group Inc. (investment advisory services)(2006 to present); Fellow in Practice, International Center for Finance, Yale University School of Management (1985 to present) | | 42 | CYS Investments, Inc. (specialty finance company) |
Jeremy I. Bulow (1954) | Trustee | Since 2011 | | Professor of Economics, Stanford University, Graduate School of Business (1979 to present) | | 42 | None |
Ronald J. Gilson (1946) | Trustee and Chairman of the Board | Since 1995 | | Charles J. Meyers Professor of Law and Business, Stanford Law School (1979 to present); Marc and Eva Stern Professor of Law and Business, Columbia University School of Law (1992 to present) | | 42 | None |
Name (Year of Birth) | Position(s) Held with Funds | Length of Time Served | | Principal Occupation(s) During Past 5 Years | | Number of American Century Portfolios Overseen by Trustee | Other Directorships Held During Past 5 Years |
| Independent Trustees |
Frederick L. A. Grauer (1946) | Trustee | Since 2008 | | Senior Advisor, BlackRock, Inc. (investment management firm) (2010 to 2011); Senior Advisor, Barclays Global Investors (investment management firm) (2003 to 2009) | | 42 | None |
Peter F. Pervere (1947) | Trustee | Since 2007 | | Retired | | 42 | Intraware, Inc. (2003 to 2009) |
Myron S. Scholes (1941) | Trustee | Since 1980 | | Chairman, Platinum Grove Asset Management, L.P. (asset manager) (1999 to 2009); Frank E. Buck Professor of Finance-Emeritus, Stanford Graduate School of Business (1996 to present) | | 42 | Dimensional Fund Advisors (investment advisor); CME Group, Inc. (futures and options exchange) |
John B. Shoven (1947) | Trustee | Since 2002 | | Professor of Economics, Stanford University (1973 to present) | | 42 | Cadence Design Systems; Exponent; Financial Engines |
| |
| Interested Trustee |
Jonathan S. Thomas (1963) | Trustee and President | Since 2007 | | President and Chief Executive Officer, ACC (March 2007 to present); Chief Administrative Officer, ACC (February 2006 to February 2007); Executive Vice President, ACC (November 2005 to February 2007). Also serves as Chief Executive Officer and Manager, ACS; Executive Vice President, ACIM; Director, ACC, ACIM and other ACC subsidiaries | | 108 | None |
Officers
The following table presents certain information about the executive officers of the funds. Each officer serves as an officer for each of the 15 investment companies in the American Century family of funds, unless otherwise noted. No officer is compensated for his or her service as an officer of the funds. The listed officers are interested persons of the funds and are appointed or re-appointed on an annual basis. The mailing address for each of the officers listed below is 4500 Main Street, Kansas City, Missouri 64111.
Name (Year of Birth) | Offices with the Funds | Principal Occupation(s) During the Past Five Years |
Jonathan S. Thomas (1963) | Trustee and President since 2007 | President and Chief Executive Officer, ACC (March 2007 to present); Chief Administrative Officer, ACC (February 2006 to February 2007); Executive Vice President, ACC (November 2005 to February 2007). Also serves as Chief Executive Officer and Manager, ACS; Executive Vice President, ACIM; Director, ACC, ACIM and other ACC subsidiaries |
Barry Fink (1955) | Executive Vice President since 2007 | Chief Operating Officer and Executive Vice President, ACC (September 2007 to present); President, ACS (October 2007 to present); Managing Director, Morgan Stanley (2000 to 2007). Also serves as Manager, ACS and Director, ACC and certain ACC subsidiaries |
Maryanne L. Roepke (1956) | Chief Compliance Officer since 2006 and Senior Vice President since 2000 | Chief Compliance Officer, American Century funds, ACIM and ACS (August 2006 to present). Also serves as Senior Vice President, ACS |
Charles A. Etherington (1957) | General Counsel since 2007 and Senior Vice President since 2006 | Attorney, ACC (February 1994 to present); Vice President, ACC (November 2005 to present), General Counsel, ACC (March 2007 to present); Also serves as General Counsel, ACIM, ACS, ACIS and other ACC subsidiaries; and Senior Vice President, ACIM and ACS |
C. Jean Wade (1964) | Vice President, Treasurer and Chief Financial Officer since 2012 | Vice President, ACS (February 2000 to present) |
Robert J. Leach (1966) | Vice President since 2006 and Assistant Treasurer since 2012 | Vice President, ACS (February 2000 to present) |
David H. Reinmiller (1963) | Vice President since 2001 | Attorney, ACC (January 1994 to present); Associate General Counsel, ACC (January 2001 to present); Also serves as Vice President, ACIM and ACS |
Ward D. Stauffer (1960) | Secretary since 2005 | Attorney, ACC (June 2003 to present) |
The Statement of Additional Information has additional information about the fund’s trustees and is available without charge, upon request, by calling 1-800-345-2021.
Approval of Management Agreement |
At a meeting held on June 14, 2012, the Fund’s Board of Directors/Trustees unanimously approved the renewal of the management agreement pursuant to which American Century Investment Management, Inc. (the “Advisor”) acts as the investment advisor for the Fund. Under Section 15(c) of the Investment Company Act, contracts for investment advisory services are required to be reviewed, evaluated, and approved by a majority of a fund’s independent directors/trustees (the “Directors”) each year.
As a part of the approval process, the Board requested and reviewed extensive data and information compiled by the Advisor and certain independent providers of evaluation data concerning the Fund and the services provided to the Fund by the Advisor. This review was in addition to the oversight and evaluation undertaken by the Board and its committees on a continuous basis throughout the year and included, but was not limited to the following:
| • | the nature, extent, and quality of investment management, shareholder services, and other services provided by the Advisor to the Fund; |
| • | the wide range of other programs and services the Advisor provides to the Fund and its shareholders on a routine and non-routine basis; |
| • | the investment performance of the fund, including data comparing the Fund’s performance to appropriate benchmarks and/or a peer group of other mutual funds with similar investment objectives and strategies; |
| • | data comparing the cost of owning the Fund to the cost of owning similar funds; |
| • | the Advisor’s compliance policies, procedures, and regulatory experience; |
| • | financial data showing the cost of services provided to the Fund, the profitability of the Fund to the Advisor, and the overall profitability of the Advisor; |
| • | data comparing services provided and charges to other investment management clients of the Advisor; and |
| • | consideration of collateral benefits derived by the Advisor from the management of the Fund and any potential economies of scale relating thereto. |
In keeping with its practice, the Board held two in-person meetings to review and discuss the information provided. The Board also had the benefit of the advice of its independent counsel throughout the period.
Factors Considered
The Directors considered all of the information provided by the Advisor, the independent data providers, and the Board’s independent counsel, and evaluated such information for the Fund. In connection with their review, the Directors did not identify any single factor as being all-important or controlling, and each Director may have attributed different levels of importance to different factors. In deciding to renew the management agreement, the Board based its decision on a number of factors, including the following:
Nature, Extent and Quality of Services — Generally. Under the management agreement, the Advisor is responsible for providing or arranging for all services necessary for the operation of the Fund. The Board noted that under the management agreement, the Advisor provides or arranges at its own expense a wide variety of services including:
| • | constructing and designing the Fund |
| • | portfolio research and security selection |
| • | initial capitalization/funding |
| • | daily valuation of the Fund’s portfolio |
| • | shareholder servicing and transfer agency, including shareholder confirmations, recordkeeping, and communications |
| • | regulatory and portfolio compliance |
| • | marketing and distribution |
The Board noted that many of these services have expanded over time both in terms of quantity and complexity in response to shareholder demands, competition in the industry, changing distribution channels, and the changing regulatory environment.
Investment Management Services. The nature of the investment management services provided to the Fund is quite complex and allows Fund shareholders access to professional money management, instant diversification of their investments within an asset class, the opportunity to easily diversify among asset classes by investing in or exchanging among various American Century Investments funds, and liquidity. In evaluating investment performance, the Board expects the Advisor to manage the Fund in accordance with its investment objectives and approved strategies. Further, the Directors recognize that the Advisor has an obligation to seek the best execution of fund trades. In providing these services, the Advisor utilizes teams of investment professionals (portfolio managers, analysts, research assistants, and securities traders) who require extensive information technology, research, training, compliance and other systems to conduct their business. The Board, directly and through its Portfolio Committee, regularly reviews investment performance information for the Fund, together with comparative information for appropriate benchmarks and/or peer groups of similarly-managed funds, over different time horizons. The Directors also review detailed performance information during the management agreement approval
process. If performance concerns are identified, the Fund receives special reviews until performance improves, during which the Board discusses with the Advisor the reasons for such results (e.g., market conditions, security selection) and any efforts being undertaken to improve performance. The Board found the investment management services provided by the Advisor to the Fund to meet or exceed industry standards. More detailed information about the Fund’s performance can be found in the Performance and Portfolio Commentary sections of this report.
Shareholder and Other Services. Under the management agreement, the Advisor provides the Fund with a comprehensive package of transfer agency, shareholder, and other services. The Board, directly and through various committees of the Board, regularly reviews reports and evaluations of such services at its regular meetings. These reports include, but are not limited to, information regarding the operational efficiency and accuracy of the shareholder and transfer agency services provided, staffing levels, shareholder satisfaction (as measured by external as well as internal sources), technology support, new products and services offered to Fund shareholders, securities trading activities, portfolio valuation services, auditing services, and legal and operational compliance activities. Certain aspects of shareholder and transfer agency service level efficiency and the quality of securities trading activities are measured by independent third party providers and are presented in comparison to other fund groups not managed by the Advisor. The Board found the services provided by the Advisor to the Fund under the management agreement to be competitive and of high quality.
Costs of Services and Profitability. The Advisor provides detailed information concerning its cost of providing various services to the Fund, its profitability in managing the Fund, its overall profitability, and its financial condition. The Directors have reviewed with the Advisor the methodology used to prepare this financial information. The financial information regarding the Advisor is considered in evaluating the Advisor’s financial condition, ability to continue to provide services under the management agreement, and the reasonableness of the current management fee. The Board concluded that the Advisor’s profits were reasonable in light of the services provided to the Fund.
Ethics. The Board generally considers the Advisor’s commitment to providing quality services to shareholders and to conducting its business ethically. They noted that the Advisor’s practices generally meet or exceed industry best practices.
Economies of Scale. The Board also reviewed information provided by the Advisor regarding the possible existence of economies of scale in connection with the management of the Fund. The Board concluded that economies of scale are difficult to measure and predict with precision, especially on a fund-by-fund basis. The Board concluded that the Advisor is appropriately sharing economies of scale through its competitive fee structure, offering competitive fees from fund inception, and through reinvestment in its business to provide shareholders additional content and services.
Comparison to Other Funds’ Fees. The management agreement provides that the Fund pay the Advisor a single, all-inclusive (or unified) management fee for providing all services necessary for the management and operation of the Fund, other than brokerage expenses, taxes, interest, extraordinary expenses, and the fees and expenses of the Fund’s independent directors (including their independent legal counsel) and expenses incurred in connection with the provision of shareholder services and distribution services under a plan adopted pursuant to Rule 12b-1 under the 1940 Act. Under the unified fee structure, the Advisor is responsible for providing all investment advisory, custody, audit, administrative, compliance, recordkeeping, marketing and shareholder services, or arranging and supervising third parties to provide such services. By contrast, most other funds are charged a variety of fees, including an investment advisory fee, a transfer agency fee, an administrative fee, distribution charges and other expenses. Other than their investment advisory fees and any applicable Rule 12b-1 distribution fees, all other components of the total fees charged by these other funds may be increased without shareholder approval. The Board believes the unified fee structure is a benefit to Fund shareholders because it clearly discloses to shareholders the cost of owning Fund shares, and, since the unified fee cannot be increased without a vote of Fund shareholders, it shifts to the Advisor the risk of increased costs of operating the Fund and provides a direct incentive to minimize administrative inefficiencies. Part of the Board’s analysis of fee levels involves reviewing certain evaluative data compiled by an independent provider and comparing the Fund’s unified fee to the total expense ratio of other funds in the Fund’s peer group. The Board concluded that the management fee paid by the Fund to the Advisor under the management agreement is reasonable in light of the services provided to the Fund.
Comparison to Fees and Services Provided to Other Clients of the Advisor. The Board also requested and received information from the Advisor concerning the nature of the services, fees, costs and profitability of its advisory services to advisory clients other than the Fund. They observed that these varying types of client accounts require different services and involve different regulatory and entrepreneurial risks than the management of the Fund. The Board analyzed this information and concluded that the fees charged and services provided to the Fund were reasonable by comparison.
Collateral or “Fall-Out” Benefits Derived by the Advisor. The Board considered the existence of collateral benefits the Advisor may receive as a result of its relationship with the Fund. They concluded that the Advisor’s primary business is managing mutual funds and it generally does not use fund or shareholder information to generate profits in other lines of business, and therefore does not derive any significant collateral benefits from them. The Board noted that the Advisor receives proprietary research from broker-dealers that execute fund portfolio transactions and concluded that this research is likely to benefit Fund shareholders. The Board also determined that the Advisor is able to provide investment management services to certain clients other than the Fund, at least in part, due to its existing infrastructure built to serve the fund complex. The Board concluded, however, that the assets of those other clients are not material to the analysis and, where applicable, may be included with the assets of the Fund to determine breakpoints in the management fee schedule.
Existing Relationship. The Board also considered whether there was any reason for not continuing the existing arrangement with the Advisor. In this regard, the Board was mindful of the potential disruptions of the Fund’s operations and various risks, uncertainties, and other effects that could occur as a result of a decision not to continue such relationship. In particular, the Board recognized that most shareholders have invested in the Fund on the strength of the Advisor’s industry standing and reputation and in the expectation that the Advisor will have a continuing role in providing advisory services to the Fund.
Conclusion of the Directors. As a result of this process, the Board, including all of the independent directors and assisted by the advice of independent legal counsel, taking into account all of the factors discussed above and the information provided by the Advisor and others, concluded that the management agreement between the Fund and the Advisor is fair and reasonable in light of the services provided and should be renewed.
Retirement Account Information
As required by law, distributions you receive from certain IRAs, or 403(b), 457 and qualified plans are subject to federal income tax withholding, unless you elect not to have withholding apply. Tax will be withheld on the total amount withdrawn even though you may be receiving amounts that are not subject to withholding, such as nondeductible contributions. In such case, excess amounts of withholding could occur. You may adjust your withholding election so that a greater or lesser amount will be withheld.
If you don’t want us to withhold on this amount, you must notify us to not withhold the federal income tax. You may notify us in writing or in certain situations by telephone or through other electronic means. You have the right to revoke your withholding election at any time and any election you make may remain in effect until revoked by filing a new election.
Remember, even if you elect not to have income tax withheld, you are liable for paying income tax on the taxable portion of your withdrawal. If you elect not to have income tax withheld or you don’t have enough income tax withheld, you may be responsible for payment of estimated tax. You may incur penalties under the estimated tax rules if your withholding and estimated tax payments are not sufficient. You can reduce or defer the income tax on a distribution by directly or indirectly rolling such distribution over to another IRA or eligible plan. You should consult your tax advisor for additional information.
State tax will be withheld if, at the time of your distribution, your address is within one of the mandatory withholding states and you have federal income tax withheld. State taxes will be withheld from your distribution in accordance with the respective state rules.
Proxy Voting Guidelines
American Century Investment Management, Inc., the fund’s investment advisor, is responsible for exercising the voting rights associated with the securities purchased and/or held by the fund. A description of the policies and procedures the advisor uses in fulfilling this responsibility is available without charge, upon request, by calling 1-800-345-2021. It is also available on American Century Investments’ website at americancentury.com and on the Securities and Exchange Commission’s website at sec.gov. Information regarding how the investment advisor voted proxies relating to portfolio securities during the most recent 12-month period ended June 30 is available on the “About Us” page at americancentury.com. It is also available at sec.gov.
Quarterly Portfolio Disclosure
The fund files its complete schedule of portfolio holdings with the Securities and Exchange Commission (SEC) for the first and third quarters of each fiscal year on Form N-Q. The fund’s Forms N-Q are available on the SEC’s website at sec.gov, and may be reviewed and copied at the SEC’s Public Reference Room in Washington, DC. Information on the operation of the Public Reference Room may be obtained by calling 1-800-SEC-0330. The fund also makes its complete schedule of portfolio holdings for the most recent quarter of its fiscal year available on its website at americancentury.com and, upon request, by calling 1-800-345-2021.
Other Tax Information
The following information is provided pursuant to provisions of the Internal Revenue Code.
The fund hereby designates $29,489 as qualified short-term capital gain distributions for purposes of Internal Revenue Code Section 871.
| Contact Us | americancentury.com |
| Automated Information Line | 1-800-345-8765 |
| Investor Services Representative | 1-800-345-2021 or 816-531-5575 |
| Investors Using Advisors | 1-800-378-9878 |
| Business, Not-For-Profit, Employer-Sponsored Retirement Plans | 1-800-345-3533 |
| Banks and Trust Companies, Broker-Dealers, Financial Professionals, Insurance Companies | 1-800-345-6488 |
| Telecommunications Device for the Deaf | 1-800-634-4113 |
American Century International Bond Funds
Investment Advisor:
American Century Investment Management, Inc.
Kansas City, Missouri
This report and the statements it contains are submitted for the general information of our shareholders. The report is not authorized for distribution to prospective investors unless preceded or accompanied by an effective prospectus.
©2012 American Century Proprietary Holdings, Inc. All rights reserved.
CL-ANN-75841 1208
ITEM 2. CODE OF ETHICS.
ITEM 3. AUDIT COMMITTEE FINANCIAL EXPERT.
ITEM 4. PRINCIPAL ACCOUNTANT FEES AND SERVICES.
The aggregate fees billed for each of the last two fiscal years for professional services rendered by the principal accountant for the audit of the registrant’s annual financial statements or services that are normally provided by the accountant in connection with statutory and regulatory filings or engagements for those fiscal years were as follows:
The aggregate fees billed in each of the last two fiscal years for assurance and related services by the principal accountant that are reasonably related to the performance of the audit of the registrant’s financial statements and are not reported under paragraph (a) of this Item were as follows:
Fees required to be approved pursuant to paragraph (c)(7)(ii) of Rule 2-01 of Regulation S-X (relating to certain engagements for non-audit services with the registrant’s investment adviser and its affiliates):
The aggregate fees billed in each of the last two fiscal years for professional services rendered by the principal accountant for tax compliance, tax advice, and tax planning were as follows:
Fees required to be approved pursuant to paragraph (c)(7)(ii) of Rule 2-01 of Regulation S-X (relating to certain engagements for non-audit services with the registrant’s investment adviser and its affiliates):
The aggregate fees billed in each of the last two fiscal years for products and services provided by the principal accountant, other than the services reported in paragraphs (a) through (c) of this Item were as follows:
Fees required to be approved pursuant to paragraph (c)(7)(ii) of Rule 2-01 of Regulation S-X (relating to certain engagements for non-audit services with the registrant’s investment adviser and its affiliates):
ITEM 5. AUDIT COMMITTEE OF LISTED REGISTRANTS.
ITEM 6. INVESTMENTS.
ITEM 7. DISCLOSURE OF PROXY VOTING POLICIES AND PROCEDURES FOR CLOSED-END MANAGEMENT INVESTMENT COMPANIES.
ITEM 8. PORTFOLIO MANAGERS OF CLOSED-END MANAGEMENT INVESTMENT COMPANIES.
ITEM 9. PURCHASES OF EQUITY SECURITIES BY CLOSED-END MANAGEMENT INVESTMENT COMPANY AND AFFILIATED PURCHASERS.
ITEM 10. SUBMISSION OF MATTERS TO A VOTE OF SECURITY HOLDERS.
During the reporting period, there were no material changes to the procedures by which shareholders may recommend nominees to the registrant’s board.
ITEM 11. CONTROLS AND PROCEDURES.
ITEM 12. EXHIBITS.
Pursuant to the requirements of the Securities Exchange Act of 1934 and the Investment Company Act of 1940, the registrant has duly caused this report to be signed on its behalf by the undersigned, thereunto duly authorized.
Pursuant to the requirements of the Securities Exchange Act of 1934 and the Investment Company Act of 1940, this report has been signed below by the following persons on behalf of the registrant and in the capacities and on the dates indicated.