UNITED STATES
SECURITIES AND EXCHANGE COMMISSION
Washington, D.C. 20549
FORM N-CSR
CERTIFIED SHAREHOLDER REPORT OF REGISTERED
MANAGEMENT INVESTMENT COMPANIES
Investment Company Act file number | 811-06441 |
| | |
| | |
| | |
AMERICAN CENTURY INTERNATIONAL BOND FUNDS |
(Exact name of registrant as specified in charter) |
| | |
| | |
| | |
4500 MAIN STREET, KANSAS CITY, MISSOURI | 64111 |
(Address of principal executive offices) | (Zip Code) |
| | |
| | |
| | |
CHARLES A. ETHERINGTON 4500 MAIN STREET, KANSAS CITY, MISSOURI 64111 |
(Name and address of agent for service) |
| | |
| | |
Registrant’s telephone number, including area code: | 816-531-5575 |
| | |
| | |
Date of fiscal year end: | 06-30 |
| | |
| | |
Date of reporting period: | 06-30-2013 |
ITEM 1. REPORTS TO STOCKHOLDERS.
ANNUAL REPORT | JUNE 30, 2013 |


Global Bond Fund
President’s Letter | 2 |
Market Perspective | 3 |
Performance | 4 |
Portfolio Commentary | 6 |
Fund Characteristics | 8 |
Shareholder Fee Example | 9 |
Schedule of Investments | 11 |
Statement of Assets and Liabilities | 26 |
Statement of Operations | 27 |
Statement of Changes in Net Assets | 28 |
Notes to Financial Statements | 29 |
Financial Highlights | 36 |
Report of Independent Registered Public Accounting Firm | 38 |
Management | 39 |
Approval of Management Agreement | 42 |
Additional Information | 47 |
Any opinions expressed in this report reflect those of the author as of the date of the report, and do not necessarily represent the opinions of American Century Investments® or any other person in the American Century Investments organization. Any such opinions are subject to change at any time based upon market or other conditions and American Century Investments disclaims any responsibility to update such opinions. These opinions may not be relied upon as investment advice and, because investment decisions made by American Century Investments funds are based on numerous factors, may not be relied upon as an indication of trading intent on behalf of any American Century Investments fund. Security examples are used for representational purposes only and are not intended as recommendations to purchase or sell securities. Performance information for comparative indices and securities is provided to American Century Investments by third party vendors. To the best of American Century Investments’ knowledge, such information is accurate at the time of printing.

Jonathan Thomas
Dear Investor:
Thank you for reviewing this annual report for the 12 months ended June 30, 2013. It provides investment performance, market analysis, and portfolio information, presented with the expert perspective of our portfolio management team.
Annual reports remain important vehicles for conveying information about fund returns, including key factors that affected fund performance. For additional, updated investment and market insights, we encourage you to visit our website, americancentury.com.
Generally Favorable Fiscal-Year Returns for U.S. Stocks and High-Yield Bonds
The 12-month reporting period began in the summer of 2012 with uncertainties caused by slowing economies, as well as the upcoming November elections and year-end fiscal deadlines in the U.S. It ended with more uncertainty about the future of U.S. monetary stimulus. In between, aggressive monetary intervention by central banks encouraged investors to take more risk, generally boosting stocks at the expense of government bonds.
U.S. mid-cap, small-cap, and value stock indices achieved performance leadership during the period, outpacing the S&P 500 Index’s 20.60% return. U.S. stocks generally outperformed non-U.S. equities—the MSCI EAFE Index returned 18.62% and the MSCI Emerging Markets Index advanced 2.87%, affected by slowing growth in emerging market economies.
Slower emerging market growth also hindered commodity price gains and helped keep inflation under control. As a result, assets used as inflation hedges, including inflation-indexed securities and precious metals, lagged other assets. Gold, in particular, plunged, starting last October. And Treasury inflation-protected securities (TIPS) were among the lowest performers in the U.S. bond market. Bond index returns generally ranged from approximately 10% gains for U.S. corporate high-yield indices all the way down to negative returns for longer-maturity global Treasury benchmarks.
Despite signs of improvement in 2013, U.S. economic growth is subpar compared with past recession recoveries, and remains vulnerable to threats that could trigger another slowdown and market volatility. Therefore, we continue to believe in a disciplined, diversified, long-term investment approach, using professionally managed stock and bond portfolios—as appropriate—for meeting financial goals. We appreciate your continued trust in us in this volatile environment.
Sincerely,

Jonathan Thomas
President and Chief Executive Officer
American Century Investments

By David MacEwen, Chief Investment Officer, Fixed Income
Global bonds posted modestly positive returns for the 12 months ended June 30, 2013. However, for U.S. investors with unhedged currency exposure, a stronger U.S. dollar led to negative overall returns for non-U.S. bonds (see the table below).
On the economic front, global economic growth slowed early in the period, particularly in the U.S. and Europe, but also in emerging economies such as China and India. In response, central banks around the world took steps to support their respective economies. The European Central Bank pledged to help stabilize and support bond markets in fiscally troubled countries; the Federal Reserve in the U.S. and the Bank of England in the U.K. implemented additional quantitative easing measures; and the Bank of Japan embarked on an aggressive program of economic stimulus measures to end deflation and revive the long-dormant Japanese economy.
By early 2013, global economic conditions began to improve. In the U.S., a recovery in the housing market and a declining unemployment rate led the Federal Reserve to signal that it may taper back its quantitative easing measures before the end of the year. This development pushed global bond yields higher near the end of the reporting period.
Other events impacting global fixed-income markets during the period included major elections in the U.S. and Japan, the U.S. government’s efforts to resolve the fiscal cliff and the sequester (which involved the expiration of certain federal tax cuts and the implementation of automatic federal budget cuts), and a contentious bailout of the banking system in Cyprus.
U.S. bond yields rose the most for the 12 months, while yields in Japan were relatively stable. European bond markets performed best, led by peripheral countries such as Italy and Spain. The Japanese bond market generated modestly positive performance, while the U.S. bond market declined for the period. From a sector perspective, corporate bonds and other non-government securities outperformed government bonds on a global basis during the reporting period.
A stronger U.S. dollar reduced non-U.S. bond returns for U.S. investors. In particular, the dollar appreciated by 24% versus the Japanese yen, reflecting the changing central bank policies in each country. The U.S. dollar also appreciated by 3% against the British pound and 12% against the Australian dollar. The main exception was the euro—the dollar declined by about 3% versus the euro for the 12-month period.
Major Currency and Global Bond Market Returns |
For the 12 months ended June 30, 2013 |
Currency Returns* | |
U.S. Dollar vs. Euro | -2.78% |
U.S. Dollar vs. Japanese Yen | 24.07% |
International Bond Market Returns (in U.S. dollars) | |
Barclays Global Treasury ex-U.S. Bond Index | -5.92% |
Barclays Global Aggregate Bond Index (USD, hedged) | 1.70% |
*All percentage changes in foreign exchange rates are calculated on the basis of that currency per one U.S. dollar.
Total Returns as of June 30, 2013 |
| | | | Average
Annual Returns | |
| | Ticker Symbol | 1 year | Since Inception | Inception Date |
Investor Class | AGBVX | 1.34% | 2.30% | 1/31/12 |
Barclays Global Aggregate
Bond Index (USD, hedged) | — | 1.70% | 2.43% | — |
Institutional Class | AGBNX | 1.53% | 2.50% | 1/31/12 |
A Class No sales charge* With sales charge* | AGBAX | 1.11% -3.44% | 2.06% -1.20% | 1/31/12 |
C Class | AGBTX | 0.32% | 1.29% | 1/31/12 |
R Class | AGBRX | 0.78% | 1.76% | 1/31/12 |
*Sales charges include initial sales charges and contingent deferred sales charges (CDSCs), as applicable. A Class shares have a 4.50% maximum initial sales charge and may be subject to a maximum CDSC of 1.00%. C Class shares redeemed within 12 months of purchase are subject to a maximum CDSC of 1.00%. The SEC requires that mutual funds provide performance information net of maximum sales charges in all cases where charges could be applied.
Data presented reflect past performance. Past performance is no guarantee of future results. Current performance may be higher or lower than the performance shown. Investment return and principal value will fluctuate, and redemption value may be more or less than original cost. To obtain performance data current to the most recent month end, please call 1-800-345-2021 or visit americancentury.com. As interest rates rise, bond values will decline. International investing involves special risks, such as political instability and currency fluctuations. Investing in emerging markets may accentuate these risks.
Unless otherwise indicated, performance reflects Investor Class shares; performance for other share classes will vary due to differences in fee structure. For information about other share classes available, please consult the prospectus. Data assumes reinvestment of dividends and capital gains, and none of the charts reflect the deduction of taxes that a shareholder would pay on fund distributions or the redemption of fund shares. Returns for the index are provided for comparison. The fund’s total returns include operating expenses (such as transaction costs and management fees) that reduce returns, while the total returns of the index do not.
Growth of $10,000 Over Life of Class |
$10,000 investment made January 31, 2012 |
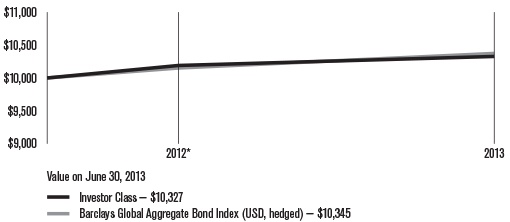
*From 1/31/12, the Investor Class’s inception date. Not annualized.
Total Annual Fund Operating Expenses |
Investor Class | Institutional Class | A Class | C Class | R Class |
0.96% | 0.76% | 1.21% | 1.96% | 1.46% |
The total annual fund operating expenses shown is as stated in the fund’s prospectus current as of the date of this report. The prospectus may vary from the expense ratio shown elsewhere in this report because it is based on a different time period, includes acquired fund fees and expenses, and, if applicable, does not include fee waivers or expense reimbursements.
Data presented reflect past performance. Past performance is no guarantee of future results. Current performance may be higher or lower than the performance shown. Investment return and principal value will fluctuate, and redemption value may be more or less than original cost. To obtain performance data current to the most recent month end, please call 1-800-345-2021 or visit americancentury.com. As interest rates rise, bond values will decline. International investing involves special risks, such as political instability and currency fluctuations. Investing in emerging markets may accentuate these risks.
Unless otherwise indicated, performance reflects Investor Class shares; performance for other share classes will vary due to differences in fee structure. For information about other share classes available, please consult the prospectus. Data assumes reinvestment of dividends and capital gains, and none of the charts reflect the deduction of taxes that a shareholder would pay on fund distributions or the redemption of fund shares. Returns for the index are provided for comparison. The fund’s total returns include operating expenses (such as transaction costs and management fees) that reduce returns, while the total returns of the index do not.
Portfolio Managers: John Lovito, Simon Chester, Edward Boyle, Robert Gahagan, and David MacEwen
Performance Summary
Global Bond returned 1.34%* for the fiscal year ended June 30, 2013, compared with the 1.70% return of the fund’s benchmark index, the Barclays Global Aggregate Bond Index (USD, hedged). (See pages 4 and 5 for additional performance comparisons.)
The positive performance for both Global Bond and its benchmark index, which is hedged to remove the effects of currency fluctuations, reflected the modestly positive returns in global bond markets for the reporting period (see page 3 for more details). Sector allocation in the U.S. portion of the portfolio detracted from portfolio performance compared with the benchmark.
U.S. Bond Component Detracted
The fund’s U.S. bond holdings, which comprised about 40% of the portfolio, contributed to the fund’s underperformance of its benchmark. This underperformance occurred largely during the last six months of the period, when overweight positions in Treasury inflation-protected securities (TIPS), which are not represented in the benchmark, and investment-grade corporate bonds weighed on results.
An overweight position in mortgage-backed securities also detracted from performance as mortgage-backed securities declined during the reporting period. However, security selection in this segment of the portfolio contributed positively to relative results; in particular, exposure to commercial mortgage-backed securities and non-government-agency residential mortgage-backed securities boosted performance.
Other favorable strategies in the U.S. portion of the portfolio included an underweight position in Treasury securities, which lagged during the 12-month period, and a small position in high-yield corporate securities, which were the best-performing sector of the U.S. bond market during the period.
As interest rates increased late in the reporting period, we reduced the portfolio’s exposure to corporate bonds, taking profits in selected securities and shifting the proceeds into more-liquid segments of the bond market. In addition, we sold some mortgage-backed securities comprised of conventional fixed-rate 30-year mortgages and replaced them with shorter-term adjustable-rate mortgages that typically fare better in a rising interest rate environment.
Non-U.S. Holdings Outperformed
The fund’s non-U.S. bond holdings, which comprised the remaining 60% of the portfolio, contributed positively to performance versus the benchmark index. Exposure to credit-related bonds outside of the U.S. added value as non-government securities outperformed government bonds thanks to strong investor demand for higher-yielding investments. The fund’s non-government bonds in
*All fund returns referenced in this commentary are for Investor Class shares.
this segment of the portfolio include corporate bonds, secured bonds (which are typically backed by mortgages or other loans), and securities issued by supra-national organizations (such as the European Investment Bank).
The fund’s non-U.S. bond market positioning generated mixed results for the 12-month period. An underweight position in Germany, combined with overweight positions in Norway and Sweden, added value during the period. In addition, an overweight position in Spain and a corresponding underweight position in Italy contributed positively to performance. On the downside, underweight positions in core European markets other than Germany (including France and Belgium) and in Asia (specifically Japan and South Korea) detracted from relative results.
Currency Positioning Mixed but Positive Overall
Although the portfolio typically hedges its foreign currency exposure, we take modest tactical currency positions in an effort to add value to performance. During the fiscal year, the fund’s currency positioning aided results. The most beneficial position was an underweight in the Japanese yen, which declined sharply against all major currencies as the Bank of Japan enacted aggressive economic stimulus measures. Overweight positions in the Norwegian krone and the Swedish krona also added value during the period.
On the downside, overweight positions in the currencies of resource-based economies, such as the Australian dollar and New Zealand dollar, weighed on performance as slowing economic growth in emerging markets reduced demand for commodities. An underweight position in the euro, which appreciated against the U.S. dollar, also detracted from portfolio performance.
Toward the end of the period, we eliminated the fund’s overweight positions in the commodity-oriented currencies, as well as its underweight position in the Japanese yen. We also shifted to an overweight position in the U.S. dollar, as expectations of higher interest rates in the U.S. should help strengthen the dollar in the near term.
Positioning for the Future
Economies in developed regions of the world have largely stabilized, but growth has slowed somewhat in developing economies such as China and Brazil. It remains to be seen whether these economies will begin to recover in the coming months or decelerate further. In addition, any policy shifts by the Federal Reserve (the U.S. central bank) in the second half of the year could negatively impact growth in the U.S. and other developed countries.
We continue to believe that global bond yields will remain in a relatively narrow range in the second half of 2013, but at a higher level than in the recent past. We see value in credit-related securities, both in the U.S. and abroad, as investor demand for yield remains robust.
JUNE 30, 2013 |
Portfolio at a Glance |
Average Duration (effective) | 6.0 years |
Weighted Average Life | 8.2 years |
| | |
Bond Holdings by Country | % of net assets |
United States | 42.8% |
Japan | 15.5% |
United Kingdom | 6.7% |
France(1) | 4.6% |
Germany(1) | 3.9% |
Italy(1) | 3.4% |
Spain(1) | 3.2% |
Canada | 2.8% |
Netherlands(1) | 2.2% |
Multi-National | 2.2% |
Other Countries | 9.9% |
Cash and Equivalents(2) | 2.8% |
(1)These countries are members of the eurozone. (2)Includes temporary cash investments and other assets and liabilities. |
| | |
Types of Investments in Portfolio | % of net assets |
Sovereign Governments and Agencies | 45.0% |
Corporate Bonds | 24.2% |
U.S. Government Agency Mortgage-Backed Securities | 13.3% |
Collateralized Mortgage Obligations | 5.9% |
U.S. Treasury Securities | 4.9% |
Commercial Mortgage-Backed Securities | 3.2% |
Municipal Securities | 0.7% |
Temporary Cash Investments | 4.1% |
Other Assets and Liabilities | (1.3)% |
Fund shareholders may incur two types of costs: (1) transaction costs, including sales charges (loads) on purchase payments and redemption/exchange fees; and (2) ongoing costs, including management fees; distribution and service (12b-1) fees; and other fund expenses. This example is intended to help you understand your ongoing costs (in dollars) of investing in your fund and to compare these costs with the ongoing cost of investing in other mutual funds.
The example is based on an investment of $1,000 made at the beginning of the period and held for the entire period from January 1, 2013 to June 30, 2013.
Actual Expenses
The table provides information about actual account values and actual expenses for each class. You may use the information, together with the amount you invested, to estimate the expenses that you paid over the period. First, identify the share class you own. Then simply divide your account value by $1,000 (for example, an $8,600 account value divided by $1,000 = 8.6), then multiply the result by the number under the heading “Expenses Paid During Period” to estimate the expenses you paid on your account during this period.
If you hold Investor Class shares of any American Century Investments fund, or Institutional Class shares of the American Century Diversified Bond Fund, in an American Century Investments account (i.e., not a financial intermediary or retirement plan account), American Century Investments may charge you a $12.50 semiannual account maintenance fee if the value of those shares is less than $10,000. We will redeem shares automatically in one of your accounts to pay the $12.50 fee. In determining your total eligible investment amount, we will include your investments in all personal accounts (including American Century Investments Brokerage accounts) registered under your Social Security number. Personal accounts include individual accounts, joint accounts, UGMA/UTMA accounts, personal trusts, Coverdell Education Savings Accounts and IRAs (including traditional, Roth, Rollover, SEP-, SARSEP- and SIMPLE-IRAs), and certain other retirement accounts. If you have only business, business retirement, employer-sponsored or American Century Investments Brokerage accounts, you are currently not subject to this fee. If you are subject to the Account Maintenance Fee, your account value could be reduced by the fee amount.
Hypothetical Example for Comparison Purposes
The table also provides information about hypothetical account values and hypothetical expenses based on the actual expense ratio of each class of your fund and an assumed rate of return of 5% per year before expenses, which is not the actual return of a fund’s share class. The hypothetical account values and expenses may not be used to estimate the actual ending account balance or expenses you paid for the period. You may use this information to compare the ongoing costs of investing in your fund and other funds. To do so, compare this 5% hypothetical example with the 5% hypothetical examples that appear in the shareholder reports of the other funds.
Please note that the expenses shown in the table are meant to highlight your ongoing costs only and do not reflect any transactional costs, such as sales charges (loads) or redemption/exchange fees. Therefore, the table is useful in comparing ongoing costs only, and will not help you determine the relative total costs of owning different funds. In addition, if these transactional costs were included, your costs would have been higher.
| | | | | |
| | Beginning
Account Value 1/1/13 | Ending
Account Value 6/30/13 | Expenses Paid During Period(1) 1/1/13 – 6/30/13 | Annualized
Expense Ratio(1) |
Actual | | | | |
Investor Class | $1,000 | $982.30 | $4.72 | 0.96% |
Institutional Class | $1,000 | $983.30 | $3.74 | 0.76% |
A Class | $1,000 | $981.30 | $5.94 | 1.21% |
C Class | $1,000 | $978.30 | $9.61 | 1.96% |
R Class | $1,000 | $980.30 | $7.17 | 1.46% |
Hypothetical | | | | |
Investor Class | $1,000 | $1,020.03 | $4.81 | 0.96% |
Institutional Class | $1,000 | $1,021.03 | $3.81 | 0.76% |
A Class | $1,000 | $1,018.79 | $6.06 | 1.21% |
C Class | $1,000 | $1,015.08 | $9.79 | 1.96% |
R Class | $1,000 | $1,017.56 | $7.30 | 1.46% |
(1) | Expenses are equal to the class’s annualized expense ratio listed in the table above, multiplied by the average account value over the period, multiplied by 181, the number of days in the most recent fiscal half-year, divided by 365, to reflect the one-half year period. |
JUNE 30, 2013
Sovereign Governments and Agencies — 45.0% | |
AUSTRALIA — 1.0% | |
Australia Government Bond, 5.75%, 7/15/22 | AUD | | 150,000 | | | $158,616 | |
New South Wales Treasury Corp., 5.50%, 3/1/17 | AUD | | 145,000 | | | 143,045 | |
| | | | | | | 301,661 | |
AUSTRIA — 1.1% | |
Austria Government Bond, 3.40%, 10/20/14(1) | EUR | | 100,000 | | | 135,739 | |
Austria Government Bond, 4.35%, 3/15/19(1) | EUR | | 75,000 | | | 114,051 | |
Austria Government Bond, 3.90%, 7/15/20(1) | EUR | | 40,000 | | | 60,152 | |
Austria Government Bond, 4.15%, 3/15/37(1) | EUR | | 10,000 | | | 16,103 | |
| | | | | | | 326,045 | |
BELGIUM — 0.6% | |
Belgium Government Bond, 4.00%, 3/28/18 | EUR | | 30,000 | | | 43,836 | |
Belgium Government Bond, 3.75%, 9/28/20 | EUR | | 25,000 | | | 36,415 | |
Belgium Government Bond, 5.00%, 3/28/35 | EUR | | 65,000 | | | 106,079 | |
| | | | | | | 186,330 | |
BRAZIL — 0.2% | |
Brazilian Government International Bond, 5.875%, 1/15/19 | | 40,000 | | | 45,760 | |
CANADA — 2.4% | |
Canadian Government Bond, 4.00%, 6/1/17 | CAD | | 170,000 | | | 176,055 | |
Canadian Government Bond, 3.75%, 6/1/19 | CAD | | 65,000 | | | 67,851 | |
Canadian Government Bond, 3.25%, 6/1/21 | CAD | | 170,000 | | | 173,285 | |
Canadian Government Bond, 5.75%, 6/1/33 | CAD | | 55,000 | | | 75,117 | |
Canadian Government Bond, 4.00%, 6/1/41 | CAD | | 30,000 | | | 34,519 | |
Province of British Columbia, 4.10%, 12/18/19 | CAD | | 65,000 | | | 67,409 | |
Province of Ontario Canada, 1.60%, 9/21/16 | | 40,000 | | | 40,612 | |
Province of Ontario Canada, 4.65%, 6/2/41 | CAD | | 70,000 | | | 74,721 | |
| | | | | | | 709,569 | |
COLOMBIA† | |
Colombia Government International Bond, 4.375%, 7/12/21 | | 10,000 | | | 10,440 | |
CZECH — 0.1% | |
Czech Republic Government Bond, 4.70%, 9/12/22 | CZK | | 600,000 | | | 35,838 | |
DENMARK — 0.3% | |
Denmark Government Bond, 4.00%, 11/15/19 | DKK | | 350,000 | | | 72,015 | |
Denmark Government Bond, 4.50%, 11/15/39 | DKK | | 55,000 | | | 13,563 | |
| | | | | | | 85,578 | |
FINLAND — 0.2% | |
Finland Government Bond, 1.625%, 9/15/22 | EUR | | 45,000 | | | 57,291 | |
FRANCE — 2.1% | |
France Government Bond OAT, 4.00%, 4/25/14 | EUR | | 55,000 | | | 73,863 | |
France Government Bond OAT, 3.25%, 10/25/21 | EUR | | 200,000 | | | 285,157 | |
France Government Bond OAT, 5.50%, 4/25/29 | EUR | | 75,000 | | | 129,444 | |
France Government Bond OAT, 4.75%, 4/25/35 | EUR | | 75,000 | | | 121,465 | |
| | | | | | | 609,929 | |
GERMANY — 2.4% | |
Bundesobligation, 2.00%, 2/26/16 | EUR | | 90,000 | | | 122,512 | |
Bundesrepublik Deutschland, 2.25%, 9/4/20 | EUR | | 290,000 | | | 405,762 | |
Bundesrepublik Deutschland, 4.25%, 7/4/39 | EUR | | 95,000 | | | 166,275 | |
| | | | | | | 694,549 | |
IRELAND — 0.5% | |
Ireland Government Bond, 4.00%, 1/15/14 | EUR | | 70,000 | | | 92,890 | |
Ireland Government Bond, 5.90%, 10/18/19 | EUR | | 35,000 | | | 51,361 | |
| | | | | | | 144,251 | |
ITALY — 3.1% | |
Italy Buoni Poliennali Del Tesoro, 3.75%, 8/1/15 | EUR | | 185,000 | | | 248,281 | |
Italy Buoni Poliennali Del Tesoro, 4.50%, 5/1/23 | EUR | | 400,000 | | | $521,180 | |
Italy Buoni Poliennali Del Tesoro, 4.00%, 2/1/37 | EUR | | 135,000 | | | 157,567 | |
| | | | | | | 927,028 | |
JAPAN — 15.5% | |
Japan Government Ten Year Bond, 1.20%, 6/20/15 | JPY | | 143,300,000 | | | 1,475,295 | |
Japan Government Ten Year Bond, 1.50%, 9/20/18 | JPY | | 105,000,000 | | | 1,122,391 | |
Japan Government Ten Year Bond, 1.00%, 12/20/21 | JPY | | 83,000,000 | | | 853,651 | |
Japan Government Thirty Year Bond, 2.40%, 3/20/37 | JPY | | 88,300,000 | | | 1,002,493 | |
Japan Government Thirty Year Bond, 2.00%, 9/20/41 | JPY | | 12,000,000 | | | 125,997 | |
| | | | | | | 4,579,827 | |
MEXICO — 0.4% | |
Mexican Bonos, 6.50%, 6/9/22 | MXN | | 900,000 | | | 73,354 | |
Mexico Government International Bond, 5.95%, 3/19/19 | | 30,000 | | | 34,485 | |
Mexico Government International Bond, 6.05%, 1/11/40 | | 20,000 | | | 21,900 | |
| | | | | | | 129,739 | |
MULTI-NATIONAL — 2.2% | |
European Investment Bank, 2.50%, 7/15/15 | EUR | | 130,000 | | | 176,477 | |
European Investment Bank, MTN, 3.625%, 1/15/21 | EUR | | 50,000 | | | 73,455 | |
European Investment Bank, MTN, 2.25%, 10/14/22 | EUR | | 200,000 | | | 262,599 | |
International Bank for Reconstruction & Development, MTN, 3.875%, 5/20/19 | EUR | | 85,000 | | | 127,169 | |
| | | | | | | 639,700 | |
NETHERLANDS — 1.5% | |
Netherlands Government Bond, 4.00%, 7/15/16(1) | EUR | | 140,000 | | | 201,053 | |
Netherlands Government Bond, 3.50%, 7/15/20(1) | EUR | | 150,000 | | | 220,667 | |
Netherlands Government Bond, 4.00%, 1/15/37(1) | EUR | | 20,000 | | | 32,330 | |
| | | | | | | 454,050 | |
NEW ZEALAND — 0.1% | |
New Zealand Government Bond, 5.00%, 3/15/19 | NZD | | 50,000 | | | 41,463 | |
NORWAY — 1.4% | |
Norway Government Bond, 4.25%, 5/19/17 | NOK | | 250,000 | | | 45,178 | |
Norway Government Bond, 3.75%, 5/25/21 | NOK | | 2,000,000 | | | 362,835 | |
| | | | | | | 408,013 | |
PERU† | |
Peruvian Government International Bond, 6.55%, 3/14/37 | | 10,000 | | | 11,850 | |
POLAND† | |
Poland Government International Bond, 3.00%, 3/17/23 | | 10,000 | | | 9,050 | |
SINGAPORE — 0.2% | |
Singapore Government Bond, 3.125%, 9/1/22 | SGD | | 60,000 | | | 50,514 | |
SOUTH AFRICA — 0.3% | |
South Africa Government Bond, 7.75%, 2/28/23 | ZAR | | 700,000 | | | 71,505 | |
SOUTH KOREA — 0.1% | |
Korea Development Bank (The), 3.25%, 3/9/16 | | 40,000 | | | 41,437 | |
SPAIN — 2.6% | |
Spain Government Bond, 4.50%, 1/31/18 | EUR | | 500,000 | | | 675,654 | |
Spain Government Bond, 5.85%, 1/31/22 | EUR | | 60,000 | | | 85,112 | |
| | | | | | | 760,766 | |
SWEDEN — 1.8% | |
Sweden Government Bond, 6.75%, 5/5/14 | SEK | | 1,000,000 | | | 156,369 | |
Sweden Government Bond, 4.25%, 3/12/19 | SEK | | 450,000 | | | 76,299 | |
Sweden Government Bond, 3.50%, 6/1/22 | SEK | | 1,780,000 | | | 295,576 | |
| | | | | | | 528,244 | |
SWITZERLAND — 0.5% | |
Switzerland Government Bond, 2.00%, 4/28/21 | CHF | | 135,000 | | | 156,050 | |
UNITED KINGDOM — 4.4% | |
United Kingdom Gilt, 4.00%, 9/7/16 | GBP | | 210,000 | | | 352,086 | |
United Kingdom Gilt, 3.75%, 9/7/21 | GBP | | 170,000 | | | $288,460 | |
United Kingdom Gilt, 4.25%, 3/7/36 | GBP | | 125,000 | | | 216,544 | |
United Kingdom Gilt, 4.50%, 12/7/42 | GBP | | 185,000 | | | 333,455 | |
United Kingdom Gilt, 4.25%, 12/7/55 | GBP | | 60,000 | | | 105,092 | |
| | | | | | | 1,295,637 | |
TOTAL SOVEREIGN GOVERNMENTS AND AGENCIES (Cost $14,455,926) | | | 13,312,114 | |
Corporate Bonds — 24.2% | |
AEROSPACE AND DEFENSE — 0.2% | |
Lockheed Martin Corp., 4.25%, 11/15/19 | | 20,000 | | | 21,794 | |
United Technologies Corp., 5.70%, 4/15/40 | | 10,000 | | | 11,761 | |
United Technologies Corp., 4.50%, 6/1/42 | | 10,000 | | | 9,912 | |
| | | | | | | 43,467 | |
AUTOMOBILES — 0.1% | |
Ford Motor Credit Co. LLC, 5.875%, 8/2/21 | | 30,000 | | | 32,745 | |
BEVERAGES — 0.4% | |
Anheuser-Busch InBev Finance, Inc., 4.00%, 1/17/43 | | 10,000 | | | 9,104 | |
Anheuser-Busch InBev Worldwide, Inc., 7.75%, 1/15/19 | | 40,000 | | | 50,633 | |
Brown-Forman Corp., 3.75%, 1/15/43 | | 10,000 | | | 8,803 | |
Coca-Cola Co. (The), 1.80%, 9/1/16 | | 30,000 | | | 30,627 | |
SABMiller Holdings, Inc., 2.45%, 1/15/17(1) | | 20,000 | | | 20,329 | |
SABMiller Holdings, Inc., 3.75%, 1/15/22(1) | | 10,000 | | | 10,190 | |
| | | | | | | 129,686 | |
BIOTECHNOLOGY — 0.2% | |
Amgen, Inc., 2.125%, 5/15/17 | | 20,000 | | | 20,095 | |
Amgen, Inc., 4.10%, 6/15/21 | | 10,000 | | | 10,498 | |
Amgen, Inc., 5.375%, 5/15/43 | | 10,000 | | | 10,393 | |
Gilead Sciences, Inc., 4.40%, 12/1/21 | | 20,000 | | | 21,503 | |
| | | | | | | 62,489 | |
CAPITAL MARKETS — 0.3% | |
Fidelity International Ltd., MTN, 6.75%, 10/19/20 | GBP | | 50,000 | | | 83,801 | |
Jefferies Group, Inc., 5.125%, 4/13/18 | | 10,000 | | | 10,500 | |
| | | | | | | 94,301 | |
CHEMICALS — 0.2% | |
Ashland, Inc., 4.75%, 8/15/22(1) | | 10,000 | | | 9,925 | |
Eastman Chemical Co., 3.60%, 8/15/22 | | 20,000 | | | 19,303 | |
Ecolab, Inc., 4.35%, 12/8/21 | | 10,000 | | | 10,570 | |
Hexion US Finance Corp. / Hexion Nova Scotia Finance ULC, 8.875%, 2/1/18 | | 25,000 | | | 25,625 | |
| | | | | | | 65,423 | |
COMMERCIAL BANKS — 3.5% | |
Abbey National Treasury Services plc, MTN, 5.125%, 4/14/22 (Secured) | GBP | | 100,000 | | | 173,013 | |
Bank of America N.A., 5.30%, 3/15/17 | | 50,000 | | | 54,260 | |
Bank of Montreal, MTN, 1.45%, 4/9/18 | | 10,000 | | | 9,660 | |
Bank of Nova Scotia, 2.55%, 1/12/17 | | 20,000 | | | 20,596 | |
Barclays Bank plc, MTN, VRN, 4.875%, 12/15/14 | EUR | | 40,000 | | | 38,357 | |
BB&T Corp., MTN, 2.05%, 6/19/18 | | 10,000 | | | 9,862 | |
Capital One Financial Corp., 2.15%, 3/23/15 | | 10,000 | | | 10,161 | |
Commerzbank AG, MTN, 7.75%, 3/16/21 | EUR | | 100,000 | | | 137,389 | |
Cooperatieve Centrale Raiffeisen-Boerenleenbank BA, 3.875%, 2/8/22 | | 10,000 | | | 10,083 | |
Cooperatieve Centrale Raiffeisen-Boerenleenbank BA, MTN, 3.75%, 11/9/20 | EUR | | 70,000 | | | 92,970 | |
HSBC Bank plc, 3.50%, 6/28/15(1) | | 20,000 | | | 20,979 | |
ING Bank NV, MTN, 3.875%, 12/23/16 | GBP | | 50,000 | | | 80,435 | |
KFW, 2.00%, 6/1/16 | | 50,000 | | | 51,749 | |
KFW, 3.875%, 1/21/19 | EUR | | 70,000 | | | 104,099 | |
KFW, MTN, 4.625%, 1/4/23 | EUR | | 70,000 | | | 112,483 | |
PNC Funding Corp., 3.625%, 2/8/15 | | 40,000 | | | 41,742 | |
Royal Bank of Scotland plc (The), 4.375%, 3/16/16 | | 10,000 | | | 10,590 | |
U.S. Bancorp., MTN, 2.95%, 7/15/22 | | $10,000 | | | $ 9,289 | |
Wells Fargo & Co., 2.10%, 5/8/17 | | 30,000 | | | 30,126 | |
Wells Fargo & Co., 5.625%, 12/11/17 | | 20,000 | | | 22,749 | |
| | | | | | | 1,040,592 | |
COMMERCIAL SERVICES AND SUPPLIES — 0.1% | |
Republic Services, Inc., 3.55%, 6/1/22 | | 10,000 | | | 9,745 | |
Waste Management, Inc., 2.60%, 9/1/16 | | 20,000 | | | 20,668 | |
| | | | | | | 30,413 | |
COMMUNICATIONS EQUIPMENT — 0.1% | |
Apple, Inc., 1.00%, 5/3/18 | | 20,000 | | | 19,221 | |
Apple, Inc., 2.40%, 5/3/23 | | 10,000 | | | 9,289 | |
| | | | | | | 28,510 | |
COMPUTERS AND PERIPHERALS — 0.1% | |
Hewlett-Packard Co., 4.30%, 6/1/21 | | 20,000 | | | 19,578 | |
Hewlett-Packard Co., 4.65%, 12/9/21 | | 10,000 | | | 10,013 | |
Seagate HDD Cayman, 4.75%, 6/1/23(1) | | 10,000 | | | 9,375 | |
| | | | | | | 38,966 | |
CONSTRUCTION MATERIALS† | |
Owens Corning, 4.20%, 12/15/22 | | 10,000 | | | 9,703 | |
CONSUMER FINANCE — 0.5% | |
American Express Credit Corp., MTN, 2.75%, 9/15/15 | | 70,000 | | | 72,638 | |
American Express Credit Corp., MTN, 2.375%, 3/24/17 | | 10,000 | | | 10,215 | |
Credit Suisse (New York), 5.50%, 5/1/14 | | 40,000 | | | 41,636 | |
Equifax, Inc., 3.30%, 12/15/22 | | 10,000 | | | 9,400 | |
SLM Corp., 6.25%, 1/25/16 | | 20,000 | | | 21,275 | |
| | | | | | | 155,164 | |
DIVERSIFIED CONSUMER SERVICES† | |
Catholic Health Initiatives, 2.95%, 11/1/22 | | 10,000 | | | 9,359 | |
DIVERSIFIED FINANCIAL SERVICES — 4.4% | |
Ally Financial, Inc., 8.30%, 2/12/15 | | 40,000 | | | 43,200 | |
Bank of America Corp., 4.50%, 4/1/15 | | 10,000 | | | 10,493 | |
Bank of America Corp., 3.75%, 7/12/16 | | $40,000 | | | $41,955 | |
Bank of America Corp., 6.50%, 8/1/16 | | 10,000 | | | 11,281 | |
Bank of America Corp., 5.75%, 12/1/17 | | 40,000 | | | 44,484 | |
Bank of America Corp., 5.70%, 1/24/22 | | 10,000 | | | 11,114 | |
Bank of America Corp., MTN, 4.75%, 4/3/17 | EUR | | 50,000 | | | 72,094 | |
Citigroup, Inc., 5.50%, 2/15/17 | | $20,000 | | | 21,883 | |
Citigroup, Inc., 6.125%, 11/21/17 | | 60,000 | | | 68,237 | |
Citigroup, Inc., 4.50%, 1/14/22 | | 10,000 | | | 10,431 | |
Citigroup, Inc., 4.05%, 7/30/22 | | 10,000 | | | 9,624 | |
Credit Agricole SA, MTN, 7.375%, 12/18/23 | GBP | | 50,000 | | | 86,640 | |
General Electric Capital Corp., 4.375%, 9/16/20 | | $50,000 | | | 52,988 | |
General Electric Capital Corp., MTN, 6.00%, 8/7/19 | | 70,000 | | | 81,336 | |
Goldman Sachs Group, Inc. (The), 5.95%, 1/18/18 | | 50,000 | | | 55,979 | |
Goldman Sachs Group, Inc. (The), 5.75%, 1/24/22 | | 50,000 | | | 55,217 | |
HSBC Holdings plc, 5.10%, 4/5/21 | | 30,000 | | | 32,997 | |
HSBC Holdings plc, MTN, 6.25%, 3/19/18 | EUR | | 100,000 | | | 150,393 | |
JPMorgan Chase & Co., 3.45%, 3/1/16 | | $10,000 | | | 10,436 | |
JPMorgan Chase & Co., 6.00%, 1/15/18 | | 60,000 | | | 68,516 | |
JPMorgan Chase & Co., 4.625%, 5/10/21 | | 20,000 | | | 21,165 | |
JPMorgan Chase & Co., 3.25%, 9/23/22 | | 10,000 | | | 9,507 | |
Morgan Stanley, 4.75%, 3/22/17 | | 10,000 | | | 10,613 | |
Morgan Stanley, 6.625%, 4/1/18 | | 30,000 | | | 34,027 | |
Morgan Stanley, 4.875%, 11/1/22 | | 10,000 | | | 9,892 | |
Morgan Stanley, 3.75%, 2/25/23 | | 10,000 | | | 9,576 | |
Morgan Stanley, MTN, 4.50%, 2/23/16 | EUR | | 50,000 | | | 69,502 | |
RL Finance Bonds PLC, VRN, 6.125%, 12/15/15 | GBP | | 50,000 | | | 70,534 | |
Royal Bank of Scotland Group plc, 6.125%, 12/15/22 | | $10,000 | | | $ 9,544 | |
Societe Generale SA, 2.50%, 1/15/14 | | 100,000 | | | 101,240 | |
Syngenta Finance NV, 3.125%, 3/28/22 | | 10,000 | | | 9,822 | |
| | | | | | | 1,294,720 | |
DIVERSIFIED TELECOMMUNICATION SERVICES — 1.1% | |
AT&T, Inc., 2.625%, 12/1/22 | | 10,000 | | | 9,167 | |
AT&T, Inc., 6.55%, 2/15/39 | | 30,000 | | | 34,594 | |
AT&T, Inc., 4.30%, 12/15/42 | | 10,000 | | | 8,753 | |
Deutsche Telekom International Finance BV, 6.75%, 8/20/18 | | 30,000 | | | 36,189 | |
France Telecom SA, MTN, 3.875%, 4/9/20 | EUR | | 50,000 | | | 70,788 | |
Frontier Communications Corp., 7.125%, 3/15/19 | | 25,000 | | | 26,438 | |
Telefonica Emisiones SAU, 5.46%, 2/16/21 | | 20,000 | | | 20,659 | |
Telefonica Emisiones SAU, MTN, 5.375%, 2/2/18 | GBP | | 50,000 | | | 80,295 | |
Virgin Media Finance plc, 8.375%, 10/15/19 | | 31,000 | | | 33,790 | |
| | | | | | | 320,673 | |
ELECTRONIC EQUIPMENT, INSTRUMENTS AND COMPONENTS — 0.1% | |
Jabil Circuit, Inc., 7.75%, 7/15/16 | | 20,000 | | | 22,750 | |
Jabil Circuit, Inc., 5.625%, 12/15/20 | | 10,000 | | | 10,400 | |
| | | | | | | 33,150 | |
ENERGY EQUIPMENT AND SERVICES — 0.1% | |
Ensco plc, 3.25%, 3/15/16 | | 20,000 | | | 20,909 | |
Ensco plc, 4.70%, 3/15/21 | | 10,000 | | | 10,629 | |
Transocean, Inc., 6.375%, 12/15/21 | | 10,000 | | | 11,253 | |
| | | | | | | 42,791 | |
FOOD AND STAPLES RETAILING — 0.3% | |
CVS Caremark Corp., 2.75%, 12/1/22 | | 30,000 | | | 28,069 | |
Safeway, Inc., 4.75%, 12/1/21 | | 10,000 | | | 10,201 | |
Wal-Mart Stores, Inc., 5.625%, 4/15/41 | | 20,000 | | | 23,248 | |
Walgreen Co., 1.80%, 9/15/17 | | 10,000 | | | 9,881 | |
Walgreen Co., 3.10%, 9/15/22 | | 10,000 | | | 9,490 | |
| | | | | | | 80,889 | |
FOOD PRODUCTS — 0.2% | |
Kraft Foods Group, Inc., 5.00%, 6/4/42 | | 10,000 | | | 10,177 | |
Mondelez International, Inc., 6.50%, 2/9/40 | | 10,000 | | | 11,984 | |
TreeHouse Foods, Inc., 7.75%, 3/1/18 | | 45,000 | | | 47,756 | |
| | | | | | | 69,917 | |
GAS UTILITIES — 0.6% | |
El Paso Corp., 7.25%, 6/1/18 | | 40,000 | | | 44,494 | |
El Paso Pipeline Partners Operating Co. LLC, 6.50%, 4/1/20 | | 10,000 | | | 11,619 | |
Energy Transfer Partners LP, 6.50%, 2/1/42 | | 10,000 | | | 10,710 | |
Enterprise Products Operating LLC, 5.20%, 9/1/20 | | 30,000 | | | 33,606 | |
Kinder Morgan Energy Partners LP, 6.50%, 9/1/39 | | 20,000 | | | 22,470 | |
Plains All American Pipeline LP/PAA Finance Corp., 3.65%, 6/1/22 | | 10,000 | | | 9,842 | |
Sunoco Logistics Partners Operations LP, 3.45%, 1/15/23 | | 20,000 | | | 18,606 | |
TransCanada PipeLines Ltd., 2.50%, 8/1/22 | | 20,000 | | | 18,470 | |
Williams Cos., Inc. (The), 3.70%, 1/15/23 | | 10,000 | | | 9,304 | |
Williams Partners LP, 4.125%, 11/15/20 | | 10,000 | | | 10,091 | |
| | | | | | | 189,212 | |
HEALTH CARE EQUIPMENT AND SUPPLIES — 0.3% | |
Baxter International, Inc., 3.20%, 6/15/23 | | 10,000 | | | 9,823 | |
Biomet, Inc., 6.50%, 8/1/20 | | 50,000 | | | 51,781 | |
Medtronic, Inc., 2.75%, 4/1/23 | | 20,000 | | | 18,722 | |
| | | | | | | 80,326 | |
HEALTH CARE PROVIDERS AND SERVICES — 0.7% | |
Aetna, Inc., 2.75%, 11/15/22 | | 10,000 | | | 9,223 | |
DaVita HealthCare Partners, Inc., 5.75%, 8/15/22 | | $50,000 | | | $50,125 | |
Express Scripts Holding Co., 2.65%, 2/15/17 | | 40,000 | | | 40,753 | |
HCA, Inc., 7.875%, 2/15/20 | | 30,000 | | | 32,381 | |
Healthsouth Corp., 8.125%, 2/15/20 | | 40,000 | | | 43,500 | |
UnitedHealth Group, Inc., 4.25%, 3/15/43 | | 10,000 | | | 9,171 | |
WellPoint, Inc., 3.125%, 5/15/22 | | 10,000 | | | 9,495 | |
| | | | | | | 194,648 | |
HOTELS, RESTAURANTS AND LEISURE — 0.1% | |
Royal Caribbean Cruises Ltd., 5.25%, 11/15/22 | | 20,000 | | | 19,700 | |
Wyndham Worldwide Corp., 2.95%, 3/1/17 | | 20,000 | | | 20,254 | |
| | | | | | | 39,954 | |
HOUSEHOLD DURABLES† | |
Lennar Corp., 4.75%, 12/15/17 | | 10,000 | | | 10,050 | |
INDUSTRIAL CONGLOMERATES† | |
General Electric Co., 4.125%, 10/9/42 | | 10,000 | | | 9,354 | |
INSURANCE — 1.6% | |
Allstate Corp. (The), 4.50%, 6/15/43 | | 10,000 | | | 9,910 | |
American International Group, Inc., 5.85%, 1/16/18 | | 20,000 | | | 22,526 | |
American International Group, Inc., 6.40%, 12/15/20 | | 20,000 | | | 23,218 | |
American International Group, Inc., 4.875%, 6/1/22 | | 10,000 | | | 10,673 | |
Berkshire Hathaway, Inc., 3.00%, 5/15/22 | | 10,000 | | | 9,688 | |
Berkshire Hathaway, Inc., 4.50%, 2/11/43 | | 20,000 | | | 19,102 | |
CNP Assurances, VRN, 4.75%, 12/22/16 | EUR | | 50,000 | | | 59,773 | |
Generali Finance BV, VRN, 6.21%, 6/16/16 | GBP | | 50,000 | | | 68,823 | |
Hartford Financial Services Group, Inc., 5.125%, 4/15/22 | | 10,000 | | | 10,895 | |
International Lease Finance Corp., 5.75%, 5/15/16 | | 10,000 | | | 10,325 | |
Lincoln National Corp., 6.25%, 2/15/20 | | 20,000 | | | 22,954 | |
Mapfre SA, VRN, 5.92%, 7/24/17 | EUR | | 50,000 | | | 59,225 | |
Markel Corp., 4.90%, 7/1/22 | | 10,000 | | | 10,650 | |
MetLife, Inc., 6.75%, 6/1/16 | | 30,000 | | | 34,354 | |
Prudential Financial, Inc., 5.375%, 6/21/20 | | 20,000 | | | 22,444 | |
QBE Insurance Group Ltd., MTN, 6.125%, 9/28/15 | GBP | | 50,000 | | | 82,795 | |
| | | | | | | 477,355 | |
IT SERVICES — 0.1% | |
Fidelity National Information Services, Inc., 5.00%, 3/15/22 | | 10,000 | | | 10,075 | |
International Business Machines Corp., 1.95%, 7/22/16 | | 20,000 | | | 20,512 | |
| | | | | | | 30,587 | |
LIFE SCIENCES TOOLS AND SERVICES† | |
Thermo Fisher Scientific, Inc., 3.60%, 8/15/21 | | 10,000 | | | 9,820 | |
MACHINERY — 0.1% | |
Caterpillar Financial Services Corp., MTN, 2.85%, 6/1/22 | | 20,000 | | | 19,144 | |
MEDIA — 1.4% | |
Comcast Corp., 5.90%, 3/15/16 | | 30,000 | | | 33,790 | |
Comcast Corp., 6.40%, 5/15/38 | | 30,000 | | | 35,962 | |
Discovery Communications LLC, 5.625%, 8/15/19 | | 20,000 | | | 22,979 | |
DISH DBS Corp., 6.75%, 6/1/21 | | 50,000 | | | 53,375 | |
Lamar Media Corp., 7.875%, 4/15/18 | | 70,000 | | | 74,900 | |
News America, Inc., 3.00%, 9/15/22 | | 10,000 | | | 9,346 | |
Time Warner Cable, Inc., 6.75%, 7/1/18 | | 30,000 | | | 34,364 | |
Time Warner, Inc., 4.875%, 3/15/20 | | 20,000 | | | 21,828 | |
Time Warner, Inc., 5.375%, 10/15/41 | | 10,000 | | | 10,160 | |
Univision Communications, Inc., 6.875%, 5/15/19(1) | | 55,000 | | | 58,025 | |
Viacom, Inc., 4.375%, 9/15/14 | | $30,000 | | | $31,284 | |
Walt Disney Co. (The), MTN, 2.35%, 12/1/22 | | 20,000 | | | 18,503 | |
| | | | | | | 404,516 | |
METALS AND MINING — 0.4% | |
Alcoa, Inc., 5.40%, 4/15/21 | | 10,000 | | | 9,745 | |
FMG Resources Pty Ltd., 7.00%, 11/1/15(1) | | 50,000 | | | 50,750 | |
Freeport-McMoRan Copper & Gold, Inc., 3.875%, 3/15/23(1) | | 10,000 | | | 9,063 | |
Newmont Mining Corp., 3.50%, 3/15/22 | | 10,000 | | | 8,568 | |
Vale Overseas Ltd., 5.625%, 9/15/19 | | 30,000 | | | 32,459 | |
Xstrata Canada Financial Corp., 4.95%, 11/15/21(1) | | 10,000 | | | 9,693 | |
| | | | | | | 120,278 | |
MULTI-UTILITIES — 1.2% | |
Consolidated Edison Co. of New York, Inc., 3.95%, 3/1/43 | | 10,000 | | | 9,096 | |
Constellation Energy Group, Inc., 5.15%, 12/1/20 | | 10,000 | | | 10,979 | |
Consumers Energy Co., 2.85%, 5/15/22 | | 10,000 | | | 9,686 | |
Dominion Resources, Inc., 2.75%, 9/15/22 | | 10,000 | | | 9,331 | |
Dominion Resources, Inc., 4.90%, 8/1/41 | | 10,000 | | | 10,145 | |
Duke Energy Corp., 6.30%, 2/1/14 | | 50,000 | | | 51,599 | |
Duke Energy Corp., 1.625%, 8/15/17 | | 20,000 | | | 19,646 | |
Duke Energy Corp., 3.55%, 9/15/21 | | 10,000 | | | 9,999 | |
Enel SpA, MTN, 6.25%, 6/20/19 | GBP | | 50,000 | | | 82,666 | |
Exelon Generation Co. LLC, 4.00%, 10/1/20 | | 10,000 | | | 10,156 | |
Exelon Generation Co. LLC, 5.60%, 6/15/42 | | 10,000 | | | 10,093 | |
FirstEnergy Corp., 4.25%, 3/15/23 | | 10,000 | | | 9,304 | |
Florida Power Corp., 3.85%, 11/15/42 | | 10,000 | | | 8,791 | |
GDF Suez, MTN, 2.75%, 10/18/17 | EUR | | 40,000 | | | 55,094 | |
Ipalco Enterprises, Inc., 5.00%, 5/1/18 | | 10,000 | | | 10,350 | |
Pacific Gas & Electric Co., 5.80%, 3/1/37 | | 10,000 | | | 11,397 | |
Progress Energy, Inc., 3.15%, 4/1/22 | | 10,000 | | | 9,591 | |
San Diego Gas & Electric Co., 3.00%, 8/15/21 | | 20,000 | | | 20,128 | |
| | | | | | | 358,051 | |
OIL, GAS AND CONSUMABLE FUELS — 1.6% | |
Alpha Natural Resources, Inc., 6.00%, 6/1/19 | | 50,000 | | | 40,875 | |
Anadarko Petroleum Corp., 5.95%, 9/15/16 | | 20,000 | | | 22,446 | |
Apache Corp., 4.75%, 4/15/43 | | 10,000 | | | 9,532 | |
BP Capital Markets plc, 4.50%, 10/1/20 | | 20,000 | | | 21,721 | |
Chevron Corp., 2.43%, 6/24/20 | | 10,000 | | | 9,952 | |
ConocoPhillips Holding Co., 6.95%, 4/15/29 | | 10,000 | | | 12,779 | |
Denbury Resources, Inc., 4.625%, 7/15/23 | | 10,000 | | | 9,238 | |
Devon Energy Corp., 5.60%, 7/15/41 | | 10,000 | | | 10,410 | |
Marathon Petroleum Corp., 3.50%, 3/1/16 | | 20,000 | | | 21,005 | |
Newfield Exploration Co., 5.625%, 7/1/24 | | 50,000 | | | 48,750 | |
Noble Energy, Inc., 4.15%, 12/15/21 | | 20,000 | | | 20,676 | |
Peabody Energy Corp., 6.50%, 9/15/20 | | 25,000 | | | 25,188 | |
Pemex Project Funding Master Trust, 6.625%, 6/15/35 | | 30,000 | | | 31,650 | |
Petro-Canada, 6.80%, 5/15/38 | | 10,000 | | | 11,637 | |
Petrobras International Finance Co. – Pifco, 5.75%, 1/20/20 | | 10,000 | | | 10,450 | |
Petrobras International Finance Co. – Pifco, 5.375%, 1/27/21 | | 30,000 | | | 30,277 | |
Phillips 66, 4.30%, 4/1/22 | | 10,000 | | | 10,345 | |
Pioneer Natural Resources Co., 3.95%, 7/15/22 | | 10,000 | | | 9,887 | |
SandRidge Energy, Inc., 8.75%, 1/15/20 | | 40,000 | | | 41,000 | |
Shell International Finance BV, 2.375%, 8/21/22 | | 20,000 | | | 18,716 | |
Shell International Finance BV, 3.625%, 8/21/42 | | $10,000 | | | $ 8,877 | |
Statoil ASA, 2.45%, 1/17/23 | | 10,000 | | | 9,277 | |
Talisman Energy, Inc., 7.75%, 6/1/19 | | 20,000 | | | 24,328 | |
| | | | | | | 459,016 | |
PAPER AND FOREST PRODUCTS — 0.1% | |
Georgia-Pacific LLC, 5.40%, 11/1/20(1) | | 20,000 | | | 22,326 | |
International Paper Co., 6.00%, 11/15/41 | | 10,000 | | | 10,686 | |
| | | | | | | 33,012 | |
PHARMACEUTICALS — 0.6% | |
AbbVie, Inc., 1.75%, 11/6/17(1) | | 20,000 | | | 19,608 | |
AbbVie, Inc., 4.40%, 11/6/42(1) | | 10,000 | | | 9,336 | |
Actavis, Inc., 1.875%, 10/1/17 | | 10,000 | | | 9,755 | |
Bristol-Myers Squibb Co., 3.25%, 8/1/42 | | 10,000 | | | 8,103 | |
GlaxoSmithKline Capital plc, 2.85%, 5/8/22 | | 10,000 | | | 9,612 | |
Merck & Co., Inc., 2.80%, 5/18/23 | | 10,000 | | | 9,475 | |
Merck & Co., Inc., 3.60%, 9/15/42 | | 10,000 | | | 8,684 | |
Roche Holdings, Inc., 6.00%, 3/1/19(1) | | 30,000 | | | 35,849 | |
Valeant Pharmaceuticals International, 6.50%, 7/15/16(1) | | 55,000 | | | 56,925 | |
| | | | | | | 167,347 | |
REAL ESTATE INVESTMENT TRUSTS (REITs) — 0.8% | |
American Tower Corp., 4.50%, 1/15/18 | | 10,000 | | | 10,672 | |
American Tower Corp., 4.70%, 3/15/22 | | 10,000 | | | 10,099 | |
BRE Properties, Inc., 3.375%, 1/15/23 | | 10,000 | | | 9,327 | |
DDR Corp., 3.375%, 5/15/23 | | 10,000 | | | 9,178 | |
DDR Corp., 4.75%, 4/15/18 | | 10,000 | | | 10,753 | |
Essex Portfolio LP, 3.625%, 8/15/22 | | 10,000 | | | 9,654 | |
HCP, Inc., 3.75%, 2/1/16 | | 40,000 | | | 42,137 | |
Health Care REIT, Inc., 3.75%, 3/15/23 | | 20,000 | | | 19,040 | |
Host Hotels & Resorts LP, 3.75%, 10/15/23 | | $10,000 | | | 9,185 | |
Kilroy Realty LP, 3.80%, 1/15/23 | | 10,000 | | | 9,380 | |
Reckson Operating Partnership LP, 6.00%, 3/31/16 | | 20,000 | | | 21,804 | |
Simon Property Group LP, 5.10%, 6/15/15 | | 60,000 | | | 64,892 | |
Ventas Realty LP/Ventas Capital Corp., 4.00%, 4/30/19 | | 10,000 | | | 10,408 | |
Ventas Realty LP/Ventas Capital Corp., 4.75%, 6/1/21 | | 10,000 | | | 10,517 | |
| | | | | | | 247,046 | |
ROAD AND RAIL — 0.4% | |
Burlington Northern Santa Fe LLC, 3.60%, 9/1/20 | | 20,000 | | | 20,767 | |
Burlington Northern Santa Fe LLC, 4.45%, 3/15/43 | | 10,000 | | | 9,366 | |
CSX Corp., 4.25%, 6/1/21 | | 10,000 | | | 10,699 | |
Firstgroup plc, 6.125%, 1/18/19 | GBP | | 40,000 | | | 65,894 | |
| | | | | | | 106,726 | |
SEMICONDUCTORS AND SEMICONDUCTOR EQUIPMENT — 0.1% | |
Intel Corp., 1.35%, 12/15/17 | | $20,000 | | | 19,586 | |
SOFTWARE — 0.1% | |
Oracle Corp., 2.50%, 10/15/22 | | 20,000 | | | 18,470 | |
SPECIALTY RETAIL — 0.5% | |
Home Depot, Inc. (The), 5.95%, 4/1/41 | | 10,000 | | | 11,970 | |
Sonic Automotive, Inc., 7.00%, 7/15/22 | | 50,000 | | | 54,750 | |
Staples, Inc., 4.375%, 1/12/23 | | 20,000 | | | 19,414 | |
United Rentals North America, Inc., 5.75%, 7/15/18 | | 50,000 | | | 52,750 | |
| | | | | | | 138,884 | |
TEXTILES, APPAREL AND LUXURY GOODS — 0.2% | |
Gap, Inc. (The), 5.95%, 4/12/21 | | 10,000 | | | 11,073 | |
L Brands, Inc., 6.625%, 4/1/21 | | 40,000 | | | 43,650 | |
| | | | | | | 54,723 | |
THRIFTS AND MORTGAGE FINANCE — 1.1% | |
Cie de Financement Foncier, 4.375%, 4/25/19 (Secured) | EUR | | 100,000 | | | $149,835 | |
Cie de Financement Foncier, MTN, 4.50%, 5/16/18 (Secured) | EUR | | 110,000 | | | 163,996 | |
| | | | | | | 313,831 | |
TOBACCO — 0.2% | |
Altria Group, Inc., 9.25%, 8/6/19 | | $10,000 | | | 13,255 | |
Altria Group, Inc., 2.85%, 8/9/22 | | 10,000 | | | 9,259 | |
Philip Morris International, Inc., 4.125%, 5/17/21 | | 20,000 | | | 21,163 | |
| | | | | | | 43,677 | |
WIRELESS TELECOMMUNICATION SERVICES — 0.1% | |
Cellco Partnership/Verizon Wireless Capital LLC, 8.50%, 11/15/18 | | 20,000 | | | 25,995 | |
TOTAL CORPORATE BONDS (Cost $7,205,578) | | | 7,154,566 | |
U.S. Government Agency Mortgage-Backed Securities(2) — 13.3% | |
ADJUSTABLE-RATE U.S. GOVERNMENT AGENCY MORTGAGE-BACKED SECURITIES — 3.8% | |
FHLMC, VRN, 1.75%, 7/15/13 | | 125,000 | | | 125,326 | |
FHLMC, VRN, 1.85%, 7/15/13 | | 123,955 | | | 124,826 | |
FHLMC, VRN, 1.97%, 7/15/13 | | 90,987 | | | 91,857 | |
FHLMC, VRN, 1.98%, 7/15/13 | | 55,000 | | | 55,694 | |
FHLMC, VRN, 2.08%, 7/15/13 | | 33,366 | | | 33,421 | |
FHLMC, VRN, 2.36%, 7/15/13 | | 106,459 | | | 105,723 | |
FHLMC, VRN, 2.37%, 7/15/13 | | 123,944 | | | 122,751 | |
FHLMC, VRN, 2.90%, 7/15/13 | | 45,457 | | | 46,446 | |
FHLMC, VRN, 3.24%, 7/15/13 | | 7,954 | | | 8,371 | |
FHLMC, VRN, 3.29%, 7/15/13 | | 85,790 | | | 88,652 | |
FHLMC, VRN, 3.81%, 7/15/13 | | 14,275 | | | 14,996 | |
FHLMC, VRN, 4.36%, 7/15/13 | | 125,283 | | | 131,959 | |
FHLMC, VRN, 5.40%, 7/15/13 | | 8,799 | | | 9,373 | |
FHLMC, VRN, 5.80%, 7/15/13 | | 25,476 | | | 26,930 | |
FHLMC, VRN, 5.97%, 7/15/13 | | 27,292 | | | 29,395 | |
FHLMC, VRN, 6.13%, 7/15/13 | | 8,859 | | | 9,546 | |
FNMA, VRN, 2.71%, 7/25/13 | | 26,216 | | | 26,622 | |
FNMA, VRN, 3.83%, 7/25/13 | | 14,576 | | | 15,333 | |
FNMA, VRN, 3.93%, 7/25/13 | | 17,207 | | | 18,167 | |
FNMA, VRN, 5.41%, 7/25/13 | | 14,157 | | | 15,261 | |
FNMA, VRN, 5.96%, 7/25/13 | | 26,404 | | | 28,879 | |
| | | | | | | 1,129,528 | |
FIXED-RATE U.S. GOVERNMENT AGENCY MORTGAGE-BACKED SECURITIES — 9.5% | |
FHLMC, 6.00%, 2/1/38 | | 10,622 | | | 11,515 | |
FHLMC, 4.00%, 12/1/40 | | 12,038 | | | 12,645 | |
FHLMC, 4.00%, 4/1/41 | | 57,644 | | | 60,770 | |
FNMA, 4.00%, 7/15/13(3) | | 75,000 | | | 78,129 | |
FNMA, 4.50%, 7/15/13(3) | | 75,000 | | | 79,371 | |
FNMA, 5.50%, 7/15/13(3) | | 150,000 | | | 162,932 | |
FNMA, 5.00%, 7/1/31 | | 84,496 | | | 93,487 | |
FNMA, 5.50%, 5/1/33 | | 26,589 | | | 29,103 | |
FNMA, 5.00%, 11/1/33 | | 18,904 | | | 20,452 | |
FNMA, 5.00%, 9/1/35 | | 93,967 | | | 101,180 | |
FNMA, 6.00%, 4/1/37 | | 31,533 | | | 34,974 | |
FNMA, 6.00%, 7/1/37 | | 45,270 | | | 50,230 | |
FNMA, 6.00%, 8/1/37 | | 33,453 | | | 36,629 | |
FNMA, 5.50%, 1/1/39 | | 72,827 | | | 78,994 | |
FNMA, 5.50%, 3/1/39 | | 9,302 | | | 10,090 | |
FNMA, 4.50%, 6/1/39 | | 140,914 | | | 152,334 | |
FNMA, 5.00%, 8/1/39 | | 11,817 | | | 13,026 | |
FNMA, 4.50%, 3/1/40 | | 228,626 | | | 246,774 | |
FNMA, 3.50%, 12/1/40 | | 75,043 | | | 76,270 | |
FNMA, 4.00%, 12/1/40 | | 59,680 | | | 62,471 | |
FNMA, 4.00%, 5/1/41 | | 88,341 | | | 92,074 | |
FNMA, 4.50%, 7/1/41 | | 88,497 | | | 95,081 | |
FNMA, 4.50%, 9/1/41 | | 44,603 | | | 47,580 | |
FNMA, 4.00%, 12/1/41 | | 104,121 | | | 109,094 | |
FNMA, 4.00%, 1/1/42 | | 54,591 | | | 57,002 | |
FNMA, 3.50%, 5/1/42 | | 91,913 | | | 93,463 | |
FNMA, 3.50%, 6/1/42 | | 48,000 | | | 48,831 | |
FNMA, 3.50%, 9/1/42 | | 47,835 | | | 48,648 | |
FNMA, 3.50%, 9/1/42 | | 67,821 | | | 68,930 | |
FNMA, 3.00%, 11/1/42 | | $48,795 | | | $47,743 | |
GNMA, 6.00%, 7/15/33 | | 11,055 | | | 12,412 | |
GNMA, 5.00%, 3/20/36 | | 104,187 | | | 113,647 | |
GNMA, 5.50%, 1/15/39 | | 9,042 | | | 10,311 | |
GNMA, 5.50%, 9/15/39 | | 69,762 | | | 76,405 | |
GNMA, 4.50%, 10/15/39 | | 25,470 | | | 27,597 | |
GNMA, 5.00%, 10/15/39 | | 39,572 | | | 43,502 | |
GNMA, 4.50%, 1/15/40 | | 42,353 | | | 45,323 | |
GNMA, 4.00%, 12/15/40 | | 33,228 | | | 35,115 | |
GNMA, 4.50%, 12/15/40 | | 101,507 | | | 110,001 | |
GNMA, 4.00%, 1/20/41 | | 136,755 | | | 144,330 | |
GNMA, 4.00%, 12/15/41 | | 64,676 | | | 67,914 | |
| | | | | | | 2,806,379 | |
TOTAL U.S. GOVERNMENT AGENCY MORTGAGE-BACKED SECURITIES (Cost $3,988,690) | | | 3,935,907 | |
Collateralized Mortgage Obligations(2) — 5.9% | |
Banc of America Funding Corp., Series 2004-2, Class 3A1, 5.50%, 9/20/34 | | 24,852 | | | 25,992 | |
Banc of America Mortgage Securities, Inc., Series 2004-L, Class 2A1, VRN, 3.00%, 7/1/13 | | 9,618 | | | 9,351 | |
Banc of America Mortgage Securities, Inc., Series 2005-1, Class 1A15, 5.50%, 2/25/35 | | 10,000 | | | 10,258 | |
Banc of America Mortgage Securities, Inc., Series 2007-1, Class 1A16, 5.625%, 3/25/37 | | 110,761 | | | 100,178 | |
Bear Stearns Adjustable Rate Mortgage Trust, Series 2004-12, Class 2A1, VRN, 2.85%, 7/1/13 | | 10,500 | | | 10,138 | |
Bear Stearns Adjustable Rate Mortgage Trust, Series 2006-1, Class A1, VRN, 2.37%, 7/1/13 | | 26,204 | | | 25,282 | |
Countrywide Home Loan Mortgage Pass-Through Trust, Series 2004-4, Class A19, 5.25%, 5/25/34 | | 12,774 | | | 13,146 | |
First Horizon Mortgage Pass-Through Trust, Series 2005-AR3, Class 4A1, VRN, 5.29%, 7/1/13 | | 11,944 | | | 11,634 | |
GSR Mortgage Loan Trust, Series 2005-AR6, Class 2A1, VRN, 2.66%, 7/1/13 | | 23,788 | | | 23,490 | |
JPMorgan Mortgage Trust, Series 2005-A4, Class 2A1, VRN, 2.78%, 7/1/13 | | 7,108 | | | 6,964 | |
JPMorgan Mortgage Trust, Series 2005-A6, Class 7A1, VRN, 3.01%, 7/1/13 | | 37,359 | | | 34,507 | |
JPMorgan Mortgage Trust, Series 2006-A3, Class 7A1, VRN, 2.90%, 7/1/13 | | 29,166 | | | 28,254 | |
JPMorgan Mortgage Trust, Series 2013-1, Class 2A2, VRN, 2.50%, 7/1/13(1) | | 102,465 | | | 103,074 | |
MASTR Adjustable Rate Mortgages Trust, Series 2004-13, Class 3A7, VRN, 2.63%, 7/1/13 | | 28,053 | | | 28,742 | |
Merrill Lynch Mortgage Investors Trust, Series 2005-A2, Class A1, VRN, 2.54%, 7/1/13 | | 62,090 | | | 60,451 | |
PHHMC Mortgage Pass-Through Certificates, Series 2007-6, Class A1, VRN, 5.73%, 7/1/13 | | 9,959 | | | 10,326 | |
Wells Fargo Mortgage-Backed Securities Trust, Series 2004-A, Class A1, VRN, 4.90%, 7/1/13 | | 33,246 | | | 33,425 | |
Wells Fargo Mortgage-Backed Securities Trust, Series 2004-K, Class 2A6, VRN, 4.73%, 7/1/13 | | 87,999 | | | 88,744 | |
Wells Fargo Mortgage-Backed Securities Trust, Series 2004-Z, Class 2A2, VRN, 2.62%, 7/1/13 | | 78,136 | | | 79,250 | |
Wells Fargo Mortgage-Backed Securities Trust, Series 2005-17, Class 1A1, 5.50%, 1/25/36 | | 38,051 | | | 38,393 | |
Wells Fargo Mortgage-Backed Securities Trust, Series 2005-18, Class 1A1, 5.50%, 1/25/36 | | 92,901 | | | 89,314 | |
Wells Fargo Mortgage-Backed Securities Trust, Series 2005-5, Class 1A1, 5.00%, 5/25/20 | | $5,688 | | | $ 5,961 | |
Wells Fargo Mortgage-Backed Securities Trust, Series 2005-AR16, Class 3A2, VRN, 2.68%, 7/1/13 | | 18,746 | | | 18,941 | |
Wells Fargo Mortgage-Backed Securities Trust, Series 2005-AR2, Class 3A1, VRN, 2.66%, 7/1/13 | | 100,378 | | | 101,410 | |
Wells Fargo Mortgage-Backed Securities Trust, Series 2006-10, Class A4 SEQ, 6.00%, 8/25/36 | | 106,133 | | | 108,888 | |
Wells Fargo Mortgage-Backed Securities Trust, Series 2006-11, Class A9 SEQ, 6.50%, 9/25/36 | | 119,382 | | | 117,247 | |
Wells Fargo Mortgage-Backed Securities Trust, Series 2006-13, Class A5, 6.00%, 10/25/36 | | 29,791 | | | 30,206 | |
Wells Fargo Mortgage-Backed Securities Trust, Series 2006-3, Class A9 SEQ, 5.50%, 3/25/36 | | 66,118 | | | 65,947 | |
Wells Fargo Mortgage-Backed Securities Trust, Series 2006-AR15, Class A1, VRN, 5.47%, 7/1/13 | | 16,921 | | | 14,936 | |
Wells Fargo Mortgage-Backed Securities Trust, Series 2006-AR2, Class 2A3, VRN, 2.64%, 7/1/13 | | 14,706 | | | 14,195 | |
Wells Fargo Mortgage-Backed Securities Trust, Series 2006-AR5, Class 2A1, VRN, 2.64%, 7/1/13 | | 14,772 | | | 13,396 | |
Wells Fargo Mortgage-Backed Securities Trust, Series 2007-10, Class 1A5, 6.00%, 7/25/37 | | 107,280 | | | 103,537 | |
Wells Fargo Mortgage-Backed Securities Trust, Series 2007-11, Class A3 SEQ, 6.00%, 8/25/37 | | 99,585 | | | 97,575 | |
Wells Fargo Mortgage-Backed Securities Trust, Series 2007-13, Class A1, 6.00%, 9/25/37 | | 39,914 | | | 40,071 | |
Wells Fargo Mortgage-Backed Securities Trust, Series 2007-14, Class 2A2, 5.50%, 10/25/22 | | 78,827 | | | 83,718 | |
Wells Fargo Mortgage-Backed Securities Trust, Series 2007-16, Class 1A1, 6.00%, 12/28/37 | | 92,136 | | | 96,095 | |
Wells Fargo Mortgage-Backed Securities Trust, Series 2007-3, Class 3A1, 5.50%, 4/25/22 | | 6,310 | | | 6,522 | |
TOTAL COLLATERALIZED MORTGAGE OBLIGATIONS (Cost $1,760,029) | | | 1,749,558 | |
U.S. Treasury Securities — 4.9% | |
U.S. Treasury Bonds, 5.50%, 8/15/28 | | 50,000 | | | 65,066 | |
U.S. Treasury Bonds, 2.75%, 11/15/42 | | 175,000 | | | 151,129 | |
U.S. Treasury Bonds, 3.125%, 2/15/43 | | 200,000 | | | 186,969 | |
U.S. Treasury Notes, 1.875%, 10/31/17(4) | | 50,000 | | | 51,434 | |
U.S. Treasury Notes, 2.625%, 4/30/18 | | 45,000 | | | 47,718 | |
U.S. Treasury Notes, 1.00%, 5/31/18 | | 490,000 | | | 481,425 | |
U.S. Treasury Notes, 1.375%, 6/30/18(5) | | 60,000 | | | 59,946 | |
U.S. Treasury Notes, 1.75%, 5/15/23 | | 450,000 | | | 421,207 | |
TOTAL U.S. TREASURY SECURITIES (Cost $1,515,800) | | | 1,464,894 | |
Commercial Mortgage-Backed Securities(2) — 3.2% | |
Banc of America Commercial Mortgage, Inc., Series 2004-1, Class A4 SEQ, 4.76%, 11/10/39 | | 48,373 | | | 48,793 | |
Banc of America Merrill Lynch Commercial Mortgage, Inc., Series 2004-2, Class A5 SEQ, 4.58%, 11/10/38 | | 50,000 | | | 50,940 | |
Bank of America Merrill Lynch Commercial Mortgage Securities Trust, Series 2012-PARK, Class A SEQ, 2.96%, 12/10/30(1) | | 75,000 | | | 70,784 | |
BB-UBS Trust, Series 2012-SHOW, Class A, 3.43%, 11/5/36(1) | | 50,000 | | | 47,136 | |
| | | | | | | |
| | | Principal Amount | | | Value | |
Citigroup/Deutsche Bank Commercial Mortgage Trust, Series 2005-CD1, Class AM, VRN, 5.39%, 7/1/13 | | $55,000 | | | $58,736 | |
Commercial Mortgage Pass-Through Certificates, Series 2004-LB2A, Class A4 SEQ, 4.72%, 3/10/39 | | 62,599 | | | 63,498 | |
GE Capital Commercial Mortgage Corp., Series 2005-C3, Class A5, VRN, 4.98%, 7/1/13 | | 14,141 | | | 14,161 | |
Greenwich Capital Commercial Funding Corp., Series 2005-GG3, Class A3 SEQ, 4.57%, 8/10/42 | | 13,569 | | | 13,560 | |
Greenwich Capital Commercial Funding Corp., Series 2005-GG3, Class A4, VRN, 4.80%, 7/1/13 | | 50,000 | | | 52,210 | |
GS Mortgage Securities Corp. II, Series 2004-GG2, Class A6 SEQ, VRN, 5.40%, 7/1/13 | | 50,000 | | | 51,457 | |
GS Mortgage Securities Corp. II, Series 2005-GG4, Class A4 SEQ, 4.76%, 7/10/39 | | 50,000 | | | 52,973 | |
GS Mortgage Securities Corp. II, Series 2005-GG4, Class A4A SEQ, 4.75%, 7/10/39 | | 75,000 | | | 78,871 | |
GS Mortgage Securities Corp. II, Series 2012-ALOH, Class A SEQ, 3.55%, 4/10/34(1) | | 75,000 | | | 74,303 | |
Irvine Core Office Trust, Series 2013-IRV, Class A2, VRN, 3.31%, 7/10/13(1) | | 50,000 | | | 47,365 | |
LB-UBS Commercial Mortgage Trust, Series 2005-C5, Class AM, VRN, 5.02%, 7/11/13 | | 35,000 | | | 37,087 | |
Morgan Stanley Capital I, Series 2005-T17, Class A5 SEQ, 4.78%, 12/13/41 | | 73,825 | | | 76,977 | |
Wachovia Bank Commercial Mortgage Trust, Series 2004-C15, Class A3 SEQ, 4.50%, 10/15/41 | | 12,872 | | | 13,014 | |
Wachovia Bank Commercial Mortgage Trust, Series 2004-C15, Class A4 SEQ, 4.80%, 10/15/41 | | 100,000 | | | 104,023 | |
TOTAL COMMERCIAL MORTGAGE-BACKED SECURITIES (Cost $989,353) | | | 955,888 | |
Municipal Securities — 0.7% | |
California GO, (Building Bonds), 7.30%, 10/1/39 | | 20,000 | | | 26,063 | |
Illinois GO, Series 2010-3, (Building Bonds), 6.73%, 4/1/35 | | 20,000 | | | 21,285 | |
Maryland State Transportation Authority Rev., (Building Bonds), 5.75%, 7/1/41 | | 30,000 | | | 34,307 | |
Missouri Highways & Transportation Commission Rev., (Building Bonds), 5.45%, 5/1/33 | | 25,000 | | | 27,919 | |
New Jersey State Turnpike Authority Rev., Series 2010 A, (Building Bonds), 7.10%, 1/1/41 | | 25,000 | | | 32,429 | |
Ohio State University (The) Rev., (Building Bonds), 4.91%, 6/1/40 | | 25,000 | | | 24,847 | |
Pennsylvania Turnpike Commission Rev., Series 2010 B, (Building Bonds), 5.56%, 12/1/49 | | 25,000 | | | 27,276 | |
TOTAL MUNICIPAL SECURITIES (Cost $207,441) | | | 194,126 | |
Temporary Cash Investments — 4.1% | |
Repurchase Agreement, Bank of America Merrill Lynch, (collateralized by various U.S. Treasury obligations, 1.00%, 1/15/14, valued at $159,170), in a joint trading account at 0.06%, dated 6/28/13, due 7/1/13 (Delivery value $155,915) | | | 155,914 | |
Repurchase Agreement, Credit Suisse First Boston, Inc., (collateralized by various U.S. Treasury obligations, 4.25%, 11/15/40, valued at $476,582), in a joint trading account at 0.05%, dated 6/28/13, due 7/1/13 (Delivery value $467,746) | | | 467,744 | |
Repurchase Agreement, Goldman Sachs & Co., (collateralized by various U.S. Treasury obligations, 3.125%, 11/15/41, valued at $158,587), in a joint trading account at 0.04%, dated 6/28/13, due 7/1/13 (Delivery value $155,916) | | | 155,915 | |
| | | | | | | |
| | | Shares | | | Value | |
SSgA U.S. Government Money Market Fund | | 427,374 | | | $427,374 | |
TOTAL TEMPORARY CASH INVESTMENTS (Cost $1,206,947) | | | 1,206,947 | |
TOTAL INVESTMENT SECURITIES — 101.3% (Cost $31,329,764) | | | 29,974,000 | |
OTHER ASSETS AND LIABILITIES — (1.3)% | | | (389,807 | ) |
TOTAL NET ASSETS — 100.0% | | | $29,584,193 | |
Forward Foreign Currency Exchange Contracts
| | | | | | | | | |
Currency Purchased | | Currency Sold | | Counterparty | Settlement Date | | Unrealized Gain (Loss) | |
AUD | | 227,000 | | USD | | 209,757 | | Barclays Bank plc | 9/17/2013 | | $(3,313 | ) |
AUD | | 30,000 | | USD | | 28,316 | | Westpac Group | 9/17/2013 | | (1,033 | ) |
USD | | 511,341 | | AUD | | 541,749 | | Westpac Group | 9/17/2013 | | 18,649 | |
USD | | 66,846 | | AUD | | 70,000 | | Westpac Group | 9/17/2013 | | 3,185 | |
USD | | 27,290 | | BRL | | 60,000 | | Barclays Bank plc | 9/17/2013 | | 814 | |
CAD | | 12,500 | | USD | | 11,918 | | Barclays Bank plc | 9/17/2013 | | (54 | ) |
USD | | 473,799 | | CAD | | 485,023 | | HSBC Holdings plc | 9/17/2013 | | 13,469 | |
USD | | 322,363 | | CAD | | 330,000 | | HSBC Holdings plc | 9/17/2013 | | 9,164 | |
CHF | | 1,750 | | USD | | 1,857 | | Barclays Bank plc | 9/17/2013 | | (3 | ) |
USD | | 133,952 | | CHF | | 123,423 | | UBS AG | 9/17/2013 | | 3,193 | |
USD | | 32,559 | | CHF | | 30,000 | | UBS AG | 9/17/2013 | | 776 | |
USD | | 43,328 | | CLP | | 22,000,000 | | Barclays Bank plc | 9/17/2013 | | 549 | |
CNY | | 390,000 | | USD | | 63,295 | | HSBC Holdings plc | 9/17/2013 | | (482 | ) |
USD | | 43,272 | | COP | | 83,000,002 | | Barclays Bank plc | 9/17/2013 | | 406 | |
USD | | 39,481 | | CZK | | 756,971 | | Deutsche Bank | 9/17/2013 | | 1,591 | |
USD | | 91,656 | | DKK | | 510,000 | | Barclays Bank plc | 9/17/2013 | | 2,579 | |
EUR | | 120,000 | | USD | | 160,028 | | Barclays Bank plc | 9/17/2013 | | (3,777 | ) |
EUR | | 40,000 | | USD | | 52,041 | | Barclays Bank plc | 9/17/2013 | | 43 | |
USD | | 6,708,181 | | EUR | | 5,030,269 | | Barclays Bank plc | 9/17/2013 | | 158,336 | |
USD | | 52,052 | | EUR | | 40,000 | | Barclays Bank plc | 9/17/2013 | | (31 | ) |
GBP | | 72,000 | | USD | | 110,305 | | Barclays Bank plc | 9/17/2013 | | (852 | ) |
GBP | | 60,000 | | USD | | 94,012 | | HSBC Holdings plc | 9/17/2013 | | (2,801 | ) |
GBP | | 10,000 | | USD | | 15,738 | | HSBC Holdings plc | 9/17/2013 | | (536 | ) |
USD | | 2,453,037 | | GBP | | 1,565,575 | | HSBC Holdings plc | 9/17/2013 | | 73,074 | |
USD | | 15,364 | | GBP | | 10,000 | | Westpac Group | 9/17/2013 | | 162 | |
HUF | | 7,531,690 | | USD | | 33,621 | | Deutsche Bank | 9/17/2013 | | (633 | ) |
USD | | 32,477 | | HUF | | 7,499,999 | | Deutsche Bank | 9/17/2013 | | (372 | ) |
USD | | 32,406 | | HUF | | 7,500,001 | | Deutsche Bank | 9/17/2013 | | (443 | ) |
IDR | | 717,838,913 | | USD | | 70,091 | | UBS AG | 9/17/2013 | | (404 | ) |
USD | | 15,705 | | INR | | 925,144 | | UBS AG | 9/17/2013 | | 408 | |
USD | | 40,000 | | INR | | 2,470,600 | | Westpac Group | 9/17/2013 | | (852 | ) |
JPY | | 30,800,000 | | USD | | 321,785 | | Barclays Bank plc | 9/17/2013 | | (11,129 | ) |
USD | | 4,274,433 | | JPY | | 409,132,497 | | Barclays Bank plc | 9/17/2013 | | 147,835 | |
USD | | 808,229 | | JPY | | 78,806,363 | | Barclays Bank plc | 9/17/2013 | | 13,371 | |
KRW | | 31,000,005 | | USD | | 27,331 | | HSBC Holdings plc | 9/17/2013 | | (290 | ) |
| | | | | | | | | |
Currency Purchased | | Currency Sold | | Counterparty | Settlement Date | | Unrealized Gain (Loss) | |
USD | | 55,384 | | KRW | | 62,999,998 | | HSBC Holdings plc | 9/17/2013 | | $431 | |
USD | | 40,000 | | KRW | | 46,410,000 | | HSBC Holdings plc | 9/17/2013 | | (482 | ) |
USD | | 26,268 | | KRW | | 29,879,799 | | HSBC Holdings plc | 9/17/2013 | | 205 | |
USD | | 78,690 | | MXN | | 1,020,016 | | Barclays Bank plc | 9/17/2013 | | 504 | |
USD | | 20,970 | | MXN | | 270,000 | | Barclays Bank plc | 9/17/2013 | | 274 | |
USD | | 37,151 | | MYR | | 120,000 | | Westpac Group | 9/17/2013 | | (457 | ) |
USD | | 27,825 | | MYR | | 90,000 | | Westpac Group | 9/17/2013 | | (381 | ) |
USD | | 24,659 | | MYR | | 80,000 | | Westpac Group | 9/17/2013 | | (413 | ) |
NOK | | 85,625 | | USD | | 13,979 | | Barclays Bank plc | 9/17/2013 | | 79 | |
NOK | | 230,000 | | USD | | 40,030 | | Deutsche Bank | 9/17/2013 | | (2,268 | ) |
USD | | 21,743 | | NOK | | 130,000 | | Barclays Bank plc | 9/17/2013 | | 400 | |
USD | | 311,442 | | NOK | | 1,800,000 | | Deutsche Bank | 9/17/2013 | | 15,917 | |
USD | | 153,918 | | NOK | | 889,582 | | Deutsche Bank | 9/17/2013 | | 7,867 | |
USD | | 40,000 | | NOK | | 244,814 | | Deutsche Bank | 9/17/2013 | | (194 | ) |
NZD | | 1,250 | | USD | | 971 | | Barclays Bank plc | 9/17/2013 | | (7 | ) |
USD | | 32,097 | | NZD | | 40,000 | | Westpac Group | 9/17/2013 | | 1,267 | |
USD | | 15,339 | | NZD | | 19,344 | | Westpac Group | 9/17/2013 | | 430 | |
PEN | | 60,000 | | USD | | 21,429 | | Barclays Bank plc | 9/17/2013 | | (3 | ) |
USD | | 25,381 | | PEN | | 70,000 | | Barclays Bank plc | 9/17/2013 | | 384 | |
USD | | 16,328 | | PHP | | 700,000 | | Westpac Group | 9/17/2013 | | 90 | |
USD | | 28,238 | | PLN | | 90,000 | | Deutsche Bank | 9/17/2013 | | 1,280 | |
RUB | | 900,000 | | USD | | 28,005 | | Westpac Group | 9/17/2013 | | (941 | ) |
USD | | 80,000 | | RUB | | 2,676,800 | | Westpac Group | 9/17/2013 | | (492 | ) |
USD | | 27,064 | | RUB | | 900,000 | | Westpac Group | 9/17/2013 | | 1 | |
SEK | | 129,800 | | USD | | 19,244 | | Barclays Bank plc | 9/17/2013 | | 78 | |
SEK | | 630,000 | | USD | | 96,638 | | Deutsche Bank | 9/17/2013 | | (2,854 | ) |
SEK | | 140,000 | | USD | | 21,594 | | Deutsche Bank | 9/17/2013 | | (754 | ) |
USD | | 692,781 | | SEK | | 4,516,366 | | Deutsche Bank | 9/17/2013 | | 20,463 | |
USD | | 17,873 | | SEK | | 120,000 | | Deutsche Bank | 9/17/2013 | | 9 | |
USD | | 71,726 | | SGD | | 90,000 | | HSBC Holdings plc | 9/17/2013 | | 710 | |
USD | | 54,835 | | SGD | | 68,805 | | HSBC Holdings plc | 9/17/2013 | | 543 | |
USD | | 49,047 | | THB | | 1,530,000 | | Westpac Group | 9/17/2013 | | (90 | ) |
USD | | 47,075 | | TRY | | 90,000 | | Deutsche Bank | 9/17/2013 | | 967 | |
USD | | 54,876 | | TWD | | 1,660,000 | | HSBC Holdings plc | 9/17/2013 | | (560 | ) |
USD | | 54,573 | | TWD | | 1,650,000 | | HSBC Holdings plc | 9/17/2013 | | (530 | ) |
USD | | 51,233 | | TWD | | 1,530,000 | | HSBC Holdings plc | 9/17/2013 | | 138 | |
USD | | 47,020 | | TWD | | 1,420,000 | | HSBC Holdings plc | 9/17/2013 | | (402 | ) |
USD | | 73,225 | | ZAR | | 748,261 | | Deutsche Bank | 9/17/2013 | | (1,640 | ) |
USD | | 17,969 | | ZAR | | 180,000 | | Deutsche Bank | 9/17/2013 | | (41 | ) |
| | | | | | | | | | | | $460,127 | |
Futures Contracts | |
Contracts Sold | Expiration Date | | Underlying Face Amount at Value | | Unrealized Gain (Loss) |
| 2 | | Euro-Bund 10-Year Bonds | September 2013 | | $368,419 | | | $4,318 | |
| 7 | | U.S. Treasury 10-Year Notes | September 2013 | | 885,937 | | | 19,015 | |
| | | | | | $1,254,356 | | | $23,333 | |
Notes to Schedule of Investments
AUD = Australian Dollar BRL = Brazilian Real CAD = Canadian Dollar CHF = Swiss Franc CLP = Chilean Peso CNY = Chinese Yuan COP = Colombian Peso CZK = Czech Koruna DKK = Danish Krone EUR = Euro FHLMC = Federal Home Loan Mortgage Corporation FNMA = Federal National Mortgage Association GBP = British Pound GNMA = Government National Mortgage Association GO = General Obligation HUF = Hungarian Forint IDR = Indonesian Rupiah INR = Indian Rupee JPY = Japanese Yen KRW = South Korea Won MTN = Medium Term Note MXN = Mexican Peso MYR = Malaysian Ringgit NOK = Norwegian Krone NZD = New Zealand Dollar PEN = Peruvian Nuevo Sol | PHP = Philippine Peso PLN = Polish Zloty RUB = Russian Rouble SEK = Swedish Krona SEQ = Sequential Payer SGD = Singapore Dollar THB = Thai Baht TRY = Turkish Lira TWD = Taiwanese Dollar USD = United States Dollar VRN = Variable Rate Note. Interest reset date is indicated. Rate shown is effective at the period end. ZAR = South African Rand † Category is less than 0.05% of total net assets. (1) Security was purchased under Rule 144A of the Securities Act of 1933 or is a private placement and, unless registered under the Act or exempted from registration, may only be sold to qualified institutional investors. The aggregate value of these securities at the period end was $1,465,130, which represented 5.0% of total net assets. (2) Final maturity date indicated, unless otherwise noted. (3) Forward commitment. Settlement date is indicated. (4) Security, or a portion thereof, has been pledged at the custodian bank or with a broker for margin requirements on futures contracts. At the period end, the aggregate value of securities pledged was $36,004. (5) When-issued security. The issue price and yield are fixed on the date of the commitment, but payment and delivery are scheduled for a future date. |
See Notes to Financial Statements.
Statement of Assets and Liabilities |
JUNE 30, 2013 | |
Assets | |
Investment securities, at value (cost of $31,329,764) | | $29,974,000 | |
Cash | | 3,026 | |
Foreign currency holdings, at value (cost of $62,325) | | 61,658 | |
Receivable for investments sold | | 99,066 | |
Receivable for capital shares sold | | 96 | |
Receivable for variation margin on futures contracts | | 547 | |
Unrealized gain on forward foreign currency exchange contracts | | 499,641 | |
Interest receivable | | 269,697 | |
| | | 30,907,731 | |
| | | | |
Liabilities | | | |
Payable for investments purchased | | 1,256,969 | |
Payable for variation margin on futures contracts | | 158 | |
Unrealized loss on forward foreign currency exchange contracts | | 39,514 | |
Accrued management fees | | 22,059 | |
Distribution and service fees payable | | 4,838 | |
| | | 1,323,538 | |
| | | | |
Net Assets | | $29,584,193 | |
| | | | |
Net Assets Consist of: | | | |
Capital paid in | | $29,697,044 | |
Undistributed net investment income | | 665,125 | |
Undistributed net realized gain | | 95,696 | |
Net unrealized depreciation | | (873,672 | ) |
| | | $29,584,193 | |
| | | | | | | | | | |
| | | Net assets | | | Shares outstanding | | | Net asset value per share | |
Investor Class | | $9,590,025 | | | 960,921 | | | $9.98 | |
Institutional Class | | $7,744,656 | | | 775,264 | | | $9.99 | |
A Class | | $6,729,458 | | | 675,171 | | | $9.97* | |
C Class | | $2,781,289 | | | 280,101 | | | $9.93 | |
R Class | | $2,738,765 | | | 275,128 | | | $9.95 | |
*Maximum offering price $10.44 (net asset value divided by 0.955).
See Notes to Financial Statements.
YEAR ENDED JUNE 30, 2013 | |
Investment Income (Loss) | |
Income: | | | |
Interest | | $ 667,381 | |
| | | | |
Expenses: | | | |
Management fees | | 263,411 | |
Distribution and service fees: | | | |
A Class | | 16,942 | |
C Class | | 27,825 | |
R Class | | 13,884 | |
Trustees’ fees and expenses | | 2,045 | |
Other expenses | | 12 | |
| | | 324,119 | |
| | | | |
Net investment income (loss) | | 343,262 | |
| | | | |
Realized and Unrealized Gain (Loss) | | | |
Net realized gain (loss) on: | | | |
Investment transactions | | 34,748 | |
Futures contract transactions | | 15,903 | |
Foreign currency transactions | | 915,627 | |
| | | 966,278 | |
| | | | |
Change in net unrealized appreciation (depreciation) on: | | | |
Investments | | (1,244,615 | ) |
Futures contracts | | 28,275 | |
Translation of assets and liabilities in foreign currencies | | 219,635 | |
| | | (996,705 | ) |
| | | | |
Net realized and unrealized gain (loss) | | (30,427 | ) |
| | | | |
Net Increase (Decrease) in Net Assets Resulting from Operations | | $ 312,835 | |
See Notes to Financial Statements.
Statement of Changes in Net Assets |
YEAR ENDED JUNE 30, 2013 AND PERIOD ENDED JUNE 30, 2012 |
Increase (Decrease) in Net Assets | June 30, 2013 | | | June 30, 2012(1) | |
Operations |
Net investment income (loss) | $343,262 | | | $147,416 | |
Net realized gain (loss) | 966,278 | | | 230,791 | |
Change in net unrealized appreciation (depreciation) | (996,705 | ) | | 123,033 | |
Net increase (decrease) in net assets resulting from operations | 312,835 | | | 501,240 | |
| | | | | | |
Distributions to Shareholders | | | | | |
From net investment income: | | | | | |
Investor Class | (288,448 | ) | | — | |
Institutional Class | (267,461 | ) | | — | |
A Class | (204,567 | ) | | — | |
C Class | (65,224 | ) | | — | |
R Class | (77,792 | ) | | — | |
From net realized gains: | | | | | |
Investor Class | (11,399 | ) | | — | |
Institutional Class | (10,045 | ) | | — | |
A Class | (8,707 | ) | | — | |
C Class | (3,574 | ) | | — | |
R Class | (3,572 | ) | | — | |
Decrease in net assets from distributions | (940,789 | ) | | — | |
| | | | | | |
Capital Share Transactions | | | | | |
Net increase (decrease) in net assets from capital share transactions | 2,081,597 | | | 27,629,310 | |
| | | | | | |
Net increase (decrease) in net assets | 1,453,643 | | | 28,130,550 | |
| | | | | | |
Net Assets | | | | | |
Beginning of period | 28,130,550 | | | — | |
End of period | $29,584,193 | | | $28,130,550 | |
| | | | | | |
Undistributed net investment income | $665,125 | | | $388,131 | |
(1) | January 31, 2012 (fund inception) through June 30, 2012. |
See Notes to Financial Statements.
Notes to Financial Statements |
JUNE 30, 2013
1. Organization
American Century International Bond Funds (the trust) is registered under the Investment Company Act of 1940, as amended (the 1940 Act), as an open-end management investment company and is organized as a Massachusetts business trust. Global Bond Fund (the fund) is one fund in a series issued by the trust. The fund is nondiversified as defined under the 1940 Act. The fund’s investment objective is to seek long-term total return.
The fund offers the Investor Class, the Institutional Class, the A Class, the C Class and the R Class. The A Class may incur an initial sales charge. The A Class and C Class may be subject to a contingent deferred sales charge. The share classes differ principally in their respective sales charges and distribution and shareholder servicing expenses and arrangements. The Institutional Class is made available to institutional shareholders or through financial intermediaries whose clients do not require the same level of shareholder and administrative services as shareholders of other classes. As a result, the Institutional Class is charged a lower unified management fee. All classes of the fund commenced sale on January 31, 2012, the fund’s inception date.
2. Significant Accounting Policies
The following is a summary of significant accounting policies consistently followed by the fund in preparation of its financial statements. The financial statements are prepared in conformity with accounting principles generally accepted in the United States of America, which may require management to make certain estimates and assumptions at the date of the financial statements. Actual results could differ from these estimates.
Investment Valuations — The fund determines the fair value of its investments and computes its net asset value per share as of the close of regular trading (usually 4 p.m. Eastern time) on the New York Stock Exchange (NYSE) on each day the NYSE is open.
Debt securities maturing in greater than 60 days at the time of purchase are valued at the evaluated mean as provided by independent pricing services or at the mean of the most recent bid and asked prices as provided by investment dealers. Debt securities maturing within 60 days at the time of purchase may be valued at cost, plus or minus any amortized discount or premium or at the evaluated mean as provided by an independent pricing service. Evaluated mean prices are commonly derived through utilization of market models, which may consider, among other factors, trade data, quotations from dealers and active market makers, relevant yield curve and spread data, related sector levels, creditworthiness, and other relevant market information on the same or comparable securities.
Investments in open-end management investment companies are valued at the reported net asset value per share. Repurchase agreements are valued at cost. Exchange-traded futures contracts are valued at the settlement price as provided by the appropriate clearing corporation. Forward foreign currency exchange contracts are valued at the mean of the latest bid and asked prices of the forward currency rates as provided by an independent pricing service.
The value of investments initially expressed in foreign currencies is translated into U.S. dollars at prevailing exchange rates.
If the fund determines that the market price for a portfolio security is not readily available or the valuation methods mentioned above do not reflect a security’s fair value, such security is valued as determined in good faith by the Board of Trustees or its designee, in accordance with procedures adopted by the Board of Trustees. Circumstances that may cause the fund to use these procedures to value a security include, but are not limited to: a security has been declared in default; trading in a security has been halted during the trading day; there is a foreign market holiday and no trading occurred; or an event occurred between the close of a foreign exchange and the NYSE that may affect the value of a security.
Security Transactions — Security transactions are accounted for as of the trade date. Net realized gains and losses are determined on the identified cost basis, which is also used for federal income tax purposes.
Investment Income — Interest income is recorded on the accrual basis and includes paydown gain (loss) and accretion of discounts and amortization of premiums. Inflation adjustments related to inflation-linked debt securities are reflected as interest income.
Foreign Currency Translations — All assets and liabilities initially expressed in foreign currencies are translated into U.S. dollars at prevailing exchange rates at period end. The fund may enter into spot foreign currency exchange contracts to facilitate transactions denominated in a foreign currency. Purchases and sales of investment securities, dividend and interest income, spot foreign currency exchange contracts, and expenses are translated at the rates of exchange prevailing on the respective dates of such transactions. Net realized and unrealized foreign currency exchange gains or losses related to investment securities are a component of net realized gain (loss) on investment transactions and change in net unrealized appreciation (depreciation) on investments, respectively.
Forward Commitments — The fund may engage in securities transactions on a forward commitment basis. In these transactions, the securities’ prices and yields are fixed on the date of the commitment. The fund may sell a to-be-announced (TBA) security and at the same time make a commitment to purchase the same security at a future date at a specified price. Conversely, the fund may purchase a TBA security and at the same time make a commitment to sell the same security at a future date at a specified price. These types of transactions are known as “TBA roll” transactions and are accounted for as purchases and sales. The fund will segregate cash, cash equivalents or other appropriate liquid securities on its records in amounts sufficient to meet the purchase price.
Repurchase Agreements — The fund may enter into repurchase agreements with institutions that American Century Investment Management, Inc. (ACIM) (the investment advisor) has determined are creditworthy pursuant to criteria adopted by the Board of Trustees. The fund requires that the collateral, represented by securities, received in a repurchase transaction be transferred to the custodian in a manner sufficient to enable the fund to obtain those securities in the event of a default under the repurchase agreement. ACIM monitors, on a daily basis, the securities transferred to ensure the value, including accrued interest, of the securities under each repurchase agreement is equal to or greater than amounts owed to the fund under each repurchase agreement.
Joint Trading Account — Pursuant to an Exemptive Order issued by the Securities and Exchange Commission, the fund, along with certain other funds in the American Century Investments family of funds, may transfer uninvested cash balances into a joint trading account. These balances are invested in one or more repurchase agreements that are collateralized by U.S. Treasury or Agency obligations.
Segregated Assets — In accordance with the 1940 Act, the fund segregates assets on its books and records to cover certain types of investments, including, but not limited to, futures contracts, forward commitments, when-issued securities, swap agreements and certain forward foreign currency exchange contracts. ACIM monitors, on a daily basis, the securities segregated to ensure the fund designates a sufficient amount of liquid assets, marked-to-market daily. The fund may also receive assets or be required to pledge assets at the custodian bank or with a broker for margin requirements on futures contracts and swap agreements.
Income Tax Status — It is the fund’s policy to distribute substantially all net investment income and net realized gains to shareholders and to otherwise qualify as a regulated investment company under provisions of the Internal Revenue Code. Accordingly, no provision has been made for income taxes. The fund files U.S. federal, state, local and non-U.S. tax returns as applicable. The fund’s tax returns are subject to examination by the relevant taxing authority until expiration of the applicable statute of limitations, which is generally three years from the date of filing but can be longer in certain jurisdictions. At this time, management believes there are no uncertain tax positions which, based on their technical merit, would not be sustained upon examination and for which it is reasonably possible that the total amounts of unrecognized tax benefits will significantly change in the next twelve months.
Multiple Class — All shares of the fund represent an equal pro rata interest in the net assets of the class to which such shares belong, and have identical voting, dividend, liquidation and other rights and the same terms and conditions, except for class specific expenses and exclusive rights to vote on matters affecting only individual classes. Income, non-class specific expenses, and realized and unrealized capital gains and losses of the fund are allocated to each class of shares based on their relative net assets.
Distributions to Shareholders — Distributions from net investment income, if any, are generally declared and paid quarterly, but may be paid less frequently. Distributions from net realized gains, if any, are generally declared and paid annually.
Indemnifications — Under the trust’s organizational documents, its officers and trustees are indemnified against certain liabilities arising out of the performance of their duties to the fund. In addition, in the normal course of business, the fund enters into contracts that provide general indemnifications. The maximum exposure under these arrangements is unknown as this would involve future claims that may be made against a fund. The risk of material loss from such claims is considered by management to be remote.
3. Fees and Transactions with Related Parties
Management Fees — The trust has entered into a management agreement with ACIM, under which ACIM provides the fund with investment advisory and management services in exchange for a single, unified management fee (the fee) per class. The agreement provides that all expenses of managing and operating the fund, except distribution and service fees, brokerage expenses, taxes, interest, fees and expenses of the independent trustees (including legal counsel fees), and extraordinary expenses, will be paid by ACIM. The fee is computed and accrued daily based on each class’s daily net assets and paid monthly in arrears. The annual management fee is 0.95% for the Investor Class, A Class, C Class and R Class and 0.75% for the Institutional Class.
Distribution and Service Fees — The Board of Trustees has adopted a separate Master Distribution and Individual Shareholder Services Plan for each of the A Class, C Class and R Class (collectively the plans), pursuant to Rule 12b-1 of the 1940 Act. The plans provide that the A Class will pay American Century Investment Services, Inc. (ACIS) an annual distribution and service fee of 0.25%. The plans provide that the C Class will pay ACIS an annual distribution and service fee of 1.00%, of which 0.25% is paid for individual shareholder services and 0.75% is paid for distribution services. The plans provide that the R Class will pay ACIS an annual distribution and service fee of 0.50%. The fees are computed and accrued daily based on each class’s daily net assets and paid monthly in arrears. The fees are used to pay financial intermediaries for distribution and individual shareholder services. Fees incurred under the plans during the year ended June 30, 2013 are detailed in the Statement of Operations.
Related Parties — Certain officers and trustees of the trust are also officers and/or directors of American Century Companies, Inc. (ACC). The trust’s investment advisor, ACIM, the trust’s distributor, ACIS, and the trust’s transfer agent, American Century Services, LLC are wholly owned, directly or indirectly, by ACC. ACIM owns 93% of the outstanding shares of the fund. Related parties do not invest in the fund for the purpose of exercising management or control.
4. Investment Transactions
Purchases of investment securities, excluding short-term investments, for the year ended June 30, 2013 totaled $23,116,777, of which $10,395,231 represented U.S. Treasury and Government Agency obligations.
Sales of investment securities, excluding short-term investments, for the year ended June 30, 2013 totaled $18,764,371, of which $9,259,745 represented U.S. Treasury and Government Agency obligations.
5. Capital Share Transactions
Transactions in shares of the fund were as follows (unlimited number of shares authorized):
| | | | | | |
| | Year ended June 30, 2013 | | | Period ended June 30, 2012(1) | |
| | Shares | | | Amount | | | Shares | | | Amount | |
Investor Class | | | | | | | | | | | |
Sold | 256,160 | | | $2,617,763 | | | 843,948 | | | $8,445,480 | |
Issued in reinvestment of distributions | 29,430 | | | 298,132 | | | — | | | — | |
Redeemed | (160,189 | ) | | (1,635,006 | ) | | (8,428 | ) | | (84,573 | ) |
| | 125,401 | | | 1,280,889 | | | 835,520 | | | 8,360,907 | |
Institutional Class | | | | | | | | | | | |
Sold | — | | | — | | | 747,869 | | | 7,478,686 | |
Issued in reinvestment of distributions | 27,395 | | | 277,506 | | | — | | | — | |
| | 27,395 | | | 277,506 | | | 747,869 | | | 7,478,686 | |
A Class | | | | | | | | | | | |
Sold | 11,693 | | | 120,053 | | | 645,054 | | | 6,451,146 | |
Issued in reinvestment of distributions | 21,054 | | | 213,274 | | | — | | | — | |
Redeemed | (2,298 | ) | | (23,563 | ) | | (332 | ) | | (3,347 | ) |
| | 30,449 | | | 309,764 | | | 644,722 | | | 6,447,799 | |
C Class | | | | | | | | | | | |
Sold | 7,213 | | | 73,334 | | | 267,096 | | | 2,670,959 | |
Issued in reinvestment of distributions | 6,788 | | | 68,766 | | | — | | | — | |
Redeemed | (996 | ) | | (10,026 | ) | | — | | | — | |
| | 13,005 | | | 132,074 | | | 267,096 | | | 2,670,959 | |
R Class | | | | | | | | | | | |
Sold | — | | | — | | | 267,096 | | | 2,670,959 | |
Issued in reinvestment of distributions | 8,032 | | | 81,364 | | | — | | | — | |
| | 8,032 | | | 81,364 | | | 267,096 | | | 2,670,959 | |
Net increase (decrease) | 204,282 | | | $2,081,597 | | | 2,762,303 | | | $27,629,310 | |
(1) | January 31, 2012 (fund inception) through June 30, 2012. |
6. Fair Value Measurements
The fund’s securities valuation process is based on several considerations and may use multiple inputs to determine the fair value of the positions held by the fund. In conformity with accounting principles generally accepted in the United States of America, the inputs used to determine a valuation are classified into three broad levels as follows:
• | Level 1 valuation inputs consist of unadjusted quoted prices in an active market for identical securities; |
• | Level 2 valuation inputs consist of direct or indirect observable market data (including quoted prices for similar securities, evaluations of subsequent market events, interest rates, prepayment speeds, credit risk, etc.); or |
• | Level 3 valuation inputs consist of unobservable data (including a fund’s own assumptions). |
The level classification is based on the lowest level input that is significant to the fair valuation measurement. The valuation inputs are not necessarily an indication of the risks associated with investing in these securities or other financial instruments.
The following is a summary of the level classifications as of period end. The Schedule of Investments provides additional information on the fund’s portfolio holdings.| | | | | | | | | |
| | Level 1 | | | Level 2 | | | Level 3 | |
Investment Securities |
Sovereign Governments and Agencies | — | | | $13,312,114 | | | — | |
Corporate Bonds | — | | | 7,154,566 | | | — | |
U.S. Government Agency Mortgage-Backed Securities | — | | | 3,935,907 | | | — | |
Collateralized Mortgage Obligations | — | | | 1,749,558 | | | — | |
U.S. Treasury Securities | — | | | 1,464,894 | | | — | |
Commercial Mortgage-Backed Securities | — | | | 955,888 | | | — | |
Municipal Securities | — | | | 194,126 | | | — | |
Temporary Cash Investments | $427,374 | | | 779,573 | | | — | |
Total Value of Investment Securities | $427,374 | | | $29,546,626 | | | — | |
| | | | | | | | | |
Other Financial Instruments |
Forward Foreign Currency Exchange Contracts | — | | | $460,127 | | | — | |
Futures Contracts | $19,015 | | | 4,318 | | | — | |
Total Unrealized Gain (Loss) on Other Financial Instruments | $19,015 | | | $464,445 | | | — | |
7. Derivative Instruments
Foreign Currency Risk — The fund is subject to foreign currency exchange rate risk in the normal course of pursuing its investment objectives. The value of foreign investments held by a fund may be significantly affected by changes in foreign currency exchange rates. The dollar value of a foreign security generally decreases when the value of the dollar rises against the foreign currency in which the security is denominated and tends to increase when the value of the dollar declines against such foreign currency. A fund may enter into forward foreign currency exchange contracts to reduce a fund’s exposure to foreign currency exchange rate fluctuations or to gain exposure to the fluctuations in the value of foreign currencies. The net U.S. dollar value of foreign currency underlying all contractual commitments held by a fund and the resulting unrealized appreciation or depreciation are determined daily. Realized gain or loss is recorded upon the termination of the contract. Net realized and unrealized gains or losses occurring during the holding period of forward foreign currency exchange contracts are a component of net realized gain (loss) on foreign currency transactions and change in net unrealized appreciation (depreciation) on translation of assets and liabilities in foreign currencies, respectively. A fund bears the risk of an unfavorable change in the foreign currency exchange rate underlying the forward contract. Additionally, losses, up to the fair value, may arise if the counterparties do not perform under the contract terms. The foreign currency risk derivative instruments held at period end as disclosed on the Schedule of Investments are indicative of the fund’s typical volume during the period.
Interest Rate Risk — The fund is subject to interest rate risk in the normal course of pursuing its investment objectives. The value of bonds generally declines as interest rates rise. A fund may enter into futures contracts based on a bond index or a specific underlying security. A fund may purchase futures contracts to gain exposure to increases in market value or sell futures contracts to protect against a decline in market value. Upon entering into a futures contract, a fund will segregate cash, cash equivalents or other appropriate liquid securities on its records in amounts sufficient to meet requirements. Subsequent payments (variation margin) are made or received daily, in cash, by a fund. The variation margin is equal to the daily change in the contract value and is recorded as unrealized gains and losses. A fund recognizes a realized gain or loss when the futures contract is closed or expires. Net realized and unrealized gains or losses occurring during the holding period of futures contracts are a component of net realized gain (loss) on futures contract transactions and change in net unrealized appreciation (depreciation) on futures contracts, respectively. One of the risks of entering into futures contracts is the possibility that the change in value of the contract may not correlate with the changes in value of the underlying securities. The interest rate risk derivative instruments held at period end as disclosed on the Schedule of Investments are indicative of the fund’s typical volume during the period.
Value of Derivative Instruments as of June 30, 2013 | |
| | Asset Derivatives | | | | | Liability Derivatives | | | |
Type of Risk Exposure | Location on Statement
of Assets and Liabilities | | Value | | | Location on Statement
of Assets and Liabilities | | Value | |
Foreign Currency Risk | Unrealized gain on
forward foreign currency exchange contracts | | $499,641 | | | Unrealized loss on
forward foreign currency exchange contracts | | $39,514 | |
Interest Rate Risk | Receivable for variation margin on futures contracts* | | 547 | | | Payable for variation margin on futures contracts* | | 158 | |
| | | | $500,188 | | | | | $39,672 | |
*Included in the unrealized gain (loss) on futures contracts as reported in the Schedule of Investments.
Effect of Derivative Instruments on the Statement of Operations for the Year Ended June 30, 2013
| |
| | Net Realized Gain (Loss) | | | | | Change in Net Unrealized Appreciation (Depreciation) | | | |
Type of Risk Exposure | Location on Statement
of Operations | | Value | | | Location on Statement
of Operations | | Value | |
Foreign Currency Risk | Net realized gain (loss)
on foreign currency transactions | | $909,646 | | | Change in net unrealized appreciation (depreciation) on translation of assets and liabilities in foreign currencies | | $215,483 | |
Interest Rate Risk | Net realized gain (loss)
on futures contract transactions | | 15,903 | | | Change in net unrealized appreciation (depreciation)
on futures contracts | | 28,275 | |
| | | | $925,549 | | | | | $243,758 | |
8. Risk Factors
There are certain risks involved in investing in foreign securities. These risks include those resulting from future adverse political, social and economic developments, fluctuations in currency exchange rates, the possible imposition of exchange controls, and other foreign laws or restrictions. Investing in emerging markets may accentuate these risks.
9. Federal Tax Information
The tax character of distributions paid during the year ended June 30, 2013 and the period January 31, 2012 (fund inception) through June 30, 2012 were as follows:
| | | | | | | |
| | | 2013 | | | 2012 | |
Distributions Paid From | | | | | | |
Ordinary income | | $940,789 | | | — | |
Long-term capital gains | | — | | | — | |
The book-basis character of distributions made during the year from net investment income or net realized gains may differ from their ultimate characterization for federal income tax purposes. These differences reflect the differing character of certain income items and net realized gains and losses for financial statement and tax purposes, and may result in reclassification among certain capital accounts on the financial statements.
The reclassifications, which are primarily due to foreign currency gains and losses, were made to undistributed net investment income $837,224, and undistributed net realized gain $(837,224).
As of June 30, 2013, the federal tax cost of investments and the components of distributable earnings on a tax-basis were as follows:
| | | | |
Federal tax cost of investments | | $31,330,052 | |
Gross tax appreciation of investments | | $ 268,470 | |
Gross tax depreciation of investments | | (1,624,522 | ) |
Net tax appreciation (depreciation) of investments | | $(1,356,052 | ) |
Net tax appreciation (depreciation) on derivatives and translation of assets
and liabilities in foreign currencies | | $12,448 | |
Net tax appreciation (depreciation) | | $(1,343,604 | ) |
Other book-to-tax adjustments | | $(90,110 | ) |
Undistributed ordinary income | | $1,281,864 | |
Accumulated long-term gains | | $38,999 | |
The difference between book-basis and tax-basis cost and unrealized appreciation (depreciation) is attributable primarily to the realization for tax purposes of unrealized gains (losses) on certain foreign currency exchange contracts. Other book-to-tax adjustments are attributable primarily to the tax deferral of losses on straddle positions.
| |
For a Share Outstanding Throughout the Years Ended June 30 (except as noted) |
Per-Share Data | Ratios and Supplemental Data |
| | | Income From Investment Operations: | Distributions From: | | | Ratio to Average Net Assets of: | | |
| | Net Asset Value, Beginning
of Period | Net
Investment Income
(Loss)(1) | Net
Realized and Unrealized
Gain (Loss) | Total From Investment Operations | Net
Investment Income | Net
Realized
Gains | Total Distributions | Net Asset Value,
End of Period | Total
Return(2) | Operating Expenses | Net
Investment Income
(Loss) | Portfolio Turnover
Rate | Net Assets,
End of Period (in thousands) |
Investor Class |
2013 | $10.19 | 0.13 | 0.01 | 0.14 | (0.34) | (0.01) | (0.35) | $9.98 | 1.34% | 0.96% | 1.31% | 68% | $9,590 |
2012(3) | $10.00 | 0.06 | 0.13 | 0.19 | — | — | — | $10.19 | 1.90% | 0.96%(4) | 1.44%(4) | 29% | $8,514 |
Institutional Class |
2013 | $10.20 | 0.15 | 0.01 | 0.16 | (0.36) | (0.01) | (0.37) | $9.99 | 1.53% | 0.76% | 1.51% | 68% | $7,745 |
2012(3) | $10.00 | 0.07 | 0.13 | 0.20 | — | — | — | $10.20 | 2.00% | 0.76%(4) | 1.64%(4) | 29% | $7,627 |
A Class |
2013 | $10.18 | 0.11 | —(5) | 0.11 | (0.31) | (0.01) | (0.32) | $9.97 | 1.11% | 1.21% | 1.06% | 68% | $6,729 |
2012(3) | $10.00 | 0.05 | 0.13 | 0.18 | — | — | — | $10.18 | 1.80% | 1.21%(4) | 1.19%(4) | 29% | $6,563 |
C Class |
2013 | $10.15 | 0.03 | —(5) | 0.03 | (0.24) | (0.01) | (0.25) | $9.93 | 0.32% | 1.96% | 0.31% | 68% | $2,781 |
2012(3) | $10.00 | 0.02 | 0.13 | 0.15 | — | — | — | $10.15 | 1.50% | 1.96%(4) | 0.44%(4) | 29% | $2,710 |
R Class |
2013 | $10.17 | 0.08 | —(5) | 0.08 | (0.29) | (0.01) | (0.30) | $9.95 | 0.78% | 1.46% | 0.81% | 68% | $2,739 |
2012(3) | $10.00 | 0.04 | 0.13 | 0.17 | — | — | — | $10.17 | 1.70% | 1.46%(4) | 0.94%(4) | 29% | $2,716 |
Notes to Financial Highlights
(1) | Computed using average shares outstanding throughout the period. |
(2) | Total returns are calculated based on the net asset value of the last business day and do not reflect applicable sales charges, if any. Total returns for periods less than one year are not annualized. |
(3) | January 31, 2012 (fund inception) through June 30, 2012. |
(5) | Per-share amount was less than $0.005. |
See Notes to Financial Statements.
Report of Independent Registered Public Accounting Firm |
To the Trustees of the American Century International Bond Funds
and Shareholders of the Global Bond Fund:
In our opinion, the accompanying statement of assets and liabilities, including the schedule of investments, and the related statements of operations and of changes in net assets and the financial highlights present fairly, in all material respects, the financial position of the Global Bond Fund (one of the two funds comprising the American Century International Bond Funds, hereafter referred to as the “Fund”) at June 30, 2013, the results of its operations for the year then ended, the changes in its net assets for each of the periods then ended, and the financial highlights for each of the periods presented, in conformity with accounting principles generally accepted in the United States of America. These financial statements and financial highlights (hereafter referred to as “financial statements”) are the responsibility of the Fund’s management; our responsibility is to express an opinion on these financial statements based on our audits. We conducted our audits of these financial statements in accordance with the standards of the Public Company Accounting Oversight Board (United States). Those standards require that we plan and perform the audit to obtain reasonable assurance about whether the financial statements are free of material misstatement. An audit includes examining, on a test basis, evidence supporting the amounts and disclosures in the financial statements, assessing the accounting principles used and significant estimates made by management, and evaluating the overall financial statement presentation. We believe that our audits, which included confirmation of securities at June 30, 2013 by correspondence with the custodian and brokers, provide a reasonable basis for our opinion.
PricewaterhouseCoopers LLP
Kansas City, Missouri
August 21, 2013
Board of Trustees
The individuals listed below serve as trustees of the funds. Each trustee will continue to serve in this capacity until death, retirement, resignation or removal from office. The board has adopted a mandatory retirement age for trustees who are not “interested persons,” as that term is defined in the Investment Company Act (independent trustees). Independent trustees shall retire on December 31 of the year in which they reach their 75th birthday; provided, however, that on or after January 1, 2022, independent trustees shall retire on December 31 of the year in which they reach their 76th birthday.
Mr. Thomas is the only trustee who is an “interested person” because he currently serves as President and Chief Executive Officer of American Century Companies, Inc. (ACC), the parent company of American Century Investment Management, Inc. (ACIM or the advisor).
The other trustees (more than three-fourths of the total number) are independent; that is, they have never been employees, directors or officers of, and have no financial interest in, ACC or any of its wholly owned, direct or indirect, subsidiaries, including ACIM, American Century Investment Services, Inc. (ACIS) and American Century Services, LLC (ACS). The trustees serve in this capacity for eight (in the case of Mr. Thomas, 15) registered investment companies in the American Century Investments family of funds.
The following table presents additional information about the trustees. The mailing address for each trustee other than Mr. Thomas is 1665 Charleston Road, Mountain View, California 94043. The mailing address for Mr. Thomas is 4500 Main Street, Kansas City, Missouri 64111.
Name
(Year of Birth) | Position(s) Held with Funds | Length
of Time Served | Principal Occupation(s) During Past 5 Years | | Number of American Century Portfolios Overseen
by Trustee | Other Directorships Held During Past 5 Years |
Independent Trustees |
Tanya S. Beder (1955) | Trustee | Since 2011 | Chairman, SBCC Group Inc. (independent advisory services) (2006 to present) | | 41 | CYS Investments, Inc. (specialty finance company) |
Jeremy I. Bulow (1954) | Trustee | Since 2011 | Professor of Economics, Stanford University, Graduate School of Business (1979 to present) | | 41 | None |
Ronald J. Gilson (1946) | Trustee and Chairman of the Board | Since 1995 | Charles J. Meyers Professor of Law and Business, Stanford Law School (1979 to present); Marc and Eva Stern Professor of Law and Business, Columbia University School of Law (1992 to present) | | 41 | None |
Frederick L. A. Grauer
(1946) | Trustee | Since 2008 | Senior Advisor, BlackRock, Inc. (investment management firm) (2010 to 2011); Senior Advisor, Barclays Global Investors (investment management firm) (2003 to 2009) | | 41 | None |
Name
(Year of Birth) | Position(s) Held with Funds | Length
of Time Served | Principal Occupation(s) During Past 5 Years | | Number of American Century Portfolios Overseen
by Trustee | Other Directorships Held During Past 5 Years |
Independent Trustees |
Peter F. Pervere (1947) | Trustee | Since 2007 | Retired | | 41 | Intraware, Inc. (2003 to 2009) |
Myron S. Scholes (1941) | Trustee | Since 1980 | Chairman, Platinum Grove Asset Management, L.P. (asset manager) (1999 to 2009); Frank E. Buck Professor of Finance-Emeritus, Stanford Graduate School of Business (1996 to present) | | 41 | Dimensional Fund Advisors (investment advisor); CME Group, Inc. (futures and options exchange) |
John B. Shoven (1947) | Trustee | Since 2002 | Professor of Economics, Stanford University (1973 to present) | | 41 | Cadence Design Systems; Exponent; Financial Engines |
| |
Interested Trustee |
Jonathan S. Thomas
(1963) | Trustee and President | Since 2007 | President and Chief Executive Officer, ACC (March 2007 to present). Also serves as Chief Executive Officer and Manager, ACS; Executive Vice President, ACIM; Director, ACC, ACIM and other ACC subsidiaries | | 106 | None |
Officers
The following table presents certain information about the executive officers of the funds. Each officer serves as an officer for each of the 15 investment companies in the American Century family of funds, unless otherwise noted. No officer is compensated for his or her service as an officer of the funds. The listed officers are interested persons of the funds and are appointed or re-appointed on an annual basis. The mailing address for each of the officers listed below is 4500 Main Street, Kansas City, Missouri 64111.
| | | |
Name
(Year of Birth) | Offices with the Funds | Principal Occupation(s) During the Past Five Years |
Jonathan S. Thomas
(1963) | Trustee and President since 2007 | President and Chief Executive Officer, ACC (March 2007 to present). Also serves as Chief Executive Officer and Manager, ACS; Executive Vice President, ACIM; Director, ACC, ACIM and other ACC subsidiaries |
Maryanne L. Roepke
(1956) | Chief Compliance Officer since 2006 and Senior Vice President since 2000 | Chief Compliance Officer, American Century funds, ACIM and ACS (August 2006 to present). Also serves as Senior Vice President, ACS |
Charles A. Etherington (1957) | General Counsel since 2007 and Senior Vice President since 2006 | Attorney, ACC (February 1994 to present); Vice President, ACC (November 2005 to present); General Counsel, ACC (March 2007 to present). Also serves as General Counsel, ACIM, ACS, ACIS and other ACC subsidiaries; and Senior Vice President, ACIM and ACS |
C. Jean Wade (1964) | Vice President, Treasurer and Chief Financial Officer since 2012 | Vice President, ACS (February 2000 to present) |
Robert J. Leach (1966) | Vice President since 2006 and Assistant Treasurer since 2012 | Vice President, ACS (February 2000 to present) |
David H. Reinmiller (1963) | Vice President since 2001 | Attorney, ACC (January 1994 to present); Associate General Counsel, ACC (January 2001 to present). Also serves as Vice President, ACIM and ACS |
Ward D. Stauffer (1960) | Secretary since 2005 | Attorney, ACC (June 2003 to present) |
The Statement of Additional Information has additional information about the fund’s trustees and is available without charge, upon request, by calling 1-800-345-2021.
Approval of Management Agreement |
At a meeting held on June 11, 2013, the Fund’s Board of Directors/Trustees unanimously approved the renewal of the management agreement pursuant to which American Century Investment Management, Inc. (the “Advisor”) acts as the investment advisor for the Fund. Under Section 15(c) of the Investment Company Act, contracts for investment advisory services are required to be reviewed, evaluated, and approved by a majority of a fund’s directors/trustees (the “Directors”), including a majority of the independent Directors each year. The Board regards this annual evaluation and renewal as one of its most important responsibilities.
In connection with their annual review and evaluation, the independent Directors memorialized a statement regarding the relationship between their ongoing obligations to oversee and evaluate the performance of the Advisor and their consideration of renewal of the management agreement. In that statement, the independent Directors noted that their assessment of the Advisor’s performance is an ongoing process that takes place over the entire year and is informed by all of the information that the Board and its committees receive and consider over time. This information, together with the materials provided in connection with the review, are central to the Board’s assessment of the Advisor’s performance and its determination whether to renew the Fund’s management agreement.
Prior to its consideration of the renewal of the management agreement, the Board requested and reviewed extensive data and analysis relating to the proposed renewal. This information and analysis was compiled by the Advisor and certain independent providers of evaluation data concerning the Fund and the services provided to the Fund by the Advisor.
In connection with its consideration of the renewal of the management agreement, the Board’s review and evaluation of the services provided by the Advisor included, but was not limited to, the following:
• | the nature, extent, and quality of investment management, shareholder services, and other services provided by the Advisor to the Fund; |
• | the wide range of other programs and services the Advisor provides to the Fund and its shareholders on a routine and non-routine basis; |
• | the investment performance of the Fund, including data comparing the Fund’s performance to appropriate benchmarks and/or a peer group of other mutual funds with similar investment objectives and strategies; |
• | data comparing the cost of owning the Fund to the cost of owning similar funds; |
• | the Advisor’s compliance policies, procedures, and regulatory experience; |
• | financial data showing the cost of services provided to the Fund, the profitability of the Fund to the Advisor, and the overall profitability of the Advisor; |
• | possible economies of scale associated with the Advisor’s management of the Fund and other accounts under its management; |
• | data comparing services provided and charges to other investment management clients of the Advisor; and |
• | consideration of collateral benefits derived by the Advisor from the management of the Fund. |
In keeping with its practice, the Board held two in-person meetings to review and discuss the information provided. The Board also had the benefit of the advice of its independent counsel throughout the period.
Factors Considered
The Directors considered all of the information provided by the Advisor, the independent data providers, and the Board’s independent counsel in connection with the review, and evaluated such information for the Fund. In connection with their review, the Directors did not identify any single factor as being all-important or controlling and each Director may have attributed different levels of importance to different factors. In deciding to renew the management agreement, the Board based its decision on a number of factors, including the following:
Nature, Extent and Quality of Services — Generally. Under the management agreement, the Advisor is responsible for providing or arranging for all services necessary for the operation of the Fund. The Board noted that under the management agreement, the Advisor provides or arranges at its own expense a wide variety of services including:
• | constructing and designing the Fund |
• | portfolio research and security selection |
• | initial capitalization/funding |
• | daily valuation of the Fund’s portfolio |
• | shareholder servicing and transfer agency, including shareholder confirmations, recordkeeping, and communications |
• | regulatory and portfolio compliance |
• | marketing and distribution |
The Board noted that many of these services have expanded over time both in terms of quantity and complexity in response to shareholder demands, competition in the industry, changing distribution channels, and the changing regulatory environment.
Investment Management Services. The nature of the investment management services provided to the Fund is quite complex and allows Fund shareholders access to professional money management, instant diversification of their investments within an asset class, the opportunity to easily diversify among asset classes by investing in or exchanging among various American Century Investments funds, and liquidity. In evaluating investment performance, the Board expects the Advisor to manage the Fund in accordance with its investment objectives and approved strategies. Further, the Directors recognize that the Advisor has an obligation to seek the best execution of fund trades. In providing these services, the Advisor utilizes teams of investment professionals (portfolio managers, analysts, research assistants, and securities traders) who require extensive information technology, research, training, compliance and other systems to conduct their business. The Board, directly and through its Portfolio Committee, regularly reviews investment performance information for the Fund, together with comparative information for appropriate benchmarks and/or peer groups of similarly-managed funds, over different time horizons. The Directors also review detailed performance information during the management agreement approval process. If performance concerns are identified, the Fund receives special reviews until performance improves, during which the Board discusses with the Advisor the reasons for such results (e.g., market conditions, security selection) and any efforts being undertaken to improve performance. The Board found the investment management services provided by the Advisor to the Fund to meet or exceed industry standards. More detailed information about the Fund’s performance can be found in the Performance and Portfolio Commentary sections of this report.
Shareholder and Other Services. Under the management agreement, the Advisor provides the Fund with a comprehensive package of transfer agency, shareholder, and other services. The Board, directly and through various committees of the Board, regularly reviews reports and evaluations of such services at its regular meetings. These reports include, but are not limited to, information regarding the operational efficiency and accuracy of the shareholder and transfer agency services provided, staffing levels, shareholder satisfaction (as measured by external as well as internal sources), technology support, new products and services offered to Fund shareholders, securities trading activities, portfolio valuation services, auditing services, and legal and operational compliance activities. Certain aspects of shareholder and transfer agency service level efficiency and the quality of securities trading activities are measured by independent third party providers and are presented in comparison to other fund groups not managed by the Advisor. The Board found the services provided by the Advisor to the Fund under the management agreement to be competitive and of high quality.
Costs of Services and Profitability. The Advisor provides detailed information concerning its cost of providing various services to the Fund, its profitability in managing the Fund, its overall profitability, and its financial condition. The Directors have reviewed with the Advisor the methodology used to prepare this financial information. The financial information regarding the Advisor is considered in evaluating the Advisor’s financial condition, its ability to continue to provide services under the management agreement, and the reasonableness of the current management fee. The Board concluded that the Advisor’s profits were reasonable in light of the services provided to the Fund.
Ethics. The Board generally considers the Advisor’s commitment to providing quality services to shareholders and to conducting its business ethically. They noted that the Advisor’s practices generally meet or exceed industry best practices.
Economies of Scale. The Board also reviewed information provided by the Advisor regarding the possible existence of economies of scale in connection with the management of the Fund. The Board concluded that economies of scale are difficult to measure and predict with precision, especially on a fund-by-fund basis. The Board concluded that the Advisor is appropriately sharing economies of scale through its competitive fee structure, offering competitive fees from fund inception, and through reinvestment in its business to provide shareholders additional content and services.
Comparison to Other Funds’ Fees. The management agreement provides that the Fund pay the Advisor a single, all-inclusive (or unified) management fee for providing all services necessary for the management and operation of the Fund, other than brokerage expenses, taxes, interest, extraordinary expenses, and the fees and expenses of the Fund’s independent directors (including their independent legal counsel) and expenses incurred in connection with the provision of shareholder services and distribution services under a plan adopted pursuant to Rule 12b-1 under the 1940 Act. Under the unified fee structure, the Advisor is responsible for providing all investment advisory, custody, audit, administrative, compliance, recordkeeping, marketing and shareholder services, or arranging and supervising third parties to provide such services. By contrast, most other funds are charged a variety of fees, including an investment advisory fee, a transfer agency fee, an administrative fee, distribution charges and other expenses. Other than their investment advisory fees and any applicable Rule 12b-1 distribution fees, all other components of the total fees charged by these other funds may be increased without shareholder approval. The Board believes the unified fee structure is a benefit to Fund shareholders because it clearly discloses to shareholders the cost of owning Fund shares, and, since the unified fee cannot be increased without a vote of Fund shareholders, it shifts to the Advisor the risk of increased costs of operating the Fund and provides a direct incentive to minimize administrative inefficiencies. Part of the Board’s analysis of fee levels involves reviewing certain evaluative data compiled by an independent provider and comparing the Fund’s unified fee to the total expense ratio of other funds in the Fund’s peer group. The Board concluded that the management fee paid by the Fund to the Advisor under the management agreement is reasonable in light of the services provided to the Fund.
Comparison to Fees and Services Provided to Other Clients of the Advisor. The Board also requested and received information from the Advisor concerning the nature of the services, fees, costs and profitability of its advisory services to advisory clients other than the Fund. They observed that these varying types of client accounts require different services and involve different regulatory and entrepreneurial risks than the management of the Fund. The Board analyzed this information and concluded that the fees charged and services provided to the Fund were reasonable by comparison.
Collateral or “Fall-Out” Benefits Derived by the Advisor. The Board considered the existence of collateral benefits the Advisor may receive as a result of its relationship with the Fund. They concluded that the Advisor’s primary business is managing mutual funds and it generally does not use fund or shareholder information to generate profits in other lines of business, and therefore does not derive any significant collateral benefits from them. The Board noted that the Advisor receives proprietary research from broker-dealers that execute fund portfolio transactions and concluded that this research is likely to benefit Fund shareholders. The Board also determined that the Advisor is able to provide investment management services to certain clients other than the Fund, at least in part, due to its existing infrastructure built to serve the fund complex. The Board concluded, however, that the assets of those other clients are not material to the analysis and, where applicable, may be included with the assets of the Fund to determine breakpoints in the management fee schedule.
Existing Relationship. The Board also considered whether there was any reason for not continuing the existing arrangement with the Advisor. In this regard, the Board was mindful of the potential disruptions of the Fund’s operations and various risks, uncertainties, and other effects that could occur as a result of a decision not to continue such relationship. In particular, the Board recognized that most shareholders have invested in the Fund on the strength of the Advisor’s industry standing and reputation and in the expectation that the Advisor will have a continuing role in providing advisory services to the Fund.
Conclusion of the Directors. As a result of this process, the Board, including all of the independent directors and assisted by the advice of independent legal counsel, taking into account all of the factors discussed above and the information provided by the Advisor and others, concluded that the management agreement between the Fund and the Advisor is fair and reasonable in light of the services provided and should be renewed.
Retirement Account Information
As required by law, distributions you receive from certain IRAs are subject to federal income tax withholding, unless you elect not to have withholding apply. Tax will be withheld on the total amount withdrawn even though you may be receiving amounts that are not subject to withholding, such as nondeductible contributions. In such case, excess amounts of withholding could occur. You may adjust your withholding election so that a greater or lesser amount will be withheld.
If you don’t want us to withhold on this amount, you must notify us to not withhold the federal income tax. You may notify us in writing or in certain situations by telephone or through other electronic means. For systematic withdrawals, your withholding election will remain in effect until revoked or changed by filing a new election. You have the right to revoke your election at any time.
Remember, even if you elect not to have income tax withheld, you are liable for paying income tax on the taxable portion of your withdrawal. If you elect not to have income tax withheld or you don’t have enough income tax withheld, you may be responsible for payment of estimated tax. You may incur penalties under the estimated tax rules if your withholding and estimated tax payments are not sufficient. You can reduce or defer the income tax on a distribution by directly or indirectly rolling such distribution over to another IRA or eligible plan. You should consult your tax advisor for additional information.
State tax will be withheld if, at the time of your distribution, your address is within one of the mandatory withholding states and you have federal income tax withheld (or as otherwise required by state law). State taxes will be withheld from your distribution in accordance with the respective state rules.
Distributions you receive from 403(b), 457 and qualified plans are subject to special tax and withholding rules. Your plan administrator or plan sponsor is required to provide you with a special tax notice explaining those rules at the time you request a distribution. If applicable, federal and/or state taxes may be withheld from your distribution amount.
Proxy Voting Guidelines
American Century Investment Management, Inc., the fund’s investment advisor, is responsible for exercising the voting rights associated with the securities purchased and/or held by the fund. A description of the policies and procedures the advisor uses in fulfilling this responsibility is available without charge, upon request, by calling 1-800-345-2021. It is also available on American Century Investments’ website at americancentury.com and on the Securities and Exchange Commission’s website at sec.gov. Information regarding how the investment advisor voted proxies relating to portfolio securities during the most recent 12-month period ended June 30 is available on the “About Us” page at americancentury.com. It is also available at sec.gov.
Quarterly Portfolio Disclosure
The fund files its complete schedule of portfolio holdings with the Securities and Exchange Commission (SEC) for the first and third quarters of each fiscal year on Form N-Q. The fund’s Forms N-Q are available on the SEC’s website at sec.gov, and may be reviewed and copied at the SEC’s Public Reference Room in Washington, DC. Information on the operation of the Public Reference Room may be obtained by calling 1-800-SEC-0330. The fund also makes its complete schedule of portfolio holdings for the most recent quarter of its fiscal year available on its website at americancentury.com and, upon request, by calling 1-800-345-2021.
Other Tax Information
The following information is provided pursuant to provisions of the Internal Revenue Code.
The fund hereby designates $37,297 as qualified short-term capital gain distributions for purposes of Internal Revenue Code Section 871.
Contact Us | americancentury.com |
Automated Information Line | 1-800-345-8765 |
Investor Services Representative | 1-800-345-2021
or 816-531-5575 |
Investors Using Advisors | 1-800-378-9878 |
Business, Not-For-Profit, Employer-Sponsored Retirement Plans | 1-800-345-3533 |
Banks and Trust Companies, Broker-Dealers, Financial Professionals, Insurance Companies | 1-800-345-6488 |
Telecommunications Device for the Deaf | 1-800-634-4113 |
American Century International Bond Funds
Investment Advisor:
American Century Investment Management, Inc.
Kansas City, Missouri
This report and the statements it contains are submitted for the general information of our shareholders. The report is not authorized for distribution to prospective investors unless preceded or accompanied by an effective prospectus.
©2013 American Century Proprietary Holdings, Inc. All rights reserved.
CL-ANN-79324 1308
ANNUAL REPORT | JUNE 30, 2013 |
International Bond Fund
President’s Letter | 2 |
Market Perspective | 3 |
Performance | 4 |
Portfolio Commentary | 6 |
Fund Characteristics | 8 |
Shareholder Fee Example | 9 |
Schedule of Investments | 11 |
Statement of Assets and Liabilities | 16 |
Statement of Operations | 17 |
Statement of Changes in Net Assets | 18 |
Notes to Financial Statements | 19 |
Financial Highlights | 26 |
Report of Independent Registered Public Accounting Firm | 28 |
Management | 29 |
Approval of Management Agreement | 32 |
Additional Information | 37 |
Any opinions expressed in this report reflect those of the author as of the date of the report, and do not necessarily represent the opinions of American Century Investments® or any other person in the American Century Investments organization. Any such opinions are subject to change at any time based upon market or other conditions and American Century Investments disclaims any responsibility to update such opinions. These opinions may not be relied upon as investment advice and, because investment decisions made by American Century Investments funds are based on numerous factors, may not be relied upon as an indication of trading intent on behalf of any American Century Investments fund. Security examples are used for representational purposes only and are not intended as recommendations to purchase or sell securities. Performance information for comparative indices and securities is provided to American Century Investments by third party vendors. To the best of American Century Investments’ knowledge, such information is accurate at the time of printing.
Jonathan Thomas
Dear Investor:
Thank you for reviewing this annual report for the 12 months ended June 30, 2013. It provides investment performance, market analysis, and portfolio information, presented with the expert perspective of our portfolio management team.
Annual reports remain important vehicles for conveying information about fund returns, including key factors that affected fund performance. For additional, updated investment and market insights, we encourage you to visit our website, americancentury.com.
Generally Favorable Fiscal-Year Returns for U.S. Stocks and High-Yield Bonds
The 12-month reporting period began in the summer of 2012 with uncertainties caused by slowing economies, as well as the upcoming November elections and year-end fiscal deadlines in the U.S. It ended with more uncertainty about the future of U.S. monetary stimulus. In between, aggressive monetary intervention by central banks encouraged investors to take more risk, generally boosting stocks at the expense of government bonds.
U.S. mid-cap, small-cap, and value stock indices achieved performance leadership during the period, outpacing the S&P 500 Index’s 20.60% return. U.S. stocks generally outperformed non-U.S. equities—the MSCI EAFE Index returned 18.62% and the MSCI Emerging Markets Index advanced 2.87%, affected by slowing growth in emerging market economies.
Slower emerging market growth also hindered commodity price gains and helped keep inflation under control. As a result, assets used as inflation hedges, including inflation-indexed securities and precious metals, lagged other assets. Gold, in particular, plunged, starting last October. And Treasury inflation-protected securities (TIPS) were among the lowest performers in the U.S. bond market. Bond index returns generally ranged from approximately 10% gains for U.S. corporate high-yield indices all the way down to negative returns for longer-maturity global Treasury benchmarks.
Despite signs of improvement in 2013, U.S. economic growth is subpar compared with past recession recoveries, and remains vulnerable to threats that could trigger another slowdown and market volatility. Therefore, we continue to believe in a disciplined, diversified, long-term investment approach, using professionally managed stock and bond portfolios—as appropriate—for meeting financial goals. We appreciate your continued trust in us in this volatile environment.
Sincerely,
Jonathan Thomas
President and Chief Executive Officer
American Century Investments
By David MacEwen, Chief Investment Officer, Fixed Income
Global bonds posted modestly positive returns for the 12 months ended June 30, 2013. However, for U.S. investors with unhedged currency exposure, a stronger U.S. dollar led to negative overall returns for non-U.S. bonds (see the table below).
On the economic front, global economic growth slowed early in the period, particularly in the U.S. and Europe, but also in emerging economies such as China and India. In response, central banks around the world took steps to support their respective economies. The European Central Bank pledged to help stabilize and support bond markets in fiscally troubled countries; the Federal Reserve in the U.S. and the Bank of England in the U.K. implemented additional quantitative easing measures; and the Bank of Japan embarked on an aggressive program of economic stimulus measures to end deflation and revive the long-dormant Japanese economy.
By early 2013, global economic conditions began to improve. In the U.S., a recovery in the housing market and a declining unemployment rate led the Federal Reserve to signal that it may taper back its quantitative easing measures before the end of the year. This development pushed global bond yields higher near the end of the reporting period.
Other events impacting global fixed-income markets during the period included major elections in the U.S. and Japan, the U.S. government’s efforts to resolve the fiscal cliff and the sequester (which involved the expiration of certain federal tax cuts and the implementation of automatic federal budget cuts), and a contentious bailout of the banking system in Cyprus.
U.S. bond yields rose the most for the 12 months, while yields in Japan were relatively stable. European bond markets performed best, led by peripheral countries such as Italy and Spain. The Japanese bond market generated modestly positive performance, while the U.S. bond market declined for the period. From a sector perspective, corporate bonds and other non-government securities outperformed government bonds on a global basis during the reporting period.
A stronger U.S. dollar reduced non-U.S. bond returns for U.S. investors. In particular, the dollar appreciated by 24% versus the Japanese yen, reflecting the changing central bank policies in each country. The U.S. dollar also appreciated by 3% against the British pound and 12% against the Australian dollar. The main exception was the euro—the dollar declined by about 3% versus the euro for the 12-month period.
Major Currency and Global Bond Market Returns |
For the 12 months ended June 30, 2013 |
Currency Returns* |
U.S. Dollar vs. Euro | -2.78% |
U.S. Dollar vs. Japanese Yen | 24.07% |
International Bond Market Returns (in U.S. dollars) |
Barclays Global Treasury ex-U.S. Bond Index | -5.92% |
Barclays Global Aggregate Bond Index (USD, hedged) | 1.70% |
*All percentage changes in foreign exchange rates are calculated on the basis of that currency per one U.S. dollar.
Total Returns as of June 30, 2013 |
| | | | Average Annual Returns | |
| | Ticker Symbol | 1 year | 5 years | 10 years | Since Inception | Inception Date |
Investor Class | BEGBX | -4.55% | 1.33% | 4.08% | 5.50% | 1/7/92 |
Barclays Global Treasury ex-U.S. Bond Index | — | -5.92% | 2.70% | 4.81% | 5.77%(1) | — |
Institutional Class | AIDIX | -4.36% | 1.51% | — | 4.05% | 8/2/04 |
A Class(2) No sales charge* With sales charge* | AIBDX | -4.81% -9.12% | 1.06% 0.14% | 3.80% 3.33% | 3.86% 3.54% | 10/27/98 |
C Class | AIQCX | -5.51% | 0.31% | — | 1.35% | 9/28/07 |
R Class | AIBRX | -5.03% | 0.81% | — | 1.85% | 9/28/07 |
* | Sales charges include initial sales charges and contingent deferred sales charges (CDSCs), as applicable. A Class shares have a 4.50% maximum initial sales charge and may be subject to a maximum CDSC of 1.00%. C Class shares redeemed within 12 months of purchase are subject to a maximum CDSC of 1.00%. The SEC requires that mutual funds provide performance information net of maximum sales charges in all cases where charges could be applied. |
(1) | Since 12/31/91, the date nearest the Investor Class’s inception for which data are available. |
(2) | Prior to September 4, 2007, the A Class was referred to as the Advisor Class and did not have a front-end sales charge. Performance prior to that date has been adjusted to reflect this charge. |
Data presented reflect past performance. Past performance is no guarantee of future results. Current performance may be higher or lower than the performance shown. Investment return and principal value will fluctuate, and redemption value may be more or less than original cost. To obtain performance data current to the most recent month end, please call 1-800-345-2021 or visit americancentury.com. As interest rates rise, bond values will decline. International investing involves special risks, such as political instability and currency fluctuations.
Unless otherwise indicated, performance reflects Investor Class shares; performance for other share classes will vary due to differences in fee structure. For information about other share classes available, please consult the prospectus. Data assumes reinvestment of dividends and capital gains, and none of the charts reflect the deduction of taxes that a shareholder would pay on fund distributions or the redemption of fund shares. Returns for the index are provided for comparison. The fund’s total returns include operating expenses (such as transaction costs and management fees) that reduce returns, while the total returns of the index do not.
Growth of $10,000 Over 10 Years |
$10,000 investment made June 30, 2003 |
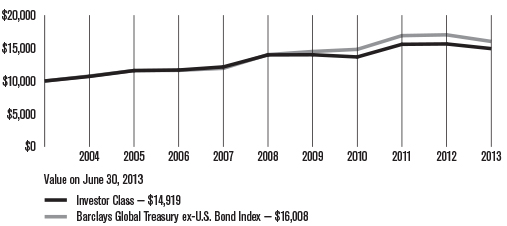
Total Annual Fund Operating Expenses |
Investor Class | Institutional Class | A Class | C Class | R Class |
0.81% | 0.61% | 1.06% | 1.81% | 1.31% |
The total annual fund operating expenses shown is as stated in the fund’s prospectus current as of the date of this report. The prospectus may vary from the expense ratio shown elsewhere in this report because it is based on a different time period, includes acquired fund fees and expenses, and, if applicable, does not include fee waivers or expense reimbursements.
Data presented reflect past performance. Past performance is no guarantee of future results. Current performance may be higher or lower than the performance shown. Investment return and principal value will fluctuate, and redemption value may be more or less than original cost. To obtain performance data current to the most recent month end, please call 1-800-345-2021 or visit americancentury.com. As interest rates rise, bond values will decline. International investing involves special risks, such as political instability and currency fluctuations.
Unless otherwise indicated, performance reflects Investor Class shares; performance for other share classes will vary due to differences in fee structure. For information about other share classes available, please consult the prospectus. Data assumes reinvestment of dividends and capital gains, and none of the charts reflect the deduction of taxes that a shareholder would pay on fund distributions or the redemption of fund shares. Returns for the index are provided for comparison. The fund’s total returns include operating expenses (such as transaction costs and management fees) that reduce returns, while the total returns of the index do not.
Portfolio CommentaPortfolio Managers: John Lovito, Simon Chester, and Edward Boyle
Performance Summary
International Bond returned –4.55%* for the fiscal year ended June 30, 2013, compared with the –5.92% return of its benchmark, the Barclays Global Treasury ex-U.S. Bond Index. (See pages 4 and 5 for additional performance comparisons.)
The negative returns for both International Bond and its benchmark index reflected the impact of a stronger U.S. dollar on non-U.S. bond returns for U.S. investors (see page 3 for more details). The fund’s outperformance of its benchmark during the 12-month period was driven primarily by favorable duration management, selected currency positioning, and exposure to non-government bonds.
Duration Management Added Value
Management of the fund’s duration (a measure of interest rate sensitivity) contributed to the fund’s outperformance of its benchmark during the fiscal year, particularly over the last six months of the period. The fund’s duration was neutral compared with the benchmark index during the first half of the period, and this positioning had little impact on performance as bond yields fluctuated within a fairly narrow range in most regions of the world.
However, in late 2012 and early 2013, yields rose toward the higher end of their range in many countries, so we extended the fund’s duration, making it longer than that of its benchmark. This positioning contributed favorably to performance as global bond yields declined from late January through the end of April.
In late April, with bond yields near the lower end of their range, we shifted from a longer duration to a shorter duration relative to the benchmark. As bond yields reversed course and rose sharply over the last two months of the reporting period, this positioning helped limit the negative impact of rising interest rates on the fund’s performance. Shortly before the end of the period, we shifted the fund’s duration back to neutral compared with its benchmark.
Non-Government Bonds Boosted Results
The fund’s exposure to non-government bonds, which are not represented in the benchmark, also contributed to its outperformance of the index. Non-government bonds include corporate bonds, secured bonds (which are typically corporate securities backed by mortgages or other loans), and securities issued by supra-national organizations (such as the European Investment Bank).
Non-government bonds outperformed during the period thanks to strong investor demand for higher-yielding investments. Early in the reporting period, we increased the fund’s position in non-government bonds from about 7% to more than 10% of the portfolio. During the last half of the period, we took profits in some of the fund’s non-government holdings, reducing the fund’s non-government exposure back to approximately 8%.
*All fund returns referenced in this commentary are for Investor Class shares.
Country Allocation Was Mixed
The fund’s bond market positioning generated mixed results for the 12-month period. For much of the period, the fund held an overweight position in the U.K. and a corresponding underweight position in Asia, specifically Japan and South Korea. This positioning contributed positively to performance as the U.K. held up slightly better than the broad global fixed-income markets, while Japan meaningfully underperformed in U.S. dollar terms. In addition, an underweight in core European markets, particularly Germany, added value.
On the downside, an underweight position in France and a lack of exposure to peripheral European countries such as Italy and Spain detracted from relative results. We avoided peripheral European bond markets because they do not meet the fund’s credit quality standards.
The main adjustment we made to the fund’s bond market allocation occurred during the latter half of the period, when we shifted assets from Germany into Norway and Sweden. The increased exposure to Scandinavian bond markets was intended to take advantage of relative values and increase the fund’s country diversification.
Currency Positioning Generally Positive
The fund’s currency positioning aided results for the reporting period. The most beneficial position was an underweight in the Japanese yen, which declined sharply against all major currencies as the Bank of Japan enacted aggressive economic stimulus measures. Overweight positions in the Norwegian krone and the Swedish krona also added value during the period.
On the downside, overweight positions in the currencies of resource-based economies, such as the Australian dollar and New Zealand dollar, weighed on performance as slowing economic growth in emerging markets reduced demand for commodities. An underweight position in the euro, which appreciated against the U.S. dollar, also detracted from portfolio performance.
Toward the end of the period, we eliminated the fund’s longtime overweight positions in the commodity-oriented currencies, as well as its underweight position in the Japanese yen. We also shifted to an overweight position in the U.S. dollar, as expectations of higher interest rates in the U.S. should help strengthen the dollar in the near term.
Positioning for the Future
Economies in developed regions of the world have largely stabilized, but growth has slowed somewhat in developing economies such as China and Brazil. It remains to be seen whether these economies will begin to recover in the coming months or decelerate further. In addition, any policy shifts by the Federal Reserve in the second half of the year could negatively impact growth in the U.S. and other developed countries.
We continue to believe that non-U.S. bond yields will remain in a relatively narrow range in the second half of the year, but at a higher level than in the recent past. We intend to continue making adjustments to the fund’s duration based on yield movements within this range.
JUNE 30, 2013 |
Portfolio at a Glance |
Average Duration (effective) | 7.4 years |
Weighted Average Life | 9.5 years |
| | |
Bond Holdings by Country | % of net assets |
Japan | 23.4% |
United Kingdom | 19.7% |
Germany(1) | 6.1% |
France(1) | 6.1% |
Netherlands(1) | 5.2% |
Canada | 4.8% |
Austria(1) | 4.5% |
Finland(1) | 4.4% |
Belgium(1) | 4.3% |
Denmark | 4.0% |
Other Countries | 11.8% |
Cash and Equivalents(2) | 5.7% |
(1) These countries are members of the eurozone. (2) Includes temporary cash investments and other assets and liabilities. |
| | |
Types of Investments in Portfolio | % of net assets |
Sovereign Governments and Agencies | 89.2% |
Corporate Bonds | 5.0% |
Short-Term Investments | 0.1% |
Temporary Cash Investments | 1.2% |
Other Assets and Liabilities | 4.5% |
Fund shareholders may incur two types of costs: (1) transaction costs, including sales charges (loads) on purchase payments and redemption/exchange fees; and (2) ongoing costs, including management fees; distribution and service (12b-1) fees; and other fund expenses. This example is intended to help you understand your ongoing costs (in dollars) of investing in your fund and to compare these costs with the ongoing cost of investing in other mutual funds.
The example is based on an investment of $1,000 made at the beginning of the period and held for the entire period from January 1, 2013 to June 30, 2013.
Actual Expenses
The table provides information about actual account values and actual expenses for each class. You may use the information, together with the amount you invested, to estimate the expenses that you paid over the period. First, identify the share class you own. Then simply divide your account value by $1,000 (for example, an $8,600 account value divided by $1,000 = 8.6), then multiply the result by the number under the heading “Expenses Paid During Period” to estimate the expenses you paid on your account during this period.
If you hold Investor Class shares of any American Century Investments fund, or Institutional Class shares of the American Century Diversified Bond Fund, in an American Century Investments account (i.e., not a financial intermediary or retirement plan account), American Century Investments may charge you a $12.50 semiannual account maintenance fee if the value of those shares is less than $10,000. We will redeem shares automatically in one of your accounts to pay the $12.50 fee. In determining your total eligible investment amount, we will include your investments in all personal accounts (including American Century Investments Brokerage accounts) registered under your Social Security number. Personal accounts include individual accounts, joint accounts, UGMA/UTMA accounts, personal trusts, Coverdell Education Savings Accounts and IRAs (including traditional, Roth, Rollover, SEP-, SARSEP- and SIMPLE-IRAs), and certain other retirement accounts. If you have only business, business retirement, employer-sponsored or American Century Investments Brokerage accounts, you are currently not subject to this fee. If you are subject to the Account Maintenance Fee, your account value could be reduced by the fee amount.
Hypothetical Example for Comparison Purposes
The table also provides information about hypothetical account values and hypothetical expenses based on the actual expense ratio of each class of your fund and an assumed rate of return of 5% per year before expenses, which is not the actual return of a fund’s share class. The hypothetical account values and expenses may not be used to estimate the actual ending account balance or expenses you paid for the period. You may use this information to compare the ongoing costs of investing in your fund and other funds. To do so, compare this 5% hypothetical example with the 5% hypothetical examples that appear in the shareholder reports of the other funds.
Please note that the expenses shown in the table are meant to highlight your ongoing costs only and do not reflect any transactional costs, such as sales charges (loads) or redemption/exchange fees. Therefore, the table is useful in comparing ongoing costs only, and will not help you determine the relative total costs of owning different funds. In addition, if these transactional costs were included, your costs would have been higher.
| | | | | |
| | Beginning
Account Value
1/1/13 | Ending
Account Value
6/30/13 | Expenses Paid
During Period(1)
1/1/13 – 6/30/13 | Annualized
Expense Ratio(1) |
Actual |
Investor Class | $1,000 | $924.00 | $3.82 | 0.80% |
Institutional Class | $1,000 | $924.70 | $2.86 | 0.60% |
A Class | $1,000 | $922.40 | $5.00 | 1.05% |
C Class | $1,000 | $919.30 | $8.57 | 1.80% |
R Class | $1,000 | $921.30 | $6.19 | 1.30% |
Hypothetical | | | | |
Investor Class | $1,000 | $1,020.83 | $4.01 | 0.80% |
Institutional Class | $1,000 | $1,021.82 | $3.01 | 0.60% |
A Class | $1,000 | $1,019.59 | $5.26 | 1.05% |
C Class | $1,000 | $1,015.87 | $9.00 | 1.80% |
R Class | $1,000 | $1,018.35 | $6.51 | 1.30% |
(1) | Expenses are equal to the class’s annualized expense ratio listed in the table above, multiplied by the average account value over the period, multiplied by 181, the number of days in the most recent fiscal half-year, divided by 365, to reflect the one-half year period. |
JUNE 30, 2013
| | | | | | | | |
| | | | Principal Amount | | | Value | |
Sovereign Governments and Agencies — 89.2% | |
AUSTRALIA — 2.0% | |
Australia Government Bond, 5.75%, 7/15/22 | AUD | | 9,620,000 | | | $ 10,172,574 | |
New South Wales Treasury Corp., 5.50%, 3/1/17 | AUD | | 12,100,000 | | | 11,936,820 | |
| | | | | | | 22,109,394 | |
AUSTRIA — 4.5% | |
Austria Government Bond, 3.40%, 10/20/14(1) | EUR | | 7,000,000 | | | 9,501,693 | |
Austria Government Bond, 4.35%, 3/15/19(1) | EUR | | 5,390,000 | | | 8,196,497 | |
Austria Government Bond, 3.90%, 7/15/20(1) | EUR | | 11,590,000 | | | 17,429,082 | |
Austria Government Bond, 3.40%, 11/22/22(1) | EUR | | 1,850,000 | | | 2,696,977 | |
Austria Government Bond, 4.15%, 3/15/37(1) | EUR | | 7,285,000 | | | 11,731,181 | |
| | | | | | | 49,555,430 | |
BELGIUM — 4.3% | |
Belgium Government Bond, 4.00%, 3/28/18 | EUR | | 12,195,000 | | | 17,819,244 | |
Belgium Government Bond, 3.75%, 9/28/20 | EUR | | 8,370,000 | | | 12,191,833 | |
Belgium Government Bond, 2.25%, 6/22/23 | EUR | | 3,020,000 | | | 3,793,829 | |
Belgium Government Bond, 5.00%, 3/28/35 | EUR | | 8,320,000 | | | 13,578,166 | |
| | | | | | | 47,383,072 | |
CANADA — 4.8% | |
Canadian Government Bond, 5.00%, 6/1/14 | CAD | | 20,090,000 | | | 19,769,653 | |
Canadian Government Bond, 1.50%, 3/1/17 | CAD | | 3,000,000 | | | 2,843,938 | |
Canadian Government Bond, 5.75%, 6/1/33 | CAD | | 9,040,000 | | | 12,346,558 | |
Province of British Columbia, 3.25%, 12/18/21 | CAD | | 7,920,000 | | | 7,686,851 | |
Province of Ontario Canada, 4.40%, 6/2/19 | CAD | | 9,500,000 | | | 9,920,757 | |
| | | | | | | 52,567,757 | |
CZECH — 0.4% | |
Czech Republic Government Bond, 4.70%, 9/12/22 | CZK | | 68,200,000 | | | 4,073,580 | |
DENMARK — 4.0% | |
Denmark Government Bond, 4.00%, 11/15/17 | DKK | | 75,000,000 | | | 14,957,331 | |
Denmark Government Bond, 4.00%, 11/15/19 | DKK | | 8,300,000 | | | 1,707,771 | |
Denmark Government Bond, 7.00%, 11/10/24 | DKK | | 47,200,000 | | | 12,668,901 | |
Denmark Government Bond, 4.50%, 11/15/39 | DKK | | 60,760,000 | | | 14,983,600 | |
| | | | | | | 44,317,603 | |
FINLAND — 4.4% | |
Finland Government Bond, 3.875%, 9/15/17 | EUR | | 13,290,000 | | | 19,458,553 | |
Finland Government Bond, 4.375%, 7/4/19 | EUR | | 2,725,000 | | | 4,181,049 | |
Finland Government Bond, 1.625%, 9/15/22 | EUR | | 6,860,000 | | | 8,733,763 | |
Finland Government Bond, 4.00%, 7/4/25 | EUR | | 10,220,000 | | | 15,779,091 | |
| | | | | | | 48,152,456 | |
FRANCE — 4.6% | |
France Government Bond OAT, 4.00%, 4/25/14 | EUR | | 4,370,000 | | | 5,868,752 | |
France Government Bond OAT, 3.25%, 10/25/21 | EUR | | 2,440,000 | | | 3,478,916 | |
France Government Bond OAT, 5.50%, 4/25/29 | EUR | | 3,580,000 | | | 6,178,801 | |
France Government Bond OAT, 4.75%, 4/25/35 | EUR | | 5,590,000 | | | 9,053,168 | |
French Treasury Note BTAN, 2.25%, 2/25/16 | EUR | | 18,980,000 | | | 25,827,990 | |
| | | | | | | 50,407,627 | |
GERMANY — 5.2% | |
Bundesobligation, 2.00%, 2/26/16 | EUR | | 19,300,000 | | | $ 26,272,063 | |
Bundesrepublik Deutschland, 4.00%, 1/4/18 | EUR | | 7,280,000 | | | 10,886,739 | |
Bundesrepublik Deutschland, 4.75%, 7/4/34 | EUR | | 10,910,000 | | | 19,676,232 | |
Bundesrepublik Deutschland, 4.25%, 7/4/39 | EUR | | 400,000 | | | 700,106 | |
| | | | | | | 57,535,140 | |
JAPAN — 23.4% | |
Japan Government Five Year Bond, 0.60%, 9/20/14 | JPY | | 2,072,600,000 | | | 21,023,557 | |
Japan Government Ten Year Bond, 1.20%, 6/20/15 | JPY | | 3,530,000,000 | | | 36,341,880 | |
Japan Government Ten Year Bond, 1.50%, 9/20/18 | JPY | | 6,453,000,000 | | | 68,978,979 | |
Japan Government Ten Year Bond, 1.00%, 12/20/21 | JPY | | 4,609,300,000 | | | 47,406,451 | |
Japan Government Thirty Year Bond, 2.40%, 3/20/37 | JPY | | 2,038,000,000 | | | 23,137,937 | |
Japan Government Thirty Year Bond, 2.00%, 9/20/41 | JPY | | 1,669,300,000 | | | 17,527,229 | |
Japan Government Twenty Year Bond, 2.10%, 12/20/26 | JPY | | 3,689,850,000 | | | 41,523,536 | |
| | | | | | | 255,939,569 | |
MULTI-NATIONAL — 2.6% | |
European Investment Bank, 2.50%, 7/15/15 | EUR | | 6,450,000 | | | 8,755,988 | |
European Investment Bank, MTN, 3.625%, 1/15/21 | EUR | | 5,100,000 | | | 7,492,397 | |
International Bank for Reconstruction & Development, MTN, 3.875%, 5/20/19 | EUR | | 8,500,000 | | | 12,716,919 | |
| | | | | | | 28,965,304 | |
NETHERLANDS — 4.0% | |
Netherlands Government Bond, 4.00%, 7/15/16(1) | EUR | | 13,850,000 | | | 19,889,887 | |
Netherlands Government Bond, 3.50%, 7/15/20(1) | EUR | | 2,200,000 | | | 3,236,453 | |
Netherlands Government Bond, 2.25%, 7/15/22(1) | EUR | | 6,800,000 | | | 9,094,271 | |
Netherlands Government Bond, 4.00%, 1/15/37(1) | EUR | | 7,140,000 | | | 11,541,663 | |
| | | | | | | 43,762,274 | |
NEW ZEALAND — 0.4% | |
New Zealand Government Bond, 5.00%, 3/15/19 | NZD | | 5,200,000 | | | 4,312,115 | |
NORWAY — 1.8% | |
Norway Government Bond, 4.25%, 5/19/17 | NOK | | 28,000,000 | | | 5,059,991 | |
Norway Government Bond, 3.75%, 5/25/21 | NOK | | 81,400,000 | | | 14,767,366 | |
| | | | | | | 19,827,357 | |
SINGAPORE — 0.8% | |
Singapore Government Bond, 2.375%, 4/1/17 | SGD | | 7,000,000 | | | 5,883,054 | |
Singapore Government Bond, 3.125%, 9/1/22 | SGD | | 3,100,000 | | | 2,609,875 | |
| | | | | | | 8,492,929 | |
SWEDEN — 2.3% | |
Sweden Government Bond, 6.75%, 5/5/14 | SEK | | 26,200,000 | | | 4,096,871 | |
Sweden Government Bond, 4.25%, 3/12/19 | SEK | | 47,530,000 | | | 8,058,816 | |
Sweden Government Bond, 3.50%, 6/1/22 | SEK | | 77,220,000 | | | 12,822,693 | |
| | | | | | | 24,978,380 | |
SWITZERLAND — 0.8% | |
Switzerland Government Bond, 2.00%, 4/28/21 | CHF | | 4,600,000 | | | 5,317,260 | |
Switzerland Government Bond, 2.50%, 3/8/36 | CHF | | 2,575,000 | | | 3,283,381 | |
| | | | | | | 8,600,641 | |
UNITED KINGDOM — 18.9% | |
United Kingdom Gilt, 5.00%, 9/7/14 | GBP | | 11,600,000 | | | 18,610,611 | |
United Kingdom Gilt, 4.00%, 9/7/16 | GBP | | 23,240,000 | | | 38,964,125 | |
United Kingdom Gilt, 4.50%, 3/7/19 | GBP | | 18,825,000 | | | 33,230,326 | |
United Kingdom Gilt, 3.75%, 9/7/21 | GBP | | 14,155,000 | | | 24,018,552 | |
United Kingdom Gilt, 6.00%, 12/7/28 | GBP | | 11,300,000 | | | 23,591,382 | |
United Kingdom Gilt, 4.25%, 3/7/36 | GBP | | 26,640,000 | | | 46,149,868 | |
United Kingdom Gilt, 4.50%, 12/7/42 | GBP | | 2,490,000 | | | $ 4,488,127 | |
United Kingdom Gilt, 4.25%, 12/7/55 | GBP | | 10,260,000 | | | 17,970,714 | |
| | | | | | | 207,023,705 | |
TOTAL SOVEREIGN GOVERNMENTS AND AGENCIES (Cost $984,732,573) | | | 978,004,333 | |
Corporate Bonds — 5.0% | |
FRANCE — 1.5% | |
Cie de Financement Foncier, 4.375%, 4/25/19 (Secured) | EUR | | 5,500,000 | | | 8,240,922 | |
Cie de Financement Foncier, MTN, 4.50%, 5/16/18 (Secured) | EUR | | 5,240,000 | | | 7,812,174 | |
| | | | | | | 16,053,096 | |
GERMANY — 0.9% | |
KFW, 3.875%, 1/21/19 | EUR | | 2,890,000 | | | 4,297,796 | |
KFW, MTN, 4.625%, 1/4/23 | EUR | | 3,790,000 | | | 6,090,139 | |
| | | | | | | 10,387,935 | |
IRELAND — 0.6% | |
GE Capital European Funding, MTN, 5.375%, 1/23/20 | EUR | | 4,500,000 | | | 6,967,925 | |
NETHERLANDS — 1.2% | |
Allianz Finance II BV, MTN, 4.75%, 7/22/19 | EUR | | 4,800,000 | | | 7,271,420 | |
Cooperatieve Centrale Raiffeisen-Boerenleenbank BA, MTN, 4.375%, 6/7/21 | EUR | | 4,000,000 | | | 5,926,368 | |
| | | | | | | 13,197,788 | |
UNITED KINGDOM — 0.8% | |
Abbey National Treasury Services plc, MTN, 5.125%, 4/14/22 (Secured) | GBP | | 2,200,000 | | | 3,806,287 | |
Co-Operative Bank plc, 4.75%, 11/11/21 (Secured) | GBP | | 3,000,000 | | | 4,718,250 | |
| | | | | | | 8,524,537 | |
TOTAL CORPORATE BONDS (Cost $52,739,777) | | | 55,131,281 | |
Short-Term Investments — 0.1% | |
UNITED STATES — 0.1% | |
U.S. Treasury Bills 0.13%, 1/9/14(2)(3) (Cost $499,665) | | 500,000 | | | 499,847 | |
Temporary Cash Investments — 1.2% | |
Repurchase Agreement, Bank of America Merrill Lynch, (collateralized by various U.S. Treasury obligations, 1.00%, 1/15/14, valued at $1,671,201), in a joint trading account at 0.06%, dated 6/28/13, due 7/1/13 (Delivery value $1,637,024) | | | 1,637,016 | |
Repurchase Agreement, Credit Suisse First Boston, Inc., (collateralized by various U.S. Treasury obligations, 4.25%, 11/15/40, valued at $5,003,847), in a joint trading account at 0.05%, dated 6/28/13, due 7/1/13 (Delivery value $4,911,069) | | | 4,911,049 | |
Repurchase Agreement, Goldman Sachs & Co., (collateralized by various U.S. Treasury obligations, 3.125%, 11/15/41, valued at $1,665,072), in a joint trading account at 0.04%, dated 6/28/13, due 7/1/13 (Delivery value $1,637,021) | | | 1,637,016 | |
SSgA U.S. Government Money Market Fund | | 4,518,962 | | | 4,518,962 | |
TOTAL TEMPORARY CASH INVESTMENTS (Cost $12,704,043) | | | 12,704,043 | |
TOTAL INVESTMENT SECURITIES — 95.5% (Cost $1,050,676,058) | | | 1,046,339,504 | |
OTHER ASSETS AND LIABILITIES — 4.5% | | | 49,742,027 | |
TOTAL NET ASSETS — 100.0% | | | $1,096,081,531 | |
Forward Foreign Currency Exchange Contracts
Currency Purchased | | Currency Sold | | Counterparty | Settlement Date | | Unrealized
Gain (Loss) | |
USD | | 2,864,826 | | AUD | | 3,000,000 | | Westpac Group | 9/17/2013 | | $136,487 | |
AUD | | 360,000 | | USD | | 343,161 | | Westpac Group | 9/17/2013 | | (15,760 | ) |
AUD | | 4,121,037 | | USD | | 3,928,275 | | Westpac Group | 9/17/2013 | | (180,414 | ) |
USD | | 381,290 | | CAD | | 400,000 | | Barclays Bank plc | 9/17/2013 | | 1,655 | |
CAD | | 564,817 | | USD | | 554,204 | | Barclays Bank plc | 9/17/2013 | | (18,142 | ) |
USD | | 392,437 | | CAD | | 400,000 | | Deutsche Bank | 9/17/2013 | | 12,801 | |
USD | | 7,360,518 | | CAD | | 7,500,000 | | Westpac Group | 9/17/2013 | | 242,349 | |
USD | | 782,037 | | CAD | | 800,000 | | Westpac Group | 9/17/2013 | | 22,765 | |
USD | | 2,400,000 | | CAD | | 2,536,608 | | Westpac Group | 9/17/2013 | | (7,467 | ) |
CHF | | 3,220,362 | | USD | | 3,497,960 | | UBS AG | 9/17/2013 | | (86,197 | ) |
USD | | 2,384,969 | | CHF | | 2,200,000 | | Westpac Group | 9/17/2013 | | 54,212 | |
CHF | | 1,400,000 | | USD | | 1,517,813 | | Westpac Group | 9/17/2013 | | (34,604 | ) |
CZK | | 21,800,000 | | USD | | 1,137,315 | | Deutsche Bank | 9/17/2013 | | (46,113 | ) |
CZK | | 26,157,555 | | USD | | 1,357,992 | | Deutsche Bank | 9/17/2013 | | (48,673 | ) |
USD | | 754,812 | | DKK | | 4,200,000 | | Barclays Bank plc | 9/17/2013 | | 21,237 | |
DKK | | 60,886,122 | | USD | | 10,878,427 | | Barclays Bank plc | 9/17/2013 | | (244,013 | ) |
USD | | 2,624,698 | | EUR | | 2,000,000 | | Barclays Bank plc | 9/17/2013 | | 20,525 | |
USD | | 536,554 | | EUR | | 400,000 | | Barclays Bank plc | 9/17/2013 | | 15,719 | |
USD | | 792,037 | | EUR | | 600,000 | | Barclays Bank plc | 9/17/2013 | | 10,785 | |
USD | | 3,123,134 | | EUR | | 2,400,000 | | Barclays Bank plc | 9/17/2013 | | (1,873 | ) |
EUR | | 800,000 | | USD | | 1,067,362 | | Barclays Bank plc | 9/17/2013 | | (25,693 | ) |
EUR | | 1,000,000 | | USD | | 1,340,094 | | Deutsche Bank | 9/17/2013 | | (38,008 | ) |
EUR | | 3,400,000 | | USD | | 4,533,339 | | HSBC Holdings plc | 9/17/2013 | | (106,245 | ) |
EUR | | 16,511,322 | | USD | | 22,015,124 | | HSBC Holdings plc | 9/17/2013 | | (515,957 | ) |
EUR | | 6,000,000 | | USD | | 7,801,830 | | Westpac Group | 9/17/2013 | | 10,688 | |
USD | | 1,837,652 | | GBP | | 1,200,000 | | Barclays Bank plc | 9/17/2013 | | 13,431 | |
USD | | 43,345,784 | | GBP | | 27,604,648 | | HSBC Holdings plc | 9/17/2013 | | 1,381,630 | |
GBP | | 1,000,000 | | USD | | 1,573,770 | | HSBC Holdings plc | 9/17/2013 | | (53,586 | ) |
GBP | | 1,730,000 | | USD | | 2,716,507 | | HSBC Holdings plc | 9/17/2013 | | (86,588 | ) |
GBP | | 2,400,000 | | USD | | 3,638,282 | | Westpac Group | 9/17/2013 | | 10,160 | |
GBP | | 500,000 | | USD | | 769,575 | | Westpac Group | 9/17/2013 | | (9,482 | ) |
HKD | | 3,000,000 | | USD | | 386,904 | | Deutsche Bank | 9/17/2013 | | 3 | |
HKD | | 3,910,000 | | USD | | 503,824 | | Westpac Group | 9/17/2013 | | 445 | |
USD | | 519,079 | | JPY | | 49,400,000 | | Barclays Bank plc | 9/17/2013 | | 20,820 | |
JPY | | 995,569,119 | | USD | | 10,575,186 | | Barclays Bank plc | 9/17/2013 | | (533,663 | ) |
USD | | 1,579,449 | | JPY | | 150,000,000 | | Deutsche Bank | 9/17/2013 | | 66,517 | |
USD | | 9,600,000 | | JPY | | 953,313,600 | | HSBC Holdings plc | 9/17/2013 | | (15,325 | ) |
USD | | 404,956 | | JPY | | 39,600,000 | | Westpac Group | 9/17/2013 | | 5,542 | |
JPY | | 187,600,000 | | USD | | 1,979,870 | | Westpac Group | 9/17/2013 | | (87,696 | ) |
JPY | | 751,500,000 | | USD | | 7,972,012 | | Westpac Group | 9/17/2013 | | (392,222 | ) |
USD | | 1,720,079 | | KRW | | 1,951,000,003 | | HSBC Holdings plc | 9/17/2013 | | 18,274 | |
USD | | 318,143 | | KRW | | 369,999,995 | | HSBC Holdings plc | 9/17/2013 | | (4,598 | ) |
USD | | 4,800,000 | | KRW | | 5,523,600,000 | | HSBC Holdings plc | 9/17/2013 | | (18,090 | ) |
USD | | 2,400,000 | | KRW | | 2,784,600,000 | | HSBC Holdings plc | 9/17/2013 | | (28,933 | ) |
USD | | 2,708,931 | | KRW | | 3,162,000,002 | | HSBC Holdings plc | 9/17/2013 | | (49,198 | ) |
KRW | | 46,400,470,002 | | USD | | 40,942,073 | | HSBC Holdings plc | 9/17/2013 | | (468,169 | ) |
USD | | 7,800,603 | | NOK | | 45,098,705 | | Deutsche Bank | 9/17/2013 | | 396,281 | |
Currency Purchased | | Currency Sold | | Counterparty | Settlement Date | | Unrealized
Gain (Loss) | |
USD | | 7,524,080 | | NOK | | 43,500,000 | | Deutsche Bank | 9/17/2013 | | $382,233 | |
USD | | 1,200,000 | | NOK | | 7,344,406 | | Deutsche Bank | 9/17/2013 | | (5,807 | ) |
USD | | 4,555,659 | | NOK | | 27,800,000 | | Deutsche Bank | 9/17/2013 | | (8,555 | ) |
NOK | | 15,200,000 | | USD | | 2,645,437 | | Deutsche Bank | 9/17/2013 | | (149,895 | ) |
USD | | 1,765,337 | | NZD | | 2,200,000 | | Westpac Group | 9/17/2013 | | 69,707 | |
USD | | 796,780 | | NZD | | 1,000,000 | | Westpac Group | 9/17/2013 | | 26,039 | |
NZD | | 3,347,340 | | USD | | 2,667,094 | | Westpac Group | 9/17/2013 | | (87,161 | ) |
USD | | 19,468,926 | | SEK | | 126,873,308 | | Deutsche Bank | 9/17/2013 | | 582,234 | |
USD | | 1,102,158 | | SEK | | 7,400,000 | | Deutsche Bank | 9/17/2013 | | 575 | |
SEK | | 2,600,000 | | USD | | 401,038 | | Deutsche Bank | 9/17/2013 | | (13,996 | ) |
USD | | 2,400,000 | | SEK | | 16,232,880 | | Deutsche Bank | 9/17/2013 | | (16,469 | ) |
SEK | | 21,000,000 | | USD | | 3,222,486 | | Deutsche Bank | 9/17/2013 | | (96,371 | ) |
USD | | 4,945,756 | | SGD | | 6,200,000 | | HSBC Holdings plc | 9/17/2013 | | 53,531 | |
USD | | 546,422 | | SGD | | 682,781 | | HSBC Holdings plc | 9/17/2013 | | 7,660 | |
USD | | 1,327,523 | | TWD | | 39,600,000 | | HSBC Holdings plc | 9/17/2013 | | 5,067 | |
USD | | 3,600,000 | | TWD | | 108,162,000 | | HSBC Holdings plc | 9/17/2013 | | (12,107 | ) |
USD | | 5,821,068 | | TWD | | 176,000,000 | | HSBC Holdings plc | 9/17/2013 | | (56,512 | ) |
| | | | | | | | | | | | $25,790 | |
Notes to Schedule of Investments
AUD = Australian Dollar
CAD = Canadian Dollar
CHF = Swiss Franc
CZK = Czech Koruna
DKK = Danish Krone
EUR = Euro
GBP = British Pound
HKD = Hong Kong Dollar
JPY = Japanese Yen
KRW = South Korea Won
MTN = Medium Term Note
NOK = Norwegian Krone
NZD = New Zealand Dollar
SEK = Swedish Krona
SGD = Singapore Dollar
TWD = Taiwanese Dollar
USD = United States Dollar
(1) | Security was purchased under Rule 144A of the Securities Act of 1933 or is a private placement and, unless registered under the Act or exempted from registration, may only be sold to qualified institutional investors. The aggregate value of these securities at the period end was $93,317,704, which represented 8.5% of total net assets. |
(2) | The rate indicated is the yield to maturity at purchase. |
(3) | Security, or a portion thereof, has been pledged at the custodian bank or with a broker for margin requirements on futures contracts. At the period end, the aggregate value of securities pledged was $499,847. |
See Notes to Financial Statements.
Statement of Assets and Liabilities |
JUNE 30, 2013 | |
Assets | |
Investment securities, at value (cost of $1,050,676,058) | | $1,046,339,504 | |
Foreign currency holdings, at value (cost of $25,701,486) | | 25,538,288 | |
Receivable for investments sold | | 14,318,885 | |
Receivable for capital shares sold | | 983,783 | |
Unrealized gain on forward foreign currency exchange contracts | | 3,589,372 | |
Interest receivable | | 11,917,939 | |
| | | 1,102,687,771 | |
| | | | |
Liabilities | | | |
Payable for capital shares redeemed | | 2,338,321 | |
Unrealized loss on forward foreign currency exchange contracts | | 3,563,582 | |
Accrued management fees | | 681,031 | |
Distribution and service fees payable | | 23,306 | |
| | | 6,606,240 | |
| | | | |
Net Assets | | $1,096,081,531 | |
| | | | |
Net Assets Consist of: | | | |
Capital paid in | | $1,109,401,288 | |
Distributions in excess of net investment income | | (3,818,500 | ) |
Accumulated net realized loss | | (4,820,856 | ) |
Net unrealized depreciation | | (4,680,401 | ) |
| | | $1,096,081,531 | |
| | | | | | | | | | |
| | | Net assets | | Shares outstanding | | Net asset value per share |
Investor Class | | $655,031,533 | | | 48,535,610 | | | $13.50 | |
Institutional Class | | $346,695,413 | | | 25,676,810 | | | $13.50 | |
A Class | | $89,103,318 | | | 6,628,603 | | | $13.44 | * |
C Class | | $5,051,434 | | | 375,517 | | | $13.45 | |
R Class | | $199,833 | | | 14,830 | | | $13.47 | |
*Maximum offering price $14.07 (net asset value divided by 0.955).
See Notes to Financial Statements.
YEAR ENDED JUNE 30, 2013 | |
Investment Income (Loss) | |
Income: | | | |
Interest | | $26,559,562 | |
| | | | |
Expenses: | | | |
Management fees | | 9,113,603 | |
Distribution and service fees: | | | |
A Class | | 243,498 | |
C Class | | 63,031 | |
R Class | | 1,153 | |
Trustees’ fees and expenses | | 62,756 | |
Other expenses | | 1,219 | |
| | | 9,485,260 | |
| | | | |
Net investment income (loss) | | 17,074,302 | |
| | | | |
Realized and Unrealized Gain (Loss) | | | |
Net realized gain (loss) on: | | | |
Investment transactions | | (3,870,336 | ) |
Futures contract transactions | | 1,256,413 | |
Foreign currency transactions | | (4,676,327 | ) |
| | | (7,290,250 | ) |
| | | | |
Change in net unrealized appreciation (depreciation) on: | | | |
Investments | | (61,511,222 | ) |
Translation of assets and liabilities in foreign currencies | | 1,197,214 | |
| | | (60,314,008 | ) |
| | | | |
Net realized and unrealized gain (loss) | | (67,604,258 | ) |
| | | | |
Net Increase (Decrease) in Net Assets Resulting from Operations | | $(50,529,956 | ) |
See Notes to Financial Statements.
Statement of Changes in Net Assets |
YEARS ENDED JUNE 30, 2013 AND JUNE 30, 2012 |
Increase (Decrease) in Net Assets | June 30, 2013 | | | June 30, 2012 | |
Operations |
Net investment income (loss) | $17,074,302 | | | $23,325,393 | |
Net realized gain (loss) | (7,290,250 | ) | | 6,468,739 | |
Change in net unrealized appreciation (depreciation) | (60,314,008 | ) | | (24,026,215 | ) |
Net increase (decrease) in net assets resulting from operations | (50,529,956 | ) | | 5,767,917 | |
| | | | | | |
Distributions to Shareholders | | | | | |
From net investment income: | | | | | |
Investor Class | (14,357,121 | ) | | (19,770,208 | ) |
Institutional Class | (6,463,354 | ) | | (6,764,758 | ) |
A Class | (1,460,577 | ) | | (2,003,488 | ) |
B Class | — | | | (3,389 | ) |
C Class | (48,218 | ) | | (99,603 | ) |
R Class | (3,021 | ) | | (3,476 | ) |
Decrease in net assets from distributions | (22,332,291 | ) | | (28,644,922 | ) |
| | | | | | |
Capital Share Transactions | | | | | |
Net increase (decrease) in net assets from capital share transactions | (179,561,017 | ) | | 21,433,031 | |
| | | | | | |
Net increase (decrease) in net assets | (252,423,264 | ) | | (1,443,974 | ) |
| | | | | | |
Net Assets | | | | | |
Beginning of period | 1,348,504,795 | | | 1,349,948,769 | |
End of period | $1,096,081,531 | | | $1,348,504,795 | |
| | | | | | |
Undistributed (distributions in excess of) net investment income | $(3,818,500 | ) | | $13,203,138 | |
See Notes to Financial Statements.
Notes to Financial Statements |
JUNE 30, 2013
1. Organization
American Century International Bond Funds (the trust) is registered under the Investment Company Act of 1940, as amended (the 1940 Act), as an open-end management investment company and is organized as a Massachusetts business trust. International Bond Fund (the fund) is one fund in a series issued by the trust. The fund is nondiversified as defined under the 1940 Act. The fund’s investment objective is to seek high total return by investing in high-quality, non-dollar-denominated government and corporate debt securities outside the United States.
The fund offers the Investor Class, the Institutional Class, the A Class, the C Class and the R Class. The A Class may incur an initial sales charge. The A Class and C Class may be subject to a contingent deferred sales charge. The share classes differ principally in their respective sales charges and distribution and shareholder servicing expenses and arrangements. The Institutional Class is made available to institutional shareholders or through financial intermediaries whose clients do not require the same level of shareholder and administrative services as shareholders of other classes. As a result, the Institutional Class is charged a lower unified management fee. On October 21, 2011, all outstanding B Class shares were converted to A Class shares and the fund discontinued offering the B Class.
2. Significant Accounting Policies
The following is a summary of significant accounting policies consistently followed by the fund in preparation of its financial statements. The financial statements are prepared in conformity with accounting principles generally accepted in the United States of America, which may require management to make certain estimates and assumptions at the date of the financial statements. Actual results could differ from these estimates.
Investment Valuations — The fund determines the fair value of its investments and computes its net asset value per share as of the close of regular trading (usually 4 p.m. Eastern time) on the New York Stock Exchange (NYSE) on each day the NYSE is open.
Debt securities maturing in greater than 60 days at the time of purchase are valued at the evaluated mean as provided by independent pricing services or at the mean of the most recent bid and asked prices as provided by investment dealers. Debt securities maturing within 60 days at the time of purchase may be valued at cost, plus or minus any amortized discount or premium or at the evaluated mean as provided by an independent pricing service. Evaluated mean prices are commonly derived through utilization of market models, which may consider, among other factors, trade data, quotations from dealers and active market makers, relevant yield curve and spread data, related sector levels, creditworthiness, and other relevant market information on the same or comparable securities.
Investments in open-end management investment companies are valued at the reported net asset value per share. Repurchase agreements are valued at cost. Forward foreign currency exchange contracts are valued at the mean of the latest bid and asked prices of the forward currency rates as provided by an independent pricing service. Exchange-traded futures contracts are valued at the settlement price as provided by the appropriate clearing corporation.
The value of investments initially expressed in foreign currencies is translated into U.S. dollars at prevailing exchange rates.
If the fund determines that the market price for a portfolio security is not readily available or the valuation methods mentioned above do not reflect a security’s fair value, such security is valued as determined in good faith by the Board of Trustees or its designee, in accordance with procedures adopted by the Board of Trustees. Circumstances that may cause the fund to use these procedures to value a security include, but are not limited to: a security has been declared in default; trading in a security has been halted during the trading day; there is a foreign market holiday and no trading occurred; or an event occurred between the close of a foreign exchange and the NYSE that may affect the value of a security.
Security Transactions — Security transactions are accounted for as of the trade date. Net realized gains and losses are determined on the identified cost basis, which is also used for federal income tax purposes.
Investment Income — Interest income is recorded on the accrual basis and includes accretion of discounts and amortization of premiums. Inflation adjustments related to inflation-linked debt securities are reflected as interest income.
Foreign Currency Translations — All assets and liabilities initially expressed in foreign currencies are translated into U.S. dollars at prevailing exchange rates at period end. The fund may enter into spot foreign currency exchange contracts to facilitate transactions denominated in a foreign currency. Purchases and sales of investment securities, dividend and interest income, spot foreign currency exchange contracts, and expenses are translated at the rates of exchange prevailing on the respective dates of such transactions. Net realized and unrealized foreign currency exchange gains or losses related to investment securities are a component of net realized gain (loss) on investment transactions and change in net unrealized appreciation (depreciation) on investments, respectively.
Repurchase Agreements — The fund may enter into repurchase agreements with institutions that American Century Investment Management, Inc. (ACIM) (the investment advisor) has determined are creditworthy pursuant to criteria adopted by the Board of Trustees. The fund requires that the collateral, represented by securities, received in a repurchase transaction be transferred to the custodian in a manner sufficient to enable the fund to obtain those securities in the event of a default under the repurchase agreement. ACIM monitors, on a daily basis, the securities transferred to ensure the value, including accrued interest, of the securities under each repurchase agreement is equal to or greater than amounts owed to the fund under each repurchase agreement.
Joint Trading Account — Pursuant to an Exemptive Order issued by the Securities and Exchange Commission, the fund, along with certain other funds in the American Century Investments family of funds, may transfer uninvested cash balances into a joint trading account. These balances are invested in one or more repurchase agreements that are collateralized by U.S. Treasury or Agency obligations.
Segregated Assets — In accordance with the 1940 Act, the fund segregates assets on its books and records to cover certain types of investments, including, but not limited to, futures contracts, forward commitments, when-issued securities, swap agreements and certain forward foreign currency exchange contracts. ACIM monitors, on a daily basis, the securities segregated to ensure the fund designates a sufficient amount of liquid assets, marked-to-market daily. The fund may also receive assets or be required to pledge assets at the custodian bank or with a broker for margin requirements on futures contracts and swap agreements.
Income Tax Status — It is the fund’s policy to distribute substantially all net investment income and net realized gains to shareholders and to otherwise qualify as a regulated investment company under provisions of the Internal Revenue Code. Accordingly, no provision has been made for income taxes. The fund files U.S. federal, state, local and non-U.S. tax returns as applicable. The fund’s tax returns are subject to examination by the relevant taxing authority until expiration of the applicable statute of limitations, which is generally three years from the date of filing but can be longer in certain jurisdictions. At this time, management believes there are no uncertain tax positions which, based on their technical merit, would not be sustained upon examination and for which it is reasonably possible that the total amounts of unrecognized tax benefits will significantly change in the next twelve months.
Multiple Class — All shares of the fund represent an equal pro rata interest in the net assets of the class to which such shares belong, and have identical voting, dividend, liquidation and other rights and the same terms and conditions, except for class specific expenses and exclusive rights to vote on matters affecting only individual classes. Income, non-class specific expenses, and realized and unrealized capital gains and losses of the fund are allocated to each class of shares based on their relative net assets.
Distributions to Shareholders — Distributions from net investment income, if any, are generally declared and paid quarterly, but may be paid less frequently. Distributions from net realized gains, if any, are generally declared and paid annually.
Indemnifications — Under the trust’s organizational documents, its officers and trustees are indemnified against certain liabilities arising out of the performance of their duties to the fund. In addition, in the normal course of business, the fund enters into contracts that provide general indemnifications. The maximum exposure under these arrangements is unknown as this would involve future claims that may be made against a fund. The risk of material loss from such claims is considered by management to be remote.
3. Fees and Transactions with Related Parties
Management Fees — The trust has entered into a management agreement with ACIM, under which ACIM provides the fund with investment advisory and management services in exchange for a single, unified management fee (the fee) per class. The agreement provides that all expenses of managing and operating the fund, except distribution and service fees, brokerage expenses, taxes, interest, fees and expenses of the independent trustees (including legal counsel fees), and extraordinary expenses, will be paid by ACIM. The fee is computed and accrued daily based on each class’s daily net assets and paid monthly in arrears. The fee consists of (1) an Investment Category Fee based on the daily net assets of the fund and certain other accounts managed by the investment advisor that are in the same broad investment category as the fund and (2) a Complex Fee based on the assets of all the funds in the American Century Investments family of funds. The rates for the Investment Category Fee range from 0.4925% to 0.6100%. The rates for the Complex Fee range from 0.2500% to 0.3100% for the Investor Class, A Class, C Class and R Class. The Institutional Class is 0.2000% less at each point within the Complex Fee range. The effective annual management fee for each class for the year ended June 30, 2013 was 0.79% for the Investor Class, A Class, C Class and R Class and 0.59% for the Institutional Class.
Distribution and Service Fees — The Board of Trustees has adopted a separate Master Distribution and Individual Shareholder Services Plan for each of the A Class, C Class and R Class (collectively the plans), pursuant to Rule 12b-1 of the 1940 Act. The plans provide that the A Class will pay American Century Investment Services, Inc. (ACIS) an annual distribution and service fee of 0.25%. The plans provide that the C Class will pay ACIS an annual distribution and service fee of 1.00%, of which 0.25% is paid for individual shareholder services and 0.75% is paid for distribution services. The plans provide that the R Class will pay ACIS an annual distribution and service fee of 0.50%. The fees are computed and accrued daily based on each class’s daily net assets and paid monthly in arrears. The fees are used to pay financial intermediaries for distribution and individual shareholder services. Fees incurred under the plans during the year ended June 30, 2013 are detailed in the Statement of Operations.
Related Parties — Certain officers and trustees of the trust are also officers and/or directors of American Century Companies, Inc. (ACC). The trust’s investment advisor, ACIM, the trust’s distributor, ACIS, and the trust’s transfer agent, American Century Services, LLC are wholly owned, directly or indirectly, by ACC. Various funds issued by American Century Asset Allocation Portfolios, Inc. and American Century Strategic Asset Allocations, Inc. own, in aggregate, 34% of the shares of the fund. Related parties do not invest in the fund for the purpose of exercising management or control.
4. Investment Transactions
Purchases and sales of investment securities, excluding short-term investments, for the year ended June 30, 2013 were $236,680,767 and $320,846,030, respectively.
5. Capital Share Transactions
Transactions in shares of the fund were as follows (unlimited number of shares authorized):
| | | | | | |
| | Year ended June 30, 2013 | | | Year ended June 30, 2012 | |
| | Shares | | | Amount | | | Shares | | | Amount | |
Investor Class | | | | | | | | | | | |
Sold | 7,903,670 | | | $113,220,499 | | | 15,469,033 | | | $224,119,401 | |
Issued in reinvestment of distributions | 927,949 | | | 13,612,908 | | | 1,253,548 | | | 18,242,762 | |
Redeemed | (22,470,361 | ) | | (321,573,079 | ) | | (19,452,664 | ) | | (282,884,524 | ) |
| | (13,638,742 | ) | | (194,739,672 | ) | | (2,730,083 | ) | | (40,522,361 | ) |
Institutional Class | | | | | | | | | | | |
Sold | 9,540,191 | | | 136,354,928 | | | 10,419,634 | | | 150,680,694 | |
Issued in reinvestment of distributions | 431,638 | | | 6,329,145 | | | 453,592 | | | 6,593,422 | |
Redeemed | (8,597,587 | ) | | (124,082,443 | ) | | (6,058,933 | ) | | (88,448,328 | ) |
| | 1,374,242 | | | 18,601,630 | | | 4,814,293 | | | 68,825,788 | |
A Class | | | | | | | | | | | |
Sold | 1,612,479 | | | 22,951,257 | | | 1,820,942 | | | 26,447,490 | |
Issued in reinvestment of distributions | 97,541 | | | 1,426,657 | | | 132,803 | | | 1,928,939 | |
Redeemed | (1,803,998 | ) | | (25,442,386 | ) | | (2,496,046 | ) | | (36,286,186 | ) |
| | (93,978 | ) | | (1,064,472 | ) | | (542,301 | ) | | (7,909,757 | ) |
B Class | N/A | | | | | | | | | | |
Sold | | | | | | | 660 | | | 10,006 | |
Issued in reinvestment of distributions | | | | | | | 110 | | | 1,615 | |
Redeemed | | | | | | | (21,173 | ) | | (310,092 | ) |
| | | | | | | | (20,403 | ) | | (298,471 | ) |
C Class | | | | | | | | | | | |
Sold | 39,044 | | | 551,077 | | | 292,303 | | | 4,307,677 | |
Issued in reinvestment of distributions | 2,258 | | | 33,169 | | | 4,297 | | | 62,816 | |
Redeemed | (202,213 | ) | | (2,910,999 | ) | | (212,241 | ) | | (3,075,872 | ) |
| | (160,911 | ) | | (2,326,753 | ) | | 84,359 | | | 1,294,621 | |
R Class | | | | | | | | | | | |
Sold | 2,903 | | | 41,191 | | | 8,560 | | | 124,230 | |
Issued in reinvestment of distributions | 206 | | | 3,021 | | | 238 | | | 3,476 | |
Redeemed | (5,414 | ) | | (75,962 | ) | | (5,861 | ) | | (84,495 | ) |
| | (2,305 | ) | | (31,750 | ) | | 2,937 | | | 43,211 | |
Net increase (decrease) | (12,521,694 | ) | | $(179,561,017 | ) | | 1,608,802 | | | $21,433,031 | |
6. Fair Value Measurements
The fund’s securities valuation process is based on several considerations and may use multiple inputs to determine the fair value of the positions held by the fund. In conformity with accounting principles generally accepted in the United States of America, the inputs used to determine a valuation are classified into three broad levels as follows:
• | Level 1 valuation inputs consist of unadjusted quoted prices in an active market for identical securities; |
• | Level 2 valuation inputs consist of direct or indirect observable market data (including quoted prices for similar securities, evaluations of subsequent market events, interest rates, prepayment speeds, credit risk, etc.); or |
• | Level 3 valuation inputs consist of unobservable data (including a fund’s own assumptions). |
The level classification is based on the lowest level input that is significant to the fair valuation measurement. The valuation inputs are not necessarily an indication of the risks associated with investing in these securities or other financial instruments.
The following is a summary of the level classifications as of period end. The Schedule of Investments provides additional information on the fund’s portfolio holdings.
| | | | | | | | | |
| | Level 1 | | Level 2 | | Level 3 |
Investment Securities |
Sovereign Governments and Agencies | — | | | $978,004,333 | | | — | |
Corporate Bonds | — | | | 55,131,281 | | | — | |
Short-Term Investments | — | | | 499,847 | | | — | |
Temporary Cash Investments | $4,518,962 | | | 8,185,081 | | | — | |
Total Value of Investment Securities | $4,518,962 | | | $1,041,820,542 | | | — | |
| | | | | | | | | |
Other Financial Instruments |
Total Unrealized Gain (Loss) on Forward Foreign Currency Exchange Contracts | — | | | $25,790 | | | — | |
7. Derivative Instruments
Foreign Currency Risk — The fund is subject to foreign currency exchange rate risk in the normal course of pursuing its investment objectives. The value of foreign investments held by a fund may be significantly affected by changes in foreign currency exchange rates. The dollar value of a foreign security generally decreases when the value of the dollar rises against the foreign currency in which the security is denominated and tends to increase when the value of the dollar declines against such foreign currency. A fund may enter into forward foreign currency exchange contracts to reduce a fund’s exposure to foreign currency exchange rate fluctuations or to gain exposure to the fluctuations in the value of foreign currencies. The net U.S. dollar value of foreign currency underlying all contractual commitments held by a fund and the resulting unrealized appreciation or depreciation are determined daily. Realized gain or loss is recorded upon the termination of the contract. Net realized and unrealized gains or losses occurring during the holding period of forward foreign currency exchange contracts are a component of net realized gain (loss) on foreign currency transactions and change in net unrealized appreciation (depreciation) on translation of assets and liabilities in foreign currencies, respectively. A fund bears the risk of an unfavorable change in the foreign currency exchange rate underlying the forward contract. Additionally, losses, up to the fair value, may arise if the counterparties do not perform under the contract terms. The foreign currency risk derivative instruments held at period end as disclosed on the Schedule of Investments are indicative of the fund’s typical volume during the period.
Interest Rate Risk — The fund is subject to interest rate risk in the normal course of pursuing its investment objectives. The value of bonds generally declines as interest rates rise. A fund may enter into futures contracts based on a bond index or a specific underlying security. A fund may purchase futures contracts to gain exposure to increases in market value or sell futures contracts to protect against a decline in market value. Upon entering into a futures contract, a fund will segregate cash, cash equivalents or other appropriate liquid securities on its records in amounts sufficient to meet requirements. Subsequent payments (variation margin) are made or received daily, in cash, by a fund. The variation margin is equal to the daily change in the contract value and is recorded as unrealized gains and losses. A fund recognizes a realized gain or loss when the futures contract is closed or expires. Net realized and unrealized gains or losses occurring during the holding period of futures contracts are a component of net realized gain (loss) on futures contract transactions and change in net unrealized appreciation (depreciation) on futures contracts, respectively. One of the risks of entering into futures contracts is the possibility that the change in value of the contract may not correlate with the changes in value of the underlying securities. The fund regularly purchased and sold interest rate risk derivative instruments during the last six months of the period, though none were held at period end.
Value of Derivative Instruments as of June 30, 2013 | |
| | Asset Derivatives | | Liability Derivatives | |
Type of Risk Exposure | Location on Statement
of Assets and Liabilities | | Value | | | Location on Statement
of Assets and Liabilities | | Value | |
Foreign Currency Risk | Unrealized gain on
forward foreign currency exchange contracts | | $3,589,372 | | | Unrealized loss on
forward foreign currency exchange contracts | | $3,563,582 | |
| | | | | | | | | | |
Effect of Derivative Instruments on the Statement of Operations for the Year Ended June 30, 2013 | |
| | Net Realized Gain (Loss) | | Change in Net Unrealized
Appreciation (Depreciation) | |
Type of Risk Exposure | Location on Statement
of Operations | | Value | | | Location on Statement
of Operations | | Value | |
Foreign Currency Risk | Net realized gain (loss) on foreign currency transactions | | $(3,971,041) | | | Change in net unrealized appreciation (depreciation) on translation of assets and liabilities in foreign currencies | | $1,397,250 | |
Interest Rate Risk | Net realized gain (loss) on futures contract transactions | | 1,256,413 | | | Change in net unrealized appreciation (depreciation)
on futures contracts | | — | |
| | | | $(2,714,628) | | | | | $1,397,250 | |
8. Risk Factors
There are certain risks involved in investing in foreign securities. These risks include those resulting from future adverse political, social and economic developments, fluctuations in currency exchange rates, the possible imposition of exchange controls, and other foreign laws or restrictions.
9. Federal Tax Information
The tax character of distributions paid during the years ended June 30, 2013 and June 30, 2012 were as follows:
| | | | | | | |
| | | 2013 | | 2012 |
Distributions Paid From | |
Ordinary income | | $22,332,291 | | | $28,644,922 | |
Long-term capital gains | | — | | | — | |
The book-basis character of distributions made during the year from net investment income or net realized gains may differ from their ultimate characterization for federal income tax purposes. These differences reflect the differing character of certain income items and net realized gains and losses for financial statement and tax purposes, and may result in reclassification among certain capital accounts on the financial statements.
The reclassifications, which are primarily due to foreign currency gains and losses, were made to distributions in excess of net investment income $(11,763,649), and accumulated net realized loss $11,763,649.
As of June 30, 2013, the federal tax cost of investments and the components of distributable earnings on a tax-basis were as follows:
| | | | |
Federal tax cost of investments | | $1,051,481,058 | |
Gross tax appreciation of investments | | $31,484,650 | |
Gross tax depreciation of investments | | (36,626,204 | ) |
Net tax appreciation (depreciation) of investments | | $(5,141,554 | ) |
Net tax appreciation (depreciation) on derivatives and translation of assets
and liabilities in foreign currencies | | $(594,328 | ) |
Net tax appreciation (depreciation) | | $(5,735,882 | ) |
Other book-to-tax adjustments | | $(2,710,772 | ) |
Undistributed ordinary income | | — | |
Accumulated short-term capital losses | | $(4,388,251 | ) |
Late-year ordinary loss deferral | | $(484,852 | ) |
The difference between book-basis and tax-basis unrealized appreciation (depreciation) is attributable primarily to the tax deferral of losses on wash sales. Other book-to-tax adjustments are attributable primarily to the tax deferral of losses on straddle positions.
Accumulated capital losses represent net capital loss carryovers that may be used to offset future realized capital gains for federal income tax purposes. The capital loss carryovers may be carried forward for an unlimited period. Future capital loss carryover utilization in any given year may be subject to Internal Revenue Code limitations.
Loss deferrals represent certain qualified losses that the fund has elected to treat as having been incurred in the following fiscal year for federal income tax purposes.
For a Share Outstanding Throughout the Years Ended June 30 (except as noted) |
Per-Share Data | Ratios and Supplemental Data |
| | | Income From Investment Operations: | Distributions From: | | | Ratio to Average Net Assets of: | | |
| | Net Asset Value, Beginning
of Period | Net
Investment Income
(Loss)(1) | Net Realized and Unrealized Gain (Loss) | Total From Investment Operations | Net
Investment Income | Net
Realized
Gains | Total
Distributions | Net Asset Value, End
of Period | Total
Return(2) | Operating
Expenses | Net
Investment Income
(Loss) | Portfolio
Turnover
Rate | Net Assets,
End of Period (in thousands) |
Investor Class |
2013 | $14.39 | 0.19 | (0.82) | (0.63) | (0.26) | — | (0.26) | $13.50 | (4.55)% | 0.80% | 1.35% | 21% | $655,032 |
2012 | $14.65 | 0.24 | (0.18) | 0.06 | (0.32) | — | (0.32) | $14.39 | 0.36% | 0.81% | 1.68% | 50% | $894,450 |
2011 | $13.45 | 0.31 | 1.53 | 1.84 | (0.56) | (0.08) | (0.64) | $14.65 | 14.07% | 0.81% | 2.19% | 44% | $951,100 |
2010 | $14.38 | 0.35 | (0.64) | (0.29) | (0.64) | — | (0.64) | $13.45 | (2.39)% | 0.82% | 2.44% | 64% | $1,135,772 |
2009 | $15.13 | 0.43 | (0.43) | —(3) | (0.54) | (0.21) | (0.75) | $14.38 | 0.16% | 0.83% | 3.05% | 64% | $1,343,268 |
Institutional Class |
2013 | $14.39 | 0.22 | (0.83) | (0.61) | (0.28) | — | (0.28) | $13.50 | (4.36)% | 0.60% | 1.55% | 21% | $346,695 |
2012 | $14.66 | 0.27 | (0.20) | 0.07 | (0.34) | — | (0.34) | $14.39 | 0.49% | 0.61% | 1.88% | 50% | $349,782 |
2011 | $13.46 | 0.34 | 1.53 | 1.87 | (0.59) | (0.08) | (0.67) | $14.66 | 14.29% | 0.61% | 2.39% | 44% | $285,697 |
2010 | $14.39 | 0.38 | (0.64) | (0.26) | (0.67) | — | (0.67) | $13.46 | (2.19)% | 0.62% | 2.64% | 64% | $286,817 |
2009 | $15.15 | 0.46 | (0.44) | 0.02 | (0.57) | (0.21) | (0.78) | $14.39 | 0.34% | 0.63% | 3.25% | 64% | $228,895 |
A Class |
2013 | $14.33 | 0.16 | (0.83) | (0.67) | (0.22) | — | (0.22) | $13.44 | (4.81)% | 1.05% | 1.10% | 21% | $89,103 |
2012 | $14.60 | 0.21 | (0.20) | 0.01 | (0.28) | — | (0.28) | $14.33 | 0.03% | 1.06% | 1.43% | 50% | $96,335 |
2011 | $13.40 | 0.27 | 1.54 | 1.81 | (0.53) | (0.08) | (0.61) | $14.60 | 13.84% | 1.06% | 1.94% | 44% | $106,044 |
2010 | $14.33 | 0.32 | (0.65) | (0.33) | (0.60) | — | (0.60) | $13.40 | (2.65)% | 1.07% | 2.19% | 64% | $77,065 |
2009 | $15.07 | 0.39 | (0.43) | (0.04) | (0.49) | (0.21) | (0.70) | $14.33 | (0.08)% | 1.08% | 2.80% | 64% | $92,778 |
26
For a Share Outstanding Throughout the Years Ended June 30 (except as noted) |
Per-Share Data | Ratios and Supplemental Data |
| | | Income From Investment Operations: | Distributions From: | | | Ratio to Average Net Assets of: | | |
| | Net Asset Value, Beginning
of Period | Net
Investment Income
(Loss)(1) | Net Realized and Unrealized Gain (Loss) | Total From Investment Operations | Net
Investment Income | Net
Realized
Gains | Total
Distributions | Net Asset Value, End
of Period | Total
Return(2) | Operating
Expenses | Net
Investment Income
(Loss) | Portfolio
Turnover
Rate | Net Assets,
End of Period (in thousands) |
C Class |
2013 | $14.34 | 0.05 | (0.83) | (0.78) | (0.11) | — | (0.11) | $13.45 | (5.51)% | 1.80% | 0.35% | 21% | $5,051 |
2012 | $14.61 | 0.10 | (0.20) | (0.10) | (0.17) | — | (0.17) | $14.34 | (0.73)% | 1.81% | 0.68% | 50% | $7,692 |
2011 | $13.41 | 0.17 | 1.53 | 1.70 | (0.42) | (0.08) | (0.50) | $14.61 | 12.96% | 1.81% | 1.19% | 44% | $6,603 |
2010 | $14.33 | 0.20 | (0.63) | (0.43) | (0.49) | — | (0.49) | $13.41 | (3.32)% | 1.82% | 1.44% | 64% | $7,666 |
2009 | $15.05 | 0.28 | (0.43) | (0.15) | (0.36) | (0.21) | (0.57) | $14.33 | (0.88)% | 1.83% | 2.05% | 64% | $2,806 |
R Class |
2013 | $14.36 | 0.12 | (0.83) | (0.71) | (0.18) | — | (0.18) | $13.47 | (5.03)% | 1.30% | 0.85% | 21% | $200 |
2012 | $14.63 | 0.17 | (0.20) | (0.03) | (0.24) | — | (0.24) | $14.36 | (0.22)% | 1.31% | 1.18% | 50% | $246 |
2011 | $13.43 | 0.24 | 1.53 | 1.77 | (0.49) | (0.08) | (0.57) | $14.63 | 13.52% | 1.31% | 1.69% | 44% | $208 |
2010 | $14.35 | 0.27 | (0.63) | (0.36) | (0.56) | — | (0.56) | $13.43 | (2.82)% | 1.32% | 1.94% | 64% | $233 |
2009 | $15.09 | 0.34 | (0.42) | (0.08) | (0.45) | (0.21) | (0.66) | $14.35 | (0.40)% | 1.33% | 2.55% | 64% | $102 |
Notes to Financial Highlights
(1) | Computed using average shares outstanding throughout the period. |
(2) | Total returns are calculated based on the net asset value of the last business day and do not reflect applicable sales charges, if any. Total returns for periods less than one year are not annualized. |
(3) | Per-share amount was less than $0.005. |
See Notes to Financial Statements.
Report of Independent Registered Public Accounting Firm |
To the Trustees of the American Century International Bond Funds
and Shareholders of the International Bond Fund:
In our opinion, the accompanying statement of assets and liabilities, including the schedule of investments, and the related statements of operations and of changes in net assets and the financial highlights present fairly, in all material respects, the financial position of the International Bond Fund (one of the two funds comprising the American Century International Bond Funds, hereafter referred to as the “Fund”) at June 30, 2013, the results of its operations for the year then ended, the changes in its net assets for each of the two years in the period then ended and the financial highlights for each of the five years in the period then ended, in conformity with accounting principles generally accepted in the United States of America. These financial statements and financial highlights (hereafter referred to as “financial statements”) are the responsibility of the Fund’s management; our responsibility is to express an opinion on these financial statements based on our audits. We conducted our audits of these financial statements in accordance with the standards of the Public Company Accounting Oversight Board (United States). Those standards require that we plan and perform the audit to obtain reasonable assurance about whether the financial statements are free of material misstatement. An audit includes examining, on a test basis, evidence supporting the amounts and disclosures in the financial statements, assessing the accounting principles used and significant estimates made by management, and evaluating the overall financial statement presentation. We believe that our audits, which included confirmation of securities at June 30, 2013 by correspondence with the custodian and brokers, provide a reasonable basis for our opinion.
PricewaterhouseCoopers LLP
Kansas City, Missouri
August 21, 2013
Board of Trustees
The individuals listed below serve as trustees of the funds. Each trustee will continue to serve in this capacity until death, retirement, resignation or removal from office. The board has adopted a mandatory retirement age for trustees who are not “interested persons,” as that term is defined in the Investment Company Act (independent trustees). Independent trustees shall retire on December 31 of the year in which they reach their 75th birthday; provided, however, that on or after January 1, 2022, independent trustees shall retire on December 31 of the year in which they reach their 76th birthday.
Mr. Thomas is the only trustee who is an “interested person” because he currently serves as President and Chief Executive Officer of American Century Companies, Inc. (ACC), the parent company of American Century Investment Management, Inc. (ACIM or the advisor).
The other trustees (more than three-fourths of the total number) are independent; that is, they have never been employees, directors or officers of, and have no financial interest in, ACC or any of its wholly owned, direct or indirect, subsidiaries, including ACIM, American Century Investment Services, Inc. (ACIS) and American Century Services, LLC (ACS). The trustees serve in this capacity for eight (in the case of Mr. Thomas, 15) registered investment companies in the American Century Investments family of funds.
The following table presents additional information about the trustees. The mailing address for each trustee other than Mr. Thomas is 1665 Charleston Road, Mountain View, California 94043. The mailing address for Mr. Thomas is 4500 Main Street, Kansas City, Missouri 64111.
| | | | | | | |
Name
(Year of Birth) | Position(s) Held with Funds | Length of Time Served | Principal Occupation(s) During Past 5 Years | | Number of American Century Portfolios Overseen by Trustee | Other Directorships Held During Past 5 Years |
Independent Trustees |
Tanya S. Beder (1955) | Trustee | Since 2011 | Chairman, SBCC Group Inc. (independent advisory services) (2006 to present) | | 41 | CYS Investments, Inc. (specialty finance company) |
Jeremy I. Bulow (1954) | Trustee | Since 2011 | Professor of Economics, Stanford University, Graduate School of Business (1979 to present) | | 41 | None |
Ronald J. Gilson (1946) | Trustee and Chairman of the Board | Since 1995 | Charles J. Meyers Professor of Law and Business, Stanford Law School (1979 to present); Marc and Eva Stern Professor of Law and Business, Columbia University School of Law (1992 to present) | | 41 | None |
Frederick L. A. Grauer
(1946) | Trustee | Since 2008 | Senior Advisor, BlackRock, Inc. (investment management firm) (2010 to 2011); Senior Advisor, Barclays Global Investors (investment management firm) (2003 to 2009) | | 41 | None |
| | | | | | | |
Name
(Year of Birth) | Position(s) Held with Funds | Length of Time Served | Principal Occupation(s) During Past 5 Years | | Number of American Century Portfolios Overseen by Trustee | Other Directorships Held During Past 5 Years |
Independent Trustees |
Peter F. Pervere (1947) | Trustee | Since 2007 | Retired | | 41 | Intraware, Inc. (2003 to 2009) |
Myron S. Scholes (1941) | Trustee | Since 1980 | Chairman, Platinum Grove Asset Management, L.P. (asset manager) (1999 to 2009); Frank E. Buck Professor of Finance-Emeritus, Stanford Graduate School of Business (1996 to present) | | 41 | Dimensional Fund Advisors (investment advisor); CME Group, Inc. (futures and options exchange) |
John B. Shoven (1947) | Trustee | Since 2002 | Professor of Economics, Stanford University (1973 to present) | | 41 | Cadence Design Systems; Exponent; Financial Engines |
| |
Interested Trustee |
Jonathan S. Thomas
(1963) | Trustee and President | Since 2007 | President and Chief Executive Officer, ACC (March 2007 to present). Also serves as Chief Executive Officer and Manager, ACS; Executive Vice President, ACIM; Director, ACC, ACIM and other ACC subsidiaries | | 106 | None |
Officers
The following table presents certain information about the executive officers of the funds. Each officer serves as an officer for each of the 15 investment companies in the American Century family of funds, unless otherwise noted. No officer is compensated for his or her service as an officer of the funds. The listed officers are interested persons of the funds and are appointed or re-appointed on an annual basis. The mailing address for each of the officers listed below is 4500 Main Street, Kansas City, Missouri 64111.
Name
(Year of Birth) | Offices with the Funds | Principal Occupation(s) During the Past Five Years |
Jonathan S. Thomas
(1963) | Trustee and President since 2007 | President and Chief Executive Officer, ACC (March 2007 to present). Also serves as Chief Executive Officer and Manager, ACS; Executive Vice President, ACIM; Director, ACC, ACIM and other ACC subsidiaries |
Maryanne L. Roepke
(1956) | Chief Compliance Officer since 2006 and Senior Vice President since 2000 | Chief Compliance Officer, American Century funds, ACIM and ACS (August 2006 to present). Also serves as Senior Vice President, ACS |
Charles A. Etherington (1957) | General Counsel since 2007 and Senior Vice President since 2006 | Attorney, ACC (February 1994 to present); Vice President, ACC (November 2005 to present); General Counsel, ACC (March 2007 to present). Also serves as General Counsel, ACIM, ACS, ACIS and other ACC subsidiaries; and Senior Vice President, ACIM and ACS |
C. Jean Wade (1964) | Vice President, Treasurer and Chief Financial Officer since 2012 | Vice President, ACS (February 2000 to present) |
Robert J. Leach (1966) | Vice President since 2006 and Assistant Treasurer since 2012 | Vice President, ACS (February 2000 to present) |
David H. Reinmiller (1963) | Vice President since 2001 | Attorney, ACC (January 1994 to present); Associate General Counsel, ACC (January 2001 to present). Also serves as Vice President, ACIM and ACS |
Ward D. Stauffer (1960) | Secretary since 2005 | Attorney, ACC (June 2003 to present) |
The Statement of Additional Information has additional information about the fund’s trustees and is available without charge, upon request, by calling 1-800-345-2021.
Approval of Management Agreement |
At a meeting held on June 11, 2013, the Fund’s Board of Directors/Trustees unanimously approved the renewal of the management agreement pursuant to which American Century Investment Management, Inc. (the “Advisor”) acts as the investment advisor for the Fund. Under Section 15(c) of the Investment Company Act, contracts for investment advisory services are required to be reviewed, evaluated, and approved by a majority of a fund’s directors/trustees (the “Directors”), including a majority of the independent Directors each year. The Board regards this annual evaluation and renewal as one of its most important responsibilities.
In connection with their annual review and evaluation, the independent Directors memorialized a statement regarding the relationship between their ongoing obligations to oversee and evaluate the performance of the Advisor and their consideration of renewal of the management agreement. In that statement, the independent Directors noted that their assessment of the Advisor’s performance is an ongoing process that takes place over the entire year and is informed by all of the information that the Board and its committees receive and consider over time. This information, together with the materials provided in connection with the review, are central to the Board’s assessment of the Advisor’s performance and its determination whether to renew the Fund’s management agreement.
Prior to its consideration of the renewal of the management agreement, the Board requested and reviewed extensive data and analysis relating to the proposed renewal. This information and analysis was compiled by the Advisor and certain independent providers of evaluation data concerning the Fund and the services provided to the Fund by the Advisor.
In connection with its consideration of the renewal of the management agreement, the Board’s review and evaluation of the services provided by the Advisor included, but was not limited to, the following:
• | the nature, extent, and quality of investment management, shareholder services, and other services provided by the Advisor to the Fund; |
• | the wide range of other programs and services the Advisor provides to the Fund and its shareholders on a routine and non-routine basis; |
• | the investment performance of the Fund, including data comparing the Fund’s performance to appropriate benchmarks and/or a peer group of other mutual funds with similar investment objectives and strategies; |
• | data comparing the cost of owning the Fund to the cost of owning similar funds; |
• | the Advisor’s compliance policies, procedures, and regulatory experience; |
• | financial data showing the cost of services provided to the Fund, the profitability of the Fund to the Advisor, and the overall profitability of the Advisor; |
• | possible economies of scale associated with the Advisor’s management of the Fund and other accounts under its management; |
• | data comparing services provided and charges to other investment management clients of the Advisor; and |
• | consideration of collateral benefits derived by the Advisor from the management of the Fund. |
In keeping with its practice, the Board held two in-person meetings to review and discuss the information provided. The Board also had the benefit of the advice of its independent counsel throughout the period.
Factors Considered
The Directors considered all of the information provided by the Advisor, the independent data providers, and the Board’s independent counsel in connection with the review, and evaluated such information for the Fund. In connection with their review, the Directors did not identify any single factor as being all-important or controlling and each Director may have attributed different levels of importance to different factors. In deciding to renew the management agreement, the Board based its decision on a number of factors, including the following:
Nature, Extent and Quality of Services — Generally. Under the management agreement, the Advisor is responsible for providing or arranging for all services necessary for the operation of the Fund. The Board noted that under the management agreement, the Advisor provides or arranges at its own expense a wide variety of services including:
• | constructing and designing the Fund |
• | portfolio research and security selection |
• | initial capitalization/funding |
• | daily valuation of the Fund’s portfolio |
• | shareholder servicing and transfer agency, including shareholder confirmations, recordkeeping, and communications |
• | regulatory and portfolio compliance |
• | marketing and distribution |
The Board noted that many of these services have expanded over time both in terms of quantity and complexity in response to shareholder demands, competition in the industry, changing distribution channels, and the changing regulatory environment.
Investment Management Services. The nature of the investment management services provided to the Fund is quite complex and allows Fund shareholders access to professional money management, instant diversification of their investments within an asset class, the opportunity to easily diversify among asset classes by investing in or exchanging among various American Century Investments funds, and liquidity. In evaluating investment performance, the Board expects the Advisor to manage the Fund in accordance with its investment objectives and approved strategies. Further, the Directors recognize that the Advisor has an obligation to seek the best execution of fund trades. In providing these services, the Advisor utilizes teams of investment professionals (portfolio managers, analysts, research assistants, and securities traders) who require extensive information technology, research, training, compliance and other systems to conduct their business. The Board, directly and through its Portfolio Committee, regularly reviews investment performance information for the Fund, together with comparative information for appropriate benchmarks and/or peer groups of similarly-managed funds, over different time horizons. The Directors also review detailed performance information during the management agreement approval process. If performance concerns are identified, the Fund receives special reviews until performance improves, during which the Board discusses with the Advisor the reasons for such results (e.g., market conditions, security selection) and any efforts being undertaken to improve performance. The Board found the investment management services provided by the Advisor to the Fund to meet or exceed industry standards. More detailed information about the Fund’s performance can be found in the Performance and Portfolio Commentary sections of this report.
Shareholder and Other Services. Under the management agreement, the Advisor provides the Fund with a comprehensive package of transfer agency, shareholder, and other services. The Board, directly and through various committees of the Board, regularly reviews reports and evaluations of such services at its regular meetings. These reports include, but are not limited to, information regarding the operational efficiency and accuracy of the shareholder and transfer agency services provided, staffing levels, shareholder satisfaction (as measured by external as well as internal sources), technology support, new products and services offered to Fund shareholders, securities trading activities, portfolio valuation services, auditing services, and legal and operational compliance activities. Certain aspects of shareholder and transfer agency service level efficiency and the quality of securities trading activities are measured by independent third party providers and are presented in comparison to other fund groups not managed by the Advisor. The Board found the services provided by the Advisor to the Fund under the management agreement to be competitive and of high quality.
Costs of Services and Profitability. The Advisor provides detailed information concerning its cost of providing various services to the Fund, its profitability in managing the Fund, its overall profitability, and its financial condition. The Directors have reviewed with the Advisor the methodology used to prepare this financial information. The financial information regarding the Advisor is considered in evaluating the Advisor’s financial condition, its ability to continue
to provide services under the management agreement, and the reasonableness of the current management fee. The Board concluded that the Advisor’s profits were reasonable in light of the services provided to the Fund.
Ethics. The Board generally considers the Advisor’s commitment to providing quality services to shareholders and to conducting its business ethically. They noted that the Advisor’s practices generally meet or exceed industry best practices.
Economies of Scale. The Board also reviewed information provided by the Advisor regarding the possible existence of economies of scale in connection with the management of the Fund. The Board concluded that economies of scale are difficult to measure and predict with precision, especially on a fund-by-fund basis. The Board concluded that the Advisor is appropriately sharing economies of scale through its competitive fee structure, offering competitive fees from fund inception, and through reinvestment in its business to provide shareholders additional content and services.
Comparison to Other Funds’ Fees. The management agreement provides that the Fund pay the Advisor a single, all-inclusive (or unified) management fee for providing all services necessary for the management and operation of the Fund, other than brokerage expenses, taxes, interest, extraordinary expenses, and the fees and expenses of the Fund’s independent directors (including their independent legal counsel) and expenses incurred in connection with the provision of shareholder services and distribution services under a plan adopted pursuant to Rule 12b-1 under the 1940 Act. Under the unified fee structure, the Advisor is responsible for providing all investment advisory, custody, audit, administrative, compliance, recordkeeping, marketing and shareholder services, or arranging and supervising third parties to provide such services. By contrast, most other funds are charged a variety of fees, including an investment advisory fee, a transfer agency fee, an administrative fee, distribution charges and other expenses. Other than their investment advisory fees and any applicable Rule 12b-1 distribution fees, all other components of the total fees charged by these other funds may be increased without shareholder approval. The Board believes the unified fee structure is a benefit to Fund shareholders because it clearly discloses to shareholders the cost of owning Fund shares, and, since the unified fee cannot be increased without a vote of Fund shareholders, it shifts to the Advisor the risk of increased costs of operating the Fund and provides a direct incentive to minimize administrative inefficiencies. Part of the Board’s analysis of fee levels involves reviewing certain evaluative data compiled by an independent provider and comparing the Fund’s unified fee to the total expense ratio of other funds in the Fund’s peer group. The Board concluded that the management fee paid by the Fund to the Advisor under the management agreement is reasonable in light of the services provided to the Fund.
Comparison to Fees and Services Provided to Other Clients of the Advisor. The Board also requested and received information from the Advisor concerning the nature of the services, fees, costs and profitability of its advisory services to advisory clients other than the Fund. They observed that these varying types of client accounts require different services and involve different regulatory and entrepreneurial risks than the management of the Fund. The Board analyzed this information and concluded that the fees charged and services provided to the Fund were reasonable by comparison.
Collateral or “Fall-Out” Benefits Derived by the Advisor. The Board considered the existence of collateral benefits the Advisor may receive as a result of its relationship with the Fund. They concluded that the Advisor’s primary business is managing mutual funds and it generally does not use fund or shareholder information to generate profits in other lines of business, and therefore does not derive any significant collateral benefits from them. The Board noted that the Advisor receives proprietary research from broker-dealers that execute fund portfolio transactions and concluded that this research is likely to benefit Fund shareholders. The Board also determined that the Advisor is able to provide investment management services to certain clients other than the Fund, at least in part, due to its existing infrastructure built to serve the fund complex. The Board concluded, however, that the assets of those other clients are not material to the analysis and, where applicable, may be included with the assets of the Fund to determine breakpoints in the management fee schedule.
Existing Relationship. The Board also considered whether there was any reason for not continuing the existing arrangement with the Advisor. In this regard, the Board was mindful of the potential disruptions of the Fund’s operations and various risks, uncertainties, and other effects that could occur as a result of a decision not to continue such relationship. In particular, the Board recognized that most shareholders have invested in the Fund on the strength of the Advisor’s industry standing and reputation and in the expectation that the Advisor will have a continuing role in providing advisory services to the Fund.
Conclusion of the Directors. As a result of this process, the Board, including all of the independent directors and assisted by the advice of independent legal counsel, taking into account all of the factors discussed above and the information provided by the Advisor and others, concluded that the management agreement between the Fund and the Advisor is fair and reasonable in light of the services provided and should be renewed.
Retirement Account Information
As required by law, distributions you receive from certain IRAs are subject to federal income tax withholding, unless you elect not to have withholding apply. Tax will be withheld on the total amount withdrawn even though you may be receiving amounts that are not subject to withholding, such as nondeductible contributions. In such case, excess amounts of withholding could occur. You may adjust your withholding election so that a greater or lesser amount will be withheld.
If you don’t want us to withhold on this amount, you must notify us to not withhold the federal income tax. You may notify us in writing or in certain situations by telephone or through other electronic means. For systematic withdrawals, your withholding election will remain in effect until revoked or changed by filing a new election. You have the right to revoke your election at any time.
Remember, even if you elect not to have income tax withheld, you are liable for paying income tax on the taxable portion of your withdrawal. If you elect not to have income tax withheld or you don’t have enough income tax withheld, you may be responsible for payment of estimated tax. You may incur penalties under the estimated tax rules if your withholding and estimated tax payments are not sufficient. You can reduce or defer the income tax on a distribution by directly or indirectly rolling such distribution over to another IRA or eligible plan. You should consult your tax advisor for additional information.
State tax will be withheld if, at the time of your distribution, your address is within one of the mandatory withholding states and you have federal income tax withheld (or as otherwise required by state law). State taxes will be withheld from your distribution in accordance with the respective state rules.
Distributions you receive from 403(b), 457 and qualified plans are subject to special tax and withholding rules. Your plan administrator or plan sponsor is required to provide you with a special tax notice explaining those rules at the time you request a distribution. If applicable, federal and/or state taxes may be withheld from your distribution amount.
Proxy Voting Guidelines
American Century Investment Management, Inc., the fund’s investment advisor, is responsible for exercising the voting rights associated with the securities purchased and/or held by the fund. A description of the policies and procedures the advisor uses in fulfilling this responsibility is available without charge, upon request, by calling 1-800-345-2021. It is also available on American Century Investments’ website at americancentury.com and on the Securities and Exchange Commission’s website at sec.gov. Information regarding how the investment advisor voted proxies relating to portfolio securities during the most recent 12-month period ended June 30 is available on the “About Us” page at americancentury.com. It is also available at sec.gov.
Quarterly Portfolio Disclosure
The fund files its complete schedule of portfolio holdings with the Securities and Exchange Commission (SEC) for the first and third quarters of each fiscal year on Form N-Q. The fund’s Forms N-Q are available on the SEC’s website at sec.gov, and may be reviewed and copied at the SEC’s Public Reference Room in Washington, DC. Information on the operation of the Public Reference Room may be obtained by calling 1-800-SEC-0330. The fund also makes its complete schedule of portfolio holdings for the most recent quarter of its fiscal year available on its website at americancentury.com and, upon request, by calling 1-800-345-2021.
Contact Us | americancentury.com |
Automated Information Line | 1-800-345-8765 |
Investor Services Representative | 1-800-345-2021
or 816-531-5575 |
Investors Using Advisors | 1-800-378-9878 |
Business, Not-For-Profit, Employer-Sponsored Retirement Plans | 1-800-345-3533 |
Banks and Trust Companies, Broker-Dealers, Financial Professionals, Insurance Companies | 1-800-345-6488 |
Telecommunications Device for the Deaf | 1-800-634-4113 |
American Century International Bond Funds
Investment Advisor:
American Century Investment Management, Inc.
Kansas City, Missouri
This report and the statements it contains are submitted for the general information of our shareholders. The report is not authorized for distribution to prospective investors unless preceded or accompanied by an effective prospectus.
©2013 American Century Proprietary Holdings, Inc. All rights reserved.
CL-ANN-79316 1308
ITEM 2. CODE OF ETHICS.
(a) | The registrant has adopted a Code of Ethics for Senior Financial Officers that applies to the registrant’s principal executive officer, principal financial officer, principal accounting officer, and persons performing similar functions. |
(f) | The registrant’s Code of Ethics for Senior Financial Officers was filed as Exhibit 12 (a)(1) to American Century Asset Allocation Portfolios, Inc.’s Annual Certified Shareholder Report on Form N-CSR, File No. 811-21591, on September 29, 2005, and is incorporated herein by reference. |
ITEM 3. AUDIT COMMITTEE FINANCIAL EXPERT.
(a)(1) | The registrant's board has determined that the registrant has at least one audit committee financial expert serving on its audit committee. |
(a)(2) | Tanya S. Beder, Peter F. Pervere and Ronald J. Gilson are the registrant's designated audit committee financial experts. They are "independent" as defined in Item 3 of Form N-CSR. |
ITEM 4. PRINCIPAL ACCOUNTANT FEES AND SERVICES.
The aggregate fees billed for each of the last two fiscal years for professional services rendered by the principal accountant for the audit of the registrant’s annual financial statements or services that are normally provided by the accountant in connection with statutory and regulatory filings or engagements for those fiscal years were as follows:
FY 2012: $27,746
FY 2013: $84,384
The aggregate fees billed in each of the last two fiscal years for assurance and related services by the principal accountant that are reasonably related to the performance of the audit of the registrant’s financial statements and are not reported under paragraph (a) of this Item were as follows:
For services rendered to the registrant:
Fees required to be approved pursuant to paragraph (c)(7)(ii) of Rule 2-01 of Regulation S-X (relating to certain engagements for non-audit services with the registrant’s investment adviser and its affiliates):
The aggregate fees billed in each of the last two fiscal years for professional services rendered by the principal accountant for tax compliance, tax advice, and tax planning were as follows:
For services rendered to the registrant:
FY 2012: $0
FY 2013: $0
Fees required to be approved pursuant to paragraph (c)(7)(ii) of Rule 2-01 of Regulation S-X (relating to certain engagements for non-audit services with the registrant’s investment adviser and its affiliates):
FY 2012: $0
FY 2013: $0
The aggregate fees billed in each of the last two fiscal years for products and services provided by the principal accountant, other than the services reported in paragraphs (a) through (c) of this Item were as follows:
For services rendered to the registrant:
Fees required to be approved pursuant to paragraph (c)(7)(ii) of Rule 2-01 of Regulation S-X (relating to certain engagements for non-audit services with the registrant’s investment adviser and its affiliates):
(e)(1) | In accordance with paragraph (c)(7)(i)(A) of Rule 2-01 of Regulation S-X, before the accountant is engaged by the registrant to render audit or non-audit services, the engagement is approved by the registrant’s audit committee. Pursuant to paragraph (c)(7)(ii) of Rule 2-01 of Regulation S-X, the registrant’s audit committee also pre-approves its accountant’s engagements for non-audit services with the registrant’s investment adviser, its parent company, and any entity controlled by, or under common control with the investment adviser that provides ongoing services to the registrant, if the engagement relates directly to the operations and financial reporting of the registrant. |
(e)(2) | All services described in each of paragraphs (b) through (d) of this Item were pre-approved before the engagement by the registrant’s audit committee pursuant to paragraph (c)(7)(i)(A) of Rule 2-01 of Regulation S-X. Consequently, none of such services were required to be approved by the audit committee pursuant to paragraph (c)(7)(i)(C). |
(f) | The percentage of hours expended on the principal accountant’s engagement to audit the registrant’s financial statements for the most recent fiscal year that were attributed to work performed by persons other than the principal accountant’s full-time, permanent employees was less than 50%. |
(g) | The aggregate non-audit fees billed by the registrant’s accountant for services rendered to the registrant, and rendered to the registrant’s investment adviser (not including any sub-adviser whose role is primarily portfolio management and is subcontracted with or overseen by another investment adviser), and any entity controlling, controlled by, or under common control with the adviser that provides ongoing services to the registrant for each of the last two fiscal years of the registrant were as follows: |
FY 2012: $199,276
FY 2013: $151,650
(h) | The registrant’s investment adviser and accountant have notified the registrant’s audit committee of all non-audit services that were rendered by the registrant’s accountant to the registrant’s investment adviser, its parent company, and any entity controlled by, or under common control with the investment adviser that provides services to the registrant, which services were not required to be pre-approved pursuant to paragraph (c)(7)(ii) of Rule 2-01 of Regulation S-X. The notification provided to the registrant’s audit committee included sufficient details regarding such services to allow the registrant’s audit committee to consider the continuing independence of its principal accountant. |
ITEM 5. AUDIT COMMITTEE OF LISTED REGISTRANTS.
Not applicable.
ITEM 6. INVESTMENTS.
(a) | The schedule of investments is included as part of the report to stockholders filed under Item 1 of this Form. |
ITEM 7. DISCLOSURE OF PROXY VOTING POLICIES AND PROCEDURES FOR CLOSED-END MANAGEMENT INVESTMENT COMPANIES.
Not applicable.
ITEM 8. PORTFOLIO MANAGERS OF CLOSED-END MANAGEMENT INVESTMENT COMPANIES.
Not applicable.
ITEM 9. PURCHASES OF EQUITY SECURITIES BY CLOSED-END MANAGEMENT INVESTMENT COMPANY AND AFFILIATED PURCHASERS.
Not applicable.
ITEM 10. SUBMISSION OF MATTERS TO A VOTE OF SECURITY HOLDERS.
During the reporting period, there were no material changes to the procedures by which shareholders may recommend nominees to the registrant’s board.
ITEM 11. CONTROLS AND PROCEDURES.
(a) | The registrant's principal executive officer and principal financial officer have concluded that the registrant's disclosure controls and procedures (as defined in Rule 30a-3(c) under the Investment Company Act of 1940) are effective based on their evaluation of these controls and procedures as of a date within 90 days of the filing date of this report. |
(b) | There were no changes in the registrant's internal control over financial reporting (as defined in Rule 30a-3(d) under the Investment Company Act of 1940) that occurred during the registrant's second fiscal quarter of the period covered by this report that have materially affected, or are reasonably likely to materially affect, the registrant's internal control over financial reporting. |
ITEM 12. EXHIBITS.
(a)(1) | Registrant’s Code of Ethics for Senior Financial Officers, which is the subject of the disclosure required by Item 2 of Form N-CSR, was filed as Exhibit 12(a)(1) to American Century Asset Allocation Portfolios, Inc.’s Certified Shareholder Report on Form N-CSR, File No. 811-21591, on September 29, 2005. |
(a)(2) | Separate certifications by the registrant’s principal executive officer and principal financial officer, pursuant to Section 302 of the Sarbanes-Oxley Act of 2002 and Rule 30a-2(a) under the Investment Company Act of 1940, are filed and attached hereto as EX-99.CERT. |
(b) | A certification by the registrant’s chief executive officer and chief financial officer, pursuant to Section 906 of the Sarbanes-Oxley Act of 2002, is furnished and attached hereto as EX-99.906CERT. |
SIGNATURES
Pursuant to the requirements of the Securities Exchange Act of 1934 and the Investment Company Act of 1940, the registrant has duly caused this report to be signed on its behalf by the undersigned, thereunto duly authorized.
Registrant: | AMERICAN CENTURY INTERNATIONAL BOND FUNDS | |
| | | | |
| | | | |
By: | /s/ Jonathan S. Thomas | |
| | Name: | Jonathan S. Thomas | |
| | Title: | President | |
| | | | |
Date: | August 29, 2013 | |
| | | |
Pursuant to the requirements of the Securities Exchange Act of 1934 and the Investment Company Act of 1940, this report has been signed below by the following persons on behalf of the registrant and in the capacities and on the dates indicated.
By: | /s/ Jonathan S. Thomas | |
| | Name: | Jonathan S. Thomas | |
| | Title: | President | |
| | | (principal executive officer) | |
| | | | |
| | | | |
Date: | August 29, 2013 | |
By: | /s/ C. Jean Wade | |
| | Name: | C. Jean Wade | |
| | Title: | Vice President, Treasurer, and | |
| | | Chief Financial Officer | |
| | | (principal financial officer) | |
| | | | |
Date: | August 29, 2013 | |