
ANNUAL REPORT / DECEMBER 31, 2008
Legg Mason Partners
Investors Value Fund
| | |
| Managed by | | CLEARBRIDGE ADVISORS |
INVESTMENT PRODUCTS: NOT FDIC INSURED • NO BANK GUARANTEE • MAY LOSE VALUE
Fund objective
The Fund seeks long-term growth of capital. Current income is a secondary objective.
What’s inside
Legg Mason Partners Fund Advisor, LLC (“LMPFA”) is the Fund’s investment manager and ClearBridge Advisors, LLC (“ClearBridge”) is the Fund’s subadviser. LMPFA and ClearBridge are wholly-owned subsidiaries of Legg Mason, Inc.
Letter from the chairman

R. Jay Gerken, CFA
Chairman, President and Chief Executive Officer
Dear Shareholder,
The U.S. economy weakened significantly during the 12-month reporting period ended December 31, 2008. Looking back, U.S. gross domestic product (“GDP”)i contracted 0.2% in the fourth quarter of 2007. This was due to continued weakness in the housing market, an ongoing credit crunch and soaring oil and food prices. The economy then expanded 0.9% and 2.8% during the first and second quarters of 2008, respectively. Contributing to this rebound were rising exports that were buoyed by a weakening U.S. dollar. In addition, consumer spending accelerated, aided by the government’s tax rebate program. However, the dollar’s rally and the end of the rebate program, combined with other strains on the economy, caused GDP to take a step backward during the second half of 2008. According to the U.S. Department of Commerce, third quarter 2008 GDP declined 0.5% and its advance estimate for fourth quarter GDP decline was 3.8%, the latter being the worst quarterly reading since 1982.
While there were increasing signs that the U.S. was headed for a recession, the speculation ended in December 2008. At that time, the National Bureau of Economic Research (“NBER”) — which has the final say on when one begins and ends — announced that a recession had begun in December 2007. The NBER determined that a recession had already started using its definition, which is based on “a significant decline in economic activity spread across the economy, lasting more than a few months, normally visible in production, employment, real income and other indicators.”
Regardless of how one defines a recession, it felt like we were in the midst of an economic contraction for much of 2008. Consumer spending, which represents approximately two-thirds of GDP, has been disappointing. According to the International Council of Shopping Centers, retail sales rose a tepid 1% in 2008, the weakest level in at least 38 years. In terms of the job market, the U.S. Department of Labor reported that payroll employment declined in each of the 12 months of 2008. During 2008 as a whole, 2.6 million jobs were lost, the largest annual decline since World War II ended in 1945. In addition, at the end of 2008, the unemployment rate had risen to 7.2%, its highest level since January 1993.
| | |
| Legg Mason Partners Investors Value Fund | | I |
Letter from the chairman continued
Ongoing issues related to the housing and subprime mortgage markets and seizing credit markets prompted the Federal Reserve Board (“Fed”)ii to take aggressive and, in some cases, unprecedented actions. When 2008 began, the federal funds rateiii was 4.25%. This was quickly brought down to 3.00% by the end of January 2008, on the back of two Fed rate cuts. The Fed continued to lower the federal funds rate to 2.00% by the end of April 2008, but then left rates on hold for several months. This was due to growing inflationary pressures as a result of soaring oil and commodity prices, coupled with the sagging U.S. dollar. However, as inflation receded along with oil prices and the global financial crisis escalated, the Fed cut rates twice in October to 1.00%. Then, in mid-December 2008, it reduced the federal funds rate to a range of zero to 0.25%, an historic low. In conjunction with its December meeting, the Fed stated that it “will employ all available tools to promote the resumption of sustainable economic growth and to preserve price stability. In particular, the Committee anticipates that weak economic conditions are likely to warrant exceptionally low levels of the federal funds rate for some time.”
In addition to the interest rate cuts, the Fed took several actions to improve liquidity in the credit markets. In March 2008, it established a new lending program allowing certain brokerage firms, known as primary dealers, to also borrow from its discount window. Also in March, the Fed played a major role in facilitating the purchase of Bear Stearns by JPMorgan Chase. In mid-September 2008, it announced an $85 billion rescue plan for ailing AIG and pumped $70 billion into the financial system as Lehman Brothers’ bankruptcy and mounting troubles at other financial firms roiled the markets.
The U.S. Department of the Treasury has also taken an active role in attempting to stabilize the financial system, as it orchestrated the government’s takeover of mortgage giants Fannie Mae and Freddie Mac in September 2008. In addition, on October 3, 2008, the Treasury’s $700 billion Troubled Asset Relief Program (“TARP”) was approved by Congress and signed into law by President Bush. As part of TARP, the Treasury had planned to purchase bad loans and other troubled financial assets. However, in November 2008, Treasury Secretary Paulson said, “Our assessment at this time is that this is not the most effective way to use TARP funds, but we will continue to examine whether targeted forms of asset purchase can play a useful role, relative to other potential uses of TARP resources, in helping to strengthen our financial system and support lending.”
The U.S. stock market was extremely volatile and generated very poor results during the 12 months ended December 31, 2008. Stock prices declined during each of the first three months of the reporting period. This was due, in part, to the credit crunch, weakening corporate profits, rising inflation and fears of an impending recession. The market then reversed course and posted positive returns in April and May 2008. The market’s gains were largely attributed to hopes that the U.S. would skirt a recession
| | |
| II | | Legg Mason Partners Investors Value Fund |
and that corporate profits would rebound as the year progressed. However, given the escalating credit crisis and the mounting turmoil in the financial markets, stock prices moved lower during five of the last seven months of the reporting period, including S&P 500 Indexiv (the “Index”) returns of -8.91%, - -16.79% and -7.18% in September, October and November 2008, respectively. While the Index rallied approximately 20% from its low on November 20, 2008 through the end of the year, it was too little, too late. All told, the Index returned -37.00% in 2008, its third worst year ever and the biggest calendar year loss since 1937.
Looking at the U.S. stock market more closely, its descent was broad in scope, with every major index posting double-digit losses. In terms of market capitalizations, large-, mid- and small-cap stocks, as measured by the Russell 1000v, Russell Midcapvi and Russell 2000vii Indexes, returned -37.60%, -41.46% and -33.79%, respectively, during the 12-month period ended December 31, 2008. From an investment style perspective, growth and value stocks, as measured by the Russell 3000 Growthviii and Russell 3000 Valueix Indexes, returned - -38.44% and -36.25%, respectively.
A special note regarding increased market volatility
In recent months, we have experienced a series of events that have impacted the financial markets and created concerns among both novice and seasoned investors alike. In particular, we have witnessed the failure and consolidation of several storied financial institutions, periods of heightened market volatility, and aggressive actions by the U.S. federal government to steady the financial markets and restore investor confidence. While we hope that the worst is over in terms of the issues surrounding the credit and housing crises, it is likely that the fallout will continue to impact the financial markets and the U.S. economy well into 2009.
Like all asset management firms, Legg Mason has not been immune to these difficult and, in some ways, unprecedented times. However, today’s challenges have only strengthened our resolve to do everything we can to help you reach your financial goals. Now, as always, we remain committed to providing you with excellent service and a full spectrum of investment choices. And rest assured, we will continue to work hard to ensure that our investment managers make every effort to deliver strong long-term results.
We also remain committed to supplementing the support you receive from your financial advisor. One way we accomplish this is through our enhanced website, www.leggmason.com/individualinvestors. Here you can gain immediate access to many special features to help guide you through difficult times, including:
| • | | Fund prices and performance, |
| • | | Market insights and commentaries from our portfolio managers, and |
| • | | A host of educational resources. |
| | |
| Legg Mason Partners Investors Value Fund | | III |
Letter from the chairman continued
During periods of market unrest, it is especially important to work closely with your financial advisor and remember that reaching one’s investment goals unfolds over time and through multiple market cycles. Time and again, history has shown that, over the long run, the markets have eventually recovered and grown.
Information about your fund
As you may be aware, several issues in the mutual fund industry have come under the scrutiny of federal and state regulators. Affiliates of the Fund’s manager have, in recent years, received requests for information from various government regulators regarding market timing, late trading, fees, and other mutual fund issues in connection with various investigations. The regulators appear to be examining, among other things, the Fund’s response to market timing and shareholder exchange activity, including compliance with prospectus disclosure related to these subjects. The Fund is not in a position to predict the outcome of these requests and investigations.
Please read on for a more detailed look at prevailing economic and market conditions during the Fund’s reporting period and to learn how those conditions have affected Fund performance.
Important information with regard to recent regulatory developments that may affect the Fund is contained in the Notes to Financial Statements included in this report.
As always, thank you for your confidence in our stewardship of your assets. We look forward to helping you meet your financial goals.
Sincerely,

R. Jay Gerken, CFA
Chairman, President and Chief Executive Officer
January 30, 2009
| | |
| IV | | Legg Mason Partners Investors Value Fund |
All index performance reflects no deduction for fees, expenses or taxes. Please note that an investor cannot invest directly in an index.
| i | Gross domestic product (“GDP”) is the market value of all final goods and services produced within a country in a given period of time. |
| ii | The Federal Reserve Board (“Fed”) is responsible for the formulation of policies designed to promote economic growth, full employment, stable prices, and a sustainable pattern of international trade and payments. |
| iii | The federal funds rate is the rate charged by one depository institution on an overnight sale of immediately available funds (balances at the Federal Reserve) to another depository institution; the rate may vary from depository institution to depository institution and from day to day. |
| iv | The S&P 500 Index is an unmanaged index of 500 stocks and is generally representative of the performance of larger companies in the U.S. |
| v | The Russell 1000 Index measures the performance of the 1,000 largest companies in the Russell 3000 Index, which represents approximately 92% of the total market capitalization of the Russell 3000 Index. The Russell 3000 Index measures the performance of the 3,000 largest U.S. companies based on total market capitalization, which represents approximately 98% of the U.S. equity market. |
| vi | The Russell Midcap Index measures the performance of the 800 smallest companies in the Russell 1000 Index, which represents approximately 25% of the total market capitalization of the Russell 1000 Index. |
| vii | The Russell 2000 Index measures the performance of the 2,000 smallest companies in the Russell 3000 Index, which represents approximately 8% of the total market capitalization of the Russell 3000 Index. |
| viii | The Russell 3000 Growth Index measures the performance of those Russell 3000 Index companies with higher price-to-book ratios and higher forecasted growth values. (A price-to-book ratio is the price of a stock compared to the difference between a company’s assets and liabilities.) |
| ix | The Russell 3000 Value Index measures the performance of those Russell 3000 Index companies with lower price-to-book ratios and lower forecasted growth values. |
| | |
| Legg Mason Partners Investors Value Fund | | V |
Fund overview
Q. What is the Fund’s investment strategy?
A. The primary investment objective of the Fund is to seek long-term growth of capital. Current income is a secondary objective. The Fund invests primarily in common stocks of established U.S. companies. The Fund may also invest in other equity securities. To a lesser degree, the Fund may invest in debt securities. In selecting individual companies for investment, the portfolio managers focus on established large-capitalization companies (over $5 billion in market capitalization), seeking to identify those companies with strong franchises and favorable valuations potentially capable of producing superior returns across a range of potential scenarios. The portfolio managers employ bottom-up fundamental analysis to analyze each company in detail. In particular, we look for stocks that we believe are temporarily mispriced for reasons that may include negative investor sentiment, misunderstood fundamentals or operational challenges that the management team believes are surmountable. We continuously attempt to balance franchise value with price, focusing on new products or services, expanding demand, strong management teams, an improving industry environment or weakness in competitors.
Q. What were the overall market conditions during the Fund’s reporting period?
A. The equity markets, as defined by the S&P 500 Indexi, declined 37%, making 2008 the worst year since 1937.
For several years, rising home prices and low interest rates supported growth in residential mortgage debt and funded elevated levels of consumer spending. These factors also masked weak underwriting standards, particularly for mortgages. As home prices started to drop, values of often highly-rated structured financial products, collateralized by residential mortgages and other forms of debt, began to show signs of distress. Deteriorating credit led to tighter underwriting standards and pressured consumer spending, which represents about 70% of the overall U.S. economy. The economic slowdown, which began in the U.S., has subsequently spread throughout the world.
The distress throughout the financial system and rapidly declining home prices led to the collapse and government-assisted sale of Bear Stearns, forced conservatorship of the nation’s two largest mortgage companies, Fannie Mae and Freddie Mac, and government seizure of the nation’s largest thrift, Washington Mutual. The government’s decision to allow Lehman Brothers, the fourth largest and oldest investment bank in the country, to fail and file for bankruptcy rippled throughout global financial markets. Concerned about the fragility of the financial system, the government was effectively forced to nationalize American International Group, the nation’s largest insurance company. Many of the nation’s largest
| | |
| Legg Mason Partners Investors Value Fund 2008 Annual Report | | 1 |
Fund overview continued
financial institutions, such as Goldman Sachs, Morgan Stanley and General Electric (GE Capital), who are dependent on capital market funding, were forced to raise capital at distressed prices. Following the collapse of Lehman Brothers, the Reserve Fund, the oldest and largest money market fund in the country, “broke the buck,” shaking the confidence of investors in all but the safest assets, such as U.S. Treasuries.
In order to restore confidence, Congress approved an unprecedented and controversial $700 billion Troubled Asset Relief Program (“TARP”) designed to provide capital relief to the financial system. Several other programs were put in place to further support credit markets. These include the Temporary Liquidity Guarantee Program, under which the Federal Deposit Insurance Corporation (“FDIC”) provides a “full faith and credit” guarantee on newly-issued senior unsecured debt, and the Commercial Paper Funding Facility, which provides a liquidity backstop for three-month unsecured and asset-backed commercial paper issuers, for both financial and non-financial institutions. In addition, President Bush signed a $17.4 billion loan rescue package to assist the ailing U.S. automakers.
Central banks across the globe continued efforts to stabilize financial markets by coordinating their efforts to lower rates and inject massive amounts of liquidity. In the U.S., the Federal Reserve Board (“Fed”)ii reduced the federal funds rateiii from 4.25% at the start of the year to a target range of 0.00-0.25% in December. A flight to safety pushed Treasury yields to record lows, with the 10-year yielding 2.25% at year end. Rates on conforming 30-year fixed mortgages dropped to 5.1% at year end after the Fed announced plans to purchase up to $500 billion of mortgage-backed securities starting in February 2009. The 30-year rate represents the lowest on record since April 1971, the year Freddie Mac started tracking the data. Slower global economic growth continued to push commodity prices down, with oil closing the year at $44.60 a barrel, down 50% from $90.11 at the end of 2007, and down 70% from the high of $146.93 reached in mid-July 2008. Easing inflationary pressures provided some relief to consumers and businesses and offered a broader set of tools to regulators to stabilize the economy.
Q. How did we respond to these changing market conditions?
A. The unprecedented disruption in the fixed-income markets, combined with a rapidly deteriorating economy, created the most precarious investment environments in decades. Government support has been critical to stabilize the economy. While we do not know the length and depth of this recession, the market is a good discounting mechanism which we believe will react positively to any sign of stabilization. In these periods of uncertainty and volatility, we have continued to seek a balance between short-term risks and longer-term opportunities as we focused on companies we believe have strong franchises capable of generating solid sustainable returns over time.
| | |
| 2 | | Legg Mason Partners Investors Value Fund 2008 Annual Report |
Performance review
For the 12 months ended December 31, 2008, Class A shares of Legg Mason Partners Investors Value Fund, excluding sales charges, returned -35.52%. The Fund’s unmanaged benchmarks, the S&P 500 Index and the Russell 1000 Value Indexiv, returned -37.00% and -36.85%, respectively, over the same time frame. The Lipper Large-Cap Value Funds Category Average1 returned -37.36% for the same period.
| | | | |
| PERFORMANCE SNAPSHOT as of December 31, 2008 (excluding sales charges) (unaudited) |
| | | 6 MONTHS | | 12 MONTHS |
| Investors Value Fund — Class A Shares | | -25.72% | | -35.52% |
| S&P 500 Index | | -28.48% | | -37.00% |
| Russell 1000 Value Index | | -26.93% | | -36.85% |
| Lipper Large-Cap Value Funds Category Average1 | | -27.93% | | -37.36% |
| | | | |
| The performance shown represents past performance. Past performance is no guarantee of future results and current performance may be higher or lower than the performance shown above. Principal value and investment returns will fluctuate and investors’ shares, when redeemed, may be worth more or less than their original cost. To obtain performance data current to the most recent month-end, please visit our website at www.leggmason.com/individualinvestors. |
| Excluding sales charges, Class B shares returned -26.00%, Class C shares returned -25.92% and Class I shares2 returned -25.51% over the six months ended December 31, 2008. Excluding sales charges, Class B shares returned -36.05%, Class C shares returned -35.94% and Class I shares returned -35.23% over the 12 months ended December 31, 2008. All share class returns assume the reinvestment of all distributions, including returns of capital, if any, at net asset value and the deduction of all Fund expenses. Returns have not been adjusted to include sales charges that may apply when shares are purchased or the deduction of taxes that a shareholder would pay on Fund distributions. |
| Performance figures reflect expense reimbursements and/or fee waivers, without which the performance would have been lower. |
| TOTAL ANNUAL OPERATING EXPENSES (unaudited) |
| As of the Fund’s most current prospectus dated April 28, 2008, the gross total operating expense ratios for Class A, Class B, Class C and Class I shares were 0.86%, 1.62%, 1.57% and 0.57%, respectively. |
| 1 | Lipper, Inc., a wholly-owned subsidiary of Reuters, provides independent insight on global collective investments. Returns are based on the period ended December 31, 2008, including the reinvestment of all distributions, including returns of capital, if any, calculated among the 610 funds for the six-month period and among the 596 funds for the 12-month period in the Fund’s Lipper category, and excluding sales charges. |
| 2 | Effective August 17, 2007, all outstanding Class I shares were converted to Class O shares and Class O shares were re-designated as Class I shares. The former Class I shares were terminated. The inception date, performance history and expense waivers/reimbursements of the former Class O shares have been maintained. |
| | |
| Legg Mason Partners Investors Value Fund 2008 Annual Report | | 3 |
Fund overview continued
Q. What were the leading contributors to performance?
A. Relative to the S&P 500 Index, our overall sector allocation contributed to performance for the period. Specifically, our underweights to the Information Technology (“IT”) and Industrials sectors contributed to relative performance, as did our overweights to the Telecommunication Services (“Telecom”) and Consumer Discretionary sectors. In addition, stock selection in the Financials and Consumer staples sectors made significant contributions to relative performance.
On an individual stock basis, the leading contributors to performance included positions in McDonald’s Corp. in the Consumer Discretionary sector, Exxon Mobil Corp. in the Energy sector, Wal-Mart Stores Inc. in the Consumer Staples sector, Verizon Communications Inc. in the Telecom sector and Chubb Corp. in the Financials sector.
Q. What were the leading detractors from performance?
A. Relative to the S&P 500 Index, overall stock selection detracted from performance for the period. In particular, stock selection in the Consumer Discretionary, Energy, Telecom, Health Care, Industrials and IT sectors negatively impacted relative performance. In terms of sector allocation, the Fund’s overweight to the Financials sector and its underweights to the Health Care and Utilities sectors also detracted from relative performance.
On an individual stock basis, the leading detractors from performance for the period included our holdings in General Electric Co. in the Industrials sector, Bank of America Corp. in the Financials sector, Transocean Ltd. in the Energy sector, as well as Sprint Nextel Corp. in the Telecom sector and Liberty Media Corp. Series A Liberty Entertainment in the Consumer Discretionary sector.
Q. Were there any significant changes to the Fund during the reporting period?
A. Over the course of the fiscal year, we increased our weightings in the Consumer Staples, Energy and Telecom sectors and decreased our weightings in the Financials, Industrials, IT and Health Care sectors.
We closed a number of positions during the year, including Fund holdings in Textron Inc. in the Industrials sector, and American International Group Inc., Merrill Lynch & Co. Inc., Freddie Mac, and Wachovia Corp., all in the Financials sector (Both Merrill Lynch and Wachovia were acquired during the year). We also sold our holdings in Nokia Corp. (ADR), Texas Instruments Inc. and Comverse Technology Inc., all in the IT sector, and Liberty Media Corp., Liberty Media Corp. Series A Liberty Entertainment and Liberty Media Holding Corp. Interactive Series A, all in the Consumer Discretionary sector.
We established new Fund positions during the year in Lorillard Inc. and Unilever PLC (ADR), both in the Consumer Staples sector, Exxon Mobil Corp., Halliburton Co., El Paso Corp., and Devon Energy Corp., all in the Energy sector, as well as Verizon Communications Inc. in the Telecom
| | |
| 4 | | Legg Mason Partners Investors Value Fund 2008 Annual Report |
sector, Scripps Networks Interactive Class A Shares in the Consumer Discretionary sector and Marshall & Ilsey Corp. in the Financials sector.
Thank you for your investment in Legg Mason Partners Investors Value Fund. As always, we appreciate that you have chosen us to manage your assets and we remain focused on achieving the Fund’s investment goals.
Sincerely,
| | |
| |
 | |  |
| Robert Feitler | | Dimitry Khaykin |
| Co-Portfolio Manager | | Co-Portfolio Manager |
| ClearBridge Advisors, LLC | | ClearBridge Advisors, LLC |
January 20, 2009
The information provided is not intended to be a forecast of future events, a guarantee of future results or investment advice. Views expressed may differ from those of the firm as a whole.
Portfolio holdings and breakdowns are as of December 31, 2008 and are subject to change and may not be representative of the portfolio managers’ current or future investments. The Fund’s top 10 holdings (as a percentage of net assets) as of this date were: AT&T Inc. (4.1%), Total SA (3.8%), Wal-Mart Stores Inc. (3.6%), McDonald’s Corp. (3.3%), Wells Fargo & Co. (3.3%), Kimberly-Clark Corp. (3.1%), Philip Morris International Inc. (3.0%), JPMorgan Chase & Co. (2.8%), General Electric Co. (2.8%) and Travelers Cos. Inc. (2.8%). Please refer to pages 11 through 14 for a list and percentage breakdown of the Fund’s holdings.
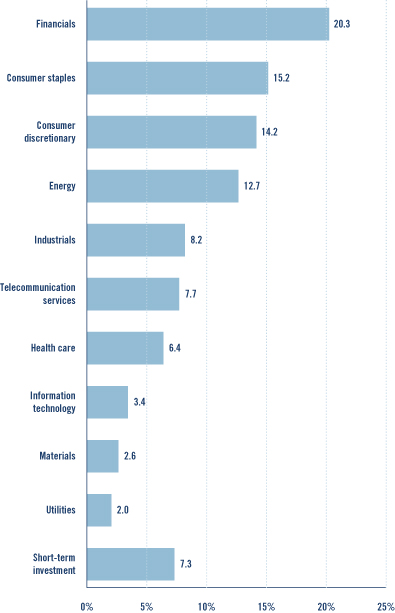
The mention of sector breakdowns is for informational purposes only and should not be construed as a recommendation to purchase or sell any securities. The information provided regarding such sectors is not a sufficient basis upon which to make an investment decision. Investors seeking financial advice regarding the appropriateness of investing in any securities or investment strategies discussed should consult their financial professional. The Fund’s top five sector holdings (as a percentage of net assets) as of December 31, 2008 were: Financials (20.4%), Consumer Staples (15.2%), Consumer Discretionary (14.2%), Energy (12.7%) and Industrials (8.3%). The Fund’s portfolio composition is subject to change at any time.
RISKS: Investments in common stocks are subject to market fluctuations. Foreign securities are subject to certain risks of overseas investing, including currency fluctuations and changes in political and economic conditions. These risks are magnified in emerging markets. The Fund may use derivatives, such as options and futures, which can be illiquid, may disproportionately increase losses, and have a potentially large impact on Fund performance. Please see the Fund’s prospectus for more information on these and other risks.
All index performance reflects no deduction for fees, expenses or taxes. Please note that an investor cannot invest directly in an index.
| i | The S&P 500 Index is an unmanaged index of 500 stocks and is generally representative of the performance of larger companies in the U.S. |
| ii | The Federal Reserve Board (“Fed”) is responsible for the formulation of policies designed to promote economic growth, full employment, stable prices and a sustainable pattern of international trade and payments. |
| iii | The federal funds rate is the rate charged by one depository institution on an overnight sale of immediately available funds (balances at the Federal Reserve) to another depository institution; the rate may vary from depository institution to depository institution and from day to day. |
| iv | The Russell 1000 Value Index measures the performance of those Russell 1000 Index companies with lower price-to-book ratios and lower forecasted growth values. (A price-to-book ratio is the price of a stock compared to the difference between a company’s assets and liabilities.) The Russell 1000 Index measures the performance of the 1,000 largest companies in the Russell 3000 Index, which represents approximately 92% of the total market capitalization of the Russell 3000 Index. The Russell 3000 Index measures the performance of the 3,000 largest U.S. companies based on total market capitalization, which represents approximately 98% of the U.S. equity market. |
| | |
| Legg Mason Partners Investors Value Fund 2008 Annual Report | | 5 |
Fund at a glance (unaudited)
|
| INVESTMENT BREAKDOWN (%) As a percent of total investments — December 31, 2008 |
| | |
| 6 | | Legg Mason Partners Investors Value Fund 2008 Annual Report |
Fund expenses (unaudited)
Example
As a shareholder of the Fund, you may incur two types of costs: (1) transaction costs, including front-end and back-end sales charges (loads) on purchase payments; and (2) ongoing costs, including management fees; distribution and/or service (12b-1) fees; and other Fund expenses. This example is intended to help you understand your ongoing costs (in dollars) of investing in the Fund and to compare these costs with the ongoing costs of investing in other mutual funds.
This example is based on an investment of $1,000 invested on July 1, 2008 and held for the six months ended December 31, 2008.
Actual expenses
The table below titled “Based on Actual Total Return” provides information about actual account values and actual expenses. You may use the information provided in this table, together with the amount you invested, to estimate the expenses that you paid over the period. To estimate the expenses you paid on your account, divide your ending account value by $1,000 (for example, an $8,600 ending account value divided by $1,000 = 8.6), then multiply the result by the number under the heading entitled “Expenses Paid During the Period”.
| | | | | | | | | | | | | | | |
| BASED ON ACTUAL TOTAL RETURN1 | | | | | |
| | | ACTUAL TOTAL
RETURN
WITHOUT
SALES
CHARGES2 | | | BEGINNING
ACCOUNT
VALUE | | ENDING
ACCOUNT
VALUE | | ANNUALIZED
EXPENSE
RATIO | | | EXPENSES
PAID DURING
THE PERIOD3 |
| Class A | | (25.72 | )% | | $ | 1,000.00 | | $ | 742.80 | | 1.06 | % | | $ | 4.64 |
| Class B | | (26.00 | ) | | | 1,000.00 | | | 740.00 | | 1.94 | | | | 8.49 |
| Class C | | (25.92 | ) | | | 1,000.00 | | | 740.80 | | 1.75 | | | | 7.66 |
| Class I | | (25.51 | ) | | | 1,000.00 | | | 744.90 | | 0.66 | | | | 2.89 |
| 1 | For the six months ended December 31, 2008. |
| 2 | Assumes the reinvestment of all distributions, including returns of capital, if any, at net asset value and does not reflect the deduction of the applicable sales charge with respect to Class A shares or the applicable contingent deferred sales charges (“CDSC”) with respect to Class B and C shares. Total return is not annualized, as it may not be representative of the total return for the year. Performance figures may reflect fee waivers and/or expense reimbursements. In the absence of fee waivers and/or expense reimbursements, the total return would have been lower. Past performance is no guarantee of future results. |
| 3 | Expenses (net of fee waivers and/or expense reimbursements) are equal to each class’ respective annualized expense ratio multiplied by the average account value over the period, multiplied by the number of days in the most recent fiscal half-year, then divided by 366. |
| | |
| Legg Mason Partners Investors Value Fund 2008 Annual Report | | 7 |
Fund expenses (unaudited) continued
Hypothetical example for comparison purposes
The table below titled “Based on Hypothetical Total Return” provides information about hypothetical account values and hypothetical expenses based on the actual expense ratio and an assumed rate of return of 5.00% per year before expenses, which is not the Fund’s actual return. The hypothetical account values and expenses may not be used to estimate the actual ending account balance or expenses you paid for the period. You may use the information provided in this table to compare the ongoing costs of investing in the Fund and other funds. To do so, compare the 5.00% hypothetical example relating to the Fund with the 5.00% hypothetical examples that appear in the shareholder reports of the other funds.
Please note that the expenses shown in the table below are meant to highlight your ongoing costs only and do not reflect any transactional costs, such as front-end or back-end sales charges (loads). Therefore, the table is useful in comparing ongoing costs only, and will not help you determine the relative total costs of owning different funds. In addition, if these transaction costs were included, your costs would have been higher.
| | | | | | | | | | | | | | | |
| BASED ON HYPOTHETICAL TOTAL RETURN1 | | | | | | | |
| | | HYPOTHETICAL
ANNUALIZED
TOTAL
RETURN | | | BEGINNING
ACCOUNT
VALUE | | ENDING
ACCOUNT
VALUE | | ANNUALIZED
EXPENSE
RATIO | | | EXPENSES
PAID DURING
THE PERIOD2 |
| Class A | | 5.00 | % | | $ | 1,000.00 | | $ | 1,019.81 | | 1.06 | % | | $ | 5.38 |
| Class B | | 5.00 | | | | 1,000.00 | | | 1,015.38 | | 1.94 | | | | 9.83 |
| Class C | | 5.00 | | | | 1,000.00 | | | 1,016.34 | | 1.75 | | | | 8.87 |
| Class I | | 5.00 | | | | 1,000.00 | | | 1,021.82 | | 0.66 | | | | 3.35 |
| 1 | For the six months ended December 31, 2008. |
| 2 | Expenses (net of fee waivers and/or expense reimbursements) are equal to each class’ respective annualized expense ratio multiplied by the average account value over the period, multiplied by the number of days in the most recent fiscal half-year, then divided by 366. |
| | |
| 8 | | Legg Mason Partners Investors Value Fund 2008 Annual Report |
Fund performance (unaudited)
| | | | | | | | | | | | |
| AVERAGE ANNUAL TOTAL RETURNS1 | |
| | | WITHOUT SALES CHARGES2 | |
| | | CLASS A | | | CLASS B | | | CLASS C | | | CLASS I | |
| Twelve Months Ended 12/31/08 | | (35.52 | )% | | (36.05 | )% | | (35.94 | )% | | (35.23 | )% |
| Five Years Ended 12/31/08 | | (1.64 | ) | | (2.52 | ) | | (2.43 | ) | | (1.32 | ) |
| Ten Years Ended 12/31/08 | | 1.50 | | | 0.63 | | | 0.70 | | | 1.80 | |
| |
| | | WITH SALES CHARGES3 | |
| | | CLASS A | | | CLASS B | | | CLASS C | | | CLASS I | |
| Twelve Months Ended 12/31/08 | | (39.23 | )% | | (39.15 | )% | | (36.56 | )% | | (35.23 | )% |
| Five Years Ended 12/31/08 | | (2.79 | ) | | (2.67 | ) | | (2.43 | ) | | (1.32 | ) |
| Ten Years Ended 12/31/08 | | 0.90 | | | 0.63 | | | 0.70 | | | 1.80 | |
| | | | | | | | | | | | |
| CUMULATIVE TOTAL RETURNS1 | |
| | | WITHOUT SALES CHARGES2 | |
| Class A (12/31/98 through 12/31/08) | | | | | 16.05% | | | | |
| Class B (12/31/98 through 12/31/08) | | | | | 6.45 | | | | |
| Class C (12/31/98 through 12/31/08) | | | | | 7.25 | | | | |
| Class I (12/31/98 through 12/31/08) | | | | | 19.54 | | | | |
| 1 | All figures represent past performance and are not a guarantee of future results. Investment return and principal value of an investment will fluctuate so that an investor’s shares, when redeemed, may be worth more or less than their original cost. The returns shown do not reflect the deduction of taxes that a shareholder would pay on Fund distributions or the redemption of Fund shares. Performance figures may reflect fee waivers and/or expense reimbursements. In the absence of fee waivers and/or expense reimbursements, the total return would have been lower. |
| 2 | Assumes the reinvestment of all distributions, including returns of capital, if any, at net asset value and does not reflect the deduction of the applicable sales charge with respect to Class A shares or the applicable CDSC with respect to Class B and C shares. |
| 3 | Assumes the reinvestment of all distributions, including returns of capital, if any, at net asset value. In addition, Class A shares reflect the deduction of the maximum initial sales charge of 5.75%; Class B shares reflect the deduction of a 5.00% CDSC, which applies if shares are redeemed within one year from purchase payment and declines thereafter by 1.00% per year until no CDSC is incurred. Class C shares also reflect the deduction of a 1.00% CDSC, which applies if shares are redeemed within one year from purchase payment. |
| | |
| Legg Mason Partners Investors Value Fund 2008 Annual Report | | 9 |
Historical performance (unaudited)
|
VALUE OF $10,000 INVESTED IN CLASS I SHARES OF LEGG MASON PARTNERS INVESTORS VALUE FUND
VS. S&P 500 INDEX AND RUSSELL 1000 VALUE INDEX† — December 1998 - December 2008 |
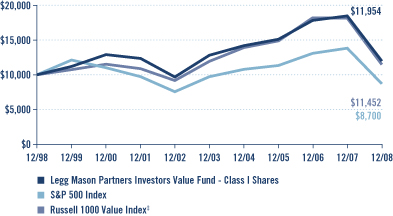
| † | Hypothetical illustration of $10,000 invested in Class I shares of Legg Mason Partners Investors Value Fund on December 31, 1998, assuming the reinvestment of all distributions, including returns of capital, if any, at net asset value through December 31, 2008. The S&P 500 Index is an unmanaged index of 500 stocks and is generally representative of the performance of larger companies in the U.S. The Russell 1000 Value Index measures the performance of those Russell 1000 Index companies with lower price-to-book ratios and lower forecasted growth values. The Indexes are unmanaged and are not subject to the same management and trading expenses as a mutual fund. Please note that an investor cannot invest directly in an index. The performance of the Fund’s other classes may be greater or less than Class I shares’ performance indicated on this chart, depending on whether greater or lesser sales charges and fees were incurred by shareholders investing in the other classes. |
| ‡ | Effective April 28, 2008, the Fund’s benchmarks are the S&P 500 Index and the Russell 1000 Value Index. Prior to April 28, 2008, the Fund’s sole benchmark was the S&P 500 Index. |
All figures represent past performance and are not a guarantee of future results. Investment return and principal value of an investment will fluctuate so that an investor’s shares, when redeemed, may be worth more or less than their original cost. The returns shown do not reflect the deduction of taxes that a shareholder would pay on Fund distributions or the redemption of Fund shares. Performance figures may reflect fee waivers and/or expense reimbursements. In the absence of fee waivers and/or expense reimbursements, the total return would have been lower.
| | |
| 10 | | Legg Mason Partners Investors Value Fund 2008 Annual Report |
Schedule of investments
December 31, 2008
| | | | | |
| LEGG MASON PARTNERS INVESTORS VALUE FUND | | |
| SHARES | | SECURITY | | VALUE |
| | | | | |
| COMMON STOCKS — 93.0% | | | |
| CONSUMER DISCRETIONARY — 14.2% | | | |
| | | Hotels, Restaurants & Leisure — 3.3% | | | |
| 361,500 | | McDonald’s Corp. | | $ | 22,481,685 |
| | | Media — 7.9% | | | |
| 729,200 | | DISH Network Corp.* | | | 8,086,828 |
| 1,416,680 | | News Corp., Class B Shares | | | 13,571,794 |
| 359,200 | | Scripps Networks Interactive, Class A Shares | | | 7,902,400 |
| 496,700 | | SES Global SA, FDR(a) | | | 9,561,759 |
| 1,350,800 | | Time Warner Inc. | | | 13,589,048 |
| | | Total Media | | | 52,711,829 |
| | | Multiline Retail — 1.3% | | | |
| 255,100 | | Target Corp. | | | 8,808,603 |
| | | Specialty Retail — 1.7% | | | |
| 501,000 | | Home Depot Inc. | | | 11,533,020 |
| | | TOTAL CONSUMER DISCRETIONARY | | | 95,535,137 |
| CONSUMER STAPLES — 15.2% | | | |
| | | Food & Staples Retailing — 3.5% | | | |
| 425,900 | | Wal-Mart Stores Inc. | | | 23,875,954 |
| | | Food Products — 3.0% | | | |
| 454,267 | | Kraft Foods Inc., Class A Shares | | | 12,197,069 |
| 336,000 | | Unilever PLC, ADR | | | 7,734,720 |
| | | Total Food Products | | | 19,931,789 |
| | | Household Products — 3.1% | | | |
| 394,500 | | Kimberly-Clark Corp. | | | 20,805,930 |
| | | Tobacco — 5.6% | | | |
| 539,100 | | Altria Group Inc. | | | 8,118,846 |
| 159,400 | | Lorillard Inc. | | | 8,982,190 |
| 468,500 | | Philip Morris International Inc. | | | 20,384,435 |
| | | Total Tobacco | | | 37,485,471 |
| | | TOTAL CONSUMER STAPLES | | | 102,099,144 |
| ENERGY — 12.7% | | | |
| | | Energy Equipment & Services — 2.0% | | | |
| 433,200 | | Halliburton Co. | | | 7,875,576 |
| 123,760 | | Transocean Ltd.* | | | 5,847,660 |
| | | Total Energy Equipment & Services | | | 13,723,236 |
| | | Oil, Gas & Consumable Fuels — 10.7% | | | |
| 104,980 | | Devon Energy Corp. | | | 6,898,236 |
| 883,200 | | El Paso Corp. | | | 6,915,456 |
| 194,800 | | Exxon Mobil Corp. | | | 15,550,884 |
See Notes to Financial Statements.
| | |
| Legg Mason Partners Investors Value Fund 2008 Annual Report | | 11 |
Schedule of investments continued
December 31, 2008
| | | | | |
| LEGG MASON PARTNERS INVESTORS VALUE FUND | | |
| SHARES | | SECURITY | | VALUE |
| | | | | |
| | | Oil, Gas & Consumable Fuels — 10.7% continued | | | |
| 210,800 | | Royal Dutch Shell PLC, ADR, Class A Shares | | $ | 11,159,752 |
| 289,892 | | Suncor Energy Inc. | | | 5,652,894 |
| 461,450 | | Total SA, ADR | | | 25,518,185 |
| | | Total Oil, Gas & Consumable Fuels | | | 71,695,407 |
| | | TOTAL ENERGY | | | 85,418,643 |
| FINANCIALS — 20.4% | | | |
| | | Capital Markets — 1.4% | | | |
| 335,919 | | Bank of New York Mellon Corp. | | | 9,516,585 |
| | | Commercial Banks — 3.8% | | | |
| 256,420 | | Marshall & Ilsley Corp. | | | 3,497,569 |
| 740,700 | | Wells Fargo & Co. | | | 21,835,836 |
| | | Total Commercial Banks | | | 25,333,405 |
| | | Consumer Finance — 2.4% | | | |
| 329,360 | | American Express Co. | | | 6,109,628 |
| 323,100 | | Capital One Financial Corp. | | | 10,303,659 |
| | | Total Consumer Finance | | | 16,413,287 |
| | | Diversified Financial Services — 4.4% | | | |
| 752,500 | | Bank of America Corp. | | | 10,595,200 |
| 602,860 | | JPMorgan Chase & Co. | | | 19,008,176 |
| | | Total Diversified Financial Services | | | 29,603,376 |
| | | Insurance — 8.4% | | | |
| 153,930 | | AFLAC Inc. | | | 7,056,151 |
| 257,600 | | Chubb Corp. | | | 13,137,600 |
| 226,060 | | Loews Corp. | | | 6,386,195 |
| 457,849 | | Marsh & McLennan Cos. Inc. | | | 11,111,995 |
| 411,180 | | Travelers Cos. Inc. | | | 18,585,336 |
| | | Total Insurance | | | 56,277,277 |
| | | TOTAL FINANCIALS | | | 137,143,930 |
| HEALTH CARE — 6.4% | | | |
| | | Health Care Providers & Services — 2.8% | | | |
| 335,530 | | UnitedHealth Group Inc. | | | 8,925,098 |
| 233,200 | | WellPoint Inc.* | | | 9,824,716 |
| | | Total Health Care Providers & Services | | | 18,749,814 |
| | | Pharmaceuticals — 3.6% | | | |
| 195,700 | | Abbott Laboratories | | | 10,444,509 |
| 280,800 | | Novartis AG, ADR | | | 13,972,608 |
| | | Total Pharmaceuticals | | | 24,417,117 |
| | | TOTAL HEALTH CARE | | | 43,166,931 |
See Notes to Financial Statements.
| | |
| 12 | | Legg Mason Partners Investors Value Fund 2008 Annual Report |
| | | | | |
| LEGG MASON PARTNERS INVESTORS VALUE FUND | | |
| SHARES | | SECURITY | | VALUE |
| | | | | |
| INDUSTRIALS — 8.3% | | | |
| | | Aerospace & Defense — 3.2% | | | |
| 155,700 | | Boeing Co. | | $ | 6,643,719 |
| 288,600 | | Raytheon Co. | | | 14,730,144 |
| | | Total Aerospace & Defense | | | 21,373,863 |
| | | Commercial Services & Supplies — 0.5% | | | |
| 105,700 | | Avery Dennison Corp. | | | 3,459,561 |
| | | Industrial Conglomerates — 4.6% | | | |
| 1,148,600 | | General Electric Co. | | | 18,607,320 |
| 222,600 | | United Technologies Corp. | | | 11,931,360 |
| | | Total Industrial Conglomerates | | | 30,538,680 |
| | | TOTAL INDUSTRIALS | | | 55,372,104 |
| INFORMATION TECHNOLOGY — 3.4% | | | |
| | | Communications Equipment — 0.2% | | | |
| 105,520 | | EchoStar Corp.* | | | 1,569,083 |
| | | Computers & Peripherals — 1.7% | | | |
| 134,900 | | International Business Machines Corp. | | | 11,353,184 |
| | | Software — 1.5% | | | |
| 499,900 | | Microsoft Corp. | | | 9,718,056 |
| | | TOTAL INFORMATION TECHNOLOGY | | | 22,640,323 |
| MATERIALS — 2.6% | | | |
| | | Chemicals — 2.6% | | | |
| 149,400 | | Air Products & Chemicals Inc. | | | 7,510,338 |
| 388,900 | | E.I. du Pont de Nemours & Co. | | | 9,839,170 |
| | | TOTAL MATERIALS | | | 17,349,508 |
| TELECOMMUNICATION SERVICES — 7.7% | | | |
| | | Diversified Telecommunication Services — 7.4% | | | |
| 974,510 | | AT&T Inc. | | | 27,773,535 |
| 271,802 | | Embarq Corp. | | | 9,774,000 |
| 349,800 | | Verizon Communications Inc. | | | 11,858,220 |
| | | Total Diversified Telecommunication Services | | | 49,405,755 |
| | | Wireless Telecommunication Services — 0.3% | | | |
| 1,319,351 | | Sprint Nextel Corp.* | | | 2,414,412 |
| | | TOTAL TELECOMMUNICATION SERVICES | | | 51,820,167 |
| UTILITIES — 2.1% | | | |
| | | Multi-Utilities — 2.1% | | | |
| 322,300 | | Sempra Energy | | | 13,739,649 |
| | | TOTAL INVESTMENTS BEFORE SHORT-TERM INVESTMENT (Cost — $709,692,406) | | | 624,285,536 |
See Notes to Financial Statements.
| | |
| Legg Mason Partners Investors Value Fund 2008 Annual Report | | 13 |
Schedule of investments continued
December 31, 2008
| | | | | | | |
| LEGG MASON PARTNERS INVESTORS VALUE FUND | | | |
FACE AMOUNT | | SECURITY | | VALUE | |
| | | | | | | |
| | SHORT-TERM INVESTMENT — 7.3% | | | | |
| | | | Repurchase Agreement — 7.3% | | | | |
| $ | 49,150,000 | | Interest in $500,000,000 joint tri-party repurchase agreement dated 12/31/08 with Greenwich Capital Markets Inc., 0.060% due 1/2/09; Proceeds at maturity $49,150,164; (Fully collateralized by various U.S. government agency obligations, 2.625% to 7.125% due 7/17/09 to 11/15/30; Market value — $50,133,392) (Cost — $49,150,000) | | $ | 49,150,000 | |
| | | | TOTAL INVESTMENTS — 100.3% (Cost — $758,842,406#) | | | 673,435,536 | |
| | | | Liabilities in Excess of Other Assets — (0.3)% | | | (2,147,338 | ) |
| | | | TOTAL NET ASSETS — 100.0% | | $ | 671,288,198 | |
| * | Non-income producing security. |
| (a) | Security is valued in good faith by or under the direction of the Board of Trustees (See Note 1). |
| # | Aggregate cost for federal income tax purposes is $760,406,480. |
| | |
| Abbreviations used in this schedule: |
| ADR | | —American Depositary Receipt |
| FDR | | —Foreign Depositary Receipt |
See Notes to Financial Statements.
| | |
| 14 | | Legg Mason Partners Investors Value Fund 2008 Annual Report |
Statement of assets and liabilities
December 31, 2008
| | | | |
| ASSETS: | | | | |
| Investments, at value (Cost — $758,842,406) | | $ | 673,435,536 | |
| Foreign currency, at value (Cost — $29) | | | 27 | |
| Cash | | | 261 | |
| Dividends and interest receivable | | | 1,749,475 | |
| Receivable for Fund shares sold | | | 322,427 | |
| Prepaid expenses | | | 49,626 | |
Total Assets | | | 675,557,352 | |
| LIABILITIES: | | | | |
| Payable for Fund shares repurchased | | | 2,641,326 | |
| Investment management fee payable | | | 1,038,391 | |
| Distribution fees payable | | | 105,275 | |
| Trustees’ fees payable | | | 47,137 | |
| Accrued expenses | | | 437,025 | |
Total Liabilities | | | 4,269,154 | |
| TOTAL NET ASSETS | | $ | 671,288,198 | |
| NET ASSETS: | | | | |
| Par value (Note 6) | | $ | 508 | |
| Paid-in capital in excess of par value | | | 807,667,620 | |
| Undistributed net investment income | | | 1,404,352 | |
| Accumulated net realized loss on investments and foreign currency transactions | | | (52,377,410 | ) |
| Net unrealized depreciation on investments and foreign currencies | | | (85,406,872 | ) |
| TOTAL NET ASSETS | | $ | 671,288,198 | |
| Shares Outstanding: | | | | |
| Class A | | | 21,907,500 | |
| Class B | | | 942,314 | |
| Class C | | | 3,182,485 | |
| Class I | | | 24,803,838 | |
| Net Asset Value: | | | | |
| Class A (and redemption price) | | | $13.24 | |
| Class B* | | | $12.89 | |
| Class C* | | | $12.95 | |
| Class I (offering price and redemption price) | | | $13.22 | |
| Maximum Public Offering Price Per Share: | | | | |
| Class A (based on maximum initial sales charge of 5.75%) | | | $14.05 | |
| * | Redemption price per share is NAV of Class B and C shares reduced by a 5.00% and 1.00% CDSC, respectively, if shares are redeemed within one year from purchase payment (See Note 2). |
See Notes to Financial Statements.
| | |
| Legg Mason Partners Investors Value Fund 2008 Annual Report | | 15 |
Statement of operations
For the Year Ended December 31, 2008
| | | | |
| INVESTMENT INCOME: | | | | |
| Dividends | | $ | 24,696,914 | |
| Interest | | | 988,302 | |
| Less: Foreign taxes withheld | | | (532,418 | ) |
Total Investment Income | | | 25,152,798 | |
| EXPENSES: | | | | |
| Investment management fee (Note 2) | | | 5,275,472 | |
| Distribution fees (Note 4) | | | 1,956,673 | |
| Transfer agent fees (Note 4) | | | 820,788 | |
| Shareholder reports (Note 4) | | | 101,579 | |
| Registration fees | | | 76,368 | |
| Trustees’ fees | | | 62,363 | |
| Legal fees | | | 46,450 | |
| Audit and tax | | | 40,276 | |
| Insurance | | | 21,676 | |
| Custody fees | | | 10,390 | |
| Miscellaneous expenses | | | 14,884 | |
Total Expenses | | | 8,426,919 | |
Less: Fee waivers and/or expense reimbursements (Notes 2 and 4) | | | (98,722 | ) |
Net Expenses | | | 8,328,197 | |
| NET INVESTMENT INCOME | | | 16,824,601 | |
| REALIZED AND UNREALIZED LOSS ON INVESTMENTS AND FOREIGN CURRENCY TRANSACTIONS (NOTES 1 AND 3): | | | | |
| Net Realized Loss From: | | | | |
Investment transactions | | | (50,309,885 | ) |
Foreign currency transactions | | | (1,445 | ) |
| Net Realized Loss | | | (50,311,330 | ) |
| Change in Net Unrealized Appreciation/Depreciation From: | | | | |
Investments | | | (370,547,840 | ) |
Foreign currencies | | | (4,909 | ) |
| Change in Net Unrealized Appreciation/Depreciation | | | (370,552,749 | ) |
| NET LOSS ON INVESTMENTS AND FOREIGN CURRENCY TRANSACTIONS | | | (420,864,079 | ) |
| DECREASE IN NET ASSETS FROM OPERATIONS | | $ | (404,039,478 | ) |
See Notes to Financial Statements.
| | |
| 16 | | Legg Mason Partners Investors Value Fund 2008 Annual Report |
Statements of changes in net assets
| | | | | | | | |
| FOR THE YEARS ENDED DECEMBER 31, | | 2008 | | | 2007 | |
| OPERATIONS: | | | | | | | | |
| Net investment income | | $ | 16,824,601 | | | $ | 21,390,480 | |
| Net realized gain (loss) | | | (50,311,330 | ) | | | 295,745,431 | |
| Change in net unrealized appreciation/depreciation | | | (370,552,749 | ) | | | (215,733,135 | ) |
Increase (Decrease) in Net Assets From Operations | | | (404,039,478 | ) | | | 101,402,776 | |
| DISTRIBUTIONS TO SHAREHOLDERS FROM (NOTES 1 AND 5): | | | | | | | | |
| Net investment income | | | (15,540,032 | ) | | | (22,093,182 | ) |
| Net realized gains | | | (22,927,598 | ) | | | (57,651,155 | ) |
Decrease in Net Assets From Distributions to Shareholders | | | (38,467,630 | ) | | | (79,744,337 | ) |
| FUND SHARE TRANSACTIONS (NOTE 6): | | | | | | | | |
| Net proceeds from sale of shares | | | 36,325,889 | | | | 136,568,711 | |
| Reinvestment of distributions | | | 32,101,478 | | | | 62,500,910 | |
| Cost of shares repurchased | | | (233,718,490 | ) | | | (879,291,553 | ) |
| Net assets of shares issued in connection with merger (Note 7) | | | — | | | | 469,842,201 | |
Decrease in Net Assets From Fund Share Transactions | | | (165,291,123 | ) | | | (210,379,731 | ) |
| DECREASE IN NET ASSETS | | | (607,798,231 | ) | | | (188,721,292 | ) |
| NET ASSETS: | | | | | | | | |
| Beginning of year | | | 1,279,086,429 | | | | 1,467,807,721 | |
| End of year* | | $ | 671,288,198 | | | $ | 1,279,086,429 | |
| * Includes undistributed net investment income of: | | | $1,404,352 | | | | $121,265 | |
See Notes to Financial Statements.
| | |
| Legg Mason Partners Investors Value Fund 2008 Annual Report | | 17 |
Financial highlights
| | | | | | | | | | | | | | | | | | | | |
FOR A SHARE OF EACH CLASS OF BENEFICIAL INTEREST OUTSTANDING THROUGHOUT EACH YEAR
ENDED DECEMBER 31: | |
| CLASS A SHARES1 | | 2008 | | | 2007 | | | 20062 | | | 20052 | | | 20042 | |
NET ASSET VALUE,
BEGINNING OF YEAR | | $ | 21.34 | | | $ | 21.81 | | | $ | 20.43 | | | $ | 20.55 | | | $ | 19.07 | |
INCOME (LOSS) FROM OPERATIONS: | | | | | | | | | | | | | | | | | |
Net investment income | | | 0.29 | | | | 0.28 | | | | 0.26 | | | | 0.23 | | | | 0.29 | |
Net realized and unrealized gain (loss) | | | (7.69 | ) | | | 0.49 | | | | 3.29 | | | | 1.01 | | | | 1.70 | |
Total income (loss) from operations | | | (7.40 | ) | | | 0.77 | | | | 3.55 | | | | 1.24 | | | | 1.99 | |
LESS DISTRIBUTIONS FROM: | | | | | | | | | | | | | | | | | | | | |
Net investment income | | | (0.27 | ) | | | (0.28 | ) | | | (0.26 | ) | | | (0.23 | ) | | | (0.28 | ) |
Net realized gains | | | (0.43 | ) | | | (0.96 | ) | | | (1.91 | ) | | | (1.13 | ) | | | (0.23 | ) |
Total distributions | | | (0.70 | ) | | | (1.24 | ) | | | (2.17 | ) | | | (1.36 | ) | | | (0.51 | ) |
NET ASSET VALUE,
END OF YEAR | | $ | 13.24 | | | $ | 21.34 | | | $ | 21.81 | | | $ | 20.43 | | | $ | 20.55 | |
Total return3 | | | (35.52 | )% | | | 3.50 | % | | | 17.63 | % | | | 6.15 | % | | | 10.50 | % |
NET ASSETS,
END OF YEAR (000s) | | | $290,115 | | | | $583,441 | | | | $304,173 | | | | $314,069 | | | | $308,990 | |
RATIOS TO AVERAGE NET ASSETS: | | | | | | | | | | | | | | | | | | | | |
Gross expenses | | | 0.95 | % | | | 0.86 | % | | | 0.91 | %4 | | | 0.93 | % | | | 0.88 | % |
Net expenses | | | 0.95 | | | | 0.85 | 5 | | | 0.90 | 4,5 | | | 0.93 | | | | 0.88 | |
Net investment income | | | 1.61 | | | | 1.23 | | | | 1.21 | | | | 1.13 | | | | 1.46 | |
PORTFOLIO TURNOVER RATE | | | 23 | % | | | 14 | % | | | 25 | % | | | 53 | % | | | 36 | % |
| 1 | Per share amounts have been calculated using the average shares method. |
| 2 | For a share of capital stock outstanding prior to April 16, 2007. |
| 3 | Performance figures may reflect fee waivers and/or expense reimbursements. In the absence of fee waivers and/or expense reimbursements, the total return would have been lower. Past performance is no guarantee of future results. |
| 4 | Included in the expense ratios are certain non-recurring restructuring (and reorganization, if applicable) fees that were incurred by the Fund during the period. Without these fees, the gross and net expense ratios would both have been 0.88%. |
| 5 | Reflects fee waivers and/or expense reimbursements. |
See Notes to Financial Statements.
| | |
| 18 | | Legg Mason Partners Investors Value Fund 2008 Annual Report |
| | | | | | | | | | | | | | | | | | | | |
FOR A SHARE OF EACH CLASS OF BENEFICIAL INTEREST OUTSTANDING THROUGHOUT EACH YEAR
ENDED DECEMBER 31: | |
| CLASS B SHARES1 | | 2008 | | | 2007 | | | 20062 | | | 20052 | | | 20042 | |
NET ASSET VALUE,
BEGINNING OF YEAR | | $ | 20.79 | | | $ | 21.28 | | | $ | 19.98 | | | $ | 20.13 | | | $ | 18.70 | |
INCOME (LOSS) FROM OPERATIONS: | | | | | | | | | | | | | | | | | | | | |
Net investment income | | | 0.12 | | | | 0.10 | | | | 0.05 | | | | 0.03 | | | | 0.10 | |
Net realized and unrealized gain (loss) | | | (7.46 | ) | | | 0.47 | | | | 3.21 | | | | 1.00 | | | | 1.67 | |
Total income (loss) from operations | | | (7.34 | ) | | | 0.57 | | | | 3.26 | | | | 1.03 | | | | 1.77 | |
LESS DISTRIBUTIONS FROM: | | | | | | | | | | | | | | | | | | | | |
Net investment income | | | (0.13 | ) | | | (0.10 | ) | | | (0.05 | ) | | | (0.05 | ) | | | (0.11 | ) |
Net realized gains | | | (0.43 | ) | | | (0.96 | ) | | | (1.91 | ) | | | (1.13 | ) | | | (0.23 | ) |
Total distributions | | | (0.56 | ) | | | (1.06 | ) | | | (1.96 | ) | | | (1.18 | ) | | | (0.34 | ) |
NET ASSET VALUE,
END OF YEAR | | | $12.89 | | | | $20.79 | | | | $21.28 | | | | $19.98 | | | | $20.13 | |
Total return3 | | | (36.05 | )% | | | 2.67 | % | | | 16.49 | % | | | 5.16 | % | | | 9.46 | % |
NET ASSETS,
END OF YEAR (000s) | | | $12,146 | | | | $36,423 | | | | $31,290 | | | | $36,803 | | | | $43,386 | |
RATIOS TO AVERAGE NET ASSETS: | | | | | | | | | | | | | | | | | | | | |
Gross expenses | | | 1.81 | % | | | 1.62 | % | | | 1.84 | %4 | | | 1.89 | % | | | 1.78 | % |
Net expenses | | | 1.80 | 5,6 | | | 1.62 | 5,6 | | | 1.84 | 4,5 | | | 1.89 | | | | 1.78 | |
Net investment income | | | 0.70 | | | | 0.44 | | | | 0.26 | | | | 0.16 | | | | 0.51 | |
PORTFOLIO TURNOVER RATE | | | 23 | % | | | 14 | % | | | 25 | % | | | 53 | % | | | 36 | % |
| 1 | Per share amounts have been calculated using the average shares method. |
| 2 | For a share of capital stock outstanding prior to April 16, 2007. |
| 3 | Performance figures may reflect fee waivers and/or expense reimbursements. In the absence of fee waivers and/or expense reimbursements, the total return would have been lower. Past performance is no guarantee of future results. |
| 4 | Included in the expense ratios are certain non-recurring restructuring (and reorganization, if applicable) fees that were incurred by the Fund during the period. Without these fees, the gross and net expense ratios would both have been 1.82%. |
| 5 | Reflects fee waivers and/or expense reimbursements. |
| 6 | As a result of a contractual expense limitation, effective March 5, 2007 until May 1, 2008, the ratio of expenses, other than brokerage, taxes and extraordinary expenses, to average net assets of Class B shares will not exceed 1.76%. |
See Notes to Financial Statements.
| | |
| Legg Mason Partners Investors Value Fund 2008 Annual Report | | 19 |
Financial highlights continued
| | | | | | | | | | | | | | | | | | | | |
FOR A SHARE OF EACH CLASS OF BENEFICIAL INTEREST OUTSTANDING THROUGHOUT EACH YEAR
ENDED DECEMBER 31: | |
| CLASS C SHARES1 | | 2008 | | | 2007 | | | 20062 | | | 20052 | | | 20042 | |
NET ASSET VALUE,
BEGINNING OF YEAR | | $ | 20.88 | | | $ | 21.37 | | | $ | 20.05 | | | $ | 20.20 | | | $ | 18.76 | |
INCOME (LOSS) FROM OPERATIONS: | | | | | | | | | | | | | | | | | | | | |
Net investment income | | | 0.16 | | | | 0.11 | | | | 0.07 | | | | 0.05 | | | | 0.11 | |
Net realized and unrealized gain (loss) | | | (7.51 | ) | | | 0.48 | | | | 3.24 | | | | 0.99 | | | | 1.68 | |
Total income (loss) from operations | | | (7.35 | ) | | | 0.59 | | | | 3.31 | | | | 1.04 | | | | 1.79 | |
LESS DISTRIBUTIONS FROM: | | | | | | | | | | | | | | | | | | | | |
Net investment income | | | (0.15 | ) | | | (0.12 | ) | | | (0.08 | ) | | | (0.06 | ) | | | (0.12 | ) |
Net realized gains | | | (0.43 | ) | | | (0.96 | ) | | | (1.91 | ) | | | (1.13 | ) | | | (0.23 | ) |
Total distributions | | | (0.58 | ) | | | (1.08 | ) | | | (1.99 | ) | | | (1.19 | ) | | | (0.35 | ) |
NET ASSET VALUE,
END OF YEAR | | $ | 12.95 | | | $ | 20.88 | | | $ | 21.37 | | | $ | 20.05 | | | $ | 20.20 | |
Total return3 | | | (35.94 | )% | | | 2.71 | % | | | 16.64 | % | | | 5.20 | % | | | 9.53 | % |
NET ASSETS,
END OF YEAR (000s) | | | $41,205 | | | | $87,905 | | | | $45,553 | | | | $52,771 | | | | $67,647 | |
RATIOS TO AVERAGE NET ASSETS: | | | | | | | | | | | | | | | | | | | | |
Gross expenses | | | 1.66 | % | | | 1.57 | % | | | 1.76 | %4 | | | 1.81 | % | | | 1.75 | % |
Net expenses | | | 1.66 | 5,6 | | | 1.57 | 5,6 | | | 1.76 | 4,5 | | | 1.81 | | | | 1.75 | |
Net investment income | | | 0.89 | | | | 0.52 | | | | 0.34 | | | | 0.24 | | | | 0.56 | |
PORTFOLIO TURNOVER RATE | | | 23 | % | | | 14 | % | | | 25 | % | | | 53 | % | | | 36 | % |
| 1 | Per share amounts have been calculated using the average shares method. |
| 2 | For a share of capital stock outstanding prior to April 16, 2007. |
| 3 | Performance figures may reflect fee waivers and/or expense reimbursements. In the absence of fee waivers and/or expense reimbursements, the total return would have been lower. Past performance is no guarantee of future results. |
| 4 | Included in the expense ratios are certain non-recurring restructuring (and reorganization, if applicable) fees that were incurred by the Fund during the period. Without these fees, the gross and net expense ratios would both have been 1.74%. |
| 5 | Reflects fee waivers and/or expense reimbursements. |
| 6 | As a result of a contractual expense limitation, effective March 5, 2007 until May 1, 2008, the ratio of expenses, other than brokerage, taxes and extraordinary expenses, to average net assets of Class C shares will not exceed 1.64%. |
See Notes to Financial Statements.
| | |
| 20 | | Legg Mason Partners Investors Value Fund 2008 Annual Report |
| | | | | | | | | | | | | | | |
FOR A SHARE OF EACH CLASS OF BENEFICIAL INTEREST OUTSTANDING THROUGHOUT EACH YEAR
ENDED DECEMBER 31: | |
| CLASS I SHARES1 | | 2008 | | | 20072 | | | 20063 | | | 20053 | | | 20043 | |
NET ASSET VALUE,
BEGINNING OF YEAR | | $21.29 | | | $21.77 | | | $20.40 | | | $20.52 | | | $19.04 | |
INCOME (LOSS) FROM OPERATIONS: | | | | | | | | | | | | | | | |
Net investment income | | 0.35 | | | 0.34 | | | 0.32 | | | 0.30 | | | 0.34 | |
Net realized and unrealized gain (loss) | | (7.66 | ) | | 0.48 | | | 3.29 | | | 1.01 | | | 1.71 | |
Total income (loss) from operations | | (7.31 | ) | | 0.82 | | | 3.61 | | | 1.31 | | | 2.05 | |
LESS DISTRIBUTIONS FROM: | | | | | | | | | | | | | | | |
Net investment income | | (0.33 | ) | | (0.34 | ) | | (0.33 | ) | | (0.30 | ) | | (0.34 | ) |
Net realized gains | | (0.43 | ) | | (0.96 | ) | | (1.91 | ) | | (1.13 | ) | | (0.23 | ) |
Total distributions | | (0.76 | ) | | (1.30 | ) | | (2.24 | ) | | (1.43 | ) | | (0.57 | ) |
NET ASSET VALUE,
END OF YEAR | | $13.22 | | | $21.29 | | | $21.77 | | | $20.40 | | | $20.52 | |
Total return4 | | (35.23 | )% | | 3.75 | % | | 17.98 | % | | 6.51 | % | | 10.83 | % |
NET ASSETS,
END OF YEAR (000s) | | $327,822 | | | $571,317 | | | $577,618 | | | $540,992 | | | $789,928 | |
RATIOS TO AVERAGE NET ASSETS: | | | | | | | | | | | | | | | |
Gross expenses | | 0.61 | % | | 0.57 | % | | 0.62 | %5 | | 0.58 | % | | 0.60 | % |
Net expenses | | 0.59 | 6,7 | | 0.54 | 6,7 | | 0.62 | 5,6 | | 0.58 | | | 0.60 | |
Net investment income | | 1.98 | | | 1.52 | | | 1.49 | | | 1.47 | | | 1.72 | |
PORTFOLIO TURNOVER RATE | | 23 | % | | 14 | % | | 25 | % | | 53 | % | | 36 | % |
| 1 | Per share amounts have been calculated using the average shares method. |
| 2 | As of August 17, 2007, all Class I shares converted to Class O shares and Class O shares were redesignated as Class I shares. |
| 3 | For a share of capital stock outstanding prior to April 16, 2007. |
| 4 | Performance figures may reflect fee waivers and/or expense reimbursements. In the absence of fee waivers and/or expense reimbursements, the total return would have been lower. Past performance is no guarantee of future results. |
| 5 | Included in the expense ratios are certain non-recurring restructuring (and reorganization, if applicable) fees that were incurred by the Fund during the period. Without these fees, the gross and net expense ratios would both have been 0.60%. |
| 6 | Reflects fee waivers and/or expense reimbursements. |
| 7 | As a result of a contractual expense limitation, effective March 5, 2007 until May 1, 2008, the ratio of expenses, other than brokerage, taxes and extraordinary expenses, to average net assets of Class I shares will not exceed 0.56%. |
See Notes to Financial Statements.
| | |
| Legg Mason Partners Investors Value Fund 2008 Annual Report | | 21 |
Notes to financial statements
1. Organization and significant accounting policies
The Legg Mason Partners Investors Value Fund (the “Fund”) is a separate investment series of Legg Mason Partners Equity Trust (the “Trust’). The Trust, a Maryland business trust, is registered under the Investment Company Act of 1940, as amended, (the “1940 Act”), as an open-end management investment company.
The following are significant accounting policies consistently followed by the Fund and are in conformity with U.S. generally accepted accounting principles (“GAAP”). Estimates and assumptions are required to be made regarding assets, liabilities and changes in net assets resulting from operations when financial statements are prepared. Changes in the economic environment, financial markets and any other parameters used in determining these estimates could cause actual results to differ.
(a) Investment valuation. Equity securities for which market quotations are available are valued at the last reported sales price or official closing price on the primary market or exchange on which they trade. Debt securities are valued at the mean between the last quoted bid and asked prices provided by an independent pricing service that are based on transactions in debt obligations, quotations from bond dealers, market transactions in comparable securities and various other relationships between securities. When prices are not readily available, or are determined not to reflect fair value, such as when the value of a security has been significantly affected by events after the close of the exchange or market on which the security is principally traded, but before the Fund calculates its net asset value, the Fund may value these securities at fair value as determined in accordance with the procedures approved by the Fund’s Board of Trustees. Short-term obligations with maturities of 60 days or less are valued at amortized cost, which approximates fair value.
Effective January 1, 2008, the Fund adopted Statement of Financial Accounting Standards No. 157 (“FAS 157”). FAS 157 establishes a single definition of fair value, creates a three-tier hierarchy as a framework for measuring fair value based on inputs used to value the Fund’s investments, and requires additional disclosure about fair value. The hierarchy of inputs is summarized below.
| | • | | Level 1 — quoted prices in active markets for identical investments |
| | • | | Level 2 — other significant observable inputs (including quoted prices for similar investments, interest rates, prepayment speeds, credit risk, etc.) |
| | • | | Level 3 — significant unobservable inputs (including the Fund’s own assumptions in determining the fair value of investments) |
| | |
| 22 | | Legg Mason Partners Investors Value Fund 2008 Annual Report |
The inputs or methodology used for valuing securities are not necessarily an indication of the risk associated with investing in those securities.
The following is a summary of the inputs used in valuing the Fund’s assets carried at fair value:
| | | | | | | | | | | |
| | | DECEMBER 31, 2008 | | QUOTED PRICES
(LEVEL 1) | | OTHER SIGNIFICANT
OBSERVABLE INPUTS
(LEVEL 2) | | SIGNIFICANT
UNOBSERVABLE
INPUTS
(LEVEL 3) |
| Investments in securities | | $ | 673,435,536 | | $ | 614,723,777 | | $ | 58,711,759 | | — |
(b) Repurchase agreements. When entering into repurchase agreements, it is the Fund’s policy that its custodian or a third party custodian take possession of the underlying collateral securities, the market value of which, at all times, at least equals the principal amount of the repurchase transaction, including accrued interest. To the extent that any repurchase transaction exceeds one business day, the value of the collateral is marked-to-market to ensure the adequacy of the collateral. If the seller defaults, and the market value of the collateral declines or if bankruptcy proceedings are commenced with respect to the seller of the security, realization of the collateral by the Fund may be delayed or limited.
(c) Security transactions and investment income. Security transactions are accounted for on a trade date basis. Interest income, adjusted for amortization of premium and accretion of discount, is recorded on the accrual basis. Dividend income is recorded on the ex-dividend date. Foreign dividend income is recorded on the ex-dividend date or as soon as practical after the Fund determines the existence of a dividend declaration after exercising reasonable due diligence. The cost of investments sold is determined by use of the specific identification method. To the extent any issuer defaults on an expected interest payment, the Fund’s policy is to generally halt any additional interest income accruals and consider the realizability of interest accrued up to the date of default.
(d) Foreign currency translation. Investment securities and other assets and liabilities denominated in foreign currencies are translated into U.S. dollar amounts based upon prevailing exchange rates at the date of valuation. Purchases and sales of investment securities and income and expense items denominated in foreign currencies are translated into U.S. dollar amounts based upon prevailing exchange rates on the respective dates of such transactions.
The Fund does not isolate that portion of the results of operations resulting from changes in foreign exchange rates on investments from the fluctuations arising from changes in market prices of securities held. Such fluctuations are included with the net realized and unrealized gain or loss on investments.
| | |
| Legg Mason Partners Investors Value Fund 2008 Annual Report | | 23 |
Notes to financial statements continued
Net realized foreign exchange gains or losses arise from sales of foreign currencies, including gains and losses on forward foreign currency contracts, currency gains or losses realized between the trade and settlement dates on securities transactions, and the difference between the amounts of dividends, interest, and foreign withholding taxes recorded on the Fund’s books and the U.S. dollar equivalent of the amounts actually received or paid. Net unrealized foreign exchange gains and losses arise from changes in the fair values of assets and liabilities, other than investments in securities, at the date of valuation, resulting from changes in exchange rates.
Foreign security and currency transactions may involve certain considerations and risks not typically associated with those of U.S. dollar denominated transactions as a result of, among other factors, the possibility of lower levels of governmental supervision and regulation of foreign securities markets and the possibility of political or economic instability.
(e) Distributions to shareholders. Distributions from net investment income for the Fund, if any, are declared and paid on a quarterly basis. Distributions of net realized gains, if any, are declared at least annually. Distributions are recorded on the ex-dividend date and are determined in accordance with income tax regulations, which may differ from GAAP.
(f) Class accounting. Investment income, common expenses and realized/unrealized gain (loss) on investments are allocated to the various classes of the Fund on the basis of daily net assets of each class. Fees relating to a specific class are charged directly to that class.
(g) Federal and other taxes. It is the Fund’s policy to comply with the federal income and excise tax requirements of the Internal Revenue Code of 1986, as amended, applicable to regulated investment companies. Accordingly, the Fund intends to distribute substantially all of its taxable income and net realized gains, if any, to shareholders each year. Therefore, no federal income tax provision is required in the Fund’s financial statements.
Management has analyzed the Fund’s tax positions taken on federal income tax returns for all open tax years and has concluded that as of December 31, 2008, no provision for income tax would be required in the Fund’s financial statements. The Fund’s federal and state income and federal excise tax returns for tax years for which the applicable statutes of limitations have not expired are subject to examination by the Internal Revenue Service and state departments of revenue.
Under the applicable foreign tax laws, a withholding tax may be imposed on interest, dividends and capital gains at various rates.
(h) Reclassification. GAAP requires that certain components of net assets be adjusted to reflect permanent differences between financial and tax reporting.
| | |
| 24 | | Legg Mason Partners Investors Value Fund 2008 Annual Report |
These reclassifications have no effect on net assets or net asset values per share. During the current year, the following reclassifications have been made:
| | | | | | | |
| | | UNDISTRIBUTED NET
INVESTMENT INCOME | | | ACCUMULATED NET
REALIZED LOSS |
| (a) | | $ | (1,482 | ) | | $ | 1,482 |
| (a) | Reclassifications are primarily due to foreign currency transactions treated as ordinary income for tax purposes and book/tax differences in the treatment of distributions. |
2. Investment management agreement and other transactions with affiliates
Legg Mason Partners Fund Advisor, LLC (“LMPFA”) is the Fund’s investment manager and ClearBridge Advisors, LLC (“ClearBridge”) is the Fund’s subadviser. LMPFA and ClearBridge are wholly-owned subsidiaries of Legg Mason, Inc. (“Legg Mason”).
Under the investment management agreement, the Fund pays a base investment management fee subject to an increase or decrease depending on the extent, if any, to which the investment performance of the Fund exceeds or is exceeded by the investment record of the S&P 500 Index. The base fee is paid quarterly based on the following breakpoint schedule:
| | | |
| AVERAGE DAILY NET ASSETS | | ANNUAL RATE | |
| First $350 million | | 0.650 | % |
| Next $150 million | | 0.550 | |
| Next $250 million | | 0.525 | |
| Next $250 million | | 0.500 | |
| Over $1 billion | | 0.450 | |
At the end of each calendar quarter, for each percentage point of difference between the investment performance of the class of shares of the Fund which has the lowest performance for the period and the S&P 500 Index over the last prior 12-month period, this base fee is adjusted upward or downward by the product of (i) 1/4 of 0.01% multiplied by (ii) the average daily net assets of the Fund for the 12 month period. If the amount by which the Fund outperforms or underperforms the S&P 500 Index is not a whole percentage point, a pro rata adjustment will be made. However, there will be no performance adjustment unless the investment performance of the Fund exceeds or is exceeded by the investment record of the S&P 500 Index by at least one percentage point. The maximum quarterly adjustment is 0.025%, which would occur if the Fund’s performance exceeds or is exceeded by S&P 500 Index by ten or more percentage points. For the rolling one year periods ended March 31, 2008, June 30, 2008, September 30, 2008 and December 31, 2008 the Fund’s performance varied from that of the S&P 500 Index performance by (3.77)%, (3.41)%, (0.50)% and 0.95%, respectively. As a result, base management fees were reduced, in aggregate, by $252,432.
| | |
| Legg Mason Partners Investors Value Fund 2008 Annual Report | | 25 |
Notes to financial statements continued
LMPFA provides administrative and certain oversight services to the Fund. LMPFA delegates to the subadviser the day-to-day portfolio management of the Fund, except for the management of cash and short-term instruments. For its services, LMPFA pays ClearBridge 70% of the net management fee it receives from the Fund.
Effective March 5, 2007 until May 1, 2008, LMPFA had contractually agreed to waive fees and/or reimburse expenses (other than brokerage, taxes and extraordinary expenses) to limit total annual operating expenses to 1.76% for Class B, 1.64% for Class C and 0.56% for Class I shares.
During the year ended December 31, 2008, the Fund was reimbursed for expenses amounting to $98,722.
Legg Mason Investor Services, LLC (“LMIS”), a wholly-owned broker-dealer subsidiary of Legg Mason, serves as the Fund’s sole and exclusive distributor.
There is a maximum initial sales charge of 5.75% for Class A shares. There is a contingent deferred sales charge (“CDSC”) of 5.00% on Class B shares, which applies if redemption occurs within one year from purchase payment. This CDSC declines by 1.00% per year until no CDSC is incurred. Class C shares also have a 1.00% CDSC, which applies if redemption occurs within one year from purchase payment. In certain cases, Class A shares have a 1.00% CDSC, which applies if redemption occurs within one year from purchase payment. This CDSC only applies to those purchases of Class A shares, which, when combined with current holdings of Class A shares, equal or exceed $1,000,000 in the aggregate. These purchases do not incur an initial sales charge. Class I shares have no initial sales charge or CDSC.
For the year ended December 31, 2008, LMIS and its affiliates received sales charges of approximately $6,000 on sales of the Fund’s Class A shares. In addition, for the year ended December 31, 2008, CDSCs paid to LMIS and its affiliates were approximately:
| | | | | | | | | | |
| | | CLASS A | | | CLASS B | | CLASS C |
| CDSCs | | $ | 0 | * | | $ | 34,000 | | $ | 1,500 |
| * | Amount represents less than $100. |
As of the close of business, March 2, 2007, the Fund assumed a liability for deferred compensation in the amount of $28,896 due to the merger with Legg Mason Partners Large Cap Value Fund. As of December 31, 2008, the amount was $15,924.
Certain officers and Trustees of the Trust are employees of Legg Mason or its affiliates and do not receive compensation from the Trust.
| | |
| 26 | | Legg Mason Partners Investors Value Fund 2008 Annual Report |
3. Investments
During the year ended December 31, 2008, the aggregate cost of purchases and proceeds from sales of investments (excluding short-term investments) were as follows:
| | | |
| Purchases | | $ | 219,937,951 |
| Sales | | | 402,336,052 |
At December 31, 2008, the aggregate gross unrealized appreciation and depreciation of investments for federal income tax purposes were as follows:
| | | | |
| Gross unrealized appreciation | | $ | 81,516,263 | |
| Gross unrealized depreciation | | | (168,487,207 | ) |
| Net unrealized depreciation | | $ | (86,970,944 | ) |
4. Class specific expenses waivers and/or reimbursements
The Fund has adopted a Rule 12b-1 distribution plan and under that plan the Fund pays a service fee with respect to its Class A, B and C shares calculated at the annual rate of 0.25% of the average daily net assets of each respective class. The Fund also pays a service fee with respect to its Class B and C shares calculated at the annual rate of 0.75% of the average daily net assets of each class, respectively. Distribution fees are accrued daily and paid monthly.
For the year ended December 31, 2008, class specific expenses were as follows:
| | | | | | | | | |
| | | DISTRIBUTION
FEES | | TRANSFER AGENT
FEES | | SHAREHOLDER REPORTS
EXPENSES |
| Class A | | $ | 1,091,574 | | $ | 530,695 | | $ | 58,732 |
| Class B | | | 223,695 | | | 40,724 | | | 14,189 |
| Class C | | | 641,404 | | | 45,488 | | | 17,924 |
| Class I | | | — | | | 203,881 | | | 10,734 |
| Total | | $ | 1,956,673 | | $ | 820,788 | | $ | 101,579 |
For the year ended December 31, 2008, class specific waivers and/or reimbursements are as follows:
| | | |
| | | WAIVERS/
REIMBURSEMENTS |
| Class A | | | — |
| Class B | | $ | 1,275 |
| Class C | | | 2,023 |
| Class I | | | 95,424 |
| Total | | $ | 98,722 |
| | |
| Legg Mason Partners Investors Value Fund 2008 Annual Report | | 27 |
Notes to financial statements continued
5. Distributions to shareholders by class
| | | | | | |
| | | YEAR ENDED
DECEMBER 31, 2008 | | YEAR ENDED
DECEMBER 31, 2007 |
| Net Investment Income: | | | | | | |
| Class A | | $ | 6,389,585 | | $ | 8,145,363 |
| Class B | | | 160,243 | | | 214,699 |
| Class C | | | 555,514 | | | 524,199 |
| Class I (formerly Class O)† | | | 8,434,690 | | | 8,988,208 |
| Class I† | | | — | | | 4,220,713 |
| Total | | $ | 15,540,032 | | $ | 22,093,182 |
| Net Realized Gains: | | | | | | |
| Class A | | $ | 9,904,633 | | $ | 24,225,226 |
| Class B | | | 532,930 | | | 1,595,909 |
| Class C | | | 1,559,061 | | | 3,674,652 |
| Class I (formerly Class O)† | | | 10,930,974 | | | 24,999,932 |
| Class I† | | | — | | | 3,155,436 |
| Total | | $ | 22,927,598 | | $ | 57,651,155 |
| † | Class I shares were converted into Class O shares and redesignated as Class I shares on August 17, 2007. |
6. Shares of beneficial interest
At December 31, 2008, the Trust had an unlimited number of shares of beneficial interest authorized with a par value of $0.00001 per share. The Fund has the ability to issue multiple classes of shares. Each share of a class represents an identical interest and has the same rights, except that each class bears certain direct expenses, including those specifically related to the distribution of its shares. Prior to April 16, 2007, the Fund had 1 billion shares of capital stock authorized with a par value of $0.001 per share.
Transactions in shares of each class were as follows:
| | | | | | | | | | | | | | |
| | | YEAR ENDED
DECEMBER 31, 2008 | | | YEAR ENDED
DECEMBER 31, 2007 | |
| | | SHARES | | | AMOUNT | | | SHARES | | | AMOUNT | |
| Class A | | | | | | | | | | | | | | |
| Shares sold | | 1,704,263 | | | $ | 30,407,268 | | | 2,443,379 | | | $ | 54,592,152 | |
| Shares issued on reinvestment | | 813,096 | | | | 14,565,632 | | | 1,321,337 | | | | 28,782,867 | |
| Shares repurchased | | (7,956,448 | ) | | | (144,072,523 | ) | | (7,924,710 | ) | | | (178,264,216 | ) |
| Shares issued with merger | | — | | | | — | | | 17,559,782 | | | | 376,626,099 | |
| Net increase (decrease) | | (5,439,089 | ) | | $ | (99,099,623 | ) | | 13,399,788 | | | $ | 281,736,902 | |
| | |
| 28 | | Legg Mason Partners Investors Value Fund 2008 Annual Report |
| | | | | | | | | | | | | | |
| | | YEAR ENDED
DECEMBER 31, 2008 | | | YEAR ENDED
DECEMBER 31, 2007 | |
| | | SHARES | | | AMOUNT | | | SHARES | | | AMOUNT | |
| Class B | | | | | | | | | | | | | | |
| Shares sold | | 34,542 | | | $ | 571,753 | | | 72,674 | | | $ | 1,582,987 | |
| Shares issued on reinvestment | | 34,352 | | | | 613,574 | | | 74,297 | | | | 1,568,738 | |
| Shares repurchased | | (878,382 | ) | | | (15,740,318 | ) | | (1,036,931 | ) | | | (22,799,877 | ) |
| Shares issued with merger | | — | | | | — | | | 1,171,665 | | | | 24,488,276 | |
| Net increase (decrease) | | (809,488 | ) | | $ | (14,554,991 | ) | | 281,705 | | | $ | 4,840,124 | |
| Class C | | | | | | | | | | | | | | |
| Shares sold | | 84,185 | | | $ | 1,324,813 | | | 70,282 | | | $ | 1,537,228 | |
| Shares issued on reinvestment | | 106,616 | | | | 1,894,757 | | | 176,843 | | | | 3,750,014 | |
| Shares repurchased | | (1,218,374 | ) | | | (20,877,619 | ) | | (1,443,635 | ) | | | (31,761,465 | ) |
| Shares issued with merger | | — | | | | — | | | 3,274,931 | | | | 68,727,826 | |
| Net increase (decrease) | | (1,027,573 | ) | | $ | (17,658,049 | ) | | 2,078,421 | | | $ | 42,253,603 | |
| Class I (formerly Class O)† | | | | | | | | | | | | | | |
| Shares sold | | 230,743 | | | $ | 4,022,055 | | | 966,391 | | | $ | 21,142,032 | |
| Shares issued on reinvestment | | 844,261 | | | | 15,027,515 | | | 1,200,404 | | | | 26,094,209 | |
| Shares repurchased | | (3,103,805 | ) | | | (53,028,030 | ) | | (1,871,740 | ) | | | (41,989,462 | ) |
| Net increase (decrease) | | (2,028,801 | ) | | $ | (33,978,460 | ) | | 295,055 | | | $ | 5,246,779 | |
| Class I† | | | | | | | | | | | | | | |
| Shares sold | | — | | | | — | | | 2,576,142 | | | $ | 57,714,312 | |
| Shares issued on reinvestment | | — | | | | — | | | 100,439 | | | | 2,305,082 | |
| Shares repurchased | | — | | | | — | | | (26,060,975 | ) | | | (604,476,533 | ) |
| Net decrease | | — | | | | — | | | (23,384,394 | ) | | $ | (544,457,139 | ) |
| † | Class I shares were converted into Class O shares and redesignated as Class I shares on August 17, 2007. |
7. Transfer of net assets
On March 2, 2007, the Fund acquired the assets and certain liabilities of the Legg Mason Partners Large Cap Value Fund (the “Acquired Fund”), pursuant to a plan of reorganization approved by the Acquired Fund shareholders. Total shares issued by the Fund and the total net assets of the Acquired Fund and the Fund on the date of the transfer were as follows:
| | | | | |
| ACQUIRED FUND | | SHARES ISSUED
BY THE FUND | | TOTAL NET ASSETS OF THE
ACQUIRED FUND |
| Legg Mason Partners Large Cap Value Fund | | 22,006,378 | | $ | 469,842,201 |
The total net assets of the Fund on the date of the transfer were $1,451,580,490.
As part of the reorganization, for each share they held, shareholders of Legg Mason Partners Large Cap Value Fund Class A, Class B, Class C and Class I
| | |
| Legg Mason Partners Investors Value Fund 2008 Annual Report | | 29 |
Notes to financial statements continued
received 0.819635, 0.837706, 0.834232 and 0.820542 shares of the Fund’s Class A, Class B, Class C and Class I shares, respectively.
The total net assets of the Acquired Fund before acquisition included unrealized appreciation of $116,754,005, accumulated net realized loss of $879,408 and accumulated net investment loss of $42,370. Total net assets of the Fund immediately after the transfer were $1,921,422,691. The transaction was structured to qualify as a tax-free reorganization under the Internal Revenue Code of 1986, as amended.
8. Income tax information and distributions to shareholders
The tax character of distributions paid during the fiscal years ended December 31, were as follows:
| | | | | | |
| | | 2008 | | 2007 |
| Distributions Paid From: | | | | | | |
| Ordinary income | | $ | 15,820,029 | | $ | 25,986,289 |
| Net long-term capital gains | | | 22,647,601 | | | 53,758,048 |
| Total taxable distributions | | $ | 38,467,630 | | $ | 79,744,337 |
As of December 31, 2008, the components of accumulated earnings on a tax basis were as follows:
| | | | |
| Undistributed ordinary income—net | | $ | 1,547,152 | |
| Capital loss carryforward* | | | (31,417,927 | ) |
| Other book/tax temporary differences(a) | | | (19,538,209 | ) |
| Unrealized appreciation/(depreciation)(b) | | | (86,970,946 | ) |
| Total accumulated earnings/(losses)—net | | $ | (136,379,930 | ) |
| * | As of December 31, 2008, the Fund had the following net capital loss carryforward remaining: |
| | | | |
| YEAR OF EXPIRATION | | AMOUNT | |
| 12/31/2016 | | $ | (31,417,927 | ) |
| | This amount will be available to offset any future taxable capital gains. |
| (a) | Other book/tax temporary differences are attributable primarily to the tax deferral of losses on straddles, the deferral of post-October capital losses for tax purposes and book/tax differences in the timing of the deductibility of various expenses. |
| (b) | The difference between book-basis and tax-basis unrealized appreciation/(depreciation) is attributable primarily to the tax deferral of losses on wash sales. |
9. Regulatory matters
On May 31, 2005, the U.S. Securities and Exchange Commission (“SEC”) issued an order in connection with the settlement of an administrative proceeding against Smith Barney Fund Management LLC (“SBFM”), a wholly-owned subsidiary of Legg Mason and the then investment adviser or manager to the Fund, and Citigroup Global Markets Inc. (“CGM”), a former distributor of the Fund, relating to the appointment of an affiliated transfer agent for the Smith Barney family of mutual funds, including the Fund (the “Affected Funds”).
| | |
| 30 | | Legg Mason Partners Investors Value Fund 2008 Annual Report |
The SEC order found that SBFM and CGM willfully violated Section 206(1) of the Investment Advisers Act of 1940, as amended, and the rules promulgated thereunder (the “Advisers Act”). Specifically, the order found that SBFM and CGM knowingly or recklessly failed to disclose to the boards of the Affected Funds in 1999 when proposing a new transfer agent arrangement with an affiliated transfer agent that: First Data Investors Services Group (“First Data”), the Affected Funds’ then-existing transfer agent, had offered to continue as transfer agent and do the same work for substantially less money than before; and that Citigroup Asset Management (“CAM”), the Citigroup business unit that, at the time, included the Affected Funds’ investment manager and other investment advisory companies, had entered into a side letter with First Data under which CAM agreed to recommend the appointment of First Data as subtransfer agent to the affiliated transfer agent in exchange, among other things, for a guarantee by First Data of specified amounts of asset management and investment banking fees to CAM and CGM. The order also found that SBFM and CGM willfully violated Section 206(2) of the Advisers Act by virtue of the omissions discussed above and other misrepresentations and omissions in the materials provided to the Affected Funds’ boards, including the failure to make clear that the affiliated transfer agent would earn a high profit for performing limited functions while First Data continued to perform almost all of the transfer agent functions, and the suggestion that the proposed arrangement was in the Affected Funds’ best interests and that no viable alternatives existed.
SBFM and CGM do not admit or deny any wrongdoing or liability. The settlement does not establish wrongdoing or liability for purposes of any other proceeding. The SEC censured SBFM and CGM and ordered them to cease and desist from violations of Sections 206(1) and 206(2) of the Advisers Act. The order required Citigroup to pay $208.1 million, including $109 million in disgorgement of profits, $19.1 million in interest, and a civil money penalty of $80 million. Approximately $24.4 million has already been paid to the Affected Funds, primarily through fee waivers. The remaining $183.7 million, including the penalty, has been paid to the U.S. Treasury and will be distributed pursuant to a plan submitted for the approval of the SEC. At this time, there is no certainty as to how the above-described proceeds of the settlement will be distributed, to whom such distributions will be made, the methodology by which such distributions will be allocated, and when such distributions will be made. The order also required that transfer agency fees received from the Affected Funds since December 1, 2004, less certain expenses, be placed in escrow and provided that a portion of such fees might be subsequently distributed in accordance with the terms of the order. On April 3, 2006, an aggregate amount of approximately $9 million held in escrow was distributed to the Affected Funds.
The order required SBFM to recommend a new transfer agent contract to the Affected Funds’ boards within 180 days of the entry of the order; if a Citigroup
| | |
| Legg Mason Partners Investors Value Fund 2008 Annual Report | | 31 |
Notes to financial statements continued
affiliate submitted a proposal to serve as transfer agent or sub-transfer agent, SBFM and CGM would have been required, at their expense, to engage an independent monitor to oversee a competitive bidding process. On November 21, 2005, and within the specified timeframe, the Affected Funds’ boards selected a new transfer agent for the Affected Funds. No Citigroup affiliate submitted a proposal to serve as transfer agent. Under the order, SBFM also must comply with an amended version of a vendor policy that Citigroup instituted in August 2004.
Although there can be no assurance, the manager does not believe that this matter will have a material adverse effect on the Affected Funds.
On December 1, 2005, Citigroup completed the sale of substantially all of its global asset management business, including SBFM, to Legg Mason.
10. Legal matters
Beginning in June 2004, class action lawsuits alleging violations of the federal securities laws were filed against CGM, a former distributor of the Fund and other affiliated funds (collectively, the “Funds”) and a number of its then affiliates, including SBFM and Salomon Brothers Asset Management Inc. (“SBAM”), which were then investment adviser or manager to certain of the Funds (the “Managers”), substantially all of the mutual funds then managed by the Managers (the “Defendant Funds”), and Board members of the Defendant Funds (collectively, the “Defendants”). The complaints alleged, among other things, that CGM created various undisclosed incentives for its brokers to sell Smith Barney and Salomon Brothers funds. In addition, according to the complaints, the Managers caused the Defendant Funds to pay excessive brokerage commissions to CGM for steering clients towards proprietary funds. The complaints also alleged that the Defendants breached their fiduciary duty to the Defendant Funds by improperly charging Rule 12b-1 fees and by drawing on fund assets to make undisclosed payments of soft dollars and excessive brokerage commissions. The complaints also alleged that the Defendant Funds failed to adequately disclose certain of the allegedly wrongful conduct. The complaints sought injunctive relief and compensatory and punitive damages, rescission of the Defendant Funds’ contracts with the Managers, recovery of all fees paid to the Managers pursuant to such contracts and an award of attorneys’ fees and litigation expenses.
On December 15, 2004, a consolidated amended complaint (the “Complaint”) was filed alleging substantially similar causes of action. On May 27, 2005, all of the Defendants filed motions to dismiss the Complaint. On July 26, 2006, the court issued a decision and order (1) finding that plaintiffs lacked standing to sue on behalf of the shareholders of the Funds in which none of the plaintiffs had invested and dismissing those Funds from the case (although stating that they could be brought back into the case if standing as to them could be established), and (2) other than one stayed claim, dismissing all of the causes
| | |
| 32 | | Legg Mason Partners Investors Value Fund 2008 Annual Report |
of action against the remaining Defendants, with prejudice, except for the cause of action under Section 36(b) of the 1940 Act, which the court granted plaintiffs leave to repeal as a derivative claim.
On October 16, 2006, plaintiffs filed their Second Consolidated Amended Complaint (“Second Amended Complaint”) which alleges derivative claims on behalf of nine funds identified in the Second Amended Complaint, under Section 36(b) of the 1940 Act, against CAM, SBAM and SBFM as investment advisers to the identified funds, as well as CGM as a distributor for the identified funds (collectively, the “Second Amended Complaint Defendants”). The Fund was not identified in the Second Amended Complaint. The Second Amended Complaint alleges no claims against any of the funds or any of their Board Members. Under Section 36(b), the Second Amended Complaint alleges similar facts and seeks similar relief against the Second Amended Complaint Defendants as the Complaint.
On December 3, 2007, the court granted the Defendants’ motion to dismiss, with prejudice. On January 2, 2008, the plaintiffs filed a notice of appeal to the Second Circuit Court of Appeals.
Additional lawsuits arising out of these circumstances and presenting similar allegations and requests for relief may be filed in the future.
* * *
Beginning in August 2005, five class action lawsuits alleging violations of federal securities laws and state law were filed against CGM and SBFM, (collectively, the “Defendants”) based on the May 31, 2005 settlement order issued against the Defendants by the SEC as described in Note 9. The complaints seek injunctive relief and compensatory and punitive damages, removal of SBFM as the investment manager for the Smith Barney family of funds, rescission of the funds’ management and other contracts with SBFM, recovery of all fees paid to SBFM pursuant to such contracts, and an award of attorneys’ fees and litigation expenses. The five actions were subsequently consolidated, and a consolidated complaint was filed.
On September 26, 2007, the United States District Court for the Southern District of New York issued an order dismissing the consolidated complaint, and judgement was later entered. An appeal has been filed and is pending before the U.S. Court of Appeals for the Second Circuit.
11. Recent accounting pronouncement
In March 2008, the Financial Accounting Standards Board issued the Statement of Financial Accounting Standards No. 161, Disclosures about Derivative Instruments and Hedging Activities (“FAS 161”). FAS 161 is effective for fiscal years and interim periods beginning after November 15, 2008. FAS 161 requires enhanced disclosures about the Fund’s derivative and hedging
| | |
| Legg Mason Partners Investors Value Fund 2008 Annual Report | | 33 |
Notes to financial statements continued
activities, including how such activities are accounted for and their effect on the Fund’s financial position, performance and cash flows. Management is currently evaluating the impact the adoption of FAS 161 will have on the Fund’s financial statements and related disclosures.
| | |
| 34 | | Legg Mason Partners Investors Value Fund 2008 Annual Report |
Report of independent registered public accounting firm
The Board of Trustees and Shareholders
Legg Mason Partners Equity Trust:
We have audited the accompanying statement of assets and liabilities, including the schedule of investments, of Legg Mason Partners Investors Value Fund, a series of Legg Mason Partners Equity Trust as of December 31, 2008, and the related statement of operations for the year then ended, the statements of changes in net assets for each of the years in the two-year period then ended, and the financial highlights for each of the years in the four-year period then ended. These financial statements and financial highlights are the responsibility of the Fund’s management. Our responsibility is to express an opinion on these financial statements and financial highlights based on our audits. The financial highlights for the year ended December 31, 2004 were audited by other independent registered public accountants whose report thereon, dated February 18, 2005, expressed an unqualified opinion on those financial highlights.
We conducted our audits in accordance with the standards of the Public Company Accounting Oversight Board (United States). Those standards require that we plan and perform the audit to obtain reasonable assurance about whether the financial statements and financial highlights are free of material misstatement. An audit includes examining, on a test basis, evidence supporting the amounts and disclosures in the financial statements. Our procedures included confirmation of securities owned as of December 31, 2008, by correspondence with the custodian and broker. An audit also includes assessing the accounting principles used and significant estimates made by management, as well as evaluating the overall financial statement presentation. We believe that our audits provide a reasonable basis for our opinion.
In our opinion, the financial statements and financial highlights referred to above present fairly, in all material respects, the financial position of Legg Mason Partners Investors Value Fund as of December 31, 2008, and the results of its operations for the year then ended, the changes in its net assets for each of the years in the two-year period then ended, and the financial highlights for each of the years in the four-year period then ended, in conformity with U.S. generally accepted accounting principles.

New York, New York
February 24, 2009
| | |
| Legg Mason Partners Investors Value Fund 2008 Annual Report | | 35 |
Board approval of management and subadvisory agreements (unaudited)
At a meeting of the Fund’s Board of Trustees, the Board considered the re-approval for an annual period of the Fund’s management agreement, pursuant to which Legg Mason Partners Fund Advisor, LLC (the “Manager”) provides the Fund with investment advisory and administrative services, and the Fund’s sub-advisory agreement, pursuant to which ClearBridge Advisors, LLC (the “Sub-Adviser”) provides day-to-day management of the Fund’s portfolio. (The management agreement and sub-advisory agreement are collectively referred to as the “Agreements.”) The Manager and the Sub-Adviser are wholly-owned subsidiaries of Legg Mason, Inc. The Trustees who are not “interested persons” (as defined in the Investment Company Act of 1940, as amended (the “Independent Trustees”)) of the Fund were assisted in their review by Fund counsel and independent legal counsel and met with independent legal counsel in executive sessions separate from representatives of the Manager and the Sub-Adviser. The Independent Trustees requested and received information from the Manager and the Sub-Adviser they deemed reasonably necessary for their review of the Agreements and the performance of the Manager and the Sub-Adviser. Included was information about the Manager, the Sub-Adviser and the Fund’s distributor (including any distributors affiliated with the Fund during the past two years), as well as the management, sub-advisory and distribution arrangements for the Fund and other funds overseen by the Board. This information was initially reviewed by a special committee of the Independent Trustees and then by the full Board.
In voting to approve the Agreements, the Independent Trustees considered whether the approval of the Agreements would be in the best interests of the Fund and its shareholders, an evaluation based on several factors including those discussed below.
Nature, extent and quality of the services provided to the fund under the management agreement and sub-advisory agreement
The Board received and considered information regarding the nature, extent and quality of services provided to the Fund by the Manager and the Sub-Adviser under the Management Agreement and Sub-Advisory Agreement, respectively, during the past two years. The Trustees also considered the Manager’s supervisory activities over the Sub-Adviser. In addition, the Independent Trustees received and considered other information regarding the administrative and other services rendered to the Fund and its shareholders by the Manager. The Board noted information received at regular meetings throughout the year related to the services rendered by the Manager in its management of the Fund’s affairs, including the management of cash and short-term instruments, and the Manager’s role in coordinating the activities of the Sub-Adviser and the Fund’s other service providers. The Board’s evaluation of the services provided by the Manager and the Sub-Adviser took into account the Board’s knowledge and familiarity gained as Trustees of funds in the Legg Mason Partners fund complex, including the scope and quality of the investment management and other capabilities of the Manager and the
| | |
| 36 | | Legg Mason Partners Investors Value Fund |
Sub-Adviser and the quality of the Manager’s administrative and other services. The Board observed that the scope of services provided by the Manager had expanded over time as a result of regulatory and other developments, including maintaining and monitoring its own and the Fund’s expanded compliance programs. The Board reviewed information received from the Manager and the Fund’s Chief Compliance Officer regarding the Fund’s compliance policies and procedures established pursuant to Rule 38a-1 under the Investment Company Act of 1940, as amended.
The Board reviewed the qualifications, backgrounds and responsibilities of the Fund’s senior personnel and the portfolio management team primarily responsible for the day-to-day portfolio management of the Fund. The Board considered the degree to which the Manager implemented organizational changes to improve investment results and the services provided to the Legg Mason Partners fund complex. The Board also considered, based on its knowledge of the Manager and the Manager’s affiliates, the financial resources available to the Manager’s parent organization, Legg Mason, Inc.
The Board also considered the division of responsibilities between the Manager and the Sub-Adviser and the oversight provided by the Manager. The Board also considered the Manager’s and the Sub-Adviser’s brokerage policies and practices, the standards applied in seeking best execution, the Manager’s policies and practices regarding soft dollars, and the existence of quality controls applicable to brokerage allocation procedures. In addition, management also reported to the Board on, among other things, its business plans, recent organizational changes, portfolio manager compensation plan and policy regarding portfolio managers’ ownership of fund shares.
The Board concluded that, overall, it was satisfied with the nature, extent and quality of services provided (and expected to be provided) under the respective Agreement by the Manager and the Sub-Adviser.
Fund performance
The Board received and reviewed performance information for the Fund and for all retail and institutional large-cap value funds (the “Performance Universe”) selected by Lipper, Inc. (“Lipper”), an independent provider of investment company data. The Board was provided with a description of the methodology Lipper used to determine the similarity of the Fund with the funds included in the Performance Universe. The Trustees noted that they also had received and discussed with management information at periodic intervals comparing the Fund’s performance to that of its benchmark index. The information comparing the Fund’s performance to that of the Performance Universe was for the one-, three-, five- and ten-year periods ended June 30, 2008. The Fund performed better than the median for the one-, three- and ten-year periods, and below the median for the five-year period. The Board also reviewed performance information provided by the Manager for periods ended September 30, 2008, which showed the Fund’s performance was better than
| | |
| Legg Mason Partners Investors Value Fund | | 37 |
Board approval of management and subadvisory agreements (unaudited) continued
the Lipper category average during the third quarter. The Trustees noted the Fund’s performance compared to its benchmark, the S&P 500® Index, and its effect on the advisory fee paid by the Fund. The Trustees then discussed with representatives of management the portfolio management strategy of the Fund’s portfolio managers. The Trustees also noted that the Manager was committed to providing the resources necessary to assist the portfolio managers and continue to improve Fund performance. Based on its review, the Board generally was satisfied with the Fund’s performance and management’s efforts to improve performance going forward. The Board determined to continue to evaluate the Fund’s performance and directed the Independent Trustees’ performance committee to continue to periodically review Fund performance with the Manager and report to the full Board during periods between Board meetings.
Management fees and expense ratios
The Board reviewed and considered, the contractual management fee (the “Contractual Management Fee”) payable by the Fund to the Manager, as it may be adjusted depending on the Fund’s performance compared to its benchmark, the S&P 500® Index, in light of the nature, extent and quality of the management and sub-advisory services provided by the Manager and the Sub-Adviser, respectively. The Board noted that the Manager, and not the Fund, pays the sub-advisory fee to the Sub-Adviser and, accordingly, that the retention of the Sub-Adviser does not increase the fees and expenses incurred by the Fund. In addition, because the management fee paid to the Manager may be increased or decreased depending on the Fund’s performance compared to the S&P 500® Index, the Board also reviewed and considered the actual management fee rate (“Actual Management Fee”).
The Board also reviewed information regarding the fees the Manager and the Sub-Adviser charged any of their U.S. clients investing primarily in an asset class similar to that of the Fund including, where applicable, separate accounts. The Manager reviewed with the Board the significant differences in the scope of services provided to the Fund and to such other clients, noting that the Fund is provided with regulatory compliance and administrative services, office facilities and Fund officers (including the Fund’s chief financial, chief legal and chief compliance officers), and that the Manager coordinates and oversees the provision of services to the Fund by other fund service providers, including the Sub-Adviser. The Board considered the fee comparisons in light of the scope of services required to manage these different types of accounts.
The Board received an analysis of complex-wide management fees provided by the Manager, which, among other things, set out a framework of fees based on asset classes. Management also discussed with the Board the Fund’s distribution arrangements, including how amounts received by the Fund’s distributors are expended, and the fees received and expenses incurred in connection with such arrangements by affiliates of the Manager.
| | |
| 38 | | Legg Mason Partners Investors Value Fund |
Additionally, the Board received and considered information comparing the Fund’s Contractual Management Fee and Actual Management Fee and the Fund’s overall expense ratio with those of a group of 12 retail front-end load large-cap value funds selected by Lipper as comparable to the Fund (the “Expense Group”), and a broader group of funds selected by Lipper consisting of all retail front-end load large-cap value funds (the “Expense Universe”). This information showed that the Fund’s Contractual Management Fee and Actual Management Fee, as adjusted based on the Fund’s performance compared to the S&P 500® Index, were lower than the median of management fees paid by the other funds in the Expense Group and lower than the average management fee paid by the other funds in the Expense Universe, and that the Fund’s actual total expense ratio also was lower than the median of the total expense ratios of the funds in the Expense Group and lower than the average total expense ratio of the other funds in the Expense Universe. The Board noted that the Fund’s actual total expense ratio was the lowest of the total expense ratios of the funds in the Expense Group.
Manager profitability
The Board received and considered a profitability analysis of the Manager and its affiliates in providing services to the Fund. The Board also received profitability information with respect to the Legg Mason Partners fund complex as a whole. In addition, the Board received information with respect to the Manager’s allocation methodologies used in preparing this profitability data as well as a report from an outside consultant that had reviewed the Manager’s methodology. The Board also noted the profitability percentage ranges determined by appropriate court cases to be reasonable given the services rendered to investment companies. The Board determined that the Manager’s profitability was not excessive in light of the nature, extent and quality of the services provided to the Fund.
Economies of scale
The Board received and considered information regarding whether there have been economies of scale with respect to the management of the Fund as the Fund’s assets grow, whether the Fund has appropriately benefited from any economies of scale, and whether there is potential for realization of any further economies of scale. The Board considered whether economies of scale in the provision of services to the Fund were being passed along to the shareholders.
The Board noted that the Manager instituted breakpoints in the Fund’s Contractual Management Fee, reflecting the potential for reducing the Contractual Management Fee as the Fund’s assets grow. The Board noted that the Fund’s assets exceeded the specified asset level at which one or more breakpoints to its Contractual Management Fee are triggered. Accordingly, the Fund and its shareholders realized economies of scale because the total expense ratio of the Fund was lower than it would have been if no breakpoints were in place. The Board also considered whether the breakpoint fee structure
| | |
| Legg Mason Partners Investors Value Fund | | 39 |
Board approval of management and subadvisory agreements (unaudited) continued
was a reasonable means of sharing any economies of scale, taking into consideration other efficiencies that might accrue as the Fund’s assets increase. The Board also noted that as the Fund’s assets increase over time, the Fund and its shareholders should realize economies of scale as certain expenses, such as fixed fund fees, become a smaller percentage of overall assets. The Board noted that it appeared that the benefits of any economies of scale also have been appropriately shared with shareholders through increased investment in fund management and administration resources.
Taking all of the above into consideration, the Board determined that the management fee was reasonable in light of the comparative performance and expense information and the nature, extent and quality of the services provided to the Fund under the Agreements.
Other benefits to the manager
The Board considered other benefits received by the Manager and its affiliates, including the Sub-Adviser, as a result of the Manager’s relationship with the Fund, including the opportunity to offer additional products and services to Fund shareholders.
In light of the costs of providing investment management and other services to the Fund and the Manager’s ongoing commitment to the Fund, the profits and other ancillary benefits that the Manager and its affiliates received were considered reasonable.
Based on their discussions and considerations, including those described above, the Trustees approved the Management Agreement and the Sub-Advisory Agreement to continue for another year.
No single factor reviewed by the Board was identified by the Board as the principal factor in determining whether to approve the Management Agreement and the Sub-Advisory Agreement.
| | |
| 40 | | Legg Mason Partners Investors Value Fund |
Additional information (unaudited)
Information about Trustees and Officers
The business and affairs of Legg Mason Partners Investors Value Fund (the “Fund”) are managed under the direction of the Board of Trustees. Information pertaining to the Trustees and Officers is set forth below. The Statement of Additional Information includes additional information about Trustees and is available, without charge, upon request by calling Legg Mason Partners Shareholder Services at 1-800-451-2010.
| | |
| NON-INTERESTED TRUSTEES |
PAUL R. ADES
c/o R. Jay Gerken, CFA, Legg Mason & Co., LLC (“Legg Mason”)
620 Eighth Avenue, New York, NY 10018 |
| Birth year | | 1940 |
| Position(s) held with Fund1 | | Trustee |
| Term of office1 and length of time served2 | | Since 1983 |
| Principal occupation(s) during past five years | | Law Firm of Paul R. Ades, PLLC (since 2000) |
| Number of portfolios in fund complex overseen by Trustee | | 57 |
| Other board memberships held by Trustee | | None |
ANDREW L. BREECH
c/o R. Jay Gerken, CFA, Legg Mason
620 Eighth Avenue, New York, NY 10018 |
| Birth year | | 1952 |
| Position(s) held with Fund1 | | Trustee |
| Term of office1 and length of time served2 | | Since 1991 |
| Principal occupation(s) during past five years | | President, Dealer Operating Control Service, Inc. (automotive retail management) (since 1985) |
| Number of portfolios in fund complex overseen by Trustee | | 57 |
| Other board memberships held by Trustee | | None |
| | |
| Legg Mason Partners Investors Value Fund | | 41 |
Additional information (unaudited) continued
Information about Trustees and Officers
| | |
DWIGHT B. CRANE
c/o R. Jay Gerken, CFA, Legg Mason
620 Eighth Avenue, New York, NY 10018 |
| Birth year | | 1937 |
| Position(s) held with Fund1 | | Trustee |
| Term of office1 and length of time served2 | | Since 1981 |
| Principal occupation(s) during past five years | | Independent Consultant (since 1969); formerly, Professor, Harvard Business School (from 1969 to 2007) |
| Number of portfolios in fund complex overseen by Trustee | | 57 |
| Other board memberships held by Trustee | | None |
ROBERT M. FRAYN, JR.
c/o R. Jay Gerken, CFA, Legg Mason
620 Eighth Avenue, New York, NY 10018 |
| Birth year | | 1934 |
| Position(s) held with Fund1 | | Trustee |
| Term of office1 and length of time served2 | | Since 1981 |
| Principal occupation(s) during past five years | | Retired |
| Number of portfolios in fund complex overseen by Trustee | | 57 |
| Other board memberships held by Trustee | | None |
FRANK G. HUBBARD
c/o R. Jay Gerken, CFA, Legg Mason
620 Eighth Avenue, New York, NY 10018 |
| Birth year | | 1937 |
| Position(s) held with Fund1 | | Trustee |
| Term of office1 and length of time served2 | | Since 1993 |
| Principal occupation(s) during past five years | | President, Avatar International, Inc. (business development) (since 1998) |
| Number of portfolios in fund complex overseen by Trustee | | 57 |
| Other board memberships held by Trustee | | None |
| | |
| 42 | | Legg Mason Partners Investors Value Fund |
| | |
HOWARD J. JOHNSON
c/o R. Jay Gerken, CFA, Legg Mason
620 Eighth Avenue, New York, NY 10018 |
| Birth year | | 1938 |
| Position(s) held with Fund1 | | Trustee |
| Term of office1 and length of time served2 | | From 1981 to 1998 and 2000 to Present |
| Principal occupation(s) during past five years | | Chief Executive Officer, Genesis Imaging LLC (technology company) (since 2003) |
| Number of portfolios in fund complex overseen by Trustee | | 57 |
| Other board memberships held by Trustee | | None |
DAVID E. MARYATT
c/o R. Jay Gerken, CFA, Legg Mason
620 Eighth Avenue, New York, NY 10018 |
| Birth year | | 1936 |
| Position(s) held with Fund1 | | Trustee |
| Term of office1 and length of time served2 | | Since 1983 |
| Principal occupation(s) during past five years | | Private Investor; President and Director, ALS Co. (real estate management and development firm) (since 1993) |
| Number of portfolios in fund complex overseen by Trustee | | 57 |
| Other board memberships held by Trustee | | None |
JEROME H. MILLER c/o R. Jay Gerken, CFA, Legg Mason
620 Eighth Avenue, New York, NY 10018 |
| Birth year | | 1938 |
| Position(s) held with Fund1 | | Trustee |
| Term of office1 and length of time served2 | | Since 1995 |
| Principal occupation(s) during past five years | | Retired |
| Number of portfolios in fund complex overseen by Trustee | | 57 |
| Other board memberships held by Trustee | | None |
| | |
| Legg Mason Partners Investors Value Fund | | 43 |
Additional information (unaudited) continued
Information about Trustees and Officers
| | |
KEN MILLER
c/o R. Jay Gerken, CFA, Legg Mason
620 Eighth Avenue, New York, NY 10018 |
| Birth year | | 1942 |
| Position(s) held with Fund1 | | Trustee |
| Term of office1 and length of time served2 | | Since 1983 |
| Principal occupation(s) during past five years | | President, Young Stuff Apparel Group, Inc. (apparel manufacturer) (since 1963) |
| Number of portfolios in fund complex overseen by Trustee | | 57 |
| Other board memberships held by Trustee | | None |
JOHN J. MURPHY
c/o R. Jay Gerken, CFA, Legg Mason
620 Eighth Avenue, New York, NY 10018 |
| Birth year | | 1944 |
| Position(s) held with Fund1 | | Trustee |
| Term of office1 and length of time served2 | | Since 2002 |
| Principal occupation(s) during past five years | | President, Murphy Capital Management (investment advice) (since 1983) |
| Number of portfolios in fund complex overseen by Trustee | | 57 |
| Other board memberships held by Trustee | | Director, Nicholas Applegate funds; Trustee, Consulting Group Capital Markets Funds; formerly, Director, Atlantic Stewardship Bank (from 2004 to 2005); Director, Barclays International Funds Group Ltd. and affiliated companies (from 1983 to 2003) |
THOMAS F. SCHLAFLY
c/o R. Jay Gerken, CFA, Legg Mason
620 Eighth Avenue, New York, NY 10018 |
| Birth year | | 1948 |
| Position(s) held with Fund1 | | Trustee |
| Term of office1 and length of time served2 | | Since 1983 |
| Principal occupation(s) during past five years | | Of Counsel, Husch Blackwell Sanders LLP (law firm) (since 1984); President, The Saint Louis Brewery, Inc. (brewery) (since 1989) |
| Number of portfolios in fund complex overseen by Trustee | | 57 |
| Other board memberships held by Trustee | | Director, Citizens National Bank of Greater St. Louis, Maplewood, MO (since 2006) |
| | |
| 44 | | Legg Mason Partners Investors Value Fund |
| | |
JERRY A. VISCIONE
c/o R. Jay Gerken, CFA, Legg Mason
620 Eighth Avenue, New York, NY 10018 |
| Birth year | | 1944 |
| Position(s) held with Fund1 | | Trustee |
| Term of office1 and length of time served2 | | Since 1993 |
| Principal occupation(s) during past five years | | Retired |
| Number of portfolios in fund complex overseen by Trustee | | 57 |
| Other board memberships held by Trustee | | None |
| INTERESTED TRUSTEE |
R. JAY GERKEN, CFA3
Legg Mason
620 Eighth Avenue, New York, NY 10018 |
| Birth year | | 1951 |
| Position(s) held with Fund1 | | Trustee, President, Chairman, and Chief Executive Officer |
| Term of office1 and length of time served2 | | Since 2002 |
| Principal occupation(s) during past five years | | Managing Director of Legg Mason; Chairman of the Board and Trustee/Director of 159 funds associated with Legg Mason Partners Fund Advisor, LLC (“LMPFA”) and its affiliates; President of LMPFA (since 2006); Chairman, President and Chief Executive Officer of certain mutual funds associated with Legg Mason and its affiliates; formerly, Chairman, Smith Barney Fund Management LLC (“SBFM”) and CitiFund Management Inc. (“CFM”) (from 2002 to 2005); formerly, Chairman President and Chief Executive Officer of Travelers Investment Adviser, Inc. (“TIA”) (from 2002 to 2005) |
| Number of portfolios in fund complex overseen by Trustee | | 146 |
| Other board memberships held by Trustee | | Trustee, Consulting Group Capital Markets Funds (from 2002 to 2006) |
| OFFICERS |
KAPREL OZSOLAK
Legg Mason
55 Water Street, New York, NY 10041 |
| Birth year | | 1965 |
| Position(s) held with Fund1 | | Chief Financial Officer and Treasurer |
| Term of office1 and length of time served2 | | Since 2004 |
| Principal occupation(s) during past five years | | Director of Legg Mason; Chief Financial Officer and Treasurer of certain mutual funds associated with Legg Mason; formerly, Controller of certain mutual funds associated with certain predecessor firms of Legg Mason (from 2002 to 2004) |
| | |
| Legg Mason Partners Investors Value Fund | | 45 |
Additional information (unaudited) continued
Information about Trustees and Officers
| | |
TED P. BECKER
Legg Mason
620 Eighth Avenue, New York, NY 10018 |
| Birth year | | 1951 |
| Position(s) held with Fund1 | | Chief Compliance Officer |
| Term of office1 and length of time served2 | | Since 2006 |
| Principal occupation(s) during past five years | | Director of Global Compliance at Legg Mason (since 2006); Chief Compliance Officer of LMPFA (since 2006); Managing Director of Compliance at Legg Mason (since 2005); Chief Compliance Officer with certain mutual funds associated with Legg Mason, LMPFA and certain affiliates (since 2006); formerly, Managing Director of Compliance at CAM or its predecessor (from 2002 to 2005) |
JOHN CHIOTA
Legg Mason
100 First Stamford Place, Stamford, CT 06902 |
| Birth year | | 1968 |
| Position(s) held with Fund1 | | Chief Anti-Money Laundering Compliance Officer/Identity Theft Prevention Officer |
| Term of office1 and length of time served2 | | Since 2006/2008 |
| Principal occupation(s) during past five years | | Identity Theft Prevention Officer of certain mutual funds associated with Legg Mason & Co. (since 2008); Chief Anti-Money Laundering Compliance Officer of certain mutual funds associated with Legg Mason & Co. (since 2006); Vice President of Legg Mason & Co. (since 2005); Vice President at CAM (since 2004); Prior to August 2004, Chief Anti-Money Laundering Compliance Officer of TD Waterhouse |
ROBERT I. FRENKEL
Legg Mason
100 First Stamford Place, Stamford, CT 06902 |
| Birth year | | 1954 |
| Position(s) held with Fund1 | | Secretary and Chief Legal Officer |
| Term of office1 and length of time served2 | | Since 2003 |
| Principal occupation(s) during past five years | | Managing Director and General Counsel of Global Mutual Funds for Legg Mason and its predecessors (since 1994); Secretary and Chief Legal Officer of mutual funds associated with Legg Mason (since 2003); formerly, Secretary of CFM (from 2001 to 2004) |
THOMAS C. MANDIA
Legg Mason
100 First Stamford Place, Stamford, CT 06902 |
| Birth year | | 1962 |
| Position(s) held with Fund1 | | Assistant Secretary |
| Term of office1 and length of time served2 | | Since 2000 |
| Principal occupation(s) during past five years | | Managing Director and Deputy General Counsel of Legg Mason (since 2005); Managing Director and Deputy General Counsel for CAM (from 1992 to 2005) |
| | |
| 46 | | Legg Mason Partners Investors Value Fund |
| | |
ALBERT LASKAJ
Legg Mason
55 Water Street, New York, NY 10041 |
| Birth year | | 1977 |
| Position(s) held with Fund1 | | Controller |
| Term of office1 and length of time served2 | | Since 2007 |
| Principal occupation(s) during past five years | | Vice President of Legg Mason (since 2008); Controller of certain mutual funds associated with Legg Mason (since 2007); formerly, Assistant Controller of certain mutual funds associated with Legg Mason (from 2005 to 2007); formerly, Accounting Manager of certain mutual funds associated with certain predecessor firms of Legg Mason (from 2003 to 2005) |
STEVEN FRANK
Legg Mason
55 Water Street, New York, NY 10041 |
| Birth year | | 1967 |
| Position(s) held with Fund1 | | Controller |
| Term of office1 and length of time served2 | | Since 2005 |
| Principal occupation(s) during past five years | | Vice President of Legg Mason (since 2002); Controller of certain mutual funds associated with Legg Mason or its predecessors (since 2005); formerly, Assistant Controller of certain mutual funds associated with Legg Mason predecessors (from 2001 to 2005) |
| 1 | Each Trustee and Officer serves until his or her successor has been duly elected and qualified or until his or her earlier death, resignation, retirement or removal. |
| 2 | Indicates the earliest year in which the Trustee or Officer became a Board Member or Officer, as applicable for a fund in the Legg Mason Partners funds complex. |
| 3 | Mr. Gerken is an “interested person” of the Trust as defined in the 1940 Act, because Mr. Gerken is an officer of LMPFA and certain of its affiliates. |
| | |
| Legg Mason Partners Investors Value Fund | | 47 |
Important tax information (unaudited)
The following information is provided with respect to the distributions paid during the taxable year ended December 31, 2008:
| | | | | | | | | | | | | | | |
| Record date: | | 3/28/2008 | | | 6/18/2008 | | | 6/27/2008 | | | 9/29/2008 | | | 12/26/2008 | |
| Payable date: | | 3/31/2008 | | | 6/19/2008 | | | 6/30/2008 | | | 9/30/2008 | | | 12/29/2008 | |
| Ordinary income: | | | | | | | | | | | | | | | |
Qualified dividend income for individuals | | 100.00 | % | | 100.00 | % | | 100.00 | % | | 100.00 | % | | 100.00 | % |
Dividends qualifying for the dividends
received deduction for corporations | | 100.00 | % | | 100.00 | % | | 100.00 | % | | 100.00 | % | | 100.00 | % |
| Long-term capital gain dividend | | — | | | $0.420231 | | | — | | | — | | | — | |
Please retain this information for your records.
| | |
| 48 | | Legg Mason Partners Investors Value Fund |
Legg Mason Partners Investors Value Fund
| | |
Trustees Paul R. Ades Andrew L. Breech Dwight B. Crane Robert M. Frayn, Jr. R. Jay Gerken, CFA
Chairman Frank G. Hubbard Howard J. Johnson David E. Maryatt Jerome H. Miller Ken Miller John J. Murphy Thomas F. Schlafly Jerry A. Viscione Investment manager Legg Mason Partners Fund Advisor, LLC Subadviser ClearBridge Advisors, LLC | | Distributor Legg Mason Investor Services, LLC Custodian State Street Bank and Trust Company Transfer agent PNC Global Investment Servicing 4400 Computer Drive Westborough,
Massachusetts 01581 Independent registered public accounting firm KPMG LLP 345 Park Avenue New York, New York 10154 |
Legg Mason Partners Investors Value Fund
The Fund is a separate investment series of Legg Mason Partners Equity Trust, a Maryland business trust.
LEGG MASON PARTNERS INVESTORS VALUE FUND
Legg Mason Partners Funds
55 Water Street
New York, New York 10041
The Fund files its complete schedule of portfolio holdings with the Securities and Exchange Commission (“SEC”) for the first and third quarters of each fiscal year on Form N-Q. The Fund’s Forms N-Q are available on the SEC’s website at www.sec.gov. The Fund’s Forms N-Q may be reviewed and copied at the SEC’s Public Reference Room in Washington, D.C., and information on the operation of the Public Reference Room may be obtained by calling 1-800-SEC-0330. To obtain information on Form N-Q from the Fund, shareholders can call Legg Mason Partners Shareholder Services at 1-800-451-2010.
Information on how the Fund voted proxies relating to portfolio securities during the prior 12-month period ended June 30th of each year and a description of the policies and procedures that the Fund uses to determine how to vote proxies related to portfolio transactions are available (1) without charge, upon request, by calling 1-800-451-2010, (2) on the Fund’s website at www.leggmason.com/individualinvestors and (3) on the SEC’s website at www.sec.gov.
This report is submitted for the general information of the shareholders of Legg Mason Partners Investors Value Fund. This report is not authorized for distribution to prospective investors in the Fund unless preceded or accompanied by a current prospectus.
Investors should consider the Fund’s investment objectives, risks, charges and expenses carefully before investing. The prospectus contains this and other important information about the Fund. Please read the prospectus carefully before investing.
www.leggmason.com/individualinvestors
© 2009 Legg Mason Investor Services, LLC
Member FINRA, SIPC
BUILT TO WINSM
At Legg Mason, we’ve assembled a collection of experienced investment management firms and empowered each of them with the tools, the resources and, most importantly, the independence to pursue the strategies they know best.
| • | | Each was purposefully chosen for their commitment to investment excellence. |
| • | | Each is focused on specific investment styles and asset classes. |
| • | | Each exhibits thought leadership in their chosen area of focus. |
Together, we’ve built a powerful portfolio of solutions for financial advisors and their clients. And it has made us a world leader in money management.*
| * | Ranked ninth-largest money manager in the world, according to Pensions & Investments, May 26, 2008, based on 12/31/07 worldwide assets under management. |
www.leggmason.com/individualinvestors
©2009 Legg Mason Investor Services, LLC Member FINRA, SIPC
FDXX010734 2/09 SR09-745
NOT PART OF THE ANNUAL REPORT