Legg Mason Classic Valuation Fund
Total returns for the Fund for various periods ended March 31, 2009 are presented below, along with those of comparative indices:
| | | | | | | | | | |
| | | | | | | Average Annual Total Returns |
| | | Three
Months | | One
Year | | Three
Years | | Five
Years | | Since
Inception |
Without Sales Charges | | | | | | | | | | |
Class A | | N/A | | N/A | | N/A | | N/A | | –4.28% |
Class C* | | –15.08% | | –47.60% | | –19.58% | | –8.36% | | –2.91% |
Institutional Class | | –15.07% | | –47.18% | | –18.83% | | –7.46% | | –5.10% |
S&P 500 IndexA | | –11.01% | | –38.09% | | –13.06% | | –4.77% | | –3.96% |
Lipper Large-Cap Value Funds Category AverageB | | –13.15% | | –39.80% | | –14.40% | | –5.11% | | –1.49% |
| | | | | |
With Sales Charges | | | | | | | | | | |
Class A | | N/A | | N/A | | N/A | | N/A | | –9.78% |
Class C* | | –15.93% | | –48.10% | | –19.58% | | –8.36% | | –2.91% |
Institutional Class | | –15.07% | | –47.18% | | –18.83% | | –7.46% | | –5.10% |
The performance data quoted represent past performance and do not guarantee future results. Current performance may be lower or higher than the performance data quoted. To obtain performance data current to the most recent month-end, please visit our website at www.leggmason.com/individualinvestors. The investment return and principal value of the Fund will fluctuate so that an investor’s shares, when redeemed, may be worth more or less than the original cost. Calculations assume reinvestment of dividends and capital gain distributions. Performance would have been lower if fees and expenses had not been waived and/or reimbursed in various periods. Performance figures for periods shorter than one year represent cumulative figures and are not annualized. Please note that Class A has been in existence for less than one year. Results for longer periods may differ, in some cases, substantially.
For performance data including the effects of sales charges, Class A shares reflect the deduction of a maximum initial sales charge of 5.75%, and Class C shares reflect the deduction of a contingent deferred sales charge of 1.00%, which applies if shares are redeemed within one year of purchase.
The inception dates of the A, C and Institutional Classes are February 3, 2009, November 8, 1999 and July 13, 2001, respectively. The Index return is for the period beginning November 8, 1999. The Lipper return is for the period beginning November 30, 1999. All index performance reflects no deduction for
The Investment Commentary is not a part of the Annual Report to Shareholders.
| | |
Investment Commentary | | iii |
fees, expenses or taxes. Please note that an investor cannot invest directly in an index.
The gross expense ratios for the A, C and Institutional Classes were 1.54%, 2.29% and 1.48%, respectively, as indicated in the Fund’s most current prospectus dated February 1, 2009. These expenses include management fees, 12b-1 distribution and/or service fees, and other expenses. As a result of contractual expense limitations, the ratio of expenses, other than interest, brokerage, taxes and extraordinary expenses, to average net assets will not exceed 1.20% for Class A shares, 1.95% for Class C shares and 0.95% for Institutional Class shares until July 31, 2009.
* Prior to February 1, 2009, Class C was known as the Primary Class. In addition, on February 1, 2009, the class began to charge a contingent deferred sales charge of 1.00% for shares purchased by investors on and after that date and redeemed within one year of purchase.
Most of the time, we feel the need to identify economic, fiscal or monetary issues to our clients as their attention is spread in a variety of directions. Today, though, all of us are intensely focused on our nation’s and our globe’s financial health. By this point, the causes of the calamity are painfully well-known and perhaps the most confusing area is keeping track of measures to arrest the descent and heal the financial system. The efforts by policy makers have been extraordinary in scope and scale. Over $11 trillion has been allocated to the “Great Rescue” when the cost of all the programs of the Federal Reserve Board (“Fed”)C, the U.S. Department of the Treasury and the Federal Deposit Insurance Corporation (“FDIC”) are added up. Of course, historically high deficits and monetary flooding can present a different set of problems in the future — headed by inflation — but getting ourselves out of the worst rut in generations is today’s agenda.
One of the economic services we subscribe to has started publishing a list of “green shoots,” or early signs of recovery. For instance, consumer confidence has ticked up recently and the wind down of inventories at all levels has run its course, requiring some rebuilding. A product of the slowdown has been lower oil prices as demand has contracted and, in a circular way, this can help prime some consumer and corporate spending. At the 2008 average price for oil of $99 per barrel, our country’s oil expenditures were roughly $752 billion. If the 2009 calendar year-to-date average price of $43 per barrel were to hold for all of 2009, our country’s expenditures would be $362 billion, or a savings of $390 billion over last year. Although these and other bright spots can be overwhelmed by deleveraging by consumers and the dramatic decline in net worth, the ledger is not all negative.
Scott Kuensell, CFA
April 15, 2009
The Investment Commentary is not a part of the Annual Report to Shareholders.
| | |
i v | | Investment Commentary |
All investments involve risk, including possible loss of principal. Past performance is no guarantee of future results.
The value approach to investing involves the risk that those stocks deemed to be undervalued by the portfolio manager may remain undervalued. Because this Fund expects to hold a concentrated portfolio of a limited number of securities, a decline in the value of these investments would cause the Fund’s overall value to decline to a greater degree than a less concentrated portfolio. The Fund may focus its investments in certain regions or industries, thereby increasing its potential vulnerability to market volatility. Investing in foreign securities is subject to certain risks not associated with domestic investing, such as currency fluctuations, and changes in political and economic conditions. Please see the Fund’s prospectus for more information on these and other risks.
The views expressed in this commentary reflect those solely of the portfolio manager as of the date of this commentary and may differ from those of Legg Mason, Inc. as a whole or the other portfolio managers of its affiliates. Any such views are subject to change at any time based on market or other conditions, and the portfolio manager, Legg Mason Classic Valuation Fund and Legg Mason Investor Services, LLC disclaim any responsibility to update such views. These views are not intended to be a forecast of future events, a guarantee of future results or investment advice. Because investment decisions for the Legg Mason Funds are based on numerous factors, these views may not be relied upon as an indication of trading intent on behalf of any Legg Mason Fund. The information contained herein has been prepared from sources believed to be reliable, but is not guaranteed by the portfolio manager, Legg Mason Classic Valuation Fund or Legg Mason Investor Services, LLC as to its accuracy or completeness.
Please note that an investor cannot invest directly in an index.
| A | The S&P 500 Index is an unmanaged index of 500 stocks and is generally representative of the performance of larger companies in the U.S. |
| B | Lipper, Inc., a wholly-owned subsidiary of Reuters, provides independent insight on global collective investments. The Lipper Large-Cap Value Funds Category Average is comprised of the Fund’s peer group of mutual funds. |
| C | The Federal Reserve Board (“Fed”) is responsible for the formulation of policies designed to promote economic growth, full employment, stable prices and a sustainable pattern of international trade and payments. |
N/A — Not applicable
The Investment Commentary is not a part of the Annual Report to Shareholders.

| | |
Annual Report to Shareholders | | 1 |
To Our Shareholders,
We are pleased to provide you with Legg Mason Classic Valuation Fund’s annual report for the twelve months ended March 31, 2009.
Total returns, excluding sales charges, for periods ended March 31, 2009 were:
| | | | | | |
| | | Three
Months | | Six
Months | | Twelve
Months |
Class C* | | –15.08% | | –37.57% | | –47.60% |
Institutional Class | | –15.07% | | –37.36% | | –47.18% |
The performance data quoted represent past performance and do not guarantee future results. Current performance may be lower or higher than the performance data quoted. To obtain performance data current to the most recent month-end, please visit our website at www.leggmason.com/individualinvestors. The investment return and principal value of the Fund will fluctuate so that an investor’s shares, when redeemed, may be worth more or less than the original cost. Calculations assume reinvestment of dividends and capital gain distributions. Returns have not been adjusted to include sales charges that may apply or the deduction of taxes that a shareholder would pay on Fund distributions. If sales charges were reflected, the performance quoted would be lower. Performance would have been lower if fees and expenses had not been waived and/or reimbursed in various periods. Performance figures for periods shorter than one year represent cumulative figures and are not annualized.
Performance of Class A shares is not shown because this share class commenced operations on February 3, 2009.
* Prior to February 1, 2009, Class C was known as the Primary Class. In addition, on February 1, 2009, the class began to charge a contingent deferred sales charge of 1.00% for shares purchased by investors on and after that date and redeemed within one year of purchase.
The market environment of the past twelve months has been among the most challenging seen by equity investors for generations. Concerns about our global financial system and the health of the global economy have negatively affected virtually all asset classes, including, of course, U.S. equities.
We understand the concerns created by market turmoil and declining prices. While no one can predict with certainty when the current crisis will end, we are heartened by the recent actions of the U.S. government to support and repair our financial system.
We continue to believe in the resiliency of the U.S. economy. We believe that turmoil and downturn will eventually be followed by recovery and appreciation. We also believe in the long-term potential of our equity markets to provide rewards to patient investors. We remain committed to helping you, our shareholders, build wealth over the long term.
Information about the Fund’s performance over longer periods of time is shown in the Performance Information section within this report. For more information about the Fund share classes included in this report, please contact your financial advisor.
| | |
2 | | Annual Report to Shareholders |
PricewaterhouseCoopers LLP, the Fund’s independent registered public accounting firm, has completed its annual examination of the Fund, and audited financial statements for the fiscal year ended March 31, 2009 are included in this report.
Many Class A and Class C shareholders invest regularly in Fund shares on a dollar cost averaging basis. Most do so by authorizing automatic, monthly transfers of $50 or more from their bank checking or brokerage accounts. Dollar cost averaging is a convenient and sensible way to invest, as it encourages continued purchases over time regardless of fluctuating price levels. Of course, it does not ensure a profit nor protect against declines in the value of your investment. Your financial advisor will be happy to help you establish a dollar cost averaging account should you wish to do so.
On behalf of the Board and the entire team at Legg Mason, we appreciate your support.
| | |
Sincerely, 
| | 
|
Mark R. Fetting Chairman | | David R. Odenath President |
May 19, 2009
| | |
Annual Report to Shareholders | | 3 |
Management’s Discussion of Fund Performance
Legg Mason Classic Valuation Fund
Total returns, excluding sales charges, for the Fund for periods ended March 31, 2009 are presented below, along with those of comparative indices:
| | | | | | |
| | | Six
Months | | | Twelve
Months | |
Class C* | | –37.57 | % | | –47.60 | % |
Institutional Class | | –37.36 | % | | –47.18 | % |
S&P 500 IndexA | | –30.54 | % | | –38.09 | % |
Lipper Large-Cap Value Funds Category AverageB | | –32.00 | % | | –39.80 | % |
The performance data quoted represent past performance and do not guarantee future results. Current performance may be lower or higher than the performance data quoted. To obtain performance data current to the most recent month-end, please visit our website at www.leggmason.com/individualinvestors. The investment return and principal value of the Fund will fluctuate so that an investor’s shares, when redeemed, may be worth more or less than the original cost. Calculations assume reinvestment of dividends and capital gain distributions. Returns have not been adjusted to include sales charges that may apply or the deduction of taxes that a shareholder would pay on Fund distributions. If sales charges were reflected, the performance quoted would be lower. Performance would have been lower if fees and expenses had not been waived and/or reimbursed in various periods. Performance figures for periods shorter than one year represent cumulative figures and are not annualized.
Performance of Class A shares is not shown because this share class commenced operations on February 3, 2009.
* Prior to February 1, 2009, Class C was known as the Primary Class. In addition, on February 1, 2009, the class began to charge a contingent deferred sales charge of 1.00% for shares purchased by investors on and after that date and redeemed within one year of purchase.
The U.S. stock market misery extended into the first quarter of 2009. After losing 37% in calendar 2008, the S&P 500 Index declined almost 11% in the first three months of the new year. A massive rally in March 2009 shaved off much of January and February’s damage, but a double-digit hit is hardly a way to start a new year. The sharpness of the economic decline coupled with yet another round of concerns for the Financials sector prompted the sell-off.
For the twelve months ended March 31, 2009, Class C shares of Legg Mason Classic Valuation Fund, excluding sales charges, returned -47.60%. The Fund’s unmanaged benchmark, the S&P 500 Index, returned -38.09% for the same period. The Lipper Large-Cap Value Funds Category Average returned -39.80% over the same time frame.
The Fund’s Energy holdings were a large source of relative underperformance as oil service names, Transocean Ltd. and Nabors Industries Ltd., weighed the Fund down.
| | |
4 | | Annual Report to Shareholders |
Management’s Discussion of Fund Performance — Continued
Legg Mason Classic Valuation Fund
Our results in the Information Technology sector were severely impacted by the collapse of Seagate Technology Inc., which was subsequently sold. The biggest positive contributor to the Fund was from our largest holding, Wal-Mart Stores Inc. The company improved execution and was well-positioned for consumers’ heightened interest in value.
Scott Kuensell, CFA
April 15, 2009
Portfolio holdings and breakdowns are as of March 31, 2009 and are subject to change and may not be representative of the portfolio manager’s current or future investments. The Fund’s top ten holdings (as a percentage of net assets) as of this date were: Wal-Mart Stores Inc. (5.9%), JPMorgan Chase and Co. (5.4%), Toyota Motor Corp. — ADR (4.1%), Tidewater Inc. (4.0%), Comcast Corp. — Class A (3.5%), Axis Capital Holdings Ltd. (3.4%), Bristol-Myers Squibb Co. (3.3%), The Goldman Sachs Group Inc. (3.2%), ConocoPhillips (3.1%) and Exxon Mobil Corp. (3.0%). Please refer to pages 13 through 16 for a list and percentage breakdown of the Fund’s holdings.
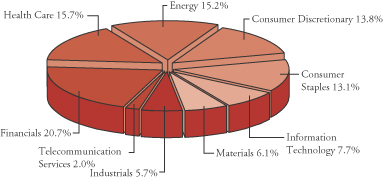
The mention of sector breakdowns is for informational purposes only and should not be construed as a recommendation to purchase or sell any securities. The information provided regarding such sectors is not a sufficient basis upon which to make an investment decision. Investors seeking financial advice regarding the appropriateness of investing in any securities or investment strategies discussed should consult their financial professional. The Fund’s top five sector holdings (as a percentage of net assets) as of March 31, 2009 were: Financials (20.6%), Health Care (15.7%), Energy (15.1)%, Consumer Discretionary (13.7%) and Consumer Staples (13.1%). The Fund’s portfolio composition is subject to change at any time.
All index performance reflects no deduction for fees, expenses or taxes. Please note that an investor cannot invest directly in an index.
| A | The S&P 500 Index is an unmanaged index of 500 stocks and is generally representative of the performance of larger companies in the U.S. |
| B | Lipper, Inc., a wholly-owned subsidiary of Reuters, provides independent insight on global collective investments. Returns are based on the period ended March 31, 2009, including the reinvestment of all distributions, including returns of capital, if any, calculated among the 608 funds for the six-month period and among the 589 funds for the twelve-month period in the Fund’s Lipper category, and excluding sales charges. |
| | |
Annual Report to Shareholders | | 5 |
Expense Example
Legg Mason Classic Valuation Fund
As a shareholder of the Fund, you may incur two types of costs; (1) transaction costs, including front-end and back-end sales charges (loads) on purchase payments; and (2) ongoing costs, including management fees, distribution and/or service (12b-1) fees; and other Fund expenses. These examples are intended to help you understand your ongoing costs (in dollars) of investing in the Fund and to compare these costs with the ongoing costs of investing in other mutual funds.
For Class CA and Institutional Class shares, the example is based on an investment of $1,000 invested on October 1, 2008 and held through March 31, 2009; For Class A shares, the example is based on an investment of $1,000 invested on February 3, 2009 (commencement of operations) and held through March 31, 2009. The ending values assume dividends were reinvested at the time they were paid.
Actual Expenses
The first line for each class in the table on the next page provides information about actual account values and actual expenses for each class. You may use the information in this line, together with the amount you invested, to estimate the expenses that you paid over the period. Simply divide your account value by $1,000 (for example, an $8,600 account value divided by $1,000 = 8.6), then multiply the result by the number in the first line under the heading entitled “Expenses Paid During the Period” to estimate the expenses you paid on your account if your shares were held through the entire period.
Hypothetical Example for Comparison Purposes
The second line for each class in the table below provides information about hypothetical account values and hypothetical expenses based on the relevant class’s actual expense ratio and an assumed rate of return of 5% per year before expenses, which is not the class’s actual return. The hypothetical account values and expenses may not be used to estimate the actual ending account balance or expenses you paid for the period. You may use this information to compare the ongoing costs of investing in the Fund and other funds. To do so, compare these 5% hypothetical examples with the 5% hypothetical examples for the relevant class that appear in the shareholder reports of other funds. Because the example is intended to be comparable to the examples provided by other funds, it is based on a hypothetical investment of $1,000 invested on October 1, 2008 and held through March 31, 2009 for each class, even though the Class A shares did not begin operations until February 3, 2009. The ending values assume dividends were reinvested at the time they were paid.
Please note that the expenses shown in the table are meant to highlight your ongoing costs only and do not reflect any transactional costs, such as sales charges (loads).
| A | On February 1, 2009, Primary Class shares were renamed Class C shares. |
| | |
6 | | Annual Report to Shareholders |
Expense Example — Continued
Therefore the second line for each class of the table is useful in comparing ongoing costs only, and will not help you determine the relative total costs of owning different funds. In addition, if these transactional costs were included, your costs would have been lower.
| | | | | | | | | | | |
| | | Beginning
Account
Value (See footnote
below) | | | Ending
Account
Value 3/31/09 | | Expenses Paid
During the
Period (See footnote
below) | |
Class A: | | | | | | | | | | | |
Actual | | $ | 1,000.00 | A | | $ | 957.20 | | $ | 1.80 | B |
Hypothetical (5% return before expenses) | | | 1,000.00 | D | | | 1,018.95 | | | 6.04 | E |
Class C:C | | | | | | | | | | | |
Actual | | $ | 1,000.00 | D | | $ | 624.30 | | $ | 7.90 | E |
Hypothetical (5% return before expenses) | | | 1,000.00 | D | | | 1,015.21 | | | 9.80 | E |
Institutional Class: | | | | | | | | | | | |
Actual | | $ | 1,000.00 | D | | $ | 626.40 | | $ | 3.85 | E |
Hypothetical (5% return before expenses) | | | 1,000.00 | D | | | 1,020.19 | | | 4.78 | E |
| A | Beginning account value is as of February 3, 2009 (commencement of operations). |
| B | This calculation is based on expenses incurred from February 3, 2009 (commencement of operations) to March 31, 2009. The dollar amount shown as “Expenses Paid” is equal to the annualized expense ratio of 1.20% for Class A shares, multiplied by the average values over the period, multiplied by the number of days in the most recent fiscal period (56), and divided by 365. |
| C | On February 1, 2009, Primary Class shares were renamed Class C shares. |
| D | Beginning account value is as of October 1, 2008. |
| E | These calculations are based on expenses incurred in the most recent fiscal half-year. The dollar amounts shown as “Expenses Paid” are equal to the annualized expense ratios of 1.20%, 1.95% and 0.95% for Class A, Class C and Institutional Class shares, respectively, multiplied by the average values over the period, multiplied by the number of days in the most recent fiscal half-year (182), and divided by 365. |
| | |
Annual Report to Shareholders | | 7 |
Performance Information
| | | | | | | | | |
Average Annual Total ReturnsA | | | |
| | | Without Sales ChargesB | |
| | | Class A | | | Class CC | | | Institutional
Class | |
Twelve Months Ended 3/31/09 | | N/A | | | –47.60 | % | | –47.18 | % |
Five Years Ended 3/31/09 | | N/A | | | –8.36 | | | –7.46 | |
Inception* through 3/31/09 | | –4.28 | %† | | –2.91 | | | –5.10 | |
| |
| | | With Sales ChargesD | |
| | | Class A | | | Class CC | | | Institutional
Class | |
Twelve Months Ended 3/31/09 | | N/A | | | –48.10 | % | | –47.18 | % |
Five Years Ended 3/31/09 | | N/A | | | –8.36 | | | –7.46 | |
Inception* through 3/31/09 | | –9.78 | %† | | –2.91 | | | –5.10 | |
| | |
Cumulative Total ReturnsA | | |
| | | Without Sales
ChargesB |
Class A (Inception date of 2/3/09 through 3/31/09) | | –4.28% |
Class CC (Inception date of 11/8/99 through 3/31/09) | | –24.20 |
Institutional Class (Inception date of 7/13/01 through 3/31/09) | | –33.20 |
| A | All figures represent past performance and are not a guarantee of future results. Investment return and principal value of an investment will fluctuate so that an investor’s shares when redeemed may be worth more or less than their original cost. Total returns shown do not reflect the deduction of taxes that a shareholder would pay on Fund distributions or the redemption of Fund shares. Performance figures may reflect fee waivers and/or expense reimbursements. In the absence of fee waivers and/or expense reimbursements, the total return would have been lower. |
| B | Assumes the reinvestment of all distributions, including returns of capital, if any, at net asset value and does not reflect the deduction of the applicable sales charge with respect to Class A shares or the applicable contingent deferred sales charge (“CDSC”) with respect to Class C shares. On February 1, 2009, Class C shares began to charge a CDSC for shares bought by investors on and after that date and redeemed within one year of purchase. |
| C | On February 1, 2009, Primary Class shares were renamed Class C shares. |
| D | Assumes the reinvestment of all distributions, including returns of capital, if any, at net asset value. In addition, Class A shares reflect the deduction of the maximum initial sales charge of 5.75%. Class C shares reflect the deduction of a 1.00% CDSC, which applies if shares are redeemed within one year from purchase payment. |
| * | Inception dates for Class A, C and Institutional Class shares are February 3, 2009, November 8, 1999 and July 13, 2001, respectively. |
| | |
8 | | Annual Report to Shareholders |
Performance Information — Continued
Legg Mason Classic Valuation Fund
The graphs on the following pages compare the Fund’s Class CA and Institutional Class shares’ total returns to those of the S&P 500 Index. The graphs illustrate the cumulative total return of an initial $10,000 and $1,000,000 investment in Class C and Institutional Class shares, respectively, for the periods indicated. The lines for the Fund represent the total return after deducting all Fund investment management and other administrative expenses and the transaction costs of buying and selling portfolio securities. The lines representing the securities market Index do not take into account any transaction costs associated with buying and selling portfolio securities in the Index or other administrative expenses. Due to the limited operating history of Class A, a performance graph is not presented.
Total return measures investment performance in terms of appreciation or depreciation in the Fund’s net asset value per share, plus dividends and any capital gain distributions. Both the Fund’s results and the Index’s results assume the reinvestment of all dividends and distributions at the time they were paid. Average annual returns tend to smooth out variations in a fund’s return, so that they differ from actual year-to-year results.
| A | On February 1, 2009, Primary Class shares were renamed Class C shares. |
| | |
Annual Report to Shareholders | | 9 |
Growth of a $10,000 Investment — Class C Shares
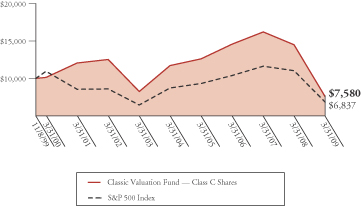
Hypothetical illustration of $10,000 invested in Class C shares (formerly, Primary Class shares) on November 8, 1999 (commencement of operations), assuming the reinvestment of all distributions, including returns of capital, if any, at net asset value through March 31, 2009. The performance data quoted represent past performance and do not guarantee future results. The performance stated may have been due to extraordinary market conditions, which may not be duplicated in the future. Current performance may be lower or higher than the performance data quoted. To obtain the most recent month-end performance, information please visit www.leggmason.com/individualinvestors. The investment return and principal value of the Fund will fluctuate so that an investor’s shares, when redeemed, may be worth more or less than the original cost. Performance would have been lower if fees and expenses had not been waived and/or reimbursed in various periods. Performance for other share classes will vary due to differences in sales charge structure and class expenses.
The graph does not reflect the deduction of taxes that a shareholder would pay on Fund distributions or the redemption of Fund shares.
| | |
10 | | Annual Report to Shareholders |
Performance Information — Continued
Growth of a $1,000,000 Investment — Institutional Class Shares
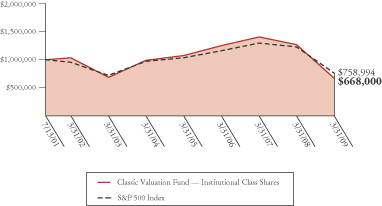
Hypothetical illustration of $1,000,000 invested in Institutional Class shares on July 13, 2001 (commencement of operations), assuming the reinvestment of all distributions, including returns of capital, if any, at net asset value through March 31, 2009. The performance data quoted represent past performance and do not guarantee future results. The performance stated may have been due to extraordinary market conditions, which may not be duplicated in the future. Current performance may be lower or higher than the performance data quoted. To obtain the most recent month-end performance information, please visit www.leggmason.com/individualinvestors. The investment return and principal value of the Fund will fluctuate so that an investor’s shares, when redeemed, may be worth more or less than the original cost. Performance would have been lower if fees and expenses had not been waived and/or reimbursed in various periods. Performance for other share classes will vary due to differences in sales charge structure and class expenses.
The graph does not reflect the deduction of taxes that a shareholder would pay on Fund distributions or the redemption of Fund shares.
| | |
Annual Report to Shareholders | | 11 |
Portfolio Composition (as of March 31, 2009)A
(As a percentage of the portfolio)
Top 10 Holdings (As of March 31, 2009)
| | |
| Security | | % of
Net Assets |
Wal-Mart Stores Inc. | | 5.9% |
JPMorgan Chase and Co. | | 5.4% |
Toyota Motor Corp. — ADR | | 4.1% |
Tidewater Inc. | | 4.0% |
Comcast Corp. — Class A | | 3.5% |
Axis Capital Holdings Ltd. | | 3.4% |
Bristol-Myers Squibb Co. | | 3.3% |
The Goldman Sachs Group Inc. | | 3.2% |
ConocoPhillips | | 3.1% |
Exxon Mobil Corp. | | 3.0% |
| A | The Fund is actively managed. As a result, the composition of its portfolio holdings and sectors is subject to change at any time. |
| | |
12 | | Annual Report to Shareholders |
Performance Information — Continued
Selected Portfolio PerformanceA
| | | | |
| Strongest performers for the year ended March 31, 2009 | | |
| 1 | | Continental Airlines Inc. — Class B | | 47.11% |
| 2 | | American Express Co. | | 28.10% |
| 3 | | Wyeth | | 20.96% |
| 4 | | Amgen Inc. | | 18.53% |
| 5 | | Aon Corp. | | 14.80% |
| 6 | | Bristol-Myers Squibb Co. | | 8.99% |
| 7 | | Allianz SE — ADR | | 1.53% |
| 8 | | Wal-Mart Stores Inc. | | 0.72% |
| 9 | | Newmont Mining Corp. | | –0.15% |
| 10 | | AT&T Inc. | | –0.58% |
| | | | |
| Weakest performers for the year ended March 31, 2009 | | |
| 1 | | American International Group Inc. | | –93.68% |
| 2 | | Wachovia Corp. (delisted 1/2/2009) | | –93.05% |
| 3 | | Bank of America Corp. | | –80.84% |
| 4 | | Conseco Inc. | | –79.31% |
| 5 | | Alcoa Inc. | | –78.69% |
| 6 | | Seagate Technology Inc. | | –78.66% |
| 7 | | The Dow Chemical Co. | | –75.52% |
| 8 | | Merrill Lynch & Co. Inc. | | –70.17% |
| 9 | | Arch Coal Inc. | | –68.79% |
| 10 | | General Electric Co. | | –66.45% |
Portfolio Changes
| | |
New positions established during
the quarter | | Positions completely sold during
the quarter |
American Express Co. | | Discover Financial Services |
CIGNA Corp. | | General Electric Co. |
UnitedHealth Group Inc. | | Merrill Lynch & Co. Inc. |
| | Seagate Technology Inc. |
| | Wyeth |
| A | Individual security performance is measured by the change in the security’s price; for stocks, dividends are assumed to be reinvested at the time they were paid. |
| | |
Annual Report to Shareholders | | 13 |
Portfolio of Investments
Legg Mason Classic Valuation Fund
March 31, 2009
| | | | | | |
| | | Shares | | Value | |
| | | | | | |
Common Stocks and Equity Interests — 99.6% | | | | |
| | |
Consumer Discretionary — 13.7% | | | | | | |
Automobiles — 4.1% | | | | | | |
Toyota Motor Corp. – ADR | | 16,800 | | $ | 1,063,440 | |
| | | | | | |
| | |
Media — 6.9% | | | | | | |
Comcast Corp. – Class A Shares | | 66,400 | | | 905,696 | |
The Walt Disney Co. | | 18,600 | | | 337,776 | |
Time Warner Cable Inc. | | 5,280 | | | 130,934 | |
Time Warner Inc. | | 21,033 | | | 405,943 | |
| | | | | | |
| | | | | 1,780,349 | |
| | | | | | |
| | |
Multiline Retail — 2.7% | | | | | | |
Kohl’s Corp. | | 16,300 | | | 689,816 | A |
| | | | | | |
| | |
Consumer Staples — 13.1% | | | | | | |
Food and Staples Retailing — 7.9% | | | | | | |
Safeway Inc. | | 26,300 | | | 530,997 | |
Wal-Mart Stores Inc. | | 28,900 | | | 1,505,690 | |
| | | | | | |
| | | | | 2,036,687 | |
| | | | | | |
| | |
Food Products — 5.2% | | | | | | |
Dean Foods Co. | | 39,400 | | | 712,352 | A |
Smithfield Foods Inc. | | 65,200 | | | 616,792 | A |
| | | | | | |
| | | | | 1,329,144 | |
| | | | | | |
| | |
Energy — 15.1% | | | | | | |
Energy Equipment and Services — 7.2% | | | | | | |
Nabors Industries Ltd. | | 19,300 | | | 192,807 | A |
Tidewater Inc. | | 27,800 | | | 1,032,214 | |
Transocean Ltd. | | 10,504 | | | 618,055 | A |
| | | | | | |
| | | | | 1,843,076 | |
| | | | | | |
| | |
Oil, Gas and Consumable Fuels — 7.9% | | | | | | |
Arch Coal Inc. | | 17,200 | | | 229,964 | |
ConocoPhillips | | 20,344 | | | 796,671 | |
Exxon Mobil Corp. | | 11,400 | | | 776,340 | |
| | |
14 | | Annual Report to Shareholders |
Portfolio of Investments — Continued
Legg Mason Classic Valuation Fund — Continued
| | | | | | |
| | | Shares | | Value | |
| | | | | | |
Energy — Continued | | | | | | |
Oil, Gas and Consumable Fuels — Continued | | | | | | |
The Williams Cos. Inc. | | 21,100 | | $ | 240,118 | |
| | | | | | |
| | | | | 2,043,093 | |
| | | | | | |
| | |
Financials — 20.6% | | | | | | |
Capital Markets — 3.2% | | | | | | |
The Goldman Sachs Group Inc. | | 7,800 | | | 826,956 | |
| | | | | | |
| | |
Commercial Banks — 1.3% | | | | | | |
Wells Fargo & Co. | | 24,100 | | | 343,184 | |
| | | | | | |
| | |
Consumer Finance — 2.0% | | | | | | |
American Express Co. | | 37,800 | | | 515,214 | |
| | | | | | |
| | |
Diversified Financial Services — 5.9% | | | | | | |
Bank of America Corp. | | 16,466 | | | 112,298 | |
JPMorgan Chase and Co. | | 52,700 | | | 1,400,766 | |
| | | | | | |
| | | | | 1,513,064 | |
| | | | | | |
| | |
Insurance — 8.2% | | | | | | |
Axis Capital Holdings Ltd. | | 38,800 | | | 874,552 | |
Marsh and McLennan Cos. Inc. | | 36,400 | | | 737,100 | |
The Chubb Corp. | | 11,600 | | | 490,912 | |
| | | | | | |
| | | | | 2,102,564 | |
| | | | | | |
| | |
Health Care — 15.7% | | | | | | |
Biotechnology — 1.9% | | | | | | |
Amgen Inc. | | 9,800 | | | 485,296 | A |
| | | | | | |
| | |
Health Care Equipment and Supplies — 2.9% | | | | | | |
Boston Scientific Corp. | | 94,000 | | | 747,300 | A |
| | | | | | |
| | |
Health Care Providers and Services — 3.0% | | | | | | |
CIGNA Corp. | | 26,200 | | | 460,858 | |
UnitedHealth Group Inc. | | 15,300 | | | 320,229 | |
| | | | | | |
| | | | | 781,087 | |
| | | | | | |
| | |
Pharmaceuticals — 7.9% | | | | | | |
Bristol-Myers Squibb Co. | | 38,800 | | | 850,496 | |
| | |
Annual Report to Shareholders | | 15 |
| | | | | | |
| | | Shares | | Value | |
| | | | | | |
Health Care — Continued | | | | | | |
Pharmaceuticals — Continued | | | | | | |
Johnson & Johnson | | 8,600 | | $ | 452,360 | |
Pfizer Inc. | | 52,700 | | | 717,774 | |
| | | | | | |
| | | | | 2,020,630 | |
| | | | | | |
| | |
Industrials — 5.7% | | | | | | |
Aerospace and Defense — 1.9% | | | | | | |
The Boeing Co. | | 13,400 | | | 476,772 | |
| | | | | | |
| | |
Airlines — 3.0% | | | | | | |
Continental Airlines Inc. — Class B Shares | | 14,900 | | | 131,269 | A |
Southwest Airlines Co. | | 102,300 | | | 647,559 | |
| | | | | | |
| | | | | 778,828 | |
| | | | | | |
| | |
Machinery — 0.8% | | | | | | |
Caterpillar Inc. | | 7,300 | | | 204,108 | |
| | | | | | |
| | |
Information Technology — 7.6% | | | | | | |
Communications Equipment — 2.7% | | | | | | |
Nokia Oyj – ADR | | 59,200 | | | 690,864 | |
| | | | | | |
| | |
Computers and Peripherals — 2.4% | | | | | | |
Dell Inc. | | 66,600 | | | 631,368 | A |
| | | | | | |
| | |
Semiconductors and Semiconductor Equipment — 2.5% | | | | | | |
Intel Corp. | | 42,800 | | | 644,140 | |
| | | | | | |
| | |
Materials — 6.1% | | | | | | |
Chemicals — 2.7% | | | | | | |
E.I. du Pont de Nemours and Co. | | 16,600 | | | 370,678 | |
The Dow Chemical Co. | | 37,900 | | | 319,497 | |
| | | | | | |
| | | | | 690,175 | |
| | | | | | |
| | |
Metals and Mining — 3.4% | | | | | | |
Alcoa Inc. | | 50,400 | | | 369,936 | |
Newmont Mining Corp. | | 11,400 | | | 510,264 | |
| | | | | | |
| | | | | 880,200 | |
| | | | | | |
| | |
16 | | Annual Report to Shareholders |
Portfolio of Investments — Continued
Legg Mason Classic Valuation Fund — Continued
| | | | | | |
| | | Shares | | Value | |
| | | | | | |
Telecommunication Services — 2.0% | | | | | | |
Diversified Telecommunication Services — 2.0% | | | | |
AT&T Inc. | | 20,400 | | $ | 514,080 | |
| | | | | | |
Total Common Stocks and Equity Interests
(Cost — $37,828,035) | | | | | 25,631,435 | |
Total Investments — 99.6% (Cost — $37,828,035)B | | | | | 25,631,435 | |
Other Assets Less Liabilities — 0.4% | | | | | 92,200 | |
| | | | | | |
| | |
Net Assets — 100.0% | | | | $ | 25,723,635 | |
| | | | | | |
| B | At March 31, 2009, the aggregate gross unrealized appreciation and depreciation of investments for federal income tax purposes were substantially as follows: |
| | | | |
| Gross unrealized appreciation | | $ | 330,987 | |
| Gross unrealized depreciation | | | (13,131,170 | ) |
| | | | |
| Net unrealized depreciation | | $ | (12,800,183 | ) |
| | | | |
Abbreviation used in this schedule:
ADR — American Depository Receipt
See notes to financial statements.
| | |
Annual Report to Shareholders | | 17 |
Statement of Assets and Liabilities
Legg Mason Classic Valuation Fund
March 31, 2009
| | | | | | | |
Assets: | | | | | | | |
Investment securities, at value
(Cost – $ 37,828,035) | | | | | $ | 25,631,435 | |
Cash | | | | | | 175,045 | |
Due from manager | | | | | | 8,060 | |
Dividends receivable | | | | | | 55,177 | |
Receivable for fund shares sold | | | | | | 51,625 | |
| | | | | | | |
Total assets | | | | | | 25,921,342 | |
Liabilities: | | | | | | | |
Accrued distribution and service fees | | $ | 19,123 | | | | |
Payable for fund shares repurchased | | | 120,680 | | | | |
Accrued expenses | | | 57,904 | | | | |
| | | | | | | |
Total liabilities | | | | | | 197,707 | |
| | | | | | | |
Net Assets | | | | | $ | 25,723,635 | |
| | | | | | | |
Net assets consist of: | | | | | | | |
Accumulated paid-in-capital | | | | | $ | 58,028,457 | |
Undistributed net investment income | | | | | | 129,965 | |
Accumulated net realized loss on investments | | | | | | (20,238,187 | ) |
Net unrealized depreciation of investments | | | | | | (12,196,600 | ) |
| | | | | | | |
Net Assets | | | | | $ | 25,723,635 | |
| | | | | | | |
Net Asset Value Per Share: | | | | | | | |
Class A (and redemption price) (97,645 shares outstanding) | | | | | | $5.81 | |
Class CA,B (4,024,688 shares outstanding) | | | | | | $5.80 | |
Institutional Class (and redemption price) (287,404 shares outstanding) | | | | | | $6.37 | |
Maximum Public Offering Price Per Share: | | | | | | | |
Class A (based on maximum initial sales charge of 5.75%) | | | | | | $6.16 | |
| | | | | | | | |
| A | On February 1, 2009, Primary Class shares were renamed Class C shares. |
| B | Redemption price per share is NAV of Class C shares reduced by a 1.00% CDSC, if shares are redeemed within one year from purchase payment. |
See notes to financial statements.
| | |
18 | | Annual Report to Shareholders |
Statement of Operations
Legg Mason Classic Valuation Fund
For the Year Ended March 31, 2009
| | | | | | | | |
Investment Income: | | | | | | | | |
Dividends | | $ | 1,179,325 | | | | | |
Interest | | | 5,562 | | | | | |
Less: Foreign taxes withheld | | | (11,854 | ) | | | | |
| | | | | | | | |
Total income | | | | | | $ | 1,173,033 | |
Expenses: | | | | | | | | |
Management fees | | | 365,933 | | | | | |
Distribution and service fees: | | | | | | | | |
Class AA | | | 198 | | | | | |
Class CB | | | 451,947 | | | | | |
Audit and legal fees | | | 44,066 | | | | | |
Custodian fees | | | 31,670 | | | | | |
Directors’ fees and expenses | | | 43,897 | | | | | |
Registration fees | | | 36,286 | | | | | |
Reports to shareholders: | | | | | | | | |
Class AA | | | 26 | | | | | |
Class CB | | | 77,776 | | | | | |
Institutional Class | | | 1,157 | | | | | |
Transfer agent and shareholder servicing expense: | | | | | | | | |
Class AA | | | 160 | | | | | |
Class CB | | | 39,759 | | | | | |
Institutional Class | | | 11,322 | | | | | |
Other expenses | | | 18,990 | | | | | |
| | | | | | | | |
| | | 1,123,187 | | | | | |
Less: Fee waivers and/or expense reimbursements (Note 3) | | | (207,502 | ) | | | | |
| | | | | | | | |
Net expenses | | | | | | | 915,685 | |
| | | | | | | | |
Net Investment Income | | | | | | | 257,348 | |
Net Realized and Unrealized Gain/(Loss) on
Investments: | | | | | | | | |
Net realized loss on investments | | | (19,504,120 | ) | | | | |
Change in unrealized appreciation/(depreciation) of: | | | | | | | | |
Investments | | | (9,030,969 | ) | | | | |
| | | | | | | | |
Net Realized and Unrealized Loss on
Investments | | | | | | | (28,535,089 | ) |
Change in Net Assets Resulting From Operations | | | | | | $ | (28,277,741 | ) |
| A | For the period February 3, 2009 (commencement of operations) to March 31, 2009. |
| B | On February 1, 2009, Primary Class shares were renamed Class C shares. |
See notes to financial statements.
| | |
Annual Report to Shareholders | | 19 |
Statement of Changes in Net Assets
Legg Mason Classic Valuation Fund
| | | | | | | | |
| | | For the Years Ended March 31, | |
| | | 2009 | | | 2008 | |
Change in Net Assets: | | | | | | | | |
Net investment income (loss) | | $ | 257,348 | | | $ | (80,519 | ) |
Net realized gain/(loss) | | | (19,504,120 | ) | | | 10,430,269 | |
Change in unrealized appreciation/(depreciation) | | | (9,030,969 | ) | | | (19,384,243 | ) |
Change in net assets resulting
from operations | | | (28,277,741 | ) | | | (9,034,493 | ) |
Distributions to shareholders from: | | | | | | | | |
Net realized gain on investments: | | | | | | | | |
Class CA | | | (3,582,463 | ) | | | (11,445,659 | ) |
Institutional Class | | | (254,675 | ) | | | (593,873 | ) |
Change in net assets from fund share
transactions: | | | | | | | | |
Class AB | | | 599,660 | | | | — | |
Class CA | | | (11,501,666 | ) | | | (7,426,162 | ) |
Institutional Class | | | (497,554 | ) | | | 1,481,381 | |
Change in net assets | | | (43,514,439 | ) | | | (27,018,806 | ) |
Net Assets: | | | | | | | | |
Beginning of year | | | 69,238,074 | | | | 96,256,880 | |
End of year | | $ | 25,723,635 | | | $ | 69,238,074 | |
Undistributed net investment income and accumulated net investment loss, respectively | | $ | 129,965 | | | $ | (125,206 | ) |
| A | On February 1, 2009, Primary Class shares were renamed Class C shares. |
| B | For the period February 3, 2009 (commencement of operations) to March 31, 2009. |
See notes to financial statements.
| | |
20 | | Annual Report to Shareholders |
Financial Highlights
Legg Mason Classic Valuation Fund
For a share of each class of capital stock outstanding:
Class A:
| | | |
| | | Period Ended
March 31, | |
| | | 2009A | |
Net asset value, beginning of period | | $6.07 | |
Investment operations: | | | |
Net investment income | | .02 | B |
Net realized and unrealized loss | | (.28 | ) |
Total from investment operations | | (.26 | ) |
Net asset value, end of period | | $5.81 | |
Total returnC | | (4.28 | )% |
Ratios to Average Net Assets: | | | |
Total expensesD | | 1.98 | %E |
Expenses net of waivers and/or expense reimbursements, if anyD | | 1.20 | %E |
Expenses net of all reductionsD | | 1.20 | %E |
Net investment income | | 2.53 | %E |
Supplemental Data: | | | |
Portfolio turnover rate | | 47.5 | % |
Net assets, end of period (in thousands) | | $567 | |
| A | For the period February 3, 2009 (commencement of operations) to March 31, 2009. |
| B | Computed using average daily shares outstanding. |
| C | Performance figures, exclusive of sales charges, may reflect compensating balance credits, fee waivers and/or expense reimbursements. In the absence of compensating balance credits, fee waivers and/or expense reimbursements, the total return would have been lower. Past performance is no guarantee of future results. Total returns for periods less than one year are not annualized. |
| D | Total expenses reflects operating expenses prior to any contractual expense waivers, expense reimbursements and/or compensating balance credits. Expenses net of waivers and/or expense reimbursements reflects total expenses before compensating balance credits but net of any contractual expense waivers and/or expense reimbursements. Expenses net of all reductions reflects expenses less any compensating balance credits, contractual expense waivers and/or expense reimbursements. |
See notes to financial statements.
| | |
Annual Report to Shareholders | | 21 |
For a share of each class of capital stock outstanding:
Class C:A
| | | | | | | | | | | | | | | | | | |
| | | Years Ended
March 31, | | | Period Ended
March 31, | | | Years Ended October 31, | |
| | | 2009 | | | 2008 | | | 2007B | | | 2006 | | | 2005 | | | 2004 | |
Net asset value, beginning of year | | $11.73 | | | $15.06 | | | $15.28 | | | $13.11 | | | $11.43 | | | $10.99 | |
Investment operations: | | | | | | | | | | | | | | | | | | |
Net investment income/(loss) | | .04 | C | | (.02 | )C | | (.02 | )C | | (.06 | ) | | (.04 | ) | | (.09 | ) |
Net realized and unrealized gain/(loss) | | (5.29 | ) | | (1.35 | ) | | .88 | | | 2.23 | | | 1.72 | | | .53 | |
Total from investment operations | | (5.25 | ) | | (1.37 | ) | | .86 | | | 2.17 | | | 1.68 | | | .44 | |
Distributions from: | | | | | | | | | | | | | | | | | | |
Net realized gain on investments | | (.68 | ) | | (1.96 | ) | | (1.08 | ) | | — | | | — | | | — | |
Total distributions | | (.68 | ) | | (1.96 | ) | | (1.08 | ) | | — | | | — | | | — | |
Net asset value, end of year | | $5.80 | | | $11.73 | | | $15.06 | | | $15.28 | | | $13.11 | | | $11.43 | |
Total returnD | | (47.60 | )% | | (10.64 | )% | | 5.68 | % | | 16.55 | % | | 14.70 | % | | 4.00 | % |
Ratios to Average Net Assets: | | | | | | | | | | | | | | | | | | |
Total expensesE | | 2.37 | % | | 2.11 | % | | 2.17 | %F | | 2.17 | % | | 2.13 | % | | 2.08 | % |
Expenses net of waivers and/or expense reimbursements, if anyE | | 1.95 | % | | 1.95 | % | | 1.95 | %F | | 1.95 | % | | 1.95 | % | | 1.95 | % |
Expenses net of all reductionsE | | 1.95 | % | | 1.95 | % | | 1.95 | %F | | 1.95 | % | | 1.95 | % | | 1.95 | % |
Net investment income (loss) | | .45 | % | | (.14 | )% | | (.29 | )%F | | (.41 | )% | | (.28 | )% | | (.76 | )% |
Supplemental Data: | | | | | | | | | | | | | | | | | | |
Portfolio turnover rate | | 47.5 | % | | 39.1 | % | | 14.9 | % | | 18.2 | % | | 46.7 | % | | 42.2 | % |
Net assets, end of year (in thousands) | | $23,325 | | | $64,593 | | | $91,974 | | | $88,135 | | | $76,061 | | | $86,920 | |
| A | On February 1, 2009 , Primary Class shares were renamed Class C shares. |
| B | For the period November 1, 2006 to March 31, 2007. |
| C | Computed using average daily shares outstanding. |
| D | Performance figures may reflect compensating balance credits, fee waivers and/or expense reimbursements. In the absence of compensating balance credits, fee waivers and/or expense reimbursements, the total return would have been lower. Past performance is no guarantee of future results. Total returns for periods less than one year are not annualized. |
| E | Total expenses reflects operating expenses prior to any contractual expense waivers, expense reimbursements and/or compensating balance credits. Expenses net of waivers and/or expense reimbursements reflects total expenses before compensating balance credits but net of any contractual expense waivers and/or expense reimbursements. Expenses net of all reductions reflects expenses less any compensating balance credits, contractual expense waivers and/or expense reimbursements. |
See notes to financial statements.
| | |
22 | | Annual Report to Shareholders |
Financial Highlights — Continued
Legg Mason Classic Valuation Fund
For a share of each class of capital stock outstanding:
Institutional Class:
| | | | | | | | | | | | | | | | | | |
| | | Years Ended
March 31, | | | Period Ended
March 31, | | | Years Ended October 31, | |
| | | 2009 | | | 2008 | | | 2007A | | | 2006 | | | 2005 | | | 2004 | |
Net asset value, beginning of year | | $12.72 | | | $16.02 | | | $16.12 | | | $13.68 | | | $11.82 | | | $11.25 | |
Investment operations: | | | | | | | | | | | | | | | | | | |
Net investment income | | .15 | B | | .13 | B | | .05 | B | | .28 | | | .06 | | | .02 | |
Net realized and unrealized gain/(loss) | | (5.82 | ) | | (1.47 | ) | | .93 | | | 2.16 | | | 1.80 | | | .55 | |
Total from investment operations | | (5.67 | ) | | (1.34 | ) | | .98 | | | 2.44 | | | 1.86 | | | .57 | |
Distributions from: | | | | | | | | | | | | | | | | | | |
Net realized gain on investments | | (.68 | ) | | (1.96 | ) | | (1.08 | ) | | — | | | — | | | — | |
Total distributions | | (.68 | ) | | (1.96 | ) | | (1.08 | ) | | — | | | — | | | — | |
Net asset value, end of year | | $6.37 | | | $12.72 | | | $16.02 | | | $16.12 | | | $13.68 | | | $11.82 | |
Total returnC | | (47.18 | )% | | (9.76 | )% | | 6.15 | % | | 17.84 | % | | 15.74 | % | | 5.07 | % |
Ratios to Average
Net Assets: | | | | | | | | | | | | | | | | | | |
Total expensesD | | 1.47 | % | | 1.32 | % | | 1.41 | %E | | 1.09 | % | | 1.06 | % | | 1.02 | % |
Expenses net of waivers and/or expense reimbursements, if anyD | | .95 | % | | .95 | % | | .95 | %E | | .95 | % | | .95 | % | | .95 | % |
Expenses net of all reductionsD | | .95 | % | | .95 | % | | .95 | %E | | .95 | % | | .95 | % | | .95 | % |
Net investment income | | 1.46 | % | | .87 | % | | .70 | %E | | .65 | % | | .62 | % | | .20 | % |
Supplemental Data: | | | | | | | | | | | | | | | | | | |
Portfolio turnover rate | | 47.5 | % | | 39.1 | % | | 14.9 | % | | 18.2 | % | | 46.7 | % | | 42.2 | % |
Net assets, end of
year (in thousands) | | $1,832 | | | $4,645 | | | $4,283 | | | $3,975 | | | $10,517 | | | $4,705 | |
| A | For the period November 1, 2006 to March 31, 2007. |
| B | Computed using average daily shares outstanding. |
| C | Performance figures may reflect compensating balance credits, fee waivers and/or expense reimbursements. In the absence of compensating balance credits, fee waivers and/or expense reimbursements, the total return would have been lower. Past performance is no guarantee of future results. Total returns for periods of less than one year are not annualized. |
| D | Total expenses reflects operating expenses prior to any contractual expense waivers, expense reimbursements and/or compensating balance credits. Expenses net of waivers and/or expense reimbursements reflects total expenses before compensating balance credits but net of any contractual expense waivers and/or expense reimbursements. Expenses net of all reductions reflects expenses less any compensating balance credits, contractual expense waivers and/or expense reimbursements. |
See notes to financial statements.
| | |
Annual Report to Shareholders | | 23 |
Notes to Financial Statements
Legg Mason Classic Valuation Fund
1. Organization and Significant Accounting Policies:
Legg Mason Light Street Trust, Inc. (“Corporation”), consisting of the Legg Mason Classic Valuation Fund (“Classic Valuation” or “Fund”), is registered under the Investment Company Act of 1940, as amended (“1940 Act”), as an open-end, diversified investment company.
The Fund offers three classes of shares: Class A, Class C (formerly known as Primary Class) and Institutional Class.
Preparation of the financial statements in accordance with accounting principles generally accepted in the United States of America (“GAAP”) requires management to make estimates and assumptions that affect the reported amounts and disclosures in the financial statements. Actual results could differ from those estimates. The following is a summary of significant accounting policies followed by the Fund in the preparation of its financial statements:
Investment Valuation
The Fund’s securities are valued under policies approved by and under the general oversight of the Board of Directors. Effective April 1, 2008, the Fund adopted Statement of Financial Accounting Standards No. 157 (“FAS 157”). FAS 157 establishes a single definition of fair value, creates a three-tier hierarchy as a framework for measuring fair value based on inputs used to value the Fund’s investments, and requires additional disclosure about fair value. The hierarchy of inputs is summarized below.
| | • | | Level 1 – quoted prices in active markets for identical investments |
| | • | | Level 2 – other significant observable inputs (including quoted prices for similar investments, interest rates, prepayment speeds, credit risk, etc.) |
| | • | | Level 3 – significant unobservable inputs (including the Fund’s own assumptions in determining the fair value of investments) |
Equity securities for which market quotations are available are valued at the last sale price or official closing price on the primary market or exchange on which they trade. Debt securities are valued at the last quoted bid prices provided by an independent pricing service that are based on transactions in debt obligations, quotations from bond dealers, market transactions in comparable securities and various other relationships between securities. Publicly traded foreign government debt securities are typically traded internationally in the over-the-counter market and are valued at the bid price as of the close of business of that market. When prices are not readily available, or are determined not to reflect fair value, such as when the value of a security has been significantly affected by events after the close of the exchange or market on which the
| | |
24 | | Annual Report to Shareholders |
Notes to Financial Statements — Continued
Legg Mason Classic Valuation Fund — Continued
security is principally traded, but before the Fund calculates its net asset value, the Fund values these securities at fair value as determined in accordance with the procedures approved by the Fund’s Board of Directors.
The inputs or methodology used for valuing securities are not necessarily an indication of the risk associated with investing in those securities.
The following is a summary of the inputs used in valuing the Fund’s assets carried at fair value:
| | | | | | | | | | |
| | | March 31, 2009 | | Quoted Prices
(Level 1) | | Other Significant
Observable Inputs
(Level 2) | | Significant
Unobservable
Inputs
(Level 3) |
Investments in Securities | | $ | 25,631,435 | | $ | 25,631,435 | | — | | — |
Security Transactions
Security transactions are accounted for as of the trade date. Realized gains and losses from security transactions are reported on an identified cost basis for both financial reporting and federal income tax purposes.
For the year ended March 31, 2009, security transactions (excluding short-term investments) were as follows:
| | | |
| Purchases | | Proceeds From Sales |
| $23,128,409 | | $ | 38,406,589 |
Foreign Currency Translation
Assets and liabilities initially expressed in non-U.S. currencies are translated into U.S. dollars using currency exchange rates determined prior to the close of trading on the New York Stock Exchange, usually at 2:00 p.m. Eastern time. Purchases and sales of securities and income and expenses are translated into U.S. dollars at the prevailing market rates on the dates of such transactions. The effects of changes in non-U.S. currency exchange rates on investment securities and other assets and liabilities are included with the net realized and unrealized gain or loss on investment securities.
Compensating Balance Credits
The Fund has an arrangement with its custodian bank, whereby a portion of the custodian’s fee is paid indirectly by credits earned on the Fund’s cash on deposit with the bank. This deposit arrangement is an alternative to purchasing overnight investments.
| | |
Annual Report to Shareholders | | 25 |
Investment Income and Distributions to Shareholders
Interest income and expenses are recorded on the accrual basis. Bond premiums and discounts are amortized for financial reporting and federal income tax purposes. Dividend income is recorded on the ex-dividend date. Dividends from net investment income, if available, are determined at the class level and paid annually. Net capital gain distributions, which are calculated at the Fund level, are declared and paid annually in June, if available. An additional distribution may be made in December, to the extent necessary in order to comply with federal excise tax requirements. Distributions are determined in accordance with federal income tax regulations, which may differ from those determined in accordance with GAAP in the United States of America. Accordingly, periodic reclassifications are made within the Fund’s capital accounts to reflect income and gains available for distribution under federal income tax regulations.
Foreign Taxes
The Fund is subject to foreign income taxes imposed by certain countries in which it invests. Foreign income taxes are accrued by the Fund and withheld from dividend and interest income.
Market Price Risk
The prices of securities held by the Fund may decline in response to certain events, including those directly involving the companies whose securities are owned by the Fund; conditions affecting the general economy; overall market changes; local, regional or global political, social or economic instability; and currency, interest rate and commodity price fluctuations. The value-oriented, equity-type securities generally purchased by the Fund may involve large price swings and potential for loss.
Other
In the normal course of business, the Fund enters into contracts that provide general indemnifications. The Fund’s maximum exposure under these arrangements is dependent upon claims that may be made against the Fund in the future and, therefore, cannot be estimated; however, based on experience, the risk of material loss from such claims is considered remote.
2. Federal Income Taxes:
It is the Fund’s policy to comply with the federal income and excise tax requirements of the Internal Revenue Code of 1986, as amended, applicable to regulated investment companies. Accordingly, the Fund intends to distribute to shareholders substantially all of its taxable income and net realized gains on
| | |
26 | | Annual Report to Shareholders |
Notes to Financial Statements — Continued
Legg Mason Classic Valuation Fund — Continued
investments, if any, to shareholders each year. Therefore, no federal income tax provision is required in the Fund’s financial statements.
Management has analyzed the Fund’s tax positions taken on federal income tax returns for all open tax years and has concluded that as of March 31, 2009, no provision for income tax would be required in the Fund’s financial statements. The Fund’s federal and state income and federal excise tax returns for tax years for which the applicable statutes of limitations have not expired are subject to examination by the Internal Revenue Service and state departments of revenue.
Under the applicable foreign tax laws, a withholding tax may be imposed on interest, dividends and capital gains at various rates.
Reclassifications:
GAAP requires that certain components of net assets be adjusted to reflect permanent differences between financial and tax reporting. These reclassifications have no effect on net assets or net asset values per share. During the current year, the following reclassifications have been made:
| | | | | |
| | | Undistributed Net
Investment Income | | Accumulated Net
Realized Loss |
A | | $(2,177) | | $ | 2,177 |
| A | Reclassifications are primarily due to book/tax differences in the treatment of various items. |
Distributions to Shareholders:
The tax character of distributions paid during the years ended March 31, was as follows:
| | | | | | |
| | | 2009 | | 2008 |
Distributions Paid From: | | | | | | |
Ordinary income | | $ | 601,193 | | | — |
Net long-term capital gains | | | 3,235,945 | | $ | 12,039,532 |
| | | | | | |
Total distributions paid | | $ | 3,837,138 | | $ | 12,039,532 |
| | | | | | |
| | |
Annual Report to Shareholders | | 27 |
Accumulated Earnings on a Tax Basis:
As of March 31, 2009, the components of accumulated earnings on a tax basis were as follows:
| | | | |
Undistributed ordinary income — net | | $ | 174,191 | |
Capital loss carryforward* | | | (9,455,953 | ) |
Other book/tax temporary differences | | | (10,222,877 | )A |
Unrealized appreciation/(depreciation) | | | (12,800,183 | )B |
| | | | |
Total accumulated earnings/(losses) — net | | $ | (32,304,822 | ) |
| | | | |
| * | As of March 31, 2009, the Fund had the following net capital loss carryforward remaining: |
| | |
Year of Expiration | | Amount |
03/31/2017 | | $(9,455,953) |
This amount will be available to offset any future taxable capital gains.
| A | Other book/tax temporary differences are attributable primarily to the deferral of post-October capital losses for tax purposes and differences in the timing of the deductibility of various expenses. |
| B | The difference between book-basis and tax-basis unrealized appreciation/(depreciation) is attributable primarily to the tax deferral of losses on wash sales. |
Tax Cost of Investments:
As of March 31, 2009, the aggregate cost of investments for federal income tax purposes was $38,431,618.
3. Transactions With Affiliates:
The Fund has a management agreement with Legg Mason Fund Adviser, Inc. (“LMFA”). LMFA provides the Fund with management and administrative services for which the Fund pays a fee, calculated daily and payable monthly, at an annual rate of the Fund’s average daily net assets in accordance with the following breakpoint schedule:
| | |
Management
Fee | | Net Assets Breakpoint |
| 0.75% | | up to $1 billion |
| 0.65% | | in excess of $1 billion |
Under the terms of an expense cap agreement, LMFA has contractually agreed, until July 31, 2009, to waive its fees and/or reimburse the Fund to the extent the Fund’s expenses (exclusive of taxes, interest, brokerage and extraordinary expenses), exceed during that month the annual rates of 1.20%, 1.95% and 0.95% for Class A, Class C and Institutional Class shares, respectively.
| | |
28 | | Annual Report to Shareholders |
Notes to Financial Statements — Continued
Legg Mason Classic Valuation Fund — Continued
Brandywine Global Investment Management, LLC (“Brandywine Global”) serves as investment adviser to the Fund and is responsible for the actual investment activity of the Fund. LMFA (not the Fund) pays Brandywine Global a fee computed daily and payable monthly, at an annual rate of 60% of the fee LMFA receives from the Fund. Fees paid to Brandywine Global are net of any waivers.
Legg Mason Investor Services, LLC (“LMIS”), serves as the Fund’s distributor. LMIS receives an annual distribution and/or service fee, computed daily and payable monthly as follows:
| | | | | | |
| | | Distribution Fee | | | Service Fee | |
Class A | | None | | | 0.25 | % |
Class C | | 0.75 | % | | 0.25 | % |
For the year ended March 31, 2009, LMFA waived fees and/or reimbursed expenses in the amount of $207,502. Any amounts waived or reimbursed in a particular fiscal year will be subject to repayment by the Fund to LMFA, to the extent that from time to time during the next thirty-six months the repayment will not cause the Fund’s expenses to exceed the expense limitations set forth in the expense cap agreement. Pursuant to this agreement, at March 31, 2009, management fee waivers or expense reimbursements in the amount of $571,118 remain subject to repayment by the Fund.
There is a maximum initial sales charge of 5.75% for Class A shares. In addition, on February 1, 2009, Class C shares began to charge a contingent deferred sales charge (“CDSC”) of 1.00% for shares bought by investors on or after that date, which applies if shares are redeemed within one year from purchase payment. In certain cases, Class A shares have a 1.00% CDSC, which applies to certain redemptions made within 12 months following purchases of $1,000,000 or more without an initial sales charge.
For the year ended March 31, 2009, LMIS and its affiliates did not receive sales charges on sales of the Fund’s Class A shares. In addition, for the year ended March 31, 2009, CDSCs paid to LMIS and its affiliates were approximately $30 on Class C shares.
LMFA, LMIS and Brandywine Global are wholly owned subsidiaries of Legg Mason, Inc.
Under a Deferred Compensation Plan (the “Plan”), directors may elect to defer receipt of all or a specified portion of their compensation. A participating director may select one or more funds in which his or her deferred director’s fees will be invested. Deferred fees remain invested in certain funds until distributed in accordance with the Plan.
| | |
Annual Report to Shareholders | | 29 |
4. Line of Credit:
The Fund, along with certain other Legg Mason Funds, participates in a $200 million line of credit (“Credit Agreement”) to be used for temporary or emergency purposes. Pursuant to the Credit Agreement, each participating fund is liable only for principal and interest payments related to borrowings made by that fund. Borrowings under the Credit Agreement bear interest at a rate equal to the prevailing federal funds rate plus the federal funds rate margin. The Fund did not utilize the line of credit during the year ended March 31, 2009.
5. Fund Share Transactions:
At March 31, 2009, there were 100,000,000 shares authorized at $0.001 par value for each of Class A, Class C and Institutional Class shares of the Fund. Share transactions were as follows:
| | | | | | | | | | | | | | |
| | | Year Ended
March 31, 2009 | | | Year Ended
March 31, 2008 | |
| | | Shares | | | Amount | | | Shares | | | Amount | |
Class AA | | | | | | | | | | | | | | |
Shares sold | | 113,566 | | | $ | 691,224 | | | — | | | | — | |
Shares repurchased | | (15,921 | ) | | | (91,564 | ) | | — | | | | — | |
| | | | | | | | | | | | | | |
Net Increase | | 97,645 | | | $ | 599,660 | | | — | | | | — | |
| | | | | | | | | | | | | | |
Class CB | | | | | | | | | | | | | | |
Shares sold | | 1,027,706 | | | $ | 8,886,035 | | | 774,057 | | | $ | 11,170,035 | |
Shares issued on reinvestment | | 315,951 | | | | 3,579,732 | | | 802,108 | | | | 11,085,098 | |
Shares repurchased | | (2,824,181 | ) | | | (23,967,433 | ) | | (2,176,269 | ) | | | (29,681,295 | ) |
| | | | | | | | | | | | | | |
Net Decrease | | (1,480,524 | ) | | $ | (11,501,666 | ) | | (600,104 | ) | | $ | (7,426,162 | ) |
| | | | | | | | | | | | | | |
Institutional Class | | | | | | | | | | | | | | |
Shares sold | | 113,983 | | | $ | 1,329,414 | | | 155,420 | | | $ | 2,251,995 | |
Shares issued on reinvestment | | 20,605 | | | | 254,675 | | | 40,472 | | | | 593,874 | |
Shares repurchased | | (212,402 | ) | | | (2,081,643 | ) | | (98,049 | ) | | | (1,364,488 | ) |
| | | | | | | | | | | | | | |
Net Increase (Decrease) | | (77,814 | ) | | $ | (497,554 | ) | | 97,843 | | | $ | 1,481,381 | |
| | | | | | | | | | | | | | |
| A | For the period February 3, 2009 (commencement of operations) to March 31, 2009. |
| B | On February 1, 2009, Primary Class shares were renamed Class C shares. |
| | |
30 | | Annual Report to Shareholders |
Notes to Financial Statements — Continued
Legg Mason Classic Valuation Fund — Continued
6. Recent Accounting Pronouncements
In March 2008, the Financial Accounting Standards Board (“FASB”) issued Statement of Financial Accounting Standards No. 161, “Disclosures about Derivative Instruments and Hedging Activities” (“FAS 161”). FAS 161 is effective for fiscal years and interim periods beginning after November 15, 2008. FAS 161 requires enhanced disclosures about the Fund’s derivative and hedging activities, including how such activities are accounted for and their effect on the Fund’s financial position, performance and cash flows. Management is currently evaluating the impact the adoption of FAS 161 will have on the Fund’s financial statements and related disclosures.
In April 2009, FASB issued FASB Staff Position No. 157-4, “Determining Fair Value When the Volume and Level of Activity for the Asset or Liability Have Significantly Decreased and Identifying Transactions That Are Not Orderly” (“FSP 157-4”). FSP 157-4 provides additional guidance for estimating fair value in accordance with FAS 157, when the volume and level of activity for the asset or liability have significantly decreased as well as guidance on identifying circumstances that indicate a transaction is not orderly. FSP 157-4 is effective for fiscal years and interim periods ending after June 15, 2009. Management is currently evaluating the impact the adoption of FSP 157-4 will have on the Fund’s financial statement disclosures.
| | |
Annual Report to Shareholders | | 31 |
Report of Independent Registered Public Accounting Firm
To the Board of Directors of Legg Mason Light Street Trust, Inc. and Shareholders of Classic Valuation Fund:
In our opinion, the accompanying statement of assets and liabilities, including the portfolio of investments, and the related statements of operations and of changes in net assets and the financial highlights present fairly, in all material respects, the financial position of Classic Valuation Fund (comprising Legg Mason Light Street Trust, Inc., the “Fund”) at March 31, 2009, the results of its operations, the changes in its net assets, and the financial highlights for each of the periods presented, in conformity with accounting principles generally accepted in the United States of America. These financial statements and financial highlights (hereafter referred to as “financial statements”) are the responsibility of the Fund’s management; our responsibility is to express an opinion on these financial statements based on our audits. We conducted our audits of these financial statements in accordance with the standards of the Public Company Accounting Oversight Board (United States). Those standards require that we plan and perform the audit to obtain reasonable assurance about whether the financial statements are free of material misstatement. An audit includes examining, on a test basis, evidence supporting the amounts and disclosures in the financial statements, assessing the accounting principles used and significant estimates made by management, and evaluating the overall financial statement presentation. We believe that our audits, which included confirmation of securities at March 31, 2009 by correspondence with the custodian and brokers, provide a reasonable basis for our opinion.
PricewaterhouseCoopers LLP
Baltimore, Maryland
May 19, 2009
| | |
32 | | Annual Report to Shareholders |
Important Tax Information (Unaudited)
The following information is provided with respect to the distributions paid during the taxable year ended March 31, 2009:
| | |
Record date: | | 06/19/2008 |
Payable date: | | 06/20/2008 |
Ordinary income: | | |
Qualified dividend income for individuals | | 100.00% |
Dividends qualifying for the dividends received
deduction for corporations | | 100.00% |
Long-term capital gain dividend | | $0.570300 |
Please retain this information for your records.
| | |
Annual Report to Shareholders | | 33 |
Directors and Officers
The table below provides information about each of the Corporation’s directors and officers, including biographical information about their business experience and information about their relationships with Legg Mason, Inc. and its affiliates. The mailing address of each director and officer is 100 Light Street, Attn: Fund Secretary c/o Legal and Compliance Department, 32nd Floor, Baltimore, Maryland 21202.
| | | | | | | | |
Name, (Year of
Birth) and Position
with Corporation | | Term of
Office and
Length of
Time
ServedA | | Number of Funds
in Fund Complex
Overseen
by Director | | Other
Directorships
Held by Director | | Principal Occupation(s)
During the Past Five Years |
| INDEPENDENT DIRECTORSB: | | | | | | |
Hearn, Ruby P.
(1940)
Director | | Since 2004 | | 14 | | None | | Senior Vice President Emerita of The Robert Wood Johnson Foundation (non-profit) since 2001. Formerly: Senior Vice President of The Robert Wood Johnson Foundation (1996-2001). |
Lehman, Arnold L.
(1944)
Lead Independent Director | | Since 1998 | | 14 | | None | | Director of the Brooklyn Museum since 1997; Trustee of American Federation of Arts since 1998. Formerly: Director of The Baltimore Museum of Art (1979-1997). |
Masters, Robin J.W.
(1955)
Director | | Since 2002 | | 14 | | Director of Cheyne Capital International Limited (investment advisory firm). Director/Trustee of Legg Mason Asian Funds plc, Legg Mason Institutional Funds plc, Western Asset Fixed Income Funds plc and Western Asset Debt Securities Fund plc. | | Retired. Formerly: Chief Investment Officer of ACE Limited (insurance) (1986-2000). |
McGovern, Jill E.
(1944)
Director | | Since 1998 | | 14 | | None | | Senior Consultant, American Institute for Contemporary German Studies (AICGS) since 2007. Formerly: Chief Executive Officer of The Marrow Foundation (non-profit) (1993-2007); Executive Director of the Baltimore International Festival (1991-1993); Senior Assistant to the President of The Johns Hopkins University (1986-1990). |
| | |
34 | | Annual Report to Shareholders |
Directors and Officers — Continued
| | | | | | | | |
Name, (Year of
Birth) and Position
with Corporation | | Term of
Office and
Length of
Time
ServedA | | Number of Funds
in Fund Complex
Overseen
by Director | | Other
Directorships
Held by Director | | Principal Occupation(s)
During the Past Five Years |
Mehlman, Arthur S.
(1942)
Director | | Since 2002 | | Director/Trustee of all Legg Mason funds consisting of 14 portfolios; Director/Trustee of the Royce Family of Funds consisting of 28 portfolios. | | Director of Municipal Mortgage & Equity, LLC. | | Retired. Formerly: Partner, KPMG LLP (international accounting firm) (1972-2002). |
O’Brien, G. Peter
(1945)
Director | | Since 1999 | | Director/Trustee of all Legg Mason funds consisting of 14 portfolios; Director/Trustee of the Royce Family of Funds consisting of 28 portfolios. | | Director of Technology Investment Capital Corp. | | Retired. Trustee Emeritus of Colgate University; Board Member, Hill House, Inc. (residential home care); Board Member, Bridges School (pre-school). Formerly: Managing Director, Equity Capital Markets Group of Merrill Lynch & Co. (1971-1999). |
Rowan, S. Ford
(1943)
Director | | Since 2002 | | 14 | | None | | Chairman, National Center for Critical Incident Analysis, National Defense University, since 2004; Professional Lecturer in Organizational Sciences, The George Washington University, since 2008. Formerly: Consultant, Rowan & Blewitt Inc. (management consulting) (1984-2007). |
Tarola, Robert M.
(1950)
Director | | Since 2004 | | 14 | | Director of TeleTech Holdings, Inc. | | President of Right Advisory LLC (corporate finance and governance consulting) since 2008; Formerly: Senior Vice President and Chief Financial Officer of W.R. Grace & Co. (specialty chemicals and materials) (1999 to 2008), and of MedStar Health, Inc. (hospitals and healthcare) (1996 to 1999); Partner, Price Waterhouse LLP (accounting and auditing) from (1984 to 1996). |
| | |
Annual Report to Shareholders | | 35 |
| | | | | | | | |
Name, (Year of
Birth) and Position
with Corporation | | Term of
Office and
Length of
Time
ServedA | | Number of Funds
in Fund Complex
Overseen by
Director | | Other
Directorships
Held by Director | | Principal Occupation(s)
During the Past Five Years |
| INTERESTED DIRECTORSC : | | | | | | |
Fetting, Mark R.
(1954)
Chairman and Director | | Director since 2002 and Chairman since 2008 | | Chairman and Director/Trustee of all Legg Mason Funds consisting of 14 portfolios; Director/Trustee of the Royce Family of Funds consisting of 28 portfolios. | | None | | President, CEO, Chairman and Director of Legg Mason, Inc. and Chairman of Legg Mason Funds since 2008. Formerly: President of all Legg Mason Funds (2001-2008). Senior Executive Vice President of Legg Mason, Inc., Director and/or officer of various Legg Mason, Inc. affiliates (2000-2008). Division President and Senior Officer of Prudential Financial Group, Inc. and related companies, including fund boards and consulting services to subsidiary companies (1991-2000); Partner, Greenwich Associates (financial consulting); Vice President, T. Rowe Price Group, Inc. |
Odenath, David
(1957)
President and Director | | Since 2008 | | 14 | | None | | Senior Executive Vice President of Legg Mason, Inc. and President of Legg Mason Funds since 2008. Formerly: President of Prudential Annuities (2002-2008); Executive Vice President (2003-2008) of American Skandia Investment Services, Inc; Chief Executive Officer and Director (2003-2008) of American Skandia Life Assurance Corporation, American Skandia Information Services and Technology Corporation and Skandia U.S. Inc.; President, Chief Executive Officer and Director (2003-2008) of American Skandia Marketing, Inc.; Formerly President, Chief Executive Officer, Chief Operating Officer and Officer-In-Charge (1999- 2003) of PI; Senior Vice President (1999-2003) of Prudential; formerly Senior Vice President (1993-1999) of PaineWebber Group, Inc. |
| | |
36 | | Annual Report to Shareholders |
Directors and Officers — Continued
| | | | | | | | |
Name, (Year of
Birth) and Position
with Corporation | | Term of
Office and
Length of
Time
ServedA | | Number of Funds
in Fund Complex
Overseen by
Director | | Other
Directorships
Held by Director | | Principal Occupation(s)
During the Past Five Years |
| EXECUTIVE OFFICERS : | | |
Gerken, R. Jay
(1951) Vice President | | Since 2009 | | N/A | | N/A | | Managing Director of Legg Mason & Co., LLC, Chairman, President and Chief Executive Officer of certain mutual funds associated with Legg Mason & Co., LLC or its affiliates (2005-present); President of Legg Mason Partners Fund Advisor, LLC (“LMPFA”) (2006-present); Chairman of Smith Barney Fund Management LLC and Citi Fund Management Inc. (2002-2005); Chairman, President and Chief Executive Officer of Travelers Investment Adviser, Inc. (2002-2005). |
Ozsolak, Kaprel (1965) Chief Financial Officer
and Treasurer | | Since 2009 | | N/A | | N/A | | Director of Legg Mason; Chief Financial Officer and Treasurer of certain mutual funds associated with Legg Mason; formerly, Controller of certain mutual funds associated with certain predecessor firms of Legg Mason (from 2002 to 2004). |
Frenkel, Robert I. (1954) Secretary and Chief Legal Officer | | Since 2009 | | N/A | | N/A | | Managing Director and General Counsel of Global Mutual Funds for Legg Mason and its predecessors (since 1994); Secretary and Chief Legal Officer of mutual funds associated with Legg Mason (since 2003); formerly, Secretary of CFM (from 2001 to 2004). |
Becker, Ted P. (1951) Vice President and Chief Compliance Officer | | Since 2007 | | N/A | | N/A | | Director of Global Compliance at Legg Mason (2006 to present); Managing Director of Compliance at Legg Mason & Co. (2005 to present); Chief Compliance Officer with certain mutual funds associated with Legg Mason & Co. (since 2006); Chief Compliance Officer of Legg Mason Partners Funds and certain affiliates; Managing Director of Compliance at Citigroup Asset Management (2002 to 2005). Prior to 2002, Managing Director-Internal Audit & Risk Review at Citigroup Inc. |
| | |
Annual Report to Shareholders | | 37 |
ADDITIONAL INFORMATION ABOUT THE CORPORATION’S
DIRECTORS AND OFFICERS IS CONTAINED IN THE STATEMENT OF ADDITIONAL INFORMATION, AVAILABLE WITHOUT CHARGE UPON REQUEST BY CALLING 1-800-822-5544 OR ON THE SECURITIES AND EXCHANGE COMMISSION’S WEBSITE (http://www.sec.gov).
| A | Officers of the Corporation are elected annually to serve until their successors are elected and qualified. Directors of the Corporation serve a term of indefinite length until their resignation, retirement in accordance with the Board’s retirement policy, or removal, and stand for re-election by shareholders only as and when required by the 1940 Act. |
| B | Each of the Independent Directors serves on the standing committees of the Board of Directors, which include the Audit Committee (chair: Arthur Mehlman), the Nominating Committee (co-chairs: Peter O’Brien and Jill McGovern), and the Independent Directors Committee (chair: Arnold Lehman). |
| C | Mr. Fetting and Mr. Odenath are considered to be interested persons, as defined in the 1940 Act, of the Corporation on the basis of their current employment with the Fund’s investment adviser or its affiliated entities (including the Fund’s principal underwriter) and Legg Mason, Inc., the parent holding company of those entities, as well as their ownership of Legg Mason, Inc. stock. |
| | |
38 | | Annual Report to Shareholders |
Board Consideration of Legg Mason Classic Valuation Fund’s Investment Advisory and Management Agreements
At its November 2008 meeting, the Board of Directors (the “Board”), including all of the Independent Directors, approved the continuation of the Management Agreement between Legg Mason Fund Adviser, Inc. (the “Manager”) and Legg Mason Light Street Trust, Inc., on behalf of Legg Mason Classic Valuation Fund (“Classic Valuation”), and the Investment Advisory Agreement between the Manager and Brandywine Global Investment Management, LLC (the “Adviser”) (each an “Agreement”). In voting to approve the continuation of each Agreement, the Board considered whether continuance would be in the best interest of Classic Valuation and its shareholders, an evaluation largely based on the nature and quality of the services provided under each Agreement and the overall fairness of each Agreement to Classic Valuation. In considering each Agreement, the Board did not identify any single factor or item of information as all-important or controlling. Based on its evaluation of all material factors, including those described below, the Board concluded that the terms of each Agreement are reasonable and fair and that the continuation of each Agreement is in the best interest of Classic Valuation and its shareholders.
Prior to the Board action, the Independent Directors met as a committee, together with experienced 1940 Act counsel, to consider their recommendation as to continuance of each Agreement. As part of the process to consider each Agreement, legal counsel to Classic Valuation requested certain information from the Manager and the Adviser on behalf of the Independent Directors, and in response, the Manager and the Adviser provided extensive reports that addressed specific factors designed to inform the Board’s consideration of each Agreement. Counsel also provided the Independent Directors and the Board with a memorandum detailing their responsibilities pertaining to the continuance of each Agreement.
In addition to the November meeting, the Independent Directors met in executive session in October 2008, at which time they reviewed and analyzed materials relating to each Agreement. The Independent Directors also retained independent consultants to assist them in their review and analysis of each Agreement. The Board meets at least another three times per year in order to oversee the Legg Mason Funds, including meetings at which the portfolio manager of Classic Valuation or others make presentations and discuss performance, compliance and other applicable issues. The Board also drew upon its long association with the Manager, the Adviser and their personnel and the Board members’ familiarity with their culture and the manner in which the management entities have sought to strengthen and enhance themselves.
With respect to the nature, scope and quality of the services provided, the Board considered the experience and commitment of the Manager’s and the Adviser’s personnel and their efforts to build and support a strong service team. The Board also considered the nature and quality of the Adviser’s investment process. In assessing
| | |
Annual Report to Shareholders | | 39 |
Board Consideration of Legg Mason Classic Valuation Fund’s Investment Advisory and Management Agreements — Continued
performance, the Board compared Classic Valuation’s returns to the average of an appropriate Lipper category, a specified benchmark index and a peer group of investment companies pursuing similar strategies, all over multiple time periods. The Board considered very carefully Classic Valuation’s performance and discussed with the Manager and the Adviser steps that the Manager and the Adviser had taken, or intended to take, to improve performance. The Board considered whether a reduction in assets under management would adversely affect the resources available to the Manager and the Adviser. The Board also considered the level of service provided by the Manager to Classic Valuation, including oversight of the transfer agent and the custodian and preparation of regulatory filings. The Board considered the Adviser’s procedures for executing portfolio transactions for Classic Valuation. The Board also reviewed the Adviser’s policies and procedures for the selection of brokers and dealers and on obtaining research from brokers.
In determining whether the terms of each Agreement are reasonable and fair, the Board considered the terms and fee structure of each Agreement. In that connection, the Board considered the costs to the Manager and the Adviser in providing services to Classic Valuation and profitability for the Manager and its affiliates from their overall association with Classic Valuation. The Board reviewed information about the advisory fee schedule and overall expense ratio of Classic Valuation and comparable fee schedules and expense ratios of a peer group of funds. In considering whether any economies of scale experienced by the Manager and the Adviser in providing services to Classic Valuation were shared with Classic Valuation, the Board noted that Classic Valuation’s advisory fee structure provides for a reduction of the effective fee rate as asset levels increase and the Manager’s contractual agreement to waive fees for Classic Valuation. The Board also compared Classic Valuation’s advisory fee schedule to the advisory fees charged by the Manager and the Adviser to their other accounts managed in a similar style. In that connection, the Board considered the differences in the level of services provided and the differences in responsibility of the Manager and the Adviser to Classic Valuation and to the other accounts. Finally, the Board considered other benefits accruing to the Manager, the Adviser and their affiliates by virtue of their relationship to Classic Valuation.
After an evaluation of all material factors, including those in the foregoing discussion, the Board concluded that the continuation of each Agreement is in the best interest of Classic Valuation.
About the Legg Mason Funds
| | | | |
| | Equity Funds American Leading Companies Trust Batterymarch U.S. Small Capitalization
Equity Portfolio Classic Valuation Fund Growth Trust Special Investment Trust U.S. Small-Capitalization Value Trust Value Trust Specialty Fund Opportunity Trust Global Funds Emerging Markets Trust International Equity Trust Taxable Bond Funds Investment Grade Income Portfolio Limited Duration Bond Portfolio Tax-Free Bond Fund Maryland Tax-Free Income Trust | | Legg Mason, Inc., based in Baltimore, Maryland, has built its reputation, at least in part, on the success of the Legg Mason Funds, introduced in 1979. The primary purpose of our funds is to enable investors to diversify their portfolios across various asset classes and, consequently, enjoy the stability and growth prospects generally associated with diversification. The success of our funds is contingent on the experience, discipline, and acumen of our fund managers. We believe the quality of our managers is crucial to investment success. Unlike many firms, which focus on a particular asset class or the fluctuations of the market, at Legg Mason we focus on providing a collection of top-notch managers in all the major asset classes. Information about the policies and procedures that the Fund uses to determine how to vote proxies relating to its portfolio securities is contained in the Statement of Additional Information, available without charge upon request by calling 1-800-822-5544 or on the Securities and Exchange Commission’s (“SEC”) website (http://www.sec.gov). Information regarding how the Fund voted proxies relating to portfolio securities during the most recent twelve-month period ended June 30 is also available on the SEC’s website or through the Legg Mason Funds’ website at www.leggmason.com/individualinvestors. The Fund files its complete schedule of portfolio holdings with the SEC for the first and third quarters of each fiscal year on Form N-Q. You may obtain a free copy of the Fund’s portfolio holdings, as filed on Form N-Q, by contacting the Fund at the appropriate phone number, address or website listed below. Additionally, the Fund’s Form N-Q is available on the SEC’s website or may be reviewed and copied at the SEC’s Public Reference Room in Washington, D.C. Information about the operation of the Public Reference Room can be obtained by calling 1-800-SEC-0330. |
This report must be preceded or accompanied by a free prospectus. Investors should consider a Fund’s investment objectives, risks, charges, and expenses carefully before investing. The prospectus contains this and other important information about the Fund. For a free prospectus for this or any other Legg Mason Fund, visit www.leggmason.com/individualinvestors. Please read the prospectus carefully before investing.
| | |
Legg Mason Funds For A and C Class Shareholders P.O. Box 55214 Boston, MA 02205-8504 800-822-5544 www.leggmason.com/individualinvestors | | Legg Mason Funds For R, FI and I Class Shareholders P.O. Box 55214 Boston, MA 02206-8037 888-425-6432 www.leggmason.com/individualinvestors |
Legg Mason Investor Services, LLC, Distributor
A Legg Mason, Inc. subsidiary

LMF-233/A (05/09) SR09-815