Exhibit (17)(i)

SEMI-ANNUAL REPORT / JANUARY 31, 2009
Legg Mason Partners
Convertible Fund
| | |
| Managed by | | CLEARBRIDGE ADVISORS |
INVESTMENT PRODUCTS: NOT FDIC INSURED • NO BANK GUARANTEE • MAY LOSE VALUE
Fund objective
The Fund seeks current income and capital appreciation.
What’s inside
Legg Mason Partners Fund Advisor, LLC (“LMPFA”) is the Fund’s investment manager and ClearBridge Advisors, LLC (“ClearBridge”) is the Fund’s subadviser. LMPFA and ClearBridge are wholly-owned subsidiaries of Legg Mason, Inc.
Letter from the chairman

R. Jay Gerken, CFA
Chairman, President and Chief Executive Officer
Dear Shareholder,
The U.S. economy weakened significantly during the six-month reporting period ended January 31, 2009. Looking back, U.S. gross domestic product (“GDP”)i growth was 2.8% during the second quarter of 2008. Contributing to the economy’s expansion were rising exports that were buoyed by a weakening U.S. dollar. In addition, consumer spending accelerated, aided by the government’s tax rebate program. However, the dollar’s rally and the end of the rebate program, combined with other strains on the economy, caused GDP to take a step backward during the second half of 2008. According to the U.S. Department of Commerce, third quarter 2008 GDP declined 0.5% and its preliminary estimate for fourth quarter GDP decline was 6.2%, the latter being the worst quarterly reading since 1982.
While there were increasing signs that the U.S. was headed for a recession, the speculation ended in December 2008. At that time, the National Bureau of Economic Research (“NBER”) — which has the final say on when one begins and ends — announced that a recession had begun in December 2007. The NBER determined that a recession had already started using its definition, which is based on “a significant decline in economic activity spread across the economy, lasting more than a few months, normally visible in production, employment, real income and other indicators.”
Regardless of how one defines a recession, it has felt like we have been in the midst of a recession for quite some time. Consumer spending, which represents approximately two-thirds of GDP, has been disappointing. According to the International Council of Shopping Centers, retail sales rose a tepid 1% in 2008, the weakest level in at least thirty-eight years. In terms of the job market, the U.S. Department of Labor reported that payroll employment declined during each of the last thirteen months ended January 2009. Over that period, 3.6 million jobs were lost, with half of the total occurring during the last three months. In addition, in January 2009, the unemployment rate hit 7.6%, a sixteen-year high.
Ongoing issues related to the housing and subprime mortgage markets and seizing credit markets prompted the Federal Reserve Board (“Fed”)ii to take aggressive and, in some cases, unprecedented actions. When the reporting
| | |
| Legg Mason Partners Convertible Fund | | I |
Letter from the chairman continued
period began, the federal funds rateiii was 2.00%. While the Fed had cut rates a total of 2.25%, from 4.25% to 2.00% during the first four months of 2008, it then left rates on hold for several months. This was due to growing inflationary pressures as a result of soaring oil and commodity prices, coupled with the sagging U.S. dollar. However, as inflation receded along with oil prices and the global financial crisis escalated, the Fed cut rates twice in October 2008 to 1.00%. Then, in December 2008, it reduced the federal funds rate to a range of zero to 0.25% — an historic low — and maintained this stance during its next meeting in January 2009. In conjunction with the January meeting, the Fed stated that it “will employ all available tools to promote the resumption of sustainable economic growth and to preserve price stability. The focus of the Committee’s policy is to support the functioning of financial markets and stimulate the economy through open market operations and other measures that are likely to keep the size of the Federal Reserve’s balance sheet at a high level.”
In addition to the interest rate cuts, the Fed took several actions to improve liquidity in the credit markets. Prior to the beginning of the reporting period, in March 2008, it established a new lending program allowing certain brokerage firms, known as primary dealers, to also borrow from its discount window. Also in March, the Fed played a major role in facilitating the purchase of Bear Stearns by JPMorgan Chase. In mid-September 2008, it announced an $85 billion rescue plan for ailing AIG and pumped $70 billion into the financial system as Lehman Brothers’ bankruptcy and mounting troubles at other financial firms roiled the markets.
The U.S. Department of the Treasury has also taken an active role in attempting to stabilize the financial system, as it orchestrated the government’s takeover of mortgage giants Fannie Mae and Freddie Mac in September 2008. In addition, on October 3, 2008, the Treasury’s $700 billion Troubled Asset Relief Program (“TARP”) was approved by Congress and signed into law by former President Bush. President Obama has made reviving the economy a priority in his administration, as his economic stimulus package is expected to surpass $800 billion.
The U.S. stock market was extremely volatile and generated very poor results during the six months ended January 31, 2009. After posting a modest gain in August 2008, the escalating credit crisis, mounting turmoil in the financial markets and the rapidly weakening economy caused stock prices to move lower during four of the last five months of the reporting period, as measured by S&P 500 Indexiv (the “Index”) returns of -8.91%, -16.79% and -7.18% in September, October and November 2008, respectively. The Index ended the period by falling 8.43% in January 2009, its worst month of January ever. All told, the Index returned -33.95% during the six months ended January 31, 2009.
| | |
| II | | Legg Mason Partners Convertible Fund |
Turning to the fixed-income markets, both short- and long-term Treasury yields experienced periods of extreme volatility during the six-month reporting period ended January 31, 2009. While earlier in 2008 investors were focused on the subprime segment of the mortgage-backed market, these concerns broadened to include a wide range of financial institutions and markets. As a result, other fixed-income instruments also experienced increased price volatility. This unrest triggered several “flights to quality,” causing Treasury yields to move lower (and their prices higher), while riskier segments of the market saw their yields move higher (and their prices lower). This was particularly true toward the end of 2008, as the turmoil in the financial markets and sharply falling stock prices caused investors to flee securities that were perceived to be risky, even high-quality corporate bonds and high-grade municipal bonds. On several occasions, the yield available from short-term Treasuries fell to nearly zero, as investors were essentially willing to forgo any return potential in order to access the relative safety of government-backed securities. During the six months ended January 31, 2009, two-year Treasury yields fell from 2.52% to 0.94%. Over the same time frame, ten-year Treasury yields moved from 3.99% to 2.87%. Looking at the six-month period as a whole, the overall bond market, as measured by the Barclays Capital U.S. Aggregate Indexv, returned 3.23%.
Performance review
For the six months ended January 31, 2009, Class A shares of Legg Mason Partners Convertible Fund, excluding sales charges, returned -37.85%. The Fund’s unmanaged benchmark, the Merrill Lynch All Convertibles Indexvi, returned -30.67% for the same period. The Lipper Convertible Securities Funds Category Average1 returned -28.93% over the same time frame.
| 1 | Lipper, Inc., a wholly-owned subsidiary of Reuters, provides independent insight on global collective investments. Returns are based on the six-month period ended January 31, 2009, including the reinvestment of all distributions, including returns of capital, if any, calculated among the 74 funds in the Fund’s Lipper category, and excluding sales charges. |
| | |
| Legg Mason Partners Convertible Fund | | III |
Letter from the chairman continued
| | |
| PERFORMANCE SNAPSHOT as of January 31, 2009 (excluding sales charges) (unaudited) |
| | | 6 MONTHS
(not annualized) |
| Convertible Fund — Class A Shares | | -37.85% |
| Merrill Lynch All Convertibles Index | | -30.67% |
| Lipper Convertible Securities Funds Category Average1 | | -28.93% |
| | |
| The performance shown represents past performance. Past performance is no guarantee of future results and current performance may be higher or lower than the performance shown above. Principal value and investment returns will fluctuate and investors’ shares, when redeemed, may be worth more or less than their original cost. To obtain performance data current to the most recent month-end, please visit our website at www.leggmason.com/individualinvestors. |
| Excluding sales charges, Class B shares returned -38.03%, Class C shares returned -38.08% and Class I shares returned -37.75% over the six months ended January 31, 2009. All share class returns assume the reinvestment of all distributions, including returns of capital, if any, at net asset value and the deduction of all Fund expenses. Returns have not been adjusted to include sales charges that may apply when shares are purchased or the deduction of taxes that a shareholder would pay on Fund distributions. |
| Performance figures reflect expense reimbursements and/or fee waivers, without which the performance would have been lower. |
| TOTAL ANNUAL OPERATING EXPENSES (unaudited) |
| As of the Fund’s most current prospectus dated November 7, 2008, the gross total operating expense ratios for Class A, Class B, Class C and Class I shares were 1.41%, 1.96%, 2.16% and 0.94%, respectively. |
| As a result of expense limitations, the ratio of expenses, other than interest, brokerage, taxes and extraordinary expenses, to average net assets will not exceed 1.17% for Class A shares, 1.71% for Class B shares, 1.89% for Class C shares and 0.78% for Class I shares. These expense limitations may be reduced or terminated at any time. |
Special shareholder notice
Peter D. Luke and Patrick J. McElroy, CFA, each of whom is a Director and Portfolio Manager for ClearBridge Advisors, LLC, the Fund’s subadviser, manage the day-to-day operations of the Fund. Mr. Luke has been responsible for the Fund’s day-to-day management and oversight since 2001. On November 7, 2008, Mr. McElroy assumed co-portfolio management responsibilities for the Fund.
A special note regarding increased market volatility
In recent months, we have experienced a series of events that have impacted the financial markets and created concerns among both novice and seasoned investors alike. In particular, we have witnessed the failure and consolidation of several storied financial institutions, periods of heightened market volatility, and aggressive actions by the U.S. federal
| 1 | Lipper, Inc., a wholly-owned subsidiary of Reuters, provides independent insight on global collective investments. Returns are based on the six-month period ended January 31, 2009, including the reinvestment of all distributions, including returns of capital, if any, calculated among the 74 funds in the Fund’s Lipper category, and excluding sales charges. |
| | |
| IV | | Legg Mason Partners Convertible Fund |
government to steady the financial markets and restore investor confidence. While we hope that the worst is over in terms of the issues surrounding the credit and housing crises, it is likely that the fallout will continue to impact the financial markets and the U.S. economy well into 2009.
Like all asset management firms, Legg Mason has not been immune to these difficult and, in some ways, unprecedented times. However, today’s challenges have only strengthened our resolve to do everything we can to help you reach your financial goals. Now, as always, we remain committed to providing you with excellent service and a full spectrum of investment choices. And rest assured, we will continue to work hard to ensure that our investment managers make every effort to deliver strong long-term results.
We also remain committed to supplementing the support you receive from your financial advisor. One way we accomplish this is through our enhanced website, www.leggmason.com/individualinvestors. Here you can gain immediate access to many special features to help guide you through difficult times, including:
| • | | Fund prices and performance, |
| • | | Market insights and commentaries from our portfolio managers, and |
| • | | A host of educational resources. |
During periods of market unrest, it is especially important to work closely with your financial advisor and remember that reaching one’s investment goals unfolds over time and through multiple market cycles. Time and again, history has shown that, over the long run, the markets have eventually recovered and grown.
Information about your fund
As you may be aware, several issues in the mutual fund industry have come under the scrutiny of federal and state regulators. Affiliates of the Fund’s manager have, in recent years, received requests for information from various government regulators regarding market timing, late trading, fees, and other mutual fund issues in connection with various investigations. The regulators appear to be examining, among other things, the Fund’s response to market timing and shareholder exchange activity, including compliance with prospectus disclosure related to these subjects. The Fund is not in a position to predict the outcome of these requests and investigations.
Important information with regard to recent regulatory developments that may affect the Fund is contained in the Notes to Financial Statements included in this report.
| | |
| Legg Mason Partners Convertible Fund | | V |
Letter from the chairman continued
As always, thank you for your confidence in our stewardship of your assets. We look forward to helping you meet your financial goals.
Sincerely,

R. Jay Gerken, CFA
Chairman, President and Chief Executive Officer
February 27, 2009
The information provided is not intended to be a forecast of future events, a guarantee of future results or investment advice. Views expressed may differ from those of the firm as a whole.
RISKS: Convertible securities are subject to stock market, credit and interest rate risks. Investments in bonds are subject to interest rate and credit risks. As interest rates rise, bond prices fall, reducing the value of the Fund’s share price. Investing in foreign securities is subject to certain risks not associated with domestic investing, such as currency fluctuations, and changes in political and economic conditions. These risks are magnified in emerging or developing markets. High-yield bonds involve greater credit and liquidity risks than investment grade bonds. The Fund may use derivatives, such as options and futures, which can be illiquid, may disproportionately increase losses, and have a potentially large impact on Fund performance. Please see the Fund’s prospectus for more information on these and other risks.
All index performance reflects no deduction for fees, expenses or taxes. Please note that an investor cannot invest directly in an index.
| i | Gross domestic product (“GDP”) is the market value of all final goods and services produced within a country in a given period of time. |
| ii | The Federal Reserve Board (“Fed”) is responsible for the formulation of policies designed to promote economic growth, full employment, stable prices, and a sustainable pattern of international trade and payments. |
| iii | The federal funds rate is the rate charged by one depository institution on an overnight sale of immediately available funds (balances at the Federal Reserve) to another depository institution; the rate may vary from depository institution to depository institution and from day to day. |
| iv | The S&P 500 Index is an unmanaged index of 500 stocks and is generally representative of the performance of larger companies in the U.S. |
| v | The Barclays Capital (formerly Lehman Brothers) U.S. Aggregate Index is a broad-based bond index comprised of government, corporate, mortgage- and asset-backed issues, rated investment grade or higher, and having at least one year to maturity. |
| vi | The Merrill Lynch All Convertibles Index is a widely used, unmanaged index that measures convertible securities’ performance. It measures the performance of U.S. dollar-denominated convertible securities not currently in bankruptcy with a total market value greater than $50 million at issuance. |
| | |
| VI | | Legg Mason Partners Convertible Fund |
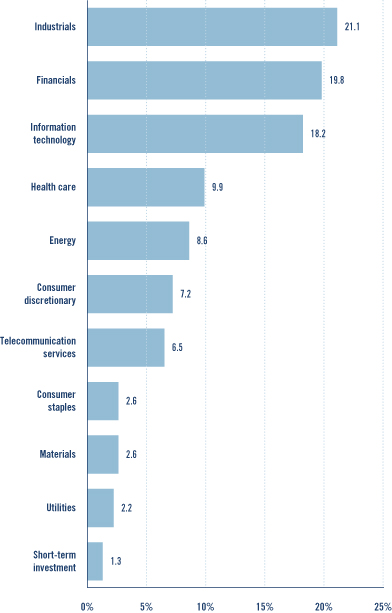
Fund at a glance (unaudited)
|
| INVESTMENT BREAKDOWN (%) As a percent of total investments — January 31, 2009 |
| | |
| Legg Mason Partners Convertible Fund 2009 Semi-Annual Report | | 1 |
Fund expenses (unaudited)
Example
As a shareholder of the Fund, you may incur two types of costs: (1) transaction costs, including front-end and back-end sales charges (loads) on purchase payments; and (2) ongoing costs, including management fees; distribution and/or service (12b-1) fees; and other Fund expenses. This example is intended to help you understand your ongoing costs (in dollars) of investing in the Fund and to compare these costs with the ongoing costs of investing in other mutual funds.
This example is based on an investment of $1,000 invested on August 1, 2008 and held for the six months ended January 31, 2009.
Actual expenses
The table below titled “Based on Actual Total Return” provides information about actual account values and actual expenses. You may use the information provided in this table together with the amount you invested to estimate the expenses that you paid over the period. To estimate the expenses you paid on your account, divide your ending account value by $1,000 (for example, an $8,600 ending account value divided by $1,000 = 8.6), then multiply the result by the number under the heading entitled “Expenses Paid During the Period”.
| | | | | | | | | | | | | | | |
| BASED ON ACTUAL TOTAL RETURN1 | | | | | | | |
| | | ACTUAL TOTAL
RETURN
WITHOUT
SALES
CHARGES2 | | | BEGINNING
ACCOUNT
VALUE | | ENDING
ACCOUNT
VALUE | | ANNUALIZED
EXPENSE
RATIO | | | EXPENSES
PAID DURING
THE PERIOD3 |
| Class A | | (37.85 | )% | | $ | 1,000.00 | | $ | 621.50 | | 1.17 | % | | $ | 4.78 |
| Class B | | (38.03 | ) | | | 1,000.00 | | | 619.70 | | 1.71 | | | | 6.98 |
| Class C | | (38.08 | ) | | | 1,000.00 | | | 619.20 | | 1.89 | | | | 7.71 |
| Class I | | (37.75 | ) | | | 1,000.00 | | | 622.50 | | 0.78 | | | | 3.19 |
| 1 | For the six months ended January 31, 2009. |
| 2 | Assumes the reinvestment of all distributions, including returns of capital, if any, at net asset value and does not reflect the deduction of the applicable sales charge with respect to Class A shares or the applicable contingent deferred sales charges (“CDSC”) with respect to Class B and C shares. Total return is not annualized, as it may not be representative of the total return for the year. Performance figures may reflect fee waivers and/or expense reimbursements. Past performance is no guarantee of future results. In the absence of fee waivers and/or expense reimbursements, the total return would have been lower. |
| 3 | Expenses (net of fee waivers and/or expense reimbursements) are equal to each class’ respective annualized expense ratio multiplied by the average account value over the period, multiplied by the number of days in the most recent fiscal half-year then divided by 365. |
| | |
| 2 | | Legg Mason Partners Convertible Fund 2009 Semi-Annual Report |
Hypothetical example for comparison purposes
The table below titled “Based on Hypothetical Total Return” provides information about hypothetical account values and hypothetical expenses based on the actual expense ratio and an assumed rate of return of 5.00% per year before expenses, which is not the Fund’s actual return. The hypothetical account values and expenses may not be used to estimate the actual ending account balance or expenses you paid for the period. You may use the information provided in this table to compare the ongoing costs of investing in the Fund and other funds. To do so, compare the 5.00% hypothetical example relating to the Fund with the 5.00% hypothetical examples that appear in the shareholder reports of the other funds.
Please note that the expenses shown in the table below are meant to highlight your ongoing costs only and do not reflect any transactional costs, such as front-end or back-end sales charges (loads). Therefore, the table is useful in comparing ongoing costs only, and will not help you determine the relative total costs of owning different funds. In addition, if these transaction costs were included, your costs would have been higher.
| | | | | | | | | | | | | | | |
| BASED ON HYPOTHETICAL TOTAL RETURN1 | | | | | | | |
| | | HYPOTHETICAL
ANNUALIZED
TOTAL
RETURN | | | BEGINNING
ACCOUNT
VALUE | | ENDING
ACCOUNT
VALUE | | ANNUALIZED
EXPENSE
RATIO | | | EXPENSES
PAID DURING
THE PERIOD2 |
| Class A | | 5.00 | % | | $ | 1,000.00 | | $ | 1,019.31 | | 1.17 | % | | $ | 5.96 |
| Class B | | 5.00 | | | | 1,000.00 | | | 1,016.59 | | 1.71 | | | | 8.69 |
| Class C | | 5.00 | | | | 1,000.00 | | | 1,015.68 | | 1.89 | | | | 9.60 |
| Class I | | 5.00 | | | | 1,000.00 | | | 1,021.27 | | 0.78 | | | | 3.97 |
| 1 | For the six months ended January 31, 2009. |
| 2 | Expenses (net of fee waivers and/or expense reimbursements) are equal to each class’ respective annualized expense ratio multiplied by the average account value over the period, multiplied by the number of days in the most recent fiscal half-year, then divided by 365. |
| | |
| Legg Mason Partners Convertible Fund 2009 Semi-Annual Report | | 3 |
Schedule of investments (unaudited)
January 31, 2009
| | | | | | |
| LEGG MASON PARTNERS CONVERTIBLE FUND | | |
FACE
AMOUNT | | SECURITY | | VALUE |
| | | | | | |
| | CONVERTIBLE BONDS & NOTES — 79.2% | | | |
| | CONSUMER DISCRETIONARY — 4.6% | | | |
| | | | Household Durables — 1.4% | | | |
| $ | 1,100,000 | | Beazer Homes USA Inc., Senior Notes, 4.625% due 6/15/24 | | $ | 467,500 |
| | | | Specialty Retail — 1.6% | | | |
| | 1,000,000 | | Charming Shoppes Inc., Senior Notes, 1.125% due 5/1/14(a) | | | 261,250 |
| | | | Pier 1 Imports Inc., Senior Notes: | | | |
| | 500,000 | | 6.375% due 2/15/36(a) | | | 143,125 |
| | 350,000 | | 6.375% due 2/15/36 | | | 100,188 |
| | | | Total Specialty Retail | | | 504,563 |
| | | | Textiles, Apparel & Luxury Goods — 1.6% | | | |
| | 900,000 | | Iconix Brand Group Inc., Senior Subordinated Notes,
1.875% due 6/30/12 | | | 522,000 |
| | | | TOTAL CONSUMER DISCRETIONARY | | | 1,494,063 |
| | CONSUMER STAPLES — 2.6% | | | |
| | | | Food & Staples Retailing — 2.6% | | | |
| | 1,150,000 | | Pantry Inc., Senior Subordinated Notes, 3.000% due 11/15/12 | | | 679,937 |
| | 850,000 | | Rite Aid Corp., Senior Notes, 8.500% due 5/15/15 | | | 160,438 |
| | | | TOTAL CONSUMER STAPLES | | | 840,375 |
| | ENERGY — 5.1% | | | |
| | | | Energy Equipment & Services — 1.2% | | | |
| | 400,000 | | Cameron International Corp., Senior Notes, 2.500% due 6/15/26 | | | 415,000 |
| | | | Oil, Gas & Consumable Fuels — 3.9% | | | |
| | | | GMX Resources Inc., Senior Notes: | | | |
| | 600,000 | | 5.000% due 2/1/13(a) | | | 534,750 |
| | 150,000 | | 5.000% due 2/1/13(b) | | | 133,688 |
| | 900,000 | | Parker Drilling Co., Senior Notes, 2.125% due 7/15/12 | | | 599,625 |
| | | | Total Oil, Gas & Consumable Fuels | | | 1,268,063 |
| | | | TOTAL ENERGY | | | 1,683,063 |
| | FINANCIALS — 13.1% | | | |
| | | | Capital Markets — 1.5% | | | |
| | 700,000 | | Affiliated Managers Group Inc., Senior Notes, 3.950% due 8/15/38(a) | | | 485,625 |
| | | | Commercial Banks — 2.6% | | | |
| | 1,400,000 | | CapitalSource Inc., Senior Subordinated Notes, 7.250% due 7/15/37 | | | 862,750 |
| | | | Consumer Finance — 3.4% | | | |
| | 1,000,000 | | AmeriCredit Corp., 2.125% due 9/15/13 | | | 376,250 |
| | 1,700,000 | | Dollar Financial Corp., Senior Notes, 2.875% due 6/30/27 | | | 722,500 |
| | | | Total Consumer Finance | | | 1,098,750 |
| | | | Diversified Financial Services — 1.5% | | | |
| | 650,000 | | Nasdaq Stock Market Inc., Senior Notes, 2.500% due 8/15/13(a) | | | 503,750 |
See Notes to Financial Statements.
| | |
| 4 | | Legg Mason Partners Convertible Fund 2009 Semi-Annual Report |
| | | | | | |
| LEGG MASON PARTNERS CONVERTIBLE FUND | | |
FACE
AMOUNT | | SECURITY | | VALUE |
| | | | | | |
| | | | Real Estate Investment Trusts (REITs) — 2.3% | | | |
| $ | 1,750,000 | | NorthStar Realty Finance LP, Senior Notes, 7.250% due 6/15/27(a) | | $ | 748,125 |
| | | | Thrifts & Mortgage Finance — 1.8% | | | |
| | 3,700,000 | | BankUnited Capital Trust, Senior Subordinated Notes,
3.125% due 3/1/34 | | | 573,500 |
| | | | TOTAL FINANCIALS | | | 4,272,500 |
| | HEALTH CARE — 9.8% | | | |
| | | | Biotechnology — 1.2% | | | |
| | 750,000 | | Incyte Corp., Subordinated Notes, 3.500% due 2/15/11 | | | 378,750 |
| | | | Health Care Equipment & Supplies — 2.0% | | | |
| | 1,000,000 | | Hologic Inc., Senior Notes, 2.000% due 12/15/37 | | | 643,750 |
| | | | Health Care Providers & Services — 2.5% | | | |
| | 800,000 | | Henry Schein Inc., Senior Bonds, 3.000% due 8/15/34 | | | 825,000 |
| | | | Health Care Technology — 2.3% | | | |
| | 900,000 | | HLTH Corp., Senior Notes, 3.125% due 9/1/25 | | | 761,625 |
| | | | Life Sciences Tools & Services — 1.8% | | | |
| | 850,000 | | Kendle International Inc., Senior Notes, 3.375% due 7/15/12 | | | 583,312 |
| | | | TOTAL HEALTH CARE | | | 3,192,437 |
| | INDUSTRIALS — 21.0% | | | |
| | | | Aerospace & Defense — 3.2% | | | |
| | 1,300,000 | | AAR Corp., Senior Notes, 1.750% due 2/1/26 | | | 1,027,000 |
| | | | Building Products — 0.4% | | | |
| | 160,000 | | NCI Building Systems Inc., 2.125% due 11/15/24 | | | 126,800 |
| | | | Electrical Equipment — 11.2% | | | |
| | 1,000,000 | | General Cable Corp., Senior Notes, 0.875% due 11/15/13 | | | 645,000 |
| | 1,000,000 | | Roper Industries Inc., Bonds, 0.000% due 1/15/34 | | | 512,500 |
| | 1,350,000 | | Sunpower Corp., Senior Debentures, 1.250% due 2/15/27 | | | 1,027,687 |
| | | | Suntech Power Holdings Co., Ltd.: | | | |
| | 700,000 | | 3.000% due 3/15/13(a) | | | 295,750 |
| | 1,100,000 | | Senior Notes, 3.000% due 3/15/13 | | | 464,750 |
| | 1,500,000 | | Yingli Green Energy Holding Co. Ltd., Senior Notes, zero coupon bond to yield 2.928% due 12/15/12 | | | 716,250 |
| | | | Total Electrical Equipment | | | 3,661,937 |
| | | | Machinery — 3.5% | | | |
| | 550,000 | | Actuant Corp., Subordinated Notes, 2.000% due 11/15/23 | | | 540,375 |
| | 700,000 | | Danaher Corp., Senior Notes, zero coupon bond to yield 1.721% due 1/22/21 | | | 613,375 |
| | | | Total Machinery | | | 1,153,750 |
See Notes to Financial Statements.
| | |
| Legg Mason Partners Convertible Fund 2009 Semi-Annual Report | | 5 |
Schedule of investments (unaudited) continued
January 31, 2009
| | | | | | |
| LEGG MASON PARTNERS CONVERTIBLE FUND | | |
FACE
AMOUNT | | SECURITY | | VALUE |
| | | | | | |
| | | | Trading Companies & Distributors — 2.7% | | | |
| $ | 1,000,000 | | WESCO International Inc., Senior Debentures, 2.625% due 10/15/25 | | $ | 868,750 |
| | | | TOTAL INDUSTRIALS | | | 6,838,237 |
| | INFORMATION TECHNOLOGY — 17.0% | | | |
| | | | Communications Equipment — 0.8% | | | |
| | 1,500,000 | | Powerwave Technologies Inc., Subordinated Notes, 1.875% due 11/15/24 | | | 256,875 |
| | | | Electronic Equipment, Instruments & Components — 2.0% | | | |
| | 950,000 | | Anixter International Inc., Senior Notes, 1.000% due 2/15/13 | | | 656,687 |
| | | | Internet Software & Services — 3.3% | | | |
| | 1,400,000 | | SAVVIS Inc., Senior Notes, 3.000% due 5/15/12 | | | 761,250 |
| | 300,000 | | Sina Corp., Subordinated Notes, zero coupon bond to yield 2.991% due 7/15/23 | | | 313,500 |
| | | | Total Internet Software & Services | | | 1,074,750 |
| | | | IT Services — 3.2% | | | |
| | 1,650,000 | | Euronet Worldwide Inc., Debentures, 3.500% due 10/15/25 | | | 1,056,000 |
| | | | Semiconductors & Semiconductor Equipment — 3.0% | | | |
| | 1,300,000 | | Conexant Systems Inc., Subordinated Notes, 4.000% due 3/1/26 | | | 563,875 |
| | | | Jazz Technologies Inc.: | | | |
| | 600,000 | | Notes, 8.000% due 12/31/11(a) | | | 124,500 |
| | 400,000 | | Senior Notes, 8.000% due 12/31/11 | | | 83,000 |
| | 300,000 | | ON Semiconductor Corp., Senior Subordinated Notes, 2.625% due 12/15/26 | | | 190,125 |
| | | | Total Semiconductors & Semiconductor Equipment | | | 961,500 |
| | | | Software — 4.7% | | | |
| | 550,000 | | Blackboard Inc., Senior Notes, 3.250% due 7/1/27 | | | 466,813 |
| | | | Lawson Software Inc., Senior Notes: | | | |
| | 400,000 | | 2.500% due 4/15/12(a) | | | 312,000 |
| | 100,000 | | 2.500% due 4/15/12 | | | 78,000 |
| | 1,050,000 | | Mentor Graphics Corp., Subordinated Debentures, 6.250% due 3/1/26 | | | 668,062 |
| | | | Total Software | | | 1,524,875 |
| | | | TOTAL INFORMATION TECHNOLOGY | | | 5,530,687 |
| | TELECOMMUNICATION SERVICES — 6.0% | | | |
| | | | Diversified Telecommunication Services — 1.4% | | | |
| | 600,000 | | Level 3 Communications Inc., Subordinated Notes, 6.000% due 3/15/10 | | | 456,000 |
| | | | Wireless Telecommunication Services — 4.6% | | | |
| | | | NII Holdings Inc., Senior Notes: | | | |
| | 1,050,000 | | 2.750% due 8/15/25 | | | 930,562 |
| | 150,000 | | 2.750% due 8/15/25(a) | | | 132,938 |
See Notes to Financial Statements.
| | |
| 6 | | Legg Mason Partners Convertible Fund 2009 Semi-Annual Report |
| | | | | | |
| LEGG MASON PARTNERS CONVERTIBLE FUND | | |
FACE
AMOUNT | �� | SECURITY | | VALUE |
| | | | | | |
| | | | Wireless Telecommunication Services — 4.6% continued | | | |
| $ | 600,000 | | SBA Communications Corp., Senior Notes, 1.875% due 5/1/13(a) | | $ | 424,500 |
| | | | Total Wireless Telecommunication Services | | | 1,488,000 |
| | | | TOTAL TELECOMMUNICATION SERVICES | | | 1,944,000 |
| | | | TOTAL CONVERTIBLE BONDS & NOTES (Cost — $41,170,471) | | | 25,795,362 |
| SHARES | | | | |
| | COMMON STOCKS — 4.7% | | | |
| | CONSUMER DISCRETIONARY — 1.0% | | | |
| | | | Specialty Retail — 1.0% | | | |
| | 20,000 | | Staples Inc. | | | 318,800 |
| | ENERGY — 2.0% | | | |
| | | | Energy Equipment & Services — 2.0% | | | |
| | 5,500 | | Diamond Offshore Drilling Inc. | | | 345,180 |
| | 20,000 | | Pride International Inc.* | | | 322,400 |
| | | | TOTAL ENERGY | | | 667,580 |
| | INFORMATION TECHNOLOGY — 1.2% | | | |
| | | | Communications Equipment — 1.0% | | | |
| | 27,000 | | Corning Inc. | | | 272,970 |
| | 90,000 | | Powerwave Technologies Inc.* | | | 40,500 |
| | | | Total Communications Equipment | | | 313,470 |
| | | | Internet Software & Services — 0.2% | | | |
| | 10,000 | | SAVVIS Inc.* | | | 63,800 |
| | | | TOTAL INFORMATION TECHNOLOGY | | | 377,270 |
| | TELECOMMUNICATION SERVICES — 0.5% | | | |
| | | | Diversified Telecommunication Services — 0.5% | | | |
| | 155,000 | | Level 3 Communications Inc.* | | | 155,000 |
| | | | TOTAL COMMON STOCKS (Cost — $2,124,222) | | | 1,518,650 |
| | CONVERTIBLE PREFERRED STOCKS — 14.3% | | | |
| | CONSUMER DISCRETIONARY — 1.6% | | | |
| | | | Hotels, Restaurants & Leisure — 0.3% | | | |
| | 70,000 | | Six Flags Inc., 7.250%* | | | 94,066 |
| | | | Media — 1.3% | | | |
| | 900 | | Interpublic Group of Cos. Inc., 5.250%(a) | | | 278,100 |
| | 500 | | Interpublic Group of Cos. Inc., Series B, 5.250% | | | 154,500 |
| | | | Total Media | | | 432,600 |
| | | | TOTAL CONSUMER DISCRETIONARY | | | 526,666 |
| | ENERGY — 1.3% | | | |
| | | | Oil, Gas & Consumable Fuels — 1.3% | | | |
| | 620 | | El Paso Corp., 4.990%(b) | | | 441,130 |
See Notes to Financial Statements.
| | |
| Legg Mason Partners Convertible Fund 2009 Semi-Annual Report | | 7 |
Schedule of investments (unaudited) continued
January 31, 2009
| | | | | | |
| LEGG MASON PARTNERS CONVERTIBLE FUND | | |
| SHARES | | SECURITY | | VALUE |
| | | | | | |
| | FINANCIALS — 6.6% | | | |
| | | | Diversified Financial Services — 2.3% | | | |
| | 1,100 | | Bank of America Corp., 7.250% | | $ | 554,950 |
| | 12,000 | | Citigroup Inc., 6.500% | | | 183,000 |
| | | | Total Diversified Financial Services | | | 737,950 |
| | | | Real Estate Investment Trusts (REITs) — 4.3% | | | |
| | 47,000 | | Digital Realty Trust Inc., 4.375% | | | 807,813 |
| | 16,000 | | Simon Property Group Inc., 6.000% | | | 600,480 |
| | | | Total Real Estate Investment Trusts (REITs) | | | 1,408,293 |
| | | | TOTAL FINANCIALS | | | 2,146,243 |
| | MATERIALS — 2.6% | | | |
| | | | Chemicals — 1.2% | | | |
| | 25,000 | | Celanese Corp., 4.250% | | | 381,250 |
| | | | Metals & Mining — 1.4% | | | |
| | 700 | | Freeport-McMoRan Copper & Gold Inc., 5.500% | | | 457,100 |
| | | | TOTAL MATERIALS | | | 838,350 |
| | UTILITIES — 2.2% | | | |
| | | | Independent Power Producers & Energy Traders — 2.2% | | | |
| | 380 | | NRG Energy Inc., 4.000%(a) | | | 448,020 |
| | 220 | | NRG Energy Inc., 4.000% | | | 259,380 |
| | | | TOTAL UTILITIES | | | 707,400 |
| | | | TOTAL CONVERTIBLE PREFERRED STOCKS (Cost — $8,951,875) | | | 4,659,789 |
| | | | TOTAL INVESTMENTS BEFORE SHORT-TERM INVESTMENT
(Cost — $52,246,568) | | | 31,973,801 |
FACE
AMOUNT | | | | |
| | SHORT-TERM INVESTMENT — 1.3% | | | |
| | | | Repurchase Agreement — 1.3% | | | |
| $ | 436,000 | | Interest in $531,945,000 joint tri-party repurchase agreement dated 1/30/09 with Greenwich Capital Markets Inc., 0.280% due 2/2/09; Proceeds at maturity — $436,010; (Fully collateralized by various U.S. government agency obligations, 2.540% to 5.375% due 5/5/09 to 3/15/16; Market value — $444,721) (Cost — $436,000) | | | 436,000 |
| | | | TOTAL INVESTMENTS — 99.5% (Cost — $52,682,568#) | | | 32,409,801 |
| | | | Other Assets in Excess of Liabilities — 0.5% | | | 170,137 |
| | | | TOTAL NET ASSETS — 100.0% | | $ | 32,579,938 |
| * | Non-income producing security. |
| (a) | Security is exempt from registration under Rule 144A of the Securities Act of 1933. This security may be resold in transactions that are exempt from registration, normally to qualified institutional buyers. This security has been deemed liquid pursuant to guidelines approved by the Board of Trustees, unless otherwise noted. |
| (b) | Security is valued in good faith at fair value by or under the direction of the Board of Trustees (See Note 1). |
| # | Aggregate cost for federal income tax purposes is substantially the same. |
See Notes to Financial Statements.
| | |
| 8 | | Legg Mason Partners Convertible Fund 2009 Semi-Annual Report |
Statement of assets and liabilities (unaudited)
January 31, 2009
| | | | |
| ASSETS: | | | | |
| Investments, at value (Cost — $52,682,568) | | $ | 32,409,801 | |
| Cash | | | 819 | |
| Dividends and interest receivable | | | 421,776 | |
| Receivable for Fund shares sold | | | 16,442 | |
| Prepaid expenses | | | 19,518 | |
Total Assets | | | 32,868,356 | |
| LIABILITIES: | | | | |
| Payable for Fund shares repurchased | | | 147,442 | |
| Trustees’ fees payable | | | 36,780 | |
| Distribution fees payable | | | 12,839 | |
| Distributions payable | | | 7,607 | |
| Investment management fee payable | | | 7,458 | |
| Accrued expenses | | | 76,292 | |
Total Liabilities | | | 288,418 | |
| TOTAL NET ASSETS | | $ | 32,579,938 | |
| NET ASSETS: | | | | |
| Par value (Note 6) | | $ | 38 | |
| Paid-in capital in excess of par value | | | 59,741,197 | |
| Undistributed net investment income | | | 686,648 | |
| Accumulated net realized loss on investments | | | (7,575,178 | ) |
| Net unrealized depreciation on investments | | | (20,272,767 | ) |
| TOTAL NET ASSETS | | $ | 32,579,938 | |
| Shares Outstanding: | | | | |
| Class A | | | 1,786,562 | |
| Class B | | | 547,150 | |
| Class C | | | 860,478 | |
| Class I | | | 582,047 | |
| Net Asset Value: | | | | |
| Class A (and redemption price) | | | $8.62 | |
| Class B1 | | | $8.58 | |
| Class C1 | | | $8.63 | |
| Class I (and redemption price) | | | $8.71 | |
| Maximum Public Offering Price Per Share: | | | | |
| Class A (based on maximum initial sales charge of 5.75%) | | | $9.15 | |
| 1 | Redemption price per share is NAV of Class B and C shares reduced by a 5.00% and 1.00% CDSC, respectively, if shares are redeemed within one year from purchase payment (See Note 2). |
See Notes to Financial Statements.
| | |
| Legg Mason Partners Convertible Fund 2009 Semi-Annual Report | | 9 |
Statement of operations (unaudited)
For the Six Months Ended January 31, 2009
| | | | |
| INVESTMENT INCOME: | | | | |
| Interest | | $ | 1,092,403 | |
| Dividends | | | 197,604 | |
Total Investment Income | | | 1,290,007 | |
| EXPENSES: | | | | |
| Investment management fee (Note 2) | | | 150,464 | |
| Distribution fees (Notes 2 and 4) | | | 99,665 | |
| Registration fees | | | 29,221 | |
| Shareholder reports (Note 4) | | | 25,219 | |
| Legal fees | | | 21,549 | |
| Audit and tax | | | 17,511 | |
| Transfer agent fees (Note 4) | | | 13,181 | |
| Trustees’ fees | | | 2,245 | |
| Custody fees | | | 1,074 | |
| Insurance | | | 783 | |
| Miscellaneous expenses | | | 2,650 | |
Total Expenses | | | 363,562 | |
Less: Fee waivers and/or expense reimbursements (Notes 2 and 4) | | | (70,853 | ) |
Net Expenses | | | 292,709 | |
| NET INVESTMENT INCOME | | | 997,298 | |
| REALIZED AND UNREALIZED LOSS ON INVESTMENTS (NOTES 1 AND 3): | | | | |
| Net Realized Loss From Investment Transactions | | | (5,867,770 | ) |
| Change in Net Unrealized Appreciation/Depreciation From Investments | | | (16,668,701 | ) |
| NET LOSS ON INVESTMENTS | | | (22,536,471 | ) |
| DECREASE IN NET ASSETS FROM OPERATIONS | | $ | (21,539,173 | ) |
See Notes to Financial Statements.
| | |
| 10 | | Legg Mason Partners Convertible Fund 2009 Semi-Annual Report |
Statements of changes in net assets
| | | | | | | | |
FOR THE SIX MONTHS ENDED JANUARY 31, 2009 (unaudited)
AND THE YEAR ENDED JULY 31, 2008 | | 2009 | | | 2008 | |
| OPERATIONS: | | | | | | | | |
| Net investment income | | $ | 997,298 | | | $ | 1,404,300 | |
| Net realized gain (loss) | | | (5,867,770 | ) | | | 3,527,931 | |
| Change in net unrealized appreciation/depreciation | | | (16,668,701 | ) | | | (10,012,069 | ) |
Decrease in Net Assets From Operations | | | (21,539,173 | ) | | | (5,079,838 | ) |
| DISTRIBUTIONS TO SHAREHOLDERS FROM (NOTES 1 AND 5): | | | | | | | | |
| Net investment income | | | (1,784,960 | ) | | | (1,875,829 | ) |
| Net realized gains | | | — | | | | (6,469,939 | ) |
Decrease in Net Assets From Distributions to Shareholders | | | (1,784,960 | ) | | | (8,345,768 | ) |
| FUND SHARE TRANSACTIONS (NOTE 6): | | | | | | | | |
| Net proceeds from sale of shares | | | 2,367,159 | | | | 4,050,598 | |
| Reinvestment of distributions | | | 1,694,503 | | | | 6,816,785 | |
| Cost of shares repurchased | | | (8,511,779 | ) | | | (20,824,761 | ) |
Decrease in Net Assets From Fund Share Transactions | | | (4,450,117 | ) | | | (9,957,378 | ) |
| DECREASE IN NET ASSETS | | | (27,774,250 | ) | | | (23,382,984 | ) |
| NET ASSETS: | | | | | | | | |
| Beginning of period | | | 60,354,188 | | | | 83,737,172 | |
| End of period* | | $ | 32,579,938 | | | $ | 60,354,188 | |
| * Includes undistributed net investment income of: | | | $686,648 | | | | $1,474,310 | |
See Notes to Financial Statements.
| | |
| Legg Mason Partners Convertible Fund 2009 Semi-Annual Report | | 11 |
Financial highlights
| | | | | | | | | | | | | | | | | | | | | | | | |
FOR A SHARE OF EACH CLASS OF BENEFICIAL INTEREST OUTSTANDING THROUGHOUT EACH YEAR
ENDED JULY 31, UNLESS OTHERWISE NOTED: | |
| CLASS A SHARES1 | | 20092 | | | 2008 | | | 2007 | | | 2006 | | | 2005 | | | 2004 | |
NET ASSET VALUE,
BEGINNING OF PERIOD | | | $14.63 | | | | $17.62 | | | | $16.63 | | | | $17.84 | | | | $16.90 | | | | $15.32 | |
INCOME (LOSS) FROM OPERATIONS: | | | | | | | | | | | | | | | | | | | | | |
Net investment income | | | 0.27 | | | | 0.35 | | | | 0.26 | | | | 0.36 | | | | 0.34 | | | | 0.41 | |
Net realized and unrealized gain (loss) | | | (5.79 | ) | | | (1.42 | ) | | | 1.76 | | | | 0.31 | | | | 1.27 | | | | 1.78 | |
Total income (loss) from operations | | | (5.52 | ) | | | (1.07 | ) | | | 2.02 | | | | 0.67 | | | | 1.61 | | | | 2.19 | |
LESS DISTRIBUTIONS FROM: | | | | | | | | | | | | | | | | | | | | | |
Net investment income | | | (0.49 | ) | | | (0.45 | ) | | | (0.28 | ) | | | (0.36 | ) | | | (0.34 | ) | | | (0.51 | ) |
Net realized gains | | | — | | | | (1.47 | ) | | | (0.75 | ) | | | (1.52 | ) | | | (0.33 | ) | | | (0.10 | ) |
Total distributions | | | (0.49 | ) | | | (1.92 | ) | | | (1.03 | ) | | | (1.88 | ) | | | (0.67 | ) | | | (0.61 | ) |
NET ASSET VALUE,
END OF PERIOD | | | $8.62 | | | | $14.63 | | | | $17.62 | | | | $16.63 | | | | $17.84 | | | | $16.90 | |
Total return3 | | | (37.85 | )% | | | (6.65 | )% | | | 12.28 | % | | | 3.86 | % | | | 9.71 | % | | | 14.35 | % |
NET ASSETS,
END OF PERIOD (000s) | | $ | 15,396 | | | $ | 28,625 | | | $ | 38,189 | | | $ | 37,302 | | | $ | 40,871 | | | $ | 43,840 | |
RATIOS TO AVERAGE NET ASSETS: | | | | | | | | | | | | | | | | | | | | | |
Gross expenses | | | 1.49 | %4 | | | 1.39 | % | | | 1.34 | %5 | | | 1.31 | % | | | 1.25 | % | | | 1.18 | % |
Net expenses | | | 1.17 | 4,6,7 | | | 1.17 | 6,7 | | | 1.20 | 5,6,7 | | | 1.15 | 6,7 | | | 1.23 | 7 | | | 1.18 | |
Net investment income | | | 4.82 | 4 | | | 2.19 | | | | 1.45 | | | | 2.06 | | | | 1.99 | | | | 2.39 | |
PORTFOLIO TURNOVER RATE | | | 24 | % | | | 83 | % | | | 76 | % | | | 98 | % | | | 79 | % | | | 113 | % |
| 1 | Per share amounts have been calculated using the average shares method. |
| 2 | For the six months ended January 31, 2009 (unaudited). |
| 3 | Performance figures may reflect fee waivers and/or expense reimbursements. In the absence of fee waivers and/or expense reimbursements, the total return would have been lower. Past performance is no guarantee of future results. Total returns for periods of less than one year are not annualized. |
| 5 | Included in the expense ratios are certain non-recurring restructuring (and reorganization, if applicable) fees that were incurred by the Fund during the period. Without these fees, the gross and net expense ratios would have been 1.29% and 1.16%, respectively. |
| 6 | As a result of a voluntary expense limitation, the ratio of expenses, other than interest, brokerage, taxes and extraordinary expenses, to average net assets of Class A shares will not exceed 1.17%. |
| 7 | Reflects fee waivers and/or expense reimbursements. |
See Notes to Financial Statements.
| | |
| 12 | | Legg Mason Partners Convertible Fund 2009 Semi-Annual Report |
| | | | | | | | | | | | | | | | | | | | | | | | |
FOR A SHARE OF EACH CLASS OF BENEFICIAL INTEREST OUTSTANDING THROUGHOUT EACH YEAR
ENDED JULY 31, UNLESS OTHERWISE NOTED: | |
| CLASS B SHARES1 | | 20092 | | | 2008 | | | 2007 | | | 2006 | | | 2005 | | | 2004 | |
NET ASSET VALUE,
BEGINNING OF PERIOD | | $ | 14.57 | | | $ | 17.55 | | | | $16.56 | | | | $17.78 | | | | $16.84 | | | | $15.28 | |
INCOME (LOSS) FROM OPERATIONS: | | | | | | | | | | | | | | | | | | | | | |
Net investment income | | | 0.24 | | | | 0.26 | | | | 0.16 | | | | 0.27 | | | | 0.24 | | | | 0.31 | |
Net realized and unrealized gain (loss) | | | (5.77 | ) | | | (1.40 | ) | | | 1.76 | | | | 0.30 | | | | 1.27 | | | | 1.77 | |
Total income (loss) from operations | | | (5.53 | ) | | | (1.14 | ) | | | 1.92 | | | | 0.57 | | | | 1.51 | | | | 2.08 | |
LESS DISTRIBUTIONS FROM: | | | | | | | | | | | | | | | | | | | | | | | | |
Net investment income | | | (0.46 | ) | | | (0.37 | ) | | | (0.18 | ) | | | (0.27 | ) | | | (0.24 | ) | | | (0.42 | ) |
Net realized gains | | | — | | | | (1.47 | ) | | | (0.75 | ) | | | (1.52 | ) | | | (0.33 | ) | | | (0.10 | ) |
Total distributions | | | (0.46 | ) | | | (1.84 | ) | | | (0.93 | ) | | | (1.79 | ) | | | (0.57 | ) | | | (0.52 | ) |
NET ASSET VALUE,
END OF PERIOD | | | $8.58 | | | $ | 14.57 | | | | $17.55 | | | | $16.56 | | | | $17.78 | | | | $16.84 | |
Total return3 | | | (38.03 | )% | | | (7.12 | )% | | | 11.73 | % | | | 3.26 | % | | | 9.13 | % | | | 13.66 | % |
NET ASSETS,
END OF PERIOD (000s) | | $ | 4,693 | | | $ | 8,800 | | | $ | 14,333 | | | $ | 18,839 | | | $ | 23,506 | | | $ | 26,109 | |
RATIOS TO AVERAGE NET ASSETS: | | | | | | | | | | | | | | | | | | | | | |
Gross expenses | | | 2.06 | %4 | | | 1.95 | % | | | 1.88 | %5 | | | 1.84 | % | | | 1.81 | % | | | 1.74 | % |
Net expenses | | | 1.71 | 4,6,7 | | | 1.71 | 6,7 | | | 1.74 | 5,6,7 | | | 1.68 | 6,7 | | | 1.79 | 7 | | | 1.74 | |
Net investment income | | | 4.29 | 4 | | | 1.60 | | | | 0.92 | | | | 1.54 | | | | 1.42 | | | | 1.82 | |
PORTFOLIO TURNOVER RATE | | | 24 | % | | | 83 | % | | | 76 | % | | | 98 | % | | | 79 | % | | | 113 | % |
| 1 | Per share amounts have been calculated using the average shares method. |
| 2 | For the six months ended January 31, 2009 (unaudited). |
| 3 | Performance figures may reflect fee waivers and/or expense reimbursements. In the absence of fee waivers and/or expense reimbursements, the total return would have been lower. Past performance is no guarantee of future results. Total returns for periods of less than one year are not annualized. |
| 5 | Included in the expense ratios are certain non-recurring restructuring (and reorganization, if applicable) fees that were incurred by the Fund during the period. Without these fees, the gross and net expense ratios would have been 1.83% and 1.70%, respectively. |
| 6 | As a result of a voluntary expense limitation, the ratio of expenses, other than interest, brokerage, taxes and extraordinary expenses, to average net assets of Class B shares will not exceed 1.71%. |
| 7 | Reflects fee waivers and/or expense reimbursements. |
See Notes to Financial Statements.
| | |
| Legg Mason Partners Convertible Fund 2009 Semi-Annual Report | | 13 |
Financial highlights continued
| | | | | | | | | | | | | | | | | | | | | | | | |
FOR A SHARE OF EACH CLASS OF BENEFICIAL INTEREST OUTSTANDING THROUGHOUT EACH YEAR
ENDED JULY 31, UNLESS OTHERWISE NOTED: | |
| CLASS C SHARES1 | | 20092 | | | 2008 | | | 2007 | | | 2006 | | | 2005 | | | 2004 | |
NET ASSET VALUE, BEGINNING OF PERIOD | | $ | 14.65 | | | $ | 17.64 | | | $ | 16.64 | | | $ | 17.86 | | | $ | 16.91 | | | $ | 15.33 | |
INCOME (LOSS) FROM OPERATIONS: | | | | | | | | | | | | | | | | | | | | | |
Net investment income | | | 0.23 | | | | 0.23 | | | | 0.13 | | | | 0.24 | | | | 0.21 | | | | 0.27 | |
Net realized and unrealized gain (loss) | | | (5.80 | ) | | | (1.41 | ) | | | 1.77 | | | | 0.30 | | | | 1.28 | | | | 1.78 | |
Total income (loss) from operations | | | (5.57 | ) | | | (1.18 | ) | | | 1.90 | | | | 0.54 | | | | 1.49 | | | | 2.05 | |
LESS DISTRIBUTIONS FROM: | | | | | | | | | | | | | | | | | | | | | | | | |
Net investment income | | | (0.45 | ) | | | (0.34 | ) | | | (0.15 | ) | | | (0.24 | ) | | | (0.21 | ) | | | (0.37 | ) |
Net realized gains | | | — | | | | (1.47 | ) | | | (0.75 | ) | | | (1.52 | ) | | | (0.33 | ) | | | (0.10 | ) |
Total distributions | | | (0.45 | ) | | | (1.81 | ) | | | (0.90 | ) | | | (1.76 | ) | | | (0.54 | ) | | | (0.47 | ) |
NET ASSET VALUE,
END OF PERIOD | | | $8.63 | | | $ | 14.65 | | | $ | 17.64 | | | $ | 16.64 | | | $ | 17.86 | | | $ | 16.91 | |
Total return3 | | | (38.08 | )% | | | (7.31 | )% | | | 11.53 | % | | | 3.07 | % | | | 8.96 | % | | | 13.42 | % |
NET ASSETS,
END OF PERIOD (000s) | | | $7,422 | | | | $14,619 | | | | $22,105 | | | | $26,353 | | | | $37,340 | | | | $43,288 | |
RATIOS TO AVERAGE NET ASSETS: | | | | | | | | | | | | | | | | | | | | | |
Gross expenses | | | 2.25 | %4 | | | 2.14 | % | | | 2.10 | %5 | | | 2.06 | % | | | 1.99 | % | | | 1.93 | % |
Net expenses | | | 1.89 | 4,6,7 | | | 1.89 | 6,7 | | | 1.92 | 5,6,7 | | | 1.86 | 6,7 | | | 1.97 | 7 | | | 1.93 | |
Net investment income | | | 4.09 | 4 | | | 1.44 | | | | 0.73 | | | | 1.36 | | | | 1.24 | | | | 1.55 | |
PORTFOLIO TURNOVER RATE | | | 24 | % | | | 83 | % | | | 76 | % | | | 98 | % | | | 79 | % | | | 113 | % |
| 1 | Per share amounts have been calculated using the average shares method. |
| 2 | For the six months ended January 31, 2009 (unaudited). |
| 3 | Performance figures may reflect fee waivers and/or expense reimbursements. In the absence of fee waivers and/or expense reimbursements, the total return would have been lower. Past performance is no guarantee of future results. Total returns for periods of less than one year are not annualized. |
| 5 | Included in the expense ratios are certain non-recurring restructuring (and reorganization, if applicable) fees that were incurred by the Fund during the period. Without these fees, the gross and net expense ratios would have been 2.05% and 1.89%, respectively. |
| 6 | As a result of a voluntary expense limitation, the ratio of expenses, other than interest, brokerage, taxes and extraordinary expenses, to average net assets of Class C shares will not exceed 1.89%. |
| 7 | Reflects fee waivers and/or expense reimbursements. |
See Notes to Financial Statements.
| | |
| 14 | | Legg Mason Partners Convertible Fund 2009 Semi-Annual Report |
| | | | | | | | | | | | | | | | | | | | | | | | |
FOR A SHARE OF EACH CLASS OF BENEFICIAL INTEREST OUTSTANDING THROUGHOUT EACH YEAR
ENDED JULY 31, UNLESS OTHERWISE NOTED: | |
| CLASS I SHARES1 | | 20092 | | | 2008 | | | 2007 | | | 2006 | | | 2005 | | | 2004 | |
NET ASSET VALUE,
BEGINNING OF PERIOD | | $ | 14.78 | | | $ | 17.78 | | | $ | 16.77 | | | $ | 17.97 | | | $ | 17.02 | | | $ | 15.44 | |
INCOME (LOSS) FROM OPERATIONS: | | | | | | | | | | | | | | | | | | | | | |
Net investment income | | | 0.29 | | | | 0.42 | | | | 0.33 | | | | 0.43 | | | | 0.42 | | | | 0.49 | |
Net realized and unrealized gain (loss) | | | (5.85 | ) | | | (1.44 | ) | | | 1.78 | | | | 0.32 | | | | 1.27 | | | | 1.77 | |
Total income (loss) from operations | | | (5.56 | ) | | | (1.02 | ) | | | 2.11 | | | | 0.75 | | | | 1.69 | | | | 2.26 | |
LESS DISTRIBUTIONS FROM: | | | | | | | | | | | | | | | | | | | | | | | | |
Net investment income | | | (0.51 | ) | | | (0.51 | ) | | | (0.35 | ) | | | (0.43 | ) | | | (0.41 | ) | | | (0.58 | ) |
Net realized gains | | | — | | | | (1.47 | ) | | | (0.75 | ) | | | (1.52 | ) | | | (0.33 | ) | | | (0.10 | ) |
Total distributions | | | (0.51 | ) | | | (1.98 | ) | | | (1.10 | ) | | | (1.95 | ) | | | (0.74 | ) | | | (0.68 | ) |
NET ASSET VALUE,
END OF PERIOD | | | $8.71 | | | $ | 14.78 | | | $ | 17.78 | | | $ | 16.77 | | | $ | 17.97 | | | $ | 17.02 | |
Total return3 | | | (37.75 | )% | | | (6.28 | )% | | | 12.74 | % | | | 4.28 | % | | | 10.13 | % | | | 14.72 | % |
NET ASSETS,
END OF PERIOD (000s) | | | $5,069 | | | | $8,310 | | | | $9,110 | | | | $8,105 | | | | $8,395 | | | | $83,456 | |
RATIOS TO AVERAGE NET ASSETS: | | | | | | | | | | | | | | | | | | | | | |
Gross expenses | | | 1.06 | %4 | | | 0.94 | % | | | 0.97 | %5 | | | 0.92 | % | | | 0.79 | % | | | 0.80 | % |
Net expenses | | | 0.78 | 4,6,7 | | | 0.78 | 6,7 | | | 0.81 | 5,6,7 | | | 0.78 | 6,7 | | | 0.78 | 7 | | | 0.80 | |
Net investment income | | | 5.29 | 4 | | | 2.63 | | | | 1.83 | | | | 2.43 | | | | 2.39 | | | | 2.84 | |
PORTFOLIO TURNOVER RATE | | | 24 | % | | | 83 | % | | | 76 | % | | | 98 | % | | | 79 | % | | | 113 | % |
| 1 | Per share amounts have been calculated using the average shares method. |
| 2 | For the six months ended January 31, 2009 (unaudited). |
| 3 | Performance figures may reflect fee waivers and/or expense reimbursements. In the absence of fee waivers and/or expense reimbursements, the total return would have been lower. Past performance is no guarantee of future results. Total returns for periods of less than one year are not annualized. |
| 5 | Included in the expense ratios are certain non-recurring restructuring (and reorganization, if applicable) fees that were incurred by the Fund during the period. Without these fees, the gross and net expense ratios would have been 0.92% and 0.78%, respectively. |
| 6 | As a result of a voluntary expense limitation, the ratio of expenses, other than interest, brokerage, taxes and extraordinary expenses, to average net assets of Class I shares will not exceed 0.78%. |
| 7 | Reflects fee waivers and/or expense reimbursements. |
See Notes to Financial Statements.
| | |
| Legg Mason Partners Convertible Fund 2009 Semi-Annual Report | | 15 |
Notes to financial statements (unaudited)
1. Organization and significant accounting policies
Legg Mason Partners Convertible Fund (the “Fund”) is a separate diversified investment series of Legg Mason Partners Equity Trust (the “Trust”). The Trust, a Maryland business trust, is registered under the Investment Company Act of 1940, as amended (the “1940 Act”), as an open-end management investment company.
The following are significant accounting policies consistently followed by the Fund and are in conformity with U.S. generally accepted accounting principles (“GAAP”). Estimates and assumptions are required to be made regarding assets, liabilities and changes in net assets resulting from operations when financial statements are prepared. Changes in the economic environment, financial markets and any other parameters used in determining these estimates could cause actual results to differ.
(a) Investment valuation. Equity securities for which market quotations are available are valued at the last reported sales price or official closing price on the primary market or exchange on which they trade. Debt securities are valued at the mean between the last quoted bid and asked prices provided by an independent pricing service that are based on transactions in debt obligations, quotations from bond dealers, market transactions in comparable securities and various other relationships between securities. When prices are not readily available, or are determined not to reflect fair value, such as when the value of a security has been significantly affected by events after the close of the exchange or market on which the security is principally traded, but before the Fund calculates its net asset value, the Fund may value these securities at fair value as determined in accordance with the procedures approved by the Fund’s Board of Trustees. Short-term obligations with maturities of 60 days or less are valued at amortized cost, which approximates fair value.
Effective August 1, 2008, the Fund adopted Statement of Financial Accounting Standards No. 157 (“FAS 157”). FAS 157 establishes a single definition of fair value, creates a three-tier hierarchy as a framework for measuring fair value based on inputs used to value the Fund’s investments, and requires additional disclosure about fair value. The hierarchy of inputs is summarized below.
| | • | | Level 1 — quoted prices in active markets for identical investments |
| | • | | Level 2 — other significant observable inputs (including quoted prices for similar investments, interest rates, prepayment speeds, credit risk, etc.) |
| | • | | Level 3 — significant unobservable inputs (including the Fund’s own assumptions in determining the fair value of investments) |
The inputs or methodology used for valuing securities are not necessarily an indication of the risk associated with investing in those securities.
| | |
| 16 | | Legg Mason Partners Convertible Fund 2009 Semi-Annual Report |
The following is a summary of the inputs used in valuing the Fund’s assets carried at fair value:
| | | | | | | | | | | |
| | | JANUARY 31, 2009 | | QUOTED PRICES
(LEVEL 1) | | OTHER SIGNIFICANT
OBSERVABLE INPUTS
(LEVEL 2) | | SIGNIFICANT
UNOBSERVABLE
INPUTS
(LEVEL 3) |
| Investments in securities | | $ | 32,409,801 | | $ | 3,695,430 | | $ | 28,714,371 | | — |
(b) Repurchase agreements. When entering into repurchase agreements, it is the Fund’s policy that its custodian or a third party custodian take possession of the underlying collateral securities, the market value of which, at all times, at least equals the principal amount of the repurchase transaction, including accrued interest. To the extent that any repurchase transaction exceeds one business day, the value of the collateral is marked-to-market to ensure the adequacy of the collateral. If the seller defaults, and the market value of the collateral declines or if bankruptcy proceedings are commenced with respect to the seller of the security, realization of the collateral by the Fund may be delayed or limited.
(c) REIT distributions. The character of distributions received from Real Estate Investment Trusts (“REITs”) held by the Fund is generally comprised of net investment income, capital gains, and return of capital. It is the policy of the Fund to estimate the character of distributions received from underlying REITs based on historical data provided by the REITs. After each calendar year end, REITs report the actual tax character of these distributions. Differences between the estimated and actual amounts reported by the REITs are reflected in the Fund’s records in the year in which they are reported by the REITs.
(d) Security transactions and investment income. Security transactions are accounted for on a trade date basis. Interest income, adjusted for amortization of premium and accretion of discount, is recorded on the accrual basis. Dividend income is recorded on the ex-dividend date. The cost of investments sold is determined by use of the specific identification method. To the extent any issuer defaults on an expected interest payment, the Fund’s policy is to generally halt any additional interest income accruals and consider the realizability of interest accrued up to the date of default.
(e) Distributions to shareholders. Distributions from net investment income for the Fund, if any, are declared and paid on a monthly basis. Distributions of net realized gains, if any, are declared at least annually. Distributions are recorded on the ex-dividend date and are determined in accordance with income tax regulations, which may differ from GAAP.
(f) Class accounting. Investment income, common expenses and realized/unrealized gain (loss) on investments are allocated to the various classes of the Fund on the basis of daily net assets of each class. Fees relating to a specific class are charged directly to that class.
| | |
| Legg Mason Partners Convertible Fund 2009 Semi-Annual Report | | 17 |
Notes to financial statements (unaudited) continued
(g) Federal and other taxes. It is the Fund’s policy to comply with the federal income and excise tax requirements of the Internal Revenue Code of 1986, as amended, applicable to regulated investment companies. Accordingly, the Fund intends to distribute substantially all of its taxable income and net realized gains, if any, to shareholders each year. Therefore, no federal income tax provision is required in the Fund’s financial statements.
Management has analyzed the Fund’s tax positions taken on federal income tax returns for all open tax years and has concluded that as of January 31, 2009, no provision for income tax would be required in the Fund’s financial statements. The Fund’s federal and state income and federal excise tax returns for tax years for which the applicable statutes of limitations have not expired are subject to examination by the Internal Revenue Service and state departments of revenue.
(h) Reclassification. GAAP requires that certain components of net assets be adjusted to reflect permanent differences between financial and tax reporting. These reclassifications have no effect on net assets or net asset values per share.
2. Investment management agreement and other transactions with affiliates
Legg Mason Partners Fund Advisor, LLC (“LMPFA”) is the Fund’s investment manager and ClearBridge Advisors, LLC (“ClearBridge”) is the Fund’s subadviser. LMPFA and ClearBridge are wholly-owned subsidiaries of Legg Mason, Inc. (“Legg Mason”).
Under the investment management agreement, the Fund pays an investment management fee calculated at an annual rate of 0.70% of the Fund’s average daily net assets.
LMPFA provides administrative and certain oversight services to the Fund. LMPFA delegates to the subadviser the day-to-day portfolio management of the Fund, except for the management of cash and short-term instruments. For its services, LMPFA pays ClearBridge 70% of the net management fee it receives from the Fund.
During the six months ended January 31, 2009, the Fund’s Class A, B, C and I shares had voluntary expense limitations in place of 1.17%, 1.71%, 1.89% and 0.78%, respectively. These voluntary expense limitations do not cover brokerage, taxes, interest and extraordinary expenses and may be reduced or terminated at any time.
During the six months ended January 31, 2009, LMPFA reimbursed the Fund for expenses amounting to $70,853.
| | |
| 18 | | Legg Mason Partners Convertible Fund 2009 Semi-Annual Report |
The manager is permitted to recapture amounts previously voluntarily forgone or reimbursed by the manager to the Fund during the same fiscal year if the Fund’s total annual operating expenses have fallen to a level below the voluntary fee waiver/reimbursement (“expense cap”) shown in the fee table of the Fund’s prospectus. In no case will the manager recapture any amount that would result, on any particular business day of the Fund, in the Fund’s total annual operating expenses exceeding the expense cap.
Legg Mason Investor Services, LLC (“LMIS”), a wholly-owned broker-dealer subsidiary of Legg Mason, serves as the Fund’s sole and exclusive distributor.
There is a maximum initial sales charge of 5.75% for Class A shares. There is a contingent deferred sales charge (“CDSC”) of 5.00% on Class B shares, which applies if redemption occurs within one year from purchase payment. This CDSC declines by 1.00% per year until no CDSC is incurred. Class C shares have a 1.00% CDSC, which applies if redemption occurs within one year from purchase payment. In certain cases, Class A shares have a 1.00% CDSC, which applies if redemption occurs within one year from purchase payment. This CDSC only applies to those purchases of Class A shares, which, when combined with current holdings of Class A shares, equal or exceed $1,000,000 in the aggregate. These purchases do not incur an initial sales charge.
For the six months ended January 31, 2009, LMIS and its affiliates received sales charges of approximately $1,000 on sales of the Fund’s Class A shares. In addition, for the six months ended January 31, 2009, CDSCs paid to LMIS and its affiliates were approximately:
| | | | | | | |
| | | Class B | | Class C | |
| CDSCs | | $ | 5,000 | | $ | 0 | * |
| * | Amount represents less than $1,000. |
The Fund had adopted an unfunded, non-qualified deferred compensation plan (the “Plan”) which allowed non-interested trustees (“Trustees”) to defer the receipt of all or a portion of the trustees’ fees earned until a later date specified by the Trustees. The deferred balances are reported in the Statement of Operations under Trustees’ fees and are considered a general obligation of the Fund and any payments made pursuant to the Plan will be made from the Fund’s general assets. The Plan was terminated effective January 1, 2007. This change will have no effect on fees previously deferred. As of January 31, 2009, the Fund had accrued $11,197 as deferred compensation payable.
Certain officers and one Trustee of the Trust are employees of Legg Mason or its affiliates and do not receive compensation from the Trust.
| | |
| Legg Mason Partners Convertible Fund 2009 Semi-Annual Report | | 19 |
Notes to financial statements (unaudited) continued
3. Investments
During the six months ended January 31, 2009, the aggregate cost of purchases and proceeds from sales of investments (excluding short-term investments) were as follows:
| | | |
| Purchases | | $ | 10,390,705 |
| Sales | | | 15,739,129 |
At January 31, 2009, the aggregate gross unrealized appreciation and depreciation of investments for federal income tax purposes were substantially as follows:
| | | | |
| Gross unrealized appreciation | | $ | 671,090 | |
| Gross unrealized depreciation | | | (20,943,857 | ) |
| Net unrealized depreciation | | $ | (20,272,767 | ) |
4. Class specific expenses, waivers and/or reimbursements
The Fund has adopted a Rule 12b-1 distribution plan and under that plan the Fund pays a service fee with respect to its Class A, B, and C shares calculated at the annual rate of 0.25% of the average daily net assets of each respective class. The Fund also pays a distribution fee with respect to its Class B and Class C shares calculated at an annual rate of 0.50% and 0.75% of the average daily net assets of each class, respectively. Distribution fees are accrued daily and paid monthly.
For the six months ended January 31, 2009, class specific expenses were as follows:
| | | | | | | | | |
| | | DISTRIBUTION FEES | | TRANSFER AGENT FEES | | SHAREHOLDER REPORTS
EXPENSES |
| Class A | | $ | 25,339 | | $ | 7,264 | | $ | 12,566 |
| Class B | | | 23,213 | | | 2,634 | | | 5,493 |
| Class C | | | 51,113 | | | 3,247 | | | 7,131 |
| Class I | | | — | | | 36 | | | 29 |
| Total | | $ | 99,665 | | $ | 13,181 | | $ | 25,219 |
For the six months ended January 31, 2009, class specific waivers and/or reimbursements were as follows:
| | | |
| | | WAIVERS/ REIMBURSEMENTS |
| Class A | | $ | 32,876 |
| Class B | | | 10,880 |
| Class C | | | 18,406 |
| Class I | | | 8,691 |
| Total | | $ | 70,853 |
| | |
| 20 | | Legg Mason Partners Convertible Fund 2009 Semi-Annual Report |
5. Distributions to shareholders by class
| | | | | | |
| | | SIX MONTHS ENDED
JANUARY 31, 2009 | | YEAR ENDED
JULY 31, 2008 |
| Net Investment Income: |
| Class A | | $ | 861,446 | | $ | 941,082 |
| Class B | | | 248,415 | | | 268,777 |
| Class C | | | 389,046 | | | 387,101 |
| Class I | | | 286,053 | | | 278,869 |
| Total | | $ | 1,784,960 | | $ | 1,875,829 |
| Net Realized Gains: | | | | | | |
| Class A | | | — | | $ | 2,972,982 |
| Class B | | | — | | | 1,090,473 |
| Class C | | | — | | | 1,665,766 |
| Class I | | | — | | | 740,718 |
| Total | | | — | | $ | 6,469,939 |
6. Shares of beneficial interest
At January 31, 2009, the Trust had an unlimited number of shares of beneficial interest authorized with a par value of $0.00001 per share. The Fund has the ability to issue multiple classes of shares. Each share of a class represents an identical interest and has the same rights, except that each class bears certain direct expenses, including those specifically related to the distribution of its shares.
Transactions in shares of each class were as follows:
| | | | | | | | | | | | | | |
| | | SIX MONTHS ENDED
JANUARY 31, 2009 | | | YEAR ENDED
JULY 31, 2008 | |
| | | SHARES | | | AMOUNT | | | SHARES | | | AMOUNT | |
| Class A | |
| Shares sold | | 163,200 | | | $ | 1,638,364 | | | 204,256 | | | $ | 3,314,068 | |
| Shares issued on reinvestment | | 90,190 | | | | 811,976 | | | 204,443 | | | | 3,237,032 | |
| Shares repurchased | | (423,081 | ) | | | (4,793,775 | ) | | (619,324 | ) | | | (9,926,071 | ) |
| Net decrease | | (169,691 | ) | | $ | (2,343,435 | ) | | (210,625 | ) | | $ | (3,374,971 | ) |
| Class B | |
| Shares sold | | 43,185 | | | $ | 381,608 | | | 9,845 | | | $ | 159,842 | |
| Shares issued on reinvestment | | 25,346 | | | | 225,005 | | | 64,988 | | | | 1,024,086 | |
| Shares repurchased | | (125,520 | ) | | | (1,333,805 | ) | | (287,407 | ) | | | (4,500,613 | ) |
| Net decrease | | (56,989 | ) | | $ | (727,192 | ) | | (212,574 | ) | | $ | (3,316,685 | ) |
| Class C | |
| Shares sold | | 29,550 | | | $ | 268,893 | | | 21,309 | | | $ | 356,930 | |
| Shares issued on reinvestment | | 41,646 | | | | 371,468 | | | 105,315 | | | | 1,668,607 | |
| Shares repurchased | | (208,915 | ) | | | (2,197,625 | ) | | (381,631 | ) | | | (6,074,117 | ) |
| Net decrease | | (137,719 | ) | | $ | (1,557,264 | ) | | (255,007 | ) | | $ | (4,048,580 | ) |
| | |
| Legg Mason Partners Convertible Fund 2009 Semi-Annual Report | | 21 |
Notes to financial statements (unaudited) continued
| | | | | | | | | | | | | | |
| | | SIX MONTHS ENDED
JANUARY 31, 2009 | | | YEAR ENDED
JULY 31, 2008 | |
| | | SHARES | | | AMOUNT | | | SHARES | | | AMOUNT | |
| Class I | |
| Shares sold | | 8,010 | | | $ | 78,294 | | | 13,814 | | | $ | 219,758 | |
| Shares issued on reinvestment | | 31,227 | | | | 286,054 | | | 55,559 | | | | 887,060 | |
| Shares repurchased | | (19,525 | ) | | | (186,574 | ) | | (19,432 | ) | | | (323,960 | ) |
| Net increase | | 19,712 | | | $ | 177,774 | | | 49,941 | | | $ | 782,858 | |
7. Regulatory matters
On May 31, 2005, the U.S. Securities and Exchange Commission (“SEC”) issued an order in connection with the settlement of an administrative proceeding against Smith Barney Fund Management LLC (“SBFM”), a wholly-owned subsidiary of Legg Mason and the then investment adviser or manager to the Fund, and Citigroup Global Markets Inc. (“CGM”), a former distributor of the Fund, relating to the appointment of an affiliated transfer agent for the Smith Barney family of mutual funds, including the Fund (the “Affected Funds”).
The SEC order found that SBFM and CGM willfully violated Section 206(1) of the Investment Advisers Act of 1940, as amended, and the rules promulgated thereunder (the “Advisers Act”). Specifically, the order found that SBFM and CGM knowingly or recklessly failed to disclose to the boards of the Affected Funds in 1999 when proposing a new transfer agent arrangement with an affiliated transfer agent that: First Data Investors Services Group (“First Data”), the Affected Funds’ then-existing transfer agent, had offered to continue as transfer agent and do the same work for substantially less money than before; and that Citigroup Asset Management (“CAM”), the Citigroup business unit that, at the time, included the Affected Funds’ investment manager and other investment advisory companies, had entered into a side letter with First Data under which CAM agreed to recommend the appointment of First Data as sub-transfer agent to the affiliated transfer agent in exchange, among other things, for a guarantee by First Data of specified amounts of asset management and investment banking fees to CAM and CGM. The order also found that SBFM and CGM willfully violated Section 206(2) of the Advisers Act by virtue of the omissions discussed above and other misrepresentations and omissions in the materials provided to the Affected Funds’ boards, including the failure to make clear that the affiliated transfer agent would earn a high profit for performing limited functions while First Data continued to perform almost all of the transfer agent functions, and the suggestion that the proposed arrangement was in the Affected Funds’ best interests and that no viable alternatives existed.
SBFM and CGM do not admit or deny any wrongdoing or liability. The settlement does not establish wrongdoing or liability for purposes of any other proceeding. The SEC censured SBFM and CGM and ordered them to cease and desist from violations of Sections 206(1) and 206(2) of the Advisers Act. The
| | |
| 22 | | Legg Mason Partners Convertible Fund 2009 Semi-Annual Report |
order required Citigroup to pay $208.1 million, including $109 million in disgorgement of profits, $19.1 million in interest, and a civil money penalty of $80 million. Approximately $24.4 million has already been paid to the Affected Funds, primarily through fee waivers. The remaining $183.7 million, including the penalty, has been paid to the U.S. Treasury and will be distributed pursuant to a plan submitted for the approval of the SEC. At this time, there is no certainty as to how the above-described proceeds of the settlement will be distributed, to whom such distributions will be made, the methodology by which such distributions will be allocated, and when such distributions will be made. The order also required that transfer agency fees received from the Affected Funds since December 1, 2004, less certain expenses, be placed in escrow and provided that a portion of such fees might be subsequently distributed in accordance with the terms of the order. On April 3, 2006, an aggregate amount of approximately $9 million held in escrow was distributed to the Affected Funds.
The order required SBFM to recommend a new transfer agent contract to the Affected Funds’ boards within 180 days of the entry of the order; if a Citigroup affiliate submitted a proposal to serve as transfer agent or sub-transfer agent, SBFM and CGM would have been required, at their expense, to engage an independent monitor to oversee a competitive bidding process. On November 21, 2005, and within the specified timeframe, the Affected Funds’ boards selected a new transfer agent for the Affected Funds. No Citigroup affiliate submitted a proposal to serve as transfer agent. Under the order, SBFM also must comply with an amended version of a vendor policy that Citigroup instituted in August 2004.
Although there can be no assurance, the manager does not believe that this matter will have a material adverse effect on the Affected Funds.
On December 1, 2005, Citigroup completed the sale of substantially all of its global asset management business, including SBFM, to Legg Mason.
8. Legal matters
Beginning in June 2004, class action lawsuits alleging violations of the federal securities laws were filed against CGM, a former distributor of the Fund, and other affiliated funds (collectively, the “Funds”) and a number of its then affiliates, including SBFM and Salomon Brothers Asset Management Inc (“SBAM”), which were then investment adviser or manager to certain of the Funds (the “Managers”), substantially all of the mutual funds then managed by the Managers (the “Defendant Funds”), and Board members of the Defendant Funds (collectively, the “Defendants”). The complaints alleged, among other things, that CGM created various undisclosed incentives for its brokers to sell Smith Barney and Salomon Brothers funds. In addition, according to the complaints, the Managers caused the Defendant Funds to pay excessive brokerage commissions to CGM for steering clients towards proprietary funds.
| | |
| Legg Mason Partners Convertible Fund 2009 Semi-Annual Report | | 23 |
Notes to financial statements (unaudited) continued
The complaints also alleged that the Defendants breached their fiduciary duty to the Defendant Funds by improperly charging Rule 12b-1 fees and by drawing on fund assets to make undisclosed payments of soft dollars and excessive brokerage commissions. The complaints also alleged that the Defendant Funds failed to adequately disclose certain of the allegedly wrongful conduct. The complaints sought injunctive relief and compensatory and punitive damages, rescission of the Defendant Funds’ contracts with the Managers, recovery of all fees paid to the Managers pursuant to such contracts and an award of attorneys’ fees and litigation expenses.
On December 15, 2004, a consolidated amended complaint (the “Complaint”) was filed alleging substantially similar causes of action. On May 27, 2005, all of the Defendants filed motions to dismiss the Complaint. On July 26, 2006, the court issued a decision and order (1) finding that plaintiffs lacked standing to sue on behalf of the shareholders of the Funds in which none of the plaintiffs had invested and dismissing those Funds from the case (although stating that they could be brought back into the case if standing as to them could be established), and (2) other than one stayed claim, dismissing all of the causes of action against the remaining Defendants, with prejudice, except for the cause of action under Section 36(b) of the 1940 Act, which the court granted plaintiffs leave to repeal as a derivative claim.
On October 16, 2006, plaintiffs filed their Second Consolidated Amended Complaint (“Second Amended Complaint”) which alleges derivative claims on behalf of nine funds identified in the Second Amended Complaint, under Section 36(b) of the 1940 Act, against CAM, SBAM and SBFM as investment advisers to the identified funds, as well as CGM as a distributor for the identified funds (collectively, the “Second Amended Complaint Defendants”). The Fund was not identified in the Second Amended Complaint. The Second Amended Complaint alleges no claims against any of the funds or any of their Board Members. Under Section 36(b), the Second Amended Complaint alleges similar facts and seeks similar relief against the Second Amended Complaint Defendants as the Complaint.
On December 3, 2007, the court granted the Defendant’s motion to dismiss, with prejudice. On January 2, 2008, the plaintiffs filed a notice of appeal to the Second Circuit Court of Appeals.
Additional lawsuits arising out of these circumstances and presenting similar allegations and requests for relief may be filed in the future.
* * *
Beginning in August 2005, five class action lawsuits alleging violations of federal securities laws and state law were filed against CGM and SBFM, (collectively, the “Defendants”) based on the May 31, 2005 settlement order issued against the Defendants by the SEC as described in Note 7. The complaints seek injunctive relief and compensatory and punitive damages,
| | |
| 24 | | Legg Mason Partners Convertible Fund 2009 Semi-Annual Report |
removal of SBFM as the investment manager for the Smith Barney family of funds, rescission of the funds’ management and other contracts with SBFM, recovery of all fees paid to SBFM pursuant to such contracts, and an award of attorneys’ fees and litigation expenses. The five actions were subsequently consolidated, and a consolidated complaint was filed.
On September 26, 2007, the United States District Court for the Southern District of New York issued an order dismissing the consolidated complaint, and judgement was later entered. An appeal has been filed and is pending before the U.S. Court of Appeals for the Second Circuit.
9. Recent accounting pronouncement
In March 2008, FASB issued the Statement of Financial Accounting Standards No. 161, Disclosures about Derivative Instruments and Hedging Activities (“FAS 161”). FAS 161 is effective for fiscal years and interim periods beginning after November 15, 2008. FAS 161 requires enhanced disclosures about the Fund’s derivative and hedging activities, including how such activities are accounted for and their effect on the Fund’s financial position, performance and cash flows. Management is currently evaluating the impact the adoption of FAS 161 will have on the Fund’s financial statements and related disclosures.
| | |
| Legg Mason Partners Convertible Fund 2009 Semi-Annual Report | | 25 |
Board approval of management and subadvisory agreements (unaudited)
At a meeting of the Fund’s Board of Trustees, the Board considered the re-approval for an annual period of the Fund’s management agreement, pursuant to which Legg Mason Partners Fund Advisor, LLC (the “Manager”) provides the Fund with investment advisory and administrative services, and the Fund’s sub-advisory agreement, pursuant to which ClearBridge Advisors, LLC (the “Sub-Adviser”) provides day-to-day management of the Fund’s portfolio. (The management agreement and sub-advisory agreement are collectively referred to as the “Agreements.”) The Manager and the Sub-Adviser are wholly-owned subsidiaries of Legg Mason, Inc. The Trustees who are not “interested persons” (as defined in the Investment Company Act of 1940, as amended (the “Independent Trustees”)) of the Fund were assisted in their review by Fund counsel and independent legal counsel and met with independent legal counsel in executive sessions separate from representatives of the Manager and the Sub-Adviser. The Independent Trustees requested and received information from the Manager and the Sub-Adviser they deemed reasonably necessary for their review of the Agreements and the performance of the Manager and the Sub-Adviser. Included was information about the Manager, the Sub-Adviser and the Fund’s distributor (including any distributors affiliated with the Fund during the past two years), as well as the management, sub-advisory and distribution arrangements for the Fund and other funds overseen by the Board. This information was initially reviewed by a special committee of the Independent Trustees and then by the full Board.
In voting to approve the Agreements, the Independent Trustees considered whether the approval of the Agreements would be in the best interests of the Fund and its shareholders, an evaluation based on several factors including those discussed below.
Nature, extent and quality of the services provided to the fund under the management agreement and sub-advisory agreement
The Board received and considered information regarding the nature, extent and quality of services provided to the Fund by the Manager and the Sub-Adviser under the Management Agreement and Sub-Advisory Agreement, respectively, during the past two years. The Trustees also considered the Manager’s supervisory activities over the Sub-Adviser. In addition, the Independent Trustees received and considered other information regarding the administrative and other services rendered to the Fund and its shareholders by the Manager. The Board noted information received at regular meetings throughout the year related to the services rendered by the Manager in its management of the Fund’s affairs, including the management of cash and short-term instruments, and the Manager’s role in coordinating the activities of the Sub-Adviser and the Fund’s other service providers. The Board’s evaluation of the services provided by the Manager and the Sub-Adviser took into account the Board’s knowledge and familiarity gained as Trustees of funds in the Legg Mason Partners fund complex, including the scope and quality of the investment management and other capabilities of the Manager and the
| | |
| 26 | | Legg Mason Partners Convertible Fund |
Sub-Adviser and the quality of the Manager’s administrative and other services. The Board observed that the scope of services provided by the Manager had expanded over time as a result of regulatory and other developments, including maintaining and monitoring its own and the Fund’s expanded compliance programs. The Board reviewed information received from the Manager and the Fund’s Chief Compliance Officer regarding the Fund’s compliance policies and procedures established pursuant to Rule 38a-1 under the Investment Company Act of 1940, as amended.
The Board reviewed the qualifications, backgrounds and responsibilities of the Fund’s senior personnel and the portfolio management team primarily responsible for the day-to-day portfolio management of the Fund. The Board considered the degree to which the Manager implemented organizational changes to improve investment results and the services provided to the Legg Mason Partners fund complex. The Board also considered, based on its knowledge of the Manager and the Manager’s affiliates, the financial resources available to the Manager’s parent organization, Legg Mason, Inc.
The Board also considered the division of responsibilities between the Manager and the Sub-Adviser and the oversight provided by the Manager. The Board also considered the Manager’s and the Sub-Adviser’s brokerage policies and practices, the standards applied in seeking best execution, the Manager’s policies and practices regarding soft dollars, and the existence of quality controls applicable to brokerage allocation procedures. In addition, management also reported to the Board on, among other things, its business plans, recent organizational changes, portfolio manager compensation plan and policy regarding portfolio managers’ ownership of fund shares.
The Board concluded that, overall, it was satisfied with the nature, extent and quality of services provided (and expected to be provided) under the respective Agreement by the Manager and the Sub-Adviser.
Fund performance
The Board received and reviewed performance information for the Fund and for all retail and institutional convertible securities funds (the “Performance Universe”) selected by Lipper, Inc. (“Lipper”), an independent provider of investment company data. The Board was provided with a description of the methodology Lipper used to determine the similarity of the Fund with the funds included in the Performance Universe. The Trustees noted that they also had received and discussed with management information at periodic intervals comparing the Fund’s performance to that of its benchmark index. The information comparing the Fund’s performance to that of the Performance Universe was for the one-, three-, five- and ten-year periods ended June 30, 2008. The Fund performed below the median for the one-, three- and ten-year periods, but performed better than the median for the five-year period. The Board also reviewed performance information provided by the Manager for periods ended September 30, 2008, which showed the Fund’s relative
| | |
| Legg Mason Partners Convertible Fund | | 27 |
Board approval of management and subadvisory agreements (unaudited) continued
performance had improved compared to the Lipper category average during the third quarter. The Trustees then discussed with representatives of management the the portfolio management strategy of the Fund’s portfolio manager and the reasons for the Fund’s underperformance versus the Performance Universe during certain periods under review. The Trustees noted that the Manager was committed to providing the resources necessary to assist the portfolio manager and improve Fund performance. Based on its review, the Board generally was satisfied with management’s efforts to improve performance going forward. The Board determined to continue to evaluate the Fund’s performance and directed the Independent Trustees’ performance committee to continue to periodically review Fund performance with the Manager and report to the full Board during periods between Board meetings.
Management fees and expense ratios
The Board reviewed and considered, the contractual management fee (the “Contractual Management Fee”) payable by the Fund to the Manager in light of the nature, extent and quality of the management and sub-advisory services provided by the Manager and the Sub-Adviser, respectively. The Board noted that the Manager, and not the Fund, pays the sub-advisory fee to the Sub-Adviser and, accordingly, that the retention of the Sub-Adviser does not increase the fees and expenses incurred by the Fund. In addition, because of the Manager’s voluntary fee waiver and/or expense reimbursement arrangement in effect for the Fund, which partially reduced the management fee paid to the Manager, the Board also reviewed and considered the actual management fee rate (after taking into account waivers and reimbursements) (“Actual Management Fee”).
The Board also reviewed information regarding the fees the Manager and the Sub-Adviser charged any of their U.S. clients investing primarily in an asset class similar to that of the Fund including, where applicable, separate accounts. The Manager reviewed with the Board the significant differences in the scope of services provided to the Fund and to such other clients, noting that the Fund is provided with regulatory compliance and administrative services, office facilities and Fund officers (including the Fund’s chief financial, chief legal and chief compliance officers), and that the Manager coordinates and oversees the provision of services to the Fund by other fund service providers, including the Sub-Adviser. The Board considered the fee comparisons in light of the scope of services required to manage these different types of accounts.
The Board received an analysis of complex-wide management fees provided by the Manager, which, among other things, set out a framework of fees based on asset classes. Management also discussed with the Board the Fund’s distribution arrangements, including how amounts received by the Fund’s distributors are expended, and the fees received and expenses incurred in connection with such arrangements by affiliates of the Manager.
| | |
| 28 | | Legg Mason Partners Convertible Fund |
Additionally, the Board received and considered information comparing the Fund’s Contractual Management Fee and Actual Management Fee and the Fund’s overall expense ratio with those of a group of 11 retail front-end load convertible securities funds selected by Lipper as comparable to the Fund (the “Expense Group”), and a broader group of funds selected by Lipper consisting of all retail front-end load convertible securities funds (the “Expense Universe”). This information showed that, while the Fund’s Contractual Management Fee was higher than the median of management fees paid by the other funds in the Expense Group, its Actual Management Fee was lower than the median of management fees paid by the other funds in the Expense Group and lower than the average management fee paid by the other funds in the Expense Universe, and that the Fund’s actual total expense ratio was higher than the median of the total expense ratios of the funds in the Expense Group and higher than the average total expense ratio of the funds in the Expense Universe.
Manager profitability
The Board received and considered a profitability analysis of the Manager and its affiliates in providing services to the Fund. The Board also received profitability information with respect to the Legg Mason Partners fund complex as a whole. In addition, the Board received information with respect to the Manager’s allocation methodologies used in preparing this profitability data as well as a report from an outside consultant that had reviewed the Manager’s methodology. The Board also noted the profitability percentage ranges determined by appropriate court cases to be reasonable given the services rendered to investment companies. The Board determined that the Manager’s profitability was not excessive in light of the nature, extent and quality of the services provided to the Fund.
Economies of scale
The Board received and considered information regarding whether there have been economies of scale with respect to the management of the Fund as the Fund’s assets grow, whether the Fund has appropriately benefited from any economies of scale, and whether there is potential for realization of any further economies of scale. The Board considered whether economies of scale in the provision of services to the Fund were being passed along to the shareholders.
The Board also noted that as the Fund’s assets increase over time, the Fund and its shareholders should realize economies of scale as certain expenses, such as fixed fund fees, become a smaller percentage of overall assets. The Board noted that it appeared that the benefits of any economies of scale also have been appropriately shared with shareholders through increased investment in fund management and administration resources.
Taking all of the above into consideration, the Board determined that the management fee was reasonable in light of the comparative performance and expense information and the nature, extent and quality of the services provided to the Fund under the Agreements.
| | |
| Legg Mason Partners Convertible Fund | | 29 |
Board approval of management and subadvisory agreements (unaudited) continued
Other benefits to the manager
The Board considered other benefits received by the Manager and its affiliates, including the Sub-Adviser, as a result of the Manager’s relationship with the Fund, including the opportunity to offer additional products and services to Fund shareholders.
In light of the costs of providing investment management and other services to the Fund and the Manager’s ongoing commitment to the Fund, the profits and other ancillary benefits that the Manager and its affiliates received were considered reasonable.
Based on their discussions and considerations, including those described above, the Trustees approved the Management Agreement and the Sub-Advisory Agreement to continue for another year.
No single factor reviewed by the Board was identified by the Board as the principal factor in determining whether to approve the Management Agreement and the Sub-Advisory Agreement.
| | |
| 30 | | Legg Mason Partners Convertible Fund |
Legg Mason Partners Convertible Fund
| | |
Trustees Paul R. Ades Andrew L. Breech Dwight B. Crane Robert M. Frayn, Jr. R. Jay Gerken, CFA
Chairman Frank G. Hubbard Howard J. Johnson David E. Maryatt Jerome H. Miller Ken Miller John J. Murphy Thomas F. Schlafly Jerry A. Viscione Investment manager Legg Mason Partners Fund Advisor, LLC Subadviser ClearBridge Advisors, LLC | | Distributor Legg Mason Investor Services, LLC Custodian State Street Bank and Trust Company Transfer agent* Boston Financial Data Services, Inc. 2 Heritage Drive North Quincy, Massachusetts 02171 Independent registered public accounting firm KPMG LLP 345 Park Avenue New York, New York 10154 |
| * | Prior to April 4, 2009, PNC Global Investment Servicing was the Fund’s transfer agent. |
Legg Mason Partners Convertible Fund
The Fund is a separate investment series of Legg Mason Partners Equity Trust, a Maryland business trust.
LEGG MASON PARTNERS CONVERTIBLE FUND
Legg Mason Funds
55 Water Street
New York, New York 10041
The Fund files its complete schedule of portfolio holdings with the Securities and Exchange Commission (“SEC”) for the first and third quarters of each fiscal year on Form N-Q. The Fund’s Forms N-Q are available on the SEC’s website at www.sec.gov. The Fund’s Forms N-Q may be reviewed and copied at the SEC’s Public Reference Room in Washington, D.C., and information on the operation of the Public Reference Room may be obtained by calling 1-800-SEC-0330. To obtain information on Form N-Q from the Fund, shareholders can call Funds Investor Services at 1-800-822-5544 or Institutional Shareholder Services at 1-888-425-6432.
Information on how the Fund voted proxies relating to portfolio securities during the prior 12-month period ended June 30th of each year and a description of the policies and procedures that the Fund uses to determine how to vote proxies relating to portfolio transactions are available (1) without charge, upon request, by calling Funds Investor Services at 1-800-822-5544 or Institutional Shareholder Services at 1-888-425-6432, (2) on the Fund’s website at www.leggmason.com/individualinvestors and (3) on the SEC’s website at www.sec.gov.
This report is submitted for the general information of shareholders of Legg Mason Partners Convertible Fund. This report is not authorized for distribution to prospective investors in the Fund unless preceded or accompanied by a current prospectus.
Investors should consider the Fund’s investment objectives, risks, charges and expenses carefully before investing. The prospectus contains this and other important information about the Fund. Please read the prospectus carefully before investing.
www.leggmason.com/individualinvestors
©2009 Legg Mason Investor Services, LLC
Member FINRA, SIPC
BUILT TO WINSM
At Legg Mason, we’ve assembled a collection of experienced investment management firms and empowered each of them with the tools, the resources and, most importantly, the independence to pursue the strategies they know best.
| • | | Each was purposefully chosen for their commitment to investment excellence. |
| • | | Each is focused on specific investment styles and asset classes. |
| • | | Each exhibits thought leadership in their chosen area of focus. |
Together, we’ve built a powerful portfolio of solutions for financial advisors and their clients. And it has made us a world leader in money management.*
| * | Ranked ninth largest money manager in the world, according to Pensions & Investments May 26, 2008, based on 12/31/07 worldwide assets under management. |
www.leggmason.com/individualinvestors
©2009 Legg Mason Investor Services, LLC Member FINRA, SIPC
FD02170 3/09 SR09-768
NOT PART OF THE SEMI-ANNUAL REPORT