UNITED STATES
SECURITIES AND EXCHANGE COMMISSION
WASHINGTON, D. C. 20549
FORM N-CSR
Investment Company Act file number: 811-02021
Deutsche DWS Securities Trust
(Exact Name of Registrant as Specified in Charter)
875 Third Avenue
New York, NY 10022-6225
(Address of Principal Executive Offices) (Zip Code)
Registrant’s Telephone Number, including Area Code: (212) 454-4500
Diane Kenneally
One International Place
Boston, MA 02110
(Name and Address of Agent for Service)
| Date of fiscal year end: | 6/30 |
| Date of reporting period: | 6/30/2020 |
| ITEM 1. | REPORT TO STOCKHOLDERS |

June 30, 2020
Annual Report
to Shareholders
DWS Enhanced Commodity Strategy Fund
Beginning on January 1, 2021, as permitted by regulations adopted by the Securities and Exchange Commission, paper copies of the Fund’s annual and semiannual shareholder reports will no longer be sent by mail, unless you specifically request paper copies of the reports. Instead, the reports will be made available on the Fund’s Web site (dws.com), and you will be notified by mail each time a report is posted and provided with a Web site link to access the report.
If you already elected to receive shareholder reports electronically, you will not be affected by this change and you need not take any action. You may elect to receive shareholder reports and other communications from the Fund electronically anytime by contacting your financial intermediary (such as a broker-dealer or bank), or if you are a direct investor, by calling (800) 728-3337 or sending an email request to service@dws.com.
You may elect to receive all future reports in paper free of charge. If you invest through a financial intermediary, you can contact your financial intermediary to request that you continue to receive paper copies of your shareholder reports. If you invest directly with the Fund, you can call (800) 728-3337 or send an email request to service@dws.com to continue receiving paper copies of your shareholder reports. Your election to receive reports in paper will apply to all funds held in your account if you invest through your financial intermediary or all funds held with DWS if you invest directly with the Fund.

This report must be preceded or accompanied by a prospectus. To obtain a summary prospectus, if available, or prospectus for any of our funds, refer to the Account Management Resources information provided in the back of this booklet. We advise you to consider the Fund’s objectives, risks, charges and expenses carefully before investing. The summary prospectus and prospectus contain this and other important information about the Fund. Please read the prospectus carefully before you invest.
The Fund invests in commodity-linked derivatives which may subject the Fund to special risks. Market price movements or regulatory and economic changes will have a significant impact on the Fund’s performance. Investing in derivatives entails special risks relating to liquidity, leverage and credit that may reduce returns and/or increase volatility. Any fund that concentrates in a particular segment of the market will generally be more volatile than a fund that invests more broadly. Bond investments are subject to interest-rate, credit, liquidity and market risks to varying degrees. When interest rates rise, bond prices generally fall. Credit risk refers to the ability of an issuer to make timely payments of principal and interest. Investing in foreign securities presents certain risks, such as currency fluctuations, political and economic changes, and market risks. Emerging markets tend to be more volatile and less liquid than the markets of more mature economies, and generally have less diverse and less mature economic structures and less stable political systems than those of developed countries. A counterparty with whom the Fund does business may decline in financial health and become unable to honor its commitments, which could cause losses for the Fund. The Fund may lend securities to approved institutions. Please read the prospectus for details.
War, terrorism, economic uncertainty, trade disputes, public health crises (including the recent pandemic spread of the novel coronavirus) and related geopolitical events could lead to increased market volatility, disruption to U.S. and world economies and markets and may have significant adverse effects on the Fund and its investments.
The brand DWS represents DWS Group GmbH & Co. KGaA and any of its subsidiaries such as DWS Distributors, Inc. which offers investment products or DWS Investment Management Americas, Inc. and RREEF America L.L.C. which offer advisory services.
NOT FDIC/NCUA INSURED NO BANK GUARANTEE MAY LOSE VALUE NOT A DEPOSIT NOT INSURED BY ANY FEDERAL GOVERNMENT AGENCY
| 2 | | | DWS Enhanced Commodity Strategy Fund |
Dear Shareholder:
While the economy is not expected to shrug off the impacts of the COVID-19 pandemic easily, DWS’s CIO Office is cautiously optimistic. Our CIO Office anticipates the recession in the United States (“U.S.”) to be shallower than in the Eurozone, followed by a more robust U.S. recovery primarily benefiting from the outsized U.S. fiscal stimulus. Our CIO office sees long-lasting disruptions of supply chains and consumer spending, potentially derailing the current outlook.
What is already becoming clear is the current assessment of the situation by financial markets. U.S. markets have moved back to relatively high valuations. However, sentiment can quickly change and March lows may be tested again in the coming months. With respect to the bond markets, we think that accommodative central bank action will continue or even accelerate, with the interest rates set to remain low for the foreseeable future.
What may come next? In the short term, we expect markets to remain volatile. While our strategists forecast peaking uncertainty on stock markets, sharp setbacks could happen at any time. We believe stocks have become even more appealing for the medium- to long-term time horizons, due to the very accommodative monetary policy of the leading central banks and growing fiscal deficits.
As the U.S. and global economies forge a path to recovery, close monitoring of developments to assess potential opportunities and risks is critical. We believe the unique structure of our CIO Office — which synthesizes the views of more than 900 DWS economists, analysts and investment professionals around the world — positions us to make timely strategic and tactical decisions. Those insights are updated frequently and are always available on the “Insights” section of dws.com.
As always, we appreciate your trust and welcome the opportunity to help you navigate these unusual times. We believe our decades of experience in managing assets through multiple market cycles and events can add significant value in times such as these.
Best regards,
 |
Hepsen Uzcan
President, DWS Funds |

Assumptions, estimates and opinions contained in this document constitute our judgment as of the date of the document and are subject to change without notice. Any projections are based on a number of assumptions as to market conditions and there can be no guarantee that any projected results will be achieved. Past performance is not a guarantee of future results.
| DWS Enhanced Commodity Strategy Fund | | | 3 |
| Portfolio Management Review |
Overview of Market and Fund Performance
All performance information below is historical and does not guarantee future results. Returns shown are for Class A shares, unadjusted for sales charges. Investment return and principal fluctuate, so your shares may be worth more or less when redeemed. Current performance may differ from performance data shown. Please visit dws.com for the most recent month-end performance of all share classes. Fund performance includes reinvestment of all distributions. Unadjusted returns do not reflect sales charges and would have been lower if they had. Please refer to pages 10 through 12 for more complete performance information.
Investment Process
Portfolio management generally allocates the Fund’s commodity-linked investments among a variety of different commodity sectors. Management employs three main strategies with respect to its commodity-linked investments: a relative value strategy, a tactical strategy, and a “roll enhancement” strategy.
In implementing the relative value strategy, management uses a proprietary quantitative, rules-based methodology to determine the Fund’s commodity sector weightings relative to the Fund’s benchmark index, the Bloomberg Commodity Index. Management normally rebalances commodity sector positions when a sector undergoes a “trigger event,” reducing the Fund’s exposure to sectors that are believed to be “expensive” and increasing its exposure to sectors that are believed to be “cheap.”
The tactical strategy focuses on the direction of commodity markets as a whole. Management uses a proprietary, momentum-driven, quantitative formula that seeks to anticipate the direction of the commodity markets. Management may reduce the Fund’s exposure to all commodity sectors when commodities in general appear overvalued.
In implementing the “roll enhancement” strategy, management seeks to invest in commodity contracts whose expiration is further out on the “commodity curve” than the subsequent month so as to avoid continually paying premiums to replace expiring contracts.
With respect to the Fund’s fixed income investments, management uses a relative value style to seek to construct a diversified portfolio of fixed-income securities.
The Fund’s Class A shares returned –14.96% during the 12-month period ended June 30, 2020, outpacing the –17.38% return of the Bloomberg Commodity Index. The Fund also outperformed both the benchmark and its Morningstar peer group, Commodities Broad Basket Funds, in the five- and 10-year periods ended June 30, 2020.
| 4 | | | DWS Enhanced Commodity Strategy Fund |
The global commodity markets experienced pronounced weakness over the past 12 months, with the bulk of the downturn occurring in the first quarter of 2020. Despite the unfavorable end result, market conditions were in fact quite positive for the first half of the period. After experiencing volatility early in the reporting period, commodities rallied in the fourth quarter of 2019 thanks to the improving outlook for the global economy and the apparent progress toward a trade agreement between the United States and China. Since China is the primary source of global commodity demand, changes to the country’s growth trajectory are a key factor driving short-term market performance. Commodities further benefited from a supportive economic outlook and investors’ hearty appetite for risk.
“Although the Fund produced a negative absolute return in the period, it succeeded in its key objective of cushioning some of the downside risk in the broader market.”
These favorable conditions abruptly reversed in early 2020 once COVID-19 spread through China and then gradually began to affect the rest of the world. The resulting efforts at containing the virus led to a sharp downward adjustment in the outlook for economic growth. The prospect of a large, unprecedented hit to the economy caused expectations for commodity demand to crater, sending prices sharply lower. The index was also affected by the collapse in the price of crude oil. In early March, a breakdown in talks between Russia and Saudi Arabia led the countries to adopt a new strategy: rather than agreeing to keep supplies stable to prop up prices, they began to boost production in an effort to gain market share. The substantial increase in supply, coming at a time in which demand was already evaporating, caused crude oil prices to plunge. Together, these factors contributed to a decline of 23.29% for the Bloomberg Commodity Index in the first quarter of 2020.
Commodities rallied in the final three months of the period, offsetting some of the prior losses. The prospect of a slowing global spread of COVID-19 led to increased optimism surrounding the economic outlook, fueling expectations for stronger commodity demand in the second half of 2020. In addition, economic data out of China showed that the country had largely returned to a normal footing in the wake of the pandemic. Commodities were further supported by the combination of producer
| DWS Enhanced Commodity Strategy Fund | | | 5 |
supply discipline, the weak showing for the U.S. dollar in April and May, and a production agreement between Russia and Saudi Arabia. Although the ensuing rally counteracted some of the earlier weakness, the index nonetheless closed deeply in the red for the full 12 months.
Fund Performance
Although the Fund produced a negative absolute return in the period, it succeeded in its key objective of cushioning some of the downside risk in the broader market. This aspect of our approach is reflected in the Fund’s longer-term results: in addition to delivering outperformance in the 10-year period ended June 30, 2020, the Fund’s realized volatility was 12.88% (based on standard deviation), versus 15.17% for the index. We believe this helps illustrate the potential merits of our risk-managed approach, which seeks to reduce the effect of volatility during times of weakness in commodity prices.
We use a number of different strategies in an effort to maximize returns and manage risk. The majority added value on a relative basis in the past year, translating to outperformance for the Fund as a whole.
Roll Enhancement Strategy: Here, we strive to optimize returns by purchasing futures contracts of varying maturities based on their relative attractiveness, rather than simply investing in front-month contracts. This element of our approach aided results due to the relative strength of longer-dated contracts. In addition, it helped cushion some of the volatility that occurred in shorter-term contracts, particularly crude oil.
Tactical Strategy: This strategy uses quantitative models to shift the portfolio’s effective exposure to commodities in a range between 50% to 100%. It initially detracted from results in the first six months of the period, during which the Fund was hurt by having less than 100% exposure to the rising market. However, it added quite a bit of value in the first quarter of 2020 by enabling the Fund to sidestep the full impact of the downturn. The Tactical Strategy has been a key contributor to the Fund’s long-term outperformance, and it demonstrated its merits once again amid challenging market conditions in the early part of the year.
Relative Value Strategy: This strategy, which actively overweights or underweights specific commodities depending on how cheap or expensive each appears from a quantitative perspective, contributed to performance. The largest contributions came from the Fund’s positioning
| 6 | | | DWS Enhanced Commodity Strategy Fund |
in oil and wheat. On the negative side, positioning in aluminum was the largest detractor.
Fixed-Income Strategy: We invest in commodities using swaps and futures, and we invest the remainder of the Fund’s assets in a fixed-income portfolio. We emphasize short-dated, higher-quality bonds to manage volatility and interest-rate risk, but we also take on a modest degree of credit risk in an effort to capture excess yield over U.S. Treasury bills. Although this approach hurt results during the first quarter sell-off in the credit sectors, it was a positive contributor over the full 12 months.
The Fund also uses an opportunistic strategy where we strive to adjust the portfolio’s positioning to take advantage of short-term market dislocations. This element of our approach detracted from performance, with the largest impact coming from our decision to hedge the portfolio’s positions in agriculture and oil in the third and fourth quarters of 2019, respectively.
Outlook and Fund Positioning
The first half of 2020 was a time of heightened uncertainty for both commodities and the financial markets in general. We anticipate that this may remain the case in the near-term as investors continue to digest headlines regarding COVID-19 and economic growth. However, we also see a generally positive trend to the market’s supply-and-demand fundamentals. On the supply side, we think companies’ need to strengthen their balance sheets will likely result in lower capital investment and thus prevent oversupply for industrial commodities. At the same time, we anticipate a gradual revival in the world economy as the effects of the coronavirus begin to dissipate. China, in particular, remains a key source of incremental demand given that the country’s economic recovery is occurring on an earlier timeline than that of Western nations. We believe our active, diverse strategy is positioned to take advantage of opportunities that may arise from these trends, while at the same time offering a potential cushion against continued volatility.
| DWS Enhanced Commodity Strategy Fund | | | 7 |
Portfolio Management Team
Darwei Kung, Managing Director
Portfolio Manager of the Fund. Began managing the Fund in 2010.
| – | Joined DWS in 2006; previously has worked as a Director, Engineering and Business Development at Calpoint LLC from 2001–2004. |
| – | Portfolio Manager: New York. |
| – | BS and MS, University of Washington, Seattle; MS and MBA, Carnegie Mellon University. |
Sonali Kapoor, Director
Portfolio Manager of the Fund. Began managing the Fund in 2015.
| – | Joined DWS in 2013 with three years of industry experience. Prior to joining, served in Foreign Exchange Sales covering Institutional Clients at BNP Paribas. Prior to that, provided Fixed Income Coverage and Execution to Energy, Utility and Real Estate Companies in the Debt Capital Markets Group at UBS Securities. Started her career in Mathematical Modeling and Quantitative Analysis of Cash CLOs in the Credit Structuring Group at UBS Securities. |
| – | Portfolio Analyst for Fixed Income, Multi-Asset and Commodities: New York. |
| – | BS in Electrical and Computer Engineering, Carnegie Mellon University; MS in Computational Finance, Carnegie Mellon University. |
Rick Smith, CFA, Managing Director
Portfolio Manager of the Fund. Began managing the Fund in 2016.
| – | Joined DWS in 2004 with 21 years of industry experience. Prior to joining, he served 11 years as a Fixed Income Investment Grade Portfolio Manager at MFS Investments. Previously, he worked as a Research Analyst at Salomon Brothers. |
| – | Senior Portfolio Manager: New York. |
| – | BA in Economics, Vassar College; MBA in Finance, Vanderbilt University. |
The views expressed reflect those of the portfolio management team only through the end of the period of the report as stated on the cover. The management team’s views are subject to change at any time based on market and other conditions and should not be construed as a recommendation. Past performance is no guarantee of future results. Current and future portfolio holdings are subject to risk.
Terms to Know
Futures contracts are contractual agreements to buy or sell a particular commodity or financial instrument at a predetermined price in the future.
The unmanaged Bloomberg Commodity Index tracks a diversified group of commodities and commodities futures contracts traded on both U.S. and London exchanges. Index returns do not reflect fees or expenses and it is not possible to invest directly into an index.
The Morningstar Commodities Broad Basket Funds category consists of funds that invest in a diversified basket of commodity goods, including but not limited to, grains, minerals, metals, livestock, cotton, oils, sugar, coffee and cocoa. These Funds may invest directly in physical assets or commodity-linked derivative instruments, such as commodity swap agreements. The average category returns for the one-, five-, and 10-year periods ended June 30, 2020 were –17.45%, –7.27%, and –6.08%, respectively.
| 8 | | | DWS Enhanced Commodity Strategy Fund |
Standard deviation is a measure of data dispersion in statistics, can be used as a measure of volatility.
Momentum is the rate of acceleration or deceleration of a security’s price.
Overweight means the Fund holds a higher weighting in a given sector, security, or commodity than the benchmark. Underweight means the Fund holds a lower weighting.
A swap is a derivative in which two counterparties exchange cash flows of one party’s financial instrument for those of the other party’s financial instrument for a set period of time. Derivatives are contracts whose values can be based on a variety of instruments including indices, currencies or securities.
Interest rate risk is the risk that changes in interest rates may reduce or increase the market value of a bond.
Credit quality is a measure of a bond issuer’s ability to repay interest and principal in a timely manner. Rating agencies assign letter designations, such as AAA, AA and so forth. The lower the rating, the higher the probability of default.
A front-month contract is the contract month with an expiration date closest to the current date.
| DWS Enhanced Commodity Strategy Fund | | | 9 |
| Performance Summary | June 30, 2020 (Unaudited) |
| Class A | 1-Year | 5-Year | 10-Year | |||||||||
| Average Annual Total Returns as of 6/30/20 | ||||||||||||
| Unadjusted for Sales Charge | –14.96% | –6.41% | –3.55% | |||||||||
| Adjusted for the Maximum Sales Charge (max 5.75% load) | –19.85% | –7.51% | –4.12% | |||||||||
| Bloomberg Commodity Index† | –17.38% | –7.69% | –5.82% | |||||||||
| Class T | 1-Year | 5-Year | 10-Year | |||||||||
| Average Annual Total Returns as of 6/30/20 | ||||||||||||
| Unadjusted for Sales Charge | –14.92% | –6.39% | –3.54% | |||||||||
| Adjusted for the Maximum Sales Charge (max 2.50% load) | –17.05% | –6.86% | –3.79% | |||||||||
| Bloomberg Commodity Index† | –17.38% | –7.69% | –5.82% | |||||||||
| Class C | 1-Year | 5-Year | 10-Year | |||||||||
| Average Annual Total Returns as of 6/30/20 | ||||||||||||
| Unadjusted for Sales Charge | –15.59% | –7.11% | –4.27% | |||||||||
| Adjusted for the Maximum Sales Charge (max 1.00% CDSC) | –15.59% | –7.11% | –4.27% | |||||||||
| Bloomberg Commodity Index† | –17.38% | –7.69% | –5.82% | |||||||||
| Class R6 | 1-Year | Life of Class* | ||||||||||
| Average Annual Total Returns as of 6/30/20 | ||||||||||||
| No Sales Charges | –14.58% | –5.46% | ||||||||||
| Bloomberg Commodity Index† | –17.38% | –5.17% | ||||||||||
| Class S | 1-Year | 5-Year | 10-Year | |||||||||
| Average Annual Total Returns as of 6/30/20 | ||||||||||||
| No Sales Charges | –14.79% | –6.21% | –3.35% | |||||||||
| Bloomberg Commodity Index† | –17.38% | –7.69% | –5.82% | |||||||||
| Institutional Class | 1-Year | 5-Year | 10-Year | |||||||||
| Average Annual Total Returns as of 6/30/20 | ||||||||||||
| No Sales Charges | –14.58% | –6.06% | –3.20% | |||||||||
| Bloomberg Commodity Index† | –17.38% | –7.69% | –5.82% | |||||||||
| 10 | | | DWS Enhanced Commodity Strategy Fund |
Performance in the Average Annual Total Returns table above and the Growth of an Assumed $10,000 Investment line graph that follows is historical and does not guarantee future results. Investment return and principal fluctuate, so your shares may be worth more or less when redeemed. Current performance may differ from performance data shown. Please visit dws.com for the Fund’s most recent month-end performance. Fund performance includes reinvestment of all distributions. Unadjusted returns do not reflect sales charges and would have been lower if they had.
The gross expense ratios of the Fund, as stated in the fee table of the prospectus dated October 1, 2019 are 1.48%, 1.40%, 2.18%, 1.06%, 1.21% and 1.16% for Class A, Class T, Class C, Class R6, Class S and Institutional Class shares, respectively, and may differ from the expense ratios disclosed in the Financial Highlights tables in this report.
Index returns do not reflect any fees or expenses and it is not possible to invest directly into an index.
Performance figures do not reflect the deduction of taxes that a shareholder would pay on fund distributions or the redemption of fund shares.
Returns shown for Class T shares for the period prior to its inception on June 5, 2017 are derived from the historical performance of Institutional Class shares of DWS Enhanced Commodity Strategy Fund during such periods and have been adjusted to reflect the higher total annual operating expenses. Any difference in expenses will affect performance.
Generally accepted accounting principles require adjustments to be made to the net assets of the Fund at period end for financial reporting purposes only, and as such, the total return based on the unadjusted net asset value per share may differ from the total return reported in the financial highlights.
| Growth of an Assumed $10,000 Investment (Adjusted for Maximum Sales Charge) |
The Fund’s growth of an assumed $10,000 investment is adjusted for the maximum sales charge of 5.75%. This results in a net initial investment of $9,425.
The growth of $10,000 is cumulative.
| DWS Enhanced Commodity Strategy Fund | | | 11 |
Performance of other share classes will vary based on the sales charges and the fee structure of those classes.
| * | Class R6 shares commenced operations on June 1, 2016. |
| † | The Bloomberg Commodity Index is an unmanaged index that tracks a diversified group of commodities and commodities futures contracts traded on both U.S. and London exchanges. |
| Class A | Class T | Class C | Class R6 | Class S | Institutional Class | |||||||||||||||||||
| Net Asset Value | ||||||||||||||||||||||||
| 6/30/20 | $ | 7.93 | $ | 7.94 | $ | 7.11 | $ | 8.05 | $ | 8.03 | $ | 8.06 | ||||||||||||
| 6/30/19 | $ | 9.47 | $ | 9.48 | $ | 8.49 | $ | 9.62 | $ | 9.59 | $ | 9.62 | ||||||||||||
| Distribution Information as of 6/30/20 |
| |||||||||||||||||||||||
| Twelve Months: Income Dividends | $ | .13 | $ | .14 | $ | .06 | $ | .17 | $ | .15 | $ | .17 | ||||||||||||
| 12 | | | DWS Enhanced Commodity Strategy Fund |
| Consolidated Portfolio Summary | (Unaudited) |
The Fund invests in commodity-linked derivative instruments backed by a portfolio of fixed-income instruments.
Commodity-Linked Investments
| Commodity Sector Allocation (Commodity Exposure from Commodity-Linked Derivative Instruments as a % of Net Assets) | 6/30/20 | 6/30/19 | ||||||
| Energy | 24% | 21% | ||||||
| Agriculture | 21% | 28% | ||||||
| Precious Metals | 16% | 15% | ||||||
| Industrial | 16% | 15% | ||||||
| Livestock | 4% | 3% | ||||||
| 81% | 82% | |||||||
Fixed-Income Investments
| Asset Allocation (As a % of Investment Portfolio excluding Options Purchased and Securities Lending Collateral) | 6/30/20 | 6/30/19 | ||||||
| Government & Agency Obligations | 44% | 43% | ||||||
| Corporate Bonds | 26% | 29% | ||||||
| Asset-Backed | 11% | 9% | ||||||
| Cash Equivalents | 9% | 8% | ||||||
| Commercial Mortgage-Backed Securities | 5% | 4% | ||||||
| Short-Term U.S. Treasury Obligations | 3% | 3% | ||||||
| Collateralized Mortgage Obligations | 2% | 2% | ||||||
| Municipal Bonds and Notes | 0% | — | ||||||
| Exchange-Traded Funds | 0% | — | ||||||
| Loan Participations and Assignments | — | 1% | ||||||
| Mortgage-Backed Securities Pass-Throughs | — | 1% | ||||||
| 100% | 100% | |||||||
| Quality (Excludes Cash Equivalents) | 6/30/20 | 6/30/19 | ||||||
| AAA | 60% | 61% | ||||||
| AA | 11% | 9% | ||||||
| A | 10% | 11% | ||||||
| BBB | 16% | 15% | ||||||
| Below BBB | 3% | 4% | ||||||
| Not Rated | 0% | 0% | ||||||
| 100% | 100% | |||||||
The quality ratings represent the higher of Moody’s Investors Service, Inc. (“Moody’s”), Fitch Ratings, Inc. (“Fitch”) or S&P Global Ratings (“S&P”) credit ratings. The ratings of Moody’s, Fitch and S&P represent their opinions as to the quality of the securities they rate. Credit quality measures a bond issuer’s ability to repay interest and principal in a timely manner. Ratings are relative and subjective and are not absolute standards of quality. Credit quality does not remove market risk and is subject to change.
| DWS Enhanced Commodity Strategy Fund | | | 13 |
| Interest Rate Sensitivity | 6/30/20 | 6/30/19 | ||||||
| Effective Maturity | 1.9 years | 2.2 years | �� | |||||
| Effective Duration | 1.2 years | 1.2 years | ||||||
Effective maturity is the weighted average of the maturity date of bonds held by the Fund taking into consideration any maturity shortening features.
Effective duration is an approximate measure of the Fund’s sensitivity to interest rate changes taking into consideration any maturity shortening features.
Portfolio holdings and characteristics are subject to change.
For more complete details about the Fund’s consolidated investment portfolio, see page 15. A quarterly Fact Sheet is available on dws.com or upon request. Please see the Account Management Resources section on page 82 for contact information.
| 14 | | | DWS Enhanced Commodity Strategy Fund |
| Consolidated Investment Portfolio | as of June 30, 2020 |
| Principal Amount ($) | Value ($) | |||||||
| Corporate Bonds 26.0% | ||||||||
| Communication Services 1.4% | ||||||||
Charter Communications Operating LLC, 4.908%, 7/23/2025 | 3,000,000 | 3,438,249 | ||||||
Clear Channel Worldwide Holdings, Inc., 9.25%, 2/15/2024 | 298,000 | 276,425 | ||||||
Interpublic Group of Companies, Inc., 3.5%, 10/1/2020 | 2,540,000 | 2,556,829 | ||||||
Kenbourne Invest SA, 144A, 6.875%, 11/26/2024 | 425,000 | 429,250 | ||||||
Oztel Holdings SPC Ltd., 144A, 5.625%, 10/24/2023 | 3,161,000 | 3,161,569 | ||||||
Sprint Spectrum Co., LLC, 144A, 3.36%, 3/20/2023 | 193,750 | 196,110 | ||||||
Tencent Holdings Ltd., 144A, 3.28%, 4/11/2024 | 9,000,000 | 9,561,053 | ||||||
VEON Holdings BV, 144A, 3.95%, 6/16/2021 | 1,910,000 | 1,933,569 | ||||||
|
| |||||||
| 21,553,054 | ||||||||
| Consumer Discretionary 3.8% | ||||||||
D.R. Horton, Inc., 2.55%, 12/1/2020 | 2,755,000 | 2,774,677 | ||||||
Daimler Finance North America LLC, 144A, 3.35%, 5/4/2021 | 5,958,000 | 6,068,076 | ||||||
Ford Motor Credit Co., LLC, 2.343%, 11/2/2020 | 4,000,000 | 3,970,000 | ||||||
General Motors Financial Co., Inc.: | ||||||||
3-month USD-LIBOR + 0.990%, 2.363%*, 1/5/2023 | 7,000,000 | 6,746,938 | ||||||
3.7%, 11/24/2020 | 4,000,000 | 4,021,132 | ||||||
Harley-Davidson Financial Services, Inc., 144A, 4.05%, 2/4/2022 | 6,500,000 | 6,699,655 | ||||||
Hyundai Capital America: | ||||||||
144A, 3-month USD-LIBOR + 0.940%, 2.292%*, 7/8/2021 | 5,000,000 | 4,946,746 | ||||||
144A, 2.375%, 2/10/2023 | 2,090,000 | 2,105,635 | ||||||
144A, 3.45%, 3/12/2021 | 1,333,000 | 1,348,580 | ||||||
Hyundai Capital Services, Inc., 144A, 2.625%, 9/29/2020 | 4,000,000 | 4,009,422 | ||||||
Meritor, Inc., 144A, 6.25%, 6/1/2025 | 310,000 | 313,100 | ||||||
Nissan Motor Acceptance Corp.: | ||||||||
144A, 2.6%, 9/28/2022 | 4,000,000 | 3,914,289 | ||||||
144A, 3.65%, 9/21/2021 | 2,612,000 | 2,618,275 | ||||||
Picasso Finance Sub, Inc., 144A, 6.125%, 6/15/2025 | 575,000 | 587,938 | ||||||
Prime Security Services Borrower LLC, 144A, 5.25%, 4/15/2024 | 2,065,000 | 2,111,462 | ||||||
Royal Caribbean Cruises Ltd., 2.65%, 11/28/2020 | 3,020,000 | 2,929,980 | ||||||
Volkswagen Group of America Finance LLC, 144A, 2.7%, 9/26/2022 | 4,160,000 | 4,297,265 | ||||||
|
| |||||||
| 59,463,170 | ||||||||
The accompanying notes are an integral part of the consolidated financial statements.
| DWS Enhanced Commodity Strategy Fund | | | 15 |
| Principal Amount ($) | Value ($) | |||||||
| Consumer Staples 0.5% | ||||||||
BAT Capital Corp., 2.764%, 8/15/2022 | 2,890,000 | 2,992,480 | ||||||
Constellation Brands, Inc., 3-month USD-LIBOR + 0.700%, 1.092%*, 11/15/2021 | 3,140,000 | 3,139,750 | ||||||
General Mills, Inc., 3-month USD-LIBOR + 0.540%, 0.811%*, 4/16/2021 | 1,418,000 | 1,420,935 | ||||||
Kraft Heinz Foods Co., 2.8%, 7/2/2020 | 526,000 | 526,000 | ||||||
|
| |||||||
| 8,079,165 | ||||||||
| Energy 1.9% | ||||||||
Bharat Petroleum Corp. Ltd., REG S, 4.625%, 10/25/2022 | 1,830,000 | 1,893,410 | ||||||
Ecopetrol SA, 5.875%, 9/18/2023 | 1,500,000 | 1,605,000 | ||||||
Energy Transfer Operating LP, 4.25%, 3/15/2023 | 1,170,000 | 1,235,973 | ||||||
KazMunayGas National Co. JSC, 144A, 4.4%, 4/30/2023 | 1,000,000 | 1,038,750 | ||||||
MarkWest Energy Partners LP, 4.875%, 6/1/2025 | 3,500,000 | 3,906,979 | ||||||
MPLX LP, 3.5%, 12/1/2022 | 605,000 | 630,324 | ||||||
ONGC Videsh Ltd., REG S, 3.75%, 5/7/2023 | 2,000,000 | 2,057,147 | ||||||
Pertamina Persero PT: | ||||||||
144A, 4.3%, 5/20/2023 | 1,500,000 | 1,584,417 | ||||||
144A, 4.875%, 5/3/2022 | 1,000,000 | 1,047,497 | ||||||
Petroleos Mexicanos, 3.5%, 1/30/2023 | 1,000,000 | 951,000 | ||||||
Precision Drilling Corp., 6.5%, 12/15/2021 | 542,968 | 504,960 | ||||||
Range Resources Corp., 5.0%, 8/15/2022 | 2,800,000 | 2,548,000 | ||||||
Shelf Drilling Holdings Ltd., 144A, 8.25%, 2/15/2025 | 4,000,000 | 1,800,000 | ||||||
Sinopec Group Overseas Development, Ltd., 144A, 2.15%, 5/13/2025 | 2,500,000 | 2,566,084 | ||||||
Sunoco LP, 4.875%, 1/15/2023 | 1,220,000 | 1,201,700 | ||||||
Western Midstream Operating LP, 3-month USD-LIBOR + 0.850%, 2.161%*, 1/13/2023 | 2,000,000 | 1,835,503 | ||||||
Williams Companies, Inc., 4.55%, 6/24/2024 | 2,200,000 | 2,440,784 | ||||||
|
| |||||||
| 28,847,528 | ||||||||
| Financials 10.8% | ||||||||
AerCap Ireland Capital DAC: | ||||||||
3.95%, 2/1/2022 | 3,485,000 | 3,486,064 | ||||||
4.875%, 1/16/2024 | 2,350,000 | 2,335,362 | ||||||
Aircastle Ltd.: | ||||||||
4.4%, 9/25/2023 | 4,345,000 | 4,215,031 | ||||||
5.5%, 2/15/2022 | 4,000,000 | 4,037,301 | ||||||
Ares Capital Corp., 3.5%, 2/10/2023 | 8,000,000 | 8,040,897 | ||||||
ASB Bank Ltd., 144A, 3.125%, 5/23/2024 | 5,290,000 | 5,674,691 | ||||||
Avolon Holdings Funding Ltd., 144A, 5.125%, 10/1/2023 | 1,675,000 | 1,549,136 | ||||||
Banco de Credito del Peru, 144A, 4.25%, 4/1/2023 | 1,000,000 | 1,054,000 | ||||||
Banco del Estado de Chile, 144A, 2.668%, 1/8/2021 | 1,640,000 | 1,648,215 | ||||||
Banco Santander Chile, 144A, 2.7%, 1/10/2025 | 3,802,000 | 3,904,198 | ||||||
The accompanying notes are an integral part of the consolidated financial statements.
| 16 | | | DWS Enhanced Commodity Strategy Fund |
| Principal Amount ($) | Value ($) | |||||||
Banco Santander SA, 3.125%, 2/23/2023 | 4,600,000 | 4,791,498 | ||||||
Bancolombia SA, 3.0%, 1/29/2025 | 3,104,000 | 3,038,071 | ||||||
Barclays PLC, 4.61%, 2/15/2023 | 8,000,000 | 8,423,280 | ||||||
BBVA USA: | ||||||||
3-month USD-LIBOR + 0.730%, 1.045%*, 6/11/2021 | 5,000,000 | 4,961,661 | ||||||
3.5%, 6/11/2021 | 2,000,000 | 2,043,472 | ||||||
BOC Aviation Ltd., 144A, 3.25%, 4/29/2025 | 1,500,000 | 1,534,924 | ||||||
BPCE SA: | ||||||||
144A, 2.375%, 1/14/2025 | 300,000 | 310,354 | ||||||
144A, 3.0%, 5/22/2022 | 1,500,000 | 1,550,962 | ||||||
Canadian Imperial Bank of Commerce, 0.95%, 6/23/2023 | 4,800,000 | 4,816,167 | ||||||
CBQ Finance Ltd., REG S, 5.0%, 5/24/2023 | 3,000,000 | 3,202,500 | ||||||
Citizens Financial Group, Inc., 144A, 4.15%, 9/28/2022 | 2,000,000 | 2,106,637 | ||||||
Credicorp Ltd., 144A, 2.75%, 6/17/2025 | 1,000,000 | 995,150 | ||||||
Danske Bank AS, 144A, 3.001%, 9/20/2022 | 4,308,000 | 4,374,982 | ||||||
Discover Bank, 3.35%, 2/6/2023 | 3,085,000 | 3,254,292 | ||||||
Equitable Holdings, Inc., 3.9%, 4/20/2023 | 4,680,000 | 5,009,455 | ||||||
Global Bank Corp., 144A, 4.5%, 10/20/2021 | 4,125,000 | 4,203,416 | ||||||
HSBC Holdings PLC, 2.95%, 5/25/2021 | 5,000,000 | 5,104,647 | ||||||
ING Groep NV: | ||||||||
3.15%, 3/29/2022 | 1,580,000 | 1,642,583 | ||||||
3.55%, 4/9/2024 | 3,950,000 | 4,301,183 | ||||||
Intercontinental Exchange, Inc., 3.45%, 9/21/2023 | 2,825,000 | 3,050,232 | ||||||
Intesa Sanpaolo SpA, 144A, 3.125%, 7/14/2022 | 4,455,000 | 4,537,825 | ||||||
JPMorgan Chase & Co., 3-month USD-LIBOR + 0.610%, 0.918%*, 6/18/2022 | 3,000,000 | 3,004,637 | ||||||
Kookmin Bank, 144A, 1.75%, 5/4/2025 | 805,000 | 822,553 | ||||||
Lloyds Banking Group PLC, 1.326%, 6/15/2023 | 3,500,000 | 3,520,373 | ||||||
Morgan Stanley, SOFR + 0.700%, 0.761%*, 1/20/2023 | 2,000,000 | 1,993,229 | ||||||
National Australia Bank Ltd., 2.5%, 1/12/2021 | 2,000,000 | 2,021,100 | ||||||
Nationwide Building Society, 144A, 3.622%, 4/26/2023 | 2,460,000 | 2,556,033 | ||||||
NatWest Markets PLC: | ||||||||
144A, 3-month USD-LIBOR + 1.400%, 1.706%*, 9/29/2022 | 3,000,000 | 3,003,401 | ||||||
5.625%, 8/24/2020 | 5,000,000 | 5,032,090 | ||||||
Nomura Holdings, Inc., 2.648%, 1/16/2025 | 2,495,000 | 2,602,536 | ||||||
Park Aerospace Holdings Ltd., 144A, 4.5%, 3/15/2023 | 2,450,000 | 2,235,120 | ||||||
REC Ltd., 144A, 4.75%, 5/19/2023 | 1,423,000 | 1,461,148 | ||||||
Santander Holdings U.S.A., Inc., 3.4%, 1/18/2023 | 6,150,000 | 6,397,155 | ||||||
Skandinaviska Enskilda Banken AB: | ||||||||
144A, 3-month USD-LIBOR + 0.430%, 0.816%*, 5/17/2021 | 5,000,000 | 5,014,158 | ||||||
144A, 3.05%, 3/25/2022 | 2,750,000 | 2,863,437 | ||||||
Societe Generale SA, 144A, 2.625%, 1/22/2025 | 3,705,000 | 3,781,123 | ||||||
Standard Chartered PLC, 144A, 4.247%, 1/20/2023 | 2,080,000 | 2,159,248 | ||||||
The accompanying notes are an integral part of the consolidated financial statements.
| DWS Enhanced Commodity Strategy Fund | | | 17 |
| Principal Amount ($) | Value ($) | |||||||
Synchrony Bank: | ||||||||
3.0%, 6/15/2022 | 4,310,000 | 4,400,733 | ||||||
3.65%, 5/24/2021 | 4,234,000 | 4,302,688 | ||||||
Turkiye Sinai Kalkinma Bankasi AS, 144A, 6.0%, 1/23/2025 | 500,000 | 475,460 | ||||||
|
| |||||||
| 166,844,408 | ||||||||
| Health Care 0.4% | ||||||||
Bausch Health Companies, Inc., 144A, 7.0%, 3/15/2024 | 3,200,000 | 3,320,000 | ||||||
Becton, Dickinson & Co., 3-month USD-LIBOR + 0.875%, 1.181%*, 12/29/2020 | 2,121,000 | 2,121,137 | ||||||
|
| |||||||
| 5,441,137 | ||||||||
| Industrials 1.8% | ||||||||
Adani Ports & Special Economic Zone Ltd., 144A, 3.95%, 1/19/2022 | 2,267,000 | 2,290,635 | ||||||
Bombardier, Inc., 144A, 6.0%, 10/15/2022 | 3,000,000 | 2,100,000 | ||||||
CNH Industrial Capital LLC, 3.875%, 10/15/2021 | 2,510,000 | 2,572,428 | ||||||
Colfax Corp., 144A, 6.0%, 2/15/2024 | 775,000 | 799,219 | ||||||
DAE Funding LLC, 144A, 5.25%, 11/15/2021 | 3,000,000 | 2,940,000 | ||||||
Delta Air Lines, Inc., 3.4%, 4/19/2021 | 3,636,000 | 3,535,974 | ||||||
Hillenbrand, Inc., 5.75%, 6/15/2025 | 1,120,000 | 1,159,200 | ||||||
Southwest Airlines Co., 4.75%, 5/4/2023 | 2,305,000 | 2,367,857 | ||||||
Spirit AeroSystems, Inc., 3-month USD-LIBOR + 0.800%, 1.113%*, 6/15/2021 | 4,390,000 | 4,088,566 | ||||||
Transnet SOC Ltd., 144A, 4.0%, 7/26/2022 | 2,000,000 | 1,938,480 | ||||||
WESCO Distribution, Inc., 144A, 7.125%, 6/15/2025 | 375,000 | 394,924 | ||||||
Westinghouse Air Brake Technologies Corp.: | ||||||||
3-month USD-LIBOR + 1.300%, 1.613%*, 9/15/2021 | 1,470,000 | 1,470,000 | ||||||
3.2%, 6/15/2025 | 1,850,000 | 1,885,145 | ||||||
|
| |||||||
| 27,542,428 | ||||||||
| Information Technology 1.4% | ||||||||
Hewlett Packard Enterprise Co., 3-month USD-LIBOR + 0.720%, 2.093%*, 10/5/2021 | 2,090,000 | 2,085,938 | ||||||
HP, Inc., 2.2%, 6/17/2025 | 4,190,000 | 4,324,762 | ||||||
Microchip Technology, Inc.: | ||||||||
144A, 2.67%, 9/1/2023 | 1,250,000 | 1,286,602 | ||||||
144A, 4.25%, 9/1/2025 | 170,000 | 171,082 | ||||||
NXP BV, 144A, 4.625%, 6/1/2023 | 5,961,000 | 6,537,866 | ||||||
Seagate HDD Cayman, 4.875%, 3/1/2024 | 1,940,000 | 2,079,381 | ||||||
VMware, Inc., 2.95%, 8/21/2022 | 4,800,000 | 4,964,917 | ||||||
|
| |||||||
| 21,450,548 | ||||||||
The accompanying notes are an integral part of the consolidated financial statements.
| 18 | | | DWS Enhanced Commodity Strategy Fund |
| Principal Amount ($) | Value ($) | |||||||
| Materials 1.5% | ||||||||
Bluestar Finance Holdings Ltd., REG S, 3.375%, 7/16/2024 | 1,000,000 | 1,022,806 | ||||||
Celanese U.S. Holdings LLC, 3.5%, 5/8/2024 | 1,010,000 | 1,066,145 | ||||||
CF Industries, Inc., 144A, 3.4%, 12/1/2021 | 340,000 | 346,660 | ||||||
Chemours Co., 6.625%, 5/15/2023 | 2,069,000 | 1,986,240 | ||||||
CNAC HK Finbridge Co., Ltd., REG S, 4.125%, 3/14/2021 | 3,000,000 | 3,039,990 | ||||||
First Quantum Minerals Ltd., 144A, 7.25%, 4/1/2023 | 486,000 | 464,130 | ||||||
Glencore Funding LLC, 144A, 4.125%, 3/12/2024 | 4,640,000 | 4,972,931 | ||||||
Hudbay Minerals, Inc., 144A, 7.25%, 1/15/2023 | 300,000 | 295,500 | ||||||
Indonesia Asahan Aluminium Persero PT, 144A, 4.75%, 5/15/2025 | 1,500,000 | 1,601,080 | ||||||
MEGlobal Canada ULC, 144A, 5.0%, 5/18/2025 | 2,419,000 | 2,601,465 | ||||||
NOVA Chemicals Corp., 144A, 4.875%, 6/1/2024 | 1,510,000 | 1,408,075 | ||||||
Nucor Corp., 2.0%, 6/1/2025 | 635,000 | 657,582 | ||||||
The Mosaic Co., 3.25%, 11/15/2022 | 4,190,000 | 4,288,699 | ||||||
|
| |||||||
| 23,751,303 | ||||||||
| Real Estate 0.3% | ||||||||
Equinix, Inc., (REIT), 1.25%, 7/15/2025 | 690,000 | 689,828 | ||||||
iStar, Inc., (REIT), 4.25%, 8/1/2025 | 450,000 | 407,250 | ||||||
MGM Growth Properties Operating Partnership LP, 144A, (REIT), 4.625%, 6/15/2025 | 330,000 | 322,700 | ||||||
Realogy Group LLC, 144A, (REIT), 7.625%, 6/15/2025 | 800,000 | 800,160 | ||||||
Ventas Realty LP, (REIT), 3.5%, 4/15/2024 | 2,800,000 | 2,913,250 | ||||||
VICI Properties LP, 144A, (REIT), 3.5%, 2/15/2025 | 140,000 | 131,600 | ||||||
|
| |||||||
| 5,264,788 | ||||||||
| Utilities 2.2% | ||||||||
CenterPoint Energy, Inc., 3.6%, 11/1/2021 | 2,030,000 | 2,107,763 | ||||||
Comision Federal de Electricidad, 144A, 4.875%, 5/26/2021 | 2,500,000 | 2,540,625 | ||||||
Dominion Energy, Inc., 3.071%, 8/15/2024 | 3,159,000 | 3,398,088 | ||||||
DTE Energy Co., Series B, 2.6%, 6/15/2022 | 4,100,000 | 4,227,825 | ||||||
Korea East-West Power Co., Ltd.: | ||||||||
144A, 1.75%, 5/6/2025 | 940,000 | 968,912 | ||||||
144A, 2.625%, 6/19/2022 | 4,740,000 | 4,898,411 | ||||||
NextEra Energy Capital Holdings, Inc., Series H, 3.342%, 9/1/2020 | 4,966,000 | 4,989,588 | ||||||
NextEra Energy Operating Partners LP, 144A, 4.25%, 7/15/2024 | 1,330,000 | 1,344,962 | ||||||
Pacific Gas and Electric Co., 1.75%, 6/16/2022 | 9,000,000 | 9,014,400 | ||||||
Perusahaan Perseroan Persero PT Perusahaan Listrik Negara, 144A, 5.5%, 11/22/2021 | 1,025,000 | 1,070,100 | ||||||
|
| |||||||
| 34,560,674 | ||||||||
Total Corporate Bonds (Cost $399,374,008) | 402,798,203 | |||||||
The accompanying notes are an integral part of the consolidated financial statements.
| DWS Enhanced Commodity Strategy Fund | | | 19 |
| Principal Amount ($) | Value ($) | |||||||
| Asset-Backed 10.2% | ||||||||
| Automobile Receivables 4.3% | ||||||||
AmeriCredit Automobile Receivables Trust: | ||||||||
“C”, Series 2019-2, 2.74%, 4/18/2025 | 2,760,000 | 2,841,025 | ||||||
“C”, Series 2016-2, 2.87%, 11/8/2021 | 191,270 | 191,459 | ||||||
“D”, Series 2017-1, 3.13%, 1/18/2023 | 6,830,000 | 6,933,647 | ||||||
Avis Budget Rental Car Funding, 3.33%, 3/20/2024 | 720,000 | 704,092 | ||||||
Canadian Pacer Auto Receivables Trust, “B”, | 1,500,000 | 1,556,489 | ||||||
CPS Auto Receivables Trust: | ||||||||
“B”, Series 2020-B, 144A, 2.11%, 4/15/2026 | 2,000,000 | 2,017,243 | ||||||
“B”, Series 2019-C, 144A, 2.63%, 8/15/2023 | 2,000,000 | 2,019,455 | ||||||
“B”, Series 2019-B, 144A, 3.09%, 4/17/2023 | 3,950,000 | 3,988,484 | ||||||
“D”, Series 2017-D, 144A, 3.73%, 9/15/2023 | 2,300,000 | 2,335,521 | ||||||
“C”, Series 2018-D, 144A, 3.83%, 9/15/2023 | 3,160,000 | 3,225,169 | ||||||
“C”, Series 2015-B, 144A, 4.2%, 5/17/2021 | 409,235 | 410,723 | ||||||
“C”, Series 2016-B, 144A, 4.22%, 3/15/2022 | 389,017 | 389,554 | ||||||
“D”, Series 2016-A, 144A, 5.0%, 12/15/2021 | 3,669,061 | 3,696,850 | ||||||
“D”, Series 2014-D, 144A, 5.33%, 11/16/2020 | 750,073 | 751,457 | ||||||
CPS Auto Trust: | ||||||||
“C”, Series 2016-D, 144A, 2.9%, 1/17/2023 | 306,842 | 307,265 | ||||||
“D”, Series 2016-D, 144A, 4.53%, 1/17/2023 | 375,000 | 379,722 | ||||||
Flagship Credit Auto Trust: | ||||||||
“C”, Series 2020-1, 144A, 2.24%, 1/15/2026 | 2,240,000 | 2,251,032 | ||||||
“C”, Series 2020-2, 144A, 2.61%, 4/15/2026 | 3,348,000 | 3,428,933 | ||||||
“C”, Series 2019-4, 144A, 2.77%, 12/15/2025 | 165,000 | 167,225 | ||||||
“D”, Series 2017-1, 144A, 3.22%, 5/15/2023 | 371,278 | 373,839 | ||||||
“C”, Series 2020-2, 144A, 3.8%, 4/15/2026 | 500,000 | 523,487 | ||||||
Ford Credit Floorplan Master Owner Trust: | ||||||||
“A1”, Series 2017-2, 2.16%, 9/15/2022 | 936,000 | 938,396 | ||||||
“B”, Series 2017-2, 2.34%, 9/15/2022 | 1,130,000 | 1,132,612 | ||||||
“A1”, Series 2018-3, 3.52%, 10/15/2023 | 530,000 | 546,183 | ||||||
Foursight Capital Automobile Receivables Trust: | ||||||||
“A3”, Series 2019-1, 144A, 2.67%, 3/15/2024 | 2,500,000 | 2,563,581 | ||||||
“B”, Series 2018-2, 144A, 3.8%, 11/15/2023 | 2,110,000 | 2,187,960 | ||||||
GMF Floorplan Owner Revolving Trust, “A”, Series 2019-1, 144A, 2.7%, 4/15/2024 | 510,000 | 521,778 | ||||||
Hertz Vehicle Financing II LP: | ||||||||
“A”, Series 2016-2A, 144A, 2.95%, 3/25/2022 | 4,827,409 | 4,773,897 | ||||||
“A”, Series 2017-2A, 144A, 3.29%, 10/25/2023 | 4,029,073 | 3,992,260 | ||||||
Santander Consumer Auto Receivables Trust, “B”, Series 2020-AA, 144A, 2.26%, 12/15/2025 | 1,000,000 | 1,018,491 | ||||||
Santander Drive Auto Receivables Trust, “C”, Series 2018-5, 3.81%, 12/16/2024 | 4,000,000 | 4,068,108 | ||||||
The accompanying notes are an integral part of the consolidated financial statements.
| 20 | | | DWS Enhanced Commodity Strategy Fund |
| Principal Amount ($) | Value ($) | |||||||
United Auto Credit Securitization Trust, “B”, Series 2020-1, 144A, 1.47%, 11/10/2022 | 3,000,000 | 2,999,400 | ||||||
World Omni Select Auto Trust: | ||||||||
“C”, Series 2019-A, 2.38%, 12/15/2025 | 1,500,000 | 1,513,082 | ||||||
“B”, Series 2018-1A, 144A, 3.68%, 7/15/2023 | 1,630,000 | 1,658,008 | ||||||
|
| |||||||
| 66,406,427 | ||||||||
| Credit Card Receivables 1.1% | ||||||||
Evergreen Credit Card Trust, “C”, Series 2019-2, 144A, 2.62%, 9/15/2024 | 1,000,000 | 1,004,248 | ||||||
First National Master Note Trust, “A”, Series 2018-1, 1-month USD-LIBOR + 0.460%, 0.645%*, 10/15/2024 | 785,000 | 783,139 | ||||||
Synchrony Credit Card Master Note Trust: | ||||||||
“A”, Series 2016-2A, 2.21%, 5/15/2024 | 2,625,000 | 2,654,674 | ||||||
“C”, Series 2016-2, 2.95%, 5/15/2024 | 415,017 | 414,850 | ||||||
“C”, Series 2017-2, 3.01%, 10/15/2025 | 3,291,836 | 3,413,310 | ||||||
World Financial Network Credit Card Master Trust: | ||||||||
“M”, Series 2016-A, 2.33%, 4/15/2025 | 6,000,000 | 6,001,702 | ||||||
“A”, Series 2019-B, 2.49%, 4/15/2026 | 3,000,000 | 3,067,715 | ||||||
|
| |||||||
| 17,339,638 | ||||||||
| Miscellaneous 4.8% | ||||||||
Apidos CLO XXIV, “A1BR”, Series 2016-24A,144A, 3-month USD-LIBOR + 1.450%, 2.585%*, 10/20/2030 | 5,100,000 | 4,931,338 | ||||||
Babson CLO Ltd., “BR”, Series 2015-IA, 144A, 3-month USD-LIBOR + 1.400%, 2.535%*, 1/20/2031 | 2,000,000 | 1,913,426 | ||||||
Babson CLO, Ltd., “BR”, Series 2014-IA, 144A, 3-month USD-LIBOR + 2.200%, 3.335%*, 7/20/2025 | 500,000 | 498,269 | ||||||
Battalion CLO XV Ltd., “B”, Series 2020-15A, 144A, 3-month USD-LIBOR + 1.700%, 3.026%*, 1/17/2033 | 5,000,000 | 4,823,620 | ||||||
BlueMountain Fuji U.S. CLO II Ltd., “A1B”, | 4,000,000 | 3,836,008 | ||||||
Dell Equipment Finance Trust: | ||||||||
“C”, Series 2019-2, 144A, 2.18%, 10/22/2024 | 1,750,000 | 1,754,226 | ||||||
“C”, Series 2017-2, 144A, 2.73%, 10/24/2022 | 2,000,000 | 2,003,269 | ||||||
“D”, Series 2019-1, 144A, 3.45%, 3/24/2025 | 2,400,000 | 2,393,605 | ||||||
“C”, Series 2018-1,144A, 3.53%, 6/22/2023 | 2,656,000 | 2,703,156 | ||||||
“C”, Series 2018-2, 144A, 3.72%, 10/22/2023 | 3,000,000 | 3,050,303 | ||||||
Flatiron CLO Ltd., “B”, Series 2018-1A, 144A, 3-month USD-LIBOR + 1.350%, 2.485%*, 4/17/2031 | 4,500,000 | 4,258,247 | ||||||
Hilton Grand Vacations Trust, “A”, Series 2019-AA, 144A, 2.34%, 7/25/2033 | 797,452 | 797,397 | ||||||
HPEFS Equipment Trust: | ||||||||
“C”, Series 2020-2A, 144A, 2.0%, 7/22/2030 | 1,890,000 | 1,889,622 | ||||||
“C”, Series 2019-1A, 144A, 2.49%, 9/20/2029 | 1,140,000 | 1,137,510 | ||||||
The accompanying notes are an integral part of the consolidated financial statements.
| DWS Enhanced Commodity Strategy Fund | | | 21 |
| Principal Amount ($) | Value ($) | |||||||
LCM LP, “BR2”, Series 16A, 144A, 3-month USD-LIBOR + 1.750%, 2.969%*, 10/15/2031 | 2,960,000 | 2,792,150 | ||||||
Madison Park Funding XII Ltd., “AR”, Series 2014-12A, 144A, 3-month USD-LIBOR + 1.260%, 2.395%*, 7/20/2026 | 1,077,123 | 1,076,250 | ||||||
MVW LLC, “B”, Series 2019-2A, 144A, 2.44%, 10/20/2038 | 1,447,096 | 1,321,402 | ||||||
MVW Owner Trust, “A”, Series 2019-1A, 144A, 2.89%, 11/20/2036 | 2,111,998 | 2,148,330 | ||||||
Neuberger Berman CLO XVII Ltd., “A2R2”, Series 2014-18A, 144A, 3-month USD-LIBOR + 1.700%, 2.809%*, 10/21/2030 | 2,700,000 | 2,581,999 | ||||||
Neuberger Berman Loan Advisers CLO Ltd.: | ||||||||
“A2”, Series 2018-29A, 144A, 3-month USD-LIBOR + 1.400%, 2.535%*, 10/19/2031 | 3,000,000 | 2,892,957 | ||||||
“B”, Series 2018-27A, 144A, 3-month USD-LIBOR + 1.400%, 2.619%*, 1/15/2030 | 5,250,000 | 5,073,201 | ||||||
NRZ Excess Spread-Collateralized Notes, “B”, Series 2018-PLS1, 144A, 3.588%, 1/25/2023 | 1,808,662 | 1,813,097 | ||||||
Transportation Finance Equipment Trust: | ||||||||
“A4”, Series 2019-1, 144A, 1.88%, 3/25/2024 | 2,500,000 | 2,491,568 | ||||||
“C”, Series 2019-1, 144A, 2.19%, 8/23/2024 | 1,250,000 | 1,224,842 | ||||||
Venture XXX CLO Ltd., “A2”, Series 2017-30A, 144A, 3-month USD-LIBOR + 1.350%, 2.569%*, 1/15/2031 | 10,000,000 | 9,472,040 | ||||||
Verizon Owner Trust, “C”, Series 2018-A, 3.55%, 4/20/2023 | 720,000 | 742,157 | ||||||
Voya CLO Ltd.: | ||||||||
“A1RR”, Series 2014-2A, 144A, 3-month USD-LIBOR + 1.020%, 2.155%*, 4/17/2030 | 3,000,000 | 2,923,095 | ||||||
“A2AR”, Series 2012-A, 144A, 3-month USD-LIBOR + 1.900%, 3.119%*, 10/15/2030 | 3,000,000 | 2,862,540 | ||||||
|
| |||||||
| 75,405,624 | ||||||||
Total Asset-Backed (Cost $160,250,566) | 159,151,689 | |||||||
| Commercial Mortgage-Backed Securities 5.0% |
| |||||||
Atrium Hotel Portfolio Trust, “B”, Series 2018-ATRM,144A, 1-month USD-LIBOR + 1.430%, 1.615%*, 6/15/2035 | 6,000,000 | 5,519,369 | ||||||
BAMLL Commercial Mortgage Securities Trust: | ||||||||
“A”, Series 2018-DSNY, 144A, 1-month USD-LIBOR + 0.850%, 1.035%*, 9/15/2034 | 950,000 | 904,723 | ||||||
“B”, Series 2018-DSNY, 144A, 1-month USD-LIBOR + 1.150%, 1.335%*, 9/15/2034 | 9,200,000 | 8,592,805 | ||||||
BFLD TRUST, “B”, Series 2019-DPLO, 144A, 1-month USD-LIBOR + 1.340%, 1.525%*, 10/15/2034 | 1,500,000 | 1,402,379 | ||||||
BX Commercial Mortgage Trust, “B”, Series 2019-IMC, 144A, 1-month USD-LIBOR + 1.300%, 1.485%*, 4/15/2034 | 6,500,000 | 5,979,018 | ||||||
The accompanying notes are an integral part of the consolidated financial statements.
| 22 | | | DWS Enhanced Commodity Strategy Fund |
| Principal Amount ($) | Value ($) | |||||||
BXP Trust: | ||||||||
“A”, Series 2017-CQHP, 144A, 1-month USD-LIBOR + 0.850%, 1.035%*, 11/15/2034 | 730,000 | 708,257 | ||||||
“B”, Series 2017-CQHP, 144A, 1-month USD-LIBOR + 1.100%, 1.285%*, 11/15/2034 | 6,210,000 | 5,798,732 | ||||||
Citigroup Commercial Mortgage Trust: | ||||||||
“AS”, Series 2013-GC11, 3.422%, 4/10/2046 | 1,500,000 | 1,570,110 | ||||||
“C”, Series 2019-PRM, 144A, 3.896%, 5/10/2036 | 1,614,506 | 1,654,787 | ||||||
“M”, Series 2005-EMG, 144A, 5.5%*, 9/20/2051 (a) | 34,661 | 34,282 | ||||||
COMM Mortgage Trust: | ||||||||
“AM”, Series 2013-CR6, 144A, 3.147%, 3/10/2046 | 2,200,000 | 2,236,028 | ||||||
“AM”, Series 2013-LC6, 3.282%, 1/10/2046 | 2,500,000 | 2,570,258 | ||||||
“B”, Series 2013-CR6, 144A, 3.397%, 3/10/2046 | 4,238,720 | 4,261,373 | ||||||
FHLMC Multifamily Structured Pass-Through Certificates: | ||||||||
“X1”, Series K058, Interest Only, 1.054%*, 8/25/2026 | 23,447,673 | 1,151,665 | ||||||
“X1”, Series K722, Interest Only, 1.439%*, 3/25/2023 | 14,916,016 | 407,708 | ||||||
FREMF Mortgage Trust, “B”, Series 2012-K23, 144A, 3.782%*, 10/25/2045 | 1,750,000 | 1,827,367 | ||||||
Hawaii Hotel Trust, “A”, Series 2019-MAUI, 144A, 1-month USD-LIBOR + 1.150%, 1.335%*, 5/15/2038 | 1,500,000 | 1,445,679 | ||||||
Hospitality Mortgage Trust, “B”, Series 2019-HIT, 144A, 1-month USD-LIBOR + 1.350%, 1.535%*, 11/15/2036 | 4,728,421 | 4,373,360 | ||||||
IMT Trust, “BFL”, Series 2017-APTS, 144A, 1-month USD-LIBOR + 0.950%, 1.135%*, 6/15/2034 | 7,229,985 | 6,837,025 | ||||||
InTown Hotel Portfolio Trust, “C”, Series 2018-STAY, 144A, 1-month USD-LIBOR + 1.250%, 1.435%*, 1/15/2033 | 2,200,000 | 2,039,937 | ||||||
JPMBB Commercial Mortgage Securities Trust, “ASB”, Series 2015-C31, 3.54%, 8/15/2048 | 749,999 | 791,451 | ||||||
Morgan Stanley Capital I Trust: | ||||||||
“B”, Series 2018-SUN, 144A, 1-month USD-LIBOR + 1.200%, 1.422%*, 7/15/2035 | 2,353,200 | 2,232,291 | ||||||
“E”, Series 2005-IQ10, 144A, 5.722%*, 9/15/2042 | 659,445 | 663,626 | ||||||
Natixis Commercial Mortgage Securities Trust, “B”, Series 2018-850T, 144A, 1-month USD-LIBOR + 0.954%, 1.138%*, 7/15/2033 | 6,500,000 | 6,246,687 | ||||||
UBS Commercial Mortgage Trust: | ||||||||
“XA”, Series 2017-C7, Interest Only, 1.204%*, 12/15/2050 | 40,161,224 | 2,255,109 | ||||||
“XA”, Series 2017-C1, Interest Only, 1.717%*, 6/15/2050 | 36,932,265 | 2,863,532 | ||||||
Wells Fargo Commercial Mortgage Trust: | ||||||||
“A2”, Series 2016-C34, 2.603%, 6/15/2049 | 500,000 | 502,638 | ||||||
“A3”, Series 2012-LC5, 2.918%, 10/15/2045 | 2,024,702 | 2,081,802 | ||||||
“ASB”, Series 2015-C31, 3.487%, 11/15/2048 | 210,000 | 221,198 | ||||||
| ||||||||
Total Commercial Mortgage-Backed Securities (Cost $80,201,599) |
| 77,173,196 | ||||||
The accompanying notes are an integral part of the consolidated financial statements.
| DWS Enhanced Commodity Strategy Fund | | | 23 |
| Principal Amount ($) | Value ($) | |||||||
| Collateralized Mortgage Obligations 1.6% | ||||||||
Angel Oak Mortgage Trust, “A1”, Series 2019-3, 144A, 2.93%, 5/25/2059 | 2,587,968 | 2,615,600 | ||||||
Ellington Financial Mortgage Trust, “A1FX”, Series 2018-1, 144A, 4.14%, 10/25/2058 | 1,366,624 | 1,398,363 | ||||||
Federal National Mortgage Association, “FB”, Series 1996-44, 1-month USD-LIBOR + 0.800%, 0.968%*, 9/25/2023 | 17,956 | 18,084 | ||||||
Flagstar Mortgage Trust, “A4”, Series 2018-4, 144A, 4.0%, 7/25/2048 | 466,509 | 467,315 | ||||||
Freddie Mac Structured Agency Credit Risk Debt Notes: | ||||||||
“M1”, Series 2017-DNA1, 1-month USD-LIBOR + 1.200%, 1.368%*, 7/25/2029 | 151,043 | 151,006 | ||||||
“M2”, Series 2016-DNA4, 1-month USD-LIBOR + 1.300%, 1.485%*, 3/25/2029 | 261,909 | 261,620 | ||||||
144A, 1x 1-month USD-LIBOR + 1.500%, 2.19%, 6/25/2050 (b) | 2,000,000 | 2,000,000 | ||||||
“M2”, Series 2015-DNA3, 1-month USD-LIBOR + 2.850%, 3.035%*, 4/25/2028 | 340,503 | 340,998 | ||||||
FWD Securitization Trust: | ||||||||
“A1”, Series 2020-INV1, 144A, 2.24%, 1/25/2050 | 2,254,951 | 2,293,338 | ||||||
“A1”, Series 2019-INV1, 144A, 2.81%, 6/25/2049 | 1,604,235 | 1,641,098 | ||||||
JPMorgan Mortgage Trust: | ||||||||
“A15”, Series 2018-9, 144A, 4.0%, 2/25/2049 | 171,868 | 171,977 | ||||||
“A15”, Series 2018-LTV1, 144A, 4.5%, 4/25/2049 | 112,791 | 113,089 | ||||||
PSMC Trust, “A3”, Series 2018-1, 144A, 3.5%, 2/25/2048 | 798,873 | 808,882 | ||||||
Sequoia Mortgage Trust: | ||||||||
“A10”, Series 2017-CH2, 144A, 4.0%, 12/25/2047 | 2,967,087 | 3,008,064 | ||||||
“A10”, Series 2018-CH1, 144A, 4.0%, 2/25/2048 | 1,685,002 | 1,700,938 | ||||||
“A10”, Series 2019-CH3, 144A, 4.0%, 9/25/2049 | 1,984,370 | 2,027,362 | ||||||
Verus Securitization Trust: | ||||||||
“A1”, Series 2020-INV1, 144A, 1.977%, 4/25/2060 | 585,562 | 586,462 | ||||||
“A1”, Series 2020-2, 144A, 2.226%, 5/25/2060 | 491,374 | 495,140 | ||||||
“A1”, Series 2019-INV1, 144A, 3.402%, 12/25/2059 | 2,908,677 | 2,974,792 | ||||||
“A1”, Series 2018-INV1, 144A, 3.626%, 3/25/2058 | 2,169,952 | 2,172,912 | ||||||
| ||||||||
Total Collateralized Mortgage Obligations (Cost $25,042,804) |
| 25,247,040 | ||||||
| Government & Agency Obligations 43.5% | ||||||||
| Other Government Related (c) 2.0% | ||||||||
Banque Ouest Africaine de Developpement, 144A, 5.5%, 5/6/2021 | 3,200,000 | 3,274,496 | ||||||
Corp. Andina de Fomento, 2.375%, 5/12/2023 | 4,000,000 | 4,102,480 | ||||||
Eastern & Southern African Trade & Development Bank, REG S, 5.375%, 3/14/2022 | 2,779,000 | 2,792,506 | ||||||
The accompanying notes are an integral part of the consolidated financial statements.
| 24 | | | DWS Enhanced Commodity Strategy Fund |
| Principal Amount ($) | Value ($) | |||||||
Eurasian Development Bank: | ||||||||
144A, 4.767%, 9/20/2022 | 3,000,000 | 3,135,000 | ||||||
144A, 5.0%, 9/26/2020 | 2,163,000 | 2,162,675 | ||||||
Qatari Diar Finance QSC, 144A, 5.0%, 7/21/2020 | 3,000,000 | 3,005,556 | ||||||
Severstal OAO: | ||||||||
144A, 3.15%, 9/16/2024 | 1,000,000 | 1,014,650 | ||||||
144A, 5.9%, 10/17/2022 | 2,000,000 | 2,155,200 | ||||||
Vnesheconombank: | ||||||||
144A, 6.025%, 7/5/2022 | 1,500,000 | 1,600,980 | ||||||
144A, 6.902%, 7/9/2020 | 6,913,000 | 6,920,397 | ||||||
|
| |||||||
| 30,163,940 | ||||||||
| Sovereign Bonds 0.4% | ||||||||
Abu Dhabi Government International Bond, 144A, 2.5%, 4/16/2025 | 1,895,000 | 1,991,285 | ||||||
Government of Malaysia, 144A, 3.043%, 4/22/2025 | 1,000,000 | 1,072,742 | ||||||
Paraguay Government International Bond, 144A, 4.625%, 1/25/2023 | 1,000,000 | 1,050,010 | ||||||
Turkey Government International Bond, 5.6%, 11/14/2024 | 2,000,000 | 1,965,000 | ||||||
|
| |||||||
| 6,079,037 | ||||||||
| U.S. Treasury Obligations 41.1% | ||||||||
U.S. Treasury Floating Rate Notes: | ||||||||
3-month U.S. Treasury Bill Money Market Yield + 0.139%, 0.259%*, 4/30/2021 (d) | 35,000,000 | 35,032,058 | ||||||
3-month U.S. Treasury Bill Money Market Yield + 0.114%, 0.264%*, 4/30/2022 (d) | 40,000,000 | 40,023,282 | ||||||
3-month U.S. Treasury Bill Money Market Yield + 0.115%, 0.265%*, 1/31/2021 (d) | 35,000,000 | 35,019,215 | ||||||
3-month U.S. Treasury Bill Money Market Yield + 0.154%, 0.274%*, 1/31/2022 (d) | 40,000,000 | 40,052,287 | ||||||
3-month U.S. Treasury Bill Money Market Yield + 0.220%, 0.37%*, 7/31/2021 (d) | 35,000,000 | 35,067,131 | ||||||
3-month U.S. Treasury Bill Money Market Yield + 0.300%, 0.45%*, 10/31/2021 (d) | 40,000,000 | 40,126,909 | ||||||
U.S. Treasury Inflation-Indexed Notes: | ||||||||
0.125%, 1/15/2023 | 44,440,400 | 45,522,362 | ||||||
0.125%, 7/15/2024 | 43,200,800 | 45,121,589 | ||||||
0.375%, 7/15/2023 | 44,078,400 | 45,900,708 | ||||||
U.S. Treasury Notes: | ||||||||
0.5%, 3/15/2023 | 40,000,000 | 40,348,438 | ||||||
1.25%, 3/31/2021 | 20,000,000 | 20,160,938 | ||||||
1.5%, 7/15/2020 | 20,000,000 | 20,010,221 | ||||||
1.625%, 4/30/2023 | 30,000,000 | 31,223,437 | ||||||
1.75%, 11/30/2021 | 35,000,000 | 35,780,664 | ||||||
2.0%, 2/28/2021 | 20,000,000 | 20,239,062 | ||||||
The accompanying notes are an integral part of the consolidated financial statements.
| DWS Enhanced Commodity Strategy Fund | | | 25 |
| Principal Amount ($) | Value ($) | |||||||
2.125%, 9/30/2021 | 30,000,000 | 30,726,563 | ||||||
2.25%, 2/15/2021 | 20,000,000 | 20,257,812 | ||||||
2.5%, 1/31/2021 | 25,000,000 | 25,333,985 | ||||||
2.75%, 5/31/2023 | 30,000,000 | 32,240,625 | ||||||
|
| |||||||
| 638,187,286 | ||||||||
Total Government & Agency Obligations (Cost $663,236,593) |
| 674,430,263 | ||||||
| Municipal Bonds and Notes 0.4% | ||||||||
New Jersey, Turnpike Authority Revenue Bonds, Series F, 2.536%, 1/1/2021(Cost $6,023,330) | 6,000,000 | 6,046,740 | ||||||
| Short-Term U.S. Treasury Obligations 3.0% | ||||||||
U.S. Treasury Bills: | ||||||||
0.075%**, 7/16/2020 (e) | 20,000,000 | 19,998,937 | ||||||
0.12%**, 7/16/2020 (e) | 2,000,000 | 1,999,894 | ||||||
0.133%**, 7/16/2020 (e) | 2,000,000 | 1,999,894 | ||||||
0.351%**, 9/10/2020 | 150,000 | 149,960 | ||||||
0.36%**, 9/10/2020 | 800,000 | 799,787 | ||||||
0.978%**, 9/10/2020 | 1,000,000 | 999,734 | ||||||
1.762%**, 7/16/2020 (e) | 20,000,000 | 19,998,937 | ||||||
| ||||||||
Total Short-Term U.S. Treasury Obligations (Cost $45,931,887) |
| 45,947,143 | ||||||
| Shares | Value ($) | |||||||
| Exchange-Traded Funds 0.1% | ||||||||
iShares 0-5 Year High Yield Corporate Bond ETF (Cost $1,073,250) | 25,000 | 1,072,250 | ||||||
| Contracts/ Notional Amount | Value ($) | |||||||
| Put Options Purchased 0.0% | ||||||||
| Options on Exchange-Traded Futures Contracts |
| |||||||
Live Cattle Futures, Expiration Date 8/7/2020, Strike Price $87.0 (Cost $885,200) | 2,000 | 540,000 | ||||||
| 80,000,000 | ||||||||
The accompanying notes are an integral part of the consolidated financial statements.
| 26 | | | DWS Enhanced Commodity Strategy Fund |
| Shares | Value ($) | |||||||
| Cash Equivalents 8.7% | ||||||||
DWS Central Cash Management Government Fund, 0.12% (f) | 128,467,296 | 128,467,296 | ||||||
DWS ESG Liquidity Fund “Capital Shares”, 0.34% (f) | 6,916,298 | 6,918,373 | ||||||
| ||||||||
Total Cash Equivalents (Cost $135,383,545) | 135,385,669 | |||||||
| % of Net Assets | Value ($) | |||||||
| Total Consolidated Investment Portfolio (Cost $1,517,402,782) | 98.5 | 1,527,792,193 | ||||||
| Other Assets and Liabilities, Net | 1.5 | 23,976,975 | ||||||
| ||||||||
| Net Assets | 100.0 | 1,551,769,168 | ||||||
A summary of the Fund’s transactions with affiliated investments during the year ended June 30, 2020 are as follows:
| Value ($) at 6/30/2019 | Pur- chases Cost ($) | Sales Proceeds ($) | Net Real- ized Gain/ (Loss) ($) | Net Change in Unreal- ized Appreci- ation (Depreci- ation) ($) | Income ($) | Capital Gain Distri- butions ($) | Number of Shares at 6/30/2020 | Value ($) at 6/30/2020 | ||||||||||||||||||||||||||
| Securities Lending Collateral 0.0% | ||||||||||||||||||||||||||||||||||
| | DWS Government & Agency Securities Portfolio “DWS Government Cash Institutional Shares”, 0.05% (f) (g) | | ||||||||||||||||||||||||||||||||
| 12,064,797 | — | 12,064,797 (h) | — | — | 9,207 | — | — | — | ||||||||||||||||||||||||||
| Cash Equivalents 8.7% | ||||||||||||||||||||||||||||||||||
| DWS Central Cash Management Government Fund, 0.12% (f) | ||||||||||||||||||||||||||||||||||
| 73,209,011 | 3,024,031,755 | 2,968,773,470 | — | — | 2,252,612 | — | 128,467,296 | 128,467,296 | ||||||||||||||||||||||||||
| DWS ESG Liquidity Fund “Capital Shares”, 0.34% (f) | ||||||||||||||||||||||||||||||||||
| 143,164,257 | 21,770,632 | 158,020,800 | 5,724 | (1,440) | 1,469,304 | — | 6,916,298 | 6,918,373 | ||||||||||||||||||||||||||
| 228,438,065 | 3,045,802,387 | 3,138,859,067 | 5,724 | (1,440) | 3,731,123 | — | 135,383,594 | 135,385,669 | ||||||||||||||||||||||||||
| * | Variable or floating rate security. These securities are shown at their current rate as of June 30, 2020. For securities based on a published reference rate and spread, the reference rate and spread are indicated within the description above. Certain variable rate securities are not based on a published reference rate and spread but adjust periodically based on current market conditions, prepayment of underlying positions and/or other variables. |
| ** | Annualized yield at time of purchase; not a coupon rate. |
| (a) | Investment was valued using significant unobservable inputs. |
| (b) | When-issued security. |
| (c) | Government-backed debt issued by financial companies or government sponsored enterprises. |
| (d) | At June 30, 2020, this security has been pledged, in whole or in part, as collateral for open commodity-linked rate swap contracts. |
The accompanying notes are an integral part of the consolidated financial statements.
| DWS Enhanced Commodity Strategy Fund | | | 27 |
| (e) | At June 30, 2020, this security has been pledged, in whole or in part, to cover initial margin requirements for open futures contracts. |
| (f) | Affiliated fund managed by DWS Investment Management Americas, Inc. The rate shown is the annualized seven-day yield at period end. |
| (g) | Represents cash collateral held in connection with securities lending. Income earned by the Fund is net of borrower rebates. |
| (h) | Represents the net increase (purchase cost) or decrease (sales proceeds) in the amount invested in cash collateral for the year ended June 30, 2020. |
144A: Security exempt from registration under Rule 144A of the Securities Act of 1933. These securities may be resold in transactions exempt from registration, normally to qualified institutional buyers.
CLO: Collateralized Loan Obligation
COT: Commitment of Traders
Interest Only: Interest Only (IO) bonds represent the “interest only” portion of payments on a pool of underlying mortgages or mortgage-backed securities. IO securities are subject to prepayment risk of the pool of underlying mortgages.
JSC: Joint Stock Company
LIBOR: London Interbank Offered Rate
LME: London Metal Exchange
OAO: Otkrytoe Aktsionernoe Obschestvo (Russian: Open Joint Stock Corporation)
REG S: Securities sold under Regulation S may not be offered, sold or delivered within the United States or to, or for the account or benefit of, U.S. persons, except pursuant to an exemption from, or in a transaction not subject to, the registration requirements of the Securities Act of 1933.
REIT: Real Estate Investment Trust
SOC: State Owned Company
SOFR: Secured Overnight Financing Rate
ULS: Ultra-Low Sulfur
Included in the portfolio are investments in mortgage or asset-backed securities which are interests in separate pools of mortgages or assets. Effective maturities of these investments may be shorter than stated maturities due to prepayments.
The accompanying notes are an integral part of the consolidated financial statements.
| 28 | | | DWS Enhanced Commodity Strategy Fund |
At June 30, 2020, open futures contracts purchased were as follows:
| Futures | Currency | Expiration Date | Contracts | Notional Amount ($) | Notional Value ($) | Unrealized Appreciation (Depreciation) ($) | ||||||||||||||||||
| Aluminum Futures | USD | 7/1/2020 | 1,200 | 46,335,000 | 47,685,000 | 1,350,000 | ||||||||||||||||||
| Aluminum Futures | USD | 7/15/2020 | 800 | 29,980,000 | 31,875,000 | 1,895,000 | ||||||||||||||||||
| Aluminum Futures | USD | 8/19/2020 | 415 | 16,185,000 | 16,685,594 | 500,594 | ||||||||||||||||||
| Copper Futures | USD | 7/15/2020 | 125 | 16,128,125 | 18,775,781 | 2,647,656 | ||||||||||||||||||
| Copper Futures | USD | 9/18/2020 | 60 | 8,715,180 | 9,022,875 | 307,695 | ||||||||||||||||||
| Gold 100 oz. Futures | USD | 8/27/2020 | 80 | 13,576,890 | 14,404,000 | 827,110 | ||||||||||||||||||
| LME Nickel Futures | USD | 8/19/2020 | 210 | 15,977,777 | 16,364,566 | 386,789 | ||||||||||||||||||
| Nickel Futures | USD | 7/1/2020 | 220 | 14,976,060 | 16,840,560 | 1,864,500 | ||||||||||||||||||
| Nickel Futures | USD | 12/16/2020 | 755 | 75,637,651 | 58,227,487 | (17,410,164 | ) | |||||||||||||||||
| Palladium Futures | USD | 9/28/2020 | 75 | 14,377,259 | 14,751,750 | 374,491 | ||||||||||||||||||
| Zinc Futures | USD | 7/1/2020 | 320 | 14,944,000 | 16,434,000 | 1,490,000 | ||||||||||||||||||
| Total net unrealized depreciation |
| (5,766,329 | ) | |||||||||||||||||||||
At June 30, 2020, open futures contracts sold were as follows:
| Futures | Currency | Expiration Date | Contracts | Notional Amount ($) | Notional Value ($) | Unrealized Appreciation (Depreciation) ($) | ||||||||||||||||||
| Aluminum Futures | USD | 7/1/2020 | 1,200 | 44,486,000 | 47,685,000 | (3,199,000 | ) | |||||||||||||||||
| Aluminum Futures | USD | 7/15/2020 | 800 | 31,625,000 | 31,875,000 | (250,000 | ) | |||||||||||||||||
| Copper Futures | USD | 7/15/2020 | 125 | 17,202,750 | 18,775,781 | (1,573,031 | ) | |||||||||||||||||
| Live Cattle Futures | USD | 8/31/2020 | 20 | 795,148 | 770,200 | 24,948 | ||||||||||||||||||
| LME Nickel Futures | USD | 12/13/2021 | 255 | 22,391,062 | 20,012,018 | 2,379,044 | ||||||||||||||||||
| LME Nickel Futures | USD | 8/19/2020 | 210 | 15,283,800 | 16,364,565 | (1,080,765 | ) | |||||||||||||||||
| LME Zinc Futures | USD | 9/3/2020 | 400 | 20,101,570 | 20,442,100 | (340,530 | ) | |||||||||||||||||
| Nickel Futures | USD | 7/1/2020 | 220 | 15,628,140 | 16,840,560 | (1,212,420 | ) | |||||||||||||||||
| Nickel Futures | USD | 12/16/2020 | 500 | 48,450,300 | 38,561,250 | 9,889,050 | ||||||||||||||||||
| Zinc Futures | USD | 7/1/2020 | 320 | 15,438,512 | 16,434,000 | (995,488 | ) | |||||||||||||||||
| Total net unrealized appreciation |
| 3,641,808 | ||||||||||||||||||||||
The accompanying notes are an integral part of the consolidated financial statements.
| DWS Enhanced Commodity Strategy Fund | | | 29 |
At June 30, 2020, open written option contracts were as follows:
Options on Exchange-Traded Futures Contracts
| Contracts | Expiration Date | Strike Price ($) | Notional Amount ($) | Premiums Received ($) | Value ($) | Unrealized Appreciation ($) | ||||||||||||||||||||||
Put Options | ||||||||||||||||||||||||||||
| Live Cattle Futures | 2,000 | 8/7/2020 | 92.0 | 80,000,000 | 1,354,800 | (1,140,000 | ) | 214,800 | ||||||||||||||||||||
Each commodity linked swap is a commitment to receive the total return of the specified commodity linked index in exchange for a fixed financing rate. At June 30, 2020, open commodity-linked swap contracts were as follows:
Pay/Receive Return of the Reference Index | Expiration Date | Counterparty | Notional Amount | Fixed Fee Received/ (Paid) by the Fund | Frequency | Value ($) (i) | ||||||||||||
Long Positions | ||||||||||||||||||
| Barclays EFS Custom Commodity Basket 08 Index/BEFSCB08 | 7/14/2020 | Barclays Bank PLC | 60,000,000 | — | At Expiration | (1,607,216 | ) | |||||||||||
Goldman Sachs Gold Vol Carry Index 04/GSVLGC04 | 8/17/2020 | Goldman Sachs & Co. | 20,000,000 | (0.35 | ) | At Expiration | 332,141 | |||||||||||
SGI Commodity Dynamic Alpha Index/SGICCODA | 7/14/2020 | Societe Generale | 83,121,000 | (0.25 | ) | At Expiration | (114,013 | ) | ||||||||||
| Bloomberg Brent Crude Index/BCOMCO | 7/14/2020 | Goldman Sachs & Co. | 26,623,000 | (0.11 | ) | At Expiration | 1,562,663 | |||||||||||
| Bloomberg Commodity Index 3 Month Forward/BCOMF3 | 7/14/2020 | Merrill Lynch International Ltd. | 49,754,000 | (0.14 | ) | At Expiration | 989,608 | |||||||||||
| Bloomberg Commodity Index 3 Month Forward/BCOMF3 | 7/14/2020 | JPMorgan Chase Securities, Inc. | 28,431,000 | (0.11 | ) | At Expiration | 565,937 | |||||||||||
| Bloomberg Commodity Index 3 Month Forward/BCOMF3 | 7/14/2020 | Credit Suisse | 20,000,000 | (0.16 | ) | At Expiration | 270,410 | |||||||||||
| Bloomberg Commodity Index 3 Month Forward/BCOMF3 | 7/14/2020 | UBS AG | 20,000,000 | (0.13 | ) | At Expiration | 270,640 | |||||||||||
| Bloomberg Commodity Index 3 Month Forward/BCOMF3 | 7/14/2020 | Societe Generale | 10,000,000 | (0.17 | ) | At Expiration | 37,684 | |||||||||||
The accompanying notes are an integral part of the consolidated financial statements.
| 30 | | | DWS Enhanced Commodity Strategy Fund |
Pay/Receive Return of the Reference Index | Expiration Date | Counterparty | Notional Amount | Fixed Fee Received/ (Paid) by the Fund | Frequency | Value ($) (i) | ||||||||||||
| Bloomberg Commodity Index 3 Month Forward/BCOMF3 | 7/14/2020 | Macquarie Bank Ltd. | 10,000,000 | (0.16 | ) | At Expiration | 37,708 | |||||||||||
| Bloomberg Commodity Index 6 Month Forward/BCOMF6 | 7/14/2020 | Macquarie Bank Ltd. | 62,192,000 | (0.17 | ) | At Expiration | 1,050,220 | |||||||||||
| Bloomberg Commodity Index 6 Month Forward/BCOMF6 | 7/14/2020 | JPMorgan Chase Securities, Inc. | 28,431,000 | (0.16 | ) | At Expiration | 480,255 | |||||||||||
| Bloomberg Commodity Index 6 Month Forward/BCOMF6 | 7/14/2020 | Goldman Sachs & Co. | 23,100,000 | (0.17 | ) | At Expiration | 390,084 | |||||||||||
| Bloomberg Commodity Index 6 Month Forward/BCOMF6 | 7/14/2020 | Royal Bank of Canada | 10,000,000 | (0.18 | ) | At Expiration | 107,476 | |||||||||||
| Bloomberg Commodity Index 6 Month Forward/BCOMF6 | 7/14/2020 | JPMorgan Chase Securities, Inc. | 10,000,000 | (0.16 | ) | At Expiration | 107,552 | |||||||||||
| Bloomberg Commodity Index 6 Month Forward/BCOMF6 | 7/14/2020 | Goldman Sachs & Co. | 10,000,000 | (0.17 | ) | At Expiration | 107,514 | |||||||||||
| Bloomberg Commodity Index 6 Month Forward/BCOMF6 | 7/14/2020 | Citigroup, Inc. | 10,000,000 | (0.15 | ) | At Expiration | 107,591 | |||||||||||
| Bloomberg Commodity Index 6 Month Forward/BCOMF6 | 7/14/2020 | Morgan Stanley | 10,000,000 | (0.17 | ) | At Expiration | 18,551 | |||||||||||
| Bloomberg Commodity Index/BCOM | 7/14/2020 | Barclays Bank PLC | 71,077,000 | (0.11 | ) | At Expiration | 1,413,438 | |||||||||||
| Bloomberg Commodity Index/BCOM | 7/14/2020 | BNP Paribas | 62,192,000 | (0.12 | ) | At Expiration | 1,236,427 | |||||||||||
| Bloomberg Commodity Index/BCOM | 7/14/2020 | Canadian Imperial Bank of Commerce | 26,654,000 | (0.13 | ) | At Expiration | 529,764 | |||||||||||
| Bloomberg Commodity Index/BCOM | 7/14/2020 | Credit Suisse | 18,658,000 | (0.11 | ) | At Expiration | 371,034 | |||||||||||
The accompanying notes are an integral part of the consolidated financial statements.
| DWS Enhanced Commodity Strategy Fund | | | 31 |
Pay/Receive Return of the Reference Index | Expiration Date | Counterparty | Notional Amount | Fixed Fee Received/ (Paid) by the Fund | Frequency | Value ($) (i) | ||||||||||||
| Bloomberg Commodity Index/BCOM | 7/14/2020 | JPMorgan Chase Securities, Inc. | 85,292,000 | (0.09 | ) | At Expiration | 1,697,005 | |||||||||||
| Bloomberg Commodity Index/BCOM | 7/14/2020 | Goldman Sachs & Co. | 69,300,000 | (0.11 | ) | At Expiration | 1,378,462 | |||||||||||
| Bloomberg Commodity Index/BCOM | 7/14/2020 | Morgan Stanley | 26,654,000 | (0.12 | ) | At Expiration | 529,903 | |||||||||||
| Bloomberg Commodity Index/BCOM | 7/14/2020 | Barclays Bank PLC | 20,000,000 | (0.11 | ) | At Expiration | 281,179 | |||||||||||
| Bloomberg Commodity Index/BCOM | 7/14/2020 | Barclays Bank PLC | 10,000,000 | (0.11 | ) | At Expiration | 21,971 | |||||||||||
| Bloomberg Commodity Index/BCOM | 7/14/2020 | JPMorgan Chase Securities, Inc. | 60,000,000 | (0.09 | ) | At Expiration | 132,122 | |||||||||||
| Bloomberg Commodity Index/BCOM | 7/14/2020 | Citigroup, Inc. | 60,000,000 | (0.09 | ) | At Expiration | 132,122 | |||||||||||
| Bloomberg Commodity Index/BCOM | 7/14/2020 | Goldman Sachs & Co. | 40,000,000 | (0.10 | ) | At Expiration | 87,982 | |||||||||||
| BNP Paribas 03 Alpha Index/BNPIFMN3 | 7/14/2020 | BNP Paribas | 60,000,000 | (0.12 | ) | At Expiration | 2,380 | |||||||||||
| BofA Merrill Lynch Commodity Excess Return Strategy/MLCIHR6S | 7/14/2020 | Merrill Lynch International Ltd. | 65,000,000 | — | At Expiration | (87,480 | ) | |||||||||||
| Citi Custom CiVICS 7 Excess Return/CVICSER7 | 7/14/2020 | Citigroup, Inc. | 253,754,000 | (0.11 | ) | At Expiration | 3,833,650 | |||||||||||
| Credit Suisse Custom 10 Excess Return Index/CSCUS10E | 7/14/2020 | Credit Suisse | 43,534,000 | (0.18 | ) | At Expiration | 864,098 | |||||||||||
| Goldman Sachs Commodity COT Strategy COT3/ABGSCOT3 | 7/14/2020 | Goldman Sachs & Co. | 15,000,000 | (0.35 | ) | At Expiration | (230,950 | ) | ||||||||||
| Macquarie Commodity Product 708E/MQCP708E | 7/14/2020 | Macquarie Bank Ltd. | 40,000,000 | — | At Expiration | (198,822 | ) | |||||||||||
The accompanying notes are an integral part of the consolidated financial statements.
| 32 | | | DWS Enhanced Commodity Strategy Fund |
Pay/Receive Return of the Reference Index | Expiration Date | Counterparty | Notional Amount | Fixed Fee Received/ (Paid) by the Fund | Frequency | Value ($) (i) | ||||||||||||
| Macquarie Vol Product 3GC1/VMAC3GC1 | 8/17/2020 | Macquarie Bank Ltd. | 20,000,000 | (0.10 | ) | At Expiration | 1,679,248 | |||||||||||
| Merrill Lynch Enhanced Benchmark—A Pre Roll Excess Return Index/MLCXAPRE | 7/14/2020 | Merrill Lynch International Ltd. | 21,323,000 | (0.14 | ) | At Expiration | 423,682 | |||||||||||
| Modified Strategy D177 on the Bloomberg Commodity Index/ENHG177P | 7/14/2020 | Goldman Sachs & Co. | 23,100,000 | (0.43 | ) | At Expiration | 411,869 | |||||||||||
| Morgan Stanley Value B2R/MSCBVB2R | 7/14/2020 | Morgan Stanley | 60,000,000 | (0.45 | ) | At Expiration | (44,144 | ) | ||||||||||
| RBC Enhanced Commodity Basket 01 Excess Return Index/RBCAEC01 | 7/14/2020 | Royal Bank of Canada | 14,215,000 | (0.11 | ) | At Expiration | 256,198 | |||||||||||
| RBC Enhanced Commodity D01 Excess Return Index/RBCADC01 | 7/14/2020 | Royal Bank of Canada | 21,323,000 | (0.20 | ) | At Expiration | 409,108 | |||||||||||
| RBC Enhanced Commodity MSC4 Index/RBCAMSC4 | 7/14/2020 | Royal Bank of Canada | 60,000,000 | (0.35 | ) | At Expiration | (109,328 | ) | ||||||||||
| Societe Generale Alpha 1 Custom Excess Return/SGCOA1CE | 7/14/2020 | Societe Generale | 97,619,000 | (0.17 | ) | At Expiration | 4,250 | |||||||||||
| Societe Generale M Po 3 U Index/SGCOL45E | 7/14/2020 | Societe Generale | 21,323,000 | (0.16 | ) | At Expiration | 428,485 | |||||||||||
| Societe Generale M Po 4 U Index/SGCOM15E | 7/14/2020 | Societe Generale | 31,984,000 | (0.18 | ) | At Expiration | 562,755 | |||||||||||
| UBS Custom Commodity Index/UBSIB163 | 7/14/2020 | UBS AG | 29,594,000 | (0.16 | ) | At Expiration | 1,126,010 | |||||||||||
The accompanying notes are an integral part of the consolidated financial statements.
| DWS Enhanced Commodity Strategy Fund | | | 33 |
| Index Description | Ticker | Notional Amount ($) | Index Weight (%) | Value ($) | ||||||||||||
Bloomberg Commodity Index | BCOM | 17,769,000 | 30.0 | 353,483 | ||||||||||||
Bloomberg Soybeans Subindex | BCOMSY | (3,130,000 | ) | 5.3 | (8,925 | ) | ||||||||||
Bloomberg Gold Subindex | BCOMGC | (13,582,000 | ) | 22.9 | (494,224 | ) | ||||||||||
Bloomberg Aluminum Subindex | BCOMAL | 925,000 | 1.6 | 17,591 | ||||||||||||
Bloomberg ULS Diesel Subindex | BCOMHO | 3,815,000 | 6.5 | 189,776 | ||||||||||||
Bloomberg Gas Oil Subindex | BCOMGO | 19,967,000 | 33.7 | 1,068,309 | ||||||||||||
Total UBS Custom Commodity Index | 1,126,010 | |||||||||||||||
| UBS Targeted Commodity Curve Carry Strategy Index/UBSTCCIS | 7/14/2020 | UBS AG | 5,000,000 | (0.11 | ) | At Expiration | 45,787 | |||||||||||
Total net unrealized appreciation | 21,903,010 | |||||||||||||||||
| (i) | There are no upfront payments on the commodity-linked swaps listed above, therefore unrealized appreciation (depreciation) is equal to their value. |
| Currency Abbreviation |
| USD United States Dollar |
For information on the Fund’s policy and additional disclosures regarding futures contracts, commodity-linked swap contracts and written and purchased options contracts, please refer to the Derivatives section of Note B in the accompanying Notes to Consolidated Financial Statements.
The accompanying notes are an integral part of the consolidated financial statements.
| 34 | | | DWS Enhanced Commodity Strategy Fund |
Fair Value Measurements
Various inputs are used in determining the value of the Fund’s investments. These inputs are summarized in three broad levels. Level 1 includes quoted prices in active markets for identical securities. Level 2 includes other significant observable inputs (including quoted prices for similar securities, interest rates, prepayment speeds and credit risk). Level 3 includes significant unobservable inputs (including the Fund’s own assumptions in determining the fair value of investments). The level assigned to the securities valuations may not be an indication of the risk or liquidity associated with investing in those securities.
The following is a summary of the inputs used as of June 30, 2020 in valuing the Fund’s investments. For information on the Fund’s policy regarding the valuation of investments, please refer to the Security Valuation section of Note A in the accompanying Notes to Consolidated Financial Statements.
| Assets | Level 1 | Level 2 | Level 3 | Total | ||||||||||||
| Fixed Income Investments (j) | ||||||||||||||||
Corporate Bonds | $ | — | $ | 402,798,203 | $ | — | $ | 402,798,203 | ||||||||
Asset-Backed | — | 159,151,689 | — | 159,151,689 | ||||||||||||
Commercial Mortgage-Backed Securities | — | 77,138,914 | 34,282 | 77,173,196 | ||||||||||||
Collateralized Mortgage Obligations | — | 25,247,040 | — | 25,247,040 | ||||||||||||
Government & Agency Obligations | — | 674,430,263 | — | 674,430,263 | ||||||||||||
Municipal Bonds and Notes | — | 6,046,740 | — | 6,046,740 | ||||||||||||
Short-Term U.S. Treasury Obligations | — | 45,947,143 | — | 45,947,143 | ||||||||||||
| Exchange-Traded Funds | 1,072,250 | — | — | 1,072,250 | ||||||||||||
| Short-Term Investments (j) | 135,385,669 | — | — | 135,385,669 | ||||||||||||
| Derivatives (k) | ||||||||||||||||
Purchased Options | 540,000 | — | — | 540,000 | ||||||||||||
Futures Contracts | 23,936,877 | — | — | 23,936,877 | ||||||||||||
Commodity-Linked Swap Contracts | — | 24,294,963 | — | 24,294,963 | ||||||||||||
| Total | $ | 160,934,796 | $ | 1,415,054,955 | $ | 34,282 | $ | 1,576,024,033 | ||||||||
| Liabilities | Level 1 | Level 2 | Level 3 | Total | ||||||||||||
| Derivatives (k) | ||||||||||||||||
Futures Contracts | $ | (26,061,398 | ) | $ | — | $ | — | $ | (26,061,398 | ) | ||||||
Written Options | (1,140,000 | ) | — | — | (1,140,000 | ) | ||||||||||
Commodity-Linked Swap Contracts | — | (2,391,953 | ) | — | (2,391,953 | ) | ||||||||||
| Total | $ | (27,201,398 | ) | $ | (2,391,953 | ) | $ | — | $ | (29,593,351 | ) | |||||
| (j) | See Consolidated Investment Portfolio for additional detailed categorizations. |
| (k) | Derivatives include value of options purchased, unrealized appreciation (depreciation) on open futures contracts, commodity-linked swap contracts and written options, at value. |
The accompanying notes are an integral part of the consolidated financial statements.
| DWS Enhanced Commodity Strategy Fund | | | 35 |
Consolidated Statement of Assets and Liabilities
| as of June 30, 2020 | ||||
| Assets |
| |||
| Investments in non-affiliated securities, at value (cost $1,382,019,237) | $ | 1,392,406,524 | ||
| Investment in affiliated securities, at value (cost $135,383,545) | 135,385,669 | |||
| Cash | 633,056 | |||
| Deposit with broker for centrally cleared swaps | 530,936 | |||
| Cash held as collateral for over-the-counter derivatives | 3,659,086 | |||
| Receivable for investments sold | 12,309,364 | |||
| Receivable for Fund shares sold | 3,329,507 | |||
| Interest receivable | 6,421,966 | |||
| Unrealized appreciation on bilateral swap contracts | 24,294,963 | |||
| Other assets | 91,005 | |||
| Total assets | 1,579,062,076 | |||
| Liabilities | ||||
| Payable for investments purchased | 10,015,657 | |||
Payable for investments purchased — when-issued securities | 2,000,000 | |||
| Payable for Fund shares redeemed | 3,113,673 | |||
| Payable for variation margin on futures contracts | 2,942,058 | |||
| Payable upon return of collateral for over-the-counter derivatives | 3,659,086 | |||
| Options written, at value (premium received $1,354,800) | 1,140,000 | |||
| Unrealized depreciation on bilateral swap contracts | 2,391,953 | |||
| Accrued management fee | 1,012,595 | |||
| Accrued Trustees’ fees | 19,907 | |||
| Other accrued expenses and payables | 997,979 | |||
| Total liabilities | 27,292,908 | |||
| Net assets, at value | $ | 1,551,769,168 | ||
The accompanying notes are an integral part of the consolidated financial statements.
| 36 | | | DWS Enhanced Commodity Strategy Fund |
| Consolidated Statement of Assets and Liabilities as of June 30, 2020 (continued) |
| Net Assets Consist of |
| |||
| Distributable earnings (loss) | $ | 10,114,689 | ||
| Paid-in capital | 1,541,654,479 | |||
| Net assets, at value | $ | 1,551,769,168 | ||
| Net Asset Value |
| |||
Class A |
| |||
| Net Asset Value and redemption price per share ($58,154,291 ÷ 7,330,366 outstanding shares of beneficial interest, $.01 par value, unlimited number of shares authorized) | $ | 7.93 | ||
| Maximum offering price per share (100 ÷ 94.25 of $7.93) | $ | 8.41 | ||
Class T |
| |||
| Net Asset Value and redemption price per share ($8,293 ÷ 1,044 outstanding shares of beneficial interest, $.01 par value, unlimited number of shares authorized) | $ | 7.94 | ||
| Maximum offering price per share (100 ÷ 97.50 of $7.94) | $ | 8.14 | ||
Class C |
| |||
| Net Asset Value, offering and redemption price (subject to contingent deferred sales charge) per share ($8,563,171 ÷ 1,203,742 outstanding shares of beneficial interest, $.01 par value, unlimited number of shares authorized) | $ | 7.11 | ||
Class R6 |
| |||
| Net Asset Value, offering and redemption price per share ($31,198,487 ÷ 3,874,357 outstanding shares of beneficial interest, $.01 par value, unlimited number of shares authorized) | $ | 8.05 | ||
Class S |
| |||
| Net Asset Value, offering and redemption price per share ($82,979,761 ÷ 10,329,091 outstanding shares of beneficial interest, $.01 par value, unlimited number of shares authorized) | $ | 8.03 | ||
Institutional Class |
| |||
| Net Asset Value, offering and redemption price per share ($1,370,865,165 ÷ 170,107,024 outstanding shares of beneficial interest, $.01 par value, unlimited number of shares authorized) | $ | 8.06 | ||
The accompanying notes are an integral part of the consolidated financial statements.
| DWS Enhanced Commodity Strategy Fund | | | 37 |
Consolidated Statement of Operations
| for the year ended June 30, 2020 | ||||
| Investment Income |
| |||
| Income: |
| |||
| Interest (net of foreign taxes withheld of $1,259) | $ | 41,397,866 | ||
| Dividends | 4,518 | |||
| Income distributions from affiliated securities | 3,721,916 | |||
| Securities lending income, net of borrower rebates | 9,207 | |||
| Total income | 45,133,507 | |||
| Expenses: | ||||
| Management fee | 16,892,366 | |||
| Administration fee | 1,896,870 | |||
| Services to shareholders | 2,998,070 | |||
| Distribution and service fees | 275,637 | |||
| Custodian fee | 203,628 | |||
| Professional fees | 142,461 | |||
| Reports to shareholders | 343,807 | |||
| Registration fees | 121,633 | |||
| Trustees’ fees and expenses | 62,956 | |||
| Other | 171,246 | |||
| Total expenses before expense reductions | 23,108,674 | |||
| Expense reductions | (5,282,713 | ) | ||
| Total expenses after expense reductions | 17,825,961 | |||
| Net investment income | 27,307,546 | |||
| Realized and Unrealized Gain (Loss) | ||||
| Net realized gain (loss) from: | ||||
| Affiliated investments | 5,724 | |||
| Non-affiliated Investments | 2,976,063 | |||
| Swap contracts | (345,870,962 | ) | ||
| Futures | 12,613,096 | |||
| Foreign currency | 21 | |||
| (330,276,058 | ) | |||
| Change in net unrealized appreciation (depreciation) on: | ||||
| Affiliated investments | (1,440 | ) | ||
| Non-affiliated investments | (6,009,327 | ) | ||
| Swap contracts | (8,325,269 | ) | ||
| Futures | (1,626,612 | ) | ||
| Written options | 214,800 | |||
| (15,747,848 | ) | |||
| Net gain (loss) | (346,023,906 | ) | ||
| Net increase (decrease) in net assets resulting from operations | $ | (318,716,360 | ) | |
The accompanying notes are an integral part of the consolidated financial statements.
| 38 | | | DWS Enhanced Commodity Strategy Fund |
Consolidated Statements of Changes in Net Assets
| Years Ended June 30, | ||||||||
| Increase (Decrease) in Net Assets | 2020 | 2019 | ||||||
| Operations: | ||||||||
| Net investment income (loss) | $ | 27,307,546 | $ | 52,553,168 | ||||
| Net realized gain (loss) | (330,276,058 | ) | (497,831,200 | ) | ||||
| Change in net unrealized appreciation (depreciation) | (15,747,848 | ) | 120,844,130 | |||||
| Net increase (decrease) in net assets resulting from operations | (318,716,360 | ) | (324,433,902 | ) | ||||
| Distributions to shareholders: | ||||||||
Class A | (985,068 | ) | (9,911,048 | ) | ||||
Class T | (140 | ) | (1,069 | ) | ||||
Class C | (87,971 | ) | (2,068,358 | ) | ||||
Class R6 | (603,995 | ) | (3,182,911 | ) | ||||
Class S | (1,999,904 | ) | (34,677,287 | ) | ||||
Institutional Class | (30,899,176 | ) | (279,282,977 | ) | ||||
| Total distributions | (34,576,254 | ) | (329,123,650 | ) | ||||
| Fund share transactions: | ||||||||
| Proceeds from shares sold | 971,270,795 | 1,201,864,248 | ||||||
| Reinvestment of distributions | 32,006,950 | 312,998,059 | ||||||
| Payments for shares redeemed | (1,863,611,943 | ) | (1,554,951,420 | ) | ||||
| Net increase (decrease) in net assets from Fund share transactions | (860,334,198 | ) | (40,089,113 | ) | ||||
| Increase (decrease) in net assets | (1,213,626,812 | ) | (693,646,665 | ) | ||||
| Net assets at beginning of period | 2,765,395,980 | 3,459,042,645 | ||||||
| Net assets at end of period | $ | 1,551,769,168 | $ | 2,765,395,980 | ||||
The accompanying notes are an integral part of the consolidated financial statements.
| DWS Enhanced Commodity Strategy Fund | | | 39 |
Consolidated Financial Highlights
Years Ended June 30, | ||||||||||||||||||||||
| Class A | 2020 | 2019 | 2018 | 2017 | 2016 | |||||||||||||||||
| Selected Per Share Data | ||||||||||||||||||||||
| Net asset value, beginning of period | $ | 9.47 | $ | 11.71 | $ | 10.88 | $ | 12.60 | $ | 13.42 | ||||||||||||
| Income (loss) from investment operations: | ||||||||||||||||||||||
Net investment income (loss)a | .09 | .15 | .08 | .03 | .02 | |||||||||||||||||
Net realized and unrealized gain (loss) | (1.50 | ) | (1.27 | ) | .78 | (.97 | ) | (.83 | ) | |||||||||||||
Total from investment operations | (1.41 | ) | (1.12 | ) | .86 | (.94 | ) | (.81 | ) | |||||||||||||
| Less distributions from: | ||||||||||||||||||||||
Net investment income | (.13 | ) | (1.12 | ) | (.03 | ) | (.78 | ) | (.01 | ) | ||||||||||||
| Redemption fees | — | — | — | .00 | * | .00 | * | |||||||||||||||
| Net asset value, end of period | $ | 7.93 | $ | 9.47 | $ | 11.71 | $ | 10.88 | $ | 12.60 | ||||||||||||
| Total Return (%)b,c | (14.96 | ) | (9.77 | ) | 7.87 | (7.70 | ) | (6.00 | ) | |||||||||||||
| Ratios to Average Net Assets and Supplemental Data |
| |||||||||||||||||||||
| Net assets, end of period ($ millions) | 58 | 75 | 121 | 110 | 129 | |||||||||||||||||
| Ratio of expenses before expense reductions (%) | 1.51 | 1.48 | 1.43 | 1.47 | 1.44 | |||||||||||||||||
| Ratio of expenses after expense reductions (%) | 1.29 | 1.34 | 1.35 | 1.33 | 1.36 | |||||||||||||||||
| Ratio of net investment income (loss) (%) | 1.05 | 1.43 | .73 | .28 | .19 | |||||||||||||||||
| Portfolio turnover rate (%) | 68 | 65 | 79 | 52 | 92 | |||||||||||||||||
| a | Based on average shares outstanding during the period. |
| b | Total return does not reflect the effect of any sales charges. |
| c | Total return would have been lower had certain expenses not been reduced. |
| * | Amount is less than $.005. |
The accompanying notes are an integral part of the consolidated financial statements.
| 40 | | | DWS Enhanced Commodity Strategy Fund |
Years Ended June 30, | Period Ended | |||||||||||||||
| Class T | 2020 | 2019 | 2018 | 6/30/17a | ||||||||||||
| Selected Per Share Data | ||||||||||||||||
| Net asset value, beginning of period | $9.48 | $11.72 | $10.88 | $10.88 | ||||||||||||
| Income (loss) from investment operations: | ||||||||||||||||
Net investment income (loss)b | .09 | .14 | .09 | .00 | *** | |||||||||||
Net realized and unrealized gain (loss) | (1.49 | ) | (1.25 | ) | .77 | (.00 | )*** | |||||||||
Total from investment operations | (1.40 | ) | (1.11 | ) | .86 | .00 | *** | |||||||||
| Less distributions from: | ||||||||||||||||
Net investment income | (.14 | ) | (1.13 | ) | (.02 | ) | (.00 | )*** | ||||||||
| Net asset value, end of period | $7.94 | $9.48 | $11.72 | $10.88 | ||||||||||||
| Total Return (%)c,d | (14.92 | ) | (9.72 | ) | 7.95 | .01 | ** | |||||||||
| Ratios to Average Net Assets and Supplemental Data |
| |||||||||||||||
| Net assets, end of period ($ thousands) | 8 | 10 | 11 | 10 | ||||||||||||
| Ratio of expenses before expense reductions (%) | 1.43 | 1.40 | 1.36 | 1.57 | * | |||||||||||
| Ratio of expenses after expense reductions (%) | 1.28 | 1.32 | 1.29 | 1.35 | * | |||||||||||
| Ratio of net investment income (loss) (%) | 1.07 | 1.42 | .80 | .47 | * | |||||||||||
| Portfolio turnover rate (%) | 68 | 65 | 79 | 52 | e | |||||||||||
| a | For the period from June 5, 2017 (commencement of operations) to June 30, 2017. |
| b | Based on average shares outstanding during the period. |
| c | Total return does not reflect the effect of any sales charges. |
| d | Total return would have been lower had certain expenses not been reduced. |
| e | Represents the Fund’s portfolio turnover rate for the year ended June 30, 2017. |
| * | Annualized |
| ** | Not annualized |
| *** | Amount is less than $.005. |
The accompanying notes are an integral part of the consolidated financial statements.
| DWS Enhanced Commodity Strategy Fund | | | 41 |
Years Ended June 30, | ||||||||||||||||||||||
| Class C | 2020 | 2019 | 2018 | 2017 | 2016 | |||||||||||||||||
| Selected Per Share Data |
| |||||||||||||||||||||
| Net asset value, beginning of period | $ | 8.49 | $ | 10.50 | $ | 9.80 | $ | 11.39 | $ | 12.21 | ||||||||||||
| Income (loss) from investment operations: | ||||||||||||||||||||||
Net investment income (loss)a | .03 | .06 | (.00 | )* | (.05 | ) | (.06 | ) | ||||||||||||||
Net realized and unrealized gain (loss) | (1.35 | ) | (1.13 | ) | .70 | (.88 | ) | (.76 | ) | |||||||||||||
Total from investment operations | (1.32 | ) | (1.07 | ) | .70 | (.93 | ) | (.82 | ) | |||||||||||||
| Less distributions from: | ||||||||||||||||||||||
Net investment income | (.06 | ) | (.94 | ) | — | (.66 | ) | — | ||||||||||||||
| Redemption fees | — | — | — | .00 | * | .00 | * | |||||||||||||||
| Net asset value, end of period | $ | 7.11 | $ | 8.49 | $ | 10.50 | $ | 9.80 | $ | 11.39 | ||||||||||||
| Total Return (%)b,c | (15.59 | ) | (10.48 | ) | 7.14 | (8.42 | ) | (6.72 | ) | |||||||||||||
| Ratios to Average Net Assets and Supplemental Data |
| |||||||||||||||||||||
| Net assets, end of period ($ millions) | 9 | 15 | 27 | 27 | 29 | |||||||||||||||||
| Ratio of expenses before expense reductions (%) | 2.20 | 2.18 | 2.17 | 2.21 | 2.22 | |||||||||||||||||
| Ratio of expenses after expense reductions (%) | 2.04 | 2.09 | 2.09 | 2.08 | 2.11 | |||||||||||||||||
| Ratio of net investment income (loss) (%) | .32 | .68 | (.02 | ) | (.47 | ) | (.56 | ) | ||||||||||||||
| Portfolio turnover rate (%) | 68 | 65 | 79 | 52 | 92 | |||||||||||||||||
| a | Based on average shares outstanding during the period. |
| b | Total return does not reflect the effect of any sales charges. |
| c | Total return would have been lower had certain expenses not been reduced. |
| * | Amount is less than $.005. |
The accompanying notes are an integral part of the consolidated financial statements.
| 42 | | | DWS Enhanced Commodity Strategy Fund |
Years Ended June 30, | Period Ended | |||||||||||||||||||||
| Class R6 | 2020 | 2019 | 2018 | 2017 | 6/30/16a | |||||||||||||||||
| Selected Per Share Data | ||||||||||||||||||||||
| Net asset value, beginning of period | $ | 9.62 | $ | 11.89 | $ | 11.04 | $ | 12.79 | $ | 12.50 | ||||||||||||
| Income (loss) from investment operations: | ||||||||||||||||||||||
Net investment incomeb | .12 | .19 | .13 | .08 | .01 | |||||||||||||||||
Net realized and unrealized gain (loss) | (1.52 | ) | (1.28 | ) | .79 | (.99 | ) | .30 | ||||||||||||||
Total from investment operations | (1.40 | ) | (1.09 | ) | .92 | (.91 | ) | .31 | ||||||||||||||
| Less distributions from: | ||||||||||||||||||||||
Net investment income | (.17 | ) | (1.18 | ) | (.07 | ) | (.84 | ) | (.02 | ) | ||||||||||||
| Redemption fees | — | — | — | .00 | *** | .00 | *** | |||||||||||||||
| Net asset value, end of period | $ | 8.05 | $ | 9.62 | $ | 11.89 | $ | 11.04 | $ | 12.79 | ||||||||||||
| Total Return (%)c | (14.58 | ) | (9.46 | ) | 8.36 | (7.37 | ) | 2.46 | ** | |||||||||||||
| Ratios to Average Net Assets and Supplemental Data |
| |||||||||||||||||||||
| Net assets, end of period ($ millions) | 31 | 30 | 22 | 13 | 5 | |||||||||||||||||
| Ratio of expenses before expense reductions (%) | 1.08 | 1.06 | 1.07 | 1.09 | 1.27 | * | ||||||||||||||||
| Ratio of expenses after expense reductions (%) | .89 | .95 | .95 | .96 | .95 | * | ||||||||||||||||
| Ratio of net investment income (%) | 1.42 | 1.86 | 1.14 | .67 | .68 | * | ||||||||||||||||
| Portfolio turnover rate (%) | 68 | 65 | 79 | 52 | 92 | d | ||||||||||||||||
| a | For the period from June 1, 2016 (commencement of operations) to June 30, 2016. |
| b | Based on average shares outstanding during the period. |
| c | Total return would have been lower had certain expenses not been reduced. |
| d | Represents the Fund’s portfolio turnover rate for the year ended June 30, 2016. |
| * | Annualized |
| ** | Not annualized |
| *** | Amount is less than $.005. |
The accompanying notes are an integral part of the consolidated financial statements.
| DWS Enhanced Commodity Strategy Fund | | | 43 |
Years Ended June 30, | ||||||||||||||||||||||
| Class S | 2020 | 2019 | 2018 | 2017 | 2016 | |||||||||||||||||
| Selected Per Share Data | ||||||||||||||||||||||
| Net asset value, beginning of period | $9.59 | $11.86 | $11.02 | $12.76 | $13.58 | |||||||||||||||||
| Income (loss) from investment operations: | ||||||||||||||||||||||
Net investment income (loss)a | .12 | .17 | .11 | .06 | .05 | |||||||||||||||||
Net realized and unrealized gain (loss) | (1.53 | ) | (1.28 | ) | .78 | (.99 | ) | (.84 | ) | |||||||||||||
Total from investment operations | (1.41 | ) | (1.11 | ) | .89 | (.93 | ) | (.79 | ) | |||||||||||||
| Less distributions from: | ||||||||||||||||||||||
Net investment income | (.15 | ) | (1.16 | ) | (.05 | ) | (.81 | ) | (.03 | ) | ||||||||||||
| Redemption fees | — | — | — | .00 | * | .00 | * | |||||||||||||||
| Net asset value, end of period | $8.03 | $9.59 | $11.86 | $11.02 | $12.76 | |||||||||||||||||
| Total Return (%)b | (14.79 | ) | (9.58 | ) | 8.08 | (7.50 | ) | (5.77 | ) | |||||||||||||
| Ratios to Average Net Assets and Supplemental Data |
| |||||||||||||||||||||
| Net assets, end of period ($ millions) | 83 | 195 | 520 | 349 | 298 | |||||||||||||||||
| Ratio of expenses before expense reductions (%) | 1.25 | 1.21 | 1.19 | 1.24 | 1.25 | |||||||||||||||||
| Ratio of expenses after expense reductions (%) | 1.09 | 1.14 | 1.12 | 1.13 | 1.17 | |||||||||||||||||
| Ratio of net investment income (loss) (%) | 1.30 | 1.60 | .97 | .48 | .39 | |||||||||||||||||
| Portfolio turnover rate (%) | 68 | 65 | 79 | 52 | 92 | |||||||||||||||||
| a | Based on average shares outstanding during the period. |
| b | Total return would have been lower had certain expenses not been reduced. |
| * | Amount is less than $.005. |
The accompanying notes are an integral part of the consolidated financial statements.
| 44 | | | DWS Enhanced Commodity Strategy Fund |
Years Ended June 30, | ||||||||||||||||||||||
| Institutional Class | 2020 | 2019 | 2018 | 2017 | 2016 | |||||||||||||||||
| Selected Per Share Data | ||||||||||||||||||||||
| Net asset value, beginning of period | $9.62 | $11.90 | $11.05 | $12.80 | $13.63 | |||||||||||||||||
| Income (loss) from investment operations: | ||||||||||||||||||||||
Net investment income (loss)a | .13 | .19 | .13 | .07 | .06 | |||||||||||||||||
Net realized and unrealized gain (loss) | (1.52 | ) | (1.29 | ) | .79 | (.99 | ) | (.84 | ) | |||||||||||||
Total from investment operations | (1.39 | ) | (1.10 | ) | .92 | (.92 | ) | (.78 | ) | |||||||||||||
| Less distributions from: | ||||||||||||||||||||||
Net investment income | (.17 | ) | (1.18 | ) | (.07 | ) | (.83 | ) | (.05 | ) | ||||||||||||
| Redemption fees | — | — | — | .00 | * | .00 | * | |||||||||||||||
| Net asset value, end of period | $8.06 | $9.62 | $11.90 | $11.05 | $12.80 | |||||||||||||||||
| Total Return (%)b | (14.58 | ) | (9.47 | ) | 8.31 | (7.40 | ) | (5.70 | ) | |||||||||||||
| Ratios to Average Net Assets and Supplemental Data |
| |||||||||||||||||||||
| Net assets, end of period ($ millions) | 1,371 | 2,450 | 2,769 | 2,246 | 2,127 | |||||||||||||||||
| Ratio of expenses before expense reductions (%) | 1.19 | 1.16 | 1.13 | 1.18 | 1.16 | |||||||||||||||||
| Ratio of expenses after expense reductions (%) | .90 | .99 | .99 | .99 | 1.01 | |||||||||||||||||
| Ratio of net investment income (loss) (%) | 1.46 | 1.79 | 1.09 | .62 | .53 | |||||||||||||||||
| Portfolio turnover rate (%) | 68 | 65 | 79 | 52 | 92 | |||||||||||||||||
| a | Based on average shares outstanding during the period. |
| b | Total return would have been lower had certain expenses not been reduced. |
| * | Amount is less than $.005. |
The accompanying notes are an integral part of the consolidated financial statements.
| DWS Enhanced Commodity Strategy Fund | | | 45 |
| Notes to Consolidated Financial Statements |
A. Organization and Significant Accounting Policies
DWS Enhanced Commodity Strategy Fund (the “Fund”) is a diversified series of Deutsche DWS Securities Trust (the “Trust”), which is registered under the Investment Company Act of 1940, as amended (the “1940 Act”), as an open-end management investment company organized as a Massachusetts business trust.
The Fund offers multiple classes of shares which provide investors with different purchase options. Class A shares are subject to an initial sales charge. Class T shares are subject to an initial sales charge and are only available through certain financial intermediaries. Class T shares are closed to new purchases, except in connection with the reinvestment of dividends or other distributions. Class C shares are not subject to an initial sales charge but are subject to higher ongoing expenses than Class A shares and a contingent deferred sales charge payable upon certain redemptions within one year of purchase. Class C shares automatically convert to Class A shares in the same fund after 10 years, provided that the fund or the financial intermediary through which the shareholder purchased the Class C shares has records verifying that the Class C shares have been held for at least 10 years. Class R6 shares are not subject to initial or contingent deferred sales charges and are generally available only to certain retirement plans. Class S shares are not subject to initial or contingent deferred sales charges and are only available to a limited group of investors. Institutional Class shares are not subject to initial or contingent deferred sales charges and are generally available only to qualified institutions.
Investment income, realized and unrealized gains and losses, and certain fund-level expenses and expense reductions, if any, are borne pro rata on the basis of relative net assets by the holders of all classes of shares, except that each class bears certain expenses unique to that class such as distribution and service fees, services to shareholders and certain other class-specific expenses. Differences in class-level expenses may result in payment of different per share dividends by class. All shares of the Fund have equal rights with respect to voting subject to class-specific arrangements.
The Fund’s consolidated financial statements are prepared in accordance with accounting principles generally accepted in the United States of America (“U.S. GAAP”) which require the use of management estimates. Actual results could differ from those estimates. The Fund qualifies as an investment company under Topic 946 of Accounting Standards Codification of U.S. GAAP. The policies described below are followed consistently by the Fund in the preparation of its consolidated financial statements.
| 46 | | | DWS Enhanced Commodity Strategy Fund |
Principles of Consolidation. The Fund invests indirectly in commodities markets through a wholly owned subsidiary, Cayman Commodity Fund II, Ltd., organized under the laws of the Cayman Islands (the “Subsidiary”). The Fund and the Subsidiary are each a commodity pool and are subject to the requirements of the Commodity Exchange Act (“CEA”), as amended, and the rules of the Commodity Futures Trading Commission (“CFTC”) promulgated thereunder. DWS Investment Management Americas, Inc. (the “Advisor”) acts as a commodity pool operator with respect to the operation of the Fund and the Subsidiary as commodity pools under and pursuant to the CEA. The Advisor, the Fund and the Subsidiary are subject to dual regulation by the CFTC and the Securities and Exchange Commission. Among other investments, the Subsidiary may invest in commodity-linked derivative instruments, such as futures and options contracts and commodity-linked swaps. The Subsidiary may also invest in debt securities, some of which are intended to serve as margin or collateral for the Subsidiary’s derivatives positions. The Subsidiary may also invest available cash in affiliated money market funds. The Subsidiary is managed by the same portfolio managers that manage the Fund. As of June 30, 2020, the Fund’s investment in the Subsidiary was $331,577,369, representing 21% of the Fund’s total assets.
The Fund’s Investment Portfolio has been consolidated and includes the portfolio holdings of the Fund and the Subsidiary. The consolidated financial statements include the accounts of the Fund and the Subsidiary. All inter-company transactions and balances have been eliminated.
Security Valuation. Investments are stated at value determined as of the close of regular trading on the New York Stock Exchange on each day the exchange is open for trading.
Various inputs are used in determining the value of the Fund’s investments. These inputs are summarized in three broad levels. Level 1 includes quoted prices in active markets for identical securities. Level 2 includes other significant observable inputs (including quoted prices for similar securities, interest rates, prepayment speeds and credit risk). Level 3 includes significant unobservable inputs (including the Fund’s own assumptions in determining the fair value of investments). The level assigned to the securities valuations may not be an indication of the risk or liquidity associated with investing in those securities.
Exchange-traded funds (“ETFs”) are valued at the most recent sale price or official closing price reported on the exchange (U.S. or foreign) or over-the-counter market on which they trade. ETFs for which no sales are reported are valued at the calculated mean between the most recent bid and asked quotations on the relevant market or, if a mean cannot be determined, at the most recent bid quotation. ETFs are generally categorized as Level 1.
| DWS Enhanced Commodity Strategy Fund | | | 47 |
Debt securities and loan participations and assignments are valued at prices supplied by independent pricing services approved by the Fund’s Board. Such services may use various pricing techniques which take into account appropriate factors such as yield, quality, coupon rate, maturity, type of issue, trading characteristics, prepayment speeds and other data, as well as broker quotes. If the pricing services are unable to provide valuations, debt securities are valued at the average of the most recent reliable bid quotations or evaluated prices, as applicable, obtained from broker-dealers and loan participations and assignments are valued at the mean of the most recent bid and ask quotations or evaluated prices, as applicable, obtained from one or more broker-dealers. Certain securities may be valued on the basis of a price provided by a single source or broker-dealer. No active trading market may exist for some senior loans and they may be subject to restrictions on resale. The inability to dispose of senior loans in a timely fashion could result in losses. These securities are generally categorized as Level 2.
Investments in open-end investment companies are valued at their net asset value each business day and are categorized as Level 1.
Futures contracts are generally valued at the settlement prices established each day on the exchange on which they are traded and are categorized as Level 1.
Swap contracts are valued daily based upon prices supplied by a Board approved pricing vendor, if available, and otherwise are valued at the price provided by the broker-dealer. Swap contracts are generally categorized as Level 2.
Exchange-traded options are valued at the last sale price or, in the absence of a sale, the mean between the closing bid and asked prices or at the most recent asked price (bid for purchased options) if no bid or asked price are available. Exchange-traded options are generally categorized as Level 1. Over-the-counter written or purchased options are valued at prices supplied by a Board approved pricing vendor, if available, and otherwise are valued at the price provided by the broker-dealer with which the option was traded. Over-the-counter written or purchased options are generally categorized as Level 2.
Securities and other assets for which market quotations are not readily available or for which the above valuation procedures are deemed not to reflect fair value are valued in a manner that is intended to reflect their fair value as determined in accordance with procedures approved by the Board and are generally categorized as Level 3. In accordance with the Fund’s valuation procedures, factors considered in determining value may include, but are not limited to, the type of the security; the size of the holding; the initial cost of the security; the existence of any contractual restrictions on the security’s disposition; the price and extent of public trading in similar
| 48 | | | DWS Enhanced Commodity Strategy Fund |
securities of the issuer or of comparable companies; quotations or evaluated prices from broker-dealers and/or pricing services; information obtained from the issuer, analysts, and/or the appropriate stock exchange (for exchange-traded securities); an analysis of the company’s or issuer’s financial statements; an evaluation of the forces that influence the issuer and the market(s) in which the security is purchased and sold; and with respect to debt securities, the maturity, coupon, creditworthiness, currency denomination and the movement of the market in which the security is normally traded. The value determined under these procedures may differ from published values for the same securities.
Disclosure about the classification of fair value measurements is included in a table following the Fund’s Consolidated Investment Portfolio.
Securities Lending. Brown Brothers Harriman & Co., as lending agent, lends securities of the Fund to certain financial institutions under the terms of its securities lending agreement. During the term of the loans, the Fund continues to receive interest and dividends generated by the securities and to participate in any changes in their market value. The Fund requires the borrowers of the securities to maintain collateral with the Fund consisting of either cash and/or U.S. Treasury Securities having a value at least equal to the value of the securities loaned. When the collateral falls below specified amounts, the lending agent will use its best efforts to obtain additional collateral on the next business day to meet required amounts under the securities lending agreement. During the year ended June 30, 2020, the Fund invested the cash collateral into a joint trading account in DWS Government & Agency Securities Portfolio, an affiliated money market fund managed by DWS Investment Management Americas, Inc. DWS Investment Management Americas, Inc. receives a management/administration fee (0.11% annualized effective rate as of June 30, 2020) on the cash collateral invested in DWS Government & Agency Securities Portfolio. The Fund receives compensation for lending its securities either in the form of fees or by earning interest on invested cash collateral net of borrower rebates and fees paid to a lending agent. Either the Fund or the borrower may terminate the loan at any time, and the borrower, after notice, is required to return borrowed securities within a standard time period. There may be risks of delay and costs in recovery of securities or even loss of rights in the collateral should the borrower of the securities fail financially. If the Fund is not able to recover securities lent, the Fund may sell the collateral and purchase a replacement investment in the market, incurring the risk that the value of the replacement security is greater than the value of the collateral. The Fund is also subject to all investment risks associated with the reinvestment of any cash collateral received, including, but not limited to, interest rate, credit and liquidity risk associated with such investments.
As of June 30, 2020, the Fund had no securities on loan.
| DWS Enhanced Commodity Strategy Fund | | | 49 |
When-Issued/Delayed Delivery Securities. The Fund may purchase or sell securities with delivery or payment to occur at a later date beyond the normal settlement period. At the time the Fund enters into a commitment to purchase or sell a security, the transaction is recorded and the value of the transaction is reflected in the net asset value. The price of such security and the date when the security will be delivered and paid for are fixed at the time the transaction is negotiated. The value of the security may vary with market fluctuations. At the time the Fund enters into a purchase transaction it is required to segregate cash or other liquid assets at least equal to the amount of the commitment. Additionally, the Fund may be required to post securities and/or cash collateral in accordance with the terms of the commitment.
Certain risks may arise upon entering into when-issued or delayed delivery transactions from the potential inability of counterparties to meet the terms of their contracts or if the issuer does not issue the securities due to political, economic, or other factors. Additionally, losses may arise due to changes in the value of the underlying securities.
Federal Income Taxes. The Fund’s policy is to comply with the requirements of the Internal Revenue Code, as amended, which are applicable to regulated investment companies and to distribute all of its taxable income to its shareholders.
Income from certain commodity-linked derivatives does not constitute “qualifying income” to the Fund. Receipt of such income could cause the Fund to be subject to tax at the Fund level. The IRS has issued a private letter ruling to the Fund stating that such income earned through its wholly owned Subsidiary constitutes qualifying income. The Fund is required to increase its taxable income by its share of the Subsidiary’s income, including net gains from commodity-linked transactions. Net investment losses of the Subsidiary cannot be deducted by the Fund in the current period nor carried forward to offset taxable income for future periods.
At June 30, 2020, the Fund had net tax basis capital loss carryforwards of approximately $25,583,000, including short-term losses ($6,701,000) and long-term losses ($18,882,000), which may be applied against realized net taxable capital gains indefinitely.
The Fund has reviewed the tax positions for the open tax years as of June 30, 2020 and has determined that no provision for income tax and/or uncertain tax positions is required in the Fund’s consolidated financial statements. The Fund’s federal tax returns for the prior three fiscal years remain open subject to examination by the Internal Revenue Service.
Distribution of Income and Gains. Distributions from net investment income of the Fund, if any, are declared and distributed to shareholders
| 50 | | | DWS Enhanced Commodity Strategy Fund |
quarterly. Net realized gains from investment transactions, in excess of available capital loss carryforwards, would be taxable to the Fund if not distributed and, therefore, will be distributed to shareholders at least annually. The Fund may also make additional distributions for tax purposes if necessary.
The timing and characterization of certain income and capital gain distributions are determined annually in accordance with federal tax regulations which may differ from accounting principles generally accepted in the United States of America. These differences primarily relate to investments in futures, swap contracts, and investment in the Subsidiary. As a result, net investment income (loss) and net realized gain (loss) on investment transactions for a reporting period may differ significantly from distributions during such period. Accordingly, the Fund may periodically make reclassifications among certain of its capital accounts without impacting the net asset value of the Fund.
At June 30, 2020, the Fund’s components of distributable earnings (accumulated losses) on a tax basis were as follows:
| Undistributed ordinary income* | $ | 6,722,753 | ||
| Capital loss carryforward | $ | (25,583,000 | ) | |
| Net unrealized appreciation (depreciation) on investments | $ | (558,271,184 | ) |
At June 30, 2020, the aggregate cost of investments for federal income tax purposes was $2,087,352,628. The net unrealized depreciation for all investments based on tax cost was $558,271,184. This consisted of aggregate gross unrealized appreciation for all investments for which there was an excess of value over tax cost of $661,584,299 and aggregate gross unrealized depreciation for all investments for which there was an excess of tax cost over value of $1,219,855,483.
In addition, the tax character of distributions paid to shareholders by the Fund is summarized as follows:
| Years Ended June 30, | ||||||||
| 2020 | 2019 | |||||||
| Distributions from ordinary income* | $ | 34,576,254 | $ | 329,123,650 | ||||
| * | For tax purposes, short-term capital gain distributions, and income and net realized gains from certain commodity-linked derivative instruments are considered ordinary income distributions. |
Expenses. Expenses of the Trust arising in connection with a specific fund are allocated to that fund. Other Trust expenses which cannot be directly attributed to a fund are apportioned among the funds in the Trust based upon the relative net assets or other appropriate measures.
Contingencies. In the normal course of business, the Fund may enter into contracts with service providers that contain general indemnification
| DWS Enhanced Commodity Strategy Fund | | | 51 |
clauses. The Fund’s maximum exposure under these arrangements is unknown, as this would involve future claims that may be made against the Fund that have not yet been made. However, based on experience, the Fund expects the risk of loss to be remote.
Other. Investment transactions are accounted for on a trade date plus one basis for daily net asset value calculations. However, for financial reporting purposes, investment transactions are reported on trade date. Interest income is recorded on the accrual basis. Realized gains and losses from investment transactions are recorded on an identified cost basis. Proceeds from litigation payments, if any, are included in net realized gain (loss) from investments. All discounts and premiums are accreted/amortized for both tax and financial reporting purposes.
B. Derivative Instruments
Swaps. A swap is a contract between two parties to exchange future cash flows at periodic intervals based on the notional amount of the swap. A bilateral swap is a transaction between the fund and a counterparty where cash flows are exchanged between the two parties. A centrally cleared swap is a transaction executed between the fund and a counterparty, then cleared by a clearing member through a central clearinghouse. The central clearinghouse serves as the counterparty, with whom the fund exchanges cash flows.
The value of a swap is adjusted daily, and the change in value, if any, is recorded as unrealized appreciation or depreciation in the Consolidated Statement of Assets and Liabilities. Gains or losses are realized when the swap expires or is closed. Certain risks may arise when entering into swap transactions including counterparty default; liquidity; or unfavorable changes in interest rates or the value of the underlying reference security, commodity or index. In connection with bilateral swaps, securities and/or cash may be identified as collateral in accordance with the terms of the swap agreement to provide assets of value and recourse in the event of default. The maximum counterparty credit risk is the net present value of the cash flows to be received from or paid to the counterparty over the term of the swap, to the extent that this amount is beneficial to the Fund, in addition to any related collateral posted to the counterparty by the Fund. This risk may be partially reduced by a master netting arrangement between the Fund and the counterparty. Upon entering into a centrally cleared swap, the Fund is required to deposit with a financial intermediary cash or securities (“initial margin”) in an amount equal to a certain percentage of the notional amount of the swap. Subsequent payments (“variation margin”) are made or received by the Fund dependent upon the daily fluctuations in the value of the swap. In a cleared swap transaction, counterparty risk is minimized as the central clearinghouse acts as the counterparty.
| 52 | | | DWS Enhanced Commodity Strategy Fund |
Credit Default Swaps. Credit default swaps are agreements between a buyer and a seller of protection against predefined credit events for the reference entity. The Fund may enter into credit default swaps to gain exposure to an underlying issuer’s credit quality characteristics without directly investing in that issuer or to hedge against the risk of a credit event on debt securities. As a seller of a credit default swap, the Fund is required to pay the par (or other agreed-upon) value of the referenced entity to the counterparty with the occurrence of a credit event by a third party, such as a U.S. or foreign corporate issuer, on the reference entity, which would likely result in a loss to the Fund. In return, the Fund receives from the counterparty a periodic stream of payments over the term of the swap provided that no credit event has occurred. If no credit event occurs, the Fund keeps the stream of payments with no payment obligations. The Fund may also buy credit default swaps, in which case the Fund functions as the counterparty referenced above. This involves the risk that the swap may expire worthless. It also involves counterparty risk that the seller may fail to satisfy its payment obligations to the Fund with the occurrence of a credit event. When the Fund sells a credit default swap, it will cover its commitment. This may be achieved by, among other methods, maintaining cash or liquid assets equal to the aggregate notional value of the reference entities for all outstanding credit default swaps sold by the Fund. For the year ended June 30, 2020, the Fund entered into credit default swap agreements to gain exposure to the underlying issuer’s credit quality characteristics and to hedge the risk of default or other specified credit events on portfolio assets.
Under the terms of a credit default swap, the Fund receives or makes periodic payments based on a specified interest rate on a fixed notional amount. These payments are recorded as a realized gain or loss in the Consolidated Statement of Operations. Payments received or made as a result of a credit event or termination of the swap are recognized, net of a proportional amount of the upfront payment, as realized gains or losses in the Consolidated Statement of Operations.
There were no open credit default swap contracts as of June 30, 2020. For the year ended June 30, 2020, the investment in credit default swap contracts purchased had a total notional amount generally indicative of a range from $0 to approximately $25,276,000.
Commodity-linked Swaps. Commodity-linked swap agreements involve a commitment to pay interest in exchange for a commodity-linked return based on a notional amount. To the extent the return of the reference commodity or commodity index underlying the commodity-linked swap exceeds or falls short of the offsetting interest rate obligation, the Fund will receive a payment or make a payment to the counterparty, respectively. For the year ended June 30, 2020, the Fund entered into commodity-linked swap agreements to gain exposure
| DWS Enhanced Commodity Strategy Fund | | | 53 |
to the investment return of assets that trade in the commodity markets, without investing directly in physical commodities.
A summary of the open commodity-linked swap contracts as of June 30, 2020 is included in a table following the Fund’s Consolidated Investment Portfolio. For the year ended June 30, 2020, the investment in long commodity-linked swap contracts had a total notional amount generally indicative of a range from approximately $1,707,980,000 to $3,028,167,000, and the investment in short commodity-linked swap contracts had a total notional amount generally indicative of a range from $0 to approximately $168,396,000.
Options. An option contract is a contract in which the writer (seller) of the option grants the buyer of the option, upon payment of a premium, the right to purchase from (call option), or sell to (put option), the writer a designated instrument at a specified price within a specified period of time. The Fund may write or purchase interest rate swaption agreements which are options to enter into a pre-defined swap agreement. The interest rate swaption agreement will specify whether the buyer of the swaption will be a fixed-rate receiver or a fixed-rate payer upon exercise. The Fund may also purchase options on exchange-traded futures contracts where the Fund is required to deposit with a financial intermediary cash or securities (“initial margin”) in an amount equal to a certain percentage of the face value indicated in the underlying futures contract. Subsequent payments (“variation margin”) are made or received by the Fund dependent upon the daily fluctuations in the value and are recorded for financial reporting purposes as unrealized gains or losses by the Fund. Certain options, including options on indices, will require cash settlement by the Fund if exercised. For the year ended June 30, 2020, the Fund entered into options on commodity futures contracts to gain exposure to the investment return of assets that trade in the commodity markets, without investing directly in physical commodities.
If the Fund writes a covered call option, the Fund foregoes, in exchange for the premium, the opportunity to profit during the option period from an increase in the market value of the underlying security above the exercise price. If the Fund writes a put option it accepts the risk of a decline in the value of the underlying security below the exercise price. Over-the-counter options have the risk of the potential inability of counterparties to meet the terms of their contracts. The Fund’s maximum exposure to purchased options is limited to the premium initially paid. There is no premium paid at the time of purchase on certain options on exchange-traded futures. At the expiration of these options on exchange-traded futures, the accumulated variation margin made or received is recorded as realized gains or losses. Certain risks may arise upon entering into option contracts including the risk that an illiquid secondary market will limit the Fund’s ability to close out an option
| 54 | | | DWS Enhanced Commodity Strategy Fund |
contract prior to the expiration date and that a change in the value of the option contract may not correlate exactly with changes in the value of the securities or currencies hedged.
A summary of open purchased option contracts as of June 30, 2020 is included in the Fund’s Consolidated Investment Portfolio. A summary of open written option contracts is included in the table following the Fund’s Consolidated Investment Portfolio. For the year ended June 30, 2020, the investment in purchased options contracts had a total value generally indicative of a range from $0 to $540,000, and the investment in written options contracts had a total value generally indicative of a range from $0 to $1,140,000.
Futures Contracts. A futures contract is an agreement between a buyer or seller and an established futures exchange or its clearinghouse in which the buyer or seller agrees to take or make a delivery of a specific amount of a financial instrument at a specified price on a specific date (settlement date). For the year ended June 30, 2020, the Fund entered into commodity futures contracts to gain exposure to the investment return of assets that trade in the commodity markets, without investing directly in physical commodities, and entered into interest rate futures to gain exposure to different parts of the yield curve while managing overall duration.
Upon entering into a futures contract, the Fund is required to deposit with a financial intermediary cash or securities (“initial margin”) in an amount equal to a certain percentage of the face value indicated in the futures contract. Subsequent payments (“variation margin”) are made or received by the Fund dependent upon the daily fluctuations in the value and are recorded for financial reporting purposes as unrealized gains or losses by the Fund. Gains or losses are realized when the contract expires or is closed. Since all futures contracts are exchange traded, counterparty risk is minimized as the exchange’s clearinghouse acts as the counterparty, and guarantees the futures against default.
Certain risks may arise upon entering into futures contracts, including the risk that an illiquid market will limit the Fund’s ability to close out a futures contract prior to the settlement date and the risk that the futures contract is not well correlated with the security, index or currency to which it relates. Risk of loss may exceed amounts disclosed in the Consolidated Statement of Assets and Liabilities.
A summary of the open futures contracts as of June 30, 2020 is included in the table following the Fund’s Consolidated Investment Portfolio. There were no open futures options contracts as of June 30, 2020. For the year ended June 30, 2020, the investment in futures contracts purchased had a total notional value generally indicative of a range from approximately $100,473,000 to $428,239,000, the investment in futures options
| DWS Enhanced Commodity Strategy Fund | | | 55 |
contracts purchased had a total notional value generally indicative of a range from $0 to $3,700,000, and the investment in futures contracts sold had a total notional value generally indicative of a range from approximately $52,988,000 to $362,377,000.
The following tables summarize the value of the Fund’s derivative instruments held as of June 30, 2020 and the related location in the accompanying Consolidated Statement of Assets and Liabilities, presented by primary underlying risk exposure:
| Asset Derivatives | Purchased Options | Swap Contracts | Futures Contracts | Total | ||||||||||||
| Commodity Contracts (a) (b) | $540,000 | $24,294,963 | $ | 23,936,877 | $48,771,840 | |||||||||||
Each of the above derivatives is located in the following Consolidated Statement of Assets and Liabilities accounts:
| (a) | Includes cumulative appreciation of futures contracts as disclosed in the Consolidated Investment Portfolio. Unsettled variation margin is disclosed separately within the Consolidated Statement of Assets and Liabilities. |
| (b) | Investments in securities at value (includes purchased options) and unrealized appreciation on bilateral swap contracts |
| Liability Derivatives | Written Options | Swap Contracts | Futures Contracts | Total | ||||||||||||
| Commodity Contracts (c) (d) | $(1,140,000) | $(2,391,953) | $(26,061,398) | $(29,593,351) | ||||||||||||
Each of the above derivatives is located in the following Consolidated Statement of Assets and Liabilities accounts:
| (c) | Includes cumulative depreciation of futures contracts as disclosed in the Consolidated Investment Portfolio. Unsettled variation margin is disclosed separately within the Consolidated Statement of Assets and Liabilities. |
| (d) | Written options, at value and unrealized depreciation on bilateral swap contracts |
Additionally, the amount of unrealized and realized gains and losses on derivative instruments recognized in Fund earnings during the year ended June 30, 2020 and the related location on the accompanying Consolidated Statement of Operations is summarized in the following tables by primary underlying risk exposure:
| Realized Gain (Loss) | Purchased Options | Swap Contracts | Futures Contracts | Total | ||||||||||||
| Interest Rate Contracts (e) | $ | — | $ | — | $ | (1,318,302 | ) | $ | (1,318,302 | ) | ||||||
| Credit Contracts (e) | — | 3,246,952 | — | 3,246,952 | ||||||||||||
| Commodity Contracts (e) | (512,082 | ) | (349,117,914 | ) | 13,931,398 | (335,698,598 | ) | |||||||||
| $ | (512,082 | ) | $ | (345,870,962 | ) | $ | 12,613,096 | $ | (333,769,948 | ) | ||||||
Each of the above derivatives is located in the following Consolidated Statement of Operations accounts:
| (e) | Net realized gain (loss) from investments (includes purchased options), written options, swap contracts and futures contracts, respectively |
| 56 | | | DWS Enhanced Commodity Strategy Fund |
| Change in Net Unrealized Appreciation (Depreciation) | ||||||||||||||||||||
Purchased Options | Written Options | Swap Contracts | Futures Contracts | Total | ||||||||||||||||
| Interest Rate Contracts (f) | $ | — | $ | — | $ | — | $ | 128,511 | $ | 128,511 | ||||||||||
| Commodity Contracts (f) | (345,200 | ) | 214,800 | (8,325,269 | ) | (1,755,123 | ) | (10,210,792 | ) | |||||||||||
| $ | (345,200 | ) | $ | 214,800 | $ | (8,325,269 | ) | $ | (1,626,612 | ) | $ | (10,082,281 | ) | |||||||
Each of the above derivatives is located in the following Consolidated Statement of Operations accounts:
| (f) | Change in net unrealized appreciation (depreciation) on investments (includes purchased options), written options, swap contracts and futures contracts, respectively |
As of June 30, 2020, the Fund has transactions subject to enforceable master netting agreements which govern the terms of certain transactions, and reduce the counterparty risk associated with such transactions. Master netting agreements allow a Fund to close out and net total exposure to a counterparty in the event of a deterioration in the credit quality or contractual default with respect to all of the transactions with a counterparty. As defined by the master netting agreement, the Fund may have collateral agreements with certain counterparties to mitigate risk. For financial reporting purposes the Consolidated Statement of Assets and Liabilities generally shows derivatives assets and liabilities on a gross basis, which reflects the full risks and exposures prior to netting. A reconciliation of the gross amounts on the Consolidated Statement of Assets and Liabilities to the net amounts by a counterparty, including any collateral exposure, is included in the following tables:
| Counterparty | Gross Amounts of Assets Presented in the Consolidated Statement of Assets and Liabilities | Financial Instruments and Derivatives Available for Offset | Non-Cash Collateral Received | Cash Collateral Received (g) | Net Amount of Derivative Assets | |||||||||||||||
| Barclays Bank PLC | $ | 1,716,588 | $ | (1,607,216 | ) | $ | — | $ | — | $ | 109,372 | |||||||||
| BNP Paribas | 1,238,807 | — | — | — | 1,238,807 | |||||||||||||||
| Canadian Imperial Bank of Commerce | 529,764 | — | — | — | 529,764 | |||||||||||||||
| Citigroup, Inc. | 4,073,363 | — | — | — | 4,073,363 | |||||||||||||||
| Credit Suisse | 1,505,542 | — | — | (570,000 | ) | 935,542 | ||||||||||||||
| Goldman Sachs & Co. | 4,270,715 | (230,950 | ) | — | (3,089,086 | ) | 950,679 | |||||||||||||
| JPMorgan Chase Securities, Inc. | 2,982,871 | — | — | — | 2,982,871 | |||||||||||||||
| Macquarie Bank Ltd. | 2,767,176 | (198,822 | ) | — | — | 2,568,354 | ||||||||||||||
| DWS Enhanced Commodity Strategy Fund | | | 57 |
| Counterparty | Gross Amounts of Assets Presented in the Consolidated Statement of Assets and Liabilities | Financial Instruments and Derivatives Available for Offset | Non-Cash Collateral Received | Cash Collateral Received (g) | Net Amount of Derivative Assets | |||||||||||||||
| Merrill Lynch International Ltd. | $ | 1,413,290 | $ | (87,480 | ) | $ | — | $ | — | $ | 1,325,810 | |||||||||
| Morgan Stanley | 548,454 | (44,144 | ) | — | — | 504,310 | ||||||||||||||
| Royal Bank of Canada | 772,782 | (109,328 | ) | — | — | 663,454 | ||||||||||||||
| Societe Generale | 1,033,174 | (114,013 | ) | — | — | 919,161 | ||||||||||||||
| UBS AG | 1,442,437 | — | — | — | 1,442,437 | |||||||||||||||
| $ | 24,294,963 | $ | (2,391,953 | ) | $ | — | $ | (3,659,086 | ) | $ | 18,243,924 | |||||||||
| Counterparty | Gross Amounts of Liabilities Presented in the Consolidated Statement of Assets and Liabilities | Financial Instruments and Derivatives Available for Offset | Non-Cash Collateral Pledged | Cash Collateral Pledged | Net Amount of Derivative Liabilities | |||||||||||||||
| Barclays Bank PLC | $ | 1,607,216 | $ | (1,607,216 | ) | $ | — | $ | — | $ | — | |||||||||
| Goldman Sachs & Co. | 230,950 | (230,950 | ) | — | — | — | ||||||||||||||
| Macquarie Bank Ltd. | 198,822 | (198,822 | ) | — | — | — | ||||||||||||||
| Merrill Lynch International Ltd. | 87,480 | (87,480 | ) | — | — | — | ||||||||||||||
| Morgan Stanley | 44,144 | (44,144 | ) | — | — | — | ||||||||||||||
| Royal Bank of Canada | 109,328 | (109,328 | ) | — | — | — | ||||||||||||||
| Societe Generale | 114,013 | (114,013 | ) | — | — | — | ||||||||||||||
| $ | 2,391,953 | $ | (2,391,953 | ) | $ | — | $ | — | $ | — | ||||||||||
| (g) | The actual collateral received and/or pledged may be more than the amounts shown. |
C. Purchases and Sales of Securities
During the year ended June 30, 2020, purchases and sales of investment securities, excluding short-term investments, were as follows:
| Purchases | Sales | |||||||
| Non-U.S. Treasury Obligations | $ | 287,500,802 | $ | 852,926,615 | ||||
| U.S. Treasury Obligations | $ | 790,633,180 | $ | 1,230,069,320 | ||||
| 58 | | | DWS Enhanced Commodity Strategy Fund |
D. Related Parties
Management Agreement. Under the Investment Management Agreement with DWS Investment Management Americas, Inc. (“DIMA” or the “Advisor”), an indirect, wholly owned subsidiary of DWS Group GmbH & Co. KGaA (“DWS Group”), the Advisor directs the investments of the Fund in accordance with its investment objectives, policies and restrictions. The Advisor determines the securities, instruments and other contracts relating to investments to be purchased, sold or entered into by the Fund.
Under the Investment Management Agreement with the Advisor, the Fund pays a monthly management fee based on the Fund’s average daily net assets, computed and accrued daily and payable monthly, at the following annual rates:
| First $500 million of the Fund’s average daily net assets | .950% | |||
| Next $500 million of such net assets | .900% | |||
| Next $500 million of such net assets | .850% | |||
| Next $1 billion of such assets | .825% | |||
| Next $1 billion of such assets | .800% | |||
| Next $1.5 billion of such net assets | .775% | |||
| Over $5 billion of such net assets | .750% |
Accordingly, for the year ended June 30, 2020, the fee pursuant to the Investment Management Agreement was equivalent to an annual rate (exclusive of any applicable waivers/reimbursements) of 0.88% of the Fund’s average daily net assets.
For the period from July 1, 2019 through September 30, 2019 (through July 25, 2019 for Class R6 and Institutional Class), the Advisor had contractually agreed to waive all or a portion of its fees and/or reimburse certain operating expenses of the Fund to the extent necessary to maintain the total annual operating expenses (excluding certain expenses such as extraordinary expenses, taxes, brokerage and interest) of each class as follows:
| Class A | 1.33% | |||
| Class T | 1.33% | |||
| Class C | 2.08% | |||
| Class R6 | .95% | |||
| Class S | 1.13% | |||
| Institutional Class | .99% |
Effective July 26, 2019 through September 30, 2020, the Advisor has contractually agreed to waive its fees and/or reimburse certain operating
| DWS Enhanced Commodity Strategy Fund | | | 59 |
expenses of the Fund to the extent necessary to maintain the total annual operating expenses (excluding certain expenses such as extraordinary expenses, taxes, brokerage and interest) of certain classes as follows:
| Class R6 | .89 | % | ||
| Institutional Class | .89 | % |
Effective October 1, 2019 through September 30, 2020, the Advisor has contractually agreed to waive all or a portion of its fees and/or reimburse certain operating expenses of the Fund to the extent necessary to maintain the total annual operating expenses (excluding certain expenses such as extraordinary expenses, taxes, brokerage and interest) of each class as follows:
| Class A | 1.27% | |||
| Class T | 1.27% | |||
| Class C | 2.02% | |||
| Class S | 1.07% |
For the year ended June 30, 2020, fees waived and/or expenses reimbursed for each class are as follows:
| Class A | $ | 145,745 | ||
| Class T | 14 | |||
| Class C | 17,930 | |||
| Class R6 | 57,212 | |||
| Class S | 199,803 | |||
| Institutional Class | 4,862,009 | |||
| $ | 5,282,713 |
Administration Fee. Pursuant to an Administrative Services Agreement, DIMA provides most administrative services to the Fund. Prior to March 1, 2020, for all services provided under the Administrative Services Agreement, the Fund paid the Advisor an annual fee (“Administration Fee”) of 0.10% of the Fund’s average daily net assets, computed and accrued daily and payable monthly. Effective March 1, 2020, for all services provided under the Administrative Services Agreement, the Fund pays the Advisor an annual Administration Fee of 0.097% of the Fund’s average daily net assets, computed and accrued daily and payable monthly. For the year ended June 30, 2020, the Administration Fee was $1,896,870, of which $121,317 is unpaid.
Service Provider Fees. DWS Service Company (“DSC”), an affiliate of the Advisor, is the transfer agent, dividend-paying agent and shareholder service agent for the Fund. Pursuant to a sub-transfer agency agreement between DSC and DST Systems, Inc. (“DST”), DSC has delegated certain
| 60 | | | DWS Enhanced Commodity Strategy Fund |
transfer agent, dividend-paying agent and shareholder service agent functions to DST. DSC compensates DST out of the shareholder servicing fee it receives from the Fund. For the year ended June 30, 2020, the amounts charged to the Fund by DSC were as follows:
| Services to Shareholders | Total Aggregated | Unpaid at June 30, 2020 | ||||||
| Class A | $ | 9,390 | $ | 1,487 | ||||
| Class T | 20 | 3 | ||||||
| Class C | 1,103 | 164 | ||||||
| Class R6 | 10,924 | 1,956 | ||||||
| Class S | 10,576 | 1,539 | ||||||
| Institutional Class | 49,770 | 6,918 | ||||||
| $ | 81,783 | $ | 12,067 | |||||
In addition, for the year ended June 30, 2020, the amounts charged to the Fund for recordkeeping and other administrative services provided by unaffiliated third parties, included in the Consolidated Statement of Operations under “Services to shareholders,” were as follows:
| Sub-Recordkeeping | Total Aggregated | |||
| Class A | $ | 132,328 | ||
| Class C | 15,945 | |||
| Class S | 244,109 | |||
| Institutional Class | 2,357,929 | |||
| $ | 2,750,311 | |||
Distribution and Service Fees. Under the Fund’s Class C 12b-1 Plan, DWS Distributors, Inc. (“DDI”), an affiliate of the Advisor, receives a fee (“Distribution Fee”) of 0.75% of the average daily net assets of Class C shares. In accordance with the Fund’s Underwriting and Distribution Services Agreement, DDI enters into related selling group agreements with various firms at various rates for sales of C shares. For the year ended June 30, 2020, the Distribution Fee was as follows:
| Distribution Fee | Total Aggregated | Unpaid at June 30, 2020 | ||||||
| Class C | $ | 85,702 | $ | 5,306 | ||||
In addition, DDI provides information and administrative services for a fee (“Service Fee”) to Class A, T and C shareholders at an annual rate of up to 0.25% of the average daily net assets for each such class. DDI in turn has various agreements with financial services firms that provide these services and pays these fees based upon the assets of shareholder
| DWS Enhanced Commodity Strategy Fund | | | 61 |
accounts the firms service. For the year ended June 30, 2020, the Service Fee was as follows:
| Service Fee | Total Aggregated | Unpaid at June 30, 2020 | Annual Rate | |||||||||
| Class A | $ | 161,411 | $ | 23,866 | .25 | % | ||||||
| Class T | 13 | 5 | .15 | % | ||||||||
| Class C | 28,511 | 3,714 | .25 | % | ||||||||
| $ | 189,935 | $ | 27,585 | |||||||||
Underwriting Agreement and Contingent Deferred Sales Charge. DDI is the principal underwriter for the Fund. Underwriting commissions paid in connection with the distribution of Class A shares for the year ended June 30, 2020 aggregated $2,561.
In addition, DDI receives any contingent deferred sales charge (“CDSC”) from Class C share redemptions occurring within one year of purchase. There is no such charge upon redemption of any share appreciation or reinvested dividends. The CDSC is 1% of the value of the shares redeemed for Class C. For the year ended June 30, 2020, the CDSC for the Fund’s Class C shares was $1,748. A deferred sales charge of up to 1% is assessed on certain redemptions of Class A shares. For the year ended June 30, 2020, DDI received $2,074 for Class A shares.
Typesetting and Filing Service Fees. Under an agreement with the Fund, DIMA is compensated for providing certain pre-press and regulatory filing services to the Fund. For the year ended June 30, 2020, the amount charged to the Fund by DIMA included in the Consolidated Statement of Operations under “Reports to shareholders” aggregated $19,383, of which $9,645 is unpaid.
Trustees’ Fees and Expenses. The Fund paid retainer fees to each Trustee not affiliated with the Advisor, plus specified amounts to the Board Chairperson and to each committee Chairperson.
Affiliated Cash Management Vehicles. The Fund may invest uninvested cash balances in DWS Central Cash Management Government Fund and DWS ESG Liquidity Fund, affiliated money market funds which are managed by the Advisor. Each affiliated money market fund is managed in accordance with Rule 2a-7 under the 1940 Act, which governs the quality, maturity, diversity and liquidity of instruments in which a money market fund may invest. DWS Central Cash Management Government Fund seeks to maintain a stable net asset value, and DWS ESG Liquidity Fund maintains a floating net asset value. The Fund indirectly bears its proportionate share of the expenses of each affiliated money market fund in which it invests. DWS Central Cash Management Government Fund does not pay the Advisor an investment management fee. To the extent that DWS ESG Liquidity Fund pays an investment management fee to the
| 62 | | | DWS Enhanced Commodity Strategy Fund |
Advisor, the Advisor will waive an amount of the investment management fee payable to the Advisor by the Fund equal to the amount of the investment management fee payable on the Fund’s assets invested in DWS ESG Liquidity Fund.
E. Line of Credit
The Fund and other affiliated funds (the “Participants”) share in a $350 million revolving credit facility provided by a syndication of banks. The Fund may borrow for temporary or emergency purposes, including the meeting of redemption requests that otherwise might require the untimely disposition of securities. The Participants are charged an annual commitment fee, which is allocated based on net assets, among each of the Participants. Interest is calculated at a rate per annum equal to the sum of the Federal Funds Rate plus 1.25 percent plus if the one-month LIBOR exceeds the Federal Funds Rate, the amount of such excess. The Fund may borrow up to a maximum of 33 percent of its net assets under the agreement. The Fund had no outstanding loans at June 30, 2020.
F. Investing in Commodities-Related Investments
The Fund invests in commodity-linked derivative instruments such as commodity-linked swaps, commodity-linked structured notes and options and futures contracts that are designed to provide exposure to the investment return of assets that trade in the commodity markets, without investing directly in physical commodities. The commodities-linked derivatives instruments in which the Fund invests are more volatile than many other types of securities and may subject the Fund to special risks that do not apply to all derivatives transactions. The value of a commodity-linked derivative investment generally is based upon the price movements of a physical commodity (such as energy, minerals, or agricultural products), a futures contract, swap or commodity index, or other economic variables based upon changes in the value of commodities or the commodities markets. The value of commodity-linked derivative instruments may be affected by changes in overall market movements, commodity index volatility, changes in interest rates, or factors affecting a particular industry or commodity, such as drought, floods, weather, livestock disease, changes in storage costs, embargoes, tariffs, policies of commodity cartels and international economic, political and regulatory developments. Also, a liquid secondary market may not exist for the types of commodity-linked derivative instruments the Fund buys, which may make it difficult for the Fund to sell them at an acceptable price.
| DWS Enhanced Commodity Strategy Fund | | | 63 |
G. Fund Share Transactions
The following table summarizes share and dollar activity in the Fund:
Year Ended June 30, 2020 | Year Ended June 30, 2019 | |||||||||||||||
| Shares | Dollars | Shares | Dollars | |||||||||||||
| Shares sold |
| |||||||||||||||
| Class A | 3,003,827 | $ | 25,768,683 | 3,324,103 | $ | 33,722,112 | ||||||||||
| Class C | 132,676 | 1,001,796 | 279,539 | 2,593,285 | ||||||||||||
| Class R6 | 2,195,970 | 19,546,506 | 2,289,583 | 23,703,106 | ||||||||||||
| Class S | 4,291,227 | 37,977,660 | 13,430,978 | 139,374,349 | ||||||||||||
| Institutional Class | 104,404,005 | 886,976,150 | 96,936,899 | 1,002,471,396 | ||||||||||||
| $ | 971,270,795 | $ | 1,201,864,248 | |||||||||||||
| Shares issued to shareholders in reinvestment of distributions |
| |||||||||||||||
| Class A | 55,864 | $ | 481,934 | 608,923 | $ | 6,111,991 | ||||||||||
| Class T | 16 | 140 | 107 | 1,069 | ||||||||||||
| Class C | 8,516 | 66,833 | 189,037 | 1,702,847 | ||||||||||||
| Class R6 | 42,751 | 369,682 | 225,931 | 2,283,073 | ||||||||||||
| Class S | 197,381 | 1,736,109 | 2,775,228 | 28,192,187 | ||||||||||||
| Institutional Class | 3,369,116 | 29,352,252 | 27,037,466 | 274,706,892 | ||||||||||||
| $ | 32,006,950 | $ | 312,998,059 | |||||||||||||
| Shares redeemed |
| |||||||||||||||
| Class A | (3,646,248 | ) | $ | (31,607,613 | ) | (6,365,569 | ) | $ | (65,245,246 | ) | ||||||
| Class C | (722,230 | ) | (5,721,740 | ) | (1,246,158 | ) | (11,429,606 | ) | ||||||||
| Class R6 | (1,488,691 | ) | (13,279,141 | ) | (1,266,367 | ) | (12,462,460 | ) | ||||||||
| Class S | (14,466,831 | ) | (132,412,485 | ) | (39,749,670 | ) | (416,188,265 | ) | ||||||||
| Institutional Class | (192,349,194 | ) | (1,680,590,964 | ) | (102,027,072 | ) | (1,049,625,843 | ) | ||||||||
| $ | (1,863,611,943 | ) | $ | (1,554,951,420 | ) | |||||||||||
| Net increase (decrease) |
| |||||||||||||||
| Class A | (586,557 | ) | $ | (5,356,996 | ) | (2,432,543 | ) | $ | (25,411,143 | ) | ||||||
| Class T | 16 | 140 | 107 | 1,069 | ||||||||||||
| Class C | (581,038 | ) | (4,653,111 | ) | (777,582 | ) | (7,133,474 | ) | ||||||||
| Class R6 | 750,030 | 6,637,047 | 1,249,147 | 13,523,719 | ||||||||||||
| Class S | (9,978,223 | ) | (92,698,716 | ) | (23,543,464 | ) | (248,621,729 | ) | ||||||||
| Institutional Class | (84,576,073 | ) | (764,262,562 | ) | 21,947,293 | 227,552,445 | ||||||||||
| $ | (860,334,198 | ) | $ | (40,089,113 | ) | |||||||||||
| 64 | | | DWS Enhanced Commodity Strategy Fund |
H. Other — COVID-19 Pandemic
A novel strain of coronavirus (COVID-19) outbreak was declared a pandemic by the World Health Organization on March 11, 2020. The situation is evolving with various cities and countries around the world responding in different ways to address the pandemic. There are direct and indirect economic effects developing for various industries and individual companies throughout the world. The recent pandemic spread of the novel coronavirus and related geopolitical events could lead to increased financial market volatility, disruption to U.S. and world economies and markets and may have significant adverse effects on the Fund and its investments. A prolonged disruption may result in the Fund and its service providers experiencing operational difficulties in implementing their business continuity plans. Management will continue to monitor the impact COVID-19 has on the Fund and reflect the consequences as appropriate in the Fund’s accounting and financial reporting.
I. Other — Deutsche Bank AG Consent Order
On June 17, 2020, Deutsche Bank AG (“DB”), an affiliate of DWS Group, resolved with the Commodity Futures Trading Commission (“CFTC”) charges stemming from alleged violations of various swap data reporting requirements and corresponding supervision and other failures. The matter, which was resolved by the issuance of a federal court order (“Consent Order”), involved unintentional conduct that resulted from a system outage that prevented DB from reporting data in accordance with applicable CFTC requirements for a period of five days in April 2016.
The matter giving rise to the Consent Order did not arise out of any investment advisory, fund management activities or distribution activities of DIMA, DWS Distributors, Inc. or their advisory affiliates (the “DWS Service Providers”). DWS Group, of which the DWS Service Providers are wholly-owned subsidiaries, is a separate publicly traded company but continues to be an affiliate of DB due to, among other things, DB’s 79.49% ownership interest in DWS Group. Under the provisions of the Investment Company Act of 1940, as a result of the Consent Order, the DWS Service Providers would not be eligible to continue to provide investment advisory and underwriting services to the Fund absent an order from the Securities and Exchange Commission (the “SEC”). DB and the DWS Service Providers are seeking temporary and permanent orders from the SEC to permit the DWS Service Providers to continue to provide investment advisory and underwriting services to the Fund and other registered investment companies notwithstanding the Consent Order. While there can be no assurance that the requested exemptive orders will be granted, the SEC has granted this type of relief in the past. Consistent with their fiduciary and other relationships with the Fund, and in
| DWS Enhanced Commodity Strategy Fund | | | 65 |
accordance with the desire of the Board of the Fund, the DWS Service Providers continue to provide investment advisory and distribution services to the Fund. Subject to the receipt of the temporary and permanent exemptive orders, the DWS Service Providers have informed the Fund that they do not believe the Consent Order will have any material impact on the Fund or the ability of the Service Providers to provide services for the Fund.
| 66 | | | DWS Enhanced Commodity Strategy Fund |
Report of Independent Registered Public Accounting Firm
To the Board of Trustees of Deutsche DWS Securities Trust and Shareholders of DWS Enhanced Commodity Strategy Fund:
Opinion on the Financial Statements
We have audited the accompanying consolidated statement of assets and liabilities of DWS Enhanced Commodity Strategy Fund (the “Fund”) (one of the funds constituting Deutsche DWS Securities Trust) (the “Trust”), including the consolidated investment portfolio, as of June 30, 2020, and the related consolidated statement of operations for the year then ended, the consolidated statements of changes in net assets and the consolidated financial highlights for each of the two years in the period then ended and the related notes (collectively referred to as the “financial statements”). In our opinion, the financial statements present fairly, in all material respects, the consolidated financial position of the Fund (one of the funds constituting Deutsche DWS Securities Trust) at June 30, 2020, the consolidated results of its operations for the year then ended, the consolidated changes in its net assets and its consolidated financial highlights for each of the two years in the period then ended, in conformity with U.S. generally accepted accounting principles.
The consolidated financial highlights for the years ended June 30, 2016, June 30, 2017 and June 30, 2018, were audited by another independent registered public accounting firm whose report, dated August 24, 2018, expressed an unqualified opinion on those consolidated financial highlights.
Basis for Opinion
These financial statements are the responsibility of the Trust’s management. Our responsibility is to express an opinion on the Fund’s financial statements based on our audits. We are a public accounting firm registered with the Public Company Accounting Oversight Board (United States) (“PCAOB”) and are required to be independent with respect to the Trust in accordance with the U.S. federal securities laws and the applicable rules and regulations of the Securities and Exchange Commission and the PCAOB.
| DWS Enhanced Commodity Strategy Fund | | | 67 |
We conducted our audits in accordance with the standards of the PCAOB. Those standards require that we plan and perform the audit to obtain reasonable assurance about whether the financial statements are free of material misstatement, whether due to error or fraud. The Trust is not required to have, nor were we engaged to perform, an audit of the Trust’s internal control over financial reporting. As part of our audits, we are required to obtain an understanding of internal control over financial reporting, but not for the purpose of expressing an opinion on the effectiveness of the Trust’s internal control over financial reporting. Accordingly, we express no such opinion.
Our audits included performing procedures to assess the risks of material misstatement of the financial statements, whether due to error or fraud, and performing procedures that respond to those risks. Such procedures included examining, on a test basis, evidence regarding the amounts and disclosures in the financial statements. Our procedures included confirmation of securities owned as of June 30, 2020, by correspondence with the custodian and others or by other appropriate auditing procedures where replies from others were not received. Our audits also included evaluating the accounting principles used and significant estimates made by management, as well as evaluating the overall presentation of the financial statements. We believe that our audits provide a reasonable basis for our opinion.

We have served as the auditor of one or more investment companies in the DWS family of funds since at least 1979, but we are unable to determine the specific year.
Boston, Massachusetts
August 25, 2020
| 68 | | | DWS Enhanced Commodity Strategy Fund |
Information About Your Fund’s Expenses
As an investor of the Fund, you incur two types of costs: ongoing expenses and transaction costs. Ongoing expenses include management fees, distribution and service (12b-1) fees and other Fund expenses. Examples of transaction costs include sales charges (loads) and account maintenance fees, which are not shown in this section. The following tables are intended to help you understand your ongoing expenses (in dollars) of investing in the Fund and to help you compare these expenses with the ongoing expenses of investing in other mutual funds. In the most recent six-month period, the Fund limited these expenses; had it not done so, expenses would have been higher. The example in the table is based on an investment of $1,000 invested at the beginning of the six-month period and held for the entire period (January 1, 2020 to June 30, 2020).
The tables illustrate your Fund’s expenses in two ways:
| – | Actual Fund Return. This helps you estimate the actual dollar amount of ongoing expenses (but not transaction costs) paid on a $1,000 investment in the Fund using the Fund’s actual return during the period. To estimate the expenses you paid over the period, simply divide your account value by $1,000 (for example, an $8,600 account value divided by $1,000 = 8.6), then multiply the result by the number in the “Expenses Paid per $1,000” line under the share class you hold. |
| – | Hypothetical 5% Fund Return. This helps you to compare your Fund’s ongoing expenses (but not transaction costs) with those of other mutual funds using the Fund’s actual expense ratio and a hypothetical rate of return of 5% per year before expenses. Examples using a 5% hypothetical fund return may be found in the shareholder reports of other mutual funds. The hypothetical account values and expenses may not be used to estimate the actual ending account balance or expenses you paid for the period. |
Please note that the expenses shown in these tables are meant to highlight your ongoing expenses only and do not reflect any transaction costs. The “Expenses Paid per $1,000” line of the tables is useful in comparing ongoing expenses only and will not help you determine the relative total expense of owning different funds. Subject to certain exceptions, an account maintenance fee of $20.00 assessed once per calendar year for Classes A, C and S shares may apply for accounts with balances less than $10,000. This fee is not included in these tables. If it was, the estimate of expenses paid for Classes A, C and S shares during the period would be higher, and account value during the period would be lower, by this amount.
| DWS Enhanced Commodity Strategy Fund | | | 69 |
| Expenses and Value of a $1,000 Investment for the six months ended June 30, 2020 (Unaudited) | ||||||||||||||||||||||||
| Actual Fund Return | Class A | Class T | Class C | Class R6 | Class S | Institutional Class | ||||||||||||||||||
| Beginning Account Value 1/1/20 | $ | 1,000.00 | $ | 1,000.00 | $ | 1,000.00 | $ | 1,000.00 | $ | 1,000.00 | $ | 1,000.00 | ||||||||||||
| Ending Account Value 6/30/20 | $ | 848.60 | $ | 848.90 | $ | 845.20 | $ | 850.60 | $ | 849.40 | $ | 850.70 | ||||||||||||
| Expenses Paid per $1,000* | $ | 5.84 | $ | 5.84 | $ | 9.27 | $ | 4.10 | $ | 4.92 | $ | 4.10 | ||||||||||||
| Hypothetical 5% Fund Return | Class A | Class T | Class C | Class R6 | Class S | Institutional Class | ||||||||||||||||||
| Beginning Account Value 1/1/20 | $ | 1,000.00 | $ | 1,000.00 | $ | 1,000.00 | $ | 1,000.00 | $ | 1,000.00 | $ | 1,000.00 | ||||||||||||
| Ending Account Value 6/30/20 | $ | 1,018.55 | $ | 1,018.55 | $ | 1,014.82 | $ | 1,020.44 | $ | 1,019.54 | $ | 1,020.44 | ||||||||||||
| Expenses Paid per $1,000* | $ | 6.37 | $ | 6.37 | $ | 10.12 | $ | 4.47 | $ | 5.37 | $ | 4.47 | ||||||||||||
| * | Expenses are equal to the Fund’s annualized expense ratio for each share class, multiplied by the average account value over the period, multiplied by 182 (the number of days in the most recent six-month period), then divided by 366. |
| Annualized Expense Ratios | Class A | Class T | Class C | Class R6 | Class S | Institutional Class | ||||||||||||||||||
| DWS Enhanced Commodity Strategy Fund | 1.27 | % | 1.27 | % | 2.02 | % | .89 | % | 1.07 | % | .89 | % | ||||||||||||
For more information, please refer to the Fund’s prospectus.
For an analysis of the fees associated with an investment in the Fund or
similar funds, please refer to tools.finra.org/fund_analyzer/.
| Tax Information | (Unaudited) |
A total of 22% of the dividends distributed during the fiscal year was derived from interest on U.S. government securities, which is generally exempt from state income tax.
Please consult a tax advisor if you have questions about federal or state income tax laws, or on how to prepare your tax returns. If you have specific questions about your account, please call (800) 728-3337.
| 70 | | | DWS Enhanced Commodity Strategy Fund |
In accordance with Rule 22e-4 (the “Liquidity Rule”) under the Investment Company Act of 1940 (the “1940 Act”), your Fund has adopted a liquidity risk management program (the “Program”), and the Board has designated DWS Investment Management Americas, Inc. (“DIMA”) as Program administrator. The Program is designed to assess and manage your Fund’s liquidity risk (the risk that the Fund would be unable to meet requests to redeem shares of the Fund without significant dilution of remaining investors’ interests in the Fund). DIMA has designated a committee (the “Committee”) composed of personnel from multiple departments within DIMA and its affiliates that is responsible for the implementation and ongoing administration of the Program, which includes assessing the Fund’s liquidity risk under both normal and reasonably foreseeable stressed conditions. Under the Program, every investment held by a Fund is classified on a daily basis into one of four liquidity categories based on estimations of the investment’s ability to be sold during designated timeframes in current market conditions without significantly changing the investment’s market value.
In February 2020, as required by the Program and the Liquidity Rule, DIMA provided the Board with an annual written report (the “Report”) addressing the operation of the Program and assessing the adequacy and effectiveness of its implementation during the period from December 1, 2018 through November 30, 2019 (the “Reporting Period”). During the Reporting Period, your Fund was primarily invested in highly liquid investments (investments that the Fund anticipates can be converted to cash within three business days or less in current market conditions without significantly changing their market value). As a result, your Fund is not required to adopt, and has not adopted, a “Highly Liquid Investment Minimum” as defined in the Liquidity Rule. During the Reporting Period, the Fund did not approach the 15% limit imposed by the Liquidity Rule on holdings in illiquid investments (investments that cannot be sold or disposed of in seven days or less in current market conditions without the sale of the investment significantly changing the market value of the investment). Your Fund did not experience any issues meeting investor redemptions at any time during the Reporting Period. In the Report, DIMA stated that it believes the Program has operated adequately and effectively to manage the Fund’s liquidity risk during the Reporting Period. DIMA also reported on a material change made to the Program in May 2019 to address Securities and Exchange Commission guidance relating to extended foreign market holidays.
| DWS Enhanced Commodity Strategy Fund | | | 71 |
Advisory Agreement Board Considerations and Fee Evaluation
The Board of Trustees (hereinafter referred to as the “Board” or “Trustees”) approved the renewal of DWS Enhanced Commodity Strategy Fund’s (the “Fund”) investment management agreement (the “Agreement”) with DWS Investment Management Americas, Inc. (“DIMA”) in September 2019.
In terms of the process that the Board followed prior to approving the Agreement, shareholders should know that:
| – | During the entire process, all of the Fund’s Trustees were independent of DIMA and its affiliates (the “Independent Trustees”). |
| – | The Board met frequently during the past year to discuss fund matters and dedicated a substantial amount of time to contract review matters. Over the course of several months, the Board’s Contract Committee reviewed extensive materials received from DIMA, independent third parties and independent counsel. These materials included an analysis of the Fund’s performance, fees and expenses, and profitability from a fee consultant retained by the Fund’s Independent Trustees (the “Fee Consultant”). Based on its evaluation of the information provided, the Contract Committee presented its findings and recommendations to the Board. The Board then reviewed the Contract Committee’s findings and recommendations. |
| – | The Board also received extensive information throughout the year regarding performance of the Fund. |
| – | The Independent Trustees regularly met privately with counsel to discuss contract review and other matters. In addition, the Independent Trustees were advised by the Fee Consultant in the course of their review of the Fund’s contractual arrangements and considered a comprehensive report prepared by the Fee Consultant in connection with their deliberations. |
| – | In connection with reviewing the Agreement, the Board also reviewed the terms of the Fund’s Rule 12b-1 plan, distribution agreement, administrative services agreement, transfer agency agreement and other material service agreements. |
In connection with the contract review process, the Contract Committee and the Board considered the factors discussed below, among others. The Board also considered that DIMA and its predecessors have managed the Fund since its inception, and the Board believes that a long-term relationship with a capable, conscientious advisor is in the best interests of the Fund. The Board considered, generally, that shareholders chose to
| 72 | | | DWS Enhanced Commodity Strategy Fund |
invest or remain invested in the Fund knowing that DIMA managed the Fund. DIMA is part of DWS Group GmbH & Co. KGaA (“DWS Group”). DWS Group is a global asset management business that offers a wide range of investing expertise and resources, including research capabilities in many countries throughout the world. In 2018, approximately 20% of DWS Group’s shares were sold in an initial public offering, with Deutsche Bank AG owning the remaining shares.
As part of the contract review process, the Board carefully considered the fees and expenses of each DWS fund overseen by the Board in light of the fund’s performance. In many cases, this led to the negotiation and implementation of expense caps. As part of these negotiations, the Board indicated that it would consider relaxing these caps in future years following sustained improvements in performance, among other considerations.
While shareholders may focus primarily on fund performance and fees, the Fund’s Board considers these and many other factors, including the quality and integrity of DIMA’s personnel and administrative support services provided by DIMA, such as back-office operations, fund valuations, and compliance policies and procedures.
Nature, Quality and Extent of Services. The Board considered the terms of the Agreement, including the scope of advisory services provided under the Agreement. The Board noted that, under the Agreement, DIMA provides portfolio management services to the Fund and that, pursuant to a separate administrative services agreement, DIMA provides administrative services to the Fund. The Board considered the experience and skills of senior management and investment personnel and the resources made available to such personnel. The Board reviewed the Fund’s performance over short-term and long-term periods and compared those returns to various agreed-upon performance measures, including market index(es) and a peer universe compiled using information supplied by Morningstar Direct (“Morningstar”), an independent fund data service. The Board also noted that it has put into place a process of identifying “Funds in Review” (e.g., funds performing poorly relative to a peer universe), and receives additional reporting from DIMA regarding such funds and, where appropriate, DIMA’s plans to address underperformance. The Board believes this process is an effective manner of identifying and addressing underperforming funds. Based on the information provided, the Board noted that, for the one-, three- and five-year periods ended December 31, 2018, the Fund’s performance (Class A shares) was in the 2nd quartile, 3rd quartile and 1st quartile, respectively, of the applicable Morningstar universe (the 1st quartile being the best performers and the 4th quartile being the worst performers). The Board also observed that the Fund has outperformed its benchmark in the five-year period and has underperformed its benchmark in the one- and
| DWS Enhanced Commodity Strategy Fund | | | 73 |
three-year periods ended December 31, 2018. The Board noted the disappointing investment performance of the Fund in some past periods and continued to discuss with senior management of DIMA the factors contributing to such underperformance and actions being taken to improve performance. The Board observed that the Fund had experienced improved relative performance in 2018. The Board recognized the efforts by DIMA in recent years to enhance its investment platform and improve long-term performance across the DWS fund complex.
Fees and Expenses. The Board considered the Fund’s investment management fee schedule, operating expenses and total expense ratios, and comparative information provided by Broadridge Financial Solutions, Inc. (“Broadridge”) and the Fee Consultant regarding investment management fee rates paid to other investment advisors by similar funds (1st quartile being the most favorable and 4th quartile being the least favorable). With respect to management fees paid to other investment advisors by similar funds, the Board noted that the contractual fee rates paid by the Fund, which include a 0.10% fee paid to DIMA under the Fund’s administrative services agreement, were higher than the median (4th quartile) of the applicable Broadridge peer group (based on Broadridge data provided as of December 31, 2018). The Board noted that the Fund’s Class A shares total (net) operating expenses (excluding 12b-1 fees) were expected to be higher than the median (3rd quartile) of the applicable Broadridge expense universe (based on Broadridge data provided as of December 31, 2018, and analyzing Broadridge expense universe Class A (net) expenses less any applicable 12b-1 fees) (“Broadridge Universe Expenses”). The Board also reviewed data comparing each other operational share class’s total (net) operating expenses to the applicable Broadridge Universe Expenses. The Board noted that the expense limitations agreed to by DIMA were expected to help the Fund’s total (net) operating expenses remain competitive. The Board considered the Fund’s management fee rate as compared to fees charged by DIMA to comparable DWS U.S. registered funds (“DWS Funds”), noting that DIMA indicated that it does not provide services to any other comparable DWS Funds. The information requested by the Board as part of its review of fees and expenses also included information about institutional accounts (including any sub-advised funds and accounts) and funds offered primarily to European investors (“DWS Europe Funds”) managed by DWS Group. The Board noted that DIMA indicated that DWS Group does not manage any institutional accounts or DWS Europe Funds comparable to the Fund. The Board noted that, in connection with the 2017 and 2018 contract renewal process, DIMA agreed to implement a new management fee breakpoint.
On the basis of the information provided, the Board concluded that management fees were reasonable and appropriate in light of the nature, quality and extent of services provided by DIMA.
| 74 | | | DWS Enhanced Commodity Strategy Fund |
Profitability. The Board reviewed detailed information regarding revenues received by DIMA under the Agreement. The Board considered the estimated costs to DIMA, and pre-tax profits realized by DIMA, from advising the DWS Funds, as well as estimates of the pre-tax profits attributable to managing the Fund in particular. The Board also received information regarding the estimated enterprise-wide profitability of DIMA and its affiliates with respect to all fund services in totality and by fund. The Board and the Fee Consultant reviewed DIMA’s methodology in allocating its costs to the management of the Fund. Based on the information provided, the Board concluded that the pre-tax profits realized by DIMA in connection with the management of the Fund were not unreasonable. The Board also reviewed certain publicly available information regarding the profitability of certain similar investment management firms. The Board noted that, while information regarding the profitability of such firms is limited (and in some cases is not necessarily prepared on a comparable basis), DIMA and its affiliates’ overall profitability with respect to the DWS Funds (after taking into account distribution and other services provided to the funds by DIMA and its affiliates) was lower than the overall profitability levels of most comparable firms for which such data was available.
Economies of Scale. The Board considered whether there are economies of scale with respect to the management of the Fund and whether the Fund benefits from any economies of scale. The Board noted that the Fund’s investment management fee schedule includes fee breakpoints. The Board concluded that the Fund’s fee schedule represents an appropriate sharing between the Fund and DIMA of such economies of scale as may exist in the management of the Fund at current asset levels.
Other Benefits to DIMA and Its Affiliates. The Board also considered the character and amount of other incidental or “fall-out” benefits received by DIMA and its affiliates, including any fees received by DIMA for administrative services provided to the Fund, any fees received by an affiliate of DIMA for transfer agency services provided to the Fund and any fees received by an affiliate of DIMA for distribution services. The Board also considered benefits to DIMA related to brokerage and soft-dollar allocations, including allocating brokerage to pay for research generated by parties other than the executing broker dealers, which pertain primarily to funds investing in equity securities. In addition, the Board considered the incidental public relations benefits to DIMA related to DWS Funds advertising and cross-selling opportunities among DIMA products and services. The Board considered these benefits in reaching its conclusion that the Fund’s management fees were reasonable.
Compliance. The Board considered the significant attention and resources dedicated by DIMA to its compliance processes in recent years. The Board noted in particular (i) the experience, seniority and time
| DWS Enhanced Commodity Strategy Fund | | | 75 |
commitment of the individuals serving as DIMA’s and the Fund’s chief compliance officers and (ii) the substantial commitment of resources by DIMA and its affiliates to compliance matters, including the retention of compliance personnel.
Based on all of the information considered and the conclusions reached, the Board determined that the continuation of the Agreement is in the best interests of the Fund. In making this determination, the Board did not give particular weight to any single factor identified above. The Board considered these factors over the course of numerous meetings, certain of which were in executive session with only the Independent Trustees and counsel present. It is possible that individual Independent Trustees may have weighed these factors differently in reaching their individual decisions to approve the continuation of the Agreement.
| 76 | | | DWS Enhanced Commodity Strategy Fund |
The following table presents certain information regarding the Board Members and Officers of the Trust/Corporation. Each Board Member’s year of birth is set forth in parentheses after his or her name. Unless otherwise noted, (i) each Board Member has engaged in the principal occupation(s) noted in the table for at least the most recent five years, although not necessarily in the same capacity; and (ii) the address of each Independent Board Member is Keith R. Fox, DWS Funds Board Chair, c/o Thomas R. Hiller, Ropes & Gray LLP, Prudential Tower, 800 Boylston Street, Boston, MA 02199-3600. Except as otherwise noted below, the term of office for each Board Member is until the election and qualification of a successor, or until such Board Member sooner dies, resigns, is removed or as otherwise provided in the governing documents of the Trust/Corporation. Because the Fund does not hold an annual meeting of shareholders, each Board Member will hold office for an indeterminate period.
The Board Members may also serve in similar capacities with other funds in the fund complex. The number of funds in DWS fund complex shown in the table below includes all registered open- and closed-end funds (including all of their portfolios) advised by the Advisor and any registered funds that have an investment advisor that is an affiliated person of the Advisor.
| Independent Board Members |
| |||||||
| Name, Year of Birth, Position with the Trust/ Corporation and Length of Time Served1 | Business Experience and Directorships During the Past Five Years | Number of Funds in DWS Fund Complex Overseen | Other Directorships Held by Board Member | |||||
Keith R. Fox, CFA (1954) Chairperson since 2017, and Board Member since 1996 | Managing General Partner, Exeter Capital Partners (a series of private investment funds) (since 1986). Directorships: ICI Mutual Insurance Company; Progressive International Corporation (kitchen goods importer and distributor); former Chairman, National Association of Small Business Investment Companies; former Directorships: BoxTop Media Inc. (advertising); Sun Capital Advisers Trust (mutual funds) (2011–2012) | 74 | — | |||||
| DWS Enhanced Commodity Strategy Fund | | | 77 |
| Name, Year of Birth, Position with the Trust/ Corporation and Length of Time Served1 | Business Experience and Directorships During the Past Five Years | Number of Funds in DWS Fund Complex Overseen | Other Directorships Held by Board Member | |||||
John W. Ballantine (1946)
Board Member since 1999 | Retired; formerly, Executive Vice President and Chief Risk Management Officer, First Chicago NBD Corporation/The First National Bank of Chicago (1996–1998); Executive Vice President and Head of International Banking (1995–1996); former Directorships: Director and Chairman of the Board, Healthways, Inc.2 (population well-being and wellness services) (2003–2014); Stockwell Capital Investments PLC (private equity); Enron Corporation; FNB Corporation; Tokheim Corporation; First Oak Brook Bancshares, Inc.; Oak Brook Bank; and Prisma Energy International. Not-for-Profit Director/Trustee: Palm Beach Civic Association; Window to the World Communications (public media); Life Director of Harris Theater for Music and Dance (Chicago); Life Director of Hubbard Street Dance Chicago; former Not-for-Profit Directorships: Public Radio International | 74 | Portland General Electric2 (utility company) (2003– present) | |||||
Dawn-Marie Driscoll (1946)
Board Member since 1987 | Emeritus Executive Fellow, Center for Business Ethics, Bentley University; formerly: Partner, Palmer & Dodge (law firm) (1988–1990); Vice President of Corporate Affairs and General Counsel, Filene’s (retail) (1978–1988). Directorships: Advisory Board, Center for Business Ethics, Bentley University; Trustee and former Chairman of the Board, Southwest Florida Community Foundation (charitable organization); former Directorships: ICI Mutual Insurance Company (2007–2015); Sun Capital Advisers Trust (mutual funds) (2007–2012), Investment Company Institute (audit, executive, nominating committees) and Independent Directors Council (governance, executive committees) | 74 | — | |||||
Richard J. Herring (1946)
Board Member since 1990 | Jacob Safra Professor of International Banking and Professor of Finance, The Wharton School, University of Pennsylvania (since July 1972); Director, The Wharton Financial Institutions Center (since 1994); formerly: Vice Dean and Director, Wharton Undergraduate Division (1995–2000) and Director, The Lauder Institute of International Management Studies (2000–2006); Member FDIC Systemic Risk Advisory Committee since 2011, member Systemic Risk Council since 2012 and member of the Advisory Board at the Yale Program on Financial Stability since 2013; Formerly Co-Chair of the Shadow Financial Regulatory Committee (2003–2015), Executive Director of The Financial Economists Roundtable (2008–2015), Director of The Thai Capital Fund (2007–2013), Director of The Aberdeen Singapore Fund (2007–2018), and Nonexecutive Director of Barclays Bank DE (2010–2018) | 74 | Director, Aberdeen Japan Fund (since 2007) | |||||
| 78 | | | DWS Enhanced Commodity Strategy Fund |
| Name, Year of Birth, Position with the Trust/ Corporation and Length of Time Served1 | Business Experience and Directorships During the Past Five Years | Number of Funds in DWS Fund Complex Overseen | Other Directorships Held by Board Member | |||||
William McClayton (1944)
Board Member since 2004 | Private equity investor (since October 2009); previously, Managing Director, Diamond Management & Technology Consultants, Inc. (global consulting firm) (2001–2009); Directorship: Board of Managers, YMCA of Metropolitan Chicago; formerly: Senior Partner, Arthur Andersen LLP (accounting) (1966–2001); Trustee, Ravinia Festival | 74 | — | |||||
Rebecca W. Rimel (1951)
Board Member since 1995 | Senior Advisor, The Pew Charitable Trusts (charitable organization) (since July 2020); formerly: Executive Vice President, The Glenmede Trust Company (investment trust and wealth management) (1983–2004); Board Member, Investor Education (charitable organization) (2004–2005); Trustee, Executive Committee, Philadelphia Chamber of Commerce (2001–2007); Director, Viasys Health Care2 (January 2007–June 2007); Trustee, Thomas Jefferson Foundation (charitable organization) (1994–2012); President, Chief Executive Officer and Director, The Pew Charitable Trusts (charitable organization) (1994–2020) | 74 | Director, Becton Dickinson and Company2 (medical technology company) (2012– present); Director, BioTelemetry Inc.2 (health care) (2009– present) | |||||
William N. Searcy, Jr. (1946)
Board Member since 1993 | Private investor since October 2003; formerly: Pension & Savings Trust Officer, Sprint Corporation2 (telecommunications) (November 1989–September 2003); Trustee, Sun Capital Advisers Trust (mutual funds) (1998–2012) | 74 | — | |||||
| DWS Enhanced Commodity Strategy Fund | | | 79 |
| Officers4 | ||
| Name, Year of Birth, Position with the Trust/Corporation and Length of Time Served5 | Business Experience and Directorships During the Past Five Years | |
Hepsen Uzcan6 (1974)
President and Chief Executive Officer, 2017–present | Managing Director,3 DWS; Secretary, DWS USA Corporation (2018–present); Assistant Secretary, DWS Distributors, Inc. (2018–present); Director and Vice President, DWS Service Company (2018–present); Assistant Secretary, DWS Investment Management Americas, Inc. (2018–present); Director and President, DB Investment Managers, Inc. (2018–present); President and Chief Executive Officer (2017–present), and Interested Director (since June 25, 2020), The European Equity Fund, Inc., The New Germany Fund, Inc. and The Central and Eastern Europe Fund, Inc.; formerly: Vice President for the Deutsche Funds (2016–2017); Assistant Secretary for the DWS funds (2013–2019); Assistant Secretary, The European Equity Fund, Inc., The New Germany Fund, Inc. and The Central and Eastern Europe Fund, Inc. (2013–2020) | |
John Millette7 (1962)
Vice President and Secretary, 1999–present | Director,3 DWS; Chief Legal Officer, DWS Investment Management Americas, Inc. (2015–present); Director and Vice President, DWS Trust Company (2016–present); Secretary, DBX ETF Trust (2020–present); Secretary, The European Equity Fund, Inc., The New Germany Fund, Inc. and The Central and Eastern Europe Fund, Inc. (2011–present); formerly: Secretary, Deutsche Investment Management Americas Inc. (2015–2017); Assistant Secretary, DBX ETF Trust (2019–2020); Assistant Secretary (July 14, 2006–December 31, 2010) and Secretary (January 31, 2006–July 13, 2006), The European Equity Fund, Inc., The New Germany Fund, Inc. and The Central and Eastern Europe Fund, Inc. | |
Ciara Crawford8 (1984)
Assistant Secretary, (2019–present) | Associate, DWS (since 2015); previously, Legal Assistant at Accelerated Tax Solutions. | |
Diane Kenneally7 (1966)
Chief Financial Officer and Treasurer, 2018–present | Director,3 DWS; Treasurer, Chief Financial Officer and Controller, DBX ETF Trust (2019–present); Treasurer and Chief Financial Officer, The European Equity Fund, Inc., The New Germany Fund, Inc. and The Central and Eastern Europe Fund, Inc. (2018–present); formerly: Assistant Treasurer for the DWS funds (2007–2018) | |
Paul Antosca7 (1957)
Assistant Treasurer, 2007–present | Director,3 DWS; and Assistant Treasurer, DBX ETF Trust (2019–present) | |
Sheila Cadogan7 (1966)
Assistant Treasurer, 2017–present | Director,3 DWS; Director and Vice President, DWS Trust Company (2018–present); Assistant Treasurer, DBX ETF Trust (2019–present); Assistant Treasurer, The European Equity Fund, Inc., The New Germany Fund, Inc. and The Central and Eastern Europe Fund, Inc. (2018–present) | |
Scott D. Hogan7 (1970)
Chief Compliance Officer, 2016–present | Director,3 DWS; Chief Compliance Officer, The European Equity Fund, Inc., The New Germany Fund, Inc. and The Central and Eastern Europe Fund, Inc. (2016–present) |
| 80 | | | DWS Enhanced Commodity Strategy Fund |
| Name, Year of Birth, Position with the Trust/Corporation and Length of Time Served5 | Business Experience and Directorships During the Past Five Years | |
Caroline Pearson7 (1962)
Chief Legal Officer, 2010–present | Managing Director3, DWS; Assistant Secretary, DBX ETF Trust (2020–present); Chief Legal Officer, DBX Advisors and DBX Strategic Advisors (2020–present); Chief Legal Officer, The European Equity Fund, Inc., The New Germany Fund, Inc. and The Central and Eastern Europe Fund, Inc. (2012–present); formerly: Secretary, Deutsche AM Distributors, Inc. (2002–2017); and Secretary, Deutsche AM Service Company (2010–2017) | |
Michelle Goveia-Pine6 (1970)
Interim Anti-Money Laundering Compliance Officer, since July 10, 2020 | Director,3 DWS; Interim AML Officer, DWS Trust Company (since July 28, 2020); Interim AML Officer, DBX ETF Trust (since July 9, 2020); Interim AML Officer, The European Equity Fund, Inc., The New Germany Fund, Inc. and The Central and Eastern Europe Fund, Inc. (since July 24, 2020) |
| 1 | The length of time served represents the year in which the Board Member joined the board of one or more DWS funds currently overseen by the Board. |
| 2 | A publicly held company with securities registered pursuant to Section 12 of the Securities Exchange Act of 1934. |
| 3 | Executive title, not a board directorship. |
| 4 | As a result of their respective positions held with the Advisor or its affiliates, these individuals are considered “interested persons” of the Advisor within the meaning of the 1940 Act. Interested persons receive no compensation from the Fund. |
| 5 | The length of time served represents the year in which the officer was first elected in such capacity for one or more DWS funds. |
| 6 | Address: 875 Third Avenue, New York, NY 10022. |
| 7 | Address: One International Place, Boston, MA 02110. |
| 8 | Address: 5022 Gate Parkway, Suite 400, Jacksonville, FL 32256. |
The Fund’s Statement of Additional Information (“SAI”) includes additional information about the Board Members. The SAI is available, without charge, upon request. If you would like to request a copy of the SAI, you may do so by calling the following toll-free number: (800) 728-3337.
| DWS Enhanced Commodity Strategy Fund | | | 81 |
| For More Information | The automated telephone system allows you to access personalized account information and obtain information on other DWS funds using either your voice or your telephone keypad. Certain account types within Classes A, T, C and S also have the ability to purchase, exchange or redeem shares using this system.
For more information, contact your financial representative. You may also access our automated telephone system or speak with a Shareholder Service representative by calling:
(800) 728-3337 | |
| Web Site | dws.com
View your account transactions and balances, trade shares, monitor your asset allocation, subscribe to fund and account updates by e-mail, and change your address, 24 hours a day.
Obtain prospectuses and applications, news about DWS funds, insight from DWS economists and investment specialists and access to DWS fund account information. | |
| Written Correspondence | DWS
PO Box 219151 Kansas City, MO 64121-9151 | |
| Proxy Voting | The Fund’s policies and procedures for voting proxies for portfolio securities and information about how the Fund voted proxies related to its portfolio securities during the most recent 12-month period ended June 30 are available on our Web site — dws.com/en-us/resources/proxy-voting — or on the SEC’s Web site — sec.gov. To obtain a written copy of the Fund’s policies and procedures without charge, upon request, call us toll free at (800) 728-3337. | |
| Portfolio Holdings | Following the Fund’s fiscal first and third quarter-end, a complete portfolio holdings listing is filed with the SEC on Form N-PORT. This Fund’s Form N-PORT will be available on the SEC’s Web site at sec.gov. The Fund’s portfolio holdings are also posted on dws.com from time to time. Please see the Fund’s current prospectus for more information. | |
| Principal Underwriter | If you have questions, comments or complaints, contact:
DWS Distributors, Inc.
222 South Riverside Plaza Chicago, IL 60606-5808 (800) 621-1148 |
| 82 | | | DWS Enhanced Commodity Strategy Fund |
| Investment Management | DWS Investment Management Americas, Inc. (“DIMA” or the “Advisor”), which is part of the DWS Group GmbH & Co. KGaA (“DWS Group”) is the investment advisor for the Fund. DIMA and its predecessors have more than 90 years of experience managing mutual funds and DIMA provides a full range of investment advisory services to both institutional and retail clients. DIMA is an indirect, wholly owned subsidiary of DWS Group.
DWS Group is a global organization that offers a wide range of investing expertise and resources, including hundreds of portfolio managers and analysts and an office network that reaches the world’s major investment centers. This well-resourced global investment platform brings together a wide variety of experience and investment insight across industries, regions, asset classes and investing styles. | |||||||||
| Class A | Class T | Class C | Class S | Institutional Class | ||||||
| Nasdaq Symbol | SKNRX | SKSTX | SKCRX | SKSRX | SKIRX | |||||
| CUSIP Number | 25159L 877 | 25159L 380 | 25159L 851 | 25159L 844 | 25159L 836 | |||||
| Fund Number | 485 | 1785 | 785 | 2085 | 817 | |||||
| For shareholders of Class R6 | ||||||||||
| Automated Information Line | DWS/Ascensus Plan Access (800) 728-3337
24-hour access to your retirement plan account. | |||||||||
| Web Site | dws.com
Obtain prospectuses and applications, news about DWS funds, insight from DWS economists and investment specialists and access to DWS fund account information.
Log in/register to manage retirement account assets at https://www.mykplan.com/participantsecure_net/login.aspx. | |||||||||
| For More Information | (800) 728-3337
To speak with a service representative. | |||||||||
| Written Correspondence | DWS Service Company
222 South Riverside Plaza Chicago, IL 60606-5806 | |||||||||
| Class R6 | ||||||||||
| Nasdaq Symbol | SKRRX |
|
|
|
| |||||
| CUSIP Number | 25159L 448 |
|
|
|
| |||||
| Fund Number | 1685 |
|
|
|
| |||||
| DWS Enhanced Commodity Strategy Fund | | | 83 |
Notes
Notes
Notes
Notes
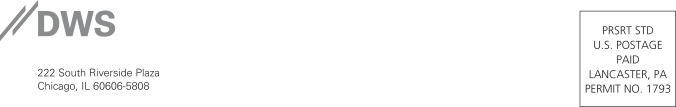
DECSF-2
(R-028287-9 8/20)
| ITEM 2. | CODE OF ETHICS |
As of the end of the period covered by this report, the registrant has adopted a code of ethics, as defined in Item 2 of Form N-CSR that applies to its Principal Executive Officer and Principal Financial Officer.
There have been no amendments to, or waivers from, a provision of the code of ethics during the period covered by this report that would require disclosure under Item 2.
A copy of the code of ethics is filed as an exhibit to this Form N-CSR. | |
| ITEM 3. | AUDIT COMMITTEE FINANCIAL EXPERT |
| The fund’s audit committee is comprised solely of trustees who are "independent" (as such term has been defined by the Securities and Exchange Commission ("SEC") in regulations implementing Section 407 of the Sarbanes-Oxley Act (the "Regulations")). The fund’s Board of Trustees has determined that there are several "audit committee financial experts" (as such term has been defined by the Regulations) serving on the fund’s audit committee including Mr. William McClayton, the chair of the fund’s audit committee. An “audit committee financial expert” is not an “expert” for any purpose, including for purposes of Section 11 of the Securities Act of 1933 and the designation or identification of a person as an “audit committee financial expert” does not impose on such person any duties, obligations or liability that are greater than the duties, obligations and liability imposed on such person as a member of the audit committee and board of directors in the absence of such designation or identification. | |
| ITEM 4. | PRINCIPAL ACCOUNTANT FEES AND SERVICES |
DWS Enhanced Commodity Strategy fund
form n-csr disclosure re: AUDIT FEES
The following table shows the amount of fees that Ernst & Young LLP (“EY”), the Fund’s Independent Registered Public Accounting Firm, billed to the Fund during the Fund’s last two fiscal years. The Audit Committee approved in advance all audit services and non-audit services that EY provided to the Fund.
Services that the Fund’s Independent Registered Public Accounting Firm Billed to the Fund
| Fiscal Year Ended June 30, | Audit Fees Billed to Fund | Audit-Related Fees Billed to Fund | Tax Fees Billed to Fund | All Other Fees Billed to Fund |
| 2020 | $62,121 | $0 | $11,267 | $0 |
| 2019 | $62,121 | $0 | $7,356 | $0 |
The above “Tax Fees” were billed for professional services rendered for tax return preparation.
Services that the Fund’s Independent Registered Public Accounting Firm Billed to the Adviser and Affiliated Fund Service Providers
The following table shows the amount of fees billed by EY to DWS Investment Management Americas, Inc. (“DIMA” or the “Adviser”), and any entity controlling, controlled by or under common control with DIMA (“Control Affiliate”) that provides ongoing services to the Fund (“Affiliated Fund Service Provider”), for engagements directly related to the Fund’s operations and financial reporting, during the Fund’s last two fiscal years.
| Fiscal Year Ended June 30, | Audit-Related Fees Billed to Adviser and Affiliated Fund Service Providers | Tax Fees Billed to Adviser and Affiliated Fund Service Providers | All Other Fees Billed to Adviser and Affiliated Fund Service Providers |
| 2020 | $0 | $625,431 | $0 |
| 2019 | $0 | $740,482 | $0 |
The above “Tax Fees” were billed in connection with tax compliance services and agreed upon procedures.
Non-Audit Services
The following table shows the amount of fees that EY billed during the Fund’s last two fiscal years for non-audit services. The Audit Committee pre-approved all non-audit services that EY provided to the Adviser and any Affiliated Fund Service Provider that related directly to the Fund’s operations and financial reporting. The Audit Committee requested and received information from EY about any non-audit services that EY rendered during the Fund’s last fiscal year to the Adviser and any Affiliated Fund Service Provider. The Committee considered this information in evaluating EY’s independence.
| Fiscal Year Ended June 30, | Total (A) | Total Non-Audit Fees billed to Adviser and Affiliated Fund Service Providers (engagements related directly to the operations and financial reporting of the Fund) (B) | Total Non-Audit Fees billed to Adviser and Affiliated Fund Service Providers (all other engagements) (C) | Total of (A), (B) and (C) |
| 2020 | $11,267 | $625,431 | $0 | $636,698 |
| 2019 | $7,356 | $740,482 | $0 | $747,838 |
All other engagement fees were billed for services in connection with agreed upon procedures and tax compliance for DIMA and other related entities.
Audit Committee Pre-Approval Policies and Procedures. Generally, each Fund’s Audit Committee must pre approve (i) all services to be performed for a Fund by a Fund’s Independent Registered Public Accounting Firm and (ii) all non-audit services to be performed by a Fund’s Independent Registered Public Accounting Firm for the DIMA Entities with respect to operations and financial reporting of the Fund, except that the Chairperson or Vice Chairperson of each Fund’s Audit Committee may grant the pre-approval for non-audit services described in items (i) and (ii) above for non-prohibited services for engagements of less than $100,000. All such delegated pre approvals shall be presented to each Fund’s Audit Committee no later than the next Audit Committee meeting.
There were no amounts that were approved by the Audit Committee pursuant to the de minimis exception under Rule 2-01 of Regulation S-X.
According to the registrant’s principal Independent Registered Public Accounting Firm, substantially all of the principal Independent Registered Public Accounting Firm's hours spent on auditing the registrant's financial statements were attributed to work performed by full-time permanent employees of the principal Independent Registered Public Accounting Firm.
***
In connection with the audit of the 2019 and 2020 financial statements, the Fund entered into an engagement letter with EY. The terms of the engagement letter required by EY, and agreed to by the Audit Committee, include a provision mandating the use of mediation and arbitration to resolve any controversy or claim between the parties arising out of or relating to the engagement letter or services provided thereunder.
***
Pursuant to PCAOB Rule 3526, EY is required to describe in writing to the Fund’s Audit Committee, on at least an annual basis, all relationships between EY, or any of its affiliates, and the DWS Funds, including the Fund, or persons in financial reporting oversight roles at the DWS Funds that, as of the date of the communication, may reasonably be thought to bear on EY’s independence. Pursuant to PCAOB Rule 3526, EY has reported the matters set forth below that may reasonably be thought to bear on EY’s independence. With respect to each reported matter, individually and in the aggregate, EY advised the Audit Committee that, after careful consideration of the facts and circumstances and the applicable independence rules, it concluded that the matters do not and will not impair EY’s ability to exercise objective and impartial judgement in connection with the audits of the financial statements for the Fund and a reasonable investor with knowledge of all relevant facts and circumstances would conclude that EY has been and is capable of exercising objective and impartial judgment on all issues encompassed within EY’s audit engagements. EY also confirmed to the Audit Committee that it can continue act as the Independent Registered Public Accounting Firm for the Fund.
| · | EY advised the Fund’s Audit Committee that various covered persons within EY’s affiliates held investments in, or had other financial relationships with, entities within the DWS Funds “investment company complex” (as defined in Regulation S-X) (the “DWS Funds Complex”). EY informed the Audit Committee that these investments and financial relationships were inconsistent with Rule 2-01(c)(1) of Regulation S-X. EY reported that all breaches have been resolved and that none of the breaches involved any investments in the Fund or any professionals who were part of the audit engagement team for the Fund. In addition, EY noted that the independence breaches did not (i) create a mutual or conflicting interest with the Fund, (ii) place EY in the position of auditing its own work, (iii) result in EY acting as management or an employee of the Fund, or (iv) place EY in a position of being an advocate of the Fund. |
| ITEM 5. | AUDIT COMMITTEE OF LISTED REGISTRANTS | |
| Not applicable | ||
| ITEM 6. | SCHEDULE OF INVESTMENTS | |
| Not applicable | ||
| ITEM 7. | DISCLOSURE OF PROXY VOTING POLICIES AND PROCEDURES FOR CLOSED-END MANAGEMENT INVESTMENT COMPANIES | |
| Not applicable | ||
| ITEM 8. | PORTFOLIO MANAGERS OF CLOSED-END MANAGEMENT INVESTMENT COMPANIES | |
| Not applicable | ||
| ITEM 9. | PURCHASES OF EQUITY SECURITIES BY CLOSED-END MANAGEMENT INVESTMENT COMPANY AND AFFILIATED PURCHASERS | |
| Not applicable | ||
| ITEM 10. | SUBMISSION OF MATTERS TO A VOTE OF SECURITY HOLDERS | |
| There were no material changes to the procedures by which shareholders may recommend nominees to the Fund’s Board. The primary function of the Nominating and Governance Committee is to identify and recommend individuals for membership on the Board and oversee the administration of the Board Governance Guidelines. Shareholders may recommend candidates for Board positions by forwarding their correspondence by U.S. mail or courier service to Keith R. Fox, DWS Funds Board Chair, c/o Thomas R. Hiller, Ropes & Gray LLP, Prudential Tower, 800 Boylston Street, Boston, MA 02199-3600. | ||
| ITEM 11. | CONTROLS AND PROCEDURES | |
| (a) | The Chief Executive and Financial Officers concluded that the Registrant’s Disclosure Controls and Procedures are effective based on the evaluation of the Disclosure Controls and Procedures as of a date within 90 days of the filing date of this report. | |
| (b) | There have been no changes in the registrant’s internal control over financial reporting that occurred during the period covered by this report that has materially affected, or is reasonably likely to materially affect, the registrant’s internal controls over financial reporting. | |
| ITEM 12. | Disclosure of Securities Lending Activities for Closed-End Management Investment Companies | |
| Not applicable | ||
| ITEM 13. | EXHIBITS | |
| (a)(1) | Code of Ethics pursuant to Item 2 of Form N-CSR is filed and attached hereto as EX-99.CODE ETH. | |
| (a)(2) | Certification pursuant to Rule 30a-2(a) under the Investment Company Act of 1940 (17 CFR 270.30a-2(a)) is filed and attached hereto as Exhibit 99.CERT. | |
| (b) | Certification pursuant to Rule 30a-2(b) under the Investment Company Act of 1940 (17 CFR 270.30a-2(b)) is furnished and attached hereto as Exhibit 99.906CERT. | |
SIGNATURES
Pursuant to the requirements of the Securities Exchange Act of 1934 and the Investment Company Act of 1940, the registrant has duly caused this report to be signed on its behalf by the undersigned, thereunto duly authorized.
| Registrant: | DWS Enhanced Commodity Strategy Fund, a series of Deutsche DWS Securities Trust |
| By: | /s/Hepsen Uzcan Hepsen Uzcan President |
| Date: | 8/28/2020 |
Pursuant to the requirements of the Securities Exchange Act of 1934 and the Investment Company Act of 1940, this report has been signed below by the following persons on behalf of the registrant and in the capacities and on the dates indicated.
| By: | /s/Hepsen Uzcan Hepsen Uzcan President |
| Date: | 8/28/2020 |
| By: | /s/Diane Kenneally Diane Kenneally Chief Financial Officer and Treasurer |
| Date: | 8/28/2020 |