UNITED STATES
SECURITIES AND EXCHANGE COMMISSION
WASHINGTON, D. C. 20549
FORM N-CSRS
Investment Company Act file number: 811-00642
Deutsche International Fund, Inc.
(Exact Name of Registrant as Specified in Charter)
345 Park Avenue
New York, NY 10154-0004
(Address of Principal Executive Offices) (Zip Code)
Registrant’s Telephone Number, including Area Code: (212) 250-3220
Paul Schubert
345 Park Avenue
New York, NY 10154-0004
(Name and Address of Agent for Service)
| Date of fiscal year end: | 10/31 |
| | |
| Date of reporting period: | 4/30/2018 |
| ITEM 1. | REPORT TO STOCKHOLDERS |
| | |
April 30, 2018
Semiannual Report
to Shareholders
Deutsche Emerging Markets Equity Fund
(Effective on or about July 2, 2018, Deutsche Emerging Markets Equity Fund will be renamed DWS Emerging Markets Equity Fund.)

Contents
This report must be preceded or accompanied by a prospectus. To obtain a summary prospectus, if available, or prospectus for any of our funds, refer to the Account Management Resources information provided in the back of this booklet. We advise you to consider the Fund’s objectives, risks, charges and expenses carefully before investing. The summary prospectus and prospectus contain this and other important information about the Fund. Please read the prospectus carefully before you invest.
Investing in derivatives entails special risks relating to liquidity, leverage and credit that may reduce returns and/or increase volatility. Emerging markets tend to be more volatile and less liquid than the markets of more mature economies, and generally have less diverse and less mature economic structures and less stable political systems than those of developed countries. Investing in foreign securities presents certain risks, such as currency fluctuations, political and economic changes, and market risks. The Fund may lend securities to approved institutions. Stocks may decline in value. Please read the prospectus for details.
The brand DWS represents DWS Group GmbH & Co. KGaA and any of its subsidiaries such as DWS Distributors, Inc. which offers investment products or Deutsche Investment Management Americas Inc. and RREEF America L.L.C. which offer advisory services.
NOT FDIC/NCUA INSURED NO BANK GUARANTEE MAY LOSE VALUE
NOT A DEPOSIT NOT INSURED BY ANY FEDERAL GOVERNMENT AGENCY
| | | | | | |
| 2 | | | | | Deutsche Emerging Markets Equity Fund | | |
Letter to Shareholders
Dear Shareholder:
You may have noticed a new logo appearing on the cover of this report. As of March 23, 2018, Deutsche Asset Management has adopted its existing European brand, DWS, globally. As we have consolidated several businesses over the last several years, each of which has grown up relatively independently, the time has now come to be united under a single brand that reflects our global identity and the full breadth of capabilities we offer to our clients.
The DWS brand — Deutsche Gesellschaft für Wertpapiersparen — draws on our roots in the German market, going back over 60 years. It was established in Hamburg in 1956 with a singular objective: to assist private investors in building wealth and managing risk. We have been fulfilling that promise for generations. Today, the DWS name is synonymous with the values that we have continuously lived up to, and those that will remain central to our future success: Excellence, Entrepreneurship, Sustainability and Integrity. It is therefore a name that we are proud to adopt and build upon as our brand here in the Americas.
In connection with this change, our web site has recently been redesigned with a new address: dws.com. However, for your convenience, the deutschefunds.com address will remain live and automatically redirect you to our new site. Please visit us online to find the most current insights from our CIO, economists and investment specialists.
As always, thank you for your ongoing trust in us. We look forward to bringing you the very best in investment insight, strategies and solutions as we march forward gathering our unique qualities and capabilities under one roof, DWS.
Best regards,
| | |
 | | 
Hepsen Uzcan President, Deutsche Funds |
Assumptions, estimates and opinions contained in this document constitute our judgment as of the date of the document and are subject to change without notice. Any projections are based on a number of assumptions as to market conditions and there can be no guarantee that any projected results will be achieved. Past performance is not a guarantee of future results.
| | | | | | | | |
| | Deutsche Emerging Markets Equity Fund | | | | | | 3 | |
| | |
| Performance Summary | | April 30, 2018 (Unaudited) |
| | | | | | | | | | | | | | | | |
| Class A | | 6-Month‡ | | | 1-Year | | | 5-Year | | | 10-Year | |
| Average Annual Total Returns as of 4/30/18 | | | | | | | | | | | | | | | | |
| Unadjusted for Sales Charge | | | 5.29% | | | | 21.31% | | | | 5.36% | | | | –0.61% | |
Adjusted for the Maximum Sales Charge
(max 5.75% load) | | | –0.76% | | | | 14.33% | | | | 4.12% | | | | –1.19% | |
| MSCI Emerging Markets Index† | | | 4.80% | | | | 21.71% | | | | 4.74% | | | | 2.17% | |
| Average Annual Total Returns as of 3/31/18 (most recent calendar quarter end) | |
| Unadjusted for Sales Charge | | | | | | | 25.59% | | | | 5.96% | | | | 0.30% | |
Adjusted for the Maximum Sales Charge
(max 5.75% load) | | | | | | | 18.37% | | | | 4.71% | | | | –0.29% | |
| MSCI Emerging Markets Index† | | | | | | | 24.93% | | | | 4.99% | | | | 3.02% | |
| | | | |
| Class T | | 6-Month‡ | | | 1-Year | | | 5-Year | | | 10-Year | |
| Average Annual Total Returns as of 4/30/18 | | | | | | | | | | | | | | | | |
| Unadjusted for Sales Charge | | | 5.29% | | | | 21.29% | | | | 5.36% | | | | –0.61% | |
Adjusted for the Maximum Sales Charge
(max 2.50% load) | | | 2.66% | | | | 18.26% | | | | 4.83% | | | | –0.86% | |
| MSCI Emerging Markets Index† | | | 4.80% | | | | 21.71% | | | | 4.74% | | | | 2.17% | |
| Average Annual Total Returns as of 3/31/18 (most recent calendar quarter end) | |
| Unadjusted for Sales Charge | | | | | | | 25.64% | | | | 5.96% | | | | 0.31% | |
Adjusted for the Maximum Sales Charge
(max 2.50% load) | | | | | | | 22.50% | | | | 5.43% | | | | 0.06% | |
| MSCI Emerging Markets Index† | | | | | | | 24.93% | | | | 4.99% | | | | 3.02% | |
| | | | |
| Class C | | 6-Month‡ | | | 1-Year | | | 5-Year | | | 10-Year | |
| Average Annual Total Returns as of 4/30/18 | |
| Unadjusted for Sales Charge | | | 4.88% | | | | 20.42% | | | | 4.58% | | | | –1.40% | |
Adjusted for the Maximum Sales Charge
(max 1.00% CDSC) | | | 3.88% | | | | 20.42% | | | | 4.58% | | | | –1.40% | |
| MSCI Emerging Markets Index† | | | 4.80% | | | | 21.71% | | | | 4.74% | | | | 2.17% | |
| Average Annual Total Returns as of 3/31/18 (most recent calendar quarter end) | |
| Unadjusted for Sales Charge | | | | | | | 24.70% | | | | 5.17% | | | | –0.49% | |
Adjusted for the Maximum Sales Charge
(max 1.00% CDSC) | | | | | | | 24.70% | | | | 5.17% | | | | –0.49% | |
| MSCI Emerging Markets Index† | | | | | | | 24.93% | | | | 4.99% | | | | 3.02% | |
| | | | | | |
| 4 | | | | | Deutsche Emerging Markets Equity Fund | | |
| | | | | | | | | | | | | | | | |
| Class S | | 6-Month‡ | | | 1-Year | | | 5-Year | | | 10-Year | |
| Average Annual Total Returns as of 4/30/18 | |
| No Sales Charges | | | 5.35% | | | | 21.47% | | | | 5.61% | | | | –0.37% | |
| MSCI Emerging Markets Index† | | | 4.80% | | | | 21.71% | | | | 4.74% | | | | 2.17% | |
| Average Annual Total Returns as of 3/31/18 (most recent calendar quarter end) | |
| No Sales Charges | | | | | | | 25.83% | | | | 6.21% | | | | 0.55% | |
| MSCI Emerging Markets Index† | | | | | | | 24.93% | | | | 4.99% | | | | 3.02% | |
| | | | |
| Institutional Class | | 6-Month‡ | | | 1-Year | | | 5-Year | | | 10-Year | |
| Average Annual Total Returns as of 4/30/18 | |
| No Sales Charges | | | 5.39% | | | | 21.59% | | | | 5.63% | | | | –0.29% | |
| MSCI Emerging Markets Index† | | | 4.80% | | | | 21.71% | | | | 4.74% | | | | 2.17% | |
| Average Annual Total Returns as of 3/31/18 (most recent calendar quarter end) | |
| No Sales Charges | | | | | | | 25.97% | | | | 6.23% | | | | 0.63% | |
| MSCI Emerging Markets Index† | | | | | | | 24.93% | | | | 4.99% | | | | 3.02% | |
Performance in the Average Annual Total Returns table(s) above and the Growth of an Assumed $10,000 Investment line graph that follows is historical and does not guarantee future results. Investment return and principal fluctuate, so your shares may be worth more or less when redeemed. Current performance may differ from performance data shown. Please visit dws.com for the Fund’s most recent month-end performance. Fund performance includes reinvestment of all distributions. Unadjusted returns do not reflect sales charges and would have been lower if they had.
The gross expense ratios of the Fund, as stated in the fee table of the prospectus dated February 1, 2018 are 1.75%, 1.67%, 2.46%, 1.46% and 1.23% for Class A, Class T, Class C, Class S and Institutional Class shares, respectively, and may differ from the expense ratios disclosed in the Financial Highlights tables in this report.
Index returns do not reflect any fees or expenses and it is not possible to invest directly into an index.
Performance figures do not reflect the deduction of taxes that a shareholder would pay on fund distributions or the redemption of fund shares.
Returns shown for Class T shares for the period prior to its inception on June 5, 2017 are derived from the historical performance of Class S shares of Deutsche Emerging Markets Equity Fund during such periods and have been adjusted to reflect the higher total annual operating expenses and applicable sales charges of Class T. Any difference in expenses will affect performance.
Generally accepted accounting principles require adjustments to be made to the net assets of the Fund at period end for financial reporting purposes only, and as such, the total return based on the unadjusted net asset value per share may differ from the total return reported in the financial highlights.
| | | | | | | | |
| | Deutsche Emerging Markets Equity Fund | | | | | | 5 | |
|
Growth of an Assumed $10,000 Investment
(Adjusted for Maximum Sales Charge) |
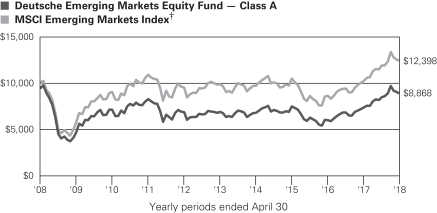
The Fund’s growth of an assumed $10,000 investment is adjusted for the maximum sales charge of 5.75%. This results in a net initial investment of $9,425.
The growth of $10,000 is cumulative.
Performance of other share classes will vary based on the sales charges and the fee structure of those classes.
| † | The Morgan Stanley Capital International (MSCI) Emerging Markets Index is an unmanaged, capitalization-weighted index of companies in a universe of 24 emerging markets. The index is calculated using closing local market prices and translates into U.S. dollars using the London close foreign exchange rates. |
| ‡ | Total returns shown for periods less than one year are not annualized. |
| | | | | | | | | | | | | | | | | | | | |
| | | Class A | | | Class T | | | Class C | | | Class S | | | Institutional
Class | |
| Net Asset Value | |
| 4/30/18 | | $ | 20.48 | | | $ | 20.48 | | | $ | 18.28 | | | $ | 20.75 | | | $ | 20.73 | |
| 10/31/17 | | $ | 19.54 | | | $ | 19.54 | | | $ | 17.43 | | | $ | 19.82 | | | $ | 19.81 | |
| Distribution Information as of 4/30/18 | |
| Income Dividends, Six Months | | $ | .09 | | | $ | .09 | | | $ | — | | | $ | .13 | | | $ | .14 | |
| | | | | | |
| 6 | | | | | Deutsche Emerging Markets Equity Fund | | |
Portfolio Management Team
Sean Taylor, Managing Director
Lead Portfolio Manager of the Fund. Began managing the Fund in 2014.
| – | Global Head of Emerging Markets Equities: Hong Kong. |
| – | Joined DWS in 2013 with 21 years of industry experience. Prior to his current role, he served as Head of Emerging Markets at Pioneer Investments, Investment Director at GAM, based in London and Dubai, and Head of International & Emerging Markets at Societe Generale. |
| – | MBA, Manchester Business School. |
Luiz Ribeiro, CFA, Managing Director
Portfolio Manager of the Fund. Began managing the Fund in 2017.
| – | Senior Equities Portfolio Manager: São Paolo. |
| – | Joined DWS in 2012 with 18 years of industry experience. Prior to joining DWS, Luiz served as the Head of Latin America - Internal Equities at the Abu Dhabi Investment Authority. Previously, he served as a Senior Portfolio Manager at HSBC Bank. Prior to HSBC Bank, he worked as an Investment Officer at IFC - World Bank and as an Analyst and then as a Senior Portfolio Manager at ABN AMRO Bank. He began his investment career as a Trader at Dibran DTVM Ltda. |
| – | BA in Business Administration from University of São Paulo (USP); MBA in Finance from Brazilian Institute of Capital Markets (IBMEC). |
Marc Currat, Assistant Vice President
Portfolio Manager of the Fund. Began managing the Fund in 2017.
| – | Analyst and Portfolio Manager for Global Emerging Markets Equities: Hong Kong. |
| – | Joined DWS in 2012 with 6 years of professional experience, thereof one year in the financial industry. Prior to joining, he served as an equities and quant analyst at Surperformance SAS. Prior to that he was an auditor advisor at Currat & Associes SA. |
| – | BSc in Management from CIBU - California International Business University; MBA in Finance from International School of Management, Paris & St. John’s University; Investment Management Certificate (IMC). |
| | | | | | | | |
| | Deutsche Emerging Markets Equity Fund | | | | | | 7 | |
| | | | | | | | |
| Portfolio Summary | | | (Unaudited) | |
| | |
Asset Allocation (As a % of Investment Portfolio excluding
Securities Lending Collateral) | | 4/30/18 | | | 10/31/17 | |
Equity Securities | | | 88% | | | | 91% | |
| Cash Equivalents | | | 7% | | | | 5% | |
Exchange-Traded Funds | | | 5% | | | | 4% | |
| Total | | | 100% | | | | 100% | |
| | |
| Sector Diversification (As a % of Equity Securities) | | 4/30/18 | | | 10/31/17 | |
| Financials | | | 31% | | | | 30% | |
| Information Technology | | | 25% | | | | 30% | |
| Energy | | | 11% | | | | 7% | |
| Consumer Discretionary | | | 10% | | | | 11% | |
| Materials | | | 9% | | | | 8% | |
| Consumer Staples | | | 5% | | | | 5% | |
| Telecommunication Services | | | 3% | | | | 2% | |
| Industrials | | | 3% | | | | 4% | |
| Real Estate | | | 2% | | | | 2% | |
| Utilities | | | 1% | | | | 1% | |
| | | | 100% | | | | 100% | |
| | |
| Geographical Diversification (As a % of Equity Securities) | | 4/30/18 | | | 10/31/17 | |
| China | | | 34% | | | | 33% | |
| Korea | | | 15% | | | | 16% | |
| Brazil | | | 11% | | | | 8% | |
| India | | | 9% | | | | 9% | |
| Taiwan | | | 7% | | | | 10% | |
| South Africa | | | 7% | | | | 5% | |
| Hong Kong | | | 5% | | | | 3% | |
| Russia | | | 4% | | | | 7% | |
| Mexico | | | 2% | | | | 2% | |
| Malaysia | | | 2% | | | | — | |
| Thailand | | | 1% | | | | 2% | |
| Other | | | 3% | | | | 5% | |
| | | | 100% | | | | 100% | |
| | | | | | |
| 8 | | | | | Deutsche Emerging Markets Equity Fund | | |
| | | | | | | | | | |
Ten Largest Equity Holdings at April 30, 2018
(35.5% of Net Assets) | | Country | | Percent | |
| | 1 | | | Samsung Electronics Co., Ltd. | | Korea | | | 5.0 | % |
| | | | | Manufacturer of electronic parts | | | | | | |
| | 2 | | | Tencent Holdings Ltd. | | China | | | 4.5 | % |
| | | | | Provides Internet, mobile, and telecommunication value-added services | | | | | | |
| | 3 | | | Alibaba Group Holding Ltd. | | China | | | 4.1 | % |
| | | | | Operates as a holding company | | | | | | |
| | 4 | | | Taiwan Semiconductor Manufacturing Co., Ltd. | | Taiwan | | | 4.0 | % |
| | | | | Manufacturer of integrated circuits and other semiconductor devices | | | | | | |
| | 5 | | | Industrial & Commercial Bank of China Ltd. | | China | | | 3.4 | % |
| | | | | Provides a broad range of personal and corporate commercial banking services | | | | | | |
| | 6 | | | China Construction Bank Corp. | | China | | | 3.3 | % |
| | | | | Provides complete range of banking services and other financial services to individual and corporate consumers | | | | | | |
| | 7 | | | Petroleo Brasileiro SA | | Brazil | | | 3.3 | % |
| | | | | Producer and distributor of petroleum | | | | | | |
| | 8 | | | HDFC Bank Ltd. | | India | | | 2.8 | % |
| | | | | Offers a wide range of services to the global corporate sector | | | | | | |
| | 9 | | | PetroChina Co., Ltd. | | China | | | 2.8 | % |
| | | | | Explores, develops and produces crude oil and natural gas | | | | | | |
| | 10 | | | China Mobile Ltd. | | China | | | 2.3 | % |
| | | | | Provider of cellular telecommunication services | | | | | | |
Portfolio holdings and characteristics are subject to change.
For more complete details about the Fund’s investment portfolio, see page 10. A quarterly Fact Sheet is available on dws.com or upon request. Please see the Account Management Resources section on page 43 for contact information.
| | | | | | | | |
| | Deutsche Emerging Markets Equity Fund | | | | | | 9 | |
| | |
| Investment Portfolio | | as of April 30, 2018 (Unaudited) |
| | | | | | | | |
| | | Shares | | | Value ($) | |
| Equity Securities 87.3% | | | | | | | | |
| Argentina 0.5% | | | | | | | | |
Grupo Financiero Galicia SA (ADR) (Cost $255,874) | | | 9,345 | | | | 597,333 | |
| | |
| Australia 1.0% | | | | | | | | |
BHP Billiton PLC (Cost $758,990) | | | 56,204 | | | | 1,191,529 | |
| | |
| Brazil 9.4% | | | | | | | | |
Banco do Brasil SA | | | 139,062 | | | | 1,456,832 | |
CCR SA | | | 57,982 | | | | 197,952 | |
Itau Unibanco Holding SA (ADR) (Preferred) | | | 56,900 | | | | 826,757 | |
Itau Unibanco Holding SA (Preferred) | | | 96,322 | | | | 1,402,542 | |
Lojas Americanas SA (Preferred) | | | 104,663 | | | | 596,034 | |
Multiplan Empreendimentos Imobiliarios SA | | | 616 | | | | 11,697 | |
Petroleo Brasileiro SA (ADR)* | | | 108,400 | | | | 1,527,356 | |
Petroleo Brasileiro SA (Preferred)* | | | 368,640 | | | | 2,417,122 | |
Rumo SA* | | | 162,854 | | | | 690,335 | |
Vale SA (ADR) | | | 155,022 | | | | 2,145,504 | |
| | | | | | | | |
(Cost $8,731,211) | | | | | | | 11,272,131 | |
| | |
| China 29.5% | | | | | | | | |
Alibaba Group Holding Ltd. (ADR)* | | | 27,544 | | | | 4,917,706 | |
Anhui Conch Cement Co., Ltd. “H” | | | 310,500 | | | | 1,940,087 | |
Baidu, Inc. (ADR)* | | | 3,500 | | | | 878,150 | |
Bank of China Ltd. “H” | | | 3,282,000 | | | | 1,784,258 | |
China Communications Construction Co., Ltd. “H” | | | 410,914 | | | | 474,644 | |
China Construction Bank Corp. “H” | | | 3,758,577 | | | | 3,947,666 | |
China Merchants Bank Co., Ltd. “H” | | | 181,120 | | | | 806,406 | |
China Petroleum & Chemical Corp. “H” | | | 1,252,000 | | | | 1,217,839 | |
Ctrip.com International Ltd. (ADR)* | | | 11,500 | | | | 470,350 | |
Datang International Power Generation Co., Ltd. “H”* | | | 1,116,000 | | | | 366,474 | |
Industrial & Commercial Bank of China Ltd. “H” | | | 4,607,095 | | | | 4,056,646 | |
JD.com, Inc. (ADR)* | | | 29,869 | | | | 1,090,517 | |
New Oriental Education & Technology Group, Inc. (ADR) | | | 15,050 | | | | 1,352,092 | |
PetroChina Co., Ltd. “H” | | | 4,543,300 | | | | 3,345,589 | |
Ping An Insurance (Group) Co. of China Ltd. “H” | | | 276,532 | | | | 2,715,471 | |
Tencent Holdings Ltd. | | | 109,700 | | | | 5,404,792 | |
Zhuzhou CRRC Times Electric Co., Ltd. “H” | | | 139,000 | | | | 737,542 | |
| | | | | | | | |
(Cost $24,742,505) | | | | | | | 35,506,229 | |
| | |
| Hong Kong 4.4% | | | | | | | | |
Brilliance China Automotive Holdings Ltd. | | | 398,000 | | | | 715,917 | |
China Mobile Ltd. | | | 288,152 | | | | 2,750,008 | |
China Overseas Land & Investment Ltd. | | | 397,475 | | | | 1,333,867 | |
The accompanying notes are an integral part of the financial statements.
| | | | | | |
| 10 | | | | | Deutsche Emerging Markets Equity Fund | | |
| | | | | | | | |
| | | Shares | | | Value ($) | |
Galaxy Entertainment Group Ltd. | | | 59,000 | | | | 517,306 | |
| | | | | | | | |
(Cost $5,387,978) | | | | | | | 5,317,098 | |
| | |
| India 7.5% | | | | | | | | |
HDFC Bank Ltd. (ADR) | | | 34,927 | | | | 3,346,356 | |
ICICI Bank Ltd. | | | 240,257 | | | | 1,022,861 | |
ICICI Bank Ltd. (ADR) | | | 102,820 | | | | 874,998 | |
Larsen & Toubro Ltd. | | | 32,190 | | | | 676,151 | |
Maruti Suzuki India Ltd. | | | 8,839 | | | | 1,165,935 | |
Tata Consultancy Services Ltd. | | | 13,772 | | | | 727,312 | |
UltraTech Cement Ltd. | | | 8,316 | | | | 510,579 | |
Zee Entertainment Enterprises Ltd. | | | 75,600 | | | | 668,567 | |
| | | | | | | | |
(Cost $7,527,275) | | | | | | | 8,992,759 | |
| | |
| Indonesia 0.7% | | | | | | | | |
PT Bank Central Asia Tbk (Cost $526,655) | | | 533,614 | | | | 846,931 | |
| | |
| Korea 13.1% | | | | | | | | |
Amorepacific Corp. | | | 1,658 | | | | 542,041 | |
Hyundai Motor Co. | | | 3,718 | | | | 555,868 | |
Hyundai Steel Co. | | | 18,188 | | | | 1,031,480 | |
KB Financial Group, Inc. | | | 23,000 | | | | 1,314,115 | |
Korea Electric Power Corp. | | | 10,336 | | | | 362,199 | |
KT Corp. | | | 20,066 | | | | 511,600 | |
LG Chem Ltd. | | | 3,637 | | | | 1,223,011 | |
LG Household & Health Care Ltd. | | | 596 | | | | 763,303 | |
Naver Corp. | | | 1,218 | | | | 815,905 | |
Netmarble Corp. 144A | | | 2,615 | | | | 360,865 | |
POSCO | | | 2,940 | | | | 1,021,082 | |
Samsung Electronics Co., Ltd. (a) | | | 2,458 | | | | 6,075,101 | |
Samsung Fire & Marine Insurance Co., Ltd. | | | 2,292 | | | | 573,414 | |
Shinhan Financial Group Co., Ltd. | | | 14,954 | | | | 666,087 | |
| | | | | | | | |
(Cost $12,043,509) | | | | | | | 15,816,071 | |
| | |
| Malaysia 1.9% | | | | | | | | |
Malayan Banking Bhd. | | | 659,000 | | | | 1,807,995 | |
Sime Darby Property Bhd. | | | 1,400,000 | | | | 534,512 | |
| | | | | | | | |
(Cost $2,229,336) | | | | | | | 2,342,507 | |
| | |
| Mexico 2.0% | | | | | | | | |
Fomento Economico Mexicano SAB de CV (ADR) | | | 13,742 | | | | 1,328,302 | |
Gruma SAB de CV “B” | | | 15,238 | | | | 186,323 | |
Grupo Financiero Inbursa SAB de CV “O” | | | 505,109 | | | | 840,766 | |
| | | | | | | | |
(Cost $2,453,138) | | | | | | | 2,355,391 | |
| | |
| Russia 3.3% | | | | | | | | |
Gazprom PJSC (ADR) | | | 130,471 | | | | 594,948 | |
LUKOIL PJSC (ADR) | | | 17,698 | | | | 1,166,121 | |
The accompanying notes are an integral part of the financial statements.
| | | | | | | | |
| | Deutsche Emerging Markets Equity Fund | | | | | | 11 | |
| | | | | | | | |
| | | Shares | | | Value ($) | |
Magnit PJSC* | | | 3,696 | | | | 287,005 | |
Rosneft Oil Co. PJSC (GDR) REG S | | | 201,759 | | | | 1,229,519 | |
Yandex NV “A”* (b) | | | 20,599 | | | | 687,183 | |
| | | | | | | | |
(Cost $4,109,178) | | | | | | | 3,964,776 | |
| | |
| South Africa 5.8% | | | | | | | | |
Dis-Chem Pharmacies Ltd. 144A | | | 204,702 | | | | 619,097 | |
FirstRand Ltd. | | | 378,000 | | | | 2,021,366 | |
Naspers Ltd. “N” | | | 9,550 | | | | 2,334,646 | |
Shoprite Holdings Ltd. | | | 35,000 | | | | 697,480 | |
Truworths International Ltd. | | | 109,301 | | | | 893,986 | |
Woolworths Holdings Ltd. | | | 71,988 | | | | 370,224 | |
| | | | | | | | |
(Cost $5,075,653) | | | | | | | 6,936,799 | |
| | |
| Taiwan 6.1% | | | | | | | | |
ASE Industrial Holdings Co., Ltd. | | | 239,761 | | | | 650,730 | |
Catcher Technology Co., Ltd. | | | 41,000 | | | | 457,146 | |
Delta Electronics, Inc. | | | 131,727 | | | | 478,877 | |
Formosa Plastics Corp. | | | 108,000 | | | | 379,879 | |
Fubon Financial Holding Co., Ltd. | | | 337,000 | | | | 578,466 | |
Taiwan Semiconductor Manufacturing Co., Ltd. | | | 630,803 | | | | 4,808,747 | |
| | | | | | | | |
(Cost $4,964,759) | | | | | | | 7,353,845 | |
| | |
| Thailand 1.3% | | | | | | | | |
CP ALL PCL (NVDR) | | | 190,300 | | | | 524,253 | |
Kasikornbank PCL (NVDR) | | | 75,600 | | | | 466,526 | |
PTT PCL (NVDR) | | | 320,000 | | | | 570,516 | |
| | | | | | | | |
(Cost $1,292,480) | | | | | | | 1,561,295 | |
| | |
| Turkey 0.5% | | | | | | | | |
KOC Holding AS | | | 100,545 | | | | 338,976 | |
Turkiye Garanti Bankasi AS | | | 97,879 | | | | 221,468 | |
| | | | | | | | |
(Cost $716,326) | | | | | | | 560,444 | |
| | |
| United Arab Emirates 0.3% | | | | | | | | |
Emaar Malls PJSC (Cost $589,330) | | | 687,850 | | | | 415,357 | |
| Total Equity Securities (Cost $81,404,197) | | | | | | | 105,030,495 | |
| | |
| Exchange-Traded Funds 4.6% | | | | | | | | |
iShares MSCI Emerging Markets ETF | | | 95,500 | | | | 4,480,860 | |
VanEck Vectors Vietnam ETF (c) | | | 62,000 | | | | 1,108,560 | |
| |
| Total Exchange-Traded Funds (Cost $5,428,015) | | | | | | | 5,589,420 | |
| | | | | | |
| 12 | | | | | Deutsche Emerging Markets Equity Fund | | |
| | | | | | | | |
| | | Shares | | | Value ($) | |
| | |
| Securities Lending Collateral 0.5% | | | | | | | | |
Deutsche Government & Agency Securities Portfolio “Deutsche Government Cash Institutional Shares,” 1.64% (d) (e) (Cost $595,700) | | | 595,700 | | | | 595,700 | |
| | |
| Cash Equivalents 6.5% | | | | | | | | |
Deutsche Central Cash Management Government Fund, 1.73% (d) (Cost $7,765,380) | | | 7,765,380 | | | | 7,765,380 | |
| | |
| | | % of Net
Assets | | | Value ($) | |
| Total Investment Portfolio (Cost $95,193,292) | | | 98.9 | | | | 118,980,995 | |
| Other Assets and Liabilities, Net | | | 1.1 | | | | 1,306,827 | |
| |
| Net Assets | | | 100.0 | | | | 120,287,822 | |
A summary of the Fund’s transactions with affiliated investments during the period ended April 30, 2018 are as follows:
| | | | | | | | | | | | | | | | | | | | | | | | | | | | | | | | |
Value ($) at
10/31/2017 | | Purchases
Cost ($) | | | Sales
Proceeds ($) | | | Net
Realized
Gain/
(Loss) ($) | | | Net
Change in
Unrealized
Appreci-
ation
(Deprecia-
tion) ($) | | | Income
($) | | | Capital
Gain
Distri-
butions
($) | | | Number of
Shares at
4/30/2018 | | | Value ($) at
4/30/2018 | |
| Securities Lending Collateral 0.5% | | | | | | | | | | | | | |
| Deutsche Government & Agency Securities Portfolio “Deutsche Government Cash Institutional Shares,” 1.64% (d) (e) | |
| 4,062,700 | | | — | | | | 3,467,000 | | | | — | | | | — | | | | 6,324 | | | | — | | | | 595,700 | | | | 595,700 | |
| Cash Equivalents 6.5% | | | | | | | | | | | | | |
| Deutsche Central Cash Management Government Fund, 1.73% (d) | |
| 4,127,957 | | | 38,508,727 | | | | 34,871,304 | | | | — | | | | — | | | | 48,723 | | | | — | | | | 7,765,380 | | | | 7,765,380 | |
| 8,190,657 | | | 38,508,727 | | | | 38,338,304 | | | | — | | | | — | | | | 55,047 | | | | — | | | | 8,361,080 | | | | 8,361,080 | |
| * | Non-income producing security. |
| (a) | Investment was valued using significant unobservable inputs. |
| (b) | Listed on the NASDAQ Stock Market, Inc. |
| (c) | All or a portion of these securities were on loan. In addition, “Other Assets and Liabilities, Net” may include pending sales that are also on loan. The value of securities loaned at April 30, 2018 amounted to $575,736, which is 0.5% of net assets. |
| (d) | Affiliated fund managed by Deutsche Investment Management Americas Inc. The rate shown is the annualized seven-day yield at period end. |
| (e) | Represents collateral held in connection with securities lending. Income earned by the Fund is net of borrower rebates. Represents the net increase (purchase cost) or decrease (sales proceeds) in the amount invested for the period ended April 30, 2018. |
144A: Security exempt from registration under Rule 144A of the Securities Act of 1933. These securities may be resold in transactions exempt from registration, normally to qualified institutional buyers.
ADR: American Depositary Receipt
| | | | | | | | |
| | Deutsche Emerging Markets Equity Fund | | | | | | 13 | |
GDR: Global Depositary Receipt
MSCI: Morgan Stanley Capital International
NVDR: Non-Voting Depository Receipt
PJSC: Public Joint Stock Company
REG S: Securities sold under Regulation S may not be offered, sold or delivered within the United States or to, or for the account or benefit of, U.S. persons, except pursuant to an exemption from, or in a transaction not subject to, the registration requirements of the Securities Act of 1933.
Fair Value Measurements
Various inputs are used in determining the value of the Fund’s investments. These inputs are summarized in three broad levels. Level 1 includes quoted prices in active markets for identical securities. Level 2 includes other significant observable inputs (including quoted prices for similar securities, interest rates, prepayment speeds, and credit risk). Level 3 includes significant unobservable inputs (including the Fund’s own assumptions in determining the fair value of investments). The level assigned to the securities valuations may not be an indication of the risk associated with investing in those securities.
The following is a summary of the inputs used as of April 30, 2018 in valuing the Fund’s investments. For information on the Fund’s policy regarding the valuation of investments, please refer to the Security Valuation section of Note A in the accompanying Notes to Financial Statements.
| | | | | | | | | | | | | | | | |
| Assets | | Level 1 | | | Level 2 | | | Level 3 | | | Total | |
Equity Securities | | | | | | | | | | | | | | | | |
Argentina | | $ | 597,333 | | | $ | — | | | $ | — | | | $ | 597,333 | |
Australia | | | — | | | | 1,191,529 | | | | — | | | | 1,191,529 | |
Brazil | | | 11,272,131 | | | | — | | | | — | | | | 11,272,131 | |
China | | | 8,708,815 | | | | 26,797,414 | | | | — | | | | 35,506,229 | |
Hong Kong | | | — | | | | 5,317,098 | | | | — | | | | 5,317,098 | |
India | | | 4,221,354 | | | | 4,771,405 | | | | — | | | | 8,992,759 | |
Indonesia | | | — | | | | 846,931 | | | | — | | | | 846,931 | |
Korea | | | — | | | | 9,740,970 | | | | 6,075,101 | | | | 15,816,071 | |
Malaysia | | | — | | | | 2,342,507 | | | | — | | | | 2,342,507 | |
Mexico | | | 2,355,391 | | | | — | | | | — | | | | 2,355,391 | |
Russia | | | 3,677,771 | | | | 287,005 | | | | — | | | | 3,964,776 | |
South Africa | | | — | | | | 6,936,799 | | | | — | | | | 6,936,799 | |
Taiwan | | | 650,730 | | | | 6,703,115 | | | | — | | | | 7,353,845 | |
Thailand | | | — | | | | 1,561,295 | | | | — | | | | 1,561,295 | |
Turkey | | | — | | | | 560,444 | | | | — | | | | 560,444 | |
United Arab Emirates | | | — | | | | 415,357 | | | | — | | | | 415,357 | |
Exchange-Traded Funds | | | 5,589,420 | | | | — | | | | — | | | | 5,589,420 | |
| Short-Term Investments (f) | | | 8,361,080 | | | | — | | | | — | | | | 8,361,080 | |
| Total | | $ | 45,434,025 | | | $ | 67,471,869 | | | $ | 6,075,101 | | | $ | 118,980,995 | |
As a result of the fair valuation model utilized by the Fund, certain international equity securities transferred from Level 1 to Level 2. During the period ended April 30, 2018, the amount of transfers between Level 1 and Level 2 was 47,343,303.
Transfers between price levels are recognized at the beginning of the reporting year.
| (f) See | Investment Portfolio for additional detailed categorizations. |
| | | | | | |
| 14 | | | | | Deutsche Emerging Markets Equity Fund | | |
Level 3 Reconciliation
The following is a reconciliation of the Fund’s Level 3 investments for which significant unobservable inputs were used in determining value:
| | | | |
| | | Common
Stock | |
Balance as of October 31, 2017 | | $ | — | |
| Realized gains (loss) | | | 611,351 | |
| Change in unrealized appreciation (depreciation) | | | (598,792 | ) |
| Amortization premium/discount | | | — | |
| Purchases | | | 1,617,941 | |
| (Sales) | | | (931,396 | ) |
| Transfers into Level 3 (g) | | | 5,375,997 | |
| Transfers (out) of Level 3 | | | — | |
| Balance as of April 30, 2018 | | $ | 6,075,101 | |
Net change in unrealized appreciation (depreciation) from
investments still held as of April 30, 2018 | | $ | (598,792 | ) |
| (g) | During the period ended April 30, 2018, the amount of transfers between Level 1 and Level 3 was 5,375,997. An investment was transferred from Level 1 to Level 3 as a result of a halt in trading on a securities exchange. |
Transfers between price levels are recognized at the beginning of the reporting period.
| | | | | | | | |
| Quantitative Disclosure About Significant Unobservable Inputs | | |
| Asset Class | | Fair Value
at 4/30/18 | | Valuation Technique(s) | | Unobservable Input | | Range
(Weighted
Average) |
| Common Stock | | $ 6,075,101 | | Market Approach | | Last Traded Price | | 100% |
Qualitative Disclosure About Unobservable Inputs
Significant unobservable inputs developed by the Pricing Committee and used in the fair value measurement of the Fund’s equity investments include the use of the aggregate value of the new securities in the event of a pending stock split, spin-off or similar transaction in which subject securities have suspended from trading or in which new securities will be issued but not immediately traded. The new securities will be initially valued such that the aggregate value of the new securities, together with any existing securities from which the new securities are split or spun-off, will be equal to the value of the original securities at the time of the stock split or spin-off until the security commences trading.
| | | | | | | | |
| | Deutsche Emerging Markets Equity Fund | | | | | | 15 | |
Statement of Assets and Liabilities
| | | | |
| As of April 30, 2018 (Unaudited) | | | | |
| | | | |
| |
| Assets | | | | |
Investments in non-affiliated securities, at value (cost $86,832,212) — including $575,736 of securities loaned | | $ | 110,619,915 | |
Investment in Deutsche Government & Agency Securities Portfolio
(cost $595,700)* | | | 595,700 | |
| Investment in Deutsche Central Cash Management Government Fund (cost $7,765,380) | | | 7,765,380 | |
| Cash | | | 127 | |
| Foreign currency, at value (cost $1,876,267) | | | 1,854,775 | |
| Receivable for Fund shares sold | | | 219,491 | |
| Dividends receivable | | | 43,285 | |
| Interest receivable | | | 16,520 | |
| Other assets | | | 55,848 | |
| Total assets | | | 121,171,041 | |
| |
| Liabilities | | | | |
| Payable upon return of securities loaned | | | 595,700 | |
| Payable for Fund shares redeemed | | | 117,613 | |
| Accrued management fee | | | 31,297 | |
| Accrued Directors’ fees | | | 1,479 | |
| Other accrued expenses and payables | | | 137,130 | |
| Total liabilities | | | 883,219 | |
| Net assets, at value | | $ | 120,287,822 | |
| |
| Net Assets Consist of | | | | |
| Distributions in excess of net investment income | | | (55,121 | ) |
| Net unrealized appreciation (depreciation) on: | | | | |
Investments | | | 23,787,703 | |
Foreign currency | | | (21,556 | ) |
| Accumulated net realized gain (loss) | | | (39,169,107 | ) |
| Paid-in capital | | | 135,745,903 | |
| Net assets, at value | | $ | 120,287,822 | |
| * | Represents collateral on securities loaned. |
The accompanying notes are an integral part of the financial statements.
| | | | | | |
| 16 | | | | | Deutsche Emerging Markets Equity Fund | | |
| | |
| Statement of Assets and Liabilities as of April 30, 2018 (Unaudited) (continued) | | |
| | | | |
| |
| Net Asset Value | | | | |
| | | | |
Class A | | | | |
Net Asset Value and redemption price per share
($11,296,263 ÷ 551,638 shares of capital stock outstanding,
$.01 par value, 50,000,000 shares authorized) | | $ | 20.48 | |
| Maximum offering price per share (100 ÷ 94.25 of $20.48) | | $ | 21.73 | |
Class T | | | | |
Net Asset Value and redemption price per share
($11,733 ÷ 573 shares of capital stock outstanding,
$.01 par value, 50,000,000 shares authorized) | | $ | 20.48 | |
| Maximum offering price per share (100 ÷ 97.50 of $20.48) | | $ | 21.01 | |
Class C | | | | |
Net Asset Value, offering and redemption price
(subject to contingent deferred sales charge) per share
($5,077,801 ÷ 277,807 shares of capital stock outstanding,
$.01 par value, 20,000,000 shares authorized) | | $ | 18.28 | |
Class S | | | | |
Net Asset Value, offering and redemption price per share
($86,907,674 ÷ 4,187,430 shares of capital stock outstanding,
$.01 par value, 100,000,000 shares authorized) | | $ | 20.75 | |
Institutional Class | | | | |
Net Asset Value, offering and redemption price per share
($16,994,351 ÷ 819,639 shares of capital stock outstanding,
$.01 par value, 100,000,000 shares authorized) | | $ | 20.73 | |
The accompanying notes are an integral part of the financial statements.
| | | | | | | | |
| | Deutsche Emerging Markets Equity Fund | | | | | | 17 | |
Statement of Operations
| | | | |
| for the six months ended April 30, 2018 (Unaudited) | | | | |
| | | | |
| |
| Investment Income | | | | |
| Income: | | | | |
| Dividends (net of foreign taxes withheld of $69,821) | | $ | 557,046 | |
| Income distributions — Deutsche Central Cash Management Government Fund | | | 48,723 | |
| Securities lending income, net of borrower rebates | | | 6,324 | |
| Total income | | | 612,093 | |
| Expenses: | | | | |
| Management fee | | | 366,936 | |
| Administration fee | | | 52,419 | |
| Services to shareholders | | | 103,026 | |
| Distribution and service fees | | | 33,638 | |
| Custodian fee | | | 28,177 | |
| Professional fees | | | 49,108 | |
| Reports to shareholders | | | 19,384 | |
| Registration fees | | | 29,288 | |
| Directors’ fees and expenses | | | 4,412 | |
| Other | | | 8,471 | |
| Total expenses before expense reductions | | | 694,859 | |
| Expense reductions | | | (157,355 | ) |
| Total expenses after expense reductions | | | 537,504 | |
| Net investment income (loss) | | | 74,589 | |
| |
| Realized and Unrealized Gain (Loss) | | | | |
| Net realized gain (loss) from: | | | | |
| Investments | | | 2,630,472 | |
| Foreign currency | | | 47,326 | |
| | | | 2,677,798 | |
| Change in net unrealized appreciation (depreciation) on: | | | | |
| Investments | | | 1,249,867 | |
| Foreign currency | | | (12,359 | ) |
| | | | 1,237,508 | |
| Net gain (loss) | | | 3,915,306 | |
| Net increase (decrease) in net assets resulting from operations | | $ | 3,989,895 | |
The accompanying notes are an integral part of the financial statements.
| | | | | | |
| 18 | | | | | Deutsche Emerging Markets Equity Fund | | |
Statements of Changes in Net Assets
| | | | | | | | |
| | | Six Months
Ended
April 30, 2018 | | | Year Ended
October 31, | |
| Increase (Decrease) in Net Assets | | (Unaudited) | | | 2017 | |
| | | | | | | | |
| Operations: | | | | | | | | |
| Net investment income (loss) | | $ | 74,589 | | | $ | 546,681 | |
| Net realized gain (loss) | | | 2,677,798 | | | | 997,833 | |
| Change in net unrealized appreciation (depreciation) | | | 1,237,508 | | | | 13,852,668 | |
| Net increase (decrease) in net assets resulting from operations | | | 3,989,895 | | | | 15,397,182 | |
| Distributions to shareholders from: | | | | | | | | |
| Net investment income: | | | | | | | | |
Class A | | | (48,514 | ) | | | (20,049 | ) |
Class T | | | (52 | ) | | | — | |
Class S | | | (423,626 | ) | | | (232,886 | ) |
Institutional Class | | | (72,972 | ) | | | (5,617 | ) |
| Total distributions | | | (545,164 | ) | | | (258,552 | ) |
| Fund share transactions: | | | | | | | | |
| Proceeds from shares sold | | | 41,712,449 | | | | 30,737,031 | |
| Reinvestment of distributions | | | 519,832 | | | | 240,893 | |
| Payments for shares redeemed | | | (12,729,189 | ) | | | (16,385,837 | ) |
| Net increase (decrease) in net assets from Fund share transactions | | | 29,503,092 | | | | 14,592,087 | |
| Increase (decrease) in net assets | | | 32,947,823 | | | | 29,730,717 | |
| Net assets at beginning of period | | | 87,339,999 | | | | 57,609,282 | |
| Net assets at end of period (including distribution in excess of net investment income and undistributed net investment income $55,121 and $415,454, respectively) | | $ | 120,287,822 | | | $ | 87,339,999 | |
The accompanying notes are an integral part of the financial statements.
| | | | | | | | |
| | Deutsche Emerging Markets Equity Fund | | | | | | 19 | |
Financial Highlights
| | | | | | | | | | | | | | | | | | | | | | | | | | |
| | | Six Months
Ended 4/30/18 | | | Years Ended October 31, | |
| Class A | | (Unaudited) | | | 2017 | | | 2016 | | | 2015 | | | 2014 | | | 2013 | |
| | | | | | |
Selected Per Share Data | | | | | | | | | | | | | | | | | | | | | | | | |
Net asset value, beginning of period | | $ | 19.54 | | | $ | 15.71 | | | $ | 14.49 | | | $ | 16.53 | | | $ | 16.46 | | | $ | 15.61 | |
Income (loss) from investment operations: | | | | | | | | | | | | | | | | | | | | | | | | |
Net investment income (loss)a | | | (.00 | )*** | | | .10 | | | | .05 | | | | .06 | | | | .14 | | | | .11 | |
Net realized and unrealized gain (loss) | | | 1.03 | | | | 3.77 | | | | 1.17 | | | | (1.95 | ) | | | .01 | | | | .91 | |
Total from investment operations | | | 1.03 | | | | 3.87 | | | | 1.22 | | | | (1.89 | ) | | | .15 | | | | 1.02 | |
Less distributions from: | | | | | | | | | | | | | | | | | | | | | | | | |
Net investment income | | | (.09 | ) | | | (.04 | ) | | | — | | | | (.15 | ) | | | (.08 | ) | | | (.17 | ) |
Redemption fees | | | — | | | | — | | | | .00 | *** | | | .00 | *** | | | .00 | *** | | | .00 | *** |
Net asset value, end
of period | | $ | 20.48 | | | $ | 19.54 | | | $ | 15.71 | | | $ | 14.49 | | | $ | 16.53 | | | $ | 16.46 | |
Total Return (%)b,c | | | 5.29 | ** | | | 24.75 | | | | 8.42 | | | | (11.57 | ) | | | .96 | | | | 6.56 | |
|
Ratios to Average Net Assets and Supplemental Data | |
Net assets, end of period ($ millions) | | | 11 | | | | 10 | | | | 8 | | | | 10 | | | | 14 | | | | 16 | |
Ratio of expenses before expense reductions (%) | | | 1.52 | * | | | 1.86 | | | | 2.16 | | | | 1.97 | | | | 1.98 | | | | 1.96 | |
Ratio of expenses after expense reductions (%) | | | 1.15 | * | | | 1.35 | | | | 1.67 | | | | 1.63 | | | | 1.65 | | | | 1.81 | |
Ratio of net investment income (loss) (%) | | | (.00 | )*,*** | | | .59 | | | | .35 | | | | .40 | | | | .88 | | | | .72 | |
Portfolio turnover rate (%) | | | 13 | ** | | | 14 | | | | 72 | | | | 18 | | | | 65 | | | | 49 | |
| a | Based on average shares outstanding during the period. |
| b | Total return does not reflect the effect of any sales charges. |
| c | Total return would have been lower had certain expenses not been reduced. |
| *** | Amount is less than $.005. |
| | | | | | |
| 20 | | | | | Deutsche Emerging Markets Equity Fund | | |
| | | | | | | | |
| Class T | | Six Months
Ended 4/30/18
(Unaudited) | | | Period
Ended
10/31/17a | |
| | |
| Selected Per Share Data | | | | | | | | |
| Net asset value, beginning of period | | | $19.54 | | | | $17.54 | |
| Income (loss) from investment operations: | | | | | | | | |
Net investment income (loss)b | | | (.00 | )*** | | | .13 | |
Net realized and unrealized gain (loss) | | | 1.03 | | | | 1.87 | |
Total from investment operations | | | 1.03 | | | | 2.00 | |
| Less distributions from: | | | | | | | | |
Net investment income | | | (.09 | ) | | | — | |
| Net asset value, end of period | | | $20.48 | | | | $19.54 | |
| Total Return (%)c,d | | | 5.29 | ** | | | 11.40 | ** |
| | |
| Ratios to Average Net Assets and Supplemental Data | | | | | | | | |
| Net assets, end of period ($ thousands) | | | 12 | | | | 11 | |
| Ratio of expenses before expense reductions (%) | | | 1.44 | * | | | 1.65 | * |
| Ratio of expenses after expense reductions (%) | | | 1.15 | * | | | 1.15 | * |
| Ratio of net investment income (loss) (%) | | | (.01 | )* | | | 1.70 | * |
| Portfolio turnover rate (%) | | | 13 | ** | | | 14 | e |
| a | For the period from June 5, 2017 (commencement of operations) to October 31, 2017. |
| b | Based on average shares outstanding during the period. |
| c | Total return does not reflect the effect of any sales charges. |
| d | Total return would have been lower had certain expenses not been reduced. |
| e | Represents the Fund’s portfolio turnover rate for the year ended October 31, 2017. |
| *** | Amount is less than $.005. |
| | | | | | | | |
| | Deutsche Emerging Markets Equity Fund | | | | | | 21 | |
| | | | | | | | | | | | | | | | | | | | | | | | | | |
| | | Six Months
Ended 4/30/18 | | | Years Ended October 31, | |
| Class C | | (Unaudited) | | | 2017 | | | 2016 | | | 2015 | | | 2014 | | | 2013 | |
| | | | | | |
Selected Per Share Data | | | | | | | | | | | | | | | | | | | | | | | | |
Net asset value, beginning of period | | $ | 17.43 | | | $ | 14.07 | | | $ | 13.07 | | | $ | 14.92 | | | $ | 14.89 | | | $ | 14.11 | |
Income (loss) from investment operations: | | | | | | | | | | | | | | | | | | | | | | | | |
Net investment income (loss)a | | | (.07 | ) | | | (.01 | ) | | | (.05 | ) | | | (.05 | ) | | | .02 | | | | (.00 | )*** |
Net realized and unrealized gain (loss) | | | .92 | | | | 3.37 | | | | 1.05 | | | | (1.77 | ) | | | .01 | | | | .82 | |
Total from investment operations | | | .85 | | | | 3.36 | | | | 1.00 | | | | (1.82 | ) | | | .03 | | | | .82 | |
Less distributions from: | | | | | | | | | | | | | | | | | | | | | | | | |
Net investment income | | | — | | | | — | | | | — | | | | (.03 | ) | | | — | | | | (.04 | ) |
Redemption fees | | | — | | | | — | | | | .00 | *** | | | .00 | *** | | | .00 | *** | | | .00 | *** |
Net asset value, end
of period | | $ | 18.28 | | | $ | 17.43 | | | $ | 14.07 | | | $ | 13.07 | | | $ | 14.92 | | | $ | 14.89 | |
Total Return (%)b,c | | | 4.88 | ** | | | 23.88 | | | | 7.65 | | | | (12.24 | ) | | | .20 | | | | 5.79 | |
|
Ratios to Average Net Assets and Supplemental Data | |
Net assets, end of period ($ millions) | | | 5 | | | | 3 | | | | 2 | | | | 2 | | | | 3 | | | | 4 | |
Ratio of expenses before expense reductions (%) | | | 2.22 | * | | | 2.57 | | | | 2.91 | | | | 2.76 | | | | 2.76 | | | | 2.77 | |
Ratio of expenses after expense reductions (%) | | | 1.90 | * | | | 2.09 | | | | 2.42 | | | | 2.38 | | | | 2.40 | | | | 2.56 | |
Ratio of net investment income (loss) (%) | | | (.73 | )* | | | (.09 | ) | | | (.40 | ) | | | (.34 | ) | | | .10 | | | | (.02 | ) |
Portfolio turnover rate (%) | | | 13 | ** | | | 14 | | | | 72 | | | | 18 | | | | 65 | | | | 49 | |
| a | Based on average shares outstanding during the period. |
| b | Total return does not reflect the effect of any sales charges. |
| c | Total return would have been lower had certain expenses not been reduced. |
| *** | Amount is less than $.005. |
| | | | | | |
| 22 | | | | | Deutsche Emerging Markets Equity Fund | | |
| | | | | | | | | | | | | | | | | | | | | | | | | | |
| | | Six Months
Ended 4/30/18 | | | Years Ended October 31, | |
| Class S | | (Unaudited) | | | 2017 | | | 2016 | | | 2015 | | | 2014 | | | 2013 | |
| | | | | | |
| Selected Per Share Data | | | | | | | | | | | | | | | | | | | | | | | | |
Net asset value, beginning of period | | $ | 19.82 | | | $ | 15.94 | | | $ | 14.70 | | | $ | 16.77 | | | $ | 16.70 | | | $ | 15.83 | |
Income (loss) from investment operations: | | | | | | | | | | | | | | | | | | | | | | | | |
Net investment income (loss)a | | | .02 | | | | .15 | | | | .09 | | | | .11 | | | | .18 | | | | .15 | |
Net realized and unrealized gain (loss) | | | 1.04 | | | | 3.81 | | | | 1.18 | | | | (1.99 | ) | | | .01 | | | | .93 | |
Total from investment operations | | | 1.06 | | | | 3.96 | | | | 1.27 | | | | (1.88 | ) | | | .19 | | | | 1.08 | |
Less distributions from: | | | | | | | | | | | | | | | | | | | | | | | | |
Net investment income | | | (.13 | ) | | | (.08 | ) | | | (.03 | ) | | | (.19 | ) | | | (.12 | ) | | | (.21 | ) |
Redemption fees | | | — | | | | — | | | | .00 | *** | | | .00 | *** | | | .00 | *** | | | .00 | *** |
Net asset value, end
of period | | $ | 20.75 | | | $ | 19.82 | | | $ | 15.94 | | | $ | 14.70 | | | $ | 16.77 | | | $ | 16.70 | |
Total Return (%)b | | | 5.35 | ** | | | 25.03 | | | | 8.68 | | | | (11.29 | ) | | | 1.20 | | | | 6.84 | |
|
Ratios to Average Net Assets and Supplemental Data | |
Net Assets, end of period ($ millions) | | | 87 | | | | 65 | | | | 46 | | | | 48 | | | | 59 | | | | 68 | |
Ratio of expenses before expense reductions (%) | | | 1.27 | * | | | 1.57 | | | | 1.90 | | | | 1.74 | | | | 1.74 | | | | 1.73 | |
Ratio of expenses after expense reductions (%) | | | .98 | * | | | 1.14 | | | | 1.42 | | | | 1.38 | | | | 1.40 | | | | 1.56 | |
Ratio of net investment income (loss) (%) | | | .19 | * | | | .87 | | | | .62 | | | | .68 | | | | 1.12 | | | | .97 | |
Portfolio turnover rate (%) | | | 13 | ** | | | 14 | | | | 72 | | | | 18 | | | | 65 | | | | 49 | |
| a | Based on average shares outstanding during the period. |
| b | Total return would have been lower had certain expenses not been reduced. |
| *** | Amount is less than $.005. |
| | | | | | | | |
| | Deutsche Emerging Markets Equity Fund | | | | | | 23 | |
| | | | | | | | | | | | | | | | | | | | | | | | | | |
| | | Six Months
Ended 4/30/18 | | | Years Ended October 31, | |
| Institutional Class | | (Unaudited) | | | 2017 | | | 2016 | | | 2015 | | | 2014 | | | 2013 | |
| | | | | | |
Selected Per Share Data | | | | | | | | | | | | | | | | | | | | | | | | |
Net asset value, beginning of period | | $ | 19.81 | | | $ | 15.92 | | | $ | 14.68 | | | $ | 16.75 | | | $ | 16.69 | | | $ | 15.88 | |
Income (loss) from investment operations: | | | | | | | | | | | | | | | | | | | | | | | | |
Net investment income (loss)a | | | .03 | | | | .21 | | | | (.04 | ) | | | .11 | | | | .18 | | | | .15 | |
Net realized and unrealized gain (loss) | | | 1.03 | | | | 3.76 | | | | 1.31 | | | | (1.99 | ) | | | .01 | | | | .91 | |
Total from investment operations | | | 1.06 | | | | 3.97 | | | | 1.27 | | | | (1.88 | ) | | | .19 | | | | 1.06 | |
Less distributions from: | | | | | | | | | | | | | | | | | | | | | | | | |
Net investment income | | | (.14 | ) | | | (.08 | ) | | | (.03 | ) | | | (.19 | ) | | | (.13 | ) | | | (.25 | ) |
Redemption fees | | | — | | | | — | | | | .00 | *** | | | .00 | *** | | | .00 | *** | | | .00 | *** |
Net asset value, end
of period | | $ | 20.73 | | | $ | 19.81 | | | $ | 15.92 | | | $ | 14.68 | | | $ | 16.75 | | | $ | 16.69 | |
Total Return (%) | | | 5.39 | b** | | | 25.05 | b | | | 8.76 | b | | | (11.30 | )b | | | 1.19 | b | | | 6.69 | |
|
Ratios to Average Net Assets and Supplemental Data | |
Net Assets, end of period ($ millions) | | | 17 | | | | 9 | | | | 1 | | | | 8 | | | | 11 | | | | 12 | |
Ratio of expenses before expense reductions (%) | | | 1.21 | * | | | 1.34 | | | | 1.72 | | | | 1.53 | | | | 1.54 | | | | 1.52 | |
Ratio of expenses after expense reductions (%) | | | .90 | * | | | .97 | | | | 1.42 | | | | 1.38 | | | | 1.40 | | | | 1.52 | |
Ratio of net investment income (loss) (%) | | | .28 | * | | | 1.14 | | | | (.28 | ) | | | .67 | | | | 1.12 | | | | .92 | |
Portfolio turnover rate (%) | | | 13 | ** | | | 14 | | | | 72 | | | | 18 | | | | 65 | | | | 49 | |
| a | Based on average shares outstanding during the period. |
| b | Total return would have been lower had certain expenses not been reduced. |
| *** | Amount is less than $.005. |
| | | | | | |
| 24 | | | | | Deutsche Emerging Markets Equity Fund | | |
| | |
| Notes to Financial Statements | | (Unaudited) |
A. Organization and Significant Accounting Policies
Deutsche Emerging Markets Equity Fund (the “Fund”) is a diversified series of Deutsche International Fund, Inc. (the “Corporation”), which is registered under the Investment Company Act of 1940, as amended (the “1940 Act”), as an open-end management investment company organized as a Maryland corporation.
The Fund offers multiple classes of shares which provide investors with different purchase options. Class A shares are subject to an initial sales charge. Class T shares are subject to an initial sales charge and are only available through certain financial intermediaries. Class C shares are not subject to an initial sales charge but are subject to higher ongoing expenses than Class A shares and a contingent deferred sales charge payable upon certain redemptions within one year of purchase. Class S shares are not subject to initial or contingent deferred sales charges and are only available to a limited group of investors. Institutional Class shares are not subject to initial or contingent deferred sales charges and are generally available only to qualified institutions.
Investment income, realized and unrealized gains and losses, and certain fund-level expenses and expense reductions, if any, are borne pro rata on the basis of relative net assets by the holders of all classes of shares, except that each class bears certain expenses unique to that class such as distribution and service fees, services to shareholders and certain other class-specific expenses. Differences in class-level expenses may result in payment of different per share dividends by class. All shares of the Fund have equal rights with respect to voting subject to class-specific arrangements.
The Fund’s financial statements are prepared in accordance with accounting principles generally accepted in the United States of America (“U.S. GAAP”) which require the use of management estimates. Actual results could differ from those estimates. The Fund qualifies as an investment company under Topic 946 of Accounting Standards Codification of U.S. GAAP. The policies described below are followed consistently by the Fund in the preparation of its financial statements.
Security Valuation. Investments are stated at value determined as of the close of regular trading on the New York Stock Exchange on each day the exchange is open for trading.
Various inputs are used in determining the value of the Fund’s investments. These inputs are summarized in three broad levels. Level 1 includes quoted prices in active markets for identical securities. Level 2 includes other significant observable inputs (including quoted prices for
| | | | | | | | |
| | Deutsche Emerging Markets Equity Fund | | | | | | 25 | |
similar securities, interest rates, prepayment speeds and credit risk). Level 3 includes significant unobservable inputs (including the Fund’s own assumptions in determining the fair value of investments). The level assigned to the securities valuations may not be an indication of the risk or liquidity associated with investing in those securities.
Equity securities are valued at the most recent sale price or official closing price reported on the exchange (U.S. or foreign) or over-the-counter market on which they trade. Securities for which no sales are reported are valued at the calculated mean between the most recent bid and asked quotations on the relevant market or, if a mean cannot be determined, at the most recent bid quotation. Equity securities are generally categorized as Level 1. For certain international equity securities, in order to adjust for events which may occur between the close of the foreign exchanges and the close of the New York Stock Exchange, a fair valuation model may be used. This fair valuation model takes into account comparisons to the valuation of American Depository Receipts (ADRs), exchange-traded funds, futures contracts and certain indices and these securities are categorized as Level 2.
Investments in open-end investment companies are valued at their net asset value each business day and are categorized as Level 1.
Securities and other assets for which market quotations are not readily available or for which the above valuation procedures are deemed not to reflect fair value are valued in a manner that is intended to reflect their fair value as determined in accordance with procedures approved by the Board and are generally categorized as Level 3. In accordance with the Fund’s valuation procedures, factors considered in determining value may include, but are not limited to, the type of the security; the size of the holding; the initial cost of the security; the existence of any contractual restrictions on the security’s disposition; the price and extent of public trading in similar securities of the issuer or of comparable companies; quotations or evaluated prices from broker-dealers and/or pricing services; information obtained from the issuer, analysts, and/or the appropriate stock exchange (for exchange-traded securities); an analysis of the company’s or issuer’s financial statements; an evaluation of the forces that influence the issuer and the market(s) in which the security is purchased and sold; and with respect to debt securities, the maturity, coupon, creditworthiness, currency denomination and the movement of the market in which the security is normally traded. The value determined under these procedures may differ from published values for the same securities.
Disclosure about the classification of fair value measurements is included in a table following the Fund’s Investment Portfolio.
| | | | | | |
| 26 | | | | | Deutsche Emerging Markets Equity Fund | | |
Foreign Currency Translations. The books and records of the Fund are maintained in U.S. dollars. Investment securities and other assets and liabilities denominated in a foreign currency are translated into U.S. dollars at the prevailing exchange rates at period end. Purchases and sales of investment securities, income and expenses are translated into U.S. dollars at the prevailing exchange rates on the respective dates of the transactions.
Net realized and unrealized gains and losses on foreign currency transactions represent net gains and losses between trade and settlement dates on securities transactions, the acquisition and disposition of foreign currencies, and the difference between the amount of net investment income accrued and the U.S. dollar amount actually received. The portion of both realized and unrealized gains and losses on investments that results from fluctuations in foreign currency exchange rates is not separately disclosed but is included with net realized and unrealized gain/appreciation and loss/depreciation on investments.
Securities Lending. Deutsche Bank AG, as lending agent, lends securities of the Fund to certain financial institutions under the terms of its securities lending agreement. During the term of the loans, the Fund continues to receive interest and dividends generated by the securities and to participate in any changes in their market value. The Fund requires the borrowers of the securities to maintain collateral with the Fund consisting of either cash or liquid, unencumbered assets having a value at least equal to the value of the securities loaned. When the collateral falls below specified amounts, the lending agent will use its best efforts to obtain additional collateral on the next business day to meet required amounts under the securities lending agreement. As of period end, any securities on loan were collateralized by cash. During the six months ended April 30, 2018, the Fund invested the cash collateral into a joint trading account in affiliated money market funds managed by Deutsche Investment Management Americas Inc. As of April 30, 2018, the Fund invested the cash collateral in Deutsche Government & Agency Securities Portfolio. Deutsche Investment Management Americas Inc. receives a management/administration fee (0.14% annualized effective rate as of April 30, 2018) on the cash collateral invested in Deutsche Government & Agency Securities Portfolio. The Fund receives compensation for lending its securities either in the form of fees or by earning interest on invested cash collateral net of borrower rebates and fees paid to a lending agent. Either the Fund or the borrower may terminate the loan at any time, and
the borrower, after notice, is required to return borrowed securities within a standard time period. There may be risks of delay and costs in recovery of securities or even loss of rights in the collateral should the borrower of the securities fail financially. If the Fund is not able to recover securities lent, the Fund may sell the collateral and purchase a replacement
| | | | | | | | |
| | Deutsche Emerging Markets Equity Fund | | | | | | 27 | |
investment in the market, incurring the risk that the value of the replacement security is greater than the value of the collateral. The Fund is also subject to all investment risks associated with the reinvestment of any cash collateral received, including, but not limited to, interest rate, credit and liquidity risk associated with such investments.
As of April 30, 2018, the Fund had securities on loan which were classified as exchange-traded funds in the Investment Portfolio. The value of the related collateral exceeded the value of the securities loaned at period end.
Taxes. The Fund’s policy is to comply with the requirements of the Internal Revenue Code, as amended, which are applicable to regulated investment companies, and to distribute all of its taxable income to its shareholders.
Additionally, the Fund may be subject to taxes imposed by the governments of countries in which it invests and are generally based on income and/or capital gains earned or repatriated. Estimated tax liabilities on certain foreign securities are recorded on an accrual basis and are reflected as components of interest income or net change in unrealized gain/loss on investments. Tax liabilities realized as a result of security sales are reflected as a component of net realized gain/loss on investments.
At October 31, 2017, the Fund had a net tax basis capital loss carryforward of approximately $41,803,000, which may be applied against realized net taxable capital gains indefinitely, including short-term losses ($14,165,000) and long-term losses ($27,638,000).
At October 31, 2017, the aggregate cost of investments for federal income tax purposes was $68,844,879. The net unrealized appreciation for all investments based on tax cost was $22,493,889. This consisted of aggregate gross unrealized appreciation for all investments which there was an excess of value over tax cost of $24,582,737 aggregate gross unrealized depreciation for all investments in which was an excess of tax cost over value of $2,088,848.
The Fund has reviewed the tax positions for the open tax years as of October 31, 2017 and has determined that no position for income tax
and/or uncertain tax provisions is required in the Fund’s financial statements. The Fund’s federal tax returns for the prior three fiscal years remain open subject to examination by the Internal Revenue Service.
Distribution of Income and Gains. Distributions from net investment income of the Fund, if any, are declared and distributed to shareholders annually. Net realized gains from investment transactions, in excess of available capital loss carryforwards, would be taxable to the Fund if not distributed, and, therefore, will be distributed to shareholders at least
| | | | | | |
| 28 | | | | | Deutsche Emerging Markets Equity Fund | | |
annually. The Fund may also make additional distributions for tax purposes, if necessary.
The timing and characterization of certain income and capital gain distributions are determined annually in accordance with federal tax regulations which may differ from accounting principles generally accepted in the United States of America. These differences primarily relate to investments in foreign denominated investments, investments in passive foreign investment companies, and certain securities sold at a loss. As a result, net investment income (loss) and net realized gain (loss) on investments for a reporting period may differ significantly from distributions during such period. Accordingly, the Fund may periodically make reclassifications among certain of its capital accounts without impacting the net asset value of the Fund.
The tax character of current year distributions will be determined at the end of the current fiscal year.
Redemption Fees. Prior to February 1, 2017, the Fund imposed a redemption fee of 2% of the total redemption amount on Fund shares redeemed or exchanged within 15 days of buying them, either by purchase or exchange (subject to certain exceptions). This fee was assessed and retained by the Fund for the benefit of the remaining shareholders. The redemption fee was accounted for as an addition to paid-in capital.
Expenses. Expenses of the Corporation arising in connection with a specific fund are allocated to that fund. Other Corporation expenses which cannot be directly attributed to a fund are apportioned among the funds in the Corporation based upon the relative net assets or other appropriate measures.
Contingencies. In the normal course of business, the Fund may enter into contracts with service providers that contain general indemnification clauses. The Fund’s maximum exposure under these arrangements is unknown, as this would involve future claims that may be made against the Fund that have not yet been made. However, based on experience, the Fund expects the risk of loss to be remote.
Other. Investment transactions are accounted for on a trade date plus one basis for daily net asset value calculations. However, for financial reporting purposes, investment transactions are reported on trade date. Interest income is recorded on the accrual basis. Dividend income is recorded on the ex-dividend date net of foreign withholding taxes. Certain dividends from foreign securities may be recorded subsequent to the ex-dividend date as soon as the Fund is informed of such dividends. Realized gains and losses from investment transactions are recorded on an identified cost basis. Proceeds from litigation payments, if any, are included in net realized gain (loss) from investments.
| | | | | | | | |
| | Deutsche Emerging Markets Equity Fund | | | | | | 29 | |
B. Purchases and Sales of Securities
During the six months ended April 30, 2018, purchases and sales of investment securities (excluding short-term investments) aggregated $35,996,234 and $12,409,696, respectively.
C. Related Parties
Management Agreement. Under the Investment Management Agreement with Deutsche Investment Management Americas Inc. (“DIMA” or the “Advisor”), an indirect, wholly owned subsidiary of DWS Group Gmbh & Co. KGaA (“DWS Group”), the Advisor directs the investments of the Fund in accordance with its investment objectives, policies and restrictions. The Advisor determines the securities, instruments and other contracts relating to investments to be purchased, sold or entered into by the Fund or delegates such responsibility to the Fund’s subadvisor.
Deutsche Asset Management (Hong Kong) Limited (DeAM HK), an affiliate of DIMA, serves as subadvisor with respect to the investment and reinvestment of assets of the Fund, and is paid by the Advisor for their services.
Under the Investment Management Agreement, the Fund pays a monthly management fee equal to an annual rate (exclusive of any applicable waivers/reimbursements) of 0.70% of the Fund’s average daily net assets, computed and accrued daily and payable monthly.
For the period from November 1, 2017 through January 31, 2019, the Advisor has contractually agreed to waive its fees and/or reimburse certain operating expenses of the Fund to the extent necessary to maintain the total annual operating expenses (excluding certain expenses such as extraordinary expenses, taxes, brokerage and interest) of certain classes as follows:
| | | | |
| Class A | | | 1.15% | |
| Class T | | | 1.15% | |
| Class C | | | 1.90% | |
| Class S | | | .98% | |
| Institutional Class | | | .90% | |
| | | | | | |
| 30 | | | | | Deutsche Emerging Markets Equity Fund | | |
For the six months ended April 30, 2018, fees waived and/or expenses reimbursed for each class are as follows:
| | | | |
| Class A | | $ | 20,405 | |
| Class T | | | 17 | |
| Class C | | | 6,838 | |
| Class S | | | 111,320 | |
| Institutional Class | | | 18,775 | |
| | | $ | 157,355 | |
Administration Fee. Pursuant to an Administrative Services Agreement, DIMA provides most administrative services to the Fund. For all services provided under the Administrative Services Agreement, the Fund pays the Advisor an annual fee (“Administration Fee”) of 0.10% of the Fund’s average daily net assets, computed and accrued daily and payable monthly. For the six months ended April 30, 2018, the Administration Fee was $52,419, of which $9,762 is unpaid.
Service Provider Fees. DWS Service Company (“DSC”), an affiliate of the Advisor, is the transfer agent, dividend-paying agent and shareholder service agent for the Fund. Pursuant to a sub-transfer agency agreement between DSC and DST Systems, Inc. (“DST”), DSC has delegated certain transfer agent, dividend-paying agent and shareholder service agent functions to DST. DSC compensates DST out of the shareholder servicing fee it receives from the Fund. For the six months ended April 30, 2018, the amounts charged to the Fund by DSC were as follows:
| | | | | | | | |
| Services to Shareholders | | Total
Aggregated | | | Unpaid at
April 30, 2018 | |
| Class A | | $ | 5,600 | | | $ | 1,433 | |
| Class T | | | 10 | | | | 5 | |
| Class C | | | 731 | | | | 217 | |
| Class S | | | 26,700 | | | | 9,551 | |
| Institutional Class | | | 234 | | | | 26 | |
| | | $ | 33,275 | | | $ | 11,232 | |
Distribution and Service Fees. Under the Fund’s Class C 12b-1 Plan, DWS Distributors, Inc. (“DDI”), an affiliate of the Advisor, receives a fee (“Distribution Fee”) of 0.75% of average daily net assets of Class C shares. In accordance with the Fund’s Underwriting and Distribution Services Agreement, DDI enters into related selling group agreements
| | | | | | | | |
| | Deutsche Emerging Markets Equity Fund | | | | | | 31 | |
with various firms at various rates for sales of Class C shares. For the six months ended April 30, 2018, the Distribution Fee was as follows:
| | | | | | | | |
| Distribution Fee | | Total
Aggregated | | | Unpaid at
April 30, 2018 | |
| Class C | | $ | 15,808 | | | $ | 3,055 | |
In addition, DDI provides information and administrative services for a fee (“Service Fee”) to Class A, T and C shareholders at an annual rate of up to 0.25% of average daily net assets for each such class. DDI in turn has various agreements with financial services firms that provide these services and pays these fees based upon the assets of shareholder accounts the firms service. For the six months ended April 30, 2018, the Service Fee was as follows:
| | | | | | | | | | | | |
| Service Fee | | Total
Aggregated | | | Unpaid at
April 30, 2018 | | | Annualized
Rate | |
| Class A | | $ | 12,749 | | | $ | 4,471 | | | | .23 | % |
| Class T | | | 10 | | | | 9 | | | | .17 | % |
| Class C | | | 5,071 | | | | 1,965 | | | | .24 | % |
| | | $ | 17,830 | | | $ | 6,445 | | | | | |
Underwriting Agreement and Contingent Deferred Sales Charge. DDI is the principal underwriter for the Fund. Underwriting commissions paid in connection with the distribution of Class A shares for the six months ended April 30, 2018 aggregated $3,113.
In addition, DDI receives any contingent deferred sales charge (“CDSC”) from Class C share redemptions occurring within one year of purchase. There is no such charge upon redemption of any share appreciation or reinvested dividends. The CDSC is 1% of the value of the shares redeemed for Class C. For the six months ended April 30, 2018, the CDSC for Class C shares aggregated $212. A deferred sales charge of up to 1% is assessed on certain redemptions of Class A shares.
Typesetting and Filing Service Fees. Under an agreement with DIMA, DIMA is compensated for providing certain prepress and regulatory filing services to the Fund. For the six months ended April 30, 2018, the amount charged to the Fund by DIMA included in the Statement of Operations under “Reports to shareholders” aggregated $9,146, of which $6,710 is unpaid.
Directors’ Fees and Expenses. The Fund paid retainer fees to each Director not affiliated with the Advisor, plus specified amounts to the Board Chairperson and Vice Chairperson and to each committee Chairperson.
| | | | | | |
| 32 | | | | | Deutsche Emerging Markets Equity Fund | | |
Affiliated Cash Management Vehicles. The Fund may invest uninvested cash balances in Deutsche Central Cash Management Government Fund and Deutsche Variable NAV Money Fund, affiliated money market funds which are managed by the Advisor. Each affiliated money market fund seeks to provide a high level of current income consistent with liquidity and the preservation of capital. Each affiliated money market fund is managed in accordance with Rule 2a-7 under the 1940 Act, which governs the quality, maturity, diversity and liquidity of instruments in which a money market fund may invest. Deutsche Central Cash Management Government Fund seeks to maintain a stable net asset value, and Deutsche Variable NAV Money Fund maintains a floating net asset value. The Fund indirectly bears its proportionate share of the expenses of each affiliated money market fund in which it invests. Deutsche Central Cash Management Government Fund does not pay the Advisor an investment management fee. To the extent that Deutsche Variable NAV Money Fund pays an investment management fee to the Advisor, the Advisor will waive an amount of the investment management fee payable to the Advisor by the Fund equal to the amount of the investment management fee payable on the Fund’s assets invested in Deutsche Variable NAV Money Fund.
Security Lending Fees. Deutsche Bank AG serves as lending agent for the Fund. For the six months ended April 30, 2018, the Fund incurred lending agent fees to Deutsche Bank AG for the amount of $476.
D. Investing in Emerging Markets
Investing in emerging markets may involve special risks and considerations not typically associated with investing in developed markets. These risks include revaluation of currencies, high rates of inflation or deflation, repatriation restrictions on income and capital, and future adverse political, social and economic developments. Moreover, securities issued in these markets may be less liquid, subject to government ownership controls or delayed settlements, and may have prices that are more volatile or less easily assessed than those of comparable securities of issuers in developed markets.
E. Line of Credit
The Fund and other affiliated funds (the “Participants”) share in a $400 million revolving credit facility provided by a syndication of banks. The Fund may borrow for temporary or emergency purposes, including the meeting of redemption requests that otherwise might require the untimely disposition of securities. The Participants are charged an annual commitment fee which is allocated based on net assets, among each of the Participants. Interest is calculated at a rate per annum equal to the sum of the Federal Funds Rate plus 1.25 percent plus if the one-month
| | | | | | | | |
| | Deutsche Emerging Markets Equity Fund | | | | | | 33 | |
LIBOR exceeds the Federal Funds Rate, the amount of such excess. The Fund may borrow up to a maximum of 25 percent of its net assets under the agreement. The Fund had no outstanding loans at April 30, 2018.
F. Fund Share Transactions
The following table summarizes share and dollar activity in the Fund:
| | | | | | | | | | | | | | | | | | | | | | | | | | | | | | | | |
| | | Six Months Ended
April 30, 2018 | | | Year Ended
October 31, 2017 | |
| | | | | | Shares | | | Dollars | | | | | | | | | Shares | | | Dollars | | | | |
|
Shares sold | |
Class A | | | | | | | 126,953 | | | $ | 2,639,544 | | | | | | | | | | | | 165,903 | | | $ | 2,930,038 | | | | | |
Class T | | | | | | | — | | | | — | | | | | | | | | | | | 570 | * | | | 10,001 | * | | | | |
Class C | | | | | | | 110,233 | | | | 2,025,843 | | | | | | | | | | | | 70,037 | | | | 1,115,546 | | | | | |
Class S | | | | | | | 1,333,719 | | | | 28,332,559 | | | | | | | | | | | | 1,029,712 | | | | 18,016,958 | | | | | |
Institutional Class | | | | | | | 412,976 | | | | 8,714,503 | | | | | | | | | | | | 475,444 | | | | 8,664,488 | | | | | |
| | | | | | | | | | | $ | 41,712,449 | | | | | | | | | | | | | | | $ | 30,737,031 | | | | | |
|
Shares issued to shareholders in reinvestment of distributions | |
Class A | | | | | | | 2,383 | | | $ | 47,718 | | | | | | | | | | | | 1,358 | | | $ | 19,820 | | | | | |
| Class T | | | | | | | 3 | | | | 52 | | | | | | | | | | | | — | | | | — | | | | | |
Class S | | | | | | | 19,679 | | | | 399,090 | | | | | | | | | | | | 14,587 | | | | 215,456 | | | | | |
Institutional Class | | | | | | | 3,604 | | | | 72,972 | | | | | | | | | | | | 381 | | | | 5,617 | | | | | |
| | | | | | | | | | | $ | 519,832 | | | | | | | | | | | | | | | $ | 240,893 | | | | | |
|
Shares redeemed | |
Class A | | | | | | | (89,979 | ) | | $ | (1,874,718 | ) | | | | | | | | | | | (179,068 | ) | | $ | (2,874,160 | ) | | | | |
Class C | | | | | | | (17,480 | ) | | | (320,948 | ) | | | | | | | | | | | (34,547 | ) | | | (515,649 | ) | | | | |
Class S | | | | | | | (430,746 | ) | | | (9,051,572 | ) | | | | | | | | | | | (676,646 | ) | | | (11,668,974 | ) | | | | |
Institutional Class | | | | | | | (70,378 | ) | | | (1,481,951 | ) | | | | | | | | | | | (71,470 | ) | | | (1,327,054 | ) | | | | |
| | | | | | | | | | | $ | (12,729,189 | ) | | | | | | | | | | | | | | $ | (16,385,837 | ) | | | | |
|
Net increase (decrease) | |
Class A | | | | | | | 39,357 | | | $ | 812,544 | | | | | | | | | | | | (11,807 | ) | | $ | 75,698 | | | | | |
Class T | | | | | | | 3 | | | | 52 | | | | | | | | | | | | 570 | * | | | 10,001 | * | | | | |
Class C | | | | | | | 92,753 | | | | 1,704,895 | | | | | | | | | | | | 35,490 | | | | 599,897 | | | | | |
Class S | | | | | | | 922,652 | | | | 19,680,077 | | | | | | | | | | | | 367,653 | | | | 6,563,440 | | | | | |
Institutional Class | | | | | | | 346,202 | | | | 7,305,524 | | | | | | | | | | | | 404,355 | | | | 7,343,051 | | | | | |
| | | | | | | | | | | $ | 29,503,092 | | | | | | | | | | | | | | | $ | 14,592,087 | | | | | |
| * | For the period from June 5, 2017 (commencement of operations of Class T) to October 31, 2017. |
| | | | | | |
| 34 | | | | | Deutsche Emerging Markets Equity Fund | | |
G. Name Changes
In connection with adoption of the DWS brand, effective on or about July 2, 2018, Deutsche Investment Management Americas Inc., the Advisor, will be renamed to DWS Investment Management Americas, Inc. In addition, the “Deutsche Funds” will become known as the “DWS Funds.” As a result, Deutsche Emerging Markets Equity Fund will be renamed DWS Emerging Markets Equity Fund.
| | | | | | | | |
| | Deutsche Emerging Markets Equity Fund | | | | | | 35 | |
Information About Your Fund’s Expenses
As an investor of the Fund, you incur two types of costs: ongoing expenses and transaction costs. Ongoing expenses include management fees, distribution and service (12b-1) fees and other Fund expenses. Examples of transaction costs include sales charges (loads) and account maintenance fees, which are not shown in this section. The following tables are intended to help you understand your ongoing expenses (in dollars) of investing in the Fund and to help you compare these expenses with the ongoing expenses of investing in other mutual funds. In the most recent six-month period, the Fund limited these expenses; had it not done so, expenses would have been higher. The example in the table is based on an investment of $1,000 invested at the beginning of the six-month period and held for the entire period (November 1, 2017 to April 30, 2018).
The tables illustrate your Fund’s expenses in two ways:
| – | Actual Fund Return. This helps you estimate the actual dollar amount of ongoing expenses (but not transaction costs) paid on a $1,000 investment in the Fund using the Fund’s actual return during the period. To estimate the expenses you paid over the period, simply divide your account value by $1,000 (for example, an $8,600 account value divided by $1,000 = 8.6), then multiply the result by the number in the “Expenses Paid per $1,000” line under the share class you hold. |
| – | Hypothetical 5% Fund Return. This helps you to compare your Fund’s ongoing expenses (but not transaction costs) with those of other mutual funds using the Fund’s actual expense ratio and a hypothetical rate of return of 5% per year before expenses. Examples using a 5% hypothetical fund return may be found in the shareholder reports of other mutual funds. The hypothetical account values and expenses may not be used to estimate the actual ending account balance or expenses you paid for the period. |
Please note that the expenses shown in these tables are meant to highlight your ongoing expenses only and do not reflect any transaction costs. The “Expenses Paid per $1,000” line of the tables is useful in comparing ongoing expenses only and will not help you determine the relative total expense of owning different funds. Subject to certain exceptions, an account maintenance fee of $20.00 assessed once per calendar year for Classes A, C and S shares may apply for accounts with balances less than $10,000. This fee is not included in these tables. If it was, the estimate of expenses paid for Classes A, C and S shares during the period would be higher, and account value during the period would be lower, by this amount.
| | | | | | |
| 36 | | | | | Deutsche Emerging Markets Equity Fund | | |
| | | | | | | | | | | | | | | | | | | | |
Expenses and Value of a $1,000 Investment
for the six months ended April 30, 2018 (Unaudited) | |
| | | | | |
| Actual Fund Return | | Class A | | | Class T | | | Class C | | | Class S | | | Institutional
Class | |
| Beginning Account Value 11/1/17 | | $ | 1,000.00 | | | $ | 1,000.00 | | | $ | 1,000.00 | | | $ | 1,000.00 | | | $ | 1,000.00 | |
| Ending Account Value 4/30/18 | | $ | 1,052.90 | | | $ | 1,052.90 | | | $ | 1,048.80 | | | $ | 1,053.50 | | | $ | 1,053.90 | |
| Expenses Paid per $1,000* | | $ | 5.85 | | | $ | 5.85 | | | $ | 9.65 | | | $ | 4.99 | | | $ | 4.58 | |
| | | | | |
Hypothetical 5%
Fund Return | | Class A | | | Class T | | | Class C | | | Class S | | | Institutional
Class | |
| Beginning Account Value 11/1/17 | | $ | 1,000.00 | | | $ | 1,000.00 | | | $ | 1,000.00 | | | $ | 1,000.00 | | | $ | 1,000.00 | |
| Ending Account Value 4/30/18 | | $ | 1,019.09 | | | $ | 1,019.09 | | | $ | 1,015.37 | | | $ | 1,019.93 | | | $ | 1,020.33 | |
| Expenses Paid per $1,000* | | $ | 5.76 | | | $ | 5.76 | | | $ | 9.49 | | | $ | 4.91 | | | $ | 4.51 | |
| * | Expenses are equal to the Fund’s annualized expense ratio for each share class, multiplied by the average account value over the period, multiplied by 181 (the number of days in the most recent six-month period), then divided by 365. |
| | | | | | | | | | | | | | | | | | | | |
| Annualized Expense Ratios | | Class A | | | Class T | | | Class C | | | Class S | | | Institutional
Class | |
| Deutsche Emerging Markets Equity Fund | | | 1.15 | % | | | 1.15 | % | | | 1.90 | % | | | 0.98 | % | | | 0.90 | % |
For more information, please refer to the Fund’s prospectus.
For an analysis of the fees associated with an investment in the Fund or similar funds, please refer to http://apps.finra.org/fundanalyzer/1/fa.aspx.
| | | | | | | | |
| | Deutsche Emerging Markets Equity Fund | | | | | | 37 | |
Advisory Agreement Board Considerations and Fee Evaluation
The Board of Directors (hereinafter referred to as the “Board” or “Directors”) approved the renewal of Deutsche Emerging Markets Equity Fund’s (the “Fund”) investment management agreement (the “Agreement”) with Deutsche Investment Management Americas Inc. (“DIMA”) and sub-advisory agreement (the “Sub-Advisory Agreement” and together with the Agreement, the “Agreements”) between DIMA and Deutsche Asset Management (Hong Kong) Limited (“DeAM HK”), an affiliate of DIMA, in September 2017.
| – | In terms of the process that the Board followed prior to approving the Agreements, shareholders should know that: |
| – | During the entire process, all of the Fund’s Directors were independent of DIMA and its affiliates (the “Independent Directors”). |
| – | The Board met frequently during the past year to discuss fund matters and dedicated a substantial amount of time to contract review matters. Over the course of several months, the Board’s Contract Committee reviewed extensive materials received from DIMA, independent third parties and independent counsel. These materials included an analysis of the Fund’s performance, fees and expenses, and profitability from a fee consultant retained by the Fund’s Independent Directors (the “Fee Consultant”). Based on its evaluation of the information provided, the Contract Committee presented its findings and recommendations to the Board. The Board then reviewed the Contract Committee’s findings and recommendations. |
| – | The Board also received extensive information throughout the year regarding performance of the Fund. |
| – | The Independent Directors regularly met privately with counsel to discuss contract review and other matters. In addition, the Independent Directors were advised by the Fee Consultant in the course of their review of the Fund’s contractual arrangements and considered a comprehensive report prepared by the Fee Consultant in connection with their deliberations. |
| – | In connection with reviewing the Agreements, the Board also reviewed the terms of the Fund’s Rule 12b-1 plan, distribution agreement, administrative services agreement, transfer agency agreement and other material service agreements. |
In connection with the contract review process, the Contract Committee and the Board considered the factors discussed below, among others. The Board also considered that DIMA and its predecessors have managed
| | | | | | |
| 38 | | | | | Deutsche Emerging Markets Equity Fund | | |
the Fund since its inception, and the Board believes that a long-term relationship with a capable, conscientious advisor is in the best interests of the Fund. The Board considered, generally, that shareholders chose to invest or remain invested in the Fund knowing that DIMA managed the Fund, and that the Agreement was approved by the Fund’s shareholders. DIMA and DeAM HK are part of Deutsche Bank AG’s (“Deutsche Bank”) Asset Management (“Deutsche AM”) division. Deutsche AM is a global asset management business that offers a wide range of investing expertise and resources, including research capabilities in many countries throughout the world.
As part of the contract review process, the Board carefully considered the fees and expenses of each Deutsche fund overseen by the Board in light of the fund’s performance. In many cases, this led to the negotiation and implementation of expense caps. As part of these negotiations, the Board indicated that it would consider relaxing these caps in future years following sustained improvements in performance, among other considerations.
While shareholders may focus primarily on fund performance and fees, the Fund’s Board considers these and many other factors, including the quality and integrity of DIMA’s and DeAM HK’s personnel and administrative support services provided by DIMA, such as back-office operations, fund valuations, and compliance policies and procedures.
Nature, Quality and Extent of Services. The Board considered the terms of the Agreements, including the scope of advisory services provided under the Agreements. The Board noted that, under the Agreements, DIMA and DeAM HK provide portfolio management services to the Fund and that, pursuant to a separate administrative services agreement, DIMA provides administrative services to the Fund. The Board considered the experience and skills of senior management and investment personnel and the resources made available to such personnel. Throughout the course of the year, the Board also received information regarding DIMA’s oversight of Fund sub-advisers, including DeAM HK. The Board reviewed the Fund’s performance over short-term and long-term periods and compared those returns to various agreed-upon performance measures, including market index(es) and a peer universe compiled using information supplied by Morningstar Direct (“Morningstar”), an independent fund data service. The Board also noted that it has put into place a process of identifying “Funds in Review” (e.g., funds performing poorly relative to a peer universe), and receives additional reporting from DIMA regarding such funds and, where appropriate, DIMA’s plans to address underperformance. The Board believes this process is an effective manner of identifying and addressing underperforming funds. Based on the information provided, the Board noted that, for the one-, three- and five-year periods ended December 31, 2016, the Fund’s performance
| | | | | | | | |
| | Deutsche Emerging Markets Equity Fund | | | | | | 39 | |
(Class A shares) was in the 2nd quartile, 2nd quartile and 3rd quartile, respectively, of the applicable Morningstar universe (the 1st quartile being the best performers and the 4th quartile being the worst performers). The Board also observed that the Fund has outperformed its benchmark in the three- and five-year periods and has underperformed its benchmark in the one-year period ended December 31, 2016.
Fees and Expenses. The Board considered the Fund’s investment management fee schedule, sub-advisory fee schedule, operating expenses and total expense ratios, and comparative information provided by Broadridge Financial Solutions, Inc. (“Broadridge”) and the Fee Consultant regarding investment management fee rates paid to other investment advisors by similar funds (1st quartile being the most favorable and 4th quartile being the least favorable). With respect to management fees paid to other investment advisors by similar funds, the Board noted that the contractual fee rates paid by the Fund, which include a 0.10% fee paid to DIMA under the Fund’s administrative services agreement, were higher than the median (3rd quartile) of the applicable Broadridge peer group (based on Broadridge data provided as of December 31, 2016). The Board considered that, effective May 1, 2017, DIMA agreed to reduce the Fund’s contractual management fee rate to an annual rate of 0.70%. With respect to the sub-advisory fee paid to DeAM HK, the Board noted that the fee is paid by DIMA out of its fee and not directly by the Fund. The Board noted that the Fund’s Class A shares total (net) operating expenses (excluding 12b-1 fees) were expected to be lower than the median of the applicable Broadridge expense universe (based on Broadridge data provided as of December 31, 2016, and analyzing Broadridge expense universe Class A (net) expenses less any applicable 12b-1 fees) (“Broadridge Universe Expenses”). The Board also reviewed data comparing each share class’s total (net) operating expenses to the applicable Broadridge Universe Expenses. The Board noted that the expense limitations agreed to by DIMA were expected to help the Fund’s total (net) operating expenses remain competitive. The Board considered the Fund’s management fee rate as compared to fees charged by DIMA to comparable Deutsche U.S. registered funds (“Deutsche Funds”) and considered differences between the Fund and the comparable Deutsche Funds. The information requested by the Board as part of its review of fees and expenses also included information about institutional accounts (including any sub-advised funds and accounts) and funds offered primarily to European investors (“Deutsche Europe funds”) managed by Deutsche AM. The Board noted that DIMA indicated that Deutsche AM manages Deutsche Europe funds comparable to the Fund, but does not manage any comparable institutional accounts. The Board took note of the differences in services provided to Deutsche Funds as compared to Deutsche Europe funds and that such differences made comparison difficult.
| | | | | | |
| 40 | | | | | Deutsche Emerging Markets Equity Fund | | |
On the basis of the information provided, the Board concluded that management fees were reasonable and appropriate in light of the nature, quality and extent of services provided by DIMA and DeAM HK.
Profitability. The Board reviewed detailed information regarding revenues received by DIMA under the Agreement. The Board considered the estimated costs to DIMA, and pre-tax profits realized by DIMA, from advising the Deutsche Funds, as well as estimates of the pre-tax profits attributable to managing the Fund in particular. The Board also received information regarding the estimated enterprise-wide profitability of DIMA and its affiliates with respect to all fund services in totality and by fund. The Board and the Fee Consultant reviewed DIMA’s methodology in allocating its costs to the management of the Fund. Based on the information provided, the Board concluded that the pre-tax profits realized by DIMA in connection with the management of the Fund were not unreasonable. The Board also reviewed certain publicly available information regarding the profitability of certain similar investment management firms. The Board noted that while information regarding the profitability of such firms is limited (and in some cases is not necessarily prepared on a comparable basis), DIMA and its affiliates’ overall profitability with respect to the Deutsche Funds (after taking into account distribution and other services provided to the funds by DIMA and its affiliates) was lower than the overall profitability levels of most comparable firms for which such data was available.
Economies of Scale. The Board considered whether there are economies of scale with respect to the management of the Fund and whether the Fund benefits from any economies of scale. In this regard, the Board observed that while the Fund’s current investment management fee schedule does not include breakpoints, the Fund’s fee schedule represents an appropriate sharing between the Fund and DIMA of such economies of scale as may exist in the management of the Fund at current asset levels.
Other Benefits to DIMA and Its Affiliates. The Board also considered the character and amount of other incidental benefits received by DIMA and its affiliates, including any fees received by DIMA for administrative services provided to the Fund, any fees received by an affiliate of DIMA for transfer agency services provided to the Fund and any fees received by an affiliate of DIMA for distribution services. The Board also considered benefits to DIMA related to brokerage and soft-dollar allocations, including allocating brokerage to pay for research generated by parties other than the executing broker dealers, which pertain primarily to funds investing in equity securities. In addition, the Board considered the incidental public relations benefits to DIMA related to Deutsche Funds advertising and cross-selling opportunities among DIMA products and services. The Board
| | | | | | | | |
| | Deutsche Emerging Markets Equity Fund | | | | | | 41 | |
considered these benefits in reaching its conclusion that the Fund’s management fees were reasonable.
Compliance. The Board considered the significant attention and resources dedicated by DIMA to documenting and enhancing its compliance processes in recent years. The Board noted in particular (i) the experience, seniority and time commitment of the individuals serving as DIMA’s and the Fund’s chief compliance officers; (ii) the large number of DIMA compliance personnel; and (iii) the substantial commitment of resources by DIMA and its affiliates to compliance matters.
Based on all of the information considered and the conclusions reached, the Board unanimously determined that the continuation of the Agreements is in the best interests of the Fund. In making this determination, the Board did not give particular weight to any single factor identified above. The Board considered these factors over the course of numerous meetings, certain of which were in executive session with only the Independent Directors and counsel present. It is possible that individual Independent Directors may have weighed these factors differently in reaching their individual decisions to approve the continuation of the Agreements.
Advisory Agreement Amendment
At a meeting held in May 2017, the Board of Directors, all members of which are Independent Directors, approved an amendment to the Fund’s Agreement to adopt a revised management fee schedule reducing DIMA’s management fee under the Agreement. The revised management fee schedule took effect as of May 1, 2017.
In connection with its review of the amendment in May 2017, the Board noted that it most recently approved the renewal of the Agreement pursuant to a process that concluded in September 2016. The Board also received a report from a fee consultant retained by the Board regarding the revised management fee schedule. In addition, the Board considered:
| — | With the exception of the revised management fee schedule, the terms of the Agreement remained the same. |
| — | DIMA’s statement that there would be no reduction in services to the Fund as a result of the revised management fee schedule. |
Based on all of the information considered, the Board concluded that the revised management fee schedule was reasonable and appropriate in light of the nature, quality and extent of services provided by DIMA. The Board unanimously determined that approval of the revised management fee schedule was in the best interests of the Fund.
| | | | | | |
| 42 | | | | | Deutsche Emerging Markets Equity Fund | | |
Account Management Resources
| | |
| For More Information | | The automated telephone system allows you to access personalized account information and obtain information on other Deutsche funds using either your voice or your telephone keypad. Certain account types within Classes A, T, C and S also have the ability to purchase, exchange or redeem shares using this system. For more information, contact your financial advisor. You may also access our automated telephone system or speak with a Shareholder Service representative by calling: (800) 728-3337 |
| Web Site | | dws.com View your account transactions and balances, trade shares, monitor your asset allocation, subscribe to fund and account updates by e-mail, and change your address, 24 hours a day. Obtain prospectuses and applications, news about Deutsche funds, insight from DWS economists and investment specialists and access to Deutsche fund account information. |
| Written Correspondence | | DWS PO Box 219151 Kansas City, MO 64121-9151 |
| Proxy Voting | | The Fund’s policies and procedures for voting proxies for portfolio securities and information about how the Fund voted proxies related to its portfolio securities during the most recent 12-month period ended June 30 are available on our Web site — dws.com/en-us/resources/proxy-voting — or on the SEC’s Web site — sec.gov. To obtain a written copy of the fund’s policies and procedures without charge, upon request, call us toll free at (800) 728-3337. |
| Portfolio Holdings | | Following the Fund’s fiscal first and third quarter-end, a complete portfolio holdings listing is filed with the SEC on Form N-Q. This form will be available on the SEC’s Web site at sec.gov, and it also may be reviewed and copied at the SEC’s Public Reference Room in Washington, D.C. Information on the operation of the SEC’s Public Reference Room may be obtained by calling (800) SEC-0330. The Fund’s portfolio holdings are also posted on dws.com from time to time. Please see the Fund’s current prospectus for more information. |
| Principal Underwriter | | If you have questions, comments or complaints, contact: DWS Distributors, Inc. 222 South Riverside Plaza Chicago, IL 60606-5808 (800) 621-1148 |
| | | | | | | | |
| | Deutsche Emerging Markets Equity Fund | | | | | | 43 | |
| | | | | | | | | | |
| Investment Management | | Deutsche Investment Management Americas Inc. (“DIMA” or the “Advisor”), which is part of DWS Group, is the investment advisor for the Fund. DIMA and its predecessors have more than 90 years of experience managing mutual funds and DIMA provides a full range of investment advisory services to both institutional and retail clients. DIMA is an indirect, wholly owned subsidiary of DWS Group. DWS Group is a global organization that offers a wide range of investing expertise and resources, including hundreds of portfolio managers and analysts and an office network that reaches the world’s major investment centers. This well-resourced global investment platform brings together a wide variety of experience and investment insight across industries, regions, asset classes and investing styles. |
| | | | | |
| | | Class A | | Class T | | Class C | | Class S | | Institutional
Class |
| Nasdaq Symbol | | SEKAX | | SEKTX | | SEKCX | | SEMGX | | SEKIX |
| CUSIP Number | | 25156G 103 | | 25156G 566 | | 25156G 301 | | 25156G 400 | | 25156G 780 |
| Fund Number | | 479 | | 1779 | | 779 | | 2079 | | 1479 |
| | | | | | |
| 44 | | | | | Deutsche Emerging Markets Equity Fund | | |
Privacy Statement
| | |
| FACTS | | What Does DWS Do With Your Personal Information? |
| Why? | | Financial companies choose how they share your personal information. Federal law gives consumers the right to limit some but not all sharing. Federal law also requires us to tell you how we collect, share and protect your personal information. Please read this notice carefully to understand what we do. |
| What? | | The types of personal information we collect and share can include: — Social Security number — Account balances — Purchase and transaction history — Bank account information — Contact information such as mailing address, e-mail address and telephone number |
| How? | | All financial companies need to share customers’ personal information to run their everyday business. In the section below, we list the reasons financial companies can share their customers’ personal information, the reasons DWS chooses to share and whether you can limit this sharing. |
| | | | |
Reasons we can share your personal
information | | Does DWS share? | | Can you limit
this sharing? |
For our everyday business purposes —
such as to process your transactions, maintain your account(s), respond to court orders or legal investigations | | Yes | | No |
| For our marketing purposes — to offer our products and services to you | | Yes | | No |
| For joint marketing with other financial companies | | No | | We do not share |
| For our affiliates’ everyday business purposes — information about your transactions and experiences | | No | | We do not share |
| For our affiliates’ everyday business purposes — information about your creditworthiness | | No | | We do not share |
| For non-affiliates to market to you | | No | | We do not share |
| | |
| Questions? | | Call (800) 728-3337 or e-mail us at service@dws.com |
| | | | | | | | |
| | Deutsche Emerging Markets Equity Fund | | | | | | 45 | |
| | |
|
| Who we are | | |
| Who is providing this notice? | | DWS Distributors, Inc; Deutsche Investment Management Americas Inc.; Deutsche AM Trust Company; the Deutsche Funds |
| What we do | | |
| How does DWS protect my personal information? | | To protect your personal information from unauthorized access and use, we use security measures that comply with federal law. These measures include computer safeguards and secured files and buildings. |
| How does DWS collect my personal information? | | We collect your personal information, for example, when you: — open an account — give us your contact information — provide bank account information for ACH or wire transactions — tell us where to send money — seek advice about your investments |
| Why can’t I limit all sharing? | | Federal law gives you the right to limit only — sharing for affiliates’ everyday business purposes — information about your creditworthiness — affiliates from using your information to market to you — sharing for non-affiliates to market to you State laws and individual companies may give you additional rights to limit sharing. |
| Definitions | | |
| Affiliates | | Companies related by common ownership or control. They can be financial or non-financial companies. Our affiliates include financial companies with the DWS or Deutsche Bank (“DB”) name, such as DB AG Frankfurt. |
| Non-affiliates | | Companies not related by common ownership or control. They can be financial and non-financial companies. Non-affiliates we share with include account service providers, service quality monitoring services, mailing service providers and verification services to help in the fight against money laundering and fraud. |
| Joint marketing | | A formal agreement between non-affiliated financial companies that together market financial products or services to you. DWS does not jointly market. |
| | Rev. 3/2018 |
| | | | | | |
| 46 | | | | | Deutsche Emerging Markets Equity Fund | | |
DEMEF-3
(R-027567-7 6/18)
| | |
| ITEM 2. | CODE OF ETHICS |
| | |
| | Not applicable. |
| | |
| ITEM 3. | AUDIT COMMITTEE FINANCIAL EXPERT |
| | |
| | Not applicable |
| | |
| ITEM 4. | PRINCIPAL ACCOUNTANT FEES AND SERVICES |
| | |
| | Not applicable |
| | |
| ITEM 5. | AUDIT COMMITTEE OF LISTED REGISTRANTS |
| | |
| | Not applicable |
| | |
| ITEM 6. | SCHEDULE OF INVESTMENTS |
| | |
| | Not applicable |
| | |
| ITEM 7. | DISCLOSURE OF PROXY VOTING POLICIES AND PROCEDURES FOR CLOSED-END MANAGEMENT INVESTMENT COMPANIES |
| | |
| | Not applicable |
| | |
| ITEM 8. | PORTFOLIO MANAGERS OF CLOSED-END MANAGEMENT INVESTMENT COMPANIES |
| | |
| | Not applicable |
| | |
| ITEM 9. | PURCHASES OF EQUITY SECURITIES BY CLOSED-END MANAGEMENT INVESTMENT COMPANY AND AFFILIATED PURCHASERS |
| | |
| | Not applicable |
| | |
| ITEM 10. | SUBMISSION OF MATTERS TO A VOTE OF SECURITY HOLDERS |
| | |
| | There were no material changes to the procedures by which shareholders may recommend nominees to the Fund’s Board. The primary function of the Nominating and Governance Committee is to identify and recommend individuals for membership on the Board and oversee the administration of the Board Governance Guidelines. Shareholders may recommend candidates for Board positions by forwarding their correspondence by U.S. mail or courier service to Keith R. Fox, Deutsche Funds Board Chair, c/o Thomas R. Hiller, Ropes & Gray LLP, Prudential Tower, 800 Boylston Street, Boston, MA 02199-3600. |
| | |
| ITEM 11. | CONTROLS AND PROCEDURES |
| | |
| | (a) | The Chief Executive and Financial Officers concluded that the Registrant’s Disclosure Controls and Procedures are effective based on the evaluation of the Disclosure Controls and Procedures as of a date within 90 days of the filing date of this report. |
| | |
| | (b) | There have been no changes in the registrant’s internal control over financial reporting that occurred during the second fiscal quarter of the period covered by this report that has materially affected, or is reasonably likely to materially affect, the registrant’s internal controls over financial reporting. |
| | |
| ITEM 12. | Disclosure of Securities Lending Activities for Closed-End Management Investment Companies. |
| | |
| | Not applicable |
| | |
| ITEM 13. | EXHIBITS |
| | |
| | (a)(1) | Not applicable |
| | |
| | (a)(2) | Certification pursuant to Rule 30a-2(a) under the Investment Company Act of 1940 (17 CFR 270.30a-2(a)) is filed and attached hereto as Exhibit 99.CERT. |
| | |
| | (b) | Certification pursuant to Rule 30a-2(b) under the Investment Company Act of 1940 (17 CFR 270.30a-2(b)) is furnished and attached hereto as Exhibit 99.906CERT. |
SIGNATURES
Pursuant to the requirements of the Securities Exchange Act of 1934 and the Investment Company Act of 1940, the registrant has duly caused this report to be signed on its behalf by the undersigned, thereunto duly authorized.
| Registrant: | Deutsche Emerging Markets Equity Fund, a series of Deutsche International Fund, Inc. |
| | |
| | |
| By: | /s/Hepsen Uzcan Hepsen Uzcan President |
| | |
| Date: | 6/29/2018 |
Pursuant to the requirements of the Securities Exchange Act of 1934 and the Investment Company Act of 1940, this report has been signed below by the following persons on behalf of the registrant and in the capacities and on the dates indicated.
| By: | /s/Hepsen Uzcan Hepsen Uzcan President |
| | |
| Date: | 6/29/2018 |
| | |
| | |
| | |
| By: | /s/Paul Schubert Paul Schubert Chief Financial Officer and Treasurer |
| | |
| Date: | 6/29/2018 |