UNITED STATES
SECURITIES AND EXCHANGE COMMISSION
WASHINGTON, D. C. 20549
FORM N-CSRS
Investment Company Act file number: 811-00642
Deutsche International Fund, Inc.
(Exact Name of Registrant as Specified in Charter)
345 Park Avenue
New York, NY 10154-0004
(Address of Principal Executive Offices) (Zip Code)
Registrant’s Telephone Number, including Area Code: (212) 250-3220
Paul Schubert
345 Park Avenue
New York, NY 10154-0004
(Name and Address of Agent for Service)
| Date of fiscal year end: | 10/31 |
| | |
| Date of reporting period: | 4/30/2018 |
| ITEM 1. | REPORT TO STOCKHOLDERS |
| | |
April 30, 2018
Semiannual Report
to Shareholders
Deutsche Global Macro Fund
(Effective on or about July 2, 2018, Deutsche Global Macro Fund will be renamed DWS Global Macro Fund.)

Contents
The brand DWS represents DWS Group GmbH & Co. KGaA and any of its subsidiaries such as DWS Distributors, Inc. which offers investment products or Deutsche Investment Management Americas Inc and RREEF America L.L.C. which offer advisory services.
NOT FDIC/NCUA INSURED NO BANK GUARANTEE MAY LOSE VALUE NOT A DEPOSIT NOT INSURED BY ANY FEDERAL GOVERNMENT AGENCY
| | | | | | |
| 2 | | | | | Deutsche Global Macro Fund | | |
This report must be preceded or accompanied by a prospectus. To obtain a summary prospectus, if available, or prospectus for any of our funds, refer to the Account Management Resources information provided in the back of this booklet. We advise you to consider the Fund’s objectives, risks, charges and expenses carefully before investing. The summary prospectus and prospectus contain this and other important information about the Fund. Please read the prospectus carefully before you invest.
Investments in mutual funds involve risk. Stocks may decline in value. Investing in foreign securities presents certain risks, such as currency fluctuations, political and economic changes, and market risks. The Fund’s use of forward currency contracts may not be successful in hedging currency exchange rates changes and could eliminate some or all of the benefit of an increase in the value of a foreign currency versus the US dollar. Because Exchange Traded Funds (ETFs) trade on a securities exchange, their shares may trade at a premium or discount to their net asset value. ETFs also incur fees and expenses so they may not fully match the performance of the indexes they are designed to track. Fund management could be wrong in its analysis of industries, companies, economic trends and favor a security that underperforms the market. Investing in derivatives entails special risks relating to liquidity, leverage and credit that may reduce returns and/or increase volatility. Market price movements or regulatory and economic changes will have a significant impact on the Fund’s performance. The Fund may lend securities to approved institutions. A counterparty with whom the Fund does business may decline in financial health and become unable to honor its commitments, which could cause losses for the Fund. In certain situations, it may be difficult or impossible to sell an investment at an acceptable price. Although allocation among different asset categories generally limits risk, fund management may favor an asset category that underperforms other assets or markets as a whole. Any fund that focuses in a particular segment of the market or region of the world will generally be more volatile than a fund that invests more broadly. Investments in lower-quality (“junk bonds”) and non-rated securities present greater risk of loss than investments in higher-quality securities. Companies in the infrastructure, transportation, energy and utility industries may be affected by a variety of factors, including, but not limited to, high interest costs, energy prices, high degrees of leverage, environmental and other government regulations, the level of government spending on infrastructure projects, intense competition and other factors. As interest rates change, issuers of higher (or lower) interest debt obligations may pay off the debts earlier (or later) than expected causing the Fund to reinvest proceeds at lower yields (or be tied up in lower interest debt obligations). Please read the prospectus for details.
| | | | | | | | |
| | Deutsche Global Macro Fund | | | | | | 3 | |
Letter to Shareholders
Dear Shareholder:
You may have noticed a new logo appearing on the cover of this report. As of March 23, 2018, Deutsche Asset Management has adopted its existing European brand, DWS, globally. As we have consolidated several businesses over the last several years, each of which has grown up relatively independently, the time has now come to be united under a single brand that reflects our global identity and the full breadth of capabilities we offer to our clients.
The DWS brand — Deutsche Gesellschaft für Wertpapiersparen — draws on our roots in the German market, going back over 60 years. It was established in Hamburg in 1956 with a singular objective: to assist private investors in building wealth and managing risk. We have been fulfilling that promise for generations. Today, the DWS name is synonymous with the values that we have continuously lived up to, and those that will remain central to our future success: Excellence, Entrepreneurship, Sustainability and Integrity. It is therefore a name that we are proud to adopt and build upon as our brand here in the Americas.
In connection with this change, our web site has recently been redesigned with a new address: dws.com. However, for your convenience, the deutschefunds.com address will remain live and automatically redirect you to our new site. Please visit us online to find the most current insights from our CIO, economists and investment specialists.
As always, thank you for your ongoing trust in us. We look forward to bringing you the very best in investment insight, strategies and solutions as we march forward gathering our unique qualities and capabilities under one roof, DWS.
Best regards,
| | |
 | | 
Hepsen Uzcan President, Deutsche Funds |
Assumptions, estimates and opinions contained in this document constitute our judgment as of the date of the document and are subject to change without notice. Any projections are based on a number of assumptions as to market conditions and there can be no guarantee that any projected results will be achieved. Past performance is not a guarantee of future results.
| | | | | | |
| 4 | | | | | Deutsche Global Macro Fund | | |
| | |
| Performance Summary | | April 30, 2018 (Unaudited) |
| | | | | | | | | | | | | | | | |
| Class A | | 6-Month‡ | | | 1-Year | | | 5-Year | | | 10-Year | |
| Average Annual Total Returns as of 4/30/18 | |
| Unadjusted for Sales Charge | | | –0.91% | | | | 2.18% | | | | 5.15% | | | | 0.86% | |
Adjusted for the Maximum Sales Charge
(max 5.75% load) | | | –6.61% | | | | –3.69% | | | | 3.91% | | | | 0.27% | |
| ICE Bank of America Merrill Lynch U.S. 3-Month Treasury Bill Index† | | | 0.68% | | | | 1.17% | | | | 0.36% | | | | 0.34% | |
| Average Annual Total Returns as of 3/31/18 (most recent calendar quarter end) | |
| Unadjusted for Sales Charge | | | | | | | 3.11% | | | | 5.73% | | | | 1.18% | |
Adjusted for the Maximum Sales Charge
(max 5.75% load) | | | | | | | –2.82% | | | | 4.48% | | | | 0.58% | |
| ICE Bank of America Merrill Lynch U.S. 3-Month Treasury Bill Index† | | | | | | | 1.11% | | | | 0.34% | | | | 0.34% | |
| | | | |
| Class C | | 6-Month‡ | | | 1-Year | | | 5-Year | | | 10-Year | |
| Average Annual Total Returns as of 4/30/18 | |
| Unadjusted for Sales Charge | | | –1.28% | | | | 1.43% | | | | 4.37% | | | | 0.10% | |
Adjusted for the Maximum Sales Charge
(max 1.00% CDSC) | | | –2.27% | | | | 1.43% | | | | 4.37% | | | | 0.10% | |
| ICE Bank of America Merrill Lynch U.S. 3-Month Treasury Bill Index† | | | 0.68% | | | | 1.17% | | | | 0.36% | | | | 0.34% | |
| Average Annual Total Returns as of 3/31/18 (most recent calendar quarter end) | |
| Unadjusted for Sales Charge | | | | | | | 2.38% | | | | 4.93% | | | | 0.42% | |
Adjusted for the Maximum Sales Charge
(max 1.00% CDSC) | | | | | | | 2.38% | | | | 4.93% | | | | 0.42% | |
| ICE Bank of America Merrill Lynch U.S. 3-Month Treasury Bill Index† | | | | | | | 1.11% | | | | 0.34% | | | | 0.34% | |
| | | | |
| Class R | | 6-Month‡ | | | 1-Year | | | 5-Year | | | 10-Year | |
| Average Annual Total Returns as of 4/30/18 | |
| No Sales Charges | | | –1.04% | | | | 1.94% | | | | 4.89% | | | | 0.66% | |
| ICE Bank of America Merrill Lynch U.S. 3-Month Treasury Bill Index† | | | 0.68% | | | | 1.17% | | | | 0.36% | | | | 0.34% | |
| Average Annual Total Returns as of 3/31/18 (most recent calendar quarter end) | |
| No Sales Charges | | | | | | | 2.89% | | | | 5.47% | | | | 0.98% | |
| ICE Bank of America Merrill Lynch U.S. 3-Month Treasury Bill Index† | | | | | | | 1.11% | | | | 0.34% | | | | 0.34% | |
| | | | | | | | |
| | Deutsche Global Macro Fund | | | | | | 5 | |
| | | | | | | | | | | | | | | | |
| | | | |
| Class S | | 6-Month‡ | | | 1-Year | | | 5-Year | | | 10-Year | |
| Average Annual Total Returns as of 4/30/18 | |
| No Sales Charges | | | –0.83% | | | | 2.45% | | | | 5.34% | | | | 1.10% | |
| ICE Bank of America Merrill Lynch U.S. 3-Month Treasury Bill Index† | | | 0.68% | | | | 1.17% | | | | 0.36% | | | | 0.34% | |
| Average Annual Total Returns as of 3/31/18 (most recent calendar quarter end) | |
| No Sales Charges | | | | | | | 3.30% | | | | 5.91% | | | | 1.41% | |
| ICE Bank of America Merrill Lynch U.S. 3-Month Treasury Bill Index† | | | | | | | 1.11% | | | | 0.34% | | | | 0.34% | |
| | | | |
| Institutional Class | | 6-Month‡ | | | 1-Year | | | 5-Year | | | 10-Year | |
| Average Annual Total Returns as of 4/30/18 | |
| No Sales Charges | | | –0.82% | | | | 2.44% | | | | 5.40% | | | | 1.19% | |
| ICE Bank of America Merrill Lynch U.S. 3-Month Treasury Bill Index† | | | 0.68% | | | | 1.17% | | | | 0.36% | | | | 0.34% | |
| Average Annual Total Returns as of 3/31/18 (most recent calendar quarter end) | |
| No Sales Charges | | | | | | | 3.40% | | | | 5.97% | | | | 1.50% | |
| ICE Bank of America Merrill Lynch U.S. 3-Month Treasury Bill Index† | | | | | | | 1.11% | | | | 0.34% | | | | 0.34% | |
Performance in the Average Annual Total Returns table(s) above and the Growth of an Assumed $10,000 Investment line graph that follows is historical and does not guarantee future results. Investment return and principal fluctuate, so your shares may be worth more or less when redeemed. Current performance may differ from performance data shown. Please visit dws.com for the Fund’s most recent month-end performance. Fund performance includes reinvestment of all distributions. Unadjusted returns do not reflect sales charges and would have been lower if they had.
The gross expense ratios of the Fund, as stated in the fee table of the prospectus dated February 1, 2018 are 2.57%, 3.28%, 2.88%, 2.35% and 2.19% for Class A, Class C, Class R, Class S and Institutional Class shares, respectively, and may differ from the expense ratios disclosed in the Financial Highlights tables in this report.
Index returns do not reflect any fees or expenses and it is not possible to invest directly into an index.
Performance figures do not reflect the deduction of taxes that a shareholder would pay on fund distributions or the redemption of fund shares.
Prior to May 8, 2017, this Fund was known as Deutsche Global Equity Fund. The Fund’s investment objective, strategy and portfolio management team also changed on that date. All returns, rankings and ratings prior to May 8, 2017 were achieved with a different objective, strategy and portfolio management Please see the prospectus for details.
Generally accepted accounting principles require adjustments to be made to the net assets of the Fund at period end for financial reporting purposes only, and as such, the total return based on the unadjusted net asset value per share may differ from the total return reported in the financial highlights.
| | | | | | |
| 6 | | | | | Deutsche Global Macro Fund | | |
|
Growth of an Assumed $10,000 Investment
(Adjusted for Maximum Sales Charge) |
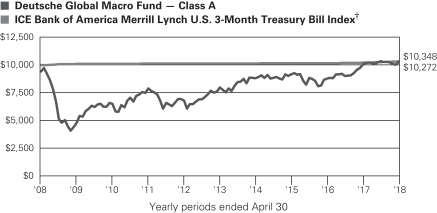
The Fund’s growth of an assumed $10,000 investment is adjusted for the maximum sales charge of 5.75%. This results in a net initial investment of $9,425.
The growth of $10,000 is cumulative.
Performance of other share classes will vary based on the sales charges and the fee structure of those classes.
| † | ICE Bank of America Merrill Lynch U.S. 3-Month Treasury Bill Index (name changed from Bank of America Merrill Lynch U.S. 3-Month Treasury Bill Index effective October 22, 2017) tracks the performance of the U.S. dollar denominated U.S. Treasury Bills publicly issued in the U.S. domestic market with a remaining term to final maturity of less than three months. |
| ‡ | Total returns shown for periods less than one year are not annualized. |
| | | | | | | | | | | | | | | | | | | | |
| | | Class A | | | Class C | | | Class R | | | Class S | | | Institutional
Class | |
| Net Asset Value | | | | | | | | | | | | | | | | | | | | |
| 4/30/18 | | $ | 9.83 | | | $ | 9.22 | | | $ | 9.47 | | | $ | 9.61 | | | $ | 9.64 | |
| 10/31/17 | | $ | 9.92 | | | $ | 9.34 | | | $ | 9.57 | | | $ | 9.69 | | | $ | 9.72 | |
| | | | | | | | |
| | Deutsche Global Macro Fund | | | | | | 7 | |
Portfolio Management Team
Henning Potstada, Managing Director
Portfolio Manager of the Fund. Began managing the Fund in 2017.
| — | Portfolio Manager for Multi Asset: Frankfurt. |
| — | MBA, University of Bayreuth, Germany. |
Christoph-Arend Schmidt, CFA, Vice President
Portfolio Manager of the Fund. Began managing the Fund in 2017.
| — | Joined Deutsche Asset Management in 2008. |
| — | Portfolio Manager for Multi Asset: Frankfurt. |
| — | MBA, University of Bayreuth, Germany. |
Stefan Flasdick, Vice President
Portfolio Manager of the Fund. Began managing the Fund in 2017.
| — | Joined DWS in 2004 with 11 years of industry experience. Prior to his current role, he served as a portfolio manager in Deutsche Bank Private Wealth Management. Previously, he served in Futures & Options Sales for Germany & Austria at JP Morgan in London and Frankfurt. He began his career as a Trainee in Treasury and F&O Sales at BfG Bank / Credit Lyonnais. |
| | | | | | |
| 8 | | | | | Deutsche Global Macro Fund | | |
| | |
| Portfolio Summary | | (Unaudited) |
| | | | | | | | |
| | |
Asset Allocation (As a % of Investment Portfolio excluding
Securities Lending Collateral) | | 4/30/18 | | | 10/31/17 | |
| Common Stocks | | | 43% | | | | 45% | |
| Corporate Bonds | | | 21% | | | | 20% | |
| Cash Equivalents | | | 17% | | | | 19% | |
| Sovereign Bonds | | | 11% | | | | 8% | |
| Fixed Income Exchange-Traded Funds | | | 6% | | | | 6% | |
| Convertible Bonds | | | 1% | | | | 1% | |
| U.S. Treasury Obligations | | | 1% | | | | 1% | |
| Preferred Stock | | | 0% | | | | — | |
| | | | 100% | | | | 100% | |
| | |
Geographical Diversification (As a % of Investment
Portfolio excluding Exchange Traded Funds, Cash Equivalents and
Securities Lending Collateral) | | 4/30/18 | | | 10/31/17 | |
| United States | | | 25% | | | | 25% | |
| Germany | | | 18% | | | | 17% | |
| Italy | | | 15% | | | | 12% | |
| France | | | 11% | | | | 13% | |
| Netherlands | | | 9% | | | | 8% | |
| United Kingdom | | | 6% | | | | 7% | |
| Switzerland | | | 5% | | | | 4% | |
| Mexico | | | 3% | | | | 3% | |
| Japan | | | 2% | | | | 4% | |
| Spain | | | 2% | | | | 3% | |
| Taiwan | | | 2% | | | | 2% | |
| Other | | | 2% | | | | 2% | |
| | | | 100% | | | | 100% | |
| | |
Sector Diversification (As a % of Common Stocks,
Corporate Bonds and Convertible Bonds) | | 4/30/18 | | | 10/31/17 | |
| Financials | | | 24% | | | | 21% | |
| Telecommunication Services | | | 18% | | | | 13% | |
| Energy | | | 12% | | | | 12% | |
| Information Technology | | | 12% | | | | 12% | |
| Health Care | | | 10% | | | | 9% | |
| Materials | | | 10% | | | | 13% | |
| Consumer Staples | | | 8% | | | | 9% | |
| Consumer Discretionary | | | 3% | | | | 6% | |
| Industrials | | | 3% | | | | 3% | |
| Utilities | | | — | | | | 2% | |
| | | | 100% | | | | 100% | |
| | | | | | | | |
| | Deutsche Global Macro Fund | | | | | | 9 | |
| | | | | | | | | | |
Five Largest Equity Holdings at April 30, 2018 (12.6% of Net Assets) | | Country | | Percent | |
| | 1 | | | Deutsche Telekom AG | | | | | | |
| | | | | Offers fixed-line and mobile telephone and information technology services for businesses | | Germany | | | 5.4 | % |
| | 2 | | | Alphabet, Inc. | | | | | | |
| | | | | Provides Web-based search, maps, hardware products and various software applications | | United States | | | 2.1 | % |
| | 3 | | | Evonik Industries AG | | | | | | |
| | | | | Manufactures specialty chemicals | | Germany | | | 1.9 | % |
| | 4 | | | Novartis AG | | | | | | |
| | | | | Manufacturer of pharmaceutical and nutrition products | | Switzerland | | | 1.6 | % |
| | 5 | | | BASF SE | | | | | | |
| | | | | Offers chemicals products for various industries | | Germany | | | 1.6 | % |
| | | | | | | | | | |
Five Largest Fixed-Income Long-Term Securities
at April 30, 2018 (15.9% of Net Assets) | | Country | | Percent | |
| | 1 | | | Republic of Italy | | | | | | |
| | | | | 0.7%, 5/1/2020 | | Italy | | | 5.6 | % |
| | 2 | | | Republic of Italy | | | | | | |
| | | | | 4.5%, 2/1/2020 | | Italy | | | 3.1 | % |
| | 3 | | | BNP Paribas SA | | | | | | |
| | | | | 0.521%, 9/22/2022 | | France | | | 2.4 | % |
| | 4 | | | HSBC Holdings PLC | | | | | | |
| | | | | 0.371%, 9/27/2022 | | United Kingdom | | | 2.4 | % |
| | 5 | | | The Goldman Sachs Group, Inc | | | | | | |
| | | | | 0.673%, 7/27/2021 | | United States | | | 2.4 | % |
Portfolio holdings and characteristics are subject to change.
For more complete details about the Fund’s investment portfolio, see page 11. A quarterly Fact Sheet is available on dws.com or upon request. Please see the Account Management Resources section on page 48 for contact information.
| | | | | | |
| 10 | | | | | Deutsche Global Macro Fund | | |
| | |
| Investment Portfolio | | as of April 30, 2018 (Unaudited) |
| | | | | | | | | | | | |
| | | | | | Shares | | | Value ($) | |
| Common Stocks 42.5% | | | | | | | | | | | | |
| France 5.1% | | | | | | | | | | | | |
AXA SA (a) | | | | | | | 7,986 | | | | 227,927 | |
Danone SA | | | | | | | 1,519 | | | | 122,800 | |
Essilor International Cie Generale d’Optique SA | | | | | | | 1,199 | | | | 163,282 | |
Ingenico Group SA | | | | | | | 1,397 | | | | 121,806 | |
Sanofi | | | | | | | 1,923 | | | | 152,107 | |
TOTAL SA | | | | | | | 2,209 | | | | 139,258 | |
| | | | | | | | | | | | |
(Cost $911,693) | | | | | | | | | | | 927,180 | |
| | | |
| Germany 13.3% | | | | | | | | | | | | |
Allianz SE (Registered) | | | | | | | 928 | | | | 219,671 | |
BASF SE | | | | | | | 2,791 | | | | 289,883 | |
CTS Eventim AG & Co. KGaA | | | | | | | 1,690 | | | | 79,110 | |
Daimler AG (Registered) | | | | | | | 812 | | | | 64,085 | |
Deutsche Post AG (Registered) | | | | | | | 5,637 | | | | 244,982 | |
Deutsche Telekom AG (Registered) | | | | | | | 56,535 | | | | 988,494 | |
Evonik Industries AG | | | | | | | 9,546 | | | | 339,223 | |
OSRAM Licht AG | | | | | | | 357 | | | | 20,773 | |
SAP SE | | | | | | | 1,647 | | | | 183,099 | |
| | | | | | | | | | | | |
(Cost $2,229,609) | | | | | | | | | | | 2,429,320 | |
| | | |
| Japan 1.8% | | | | | | | | | | | | |
FANUC Corp. | | | | | | | 500 | | | | 107,528 | |
Murata Manufacturing Co., Ltd. | | | | | | | 600 | | | | 74,614 | |
Panasonic Corp. | | | | | | | 10,000 | | | | 148,929 | |
| | | | | | | | | | | | |
(Cost $354,448) | | | | | | | | | | | 331,071 | |
| | | |
| Netherlands 3.1% | | | | | | | | | | | | |
ING Groep NV | | | | | | | 10,436 | | | | 175,519 | |
Koninklijke Ahold Delhaize NV | | | | | | | 4,888 | | | | 117,777 | |
Royal Dutch Shell PLC “A” | | | | | | | 7,565 | | | | 264,718 | |
| | | | | | | | | | | | |
(Cost $491,253) | | | | | | | | | | | 558,014 | |
| | | |
| Russia 0.3% | | | | | | | | | | | | |
Sberbank of Russia PJSC (ADR) (Cost $60,042) | | | | | | | 4,264 | | | | 62,979 | |
| | | |
| Singapore 0.4% | | | | | | | | | | | | |
Singapore Exchange Ltd. | | | | | | | 4,100 | | | | 23,837 | |
Singapore Telecommunications Ltd. | | | | | | | 19,500 | | | | 51,883 | |
| | | | | | | | | | | | |
(Cost $74,130) | | | | | | | | | | | 75,720 | |
| | | |
| Spain 1.5% | | | | | | | | | | | | |
Banco Santander SA (Cost $287,370) | | | | | | | 43,710 | | | | 282,389 | |
The accompanying notes are an integral part of the financial statements.
| | | | | | | | |
| | Deutsche Global Macro Fund | | | | | | 11 | |
| | | | | | | | | | | | |
| | | | | | Shares | | | Value ($) | |
| | | |
| Switzerland 3.6% | | | | | | | | | | | | |
Nestle SA (Registered) | | | | | | | 2,791 | | | | 216,513 | |
Novartis AG (Registered) | | | | | | | 3,875 | | | | 298,797 | |
Roche Holding AG (Genusschein) | | | | | | | 642 | | | | 142,752 | |
| | | | | | | | | | | | |
(Cost $570,767) | | | | | | | | | | | 658,062 | |
| | | |
| Taiwan 1.5% | | | | | | | | | | | | |
Taiwan Semiconductor Manufacturing Co., Ltd. (Cost $242,632) | | | | | | | 35,000 | | | | 266,813 | |
| | | |
| United Kingdom 2.0% | | | | | | | | | | | | |
AstraZeneca PLC | | | | | | | 1,292 | | | | 90,779 | |
Reckitt Benckiser Group PLC | | | | | | | 1,879 | | | | 147,625 | |
Unilever NV (CVA) | | | | | | | 2,326 | | | | 132,964 | |
| | | | | | | | | | | | |
(Cost $378,065) | | | | | | | | | | | 371,368 | |
| | | |
| United States 9.9% | | | | | | | | | | | | |
Allergan PLC | | | | | | | 705 | | | | 108,323 | |
Alphabet, Inc. “A”* | | | | | | | 380 | | | | 387,060 | |
American Express Co. | | | | | | | 939 | | | | 92,726 | |
Amgen, Inc. | | | | | | | 522 | | | | 91,078 | |
Cisco Systems, Inc. | | | | | | | 1,202 | | | | 53,237 | |
CVS Health Corp. | | | | | | | 2,313 | | | | 161,517 | |
Mastercard, Inc. “A” | | | | | | | 1,232 | | | | 219,629 | |
Microsoft Corp. | | | | | | | 503 | | | | 47,041 | |
Monsanto Co. | | | | | | | 2,221 | | | | 278,447 | |
Pfizer, Inc. | | | | | | | 2,444 | | | | 89,475 | |
Regions Financial Corp. | | | | | | | 2,190 | | | | 40,953 | |
Shire PLC (b) | | | | | | | 952 | | | | 50,442 | |
Wells Fargo & Co. | | | | | | | 3,491 | | | | 181,392 | |
| | | | | | | | | | | | |
(Cost $1,604,093) | | | | | | | | | | | 1,801,320 | |
| Total Common Stocks (Cost $7,204,102) | | | | | | | | | | | 7,764,236 | |
| | | |
| Preferred Stocks 0.3% | | | | | | | | | | | | |
| Germany | | | | | | | | | | | | |
Henkel AG & Co. KGaA (Cost $51,565) | | | | | | | 396 | | | | 50,284 | |
| | | |
| Bonds 33.3% | | | | | | | | | | | | |
| France 3.4% | | | | | | | | | | | | |
Altice France SA, REG S, 6.25%, 5/15/2024 | | | | | | | 200,000 | | | | 190,500 | |
BNP Paribas SA, REG S, 3-month EURIBOR + 0.850%, 0.521%**, 9/22/2022 | | | EUR | | | | 357,000 | | | | 438,970 | |
| | | | | | | | | | | | |
(Cost $608,399) | | | | | | | | | | | 629,470 | |
| | | | | | |
| 12 | | | | | Deutsche Global Macro Fund | | |
| | | | | | | | | | | | |
| | | |
| | | | | | Principal
Amount ($) (c) | | | Value ($) | |
| Ireland 1.1% | | | | | | | | | | | | |
GE Capital International Funding Co. Unlimited Co., 2.342%, 11/15/2020 (Cost $196,161) | | | | | | | 200,000 | | | | 195,453 | |
| | | |
| Italy 11.2% | | | | | | | | | | | | |
Italy Buoni Poliennali Del Tesoro, 4.5%, 5/1/2023 | | | EUR | | | | 320,000 | | | | 458,980 | |
Republic of Italy: | | | | | | | | | | | | |
0.7%, 5/1/2020 | | | | | | | 829,000 | | | | 1,019,310 | |
REG S, 4.5%, 2/1/2020 | | | | | | | 429,000 | | | | 561,345 | |
| | | | | | | | | | | | |
(Cost $1,882,220) | | | | | | | | | | | 2,039,635 | |
| | | |
| Mexico 2.1% | | | | | | | | | | | | |
America Movil SAB de CV, REG S, 0.00%, 5/28/2020 * | | | EUR | | | | 100,000 | | | | 119,552 | |
Petroleos Mexicanos, 6.5%, 3/13/2027 | | | | | | | 263,000 | | | | 272,366 | |
| | | | | | | | | | | | |
(Cost $393,828) | | | | | | | | | | | 391,918 | |
| | | |
| Netherlands 3.8% | | | | | | | | | | | | |
Petrobras Global Finance BV: | | | | | | | | | | | | |
5.375%, 1/27/2021 | | | | | | | 330,000 | | | | 341,880 | |
8.375%, 5/23/2021 | | | | | | | 308,000 | | | | 347,054 | |
| | | | | | | | | | | | |
(Cost $674,366) | | | | | | | | | | | 688,934 | |
| | | |
| United Kingdom 2.4% | | | | | | | | | | | | |
HSBC Holdings PLC, REG S, 3-month EURIBOR + 0.700%, 0.371% **, 9/27/2022 (Cost $398,765) | | | EUR | | | | 356,000 | | | | 434,371 | |
| | | |
| United States 9.3% | | | | | | | | | | | | |
Arconic, Inc., 5.125%, 10/1/2024 | | | | | | | 277,000 | | | | 280,896 | |
T-Mobile U.S.A., Inc.: | | | | | | | | | | | | |
6.0%, 3/1/2023 | | | | | | | 321,000 | | | | 332,636 | |
6.375%, 3/1/2025 | | | | | | | 250,000 | | | | 262,500 | |
The Goldman Sachs Group, Inc., REG S, 3-month EURIBOR + 1.000%, 0.673% **, 7/27/2021 | | | EUR | | | | 352,000 | | | | 432,769 | |
Transocean, Inc., 6.5%, 11/15/2020 | | | | | | | 79,000 | | | | 81,568 | |
Twitter, Inc., 1.0%, 9/15/2021 | | | | | | | 96,000 | | | | 90,079 | |
U.S. Treasury Note, 1.125%, 2/28/2019 | | | | | | | 166,400 | | | | 164,866 | |
VeriSign, Inc., 5.25%, 4/1/2025 | | | | | | | 55,000 | | | | 56,444 | |
| | | | | | | | | | | | |
(Cost $1,679,615) | | | | | | | | | | | 1,701,758 | |
| Total Bonds (Cost $5,833,354) | | | | | | | | | | | $6,081,539 | |
The accompanying notes are an integral part of the financial statements.
| | | | | | | | |
| | Deutsche Global Macro Fund | | | | | | 13 | |
| | | | | | | | |
| | |
| | | Shares | | | Value ($) | |
| Exchange-Traded Funds 5.5% | | | | | | | | |
iShares Floating Rate Bond ETF (a) | | | 11,747 | | | | 599,449 | |
SPDR Bloomberg Barclays 1-3 Month T-Bill ETF | | | 4,350 | | | | 398,199 | |
| Total Exchange-Traded Funds (Cost $995,390) | | | | | | | 997,648 | |
| | |
| Securities Lending Collateral 4.5% | | | | | | | | |
Deutsche Government & Agency Securities Portfolio “Deutsche Government Cash Institutional Shares”, 1.64% (d) (e) (Cost $818,325) | | | 818,325 | | | | 818,325 | |
| | |
| Cash Equivalents 16.8% | | | | | | | | |
| Deutsche Central Cash Management Government Fund, 1.73% (d) (Cost $3,059,104) | | | 3,059,104 | | | | 3,059,104 | |
| | |
| | | % of Net
Assets | | | Value ($) | |
| Total Investment Portfolio (Cost $17,961,840) | | | 102.9 | | | | 18,771,136 | |
| Other Assets and Liabilities, Net | | | (2.9 | ) | | | (525,549 | ) |
| |
| Net Assets | | | 100.0 | | | | 18,245,587 | |
A summary of the Fund’s transactions with affiliated Underlying Deutsche Funds during the period ended April 30, 2018 are as follows:
| | | | | | | | | | | | | | | | | | | | | | | | | | | | | | | | |
Value ($) at 10/31/2017 | | Pur-
chases
Cost ($) | | | Sales Pro-
ceeds ($) | | | Net
Realized
Gain/
(Loss)
($) | | | Net
Change in
Unrealized
Appreci-
ation
(Deprecia-
tion) ($) | | | Income
($) | | | Capital
Gain
Distribu-
tions ($) | | | Number
of Shares
at
4/30/2018 | | | Value ($)
at
4/30/2018 | |
| Securities Lending Collateral 4.5% | |
| Deutsche Government & Agency Securities Portfolio “Deutsche Government Cash Institutional Shares”, 1.64% (d) (e) | |
| 70,850 | | | 747,475 | | | | — | | | | — | | | | — | | | | 1,464 | | | | — | | | | 818,325 | | | | 818,325 | |
| Cash Equivalents 16.8% | |
| Deutsche Central Cash Management Government Fund, 1.73% (d) | |
| 3,545,282 | | | 4,348,789 | | | | 4,834,967 | | | | — | | | | — | | | | 22,855 | | | | — | | | | 3,059,104 | | | | 3,059,104 | |
| 3,616,132 | | | 5,096,264 | | | | 4,834,967 | | | | — | | | | — | | | | 24,319 | | | | — | | | | 3,877,429 | | | | 3,877,429 | |
| * | Non-income producing security. |
| ** | Variable or floating rate security. These securities are shown at their current rate as of April 30, 2018. For securities based on a published reference rate and spread, the reference rate and spread are indicated within the description above. Certain variable rate securities are not based on a published reference rate and spread but adjust periodically based on current market conditions, prepayment of underlying positions and/or other variables. |
The accompanying notes are an integral part of the financial statements.
| | | | | | |
| 14 | | | | | Deutsche Global Macro Fund | | |
| (a) | All or a portion of these securities were on loan. In addition, “Other Assets and Liabilities, Net” may include pending sales that are also on loan. The value of securities loaned at April 30, 2018 amounted to $793,982, which is 4.4% of net assets. |
| (b) | Listed on the London Stock Exchange. |
| (c) | Principal amount stated in U.S. dollars unless otherwise noted. |
| (d) | Affiliated fund managed by Deutsche Investment Management Americas Inc. The rate shown is the annualized seven-day yield at period end. |
| (e) | Represents collateral held in connection with securities lending. Income earned by the Fund is net of borrower rebates. Represents the net increase (purchase cost) or decrease (sales proceeds) in the amount invested for the period ended April 30, 2018. |
ADR: American Depositary Receipt
CVA: Certificaten Van Aandelen (Certificate of Stock)
EURIBOR: Euro Interbank Offered Rate
PJSC: Public Joint Stock Company
REG S: Securities sold under Regulation S may not be offered, sold or delivered within the United States or to, or for the account or benefit of, U.S. persons, except pursuant to an exemption from, or in a transaction not subject to, the registration requirements of the Securities Act of 1933.
SPDR: Standard & Poor’s Depositary Receipt
At April 30, 2018, open futures contracts purchased were as follows:
| | | | | | | | | | | | | | | | | | | | | | | | |
| Futures | | Currency | | | Expiration
Date | | | Contracts | | | Notional
Amount ($) | | | Notional
Value ($) | | | Unrealized
Appreciation ($) | |
| Nikkei 225 Index | | | USD | | | | 6/7/2018 | | | | 2 | | | | 213,558 | | | | 224,500 | | | | 10,942 | |
At April 30, 2018, open futures contracts sold were as follows:
| | | | | | | | | | | | | | | | | | | | | | | | |
| Futures | | Currency | | | Expiration
Date | | | Contracts | | | Notional
Amount ($) | | | Notional
Value ($) | | | Unrealized
Appreciation
(Depreciation) ($) | |
| Euro-BTP Italian Government Bond | | | EUR | | | | 6/7/2018 | | | | 2 | | | | 335,419 | | | | 335,737 | | | | (318) | |
| Hang Seng China Enterprises Index | | | HKD | | | | 5/30/2018 | | | | 5 | | | | 385,411 | | | | 390,672 | | | | (5,261) | |
| Mini DAX Index | | | EUR | | | | 6/15/2018 | | | | 1 | | | | 76,106 | | | | 76,145 | | | | (39) | |
| S&P 500 E-Mini Index | | | USD | | | | 6/15/2018 | | | | 1 | | | | 133,661 | | | | 132,350 | | | | 1,311 | |
| U.S. Treasury Long Bond | | | USD | | | | 6/20/2018 | | | | 2 | | | | 285,297 | | | | 287,687 | | | | (2,390 | ) |
| Total net unrealized depreciation | | | | (6,697 | ) |
As of April 30, 2018, the Fund had the following open forward foreign currency contracts:
| | | | | | | | | | | | | | | | | | | | | | |
| | | | |
Contracts to
Deliver | | | In Exchange For | | | Settlement
Date | | | Unrealized
Appreciation ($) | | | Counterparty |
| JPY | | | 19,067,782 | | | | USD | | | | 174,496 | | | | 5/2/2018 | | | | 52 | | | Toronto-Dominion Bank |
| EUR | | | 11,855,095 | | | | USD | | | | 14,460,805 | | | | 5/31/2018 | | | | 111,876 | | | Toronto-Dominion Bank |
| CHF | | | 676,196 | | | | USD | | | | 689,113 | | | | 5/31/2018 | | | | 4,974 | | | Toronto-Dominion Bank |
| USD | | | 145,240 | | | | KRW | | | | 157,287,768 | | | | 5/31/2018 | | | | 2,137 | | | Toronto-Dominion Bank |
| Total unrealized appreciation | | | | 119,039 | | | |
The accompanying notes are an integral part of the financial statements.
| | | | | | | | |
| | Deutsche Global Macro Fund | | | | | | 15 | |
| | | | | | | | | | | | | | | | | | | | | | |
| | | | |
Contracts to
Deliver | | | In Exchange For | | | Settlement
Date | | | Unrealized
Depreciation ($) | | | Counterparty |
| USD | | | 181,950 | | | | JPY | | | | 19,067,782 | | | | 5/2/2018 | | | | (7,506 | ) | | Toronto-Dominion Bank |
| USD | | | 208,359 | | | | JPY | | | | 22,725,270 | | | | 5/31/2018 | | | | (49 | ) | | Toronto-Dominion Bank |
| Total unrealized depreciation | | | | (7,555 | ) | | |
| | | | |
| Currency Abbreviations |
| CH | | Swiss Franc | | |
| EUR | | Euro | | |
| HKD | | Hong Kong Dollar | | |
| JPY | | Japanese Yen | | |
| KRW | | South Korean Won | | |
| USD | | United States Dollar | | |
For information on the Fund’s policy and additional disclosures regarding futures contracts and forward foreign currency contracts, please refer to the Derivatives section of Note B in the accompanying Notes to Financial Statements.
The accompanying notes are an integral part of the financial statements.
| | | | | | |
| 16 | | | | | Deutsche Global Macro Fund | | |
Fair Value Measurements
Various inputs are used in determining the value of the Fund’s investments. These inputs are summarized in three broad levels. Level 1 includes quoted prices in active markets for identical securities. Level 2 includes other significant observable inputs (including quoted prices for similar securities, interest rates, prepayment speeds and credit risk). Level 3 includes significant unobservable inputs (including the Fund’s own assumptions in determining the fair value of investments). The level assigned to the securities valuations may not be an indication of the risk or liquidity associated with investing in those securities.
The following is a summary of the inputs used as of April 30, 2018 in valuing the Fund’s investments. For information on the Fund’s policy regarding the valuation of investments, please refer to the Security Valuation section of Note A in the accompanying Notes to Financial Statements.
| | | | | | | | | | | | | | | | |
| Assets | | Level 1 | | | Level 2 | | | Level 3 | | | Total | |
| Common Stocks | | | | | | | | | | | | | | | | |
France | | $ | — | | | $ | 927,180 | | | $ | — | | | $ | 927,180 | |
Germany | | | — | | | | 2,429,320 | | | | — | | | | 2,429,320 | |
Japan | | | — | | | | 331,071 | | | | — | | | | 331,071 | |
Netherlands | | | — | | | | 558,014 | | | | — | | | | 558,014 | |
Russia | | | 62,979 | | | | — | | | | — | | | | 62,979 | |
Singapore | | | — | | | | 75,720 | | | | — | | | | 75,720 | |
Spain | | | — | | | | 282,389 | | | | — | | | | 282,389 | |
Switzerland | | | — | | | | 658,062 | | | | — | | | | 658,062 | |
Taiwan | | | — | | | | 266,813 | | | | — | | | | 266,813 | |
United Kingdom | | | — | | | | 371,368 | | | | — | | | | 371,368 | |
United States | | | 1,750,878 | | | | 50,442 | | | | — | | | | 1,801,320 | |
| Preferred Stock | | | — | | | | 50,284 | | | | — | | | | 50,284 | |
| Bonds | | | — | | | | 6,081,539 | | | | — | | | | 6,081,539 | |
| Exchange-Traded Funds | | | 997,648 | | | | — | | | | — | | | | 997,648 | |
| Short-Term Investments (f) | | | 3,877,429 | | | | — | | | | — | | | | 3,877,429 | |
| Derivatives (g) | | | | | | | | | | | | | | | | |
Futures Contracts | | | 12,253 | | | | — | | | | — | | | | 12,253 | |
Forward Foreign Currency Contracts | | | — | | | | 119,039 | | | | — | | | | 119,039 | |
| Total | | $ | 6,701,187 | | | $ | 12,201,241 | | | $ | — | | | $ | 18,902,428 | |
| | | | |
| Liabilities | | | Level 1 | | | | Level 2 | | | | Level 3 | | | | Total | |
| Derivatives (g) | | | | | | | | | | | | | | | | |
Futures Contracts | | $ | (8,008 | ) | | $ | — | | | $ | — | | | $ | (8,008 | ) |
Forward Foreign Currency Contracts | | | — | | | | (7,555 | ) | | | — | | | | (7,555 | ) |
| Total | | $ | (8,008 | ) | | $ | (7,555 | ) | | $ | — | | | $ | (15,563 | ) |
As a result of the fair valuation model utilized by the Fund, certain international securities transferred from Level 1 to Level 2. During the period ended April 30, 2018, the amount of the transfers between Level 1 and Level 2 was $3,118,541.
Transfers between price levels are recognized at the beginning of the reporting period.
| (f) | See Investment Portfolio for additional detailed categorizations. |
| (g) | Derivatives include unrealized appreciation (depreciation) on open futures contracts and forward foreign currency contracts. |
The accompanying notes are an integral part of the financial statements.
| | | | | | | | |
| | Deutsche Global Macro Fund | | | | | | 17 | |
Statement of Assets and Liabilities
| | | | |
| as of April 30, 2018 (Unaudited) | |
| | | | |
| |
| Assets | | | | |
| Investments in non-affiliated securities, at value (cost $14,084,411) — including $793,982 of securities loaned | | $ | 14,893,707 | |
Investment in Deutsche Government & Agency Securities Portfolio
(cost $818,325)* | | | 818,325 | |
Investment in Deutsche Central Cash Management Government Fund
(cost $3,059,104) | | | 3,059,104 | |
| Foreign currency, at value (cost $202,190) | | | 200,165 | |
| Deposit with broker for futures contracts | | | 60,096 | |
| Receivable for investments sold | | | 25,146 | |
| Receivable for Fund shares sold | | | 1,190 | |
| Dividends receivable | | | 15,474 | |
| Interest receivable | | | 56,268 | |
| Receivable for variation margin on futures contracts | | | 19,685 | |
| Unrealized appreciation on forward foreign currency contracts | | | 119,039 | |
| Foreign taxes recoverable | | | 23,371 | |
| Due from Advisor | | | 3,863 | |
| Other assets | | | 26,693 | |
| Total assets | | | 19,322,126 | |
| |
| Liabilities | | | | |
| Payable upon return of securities loaned | | | 818,325 | |
| Payable for investments purchased | | | 77,284 | |
| Payable for Fund shares redeemed | | | 88,224 | |
| Unrealized depreciation on forward foreign currency contracts | | | 7,555 | |
| Accrued Directors’ fees | | | 570 | |
| Other accrued expenses and payables | | | 84,581 | |
| Total liabilities | | | 1,076,539 | |
| Net assets, at value | | $ | 18,245,587 | |
| |
| Net Assets Consist of | | | | |
| Undistributed net investment income | | | 22,479 | |
| Net unrealized appreciation (depreciation) on: | | | | |
Investments | | | 809,296 | |
Futures | | | 4,245 | |
Foreign currency | | | (3,703 | ) |
Forward foreign currency contracts | | | 111,484 | |
| Accumulated net realized gain (loss) | | | (6,726 | ) |
| Paid-in capital | | | 17,308,512 | |
| Net assets, at value | | $ | 18,245,587 | |
| * | Represents collateral on securities loaned. |
The accompanying notes are an integral part of the financial statements.
| | | | | | |
| 18 | | | | | Deutsche Global Macro Fund | | |
| | |
| Statement of Assets and Liabilities as of April 30, 2018 (Unaudited) (continued) | | |
| | | | |
|
| Net Asset Value | |
| | | | |
Class A | | | | |
Net Asset Value and redemption price per share ($9,299,608 ÷ 946,099 shares of capital stock outstanding,
$.01 par value, $50,000,000 shares authorized) | | $ | 9.83 | |
| Maximum offering price per share (100 ÷ 94.25 of $9.83) | | $ | 10.43 | |
Class C | | | | |
Net Asset Value, offering and redemption price
(subject to contingent deferred sales charge) per share
($2,735,503 ÷ 296,643 shares of capital stock outstanding,
$.01 par value, $50,000,000 shares authorized) | | $ | 9.22 | |
Class R | | | | |
Net Asset Value, offering and redemption price per share
($372,608 ÷ 39,334 shares of capital stock outstanding,
$.01 par value, $50,000,000 shares authorized) | | $ | 9.47 | |
Class S | | | | |
Net Asset Value, offering and redemption price per share
($3,868,618 ÷ 402,638 shares of capital stock outstanding,
$.01 par value, $50,000,000 shares authorized) | | $ | 9.61 | |
Institutional Class | | | | |
Net Asset Value, offering and redemption price per share
($1,969,250 ÷ 204,346 shares of capital stock outstanding,
$.01 par value, $50,000,000 shares authorized) | | $ | 9.64 | |
The accompanying notes are an integral part of the financial statements.
| | | | | | | | |
| | Deutsche Global Macro Fund | | | | | | 19 | |
Statement of Operations
| | | | |
| for the six months ended April 30, 2018 (Unaudited) | |
| | | | |
| |
| Investment Income | | | | |
| Income: | | | | |
| Dividends (net of foreign taxes withheld of $8,808) | | $ | 99,706 | |
| Interest | | | 54,165 | |
| Income distributions — Deutsche Central Cash Management Government Fund | | | 22,855 | |
| Securities lending income, net of borrower rebates | | | 1,464 | |
| Total income | | | 178,190 | |
| Expenses: | | | | |
| Management fee | | | 54,938 | |
| Administration fee | | | 9,156 | |
| Services to shareholders | | | 22,436 | |
| Distribution and service fees | | | 27,318 | |
| Custodian fee | | | 18,203 | |
| Professional fees | | | 46,481 | |
| Reports to shareholders | | | 18,630 | |
| Registration fees | | | 34,071 | |
| Directors’ fees and expenses | | | 1,501 | |
| Other | | | 9,280 | |
| Total expenses before expense reductions | | | 242,014 | |
| Expense reductions | | | (142,707 | ) |
| Total expenses after expense reductions | | | 99,307 | |
| Net investment income | | | 78,883 | |
| |
| Realized and Unrealized Gain (Loss) | | | | |
| Net realized gain (loss) from: | | | | |
| Investments | | | 364,588 | |
| Futures | | | (98,696 | ) |
| Forward foreign currency contracts | | | (345,598 | ) |
| Foreign currency | | | 11,802 | |
| | | | (67,904 | ) |
| Change in net unrealized appreciation (depreciation) on: | | | | |
| Investments | | | (310,378 | ) |
| Futures | | | 63,885 | |
| Forward foreign currency contracts | | | 55,080 | |
| Foreign currency | | | (2,376 | ) |
| | | | (193,789 | ) |
| Net gain (loss) | | | (261,693 | ) |
| Net increase (decrease) in net assets resulting from operations | | $ | (182,810 | ) |
The accompanying notes are an integral part of the financial statements.
| | | | | | |
| 20 | | | | | Deutsche Global Macro Fund | | |
Statements of Changes in Net Assets
| | | | | | | | |
| | | Six Months
Ended April 30,
2018
(Unaudited) | | | Year Ended
October 31,
2017 | |
| Increase (Decrease) in Net Assets | | |
| | | | | | | | |
| Operations: | | | | | | | | |
| Net investment income (loss) | | $ | 78,883 | | | $ | 117,478 | |
| Net realized gain (loss) | | | (67,904 | ) | | | 4,090,075 | |
| Change in net unrealized appreciation (depreciation) | | | (193,789 | ) | | | (1,483,583 | ) |
| Net increase (decrease) in net assets resulting from operations | | | (182,810 | ) | | | 2,723,970 | |
| Net investment income: | | | | | | | | |
| Net realized gains: | | | | | | | | |
| Fund share transactions: | | | | | | | | |
| Proceeds from shares sold | | | 1,333,567 | | | | 3,000,340 | |
| Payments for shares redeemed | | | (2,156,153 | ) | | | (5,897,321 | ) |
| Redemption fees | | | — | | | | 2 | |
| Net increase (decrease) in net assets from Fund share transactions | | | (822,586 | ) | | | (2,896,979 | ) |
| Increase (decrease) in net assets | | | (1,005,396 | ) | | | (173,009 | ) |
| Net assets at beginning of period | | | 19,250,983 | | | | 19,423,992 | |
| Net assets at end of period (including net investment income and net investment loss of $22,479 and $56,404, respectively | | $ | 18,245,587 | | | $ | 19,250,983 | |
The accompanying notes are an integral part of the financial statements.
| | | | | | | | |
| | Deutsche Global Macro Fund | | | | | | 21 | |
Financial Highlights
| | | | | | | | | | | | | | | | | | | | | | | | | | |
| | | Six Months
Ended 4/30/18 | | | Years Ended October 31, | |
| Class A | | (Unaudited) | | | 2017 | | | 2016 | | | 2015 | | | 2014 | | | 2013 | |
| | | | | | |
| Selected Per Share Data | | | | | | | | | | | | | | | | | | | | | | | | |
| Net asset value, beginning of period | | $ | 9.92 | | | $ | 8.61 | | | $ | 8.49 | | | $ | 8.47 | | | $ | 8.24 | | | $ | 6.90 | |
| Income (loss) from investment operations: | | | | | | | | | | | | | | | | | |
Net investment income (loss)a | | | .04 | | | | .06 | | | | .00 | *** | | | .00 | *** | | | .01 | | | | .10 | |
Net realized and unrealized gain (loss) | | | (.13 | ) | | | 1.25 | | | | .12 | | | | .02 | | | | .35 | | | | 1.40 | |
Total from investment operations | | | (.09 | ) | | | 1.31 | | | | .12 | | | | .02 | | | | .36 | | | | 1.50 | |
| Less distributions from: | | | | | | | | | | | | | | | | | | | | | | | | |
Net investment income | | | — | | | | — | | | | — | | | | — | | | | (.13 | ) | | | (.16 | ) |
| Redemption fees | | | — | | | | .00 | *** | | | .00 | *** | | | — | | | | .00 | *** | | | .00 | *** |
Net asset value, end
of period | | $ | 9.83 | | | $ | 9.92 | | | $ | 8.61 | | | $ | 8.49 | | | $ | 8.47 | | | $ | 8.24 | |
| Total Return (%)b,c | | | (.91 | )** | | | 15.21 | e | | | 1.41 | d | | | .24 | | | | 4.45 | | | | 22.16 | |
|
| Ratios to Average Net Assets and Supplemental Data | |
| Net assets, end of period ($ millions) | | | 9 | | | | 10 | | | | 11 | | | | 15 | | | | 18 | | | | 22 | |
| Ratio of expenses before expense reductions (%) | | | 2.61 | * | | | 2.63 | | | | 2.32 | | | | 2.06 | | | | 1.80 | | | | 1.77 | |
| Ratio of expenses after expense reductions (%) | | | 1.02 | * | | | 1.20 | | | | 1.40 | | | | 1.44 | | | | 1.47 | | | | 1.49 | |
| Ratio of net investment income (%) | | | .92 | * | | | .66 | | | | .02 | | | | .02 | | | | .17 | | | | 1.34 | |
| Portfolio turnover rate (%) | | | 36 | ** | | | 121 | | | | 42 | | | | 88 | | | | 70 | | | | 124 | |
| a | Based on average shares outstanding during the period. |
| b | Total return does not reflect the effect of any sales charges. |
| c | Total return would have been lower had certain expenses not been reduced. |
| d | The Fund’s total return includes a reimbursement by the Advisor for a realized loss on a trade executed incorrectly. Excluding this reimbursement, total return would have been 0.35% lower. |
| e | The Fund’s total return includes a reimbursement for commissions paid on trades for portfolio rebalancing related to implementing a new investment strategy. Excluding this reimbursement, total return would have been 0.33% lower. |
| *** | Amount is less than $.005. |
| | | | | | |
| 22 | | | | | Deutsche Global Macro Fund | | |
| | | | | | | | | | | | | | | | | | | | | | | | | | |
| | | Six Months
Ended 4/30/18 | | | Years Ended October 31, | |
| Class C | | (Unaudited) | | | 2017 | | | 2016 | | | 2015 | | | 2014 | | | 2013 | |
| | | | | | |
| Selected Per Share Data | | | | | | | | | | | | | | | | | | | | | | | | |
| Net asset value, beginning of period | | $ | 9.34 | | | $ | 8.17 | | | $ | 8.12 | | | $ | 8.16 | | | $ | 7.94 | | | $ | 6.64 | |
| Income (loss) from investment operations: | | | | | | | | | | | | | | | | | | | | | |
Net investment income (loss)a | | | .01 | | | | (.01 | ) | | | (.06 | ) | | | (.06 | ) | | | (.05 | ) | | | .04 | |
Net realized and unrealized gain (loss) | | | (.13 | ) | | | 1.18 | | | | .11 | | | | .02 | | | | .34 | | | | 1.37 | |
Total from investment operations | | | (.12 | ) | | | 1.17 | | | | .05 | | | | (.04 | ) | | | .29 | | | | 1.41 | |
| Less distributions from: | | | | | | | | | | | | | | | | | | | | | | | | |
Net investment income | | | — | | | | — | | | | — | | | | — | | | | (.07 | ) | | | (.11 | ) |
| Redemption fees | | | — | | | | .00 | *** | | | .00 | *** | | | — | | | | .00 | *** | | | .00 | *** |
Net asset value, end
of period | | $ | 9.22 | | | $ | 9.34 | | | $ | 8.17 | | | $ | 8.12 | | | $ | 8.16 | | | $ | 7.94 | |
| Total Return (%)b,c | | | (1.28 | )** | | | 14.32 | e | | | .62 | d | | | (.49 | ) | | | 3.65 | | | | 21.39 | |
|
| Ratios to Average Net Assets and Supplemental Data | |
| Net assets, end of period ($ millions) | | | 3 | | | | 3 | | | | 3 | | | | 3 | | | | 3 | | | | 4 | |
| Ratio of expenses before expense reductions (%) | | | 3.35 | * | | | 3.34 | | | | 3.01 | | | | 2.79 | | | | 2.54 | | | | 2.50 | |
| Ratio of expenses after expense reductions (%) | | | 1.77 | * | | | 1.95 | | | | 2.15 | | | | 2.19 | | | | 2.22 | | | | 2.24 | |
| Ratio of net investment income (loss) (%) | | | .15 | * | | | (.10 | ) | | | (.76 | ) | | | (.73 | ) | | | (.58 | ) | | | .60 | |
| Portfolio turnover rate (%) | | | 36 | ** | | | 121 | | | | 42 | | | | 88 | | | | 70 | | | | 124 | |
| a | Based on average shares outstanding during the period. |
| b | Total return does not reflect the effect of any sales charges. |
| c | Total return would have been lower had certain expenses not been reduced. |
| d | The Fund’s total return includes a reimbursement by the Advisor for a realized loss on a trade executed incorrectly. Excluding this reimbursement, total return would have been 0.35% lower. |
| e | The Fund’s total return includes a reimbursement for commissions paid on trades for portfolio rebalancing related to implementing a new investment strategy. Excluding this reimbursement, total return would have been 0.33% lower. |
| *** | Amount is less than $.005. |
| | | | | | | | |
| | Deutsche Global Macro Fund | | | | | | 23 | |
| | | | | | | | | | | | | | | | | | | | | | | | | | |
| | | Six Months
Ended 4/30/18 | | | Years Ended October 31, | |
| Class R | | (Unaudited) | | | 2017 | | | 2016 | | | 2015 | | | 2014 | | | 2013 | |
| | | | | | |
| Selected Per Share Data | | | | | | | | | | | | | | | | | | | | | | | | |
| Net asset value, beginning of period | | $ | 9.57 | | | $ | 8.33 | | | $ | 8.24 | | | $ | 8.23 | | | $ | 8.01 | | | $ | 6.70 | |
| Income (loss) from investment operations: | | | | | | | | | | | | | | | | | | | | | |
Net investment income (loss)a | | | .03 | | | | .04 | | | | (.02 | ) | | | (.02 | ) | | | (.01 | ) | | | .08 | |
Net realized and unrealized gain (loss) | | | (.13 | ) | | | 1.20 | | | | .11 | | | | .03 | | | | .34 | | | | 1.37 | |
Total from investment operations | | | (.10 | ) | | | 1.24 | | | | .09 | | | | .01 | | | | .33 | | | | 1.45 | |
| Less distributions from: | | | | | | | | | | | | | | | | | | | | | | | | |
Net investment income | | | — | | | | — | | | | — | | | | — | | | | (.11 | ) | | | (.14 | ) |
| Redemption fees | | | — | | | | .00 | *** | | | .00 | *** | | | — | | | | .00 | *** | | | .00 | *** |
Net asset value, end
of period | | $ | 9.47 | | | $ | 9.57 | | | $ | 8.33 | | | $ | 8.24 | | | $ | 8.23 | | | $ | 8.01 | |
| Total Return (%)b | | | (1.04 | )** | | | 14.89 | d | | | 1.09 | c | | | .12 | | | | 4.15 | | | | 21.98 | |
|
| Ratios to Average Net Assets and Supplemental Data | |
| Net assets, end of period ($ millions) | | | .4 | | | | 1 | | | | 1 | | | | 1 | | | | 1 | | | | 1 | |
| Ratio of expenses before expense reductions (%) | | | 2.91 | * | | | 2.94 | | | | 2.63 | | | | 2.32 | | | | 2.08 | | | | 2.05 | |
| Ratio of expenses after expense reductions (%) | | | 1.27 | * | | | 1.44 | | | | 1.65 | | | | 1.69 | | | | 1.72 | | | | 1.74 | |
| Ratio of net investment income (%) | | | .57 | * | | | .44 | | | | (.21 | ) | | | (.20 | ) | | | (.07 | ) | | | 1.05 | |
| Portfolio turnover rate (%) | | | 36 | ** | | | 121 | | | | 42 | | | | 88 | | | | 70 | | | | 124 | |
| a | Based on average shares outstanding during the period. |
| b | Total return would have been lower had certain expenses not been reduced. |
| c | The Fund’s total return includes a reimbursement by the Advisor for a realized loss on a trade executed incorrectly. Excluding this reimbursement, total return would have been 0.35% lower. |
| d | The Fund’s total return includes a reimbursement for commissions paid on trades for portfolio rebalancing related to implementing a new investment strategy. Excluding this reimbursement, total return would have been 0.33% lower. |
| *** | Amount is less than $.005. |
| | | | | | |
| 24 | | | | | Deutsche Global Macro Fund | | |
| | | | | | | | | | | | | | | | | | | | | | | | | | |
| | | Six Months
Ended 4/30/18 | | | Years Ended October 31, | |
| Class S | | (Unaudited) | | | 2017 | | | 2016 | | | 2015 | | | 2014 | | | 2013 | |
| | | | | | |
| Selected Per Share Data | | | | | | | | | | | | | | | | | | | | | | | | |
| Net asset value, beginning of period | | $ | 9.69 | | | $ | 8.39 | | | $ | 8.26 | | | $ | 8.22 | | | $ | 8.00 | | | $ | 6.71 | |
| Income (loss) from investment operations: | | | | | | | | | | | | | | | | | | | | | |
Net investment income (loss)a | | | .05 | | | | .09 | | | | .02 | | | | .01 | | | | .02 | | | | .11 | |
Net realized and unrealized gain (loss) | | | (.13 | ) | | | 1.21 | | | | .11 | | | | .03 | | | | .34 | | | | 1.36 | |
Total from
investment operations | | | (.08 | ) | | | 1.30 | | | | .13 | | | | .04 | | | | .36 | | | | 1.47 | |
| Less distributions from: | | | | | | | | | | | | | | | | | | | | | | | | |
Net investment income | | | — | | | | — | | | | — | | | | — | | | | (.14 | ) | | | (.18 | ) |
| Redemption fees | | | — | | | | .00 | *** | | | .00 | *** | | | — | | | | .00 | *** | | | .00 | *** |
Net asset value, end
of period | | $ | 9.61 | | | $ | 9.69 | | | $ | 8.39 | | | $ | 8.26 | | | $ | 8.22 | | | $ | 8.00 | |
| Total Return (%)b | | | (.83 | )** | | | 15.49 | d | | | 1.57 | c | | | .49 | | | | 4.57 | | | | 22.28 | |
|
| Ratios to Average Net Assets and Supplemental Data | |
| Net assets, end of period ($ millions) | | | 4 | | | | 4 | | | | 3 | | | | 4 | | | | 11 | | | | 13 | |
| Ratio of expenses before expense reductions (%) | | | 2.33 | * | | | 2.41 | | | | 2.11 | | | | 1.79 | | | | 1.58 | | | | 1.52 | |
| Ratio of expenses after expense reductions (%) | | | .82 | * | | | .96 | | | | 1.19 | | | | 1.29 | | | | 1.32 | | | | 1.34 | |
| Ratio of net investment income (%) | | | 1.15 | * | | | .94 | | | | .22 | | | | .13 | | | | .31 | | | | 1.48 | |
| Portfolio turnover rate (%) | | | 36 | ** | | | 121 | | | | 42 | | | | 88 | | | | 70 | | | | 124 | |
| a | Based on average shares outstanding during the period. |
| b | Total return would have been lower had certain expenses not been reduced. |
| c | The Fund’s total return includes a reimbursement by the Advisor for a realized loss on a trade executed incorrectly. Excluding this reimbursement, total return would have been 0.35% lower. |
| d | The Fund’s total return includes a reimbursement for commissions paid on trades for portfolio rebalancing related to implementing a new investment strategy. Excluding this reimbursement, total return would have been 0.33% lower. |
| *** | Amount is less than $.005. |
| | | | | | | | |
| | Deutsche Global Macro Fund | | | | | | 25 | |
| | | | | | | | | | | | | | | | | | | | | | | | | | |
| | | Six Months
Ended 4/30/18 | | | Years Ended October 31, | |
| Institutional Class | | (Unaudited) | | | 2017 | | | 2016 | | | 2015 | | | 2014 | | | 2013 | |
| | | | | | |
| Selected Per Share Data | | | | | | | | | | | | | | | | | | | | | | | | |
| Net asset value, beginning of period | | $ | 9.72 | | | $ | 8.41 | | | $ | 8.28 | | | $ | 8.23 | | | $ | 8.02 | | | $ | 6.71 | |
| Income (loss) from investment operations: | | | | | | | | | | | | | | | | | | | | | |
Net investment income (loss)a | | | .06 | | | | .08 | | | | .02 | | | | .02 | | | | .03 | | | | .11 | |
Net realized and unrealized gain (loss) | | | (.14 | ) | | | 1.23 | | | | .11 | | | | .03 | | | | .33 | | | | 1.38 | |
Total from investment operations | | | (.08 | ) | | | 1.31 | | | | .13 | | | | .05 | | | | .36 | | | | 1.49 | |
| Less distributions from: | | | | | | | | | | | | | | | | | | | | | |
Net investment income | | | — | | | | — | | | | — | | | | — | | | | (.15 | ) | | | (.18 | ) |
| Redemption fees | | | — | | | | .00 | *** | | | .00 | *** | | | — | | | | .00 | *** | | | .00 | *** |
Net asset value, end
of period | | $ | 9.64 | | | $ | 9.72 | | | $ | 8.41 | | | $ | 8.28 | | | $ | 8.23 | | | $ | 8.02 | |
| Total Return (%)b | | | (.82 | )** | | | 15.58 | d | | | 1.57 | c | | | .61 | | | | 4.54 | | | | 22.65 | |
|
| Ratios to Average Net Assets and Supplemental Data | |
| Net assets, end of period ($ millions) | | | 2 | | | | 2 | | | | 2 | | | | 7 | | | | 9 | | | | 25 | |
| Ratio of expenses before expense reductions (%) | | | 2.18 | * | | | 2.25 | | | | 1.90 | | | | 1.61 | | | | 1.37 | | | | 1.32 | |
| Ratio of expenses after expense reductions (%) | | | .77 | * | | | .94 | | | | 1.15 | | | | 1.19 | | | | 1.22 | | | | 1.24 | |
| Ratio of net investment income (%) | | | 1.24 | * | | | .93 | | | | .24 | | | | .27 | | | | .31 | | | | 1.48 | |
| Portfolio turnover rate (%) | | | 36 | ** | | | 121 | | | | 42 | | | | 88 | | | | 70 | | | | 124 | |
| a | Based on average shares outstanding during the period. |
| b | Total return would have been lower had certain expenses not been reduced. |
| c | The Fund’s total return includes a reimbursement by the Advisor for a realized loss on a trade executed incorrectly. Excluding this reimbursement, total return would have been 0.35% lower. |
| d | The Fund’s total return includes a reimbursement for commissions paid on trades for portfolio rebalancing related to implementing a new investment strategy. Excluding this reimbursement, total return would have been 0.33% lower. |
| *** | Amount is less than $.005. |
| | | | | | |
| 26 | | | | | Deutsche Global Macro Fund | | |
| | | | |
| Notes to Financial Statements | | (Unaudited) | | |
A. Organization and Significant Accounting Policies
Deutsche Global Macro Fund (the “Fund”) is a diversified series of Deutsche International Fund, Inc. (the “Corporation”), which is registered under the Investment Company Act of 1940, as amended (the “1940 Act”), as an open-end management investment company organized as a Maryland corporation.
The Fund offers multiple classes of shares which provide investors with different purchase options. Class A shares are subject to an initial sales charge. Class C shares are not subject to an initial sales charge but are subject to higher ongoing expenses than Class A shares and a contingent deferred sales charge payable upon certain redemptions within one year of purchase. Class R shares are not subject to initial or contingent deferred sales charges and are generally available only to certain retirement plans. Class S shares are not subject to initial or contingent deferred sales charges and are only available to a limited group of investors. Institutional Class shares are not subject to initial or contingent deferred sales charges and are generally available only to qualified institutions.
Investment income, realized and unrealized gains and losses, and certain fund-level expenses and expense reductions, if any, are borne pro rata on the basis of relative net assets by the holders of all classes of shares, except that each class bears certain expenses unique to that class such as distribution and service fees, services to shareholders and certain other class-specific expenses. Differences in class-level expenses may result in payment of different per share dividends by class. All shares of the Fund have equal rights with respect to voting subject to class-specific arrangements.
The Fund’s financial statements are prepared in accordance with accounting principles generally accepted in the United States of America (“U.S. GAAP”) which require the use of management estimates. Actual results could differ from those estimates. The Fund qualifies as an investment company under Topic 946 of Accounting Standards Codification of U.S. GAAP. The policies described below are followed consistently by the Fund in the preparation of their financial statements.
Security Valuation. Investments are stated at value determined as of the close of regular trading on the New York Stock Exchange on each day the exchange is open for trading.
Various inputs are used in determining the value of the Fund’s investments. These inputs are summarized in three broad levels. Level 1 includes quoted prices in active markets for identical securities. Level 2
| | | | | | | | |
| | Deutsche Global Macro Fund | | | | | | 27 | |
includes other significant observable inputs (including quoted prices for similar securities, interest rates, prepayment speeds and credit risk). Level 3 includes significant unobservable inputs (including the Fund’s own assumptions in determining the fair value of investments). The level assigned to the securities valuations may not be an indication of the risk or liquidity associated with investing in those securities.
Equity securities and exchange-traded funds (“ETFs”) are valued at the most recent sale price or official closing price reported on the exchange (U.S. or foreign) or over-the-counter market on which they trade. Equity securities or ETFs for which no sales are reported are valued at the calculated mean between the most recent bid and asked quotations on the relevant market or, if a mean cannot be determined, at the most recent bid quotation. Equity securities or ETFs are generally categorized as Level 1. For certain international equity securities, in order to adjust for events which may occur between the close of the foreign exchanges and the close of the New York Stock Exchange, a fair valuation model may be used. This fair valuation model takes into account comparisons to the valuation of American Depository Receipts (ADRs), exchange-traded funds, futures contracts and certain indices and these securities are categorized as Level 2.
Debt securities are valued at prices supplied by independent pricing services approved by the Fund’s Board. Such services may use various pricing techniques which take into account appropriate factors such as yield, quality, coupon rate, maturity, type of issue, trading characteristics, prepayment speeds and other data, as well as broker quotes. If the pricing services are unable to provide valuations, debt securities are valued at the average of the most recent reliable bid quotations or evaluated prices, as applicable, obtained from broker-dealers. These securities are generally categorized as Level 2.
Investments in open-end investment companies are valued at their net asset value each business day and are categorized as Level 1.
Futures contracts are generally valued at the settlement prices established each day on the exchange on which they are traded and are categorized as Level 1.
Forward currency contracts are valued at the prevailing forward exchange rate of the underlying currencies and are categorized as Level 2.
Securities and other assets for which market quotations are not readily available or for which the above valuation procedures are deemed not to reflect fair value are valued in a manner that is intended to reflect their fair value as determined in accordance with procedures approved by the Board and are generally categorized as Level 3. In accordance with the Fund’s valuation procedures, factors considered in determining value may
| | | | | | |
| 28 | | | | | Deutsche Global Macro Fund | | |
include, but are not limited to, the type of the security; the size of the holding; the initial cost of the security; the existence of any contractual restrictions on the security’s disposition; the price and extent of public trading in similar securities of the issuer or of comparable companies; quotations or evaluated prices from broker-dealers and/or pricing services; information obtained from the issuer, analysts, and/or the appropriate stock exchange (for exchange-traded securities); an analysis of the company’s or issuer’s financial statements; an evaluation of the forces that influence the issuer and the market(s) in which the security is purchased and sold; and with respect to debt securities, the maturity, coupon, creditworthiness, currency denomination and the movement of the market in which the security is normally traded. The value determined under these procedures may differ from published values for the same securities.
Disclosure about the classification of fair value measurements is included in a table following the Fund’s Investment Portfolio.
Foreign Currency Translations. The books and records of the Fund are maintained in U.S. dollars. Investment securities and other assets and liabilities denominated in a foreign currency are translated into U.S. dollars at the prevailing exchange rates at period end. Purchases and sales of investment securities, income and expenses are translated into U.S. dollars at the prevailing exchange rates on the respective dates of the transactions.
Net realized and unrealized gains and losses on foreign currency transactions represent net gains and losses between trade and settlement dates on securities transactions, the acquisition and disposition of foreign currencies, and the difference between the amount of net investment income accrued and the U.S. dollar amount actually received. The portion of both realized and unrealized gains and losses on investments that results from fluctuations in foreign currency exchange rates is not separately disclosed but is included with net realized and unrealized gain/appreciation and loss/depreciation on investments.
Securities Lending. Deutsche Bank AG, as lending agent, lends securities of the Fund to certain financial institutions under the terms of its securities lending agreement. During the term of the loans, the Fund continues to receive interest and dividends generated by the securities and to participate in any changes in their market value. The Fund requires the borrowers of the securities to maintain collateral with the Fund consisting of either cash or liquid, unencumbered assets having a value at least equal to the value of the securities loaned. When the collateral falls below specified amounts, the lending agent will use its best effort to obtain additional collateral on the next business day to meet required amounts under the securities lending agreement. As of period end, any securities on loan were collateralized by cash. During the six months
| | | | | | | | |
| | Deutsche Global Macro Fund | | | | | | 29 | |
ended April 30, 2018, the Fund invested the cash collateral into a joint trading account in affiliated money market funds managed by Deutsche Investment Management Americas Inc. As of April 30, 2018, the Fund invested the cash collateral in Deutsche Government & Agency Securities Portfolio. Deutsche Investment Management Americas Inc. receives a management/administration fee (0.14% annualized effective rate as of April 30, 2018) on the cash collateral invested in Deutsche Government & Agency Securities Portfolio. The Fund receives compensation for lending its securities either in the form of fees or by earning interest on invested cash collateral net of borrower rebates and fees paid to a lending agent. Either the Fund or the borrower may terminate the loan at any time, and the borrower, after notice, is required to return borrowed securities within a standard time period. There may be risks of delay and costs in recovery of securities or even loss of rights in the collateral should the borrower of the securities fail financially. If the Fund is not able to recover securities lent, the Fund may sell the collateral and purchase a replacement investment in the market, incurring the risk that the value of the replacement security is greater than the value of the collateral. The Fund is also subject to all investment risks associated with the reinvestment of any cash collateral received, including, but not limited to, interest rate, credit and liquidity risk associated with such investments.
As of April 30, 2018, the Fund had securities on loan, which were classified as common stock and exchange-traded fund in the Investment Portfolio. The value of the related collateral exceeded the value of the securities loaned at period end.
| | | | | | | | | | | | | | | | | | | | |
| Remaining Contractual Maturity of the Agreements as of April 30, 2018 | |
| | | Overnight and
Continuous | | | <30 days | | | Between
30 & 90
days | | | >90 days | | | Total | |
| Securities Lending Transactions | | | | | |
| Common Stock | | $ | 611,325 | | | $ | — | | | $ | — | | | $ | — | | | $ | 611,325 | |
| Exchange-Traded Fund | | | 207,000 | | | | — | | | | — | | | | — | | | | 207,000 | |
| Total | | $ | 818,325 | | | $ | — | | | $ | — | | | $ | — | | | $ | 818,325 | |
| |
| Gross amount of recognized liabilities for securities lending transactions | | | $ | 818,325 | |
Taxes. The Fund’s policy is to comply with the requirements of the Internal Revenue Code, as amended, which are applicable to regulated investment companies, and to distribute all of its taxable income to its shareholders.
Additionally, the Fund may be subject to taxes imposed by the governments of countries in which it invests and are generally based on income and/or capital gains earned or repatriated. Estimated tax liabilities on certain foreign securities are recorded on an accrual basis and are
| | | | | | |
| 30 | | | | | Deutsche Global Macro Fund | | |
reflected as components of interest income or net change in unrealized gain/loss on investments. Tax liabilities realized as a result of security sales are reflected as a component of net realized gain/loss on investments.
At October 31, 2017, the aggregate cost of investments for federal income tax purposes was $17,389,706. The net unrealized appreciation for all investments based on tax cost was $1,117,710. This consisted of aggregate gross unrealized appreciation for all investments which there was an excess of value over tax cost of $1,225,191 aggregate gross unrealized depreciation for all investments in which was an excess of tax cost over value of $107,481.
The Fund has reviewed the tax positions for each of the open tax years as of October 31, 2017 and has determined that no provision for income tax and/or uncertain tax positions is required in the Fund’s financial statements. The Fund’s federal tax returns for the prior three fiscal years remain open, subject to examination by the Internal Revenue Service.
Distribution of Income and Gains. Distributions from net investment income of the Fund, if any, are declared and distributed to shareholders annually. Net realized gains from investment transactions, in excess of available capital loss carryforwards, would be taxable to the Fund if not distributed and, therefore, will be distributed to shareholders at least annually. The Fund may also make additional distributions for tax purposes if necessary.
The timing and characterization of certain income and capital gain distributions are determined annually in accordance with federal tax regulations which may differ from accounting principles generally accepted in the United States of America. These differences primarily relate to net investment losses incurred by the Fund, investments in foreign denominated securities, investments in futures and certain securities sold at a loss. As a result, net investment income (loss) and net realized gain (loss) on investment transactions for a reporting period may differ significantly from distributions during such period. Accordingly, the Fund may periodically make reclassifications among certain of its capital accounts without impacting the net asset value of the Fund.
The tax character of current year distributions will be determined at the end of the current fiscal year.
Redemption Fees. Prior to February 1, 2017, the Fund imposed a redemption fee of 2% of the total redemption amount on Fund shares redeemed or exchanged within 15 days of buying them, either by purchase or exchange (subject to certain exceptions). This fee was assessed and retained by the Fund for the benefit of the remaining shareholders. The redemption fee was accounted for as an addition to paid-in-capital.
| | | | | | | | |
| | Deutsche Global Macro Fund | | | | | | 31 | |
Expenses. Expenses of the Corporation arising in connection with a specific Fund are allocated to that Fund. Other Corporation expenses which cannot be directly attributed to a Fund are apportioned among the Funds in the Corporation based upon the relative net assets or other appropriate measures.
Contingencies. In the normal course of business, the Fund may enter into contracts with service providers that contain general indemnification clauses. The Fund’s maximum exposure under these arrangements is unknown, as this would involve future claims that may be made against the Fund that have not yet been made. However, based on experience, the Fund expects the risk of loss to be remote.
Other. Investment transactions are accounted for a trade date plus one basis for daily net asset value calculations. However, for financial reporting purposes, investment transactions are reported on trade date. Interest income is recorded on the accrual basis. Dividend income is recorded on the ex-dividend date net of foreign withholding taxes. Certain dividends from foreign securities may be recorded subsequent to the ex-dividend date as soon as the Fund is informed of such dividends. Realized gains and losses from investment transactions are recorded on an identified cost basis. Proceeds from litigation payments, if any, are included in net realized gain (loss) from investments. All premiums and discounts are amortized/accreted for both tax and financial reporting purposes.
B. Derivative Instruments
Futures Contracts. A futures contract is an agreement between a buyer or seller and an established futures exchange or its clearinghouse in which the buyer or seller agrees to take or make a delivery of a specific amount of a financial instrument at a specified price on a specific date (settlement date). For the six months ended April 30, 2018, the Fund entered into futures as a substitute for direct investment in a particular asset class, for duration management, and for hedging purposes.
Upon entering into a futures contract, the Fund is required to deposit with a financial intermediary cash or securities (“initial margin”) in an amount equal to a certain percentage of the face value indicated in the futures contract. Subsequent payments (“variation margin”) are made or received by the Fund dependent upon the daily fluctuations in the value and are recorded for financial reporting purposes as unrealized gains or losses by the Fund. Gains or losses are realized when the contract expires or is closed. Since all futures contracts are exchange traded, counterparty risk is minimized as the exchange’s clearinghouse acts as the counterparty and guarantees the futures against default.
| | | | | | |
| 32 | | | | | Deutsche Global Macro Fund | | |
Certain risks may arise upon entering into futures contracts, including the risk that an illiquid market will limit the Fund’s ability to close out a futures contract prior to the settlement date and the risk that the futures contract is not well correlated with the security, index or currency to which it relates. Risk of loss may exceed amounts disclosed in the Statement of Assets and Liabilities.
A summary of the open futures contracts as of April 30, 2018, is included in a table following the Fund’s Investment Portfolio. For the six months ended April 30, 2018, the investment in futures contracts purchased had a total notional value generally indicative of a range from approximately $164,000 to $667,000, and the investment in futures contracts sold had a total notional value generally indicative of a range from approximately $1,223,000 to $6,697,000.
Forward Foreign Currency Contracts. A forward foreign currency contract (“forward currency contract”) is a commitment to purchase or sell a foreign currency at the settlement date at a negotiated rate. For the six months ended April 30, 2018, the Fund entered into forward currency contracts in order to hedge its exposure to changes in foreign currency exchange rates on its foreign currency denominated portfolio holdings and to facilitate transactions in foreign currency denominated securities.
Forward currency contracts are valued at the prevailing forward exchange rate of the underlying currencies and unrealized gain (loss) is recorded daily. On the settlement date of the forward currency contract, the Fund records a realized gain or loss equal to the difference between the value of the contract at the time it was opened and the value of the contract at the time it was closed. Certain risks may arise upon entering into forward currency contracts from the potential inability of counterparties to meet the terms of their contracts. The maximum counterparty credit risk to the Fund is measured by the unrealized gain on appreciated contracts. Additionally, when utilizing forward currency contracts to hedge, the Fund gives up the opportunity to profit from favorable exchange rate movements during the term of the contract.
A summary of the open forward currency contracts as of April 30, 2018, is included in a table following the Fund’s Investment Portfolio. For the six months ended April 30, 2018, the investment in forward currency contracts short vs. U.S. dollars had a total contract value generally indicative of a range from approximately $14,245,000 to $15,324,000, and the investment in forward currency contracts long vs. U.S. dollars had a total contract value generally indicative of a range from $0 to approximately $576,000.
| | | | | | | | |
| | Deutsche Global Macro Fund | | | | | | 33 | |
The following tables summarize the value of the Fund’s derivative instruments held as of April 30, 2018 and the related location in the accompanying Statement of Assets and Liabilities, presented by primary underlying risk exposure:
| | | | | | | | | | | | |
| Asset Derivatives | | Futures
Contracts | | | Forward
Contracts | | | Total | |
| Equity Contracts (a) | | $ | 12,253 | | | $ | — | | | $ | 12,253 | |
| Foreign Exchange Contracts (b) | | | — | | | | 119,039 | | | | 119,039 | |
| | | $ | 12,253 | | | $ | 119,039 | | | $ | 131,292 | |
Each of the above derivatives is located in the following Statement of Assets and Liabilities accounts:
| (a) | Includes cumulative appreciation of futures as disclosed in the Investment Portfolio. Unsettled variation margin is disclosed separately within the Statement of Assets and Liabilities. |
| (b) | Unrealized appreciation on forward foreign currency contracts |
| | | | | | | | | | | | |
| Liability Derivatives | | Futures
Contracts | | | Forward
Contracts | | | Total | |
| Equity Contracts (c) | | $ | (5,300 | ) | | $ | — | | | $ | (5,300 | ) |
| Interest Rate Contracts (c) | | | (2,708 | ) | | | — | | | | (2,708 | ) |
| Foreign Exchange Contracts (d) | | | — | | | | (7,555 | ) | | | (7,555 | ) |
| | | $ | (8,008 | ) | | $ | (7,555 | ) | | $ | (15,563 | ) |
Each of the above derivatives is located in the following Statement of Assets and Liabilities accounts:
| (c) | Includes cumulative depreciation of futures as disclosed in the Investment Portfolio. Unsettled variation margin is disclosed separately within the Statement of Assets and Liabilities. |
| (d) | Unrealized depreciation on forward foreign currency contracts |
Additionally, the amount of unrealized and realized gains and losses on derivative instruments recognized in Fund earnings during the six months ended April 30, 2018 and the related location in the accompanying Statement of Operations is summarized in the following tables by primary underlying risk exposure:
| | | | | | | | | | | | |
| Realized Gain (Loss) | | Futures
Contracts | | | Forward
Contracts | | | Total | |
| Equity Contracts (e) | | $ | (130,836 | ) | | $ | — | | | $ | (130,836 | ) |
| Interest Rate Contracts (e) | | | 32,140 | | | | — | | | | 32,140 | |
| Foreign Exchange Contracts (e) | | | — | | | | (345,598 | ) | | | (345,598 | ) |
| | | $ | (98,696 | ) | | $ | (345,598 | ) | | $ | (444,294 | ) |
Each of the above derivatives is located in the following Statement of Operations accounts:
| (e) | Net realized gain (loss) from futures and forward foreign currency contracts, respectively |
| | | | | | |
| 34 | | | | | Deutsche Global Macro Fund | | |
| | | | | | | | | | | | |
| Change in Net Unrealized Appreciation (Depreciation) | | | | |
| | | Futures
Contracts | | | Forward
Contracts | | | Total | |
| Equity Contracts (f) | | $ | 61,241 | | | $ | — | | | $ | 61,241 | |
| Interest Rate Contracts (f) | | | 2,644 | | | | — | | | | 2,644 | |
| Foreign Exchange Contracts (f) | | | — | | | | 55,080 | | | | 55,080 | |
| | | $ | 63,885 | | | $ | 55,080 | | | $ | 118,965 | |
Each of the above derivatives is located in the following Statement of Operations accounts:
| (f) | Change in net unrealized appreciation (depreciation) on futures and forward foreign currency contracts, respectively |
As of April 30, 2018, the Fund has transactions subject to enforceable master netting agreements which govern the terms of certain transactions, and reduce the counterparty risk associated with such transactions. Master netting agreements allow a Fund to close out and net total exposure to a counterparty in the event of a deterioration in the credit quality or contractual default with respect to all of the transactions with a counterparty. As defined by the master netting agreement, the Fund may have collateral agreements with certain counterparties to mitigate risk. For financial reporting purposes the Statement of Assets and Liabilities generally shows derivatives assets and liabilities on a gross basis, which reflects the full risks and exposures prior to netting. A reconciliation of the gross amounts on the Statement of Assets and Liabilities to the net amounts by counterparty, including any collateral exposure, is included in the following tables:
| | | | | | | | | | | | | | | | | | | | |
| Counterparty | | | | | Gross Amounts
of Assets
Presented in the
Statement of
Assets and
Liabilities | | | Financial
Instruments
and
Derivatives
Available
for Offset | | | Collateral
Received | | | Net Amount
of Derivative
Assets | |
| Toronto-Dominion Bank | | | | | | $ | 119,039 | | | $ | (7,555 | ) | | $ | — | | | $ | 111,484 | |
| | | | | | | | | | | | | | | | |
| Counterparty | | Gross Amounts
of Liabilities
Presented in the
Statement of
Assets and
Liabilities | | | Financial
Instruments
and
Derivatives
Available
for Offset | | | Collateral
Pledged | | | Net Amount
of Derivative
Liabilities | |
| Toronto-Dominion Bank | | $ | 7,555 | | | $ | (7,555 | ) | | $ | — | | | $ | — | |
C. Purchases and Sales of Securities
During the six months ended April 30, 2018, purchases and sales of investment securities (excluding short-term investments) aggregated $5,358,306 and $5,244,119, respectively.
| | | | | | | | |
| | Deutsche Global Macro Fund | | | | | | 35 | |
D. Related Parties
Management Agreement. Under the Investment Management Agreement with Deutsche Investment Management Americas Inc. (“DIMA” or the “Advisor”), an indirect, wholly owned subsidiary of DWS Group GmbH & Co. KGaA (“DWS Group”), the Advisor directs the investments of the Fund in accordance with its investment objectives, policies and restrictions. The Advisor determines the securities, instruments and other contracts relating to investments to be purchased, sold or entered into by the Fund or delegates such responsibility to the Fund’s sub advisor.
Deutsche Asset Management International GmbH (Deutsche AM International GmbH), a direct, wholly owned subsidiary of DWS Group, serves as subadvisor to the Fund. Pursuant to a sub-advisory agreement between DIMA and Deutsche AM International GmbH, DIMA, not the Fund, compensates Deutsche AM International GmbH for the services it provides to the Fund.
Under the Investment Management Agreement with the Advisor, the Fund pays a monthly management fee based on the Fund’s average daily net assets, computed and accrued daily and payable monthly, at the annual rate (exclusive of any applicable waivers/reimbursements) of 0.60%.
Effective November 1, 2017 through January 31, 2019, the Advisor has contractually agreed to waive its fees and/or reimburse certain operating expenses of the Fund to the extent necessary to maintain the total annual operating expenses (excluding certain expenses such as extraordinary expenses, taxes, brokerage and interest) of each class as follows:
| | | | |
| Class A | | | 1.02% | |
| Class C | | | 1.77% | |
| Class R | | | 1.27% | |
| Class S | | | .82% | |
| Institutional Class | | | .77% | |
For the six months ended April 30, 2018, fees waived and/or expenses reimbursed for each class are as follows:
| | | | |
| Class A | | $ | 75,537 | |
| Class C | | | 23,461 | |
| Class R | | | 3,805 | |
| Class S | | | 27,627 | |
| Institutional Class | | | 12,277 | |
| | | $ | 142,707 | |
| | | | | | |
| 36 | | | | | Deutsche Global Macro Fund | | |
Administration Fee. Pursuant to an Administrative Services Agreement, DIMA provides most administrative services to the Fund. For all services provided under the Administrative Services Agreement, the Fund pays the Advisor an annual fee (“Administration Fee”) of 0.10% of the Fund’s average daily net assets, computed and accrued daily and payable monthly. For the six months ended April 30, 2018, the Administration Fee was $9,156, of which $1,491 is unpaid.
Service Provider Fees. DWS Service Company (“DSC”), an affiliate of the Advisor, is the transfer agent, dividend-paying agent and shareholder service agent for the Fund. Pursuant to a sub-transfer agency agreement between DSC and DST Systems, Inc. (“DST”), DSC has delegated certain transfer agent, dividend-paying agent and shareholder service agent functions to DST. DSC compensates DST out of the shareholder servicing fee they receive from the Fund. For the six months ended April 30, 2018, the amounts charged to the Fund by DSC were as follows:
| | | | | | | | |
| Services to Shareholders | | Total
Aggregated | | | Unpaid at April 30, 2018 | |
| Class A | | $ | 3,918 | | | $ | 1,522 | |
| Class C | | | 660 | | | | 236 | |
| Class R | | | 113 | | | | 38 | |
| Class S | | | 1,794 | | | | 753 | |
| Institutional Class | | | 248 | | | | 89 | |
| | | $ | 6,733 | | | $ | 2,638 | |
Distribution and Service Fees. Under the Fund’s Class C and R 12b-1 Plans, DWS Distributors, Inc. (“DDI”), an affiliate of the Advisor, receives a fee (“Distribution Fee”) of 0.75% of the average daily net assets of Class C shares of the Fund and 0.25% of the average daily net assets of Class R shares. In accordance with the Fund’s Underwriting and Distribution Services Agreement, DDI enters into related selling group agreements with various firms at various rates for sales of Class C and R shares. For the six months ended April 30, 2018, the Distribution Fee was as follows:
| | | | | | | | |
| Distribution Fee | | Total
Aggregated | | | Unpaid at
April 30, 2018 | |
| Class C | | $ | 11,155 | | | $ | 1,721 | |
| Class R | | | 579 | | | | 78 | |
| | | $ | 11,734 | | | $ | 1,799 | |
In addition, DDI provides information and administrative services for a fee (“Service Fee”) to Class A, C and R shareholders at an annual rate of up to 0.25% of average daily net assets for each such class. DDI in turn has various agreements with financial services firms that provide these services and pays these fees based upon the assets of shareholder
| | | | | | | | |
| | Deutsche Global Macro Fund | | | | | | 37 | |
accounts the firms service. For the six months ended April 30, 2018, the Service Fee was as follows:
| | | | | | | | | | | | |
| Service Fee | | Total
Aggregated | | | Unpaid at April 30, 2018 | | | Annualized Rate | |
| Class A | | $ | 11,368 | | | $ | 3,883 | | | | .24 | % |
| Class C | | | 3,641 | | | | 1,268 | | | | .24 | % |
| Class R | | | 575 | | | | 329 | | | | .25 | % |
| | | $ | 15,584 | | | $ | 5,480 | | | | | |
Underwriting Agreement and Contingent Deferred Sales Charge. DDI is the principal underwriter for the Fund. Underwriting commissions paid in connection with the distribution of Class A shares for the six months ended April 30, 2018 aggregated $237.
In addition, DDI receives any contingent deferred sales charge (“CDSC”) from Class C share redemptions occurring within one year of purchase. There is no such charge upon redemption of any share appreciation or reinvested dividends. The CDSC is 1% of the value of the shares redeemed for Class C. For the six months ended April 30, 2018, the CDSC for Class C shares aggregated $171. A deferred sales charge of up to 1% is assessed on certain redemptions of Class A shares.
Typesetting and Filing Service Fees. Under an agreement with DIMA, DIMA is compensated for providing certain pre-press and regulatory filing services to the Fund. For the six months ended April 30, 2018, the amount charged to the Fund by DIMA included in the Statement of Operations under “Reports to shareholders” aggregated $11,081, of which $9,218 is unpaid.
Directors’ Fees and Expenses. The Fund paid retainer fees to each Director not affiliated with the Advisor, plus specified amounts to the Board Chairperson and Vice Chairperson and to each committee Chairperson.
Affiliated Cash Management Vehicles. The Fund may invest uninvested cash balances in Deutsche Central Cash Management Government Fund and Deutsche Variable NAV Money Fund, affiliated money market funds which are managed by the Advisor. Each affiliated money market fund is managed in accordance with Rule 2a-7 under the 1940 Act, which governs the quality, maturity, diversity and liquidity of instruments in which a money market fund may invest. Deutsche Central Cash Management Government Fund seeks to maintain a stable net asset value, and Deutsche Variable NAV Money Fund maintains a floating net asset value. The Fund indirectly bears its proportionate share of the expenses of each affiliated money market fund in which it invests. Deutsche Central Cash Management Government Fund does not pay the Advisor an investment management fee. To the extent that Deutsche
| | | | | | |
| 38 | | | | | Deutsche Global Macro Fund | | |
Variable NAV Money Fund pays an investment management fee to the Advisor, the Advisor will waive an amount of the investment management fee payable to the Advisor by the Fund equal to the amount of the investment management fee payable on the Fund’s assets invested in Deutsche Variable NAV Money Fund.
Security Lending Fees. Deutsche Bank AG serves as lending agent for the Fund. For the six months ended April 30, 2018, the Fund incurred lending agent fees to Deutsche Bank AG for the amount of $110.
E. Line of Credit
The Fund and other affiliated funds (the “Participants”) share in a $400 million revolving credit facility provided by a syndication of banks. The Fund may borrow for temporary or emergency purposes, including the meeting of redemption requests that otherwise might require the untimely disposition of securities. The Participants are charged an annual commitment fee which is allocated based on net assets, among each of the Participants. Interest is calculated at a rate per annum equal to the sum of the Federal Funds Rate plus 1.25 percent plus if the one-month LIBOR exceeds the Federal Funds Rate, the amount of such excess. The Fund may borrow up to a maximum of 33 percent of its net assets under the agreement. The Fund had no outstanding loans at April 30, 2018.
| | | | | | | | |
| | Deutsche Global Macro Fund | | | | | | 39 | |
F. Fund Share Transactions
The following table summarizes share and dollar activity in the Fund:
| | | | | | | | | | | | | | | | | | | | | | | | | | | | | | | | |
| | | Six Months Ended April 30, 2018 | | | Year Ended October 31, 2017 | |
| | | | | | Shares | | | Dollars | | | | | | | | | Shares | | | Dollars | | | | |
|
| Shares sold | |
| Class A | | | | | | | 27,997 | | | $ | 273,734 | | | | | | | | | | | | 114,355 | | | $ | 1,073,466 | | | | | |
| Class C | | | | | | | 8,519 | | | | 78,321 | | | | | | | | | | | | 71,566 | | | | 637,957 | | | | | |
| Class R | | | | | | | 5,174 | | | | 48,735 | | | | | | | | | | | | 12,982 | | | | 117,664 | | | | | |
| Class S | | | | | | | 48,411 | | | | 458,562 | | | | | | | | | | | | 123,708 | | | | 1,123,998 | | | | | |
| Institutional Class | | | | | | | 49,694 | | | | 474,215 | | | | | | | | | | | | 5,052 | | | | 47,255 | | | | | |
| | | | | | | | | | | $ | 1,333,567 | | | | | | | | | | | | | | | $ | 3,000,340 | | | | | |
|
| Shares redeemed | |
| Class A | | | | | | | (86,528 | ) | | $ | (843,891 | ) | | | | | | | | | | | (353,846 | ) | | $ | (3,268,221 | ) | | | | |
| Class C | | | | | | | (64,606 | ) | | | (594,197 | ) | | | | | | | | | | | (106,858 | ) | | | (945,512 | ) | | | | |
| Class R | | | | | | | (29,186 | ) | | | (278,389 | ) | | | | | | | | | | | (15,310 | ) | | | (142,589 | ) | | | | |
| Class S | | | | | | | (35,257 | ) | | | (338,462 | ) | | | | | | | | | | | (136,559 | ) | | | (1,253,007 | ) | | | | |
| Institutional Class | | | | | | | (10,706 | ) | | | (101,214 | ) | | | | | | | | | | | (31,837 | ) | | | (287,992 | ) | | | | |
| | | | | | | | | | | $ | (2,156,153 | ) | | | | | | | | | | | | | | $ | (5,897,321 | ) | | | | |
| | | | | | | | |
| Redemption fees | | | | | | | | | | $ | — | | | | | | | | | | | | | | | $ | 2 | | | | | |
| | | | |
| Net increase (decrease) | | | | | | | | | | | | | | | | | |
| Class A | | | | | | | (58,531 | ) | | $ | (570,157 | ) | | | | | | | | | | | (239,491 | ) | | $ | (2,194,753 | ) | | | | |
| Class C | | | | | | | (56,087 | ) | | | (515,876 | ) | | | | | | | | | | | (35,292 | ) | | | (307,555 | ) | | | | |
| Class R | | | | | | | (24,012 | ) | | | (229,654 | ) | | | | | | | | | | | (2,328 | ) | | | (24,925 | ) | | | | |
| Class S | | | | | | | 13,154 | | | | 120,100 | | | | | | | | | | | | (12,851 | ) | | | (129,009 | ) | | | | |
| Institutional Class | | | | | | | 38,988 | | | | 373,001 | | | | | | | | | | | | (26,785 | ) | | | (240,737 | ) | | | | |
| | | | | | | | | | | $ | (822,586 | ) | | | | | | | | | | | | | | $ | (2,896,979 | ) | | | | |
| | | | | | |
| 40 | | | | | Deutsche Global Macro Fund | | |
Information About Your Fund’s Expenses
As an investor of the Fund, you incur two types of costs: ongoing expenses and transaction costs. Ongoing expenses include management fees, distribution and service (12b-1) fees and other Fund expenses. Examples of transaction costs include sales charges (loads) and account maintenance fees, which are not shown in this section. The following tables are intended to help you understand your ongoing expenses (in dollars) of investing in the Fund and to help you compare these expenses with the ongoing expenses of investing in other mutual funds. In the most recent six-month period, the Fund limited these expenses; had it not done so, expenses would have been higher. The example in the table is based on an investment of $1,000 invested at the beginning of the six-month period and held for the entire period (November 1, 2017 to April 30, 2018).
The tables illustrate your Fund’s expenses in two ways:
| – | Actual Fund Return. This helps you estimate the actual dollar amount of ongoing expenses (but not transaction costs) paid on a $1,000 investment in the Fund using the Fund’s actual return during the period. To estimate the expenses you paid over the period, simply divide your account value by $1,000 (for example, an $8,600 account value divided by $1,000 = 8.6), then multiply the result by the number in the “Expenses Paid per $1,000” line under the share class you hold. |
| – | Hypothetical 5% Fund Return. This helps you to compare your Fund’s ongoing expenses (but not transaction costs) with those of other mutual funds using the Fund’s actual expense ratio and a hypothetical rate of return of 5% per year before expenses. Examples using a 5% hypothetical fund return may be found in the shareholder reports of other mutual funds. The hypothetical account values and expenses may not be used to estimate the actual ending account balance or expenses you paid for the period. |
Please note that the expenses shown in these tables are meant to highlight your ongoing expenses only and do not reflect any transaction costs. The “Expenses Paid per $1,000” line of the tables is useful in comparing ongoing expenses only and will not help you determine the relative total expense of owning different funds. Subject to certain exceptions, an account maintenance fee of $20.00 assessed once per calendar year for Classes A, C and S shares may apply for accounts with balances less than $10,000. This fee is not included in these tables. If it was, the estimate of expenses paid for Classes A, C and S shares during the period would be higher, and account value during the period would be lower, by this amount.
| | | | | | | | |
| | Deutsche Global Macro Fund | | | | | | 41 | |
| | | | | | | | | | | | | | | | | | | | |
Expenses and Value of a $1,000 Investment
for the six months ended April 30, 2018 (Unaudited) | |
| | | | | |
| Actual Fund Return | | Class A | | | Class C | | | Class R | | | Class S | | | Institutional
Class | |
Beginning Account
Value 11/1/17 | | $ | 1,000.00 | | | $ | 1,000.00 | | | $ | 1,000.00 | | | $ | 1,000.00 | | | $ | 1,000.00 | |
Ending Account
Value 4/30/18 | | $ | 990.90 | | | $ | 987.20 | | | $ | 989.60 | | | $ | 991.70 | | | $ | 991.80 | |
| Expenses Paid per $1,000* | | $ | 5.04 | | | $ | 8.72 | | | $ | 6.27 | | | $ | 4.05 | | | $ | 3.80 | |
| | | | | |
Hypothetical 5%
Fund Return | | Class A | | | Class C | | | Class R | | | Class S | | | Institutional
Class | |
Beginning Account
Value 11/1/17 | | $ | 1,000.00 | | | $ | 1,000.00 | | | $ | 1,000.00 | | | $ | 1,000.00 | | | $ | 1,000.00 | |
Ending Account
Value 4/30/18 | | $ | 1,019.74 | | | $ | 1,016.02 | | | $ | 1,018.50 | | | $ | 1,020.73 | | | $ | 1,020.98 | |
| Expenses Paid per $1,000* | | $ | 5.11 | | | $ | 8.85 | | | $ | 6.36 | | | $ | 4.11 | | | $ | 3.86 | |
| * | Expenses are equal to the Fund’s annualized expense ratio for each share class, multiplied by the average account value over the period, multiplied by 181 (the number of days in the most recent six-month period), then divided by 365. |
| | | | | | | | | | | | | | | | | | | | |
Annualized
Expense Ratios | | Class A | | | Class C | | | Class R | | | Class S | | | Institutional
Class | |
| Deutsche Global Macro Fund | | | 1.02 | % | | | 1.77 | % | | | 1.27 | % | | | 0.82 | % | | | 0.77 | % |
For more information, please refer to the Fund’s prospectus.
For an analysis of the fees associated with an investment in the Fund or
similar funds, please refer to http://apps.finra.org/fundanalyzer/1/fa.aspx.
| | | | | | |
| 42 | | | | | Deutsche Global Macro Fund | | |
Advisory Agreement Board Considerations and Fee Evaluation
The Board of Directors (hereinafter referred to as the “Board” or “Directors”) approved the renewal of Deutsche Global Macro Fund’s (formerly Deutsche Global Equity Fund) (the “Fund”) investment management agreement (the “Agreement”) with Deutsche Investment Management Americas Inc. (“DIMA”) in September 2017. DIMA has also entered into a sub-advisory agreement with Deutsche Asset Management International GmbH (“DeAMI”), an affiliate of DIMA, that has an initial term through September 30, 2018.
In terms of the process that the Board followed prior to approving the Agreement, shareholders should know that:
| – | During the entire process, all of the Fund’s Directors were independent of DIMA and its affiliates (the “Independent Directors”). |
| – | The Board met frequently during the past year to discuss fund matters and dedicated a substantial amount of time to contract review matters. Over the course of several months, the Board’s Contract Committee reviewed extensive materials received from DIMA, independent third parties and independent counsel. These materials included an analysis of the Fund’s performance, fees and expenses, and profitability from a fee consultant retained by the Fund’s Independent Directors (the “Fee Consultant”). Based on its evaluation of the information provided, the Contract Committee presented its findings and recommendations to the Board. The Board then reviewed the Contract Committee’s findings and recommendations. |
| – | The Board also received extensive information throughout the year regarding performance of the Fund. |
| –The | Independent Directors regularly met privately with counsel to discuss contract review and other matters. In addition, the Independent Directors were advised by the Fee Consultant in the course of their review of the Fund’s contractual arrangements and considered a comprehensive report prepared by the Fee Consultant in connection with their deliberations. |
| – | In connection with reviewing the Agreement, the Board also reviewed the terms of the Fund’s Rule 12b-1 plan, distribution agreement, administrative services agreement, transfer agency agreement and other material service agreements. |
In connection with the contract review process, the Contract Committee and the Board considered the factors discussed below, among others. The Board also considered that DIMA and its predecessors have managed
| | | | | | | | |
| | Deutsche Global Macro Fund | | | | | | 43 | |
the Fund since its inception, and the Board believes that a long-term relationship with a capable, conscientious advisor is in the best interests of the Fund. The Board considered, generally, that shareholders chose to invest or remain invested in the Fund knowing that DIMA managed the Fund. DIMA and DeAMI are part of Deutsche Bank AG’s (“Deutsche Bank”) Asset Management (“Deutsche AM”) division. Deutsche AM is a global asset management business that offers a wide range of investing expertise and resources, including research capabilities in many countries throughout the world.
As part of the contract review process, the Board carefully considered the fees and expenses of each Deutsche fund overseen by the Board in light of the fund’s performance. In many cases, this led to the negotiation and implementation of expense caps. As part of these negotiations, the Board indicated that it would consider relaxing these caps in future years following sustained improvements in performance, among other considerations.
While shareholders may focus primarily on fund performance and fees, the Fund’s Board considers these and many other factors, including the quality and integrity of DIMA’s and DeAMI’s personnel and administrative support services provided by DIMA, such as back-office operations, fund valuations, and compliance policies and procedures.
Nature, Quality and Extent of Services. The Board considered the terms of the Agreement, including the scope of advisory services provided under the Agreement. The Board noted that DIMA and DeAMI provide portfolio management services to the Fund and that, pursuant to a separate administrative services agreement, DIMA provides administrative services to the Fund. The Board considered the experience and skills of senior management and investment personnel and the resources made available to such personnel. Throughout the course of the year, the Board also received information regarding DIMA’s oversight of Fund sub-advisers, including DeAMI. The Board reviewed the Fund’s performance over short-term and long-term periods and compared those returns to various agreed-upon performance measures, including market index(es) and a peer universe compiled using information supplied by Morningstar Direct (“Morningstar”), an independent fund data service. The Board also noted that it has put into place a process of identifying “Funds in Review” (e.g., funds performing poorly relative to a peer universe), and receives additional reporting from DIMA regarding such funds and, where appropriate, DIMA’s plans to address underperformance. The Board believes this process is an effective manner of identifying and addressing underperforming funds. Based on the information provided, the Board noted that, for the one-, three- and five-year periods ended December 31, 2016, the Fund’s performance (Class A shares) was in the 2nd quartile, 3rd quartile and 4th quartile,
| | | | | | |
| 44 | | | | | Deutsche Global Macro Fund | | |
respectively, of the applicable Morningstar universe (the 1st quartile being the best performers and the 4th quartile being the worst performers). The Board noted the disappointing investment performance of the Fund in some past periods and continued to discuss with senior management of DIMA and DeAMI the factors contributing to such underperformance and actions being taken to improve performance. The Board noted the change in the Fund’s investment strategy and portfolio management team effective May 8, 2017. The Board recognized the efforts by DIMA in recent years to enhance its investment platform and improve long-term performance across the Deutsche fund complex.
Fees and Expenses. The Board considered the Fund’s investment management fee schedule, operating expenses and total expense ratios, and comparative information provided by Broadridge Financial Solutions, Inc. (“Broadridge”) and the Fee Consultant regarding investment management fee rates paid to other investment advisors by similar funds (1st quartile being the most favorable and 4th quartile being the least favorable). With respect to management fees paid to other investment advisors by similar funds, the Board noted that the contractual fee rates paid by the Fund, which include a 0.10% fee paid to DIMA under the Fund’s administrative services agreement, were lower than the median (2nd quartile) of the applicable Broadridge peer group (based on Broadridge data provided as of December 31, 2016). The Board noted that DIMA pays a sub-advisory fee to DeAMI out of its fee. The Board noted that, effective July 1, 2017, DIMA agreed to reduce the Fund’s contractual management fee rate to an annual rate of 0.60%. The Board noted that the Fund’s Class A shares total (net) operating expenses (excluding 12b-1 fees) were expected to be lower than the median of the applicable Broadridge expense universe (based on Broadridge data provided as of December 31, 2016, and analyzing Broadridge expense universe Class A (net) expenses less any applicable 12b-1 fees) (“Broadridge Universe Expenses”). The Board also reviewed data comparing each share class’s total (net) operating expenses to the applicable Broadridge Universe Expenses. The Board noted that the expense limitations agreed to by DIMA were expected to help the Fund’s total (net) operating expenses remain competitive. The Board considered the Fund’s management fee rate as compared to fees charged by DIMA to comparable Deutsche U.S. registered funds (“Deutsche Funds”) and considered differences between the Fund (including the investment strategy change) and the comparable Deutsche Funds. The information requested by the Board as part of its review of fees and expenses also included information about institutional accounts (including any sub-advised funds and accounts) and funds offered primarily to European investors (“Deutsche Europe funds”) managed by Deutsche AM. The Board noted that DIMA indicated that Deutsche AM does not manage any institutional accounts or Deutsche Europe funds comparable to the Fund.
| | | | | | | | |
| | Deutsche Global Macro Fund | | | | | | 45 | |
On the basis of the information provided, the Board concluded that management fees were reasonable and appropriate in light of the nature, quality and extent of services provided by DIMA and DeAMI.
Profitability. The Board reviewed detailed information regarding revenues received by DIMA under the Agreement. The Board considered the estimated costs to DIMA, and pre-tax profits realized by DIMA, from advising the Deutsche Funds, as well as estimates of the pre-tax profits attributable to managing the Fund in particular. The Board also received information regarding the estimated enterprise-wide profitability of DIMA and its affiliates with respect to all fund services in totality and by fund. The Board and the Fee Consultant reviewed DIMA’s methodology in allocating its costs to the management of the Fund. Based on the information provided, the Board concluded that the pre-tax profits realized by DIMA in connection with the management of the Fund were not unreasonable. The Board also reviewed certain publicly available information regarding the profitability of certain similar investment management firms. The Board noted that while information regarding the profitability of such firms is limited (and in some cases is not necessarily prepared on a comparable basis), DIMA and its affiliates’ overall profitability with respect to the Deutsche Funds (after taking into account distribution and other services provided to the funds by DIMA and its affiliates) was lower than the overall profitability levels of most comparable firms for which such data was available.
Economies of Scale. The Board considered whether there are economies of scale with respect to the management of the Fund and whether the Fund benefits from any economies of scale. In this regard, the Board observed that while the Fund’s current investment management fee schedule does not include breakpoints, the Fund’s fee schedule represents an appropriate sharing between the Fund and DIMA of such economies of scale as may exist in the management of the Fund at current asset levels.
Other Benefits to DIMA and Its Affiliates. The Board also considered the character and amount of other incidental benefits received by DIMA and its affiliates, including any fees received by DIMA for administrative services provided to the Fund, any fees received by an affiliate of DIMA for transfer agency services provided to the Fund and any fees received by an affiliate of DIMA for distribution services. The Board also considered benefits to DIMA related to brokerage and soft-dollar allocations, including allocating brokerage to pay for research generated by parties other than the executing broker dealers, which pertain primarily to funds investing in equity securities. In addition, the Board considered the incidental public relations benefits to DIMA related to Deutsche Funds advertising and cross-selling opportunities among DIMA products and services. The Board
| | | | | | |
| 46 | | | | | Deutsche Global Macro Fund | | |
considered these benefits in reaching its conclusion that the Fund’s management fees were reasonable.
Compliance. The Board considered the significant attention and resources dedicated by DIMA to documenting and enhancing its compliance processes in recent years. The Board noted in particular (i) the experience, seniority and time commitment of the individuals serving as DIMA’s and the Fund’s chief compliance officers; (ii) the large number of DIMA compliance personnel; and (iii) the substantial commitment of resources by DIMA and its affiliates to compliance matters.
Based on all of the information considered and the conclusions reached, the Board unanimously determined that the continuation of the Agreement is in the best interests of the Fund. In making this determination, the Board did not give particular weight to any single factor identified above. The Board considered these factors over the course of numerous meetings, certain of which were in executive session with only the Independent Directors and counsel present. It is possible that individual Independent Directors may have weighed these factors differently in reaching their individual decisions to approve the continuation of the Agreement.
Advisory Agreement Amendment
At a meeting held in July 2017, the Board of Directors, all members of which are Independent Directors, approved an amendment to the Fund’s Agreement to adopt a revised management fee schedule reducing DIMA’s management fee under the Agreement. The revised management fee schedule took effect as of July 1, 2017.
In connection with its review of the amendment in July 2017, the Board noted that it most recently approved the renewal of the Agreement pursuant to a process that concluded in September 2016. In addition, the Board considered:
| – | With the exception of the revised management fee schedule, the terms of the Agreement remained the same. |
| – | DIMA’s statement that there would be no reduction in services to the Fund as a result of the revised management fee schedule. |
Based on all of the information considered, the Board concluded that the revised management fee schedule was reasonable and appropriate in light of the nature, quality and extent of services provided by DIMA. The Board unanimously determined that approval of the revised management fee schedule was in the best interests of the Fund.
| | | | | | | | |
| | Deutsche Global Macro Fund | | | | | | 47 | |
Account Management Resources
| | |
| For More Information | | The automated telephone system allows you to access personalized account information and obtain information on other Deutsche funds using either your voice or your telephone keypad. Certain account types within Classes A, C and S also have the ability to purchase, exchange or redeem shares using this system. For more information, contact your financial advisor. You may also access our automated telephone system or speak with a Shareholder Service representative by calling: (800) 728-3337 |
| Web Site | | dws.com View your account transactions and balances, trade shares, monitor your asset allocation, subscribe to fund and account updates by e-mail, and change your address, 24 hours a day. Obtain prospectuses and applications, news about Deutsche funds, insight from DWS economists and investment specialists and access to Deutsche fund account information. |
| Written Correspondence | | DWS PO Box 219151 Kansas City, MO 64121-9151 |
| Proxy Voting | | The Fund’s policies and procedures for voting proxies for portfolio securities and information about how the Fund voted proxies related to its portfolio securities during the most recent 12-month period ended June 30 are available on our Web site — dws.com/en-us/resources/proxy-voting — or on the SEC’s Web site — sec.gov. To obtain a written copy of the Fund’s policies and procedures without charge, upon request, call us toll free at (800) 728-3337. |
| Portfolio Holdings | | Following the Fund’s fiscal first and third quarter-end, a complete portfolio holdings listing is filed with the SEC on Form N-Q. This form will be available on the SEC’s Web site at sec.gov, and it also may be reviewed and copied at the SEC’s Public Reference Room in Washington, D.C. Information on the operation of the SEC’s Public Reference Room may be obtained by calling (800) SEC-0330. The Fund portfolio holdings are also posted on dws.com from time to time. Please see the Fund’s current prospectus for more information. |
| Principal Underwriter | | If you have questions, comments or complaints, contact: DWS, Inc. 222 South Riverside Plaza Chicago, IL 60606-5808 (800) 621-1148 |
| | | | | | |
| 48 | | | | | Deutsche Global Macro Fund | | |
| | | | | | | | |
| Investment Management | | Deutsche Investment Management Americas Inc. (“DIMA” or the “Advisor”), which is part of DWS Group, is the investment advisor for the Fund. DIMA and its predecessors have more than 90 years of experience managing mutual funds and DIMA provides a full range of investment advisory services to both institutional and retail clients. DIMA is an indirect, wholly owned subsidiary of DWS Group. DWS Group is a global organization that offers a wide range of investing expertise and resources, including hundreds of portfolio managers and analysts and an office network that reaches the world’s major investment centers. This well-resourced global investment platform brings together a wide variety of experience and investment insight across industries, regions, asset classes and investing styles. |
| | | | |
| | | Class A | | Class C | | Class S | | Institutional
Class |
| Nasdaq Symbol | | DBISX | | DBICX | | DBIVX | | MGINX |
| CUSIP Number | | 25156G 871 | | 25156G 806 | | 25156G 608 | | 25156G 509 |
| Fund Number | | 499 | | 799 | | 2399 | | 559 |
| | |
| For shareholders of Class R | | | | |
| Automated Information Line | | DWS/Ascensus Plan Access (800) 728-3337 24-hour access to your retirement plan account. |
| Web Site | | dws.com Obtain prospectuses and applications, news about Deutsche funds, insight from DWS economists and investment specialists and access to Deutsche fund account information. Log in/register to manage retirement account assets at https://www.mykplan.com/participantsecure_net/login.aspx. |
| For More Information | | (800) 728-3337 To speak with a service representative. |
| Written Correspondence | | DWS Service Company 222 South Riverside Plaza Chicago, IL 60606-5806 |
| Nasdaq Symbol | | DBITX | | | | | | |
| CUSIP Number | | 25156G 707 | | | | | | |
| Fund Number | | 1501 | | | | | | |
| | | | | | | | |
| | Deutsche Global Macro Fund | | | | | | 49 | |
Privacy Statement
| | |
| FACTS | | What Does DWS Do With Your Personal Information? |
| Why? | | Financial companies choose how they share your personal information. Federal law gives consumers the right to limit some but not all sharing. Federal law also requires us to tell you how we collect, share and protect your personal information. Please read this notice carefully to understand what we do. |
| What? | | The types of personal information we collect and share can include: – Social Security number – Account balances –Purchaseand transaction history – Bank account information – Contact information such as mailing address, e-mail address and telephone number |
| How? | | All financial companies need to share customers’ personal information to run their everyday business. In the section below, we list the reasons financial companies can share their customers’ personal information, the reasons DWS chooses to share and whether you can limit this sharing. |
| | | | |
Reasons we can share your personal
information | | Does DWS share? | | Can you limit
this sharing? |
For our everyday business purposes —
such as to process your transactions, maintain your account(s), respond to court orders or legal investigations | | Yes | | No |
| For our marketing purposes — to offer our products and services to you | | Yes | | No |
| For joint marketing with other financial companies | | No | | We do not share |
| For our affiliates’ everyday business purposes — information about your transactions and experiences | | No | | We do not share |
| For our affiliates’ everyday business purposes — information about your creditworthiness | | No | | We do not share |
| For non-affiliates to market to you | | No | | We do not share |
| | |
| Questions? | | Call (800) 728-3337 or e-mail us at service@dws.com |
| | | | | | |
| 50 | | | | | Deutsche Global Macro Fund | | |
| | |
|
| Who we are | | |
| Who is providing this notice? | | DWS Distributors, Inc; Deutsche Investment Management Americas Inc.; Deutsche AM Trust Company; the Deutsche Funds |
| What we do | | |
| How does DWS protect my personal information? | | To protect your personal information from unauthorized access and use, we use security measures that comply with federal law. These measures include computer safeguards and secured files and buildings. |
How does DWS collect my personal information? | | We collect your personal information, for example, when you: – open an account – give us your contact information – provide bank account information for ACH or wire transactions – tell us where to send money – seek advice about your investments |
| Why can’t I limit all sharing? | | Federal law gives you the right to limit only – sharing for affiliates’ everyday business purposes – information about your creditworthiness – affiliates from using your information to market to you – sharing for non-affiliates to market to you State laws and individual companies may give you additional rights to limit sharing. |
| Definitions | | |
| Affiliates | | Companies related by common ownership or control. They can be financial or non-financial companies. Our affiliates include financial companies with the DWS or Deutsche Bank (“DB”) name, such as DB AG Frankfurt. |
| Non-affiliates | | Companies not related by common ownership or control. They can be financial and non-financial companies. Non-affiliates we share with include account service providers, service quality monitoring services, mailing service providers and verification services to help in the fight against money laundering and fraud. |
| Joint marketing | | A formal agreement between non-affiliated financial companies that together market financial products or services to you. DWS does not jointly market. |
Rev. 3/2018
| | | | | | | | |
| | Deutsche Global Macro Fund | | | | | | 51 | |
DGMF-3
(R-027566-7 6/18)
| | |
| ITEM 2. | CODE OF ETHICS |
| | |
| | Not applicable. |
| | |
| ITEM 3. | AUDIT COMMITTEE FINANCIAL EXPERT |
| | |
| | Not applicable |
| | |
| ITEM 4. | PRINCIPAL ACCOUNTANT FEES AND SERVICES |
| | |
| | Not applicable |
| | |
| ITEM 5. | AUDIT COMMITTEE OF LISTED REGISTRANTS |
| | |
| | Not applicable |
| | |
| ITEM 6. | SCHEDULE OF INVESTMENTS |
| | |
| | Not applicable |
| | |
| ITEM 7. | DISCLOSURE OF PROXY VOTING POLICIES AND PROCEDURES FOR CLOSED-END MANAGEMENT INVESTMENT COMPANIES |
| | |
| | Not applicable |
| | |
| ITEM 8. | PORTFOLIO MANAGERS OF CLOSED-END MANAGEMENT INVESTMENT COMPANIES |
| | |
| | Not applicable |
| | |
| ITEM 9. | PURCHASES OF EQUITY SECURITIES BY CLOSED-END MANAGEMENT INVESTMENT COMPANY AND AFFILIATED PURCHASERS |
| | |
| | Not applicable |
| | |
| ITEM 10. | SUBMISSION OF MATTERS TO A VOTE OF SECURITY HOLDERS |
| | |
| | There were no material changes to the procedures by which shareholders may recommend nominees to the Fund’s Board. The primary function of the Nominating and Governance Committee is to identify and recommend individuals for membership on the Board and oversee the administration of the Board Governance Guidelines. Shareholders may recommend candidates for Board positions by forwarding their correspondence by U.S. mail or courier service to Keith R. Fox, Deutsche Funds Board Chair, c/o Thomas R. Hiller, Ropes & Gray LLP, Prudential Tower, 800 Boylston Street, Boston, MA 02199-3600. |
| | |
| ITEM 11. | CONTROLS AND PROCEDURES |
| | |
| | (a) | The Chief Executive and Financial Officers concluded that the Registrant’s Disclosure Controls and Procedures are effective based on the evaluation of the Disclosure Controls and Procedures as of a date within 90 days of the filing date of this report. |
| | |
| | (b) | There have been no changes in the registrant’s internal control over financial reporting that occurred during the second fiscal quarter of the period covered by this report that has materially affected, or is reasonably likely to materially affect, the registrant’s internal controls over financial reporting. |
| | |
| ITEM 12. | Disclosure of Securities Lending Activities for Closed-End Management Investment Companies. |
| | |
| | Not applicable |
| | |
| ITEM 13. | EXHIBITS |
| | |
| | (a)(1) | Not applicable |
| | |
| | (a)(2) | Certification pursuant to Rule 30a-2(a) under the Investment Company Act of 1940 (17 CFR 270.30a-2(a)) is filed and attached hereto as Exhibit 99.CERT. |
| | |
| | (b) | Certification pursuant to Rule 30a-2(b) under the Investment Company Act of 1940 (17 CFR 270.30a-2(b)) is furnished and attached hereto as Exhibit 99.906CERT. |
SIGNATURES
Pursuant to the requirements of the Securities Exchange Act of 1934 and the Investment Company Act of 1940, the registrant has duly caused this report to be signed on its behalf by the undersigned, thereunto duly authorized.
| Registrant: | Deutsche Global Macro Fund, a series of Deutsche International Fund, Inc. |
| | |
| | |
| By: | /s/Hepsen Uzcan Hepsen Uzcan President |
| | |
| Date: | 6/29/2018 |
Pursuant to the requirements of the Securities Exchange Act of 1934 and the Investment Company Act of 1940, this report has been signed below by the following persons on behalf of the registrant and in the capacities and on the dates indicated.
| By: | /s/Hepsen Uzcan Hepsen Uzcan President |
| | |
| Date: | 6/29/2018 |
| | |
| | |
| | |
| By: | /s/Paul Schubert Paul Schubert Chief Financial Officer and Treasurer |
| | |
| Date: | 6/29/2018 |