UNITED STATES
SECURITIES AND EXCHANGE COMMISSION
WASHINGTON, D. C. 20549
FORM N-CSR
CERTIFIED SHAREHOLDER REPORT OF
REGISTERED MANAGEMENT INVESTMENT COMPANIES
Investment Company Act file number: 811-00642
Deutsche DWS International Fund, Inc.
(Exact Name of Registrant as Specified in Charter)
875 Third Avenue
New York, NY 10022-6225
(Address of Principal Executive Offices) (Zip Code)
Registrant’s Telephone Number, including Area Code: (212) 454-4500
Diane Kenneally
100 Summer Street
Boston, MA 02110
(Name and Address of Agent for Service)
| Date of fiscal year end: | 10/31 |
| | |
| Date of reporting period: | 10/31/2024 |
| Item 1. | Reports to Stockholders. |
| | |
| | (a) |
0000088053 dws:DWSIndexICEBofA3MinusMonthUSTreasuryBillIndex18843AdditionalIndexMember 2023-08-31 0000088053 dws:DWSIndexBloombergGlobalAggregateIndex18846AdditionalIndexMember 2015-06-30
Annual Shareholder Report—October 31, 2024
This annual shareholder report contains important information about DWS Global Macro Fund (the "Fund") for the period November 1, 2023 to October 31, 2024. You can find additional information about the Fund on the Fund's website at dws.com/mutualreports. You can also request this information by contacting us at (800) 728-3337.
This report describes changes to the Fund that occurred during the reporting period.
What were the Fund costs for the last year?
(Based on a hypothetical $10,000 investment)
| Fund | Costs of a $10,000 investment | Costs paid as a percentage of a $10,000 investment |
|---|
| Class A | $132 | 1.25% |
Gross expense ratio as of the latest prospectus: 1.30%. See prospectus for any contractual or voluntary waivers; without a waiver, costs would have been higher.
How did the Fund perform last year and what affected its performance?
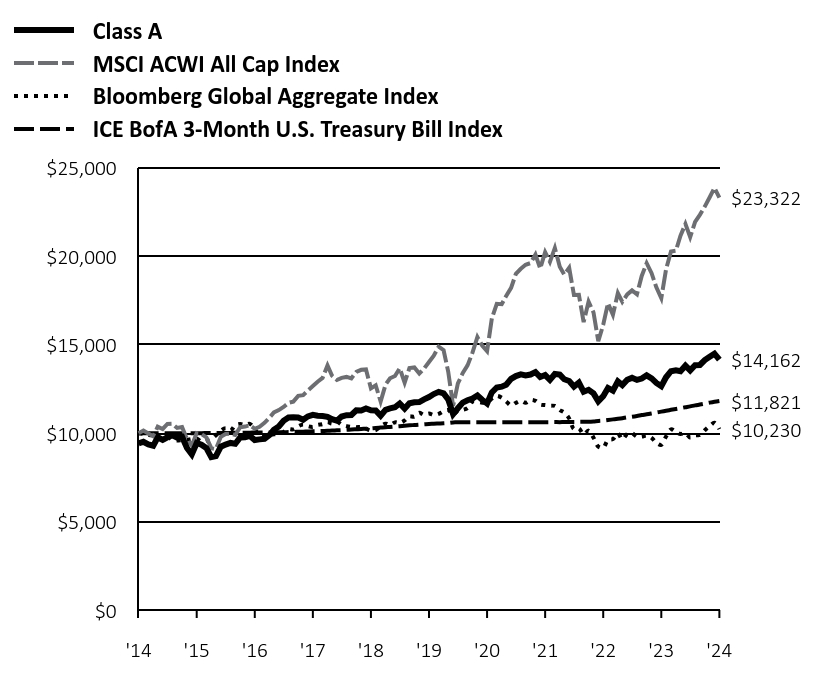
Class A shares of the Fund returned 11.88% (unadjusted for sales charges) for the period ended October 31, 2024. The Fund's broad-based indices, the MSCI ACWI All Cap Index and the Bloomberg Global Aggregate Index, returned 32.26% and 9.54%, respectively for the same period, while the Fund's additional, more narrowly based index, the ICE BofA 3-Month U.S. Treasury Bill Index, returned 5.39%.
The Fund’s allocation to equities was the primary factor in its outperformance relative to the ICE BofA 3-Month U.S. Treasury Bill Index. Stocks performed very well in the period thanks to the combination of positive economic growth, steady corporate earnings, and a shift toward more accommodative policy by the world’s central banks. Holdings in the financials and communications services sectors led the gains in the equity portfolio. Consumer staples was the only sector that was a net detractor from results. The Fund’s hedging strategy, which is designed to dampen stock-market volatility and help manage “tail risk” through the use of futures contracts, was also a modest contributor.
The Fund’s positioning in bonds contributed to performance, as well. Here, the Fund’s duration positioning made the largest contribution to performance. (Duration is a measure of interest rates sensitivity.) We managed duration in part through the use of derivatives, which was a net contributor to results.
The Fund’s currency positioning was a net detractor, primarily as a result of a long exposure to the euro.
The Fund had an allocation to gold through an investment in the exchange-traded fund SPDR Gold MiniShares Trust (8.1%). Given that gold prices hit a series of all-time highs in the period, this aspect of positioning contributed to performance.
Percentages in parentheses are based on the Fund’s net assets as of October 31, 2024.
Cumulative Growth of an Assumed $10,000Investment
(Adjusted for Maximum Sales Charge)
MSCI ACWI All Cap Index captures large, mid, small and micro-cap representation across Developed Markets countries and large, mid and small cap representation across Emerging Markets countries. The index is comprehensive, covering approximately 99% of the global equity investment opportunity set.
Bloomberg Global Aggregate Index is a flagship measure of global investment grade debt from local currency markets. This multi-currency benchmark includes treasury, government-related, corporate and securitized fixed-rate bonds from both developed and emerging markets issuers.
The MSCI ACWI All Cap Index and the Bloomberg Global Aggregate Index are broad-based indices that represent the Fund's overall equity and debt markets, respectively. These indices replace the ICE BofA 3-Month U.S. Treasury Bill Index as the Fund's broad-based indices in compliance with updated regulatory requirements.
ICE BofA 3-Month U.S. Treasury Bill Index tracks the performance of the U.S. dollar denominated U.S. Treasury Bills publicly issued in the U.S. domestic market with a remaining term to final maturity of less than three months. The ICE BofA 3-Month U.S. Treasury Bill Index is a more narrowly based index that reflects the market sector in which the fund invests.
Index returns do not reflect any fees or expenses and it is not possible to invest directly into an index.
| Class A | MSCI ACWI All Cap Index | Bloomberg Global Aggregate Index | ICE BofA 3-Month U.S. Treasury Bill Index |
|---|
| '14 | $9,425 | $10,000 | $10,000 | $10,000 |
| '14 | $9,514 | $10,146 | $9,963 | $10,000 |
| '14 | $9,369 | $9,979 | $9,895 | $10,000 |
| '15 | $9,291 | $9,824 | $9,879 | $10,001 |
| '15 | $9,759 | $10,372 | $9,799 | $10,001 |
| '15 | $9,625 | $10,236 | $9,705 | $10,001 |
| '15 | $9,770 | $10,519 | $9,808 | $10,001 |
| '15 | $9,881 | $10,528 | $9,633 | $10,001 |
| '15 | $9,748 | $10,297 | $9,590 | $10,001 |
| '15 | $9,792 | $10,353 | $9,612 | $10,001 |
| '15 | $9,158 | $9,660 | $9,623 | $10,002 |
| '15 | $8,802 | $9,307 | $9,672 | $10,002 |
| '15 | $9,447 | $10,008 | $9,693 | $10,002 |
| '15 | $9,347 | $9,947 | $9,532 | $10,002 |
| '15 | $9,158 | $9,763 | $9,583 | $10,006 |
| '16 | $8,646 | $9,150 | $9,666 | $10,006 |
| '16 | $8,702 | $9,103 | $9,881 | $10,008 |
| '16 | $9,236 | $9,792 | $10,148 | $10,013 |
| '16 | $9,358 | $9,949 | $10,283 | $10,016 |
| '16 | $9,447 | $9,968 | $10,145 | $10,016 |
| '16 | $9,403 | $9,896 | $10,441 | $10,020 |
| '16 | $9,759 | $10,337 | $10,520 | $10,023 |
| '16 | $9,770 | $10,372 | $10,469 | $10,025 |
| '16 | $9,848 | $10,452 | $10,527 | $10,030 |
| '16 | $9,614 | $10,249 | $10,234 | $10,032 |
| '16 | $9,648 | $10,360 | $9,828 | $10,034 |
| '16 | $9,681 | $10,583 | $9,783 | $10,038 |
| '17 | $9,892 | $10,872 | $9,893 | $10,043 |
| '17 | $10,193 | $11,171 | $9,940 | $10,047 |
| '17 | $10,382 | $11,303 | $9,955 | $10,049 |
| '17 | $10,705 | $11,484 | $10,067 | $10,055 |
| '17 | $10,883 | $11,714 | $10,223 | $10,060 |
| '17 | $10,894 | $11,785 | $10,214 | $10,069 |
| '17 | $10,883 | $12,108 | $10,386 | $10,077 |
| '17 | $10,760 | $12,151 | $10,489 | $10,087 |
| '17 | $10,949 | $12,414 | $10,394 | $10,095 |
| '17 | $11,038 | $12,663 | $10,355 | $10,105 |
| '17 | $10,983 | $12,912 | $10,470 | $10,113 |
| '17 | $10,972 | $13,124 | $10,506 | $10,124 |
| '18 | $10,927 | $13,831 | $10,631 | $10,136 |
| '18 | $10,794 | $13,255 | $10,537 | $10,146 |
| '18 | $10,705 | $13,008 | $10,649 | $10,160 |
| '18 | $10,938 | $13,128 | $10,479 | $10,173 |
| '18 | $11,016 | $13,181 | $10,399 | $10,189 |
| '18 | $11,027 | $13,101 | $10,353 | $10,206 |
| '18 | $11,294 | $13,460 | $10,336 | $10,222 |
| '18 | $11,283 | $13,583 | $10,346 | $10,240 |
| '18 | $11,395 | $13,603 | $10,257 | $10,256 |
| '18 | $11,294 | $12,536 | $10,143 | $10,274 |
| '18 | $11,283 | $12,710 | $10,174 | $10,295 |
| '18 | $10,991 | $11,789 | $10,380 | $10,314 |
| '19 | $11,322 | $12,747 | $10,538 | $10,334 |
| '19 | $11,405 | $13,102 | $10,477 | $10,353 |
| '19 | $11,465 | $13,235 | $10,609 | $10,376 |
| '19 | $11,678 | $13,671 | $10,577 | $10,395 |
| '19 | $11,394 | $12,856 | $10,720 | $10,419 |
| '19 | $11,690 | $13,679 | $10,958 | $10,442 |
| '19 | $11,749 | $13,719 | $10,928 | $10,461 |
| '19 | $11,761 | $13,371 | $11,150 | $10,482 |
| '19 | $11,915 | $13,651 | $11,036 | $10,501 |
| '19 | $12,046 | $14,028 | $11,110 | $10,521 |
| '19 | $12,212 | $14,377 | $11,026 | $10,534 |
| '19 | $12,337 | $14,889 | $11,090 | $10,549 |
| '20 | $12,252 | $14,691 | $11,232 | $10,563 |
| '20 | $11,910 | $13,485 | $11,307 | $10,579 |
| '20 | $11,080 | $11,539 | $11,054 | $10,610 |
| '20 | $11,410 | $12,812 | $11,271 | $10,611 |
| '20 | $11,727 | $13,404 | $11,320 | $10,611 |
| '20 | $11,861 | $13,834 | $11,421 | $10,612 |
| '20 | $11,959 | $14,551 | $11,785 | $10,614 |
| '20 | $12,130 | $15,434 | $11,767 | $10,615 |
| '20 | $11,888 | $14,959 | $11,725 | $10,616 |
| '20 | $11,680 | $14,636 | $11,736 | $10,617 |
| '20 | $12,305 | $16,493 | $11,949 | $10,618 |
| '20 | $12,583 | $17,317 | $12,110 | $10,619 |
| '21 | $12,632 | $17,295 | $12,003 | $10,620 |
| '21 | $12,742 | $17,763 | $11,797 | $10,621 |
| '21 | $13,069 | $18,221 | $11,570 | $10,622 |
| '21 | $13,229 | $19,009 | $11,716 | $10,622 |
| '21 | $13,327 | $19,296 | $11,826 | $10,623 |
| '21 | $13,265 | $19,525 | $11,722 | $10,622 |
| '21 | $13,314 | $19,619 | $11,878 | $10,623 |
| '21 | $13,450 | $20,103 | $11,828 | $10,623 |
| '21 | $13,174 | $19,307 | $11,618 | $10,624 |
| '21 | $13,285 | $20,240 | $11,590 | $10,623 |
| '21 | $13,013 | $19,691 | $11,556 | $10,624 |
| '21 | $13,348 | $20,470 | $11,540 | $10,625 |
| '22 | $13,311 | $19,405 | $11,303 | $10,624 |
| '22 | $13,050 | $18,962 | $11,169 | $10,626 |
| '22 | $12,950 | $19,349 | $10,829 | $10,629 |
| '22 | $12,639 | $17,812 | $10,236 | $10,630 |
| '22 | $12,863 | $17,820 | $10,264 | $10,638 |
| '22 | $12,341 | $16,282 | $9,934 | $10,640 |
| '22 | $12,453 | $17,442 | $10,145 | $10,645 |
| '22 | $12,253 | $16,826 | $9,745 | $10,663 |
| '22 | $11,805 | $15,199 | $9,244 | $10,689 |
| '22 | $12,094 | $16,131 | $9,181 | $10,706 |
| '22 | $12,558 | $17,356 | $9,613 | $10,740 |
| '22 | $12,406 | $16,695 | $9,665 | $10,779 |
| '23 | $12,924 | $17,926 | $9,982 | $10,813 |
| '23 | $12,717 | $17,426 | $9,650 | $10,848 |
| '23 | $13,024 | $17,848 | $9,955 | $10,895 |
| '23 | $13,129 | $18,073 | $9,999 | $10,929 |
| '23 | $13,011 | $17,852 | $9,804 | $10,972 |
| '23 | $13,086 | $18,890 | $9,803 | $11,022 |
| '23 | $13,271 | $19,613 | $9,871 | $11,066 |
| '23 | $13,100 | $19,047 | $9,736 | $11,116 |
| '23 | $12,844 | $18,246 | $9,452 | $11,167 |
| '23 | $12,658 | $17,633 | $9,339 | $11,217 |
| '23 | $13,163 | $19,262 | $9,809 | $11,267 |
| '23 | $13,505 | $20,278 | $10,217 | $11,320 |
| '24 | $13,558 | $20,321 | $10,076 | $11,368 |
| '24 | $13,505 | $21,165 | $9,950 | $11,415 |
| '24 | $13,818 | $21,834 | $10,004 | $11,466 |
| '24 | $13,552 | $21,091 | $9,752 | $11,515 |
| '24 | $13,845 | $21,946 | $9,880 | $11,571 |
| '24 | $13,857 | $22,345 | $9,894 | $11,618 |
| '24 | $14,137 | $22,812 | $10,167 | $11,670 |
| '24 | $14,324 | $23,342 | $10,408 | $11,726 |
| '24 | $14,497 | $23,877 | $10,585 | $11,776 |
| '24 | $14,162 | $23,322 | $10,230 | $11,821 |
Yearly periods ended October 31
The Fund's growth of an assumed $10,000 investment is adjusted for the maximum sales charge of 5.75%. This results in a net initial invesment of $9,425.
Average Annual Total Returns
| Class/Index | 1-Year | 5-Year | 10-Year |
|---|
| Class A Unadjusted for Sales Charge | 11.88% | 3.29% | 4.16% |
| Class A Adjusted for the Maximum Sales Charge (max 5.75% load) | 5.44% | 2.07% | 3.54% |
| MSCI ACWI All Cap Index | 32.26% | 10.70% | 8.84% |
| Bloomberg Global Aggregate Index | 9.54% | -1.64% | 0.23% |
| ICE BofA 3-Month U.S. Treasury Bill Index | 5.39% | 2.36% | 1.69% |
Prior to May 8, 2017, the Fund had a different management team and operated with a different investment strategy. Performance would have been different if the Fund’s current investment strategy had been in effect.
Performance shown is historical. The Fund's past performance is not a good predictor or guarantee of the Fund's future performance. Investment return and principal fluctuate, so your shares may be worth more or less when redeemed. Current performance may be lower or higher than the performance data quoted. The performance graph and returns table do not reflect the deduction of taxes that a shareholder would pay on Fund distributions or the redemption of Fund shares.Please visit dws.com/en-us/products/mutual-funds for the Fund’s most recent month-end performance. Fund performance includes reinvestment of all distributions. Unadjusted returns do not reflect sales charges and would have been lower if they had reflected sales charges.
| Net Assets ($) | 176,993,076 |
| Number of Portfolio Holdings | 76 |
| Portfolio Turnover Rate (%) | 39 |
| Total Net Advisory Fees Paid ($) | 1,163,804 |
What did the Fund invest in?
Holdings-based data is subject to change.
| Asset Type | % of Net Assets |
| Common Stocks | 37% |
| U.S. Treasury Obligations | 34% |
| Cash and Cash Equivalents | 9% |
| Gold Exchange-Traded Funds | 8% |
| Corporate Bonds | 6% |
| Futures Contracts Fixed income | 4% |
| Sovereign Bonds | 3% |
| Equity Exchange-Traded Funds | 3% |
| Fixed Income Exchange -Traded Funds | 1% |
| Futures Contracts Equity | (0%) |
| Sector | % of Net Assets |
| Health Care | 10% |
| Financials | 7% |
| Communication Services | 7% |
| Information Technology | 6% |
| Industrials | 3% |
| Utilities | 3% |
| Consumer Discretionary | 2% |
| Consumer Staples | 2% |
| Materials | 2% |
| Real Estate | 1% |
Geographical Diversification
| Country | % of Net Assets |
| United States | 52% |
| France | 7% |
| Germany | 6% |
| Netherlands | 3% |
| Ireland | 2% |
| Australia | 2% |
| Switzerland | 2% |
| Japan | 2% |
| Denmark | 1% |
| Korea | 1% |
| Other | 1% |
This is a summary of certain changes of the Fund since November 1, 2023. For more information, review the Fund's current prospectus at dws.com/mutualreports, or call (800) 728-3337.
Effective March 1, 2024, the Fund’s contractual cap on total annual operating expense for Class A shares changed from 1.18% to 1.29%. The cap excludes certain expenses such as extraordinary expenses, taxes, brokerage, interest expense and acquired fund fees and expenses.
If you wish to view additional information about the Fund, including, but not limited to, its prospectus, quarterly holdings, Board fee evaluation reports, and financial statements and other information, please visit dws.com/mutualreports. For information about the Fund's proxy voting policies and procedures and how the Fund voted proxies related to its portfolio securities, please visit dws.com/en-us/resources/proxy-voting. This additional information is also available free of charge by contacting us at (800) 728-3337.
In order to reduce the amount of mail you receive and to help reduce expenses, we generally send a single copy of any shareholder report and prospectus to each household. If you do not want the mailing of these documents to be combined with those for other members of your household, please contact your financial representative or call DWS toll free at (800) 728-3337.
Stocks may decline in value. Investing in foreign securities presents certain risks, such as currency fluctuations, political and economic changes, and market risks. Emerging markets tend to be more volatile and less liquid than the markets of more mature economies, and generally have less diverse and less mature economic structures and less stable political systems than those of developed countries. The Fund’s use of forward currency contracts may not be successful in hedging currency exchange rates changes and could eliminate some or all of the benefit of an increase in the value of a foreign currency versus the US dollar. Although allocation among different asset categories generally limits risk, fund management may favor an asset category that underperforms other assets or markets as a whole. Investing in derivatives entails special risks relating to liquidity, leverage and credit that may reduce returns and/or increased volatility. Investments in lower-quality (“junk bonds”) and non-rated securities present greater risk of loss than investments in higher-quality securities. The Fund may lend securities to approved institutions. Please read the prospectus for details.
This report must be preceded or accompanied by a prospectus. We advise you to consider the Fund's objectives, risks, charges, and expenses carefully before investing. The prospectus contains this and other important information about the Fund, which can be requested by calling (800) 728-3337, contacting your financial representative, or visit dws.com/mutualreports to view or download a prospectus. Please read the prospectus carefully before you invest.
The brand DWS represents DWS Group GmbH & Co. KGaA and any of its subsidiaries such as DWS Distributors, Inc., which offers investment products, or DWS Investment Management Americas, Inc. and RREEF America L.L.C., which offer advisory services.
©2024 DWS Group GmbH&Co. KGaA. All rights reserved
DGMF-TSRA-A
R-103424-1 (12/24)
Annual Shareholder Report—October 31, 2024
This annual shareholder report contains important information about DWS Global Macro Fund (the "Fund") for the period November 1, 2023 to October 31, 2024. You can find additional information about the Fund on the Fund's website at dws.com/mutualreports. You can also request this information by contacting us at (800) 728-3337.
This report describes changes to the Fund that occurred during the reporting period.
What were the Fund costs for the last year?
(Based on a hypothetical $10,000 investment)
| Fund | Costs of a $10,000 investment | Costs paid as a percentage of a $10,000 investment |
|---|
| Class C | $212 | 2.01% |
Gross expense ratio as of the latest prospectus: 2.09%. See prospectus for any contractual or voluntary waivers; without a waiver, costs would have been higher.
How did the Fund perform last year and what affected its performance?
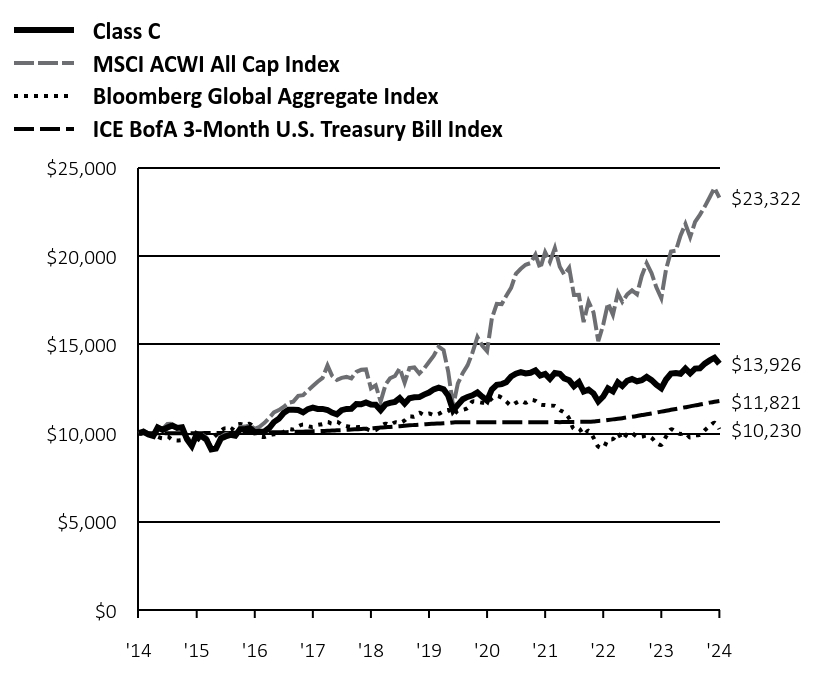
Class C shares of the Fund returned 11.04% (unadjusted for sales charges) for the period ended October 31, 2024. The Fund's broad-based indices, the MSCI ACWI All Cap Index and the Bloomberg Global Aggregate Index, returned 32.26% and 9.54%, respectively for the same period, while the Fund's additional, more narrowly based index, the ICE BofA 3-Month U.S. Treasury Bill Index, returned 5.39%.
The Fund’s allocation to equities was the primary factor in its outperformance relative to the ICE BofA 3-Month U.S. Treasury Bill Index. Stocks performed very well in the period thanks to the combination of positive economic growth, steady corporate earnings, and a shift toward more accommodative policy by the world’s central banks. Holdings in the financials and communications services sectors led the gains in the equity portfolio. Consumer staples was the only sector that was a net detractor from results. The Fund’s hedging strategy, which is designed to dampen stock-market volatility and help manage “tail risk” through the use of futures contracts, was also a modest contributor.
The Fund’s positioning in bonds contributed to performance, as well. Here, the Fund’s duration positioning made the largest contribution to performance. (Duration is a measure of interest rates sensitivity.) We managed duration in part through the use of derivatives, which was a net contributor to results.
The Fund’s currency positioning was a net detractor, primarily as a result of a long exposure to the euro.
The Fund had an allocation to gold through an investment in the exchange-traded fund SPDR Gold MiniShares Trust (8.1%). Given that gold prices hit a series of all-time highs in the period, this aspect of positioning contributed to performance.
Percentages in parentheses are based on the Fund’s net assets as of October 31, 2024.
Cumulative Growth of an Assumed $10,000Investment
MSCI ACWI All Cap Index captures large, mid, small and micro-cap representation across Developed Markets countries and large, mid and small cap representation across Emerging Markets countries. The index is comprehensive, covering approximately 99% of the global equity investment opportunity set.
Bloomberg Global Aggregate Index is a flagship measure of global investment grade debt from local currency markets. This multi-currency benchmark includes treasury, government-related, corporate and securitized fixed-rate bonds from both developed and emerging markets issuers.
The MSCI ACWI All Cap Index and the Bloomberg Global Aggregate Index are broad-based indices that represent the Fund's overall equity and debt markets, respectively. These indices replace the ICE BofA 3-Month U.S. Treasury Bill Index as the Fund's broad-based indices in compliance with updated regulatory requirements.
ICE BofA 3-Month U.S. Treasury Bill Index tracks the performance of the U.S. dollar denominated U.S. Treasury Bills publicly issued in the U.S. domestic market with a remaining term to final maturity of less than three months. The ICE BofA 3-Month U.S. Treasury Bill Index is a more narrowly based index that reflects the market sector in which the fund invests.
Index returns do not reflect any fees or expenses and it is not possible to invest directly into an index.
| Class C | MSCI ACWI All Cap Index | Bloomberg Global Aggregate Index | ICE BofA 3-Month U.S. Treasury Bill Index |
|---|
| '14 | $10,000 | $10,000 | $10,000 | $10,000 |
| '14 | $10,086 | $10,146 | $9,963 | $10,000 |
| '14 | $9,926 | $9,979 | $9,895 | $10,000 |
| '15 | $9,841 | $9,824 | $9,879 | $10,001 |
| '15 | $10,319 | $10,372 | $9,799 | $10,001 |
| '15 | $10,184 | $10,236 | $9,705 | $10,001 |
| '15 | $10,319 | $10,519 | $9,808 | $10,001 |
| '15 | $10,429 | $10,528 | $9,633 | $10,001 |
| '15 | $10,294 | $10,297 | $9,590 | $10,001 |
| '15 | $10,331 | $10,353 | $9,612 | $10,001 |
| '15 | $9,657 | $9,660 | $9,623 | $10,002 |
| '15 | $9,277 | $9,307 | $9,672 | $10,002 |
| '15 | $9,951 | $10,008 | $9,693 | $10,002 |
| '15 | $9,841 | $9,947 | $9,532 | $10,002 |
| '15 | $9,632 | $9,763 | $9,583 | $10,006 |
| '16 | $9,081 | $9,150 | $9,666 | $10,006 |
| '16 | $9,130 | $9,103 | $9,881 | $10,008 |
| '16 | $9,694 | $9,792 | $10,148 | $10,013 |
| '16 | $9,816 | $9,949 | $10,283 | $10,016 |
| '16 | $9,902 | $9,968 | $10,145 | $10,016 |
| '16 | $9,853 | $9,896 | $10,441 | $10,020 |
| '16 | $10,221 | $10,337 | $10,520 | $10,023 |
| '16 | $10,221 | $10,372 | $10,469 | $10,025 |
| '16 | $10,294 | $10,452 | $10,527 | $10,030 |
| '16 | $10,049 | $10,249 | $10,234 | $10,032 |
| '16 | $10,074 | $10,360 | $9,828 | $10,034 |
| '16 | $10,098 | $10,583 | $9,783 | $10,038 |
| '17 | $10,306 | $10,872 | $9,893 | $10,043 |
| '17 | $10,625 | $11,171 | $9,940 | $10,047 |
| '17 | $10,809 | $11,303 | $9,955 | $10,049 |
| '17 | $11,140 | $11,484 | $10,067 | $10,055 |
| '17 | $11,324 | $11,714 | $10,223 | $10,060 |
| '17 | $11,324 | $11,785 | $10,214 | $10,069 |
| '17 | $11,311 | $12,108 | $10,386 | $10,077 |
| '17 | $11,176 | $12,151 | $10,489 | $10,087 |
| '17 | $11,360 | $12,414 | $10,394 | $10,095 |
| '17 | $11,446 | $12,663 | $10,355 | $10,105 |
| '17 | $11,373 | $12,912 | $10,470 | $10,113 |
| '17 | $11,373 | $13,124 | $10,506 | $10,124 |
| '18 | $11,311 | $13,831 | $10,631 | $10,136 |
| '18 | $11,164 | $13,255 | $10,537 | $10,146 |
| '18 | $11,066 | $13,008 | $10,649 | $10,160 |
| '18 | $11,299 | $13,128 | $10,479 | $10,173 |
| '18 | $11,373 | $13,181 | $10,399 | $10,189 |
| '18 | $11,385 | $13,101 | $10,353 | $10,206 |
| '18 | $11,642 | $13,460 | $10,336 | $10,222 |
| '18 | $11,630 | $13,583 | $10,346 | $10,240 |
| '18 | $11,740 | $13,603 | $10,257 | $10,256 |
| '18 | $11,618 | $12,536 | $10,143 | $10,274 |
| '18 | $11,605 | $12,710 | $10,174 | $10,295 |
| '18 | $11,299 | $11,789 | $10,380 | $10,314 |
| '19 | $11,636 | $12,747 | $10,538 | $10,334 |
| '19 | $11,714 | $13,102 | $10,477 | $10,353 |
| '19 | $11,766 | $13,235 | $10,609 | $10,376 |
| '19 | $11,986 | $13,671 | $10,577 | $10,395 |
| '19 | $11,675 | $12,856 | $10,720 | $10,419 |
| '19 | $11,973 | $13,679 | $10,958 | $10,442 |
| '19 | $12,025 | $13,719 | $10,928 | $10,461 |
| '19 | $12,038 | $13,371 | $11,150 | $10,482 |
| '19 | $12,181 | $13,651 | $11,036 | $10,501 |
| '19 | $12,298 | $14,028 | $11,110 | $10,521 |
| '19 | $12,479 | $14,377 | $11,026 | $10,534 |
| '19 | $12,578 | $14,889 | $11,090 | $10,549 |
| '20 | $12,486 | $14,691 | $11,232 | $10,563 |
| '20 | $12,128 | $13,485 | $11,307 | $10,579 |
| '20 | $11,281 | $11,539 | $11,054 | $10,610 |
| '20 | $11,599 | $12,812 | $11,271 | $10,611 |
| '20 | $11,916 | $13,404 | $11,320 | $10,611 |
| '20 | $12,049 | $13,834 | $11,421 | $10,612 |
| '20 | $12,142 | $14,551 | $11,785 | $10,614 |
| '20 | $12,300 | $15,434 | $11,767 | $10,615 |
| '20 | $12,062 | $14,959 | $11,725 | $10,616 |
| '20 | $11,837 | $14,636 | $11,736 | $10,617 |
| '20 | $12,473 | $16,493 | $11,949 | $10,618 |
| '20 | $12,734 | $17,317 | $12,110 | $10,619 |
| '21 | $12,773 | $17,295 | $12,003 | $10,620 |
| '21 | $12,879 | $17,763 | $11,797 | $10,621 |
| '21 | $13,205 | $18,221 | $11,570 | $10,622 |
| '21 | $13,364 | $19,009 | $11,716 | $10,622 |
| '21 | $13,457 | $19,296 | $11,826 | $10,623 |
| '21 | $13,377 | $19,525 | $11,722 | $10,622 |
| '21 | $13,417 | $19,619 | $11,878 | $10,623 |
| '21 | $13,550 | $20,103 | $11,828 | $10,623 |
| '21 | $13,258 | $19,307 | $11,618 | $10,624 |
| '21 | $13,351 | $20,240 | $11,590 | $10,623 |
| '21 | $13,072 | $19,691 | $11,556 | $10,624 |
| '21 | $13,403 | $20,470 | $11,540 | $10,625 |
| '22 | $13,363 | $19,405 | $11,303 | $10,624 |
| '22 | $13,097 | $18,962 | $11,169 | $10,626 |
| '22 | $12,989 | $19,349 | $10,829 | $10,629 |
| '22 | $12,656 | $17,812 | $10,236 | $10,630 |
| '22 | $12,882 | $17,820 | $10,264 | $10,638 |
| '22 | $12,351 | $16,282 | $9,934 | $10,640 |
| '22 | $12,457 | $17,442 | $10,145 | $10,645 |
| '22 | $12,244 | $16,826 | $9,745 | $10,663 |
| '22 | $11,791 | $15,199 | $9,244 | $10,689 |
| '22 | $12,073 | $16,131 | $9,181 | $10,706 |
| '22 | $12,528 | $17,356 | $9,613 | $10,740 |
| '22 | $12,365 | $16,695 | $9,665 | $10,779 |
| '23 | $12,875 | $17,926 | $9,982 | $10,813 |
| '23 | $12,668 | $17,426 | $9,650 | $10,848 |
| '23 | $12,962 | $17,848 | $9,955 | $10,895 |
| '23 | $13,059 | $18,073 | $9,999 | $10,929 |
| '23 | $12,934 | $17,852 | $9,804 | $10,972 |
| '23 | $12,997 | $18,890 | $9,803 | $11,022 |
| '23 | $13,179 | $19,613 | $9,871 | $11,066 |
| '23 | $12,997 | $19,047 | $9,736 | $11,116 |
| '23 | $12,738 | $18,246 | $9,452 | $11,167 |
| '23 | $12,541 | $17,633 | $9,339 | $11,217 |
| '23 | $13,033 | $19,262 | $9,809 | $11,267 |
| '23 | $13,371 | $20,278 | $10,217 | $11,320 |
| '24 | $13,399 | $20,321 | $10,076 | $11,368 |
| '24 | $13,357 | $21,165 | $9,950 | $11,415 |
| '24 | $13,652 | $21,834 | $10,004 | $11,466 |
| '24 | $13,385 | $21,091 | $9,752 | $11,515 |
| '24 | $13,652 | $21,946 | $9,880 | $11,571 |
| '24 | $13,665 | $22,345 | $9,894 | $11,618 |
| '24 | $13,933 | $22,812 | $10,167 | $11,670 |
| '24 | $14,116 | $23,342 | $10,408 | $11,726 |
| '24 | $14,265 | $23,877 | $10,585 | $11,776 |
| '24 | $13,926 | $23,322 | $10,230 | $11,821 |
Yearly periods ended October 31
Average Annual Total Returns
| Class/Index | 1-Year | 5-Year | 10-Year |
|---|
| Class C Unadjusted for Sales Charge | 11.04% | 2.52% | 3.37% |
| Class C Adjusted for the Maximum Sales Charge (max 1.00% CDSC) | 10.04% | 2.52% | 3.37% |
| MSCI ACWI All Cap Index | 32.26% | 10.70% | 8.84% |
| Bloomberg Global Aggregate Index | 9.54% | -1.64% | 0.23% |
| ICE BofA 3-Month U.S. Treasury Bill Index | 5.39% | 2.36% | 1.69% |
Prior to May 8, 2017, the Fund had a different management team and operated with a different investment strategy. Performance would have been different if the Fund’s current investment strategy had been in effect.
Performance shown is historical. The Fund's past performance is not a good predictor or guarantee of the Fund's future performance. Investment return and principal fluctuate, so your shares may be worth more or less when redeemed. Current performance may be lower or higher than the performance data quoted. The performance graph and returns table do not reflect the deduction of taxes that a shareholder would pay on Fund distributions or the redemption of Fund shares.Please visit dws.com/en-us/products/mutual-funds for the Fund’s most recent month-end performance. Fund performance includes reinvestment of all distributions.
| Net Assets ($) | 176,993,076 |
| Number of Portfolio Holdings | 76 |
| Portfolio Turnover Rate (%) | 39 |
| Total Net Advisory Fees Paid ($) | 1,163,804 |
What did the Fund invest in?
Holdings-based data is subject to change.
| Asset Type | % of Net Assets |
| Common Stocks | 37% |
| U.S. Treasury Obligations | 34% |
| Cash and Cash Equivalents | 9% |
| Gold Exchange-Traded Funds | 8% |
| Corporate Bonds | 6% |
| Futures Contracts Fixed income | 4% |
| Sovereign Bonds | 3% |
| Equity Exchange-Traded Funds | 3% |
| Fixed Income Exchange -Traded Funds | 1% |
| Futures Contracts Equity | (0%) |
| Sector | % of Net Assets |
| Health Care | 10% |
| Financials | 7% |
| Communication Services | 7% |
| Information Technology | 6% |
| Industrials | 3% |
| Utilities | 3% |
| Consumer Discretionary | 2% |
| Consumer Staples | 2% |
| Materials | 2% |
| Real Estate | 1% |
Geographical Diversification
| Country | % of Net Assets |
| United States | 52% |
| France | 7% |
| Germany | 6% |
| Netherlands | 3% |
| Ireland | 2% |
| Australia | 2% |
| Switzerland | 2% |
| Japan | 2% |
| Denmark | 1% |
| Korea | 1% |
| Other | 1% |
This is a summary of certain changes of the Fund since November 1, 2023. For more information, review the Fund's current prospectus at dws.com/mutualreports, or call (800) 728-3337.
Effective March 1, 2024, the Fund’s contractual cap on total annual operating expense for Class C shares changed from 1.93% to 2.04%. The cap excludes certain expenses such as extraordinary expenses, taxes, brokerage, interest expense and acquired fund fees and expenses.
If you wish to view additional information about the Fund, including, but not limited to, its prospectus, quarterly holdings, Board fee evaluation reports, and financial statements and other information, please visit dws.com/mutualreports. For information about the Fund's proxy voting policies and procedures and how the Fund voted proxies related to its portfolio securities, please visit dws.com/en-us/resources/proxy-voting. This additional information is also available free of charge by contacting us at (800) 728-3337.
In order to reduce the amount of mail you receive and to help reduce expenses, we generally send a single copy of any shareholder report and prospectus to each household. If you do not want the mailing of these documents to be combined with those for other members of your household, please contact your financial representative or call DWS toll free at (800) 728-3337.
Stocks may decline in value. Investing in foreign securities presents certain risks, such as currency fluctuations, political and economic changes, and market risks. Emerging markets tend to be more volatile and less liquid than the markets of more mature economies, and generally have less diverse and less mature economic structures and less stable political systems than those of developed countries. The Fund’s use of forward currency contracts may not be successful in hedging currency exchange rates changes and could eliminate some or all of the benefit of an increase in the value of a foreign currency versus the US dollar. Although allocation among different asset categories generally limits risk, fund management may favor an asset category that underperforms other assets or markets as a whole. Investing in derivatives entails special risks relating to liquidity, leverage and credit that may reduce returns and/or increased volatility. Investments in lower-quality (“junk bonds”) and non-rated securities present greater risk of loss than investments in higher-quality securities. The Fund may lend securities to approved institutions. Please read the prospectus for details.
This report must be preceded or accompanied by a prospectus. We advise you to consider the Fund's objectives, risks, charges, and expenses carefully before investing. The prospectus contains this and other important information about the Fund, which can be requested by calling (800) 728-3337, contacting your financial representative, or visit dws.com/mutualreports to view or download a prospectus. Please read the prospectus carefully before you invest.
The brand DWS represents DWS Group GmbH & Co. KGaA and any of its subsidiaries such as DWS Distributors, Inc., which offers investment products, or DWS Investment Management Americas, Inc. and RREEF America L.L.C., which offer advisory services.
©2024 DWS Group GmbH&Co. KGaA. All rights reserved
DGMF-TSRA-C
R-103424-1 (12/24)
Annual Shareholder Report—October 31, 2024
This annual shareholder report contains important information about DWS Global Macro Fund (the "Fund") for the period November 1, 2023 to October 31, 2024. You can find additional information about the Fund on the Fund's website at dws.com/mutualreports. You can also request this information by contacting us at (800) 728-3337.
This report describes changes to the Fund that occurred during the reporting period.
What were the Fund costs for the last year?
(Based on a hypothetical $10,000 investment)
| Fund | Costs of a $10,000 investment | Costs paid as a percentage of a $10,000 investment |
|---|
| Class R6 | $97 | 0.91% |
Gross expense ratio as of the latest prospectus: 1.00%. See prospectus for any contractual or voluntary waivers; without a waiver, costs would have been higher.
How did the Fund perform last year and what affected its performance?
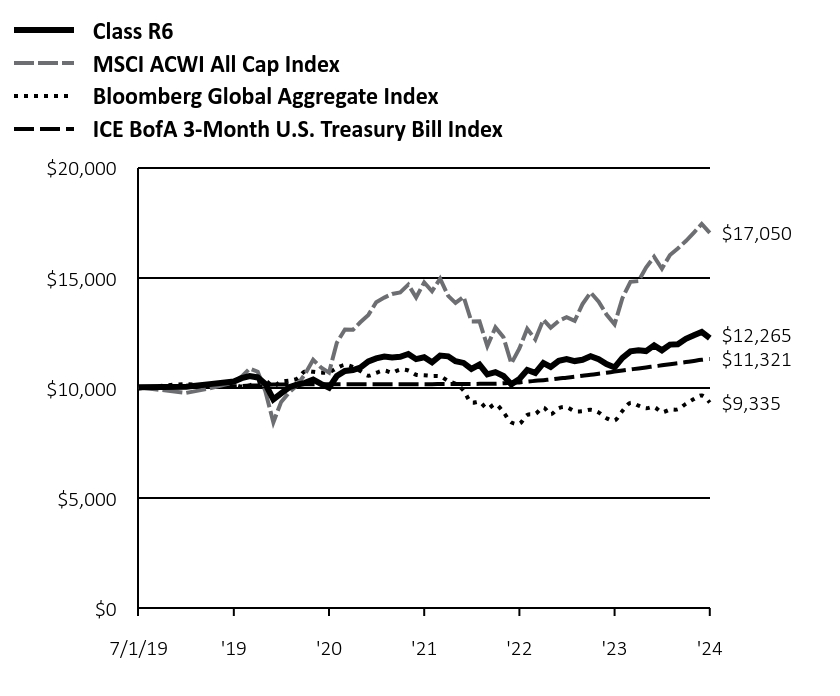
Class R6 shares of the Fund returned 12.17% for the period ended October 31, 2024. The Fund's broad-based indices, the MSCI ACWI All Cap Index and the Bloomberg Global Aggregate Index, returned 32.26% and 9.54%, respectively for the same period, while the Fund's additional, more narrowly based index, the ICE BofA 3-Month U.S. Treasury Bill Index, returned 5.39%.
The Fund’s allocation to equities was the primary factor in its outperformance relative to the ICE BofA 3-Month U.S. Treasury Bill Index. Stocks performed very well in the period thanks to the combination of positive economic growth, steady corporate earnings, and a shift toward more accommodative policy by the world’s central banks. Holdings in the financials and communications services sectors led the gains in the equity portfolio. Consumer staples was the only sector that was a net detractor from results. The Fund’s hedging strategy, which is designed to dampen stock-market volatility and help manage “tail risk” through the use of futures contracts, was also a modest contributor.
The Fund’s positioning in bonds contributed to performance, as well. Here, the Fund’s duration positioning made the largest contribution to performance. (Duration is a measure of interest rates sensitivity.) We managed duration in part through the use of derivatives, which was a net contributor to results.
The Fund’s currency positioning was a net detractor, primarily as a result of a long exposure to the euro.
The Fund had an allocation to gold through an investment in the exchange-traded fund SPDR Gold MiniShares Trust (8.1%). Given that gold prices hit a series of all-time highs in the period, this aspect of positioning contributed to performance.
Percentages in parentheses are based on the Fund’s net assets as of October 31, 2024.
Cumulative Growth of an Assumed $10,000Investment
MSCI ACWI All Cap Index captures large, mid, small and micro-cap representation across Developed Markets countries and large, mid and small cap representation across Emerging Markets countries. The index is comprehensive, covering approximately 99% of the global equity investment opportunity set.
Bloomberg Global Aggregate Index is a flagship measure of global investment grade debt from local currency markets. This multi-currency benchmark includes treasury, government-related, corporate and securitized fixed-rate bonds from both developed and emerging markets issuers.
The MSCI ACWI All Cap Index and the Bloomberg Global Aggregate Index are broad-based indices that represent the Fund's overall equity and debt markets, respectively. These indices replace the ICE BofA 3-Month U.S. Treasury Bill Index as the Fund's broad-based indices in compliance with updated regulatory requirements.
ICE BofA 3-Month U.S. Treasury Bill Index tracks the performance of the U.S. dollar denominated U.S. Treasury Bills publicly issued in the U.S. domestic market with a remaining term to final maturity of less than three months. The ICE BofA 3-Month U.S. Treasury Bill Index is a more narrowly based index that reflects the market sector in which the fund invests.
Index returns do not reflect any fees or expenses and it is not possible to invest directly into an index.
| Class R6 | MSCI ACWI All Cap Index | Bloomberg Global Aggregate Index | ICE BofA 3-Month U.S. Treasury Bill Index |
|---|
| 7/1/19 | $10,031 | $10,029 | $9,972 | $10,018 |
| 8/31/19 | $10,052 | $9,775 | $10,175 | $10,039 |
| 9/30/19 | $10,175 | $9,980 | $10,071 | $10,056 |
| 10/31/19 | $10,289 | $10,255 | $10,139 | $10,076 |
| 11/30/19 | $10,443 | $10,510 | $10,062 | $10,088 |
| 12/31/19 | $10,543 | $10,885 | $10,120 | $10,103 |
| 1/31/20 | $10,479 | $10,740 | $10,250 | $10,116 |
| 2/29/20 | $10,181 | $9,858 | $10,318 | $10,131 |
| 3/31/20 | $9,479 | $8,436 | $10,087 | $10,161 |
| 4/30/20 | $9,756 | $9,366 | $10,285 | $10,161 |
| 5/31/20 | $10,032 | $9,799 | $10,330 | $10,162 |
| 6/30/20 | $10,149 | $10,114 | $10,422 | $10,163 |
| 7/31/20 | $10,234 | $10,637 | $10,755 | $10,165 |
| 8/31/20 | $10,383 | $11,283 | $10,738 | $10,166 |
| 9/30/20 | $10,182 | $10,936 | $10,700 | $10,167 |
| 10/31/20 | $10,010 | $10,700 | $10,710 | $10,168 |
| 11/30/20 | $10,545 | $12,057 | $10,905 | $10,169 |
| 12/31/20 | $10,773 | $12,660 | $11,051 | $10,170 |
| 1/31/21 | $10,816 | $12,644 | $10,954 | $10,171 |
| 2/28/21 | $10,923 | $12,986 | $10,765 | $10,172 |
| 3/31/21 | $11,205 | $13,321 | $10,558 | $10,173 |
| 4/30/21 | $11,344 | $13,897 | $10,691 | $10,173 |
| 5/31/21 | $11,431 | $14,106 | $10,792 | $10,173 |
| 6/30/21 | $11,382 | $14,274 | $10,697 | $10,172 |
| 7/31/21 | $11,415 | $14,343 | $10,839 | $10,173 |
| 8/31/21 | $11,544 | $14,697 | $10,794 | $10,173 |
| 9/30/21 | $11,310 | $14,114 | $10,602 | $10,174 |
| 10/31/21 | $11,396 | $14,797 | $10,577 | $10,174 |
| 11/30/21 | $11,169 | $14,396 | $10,546 | $10,174 |
| 12/31/21 | $11,469 | $14,965 | $10,531 | $10,175 |
| 1/31/22 | $11,436 | $14,186 | $10,315 | $10,174 |
| 2/28/22 | $11,219 | $13,863 | $10,192 | $10,176 |
| 3/31/22 | $11,137 | $14,145 | $9,882 | $10,179 |
| 4/30/22 | $10,864 | $13,022 | $9,341 | $10,180 |
| 5/31/22 | $11,060 | $13,028 | $9,366 | $10,187 |
| 6/30/22 | $10,619 | $11,903 | $9,066 | $10,190 |
| 7/31/22 | $10,718 | $12,751 | $9,258 | $10,195 |
| 8/31/22 | $10,543 | $12,301 | $8,893 | $10,211 |
| 9/30/22 | $10,165 | $11,111 | $8,436 | $10,237 |
| 10/31/22 | $10,408 | $11,793 | $8,378 | $10,253 |
| 11/30/22 | $10,816 | $12,688 | $8,772 | $10,286 |
| 12/31/22 | $10,685 | $12,205 | $8,820 | $10,323 |
| 1/31/23 | $11,129 | $13,105 | $9,109 | $10,355 |
| 2/28/23 | $10,958 | $12,740 | $8,806 | $10,389 |
| 3/31/23 | $11,233 | $13,048 | $9,085 | $10,434 |
| 4/30/23 | $11,314 | $13,213 | $9,125 | $10,467 |
| 5/31/23 | $11,222 | $13,051 | $8,947 | $10,508 |
| 6/30/23 | $11,282 | $13,810 | $8,946 | $10,556 |
| 7/31/23 | $11,445 | $14,339 | $9,008 | $10,598 |
| 8/31/23 | $11,305 | $13,925 | $8,885 | $10,646 |
| 9/30/23 | $11,086 | $13,339 | $8,625 | $10,694 |
| 10/31/23 | $10,934 | $12,891 | $8,522 | $10,742 |
| 11/30/23 | $11,367 | $14,082 | $8,952 | $10,790 |
| 12/31/23 | $11,663 | $14,824 | $9,324 | $10,841 |
| 1/31/24 | $11,710 | $14,856 | $9,195 | $10,887 |
| 2/29/24 | $11,675 | $15,473 | $9,080 | $10,932 |
| 3/31/24 | $11,935 | $15,962 | $9,130 | $10,981 |
| 4/30/24 | $11,712 | $15,419 | $8,899 | $11,028 |
| 5/31/24 | $11,970 | $16,044 | $9,016 | $11,081 |
| 6/30/24 | $11,988 | $16,336 | $9,029 | $11,126 |
| 7/31/24 | $12,235 | $16,677 | $9,278 | $11,176 |
| 8/31/24 | $12,400 | $17,064 | $9,498 | $11,229 |
| 9/30/24 | $12,549 | $17,455 | $9,659 | $11,278 |
| 10/31/24 | $12,265 | $17,050 | $9,335 | $11,321 |
Yearly periods ended October 31
Average Annual Total Returns
| Class/Index | 1-Year | 5-Year | Since Inception 7/1/19 |
|---|
| Class R6 No Sales Charge | 12.17% | 3.58% | 3.90% |
| MSCI ACWI All Cap Index | 32.26% | 10.70% | 10.52% |
| Bloomberg Global Aggregate Index | 9.54% | -1.64% | -1.28% |
| ICE BofA 3-Month U.S. Treasury Bill Index | 5.39% | 2.36% | 2.35% |
Performance shown is historical. The Fund's past performance is not a good predictor or guarantee of the Fund's future performance. Investment return and principal fluctuate, so your shares may be worth more or less when redeemed. Current performance may be lower or higher than the performance data quoted. The performance graph and returns table do not reflect the deduction of taxes that a shareholder would pay on Fund distributions or the redemption of Fund shares.Please visit dws.com/en-us/products/mutual-funds for the Fund’s most recent month-end performance. Fund performance includes reinvestment of all distributions.
| Net Assets ($) | 176,993,076 |
| Number of Portfolio Holdings | 76 |
| Portfolio Turnover Rate (%) | 39 |
| Total Net Advisory Fees Paid ($) | 1,163,804 |
What did the Fund invest in?
Holdings-based data is subject to change.
| Asset Type | % of Net Assets |
| Common Stocks | 37% |
| U.S. Treasury Obligations | 34% |
| Cash and Cash Equivalents | 9% |
| Gold Exchange-Traded Funds | 8% |
| Corporate Bonds | 6% |
| Futures Contracts Fixed income | 4% |
| Sovereign Bonds | 3% |
| Equity Exchange-Traded Funds | 3% |
| Fixed Income Exchange -Traded Funds | 1% |
| Futures Contracts Equity | (0%) |
| Sector | % of Net Assets |
| Health Care | 10% |
| Financials | 7% |
| Communication Services | 7% |
| Information Technology | 6% |
| Industrials | 3% |
| Utilities | 3% |
| Consumer Discretionary | 2% |
| Consumer Staples | 2% |
| Materials | 2% |
| Real Estate | 1% |
Geographical Diversification
| Country | % of Net Assets |
| United States | 52% |
| France | 7% |
| Germany | 6% |
| Netherlands | 3% |
| Ireland | 2% |
| Australia | 2% |
| Switzerland | 2% |
| Japan | 2% |
| Denmark | 1% |
| Korea | 1% |
| Other | 1% |
This is a summary of certain changes of the Fund since November 1, 2023. For more information, review the Fund's current prospectus at dws.com/mutualreports, or call (800) 728-3337.
Effective March 1, 2024, the Fund’s investment advisor voluntarily capped the Fund’s total annual operating expenses for its Class R6 shares at 0.90%. This voluntary expense cap excludes certain expenses such as extraordinary expenses, taxes, brokerage, interest expenses and acquired fund fees and expenses and may be terminated by the Fund’s investment advisor at any time.
If you wish to view additional information about the Fund, including, but not limited to, its prospectus, quarterly holdings, Board fee evaluation reports, and financial statements and other information, please visit dws.com/mutualreports. For information about the Fund's proxy voting policies and procedures and how the Fund voted proxies related to its portfolio securities, please visit dws.com/en-us/resources/proxy-voting. This additional information is also available free of charge by contacting us at (800) 728-3337.
In order to reduce the amount of mail you receive and to help reduce expenses, we generally send a single copy of any shareholder report and prospectus to each household. If you do not want the mailing of these documents to be combined with those for other members of your household, please contact your financial representative or call DWS toll free at (800) 728-3337.
Stocks may decline in value. Investing in foreign securities presents certain risks, such as currency fluctuations, political and economic changes, and market risks. Emerging markets tend to be more volatile and less liquid than the markets of more mature economies, and generally have less diverse and less mature economic structures and less stable political systems than those of developed countries. The Fund’s use of forward currency contracts may not be successful in hedging currency exchange rates changes and could eliminate some or all of the benefit of an increase in the value of a foreign currency versus the US dollar. Although allocation among different asset categories generally limits risk, fund management may favor an asset category that underperforms other assets or markets as a whole. Investing in derivatives entails special risks relating to liquidity, leverage and credit that may reduce returns and/or increased volatility. Investments in lower-quality (“junk bonds”) and non-rated securities present greater risk of loss than investments in higher-quality securities. The Fund may lend securities to approved institutions. Please read the prospectus for details.
This report must be preceded or accompanied by a prospectus. We advise you to consider the Fund's objectives, risks, charges, and expenses carefully before investing. The prospectus contains this and other important information about the Fund, which can be requested by calling (800) 728-3337, contacting your financial representative, or visit dws.com/mutualreports to view or download a prospectus. Please read the prospectus carefully before you invest.
The brand DWS represents DWS Group GmbH & Co. KGaA and any of its subsidiaries such as DWS Distributors, Inc., which offers investment products, or DWS Investment Management Americas, Inc. and RREEF America L.L.C., which offer advisory services.
©2024 DWS Group GmbH&Co. KGaA. All rights reserved
DGMF-TSRA-R6
R-103424-1 (12/24)
Annual Shareholder Report—October 31, 2024
This annual shareholder report contains important information about DWS Global Macro Fund (the "Fund") for the period November 1, 2023 to October 31, 2024. You can find additional information about the Fund on the Fund's website at dws.com/mutualreports. You can also request this information by contacting us at (800) 728-3337.
This report describes changes to the Fund that occurred during the reporting period.
What were the Fund costs for the last year?
(Based on a hypothetical $10,000 investment)
| Fund | Costs of a $10,000 investment | Costs paid as a percentage of a $10,000 investment |
|---|
| Class S | $107 | 1.01% |
Gross expense ratio as of the latest prospectus: 1.07%. See prospectus for any contractual or voluntary waivers; without a waiver, costs would have been higher.
How did the Fund perform last year and what affected its performance?
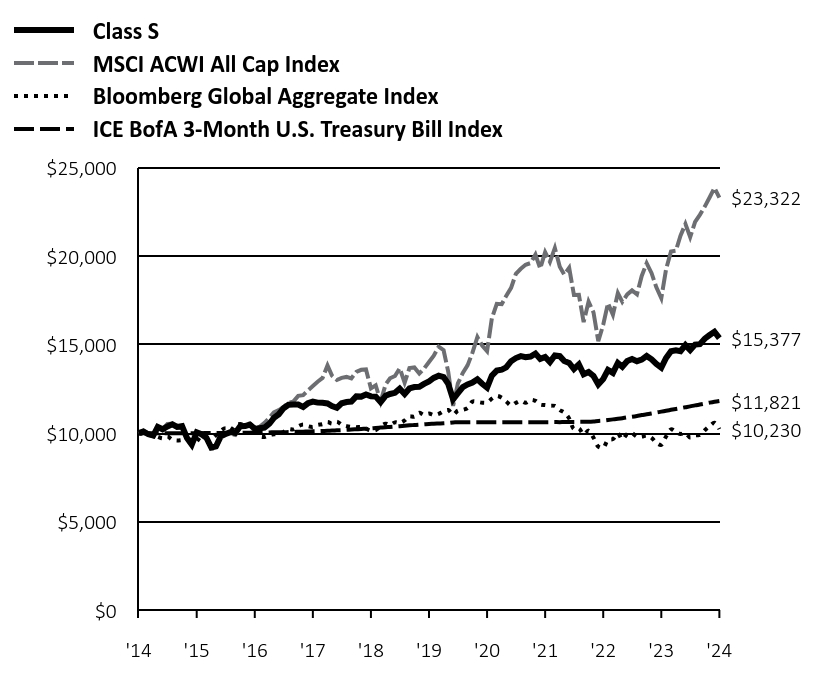
Class S shares of the Fund returned 12.21% for the period ended October 31, 2024. The Fund's broad-based indices, the MSCI ACWI All Cap Index and the Bloomberg Global Aggregate Index, returned 32.26% and 9.54%, respectively for the same period, while the Fund's additional, more narrowly based index, the ICE BofA 3-Month U.S. Treasury Bill Index, returned 5.39%.
The Fund’s allocation to equities was the primary factor in its outperformance relative to the ICE BofA 3-Month U.S. Treasury Bill Index. Stocks performed very well in the period thanks to the combination of positive economic growth, steady corporate earnings, and a shift toward more accommodative policy by the world’s central banks. Holdings in the financials and communications services sectors led the gains in the equity portfolio. Consumer staples was the only sector that was a net detractor from results. The Fund’s hedging strategy, which is designed to dampen stock-market volatility and help manage “tail risk” through the use of futures contracts, was also a modest contributor.
The Fund’s positioning in bonds contributed to performance, as well. Here, the Fund’s duration positioning made the largest contribution to performance. (Duration is a measure of interest rates sensitivity.) We managed duration in part through the use of derivatives, which was a net contributor to results.
The Fund’s currency positioning was a net detractor, primarily as a result of a long exposure to the euro.
The Fund had an allocation to gold through an investment in the exchange-traded fund SPDR Gold MiniShares Trust (8.1%). Given that gold prices hit a series of all-time highs in the period, this aspect of positioning contributed to performance.
Percentages in parentheses are based on the Fund’s net assets as of October 31, 2024.
Cumulative Growth of an Assumed $10,000Investment
MSCI ACWI All Cap Index captures large, mid, small and micro-cap representation across Developed Markets countries and large, mid and small cap representation across Emerging Markets countries. The index is comprehensive, covering approximately 99% of the global equity investment opportunity set.
Bloomberg Global Aggregate Index is a flagship measure of global investment grade debt from local currency markets. This multi-currency benchmark includes treasury, government-related, corporate and securitized fixed-rate bonds from both developed and emerging markets issuers.
The MSCI ACWI All Cap Index and the Bloomberg Global Aggregate Index are broad-based indices that represent the Fund's overall equity and debt markets, respectively. These indices replace the ICE BofA 3-Month U.S. Treasury Bill Index as the Fund's broad-based indices in compliance with updated regulatory requirements.
ICE BofA 3-Month U.S. Treasury Bill Index tracks the performance of the U.S. dollar denominated U.S. Treasury Bills publicly issued in the U.S. domestic market with a remaining term to final maturity of less than three months. The ICE BofA 3-Month U.S. Treasury Bill Index is a more narrowly based index that reflects the market sector in which the fund invests.
Index returns do not reflect any fees or expenses and it is not possible to invest directly into an index.
| Class S | MSCI ACWI All Cap Index | Bloomberg Global Aggregate Index | ICE BofA 3-Month U.S. Treasury Bill Index |
|---|
| '14 | $10,000 | $10,000 | $10,000 | $10,000 |
| '14 | $10,097 | $10,146 | $9,963 | $10,000 |
| '14 | $9,939 | $9,979 | $9,895 | $10,000 |
| '15 | $9,866 | $9,824 | $9,879 | $10,001 |
| '15 | $10,353 | $10,372 | $9,799 | $10,001 |
| '15 | $10,219 | $10,236 | $9,705 | $10,001 |
| '15 | $10,377 | $10,519 | $9,808 | $10,001 |
| '15 | $10,499 | $10,528 | $9,633 | $10,001 |
| '15 | $10,353 | $10,297 | $9,590 | $10,001 |
| '15 | $10,401 | $10,353 | $9,612 | $10,001 |
| '15 | $9,732 | $9,660 | $9,623 | $10,002 |
| '15 | $9,355 | $9,307 | $9,672 | $10,002 |
| '15 | $10,049 | $10,008 | $9,693 | $10,002 |
| '15 | $9,939 | $9,947 | $9,532 | $10,002 |
| '15 | $9,745 | $9,763 | $9,583 | $10,006 |
| '16 | $9,185 | $9,150 | $9,666 | $10,006 |
| '16 | $9,246 | $9,103 | $9,881 | $10,008 |
| '16 | $9,830 | $9,792 | $10,148 | $10,013 |
| '16 | $9,951 | $9,949 | $10,283 | $10,016 |
| '16 | $10,061 | $9,968 | $10,145 | $10,016 |
| '16 | $10,012 | $9,896 | $10,441 | $10,020 |
| '16 | $10,389 | $10,337 | $10,520 | $10,023 |
| '16 | $10,401 | $10,372 | $10,469 | $10,025 |
| '16 | $10,487 | $10,452 | $10,527 | $10,030 |
| '16 | $10,243 | $10,249 | $10,234 | $10,032 |
| '16 | $10,280 | $10,360 | $9,828 | $10,034 |
| '16 | $10,316 | $10,583 | $9,783 | $10,038 |
| '17 | $10,535 | $10,872 | $9,893 | $10,043 |
| '17 | $10,864 | $11,171 | $9,940 | $10,047 |
| '17 | $11,071 | $11,303 | $9,955 | $10,049 |
| '17 | $11,411 | $11,484 | $10,067 | $10,055 |
| '17 | $11,606 | $11,714 | $10,223 | $10,060 |
| '17 | $11,618 | $11,785 | $10,214 | $10,069 |
| '17 | $11,618 | $12,108 | $10,386 | $10,077 |
| '17 | $11,484 | $12,151 | $10,489 | $10,087 |
| '17 | $11,691 | $12,414 | $10,394 | $10,095 |
| '17 | $11,788 | $12,663 | $10,355 | $10,105 |
| '17 | $11,727 | $12,912 | $10,470 | $10,113 |
| '17 | $11,715 | $13,124 | $10,506 | $10,124 |
| '18 | $11,679 | $13,831 | $10,631 | $10,136 |
| '18 | $11,533 | $13,255 | $10,537 | $10,146 |
| '18 | $11,436 | $13,008 | $10,649 | $10,160 |
| '18 | $11,691 | $13,128 | $10,479 | $10,173 |
| '18 | $11,764 | $13,181 | $10,399 | $10,189 |
| '18 | $11,788 | $13,101 | $10,353 | $10,206 |
| '18 | $12,080 | $13,460 | $10,336 | $10,222 |
| '18 | $12,068 | $13,583 | $10,346 | $10,240 |
| '18 | $12,190 | $13,603 | $10,257 | $10,256 |
| '18 | $12,080 | $12,536 | $10,143 | $10,274 |
| '18 | $12,068 | $12,710 | $10,174 | $10,295 |
| '18 | $11,761 | $11,789 | $10,380 | $10,314 |
| '19 | $12,112 | $12,747 | $10,538 | $10,334 |
| '19 | $12,216 | $13,102 | $10,477 | $10,353 |
| '19 | $12,281 | $13,235 | $10,609 | $10,376 |
| '19 | $12,515 | $13,671 | $10,577 | $10,395 |
| '19 | $12,216 | $12,856 | $10,720 | $10,419 |
| '19 | $12,528 | $13,679 | $10,958 | $10,442 |
| '19 | $12,606 | $13,719 | $10,928 | $10,461 |
| '19 | $12,618 | $13,371 | $11,150 | $10,482 |
| '19 | $12,787 | $13,651 | $11,036 | $10,501 |
| '19 | $12,930 | $14,028 | $11,110 | $10,521 |
| '19 | $13,125 | $14,377 | $11,026 | $10,534 |
| '19 | $13,250 | $14,889 | $11,090 | $10,549 |
| '20 | $13,170 | $14,691 | $11,232 | $10,563 |
| '20 | $12,794 | $13,485 | $11,307 | $10,579 |
| '20 | $11,908 | $11,539 | $11,054 | $10,610 |
| '20 | $12,257 | $12,812 | $11,271 | $10,611 |
| '20 | $12,606 | $13,404 | $11,320 | $10,611 |
| '20 | $12,753 | $13,834 | $11,421 | $10,612 |
| '20 | $12,861 | $14,551 | $11,785 | $10,614 |
| '20 | $13,049 | $15,434 | $11,767 | $10,615 |
| '20 | $12,794 | $14,959 | $11,725 | $10,616 |
| '20 | $12,578 | $14,636 | $11,736 | $10,617 |
| '20 | $13,253 | $16,493 | $11,949 | $10,618 |
| '20 | $13,540 | $17,317 | $12,110 | $10,619 |
| '21 | $13,594 | $17,295 | $12,003 | $10,620 |
| '21 | $13,716 | $17,763 | $11,797 | $10,621 |
| '21 | $14,071 | $18,221 | $11,570 | $10,622 |
| '21 | $14,247 | $19,009 | $11,716 | $10,622 |
| '21 | $14,356 | $19,296 | $11,826 | $10,623 |
| '21 | $14,294 | $19,525 | $11,722 | $10,622 |
| '21 | $14,335 | $19,619 | $11,878 | $10,623 |
| '21 | $14,499 | $20,103 | $11,828 | $10,623 |
| '21 | $14,199 | $19,307 | $11,618 | $10,624 |
| '21 | $14,308 | $20,240 | $11,590 | $10,623 |
| '21 | $14,022 | $19,691 | $11,556 | $10,624 |
| '21 | $14,395 | $20,470 | $11,540 | $10,625 |
| '22 | $14,354 | $19,405 | $11,303 | $10,624 |
| '22 | $14,080 | $18,962 | $11,169 | $10,626 |
| '22 | $13,973 | $19,349 | $10,829 | $10,629 |
| '22 | $13,629 | $17,812 | $10,236 | $10,630 |
| '22 | $13,890 | $17,820 | $10,264 | $10,638 |
| '22 | $13,331 | $16,282 | $9,934 | $10,640 |
| '22 | $13,455 | $17,442 | $10,145 | $10,645 |
| '22 | $13,234 | $16,826 | $9,745 | $10,663 |
| '22 | $12,757 | $15,199 | $9,244 | $10,689 |
| '22 | $13,063 | $16,131 | $9,181 | $10,706 |
| '22 | $13,577 | $17,356 | $9,613 | $10,740 |
| '22 | $13,408 | $16,695 | $9,665 | $10,779 |
| '23 | $13,968 | $17,926 | $9,982 | $10,813 |
| '23 | $13,753 | $17,426 | $9,650 | $10,848 |
| '23 | $14,083 | $17,848 | $9,955 | $10,895 |
| '23 | $14,199 | $18,073 | $9,999 | $10,929 |
| '23 | $14,069 | $17,852 | $9,804 | $10,972 |
| '23 | $14,158 | $18,890 | $9,803 | $11,022 |
| '23 | $14,363 | $19,613 | $9,871 | $11,066 |
| '23 | $14,172 | $19,047 | $9,736 | $11,116 |
| '23 | $13,910 | $18,246 | $9,452 | $11,167 |
| '23 | $13,704 | $17,633 | $9,339 | $11,217 |
| '23 | $14,249 | $19,262 | $9,809 | $11,267 |
| '23 | $14,637 | $20,278 | $10,217 | $11,320 |
| '24 | $14,681 | $20,321 | $10,076 | $11,368 |
| '24 | $14,637 | $21,165 | $9,950 | $11,415 |
| '24 | $14,979 | $21,834 | $10,004 | $11,466 |
| '24 | $14,698 | $21,091 | $9,752 | $11,515 |
| '24 | $15,009 | $21,946 | $9,880 | $11,571 |
| '24 | $15,031 | $22,345 | $9,894 | $11,618 |
| '24 | $15,342 | $22,812 | $10,167 | $11,670 |
| '24 | $15,550 | $23,342 | $10,408 | $11,726 |
| '24 | $15,735 | $23,877 | $10,585 | $11,776 |
| '24 | $15,377 | $23,322 | $10,230 | $11,821 |
Yearly periods ended October 31
Average Annual Total Returns
| Class/Index | 1-Year | 5-Year | 10-Year |
|---|
| Class S No Sales Charge | 12.21% | 3.53% | 4.40% |
| MSCI ACWI All Cap Index | 32.26% | 10.70% | 8.84% |
| Bloomberg Global Aggregate Index | 9.54% | -1.64% | 0.23% |
| ICE BofA 3-Month U.S. Treasury Bill Index | 5.39% | 2.36% | 1.69% |
Prior to May 8, 2017, the Fund had a different management team and operated with a different investment strategy. Performance would have been different if the Fund’s current investment strategy had been in effect.
Performance shown is historical. The Fund's past performance is not a good predictor or guarantee of the Fund's future performance. Investment return and principal fluctuate, so your shares may be worth more or less when redeemed. Current performance may be lower or higher than the performance data quoted. The performance graph and returns table do not reflect the deduction of taxes that a shareholder would pay on Fund distributions or the redemption of Fund shares.Please visit dws.com/en-us/products/mutual-funds for the Fund’s most recent month-end performance. Fund performance includes reinvestment of all distributions.
| Net Assets ($) | 176,993,076 |
| Number of Portfolio Holdings | 76 |
| Portfolio Turnover Rate (%) | 39 |
| Total Net Advisory Fees Paid ($) | 1,163,804 |
What did the Fund invest in?
Holdings-based data is subject to change.
| Asset Type | % of Net Assets |
| Common Stocks | 37% |
| U.S. Treasury Obligations | 34% |
| Cash and Cash Equivalents | 9% |
| Gold Exchange-Traded Funds | 8% |
| Corporate Bonds | 6% |
| Futures Contracts Fixed income | 4% |
| Sovereign Bonds | 3% |
| Equity Exchange-Traded Funds | 3% |
| Fixed Income Exchange -Traded Funds | 1% |
| Futures Contracts Equity | (0%) |
| Sector | % of Net Assets |
| Health Care | 10% |
| Financials | 7% |
| Communication Services | 7% |
| Information Technology | 6% |
| Industrials | 3% |
| Utilities | 3% |
| Consumer Discretionary | 2% |
| Consumer Staples | 2% |
| Materials | 2% |
| Real Estate | 1% |
Geographical Diversification
| Country | % of Net Assets |
| United States | 52% |
| France | 7% |
| Germany | 6% |
| Netherlands | 3% |
| Ireland | 2% |
| Australia | 2% |
| Switzerland | 2% |
| Japan | 2% |
| Denmark | 1% |
| Korea | 1% |
| Other | 1% |
This is a summary of certain changes of the Fund since November 1, 2023. For more information, review the Fund's current prospectus at dws.com/mutualreports, or call (800) 728-3337.
Effective March 1, 2024, the Fund’s contractual cap on total annual operating expense for Class S shares changed from 0.93% to 1.04%. The cap excludes certain expenses such as extraordinary expenses, taxes, brokerage, interest expense and acquired fund fees and expenses.
If you wish to view additional information about the Fund, including, but not limited to, its prospectus, quarterly holdings, Board fee evaluation reports, and financial statements and other information, please visit dws.com/mutualreports. For information about the Fund's proxy voting policies and procedures and how the Fund voted proxies related to its portfolio securities, please visit dws.com/en-us/resources/proxy-voting. This additional information is also available free of charge by contacting us at (800) 728-3337.
In order to reduce the amount of mail you receive and to help reduce expenses, we generally send a single copy of any shareholder report and prospectus to each household. If you do not want the mailing of these documents to be combined with those for other members of your household, please contact your financial representative or call DWS toll free at (800) 728-3337.
Stocks may decline in value. Investing in foreign securities presents certain risks, such as currency fluctuations, political and economic changes, and market risks. Emerging markets tend to be more volatile and less liquid than the markets of more mature economies, and generally have less diverse and less mature economic structures and less stable political systems than those of developed countries. The Fund’s use of forward currency contracts may not be successful in hedging currency exchange rates changes and could eliminate some or all of the benefit of an increase in the value of a foreign currency versus the US dollar. Although allocation among different asset categories generally limits risk, fund management may favor an asset category that underperforms other assets or markets as a whole. Investing in derivatives entails special risks relating to liquidity, leverage and credit that may reduce returns and/or increased volatility. Investments in lower-quality (“junk bonds”) and non-rated securities present greater risk of loss than investments in higher-quality securities. The Fund may lend securities to approved institutions. Please read the prospectus for details.
This report must be preceded or accompanied by a prospectus. We advise you to consider the Fund's objectives, risks, charges, and expenses carefully before investing. The prospectus contains this and other important information about the Fund, which can be requested by calling (800) 728-3337, contacting your financial representative, or visit dws.com/mutualreports to view or download a prospectus. Please read the prospectus carefully before you invest.
The brand DWS represents DWS Group GmbH & Co. KGaA and any of its subsidiaries such as DWS Distributors, Inc., which offers investment products, or DWS Investment Management Americas, Inc. and RREEF America L.L.C., which offer advisory services.
©2024 DWS Group GmbH&Co. KGaA. All rights reserved
DGMF-TSRA-S
R-103424-1 (12/24)
Institutional Class: MGINX
Annual Shareholder Report—October 31, 2024
This annual shareholder report contains important information about DWS Global Macro Fund (the "Fund") for the period November 1, 2023 to October 31, 2024. You can find additional information about the Fund on the Fund's website at dws.com/mutualreports. You can also request this information by contacting us at (800) 728-3337.
What were the Fund costs for the last year?
(Based on a hypothetical $10,000 investment)
| Fund | Costs of a $10,000 investment | Costs paid as a percentage of a $10,000 investment |
|---|
| Institutional Class | $99 | 0.93% |
Gross expense ratio as of the latest prospectus: 0.95%. See prospectus for any contractual or voluntary waivers; without a waiver, costs would have been higher.
How did the Fund perform last year and what affected its performance?
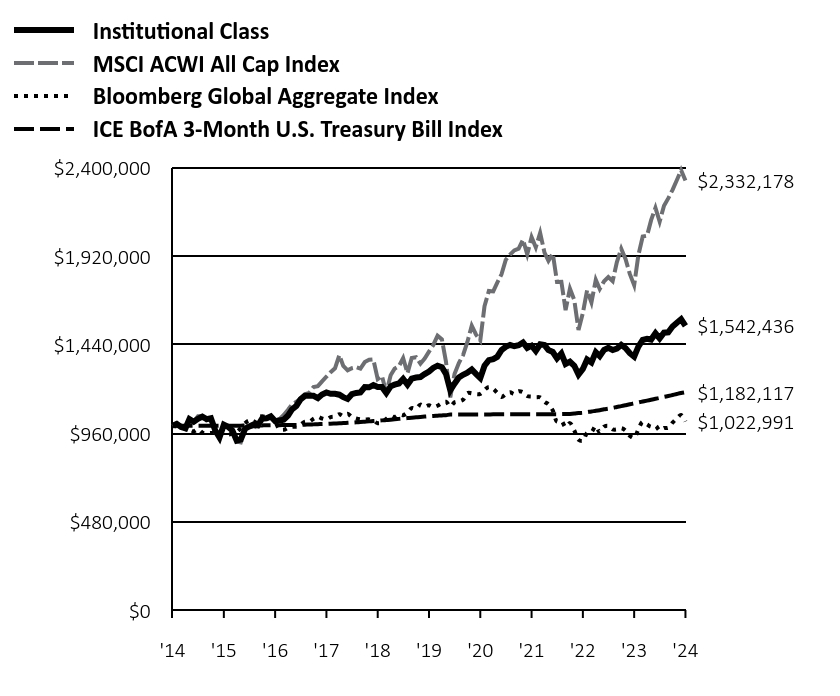
Institutional Class shares of the Fund returned 12.18% for the period ended October 31, 2024. The Fund's broad-based indices, the MSCI ACWI All Cap Index and the Bloomberg Global Aggregate Index, returned 32.26% and 9.54%, respectively for the same period, while the Fund's additional, more narrowly based index, the ICE BofA 3-Month U.S. Treasury Bill Index, returned 5.39%.
The Fund’s allocation to equities was the primary factor in its outperformance relative to the ICE BofA 3-Month U.S. Treasury Bill Index. Stocks performed very well in the period thanks to the combination of positive economic growth, steady corporate earnings, and a shift toward more accommodative policy by the world’s central banks. Holdings in the financials and communications services sectors led the gains in the equity portfolio. Consumer staples was the only sector that was a net detractor from results. The Fund’s hedging strategy, which is designed to dampen stock-market volatility and help manage “tail risk” through the use of futures contracts, was also a modest contributor.
The Fund’s positioning in bonds contributed to performance, as well. Here, the Fund’s duration positioning made the largest contribution to performance. (Duration is a measure of interest rates sensitivity.) We managed duration in part through the use of derivatives, which was a net contributor to results.
The Fund’s currency positioning was a net detractor, primarily as a result of a long exposure to the euro.
The Fund had an allocation to gold through an investment in the exchange-traded fund SPDR Gold MiniShares Trust (8.1%). Given that gold prices hit a series of all-time highs in the period, this aspect of positioning contributed to performance.
Percentages in parentheses are based on the Fund’s net assets as of October 31, 2024.
Cumulative Growth of an Assumed $1,000,000Investment
MSCI ACWI All Cap Index captures large, mid, small and micro-cap representation across Developed Markets countries and large, mid and small cap representation across Emerging Markets countries. The index is comprehensive, covering approximately 99% of the global equity investment opportunity set.
Bloomberg Global Aggregate Index is a flagship measure of global investment grade debt from local currency markets. This multi-currency benchmark includes treasury, government-related, corporate and securitized fixed-rate bonds from both developed and emerging markets issuers.
The MSCI ACWI All Cap Index and the Bloomberg Global Aggregate Index are broad-based indices that represent the Fund's overall equity and debt markets, respectively. These indices replace the ICE BofA 3-Month U.S. Treasury Bill Index as the Fund's broad-based indices in compliance with updated regulatory requirements.
ICE BofA 3-Month U.S. Treasury Bill Index tracks the performance of the U.S. dollar denominated U.S. Treasury Bills publicly issued in the U.S. domestic market with a remaining term to final maturity of less than three months. The ICE BofA 3-Month U.S. Treasury Bill Index is a more narrowly based index that reflects the market sector in which the fund invests.
Index returns do not reflect any fees or expenses and it is not possible to invest directly into an index.
| Institutional Class | MSCI ACWI All Cap Index | Bloomberg Global Aggregate Index | ICE BofA 3-Month U.S. Treasury Bill Index |
|---|
| '14 | $1,000,000 | $1,000,000 | $1,000,000 | $1,000,000 |
| '14 | $1,009,721 | $1,014,552 | $996,349 | $1,000,016 |
| '14 | $993,925 | $997,899 | $989,489 | $1,000,020 |
| '15 | $986,634 | $982,372 | $987,924 | $1,000,052 |
| '15 | $1,036,452 | $1,037,172 | $979,924 | $1,000,052 |
| '15 | $1,021,871 | $1,023,555 | $970,479 | $1,000,053 |
| '15 | $1,037,667 | $1,051,889 | $980,800 | $1,000,075 |
| '15 | $1,049,818 | $1,052,782 | $963,264 | $1,000,084 |
| '15 | $1,036,452 | $1,029,714 | $959,045 | $1,000,107 |
| '15 | $1,041,312 | $1,035,301 | $961,194 | $1,000,061 |
| '15 | $974,484 | $966,022 | $962,312 | $1,000,210 |
| '15 | $936,817 | $930,716 | $967,216 | $1,000,235 |
| '15 | $1,006,075 | $1,000,839 | $969,259 | $1,000,162 |
| '15 | $995,140 | $994,749 | $953,212 | $1,000,221 |
| '15 | $974,484 | $976,343 | $958,279 | $1,000,550 |
| '16 | $919,806 | $914,960 | $966,583 | $1,000,580 |
| '16 | $925,881 | $910,264 | $988,107 | $1,000,824 |
| '16 | $984,204 | $979,182 | $1,014,808 | $1,001,282 |
| '16 | $996,355 | $994,935 | $1,028,306 | $1,001,552 |
| '16 | $1,007,290 | $996,800 | $1,014,511 | $1,001,630 |
| '16 | $1,002,430 | $989,570 | $1,044,137 | $1,002,007 |
| '16 | $1,040,097 | $1,033,669 | $1,052,008 | $1,002,297 |
| '16 | $1,041,312 | $1,037,227 | $1,046,898 | $1,002,475 |
| '16 | $1,051,033 | $1,045,188 | $1,052,662 | $1,002,969 |
| '16 | $1,025,516 | $1,024,881 | $1,023,445 | $1,003,220 |
| '16 | $1,029,162 | $1,035,973 | $982,782 | $1,003,395 |
| '16 | $1,032,807 | $1,058,345 | $978,267 | $1,003,821 |
| '17 | $1,055,893 | $1,087,232 | $989,296 | $1,004,265 |
| '17 | $1,088,700 | $1,117,107 | $993,971 | $1,004,681 |
| '17 | $1,108,141 | $1,130,329 | $995,498 | $1,004,855 |
| '17 | $1,143,378 | $1,148,365 | $1,006,719 | $1,005,529 |
| '17 | $1,162,819 | $1,171,356 | $1,022,298 | $1,006,037 |
| '17 | $1,162,819 | $1,178,457 | $1,021,401 | $1,006,884 |
| '17 | $1,162,819 | $1,210,774 | $1,038,574 | $1,007,741 |
| '17 | $1,150,668 | $1,215,104 | $1,048,863 | $1,008,685 |
| '17 | $1,170,109 | $1,241,374 | $1,039,415 | $1,009,549 |
| '17 | $1,181,045 | $1,266,332 | $1,035,482 | $1,010,451 |
| '17 | $1,173,755 | $1,291,159 | $1,046,981 | $1,011,291 |
| '17 | $1,173,755 | $1,312,366 | $1,050,609 | $1,012,415 |
| '18 | $1,168,894 | $1,383,108 | $1,063,129 | $1,013,624 |
| '18 | $1,155,529 | $1,325,470 | $1,053,695 | $1,014,582 |
| '18 | $1,145,808 | $1,300,784 | $1,064,910 | $1,016,004 |
| '18 | $1,171,324 | $1,312,769 | $1,047,853 | $1,017,332 |
| '18 | $1,178,615 | $1,318,139 | $1,039,905 | $1,018,885 |
| '18 | $1,181,045 | $1,310,095 | $1,035,281 | $1,020,599 |
| '18 | $1,210,207 | $1,345,954 | $1,033,553 | $1,022,198 |
| '18 | $1,208,991 | $1,358,257 | $1,034,637 | $1,024,041 |
| '18 | $1,221,142 | $1,360,319 | $1,025,718 | $1,025,614 |
| '18 | $1,210,207 | $1,253,616 | $1,014,260 | $1,027,387 |
| '18 | $1,210,207 | $1,271,007 | $1,017,432 | $1,029,495 |
| '18 | $1,177,839 | $1,178,906 | $1,038,002 | $1,031,390 |
| '19 | $1,214,200 | $1,274,726 | $1,053,806 | $1,033,423 |
| '19 | $1,223,290 | $1,310,225 | $1,047,740 | $1,035,263 |
| '19 | $1,229,783 | $1,323,510 | $1,060,857 | $1,037,574 |
| '19 | $1,254,457 | $1,367,137 | $1,057,716 | $1,039,526 |
| '19 | $1,223,290 | $1,285,552 | $1,072,039 | $1,041,898 |
| '19 | $1,255,755 | $1,367,860 | $1,095,808 | $1,044,204 |
| '19 | $1,262,248 | $1,371,885 | $1,092,763 | $1,046,098 |
| '19 | $1,264,846 | $1,337,132 | $1,114,984 | $1,048,244 |
| '19 | $1,280,429 | $1,365,128 | $1,103,643 | $1,050,075 |
| '19 | $1,294,714 | $1,402,775 | $1,110,992 | $1,052,095 |
| '19 | $1,314,193 | $1,437,659 | $1,102,568 | $1,053,407 |
| '19 | $1,326,282 | $1,488,897 | $1,108,998 | $1,054,911 |
| '20 | $1,318,236 | $1,469,066 | $1,123,154 | $1,056,320 |
| '20 | $1,282,028 | $1,348,467 | $1,130,708 | $1,057,882 |
| '20 | $1,192,179 | $1,153,869 | $1,105,373 | $1,060,972 |
| '20 | $1,228,387 | $1,281,195 | $1,127,075 | $1,061,055 |
| '20 | $1,261,912 | $1,340,392 | $1,132,019 | $1,061,072 |
| '20 | $1,276,664 | $1,383,389 | $1,142,076 | $1,061,208 |
| '20 | $1,288,733 | $1,455,057 | $1,178,501 | $1,061,418 |
| '20 | $1,306,166 | $1,543,353 | $1,176,704 | $1,061,499 |
| '20 | $1,281,888 | $1,495,894 | $1,172,472 | $1,061,625 |
| '20 | $1,258,973 | $1,463,557 | $1,173,593 | $1,061,735 |
| '20 | $1,326,370 | $1,649,290 | $1,194,932 | $1,061,829 |
| '20 | $1,356,365 | $1,731,749 | $1,210,983 | $1,061,946 |
| '21 | $1,361,774 | $1,729,484 | $1,200,318 | $1,062,046 |
| '21 | $1,373,945 | $1,776,307 | $1,179,657 | $1,062,136 |
| '21 | $1,410,724 | $1,822,147 | $1,156,964 | $1,062,213 |
| '21 | $1,428,358 | $1,900,935 | $1,171,580 | $1,062,229 |
| '21 | $1,439,210 | $1,929,550 | $1,182,583 | $1,062,251 |
| '21 | $1,431,793 | $1,952,524 | $1,172,150 | $1,062,212 |
| '21 | $1,437,232 | $1,961,860 | $1,187,752 | $1,062,266 |
| '21 | $1,452,189 | $2,010,335 | $1,182,813 | $1,062,308 |
| '21 | $1,422,610 | $1,930,655 | $1,161,796 | $1,062,366 |
| '21 | $1,434,874 | $2,024,017 | $1,158,988 | $1,062,322 |
| '21 | $1,406,258 | $1,969,134 | $1,155,598 | $1,062,393 |
| '21 | $1,442,598 | $2,047,020 | $1,153,985 | $1,062,468 |
| '22 | $1,438,492 | $1,940,469 | $1,130,336 | $1,062,420 |
| '22 | $1,411,119 | $1,896,216 | $1,116,901 | $1,062,556 |
| '22 | $1,400,759 | $1,934,860 | $1,082,888 | $1,062,884 |
| '22 | $1,366,393 | $1,781,197 | $1,023,558 | $1,063,033 |
| '22 | $1,392,511 | $1,782,016 | $1,026,352 | $1,063,765 |
| '22 | $1,335,575 | $1,628,201 | $993,419 | $1,063,997 |
| '22 | $1,348,006 | $1,744,222 | $1,014,538 | $1,064,542 |
| '22 | $1,325,907 | $1,682,568 | $974,503 | $1,066,260 |
| '22 | $1,278,310 | $1,519,876 | $924,433 | $1,068,913 |
| '22 | $1,308,878 | $1,613,059 | $918,075 | $1,070,591 |
| '22 | $1,360,288 | $1,735,582 | $961,281 | $1,074,043 |
| '22 | $1,343,690 | $1,669,530 | $966,479 | $1,077,930 |
| '23 | $1,399,617 | $1,792,564 | $998,208 | $1,081,306 |
| '23 | $1,378,107 | $1,742,646 | $965,023 | $1,084,835 |
| '23 | $1,412,695 | $1,784,838 | $995,539 | $1,089,501 |
| '23 | $1,422,858 | $1,807,288 | $999,932 | $1,092,930 |
| '23 | $1,411,243 | $1,785,182 | $980,386 | $1,097,210 |
| '23 | $1,418,814 | $1,889,036 | $980,309 | $1,102,231 |
| '23 | $1,439,292 | $1,961,306 | $987,098 | $1,106,620 |
| '23 | $1,421,739 | $1,904,718 | $973,594 | $1,111,617 |
| '23 | $1,394,083 | $1,824,590 | $945,152 | $1,116,711 |
| '23 | $1,374,926 | $1,763,336 | $933,855 | $1,121,699 |
| '23 | $1,429,451 | $1,926,156 | $980,946 | $1,126,735 |
| '23 | $1,466,778 | $2,027,758 | $1,021,715 | $1,131,987 |
| '24 | $1,472,687 | $2,032,050 | $1,007,617 | $1,136,824 |
| '24 | $1,468,255 | $2,116,530 | $994,954 | $1,141,481 |
| '24 | $1,502,464 | $2,183,395 | $1,000,432 | $1,146,607 |
| '24 | $1,474,367 | $2,109,124 | $975,184 | $1,151,527 |
| '24 | $1,505,422 | $2,194,595 | $987,964 | $1,157,053 |
| '24 | $1,507,639 | $2,234,527 | $989,382 | $1,161,771 |
| '24 | $1,538,801 | $2,281,186 | $1,016,703 | $1,166,975 |
| '24 | $1,559,576 | $2,334,172 | $1,040,758 | $1,172,557 |
| '24 | $1,578,307 | $2,387,655 | $1,058,470 | $1,177,644 |
| '24 | $1,542,436 | $2,332,178 | $1,022,991 | $1,182,117 |
Yearly periods ended October 31
Average Annual Total Returns
| Class/Index | 1-Year | 5-Year | 10-Year |
|---|
| Institutional Class No Sales Charge | 12.18% | 3.56% | 4.43% |
| MSCI ACWI All Cap Index | 32.26% | 10.70% | 8.84% |
| Bloomberg Global Aggregate Index | 9.54% | -1.64% | 0.23% |
| ICE BofA 3-Month U.S. Treasury Bill Index | 5.39% | 2.36% | 1.69% |
Prior to May 8, 2017, the Fund had a different management team and operated with a different investment strategy. Performance would have been different if the Fund’s current investment strategy had been in effect.
Performance shown is historical. The Fund's past performance is not a good predictor or guarantee of the Fund's future performance. Investment return and principal fluctuate, so your shares may be worth more or less when redeemed. Current performance may be lower or higher than the performance data quoted. The performance graph and returns table do not reflect the deduction of taxes that a shareholder would pay on Fund distributions or the redemption of Fund shares.Please visit dws.com/en-us/products/mutual-funds for the Fund’s most recent month-end performance. Fund performance includes reinvestment of all distributions.
| Net Assets ($) | 176,993,076 |
| Number of Portfolio Holdings | 76 |
| Portfolio Turnover Rate (%) | 39 |
| Total Net Advisory Fees Paid ($) | 1,163,804 |
What did the Fund invest in?
Holdings-based data is subject to change.
| Asset Type | % of Net Assets |
| Common Stocks | 37% |
| U.S. Treasury Obligations | 34% |
| Cash and Cash Equivalents | 9% |
| Gold Exchange-Traded Funds | 8% |
| Corporate Bonds | 6% |
| Futures Contracts Fixed income | 4% |
| Sovereign Bonds | 3% |
| Equity Exchange-Traded Funds | 3% |
| Fixed Income Exchange -Traded Funds | 1% |
| Futures Contracts Equity | (0%) |
| Sector | % of Net Assets |
| Health Care | 10% |
| Financials | 7% |
| Communication Services | 7% |
| Information Technology | 6% |
| Industrials | 3% |
| Utilities | 3% |
| Consumer Discretionary | 2% |
| Consumer Staples | 2% |
| Materials | 2% |
| Real Estate | 1% |
Geographical Diversification
| Country | % of Net Assets |
| United States | 52% |
| France | 7% |
| Germany | 6% |
| Netherlands | 3% |
| Ireland | 2% |
| Australia | 2% |
| Switzerland | 2% |
| Japan | 2% |
| Denmark | 1% |
| Korea | 1% |
| Other | 1% |
If you wish to view additional information about the Fund, including, but not limited to, its prospectus, quarterly holdings, Board fee evaluation reports, and financial statements and other information, please visit dws.com/mutualreports. For information about the Fund's proxy voting policies and procedures and how the Fund voted proxies related to its portfolio securities, please visit dws.com/en-us/resources/proxy-voting. This additional information is also available free of charge by contacting us at (800) 728-3337.
In order to reduce the amount of mail you receive and to help reduce expenses, we generally send a single copy of any shareholder report and prospectus to each household. If you do not want the mailing of these documents to be combined with those for other members of your household, please contact your financial representative or call DWS toll free at (800) 728-3337.
Stocks may decline in value. Investing in foreign securities presents certain risks, such as currency fluctuations, political and economic changes, and market risks. Emerging markets tend to be more volatile and less liquid than the markets of more mature economies, and generally have less diverse and less mature economic structures and less stable political systems than those of developed countries. The Fund’s use of forward currency contracts may not be successful in hedging currency exchange rates changes and could eliminate some or all of the benefit of an increase in the value of a foreign currency versus the US dollar. Although allocation among different asset categories generally limits risk, fund management may favor an asset category that underperforms other assets or markets as a whole. Investing in derivatives entails special risks relating to liquidity, leverage and credit that may reduce returns and/or increased volatility. Investments in lower-quality (“junk bonds”) and non-rated securities present greater risk of loss than investments in higher-quality securities. The Fund may lend securities to approved institutions. Please read the prospectus for details.
This report must be preceded or accompanied by a prospectus. We advise you to consider the Fund's objectives, risks, charges, and expenses carefully before investing. The prospectus contains this and other important information about the Fund, which can be requested by calling (800) 728-3337, contacting your financial representative, or visit dws.com/mutualreports to view or download a prospectus. Please read the prospectus carefully before you invest.
The brand DWS represents DWS Group GmbH & Co. KGaA and any of its subsidiaries such as DWS Distributors, Inc., which offers investment products, or DWS Investment Management Americas, Inc. and RREEF America L.L.C., which offer advisory services.
©2024 DWS Group GmbH&Co. KGaA. All rights reserved
DGMF-TSRA-I
R-103424-1 (12/24)
| | |
| | (b) Not applicable |
| | |
| Item 2. | Code of Ethics. |
| | |
| | As of the end of the period covered by this report, the registrant has adopted a code of ethics, as defined in Item 2 of Form N-CSR that applies to its Principal Executive Officer and Principal Financial Officer. There have been no amendments to, or waivers from, a provision of the code of ethics during the period covered by this report that would require disclosure under Item 2. A copy of the code of ethics is filed as an exhibit to this Form N-CSR. |
| | |
| Item 3. | Audit Committee Financial Expert. |
| | |
| | The fund’s audit committee is comprised solely of trustees who are "independent" (as such term has been defined by the Securities and Exchange Commission ("SEC") in regulations implementing Section 407 of the Sarbanes-Oxley Act (the "Regulations")). The fund’s Board of Trustees has determined that there are several "audit committee financial experts" (as such term has been defined by the Regulations) serving on the fund’s audit committee including Ms. Catherine Schrand, the chair of the fund’s audit committee. An “audit committee financial expert” is not an “expert” for any purpose, including for purposes of Section 11 of the Securities Act of 1933 and the designation or identification of a person as an “audit committee financial expert” does not impose on such person any duties, obligations or liability that are greater than the duties, obligations and liability imposed on such person as a member of the audit committee and board of directors in the absence of such designation or identification. |
| | |
| Item 4. | Principal Accountant Fees and Services. |
| | |
DWS global macro Fund
form n-csr disclosure re: AUDIT FEES
The following table shows the amount of fees that Ernst & Young LLP (“EY”), the Fund’s Independent Registered Public Accounting Firm, billed to the Fund during the Fund’s last two fiscal years. The Audit Committee approved in advance all audit services and non-audit services that EY provided to the Fund.
Services that the Fund’s Independent Registered Public Accounting Firm Billed to the Fund
Fiscal Year
Ended
October 31, | Audit Fees Billed to Fund | Audit-Related
Fees Billed to Fund | Tax Fees Billed to Fund | All
Other Fees Billed to Fund |
| 2024 | $61,012 | $0 | $7,629 | $0 |
| 2023 | $58,361 | $0 | $7,629 | $0 |
The above “Tax Fees” were billed for professional services rendered for tax preparation.
Services that the Fund’s Independent Registered Public Accounting Firm Billed to the Adviser and Affiliated Fund Service Providers
The following table shows the amount of fees billed by EY to DWS Investment Management Americas, Inc. (“DIMA” or the “Adviser”), and any entity controlling, controlled by or under common control with DIMA (“Control Affiliate”) that provides ongoing services to the Fund (“Affiliated Fund Service Provider”), for engagements directly related to the Fund’s operations and financial reporting, during the Fund’s last two fiscal years.
Fiscal Year
Ended
October 31, | Audit-Related
Fees Billed to Adviser and Affiliated Fund Service Providers | Tax Fees Billed to Adviser and Affiliated Fund Service Providers | All
Other Fees Billed to Adviser and Affiliated Fund Service Providers |
| 2024 | $0 | $560,206 | $0 |
| 2023 | $0 | $539,907 | $0 |
The above “Tax Fees” were billed in connection with tax compliance services and agreed upon procedures.
Non-Audit Services
The following table shows the amount of fees that EY billed during the Fund’s last two fiscal years for non-audit services. The Audit Committee pre-approved all non-audit services that EY provided to the Adviser and any Affiliated Fund Service Provider that related directly to the Fund’s operations and financial reporting. The Audit Committee requested and received information from EY about any non-audit services that EY rendered during the Fund’s last fiscal year to the Adviser and any Affiliated Fund Service Provider. The Committee considered this information in evaluating EY’s independence.
Fiscal Year
Ended
October 31, | Total
Non-Audit Fees Billed to Fund
(A) | Total Non-Audit Fees billed to Adviser and Affiliated Fund Service Providers (engagements related directly to the operations and financial reporting of the Fund)
(B) | Total Non-Audit Fees billed to Adviser and Affiliated Fund Service Providers (all other engagements)
(C) | Total of
(A), (B) and (C) |
| 2024 | $7,629 | $560,206 | $0 | $567,835 |
| 2023 | $7,629 | $539,907 | $0 | $547,536 |
All other engagement fees were billed for services in connection with agreed upon procedures and tax compliance for DIMA and other related entities.
Audit Committee Pre-Approval Policies and Procedures. Generally, each Fund’s Audit Committee must pre approve (i) all services to be performed for a Fund by a Fund’s Independent Registered Public Accounting Firm and (ii) all non-audit services to be performed by a Fund’s Independent Registered Public Accounting Firm for the DIMA Entities with respect to operations and financial reporting of the Fund, except that the Chairperson or Vice Chairperson of each Fund’s Audit Committee may grant the pre-approval for non-audit services described in items (i) and (ii) above for non-prohibited services for engagements of less than $100,000. All such delegated pre approvals shall be presented to each Fund’s Audit Committee no later than the next Audit Committee meeting.
There were no amounts that were approved by the Audit Committee pursuant to the de minimis exception under Rule 2-01 of Regulation S-X.
According to the registrant’s principal Independent Registered Public Accounting Firm, substantially all of the principal Independent Registered Public Accounting Firm's hours spent on auditing the registrant's financial statements were attributed to work performed by full-time permanent employees of the principal Independent Registered Public Accounting Firm and (i) and (j) are not applicable.
***
In connection with the audit of the 2023 and 2024 financial statements, the Fund entered into an engagement letter with EY. The terms of the engagement letter required by EY, and agreed to by the Audit Committee, include a provision mandating the use of mediation and arbitration to resolve any controversy or claim between the parties arising out of or relating to the engagement letter or services provided thereunder.
***
| | |
| Item 5. | Audit Committee of Listed Registrants |
| | |
| | Not applicable |
| | |
| Item 6. | Investments. |
| | |
| | Not applicable |
| | |
| Item 7. | Financial Statements and Financial Highlights for Open-End Management Investment Companies. |
| | |
| | (a) |
October 31, 2024
Annual Financial Statements and Other Information
The brand DWS represents DWS Group GmbH & Co. KGaA and any of its subsidiaries such as DWS Distributors, Inc., which offers investment products, or DWS Investment Management Americas, Inc. and RREEF America L.L.C., which offer advisory services.
ConsolidatedInvestment Portfolioas of October 31, 2024
| | |
| |
| |
Nutrien Ltd. (Cost $1,043,708) | | | |
| |
Novo Nordisk A/S “B” (Cost $2,073,977) | | | |
| |
| | | |
| | | |
| | | |
| | | |
| | | |
LVMH Moet Hennessy Louis Vuitton SE | | | |
| | | |
| | | |
| | | |
| | | |
| | | |
| |
| | | |
| | | |
Deutsche Telekom AG (Registered) | | | |
| | | |
| | | |
| | | |
| |
| | | |
| | | |
| | | |
| |
Enel SpA (Cost $1,124,460) | | | |
| |
| | | |
| | | |
Mitsubishi Electric Corp. | | | |
Takeda Pharmaceutical Co., Ltd. | | | |
| | | |
The accompanying notes are an integral part of the consolidated financial statements.
| | |
| |
Samsung Electronics Co., Ltd. (Cost $2,026,563) | | | |
| |
| | | |
| | | |
Koninklijke Ahold Delhaize NV | | | |
| | | |
| |
| | | |
Roche Holding AG (Genusschein) | | | |
| | | |
| |
Taiwan Semiconductor Manufacturing Co., Ltd. (Cost $412,584) | | | |
| |
| | | |
| | | |
| | | |
| | | |
| | | |
| | | |
| | | |
| | | |
| | | |
| | | |
| | | |
| | | |
| | | |
| | | |
Total Common Stocks (Cost $51,769,694) | | | |
| | |
| |
| |
Australia Government Bond, Series 159, REG S, 0.25%, 11/21/2024 (Cost $4,217,991) | | | |
The accompanying notes are an integral part of the consolidated financial statements.
| | |
| |
ING Groep NV, 3.95%, 3/29/2027 | | | |
Teva Pharmaceutical Finance Netherlands II BV, 4.5%, 3/1/2025 | | | |
| | | |
| |
| | | |
| | | |
| | | |
| | | |
| |
AbbVie, Inc., 2.95%, 11/21/2026 | | | |
Anheuser-Busch InBev Worldwide, Inc., 4.0%, 4/13/2028 | | | |
Coty, Inc., REG S, 4.75%, 4/15/2026 | | | |
DISH DBS Corp., 7.75%, 7/1/2026 | | | |
General Motors Financial Co., Inc., 2.7%, 8/20/2027 | | | |
HP, Inc., 3.0%, 6/17/2027 | | | |
| | | |
| | | |
| | | |
| | | |
| | | |
| | | |
| | | |
| | | |
| | | |
| | | |
| | | |
| | | |
| | | |
| | | |
| | | |
| | | |
| | | |
VeriSign, Inc., 5.25%, 4/1/2025 | | | |
Verizon Communications, Inc., 2.625%, 8/15/2026 | | | |
Warnermedia Holdings, Inc., 3.755%, 3/15/2027 | | | |
| | | |
Total Bonds (Cost $75,716,398) | | | |
The accompanying notes are an integral part of the consolidated financial statements.
| | |
Exchange-Traded Funds 11.8% | |
Invesco S&P 500 Equal Weight ETF | | | |
iShares EUR High Yield Corp. Bond UCITS ETF | | | |
SPDR Gold MiniShares Trust | | | |
Total Exchange-Traded Funds (Cost $16,238,436) | | | |
| |
DWS Central Cash Management Government Fund, 4.86% (d) (Cost $13,009,251) | | | |
| | | |
Total Consolidated Investment Portfolio (Cost $156,733,779) | | | |
Other Assets and Liabilities, Net | | | |
| | | |
A summary of the Fund’s transactions with affiliated investments during the year ended October 31, 2024 are as follows:
| | | Net
Real-
ized
Gain/
(Loss)
($) | Net
Change
in
Unreal-
ized
Appreci-
ation
(Depreci-
ation)
($) | | Capital
Gain
Distri-
butions
($) | Number of
Shares at
10/31/2024 | |
Securities Lending Collateral 0.0% |
DWS Government & Agency Securities Portfolio “DWS Government Cash Institutional Shares” ,
4.75% (d) (e) |
| | | | | | | | |
|
DWS Central Cash Management Government Fund, 4.86% (d) |
| | | | | | | | |
| | | | | | | | |
| Non-income producing security. |
| Listed on the New York Stock Exchange. |
| Principal amount stated in U.S. dollars unless otherwise noted. |
| At October 31, 2024, this security has been pledged, in whole or in part, to cover initial margin requirements for open futures contracts. |
| Affiliated fund managed by DWS Investment Management Americas, Inc. The rate shown is the annualized seven-day yield at period end. |
The accompanying notes are an integral part of the consolidated financial statements.
| Represents cash collateral held in connection with securities lending. Income earned by the Fund is net of borrower rebates. |
| Represents the net increase (purchase cost) or decrease (sales proceeds) in the amount invested in cash collateral for the year ended October 31, 2024. |
REG S: Securities sold under Regulation S may not be offered, sold or delivered within the United States or to, or for the account or benefit of, U.S. persons, except pursuant to an exemption from, or in a transaction not subject to, the registration requirements of the Securities Act of 1933. |
|
SPDR: Standard & Poor’s Depositary Receipt |
At October 31, 2024, open futures contracts purchased were as follows:
| | | | | | Unrealized
Appreciation/
(Depreciation) ($) |
10 Year U.S. Treasury Note | | | | | | |
| | | | | | |
| | | | | | |
| | | | | | |
Total net unrealized depreciation | |
At October 31, 2024, open futures contracts sold were as follows:
| | | | | | Unrealized
Depreciation ($) |
| | | | | | |
At October 31, 2024, the Fund had the following open forward foreign currency contracts:
| | | Unrealized
Appreciation ($) | |
| | | | | | Brown Brothers Harriman & Co. |
| | | | | | |
Total unrealized appreciation | | |
| | | Unrealized
Depreciation ($) | |
| | | | | | |
The accompanying notes are an integral part of the consolidated financial statements.
| | | Unrealized Depreciation ($) | |
| | | | | | |
| | | | | | |
Total unrealized depreciation | | |
For information on the Fund’s policy and additional disclosures regarding futures contracts and forward foreign currency contracts, please refer to the Derivatives section of Note B in the accompanying Notes to Consolidated Financial Statements.
Various inputs are used in determining the value of the Fund’s investments. These inputs are summarized in three broad levels. Level 1 includes quoted prices in active markets for identical securities. Level 2 includes other significant observable inputs (including quoted prices for similar securities, interest rates, prepayment speeds and credit risk). Level 3 includes significant unobservable inputs (including the Fund’s own assumptions in determining the fair value of investments). The level assigned to the securities valuations may not be an indication of the risk or liquidity associated with investing in those securities.
The following is a summary of the inputs used as of October 31, 2024 in valuing the Fund’s investments. For information on the Fund’s policy regarding the valuation of investments,
The accompanying notes are an integral part of the consolidated financial statements.
please refer to the Security Valuation section of Note A in the accompanying Notes to Consolidated Financial Statements.
| | | | |
| | | | |
| | | | |
| | | | |
| | | | |
| | | | |
| | | | |
| | | | |
| | | | |
| | | | |
| | | | |
| | | | |
| | | | |
| | | | |
| | | | |
| | | | |
| | | | |
| | | | |
| | | | |
Forward Foreign Currency Contracts | | | | |
| | | | |
| | | | |
| | | | |
| | | | |
Forward Foreign Currency Contracts | | | | |
| | | | |
| See Consolidated Investment Portfolio for additional detailed categorizations. |
| Derivatives include unrealized appreciation (depreciation) on open futures contracts and forward foreign currency contracts. |
The accompanying notes are an integral part of the consolidated financial statements.
Consolidated Statement of Assets and Liabilities
| |
Investments in non-affiliated securities, at value (cost $143,724,528) | |
Investment in DWS Central Cash Management Government Fund (cost $13,009,251) | |
| |
Foreign currency, at value (cost $2,051,033) | |
Receivable for investments sold | |
Receivable for Fund shares sold | |
| |
| |
Affiliated securities lending income receivable | |
Unrealized appreciation on forward foreign currency contracts | |
Foreign taxes recoverable | |
| |
| |
| |
Payable for Fund shares redeemed | |
Payable for variation margin on futures contracts | |
Unrealized depreciation on forward foreign currency contracts | |
| |
| |
Other accrued expenses and payables | |
| |
| |
| |
Distributable earnings (loss) | |
| |
| |
The accompanying notes are an integral part of the consolidated financial statements.
Consolidated Statement of Assets and Liabilitiesas of October 31, 2024 (continued)
| |
| |
Net Asset Value and redemption price per share
($32,834,149 ÷ 3,115,688 shares of capital stock outstanding,
$.01 par value, 50,000,000 shares authorized) | |
Maximum offering price per share (100 ÷ 94.25 of $10.54) | |
| |
Net Asset Value, offering and redemption price
(subject to contingent deferred sales charge) per share
($1,481,349 ÷ 150,397 shares of capital stock outstanding, $.01 par value, 50,000,000 shares authorized) | |
| |
Net Asset Value, offering and redemption price per share
($25,116 ÷ 2,429 shares of capital stock outstanding, $.01 par value, 50,000,000 shares authorized) | |
| |
Net Asset Value, offering and redemption price per share
($80,683,067 ÷ 7,843,579 shares of capital stock outstanding, $.01 par value, 50,000,000 shares authorized) | |
| |
Net Asset Value, offering and redemption price per share
($61,969,395 ÷ 6,005,309 shares of capital stock outstanding, $.01 par value, 50,000,000 shares authorized) | |
The accompanying notes are an integral part of the consolidated financial statements.
Consolidated Statement of Operations
for the year ended October 31, 2024
| |
| |
| |
Dividends (net of foreign taxes withheld of $253,907) | |
Income distributions — DWS Central Cash Management Government Fund | |
Affiliated securities lending income | |
| |
| |
| |
| |
| |
Distribution and service fees | |
| |
| |
| |
| |
Directors' fees and expenses | |
| |
Total expenses before expense reductions | |
| |
Total expenses after expense reductions | |
| |
Realized and Unrealized Gain (Loss) | |
Net realized gain (loss) from: | |
| |
| |
Forward foreign currency contracts | |
| |
| |
Change in net unrealized appreciation (depreciation) on: | |
| |
| |
Forward foreign currency contracts | |
| |
| |
| |
Net increase (decrease) in net assets resulting from operations | |
The accompanying notes are an integral part of the consolidated financial statements.
Consolidated Statements of Changes in Net Assets
| |
Increase (Decrease) in Net Assets | | |
| | |
| | |
| | |
Change in net unrealized appreciation
(depreciation) | | |
Net increase (decrease) in net assets resulting from operations | | |
Distributions to shareholders: | | |
| | |
| | |
| | |
| | |
| | |
| | |
Return of capital distributions to shareholders: | | |
| | |
| | |
| | |
| | |
| | |
| | |
| | |
| | |
Proceeds from shares sold | | |
Reinvestment of distributions | | |
Payments for shares redeemed | | |
Net increase (decrease) in net assets from Fund share transactions | | |
Increase (decrease) in net assets | | |
Net assets at beginning of period | | |
Net assets at end of period | | |
| For the period from November 1, 2023 to March 25, 2024 (Class R liquidation date). |
The accompanying notes are an integral part of the consolidated financial statements.
Consolidated Financial Highlights
DWS Global Macro Fund — Class A |
| |
| | | | | |
|
Net asset value, beginning of period | | | | | |
Income (loss) from investment operations: | | | | | |
| | | | | |
Net realized and unrealized gain (loss) | | | | | |
Total from investment operations | | | | | |
| | | | | |
| | | | | |
| | | | | |
| | | | | |
| | | | | |
Net asset value, end of period | | | | | |
| | | | | |
Ratios to Average Net Assets and Supplemental Data |
Net assets, end of period ($ millions) | | | | | |
Ratio of expenses before expense reductions (%) | | | | | |
Ratio of expenses after expense reductions (%) | | | | | |
Ratio of net investment income (%) | | | | | |
Portfolio turnover rate (%) | | | | | |
Effective July 11, 2023, the Fund invests indirectly in commodities markets through a wholly owned subsidiary and the financial highlights have been consolidated. The financial highlights prior to the year ended October 31, 2023 have not been consolidated. |
| Based on average shares outstanding during the period. |
| Total return does not reflect the effect of any sales charges. |
| Total return would have been lower had certain expenses not been reduced. |
The accompanying notes are an integral part of the consolidated financial statements.
DWS Global Macro Fund — Class C |
| |
| | | | | |
|
Net asset value, beginning of period | | | | | |
Income (loss) from investment operations: | | | | | |
| | | | | |
Net realized and unrealized gain (loss) | | | | | |
Total from investment operations | | | | | |
| | | | | |
| | | | | |
| | | | | |
| | | | | |
| | | | | |
Net asset value, end of period | | | | | |
| | | | | |
Ratios to Average Net Assets and Supplemental Data |
Net assets, end of period ($ millions) | | | | | |
Ratio of expenses before expense reductions (%) | | | | | |
Ratio of expenses after expense reductions (%) | | | | | |
Ratio of net investment income (%) | | | | | |
Portfolio turnover rate (%) | | | | | |
Effective July 11, 2023, the Fund invests indirectly in commodities markets through a wholly owned subsidiary and the financial highlights have been consolidated. The financial highlights prior to the year ended October 31, 2023 have not been consolidated. |
| Based on average shares outstanding during the period. |
| Total return does not reflect the effect of any sales charges. |
| Total return would have been lower had certain expenses not been reduced. |
The accompanying notes are an integral part of the consolidated financial statements.
DWS Global Macro Fund — Class R6 |
| |
| | | | | |
|
Net asset value, beginning of period | | | | | |
Income (loss) from investment operations: | | | | | |
| | | | | |
Net realized and unrealized gain (loss) | | | | | |
Total from investment operations | | | | | |
| | | | | |
| | | | | |
| | | | | |
| | | | | |
| | | | | |
Net asset value, end of period | | | | | |
| | | | | |
Ratios to Average Net Assets and Supplemental Data |
Net assets, end of period ($ thousands) | | | | | |
Ratio of expenses before expense reductions (%) | | | | | |
Ratio of expenses after expense reductions (%) | | | | | |
Ratio of net investment income (%) | | | | | |
Portfolio turnover rate (%) | | | | | |
Effective July 11, 2023, the Fund invests indirectly in commodities markets through a wholly owned subsidiary and the financial highlights have been consolidated. The financial highlights prior to the year ended October 31, 2023 have not been consolidated. |
| Based on average shares outstanding during the period. |
| Total return would have been lower had certain expenses not been reduced. |
The accompanying notes are an integral part of the consolidated financial statements.
DWS Global Macro Fund — Class S |
| |
| | | | | |
|
Net asset value, beginning of period | | | | | |
Income (loss) from investment operations: | | | | | |
| | | | | |
Net realized and unrealized gain (loss) | | | | | |
Total from investment operations | | | | | |
| | | | | |
| | | | | |
| | | | | |
| | | | | |
| | | | | |
Net asset value, end of period | | | | | |
| | | | | |
Ratios to Average Net Assets and Supplemental Data |
Net assets, end of period ($ millions) | | | | | |
Ratio of expenses before expense reductions (%) | | | | | |
Ratio of expenses after expense reductions (%) | | | | | |
Ratio of net investment income (%) | | | | | |
Portfolio turnover rate (%) | | | | | |
Effective July 11, 2023, the Fund invests indirectly in commodities markets through a wholly owned subsidiary and the financial highlights have been consolidated. The financial highlights prior to the year ended October 31, 2023 have not been consolidated. |
| Based on average shares outstanding during the period. |
| Total return would have been lower had certain expenses not been reduced. |
The accompanying notes are an integral part of the consolidated financial statements.
DWS Global Macro Fund — Institutional Class |
| |
| | | | | |
|
Net asset value, beginning of period | | | | | |
Income (loss) from investment operations: | | | | | |
| | | | | |
Net realized and unrealized gain (loss) | | | | | |
Total from investment operations | | | | | |
| | | | | |
| | | | | |
| | | | | |
| | | | | |
| | | | | |
Net asset value, end of period | | | | | |
| | | | | |
Ratios to Average Net Assets and Supplemental Data |
Net assets, end of period ($ millions) | | | | | |
Ratio of expenses before expense reductions (%) | | | | | |
Ratio of expenses after expense reductions (%) | | | | | |
Ratio of net investment income (%) | | | | | |
Portfolio turnover rate (%) | | | | | |
Effective July 11, 2023, the Fund invests indirectly in commodities markets through a wholly owned subsidiary and the financial highlights have been consolidated. The financial highlights prior to the year ended October 31, 2023 have not been consolidated. |
| Based on average shares outstanding during the period. |
| Total return would have been lower had certain expenses not been reduced. |
The accompanying notes are an integral part of the consolidated financial statements.
Notes to Consolidated Financial Statements
A.
Organization and Significant Accounting Policies
DWS Global Macro Fund (the “Fund” ) is a diversified series of Deutsche DWS International Fund, Inc. (the “Corporation” ), which is registered under the Investment Company Act of 1940, as amended (the “1940 Act” ), as an open-end management investment company organized as a Maryland corporation.
The Fund offers multiple classes of shares which provide investors with different purchase options. Class A shares are subject to an initial sales charge. Class C shares are not subject to an initial sales charge but are subject to higher ongoing expenses than Class A shares and a contingent deferred sales charge payable upon certain redemptions within one year of purchase. Class C shares automatically convert to Class A shares in the same fund after 8 years, provided that the Fund or the financial intermediary through which the shareholder purchased the Class C shares has records verifying that the Class C shares have been held for at least 8 years. Class R shares are not subject to initial or contingent deferred sales charges and are generally available only to certain retirement plans. Upon the recommendation of the Advisor, the Fund’s Board of Directors authorized the termination and liquidation of Class R Shares, effective on March 25, 2024. Class R6 shares are not subject to initial or contingent deferred sales charges and are generally available only to certain qualifying plans and programs. Class S shares are not subject to initial or contingent deferred sales charges and are available through certain intermediary relationships with financial services firms, or can be purchased by establishing an account directly with the Fund’s transfer agent. Institutional Class shares are not subject to initial or contingent deferred sales charges and are generally available only to qualified institutions.
Investment income, realized and unrealized gains and losses, and certain fund-level expenses and expense reductions, if any, are borne pro rata on the basis of relative net assets by the holders of all classes of shares, except that each class bears certain expenses unique to that class such as distribution and service fees, services to shareholders and certain other class-specific expenses. Differences in class-level expenses may result in payment of different per share dividends by class. All shares of the Fund have equal rights with respect to voting subject to class-specific arrangements.
The Fund’s consolidated financial statements are prepared in accordance with accounting principles generally accepted in the United States of America (“U.S. GAAP” ) which require the use of management estimates. Actual results could differ from those estimates. The Fund qualifies as an investment company under Topic 946 of Accounting Standards
Codification of U.S. GAAP. The policies described below are followed consistently by the Fund in the preparation of its consolidated financial statements.
Principles of Consolidation. Effective July 11, 2023 the Fund invests indirectly in commodities markets through a wholly owned subsidiary, Cayman Global Macro Fund LLC, organized under the laws of the Cayman Islands (the “Subsidiary” ). The Fund and the Subsidiary each operate in compliance with the requirements of Rule 4.5 of the Commodity Futures Trading Commission. As a result, both the Fund and the Subsidiary are not deemed to be a commodity pool under the Commodity Exchange Act (“CEA” ), as amended, and are limited in their ability to use certain financial instruments regulated under the CEA. Among other investments, the Subsidiary may invest in gold exchange-traded funds that do not operate as commodity pools and fixed income instruments. The Subsidiary may also invest available cash in affiliated money market funds. The Subsidiary is managed by the same portfolio managers that manage the Fund. As of October 31, 2024, the Fund’s investment in the Subsidiary was $1,243,997, representing 0.7% of the Fund’s total assets.
The Fund’s Investment Portfolio has been consolidated and includes the portfolio holdings of the Fund and the Subsidiary. The consolidated financial statements include the accounts of the Fund and the Subsidiary. All inter-company transactions and balances have been eliminated.
Security Valuation. Investments are stated at value determined as of the close of regular trading on the New York Stock Exchange on each day the exchange is open for trading.
The Fund’s Board has designated DWS Investment Management Americas, Inc. (the “Advisor” ) as the valuation designee for the Fund pursuant to Rule 2a-5 under the 1940 Act. The Advisor’s Pricing Committee (the “Pricing Committee” ) typically values securities using readily available market quotations or prices supplied by independent pricing services (which are considered fair values under Rule 2a-5). The Advisor has adopted fair valuation procedures that provide methodologies for fair valuing securities.
Various inputs are used in determining the value of the Fund’s investments. These inputs are summarized in three broad levels. Level 1 includes quoted prices in active markets for identical securities. Level 2 includes other significant observable inputs (including quoted prices for similar securities, interest rates, prepayment speeds and credit risk). Level 3 includes significant unobservable inputs (including the Fund’s own assumptions in determining the fair value of investments). The level assigned to the securities valuations may not be an indication of the risk or liquidity associated with investing in those securities.
Equity securities and exchange-traded funds (“ETFs” ) are valued at the most recent sale price or official closing price reported on the exchange
(U.S. or foreign) or over-the-counter market on which they trade. Equity securities or ETFs for which no sales are reported are valued at the calculated mean between the most recent bid and asked quotations on the relevant market or, if a mean cannot be determined, at the most recent bid quotation. Equity securities and ETFs are generally categorized as Level 1. For certain international equity securities and ETFs, in order to adjust for events which may occur between the close of the foreign exchanges and the close of the New York Stock Exchange, a fair valuation model may be used. This fair valuation model takes into account comparisons to the valuation of American Depository Receipts (ADRs), exchange-traded funds, futures contracts and certain indices and these securities are categorized as Level 2.
Debt securities are valued at prices supplied by independent pricing services approved by the Pricing Committee. Such services may use various pricing techniques which take into account appropriate factors such as yield, quality, coupon rate, maturity, type of issue, trading characteristics, prepayment speeds and other data, as well as broker quotes. If the pricing services are unable to provide valuations, debt securities are valued at the average of the most recent reliable bid quotations or evaluated prices, as applicable, obtained from broker-dealers. These securities are generally categorized as Level 2.
Investments in open-end investment companies are valued at their net asset value each business day and are categorized as Level 1.
Futures contracts are generally valued at the settlement prices established each day on the exchange on which they are traded and are categorized as Level 1.
Forward currency contracts are valued at the prevailing forward exchange rate of the underlying currencies and are categorized as Level 2.
Securities and other assets for which market quotations are not readily available or for which the above valuation procedures are deemed not to reflect fair value are valued in a manner that is intended to reflect their fair value as determined in accordance with procedures approved by the Pricing Committee and are generally categorized as Level 3. In accordance with the Fund’s valuation procedures, factors considered in determining value may include, but are not limited to, the type of the security; the size of the holding; the initial cost of the security; the existence of any contractual restrictions on the security’s disposition; the price and extent of public trading in similar securities of the issuer or of comparable companies; quotations or evaluated prices from broker-dealers and/or pricing services; information obtained from the issuer, analysts, and/or the appropriate stock exchange (for exchange-traded securities); an analysis of the company’s or issuer’s financial statements; an evaluation of the forces that influence the issuer and the market(s) in which the security is purchased and sold; and with respect to debt securities, the maturity,
coupon, creditworthiness, currency denomination and the movement of the market in which the security is normally traded. The value determined under these procedures may differ from published values for the same securities.
Disclosure about the classification of fair value measurements is included in a table following the Fund’s Consolidated Investment Portfolio.
Foreign Currency Translations. The books and records of the Fund are maintained in U.S. dollars. Investment securities and other assets and liabilities denominated in a foreign currency are translated into U.S. dollars at the prevailing exchange rates at period end. Purchases and sales of investment securities, income and expenses are translated into U.S. dollars at the prevailing exchange rates on the respective dates of the transactions.
Net realized and unrealized gains and losses on foreign currency transactions represent net gains and losses between trade and settlement dates on securities transactions, the acquisition and disposition of foreign currencies, and the difference between the amount of net investment income accrued and the U.S. dollar amount actually received. The portion of both realized and unrealized gains and losses on investments that results from fluctuations in foreign currency exchange rates is not separately disclosed but is included with net realized and unrealized gain/appreciation and loss/depreciation on investments.
Securities Lending. National Financial Services LLC (Fidelity Agency Lending), as securities lending agent, lends securities of the Fund to certain financial institutions under the terms of its securities lending agreement. During the term of the loans, the Fund continues to receive interest and dividends generated by the securities and to participate in any changes in their market value. The Fund requires the borrowers of the securities to maintain collateral with the Fund consisting of cash and/or securities issued or guaranteed by the U.S. Government, its agencies or instrumentalities having a value at least equal to the value of the securities loaned. When the collateral falls below specified amounts, the securities lending agent will use its best efforts to obtain additional collateral on the next business day to meet required amounts under the securities lending agreement. During the year ended October 31, 2024, the Fund invested the cash collateral, if any, into a joint trading account in affiliated money market funds, including DWS Government & Agency Securities Portfolio, managed by DWS Investment Management Americas, Inc. DWS Investment Management Americas, Inc. receives a management/ administration fee (0.13% annualized effective rate as of October 31, 2024) on the cash collateral invested in DWS Government & Agency Securities Portfolio. The Fund receives compensation for lending its securities either in the form of fees or by earning interest on invested cash collateral net of borrower rebates and fees paid to a securities
lending agent. Either the Fund or the borrower may terminate the loan at any time, and the borrower, after notice, is required to return borrowed securities within a standard time period. There may be risks of delay and costs in recovery of securities or even loss of rights in the collateral should the borrower of the securities fail financially. If the Fund is not able to recover securities lent, the Fund may sell the collateral and purchase a replacement investment in the market, incurring the risk that the value of the replacement security is greater than the value of the collateral. The Fund is also subject to all investment risks associated with the reinvestment of any cash collateral received, including, but not limited to, interest rate, credit and liquidity risk associated with such investments.
As of October 31, 2024, the Fund had no securities on loan.
When-Issued, Delayed-Delivery Securities. The Fund may purchase or sell securities with delivery or payment to occur at a later date beyond the normal settlement period. At the time the Fund enters into a commitment to purchase or sell a security, the transaction is recorded and the value of the transaction is reflected in the net asset value. The price of such security and the date when the security will be delivered and paid for are fixed at the time the transaction is negotiated. The value of the security may vary with market fluctuations.
Certain risks may arise upon entering into when-issued, delayed-delivery transactions from the potential inability of counterparties to meet the terms of their contracts or if the issuer does not issue the securities due to political, economic or other factors. Additionally, losses may arise due to changes in the value of the underlying securities.
Tax Information. The Fund’s policy is to comply with the requirements of the Internal Revenue Code of 1986, as amended, which are applicable to regulated investment companies, and to distribute all of its taxable income to its shareholders.
Additionally, the Fund may be subject to taxes imposed by the governments of countries in which it invests and are generally based on income and/or capital gains earned or repatriated. Estimated tax liabilities on certain foreign securities are recorded on an accrual basis and are reflected as components of interest income or net change in unrealized gain/loss on investments. Tax liabilities realized as a result of security sales are reflected as a component of net realized gain/loss on investments.
Income from certain commodity-linked exchange-traded funds does not constitute “qualifying income” to the Fund. Receipt of such income could cause the Fund to be subject to tax at the Fund level. The IRS has issued a private letter ruling to the Fund stating that such income earned through its wholly owned Subsidiary constitutes qualifying income. The Fund is required to increase its taxable income by its share of the Subsidiary’s income, including net gains from commodity-linked transactions. Net
investment losses of the Subsidiary cannot be deducted by the Fund in the current period nor carried forward to offset taxable income for future periods.
At October 31, 2024, the Fund had net tax basis capital loss carryforwards of $4,100,496 of long-term losses, which may be applied against realized net taxable capital gains indefinitely.
The Fund files tax returns with the Internal Revenue Service, the State of New York, and various other states. Specific to U.S. federal and state taxes, generally, each of the tax years in the four-year period ended October 31, 2024, remains subject to examination by taxing authorities. Specific to foreign countries in which the Fund invests, all open tax years remain subject to examination by taxing authorities in the respective jurisdictions. The open tax years vary by each jurisdiction in which the Fund invests.
Distribution of Income and Gains. Distributions from net investment income of the Fund, if any, are declared and distributed to shareholders quarterly. Net realized gains from investment transactions, in excess of available capital loss carryforwards, would be taxable to the Fund if not distributed, and, therefore, will be distributed to shareholders at least annually. The Fund may also make additional distributions for tax purposes if necessary.
The timing and characterization of certain income and capital gain distributions are determined annually in accordance with federal tax regulations which may differ from accounting principles generally accepted in the United States of America. These differences primarily relate to certain securities sold at a loss, income received from passive foreign investment companies, investments in derivatives, premium amortization on debt securities, the realized tax character on distributions from certain securities and investment in the subsidiary. The Fund may utilize a portion of the proceeds from capital shares redeemed as a distribution from net investment income and realized capital gains. As a result, net investment income (loss) and net realized gain (loss) on investment transactions for a reporting period may differ significantly from distributions during such period. Accordingly, the Fund may periodically make reclassifications among certain of its capital accounts without impacting the net asset value of the Fund.
At October 31, 2024, the Fund’s components of distributable earnings (accumulated losses) on a net tax basis were as follows:
Undistributed ordinary income* | |
Capital loss carryforwards | |
Net unrealized appreciation (depreciation) on investments | |
At October 31, 2024, the aggregate cost of investments for federal income tax purposes was $157,392,206. The net unrealized appreciation for all investments based on tax cost was $16,338,498. This consisted of aggregate gross unrealized appreciation for all investments for which there was an excess of value over tax cost of $24,081,103 and aggregate gross unrealized depreciation for all investments for which there was an excess of tax cost over value of $7,742,605.
In addition, the tax character of distributions paid to shareholders by the Fund is summarized as follows:
| |
| | |
Distributions from ordinary income* | | |
Distributions from long-term capital gains | | |
Return of capital distributions | | |
| For tax purposes, short-term capital gain distributions are considered ordinary income distributions. |
Expenses. Expenses of the Corporation arising in connection with a specific fund are allocated to that fund. Other Corporation expenses which cannot be directly attributed to a fund are apportioned among the funds in the Corporation based upon the relative net assets or other appropriate measures.
Contingencies. In the normal course of business, the Fund may enter into contracts with service providers that contain general indemnification clauses. The Fund’s maximum exposure under these arrangements is unknown, as this would involve future claims that may be made against the Fund that have not yet been made. However, based on experience, the Fund expects the risk of loss to be remote.
Other. Investment transactions are accounted for on a trade date plus one basis for daily net asset value calculations. However, for financial reporting purposes, investment transactions are reported on trade date. Interest income is recorded on the accrual basis. Dividend income is recorded on the ex-dividend date net of foreign withholding taxes. Certain dividends from foreign securities may be recorded subsequent to the ex-dividend date as soon as the Fund is informed of such dividends. Realized gains and losses from investment transactions are recorded on an identified cost basis. Proceeds from litigation payments, if any, are included in net realized gain (loss) from investments. All premiums and discounts are amortized/accreted for both tax and financial reporting purposes.
Futures Contracts. A futures contract is an agreement between a buyer or seller and an established futures exchange or its clearinghouse in which
the buyer or seller agrees to take or make a delivery of a specific amount of a financial instrument at a specified price on a specific date (settlement date). For the year ended October 31, 2024, the Fund entered into futures as a substitute for direct investment in a particular asset class, for duration management, and for hedging purposes.
Upon entering into a futures contract, the Fund is required to deposit with a financial intermediary cash or securities (“initial margin” ) in an amount equal to a certain percentage of the face value indicated in the futures contract. Subsequent payments (“variation margin” ) are made or received by the Fund dependent upon the daily fluctuations in the value and are recorded for financial reporting purposes as unrealized gains or losses by the Fund. Gains or losses are realized when the contract expires or is closed. Since all futures contracts are exchange-traded, counterparty risk is minimized as the exchange’s clearinghouse acts as the counterparty, and guarantees the futures against default.
Certain risks may arise upon entering into futures contracts, including the risk that an illiquid market will limit the Fund’s ability to close out a futures contract prior to the settlement date and the risk that the futures contract is not well correlated with the security, index or currency to which it relates. Risk of loss may exceed amounts recognized in the Consolidated Statement of Assets and Liabilities.
A summary of the open futures contracts as of October 31, 2024, is included in a table following the Fund’s Consolidated Investment Portfolio. For the year ended October 31, 2024, the investment in futures contracts purchased had a total notional value generally indicative of a range from approximately $12,655,000 to $26,977,000, and the investment in futures contracts sold had a total notional value generally indicative of a range from approximately $3,538,000 to $5,208,000.
Forward Foreign Currency Contracts. A forward foreign currency exchange contract (“forward currency contract” ) is a commitment to purchase or sell a foreign currency at the settlement date at a negotiated rate. For the year ended October 31, 2024, the Fund entered into forward currency contracts in order to hedge its exposure to changes in foreign currency exchange rates on its foreign currency denominated portfolio holdings, to facilitate transactions in foreign currency denominated securities and for non-hedging purposes to seek to enhance potential gains.
Forward currency contracts are valued at the prevailing forward exchange rate of the underlying currencies and unrealized gain (loss) is recorded daily. On the settlement date of the forward currency contract, the Fund records a realized gain or loss equal to the difference between the value of the contract at the time it was opened and the value of the contract at the time it was closed. Certain risks may arise upon entering into forward currency contracts from the potential inability of counterparties to meet
the terms of their contracts. The maximum counterparty credit risk to the Fund is measured by the unrealized gain on appreciated contracts. Additionally, when utilizing forward currency contracts to hedge, the Fund gives up the opportunity to profit from favorable exchange rate movements during the term of the contract.
A summary of the open forward currency contracts as of October 31, 2024, is included in the table following the Fund’s Consolidated Investment Portfolio. For the year ended October 31, 2024, the investment in forward currency contracts short vs. U.S. dollars had a total contract value generally indicative of a range from approximately $34,241,000 to $44,280,000, and the investment in forward currency contracts long vs. U.S. dollars had a total contract value generally indicative of a range from approximately $2,594,000 to $16,033,000.
The following tables summarize the value of the Fund’s derivative instruments held as of October 31, 2024 and the related location in the accompanying Consolidated Statement of Assets and Liabilities, presented by primary underlying risk exposure:
| | | |
| | | |
Foreign Exchange Contracts (b) | | | |
| | | |
Each of the above derivatives is located in the following Consolidated Statement of Assets and Liabilities accounts: |
| Futures contracts are reported in the table above using cumulative appreciation of futures contracts, as reported in the futures contracts table following the Fund’s Consolidated Investment Portfolio; within the Consolidated Statement of Assets and Liabilities, the variation margin at period end is reported as Receivable (Payable) for variation margin on futures contracts. |
| Unrealized appreciation on forward foreign currency contracts |
| | | |
| | | |
Interest Rate Contracts (a) | | | |
Foreign Exchange Contracts (b) | | | |
| | | |
Each of the above derivatives is located in the following Consolidated Statement of Assets and Liabilities accounts: |
| Futures contracts are reported in the table above using cumulative depreciation of futures contracts, as reported in the futures contracts table following the Fund’s Consolidated Investment Portfolio; within the Consolidated Statement of Assets and Liabilities, the variation margin at period end is reported as Receivable (Payable) for variation margin on futures contracts. |
| Unrealized depreciation on forward foreign currency contracts |
Additionally, the amount of unrealized and realized gains and losses on derivative instruments recognized in Fund earnings during the year ended October 31, 2024 and the related location in the accompanying Consolidated Statement of Operations is summarized in the following tables by primary underlying risk exposure:
| | | |
| | | |
Interest Rate Contracts (a) | | | |
Foreign Exchange Contracts (a) | | | |
| | | |
Each of the above derivatives is located in the following Consolidated Statement of Operations accounts: |
| Net realized gain (loss) from forward foreign currency contracts and futures, respectively |
Change in Net Unrealized Appreciation (Depreciation) | | | |
| | | |
Interest Rate Contracts (a) | | | |
Foreign Exchange Contracts (a) | | | |
| | | |
Each of the above derivatives is located in the following Consolidated Statement of Operations accounts: |
| Change in net unrealized appreciation (depreciation) on forward foreign currency contracts and futures, respectively |
As of October 31, 2024, the Fund has transactions subject to enforceable master netting agreements which govern the terms of certain transactions, and reduce the counterparty risk associated with such transactions. Master netting agreements allow a Fund to close out and net total exposure to a counterparty in the event of a deterioration in the credit quality or contractual default with respect to all of the transactions with a counterparty. As defined by the master netting agreement, the Fund may have collateral agreements with certain counterparties to mitigate risk. For financial reporting purposes the Consolidated Statement of Assets and Liabilities generally shows derivatives assets and liabilities on a gross basis, which reflects the full risks and exposures prior to netting. A reconciliation of the gross amounts on the Consolidated Statement of Assets and Liabilities to the net amounts by a counterparty, including any collateral exposure, is included in the following tables:
| Gross Amount
of Assets
Presented
in the
Consolidated
Statement of
Assets and
Liabilities | Financial
Instruments
and
Derivatives
Available
for Offset | | Net Amount
of Derivative
Assets |
Brown Brothers Harriman & Co. | | | | |
| | | | |
| | | | |
| Gross Amount
of Liabilities
Presented
in the
Consolidated
Statement of
Assets and
Liabilities | Financial
Instruments
and
Derivatives
Available
for Offset | | Net Amount
of Derivative
Liabilities |
| | | | |
| | | | |
| | | | |
C.
Purchases and Sales of Securities
During the year ended October 31, 2024, purchases and sales of investment securities, excluding short-term investments, were as follows:
| | |
Non-U.S. Treasury Obligations | | |
U.S. Treasury Obligations | | |
Management Agreement. Under the Investment Management Agreement with DWS Investment Management Americas, Inc. (“DIMA” or the “Advisor” ), an indirect, wholly owned subsidiary of DWS Group GmbH & Co. KGaA (“DWS Group” ), the Advisor directs the investments of the Fund in accordance with its investment objectives, policies and restrictions. The Advisor determines the securities, instruments and other contracts relating to investments to be purchased, sold or entered into by the Fund or delegates such responsibility to the Fund’s subadvisor.
DWS International GmbH, a direct, wholly owned subsidiary of DWS Group, serves as subadvisor to the Fund. Pursuant to a subadvisory agreement between DIMA and DWS International GmbH, DIMA, not the Fund, compensates DWS International GmbH for the services it provides to the Fund.
Under the Investment Management Agreement with the Advisor, the Fund pays a monthly management fee based on the average daily net assets of the Fund, computed and accrued daily and payable monthly, at the following annual rates:
First $2.5 billion of the Fund’s average daily net assets | |
Next $2.5 billion of such net assets | |
Next $2.5 billion of such net assets | |
Next $2.5 billion of such net assets | |
Next $2.5 billion of such net assets | |
Over $12.5 billion of such net assets | |
Accordingly, for the year ended October 31, 2024, the fee pursuant to the Investment Management Agreement was equivalent to an annual rate (exclusive of any applicable waivers/reimbursements) of 0.60% of the Fund’s average daily net assets.
For the period from November 1, 2023 through February 29, 2024 (through September 30, 2025 for Institutional Class shares), the Advisor had contractually agreed to waive its fees and/or reimburse certain operating expenses of the Fund to the extent necessary to maintain the total annual operating expenses (excluding certain expenses
such as extraordinary expenses, taxes, brokerage, interest expense and acquired fund fees and expenses) of each class as follows:
Effective March 1, 2024 through September 30, 2025 (through March 25, 2024 (Class R liquidation date) for Class R shares and through February 28, 2025 for Class R6 shares), the Advisor has contractually agreed to waive its fees and/or reimburse certain operating expenses of the Fund to the extent necessary to maintain the total annual operating expenses (excluding certain expenses such as extraordinary expenses, taxes, brokerage, interest expense and acquired fund fees and expenses) of certain classes as follows:
In addition, effective March 1, 2024 through October 31, 2024, the Advisor voluntarily agreed to waive its fees and/or reimburse certain operating expenses of Class R6 shares to the extent necessary to maintain the total annual operating expenses (excluding certain expenses such as extraordinary expenses, taxes, brokerage, interest expense and acquired fund fees and expenses) at 0.90%.
For the year ended October 31, 2024 (through March 25, 2024 (Class R liquidation date) for Class R shares), fees waived and/or expenses reimbursed for certain classes are as follows:
Administration Fee. Pursuant to an Administrative Services Agreement, DIMA provides most administrative services to the Fund. For all services provided under the Administrative Services Agreement, the Fund pays the Advisor an annual fee (“Administration Fee” ) of 0.097% of the Fund’s average daily net assets, computed and accrued daily and payable monthly. For the year ended October 31, 2024, the Administration Fee was $188,148, of which $14,784 is unpaid.
Service Provider Fees. DWS Service Company (“DSC” ), an affiliate of the Advisor, is the transfer agent, dividend-paying agent and shareholder service agent for the Fund. Pursuant to a sub-transfer agency agreement between DSC and SS&C GIDS, Inc. (“SS&C” ), DSC has delegated certain transfer agent, dividend-paying agent and shareholder service agent functions to SS&C. DSC compensates SS&C out of the shareholder servicing fee it receives from the Fund. For the year ended October 31, 2024 (through March 25, 2024 (Class R liquidation date) for Class R shares), the amounts charged to the Fund by DSC were as follows:
| | Unpaid at
October 31, 2024 |
| | |
| | |
| | |
| | |
| | |
| | |
| | |
In addition, for the year ended October 31, 2024 (through March 25, 2024 (Class R liquidation date) for Class R shares), the amounts charged to the Fund for recordkeeping and other administrative services provided by unaffiliated third parties, included in the Consolidated Statement of Operations under “Services to shareholders,” were as follows:
Distribution and Service Fees. Under the Fund’s Class C and R 12b-1 Plans, DWS Distributors, Inc. (“DDI” ), an affiliate of the Advisor, receives a fee (“Distribution Fee” ) of 0.75% of the average daily net assets of
Class C shares and 0.25% of the average daily net assets of Class R shares. In accordance with the Fund’s Underwriting and Distribution Services Agreement, DDI enters into related selling group agreements with various firms at various rates for sales of Class C and R shares. For the year ended October 31, 2024 (through March 25, 2024 (Class R liquidation date) for Class R shares), the Distribution Fee was as follows:
| | Unpaid at
October 31, 2024 |
| | |
| | |
| | |
In addition, DDI provides information and administrative services for a fee (“Service Fee” ) to Class A, C and R shareholders at an annual rate of up to 0.25% of the average daily net assets for each such class. DDI in turn has various agreements with financial services firms that provide these services and pays these fees based upon the assets of shareholder accounts the firms service. For the year ended October 31, 2024 (through March 25, 2024 (Class R liquidation date) for Class R shares), the Service Fee was as follows:
| | Unpaid at
October 31, 2024 | |
| | | |
| | | |
| | | |
| | | |
Underwriting Agreement and Contingent Deferred Sales Charge. DDI is the principal underwriter for the Fund. Underwriting commissions paid in connection with the distribution of Class A shares for the year ended October 31, 2024 aggregated $338.
In addition, DDI receives any contingent deferred sales charge (“CDSC” ) from Class C share redemptions occurring within one year of purchase. There is no such charge upon redemption of any share appreciation or reinvested dividends. The CDSC is 1% of the value of the shares redeemed for Class C. For the year ended October 31, 2024, the CDSC for Class C shares aggregated $650. A deferred sales charge of up to 1% is assessed on certain redemptions of Class A shares.
Other Service Fees. Under an agreement with the Fund, DIMA is compensated for providing regulatory filing services to the Fund. For the year ended October 31, 2024, the amount charged to the Fund by DIMA included in the Consolidated Statement of Operations under “Reports to shareholders” aggregated $1,312, of which $736 is unpaid.
Directors' Fees and Expenses. The Fund paid retainer fees to each Director not affiliated with the Advisor, plus specified amounts to the Board Chairperson and to each committee Chairperson.
Affiliated Cash Management Vehicles. The Fund may invest uninvested cash balances in DWS Central Cash Management Government Fund, an affiliated money market fund which is managed by the Advisor. DWS Central Cash Management Government Fund is managed in accordance with Rule 2a-7 under the 1940 Act, which governs the quality, maturity, diversity and liquidity of instruments in which a money market fund may invest and seeks to maintain a stable net asset value. The Fund indirectly bears its proportionate share of the expenses of its investment in DWS Central Cash Management Government Fund. DWS Central Cash Management Government Fund does not pay the Advisor an investment management fee.
The Fund and other affiliated funds (the “Participants” ) share in a $345 million revolving credit facility provided by a syndication of banks. The Fund may borrow for temporary or emergency purposes, including the meeting of redemption requests that otherwise might require the untimely disposition of securities. The Participants are charged an annual commitment fee, which is allocated based on net assets, among each of the Participants. Interest is calculated at a daily fluctuating rate per annum equal to the sum of 0.10% plus the higher of the Federal Funds Effective Rate and the Overnight Bank Funding Rate, plus 1.25%. The Fund may borrow up to a maximum of 25 percent of its net assets under the agreement. The Fund had no outstanding loans at October 31, 2024.
F.
Concentration of Ownership
From time to time, the Fund may have a concentration of several shareholders, including affiliated DWS Funds, holding a significant percentage of shares outstanding. Investment activities of these shareholders could have a material impact on the Fund. As of October 31, 2024, DWS Alternative Asset Allocation VIP held 20% of the total shares outstanding of the Fund.
G.
Fund Share Transactions
The following table summarizes share and dollar activity in the Fund:
| Year Ended
October 31, 2024 | Year Ended
October 31, 2023 |
| | | | |
|
| | | | |
| | | | |
| | | | |
| | | | |
| | | | |
| | | | |
Shares issued to shareholders in reinvestment of distributions |
| | | | |
| | | | |
| | | | |
| | | | |
| | | | |
| | | | |
| | | | |
|
| | | | |
| | | | |
| | | | |
| | | | |
| | | | |
| | | | |
| Year Ended October 31, 2024 | Year Ended October 31, 2023 |
| | | | |
|
| | | | |
| | | | |
| | | | |
| | | | |
| | | | |
| | | | |
| | | | |
| For the period from November 1, 2023 to March 25, 2024 (Class R liquidation date). |
Report of Independent Registered Public Accounting Firm
To the Board of Directors of Deutsche DWS International Fund, Inc. and Shareholders of DWS Global Macro Fund:
Opinion on the Financial Statements
We have audited the accompanying consolidated statement of assets and liabilities of DWS Global Macro Fund (the “Fund” ) (one of the funds constituting Deutsche DWS International Fund, Inc. (the “Corporation” )), including the consolidated investment portfolio, as of October 31, 2024, and the related consolidated statement of operations for the year then ended, the consolidated statements of changes in net assets for each of the two years in the period then ended, the consolidated financial highlights for each of the five years in the period then ended and the related notes (collectively referred to as the “financial statements” ). In our opinion, the financial statements present fairly, in all material respects, the consolidated financial position of the Fund (one of the funds constituting Deutsche DWS International Fund, Inc.) at October 31, 2024, the consolidated results of its operations for the year then ended, the consolidated changes in its net assets for each of the two years in the period then ended and its consolidated financial highlights for each of the five years in the period then ended, in conformity with U.S. generally accepted accounting principles.
These financial statements are the responsibility of the Corporation’s management. Our responsibility is to express an opinion on the Fund’s financial statements based on our audits. We are a public accounting firm registered with the Public Company Accounting Oversight Board (United States) (“PCAOB” ) and are required to be independent with respect to the Corporation in accordance with the U.S. federal securities laws and the applicable rules and regulations of the Securities and Exchange Commission and the PCAOB.
We conducted our audits in accordance with the standards of the PCAOB. Those standards require that we plan and perform the audit to obtain reasonable assurance about whether the financial statements are free of material misstatement, whether due to error or fraud. The Corporation is not required to have, nor were we engaged to perform, an audit of the Corporation’s internal control over financial reporting. As part of our audits, we are required to obtain an understanding of internal control over financial reporting, but not for the purpose of expressing an opinion on the
effectiveness of the Corporation’s internal control over financial reporting. Accordingly, we express no such opinion.
Our audits included performing procedures to assess the risks of material misstatement of the financial statements, whether due to error or fraud, and performing procedures that respond to those risks. Such procedures included examining, on a test basis, evidence regarding the amounts and disclosures in the financial statements. Our procedures included confirmation of securities owned as of October 31, 2024, by correspondence with the custodian, brokers, and others; when replies were not received from brokers and others, we performed other auditing procedures. Our audits also included evaluating the accounting principles used and significant estimates made by management, as well as evaluating the overall presentation of the financial statements. We believe that our audits provide a reasonable basis for our opinion.
We have served as the auditor of one or more investment companies in the DWS family of funds since at least 1979, but we are unable to determine the specific year.
December 19, 2024
Tax Information (Unaudited)
For corporate shareholders, 13% of the ordinary dividends (i.e., income dividends plus short-term capital gains) paid during the Fund’s fiscal year ended October 31, 2024, qualified for the dividends received deduction.
For federal income tax purposes, the Fund designates approximately $2,893,000, or the maximum amount allowable under tax law, as qualified dividend income.
Please consult a tax advisor if you have questions about federal or state income tax laws, or on how to prepare your tax returns. If you have specific questions about your account, please call (800) 728-3337.
Advisory Agreement Board Considerations and Fee Evaluation
The Board of Directors (hereinafter referred to as the “Board” or “Directors” ) approved the renewal of DWS Global Macro Fund’s (the “Fund” ) investment management agreement (the “Agreement” ) with DWS Investment Management Americas, Inc. (“DIMA” ) and sub-advisory agreement (the “Sub-Advisory Agreement” and together with the Agreement, the “Agreements” ) between DIMA and DWS International GmbH (“DWS International” ), an affiliate of DIMA, in September 2024.
In terms of the process that the Board followed prior to approving the Agreements, shareholders should know that:
—
During the entire process, all of the Fund’s Directors were independent of DIMA and its affiliates (the “Independent Directors” ).
—
The Board met frequently during the past year to discuss fund matters and dedicated a substantial amount of time to contract review matters. Over the course of several months, the Board reviewed extensive materials received from DIMA, independent third parties and independent counsel, including materials containing information on the Fund’s performance, fees and expenses, profitability, economies of scale and fall-out benefits.
—
The Board also received extensive information throughout the year regarding performance of the Fund.
—
The Independent Directors regularly met privately with counsel to discuss contract review and other matters.
—
In connection with reviewing the Agreements, the Board also reviewed the terms of the Fund’s Rule 12b-1 plan, distribution agreement, administrative services agreement, transfer agency agreement, and certain other material service agreements.
In connection with the contract review process, the Board considered the factors discussed below, among others. The Board also considered that DIMA and its predecessors have managed the Fund since its inception, and the Board believes that a long-term relationship with a capable, conscientious advisor is in the best interests of the Fund. The Board considered, generally, that shareholders chose to invest or remain invested in the Fund knowing that DIMA managed the Fund. DIMA and DWS International are part of DWS Group GmbH & Co. KGaA (“DWS Group” ). DWS Group is a global asset management business that offers a wide range of investing expertise and resources, including research capabilities in many countries throughout the world. DWS Group is majority-owned by Deutsche Bank AG, with approximately 20% of its shares publicly traded.
As part of the contract review process, the Board carefully considered the fees and expenses of each DWS fund overseen by the Board in light of the fund’s performance. In many cases, this led to the negotiation and implementation of expense caps.
While shareholders may focus primarily on fund performance and fees, the Fund’s Board considers these and many other factors, including the quality and integrity of DIMA’s and DWS International’s personnel and administrative support services provided by DIMA, such as back-office operations, fund valuations, and compliance policies and procedures.
Nature, Quality and Extent of Services. The Board considered the terms of the Agreements, including the scope of advisory services provided under the Agreements. The Board noted that, under the Agreements, DIMA and DWS International provide portfolio management services to the Fund and that, pursuant to a separate administrative services agreement, DIMA provides administrative services to the Fund. The Board considered the experience and skills of senior management and investment personnel and the resources made available to such personnel. The Board also considered the risks to DIMA in sponsoring or managing the Fund, including financial, operational and reputational risks, the potential economic impact to DIMA from such risks and DIMA’s approach to addressing such risks. Throughout the course of the year, the Board also received information regarding DIMA’s oversight of fund sub-advisors, including DWS International. The Board reviewed the Fund’s performance over short-term and long-term periods and compared those returns to various agreed-upon performance measures, including market index(es) and a peer universe compiled using information supplied by Morningstar Direct (“Morningstar” ), an independent fund data service. The Board also noted that it has put into place a process of identifying “Funds in Review” (e.g., funds performing poorly relative to a peer universe), and receives additional reporting from DIMA regarding such funds and, where appropriate, DIMA’s plans to address underperformance. The Board believes this process is an effective manner of identifying and addressing underperforming funds. Based on the information provided, the Board noted that, for the one-, three- and five-year periods ended December 31, 2023, the Fund’s performance (Class A shares) was in the 1st quartile, 2nd quartile and 3rd quartile, respectively, of the applicable Morningstar universe (the 1st quartile being the best performers and the 4th quartile being the worst performers). The Board also observed that the Fund has outperformed its benchmark in the one-, three- and five-year periods ended December 31, 2023.
Fees and Expenses. The Board considered the Fund’s investment management fee schedule, sub-advisory fee schedule, operating expenses and total expense ratios, and comparative information provided by Broadridge Financial Solutions, Inc. (“Broadridge” ) regarding investment management fee rates paid to other investment advisors by similar funds (1st quartile being the most favorable and 4th quartile being
the least favorable). With respect to management fees paid to other investment advisors by similar funds, the Board noted that the contractual fee rates paid by the Fund, which include a 0.097% fee paid to DIMA under the Fund’s administrative services agreement, were lower than the median (1st quartile) of the applicable Broadridge peer group (based on Broadridge data provided as of December 31, 2023). With respect to the sub-advisory fee paid to DWS International, the Board noted that the fee is paid by DIMA out of its fee and not directly by the Fund. The Board noted that the Fund’s Class A shares total (net) operating expenses (excluding 12b-1 fees) were expected to be higher than the median (3rd quartile) of the applicable Broadridge expense universe (based on Broadridge data provided as of December 31, 2023, and analyzing Broadridge expense universe Class A (net) expenses less any applicable 12b-1 fees) (“Broadridge Universe Expenses” ). The Board also reviewed data comparing each other operational share class’s total (net) operating expenses to the applicable Broadridge Universe Expenses. The Board noted that the expense limitations agreed to by DIMA were expected to help the Fund’s total (net) operating expenses remain competitive. The Board considered the Fund’s management fee rate as compared to fees charged by DIMA to comparable DWS U.S. registered funds (“DWS Funds” ), noting that DIMA indicated that it does not provide services to any other comparable DWS Funds. The information requested by the Board as part of its review of fees and expenses also included information about institutional accounts (including any sub-advised funds and accounts) and funds offered primarily to European investors (“DWS Europe Funds” ) managed by DWS Group. The Board noted that DIMA indicated that DWS Group does not manage any institutional accounts or DWS Europe Funds comparable to the Fund.
On the basis of the information provided, the Board concluded that management fees were reasonable and appropriate in light of the nature, quality and extent of services provided by DIMA and DWS International.
Profitability. The Board reviewed detailed information regarding revenues received by DIMA under the Agreement. The Board considered the estimated costs to DIMA, and pre-tax profits realized by DIMA, from advising the DWS Funds, as well as estimates of the pre-tax profits attributable to managing the Fund in particular. The Board also received information regarding the estimated enterprise-wide profitability of DIMA and its affiliates with respect to all fund services in totality and by fund. The Board reviewed DIMA’s methodology in allocating its costs to the management of the Fund. Based on the information provided, the Board concluded that the pre-tax profits realized by DIMA in connection with the management of the Fund were not unreasonable. The Board also reviewed certain publicly available information regarding the profitability of certain similar investment management firms. The Board noted that, while information regarding the profitability of such firms is limited (and in some cases is not necessarily prepared on a comparable basis), DIMA and its
affiliates’ overall profitability with respect to the DWS Funds (after taking into account distribution and other services provided to the funds by DIMA and its affiliates) was lower than the overall profitability levels of most comparable firms for which such data was available.
Economies of Scale. The Board considered whether there are economies of scale with respect to the management of the Fund and whether the Fund benefits from any economies of scale. In this regard, the Board observed that while the Fund’s current investment management fee schedule does not include breakpoints, the Fund’s fee schedule represents an appropriate sharing between the Fund and DIMA of such economies of scale as may exist in the management of the Fund at current asset levels.
Other Benefits to DIMA and Its Affiliates. The Board also considered the character and amount of other incidental or “fall-out” benefits received by DIMA and its affiliates, including any fees received by DIMA for administrative services provided to the Fund, any fees received by an affiliate of DIMA for transfer agency services provided to the Fund and any fees received by an affiliate of DIMA for distribution services. The Board also considered benefits to DIMA related to brokerage and soft-dollar allocations, including allocating brokerage to pay for research generated by parties other than the executing broker dealers, which pertain primarily to funds investing in equity securities. In addition, the Board considered the incidental public relations benefits to DIMA related to DWS Funds advertising and cross-selling opportunities among DIMA products and services. The Board considered these benefits in reaching its conclusion that the Fund’s management fees were reasonable.
Compliance. The Board considered the significant attention and resources dedicated by DIMA to its compliance processes in recent years. The Board noted in particular (i) the experience, seniority and time commitment of the individuals serving as DIMA’s and the Fund’s chief compliance officers; (ii) the substantial commitment of resources by DIMA and its affiliates to compliance matters, including the retention of compliance personnel; and (iii) ongoing efforts to enhance the compliance program.
Based on all of the information considered and the conclusions reached, the Board determined that the continuation of the Agreements is in the best interests of the Fund. In making this determination, the Board did not give particular weight to any single factor identified above and individual Independent Directors may have weighed these factors differently in reaching their individual decisions to approve the continuation of the Agreements. The Board considered these factors over the course of numerous meetings, certain of which were in executive session with only the Independent Directors and counsel present.
| | (b) The Financial Highlights are included with the Financial Statements under Item 7(a). |
| | |
| Item 8. | Changes in and Disagreements with Accountants for Open-End Management Investment Companies. |
| | |
| | Not applicable |
| | |
| Item 9. | Proxy Disclosures for Open-End Management Investment Companies. |
| | |
| | Not applicable |
| | |
| Item 10. | Remuneration Paid to Directors, Officers, and Others of Open-End Management Investment Companies. |
| | |
| | See Item 7(a) |
| | |
| Item 11. | Statement Regarding Basis for Approval of Investment Advisory Contract. |
| | |
| | See Item 7(a) |
| | |
| Item 12. | Disclosure of Proxy Voting Policies and Procedures for Closed-End Management Investment Companies. |
| | |
| | Not applicable |
| | |
| Item 13. | Portfolio Managers of Closed-End Management Investment Companies. |
| | |
| | Not applicable |
| | |
| Item 14. | Purchases of Equity Securities by Closed-End Management Investment Company and Affiliated Purchasers. |
| | |
| | Not applicable |
| | |
| Item 15. | Submission of Matters to a Vote of Security. |
| | |
| | There were no material changes to the procedures by which shareholders may recommend nominees to the Fund’s Board. The primary function of the Nominating and Governance Committee is to identify and recommend individuals for membership on the Board and oversee the administration of the Board Governance Guidelines. Shareholders may recommend candidates for Board positions by forwarding their correspondence by U.S. mail or courier service to Keith R. Fox, DWS Funds Board Chair, c/o Thomas R. Hiller, Ropes & Gray LLP, Prudential Tower, 800 Boylston Street, Boston, MA 02199-3600. |
| | |
| Item 16. | Controls and Procedures. |
| | |
| | (a) | The Chief Executive and Financial Officers concluded that the Registrant’s Disclosure Controls and Procedures are effective based on the evaluation of the Disclosure Controls and Procedures as of a date within 90 days of the filing date of this report. |
| | |
| | (b) | There have been no changes in the registrant’s internal control over financial reporting that occurred during the period covered by this report that has materially affected, or is reasonably likely to materially affect, the registrant’s internal controls over financial reporting. |
| | |
| | |
| Item 17. | Disclosure of Securities Lending Activities for Closed-End Management Investment Companies. |
| | |
| | Not applicable |
| | |
| | |
| Item 18. | Recovery of Erroneously Awarded Compensation. |
| | |
| | Not applicable |
| | |
| Item 19. | Exhibits |
| | |
| | (a)(1) | Code of Ethics pursuant to Item 2 of Form N-CSR is filed and attached hereto as EX-99.CODE ETH. |
| | |
| | (a)(2) | Certification pursuant to Rule 30a-2(a) under the Investment Company Act of 1940 (17 CFR 270.30a-2(a)) is filed and attached hereto as Exhibit 99.CERT. |
| | |
| | (b) | Certification pursuant to Rule 30a-2(b) under the Investment Company Act of 1940 (17 CFR 270.30a-2(b)) is furnished and attached hereto as Exhibit 99.906CERT. |
SIGNATURES
Pursuant to the requirements of the Securities Exchange Act of 1934 and the Investment Company Act of 1940, the registrant has duly caused this report to be signed on its behalf by the undersigned, thereunto duly authorized.
| Registrant: | DWS Global Macro Fund, a series of Deutsche DWS International Fund, Inc. |
| | |
| | |
| By: | /s/Hepsen Uzcan Hepsen Uzcan Principal Executive Officer |
| | |
| Date: | 12/30/2024 |
Pursuant to the requirements of the Securities Exchange Act of 1934 and the Investment Company Act of 1940, this report has been signed below by the following persons on behalf of the registrant and in the capacities and on the dates indicated.
| By: | /s/Hepsen Uzcan Hepsen Uzcan Principal Executive Officer |
| | |
| Date: | 12/30/2024 |
| | |
| | |
| | |
| By: | /s/Diane Kenneally Diane Kenneally Principal Financial Officer |
| | |
| Date: | 12/30/2024 |
| | |