UNITED STATES
SECURITIES AND EXCHANGE COMMISSION
Washington, D.C. 20549
FORM N-CSR
CERTIFIED SHAREHOLDER REPORT OF REGISTERED
MANAGEMENT INVESTMENT COMPANIES
Investment Company Act file number 811-6453
Fidelity Court Street Trust II
(Exact name of registrant as specified in charter)
82 Devonshire St., Boston, Massachusetts 02109
(Address of principal executive offices) (Zip code)
Eric D. Roiter, Secretary
82 Devonshire St.
Boston, Massachusetts 02109
(Name and address of agent for service)
Registrant's telephone number, including area code: 617-563-7000
Date of fiscal year end: | November 30 |
| |
Date of reporting period: | November 30, 2005 |
Item 1. Reports to Stockholders
| | Fidelity®
Connecticut Municipal
Income Fund
(formerly Spartan® Connecticut Municipal
Income Fund)
and
Fidelity
Connecticut Municipal
Money Market Fund
|
Annual Report
November 30, 2005
|


| Contents | | | | |
| |
| Chairman’s Message | | 4 | | Ned Johnson’s message to |
| | | | | shareholders |
| Shareholder Expense | | 5 | | An example of shareholder expenses. |
| Example | | | | |
| Fidelity Connecticut Municipal Income Fund |
| Performance | | 7 | | How the fund has done over time. |
| Management’s Discussion | | 8 | | The manager’s review of fund |
| | | | | performance, strategy and outlook. |
| Investment Changes | | 9 | | A summary of major shifts in the fund’s |
| | | | | investments over the past six months. |
| Investments | | 10 | | A complete list of the fund’s |
| | | | | investments with their market values. |
| Financial Statements | | 16 | | Statements of assets and liabilities, |
| | | | | operations, and changes in net assets, |
| | | | | as well as financial highlights. |
| Fidelity Connecticut Municipal Money Market Fund |
| Investment Changes/ | | 20 | | A summary of major shifts in the fund’s |
| Performance | | | | investments over the past six months |
| | | | | and one year, and performance |
| | | | | information. |
| Investments | | 21 | | A complete list of the fund’s |
| | | | | investments. |
| Financial Statements | | 28 | | Statements of assets and liabilities, |
| | | | | operations, and changes in net assets, |
| | | | | as well as financial highlights. |
| Notes | | 32 | | Notes to the Financial Statements |
| Report of Independent | | 38 | | |
| Registered Public | | | | |
| Accounting Firm | | | | |
| Trustees and Officers | | 39 | | |
| Distributions | | 51 | | |
| Board Approval of | | 52 | | |
| Investment Advisory | | | | |
| Contracts and | | | | |
| Management Fees | | | | |
To view a fund’s proxy voting guidelines and proxy voting record for the 12 month period
ended June 30, visit www.fidelity.com/proxyvotingresults or visit the Securities and Exchange
Commission’s (SEC) web site at www.sec.gov. You may also call 1-800-544-8544 to request a free
copy of the proxy voting guidelines.
Standard & Poor’s, S&P and S&P 500 are registered service marks of The McGraw Hill Companies,
Inc. and have been licensed for use by Fidelity Distributors Corporation.
Other third party marks appearing herein are the property of their respective owners.
All other marks appearing herein are registered or unregistered trademarks or service marks
of FMR Corp. or an affiliated company.
|
Annual Report 2
This report and the financial statements contained herein are submitted for the general
information of the shareholders of the funds. This report is not authorized for distribution to
prospective investors in the funds unless preceded or accompanied by an effective prospectus.
A fund files its complete schedule of portfolio holdings with the SEC for the first and third
quarters of each fiscal year on Form N Q. Forms N Q are available on the SEC’s web site at
http://www.sec.gov. A fund’s Forms N Q may be reviewed and copied at the SEC’s Public Reference
Room in Washington, DC. Information regarding the operation of the SEC’s Public Reference
Room may be obtained by calling 1-800-SEC-0330. For a complete list of a fund’s portfolio
holdings, view the most recent quarterly holdings report, semiannual report, or annual report
on Fidelity’s web site at http://www.fidelity.com/holdings.
NOT FDIC INSURED · MAY LOSE VALUE · NO BANK GUARANTEE
Neither the funds nor Fidelity Distributors Corporation is a bank.
|
3 Annual Report
Chairman’s Message
(photograph of Edward C. Johnson 3d)
Dear Shareholder:
During the past year or so, much has been reported about the mutual fund industry, and much of it has been more critical than I believe is warranted. Allegations that some companies have been less than forthright with their shareholders have cast a shadow on the entire industry. I continue to find these reports disturbing, and assert that they do not create an accurate picture of the industry overall. Therefore, I would like to remind every one where Fidelity stands on these issues. I will say two things specifically regarding allegations that some mutual fund companies were in violation of the Securities and Exchange Commission’s forward pricing rules or were involved in so called “market timing” activities.
First, Fidelity has no agreements that per mit customers who buy fund shares after 4 p.m. to obtain the 4 p.m. price. This is not a new policy. This is not to say that some one could not deceive the company through fraudulent acts. However, we are extremely diligent in preventing fraud from occurring in this manner and in every other. But I underscore again that Fidelity has no so called “agreements” that sanction illegal practices.
Second, Fidelity continues to stand on record, as we have for years, in opposition to predatory short term trading that adversely affects shareholders in a mutual fund. Back in the 1980s, we initiated a fee which is returned to the fund and, therefore, to investors to discourage this activity. Further, we took the lead several years ago in developing a Fair Value Pricing Policy to prevent market timing on foreign securities in our funds. I am confident we will find other ways to make it more difficult for predatory traders to operate. However, this will only be achieved through close cooperation among regulators, legislators and the industry.
Yes, there have been unfortunate instances of unethical and illegal activity within the mutual fund industry from time to time. That is true of any industry. When this occurs, confessed or convicted offenders should be dealt with appropriately. But we are still concerned about the risk of over regulation and the quick application of simplistic solutions to intricate problems. Every system can be improved, and we support and applaud well thought out improvements by regulators, legislators and industry representatives that achieve the common goal of building and protecting the value of investors’ holdings.
For nearly 60 years, Fidelity has worked very hard to improve its products and service to justify your trust. When our family founded this company in 1946, we had only a few hundred customers. Today, we serve more than 18 million customers including individual investors and participants in retirement plans across America.
Let me close by saying that we do not take your trust in us for granted, and we realize that we must always work to improve all aspects of our service to you. In turn, we urge you to continue your active participation with your financial matters, so that your interests can be well served.
Best regards,
/s/ Edward C. Johnson 3d
Edward C. Johnson 3d
Annual Report 4
Shareholder Expense Example
As a shareholder of a Fund, you incur two types of costs: (1) transaction costs, including redemption fees, and (2) ongoing costs, including management fees and other Fund expenses. This Example is intended to help you understand your ongoing costs (in dollars) of investing in the Funds and to compare these costs with the ongoing costs of investing in other mutual funds.
The Example is based on an investment of $1,000 invested at the beginning of the period and held for the entire period (June 1, 2005 to November 30, 2005).
The first line of the table below for each fund provides information about actual account values and actual expenses. You may use the information in this line, together with the amount you invested, to estimate the expenses that you paid over the period. Simply divide your account value by $1,000.00 (for example, an $8,600 account value divided by $1,000.00 = 8.6), then multiply the result by the number in the first line for a fund under the heading entitled “Expenses Paid During Period” to estimate the expenses you paid on your account during this period. A small balance maintenance fee of $12.00 that is charged once a year may apply for certain accounts with a value of less than $2,000. This fee is not included in the table below. If it was, the estimate of expenses you paid during the period would be higher, and your ending account value lower, by this amount.
Hypothetical Example for Comparison Purposes
The second line of the table below for each fund provides information about hypothetical account values and hypothetical expenses based on a fund’s actual expense ratio and an assumed rate of return of 5% per year before expenses, which is not the Fund’s actual return. The hypothetical account values and expenses may not be used to estimate the actual ending account balance or expenses you paid for the period. You may use this information to compare the ongoing costs of investing in the Fund and other funds. To do so, compare this 5% hypothetical example with the 5% hypothetical examples that appear in the shareholder reports of the other funds. A small balance maintenance fee of $12.00 that is charged once a year may apply for certain accounts with a value of less than $2,000. This fee is not included in the table below. If it was, the estimate of expenses you paid during the period would be higher, and your ending account value lower, by this amount. Please note that the expenses shown in the table are meant to highlight your ongoing costs only and do not reflect any transaction costs. Therefore, the second line of the table is useful in comparing ongoing costs only, and will not help you determine the relative total costs of owning different funds. In addition, if these transactional costs were included, your costs would have been higher.
5 Annual Report
| Shareholder Expense Example continued | | |
| |
| |
| | | | | | | | | | | Expenses Paid |
| | | | | | | | | | | During Period* |
| | | | | Beginning | | Ending | | June 1, 2005 |
| | | | | Account Value | | Account Value | | to November 30, |
| | | | | June 1, 2005 | | November 30, 2005 | | 2005 |
| Fidelity Connecticut Municipal | | | | | | | | | | |
| Income Fund | | | | | | | | | | |
| Actual | | $ | | 1,000.00 | | $ | | 999.80 | $ | 2.41 |
| HypotheticalA | | $ | | 1,000.00 | | $ | | 1,022.66 | $ | 2.43 |
| Fidelity Connecticut Municipal | | | | | | | | | | |
| Money Market Fund | | | | | | | | | | |
| Actual | | $ | | 1,000.00 | | $ | | 1,010.50 | $ | 2.42 |
| HypotheticalA | | $ | | 1,000.00 | | $ | | 1,022.66 | $ | 2.43 |
| |
| A 5% return per year before expenses | | | | | | |
* Expenses are equal to each Fund’s annualized expense ratio (shown in the table below); multiplied by the average account value over the period, multiplied by 183/365 (to reflect the one half year period).
| | | Annualized |
| | | Expense Ratio |
| Fidelity Connecticut Municipal Income Fund | | 48% |
| Fidelity Connecticut Municipal Money Market Fund | | 48% |
Fidelity Connecticut Municipal Income Fund
Performance: The Bottom Line
Average annual total return reflects the change in the value of an investment, assuming reinvestment of the fund’s dividend income and capital gains (the profits earned upon the sale of securities that have grown in value) and assuming a constant rate of perfor mance each year. The $10,000 table and the fund’s returns do not reflect the deduction of taxes that a shareholder would pay on fund distributions or the redemption of fund shares. During periods of reimbursement by Fidelity, a fund’s total return will be greater than it would be had the reimbursement not occurred. How a fund did yesterday is no guarantee of how it will do tomorrow.
| Average Annual Total Returns | | | | | | |
| Periods ended November 30, 2005 | | Past 1 | | Past 5 | | Past 10 |
| | | year | | years | | years |
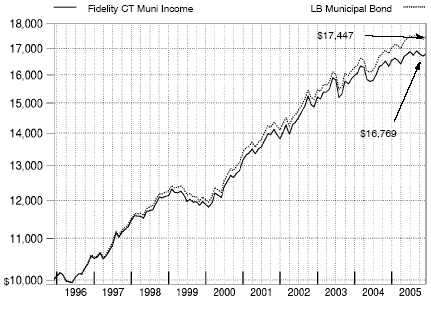
| Fidelity® CT Municipal Income | | 2.72% | | 5.46% | | 5.31% |
| |
| |
| $10,000 Over 10 Years | | | | | | |
Let’s say hypothetically that $10,000 was invested in Fidelity® Connecticut Municipal Income Fund on November 30, 1995. The chart shows how the value of your investment would have changed, and also shows how the Lehman Brothers® Municipal Bond Index performed over the same period.
7 Annual Report
Management’s Discussion of Fund Performance
Comments from Mark Sommer, Portfolio Manager of Fidelity® Connecticut Municipal Income Fund
Municipal bonds were one of the best performing debt instruments during the year ending November 30, 2005. Munis withstood higher short term interest rates and inflation fears much better than taxable bonds. The Federal Reserve Board hiked short term interest rates eight times during the period, responding to fears about a possible spike in inflation. The tighter monetary policy tempered bond performance, while also leading to a consider able flattening of the yield curve. As short term Treasury and municipal yields continued to rise, longer dated issues saw their yields fall or remain steady, sparking concerns about a possible inversion in the curve. The lower long term rates drove heavy muni issuance, but demand was able to keep up for the most part. The improved creditworthiness of many issuers also boosted muni performance, as the general uptick in the economy helped bolster their attractiveness. Against this backdrop, the Lehman Brothers® Municipal Bond Index rose 3.88% . In comparison, the taxable bond market, as measured by the Lehman Brothers Aggregate Bond Index, advanced 2.40% .
For the 12 months ending November 30, 2005, the fund returned 2.72% . During the same period, the LipperSM Connecticut Municipal Debt Funds Average gained 2.89% and the Lehman Brothers Connecticut 4 Plus Year Enhanced Municipal Bond Index rose 3.21% . Although Connecticut’s municipal market was helped by improving creditworthiness for many issuers, it modestly lagged other state muni markets due to its comparatively high credit quality during a period in which lower quality securities performed better. My emphasis on high quality securities was even more pronounced, causing the fund to underperform the Lehman Brothers index and, I suspect, the Lipper peer group average. Among the fund’s high quality holdings were bonds issued in Puerto Rico — mostly insured or U.S. government backed securities — which are free from state taxes in all 50 states and offered what I felt were better values in some cases than bonds issued in Connecticut. Working in the fund’s favor was its large stake relative to the index in bonds that were prerefunded during the period, a process that helped boost the bonds’ returns.
The views expressed in this statement reflect those of the portfolio manager only through the end of the period of the report as stated on the cover and do not necessarily represent the views of Fidelity or any other person in the Fidelity organization. Any such views are subject to change at any time based upon market or other conditions and Fidelity disclaims any responsibility to update such views. These views may not be relied on as investment advice and, because investment decisions for a Fidelity fund are based on numerous factors, may not be relied on as an indication of trading intent on behalf of any Fidelity fund.
| Fidelity Connecticut Municipal Income Fund | | |
| Investment Changes | | | | |
| |
| Top Five Sectors as of November 30, 2005 | | |
| | | % of fund’s | | % of fund’s net assets |
| | | net assets | | 6 months ago |
| Escrowed/Pre Refunded | | 28.2 | | 28.5 |
| General Obligations | | 23.1 | | 25.6 |
| Special Tax | | 14.1 | | 12.6 |
| Health Care | | 8.8 | | 8.4 |
| Education | | 7.2 | | 7.4 |
Average Years to Maturity as of November 30, 2005 | | |
| | | | | 6 months ago |
| Years | | 12.4 | | 12.4 |
Average years to maturity is based on the average time remaining to the stated maturity date of each bond, weighted by the market value of each bond.
| Duration as of November | | 30, 2005 | | | | |
| | | | | | | 6 months ago |
| Years | | | | 6.1 | | 6.2 |
Duration shows how much a bond fund’s price fluctuates with changes in comparable interest rates. If rates rise 1%, for example, a fund with a five year duration is likely to lose about 5% of its value. Other factors also can influence a bond fund’s performance and share price. Accordingly, a bond fund’s actual performance may differ from this example.
We have used ratings from Moody’s® Investors Services, Inc. Where Moody’s ratings are not available, we have used S&P® ratings.
9 Annual Report
Fidelity Connecticut Municipal Income Fund
Investments November 30, 2005
| Showing Percentage of Net Assets | | | | | | | | |
| Municipal Bonds 98.6% | | | | | | | | |
| | | | | Principal | | | | Value |
| | | | | Amount | | | | (Note 1) |
| Connecticut – 85.5% | | | | | | | | |
| Branford Gen. Oblig.: | | | | | | | | |
| 5.25% 5/15/13 (MBIA Insured) | | $ | | 500,000 | | $ | | 544,785 |
| 7% 6/15/08 (FGIC Insured) | | | | 500,000 | | | | 544,760 |
| 7% 6/15/09 (FGIC Insured) | | | | 500,000 | | | | 560,770 |
| Bridgeport Gen. Oblig.: | | | | | | | | |
| Series 2001 C: | | | | | | | | |
| 5.375% 8/15/12 (Pre-Refunded to 8/15/11 @ | | | | | | | | |
| 100) (c) | | | | 3,290,000 | | | | 3,588,074 |
| 5.375% 8/15/14 (Pre-Refunded to 8/15/11 @ | | | | | | | | |
| 100) (c) | | | | 2,305,000 | | | | 2,513,833 |
| 5.375% 8/15/15 (Pre-Refunded to 8/15/11 @ | | | | | | | | |
| 100) (c) | | | | 1,070,000 | | | | 1,166,942 |
| 5.375% 8/15/16 (Pre-Refunded to 8/15/11 @ | | | | | | | | |
| 100) (c) | | | | 2,000,000 | | | | 2,181,200 |
| Series 2002 A, 5.375% 8/15/19 (FGIC Insured) | | | | 3,000,000 | | | | 3,249,150 |
| Series A: | | | | | | | | |
| 5.25% 8/15/16 (MBIA Insured) | | | | 1,320,000 | | | | 1,438,061 |
| 6% 7/15/11 (Pre-Refunded to 7/15/10 @ 101) (c) | | | | 1,700,000 | | | | 1,895,483 |
| 6% 7/15/12 (Pre-Refunded to 7/15/10 @ 101) (c) | | | | 5,830,000 | | | | 6,500,392 |
| 6.125% 7/15/15 (Pre-Refunded to 7/15/10 @ | | | | | | | | |
| 101) (c) | | | | 6,235,000 | | | | 6,984,883 |
| Cap. City Econ. Dev. Auth. Series 2004 A, 5% 6/15/15 | | | | | | | | |
| (FSA Insured) | | | | 1,705,000 | | | | 1,829,704 |
| Connecticut Arpt. Rev. (Bradley Int’l. Arpt. Proj.) Series A: | | | | | | | | |
| 5.125% 10/1/31 (FGIC Insured) (b) | | | | 5,750,000 | | | | 5,866,208 |
| 5.25% 10/1/09 (FGIC Insured) (b) | | | | 2,100,000 | | | | 2,209,557 |
| 5.25% 10/1/10 (FGIC Insured) (b) | | | | 3,390,000 | | | | 3,593,807 |
| 5.25% 10/1/11 (FGIC Insured) (b) | | | | 4,150,000 | | | | 4,423,485 |
| 5.25% 10/1/12 (FGIC Insured) (b) | | | | 4,075,000 | | | | 4,341,709 |
| Connecticut Clean Wtr. Fund Rev. 6% 10/1/12 | | | | 6,000,000 | | | | 6,697,800 |
| Connecticut Dev. Auth. Rev. (Hartford Civic Ctr. Proj.) | | | | | | | | |
| Series A, 6% 11/15/09 | | | | 1,525,000 | | | | 1,663,119 |
| Connecticut Dev. Auth. Wtr. Facilities Rev. (Bridgeport | | | | | | | | |
| Hydraulic Proj.) 6.15% 4/1/35 (MBIA Insured) (b) | | | | 3,000,000 | | | | 3,150,570 |
| Connecticut Gen. Oblig.: | | | | | | | | |
| Series 1999 B, 5.875% 11/1/16 (Pre-Refunded to | | | | | | | | |
| 11/1/11 @ 100) (c) | | | | 4,550,000 | | | | 4,975,607 |
| Series 2000 B, 5.5% 6/15/19 (Pre-Refunded to | | | | | | | | |
| 6/15/10 @ 100) (c) | | | | 2,185,000 | | | | 2,354,163 |
| Series 2001 D: | | | | | | | | |
| 5.125% 11/15/15 (Pre-Refunded to 11/15/11 @ | | | | | | | | |
| 100) (c) | | | | 3,215,000 | | | | 3,466,284 |
See accompanying notes which are an integral part of the financial statements.
| Municipal Bonds continued | | | | | | | | |
| | | | | Principal | | | | Value |
| | | | | Amount | | | | (Note 1) |
| Connecticut – continued | | | | | | | | |
| Connecticut Gen. Oblig.: – continued | | | | | | | | |
| Series 2001 D: | | | | | | | | |
| 5.125% 11/15/18 (Pre-Refunded to 11/15/11 @ | | | | | | | | |
| 100) (c) | | $ | | 5,995,000 | | $ | | 6,463,569 |
| Series 2002 D, 5.375% 11/15/21 | | | | 5,000,000 | | | | 5,432,100 |
| Series 2003 E, 5.25% 8/15/17 (FGIC Insured) | | | | 3,295,000 | | | | 3,574,350 |
| Series 2004 A, 5% 3/1/15 (MBIA Insured) | | | | 5,000,000 | | | | 5,369,500 |
| Series B: | | | | | | | | |
| 5.375% 6/15/13 (Pre-Refunded to 6/15/11 @ | | | | | | | | |
| 100) (c) | | | | 6,325,000 | | | | 6,833,783 |
| 5.375% 6/15/14 (Pre-Refunded to 6/15/11 @ | | | | | | | | |
| 100) (c) | | | | 3,730,000 | | | | 4,030,041 |
| 5.375% 6/15/18 (Pre-Refunded to 6/15/11 @ | | | | | | | | |
| 100) (c) | | | | 8,840,000 | | | | 9,551,090 |
| 5.5% 6/15/17 (Pre-Refunded to 6/15/12 @ | | | | | | | | |
| 100) (c) | | | | 7,815,000 | | | | 8,657,535 |
| 5.5% 11/1/17 (Pre-Refunded to 11/1/11 @ | | | | | | | | |
| 100) (c) | | | | 1,500,000 | | | | 1,619,955 |
| 5.75% 11/1/10 (Pre-Refunded to 11/1/09 @ | | | | | | | | |
| 101) (c) | | | | 1,000,000 | | | | 1,089,020 |
| 5.75% 6/15/12 (Pre-Refunded to 6/15/10 @ | | | | | | | | |
| 100) (c) | | | | 1,500,000 | | | | 1,641,480 |
| Series D: | | | | | | | | |
| 5.375% 11/15/16 (Pre-Refunded to 11/15/12 @ | | | | | | | | |
| 100) (c) | | | | 8,595,000 | | | | 9,480,457 |
| 5.375% 11/15/18 (Pre-Refunded to 11/15/12 @ | | | | | | | | |
| 100) (c) | | | | 5,000,000 | | | | 5,515,100 |
| 5.375% 11/15/20 | | | | 2,435,000 | | | | 2,648,525 |
| Series E, 6% 3/15/12 (Escrowed to Maturity) (c) | | | | 35,000 | | | | 39,575 |
| 5.25% 6/1/18 (AMBAC Insured) | | | | 3,150,000 | | | | 3,498,044 |
| Connecticut Gen. Oblig. Rev. (Revolving Fund Ln. Prog.) | | | | | | | | |
| Series 2003 A, 5% 10/1/17 | | | | 2,000,000 | | | | 2,128,940 |
| Connecticut Health & Edl. Facilities Auth. Rev.: | | | | | | | | |
| (Danbury Hosp. Proj.) Series G, 5.625% 7/1/25 | | | | | | | | |
| (AMBAC Insured) | | | | 4,695,000 | | | | 5,022,852 |
| (Eastern Connecticut Health Network Proj.) 5.125% | | | | | | | | |
| 7/1/30 | | | | 1,500,000 | | | | 1,537,005 |
| (Greenwich Hosp. Proj.) Series A, 5.8% 7/1/26 | | | | | | | | |
| (MBIA Insured) | | | | 6,230,000 | | | | 6,434,967 |
| (Hebrew Home & Hosp. Proj.) Series B: | | | | | | | | |
| 5.15% 8/1/28 | | | | 2,480,000 | | | | 2,565,833 |
| 5.2% 8/1/38 | | | | 4,190,000 | | | | 4,343,773 |
See accompanying notes which are an integral part of the financial statements.
11 Annual Report
| Fidelity Connecticut Municipal Income Fund | | | | | | | | |
| Investments continued | | | | | | | | |
| |
| Municipal Bonds continued | | | | | | | | |
| | | | | Principal | | | | Value |
| | | | | Amount | | | | (Note 1) |
| Connecticut – continued | | | | | | | | |
| Connecticut Health & Edl. Facilities Auth. Rev.: - | | | | | | | | |
| continued | | | | | | | | |
| (Loomis Chaffee School Proj.): | | | | | | | | |
| Series D, 5.25% 7/1/31 (Pre-Refunded to 7/1/11 | | | | | | | | |
| @ 101) (c) | | $ | | 2,005,000 | | $ | | 2,187,074 |
| Series E, 5% 7/1/25 | | | | 1,000,000 | | | | 1,038,520 |
| 5.5% 7/1/26 (MBIA Insured) | | | | 610,000 | | | | 623,200 |
| 5.5% 7/1/26 (Pre-Refunded to 7/1/06 @ 101) (c) . | | | | 820,000 | | | | 838,876 |
| (Lutheran Gen. Health Care Sys. Proj.) 7.375% | | | | | | | | |
| 7/1/19 (Escrowed to Maturity) (c) | | | | 3,075,000 | | | | 3,740,430 |
| (New Britain Gen. Hosp. Proj.) Series B, 6% 7/1/24 | | | | | | | | |
| (AMBAC Insured) | | | | 1,940,000 | | | | 1,963,959 |
| (Sacred Heart Univ. Proj.) Series C, 6% 7/1/06 | | | | | | | | |
| (Escrowed to Maturity) (c) | | | | 190,000 | | | | 192,879 |
| (Saint Raphael Hosp. Proj.) Series H: | | | | | | | | |
| 5.25% 7/1/14 (AMBAC Insured) | | | | 4,050,000 | | | | 4,438,841 |
| 6.5% 7/1/11 (AMBAC Insured) | | | | 3,280,000 | | | | 3,749,171 |
| 6.5% 7/1/13 (AMBAC Insured) | | | | 3,125,000 | | | | 3,671,094 |
| (Veterans Memorial Med. Ctr. Proj.) Series A, 5.5% | | | | | | | | |
| 7/1/26 (MBIA Insured) | | | | 3,770,000 | | | | 3,887,699 |
| (Yale Univ. Proj.): | | | | | | | | |
| Series W, 5.125% 7/1/27 | | | | 13,000,000 | | | | 13,547,820 |
| Series X1, 5% 7/1/42 | | | | 13,515,000 | | | | 13,935,317 |
| 5.25% 7/1/30 (AMBAC Insured) | | | | 1,950,000 | | | | 2,175,362 |
| Connecticut Higher Ed. Supplemental Ln. Auth. Rev. | | | | | | | | |
| (Family Ed. Ln. Prog.) Series A, 5.5% 11/15/09 (b) | | | | 375,000 | | | | 374,723 |
| Connecticut Resource Recovery Auth. Resource Recovery | | | | | | | | |
| Rev.: | | | | | | | | |
| (Bridgeport Resco Co. LP Proj.) 5.5% 1/1/08 (MBIA | | | | | | | | |
| Insured) | | | | 1,000,000 | | | | 1,041,450 |
| (Fuel Co. Proj.) Series A: | | | | | | | | |
| 5.125% 11/15/13 (MBIA Insured) (b) | | | | 3,000,000 | | | | 3,139,950 |
| 5.5% 11/15/09 (MBIA Insured) (b) | | | | 2,000,000 | | | | 2,122,080 |
| Connecticut Spl. Tax Oblig. Rev. (Trans. Infrastructure Proj.): | | | | | | | | |
| Series A: | | | | | | | | |
| 5% 7/1/18 (AMBAC Insured) | | | | 2,000,000 | | | | 2,141,260 |
| 5% 7/1/23 (AMBAC Insured) | | | | 3,260,000 | | | | 3,432,193 |
| 5.375% 7/1/15 (Pre-Refunded to 7/1/12 @ | | | | | | | | |
| 100) (c) | | | | 3,785,000 | | | | 4,168,004 |
| 5.375% 7/1/18 (Pre-Refunded to 7/1/12 @ | | | | | | | | |
| 100) (c) | | | | 2,000,000 | | | | 2,202,380 |
| 7.125% 6/1/10 | | | | 3,550,000 | | | | 3,957,895 |
See accompanying notes which are an integral part of the financial statements.
| Municipal Bonds continued | | | | | | | | |
| | | | | Principal | | | | Value |
| | | | | Amount | | | | (Note 1) |
| Connecticut – continued | | | | | | | | |
| Connecticut Spl. Tax Oblig. Rev. (Trans. Infrastructure Proj.): | | | | | | | | |
| – continued | | | | | | | | |
| Series B: | | | | | | | | |
| 5% 1/1/15 (FGIC Insured) | | $ | | 8,910,000 | | $ | | 9,576,468 |
| 5.25% 7/1/16 (AMBAC Insured) | | | | 4,510,000 | | | | 4,992,029 |
| 6.125% 9/1/12 | | | | 7,115,000 | | | | 7,964,389 |
| 6.15% 9/1/09 | | | | 5,000,000 | | | | 5,456,600 |
| 6.5% 10/1/10 | | | | 3,400,000 | | | | 3,823,096 |
| 6.5% 10/1/12 | | | | 7,100,000 | | | | 8,228,190 |
| Fairfield Gen. Oblig. 5% 1/1/14 | | | | 1,835,000 | | | | 1,994,773 |
| Greater New Haven Wtr. Poll. Cont. Auth. Reg’l. Wastewtr. | | | | | | | | |
| Sys. Rev. Series A, 5% 8/15/35 (MBIA Insured) | | | | 1,000,000 | | | | 1,039,710 |
| Hartford Gen. Oblig.: | | | | | | | | |
| Series 2005 D: | | | | | | | | |
| 5% 9/1/19 (MBIA Insured) | | | | 1,700,000 | | | | 1,807,678 |
| 5% 9/1/22 (MBIA Insured) | | | | 1,700,000 | | | | 1,793,772 |
| Series A, 5.25% 8/1/15 (FSA Insured) | | | | 1,335,000 | | | | 1,471,998 |
| Naugatuck Ctfs. of Prtn. (Incineration Facilities Proj.) | | | | | | | | |
| Series A: | | | | | | | | |
| 5% 6/15/14 (AMBAC Insured) (b) | | | | 1,335,000 | | | | 1,399,294 |
| 5% 6/15/17 (AMBAC Insured) (b) | | | | 775,000 | | | | 808,271 |
| Naugatuck Gen. Oblig.: | | | | | | | | |
| 5.875% 2/15/21 (AMBAC Insured) | | | | 3,555,000 | | | | 3,938,122 |
| 7.4% 9/1/07 (MBIA Insured) | | | | 370,000 | | | | 395,663 |
| 7.4% 9/1/08 (MBIA Insured) | | | | 370,000 | | | | 409,594 |
| New Britain Gen. Oblig.: | | | | | | | | |
| Series B, 6% 3/1/12 (MBIA Insured) | | | | 2,000,000 | | | | 2,195,640 |
| 6% 2/1/12 (MBIA Insured) | | | | 400,000 | | | | 452,324 |
| 7% 4/1/07 (MBIA Insured) | | | | 580,000 | | | | 607,968 |
| 7% 4/1/08 (MBIA Insured) | | | | 580,000 | | | | 627,827 |
| New Haven Air Rights Parking Facility Rev. 5.375% | | | | | | | | |
| 12/1/11 (AMBAC Insured) | | | | 1,165,000 | | | | 1,276,164 |
| New Haven Gen. Oblig.: | | | | | | | | |
| Series B, 5.125% 11/1/16 (MBIA Insured) | | | | 4,000,000 | | | | 4,319,600 |
| 5% 2/1/14 (MBIA Insured) | | | | 2,080,000 | | | | 2,247,482 |
| 5% 2/1/15 (MBIA Insured) | | | | 1,705,000 | | | | 1,846,788 |
| 5% 2/1/20 (MBIA Insured) | | | | 2,430,000 | | | | 2,576,359 |
| New Milford Gen. Oblig.: | | | | | | | | |
| 5% 1/15/15 (AMBAC Insured) | | | | 1,025,000 | | | | 1,114,001 |
| 5% 1/15/16 (AMBAC Insured) | | | | 1,025,000 | | | | 1,112,176 |
| 5% 1/15/17 (AMBAC Insured) | | | | 1,025,000 | | | | 1,115,221 |
See accompanying notes which are an integral part of the financial statements.
13 Annual Report
| Fidelity Connecticut Municipal Income Fund | | | | | | |
| Investments continued | | | | | | | | |
| |
| Municipal Bonds continued | | | | | | | | |
| | | | | | | Principal | | Value |
| | | | | | | Amount | | (Note 1) |
| Connecticut – continued | | | | | | | | |
| North Thompsonville Fire District #10: | | | | | | | | |
| 6.75% 6/1/07 (MBIA Insured) | | | | $ | | 180,000 | | $ 189,085 |
| 6.75% 6/1/08 (MBIA Insured) | | | | | | 190,000 | | 205,633 |
| South Central Reg’l. Wtr. Auth. Wtr. Sys. Rev. Series | | | | | | | | |
| 18B1, 5% 8/1/28 (MBIA Insured) | | | | | | 4,655,000 | | 4,871,039 |
| Stamford Gen. Oblig.: | | | | | | | | |
| 5.25% 7/15/12 | | | | | | 2,810,000 | | 2,939,457 |
| 5.25% 7/15/14 | | | | | | 6,565,000 | | 7,179,681 |
| 5.25% 7/15/15 | | | | | | 3,000,000 | | 3,268,500 |
| 5.25% 2/1/21 (Pre-Refunded to 2/1/14 @ 100) (c) | | . | | | | 1,045,000 | | 1,148,821 |
| 5.25% 2/1/24 (Pre-Refunded to 2/1/14 @ 100) (c) | | . | | | | 1,070,000 | | 1,176,305 |
| 5.5% 7/15/13 | | | | | | 2,675,000 | | 2,956,624 |
| 5.5% 7/15/14 | | | | | | 1,250,000 | | 1,375,450 |
| Stamford Hsg. Auth. Multi-family Rev. (Fairfield Apts. | | | | | | | | |
| Proj.) 4.75%, tender 12/1/08 (a)(b) | | | | | | 6,000,000 | | 6,091,740 |
| Stratford Gen. Oblig. 7% 6/15/08 (FGIC Insured) | | | | | | 500,000 | | 544,760 |
| Trumbull Gen. Oblig. 5% 1/15/17 (AMBAC Insured) | | | | | | 1,100,000 | | 1,169,245 |
| Univ. of Connecticut Series A: | | | | | | | | |
| 5% 1/15/17 (MBIA Insured) | | | | | | 2,000,000 | | 2,134,440 |
| 5.375% 4/1/19 | | | | | | 2,230,000 | | 2,415,202 |
| Watertown Gen. Oblig. 5% 8/1/18 (MBIA Insured) | | | | | | 1,060,000 | | 1,138,217 |
| West Hartford Gen. Oblig. Series A: | | | | | | | | |
| 5% 1/15/14 | | | | | | 1,135,000 | | 1,234,222 |
| 5% 1/15/15 | | | | | | 1,135,000 | | 1,226,390 |
| 5% 1/15/16 | | | | | | 1,135,000 | | 1,221,226 |
| West Haven Gen. Oblig. 5% 7/1/15 (MBIA Insured) | | | | | | 2,480,000 | | 2,694,049 |
| | | | | | | | | 371,559,300 |
| |
| Guam 0.1% | | | | | | | | |
| Guam Wtrwks. Auth. Wtr. and Wastewtr. Sys. Rev. | | | | | | | | |
| 5.875% 7/1/35 | | | | | | 300,000 | | 309,630 |
| Puerto Rico 13.0% | | | | | | | | |
| Puerto Rico Commonwealth Gen. Oblig.: | | | | | | | | |
| Series A, 5.5% 7/1/18 (MBIA Insured) | | | | | | 1,820,000 | | 2,064,462 |
| Series B, 5.5% 7/1/12 (FGIC Insured) | | | | | | 3,500,000 | | 3,868,760 |
| 5.75% 7/1/26 (Pre-Refunded to 7/1/10 @ 100) (c) | | . | | | | 3,700,000 | | 4,035,775 |
| Puerto Rico Commonwealth Hwy. & Trans. Auth. Hwy. | | | | | | | | |
| Rev.: | | | | | | | | |
| Series 1996 Y, 5% 7/1/36 (FSA Insured) | | | | | | 2,750,000 | | 2,885,823 |
| Series Y, 5.5% 7/1/36 (FSA Insured) | | | | | | 1,500,000 | | 1,652,925 |
See accompanying notes which are an integral part of the financial statements.
| Municipal Bonds continued | | | | | | |
| | | | | Principal | | Value |
| | | | | Amount | | (Note 1) |
| Puerto Rico continued | | | | | | |
| Puerto Rico Commonwealth Infrastructure Fing. Auth.: | | | | | | |
| Series 2000 A: | | | | | | |
| 5.5% 10/1/32 (Escrowed to Maturity) (c) | | $ | | 3,640,000 | | $ 3,945,978 |
| 5.5% 10/1/40 (Escrowed to Maturity) (c) | | | | 7,215,000 | | 7,771,782 |
| Series C, 5.5% 7/1/17 (AMBAC Insured) | | | | 6,000,000 | | 6,785,400 |
| Puerto Rico Elec. Pwr. Auth. Pwr. Rev.: | | | | | | |
| Series HH, 5.25% 7/1/29 (FSA Insured) | | | | 13,235,000 | | 14,121,606 |
| Series JJ, 5.25% 7/1/15 (MBIA Insured) | | | | 5,000,000 | | 5,517,950 |
| Series QQ: | | | | | | |
| 5.25% 7/1/14 (XL Cap. Assurance, Inc. Insured) | | | | 1,300,000 | | 1,425,801 |
| 5.5% 7/1/18 (XL Cap. Assurance, Inc. Insured) | | | | 800,000 | | 903,264 |
| Puerto Rico Muni. Fin. Agcy. Series A, 5.5% 8/1/23 | | | | | | |
| (FSA Insured) | | | | 1,250,000 | | 1,337,575 |
| | | | | | | 56,317,101 |
| |
| |
| TOTAL INVESTMENT PORTFOLIO 98.6% | | | | | | |
| (Cost $414,519,644) | | | | | | 428,186,031 |
| |
| NET OTHER ASSETS – 1.4% | | | | | | 6,297,264 |
| NET ASSETS 100% | | | | | | $ 434,483,295 |
Legend
(a) The coupon rate shown on floating or
adjustable rate securities represents the
rate at period end.
(b) Private activity obligations whose
interest is subject to the federal
alternative minimum tax for individuals.
(c) Security collateralized by an amount
sufficient to pay interest and principal.
|
Other Information
The distribution of municipal securities by revenue source, as a percentage of total net assets, is as follows:
| Escrowed/Pre Refunded | | 28.2% |
| General Obligations | | 23.1% |
| Special Tax | | 14.1% |
| Health Care | | 8.8% |
| Education | | 7.2% |
| Electric Utilities | | 5.0% |
| Others* (individually less than 5%) | | 13.6% |
| | | 100.0% |
| *Includes net other assets | | |
See accompanying notes which are an integral part of the financial statements.
15 Annual Report
| Fidelity Connecticut Municipal Income Fund | | | | | | |
| |
| Financial Statements | | | | | | | | |
| |
| Statement of Assets and Liabilities | | | | | | | | |
| | | | | | | November 30, 2005 |
| |
| Assets | | | | | | | | |
| Investment in securities, at value | | | | | | | | |
| See accompanying schedule: | | | | | | | | |
| Unaffiliated issuers (cost $414,519,644) | | | | | | $ | | 428,186,031 |
| Cash | | | | | | | | 885,318 |
| Receivable for fund shares sold | | | | | | | | 23,791 |
| Interest receivable | | | | | | | | 6,767,719 |
| Prepaid expenses | | | | | | | | 2,383 |
| Other receivables | | | | | | | | 1,252 |
| Total assets | | | | | | | | 435,866,494 |
| |
| Liabilities | | | | | | | | |
| Payable for investments purchased | | $ | | 309,618 | | | | |
| Payable for fund shares redeemed | | | | 455,923 | | | | |
| Distributions payable | | | | 412,618 | | | | |
| Accrued management fee | | | | 134,800 | | | | |
| Other affiliated payables | | | | 35,178 | | | | |
| Other payables and accrued expenses | | | | 35,062 | | | | |
| Total liabilities | | | | | | | | 1,383,199 |
| |
| Net Assets | | | | | | $ | | 434,483,295 |
| Net Assets consist of: | | | | | | | | |
| Paid in capital | | | | | | $ | | 416,520,528 |
| Distributions in excess of net investment income | | | | | | | | (2,721) |
| Accumulated undistributed net realized gain (loss) on | | | | | | | | |
| investments | | | | | | | | 4,299,101 |
| Net unrealized appreciation (depreciation) on | | | | | | | | |
| investments | | | | | | | | 13,666,387 |
| Net Assets, for 37,916,863 shares outstanding | | | | | | $ | | 434,483,295 |
| Net Asset Value, offering price and redemption price per | | | | | | |
| share ($434,483,295 ÷ 37,916,863 shares) | | | | | | $ | | 11.46 |
See accompanying notes which are an integral part of the financial statements.
| Statement of Operations | | | | | | |
| | | | | Year ended November 30, 2005 |
| |
| Investment Income | | | | | | |
| Interest | | | | | | $ 19,436,890 |
| |
| Expenses | | | | | | |
| Management fee | | $ | | 1,636,260 | | |
| Transfer agent fees | | | | 295,391 | | |
| Accounting fees and expenses | | | | 109,502 | | |
| Independent trustees’ compensation | | | | 2,052 | | |
| Custodian fees and expenses | | | | 7,192 | | |
| Registration fees | | | | 19,659 | | |
| Audit | | | | 47,556 | | |
| Legal | | | | 2,210 | | |
| Miscellaneous | | | | 5,671 | | |
| Total expenses before reductions | | | | 2,125,493 | | |
| Expense reductions | | | | (54,470) | | 2,071,023 |
| |
| Net investment income | | | | | | 17,365,867 |
| Realized and Unrealized Gain (Loss) | | | | | | |
| Net realized gain (loss) on: | | | | | | |
| Investment securities: | | | | | | |
| Unaffiliated issuers | | | | 4,331,246 | | |
| Futures contracts | | | | 146,748 | | |
| Swap agreements | | | | 199,413 | | |
| Total net realized gain (loss) | | | | | | 4,677,407 |
| Change in net unrealized appreciation (depreciation) on: | | | | | | |
| Investment securities | | | | (10,403,599) | | |
| Swap agreements | | | | (133,952) | | |
| Total change in net unrealized appreciation | | | | | | |
| (depreciation) | | | | | | (10,537,551) |
| Net gain (loss) | | | | | | (5,860,144) |
| Net increase (decrease) in net assets resulting from | | | | | | |
| operations | | | | | | $ 11,505,723 |
See accompanying notes which are an integral part of the financial statements.
17 Annual Report
| Fidelity Connecticut Municipal Income Fund | | | | | | |
| Financial Statements continued | | | | | | | | |
| |
| Statement of Changes in Net Assets | | | | | | | | |
| | | | | Year ended | | | | Year ended |
| | | | | November 30, | | | | November 30, |
| | | | | 2005 | | | | 2004 |
| Increase (Decrease) in Net Assets | | | | | | | | |
| Operations | | | | | | | | |
| Net investment income | | $ | | 17,365,867 | | $ | | 17,409,978 |
| Net realized gain (loss) | | | | 4,677,407 | | | | 3,052,825 |
| Change in net unrealized appreciation (depreciation) . | | (10,537,551) | | | | (7,808,780) |
| Net increase (decrease) in net assets resulting | | | | | | | | |
| from operations | | | | 11,505,723 | | | | 12,654,023 |
| Distributions to shareholders from net investment income | | . | | (17,318,110) | | | | (17,426,240) |
| Distributions to shareholders from net realized gain | | | | (2,741,730) | | | | (4,217,325) |
| Total distributions | | | | (20,059,840) | | | | (21,643,565) |
| Share transactions | | | | | | | | |
| Proceeds from sales of shares | | | | 66,228,118 | | | | 60,136,231 |
| Reinvestment of distributions | | | | 14,391,152 | | | | 15,389,096 |
| Cost of shares redeemed | | | | (64,366,400) | | | | (78,289,137) |
| Net increase (decrease) in net assets resulting from | | | | | | | | |
| share transactions | | | | 16,252,870 | | | | (2,763,810) |
| Redemption fees | | | | 1,512 | | | | 2,027 |
| Total increase (decrease) in net assets | | | | 7,700,265 | | | | (11,751,325) |
| |
| Net Assets | | | | | | | | |
| Beginning of period | | | | 426,783,030 | | | | 438,534,355 |
| End of period (including distributions in excess of net | | | | | | | | |
| investment income of $2,721 and undistributed net | | | | | | | | |
| investment income of $63,830, respectively) | | $ | | 434,483,295 | | $ | | 426,783,030 |
| |
| Other Information | | | | | | | | |
| Shares | | | | | | | | |
| Sold | | | | 5,690,479 | | | | 5,083,305 |
| Issued in reinvestment of distributions | | | | 1,237,566 | | | | 1,305,752 |
| Redeemed | | | | (5,547,119) | | | | (6,667,106) |
| Net increase (decrease) | | | | 1,380,926 | | | | (278,049) |
See accompanying notes which are an integral part of the financial statements.
| Financial Highlights | | | | | | | | | | |
| |
| Years ended November 30, | | 2005 | | 2004 | | 2003 | | 2002 | | 2001 |
| Selected Per Share Data | | | | | | | | | | |
| Net asset value, | | | | | | | | | | |
| beginning of period | | $ 11.68 | | $ 11.91 | | $ 11.69 | | $ 11.51 | | $ 11.11 |
| Income from Investment | | | | | | | | | | |
| Operations | | | | | | | | | | |
| Net investment incomeB | | 461 | | .477 | | .489 | | .497 | | .527 |
| Net realized and unrealized | | | | | | | | | | |
| gain (loss) | | (.146) | | (.115) | | .253 | | .249 | | .401 |
| Total from investment operations | | .315 | | .362 | | .742 | | .746 | | .928 |
| Distributions from net investment | | | | | | | | | | |
| income | | (.460) | | (.477) | | (.487) | | (.497) | | (.527) |
| Distributions from net realized | | | | | | | | | | |
| gain | | (.075) | | (.115) | | (.035) | | (.069) | | (.001) |
| Total distributions | | (.535) | | (.592) | | (.522) | | (.566) | | (.528) |
| Redemption fees added to paid | | | | | | | | | | |
| in capitalB,D | | — | | — | | — | | — | | — |
| Net asset value, end of period | | $ 11.46 | | $ 11.68 | | $ 11.91 | | $ 11.69 | | $ 11.51 |
| Total ReturnA | | 2.72% | | 3.11% | | 6.45% | | 6.64% | | 8.47% |
| Ratios to Average Net AssetsC | | | | | | | | | | |
| Expenses before reductions | | 49% | | .49% | | .50% | | .50% | | .50% |
| Expenses net of fee waivers, | | | | | | | | | | |
| if any | | 49% | | .49% | | .50% | | .50% | | .50% |
| Expenses net of all reductions | | 47% | | .48% | | .49% | | .46% | | .41% |
| Net investment income | | 3.96% | | 4.05% | | 4.11% | | 4.28% | | 4.59% |
| Supplemental Data | | | | | | | | | | |
| Net assets, end of period | | | | | | | | | | |
| (000 omitted) | | $434,483 | | $426,783 | | $438,534 | | $455,676 | | $416,337 |
| Portfolio turnover rate | | 16% | | 12% | | 14% | | 18% | | 17% |
A Total returns would have been lower had certain expenses not been reduced during the periods shown.
B Calculated based on average shares outstanding during the period.
C Expense ratios reflect operating expenses of the fund. Expenses before reductions do not reflect amounts reimbursed by the investment adviser or
reductions from brokerage service arrangements or other expense offset arrangements and do not represent the amount paid by the fund during
periods when reimbursements or reductions occur. Expenses net of fee waivers reflect expenses after reimbursement by the investment adviser but
prior to reductions from brokerage service arrangements or other expense offset arrangements. Expenses net of all reductions represent the net
expenses paid by the fund.
D Amount represents less than $.001 per share.
|
See accompanying notes which are an integral part of the financial statements.
19 Annual Report
| Fidelity Connecticut Municipal Money Market Fund | | |
| Investment Changes/Performance |
| |
| Maturity Diversification | | | | | | |
| Days | | % of fund’s | | % of fund’s | | % of fund’s |
| | | investments | | investments | | investments |
| | | 11/30/05 | | 5/31/05 | | 11/30/04 |
| 0 – 30 | | 88.7 | | 88.2 | | 85.6 |
| 31 – 90 | | 3.0 | | 3.5 | | 3.7 |
| 91 – 180 | | 3.6 | | 4.6 | | 4.7 |
| 181 – 397 | | 4.7 | | 3.7 | | 6.0 |
Weighted Average Maturity | | | | | | |
| | | 11/30/05 | | 5/31/05 | | 11/30/04 |
| Fidelity Connecticut Municipal Money | | | | | | |
| Market Fund | | 26 Days | | 25 Days | | 31 Days |
| Connecticut Tax Free Money Market | | | | | | |
| Funds Average* | | 32 Days | | 29 Days | | 34 Days |
| Current and Historical Seven Day Yields | | | | | | |
| | | 11/28/05 | | 8/29/05 | | 5/30/05 | | 2/28/05 | | 11/29/04 |
| Fidelity Connecticut Municipal | | | | | | | | | | |
| Money Market Fund | | 2.62% | | 2.05% | | 2.42% | | 1.40% | | 1.19% |
| If Fidelity had not reimbursed | | | | | | | | | | |
| certain fund expenses | | 2.58% | | 2.04% | | 2.39% | | 1.32% | | 1.16% |
Yield refers to the income paid by the fund over a given period. Yields for money market funds are usually for seven day periods, as they are here, though they are expressed as annual percentage rates. Past performance is no guarantee of future results. Yield will vary and it is possible to lose money by investing in the fund.
*Source: iMoneyNet, Inc.
Annual Report 20
Fidelity Connecticut Municipal Money Market Fund
Investments November 30, 2005
| Showing Percentage of Net Assets | | | | |
| Municipal Securities 95.1% | | | | |
| | | Principal | | Value |
| | | Amount | | (Note 1) |
| Connecticut – 73.2% | | | | |
| Bethel Gen. Oblig. BAN 4% 8/1/06 | | $15,000,000 | | $ 15,097,825 |
| Bridgeport Gen. Oblig. Participating VRDN: | | | | |
| Series ROC II R182, 3.08% (Liquidity Facility Citibank | | | | |
| NA) (b)(f) | | 2,865,000 | | 2,865,000 |
| Series ROC II R45, 3.08% (Liquidity Facility Citibank | | | | |
| NA) (b)(f) | | 5,000,000 | | 5,000,000 |
| Connecticut Arpt. Rev. Participating VRDN Series MSTC 01 | | | | |
| 129, 3.03% (Liquidity Facility Bear Stearns Companies, | | | | |
| Inc.) (b)(e)(f) | | 17,915,000 | | 17,915,000 |
| Connecticut Dev. Auth. Arpt. Facility Rev.: | | | | |
| Participating VRDN Series PT 2311, 3.1% (Liquidity Facility | | | | |
| Merrill Lynch & Co., Inc.) (b)(e)(f) | | 4,130,000 | | 4,130,000 |
| (Bradley Arpt. Hotel Proj.): | | | | |
| Series 1997 A, 3.02%, LOC KBC Bank NV, VRDN (b) | | 3,000,000 | | 3,000,000 |
| Series 1997 B, 3.02%, LOC JPMorgan Chase Bank, | | | | |
| VRDN (b) | | 1,000,000 | | 1,000,000 |
| Series 1997 C, 3.02%, LOC Fleet Nat’l. Bank, VRDN (b) | | 700,000 | | 700,000 |
| Connecticut Dev. Auth. Health Care Rev. (Corp. for | | | | |
| Independent Living Proj.) Series 1990, 2.97%, LOC | | | | |
| JPMorgan Chase Bank, VRDN (b) | | 18,500,000 | | 18,500,000 |
| Connecticut Dev. Auth. Indl. Dev. Rev. (W.E. Bassett Co. Proj.) | | | | |
| Series 1986, 3%, LOC Fleet Bank NA, VRDN (b)(e) | | 400,000 | | 400,000 |
| Connecticut Dev. Auth. Poll. Cont. Rev. Bonds (New England | | | | |
| Pwr. Co. Proj.) Series 1999, 3.2% tender 2/9/06, CP mode | | 10,000,000 | | 10,000,000 |
| Connecticut Dev. Auth. Wtr. Facilities Rev.: | | | | |
| Participating VRDN Series PA 1250, 3.06% (Liquidity Facility | | | | |
| Merrill Lynch & Co., Inc.) (b)(e)(f) | | 7,650,000 | | 7,650,000 |
| (Connecticut Wtr. Co. Proj.) Series 2004 A, 3.02%, LOC | | | | |
| Citizens Bank of Rhode Island, VRDN (b)(e) | | 1,250,000 | | 1,250,000 |
| Connecticut Gen. Oblig.: | | | | |
| Bonds Series 2005 D, 5% 11/15/06 | | 13,800,000 | | 14,046,220 |
| Participating VRDN: | | | | |
| Series 03 11, 3.08% (Liquidity Facility Citibank NA, New | | | | |
| York) (b)(f) | | 9,900,000 | | 9,900,000 |
| Series BA 02 A, 3.07% (Liquidity Facility Bank of America | | | | |
| NA) (b)(f) | | 4,815,000 | | 4,815,000 |
| Series EGL 01 701, 3.08% (Liquidity Facility Citibank NA, | | | | |
| New York) (b)(f) | | 20,000,000 | | 20,000,000 |
| Series EGL 03 11, 3.08% (Liquidity Facility Citibank NA, | | | | |
| New York) (b)(f) | | 9,900,000 | | 9,900,000 |
| Series EGL 7050017, 3.08% (Liquidity Facility Citibank | | | | |
| NA) (b)(f) | | 12,100,000 | | 12,100,000 |
| |
| |
| See accompanying notes which are an integral part of the financial statements. | | |
| |
| 21 | | | | Annual Report |
| Fidelity Connecticut Municipal Money Market Fund | | | | |
| Investments continued | | | | | | |
| |
| Municipal Securities continued | | | | | | |
| | | Principal | | | | Value |
| | | Amount | | | | (Note 1) |
| Connecticut – continued | | | | | | |
| Connecticut Gen. Oblig.: – continued | | | | | | |
| Participating VRDN: | | | | | | |
| Series Floaters 01 681, 3.06% (Liquidity Facility Morgan | | | | | | | | |
| Stanley) (b)(f) | | $10,280,000 | | $ | | 10,280,000 |
| Series IXIS 05 17, 3.05% (Liquidity Facility CDC Fin.-CDC | | | | |
| IXIS) (b)(f) | | 11,380,000 | | | | 11,380,000 |
| Series MS 00 514, 3.06% (Liquidity Facility Morgan | | | | |
| Stanley) (b)(f) | | 9,695,000 | | | | 9,695,000 |
| Series MS 01 571, 3.06% (Liquidity Facility Morgan | | | | |
| Stanley) (b)(f) | | 24,625,000 | | | | 24,625,000 |
| Series MS 1053, 3.06% (Liquidity Facility Morgan | | | | |
| Stanley) (b)(f) | | 12,095,000 | | | | 12,095,000 |
| Series MS 1144, 3.06% (Liquidity Facility Morgan | | | | |
| Stanley) (b)(f) | | 17,995,000 | | | | 17,995,000 |
| Series PA 888R, 3.05% (Liquidity Facility Merrill Lynch & | | | | |
| Co., Inc.) (b)(f) | | 2,995,000 | | | | 2,995,000 |
| Series PT 1246, 3.05% (Liquidity Facility Merrill Lynch & | | | | |
| Co., Inc.) (b)(f) | | 6,100,000 | | | | 6,100,000 |
| Series PT 1409, 3.05% (Liquidity Facility Merrill Lynch & | | | | |
| Co., Inc.) (b)(f) | | 12,340,000 | | | | 12,340,000 |
| Series PT 1803, 3.05% (Liquidity Facility Merrill Lynch & | | | | |
| Co., Inc.) (b)(f) | | 6,990,000 | | | | 6,990,000 |
| Series PT 2693, 3.05% (Liquidity Facility Dexia Cr. Local | | | | |
| de France) (b)(f) | | 17,635,000 | | | | 17,635,000 |
| Series Putters 291, 3.07% (Liquidity Facility JPMorgan | | | | |
| Chase & Co.) (b)(f) | | 13,080,000 | | | | 13,080,000 |
| Series Putters 320, 3.07% (Liquidity Facility JPMorgan | | | | |
| Chase & Co.) (b)(f) | | 6,670,000 | | | | 6,670,000 |
| Series Putters 432, 3.07% (Liquidity Facility JPMorgan | | | | |
| Chase Bank) (b)(f) | | 2,470,000 | | | | 2,470,000 |
| Series Putters 961, 3.07% (Liquidity Facility PNC Bank | | | | |
| NA, Pittsburgh) (b)(f) | | 75,000 | | | | 75,000 |
| Series ROC II R1064, 3.08% (Liquidity Facility Citigroup | | | | |
| Global Markets Hldgs., Inc.) (b)(f) | | 6,790,000 | | | | 6,790,000 |
| Series ROC II R3013, 3.08% (Liquidity Facility Citigroup | | | | |
| Global Markets Hldgs., Inc.) (b)(f) | | 5,275,000 | | | | 5,275,000 |
| Series ROC II R4009, 3.08% (Liquidity Facility Citigroup | | | | |
| Global Markets Hldgs., Inc.) (b)(f) | | 18,725,000 | | | | 18,725,000 |
| Series ROC II R4048, 3.08% (Liquidity Facility Citigroup | | | | |
| Global Markets Hldgs., Inc.) (b)(f) | | 5,200,000 | | | | 5,200,000 |
| Series 2004 A, 3.03% (Liquidity Facility Landesbank | | | | |
| Hessen-Thuringen), VRDN (b) | | 10,355,000 | | | | 10,355,000 |
| |
| |
| See accompanying notes which are an integral part of the financial statements. | | | | |
| |
| Annual Report | | 22 | | | | |
| Municipal Securities continued | | | | | | |
| | | Principal | | | | Value |
| | | Amount | | | | (Note 1) |
| Connecticut – continued | | | | | | |
| Connecticut Health & Edl. Facilities Auth. Rev.: | | | | | | |
| Participating VRDN: | | | | | | |
| Series AAB 05 59, 3.09% (Liquidity Facility ABN AMRO | | | | | | |
| Bank NV) (b)(f) | | $17,495,000 | | $ | | 17,495,000 |
| Series EGL 02 6027, 3.08% (Liquidity Facility Citibank | | | | | | |
| NA, New York) (b)(f) | | 7,305,000 | | | | 7,305,000 |
| Series EGL 04 19, 3.08% (Liquidity Facility Citibank | | | | | | |
| NA) (b)(f) | | 14,850,000 | | | | 14,850,000 |
| Series LB 05 K6, 3.09% (Liquidity Facility Lehman Brothers | | | | | | |
| Hldgs., Inc.) (b)(f) | | 9,230,000 | | | | 9,230,000 |
| (Ascension Health Cr. Group Proj.) Series 1999 B, 2.96%, | | | | | | |
| VRDN (b) | | 2,490,000 | | | | 2,490,000 |
| (Charlotte Hungerford Hosp. Proj.) Series C, 3.01%, LOC | | | | | | |
| Fleet Bank NA, VRDN (b) | | 2,520,000 | | | | 2,520,000 |
| (Greenwich Family YMCA Proj.) Series A, 3.04%, LOC Bank | | | | | | |
| of New York, New York, VRDN (b) | | 5,000,000 | | | | 5,000,000 |
| (Univ. of New Haven Proj.) Series 2005 E, 3.03%, LOC | | | | | | |
| Wachovia Bank NA, VRDN (b) | | 12,000,000 | | | | 12,000,000 |
| Connecticut Hsg. Fin. Auth.: | | | | | | |
| Participating VRDN: | | | | | | |
| Series BA 99 D, 3.07% (Liquidity Facility Bank of America | | | | | | |
| NA) (b)(e)(f) | | 19,995,000 | | | | 19,995,000 |
| Series LB 05 L14, 3.14% (Liquidity Facility Lehman | | | | | | |
| Brothers Hldgs., Inc.) (b)(e)(f) | | 9,000,000 | | | | 9,000,000 |
| Series MT 37, 3.06% (Liquidity Facility Merrill Lynch & | | | | | | |
| Co., Inc.) (b)(f) | | 40,735,000 | | | | 40,735,001 |
| Series MT 38, 3.09% (Liquidity Facility Landesbank | | | | | | |
| Hessen-Thuringen) (b)(e)(f) | | 15,660,000 | | | | 15,660,000 |
| Series MT 63, 3.09% (Liquidity Facility Landesbank | | | | | | |
| Hessen-Thuringen) (b)(e)(f) | | 6,770,000 | | | | 6,770,000 |
| Series PT 2337, 3.09% (Liquidity Facility Merrill Lynch & | | | | | | |
| Co., Inc.) (b)(f) | | 3,970,000 | | | | 3,970,000 |
| Series PT 2817, 3.09% (Liquidity Facility Merrill Lynch & | | | | | | |
| Co., Inc.) (b)(e)(f) | | 7,985,000 | | | | 7,985,000 |
| Series ROC II R402, 3.11% (Liquidity Facility Citibank | | | | | | |
| NA) (b)(e)(f) | | 3,895,000 | | | | 3,895,000 |
| Series 1990 C, 3.11% (Liquidity Facility Fed. Home Ln. Bank | | | | | | |
| of Boston), VRDN (b)(e) | | 7,295,000 | | | | 7,295,000 |
| Series 1990 D, 3.11% (Liquidity Facility Fed. Home Ln. Bank | | | | | | |
| of Boston), VRDN (b)(e) | | 13,007,000 | | | | 13,007,000 |
| Series 2001 A3, 3.08% (AMBAC Insured), VRDN (b)(e) | | 11,000,000 | | | | 11,000,000 |
| Series 2002 A3, 3.04% (AMBAC Insured), VRDN (b)(e) | | 20,000,000 | | | | 20,000,000 |
| Series 2002 B3, 3.08% (AMBAC Insured), VRDN (b)(e) | | 35,900,000 | | | | 35,900,000 |
See accompanying notes which are an integral part of the financial statements.
23 Annual Report
| Fidelity Connecticut Municipal Money Market Fund | | | | |
| Investments continued | | | | | | | | | | |
| |
| Municipal Securities continued | | | | | | | | |
| | | | | | | Principal | | | | Value |
| | | | | | | Amount | | | | (Note 1) |
| Connecticut – continued | | | | | | | | | | |
| Connecticut Hsg. Fin. Auth.: – continued | | | | | | | | | | |
| Series 2002 F2, 3.07% (AMBAC Insured), VRDN (b)(e) | | | | $31,060,000 | | | | $31,060,000 |
| Subseries 2005 A4, 3.08% (AMBAC Insured), VRDN (b)(e) | | . | | 9,000,000 | | | | 9,000,000 |
| Subseries 2005 D5, 3.05% (AMBAC Insured), VRDN (b)(e) | | . | | 13,370,000 | | | | 13,370,000 |
| Subseries E4, 3.04% (AMBAC Insured), VRDN (b)(e) | | | | 10,000,000 | | | | 10,000,000 |
| Connecticut Spl. Tax Oblig. Rev.: | | | | | | | | | | |
| Bonds Series MT 75, 2.95%, tender 7/20/06 (Liquidity | | | | | | | | |
| Facility Merrill Lynch & Co., Inc.) (b)(f)(g) | | | | 13,790,000 | | | | 13,790,000 |
| Participating VRDN: | | | | | | | | | | |
| Series IXIS 05 3, 3.05% (Liquidity Facility CDC Fin.-CDC | | | | | | | | |
| IXIS) (b)(f) | | | | | | 16,570,000 | | | | 16,570,000 |
| Series MS 01 735, 3.06% (Liquidity Facility Morgan | | | | | | | | |
| Stanley) (b)(f) | | | | | | 8,000,000 | | | | 8,000,000 |
| Series PA 1039R, 3.06% (Liquidity Facility Merrill Lynch & | | | | | | |
| Co., Inc.) (b)(f) | | | | | | 3,530,000 | | | | 3,530,000 |
| Series Putters 612, 3.07% (Liquidity Facility JPMorgan | | | | | | | | |
| Chase & Co.) (b)(f) | | | | | | 5,240,000 | | | | 5,240,000 |
| Series ROC II R122, 3.08% (Liquidity Facility Citibank | | | | | | | | |
| NA) (b)(f) | | | | | | 12,265,000 | | | | 12,265,000 |
| Series ROC II R4068 3.08% (Liquidity Facility Citigroup | | | | | | | | |
| Global Markets Hldgs., Inc.) (b)(f) | | | | | | 4,990,000 | | | | 4,990,000 |
| (Trans. Infrastructure Proj.): | | | | | | | | | | |
| Series 1, 2.97% (FSA Insured), VRDN (b) | | | | 1,600,000 | | | | 1,600,000 |
| Series 2003 1, 3.06% (AMBAC Insured), VRDN (b) | | | | 37,915,000 | | | | 37,915,000 |
| Series 2000 1, 3.03% (FGIC Insured), VRDN (b) | | | | 8,165,000 | | | | 8,165,000 |
| Series 2003 2, 3.06% (AMBAC Insured), VRDN (b) | | | | 38,410,000 | | | | 38,410,000 |
| Farmington Gen. Oblig. BAN 3.5% 4/14/06 | | | | 8,400,000 | | | | 8,424,306 |
| Monroe Gen. Oblig. BAN 3.5% 4/5/06 | | | | | | 6,085,000 | | | | 6,102,657 |
| New Fairfield Gen. Oblig. BAN 4% 4/27/06 | | | | 4,200,000 | | | | 4,218,047 |
| New Haven Gen. Oblig. Series A: | | | | | | | | | | |
| 2.78% 1/13/06, LOC Landesbank Hessen-Thuringen, CP | | | | 3,130,000 | | | | 3,130,000 |
| 3.18% 3/9/06, LOC Landesbank Hessen-Thuringen, CP | | | | 3,680,000 | | | | 3,680,000 |
| North Haven Gen. Oblig. BAN 3.75% 4/26/06 | | | | 20,000,000 | | | | 20,076,289 |
| Plainfield Gen. Oblig. BAN 3.75% 1/11/06 | | | | 9,500,000 | | | | 9,510,396 |
| Reg’l. School District #10 BAN 4% 8/14/06 | | | | 9,000,000 | | | | 9,067,474 |
| Weston Gen. Oblig. Participating VRDN Series ROC II R6501, | | | | | | |
| 3.08% (Liquidity Facility Citibank NA) (b)(f) | | | | 1,865,000 | | | | 1,865,000 |
| | | | | | | | | | | 905,120,215 |
| |
| Puerto Rico 16.9% | | | | | | | | | | |
| Puerto Rico Commonwealth Gen. Oblig. Participating VRDN: | | | | | | | | |
| Series CDC 04 A, 3.03% (Liquidity Facility CDC Fin.-CDC | | | | | | | | |
| IXIS) (b)(f) | | | | | | 12,815,000 | | | | 12,815,000 |
| See accompanying notes which are an integral part of the financial statements. | | | | |
| |
| Annual Report | | 24 | | | | | | | | |
| Municipal Securities continued | | | | | | |
| | | Principal | | | | Value |
| | | Amount | | | | (Note 1) |
| Puerto Rico continued | | | | | | |
| Puerto Rico Commonwealth Gen. Oblig. Participating VRDN: | | | | | | |
| continued | | | | | | |
| Series Merlots 00 EE, 2.99% (Liquidity Facility Wachovia | | | | | | |
| Bank NA) (b)(f) | | $ 9,400,000 | | | | $ 9,400,000 |
| Series Merlots 03 A44, 2.99% (Liquidity Facility Wachovia | | | | | | |
| Bank NA) (b)(f) | | 3,940,000 | | | | 3,940,000 |
| Series MS 975, 3.04% (Liquidity Facility Morgan | | | | | | |
| Stanley) (b)(f) | | 10,000,000 | | | | 10,000,000 |
| Series PA 1225, 3.06% (Liquidity Facility Merrill Lynch & | | | | | | |
| Co., Inc.) (b)(f) | | 9,060,000 | | | | 9,060,000 |
| Series Putters 441, 3.07% (Liquidity Facility JPMorgan Chase | | | | | | |
| Bank) (b)(f) | | 4,000,000 | | | | 4,000,000 |
| Series ROC II R185, 3.05% (Liquidity Facility Citibank | | | | | | |
| NA) (b)(f) | | 4,000,000 | | | | 4,000,000 |
| Puerto Rico Commonwealth Hwy. & Trans. Auth. Hwy. Rev. | | | | | | |
| Participating VRDN: | | | | | | |
| Series Floaters 05 20, 3.05% (Liquidity Facility BNP Paribas | | | | | | |
| SA) (b)(f) | | 5,635,000 | | | | 5,635,000 |
| Series MS 969, 3.04% (Liquidity Facility Morgan Stanley) (b)(f) | | 3,965,000 | | | | 3,965,000 |
| 3.05% (Liquidity Facility Citibank NA) (b)(f) | | 2,400,000 | | | | 2,400,000 |
| Puerto Rico Commonwealth Hwy. & Trans. Auth. Trans. Rev. | | | | | | |
| Participating VRDN: | | | | | | |
| Series Floaters 05 21, 3.05% (Liquidity Facility BNP Paribas | | | | | | |
| SA) (b)(f) | | 9,140,000 | | | | 9,140,000 |
| Series MACN 05 N, 3.07% (Liquidity Facility Bank of | | | | | | |
| America NA) (b)(f) | | 3,500,000 | | | | 3,500,000 |
| Series Merlots 00 FFF, 2.99% (Liquidity Facility Wachovia | | | | | | |
| Bank NA) (b)(f) | | 5,945,000 | | | | 5,945,000 |
| Series Merlots 98 B8, 2.99% (Liquidity Facility Wachovia | | | | | | |
| Bank NA) (b)(f) | | 5,150,000 | | | | 5,150,000 |
| Series Merlots C4, 2.99% (Liquidity Facility Wachovia Bank | | | | | | |
| NA) (b)(f) | | 15,565,000 | | | | 15,565,000 |
| Series RobIns 14, 3.04% (Liquidity Facility Bank of New | | | | | | |
| York, New York) (b)(f) | | 9,645,000 | | | | 9,645,000 |
| Puerto Rico Commonwealth Infrastructure Fing. Auth.: | | | | | | |
| Bonds Series MT 173, 3.23%, tender 10/26/06 (Liquidity | | | | | | |
| Facility Merrill Lynch & Co., Inc.) (b)(f)(g) | | 3,060,000 | | | | 3,060,000 |
| Participating VRDN: | | | | | | |
| Sereis CRVS 05 10, 3.05% (Liquidity Facility Landesbank | | | | | | |
| Hessen-Thuringen) (b)(f) | | 20,130,000 | | | | 20,130,000 |
| Series EGL 00 5101, 3.05% (Liquidity Facility Citibank | | | | | | |
| NA, New York) (b)(f) | | 10,000,000 | | | | 10,000,000 |
See accompanying notes which are an integral part of the financial statements.
25 Annual Report
| Fidelity Connecticut Municipal Money Market Fund | | |
| Investments continued | | | | |
| |
| Municipal Securities continued | | | | |
| | | Principal | | Value |
| | | Amount | | (Note 1) |
| Puerto Rico continued | | | | |
| Puerto Rico Commonwealth Infrastructure Fing. Auth.: - | | | | |
| continued | | | | |
| Participating VRDN: | | | | |
| Series Merlots 00 A15, 2.99% (Liquidity Facility Wachovia | | | | |
| Bank NA) (b)(f) | | $12,095,000 | | $ 12,095,000 |
| Puerto Rico Elec. Pwr. Auth. Pwr. Rev. Participating VRDN: | | | | |
| Series Floaters 682, 3.04% (Liquidity Facility Morgan | | | | |
| Stanley) (b)(f) | | 3,580,000 | | 3,580,000 |
| Series Merlots A40, 2.99% (Liquidity Facility Wachovia Bank | | | | |
| NA) (b)(f) | | 4,670,000 | | 4,670,000 |
| Series MSDW 00 482, 3.04% (Liquidity Facility Morgan | | | | |
| Stanley) (b)(f) | | 7,170,000 | | 7,170,000 |
| Series Putters 147, 3.07% (Liquidity Facility JPMorgan Chase | | | | |
| Bank) (b)(f) | | 1,100,000 | | 1,100,000 |
| Series Putters 866, 3.07% (Liquidity Facility JPMorgan Chase | | | | |
| Bank) (b)(f) | | 3,000,000 | | 3,000,000 |
| Series RobIns 16, 3.04% (Liquidity Facility Bank of New | | | | |
| York, New York) (b)(f) | | 4,200,000 | | 4,200,000 |
| Series ROC II R357, 3.05% (Liquidity Facility Citibank | | | | |
| NA) (b)(f) | | 5,225,000 | | 5,225,000 |
| Puerto Rico Govt. Dev. Bank 2.85% 1/30/06, LOC Societe | | | | |
| Generale, CP (a) | | 12,300,000 | | 12,300,000 |
| Puerto Rico Indl., Tourist, Edl., Med. & Envir. Cont. Facilities | | | | |
| Fing. Auth. (Ana G. Mendez Univ. Sys. Proj.) Series 1998, | | | | |
| 3.26%, LOC Banco Santander Central Hispano SA, | | | | |
| VRDN (b) | | 1,800,000 | | 1,800,000 |
| Puerto Rico Muni. Fin. Agcy. Participating VRDN Series MS 00 | | | | |
| 225, 3.04% (Liquidity Facility Morgan Stanley) (b)(f) | | 2,335,000 | | 2,335,000 |
| Puerto Rico Pub. Bldgs Auth. Rev. Participating VRDN Series | | | | |
| MS 968, 3.04% (Liquidity Facility Morgan Stanley) (b)(f) | | 4,480,000 | | 4,480,000 |
| | | | | 209,305,000 |
| |
| | | Shares | | |
| Other – 5.0% | | | | |
| Fidelity Municipal Cash Central Fund, 3.08% (c)(d) | | 62,304,426 | | 62,304,426 |
| |
| TOTAL INVESTMENT PORTFOLIO 95.1% | | | | |
| (Cost $1,176,729,641) | | | | 1,176,729,641 |
| |
| NET OTHER ASSETS – 4.9% | | | | 60,700,403 |
| NET ASSETS 100% | | $ 1,237,430,044 |
See accompanying notes which are an integral part of the financial statements.
Annual Report 26
| Security Type Abbreviations |
| BAN | | — BOND ANTICIPATION NOTE |
| CP | | — COMMERCIAL PAPER |
| VRDN | | — VARIABLE RATE DEMAND NOTE |
Legend
(a) Security exempt from registration under
Rule 144A of the Securities Act of 1933.
These securities may be resold in
transactions exempt from registration,
normally to qualified institutional buyers.
At the period end, the value of these
securities amounted to $12,300,000 or
1.0% of net assets.
(b) The coupon rate shown on floating or
adjustable rate securities represents the
rate at period end.
(c) Information in this report regarding
holdings by state and security types
does not reflect the holdings of the
Fidelity Municipal Cash Central Fund.
(d) Affiliated fund that is available only to
investment companies and other
accounts managed by Fidelity
Investments. The rate quoted is the
annualized seven-day yield of the fund
at period end. A complete unaudited
listing of the fund’s holdings as of its
most recent quarter end is available
upon request.
|
(e) Private activity obligations whose
interest is subject to the federal
alternative minimum tax for individuals.
(f) Provides evidence of ownership in one
or more underlying municipal bonds.
(g) Restricted securities – Investment in
securities not registered under the
Securities Act of 1933 (excluding 144A
issues). At the end of the period, the
value of restricted securities (excluding
144A issues) amounted to $16,850,000
or 1.4% of net assets.
|
Additional information on each holding is as follows:
| | | Acquisition | | |
| Security | | Date | | Cost |
| Connecticut Spl. | | | | |
| Tax Oblig. Rev. | | | | |
| Bonds Series MT | | | | |
| 75, 2.95%, tender | | | | |
| 7/20/06 | | | | |
| (Liquidity Facility | | | | |
| Merrill Lynch & | | 4/1/05 | | |
| Co., Inc.) | | 4/4/05 | | $13,790,000 |
| |
| Puerto Rico | | | | |
| Commonwealth | | | | |
| Infrastructure Fing. | | | | |
| Auth. Bonds Series | | | | |
| MT 173, 3.23%, | | | | |
| tender 10/26/06 | | | | |
| (Liquidity Facility | | | | |
| Merrill Lynch & | | | | |
| Co., Inc.) | | 10/27/05 | | $ 3,060,000 |
Affiliated Central Funds
Information regarding income received by the fund from the affiliated Central funds during the period is as follows:
| Fund | | | | Income received |
| Fidelity Municipal Cash Central Fund | | | $ | 2,531,418 |
Income Tax Information
At November 30, 2005, the fund had a capital loss carryforward of approximately $110,028 all of which will expire on November 30, 2013.
See accompanying notes which are an integral part of the financial statements.
27 Annual Report
| Fidelity Connecticut Municipal Money Market Fund | | | | |
| |
| Financial Statements | | | | | | |
| |
| Statement of Assets and Liabilities | | | | | | |
| | | | | November 30, 2005 |
| |
| Assets | | | | | | |
| Investment in securities, at value | | | | | | |
| See accompanying schedule: | | | | | | |
| Unaffiliated issuers (cost $1,114,425,215) | | $1,114,425,215 | | | | |
| Affiliated Central Funds (cost $62,304,426) | | 62,304,426 | | | | |
| Total Investments (cost $1,176,729,641) | | | | $1,176,729,641 |
| Cash | | | | | | 31,560,643 |
| Receivable for investments sold | | | | | | 15,955,000 |
| Receivable for fund shares sold | | | | | | 11,930,806 |
| Interest receivable | | | | | | 7,243,692 |
| Prepaid expenses | | | | | | 6,667 |
| Receivable from investment adviser for expense | | | | | | |
| reductions | | | | | | 26,680 |
| Other receivables | | | | | | 122,225 |
| Total assets | | | | | | 1,243,575,354 |
| |
| Liabilities | | | | | | |
| Payable for fund shares redeemed | | 5,561,267 | | | | |
| Distributions payable | | 21,005 | | | | |
| Accrued management fee | | 389,384 | | | | |
| Other affiliated payables | | 124,885 | | | | |
| Other payables and accrued expenses | | 48,769 | | | | |
| Total liabilities | | | | | | 6,145,310 |
| |
| Net Assets | | | | $ 1,237,430,044 |
| Net Assets consist of: | | | | | | |
| Paid in capital | | | | $1,237,459,549 |
| Undistributed net investment income | | | | | | 80,586 |
| Accumulated undistributed net realized gain (loss) on | | | | | | |
| investments | | | | | | (110,091) |
| Net Assets, for 1,236,728,520 shares outstanding | | | | $ 1,237,430,044 |
| Net Asset Value, offering price and redemption price per | | | | | | |
| share ($1,237,430,044 ÷ 1,236,728,520 shares) | | | | | | $ 1.00 |
See accompanying notes which are an integral part of the financial statements.
| Statement of Operations | | | | | | |
| | | | | Year ended November 30, 2005 |
| |
| Investment Income | | | | | | |
| Interest | | | | $ | | 24,833,591 |
| Income from affiliated Central Funds | | | | | | 2,531,418 |
| Total income | | | | | | 27,365,009 |
| |
| Expenses | | | | | | |
| Management fee | | $ | | 4,505,404 | | |
| Transfer agent fees | | | | 1,279,563 | | |
| Accounting fees and expenses | | | | 127,954 | | |
| Independent trustees’ compensation | | | | 5,463 | | |
| Custodian fees and expenses | | | | 17,753 | | |
| Registration fees | | | | 41,316 | | |
| Audit | | | | 43,170 | | |
| Legal | | | | 4,315 | | |
| Miscellaneous | | | | 13,220 | | |
| Total expenses before reductions | | | | 6,038,158 | | |
| Expense reductions | | | | (1,391,885) | | 4,646,273 |
| |
| Net investment income | | | | | | 22,718,736 |
| Realized and Unrealized Gain (Loss) | | | | | | |
| Net realized gain (loss) on: | | | | | | |
| Investment securities: | | | | | | |
| Unaffiliated issuers | | | | | | (77,110) |
| Net increase in net assets resulting from operations | | | | $ | | 22,641,626 |
See accompanying notes which are an integral part of the financial statements.
29 Annual Report
| Fidelity Connecticut Municipal Money Market Fund | | | | |
| Financial Statements continued | | | | | | |
| |
| Statement of Changes in Net Assets | | | | | | |
| | | Year ended | | | | Year ended |
| | | November 30, | | | | November 30, |
| | | 2005 | | | | 2004 |
| Increase (Decrease) in Net Assets | | | | | | |
| Operations | | | | | | |
| Net investment income | | $ 22,718,736 | | | | $ 7,436,211 |
| Net realized gain (loss) | | (77,110) | | | | 352,441 |
| Net increase in net assets resulting | | | | | | |
| from operations | | 22,641,626 | | | | 7,788,652 |
| Distributions to shareholders from net investment income . | | (22,721,124) | | | | (7,428,995) |
| Distributions to shareholders from net realized gain | | (106,141) | | | | |
| Total distributions | | (22,827,265) | | | | (7,428,995) |
| Share transactions at net asset value of $1.00 per share | | | | | | |
| Proceeds from sales of shares | | 2,800,057,497 | | | | 2,113,884,878 |
| Reinvestment of distributions | | 22,599,242 | | | | 7,322,895 |
| Cost of shares redeemed | | (2,650,744,276) | | (2,110,441,037) |
| Net increase (decrease) in net assets and shares | | | | | | |
| resulting from share transactions | | 171,912,463 | | | | 10,766,736 |
| Total increase (decrease) in net assets | | 171,726,824 | | | | 11,126,393 |
| |
| Net Assets | | | | | | |
| Beginning of period | | 1,065,703,220 | | | | 1,054,576,827 |
| End of period (including undistributed net investment | | | | | | |
| income of $80,586 and undistributed net investment | | | | | | |
| income of $428,638, respectively) | | $ 1,237,430,044 | | $ 1,065,703,220 |
See accompanying notes which are an integral part of the financial statements.
| Financial Highlights | | | | | | | | | | | | | | | | | | | | |
| |
| Years ended November 30, | | | | 2005 | | | | 2004 | | | | 2003 | | | | 2002 | | | | 2001 |
| Selected Per Share Data | | | | | | | | | | | | | | | | | | | | |
| Net asset value, | | | | | | | | | | | | | | | | | | | | |
| beginning of period | | | | $1.00 | | | | $1.00 | | | | $1.00 | | | | $1.00 | | | | $ 1.00 |
| Income from Investment | | | | | | | | | | | | | | | | | | | | |
| Operations | | | | | | | | | | | | | | | | | | | | |
| Net investment income | | | | 019 | | | | .007 | | | | .006 | | | | .010 | | | | .024 |
| Net realized and unrealized | | | | | | | | | | | | | | | | | | | | |
| gain (loss)C | | | | — | | | | — | | | | — | | | | — | | | | — |
| Total from investment | | | | | | | | | | | | | | | | | | | | |
| operations | | | | 019 | | | | .007 | | | | .006 | | | | .010 | | | | .024 |
| Distributions from net investment | | | | | | | | | | | | | | | | | | | | |
| income | | | | (.019) | | | | (.007) | | | | (.006) | | | | (.010) | | | | (.024) |
| Distributions from net realized | | | | | | | | | | | | | | | | | | | | |
| gain | | | | —C | | | | — | | | | — | | | | — | | | | — |
| Total distributions | | | | (.019) | | | | (.007) | | | | (.006) | | | | (.010) | | | | (.024) |
| Net asset value, | | | | | | | | | | | | | | | | | | | | |
| end of period | | | | $1.00 | | | | $1.00 | | | | $1.00 | | | | $1.00 | | | | $1.00 |
| Total ReturnA | | | | 1.89% | | | | .71% | | | | .62% | | | | .99% | | | | 2.44% |
| Ratios to Average Net AssetsB | | | | | | | | | | | | | | | | | | | | |
| Expenses before reductions | | | | 50% | | | | .50% | | | | .50% | | | | .51% | | | | .51% |
| Expenses net of fee waivers, | | | | | | | | | | | | | | | | | | | | |
| if any | | | | 48% | | | | .48% | | | | .48% | | | | .49% | | | | .51% |
| Expenses net of all reductions | | | | .39% | | | | .46% | | | | .47% | | | | .45% | | | | .46% |
| Net investment income | | | | 1.88% | | | | .71% | | | | .61% | | | | 1.00% | | | | 2.41% |
| Supplemental Data | | | | | | | | | | | | | | | | | | | | |
| Net assets, end of period | | | | | | | | | | | | | | | | | | | | |
| (000 omitted) | | | | $1,237,430 | | | | | | $1,065,703 | | | | | | $1,054,577 | | | | | | $975,920 | | | | $807,225 |
A Total returns would have been lower had certain expenses not been reduced during the periods shown.
B Expense ratios reflect operating expenses of the fund. Expenses before reductions do not reflect amounts reimbursed by the investment adviser or
reductions from brokerage service arrangements or other expense offset arrangements and do not represent the amount paid by the fund during
periods when reimbursements or reductions occur. Expenses net of fee waivers reflect expenses after reimbursement by the investment adviser but
prior to reductions from brokerage service arrangements or other expense offset arrangements. Expenses net of all reductions represent the net
expenses paid by the fund.
C Amount represents less than $.001 per share.
|
See accompanying notes which are an integral part of the financial statements.
31 Annual Report
Notes to Financial Statements
For the period ended November 30, 2005
1. Significant Accounting Policies.
Fidelity Connecticut Municipal Income Fund (the income fund) is a fund of Fidelity Court Street Trust. On July 21, 2005, the Board of Trustees approved a change in the name of Spartan Connecticut Municipal Income Fund to Fidelity Connecticut Municipal Income Fund effective August 15, 2005. Fidelity Connecticut Municipal Money Market Fund (the money market fund) is a fund of Fidelity Court Street Trust II. Each trust is registered under the Investment Company Act of 1940, as amended (the 1940 Act), as an open end management investment company. Fidelity Court Street Trust and Fidelity Court Street Trust II (the trusts) are organized as a Massachusetts business trust and a Delaware statutory trust, respectively. The income fund is a non diversified fund. Each fund is authorized to issue an unlimited number of shares. Each fund may be affected by economic and political developments in the state of Connecticut. Certain funds may invest in affiliated money market central funds (Money Market Central Funds) which are open end investment companies available to investment companies and other accounts managed by Fidelity Management & Research Company (FMR) and its affili ates. The financial statements have been prepared in conformity with accounting principles generally accepted in the United States of America, which require manage ment to make certain estimates and assumptions at the date of the financial statements. The following summarizes the significant accounting policies of the income fund and the money market fund:
Security Valuation. Investments are valued and net asset value per share is calculated (NAV calculation) as of the close of business of the New York Stock Exchange, normally 4:00 p.m. Eastern time. Wherever possible, each fund uses independent pricing services approved by the Board of Trustees to value their investments. For the income fund, debt securities, including restricted securities, for which quotes are readily available, are valued by independent pricing services or by dealers who make markets in such securi ties. Pricing services consider yield or price of bonds of comparable quality, coupon, maturity and type as well as dealer supplied prices. When current market prices or quotations are not readily available or do not accurately reflect fair value, valuations may be determined in accordance with procedures adopted by the Board of Trustees. The frequency of when fair value pricing is used is unpredictable. The value of securities used for NAV calculation under fair value pricing may differ from published prices for the same securities. Investments in open end mutual funds are valued at their closing net asset value each business day. Short term securities with remaining maturities of sixty days or less for which quotations are not readily available are valued at amortized cost, which approximates value.
| 1. Significant Accounting Policies continued |
Security Valuation continued | | |
As permitted by compliance with certain conditions under Rule 2a 7 of the 1940 Act, securities owned by the money market fund are valued at amortized cost which approxi mates value.
Investment Transactions and Income. Security transactions are accounted for as of trade date. Gains and losses on securities sold are determined on the basis of identified cost. Interest income is accrued as earned. Interest income includes coupon interest and amortization of premium and accretion of discount on debt securities.
Expenses. Most expenses of each trust can be directly attributed to a fund. Expenses which cannot be directly attributed are apportioned among each fund in the trust.
Income Tax Information and Distributions to Shareholders. Each year, each fund intends to qualify as a regulated investment company by distributing all of its taxable income and realized gains under Subchapter M of the Internal Revenue Code. As a result, no provision for income taxes is required in the accompanying financial statements.
Dividends are declared daily and paid monthly from net investment income. Distribu tions from realized gains, if any, are recorded on the ex dividend date. Income and capital gain distributions are determined in accordance with income tax regulations, which may differ from generally accepted accounting principles. In addition, each fund will claim a portion of the payment made to redeeming shareholders as a distribution for income tax purposes.
Capital accounts within the financial statements are adjusted for permanent book tax differences. These adjustments have no impact on net assets or the results of operations. Temporary book tax differences will reverse in a subsequent period.
Book tax differences are primarily due to short term capital gains, futures transactions, market discount, deferred trustees compensation and capital loss carryforwards.
The funds purchase municipal securities whose interest, in the opinion of the issuer, is free from federal income tax. There is no assurance that the Internal Revenue Service (IRS) will agree with this opinion. In the event the IRS determines that the issuer does not comply with relevant tax requirements, interest payments from a security could become federally taxable, possibly retroactively to the date the security was issued.
33 Annual Report
Notes to Financial Statements continued
1. Significant Accounting Policies continued
Income Tax Information and Distributions to Shareholders continued
The tax basis components of distributable earnings and the federal tax cost as of period end were as follows for each fund:
| | | | | Cost for Federal | | | | | | | | | | Net Unrealized |
| | | | | Income Tax | | | | Unrealized | | | | Unrealized | | Appreciation/ |
| | | | | Purposes | | | | Appreciation | | | | Depreciation | | (Depreciation) |
| Fidelity Connecticut | | | | | | | | | | | | | | | | |
| Municipal Income Fund . | | | | | | $ 414,436,888 | | $ | | 15,356,437 | | $ | | (1,607,294) | | | $ | | | 13,749,143 |
| Fidelity Connecticut | | | | | | | | | | | | | | | | |
| Municipal Money | | | | | | | | | | | | | | | | |
| Market Fund | | 1,176,729,641 | | | | | | | | | | | | |
| |
| | | | | | | | | Undistributed | | | | Undistributed | | | | |
| | | | | | | | | Ordinary | | | | Long-term | | | | Capital Loss |
| | | | | | | | | Income | | | | Capital Gain | | | | Carryforward |
| Fidelity Connecticut Municipal | | | | | | | | | | | | | | |
| Income Fund | | | | | | $ | | 716 | | $ | | 3,902,644 | | $ | | — |
| Fidelity Connecticut Municipal | | | | | | | | | | | | | | |
| Money Market Fund | | | | | | | | 82,353 | | | | — | | | | (110,028) |
| |
| The tax character of distributions paid was as follows: | | | | | | | | |
| |
| November 30, 2005 | | | | Tax-exempt | | | | Ordinary | | | | Long-term | | | | |
| | | | | Income | | | | Income | | | | Capital Gains | | | | Total |
| Fidelity Connecticut | | | | | | | | | | | | | | | | |
| Municipal Income Fund | | $ | | 17,318,110 | | $ | | — | | $ | | 2,741,730 | | $ | | 20,059,840 |
| Fidelity Connecticut | | | | | | | | | | | | | | | | |
| Municipal Money Market | | | | | | | | | | | | | | | | |
| Fund | | | | 22,721,124 | | | | — | | | | 106,141 | | | | 22,827,265 |
| |
| |
| |
| November 30, 2004 | | | | Tax-exempt | | | | Ordinary | | | | Long-term | | | | |
| | | | | Income | | | | Income | | | | Capital Gains | | | | Total |
| Fidelity Connecticut | | | | | | | | | | | | | | | | |
| Municipal Income Fund | | $ | | 17,426,240 | | $ | | — | | $ | | 4,217,325 | | $ | | 21,643,565 |
| Fidelity Connecticut | | | | | | | | | | | | | | | | |
| Municipal Money Market | | | | | | | | | | | | | | | | |
| Fund | | | | 7,428,995 | | | | — | | | | — | | | | 7,428,995 |
Short Term Trading (Redemption) Fees. Shares held in the income fund less than 30 days are subject to a redemption fee equal to .50% of the proceeds of the redeemed shares. All redemption fees, including any estimated redemption fees paid by FMR, are retained by the fund and accounted for as an addition to paid in capital.
Futures Contracts. The income fund may use futures contracts to manage its exposure to the bond market and to fluctuations in interest rates. Buying futures tends to increase a fund’s exposure to the underlying instrument, while selling futures tends to decrease a fund’s exposure to the underlying instrument or hedge other fund investments. Losses may arise from changes in the value of the underlying instruments or if the counter parties do not perform under the contracts’ terms. Gains (losses) are realized upon the expiration or closing of the futures contracts. Futures contracts are valued at the settle ment price established each day by the board of trade or exchange on which they are traded.
Restricted Securities. Certain funds may invest in securities that are subject to legal or contractual restrictions on resale. These securities generally may be resold in transac tions exempt from registration or to the public if the securities are registered. Disposal of these securities may involve time consuming negotiations and expense, and prompt sale at an acceptable price may be difficult. Information regarding restricted securities is included at the end of each applicable fund’s Schedule of Investments.
Swap Agreements. The income fund may invest in swaps for the purpose of managing its exposure to interest rate, credit or market risk.
Interest rate swaps are agreements to exchange cash flows periodically based on a notional principal amount, for example, the exchange of fixed rate interest payments for floating rate interest payments. The primary risk associated with interest rate swaps is that unfavorable changes in the fluctuation of interest rates could adversely impact the fund.
Swaps are marked to market daily based on dealer supplied valuations and changes in value are recorded as unrealized appreciation (depreciation). Gains or losses are realized upon early termination of the swap agreement. Collateral, in the form of cash or securities, may be required to be held in segregated accounts with the fund’s custodian in compliance with swap contracts.
3. Purchases and Sales of Investments.
Purchases and sales of securities, other than short term securities and U.S. government securities, for the income fund aggregated $82,546,552 and $68,787,900, respectively.
4. Fees and Other Transactions with Affiliates.
Management Fee. FMR and its affiliates provide the funds with investment manage ment related services for which the funds pay a monthly management fee. The manage ment fee is the sum of an individual fund fee rate and a group fee rate. The individual fund fee rate is applied to each fund’s average net assets. The group fee rate is based
35 Annual Report
| Notes to Financial Statements continued | | |
4. Fees and Other Transactions with Affiliates continued |
Management Fee continued | | |
upon the average net assets of all the mutual funds advised by FMR. The group fee rate decreases as assets under management increase and increases as assets under manage ment decrease. For the period, each fund’s annual management fee rate expressed as a percentage of each fund’s average net assets was as follows:
| | | Individual Rate | | Group Rate | | Total |
| Fidelity Connecticut Municipal Income Fund | | 25% | | .12% | | .37% |
| Fidelity Connecticut Municipal Money | | | | | | |
| Market Fund | | 25% | | .12% | | .37% |
Transfer Agent and Accounting Fees. Citibank, N.A. (Citibank) is the custodian, transfer agent and shareholder servicing agent for the funds. Citibank has entered into a sub arrangement with Fidelity Service Company, Inc. (FSC), an affiliate of FMR, under which FSC performs the activities associated with the funds’ transfer and shareholder servicing agent and accounting functions. The funds pay account fees and asset based fees that vary according to account size and type of account. FSC pays for typesetting, printing and mailing of shareholder reports, except proxy statements. The accounting fee is based on the level of average net assets for the month. For the period, the transfer agent fees were equivalent to the following annual rates expressed as a percentage of average net assets:
| Fidelity Connecticut Municipal Income Fund | | 07% | | |
| Fidelity Connecticut Municipal Money Market Fund | | 11% | | |
Affiliated Central Funds. Certain funds may invest in Money Market Central Funds which seek preservation of capital and current income and are managed by Fidelity Investments Money Management, Inc. (FIMM) an affiliate of FMR. The Money Market Central Funds do not pay a management fee.
5. Committed Line of Credit.
|
The income fund participates with other funds managed by FMR in a $4.2 billion credit facility (the “line of credit”) to be utilized for temporary or emergency purposes to fund shareholder redemptions or for other short term liquidity purposes. The participating funds have agreed to pay commitment fees on their pro rata portion of the line of credit. During the period, there were no borrowings on this line of credit.
FMR voluntarily agreed to reimburse funds to the extent annual operating expenses exceeded certain levels of average net assets as noted in the table below. Some expenses, for example interest expense, are excluded from this reimbursement.
The following funds were in reimbursement during the period:
| | | Expense | | Reimbursement |
| | | Limitations | | from adviser |
| |
| |
| Fidelity Connecticut Municipal Money Market Fund | | 48% | | $ 249,938 |
In addition, through arrangements with each applicable fund’s custodian and transfer agent, credits realized as a result of uninvested cash balances were used to reduce each applicable fund’s expenses. All of the applicable expense reductions are noted in the table below.
| | | | | | | Transfer | | | | |
| | | Custody | | | | Agent | | | | Accounting |
| | | expense | | | | expense | | | | expense |
| | | reduction | | | | reduction | | | | reduction |
| |
| Fidelity Connecticut Municipal Income Fund $ | | 7,173 | | $ | | 47,297 | | $ | | — |
| Fidelity Connecticut Municipal Money | | | | | | | | | | |
| Market Fund | | 17,753 | | | | 1,070,369 | | | | 53,825 |
| |
| 7. Other. | | | | | | | | | | |
The funds’ organizational documents provide former and current trustees and officers with a limited indemnification against liabilities arising in connection with the perfor mance of their duties to the funds. In the normal course of business, the funds may also enter into contracts that provide general indemnifications. The funds’ maximum exposure under these arrangements is unknown as this would be dependent on future claims that may be made against the funds. The risk of material loss from such claims is considered remote.
37 Annual Report
Report of Independent Registered Public Accounting Firm
To the Trustees of Fidelity Court Street Trust and Fidelity Court Street Trust II and the Shareholders of Fidelity Connecticut Municipal Income Fund (formerly Spartan Connecticut Municipal Income Fund) and Fidelity Connecticut Municipal Money Market Fund:
In our opinion, the accompanying statements of assets and liabilities, including the schedules of investments, and the related statements of operations and of changes in net assets and the financial highlights present fairly, in all material respects, the financial position of Fidelity Connecticut Municipal Income Fund (formerly Spartan Connecticut Municipal Income Fund) (a fund of Fidelity Court Street Trust) and Fidelity Connecticut Municipal Money Market Fund (a fund of Fidelity Court Street Trust II) at November 30, 2005 and the results of their operations, the changes in their net assets and the financial highlights for the periods indicated, in conformity with accounting principles generally accepted in the United States of America. These financial statements and financial highlights (hereafter referred to as “financial statements”) are the responsibility of the Fidelity Court Street Trust’s and Fidelity Court Street Trust II’s management; our responsi bility is to express an opinion on these financial statements based on our audits. We conducted our audits of these financial statements in accordance with the standards of the Public Company Accounting Oversight Board (United States). Those standards require that we plan and perform the audit to obtain reasonable assurance about whether the financial statements are free of material misstatement. An audit includes examining, on a test basis, evidence supporting the amounts and disclosures in the financial state ments, assessing the accounting principles used and significant estimates made by management, and evaluating the overall financial statement presentation. We believe that our audits, which included confirmation of securities at November 30, 2005 by correspon dence with the custodian and brokers, provide a reasonable basis for our opinion.
/s/ PricewaterhouseCoopers LLP
PricewaterhouseCoopers LLP
Boston, Massachusetts
January 17, 2006
|
Trustees and Officers
The Trustees, Member of the Advisory Board, and executive officers of the trusts and funds, as applicable, are listed below. The Board of Trustees governs each fund and is responsible for protecting the interests of shareholders. The Trustees are experienced executives who meet periodically throughout the year to oversee each fund’s activities, review contractual arrangements with companies that provide services to each fund, and review each fund’s performance. Except for William O. McCoy and Albert R. Gamper, Jr., each of the Trustees oversees 326 funds advised by FMR or an affiliate. Mr. McCoy oversees 328 funds advised by FMR or an affiliate. Mr. Gamper oversees 235 funds advised by FMR or an affiliate.
The Trustees hold office without limit in time except that (a) any Trustee may resign; (b) any Trustee may be removed by written instrument, signed by at least two thirds of the number of Trustees prior to such removal; (c) any Trustee who requests to be retired or who has become incapacitated by illness or injury may be retired by written instru ment signed by a majority of the other Trustees; and (d) any Trustee may be removed at any special meeting of shareholders by a two thirds vote of the outstanding voting securities of the trust. Each Trustee who is not an interested person (as defined in the 1940 Act) (Independent Trustee), shall retire not later than the last day of the calendar year in which his or her 72nd birthday occurs. The Independent Trustees may waive this mandatory retirement age policy with respect to individual Trustees. The executive officers and Advisory Board Members hold office without limit in time, except that any officer and Advisory Board Member may resign or may be removed by a vote of a majority of the Trustees at any regular meeting or any special meeting of the Trustees. Except as indicated, each individual has held the office shown or other offices in the same company for the past five years.
The funds’ Statement of Additional Information (SAI) includes more information about the Trustees. To request a free copy, call Fidelity at 1-800-544-8544.
Correspondence intended for each Trustee who is an interested person may be sent to Fidelity Investments, 82 Devonshire Street, Boston, Massachusetts 02109.
| | Name, Age; Principal Occupation
Edward C. Johnson 3d (75)
|
Year of Election or Appointment: 1977 or 1991
Trustee of Fidelity Court Street Trust (1977) and Fidelity Court Street Trust II (1991). Mr. Johnson is Chairman of the Board of Trustees. Mr. Johnson serves as Chief Executive Officer, Chairman, and a Director of FMR Corp.; a Director and Chairman of the Board and of the Executive Committee of FMR; Chairman and a Director of Fidelity Management & Research (Far East) Inc.; Chairman and a Director of Fidelity Investments Money Management, Inc.; and Chairman (2001 present) and a Director (2000 present) of FMR Co., Inc.
39 Annual Report
Trustees and Officers - continued
| | Name, Age; Principal Occupation
Stephen P. Jonas (52)
|
Year of Election or Appointment: 2005
Trustee of Fidelity Court Street Trust and Fidelity Court Street Trust II. Mr. Jonas is Senior Vice President of Connecticut Municipal Money Market and Connecticut Municipal Income (2005 present). He also serves as Senior Vice President of other Fidelity funds (2005 present). Mr. Jonas is Executive Director of FMR (2005 present). Previously, Mr. Jonas served as President of Fidelity Enterprise Operations and Risk Services (2004 2005), Chief Administrative Officer (2002 2004), and Chief Financial Officer of FMR Co. (1998 2000). Mr. Jonas has been with Fidelity Investments since 1987 and has held various financial and management positions including Chief Financial Officer of FMR. In addition, he serves on the Boards of Boston Ballet (2003 present) and Simmons College (2003 present).
Year of Election or Appointment: 2003
Mr. Reynolds is a Director (2003 present) and Chief Operating Officer (2002 present) of FMR Corp. He also serves on the Board at Fidelity Investments Canada, Ltd. (2000 present). Previously, Mr. Reynolds served as President of Fidelity Investments Institutional Retirement Group (1996 2000).
* Trustees have been determined to be “Interested Trustees” by virtue of, among other things, their affiliation with the trusts or various entities under common control with FMR.
Correspondence intended for each Independent Trustee (that is, the Trustees other than the Interested Trustees) may be sent to Fidelity Investments, P.O. Box 55235, Boston, Massachusetts 02205 5235.
| | Name, Age; Principal Occupation
Dennis J. Dirks (57)
|
Year of Election or Appointment: 2005
Prior to his retirement in May 2003, Mr. Dirks was Chief Operating Officer and a member of the Board of The Depository Trust & Clearing Corporation (DTCC) (1999 2003). He also served as President, Chief Operating Officer, and Board member of The Depository Trust Company (DTC) (1999 2003) and President and Board member of the National Securities Clearing Corporation (NSCC) (1999 2003). In addition, Mr. Dirks served as Chief Executive Officer and Board member of the Government Securities Clearing Corporation (2001 2003) and Chief Executive Officer and Board member of the Mortgage Backed Securities Clearing Corporation (2001 2003). Mr. Dirks also serves as a Trustee of Manhattan College (2005 present).
| | Albert R. Gamper, Jr. (63)
|
Year of Election or Appointment: 2005
Mr. Gamper also serves as a Trustee (2006 present) or Member of the Advisory Board (2005 present) of other investment companies advised by FMR. Prior to his retirement in December 2004, Mr. Gamper served as Chairman of the Board of CIT Group Inc. (commercial finance). During his tenure with CIT Group Inc. Mr. Gamper served in numerous senior management positions, including Chairman (1987 1989; 1999 2001; 2002 2004), Chief Executive Officer (1987 2004), and President (1989 2002). He currently serves as a member of the Board of Directors of Public Service Enterprise Group (utilities, 2001 present), Chairman of the Board of Governors, Rutgers University (2004 present), and Chairman of the Board of Saint Barnabas Health Care System.
41 Annual Report
Trustees and Officers - continued
| | Name, Age; Principal Occupation
Robert M. Gates (62)
|
Year of Election or Appointment: 1997
Dr. Gates is Chairman of the Independent Trustees (2006 present). Dr. Gates is President of Texas A&M University (2002 present). He was Director of the Central Intelligence Agency (CIA) from 1991 to 1993. From 1989 to 1991, Dr. Gates served as Assistant to the President of the United States and Deputy National Security Advisor. Dr. Gates is a Director of NACCO Industries, Inc. (mining and manufacturing), Parker Drilling Co., Inc. (drilling and rental tools for the energy industry, 2001 present), and Brinker International (restaurant management, 2003 present). Previously, Dr. Gates served as a Director of LucasVarity PLC (automotive components and diesel engines), a Director of TRW Inc. (automotive, space, defense, and information technology), and Dean of the George Bush School of Government and Public Service at Texas A&M University (1999 2001). Dr. Gates also is a Trustee of the Forum for International Policy.
Year of Election or Appointment: 2004
Dr. Heilmeier is Chairman Emeritus of Telcordia Technologies (commu nication software and systems), where prior to his retirement, he served as company Chairman and Chief Executive Officer. He currently serves on the Boards of Directors of The Mitre Corporation (systems engineer ing and information technology support for the government), and HRL Laboratories (private research and development, 2004 present). He is Chairman of the General Motors Science & Technology Advisory Board and a Life Fellow of the Institute of Electrical and Electronics Engineers (IEEE) (2000 present). Dr. Heilmeier is a member of the Defense Science Board and the National Security Agency Advisory Board. He is also a member of the National Academy of Engineering, the American Academy of Arts and Sciences, and the Board of Overseers of the School of Engineering and Applied Science of the University of Pennsylvania. Previously, Dr. Heilmeier served as a Director of TRW Inc. (automotive, space, defense, and information technology, 1992 2002), Compaq (1994 2002), Automatic Data Processing, Inc. (ADP) (technology based business outsourcing, 1995 2002), INET Technologies Inc. (telecommu nications network surveillance, 2001 2004), and Teletech Holdings (customer management services). He is the recipient of the 2005 Kyoto Prize in Advanced Technology for his invention of the liquid display.
Name, Age; Principal Occupation
Marie L. Knowles (59)
|
Year of Election or Appointment: 2001
Prior to Ms. Knowles’ retirement in June 2000, she served as Executive Vice President and Chief Financial Officer of Atlantic Richfield Company (ARCO) (diversified energy, 1996 2000). From 1993 to 1996, she was a Senior Vice President of ARCO and President of ARCO Transportation Company. She served as a Director of ARCO from 1996 to 1998. She currently serves as a Director of Phelps Dodge Corporation (copper mining and manufacturing) and McKesson Corporation (healthcare ser vice, 2002 present). Ms. Knowles is a Trustee of the Brookings Institution and the Catalina Island Conservancy and also serves as a member of the Advisory Board for the School of Engineering of the University of Southern California.
Year of Election or Appointment: 2000
Mr. Lautenbach has been a partner of Clayton, Dubilier & Rice, Inc. (private equity investment firm) since September 1998. Previously, Mr. Lautenbach was with the International Business Machines Corpora tion (IBM) from 1968 until his retirement in 1998. Mr. Lautenbach serves as a Director of Italtel Holding S.p.A. (telecommunications (Milan, Italy), 2004 present) and Eaton Corporation (diversified industrial) as well as the Philharmonic Center for the Arts in Naples, Florida. He also is a member of the Board of Trustees of Fairfield University (2005 present), as well as a member of the Council on Foreign Relations.
Year of Election or Appointment: 1997
Prior to his retirement in December 1994, Mr. McCoy was Vice Chair man of the Board of BellSouth Corporation (telecommunications) and President of BellSouth Enterprises. He is currently a Director of Liberty Corporation (holding company), Duke Realty Corporation (real estate), and Progress Energy, Inc. (electric utility). He is also a partner of Frank lin Street Partners (private investment management firm) and a member of the Research Triangle Foundation Board. In addition, Mr. McCoy served as the Interim Chancellor (1999 2000) and a member of the Board of Visitors for the University of North Carolina at Chapel Hill and currently serves on the Board of Directors of the University of North Carolina Health Care System and the Board of Visitors of the Kenan Flagler Business School (University of North Carolina at Chapel Hill). He also served as Vice President of Finance for the University of North Carolina (16 school system).
43 Annual Report
Trustees and Officers - continued
| | Name, Age; Principal Occupation
Cornelia M. Small (61)
|
Year of Election or Appointment: 2005
Ms. Small is a member (2000 present) and Chairperson (2002 present) of the Investment Committee, and a member (2002 present) of the Board of Trustees of Smith College. Previously, she served as Chief Investment Officer (1999 2000), Director of Global Equity Investments (1996 1999), and a member of the Board of Directors of Scudder, Stevens & Clark (1990 1997) and Scudder Kemper Investments (1997 1998). In addition, Ms. Small served as Co Chair (2000 2003) of the Annual Fund for the Fletcher School of Law and Diplomacy.
| | William S. Stavropoulos (66)
|
Year of Election or Appointment: 2002
Mr. Stavropoulos is Chairman of the Board (2000 present) and a Member of the Board of Directors of The Dow Chemical Company. Since joining The Dow Chemical Company in 1967, Mr. Stavropoulos served in numerous senior management positions, including President (1993 2000; 2002 2003), CEO (1995 2000; 2002 2004), and Chair man of the Executive Committee (2000 2004). Currently, he is a Direc tor of NCR Corporation (data warehousing and technology solutions), BellSouth Corporation (telecommunications), Chemical Financial Corpo ration, Maersk Inc. (industrial conglomerate, 2002 present), and Metal mark Capital (private equity investment firm, 2005 present). He also serves as a member of the Board of Trustees of the American Enterprise Institute for Public Policy Research. In addition, Mr. Stavropoulos is a member of The Business Council, J.P. Morgan International Council and the University of Notre Dame Advisory Council for the College of Science.
Year of Election or Appointment: 2005
Prior to his retirement in 2001, Mr. Wolfe was Chairman and Chief Executive Officer of Hershey Foods Corporation (1993 2001). He currently serves as a member of the boards of Adelphia Communica tions Corporation (2003 present), Bausch & Lomb, Inc., and Revlon Inc. (2004 present).
Advisory Board Member and Executive Officers:
Correspondence intended for each executive officer and Mr. Lynch may be sent to Fidelity Investments, 82 Devonshire Street, Boston, Massachusetts 02109.
| | Name, Age; Principal Occupation
Peter S. Lynch (61)
|
Year of Election or Appointment: 2003
Member of the Advisory Board of Fidelity Court Street Trust and Fidelity Court Street Trust II. Vice Chairman and a Director of FMR, and Vice Chairman (2001 present) and a Director (2000 present) of FMR Co., Inc. Previously, Mr. Lynch served as a Trustee of the Fidelity funds (1990 2003). In addition, he serves as a Trustee of Boston College, Massachusetts Eye & Ear Infirmary, Historic Deerfield, John F. Kennedy Library, and the Museum of Fine Arts of Boston.
Year of Election or Appointment: 2005
Vice President of Connecticut Municipal Money Market and Connecticut Municipal Income. Mr. Donovan also serves as Vice President of Fidelity’s High Income Funds (2005 present), Fidelity’s Fixed Income Funds (2005 present), certain Asset Allocation Funds (2005 present), and certain Balanced Funds (2005 present). Mr. Donovan also serves as Executive Vice President of FMR (2005 present) and FMRC (2005 present). Previously, Mr. Donovan served as Vice President and Director of Fidelity’s International Equity Trading group (1998 2005).
Year of Election or Appointment: 2005
Vice President of Connecticut Municipal Money Market. Mr. Morrison also serves as Vice President of Fidelity’s Money Market Funds (2005 present) and certain Asset Allocation Funds (2002 present). Previously, he served as Vice President of Fidelity’s Bond Funds (2002 2005) and certain Balanced Funds (2002 2005). He served as Vice President (2002 2005) and Bond Group Leader (2002 2005) of Fidelity Investments Fixed Income Division. Mr. Morrison is also Vice President of FIMM (2002 present) and FMR (2002 present). Mr. Morrison joined Fidelity Investments in 1987 as a Corporate Bond Analyst in the Fixed Income Research Division.
45 Annual Report
Trustees and Officers - continued
| | Name, Age; Principal Occupation
David L. Murphy (57)
|
Year of Election or Appointment: 2002
Vice President of Connecticut Municipal Money Market and Connecticut Municipal Income. Mr. Murphy also serves as Vice President of Fidelity’s Money Market Funds (2002 present), certain Asset Allocation Funds (2003 present), Fidelity’s Investment Grade Bond Funds (2005 present), and Fidelity’s Balanced Funds (2005 present). He serves as Senior Vice President (2000 present) and Head (2004 present) of the Fidelity Invest ments Fixed Income Division. Mr. Murphy is also a Senior Vice President of FIMM (2003 present) and a Vice President of FMR (2000 present). Previously, Mr. Murphy served as Money Market Group Leader (2002 2004), Bond Group Leader (2000 2002), and Vice President of Fidelity’s Taxable Bond Funds (2000 2002) and Fidelity’s Municipal Bond Funds (2001 2002). Mr. Murphy joined Fidelity Investments in 1989 as a portfolio manager in the Bond Group.
Year of Election or Appointment: 2005
Vice President of Connecticut Municipal Income. Mr. Silvia also serves as Vice President of Fidelity’s Bond Funds (2005 present) and Senior Vice President and Bond Group Leader of the Fidelity Investments Fixed Income Division (2005 present). Previously, Mr. Silvia served as Director of Fidelity’s Taxable Bond portfolio managers (2002 2004) and a port folio manager in the Bond Group (1997 2004).
Year of Election or Appointment: 2004
Vice President of Connecticut Municipal Money Market. Mr. Marchese also serves as Vice President of other funds advised by FMR. Prior to assuming his current responsibilities, Mr. Marchese worked as a legal analyst and portfolio manager.
Year of Election or Appointment: 2004
Vice President of Connecticut Municipal Income. Mr. Sommer also serves as Vice President of other funds advised by FMR. Prior to assuming his current responsibilities, Mr. Sommer worked as an analyst and manager.
Name, Age; Principal Occupation
Eric D. Roiter (57)
|
Year of Election or Appointment: 1998
Secretary of Connecticut Municipal Money Market and Connecticut Municipal Income. He also serves as Secretary of other Fidelity funds; Vice President, General Counsel, and Secretary of FMR Co., Inc. (2001 present) and FMR; Assistant Secretary of Fidelity Management & Research (U.K.) Inc. (2001 present), Fidelity Management & Research (Far East) Inc. (2001 present), and Fidelity Investments Money Manage ment, Inc. (2001 present). Mr. Roiter is an Adjunct Member, Faculty of Law, at Boston College Law School (2003 present). Previously, Mr. Roiter served as Vice President and Secretary of Fidelity Distributors Corpora tion (FDC) (1998 2005).
Year of Election or Appointment: 2003
Assistant Secretary of Connecticut Municipal Money Market and Con necticut Municipal Income. Mr. Fross also serves as Assistant Secretary of other Fidelity funds (2003 present), Vice President and Secretary of FDC (2005 present), and is an employee of FMR.
Year of Election or Appointment: 2004
President, Treasurer, and Anti Money Laundering (AML) officer of Connecticut Municipal Money Market and Connecticut Municipal Income. Ms. Reynolds also serves as President, Treasurer, and AML officer of other Fidelity funds (2004) and is a Vice President (2003) and an employee (2002) of FMR. Before joining Fidelity Investments, Ms. Reynolds worked at PricewaterhouseCoopers LLP (PwC) (1980 2002), where she was most recently an audit partner with PwC’s investment management practice.
Year of Election or Appointment: 2005
Chief Financial Officer of Connecticut Municipal Money Market and Connecticut Municipal Income. Mr. Murphy also serves as Chief Finan cial Officer of other Fidelity funds (2005 present). He also serves as Senior Vice President of Fidelity Pricing and Cash Management Services Group (FPCMS).
47 Annual Report
Trustees and Officers - continued
| | Name, Age; Principal Occupation
Kenneth A. Rathgeber (58)
|
Year of Election or Appointment: 2004
Chief Compliance Officer of Connecticut Municipal Money Market and Connecticut Municipal Income. Mr. Rathgeber also serves as Chief Compliance Officer of other Fidelity funds (2004) and Executive Vice President of Risk Oversight for Fidelity Investments (2002). Previously, he served as Executive Vice President and Chief Operating Officer for Fidelity Investments Institutional Services Company, Inc. (1998 2002).
Year of Election or Appointment: 2003
Deputy Treasurer of Connecticut Municipal Money Market and Con necticut Municipal Income. Mr. Hebble also serves as Deputy Treasurer of other Fidelity funds (2003), and is an employee of FMR. Before joining Fidelity Investments, Mr. Hebble worked at Deutsche Asset Man agement where he served as Director of Fund Accounting (2002 2003) and Assistant Treasurer of the Scudder Funds (1998 2003).
Year of Election or Appointment: 2005
Deputy Treasurer of Connecticut Municipal Money Market and Con necticut Municipal Income. Mr. Mehrmann also serves as Deputy Treasurer of other Fidelity funds (2005 present) and is an employee of FMR. Previously, Mr. Mehrmann served as Vice President of Fidelity Invest ments Institutional Services Group (FIIS)/Fidelity Investments Institutional Operations Corporation, Inc. (FIIOC) Client Services (1998 2004).
| | Kimberley H. Monasterio (41)
|
Year of Election or Appointment: 2004
Deputy Treasurer of Connecticut Municipal Money Market and Connecticut Municipal Income. Ms. Monasterio also serves as Deputy Treasurer of other Fidelity funds (2004) and is an employee of FMR (2004). Before joining Fidelity Investments, Ms. Monasterio served as Treasurer (2000 2004) and Chief Financial Officer (2002 2004) of the Franklin Templeton Funds and Senior Vice President of Franklin Temple ton Services, LLC (2000 2004).
Name, Age; Principal Occupation
Kenneth B. Robins (36)
|
Year of Election or Appointment: 2005
Deputy Treasurer of Connecticut Municipal Money Market and Con necticut Municipal Income. Mr. Robins also serves as Deputy Treasurer of other Fidelity funds (2005 present) and is an employee of FMR (2004 present). Before joining Fidelity Investments, Mr. Robins worked at KPMG LLP, where he was a partner in KPMG’s department of profes sional practice (2002 2004) and a Senior Manager (1999 2000). In addition, Mr. Robins served as Assistant Chief Accountant, United States Securities and Exchange Commission (2000 2002).
Year of Election or Appointment: 2005
Assistant Treasurer of Connecticut Municipal Money Market and Connecticut Municipal Income. Mr. Byrnes also serves as Assistant Treasurer of other Fidelity funds (2005 present) and is an employee of FMR (2005 present). Previously, Mr. Byrnes served as Vice President of FPCMS (2003 2005). Before joining Fidelity Investments, Mr. Byrnes worked at Deutsche Asset Management where he served as Vice President of the Investment Operations Group (2000 2003).
Year of Election or Appointment: 1987 or 1989
Assistant Treasurer of Connecticut Municipal Money Market and Connecticut Municipal Income. Mr. Costello also serves as Assistant Treasurer of other Fidelity funds and is an employee of FMR.
Year of Election or Appointment: 2004
Assistant Treasurer of Connecticut Municipal Money Market and Connecticut Municipal Income. Mr. Lydecker also serves as Assistant Treasurer of other Fidelity funds (2004) and is an employee of FMR.
Year of Election or Appointment: 2002
Assistant Treasurer of Connecticut Municipal Money Market and Connecticut Municipal Income. Mr. Osterheld also serves as Assistant Treasurer of other Fidelity funds (2002) and is an employee of FMR.
49 Annual Report
Trustees and Officers - continued
| | Name, Age; Principal Occupation
Gary W. Ryan (47)
|
Year of Election or Appointment: 2005
Assistant Treasurer of Connecticut Municipal Money Market and Connecticut Municipal Income. Mr. Ryan also serves as Assistant Trea surer of other Fidelity funds (2005 present) and is an employee of FMR (2005 present). Previously, Mr. Ryan served as Vice President of Fund Reporting in FPCMS (1999 2005).
Year of Election or Appointment: 2005
Assistant Treasurer of Connecticut Municipal Money Market and Connecticut Municipal Income. Mr. Schiavone also serves as Assistant Treasurer of other Fidelity funds (2005 present) and is an employee of FMR (2005 present). Before joining Fidelity Investments, Mr. Schiavone worked at Deutsche Asset Management, where he most recently served as Assistant Treasurer (2003 2005) of the Scudder Funds and Vice President and Head of Fund Reporting (1996 2003).
The Board of Trustees of Fidelity Connecticut Municipal Income Fund voted to pay on December 19, 2005, to shareholders of record at the opening of business on December 16, 2005, a distribution of $.105 per share derived from capital gains real ized from sales of portfolio securities.
The Fidelity Connecticut Municipal Income Fund hereby designate as capital gain dividends: For dividends with respect to the taxable year November 30, 2005, $4,017,778, or, if subsequently determined to be different, the net capital gain of such year, and for dividends for the taxable year November 30, 2004, $2,679,564, if subsequently determined to be different, the excess of: (a) the net capital gain of such year, over (b) amounts previously designated as capital gain dividends with respect to such year.
During fiscal year ended 2005, 100% of each fund’s income dividends were free from federal income tax, and 9.16% and 30.05% of Fidelity Connecticut Municipal Income Fund and Fidelity Connecticut Municipal Money Market Fund’s income dividends were subject to the federal alternative minimum tax.
The fund will notify shareholders in January 2006 of amounts for use in preparing 2005 income tax returns.
51 Annual Report
Board Approval of Investment Advisory Contracts and Management Fees
Fidelity Connecticut Municipal Income Fund (formerly Spartan Connecticut Municipal Income Fund) / Fidelity Connecticut Municipal Money Market Fund
Each year, typically in June, the Board of Trustees, including the independent Trustees (together, the Board), votes on the renewal of the management contract and sub advisory agreements (together, the Advisory Contracts) for each fund. The Board, assisted by the advice of fund counsel and independent Trustees’ counsel, requests and considers a broad range of information throughout the year.
The Board meets regularly each month except August and takes into account throughout the year matters bearing on Advisory Contracts. The Board, acting directly and through its separate committees, considers at each of its meetings factors that are relevant to the annual renewal of each fund’s Advisory Contracts, including the services and support provided to each fund and its shareholders by Fidelity. At the time of the renewal, the Board had 11 standing committees, each composed of independent Trustees with varying backgrounds, to which the Board has assigned specific subject matter responsibilities in order to enhance effective decision making by the Board. Each committee has adopted a written charter outlining the structure and purposes of the committee. One such com mittee, the Fixed Income Contract Committee, meets periodically during the first six months of each year and as necessary to consider matters specifically related to the annual renewal of Advisory Contracts. The committee requests and receives information on, and makes recommendations to the independent Trustees concerning, the approval and annual review of the Advisory Contracts.
At its June 2005 meeting, the Board of Trustees, including the independent Trustees, unanimously determined to renew the Advisory Contracts for each fund. In reaching its determination, the Board considered all factors it believed relevant, including (1) the nature, extent, and quality of the services to be provided to each fund and its sharehold ers by Fidelity (including the investment performance of each fund); (2) the competi tiveness of the management fee and total expenses of each fund; (3) the total costs of the services to be provided by and the profits to be realized by the investment adviser and its affiliates from the relationship with each fund; (4) the extent to which economies of scale would be realized as each fund grows; and (5) whether fee levels reflect these economies of scale, if any, for the benefit of fund shareholders.
In determining whether to renew the Advisory Contracts for each fund, the Board ultimately reached a determination, with the assistance of fund counsel and indepen dent Trustees’ counsel, that the renewal of the Advisory Contracts and the compensation to be received by Fidelity under the management contracts is consistent with Fidelity’s fiduciary duty under applicable law. In addition to evaluating the specific factors noted above, the Board, in reaching its determination, is aware that shareholders in each fund have a broad range of investment choices available to them, including a wide choice among mutual funds offered by competitors to Fidelity, and that each fund’s
shareholders, with the opportunity to review and weigh the disclosure provided by the fund in its prospectus and other public disclosures, have chosen to invest in that fund, managed by Fidelity.
Nature, Extent, and Quality of Services Provided by Fidelity. The Board consid ered staffing within the investment adviser, FMR, and the sub advisers (together, the Investment Advisers), including the backgrounds of the funds’ portfolio managers and the funds’ investment objectives and disciplines. The independent Trustees also had discussions with senior management of Fidelity’s investment operations and investment groups. The Board considered the structure of the portfolio manager compensation program and whether this structure provides appropriate incentives.
Fidelity Resources Dedicated to Investment Management and Support Services. The Board reviewed the size, education, and experience of the Investment Advisers’ invest ment staff, their use of technology, and the Investment Advisers’ approach to recruiting, training, and retaining portfolio managers and other research, advisory, and manage ment personnel. The Board considered Fidelity’s extensive global research capabilities that enable the Investment Advisers to aggregate data from various sources in an effort to produce positive investment results. The Board noted that Fidelity’s analysts have access to a variety of technological tools that enable them to perform both fundamental and quantitative analysis and to specialize in various disciplines. The Board also considered that Fidelity’s portfolio managers and analysts have access to daily portfolio attribution that allows for monitoring of a fund’s portfolio, as well as an electronic communication system that provides immediate real time access to research concerning issuers and credit enhancers.
Shareholder and Administrative Services. The Board considered the nature, extent, quality, and cost of administrative, distribution, and shareholder services performed by the Investment Advisers and their affiliates under the Advisory Contracts and under separate agreements covering transfer agency and pricing and bookkeeping services for each fund. The Board also considered the nature and extent of the Investment Advisers’ supervision of third party service providers, principally custodians and subcustodians. The Board reviewed the allocation of fund brokerage, including allocations to brokers affiliated with the Investment Advisers. The Board also considered the resources devoted to, and the record of compliance with, each fund’s compliance policies and procedures.
The Board noted that the growth of fund assets across the complex allows Fidelity to reinvest in the development of services designed to enhance the value or convenience of the Fidelity funds as investment vehicles. These services include 24 hour access to account information and market information through phone representatives and over the Internet, and investor education materials and asset allocation tools.
Investment in a Large Fund Family. The Board considered the benefits to shareholders of investing in a Fidelity fund, including the benefits of investing in a fund that is part of a
53 Annual Report
Board Approval of Investment Advisory Contracts and Management Fees continued
large family of funds offering a variety of investment disciplines and providing for a large variety of mutual fund investor services. For example, fund shareholders are offered the privilege of exchanging shares of a fund for shares of other Fidelity funds, as set forth in the fund’s prospectus, without paying a sales charge. The Board noted that, since the last Advisory Contract renewals in June 2004, Fidelity has taken a number of actions that benefited particular funds, including (i) voluntarily deciding in 2004 to stop using “soft” commission dollars to pay for market data and, instead, to pay for that data out of its own resources, (ii) contractually agreeing to impose management fee reductions and expense limitations on its five Spartan stock index funds and its stock index fund available through variable insurance products, (iii) contractually agreeing to eliminate the management fees on the Fidelity Freedom Funds and the Fidelity Advisor Freedom Funds, (iv) contractually agreeing to reduce the management fees on most of its investment grade taxable bond funds, and (v) contractually agreeing to impose expense limitations on its retail and Spartan investment grade taxable bond funds.
Investment Performance. The Board considered whether each fund has operated within its investment objective, as well as its record of compliance with its investment restric tions. It also reviewed each fund’s absolute investment performance, as well as each fund’s relative investment performance measured against (i) a broad based securities market index (bond fund only , as money market funds are typically not compared against a market index), and (ii) a peer group of mutual funds deemed appropriate by the Board over multiple periods. For each fund, the following charts considered by the Board show, over the one , three , and five year periods ended December 31, 2004, the fund’s returns, the returns of a broad based securities market index (“benchmark”) (bond fund only), and a range of returns of a peer group of mutual funds identified by Lipper Inc. as having an investment objective similar to that of the fund. The box within each chart shows the 25th percentile return (bottom of box) and the 75th percentile return (top of box) of the Lipper peer group. The percentage beaten number noted below each chart corresponds to the percentile box and represents the percentage of funds in the Lipper peer group whose performance was equal to or lower than that of the fund.
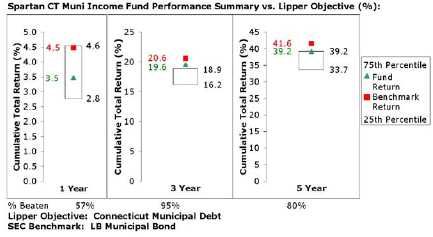
The Board noted that the relative investment performance of the fund has compared favorably to its Lipper peer group over time. The Board also noted that the relative investment performance of the fund was lower than its benchmark over time.
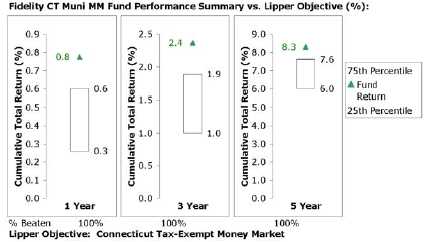
The Board noted that the relative investment performance of the fund has compared favorably to its Lipper peer group over time.
Based on its review, and giving particular weight to the nature and quality of the resources dedicated by the Investment Advisers to maintain and improve relative
55 Annual Report
Board Approval of Investment Advisory Contracts and Management Fees continued
performance, the Board concluded that the nature, extent, and quality of the services provided by Fidelity will benefit each fund’s shareholders, particularly in light of the Board’s view that each fund’s shareholders benefit from investing in a fund that is part of a large family of funds offering a variety of investment disciplines and services.
Competitiveness of Management Fee and Total Fund Expenses. The Board considered each fund’s management fee and total expenses compared to “mapped groups” of competitive funds and classes. Fidelity creates “mapped groups” by combining similar Lipper investment objective categories that have comparable management fee characteristics. Combining Lipper investment objective categories aids the Board’s management fee and total expense comparisons by broadening the competitive group used for comparison and by reducing the number of universes to which various Fidelity funds are compared.
The Board considered two proprietary management fee comparisons for the 12 month periods shown in the charts below. The group of Lipper funds used by the Board for management fee comparisons is referred to below as the “Total Mapped Group” and, for the reasons explained above, is broader than the Lipper peer group used by the Board for performance comparisons. The Total Mapped Group comparison focuses on a fund’s standing relative to the total universe of comparable funds available to investors, in terms of gross management fees before expense reimbursements or caps. “TMG %” represents the percentage of funds in the Total Mapped Group that had management fees that were lower than a fund’s. For example, a TMG % of 24% would mean that 76% of the funds in the Total Mapped Group had higher management fees than a fund. The “Asset Size Peer Group” (ASPG) comparison focuses on a fund’s standing relative to non Fidelity funds similar in size to the fund within the Total Mapped Group. The ASPG represents at least 15% of the funds in the Total Mapped Group with comparable asset size and management fee characteristics, subject to a minimum of 50 funds (or all funds in the Total Mapped Group if fewer than 50). Additional information, such as the ASPG quartile (“quadrant”) in which a fund’s management fee ranked, is also included in the charts and considered by the Board.
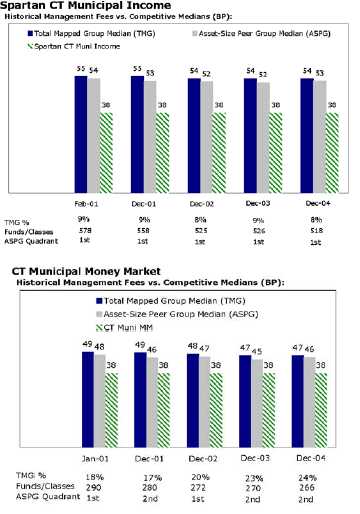
The Board noted that each fund’s management fee ranked below the median of its Total Mapped Group and below the median of its ASPG for 2004. Based on its review, the Board concluded that each fund’s management fee was fair and reasonable in light of the services that the fund receives and the other factors considered.
In its review of each fund’s total expenses, the Board considered the fund’s management fee as well as other fund expenses, such as transfer agent fees, pricing and bookkeeping fees, and custodial, legal, and audit fees. The Board also noted the effects of any waivers and reimbursements on fees and expenses. As part of its review, the Board also
57 Annual Report
Board Approval of Investment Advisory Contracts and Management Fees continued
considered current and historical total expenses of each fund compared to competitive fund median expenses. Each fund is compared to those funds and classes in the Total Mapped Group (used by the Board for management fee comparisons) that have a similar sales load structure.
The Board noted that each fund’s total expenses ranked below its competitive median for calendar 2004.
In its review of total expenses, the Board also considered Fidelity fee structures and other information on clients that FMR and its affiliates service in other competitive markets, such as other mutual funds advised or subadvised by FMR or its affiliates, pension plan clients, and other institutional clients.
Based on its review, the Board concluded that each fund’s total expenses were reason able in light of the services that the fund and its shareholders receive and the other factors considered.
Costs of the Services and Profitability. The Board considered the revenues earned and the expenses incurred by Fidelity in conducting the business of developing, market ing, distributing, managing, administering and servicing each fund and its shareholders. The Board also considered the level of Fidelity’s profits in respect of all the Fidelity funds.
On an annual basis, FMR presents to the Board Fidelity’s profitability for each fund. Fidelity calculates the profitability for each fund, as well as aggregate profitability for groups of Fidelity funds and all Fidelity funds, using a series of detailed revenue and cost allocation methodologies which originate with the audited books and records of Fidelity. The Audit Committee of the Board reviews any significant changes from the prior year’s methodologies.
PricewaterhouseCoopers LLP (PwC), independent registered accounting firm and auditor to Fidelity and certain Fidelity funds, has been engaged annually by the Board as part of the Board’s assessment of the results of Fidelity’s profitability analysis. PwC’s engagement includes the review and assessment of Fidelity’s methodologies used in determining the revenues and expenses attributable to Fidelity’s mutual fund business, and completion of agreed upon procedures surrounding the mathematical accuracy of fund profitability and its conformity to allocation methodologies. After considering PwC’s reports issued under the engagement and information provided by Fidelity, the Board believes that while other allocation methods may also be reasonable, Fidelity’s profitabil ity methodologies are reasonable in all material respects.
The Board has also reviewed Fidelity’s non fund businesses and any fall out benefits related to the mutual fund business as well as cases where Fidelity’s affiliates may benefit from or be related to the funds’ business. In addition, a special committee of the
Board reviewed services provided to Fidelity by its affiliates and determined that the fees that Fidelity paid for such services were reasonable.
The Board considered the costs of the services provided by and the profits realized by Fidelity in connection with the operation of each fund and determined that the amount of profit is a fair entrepreneurial profit for the management of each fund.
Economies of Scale. The Board considered whether there have been economies of scale in respect of the management of the Fidelity funds, whether the Fidelity funds (including each fund) have appropriately benefited from any such economies of scale, and whether there is potential for realization of any further economies of scale. The Board considered the extent to which each fund will benefit from economies of scale through increased services to the fund, through waivers or reimbursements, or through fee or expense reductions, including reductions that occur through operation of the transfer agent agreement. The transfer agent fee varies in part based on the number of accounts in the fund. If the number of accounts decreases or the average account size increases, the overall transfer agent fee rate decreases.
The Board recognized that each fund’s management contract incorporates a “group fee” structure, which provides for lower fee rates as total fund assets under FMR’s manage ment increase, and for higher fee rates as total fund assets under FMR’s management decrease. The Board considered that the group fee is designed to deliver the benefits of economies of scale to fund shareholders when total fund assets increase, even if assets of any particular fund are unchanged or have declined, because some portion of Fidelity’s costs are attributable to services provided to all Fidelity funds, and all funds benefit if those costs can be allocated among more assets.
The Board concluded that, given the group fee structure, fund shareholders will achieve a certain level of economies of scale as assets under FMR’s management increase at the fund complex level, regardless of whether Fidelity achieves any such economies of scale. The Board further concluded that any potential economies of scale are being shared between fund shareholders and Fidelity in an appropriate manner.
Additional Information Requested by the Board. In order to develop fully the factual basis for consideration of the Advisory Contracts, the Board requested additional information regarding (i) Fidelity’s fund profitability methodology, including additional detail on various cost allocations; (ii) fall out benefits to Fidelity; and (iii) compensation of portfolio managers and research analysts.
Based on its evaluation of all of the conclusions noted above, and after considering all material factors, the Board ultimately concluded that the existing advisory fee structures are fair and reasonable, and that each fund’s existing Advisory Contracts should be renewed.
59 Annual Report
Managing Your Investments
Fidelity offers several ways to conveniently manage your personal investments via your telephone or PC. You can access your account information, conduct trades and research your investments 24 hours a day.
By Phone
Fidelity Automated Service Telephone provides a single toll free number to access account balances, positions, quotes and trading. It’s easy to navigate the service, and on your first call, the system will help you create a personal identification number (PIN) for security


By PC
Fidelity’s web site on the Internet provides a wide range of information, including daily financial news, fund performance, interactive planning tools and news about Fidelity products and services.

* When you call the quotes line, please remember that a fund’s yield and return will vary and, except for money market funds, share price will also vary. This means that you may have a gain or loss when you sell your shares. There is no assurance that money market funds will be able to maintain a stable $1 share price; an investment in a money market fund is not insured or guar anteed by the U.S. government. Total returns are historical and include changes in share price, reinvestment of dividends and capital gains, and the effects of any sales charges.
Annual Report 60
To Write Fidelity
We’ll give your correspondence immediate attention and send you written confirmation upon completion of your request.

| | (such as changing name, address, bank, etc.)
Fidelity Investments
P.O. Box 770001
Cincinnati, OH 45277-0002
|

| | Buying shares
Fidelity Investments
P.O. Box 770001
Cincinnati, OH 45277-0003
Overnight Express
Fidelity Investments
Attn: Distribution Services
100 Crosby Parkway KC1H
Covington, KY 41015
Selling shares
Fidelity Investments
P.O. Box 770001
Cincinnati, OH 45277-0035
Overnight Express
Fidelity Investments
Attn: Distribution Services
100 Crosby Parkway KC1H
Covington, KY 41015
General Correspondence
Fidelity Investments
P.O. Box 500
Merrimack, NH 03054-0500
|

| | Buying shares
Fidelity Investments
P.O. Box 770001
Cincinnati, OH 45277-0003
Selling shares
Fidelity Investments
P.O. Box 770001
Cincinnati, OH 45277-0035
Overnight Express
Fidelity Investments
Attn: Distribution Services
100 Crosby Parkway KC1H
Covington, KY 41015
General Correspondence
Fidelity Investments
P.O. Box 500
Merrimack, NH 03054-0500
|
61 Annual Report
To Visit Fidelity
For directions and hours,
please call 1-800-544-9797.
Arizona
7001 West Ray Road
Chandler, AZ
7373 N. Scottsdale Road
Scottsdale, AZ
California
815 East Birch Street
Brea, CA
1411 Chapin Avenue
Burlingame, CA
851 East Hamilton Avenue
Campbell, CA
19200 Von Karman Avenue
Irvine, CA
601 Larkspur Landing Circle
Larkspur, CA
10100 Santa Monica Blvd.
Los Angeles, CA
27101 Puerta Real
Mission Viejo, CA
73 575 El Paseo
Palm Desert, CA
251 University Avenue
Palo Alto, CA
123 South Lake Avenue
Pasadena, CA
16995 Bernardo Ctr. Drive
Rancho Bernardo, CA
1740 Arden Way
Sacramento, CA
7676 Hazard Center Drive
San Diego, CA
8 Montgomery Street
San Francisco, CA
3793 State Street
Santa Barbara, CA
21701 Hawthorne Boulevard
Torrance, CA
2001 North Main Street
Walnut Creek, CA
6300 Canoga Avenue
Woodland Hills, CA
|
Colorado
1625 Broadway
Denver, CO
9185 East Westview Road
Littleton, CO
Connecticut
48 West Putnam Avenue
Greenwich, CT
265 Church Street
New Haven, CT
300 Atlantic Street
Stamford, CT
29 South Main Street
West Hartford, CT
Delaware
222 Delaware Avenue
Wilmington, DE
Florida
4400 N. Federal Highway
Boca Raton, FL
121 Alhambra Plaza
Coral Gables, FL
2948 N. Federal Highway
Ft. Lauderdale, FL
1907 West State Road 434
Longwood, FL
8880 Tamiami Trail, North
Naples, FL
3550 Tamiami Trail, South
Sarasota, FL
1502 N. Westshore Blvd.
Tampa, FL
2465 State Road 7
Wellington, FL
3501 PGA Boulevard
West Palm Beach, FL
Georgia
3445 Peachtree Road, N.E.
Atlanta, GA
1000 Abernathy Road
Atlanta, GA
Illinois
One North LaSalle Street
Chicago, IL
875 North Michigan Ave.
Chicago, IL
1415 West 22nd Street
Oak Brook, IL
|
1700 East Golf Road
Schaumburg, IL
3232 Lake Avenue
Wilmette, IL
Indiana
4729 East 82nd Street
Indianapolis, IN
Kansas
5400 College Boulevard
Overland Park, KS
Maine
Three Canal Plaza
Portland, ME
Maryland
7315 Wisconsin Avenue
Bethesda, MD
One W. Pennsylvania Ave.
Towson, MD
Massachusetts
801 Boylston Street
Boston, MA
155 Congress Street
Boston, MA
300 Granite Street
Braintree, MA
44 Mall Road
Burlington, MA
405 Cochituate Road
Framingham, MA
416 Belmont Street
Worcester, MA
Michigan
500 E. Eisenhower Pkwy.
Ann Arbor, MI
280 Old N. Woodward Ave.
Birmingham, MI
43420 Grand River Avenue
Novi, MI
29155 Northwestern Hwy.
Southfield, MI
Minnesota
7600 France Avenue South
Edina, MN
Missouri
8885 Ladue Road
Ladue, MO
|
| | Nevada
2225 Village Walk Drive
Henderson, NV
New Jersey
150 Essex Street
Millburn, NJ
56 South Street
Morristown, NJ
396 Route 17, North
Paramus, NJ
3518 Route 1 North
Princeton, NJ
530 Highway 35
Shrewsbury, NJ
New York
1055 Franklin Avenue
Garden City, NY
37 West Jericho Turnpike
Huntington Station, NY
1271 Avenue of the Americas
New York, NY
61 Broadway
New York, NY
350 Park Avenue
New York, NY
200 Fifth Avenue
New York, NY
733 Third Avenue
New York, NY
11 Penn Plaza
New York, NY
2070 Broadway
New York, NY
1075 Northern Blvd.
Roslyn, NY
North Carolina
4611 Sharon Road
Charlotte, NC
Ohio
3805 Edwards Road
Cincinnati, OH
1324 Polaris Parkway
Columbus, OH
28699 Chagrin Boulevard
Woodmere Village, OH
Oregon
16850 SW 72nd Avenue
Tigard, OR
|
| Pennsylvania
600 West DeKalb Pike
King of Prussia, PA
1735 Market Street
Philadelphia, PA
12001 Perry Highway
Wexford, PA
Rhode Island
47 Providence Place
Providence, RI
Tennessee
6150 Poplar Avenue
Memphis, TN
Texas
10000 Research Boulevard
Austin, TX
4001 Northwest Parkway
Dallas, TX
12532 Memorial Drive
Houston, TX
2701 Drexel Drive
Houston, TX
6500 N. MacArthur Blvd.
Irving, TX
6005 West Park Boulevard
Plano, TX
14100 San Pedro
San Antonio, TX
1576 East Southlake Blvd.
Southlake, TX
19740 IH 45 North
Spring, TX
Utah
215 South State Street
Salt Lake City, UT
Virginia
1861 International Drive
McLean, VA
Washington
411 108th Avenue, N.E.
Bellevue, WA
1518 6th Avenue
Seattle, WA
Washington, DC
1900 K Street, N.W.
Washington, DC
Wisconsin
595 North Barker Road
Brookfield, WI
|
Fidelity Brokerage Services, Inc., 100 Summer St., Boston, MA 02110 Member NYSE/SIPC
63 Annual Report
63
65 Annual Report
Investment Adviser
Fidelity Management & Research Company
Boston, MA
Investment Sub Adviser
Fidelity Investments
Money Management, Inc.
Fidelity International Investment Advisors
Fidelity International Investment Advisors
(U.K.) Limited
General Distributor
Fidelity Distributors Corporation
Boston, MA
Transfer and Service Agents
Citibank, N.A.
New York, NY
Fidelity Service Company, Inc.
Boston, MA
Custodian
Citibank, N.A.
New York, NY
|
| The Fidelity Telephone Connection |
| Mutual Fund 24-Hour Service |
| Exchanges/Redemptions | | |
| and Account Assistance | | 1-800-544-6666 |
| Product Information | | 1-800-544-6666 |
| Retirement Accounts | | 1-800-544-4774 |
| (8 a.m. - 9 p.m.) | | |
| TDD Service | | 1-800-544-0118 |
| for the deaf and hearing impaired |
| (9 a.m. - 9 p.m. Eastern time) |
| Fidelity Automated Service | | |
| Telephone (FAST® ) (automated phone logo) | | 1-800-544-5555 |
| (automated phone logo) Automated line for quickest service |
CTR-UANN-0106
1.786713.102
|

Fidelity®
Florida Municipal
Income Fund
(formerly Spartan® Florida Municipal
Income Fund)
and
Fidelity
Florida Municipal
Money Market Fund
|
| | Annual Report
November 30, 2005
|


| Contents | | | | |
| |
| |
| Chairman’s Message | | 4 | | Ned Johnson’s message to shareholders |
| Shareholder Expense | | 5 | | An example of shareholder expenses. |
| Example | | | | |
| Fidelity Florida Municipal Income Fund |
| Performance | | 7 | | How the fund has done over time. |
| Management’s | | 8 | | The manager’s review of fund performance, |
| Discussion | | | | strategy and outlook. |
| Investment Changes | | 9 | | A summary of major shifts in the fund’s |
| | | | | investments over the past six months. |
| Investments | | 10 | | A complete list of the fund’s investments |
| | | | | with their market values. |
| Financial Statements | | 19 | | Statements of assets and liabilities, |
| | | | | operations, and changes in net assets, |
| | | | | as well as financial highlights. |
| Fidelity Florida Municipal Money Market Fund |
| Investment Changes/ | | 23 | | A summary of major shifts in the fund’s |
| Performance | | | | investments over the past six months. |
| Investments | | 24 | | A complete list of the fund’s investments. |
| Financial Statements | | 46 | | Statements of assets and liabilities, |
| | | | | operations, and changes in net assets, |
| | | | | as well as financial highlights. |
| Notes | | 50 | | Notes to the Financial Statements |
| Report of Independent | | 56 | | |
| Registered Public | | | | |
| Accounting Firm | | | | |
| Trustees and Officers | | 57 | | |
| Distributions | | 69 | | |
| Board Approval of | | 70 | | |
| Investment Advisory | | | | |
| Contracts and | | | | |
| Management Fees | | | | |
To view a fund’s proxy voting guidelines and proxy voting record for the 12 month period
ended June 30, visit www.fidelity.com/proxyvotingresults or visit the Securities and Exchange
Commission’s (SEC) web site at www.sec.gov. You may also call 1-800-544-8544 to request a free
copy of the proxy voting guidelines.
Standard & Poor’s, S&P and S&P 500 are registered service marks of The McGraw Hill Companies, Inc.
and have been licensed for use by Fidelity Distributors Corporation.
Other third party marks appearing herein are the property of their respective owners.
All other marks appearing herein are registered or unregistered trademarks or service marks
of FMR Corp. or an affiliated company.
|
Annual Report 2
This report and the financial statements contained herein are submitted for the general
information of the shareholders of the funds. This report is not authorized for distribution to
prospective investors in the funds unless preceded or accompanied by an effective prospectus.
A fund files its complete schedule of portfolio holdings with the SEC for the first and third
quarters of each fiscal year on Form N Q. Forms N Q are available on the SEC’s web site at
http://www.sec.gov. A fund’s Forms N Q may be reviewed and copied at the SEC’s Public Reference
Room in Washington, DC. Information regarding the operation of the SEC’s Public Reference
Room may be obtained by calling 1-800-SEC-0330. For a complete list of a fund’s portfolio
holdings, view the most recent quarterly holdings report, semiannual report, or annual report
on Fidelity’s web site at http://www.fidelity.com/holdings.
NOT FDIC INSURED · MAY LOSE VALUE · NO BANK GUARANTEE
Neither the funds nor Fidelity Distributors Corporation is a bank.
|
3 Annual Report
Chairman’s Message
(photograph of Edward C. Johnson 3d)
Dear Shareholder:
During the past year or so, much has been reported about the mutual fund industry, and much of it has been more critical than I believe is warranted. Allegations that some companies have been less than forthright with their shareholders have cast a shadow on the entire industry. I continue to find these reports disturbing, and assert that they do not create an accurate picture of the industry overall. Therefore, I would like to remind every one where Fidelity stands on these issues. I will say two things specifically regarding allegations that some mutual fund compa nies were in violation of the Securities and Exchange Commission’s forward pric ing rules or were involved in so called “market timing” activities.
First, Fidelity has no agreements that permit customers who buy fund shares after 4 p.m. to obtain the 4 p.m. price. This is not a new policy. This is not to say that some one could not deceive the company through fraudulent acts. However, we are extremely diligent in preventing fraud from occurring in this manner and in every other. But I underscore again that Fidelity has no so called “agreements” that sanction illegal practices.
Second, Fidelity continues to stand on record, as we have for years, in opposition to predatory short term trading that adversely affects shareholders in a mutual fund. Back in the 1980s, we initiated a fee which is returned to the fund and, therefore, to investors to discourage this activity. Further, we took the lead sev eral years ago in developing a Fair Value Pricing Policy to prevent market timing on foreign securities in our funds. I am confident we will find other ways to make it more difficult for predatory traders to operate. However, this will only be achieved through close cooperation among regulators, legislators and the industry.
Yes, there have been unfortunate instances of unethical and illegal activity within the mutual fund industry from time to time. That is true of any industry. When this occurs, confessed or convicted offenders should be dealt with appropriately. But we are still concerned about the risk of over regulation and the quick application of simplistic solutions to intricate problems. Every system can be improved, and we support and applaud well thought out improvements by regulators, legislators and industry representatives that achieve the common goal of building and protecting the value of investors’ holdings.
For nearly 60 years, Fidelity has worked very hard to improve its products and service to justify your trust. When our family founded this company in 1946, we had only a few hundred customers. Today, we serve more than 18 million customers including individual investors and participants in retirement plans across America.
Let me close by saying that we do not take your trust in us for granted, and we realize that we must always work to improve all aspects of our service to you. In turn, we urge you to continue your active participation with your financial matters, so that your interests can be well served.
Best regards,
/s/ Edward C. Johnson 3d
Edward C. Johnson 3d
Annual Report 4
Shareholder Expense Example
As a shareholder of a Fund, you incur two types of costs: (1) transaction costs, including redemption fees, and (2) ongoing costs, including management fees and other Fund expenses. This Example is intended to help you understand your ongoing costs (in dollars) of investing in the Funds and to compare these costs with the ongoing costs of investing in other mutual funds.
The Example is based on an investment of $1,000 invested at the beginning of the period and held for the entire period (June 1, 2005 to November 30, 2005).
The first line of the table below for each fund provides information about actual account values and actual expenses. You may use the information in this line, together with the amount you invested, to estimate the expenses that you paid over the period. Simply divide your account value by $1,000.00 (for example, an $8,600 account value divided by $1,000.00 = 8.6), then multiply the result by the number in the first line for a fund under the heading entitled “Expenses Paid During Period” to estimate the expenses you paid on your account during this period. A small balance maintenance fee of $12.00 that is charged once a year may apply for certain accounts with a value of less than $2,000. This fee is not included in the table below. If it was, the estimate of expenses you paid during the period would be higher, and your ending account value lower, by this amount.
Hypothetical Example for Comparison Purposes
The second line of the table below for each fund provides information about hypothetical account values and hypothetical expenses based on a fund’s actual expense ratio and an assumed rate of return of 5% per year before expenses, which is not the Fund’s actual return. The hypothetical account values and expenses may not be used to estimate the actual ending account balance or expenses you paid for the period. You may use this information to compare the ongoing costs of investing in the Fund and other funds. To do so, compare this 5% hypothetical example with the 5% hypothetical examples that appear in the shareholder reports of the other funds. A small balance maintenance fee of $12.00 that is charged once a year may apply for certain accounts with a value of less than $2,000. This fee is not included in the table below. If it was, the estimate of expenses you paid during the period would be higher, and your ending account value lower, by this amount. Please note that the expenses shown in the table are meant to highlight your ongoing costs only and do not reflect any transaction costs. Therefore, the second line of the table is useful in comparing ongoing costs only, and will not help you determine the relative total costs of owning different funds. In addition, if these transactional costs were included, your costs would have been higher.
5 Annual Report
| Shareholder Expense Example continued | | |
| |
| |
| | | | | | | | | | | Expenses Paid |
| | | | | | | | | | | During Period* |
| | | | | Beginning | | Ending | | June 1, 2005 |
| | | | | Account Value | | Account Value | | to November 30, |
| | | | | June 1, 2005 | | November 30, 2005 | | 2005 |
| Fidelity Florida Municipal Income | | | | | | | | | | |
| Fund | | | | | | | | | | |
| Actual | | $ | | 1,000.00 | | $ | | 1,000.50 | $ | 2.41 |
| HypotheticalA | | $ | | 1,000.00 | | $ | | 1,022.66 | $ | 2.43 |
| Fidelity Florida Municipal Money | | | | | | | | | | |
| Market Fund | | | | | | | | | | |
| Actual | | $ | | 1,000.00 | | $ | | 1,010.70 | $ | 2.52 |
| HypotheticalA | | $ | | 1,000.00 | | $ | | 1,022.56 | $ | 2.54 |
| |
| A 5% return per year before expenses | | | | | | |
* Expenses are equal to each Fund’s annualized expense ratio (shown in the table below); multiplied by the average account value over the period, multiplied by 183/365 (to reflect the one half year period).
| | | Annualized |
| | | Expense Ratio |
| Fidelity Florida Municipal Income Fund | | 48% |
| Fidelity Florida Municipal Money Market Fund | | 50% |
Fidelity Florida Municipal Income Fund
Performance: The Bottom Line
Average annual total return reflects the change in the value of an investment, assuming reinvestment of the fund’s dividend income and capital gains (the profits earned upon the sale of securities that have grown in value) and assuming a constant rate of perfor mance each year. The $10,000 table does not reflect the deduction of taxes that a share holder would pay on fund distributions or the redemption of fund shares. During periods of reimbursement by Fidelity, a fund’s total return will be greater than it would be had the reimbursement not occurred. How a fund did yesterday is no guarantee of how it will do tomorrow.
| Average Annual Total Returns | | | | | | |
| Periods ended November 30, 2005 | | Past 1 | | Past 5 | | Past 10 |
| | | year | | years | | years |
| Fidelity® FL Municipal Income Fund | | 3.27% | | 5.61% | | 5.32% |
| |
| |
| $10,000 Over 10 Years | | | | | | |
Let’s say hypothetically that $10,000 was invested in Fidelity® Florida Municipal Income Fund on November 30, 1995. The chart shows how the value of your investment would have changed, and also shows how the Lehman Brothers® Municipal Bond Index performed over the same period.
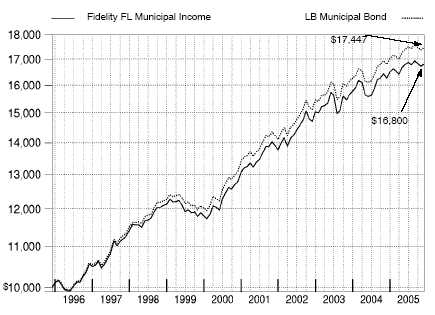
7 Annual Report
Management’s Discussion of Fund Performance
Comments from Doug McGinley, Portfolio Manager of Fidelity® Florida Municipal Income Fund
Municipal bonds were one of the best performing debt instruments during the year ending November 30, 2005. Munis withstood higher short term interest rates and inflation fears much better than taxable bonds. The Federal Reserve Board hiked short term interest rates eight times during the period, responding to fears about a possible spike in inflation. The tighter monetary policy tempered bond performance, while also leading to a consider able flattening of the yield curve. As short term Treasury and municipal yields continued to rise, longer dated issues saw their yields fall or remain steady, sparking concerns about a possible inversion in the curve. The lower long term rates drove heavy muni issuance, but demand was able to keep up for the most part. The improved creditworthiness of many issuers also boosted muni performance, as the general uptick in the economy helped bolster their attractiveness. Against this backdrop, the Lehman Brothers® Municipal Bond Index rose 3.88% . In comparison, the taxable bond market, as measured by the Lehman Brothers Aggregate Bond Index, advanced 2.40% .
For the 12 months ending November 30, 2005, the fund returned 3.27% . During the same period, the LipperSM Florida Municipal Debt Funds Average gained 3.69% and the Lehman Brothers Florida Enhanced Municipal Bond Index rose 3.87% . Against a backdrop of rising interest rates, Florida’s municipal bond market performed in line with most other state municipal markets, helped by robust demand for tax free investments, plus higher reve nues and improved creditworthiness for many Florida issuers. The fund lost ground to the Lehman Brothers index and, I suspect, the Lipper peer group average due to my focus on intermediate maturity securities in a year when longer term securities performed better. However, my decision to maintain a slight overweighting relative to the index in lower quality investment grade bonds particularly some health care issues helped because they consistently outpaced higher quality securities throughout the year. That said, I suspect the fund had less invested than many of its competitors in below investment grade securities, which may have hurt relative performance since those securities were some of the market’s best performers. Likely aiding the fund’s returns was its comparatively large stake in bonds that were prerefunded during the period, a process that boosts the bonds’ prices.
The views expressed in this statement reflect those of the portfolio manager only through the end of the period of the report as stated on the cover and do not necessarily represent the views of Fidelity or any other person in the Fidelity organization. Any such views are subject to change at any time based upon market or other conditions and Fidelity disclaims any responsibility to update such views. These views may not be relied on as investment advice and, because investment decisions for a Fidelity fund are based on numerous factors, may not be relied on as an indication of trading intent on behalf of any Fidelity fund.
| Fidelity Florida Municipal Income Fund | | | | |
| Investment Changes | | | | |
| |
| Top Five Sectors as of November 30, 2005 | | |
| | | % of fund’s | | % of fund’s net assets |
| | | net assets | | 6 months ago |
| General Obligations | | 29.3 | | 28.0 |
| Health Care | | 17.3 | | 16.1 |
| Transportation | | 11.6 | | 12.1 |
| Special Tax | | 7.6 | | 8.3 |
| Education | | 7.6 | | 4.8 |
Average Years to Maturity as of November 30, 2005 |
| | | | | 6 months ago |
| Years | | 12.8 | | 11.6 |
Average years to maturity is based on the average time remaining to the stated maturity date of each bond, weighted by the market value of each bond.
| Duration as of November 30, 2005 | | | | |
| | | | | | | 6 months ago |
| Years | | | | 6.4 | | 6.0 |
Duration shows how much a bond fund’s price fluctuates with changes in comparable interest rates. If rates rise 1%, for example, a fund with a five year duration is likely to lose about 5% of its value. Other factors also can influence a bond fund’s performance and share price. Accordingly, a bond fund’s actual performance may differ from this example.

We have used ratings from Moody’s® Investors Services, Inc. Where Moody’s ratings are not available, we have used S&P® ratings.
9 Annual Report
| Fidelity Florida Municipal Income Fund | | | | |
| Investments November 30, 2005 | | |
| Showing Percentage of Net Assets | | | | | | |
| |
| Municipal Bonds 97.4% | | | | | | |
| | | | | Principal | | Value (Note 1) |
| | | | | Amount | | |
| Florida – 95.6% | | | | | | |
| Alachua County Health Facilities Auth. Health Facilities | | | | |
| Rev. (Avmed/Santa Fe Health Care Sys. Proj.): | | | | |
| 6% 11/15/09 (Escrowed to Maturity) (c) | | $ 1,225,000 | | $ 1,293,919 |
| 6.05% 11/15/16 (Escrowed to Maturity) (c) | | 6,230,000 | | 7,067,935 |
| Brevard County School Board Ctfs. of Prtn. Series B, 5% | | | | |
| 7/1/14 (FGIC Insured) | | | | 1,000,000 | | 1,070,440 |
| Broward County Arpt. Sys. Rev.: | | | | | | |
| Series 1, 5.75% 10/1/12 (AMBAC Insured) (b) | | 1,210,000 | | 1,324,587 |
| Series 1998 H1, 5.25% 10/1/11 (AMBAC | | | | |
| Insured) (b) | | | | 1,505,000 | | 1,577,571 |
| Series J1, 5.75% 10/1/18 (AMBAC Insured) (b) | | 2,755,000 | | 2,990,525 |
| Broward County Gen. Oblig. Series 2001 A, 5.25% | | | | |
| 1/1/21 | | | | 3,500,000 | | 3,739,225 |
| Broward County Resource Recovery Rev. (Wheelabrator | | | | |
| South Broward, Inc. Proj.) Series A, 5% 12/1/06 | | 3,050,000 | | 3,092,578 |
| Broward County School Board Ctfs. of Prtn.: | | | | |
| 5.25% 7/1/15 (MBIA Insured) | | | | 1,750,000 | | 1,883,350 |
| 5.25% 7/1/16 (MBIA Insured) | | | | 6,060,000 | | 6,489,169 |
| Cap. Projs. Fin. Auth. Student Hsg. Rev.: | | | | | | |
| 5.5% 10/1/11 (MBIA Insured) | | | | 2,275,000 | | 2,477,043 |
| 5.5% 10/1/12 (MBIA Insured) | | | | 1,460,000 | | 1,598,656 |
| 5.5% 10/1/13 (MBIA Insured) | | | | 1,265,000 | | 1,376,978 |
| Cape Canaveral Hosp. District Rev. Ctfs. 5.25% 1/1/18 | | | | |
| (MBIA Insured) | | | | 2,765,000 | | 2,878,669 |
| Clearwater Impt. Rev. Series 2001, 5.25% 2/1/22 (FSA | | | | |
| Insured) | | | | 2,200,000 | | 2,343,726 |
| Clearwater Rev. 5.375% 3/1/31 (MBIA Insured) | | 1,250,000 | | 1,411,863 |
| Collier County School Board Ctfs. of Prtn. (School Board | | | | |
| of Collier County Master Lease Prog.) 5.375% | | | | |
| 2/15/19 (Pre-Refunded to 2/15/12 @ 100) (c) | | 2,000,000 | | 2,189,620 |
| Dade County Aviation Rev.: | | | | | | |
| (Miami Int’l. Arpt. Proj.) Series A, 6% 10/1/08 (FSA | | | | |
| Insured) (b) | | | | 6,675,000 | | 7,087,982 |
| Series C, 5.5% 10/1/11 (MBIA Insured) | | 5,200,000 | | 5,396,508 |
| Series D, 5.75% 10/1/09 (AMBAC Insured) (b) | | 2,125,000 | | 2,167,500 |
| Dade County Resource Recovery Facilities Rev. 5.5% | | | | |
| 10/1/09 (AMBAC Insured) (b) | | | | 5,000,000 | | 5,175,200 |
| Dade County Wtr. & Swr. Sys. Rev. 5.25% 10/1/21 | | | | |
| (FGIC Insured) | | | | 3,495,000 | | 3,629,662 |
| Daytona Beach Util. Sys. Rev. Series D, 5.25% | | | | |
| 11/15/17 (FSA Insured) | | | | 1,825,000 | | 1,985,144 |
| De Soto County Cap. Impt. Rev.: | | | | | | |
| 5.25% 10/1/21 (MBIA Insured) | | | | 1,640,000 | | 1,766,198 |
See accompanying notes which are an integral part of the financial statements. | | |
| |
| Annual Report | | 10 | | | | |
| Municipal Bonds continued | | | | | | | | |
| | | | | Principal | | Value (Note 1) |
| | | | | Amount | | | | |
| Florida – continued | | | | | | | | |
| De Soto County Cap. Impt. Rev.: – continued | | | | | | | | |
| 5.25% 10/1/22 (MBIA Insured) | | $ | | 1,725,000 | | $ | | 1,846,751 |
| Escambia County Health Facilities Auth. Health Facilities | | | | | | | | |
| Rev. (Baptist Hosp. & Baptist Manor Proj.) 5% | | | | | | | | |
| 10/1/07 | | | | 1,260,000 | | | | 1,282,302 |
| Escambia County Utils. Auth. Util. Sys. Rev. Series B, | | | | | | | | |
| 6.25% 1/1/15 (FGIC Insured) | | | | 3,050,000 | | | | 3,549,529 |
| Flagler County School Board Ctfs. Series A, 5% 8/1/15 | | | | | | | | |
| (FSA Insured) | | | | 2,005,000 | | | | 2,144,287 |
| Florida Board of Ed. Cap. Outlay: | | | | | | | | |
| Series 2001 F, 5% 6/1/32 (MBIA Insured) | | | | 5,030,000 | | | | 5,207,760 |
| Series B: | | | | | | | | |
| 5% 6/1/33 | | | | 5,350,000 | | | | 5,510,340 |
| 5.375% 6/1/17 | | | | 5,000,000 | | | | 5,462,750 |
| 5.5% 6/1/16 (FGIC Insured) | | | | 2,825,000 | | | | 3,097,104 |
| Florida Board of Ed. Lottery Rev.: | | | | | | | | |
| Series 2002 A, 5.375% 7/1/15 (FGIC Insured) | | | | 5,360,000 | | | | 5,865,662 |
| Series A, 5.375% 7/1/17 (FGIC Insured) | | | | 1,000,000 | | | | 1,092,520 |
| Florida Board of Ed. Pub. Ed.: | | | | | | | | |
| Series 2000 A, 5.25% 6/1/24 | | | | 2,400,000 | | | | 2,560,656 |
| Series A: | | | | | | | | |
| 5.125% 6/1/30 | | | | 1,360,000 | | | | 1,412,319 |
| 5.625% 6/1/14 | | | | 1,000,000 | | | | 1,089,160 |
| Florida Dept. of Children and Family Services Ctfs. of | | | | | | | | |
| Prtn. (South Florida Evaluation Treatment Ctr. Proj.): | | | | | | | | |
| 5% 10/1/16 | | | | 1,025,000 | | | | 1,082,769 |
| 5% 10/1/17 | | | | 2,130,000 | | | | 2,232,645 |
| Florida Dept. of Envir. Protection Preservation Rev. | | | | | | | | |
| Series A, 5.375% 7/1/17 (MBIA Insured) | | | | 6,000,000 | | | | 6,555,120 |
| Florida Dept. of Trans. Rev. Series 2005 A: | | | | | | | | |
| 5% 7/1/17 | | | | 3,360,000 | | | | 3,556,392 |
| 5% 7/1/18 | | | | 3,320,000 | | | | 3,500,674 |
| Florida Gen. Oblig.: | | | | | | | | |
| (Dept. of Trans. Right of Way Proj.) Series A, 5% | | | | | | | | |
| 7/1/33 | | | | 1,000,000 | | | | 1,035,920 |
| 5.375% 7/1/15 (MBIA Insured) | | | | 2,110,000 | | | | 2,311,568 |
| Florida Mid-Bay Bridge Auth. Rev. Series A, 6.875% | | | | | | | | |
| 10/1/22 (Escrowed to Maturity) (c) | | | | 3,000,000 | | | | 3,855,000 |
| Florida Muni. Pwr. Agcy. Rev. (Stanton II Proj.): | | | | | | | | |
| 5.5% 10/1/18 (AMBAC Insured) | | | | 1,350,000 | | | | 1,479,911 |
| 5.5% 10/1/19 (AMBAC Insured) | | | | 2,430,000 | | | | 2,665,370 |
| Florida Wtr. Poll. Cont. Fing. Corp. Rev. 5.25% 1/15/20 | | | | 1,950,000 | | | | 2,124,389 |
See accompanying notes which are an integral part of the financial statements.
11 Annual Report
| Fidelity Florida Municipal Income Fund | | | | | | |
| Investments continued | | | | | | |
| |
| Municipal Bonds continued | | | | | | |
| | | | | Principal | | Value (Note 1) |
| | | | | Amount | | |
| Florida – continued | | | | | | |
| Gainesville Utils. Sys. Rev. Series A, 5.2% 10/1/22 | | $ | | 3,270,000 | | $ 3,379,153 |
| Greater Orlando Aviation Auth. Arpt. Facilities Rev. | | | | | | |
| 5.75% 10/1/09 (FGIC Insured) (b) | | | | 2,500,000 | | 2,679,125 |
| Gulf Breeze Rev.: | | | | | | |
| Series 1985 C, 5%, tender 12/1/12 (FGIC | | | | | | |
| Insured) (a) | | | | 1,825,000 | | 1,957,148 |
| Series 1985 E: | | | | | | |
| 5%, tender 12/1/11 (FGIC Insured) (a) | | | | 1,330,000 | | 1,421,371 |
| 5%, tender 12/1/13 (FGIC Insured) (a) | | | | 1,465,000 | | 1,573,659 |
| Gulf Breeze Util. Sys. Rev. 5% 10/1/16 (AMBAC | | | | | | |
| Insured) | | | | 1,010,000 | | 1,082,851 |
| Highlands County Health Facilities Auth. Rev. (Adventist | | | | | | |
| Health Sys./Sunbelt Obligated Group Proj.): | | | | | | |
| Series 2002 B, 5% 11/15/08 | | | | 2,835,000 | | 2,940,859 |
| Series A, 5% 11/15/15 | | | | 1,000,000 | | 1,054,480 |
| Series B: | | | | | | |
| 5% 11/15/15 | | | | 1,000,000 | | 1,054,480 |
| 5% 11/15/16 | | | | 1,190,000 | | 1,240,159 |
| Series D, 6% 11/15/25 | | | | 5,360,000 | | 5,814,850 |
| 3.95%, tender 9/1/12 (a) | | | | 3,800,000 | | 3,759,910 |
| Hillsborough County Aviation Auth. Rev. (Tampa Int’l. | | | | | | |
| Arpt. Proj.) Series B, 6% 10/1/17 (FGIC Insured) | | | | 5,880,000 | | 6,804,336 |
| Hillsborough County Indl. Dev. (Tampa Gen. Hosp. Proj.) | | | | | | |
| Series A: | | | | | | |
| 5% 10/1/07 | | | | 1,300,000 | | 1,329,679 |
| 5% 10/1/08 | | | | 1,000,000 | | 1,033,940 |
| Hillsborough County Indl. Dev. Auth. Indl. Dev. Rev. | | | | | | |
| (Health Facilities/Univ. Cmnty. Hosp. Proj.) | | | | | | |
| Series 1999 A, 5.625% 8/15/19 | | | | 5,000,000 | | 5,133,100 |
| Hillsborough County Indl. Dev. Auth. Poll. Cont. Rev. | | | | | | |
| (Tampa Elec. Co. Proj.): | | | | | | |
| 4%, tender 8/1/07 (a) | | | | 2,030,000 | | 2,030,568 |
| 4.25%, tender 8/1/07 (a)(b) | | | | 2,110,000 | | 2,110,570 |
| 5.1% 10/1/13 | | | | 3,005,000 | | 3,120,452 |
| Hillsborough County School Board Ctfs. of Prtn. (Master | | | | | | |
| Lease Prog.) Series A, 5.25% 7/1/22 (MBIA Insured) . | | | | 4,905,000 | | 5,133,181 |
| Jacksonville Econ. Dev. Commission Healthcare Rev. | | | | | | |
| (Mayo Clinic Foundation Proj.): | | | | | | |
| Series B, 5.5% 11/15/36 (MBIA Insured) | | | | 5,870,000 | | 6,297,453 |
| Series C, 5.5% 11/15/36 (MBIA Insured) | | | | 12,250,000 | | 13,142,040 |
| Jacksonville Excise Tax Rev. Series B: | | | | | | |
| 5.5% 10/1/10 (FGIC Insured) (b) | | | | 1,540,000 | | 1,650,695 |
| 5.5% 10/1/11 (FGIC Insured) (b) | | | | 2,730,000 | | 2,916,131 |
See accompanying notes which are an integral part of the financial statements.
| Municipal Bonds continued | | | | | | |
| | | | | Principal | | Value (Note 1) |
| | | | | Amount | | |
| Florida – continued | | | | | | |
| Jacksonville Health Facilities Auth. Hosp. Rev. (Charity | | | | | | |
| Obligated Group Proj.) Series A, 5.25% 8/15/08 | | | | | | |
| (MBIA Insured) | | $ | | 3,720,000 | | $ 3,866,717 |
| Jacksonville Sales Tax Rev.: | | | | | | |
| 5.25% 10/1/19 (MBIA Insured) | | | | 1,500,000 | | 1,617,480 |
| 5.5% 10/1/18 (FGIC Insured) | | | | 1,000,000 | | 1,136,330 |
| Jupiter Wtr. Rev.: | | | | | | |
| 5.375% 10/1/16 (AMBAC Insured) | | | | 1,040,000 | | 1,129,752 |
| 5.375% 10/1/17 (AMBAC Insured) | | | | 1,000,000 | | 1,087,550 |
| 5.375% 10/1/18 (AMBAC Insured) | | | | 1,160,000 | | 1,265,189 |
| Kissimmee Util. Auth. Elec. Sys. Rev. 5.25% 10/1/16 | | | | | | |
| (FSA Insured) | | | | 2,230,000 | | 2,420,197 |
| Lake County School Board Ctfs. of Prtn.: | | | | | | |
| Series 2005 B, 5.25% 6/1/15 (AMBAC Insured) | | | | 4,075,000 | | 4,440,324 |
| Series B: | | | | | | |
| 5% 6/1/16 (AMBAC Insured) | | | | 2,060,000 | | 2,179,604 |
| 5.25% 6/1/14 (AMBAC Insured) | | | | 2,770,000 | | 3,002,625 |
| 5.375% 7/1/18 (AMBAC Insured) | | | | 1,000,000 | | 1,084,160 |
| Lakeland Energy Sys. Rev. 5.5% 10/1/14 (MBIA | | | | | | |
| Insured) | | | | 1,000,000 | | 1,090,170 |
| Lee Memorial Health Sys. Board of Directors Hosp. Rev. | | | | | | |
| Series A, 5.75% 4/1/12 (FSA Insured) | | | | 3,000,000 | | 3,324,090 |
| Manatee County Port Auth. Port Rev. Series A: | | | | | | |
| 5.25% 10/1/15 (MBIA Insured) (b) | | | | 1,035,000 | | 1,105,784 |
| 5.25% 10/1/16 (MBIA Insured) (b) | | | | 1,090,000 | | 1,165,886 |
| 5.25% 10/1/17 (MBIA Insured) (b) | | | | 1,145,000 | | 1,224,005 |
| 5.25% 10/1/18 (MBIA Insured) (b) | | | | 1,205,000 | | 1,288,892 |
| Martin County Utils. Sys. Rev. 5.5% 10/1/16 (FGIC | | | | | | |
| Insured) | | | | 1,265,000 | | 1,373,347 |
| Melbourne Arpt. Rev.: | | | | | | |
| 6.75% 10/1/07 (MBIA Insured) (b) | | | | 350,000 | | 369,635 |
| 6.75% 10/1/08 (MBIA Insured) (b) | | | | 375,000 | | 405,671 |
| 6.75% 10/1/09 (MBIA Insured) (b) | | | | 400,000 | | 442,784 |
| 6.75% 10/1/10 (MBIA Insured) (b) | | | | 425,000 | | 478,346 |
| Melbourne Wtr. & Swr. Rev. 5% 10/1/34 (FGIC Insured) | | | | 5,000,000 | | 5,165,350 |
| Miami Beach Health Facilities Auth. Hosp. Rev. (Mount | | | | | | |
| Sinai Med. Ctr. Proj.) 5.75% 11/15/06 | | | | 1,500,000 | | 1,523,640 |
| Miami Beach Parking Rev. 5.125% 9/1/22 (FSA | | | | | | |
| Insured) | | | | 1,010,000 | | 1,044,481 |
| Miami Beach Stormwater Rev.: | | | | | | |
| 5.375% 9/1/30 (FGIC Insured) | | | | 1,000,000 | | 1,066,690 |
| 5.75% 9/1/13 (FGIC Insured) | | | | 1,380,000 | | 1,517,241 |
See accompanying notes which are an integral part of the financial statements.
13 Annual Report
| Fidelity Florida Municipal Income Fund | | | | | | |
| Investments continued | | | | | | |
| |
| Municipal Bonds continued | | | | | | |
| | | | | Principal | | Value (Note 1) |
| | | | | Amount | | |
| Florida – continued | | | | | | |
| Miami Beach Wtr. & Swr. Rev. 5.5% 9/1/27 (AMBAC | | | | | | |
| Insured) | | $ | | 6,000,000 | | $ 6,410,220 |
| Miami Gen. Oblig.: | | | | | | |
| (Homeland Defense/Neighborhood Cap. Impt. Projs.) | | | | | | |
| Series 2002, 5.5% 1/1/16 (MBIA Insured) | | | | 5,000,000 | �� | 5,409,050 |
| 5.5% 1/1/19 (MBIA Insured) | | | | 2,370,000 | | 2,555,927 |
| Miami-Dade County Aviation Rev.: | | | | | | |
| Series A, 5% 10/1/38 (CIFG North America | | | | | | |
| Insured) (b) | | | | 3,000,000 | | 3,029,940 |
| Series C: | | | | | | |
| 5.25% 10/1/10 (MBIA Insured) (b) | | | | 3,435,000 | | 3,605,342 |
| 5.25% 10/1/12 (MBIA Insured) (b) | | | | 5,185,000 | | 5,422,214 |
| Miami-Dade County Edl. Facilities Auth. Rev.: | | | | | | |
| Series A, 5.75% 4/1/13 (AMBAC Insured) | | | | 2,500,000 | | 2,729,400 |
| 5.75% 4/1/29 (AMBAC Insured) | | | | 6,520,000 | | 7,074,656 |
| Miami-Dade County Expressway Auth. 6% 7/1/13 | | | | | | |
| (FGIC Insured) | | | | 1,200,000 | | 1,328,436 |
| Miami-Dade County Gen. Oblig. (Bldg. Better | | | | | | |
| Communities Prog.) 5% 7/1/33 (FGIC Insured) | | | | 5,000,000 | | 5,184,650 |
| Miami-Dade County Health Facilities Auth. Hosp. Rev. | | | | | | |
| (Miami Childrens Hosp. Proj.) Series A, 5.5% | | | | | | |
| 8/15/11 (AMBAC Insured) | | | | 3,000,000 | | 3,273,210 |
| Miami-Dade County Indl. Dev. Auth. Solid Waste Disp. | | | | | | |
| Rev. (Waste Mgmt., Inc. Proj.) Series 1, 3.5%, tender | | | | | | |
| 12/1/07 (a)(b) | | | | 2,000,000 | | 1,980,680 |
| Miami-Dade County School Board Ctfs. of Prtn.: | | | | | | |
| Series B, 5.5%, tender 5/1/11 (MBIA Insured) (a) | | | | 5,300,000 | | 5,741,702 |
| 5%, tender 5/1/11 (MBIA Insured) (a) | | | | 7,000,000 | | 7,438,410 |
| 5.25% 10/1/16 (FGIC Insured) | | | | 5,925,000 | | 6,424,833 |
| 5.25% 10/1/17 (FGIC Insured) | | | | 1,000,000 | | 1,084,360 |
| Ocala Util. Sys. Rev. Series B, 5.25% 10/1/22 (FGIC | | | | | | |
| Insured) | | | | 1,000,000 | | 1,077,890 |
| Okeechobee County Solid Waste Rev. (Chambers Waste | | | | | | |
| Sys. Proj.) Series A, 4.2%, tender 7/1/09 (a)(b) | | | | 2,250,000 | | 2,274,503 |
| Orange County Health Facilities Auth. Rev.: | | | | | | |
| (Adventist Health Sys./Sunbelt Obligated Group Proj.): | | | | | | |
| 5.625% 11/15/32 | | | | 4,000,000 | | 4,241,040 |
| 6.375% 11/15/20 (Pre-Refunded to 11/15/10 @ | | | | | | |
| 101) (c) | | | | 2,000,000 | | 2,272,860 |
| 6.5% 11/15/30 (Pre-Refunded to 11/15/10 @ | | | | | | |
| 101) (c) | | | | 2,545,000 | | 2,906,543 |
| (Orlando Reg’l. Health Care Sys. Proj.): | | | | | | |
| Series 1999 D, 5.75% 10/1/11 (MBIA Insured) | | | | 4,200,000 | | 4,554,606 |
See accompanying notes which are an integral part of the financial statements.
| Municipal Bonds continued | | | | | | | | |
| | | | | Principal | | Value (Note 1) |
| | | | | Amount | | | | |
| Florida – continued | | | | | | | | |
| Orange County Health Facilities Auth. Rev.: – continued | | | | | | | | |
| Series A, 6.25% 10/1/18 (MBIA Insured) | | $ | | 4,500,000 | | $ | | 5,333,175 |
| Orange County Hsg. Fin. Auth. Single Family Mtg. Rev. | | | | | | | | |
| (Mtg. Backed Securities Prog.) 6.4% 10/1/14 (b) | | | | 170,000 | | | | 172,431 |
| Orange County School Board Ctfs. of Prtn. Series A: | | | | | | | | |
| 0% 8/1/13 (MBIA Insured) | | | | 3,005,000 | | | | 2,177,814 |
| 5% 8/1/16 (MBIA Insured) | | | | 2,940,000 | | | | 3,136,980 |
| 5.25% 8/1/15 (AMBAC Insured) | | | | 8,000,000 | | | | 8,645,200 |
| 5.5% 8/1/15 (MBIA Insured) | | | | 2,265,000 | | | | 2,486,653 |
| 5.5% 8/1/16 (MBIA Insured) | | | | 2,175,000 | | | | 2,387,846 |
| Orlando Utils. Commission Wtr. & Elec. Rev. Subseries D, | | | | | | | | |
| 6.75% 10/1/17 (Escrowed to Maturity) (c) | | | | 7,560,000 | | | | 9,088,254 |
| Osceola County Infrastructure Sales Surtax Rev. 5.375% | | | | | | | | |
| 10/1/17 (AMBAC Insured) | | | | 1,000,000 | | | | 1,084,430 |
| Osceola County Tourist Dev. Tax Rev. Series A, 5.5% | | | | | | | | |
| 10/1/19 (FGIC Insured) | | | | 1,190,000 | | | | 1,297,802 |
| Palm Beach County Gen. Oblig. (Land Acquisition Proj.) | | | | | | | | |
| Series A, 5.5% 6/1/15 | | | | 1,000,000 | | | | 1,084,020 |
| Palm Beach County School Board Ctfs. of Prtn.: | | | | | | | | |
| Series A, 5.375% 8/1/14 (FSA Insured) | | | | 2,060,000 | | | | 2,244,061 |
| Series D, 5.25% 8/1/17 (FSA Insured) | | | | 2,025,000 | | | | 2,172,744 |
| Pasco County School Board Series A, 5% 8/1/30 | | | | | | | | |
| (AMBAC Insured) | | | | 4,000,000 | | | | 4,142,320 |
| Pasco County Solid Waste Disp. & Resource Recovery Sys. | | | | | | | | |
| Rev.: | | | | | | | | |
| 6% 4/1/08 (AMBAC Insured) (b) | | | | 2,400,000 | | | | 2,512,872 |
| 6% 4/1/10 (AMBAC Insured) (b) | | | | 5,770,000 | | | | 6,223,522 |
| 6% 4/1/11 (AMBAC Insured) (b) | | | | 5,900,000 | | | | 6,427,814 |
| Pensacola Arpt. Rev. Series A, 6.125% 10/1/18 (MBIA | | | | | | | | |
| Insured) (b) | | | | 1,500,000 | | | | 1,608,075 |
| Pinellas County Health Facilities Auth. Rev. (Baycare | | | | | | | | |
| Health Sys. Proj.) 5.5% 11/15/33 | | | | 3,670,000 | | | | 3,843,151 |
| Plant City Util. Sys. Rev. 6% 10/1/15 (MBIA Insured) | | | | 2,200,000 | | | | 2,489,058 |
| Polk Co. Pub. Facilities Rev. 5% 12/1/33 (MBIA Insured) | | | | 2,000,000 | | | | 2,069,960 |
| Polk County Cap. Impt. Rev. Series 2004, 5.5%, tender | | | | | | | | |
| 12/1/10 (FSA Insured) (a) | | | | 3,000,000 | | | | 3,228,360 |
| Port Saint Lucie Gen. Oblig. 5% 7/1/32 (MBIA Insured) | | | | 3,650,000 | | | | 3,767,603 |
| Reedy Creek Impt. District Utils. Rev. Series 1, 5.25% | | | | | | | | |
| 10/1/19 (MBIA Insured) | | | | 3,700,000 | | | | 3,994,927 |
| Saint Petersburg Health Facilities Auth. Rev. (All | | | | | | | | |
| Children’s Hosp. Proj.): | | | | | | | | |
| 5.5% 11/15/17 (AMBAC Insured) | | | | 1,225,000 | | | | 1,351,824 |
| 5.5% 11/15/18 (AMBAC Insured) | | | | 1,000,000 | | | | 1,101,600 |
See accompanying notes which are an integral part of the financial statements.
15 Annual Report
| Fidelity Florida Municipal Income Fund | | | | | | | | | | |
| Investments continued | | | | | | | | | | |
| |
| Municipal Bonds continued | | | | | | | | | | |
| | | | | | | Principal | | Value (Note 1) |
| | | | | | | Amount | | | | |
| Florida – continued | | | | | | | | | | |
| Sarasota County Solid Waste Sys. Rev. 5% 10/1/15 | | | | | | | | | | |
| (MBIA Insured) | | | | $ | | 1,000,000 | | $ | | 1,072,110 |
| South Broward Hosp. District Rev.: | | | | | | | | | | |
| 5.6% 5/1/27 (MBIA Insured) | | | | | | 1,920,000 | | | | 2,104,627 |
| 5.625% 5/1/32 (MBIA Insured) | | | | | | 2,600,000 | | | | 2,836,730 |
| Sumter County School District Rev. (Multi-District Ln. | | | | | | | | | | |
| Prog.) 7.15% 11/1/15 (FSA Insured) | | | | | | 985,000 | | | | 1,239,426 |
| Tampa Rev. (Catholic Health East Proj.) Series A1: | | | | | | | | | | |
| 4.7% 11/15/10 (MBIA Insured) | | | | | | 1,500,000 | | | | 1,566,495 |
| 5.5% 11/15/08 (MBIA Insured) | | | | | | 500,000 | | | | 527,595 |
| 5.5% 11/15/12 (MBIA Insured) | | | | | | 1,015,000 | | | | 1,105,853 |
| Tampa Sales Tax Rev.: | | | | | | | | | | |
| Series 2001 A: | | | | | | | | | | |
| 5.375% 10/1/18 (AMBAC Insured) | | | | | | 2,465,000 | | | | 2,684,385 |
| 5.375% 10/1/19 (AMBAC Insured) | | | | | | 2,650,000 | | | | 2,882,962 |
| Series A, 5.375% 10/1/15 (AMBAC Insured) | | | | | | 2,150,000 | | | | 2,342,189 |
| Univ. Athletic Assoc., Inc. Athletic Prog. Rev. Series | | | | | | | | | | |
| 2001: | | | | | | | | | | |
| 2.8%, tender 10/1/08, LOC SunTrust Banks of | | | | | | | | | | |
| Florida, Inc. (a) | | | | | | 3,000,000 | | | | 2,939,220 |
| 3%, tender 10/1/09, LOC SunTrust Banks (a) | | | | | | 3,000,000 | | | | 2,927,790 |
| Univ. of Central Florida Athletics Assoc., Inc. Ctfs. of | | | | | | | | | | |
| Prtn. Series A: | | | | | | | | | | |
| 5% 10/1/16 (FGIC Insured) | | | | | | 1,715,000 | | | | 1,822,976 |
| 5% 10/1/17 (FGIC Insured) | | | | | | 1,805,000 | | | | 1,906,730 |
| 5% 10/1/35 (FGIC Insured) | | | | | | 2,275,000 | | | | 2,347,937 |
| 5.25% 10/1/34 (FGIC Insured) | | | | | | 2,000,000 | | | | 2,112,580 |
| USF Fing. Corp. Ctfs. of Prtn. (Master Lease Prog.) Series A: | | | | | | | | |
| 5.25% 7/1/15 (AMBAC Insured) | | | | | | 2,690,000 | | | | 2,910,661 |
| 5.25% 7/1/16 (AMBAC Insured) | | | | | | 2,830,000 | | | | 3,039,052 |
| Volusia County Edl. Facilities Auth. Rev.: | | | | | | | | | | |
| 5% 10/15/11 (Radian Asset Assurance Ltd. Insured) | | . | | | | 1,000,000 | | | | 1,055,480 |
| 5% 10/15/12 (Radian Asset Assurance Ltd. Insured) | | . | | | | 1,260,000 | | | | 1,332,563 |
| Walton County School Board Ctfs. of Prtn.: | | | | | | | | | | |
| 5% 7/1/15 (FSA Insured) | | | | | | 1,625,000 | | | | 1,726,546 |
| 5% 7/1/16 (FSA Insured) | | | | | | 1,705,000 | | | | 1,808,459 |
| 5.25% 7/1/18 (FSA Insured) | | | | | | 1,865,000 | | | | 2,026,173 |
| Winter Park Gen. Oblig. 5.25% 7/1/18 | | | | | | 1,000,000 | | | | 1,077,900 |
| | | | | | | | | 484,500,483 |
See accompanying notes which are an integral part of the financial statements.
| Municipal Bonds continued | | | | | | | | |
| | | | | | | Principal | | Value (Note 1) |
| | | | | | | Amount | | |
| Guam 0.1% | | | | | | | | |
| Guam Wtrwks. Auth. Wtr. and Wastewtr. Sys. Rev. | | | | | | |
| 5.875% 7/1/35 | | | | $ | | 400,000 | | $ 412,840 |
| Puerto Rico 1.7% | | | | | | | | |
| Puerto Rico Commonwealth Hwy. & Trans. Auth. Hwy. | | | | | | |
| Rev. Series Y, 5.5% 7/1/36 (FSA Insured) | | | | 2,400,000 | | 2,644,680 |
| Puerto Rico Commonwealth Infrastructure Fing. Auth. | | | | | | |
| Series 2000 A, 5.5% 10/1/32 (Escrowed to | | | | | | |
| Maturity) (c) | | | | | | 2,890,000 | | 3,132,933 |
| Puerto Rico Elec. Pwr. Auth. Pwr. Rev. Series QQ, 5.5% | | | | | | |
| 7/1/16 (XL Cap. Assurance, Inc. Insured) | | | | 900,000 | | 1,010,475 |
| Puerto Rico Muni. Fin. Agcy. Series A, 5.5% 8/1/23 | | | | | | |
| (FSA Insured) | | | | | | 1,750,000 | | 1,872,605 |
| | | | | | | | | 8,660,693 |
| |
| |
| TOTAL INVESTMENT PORTFOLIO 97.4% | | | | | | |
| (Cost $481,269,755) | | | | | | | | 493,574,016 |
| |
| |
| NET OTHER ASSETS – 2.6% | | | | | | | | 13,164,450 |
| NET ASSETS 100% | | | | | | | | $ 506,738,466 |
| |
| |
| Swap Agreements | | | | | | | | |
| | | Expiration | | | | Notional | | Value |
| | | Date | | | | Amount | | |
| |
| Interest Rate Swaps | | | | | | | | |
| Receive quarterly a floating rate based on | | | | | | | | |
| 3-month LIBOR and pay quarterly a fixed | | | | | | |
| rate equal to 4.84% with Morgan Stanley, | | | | | | |
| Inc. | | Feb. 2016 | | | | $ 5,000,000 | | $ 77,650 |
Legend
(a) The coupon rate shown on floating or
adjustable rate securities represents the
rate at period end.
(b) Private activity obligations whose
interest is subject to the federal
alternative minimum tax for individuals.
(c) Security collateralized by an amount
sufficient to pay interest and principal.
|
See accompanying notes which are an integral part of the financial statements.
17 Annual Report
Fidelity Florida Municipal Income Fund Investments continued
Affiliated Central Funds
Information regarding income received by the fund from the affiliated Central funds during the period is as follows:
| Fund | | | | Income received |
| Fidelity Municipal Cash Central Fund | | | $ | 56,175 |
Other Information
The distribution of municipal securities by revenue source, as a percentage of total net assets, is as follows:
| General Obligations | | 29.3% |
| Health Care | | 17.3% |
| Transportation | | 11.6% |
| Special Tax | | 7.6% |
| Education | | 7.6% |
| Water & Sewer | | 7.4% |
| Escrowed/Pre Refunded | | 6.3% |
| Others* (individually less than 5%) | | 12.9% |
| | | 100.0% |
| |
| *Includes net other assets | | |
See accompanying notes which are an integral part of the financial statements.
| Fidelity Florida Municipal Income Fund | | | | | | | | |
| Financial Statements | | | | | | | | |
| |
| Statement of Assets and Liabilities | | | | | | | | |
| | | | | | | November 30, 2005 |
| |
| Assets | | | | | | | | |
| Investment in securities, at value See accompanying | | | | | | | | |
| schedule: | | | | | | | | |
| Unaffiliated issuers (cost $481,269,755) | | | | | | $ | | 493,574,016 |
| Cash | | | | | | | | 6,469,660 |
| Receivable for investments sold | | | | | | | | 1,456,006 |
| Receivable for fund shares sold | | | | | | | | 756,323 |
| Interest receivable | | | | | | | | 5,738,630 |
| Swap agreements, at value | | | | | | | | 77,650 |
| Prepaid expenses | | | | | | | | 2,794 |
| Other receivables | | | | | | | | 25,216 |
| Total assets | | | | | | | | 508,100,295 |
| |
| Liabilities | | | | | | | | |
| Payable for investments purchased | | $ | | 412,824 | | | | |
| Payable for fund shares redeemed | | | | 141,309 | | | | |
| Distributions payable | | | | 576,528 | | | | |
| Accrued management fee | | | | 156,864 | | | | |
| Other affiliated payables | | | | 39,155 | | | | |
| Other payables and accrued expenses | | | | 35,149 | | | | |
| Total liabilities | | | | | | | | 1,361,829 |
| |
| Net Assets | | | | | | $ | | 506,738,466 |
| Net Assets consist of: | | | | | | | | |
| Paid in capital | | | | | | $ | | 486,980,324 |
| Undistributed net investment income | | | | | | | | 355,808 |
| Accumulated undistributed net realized gain (loss) on | | | | | | | | |
| investments | | | | | | | | 7,020,423 |
| Net unrealized appreciation (depreciation) on | | | | | | | | |
| investments | | | | | | | | 12,381,911 |
| Net Assets, for 43,926,091 shares outstanding | | | | | | $ | | 506,738,466 |
| Net Asset Value, offering price and redemption price per | | | | | | |
| share ($506,738,466 ÷ 43,926,091 shares) | | | | | | $ | | 11.54 |
See accompanying notes which are an integral part of the financial statements.
19 Annual Report
| Fidelity Florida Municipal Income Fund | | | | |
| Financial Statements continued | | | | |
| |
| Statement of Operations | | | | | | |
| | | | | Year ended November 30, 2005 |
| |
| Investment Income | | | | | | |
| Interest | | | | | | $ 22,151,769 |
| Income from affiliated Central Funds | | | | | | 56,175 |
| Total income | | | | | | 22,207,944 |
| |
| Expenses | | | | | | |
| Management fee | | $ | | 1,927,933 | | |
| Transfer agent fees | | | | 337,953 | | |
| Accounting fees and expenses | | | | 127,410 | | |
| Independent trustees’ compensation | | | | 2,401 | | |
| Custodian fees and expenses | | | | 8,442 | | |
| Registration fees | | | | 22,520 | | |
| Audit | | | | 47,969 | | |
| Legal | | | | 5,821 | | |
| Miscellaneous | | | | 6,247 | | |
| Total expenses before reductions | | | | 2,486,696 | | |
| Expense reductions | | | | (353,961) | | 2,132,735 |
| |
| Net investment income | | | | | | 20,075,209 |
| Realized and Unrealized Gain (Loss) | | | | |
| Net realized gain (loss) on: | | | | | | |
| Investment securities: | | | | | | |
| Unaffiliated issuers | | | | 6,674,435 | | |
| Futures contracts | | | | 119,117 | | |
| Swap agreements | | | | 75,055 | | |
| Total net realized gain (loss) | | | | | | 6,868,607 |
| Change in net unrealized appreciation (depreciation) on: | | | | |
| Investment securities | | | | (10,977,599) | | |
| Swap agreements | | | | 77,650 | | |
| Total change in net unrealized appreciation | | | | |
| (depreciation) | | | | | | (10,899,949) |
| Net gain (loss) | | | | | | (4,031,342) |
| Net increase (decrease) in net assets resulting from | | | | |
| operations | | | | | | $ 16,043,867 |
See accompanying notes which are an integral part of the financial statements.
| Statement of Changes in Net Assets | | | | | | | | |
| | | | | Year ended | | | | Year ended |
| | | | | November 30, | | | | November 30, |
| | | | | 2005 | | | | 2004 |
| Increase (Decrease) in Net Assets | | | | | | | | |
| Operations | | | | | | | | |
| Net investment income | | $ | | 20,075,209 | | $ | | 20,590,813 |
| Net realized gain (loss) | | | | 6,868,607 | | | | 1,894,911 |
| Change in net unrealized appreciation (depreciation) . | | | | (10,899,949) | | | | (2,687,499) |
| Net increase (decrease) in net assets resulting | | | | | | | | |
| from operations | | | | 16,043,867 | | | | 19,798,225 |
| Distributions to shareholders from net investment income . | | | | (20,024,782) | | | | (20,814,218) |
| Distributions to shareholders from net realized gain | | | | (1,482,849) | | | | (8,261,770) |
| Total distributions | | | | (21,507,631) | | | | (29,075,988) |
| Share transactions | | | | | | | | |
| Proceeds from sales of shares | | | | 91,183,311 | | | | 105,574,499 |
| Reinvestment of distributions | | | | 13,970,273 | | | | 18,506,466 |
| Cost of shares redeemed | | | | (97,893,031) | | | | (160,741,128) |
| Net increase (decrease) in net assets resulting from | | | | | | | | |
| share transactions | | | | 7,260,553 | | | | (36,660,163) |
| Redemption fees | | | | 3,470 | | | | 11,803 |
| Total increase (decrease) in net assets | | | | 1,800,259 | | | | (45,926,123) |
| |
| Net Assets | | | | | | | | |
| Beginning of period | | | | 504,938,207 | | | | 550,864,330 |
| End of period (including undistributed net investment | | | | | | | | |
| income of $355,808 and undistributed net invest- | | | | | | | | |
| ment income of $304,425, respectively) | | $ | | 506,738,466 | | $ | | 504,938,207 |
| |
| Other Information | | | | | | | | |
| Shares | | | | | | | | |
| Sold | | | | 7,790,603 | | | | 9,010,161 |
| Issued in reinvestment of distributions | | | | 1,195,945 | | | | 1,584,499 |
| Redeemed | | | | (8,392,197) | | | | (13,802,534) |
| Net increase (decrease) | | | | 594,351 | | | | (3,207,874) |
See accompanying notes which are an integral part of the financial statements.
21 Annual Report
| Financial Highlights | | | | | | | | | | |
| Years ended November 30, | | 2005 | | 2004 | | 2003 | | 2002 | | 2001 |
| Selected Per Share Data | | | | | | | | | | |
| Net asset value, beginning of period | | $ 11.65 | | $ 11.84 | | $ 11.67 | | $ 11.51 | | $ 11.10 |
| Income from Investment Operations | | | | | | | | | | |
| Net investment incomeB | | 454 | | .464 | | .479 | | .506D | | .547 |
| Net realized and unrealized gain | | | | | | | | | | |
| (loss) | | (.077) | | (.010) | | .253 | | .163D | | .393 |
| Total from investment operations | | 377 | | .454 | | .732 | | .669 | | .940 |
| Distributions from net investment | | | | | | | | | | |
| income | | (.453) | | (.469) | | (.484) | | (.510) | | (.528) |
| Distributions from net realized gain . | | (.034) | | (.175) | | (.078) | | | | (.002) |
| Total distributions | | (.487) | | (.644) | | (.562) | | (.510) | | (.530) |
| Redemption fees added to paid in | | | | | | | | | | |
| capitalB | | —E | | —E | | —E | | .001 | | —E |
| Net asset value, end of period | | $ 11.54 | | $ 11.65 | | $ 11.84 | | $ 11.67 | | $ 11.51 |
| Total ReturnA | | 3.27% | | 3.95% | | 6.40% | | 5.93% | | 8.60% |
| Ratios to Average Net AssetsC | | | | | | | | | | |
| Expenses before reductions | | 48% | | .49% | | .49% | | .49% | | .49% |
| Expenses net of fee waivers, if any | | .48% | | .49% | | .49% | | .49% | | .49% |
| Expenses net of all reductions | | 41% | | .48% | | .48% | | .47% | | .40% |
| Net investment income | | 3.89% | | 3.96% | | 4.05% | | 4.35%D | | 4.78% |
| Supplemental Data | | | | | | | | | | |
| Net assets, end of period (000 | | | | | | | | | | |
| omitted) | | $506,738 | | $504,938 | | $550,864 | | $552,720 | | $510,762 |
| Portfolio turnover rate | | 35% | | 24% | | 33% | | 26% | | 12% |
A Total returns would have been lower had certain expenses not been reduced during the periods shown.
B Calculated based on average shares outstanding during the period.
C Expense ratios reflect operating expenses of the fund. Expenses before reductions do not reflect amounts reimbursed by the investment adviser or
reductions from brokerage service arrangements or other expense offset arrangements and do not represent the amount paid by the fund during
periods when reimbursements or reductions occur. Expenses net of fee waivers reflect expenses after reimbursement by the investment adviser but
prior to reductions from brokerage service arrangements or other expense offset arrangements. Expenses net of all reductions represent the net
expenses paid by the fund.
D Effective December 1, 2001, the fund adopted the provisions of the AICPA Audit and Accounting Guide for Investment Companies and began
amortizing premium and discount on all debt securities. Per share data and ratios for periods prior to adoption have not been restated to reflect
this change.
E Amount represents less than $.001 per share.
|
See accompanying notes which are an integral part of the financial statements.
| Fidelity Florida Municipal Money Market Fund | | | | |
| Investment Changes | | | | | | |
| |
| |
| Maturity Diversification | | | | | | |
| Days | | % of fund’s | | % of fund’s | | % of fund’s |
| | | investments | | investments | | investments |
| | | 11/30/05 | | 5/31/05 | | 11/30/04 |
| 0 – 30 | | 89.9 | | 76.4 | | 85.7 |
| 31 – 90 | | 2.7 | | 17.7 | | 2.3 |
| 91 – 180 | | 4.9 | | 4.2 | | 8.4 |
| 181 – 397 | | 2.5 | | 1.7 | | 3.6 |
| Weighted Average Maturity | | | | | | |
| | | 11/30/05 | | 5/31/05 | | 11/30/04 |
| Fidelity Florida Municipal Money | | | | | | |
| Market Fund | | 20 Days | | 24 Days | | 24 Days |
| Florida Tax Free Money Market | | | | | | |
| Funds Average* | | 25 Days | | 22 Days | | 34 Days |

| Current and Historical Seven Day Yields | | | | | | |
| | | 11/28/05 | | 8/29/05 | | 5/30/05 | | 2/28/05 | | 11/29/04 |
| Fidelity Florida Municipal | | | | | | | | | | |
| Money Market Fund | | 2.58% | | 2.13% | | 2.44% | | 1.41% | | 1.24% |
Yield refers to the income paid by the fund over a given period. Yields for money market funds are usually for seven day periods, as they are here, though they are expressed as annual percentage rates. Past performance is no guarantee of future results. Yield will vary and it is possible to lose money by investing in the fund.
*Source: iMoneyNet, Inc.
23 Annual Report
Fidelity Florida Municipal Money Market Fund
Investments November 30, 2005
Showing Percentage of Net Assets
Municipal Securities 94.6%
| | | Principal | | Value (Note 1) |
| | | Amount | | |
| Alaska – 0.2% | | | | |
| Alaska Intl. Arpts. Revs. Participating VRDN Series PT 2061, | | | | |
| 3.12% (Liquidity Facility Merrill Lynch & Co., Inc.) (a)(b)(c) | | $ 3,185,000 | | $ 3,185,000 |
| Arizona – 0.4% | | | | |
| Maricopa County Indl. Dev. Auth. Single Family Mtg. Rev. | | | | |
| Participating VRDN Series MS 1165, 3.12% (Liquidity | | | | |
| Facility Morgan Stanley) (a)(b)(c) | | 4,000,000 | | 4,000,000 |
| Phoenix Civic Impt. Corp. District Rev. Participating VRDN | | | | |
| Series PZ 85, 3.12% (Liquidity Facility Merrill Lynch & Co., | | | | |
| Inc.) (a)(c) | | 1,700,000 | | 1,700,000 |
| Phoenix Indl. Dev. Auth. Rev. (Laura Dozer Ctr. Proj.) 3.25%, | | | | |
| LOC JPMorgan Chase Bank, VRDN (a) | | 1,500,000 | | 1,500,000 |
| | | | | 7,200,000 |
| |
| Arkansas – 0.4% | | | | |
| Arkansas Dev. Fin. Auth. Envir. Facilities Rev. (Teris LLC Proj.) | | | | |
| 3.1%, LOC Wachovia Bank NA, VRDN (a)(b) | | 4,000,000 | | 4,000,000 |
| Arkansas Dev. Fin. Auth. Single Family Mtg. Rev. Participating | | | | |
| VRDN Series MS 1139, 3.12% (Liquidity Facility Morgan | | | | |
| Stanley) (a)(b)(c) | | 3,063,000 | | 3,063,000 |
| | | | | 7,063,000 |
| |
| California – 0.4% | | | | |
| California Hsg. Fin. Agcy. Home Mtg. Rev. Participating | | | | |
| VRDN: | | | | |
| Series MT 22, 3.11% (Liquidity Facility Landesbank | | | | |
| Hessen-Thuringen) (a)(b)(c) | | 1,580,000 | | 1,580,000 |
| Series MT 7, 3.11% (Liquidity Facility Merrill Lynch & Co., | | | | |
| Inc.) (a)(b)(c) | | 3,395,000 | | 3,395,000 |
| Series PT 998, 3.11% (Liquidity Facility Merrill Lynch & Co., | | | | |
| Inc.) (a)(b)(c) | | 1,500,000 | | 1,500,000 |
| | | | | 6,475,000 |
| |
| Colorado – 1.9% | | | | |
| Colorado Hsg. & Fin. Auth. Participating VRDN: | | | | |
| Series LB 05 F1, 3.19% (Lehman Brothers Hldgs., Inc. | | | | |
| Guaranteed) (Liquidity Facility Lehman Brothers Hldgs., | | | | |
| Inc.) (a)(b)(c) | | 9,475,000 | | 9,475,000 |
| Series LB 05 F4, 3.19% (Lehman Brothers Hldgs., Inc. | | | | |
| Guaranteed) (Liquidity Facility Lehman Brothers Hldgs., | | | | |
| Inc.) (a)(b)(c) | | 6,710,000 | | 6,710,000 |
| Series Merlots 01 A20, 3.07% (Liquidity Facility Wachovia | | | | |
| Bank NA) (a)(b)(c) | | 4,445,000 | | 4,445,000 |
| Denver City & County Arpt. Rev. Participating VRDN Series PT | | | | |
| 2496, 3.12% (Liquidity Facility Merrill Lynch & Co., | | | | |
| Inc.) (a)(b)(c) | | 4,160,000 | | 4,160,000 |
See accompanying notes which are an integral part of the financial statements.
| Municipal Securities continued | | | | |
| | | Principal | | Value (Note 1) |
| | | Amount | | |
| Colorado – continued | | | | |
| E-470 Pub. Hwy. Auth. Rev. Participating VRDN Series 04 BS | | | | |
| 219 Class A, 3.1% (Liquidity Facility Bear Stearns | | | | |
| Companies, Inc.) (a)(c) | | $ 4,100,000 | | $ 4,100,000 |
| Moffat County Poll. Cont. Rev. (Colorado-UTE Elec. Assoc., Inc. | | | | |
| Proj.) Series 1984, 3.06% (AMBAC Insured), VRDN (a) | | 3,050,000 | | 3,050,000 |
| | | | | 31,940,000 |
| |
| Delaware – 0.1% | | | | |
| Delaware Econ. Dev. Auth. Rev. (Delmarva Pwr. & Lt. Co. | | | | |
| Proj.): | | | | |
| Series 1988, 3.15%, VRDN (a)(b) | | 1,500,000 | | 1,500,000 |
| Series 1999 B, 3.12%, VRDN (a)(b) | | 900,000 | | 900,000 |
| | | | | 2,400,000 |
| |
| District Of Columbia – 0.5% | | | | |
| Metropolitan Washington Arpts. Auth. Sys. Rev.: | | | | |
| Participating VRDN Series PT 689, 3.12% (Liquidity Facility | | | | |
| Merrill Lynch & Co., Inc.) (a)(b)(c) | | 5,870,000 | | 5,870,000 |
| 3.03% (FSA Insured), VRDN (a)(b) | | 1,900,000 | | 1,900,000 |
| | | | | 7,770,000 |
| |
| Florida – 65.8% | | | | |
| Boynton Beach Cmnty. Redev. Agcy. Tax Increment Rev. | | | | |
| Participating VRDN Series Putters 657, 3.08% (Liquidity | | | | |
| Facility JPMorgan Chase & Co.) (a)(c) | | 1,595,000 | | 1,595,000 |
| Brevard County Hsg. Fin. Auth.: | | | | |
| (Manatee Cove Apts. Proj.) 3.03%, LOC Citibank NA, | | | | |
| VRDN (a)(b) | | 5,700,000 | | 5,700,000 |
| (Wickham Club Apts. Proj.) Series A, 3.06%, LOC Southtrust | | | | |
| Bank NA, VRDN (a)(b) | | 7,405,000 | | 7,405,000 |
| Brevard County Hsg. Fin. Auth. Homeowner Mtg. Rev. | | | | |
| Participating VRDN Series PT 1377, 3.12% (Liquidity Facility | | | | |
| Merrill Lynch & Co., Inc.) (a)(b)(c) | | 4,330,000 | | 4,330,000 |
| Brevard County School Board RAN 3.75% 4/28/06 | | 15,165,000 | | 15,221,213 |
| Brevard County School Board Ctfs. of Prtn. Participating VRDN | | | | |
| Series Putters 638, 3.08% (Liquidity Facility JPMorgan Chase | | | | |
| Bank) (a)(c) | | 2,490,000 | | 2,490,000 |
| Broward County Arpt. Sys. Rev. Participating VRDN: | | | | |
| Series PT 2415, 3.08% (Liquidity Facility Merrill Lynch & Co., | | | | |
| Inc.) (a)(c) | | 5,275,000 | | 5,275,000 |
| Series PT 2417, 3.08% (Liquidity Facility Merrill Lynch & Co., | | | | |
| Inc.) (a)(c) | | 5,300,000 | | 5,300,000 |
| Series Stars 93, 3.12% (Liquidity Facility BNP Paribas | | | | |
| SA) (a)(b)(c) | | 3,395,000 | | 3,395,000 |
See accompanying notes which are an integral part of the financial statements.
25 Annual Report
| Fidelity Florida Municipal Money Market Fund | | | | |
| Investments continued | | | | | | |
| |
| Municipal Securities continued | | | | |
| | | | | Principal | | Value (Note 1) |
| | | | | Amount | | |
| Florida – continued | | | | | | |
| Broward County Fin. Auth. Multi-family Hsg. Rev. (Pinnacle | | | | |
| Village Apts. Proj.) 3.06%, LOC Citibank NA, VRDN (a)(b) . | | $ 9,200,000 | | $ 9,200,000 |
| Broward County Gen. Oblig. Participating VRDN Series | | | | |
| Merlots 04 B9, 3.02% (Liquidity Facility Wachovia Bank | | | | |
| NA) (a)(c) | | | | 5,615,000 | | 5,615,000 |
| Broward County Hsg. Fin. Auth. Single Family Mtg. Rev. | | | | |
| Participating VRDN Series Merlots 01 A27, 3.07% (Liquidity | | | | |
| Facility Wachovia Bank NA) (a)(b)(c) | | | | 1,210,000 | | 1,210,000 |
| Broward County Indl. Dev. Rev. (Fast Real Estate Partners Ltd. | | | | |
| Proj.) 3.1%, LOC SunTrust Bank, VRDN (a)(b) | | 1,400,000 | | 1,400,000 |
| Broward County Port Facilities Rev. (Port Everglades Proj.) | | | | |
| Series 1998, 3.08% (AMBAC Insured), VRDN (a)(b) | | 4,300,000 | | 4,300,000 |
| Cape Coral Gen. Oblig. 3% 2/17/06, LOC Bank of America | | | | |
| NA, CP | | | | 3,000,000 | | 3,000,000 |
| Clay County Hsg. Fin. Auth. Multi-family Hsg. Rev. (Nassau | | | | |
| Club Apts. Proj.) 3.06%, LOC Key Bank NA, VRDN (a)(b) | | 5,000,000 | | 5,000,000 |
| Clay County Hsg. Fin. Auth. Rev. Participating VRDN Series | | | | |
| BA 00 O, 3.19% (Liquidity Facility Bank of America | | | | |
| NA) (a)(b)(c) | | | | 4,095,000 | | 4,095,000 |
| Clipper Tax-Exempt Trust Participating VRDN: | | | | |
| Series Clipper 05 17, 3.16% (Liquidity Facility Merrill Lynch | | | | |
| & Co., Inc.) (a)(b)(c) | | | | 13,051,000 | | 13,051,000 |
| Series Clipper 05 41, 3.12% (Liquidity Facility State Street | | | | |
| Bank & Trust Co., Boston) (a)(b)(c) | | | | 10,275,000 | | 10,275,000 |
| Coconut Creek Indl. Dev. Rev. (Elite Aluminum Corp. Proj.) | | | | |
| 3.1%, LOC Bank of America NA, VRDN (a)(b) | | 2,670,000 | | 2,670,000 |
| Collier County Health Facilities Auth. Hosp. Rev. Bonds | | | | |
| (Cleveland Clinic Health Sys. Proj.) Series 2003 C2, 2.8% | | | | |
| tender 1/9/06, LOC Bank of America NA, CP mode | | 1,500,000 | | 1,500,000 |
| Collier County Hsg. Fin. Auth. Multi-family Rev.: | | | | |
| (Sawgrass Pines Apts. Proj.) 3.08%, LOC Fannie Mae, | | | | |
| VRDN (a)(b) | | | | 6,800,000 | | 6,800,000 |
| (Summer Lakes Phase II Apts. Proj.) 3.04%, LOC Citibank | | | | |
| NA, VRDN (a)(b) | | | | 12,000,000 | | 12,000,000 |
| Collier County School Board Ctfs. of Prtn. Participating VRDN | | | | |
| Series PT 2295, 3.07% (Liquidity Facility Merrill Lynch & Co., | | | | |
| Inc.) (a)(c) | | | | 6,995,000 | | 6,995,000 |
| Dade County Multi-family Hsg. Rev. (Biscayne View Apts. Proj.) | | | | |
| Series 1993, 3.15% (Monumental Life Ins. Co. Guaranteed), | | | | |
| VRDN (a)(b) | | | | 28,475,000 | | 28,475,000 |
| Deltona Util. Sys. Rev. Participating VRDN Series PT 2026, | | | | |
| 3.07% (Liquidity Facility Merrill Lynch & Co., Inc.) (a)(c) | | 4,225,000 | | 4,225,000 |
| |
| |
| |
| See accompanying notes which are an integral part of the financial statements. | | |
| |
| Annual Report | | 26 | | | | |
| Municipal Securities continued | | | | |
| | | Principal | | Value (Note 1) |
| | | Amount | | |
| Florida – continued | | | | |
| Escambia County Hsg. Fin. Auth. Single Family Mtg. Rev. | | | | |
| Participating VRDN: | | | | |
| Series BA 01 C, 3.16% (Liquidity Facility Bank of America | | | | |
| NA) (a)(b)(c) | | $ 1,565,000 | | $ 1,565,000 |
| Series PT 519, 3.12% (Liquidity Facility BNP Paribas | | | | |
| SA) (a)(b)(c) | | 1,660,000 | | 1,660,000 |
| Escambia County Hsg. Fin. Rev. Participating VRDN Series RF | | | | |
| 00 15, 3.19% (Liquidity Facility Bank of New York, New | | | | |
| York) (a)(b)(c) | | 3,965,000 | | 3,965,000 |
| Florida Board of Ed. Cap. Outlay Participating VRDN: | | | | |
| Series EGL 00 901, 3.08% (Liquidity Facility Citibank NA, | | | | |
| New York) (a)(c) | | 6,100,000 | | 6,100,000 |
| Series EGL 00 902, 3.08% (Liquidity Facility Citibank NA, | | | | |
| New York) (a)(c) | | 5,000,000 | | 5,000,000 |
| Series EGL 03 25, 3.08% (Liquidity Facility Citibank NA, | | | | |
| New York) (a)(c) | | 4,900,000 | | 4,900,000 |
| Series EGL 04 1007 Class A, 3.08% (Liquidity Facility | | | | |
| Citibank NA) (a)(c) | | 3,875,000 | | 3,875,000 |
| Series Putters 137, 3.08% (Liquidity Facility JPMorgan Chase | | | | |
| & Co.) (a)(c) | | 16,055,000 | | 16,055,000 |
| Florida Board of Ed. Lottery Rev. Participating VRDN: | | | | |
| Series EGL 01 906, 3.08% (Liquidity Facility Citibank NA, | | | | |
| New York) (a)(c) | | 3,000,000 | | 3,000,000 |
| Series PT 2030, 3.07% (Liquidity Facility Merrill Lynch & Co., | | | | |
| Inc.) (a)(c) | | 13,960,000 | | 13,960,000 |
| Series ROC II R4521, 3.08% (Liquidity Facility Citigroup | | | | |
| Global Markets Hldgs., Inc.) (a)(c) | | 2,470,000 | | 2,470,000 |
| Florida Board of Ed. Pub. Ed. Participating VRDN Series ROC | | | | |
| II R6037, 3.08% (Liquidity Facility Citibank NA) (a)(c) | | 3,325,000 | | 3,325,000 |
| Florida Dept. of Envir. Protection Preservation Rev. | | | | |
| Participating VRDN: | | | | |
| Series Floaters 722, 3.07% (Liquidity Facility Morgan | | | | |
| Stanley) (a)(c) | | 3,680,000 | | 3,680,000 |
| Series ROC II R3043, 3.08% (Liquidity Facility Citigroup | | | | |
| Global Markets Hldgs., Inc.) (a)(c) | | 2,990,000 | | 2,990,000 |
| Florida Dept. of Trans. Tpk. Rev. Participating VRDN Series | | | | |
| ROC II R314, 3.08% (Liquidity Facility Citibank NA) (a)(c) | | 7,155,000 | | 7,155,000 |
| Florida Dev. Fin. Corp. Indl. Dev.: | | | | |
| (Axon Circuit, Inc. Proj.) Series 2003 B1, 3.2%, LOC | | | | |
| SunTrust Bank, VRDN (a)(b) | | 1,180,000 | | 1,180,000 |
| (Cabinet Connection of the Treasure Coast Proj.) Series 2003 | | | | |
| B3, 3.2%, LOC Wachovia Bank NA, VRDN (a)(b) | | 1,895,000 | | 1,895,000 |
| (The Ultimate Umbrella Co., Inc. Proj.) Series 2003 B3, | | | | |
| 3.35%, LOC Wachovia Bank NA, VRDN (a)(b) | | 760,000 | | 760,000 |
See accompanying notes which are an integral part of the financial statements.
27 Annual Report
| Fidelity Florida Municipal Money Market Fund | | | | |
| Investments continued | | | | |
| |
| Municipal Securities continued | | | | |
| | | Principal | | Value (Note 1) |
| | | Amount | | |
| Florida – continued | | | | |
| Florida Division of Bond Fin. Dept. Gen. Svcs. Revs. | | | | |
| Participating VRDN Series MS 00 317, 3.07% (Liquidity | | | | |
| Facility Morgan Stanley) (a)(c) | | $ 1,100,000 | | $ 1,100,000 |
| Florida Gen. Oblig.: | | | | |
| Bonds Series Merlots 05 A22, 3.35%, tender 11/14/06 | | | | |
| (Liquidity Facility Wachovia Bank NA) (a)(c)(e) | | 15,600,000 | | 15,600,000 |
| Participating VRDN: | | | | |
| Series MS 98 117, 3.07% (Liquidity Facility Morgan | | | | |
| Stanley) (a)(c) | | 2,245,000 | | 2,245,000 |
| Series ROC II R7507, 3.08% (Liquidity Facility Citibank | | | | |
| NA) (a)(c) | | 2,640,000 | | 2,640,000 |
| Florida Hsg. Fin. Corp. Participating VRDN Series Clipper 05 | | | | |
| 40, 3.12% (Liquidity Facility State Street Bank & Trust Co., | | | | |
| Boston) (a)(b)(c) | | 5,090,000 | | 5,090,000 |
| Florida Hsg. Fin. Corp. Multi-family Mtg. Rev.: | | | | |
| (Avalon Reserve Apts. Proj.) Series 2003 R1, 3.08%, LOC | | | | |
| Fannie Mae, VRDN (a)(b) | | 7,500,000 | | 7,500,000 |
| (Grande Court at North Port Apts. Proj.) Series 2004 E, | | | | |
| 3.08%, LOC Fannie Mae, VRDN (a)(b) | | 6,100,000 | | 6,100,000 |
| (Mill Creek Apts. Proj.) 3.08%, LOC Fannie Mae, | | | | |
| VRDN (a)(b) | | 6,000,000 | | 6,000,000 |
| (Pinnacle Grove Apts. Proj.) Series 2003 A, 3.08%, LOC | | | | |
| Fannie Mae, VRDN (a)(b) | | 8,000,000 | | 8,000,000 |
| Florida Hsg. Fin. Corp. Rev.: | | | | |
| Participating VRDN: | | | | |
| Series BA 00 J, 3.16% (Liquidity Facility Bank of America | | | | |
| NA) (a)(b)(c) | | 2,625,000 | | 2,625,000 |
| Series LB 04 L74J, 3.14% (Liquidity Facility Lehman | | | | |
| Brothers Hldgs., Inc.) (a)(b)(c) | | 7,385,000 | | 7,385,000 |
| Series LB 04 L9, 3.14% (Liquidity Facility Lehman Brothers | | | | |
| Hldgs., Inc.) (a)(b)(c) | | 8,285,000 | | 8,285,000 |
| (Riverside Apts. Proj.) Series 2000 1, 3.04%, LOC Bank of | | | | |
| America NA, VRDN (a)(b) | | 5,735,000 | | 5,735,000 |
| (Tuscany Lakes Apts. Proj.) Series 2002 K1, 3.12%, LOC | | | | |
| Fannie Mae, VRDN (a)(b) | | 4,000,000 | | 4,000,000 |
| (Valencia Village Apts. Proj.) Series G, 3.03%, LOC Fannie | | | | |
| Mae, VRDN (a)(b) | | 11,755,000 | | 11,755,000 |
| (Waterford Pointe Apts. Proj.) Series 2000 E1, 3.08%, LOC | | | | |
| Fannie Mae, VRDN (a)(b) | | 8,155,000 | | 8,155,000 |
| Florida Local Govt. Fin. Auth. Rev.: | | | | |
| Series A: | | | | |
| 2.85% 3/10/06, LOC Wachovia Bank NA, CP | | 15,490,000 | | 15,490,000 |
| 3.2% 3/10/06, LOC Wachovia Bank NA, CP | | 2,000,000 | | 2,000,000 |
See accompanying notes which are an integral part of the financial statements.
| Municipal Securities continued | | | | |
| | | Principal | | Value (Note 1) |
| | | Amount | | |
| Florida – continued | | | | |
| Florida Local Govt. Fin. Auth. Rev.: – continued | | | | |
| Series B, 2.92% 1/3/06, LOC Wachovia Bank NA, CP (b) . | | $ 1,399,000 | | $ 1,399,000 |
| Florida Muni. Ln. Council Rev. Participating VRDN Series | | | | |
| Putters 1084, 3.08% (Liquidity Facility JPMorgan Chase & | | | | |
| Co.) (a)(c) | | 5,720,000 | | 5,720,000 |
| Greater Orlando Aviation Auth. Arpt. Facilities Rev.: | | | | |
| Participating VRDN: | | | | |
| Series PA 535, 3.12% (Liquidity Facility Merrill Lynch & | | | | |
| Co., Inc.) (a)(b)(c) | | 9,595,000 | | 9,595,000 |
| Series PT 1981, 3.08% (Liquidity Facility Merrill Lynch & | | | | |
| Co., Inc.) (a)(c) | | 4,995,000 | | 4,995,000 |
| Series PT 2319, 3.12% (Liquidity Facility Merrill Lynch & | | | | |
| Co., Inc.) (a)(b)(c) | | 5,175,000 | | 5,175,000 |
| Series 2002 E, 3.03% (FSA Insured), VRDN (a)(b) | | 27,760,000 | | 27,760,000 |
| Series 2003 B, 3.05% 3/2/06, LOC Bayerische Landesbank | | | | |
| Girozentrale, LOC State Street Bank & Trust Co., Boston, | | | | |
| CP (b) | | 5,000,000 | | 5,000,000 |
| Highlands County Ind. Dev. Auth. (Amerikan LLC Proj.) 3.05%, | | | | |
| LOC SunTrust Bank, VRDN (a)(b) | | 8,000,000 | | 8,000,000 |
| Hillsborough County Aviation Auth. Rev. Participating VRDN: | | | | |
| Series Merlots 03 A18, 3.07% (Liquidity Facility Wachovia | | | | |
| Bank NA) (a)(b)(c) | | 3,555,000 | | 3,555,000 |
| Series MS 1060, 3.11% (Liquidity Facility Morgan | | | | |
| Stanley) (a)(b)(c) | | 4,555,000 | | 4,555,000 |
| Series PT 2723, 3.12% (Liquidity Facility Dexia Cr. Local de | | | | |
| France) (a)(b)(c) | | 3,490,000 | | 3,490,000 |
| Series PT 2725, 3.12% (Liquidity Facility Merrill Lynch & Co., | | | | |
| Inc.) (a)(b)(c) | | 5,300,000 | | 5,300,000 |
| Series Putters 930, 3.08% (Liquidity Facility JPMorgan Chase | | | | |
| & Co.) (a)(c) | | 3,695,000 | | 3,695,000 |
| Hillsborough County Hsg. Fin. Auth. Multi-family Rev.: | | | | |
| (Grande Oaks Apts. Proj.) Series A, 3.07%, LOC SunTrust | | | | |
| Bank, VRDN (a)(b) | | 7,300,000 | | 7,300,000 |
| (Lakewood Shores Apt. Proj.) Series 2000 A, 3.04%, LOC | | | | |
| Bank of America NA, VRDN (a)(b) | | 5,600,000 | | 5,600,000 |
| (Meridian Pointe Apts. proj.) 3.03%, LOC Citibank NA, | | | | |
| VRDN (a)(b) | | 6,600,000 | | 6,600,000 |
| (Mobley Park Apts. Proj.) Series A, 3.09%, LOC Freddie | | | | |
| Mac, VRDN (a)(b) | | 8,000,000 | | 8,000,000 |
| (Morgan Creek Apts. Proj.) 3.08%, LOC Fannie Mae, | | | | |
| VRDN (a)(b) | | 12,700,000 | | 12,700,000 |
| (Royal Palm Key Apts. Proj.) 3.03%, LOC Fannie Mae, | | | | |
| VRDN (a)(b) | | 4,530,000 | | 4,530,000 |
See accompanying notes which are an integral part of the financial statements.
29 Annual Report
| Fidelity Florida Municipal Money Market Fund | | | | | | | | |
| Investments continued | | | | | | | | | | |
| |
| Municipal Securities continued | | | | | | | | |
| | | | | | | Principal | | Value (Note 1) |
| | | | | | | Amount | | | | |
| Florida – continued | | | | | | | | | | |
| Hillsborough County Indl. Dev. Auth. Indl. Dev. Rev. (Vigo | | | | | | | | |
| Importing Co. Proj.): | | | | | | | | | | |
| 3.15%, LOC Bank of America NA, VRDN (a)(b) | | | $ | 20,000 | | | $ | 20,000 |
| 3.26%, LOC Bank of America NA, VRDN (a)(b) | | | | 700,000 | | | | 700,000 |
| Hillsborough County Port District Participating VRDN: | | | | | | | | |
| Series MS 1019, 3.11% (Liquidity Facility Morgan | | | | | | | | |
| Stanley) (a)(b)(c) | | | | | | 2,873,000 | | | | 2,873,000 |
| Series PT 2571, 3.12% (Liquidity Facility Merrill Lynch & Co., | | | | | | | | |
| Inc.) (a)(b)(c) | | | | | | 4,380,000 | | | | 4,380,000 |
| Hollywood Wtr. & Swr. Rev. Participating VRDN Series ROC II | | | | | | | | |
| R4055, 3.08% (Liquidity Facility Citigroup Global Markets | | | | | | | | |
| Hldgs., Inc.) (a)(c) | | | | | | 2,750,000 | | | | 2,750,000 |
| Indian River County Hosp. District Hosp. Rev.: | | | | | | | | |
| Bonds (Indian River Memorial Hosp. Proj.): | | | | | | | | |
| Series 1988, 2.8% tender 3/3/06, LOC Wachovia Bank | | | | | | | | |
| NA, CP mode | | | | | | 11,800,000 | | | | 11,800,000 |
| Series 1989, 2.8% tender 3/3/06, LOC Wachovia Bank | | | | | | | | |
| NA, CP mode | | | | | | 5,250,000 | | | | 5,250,000 |
| Series 1990, 2.8% tender 3/3/06, LOC Wachovia Bank | | | | | | | | |
| NA, CP mode | | | | | | 4,500,000 | | | | 4,500,000 |
| Series 1985, 3.14%, LOC Wachovia Bank NA, VRDN (a) | | | | 12,700,000 | | | | 12,700,000 |
| Jacksonville Econ. Dev. (Holland Sheltair Aviation Group Proj.) | | | | | | | | |
| 3.1%, LOC Mellon Bank NA, Pittsburgh, VRDN (a)(b) | | | | 2,100,000 | | | | 2,100,000 |
| Jacksonville Econ. Dev. Commission Indl. Dev. Rev. (STI Proj.) | | | | | | | | |
| Series 2002, 3.1%, LOC Bank of America NA, VRDN (a)(b) | | | | 3,675,000 | | | | 3,675,000 |
| Jacksonville Health Facilities Auth. Hosp. Rev. Bonds (Baptist | | | | | | | | |
| Med. Ctr. Proj.) 2.8% tender 1/9/06, LOC Bank of America | | | | | | | | |
| NA, CP mode | | | | | | 1,500,000 | | | | 1,500,000 |
| Jacksonville Hsg. Fin. Auth. Multi-family Hsg. Rev. (Brookwood | | | | | | | | |
| Forest Apts. Proj.) 3.04%, LOC JPMorgan Chase Bank, | | | | | | | | |
| VRDN (a)(b) | | | | | | 2,500,000 | | | | 2,500,000 |
| JEA Wtr. & Swr. Sys. Rev. Participating VRDN Series Putters | | | | | | | | |
| 408, 3.08% (Liquidity Facility JPMorgan Chase Bank) (a)(c) . | | | | 2,695,000 | | | | 2,695,000 |
| Lee County Arpt. Rev. Participating VRDN: | | | | | | | | |
| Series Floaters 01 580X, 3.12% (Liquidity Facility Morgan | | | | | | | | |
| Stanley) (a)(b)(c) | | | | | | 6,995,000 | | | | 6,995,000 |
| Series MS 01 811, 3.12% (Liquidity Facility Morgan | | | | | | | | |
| Stanley) (a)(b)(c) | | | | | | 3,000,000 | | | | 3,000,000 |
| Series ROC II R14, 3.11% (Liquidity Facility Citibank | | | | | | | | |
| NA) (a)(b)(c) | | | | | | 6,870,000 | | | | 6,870,000 |
| Lee County Hosp. Board of Directors Hosp. Rev. Bonds (Lee | | | | | | | | |
| Memorial Health Sys. Proj.) 6% 4/1/06 (MBIA Insured) | | | | 2,640,000 | | | | 2,667,630 |
| |
| |
| See accompanying notes which are an integral part of the financial statements. | | | | |
| |
| Annual Report | | 30 | | | | | | | | |
| Municipal Securities continued | | | | |
| | | Principal | | Value (Note 1) |
| | | Amount | | |
| |
| Florida – continued | | | | |
| Lee County Indl. Dev. Auth. Util. Sys. Rev. (North Fort Myers | | | | |
| Util., Inc. Proj.) Series A, 3.05%, LOC SunTrust Bank, | | | | |
| VRDN (a)(b) | | $13,240,000 | | $ 13,240,000 |
| Manatee County Hsg. Fin. Auth. Mtg. Rev. Participating VRDN | | | | |
| Series PT 2072, 3.12% (Liquidity Facility Merrill Lynch & Co., | | | | |
| Inc.) (a)(b)(c) | | 3,555,000 | | 3,555,000 |
| Manatee County Hsg. Fin. Auth. Multi-family Hsg. Rev. (Centre | | | | |
| Court Apts. Proj.) Series 2000 A, 3.04%, LOC SunTrust | | | | |
| Bank, VRDN (a)(b) | | 3,655,000 | | 3,655,000 |
| Marion County School Board Ctfs. of Prtn. Participating VRDN | | | | |
| Series Merlots 05 D7, 3.01% (Liquidity Facility Wachovia | | | | |
| Bank NA) (a)(c) | | 12,720,000 | | 12,720,000 |
| Martin County Poll. Cont. Rev. (Florida Pwr. & Lt. Co. Proj.) | | | | |
| Series 2000, 3.05%, VRDN (a) | | 15,200,000 | | 15,200,000 |
| Miami-Dade County Aviation Rev. Participating VRDN: | | | | |
| Series 2003 L22J, 3.14% (Liquidity Facility Lehman Brothers | | | | |
| Hldgs., Inc.) (a)(b)(c) | | 1,300,000 | | 1,300,000 |
| Series LB O5 L23, 3.14% (Liquidity Facility Lehman Brothers | | | | |
| Hldgs., Inc.) (a)(b)(c) | | 7,655,000 | | 7,655,000 |
| Series PT 3246, 3.12% (Liquidity Facility Merrill Lynch & Co., | | | | |
| Inc.) (a)(b)(c) | | 1,225,000 | | 1,225,000 |
| Series PT 3247, 3.12% (Liquidity Facility Merrill Lynch & Co., | | | | |
| Inc.) (a)(b)(c) | | 15,800,000 | | 15,800,000 |
| Series TOC 05 II, 3.11% (Liquidity Facility Goldman Sachs | | | | |
| Group, Inc.) (a)(b)(c) | | 5,400,000 | | 5,400,000 |
| Miami-Dade County Cap. Asset Acquisition Participating | | | | |
| VRDN Series TOC 05 Z9, 3.12% (Liquidity Facility Goldman | | | | |
| Sachs Group, Inc.) (a)(c) | | 13,960,000 | | 13,960,000 |
| Miami-Dade County Expressway Auth. Participating VRDN | | | | |
| Series Putters 01 160, 3.08% (Liquidity Facility JPMorgan | | | | |
| Chase Bank) (a)(c) | | 7,995,000 | | 7,995,000 |
| Miami-Dade County Health Facilities Auth. Hosp. Rev. | | | | |
| Participating VRDN Series Putters 208, 3.08% (Liquidity | | | | |
| Facility JPMorgan Chase Bank) (a)(c) | | 6,775,000 | | 6,775,000 |
| Miami-Dade County Hsg. Fin. Auth. Bonds Series Merlots 00 | | | | |
| HHH, 3.32%, tender 11/7/06 (Liquidity Facility Wachovia | | | | |
| Bank NA) (a)(b)(c)(e) | | 6,055,000 | | 6,055,000 |
| Miami-Dade County Hsg. Fin. Auth. Multi-family Mtg. Rev. | | | | |
| (22nd Avenue Apartments, 183rd Street Apartments & | | | | |
| 187th Street Apartments Proj.) Series 2003 3, 3.04%, LOC | | | | |
| Citibank NA, VRDN (a)(b) | | 8,800,000 | | 8,800,000 |
| Miami-Dade County Indl. Dev. Auth. Rev.: | | | | |
| (Airis Miami LLC Proj.) Series 1999 A, 3.08% (AMBAC | | | | |
| Insured), VRDN (a)(b) | | 13,450,000 | | 13,450,000 |
See accompanying notes which are an integral part of the financial statements.
31 Annual Report
| Fidelity Florida Municipal Money Market Fund | | | | |
| Investments continued | | | | |
| |
| Municipal Securities continued | | | | |
| | | Principal | | Value (Note 1) |
| | | Amount | | |
| Florida – continued | | | | |
| Miami-Dade County Indl. Dev. Auth. Rev.: – continued | | | | |
| (Badia Spices, Inc. Proj.) 3.1%, LOC Bank of America NA, | | | | |
| VRDN (a)(b) | | $ 5,400,000 | �� | $ 5,400,000 |
| (Cigarette Boats Racing Team Proj.) 3.1%, LOC Bank of | | | | |
| America NA, VRDN (a)(b) | | 2,440,000 | | 2,440,000 |
| (Tarmac America Proj.) 3.1%, LOC Bank of America NA, | | | | |
| VRDN (a)(b) | | 3,200,000 | | 3,200,000 |
| Miami-Dade County Pub. Svc. Tax Rev. Participating VRDN | | | | |
| Series MSTC 02 9043, 3.02% (Liquidity Facility Bear Stearns | | | | |
| Companies, Inc.) (a)(c) | | 6,800,000 | | 6,800,000 |
| Miami-Dade County School Board Ctfs. of Prtn.: | | | | |
| Bonds Series A, 3.5% 4/1/06 (AMBAC Insured) | | 2,225,000 | | 2,230,764 |
| Participating VRDN: | | | | |
| Series Putters 534, 3.08% (Liquidity Facility JPMorgan | | | | |
| Chase Bank) (a)(c) | | 3,195,000 | | 3,195,000 |
| Series ROC II R4022, 3.08% (Liquidity Facility Citigroup | | | | |
| Global Markets Hldgs., Inc.) (a)(c) | | 4,185,000 | | 4,185,000 |
| Miami-Dade County Stormwater Util. Rev. Participating VRDN | | | | |
| Series Putters 1086, 3.08% (Liquidity Facility JPMorgan | | | | |
| Chase & Co.) (a)(c) | | 1,960,000 | | 1,960,000 |
| Miramar Cap. Impt. Rev. Participating VRDN Series ROC II | | | | |
| R3044, 3.08% (Liquidity Facility Citigroup Global Markets | | | | |
| Hldgs., Inc.) (a)(c) | | 7,655,000 | | 7,655,000 |
| Ocean Hwy. & Port Auth. Rev. Series 1990: | | | | |
| 3.05%, LOC Wachovia Bank NA, VRDN (a)(b) | | 1,700,000 | | 1,700,000 |
| 3.05%, LOC Wachovia Bank NA, VRDN (a)(b) | | 1,700,000 | | 1,700,000 |
| Okeechobee County Solid Waste Rev. (Chambers Waste Sys. | | | | |
| Proj.) Series 1992, 3.17%, LOC JPMorgan Chase Bank, | | | | |
| VRDN (a)(b) | | 1,515,000 | | 1,515,000 |
| Orange County Hsg. Fin. Auth. Homeowner Rev. Participating | | | | |
| VRDN: | | | | |
| Series MT 118, 3.13% (Liquidity Facility Merrill Lynch & Co., | | | | |
| Inc.) (a)(b)(c) | | 2,000,000 | | 2,000,000 |
| Series MT 164, 3.13% (Liquidity Facility Merrill Lynch & Co., | | | | |
| Inc.) (a)(b)(c) | | 10,715,000 | | 10,715,000 |
| Series PT 2411, 3.13% (Liquidity Facility Merrill Lynch & Co., | | | | |
| Inc.) (a)(b)(c) | | 15,200,000 | | 15,200,000 |
| Series PT 919, 3.09% (Liquidity Facility Merrill Lynch & Co., | | | | |
| Inc.) (a)(c) | | 5,485,000 | | 5,485,000 |
| Orange County Hsg. Fin. Auth. Multi-family Rev.: | | | | |
| (Alta Westgate Apts. Proj.) Series C, 3.04%, LOC Citibank | | | | |
| NA, VRDN (a)(b) | | 6,920,000 | | 6,920,000 |
| (Osprey Ridge Apts. Proj.) Series 2000 H, 3.08%, LOC | | | | |
| Fannie Mae, VRDN (a)(b) | | 8,460,000 | | 8,460,000 |
See accompanying notes which are an integral part of the financial statements.
| Municipal Securities continued | | | | |
| | | Principal | | Value (Note 1) |
| | | Amount | | |
| |
| Florida – continued | | | | |
| Orange County Indl. Dev. Auth. Indl. Dev. Rev. (Advanced | | | | |
| Drainage Sys., Inc. Proj.) 3.17%, LOC Nat’l. City Bank, | | | | |
| VRDN (a)(b) | | $ 2,655,000 | | $ 2,655,000 |
| Orange County School Board Ctfs. of Prtn. Participating VRDN | | | | |
| Series Putters 738, 3.08% (Liquidity Facility JPMorgan Chase | | | | |
| & Co.) (a)(c) | | 1,750,000 | | 1,750,000 |
| Orlando Utils. Commission Util. Sys. Rev. Participating VRDN | | | | |
| Series EGL 04 1015 Class A, 3.08% (Liquidity Facility | | | | |
| Citibank NA) (a)(c) | | 4,260,000 | | 4,260,000 |
| Osceola County Hsg. Fin. Auth. Multi-family Rev. (Regatta Bay | | | | |
| Apts. Proj.) Series A, 3.04%, LOC Fannie Mae, VRDN (a)(b) | | 5,600,000 | | 5,600,000 |
| Palm Beach Co. Pub. Impt. Rev. Participating VRDN Series DB | | | | |
| 184, 3.07% (Liquidity Facility Deutsche Bank AG) (a)(c) | | 4,360,000 | | 4,360,000 |
| Palm Beach County Edl. Facilities Auth. (Atlantic College Proj.) | | | | |
| Series 2001, 3.1%, LOC Bank of America NA, VRDN (a) | | 5,800,000 | | 5,800,000 |
| Palm Beach County Hsg. Fin. Auth. Multi-family Hsg. Rev. | | | | |
| (Renaissance Apts. Proj.) 3.03%, LOC Fannie Mae, | | | | |
| VRDN (a)(b) | | 18,500,000 | | 18,500,000 |
| Palm Beach County Rev. (Zoological Society of Palm Beach | | | | |
| Proj.) 3.1%, LOC Northern Trust Co., Chicago, VRDN (a) | | 3,900,000 | | 3,900,000 |
| Palm Beach County School Board Ctfs. of Prtn. Participating | | | | |
| VRDN Series ROC II R5035, 3.08% (Liquidity Facility | | | | |
| Citigroup Global Markets Hldgs., Inc.) (a)(c) | | 5,580,000 | | 5,580,000 |
| Pasco County Indl. Dev. Rev. (Pacific Med., Inc. Proj.) Series | | | | |
| 1999, 3.15%, LOC Bank of America NA, VRDN (a)(b) | | 2,055,000 | | 2,055,000 |
| Pinellas County Hsg. Fin. Auth. Single Family Hsg. Rev. | | | | |
| Participating VRDN Series FRRI 03 L10J, 3.14% (Liquidity | | | | |
| Facility Lehman Brothers Hldgs., Inc.) (a)(b)(c) | | 3,840,000 | | 3,840,000 |
| Pinellas County Hsg. Fin. Auth. Single Family Mortgage Rev. | | | | |
| Participating VRDN: | | | | |
| Series CDC 04 4 Class A, 3.13% (Liquidity Facility CDC | | | | |
| Fin. CDC IXIS) (a)(b)(c) | | 5,465,000 | | 5,465,000 |
| Series MT 66, 3.13% (Liquidity Facility Landesbank | | | | |
| Hessen-Thuringen) (a)(b)(c) | | 16,945,000 | | 16,945,000 |
| Series MT 9, 3.13% (Liquidity Facility Merrill Lynch & Co., | | | | |
| Inc.) (a)(b)(c) | | 5,155,000 | | 5,155,000 |
| Series PT 2239, 3.13% (Liquidity Facility Merrill Lynch & Co., | | | | |
| Inc.) (a)(b)(c) | | 9,360,000 | | 9,360,000 |
| Pinellas County Indl. Council Indl. Dev. Rev. (Hunter Douglas, | | | | |
| Inc. Proj.) 3.1%, LOC ABN AMRO Bank NV, VRDN (a)(b) | | 2,100,000 | | 2,100,000 |
| Polk County Hsg. Fin. Auth. Multi-family Hsg. Rev. (Cambridge | | | | |
| Cove Apts. Proj.) Series 2001, 3.04%, LOC Fannie Mae, | | | | |
| VRDN (a)(b) | | 3,900,000 | | 3,900,000 |
| Port of Saint Lucie Util. Rev. Participating VRDN Series PZ 91, | | | | |
| 3.12% (Liquidity Facility Merrill Lynch & Co., Inc.) (a)(c) | | 3,020,000 | | 3,020,000 |
See accompanying notes which are an integral part of the financial statements.
33 Annual Report
| Fidelity Florida Municipal Money Market Fund | | | | |
| Investments continued | | | | | | |
| |
| Municipal Securities continued | | | | |
| | | | | Principal | | Value (Note 1) |
| | | | | Amount | | |
| Florida – continued | | | | | | |
| Putnam County Dev. Auth. Poll. Cont. Rev.: | | | | |
| Bonds (Seminole Elec. Coop., Inc. Proj.): | | | | |
| Series 1984 H3, 2.8%, tender 3/15/06 (Nat’l. Rural Utils. | | | | |
| Coop. Fin. Corp. Guaranteed) (a) | | | | $ 6,000,000 | | $ 6,000,000 |
| Series 1984 H4, 2.8%, tender 3/15/06 (Nat’l. Rural Utils. | | | | |
| Coop. Fin. Corp. Guaranteed) (a) | | | | 3,000,000 | | 3,000,000 |
| (Seminole Elec. Coop., Inc. Proj.): | | | | | | |
| Series 1984 H1, 3.15% (Nat’l. Rural Utils. Coop. Fin. | | | | |
| Corp. Guaranteed), VRDN (a) | | | | 13,565,000 | | 13,565,000 |
| Series 1984 H2, 3.15% (Nat’l. Rural Utils. Coop. Fin. | | | | |
| Corp. Guaranteed), VRDN (a) | | | | 9,915,000 | | 9,915,000 |
| Series 1984 S, 3.15% (Nat’l. Rural Utils. Coop. Fin. Corp. | | | | |
| Guaranteed), VRDN (a) | | | | 4,240,000 | | 4,240,000 |
| Reedy Creek Impt. District Participating VRDN Series Putters | | | | |
| 902, 3.08% (Liquidity Facility JPMorgan Chase Bank) (a)(c) . | | 7,180,000 | | 7,180,000 |
| Reedy Creek Impt. District Utils. Rev. Participating VRDN Series | | | | |
| ROC II R4027, 3.08% (Liquidity Facility Citigroup Global | | | | |
| Markets Hldgs., Inc.) (a)(c) | | | | 2,820,000 | | 2,820,000 |
| Saint Johns County Hsg. Fin. Auth. Multifamily Hsg. Rev.: | | | | |
| (Ponce Hbr. Apts. Proj.) 3.03%, LOC Fannie Mae, | | | | |
| VRDN (a)(b) | | | | 1,000,000 | | 1,000,000 |
| (Summerset Village Proj.) 3.09%, LOC SunTrust Bank, | | | | |
| VRDN (a)(b) | | | | 10,740,000 | | 10,740,000 |
| Saint Johns County Sales Tax Rev. Participating VRDN Series | | | | |
| ROC II R 2142, 3.08% (Liquidity Facility Citigroup Global | | | | |
| Markets Hldgs., Inc.) (a)(c) | | | | 5,365,000 | | 5,365,000 |
| Saint Johns County Wtr. & Swr. Rev. Participating VRDN Series | | | | |
| PZ 90, 3.12% (Liquidity Facility Merrill Lynch & Co., | | | | |
| Inc.) (a)(c) | | | | 2,880,000 | | 2,880,000 |
| Saint Petersburg Cap. Impt. Rev. (Arpt. Proj.) Series 1997 C, | | | | |
| 3.1%, LOC SunTrust Bank, VRDN (a)(b) | | | | 500,000 | | 500,000 |
| Sarasota County Util. Sys. Rev. Participating VRDN Series | | | | |
| Putters 852, 3.08% (Liquidity Facility JPMorgan Chase | | | | |
| Bank) (a)(c) | | | | 4,520,000 | | 4,520,000 |
| Seminole County School Board Ctfs. of Prtn. Participating | | | | |
| VRDN Series ROC II R4537, 3.08% (Liquidity Facility | | | | |
| Citigroup Global Markets Hldgs., Inc.) (a)(c) | | 5,705,000 | | 5,705,000 |
| Sumter County Indl. Auth. Rev. (Villages Tri-County Med. Ctr. | | | | |
| Proj.) Series 2001, 3.15%, LOC SunTrust Bank, VRDN (a) | | 2,655,000 | | 2,655,000 |
| Sunshine State Govt. Fing. Commission Rev. Series 2001 G, | | | | |
| 2.8% 1/9/06 (FGIC Insured), CP (b) | | | | 29,895,000 | | 29,895,000 |
| Tallahassee Cap. Rev. Participating VRDN: | | | | |
| Series Putters 606, 3.08% (Liquidity Facility JPMorgan Chase | | | | |
| & Co.) (a)(c) | | | | 2,595,000 | | 2,595,000 |
See accompanying notes which are an integral part of the financial statements. | | |
| |
| Annual Report | | 34 | | | | |
| Municipal Securities continued | | | | |
| | | Principal | | Value (Note 1) |
| | | Amount | | |
| Florida – continued | | | | |
| Tallahassee Cap. Rev. Participating VRDN: – continued | | | | |
| Series Putters 607, 3.08% (Liquidity Facility JPMorgan Chase | | | | |
| Bank) (a)(c) | | $ 2,295,000 | | $ 2,295,000 |
| Tamarac Indl. Dev. Rev. (Fazio Hldgs. LP Proj.) Series 2000, | | | | |
| 3.15%, LOC Wachovia Bank NA, VRDN (a)(b) | | 4,240,000 | | 4,240,000 |
| Tampa Bay Wtr. Util. Sys. Rev.: | | | | |
| Participating VRDN: | | | | |
| Series Merlots 01 A130, 3.02% (Liquidity Facility | | | | |
| Wachovia Bank NA) (a)(c) | | 9,915,000 | | 9,915,000 |
| Series MS 98 112, 3.07% (Liquidity Facility Morgan | | | | |
| Stanley) (a)(c) | | 5,745,000 | | 5,745,000 |
| 3.1%, LOC Bank of America NA, VRDN (a)(b) | | 10,315,000 | | 10,315,000 |
| Volusia County Edl. Facilities Auth. Rev. Participating VRDN | | | | |
| Series Putters 886, 3.08% (Liquidity Facility JPMorgan Chase | | | | |
| & Co.) (a)(c) | | 3,335,000 | | 3,335,000 |
| Volusia County Hsg. Fin. Auth. Multi-family Hsg. Rev. (Saxon | | | | |
| Trace Apts. Proj.) 3.03%, LOC Fannie Mae, VRDN (a)(b) | | 9,500,000 | | 9,500,000 |
| Volusia County Tourist Dev. Tax Rev. Participating VRDN Series | | | | |
| MS 979, 3.07% (Liquidity Facility Morgan Stanley) (a)(c) | | 7,057,500 | | 7,057,500 |
| | | | | 1,080,475,107 |
| |
| Georgia – 0.7% | | | | |
| Atlanta Arpt. Rev. Participating VRDN: | | | | |
| Series MT 11, 3.12% (Liquidity Facility Merrill Lynch & Co., | | | | |
| Inc.) (a)(b)(c) | | 1,490,000 | | 1,490,000 |
| Series MT 43, 3.12% (Liquidity Facility Landesbank | | | | |
| Hessen-Thuringen) (a)(b)(c) | | 2,150,000 | | 2,150,000 |
| Clayton County Dev. Auth. Spl. Facilities Rev. (Delta Air Lines, | | | | |
| Inc. Proj.): | | | | |
| Series 2000 B, 3.11%, LOC Gen. Elec. Cap. Corp., | | | | |
| VRDN (a)(b) | | 3,290,000 | | 3,290,000 |
| Series 2000 C, 3.11%, LOC Gen. Elec. Cap. Corp., | | | | |
| VRDN (a)(b) | | 2,800,000 | | 2,800,000 |
| Paulding County Indl. Bldg. Auth. Rev. (Cadillac Products, Inc. | | | | |
| Proj.) Series 1994, 3.14%, LOC JPMorgan Chase Bank, | | | | |
| VRDN (a)(b) | | 1,075,000 | | 1,075,000 |
| | | | | 10,805,000 |
| |
| Hawaii – 0.1% | | | | |
| Hawaii Arpts. Sys. Rev. Participating VRDN Series PA 1238, | | | | |
| 3.12% (Liquidity Facility Merrill Lynch & Co., Inc.) (a)(b)(c) | | 1,695,000 | | 1,695,000 |
See accompanying notes which are an integral part of the financial statements.
35 Annual Report
| Fidelity Florida Municipal Money Market Fund | | | | |
| Investments continued | | | | | | | | |
| |
| Municipal Securities continued | | | | | | |
| | | | | | | Principal | | Value (Note 1) |
| | | | | | | Amount | | |
| Illinois – 1.7% | | | | | | | | |
| Aurora Single Family Mtg. Rev. Participating VRDN Series MS | | | | |
| 1152, 3.12% (Liquidity Facility Morgan Stanley) (a)(b)(c) | | | | $ 6,500,000 | | $ 6,500,000 |
| Belvidere Indl. Dev. Rev. (R&D Thiel, Inc. Proj.) Series 1996, | | | | |
| 3.15%, LOC U.S. Bank NA, Minnesota, VRDN (a)(b) | | | | 1,500,000 | | 1,500,000 |
| Chicago O’Hare Int’l. Arpt. Rev. Participating VRDN: | | | | | | |
| Series MT 49, 3.12% (Liquidity Facility Merrill Lynch & Co., | | | | |
| Inc.) (a)(b)(c) | | | | | | 2,000,000 | | 2,000,000 |
| Series PT 1993, 3.12% (Liquidity Facility Merrill Lynch & Co., | | | | |
| Inc.) (a)(b)(c) | | | | | | 1,080,000 | | 1,080,000 |
| Series PT 980, 3.12% (Liquidity Facility Merrill Lynch & Co., | | | | |
| Inc.) (a)(b)(c) | | | | | | 2,665,000 | | 2,665,000 |
| Series ROC II R70, 3.12% (Liquidity Facility Citibank | | | | | | |
| NA) (a)(b)(c) | | | | | | 2,100,000 | | 2,100,000 |
| Illinois Dev. Fin. Auth. Indl. Dev. Rev. (Camcraft Proj.) Series | | | | |
| 1993, 3.22%, LOC JPMorgan Chase Bank, VRDN (a)(b) | | | | 100,000 | | 100,000 |
| Illinois Dev. Fin. Auth. Poll. Cont. Rev. (Uno-Ven Co. Proj.) | | | | | | |
| Series 1994, 3%, LOC JPMorgan Chase Bank, VRDN (a) | | | | 2,900,000 | | 2,900,000 |
| Metropolitan Pier & Exposition Auth. Dedicated State Tax Rev. | | | | |
| Participating VRDN Series PZ 62, 3.12% (Liquidity Facility | | | | |
| Merrill Lynch & Co., Inc.) (a)(c) | | | | | | 2,000,000 | | 2,000,000 |
| Puttable Floating Option Tax Receipts Participating VRDN | | | | | | |
| Series PZP 6, 3.19% (Liquidity Facility Merrill Lynch & Co., | | | | |
| Inc.) (a)(c) | | | | | | 2,595,000 | | 2,595,000 |
| Will County School District #122 Participating VRDN Series PZ | | | | |
| 59, 3.12% (Liquidity Facility Merrill Lynch & Co., Inc.) (a)(c) . | | 5,130,000 | | 5,130,000 |
| | | | | | | | | 28,570,000 |
| |
| Indiana – 0.4% | | | | | | | | |
| Indianapolis Econ. Dev. Rev. (US LLC Proj.) Series 1996, | | | | | | |
| 3.26%, LOC JPMorgan Chase Bank, VRDN (a)(b) | | | | 100,000 | | 100,000 |
| Indianapolis Local Pub. Impt. Bond Bank Participating VRDN: | | | | |
| Series MACN 05 P, 3.12% (Liquidity Facility Bank of | | | | | | |
| America NA) (a)(b)(c) | | | | | | 3,125,000 | | 3,125,000 |
| Series Putters 1154, 3.11% (Liquidity Facility JPMorgan | | | | | | |
| Chase Bank) (a)(b)(c) | | | | | | 3,710,000 | | 3,710,000 |
| Lebanon Econ. Dev. Rev. (White Castle Sys., Inc. Proj.) 3.25%, | | | | |
| LOC JPMorgan Chase Bank, VRDN (a)(b) | | | | 255,000 | | 255,000 |
| | | | | | | | | 7,190,000 |
| |
| |
| |
| |
| See accompanying notes which are an integral part of the financial statements. | | |
| |
| Annual Report | | 36 | | | | | | |
| Municipal Securities continued | | | | |
| | | Principal | | Value (Note 1) |
| | | Amount | | |
| Kentucky 0.5% | | | | |
| Kenton County Arpt. Board Arpt. Rev. Participating VRDN | | | | |
| Series FRRI 02 L15, 3.14% (Liquidity Facility Lehman | | | | |
| Brothers Hldgs., Inc.) (a)(b)(c) | | $ 5,000,000 | | $ 5,000,000 |
| Kentucky Higher Ed. Student Ln. Corp. Student Ln. Rev. Series | | | | |
| 1991 E, 3.03% (AMBAC Insured), VRDN (a)(b) | | 2,800,000 | | 2,800,000 |
| | | | | 7,800,000 |
| |
| Louisiana – 2.1% | | | | |
| East Baton Rouge Mtg. Fing. Auth. Single Family Rev. | | | | |
| Participating VRDN Series MS 973, 3.14% (Liquidity Facility | | | | |
| Morgan Stanley) (a)(b)(c) | | 3,795,000 | | 3,795,000 |
| Louisiana Hsg. Fin. Agcy. Mtg. Rev.: | | | | |
| Participating VRDN Series MS 1066, 3.14% (Liquidity | | | | |
| Facility Morgan Stanley) (a)(b)(c) | | 1,327,000 | | 1,327,000 |
| Participating VRDN Series Clipper 05 11, 3.19% (Liquidity | | | | |
| Facility State Street Bank & Trust Co., Boston) (a)(b)(c) | | 4,559,000 | | 4,559,000 |
| Louisiana Pub. Facilities Auth. Rev. (Air Products & Chemicals, | | | | |
| Inc. Proj.): | | | | |
| 3.08%, VRDN (a)(b) | | 6,250,000 | | 6,250,000 |
| 3.08%, VRDN (a)(b) | | 5,000,000 | | 5,000,000 |
| West Baton Rouge Parish Indl. District #3 Rev.: | | | | |
| Bonds (Dow Chemical Co. Proj.) Series 1991, 3.1% tender | | | | |
| 12/15/05, CP mode | | 3,300,000 | | 3,300,000 |
| (Dow Chemical Co. Proj.): | | | | |
| Series 1993, 3.17%, VRDN (a)(b) | | 3,800,000 | | 3,800,000 |
| Series 1994 B, 3.1%, VRDN (a) | | 2,000,000 | | 2,000,000 |
| Series 1995, 3.17%, VRDN (a)(b) | | 5,150,000 | | 5,150,000 |
| | | | | 35,181,000 |
| |
| Maine – 0.3% | | | | |
| Maine Fin. Auth. Solid Waste Disposable Rev. Participating | | | | |
| VRDN Series PT 2833, 3.15% (Liquidity Facility Merrill Lynch | | | | |
| & Co., Inc.) (a)(b)(c) | | 4,995,000 | | 4,995,000 |
| Maryland 0.7% | | | | |
| Maryland Cmnty. Dev. Administration Dept. of Hsg. & Cmnty. | | | | |
| Dev. Participating VRDN Series MT 160, 3.09% (Liquidity | | | | |
| Facility Merrill Lynch & Co., Inc.) (a)(c) | | 2,900,000 | | 2,900,000 |
| Montgomery County Hsg. Opportunity Commission Single | | | | |
| Family Mtg. Rev. Participating VRDN Series MT 89, 3.13% | | | | |
| (Liquidity Facility Landesbank Hessen-Thuringen) (a)(b)(c) | | 7,835,000 | | 7,835,000 |
| | | | | 10,735,000 |
See accompanying notes which are an integral part of the financial statements.
37 Annual Report
| Fidelity Florida Municipal Money Market Fund | | | | |
| Investments continued | | | | |
| |
| Municipal Securities continued | | | | |
| | | Principal | | Value (Note 1) |
| | | Amount | | |
| Michigan – 0.4% | | | | |
| Michigan Strategic Fund Ltd. Oblig. Rev. Participating VRDN | | | | |
| Series Putters 858Z, 3.11% (Liquidity Facility JPMorgan | | | | |
| Chase Bank) (a)(b)(c) | | $ 3,070,000 | | $ 3,070,000 |
| Wayne County Arpt. Auth. Rev. Participating VRDN Series MT | | | | |
| 115, 3.12% (Liquidity Facility Svenska Handelsbanken | | | | |
| AB) (a)(b)(c) | | 2,735,000 | | 2,735,000 |
| | | | | 5,805,000 |
| |
| Minnesota 0.4% | | | | |
| Minneapolis & Saint Paul Hsg. Fin. Board Rev. Participating | | | | |
| VRDN: | | | | |
| Series MT 118, 3.13% (Liquidity Facility Landesbank | | | | |
| Hessen-Thuringen) (a)(b)(c) | | 1,755,000 | | 1,755,000 |
| Series MT 120, 3.09% (Liquidity Facility Landesbank | | | | |
| Hessen-Thuringen) (a)(c) | | 1,740,000 | | 1,740,000 |
| Minneapolis & Saint Paul Metropolitan Arpts. Commission | | | | |
| Arpt. Rev. Participating VRDN Series PT 727, 3.12% | | | | |
| (Liquidity Facility BNP Paribas SA) (a)(b)(c) | | 1,700,000 | | 1,700,000 |
| Minnesota Hsg. Fin. Agcy. Participating VRDN Series PA | | | | |
| 1256, 3.12% (Liquidity Facility Merrill Lynch & Co., | | | | |
| Inc.) (a)(b)(c) | | 1,240,000 | | 1,240,000 |
| | | | | 6,435,000 |
| |
| Mississippi – 0.1% | | | | |
| Mississippi Home Corp. Single Family Rev. Participating VRDN | | | | |
| Series PT 1446, 3.12% (Liquidity Facility Merrill Lynch & Co., | | | | |
| Inc.) (a)(b)(c) | | 1,730,000 | | 1,730,000 |
| Missouri – 0.8% | | | | |
| Missouri Higher Ed. Ln. Auth. Student Ln. Rev. Series 1990 A, | | | | |
| 3.03%, LOC Bank of America NA, VRDN (a)(b) | | 2,700,000 | | 2,700,000 |
| Missouri Hsg. Dev. Commission Single Family Mtg. Rev. | | | | |
| Participating VRDN Series PT 2530, 3.12% (Liquidity Facility | | | | |
| Merrill Lynch & Co., Inc.) (a)(b)(c) | | 5,875,000 | | 5,875,000 |
| Saint Louis Indl. Dev. Auth. (Metropolitan Lofts Apts. Proj.) | | | | |
| Series 2003 C, 3.06%, LOC U.S. Bank NA, Minnesota, | | | | |
| VRDN (a)(b) | | 4,050,000 | | 4,050,000 |
| | | | | 12,625,000 |
| |
| Nebraska – 0.1% | | | | |
| Nebraska Invt. Fin. Auth. Single Family Hsg. Rev. Participating | | | | |
| VRDN Series Merlots 00 UU, 3.07% (Liquidity Facility | | | | |
| Wachovia Bank NA) (a)(b)(c) | | 950,000 | | 950,000 |
| Nevada 0.4% | | | | |
| Clark County Arpt. Rev. Participating VRDN Series Putters 910, | | | | |
| 3.11% (Liquidity Facility JPMorgan Chase & Co.) (a)(b)(c) | | 5,385,000 | | 5,385,000 |
See accompanying notes which are an integral part of the financial statements.
| Municipal Securities continued | | | | | | | | |
| | | | | Principal | | Value (Note 1) |
| | | | | Amount | | | | |
| Nevada – continued | | | | | | | | |
| Nevada Director of Dept. Commerce Indl. Dev. Rev. (Primex | | | | | | | | |
| Corp. Proj.) 3.26%, LOC JPMorgan Chase Bank, | | | | | | | | |
| VRDN (a)(b) | | $ | | 525,000 | | $ | | 525,000 |
| Nevada Gen. Oblig. Participating VRDN Series Putters 840, | | | | | | | | |
| 3.08% (Liquidity Facility JPMorgan Chase Bank) (a)(c) | | | | 5,000 | | | | 5,000 |
| | | | | | | | | 5,915,000 |
| |
| New Hampshire – 0.4% | | | | | | | | |
| Clipper Tax-Exempt Trust Participating VRDN Series Clipper 05 | | | | | | | | |
| 3, 3.15% (Liquidity Facility State Street Bank & Trust Co., | | | | | | | | |
| Boston) (a)(b)(c) | | | | 4,114,000 | | | | 4,114,000 |
| New Hampshire Hsg. Fin. Auth. Single Family Rev. | | | | | | | | |
| Participating VRDN Series Merlots 01 A82, 3.07% (Liquidity | | | | | | | | |
| Facility Wachovia Bank NA) (a)(b)(c) | | | | 3,145,000 | | | | 3,145,000 |
| | | | | | | | | 7,259,000 |
| |
| New Mexico – 0.6% | | | | | | | | |
| Bernalillo County Gross Receipt Tax Rev. Participating VRDN | | | | | | | | |
| Series BA 04B, 3.08% (Liquidity Facility Bank of America | | | | | | | | |
| NA) (a)(c) | | | | 5,160,000 | | | | 5,160,000 |
| New Mexico Mtg. Fin. Auth. Participating VRDN Series | | | | | | | | |
| Clipper 05 15, 3.24% (Liquidity Facility State Street Bank & | | | | | | | | |
| Trust Co., Boston) (a)(b)(c) | | | | 4,100,000 | | | | 4,100,000 |
| | | | | | | | | 9,260,000 |
| |
| Non State Specific 0.3% | | | | | | | | |
| Clipper Tax-Exempt Trust Participating VRDN: | | | | | | | | |
| Series Clipper 04 11, 3.19% (Liquidity Facility State Street | | | | | | | | |
| Bank & Trust Co., Boston) (a)(b)(c) | | | | 3,640,000 | | | | 3,640,000 |
| Series Clipper 05 7, 3.16% (Liquidity Facility State Street | | | | | | | | |
| Bank & Trust Co., Boston) (a)(c) | | | | 1,700,000 | | | | 1,700,000 |
| | | | | | | | | 5,340,000 |
| |
| North Carolina – 1.1% | | | | | | | | |
| North Carolina Hsg. Fin. Agcy. Home Ownership Rev. | | | | | | | | |
| Participating VRDN: | | | | | | | | |
| Series FRRI 03 L17, 3.14% (Liquidity Facility Lehman | | | | | | | | |
| Brothers Hldgs., Inc.) (a)(b)(c) | | | | 2,100,000 | | | | 2,100,000 |
| Series LB 03 L44J, 3.14% (Liquidity Facility Lehman Brothers | | | | | | | | |
| Hldgs., Inc.) (a)(b)(c) | | | | 1,800,000 | | | | 1,800,000 |
See accompanying notes which are an integral part of the financial statements.
39 Annual Report
| Fidelity Florida Municipal Money Market Fund | | | | |
| Investments continued | | | | |
| |
| Municipal Securities continued | | | | |
| | | Principal | | Value (Note 1) |
| | | Amount | | |
| North Carolina – continued | | | | |
| North Carolina State Ed. Assistance Auth. Student Ln. Rev. | | | | |
| Series 2005 A3, 3.08% (AMBAC Insured), VRDN (a)(b) | | $11,900,000 | | $ 11,900,000 |
| Raleigh Durham Arpt. Auth. Rev. Participating VRDN Series PT | | | | |
| 2569, 3.12% (Liquidity Facility Dexia Cr. Local de | | | | |
| France) (a)(b)(c) | | 2,970,000 | | 2,970,000 |
| | | | | 18,770,000 |
| |
| North Dakota 0.1% | | | | |
| Hebron Indl. Dev. Rev. (Dacco, Inc. Proj.) 3.15%, LOC U.S. | | | | |
| Bank NA, Minnesota, VRDN (a)(b) | | 1,200,000 | | 1,200,000 |
| Ohio – 0.1% | | | | |
| Ohio Solid Waste Rev. (Republic Svcs., Inc. Proj.) 3.35%, | | | | |
| VRDN (a)(b) | | 1,300,000 | | 1,300,000 |
| Summit County Indl. Dev. Rev. (Ganzhorn Properties Proj.) | | | | |
| 3.26%, LOC JPMorgan Chase Bank, VRDN (a)(b) | | 625,000 | | 625,000 |
| | | | | 1,925,000 |
| |
| Oklahoma – 0.2% | | | | |
| Oklahoma Hsg. Fin. Agcy. Single Family Mtg. Rev. | | | | |
| Participating VRDN Series LB 03 L29J, 3.14% (Liquidity | | | | |
| Facility Lehman Brothers Hldgs., Inc.) (a)(b)(c) | | 3,470,000 | | 3,470,000 |
| Tulsa County Hsg. Fin. Auth. Single Family Mtg. Rev. | | | | |
| Participating VRDN Series MS 01 582, 3.12% (Liquidity | | | | |
| Facility Morgan Stanley) (a)(b)(c) | | 290,000 | | 290,000 |
| | | | | 3,760,000 |
| |
| Oregon – 0.1% | | | | |
| Portland Econ. Dev. Rev. (Columbia Aluminum Recycling Proj.) | | | | |
| 3.1%, LOC U.S. Bank NA, Minnesota, VRDN (a)(b) | | 2,400,000 | | 2,400,000 |
| Pennsylvania – 0.8% | | | | |
| Allegheny County Indl. Dev. Auth. Rev. (UPMC Children’s | | | | |
| Hosp. Proj.) Series 2004 A, 3.17%, VRDN (a) | | 3,600,000 | | 3,600,000 |
| Cambria County Ind. Dev. Auth. (Cambria Cogen Co. Proj.) | | | | |
| Series 1998 A1, 3.1%, LOC Bayerische Hypo-und | | | | |
| Vereinsbank AG, VRDN (a)(b) | | 7,300,000 | | 7,300,000 |
| Pittsburgh Urban Redev. Auth. Single Family Mortgage Rev. | | | | |
| Participating VRDN Series PT 996, 3.11% (Liquidity Facility | | | | |
| Merrill Lynch & Co., Inc.) (a)(b)(c) | | 1,505,000 | | 1,505,000 |
| | | | | 12,405,000 |
| |
| Rhode Island – 0.1% | | | | |
| Rhode Island Econ. Dev. Corp. Participating VRDN Series | | | | |
| Putters 971, 3.11% (Liquidity Facility JPMorgan Chase & | | | | |
| Co.) (a)(b)(c) | | 1,740,000 | | 1,740,000 |
See accompanying notes which are an integral part of the financial statements.
| Municipal Securities continued | | | | |
| | | Principal | | Value (Note 1) |
| | | Amount | | |
| South Carolina – 0.7% | | | | |
| Oconee County Poll. Cont. Rev. (Duke Energy Corp. Proj.) | | | | |
| Series A, 3.11%, VRDN (a) | | $ 2,600,000 | | $ 2,600,000 |
| South Carolina Hsg. Fin. & Dev. Auth. Mtg. Rev. Participating | | | | |
| VRDN Series BA 01 L, 3.19% (Liquidity Facility Bank of | | | | |
| America NA) (a)(b)(c) | | 2,775,000 | | 2,775,000 |
| South Carolina Jobs Econ. Dev. Auth. Econ. Dev. Rev. | | | | |
| (Mohawk Ind., Inc. Proj.) Series 1997 B, 3.14%, LOC | | | | |
| Wachovia Bank NA, VRDN (a)(b) | | 1,200,000 | | 1,200,000 |
| York County Poll. Cont. Rev. Bonds 3.05% tender 1/6/06, CP | | | | |
| mode | | 5,100,000 | | 5,100,000 |
| | | | | 11,675,000 |
| |
| South Dakota 0.5% | | | | |
| South Dakota Hsg. Dev. Auth. Participating VRDN: | | | | |
| Series LB 04 L34J, 3.14% (Liquidity Facility Lehman Brothers | | | | |
| Hldgs., Inc.) (a)(b)(c) | | 2,210,000 | | 2,210,000 |
| Series LB 04 L67 3.14% (Liquidity Facility Lehman Brothers | | | | |
| Hldgs., Inc.) (a)(b)(c) | | 3,375,000 | | 3,375,000 |
| South Dakota Hsg. Dev. Auth. Single Family Rev. Participating | | | | |
| VRDN Series PT 957, 3.13% (Liquidity Facility Merrill Lynch | | | | |
| & Co., Inc.) (a)(b)(c) | | 3,320,000 | | 3,320,000 |
| | | | | 8,905,000 |
| |
| Tennessee – 0.5% | | | | |
| Memphis Gen. Oblig. Participating VRDN Series Putters 757, | | | | |
| 3.08% (Liquidity Facility JPMorgan Chase Bank) (a)(c) | | 1,795,000 | | 1,795,000 |
| Tennessee Hsg. Dev. Agcy. Participating VRDN: | | | | |
| Series LB 04 L7, 3.14% (Liquidity Facility Lehman Brothers | | | | |
| Hldgs., Inc.) (a)(b)(c) | | 2,430,000 | | 2,430,000 |
| Series LB L32J, 3.19% (Liquidity Facility Lehman Brothers | | | | |
| Hldgs., Inc.) (a)(b)(c) | | 4,220,000 | | 4,220,000 |
| | | | | 8,445,000 |
| |
| Texas 4.3% | | | | |
| Austin Util. Sys. Rev. Participating VRDN Series BA 98 V, | | | | |
| 3.12% (Liquidity Facility Bank of America NA) (a)(c) | | 6,415,000 | | 6,415,000 |
| Brazos River Auth. Poll. Cont. Rev. (Texas Utils. Elec. Co. Proj.): | | | | |
| 3.04%, LOC Wachovia Bank NA, VRDN (a)(b) | | 1,400,000 | | 1,400,000 |
| 3.04%, LOC Wachovia Bank NA, VRDN (a)(b) | | 1,100,000 | | 1,100,000 |
| Brazos River Hbr. Navigation Brazoria County Envir. Facilities | | | | |
| Rev. (Dow Chemical Co. Proj.) Series A2, 3.17%, | | | | |
| VRDN (a)(b) | | 1,000,000 | | 1,000,000 |
See accompanying notes which are an integral part of the financial statements.
41 Annual Report
| Fidelity Florida Municipal Money Market Fund | | | | |
| Investments continued | | | | | | |
| |
| Municipal Securities continued | | | | |
| | | | | Principal | | Value (Note 1) |
| | | | | Amount | | |
| Texas continued | | | | | | |
| Dallas Fort Worth Int’l. Arpt. Rev. Participating VRDN: | | | | |
| Series Merlots 00 II, 3.07% (Liquidity Facility Wachovia Bank | | | | |
| NA) (a)(b)(c) | | | | $ 3,200,000 | | $ 3,200,000 |
| Series Merlots 03 A34, 3.07% (Liquidity Facility Wachovia | | | | |
| Bank NA) (a)(b)(c) | | | | 1,600,000 | | 1,600,000 |
| Series PT 2156, 3.12% (Liquidity Facility Merrill Lynch & Co., | | | | |
| Inc.) (a)(b)(c) | | | | 2,610,000 | | 2,610,000 |
| Series Putters 1022, 3.11% (Liquidity Facility JPMorgan | | | | |
| Chase Bank) (a)(b)(c) | | | | 4,470,000 | | 4,470,000 |
| Series Putters 353, 3.11% (Liquidity Facility JPMorgan Chase | | | | |
| Bank) (a)(b)(c) | | | | 1,650,000 | | 1,650,000 |
| Series Putters 604, 3.11% (Liquidity Facility JPMorgan Chase | | | | |
| & Co.) (a)(b)(c) | | | | 2,155,000 | | 2,155,000 |
| Series ROC II 251, 3.12% (Liquidity Facility Citibank | | | | |
| NA) (a)(b)(c) | | | | 2,525,000 | | 2,525,000 |
| Dallas Hsg. Fin. Corp. Multi-family Hsg. Rev. (Cherrycrest | | | | |
| Villas Apts. Proj.) 3.15%, LOC Wachovia Bank NA, | | | | |
| VRDN (a)(b) | | | | 4,800,000 | | 4,800,000 |
| Gulf Coast Waste Disp. Auth. Envir. Facilities Rev. (Exxon | | | | |
| Mobil Proj.) 2.98% (Exxon Mobil Corp. Guaranteed), | | | | |
| VRDN (a)(b) | | | | 3,000,000 | | 3,000,000 |
| Harris County Gen. Oblig. Participating VRDN Series Putters | | | | |
| 1172Z, 3.08% (Liquidity Facility JPMorgan Chase | | | | |
| Bank) (a)(c) | | | | 5,835,000 | | 5,835,000 |
| Lower Neches Valley Auth. Indl. Dev. Corp. Exempt Facilities | | | | |
| Rev. (Onyx Envir. Svcs. Proj.) 3.1%, LOC Fleet Nat’l. Bank, | | | | |
| VRDN (a)(b) | | | | 3,500,000 | | 3,500,000 |
| North Texas Higher Ed. Auth. Student Ln. Rev. Series A, 3.03% | | | | |
| (AMBAC Insured), VRDN (a)(b) | | | | 4,900,000 | | 4,900,000 |
| San Antonio Arpt. Sys. Rev. Participating VRDN Series Stars | | | | |
| 107, 3.12% (Liquidity Facility BNP Paribas SA) (a)(b)(c) | | 4,325,000 | | 4,325,000 |
| Texas Gen. Oblig. TRAN 4.5% 8/31/06 | | | | 16,000,000 | | 16,174,240 |
| | | | | | | 70,659,240 |
| |
| Utah 0.3% | | | | | | |
| Utah Board of Regents Student Ln. Rev. Series 1996 Q, 3.03% | | | | |
| (AMBAC Insured), VRDN (a)(b) | | | | 5,000,000 | | 5,000,000 |
| Vermont – 0.1% | | | | | | |
| Vermont Hsg. Fin. Agcy. Single Family Participating VRDN | | | | |
| Series BA 02 I, 3.17% (Liquidity Facility Bank of America | | | | |
| NA) (a)(b)(c) | | | | 2,095,000 | | 2,095,000 |
| |
| |
| |
| See accompanying notes which are an integral part of the financial statements. | | |
| |
| Annual Report | | 42 | | | | |
| Municipal Securities continued | | | | |
| | | Principal | | Value (Note 1) |
| | | Amount | | |
| Virginia – 0.9% | | | | |
| Chesterfield County Indl. Dev. Auth. Rev. Participating VRDN | | | | |
| Series PT 886, 3.13% (Liquidity Facility Lloyds TSB Bank | | | | |
| PLC) (a)(c) | | $ 1,300,000 | | $ 1,300,000 |
| Halifax County Indl. Dev. Auth. Poll. Cont. Rev. Bonds (Virginia | | | | |
| Elec. & Pwr. Co. Proj.) Series 1992, 3.15% tender 3/9/06, | | | | |
| CP mode (b) | | 1,200,000 | | 1,200,000 |
| Louisa Indl. Dev. Auth. Poll. Cont. Rev. Bonds (Virginia Elec. & | | | | |
| Pwr. Co. Proj.): | | | | |
| Series 1984: | | | | |
| 2.93% tender 12/9/05, CP mode | | 4,000,000 | | 4,000,000 |
| 2.95% tender 12/19/05, CP mode | | 4,000,000 | | 4,000,000 |
| Series 1987, 3.1% tender 3/9/06, CP mode | | 2,100,000 | | 2,100,000 |
| Virginia Port Auth. Commonwealth Port Rev. Participating | | | | |
| VRDN Series PT 2671, 3.11% (Liquidity Facility Dexia Cr. | | | | |
| Local de France) (a)(b)(c) | | 2,640,000 | | 2,640,000 |
| | | | | 15,240,000 |
| |
| Washington 0.8% | | | | |
| Port of Seattle Rev. Participating VRDN: | | | | |
| Series MS 1169X, 3.09% (Liquidity Facility Morgan | | | | |
| Stanley) (a)(b)(c) | | 5,005,000 | | 5,005,000 |
| Series MT 139, 3.12% (Liquidity Facility BNP Paribas | | | | |
| SA) (a)(b)(c) | | 2,875,000 | | 2,875,000 |
| Washington Econ. Dev. Fin. Auth. Solid Waste Disp. Rev. | | | | |
| (Waste Mgmt., Inc. Proj.) Series E, 3.1%, LOC JPMorgan | | | | |
| Chase Bank, VRDN (a)(b) | | 5,000,000 | | 5,000,000 |
| | | | | 12,880,000 |
| |
| West Virginia – 0.3% | | | | |
| Elkins Bldg. Commission Rev. (Davis & Elkins College Proj.) | | | | |
| 3.24%, LOC Huntington Nat’l. Bank, Columbus, VRDN (a) | | 4,640,000 | | 4,640,000 |
| Wisconsin – 0.9% | | | | |
| Hartford Cmnty. Dev. Auth. Indl. Dev. Rev. (TNT/Larpen Supply | | | | |
| Proj.) 3.26%, LOC JPMorgan Chase Bank, VRDN (a)(b) | | 1,070,000 | | 1,070,000 |
| Wisconsin Hsg. & Econ. Dev. Auth. Home Ownership Rev.: | | | | |
| Participating VRDN Series ROC II R367, 3.12% (Liquidity | | | | |
| Facility Citibank NA) (a)(b)(c) | | 3,745,000 | | 3,745,000 |
| Series 2003 B, 3.03% (Liquidity Facility State Street Bank & | | | | |
| Trust Co., Boston), VRDN (a)(b) | | 9,180,000 | | 9,180,000 |
| Wisconsin Hsg. & Econ. Dev. Auth. Single Family Rev. | | | | |
| Participating VRDN Series MT 106, 3.13% (Liquidity Facility | | | | |
| Lloyds TSB Bank PLC) (a)(b)(c) | | 725,000 | | 725,000 |
| | | | | 14,720,000 |
See accompanying notes which are an integral part of the financial statements.
43 Annual Report
| Fidelity Florida Municipal Money Market Fund | | | | |
| Investments continued | | | | |
| |
| Municipal Securities continued | | | | |
| | | Shares | | Value (Note 1) |
| Other – 3.1% | | | | |
| Fidelity Municipal Cash Central Fund, 3.08% (d) | | 50,067,400 | | $ 50,067,400 |
| |
| TOTAL INVESTMENT PORTFOLIO 94.6% | | | | |
| (Cost $1,555,324,747) | | | | 1,555,324,747 |
| |
| NET OTHER ASSETS – 5.4% | | | | 88,036,429 |
| NET ASSETS 100% | | $ 1,643,361,176 |
| Security Type Abbreviations |
| CP | | — | | COMMERCIAL PAPER |
| RAN | | — | | REVENUE ANTICIPATION |
| | | | | NOTE |
| TRAN | | — | | TAX AND REVENUE |
| | | | | ANTICIPATION NOTE |
| VRDN | | — | | VARIABLE RATE DEMAND |
| | | | | NOTE |
Legend
(a) The coupon rate shown on floating or
adjustable rate securities represents the
rate at period end.
(b) Private activity obligations whose
interest is subject to the federal
alternative minimum tax for individuals.
(c) Provides evidence of ownership in one
or more underlying municipal bonds.
(d) Affiliated fund that is available only to
investment companies and other
accounts managed by Fidelity
Investments. The rate quoted is the
annualized seven-day yield of the fund
at period end. A complete unaudited
listing of the fund’s holdings as of its
most recent quarter end is available
upon request.
|
(e) Restricted securities – Investment in
securities not registered under the
Securities Act of 1933 (excluding 144A
issues). At the end of the period, the
value of restricted securities (excluding
144A issues) amounted to $21,655,000
or 1.3% of net assets.
|
Additional information on each holding is as follows:
| | | Acquisition | | |
| Security | | Date | | Cost |
| Florida Gen. | | | | |
| Oblig. Bonds | | | | |
| Series Merlots 05 | | | | |
| A22, 3.35%, | | | | |
| tender 11/14/06 | | | | |
| (Liquidity Facility | | | | |
| Wachovia Bank | | | | |
| NA) | | 11/16/05 | | $15,600,000 |
| Miami Dade | | | | |
| County Hsg. Fin. | | | | |
| Auth. Bonds | | | | |
| Series Merlots 00 | | | | |
| HHH, 3.32%, | | | | |
| tender 11/7/06 | | | | |
| (Liquidity Facility | | | | |
| Wachovia Bank | | 7/17/00 - | | |
| NA) | | 11/12/03 | | $ 6,055,000 |
See accompanying notes which are an integral part of the financial statements.
Annual Report 44
Information regarding income received by the fund from the affiliated Central funds during the period is as follows:
| Fund | | | | Income received |
| Fidelity Municipal Cash Central Fund | | | $ | 724,244 |
See accompanying notes which are an integral part of the financial statements.
45 Annual Report
| Fidelity Florida Municipal Money Market Fund | | | | |
| Financial Statements | | | | | | |
| |
| Statement of Assets and Liabilities | | | | | | |
| | | | | November 30, 2005 |
| |
| Assets | | | | | | |
| Investment in securities, at value See accompanying | | | | | | |
| schedule: | | | | | | |
| Unaffiliated issuers (cost $1,505,257,347) | | $1,505,257,347 | | | | |
| Affiliated Central Funds (cost $50,067,400) | | 50,067,400 | | | | |
| Total Investments (cost $1,555,324,747) | | | | $1,555,324,747 |
| Cash | | | | | | 76,504,737 |
| Receivable for fund shares sold | | | | | | 32,418,667 |
| Interest receivable | | | | | | 7,089,918 |
| Other receivables | | | | | | 153,759 |
| Total assets | | | | | | 1,671,491,828 |
| |
| Liabilities | | | | | | |
| Payable for investments purchased | | $ 18,397,710 | | | | |
| Payable for fund shares redeemed | | 9,038,162 | | | | |
| Distributions payable | | 33,589 | | | | |
| Accrued management fee | | 660,305 | | | | |
| Other affiliated payables | | 886 | | | | |
| Total liabilities | | | | | | 28,130,652 |
| |
| Net Assets | | | | $ 1,643,361,176 |
| Net Assets consist of: | | | | | | |
| Paid in capital | | | | $1,643,271,883 |
| Undistributed net investment income | | | | | | 63,699 |
| Accumulated undistributed net realized gain (loss) on | | | | | | |
| investments | | | | | | 25,594 |
| Net Assets, for 1,643,221,603 shares outstanding | | | | $ 1,643,361,176 |
| Net Asset Value, offering price and redemption price per | | | | | | |
| share ($1,643,361,176 ÷ 1,643,221,603 shares) | | | | $ | | 1.00 |
See accompanying notes which are an integral part of the financial statements.
| Statement of Operations | | | | | | |
| | | | | Year ended November 30, 2005 |
| |
| Investment Income | | | | | | |
| Interest | | | | $ | | 36,012,987 |
| Income from affiliated Central Funds | | | | | | 724,244 |
| Total income | | | | | | 36,737,231 |
| |
| Expenses | | | | | | |
| Management fee | | $ | | 8,053,290 | | |
| Independent trustees’ compensation | | | | 7,289 | | |
| Total expenses before reductions | | | | 8,060,579 | | |
| Expense reductions | | | | (1,571,235) | | 6,489,344 |
| |
| Net investment income | | | | | | 30,247,887 |
| Realized and Unrealized Gain (Loss) | | | | | | |
| Net realized gain (loss) on: | | | | | | |
| Investment securities: | | | | | | |
| Unaffiliated issuers | | | | | | 40,377 |
| Net increase in net assets resulting from operations | | | | $ | | 30,288,264 |
See accompanying notes which are an integral part of the financial statements.
47 Annual Report
| Fidelity Florida Municipal Money Market Fund | | | | |
| Financial Statements continued | | | | | | | | |
| |
| Statement of Changes in Net Assets | | | | | | | | |
| | | | | Year ended | | | | Year ended |
| | | | | November 30, | | | | November 30, |
| | | | | 2005 | | | | 2004 |
| Increase (Decrease) in Net Assets | | | | | | | | |
| Operations | | | | | | | | |
| Net investment income | | | | $ 30,247,887 | | | | $ 9,815,717 |
| Net realized gain (loss) | | | | 40,377 | | | | 12,418 |
| Net increase in net assets resulting from operations | | . | | 30,288,264 | | | | 9,828,135 |
| Distributions to shareholders from net investment income | | . | | (30,248,445) | | | | (9,814,480) |
| Share transactions at net asset value of $1.00 per share | | | | | | | | |
| Proceeds from sales of shares | | | | 5,221,578,190 | | | | 3,742,100,400 |
| Reinvestment of distributions | | | | 29,775,180 | | | | 9,653,318 |
| Cost of shares redeemed | | | | (5,001,856,968) | | (3,320,390,700) |
| Net increase (decrease) in net assets and shares | | | | | | | | |
| resulting from share transactions | | | | 249,496,402 | | | | 431,363,018 |
| Total increase (decrease) in net assets | | | | 249,536,221 | | | | 431,376,673 |
| |
| Net Assets | | | | | | | | |
| Beginning of period | | | | 1,393,824,955 | | | | 962,448,282 |
| End of period (including undistributed net investment | | | | | | | | |
| income of $63,699 and undistributed net investment | | | | | | |
| income of $64,257, respectively) | | | | $ 1,643,361,176 | | $ 1,393,824,955 |
See accompanying notes which are an integral part of the financial statements.
| Financial Highlights | | | | | | | | | | |
| Years ended November 30, | | 2005 | | 2004 | | 2003 | | 2002 | | 2001 |
| Selected Per Share Data | | | | | | | | | | |
| Net asset value, beginning of | | | | | | | | | | |
| period | | $ 1.00 | | $ 1.00 | | $ 1.00 | | $ 1.00 | | $ 1.00 |
| Income from Investment | | | | | | | | | | |
| Operations | | | | | | | | | | |
| Net investment income | | 019 | | .007 | | .007 | | .011 | | .027 |
| Distributions from net investment | | | | | | | | | | |
| income | | (.019) | | (.007) | | (.007) | | (.011) | | (.027) |
| Net asset value, end of period | | $ 1.00 | | $ 1.00 | | $ 1.00 | | $ 1.00 | | $ 1.00 |
| Total ReturnA,B | | 1.91% | | .75% | | .66% | | 1.14% | | 2.69% |
| Ratios to Average Net AssetsC | | | | | | | | | | |
| Expenses before reductions | | 50% | | .50% | | .50% | | .50% | | .50% |
| Expenses net of fee waivers, if | | | | | | | | | | |
| any | | 50% | | .50% | | .50% | | .50% | | .50% |
| Expenses net of all reductions | | 40% | | .49% | | .49% | | .46% | | .45% |
| Net investment income | | 1.88% | | .75% | | .67% | | 1.14% | | 2.77% |
| Supplemental Data | | | | | | | | | | |
| Net assets, end of period | | | | | | | | | | |
| (000 omitted) | | $1,643,361 | | $1,393,825 | | $962,448 | | $787,714 | | $556,295 |
A Total returns would have been lower had certain expenses not been reduced during the periods shown.
B Total returns do not include the effect of the former account closeout fee.
C Expense ratios reflect operating expenses of the fund. Expenses before reductions do not reflect amounts reimbursed by the investment adviser or
reductions from brokerage service arrangements or other expense offset arrangements and do not represent the amount paid by the fund during
periods when reimbursements or reductions occur. Expenses net of fee waivers reflect expenses after reimbursement by the investment adviser but
prior to reductions from brokerage service arrangements or other expense offset arrangements. Expenses net of all reductions represent the net
expenses paid by the fund.
|
See accompanying notes which are an integral part of the financial statements.
49 Annual Report
Notes to Financial Statements
For the period ended November 30, 2005
1. Significant Accounting Policies.
Fidelity Florida Municipal Income Fund (the income fund) is a fund of Fidelity Court Street Trust. On July 21, 2005, the Board of Trustees approved a change in the name of Spartan Florida Municipal Income Fund to Fidelity Florida Municipal Income Fund effective August 15, 2005. Fidelity Florida Municipal Money Market Fund (the money market fund) is a fund of Fidelity Court Street Trust II. Each trust is registered under the Investment Company Act of 1940, as amended (the 1940 Act), as an open end manage ment investment company. Fidelity Court Street Trust and Fidelity Court Street Trust II (the trusts) are organized as a Massachusetts business trust and a Delaware statutory trust, respectively. Each fund is authorized to issue an unlimited number of shares. Each fund may be affected by economic and political developments in the state of Florida. Certain funds may invest in affiliated money market central funds (Money Market Central Funds) which are open end investment companies available to investment companies and other accounts managed by Fidelity Management & Research Company (FMR) and its affiliates. The financial statements have been prepared in conformity with accounting principles generally accepted in the United States of America, which require management to make certain estimates and assumptions at the date of the financial statements. The following summarizes the significant accounting policies of the income fund and the money market fund:
Security Valuation. Investments are valued and net asset value per share is calculated (NAV calculation) as of the close of business of the New York Stock Exchange, normally 4:00 p.m. Eastern time. Wherever possible, each fund uses independent pricing services approved by the Board of Trustees to value their investments. For the income fund, debt securities, including restricted securities, for which quotes are readily available, are valued by independent pricing services or by dealers who make markets in such securi ties. Pricing services consider yield or price of bonds of comparable quality, coupon, maturity and type as well as dealer supplied prices. When current market prices or quotations are not readily available or do not accurately reflect fair value, valuations may be determined in accordance with procedures adopted by the Board of Trustees. The frequency of when fair value pricing is used is unpredictable. The value of securities used for NAV calculation under fair value pricing may differ from published prices for the same securities. Investments in open end mutual funds are valued at their closing net asset value each business day. Short term securities with remaining maturities of sixty days or less for which quotations are not readily available are valued at amortized cost, which approximates value.
As permitted by compliance with certain conditions under Rule 2a 7 of the 1940 Act, securities owned by the money market fund are valued at amortized cost which approximates value.
1. Significant Accounting Policies continued
Investment Transactions and Income. Security transactions are accounted for as of trade date. Gains and losses on securities sold are determined on the basis of identified cost. Interest income is accrued as earned. Interest income includes coupon interest and amortization of premium and accretion of discount on debt securities.
Expenses. Most expenses of each trust can be directly attributed to a fund. Expenses which cannot be directly attributed are apportioned among each fund in the trust.
Income Tax Information and Distributions to Shareholders. Each year, each fund intends to qualify as a regulated investment company by distributing all of its taxable income and realized gains under Subchapter M of the Internal Revenue Code. As a result, no provision for income taxes is required in the accompanying financial statements. Dividends are declared daily and paid monthly from net investment income. Distribu tions from realized gains, if any, are recorded on the ex dividend date. Income and capital gain distributions are determined in accordance with income tax regulations, which may differ from generally accepted accounting principles. In addition, each fund will claim a portion of the payment made to redeeming shareholders as a distribution for income tax purposes.
Capital accounts within the financial statements are adjusted for permanent book tax differences. These adjustments have no impact on net assets or the results of operations. Temporary book tax differences will reverse in a subsequent period.
Book tax differences are primarily due to losses deferred on futures transactions, market discount, deferred trustees compensation and wash sales.
The funds purchase municipal securities whose interest, in the opinion of the issuer, is free from federal income tax. There is no assurance that the Internal Revenue Service (IRS) will agree with this opinion. In the event the IRS determines that the issuer does not comply with relevant tax requirements, interest payments from a security could become federally taxable, possibly retroactively to the date the security was issued. The tax basis components of distributable earnings and the federal tax cost as of period end were as follows for each fund:
| | | Cost for Federal | | | | | | Net Unrealized |
| | | Income Tax | | Unrealized | | Unrealized | | Appreciation/ |
| | | Purposes | | Appreciation | | Depreciation | | (Depreciation) |
| Fidelity Florida Municipal | | | | | | | | |
| Income Fund | | $ 480,776,339 | | $ 15,678,546 | | $ (2,880,869) | | $ 12,797,677 |
| Fidelity Florida Municipal | | | | | | | | |
| Money Market Fund | | 1,555,324,747 | | | | | | |
| |
| | | | | | | | | Undistributed |
| | | | | | | Undistributed | | Long-term |
| | | | | | | Ordinary Income | | Capital Gain |
| Fidelity Florida Municipal Income Fund | | | | $ 7,904 | | $ 6,340,320 |
| Fidelity Florida Municipal Money Market Fund | | 64,584 | | — |
| |
| |
| |
| | | | | 51 | | | | Annual Report |
| Notes to Financial Statements continued | | | | |
| |
| 1. Significant Accounting Policies continued | | | | |
| |
| Income Tax Information and Distributions to Shareholders continued |
| |
| The tax character of distributions paid was as follows: | | | | |
| |
| | | | | | | November 30, 2005 | | | | |
| | | | | | | Long-term Capital | | | | |
| | | Tax-exempt Income | | | | Gains | | | | Total |
| Fidelity Florida Municipal | | | | | | | | | | |
| Income Fund | | $ 20,024,782 | | | | $ 1,482,849 | | | | $ 21,507,631 |
| Fidelity Florida Municipal | | | | | | | | | | |
| Money Market Fund | | 30,248,445 | | | | — | | | | 30,248,445 |
| |
| | | | | | | November 30, 2004 | | | | |
| | | | | | | Long-term Capital | | | | |
| | | Tax-exempt Income | | | | Gains | | | | Total |
| Fidelity Florida Municipal | | | | | | | | | | |
| Income Fund | | $ 20,814,218 | | | | $ 8,261,770 | | | | $ 29,075,988 |
| Fidelity Florida Municipal | | | | | | | | | | |
| Money Market Fund | | 9,814,480 | | | | | | | | 9,814,480 |
Short Term Trading (Redemption) Fees. Shares held in the income fund less than 30 days are subject to a redemption fee equal to .50% of the proceeds of the redeemed shares. All redemption fees, including any estimated redemption fees paid by Fidelity Management & Research Company (FMR), are retained by the fund and accounted for as an addition to paid in capital.
Futures Contracts. The income fund may use futures contracts to manage its exposure to the bond market and to fluctuations in interest rates. Buying futures tends to increase a fund’s exposure to the underlying instrument, while selling futures tends to decrease a fund’s exposure to the underlying instrument or hedge other fund investments. Losses may arise from changes in the value of the underlying instruments or if the counterpar ties do not perform under the contracts’ terms. Gains (losses) are realized upon the expiration or closing of the futures contracts. Futures contracts are valued at the settle ment price established each day by the board of trade or exchange on which they are traded.
Restricted Securities. Certain funds may invest in securities that are subject to legal or contractual restrictions on resale. These securities generally may be resold in transac tions exempt from registration or to the public if the securities are registered. Disposal of these securities may involve time consuming negotiations and expense, and prompt sale at an acceptable price may be difficult. Information regarding restricted securities is included at the end of each applicable fund’s Schedule of Investments.
2. Operating Policies continued
Swap Agreements. The income fund may invest in swaps for the purpose of managing its exposure to interest rate, credit or market risk.
Interest rate swaps are agreements to exchange cash flows periodically based on a notional principal amount, for example, the exchange of fixed rate interest payments for floating rate interest payments. The primary risk associated with interest rate swaps is that unfavorable changes in the fluctuation of interest rates could adversely impact the fund.
Swaps are marked to market daily based on dealer supplied valuations and changes in value are recorded as unrealized appreciation (depreciation). Gains or losses are realized upon early termination of the swap agreement. Collateral, in the form of cash or securities, may be required to be held in segregated accounts with the fund’s custodian in compliance with swap contracts. Risks may exceed amounts recognized on the State ment of Assets and Liabilities. These risks include changes in the returns of the underly ing instruments, failure of the counterparties to perform under the contracts’ terms and the possible lack of liquidity with respect to the swap agreements. Details of swap agreements open at period end are included in the fund’s Schedule of Investments under the caption “Swap Agreements”.
3. Purchases and Sales of Investments.
Purchases and sales of securities, other than short term securities and U.S. government securities, for the income fund aggregated $177,195,874 and $174,459,602, respectively.
4. Fees and Other Transactions with Affiliates.
Management Fee. FMR and its affiliates provide the income fund with investment management related services for which the fund pays a monthly management fee. The management fee is the sum of an individual fund fee rate that is based on an annual rate of.25% of the fund’s average net assets and a group fee rate that averaged .12% during the period. The group fee rate is based upon the average net assets of all the mutual funds advised by FMR. The group fee rate decreases as assets under management increase and increases as assets under management decrease. For the period, the total annual man agement fee rate was .37% of the fund’s average net assets.
FMR and its affiliates provide money market fund with investment management related services for which the fund pays a monthly management fee that is based on an annual rate of .50% of the fund’s average net assets. FMR pays all other expenses, except the compensation of the independent Trustees and certain exceptions such as interest expense. The management fee paid to FMR by the fund is reduced by an amount equal to the fees and expenses paid by the fund to the independent Trustees.
53 Annual Report
Notes to Financial Statements continued
4. Fees and Other Transactions with Affiliates continued
Transfer Agent and Accounting Fees. Citibank, N.A. (Citibank) is the custodian, transfer agent and shareholder servicing agent for the income fund. Citibank has entered into a sub arrangement with Fidelity Service Company, Inc. (FSC), an affiliate of FMR, under which FSC performs the activities associated with the fund’s transfer and share holder servicing agent and accounting functions. The fund pays account fees and asset based fees that vary according to account size and type of account. FSC pays for typesetting, printing and mailing of shareholder reports, except proxy statements. The accounting fee is based on the level of average net assets for the month. For the period, the transfer agent fees were equivalent to the following annual rates expressed as a percentage of average net assets:
| Fidelity Florida Municipal Income Fund | | 07% |
Affiliated Central Funds. Certain funds may invest in Money Market Central Funds which seek preservation of capital and current income and are managed by Fidelity Investments Money Management, Inc. (FIMM) an affiliate of FMR. The Central Funds do not pay a management fee.
5. Committed Line of Credit.
The income fund participates with other funds managed by FMR in a $4.2 billion credit facility (the “line of credit”) to be utilized for temporary or emergency purposes to fund shareholder redemptions or for other short term liquidity purposes. The participating funds have agreed to pay commitment fees on their pro rata portion of the line of credit. During the period, there were no borrowings on this line of credit.
6. Expense Reductions.
Through arrangements with the income fund’s custodian and transfer agent, credits realized as a result of uninvested cash balances were used to reduce fund expenses. These expense reductions are noted in the table below.
| | | | | | | | | Transfer | | | | |
| | | | | Custody | | | | Agent | | | | Accounting |
| | | | | expense | | | | expense | | | | expense |
| | | | | reduction | | | | reduction | | | | reduction |
| |
| Fidelity Florida Municipal Income | | | | | | | | | | | | |
| Fund | | $ | | 8,437 | | $ | | 282,630 | | $ | | 62,894 |
In addition, through an arrangement with the money market fund’s custodian and transfer agent, $1,571,235 of credits realized as a result of uninvested cash balances were used to reduce the fund’s management fee.
Annual Report 54
The funds’ organizational documents provide former and current trustees and officers with a limited indemnification against liabilities arising in connection with the perfor mance of their duties to the funds. In the normal course of business, the funds may also enter into contracts that provide general indemnifications. The funds’ maximum expo sure under these arrangements is unknown as this would be dependent on future claims that may be made against the funds. The risk of material loss from such claims is consid ered remote.
55 Annual Report
Report of Independent Registered Public Accounting Firm
To the Trustees of Fidelity Court Street Trust and Fidelity Court Street Trust II and the Shareholders of Fidelity Florida Municipal Income Fund (formerly Spartan Florida Municipal Income Fund) and Fidelity Florida Municipal Money Market Fund:
In our opinion, the accompanying statements of assets and liabilities, including the schedules of investments, and the related statements of operations and of changes in net assets and the financial highlights present fairly, in all material respects, the financial position of Fidelity Florida Municipal Income Fund (formerly Spartan Florida Municipal Income Fund) (a fund of Fidelity Court Street Trust) and Fidelity Florida Municipal Money Market Fund (a fund of Fidelity Court Street Trust II) at November 30, 2005 and the results of their operations, the changes in their net assets and the financial highlights for the periods indicated, in conformity with accounting principles generally accepted in the United States of America. These financial statements and financial highlights (here after referred to as “financial statements”) are the responsibility of the Fidelity Court Street Trust’s and Fidelity Court Street Trust II’s management; our responsibility is to express an opinion on these financial statements based on our audits. We conducted our audits of these financial statements in accordance with the standards of the Public Company Accounting Oversight Board (United States). Those standards require that we plan and perform the audit to obtain reasonable assurance about whether the financial statements are free of material misstatement. An audit includes examining, on a test basis, evidence supporting the amounts and disclosures in the financial statements, assessing the accounting principles used and significant estimates made by management, and evaluating the overall financial statement presentation. We believe that our audits, which included confirmation of securities at November 30, 2005 by correspondence with the custodian and brokers, provide a reasonable basis for our opinion.
/s/ PricewaterhouseCoopers LLP
PricewaterhouseCoopers LLP
Boston, Massachusetts
January 17, 2006
|
Trustees and Officers
The Trustees, Member of the Advisory Board, and executive officers of the trusts and funds, as applicable, are listed below. The Board of Trustees governs each fund and is responsible for protecting the interests of shareholders. The Trustees are experienced executives who meet periodically throughout the year to oversee each fund’s activities, review contractual arrangements with companies that provide services to each fund, and review each fund’s performance. Except for William O. McCoy and Albert R. Gamper, Jr., each of the Trustees oversees 326 funds advised by FMR or an affiliate. Mr. McCoy oversees 328 funds advised by FMR or an affiliate. Mr. Gamper oversees 235 funds advised by FMR or an affiliate.
The Trustees hold office without limit in time except that (a) any Trustee may resign; (b) any Trustee may be removed by written instrument, signed by at least two thirds of the number of Trustees prior to such removal; (c) any Trustee who requests to be retired or who has become incapacitated by illness or injury may be retired by written instru ment signed by a majority of the other Trustees; and (d) any Trustee may be removed at any special meeting of shareholders by a two thirds vote of the outstanding voting securities of the trust. Each Trustee who is not an interested person (as defined in the 1940 Act) (Independent Trustee), shall retire not later than the last day of the calendar year in which his or her 72nd birthday occurs. The Independent Trustees may waive this mandatory retirement age policy with respect to individual Trustees. The executive officers and Advisory Board Member hold office without limit in time, except that any officer and Advisory Board Member may resign or may be removed by a vote of a majority of the Trustees at any regular meeting or any special meeting of the Trustees. Except as indicated, each individual has held the office shown or other offices in the same company for the past five years.
The funds’ Statement of Additional Information (SAI) includes more information about the Trustees. To request a free copy, call Fidelity at 1-800-544-8544.
Correspondence intended for each Trustee who is an interested person may be sent to Fidelity Investments, 82 Devonshire Street, Boston, Massachusetts 02109.
| | Name, Age; Principal Occupation
Edward C. Johnson 3d (75)
|
Year of Election or Appointment: 1977 or 1991
Trustee of Fidelity Court Street Trust (1977) and Fidelity Court Street Trust II (1991). Mr. Johnson is Chairman of the Board of Trustees.
Mr. Johnson serves as Chief Executive Officer, Chairman, and a Director of FMR Corp.; a Director and Chairman of the Board and of the Execu tive Committee of FMR; Chairman and a Director of Fidelity Manage ment & Research (Far East) Inc.; Chairman and a Director of Fidelity Investments Money Management, Inc.; and Chairman (2001 present) and a Director (2000 present) of FMR Co., Inc.
57 Annual Report
Trustees and Officers - continued
| | Name, Age; Principal Occupation
Stephen P. Jonas (52)
|
Year of Election or Appointment: 2005
Mr. Jonas is Senior Vice President of Florida Municipal Money Market (2005 present) and Florida Municipal Income (2005 present). He also serves as Senior Vice President of other Fidelity funds (2005 present). Mr. Jonas is Executive Director of FMR (2005 present). Previously, Mr. Jonas served as President of Fidelity Enterprise Operations and Risk Services (2004 2005), Chief Administrative Officer (2002 2004), and Chief Financial Officer of FMR Co. (1998 2000). Mr. Jonas has been with Fidelity Investments since 1987 and has held various financial and management positions including Chief Financial Officer of FMR. In addi tion, he serves on the Boards of Boston Ballet (2003 present) and Sim mons College (2003 present).
Year of Election or Appointment: 2003
Mr. Reynolds is a Director (2003 present) and Chief Operating Officer (2002 present) of FMR Corp. He also serves on the Board at Fidelity Investments Canada, Ltd. (2000 present). Previously, Mr. Reynolds served as President of Fidelity Investments Institutional Retirement Group (1996 2000).
* Trustees have been determined to be “Interested Trustees” by virtue of, among other things, their affiliation with the trusts or various entities under common control with FMR.
Correspondence intended for each Independent Trustee (that is, the Trustees other than the Interested Trustees) may be sent to Fidelity Investments, P.O. Box 55235, Boston, Massachusetts 02205 5235.
| | Name, Age; Principal Occupation
Dennis J. Dirks (57)
|
Year of Election or Appointment: 2005
Prior to his retirement in May 2003, Mr. Dirks was Chief Operating Officer and a member of the Board of The Depository Trust & Clearing Corporation (DTCC) (1999 2003). He also served as President, Chief Operating Officer, and Board member of The Depository Trust Compa ny (DTC) (1999 2003) and President and Board member of the Nation al Securities Clearing Corporation (NSCC) (1999 2003). In addition, Mr. Dirks served as Chief Executive Officer and Board member of the Government Securities Clearing Corporation (2001 2003) and Chief Executive Officer and Board member of the Mortgage Backed Securities Clearing Corporation (2001 2003). Mr. Dirks also serves as a Trustee of Manhattan College (2005 present).
| | Albert R. Gamper, Jr. (63)
|
Year of Election or Appointment: 2006
Mr. Gamper also serves as a Trustee (2006 present) or Member of the Advisory Board (2005 present) of other investment companies advised by FMR. Prior to his retirement in December 2004, Mr. Gamper served as Chairman of the Board of CIT Group Inc. (commercial finance). During his tenure with CIT Group Inc. Mr. Gamper served in numerous senior management positions, including Chairman (1987 1989; 1999 2001; 2002 2004), Chief Executive Officer (1987 2004), and President (1989 2002). He currently serves as a member of the Board of Directors of Public Service Enterprise Group (utilities, 2001 present), Chairman of the Board of Governors, Rutgers University (2004 present), and Chairman of the Board of Saint Barnabas Health Care System.
59 Annual Report
Trustees and Officers - continued
| | Name, Age; Principal Occupation
Robert M. Gates (62)
|
Year of Election or Appointment: 1997
Dr. Gates is Chairman of the Independent Trustees (2006 present). Dr. Gates is President of Texas A&M University (2002 present). He was Director of the Central Intelligence Agency (CIA) from 1991 to 1993. From 1989 to 1991, Dr. Gates served as Assistant to the President of the United States and Deputy National Security Advisor. Dr. Gates is a Director of NACCO Industries, Inc. (mining and manufacturing), Parker Drilling Co., Inc. (drilling and rental tools for the energy industry, 2001 present), and Brinker International (restaurant management, 2003 present). Previously, Dr. Gates served as a Director of LucasVarity PLC (automotive components and diesel engines), a Director of TRW Inc. (automotive, space, defense, and information technology), and Dean of the George Bush School of Government and Public Service at Texas A&M University (1999 2001). Dr. Gates also is a Trustee of the Forum for International Policy.
Year of Election or Appointment: 2004
Dr. Heilmeier is Chairman Emeritus of Telcordia Technologies (commu nication software and systems), where prior to his retirement, he served as company Chairman and Chief Executive Officer. He currently serves on the Boards of Directors of The Mitre Corporation (systems engineer ing and information technology support for the government), and HRL Laboratories (private research and development, 2004 present). He is Chairman of the General Motors Science & Technology Advisory Board and a Life Fellow of the Institute of Electrical and Electronics Engineers (IEEE) (2000 present). Dr. Heilmeier is a member of the Defense Science Board and the National Security Agency Advisory Board. He is also a member of the National Academy of Engineering, the American Academy of Arts and Sciences, and the Board of Overseers of the School of Engineering and Applied Science of the University of Pennsylvania. Previously, Dr. Heilmeier served as a Director of TRW Inc. (automotive, space, defense, and information technology, 1992 2002), Compaq (1994 2002), Automatic Data Processing, Inc. (ADP) (technology based business outsourcing, 1995 2002), INET Technologies Inc. (telecommu nications network surveillance, 2001 2004), and Teletech Holdings (customer management services). He is the recipient of the 2005 Kyoto Prize in Advanced Technology for his invention of the liquid display.
Name, Age; Principal Occupation
Marie L. Knowles (59)
|
Year of Election or Appointment: 2001
Prior to Ms. Knowles’ retirement in June 2000, she served as Executive Vice President and Chief Financial Officer of Atlantic Richfield Company (ARCO) (diversified energy, 1996 2000). From 1993 to 1996, she was a Senior Vice President of ARCO and President of ARCO Transportation Company. She served as a Director of ARCO from 1996 to 1998. She currently serves as a Director of Phelps Dodge Corporation (copper mining and manufacturing) and McKesson Corporation (healthcare ser vice, 2002 present). Ms. Knowles is a Trustee of the Brookings Institution and the Catalina Island Conservancy and also serves as a member of the Advisory Board for the School of Engineering of the University of Southern California.
Year of Election or Appointment: 2000
Mr. Lautenbach has been a partner of Clayton, Dubilier & Rice, Inc. (private equity investment firm) since September 1998. Previously, Mr. Lautenbach was with the International Business Machines Corpora tion (IBM) from 1968 until his retirement in 1998. Mr. Lautenbach serves as a Director of Italtel Holding S.p.A. (telecommunications (Milan, Italy), 2004 present) and Eaton Corporation (diversified industrial) as well as the Philharmonic Center for the Arts in Naples, Florida. He also is a member of the Board of Trustees of Fairfield University (2005 present), as well as a member of the Council on Foreign Relations.
Year of Election or Appointment: 1997
Prior to his retirement in December 1994, Mr. McCoy was Vice Chair man of the Board of BellSouth Corporation (telecommunications) and President of BellSouth Enterprises. He is currently a Director of Liberty Corporation (holding company), Duke Realty Corporation (real estate), and Progress Energy, Inc. (electric utility). He is also a partner of Frank lin Street Partners (private investment management firm) and a member of the Research Triangle Foundation Board. In addition, Mr. McCoy served as the Interim Chancellor (1999 2000) and a member of the Board of Visitors for the University of North Carolina at Chapel Hill and currently serves on the Board of Directors of the University of North Carolina Health Care System and the Board of Visitors of the Kenan Flagler Business School (University of North Carolina at Chapel Hill). He also served as Vice President of Finance for the University of North Carolina (16 school system).
61 Annual Report
Trustees and Officers - continued
| | Name, Age; Principal Occupation
Cornelia M. Small (61)
|
Year of Election or Appointment: 2005
Ms. Small is a member (2000 present) and Chairperson (2002 present) of the Investment Committee, and a member (2002 present) of the Board of Trustees of Smith College. Previously, she served as Chief Investment Officer (1999 2000), Director of Global Equity Investments (1996 1999), and a member of the Board of Directors of Scudder, Stevens & Clark (1990 1997) and Scudder Kemper Investments (1997 1998). In addition, Ms. Small served as Co Chair (2000 2003) of the Annual Fund for the Fletcher School of Law and Diplomacy.
| | William S. Stavropoulos (66)
|
Year of Election or Appointment: 2002
Mr. Stavropoulos is Chairman of the Board (2000 present) and a Mem ber of the Board of Directors of The Dow Chemical Company. Since joining The Dow Chemical Company in 1967, Mr. Stavropoulos served in numerous senior management positions, including President (1993 2000; 2002 2003), CEO (1995 2000; 2002 2004), and Chair man of the Executive Committee (2000 2004). Currently, he is a Direc tor of NCR Corporation (data warehousing and technology solutions), BellSouth Corporation (telecommunications), Chemical Financial Corpo ration, Maersk Inc. (industrial conglomerate, 2002 present), and Metal mark Capital (private equity investment firm, 2005 present). He also serves as a member of the Board of Trustees of the American Enterprise Institute for Public Policy Research. In addition, Mr. Stavropoulos is a member of The Business Council, J.P. Morgan International Council and the University of Notre Dame Advisory Council for the College of Science.
Year of Election or Appointment: 2005
Prior to his retirement in 2001, Mr. Wolfe was Chairman and Chief Executive Officer of Hershey Foods Corporation (1993 2001). He currently serves as a member of the boards of Adelphia Communica tions Corporation (2003 present), Bausch & Lomb, Inc., and Revlon Inc. (2004 present).
Advisory Board Member and Executive Officers:
Correspondence intended for each executive officer and Mr. Lynch may be sent to Fidelity Investments, 82 Devonshire Street, Boston, Massachusetts 02109.
| | Name, Age; Principal Occupation
Peter S. Lynch (61)
|
Year of Election or Appointment: 2003
Member of the Advisory Board of Fidelity Court Street Trust and Fidelity Court Street Trust II. Vice Chairman and a Director of FMR, and Vice Chairman (2001 present) and a Director (2000 present) of FMR Co., Inc. Previously, Mr. Lynch served as a Trustee of the Fidelity funds (1990 2003). In addition, he serves as a Trustee of Boston College, Massachusetts Eye & Ear Infirmary, Historic Deerfield, John F. Kennedy Library, and the Museum of Fine Arts of Boston.
Year of Election or Appointment: 2005
Vice President of Florida Municipal Money Market and Florida Muni cipal Income. Mr. Donovan also serves as Vice President of Fidelity’s High Income Funds (2005 present), Fidelity’s Fixed Income Funds (2005 present), certain Asset Allocation Funds (2005 present), and certain Balanced Funds (2005 present). Mr. Donovan also serves as Executive Vice President of FMR (2005 present) and FMRC (2005 present). Previously, Mr. Donovan served as Vice President and Director of Fidelity’s International Equity Trading group (1998 2005).
Year of Election or Appointment: 2005
Vice President of Florida Municipal Money Market. Mr. Morrison also serves as Vice President of Fidelity’s Money Market Funds (2005 present) and certain Asset Allocation Funds (2002 present). Previously, he served as Vice President of Fidelity’s Bond Funds (2002 2005) and certain Balanced Funds (2002 2005). He served as Vice President (2002 2005) and Bond Group Leader (2002 2005) of Fidelity Investments Fixed Income Division. Mr. Morrison is also Vice President of FIMM (2002 present) and FMR (2002 present).
Mr. Morrison joined Fidelity Investments in 1987 as a Corporate Bond Analyst in the Fixed Income Research Division.
63 Annual Report
Trustees and Officers - continued
| | Name, Age; Principal Occupation
David L. Murphy (57)
|
Year of Election or Appointment: 2002 or 2005
Vice President of Florida Municipal Money Market (2002) and Florida Municipal Income (2005). Mr. Murphy also serves as Vice President of Fidelity’s Money Market Funds (2002 present), certain Asset Allocation Funds (2003 present), Fidelity’s Investment Grade Bond Funds (2005 present), and Fidelity’s Balanced Funds (2005 present). He serves as Senior Vice President (2000 present) and Head (2004 present) of the Fidelity Investments Fixed Income Division. Mr. Murphy is also a Senior Vice President of FIMM (2003 present) and a Vice President of FMR (2000 present). Previously, Mr. Murphy served as Money Market Group Leader (2002 2004), Bond Group Leader (2000 2002), and Vice President of Fidelity’s Taxable Bond Funds (2000 2002) and Fidelity’s Municipal Bond Funds (2001 2002). Mr. Murphy joined Fidelity Invest ments in 1989 as a portfolio manager in the Bond Group.
Year of Election or Appointment: 2005
Vice President of Florida Municipal Income. Mr. Silvia also serves as Vice President of Fidelity’s Bond Funds (2005 present) and Senior Vice President and Bond Group Leader of the Fidelity Investments Fixed Income Division (2005 present). Previously, Mr. Silvia served as Director of Fidelity’s Taxable Bond portfolio managers (2002 2004) and a portfolio manager in the Bond Group (1997 2004).
Year of Election or Appointment: 2004
Vice President of Florida Municipal Money Market. Mr. Marchese also serves as Vice President of other funds advised by FMR. Prior to assum ing his current responsibilities, Mr. Marchese worked as a legal analyst and portfolio manager.
Year of Election or Appointment: 2004
Vice President of Florida Municipal Income. Mr. McGinley also serves as Vice President of other funds advised by FMR. Prior to assuming his current responsibilities, Mr. McGinley served as an analyst and manager.
Name, Age; Principal Occupation
Eric D. Roiter (57)
|
Year of Election or Appointment: 1998
Secretary of Florida Municipal Money Market and Florida Municipal Income. He also serves as Secretary of other Fidelity funds; Vice Presi dent, General Counsel, and Secretary of FMR Co., Inc. (2001 present) and FMR; Assistant Secretary of Fidelity Management & Research (U.K.) Inc. (2001 present), Fidelity Management & Research (Far East) Inc. (2001 present), and Fidelity Investments Money Management, Inc. (2001 present). Mr. Roiter is an Adjunct Member, Faculty of Law, at Boston College Law School (2003 present). Previously, Mr. Roiter served as Vice President and Secretary of Fidelity Distributors Corporation (FDC)(1998 2005).
Year of Election or Appointment: 2003
Assistant Secretary of Florida Municipal Money Market and Florida Municipal Income. Mr. Fross also serves as Assistant Secretary of other Fidelity funds (2003 present), Vice President and Secretary of FDC (2005 present), and is an employee of FMR.
Year of Election or Appointment: 2004
President, Treasurer, and Anti Money Laundering (AML) officer of Florida Municipal Money Market and Florida Municipal Income. Ms. Reynolds also serves as President, Treasurer, and AML officer of other Fidelity funds (2004) and is a Vice President (2003) and an employee (2002) of FMR. Before joining Fidelity Investments, Ms. Reynolds worked at PricewaterhouseCoopers LLP (PwC) (1980 2002), where she was most recently an audit partner with PwC’s investment management practice.
65 Annual Report
Trustees and Officers - continued
| | Name, Age; Principal Occupation
Paul M. Murphy (58)
|
Year of Election or Appointment: 2005
Chief Financial Officer of Florida Municipal Money Market and Florida Municipal Income. Mr. Murphy also serves as Chief Financial Officer of other Fidelity funds (2005 present). He also serves as Senior Vice President of Fidelity Pricing and Cash Management Services Group (FPCMS).
| | Kenneth A. Rathgeber (58)
|
Year of Election or Appointment: 2004
Chief Compliance Officer of Florida Municipal Money Market and Florida Municipal Income. Mr. Rathgeber also serves as Chief Compliance Officer of other Fidelity funds (2004) and Executive Vice President of Risk Oversight for Fidelity Investments (2002). Previously, he served as Executive Vice President and Chief Operating Officer for Fidelity Investments Institutional Services Company, Inc. (1998 2002).
Year of Election or Appointment: 2003
Deputy Treasurer of Florida Municipal Money Market and Florida Municipal Income. Mr. Hebble also serves as Deputy Treasurer of other Fidelity funds (2003), and is an employee of FMR. Before joining Fidelity Investments, Mr. Hebble worked at Deutsche Asset Management where he served as Director of Fund Accounting (2002 2003) and Assistant Treasurer of the Scudder Funds (1998 2003).
Year of Election or Appointment: 2005
Deputy Treasurer of Florida Municipal Money Market and Florida Municipal Income. Mr. Mehrmann also serves as Deputy Treasurer of other Fidelity funds (2005 present) and is an employee of FMR. Previously, Mr. Mehrmann served as Vice President of Fidelity Investments Institutional Services Group (FIIS)/Fidelity Investments Institutional Operations Corporation, Inc. (FIIOC) Client Services (1998 2004).
Name, Age; Principal Occupation
Kimberley H. Monasterio (41)
|
Year of Election or Appointment: 2004
Deputy Treasurer of Florida Municipal Money Market and Florida Municipal Income. Ms. Monasterio also serves as Deputy Treasurer of other Fidelity funds (2004) and is an employee of FMR (2004). Before joining Fidelity Investments, Ms. Monasterio served as Treasurer (2000 2004) and Chief Financial Officer (2002 2004) of the Franklin Templeton Funds and Senior Vice President of Franklin Templeton Services, LLC (2000 2004).
Year of Election or Appointment: 2005
Deputy Treasurer of Florida Municipal Money Market and Florida Municipal Income. Mr. Robins also serves as Deputy Treasurer of other Fidelity funds (2005 present) and is an employee of FMR
(2004 present). Before joining Fidelity Investments, Mr. Robins worked at KPMG LLP, where he was a partner in KPMG’s department of professional practice (2002 2004) and a Senior Manager (1999 2000). In addition, Mr. Robins served as Assistant Chief Accountant, United States Securities and Exchange Commission (2000 2002).
Year of Election or Appointment: 2005
Assistant Treasurer of Florida Municipal Money Market and Florida Municipal Income. Mr. Byrnes also serves as Assistant Treasurer of other Fidelity funds (2005 present) and is an employee of FMR
(2005 present). Previously, Mr. Byrnes served as Vice President of FPCMS (2003 2005). Before joining Fidelity Investments, Mr. Byrnes worked at Deutsche Asset Management where he served as Vice President of the Investment Operations Group (2000 2003).
Year of Election or Appointment: 1992
Assistant Treasurer of Florida Municipal Money Market and Florida Municipal Income. Mr. Costello also serves as Assistant Treasurer of other Fidelity funds and is an employee of FMR.
Year of Election or Appointment: 2004
Assistant Treasurer of Florida Municipal Money Market and Florida Municipal Income. Mr. Lydecker also serves as Assistant Treasurer of other Fidelity funds (2004) and is an employee of FMR.
67 Annual Report
Trustees and Officers - continued
| | Name, Age; Principal Occupation
Mark Osterheld (50)
|
Year of Election or Appointment: 2002
Assistant Treasurer of Florida Municipal Money Market and Florida Municipal Income. Mr. Osterheld also serves as Assistant Treasurer of other Fidelity funds (2002) and is an employee of FMR.
Year of Election or Appointment: 2005
Assistant Treasurer of Florida Municipal Money Market and Florida Municipal Income. Mr. Ryan also serves as Assistant Treasurer of other Fidelity funds (2005 present) and is an employee of FMR (2005 present). Previously, Mr. Ryan served as Vice President of Fund Reporting in FPCMS (1999 2005).
Year of Election or Appointment: 2005
Assistant Treasurer of Florida Municipal Money Market and Florida Municipal Income. Mr. Schiavone also serves as Assistant Treasurer of other Fidelity funds (2005 present) and is an employee of FMR (2005 present). Before joining Fidelity Investments, Mr. Schiavone worked at Deutsche Asset Management, where he most recently served as Assistant Treasurer (2003 2005) of the Scudder Funds and Vice President and Head of Fund Reporting (1996 2003).
The Board of Trustees of Fidelity Florida Municipal Income Fund voted to pay on December 19, 2005, to shareholders of record at the opening of business on December 16, 2005, a distribution of $.145 per share derived from capital gains realized from sales of portfolio securities.
The funds hereby designate as capital gain dividends the amounts noted below for the taxable year indicated or for dividends for the taxable year ended 2005, if sub sequently determined to be different, the net capital gain of such year; and for dividends for the taxable year ended 2004, if subsequently determined to be different, the excess of: (a) the net capital gain of such year, over (b) amounts previously designated as capital gain dividends with respect to such year.
| Fund | | November 30, 2005 | | November 30, 2004 |
| Fidelity Florida Municipal Income Fund | | $ | | 6,913,638 | | $ | | 1,478,128 |
| Fidelity Florida Municipal Money Market Fund | | $ | | 25,592 | | | | — |
During fiscal year ended 2005, 100% of each fund’s income dividends were free from federal income tax, and 14.71% and 59.75% of the income fund and money market’s income dividends were subject to the federal alternative minimum tax.
The fund will notify shareholders in January 2006 of amounts for use in preparing 2005 income tax returns.
Board Approval of Investment Advisory Contracts and Management Fees
Fidelity Florida Municipal Income Fund (formerly Spartan Florida Municipal Income Fund) / Fidelity Florida Municipal Money Market Fund
Each year, typically in June, the Board of Trustees, including the independent Trustees (together, the Board), votes on the renewal of the management contract and sub advisory agreements (together, the Advisory Contracts) for each fund. The Board, assisted by the advice of fund counsel and independent Trustees’ counsel, requests and considers a broad range of information throughout the year.
The Board meets regularly each month except August and takes into account throughout the year matters bearing on Advisory Contracts. The Board, acting directly and through its separate committees, considers at each of its meetings factors that are relevant to the annual renewal of each fund’s Advisory Contracts, including the services and support provided to each fund and its shareholders by Fidelity. At the time of the renewal, the Board had 11 standing committees, each composed of independent Trustees with varying backgrounds, to which the Board has assigned specific subject matter responsibilities in order to enhance effective decision making by the Board. Each committee has adopted a written charter outlining the structure and purposes of the committee. One such com mittee, the Fixed Income Contract Committee, meets periodically during the first six months of each year and as necessary to consider matters specifically related to the annual renewal of Advisory Contracts. The committee requests and receives information on, and makes recommendations to the independent Trustees concerning, the approval and annual review of the Advisory Contracts.
At its June 2005 meeting, the Board of Trustees, including the independent Trustees, unanimously determined to renew the Advisory Contracts for each fund. In reaching its determination, the Board considered all factors it believed relevant, including (1) the nature, extent, and quality of the services to be provided to each fund and its sharehold ers by Fidelity (including the investment performance of each fund); (2) the competi tiveness of the management fee and total expenses of each fund; (3) the total costs of the services to be provided by and the profits to be realized by the investment adviser and its affiliates from the relationship with each fund; (4) the extent to which economies of scale would be realized as each fund grows; and (5) whether fee levels reflect these economies of scale, if any, for the benefit of fund shareholders.
In determining whether to renew the Advisory Contracts for each fund, the Board ultimately reached a determination, with the assistance of fund counsel and indepen dent Trustees’ counsel, that the renewal of the Advisory Contracts and the compensation to be received by Fidelity under the management contracts is consistent with Fidelity’s fiduciary duty under applicable law. In addition to evaluating the specific factors noted above, the Board, in reaching its determination, is aware that shareholders in each fund have a broad range of investment choices available to them, including a wide choice among mutual funds offered by competitors to Fidelity, and that each fund’s
shareholders, with the opportunity to review and weigh the disclosure provided by the fund in its prospectus and other public disclosures, have chosen to invest in that fund, managed by Fidelity.
Nature, Extent, and Quality of Services Provided by Fidelity. The Board consid ered staffing within the investment adviser, FMR, and the sub advisers (together, the Investment Advisers), including the backgrounds of the funds’ portfolio managers and the funds’ investment objectives and disciplines. The independent Trustees also had discussions with senior management of Fidelity’s investment operations and investment groups. The Board considered the structure of the portfolio manager compensation program and whether this structure provides appropriate incentives.
Fidelity Resources Dedicated to Investment Management and Support Services. The Board reviewed the size, education, and experience of the Investment Advisers’ invest ment staff, their use of technology, and the Investment Advisers’ approach to recruiting, training, and retaining portfolio managers and other research, advisory, and manage ment personnel. The Board considered Fidelity’s extensive global research capabilities that enable the Investment Advisers to aggregate data from various sources in an effort to produce positive investment results. The Board noted that Fidelity’s analysts have access to a variety of technological tools that enable them to perform both fundamental and quantitative analysis and to specialize in various disciplines. The Board also considered that Fidelity’s portfolio managers and analysts have access to daily portfolio attribution that allows for monitoring of a fund’s portfolio, as well as an electronic communication system that provides immediate real time access to research concerning issuers and credit enhancers.
Shareholder and Administrative Services. The Board considered the nature, extent, quality, and cost of administrative, distribution, and shareholder services performed by the Investment Advisers and their affiliates under the Advisory Contracts and under separate agreements covering transfer agency and pricing and bookkeeping services for each fund. The Board also considered the nature and extent of the Investment Advisers’ supervision of third party service providers, principally custodians and subcustodians. The Board reviewed the allocation of fund brokerage, including allocations to brokers affiliated with the Investment Advisers. The Board also considered the resources devoted to, and the record of compliance with, each fund’s compliance policies and procedures.
The Board noted that the growth of fund assets across the complex allows Fidelity to reinvest in the development of services designed to enhance the value or convenience of the Fidelity funds as investment vehicles. These services include 24 hour access to account information and market information through phone representatives and over the Internet, and investor education materials and asset allocation tools.
Investment in a Large Fund Family. The Board considered the benefits to shareholders of investing in a Fidelity fund, including the benefits of investing in a fund that is part of a
71 Annual Report
Board Approval of Investment Advisory Contracts and Management Fees continued
large family of funds offering a variety of investment disciplines and providing for a large variety of mutual fund investor services. For example, fund shareholders are offered the privilege of exchanging shares of a fund for shares of other Fidelity funds, as set forth in the fund’s prospectus, without paying a sales charge. The Board noted that, since the last Advisory Contract renewals in June 2004, Fidelity has taken a number of actions that benefited particular funds, including (i) voluntarily deciding in 2004 to stop using “soft” commission dollars to pay for market data and, instead, to pay for that data out of its own resources, (ii) contractually agreeing to impose management fee reductions and expense limitations on its five Spartan stock index funds and its stock index fund available through variable insurance products, (iii) contractually agreeing to eliminate the management fees on the Fidelity Freedom Funds and the Fidelity Advisor Freedom Funds, (iv) contractually agreeing to reduce the management fees on most of its investment grade taxable bond funds, and (v) contractually agreeing to impose expense limitations on its retail and Spartan investment grade taxable bond funds.
Investment Performance. The Board considered whether each fund has operated within its investment objective, as well as its record of compliance with its investment restric tions. It also reviewed each fund’s absolute investment performance, as well as each fund’s relative investment performance measured against (i) a broad based securities market index (bond fund only, as money market funds are typically not compared against a market index), and (ii) a peer group of mutual funds over multiple periods. For each fund, the following charts considered by the Board show, over the one , three , and five year periods ended December 31, 2004, the fund’s returns, the returns of a broad based securities market index (“benchmark”) (bond fund only), and a range of returns of a peer group of mutual funds identified by Lipper Inc. as having an investment objec tive similar to that of the fund. The Board did not consider that Lipper peer group to be a meaningful comparison for Fidelity Florida Municipal Money Market Fund, however, because the peer group combines tax exempt money market funds from several different states. The box within each chart shows the 25th percentile return (bottom of box) and the 75th percentile return (top of box) of the Lipper peer group. The percentage beaten number noted below each chart corresponds to the percentile box and represents the percentage of funds in the Lipper peer group whose performance was equal to or lower than that of the fund.
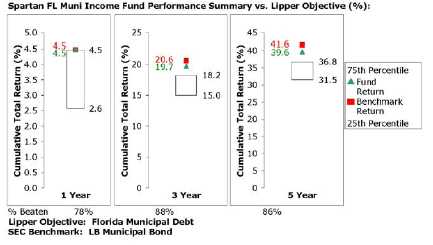
The Board noted that the relative investment performance of the fund has compared favorably to its Lipper peer group over time. The Board also noted that the relative investment performance of the fund was lower than its benchmark for certain periods, although the one year cumulative total return of the fund compared favorably to its benchmark.
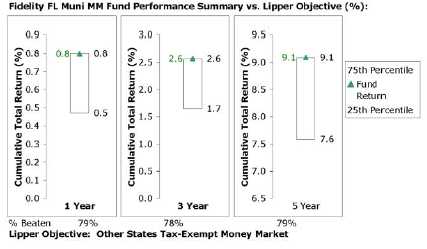
The Board noted that the relative investment performance of the fund has compared favorably to its Lipper peer group over time.
73 Annual Report
Board Approval of Investment Advisory Contracts and Management Fees continued
Based on its review, and giving particular weight to the nature and quality of the resources dedicated by the Investment Advisers to maintain and improve relative performance, the Board concluded that the nature, extent, and quality of the services provided by Fidelity will benefit each fund’s shareholders, particularly in light of the Board’s view that each fund’s shareholders benefit from investing in a fund that is part of a large family of funds offering a variety of investment disciplines and services.
Competitiveness of Management Fee and Total Fund Expenses. The Board considered each fund’s management fee and total expenses compared to “mapped groups” of competitive funds and classes. Fidelity creates “mapped groups” by combining similar Lipper investment objective categories that have comparable management fee characteristics. Combining Lipper investment objective categories aids the Board’s management fee and total expense comparisons by broadening the competitive group used for comparison and by reducing the number of universes to which various Fidelity funds are compared.
The Board considered two proprietary management fee comparisons for the 12 month periods shown in the charts below. The group of Lipper funds used by the Board for management fee comparisons is referred to below as the “Total Mapped Group” and, for the reasons explained above, is broader than the Lipper peer group used by the Board for performance comparisons. The Total Mapped Group comparison focuses on a fund’s standing relative to the total universe of comparable funds available to investors, in terms of gross management fees before expense reimbursements or caps. “TMG %” represents the percentage of funds in the Total Mapped Group that had management fees that were lower than a fund’s. For example, a TMG % of 23% would mean that 77% of the funds in the Total Mapped Group had higher management fees than a fund. The “Asset Size Peer Group” (ASPG) comparison focuses on a fund’s standing relative to non Fidelity funds similar in size to the fund within the Total Mapped Group. The ASPG represents at least 15% of the funds in the Total Mapped Group with comparable asset size and management fee characteristics, subject to a minimum of 50 funds (or all funds in the Total Mapped Group if fewer than 50). Additional information, such as the ASPG quartile (“quadrant”) in which a fund’s management fee ranked, is also included in the charts and considered by the Board. For a more meaningful comparison of management fees, Fidelity Florida Municipal Money Market Fund is compared on the basis of a hypothetical “net management fee,” which is derived by subtracting payments made by FMR for non management expenses (including transfer agent fees, pricing and book keeping fees, and custody fees) from the fund’s all inclusive fee. In this regard, the Board realizes that net management fees can vary from year to year because of differences in non management expenses.
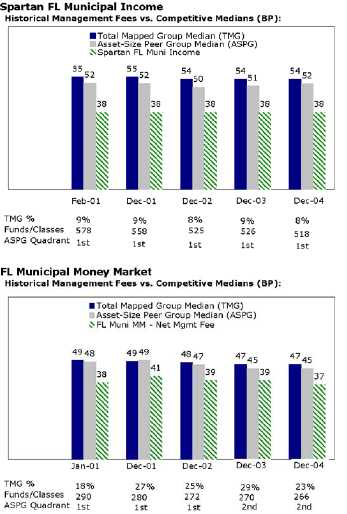
The Board noted that each fund’s management fee ranked below the median of its Total Mapped Group and below the median of its ASPG for 2004. Based on its review, the Board concluded that each fund’s management fee was fair and reasonable in light of the services that the fund receives and the other factors considered.
In its review of Spartan Florida Municipal Income Fund’s total expenses, the Board considered the fund’s management fee as well as other fund expenses, such as transfer agent fees, pricing and bookkeeping fees, and custodial, legal, and audit fees. The Board also noted the effects of any waivers and reimbursements on fees and expenses.
75 Annual Report
Board Approval of Investment Advisory Contracts and Management Fees continued
In its review of Fidelity Florida Municipal Money Market Fund’s total expenses, the Board considered the fund’s hypothetical net management fee as well as the fund’s all inclusive fee. The Board also considered other expenses, such as transfer agent fees, pricing and bookkeeping fees, and custodial, legal, and audit fees, paid by FMR under the all inclusive arrangement. The Board also noted the effects of any waivers and reim bursements on fees and expenses.
As part of its review, the Board also considered current and historical total expenses of each fund compared to competitive fund median expenses. Each fund is compared to those funds and classes in the Total Mapped Group (used by the Board for management fee comparisons) that have a similar sales load structure.
The Board noted that each fund’s total expenses ranked below its competitive median for 2004.
In its review of total expenses, the Board also considered Fidelity fee structures and other information on clients that FMR and its affiliates service in other competitive markets, such as other mutual funds advised or subadvised by FMR or its affiliates, pension plan clients, and other institutional clients.
Based on its review, the Board concluded that each fund’s total expenses were reason able in light of the services that the fund and its shareholders receive and the other factors considered.
Costs of the Services and Profitability. The Board considered the revenues earned and the expenses incurred by Fidelity in conducting the business of developing, market ing, distributing, managing, administering and servicing each fund and its shareholders. The Board also considered the level of Fidelity’s profits in respect of all the Fidelity funds.
On an annual basis, FMR presents to the Board Fidelity’s profitability for each fund. Fidelity calculates the profitability for each fund, as well as aggregate profitability for groups of Fidelity funds and all Fidelity funds, using a series of detailed revenue and cost allocation methodologies which originate with the audited books and records of Fidelity. The Audit Committee of the Board reviews any significant changes from the prior year’s methodologies.
PricewaterhouseCoopers LLP (PwC), independent registered accounting firm and auditor to Fidelity and certain Fidelity funds, has been engaged annually by the Board as part of the Board’s assessment of the results of Fidelity’s profitability analysis. PwC’s engagement includes the review and assessment of Fidelity’s methodologies used in determining the revenues and expenses attributable to Fidelity’s mutual fund business, and completion of agreed upon procedures surrounding the mathematical accuracy of fund profitability and its conformity to allocation methodologies. After considering PwC’s reports issued under the engagement and information provided by Fidelity, the Board
believes that while other allocation methods may also be reasonable, Fidelity’s profitabil ity methodologies are reasonable in all material respects.
The Board has also reviewed Fidelity’s non fund businesses and any fall out benefits related to the mutual fund business as well as cases where Fidelity’s affiliates may benefit from or be related to the funds’ business. In addition, a special committee of the Board reviewed services provided to Fidelity by its affiliates and determined that the fees that Fidelity paid for such services were reasonable.
The Board considered the costs of the services provided by and the profits realized by Fidelity in connection with the operation of each fund and determined that the amount of profit is a fair entrepreneurial profit for the management of each fund.
Economies of Scale. The Board considered whether there have been economies of scale in respect of the management of the Fidelity funds, whether the Fidelity funds (including each fund) have appropriately benefited from any such economies of scale, and whether there is potential for realization of any further economies of scale. The Board considered the extent to which each fund will benefit from economies of scale through increased services to the fund, through waivers or reimbursements, or through fee or expense reductions, including (Spartan Florida Municipal Income Fund only) reductions that occur through operation of the transfer agent agreement. The transfer agent fee varies in part based on the number of accounts in the fund. If the number of accounts decreases or the average account size increases, the overall transfer agent fee rate decreases.
The Board recognized that Spartan Florida Municipal Income Fund’s management contract incorporates a “group fee” structure, which provides for lower fee rates as total fund assets under FMR’s management increase, and for higher fee rates as total fund assets under FMR’s management decrease. The Board considered that the group fee is designed to deliver the benefits of economies of scale to fund shareholders when total fund assets increase, even if assets of any particular fund are unchanged or have declined, because some portion of Fidelity’s costs are attributable to services provided to all Fidelity funds, and all funds benefit if those costs can be allocated among more assets. The Board concluded that, given the group fee structure, fund shareholders will achieve a certain level of economies of scale as assets under FMR’s management increase at the fund complex level, regardless of whether Fidelity achieves any such economies of scale.
The Board further concluded that any potential economies of scale are being shared between fund shareholders and Fidelity in an appropriate manner.
Additional Information Requested by the Board. In order to develop fully the factual basis for consideration of the Advisory Contracts, the Board requested additional information regarding (i) Fidelity’s fund profitability methodology, including additional
77 Annual Report
Board Approval of Investment Advisory Contracts and Management Fees continued
detail on various cost allocations; (ii) fall out benefits to Fidelity; and (iii) compensation of portfolio managers and research analysts.
Based on its evaluation of all of the conclusions noted above, and after considering all material factors, the Board ultimately concluded that the existing advisory fee structures are fair and reasonable, and that each fund’s existing Advisory Contracts should be renewed.
Managing Your Investments
Fidelity offers several ways to conveniently manage your personal investments via your telephone or PC. You can access your account information, conduct trades and research your investments 24 hours a day.
By Phone
Fidelity Automated Service Telephone provides a single toll free number to access account balances, positions, quotes and trading. It’s easy to navigate the service, and on your first call, the system will help you create a personal identification number (PIN) for security.


By PC
Fidelity’s web site on the Internet provides a wide range of information, including daily financial news, fund performance, interactive planning tools and news about Fidelity products and services.

* When you call the quotes line, please remember that a fund’s yield and return will vary and, except for money market funds, share price will also vary. This means that you may have a gain or loss when you sell your shares. There is no assurance that money market funds will be able to maintain a stable $1 share price; an investment in a money market fund is not insured or guar anteed by the U.S. government. Total returns are historical and include changes in share price, reinvestment of dividends and capital gains, and the effects of any sales charges.
79 Annual Report
To Visit Fidelity
For directions and hours,
please call 1-800-544-9797.
Arizona
7001 West Ray Road
Chandler, AZ
7373 N. Scottsdale Road
Scottsdale, AZ
California
815 East Birch Street
Brea, CA
1411 Chapin Avenue
Burlingame, CA
851 East Hamilton Avenue
Campbell, CA
19200 Von Karman Avenue
Irvine, CA
601 Larkspur Landing Circle
Larkspur, CA
10100 Santa Monica Blvd.
Los Angeles, CA
27101 Puerta Real
Mission Viejo, CA
73 575 El Paseo
Palm Desert, CA
251 University Avenue
Palo Alto, CA
123 South Lake Avenue
Pasadena, CA
16995 Bernardo Ctr. Drive
Rancho Bernardo, CA
1740 Arden Way
Sacramento, CA
7676 Hazard Center Drive
San Diego, CA
8 Montgomery Street
San Francisco, CA
3793 State Street
Santa Barbara, CA
21701 Hawthorne Boulevard
Torrance, CA
2001 North Main Street
Walnut Creek, CA
6300 Canoga Avenue
Woodland Hills, CA
|
Colorado
1625 Broadway
Denver, CO
9185 East Westview Road
Littleton, CO
Connecticut
48 West Putnam Avenue
Greenwich, CT
265 Church Street
New Haven, CT
300 Atlantic Street
Stamford, CT
29 South Main Street
West Hartford, CT
Delaware
222 Delaware Avenue
Wilmington, DE
Florida
4400 N. Federal Highway
Boca Raton, FL
121 Alhambra Plaza
Coral Gables, FL
2948 N. Federal Highway
Ft. Lauderdale, FL
1907 West State Road 434
Longwood, FL
8880 Tamiami Trail, North
Naples, FL
3550 Tamiami Trail, South
Sarasota, FL
1502 N. Westshore Blvd.
Tampa, FL
2465 State Road 7
Wellington, FL
3501 PGA Boulevard
West Palm Beach, FL
Georgia
3445 Peachtree Road, N.E.
Atlanta, GA
1000 Abernathy Road
Atlanta, GA
Illinois
One North LaSalle Street
Chicago, IL
875 North Michigan Ave.
Chicago, IL
1415 West 22nd Street
Oak Brook, IL
|
1700 East Golf Road
Schaumburg, IL
3232 Lake Avenue
Wilmette, IL
Indiana
4729 East 82nd Street
Indianapolis, IN
Kansas
5400 College Boulevard
Overland Park, KS
Maine
Three Canal Plaza
Portland, ME
Maryland
7315 Wisconsin Avenue
Bethesda, MD
One W. Pennsylvania Ave.
Towson, MD
Massachusetts
801 Boylston Street
Boston, MA
155 Congress Street
Boston, MA
300 Granite Street
Braintree, MA
44 Mall Road
Burlington, MA
405 Cochituate Road
Framingham, MA
416 Belmont Street
Worcester, MA
Michigan
500 E. Eisenhower Pkwy.
Ann Arbor, MI
280 Old N. Woodward Ave.
Birmingham, MI
43420 Grand River Avenue
Novi, MI
29155 Northwestern Hwy.
Southfield, MI
Minnesota
7600 France Avenue South
Edina, MN
Missouri
8885 Ladue Road
Ladue, MO
|
Annual Report 80
Nevada
2225 Village Walk Drive
Henderson, NV
New Jersey
150 Essex Street
Millburn, NJ
56 South Street
Morristown, NJ
396 Route 17, North
Paramus, NJ
3518 Route 1 North
Princeton, NJ
530 Highway 35
Shrewsbury, NJ
New York
1055 Franklin Avenue
Garden City, NY
37 West Jericho Turnpike
Huntington Station, NY
1271 Avenue of the Americas
New York, NY
61 Broadway
New York, NY
350 Park Avenue
New York, NY
200 Fifth Avenue
New York, NY
733 Third Avenue
New York, NY
11 Penn Plaza
New York, NY
2070 Broadway
New York, NY
1075 Northern Blvd.
Roslyn, NY
North Carolina
4611 Sharon Road
Charlotte, NC
Ohio
3805 Edwards Road
Cincinnati, OH
1324 Polaris Parkway
Columbus, OH
28699 Chagrin Boulevard
Woodmere Village, OH
Oregon
16850 SW 72nd Avenue
Tigard, OR
|
Pennsylvania
600 West DeKalb Pike
King of Prussia, PA
1735 Market Street
Philadelphia, PA
12001 Perry Highway
Wexford, PA
Rhode Island
47 Providence Place
Providence, RI
Tennessee
6150 Poplar Avenue
Memphis, TN
Texas
10000 Research Boulevard
Austin, TX
4001 Northwest Parkway
Dallas, TX
12532 Memorial Drive
Houston, TX
2701 Drexel Drive
Houston, TX
6500 N. MacArthur Blvd.
Irving, TX
6005 West Park Boulevard
Plano, TX
14100 San Pedro
San Antonio, TX
1576 East Southlake Blvd.
Southlake, TX
19740 IH 45 North
Spring, TX
Utah
215 South State Street
Salt Lake City, UT
Virginia
1861 International Drive
McLean, VA
Washington
411 108th Avenue, N.E.
Bellevue, WA
1518 6th Avenue
Seattle, WA
Washington, DC
1900 K Street, N.W.
Washington, DC
Wisconsin
595 North Barker Road
Brookfield, WI
|
Fidelity Brokerage Services, Inc., 100 Summer St., Boston, MA 02110 Member NYSE/SIPC
81 Annual Report
81
Investment Adviser
Fidelity Management & Research
Company
Boston, MA
Investment Sub Adviser
Fidelity Investments
Money Management, Inc.
Fidelity International Investment Advisors
Fidelity International Investment Advisors
(U.K.) Limited
General Distributor
Fidelity Distributors Corporation
Boston, MA
Transfer and Service Agents
Citibank, N.A.
New York, NY
Fidelity Service Company, Inc.
Boston, MA
Custodian
Citibank, N.A.
New York, NY
|
| The Fidelity Telephone Connection |
| Mutual Fund 24-Hour Service |
| Exchanges/Redemptions | | |
| and Account Assistance | | 1-800-544-6666 |
| Product Information | | 1-800-544-6666 |
| Retirement Accounts | | 1-800-544-4774 |
| (8 a.m. - 9 p.m.) | | |
| TDD Service | | 1-800-544-0118 |
| for the deaf and hearing impaired |
| (9 a.m. - 9 p.m. Eastern time) |
| Fidelity Automated Service | | |
| Telephone (FAST® ) (automated phone logo) | | 1-800-544-5555 |
| (automated phone logo) Automated line for quickest service |
SFC UANN-0106
1.786714.102
|

| | Fidelity® New Jersey
Municipal Income Fund
(formerly Spartan® New Jersey
Municipal Income Fund)
Fidelity New Jersey AMT
Tax Free Money Market Fund
(formerly Spartan New Jersey
Municipal Money Market Fund)
Fidelity New Jersey Municipal
Money Market Fund
|
| | Annual Report
November 30, 2005
|


| Contents | | | | |
| |
| |
| Chairman’s Message | | 4 | | Ned Johnson’s message to shareholders |
| Shareholder Expense | | 5 | | An example of shareholder expenses. |
| Example | | | | |
| Fidelity New Jersey Municipal Income Fund |
| | | 7 | | Performance |
| | | 8 | | Management’s Discussion |
| | | 9 | | Investment Changes |
| | | 10 | | Investments |
| | | 18 | | Financial Statements |
| Fidelity New Jersey AMT Tax Free Money Market Fund |
| | | 22 | | Investment Changes/Performance |
| | | 23 | | Investments |
| | | 31 | | Financial Statements |
| Fidelity New Jersey Municipal Money Market Fund |
| | | 35 | | Investment Changes/Performance |
| | | 36 | | Investments |
| | | 47 | | Financial Statements |
| Notes | | 51 | | Notes to the financial statements |
| Report of Independent | | 58 | | |
| Registered Public | | | | |
| Accounting Firm | | | | |
| Trustees and Officers | | 59 | | |
| Distributions | | 71 | | |
| Board Approval of | | 72 | | |
| Investment Advisory | | | | |
| Contracts and | | | | |
| Management Fees | | | | |
To view a fund’s proxy voting guidelines and proxy voting record for the 12 month period
ended June 30, visit www.fidelity.com/proxyvotingresults or visit the Securities and Exchange
Commission’s (SEC) website at www.sec.gov. You may also call 1-800-544-8544 to request a free
copy of the proxy voting guidelines.
Standard & Poor’s, S&P and S&P 500 are registered service marks of The McGraw Hill Companies,
Inc. and have been licensed for use by Fidelity Distributors Corporation.
Other third party marks appearing herein are the property of their respective owners.
All other marks appearing herein are registered or unregistered trademarks or service marks
of FMR Corp. or an affiliated company.
|
Annual Report 2
This report and the financial statements contained herein are submitted for the general
information of the shareholders of the funds. This report is not authorized for distribution to
prospective investors in the funds unless preceded or accompanied by an effective prospectus.
A fund files its complete schedule of portfolio holdings with the SEC for the first and third
quarters of each fiscal year on Form N Q. Forms N Q are available on the SEC’s web site at
http://www.sec.gov. A fund’s Forms N Q may be reviewed and copied at the SEC’s Public Reference
Room in Washington, DC. Information regarding the operation of the SEC’s Public Reference
Room may be obtained by calling 1-800-SEC-0330. For a complete list of a fund’s portfolio
holdings, view the most recent quarterly holdings report, semiannual report, or annual report
on Fidelity’s web site at http://www.fidelity.com/holdings.
NOT FDIC INSURED · MAY LOSE VALUE · NO BANK GUARANTEE
Neither the funds nor Fidelity Distributors Corporation is a bank.
|
3 Annual Report
Chairman’s Message
(photograph of Edward C. Johnson 3d)
Dear Shareholder:
During the past year or so, much has been reported about the mutual fund industry, and much of it has been more critical than I believe is warranted. Allegations that some companies have been less than forthright with their shareholders have cast a shadow on the entire industry. I continue to find these reports disturbing, and assert that they do not create an accurate picture of the industry overall. Therefore, I would like to remind every one where Fidelity stands on these issues. I will say two things specifically regarding allegations that some mutual fund companies were in violation of the Securities and Exchange Commission’s forward pricing rules or were involved in so called “market timing” activities.
First, Fidelity has no agreements that per mit customers who buy fund shares after 4 p.m. to obtain the 4 p.m. price. This is not a new policy. This is not to say that some one could not deceive the company through fraudulent acts. However, we are extremely diligent in preventing fraud from occurring in this manner and in every other. But I underscore again that Fidelity has no so called “agreements” that sanction illegal practices.
Second, Fidelity continues to stand on record, as we have for years, in opposition to predatory short term trading that adversely affects shareholders in a mutual fund. Back in the 1980s, we initiated a fee which is returned to the fund and, therefore, to investors to discourage this activity. Further, we took the lead several years ago in developing a Fair Value Pricing Policy to prevent market timing on foreign securities in our funds. I am confident we will find other ways to make it more difficult for predatory traders to operate. However, this will only be achieved through close cooperation among regulators, legislators and the industry.
Yes, there have been unfortunate instances of unethical and illegal activity within the mutual fund industry from time to time. That is true of any industry. When this occurs, confessed or convicted offenders should be dealt with appropriately. But we are still concerned about the risk of over regulation and the quick application of simplistic solutions to intricate problems. Every system can be improved, and we support and applaud well thought out improvements by regulators, legislators and industry representatives that achieve the common goal of building and protecting the value of investors’ holdings.
For nearly 60 years, Fidelity has worked very hard to improve its products and service to justify your trust. When our family founded this company in 1946, we had only a few hundred customers. Today, we serve more than 18 million customers including individual investors and participants in retirement plans across America.
Let me close by saying that we do not take your trust in us for granted, and we realize that we must always work to improve all aspects of our service to you. In turn, we urge you to continue your active participation with your financial matters, so that your interests can be well served.
Best regards,
/s/ Edward C. Johnson 3d
Edward C. Johnson 3d
Annual Report 4
Shareholder Expense Example
As a shareholder of a Fund, you incur two types of costs: (1) transaction costs, including redemption fees, and (2) ongoing costs, including management fees and other Fund expenses. This Example is intended to help you understand your ongoing costs (in dollars) of investing in the Funds and to compare these costs with the ongoing costs of investing in other mutual funds.
The Example is based on an investment of $1,000 invested at the beginning of the period and held for the entire period (June 1, 2005 to November 30, 2005).
The first line of the table below for each fund provides information about actual account values and actual expenses. You may use the information in this line, together with the amount you invested, to estimate the expenses that you paid over the period. Simply divide your account value by $1,000.00 (for example, an $8,600 account value divided by $1,000.00 = 8.6), then multiply the result by the number in the first line for a fund under the heading entitled “Expenses Paid During Period” to estimate the expenses you paid on your account during this period. A small balance maintenance fee of $12.00 that is charged once a year may apply for certain accounts with a value of less than $2,000. This fee is not included in the table below. If it was, the estimate of expenses you paid during the period would be higher, and your ending account value lower, by this amount.
Hypothetical Example for Comparison Purposes
The second line of the table below for each fund provides information about hypothetical account values and hypothetical expenses based on a fund’s actual expense ratio and an assumed rate of return of 5% per year before expenses, which is not the Fund’s actual return. The hypothetical account values and expenses may not be used to estimate the actual ending account balance or expenses you paid for the period. You may use this information to compare the ongoing costs of investing in the Fund and other funds. To do so, compare this 5% hypothetical example with the 5% hypothetical examples that appear in the shareholder reports of the other funds. A small balance maintenance fee of $12.00 that is charged once a year may apply for certain accounts with a value of less than $2,000. This fee is not included in the table below. If it was, the estimate of expenses you paid during the period would be higher, and your ending account value lower, by this amount. Please note that the expenses shown in the table are meant to highlight your ongoing costs only and do not reflect any transaction costs. Therefore, the second line of the table is useful in comparing ongoing costs only, and will not help you determine the relative total costs of owning different funds. In addition, if these transactional costs were included, your costs would have been higher.
5 Annual Report
| Shareholder Expense Example continued | | | | |
| |
| |
| | | | | | | | | | | | | Expenses Paid |
| | | | | | | | | | | | | During Period* |
| | | | | Beginning | | Ending�� | | | | June 1, 2005 |
| | | | | Account Value | | Account Value | | | | to November 30, |
| | | | | June 1, 2005 | | November 30, 2005 | | | | 2005 |
| Fidelity New Jersey Municipal | | | | | | | | | | | | |
| Income Fund | | | | | | | | | | | | |
| Actual | | $ | | 1,000.00 | | $ | | 999.80 | | $ | | 2.41 |
| HypotheticalA | | $ | | 1,000.00 | | $ | | 1,022.66 | | $ | | 2.43 |
| Fidelity New Jersey AMT | | | | | | | | | | | | |
| Tax Free Money Market Fund | | | | | | | | | | | | |
| Actual | | $ | | 1,000.00 | | $ | | 1,011.00 | | $ | | 1.76 |
| HypotheticalA | | $ | | 1,000.00 | | $ | | 1,023.31 | | $ | | 1.78 |
| Fidelity New Jersey Municipal | | | | | | | | | | | | |
| Money Market Fund | | | | | | | | | | | | |
| Actual | | $ | | 1,000.00 | | $ | | 1,010.30 | | $ | | 2.62 |
| HypotheticalA | | $ | | 1,000.00 | | $ | | 1,022.46 | | $ | | 2.64 |
| |
| A 5% return per year before expenses | | | | | | | | |
* Expenses are equal to each Fund’s annualized expense ratio (shown in the table below); multiplied by the average account value over the period, multiplied by 183/365 (to reflect the one half year period).
| | | Annualized |
| | | Expense Ratio |
| Fidelity New Jersey Municipal Income Fund | | 48% |
| Fidelity New Jersey AMT Tax Free Money Market Fund | | 35% |
| Fidelity New Jersey Municipal Money Market Fund | | 52% |
Fidelity New Jersey Municipal Income Fund
Performance: The Bottom Line
Average annual total return reflects the change in the value of an investment, assuming reinvestment of the fund’s dividend income and capital gains (the profits earned upon the sale of securities that have grown in value) and assuming a constant rate of perfor mance each year. The $10,000 table and the fund’s returns do not reflect the deduction of taxes that a shareholder would pay on fund distributions or the redemption of fund shares. During periods of reimbursement by Fidelity, a fund’s total return will be greater than it would be had the reimbursement not occurred. How a fund did yesterday is no guarantee of how it will do tomorrow.
| Average Annual Total Returns | | | | | | |
| Periods ended November 30, 2005 | | Past 1 | | Past 5 | | Past 10 |
| | | year | | years | | years |
| Fidelity NJ Municipal Income Fund | | 3.77% | | 5.66% | | 5.42% |
| |
| $10,000 Over 10 Years | | | | | | |
Let’s say hypothetically that $10,000 was invested in Fidelity® New Jersey Municipal Income Fund on November 30, 1995. The chart shows how the value of your investment would have changed, and also shows how the Lehman Brothers® Municipal Bond Index performed over the same period.
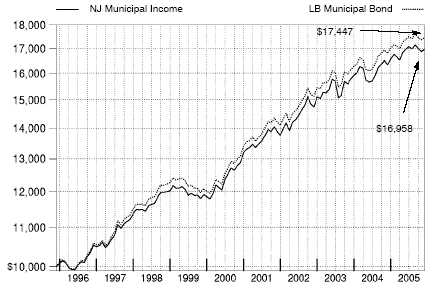
7 Annual Report
Fidelity New Jersey Municipal Income Fund
Management’s Discussion of Fund Performance
Comments from Mark Sommer, Portfolio Manager of Fidelity® New Jersey Municipal Income Fund
Municipal bonds were one of the best performing debt instruments during the year ending November 30, 2005. Munis withstood higher short term interest rates and inflation fears much better than taxable bonds. The Federal Reserve Board hiked short term interest rates eight times during the period, responding to fears about a possible spike in inflation. The tighter monetary policy tempered bond performance, while also leading to a consider able flattening of the yield curve. As short term Treasury and municipal yields continued to rise, longer dated issues saw their yields fall or remain steady, sparking concerns about a possible inversion in the curve. The lower long term rates drove heavy muni issuance, but demand was able to keep up for the most part. The improved creditworthiness of many issuers also boosted muni performance, as the general uptick in the economy helped bolster their attractiveness. Against this backdrop, the Lehman Brothers® Municipal Bond Index rose 3.88% . In comparison, the taxable bond market, as measured by the Lehman Brothers Aggregate Bond Index, advanced 2.40% .
For the 12 months ending November 30, 2005, the fund returned 3.77% . During the same period, the LipperSM New Jersey Municipal Debt Funds Average gained 3.52% and the Lehman New Jersey 4 Plus Year Enhanced Modified Municipal Bond Index rose 4.28% . New Jersey’s municipal market was helped by improving creditworthiness for many issuers and performed roughly in line with most other state municipal markets. I believe that one factor helping the fund outpace its Lipper peer group average was its comparatively large stake relative to the index in bonds that were prerefunded during the period, a process that helped boost the bonds’ returns. In contrast, my focus on high quality securities worked against the fund as lower quality securities outperformed during the period. Among the fund’s high quality holdings that lagged were bonds issued in Puerto Rico mostly insured or backed by U.S. government backed securities which are free from state taxes in all 50 states and offered what I felt were better values in some cases than bonds avail able in New Jersey.
The views expressed in this statement reflect those of the portfolio manager only through the end of the period of the report as stated on the cover and do not necessarily represent the views of Fidelity or any other person in the Fidelity organization. Any such views are subject to change at any time based upon market or other conditions and Fidelity disclaims any responsibility to update such views. These views may not be relied on as investment advice and, because investment decisions for a Fidelity fund are based on numerous factors, may not be relied on as an indication of trading intent on behalf of any Fidelity fund.
| Fidelity New Jersey Municipal Income Fund | | |
| Investment Changes | | | | |
| |
| Top Five Sectors as of November 30, 2005 | | |
| | | % of fund’s | | % of fund’s net assets |
| | | net assets | | 6 months ago |
| General Obligations | | 48.9 | | 37.2 |
| Escrowed/Pre Refunded | | 12.6 | | 17.5 |
| Transportation | | 11.6 | | 20.7 |
| Special Tax | | 5.9 | | 5.1 |
| Electric Utilities | | 5.2 | | 5.4 |
Average Years to Maturity as of November 30, 2005 |
| | | | | 6 months ago |
| Years | | 13.5 | | 14.4 |
Average years to maturity is based on the average time remaining to the stated maturity date of each bond, weighted by the market value of each bond.
| Duration as of November 30, 2005 | | | | |
| | | | | | | 6 months ago |
| Years | | | | 6.9 | | 7.1 |
Duration shows how much a bond fund’s price fluctuates with changes in comparable interest rates. If rates rise 1%, for example, a fund with a five year duration is likely to lose about 5% of its value. Other factors also can influence a bond fund’s performance and share price. Accordingly, a bond fund’s actual performance may differ from this example.
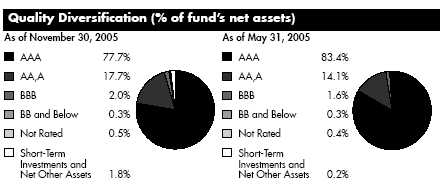
We have used ratings from Moody’s® Investors Services, Inc. Where Moody’s ratings are not available, we have used S&P® ratings.
9 Annual Report
| Fidelity New Jersey Municipal Income Fund | | | | | | |
| Investments November 30, 2005 | | |
| Showing Percentage of Net Assets | | | | | | | | |
| Municipal Bonds 98.2% | | | | | | | | |
| | | | | Principal | | | | Value |
| | | | | Amount | | | | (Note 1) |
| Guam 0.1% | | | | | | | | |
| Guam Wtrwks. Auth. Wtr. and Wastewtr. Sys. Rev. 6% | | | | | | |
| 7/1/25 | | | $ | 400,000 | | | $ | 420,780 |
| New Jersey – 79.8% | | | | | | | | |
| Atlantic County Impt. Auth. Luxury Tax Rev. (Convention | | | | | | |
| Ctr. Proj.): | | | | | | | | |
| 7.375% 7/1/10 (Escrowed to Maturity) (c) | | 655,000 | | | | 715,961 |
| 7.4% 7/1/16 (Escrowed to Maturity) (c) | | 3,510,000 | | | | 4,329,059 |
| Bordentown Swr. Auth. Rev. Series E, 5.5% 12/1/25 | | | | | | |
| (FGIC Insured) | | | | 2,750,000 | | | | 2,938,733 |
| Burlington County Board Commission Pooled Ln. Rev. | | | | | | |
| (Govt. Ln. Prog.) 5.25% 12/15/22 (AMBAC Insured) . | | 3,290,000 | | | | 3,547,278 |
| Burlington County Bridge Commission Lease Rev. (Govt. | | | | | | |
| Leasing Prog.): | | | | | | | | |
| 5.25% 8/15/16 | | | | 1,100,000 | | | | 1,183,336 |
| 5.25% 8/15/17 | | | | 1,000,000 | | | | 1,070,290 |
| 5.25% 8/15/19 | | | | 1,000,000 | | | | 1,073,330 |
| Cape May County Indl. Poll. Cont. Fing. Auth. Rev. | | | | | | |
| (Atlantic City Elec. Co. Proj.) Series A, 6.8% 3/1/21 | | | | | | |
| (MBIA Insured) | | | | 1,350,000 | | | | 1,734,912 |
| Casino Reinvestment Dev. Auth. Hotel Room Fee Rev. | | | | | | |
| 5.25% 1/1/24 (AMBAC Insured) | | | | 1,600,000 | | | | 1,721,040 |
| Egg Hbr. Township School District: | | | | | | | | |
| 5.5% 7/15/17 (FSA Insured) | | | | 1,970,000 | | | | 2,236,344 |
| 5.5% 7/15/18 (FSA Insured) | | | | 1,685,000 | | | | 1,922,551 |
| Essex County Impt. Auth. (County Correctional Facility | | | | | | |
| Proj.): | | | | | | | | |
| Series 2000, 5.75% 10/1/30 (Pre-Refunded to | | | | | | |
| 10/1/10 @ 100) (c) | | | | 3,605,000 | | | | 3,965,212 |
| 5.25% 10/1/18 (MBIA Insured) | | | | 1,000,000 | | | | 1,084,490 |
| Evesham Township Muni. Utils. Auth. Rev. Series 2003 | | | | | | |
| A, 5.125% 7/1/15 (AMBAC Insured) | | | | 2,570,000 | | | | 2,743,218 |
| Garden State Preservation Trust Open Space & | | | | | | |
| Farmland Preservation: | | | | | | | | |
| Series A, 5.25% 11/1/19 (FSA Insured) | | 7,900,000 | | | | 8,698,295 |
| Series B: | | | | | | | | |
| 6.375% 11/1/13 (MBIA Insured) (a) | | | | 4,000,000 | | | | 4,685,560 |
| 6.375% 11/1/15 (MBIA Insured) (a) | | | | 1,630,000 | | | | 1,949,888 |
| 6.375% 11/1/16 (MBIA Insured) (a) | | | | 3,490,000 | | | | 4,209,743 |
| Hudson County Ctfs. of Prtn.: | | | | | | | | |
| 6% 6/1/11 (MBIA Insured) | | | | 2,685,000 | | | | 2,975,168 |
| 6.25% 6/1/14 (MBIA Insured) | | | | 3,210,000 | | | | 3,690,633 |
| 6.25% 6/1/15 (MBIA Insured) | | | | 2,420,000 | | | | 2,802,892 |
| 6.25% 12/1/15 (MBIA Insured) | | | | 1,525,000 | | | | 1,776,549 |
See accompanying notes which are an integral part of the financial statements. | | | | |
| |
| Annual Report | | 10 | | | | | | |
| Municipal Bonds continued | | | | | | | | |
| | | | | Principal | | | | Value |
| | | | | Amount | | | | (Note 1) |
| New Jersey – continued | | | | | | | | |
| Hudson County Ctfs. of Prtn.: – continued | | | | | | | | |
| 6.25% 6/1/16 (MBIA Insured) | | | $ | 1,610,000 | | | $ | 1,877,260 |
| Jersey City Gen. Oblig.: | | | | | | | | |
| Series 2005 C, 5% 9/1/18 (MBIA Insured) | | | | 4,000,000 | | | | 4,243,520 |
| Series B, 5.25% 3/1/15 (AMBAC Insured) | | | | 1,250,000 | | | | 1,381,825 |
| Lenape Reg’l. High School District: | | | | | | | | |
| 7.625% 1/1/13 (MBIA Insured) | | | | 675,000 | | | | 838,040 |
| 7.625% 1/1/14 (MBIA Insured) | | | | 1,000,000 | | | | 1,262,930 |
| Manalapan-Englishtown Reg’l. Board of Ed. 5.75% | | | | | | | | |
| 12/1/22 (FGIC Insured) | | | | 1,340,000 | | | | 1,592,255 |
| Middlesex County Ctfs. of Prtn. 5.5% 8/1/17 (MBIA | | | | | | | | |
| Insured) | | | | 1,000,000 | | | | 1,076,770 |
| Middlesex County Impt. Auth. Rev. (Guaranteed Open | | | | | | | | |
| Space Trust Fund Prog.): | | | | | | | | |
| 5.25% 9/15/16 | | | | 1,360,000 | | | | 1,482,074 |
| 5.25% 9/15/17 | | | | 2,000,000 | | | | 2,161,400 |
| Monmouth County Impt. Auth. Rev. (Howell Township | | | | | | | | |
| Board of Ed. Impt. Proj.) Series A: | | | | | | | | |
| 5.25% 7/15/17 (AMBAC Insured) | | | | 1,910,000 | | | | 2,050,863 |
| 5.25% 7/15/18 (AMBAC Insured) | | | | 2,010,000 | | | | 2,175,222 |
| Monroe Township Muni. Util. Auth. Middlesex County Rev. | | | | | | | | |
| 5.25% 2/1/12 (Pre Refunded to 2/1/11 @ 100) (c) | | | | 1,130,000 | | | | 1,220,829 |
| Montgomery Township Board of Ed. Series 2001, 5.25% | | | | | | | | |
| 8/1/15 (MBIA Insured) | | | | 1,285,000 | | | | 1,381,182 |
| Morristown Gen. Oblig.: | | | | | | | | |
| 6.5% 8/1/17 (FSA Insured) | | | | 1,225,000 | | | | 1,490,090 |
| 6.5% 8/1/19 (FSA Insured) | | | | 630,000 | | | | 776,412 |
| New Jersey Bldg. Auth. Bldg. Rev. 5.75% 6/15/09 | | | | 1,185,000 | | | | 1,248,243 |
| New Jersey Econ. Dev. Auth. Econ. Dev. Rev. | | | | | | | | |
| (The Seeing Eye, Inc. Proj.) 6.2% 12/1/24 | | | | | | | | |
| (Pre-Refunded to 12/1/09 @ 102) (c) | | | | 2,000,000 | | | | 2,232,640 |
| New Jersey Econ. Dev. Auth. Rev.: | | | | | | | | |
| (Trans. Proj.) Series B, 5.75% 5/1/10 (FSA Insured) | | | | 1,000,000 | | | | 1,091,090 |
| Series 2004 A, 5.25% 7/1/31 (MBIA Insured) | | | | 5,000,000 | | | | 5,307,950 |
| Series 2005 K: | | | | | | | | |
| 5.25% 12/15/15 (FGIC Insured) | | | | 6,000,000 | | | | 6,609,300 |
| 5.5% 12/15/19 (AMBAC Insured) | | | | 14,000,000 | | | | 15,962,240 |
| Series 2005 O: | | | | | | | | |
| 5.125% 3/1/28 | | | | 3,000,000 | | | | 3,137,940 |
| 5.25% 3/1/26 | | | | 3,000,000 | | | | 3,177,630 |
| Series F, 5.25% 6/15/19 (Pre-Refunded to 6/15/13 | | | | | | | | |
| @ 100) (c) | | | | 1,500,000 | | | | 1,645,335 |
See accompanying notes which are an integral part of the financial statements.
11 Annual Report
| Fidelity New Jersey Municipal Income Fund | | | | | | | | |
| Investments continued | | | | | | | | | | |
| |
| Municipal Bonds continued | | | | | | | | | | |
| | | | | | | Principal | | | | Value |
| | | | | | | Amount | | | | (Note 1) |
| New Jersey – continued | | | | | | | | | | |
| New Jersey Econ. Dev. Auth. Rev.: – continued | | | | | | | | | | |
| Series I, 5.25% 9/1/28 (Pre-Refunded to 9/1/14 @ | | | | | | | | | | |
| 100) (c) | | | | $ | | 2,000,000 | | $ | | 2,206,000 |
| Series N1, 5.5% 9/1/24 (AMBAC Insured) | | | | | | 5,000,000 | | | | 5,773,300 |
| Series O: | | | | | | | | | | |
| 5.25% 3/1/21 (MBIA Insured) | | | | | | 3,000,000 | | | | 3,236,580 |
| 5.25% 3/1/22 | | | | | | 10,000,000 | | | | 10,638,900 |
| New Jersey Econ. Dev. Auth. Wtr. Facilities Rev.: | | | | | | | | | | |
| (American Wtr. Co., Inc. Proj.): | | | | | | | | | | |
| Series 1994 B, 5.95% 11/1/29 (FGIC Insured) (b) | | . | | | | 7,700,000 | | | | 7,923,146 |
| Series 1997 B, 5.375% 5/1/32 (FGIC Insured) (b) | | . | | | | 3,750,000 | | | | 3,882,675 |
| Series A, 5.25% 7/1/38 (FGIC Insured) (b) | | | | | | 3,270,000 | | | | 3,357,996 |
| (Middlesex Wtr. Co. Proj.) 5.35% 2/1/38 (MBIA | | | | | | | | | | |
| Insured) (b) | | | | | | 1,000,000 | | | | 1,028,390 |
| New Jersey Edl. Facilities Auth. Dorm. Safety Trust Fund | | | | | | | | | | |
| Rev. Series 2001 A: | | | | | | | | | | |
| 5.25% 3/1/09 | | | | | | 4,855,000 | | | | 5,112,752 |
| 5.25% 3/1/10 | | | | | | 4,855,000 | | | | 5,172,954 |
| 5.25% 3/1/11 | | | | | | 4,605,000 | | | | 4,937,297 |
| New Jersey Edl. Facilities Auth. Rev.: | | | | | | | | | | |
| (College of New Jersey Proj.) Series C, 5.375% | | | | | | | | | | |
| 7/1/16 (FGIC Insured) | | | | | | 2,000,000 | | | | 2,165,900 |
| (Higher Ed. Cap. Impt. Fund Prog.) Series 2000 A, | | | | | | | | | | |
| 5.75% 9/1/12 (FSA Insured) | | | | | | 1,595,000 | | | | 1,782,301 |
| (Montclair State Univ. Proj.) Series L, 5.125% 7/1/20 | | | | | | | | | | |
| (MBIA Insured) | | | | | | 2,145,000 | | | | 2,297,703 |
| (Ramapo College Proj.) Series E, 5% 7/1/34 (FGIC | | | | | | | | | | |
| Insured) | | | | | | 1,500,000 | | | | 1,554,960 |
| (Saint Peters College Proj.) Series B, 5.375% 7/1/12 | | . | | | | 1,450,000 | | | | 1,460,629 |
| New Jersey Envir. Infrastructure Trust Series A: | | | | | | | | | | |
| 5.5% 9/1/10 | | | | | | 1,675,000 | | | | 1,801,781 |
| 5.5% 9/1/11 | | | | | | 2,830,000 | | | | 3,039,080 |
| 5.5% 9/1/12 | | | | | | 2,980,000 | | | | 3,192,593 |
| New Jersey Gen. Oblig.: | | | | | | | | | | |
| Series 1996 E, 6% 7/15/09 | | | | | | 1,500,000 | | | | 1,627,695 |
| Series 2005 N: | | | | | | | | | | |
| 5.5% 7/15/16 (AMBAC Insured) | | | | | | 1,900,000 | | | | 2,135,638 |
| 5.5% 7/15/17 (FGIC Insured) | | | | | | 1,000,000 | | | | 1,128,260 |
| Series H, 5.25% 7/1/11 | | | | | | 3,345,000 | | | | 3,612,567 |
| 4.5% 4/1/18 (AMBAC Insured) | | | | | | 1,500,000 | | | | 1,548,285 |
| 4.5% 4/1/20 (AMBAC Insured) | | | | | | 1,500,000 | | | | 1,537,605 |
See accompanying notes which are an integral part of the financial statements.
| Municipal Bonds continued | | | | | | | | |
| | | | | Principal | | | | Value |
| | | | | Amount | | | | (Note 1) |
| New Jersey – continued | | | | | | | | |
| New Jersey Health Care Facilities Fing. Auth. Rev.: | | | | | | | | |
| (AHS Hosp. Corp. Proj.) Series A, 6% 7/1/11 | | | | | | | | |
| (AMBAC Insured) | | $ | | 3,500,000 | | $ | | 3,892,595 |
| (Atlantic City Med. Ctr. Proj.) 5.75% 7/1/25 | | | | 3,000,000 | | | | 3,164,070 |
| (Burdette Tomlin Memorial Hosp. Proj.) Series D, | | | | | | | | |
| 6.25% 7/1/06 (FGIC Insured) | | | | 1,710,000 | | | | 1,714,343 |
| (Cmnty. Med. Ctr./Kimball Med. Ctr. Proj.) 5.25% | | | | | | | | |
| 7/1/11 (FSA Insured) | | | | 750,000 | | | | 788,670 |
| (Hackensack Univ. Med. Ctr. Proj.) Series A, 5.25% | | | | | | | | |
| 1/1/12 (MBIA Insured) | | | | 3,165,000 | | | | 3,302,867 |
| (Kennedy Health Sys. Proj.) Series B: | | | | | | | | |
| 5.75% 7/1/07 (MBIA Insured) | | | | 1,930,000 | | | | 1,998,515 |
| 5.75% 7/1/08 (MBIA Insured) | | | | 1,135,000 | | | | 1,201,284 |
| (Saint Josephs Hosp. & Med. Ctr. Proj.) Series A, | | | | | | | | |
| 5.75% 7/1/16 (Connie Lee Hldgs., Inc. Insured) | | | | 1,000,000 | | | | 1,032,450 |
| (Saint Peters Univ. Hosp. Proj.) Series A, 6.875% | | | | | | | | |
| 7/1/30 | | | | 1,500,000 | | | | 1,642,440 |
| 5.375% 11/15/33 | | | | 2,040,000 | | | | 2,124,395 |
| New Jersey Hwy. Auth. Garden State Parkway Gen. Rev. | | | | | | | | |
| (Sr. Parkway Proj.): | | | | | | | | |
| 6% 1/1/19 (Escrowed to Maturity) (c) | | | | 5,385,000 | | | | 6,329,906 |
| 6.2% 1/1/10 (Escrowed to Maturity) (c) | | | | 6,225,000 | | | | 6,715,219 |
| New Jersey Sports & Exposition Auth. Contract Rev. | | | | | | | | |
| Series A: | | | | | | | | |
| 5.25% 3/1/11 (Escrowed to Maturity) (c) | | | | 15,000 | | | | 16,223 |
| 5.25% 3/1/11 (MBIA Insured) | | | | 1,345,000 | | | | 1,453,353 |
| 6% 3/1/14 (MBIA Insured) | | | | 4,220,000 | | | | 4,612,882 |
| New Jersey Tpk. Auth. Tpk. Rev.: | | | | | | | | |
| Series 2005 C: | | | | | | | | |
| 6.5% 1/1/16 | | | | 555,000 | | | | 643,289 |
| 6.5% 1/1/16 (Escrowed to Maturity) (c) | | | | 185,000 | | | | 215,991 |
| Series A: | | | | | | | | |
| 5.75% 1/1/10 (Escrowed to Maturity) (c) | | | | 735,000 | | | | 798,982 |
| 6% 1/1/11 (Escrowed to Maturity) (c) | | | | 580,000 | | | | 645,981 |
| Series C, 6.5% 1/1/16 (Escrowed to Maturity) (c) | | | | 2,715,000 | | | | 3,179,998 |
| New Jersey Trans. Trust Fund Auth.: | | | | | | | | |
| Series 2001 A: | | | | | | | | |
| 5.5% 6/15/12 | | | | 7,510,000 | | | | 8,182,971 |
| 5.5% 6/15/12 (Escrowed to Maturity) (c) | | | | 2,490,000 | | | | 2,758,447 |
| Series 2003 C: | | | | | | | | |
| 5.5% 6/15/16 (Pre Refunded to 6/15/13 @ 100) (c) | | | | 3,000,000 | | | | 3,339,450 |
| 5.5% 6/15/24 (Pre Refunded to 6/15/13 @ 100) (c) | | | | 3,000,000 | | | | 3,339,450 |
See accompanying notes which are an integral part of the financial statements.
13 Annual Report
| Fidelity New Jersey Municipal Income Fund | | | | |
| Investments continued | | | | |
| |
| Municipal Bonds continued | | | | |
| | | Principal | | Value |
| | | Amount | | (Note 1) |
| New Jersey – continued | | | | |
| New Jersey Trans. Trust Fund Auth.: – continued | | | | |
| Series 2005 C, 5.25% 6/15/20 (FGIC Insured) | | $10,000,000 | | $10,776,700 |
| Series 2005 D, 5% 6/15/20 | | 4,000,000 | | 4,191,440 |
| Series A: | | | | |
| 5.25% 12/15/11 (MBIA Insured) | | 4,205,000 | | 4,554,225 |
| 5.75% 6/15/15 (MBIA Insured) | | 3,000,000 | | 3,384,600 |
| Series B: | | | | |
| 5.25% 12/15/16 (MBIA Insured) | | 9,830,000 | | 10,734,852 |
| 5.25% 12/15/22 (AMBAC Insured) | | 3,000,000 | | 3,326,190 |
| 5.5% 12/15/15 (MBIA Insured) (a) | | 11,000,000 | | 12,294,040 |
| 5.5% 12/15/16 (MBIA Insured) | | 5,000,000 | | 5,606,500 |
| 5.5% 12/15/20 (FGIC Insured) | | 15,235,000 | | 17,243,121 |
| Series C: | | | | |
| 5.25% 6/15/18 (FGIC Insured) | | 10,000,000 | | 10,833,700 |
| 5.5% 12/15/10 (FSA Insured) | | 3,000,000 | | 3,262,860 |
| 5.5% 12/15/13 (FSA Insured) | | 11,055,000 | | 12,256,015 |
| 5.5% 6/15/21 (Pre Refunded to 6/15/13 @ 100) (c) | | 5,000,000 | | 5,565,750 |
| 5.75% 12/15/12 (FSA Insured) | | 5,000,000 | | 5,586,550 |
| New Jersey Transit Corp. Ctfs. of Prtn. Series A: | | | | |
| 5.25% 9/15/15 (AMBAC Insured) | | 3,300,000 | | 3,586,341 |
| 6% 9/15/13 (Pre-Refunded to 9/15/09 @ 100) (c) | | 3,000,000 | | 3,265,290 |
| New Jersey Wtr. Supply Auth. Rev. (Delaware & Raritan | | | | |
| Sys. Proj.) 5.375% 11/1/12 (MBIA Insured) (b) | | 2,465,000 | | 2,609,622 |
| Newark Gen. Oblig.: | | | | |
| 5.3% 9/1/16 (MBIA Insured) | | 3,500,000 | | 3,584,910 |
| 5.375% 12/15/13 (MBIA Insured) | | 2,840,000 | | 3,117,241 |
| Newark Port Auth. Hsg. Auth. (City of Newark Redev. | | | | |
| Proj.): | | | | |
| 5% 1/1/34 (MBIA Insured) | | 5,000,000 | | 5,157,250 |
| 5.5% 1/1/27 (MBIA Insured) | | 2,500,000 | | 2,734,800 |
| North Bergen Township Muni. Utils. Auth. Swr. Rev.: | | | | |
| 5.25% 12/15/16 (MBIA Insured) | | 2,800,000 | | 3,042,284 |
| 5.25% 12/15/17 (MBIA Insured) | | 1,000,000 | | 1,083,670 |
| North Hudson Swr. Auth. Swr. Rev. Series A: | | | | |
| 0% 8/1/24 (MBIA Insured) | | 2,000,000 | | 825,520 |
| 5.25% 8/1/17 (FGIC Insured) | | 3,000,000 | | 3,231,600 |
| Ocean County Utils. Auth. Wastewtr. Rev.: | | | | |
| Series 2001: | | | | |
| 5.25% 1/1/15 | | 4,540,000 | | 4,898,978 |
| 5.25% 1/1/16 | | 2,400,000 | | 2,584,368 |
| 5.125% 1/1/10 | | 2,180,000 | | 2,260,791 |
See accompanying notes which are an integral part of the financial statements.
| Municipal Bonds continued | | | | | | |
| | | | | Principal | | Value |
| | | | | Amount | | (Note 1) |
| New Jersey – continued | | | | | | |
| Plainfield Board of Ed. 5% 8/1/20 (FSA Insured) | | $ | | 1,500,000 | | $ 1,544,295 |
| Rutgers State Univ. Rev. (State Univ. of New Jersey Proj.) | | | | | | |
| Series A, 6.4% 5/1/13 | | | | 2,000,000 | | 2,241,980 |
| Southeast Morris County Muni. Utils. Auth. Wtr. Rev. 5% | | | | | | |
| 1/1/14 (MBIA Insured) | | | | 1,145,000 | | 1,204,036 |
| Tobacco Settlement Fing. Corp.: | | | | | | |
| 6.375% 6/1/32 | | | | 7,200,000 | | 7,887,816 |
| 6.75% 6/1/39 | | | | 750,000 | | 836,655 |
| Union County Impt. Auth. (Juvenile Detention Ctr. Facility | | | | | | |
| Proj.) 5.5% 5/1/34 (FGIC Insured) | | | | 6,000,000 | | 6,537,360 |
| Univ. of Medicine & Dentistry Series A: | | | | | | |
| 5.5% 12/1/23 (AMBAC Insured) | | | | 1,800,000 | | 1,987,434 |
| 5.5% 12/1/27 (AMBAC Insured) | | | | 4,000,000 | | 4,395,920 |
| Univ. of Medicine & Dentistry of New Jersey Ctfs. of Prtn. | | | | | | |
| 5% 6/15/29 (MBIA Insured) | | | | 1,000,000 | | 1,035,790 |
| | | | | | | 450,996,774 |
| |
| New Jersey/Pennsylvania – 1.6% | | | | | | |
| Delaware River Joint Toll Bridge Commission Bridge Rev.: | | | | | | |
| 5.25% 7/1/17 | | | | 1,300,000 | | 1,380,782 |
| 5.25% 7/1/17 (Pre-Refunded to 7/1/13 @ 100) (c) . | | | | 1,700,000 | | 1,859,664 |
| Delaware River Port Auth. Pennsylvania & New Jersey | | | | | | |
| Rev.: | | | | | | |
| (Port District Proj.) Series 1999 B, 5.7% 1/1/22 (FSA | | | | | | |
| Insured) | | | | 2,000,000 | | 2,153,780 |
| Series 1999: | | | | | | |
| 5.75% 1/1/15 (FSA Insured) | | | | 2,000,000 | | 2,158,320 |
| 6% 1/1/18 (FSA Insured) | | | | 1,300,000 | | 1,417,156 |
| | | | | | | 8,969,702 |
| |
| New York & New Jersey – 9.6% | | | | | | |
| Port Auth. of New York & New Jersey: | | | | | | |
| 117th Series, 5.125% 11/15/11 (FGIC Insured) (b) | | | | 5,220,000 | | 5,435,325 |
| 120th Series, 5.75% 10/15/13 (MBIA Insured) (b) | | | | 3,000,000 | | 3,140,820 |
| 124th Series, 5% 8/1/13 (FGIC Insured) (b) | | | | 3,000,000 | | 3,101,730 |
| 126th Series: | | | | | | |
| 5.25% 5/15/37 (FGIC Insured) (b) | | | | 12,000,000 | | 12,588,360 |
| 5.5% 11/15/11 (FGIC Insured) (b) | | | | 1,495,000 | | 1,623,256 |
| 127th Series: | | | | | | |
| 5% 12/15/07 (AMBAC Insured) (b) | | | | 2,540,000 | | 2,602,916 |
| 5.5% 12/15/13 (AMBAC Insured) (b) | | | | 8,600,000 | | 9,282,668 |
See accompanying notes which are an integral part of the financial statements.
15 Annual Report
| Fidelity New Jersey Municipal Income Fund | | | | | | |
| Investments continued | | | | | | |
| |
| Municipal Bonds continued | | | | | | |
| | | | | Principal | | Value |
| | | | | Amount | | (Note 1) |
| New York & New Jersey – continued | | | | | | |
| Port Auth. of New York & New Jersey: – continued | | | | | | |
| 128th Series: | | | | | | |
| 5% 11/1/18 (FSA Insured) | | $ | | 3,000,000 | | $ 3,187,230 |
| 5% 11/1/19 (FSA Insured) | | | | 2,800,000 | | 2,969,540 |
| 5% 11/1/22 (FSA Insured) | | | | 2,190,000 | | 2,305,041 |
| 134th Series, 5% 1/15/39 | | | | 4,500,000 | | 4,622,040 |
| Port Auth. of New York & New Jersey Spl. Oblig. Rev. | | | | | | |
| (JFK Int’l. Air Term. Spl. Proj.) Series 6, 6.25% | | | | | | |
| 12/1/15 (MBIA Insured) (b) | | | | 3,000,000 | | 3,374,940 |
| | | | | | | 54,233,866 |
| |
| Puerto Rico 7.1% | | | | | | |
| Puerto Rico Commonwealth Hwy. & Trans. Auth. Hwy. | | | | | | |
| Rev. Series Y, 5.5% 7/1/36 (FSA Insured) | | | | 2,100,000 | | 2,314,095 |
| Puerto Rico Commonwealth Hwy. & Trans. Auth. Trans. | | | | | | |
| Rev.: | | | | | | |
| Series E, 5.5% 7/1/16 (FSA Insured) | | | | 2,525,000 | | 2,846,534 |
| 5.75% 7/1/19 (FGIC Insured) | | | | 3,000,000 | | 3,346,200 |
| Puerto Rico Commonwealth Infrastructure Fing. Auth.: | | | | | | |
| Series 2000 A: | | | | | | |
| 5.5% 10/1/32 (Escrowed to Maturity) (c) | | | | 4,345,000 | | 4,710,241 |
| 5.5% 10/1/40 (Escrowed to Maturity) (c) | | | | 11,285,000 | | 12,155,863 |
| Series C, 5.5% 7/1/18 (AMBAC Insured) | | | | 2,000,000 | | 2,268,640 |
| Puerto Rico Elec. Pwr. Auth. Pwr. Rev.: | | | | | | |
| Series NN, 5.25% 7/1/21 (MBIA Insured) | | | | 5,000,000 | | 5,571,200 |
| Series QQ: | | | | | | |
| 5.5% 7/1/17 (XL Cap. Assurance, Inc. Insured) | | | | 1,700,000 | | 1,914,166 |
| 5.5% 7/1/18 (XL Cap. Assurance, Inc. Insured) | | | | 1,000,000 | | 1,129,080 |
| Puerto Rico Hsg. Fin. Corp. Rev. (Multi-family Mtg. Prog.) | | | | | | |
| Series AI, 7.5% 4/1/22, LOC Puerto Rico Govt. Dev. | | | | | | |
| Bank | | | | 890,000 | | 890,552 |
| Puerto Rico Muni. Fin. Agcy. Series A, 5.5% 8/1/19 | | | | | | |
| (FSA Insured) | | | | 2,740,000 | | 2,938,787 |
| | | | | | | 40,085,358 |
| |
| |
| TOTAL INVESTMENT PORTFOLIO 98.2% | | | | | | |
| (Cost $541,071,195) | | | | | | 554,706,480 |
| |
| NET OTHER ASSETS – 1.8% | | | | | | 10,250,739 |
| NET ASSETS 100% | | | | | | $ 564,957,219 |
See accompanying notes which are an integral part of the financial statements.
Legend
(a) Security or a portion of the security
purchased on a delayed delivery or
when-issued basis.
(b) Private activity obligations whose
interest is subject to the federal
alternative minimum tax for individuals.
(c) Security collateralized by an amount
sufficient to pay interest and principal.
|
Other Information
The distribution of municipal securities by revenue source, as a percentage of total net assets, is as follows:
| General Obligations | | 48.9% |
| Escrowed/Pre Refunded | | 12.6% |
| Transportation | | 11.6% |
| Special Tax | | 5.9% |
| Electric Utilities | | 5.2% |
| Others* (individually less than 5%) | | 15.8% |
| | | 100.0% |
| * Includes net other assets | | |
See accompanying notes which are an integral part of the financial statements.
17 Annual Report
| Fidelity New Jersey Municipal Income Fund | | | | | | |
| |
| Financial Statements | | | | | | | | |
| |
| Statement of Assets and Liabilities | | | | | | | | |
| | | | | | | November 30, 2005 |
| |
| Assets | | | | | | | | |
| Investment in securities, at value | | | | | | | | |
| See accompanying schedule: | | | | | | | | |
| Unaffiliated issuers (cost $541,071,195) | | | | | | $ | | 554,706,480 |
| Cash | | | | | | | | 6,470,884 |
| Receivable for investments sold | | | | | | | | 12,054,026 |
| Receivable for fund shares sold | | | | | | | | 27,508 |
| Interest receivable | | | | | | | | 10,682,551 |
| Prepaid expenses | | | | | | | | 3,038 |
| Other receivables | | | | | | | | 19,330 |
| Total assets | | | | | | | | 583,963,817 |
| |
| Liabilities | | | | | | | | |
| Payable for investments purchased | | | | | | | | |
| Regular delivery | | $ | | 420,780 | | | | |
| Delayed delivery | | | | 17,571,456 | | | | |
| Payable for fund shares redeemed | | | | 223,801 | | | | |
| Distributions payable | | | | 539,064 | | | | |
| Accrued management fee | | | | 175,416 | | | | |
| Other affiliated payables | | | | 45,149 | | | | |
| Other payables and accrued expenses | | | | 30,932 | | | | |
| Total liabilities | | | | | | | | 19,006,598 |
| |
| Net Assets | | | | | | $ | | 564,957,219 |
| Net Assets consist of: | | | | | | | | |
| Paid in capital | | | | | | $ | | 544,253,157 |
| Distributions in excess of net investment income | | | | | | | | (72,754) |
| Accumulated undistributed net realized gain (loss) on | | | | | | | | |
| investments | | | | | | | | 7,141,531 |
| Net unrealized appreciation (depreciation) on | | | | | | | | |
| investments | | | | | | | | 13,635,285 |
| Net Assets, for 48,840,805 shares outstanding | | | | | | $ | | 564,957,219 |
| Net Asset Value, offering price and redemption price per | | | | | | |
| share ($564,957,219 ÷ 48,840,805 shares) | | | | | | $ | | 11.57 |
See accompanying notes which are an integral part of the financial statements.
| Statement of Operations | | | | | | |
| | | | | Year ended November 30, 2005 |
| |
| Investment Income | | | | | | |
| Interest | | | | | | $ 24,286,528 |
| |
| Expenses | | | | | | |
| Management fee | | $ | | 2,082,995 | | |
| Transfer agent fees | | | | 384,164 | | |
| Accounting fees and expenses | | | | 133,639 | | |
| Independent trustees’ compensation | | | | 2,606 | | |
| Custodian fees and expenses | | | | 8,847 | | |
| Registration fees | | | | 19,875 | | |
| Audit | | | | 43,858 | | |
| Legal | | | | 4,725 | | |
| Miscellaneous | | | | 7,174 | | |
| Total expenses before reductions | | | | 2,687,883 | | |
| Expense reductions | | | | (266,469) | | 2,421,414 |
| |
| Net investment income | | | | | | 21,865,114 |
| Realized and Unrealized Gain (Loss) | | | | | | |
| Net realized gain (loss) on: | | | | | | |
| Investment securities: | | | | | | |
| Unaffiliated issuers | | | | 7,256,387 | | |
| Futures contracts | | | | 131,080 | | |
| Swap agreements | | | | 71,599 | | |
| Total net realized gain (loss) | | | | | | 7,459,066 |
| Change in net unrealized appreciation (depreciation) on: | | | | |
| Investment securities | | | | (9,383,175) | | |
| Swap agreements | | | | 107,276 | | |
| Total change in net unrealized appreciation | | | | | | |
| (depreciation) | | | | | | (9,275,899) |
| Net gain (loss) | | | | | | (1,816,833) |
| Net increase (decrease) in net assets resulting from | | | | | | |
| operations | | | | | | $ 20,048,281 |
See accompanying notes which are an integral part of the financial statements.
19 Annual Report
| Fidelity New Jersey Municipal Income Fund | | | | | | |
| Financial Statements continued | | | | | | | | |
| |
| Statement of Changes in Net Assets | | | | | | | | |
| | | | | Year ended | | | | Year ended |
| | | | | November 30, | | | | November 30, |
| | | | | 2005 | | | | 2004 |
| Increase (Decrease) in Net Assets | | | | | | | | |
| Operations | | | | | | | | |
| Net investment income | | $ | | 21,865,114 | | $ | | 21,544,783 |
| Net realized gain (loss) | | | | 7,459,066 | | | | 5,336,057 |
| Change in net unrealized appreciation (depreciation) . | | (9,275,899) | | | | (8,963,111) |
| Net increase (decrease) in net assets resulting | | | | | | | | |
| from operations | | | | 20,048,281 | | | | 17,917,729 |
| Distributions to shareholders from net investment income | | . | | (21,774,493) | | | | (21,618,856) |
| Distributions to shareholders from net realized gain | | | | (4,916,800) | | | | (6,439,707) |
| Total distributions | | | | (26,691,293) | | | | (28,058,563) |
| Share transactions | | | | | | | | |
| Proceeds from sales of shares | | | | 102,802,127 | | | | 74,704,644 |
| Reinvestment of distributions | | | | 18,863,621 | | | | 20,036,098 |
| Cost of shares redeemed | | | | (81,942,646) | | | | (103,029,572) |
| Net increase (decrease) in net assets resulting from | | | | | | | | |
| share transactions | | | | 39,723,102 | | | | (8,288,830) |
| Redemption fees | | | | 3,165 | | | | 5,329 |
| Total increase (decrease) in net assets | | | | 33,083,255 | | | | (18,424,335) |
| |
| Net Assets | | | | | | | | |
| Beginning of period | | | | 531,873,964 | | | | 550,298,299 |
| End of period (including distributions in excess of net | | | | | | | | |
| investment income of $72,754 and distributions in | | | | | | | | |
| excess of net investment income of $163,375, | | | | | | | | |
| respectively) | | $ | | 564,957,219 | | $ | | 531,873,964 |
| |
| Other Information | | | | | | | | |
| Shares | | | | | | | | |
| Sold | | | | 8,767,720 | | | | 6,339,101 |
| Issued in reinvestment of distributions | | | | 1,611,513 | | | | 1,704,626 |
| Redeemed | | | | (7,005,118) | | | | (8,822,784) |
| Net increase (decrease) | | | | 3,374,115 | | | | (779,057) |
See accompanying notes which are an integral part of the financial statements.
| Financial Highlights | | | | | | | | | | |
| |
| Years ended November 30, | | 2005 | | 2004 | | 2003 | | 2002 | | 2001 |
| Selected Per Share Data | | | | | | | | | | |
| Net asset value, | | | | | | | | | | |
| beginning of period | | $ 11.70 | | $ 11.90 | | $ 11.65 | | $ 11.51 | | $ 11.18 |
| Income from Investment | | | | | | | | | | |
| Operations | | | | | | | | | | |
| Net investment incomeB | | 459 | | .470 | | .487 | | .495 | | .532 |
| Net realized and unrealized | | | | | | | | | | |
| gain (loss) | | (.023) | | (.058) | | .318 | | .196 | | .334 |
| Total from investment operations | | .436 | | .412 | | .805 | | .691 | | .866 |
| Distributions from net investment | | | | | | | | | | |
| income | | (.458) | | (.472) | | (.488) | | (.495) | | (.534) |
| Distributions from net realized | | | | | | | | | | |
| gain | | (.108) | | (.140) | | (.067) | | (.056) | | (.003) |
| Total distributions | | (.566) | | (.612) | | (.555) | | (.551) | | (.537) |
| Redemption fees added to paid | | | | | | | | | | |
| in capitalB | | —D | | —D | | —D | | —D | | .001 |
| Net asset value, | | | | | | | | | | |
| end of period | | $ 11.57 | | $ 11.70 | | $ 11.90 | | $ 11.65 | | $ 11.51 |
| Total ReturnA | | 3.77% | | 3.56% | | 7.04% | | 6.15% | | 7.86% |
| Ratios to Average Net AssetsC | | | | | | | | | | |
| Expenses before reductions | | 48% | | .49% | | .49% | | .50% | | .50% |
| Expenses net of fee waivers, | | | | | | | | | | |
| if any | | 48% | | .49% | | .49% | | .50% | | .50% |
| Expenses net of all reductions | | 43% | | .48% | | .49% | | .47% | | .41% |
| Net investment income | | 3.92% | | 4.00% | | 4.11% | | 4.26% | | 4.62% |
| Supplemental Data | | | | | | | | | | |
| Net assets, end of period | | | | | | | | | | |
| (000 omitted) | | $564,957 | | $531,874 | | $550,298 | | $573,295 | | $514,086 |
| Portfolio turnover rate | | 36% | | 18% | | 24% | | 21% | | 19% |
A Total returns would have been lower had certain expenses not been reduced during the periods shown.
B Calculated based on average shares outstanding during the period.
C Expense ratios reflect operating expenses of the fund. Expenses before reductions do not reflect amounts reimbursed by the investment adviser or
reductions from brokerage service arrangements or other expense offset arrangements and do not represent the amount paid by the fund during
periods when reimbursements or reductions occur. Expenses net of fee waivers reflect expenses after reimbursement by the investment adviser but
prior to reductions from brokerage service arrangements or other expense offset arrangements. Expenses net of all reductions represent the net
expenses paid by the fund.
D Amount represents less than $.001 per share.
|
See accompanying notes which are an integral part of the financial statements.
21 Annual Report
| Fidelity New Jersey AMT Tax Free Money Market Fund | | |
| Investment Changes/Performance |
| |
| Maturity Diversification | | | | | | |
| Days | | % of fund’s | | % of fund’s | | % of fund’s |
| | | investments | | investments | | investments |
| | | 11/30/05 | | 5/31/05 | | 11/30/04 |
| 0 – 30 | | 85.6 | | 89.1 | | 82.4 |
| 31 – 90 | | 6.6 | | 1.5 | | 7.3 |
| 91 – 180 | | 3.7 | | 3.0 | | 3.4 |
| 181 – 397 | | 4.1 | | 6.4 | | 6.9 |
| Weighted Average Maturity | | | | | | |
| | | 11/30/05 | | 5/31/05 | | 11/30/04 |
| Fidelity New Jersey AMT Tax Free Money | | | | | | |
| Market Fund | | 29 Days | | 28 Days | | 34 Days |
| New Jersey Tax Free Money Market Funds | | | | | | |
| Average * | | 33 Days | | 27 Days | | 36 Days |
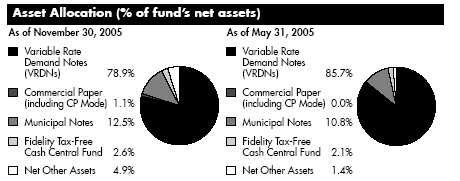
| Current and Historical Seven Day Yields | | | | | | |
| | | 11/28/05 | | 8/29/05 | | 5/30/05 | | 2/28/05 | | 11/29/04 |
| Fidelity New Jersey AMT | | | | | | | | | | |
| Tax Free Money Market Fund | | 2.60% | | 2.16% | | 2.53% | | 1.51% | | 1.31% |
| If Fidelity had not reimbursed | | | | | | | | | | |
| certain fund expenses | | 2.52% | | 2.09% | | 2.46% | | 1.39% | | 1.23% |
Yield refers to the income paid by the fund over a given period. Yields for money market funds are usually for seven day periods, as they are here, though they are expressed as annual percentage rates. Past performance is no guarantee of future results. Yield will vary and it is possible to lose money by investing in the fund.
*Source: iMoneyNet, Inc.
Annual Report 22
| Fidelity New Jersey AMT Tax Free Money Market Fund | | |
| Investments November 30, 2005 |
| Showing Percentage of Net Assets | | | | |
| |
| Municipal Securities 95.1% | | | | |
| | | Principal | | Value |
| | | Amount | | (Note 1) |
| Delaware/New Jersey – 0.6% | | | | |
| Delaware River & Bay Auth. Rev. Participating VRDN Series | | | | |
| Merlots 00 B8, 3.01% (Liquidity Facility Wachovia Bank | | | | |
| NA) (b)(e) | | $ 4,970,000 | | $ 4,970,000 |
| New Jersey – 76.2% | | | | |
| Burlington County Board Commission Pooled Ln. Rev. | | | | |
| Participating VRDN Series ROC II R1023, 3.07% (Liquidity | | | | |
| Facility Citigroup Global Markets Hldgs., Inc.) (b)(e) | | 2,160,000 | | 2,160,000 |
| Carteret Gen. Oblig. BAN 4% 10/26/06 | | 11,014,500 | | 11,096,308 |
| Casino Reinvestment Dev. Auth. Packaging Fee Rev. | | | | |
| Participating VRDN Series MSTC 01 175, 3% (Liquidity | | | | |
| Facility Bear Stearns Companies, Inc.) (b)(e) | | 5,200,000 | | 5,200,000 |
| Casino Reinvestment Dev. Auth. Rev. Participating VRDN | | | | |
| Series Merlots 05 A3, 3.01% (Liquidity Facility Wachovia | | | | |
| Bank NA) (b)(e) | | 9,375,000 | | 9,375,000 |
| Clark County School District Participating VRDN Series Clipper | | | | |
| 05 33, 3.08% (Liquidity Facility State Street Bank & Trust | | | | |
| Co., Boston) (b)(e) | | 5,320,000 | | 5,320,000 |
| Clipper Tax-Exempt Trust Participating VRDN Series Clipper 05 | | | | |
| 25, 3.08% (Liquidity Facility State Street Bank & Trust Co., | | | | |
| Boston) (b)(e) | | 3,300,000 | | 3,300,000 |
| Colts Neck Township Gen. Oblig. BAN Series A, 4% 1/6/06 . | | 7,121,950 | | 7,129,470 |
| Cranford Township Gen. Oblig. BAN 3.25% 1/6/06 | | 9,617,794 | | 9,626,878 |
| Cumberland County Gen. Oblig. BAN 3.75% 5/16/06 | | 10,500,000 | | 10,539,874 |
| Essex County Impt. Auth. Rev. Participating VRDN: | | | | |
| Series Merlots 04 C41, 3.01% (Liquidity Facility Wachovia | | | | |
| Bank NA) (b)(e) | | 7,790,000 | | 7,790,000 |
| Series MT 18, 3.07% (Liquidity Facility Landesbank | | | | |
| Hessen-Thuringen) (b)(e) | | 5,900,000 | | 5,900,000 |
| Evesham Township Board of Ed. Participating VRDN | | | | |
| Series PT 2927, 3.07% (Liquidity Facility Dexia Cr. Local de | | | | |
| France) (b)(e) | | 1,885,000 | | 1,885,000 |
| Garden State Preservation Trust Open Space & Farmland | | | | |
| Preservation Participating VRDN Series MS 860, 3.06% | | | | |
| (Liquidity Facility Morgan Stanley) (b)(e) | | 1,495,000 | | 1,495,000 |
| Jersey City Redev. Auth. Multi-family Hsg. Rev. (Dixon Mill | | | | |
| Apts. Proj.) Series 2000 A, 3%, LOC Fannie Mae, VRDN (b) | | 12,980,000 | | 12,980,000 |
| Long Branch Gen. Oblig. BAN 3% 2/28/06 | | 8,600,000 | | 8,603,052 |
| Montclair Township Gen. Oblig. BAN: | | | | |
| 3.5% 3/17/06 | | 8,000,000 | | 8,021,736 |
| 3.75% 5/25/06 | | 8,865,000 | | 8,908,774 |
| New Jersey Ctfs. of Prtn. Participating VRDN: | | | | |
| Series LB 04 L26, 3.08% (Liquidity Facility Lehman Brothers | | | | |
| Hldgs., Inc.) (b)(e) | | 5,385,000 | | 5,385,000 |
| |
| |
| See accompanying notes which are an integral part of the financial statements. | | |
| |
| 23 | | | | Annual Report |
| Fidelity New Jersey AMT Tax Free Money Market Fund | | | | |
| Investments continued | | | | | | |
| |
| Municipal Securities continued | | | | |
| | | Principal | | | | Value |
| | | Amount | | | | (Note 1) |
| New Jersey – continued | | | | | | |
| New Jersey Ctfs. of Prtn. Participating VRDN: – continued | | | | | | | | |
| Series PT 2291, 3.07% (Liquidity Facility Merrill Lynch & Co., | | | | |
| Inc.) (b)(e) | | $ 1,980,000 | | | | $ 1,980,000 |
| New Jersey Econ. Dev. Auth. Rev.: | | | | | | |
| Participating VRDN: | | | | | | |
| Series EGL 20040012 Class A, 3.07% (Liquidity Facility | | | | |
| Citibank NA) (b)(e) | | 2,385,000 | | | | 2,385,000 |
| Series EGL 720050002 Class A, 3.07% (Liquidity Facility | | | | |
| Citibank NA) (b)(e) | | 2,600,000 | | | | 2,600,000 |
| Series Merlots 04 B14, 3.01% (Liquidity Facility Wachovia | | | | |
| Bank NA) (b)(e) | | 6,000,000 | | | | 6,000,000 |
| Series Merlots A41, 3.01% (Liquidity Facility Wachovia | | | | |
| Bank NA) (b)(e) | | 6,775,000 | | | | 6,775,000 |
| Series MS 1149, 3.06% (Liquidity Facility Morgan | | | | |
| Stanley) (b)(e) | | 2,500,000 | | | | 2,500,000 |
| Series MSCO 01 572, 3.06% (Liquidity Facility Morgan | | | | |
| Stanley) (b)(e) | | 10,776,500 | | | | 10,776,500 |
| Series MSTC 9057, 2.99% (Liquidity Facility Bear Stearns | | | | |
| Companies, Inc.) (b)(e) | | 3,000,000 | | | | 3,000,000 |
| Series MT 34, 3.07% (Liquidity Facility Landesbank | | | | |
| Hessen-Thuringen) (b)(e) | | 3,495,000 | | | | 3,495,000 |
| Series Putters 538, 3.08% (Liquidity Facility JPMorgan | | | | |
| Chase Bank) (b)(e) | | 6,365,000 | | | | 6,365,000 |
| Series ROC II R203, 3.07% (Liquidity Facility Citibank | | | | |
| NA) (b)(e) | | 3,370,000 | | | | 3,370,000 |
| Series ROC II R2087, 3.07% (Liquidity Facility Citigroup | | | | |
| Global Markets Hldgs., Inc.) (b)(e) | | 8,700,000 | | | | 8,700,000 |
| Series ROC II R298, 3.07% (Liquidity Facility Citibank | | | | |
| NA) (b)(e) | | 12,025,000 | | | | 12,025,000 |
| (Jewish Home Rockleigh Proj.) Series B, 3.06%, LOC PNC | | | | |
| Bank NA, Pittsburgh, VRDN (b) | | 4,200,000 | | | | 4,200,000 |
| (The Hun School of Princeton Proj.) 3.01%, LOC Allied Irish | | | | |
| Banks PLC, VRDN (b) | | 10,845,000 | | | | 10,845,000 |
| New Jersey Edl. Facilities Auth. Rev. Participating VRDN: | | | | |
| Series EGL 720050059, 3.07% (Liquidity Facility Citibank | | | | |
| NA) (b)(e) | | 1,400,000 | | | | 1,400,000 |
| Series PT 1900, 3.07% (Liquidity Facility Merrill Lynch & Co., | | | | |
| Inc.) (b)(e) | | 12,330,000 | | | | 12,330,000 |
| Series ROC II R2102, 3.07% (Liquidity Facility Citigroup | | | | |
| Global Markets Hldgs., Inc.) (b)(e) | | 995,000 | | | | 995,000 |
| New Jersey Envir. Infrastructure Trust Participating VRDN: | | | | |
| Series PT 1556, 3.07% (Liquidity Facility Merrill Lynch & Co., | | | | |
| Inc.) (b)(e) | | 4,965,000 | | | | 4,965,000 |
| |
| See accompanying notes which are an integral part of the financial statements. | | | | |
| |
| Annual Report | | 24 | | | | |
| Municipal Securities continued | | | | | | |
| | | Principal | | | | Value |
| | | Amount | | | | (Note 1) |
| New Jersey – continued | | | | | | |
| New Jersey Envir. Infrastructure Trust Participating VRDN: - | | | | | | |
| continued | | | | | | |
| Series PT 1560, 3.07% (Liquidity Facility Merrill Lynch & Co., | | | | | | |
| Inc.) (b)(e) | | $ 5,465,000 | | | | $ 5,465,000 |
| New Jersey Gen. Oblig. Participating VRDN: | | | | | | |
| Series EGL 03 5, 3.07% (Liquidity Facility Citibank NA, New | | | | | | |
| York) (b)(e) | | 6,000,000 | | | | 6,000,000 |
| Series EGL 96 3001, 3.07% (Liquidity Facility Citibank NA, | | | | | | |
| New York) (b)(e) | | 3,100,000 | | | | 3,100,000 |
| Series FRRI L8, 3.13% (Liquidity Facility Lehman Brothers | | | | | | |
| Hldgs., Inc.) (b)(e) | | 5,700,000 | | | | 5,700,000 |
| Series MS 1196, 3.07% (Liquidity Facility Morgan | | | | | | |
| Stanley) (b)(e) | | 7,800,000 | | | | 7,800,000 |
| Series MSTC 01 174, 3% (Liquidity Facility Bear Stearns | | | | | | |
| Companies, Inc.) (b)(e) | | 10,000,000 | | | | 10,000,000 |
| Series PT 2509, 3.07% (Liquidity Facility Dexia Cr. Local de | | | | | | |
| France) (b)(e) | | 1,000,000 | | | | 1,000,000 |
| New Jersey Tpk. Auth. Tpk. Rev. Participating VRDN: | | | | | | |
| Series AAB 00 6, 3.07% (Liquidity Facility ABN-AMRO Bank | | | | | | |
| NV) (b)(e) | | 7,980,000 | | | | 7,980,000 |
| Series CRVS 05 9, 3.07% (Liquidity Facility Landesbank | | | | | | |
| Hessen-Thuringen) (b)(e) | | 6,000,000 | | | | 6,000,000 |
| Series EGL 00 3002, 3.07% (Liquidity Facility Citibank NA, | | | | | | |
| New York) (b)(e) | | 5,830,000 | | | | 5,830,000 |
| Series EGL 03 47, 3.07% (Liquidity Facility Citibank NA, | | | | | | |
| New York) (b)(e) | | 6,100,000 | | | | 6,100,000 |
| Series FRRI 02 L30J, 3.08% (Liquidity Facility Lehman | | | | | | |
| Brothers Hldgs., Inc.) (b)(e) | | 17,100,000 | | | | 17,100,000 |
| Series Merlots 00 EEE, 3.01% (Liquidity Facility Wachovia | | | | | | |
| Bank NA) (b)(e) | | 11,500,000 | | | | 11,500,000 |
| Series MS 03 835, 3.06% (Liquidity Facility Morgan | | | | | | |
| Stanley) (b)(e) | | 6,595,000 | | | | 6,595,000 |
| Series MS 995, 3.06% (Liquidity Facility Morgan | | | | | | |
| Stanley) (b)(e) | | 4,402,000 | | | | 4,402,000 |
| Series PA 667, 3.07% (Liquidity Facility Merrill Lynch & Co., | | | | | | |
| Inc.) (b)(e) | | 4,995,000 | | | | 4,995,000 |
| Series PA 670, 3.07% (Liquidity Facility Merrill Lynch & Co., | | | | | | |
| Inc.) (b)(e) | | 4,000,000 | | | | 4,000,000 |
| Series PA 751, 3.07% (Liquidity Facility Merrill Lynch & Co., | | | | | | |
| Inc.) (b)(e) | | 9,995,000 | | | | 9,995,000 |
| Series PT 2096, 3.07% (Liquidity Facility Merrill Lynch & Co., | | | | | | |
| Inc.) (b)(e) | | 3,900,000 | | | | 3,900,000 |
See accompanying notes which are an integral part of the financial statements.
25 Annual Report
| Fidelity New Jersey AMT Tax Free Money Market Fund | | | | |
| Investments continued | | | | | | |
| |
| Municipal Securities continued | | | | |
| | | Principal | | | | Value |
| | | Amount | | | | (Note 1) |
| New Jersey – continued | | | | | | |
| New Jersey Tpk. Auth. Tpk. Rev. Participating VRDN: - | | | | |
| continued | | | | | | |
| Series PT 2105, 3.07% (Liquidity Facility Merrill Lynch & Co., | | | | | | | | |
| Inc.) (b)(e) | | $ 780,000 | | | | $ 780,000 |
| Series PT 2129, 3.07% (Liquidity Facility Merrill Lynch & Co., | | | | |
| Inc.) (b)(e) | | 3,000,000 | | | | 3,000,000 |
| Series PT 2493, 3.07% (Liquidity Facility Dexia Cr. Local de | | | | |
| France) (b)(e) | | 4,980,000 | | | | 4,980,000 |
| Series PT 2843, 3.07% (Liquidity Facility Dexia Cr. Local de | | | | |
| France) (b)(e) | | 1,000,000 | | | | 1,000,000 |
| Series PT 3194, 3.07% (Liquidity Facility DEPFA BANK | | | | |
| PLC) (b)(e) | | 10,000,000 | | | | 10,000,000 |
| Series ROC II R4017, 3.07% (Liquidity Facility Citigroup | | | | |
| Global Markets Hldgs., Inc.) (b)(e) | | 7,905,000 | | | | 7,905,000 |
| Series ROC II R4032, 3.07% (Liquidity Facility Citigroup | | | | |
| Global Markets Hldgs., Inc.) (b)(e) | | 5,250,000 | | | | 5,250,000 |
| Series ROC II R428, 3.07% (Liquidity Facility Citibank | | | | |
| NA) (b)(e) | | 3,000,000 | | | | 3,000,000 |
| Series ROC II R6042, 3.07% (Liquidity Facility Citibank | | | | |
| NA) (b)(e) | | 3,280,000 | | | | 3,280,000 |
| Series TOC 05 K, 3.07% (Liquidity Facility Goldman Sachs | | | | |
| Group, Inc.) (b)(e) | | 6,300,000 | | | | 6,300,000 |
| New Jersey Trans. Trust Fund Auth. Participating VRDN: | | | | |
| Series BA 00 C, 3.07% (Liquidity Facility Bank of America | | | | |
| NA) (b)(e) | | 3,500,000 | | | | 3,500,000 |
| Series EGL 20030034 Class A, 3.07% (Liquidity Facility | | | | |
| Citibank NA, New York) (b)(e) | | 9,100,000 | | | | 9,100,000 |
| Series IXIS 05 6, 3.07% (Liquidity Facility CDC Fin.-CDC | | | | |
| IXIS) (b)(e) | | 3,800,000 | | | | 3,800,000 |
| Series MS 00 203, 3.06% (Liquidity Facility Morgan | | | | |
| Stanley) (b)(e) | | 4,395,000 | | | | 4,395,000 |
| Series MS 00 224, 3.06% (Liquidity Facility Morgan | | | | |
| Stanley) (b)(e) | | 1,695,000 | | | | 1,695,000 |
| Series MS 963D, 3.06% (Liquidity Facility Morgan | | | | |
| Stanley) (b)(e) | | 2,300,000 | | | | 2,300,000 |
| Series MT 72, 3.07% (Liquidity Facility Lloyds TSB Bank | | | | |
| PLC) (b)(e) | | 3,750,000 | | | | 3,750,000 |
| Series PA 958P, 3.07% (Liquidity Facility Merrill Lynch & Co., | | | | |
| Inc.) (b)(e) | | 3,500,000 | | | | 3,500,000 |
| Series PT 1723, 3.07% (Liquidity Facility Merrill Lynch & Co., | | | | |
| Inc.) (b)(e) | | 3,110,000 | | | | 3,110,000 |
| Series PT 1751, 3.07% (Liquidity Facility Merrill Lynch & Co., | | | | |
| Inc.) (b)(e) | | 6,990,000 | | | | 6,990,000 |
| |
| See accompanying notes which are an integral part of the financial statements. | | | | |
| |
| Annual Report | | 26 | | | | |
| Municipal Securities continued | | | | | | |
| | | Principal | | | | Value |
| | | Amount | | | | (Note 1) |
| New Jersey – continued | | | | | | |
| New Jersey Trans. Trust Fund Auth. Participating VRDN: - | | | | | | |
| continued | | | | | | |
| Series PT 1926, 3.07% (Liquidity Facility Merrill Lynch & Co., | | | | | | |
| Inc.) (b)(e) | | $ 1,980,000 | | | | $ 1,980,000 |
| Series PT 2363A, 3.07% (Liquidity Facility Dexia Cr. Local de | | | | | | |
| France) (b)(e) | | 11,400,000 | | | | 11,400,000 |
| Series PT 2402, 3.07% (Liquidity Facility Dexia Cr. Local de | | | | | | |
| France) (b)(e) | | 48,640,000 | | | | 48,640,000 |
| Series PT 2500, 3.07% (Liquidity Facility Dexia Cr. Local de | | | | | | |
| France) (b)(e) | | 4,500,000 | | | | 4,500,000 |
| Series PT 2572, 3.07% (Liquidity Facility Dexia Cr. Local de | | | | | | |
| France) (b)(e) | | 1,880,000 | | | | 1,880,000 |
| Series Putters 1148, 3.08% (Liquidity Facility PNC Bank NA, | | | | | | |
| Pittsburgh) (b)(e) | | 5,410,000 | | | | 5,410,000 |
| Series Putters 1149, 3.08% (Liquidity Facility JPMorgan | | | | | | |
| Chase & Co.) (b)(e) | | 4,590,000 | | | | 4,590,000 |
| Series Putters 1156T, 3.08% (Liquidity Facility JPMorgan | | | | | | |
| Chase Bank) (b)(e) | | 3,200,000 | | | | 3,200,000 |
| Series Putters 503, 3.08% (Liquidity Facility JPMorgan Chase | | | | | | |
| Bank) (b)(e) | | 1,300,000 | | | | 1,300,000 |
| Series Putters 504, 3.08% (Liquidity Facility JPMorgan Chase | | | | | | |
| Bank) (b)(e) | | 5,370,000 | | | | 5,370,000 |
| Series Putters 725, 3.08% (Liquidity Facility JPMorgan Chase | | | | | | |
| Bank) (b)(e) | | 3,160,000 | | | | 3,160,000 |
| Series Putters 795, 3.08% (Liquidity Facility Dresdner Bank | | | | | | |
| AG) (b)(e) | | 10,970,000 | | | | 10,970,000 |
| Series Putters 820, 3.08% (Liquidity Facility JPMorgan Chase | | | | | | |
| Bank) (b)(e) | | 5,100,000 | | | | 5,100,000 |
| Series Putters 825, 3.08% (Liquidity Facility Dresdner Bank | | | | | | |
| AG) (b)(e) | | 1,070,000 | | | | 1,070,000 |
| Series Stars 129, 3.07% (Liquidity Facility BNP Paribas | | | | | | |
| SA) (b)(e) | | 3,000,000 | | | | 3,000,000 |
| Newark Gen. Oblig. Participating VRDN Series ROC II R4539, | | | | | | |
| 3.07% (Liquidity Facility Citigroup Global Markets Hldgs., | | | | | | |
| Inc.) (b)(e) | | 4,160,000 | | | | 4,160,000 |
| North Brunswick Township Gen. Oblig. BAN 4% 8/22/06 | | 3,300,000 | | | | 3,322,689 |
| Randolph Township Gen. Oblig. BAN 4% 9/6/06 | | 7,680,000 | | | | 7,732,952 |
| Saddle Brook Township Gen. Oblig. BAN 3.25% 2/2/06 | | 15,560,954 | | | | 15,571,919 |
| Tobacco Settlement Fing. Corp. Participating VRDN | | | | | | |
| Series PA 1285, 3.1% (Liquidity Facility Merrill Lynch & Co., | | | | | | |
| Inc.) (b)(e) | | 2,400,000 | | | | 2,400,000 |
See accompanying notes which are an integral part of the financial statements.
27 Annual Report
| Fidelity New Jersey AMT Tax Free Money Market Fund | | | | |
| Investments continued | | | | | | |
| |
| Municipal Securities continued | | | | | | |
| | | Principal | | | | Value |
| | | Amount | | | | (Note 1) |
| New Jersey – continued | | | | | | |
| Trenton Gen. Oblig. BAN 4% 10/13/06 | | $ 8,600,000 | | | | $ 8,659,862 |
| Washington Township Board of Ed. Mercer County | | | | | | |
| Participating VRDN Series PT 2808, 3.07% (Liquidity Facility | | | | |
| Dexia Cr. Local de France) (b)(e) | | 3,900,000 | | | | 3,900,000 |
| | | | | | | 601,837,014 |
| |
| New Jersey/Pennsylvania – 4.0% | | | | | | |
| Delaware River Port Auth. Pennsylvania & New Jersey Rev. | | | | |
| Participating VRDN: | | | | | | |
| Series Merlots 00 B4, 3.01% (Liquidity Facility Wachovia | | | | |
| Bank NA) (b)(e) | | 3,910,000 | | | | 3,910,000 |
| Series Merlots 00 K, 3.01% (Liquidity Facility Wachovia | | | | |
| Bank NA) (b)(e) | | 13,900,000 | | | | 13,900,000 |
| Series PA 606, 3.07% (Liquidity Facility Merrill Lynch & Co., | | | | |
| Inc.) (b)(e) | | 7,900,000 | | | | 7,900,000 |
| Series SG 53, 3.07% (Liquidity Facility Societe | | | | | | |
| Generale) (b)(e) | | 5,700,000 | | | | 5,700,000 |
| | | | | | | 31,410,000 |
| |
| New York & New Jersey – 7.1% | | | | | | |
| Port Auth. of New York & New Jersey: | | | | | | |
| Participating VRDN: | | | | | | |
| Series AAB 00 19, 3.09% (Liquidity Facility ABN AMRO | | | | |
| Bank NV) (b)(e) | | 6,670,000 | | | | 6,670,000 |
| Series EGL 03 59, 3.08% (Liquidity Facility Citibank NA, | | | | |
| New York) (b)(e) | | 5,000,000 | | | | 5,000,000 |
| Series PA 1251, 3.09% (Liquidity Facility Merrill Lynch & | | | | |
| Co., Inc.) (b)(e) | | 1,900,000 | | | | 1,900,000 |
| Series ROC II R319, 3.08% (Liquidity Facility Citibank | | | | |
| NA) (b)(e) | | 4,735,000 | | | | 4,735,000 |
| Series 1992 2, 3.09%, VRDN (b)(f) | | 6,900,000 | | | | 6,900,000 |
| Series 1997 1, 3.09%, VRDN (b)(f) | | 8,900,000 | | | | 8,900,000 |
| Series 1997 2, 3.09%, VRDN (b)(f) | | 10,400,000 | | | | 10,400,000 |
| Series 2004 1, 3.1%, VRDN (b) | | 2,000,000 | | | | 2,000,000 |
| Series 3, 3.1%, VRDN (b) | | 6,600,000 | | | | 6,600,000 |
| Port Auth. of New York & New Jersey Spl. Oblig. Rev. | | | | | | |
| Series 3, 2.97%, VRDN (b) | | 2,800,000 | | | | 2,800,000 |
| | | | | | | 55,905,000 |
| |
| Puerto Rico 4.6% | | | | | | |
| Puerto Rico Commonwealth Gen. Oblig. Participating VRDN: | | | | |
| Series LB 05 F2, 3.14% (Lehman Brothers Hldgs., Inc. | | | | |
| Guaranteed) (Liquidity Facility Lehman Brothers Hldgs., | | | | |
| Inc.) (b)(e) | | 5,000,000 | | | | 5,000,000 |
See accompanying notes which are an integral part of the financial statements.
| Municipal Securities continued | | | | | | | | |
| | | | | Principal | | | | Value |
| | | | | Amount | | | | (Note 1) |
| Puerto Rico continued | | | | | | | | |
| Puerto Rico Commonwealth Gen. Oblig. Participating VRDN: | | | | | | | | |
| continued | | | | | | | | |
| Series Merlots 00 EE, 2.99% (Liquidity Facility Wachovia | | | | | | | | |
| Bank NA) (b)(e) | | | | $ 900,000 | | | | $ 900,000 |
| Puerto Rico Commonwealth Hwy. & Trans. Auth. Trans. Rev. | | | | | | | | |
| Participating VRDN: | | | | | | | | |
| Series MACN 05 N, 3.07% (Liquidity Facility Bank of | | | | | | | | |
| America NA) (b)(e) | | | | 2,100,000 | | | | 2,100,000 |
| Series Merlots 00 FFF, 2.99% (Liquidity Facility Wachovia | | | | | | | | |
| Bank NA) (b)(e) | | | | 2,725,000 | | | | 2,725,000 |
| Puerto Rico Commonwealth Infrastructure Fing. Auth. | | | | | | | | |
| Participating VRDN Sereis CRVS 05 10, 3.05% (Liquidity | | | | | | | | |
| Facility Landesbank Hessen-Thuringen) (b)(e) | | | | 7,270,000 | | | | 7,270,000 |
| Puerto Rico Elec. Pwr. Auth. Pwr. Rev. Participating VRDN: | | | | | | | | |
| Series Putters 147, 3.07% (Liquidity Facility JPMorgan Chase | | | | | | | | |
| Bank) (b)(e) | | | | 1,000,000 | | | | 1,000,000 |
| Series Putters 681, 3.07% (Liquidity Facility JPMorgan Chase | | | | | | | | |
| & Co.) (b)(e) | | | | 1,750,000 | | | | 1,750,000 |
| Series Putters 866, 3.07% (Liquidity Facility JPMorgan Chase | | | | | | | | |
| Bank) (b)(e) | | | | 1,050,000 | | | | 1,050,000 |
| Series RobIns 16, 3.04% (Liquidity Facility Bank of New | | | | | | | | |
| York, New York) (b)(e) | | | | 2,165,000 | | | | 2,165,000 |
| Series ROC 2 99 3, 3.05% (Liquidity Facility Citibank | | | | | | | | |
| NA) (b)(e) | | | | 2,175,000 | | | | 2,175,000 |
| Puerto Rico Govt. Dev. Bank 2.85% 1/30/06, LOC Societe | | | | | | | | |
| Generale, CP (a) | | | | 8,900,000 | | | | 8,900,000 |
| Puerto Rico Indl., Tourist, Edl., Med. & Envir. Cont. Facilities | | | | | | | | |
| Fing. Auth. (Ana G. Mendez Univ. Sys. Proj.) Series 1998, | | | | | | | | |
| 3.26%, LOC Banco Santander Central Hispano SA, | | | | | | | | |
| VRDN (b) | | | | 1,550,000 | | | | 1,550,000 |
| | | | | | | | | 36,585,000 |
| |
| | | | | Shares | | | | |
| Other – 2.6% | | | | | | | | |
| Fidelity Tax Free Cash Central Fund, 3.04% (c)(d) | | | | 20,898,900 | | | | 20,898,900 |
| |
| TOTAL INVESTMENT PORTFOLIO 95.1% | | | | | | | | |
| (Cost $751,605,914) | | | | | | 751,605,914 |
| |
| NET OTHER ASSETS – 4.9% | | | | | | 38,340,839 |
| NET ASSETS 100% | | | | | | $ 789,946,753 |
See accompanying notes which are an integral part of the financial statements.
29 Annual Report
Fidelity New Jersey AMT Tax Free Money Market Fund
Investments continued
| Security Type Abbreviations |
| BAN | | — BOND ANTICIPATION NOTE |
| CP | | — COMMERCIAL PAPER |
| VRDN | | — VARIABLE RATE DEMAND NOTE |
Legend
(a) Security exempt from registration under
Rule 144A of the Securities Act of 1933.
These securities may be resold in
transactions exempt from registration,
normally to qualified institutional buyers.
At the period end, the value of these
securities amounted to $8,900,000 or
1.1% of net assets.
(b) The coupon rate shown on floating or
adjustable rate securities represents the
rate at period end.
(c) Information in this report regarding
holdings by state and security types
does not reflect the holdings of the
Fidelity Tax-Free Cash Central Fund.
|
(d) Affiliated fund that is available only to
investment companies and other accounts
managed by Fidelity Investments. The rate
quoted is the annualized seven day yield
of the fund at period end. A complete
unaudited listing of the fund’s holdings as
of its most recent quarter end is available
upon request.
(e) Provides evidence of ownership in one
or more underlying municipal bonds.
(f) Restricted securities – Investment in
securities not registered under the
Securities Act of 1933 (excluding 144A
issues). At the end of the period, the
value of restricted securities (excluding
144A issues) amounted to $26,200,000
or 3.3% of net assets.
|
Additional information on each holding is as follows:
| | | Acquisition | | | | |
| Security | | Date | | | | Cost |
| Port Auth. of New | | | | | | |
| York & New Jersey: | | | | | | |
| Series 1992 2, | | | | | | |
| 3.09%, VRDN | | 2/14/92 | | $ | | 6,900,000 |
| Series 1997 1, | | | | | | |
| 3.09%, VRDN | | 8/9/02 | | $ | | 8,900,000 |
| Series 1997 2, | | | | | | |
| 3.09%, VRDN | | 9/15/97 | | $ | | 10,400,000 |
Affiliated Central Funds
Information regarding income received by the fund from the affiliated Central funds during the period is as follows:
| Fund | | | | Income received |
| Fidelity Tax Free Cash Central Fund | | | $ | 310,644 |
See accompanying notes which are an integral part of the financial statements.
Annual Report 30
Fidelity New Jersey AMT Tax Free Money Market Fund
Financial Statements
| Statement of Assets and Liabilities | | | | | | | | |
| | | | | | | November 30, 2005 |
| |
| Assets | | | | | | | | |
| Investment in securities, at value | | | | | | | | |
| See accompanying schedule: | | | | | | | | |
| Unaffiliated issuers (cost $730,707,014) | | $ | | 730,707,014 | | | | |
| Affiliated Central Funds (cost $20,898,900) | | | | 20,898,900 | | | | |
| Total Investments (cost $751,605,914) | | | | | | $ | | 751,605,914 |
| Cash | | | | | | | | 29,554,163 |
| Receivable for investments sold on a delayed delivery | | | | | | | | |
| basis | | | | | | | | 7,220,000 |
| Receivable for fund shares sold | | | | | | | | 525,048 |
| Interest receivable | | | | | | | | 7,753,365 |
| Receivable from investment adviser for expense | | | | | | | | |
| reductions | | | | | | | | 55,107 |
| Other receivables | | | | | | | | 58,148 |
| Total assets | | | | | | | | 796,771,745 |
| |
| Liabilities | | | | | | | | |
| Payable for fund shares redeemed | | $ | | 6,395,953 | | | | |
| Distributions payable | | | | 146,601 | | | | |
| Accrued management fee | | | | 281,306 | | | | |
| Other affiliated payables | | | | 1,132 | | | | |
| Total liabilities | | | | | | | | 6,824,992 |
| |
| Net Assets | | | | | | $ | | 789,946,753 |
| Net Assets consist of: | | | | | | | | |
| Paid in capital | | | | | | $ | | 789,912,986 |
| Undistributed net investment income | | | | | | | | 17,332 |
| Accumulated undistributed net realized gain (loss) on | | | | | | | | |
| investments | | | | | | | | 16,435 |
| Net Assets, for 789,645,863 shares outstanding | | | | | | $ | | 789,946,753 |
| Net Asset Value, offering price and redemption price per | | | | | | | | |
| share ($789,946,753 ÷ 789,645,863 shares) | | | | | | $ | | 1.00 |
See accompanying notes which are an integral part of the financial statements.
31 Annual Report
Fidelity New Jersey AMT Tax Free Money Market Fund
Financial Statements continued
Statement of Operations
| | | | | Year ended November 30, 2005 |
| |
| Investment Income | | | | | | |
| Interest | | | | $ | | 16,103,075 |
| Income from affiliated Central Funds | | | | | | 310,644 |
| Total income | | | | | | 16,413,719 |
| |
| Expenses | | | | | | |
| Management fee | | $ | | 3,108,248 | | |
| Independent trustees’ compensation | | | | 3,286 | | |
| Total expenses before reductions | | | | 3,111,534 | | |
| Expense reductions | | | | (1,069,656) | | 2,041,878 |
| |
| Net investment income | | | | | | 14,371,841 |
| Realized and Unrealized Gain (Loss) | | | | | | |
| Net realized gain (loss) on: | | | | | | |
| Investment securities: | | | | | | |
| Unaffiliated issuers | | | | | | 26,566 |
| Net increase in net assets resulting from operations | | | | $ | | 14,398,407 |
See accompanying notes which are an integral part of the financial statements.
| Statement of Changes in Net Assets | | | | | | | | |
| | | | | Year ended | | | | Year ended |
| | | | | November 30, | | | | November 30, |
| | | | | 2005 | | | | 2004 |
| Increase (Decrease) in Net Assets | | | | | | | | |
| Operations | | | | | | | | |
| Net investment income | | $ | | 14,371,841 | | $ | | 5,194,866 |
| Net realized gain (loss) | | | | 26,566 | | | | 250,813 |
| Net increase in net assets resulting | | | | | | | | |
| from operations | | | | 14,398,407 | | | | 5,445,679 |
| Distributions to shareholders from net investment income . | | | | (14,369,544) | | | | (5,194,259) |
| Distributions to shareholders from net realized gain | | | | (136,555) | | | | — |
| Total distributions | | | | (14,506,099) | | | | (5,194,259) |
| Share transactions at net asset value of $1.00 per share | | | | | | | | |
| Proceeds from sales of shares | | | | 578,649,316 | | | | 467,124,250 |
| Reinvestment of distributions | | | | 13,087,968 | | | | 4,698,525 |
| Cost of shares redeemed | | | | (475,396,074) | | | | (369,223,198) |
| Net increase (decrease) in net assets and shares | | | | | | | | |
| resulting from share transactions | | | | 116,341,210 | | | | 102,599,577 |
| Total increase (decrease) in net assets | | | | 116,233,518 | | | | 102,850,997 |
| |
| Net Assets | | | | | | | | |
| Beginning of period | | | | 673,713,235 | | | | 570,862,238 |
| End of period (including undistributed net investment | | | | | | | | |
| income of $17,332 and undistributed net investment | | | | | | | | |
| income of $15,037, respectively) | | $ | | 789,946,753 | | $ | | 673,713,235 |
See accompanying notes which are an integral part of the financial statements.
33 Annual Report
| Financial Highlights | | | | | | | | | | | | | | | | | | | | |
| |
| Years ended November 30, | | | | 2005 | | | | 2004 | | | | 2003 | | | | 2002 | | | | 2001 |
| Selected Per Share Data | | | | | | | | | | | | | | | | | | | | |
| Net asset value, | | | | | | | | | | | | | | | | | | | | |
| beginning of period | | $ | | 1.00 | | $ | | 1.00 | | $ | | 1.00 | | $ | | 1.00 | | $ | | 1.00 |
| Income from Investment | | | | | | | | | | | | | | | | | | | | |
| Operations | | | | | | | | | | | | | | | | | | | | |
| Net investment income | | | | 020 | | | | .009 | | | | .008 | | | | .012 | | | | .026 |
| Net realized and unrealized | | | | | | | | | | | | | | | | | | | | |
| gain (loss)C | | | | — | | | | — | | | | — | | | | — | | | | — |
| Total from investment operations | | | | .020 | | | | .009 | | | | .008 | | | | .012 | | | | .026 |
| Distributions from net investment | | | | | | | | | | | | | | | | | | | | |
| income | | | | (.020) | | | | (.009) | | | | (.008) | | | | (.012) | | | | (.026) |
| Distributions from net realized | | | | | | | | | | | | | | | | | | | | |
| gain | | | | —C | | | | — | | | | —C | | | | — | | | | — |
| Total distributions | | | | (.020) | | | | (.009) | | | | (.008) | | | | (.012) | | | | (.026) |
| Net asset value, | | | | | | | | | | | | | | | | | | | | |
| end of period | | $ | | 1.00 | | $ | | 1.00 | | $ | | 1.00 | | $ | | 1.00 | | $ | | 1.00 |
| Total ReturnA,D | | | | 2.01% | | | | .86% | | | | .83% | | | | 1.23% | | | | 2.61% |
| Ratios to Average Net AssetsB | | | | | | | | | | | | | | | | | | | | |
| Expenses before reductions | | | | 43% | | | | .43% | | | | .43% | | | | .43% | | | | .49% |
| Expenses net of fee waivers, | | | | | | | | | | | | | | | | | | | | |
| if any | | | | 35% | | | | .35% | | | | .35% | | | | .35% | | | | .48% |
| Expenses net of all reductions | | | | 28% | | | | .33% | | | | .33% | | | | .31% | | | | .45% |
| Net investment income | | | | 1.99% | | | | .87% | | | | .78% | | | | 1.22% | | | | 2.57% |
| Supplemental Data | | | | | | | | | | | | | | | | | | | | |
| Net assets, end of period | | | | | | | | | | | | | | | | | | | | |
| (000 omitted) | | $ | | 789,947 | | $ | | 673,713 | | $ | | 570,862 | | $ | | 571,396 | | $ | | 493,863 |
A Total returns would have been lower had certain expenses not been reduced during the periods shown.
B Expense ratios reflect operating expenses of the fund. Expenses before reductions do not reflect amounts reimbursed by the investment adviser or
reductions from brokerage service arrangements or other expense offset arrangements and do not represent the amount paid by the fund during
periods when reimbursements or reductions occur. Expenses net of fee waivers reflect expenses after reimbursement by the investment adviser but
prior to reductions from brokerage service arrangements or other expense offset arrangements. Expenses net of all reductions represent the net
expenses paid by the fund.
C Amount represents less than $.001 per share.
D Total returns do not include the effect of the former account closeout fee.
|
See accompanying notes which are an integral part of the financial statements.
| Fidelity New Jersey Municipal Money Market Fund | | |
| Investment Changes/Performance |
| |
| Maturity Diversification | | | | | | |
| Days | | % of fund’s | | % of fund’s | | % of fund’s |
| | | investments | | investments | | investments |
| | | 11/30/05 | | 5/31/05 | | 11/30/04 |
| 0 – 30 | | 89.1 | | 89.4 | | 84.0 |
| 31 – 90 | | 3.5 | | 2.7 | | 5.9 |
| 91 – 180 | | 3.4 | | 4.1 | | 2.0 |
| 181 – 397 | | 4.0 | | 3.8 | | 8.1 |
| Weighted Average Maturity | | | | | | |
| | | 11/30/05 | | 5/31/05 | | 11/30/04 |
| Fidelity New Jersey Municipal Money | | | | | | |
| Market Fund | | 28 Days | | 24 Days | | 33 Days |
| New Jersey Tax Free Money Market Funds | | | | | | |
| Average * | | 33 Days | | 27 Days | | 36 Days |
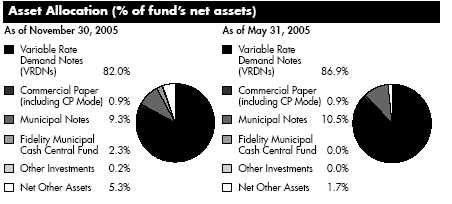
| Current and Historical Seven Day Yields | | | | | | |
| | | 11/28/05 | | 8/29/05 | | 5/30/05 | | 2/28/05 | | 11/29/04 |
| Fidelity New Jersey Municipal | | | | | | | | | | |
| Money Market Fund | | 2.52% | | 2.03% | | 2.40% | | 1.35% | | 1.12% |
Yield refers to the income paid by the fund over a given period. Yields for money market funds are usually for seven day periods, as they are here, though they are expressed as annual percentage rates. Past performance is no guarantee of future results. Yield will vary and it is possible to lose money by investing in the fund.
*Source: iMoneyNet, Inc.
35 Annual Report
| Fidelity New Jersey Municipal Money Market Fund | | |
| Investments November 30, 2005 | | |
| Showing Percentage of Net Assets | | | | | | |
| |
| Municipal Securities 94.7% | | | | | | |
| | | | | Principal | | Value |
| | | | | Amount | | (Note 1) |
| Delaware/New Jersey – 0.7% | | | | | | |
| Delaware River & Bay Auth. Rev. Participating VRDN Series | | | | |
| Merlots 00 B8, 3.01% (Liquidity Facility Wachovia Bank | | | | |
| NA) (c)(g) | | | | $ 9,895,000 | | $ 9,895,000 |
| New Jersey – 69.8% | | | | | | |
| Bergen County Impt. Auth. Multi-family Hsg. Rev. (Kentshire | | | | |
| Apts. Proj.) Series 2001, 3.02%, LOC Fannie Mae, | | | | |
| VRDN (c)(f) | | | | 6,000,000 | | 6,000,000 |
| Burlington County Board Commission Pooled Ln. Rev. | | | | |
| Participating VRDN Series ROC II R1023, 3.07% (Liquidity | | | | |
| Facility Citigroup Global Markets Hldgs., Inc.) (c)(g) | | 4,840,000 | | 4,840,000 |
| Camden County Impt. Auth. Rev. (Parkview Redev. Hsg. Proj.) | | | | |
| 3%, LOC Gen. Elec. Cap. Corp., VRDN (c)(f) | | 12,800,000 | | 12,800,000 |
| Casino Reinvestment Dev. Auth. Packaging Fee Rev. | | | | |
| Participating VRDN Series MSTC 01 175, 3% (Liquidity | | | | |
| Facility Bear Stearns Companies, Inc.) (c)(g) | | 7,165,000 | | 7,165,000 |
| Casino Reinvestment Dev. Auth. Rev. Participating VRDN Series | | | | |
| Merlots 05 A3, 3.01% (Liquidity Facility Wachovia Bank | | | | |
| NA) (c)(g) | | | | 8,180,000 | | 8,180,000 |
| Chester Township Gen. Oblig. BAN 3.5% 3/30/06 | | 5,714,000 | | 5,728,680 |
| Clark County School District Participating VRDN Series Clipper | | | | |
| 05 33, 3.08% (Liquidity Facility State Street Bank & Trust Co., | | | | |
| Boston) (c)(g) | | | | 10,100,000 | | 10,100,000 |
| Clipper Tax-Exempt Trust Participating VRDN Series Clipper 05 | | | | |
| 25, 3.08% (Liquidity Facility State Street Bank & Trust Co., | | | | |
| Boston) (c)(g) | | | | 6,700,000 | | 6,700,000 |
| East Brunswick Township Gen. Oblig. BAN: | | | | |
| 3.25% 2/24/06 | | | | 19,000,000 | | 18,999,443 |
| 3.75% 5/12/06 | | | | 3,000,000 | | 3,012,037 |
| East Windsor Township Gen. Oblig. BAN 4.3% 12/1/06 (b) . | | 8,993,996 | | 9,077,460 |
| Essex County Impt. Auth. Rev. Participating VRDN: | | | | |
| Series BS 216, 3% (Liquidity Facility Bear Stearns | | | | |
| Companies, Inc.) (c)(g) | | | | 10,675,000 | | 10,675,000 |
| Series MS 966 D, 3.06% (Liquidity Facility Morgan | | | | |
| Stanley) (c)(g) | | | | 11,555,000 | | 11,555,000 |
| Evesham Township Board of Ed. Participating VRDN | | | | |
| Series PT 2927, 3.07% (Liquidity Facility Dexia Cr. Local de | | | | |
| France) (c)(g) | | | | 3,700,000 | | 3,700,000 |
| Florham Park Gen. Oblig. BAN 3.75% 5/12/06 | | 6,174,000 | | 6,197,155 |
| Garden State Preservation Trust Open Space & Farmland | | | | |
| Preservation Participating VRDN Series PT 1916, 3.07% | | | | |
| (Liquidity Facility Merrill Lynch & Co., Inc.) (c)(g) | | 7,865,000 | | 7,865,000 |
| Haledon Gen. Oblig. BAN 3.75% 4/28/06 | | 7,926,000 | | 7,954,410 |
| Holmdel Township Gen. Oblig. BAN 4.25% 11/22/06 | | 8,114,500 | | 8,181,878 |
| Long Branch Gen. Oblig. BAN 3% 2/28/06 | | 16,711,000 | | 16,716,930 |
| |
| See accompanying notes which are an integral part of the financial statements. | | |
| |
| Annual Report | | 36 | | | | |
| Municipal Securities continued | | | | | | |
| | | Principal | | | | Value |
| | | Amount | | | | (Note 1) |
| New Jersey – continued | | | | | | |
| Montclair Township Gen. Oblig. BAN 3.75% 5/25/06 | | $18,594,000 | | | | $ 18,685,815 |
| New Jersey Ctfs. of Prtn. Participating VRDN Series LB 04 L26, | | | | | | |
| 3.08% (Liquidity Facility Lehman Brothers Hldgs., Inc.) (c)(g) . | | 1,800,000 | | | | 1,800,000 |
| New Jersey Econ. Dev. Auth. Econ. Dev. Rev.: | | | | | | |
| (Encap Golf Hldgs. LLC Proj.) 3.05%, LOC Wachovia Bank | | | | | | |
| NA, VRDN (c)(f) | | 44,000,000 | | | | 43,999,999 |
| (Int’l. Processing Corp. Proj.) 3.1%, LOC Bank of America | | | | | | |
| NA, VRDN (c)(f) | | 400,000 | | | | 400,000 |
| New Jersey Econ. Dev. Auth. Natural Gas Facilities Rev. | | | | | | |
| Participating VRDN: | | | | | | |
| Series MS 1202X, 3.08% (Liquidity Facility Morgan | | | | | | |
| Stanley) (c)(f)(g) | | 3,200,000 | | | | 3,200,000 |
| Series MS 98 161, 3.09% (Liquidity Facility Morgan | | | | | | |
| Stanley) (c)(f)(g) | | 1,625,000 | | | | 1,625,000 |
| New Jersey Econ. Dev. Auth. Rev.: | | | | | | |
| Participating VRDN: | | | | | | |
| Series EGL 04 18 Class A, 3.07% (Liquidity Facility | | | | | | |
| Citibank NA) (c)(g) | | 3,000,000 | | | | 3,000,000 |
| Series EGL 20040012 Class A, 3.07% (Liquidity Facility | | | | | | |
| Citibank NA) (c)(g) | | 9,000,000 | | | | 9,000,000 |
| Series FRRI 01 N10, 3.08% (Liquidity Facility Bank of New | | | | | | |
| York, New York) (c)(g) | | 7,150,000 | | | | 7,150,000 |
| Series MACN 05 H, 3.07% (Liquidity Facility Bank of | | | | | | |
| America NA) (c)(g) | | 3,030,000 | | | | 3,030,000 |
| Series Merlots 04 B14, 3.01% (Liquidity Facility Wachovia | | | | | | |
| Bank NA) (c)(g) | | 8,490,000 | | | | 8,490,000 |
| Series Merlots A41, 3.01% (Liquidity Facility Wachovia | | | | | | |
| Bank NA) (c)(g) | | 1,290,000 | | | | 1,290,000 |
| Series MS 1149, 3.06% (Liquidity Facility Morgan | | | | | | |
| Stanley) (c)(g) | | 2,050,000 | | | | 2,050,000 |
| Series MSTC 9057, 2.99% (Liquidity Facility Bear Stearns | | | | | | |
| Companies, Inc.) (c)(g) | | 6,990,000 | | | | 6,990,000 |
| Series MT 14, 3.07% (Liquidity Facility BNP Paribas | | | | | | |
| SA) (c)(g) | | 9,080,000 | | | | 9,080,000 |
| Series MT 34, 3.07% (Liquidity Facility Landesbank | | | | | | |
| Hessen-Thuringen) (c)(g) | | 7,500,000 | | | | 7,500,000 |
| Series PA 1239, 3.09% (Liquidity Facility Merrill Lynch & | | | | | | |
| Co., Inc.) (c)(g) | | 6,000,000 | | | | 6,000,000 |
| Series PA 1253, 3.07% (Liquidity Facility Merrill Lynch & | | | | | | |
| Co., Inc.) (c)(g) | | 8,610,000 | | | | 8,610,000 |
| Series Putters 502, 3.08% (Liquidity Facility PNC Bank NA, | | | | | | |
| Pittsburgh) (c)(g) | | 10,765,000 | | | | 10,765,000 |
See accompanying notes which are an integral part of the financial statements.
37 Annual Report
| Fidelity New Jersey Municipal Money Market Fund | | | | |
| Investments continued | | | | | | |
| |
| Municipal Securities continued | | | | | | |
| | | Principal | | | | Value |
| | | Amount | | | | (Note 1) |
| New Jersey – continued | | | | | | |
| New Jersey Econ. Dev. Auth. Rev.: – continued | | | | | | |
| Participating VRDN: | | | | | | |
| Series Putters 538, 3.08% (Liquidity Facility JPMorgan | | | | | | | | |
| Chase Bank) (c)(g) | | $ 3,055,000 | | | | $ 3,055,000 |
| Series Putters 785Z, 3.08% (Liquidity Facility JPMorgan | | | | |
| Chase Bank) (c)(g) | | 7,370,000 | | | | 7,370,000 |
| Series Putters 883T, 3.08% (Liquidity Facility JPMorgan | | | | |
| Chase Bank) (c)(g) | | 10,805,000 | | | | 10,805,000 |
| (5901 Tonelle Ave. Assoc. Proj.) Series 2001, 3.11%, LOC | | | | |
| Wachovia Bank NA, VRDN (c)(f) | | 3,870,000 | | | | 3,870,000 |
| (Jewish Home Rockleigh Proj.) Series B, 3.06%, LOC PNC | | | | |
| Bank NA, Pittsburgh, VRDN (c) | | 5,830,000 | | | | 5,830,000 |
| (LPS Inds. Proj.) 3.11%, LOC Wachovia Bank NA, | | | | |
| VRDN (c)(f) | | 7,725,000 | | | | 7,725,000 |
| (Meriden Assisted Living at Shrewsbury Proj.) 3.05%, LOC | | | | |
| Fannie Mae, VRDN (c)(f) | | 5,250,000 | | | | 5,250,000 |
| New Jersey Econ. Dev. Auth. Spl. Facilities Rev. (Port Newark | | | | |
| Container LLC Proj.) 3.01%, LOC Citibank NA, New York, | | | | |
| VRDN (c)(f) | | 30,300,000 | | | | 30,300,000 |
| New Jersey Econ. Dev. Auth. Thermal Energy Facilities Rev. | | | | |
| (Marina Energy LLC Proj.) Series 2001 A, 2.98%, LOC | | | | |
| Wachovia Bank NA, VRDN (c)(f) | | 4,000,000 | | | | 4,000,000 |
| New Jersey Econ. Dev. Auth. Wtr. Facilities Rev.: | | | | |
| Participating VRDN Series PT 2071, 3.09% (Liquidity Facility | | | | |
| Merrill Lynch & Co., Inc.) (c)(f)(g) | | 10,335,000 | | | | 10,335,000 |
| (United Wtr., Inc. Proj.) Series 1996 C, 3.08% (AMBAC | | | | |
| Insured), VRDN (c)(f) | | 2,135,000 | | | | 2,135,000 |
| New Jersey Edl. Facilities Auth. Rev.: | | | | | | |
| Bonds Series 2005 A, 4% 9/1/06 | | 3,000,000 | | | | 3,023,965 |
| Participating VRDN: | | | | | | |
| Series EGL 720050059, 3.07% (Liquidity Facility Citibank | | | | |
| NA) (c)(g) | | 3,810,000 | | | | 3,810,000 |
| Series PA 1325, 3.07% (Liquidity Facility Merrill Lynch & | | | | |
| Co., Inc.) (c)(g) | | 4,000,000 | | | | 4,000,000 |
| Series Putters 801, 3.08% (Liquidity Facility JPMorgan | | | | |
| Chase & Co.) (c)(g) | | 2,780,000 | | | | 2,780,000 |
| Series ROC II R2191, 3.07% (Liquidity Facility Citigroup | | | | |
| Global Markets Hldgs., Inc.) (c)(g) | | 5,720,000 | | | | 5,720,000 |
| Series ROC II R295, 3.07% (Liquidity Facility Citibank | | | | |
| NA) (c)(g) | | 4,995,000 | | | | 4,995,000 |
| New Jersey Envir. Infrastructure Trust Participating VRDN Series | | | | |
| Putters 585, 3.11% (Liquidity Facility JPMorgan Chase & | | | | |
| Co.) (c)(f)(g) | | 3,980,000 | | | | 3,980,000 |
| |
| See accompanying notes which are an integral part of the financial statements. | | | | |
| |
| Annual Report | | 38 | | | | |
| Municipal Securities continued | | | | | | |
| | | Principal | | | | Value |
| | | Amount | | | | (Note 1) |
| New Jersey – continued | | | | | | |
| New Jersey Gen. Oblig. Participating VRDN: | | | | | | |
| Series EGL 03 5, 3.07% (Liquidity Facility Citibank NA, New | | | | | | |
| York) (c)(g) | | $21,095,000 | | | | $ 21,095,000 |
| Series FRRI L8, 3.13% (Liquidity Facility Lehman Brothers | | | | | | |
| Hldgs., Inc.) (c)(g) | | 9,950,000 | | | | 9,950,000 |
| Series Macon 04 F, 3.07% (Liquidity Facility Bank of America | | | | | | |
| NA) (c)(g) | | 4,635,000 | | | | 4,635,000 |
| Series MS 1196, 3.07% (Liquidity Facility Morgan | | | | | | |
| Stanley) (c)(g) | | 5,000,000 | | | | 5,000,000 |
| Series PT 2509, 3.07% (Liquidity Facility Dexia Cr. Local de | | | | | | |
| France) (c)(g) | | 18,435,000 | | | | 18,435,000 |
| New Jersey Health Care Facilities Fing. Auth. Participating | | | | | | |
| VRDN Series Putters 1063, 3.08% (Liquidity Facility | | | | | | |
| JPMorgan Chase Bank) (c)(g) | | 5,805,000 | | | | 5,805,000 |
| New Jersey Health Care Facilities Fing. Auth. Rev. Participating | | | | | | |
| VRDN: | | | | | | |
| Series MT 24, 3.07% (Liquidity Facility Svenska | | | | | | |
| Handelsbanken AB) (c)(g) | | 7,095,000 | | | | 7,095,000 |
| Series MT 25, 3.07% (Liquidity Facility Svenska | | | | | | |
| Handelsbanken AB) (c)(g) | | 3,460,000 | | | | 3,460,000 |
| New Jersey Hsg. & Mtg. Fin. Agcy. Rev.: | | | | | | |
| Participating VRDN: | | | | | | |
| Series 1999 V, 3.11% (Liquidity Facility Bank of America | | | | | | |
| NA) (c)(f)(g) | | 5,785,000 | | | | 5,785,000 |
| Series Merlots 00 A2, 3.06% (Liquidity Facility Wachovia | | | | | | |
| Bank NA) (c)(f)(g) | | 1,055,000 | | | | 1,055,000 |
| Series PT 118, 3.09% (Liquidity Facility Merrill Lynch & | | | | | | |
| Co., Inc.) (c)(f)(g) | | 3,505,000 | | | | 3,505,000 |
| Series PT 1289, 3.09% (Liquidity Facility Merrill Lynch & | | | | | | |
| Co., Inc.) (c)(f)(g) | | 1,570,000 | | | | 1,570,000 |
| Series PT 287, 3.05% (Liquidity Facility Landesbank | | | | | | |
| Hessen-Thuringen) (c)(f)(g) | | 3,635,000 | | | | 3,635,000 |
| Series PT 456, 3.09% (Liquidity Facility BNP Paribas | | | | | | |
| SA) (c)(f)(g) | | 2,220,000 | | | | 2,220,000 |
| Series PT 635, 3.09% (Liquidity Facility Svenska | | | | | | |
| Handelsbanken AB) (c)(f)(g) | | 2,070,000 | | | | 2,070,000 |
| (Single Family Hsg. Proj.): | | | | | | |
| Series 2005 O, 3.08% (Liquidity Facility Dexia Cr. Local de | | | | | | |
| France), VRDN (c)(f) | | 15,000,000 | | | | 15,000,000 |
| Series 2005 R, 3.01% (Liquidity Facility Dexia Cr. Local de | | | | | | |
| France), VRDN (c)(f) | | 28,610,000 | | | | 28,610,000 |
| New Jersey Tpk. Auth. Tpk. Rev. Participating VRDN: | | | | | | |
| Series AAB 00 6, 3.07% (Liquidity Facility ABN-AMRO Bank | | | | | | |
| NV) (c)(g) | | 29,240,000 | | | | 29,240,000 |
See accompanying notes which are an integral part of the financial statements.
39 Annual Report
| Fidelity New Jersey Municipal Money Market Fund | | | | |
| Investments continued | | | | | | |
| |
| Municipal Securities continued | | | | |
| | | Principal | | | | Value |
| | | Amount | | | | (Note 1) |
| New Jersey – continued | | | | | | |
| New Jersey Tpk. Auth. Tpk. Rev. Participating VRDN: - | | | | | | | | |
| continued | | | | | | |
| Series FRRI 02 L30J, 3.08% (Liquidity Facility Lehman | | | | |
| Brothers Hldgs., Inc.) (c)(g) | | $29,130,000 | | | | $ 29,130,000 |
| Series IXIS 05 14, 3.07% (Liquidity Facility CDC Fin.-CDC | | | | |
| IXIS) (c)(g) | | 5,740,000 | | | | 5,740,000 |
| Series LB 05 K9, 3.09% (Liquidity Facility Lehman Brothers | | | | |
| Hldgs., Inc.) (c)(g) | | 7,505,000 | | | | 7,505,000 |
| Series Merlots 00 EEE, 3.01% (Liquidity Facility Wachovia | | | | |
| Bank NA) (c)(g) | | 3,980,000 | | | | 3,980,000 |
| Series MS 995, 3.06% (Liquidity Facility Morgan | | | | |
| Stanley) (c)(g) | | 8,492,000 | | | | 8,492,000 |
| Series PA 613, 3.07% (Liquidity Facility Merrill Lynch & Co., | | | | |
| Inc.) (c)(g) | | 2,000,000 | | | | 2,000,000 |
| Series PA 670, 3.07% (Liquidity Facility Merrill Lynch & Co., | | | | |
| Inc.) (c)(g) | | 2,345,000 | | | | 2,345,000 |
| Series PT 2096, 3.07% (Liquidity Facility Merrill Lynch & Co., | | | | |
| Inc.) (c)(g) | | 990,000 | | | | 990,000 |
| Series PT 2105, 3.07% (Liquidity Facility Merrill Lynch & Co., | | | | |
| Inc.) (c)(g) | | 5,060,000 | | | | 5,060,000 |
| Series PT 2129, 3.07% (Liquidity Facility Merrill Lynch & Co., | | | | |
| Inc.) (c)(g) | | 16,135,000 | | | | 16,135,000 |
| Series PT 2493, 3.07% (Liquidity Facility Dexia Cr. Local de | | | | |
| France) (c)(g) | | 9,980,000 | | | | 9,980,000 |
| Series Putters 155, 3.08% (Liquidity Facility JPMorgan Chase | | | | |
| Bank) (c)(g) | | 5,000,000 | | | | 5,000,000 |
| Series ROC II R323, 3.07% (Liquidity Facility Citibank | | | | |
| NA) (c)(g) | | 9,495,000 | | | | 9,495,000 |
| Series ROC II R4017, 3.07% (Liquidity Facility Citigroup | | | | |
| Global Markets Hldgs., Inc.) (c)(g) | | 11,200,000 | | | | 11,200,000 |
| Series ROC II R4032, 3.07% (Liquidity Facility Citigroup | | | | |
| Global Markets Hldgs., Inc.) (c)(g) | | 2,805,000 | | | | 2,805,000 |
| Series ROC II R428, 3.07% (Liquidity Facility Citibank | | | | |
| NA) (c)(g) | | 5,975,000 | | | | 5,975,000 |
| Series ROC II R6042, 3.07% (Liquidity Facility Citibank | | | | |
| NA) (c)(g) | | 4,785,000 | | | | 4,785,000 |
| Series TOC 05 K, 3.07% (Liquidity Facility Goldman Sachs | | | | |
| Group, Inc.) (c)(g) | | 9,700,000 | | | | 9,700,000 |
| New Jersey Trans. Trust Fund Auth. Participating VRDN: | | | | |
| Series EGL 20030034 Class A, 3.07% (Liquidity Facility | | | | |
| Citibank NA, New York) (c)(g) | | 17,100,000 | | | | 17,100,000 |
| Series EGL 720050001 Class A, 3.08% (Liquidity Facility | | | | |
| Citibank NA) (c)(g) | | 13,500,000 | | | | 13,500,000 |
| |
| See accompanying notes which are an integral part of the financial statements. | | | | |
| |
| Annual Report | | 40 | | | | |
| Municipal Securities continued | | | | | | |
| | | | | Principal | | | | Value |
| | | | | Amount | | | | (Note 1) |
| New Jersey – continued | | | | | | | | |
| New Jersey Trans. Trust Fund Auth. Participating VRDN: - | | | | | | |
| continued | | | | | | | | |
| Series IXIS 05 6, 3.07% (Liquidity Facility CDC Fin.-CDC | | | | | | |
| IXIS) (c)(g) | | | | $ 8,040,000 | | | | $ 8,040,000 |
| Series MS 963D, 3.06% (Liquidity Facility Morgan | | | | | | |
| Stanley) (c)(g) | | | | 10,050,000 | | | | 10,050,000 |
| Series MS 967, 3.06% (Liquidity Facility Morgan | | | | | | |
| Stanley) (c)(g) | | | | 8,570,000 | | | | 8,570,000 |
| Series MS 98 54, 3.06% (Liquidity Facility Morgan | | | | | | |
| Stanley) (c)(g) | | | | 10,455,000 | | | | 10,455,000 |
| Series PA 958P, 3.07% (Liquidity Facility Merrill Lynch & Co., | | | | | | |
| Inc.) (c)(g) | | | | 1,000,000 | | | | 1,000,000 |
| Series PT 1204, 3.07% (Liquidity Facility Merrill Lynch & Co., | | | | | | |
| Inc.) (c)(g) | | | | 3,500,000 | | | | 3,500,000 |
| Series PT 1723, 3.07% (Liquidity Facility Merrill Lynch & Co., | | | | | | |
| Inc.) (c)(g) | | | | 5,000,000 | | | | 5,000,000 |
| Series PT 2362A, 3.07% (Liquidity Facility Dexia Cr. Local de | | | | | | |
| France) (c)(g) | | | | 2,380,000 | | | | 2,380,000 |
| Series PT 2363A, 3.07% (Liquidity Facility Dexia Cr. Local de | | | | | | |
| France) (c)(g) | | | | 2,000,000 | | | | 2,000,000 |
| Series PT 2402, 3.07% (Liquidity Facility Dexia Cr. Local de | | | | | | |
| France) (c)(g) | | | | 43,505,000 | | | | 43,505,000 |
| Series PT 2488, 3.07% (Liquidity Facility Merrill Lynch & Co., | | | | | | |
| Inc.) (c)(g) | | | | 980,000 | | | | 980,000 |
| Series PT 2489, 3.07% (Liquidity Facility Merrill Lynch & Co., | | | | | | |
| Inc.) (c)(g) | | | | 3,000,000 | | | | 3,000,000 |
| Series PT 2500, 3.07% (Liquidity Facility Dexia Cr. Local de | | | | | | |
| France) (c)(g) | | | | 15,100,000 | | | | 15,100,000 |
| Series PT 2572, 3.07% (Liquidity Facility Dexia Cr. Local de | | | | | | |
| France) (c)(g) | | | | 3,825,000 | | | | 3,825,000 |
| Series PT 2711, 3.07% (Liquidity Facility Dexia Cr. Local de | | | | | | |
| France) (c)(g) | | | | 5,995,000 | | | | 5,995,000 |
| Series Putters 1156T, 3.08% (Liquidity Facility JPMorgan | | | | | | |
| Chase Bank) (c)(g) | | | | 3,000,000 | | | | 3,000,000 |
| Series Putters 1166, 3.08% (Liquidity Facility JPMorgan | | | | | | |
| Chase Bank) (c)(g) | | | | 2,000,000 | | | | 2,000,000 |
| Series Putters 503, 3.08% (Liquidity Facility JPMorgan Chase | | | | | | |
| Bank) (c)(g) | | | | 2,695,000 | | | | 2,695,000 |
| Series Putters 725, 3.08% (Liquidity Facility JPMorgan Chase | | | | | | |
| Bank) (c)(g) | | | | 19,960,000 | | | | 19,960,000 |
| Series Putters 818, 3.08% (Liquidity Facility JPMorgan Chase | | | | | | |
| Bank) (c)(g) | | | | 21,580,000 | | | | 21,580,000 |
| Series Putters 820, 3.08% (Liquidity Facility JPMorgan Chase | | | | | | |
| Bank) (c)(g) | | | | 10,785,000 | | | | 10,785,000 |
See accompanying notes which are an integral part of the financial statements.
41 Annual Report
| Fidelity New Jersey Municipal Money Market Fund | | |
| Investments continued | | | | | | |
| |
| Municipal Securities continued | | | | |
| | | | | Principal | | Value |
| | | | | Amount | | (Note 1) |
| New Jersey – continued | | | | | | |
| New Jersey Trans. Trust Fund Auth. Participating VRDN: - | | | | |
| continued | | | | | | |
| Series ROC II R146, 3.07% (Liquidity Facility Citibank | | | | |
| NA) (c)(g) | | | | $ 7,495,000 | | $ 7,495,000 |
| Series ROC II R2103, 3.07% (Liquidity Facility Citigroup | | | | |
| Global Markets Hldgs., Inc.) (c)(g) | | | | 5,635,000 | | 5,635,000 |
| Series ROC II R447, 3.07% (Liquidity Facility Citibank | | | | |
| NA) (c)(g) | | | | 3,000,000 | | 3,000,000 |
| Series Stars 116, 3.07% (Liquidity Facility BNP Paribas | | | | |
| SA) (c)(g) | | | | 7,885,000 | | 7,885,000 |
| Series Stars 129, 3.07% (Liquidity Facility BNP Paribas | | | | |
| SA) (c)(g) | | | | 6,570,000 | | 6,570,000 |
| New Jersey Transit Corp. Ctfs. of Prtn. Participating VRDN | | | | |
| Series ROC II R3045, 3.07% (Liquidity Facility Citigroup | | | | |
| Global Markets Hldgs., Inc.) (c)(g) | | | | 2,670,000 | | 2,670,000 |
| Newark Gen. Oblig. Participating VRDN Series ROC II R4539, | | | | |
| 3.07% (Liquidity Facility Citigroup Global Markets Hldgs., | | | | |
| Inc.) (c)(g) | | | | 2,185,000 | | 2,185,000 |
| North Brunswick Township Gen. Oblig. BAN 4% 8/22/06 | | 6,700,000 | | 6,746,067 |
| North Caldwell Gen. Oblig. BAN 4.25% 9/6/06 | | 5,383,927 | | 5,431,013 |
| Ridgefield Gen. Oblig. BAN 4% 10/20/06 | | 8,306,000 | | 8,368,698 |
| Rutgers State Univ. Rev. Participating VRDN Series MS 971, | | | | |
| 3.06% (Liquidity Facility Morgan Stanley) (c)(g) | | 3,000,000 | | 3,000,000 |
| Somerset County Indl. Poll. Cont. Fing. Auth. Rev. (American | | | | |
| Cyanamid Co. Proj.) 3.5%, VRDN (c) | | | | 4,900,000 | | 4,900,000 |
| Tobacco Settlement Fing. Corp. Participating VRDN Series PA | | | | |
| 1285, 3.1% (Liquidity Facility Merrill Lynch & Co., Inc.) (c)(g) | | 5,100,000 | | 5,100,000 |
| Trenton Gen. Oblig. BAN 4% 10/13/06 | | | | 16,230,000 | | 16,342,971 |
| Union City Gen. Oblig. BAN 4% 5/17/06 | | 6,943,500 | | 6,974,316 |
| | | | | | | 1,051,902,837 |
| |
| New Jersey/Pennsylvania – 4.6% | | | | | | |
| Delaware River Port Auth. Pennsylvania & New Jersey Rev. | | | | |
| Participating VRDN: | | | | | | |
| Series Merlots 00 B4, 3.01% (Liquidity Facility Wachovia | | | | |
| Bank NA) (c)(g) | | | | 5,900,000 | | 5,900,000 |
| Series Merlots 00 K, 3.01% (Liquidity Facility Wachovia Bank | | | | |
| NA) (c)(g) | | | | 15,265,000 | | 15,265,000 |
| Series MS 00 396, 3.06% (Liquidity Facility Morgan | | | | |
| Stanley) (c)(g) | | | | 11,510,000 | | 11,510,000 |
| Series PA 606, 3.07% (Liquidity Facility Merrill Lynch & Co., | | | | |
| Inc.) (c)(g) | | | | 7,995,000 | | 7,995,000 |
| |
| |
| See accompanying notes which are an integral part of the financial statements. | | |
| |
| Annual Report | | 42 | | | | |
| Municipal Securities continued | | | | |
| | | Principal | | Value |
| | | Amount | | (Note 1) |
| New Jersey/Pennsylvania – continued | | | | |
| Delaware River Port Auth. Pennsylvania & New Jersey Rev. | | | | |
| Participating VRDN: – continued | | | | |
| Series PA 611, 3.07% (Liquidity Facility Merrill Lynch & Co., | | | | |
| Inc.) (c)(g) | | $ 9,995,000 | | $ 9,995,000 |
| Series PA 965R, 3.07% (Liquidity Facility Merrill Lynch & Co., | | | | |
| Inc.) (c)(g) | | 5,000,000 | | 5,000,000 |
| Series SG 53, 3.07% (Liquidity Facility Societe | | | | |
| Generale) (c)(g) | | 12,940,000 | | 12,940,000 |
| | | | | 68,605,000 |
| |
| New York & New Jersey – 14.0% | | | | |
| Port Auth. of New York & New Jersey: | | | | |
| Participating VRDN: | | | | |
| Series MS 01 701, 3.08% (Liquidity Facility Morgan | | | | |
| Stanley) (c)(f)(g) | | 4,995,000 | | 4,995,000 |
| Series PA 1038R, 3.09% (Liquidity Facility Merrill Lynch & | | | | |
| Co., Inc.) (c)(f)(g) | | 4,995,000 | | 4,995,000 |
| Series PA 1171R, 3.09% (Liquidity Facility Merrill Lynch & | | | | |
| Co., Inc.) (c)(f)(g) | | 5,100,000 | | 5,100,000 |
| Series PA 1251, 3.09% (Liquidity Facility Merrill Lynch & | | | | |
| Co., Inc.) (c)(g) | | 4,600,000 | | 4,600,000 |
| Series PA 1332, 3.09% (Liquidity Facility Merrill Lynch & | | | | |
| Co., Inc.) (c)(f)(g) | | 5,895,000 | | 5,895,000 |
| Series PT 1269, 3.09% (Liquidity Facility Merrill Lynch & | | | | |
| Co., Inc.) (c)(f)(g) | | 9,805,000 | | 9,805,000 |
| Series PT 2698, 3.09% (Liquidity Facility Merrill Lynch & | | | | |
| Co., Inc.) (c)(f)(g) | | 7,745,000 | | 7,745,000 |
| Series PT 870, 3.09% (Liquidity Facility DEPFA BANK | | | | |
| PLC) (c)(f)(g) | | 1,800,000 | | 1,800,000 |
| Series PT 984, 3.07% (Liquidity Facility Landesbank | | | | |
| Hessen-Thuringen) (c)(g) | | 7,870,000 | | 7,870,000 |
| Series Putters 153, 3.11% (Liquidity Facility JPMorgan | | | | |
| Chase Bank) (c)(f)(g) | | 2,000,000 | | 2,000,000 |
| Series Putters 177, 3.11% (Liquidity Facility JPMorgan | | | | |
| Chase Bank) (c)(f)(g) | | 7,000,000 | | 7,000,000 |
| Series ROC II R373, 3.08% (Liquidity Facility Citibank | | | | |
| NA) (c)(g) | | 5,640,000 | | 5,640,000 |
| Series ROC II R43, 3.12% (Liquidity Facility Citibank | | | | |
| NA) (c)(f)(g) | | 7,015,000 | | 7,015,000 |
| Series SG 96 52, 3.09% (Liquidity Facility Societe | | | | |
| Generale) (c)(f)(g) | | 19,465,000 | | 19,465,000 |
| |
| |
| |
| See accompanying notes which are an integral part of the financial statements. | | |
| |
| 43 | | | | Annual Report |
| Fidelity New Jersey Municipal Money Market Fund | | | | |
| Investments continued | | | | | | |
| |
| Municipal Securities continued | | | | | | |
| | | Principal | | | | Value |
| | | Amount | | | | (Note 1) |
| New York & New Jersey – continued | | | | | | |
| Port Auth. of New York & New Jersey: – continued | | | | | | |
| Series 1991 3, 3.12%, VRDN (c)(f)(h) | | $ 9,800,000 | | | | $ 9,800,000 |
| Series 1991, 3.12%, VRDN (c)(f)(h) | | 8,800,000 | | | | 8,800,000 |
| Series 1992, 3.09%, VRDN (c)(h) | | 6,800,000 | | | | 6,800,000 |
| Series 1995 4, 3.12%, VRDN (c)(f)(h) | | 10,500,000 | | | | 10,500,000 |
| Series 1995, 3.12%, VRDN (c)(f)(h) | | 9,400,000 | | | | 9,400,000 |
| Port Auth. of New York & New Jersey Spl. Oblig. Rev.: | | | | | | |
| Participating VRDN: | | | | | | |
| Series MS 00 331, 3.08% (Liquidity Facility Morgan | | | | | | |
| Stanley) (c)(f)(g) | | 18,830,000 | | | | 18,830,000 |
| Series MS 98 157, 3.08% (Liquidity Facility Morgan | | | | | | |
| Stanley) (c)(f)(g) | | 3,160,000 | | | | 3,160,000 |
| Series Putters 192, 3.11% (Liquidity Facility JPMorgan | | | | | | |
| Chase Bank) (c)(f)(g) | | 21,695,000 | | | | 21,695,000 |
| Series Putters 278, 3.11% (Liquidity Facility JPMorgan | | | | | | |
| Chase Bank) (c)(f)(g) | | 18,435,000 | | | | 18,435,000 |
| Series 1R, 3.01% (Liquidity Facility Bayerische Landesbank | | | | | | |
| Girozentrale), VRDN (c)(f) | | 10,000,000 | | | | 10,000,000 |
| | | | | | | 211,345,000 |
| |
| Puerto Rico 3.3% | | | | | | |
| Puerto Rico Commonwealth Gen. Oblig. Participating VRDN: | | | | | | |
| Series Merlots 00 EE, 2.99% (Liquidity Facility Wachovia | | | | | | |
| Bank NA) (c)(g) | | 1,080,000 | | | | 1,080,000 |
| Series Merlots 03 A44, 2.99% (Liquidity Facility Wachovia | | | | | | |
| Bank NA) (c)(g) | | 7,970,000 | | | | 7,970,000 |
| Puerto Rico Commonwealth Hwy. & Trans. Auth. Hwy. Rev. | | | | | | |
| Participating VRDN Series LB 04 L28, 3.09% (Liquidity | | | | | | |
| Facility Lehman Brothers Hldgs., Inc.) (c)(g) | | 9,975,000 | | | | 9,975,000 |
| Puerto Rico Commonwealth Hwy. & Trans. Auth. Trans. Rev. | | | | | | |
| Participating VRDN Series MACN 05 N, 3.07% (Liquidity | | | | | | |
| Facility Bank of America NA) (c)(g) | | 4,100,000 | | | | 4,100,000 |
| Puerto Rico Elec. Pwr. Auth. Pwr. Rev. Participating VRDN | | | | | | |
| Series Putters 147, 3.07% (Liquidity Facility JPMorgan Chase | | | | | | |
| Bank) (c)(g) | | 1,560,000 | | | | 1,560,000 |
| Puerto Rico Govt. Dev. Bank 2.85% 1/30/06, LOC Societe | | | | | | |
| Generale, CP (a) | | 14,000,000 | | | | 14,000,000 |
| Puerto Rico Pub. Bldgs Auth. Rev. Participating VRDN: | | | | | | |
| Series MS 787, 3.04% (Liquidity Facility Morgan Stanley) (c)(g) | | 6,000,000 | | | | 6,000,000 |
| Series MS 968, 3.04% (Liquidity Facility Morgan Stanley) (c)(g) | | 4,600,000 | | | | 4,600,000 |
| | | | | | | 49,285,000 |
See accompanying notes which are an integral part of the financial statements.
| Municipal Securities continued | | | | |
| | | Shares | | Value |
| | | | | (Note 1) |
| Other – 2.3% | | | | |
| Fidelity Municipal Cash Central Fund, 3.08% (d)(e) | | 35,195,400 | | $ 35,195,400 |
| |
| TOTAL INVESTMENT PORTFOLIO 94.7% | | | | |
| (Cost $1,426,228,237) | | 1,426,228,237 |
| |
| NET OTHER ASSETS – 5.3% | | | | 80,448,541 |
| NET ASSETS 100% | | $ 1,506,676,778 |
| Security Type Abbreviations |
| BAN | | — BOND ANTICIPATION NOTE |
| CP | | — COMMERCIAL PAPER |
| VRDN | | — VARIABLE RATE DEMAND NOTE |
Legend
(a) Security exempt from registration under
Rule 144A of the Securities Act of 1933.
These securities may be resold in
transactions exempt from registration,
normally to qualified institutional buyers.
At the period end, the value of these
securities amounted to $14,000,000 or
0.9% of net assets.
(b) Security or a portion of the security
purchased on a delayed delivery or
when-issued basis.
|
(c) The coupon rate shown on floating or
adjustable rate securities represents the
rate at period end.
(d) Information in this report regarding
holdings by state and security types
does not reflect the holdings of the
Fidelity Municipal Cash Central Fund.
(e) Affiliated fund that is available only to
investment companies and other
accounts managed by Fidelity
Investments. The rate quoted is the
annualized seven-day yield of the fund
at period end. A complete unaudited
listing of the fund’s holdings as of its
most recent quarter end is available
upon request.
(f) Private activity obligations whose
interest is subject to the federal
alternative minimum tax for individuals.
(g) Provides evidence of ownership in one
or more underlying municipal bonds.
|
See accompanying notes which are an integral part of the financial statements.
45 Annual Report
Fidelity New Jersey Municipal Money Market Fund
Investments continued
(h) Restricted securities – Investment in
securities not registered under the
Securities Act of 1933 (excluding 144A
issues). At the end of the period, the
value of restricted securities (excluding
144A issues) amounted to $45,300,000
or 3.0% of net assets.
|
Additional information on each holding is as follows:
| | | Acquisition | | | | |
| Security | | Date | | | | Cost |
| Port Auth. of New | | | | | | |
| York & New Jersey: | | | | | | |
| Series 1991 3, | | | | | | |
| 3.12%, VRDN | | 12/3/03 | | $ | | 9,800,000 |
| Series 1991, | | | | | | |
| 3.12%, VRDN | | 6/18/91 | | $ | | 8,800,000 |
| Series 1992, | | | | | | |
| 3.09%, VRDN | | 2/14/92 | | $ | | 6,800,000 |
| Series 1995 4, | | | | | | |
| 3.12%, VRDN | | 8/9/02 | | $ | | 10,500,000 |
| Series 1995, | | | | | | |
| 3.12%, VRDN | | 9/15/95 | | $ | | 9,400,000 |
Affiliated Central Funds
Information regarding income received by the fund from the affiliated Central funds during the period is as follows:
| Fund | | | | Income received |
| Fidelity Municipal Cash Central Fund | | | $ | 188,316 |
See accompanying notes which are an integral part of the financial statements.
Annual Report 46
| Fidelity New Jersey Municipal Money Market Fund | | | | |
| |
| Financial Statements | | | | | | | | |
| |
| Statement of Assets and Liabilities | | | | | | | | |
| | | | | | | November 30, 2005 |
| |
| Assets | | | | | | | | |
| Investment in securities, at value | | | | | | | | |
| See accompanying schedule: | | | | | | | | |
| Unaffiliated issuers (cost $1,391,032,837) | | $ | | 1,391,032,837 | | | | |
| Affiliated Central Funds (cost $35,195,400) | | | | 35,195,400 | | | | |
| Total Investments (cost $1,426,228,237) | | | | | | $1,426,228,237 |
| Cash | | | | | | | | 66,272,612 |
| Receivable for investments sold on a delayed delivery | | | | | | | | |
| basis | | | | | | | | 9,500,000 |
| Receivable for fund shares sold | | | | | | | | 12,146,987 |
| Interest receivable | | | | | | | | 12,910,908 |
| Prepaid expenses | | | | | | | | 7,979 |
| Other receivables | | | | | | | | 172,168 |
| Total assets | | | | | | | | 1,527,238,891 |
| |
| Liabilities | | | | | | | | |
| Payable for investments purchased on a delayed delivery | | | | | | | | |
| basis | | $ | | 9,077,460 | | | | |
| Payable for fund shares redeemed | | | | 10,773,191 | | | | |
| Distributions payable | | | | 38,906 | | | | |
| Accrued management fee | | | | 464,000 | | | | |
| Other affiliated payables | | | | 172,503 | | | | |
| Other payables and accrued expenses | | | | 36,053 | | | | |
| Total liabilities | | | | | | | | 20,562,113 |
| |
| Net Assets | | | | | | $ 1,506,676,778 |
| Net Assets consist of: | | | | | | | | |
| Paid in capital | | | | | | $1,506,643,360 |
| Undistributed net investment income | | | | | | | | 33,418 |
| Net Assets, for 1,505,590,638 shares outstanding | | | | | | $ 1,506,676,778 |
| Net Asset Value, offering price and redemption price per | | | | | | | | |
| share ($1,506,676,778 ÷ 1,505,590,638 shares) | | | | | | | | $ 1.00 |
See accompanying notes which are an integral part of the financial statements.
47 Annual Report
| Fidelity New Jersey Municipal Money Market Fund | | |
| Financial Statements continued | | | | | | |
| |
| Statement of Operations | | | | | | |
| | | | | Year ended November 30, 2005 |
| |
| Investment Income | | | | | | |
| Interest | | | | $ | | 32,971,201 |
| Income from affiliated Central Funds | | | | | | 188,316 |
| Total income | | | | | | 33,159,517 |
| |
| Expenses | | | | | | |
| Management fee | | $ | | 5,490,416 | | |
| Transfer agent fees | | | | 1,884,835 | | |
| Accounting fees and expenses | | | | 147,727 | | |
| Independent trustees’ compensation | | | | 6,736 | | |
| Custodian fees and expenses | | | | 23,052 | | |
| Registration fees | | | | 32,711 | | |
| Audit | | | | 41,389 | | |
| Legal | | | | 7,328 | | |
| Miscellaneous | | | | 9,424 | | |
| Total expenses before reductions | | | | 7,643,618 | | |
| Expense reductions | | | | (1,291,518) | | 6,352,100 |
| |
| Net investment income | | | | | | 26,807,417 |
| Realized and Unrealized Gain (Loss) | | | | | | |
| Net realized gain (loss) on: | | | | | | |
| Investment securities: | | | | | | |
| Unaffiliated issuers | | | | | | 134,179 |
| Net increase in net assets resulting from operations | | | | $ | | 26,941,596 |
See accompanying notes which are an integral part of the financial statements.
| Statement of Changes in Net Assets | | | | | | |
| | | Year ended | | | | Year ended |
| | | November 30, | | | | November 30, |
| | | 2005 | | | | 2004 |
| Increase (Decrease) in Net Assets | | | | | | |
| Operations | | | | | | |
| Net investment income | | $ 26,807,417 | | | | $ 9,270,975 |
| Net realized gain (loss) | | 134,179 | | | | 443,798 |
| Net increase in net assets resulting | | | | | | |
| from operations | | 26,941,596 | | | | 9,714,773 |
| Distributions to shareholders from net investment income . | | (26,812,288) | | | | (9,269,713) |
| Share transactions at net asset value of $1.00 per share | | | | | | |
| Proceeds from sales of shares | | 4,172,438,591 | | | | 3,429,878,413 |
| Reinvestment of distributions | | 26,498,785 | | | | 9,177,801 |
| Cost of shares redeemed | | (4,116,268,457) | | (3,259,472,810) |
| Net increase (decrease) in net assets and shares | | | | | | |
| resulting from share transactions | | 82,668,919 | | | | 179,583,404 |
| Total increase (decrease) in net assets | | 82,798,227 | | | | 180,028,464 |
| |
| Net Assets | | | | | | |
| Beginning of period | | 1,423,878,551 | | | | 1,243,850,087 |
| End of period (including undistributed net investment | | | | | | |
| income of $33,418 and undistributed net investment | | | | | | |
| income of $3,697, respectively) | | $ 1,506,676,778 | | $ 1,423,878,551 |
See accompanying notes which are an integral part of the financial statements.
49 Annual Report
| Financial Highlights | | | | | | | | | | | | | | | | | | | | |
| |
| Years ended November 30, | | | | 2005 | | | | 2004 | | | | 2003 | | | | 2002 | | | | 2001 |
| Selected Per Share Data | | | | | | | | | | | | | | | | | | | | |
| Net asset value, | | | | | | | | | | | | | | | | | | | | |
| beginning of period | | | | $ 1.00 | | | | $ 1.00 | | | | $ 1.00 | | | | $ 1.00 | | | | $ 1.00 |
| Income from Investment | | | | | | | | | | | | | | | | | | | | |
| Operations | | | | | | | | | | | | | | | | | | | | |
| Net investment income | | | | 018 | | | | .007 | | | | .006 | | | | .010 | | | | .025 |
| Net realized and unreal- | | | | | | | | | | | | | | | | | | | | |
| ized gain (loss)C | | | | — | | | | — | | | | — | | | | — | | | | — |
| Total from investment | | | | | | | | | | | | | | | | | | | | |
| operations | | | | 018 | | | | .007 | | | | .006 | | | | .010 | | | | .025 |
| Distributions from net | | | | | | | | | | | | | | | | | | | | |
| investment income | | | | (.018) | | | | (.007) | | | | (.006) | | | | (.010) | | | | (.025) |
| Distributions from net realized | | | | | | | | | | | | | | | | | | | | |
| gain | | | | — | | | | — | | | | —C | | | | — | | | | — |
| Total distributions | | | | (.018) | | | | (.007) | | | | (.006) | | | | (.010) | | | | (.025) |
| Net asset value, | | | | | | | | | | | | | | | | | | | | |
| end of period | | | | $ 1.00 | | | | $ 1.00 | | | | $ 1.00 | | | | $ 1.00 | | | | $ 1.00 |
| Total ReturnA | | | | 1.84% | | | | .68% | | | | .64% | | | | 1.05% | | | | 2.55% |
| Ratios to Average Net AssetsB | | | | | | | | | | | | | | | | | | | | |
| Expenses before reductions | | | | .52% | | | | .53% | | | | .52% | | | | .52% | | | | .53% |
| Expenses net of fee | | | | | | | | | | | | | | | | | | | | |
| waivers, if any | | | | 52% | | | | .53% | | | | .52% | | | | .52% | | | | .53% |
| Expenses net of all | | | | | | | | | | | | | | | | | | | | |
| reductions | | | | 43% | | | | .51% | | | | .50% | | | | .48% | | | | .48% |
| Net investment income | | | | 1.82% | | | | .68% | | | | .61% | | | | 1.04% | | | | 2.49% |
| Supplemental Data | | | | | | | | | | | | | | | | | | | | |
| Net assets, end of period | | | | | | | | | | | | | | | | | | | | |
| (000 omitted) | | | | $1,506,677 | | | | | | $1,423,879 | | | | | | $1,243,850 | | | | | | $1,242,248 | | | | | | $1,118,731 |
A Total returns would have been lower had certain expenses not been reduced during the periods shown.
B Expense ratios reflect operating expenses of the fund. Expenses before reductions do not reflect amounts reimbursed by the investment adviser or
reductions from brokerage service arrangements or other expense offset arrangements and do not represent the amount paid by the fund during
periods when reimbursements or reductions occur. Expenses net of fee waivers reflect expenses after reimbursement by the investment adviser but
prior to reductions from brokerage service arrangements or other expense offset arrangements. Expenses net of all reductions represent the net
expenses paid by the fund.
C Amount represents less than $.001 per share.
|
See accompanying notes which are an integral part of the financial statements.
Annual Report 50
Notes to Financial Statements
For the period ended November 30, 2005
1. Significant Accounting Policies.
Fidelity New Jersey Municipal Income Fund (the income fund) is a fund of Fidelity Court Street Trust. Fidelity New Jersey AMT Tax Free Money Market Fund and Fidelity New Jersey Municipal Money Market Fund (the money market funds) are funds of Fidelity Court Street Trust II. On July 21, 2005, the Board of Trustees approved a change in the names of Spartan New Jersey Municipal Income Fund and Spartan New Jersey Municipal Money Market Fund to Fidelity New Jersey Municipal Income Fund and Fidelity New Jersey AMT Tax Free Money Market Fund effective August 15, 2005. Each trust is registered under the Investment Company Act of 1940, as amended (the 1940 Act), as an open end management investment company. Fidelity Court Street Trust and Fidelity Court Street Trust II (the trusts) are organized as a Massachusetts business trust and a Delaware statutory trust, respectively. The income fund is a non diversified fund. Each fund is authorized to issue an unlimited number of shares. Each fund may be affected by economic and political developments in the state of New Jersey. Certain funds may invest in affiliated money market central funds (Money Market Central Funds) and fixed income Central Investment Portfolios (CIPs), collectively referred to as Central Funds, which are open end investment companies available to investment companies and other accounts managed by Fidelity Management & Research Company (FMR) and its affiliates. The financial statements have been prepared in conformity with accounting principles generally accepted in the United States of America, which require management to make certain estimates and assumptions at the date of the financial statements. The following summarizes the significant accounting policies of the income fund and the money market funds:
Security Valuation. Investments are valued and net asset value per share is calculated (NAV calculation) as of the close of business of the New York Stock Exchange, normally 4:00 p.m. Eastern time. Wherever possible, each fund uses independent pricing services approved by the Board of Trustees to value their investments. For the income fund, debt securities, including restricted securities, for which quotes are readily available, are valued by independent pricing services or by dealers who make markets in such securi ties. Pricing services consider yield or price of bonds of comparable quality, coupon, maturity and type as well as dealer supplied prices. When current market prices or quotations are not readily available or do not accurately reflect fair value, valuations may be determined in accordance with procedures adopted by the Board of Trustees. The frequency of when fair value pricing is used is unpredictable. The value of securities used for NAV calculation under fair value pricing may differ from published prices for the same securities. Investments in open end mutual funds are valued at their closing net asset value each business day. Short term securities with remaining maturities of sixty days or less for which quotations are not readily available are valued at amortized cost, which approximates value.
51 Annual Report
| Notes to Financial Statements continued |
1. Significant Accounting Policies continued |
Security Valuation continued | | |
As permitted by compliance with certain conditions under Rule 2a 7 of the 1940 Act, securities owned by the money market funds are valued at amortized cost which approxi mates value.
Investment Transactions and Income. Security transactions are accounted for as of trade date. Gains and losses on securities sold are determined on the basis of identified cost. Interest income is accrued as earned. Interest income includes coupon interest and amortization of premium and accretion of discount on debt securities.
Expenses. Most expenses of the trust can be directly attributed to a fund. Expenses which cannot be directly attributed are apportioned among each fund in the trust.
Income Tax Information and Distributions to Shareholders. Each year, each fund intends to qualify as a regulated investment company by distributing all of its taxable income and realized gains under Subchapter M of the Internal Revenue Code. As a result, no provision for income taxes is required in the accompanying financial statements.
Dividends are declared daily and paid monthly from net investment income. Distribu tions from realized gains, if any, are recorded on the ex dividend date. Income and capital gain distributions are determined in accordance with income tax regulations, which may differ from generally accepted accounting principles. In addition, certain funds will claim a portion of the payment made to redeeming shareholders as a distribu tion for income tax purposes.
Capital accounts within the financial statements are adjusted for permanent book tax differences. These adjustments have no impact on net assets or the results of operations. Temporary book tax differences will reverse in a subsequent period.
Book tax differences are primarily due to futures transactions, market discount, deferred trustees compensation and losses deferred due to futures transactions.
The funds purchase municipal securities whose interest, in the opinion of the issuer, is free from federal income tax. There is no assurance that the Internal Revenue Service (IRS) will agree with this opinion. In the event the IRS determines that the issuer does not comply with relevant tax requirements, interest payments from a security could become federally taxable, possibly retroactively to the date the security was issued.
1. Significant Accounting Policies continued
| | |
| Income Tax Information and Distributions to Shareholders continued |
The tax basis components of distributable earnings and the federal tax cost as of period end were as follows for each fund:
| | | | | Cost for Federal | | | | | | | | | | Net Unrealized |
| | | | | Income Tax | | | | Unrealized | | | | Unrealized | | Appreciation/ |
| | | | | Purposes | | | | Appreciation | | | | Depreciation | | (Depreciation) |
| Fidelity New Jersey | | | | | | | | | | | | | | | | |
| Municipal Income Fund | | $ | | 541,397,480 | | $ | | 16,011,260 | | $ | | (2,702,260) | | $ | | 13,309,000 |
| Fidelity NJ AMT Tax Free | | | | | | | | | | | | | | | | |
| Money Market Fund | | | | 751,605,914 | | | | — | | | | — | | | | — |
| Fidelity New Jersey | | | | | | | | | | | | | | | | |
| Municipal Money Market | | | | | | | | | | | | | | | | |
| Fund | | | | 1,426,228,237 | | | | — | | | | — | | | | — |
| |
| | | | | | | | | Undistributed | | | | Undistributed | | | | |
| | | | | | | | | Ordinary | | | | Long-term | | | | Capital Loss |
| | | | | | | | | Income | | | | Capital Gain | | | | Carryforward |
| Fidelity New Jersey Municipal | | | | | | | | | | | | | | | | |
| Income Fund | | | | | | $ | | — | | $ | | 6,896,655 | | $ | | — |
| Fidelity NJ AMT Tax Free | | | | | | | | | | | | | | | | |
| Money Market Fund | | | | | | | | 18,465 | | | | 13,418 | | | | — |
| Fidelity New Jersey Municipal | | | | | | | | | | | | | | | | |
| Money Market Fund | | | | | | | | 35,337 | | | | — | | | | — |
| |
| The tax character of distributions paid was as follows: | | | | | | | | |
| |
| | | | | Tax-exempt | | | | Ordinary | | | | Long-term | | | | |
| November 30, 2005 | | | | Income | | | | Income | | | | Capital Gains | | | | Total |
| Fidelity New Jersey | | | | | | | | | | | | | | | | |
| Municipal Income Fund | | $ | | 21,774,493 | | $ | | — | | $ | | 4,916,800 | | $ | | 26,691,293 |
| Fidelity NJ AMT Tax Free | | | | | | | | | | | | | | | | |
| Money Market Fund | | | | 14,369,544 | | | | — | | | | 136,555 | | | | 14,506,099 |
| Fidelity New Jersey | | | | | | | | | | | | | | | | |
| Municipal Money Market | | | | | | | | | | | | | | | | |
| Fund | | | | 26,812,288 | | | | — | | | | — | | | | 26,812,288 |
| |
| | | | | Tax-exempt | | | | Ordinary | | | | Long-term | | | | |
| November 30, 2004 | | | | Income | | | | Income | | | | Capital Gains | | | | Total |
| Fidelity New Jersey | | | | | | | | | | | | | | | | |
| Municipal Income Fund | | $ | | 21,618,856 | | $ | | — | | $ | | 6,439,707 | | $ | | 28,058,563 |
| Fidelity NJ AMT Tax Free | | | | | | | | | | | | | | | | |
| Money Market Fund | | | | 5,194,259 | | | | — | | | | — | | | | 5,194,259 |
| Fidelity New Jersey | | | | | | | | | | | | | | | | |
| Municipal Money Market | | | | | | | | | | | | | | | | |
| Fund | | | | 9,232,177 | | | | — | | | | 37,536 | | | | 9,269,713 |
53 Annual Report
Notes to Financial Statements continued
|
| 1. Significant Accounting Policies continued |
Short Term Trading (Redemption) Fees. Shares held in the income fund less than 30 days are subject to a redemption fee equal to .50% of the proceeds of the redeemed shares. All redemption fees, including any estimated redemption fees paid by FMR, are retained by the fund and accounted for as an addition to paid in capital.
Delayed Delivery Transactions and When Issued Securities. Certain funds may purchase or sell securities on a delayed delivery or when issued basis. Payment and delivery may take place after the customary settlement period for that security. The price of the underlying securities and the date when the securities will be delivered and paid for are fixed at the time the transaction is negotiated. During the time a delayed delivery sell is outstanding, the contract is marked to market daily and equivalent deliverable securities are held for the transaction. The value of the securities purchased on a delayed delivery or when issued basis are identified as such in each applicable fund’s Schedule of Investments. Certain funds may receive compensation for interest forgone in the purchase of a delayed delivery or when issued security. With respect to purchase commitments, each applicable fund identifies securities as segregated in its records with a value at least equal to the amount of the commitment. Losses may arise due to changes in the value of the underlying securities or if the counterparty does not perform under the contract’s terms, or if the issuer does not issue the securities due to political, economic, or other factors.
Futures Contracts. The income fund may use futures contracts to manage its exposure to the bond market and to fluctuations in interest rates. Buying futures tends to increase a fund’s exposure to the underlying instrument, while selling futures tends to decrease a fund’s exposure to the underlying instrument or hedge other fund investments. Losses may arise from changes in the value of the underlying instruments or if the counter parties do not perform under the contracts’ terms. Gains (losses) are realized upon the expiration or closing of the futures contracts. Futures contracts are valued at the settlement price established each day by the board of trade or exchange on which they are traded.
Restricted Securities. Certain funds may invest in securities that are subject to legal or contractual restrictions on resale. These securities generally may be resold in transac tions exempt from registration or to the public if the securities are registered. Disposal of these securities may involve time consuming negotiations and expense, and prompt sale at an acceptable price may be difficult. Information regarding restricted securities is included at the end of each applicable fund’s Schedule of Investments.
2. Operating Policies continued
Swap Agreements. The income fund may invest in swaps for the purpose of managing its exposure to interest rate, credit or market risk.
Interest rate swaps are agreements to exchange cash flows periodically based on a notional principal amount, for example, the exchange of fixed rate interest payments for floating rate interest payments. The primary risk associated with interest rate swaps is that unfavorable changes in the fluctuation of interest rates could adversely impact the fund.
Swaps are marked to market daily based on dealer supplied valuations and changes in value are recorded as unrealized appreciation (depreciation). Gains or losses are realized upon early termination of the swap agreement. Collateral, in the form of cash or securities, may be required to be held in segregated accounts with the fund’s custodian in compliance with swap contracts.
3. Purchases and Sales of Investments.
Purchases and sales of securities, other than short term securities and U.S. government securities, for the income fund aggregated $230,352,228 and $198,124,099, respectively.
4. Fees and Other Transactions with Affiliates.
Management Fee. FMR and its affiliates provide Fidelity New Jersey Municipal Income Fund and Fidelity New Jersey Municipal Money Market Fund with investment management related services for which the funds pay a monthly management fee. The management fee is the sum of an individual fund fee rate and a group fee rate. The individual fund fee rate is applied to each fund’s average net assets. The group fee rate is based upon the average net assets of all the mutual funds advised by FMR. The group fee rate decreases as assets under management increase and increases as assets under management decrease. For the period, each fund’s annual management fee rate expressed as a percentage of each fund’s average net assets was as follows:
| | | Individual | | Group | | |
| | | Rate | | Rate | | Total |
| Fidelity New Jersey Municipal Income Fund | | 25% | | .12% | | .37% |
| Fidelity New Jersey Municipal Money Market Fund | | 25% | | .12% | | .37% |
FMR and its affiliates provide Fidelity New Jersey AMT Tax Free Money Market Fund with investment management related services for which the fund pays a monthly man agement fee that is based on an annual rate of .43% of the fund’s average net assets. FMR pays all other expenses, except the compensation of the independent Trustees and certain exceptions such as interest expense. The management fee paid to FMR by the fund is reduced by an amount equal to the fees and expenses paid by the fund to the independent Trustees.
55 Annual Report
Notes to Financial Statements continued
| | |
| 4. Fees and Other Transactions with Affiliates continued |
Transfer Agent and Accounting Fees. Citibank, N.A. (Citibank) is the custodian, transfer agent and shareholder servicing agent for the income fund and Fidelity New Jersey Municipal Money Market Fund. Citibank has entered into a sub arrangement with Fidelity Service Company, Inc. (FSC), an affiliate of FMR, under which FSC performs the activities associated with the funds’ transfer and shareholder servicing agent and accounting functions. The funds pay account fees and asset based fees that vary accord ing to account size and type of account. FSC pays for typesetting, printing and mailing of shareholder reports, except proxy statements. The accounting fee is based on the level of average net assets for the month. For the period, the transfer agent fees were equivalent to the following annual rates expressed as a percentage of average net assets:
| Fidelity New Jersey Municipal Income Fund | | 07% | | |
| Fidelity New Jersey Municipal Money Market Fund | | 13% | | |
Affiliated Central Funds. Certain funds may invest in Money Market Central Funds which seek preservation of capital and current income and are managed by Fidelity Investments Money Management, Inc. (FIMM) an affiliate of FMR. The Money Market Central Funds do not pay a management fee.
5. Committed Line of Credit.
|
The income fund participates with other funds managed by FMR in a $4.2 billion credit facility (the “line of credit”) to be utilized for temporary or emergency purposes to fund shareholder redemptions or for other short term liquidity purposes. The participating funds have agreed to pay commitment fees on their pro rata portion of the line of credit. During the period, there were no borrowings on this line of credit.
FMR voluntarily agreed to reimburse funds to the extent annual operating expenses exceeded certain levels of average net assets as noted in the table below. Some expenses, for example interest expense, are excluded from this reimbursement.
| The following funds were in reimbursement during the period: | | | | |
| |
| | | Expense | | | | Reimbursement |
| | | Limitations | | | | from adviser |
| |
| |
| Fidelity New Jersey AMT Tax Free Money | | | | | | |
| Market Fund | | 35% | | | $ | 578,329 |
In addition, through an arrangement with Fidelity New Jersey AMT Tax Free Money Market Fund’s custodian and transfer agent, $491,327 of credits realized as a result of uninvested cash balances were used to reduce the fund’s management fee.
6. Expense Reductions - continued
Through arrangements with the income fund’s and Fidelity New Jersey Municipal Money Market Fund’s custodian and transfer agent, credits realized as a result of uninvested cash balances were used to reduce fund expenses. These expense reductions are noted in the table below.
| | | | | | | | | Transfer | | | | |
| | | | | Custody | | | | Agent | | | | Accounting |
| | | | | expense | | | | expense | | | | expense |
| | | | | reduction | | | | reduction | | | | reduction |
| Fidelity New Jersey Municipal | | | | | | | | | | | | |
| Income Fund | | $ | | 8,847 | | $ | | 249,768 | | $ | | 7,854 |
| Fidelity New Jersey Municipal | | | | | | | | | | | | |
| Money Market Fund | | | | 23,052 | | | | 1,243,808 | | | | 24,658 |
| |
| 7. Other. | | | | | | | | | | | | |
The funds’ organizational documents provide former and current trustees and officers with a limited indemnification against liabilities arising in connection with the perfor mance of their duties to the funds. In the normal course of business, the funds may also enter into contracts that provide general indemnifications. The funds’ maximum exposure under these arrangements is unknown as this would be dependent on future claims that may be made against the funds. The risk of material loss from such claims is considered remote.
57 Annual Report
Report of Independent Registered Public Accounting Firm
To the Trustees of Fidelity Court Street Trust and Fidelity Court Street Trust II and the Shareholders of Fidelity New Jersey Municipal Income Fund (formerly Spartan New Jersey Municipal Income Fund), Fidelity New Jersey AMT Tax Free Money Market Fund (formerly Spartan New Jersey Municipal Money Market Fund) and Fidelity New Jersey Municipal Money Market Fund:
In our opinion, the accompanying statements of assets and liabilities, including the schedules of investments, and the related statements of operations and of changes in net assets and the financial highlights present fairly, in all material respects, the financial position of Fidelity New Jersey Municipal Income Fund (formerly Spartan New Jersey Municipal Income Fund) (a fund of Fidelity Court Street Trust) and Fidelity New Jersey AMT Tax Free Money Market Fund (formerly Spartan New Jersey Municipal Money Market Fund) and Fidelity New Jersey Municipal Money Market Fund (a fund of Fidelity Court Street Trust II) at November 30, 2005 and the results of their operations, the changes in their net assets and the financial highlights for the periods indicated, in conformity with accounting principles generally accepted in the United States of America. These financial statements and financial highlights (hereafter referred to as “financial statements”) are the responsibility of the Fidelity Court Street Trust’s and Fidelity Court Street Trust II’s management; our responsibility is to express an opinion on these financial statements based on our audits. We conducted our audits of these financial statements in accordance with the standards of the Public Company Accounting Oversight Board (United States). Those standards require that we plan and perform the audit to obtain reasonable assurance about whether the financial statements are free of material mis statement. An audit includes examining, on a test basis, evidence supporting the amounts and disclosures in the financial statements, assessing the accounting principles used and significant estimates made by management, and evaluating the overall financial statement presentation. We believe that our audits, which included confirmation of securities at November 30, 2005 by correspondence with the custodian and brokers, provide a reason able basis for our opinion.
/s/ PricewaterhouseCoopers LLP
PricewaterhouseCoopers LLP
Boston, Massachusetts
January 17, 2006
|
Trustees and Officers
The Trustees, Member of the Advisory Board, and executive officers of the trusts and funds, as applicable, are listed below. The Board of Trustees governs each fund and is responsible for protecting the interests of shareholders. The Trustees are experienced executives who meet periodically throughout the year to oversee each fund’s activities, review contractual arrangements with companies that provide services to each fund, and review each fund’s performance. Except for William O. McCoy, Stephen P. Jonas, and Albert R. Gamper, Jr., each of the Trustees oversees 326 funds advised by FMR or an affiliate. Mr. McCoy oversees 328 funds advised by FMR or an affiliate. Mr. Gamper oversees 235 funds advised by FMR or an affiliate.
The Trustees hold office without limit in time except that (a) any Trustee may resign; (b) any Trustee may be removed by written instrument, signed by at least two thirds of the number of Trustees prior to such removal; (c) any Trustee who requests to be retired or who has become incapacitated by illness or injury may be retired by written instrument signed by a majority of the other Trustees; and (d) any Trustee may be removed at any special meeting of shareholders by a two thirds vote of the outstanding voting securities of the trust. Each Trustee who is not an interested person (as defined in the 1940 Act) (Indepen dent Trustee), shall retire not later than the last day of the calendar year in which his or her 72nd birthday occurs. The Independent Trustees may waive this mandatory retirement age policy with respect to individual Trustees. The executive officers and Advisory Board Member hold office without limit in time, except that any officer and Advisory Board Member may resign or may be removed by a vote of a majority of the Trustees at any regular meeting or any special meeting of the Trustees. Except as indicated, each individual has held the office shown or other offices in the same company for the past five years.
The funds’ Statement of Additional Information (SAI) includes more information about the Trustees. To request a free copy, call Fidelity at 1-800-544-8544.
Correspondence intended for each Trustee who is an interested person may be sent to Fidelity Investments, 82 Devonshire Street, Boston, Massachusetts 02109.
| | Name, Age; Principal Occupation
Edward C. Johnson 3d (75)
|
Year of Election or Appointment: 1977 or 1991
Trustee of Fidelity Court Street Trust (1977) and Fidelity Court Street Trust II (1991). Mr. Johnson is Chairman of the Board of Trustees. Mr. Johnson serves as Chief Executive Officer, Chairman, and a Director of FMR Corp.; a Director and Chairman of the Board and of the Execu tive Committee of FMR; Chairman and a Director of Fidelity Manage ment & Research (Far East) Inc.; Chairman and a Director of Fidelity Investments Money Management, Inc.; and Chairman (2001 present) and a Director (2000 present) of FMR Co., Inc.
Trustees and Officers - continued
| | Name, Age; Principal Occupation
Stephen P. Jonas (52)
|
Year of Election or Appointment: 2005
Mr. Jonas is Senior Vice President of New Jersey Municipal Income (2005 present), New Jersey Money Market (2005 present) and New Jersey AMT Tax Free Money Market (2005 present). He also serves as Senior Vice President of other Fidelity funds (2005 present). Mr. Jonas is Executive Director of FMR (2005 present). Previously, Mr. Jonas served as President of Fidelity Enterprise Operations and Risk Services (2004 2005), Chief Administrative Officer (2002 2004), and Chief Financial Officer of FMR Co. (1998 2000). Mr. Jonas has been with Fidelity Investments since 1987 and has held various financial and man agement positions including Chief Financial Officer of FMR. In addition, he serves on the Boards of Boston Ballet (2003 present) and Simmons College (2003 present).
Year of Election or Appointment: 2003
Mr. Reynolds is a Director (2003 present) and Chief Operating Officer (2002 present) of FMR Corp. He also serves on the Board at Fidelity Investments Canada, Ltd. (2000 present). Previously, Mr. Reynolds served as President of Fidelity Investments Institutional Retirement Group (1996 2000).
* Trustees have been determined to be “Interested Trustees” by virtue of, among other things, their affiliation with the trusts or various entities under common control with FMR.
Correspondence intended for each Independent Trustee (that is, the Trustees other than the Interested Trustees) may be sent to Fidelity Investments, P.O. Box 55235, Boston, Massachusetts 02205 5235.
| | Name, Age; Principal Occupation
Dennis J. Dirks (57)
|
Year of Election or Appointment: 2005
Prior to his retirement in May 2003, Mr. Dirks was Chief Operating Officer and a member of the Board of The Depository Trust & Clearing Corporation (DTCC) (1999 2003). He also served as President, Chief Operating Officer, and Board member of The Depository Trust Company (DTC) (1999 2003) and President and Board member of the National Securities Clearing Corporation (NSCC) (1999 2003). In addition, Mr. Dirks served as Chief Executive Officer and Board member of the Government Securities Clearing Corporation (2001 2003) and Chief Executive Officer and Board member of the Mortgage Backed Securities Clearing Corporation (2001 2003). Mr. Dirks also serves as a Trustee of Manhattan College (2005 present).
| | Albert R. Gamper, Jr. (63)
|
Year of Election or Appointment: 2006
Mr. Gamper also serves as a Trustee (2006 present) or Member of the Advisory Board (2005 present) of other investment companies advised by FMR. Prior to his retirement in December 2004, Mr. Gamper served as Chairman of the Board of CIT Group Inc. (commercial finance). Dur ing his tenure with CIT Group Inc. Mr. Gamper served in numerous senior management positions, including Chairman (1987 1989; 1999 2001; 2002 2004), Chief Executive Officer (1987 2004), and President (1989 2002). He currently serves as a member of the Board of Directors of Public Service Enterprise Group (utilities, 2001 present), Chairman of the Board of Governors, Rutgers University (2004 present), and Chairman of the Board of Saint Barnabas Health Care System.
61 Annual Report
Trustees and Officers - continued
| | Name, Age; Principal Occupation
Robert M. Gates (62)
|
Year of Election or Appointment: 1997
Dr. Gates is Chairman of the Independent Trustees (2006 present). Dr. Gates is President of Texas A&M University (2002 present). He was Director of the Central Intelligence Agency (CIA) from 1991 to 1993. From 1989 to 1991, Dr. Gates served as Assistant to the President of the United States and Deputy National Security Advisor. Dr. Gates is a Director of NACCO Industries, Inc. (mining and manufacturing), Parker Drilling Co., Inc. (drilling and rental tools for the energy industry, 2001 present), and Brinker International (restaurant management, 2003 present). Previously, Dr. Gates served as a Director of LucasVarity PLC (automotive components and diesel engines), a Director of TRW Inc. (automotive, space, defense, and information technology), and Dean of the George Bush School of Government and Public Service at Texas A&M University (1999 2001). Dr. Gates also is a Trustee of the Forum for International Policy.
Year of Election or Appointment: 2004
Dr. Heilmeier is Chairman Emeritus of Telcordia Technologies (commu nication software and systems), where prior to his retirement, he served as company Chairman and Chief Executive Officer. He currently serves on the Boards of Directors of The Mitre Corporation (systems engineer ing and information technology support for the government), and HRL Laboratories (private research and development, 2004 present). He is Chairman of the General Motors Science & Technology Advisory Board and a Life Fellow of the Institute of Electrical and Electronics Engineers (IEEE) (2000 present). Dr. Heilmeier is a member of the Defense Science Board and the National Security Agency Advisory Board. He is also a member of the National Academy of Engineering, the American Academy of Arts and Sciences, and the Board of Overseers of the School of Engineering and Applied Science of the University of Penn sylvania. Previously, Dr. Heilmeier served as a Director of TRW Inc. (automotive, space, defense, and information technology, 1992 2002), Compaq (1994 2002), Automatic Data Processing, Inc. (ADP) (technology based business outsourcing, 1995 2002), INET Technologies Inc. (tele communications network surveillance, 2001 2004), and Teletech Holdings (customer management services). He is the recipient of the 2005 Kyoto Prize in Advanced Technology for his invention of the liquid display.
Name, Age; Principal Occupation
Marie L. Knowles (59)
|
Year of Election or Appointment: 2001
Prior to Ms. Knowles’ retirement in June 2000, she served as Executive Vice President and Chief Financial Officer of Atlantic Richfield Company (ARCO) (diversified energy, 1996 2000). From 1993 to 1996, she was a Senior Vice President of ARCO and President of ARCO Transportation Company. She served as a Director of ARCO from 1996 to 1998. She currently serves as a Director of Phelps Dodge Corporation (copper mining and manufacturing) and McKesson Corporation (healthcare ser vice, 2002 present). Ms. Knowles is a Trustee of the Brookings Institution and the Catalina Island Conservancy and also serves as a member of the Advisory Board for the School of Engineering of the University of Southern California.
Year of Election or Appointment: 2000
Mr. Lautenbach has been a partner of Clayton, Dubilier & Rice, Inc. (private equity investment firm) since September 1998. Previously, Mr. Lautenbach was with the International Business Machines Corpora tion (IBM) from 1968 until his retirement in 1998. Mr. Lautenbach serves as a Director of Italtel Holding S.p.A. (telecommunications (Milan, Italy), 2004 present) and Eaton Corporation (diversified industrial) as well as the Philharmonic Center for the Arts in Naples, Florida. He also is a member of the Board of Trustees of Fairfield University (2005 present), as well as a member of the Council on Foreign Relations.
Year of Election or Appointment: 1997
Prior to his retirement in December 1994, Mr. McCoy was Vice Chair man of the Board of BellSouth Corporation (telecommunications) and President of BellSouth Enterprises. He is currently a Director of Liberty Corporation (holding company), Duke Realty Corporation (real estate), and Progress Energy, Inc. (electric utility). He is also a partner of Frank lin Street Partners (private investment management firm) and a member of the Research Triangle Foundation Board. In addition, Mr. McCoy served as the Interim Chancellor (1999 2000) and a member of the Board of Visitors for the University of North Carolina at Chapel Hill and currently serves on the Board of Directors of the University of North Carolina Health Care System and the Board of Visitors of the Kenan Flagler Business School (University of North Carolina at Chapel Hill). He also served as Vice President of Finance for the University of North Carolina (16 school system).
63 Annual Report
Trustees and Officers - continued
| | Name, Age; Principal Occupation
Cornelia M. Small (61)
|
Year of Election or Appointment: 2005
Ms. Small is a member (2000 present) and Chairperson (2002 present) of the Investment Committee, and a member (2002 present) of the Board of Trustees of Smith College. Previously, she served as Chief Investment Officer (1999 2000), Director of Global Equity Investments (1996 1999), and a member of the Board of Directors of Scudder, Stevens & Clark (1990 1997) and Scudder Kemper Investments (1997 1998). In addition, Ms. Small served as Co Chair (2000 2003) of the Annual Fund for the Fletcher School of Law and Diplomacy.
| | William S. Stavropoulos (66)
|
Year of Election or Appointment: 2002
Mr. Stavropoulos is Chairman of the Board (2000 present) and a Member of the Board of Directors of The Dow Chemical Company. Since joining The Dow Chemical Company in 1967, Mr. Stavropoulos served in numerous senior management positions, including President (1993 2000; 2002 2003), CEO (1995 2000; 2002 2004), and Chair man of the Executive Committee (2000 2004). Currently, he is a Direc tor of NCR Corporation (data warehousing and technology solutions), BellSouth Corporation (telecommunications), Chemical Financial Corpo ration, Maersk Inc. (industrial conglomerate, 2002 present), and Metal mark Capital (private equity investment firm, 2005 present). He also serves as a member of the Board of Trustees of the American Enterprise Institute for Public Policy Research. In addition, Mr. Stavropoulos is a member of The Business Council, J.P. Morgan International Council and the University of Notre Dame Advisory Council for the College of Science.
Year of Election or Appointment: 2005
Prior to his retirement in 2001, Mr. Wolfe was Chairman and Chief Executive Officer of Hershey Foods Corporation (1993 2001). He cur rently serves as a member of the boards of Adelphia Communications Corporation (2003 present), Bausch & Lomb, Inc., and Revlon Inc. (2004 present).
Advisory Board Member and Executive Officers:
Correspondence intended for each executive officer and Mr. Lynch may be sent to Fidelity Investments, 82 Devonshire Street, Boston, Massachusetts 02109.
| | Name, Age; Principal Occupation
Peter S. Lynch (61)
|
Year of Election or Appointment: 2003
Member of the Advisory Board of Fidelity Court Street Trust and Fidelity Court Street Trust II. Vice Chairman and a Director of FMR, and Vice Chairman (2001 present) and a Director (2000 present) of FMR Co., Inc. Previously, Mr. Lynch served as a Trustee of the Fidelity funds (1990 2003). In addition, he serves as a Trustee of Boston College, Massachusetts Eye & Ear Infirmary, Historic Deerfield, John F. Kennedy Library, and the Museum of Fine Arts of Boston.
Year of Election or Appointment: 2005
Vice President of New Jersey Municipal Income, New Jersey Money Market, and New Jersey AMT Tax Free Money Market. Mr. Donovan also serves as Vice President of Fidelity’s High Income Funds (2005 present), Fidelity’s Fixed Income Funds (2005 present), certain Asset Allocation Funds (2005 present), and certain Balanced Funds (2005 present). Mr. Donovan also serves as Executive Vice President of FMR (2005 present) and FMRC (2005 present). Previously, Mr. Donovan served as Vice President and Director of Fidelity’s International Equity Trading group (1998 2005).
Year of Election or Appointment: 2005
Vice President of New Jersey Money Market and New Jersey AMT Tax Free Money Market. Mr. Morrison also serves as Vice President of Fidelity’s Money Market Funds (2005 present) and certain Asset Alloca tion Funds (2002 present). Previously, he served as Vice President of Fidelity’s Bond Funds (2002 2005) and certain Balanced Funds (2002 2005). He served as Vice President (2002 2005) and Bond Group Leader (2002 2005) of Fidelity Investments Fixed Income Divi sion. Mr. Morrison is also Vice President of FIMM (2002 present) and FMR (2002 present). Mr. Morrison joined Fidelity Investments in 1987 as a Corporate Bond Analyst in the Fixed Income Research Division.
65 Annual Report
Trustees and Officers - continued
| | Name, Age; Principal Occupation
David L. Murphy (57)
|
Year of Election or Appointment: 2002 or 2005
Vice President of New Jersey Municipal Income (2002), New Jersey Money Market (2005), and New Jersey AMT Tax Free Money Mar ket(2005). Mr. Murphy also serves as Vice President of Fidelity’s Money Market Funds (2002 present), certain Asset Allocation Funds (2003 present), Fidelity’s Investment Grade Bond Funds (2005 present), and Fidelity’s Balanced Funds (2005 present). He serves as Senior Vice President (2000 present) and Head (2004 present) of the Fidelity Invest ments Fixed Income Division. Mr. Murphy is also a Senior Vice President of FIMM (2003 present) and a Vice President of FMR (2000 present). Previously, Mr. Murphy served as Money Market Group Leader (2002 2004), Bond Group Leader (2000 2002), and Vice President of Fidelity’s Taxable Bond Funds (2000 2002) and Fidelity’s Municipal Bond Funds (2001 2002). Mr. Murphy joined Fidelity Investments in 1989 as a portfolio manager in the Bond Group.
Year of Election or Appointment: 2005
Vice President of New Jersey Muni Income. Mr. Silvia also serves as Vice President of Fidelity’s Bond Funds (2005 present) and Senior Vice President and Bond Group Leader of the Fidelity Investments Fixed Income Division (2005 present). Previously, Mr. Silvia served as Director of Fidelity’s Taxable Bond portfolio managers (2002 2004) and a port folio manager in the Bond Group (1997 2004).
Year of Election or Appointment: 2004
Vice President of New Jersey Municipal Income. Mr. Sommer also serves as Vice President of other funds advised by FMR. Prior to assuming his current responsibilities, Mr. Sommer managed a variety of Fidelity funds.
Year of Election or Appointment: 2004
Vice President of New Jersey Municipal Money Market and New Jersey AMT Tax Free Money Market. Mr. Widrig also serves as Vice President of other funds advised by FMR. Prior to assuming his current responsibi lities, Mr. Widrig worked as an analyst and manager.
Name, Age; Principal Occupation
Eric D. Roiter (57)
|
Year of Election or Appointment: 1998
Secretary of New Jersey Municipal Income, New Jersey Municipal Money Market, and New Jersey AMT Tax Free Money Market. He also serves as Secretary of other Fidelity funds; Vice President, General Counsel, and Secretary of FMR Co., Inc. (2001 present) and FMR; Assistant Secretary of Fidelity Management & Research (U.K.) Inc. (2001 present), Fidelity Management & Research (Far East) Inc. (2001 present), and Fidelity Investments Money Management, Inc. (2001 present). Mr. Roiter is an Adjunct Member, Faculty of Law, at Boston College Law School (2003 present). Previously, Mr. Roiter served as Vice President and Secretary of Fidelity Distributors Corporation (FDC) (1998 2005).
Year of Election or Appointment: 2003
Assistant Secretary of New Jersey Municipal Income, New Jersey Municipal Money Market, and New Jersey AMT Tax Free Money Market. Mr. Fross also serves as Assistant Secretary of other Fidelity funds (2003 present), Vice President and Secretary of FDC (2005 present), and is an employee of FMR.
Year of Election or Appointment: 2004
President, Treasurer, and Anti Money Laundering (AML) officer of New Jersey Municipal Income, New Jersey Municipal Money Market, and New Jersey AMT Tax Free Money Market. Ms. Reynolds also serves as President, Treasurer, and AML officer of other Fidelity funds (2004) and is a Vice President (2003) and an employee (2002) of FMR. Before joining Fidelity Investments, Ms. Reynolds worked at Pricewaterhouse Coopers LLP (PwC) (1980 2002), where she was most recently an audit partner with PwC’s investment management practice.
Year of Election or Appointment: 2005
Chief Financial Officer of New Jersey Municipal Income, New Jersey Municipal Money Market, and New Jersey AMT Tax Free Money Mar ket. Mr. Murphy also serves as Chief Financial Officer of other Fidelity funds (2005 present). He also serves as Senior Vice President of Fidelity Pricing and Cash Management Services Group (FPCMS).
67 Annual Report
Trustees and Officers - continued
| | Name, Age; Principal Occupation
Kenneth A. Rathgeber (58)
|
Year of Election or Appointment: 2004
Chief Compliance Officer of New Jersey Municipal Income, New Jersey Municipal Money Market, and New Jersey AMT Tax Free Money Mar ket. Mr. Rathgeber also serves as Chief Compliance Officer of other Fidelity funds (2004) and Executive Vice President of Risk Oversight for Fidelity Investments (2002). Previously, he served as Executive Vice Pres ident and Chief Operating Officer for Fidelity Investments Institutional Services Company, Inc. (1998 2002).
Year of Election or Appointment: 2003
Deputy Treasurer of New Jersey Municipal Income, New Jersey Munici pal Money Market, and New Jersey AMT Tax Free Money Market. Mr. Hebble also serves as Deputy Treasurer of other Fidelity funds (2003), and is an employee of FMR. Before joining Fidelity Investments, Mr. Hebble worked at Deutsche Asset Management where he served as Director of Fund Accounting (2002 2003) and Assistant Treasurer of the Scudder Funds (1998 2003).
Year of Election or Appointment: 2005
Deputy Treasurer of New Jersey Municipal Income, New Jersey Munici pal Money Market, and New Jersey AMT Tax Free Money Market. Mr. Mehrmann also serves as Deputy Treasurer of other Fidelity funds (2005 present) and is an employee of FMR. Previously, Mr. Mehrmann served as Vice President of Fidelity Investments Institutional Services Group (FIIS)/Fidelity Investments Institutional Operations Corporation, Inc. (FIIOC) Client Services (1998 2004).
| | Kimberley H. Monasterio (41)
|
Year of Election or Appointment: 2004
Deputy Treasurer of New Jersey Municipal Income, New Jersey Munici pal Money Market, and New Jersey AMT Tax Free Money Market. Ms. Monasterio also serves as Deputy Treasurer of other Fidelity funds (2004) and is an employee of FMR (2004). Before joining Fidelity Investments, Ms. Monasterio served as Treasurer (2000 2004) and Chief Financial Officer (2002 2004) of the Franklin Templeton Funds and Senior Vice President of Franklin Templeton Services, LLC (2000 2004).
Name, Age; Principal Occupation
Kenneth B. Robins (36)
|
Year of Election or Appointment: 2005
Deputy Treasurer of New Jersey Municipal Income, New Jersey Munici pal Money Market, and New Jersey AMT Tax Free Money Market. Mr. Robins also serves as Deputy Treasurer of other Fidelity funds (2005 present) and is an employee of FMR (2004 present). Before join ing Fidelity Investments, Mr. Robins worked at KPMG LLP, where he was a partner in KPMG’s department of professional practice (2002 2004) and a Senior Manager (1999 2000). In addition, Mr. Robins served as Assistant Chief Accountant, United States Securities and Exchange Commission (2000 2002).
Year of Election or Appointment: 2005
Assistant Treasurer of New Jersey Municipal Income, New Jersey Munic ipal Money Market, and New Jersey AMT Tax Free Money Market. Mr. Byrnes also serves as Assistant Treasurer of other Fidelity funds (2005 present) and is an employee of FMR (2005 present). Previously, Mr. Byrnes served as Vice President of FPCMS (2003 2005). Before joining Fidelity Investments, Mr. Byrnes worked at Deutsche Asset Management where he served as Vice President of the Investment Operations Group (2000 2003).
Year of Election or Appointment: 1988 or 1990
Assistant Treasurer of New Jersey Municipal Income (1988), New Jersey Municipal Money Market (1988), and New Jersey AMT Tax Free Money Market (1990). Mr. Costello also serves as Assistant Treasurer of other Fidelity funds and is an employee of FMR.
Year of Election or Appointment: 2004
Assistant Treasurer of New Jersey Municipal Income, New Jersey Munic ipal Money Market, and New Jersey AMT Tax Free Money Market. Mr. Lydecker also serves as Assistant Treasurer of other Fidelity funds (2004) and is an employee of FMR.
Year of Election or Appointment: 2002
Assistant Treasurer of New Jersey Municipal Income, New Jersey Munic ipal Money Market, and New Jersey AMT Tax Free Money Market. Mr. Osterheld also serves as Assistant Treasurer of other Fidelity funds (2002) and is an employee of FMR.
69 Annual Report
Trustees and Officers - continued
| | Name, Age; Principal Occupation
Gary W. Ryan (47)
|
Year of Election or Appointment: 2005
Assistant Treasurer of New Jersey Municipal Income, New Jersey Munic ipal Money Market, and New Jersey AMT Tax Free Money Market. Mr. Ryan also serves as Assistant Treasurer of other Fidelity funds (2005 present) and is an employee of FMR (2005 present). Previously, Mr. Ryan served as Vice President of Fund Reporting in FPCMS (1999 2005).
Year of Election or Appointment: 2005
Assistant Treasurer of New Jersey Municipal Income, New Jersey Munic ipal Money Market, and New Jersey AMT Tax Free Money Market. Mr. Schiavone also serves as Assistant Treasurer of other Fidelity funds (2005 present) and is an employee of FMR (2005 present). Before joining Fidelity Investments, Mr. Schiavone worked at Deutsche Asset Management, where he most recently served as Assistant Treasurer (2003 2005) of the Scudder Funds and Vice President and Head of Fund Reporting (1996 2003).
The Board of Trustees of the income fund voted to pay to shareholders of record at the opening of business on record date, the following distributions per share derived from capital gains realized from sales of portfolio securities:
| Pay Date | | Record Date | | Capital Gains |
| 12/19/05 | | 12/16/05 | | $ | | 0.12 |
| 01/09/06 | | 01/06/06 | | $ | | 0.025 |
The funds hereby designate as capital gain dividends the amounts noted below for the taxable year indicated or for dividends for the taxable year ended 2005, if subse quently determined to be different, the net capital gain of such year, and for dividends for the taxable year ended 2004, if subsequently determined to be different, the excess of: (a) the net capital gain of such year, over (b) amounts previously desig nated as capital gain dividends with respect to such year.
| Fund | | | | 2005 | | 2004 |
| Fidelity New Jersey Municipal Income Fund | | $ | | 7,467,081 | $ | 4,841,184 |
| Fidelity New Jersey AMT Tax Free Money Market Fund | | $ | | 26,566 | $ | 126,424 |
| Fidelity New Jersey Municipal Money Market Fund | | $ | | 134,179 | | — |
During fiscal year ended 2005, 100% of each fund’s income dividends were free from federal income tax, and 13.06%, 1.45% and 29.62% of Fidelity New Jersey Municipal Income Fund’s, Fidelity New Jersey AMT Tax-Free Money Market Fund’s, and Fidelity New Jersey Municipal Money Market Fund’s, respectively, income dividends were subject to the federal alternative minimum tax.
The fund will notify shareholders in January 2006 of amounts for use in preparing 2005 income tax returns.
71 Annual Report
Board Approval of Investment Advisory Contracts and Management Fees
Fidelity New Jersey Municipal Income Fund (formerly Spartan New Jersey Municipal Income Fund) / Fidelity New Jersey AMT Tax Free Money Market Fund (formerly Spartan New Jersey Municipal Money Market Fund) / Fidelity New Jersey Municipal Money Market Fund
Each year, typically in June, the Board of Trustees, including the independent Trustees (together, the Board), votes on the renewal of the management contract and sub advisory agreements (together, the Advisory Contracts) for each fund. The Board, assisted by the advice of fund counsel and independent Trustees’ counsel, requests and considers a broad range of information throughout the year.
The Board meets regularly each month except August and takes into account throughout the year matters bearing on Advisory Contracts. The Board, acting directly and through its separate committees, considers at each of its meetings factors that are relevant to the annual renewal of each fund’s Advisory Contracts, including the services and support provided to each fund and its shareholders by Fidelity. At the time of the renewal, the Board had 11 standing committees, each composed of independent Trustees with varying backgrounds, to which the Board has assigned specific subject matter responsibilities in order to enhance effective decision making by the Board. Each committee has adopted a written charter outlining the structure and purposes of the committee. One such com mittee, the Fixed Income Contract Committee, meets periodically during the first six months of each year and as necessary to consider matters specifically related to the annual renewal of Advisory Contracts. The committee requests and receives information on, and makes recommendations to the independent Trustees concerning, the approval and annual review of the Advisory Contracts.
At its June 2005 meeting, the Board of Trustees, including the independent Trustees, unanimously determined to renew the Advisory Contracts for each fund. In reaching its determination, the Board considered all factors it believed relevant, including (1) the nature, extent, and quality of the services to be provided to each fund and its sharehold ers by Fidelity (including the investment performance of each fund); (2) the competi tiveness of the management fee and total expenses of each fund; (3) the total costs of the services to be provided by and the profits to be realized by the investment adviser and its affiliates from the relationship with each fund; (4) the extent to which economies of scale would be realized as each fund grows; and (5) whether fee levels reflect these economies of scale, if any, for the benefit of fund shareholders.
In determining whether to renew the Advisory Contracts for each fund, the Board ultimately reached a determination, with the assistance of fund counsel and indepen dent Trustees’ counsel, that the renewal of the Advisory Contracts and the compensation to be received by Fidelity under the management contracts is consistent with Fidelity’s fiduciary duty under applicable law. In addition to evaluating the specific factors noted above, the Board, in reaching its determination, is aware that shareholders in each fund
have a broad range of investment choices available to them, including a wide choice among mutual funds offered by competitors to Fidelity, and that each fund’s sharehold ers, with the opportunity to review and weigh the disclosure provided by the fund in its prospectus and other public disclosures, have chosen to invest in that fund, managed by Fidelity.
Nature, Extent, and Quality of Services Provided by Fidelity. The Board consid ered staffing within the investment adviser, FMR, and the sub advisers (together, the Investment Advisers), including the backgrounds of the funds’ portfolio managers and the funds’ investment objectives and disciplines. The independent Trustees also had discussions with senior management of Fidelity’s investment operations and investment groups. The Board considered the structure of the portfolio manager compensation program and whether this structure provides appropriate incentives.
Fidelity Resources Dedicated to Investment Management and Support Services. The Board reviewed the size, education, and experience of the Investment Advisers’ invest ment staff, their use of technology, and the Investment Advisers’ approach to recruiting, training, and retaining portfolio managers and other research, advisory, and manage ment personnel. The Board considered Fidelity’s extensive global research capabilities that enable the Investment Advisers to aggregate data from various sources in an effort to produce positive investment results. The Board noted that Fidelity’s analysts have access to a variety of technological tools that enable them to perform both fundamental and quantitative analysis and to specialize in various disciplines. The Board also considered that Fidelity’s portfolio managers and analysts have access to daily portfolio attribution that allows for monitoring of a fund’s portfolio, as well as an electronic communication system that provides immediate real time access to research concerning issuers and credit enhancers.
Shareholder and Administrative Services. The Board considered the nature, extent, quality, and cost of administrative, distribution, and shareholder services performed by the Investment Advisers and their affiliates under the Advisory Contracts and under separate agreements covering transfer agency and pricing and bookkeeping services for each fund. The Board also considered the nature and extent of the Investment Advisers’ supervision of third party service providers, principally custodians and subcustodians. The Board reviewed the allocation of fund brokerage, including allocations to brokers affiliated with the Investment Advisers. The Board also considered the resources devoted to, and the record of compliance with, each fund’s compliance policies and procedures.
The Board noted that the growth of fund assets across the complex allows Fidelity to reinvest in the development of services designed to enhance the value or convenience of the Fidelity funds as investment vehicles. These services include 24 hour access to account information and market information through phone representatives and over the Internet, and investor education materials and asset allocation tools.
73 Annual Report
Board Approval of Investment Advisory Contracts and Management Fees continued
Investment in a Large Fund Family. The Board considered the benefits to shareholders of investing in a Fidelity fund, including the benefits of investing in a fund that is part of a large family of funds offering a variety of investment disciplines and providing for a large variety of mutual fund investor services. For example, fund shareholders are offered the privilege of exchanging shares of a fund for shares of other Fidelity funds, as set forth in the fund’s prospectus, without paying a sales charge. The Board noted that, since the last Advisory Contract renewals in June 2004, Fidelity has taken a number of actions that benefited particular funds, including (i) voluntarily deciding in 2004 to stop using “soft” commission dollars to pay for market data and, instead, to pay for that data out of its own resources, (ii) contractually agreeing to impose management fee reductions and expense limitations on its five Spartan stock index funds and its stock index fund available through variable insurance products, (iii) contractually agreeing to eliminate the management fees on the Fidelity Freedom Funds and the Fidelity Advisor Freedom Funds,(iv) contractually agreeing to reduce the management fees on most of its investment grade taxable bond funds, and (v) contractually agreeing to impose expense limitations on its retail and Spartan investment grade taxable bond funds.
Investment Performance. The Board considered whether each fund has operated within its investment objective, as well as its record of compliance with its investment restric tions. It also reviewed each fund’s absolute investment performance, as well as each fund’s relative investment performance measured against (i) a broad based securities market index (bond fund only, as money market funds are typically not compared against a market index), and (ii) a peer group of mutual funds deemed appropriate by the Board over multiple periods. For each fund, the following charts considered by the Board show, over the one , three , and five year periods ended December 31, 2004, the fund’s returns, the returns of a broad based securities market index (“benchmark”) (bond fund only), and a range of returns of a peer group of mutual funds identified by Lipper Inc. as having an investment objective similar to that of the fund. The box within each chart shows the 25th percentile return (bottom of box) and the 75th percentile return (top of box) of the Lipper peer group. The percentage beaten number noted below each chart corresponds to the percentile box and represents the percentage of funds in the Lipper peer group whose performance was equal to or lower than that of the fund.
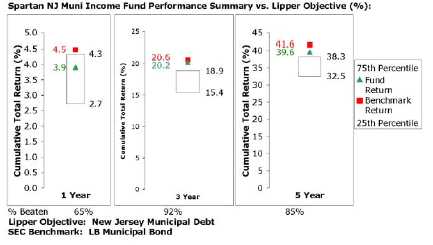
The Board noted that the relative investment performance of the fund has compared favorably to its Lipper peer group over time. The Board also noted that the relative investment performance of the fund was lower than its benchmark over time.
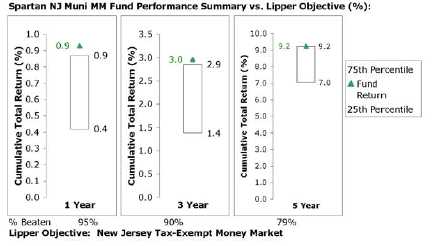
The Board noted that the relative investment performance of the fund has compared favorably to its Lipper peer group over time.
75 Annual Report
Board Approval of Investment Advisory Contracts and Management Fees continued
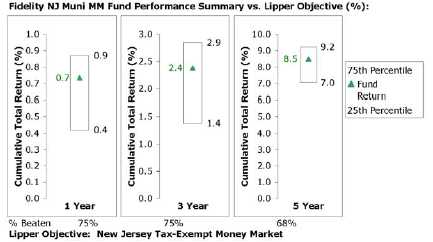
The Board noted that the relative investment performance of the fund has compared favorably to its Lipper peer group over time.
Based on its review, and giving particular weight to the nature and quality of the resources dedicated by the Investment Advisers to maintain and improve relative performance, the Board concluded that the nature, extent, and quality of the services provided by Fidelity will benefit each fund’s shareholders, particularly in light of the Board’s view that each fund’s shareholders benefit from investing in a fund that is part of a large family of funds offering a variety of investment disciplines and services.
Competitiveness of Management Fee and Total Fund Expenses. The Board considered each fund’s management fee and total expenses compared to “mapped groups” of competitive funds and classes. Fidelity creates “mapped groups” by combining similar Lipper investment objective categories that have comparable management fee characteristics. Combining Lipper investment objective categories aids the Board’s management fee and total expense comparisons by broadening the competitive group used for comparison and by reducing the number of universes to which various Fidelity funds are compared.
The Board considered two proprietary management fee comparisons for the 12 month periods shown in the charts below. The group of Lipper funds used by the Board for management fee comparisons is referred to below as the “Total Mapped Group��� and, for the reasons explained above, is broader than the Lipper peer group used by the Board for performance comparisons. The Total Mapped Group comparison focuses on a fund’s standing relative to the total universe of comparable funds available to investors, in terms of gross management fees before expense reimbursements or caps. “TMG %”
represents the percentage of funds in the Total Mapped Group that had management fees that were lower than a fund’s. For example, a TMG % of 24% would mean that 76% of the funds in the Total Mapped Group had higher management fees than a fund. The “Asset Size Peer Group” (ASPG) comparison focuses on a fund’s standing relative to non Fidelity funds similar in size to the fund within the Total Mapped Group. The ASPG represents at least 15% of the funds in the Total Mapped Group with comparable asset size and management fee characteristics, subject to a minimum of 50 funds (or all funds in the Total Mapped Group if fewer than 50). Additional information, such as the ASPG quartile (“quadrant”) in which a fund’s management fee ranked, is also included in the charts and considered by the Board. For a more meaningful comparison of management fees, Spartan New Jersey Municipal Money Market Fund is compared on the basis of a hypothetical “net management fee,” which is derived by subtracting payments made by FMR for non management expenses (including transfer agent fees, pricing and book keeping fees, and custody fees) from the fund’s all inclusive fee. In this regard, the Board realizes that net management fees can vary from year to year because of differences in non management expenses.
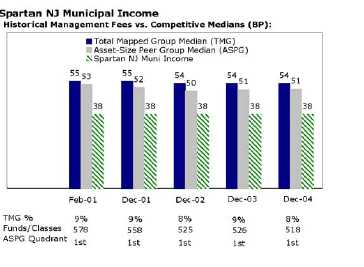
77 Annual Report
Board Approval of Investment Advisory Contracts and Management Fees continued

The Board noted that each fund’s management fee ranked below the median of its Total Mapped Group and below the median of its ASPG for 2004. Based on its review, the Board concluded that each fund’s management fee was fair and reasonable in light of the services that the fund receives and the other factors considered.
In its review of each of Spartan New Jersey Municipal Income Fund’s and Fidelity New Jersey Municipal Money Market Fund’s total expenses, the Board considered the fund’s management fee as well as other fund expenses, such as transfer agent fees, pricing and
bookkeeping fees, and custodial, legal, and audit fees. The Board also noted the effects of any waivers and reimbursements on fees and expenses.
In its review of Spartan New Jersey Municipal Money Market Fund’s total expenses, the Board considered the fund’s hypothetical net management fee as well as the fund’s all inclusive fee. The Board also considered other expenses, such as transfer agent fees, pricing and bookkeeping fees, and custodial, legal, and audit fees, paid by FMR under the all inclusive arrangement. The Board also noted the effects of any waivers and reim bursements on fees and expenses.
As part of its review, the Board also considered current and historical total expenses of each fund compared to competitive fund median expenses. Each fund is compared to those funds and classes in the Total Mapped Group (used by the Board for management fee comparisons) that have a similar sales load structure.
The Board noted that each fund’s total expenses ranked below its competitive median for 2004.
In its review of total expenses, the Board also considered Fidelity fee structures and other information on clients that FMR and its affiliates service in other competitive markets, such as other mutual funds advised or subadvised by FMR or its affiliates, pension plan clients, and other institutional clients.
Based on its review, the Board concluded that each fund’s total expenses were reason able in light of the services that the fund and its shareholders receive and the other factors considered.
Costs of the Services and Profitability. The Board considered the revenues earned and the expenses incurred by Fidelity in conducting the business of developing, market ing, distributing, managing, administering and servicing each fund and its shareholders. The Board also considered the level of Fidelity’s profits in respect of all the Fidelity funds.
On an annual basis, FMR presents to the Board Fidelity’s profitability for each fund. Fidelity calculates the profitability for each fund, as well as aggregate profitability for groups of Fidelity funds and all Fidelity funds, using a series of detailed revenue and cost allocation methodologies which originate with the audited books and records of Fidelity. The Audit Committee of the Board reviews any significant changes from the prior year’s methodologies.
PricewaterhouseCoopers LLP (PwC), independent registered accounting firm and auditor to Fidelity and certain Fidelity funds, has been engaged annually by the Board as part of the Board’s assessment of the results of Fidelity’s profitability analysis. PwC’s engagement includes the review and assessment of Fidelity’s methodologies used in determining the revenues and expenses attributable to Fidelity’s mutual fund business,
79 Annual Report
Board Approval of Investment Advisory Contracts and Management Fees continued
and completion of agreed upon procedures surrounding the mathematical accuracy of fund profitability and its conformity to allocation methodologies. After considering PwC’s reports issued under the engagement and information provided by Fidelity, the Board believes that while other allocation methods may also be reasonable, Fidelity’s profitabil ity methodologies are reasonable in all material respects.
The Board has also reviewed Fidelity’s non fund businesses and any fall out benefits related to the mutual fund business as well as cases where Fidelity’s affiliates may benefit from or be related to the funds’ business. In addition, a special committee of the Board reviewed services provided to Fidelity by its affiliates and determined that the fees that Fidelity paid for such services were reasonable.
The Board considered the costs of the services provided by and the profits realized by Fidelity in connection with the operation of each fund and determined that the amount of profit is a fair entrepreneurial profit for the management of each fund.
Economies of Scale. The Board considered whether there have been economies of scale in respect of the management of the Fidelity funds, whether the Fidelity funds (including each fund) have appropriately benefited from any such economies of scale, and whether there is potential for realization of any further economies of scale. The Board considered the extent to which each fund will benefit from economies of scale through increased services to the fund, through waivers or reimbursements, or through fee or expense reductions, including (Spartan New Jersey Municipal Income Fund and Fidelity New Jersey Municipal Money Market Fund only) reductions that occur through operation of the transfer agent agreement. The transfer agent fee varies in part based on the number of accounts in a fund. If the number of accounts decreases or the average account size increases, the overall transfer agent fee rate decreases.
The Board recognized that Spartan New Jersey Municipal Income Fund’s and Fidelity New Jersey Municipal Money Market Fund’s management contracts incorporate a “group fee” structure, which provides for lower fee rates as total fund assets under FMR’s management increase, and for higher fee rates as total fund assets under FMR’s manage ment decrease. The Board considered that the group fee is designed to deliver the benefits of economies of scale to fund shareholders when total fund assets increase, even if assets of any particular fund are unchanged or have declined, because some portion of Fidelity’s costs are attributable to services provided to all Fidelity funds, and all funds benefit if those costs can be allocated among more assets. The Board concluded that, given the group fee structure, fund shareholders will achieve a certain level of economies of scale as assets under FMR’s management increase at the fund complex level, regard less of whether Fidelity achieves any such economies of scale.
The Board further concluded that any potential economies of scale are being shared between fund shareholders and Fidelity in an appropriate manner.
Additional Information Requested by the Board. In order to develop fully the factual basis for consideration of the Advisory Contracts, the Board requested additional information regarding (i) Fidelity’s fund profitability methodology, including additional detail on various cost allocations; (ii) fall out benefits to Fidelity; and (iii) compensation of portfolio managers and research analysts.
Based on its evaluation of all of the conclusions noted above, and after considering all material factors, the Board ultimately concluded that the existing advisory fee structures are fair and reasonable, and that each fund’s existing Advisory Contracts should be renewed.
81 Annual Report
Managing Your Investments
Fidelity offers several ways to conveniently manage your personal investments via your telephone or PC. You can access your account information, conduct trades and research your investments 24 hours a day.
By Phone
Fidelity Automated Service Telephone provides a single toll free number to access account balances, positions, quotes and trading. It’s easy to navigate the service, and on your first call, the system will help you create a personal identification number (PIN) for security.


By PC
Fidelity’s web site on the Internet provides a wide range of information, including daily financial news, fund performance, interactive planning tools and news about Fidelity products and services.

* When you call the quotes line, please remember that a fund’s yield and return will vary and, except for money market funds, share price will also vary. This means that you may have a gain or loss when you sell your shares. There is no assurance that money market funds will be able to maintain a stable $1 share price; an investment in a money market fund is not insured or guar anteed by the U.S. government. Total returns are historical and include changes in share price, reinvestment of dividends and capital gains, and the effects of any sales charges.
Annual Report 82
To Write Fidelity
We’ll give your correspondence immediate attention and send you written confirmation upon completion of your request.

| | (such as changing name, address, bank, etc.)
Fidelity Investments
P.O. Box 770001
Cincinnati, OH 45277-0002
|

Buying shares
Fidelity Investments
P.O. Box 770001
Cincinnati, OH 45277-0003
Overnight Express
Fidelity Investments
Attn: Distribution Services
100 Crosby Parkway KC1H
Covington, KY 41015
Selling shares
Fidelity Investments
P.O. Box 770001
Cincinnati, OH 45277-0035
Overnight Express
Fidelity Investments
Attn: Distribution Services
100 Crosby Parkway KC1H
Covington, KY 41015
General Correspondence
Fidelity Investments
P.O. Box 500
Merrimack, NH 03054-0500
|

Buying shares
Fidelity Investments
P.O. Box 770001
Cincinnati, OH 45277-0003
Selling shares
Fidelity Investments
P.O. Box 770001
Cincinnati, OH 45277-0035
Overnight Express
Fidelity Investments
Attn: Distribution Services
100 Crosby Parkway KC1H
Covington, KY 41015
General Correspondence
Fidelity Investments
P.O. Box 500
Merrimack, NH 03054-0500
|
83 Annual Report
To Visit Fidelity
For directions and hours,
please call 1-800-544-9797.
Arizona
7001 West Ray Road
Chandler, AZ
7373 N. Scottsdale Road
Scottsdale, AZ
California
815 East Birch Street
Brea, CA
1411 Chapin Avenue
Burlingame, CA
851 East Hamilton Avenue
Campbell, CA
19200 Von Karman Avenue
Irvine, CA
601 Larkspur Landing Circle
Larkspur, CA
10100 Santa Monica Blvd.
Los Angeles, CA
27101 Puerta Real
Mission Viejo, CA
73 575 El Paseo
Palm Desert, CA
251 University Avenue
Palo Alto, CA
123 South Lake Avenue
Pasadena, CA
16995 Bernardo Ctr. Drive
Rancho Bernardo, CA
1740 Arden Way
Sacramento, CA
7676 Hazard Center Drive
San Diego, CA
8 Montgomery Street
San Francisco, CA
3793 State Street
Santa Barbara, CA
21701 Hawthorne Boulevard
Torrance, CA
2001 North Main Street
Walnut Creek, CA
6300 Canoga Avenue
Woodland Hills, CA
|
Colorado
1625 Broadway
Denver, CO
9185 East Westview Road
Littleton, CO
Connecticut
48 West Putnam Avenue
Greenwich, CT
265 Church Street
New Haven, CT
300 Atlantic Street
Stamford, CT
29 South Main Street
West Hartford, CT
Delaware
222 Delaware Avenue
Wilmington, DE
Florida
4400 N. Federal Highway
Boca Raton, FL
121 Alhambra Plaza
Coral Gables, FL
2948 N. Federal Highway
Ft. Lauderdale, FL
1907 West State Road 434
Longwood, FL
8880 Tamiami Trail, North
Naples, FL
3550 Tamiami Trail, South
Sarasota, FL
1502 N. Westshore Blvd.
Tampa, FL
2465 State Road 7
Wellington, FL
3501 PGA Boulevard
West Palm Beach, FL
Georgia
3445 Peachtree Road, N.E.
Atlanta, GA
1000 Abernathy Road
Atlanta, GA
Illinois
One North LaSalle Street
Chicago, IL
875 North Michigan Ave.
Chicago, IL
1415 West 22nd Street
Oak Brook, IL
|
1700 East Golf Road
Schaumburg, IL
3232 Lake Avenue
Wilmette, IL
Indiana
4729 East 82nd Street
Indianapolis, IN
Kansas
5400 College Boulevard
Overland Park, KS
Maine
Three Canal Plaza
Portland, ME
Maryland
7315 Wisconsin Avenue
Bethesda, MD
One W. Pennsylvania Ave.
Towson, MD
Massachusetts
801 Boylston Street
Boston, MA
155 Congress Street
Boston, MA
300 Granite Street
Braintree, MA
44 Mall Road
Burlington, MA
405 Cochituate Road
Framingham, MA
416 Belmont Street
Worcester, MA
Michigan
500 E. Eisenhower Pkwy.
Ann Arbor, MI
280 Old N. Woodward Ave.
Birmingham, MI
43420 Grand River Avenue
Novi, MI
29155 Northwestern Hwy.
Southfield, MI
Minnesota
7600 France Avenue South
Edina, MN
Missouri
8885 Ladue Road
Ladue, MO
|
Annual Report 84
Nevada
2225 Village Walk Drive
Henderson, NV
New Jersey
150 Essex Street
Millburn, NJ
56 South Street
Morristown, NJ
396 Route 17, North
Paramus, NJ
3518 Route 1 North
Princeton, NJ
530 Highway 35
Shrewsbury, NJ
New York
1055 Franklin Avenue
Garden City, NY
37 West Jericho Turnpike
Huntington Station, NY
1271 Avenue of the Americas
New York, NY
61 Broadway
New York, NY
350 Park Avenue
New York, NY
200 Fifth Avenue
New York, NY
733 Third Avenue
New York, NY
11 Penn Plaza
New York, NY
2070 Broadway
New York, NY
1075 Northern Blvd.
Roslyn, NY
North Carolina
4611 Sharon Road
Charlotte, NC
Ohio
3805 Edwards Road
Cincinnati, OH
1324 Polaris Parkway
Columbus, OH
28699 Chagrin Boulevard
Woodmere Village, OH
Oregon
16850 SW 72nd Avenue
Tigard, OR
|
Pennsylvania
600 West DeKalb Pike
King of Prussia, PA
1735 Market Street
Philadelphia, PA
12001 Perry Highway
Wexford, PA
Rhode Island
47 Providence Place
Providence, RI
Tennessee
6150 Poplar Avenue
Memphis, TN
Texas
10000 Research Boulevard
Austin, TX
4001 Northwest Parkway
Dallas, TX
12532 Memorial Drive
Houston, TX
2701 Drexel Drive
Houston, TX
6500 N. MacArthur Blvd.
Irving, TX
6005 West Park Boulevard
Plano, TX
14100 San Pedro
San Antonio, TX
1576 East Southlake Blvd.
Southlake, TX
19740 IH 45 North
Spring, TX
Utah
215 South State Street
Salt Lake City, UT
Virginia
1861 International Drive
McLean, VA
Washington
411 108th Avenue, N.E.
Bellevue, WA
1518 6th Avenue
Seattle, WA
Washington, DC
1900 K Street, N.W.
Washington, DC
Wisconsin
595 North Barker Road
Brookfield, WI
|
Fidelity Brokerage Services, Inc., 100 Summer St., Boston, MA 02110 Member NYSE/SIPC
85 Annual Report
85
Investment Adviser
Fidelity Management & Research Company
Boston, MA
Investment Sub Adviser
Fidelity Investments
Money Management, Inc.
Fidelity International Investment Advisors
Fidelity International Investment Advisors
(U.K.) Limited
General Distributor
Fidelity Distributors Corporation
Boston, MA
Transfer and Service Agents
Citibank, N.A.
New York, NY
and
Fidelity Service Company, Inc.
Boston, MA
Custodian
Citibank, N.A.
New York, NY
|
| The Fidelity Telephone Connection |
| Mutual Fund 24-Hour Service |
| Exchanges/Redemptions | | |
| and Account Assistance | | 1-800-544-6666 |
| Product Information | | 1-800-544-6666 |
| Retirement Accounts | | 1-800-544-4774 |
| (8 a.m. - 9 p.m.) | | |
| TDD Service | | 1-800-544-0118 |
| for the deaf and hearing impaired |
| (9 a.m. 9 p.m. Eastern time) |
| Fidelity Automated Service | | |
| Telephone (FAST® ) (automated phone logo) | | 1-800-544-5555 |
| (automated phone logo) Automated line for quickest service |
NJN-UANN-0106
1.786715.102
|

Item 2. Code of Ethics
As of the end of the period, November 30, 2005, Fidelity Court Street Trust II (the trust) has adopted a code of ethics, as defined in Item 2 of Form N-CSR, that applies to its President and Treasurer and its Chief Financial Officer. A copy of the code of ethics is filed as an exhibit to this Form N-CSR.
Item 3. Audit Committee Financial Expert
The Board of Trustees of the trust has determined that Marie L. Knowles is an audit committee financial expert, as defined in Item 3 of Form N-CSR. Ms. Knowles is independent for purposes of Item 3 of Form N-CSR.
Item 4. Principal Accountant Fees and Services
(a) Audit Fees.
For the fiscal years ended November 30, 2005 and November 30, 2004, the aggregate Audit Fees billed by PricewaterhouseCoopers LLP (PwC) for professional services rendered for the audits of the financial statements, or services that are normally provided in connection with statutory and regulatory filings or engagements for those fiscal years, for the Fidelity Connecticut Municipal Money Market Fund, Fidelity Florida Municipal Money Market Fund, Fidelity New Jersey AMT Tax-Free Money Market Fund and Fidelity New Jersey Municipal Money Market Fund (the funds) and for all funds in the Fidelity Group of Funds are shown in the table below.
Fund | 2005A | 2004A |
Fidelity Connecticut Municipal Money Market Fund | $36,000 | $31,000 |
Fidelity Florida Municipal Money Market Fund | $37,000 | $32,000 |
Fidelity New Jersey AMT Tax-Free Money Market Fund | $31,000 | $30,000 |
Fidelity New Jersey Municipal Money Market Fund | $34,000 | $32,000 |
All funds in the Fidelity Group of Funds audited by PwC | $12,100,000 | $10,600,000 |
A | Aggregate amounts may reflect rounding. |
(b) Audit-Related Fees.
In each of the fiscal years ended November 30, 2005 and November 30, 2004 the aggregate Audit-Related Fees billed by PwC for services rendered for assurance and related services to each fund that are reasonably related to the performance of the audit or review of the fund's financial statements, but not reported as Audit Fees, are shown in the table below.
Fund | 2005A | 2004A |
Fidelity Connecticut Municipal Money Market Fund | $0 | $0 |
Fidelity Florida Municipal Money Market Fund | $0 | $0 |
Fidelity New Jersey AMT Tax-Free Money Market Fund | $0 | $0 |
Fidelity New Jersey Municipal Money Market Fund | $0 | $0 |
A | Aggregate amounts may reflect rounding. |
In each of the fiscal years ended November 30, 2005 and November 30, 2004, the aggregate Audit-Related Fees that were billed by PwC that were required to be approved by the Audit Committee for services rendered on behalf of Fidelity Management & Research Company (FMR) and entities controlling, controlled by, or under common control with FMR (not including any sub-adviser whose role is primarily portfolio management and is subcontracted with or overseen by another investment adviser) that provide ongoing services to the funds ("Fund Service Providers") for assurance and related services that relate directly to the operations and financial reporting of each fund that are reasonably related to the performance of the audit or review of the fund's financial statements, but not reported as Audit Fees, are shown in the table below.
Billed By | 2005A | 2004A |
PwC | $0 | $0 |
A | Aggregate amounts may reflect rounding. |
Fees included in the audit-related category comprise assurance and related services (e.g., due diligence services) that are traditionally performed by the independent registered public accounting firm. These audit-related services include due diligence related to mergers and acquisitions, accounting consultations and audits in connection with acquisitions, internal control reviews, attest services that are not required by statute or regulation and consultation concerning financial accounting and reporting standards.
(c) Tax Fees.
In each of the fiscal years ended November 30, 2005 and November 30, 2004, the aggregate Tax Fees billed by PwC for professional services rendered for tax compliance, tax advice, and tax planning for each fund is shown in the table below.
Fund | 2005A | 2004A |
Fidelity Connecticut Municipal Money Market Fund | $1,700 | $1,600 |
Fidelity Florida Municipal Money Market Fund | $1,700 | $1,600 |
Fidelity New Jersey AMT Tax-Free Money Market Fund | $1,700 | $1,600 |
Fidelity New Jersey Municipal Money Market Fund | $1,700 | $1,600 |
A | Aggregate amounts may reflect rounding. |
In each of the fiscal years ended November 30, 2005 and November 30, 2004, the aggregate Tax Fees billed by PwC that were required to be approved by the Audit Committee for professional services rendered on behalf of the Fund Service Providers for tax compliance, tax advice, and tax planning that relate directly to the operations and financial reporting of each fund is shown in the table below.
Billed By | 2005A | 2004A |
PwC | $0 | $0 |
A | Aggregate amounts may reflect rounding. |
Fees included in the Tax Fees category comprise all services performed by professional staff in the independent registered public accounting firm's tax division except those services related to the audit. Typically, this category would include fees for tax compliance, tax planning, and tax advice. Tax compliance, tax advice, and tax planning services include preparation of original and amended tax returns, claims for refund and tax payment-planning services, assistance with tax audits and appeals, tax advice related to mergers and acquisitions and requests for rulings or technical advice from taxing authorities.
(d) All Other Fees.
In each of the fiscal years ended November 30, 2005 and November 30, 2004, the aggregate Other Fees billed by PwC for all other non-audit services rendered to the funds is shown in the table below.
Fund | 2005A | 2004A |
Fidelity Connecticut Municipal Money Market Fund | $2,100 | $1,800 |
Fidelity Florida Municipal Money Market Fund | $2,500 | $2,100 |
Fidelity New Jersey AMT Tax-Free Money Market Fund | $1,700 | $1,500 |
Fidelity New Jersey Municipal Money Market Fund | $2,300 | $2,100 |
A | Aggregate amounts may reflect rounding. |
In each of the fiscal years ended November 30, 2005 and November 30, 2004, the aggregate Other Fees billed by PwC that were required to be approved by the Audit Committee for all other non-audit services rendered on behalf of the Fund Service Providers that relate directly to the operations and financial reporting of each fund is shown in the table below.
Billed By | 2005A | 2004A |
PwC | $170,000 | $540,000 |
A | Aggregate amounts may reflect rounding. |
Fees included in the All Other Fees category include services related to internal control reviews, strategy and other consulting, financial information systems design and implementation, consulting on other information systems, and other tax services unrelated to the fund.
(e) (1) | Audit Committee Pre-Approval Policies and Procedures: |
The trust's Audit Committee must pre-approve all audit and non-audit services provided by the independent registered public accounting firm relating to the operations or financial reporting of the funds. Prior to the commencement of any audit or non-audit services to a fund, the Audit Committee reviews the services to determine whether they are appropriate and permissible under applicable law.
The trust's Audit Committee has adopted policies and procedures to, among other purposes, provide a framework for the Committee's consideration of non-audit services by the audit firms that audit the Fidelity funds. The policies and procedures require that any non-audit service provided by a fund audit firm to a Fidelity Fund and any non-audit service provided by a fund auditor to a Fund Service Provider that relates directly to the operations and financial reporting of a Fidelity fund (Covered Service) are subject to approval by the Audit Committee before such service is provided. Non-audit services provided by a fund audit firm for a Fund Service Provider that do not relate directly to the operations and financial reporting of a Fidelity fund (Non-Covered Service) but that are expected to exceed $50,000 are also subject to pre-approval by the Audit Committee.
All Covered Services, as well as Non-Covered Services that are expected to exceed $50,000, must be approved in advance of provision of the service either: (i) by formal resolution of the Audit Committee, or (ii) by oral or written approval of the service by the Chair of the Audit Committee (or if the Chair is unavailable, such other member of the Audit Committee as may be designated by the Chair to act in the Chair's absence). The approval contemplated by (ii) above is permitted where the Treasurer determines that action on such an engagement is necessary before the next meeting of the Audit Committee. Neither pre-approval nor advance notice of Non-Covered Service engagements for which fees are not expected to exceed $50,000 is required; such engagements are to be reported to the Audit Committee monthly.
(e) (2) | Services approved pursuant to paragraph (c)(7)(i)(C) of Rule 2-01 of Regulation S-X: |
Audit-Related Fees:
There were no amounts that were approved by the Audit Committee pursuant to the de minimis exception for the fiscal years ended November 30, 2005 and November 30, 2004 on behalf of each fund.
There were no amounts that were required to be approved by the Audit Committee pursuant to the de minimis exception for the fiscal years ended November 30, 2005 and November 30, 2004 on behalf of the Fund Service Providers that relate directly to the operations and financial reporting of each fund.
Tax Fees:
There were no amounts that were approved by the Audit Committee pursuant to the de minimis exception for the fiscal years ended November 30, 2005 and November 30, 2004 on behalf of each fund.
There were no amounts that were required to be approved by the Audit Committee pursuant to the de minimis exception for the fiscal years ended November 30, 2005 and November 30, 2004 on behalf of the Fund Service Providers that relate directly to the operations and financial reporting of each fund.
All Other Fees:
There were no amounts that were approved by the Audit Committee pursuant to the de minimis exception for the fiscal years ended November 30, 2005 and November 30, 2004 on behalf of each fund.
There were no amounts that were required to be approved by the Audit Committee pursuant to the de minimis exception for the fiscal years ended November 30, 2005 and November 30, 2004 on behalf of the Fund Service Providers that relate directly to the operations and financial reporting of each fund.
(f) Not applicable.
(g) For the fiscal years ended November 30, 2005 and November 30, 2004, the aggregate fees billed by PwC of $3,650,000A and $2,700,000A for non-audit services rendered on behalf of the funds, FMR (not including any sub-adviser whose role is primarily portfolio management and is subcontracted with or overseen by another investment adviser) and Fund Service Providers relating to Covered Services and Non-Covered Services are shown in the table below.
| 2005A | 2004A |
Covered Services | $150,000 | $550,000 |
Non-Covered Services | $3,500,000 | $2,150,000 |
A | Aggregate amounts may reflect rounding. |
(h) The trust's Audit Committee has considered Non-Covered Services that were not pre-approved that were provided by PwC to Fund Service Providers to be compatible with maintaining the independence of PwC in its audit of the funds, taking into account representations from PwC, in accordance with Independence Standards Board Standard No.1, regarding its independence from the funds and their related entities.
Item 5. Audit Committee of Listed Registrants
Not applicable.
Item 6. Schedule of Investments
Not applicable.
Item 7. Disclosure of Proxy Voting Policies and Procedures for Closed-End Management Investment Companies
Not applicable.
Item 8. Portfolio Managers of Closed-End Management Investment Companies
Not applicable.
Item 9. Purchase of Equity Securities by Closed-End Management Investment Company and Affiliated Purchasers
Not applicable.
Item 10. Submission of Matters to a Vote of Security Holders
There were no material changes to the procedures by which shareholders may recommend nominees to the trust's Board of Trustees.
Item 11. Controls and Procedures
(a)(i) The President and Treasurer and the Chief Financial Officer have concluded that the trust's disclosure controls and procedures (as defined in Rule 30a-3(c) under the Investment Company Act) provide reasonable assurances that material information relating to the trust is made known to them by the appropriate persons, based on their evaluation of these controls and procedures as of a date within 90 days of the filing date of this report.
(a)(ii) There was no change in the trust's internal control over financial reporting (as defined in Rule 30a-3(d) under the Investment Company Act) that occurred during the second fiscal quarter of the period covered by this report that has materially affected, or is reasonably likely to materially affect, the trust's internal control over financial reporting.
Item 12. Exhibits
(a) | (1) | Code of Ethics pursuant to Item 2 of Form N-CSR is filed and attached hereto as EX-99.CODE ETH. |
(a) | (2) | Certification pursuant to Rule 30a-2(a) under the Investment Company Act of 1940 (17 CFR 270.30a-2(a)) is filed and attached hereto as Exhibit 99.CERT. |
(a) | (3) | Not applicable. |
(b) | | Certification pursuant to Rule 30a-2(b) under the Investment Company Act of 1940 (17 CFR 270.30a-2(b)) is furnished and attached hereto as Exhibit 99.906CERT. |
SIGNATURES
Pursuant to the requirements of the Securities Exchange Act of 1934 and the Investment Company Act of 1940, the registrant has duly caused this report to be signed on its behalf by the undersigned, thereunto duly authorized.
Fidelity Court Street Trust II
By: | /s/Christine Reynolds |
| Christine Reynolds |
| President and Treasurer |
| |
Date: | January 20, 2006 |
Pursuant to the requirements of the Securities Exchange Act of 1934 and the Investment Company Act of 1940, this report has been signed below by the following persons on behalf of the registrant and in the capacities and on the dates indicated.
By: | /s/Christine Reynolds |
| Christine Reynolds |
| President and Treasurer |
| |
Date: | January 20, 2006 |
By: | /s/Paul M. Murphy |
| Paul M. Murphy |
| Chief Financial Officer |
| |
Date: | January 20, 2006 |