| |
| | BlackRock MuniYield New Jersey Fund, Inc.
|
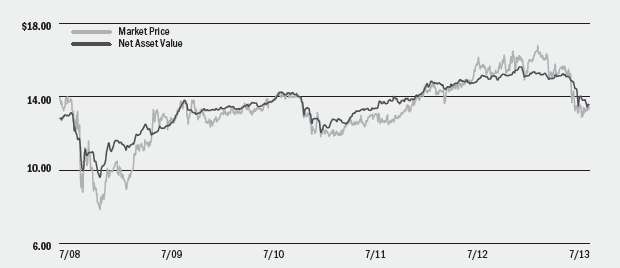
Market Price and Net Asset Value Per Share Summary
|
|
|
| 7/31/13
|
| 7/31/12
|
| Change
|
| High
|
| Low
|
Market Price | | | | $ | 13.74 | | | $ | 17.07 | | | | (19.51 | )% | | $ | 18.23 | | | $ | 13.54 | |
Net Asset Value | | | | $ | 14.92 | | | $ | 16.92 | | | | (11.82 | )% | | $ | 17.57 | | | $ | 14.75 | |
| | | | | | | | | | | | | | | | | | | | | | | |
Market Price and Net Asset Value History For the Past Five Years | | | |
| | | | |

Overview of the Fund’s Long-Term Investments
Sector Allocation
|
|
|
| 7/31/13
|
| 7/31/12
|
State | | | | | 27 | % | | | 35 | % |
Transportation | | | | | 26 | | | | 16 | |
Education | | | | | 14 | | | | 14 | |
County/City/Special District/School District | | | | | 14 | | | | 10 | |
Health | | | | | 9 | | | | 9 | |
Housing | | | | | 5 | | | | 6 | |
Corporate | | | | | 4 | | | | 3 | |
Utilities | | | | | 1 | | | | 7 | |
Credit Quality Allocation1
|
|
|
| 7/31/13
|
| 7/31/12
|
AAA/Aaa | | | | | 4 | % | | | 5 | % |
AA/Aa | | | | | 36 | | | | 39 | |
A | | | | | 52 | | | | 48 | |
BBB/Baa | | | | | 7 | | | | 7 | |
Not Rated2 | | | | | 1 | | | | 1 | |
| 1 | | Using the higher of S&P’s or Moody’s ratings. |
| 2 | | The investment advisor has deemed certain of these non-rated securities to be of investment grade quality. As of July 31, 2013 and July 31, 2012, the market value of these securities was $3,519,770 and $3,600,470, each representing 1%, respectively, of the Fund’s long-term investments. |
|
|
Call/Maturity Schedule3
|
|
Calendar Year Ended December 31,
| | | | | | |
| |
2013 | | | | | 1 | % |
2014 | | | | | 5 | |
2015 | | | | | 5 | |
2016 | | | | | 2 | |
2017 | | | | | 9 | |
| 3 | | Scheduled maturity dates and/or bonds that are subject to potential calls by issuers over the next five years. |
| ANNUAL REPORT | JULY 31, 2013 | 15
|
| |
| Schedule of Investments July 31, 2013 | BlackRock Muni New York Intermediate Duration Fund, Inc. (MNE)
(Percentages shown are based on Net Assets)
|
| | |
Municipal Bonds
| | | | Par
(000)
| | Value
|
New York — 128.6% |
Corporate — 11.5% | | | | | | | | | | |
Essex County Industrial Development Agency, Refunding RB, Series A, AMT, 5.20%, 12/01/23 | | | | $ | 1,000 | | | $ | 1,029,780 | |
Jefferson County Industrial Development Agency, Refunding RB, Solid Waste, Series A, AMT, 5.20%, 12/01/20 | | | | | 500 | | | | 498,700 | |
New York City Industrial Development Agency, RB, British Airways PLC Project, AMT, 7.63%, 12/01/32 | | | | | 1,000 | | | | 1,007,180 | |
New York City Industrial Development Agency, Refunding RB, Terminal One Group Association Project, AMT (a): | | | | | | | | | | |
5.50%, 1/01/18 | | | | | 1,000 | | | | 1,092,320 | |
5.50%, 1/01/21 | | | | | 250 | | | | 270,600 | |
5.50%, 1/01/24 | | | | | 1,000 | | | | 1,077,480 | |
New York State Energy Research & Development Authority, Refunding RB (NPFGC): | | | | | | | | | | |
Brooklyn Union Gas/Keyspan, Series A, AMT, 4.70%, 2/01/24 | | | | | 500 | | | | 509,290 | |
Rochester Gas & Electric Corp., Series C, 5.00%, 8/01/32 (a) | | | | | 1,000 | | | | 1,088,020 | |
Niagara Area Development Corp., Refunding RB, Covanta Energy Project, Series B, 4.00%, 11/01/24 | | | | | 500 | | | | 458,960 | |
| | | | | | | | | 7,032,330 | |
County/City/Special District/School District — 18.8% | | | | | | | | | | |
Amherst Development Corp., Refunding RB, University at Buffalo Foundation Faculty-Student Housing Corp., Series A (AGM), 4.00%, 10/01/24 | | | | | 1,000 | | | | 1,014,440 | |
City of New York, New York, GO: | | | | | | | | | | |
Sub-Series A-1, 5.00%, 8/01/33 (b) | | | | | 700 | | | | 729,085 | |
Sub-Series G-1, 5.00%, 4/01/29 | | | | | 750 | | | | 799,342 | |
Sub-Series I-1, 5.13%, 4/01/25 | | | | | 750 | | | | 839,160 | |
City of New York, New York, GO, Refunding: | | | | | | | | | | |
Series E, 5.00%, 8/01/27 | | | | | 600 | | | | 647,118 | |
Series E, 5.00%, 8/01/30 | | | | | 500 | | | | 531,070 | |
Series J, 5.00%, 8/01/23 | | | | | 2,000 | | | | 2,317,780 | |
Hudson New York Yards Infrastructure Corp., RB, Series A, 5.75%, 2/15/47 | | | | | 1,000 | | | | 1,061,710 | |
New York City Industrial Development Agency, RB, PILOT, Queens Baseball Stadium (AMBAC), 5.00%, 1/01/31 | | | | | 1,500 | | | | 1,383,375 | |
New York City Industrial Development Agency, Refunding RB, Transportation Infrastructure Properties LLC, Series A, AMT, 5.00%, 7/01/22 | | | | | 500 | | | | 503,555 | |
New York Convention Center Development Corp., RB, Hotel Unit Fee Secured (AMBAC), 5.00%, 11/15/35 | | | | | 120 | | | | 120,094 | |
New York Liberty Development Corp., Refunding RB, 4 World Trade Center Project, 5.00%, 11/15/31 | | | | | 1,000 | | | | 1,023,780 | |
United Nations Development Corp., Refunding RB, Series A, 4.25%, 7/01/24 | | | | | 500 | | | | 518,250 | |
| | | | | | | | | 11,488,759 | |
| | | | | | | | | | | |
Municipal Bonds
| | | | Par
(000)
| | Value
|
New York (continued) |
Education — 18.6% |
Build NYC Resource Corp., RB: | | | | | | | | | | |
3.88%, 4/15/23 | | | | $ | 505 | | | $ | 468,140 | |
5.00%, 4/01/33 | | | | | 750 | | | | 723,555 | |
Madison County Capital Resource Corp., Refunding RB, Colgate University Project, Series A, 5.00%, 7/01/33 | | | | | 650 | | | | 672,061 | |
Nassau County Industrial Development Agency, Refunding RB, New York Institute of Technology Project, Series A, 5.00%, 3/01/21 | | | | | 1,000 | | | | 1,088,670 | |
New York State Dormitory Authority, RB: | | | | | | | | | | |
Convent of the Sacred Heart (AGM), 4.00%, 11/01/18 | | | | | 880 | | | | 972,426 | |
Convent of the Sacred Heart (AGM), 5.00%, 11/01/21 | | | | | 120 | | | | 133,321 | |
Fordham University, Series A, 5.25%, 7/01/25 | | | | | 500 | | | | 552,580 | |
Mount Sinai School of Medicine, 5.50%, 7/01/25 | | | | | 1,000 | | | | 1,085,170 | |
Mount Sinai School of Medicine, Series A (NPFGC), 5.15%, 7/01/24 | | | | | 570 | | | | 613,058 | |
New York State Dormitory Authority, Refunding RB: | | | | | | | | | | |
Pace University, Series A, 5.00%, 5/01/24 | | | | | 850 | | | | 908,591 | |
Teachers College, Series A, 5.00%, 7/01/31 | | | | | 375 | | | | 388,631 | |
The Culinary Institute of America, 5.00%, 7/01/28 | | | | | 500 | | | | 506,080 | |
Third General Resolution, State University Educational Facilities Issue, Series E, 5.00%, 5/15/27 | | | | | 570 | | | | 615,041 | |
Schenectady County Capital Resource Corp., Refunding RB, Union College, 5.00%, 7/01/32 | | | | | 940 | | | | 981,896 | |
Schenectady County Industrial Development Agency, Refunding RB, Union College Project, 5.00%, 7/01/26 | | | | | 1,000 | | | | 1,063,690 | |
Suffolk County Industrial Development Agency, Refunding RB, New York Institute of Technology Project, 5.25%, 3/01/21 | | | | | 600 | | | | 616,194 | |
| | | | | | | | | 11,389,104 | |
Health — 20.0% | | | | | | | | | | |
Dutchess County Industrial Development Agency, RB, Vassar Brothers Medical Center (AGC), 5.00%, 4/01/21 | | | | | 215 | | | | 242,210 | |
Dutchess County Local Development Corp., Refunding RB, Health Quest System, Inc., Series A (AGM), 5.25%, 7/01/25 | | | | | 1,000 | | | | 1,081,140 | |
Erie County Industrial Development Agency, RB, Episcopal Church Home, Series A, 5.88%, 2/01/18 | | | | | 530 | | | | 530,726 | |
Genesee County Industrial Development Agency, Refunding RB, United Memorial Medical Center Project, 4.75%, 12/01/14 | | | | | 150 | | | | 150,158 | |
New York City Industrial Development Agency, RB, PSCH, Inc. Project, 6.20%, 7/01/20 | | | | | 1,415 | | | | 1,371,616 | |
Portfolio Abbreviations
To simplify the listings of portfolio holdings in the Schedules of Investments, the names and descriptions of many of the securities have been abbreviated according to the following list: | AGC | | Assured Guaranty Corp. | | GO | | General Obligation Bonds |
| AGM | | Assured Guaranty Municipal Corp. | | HFA | | Housing Finance Agency |
| AMBAC | | American Municipal Bond Assurance Corp. | | HRB | | Housing Revenue Bonds |
| AMT | | Alternative Minimum Tax (subject to) | | IDA | | Industrial Development Authority |
| ARB | | Airport Revenue Bonds | | IDB | | Industrial Development Board |
| BARB | | Building Aid Revenue Bonds | | IDRB | | Industrial Development Revenue Bonds |
| BHAC | | Berkshire Hathaway Assurance Corp. | | ISD | | Independent School District |
| CAB | | Capital Appreciation Bonds | | LRB | | Lease Revenue Bonds |
| CIFG | | CDC IXIS Financial Guaranty | | M/F | | Multi-Family |
| COP | | Certificates of Participation | | NPFGC | | National Public Finance Guarantee Corp. |
| EDA | | Economic Development Authority | | PILOT | | Payment in Lieu of Taxes |
| ERB | | Education Revenue Bonds | | RB | | Revenue Bonds |
| Fanie Mae | | Federal National Mortgage Association | | S/F | | Single-Family |
| GARB | | General Airport Revenue Bonds | | SONYMA | | State of New York Mortgage Agency |
| Ginnie Mae | | Government National Mortgage Association | | Syncora | | Syncora Guarantee |
See Notes to Financial Statements.
| 16 | ANNUAL REPORT | JULY 31, 2013
|
| |
| Schedule of Investments (continued) | BlackRock Muni New York Intermediate Duration Fund, Inc. (MNE)
(Percentages shown are based on Net Assets)
|
| | | | | | | |
Municipal Bonds
| | | | Par
(000)
| | Value
|
New York (continued) |
Health (concluded) | | | | | | | | | | |
New York State Dormitory Authority, RB: | | | | | | | | | | |
New York State Association for Retarded Children, Inc., Series A, 5.30%, 7/01/23 | | | | $ | 450 | | | $ | 487,809 | |
New York University Hospitals Center, Series A, 5.00%, 7/01/22 | | | | | 1,000 | | | | 1,098,190 | |
New York University Hospitals Center, Series B, 5.25%, 7/01/24 | | | | | 380 | | | | 402,561 | |
North Shore-Long Island Jewish Obligated Group, Series A, 5.25%, 5/01/25 | | | | | 780 | | | | 787,160 | |
New York State Dormitory Authority, Refunding RB: | | | | | | | | | | |
Mount Sinai Hospital Health System, Series A, 4.25%, 7/01/23 | | | | | 250 | | | | 258,240 | |
North Shore-Long Island Jewish Obligated Group, Series A, 5.00%, 5/01/32 | | | | | 500 | | | | 505,080 | |
North Shore-Long Island Jewish Obligated Group, Series E, 5.00%, 5/01/22 | | | | | 650 | | | | 704,470 | |
Suffolk County Industrial Development Agency, Refunding RB, Jefferson’s Ferry Project, 4.63%, 11/01/16 | | �� | | | 800 | | | | 865,552 | |
Westchester County Healthcare Corp. New York, Refunding RB, Senior Lien: | | | | | | | | | | |
Remarketing, Series A, 5.00%, 11/01/24 | | | | | 910 | | | | 970,051 | |
Remarketing, Series A, 5.00%, 11/01/30 | | | | | 250 | | | | 254,890 | |
Series B, 6.00%, 11/01/30 | | | | | 240 | | | | 262,195 | |
Westchester County IDA, RB, Special Needs Facilities Pooled Program, Series D-1, 6.80%, 7/01/19 | | | | | 515 | | | | 515,809 | |
Westchester County Local Development Corp., Refunding RB, Kendal On Hudson Project: | | | | | | | | | | |
3.00%, 1/01/18 | | | | | 500 | | | | 511,230 | |
4.00%, 1/01/23 | | | | | 480 | | | | 473,126 | |
Yonkers Industrial Development Agency, RB, Sacred Heart Association Project, Series A, AMT (SONYMA), 4.80%, 10/01/26 | | | | | 750 | | | | 753,338 | |
| | | | | | | | | 12,225,551 | |
Housing — 6.8% | | | | | | | | | | |
New York City Housing Development Corp., RB, Series H-2-A, AMT, 5.00%, 11/01/30 | | | | | 780 | | | | 785,709 | |
New York Mortgage Agency, Refunding RB, AMT: | | | | | | | | | | |
Homeowner Mortgage, Series 130, 4.75%, 10/01/30 | | | | | 2,500 | | | | 2,507,400 | |
Series 133, 4.95%, 10/01/21 | | | | | 395 | | | | 402,379 | |
Series 143, 4.85%, 10/01/27 | | | | | 500 | | | | 506,025 | |
| | | | | | | | | 4,201,513 | |
State — 19.3% | | | | | | | | | | |
Buffalo & Erie County Industrial Land Development Corp., Refunding RB, Buffalo State College Foundation Housing, 6.00%, 10/01/31 | | | | | 1,000 | | | | 1,103,780 | |
City of New York New York, GO: | | | | | | | | | | |
Refunding, Series H, 5.00%, 8/01/25 | | | | | 1,000 | | | | 1,122,510 | |
Sub-Series F-1, 5.00%, 3/01/29 | | | | | 250 | | | | 267,880 | |
Long Beach City School District, GO, 4.00%, 5/01/24 | | | | | 500 | | | | 521,935 | |
Metropolitan Transportation Authority, Refunding RB, Series B, 5.25%, 11/15/25 | | | | | 750 | | | | 851,602 | |
New York City Transitional Finance Authority, BARB, Fiscal 2009, Series S-3, 5.00%, 1/15/23 | | | | | 575 | | | | 649,733 | |
New York State Dormitory Authority, RB: | | | | | | | | | | |
Haverstraw King’s Daughters Public Library, 5.00%, 7/01/26 | | | | | 1,015 | | | | 1,095,063 | |
Municipal Health Facilities Improvement Program, 5.00%, 1/15/27 | | | | | 600 | | | | 637,506 | |
Series D, 5.00%, 3/15/31 | | | | | 500 | | | | 519,640 | |
Series F, 5.00%, 3/15/30 | | | | | 1,290 | | | | 1,339,665 | |
New York State Dormitory Authority, Refunding RB, Department of Health of the State of New York, Series A (CIFG), 5.00%, 7/01/25 | | | | | 1,500 | | | | 1,600,590 | |
| | | | | | | | | | | |
Municipal Bonds
| | | | Par
(000)
| | Value
|
New York (concluded) |
State (concluded) | | | | | | | | | | |
New York State Thruway Authority, RB, Transportation, Series A, 5.00%, 3/15/32 | | | | $ | 250 | | | $ | 263,258 | |
New York State Thruway Authority, Refunding RB, Series A-1, 5.00%, 4/01/22 | | | | | 1,000 | | | | 1,147,510 | |
New York State Urban Development Corp., RB, State Personal Income Tax, Series A, 3.50%, 3/15/28 | | | | | 750 | | | | 700,065 | |
| | | | | | | | | 11,820,737 | |
Transportation — 20.9% | | | | | | | | | | |
Metropolitan Transportation Authority, RB: | | | | | | | | | | |
Series A (NPFGC), 5.00%, 11/15/16 (c) | | | | | 990 | | | | 1,125,996 | |
Series A (NPFGC), 5.00%, 11/15/24 | | | | | 1,010 | | | | 1,125,332 | |
Series B (NPFGC), 5.25%, 11/15/19 | | | | | 860 | | | | 1,008,230 | |
Sub-Series B-1, 5.00%, 11/15/24 | | | | | 460 | | | | 511,745 | |
Sub-Series B-4, 5.00%, 11/15/24 | | | | | 300 | | | | 333,747 | |
Transportation, Series A, 5.00%, 11/15/27 | | | | | 1,000 | | | | 1,059,220 | |
Metropolitan Transportation Authority, Refunding RB: | | | | | | | | | | |
Series D, 4.00%, 11/15/32 | | | | | 250 | | | | 232,235 | |
Series F, 5.00%, 11/15/30 | | | | | 500 | | | | 520,320 | |
Port Authority of New York & New Jersey, RB, LLC Project, JFK International Air Terminal Special Project, 5.00%, 12/01/20 | | | | | 1,000 | | | | 1,085,450 | |
Port Authority of New York & New Jersey, Refunding RB, Consolidated, AMT: | | | | | | | | | | |
138th, 4.75%, 12/01/30 | | | | | 205 | | | | 205,613 | |
152nd, 5.00%, 11/01/23 | | | | | 500 | | | | 537,315 | |
152nd, 5.00%, 11/01/24 | | | | | 1,000 | | | | 1,067,210 | |
Triborough Bridge & Tunnel Authority, Refunding RB, Series A: | | | | | | | | | | |
5.00%, 11/15/22 | | | | | 1,025 | | | | 1,178,330 | |
5.00%, 11/15/24 | | | | | 2,000 | | | | 2,257,580 | |
5.00%, 1/01/27 | | | | | 500 | | | | 545,495 | |
| | | | | | | | | 12,793,818 | |
Utilities — 12.7% | | | | | | | | | | |
Long Island Power Authority, Refunding RB: | | | | | | | | | | |
Series A, 5.50%, 4/01/24 | | | | | 500 | | | | 563,535 | |
Series D (NPFGC), 5.00%, 9/01/25 | | | | | 2,000 | | | | 2,133,380 | |
New York City Municipal Water Finance Authority, Refunding RB: | | | | | | | | | | |
Series DD, 5.00%, 6/15/32 | | | | | 500 | | | | 519,445 | |
Series EE, 5.00%, 6/15/34 | | | | | 3,000 | | | | 3,135,360 | |
New York State Environmental Facilities Corp., Refunding RB, NYC Municipal Water, 5.00%, 6/15/31 | | | | | 1,000 | | | | 1,068,310 | |
Suffolk County Water Authority, Refunding RB, 3.00%, 6/01/25 | | | | | 400 | | | | 377,776 | |
| | | | | | | | | 7,797,806 | |
Total Municipal Bonds in New York | | | | | | | | | 78,749,618 | |
|
Puerto Rico — 9.1% |
Housing — 2.6% | | | | | | | | | | |
Puerto Rico Housing Finance Authority, Refunding RB, Subordinate, Capital Fund Modernization, 5.13%, 12/01/27 | | | | | 1,570 | | | | 1,617,603 | |
State — 0.8% | | | | | | | | | | |
Puerto Rico Public Buildings Authority, Refunding RB, Government Facilities, Series M-3 (NPFGC), 6.00%, 7/01/28 | | | | | 500 | | | | 486,065 | |
Transportation — 5.7% | | | | | | | | | | |
Puerto Rico Highway & Transportation Authority, RB, Series Y (AGM), 6.25%, 7/01/21 | | | | | 3,000 | | | | 3,454,200 | |
Total Municipal Bonds in Puerto Rico | | | | | | | | | 5,557,868 | |
Total Municipal Bonds — 137.7% | | | | | | | | | 84,307,486 | |
See Notes to Financial Statements.
| ANNUAL REPORT | JULY 31, 2013 | 17
|
| |
| Schedule of Investments (continued) | BlackRock Muni New York Intermediate Duration Fund, Inc. (MNE)
(Percentages shown are based on Net Assets)
|
| | | | | | | |
Municipal Bonds Transferred to
Tender Option Bond Trusts (d) | | | | Par
(000)
| | Value
|
New York — 17.3% |
County/City/Special District/School District — 7.1% | | | | | | | | | | |
City of New York, New York, GO: | | | | | | | | | | |
Sub-Series B-1, 5.25%, 9/01/22 | | | | $ | 750 | | | $ | 859,358 | |
Sub-Series I-1, 5.50%, 4/01/21 | | | | | 1,499 | | | | 1,753,638 | |
New York State Urban Development Corp., Refunding RB, Service Contracts, Series B, 5.00%, 1/01/21 | | | | | 1,499 | | | | 1,697,453 | |
| | | | | | | | | 4,310,449 | |
Transportation — 5.0% | | | | | | | | | | |
Port Authority of New York & New Jersey, RB, Consolidated, 169th Series, AMT: | | | | | | | | | | |
5.00%, 10/15/21 | | | | | 2,000 | | | | 2,260,040 | |
5.00%, 10/15/26 | | | | | 750 | | | | 805,778 | |
| | | | | | | | | 3,065,818 | |
Utilities — 5.2% | | | | | | | | | | |
New York City Municipal Water Finance Authority, Refunding RB: | | | | | | | | | | |
Second General Resolution, Series HH, 5.00%, 6/15/32 | | | | | 1,560 | | | | 1,640,714 | |
Series A, 4.75%, 6/15/30 | | | | | 1,500 | | | | 1,549,320 | |
| | | | | | | | | 3,190,034 | |
Total Municipal Bonds Transferred to
Tender Option Bond Trusts — 17.3% | | | | | | | | | 10,566,301 | |
Total Long-Term Investments
(Cost — $92,917,319) — 155.0% | | | | | | | | | 94,873,787 | |
| | | | | | | | | | | |
| Short-Term Securities | | | |
Shares | | Value |
BIF New York Municipal Money Fund, 0.00% (e)(f) | | | | | 802,542 | | | $ | 802,542 | |
Total Short-Term Securities
(Cost — $802,542) — 1.3% | | | | | | | | | 802,542 | |
Total Investments (Cost — $93,719,861) — 156.3% | | | | | | | | | 95,676,329 | |
Other Assets Less Liabilities — 1.1% | | | | | | | | | 677,815 | |
Liability for TOB Trust Certificates, Including Interest Expense and Fees Payable — (9.0%) | | | | | | | | | (5,539,696 | ) |
VRDP Shares, at Liquidation Value — (48.4%) | | | | | | | | | (29,600,000 | ) |
Net Assets Applicable to Common Shares — 100.0% | | | | | | | | $ | 61,214,448 | |
Notes to Schedule of Investments
| (a) | | | | Variable rate security. Rate shown is as of report date. |
| (b) | | | | When-issued security. Unsettled when-issued transactions were as follows: |
Counterparty
|
|
|
| Value
|
| Unrealized
Appreciation
|
JPMorgan Chase & Co. | | | | $ | 729,085 | | | $ | 8,624 | |
| (c) | | | | US government securities, held in escrow, are used to pay interest on this security, as well as to retire the bond in full at the date indicated, typically at a premium to par. |
| (d) | | | | Securities represent bonds transferred to a TOB in exchange for which the Fund acquired residual interest certificates. These securities serve as collateral in a financing transaction. See Note 3 of the Notes to Financial Statements for details of municipal bonds transferred to TOBs. |
| (e) | | | | Investments in issuers considered to be an affiliate of the Fund during the year, for purposes of Section 2(a)(3) of the 1940 Act, were as follows: |
Affiliate
|
|
|
| Shares
Held at
July 31, 2012
|
| Net
Activity
| ��
| Shares
Held at
July 31, 2013
|
| Income
|
BIF New York Municipal Money Fund | | | | | 480,082 | | | | 322,460 | | | | 802,542 | | | $ | 37 | |
| (f) | | | | Represents the current yield as of report date. |
| • | | | | For Fund compliance purposes, the Fund’s sector classifications refer to any one or more of the sector sub-classifications used by one or more widely recognized market indexes or rating group indexes, and/or as defined by Fund management. These definitions may not apply for purposes of this report, which may combine such sector sub-classifications for reporting ease. |
| • | | | | Fair Value Measurements — Various inputs are used in determining the fair value of investments. These inputs to valuation techniques are categorized into a disclosure hierarchy consisting of three broad levels for financial statement purposes as follows: |
| • | | | | Level 1 — unadjusted price quotations in active markets/exchanges for identical assets or liabilities that the Fund has the ability to access |
| • | | | | Level 2 — other observable inputs (including, but not limited to, quoted prices for similar assets or liabilities in markets that are active, quoted prices for identical or similar assets or liabilities in markets that are not active, inputs other than quoted prices that are observable for the assets or liabilities (such as interest rates, yield curves, volatilities, prepayment speeds, loss severities, credit risks and default rates) or other market-corroborated inputs) |
| • | | | | Level 3 — unobservable inputs based on the best information available in the circumstances, to the extent observable inputs are not available (including the Fund’s own assumptions used in determining the fair value of investments) |
| | | | | The hierarchy gives the highest priority to unadjusted quoted prices in active markets for identical assets or liabilities (Level 1 measurements) and the lowest priority to unobservable inputs (Level 3 measurements). Accordingly, the degree of judgment exercised in determining fair value is greatest for instruments categorized in Level 3. The inputs used to measure fair value may fall into different levels of the fair value hierarchy. In such cases, for disclosure purposes, the fair value hierarchy classification is determined based on the lowest level input that is significant to the fair value measurement in its entirety. |
See Notes to Financial Statements.
| 18 | ANNUAL REPORT | JULY 31, 2013
|
| |
| Schedule of Investments (concluded) | BlackRock Muni New York Intermediate Duration Fund, Inc. (MNE)
|
Changes in valuation techniques may result in transfers into or out of an assigned level within the disclosure hierarchy. In accordance with the Fund’s policy, transfers between different levels of the fair value disclosure hierarchy are deemed to have occurred as of the beginning of the reporting period. The categorization of a value determined for investments is based on the pricing transparency of the investment and is not necessarily an indication of the risks associated with investing in those securities. For information about the Fund’s policy regarding valuation of investments, please refer to Note 2 of the Notes to Financial Statements.
The following table summarizes the Fund’s investments categorized in the disclosure hierarchy as of July 31, 2013:
|
|
|
| Level 1
|
| Level 2
|
| Level 3
|
| Total
|
Assets:
| | | | | | | | | | | | | | | | | | |
Investments:
| | | | | | | | | | | | | | | | | | |
Long-Term Investments 1 | | | | | — | | | $ | 94,873,787 | | | | — | | | $ | 94,873,787 | |
Short-Term Securities | | | | $ | 802,542 | | | | — | | | | — | | | | 802,542 | |
Total
| | | | $ | 802,542 | | | $ | 94,873,787 | | | | — | | | $ | 95,676,329 | |
| 1 | See above Schedule of Investments for values in each sector or political subdivision. |
Certain of the Fund’s liabilities are held at carrying amount, which approximates fair value for financial statement purposes. As of July 31, 2013, such liabilities are categorized within the disclosure hierarchy as follows:
|
|
|
| Level 1
|
| Level 2
|
| Level 3
|
| Total
|
Liabilities:
| | | | | | | | | | | | | | | | | | |
TOB trust certificates | | | | | — | | | $ | (5,537,752 | ) | | | — | | | $ | (5,537,752 | ) |
VRDP Shares | | | | | — | | | | (29,600,000 | ) | | | — | | | | (29,600,000 | ) |
Total
| | | | | — | | | $ | (35,137,752 | ) | | | — | | | $ | (35,137,752 | ) |
There were no transfers between levels during the year ended July 31, 2013.
See Notes to Financial Statements.
| ANNUAL REPORT | JULY 31, 2013 | 19
|
| |
| Schedule of Investments July 31, 2013 | BlackRock MuniYield Arizona Fund, Inc. (MZA)
(Percentages shown are based on Net Assets)
|
| | | | | | | |
| Municipal Bonds | | | | Par
(000)
| | Value
|
Arizona — 145.4% |
Corporate — 13.2% | | | | | | | | | | |
Maricopa County Pollution Control Corp., Refunding RB, Southern California Edison Co., Series A, 5.00%, 6/01/35 | | | | $ | 4,350 | | | $ | 4,427,778 | |
Pima County IDA, RB, Tucson Electric Power Co. Project, Series A, 5.25%, 10/01/40 | | | | | 1,000 | | | | 962,150 | |
Pima County IDA, Refunding IDRB, Tucson Electric Power Co. Project, Series B, 5.75%, 9/01/29 | | | | | 500 | | | | 511,960 | |
Pinal County IDA Arizona, Refunding RB, Tucson Electric Power Co. Project, Series A, 4.00%, 9/01/29 | | | | | 1,000 | | | | 886,280 | |
Salt Verde Financial Corp., RB, Natural Gas Utility Improvements, Senior, 5.00%, 12/01/37 | | | | | 1,500 | | | | 1,434,795 | |
| | | | | | | | | 8,222,963 | |
County/City/Special District/School District — 47.2% | | | | | | | | | | |
City of Glendale Arizona, RB (NPFGC), 5.00%, 7/01/25 | | | | | 1,000 | | | | 1,076,320 | |
City of Tucson Arizona, COP (AGC), 5.00%, 7/01/29 | | | | | 1,000 | | | | 1,035,660 | |
County of Pinal Arizona, COP: | | | | | | | | | | |
5.00%, 12/01/26 | | | | | 1,250 | | | | 1,321,937 | |
5.00%, 12/01/29 | | | | | 1,250 | | | | 1,298,137 | |
Gilbert Public Facilities Municipal Property Corp., RB, 5.50%, 7/01/27 | | | | | 2,000 | | | | 2,146,800 | |
Gladden Farms Community Facilities District, GO, 5.50%, 7/15/31 | | | | | 750 | | | | 713,843 | |
Glendale Municipal Property Corp., Refunding RB, Sub-Series C, 5.00%, 7/01/38 | | | | | 2,000 | | | | 2,016,360 | |
Greater Arizona Development Authority, RB, Santa Cruz County Jail, Series 2, 5.25%, 8/01/31 | | | | | 1,155 | | | | 1,183,020 | |
Marana Municipal Property Corp., RB, Series A, 5.00%, 7/01/28 | | | | | 2,500 | | | | 2,634,650 | |
Maricopa County Community College District, GO, Series C, 3.00%, 7/01/22 | | | | | 1,000 | | | | 1,010,290 | |
Maricopa County Public Finance Corp., RB, Series A (AMBAC), 5.00%, 7/01/24 | | | | | 1,000 | | | | 1,097,490 | |
Maricopa County Unified School District No. 89-Dysart, GO, School Improvement Project of 2006, Series C, 6.00%, 7/01/28 | | | | | 1,000 | | | | 1,135,180 | |
Mohave County Unified School District No. 20 Kingman, GO, School Improvement Project of 2006, Series C (AGC), 5.00%, 7/01/26 | | | | | 1,000 | | | | 1,118,310 | |
Phoenix Civic Improvement Corp., RB, Subordinate, Civic Plaza Expansion Project, Series A (NPFGC), 5.00%, 7/01/35 | | | | | 3,325 | | | | 3,342,523 | |
Phoenix Mesa Airport Authority, RB, Mesa Project, AMT, 5.00%, 7/01/38 | | | | | 3,600 | | | | 3,375,792 | |
Scottsdale Municipal Property Corp., RB, Water & Sewer Development Project, Series A, 5.00%, 7/01/24 | | | | | 1,500 | | | | 1,688,880 | |
Vistancia Community Facilities District, GO: | | | | | | | | | | |
6.75%, 7/15/22 | | | | | 1,275 | | | | 1,277,894 | |
5.75%, 7/15/24 | | | | | 750 | | | | 770,303 | |
Yuma County Library District, GO (Syncora), 5.00%, 7/01/26 | | | | | 1,000 | | | | 1,058,610 | |
| | | | | | | | | 29,301,999 | |
Education — 19.4% | | | | | | | | | | |
Arizona Board of Regents, Refunding, COP, University of Arizona, Series C, 5.00%, 6/01/31 | | | | | 2,000 | | | | 2,055,940 | |
Arizona State University, RB, Series 2008-C: | | | | | | | | | | |
6.00%, 7/01/25 | | | | | 970 | | | | 1,133,183 | |
6.00%, 7/01/26 | | | | | 745 | | | | 867,694 | |
6.00%, 7/01/27 | | | | | 425 | | | | 484,955 | |
6.00%, 7/01/28 | | | | | 400 | | | | 455,248 | |
Florence Town, Inc., IDA, ERB, Legacy Traditional School Project, Queen Creek and Casa Grande Campuses, 6.00%, 7/01/43 | | | | | 500 | | | | 444,465 | |
Maricopa County IDA, RB, Arizona Charter School Project, Series A, 6.63%, 7/01/20 | | | | | 550 | | | | 497,106 | |
| | | | | | | | | | | |
| Municipal Bonds | | | | Par
(000)
| | Value
|
Arizona (continued) |
Education (concluded) | | | | | | | | | | |
Northern Arizona University, RB, Stimulus Plan for Economic and Educational Development, 5.00%, 8/01/38 | | | | $ | 3,000 | | | $ | 3,025,860 | |
Phoenix IDA, ERB, Great Hearts Academies Project, 6.30%, 7/01/42 | | | | | 500 | | | | 492,510 | |
Pima County IDA, RB, Arizona Charter Schools Project, Series C: | | | | | | | | | | |
6.70%, 7/01/21 | | | | | 20 | | | | 20,046 | |
6.75%, 7/01/31 | | | | | 45 | | | | 44,286 | |
Pima County IDA, Refunding RB, Arizona Charter Schools Project, Series O, 5.00%, 7/01/26 | | | | | 985 | | | | 985,226 | |
Sun Devil Energy Center LLC, Refunding RB, Arizona State University, 5.00%, 7/01/30 | | | | | 1,500 | | | | 1,567,965 | |
| | | | | | | | | 12,074,484 | |
Health — 19.3% | | | | | | | | | | |
Arizona Health Facilities Authority, RB, Catholic Healthcare West, Series B-2 (AGM), 5.00%, 3/01/41 | | | | | 500 | | | | 491,165 | |
Arizona Health Facilities Authority, Refunding RB: | | | | | | | | | | |
Banner Health, Series D, 5.50%, 1/01/38 | | | | | 2,300 | | | | 2,393,909 | |
Phoenix Children’s Hospital, Series A, 5.00%, 2/01/42 | | | | | 1,000 | | | | 919,050 | |
Maricopa County IDA, Refunding RB, Series A: | | | | | | | | | | |
Catholic Healthcare West, 6.00%, 7/01/39 | | | | | 170 | | | | 180,033 | |
Catholic Helathcare West, 5.50%, 7/01/26 | | | | | 1,850 | | | | 1,919,690 | |
Samaritan Health Services (NPFGC), 7.00%, 12/01/16 (a) | | | | | 1,000 | | | | 1,120,100 | |
Tempe Arizona IDA, Refunding RB, Friendship Village of Tempe, Series A, 6.25%, 12/01/42 | | | | | 500 | | | | 502,040 | |
University Medical Center Corp., RB, 6.50%, 7/01/39 | | | | | 500 | | | | 538,245 | |
University Medical Center Corp., Refunding RB, 6.00%, 7/01/39 | | | | | 1,000 | | | | 1,055,970 | |
Yavapai County IDA, RB, Yavapai Regional Medical Center, Series A, 6.00%, 8/01/33 | | | | | 1,800 | | | | 1,805,130 | |
Yavapai County IDA, Refunding RB, Northern Arizona Healthcare System, 5.25%, 10/01/26 | | | | | 1,000 | | | | 1,087,030 | |
| | | | | | | | | 12,012,362 | |
Housing — 1.0% | | | | | | | | | | |
Maricopa County & Phoenix IDA, Refunding RB, S/F, AMT (Fannie Mae): | | | | | | | | | | |
Series A-1, 5.75%, 5/01/40 | | | | | 75 | | | | 80,530 | |
Series A-2, 5.80%, 7/01/40 | | | | | 90 | | | | 92,724 | |
Maricopa County IDA, RB, Series 3-B, AMT (Ginnie Mae), 5.25%, 8/01/38 | | | | | 186 | | | | 194,967 | |
Phoenix & Pima County IDA, RB, Series 1A, AMT (Fannie Mae), 5.65%, 7/01/39 | | | | | 48 | | | | 50,950 | |
Phoenix & Pima County IDA, Refunding RB, AMT (Fannie Mae), 5.25%, 8/01/38 | | | | | 74 | | | | 74,311 | |
Phoenix IDA, Refunding RB, Series 2007-2, AMT (Fannie Mae), 5.50%, 12/01/38 | | | | | 100 | | | | 106,039 | |
| | | | | | | | | 599,521 | |
State — 20.4% | | | | | | | | | | |
Arizona Department of Transportation State Highway Fund Revenue, RB, Series B, 5.00%, 7/01/30 | | | | | 4,000 | | | | 4,289,040 | |
Arizona School Facilities Board, COP: | | | | | | | | | | |
5.13%, 9/01/21 | | | | | 1,000 | | | | 1,107,580 | |
5.75%, 9/01/22 | | | | | 2,000 | | | | 2,256,120 | |
Arizona Sports & Tourism Authority, Refunding RB, Multipurpose Stadium Facility Project, Series A, 5.00%, 7/01/36 | | | | | 3,000 | | | | 3,010,590 | |
State of Arizona, RB, Lottery Revenue, Series A (AGM), 5.00%, 7/01/29 | | | | | 1,930 | | | | 2,014,882 | |
| | | | | | | | | 12,678,212 | |
See Notes to Financial Statements.
| 20 | ANNUAL REPORT | JULY 31, 2013
|
| |
| Schedule of Investments (continued) | BlackRock MuniYield Arizona Fund, Inc. (MZA)
(Percentages shown are based on Net Assets)
|
| | | | | | | |
| Municipal Bonds | | | | Par
(000)
| | Value
|
Arizona (concluded) |
Transportation — 4.4% | | | | | | | | | | |
Phoenix Civic Improvement Corp., RB, Senior Lien AMT, Series A, 5.00%, 7/01/33 | | | | $ | 1,000 | | | $ | 1,034,540 | |
Phoenix Civic Improvement Corp., Refunding RB: | | | | | | | | | | |
AMT, 5.00%, 7/01/32 | | | | | 700 | | | | 705,964 | |
Junior Lien, Series A, 5.00%, 7/01/40 | | | | | 1,000 | | | | 1,005,180 | |
| | | | | | | | | 2,745,684 | |
Utilities — 20.5% | | | | | | | | | | |
Gilbert Water Resource Municipal Property Corp., RB, Subordinate Lien (NPFGC), 5.00%, 10/01/29 | | | | | 900 | | | | 930,285 | |
Greater Arizona Development Authority, RB, Series B (NPFGC): | | | | | | | | | | |
5.00%, 8/01/30 | | | | | 1,600 | | | | 1,663,392 | |
5.00%, 8/01/35 | | | | | 1,000 | | | | 1,002,070 | |
Phoenix Civic Improvement Corp., Refunding RB, Senior Lien, 5.50%, 7/01/22 | | | | | 2,000 | | | | 2,344,020 | |
Pima County Arizona Sewer System RB, Series B, 5.00%, 7/01/26 | | | | | 1,000 | | | | 1,076,760 | |
Pinal County Electric District No. 3, Refunding RB, 5.25%, 7/01/36 | | | | | 2,500 | | | | 2,566,650 | |
Pinal County IDA Arizona, RB, San Manuel Facility Project, AMT, 6.25%, 6/01/26 | | | | | 500 | | | | 463,580 | |
Salt River Project Agricultural Improvement & Power District, RB, Series A, 5.00%, 1/01/24 | | | | | 1,000 | | | | 1,117,920 | |
Salt River Project Agricultural Improvement & Power District, Refunding RB, Series A, 5.00%, 1/01/35 | | | | | 1,500 | | | | 1,558,215 | |
| | | | | | | | | 12,722,892 | |
Total Municipal Bonds in Arizona | | | | | | | | | 90,358,117 | |
|
Guam — 1.5% |
State — 1.5% | | | | | | | | | | |
Territory of Guam, RB, Government of Guam Business Privilege Tax: | | | | | | | | | | |
Series A, 5.13%, 1/01/42 | | | | | 800 | | | | 809,504 | |
Series B-1, 5.00%, 1/01/37 | | | | | 145 | | | | 144,400 | |
Total Municipal Bonds in Guam | | | | | | | | | 953,904 | |
| | | | | | | | | | | |
| Municipal Bonds | | | | Par
(000)
| | Value
|
Puerto Rico — 5.8% |
State — 5.8% | | | | | | | | | | |
Puerto Rico Public Buildings Authority, Refunding RB, Government Facilities, Series M-3 (NPFGC), 6.00%, 7/01/28 | | | | $ | 700 | | | $ | 680,491 | |
Puerto Rico Sales Tax Financing Corp., RB, First Sub-Series A, 6.38%, 8/01/39 | | | | | 1,375 | | | | 1,400,657 | |
Puerto Rico Sales Tax Financing Corp., Refunding RB, CAB, Series A (NPFGC), 6.60%, 8/01/41 (b) | | | | | 9,530 | | | | 1,545,766 | |
Total Municipal Bonds in Puerto Rico | | | | | | | | | 3,626,914 | |
Total Municipal Bonds — 152.7% | | | | | | | | | 94,938,935 | |
|
Municipal Bonds Transferred to
Tender Option Bond Trusts (c) | | | | | | | | | | |
Arizona — 11.2% |
Utilities — 11.2% | | | | | | | | | | |
City of Mesa Arizona, RB, 5.00%, 7/01/35 | | | | | 3,000 | | | | 3,117,090 | |
Phoenix Arizona Civic Improvement Corp., RB, 5.00%, 7/01/34 | | | | | 3,000 | | | | 3,139,350 | |
Salt River Project Agricultural Improvement & Power District, RB, Series A, 5.00%, 1/01/38 | | | | | 660 | | | | 677,873 | |
Total Municipal Bonds Transferred to
Tender Option Bond Trusts — 11.2% | | | | | | | | | 6,934,313 | |
Total Long-Term Investments
(Cost — $100,484,674) — 163.9% | | | | | | | | | 101,873,248 | |
|
Short-Term Securities | | | | | Shares | | | | | |
FFI Institutional Tax-Exempt Fund, 0.03% (d)(e) | | | | | 210,260 | | | | 210,260 | |
Total Short-Term Securities
(Cost — $210,260) — 0.3% | | | | | | | | | 210,260 | |
Total Investments (Cost — $100,694,934) — 164.2% | | | | | | | | | 102,083,508 | |
Other Assets Less Liabilities — 1.2% | | | | | | | | | 713,591 | |
Liability for TOB Trust Certificates, Including Interest Expense and Fees Payable — (5.4%) | | | | | | | | | (3,330,407 | ) |
VRDP Shares, at Liquidation Value — (60.0%) | | | | | | | | | (37,300,000 | ) |
Net Assets Applicable to Common Shares — 100.0% | | | | | | | | $ | 62,166,692 | |
Notes to Schedule of Investments
| (a) | | | | Security is collateralized by municipal or US Treasury obligations. |
| (b) | | | | Represents a zero-coupon bond. Rate shown reflects the current yield as of report date. |
| (c) | | | | Securities represent bonds transferred to a TOB in exchange for which the Fund acquired residual interest certificates. These securities serve as collateral in a financing transaction. See Note 3 of the Notes to Financial Statements for details of municipal bonds transferred to TOBs. |
| (d) | | | | Investments in issuers considered to be an affiliate of the Fund during the year, for purposes of Section 2(a)(3) of the 1940 Act, as amended, were as follows: |
Affiliate
|
|
|
| Shares
Held at
July 31, 2012
|
| Net
Activity
|
| Shares
Held at
July 31, 2013
|
| Income
|
FFI Institutional Tax-Exempt Fund | | | | | 1,351,621 | | | | (1,141,362 | ) | | | 210,260 | | | $ | 123 | |
| (e) | | | | Represents the current yield as of report date. |
| • | | | | For Fund compliance purposes, the Fund’s sector classifications refer to any one or more of the sector sub-classifications used by one or more widely recognized market indexes or rating group indexes, and/or as defined by Fund management. These definitions may not apply for purposes of this report, which may combine such sector sub-classifications for reporting ease. |
See Notes to Financial Statements.
| ANNUAL REPORT | JULY 31, 2013 | 21
|
| |
| Schedule of Investments (concluded) | BlackRock MuniYield Arizona Fund, Inc. (MZA)
|
| | | | | |
| • | | | | Fair Value Measurements — Various inputs are used in determining the fair value of investments. These inputs to valuation techniques are categorized into a disclosure hierarchy consisting of three broad levels for financial statement purposes as follows: |
| • | | | | Level 1 — unadjusted price quotations in active markets/exchanges for identical assets or liabilities that the Fund has the ability to access |
| • | | | | Level 2 — other observable inputs (including, but not limited to, quoted prices for similar assets or liabilities in markets that are active, quoted prices for identical or similar assets or liabilities in markets that are not active, inputs other than quoted prices that are observable for the assets or liabilities (such as interest rates, yield curves, volatilities, prepayment speeds, loss severities, credit risks and default rates) or other market-corroborated inputs) |
| • | | | | Level 3 — unobservable inputs based on the best information available in the circumstances, to the extent observable inputs are not available (including the Fund’s own assumptions used in determining the fair value of investments) |
| | | | | The hierarchy gives the highest priority to unadjusted quoted prices in active markets for identical assets or liabilities (Level 1 measurements) and the lowest priority to unobservable inputs (Level 3 measurements). Accordingly, the degree of judgment exercised in determining fair value is greatest for instruments categorized in Level 3. The inputs used to measure fair value may fall into different levels of the fair value hierarchy. In such cases, for disclosure purposes, the fair value hierarchy classification is determined based on the lowest level input that is significant to the fair value measurement in its entirety. |
| | | | | Changes in valuation techniques may result in transfers into or out of an assigned level within the disclosure hierarchy. In accordance with the Fund’s policy, transfers between different levels of the fair value disclosure hierarchy are deemed to have occurred as of the beginning of the reporting period. The categorization of a value determined for investments is based on the pricing transparency of the investment and is not necessarily an indication of the risks associated with investing in those securities. For information about the Fund’s policy regarding valuation of investments, please refer to Note 2 of the Notes to Financial Statements. |
| | | | | The following table summarizes the Fund’s investments categorized in the disclosure hierarchy as of July 31, 2013: |
|
|
|
| Level 1
|
| Level 2
|
| Level 3
|
| Total
|
Assets:
| | | | | | | | | | | | | | | | | | |
Investments:
| | | | | | | | | | | | | | | | | | |
Long-Term Investments 1 | | | | | — | | | $ | 101,873,248 | | | | — | | | $ | 101,873,248 | |
Short-Term Securities | | | | $ | 210,260 | | | | — | | | | — | | | | 210,260 | |
Total
| | | | $ | 210,260 | | | $ | 101,873,248 | | | | — | | | $ | 102,083,508 | |
| 1 | See above Schedule of Investments for values in each sector or political subdivision. |
| | | |
Certain of the Fund’s liabilities are held at carrying amount, which approximates fair value for financial statement purposes. As of July 31, 2013, such liabilities are categorized within the disclosure hierarchy as follows:
|
|
|
| Level 1
|
| Level 2
|
| Level 3
|
| Total
|
Liabilities:
| | | | | | | | | | | | | | | | | | |
Bank overdraft | | | | | — | | | $ | (2,391 | ) | | | — | | | $ | (2,391 | ) |
TOB trust certificates | | | | | — | | | | (3,330,000 | ) | | | — | | | | (3,330,000 | ) |
VRDP Shares | | | | | — | | | | (37,300,000 | ) | | | — | | | | (37,300,000 | ) |
Total
| | | | | — | | | $ | (40,632,391 | ) | | | — | | | $ | (40,632,391 | ) |
| | | | | | | | | | | | | | | | | | | |
There were no transfers between levels during the year ended July 31, 2013.
See Notes to Financial Statements.
| 22 | ANNUAL REPORT | JULY 31, 2013
|
| |
| Schedule of Investments July 31, 2013 | BlackRock MuniYield California Fund, Inc. (MYC)
(Percentages shown are based on Net Assets)
|
| | | | | | | |
| Municipal Bonds | | | | Par
(000)
| | Value
|
California — 96.0% |
Corporate — 1.7% | | | | | | | | | | |
City of Chula Vista California, Refunding RB, San Diego Gas & Electric: | | | | | | | | | | |
Series A, 5.88%, 2/15/34 | | | | $ | 975 | | | $ | 1,082,386 | |
Series D, 5.88%, 1/01/34 | | | | | 4,000 | | | | 4,438,960 | |
| | | | | | | | | 5,521,346 | |
County/City/Special District/School District — 37.6% | | | | | | | | | | |
Campbell Union High School District, GO, Election of 2006, Series C, 5.75%, 8/01/40 | | | | | 4,000 | | | | 4,341,800 | |
Chaffey Joint Union High School District, GO, Election of 2012, Series A: | | | | | | | | | | |
5.00%, 8/01/33 | | | | | 4,365 | | | | 4,582,246 | |
5.00%, 8/01/37 | | | | | 6,420 | | | | 6,697,216 | |
City of Los Angeles California, COP, Senior, Sonnenblick Del Rio West Los Angeles (AMBAC), 6.20%, 11/01/31 | | | | | 2,000 | | | | 2,006,980 | |
City of San Jose California Hotel Tax, RB, Convention Center Expansion & Renovation Project: | | | | | | | | | | |
6.50%, 5/01/36 | | | | | 1,520 | | | | 1,715,867 | |
6.50%, 5/01/42 | | | | | 1,860 | | | | 2,095,792 | |
El Monte Union High School District, GO, Election of 2002, Series C, 5.25%, 6/01/32 | | | | | 9,620 | | | | 10,176,613 | |
Grossmont Healthcare District, GO, Election of 2006, Series B, 6.13%, 7/15/40 | | | | | 2,000 | | | | 2,249,780 | |
Los Angeles Community College District California, GO, Election of 2008, Series C, 5.25%, 8/01/39 | | | | | 7,185 | | | | 7,618,112 | |
Los Angeles Municipal Improvement Corp., RB, Real Property, Series E: | | | | | | | | | | |
5.75%, 9/01/34 | | | | | 1,215 | | | | 1,337,885 | |
6.00%, 9/01/34 | | | | | 2,475 | | | | 2,808,878 | |
Los Rios Community College District, GO, Election of 2002, Series D, 5.38%, 8/01/34 | | | | | 4,315 | | | | 4,623,177 | |
Mount San Antonio Community College District, GO, Refunding, Election of 2008, Series 2013A, 5.00%, 8/01/34 (a) | | | | | 4,500 | | | | 4,628,430 | |
Oak Grove School District California, GO, Election of 2008, Series A, 5.50%, 8/01/33 | | | | | 4,000 | | | | 4,439,600 | |
Ohlone Community College District, GO, Election of 2010, Series A, 5.25%, 8/01/41 | | | | | 7,135 | | | | 7,550,114 | |
Pico Rivera Public Financing Authority, RB, 5.75%, 9/01/39 | | | | | 6,035 | | | | 6,425,706 | |
San Diego Community College District California, GO, Election of 2006, 5.00%, 8/01/43 | | | | | 2,145 | | | | 2,227,111 | |
San Diego Regional Building Authority California, RB, County Operations Center & Annex, Series A, 5.38%, 2/01/36 | | | | | 4,100 | | | | 4,422,219 | |
San Jose Financing Authority, Refunding LRB, Civic Center Project, Series A, 5.00%, 6/01/39 | | | | | 9,340 | | | | 9,360,922 | |
Santa Ana Unified School District, GO, Election of 2008, Series A, 5.13%, 8/01/33 | | | | | 6,105 | | | | 6,318,431 | |
Santa Clara County Financing Authority, Refunding LRB, Series L, 5.25%, 5/15/36 | | | | | 16,000 | | | | 16,944,000 | |
Westminster Redevelopment Agency California, Tax Allocation Bonds, Subordinate, Commercial Redevelopment Project No. 1 (AGC), 6.25%, 11/01/39 | | | | | 1,250 | | | | 1,371,125 | |
William S. Hart Union High School District, GO, CAB, Refunding, Series B (AGM) (b): | | | | | | | | | | |
5.82%, 8/01/34 | | | | | 10,850 | | | | 3,252,504 | |
5.84%, 8/01/35 | | | | | 9,525 | | | | 2,684,526 | |
| | | | | | | | | 119,879,034 | |
| | | | | | | | | | | |
| Municipal Bonds | | | | Par
(000)
| | Value
|
California (continued) |
Education — 2.2% | | | | | | | | | | |
California Educational Facilities Authority, Refunding RB: | | | | | | | | | | |
Pitzer College, 6.00%, 4/01/40 | | | | $ | 2,500 | | | $ | 2,716,750 | |
San Francisco University, 6.13%, 10/01/36 | | | | | 1,560 | | | | 1,740,851 | |
California Municipal Finance Authority, RB, Emerson College, 6.00%, 1/01/42 | | | | | 2,500 | | | | 2,725,475 | |
| | | | | | | | | 7,183,076 | |
Health — 16.4% | | | | | | | | | | |
ABAG Finance Authority for Nonprofit Corps, Refunding RB, Sharp Healthcare: | | | | | | | | | | |
6.38%, 8/01/34 | | | | | 2,000 | | | | 2,087,020 | |
Series A, 6.00%, 8/01/30 | | | | | 2,270 | | | | 2,512,708 | |
California Health Facilities Financing Authority, RB: | | | | | | | | | | |
Children’s Hospital, Series A, 5.25%, 11/01/41 | | | | | 11,190 | | | | 11,248,524 | |
Sutter Health, Series B, 6.00%, 8/15/42 | | | | | 7,530 | | | | 8,451,823 | |
California Health Facilities Financing Authority, Refunding RB: | | | | | | | | | | |
Catholic Healthcare West, Series A, 6.00%, 7/01/39 | | | | | 10,000 | | | | 11,328,200 | |
Providence Health, 6.50%, 10/01/38 | | | | | 3,625 | | | | 4,153,597 | |
California Statewide Communities Development Authority, RB: | | | | | | | | | | |
Kaiser Permanente, Series B, 5.25%, 3/01/45 | | | | | 2,000 | | | | 2,000,380 | |
Sutter Health, Series A, 6.00%, 8/15/42 | | | | | 7,995 | | | | 8,973,748 | |
California Statewide Communities Development Authority, Refunding RB, Trinity Health Credit Group Composite Issue, 5.00%, 12/01/41 | | | | | 1,770 | | | | 1,748,725 | |
| | | | | | | | | 52,504,725 | |
Housing — 1.1% | | | | | | | | | | |
Santa Clara County Housing Authority, RB, John Burns Gardens Apartments Project, Series A, AMT, 6.00%, 8/01/41 | | | | | 3,500 | | | | 3,500,490 | |
State — 13.6% | | | | | | | | | | |
California State Public Works Board, RB: | | | | | | | | | | |
Department of Developmental Services, Poterville, Series C, 6.25%, 4/01/34 | | | | | 1,465 | | | | 1,676,854 | |
Department of Education, Riverside Campus Project, Series B, 6.50%, 4/01/34 | | | | | 10,000 | | | | 11,573,900 | |
Trustees of the California State University, Series D, 6.00%, 4/01/27 | | | | | 215 | | | | 247,044 | |
Various Capital Projects, Sub-Series I-1, 6.38%, 11/01/34 | | | | | 4,400 | | | | 5,119,488 | |
State of California, GO, Various Purpose: | | | | | | | | | | |
5.00%, 9/01/36 | | | | | 4,080 | | | | 4,175,553 | |
6.00%, 4/01/38 | | | | | 15,000 | | | | 16,780,800 | |
6.00%, 11/01/39 | | | | | 3,280 | | | | 3,705,121 | |
| | | | | | | | | 43,278,760 | |
Transportation — 8.3% | | | | | | | | | | |
City of San Jose California, RB, Series A-1, AMT (AGM): | | | | | | | | | | |
5.50%, 3/01/30 | | | | | 1,000 | | | | 1,044,010 | |
5.75%, 3/01/34 | | | | | 1,000 | | | | 1,055,840 | |
City of San Jose California, Refunding ARB, Series A-1, AMT, 6.25%, 3/01/34 | | | | | 1,400 | | | | 1,532,356 | |
County of Orange California, ARB, Series B, 5.75%, 7/01/34 | | | | | 3,000 | | | | 3,294,510 | |
County of Sacramento California, ARB: | | | | | | | | | | |
Senior Series B, 5.75%, 7/01/39 | | | | | 900 | | | | 997,794 | |
Subordinate PFC/Grant, Sub-Series D, 6.00%, 7/01/35 | | | | | 3,000 | | | | 3,352,500 | |
San Francisco City & County Airports Commission, RB, Series E, 6.00%, 5/01/39 | | | | | 5,065 | | | | 5,762,400 | |
San Francisco City & County Airports Commission, Refunding RB, Second Series A, AMT, 5.25%, 5/01/33 | | | | | 1,440 | | | | 1,478,578 | |
See Notes to Financial Statements.
| ANNUAL REPORT | JULY 31, 2013 | 23
|
| |
| Schedule of Investments (continued) | BlackRock MuniYield California Fund, Inc. (MYC)
(Percentages shown are based on Net Assets)
|
| | | | | | | |
| Municipal Bonds | | | | Par
(000)
| | Value
|
California (concluded) |
Transportation (concluded) | | | | | | | | | | |
San Francisco Port Commission California, RB, Series A, 5.13%, 3/01/40 | | | | $ | 5,050 | | | $ | 5,121,558 | |
San Joaquin County Transportation Authority, Refunding RB, Limited Tax, Measure K, Series A, 6.00%, 3/01/36 | | | | | 2,440 | | | | 2,727,651 | |
| | | | | | | | | 26,367,197 | |
Utilities — 15.1% | | | | | | | | | | |
City of Los Angeles California Wastewater System, Refunding RB, Sub-Series A: | | | | | | | | | | |
5.00%, 6/01/32 | | | | | 3,000 | | | | 3,119,100 | |
5.00%, 6/01/35 | | | | | 8,000 | | | | 8,385,840 | |
City of Petaluma California Wastewater, Refunding RB, 6.00%, 5/01/36 | | | | | 2,645 | | | | 2,962,532 | |
City of Sacramento California, RB, Water Revenue, 5.00%, 9/01/42 | | | | | 2,000 | | | | 2,039,620 | |
Dublin-San Ramon Services District, Refunding RB, 6.00%, 8/01/41 | | | | | 2,420 | | | | 2,719,354 | |
Eastern Municipal Water District, COP, Series H, 5.00%, 7/01/35 | | | | | 8,420 | | | | 8,577,538 | |
Los Angeles Department of Water & Power, RB, Power System, Sub-Series A-1, 5.25%, 7/01/38 | | | | | 3,000 | | | | 3,127,920 | |
Los Angeles Department of Water & Power, Refunding RB, Series A, 5.25%, 7/01/39 | | | | | 4,000 | | | | 4,228,560 | |
Oceanside Public Financing Authority, Refunding RB, Series A (a): | | | | | | | | | | |
5.25%, 5/01/30 | | | | | 1,245 | | | | 1,334,204 | |
5.25%, 5/01/33 | | | | | 2,810 | | | | 2,972,390 | |
San Diego Public Facilities Financing Authority, Refunding RB, Senior Series A: | | | | | | | | | | |
5.25%, 5/15/34 | | | | | 2,000 | | | | 2,114,700 | |
5.38%, 5/15/34 | | | | | 3,910 | | | | 4,198,011 | |
San Francisco City & County California Public Utilities Commission, Refunding RB, Series A, 5.13%, 11/01/39 | | | | | 2,295 | | | | 2,366,466 | |
| | | | | | | | | 48,146,235 | |
Total Municipal Bonds — 96.0% | | | | | | | | | 306,380,863 | |
|
Municipal Bonds Transferred to
Tender Option Bond Trusts (c) | | | | | | | | | | |
California — 72.3% |
County/City/Special District/School District — 31.1% | | | | | | | | | | |
City of Los Angeles California, Refunding RB, Series A, 5.00%, 6/01/39 | | | | | 9,870 | | | | 10,013,115 | |
El Dorado Union High School District, GO, Election of 2008, 5.00%, 8/01/35 | | | | | 5,000 | | | | 5,124,550 | |
Los Angeles Community College District California, GO: | | | | | | | | | | |
Election of 2001, Series E-1, 5.00%, 8/01/33 | | | | | 14,850 | | | | 15,403,905 | |
Election of 2003, Series E (AGM), 5.00%, 8/01/31 | | | | | 10,002 | | | | 10,576,102 | |
Election of 2008, Series C, 5.25%, 8/01/39 (d) | | | | | 9,680 | | | | 10,263,559 | |
Los Angeles Community College District California, GO, Refunding, Election of 2008, Series A, 6.00%, 8/01/33 | | | | | 3,828 | | | | 4,432,082 | |
San Diego Community College District California, GO, Election of 2002, 5.25%, 8/01/33 | | | | | 7,732 | | | | 8,556,901 | |
San Francisco Bay Area Rapid Transit District, Refunding RB, Series A (NPFGC): | | | | | | | | | | |
5.00%, 7/01/30 | | | | | 6,000 | | | | 6,284,700 | |
5.00%, 7/01/34 | | | | | 5,439 | | | | 5,631,969 | |
| | | | | | | | | | | |
Municipal Bonds Transferred to
Tender Option Bond Trusts (c) | | | | Par
(000)
| | Value
|
California (concluded) |
County/City/Special District/School District (concluded) |
San Marcos Unified School District, GO, Election of 2010, Series A, 5.00%, 8/01/38 | | | | $ | 15,520 | | | $ | 15,837,850 | |
Sonoma County Junior College District, GO, Election of 2002, Series B (AGM), 5.00%, 8/01/28 | | | | | 6,875 | | | | 7,249,756 | |
| | | | | | | | | 99,374,489 | |
Education — 14.7% | | | | | | | | | | |
California Educational Facilities Authority, RB, University of Southern California, Series B, 5.25%, 10/01/39 (d) | | | | | 13,845 | | | | 14,788,398 | |
Peralta Community College District, GO, Election of 2000, Series D (AGM), 5.00%, 8/01/30 | | | | | 1,995 | | | | 2,040,386 | |
University of California, RB: | | | | | | | | | | |
Series L, 5.00%, 5/15/36 | | | | | 8,500 | | | | 8,829,460 | |
Series L, 5.00%, 5/15/40 | | | | | 11,597 | | | | 11,820,475 | |
Series O, 5.75%, 5/15/34 | | | | | 2,805 | | | | 3,174,101 | |
University of California, Refunding RB, Limited Project, Series G, 5.00%, 5/15/37 | | | | | 6,160 | | | | 6,367,842 | |
| | | | | | | | | 47,020,662 | |
Health — 3.1% | | | | | | | | | | |
California Health Facilities FInancing Authority, RB, Sutter Health, Series A (BHAC), 5.00%, 11/15/42 | | | | | 10,002 | | | | 9,985,995 | |
Transportation — 1.6% | | | | | | | | | | |
City of Los Angeles California Department of Airports, Refunding RB, Los Angeles International Airport, Senior Series A, 5.00%, 5/15/40 | | | | | 4,999 | | | | 5,073,535 | |
Utilities — 21.8% | | | | | | | | | | |
City of Los Angeles California Wastewater System, Refunding RB, Series A, 5.00%, 6/01/34 | | | | | 7,500 | | | | 7,898,475 | |
Eastern Municipal Water District, COP, Series H, 5.00%, 7/01/33 | | | | | 4,748 | | | | 4,862,551 | |
Los Angeles Department of Water & Power, RB, Power System: | | | | | | | | | | |
Sub-Series A-1 (AMBAC), 5.00%, 7/01/37 | | | | | 15,098 | | | | 15,611,384 | |
Sub-Series A-2 (AGM), 5.00%, 7/01/35 | | | | | 7,250 | | | | 7,585,965 | |
Metropolitan Water District of Southern California, RB: | | | | | | | | | | |
Series A, 5.00%, 7/01/37 | | | | | 20,000 | | | | 20,885,000 | |
Series C, 5.00%, 7/01/35 | | | | | 7,145 | | | | 7,426,065 | |
San Diego County Water Authority, COP, Series A (AGM), 5.00%, 5/01/31 | | | | | 5,010 | | | | 5,176,984 | |
| | | | | | | | | 69,446,424 | |
Total Municipal Bonds Transferred to
Tender Option Bond Trusts — 72.3% | | | | | | | | | 230,901,105 | |
Total Long-Term Investments
(Cost — $521,728,543) — 168.3% | | | | | | | | | 537,281,968 | |
|
Short-Term Securities | | | | | Shares | | | | | |
BIF California Municipal Money Fund, 0.04% (e)(f) | | | | | 4,979,601 | | | | 4,979,601 | |
Total Short-Term Securities
(Cost — $4,979,601) — 1.6% | | | | | | | | | 4,979,601 | |
Total Investments (Cost — $526,708,144) — 169.9% | | | | | | | | | 542,261,569 | |
Liabilities in Excess of Other Assets — (0.1%) | | | | | | | | | (392,502 | ) |
Liability for TOB Trust Certificates, Including Interest Expense and Fees Payable — (36.6%) | | | | | | | | | (116,824,861 | ) |
VRDP Shares, at Liquidation Value — (33.2%) | | | | | | | | | (105,900,000 | ) |
Net Assets Applicable to Common Shares — 100.0% | | | | | | | | $ | 319,144,206 | |
See Notes to Financial Statements.
| 24 | ANNUAL REPORT | JULY 31, 2013
|
| |
| Schedule of Investments (concluded) | BlackRock MuniYield California Fund, Inc. (MYC)
|
Notes to Schedule of Investments
| (a) | | | | When-issued security. Unsettled when-issued transactions were as follows: |
Counterparty
|
|
|
| Value
|
| Unrealized
Depreciation
|
Royal Bank of Canada | | | | $ | 4,628,430 | | | $ | (54,810 | ) |
Stifel Nicolaus & Co. | | | | $ | 4,306,594 | | | $ | (84,151 | ) |
| (b) | | | | Represents a zero-coupon bond. Rate shown reflects the current yield as of report date. |
| (c) | | | | Securities represent bonds transferred to a TOB in exchange for which the Fund acquired residual interest certificates. These securities serve as collateral in a financing transaction. See Note 3 of the Notes to Financial Statements for details of municipal bonds transferred to TOBs. |
| (d) | | | | All or a portion of security is subject to a recourse agreement, which may require the Fund to pay the Liquidity Provider in the event there is a shortfall between the TOB trust certificates and proceeds received from the sale of the security contributed to the TOB trust. In the case of a shortfall, the aggregate maximum potential amount the Fund could ultimately be required to pay under the agreements, which expire from 10/01/16 to 8/01/18, is $14,704,685. |
| (e) | | | | Investments in issuers considered to be an affiliate of the Fund during the year, for purposes of Section 2(a)(3) of the 1940 Act, as amended, were as follows: |
Affiliate
|
|
|
| Shares
Held at
July 31, 2012
|
| Net
Activity
|
| Shares
Held at
July 31, 2013
|
| Income
|
BIF California Municipal Money Fund | | | | | 3,043,312 | | | | 1,936,289 | | | | 4,979,601 | | | $ | 12 | |
| (f) | | | | Represents the current yield as of report date. |
| • | | | | For Fund compliance purposes, the Fund’s sector classifications refer to any one or more of the sector sub-classifications used by one or more widely recognized market indexes or rating group indexes, and/or as defined by Fund management. These definitions may not apply for purposes of this report, which may combine such sector sub-classifications for reporting ease. |
| • | | | | Fair Value Measurements — Various inputs are used in determining the fair value of investments. These inputs to valuation techniques are categorized into a disclosure hierarchy consisting of three broad levels for financial statement purposes as follows: |
| • | | | | Level 1 — unadjusted price quotations in active markets/exchanges for identical assets or liabilities that the Fund has the ability to access |
| • | | | | Level 2 — other observable inputs (including, but not limited to, quoted prices for similar assets or liabilities in markets that are active, quoted prices for identical or similar assets or liabilities in markets that are not active, inputs other than quoted prices that are observable for the assets or liabilities (such as interest rates, yield curves, volatilities, prepayment speeds, loss severities, credit risks and default rates) or other market-corroborated inputs) |
| • | | | | Level 3 — unobservable inputs based on the best information available in the circumstances, to the extent observable inputs are not available (including the Fund’s own assumptions used in determining the fair value of investments) |
| | | | | The hierarchy gives the highest priority to unadjusted quoted prices in active markets for identical assets or liabilities (Level 1 measurements) and the lowest priority to unobservable inputs (Level 3 measurements). Accordingly, the degree of judgment exercised in determining fair value is greatest for instruments categorized in Level 3. The inputs used to measure fair value may fall into different levels of the fair value hierarchy. In such cases, for disclosure purposes, the fair value hierarchy classification is determined based on the lowest level input that is significant to the fair value measurement in its entirety. |
| | | | | Changes in valuation techniques may result in transfers into or out of an assigned level within the disclosure hierarchy. In accordance with the Fund’s policy, transfers between different levels of the fair value disclosure hierarchy are deemed to have occurred as of the beginning of the reporting period. The categorization of a value determined for investments is based on the pricing transparency of the investment and is not necessarily an indication of the risks associated with investing in those securities. For information about the Fund’s policy regarding valuation of investments, please refer to Note 2 of the Notes to Financial Statements. |
| | | | | The following table summarizes the Fund’s investments categorized in the disclosure hierarchy as of July 31, 2013: |
|
|
|
| Level 1
|
| Level 2
|
| Level 3
|
| Total
|
Assets:
| | | | | | | | | | | | | | | | | | |
Investments:
| | | | | | | | | | | | | | | | | | |
Long-Term Investments 1 | | | | | — | | | $ | 537,281,968 | | | | — | | | $ | 537,281,968 | |
Short-Term Securities | | | | $ | 4,979,601 | | | | — | | | | — | | | | 4,979,601 | |
Total
| | | | $ | 4,979,601 | | | $ | 537,281,968 | | | | — | | | $ | 542,261,569 | |
| 1 | See above Schedule of Investments for values in each sector. |
Certain of the Fund’s liabilities are held at carrying amount, which approximates fair value for financial statement purposes. As of July 31, 2013, such liabilities are categorized within the disclosure hierarchy as follows:
|
|
|
| Level 1
|
| Level 2
|
| Level 3
|
| Total
|
Liabilities:
| | | | | | | | | | | | | | | | | | |
Bank overdraft | | | | | — | | | $ | (7,947 | ) | | | — | | | $ | (7,947 | ) |
TOB trust certificates | | | | | — | | | | (116,774,796 | ) | | | — | | | | (116,774,796 | ) |
VRDP Shares | | | | | — | | | | (105,900,000 | ) | | | — | | | | (105,900,000 | ) |
Total
| | | | | — | | | $ | (222,682,743 | ) | | | — | | | $ | (222,682,743 | ) |
There were no transfers between levels during the year ended July 31, 2013.
See Notes to Financial Statements.
| ANNUAL REPORT | JULY 31, 2013 | 25
|
| |
| Schedule of Investments July 31, 2013 | BlackRock MuniYield Investment Fund (MYF)
(Percentages shown are based on Net Assets)
|
| | | | | | | |
| Municipal Bonds | | | | Par
(000) | | Value |
Alabama — 2.1% |
Alabama Incentives Financing Authority, RB, Series A, 5.00%, 9/01/42 | | | | $ | 1,950 | | | $ | 1,958,405 | |
Birmingham Water Works Board, RB, Series B, 5.00%, 1/01/38 | | | | | 550 | | | | 554,499 | |
Courtland IDB, Refunding RB, International Paper Co. Projects, Series A, AMT, 5.20%, 6/01/25 | | | | | 1,000 | | | | 1,015,640 | |
Selma IDB, RB, International Paper Co. Project, Series A, 5.38%, 12/01/35 | | | | | 545 | | | | 545,501 | |
| | | | | | | | | 4,074,045 | |
Alaska — 0.8% | | | | | | | | | | |
Alaska Municipal Bond Bank Authority, RB, Series 1, 5.75%, 9/01/33 | | | | | 1,000 | | | | 1,108,170 | |
Northern Tobacco Securitization Corp., Refunding RB, Tobacco Settlement, Asset-Backed, Series A, 5.00%, 6/01/46 | | | | | 690 | | | | 502,444 | |
| | | | | | | | | 1,610,614 | |
California — 10.9% | | | | | | | | | | |
California Educational Facilities Authority, RB, University of Southern California, Series A, 5.25%, 10/01/38 | | | | | 2,740 | | | | 2,914,675 | |
California Health Facilities Financing Authority, RB, Sutter Health, Series B, 6.00%, 8/15/42 | | | | | 1,645 | | | | 1,846,381 | |
California Health Facilities Financing Authority, Refunding RB, Catholic Healthcare West, Series A, 6.00%, 7/01/39 | | | | | 710 | | | | 804,302 | |
City of San Jose California, Refunding ARB, Series A-1, AMT, 5.50%, 3/01/30 | | | | | 1,500 | | | | 1,571,850 | |
Grossmont Union High School District, GO, Election of 2008, Series B, 4.75%, 8/01/45 | | | | | 2,230 | | | | 2,208,257 | |
Los Angeles Department of Water & Power, RB, Power System, Sub-Series A-1, 5.25%, 7/01/38 | | | | | 3,600 | | | | 3,753,504 | |
Sacramento Municipal Utility District, RB, Series A, 5.00%, 8/15/37 | | | | | 1,695 | | | | 1,731,205 | |
San Diego Regional Building Authority California, RB, County Operations Center & Annex, Series A, 5.38%, 2/01/36 | | | | | 1,310 | | | | 1,412,953 | |
San Francisco City & County Airports Commission, Refunding RB, Second Series A, AMT: | | | | | | | | | | |
5.50%, 5/01/28 | | | | | 1,065 | | | | 1,135,237 | |
5.25%, 5/01/33 | | | | | 830 | | | | 852,236 | |
State of California, GO, Various Purposes, 6.00%, 3/01/33 | | | | | 2,535 | | | | 2,891,877 | |
| | | | | | | | | 21,122,477 | |
Colorado — 1.6% | | | | | | | | | | |
City & County of Denver Colorado, ARB, Airport System, Series A, AMT: | | | | | | | | | | |
5.50%, 11/15/28 | | | | | 1,000 | | | | 1,046,310 | |
5.50%, 11/15/30 | | | | | 330 | | | | 340,973 | |
5.50%, 11/15/31 | | | | | 400 | | | | 411,684 | |
Regional Transportation District, RB, Fastracks Project, Series A, 5.00%, 11/01/37 | | | | | 1,265 | | | | 1,312,336 | |
| | | | | | | | | 3,111,303 | |
Florida — 8.2% | | | | | | | | | | |
County of Escambia Florida, Refunding RB, International Paper Co., Series B, AMT, 5.00%, 8/01/26 | | | | | 600 | | | | 591,768 | |
County of Lee Florida, Refunding RB, Series A, AMT, 5.38%, 10/01/32 | | | | | 2,000 | | | | 2,024,680 | |
County of Miami-Dade Florida, Refunding RB, Water & Sewer System, Series B, 5.25%, 10/01/29 (a) | | | | | 2,795 | | | | 2,978,436 | |
County of Miami-Dade Florida Aviation, Refunding RB, Series A, AMT, 5.00%, 10/01/31 | | | | | 2,440 | | | | 2,394,152 | |
County of Osceola Florida School Board, COP, Refunding, Series A, 5.00%, 6/01/28 | | | | | 675 | | | | 699,367 | |
Hillsborough County IDA, RB, National Gypsum Co., AMT: | | | | | | | | | | |
Series A, 7.13%, 4/01/30 | | | | | 2,500 | | | | 2,499,875 | |
Series B, 7.13%, 4/01/30 | | | | | 2,290 | | | | 2,289,863 | |
| | | | | | | | | | | |
| Municipal Bonds | | | | Par
(000) | | Value |
Florida (concluded) | | | | | | | | | | |
Jacksonville Florida Port Authority, Refunding RB, AMT, 5.00%, 11/01/38 | | | | $ | 225 | | | $ | 219,004 | |
JEA Florida Electric System, Refunding RB, Sub-Series C, 5.00%, 10/01/37 | | | | | 1,790 | | | | 1,825,496 | |
Manatee County Housing Finance Authority, RB, Series A, AMT (Fannie Mae), 5.90%, 9/01/40 | | | | | 380 | | | | 392,293 | |
| | | | | | | | | 15,914,934 | |
Georgia — 0.5% | | | | | | | | | | |
Municipal Electric Authority of Georgia, Refunding RB, Project One, Sub-Series D, 6.00%, 1/01/23 | | | | | 880 | | | | 1,034,748 | |
Illinois — 13.9% | | | | | | | | | | |
Chicago Illinois Board of Education, GO, Series A, 5.50%, 12/01/39 | | | | | 1,815 | | | | 1,872,354 | |
Chicago Illinois Transit Authority, RB, Sales Tax Receipts Revenue, 5.25%, 12/01/36 | | | | | 615 | | | | 629,539 | |
City of Chicago Illinois, GARB, O’Hare International Airport, Third Lien, Series C, 6.50%, 1/01/41 | | | | | 6,065 | | | | 7,140,142 | |
City of Chicago Illinois, Refunding RB: | | | | | | | | | | |
Sales Tax Revenue, Series A, 5.25%, 1/01/38 | | | | | 765 | | | | 797,176 | |
Second Lien, Water Project, 5.00%, 11/01/42 | | | | | 1,545 | | | | 1,521,531 | |
Illinois Finance Authority, RB: | | | | | | | | | | |
Carle Foundation, Series A, 6.00%, 8/15/41 | | | | | 4,000 | | | | 4,339,120 | |
University of Chicago, Series B, 5.50%, 7/01/37 | | | | | 1,000 | | | | 1,072,170 | |
Illinois Finance Authority, Refunding RB: | | | | | | | | | | |
Central DuPage Health, Series B, 5.38%, 11/01/39 | | | | | 1,200 | | | | 1,224,444 | |
Northwestern Memorial Hospital, Series A, 6.00%, 8/15/39 | | | | | 4,160 | | | | 4,657,369 | |
Northwestern Memorial Healthcare, 5.00%, 8/15/37 | | | | | 450 | | | | 457,848 | |
Railsplitter Tobacco Settlement Authority, RB: | | | | | | | | | | |
5.50%, 6/01/23 | | | | | 1,370 | | | | 1,522,947 | |
6.00%, 6/01/28 | | | | | 390 | | | | 425,545 | |
State of Illinois, GO: | | | | | | | | | | |
5.50%, 7/01/33 | | | | | 1,000 | | | | 1,012,910 | |
5.50%, 7/01/38 | | | | | 415 | | | | 418,449 | |
| | | | | | | | | 27,091,544 | |
Indiana — 4.7% | | | | | | | | | | |
Indiana Finance Authority, RB, Private Activity Bonds, Ohio River Bridges East End Crossing Project, Series A, AMT, 5.00%, 7/01/44 | | | | | 555 | | | | 496,597 | |
Indiana Municipal Power Agency, RB, Series B, 6.00%, 1/01/39 | | | | | 4,525 | | | | 5,083,385 | |
Indianapolis Local Public Improvement Bond Bank, RB, Series F, 5.25%, 2/01/36 | | | | | 3,360 | | | | 3,527,631 | |
| | | | | | | | | 9,107,613 | |
Kansas — 1.8% | | | | | | | | | | |
Kansas Development Finance Authority, Refunding RB, Adventist Health System/Sunbelt Obligated Group, Series C, 5.50%, 11/15/29 | | | | | 3,275 | | | | 3,517,317 | |
Kentucky — 1.4% | | | | | | | | | | |
Kentucky Economic Development Finance Authority, RB, Owensboro Medical Health System, Series A, 6.38%, 6/01/40 | | | | | 1,300 | | | | 1,375,309 | |
Louisville & Jefferson County Metropolitan Government Parking Authority, RB, Series A, 5.75%, 12/01/34 | | | | | 1,200 | | | | 1,367,040 | |
| | | | | | | | | 2,742,349 | |
Louisiana — 2.4% | | | | | | | | | | |
Louisiana Local Government Environmental Facilities & Community Development Authority, RB, Westlake Chemical Corp. Project, Series A-1, 6.50%, 11/01/35 | | | | | 1,420 | | | | 1,498,597 | |
Terrebonne Levee & Conservation District, RB, Sales Tax, 5.00%, 7/01/38 | | | | | 730 | | | | 721,766 | |
See Notes to Financial Statements.
| 26 | ANNUAL REPORT | JULY 31, 2013
|
| |
| Schedule of Investments (continued) | BlackRock MuniYield Investment Fund (MYF)
(Percentages shown are based on Net Assets)
|
| | | | | | | |
| Municipal Bonds | | | | Par
(000) | | Value |
Louisiana (concluded) | | | | | | | | | | |
Tobacco Settlement Financing Corp., Refunding RB, Series A: | | | | | | | | | | |
5.50%, 5/15/28 | | | | $ | 1,120 | | | $ | 1,184,478 | |
5.50%, 5/15/29 | | | | | 1,195 | | | | 1,254,595 | |
| | | | | | | | | 4,659,436 | |
Maine — 1.5% | | | | | | | | | | |
Maine Health & Higher Educational Facilities Authority, RB, Maine General Medical Center, 7.50%, 7/01/32 | | | | | 2,500 | | | | 2,985,550 | |
Massachusetts — 4.0% | | | | | | | | | | |
Massachusetts HFA, Refunding HRB, AMT: | | | | | | | | | | |
Series B, 5.50%, 6/01/41 | | | | | 3,000 | | | | 3,075,240 | |
Series C, 5.35%, 12/01/42 | | | | | 1,630 | | | | 1,665,078 | |
Series F, 5.70%, 6/01/40 | | | | | 1,995 | | | | 2,054,810 | |
Massachusetts School Building Authority, RB, Dedicated Sales Tax Revenue, Senior Series A, 5.00%, 5/15/43 | | | | | 955 | | | | 992,407 | |
| | | | | | | | | 7,787,535 | |
Michigan — 2.9% | | | | | | | | | | |
Lansing Board of Water & Light Utilities System, RB, Series A, 5.50%, 7/01/41 | | | | | 1,805 | | | | 1,926,495 | |
Michigan State Building Authority, Refunding RB, Series I, 6.00%, 10/15/38 | | | | | 1,250 | | | | 1,408,900 | |
Royal Oak Hospital Finance Authority, Refunding RB, William Beaumont Hospital, 8.25%, 9/01/39 | | | | | 1,970 | | | | 2,378,420 | |
| | | | | | | | | 5,713,815 | |
Mississippi — 3.7% | | | | | | | | | | |
Mississippi Development Bank, RB, Jackson Water & Sewer System Project (AGM), 6.88%, 12/01/40 | | | | | 1,220 | | | | 1,420,983 | |
Mississippi Development Bank, Refunding RB, Series A: | | | | | | | | | | |
Jackson Mississippi Water & Sewer System (AGM), 5.00%, 9/01/30 | | | | | 3,010 | | | | 3,141,627 | |
Jackson Public School District Project, 5.00%, 4/01/28 | | | | | 1,500 | | | | 1,533,375 | |
University of Southern Mississippi, Refunding RB, S.M. Educational Building Corp., Residence Hall Construction Project: | | | | | | | | | | |
5.00%, 3/01/33 | | | | | 410 | | | | 425,478 | |
5.00%, 3/01/38 | | | | | 560 | | | | 572,387 | |
| | | | | | | | | 7,093,850 | |
Missouri — 0.2% | | | | | | | | | | |
The Bi-State Development Agency of the Missouri-Illinois Metropolitan District, Refunding RB, Combined Lien, Series A, 5.00%, 10/01/28 (a) | | | | | 445 | | | | 470,245 | |
Nevada — 3.5% | | | | | | | | | | |
City of Las Vegas Nevada, GO, Limited Tax, Performing Arts Center, 6.00%, 4/01/34 | | | | | 2,850 | | | | 3,095,641 | |
County of Clark Nevada, RB, Series B, 5.75%, 7/01/42 | | | | | 3,375 | | | | 3,666,904 | |
| | | | | | | | | 6,762,545 | |
New Jersey — 3.9% | | | | | | | | | | |
New Jersey EDA, Refunding RB, New Jersey American Water Co., Inc. Project, Series A, AMT, 5.70%, 10/01/39 | | | | | 2,250 | | | | 2,366,617 | |
New Jersey Transportation Trust Fund Authority, RB, Transportation System, Series A, 5.88%, 12/15/38 | | | | | 2,670 | | | | 2,981,055 | |
Rutgers State University of New Jersey, Refunding RB: | | | | | | | | | | |
Series J, 5.00%, 5/01/32 | | | | | 1,250 | | | | 1,324,113 | |
Series L, 5.00%, 5/01/32 | | | | | 775 | | | | 820,950 | |
| | | | | | | | | 7,492,735 | |
New York — 2.1% | | | | | | | | | | |
New York City Municipal Water Finance Authority, Refunding RB, Second General Resolution, Fiscal 2012, Series BB, 5.25%, 6/15/44 | | | | | 2,610 | | | | 2,722,961 | |
| | | | | | | | | | | |
| Municipal Bonds | | | | Par
(000) | | Value |
New York (concluded) | | | | | | | | | | |
New York Liberty Development Corp., Refunding RB, Second Priority, Bank of America Tower at One Bryant Park Project, 6.38%, 7/15/49 | | | | $ | 1,200 | | | $ | 1,304,520 | |
| | | | | | | | | 4,027,481 | |
Ohio — 1.0% | | | | | | | | | | |
Ohio Higher Educational Facility Commission, Refunding RB, Kenyon College Project, 5.00%, 7/01/37 | | | | �� | 280 | | | | 280,857 | |
Ohio State Turnpike Commission, RB, Junior Lien Infrastructure Projects, Series A-1 (a): | | | | | | | | | | |
5.25%, 2/15/30 | | | | | 750 | | | | 792,030 | |
5.25%, 2/15/31 | | | | | 750 | | | | 788,467 | |
| | | | | | | | | 1,861,354 | |
Pennsylvania — 3.6% | | | | | | | | | | |
Pennsylvania Economic Development Financing Authority, RB, American Water Co. Project, 6.20%, 4/01/39 | | | | | 1,075 | | | | 1,165,655 | |
Pennsylvania Turnpike Commission, RB, Sub-Series A: | | | | | | | | | | |
5.63%, 12/01/31 | | | | | 2,455 | | | | 2,625,720 | |
6.00%, 12/01/41 | | | | | 3,000 | | | | 3,273,780 | |
| | | | | | | | | 7,065,155 | |
Puerto Rico — 1.4% | | | | | | | | | | |
Puerto Rico Sales Tax Financing Corp., RB, First Sub-Series A, 6.00%, 8/01/42 | | | | | 1,000 | | | | 998,630 | |
Puerto Rico Sales Tax Financing Corp., Refunding RB, Senior Series C, 5.25%, 8/01/40 | | | | | 1,750 | | | | 1,676,973 | |
| | | | | | | | | 2,675,603 | |
Texas — 10.8% | | | | | | | | | | |
Central Texas Regional Mobility Authority, Refunding RB, Senior Lien: | | | | | | | | | | |
5.75%, 1/01/31 | | | | | 1,000 | | | | 1,060,570 | |
6.00%, 1/01/41 | | | | | 2,600 | | | | 2,756,052 | |
Series A, 5.00%, 1/01/33 | | | | | 425 | | | | 415,174 | |
City of Beaumont Texas, GO, Certificates of Obligation, 5.25%, 3/01/37 (a) | | | | | 1,555 | | | | 1,637,493 | |
City of Brownsville Texas Utilities System, Refunding RB, Series A, 5.00%, 9/01/29 | | | | | 1,230 | | | | 1,286,924 | |
Conroe ISD Texas, GO, School Building, Series A, 5.75%, 2/15/35 | | | | | 1,800 | | | | 2,006,442 | |
Dallas-Fort Worth International Airport, ARB, Series H, AMT, 5.00%, 11/01/42 | | | | | 2,900 | | | | 2,738,267 | |
Dallas-Fort Worth International Airport, RB, Joint Improvement, Series D, AMT, 5.00%, 11/01/38 | | | | | 900 | | | | 855,378 | |
Lower Colorado River Authority, Refunding RB, Series A, 5.00%, 5/15/29 | | | | | 1,000 | | | | 1,044,020 | |
North Texas Tollway Authority, Refunding RB, First Tier, Series K-1 (AGC), 5.75%, 1/01/38 | | | | | 1,000 | | | | 1,058,470 | |
Tarrant County Cultural Education Facilities Finance Corp., RB, Scott & White Healthcare, 6.00%, 8/15/45 | | | | | 3,795 | | | | 4,208,617 | |
Texas Private Activity Bond Surface Transportation Corp., RB, Senior Lien, NTE Mobility Partners LLC, North Tarrant Express Managed Lanes Project, 6.88%, 12/31/39 | | | | | 1,700 | | | | 1,904,697 | |
| | | | | | | | | 20,972,104 | |
Virginia — 2.1% | | | | | | | | | | |
Lexington IDA, RB, Washington & Lee University, 5.00%, 1/01/43 | | | | | 560 | | | | 580,210 | |
Virginia Public School Authority, RB, School Financing, 6.50%, 12/01/18 (b) | | | | | 800 | | | | 1,007,336 | |
Virginia Small Business Financing Authority, RB, Senior Lien, Elizabeth River Crossings OPCO, LLC Project, AMT, 6.00%, 1/01/37 | | | | | 2,440 | | | | 2,458,276 | |
| | | | | | | | | 4,045,822 | |
See Notes to Financial Statements.
| ANNUAL REPORT | JULY 31, 2013 | 27
|
| |
| Schedule of Investments (continued) | BlackRock MuniYield Investment Fund (MYF)
(Percentages shown are based on Net Assets)
|
| | | | | | | |
| Municipal Bonds | | | | Par
(000) | | Value |
Washington — 0.9% | | | | | | | | | | |
Spokane Public Facilities District, RB, Hotel/Motel & Sales/Use Tax, Series A, 5.00%, 12/01/38 | | | | $ | 1,830 | | | $ | 1,816,879 | |
Wisconsin — 1.8% | | | | | | | | | | |
Wisconsin Health & Educational Facilities Authority, Refunding RB, Froedtert & Community Health, Inc., Series C, 5.25%, 4/01/39 | | | | | 3,470 | | | | 3,544,709 | |
Total Municipal Bonds — 91.7% | | | | | | | | | 178,301,762 | |
|
Municipal Bonds Transferred to
Tender Option Bond Trusts (c)
|
California — 21.7% | | | | | | | | | | |
Bay Area Toll Authority, Refunding RB, San Francisco Bay Area, Series F-1, 5.63%, 4/01/44 | | | | | 2,680 | | | | 2,876,707 | |
California Educational Facilities Authority, RB, University of Southern California, Series B, 5.25%, 10/01/39 (d) | | | | | 4,200 | | | | 4,486,188 | |
Grossmont Union High School District, GO, Election of 2008, Series B, 5.00%, 8/01/40 | | | | | 6,000 | | | | 6,149,460 | |
Los Angeles Community College District California, GO, Election of 2008, Series C, 5.25%, 8/01/39 (d) | | | | | 5,250 | | | | 5,566,496 | |
Los Angeles Community College District California, GO, Refunding, Election of 2008, Series A, 6.00%, 8/01/33 | | | | | 7,697 | | | | 8,910,452 | |
Los Angeles Unified School District California, GO, Series I, 5.00%, 1/01/34 | | | | | 790 | | | | 804,188 | |
San Diego Public Facilities Financing Authority, Refunding RB, Series B, 5.50%, 8/01/39 | | | | | 8,412 | | | | 9,033,337 | |
University of California, RB, Series O, 5.75%, 5/15/34 | | | | | 3,000 | | | | 3,394,760 | |
University of California, Refunding RB, Limited Project, Series G, 5.00%, 5/15/37 | | | | | 1,000 | | | | 1,033,740 | |
| | | | | | | | | 42,255,328 | |
Colorado — 1.2% | | | | | | | | | | |
Colorado Health Facilities Authority, Refunding RB, Catholic Healthcare, Series A, 5.50%, 7/01/34 (d) | | | | | 2,149 | | | | 2,316,957 | |
District of Columbia — 3.6% | | | | | | | | | | |
District of Columbia, RB, Series A, 5.50%, 12/01/30 (d) | | | | | 2,805 | | | | 3,143,610 | |
District of Columbia Water & Sewer Authority, Refunding RB, Series A, 5.50%, 10/01/39 | | | | | 3,507 | | | | 3,767,000 | |
| | | | | | | | | 6,910,610 | |
Florida — 3.1% | | | | | | | | | | |
County of Miami-Dade Florida, Refunding RB, Transit System, Sales Surtax, 5.00%, 7/01/42 | | | | | 980 | | | | 991,211 | |
Hillsborough County Aviation Authority, RB, Series A, AMT (AGC), 5.50%, 10/01/38 | | | | | 3,869 | | | | 4,086,647 | |
Lee County Housing Finance Authority, RB, Multi-County Program, Series A-2, AMT (Ginnie Mae), 6.00%, 9/01/40 | | | | �� | 840 | | | | 878,791 | |
| | | | | | | | | 5,956,649 | |
Illinois — 4.8% | | | | | | | | | | |
Illinois Finance Authority, RB, University of Chicago, Series B, 6.25%, 7/01/38 | | | | | 5,300 | | | | 5,880,933 | |
Illinois State Toll Highway Authority, RB: | | | | | | | | | | |
Series A, 5.00%, 1/01/38 | | | | | 1,479 | | | | 1,496,570 | |
Series B, 5.50%, 1/01/33 | | | | | 1,750 | | | | 1,884,761 | |
| | | | | | | | | 9,262,264 | |
Massachusetts — 1.6% | | | | | | | | | | |
Massachusetts School Building Authority, RB, Dedicated Sales Tax Revenue, Senior Series B, 5.00%, 10/15/41 | | | | | 2,950 | | | | 3,054,165 | |
Nevada — 9.5% | | | | | | | | | | |
Clark County Water Reclamation District, GO: | | | | | | | | | | |
Limited Tax, 6.00%, 7/01/38 | | | | | 5,000 | | | | 5,660,050 | |
Series B, 5.50%, 7/01/29 | | | | | 5,668 | | | | 6,432,299 | |
| | | | | | | | | | | |
Municipal Bonds Transferred to
Tender Option Bond Trusts (c) | | | | Par
(000) | | Value |
Nevada (concluded) | | | | | | | | | | |
Las Vegas Valley Water District, GO, Refunding, Series C, 5.00%, 6/01/28 | | | | $ | 6,070 | | | $ | 6,440,877 | |
| | | | | | | | | 18,533,226 | |
New Hampshire — 1.2% | | | | | | | | | | |
New Hampshire Health & Education Facilities Authority, RB, Dartmouth College, 5.25%, 6/01/39 (d) | | | | | 2,159 | | | | 2,318,479 | |
New Jersey — 3.9% | | | | | | | | | | |
New Jersey State Housing & Mortgage Finance Agency, RB, S/F Housing, Series CC, 5.25%, 10/01/29 | | | | | 2,251 | | | | 2,346,639 | |
New Jersey Transportation Trust Fund Authority, RB, Transportation System: | | | | | | | | | | |
Series A (AGM), 5.00%, 12/15/32 | | | | | 4,000 | | | | 4,157,960 | |
Series B, 5.25%, 6/15/36 (d) | | | | | 1,000 | | | | 1,038,681 | |
| | | | | | | | | 7,543,280 | |
New York — 14.7% | | | | | | | | | | |
Hudson New York Yards Infrastructure Corp., RB, Fiscal 2012, Senior Series A, 5.75%, 2/15/47 (d) | | | | | 1,290 | | | | 1,369,484 | |
New York City Municipal Water Finance Authority, Refunding RB: | | | | | | | | | | |
Second General Resolution, Fiscal 2012, Series BB, 5.25%, 6/15/44 | | | | | 4,408 | | | | 4,598,998 | |
Series FF, 5.00%, 6/15/45 | | | | | 3,859 | | | | 3,958,689 | |
Series FF-2, 5.50%, 6/15/40 | | | | | 2,504 | | | | 2,727,350 | |
New York City Transitional Finance Authority, BARB, Fiscal 2009, Series S-3, 5.25%, 1/15/39 | | | | | 2,499 | | | | 2,601,481 | |
New York Liberty Development Corp., RB, 1 World Trade Center Port Authority Construction, 5.25%, 12/15/43 | | | | | 4,365 | | | | 4,535,341 | |
New York Liberty Development Corp., Refunding RB, 4 World Trade Center Project, 5.75%, 11/15/51 (d) | | | | | 2,560 | | | | 2,771,789 | |
New York State Dormitory Authority, ERB, Series B, 5.25%, 3/15/38 | | | | | 5,700 | | | | 5,958,894 | |
| | | | | | | | | 28,522,026 | |
Ohio — 1.6% | | | | | | | | | | |
County of Allen Ohio, Refunding RB, Catholic Healthcare, Series A, 5.25%, 6/01/38 | | | | | 3,120 | | | | 3,182,556 | |
South Carolina — 1.8% | | | | | | | | | | |
South Carolina State Public Service Authority, Refunding RB, Santee Cooper, Series A, 5.50%, 1/01/38 (d) | | | | | 3,240 | | | | 3,476,358 | |
Texas — 8.7% | | | | | | | | | | |
City of San Antonio Texas, Refunding RB, Electric & Gas Systems, Series A, 5.25%, 2/01/31 (d) | | | | | 3,989 | | | | 4,410,331 | |
Harris County Cultural Education Facilities Finance Corp., RB, Texas Children’s Hospital Project, 5.50%, 10/01/39 | | | | | 5,400 | | | | 5,841,018 | |
North Texas Tollway Authority, RB, Special Project System, Series A, 5.50%, 9/01/41 | | | | | 3,480 | | | | 3,725,653 | |
Waco Educational Finance Corp., Refunding RB, Baylor University, 5.00%, 3/01/43 | | | | | 3,000 | | | | 3,035,370 | |
| | | | | | | | | 17,012,372 | |
Utah — 1.0% | | | | | | | | | | |
City of Riverton Utah Hospital, RB, IHC Health Services, Inc., 5.00%, 8/15/41 | | | | | 1,995 | | | | 1,994,475 | |
Virginia — 0.9% | | | | | | | | | | |
County of Fairfax Virginia IDA, Refunding RB, Inova Health System, Series A, 5.50%, 5/15/35 | | | | | 1,749 | | | | 1,852,438 | |
Washington — 1.5% | | | | | | | | | | |
University of Washington, Refunding RB, Series A, 5.00%, 7/01/41 | | | | | 2,744 | | | | 2,842,173 | |
Total Municipal Bonds Transferred to
Tender Option Bond Trusts — 80.8% | | | | | | | | | 157,033,356 | |
Total Long-Term Investments
(Cost — $323,573,007) — 172.5% | | | | | | | | | 335,335,118 | |
See Notes to Financial Statements.
| 28 | ANNUAL REPORT | JULY 31, 2013
|
| |
| Schedule of Investments (continued) | BlackRock MuniYield Investment Fund (MYF)
(Percentages shown are based on Net Assets)
|
Short-Term Securities | | | | Shares | | Value |
FFI Institutional Tax-Exempt Fund, 0.03% (e)(f) | | | | | 7,703,960 | | | $ | 7,703,960 | |
Total Short-Term Securities
(Cost — $7,703,960) — 4.0% | | | | | | | | | 7,703,960 | |
Total Investments (Cost — $331,276,967) — 176.5% | | | | | | | | | 343,039,078 | |
Liabilities in Excess of Other Assets — (2.1%) | | | | | | | | | (4,255,455 | ) |
Liability for TOB Trust Certificates, Including Interest Expense and Fees Payable — (43.8%) | | | | | | | | | (85,066,808 | ) |
VRDP Shares, at Liquidation Value — (30.6%) | | | | | | | | | (59,400,000 | ) |
Net Assets Applicable to Common Shares — 100.0% | | | | | | | | $ | 194,316,815 | |
Notes to Schedule of Investments
| (a) | | | | When-issued security. Unsettled when-issued transactions were as follows: |
Counterparty
|
|
|
| Value
|
| Unrealized
Appreciation
(Depreciation)
|
Citigroup Global Markets | | | | $ | 1,580,497 | | | $ | 2,010 | |
Morgan Stanley Co. | | | | $ | 2,978,436 | | | $ | (35,552 | ) |
Royal Bank of Canada | | | | $ | 470,245 | | | $ | (5,380 | ) |
Wells Fargo | | | | $ | 1,637,493 | | | $ | 6,578 | |
| (b) | | | | US government securities, held in escrow, are used to pay interest on this security, as well as to retire the bond in full at the date indicated, typically at a premium to par. |
| (c) | | | | Securities represent bonds transferred to a TOB in exchange for which the Fund acquired residual interest certificates. These securities serve as collateral in a financing transaction. See Note 3 of the Notes to Financial Statements for details of municipal bonds transferred to TOBs. |
| (d) | | | | All or a portion of security is subject to a recourse agreement, which may require the Fund to pay the Liquidity Provider in the event there is a shortfall between the TOB trust certificates and proceeds received from the sale of the security contributed to the TOB trust. In the case of a shortfall, the aggregate maximum potential amount the Fund could ultimately be required to pay under the agreements, which expire from 10/1/16 to 11/15/19 is $18,095,736. |
| (e) | | | | Investments in issuers considered to be an affiliate of the Fund during the year July 31, 2013, for purposes of Section 2(a)(3) of the 1940 Act, as amended, were as follows: |
Affiliate
|
|
|
| Shares
Held at
July 31, 2012
|
| Net
Activity
|
| Shares
Held at
July 31, 2013
|
| Income
|
FFI Institutional Tax-Exempt Fund | | | | | 176,582 | | | | 7,527,378 | | | | 7,703,960 | | | $ | 520 | |
| (f) | | | | Represents the current yield as of report date. |
| • | | | | For Fund compliance purposes, the Fund’s sector classifications refer to any one or more of the sector sub-classifications used by one or more widely recognized market indexes or rating group indexes, and/or as defined by Fund management. These definitions may not apply for purposes of this report, which may combine such sector sub-classifications for reporting ease. |
| • | | | | Fair Value Measurements — Various inputs are used in determining the fair value of investments. These inputs to valuation techniques are categorized into a disclosure hierarchy consisting of three broad levels for financial statement purposes as follows: |
| • | | | | Level 1 — unadjusted price quotations in active markets/exchanges for identical assets or liabilities that the Fund has the ability to access |
| • | | | | Level 2 — other observable inputs (including, but not limited to, quoted prices for similar assets or liabilities in markets that are active, quoted prices for identical or similar assets or liabilities in markets that are not active, inputs other than quoted prices that are observable for the assets or liabilities (such as interest rates, yield curves, volatilities, prepayment speeds, loss severities, credit risks and default rates) or other market-corroborated inputs) |
| • | | | | Level 3 — unobservable inputs based on the best information available in the circumstances, to the extent observable inputs are not available (including the Fund’s own assumptions used in determining the fair value of investments) |
| | | | | The hierarchy gives the highest priority to unadjusted quoted prices in active markets for identical assets or liabilities (Level 1 measurements) and the lowest priority to unobservable inputs (Level 3 measurements). Accordingly, the degree of judgment exercised in determining fair value is greatest for instruments categorized in Level 3. The inputs used to measure fair value may fall into different levels of the fair value hierarchy. In such cases, for disclosure purposes, the fair value hierarchy classification is determined based on the lowest level input that is significant to the fair value measurement in its entirety. |
| | | | | Changes in valuation techniques may result in transfers into or out of an assigned level within the disclosure hierarchy. In accordance with the Fund’s policy, transfers between different levels of the fair value disclosure hierarchy are deemed to have occurred as of the beginning of the reporting period. The categorization of a value determined for investments is based on the pricing transparency of the investment and is not necessarily an indication of the risks associated with investing in those securities. For information about the Fund’s policy regarding valuation of investments, please refer to Note 2 of the Notes to Financial Statements. |
See Notes to Financial Statements.
| ANNUAL REPORT | JULY 31, 2013 | 29
|
| |
| Schedule of Investments (concluded) | BlackRock MuniYield Investment Fund (MYF)
|
| | |
The following table summarizes the Fund’s investments categorized in the disclosure hierarchy as of July 31, 2013:
|
|
|
| Level 1
|
| Level 2
|
| Level 3
|
| Total
|
Assets:
| | | | | | | | | | | | | | | | | | |
Investments:
| | | | | | | | | | | | | | | | | | |
Long-Term Investments 1 | | | | | — | | | $ | 335,335,118 | | | | — | | | $ | 335,335,118 | |
Short-Term Securities | | | | $ | 7,703,960 | | | | — | | | | — | | | | 7,703,960 | |
Total
| | | | $ | 7,703,960 | | | $ | 335,335,118 | | | | — | | | $ | 343,039,078 | |
| 1 | See above Schedule of Investments for values in each state or political subdivision. |
Certain of the Fund’s liabilities are held at carrying amount, which approximates fair value for financial statement purposes. As of July 31, 2013, such liabilities are categorized within the disclosure hierarchy as follows:
|
|
|
| Level 1
|
| Level 2
|
| Level 3
|
| Total
|
Liabilities:
| | | | | | | | | | | | | | | | | | |
Bank overdraft | | | | | — | | | $ | (6,147 | ) | | | — | | | $ | (6,147 | ) |
TOB trust certificates | | | | | — | | | | (85,029,096 | ) | | | — | | | | (85,029,096 | ) |
VRDP Shares | | | | | — | | | | (59,400,000 | ) | | | — | | | | (59,400,000 | ) |
Total
| | | | | — | | | $ | (144,435,243 | ) | | | — | | | $ | (144,435,243 | ) |
There were no transfers between levels during the year ended July 31, 2013.
See Notes to Financial Statements.
| 30 | ANNUAL REPORT | JULY 31, 2013
|
| |
| Schedule of Investments July 31, 2013 | BlackRock MuniYield New Jersey Fund, Inc. (MYJ)
(Percentages shown are based on Net Assets)
|
| | | | | | | |
| Municipal Bonds | | | | Par
(000)
| | Value
|
New Jersey — 128.1% |
Corporate — 7.2% | | | | | | | | | | |
Middlesex County Improvement Authority, RB, Senior Heldrich Center Hotel, Series A, 5.00%, 1/01/20 | | | | $ | 655 | | | $ | 470,015 | |
New Jersey EDA, Refunding RB: | | | | | | | | | | |
New Jersey American Water Co., Inc. Project,
Series A, AMT, 5.70%, 10/01/39 | | | | | 2,925 | | | | 3,076,603 | |
New Jersey American Water Co., Inc. Project,
Series B, AMT, 5.60%, 11/01/34 | | | | | 2,430 | | | | 2,560,807 | |
United Water of New Jersey, Inc.,
Series B (AMBAC), 4.50%, 11/01/25 | | | | | 4,500 | | | | 4,630,230 | |
Salem County Pollution Control Financing Authority, Refunding RB, Atlantic City Electric, Series A, 4.88%, 6/01/29 | | | | | 4,550 | | | | 4,638,543 | |
| | | | | | | | | 15,376,198 | |
County/City/Special District/School District — 16.0% | | | | | | | | | | |
Bergen County New Jersey Improvement Authority, Refunding RB, Fair Lawn Community Center, Inc. Project, 5.00%, 9/15/34 | | | | | 1,470 | | | | 1,561,728 | |
City of Margate City New Jersey, GO, Refunding, Improvement: | | | | | | | | | | |
5.00%, 1/15/26 | | | | | 1,200 | | | | 1,290,072 | |
5.00%, 1/15/27 | | | | | 845 | | | | 896,714 | |
City of Perth Amboy New Jersey, GO, Refunding CAB (AGM): | | | | | | | | | | |
5.00%, 7/01/34 | | | | | 1,925 | | | | 1,955,685 | |
5.00%, 7/01/33 | | | | | 1,575 | | | | 1,607,461 | |
County of Hudson New Jersey, COP, Refunding (NPFGC), 6.25%, 12/01/16 | | | | | 1,500 | | | | 1,707,810 | |
Essex County Improvement Authority, Refunding RB, Project Consolidation (NPFGC): | | | | | | | | | | |
5.50%, 10/01/28 | | | | | 2,700 | | | | 3,080,808 | |
5.50%, 10/01/29 | | | | | 5,085 | | | | 5,758,559 | |
Gloucester County Improvement Authority, RB, County Guaranteed Loan—County Capital Program, 5.00%, 4/01/38 | | | | | 1,000 | | | | 1,024,160 | |
Hudson County Improvement Authority, RB, Harrison Parking Facility Project, Series C (AGC), 5.38%, 1/01/44 | | | | | 4,800 | | | | 4,971,696 | |
Monmouth County Improvement Authority, Refunding RB, Government Loan (AMBAC): | | | | | | | | | | |
5.00%, 12/01/15 | | | | | 5 | | | | 5,012 | |
5.00%, 12/01/16 | | | | | 5 | | | | 5,011 | |
Newark Housing Authority, Refunding RB, Newark Redevelopment Project (NPFGC), 4.38%, 1/01/37 | | | | | 2,875 | | | | 2,479,026 | |
Union County Improvement Authority, RB, Guaranteed Lease, Family Court Building Project, 5.00%, 5/01/42 | | | | | 2,835 | | | | 2,903,409 | |
Union County Utilities Authority, Refunding RB, Series A: | | | | | | | | | | |
Covanta Union, AMT, 5.25%, 12/01/31 | | | | | 670 | | | | 682,167 | |
New Jersey Solid Waste System, County Deficiency Agreement, 5.00%, 6/15/41 | | | | | 4,115 | | | | 4,255,445 | |
| | | | | | | | | 34,184,763 | |
Education — 21.9% | | | | | | | | | | |
New Jersey EDA, RB: | | | | | | | | | | |
MSU Student Housing Project Provide,
5.88%, 6/01/42 | | | | | 1,500 | | | | 1,571,085 | |
School Facilities Construction, Series CC-2,
5.00%, 12/15/31 | | | | | 1,700 | | | | 1,768,017 | |
New Jersey EDA, Refunding RB, School Facilities Construction, Series GG, 5.25%, 9/01/27 | | | | | 3,000 | | | | 3,224,160 | |
New Jersey Educational Facilities Authority, RB, Montclair State University, Series J, 5.25%, 7/01/38 | | | | | 1,140 | | | | 1,181,952 | |
New Jersey Educational Facilities Authority, Refunding RB: | | | | | | | | | | |
College of New Jersey, Series D (AGM),
5.00%, 7/01/35 | | | | | 6,115 | | | | 6,157,132 | |
| | | | | | | | | | | |
| Municipal Bonds | | | | Par
(000)
| | Value
|
New Jersey (continued) |
Education (concluded) | | | | | | | | | | |
New Jersey Educational Facilities Authority, Refunding RB (concluded): | | | | | | | | | | |
Georgian Court University, Series D, 5.25%, 7/01/37 | | | | $ | 1,000 | | | $ | 994,560 | |
Kean University, Series A, 5.50%, 9/01/36 | | | | | 4,500 | | | | 4,739,400 | |
New Jersey Institute of Technology, Series H, 5.00%, 7/01/31 | | | | | 1,250 | | | | 1,288,250 | |
Ramapo College, Series B, 5.00%, 7/01/37 | | | | | 155 | | | | 158,123 | |
Ramapo College, Series B, 5.00%, 7/01/42 | | | | | 340 | | | | 345,858 | |
Rider University, Series A, 5.00%, 7/01/32 | | | | | 1,000 | | | | 980,780 | |
Rowan University, Series B (AGC), 5.00%, 7/01/24 | | | | | 1,800 | | | | 1,948,788 | |
Seton Hall University, Series D, 5.00%, 7/01/38 | | | | | 395 | | | | 407,134 | |
Seton Hall University, Series D, 5.00%, 7/01/43 | | | | | 255 | | | | 261,610 | |
University of Medicine & Dentistry, Series B, 7.13%, 6/01/19 (a) | | | | | 1,300 | | | | 1,689,649 | |
University of Medicine & Dentistry, Series B, 7.50%, 6/01/19 (a) | | | | | 1,625 | | | | 2,145,747 | |
New Jersey Higher Education Student Assistance Authority, Refunding RB: | | | | | | | | | | |
Series 1, AMT, 5.75%, 12/01/29 | | | | | 4,045 | | | | 4,226,944 | |
Series 1A, 5.00%, 12/01/25 | | | | | 965 | | | | 1,002,452 | |
Series 1A, 5.00%, 12/01/26 | | | | | 605 | | | | 623,350 | |
Series 1A, 5.25%, 12/01/32 | | | | | 900 | | | | 923,310 | |
New Jersey Institute of Technology, RB, Series A, 5.00%, 7/01/42 | | | | | 4,320 | | | | 4,400,741 | |
Rutgers — The State University of New Jersey, RB, Series F, 5.00%, 5/01/39 | | | | | 500 | | | | 519,940 | |
Rutgers — The State University of New Jersey, Refunding RB, Series L, 5.00%, 5/01/43 | | | | | 5,870 | | | | 6,047,744 | |
| | | | | | | | | 46,606,726 | |
Health — 14.7% | | | | | | | | | | |
New Jersey EDA, RB, Masonic Charity Foundation of New Jersey: | | | | | | | | | | |
5.25%, 6/01/24 | | | | | 1,425 | | | | 1,442,299 | |
5.25%, 6/01/32 | | | | | 685 | | | | 687,918 | |
New Jersey EDA, Refunding RB, First Mortgage, Winchester, Series A: | | | | | | | | | | |
5.75%, 11/01/24 | | | | | 2,500 | | | | 2,518,250 | |
5.80%, 11/01/31 | | | | | 1,000 | | | | 1,001,520 | |
New Jersey Health Care Facilities Financing Authority, RB: | | | | | | | | | | |
Children’s Specialized Hospital, Series A, 5.50%, 7/01/36 | | | | | 1,540 | | | | 1,550,765 | |
Hunterdon Medical Center, Series A, 5.13%, 7/01/35 | | | | | 1,950 | | | | 1,950,175 | |
Meridian Health, Series I (AGC), 5.00%, 7/01/38 | | | | | 955 | | | | 960,749 | |
Virtua Health (AGC), 5.50%, 7/01/38 | | | | | 2,500 | | | | 2,563,225 | |
New Jersey Health Care Facilities Financing Authority, Refunding RB: | | | | | | | | | | |
AHS Hospital Corp., 6.00%, 7/01/41 | | | | | 2,435 | | | | 2,736,234 | |
Barnabas Health, Series A, 5.00%, 7/01/25 | | | | | 210 | | | | 217,323 | |
Barnabas Health, Series A, 5.63%, 7/01/32 | | | | | 1,090 | | | | 1,119,692 | |
Barnabas Health, Series A, 5.63%, 7/01/37 | | | | | 3,030 | | | | 3,088,933 | |
Kennedy Health System, 5.00%, 7/01/31 | | | | | 750 | | | | 762,923 | |
Meridian Health System, 5.00%, 7/01/23 | | | | | 500 | | | | 540,095 | |
Meridian Health System, 5.00%, 7/01/27 | | | | | 1,000 | | | | 1,028,950 | |
Meridian Health System Obligation, 5.00%, 7/01/25 | | | | | 1,000 | | | | 1,053,630 | |
Meridian Health System Obligation, 5.00%, 7/01/26 | | | | | 830 | | | | 863,897 | |
Robert Wood Johnson, 5.00%, 7/01/31 | | | | | 1,000 | | | | 1,013,100 | |
South Jersey Hospital, 5.00%, 7/01/36 | | | | | 385 | | | | 382,386 | |
South Jersey Hospital, 5.00%, 7/01/46 | | | | | 1,650 | | | | 1,613,436 | |
St. Barnabas Health Care System, Series A, 5.00%, 7/01/29 | | | | | 4,155 | | | | 4,109,918 | |
| | | | | | | | | 31,205,418 | |
See Notes to Financial Statements.
| ANNUAL REPORT | JULY 31, 2013 | 31
|
| |
| Schedule of Investments (continued) | BlackRock MuniYield New Jersey Fund, Inc. (MYJ)
(Percentages shown are based on Net Assets)
|
| | |
| Municipal Bonds | | | | Par
(000)
| | Value
|
New Jersey (continued) |
Housing — 8.8% | | | | | | | | | | |
New Jersey Housing & Mortgage Finance Agency, RB: | | | | | | | | | | |
M/F Housing, Series A, 4.55%, 11/01/43 | | | | $ | 2,880 | | | $ | 2,591,942 | |
S/F Housing, Series AA, 6.50%, 10/01/38 | | | | | 815 | | | | 838,073 | |
S/F Housing, Series CC, 5.00%, 10/01/34 | | | | | 2,215 | | | | 2,266,388 | |
S/F Housing, Series U, AMT, 4.95%, 10/01/32 | | | | | 555 | | | | 559,679 | |
S/F Housing, Series U, AMT, 5.00%, 10/01/37 | | | | | 765 | | | | 767,808 | |
S/F Housing, Series X, AMT, 4.85%, 4/01/16 | | | | | 1,090 | | | | 1,117,021 | |
S/F Housing, Series X, AMT, 5.05%, 4/01/18 | | | | | 295 | | | | 320,500 | |
Series A, 4.75%, 11/01/29 | | | | | 2,305 | | | | 2,330,931 | |
Series A, AMT (NPFGC), 4.90%, 11/01/35 | | | | | 1,365 | | | | 1,327,053 | |
New Jersey Housing & Mortgage Finance Agency, Refunding RB, S/F Housing, Series T, AMT, 4.65%, 10/01/32 | | | | | 4,505 | | | | 4,522,569 | |
Newark Housing Authority, RB, South Ward Police Facility (AGC), 6.75%, 12/01/38 | | | | | 1,750 | | | | 1,995,263 | |
| | | | | | | | | 18,637,227 | |
State — 30.9% | | | | | | | | | | |
Garden State Preservation Trust, RB (AGM): | | | | | | | | | | |
CAB, Series B, 3.73%, 11/01/23 (b) | | | | | 1,860 | | | | 1,272,835 | |
CAB, Series B, 4.42%, 11/01/28 (b) | | | | | 4,540 | | | | 2,330,836 | |
Election of 2005, Series A, 5.80%, 11/01/15 (a) | | | | | 2,500 | | | | 2,790,250 | |
New Jersey EDA, RB: | | | | | | | | | | |
Motor Vehicle Surcharge, Series A (NPFGC), 5.25%, 7/01/33 | | | | | 12,500 | | | | 12,857,750 | |
Motor Vehicle Surcharge, Series A (NPFGC), 5.25%, 7/01/25 | | | | | 2,000 | | | | 2,252,320 | |
School Facilities Construction, Series CC-2, 5.00%, 12/15/32 | | | | | 1,300 | | | | 1,347,320 | |
School Facilities Construction, Series KK, 5.00%, 3/01/35 | | | | | 1,500 | | | | 1,518,510 | |
School Facilities Construction, Series KK, 5.00%, 3/01/38 | | | | | 1,470 | | | | 1,488,140 | |
School Facilities Construction, Series L (AGM), 5.00%, 3/01/15 (a) | | | | | 5,800 | | | | 6,214,294 | |
School Facilities Construction, Series P, 5.00%, 9/01/15 | | | | | 3,000 | | | | 3,272,640 | |
School Facilities Construction, Series P, 5.25%, 9/01/15 (a) | | | | | 2,710 | | | | 2,980,404 | |
School Facilities Construction, Series Y, 5.00%, 9/01/33 | | | | | 880 | | | | 897,917 | |
School Facilities Construction, Series Z (AGC), 5.50%, 12/15/34 | | | | | 3,665 | | | | 3,954,058 | |
New Jersey EDA, Refunding RB: | | | | | | | | | | |
Cigarette Tax, 5.00%, 6/15/26 | | | | | 440 | | | | 445,584 | |
Cigarette Tax, 5.00%, 6/15/28 | | | | | 720 | | | | 711,778 | |
Cigarette Tax, 5.00%, 6/15/29 | | | | | 1,760 | | | | 1,712,902 | |
School Facilities Construction, Series AA, 5.50%, 12/15/29 | | | | | 3,000 | | | | 3,207,390 | |
School Facilities Construction, Series AA, 5.25%, 12/15/33 | | | | | 1,000 | | | | 1,045,620 | |
School Facilities Construction, Series GG, 5.25%, 9/01/26 | | | | | 7,000 | | | | 7,597,380 | |
New Jersey Health Care Facilities Financing Authority, RB, Hospital Asset Transformation Program, Series A, 5.25%, 10/01/38 | | | | | 2,300 | | | | 2,328,865 | |
State of New Jersey, COP, Equipment Lease Purchase, Series A: | | | | | | | | | | |
5.25%, 6/15/27 | | | | | 4,200 | | | | 4,449,816 | |
5.25%, 6/15/28 | | | | | 1,100 | | | | 1,157,750 | |
| | | | | | | | | 65,834,359 | |
| | | | | | | | | | | |
| Municipal Bonds | | | | Par
(000)
| | Value
|
New Jersey (concluded) |
Transportation — 27.5% | | | | | | | | | | |
Delaware River Port Authority of Pennsylvania & New Jersey, RB, Series D, 5.00%, 1/01/40 | | | | $ | 1,535 | | | $ | 1,570,428 | |
New Jersey State Turnpike Authority, RB: | | | | | | | | | | |
Growth & Income Securities, Series B (AMBAC), 0.00%, 1/01/35 (c) | | | | | 4,870 | | | | 4,490,091 | |
Series E, 5.25%, 1/01/40 | | | | | 2,525 | | | | 2,589,413 | |
New Jersey State Turnpike Authority, Refunding RB: | | | | | | | �� | | | |
Series A, 5.00%, 1/01/35 | | | | | 1,000 | | | | 1,022,710 | |
Series B, 5.00%, 1/01/30 | | | | | 2,660 | | | | 2,773,529 | |
New Jersey Transportation Trust Fund Authority, RB, Transportation System: | | | | | | | | | | |
6.00%, 12/15/38 | | | | | 1,950 | | | | 2,193,087 | |
CAB, Series C (AMBAC), 5.88%, 12/15/35 (b) | | | | | 4,140 | | | | 1,132,207 | |
Series A, 6.00%, 6/15/35 | | | | | 6,030 | | | | 6,632,035 | |
Series A, 5.88%, 12/15/38 | | | | | 3,650 | | | | 4,075,225 | |
Series A, 5.50%, 6/15/41 | | | | | 6,000 | | | | 6,308,400 | |
Series A (AGC), 5.63%, 12/15/28 | | | | | 1,250 | | | | 1,414,950 | |
Series A (AGC), 5.50%, 12/15/38 | | | | | 1,000 | | | | 1,072,870 | |
Series B, 5.00%, 6/15/42 | | | | | 7,340 | | | | 7,425,291 | |
Port Authority of New York & New Jersey, RB: | | | | | | | | | | |
Consolidated, 169th Series, AMT, 5.00%, 10/15/41 | | | | | 250 | | | | 252,025 | |
Consolidated, 93rd Series, 6.13%, 6/01/94 | | | | | 5,000 | | | | 5,536,350 | |
JFK International Air Terminal, Series 8, 6.00%, 12/01/42 | | | | | 2,700 | | | | 2,985,903 | |
Port Authority of New York & New Jersey, Refunding RB, Consolidated AMT: | | | | | | | | | | |
152nd Series, 5.75%, 11/01/30 | | | | | 3,300 | | | | 3,597,033 | |
152nd Series, 5.25%, 11/01/35 | | | | | 240 | | | | 247,190 | |
172nd Series, 5.00%, 10/01/34 | | | | | 1,500 | | | | 1,530,570 | |
South Jersey Transportation Authority, Refunding RB, Series A: | | | | | | | | | | |
5.00%, 11/01/28 | | | | | 1,075 | | | | 1,127,675 | |
5.00%, 11/01/29 | | | | | 575 | | | | 599,173 | |
| | | | | | | | | 58,576,155 | |
Utilities — 1.1% | | | | | | | | | | |
Rahway Valley Sewerage Authority, RB, CAB, Series A (NPFGC), 5.09%, 9/01/31 (b) | | | | | 6,000 | | | | 2,417,760 | |
Total Municipal Bonds in New Jersey | | | | | | | | | 272,838,606 | |
|
Puerto Rico — 5.6% |
State — 5.6% | | | | | | | | | | |
Puerto Rico Sales Tax Financing Corp., RB, First Sub-Series A: | | | | | | | | | | |
5.75%, 8/01/37 | | | | | 6,000 | | | | 5,870,160 | |
6.00%, 8/01/42 | | | | | 4,000 | | | | 3,994,520 | |
Puerto Rico Sales Tax Financing Corp., Refunding RB, Senior Series C, 5.25%, 8/01/40 | | | | | 2,220 | | | | 2,127,359 | |
Total Municipal Bonds in Puerto Rico | | | | | | | | | 11,992,039 | |
Total Municipal Bonds — 133.7% | | | | | | | | | 284,830,645 | |
|
Municipal Bonds Transferred to
Tender Option Bond Trusts (d) | | | | | | | | | | |
New Jersey — 30.4% |
County/City/Special District/School District — 6.1% | | | | | | | | | | |
Union County Utilities Authority, Refunding LRB, Covanta Union, Series A, AMT, 5.25%, 12/01/31 | | | | | 12,820 | | | | 13,052,811 | |
Education — 1.0% | | | | | | | | | | |
Rutgers State University of New Jersey, Refunding RB, Series F, 5.00%, 5/01/39 | | | | | 2,009 | | | | 2,089,114 | |
See Notes to Financial Statements.
| 32 | ANNUAL REPORT | JULY 31, 2013
|
| |
| Schedule of Investments (continued) | BlackRock MuniYield New Jersey Fund, Inc. (MYJ)
(Percentages shown are based on Net Assets)
|
| | | | | | | |
Municipal Bonds Transferred to
Tender Option Bond Trusts (d)
| | | | Par
(000) | | Value |
New Jersey (continued) |
State — 7.5% | | | | | | | | | | |
Garden State Preservation Trust, RB, Election of 2005, Series A (AGM), 5.75%, 11/01/28 | | | | $ | 5,460 | | | $ | 6,510,941 | |
New Jersey EDA, RB, School Facilities Construction (AGC): | | | | | | | | | | |
6.00%, 12/15/18 (a) | | | | | 1,185 | | | | 1,332,794 | |
6.00%, 12/15/34 | | | | | 2,415 | | | | 2,717,854 | |
New Jersey EDA, Refunding RB, 5.00%, 3/01/29 (e) | | | | | 5,232 | | | | 5,429,124 | |
| | | | | | | | | 15,990,713 | |
Transportation — 15.8% | | | | | | | | | | |
New Jersey State Turnpike Authority, RB, Series A, 5.00%, 1/01/38 (e) | | | | | 8,820 | | | | 8,997,723 | |
New Jersey Transportation Trust Fund Authority, RB, Transportation System: | | | | | | | | | | |
Series A (AGM), 5.00%, 12/15/32 | | | | | 4,100 | | | | 4,261,909 | |
Series B, 5.25%, 6/15/36 (e) | | | | | 5,001 | | | | 5,193,404 | |
Port Authority of New York & New Jersey, RB, Consolidated, 169th Series, AMT, 5.00%, 10/15/41 | | | | | 11,250 | | | | 11,341,125 | |
| | | | | | | | | | | |
Municipal Bonds Transferred to
Tender Option Bond Trusts (d)
| | | | Par
(000) | | Value |
New Jersey (concluded) |
Transportation (concluded) | | | | | | | | | | |
Port Authority of New York & New Jersey, Refunding RB, 152nd Series, Consolidated, AMT, 5.25%, 11/01/35 | | | | $ | 3,764 | | | $ | 3,876,450 | |
| | | | | | | | | 33,670,611 | |
Total Municipal Bonds Transferred to
Tender Option Bond Trusts — 30.4% | | | | | | | | | 64,803,249 | |
Total Long-Term Investments
(Cost — $345,895,956) — 164.1% | | | | | | | | | 349,633,894 | |
|
Short-Term Securities | | | | | Shares | | | | | |
BIF New Jersey Municipal Money Fund, 0.00% (f)(g) | | | | | 3,819,692 | | | | 3,819,692 | |
Total Short-Term Securities
(Cost — $3,819,692) — 1.8% | | | | | | | | | 3,819,692 | |
Total Investments (Cost — $349,715,648) — 165.9% | | | | | | | | | 353,453,586 | |
Other Assets Less Liabilities — 0.7% | | | | | | | | | 1,414,635 | |
Liability for TOB Trust Certificates, Including Interest Expense and Fees Payable — (18.6%) | | | | | | | | | (39,569,586 | ) |
VRDP Shares, at Liquidation Value — (48.0%) | | | | | | | | | (102,200,000 | ) |
Net Assets Applicable to Common Shares — 100.0% | | | | | | | | $ | 213,098,635 | |
Notes to Schedule of Investments
| (a) | | | | US government securities, held in escrow, are used to pay interest on this security, as well as to retire the bond in full at the date indicated, typically at a premium to par. |
| (b) | | | | Represents a zero-coupon bond. Rate shown reflects the current yield as of report date. |
| (c) | | | | Represents a step-up bond that pays an initial coupon rate for the first period and then a higher coupon rate for the following periods. Rate shown is as of report date. |
| (d) | | | | Securities represent bonds transferred to a TOB in exchange for which the Fund acquired residual interest certificates. These securities serve as collateral in a financing transaction. See Note 3 of the Notes to Financial Statements for details of municipal bonds transferred to TOBs. |
| (e) | | | | All or a portion of security is subject to a recourse agreement, which may require the Fund to pay the Liquidity Provider in the event there is a shortfall between the TOB trust certificates and proceeds received from the sale of the security contributed to the TOB trust. In the case of a shortfall, the aggregate maximum potential amount the Fund could ultimately be required to pay under the agreements, which expire from June 15, 2019 to September 1, 2020 is $14,348,772. |
| (f) | | | | Investments in issuers considered to be an affiliate of the Fund during the year July 31, 2013, for purposes of Section 2(a)(3) of the 1940 Act, were as follows: |
Affiliate
|
|
|
| Shares
Held at
July 31, 2012
|
| Net
Activity
|
| Shares
Held at
July 31, 2013
|
| Income
|
BIF New Jersey Municipal Money Fund | | | | | 1,495,608 | | | | 2,324,084 | | | | 3,819,692 | | | | — | |
| (g) | | | | Represents the current yield as of report date. |
| | | | | For Fund compliance purposes, the Fund’s sector classifications refer to any one or more of the sector sub-classifications used by one or more widely recognized market indexes or rating group indexes, and/or as defined by Fund’s management. These definitions may not apply for purposes of this report, which may combine such sector sub-classifications for reporting ease. |
| • | | | | Fair Value Measurements — Various inputs are used in determining the fair value of investments. These inputs to valuation techniques are categorized into a disclosure hierarchy consisting of three broad levels for financial statement purposes as follows: |
| • | | | | Level 1 — unadjusted price quotations in active markets/exchanges for identical assets or liabilities that the Fund has the ability to access |
| • | | | | Level 2 — other observable inputs (including, but not limited to, quoted prices for similar assets or liabilities in markets that are active, quoted prices for identical or similar assets or liabilities in markets that are not active, inputs other than quoted prices that are observable for the assets or liabilities (such as interest rates, yield curves, volatilities, prepayment speeds, loss severities, credit risks and default rates) or other market-corroborated inputs) |
| • | | | | Level 3 — unobservable inputs based on the best information available in the circumstances, to the extent observable inputs are not available (including the Fund’s own assumptions used in determining the fair value of investments) |
| | | | | The hierarchy gives the highest priority to unadjusted quoted prices in active markets for identical assets or liabilities (Level 1 measurements) and the lowest priority to unobservable inputs (Level 3 measurements). Accordingly, the degree of judgment exercised in determining fair value is greatest for instruments categorized in Level 3. The inputs used to measure fair value may fall into different levels of the fair value hierarchy. In such cases, for disclosure purposes, the fair value hierarchy classification is determined based on the lowest level input that is significant to the fair value measurement in its entirety. |
| | | | | Changes in valuation techniques may result in transfers into or out of an assigned level within the disclosure hierarchy. In accordance with the Fund’s policy, transfers between different levels of the fair value disclosure hierarchy are deemed to have occurred as of the beginning of the reporting period. The categorization of a value determined for investments is based on the pricing transparency of the investment and is not necessarily an indication of the risks associated with investing in those securities. For information about the Fund’s policy regarding valuation of investments, please refer to Note 2 of the Notes to Financial Statements. |
See Notes to Financial Statements.
| ANNUAL REPORT | JULY 31, 2013 | 33
|
| |
| Schedule of Investments (concluded) | BlackRock MuniYield New Jersey Fund, Inc. (MYJ)
|
The following table summarizes the Fund’s investments categorized in the disclosure hierarchy as of July 31, 2013:
|
|
|
| Level 1
|
| Level 2
|
| Level 3
|
| Total
|
Assets:
| | | | | | | | | | | | | | | | | | |
Investments:
| | | | | | | | | | | | | | | | | | |
Long-Term Investments 1 | | | | | — | | | $ | 349,633,894 | | | | — | | | $ | 349,633,894 | |
Short-Term Securities | | | | $ | 3,819,692 | | | | — | | | | — | | | | 3,819,692 | |
Total
| | | | $ | 3,819,692 | | | $ | 349,633,894 | | | | — | | | $ | 353,453,586 | |
1 See above Schedule of Investments for values in each sector or political subdivision.
Certain of the Fund’s liabilities are held at carrying amount, which approximates fair value for financial statement purposes. As of July 31, 2013, such liabilities are categorized within the disclosure hierarchy as follows:
|
|
|
| Level 1
|
| Level 2
|
| Level 3
|
| Total
|
Liabilities:
| | | | | | | | | | | | | | | | | | |
Bank overdraft | | | | | — | | | $ | (6,115 | ) | | | — | | | $ | (6,115 | ) |
TOB trust certificates | | | | | — | | | | (39,555,492 | ) | | | — | | | | (39,555,492 | ) |
VRDP Shares | | | | | — | | | | (102,200,000 | ) | | | — | | | | (102,200,000 | ) |
Total
| | | | | — | | | $ | (141,761,607 | ) | | | — | | | $ | (141,761,607 | ) |
There were no transfers between levels during the year ended July 31, 2013.
See Notes to Financial Statements.
| 34 | ANNUAL REPORT | JULY 31, 2013
|
| |
| Statements of Assets and Liabilities |
|
July 31, 2013
| | | | BlackRock
Muni New York
Intermediate
Duration
Fund, Inc.
(MNE) | | BlackRock
MuniYield
Arizona
Fund, Inc.
(MZA) | | BlackRock
MuniYield
California
Fund, Inc.
(MYC) | | BlackRock
MuniYield
Investment
Fund
(MYF) | | BlackRock
MuniYield
New Jersey
Fund, Inc.
(MYJ) |
Assets
|
Investments at value — unaffiliated1 | | | | $ | 94,873,787 | | | $ | 101,873,248 | | | $ | 537,281,968 | | | $ | 335,335,118 | | | $ | 349,633,894 | |
Investments at value — affiliated2 | | | | | 802,542 | | | | 210,260 | | | | 4,979,601 | | | | 7,703,960 | | | | 3,819,692 | |
Interest receivable | | | | | 955,700 | | | | 775,015 | | | | 7,467,993 | | | | 4,232,020 | | | | 3,570,238 | |
Investments sold receivable | | | | | 1,556,553 | | | | 178,973 | | | | 3,076,110 | | | | 2,809,281 | | | | — | |
Deferred offering costs | | | | | 157,505 | | | | 179,666 | | | | 243,473 | | | | 201,196 | | | | 249,885 | |
Prepaid expenses | | | | | 39,277 | | | | 1,117 | | | | 5,746 | | | | 3,636 | | | | 3,729 | |
Total assets | | | | | 98,385,364 | | | | 103,218,279 | | | | 553,054,891 | | | | 350,285,211 | | | | 357,277,438 | |
| | | | | | | | | | | | | | | | | | | | | | | |
Accrued Liabilities
|
Investments purchased payable | | | | | 1,033,566 | | | | — | | | | 9,146,324 | | | | 8,155,106 | | | | — | |
Income dividends payable | | | | | 263,115 | | | | 318,362 | | | | 1,685,317 | | | | 1,076,307 | | | | 1,057,052 | |
TOB trust payable | | | | | 665,000 | | | | — | | | | — | | | | 2,030,000 | | | | 1,110,000 | |
Investment advisory fees payable | | | | | 45,452 | | | | 44,040 | | | | 234,269 | | | | 146,419 | | | | 151,913 | |
Interest expense and fees payable | | | | | 1,944 | | | | 407 | | | | 50,065 | | | | 37,712 | | | | 14,094 | |
Officer’s and Directors’ fees payable | | | | | 944 | | | | 979 | | | | 5,130 | | | | 3,179 | | | | 3,410 | |
Bank overdraft | | | | | — | | | | 2,391 | | | | 7,947 | | | | 6,147 | | | | 6,115 | |
Other accrued expenses payable | | | | | 23,143 | | | | 55,408 | | | | 106,837 | | | | 84,430 | | | | 80,727 | |
Total accrued liabilities | | | | | 2,033,164 | | | | 421,587 | | | | 11,235,889 | | | | 11,539,300 | | | | 2,423,311 | |
| | | | | | | | | | | | | | | | | | | | | | | |
Other Liabilities
|
TOB trust certificates | | | | | 5,537,752 | | | | 3,330,000 | | | | 116,774,796 | | | | 85,029,096 | | | | 39,555,492 | |
VRDP Shares, at liquidation value of $100,000 per share3,4,5 | | | | | 29,600,000 | | | | 37,300,000 | | | | 105,900,000 | | | | 59,400,000 | | | | 102,200,000 | |
Total other liabilities | | | | | 35,137,752 | | | | 40,630,000 | | | | 222,674,796 | | | | 144,429,096 | | | | 141,755,492 | |
Total liabilities | | | | | 37,170,916 | | | | 41,051,587 | | | | 233,910,685 | | | | 155,968,396 | | | | 144,178,803 | |
Net Assets Applicable to Common Shareholders | | | | $ | 61,214,448 | | | $ | 62,166,692 | | | $ | 319,144,206 | | | $ | 194,316,815 | | | $ | 213,098,635 | |
| | | | | | | | | | | | | | | | | | | | | | | |
Net Assets Applicable to Common Shareholders Consist of
|
Paid-in capital6,7 | | | | $ | 59,619,114 | | | $ | 60,760,018 | | | $ | 302,001,440 | | | $ | 189,742,464 | | | $ | 205,588,973 | |
Undistributed net investment income | | | | | 795,824 | | | | 878,921 | | | | 4,038,794 | | | | 3,757,218 | | | | 4,468,086 | |
Accumulated net realized loss | | | | | (1,156,958 | ) | | | (860,821 | ) | | | (2,449,453 | ) | | | (10,944,978 | ) | | | (696,362 | ) |
Net unrealized appreciation/depreciation | | | | | 1,956,468 | | | | 1,388,574 | | | | 15,553,425 | | | | 11,762,111 | | | | 3,737,938 | |
Net Assets Applicable to Common Shareholders | | | | $ | 61,214,448 | | | $ | 62,166,692 | | | $ | 319,144,206 | | | $ | 194,316,815 | | | $ | 213,098,635 | |
Net asset value per Common Share | | | | $ | 14.54 | | | $ | 13.57 | | | $ | 14.96 | | | $ | 14.26 | | | $ | 14.92 | |
| |
1 Investments at cost — unaffiliated | | | | $ | 92,917,319 | | | $ | 100,484,674 | | | $ | 521,728,543 | | | $ | 323,573,007 | | | $ | 345,895,956 | |
| |
2 Investments at cost — affiliated | | | | $ | 802,542 | | | $ | 210,260 | | | $ | 4,979,601 | | | $ | 7,703,960 | | | $ | 3,819,692 | |
| |
3 Preferred Shares outstanding, par value $0.10 per share | | | | | 296 | | | | 373 | | | | 1,059 | | | | — | | | | 1,022 | |
| |
4 Preferred Shares outstanding, par value $0.05 per share | | | | | — | | | | — | | | | — | | | | 594 | | | | — | |
| |
5 Preferred Shares authorized, including Auction Market Preferred Shares (“AMPS”) | | | | | 1,536 | | | | 1,985 | | | | 8,059 | | | | 1,000,594 | | | | 5,782 | |
| |
6 Common Shares outstanding | | | | | 4,209,844 | | | | 4,580,755 | | | | 21,333,129 | | | | 13,624,137 | | | | 14,284,482 | |
| |
7 Common Shares authorized | | | | | 200 million | | | | 200 million | | | | 200 million | | | | unlimited | | | | 200 million | |
See Notes to Financial Statements.
| ANNUAL REPORT | JULY 31, 2013 | 35
|
Year Ended July 31, 2013
| | | | BlackRock
Muni New York
Intermediate
Duration
Fund, Inc.
(MNE) | | BlackRock
MuniYield
Arizona
Fund, Inc.
(MZA) | | BlackRock
MuniYield
California
Fund, Inc.
(MYC) | | BlackRock
MuniYield
Investment
Fund
(MYF) | | BlackRock
MuniYield
New Jersey
Fund, Inc.
(MYJ) |
Investment Income
|
Interest | | | | $ | 4,236,419 | | | $ | 4,935,422 | | | $ | 24,563,527 | | | $ | 16,269,445 | | | $ | 16,198,077 | |
Income — affiliated | | | | | 37 | | | | 123 | | | | 12 | | | | 520 | | | | — | |
Total income | | | | | 4,236,456 | | | | 4,935,545 | | | | 24,563,539 | | | | 16,269,965 | | | | 16,198,077 | |
| | | | | | | | | | | | | | | | | | | | | | | |
Expenses
|
Investment advisory | | | | | 562,529 | | | | 546,320 | | | | 2,907,474 | | | | 1,834,940 | | | | 1,865,613 | |
Liquidity fees | | | | | 265,048 | | | | — | | | | — | | | | — | | | | — | |
Professional | | | | | 74,041 | | | | 50,968 | | | | 138,131 | | | | 115,909 | | | | 114,457 | |
Remarketing fees on Preferred Shares | | | | | 30,010 | | | | — | | | | — | | | | — | | | | — | |
Accounting services | | | | | 21,354 | | | | 21,721 | | | | 86,938 | | | | 60,935 | | | | 60,779 | |
Transfer agent | | | | | 18,145 | | | | 20,217 | | | | 30,373 | | | | 28,558 | | | | 28,911 | |
Custodian | | | | | 9,213 | | | | 8,899 | | | | 28,603 | | | | 18,915 | | | | 21,121 | |
Printing | | | | | 8,687 | | | | 8,804 | | | | 10,846 | | | | 10,015 | | | | 10,090 | |
Officer and Directors | | | | | 5,890 | | | | 6,116 | | | | 32,511 | | | | 20,035 | | | | 21,173 | |
Registration | | | | | 5,532 | | | | 1,227 | | | | 5,586 | | | | 5,579 | | | | 5,533 | |
Miscellaneous | | | | | 46,923 | | | | 40,845 | | | | 61,121 | | | | 43,473 | | | | 58,833 | |
Total expenses excluding interest expense, fees and amortization of offering costs | | | | | 1,047,372 | | | | 705,117 | | | | 3,301,583 | | | | 2,138,359 | | | | 2,186,510 | |
Interest expense, fees and amortization of offering costs1 | | | | | 139,640 | | | | 432,064 | | | | 1,925,166 | | | | 1,285,465 | | | | 1,339,828 | |
Total expenses | | | | | 1,187,012 | | | | 1,137,181 | | | | 5,226,749 | | | | 3,423,824 | | | | 3,526,338 | |
Less fees waived by Manager | | | | | (1,104 | ) | | | (349 | ) | | | (6,059 | ) | | | (1,172 | ) | | | (5,055 | ) |
Total expenses after fees waived | | | | | 1,185,908 | | | | 1,136,832 | | | | 5,220,690 | | | | 3,422,652 | | | | 3,521,283 | |
Net investment income | | | | | 3,050,548 | | | | 3,798,713 | | | | 19,342,849 | | | | 12,847,313 | | | | 12,676,794 | |
| | | | | | | | | | | | | | | | | | | | | | | |
Realized and Unrealized Gain (Loss)
|
Net realized gain (loss) from:
| | | | | | | | | | | | | | | | | | | | | | |
Investments | | | | | 793,787 | | | | 223,425 | | | | (801,819 | ) | | | (252,822 | ) | | | 11,405 | |
Financial futures contracts | | | | | 59,654 | | | | 32,872 | | | | 535,022 | | | | 761,196 | | | | 828,513 | |
| | | | | 853,441 | | | | 256,297 | | | | (266,797 | ) | | | 508,374 | | | | 839,918 | |
Net change in unrealized appreciation/depreciation on investments | | | | | (6,746,189 | ) | | | (7,336,879 | ) | | | (41,706,382 | ) | | | (28,251,097 | ) | | | (28,435,795 | ) |
Total realized and unrealized loss | | | | | (5,892,748 | ) | | | (7,080,582 | ) | | | (41,973,179 | ) | | | (27,742,723 | ) | | | (27,595,877 | ) |
Distributions to VRDP Shareholders from net realized gain | | | | | — | | | | — | | | | — | | | | — | | | | (43,759 | ) |
Net Decrease in Net Assets Applicable to Common Shareholders Resulting from Operations | | | | $ | (2,842,200 | ) | | $ | (3,281,869 | ) | | $ | (22,630,330 | ) | | $ | (14,895,410 | ) | | $ | (14,962,842 | ) |
| 1 | | Related to TOBs and/or VRDP Shares. |
See Notes to Financial Statements.
| 36 | ANNUAL REPORT | JULY 31, 2013
|
| |
| Statements of Changes in Net Assets | BlackRock Muni New York Intermediate Duration Fund, Inc. (MNE)
|
| | | | Year Ended July 31,
|
|
Increase (Decrease) in Net Assets Applicable to Common Shareholders:
| | | | 2013 | | 2012 |
Operations
|
Net investment income | | | | $ | 3,050,548 | | | $ | 3,111,996 | |
Net realized gain | | | | | 853,441 | | | | 126,657 | |
Net change in unrealized appreciation/depreciation | | | | | (6,746,189 | ) | | | 6,079,939 | |
Dividends to AMPS shareholders from net investment income | | | | | — | | | | (68,450 | ) |
Net increase (decrease) in net assets applicable to Common Shareholders resulting from operations | | | | | (2,842,200 | ) | | | 9,250,142 | |
| | | | | | | | | | | |
Dividends to Common Shareholders From1
|
Net investment income | | | | | (3,156,624 | ) | | | (3,110,662 | ) |
| | | | | | | | | | | |
Capital Share Transactions
|
Reinvestment of common dividends | | | | | 54,512 | | | | — | |
| | | | | | | | | | | |
Net Assets Applicable to Common Shareholders
|
Total increase (decrease) in net assets applicable to Common Shareholders | | | | | (5,944,312 | ) | | | 6,139,480 | |
Beginning of year | | | | | 67,158,760 | | | | 61,019,280 | |
End of year | | | | $ | 61,214,448 | | | $ | 67,158,760 | |
Undistributed net investment income | | | | $ | 795,824 | | | $ | 879,509 | |
BlackRock MuniYield Arizona Fund, Inc. (MZA)
| | | | Year Ended July 31,
|
|
Increase (Decrease) in Net Assets Applicable to Common Shareholders:
| | | | 2013 | | 2012 |
Operations
|
Net investment income | | | | $ | 3,798,713 | | | $ | 3,683,450 | |
Net realized gain | | | | | 256,297 | | | | 778,352 | |
Net change in unrealized appreciation/depreciation | | | | | (7,336,879 | ) | | | 7,268,040 | |
Net increase (decrease) in net assets applicable to Common Shareholders resulting from operations | | | | | (3,281,869 | ) | | | 11,729,842 | |
| | | | | | | | | | | |
Dividends to Common Shareholders From1
|
Net investment income | | | | | (3,816,654 | ) | | | (3,806,859 | ) |
| | | | | | | | | | | |
Capital Share Transactions
|
Reinvestment of common dividends | | | | | 194,255 | | | | 61,778 | |
| | | | | | | | | | | |
Net Assets Applicable to Common Shareholders
|
Total increase (decrease) in net assets applicable to Common Shareholders | | | | | (6,904,268 | ) | | | 7,984,761 | |
Beginning of year | | | | | 69,070,960 | | | | 61,086,199 | |
End of year | | | | $ | 62,166,692 | | | $ | 69,070,960 | |
Undistributed net investment income | | | | $ | 878,921 | | | $ | 891,309 | |
| 1 | | Dividends are determined in accordance with federal income tax regulations. |
See Notes to Financial Statements.
| ANNUAL REPORT | JULY 31, 2013 | 37
|
| |
| Statements of Changes in Net Assets | BlackRock MuniYield California Fund, Inc. (MYC)
|
| | | | Year Ended July 31,
|
|
Increase (Decrease) in Net Assets Applicable to Common Shareholders:
| | | | 2013 | | 2012 |
Operations
|
Net investment income | | | | $ | 19,342,849 | | | $ | 20,005,315 | |
Net realized gain (loss) | | | | | (266,797 | ) | | | 6,412,710 | |
Net change in unrealized appreciation/depreciation | | | | | (41,706,382 | ) | | | 48,830,780 | |
Net increase (decrease) in net assets applicable to Common Shareholders resulting from operations | | | | | (22,630,330 | ) | | | 75,248,805 | |
| | | | | | | | | | | |
Dividends to Common Shareholders From1
|
Net investment income | | | | | (20,214,466 | ) | | | (20,187,902 | ) |
| | | | | | | | | | | |
Capital Share Transactions
|
Reinvestment of common dividends | | | | | 648,309 | | | | — | |
| | | | | | | | | | | |
Net Assets Applicable to Common Shareholders
|
Total increase (decrease) in net assets applicable to Common Shareholders | | | | | (42,196,487 | ) | | | 55,060,903 | |
Beginning of year | | | | | 361,340,693 | | | | 306,279,790 | |
End of year | | | | $ | 319,144,206 | | | $ | 361,340,693 | |
Undistributed net investment income | | | | $ | 4,038,794 | | | $ | 4,900,807 | |
BlackRock MuniYield Investment Fund (MYF)
| | | | Year Ended July 31,
|
|
Increase (Decrease) in Net Assets Applicable to Common Shareholders:
| | | | 2013 | | 2012 |
Operations
|
Net investment income | | | | $ | 12,847,313 | | | $ | 12,618,649 | |
Net realized gain | | | | | 508,374 | | | | 3,366,670 | |
Net change in unrealized appreciation/depreciation | | | | | (28,251,097 | ) | | | 32,015,417 | |
Net increase (decrease) in net assets applicable to Common Shareholders resulting from operations | | | | | (14,895,410 | ) | | | 48,000,736 | |
| | | | | | | | | | | |
Dividends to Common Shareholders From1
|
Net investment income | | | | | (12,908,151 | ) | | | (12,738,803 | ) |
| | | | | | | | | | | |
Capital Share Transactions
|
Reinvestment of common dividends | | | | | 342,807 | | | | 388,311 | |
| | | | | | | | | | | |
Net Assets Applicable to Common Shareholders
|
Total increase (decrease) in net assets applicable to Common Shareholders | | | | | (27,460,754 | ) | | | 35,650,244 | |
Beginning of year | | | | | 221,777,569 | | | | 186,127,325 | |
End of year | | | | $ | 194,316,815 | | | $ | 221,777,569 | |
Undistributed net investment income | | | | $ | 3,757,218 | | | $ | 3,803,497 | |
| 1 | | Dividends are determined in accordance with federal income tax regulations. |
See Notes to Financial Statements.
| 38 | ANNUAL REPORT | JULY 31, 2013
|
| |
| Statements of Changes in Net Assets | BlackRock MuniYield New Jersey Fund, Inc. (MYJ)
|
| | | | Year Ended July 31,
|
|
Increase (Decrease) in Net Assets Applicable to Common Shareholders:
| | | | 2013 | | 2012 |
Operations
|
Net investment income | | | | $ | 12,676,794 | | | $ | 12,296,804 | |
Net realized gain | | | | | 839,918 | | | | 809,303 | |
Net change in unrealized appreciation/depreciation | | | | | (28,435,795 | ) | | | 29,093,368 | |
Distributions to VRDP Shareholders from net realized gain | | | | | (43,759 | ) | | | — | |
Net increase (decrease) in net assets applicable to Common Shareholders resulting from operations | | | | | (14,962,842 | ) | | | 42,199,475 | |
| | | | | | | | | | | |
Dividends and Distributions to Common Shareholders From1
|
Net investment income | | | | | (12,730,155 | ) | | | (12,674,633 | ) |
Net realized gain | | | | | (918,415 | ) | | | — | |
Decrease in net assets resulting from dividends and distributions to Common Shareholders | | | | | (13,648,570 | ) | | | (12,674,633 | ) |
| | | | | | | | | | | |
Capital Share Transactions
|
Reinvestment of common dividends and distributions | | | | | 950,740 | | | | 113,352 | |
| | | | | | | | | | | |
Net Assets Applicable to Common Shareholders
|
Total increase (decrease) in net assets applicable to Common Shareholders | | | | | (27,660,672 | ) | | | 29,638,194 | |
Beginning of year | | | | | 240,759,307 | | | | 211,121,113 | |
End of year | | | | $ | 213,098,635 | | | $ | 240,759,307 | |
Undistributed net investment income | | | | $ | 4,468,086 | | | $ | 4,512,450 | |
| 1 | | Dividends and distributions are determined in accordance with federal income tax regulations. |
See Notes to Financial Statements.
| ANNUAL REPORT | JULY 31, 2013 | 39
|
Year Ended July 31, 2013
| | | | BlackRock
Muni New York
Intermediate
Duration
Fund, Inc.
(MNE) | | BlackRock
MuniYield
Arizona
Fund, Inc.
(MZA) | | BlackRock
MuniYield
California
Fund, Inc.
(MYC) | | BlackRock
MuniYield
Investment
Fund, Inc.
(MYF) | | BlackRock
MuniYield
New Jersey
Fund, Inc.
(MYJ) |
Cash Provided by (Used for) Operating Activities
|
Net decrease in net assets resulting from operations, excluding distributions to VRDP Shareholders | | | | $ | (2,842,200 | ) | | $ | (3,281,869 | ) | | $ | (22,630,330 | ) | | $ | (14,895,410 | ) | | $ | (14,919,083 | ) |
Adjustments to reconcile net increase in net assets
resulting from operations to net cash provided by (used for)
operating activities:
| | | | | | | | | | | | | | | | | | | | | | |
(Increase) decrease in interest receivable | | | | | (13,095 | ) | | | (17,704 | ) | | | 469,561 | | | | 112,409 | | | | (144,659 | ) |
(Increase) decrease in prepaid expenses | | | | | (37,843 | ) | | | 492 | | | | 2,254 | | | | 1,303 | | | | 1,444 | |
Decrease in investment advisory fees payable | | | | | (2,039 | ) | | | (2,128 | ) | | | (13,696 | ) | | | (6,960 | ) | | | (2,795 | ) |
Increase (decrease) in interest expense and fees payable | | | | | (636 | ) | | | (41 | ) | | | (12,774 | ) | | | (5,023 | ) | | | 2,413 | |
Increase (decrease) in other accrued expenses payable | | | | | (25,164 | ) | | | (10,632 | ) | | | 49,535 | | | | 32,628 | | | | 41,939 | |
Decrease in Officer’s and Directors’ fees payable | | | | | (511 | ) | | | (495 | ) | | | (2,071 | ) | | | (1,184 | ) | | | (1,689 | ) |
Net realized and unrealized loss on investments | | | | | 5,952,402 | | | | 7,113,454 | | | | 42,508,201 | | | | 28,503,919 | | | | 28,424,390 | |
Amortization of premium and accretion of discount on investments | | | | | 359,252 | | | | 123,827 | | | | 1,924,537 | | | | 1,106,400 | | | | 587,256 | |
Amortization of deferred offering costs | | | | | 22,399 | | | | 45,794 | | | | 2,011 | | | | 6,353 | | | | 8,098 | |
Proceeds from sales of long-term investments | | | | | 21,347,049 | | | | 16,622,681 | | | | 157,591,672 | | | | 122,311,395 | | | | 26,017,806 | |
Purchases of long-term investments | | | | | (21,329,608 | ) | | | (18,115,615 | ) | | | (158,316,288 | ) | | | (118,897,657 | ) | | | (38,812,485 | ) |
Net proceeds from sales (purchases) of short-term securities | | | | | (322,460 | ) | | | 1,141,361 | | | | (1,936,289 | ) | | | (7,527,378 | ) | | | (2,324,084 | ) |
Cash provided by (used for) operating activities | | | | | 3,107,546 | | | | 3,619,125 | | | | 19,636,323 | | | | 10,740,795 | | | | (1,121,449 | ) |
| | | | | | | | | | | | | | | | | | | | | | | |
Cash Provided by (Used for) Financing Activities
|
Cash receipts from TOB trust certificates | | | | | — | | | | — | | | | 15,500,250 | | | | 2,849,170 | | | | 13,852,796 | |
Cash payments for TOB trust certificates | | | | | (5,647 | ) | | | — | | | | (15,581,355 | ) | | | (1,674,017 | ) | | | — | |
Cash dividends paid to Common Shareholders | | | | | (3,101,899 | ) | | | (3,621,516 | ) | | | (19,563,165 | ) | | | (12,563,725 | ) | | | (12,693,703 | ) |
Cash distributions paid to VRDP Shareholders | | | | | — | | | | — | | | | — | | | | — | | | | (43,759 | ) |
Increase in bank overdraft | | | | | — | | | | 2,391 | | | | 7,947 | | | | 6,147 | | | | 6,115 | |
Cash provided by (used for) financing activities | | | | | (3,107,546 | ) | | | (3,619,125 | ) | | | (19,636,323 | ) | | | (11,382,425 | ) | | | 1,121,449 | |
| | | | | | | | | | | | | | | | | | | | | | | |
Cash
|
Net decrease in cash | | | | | — | | | | — | | | | — | | | $ | (641,630 | ) | | | — | |
Cash at beginning of period | | | | | — | | | | — | | | | — | | | | 641,630 | | | | — | |
Cash at end of period | | | | | — | | | | — | | | | — | | | | — | | | | — | |
| | | | | | | | | | | | | | | | | | | | | | | |
Cash Flow Information
|
Cash paid during the period for interest and fees | | | | $ | 117,877 | | | $ | 386,311 | | | $ | 1,935,929 | | | $ | 1,284,135 | | | $ | 1,373,076 | |
| | | | | | | | | | | | | | | | | | | | | | | |
Non-cash Financing Activities
|
Capital shares issued in reinvestment of dividends paid to Common Shareholders | | | | $ | 54,512 | | | $ | 194,255 | | | $ | 648,309 | | | $ | 342,807 | | | $ | 950,740 | |
See Notes to Financial Statements.
| 40 | ANNUAL REPORT | JULY 31, 2013
|
| |
| Financial Highlights | BlackRock Muni New York Intermediate Duration Fund, Inc. (MNE)
|
| | | | Year Ended July 31,
|
|
| | | | 2013 | | 2012 | | 2011 | | 2010 | | 2009 |
Per Share Operating Performance
|
Net asset value, beginning of year | | | | $ | 15.97 | | | $ | 14.51 | | | $ | 14.50 | | | $ | 12.99 | | | $ | 13.51 | |
Net investment income1 | | | | | 0.72 | | | | 0.74 | | | | 0.87 | | | | 0.88 | | | | 0.87 | |
Net realized and unrealized gain (loss) | | | | | (1.40 | ) | | | 1.48 | | | | (0.03 | ) | | | 1.40 | | | | (0.55 | ) |
Dividends to AMPS shareholders from net investment income | | | | | — | | | | (0.02 | ) | | | (0.10 | ) | | | (0.10 | ) | | | (0.20 | ) |
Net increase (decrease) from investment operations | | | | | (0.68 | ) | | | 2.20 | | | | 0.74 | | | | 2.18 | | | | 0.12 | |
Dividends to Common Shareholders from net investment income2 | | | | | (0.75 | ) | | | (0.74 | ) | | | (0.73 | ) | | | (0.67 | ) | | | (0.64 | ) |
Net asset value, end of year | | | | $ | 14.54 | | | $ | 15.97 | | | $ | 14.51 | | | $ | 14.50 | | | $ | 12.99 | |
Market price, end of year | | | | $ | 13.06 | | | $ | 15.80 | | | $ | 12.98 | | | $ | 13.54 | | | $ | 11.60 | |
| | | | | | | | | | | | | | | | | | | | | | | |
Total Investment Return Applicable to Common Shareholders3
|
Based on net asset value | | | | | (4.38 | )% | | | 15.73 | % | | | 5.71 | % | | | 17.67 | % | | | 2.26 | % |
Based on market price | | | | | (13.18 | )% | | | 28.00 | % | | | 1.26 | % | | | 23.05 | % | | | 1.79 | % |
| | | | | | | | | | | | | | | | | | | | | | | |
Ratios to Average Net Assets Applicable to Common Shareholders
|
Total expenses | | | | | 1.79 | % | | | 1.82 | %4 | | | 1.2 | 3%4 | | | 1.20 | %4 | | | 1.33 | %4 |
Total expenses after fees waived and paid indirectly | | | | | 1.78 | % | | | 1.81 | %4 | | | 1.2 | 2%4 | | | 1.12 | %4 | | | 1.15 | %4 |
Total expenses after fees waived and paid indirectly and excluding interest expense, fees and amortization of offering costs5 | | | | | 1.57 | %6 | | | 1.57 | %4,6 | | | 1.21 | %4 | | | 1.12 | %4 | | | 1.11 | %4 |
Net investment income | | | | | 4.59 | % | | | 4.86 | %4 | | | 6.16 | %4 | | | 6.30 | %4 | | | 7.01 | %4 |
Dividends to AMPS shareholders | | | | | — | | | | 0.11 | % | | | 0.71 | % | | | 0.75 | % | | | 1.59 | % |
Net investment income to Common Shareholders | | | | | 4.59 | % | | | 4.75 | % | | | 5.45 | % | | | 5.55 | % | | | 5.42 | % |
| | | | | | | | | | | | | | | | | | | | | | | |
Supplemental Data
|
Net assets applicable to Common Shareholders, end of year (000) | | | | $ | 61,214 | | | $ | 67,159 | | | $ | 61,019 | | | $ | 61,010 | | | $ | 54,642 | |
AMPS outstanding at $25,000 liquidation preference, end of year (000) | | | | | — | | | | — | | | $ | 29,632 | | | $ | 29,625 | | | $ | 29,625 | |
VRDP Shares outstanding at $100,000 liquidation value, end of year (000) | | | | $ | 29,600 | | | $ | 29,600 | | | | — | | | | — | | | | — | |
Portfolio turnover | | | | | 21 | % | | | 27 | % | | | 23 | % | | | 27 | % | | | 32 | % |
Asset coverage per AMPS at $25,000 liquidation preference, end of year | | | | | — | | | | — | | | $ | 76,499 | | | $ | 76,492 | | | $ | 71,119 | |
Asset coverage per VRDP Shares at $100,000 liquidation value, end of year | | | | $ | 306,806 | | | $ | 326,888 | | | | — | | | | — | | | | — | |
| 1 | | Based on average Common Shares outstanding. |
| 2 | | Dividends are determined in accordance with federal income tax regulations. |
| 3 | | Total investment returns based on market price, which can be significantly greater or lesser than the net asset value, may result in substantially different returns. Where applicable, total investment returns exclude the effects of any sales charges and assume the reinvestment of dividends and distributions. |
| 4 | | Do not reflect the effect of dividends to AMPS shareholders. |
| 5 | | Interest expense, fees and amortization of offering costs relate to TOBs and/or VRDP Shares. See Note 3 and Note 9 of the Notes to Financial Statements for details of municipal bonds transferred to TOBs and VRDP Shares, respectively. |
| 6 | | For the years ended July 31, 2013 and July 31, 2012, the total expense ratio after fees waived and paid indirectly and excluding interest expense, fees, amortization of offering costs, liquidity and remarketing fees was 1.13% and 1.18%, respectively. |
See Notes to Financial Statements.
| ANNUAL REPORT | JULY 31, 2013 | 41
|
| |
| Financial Highlights | BlackRock MuniYield Arizona Fund, Inc. (MZA)
|
| | | | Year Ended July 31,
|
|
| | | | 2013 | | 2012 | | 2011 | | 2010 | | 2009 |
Per Share Operating Performance
|
Net asset value, beginning of year | | | | $ | 15.12 | | | $ | 13.38 | | | $ | 13.73 | | | $ | 12.40 | | | $ | 12.81 | |
Net investment income1 | | | | | 0.83 | | | | 0.80 | | | | 0.87 | | | | 0.93 | | | | 0.95 | |
Net realized and unrealized gain (loss) | | | | | (1.55 | ) | | | 1.77 | | | | (0.33 | ) | | | 1.28 | | | | (0.47 | ) |
Dividends to AMPS shareholders from net investment income | | | | | — | | | | — | | | | (0.06 | ) | | | (0.06 | ) | | | (0.19 | ) |
Net increase (decrease) from investment operations | | | | | (0.72 | ) | | | 2.57 | | | | 0.48 | | | | 2.15 | | | | 0.29 | |
Dividends to Common Shareholders from net investment income2 | | | | | (0.83 | ) | | | (0.83 | ) | | | (0.83 | ) | | | (0.82 | ) | | | (0.70 | ) |
Net asset value, end of year | | | | $ | 13.57 | | | $ | 15.12 | | | $ | 13.38 | | | $ | 13.73 | | | $ | 12.40 | |
Market price, end of year | | | | $ | 13.33 | | | $ | 15.61 | | | $ | 12.83 | | | $ | 13.67 | | | $ | 12.85 | |
| | | | | | | | | | | | | | | | | | | | | | | |
Total Investment Return Applicable to Common Shareholders3
|
Based on net asset value | | | | | (5.08 | )% | | | 19.86 | % | | | 3.92 | % | | | 17.75 | % | | | 3.27 | % |
Based on market price | | | | | (9.69 | )% | | | 29.05 | % | | | 0.09 | % | | | 13.13 | % | | | (1.66 | )% |
| | | | | | | | | | | | | | | | | | | | | | | |
Ratios to Average Net Assets Applicable to Common Shareholders
|
Total expenses | | | | | 1.66 | % | | | 1.96 | % | | | 1.52 | %4 | | | 1.25 | %4 | | | 1.46 | %4 |
Total expenses after fees waived and paid indirectly | | | | | 1.66 | % | | | 1.96 | % | | | 1.52 | %4 | | | 1.24 | %4 | | | 1.42 | %4 |
Total expenses after fees waived and paid indirectly and excluding interest expense, fees and amortization of offering costs5 | | | | | 1.03 | % | | | 1.58 | %6 | | | 1.43 | %4 | | | 1.22 | %4 | | | 1.36 | %4 |
Net investment income | | | | | 5.53 | % | | | 5.62 | % | | | 6.62 | %4 | | | 6.99 | %4 | | | 8.16 | %4 |
Dividends to AMPS shareholders | | | | | — | | | | — | | | | 0.36 | % | | | 0.44 | % | | | 1.61 | % |
Net investment income to Common Shareholders | | | | | 5.53 | % | | | 5.62 | % | | | 6.26 | % | | | 6.56 | % | | | 6.55 | % |
| | | | | | | | | | | | | | | | | | | | | | | |
Supplemental Data
|
Net assets applicable to Common Shareholders, end of year (000) | | | | $ | 62,167 | | | $ | 69,071 | | | $ | 61,086 | | | $ | 62,618 | | | $ | 56,449 | |
AMPS outstanding at $25,000 liquidation preference, end of year (000) | | | | | — | | | | — | | | | — | | | $ | 38,800 | | | $ | 38,800 | |
VRDP Shares outstanding at $100,000 liquidation value, end of year (000) | | | | $ | 37,300 | | | $ | 37,300 | | | $ | 37,300 | | | | — | | | | — | |
Portfolio turnover | | | | | 16 | % | | | 26 | % | | | 16 | % | | | 25 | % | | | 39 | % |
Asset coverage per AMPS at $25,000 liquidation preference, end of year | | | | | — | | | | — | | | | — | | | $ | 65,350 | | | $ | 61,375 | |
Asset coverage per VRDP Shares at $100,000 liquidation value, end of year | | | | $ | 266,667 | | | $ | 285,177 | | | $ | 263,770 | | | | — | | | | — | |
| 1 | | Based on average Common Shares outstanding. |
| 2 | | Dividends are determined in accordance with federal income tax regulations. |
| 3 | | Total investment returns based on market price, which can be significantly greater or lesser than the net asset value, may result in substantially different returns. Where applicable, total investment returns exclude the effects of any sales charges and assume the reinvestment of dividends and distributions. |
| 4 | | Do not reflect the effect of dividends to AMPS shareholders. |
| 5 | | Interest expense, fees and amortization of offering costs relate to TOBs and/or VRDP Shares. See Note 3 and Note 9 of the Notes to Financial Statements for details of municipal bonds transferred to TOBs and VRDP Shares, respectively. |
| 6 | | For the year ended July 31, 2012, the total expense ratio after fees waived and paid indirectly and excluding interest expense, fees, amortization of offering costs, liquidity and remarketing fees was 1.14%. |
See Notes to Financial Statements.
| 42 | ANNUAL REPORT | JULY 31, 2013
|
| |
| Financial Highlights | BlackRock MuniYield California Fund, Inc. (MYC)
|
| | | | Year Ended July 31,
|
|
| | | | 2013 | | 2012 | | 2011 | | 2010 | | 2009 |
Per Share Operating Performance
|
Net asset value, beginning of year | | | | $ | 16.97 | | | $ | 14.38 | | | $ | 14.76 | | | $ | 13.47 | | | $ | 13.71 | |
Net investment income1 | | | | | 0.91 | | | | 0.94 | | | | 0.95 | | | | 0.94 | | | | 0.91 | |
Net realized and unrealized gain (loss) | | | | | (1.97 | ) | | | 2.60 | | | | (0.37 | ) | | | 1.21 | | | | (0.33 | ) |
Dividends to AMPS shareholders from net investment income | | | | | — | | | | — | | | | (0.03 | ) | | | (0.03 | ) | | | (0.13 | ) |
Net increase (decrease) from investment operations | | | | | (1.06 | ) | | | 3.54 | | | | 0.55 | | | | 2.12 | | | | 0.45 | |
Dividends to Common Shareholders from net investment income2 | | | | | (0.95 | ) | | | (0.95 | ) | | | (0.93 | ) | | | (0.83 | ) | | | (0.69 | ) |
Net asset value, end of year | | | | $ | 14.96 | | | $ | 16.97 | | | $ | 14.38 | | | $ | 14.76 | | | $ | 13.47 | |
Market price, end of year | | | | $ | 13.94 | | | $ | 17.31 | | | $ | 13.29 | | | $ | 14.44 | | | $ | 12.44 | |
| | | | | | | | | | | | | | | | | | | | | | | |
Total Investment Return Applicable to Common Shareholders3
|
Based on net asset value | | | | | (6.61 | )% | | | 25.45 | % | | | 4.28 | % | | | 16.59 | % | | | 4.64 | % |
Based on market price | | | | | (14.68 | )% | | | 38.46 | % | | | (1.49 | )% | | | 23.51 | % | | | 1.37 | % |
| | | | | | | | | | | | | | | | | | | | | | | |
Ratios to Average Net Assets Applicable to Common Shareholders
|
Total expenses | | | | | 1.46 | % | | | 1.64 | % | | | 1.49 | %4 | | | 1.19 | %4 | | | 1.49 | %4 |
Total expenses after fees waived | | | | | 1.45 | % | | | 1.64 | % | | | 1.49 | %4 | | | 1.18 | %4 | | | 1.47 | %4 |
Total expenses after fees waived and excluding interest expense, fees, and amortization of offering costs5 | | | | | 0.92 | % | | | 1.21 | %6 | | | 1.16 | %4 | | | 0.99 | %4 | | | 1.08 | %4 |
Net investment income | | | | | 5.39 | % | | | 5.96 | % | | | 6.76 | %4 | | | 6.53 | %4 | | | 7.07 | %4 |
Dividends to AMPS shareholders | | | | | — | | | | — | | | | 0.18 | % | | | 0.22 | % | | | 0.99 | % |
Net investment income to Common Shareholders | | | | | 5.39 | % | | | 5.96 | % | | | 6.58 | % | | | 6.31 | % | | | 6.08 | % |
| | | | | | | | | | | | | | | | | | | | | | | |
Supplemental Data
|
Net assets applicable to Common Shareholders, end of year (000) | | | | $ | 319,144 | | | $ | 361,341 | | | $ | 306,280 | | | $ | 314,326 | | | $ | 286,805 | |
AMPS outstanding at $25,000 liquidation preference, end of year (000) | | | | | — | | | | — | | | | — | | | $ | 105,950 | | | $ | 105,950 | |
VRDP Shares outstanding at $100,000 liquidation value, end of year (000) | | | | $ | 105,900 | | | $ | 105,900 | | | $ | 105,900 | | | | — | | | | — | |
Portfolio turnover | | | | | 27 | % | | | 48 | % | | | 33 | % | | | 41 | % | | | 38 | % |
Asset coverage per AMPS at $25,000 liquidation preference, end of year | | | | | — | | | | — | | | | — | | | $ | 99,173 | | | $ | 92,679 | |
Asset coverage per VRDP Shares at $100,000 liquidation value, end of year | | | | $ | 401,364 | | | $ | 441,209 | | | $ | 389,216 | | | | — | | | | — | |
| 1 | | Based on average Common Shares outstanding. |
| 2 | | Dividends are determined in accordance with federal income tax regulations. |
| 3 | | Total investment returns based on market price, which can be significantly greater or lesser than the net asset value, may result in substantially different returns. Where applicable, total investment returns exclude the effects of any sales charges and assume the reinvestment of dividends and distributions. |
| 4 | | Do not reflect the effect of dividends to AMPS shareholders. |
| 5 | | Interest expense, fees and amortization of offering costs relate to TOBs and/or VRDP Shares. See Note 3 and Note 9 of the Notes to Financial Statements for details of municipal bonds transferred to TOBs and VRDP Shares, respectively. |
| 6 | | For the year ended July 31, 2012, the total expense ratio after fees waived and excluding interest expense, fees, amortization of offering costs, liquidity and remarketing fees was 0.97%. |
See Notes to Financial Statements.
| ANNUAL REPORT | JULY 31, 2013 | 43
|
| |
| Financial Highlights | BlackRock MuniYield Investment Fund (MYF)
|
| | | | Year Ended July 31,
|
|
| | | | 2013 | | 2012 | | 2011 | | 2010 | | 2009 |
Per Share Operating Performance
|
Net asset value, beginning of year | | | | $ | 16.30 | | | $ | 13.71 | | | $ | 14.26 | | | $ | 12.95 | | | $ | 13.59 | |
Net investment income1 | | | | | 0.94 | | | | 0.93 | | | | 0.97 | | | | 0.96 | | | | 0.96 | |
Net realized and unrealized gain (loss) | | | | | (2.03 | ) | | | 2.60 | | | | (0.58 | ) | | | 1.18 | | | | (0.77 | ) |
Dividends to AMPS shareholders from net investment income | | | | | — | | | | — | | | | (0.02 | ) | | | (0.02 | ) | | | (0.13 | ) |
Net increase (decrease) from investment operations | | | | | (1.09 | ) | | | 3.53 | | | | 0.37 | | | | 2.12 | | | | 0.06 | |
Dividends to Common Shareholders from net investment income2 | | | | | (0.95 | ) | | | (0.94 | ) | | | (0.92 | ) | | | (0.81 | ) | | | (0.70 | ) |
Net asset value, end of year | | | | $ | 14.26 | | | $ | 16.30 | | | $ | 13.71 | | | $ | 14.26 | | | $ | 12.95 | |
Market price, end of year | | | | $ | 13.55 | | | $ | 16.52 | | | $ | 13.08 | | | $ | 14.36 | | | $ | 11.72 | |
| | | | | | | | | | | | | | | | | | | | | | | |
Total Investment Return Applicable to Common Shareholders3
|
Based on net asset value | | | | | (7.14 | )% | | | 26.55 | % | | | 2.97 | % | | | 17.12 | % | | | 1.93 | % |
Based on market price | | | | | (12.94 | )% | | | 34.44 | % | | | (2.45 | )% | | | 30.32 | % | | | 5.26 | % |
| | | | | | | | | | | | | | | | | | | | | | | |
Ratios to Average Net Assets Applicable to Common Shareholders
|
Total expenses | | | | | 1.55 | % | | | 1.66 | % | | | 1.45 | %4 | | | 1.26 | %4 | | | 1.35 | %4 |
Total expenses after fees waived | | | | | 1.55 | % | | | 1.66 | % | | | 1.45 | %4 | | | 1.26 | %4 | | | 1.34 | %4 |
Total expenses after fees waived and excluding interest expense, fees and amortization of offering costs5 | | | | | 0.97 | % | | | 1.22 | %6 | | | 1.14 | %4 | | | 1.02 | %4 | | | 1.12 | %4 |
Net investment income | | | | | 5.82 | % | | | 6.19 | % | | | 7.22 | %4 | | | 6.92 | %4 | | | 7.66 | %4 |
Dividends to AMPS shareholders | | | | | — | | | | — | | | | 0.15 | % | | | 0.18 | % | | | 1.09 | % |
Net investment income to Common Shareholders | | | | | 5.82 | % | | | 6.19 | % | | | 7.07 | % | | | 6.74 | % | | | 6.57 | % |
| | | | | | | | | | | | | | | | | | | | | | | |
Supplemental Data
|
Net assets applicable, end of year (000) | | | | $ | 194,317 | | | $ | 221,778 | | | $ | 186,127 | | | $ | 193,270 | | | $ | 175,610 | |
AMPS outstanding at $25,000 liquidation preference, end of year (000) | | | | | — | | | | — | | | | — | | | $ | 59,475 | | | $ | 59,475 | |
VRDP Shares outstanding at $100,000 liquidation value, end of year (000) | | | | $ | 59,400 | | | $ | 59,400 | | | $ | 59,400 | | | | — | | | | — | |
Portfolio turnover | | | | | 33 | % | | | 34 | % | | | 27 | % | | | 41 | % | | | 63 | % |
Asset coverage per AMPS at $25,000 liquidation preference, end of year | | | | | — | | | | — | | | | — | | | $ | 106,242 | | | $ | 98,819 | |
Asset coverage per VRDP Shares at $100,000 liquidation value, end of year | | | | $ | 427,133 | | | $ | 473,363 | | | $ | 413,346 | | | | — | | | | — | |
| 1 | | Based on average Common Shares outstanding. |
| 2 | | Dividends are determined in accordance with federal income tax regulations. |
| 3 | | Total investment returns based on market price, which can be significantly greater or lesser than the net asset value, may result in substantially different returns. Where applicable, total investment returns exclude the effects of any sales charges and assume the reinvestment of dividends and distributions. |
| 4 | | Do not reflect the effect of dividends to AMPS shareholders. |
| 5 | | Interest expense, fees and amortization of offering costs relate to TOBs and/or VRDP Shares. See Note 3 and Note 9 of the Notes to Financial Statements for details of municipal bonds transferred to TOBs and VRDP Shares, respectively. |
| 6 | | For the year ended July 31, 2012, the total expense ratio after fees waived and excluding interest expense, fees, amortization of offering costs, liquidity and remarketing fees was 0.99%. |
See Notes to Financial Statements.
| 44 | ANNUAL REPORT | JULY 31, 2013
|
| |
| Financial Highlights | BlackRock MuniYield New Jersey Fund, Inc. (MYJ)
|
| | | | Year Ended July 31,
|
|
| | | | 2013 | | 2012 | | 2011 | | 2010 | | 2009 |
Per Share Operating Performance
|
Net asset value, beginning of year | | | | $ | 16.92 | | | $ | 14.84 | | | $ | 15.24 | | | $ | 14.13 | | | $ | 14.36 | |
Net investment income1 | | | | | 0.89 | | | | 0.86 | | | | 0.92 | | | | 1.00 | | | | 0.98 | |
Net realized and unrealized gain (loss) | | | | | (1.94 | ) | | | 2.11 | | | | (0.41 | ) | | | 1.00 | | | | (0.34 | ) |
Distributions to VRDP Shareholders from net realized gain | | | | | (0.00 | )2 | | | — | | | | — | | | | — | | | | — | |
Dividends to AMPS shareholders from net investment income | | | | | — | | | | — | | | | (0.03 | ) | | | (0.04 | ) | | | (0.15 | ) |
Net increase (decrease) from investment operations | | | | | (1.05 | ) | | | 2.97 | | | | 0.48 | | | | 1.96 | | | | 0.49 | |
Dividends and distributions to Common Shareholders from:3
| | | | | | | | | | | | | | | | | | | | | | |
Net investment income | | | | | (0.89 | ) | | | (0.89 | ) | | | (0.88 | ) | | | (0.85 | ) | | | (0.72 | ) |
Net realized gain | | | | | (0.06 | ) | | | — | | | | — | | | | — | | | | — | |
Total dividends and distributions | | | | | (0.95 | ) | | | (0.89 | ) | | | (0.88 | ) | | | (0.85 | ) | | | (0.72 | ) |
Net asset value, end of year | | | | $ | 14.92 | | | $ | 16.92 | | | $ | 14.84 | | | $ | 15.24 | | | $ | 14.13 | |
Market price, end of year | | | | $ | 13.74 | | | $ | 17.07 | | | $ | 13.53 | | | $ | 15.19 | | | $ | 13.49 | |
| | | | | | | | | | | | | | | | | | | | | | | |
Total Investment Return Applicable to Common Shareholders4
|
Based on net asset value | | | | | (6.51 | )% | | | 20.72 | % | | | 3.55 | % | | | 14.34 | % | | | 4.50 | % |
Based on market price | | | | | (14.66 | )% | | | 33.59 | % | | | (5.28 | )% | | | 19.38 | % | | | 5.96 | % |
| | | | | | | | | | | | | | | | | | | | | | | |
Ratios to Average Net Assets Applicable to Common Shareholders
|
Total expenses | | | | | 1.48 | % | | | 1.61 | % | | | 1.26 | %5 | | | 1.01 | %5 | | | 1.15 | %5 |
Total expenses after fees waived | | | | | 1.48 | % | | | 1.60 | % | | | 1.25 | %5 | | | 1.00 | %5 | | | 1.14 | %5 |
Total expenses after fees waived and excluding interest expense, fees and amortization of offering costs6 | | | | | 0.92 | % | | | 1.28 | %7 | | | 1.14 | %5 | | | 0.98 | %5 | | | 1.05 | %5 |
Net investment income | | | | | 5.32 | % | | | 5.41 | % | | | 6.26 | %5 | | | 6.71 | %5 | | | 7.21 | %5 |
Dividends to AMPS shareholders | | | | | — | | | | — | | | | 0.23 | % | | | 0.30 | % | | | 1.12 | % |
Net investment income to Common Shareholders | | | | | 5.32 | % | | | 5.41 | % | | | 6.03 | % | | | 6.41 | % | | | 6.09 | % |
| | | | | | | | | | | | | | | | | | | | | | | |
Supplemental Data
|
Net assets applicable to Common Shareholders, end of year (000) | | | | $ | 213,099 | | | $ | 240,759 | | | $ | 211,121 | | | $ | 216,433 | | | $ | 200,740 | |
AMPS outstanding at $25,000 liquidation preference, end of year (000) | | | | | — | | | | — | | | | — | | | $ | 102,200 | | | $ | 102,200 | |
VRDP Shares outstanding at $100,000 liquidation value, end of year (000) | | | | $ | 102,200 | | | $ | 102,200 | | | $ | 102,200 | | | | — | | | | — | |
Portfolio turnover | | | | | 7 | % | | | 23 | % | | | 18 | % | | | 15 | % | | | 21 | % |
Asset coverage per AMPS at $25,000 liquidation preference, end of year | | | | | — | | | | — | | | | — | | | $ | 77,946 | | | $ | 74,107 | |
Asset coverage per VRDP Shares at $100,000 liquidation value, end of year | | | | $ | 308,511 | | | $ | 335,577 | | | $ | 306,576 | | | | — | | | | — | |
| 1 | | Based on average Common Shares outstanding. |
| 2 | | Amount is greater than $(0.00) per share. |
| 3 | | Dividends and distributions are determined in accordance with federal income tax regulations. |
| 4 | | Total investment returns based on market price, which can be significantly greater or lesser than the net asset value, may result in substantially different returns. Where applicable, total investment returns exclude the effects of any sales charges and assume the reinvestment of dividends and distributions. |
| 5 | | Do not reflect the effect of dividends to AMPS shareholders. |
| 6 | | Interest expense, fees and amortization of offering costs relate to TOBs and/or VRDP Shares. See Note 3 and Note 9 of the Notes to Financial Statements for details of municipal bonds transferred to TOBs and VRDP Shares, respectively. |
| 7 | | For the year ended July 31, 2012, the total expense ratio after fees waived and excluding interest expense, fees, amortization of offering costs, liquidity and remarketing fees was 0.93%. |
See Notes to Financial Statements.
| ANNUAL REPORT | JULY 31, 2013 | 45
|
| |
| Notes to Financial Statements |
|
1. Organization:
BlackRock Muni New York Intermediate Duration Fund, Inc. (“MNE”), BlackRock MuniYield Arizona Fund, Inc. (“MZA”), BlackRock MuniYield California Fund, Inc. (“MYC”), BlackRock MuniYield Investment Fund (“MYF”) and BlackRock MuniYield New Jersey Fund, Inc. (“MYJ”) (collectively, the “Funds”) are registered under the Investment Company Act of 1940, as amended (the “1940 Act”), as non-diversified, closed-end management investment companies. MNE, MZA, MYC and MYJ are organized as Maryland corporations. MYF is organized as a Massachusetts business trust. The Board of Directors and the Board of Trustees of the Funds are collectively referred to throughout this report as the “Board of Trustees” or the “Board”, and the directors/trustees thereof are collectively referred to throughout this report as “Directors”. The Funds determine, and make available for publication the NAVs of their Common Shares on a daily basis.
2. Significant Accounting Policies:
The Funds’ financial statements are prepared in conformity with accounting principles generally accepted in the United States of America (“US GAAP”), which may require management to make estimates and assumptions that affect the reported amounts of assets and liabilities in the financial statements and the reported amounts of increases and decreases in net assets from operations during the reported period. Actual results could differ from those estimates. The following is a summary of significant accounting policies followed by the Funds:
Valuation: US GAAP defines fair value as the price the Funds would receive to sell an asset or pay to transfer a liability in an orderly transaction between market participants at the measurement date. The Funds determine the fair values of their financial instruments at market value using independent dealers or pricing services under policies approved by the Board. The BlackRock Global Valuation Methodologies Committee (the “Global Valuation Committee”) is the committee formed by management to develop global pricing policies and procedures and to provide oversight of the pricing function for the Funds for all financial instruments.
Municipal investments (including commitments to purchase such investments on a “when-issued” basis) are valued on the basis of prices provided by dealers or pricing services. In determining the value of a particular investment, pricing services may use certain information with respect to transactions in such investments, quotations from dealers, pricing matrixes, market transactions in comparable investments and information with respect to various relationships between investments. Financial futures contracts traded on exchanges are valued at their last sale price. Investments in open-end registered investment companies are valued at NAV each business day.
Exchange-traded options are valued at the mean between the last bid and ask prices at the close of the options market in which the options trade. An exchange-traded option for which there is no mean price is valued at the last bid price. If no bid price is available, the prior day’s price will be used, unless it is determined that the prior day’s price no longer reflects the fair value of the option. Over-the-counter (“OTC”) options are valued by an independent pricing service using a mathematical model, which incorporates a number of market data factors, such as the trades and prices of the underlying instruments.
In the event that application of these methods of valuation results in a price for an investment that is deemed not to be representative of the market value of such investment, or if a price is not available, the investment will be valued by the Global Valuation Committee, or its delegate, in accordance with a policy approved by the Board as reflecting fair value (“Fair Value Assets”). When determining the price for Fair Value Assets, the Global Valuation Committee, or its delegate, seeks to determine the price that each Fund might reasonably expect to receive from the current sale of that asset in an arm’s-length transaction. Fair value determinations shall be based upon all available factors that the Global Valuation Committee, or its delegate, deem relevant consistent with the principals of fair value measurement which include the market approach, income approach and/or in the case of recent investments, the cost approach, as appropriate. The market approach generally consists of using comparable market transactions. The income approach generally is used to discount future cash flows to present value and is adjusted for liquidity as appropriate. These factors include but are not limited to: (i) attributes specific to the investment or asset; (ii) the principal market for the investment or asset; (iii) the customary participants in the principal market for the investment or asset; (iv) data assumptions by market participants for the investment or asset, if reasonably available; (v) quoted prices for similar investments or assets in active markets; and (vi) other factors, such as future cash flows, interest rates, yield curves, volatilities, prepayment speeds, loss severities, credit risks, recovery rates, liquidation amounts and/or default rates. Due to the inherent uncertainty of valuations of such investments, the fair values may differ from the values that would have been used had an active market existed. The Global Valuation Committee, or its delegate, employs various methods for calibrating valuation approaches for investments where an active market does not exist, including regular due diligence of the Funds’ pricing vendors, a regular review of key inputs and assumptions, transactional back-testing or disposition analysis to compare unrealized gains and losses to realized gains and losses, reviews of missing or stale prices and large movements in market values and reviews of any market related activity. The pricing of all Fair Value Assets is subsequently reported to the Board or a committee thereof on a quarterly basis.
Segregation and Collateralization: In cases in which the 1940 Act and the interpretive positions of the Securities and Exchange Commission (“SEC”) require that each Fund either deliver collateral or segregate assets in connection with certain investments (e.g., TOBs and financial futures contracts), each Fund will, consistent with SEC rules and/or certain interpretive letters issued by the SEC, segregate collateral or designate on their books and records cash or liquid securities having a market value at least equal to the amount that would otherwise be required to be physically segregated. Furthermore, based on requirements and agreements with certain exchanges and third party broker-dealers, a fund engaging in such transactions may have requirements to deliver/deposit securities to/with an exchange or broker-dealer as collateral for certain investments.
| 46 | ANNUAL REPORT | JULY 31, 2013
|
| |
| Notes to Financial Statements (continued) |
|
Investment Transactions and Investment Income: For financial reporting purposes, investment transactions are recorded on the dates the transactions are entered into (the trade dates). Realized gains and losses on investment transactions are determined on the identified cost basis. Dividend income is recorded on the ex-dividend dates. Interest income, including amortization and accretion of premiums and discounts on debt securities, is recognized on the accrual basis.
Dividends and Distributions: Dividends from net investment income are declared and paid monthly. Distributions of capital gains are recorded on the ex-dividend dates. The character and timing of dividends and distributions are determined in accordance with federal income tax regulations, which may differ from US GAAP. Dividends and distributions to Preferred Shareholders are accrued and determined as described in Note 9.
Income Taxes: It is each Fund’s policy to comply with the requirements of the Internal Revenue Code of 1986, as amended, applicable to regulated investment companies and to distribute substantially all of their taxable income to their shareholders. Therefore, no federal income tax provision is required.
Each Fund files US federal and various state and local tax returns. No income tax returns are currently under examination. The statute of limitations on the Funds’ US federal tax returns remains open for each of the four years ended July 31, 2013. The statutes of limitations on each Fund’s state and local tax returns may remain open for an additional year depending upon the jurisdiction. Management does not believe there are any uncertain tax positions that require recognition of a tax liability.
Recent Accounting Standards: In December 2011, the Financial Accounting Standards Board (the “FASB”) issued guidance that will expand current disclosure requirements on the offsetting of certain assets and liabilities. The new disclosures will be required for investments and derivative financial instruments subject to master netting or similar agreements, which are eligible for offset in the Statements of Assets and Liabilities and will require an entity to disclose both gross and net information about such investments and transactions in the financial statements. In January 2013, the FASB issued guidance that clarifies which investments and transactions are subject to the offsetting disclosure requirements. The scope of the disclosure requirements for offsetting will be limited to derivative instruments, repurchase agreements and reverse repurchase agreements, and securities borrowing and securities lending transactions. The guidance is effective for financial statements with fiscal years beginning on or after January 1, 2013, and interim periods within those fiscal years. Management is evaluating the impact, if any, of this guidance on the Funds’ financial statement disclosures.
Deferred Compensation Plan: Under the Deferred Compensation Plan (the “Plan”) approved by each Fund’s Board, the independent Directors (“Independent Directors”) may defer a portion of their annual complex-wide compensation. Deferred amounts earn an approximate return as though equivalent dollar amounts had been invested in common shares of certain other BlackRock Closed-End Funds selected by the Independent Directors. This has the same economic effect for the Independent Directors as if the Independent Directors had invested the deferred amounts directly in certain other BlackRock Closed-End Funds.
The Plan is not funded and obligations thereunder represent general unsecured claims against the general assets of each Fund. Deferred compensation liabilities are included in officer’s and directors’ fees payable in the Statements of Assets and Liabilities and will remain as a liability of the Funds until such amounts are distributed in accordance with the Plan.
Other: Expenses directly related to a Fund are charged to that Fund. Other operating expenses shared by several funds are pro rated among those funds on the basis of relative net assets or other appropriate methods.
The Funds have an arrangement with the custodians whereby fees may be reduced by credits earned on uninvested cash balances, which, if applicable, are shown as fees paid indirectly in the Statements of Operations. The custodians impose fees on overdrawn cash balances, which can be offset by accumulated credits earned or may result in additional custody charges.
3. Securities and Other Investments:
Zero-Coupon Bonds: The Funds may invest in zero-coupon bonds, which are normally issued at a significant discount from face value and do not provide for periodic interest payments. Zero-coupon bonds may experience greater volatility in market value than similar maturity debt obligations which provide for regular interest payments.
Forward Commitments and When-Issued Delayed Delivery Securities: The Funds may purchase securities on a when-issued basis and may purchase or sell securities on a forward commitment basis. Settlement of such transactions normally occurs within a month or more after the purchase or sale commitment is made. The Funds may purchase securities under such conditions with the intention of actually acquiring them, but may enter into a separate agreement to sell the securities before the settlement date. Since the value of securities purchased may fluctuate prior to settlement, the Funds may be required to pay more at settlement than the security is worth. In addition, the Funds are not entitled to any of the interest earned prior to settlement. When purchasing a security on a delayed delivery basis, the Funds assume the rights and risks of ownership of the security, including the risk of price and yield fluctuations. In the event of default by the counterparty, the Funds’ maximum amount of loss is the unrealized appreciation of unsettled when-issued transactions, which is shown in the Schedules of Investments.
Municipal Bonds Transferred to TOBs: The Funds leverage their assets through the use of TOBs. A TOB is a special purpose entity established by a third party sponsor, into which a fund, or an agent on behalf of a fund, transfers municipal bonds into a trust (“TOB Trust”). Other funds managed by the investment advisor may also contribute municipal bonds to a TOB into which a Fund has contributed bonds. A TOB typically issues two classes of beneficial interests: short-term floating rate certificates (“TOB Trust Certificates”), which are sold to third party investors, and residual certificates (“TOB Residuals”), which are generally issued to the
| ANNUAL REPORT | JULY 31, 2013 | 47
|
| |
| Notes to Financial Statements (continued) |
|
participating funds that contributed the municipal bonds to the TOB Trust. If multiple funds participate in the same TOB, the rights and obligations under the TOB Residual will be shared among the funds ratably in proportion to their participation.
The TOB Residuals held by a Fund include the right of a Fund (1) to cause the holders of a proportional share of the TOB Trust Certificates to tender their certificates at par plus accrued interest upon the occurrence of certain mandatory tender events defined in the TOB agreements, and (2) to transfer, subject to a specified number of days’ prior notice, a corresponding share of the municipal bonds from the TOB to a Fund. The TOB may also be collapsed without the consent of a Fund, as the TOB Residual holder, upon the occurrence of certain termination events as defined in the TOB agreements. Such termination events may include the bankruptcy or default of the municipal bond, a substantial downgrade in credit quality of the municipal bond, the inability of the TOB to obtain renewal of the liquidity support agreement, a substantial decline in market value of the municipal bond and a judgment or ruling that interest on the municipal bond is subject to federal income taxation. Upon the occurrence of a Termination Event, the TOB would generally be liquidated in full with the proceeds typically applied first to any accrued fees owed to the trustee, remarketing agent and liquidity provider, and then to the holders of the TOB Trust Certificates up to par plus accrued interest owed on the TOB Trust Certificates, with the balance paid out to the TOB Residual holder. During the year ended July 31, 2013, no TOBs in which the Funds participated were terminated without the consent of the Trusts.
The cash received by the TOB from the sale of TOB Trust certificates, less transaction expenses, is paid to a Fund. The Fund typically invests the cash received in additional municipal bonds. Each Fund’s transfer of the municipal bonds to a TOB Trust is accounted for as a secured borrowing; therefore, the municipal bonds deposited into a TOB are presented in the Funds’ Schedules of Investments and the TOB Trust Certificates are shown in other liabilities in the Statements of Assets and Liabilities. The carrying amount of the Funds payable to the holder of the TOB Trust Certificates, as reported in Statements of Assets and Liabilities as TOB Trust Certificates, approximates its fair value.
The Funds may invest in TOBs on either a non-recourse or recourse basis. TOB Trusts are typically supported by a liquidity facility provided by a bank or other financial institution (the “Liquidity Provider”) that allows the holders of the TOB Trust Certificates to tender their certificates in exchange for payment from the Liquidity Provider of par plus accrued interest on any business day prior to the occurrence of the termination events described above. When a Fund invests in TOBS on a non-recourse basis, and the Liquidity Provider is required to make a payment under the liquidity facility due to a termination event, the Liquidity Provider will typically liquidate all or a portion of the municipal securities held in the TOB Trust and then fund, on a net basis, the balance, if any, of the amount owed under the liquidity facility over the liquidation proceeds (the “Liquidation Shortfall”). If a Fund invests in a TOB on a recourse basis, the the Fund will typically enter into a reimbursement agreement with the Liquidity Provider where the Fund is required to repay the Liquidity Provider the amount of any Liquidation Shortfall. As a result, a Fund investing in a recourse TOB will bear the risk of loss with respect to any Liquidation Shortfall. If multiple funds participate in any such TOB, these losses will be shared ratably in proportion to their participation. The recourse TOB Trusts, if any, are identified in the Schedules of Investments.
Interest income, including amortization and accretion of premiums and discounts, from the underlying municipal bonds is recorded by the Funds on an accrual basis. Interest expense incurred on the secured borrowing and other expenses related to remarketing, administration and trustee services to a TOB are shown as interest expense fees and amortization of offering costs in the Statements of Operations. The TOB Trust Certificates have interest rates that generally reset weekly and their holders have the option to tender such certificates to the TOB for redemption at par at each reset date. At July 31, 2013, the aggregate value of the underlying municipal bonds transferred to TOBs, the related liability for TOB Trust Certificates and the range of interest rates on the liability for TOB Trust Certificates were as follows:
|
|
|
| Underlying
Municipal
Bonds
Transferred
to TOBs
|
| Liability for
TOB Trust
Certificates
|
| Range of
Interest
Rates
|
MNE | | | | $ | 10,566,301 | | | $ | 5,537,752 | | | 0.06% – 0.11% |
MZA | | | | $ | 6,934,313 | | | $ | 3,330,000 | | | 0.06% – 0.07% |
MYC | | | | $ | 230,901,105 | | | $ | 116,774,796 | | | 0.06% – 0.19% |
MYF | | | | $ | 157,033,356 | | | $ | 85,029,096 | | | 0.06% – 0.34% |
MYJ | | | | $ | 64,803,249 | | | $ | 39,555,492 | | | 0.06% – 0.31% |
For the year ended July 31, 2013, the Funds’ average TOB Trust Certificates outstanding and the daily weighted average interest rate, including fees, were as follows:
|
|
|
| Average TOB
Trust Certificates
Outstanding
|
| Daily Weighted
Average
Interest Rate
|
MNE | | | | $ | 6,206,561 | | | | 0.67 | % |
MZA | | | | $ | 3,330,000 | | | | 0.68 | % |
MYC | | | | $ | 116,416,075 | | | | 0.66 | % |
MYF | | | | $ | 87,038,223 | | | | 0.73 | % |
MYJ | | | | $ | 32,948,271 | | | | 0.75 | % |
Should short-term interest rates rise, the Funds’ investments in TOBs may adversely affect the Funds’ net investment income and dividends to Common Shareholders. Also, fluctuations in the market value of municipal bonds deposited into the TOB Trust may adversely affect the Funds’ NAVs per share.
4. Derivative Financial Instruments:
The Funds engage in various portfolio investment strategies using derivative contracts both to increase the returns of the Funds and/or to economically hedge their exposure to certain risks such as interest rate risk. These contracts may be transacted on an exchange or OTC.
Financial Futures Contracts: The Funds purchase and/or sell financial futures contracts and options on financial futures contracts to gain exposure to, or economically hedge against, changes in interest rates (interest rate risk). Financial futures contracts are agreements between the Funds and counterparty to buy or sell a specific quantity of an underlying instrument at a specified price and at a specified date. Depending on the terms of the particular contract, financial futures contracts are settled
| 48 | ANNUAL REPORT | JULY 31, 2013
|
| |
| Notes to Financial Statements (continued) |
|
either through physical delivery of the underlying instrument on the settlement date or by payment of a cash settlement amount on the settlement date. Upon entering into a financial futures contract, the Funds are required to deposit initial margin with the broker in the form of cash or securities in an amount that varies depending on a contract’s size and risk profile. The initial margin deposit must then be maintained at an established level over the life of the contract. Securities deposited as initial margin are designated on the Schedules of Investments and cash deposited is recorded on the Statements of Assets and Liabilities as cash pledged for financial futures contracts. Pursuant to the contract, the Funds agree to receive from or pay to the broker an amount of cash equal to the daily fluctuation in value of the contract. Such receipts or payments are known as variation margin and are recorded by the Funds as unrealized appreciation or depreciation. When the contract is closed, the Funds record a realized gain or loss equal to the difference between the value of the contract at the time it was opened and the value at the time it was closed. The use of financial futures contracts involves the risk of an imperfect correlation in the movements in the price of financial futures contracts, interest rates and the underlying assets.
Options: The Funds purchase and write call and put options to increase or decrease their exposure to underlying instruments (including interest rate risk) and/or, in the case of options written, to generate gains from options premiums. A call option gives the purchaser (holder) of the option the right (but not the obligation) to buy, and obligates the seller (writer) to sell (when the option is exercised) the underlying instrument at the exercise or strike price at any time or at a specified time during the option period. A put option gives the holder the right to sell and obligates the writer to buy the underlying instrument at the exercise or strike price at any time or at a specified time during the option period. When the Funds purchase (write) an option, an amount equal to the premium paid (received) by the Funds is reflected as an asset (liability). The amount of the asset (liability) is subsequently marked-to-market to reflect the current market value of the option purchased (written). When an instrument is purchased or sold through an exercise of an option, the related premium paid (or received) is added to (or deducted from) the basis of the instrument acquired or deducted from (or added to) the proceeds of the instrument sold. When an option expires (or the Funds enter into a closing transaction), the Funds realize a gain or loss on the option to the extent of the premiums received or paid (or gain or loss to the extent the cost of the closing transaction exceeds the premiums received or paid). When the Funds write a call option, such option is “covered,” meaning that the Funds hold the underlying instrument subject to being called by the option counterparty. When the Funds write a put option, such option is covered by cash in an amount sufficient to cover the obligation.
In purchasing and writing options, the Funds bear the risk of an unfavorable change in the value of the underlying instrument or the risk that the Funds may not be able to enter into a closing transaction due to an illiquid market. Exercise of written option could result in the Funds purchasing or selling a security when it otherwise would not, or at a price different from the current market value.
The following is a summary of the Funds’ derivative financial instruments categorized by risk exposure:
The Effect of Derivative Financial Instruments in the Statements of Operations
Year Ended July 31, 2013
|
|
| | | | Net Realized Gain (Loss) From
|
|
|
|
| MNE
|
| MZA
|
| MYC
|
| MYF
|
| MYJ
|
Interest rate contracts:
| | | | | | | | | | | | | | | | | | | | | | |
Financial futures contracts | | | | $ | 59,654 | | | $ | 32,872 | | | $ | 535,022 | | | $ | 761,196 | | | $ | 828,513 | |
Options1 | | | | | (21,815 | ) | | | — | | | | — | | | | — | | | | — | |
Total
| | | | $ | 37,839 | | | $ | 32,872 | | | $ | 535,022 | | | $ | 761,196 | | | $ | 828,513 | |
| 1 | | Options purchased are included in the net realized gain (loss) from investments. |
For the year ended July 31, 2013, the average quarterly balance of outstanding derivative financial instruments were as follows:
|
|
|
| MNE
|
| MZA
|
| MYC
|
| MYF
|
| MYJ
|
Financial future contracts:
| | | | | | | | | | | | | | | | | | | | | | |
Average number of contracts sold | | | | | 12 | | | | 5 | | | | 75 | | | | 52 | | | | 56 | |
Average notional value of contracts sold | | | | $ | 1,592,000 | | | $ | 666,797 | | | $ | 9,950,000 | | | $ | 6,901,348 | | | $ | 7,501,465 | |
Options:
| | | | | | | | | | | | | | | | | | | | | | |
Average number of contracts purchased | | | | | 35 | 2 | | | — | | | | — | | | | — | | | | — | |
Average notional value of contracts purchased | | | | $ | 5,391 | 2 | | | — | | | | — | | | | — | | | | — | |
| 2 | | Actual contract amount shown due to limited activity. |
Counterparty Credit Risk: A derivative contract may suffer a mark to market loss if the value of the contract decreases due to an unfavorable change in the market rates or values of the underlying instrument. Losses can also occur if the counterparty does not perform under the contract.
With exchange traded purchased options and futures, there is less counterparty credit risk to the Funds since the exchange or clearinghouse, as counterparty to such instruments, guarantees against a possible default. The clearinghouse stands between the buyer and the seller of the contract; therefore, the credit risk is limited to failure of the clearinghouse. While offset rights may exist under applicable law, the Funds do not have a contractual right of offset against a clearing broker or clearinghouse in the event of a default (including the bankruptcy or insolvency) of the clearing broker or clearinghouse. Additionally, credit risk exists in exchange traded futures with respect to initial and variation margin that is held in a broker’s customer accounts. While brokers are required to segregate customer margin from their own assets, in the event that a broker becomes insolvent
| ANNUAL REPORT | JULY 31, 2013 | 49
|
| |
| Notes to Financial Statements (continued) |
|
or goes into bankruptcy and at that time there is a shortfall in the aggregate amount of margin held by the broker for all its clients, typically the shortfall would be allocated on a pro rata basis across all the broker’s customers, potentially resulting in losses to the Funds.
5. Investment Advisory Agreement and Other Transactions with Affiliates:
The PNC Financial Services Group, Inc. is the largest stockholder and an affiliate, for 1940 Act purposes of BlackRock, Inc. (“BlackRock”).
Each Fund entered into an Investment Advisory Agreement with BlackRock Advisors, LLC (the “Manager”), the Funds’ investment advisor, an indirect, wholly owned subsidiary of BlackRock, to provide investment advisory and administration services. The Manager is responsible for the management of each Fund’s portfolio and provides the necessary personnel, facilities, equipment and certain other services necessary to the operations of each Fund. For such services, each Fund pays the Manager a monthly fee based on a percentage of each Fund’s average daily net assets at the following annual rates:
MNE | | | | | 0.55 | % |
MZA | | | | | 0.50 | % |
MYC | | | | | 0.50 | % |
MYF | | | | | 0.50 | % |
MYJ | | | | | 0.50 | % |
Average daily net assets are the average daily value of each Fund’s total assets minus the sum of its accrued liabilities.
The Manager voluntarily agreed to waive its investment advisory fees by the amount of investment advisory fees each Fund pays to the Manager indirectly through its investment in affiliated money market funds. However, the Manager does not waive its investment advisory fees by the amount of investment advisory fees paid in connection with each Fund’s investment in other affiliated investment companies, if any. These amounts waived or reimbursed are shown as fees waived by Manager in the Statements of Operations.
The Manager entered into a sub-advisory agreement with BlackRock Investment Management, LLC (“BIM”), an affiliate of the Manager. The Manager pays BIM, for services it provides, a monthly fee that is a percentage of the investment advisory fees paid by each Fund to the Manager.
Certain officers and/or Directors of the Funds are officers and/or directors of BlackRock or its affiliates. The Funds reimburse the Manager for a portion of the compensation paid to the Funds’ Chief Compliance Officer, which is included in Officer and Directors in the Statements of Operations.
The Funds may purchase securities from, or sell securities to, an affiliated fund provided the affiliation is solely due to having a common investment advisor, common officers, or common trustees. For the year ended July 31, 2013, the purchase and sale transactions with an affiliated fund in compliance with Rule 17a-7 under the 1940 Act were as follows:
|
|
|
| Purchases
|
| Sales
|
MYC | | | | $ | 325,391 | | | $ | 4,423,911 | |
MYF | | | | | — | | | $ | 1,171,724 | |
6. Purchases and Sales:
Purchases and sales of investments, excluding short-term securities for the year ended July 31, 2013, were as follows:
|
|
|
| Purchases
|
| Sales
|
MNE | | | | $ | 21,077,271 | | | $ | 22,903,602 | |
MZA | | | | $ | 18,115,615 | | | $ | 16,701,692 | |
MYC | | | | $ | 153,774,388 | | | $ | 152,706,457 | |
MYF | | | | $ | 120,268,975 | | | $ | 118,874,719 | |
MYJ | | | | $ | 38,812,485 | | | $ | 26,017,806 | |
7. Income Tax Information:
US GAAP requires that certain components of net assets be adjusted to reflect permanent differences between financial and tax reporting. These reclassifications have no effect on net assets or net asset values per share. The following permanent differences as of July 31, 2013 attributable to amortization methods on fixed income securities and non-deductible expenses were reclassified to the following accounts:
|
|
|
| MNE
|
| MZA
|
| MYC
|
| MYF
|
| MYJ
|
Paid-in Capital | | | | $ | (22,400 | ) | | $ | (5,562 | ) | | $ | (7,952 | ) | | $ | (7,220 | ) | | $ | (8,997 | ) |
Undistributed net investment income | | | | $ | 22,391 | | | $ | 5,553 | | | $ | 9,604 | | | $ | 14,559 | | | $ | 8,997 | |
Accumulated net realized loss | | | | $ | 9 | | | $ | 9 | | | $ | (1,652 | ) | | $ | (7,339 | ) | | | — | |
The tax character of distributions paid during the fiscal years ended July 31, 2013 and July 31, 2012 was as follows:
|
|
|
|
|
| MNE
|
| MZA
|
| MYC
|
| MYF
|
| MYJ
|
Tax-exempt income1 | | | | | 7/31/13 | | | $ | 3,230,525 | | | $ | 4,218,308 | | | $ | 21,361,362 | | | $ | 13,550,755 | | | $ | 13,747,730 | |
| | | | | 7/31/12 | | | | 3,263,872 | | | | 3,952,445 | | | | 20,582,409 | | | | 12,970,647 | | | | 12,871,675 | |
Ordinary income2 | | | | | 7/31/13 | | | | 2,002 | | | | 2,305 | | | | — | | | | 697 | | | | 64,566 | |
| | | | | 7/31/12 | | | | — | | | | — | | | | — | | | | — | | | | 201,855 | |
Long-term capital gain3 | | | | | 7/31/13 | | | | — | | | | — | | | | — | | | | — | | | | 962,174 | |
Total
| | | | | 7/31/13 | | | $ | 3,232,527 | | | $ | 4,220,613 | | | $ | 21,361,362 | | | $ | 13,551,452 | | | $ | 14,774,470 | |
| | | | | 7/31/12 | | | $ | 3,263,872 | | | $ | 3,952,445 | | | $ | 20,582,409 | | | $ | 12,970,647 | | | $ | 13,073,530 | |
| 1 | | The Funds designate these amounts paid during the fiscal year ended July 31, 2013, as exempt-interest dividends. |
| 2 | | Ordinary income consists primarily of taxable income recognized from market discount. Additionally, all ordinary income distributions are comprised of interest related dividends for non-US residents and are eligible for exemption from US withholding tax for nonresident aliens and foreign corporations. |
| 3 | | The Fund designates the amount paid during the fiscal year ended July 31, 2013, as capital gain dividends. |
| 50 | ANNUAL REPORT | JULY 31, 2013
|
| |
| Notes to Financial Statements (continued) |
|
As of July 31, 2013, the tax components of accumulated net earnings were as follows:
|
|
|
| MNE
|
| MZA
|
| MYC
|
| MYF
|
| MYJ
|
Undistributed tax-exempt income | | | | $ | 702,741 | | | $ | 889,888 | | | $ | 4,186,115 | | | $ | 3,185,090 | | | $ | 4,060,795 | |
Undistributed ordinary income | | | | | 4,402 | | | | 326 | | | | — | | | | 117 | | | | 137,279 | |
Undistributed long-term capital gains | | | | | — | | | | — | | | | — | | | | — | | | | 403,623 | |
Capital loss carryforwards | | | | | (750,672 | ) | | | (884,995 | ) | | | (758,242 | ) | | | (7,205,475 | ) | | | — | |
Net unrealized gains1 | | | | | 1,638,863 | | | | 1,401,455 | | | | 15,515,106 | | | | 10,819,162 | | | | 2,907,965 | |
Qualified late-year losses2 | | | | | — | | | | — | | | | (1,800,213 | ) | | | (2,224,543 | ) | | | — | |
Total
| | | | $ | 1,595,334 | | | $ | 1,406,674 | | | $ | 17,142,766 | | | $ | 4,574,351 | | | $ | 7,509,662 | |
| 1 | | The difference between book-basis and tax-basis net unrealized gains was attributable primarily to the tax deferral of losses on wash sales, amortization and accretion methods of premiums and discounts on fixed income securities, the deferral of compensation to directors and the treatment of residual interests in tender options bond trusts. |
| 2 | | The Funds have elected to defer certain qualified late-year losses and recognize such losses in the year ending July 31, 2014. |
As of July 31, 2013, the Funds had capital loss carryforwards available to offset future realized capital gains through the indicated expiration dates as follows:
Expires July 31,
|
|
|
| MNE
|
| MZA
|
| MYC
|
| MYF
|
2018 | | | | $ | 750,672 | | | $ | 816,347 | | | $ | 758,242 | | | $ | 7,205,475 | |
2019 | | | | | — | | | | 68,648 | | | | — | | | | — | |
Total
| | | | $ | 750,672 | | | $ | 884,995 | | | $ | 758,242 | | | $ | 7,205,475 | |
During the year ended July 31, 2013, the Funds listed below utilized the following amounts of their respective capital loss carryforward:
MNE | | | | $ 849,155 | | | | |
MZA | | | | $ 256,306 | | | | |
MYC | | | | $ 1,542,851 | | | | |
MYF | | | | $ 2,828,295 | | | | |
As of July 31, 2013, gross unrealized appreciation and gross unrealized depreciation based on cost for federal income tax purposes were as follows:
|
|
|
| MNE
|
| MZA
|
| MYC
|
| MYF
|
| MYJ
|
| | | | | | | | | | | | | | | | | | | | | | |
Tax cost | | | | $ | 88,499,714 | | | $ | 97,352,053 | | | $ | 409,971,668 | | | $ | 247,190,822 | | | $ | 310,986,695 | |
Gross unrealized appreciation | | | | $ | 3,700,994 | | | $ | 3,462,781 | | | $ | 21,577,940 | | | $ | 16,413,356 | | | $ | 10,865,336 | |
Gross unrealized depreciation | | | | | (2,062,131 | ) | | | (2,061,326 | ) | | | (6,062,835 | ) | | | (5,594,196 | ) | | | (7,953,937 | ) |
Net unrealized appreciation | | | | $ | 1,638,863 | | | $ | 1,401,455 | | | $ | 15,515,105 | | | $ | 10,819,160 | | | $ | 2,911,399 | |
8. Concentration, Market and Credit Risk:
MNE, MZA, MYC and MYJ invest a substantial amount of their assets in issuers located in a single state or limited number of states. Please see the Schedules of Investments for concentrations in specific states or US territories.
Many municipalities insure repayment of their bonds, which may reduce the potential for loss due to credit risk. The market value of these bonds may fluctuate for other reasons, including market perception of the value of such insurance, and there is no guarantee that the insurer will meet its obligation.
In the normal course of business, the Funds invest in securities and enter into transactions where risks exist due to fluctuations in the market (market risk) or failure of the issuer of a security to meet all its obligations (issuer credit risk). The value of securities held by the Funds may decline in response to certain events, including those directly involving the issuers whose securities are owned by the Funds; conditions affecting the general economy; overall market changes; local, regional or global political, social or economic instability; and currency and interest rate and price fluctuations. Similar to issuer credit risk, the Funds may be exposed to counterparty credit risk, or the risk that an entity with which the Funds have unsettled or open transactions may fail to or be unable to perform on its commitments. The Funds manage counterparty credit risk by entering into transactions only with counterparties that they believe have the financial resources to honor their obligations and by monitoring the financial stability of those counterparties. Financial assets, which potentially expose the Funds to market, issuer and counterparty credit risks, consist principally of financial instruments and receivables due from counterparties. The extent of the Funds’ exposure to market, issuer and counterparty credit risks with respect to these financial assets is generally approximated by their value recorded in the Statements of Assets and Liabilities, less any collateral held by the Funds.
As of July 31, 2013, MZA and MYC invested a significant portion of their assets in securities in the county/city/special district/school district and utilities sectors. MYF invested a significant portion of its assets in securities in the county/city/special district/school district, transportation and utilities sectors. MNE invested a significant portion of its assets in securities in the transportation sector. MYJ invested a significant portion of its assets in securities in the state sector. Changes in economic conditions affecting the county/city/special district/school district, state and transportation sectors would have a greater impact on the Funds and could affect the value, income and/or liquidity of positions in such securities.
| ANNUAL REPORT | JULY 31, 2013 | 51
|
| |
| Notes to Financial Statements (continued) |
|
9. Capital Share Transactions:
Each Fund is authorized to issue 200 million shares (unlimited number of shares for MYF), all of which were initially classified as Common Shares. The par value for each Fund’s Common Shares is $0.10. The Board is authorized, however, to reclassify any unissued Common Shares to Preferred Shares, including AMPS, without approval of Common Shareholders. MYF is authorized to issue 1 million Preferred Shares, including AMPS, par value $0.05 per share.
Common Shares
For the years shown, shares issued and outstanding increased by the following amounts as a result of dividend reinvestment:
|
|
|
| Year Ended
July 31,
2013
|
| Year Ended
July 31,
2012
|
MNE | | | | | 3,405 | | | | — | |
MZA | | | | | 12,706 | | | | 4,161 | |
MYC | | | | | 37,874 | | | | — | |
MYF | | | | | 20,747 | | | | 25,531 | |
MYJ | | | | | 55,771 | | | | 6,882 | |
Preferred Shares
Each Fund’s Preferred Shares rank prior to the Fund’s Common Shares to the payment of dividends by the Fund and distribution of assets upon dissolution or liquidation of the Fund. The 1940 Act prohibits the declaration of any dividend on the Fund’s Common Shares or the repurchase of the Fund’s Common Shares if the Fund fails to maintain asset coverage of at least 200% of the liquidation preference of the outstanding Preferred Shares. In addition, pursuant to the Preferred Shares’ governing instrument, the Funds are restricted from declaring and paying dividends on classes of shares ranking junior to or on parity with the Preferred Shares or repurchasing such shares if the Funds fail to declare and pay dividends on the Preferred Shares, redeem any Preferred Shares required to be redeemed under the Preferred Shares governing instrument or comply with the basic maintenance amount requirement of the rating agencies then rating the Preferred Shares.
The holders of Preferred Shares have voting rights equal to the holders of Common Shares (one vote per share) and will vote together with holders of Common Shares (one vote per share) as a single class. However, the holders of Preferred Shares, voting as a separate class, are also entitled to elect two Directors for each Fund. In addition, the 1940 Act requires that along with approval by shareholders that might otherwise be required, the approval of the holders of a majority of any outstanding Preferred Shares, voting separately as a class would be required to (a) adopt any plan of reorganization that would adversely affect the Preferred Shares, (b) change a Fund’s sub-classification as a closed-end investment company or change its fundamental investment restrictions or (c) change its business so as to cease to be an investment company.
VRDP Shares
MNE, MZA, MYC, MYF and MYJ (collectively, the “VRDP Funds”), have issued Series W-7 VRDP Shares, $100,000 liquidation value per share, in a privately negotiated offering. The VRDP Shares were offered to qualified institutional buyers as defined pursuant to Rule 144A under the Securities Act of 1933, as amended, (the “Securities Act”) and include a liquidity feature, pursuant to a liquidity agreement, that allows the holders of VRDP Shares to have their shares purchased by the liquidity provider in the event of a failed remarketing. The VRDP Funds are required to redeem the VRDP Shares owned by the liquidity provider after six months of continuous, unsuccessful remarketing. Upon the occurrence of the first unsuccessful remarketing, the VRDP Funds are required to segregate liquid assets to fund the redemption. The VRDP Shares are subject to certain restrictions on transfer.
The VRDP Shares outstanding as of the year ended July 31, 2013 were as follows:
|
|
|
| Issue
Date
|
| Shares
Issued
|
| Aggregate
Principal
|
| Maturity
Date
|
MNE | | | | | 9/15/11 | | | | 296 | | | $ | 29,600,000 | | | | 10/01/41 | |
MZA | | | | | 5/19/11 | | | | 373 | | | $ | 37,300,000 | | | | 6/01/41 | |
MYC | | | | | 5/19/11 | | | | 1,059 | | | $ | 105,900,000 | | | | 6/01/41 | |
MYF | | | | | 5/19/11 | | | | 594 | | | $ | 59,400,000 | | | | 6/01/41 | |
MYJ | | | | | 4/21/11 | | | | 1,022 | | | $ | 102,200,000 | | | | 5/01/41 | |
The VRDP Funds entered into a fee agreement with the liquidity provider that required a per annum liquidity fee payable to the liquidity provider. These fees, if applicable, are shown as liquidity fees in the Statements of Operations.
The fee agreement between each of MZA, MYC, MYF and MYJ and the liquidity provider is scheduled to expire on July 9, 2015 unless renewed or terminated in advance.
The initial fee agreement between MNE and the liquidity provider was for a 364 day term and was scheduled to expire on September 15, 2012 and subsequently extended until March 15, 2013, unless renewed or terminated in advance. On November 29, 2012, MNE entered into a new fee agreement with an alternate liquidity provider. The new fee agreement is for a two year term and is scheduled to expire on December 4, 2014, unless renewed or terminated in advance. The change in liquidity provider resulted in a mandatory tender of MNE’s VRDP Shares on November 28, 2012, which were successfully remarketed by the remarketing agent.
In the event the fee agreements are not renewed or are terminated in advance, and the VRDP Funds do not enter into a fee agreement with an alternate liquidity provider, the VRDP Shares will be subject to mandatory purchase by the liquidity provider prior to the termination of the fee agreement. The VRDP Funds are required to redeem any VRDP Shares purchased by the liquidity provider six months after the purchase date. Immediately after the purchase of any VRDP Shares by the liquidity provider, the VRDP Funds are required to begin to segregate liquid assets with the VRDP Funds’ custodian to fund the redemption. There is no assurance the VRDP Funds will replace such redeemed VRDP Shares with any other preferred shares or other form of leverage.
Each VRDP Fund is required to redeem its VRDP Shares on the maturity date, unless earlier redeemed or repurchased. Six months prior to the maturity date, each VRDP Fund is required to begin to segregate liquid assets with the Fund’s custodian to fund the redemption. In addition, the VRDP Funds are required to redeem certain of their outstanding VRDP Shares if they fail to maintain certain asset coverage, basic maintenance amount or leverage requirements.
| 52 | ANNUAL REPORT | JULY 31, 2013
|
| |
| Notes to Financial Statements (continued) |
|
Subject to certain conditions, the VRDP Shares may be redeemed, in whole or in part, at any time at the option of the VRDP Funds. The redemption price per VRDP Share is equal to the liquidation value per share plus any outstanding unpaid dividends. In the event of an optional redemption of the VRDP Shares prior to the initial termination date of the fee agreement, the VRDP Funds must pay the respective liquidity provider fees on such redeemed VRDP Shares for the remaining term of the fee agreement up to the initial termination date.
Dividends on the VRDP Shares are payable monthly at a variable rate set weekly by the remarketing agent. Such dividend rates are generally based upon a spread over a base rate and cannot exceed a maximum rate. In the event of a failed remarketing, the dividend rate of the VRDP Shares will be reset to a maximum rate. The maximum rate is determined based on, among other things, the long-term preferred share rating assigned to the VRDP Shares and the length of time that the VRDP Shares fail to be remarketed. At the date of issuance, the VRDP Shares were assigned a long-term rating of Aaa from Moody’s and AAA from Fitch. In May 2012, Moody’s completed a review of its methodology for rating securities issued by registered closed-end funds. As of July 31, 2013 the VRDP Shares were assigned a long-term rating from Moody’s under its new ratings methodology as follows:
|
|
|
| Rating
|
MNE | | | | | Aa2 | |
MZA | | | | | Aa2 | |
MYC | | | | | Aa2 | |
MYF | | | | | Aa1 | |
MYJ | | | | | Aa2 | |
The VRDP Shares continue to be assigned a long-term rating of AAA from Fitch.
The short-term ratings on the VRDP Shares are directly related to the short-term ratings of the liquidity provider for such VRDP Shares. Changes in the credit quality of the liquidity provider could cause a change in the short-term credit ratings of the VRDP Shares as rated by Moody’s, Fitch and/or S&P. A change in the short-term credit rating of the liquidity provider or the VRDP Shares may adversely affect the dividend rate paid on such shares, although the dividend rate paid on the VRDP Shares is not directly related based upon either short-term rating. As of July 31, 2013, the short-term ratings of the liquidity provider and the VRDP Shares for MNE were P1, F1 and A1 as rated by Moody’s, Fitch and S&P, respectively, which is within the two highest rating categories. The liquidity provider may be terminated prior to the scheduled termination date if the liquidity provider fails to maintain short-term debt ratings in one of the two highest rating categories. The short-term ratings on the VRDP Shares for MZA, MYC, MYF and MYJ were withdrawn by Moody’s, Fitch and/or S&P at the commencement of the special rate period, as described below.
For financial reporting purposes, the VRDP Shares are considered debt of the issuer; therefore, the liquidation value, which approximates fair value, of the VRDP Shares is recorded as a liability in the Statements of Assets and Liabilities. Unpaid dividends are included in interest expense and fees payable in the Statements of Assets and Liabilities, and the dividends accrued and paid on the VRDP Shares are included as a component of interest expense, fees and amortization of offering costs in the Statements of Operations. The VRDP Shares are treated as equity for tax purposes. Dividends paid to holders of the VRDP Shares are generally classified as tax-exempt income for tax-reporting purposes.
The VRDP Funds may incur remarketing fees of 0.10% on the aggregate principal amount of all the VRDP Shares, which, if any, are included in remarketing fees on Preferred Shares in the Statements of Operations. All of the remarketable VRDP Shares that were tendered for remarketing during the year ended July 31, 2013 were successfully remarketed.
The annualized dividend rates for the VRDP Shares for the year ended July 31, 2013 were as follows:
MNE | | | | | 0.26 | % |
MZA | | | | | 1.08 | % |
MYC | | | | | 1.08 | % |
MYF | | | | | 1.08 | % |
MYJ | | | | | 1.08 | % |
On June 21, 2012, MZA, MYC, MYF and MYJ announced a special rate period for a three-year term ending June 24, 2015 with respect to their VRDP Shares. The liquidity and fee agreements remain in effect for the duration of the special rate period and the VRDP shares are still subject to mandatory redemption by the VRDP Funds on maturity date. The VRDP Shares will not be remarketed or subject to optional or mandatory tender events during such time. During the special rate period, MZA, MYC, MYF and MYJ are required to maintain the same asset coverage, basic maintenance amount and leverage requirements for the VRDP Shares. MZA, MYC, MYF and MYJ will not pay any liquidity and remarketing fees during the special rate period and instead will pay dividends monthly based on the sum of the SIFMA Municipal Swap Index and a percentage per annum based on the long-term ratings assigned to the VRDP Shares. The short-term ratings were withdrawn by Moody’s, Fitch and/or S&P. Short-term ratings may be re-assigned upon the termination of the special rate period when the VRDP Shares revert back to remarketable securities.
If MZA, MYC, MYF and MYJ redeem their VRDP Shares on a date that is one year or more before the end of the special rate period and the VRDP Shares are rated above A1/A by Moody’s and Fitch respectively, then such redemption is subject to a redemption premium (up to 3% of the liquidation preference) payable to the holder of the VRDP Shares based on the time remaining in the special rate period, subject to certain exceptions for redemptions that are required to maintain minimum asset coverage requirements. After June 24, 2015, the holder of the VRDP Shares and MZA, MYC, MYF and MYJ may mutually agree to extend the special rate period. If the special rate period is not extended, the VRDP Shares will revert back to remarketable securities and will be remarketed and available for purchase by qualified institutional investors.
VRDP Shares issued and outstanding remained constant for the year ended July 31, 2013.
During the year ended July 31, 2012, MNE issued 296 VRDP Shares.
Offering Costs: The Funds incurred costs in connection with the issuance of VRDP Shares, which were recorded as a deferred charge and will be amortized over the 30-year life of the VRDP Shares with the exception of upfront fees paid to the liquidity provider, which were amortized over the
| ANNUAL REPORT | JULY 31, 2013 | 53
|
| |
| Notes to Financial Statements (concluded) |
|
life of the liquidity agreement. Amortization of these costs is included in interest expense, fees and amortization of offering costs in the Statements of Operations.
AMPS
The AMPS were redeemable at the option of MNE, in whole or in part, on any dividend payment date at their liquidation preference per share plus any accumulated and unpaid dividends whether or not declared. The AMPS were also subject to mandatory redemption at their liquidation preference plus any accumulated and unpaid dividends, whether or not declared, if certain requirements relating to the composition of the assets and liabilities of MNE, as set forth in the Fund’s Articles Supplementary were not satisfied. From February 13, 2008 to the redemption date listed below, the AMPS of MNE failed to clear any of their auctions. A failed auction was not an event of default for MNE, but it had a negative impact on the liquidity of the AMPS. A failed auction occurs when there are more sellers of a fund’s AMPS than buyers.
As of July 31, 2013, the Funds did not have any AMPS outstanding.
During the year ended July 31, 2012, MNE announced the following redemptions of AMPS at a price of $25,000 per share plus any accrued and unpaid dividends through the redemption date:
|
|
|
| Series
|
| Redemption
Date
|
| Shares
Redeemed
|
| Aggregate
Principal
|
MNE | | | | | F7 | | | | 10/03/11 | | | | 1,185 | | | $ | 29,625,000 | |
MNE financed the AMPS redemptions with the proceeds received from the issuance of VRDP Shares of $29,600,000 and the cash received from TOB transactions.
10. Subsequent Events:
Management’s evaluation of the impact of all subsequent events on the Funds’ financial statements was completed through the date the financial statements were issued and the following items were noted:
Each Fund paid a net investment income dividend in the following amounts per share on September 3, 2013 to Common Shareholders of record on August 15, 2013:
|
|
|
| Common
Dividend
Per Share
|
MNE | | | | $ | 0.0625 | |
MZA | | | | $ | 0.0695 | |
MYC | | | | $ | 0.0790 | |
MYF | | | | $ | 0.0790 | |
MYJ | | | | $ | 0.0740 | |
Additionally, the Funds declared a net investment income dividend on September 3, 2013 payable to Common Shareholders of record on September 16, 2013 for the same amounts noted above.
The dividends declared on VRDP Shares for the period August 1, 2013 to August 31, 2013 for the Funds were as follows:
|
|
|
| Series
|
| Dividends
Declared
|
MNE | | | | | W-7 | | | $ | 4,168 | |
MZA | | | | | W-7 | | | $ | 33,917 | |
MYC | | | | | W-7 | | | $ | 96,296 | |
MYF | | | | | W-7 | | | $ | 54,013 | |
MYJ | | | | | W-7 | | | $ | 92,932 | |
| 54 | ANNUAL REPORT | JULY 31, 2013
|
| |
| Report of Independent Registered Public Accounting Firm |
|
To the Shareholders and Board of Trustees of BlackRock MuniYield Investment Fund and to the Shareholders and Board of Directors of BlackRock Muni New York Intermediate Duration Fund, Inc., BlackRock MuniYield Arizona Fund, Inc., BlackRock MuniYield California Fund, Inc., and BlackRock MuniYield New Jersey Fund, Inc.:
We have audited the accompanying statements of assets and liabilities of BlackRock Muni New York Intermediate Duration Fund, Inc., BlackRock MuniYield Arizona Fund, Inc., BlackRock MuniYield California Fund, Inc., BlackRock MuniYield Investment Fund and BlackRock MuniYield New Jersey Fund, Inc. (collectively the “Funds”), including the schedules of investments, as of July 31, 2013, and the related statements of operations and cash flows for the year then ended, the statements of changes in net assets for the each of the two years in the period then ended, and the financial highlights for each of the five years in the period then ended. These financial statements and financial highlights are the responsibility of the Funds’ management. Our responsibility is to express an opinion on these financial statements and financial highlights based on our audits.
We conducted our audits in accordance with the standards of the Public Company Accounting Oversight Board (United States). Those standards require that we plan and perform the audit to obtain reasonable assurance about whether the financial statements and financial highlights are free of material misstatement. The Funds are not required to have, nor were we engaged to perform, an audit of their internal control over financial reporting. Our audits included consideration of internal control over financial reporting as a basis for designing audit procedures that are appropriate in the circumstances, but not for the purpose of expressing an opinion on the effectiveness of the Funds’ internal control over financial reporting. Accordingly, we express no such opinion. An audit also includes examining, on a test basis, evidence supporting the amounts and disclosures in the financial statements, assessing the accounting principles used and significant estimates made by management, as well as evaluating the overall financial statement presentation. Our procedures included confirmation of securities owned as of July 31, 2013, by correspondence with the custodians and brokers; where replies were not received from brokers, we performed other auditing procedures. We believe that our audits provide a reasonable basis for our opinion.
In our opinion, the financial statements and financial highlights referred to above present fairly, in all material respects, the financial positions of BlackRock Muni New York Intermediate Duration Fund, Inc., BlackRock MuniYield Arizona Fund, Inc., BlackRock MuniYield California Fund, Inc., BlackRock MuniYield Investment Fund and BlackRock MuniYield New Jersey Fund, Inc., as of July 31, 2013, the results of their operations and their cash flows for the year then ended, the changes in their net assets for each of the two years in the period then ended, and the financial highlights for each of the five years in the period then ended, in conformity with accounting principles generally accepted in the United States of America.
Deloitte & Touche LLP
Boston, Massachusetts
September 25, 2013
| ANNUAL REPORT | JULY 31, 2013 | 55
|
| |
| Disclosure of Investment Advisory Agreements and Sub-Advisory Agreements |
|
The Board of Directors or Trustees, as applicable, (each, a “Board,” collectively, the “Boards,” and the members of which are referred to as “Board Members”) of BlackRock Muni New York Intermediate Duration Fund, Inc. (“MNE”), BlackRock MuniYield Arizona Fund, Inc. (“MZA”), BlackRock MuniYield California Fund, Inc. (“MYC”), BlackRock MuniYield Investment Fund (“MYF”) and BlackRock MuniYield New Jersey Fund, Inc., (“MYJ” and together with MNE, MZA, MYC and MYF, each a “Fund,” and, collectively, the ��Funds”) met in person on April 18, 2013 (the “April Meeting”) and June 4-5, 2013 (the “June Meeting”) to consider the approval of each Fund’s investment advisory agreement (each, an “Advisory Agreement”) with BlackRock Advisors, LLC (the “Manager”), each Fund’s investment advisor. The Board of each Fund also considered the approval of the sub-advisory agreement (each, a “Sub-Advisory Agreement”) among the Manager, BlackRock Investment Management, LLC (the “Sub-Advisor”), and its Fund. The Manager and the Sub-Advisor are referred to herein as “BlackRock.” The Advisory Agreements and the Sub-Advisory Agreements are referred to herein as the “Agreements.”
Activities and Composition of the Board
Each Board consists of eleven individuals, nine of whom are not “interested persons” of such Fund as defined in the Investment Company Act of 1940 (the “1940 Act”) (the “Independent Board Members”). The Board Members are responsible for the oversight of the operations of the Funds and perform the various duties imposed on the directors of investment companies by the 1940 Act. The Independent Board Members have retained independent legal counsel to assist them in connection with their duties. The Chairman of each Board is an Independent Board Member. Each Board has established six standing committees: an Audit Committee, a Governance and Nominating Committee, a Compliance Committee, a Performance Oversight Committee, an Executive Committee, and a Leverage Committee, each of which is chaired by an Independent Board Member and composed of Independent Board Members (except for the Executive Committee and the Leverage Committee, each of which also has one interested Board Member).
The Agreements
Pursuant to the 1940 Act, the Boards are required to consider the continuation of the Agreements on an annual basis. The Boards have four quarterly meetings per year, each extending over two days, and a fifth one-day meeting to consider specific information surrounding the consideration of renewing the Agreements. In connection with this process, the Boards assessed, among other things, the nature, scope and quality of the services provided to the Funds by BlackRock, its personnel and its affiliates, including investment management, administrative and shareholder services, oversight of fund accounting and custody, marketing services, risk oversight, compliance and assistance in meeting applicable legal and regulatory requirements.
The Boards, acting directly and through their respective committees, considered at each of their meetings, and from time to time as appropriate, factors that are relevant to their annual consideration of the renewal of the Agreements, including the services and support provided by BlackRock to the Funds and their shareholders. Among the matters the Boards considered were: (a) investment performance for one-year, three-year, five-year and/or since inception periods, as applicable, against peer funds, and applicable benchmarks, if any, as well as senior management’s and portfolio managers’ analysis of the reasons for any over-performance or underperformance against their peers and/or benchmark, as applicable; (b) fees, including advisory, administration, if applicable, and other amounts paid to BlackRock and its affiliates by the Funds for services such as call center and fund accounting; (c) Fund operating expenses and how BlackRock allocates expenses to the Funds; (d) the resources devoted to, risk oversight of, and compliance reports relating to, implementation of the Funds’ investment objectives, policies and restrictions; (e) the Funds’ compliance with their Code of Ethics and other compliance policies and procedures; (f) the nature, cost and character of non-investment management services provided by BlackRock and its affiliates; (g) BlackRock’s and other service providers’ internal controls and risk and compliance oversight mechanisms; (h) BlackRock’s implementation of the proxy voting policies approved by the Boards; (i) execution quality of portfolio transactions; (j) BlackRock’s implementation of the Funds’ valuation and liquidity procedures; (k) an analysis of management fees for products with similar investment objectives across the open-end fund, closed-end fund and institutional account product channels, as applicable; (l) BlackRock’s compensation methodology for its investment professionals and the incentives it creates; and (m) periodic updates on BlackRock’s business.
The Boards have engaged in an ongoing strategic review with BlackRock of opportunities to consolidate funds and of BlackRock’s commitment to investment performance. In addition, the Boards requested and BlackRock provided an analysis of fair valuation and stale pricing policies. BlackRock also furnished information to the Boards in response to specific questions. These questions covered issues such as BlackRock’s profitability, investment performance and management fee levels. The Boards further considered the importance of: (i) organizational and structural variables to investment performance; (ii) rates of portfolio turnover; (iii) BlackRock’s performance accountability for portfolio managers; (iv) marketing support for the funds; (v) services provided to the Funds by BlackRock affiliates; and (vi) BlackRock’s oversight of relationships with third party service providers.
The Boards considered BlackRock’s efforts during the past year with regard to refinancing outstanding AMPS, as well as ongoing time and resources devoted to other forms of preferred shares and alternative leverage. As of the date of this report, the Funds have redeemed 100% of their outstanding AMPS.
Board Considerations in Approving the Agreements
The Approval Process: Prior to the April Meeting, the Boards requested and received materials specifically relating to the Agreements. The Boards are engaged in a process with its independent legal counsel and BlackRock to review the nature and scope of the information provided to better assist their deliberations. The materials provided in connection with the April Meeting included (a) information independently compiled and prepared by Lipper, Inc. (“Lipper”) on Fund fees and expenses as compared with a peer group of funds as determined by Lipper (“Expense Peers”) and the investment performance of the Funds as compared with a peer group of funds as determined by Lipper1 and, where applicable, a customized peer group selected by BlackRock; (b) information on the profits realized by BlackRock and its affiliates pursuant to the Agreements and a discussion of fall-out benefits to BlackRock and its affiliates; (c) a general analysis
| 1 | | Lipper ranks funds in quartiles, ranging from first to fourth, where first is the most desirable quartile position and fourth is the least desirable. |
| 56 | ANNUAL REPORT | JULY 31, 2013
|
| |
| Disclosure of Investment Advisory Agreements and Sub-Advisory Agreements (continued) |
|
provided by BlackRock concerning investment management fees charged to other clients, such as institutional clients and open-end funds, under similar investment mandates, as applicable; (d) review of non-management fees; (e) the existence, impact and sharing of potential economies of scale; (f) a summary of aggregate amounts paid by each Fund to BlackRock and (g) if applicable, a comparison of management fees to similar BlackRock closed-end funds, as classified by Lipper.
At the April Meeting, the Boards reviewed materials relating to their consideration of the Agreements. As a result of the discussions that occurred during the April Meeting, and as a culmination of the Boards’ year-long deliberative process, the Boards presented BlackRock with questions and requests for additional information. BlackRock responded to these requests with additional written information in advance of the June Meeting.
At the June Meeting, each Board, including the Independent Board Members, unanimously approved the continuation of the Advisory Agreement between the Manager and its Fund, and the Sub-Advisory Agreement among the Manager, the Sub-Advisor, and its Fund, each for a one-year term ending June 30, 2014. In approving the continuation of the Agreements, the Boards considered: (a) the nature, extent and quality of the services provided by BlackRock; (b) the investment performance of the Funds and BlackRock; (c) the advisory fee and the cost of the services and profits to be realized by BlackRock and its affiliates from their relationship with the Funds; (d) the Funds’ costs to investors compared to the costs of Expense Peers and performance compared to the relevant performance comparison as previously discussed; (e) economies of scale; (f) fall-out benefits to BlackRock as a result of its relationship with the Funds; and (g) other factors deemed relevant by the Board Members.
The Boards also considered other matters they deemed important to the approval process, such as payments made to BlackRock or its affiliates relating to securities lending, services related to the valuation and pricing of Fund portfolio holdings, direct and indirect benefits to BlackRock and its affiliates from their relationship with the Funds and advice from independent legal counsel with respect to the review process and materials submitted for the Boards’ review. The Boards noted the willingness of BlackRock personnel to engage in open, candid discussions with the Boards. The Boards did not identify any particular information as determinative, and each Board Member may have attributed different weights to the various items considered.
A. Nature, Extent and Quality of the Services Provided by BlackRock: The Boards, including the Independent Board Members, reviewed the nature, extent and quality of services provided by BlackRock, including the investment advisory services and the resulting performance of the Funds. Throughout the year, the Boards compared Fund performance to the performance of a comparable group of closed-end funds and/or the performance of a relevant benchmark, if any. The Boards met with BlackRock’s senior management personnel responsible for investment operations, including the senior investment officers. Each Board also reviewed the materials provided by its Fund’s portfolio management team discussing the Fund’s performance and the Fund’s investment objective, strategies and outlook.
The Boards considered, among other factors, with respect to BlackRock: the number, education and experience of investment personnel generally and their Funds’ portfolio management teams; investments by portfolio managers in the funds they manage; portfolio trading capabilities; use of technology; commitment to compliance; credit analysis capabilities; risk analysis and oversight capabilities; and the approach to training and retaining portfolio managers and other research, advisory and management personnel. The Boards engaged in a review of BlackRock’s compensation structure with respect to their Funds’ portfolio management teams and BlackRock’s ability to attract and retain high-quality talent and create performance incentives.
In addition to advisory services, the Boards considered the quality of the administrative and other non-investment advisory services provided to the Funds. BlackRock and its affiliates provide the Funds with certain services (in addition to any such services provided to the Funds by third parties) and officers and other personnel as are necessary for the operations of the Funds. In particular, BlackRock and its affiliates provide the Funds with the following administrative services including, among others: (i) preparing disclosure documents, such as the prospectus, the summary prospectus (as applicable) and the statement of additional information in connection with the initial public offering and periodic shareholder reports; (ii) preparing communications with analysts to support secondary market trading of the Funds; (iii) assisting with daily accounting and pricing; (iv) preparing periodic filings with regulators and stock exchanges; (v) overseeing and coordinating the activities of other service providers; (vi) organizing Board meetings and preparing the materials for such Board meetings; (vii) providing legal and compliance support; (viii) furnishing analytical and other support to assist the Boards in their consideration of strategic issues such as the merger or consolidation of certain closed-end funds; and (ix) performing other administrative functions necessary for the operation of the Funds, such as tax reporting, fulfilling regulatory filing requirements and call center services. The Boards reviewed the structure and duties of BlackRock’s fund administration, shareholder services, legal and compliance departments and considered BlackRock’s policies and procedures for assuring compliance with applicable laws and regulations.
B. The Investment Performance of the Funds and BlackRock: Each Board, including the Independent Board Members, also reviewed and considered the performance history of its Funds. In preparation for the April Meeting, the Boards worked with its independent legal counsel, BlackRock and Lipper to develop a template for, and was provided with reports independently prepared by Lipper, which included a comprehensive analysis of each Fund’s performance. The Boards also reviewed a narrative and statistical analysis of the Lipper data that was prepared by BlackRock, which analyzed various factors that affect Lipper’s rankings. In connection with their review, each Board received and reviewed information regarding the investment performance, based on net asset value (NAV), of its Fund as compared to other funds in its applicable Lipper category and, where applicable, the customized peer group selected by BlackRock. The Boards were provided with a description of the methodology used by Lipper to select peer funds and periodically meets with Lipper representatives to review their methodology. Each Board and its Performance Oversight Committee regularly review, and meet with Fund management to discuss, the performance of its Fund throughout the year.
| ANNUAL REPORT | JULY 31, 2013 | 57
|
| |
| Disclosure of Investment Advisory Agreements and Sub-Advisory Agreements (continued) |
|
The Board of MNE noted that MNE ranked in the second quartile against its Lipper Performance Universe Composite for each of the one-, three- and five-year periods reported. BlackRock believes that the Lipper Performance Universe Composite is an appropriate performance metric for MNE in that it measures a blend of total return and yield.
The Board of MZA noted that MZA ranked in the first quartile against its Customized Lipper Peer Group Composite for each of the one-, three- and five-year periods reported. BlackRock believes that the Customized Lipper Peer Group Composite is an appropriate performance metric for MZA in that it measures a blend of total return and yield.
The Board of MYC Board noted that MYC ranked in the third, third and first quartiles against its Customized Lipper Peer Group Composite for the one-, three- and five-year periods reported, respectively. BlackRock believes that the Customized Lipper Peer Group Composite is an appropriate performance metric for MYC in that it measures a blend of total return and yield. The Board of MYC and BlackRock reviewed and discussed the reasons for MYC’s underperformance during the one- and three-year periods compared to its Customized Lipper Peer Group Composite. MYC’s Board was informed that, among other things, MYC has historically been restricted from investing in non-investment grade securities. Consequently, under normal circumstances MYC typically invested in a greater degree of higher quality holdings relative to peers. In times of credit spread tightening, MYC typically did not benefit as much as peers with a high yield overweight. This factor also detracts from MYC’s ability to generate a higher income accrual. MYC’s investment guidelines have been updated, effective July 1, 2013, to allow MYC to invest up to 20% of its total assets in securities rated below investment grade at the time of purchase. Also, in past periods, MYC’s management has held a higher relative level of cash reserves in order to maintain a defensive posture during periods of defensive strategic posturing. This has served MYC well in protecting NAV, but did lead to underperformance in terms of relative yield accrual.
The Board of MYF noted that MYF ranked in the second, third and third quartiles against its Customized Lipper Peer Group Composite for the one-, three- and five-year periods reported, respectively. BlackRock believes that the Customized Lipper Peer Group Composite is an appropriate performance metric for MYF in that it measures a blend of total return and yield. The Board of MYF noted MYF’s improved performance, relative to its peers, during the one-year period. The Board of MYF and BlackRock reviewed and discussed the reasons for MYF’s underperformance during the three- and five-year periods compared to its Customized Lipper Peer Group Composite. MYF’s Board was informed that, among other things, underperformance is attributed to MYF’s below market distribution yield for the three- and five-year periods. The continued challenge going forward for MYF is seeking ways to increase its yield component. One disadvantage MYF has versus its Customized Lipper Peer Group Composite is that its investment guidelines have historically not allowed it to purchase securities that are non-investment grade, which provides peer funds with additional yield. MYF’s investment guidelines have been updated, effective July 1, 2013, to allow MYF to invest up to 20% of its total assets in securities rated below investment grade at the time of purchase.
The Board of each of MYC and MYF and BlackRock also discussed BlackRock’s strategy for improving its respective Fund’s performance and BlackRock’s commitment to providing the resources necessary to assist its Fund’s portfolio managers and to improve its Fund’s performance.
The Board of MYJ Board noted that MYJ ranked in the third, second and second quartiles against its Customized Lipper Peer Group Composite for the one-, three- and five-year periods reported, respectively. BlackRock believes that the Customized Lipper Peer Group Composite is an appropriate performance metric for MYJ in that it measures a blend of total return and yield. The Board of MYJ and BlackRock reviewed and discussed the reasons for MYJ’s underperformance during the one-year period and will monitor MYJ’s performance in the coming year.
The Boards noted that BlackRock has recently made, and continues to make, changes to the organization of BlackRock’s overall portfolio management structure designed to result in strengthened leadership teams.
C. Consideration of the Advisory/Management Fees and the Cost of the Services and Profits to be Realized by BlackRock and its Affiliates from their Relationship with the Funds: Each Board, including the Independent Board Members, reviewed its Fund’s contractual management fee rate compared with the other funds in its Lipper category. The contractual management fee rate represents a combination of the advisory fee and any administrative fees, before taking into account any reimbursements or fee waivers. Each Board also compared its Fund’s total net operating expense ratio, as well as actual management fee rate, to those of other funds in its Lipper category. The total net operating expense ratio and actual management fee rate both give effect to any expense reimbursements or fee waivers that benefit the funds. The Boards considered the services provided and the fees charged by BlackRock to other types of clients with similar investment mandates, including institutional accounts.
The Boards received and reviewed statements relating to BlackRock’s financial condition. The Boards were also provided with a profitability analysis that detailed the revenues earned and the expenses incurred by BlackRock for services provided to the Funds. The Boards reviewed BlackRock’s profitability with respect to the Funds and other funds the Boards currently oversee for the year ended December 31, 2012 compared to available aggregate profitability data provided for the prior two years. The Boards reviewed BlackRock’s profitability with respect to certain other fund complexes managed by the Manager and/or its affiliates. The Boards reviewed BlackRock’s assumptions and methodology of allocating expenses in the profitability analysis, noting the inherent limitations in allocating costs among various advisory products. The Boards recognized that profitability may be affected by numerous factors including, among other things, fee waivers and expense reimbursements by the Manager, the types of funds managed, precision of expense allocations and business mix. As a result, comparing profitability is difficult.
| 58 | ANNUAL REPORT | JULY 31, 2013
|
| |
| Disclosure of Investment Advisory Agreements and Sub-Advisory Agreements (concluded) |
|
The Boards noted that, in general, individual fund or product line profitability of other advisors is not publicly available. The Boards reviewed BlackRock’s overall operating margin, in general, compared to that of certain other publicly-traded asset management firms. The Boards considered the differences between BlackRock and these other firms, including the contribution of technology at BlackRock, BlackRock’s expense management, and the relative product mix.
In addition, the Boards considered the cost of the services provided to the Funds by BlackRock, and BlackRock’s and its affiliates’ profits relating to the management of the Funds and the other funds advised by BlackRock and its affiliates. As part of its analysis, the Boards reviewed BlackRock’s methodology in allocating its costs to the management of the Funds. The Boards also considered whether BlackRock has the financial resources necessary to attract and retain high quality investment management personnel to perform its obligations under the Agreements and to continue to provide the high quality of services that is expected by the Boards.
The Board of each of MNE, MZA, MYC, MYF and MYJ noted that its respective Fund’s contractual management fee rate ranked in the first quartile relative to the Fund’s Expense Peers.
D. Economies of Scale: Each Board, including the Independent Board Members, considered the extent to which economies of scale might be realized as the assets of its Fund increase. Each Board also considered the extent to which its Fund benefits from such economies and whether there should be changes in the advisory fee rate or breakpoint structure in order to enable the Fund to participate in these economies of scale, for example through the use of breakpoints in the advisory fee based upon the asset level of the Fund.
Based on the Boards’ review and consideration of the issue, the Boards concluded that most closed-end funds do not have fund level breakpoints because closed-end funds generally do not experience substantial growth after the initial public offering. They are typically priced at scale at a fund’s inception. The Boards noted that only one closed-end fund in the Fund Complex has breakpoints in its advisory fee structure.
E. Other Factors Deemed Relevant by the Board Members: The Boards, including the Independent Board Members, also took into account other ancillary or “fall-out” benefits that BlackRock or its affiliates may derive from their respective relationships with the Funds, both tangible and intangible, such as BlackRock’s ability to leverage its investment professionals who manage other portfolios and risk management personnel, an increase in BlackRock’s profile in the investment advisory community, and the engagement of BlackRock’s affiliates as service providers to the Funds, including securities lending and cash management services. The Boards also considered BlackRock’s overall operations and its efforts to expand the scale of, and improve the quality of, its operations. The Boards also noted that BlackRock may use and benefit from third party research obtained by soft dollars generated by certain registered fund transactions to assist in managing all or a number of its other client accounts. The Boards further noted that they had considered the investment by BlackRock’s funds in exchange traded funds (i.e., ETFs) without any offset against the management fees payable by the funds to BlackRock.
In connection with its consideration of the Agreements, the Boards also received information regarding BlackRock’s brokerage and soft dollar practices. The Boards received reports from BlackRock which included information on brokerage commissions and trade execution practices throughout the year.
The Boards noted the competitive nature of the closed-end fund marketplace, and that shareholders are able to sell their Fund shares in the secondary market if they believe that the Fund’s fees and expenses are too high or if they are dissatisfied with the performance of the Fund.
The Boards also considered the various notable initiatives and projects BlackRock performed in connection with its closed-end fund product line. These initiatives included completion of the refinancing of auction rate preferred securities; efforts to eliminate product overlap with fund mergers; ongoing services to manage leverage that has become increasingly complex; share repurchases and other support initiatives for certain BlackRock funds; and continued communications efforts with shareholders, fund analysts and financial advisers. With respect to the latter, the Independent Board Members noted BlackRock’s continued commitment to supporting the secondary market for the common shares of its closed-end funds through a comprehensive secondary market communication program designed to raise investor and analyst awareness and understanding of closed-end funds. BlackRock’s support services included, among other things: continuing communications concerning the refinancing efforts related to auction rate preferred securities; sponsoring and participating in conferences; communicating with closed-end fund analysts covering the BlackRock funds throughout the year; providing marketing and product updates for the closed-end funds; and maintaining and enhancing its closed-end fund website.
Conclusion
Each Board, including the Independent Board Members, unanimously approved the continuation of the Advisory Agreement between the Manager and its Fund for a one-year term ending June 30, 2014, and the Sub-Advisory Agreement among the Manager, the Sub-Advisor, and its Fund for a one-year term ending June 30, 2014. Based upon its evaluation of all of the aforementioned factors in their totality, the Boards, including the Independent Board Members, were satisfied that the terms of the Agreements were fair and reasonable and in the best interest of the Funds and their shareholders. In arriving at their decision to approve the Agreements, the Boards did not identify any single factor or group of factors as all-important or controlling, but considered all factors together, and different Board Members may have attributed different weights to the various factors considered. The Independent Board Members were also assisted by the advice of independent legal counsel in making these determinations. The contractual fee arrangements for the Funds reflect the results of several years of review by the Board Members and predecessor Board Members, and discussions between such Board Members (and predecessor Board Members) and BlackRock. As a result, the Board Members’ conclusions may be based in part on their consideration of these arrangements in prior years.
| ANNUAL REPORT | JULY 31, 2013 | 59
|
| |
| Automatic Dividend Reinvestment Plans |
|
Pursuant to each Fund’s Dividend Reinvestment Plan (the “Reinvestment Plan”), Common Shareholders are automatically enrolled to have all distributions of dividends and capital gains reinvested by Computershare Trust Company, N.A. (the “Reinvestment Plan Agent”) in the respective Fund’s shares pursuant to the Reinvestment Plan. Shareholders who do not participate in the Reinvestment Plan will receive all distributions in cash paid by check and mailed directly to the shareholders of record (or if the shares are held in street name or other nominee name, then to the nominee) by the Reinvestment Plan Agent, which serves as agent for the shareholders in administering the Reinvestment Plan.
After the Funds declare a dividend or determine to make a capital gain distribution, the Reinvestment Plan Agents will acquire shares for the participants’ accounts, depending upon the following circumstances, either (i) through receipt of unissued but authorized shares from the Funds (“newly issued shares”) or (ii) by purchase of outstanding shares on the open market or on the Fund’s primary exchange (“open-market purchases”). If, on the dividend payment date, the net asset value per share (“NAV”) is equal to or less than the market price per share plus estimated brokerage commissions (such condition often referred to as a “market premium”), the Reinvestment Plan Agent will invest the dividend amount in newly issued shares acquired on behalf of the participants. The number of newly issued shares to be credited to each participant’s account will be determined by dividing the dollar amount of the dividend by the NAV on the date the shares are issued. However, if the NAV is less than 95% of the market price on the dividend payment date, the dollar amount of the dividend will be divided by 95% of the market price on the dividend payment date. If, on the dividend payment date, the NAV is greater than the market price per share plus estimated brokerage commissions (such condition often referred to as a “market discount”), the Reinvestment Plan Agent will invest the dividend amount in shares acquired on behalf of the participants in open-market purchases. If the Reinvestment Plan Agent is unable to invest the full dividend amount in open-market purchases, or if the market discount shifts to a market premium during the purchase period, the Reinvestment Plan Agent will invest any un-invested portion in newly issued shares. Investments in newly issued shares made in this manner would be made pursuant to the same process described above and the date of issue for such newly issued shares will substitute for the dividend payment date.
Participation in the Reinvestment Plan is completely voluntary and may be terminated or resumed at any time without penalty by notice if received and processed by the Reinvestment Plan Agent prior to the dividend record date. Additionally, the Reinvestment Plan Agent seeks to process notices received after the record date but prior to the payable date and such notices often will become effective by the payable date. Where late notices are not processed by the applicable payable date, such termination or resumption will be effective with respect to any subsequently declared dividend or other distribution.
The Reinvestment Plan Agent’s fees for the handling of the reinvestment of dividends and distributions will be paid by each Fund. However, each participant will pay a pro rata share of brokerage commissions incurred with respect to the Reinvestment Plan Agent’s open market purchases in connection with the reinvestment of dividends and distributions. The automatic reinvestment of dividends and distributions will not relieve participants of any federal income tax that may be payable on such dividends or distributions.
Each Fund reserves the right to amend or terminate the Reinvestment Plan. There is no direct service charge to participants in the Reinvestment Plan. However, each Fund reserves the right to amend the Reinvestment Plan to include a service charge payable by the participants. Participants in MNE that request a sale of shares are subject to a $2.50 sales fee and a $0.15 per share fee. Per share fees include any applicable brokerage commissions the Reinvestment Plan Agent is required to pay. Participants in MZA, MYC, MYF and MYJ that request a sale of shares are subject to a $0.02 per share sold brokerage commission. All correspondence concerning the Reinvestment Plan should be directed to Computershare Trust Company, N.A., through the internet at http://www.computershare.com/blackrock, or in writing to Computershare, P.O. Box 43078, Providence, RI 02940-3078, Telephone: (800) 699-1236. Overnight correspondence should be directed to the Reinvestment Plan Agent at 250 Royall Street, Canton, MA 02021.
| 60 | ANNUAL REPORT | JULY 31, 2013
|
Name, Address
and Year of Birth | | | | Position(s)
Held with
Funds | | Length
of Time
Served as
a Director2 | | Principal Occupation(s) During Past Five Years | | Number of BlackRock-
Advised Registered
Investment Companies
(“RICs”) Consisting of
Investment Portfolios
(“Portfolios”) Overseen | | Public
Directorships |
Independent Directors1 |
| |
Richard E. Cavanagh
55 East 52nd Street
New York, NY 10055
1946 | | | | Chairman of
the Board
and Director | | Since
2007 | | Trustee, Aircraft Finance Trust from 1999 to 2009; Director, The Guardian Life Insurance Company of America since 1998; Director, Arch Chemical (chemical and allied products) from 1999 to 2011; Trustee, Educational Testing Service from 1997 to 2009 and Chairman thereof from 2005 to 2009; Senior Advisor, The Fremont Group since 2008 and Director thereof since 1996; Faculty Member/Adjunct Lecturer, Harvard University since 2007; President and Chief Executive Officer, The Conference Board, Inc. (global business research organization) from 1995 to 2007. | | 94 RICs consisting of
90 Portfolios | | None |
| |
Karen P. Robards
55 East 52nd Street
New York, NY 10055
1950 | | | | Vice Chairperson of the Board, Chairperson of the Audit Committee
and Director | | Since
2007 | | Partner of Robards & Company, LLC (financial advisory firm) since 1987; Co-founder and Director of the Cooke Center for Learning and Development (a not-for-profit organization) since 1987; Director of Care Investment Trust, Inc. (health care real estate investment trust) from 2007 to 2010; Investment Banker at Morgan Stanley from 1976 to 1987. | | 94 RICs consisting of
90 Portfolios | | AtriCure, Inc.
(medical devices); Greenhill & Co., Inc. |
| |
Michael J. Castellano
55 East 52nd Street
New York, NY 10055
1946 | | | | Director and Member of the Audit Committee | | Since
2011 | | Chief Financial Officer of Lazard Group LLC from 2001 to 2011; Chief Financial Officer of Lazard Ltd from 2004 to 2011; Director, Support Our Aging Religious (non-profit) since 2009; Director, National Advisory Board of Church Management at Villanova University since 2010; Trustee, Domestic Church Media Foundation since 2012. | | 94 RICs consisting of
90 Portfolios | | None |
| |
Frank J. Fabozzi
55 East 52nd Street
New York, NY 10055
1948 | | | | Director and Member of the Audit Committee | | Since
2007 | | Editor of and Consultant for The Journal of Portfolio Management since 2006; Professor of Finance, EDHEC Business School since 2011; Professor in the Practice of Finance and Becton Fellow, Yale University School of Management from 2006 to 2011; Adjunct Professor of Finance and Becton Fellow, Yale University from 1994 to 2006. | | 94 RICs consisting of
90 Portfolios | | None |
| |
Kathleen F. Feldstein
55 East 52nd Street
New York, NY 10055
1941 | | | | Director | | Since
2007 | | President of Economics Studies, Inc. (private economic consulting firm) since 1987; Chair, Board of Trustees, McLean Hospital from 2000 to 2008 and Trustee Emeritus thereof since 2008; Member of the Board of Partners Community Healthcare, Inc. from 2005 to 2009; Member of the Corporation of Partners HealthCare since 1995; Trustee, Museum of Fine Arts, Boston since 1992; Member of the Visiting Committee to the Harvard University Art Museum since 2003; Director, Catholic Charities of Boston since 2009. | | 94 RICs consisting of
90 Portfolios | | The McClatchy
Company
(publishing)
|
| |
James T. Flynn
55 East 52nd Street
New York, NY 10055
1939 | | | | Director and Member of the Audit Committee | | Since
2007 | | Chief Financial Officer of JPMorgan & Co., Inc. from 1990 to 1995. | | 94 RICs consisting of
90 Portfolios | | None |
| |
Jerrold B. Harris
55 East 52nd Street
New York, NY 10055
1942 | | | | Director | | Since
2007 | | Trustee, Ursinus College since 2000; Director, Troemner LLC (scientific equipment) since 2000; Director of Delta Waterfowl Foundation from 2010 to 2012; President and Chief Executive Officer, VWR Scientific Products Corporation from 1990 to 1999. | | 94 RICs consisting of
90 Portfolios | | BlackRock Kelso
Capital Corp.
(business develop-
ment company) |
| |
R. Glenn Hubbard
55 East 52nd Street
New York, NY 10055
1958 | | | | Director | | Since
2007 | | Dean, Columbia Business School since 2004; Faculty member, Columbia Business School since 1988. | | 94 RICs consisting of
90 Portfolios | | ADP (data and information services); KKR Financial Corporation (finance); Metropolitan Life Insurance Company (insurance) |
| ANNUAL REPORT | JULY 31, 2013 | 61
|
| |
| Officers and Directors (continued) |
|
Name, Address
and Year of Birth | | | | Position(s)
Held with
Funds | | Length
of Time
Served as
a Director2 | | Principal Occupation(s) During Past Five Years | | Number of BlackRock-
Advised Registered
Investment Companies
(“RICs”) Consisting of
Investment Portfolios
(“Portfolios”) Overseen | | Public
Directorships |
Independent Directors1 (concluded) |
| |
W. Carl Kester
55 East 52nd Street
New York, NY 10055
1951 | | | | Director and Member of the Audit Committee | | Since
2007 | | George Fisher Baker Jr. Professor of Business Administration, Harvard Business School since 2008; Deputy Dean for Academic Affairs from 2006 to 2010; Chairman of the Finance Unit from 2005 to 2006; Senior Associate Dean and Chairman of the MBA Program from 1999 to 2005; Member of the faculty of Harvard Business School since 1981. | | 94 RICs consisting of
90 Portfolios | | None |
| |
| | | | | 1 Directors serve until their resignation, removal or death, or until December 31 of the year in which they turn 72. In 2011, 2012, and 2013, the Board of Directors unanimously approved extending the mandatory retirement age for James T. Flynn and in 2013, the Board unanimously approved extending the retirement age for Kathleen F. Feldstein, in each case, by one additional year, which the Board believed would be in the best interest of shareholders. Mr. Flynn can serve until December 31 of the year in which he turns 75 and Ms. Feldstein can serve until December 31 of the year in which she turns 73. Mr. Flynn and Ms. Feldstein turn 75 and 73, respectively, in 2014. |
| | | | | 2 Date shown is the earliest date a person has served for the Funds covered by this annual report. Following the combination of Merrill Lynch Investment Managers, L.P. (“MLIM”) and BlackRock, Inc. (“BlackRock”) in September 2006, the various legacy MLIM and legacy BlackRock fund boards were realigned and consolidated into three new fund boards in 2007. As a result, although the chart shows certain Directors as joining the Funds’ board in 2007, those Directors first became members of the boards of other legacy MLIM or legacy BlackRock funds as follows: Richard E. Cavanagh, 1994; Frank J. Fabozzi, 1988; Kathleen F. Feldstein, 2005; James T. Flynn, 1996; Jerrold B. Harris, 1999; R. Glenn Hubbard, 2004; W. Carl Kester, 1995; and Karen P. Robards, 1998. |
| | | | | | | | | | | | | | | | | | | | | | | |
Interested Directors3 |
| |
Paul L. Audet
55 East 52nd Street
New York, NY 10055
1953 | | | | Director | | Since
2011 | | Senior Managing Director of BlackRock and Head of U.S. Mutual Funds since 2011; Chair of the U.S. Mutual Funds Committee reporting to the Global Executive Committee since 2011; Head of BlackRock’s Real Estate business from 2008 to 2011; Member of BlackRock’s Global Operating and Corporate Risk Management Committees and of the BlackRock Alternative Investors Executive Committee and Investment Committee for the Private Equity Fund of Funds business since 2008; Head of BlackRock’s Global Cash Management business from 2005 to 2010; Acting Chief Financial Officer of BlackRock from 2007 to 2008; Chief Financial Officer of BlackRock from 1998 to 2005. | | 155 RICs consisting of
282 Portfolios | | None |
| |
Henry Gabbay
55 East 52nd Street
New York, NY 10055
1947 | | | | Director | | Since
2007 | | Consultant, BlackRock from 2007 to 2008; Managing Director, BlackRock from 1989 to 2007; Chief Administrative Officer, BlackRock Advisors, LLC from 1998 to 2007; President of BlackRock Funds and BlackRock Bond Allocation Target Shares from 2005 to 2007; Treasurer of certain closed-end funds in the BlackRock fund complex from 1989 to 2006. | | 155 RICs consisting of
282 Portfolios | | None |
| |
| | | | | 3 Mr. Audet is an “interested person,” as defined in the 1940 Act, of the Funds based on his position with BlackRock and its affiliates as well as his ownership of BlackRock securities. Mr. Gabbay is an “interested person” of the Funds based on his former positions with BlackRock and its affiliates as well as his ownership of BlackRock and The PNC Financial Services Group, Inc. securities. Mr. Audet and Mr. Gabbay are also Directors of two complexes of BlackRock registered open-end funds, the BlackRock Equity-Liquidity Complex and the BlackRock Equity-Bond Complex. Directors serve until their resignation, removal or death, or until December 31 of the year in which they turn 72. The maximum age limitation may be waived as to any Director by action of a majority of the Directors upon finding a good cause thereof. |
| 62 | ANNUAL REPORT | JULY 31, 2013
|
| |
| Officers and Directors (concluded) |
|
Name, Address
and Year of Birth | | | | Position(s)
Held with
Funds | | Length of
Time Served | | Principal Occupation(s) During Past Five Years |
Officers1 |
| |
John M. Perlowski
55 East 52nd Street
New York, NY 10055
1964 | | | | President and Chief Executive Officer | | Since
2011 | | Managing Director of BlackRock since 2009; Global Head of BlackRock Fund Services since 2009; Managing Director and Chief Operating Officer of the Global Product Group at Goldman Sachs Asset Management, L.P. from 2003 to 2009; Treasurer of Goldman Sachs Mutual Funds from 2003 to 2009 and Senior Vice President thereof from 2007 to 2009; Director of Goldman Sachs Offshore Funds from 2002 to 2009; Director of Family Resource Network (charitable foundation) since 2009. |
| |
Anne Ackerley
55 East 52nd Street
New York, NY 10055
1962 | | | | Vice
President | | Since
20072 | | Managing Director of BlackRock since 2000; Chief Marketing Officer of BlackRock since 2012; President and Chief Executive Officer of the BlackRock-advised funds from 2009 to 2011; Vice President of the BlackRock-advised funds from 2007 to 2009; Chief Operating Officer of BlackRock’s Global Client Group from 2009 to 2012; Chief Operating Officer of BlackRock’s U.S. Retail Group from 2006 to 2009; Head of BlackRock’s Mutual Fund Group from 2000 to 2006. |
| |
Brendan Kyne
55 East 52nd Street
New York, NY 10055
1977 | | | | Vice
President | | Since
2009 | | Managing Director of BlackRock since 2010; Director of BlackRock from 2008 to 2009; Head of Product Development and Management for BlackRock’s U.S. Retail Group since 2009 and Co-head thereof from 2007 to 2009; Vice President of BlackRock from 2005 to 2008. |
| |
Robert W. Crothers
55 East 52nd Street
New York, NY 10055
1981 | | | | Vice
President | | Since
2012 | | Director of BlackRock since 2011; Vice President of BlackRock from 2008 to 2010; Associate of BlackRock from 2006 to 2007. |
| |
Neal Andrews
55 East 52nd Street
New York, NY 10055
1966 | | | | Chief
Financial
Officer | | Since
2007 | | Managing Director of BlackRock since 2006; Senior Vice President and Line of Business Head of Fund Accounting and Administration at PNC Global Investment Servicing (U.S.) Inc. from 1992 to 2006. |
| |
Jay Fife
55 East 52nd Street
New York, NY 10055
1970 | | | | Treasurer | | Since
2007 | | Managing Director of BlackRock since 2007; Director of BlackRock in 2006; Assistant Treasurer of the MLIM and Fund Asset Management, L.P. advised funds from 2005 to 2006; Director of MLIM Fund Services Group from 2001 to 2006. |
| |
Brian Kindelan
55 East 52nd Street
New York, NY 10055
1959 | | | | Chief Compliance Officer and
Anti-Money Laundering Officer | | Since
2007 | | Chief Compliance Officer of the BlackRock-advised funds since 2007; Managing Director and Senior Counsel of BlackRock since 2005. |
| |
Janey Ahn
55 East 52nd Street
New York, NY 10055
1975 | | | | Secretary | | Since
2012 | | Director of BlackRock since 2009; Vice President of BlackRock from 2008 to 2009; Assistant Secretary of the Funds from 2008 to 2012; Associate at Willkie Farr & Gallagher LLP from 2006 to 2008. |
| | | | | 1 Officers of the Funds serve at the pleasure of the Boards. |
| | | | | 2 Ms. Ackerley was President and Chief Executive Officer from 2009 to 2011. |
| |
Investment Advisor
BlackRock Advisors, LLC
Wilmington, DE 19809
Sub-Advisor
BlackRock Investment Management, LLC
Princeton, NJ 08540
Custodians
State Street Bank and Trust Company3
Boston, MA 02110
The Bank of New York Mellon4
New York, NY 10286 | | | | Transfer Agent
Common Shares
Computershare Trust
Company, N.A.
Canton, MA 02021
VRDP Tender and Paying Agent
The Bank of New York Mellon
New York, NY 10289
VRDP Remarketing Agent
Barclays Capital, Inc.3
New York, NY 10019
Citigroup Global Markets Inc.4
New York, NY 10179 | | VRDP Liquidity Providers
Barclays Bank PLC3
New York, NY 10019
Citibank, N.A.4
New York, NY 10179
Accounting Agent
State Street Bank and
Trust Company
Boston, MA 02110
Independent Registered
Public Accounting Firm
Deloitte & Touche LLP
Boston, MA 02116 | | Legal Counsel
Skadden, Arps, Slate,
Meagher & Flom LLP
New York, NY 10036
Address of the Funds
100 Bellevue Parkway
Wilmington, DE 19809 |
| 4 | | For MZA, MYC, MYF and MYJ. |
| ANNUAL REPORT | JULY 31, 2013 | 63
|
Proxy Results
The Annual Meeting of Shareholders was held on July 30, 2013 for shareholders of record on June 3, 2013 to elect director nominees for each Fund. There were no broker non-votes with regard to any of the Funds.
|
|
| | | | Paul L. Audet
| | Michael J. Castellano
| | Richard E. Cavanagh
|
|
|
|
| Votes For
|
| Votes
Withheld
|
| Abstain
|
| Votes For
|
| Votes
Withheld
|
| Abstain
|
| Votes For
|
| Votes
Withheld
|
| Abstain
|
MNE | | | | | 3,487,925 | | | | 108,114 | | | | 0 | | | | 3,487,925 | | | | 108,114 | | | | 0 | | | | 3,463,513 | | | | 132,526 | | | | 0 | |
MZA | | | | | 4,133,418 | | | | 77,630 | | | | 0 | | | | 4,133,661 | | | | 77,387 | | | | 0 | | | | 4,126,051 | | | | 84,997 | | | | 0 | |
MYC | | | | | 17,195,742 | | | | 496,972 | | | | 0 | | | | 17,131,529 | | | | 561,185 | | | | 0 | | | | 17,193,169 | | | | 499,545 | | | | 0 | |
MYF | | | | | 11,498,829 | | | | 495,843 | | | | 0 | | | | 11,523,997 | | | | 470,675 | | | | 0 | | | | 11,523,281 | | | | 471,391 | | | | 0 | |
MYJ | | | | | 12,530,253 | | | | 191,133 | | | | 0 | | | | 12,517,735 | | | | 203,651 | | | | 0 | | | | 12,515,405 | | | | 205,981 | | | | 0 | |
|
|
| | | | Frank J. Fabozzi1
| | Kathleen F. Feldstein
| | James T. Flynn
|
|
|
|
| Votes For
|
| Votes
Withheld
|
| Abstain
|
| Votes For
|
| Votes
Withheld
|
| Abstain
|
| Votes For
|
| Votes
Withheld
|
| Abstain
|
MNE | | | | | 296 | | | | 0 | | | | 0 | | | | 3,345,399 | | | | 250,640 | | | | 0 | | | | 3,369,566 | | | | 226,473 | | | | 0 | |
MZA | | | | | 373 | | | | 0 | | | | 0 | | | | 4,035,963 | | | | 175,085 | | | | 0 | | | | 4,097,265 | | | | 113,783 | | | | 0 | |
MYC | | | | | 1,059 | | | | 0 | | | | 0 | | | | 17,142,995 | | | | 549,719 | | | | 0 | | | | 17,176,686 | | | | 516,028 | | | | 0 | |
MYF | | | | | 594 | | | | 0 | | | | 0 | | | | 11,495,059 | | | | 499,613 | | | | 0 | | | | 11,483,088 | | | | 511,584 | | | | 0 | |
MYJ | | | | | 1,022 | | | | 0 | | | | 0 | | | | 12,478,158 | | | | 243,228 | | | | 0 | | | | 12,500,594 | | | | 220,792 | | | | 0 | |
|
|
| | | | Henry Gabbay
| | Jerrold B. Harris
| | R. Glenn Hubbard
|
|
|
|
| Votes For
|
| Votes
Withheld
|
| Abstain
|
| Votes For
|
| Votes
Withheld
|
| Abstain
|
| Votes For
|
| Votes
Withheld
|
| Abstain
|
MNE | | | | | 3,487,925 | | | | 108,114 | | | | 0 | | | | 3,378,988 | | | | 217,051 | | | | 0 | | | | 3,463,513 | | | | 132,526 | | | | 0 | |
MZA | | | | | 4,131,320 | | | | 79,728 | | | | 0 | | | | 4,129,595 | | | | 81,453 | | | | 0 | | | | 4,132,236 | | | | 78,812 | | | | 0 | |
MYC | | | | | 17,170,462 | | | | 522,252 | | | | 0 | | | | 17,126,077 | | | | 566,637 | | | | 0 | | | | 17,200,057 | | | | 492,657 | | | | 0 | |
MYF | | | | | 11,515,642 | | | | 479,030 | | | | 0 | | | | 11,479,768 | | | | 514,904 | | | | 0 | | | | 11,496,414 | | | | 498,258 | | | | 0 | |
MYJ | | | | | 12,521,497 | | | | 199,889 | | | | 0 | | | | 12,534,015 | | | | 187,371 | | | | 0 | | | | 12,494,061 | | | | 227,325 | | | | 0 | |
| |
| | | | W. Carl Kester1
| | Karen P. Robards
|
|
|
|
| Votes For
|
| Votes
Withheld
|
| Abstain
|
| Votes For
|
| Votes
Withheld
|
| Abstain
|
MNE | | | | | 296 | | | | 0 | | | | 0 | | | | 3,487,312 | | | | 108,727 | | | | 0 | |
MZA | | | | | 373 | | | | 0 | | | | 0 | | | | 4,073,051 | | | | 137,997 | | | | 0 | |
MYC | | | | | 1,059 | | | | 0 | | | | 0 | | | | 17,144,925 | | | | 547,789 | | | | 0 | |
MYF | | | | | 594 | | | | 0 | | | | 0 | | | | 11,499,953 | | | | 494,719 | | | | 0 | |
MYJ | | | | | 1,022 | | | | 0 | | | | 0 | | | | 12,535,520 | | | | 185,866 | | | | 0 | |
1Voted on by holders of Preferred Shares only.
| 64 | ANNUAL REPORT | JULY 31, 2013
|
| |
Additional Information (continued)
|
|
Fund Certification
Certain Funds are listed for trading on the NYSE and have filed with the NYSE their annual chief executive officer certification regarding compliance with the NYSE’s listing standards. The Funds filed with the SEC the certification of its chief executive officer and chief financial officer required by section 302 of the Sarbanes-Oxley Act.
Regulation Regarding Derivatives
Effective December 31, 2012, the Commodity Futures Trading Commission (“CFTC”) adopted certain regulatory changes that subject registered investment companies and advisers to registered investment companies to regulation by the CFTC if a fund invests more than a prescribed level of its net assets in CFTC-regulated futures, options and swaps (“CFTC Derivatives”), or if the fund markets itself as providing investment exposure to such instruments. To the extent a Fund uses CFTC-regulated futures, options and swaps, it intends to do so below such prescribed levels and will not market itself as a “commodity pool” or a vehicle for trading such instruments. Accordingly, BlackRock Advisors, LLC has claimed an exclusion from the definition of the term “commodity pool operator” under the Commodity Exchange Act (“CEA”) pursuant to Rule 4.5 under the CEA. BlackRock Advisors, LLC is not, therefore, subject to registration or regulation as a “commodity pool operator” under the CEA in respect of each Fund.
Dividend Policy
The Funds’ dividend policy is to distribute all or a portion of their net investment income to its shareholders on a monthly basis. In order to provide shareholders with a more stable level of dividend distributions, the Funds may at times pay out less than the entire amount of net investment income earned in any particular month and may at times in any particular month pay out such accumulated but undistributed income in addition to net investment income earned in that month. As a result, the dividends paid by the Funds for any particular month may be more or less than the amount of net investment income earned by the Funds during such month. The Funds’ current accumulated but undistributed net investment income, if any, is disclosed in the Statements of Assets and Liabilities, which comprises part of the financial information included in this report.
| ANNUAL REPORT | JULY 31, 2013 | 65
|
| |
| Additional Information (continued) |
|
General Information
The Funds do not make available copies of their Statements of Additional Information because the Funds’ shares are not continuously offered, which means that the Statement of Additional Information of each Fund has not been updated after completion of the respective Fund’s offerings and the information contained in each Fund’s Statement of Additional Information may have become outdated.
Effective July 1, 2013, each of MYC, MYF and MYJ no longer restricts its investments to long-term municipal obligations that are rated investment grade at time of purchase; instead each of MYC, MYF and MYJ may invest up to 20% of its total assets in securities rated below investment grade or deemed equivalent at time of purchase. Below investment grade quality is regarded as predominantly speculative with respect to the issuer’s capacity to pay interest and repay principal. Below investment grade securities, though high yielding, are characterized by high risk and subject to greater market fluctuations than certain lower yielding, higher rated securities. The value of high yield, lower quality bonds is affected by the creditworthiness of the issuers of the securities and by general economic and specific industry conditions. Issuers of high yield bonds are not as strong financially as those with higher credit ratings. These issuers are more vulnerable to financial setbacks and recession than more creditworthy issuers, which may impair their ability to make interest and principal payments. Below investment grade securities may also be less liquid than higher rated securities and more susceptible to economic downturns. It is likely that an economic recession could severely disrupt the market for such securities and may have an adverse impact on the value of such securities. In addition, it is likely that any such economic downturn could adversely affect the ability of the issuers of such securities to repay principal and pay interest thereon and increase the incidence of default for such securities.
Except as described above, during the period there were no material changes in the Funds’ investment objectives or policies or to the Funds’ charters or by-laws that would delay or prevent a change of control of the Funds that were not approved by the shareholders or in the principal risk factors associated with investment in the Funds. There have been no changes in the persons who are primarily responsible for the day-to-day management of the Funds’ portfolios.
Quarterly performance, semi-annual and annual reports and other information regarding the Funds may be found on BlackRock’s website, which can be accessed at http://www.blackrock.com. This reference to BlackRock’s website is intended to allow investors public access to information regarding the Funds and does not, and is not intended to, incorporate BlackRock’s website in this report.
Electronic Delivery
Electronic copies of most financial reports are available on the Funds’ websites or shareholders can sign up for e-mail notifications of quarterly statements, annual and semi-annual reports by enrolling in the Funds’ electronic delivery program.
Shareholders Who Hold Accounts with Investment Advisors, Banks or Brokerages:
Please contact your financial advisor to enroll. Please note that not all investment advisors, banks or brokerages may offer this service.
Householding
The Funds will mail only one copy of shareholder documents, including annual and semi-annual reports and proxy statements, to shareholders with multiple accounts at the same address. This practice is commonly called “householding” and is intended to reduce expenses and eliminate duplicate mailings of shareholder documents. Mailings of your shareholder documents may be householded indefinitely unless you instruct us otherwise. If you do not want the mailing of these documents to be combined with those for other members of your household, please call (800) 882-0052.
Availability of Quarterly Schedule of Investments
Each Fund files its complete schedule of portfolio holdings with the SEC for the first and third quarters of each fiscal year on Form N-Q. The Funds’ Forms N-Q are available on the SEC’s website at http://www.sec.gov and may also be reviewed and copied at the SEC’s Public Reference Room in Washington, DC. Information on how to access documents on the SEC’s website without charge may be obtained by calling (800) SEC-0330. Each Fund’s Forms N-Q may also be obtained upon request and without charge by calling (800) 882-0052.
| 66 | ANNUAL REPORT | JULY 31, 2013
|
| |
Additional Information (concluded)
|
|
General Information (concluded)
Availability of Proxy Voting Policies and Procedures
A description of the policies and procedures that the Funds use to determine how to vote proxies relating to portfolio securities is available (1) without charge, upon request, by calling (800) 882-0052; (2) at http://www.blackrock.com; and (3) on the SEC’s website at http://www.sec.gov.
Availability of Proxy Voting Record
Information about how the Funds voted proxies relating to securities held in the Funds’ portfolios during the most recent 12-month period ended June 30 is available upon request and without charge (1) at http://www.blackrock.com or by calling (800) 882-0052 and (2) on the SEC’s website at http://www.sec.gov.
Availability of Fund Updates
BlackRock will update performance and certain other data for the Funds on a monthly basis on its website in the “Closed-end Funds” section of http://www.blackrock.com as well as certain other material information as necessary from time to time. Investors and others are advised to periodically check the website for updated performance information and the release of other material information about the Funds. This reference to BlackRock’s website is intended to allow investors public access to information regarding the Funds and does not, and is not intended to, incorporate BlackRock’s website in this report.
BlackRock Privacy Principles
BlackRock is committed to maintaining the privacy of its current and former fund investors and individual clients (collectively, “Clients”) and to safeguarding their non-public personal information. The following information is provided to help you understand what personal information BlackRock collects, how we protect that information and why in certain cases we share such information with select parties.
If you are located in a jurisdiction where specific laws, rules or regulations require BlackRock to provide you with additional or different privacy-related rights beyond what is set forth below, then BlackRock will comply with those specific laws, rules or regulations.
BlackRock obtains or verifies personal non-public information from and about you from different sources, including the following: (i) information we receive from you or, if applicable, your financial intermediary, on applications, forms or other documents; (ii) information about your transactions with us, our affiliates, or others; (iii) information we receive from a consumer reporting agency; and (iv) from visits to our websites.
BlackRock does not sell or disclose to non-affiliated third parties any non-public personal information about its Clients, except as permitted by law or as is necessary to respond to regulatory requests or to service Client accounts. These non-affiliated third parties are required to protect the confidentiality and security of this information and to use it only for its intended purpose.
We may share information with our affiliates to service your account or to provide you with information about other BlackRock products or services that may be of interest to you. In addition, BlackRock restricts access to non-public personal information about its Clients to those BlackRock employees with a legitimate business need for the information. BlackRock maintains physical, electronic and procedural safeguards that are designed to protect the non-public personal information of its Clients, including procedures relating to the proper storage and disposal of such information.
| ANNUAL REPORT | JULY 31, 2013 | 67
|
This report is transmitted to shareholders only. It is not a prospectus. Past performance results shown in this report should not be considered a representation of future performance. The Funds have leveraged their Common Shares, which creates risks for Common Shareholders, including the likelihood of greater volatility of net asset value and market price of the Common Shares, and the risk that fluctuations in the short-term dividend rates of the Preferred Shares, currently set at the maximum reset rate as a result of failed auctions, may reduce the Common Shares’ yield. Statements and other information herein are as dated and are subject to change.
MY5-7/13-AR | | | | | 
| |
Item 2 – Code of Ethics – The registrant (or the “Fund”) has adopted a code of ethics, as of the end of the period covered by this report, applicable to the registrant’s principal executive officer, principal financial officer, principal accounting officer or controller, or persons performing similar functions. During the period covered by this report, there have been no amendments to or waivers granted under the code of ethics. A copy of the code of ethics is available without charge at www.blackrock.com.
Item 3 – Audit Committee Financial Expert – The registrant’s board of directors (the “board of directors”), has determined that (i) the registrant has the following audit committee financial experts serving on its audit committee and (ii) each audit committee financial expert is independent:
Michael Castellano
Frank J. Fabozzi
James T. Flynn
W. Carl Kester
Karen P. Robards
The registrant’s board of directors has determined that W. Carl Kester and Karen P. Robards qualify as financial experts pursuant to Item 3(c)(4) of Form N-CSR.
Prof. Kester has a thorough understanding of generally accepted accounting principles, financial statements and internal control over financial reporting as well as audit committee functions. Prof. Kester has been involved in providing valuation and other financial consulting services to corporate clients since 1978. Prof. Kester’s financial consulting services present a breadth and level of complexity of accounting issues that are generally comparable to the breadth and complexity of issues that can reasonably be expected to be raised by the registrant’s financial statements.
Ms. Robards has a thorough understanding of generally accepted accounting principles, financial statements and internal control over financial reporting as well as audit committee functions. Ms. Robards has been President of Robards & Company, a financial advisory firm, since 1987. Ms. Robards was formerly an investment banker for more than 10 years where she was responsible for evaluating and assessing the performance of companies based on their financial results. Ms. Robards has over 30 years of experience analyzing financial statements. She also is a member of the audit committee of one publicly held company and a non-profit organization.
Under applicable securities laws, a person determined to be an audit committee financial expert will not be deemed an “expert” for any purpose, including without limitation for the purposes of Section 11 of the Securities Act of 1933, as a result of being designated or identified as an audit committee financial expert. The designation or identification as an audit committee financial expert does not impose on such person any duties, obligations, or liabilities greater than the duties, obligations, and liabilities imposed on such person as a member of the audit committee and board of directors in the absence of such designation or identification. The designation or identification of a person as an audit committee financial expert does not affect the duties, obligations, or liability of any other member of the audit committee or board of directors.
Item 4 – Principal Accountant Fees and Services
The following table presents fees billed by Deloitte & Touche LLP (“D&T”) in each of the last two fiscal years for the services rendered to the Fund:
| | (a) Audit Fees | (b) Audit-Related Fees1 | (c) Tax Fees2 | (d) All Other Fees3 |
| Entity Name | Current Fiscal Year End | Previous Fiscal Year End | Current Fiscal Year End | Previous Fiscal Year End | Current Fiscal Year End | Previous Fiscal Year End | Current Fiscal Year End | Previous Fiscal Year End |
| BlackRock MuniYield California Fund, Inc. | $35,263 | $35,000 | $0 | $0 | $14,100 | $13,600 | $0 | $0 |
The following table presents fees billed by D&T that were required to be approved by the registrant’s audit committee (the “Committee”) for services that relate directly to the operations or financial reporting of the Fund and that are rendered on behalf of BlackRock Advisors, LLC (“Investment Adviser” or “BlackRock”) and entities controlling, controlled by, or under common control with BlackRock (not including any sub-adviser whose role is primarily portfolio management and is subcontracted with or overseen by another investment adviser) that provide ongoing services to the Fund (“Fund Service Providers”):
| | Current Fiscal Year End | Previous Fiscal Year End |
| (b) Audit-Related Fees1 | $0 | $0 |
| (c) Tax Fees2 | $0 | $0 |
| (d) All Other Fees3 | $2,865,000 | $2,970,000 |
1 The nature of the services includes assurance and related services reasonably related to the performance of the audit of financial statements not included in Audit Fees.
2 The nature of the services includes tax compliance, tax advice and tax planning.
3 Aggregate fees borne by BlackRock in connection with the review of compliance procedures and attestation thereto performed by D&T with respect to all of the registered closed-end funds and some of the registered open-end funds advised by BlackRock.
(e)(1) Audit Committee Pre-Approval Policies and Procedures:
The Committee has adopted policies and procedures with regard to the pre-approval of services. Audit, audit-related and tax compliance services provided to the registrant on an annual basis require specific pre-approval by the Committee. The Committee also must approve other non-audit services provided to the registrant and those non-audit services provided to the Investment Adviser and Fund Service Providers that relate directly to the operations and the financial reporting of the registrant. Certain of these non-audit services that the Committee believes are (a) consistent with the SEC’s auditor independence rules and (b) routine and recurring services that will not impair the independence of the independent accountants may be approved by the Committee without consideration on a specific case-by-case basis (“general pre-approval”). The term of any general pre-approval is 12 months from the date of the pre-approval, unless the Committee provides for a different period. Tax or other non-audit services provided to the registrant which have a direct impact on the operations or financial reporting of the registrant will only be deemed pre-approved provided that any individual project does not exceed $10,000 attributable to the registrant or $50,000 per project. For this purpose, multiple projects will be aggregated to determine if they exceed the previously mentioned cost levels.
Any proposed services exceeding the pre-approved cost levels will require specific pre-approval by the Committee, as will any other services not subject to general pre-approval (e.g.,
| | unanticipated but permissible services). The Committee is informed of each service approved subject to general pre-approval at the next regularly scheduled in-person board meeting. At this meeting, an analysis of such services is presented to the Committee for ratification. The Committee may delegate to the Committee Chairman the authority to approve the provision of and fees for any specific engagement of permitted non-audit services, including services exceeding pre-approved cost levels.
(e)(2) None of the services described in each of Items 4(b) through (d) were approved by the Committee pursuant to the de minimis exception in paragraph (c)(7)(i)(C) of Rule 2-01 of Regulation S-X.
(f) Not Applicable
(g) The aggregate non-audit fees paid to the accountant for services rendered by the accountant to the registrant, the Investment Adviser and the Fund Service Providers were: |
| Entity Name | Current Fiscal Year End | Previous Fiscal Year End |
| BlackRock MuniYield California Fund, Inc. | $14,100 | $13,600 |
| | Additionally, SSAE 16 Review (Formerly, SAS No. 70) fees for the current and previous fiscal years of $2,865,000 and $2,970,000, respectively, were billed by D&T to the Investment Adviser. |
| | (h) The Committee has considered and determined that the provision of non-audit services that were rendered to the Investment Adviser, and the Fund Service Providers that were not pre-approved pursuant to paragraph (c)(7)(ii) of Rule 2-01 of Regulation S-X is compatible with maintaining the principal accountant’s independence. |
Item 5 – Audit Committee of Listed Registrants
| (a) | The following individuals are members of the registrant’s separately-designated standing audit committee established in accordance with Section 3(a)(58)(A) of the Securities Exchange Act of 1934 (15 U.S.C. 78c(a)(58)(A)):
Michael Castellano |
Frank J. Fabozzi
James T. Flynn
W. Carl Kester
Karen P. Robards
Item 6 – Investments
(a) The registrant’s Schedule of Investments is included as part of the Report to Stockholders filed under Item 1 of this Form.
(b) Not Applicable due to no such divestments during the semi-annual period covered since the previous Form N-CSR filing.
Item 7 – Disclosure of Proxy Voting Policies and Procedures for Closed-End Management Investment Companies – The board of directors has delegated the voting of proxies for the Fund’s portfolio securities to the Investment Adviser pursuant to the Investment Adviser’s proxy voting guidelines. Under these guidelines, the Investment Adviser will vote proxies related to Fund securities in the best interests of the Fund and its stockholders. From time to time, a vote may present a conflict between the interests of the Fund’s stockholders, on the one hand, and those of the Investment Adviser, or any affiliated person of the Fund or the Investment Adviser, on the other. In such event, provided that the Investment Adviser’s Equity Investment Policy Oversight Committee, or a sub-committee thereof (the “Oversight Committee”) is aware of the real or potential conflict or material non-routine matter and if the Oversight Committee does not reasonably believe it is able to follow its general voting guidelines (or if the particular proxy matter is not addressed in the guidelines) and vote impartially, the Oversight Committee may retain an independent fiduciary to advise the Oversight Committee on how to vote or to cast votes on behalf of the Investment Adviser’s clients. If the Investment Adviser determines not to retain an independent fiduciary, or does not desire to follow the advice of such independent fiduciary, the Oversight Committee shall determine how to vote the proxy after consulting with the Investment Adviser’s Portfolio Management Group and/or the Investment Adviser’s Legal and Compliance Department and concluding that the vote cast is in its client’s best interest notwithstanding the conflict. A copy of the Fund’s Proxy Voting Policy and Procedures are attached as Exhibit 99.PROXYPOL. Information on how the Fund voted proxies relating to portfolio securities during the most recent 12-month period ended June 30 is available without charge, (i) at www.blackrock.com and (ii) on the SEC’s website at http://www.sec.gov.
Item 8 – Portfolio Managers of Closed-End Management Investment Companies – as of July 31, 2013.
| (a)(1) | The registrant is managed by a team of investment professionals comprised of Theodore R. Jaeckel, Jr., CFA, Managing Director at BlackRock and Walter O’Connor, Managing Director at BlackRock Each is a member of BlackRock’s municipal tax-exempt management group. Each is jointly responsible for the day-to-day management of the registrant’s portfolio, which includes setting the registrant’s overall investment strategy, overseeing the management of the registrant and/or selection of its investments. Messrs. Jaeckel and O’Connor have been members of the registrant’s portfolio management team since 2006 and 1992, respectively. |
| Portfolio Manager | Biography |
| Theodore R. Jaeckel, Jr. | Managing Director at BlackRock since 2006; Managing Director of MLIM from 2005 to 2006; Director of MLIM from 1997 to 2005. |
| Walter O’Connor | Managing Director of BlackRock since 2006; Managing Director of MLIM from 2003 to 2006; Director of MLIM from 1998 to 2003. |
| (a)(2) | As of July 31, 2013: |
| | (ii) Number of Other Accounts Managed and Assets by Account Type | (iii) Number of Other Accounts and Assets for Which Advisory Fee is Performance-Based |
(i) Name of Portfolio Manager | Other Registered Investment Companies | Other Pooled Investment Vehicles | Other Accounts | Other Registered Investment Companies | Other Pooled Investment Vehicles | Other Accounts |
| Theodore R. Jaeckel, Jr. | 63 | 0 | 0 | 0 | 0 | 0 |
| | $23.58 Billion | $0 | $0 | $0 | $0 | $0 |
| Walter O’Connor | 63 | 0 | 0 | 0 | 0 | 0 |
| | $23.58 Billion | $0 | $0 | $0 | $0 | $0 |
| (iv) | Potential Material Conflicts of Interest |
BlackRock has built a professional working environment, firm-wide compliance culture and compliance procedures and systems designed to protect against potential incentives that may favor one account over another. BlackRock has adopted policies and procedures that address the allocation of investment opportunities, execution of portfolio transactions, personal trading by employees and other potential conflicts of interest that are designed to ensure that all client accounts are treated equitably over time. Nevertheless, BlackRock furnishes investment management and advisory services to numerous clients in addition to the Fund, and BlackRock may, consistent with applicable law, make investment recommendations to other clients or accounts (including accounts which are hedge funds or have performance or higher fees paid to BlackRock, or in which portfolio managers have a personal interest in the receipt of such fees), which may be the same as or different from those made to the Fund. In addition, BlackRock, Inc., its affiliates and significant shareholders and any officer, director, shareholder or employee may or may not have an interest in the securities whose purchase and sale BlackRock recommends to the Fund. BlackRock, Inc., or any of its affiliates or significant shareholders, or any officer, director, shareholder, employee or any member of their families may take different actions than those recommended to the Fund by BlackRock with respect to the same securities. Moreover, BlackRock may refrain from rendering any advice or services concerning securities of companies of which any of BlackRock, Inc.’s (or its affiliates’ or significant shareholders’) officers, directors or employees are directors or officers, or companies as to which BlackRock, Inc. or any of its affiliates or significant shareholders or the officers, directors and employees of any of them has any substantial economic interest or possesses material non-public information. Certain portfolio managers also may manage accounts whose investment strategies may at times be opposed to the strategy utilized for a fund. It should also be noted that a portfolio manager may be managing certain hedge fund and/or long only accounts, or may be part of a team managing certain hedge fund and/or long only accounts, subject to incentive fees. Such portfolio managers may therefore be entitled to receive a portion of any incentive fees earned on such accounts. Currently, the portfolio managers of the Fund are not entitled to receive a portion of incentive fees of other accounts.
As a fiduciary, BlackRock owes a duty of loyalty to its clients and must treat each client fairly. When BlackRock purchases or sells securities for more than one account, the trades must be allocated in a manner consistent with its fiduciary duties. BlackRock attempts to allocate investments in a fair and equitable manner among client accounts, with no account receiving preferential treatment. To this end, BlackRock, Inc. has adopted policies that are intended to ensure reasonable efficiency in client transactions and provide BlackRock with
sufficient flexibility to allocate investments in a manner that is consistent with the particular investment discipline and client base, as appropriate.
| (a)(3) | As of July 31, 2013: |
Portfolio Manager Compensation Overview
BlackRock’s financial arrangements with its portfolio managers, its competitive compensation and its career path emphasis at all levels reflect the value senior management places on key resources. Compensation may include a variety of components and may vary from year to year based on a number of factors. The principal components of compensation include a base salary, a performance-based discretionary bonus, participation in various benefits programs and one or more of the incentive compensation programs established by BlackRock.
Base Compensation.
Generally, portfolio managers receive base compensation based on their position with BlackRock, Inc.
Discretionary Incentive Compensation.
Discretionary incentive compensation is a function of several components: the performance of BlackRock, Inc., the performance of the portfolio manager’s group within BlackRock, the investment performance, including risk-adjusted returns, of the firm’s assets under management or supervision by that portfolio manager relative to predetermined benchmarks, and the individual’s performance and contribution to the overall performance of these portfolios and BlackRock. In most cases, these benchmarks are the same as the benchmark or benchmarks against which the performance of the Fund or other accounts managed by the portfolio managers are measured. Among other things, BlackRock’s Chief Investment Officers make a subjective determination with respect to each portfolio manager’s compensation based on the performance of the funds and other accounts managed by each portfolio manager relative to the various benchmarks. Performance of fixed income funds is measured on a pre-tax and/or after-tax basis over various time periods including 1-, 3- and 5- year periods, as applicable. With respect to these portfolio managers, such benchmarks for the Fund and other accounts are:
| Portfolio Manager | Benchmark |
| Theodore R. Jaeckel, Jr. | A combination of peer based fund classifications or subsets thereof (e.g., Lipper Intermediate Debt Funds classification, Lipper NJ Municipal Debt Funds classification, Lipper Closed-End General Bond Fund classification, subset of Lipper Closed-End High Quality/Insured Muni Debt Leveraged Fund classification, subset of Lipper Closed-End Other Single State High Quality/Insured Muni Fund classification). |
Walter O’Connor | A combination of market-based indices (e.g., Barclays Capital Muni Bond Index, Standard & Poor's Municipal Bond Index), certain customized indices and certain fund industry peer groups. |
Distribution of Discretionary Incentive Compensation
Discretionary incentive compensation is distributed to portfolio managers in a combination of cash and BlackRock, Inc. restricted stock units which vest ratably over a number of years. For some portfolio managers, discretionary incentive compensation is also distributed in deferred cash awards that notionally track the returns of select BlackRock investment products they manage and that vest ratably over a number of years. The BlackRock, Inc. restricted stock units, upon vesting, will be settled in BlackRock, Inc. common stock. Typically, the cash portion of the discretionary incentive compensation, when combined with base salary, represents more than 60% of total compensation for the portfolio managers. Paying a portion of discretionary incentive compensation in BlackRock stock puts compensation earned by a portfolio manager for a given year “at risk” based on BlackRock’s ability to sustain and improve its performance over future periods. Providing a portion of discretionary incentive compensation in deferred cash awards that notionally track the BlackRock investment products they manage provides direct alignment with investment product results.
Long-Term Incentive Plan Awards — From time to time long-term incentive equity awards are granted to certain key employees to aid in retention, align their interests with long-term shareholder interests and motivate performance. Equity awards are generally granted in the form of BlackRock, Inc. restricted stock units that, once vested, settle in BlackRock, Inc. common stock. Messrs. Jaeckel and O’Connor have unvested long-term incentive awards.
Deferred Compensation Program — A portion of the compensation paid to eligible United States-based BlackRock employees may be voluntarily deferred at their election for defined periods of time into an account that tracks the performance of certain of the firm’s investment products. Any portfolio manager who is either a managing director or director at BlackRock is eligible to participate in the deferred compensation program.
Other Compensation Benefits. In addition to base compensation and discretionary incentive compensation, portfolio managers may be eligible to receive or participate in one or more of the following:
Incentive Savings Plans — BlackRock, Inc. has created a variety of incentive savings plans in which BlackRock, Inc. employees are eligible to participate, including a 401(k) plan, the BlackRock Retirement Savings Plan (RSP), and the BlackRock Employee Stock Purchase Plan (ESPP). The employer contribution components of the RSP include a company match equal to 50% of the first 8% of eligible pay contributed to the plan capped at $5,000 per year, and a company retirement contribution equal to 3-5% of eligible compensation up to the Internal Revenue Service limit ($255,000 for 2013). The RSP offers a range of investment options, including registered investment companies and collective investment funds managed by the firm. BlackRock, Inc. contributions follow the investment direction set by participants for their own contributions or, absent participant investment direction, are invested into a target date fund that corresponds to, or is closest to, the year in which the participant attains age 65. The ESPP allows for investment in BlackRock, Inc. common stock at a 5% discount on the fair market value of the stock on the purchase date. Annual participation in the ESPP is limited to the purchase of 1,000 shares of common stock or a dollar value of $25,000 based on its fair market value on the Purchase Date. All of the eligible portfolio managers are eligible to participate in these plans.
| (a)(4) | Beneficial Ownership of Securities – As of July 31, 2013. |
| Portfolio Manager | Dollar Range of Equity Securities
of the Fund Beneficially Owned |
| Theodore R. Jaeckel, Jr. | None |
| Walter O’Connor | None |
Item 9 – Purchases of Equity Securities by Closed-End Management Investment Company and Affiliated Purchasers – Not Applicable due to no such purchases during the period covered by this report.
Item 10 – Submission of Matters to a Vote of Security Holders – There have been no material changes to these procedures.
Item 11 – Controls and Procedures
(a) – The registrant’s principal executive and principal financial officers, or persons performing similar functions, have concluded that the registrant’s disclosure controls and procedures (as defined in Rule 30a-3(c) under the Investment Company Act of 1940, as amended (the “1940 Act”)) are effective as of a date within 90 days of the filing of this report based on the evaluation of these controls and procedures required by Rule 30a-3(b) under the 1940 Act and Rule 13a-15(b) under the Securities Exchange Act of 1934, as amended.
(b) – There were no changes in the registrant’s internal control over financial reporting (as defined in Rule 30a-3(d) under the 1940 Act) that occurred during the second fiscal quarter of the period covered by this report that have materially affected, or are reasonably likely to materially affect, the registrant’s internal control over financial reporting.
Item 12 – Exhibits attached hereto
| | (a)(1) – Code of Ethics – See Item 2 |
| | (a)(2) – Certifications – Attached hereto |
(a)(3) – Not Applicable
(b) – Certifications – Attached hereto
Pursuant to the requirements of the Securities Exchange Act of 1934 and the Investment Company Act of 1940, the registrant has duly caused this report to be signed on its behalf by the undersigned, thereunto duly authorized.
BlackRock MuniYield California Fund, Inc.
| | By: | /s/ John M. Perlowski |
| | | John M. Perlowski |
| | | Chief Executive Officer (principal executive officer) of |
| | | BlackRock MuniYield California Fund, Inc. |
Date: October 2, 2013
Pursuant to the requirements of the Securities Exchange Act of 1934 and the Investment Company Act of 1940, this report has been signed below by the following persons on behalf of the registrant and in the capacities and on the dates indicated.
| | By: | /s/ John M. Perlowski |
| | | John M. Perlowski |
| | | Chief Executive Officer (principal executive officer) of |
| | | BlackRock MuniYield California Fund, Inc. |
Date: October 2, 2013
| | By: | /s/ Neal J. Andrews |
| | | Neal J. Andrews |
| | | Chief Financial Officer (principal financial officer) of |
| | | BlackRock MuniYield California Fund, Inc. |
Date: October 2, 2013