UNITED STATES
SECURITIES AND EXCHANGE COMMISSION
Washington, D.C. 20549
FORM N-CSR
CERTIFIED SHAREHOLDER REPORT OF REGISTERED
MANAGEMENT INVESTMENT COMPANIES
Investment Company Act file number: 811-06515
Morgan Stanley Global Fixed Income Opportunities Fund
(Exact name of registrant as specified in charter)
1585 Broadway, New York, New York 10036
(Address of principal executive offices) (Zip code)
John H. Gernon
1585 Broadway, New York, New York 10036
(Name and address of agent for service)
Registrant's telephone number, including area code: 212-762-1886
Date of fiscal year end: October 31,
Date of reporting period: October 31, 2023
Item 1 - Report to Shareholders

Morgan Stanley
Global Fixed Income
Opportunities Fund
Annual Report
October 31, 2023

Morgan Stanley Global Fixed Income Opportunities Fund
Table of Contents (unaudited)
Welcome Shareholder | 3 | ||||||
Fund Report | 4 | ||||||
| Performance Summary | 10 | ||||||
| Expense Example | 12 | ||||||
| Portfolio of Investments | 14 | ||||||
| Statement of Assets and Liabilities | 38 | ||||||
| Statement of Operations | 40 | ||||||
| Statements of Changes in Net Assets | 42 | ||||||
| Notes to Financial Statements | 43 | ||||||
| Financial Highlights | 67 | ||||||
| Report of Independent Registered Public Accounting Firm | 73 | ||||||
| Investment Advisory Agreement Approval | 74 | ||||||
| Liquidity Risk Management Program | 77 | ||||||
Important Notices | 78 | ||||||
U.S. Customer Privacy Notice | 80 | ||||||
Trustees and Officers Information | 83 | ||||||
2
Welcome Shareholder,
We are pleased to provide this Annual Report, in which you will learn how your investment in Morgan Stanley Global Fixed Income Opportunities Fund (the "Fund") performed during the latest twelve-month period. It includes an overview of the market conditions and discusses some of the factors that affected performance during the reporting period. In addition, the report contains financial statements and a list of portfolio holdings.
Morgan Stanley Investment Management is a client-centric, investor-led organization. Our global presence, intellectual capital, and breadth of products and services enable us to partner with investors to meet the evolving challenges of today's financial markets. We aim to deliver superior investment service and to empower our clients to make the informed decisions that help them reach their investment goals.
As always, we thank you for selecting Morgan Stanley Investment Management and look forward to working with you in the months and years ahead.
This material must be preceded or accompanied by a prospectus for the fund being offered.
Market forecasts provided in this report may not necessarily come to pass. There is no assurance that the Fund will achieve its investment objective. The Fund is subject to market risk, which is the possibility that market values of securities owned by the Fund will decline and, therefore, the value of the Fund's shares may be less than what you paid for them. Accordingly, you can lose money investing in this Fund. Please see the prospectus for more complete information on investment risks.
3
Fund Report (unaudited)
For the year ended October 31, 2023
Total Return for the 12 Months Ended October 31, 2023 | |||||||||||||||||||||||
| Class A | Class L | Class I | Class C | Class R6 | Class IR | ||||||||||||||||||
| 4.26 | % | 4.09 | % | 4.68 | % | 3.47 | % | 4.78 | % | 4.78 | % | ||||||||||||
| Bloomberg Global Aggregate (Hedged USD) Index1(i) | Global Fixed Income Opportunities Blend Index2 | Lipper Global Income Funds Index3 | |||||||||
| 1.72 | % | 1.72 | % | 3.29 | % | ||||||
The performance of Morgan Stanley Global Fixed Income Opportunities Fund's (the "Fund") six share classes varies because each has different expenses. The Fund's total returns assume the reinvestment of all distributions but do not reflect the deduction of any applicable sales charges. Such costs would lower performance. See Performance Summary for standardized performance and benchmark information.
Market Conditions
The market rallied in November 2022 as central banks adopted a dovish tone. U.S. Treasury 10-year yields ended the month at 3.61%, down a whopping 61 basis points (bps) from their October 2022 peak.(ii) Real yields joined the party as well, with U.S. 10-year real yields down approximately 20 bps over the month of November 2022, about 50 bps down from their intra-month high.(ii) It wasn't just the U.S. bond market that rallied; it was truly a global phenomenon, with yields falling anywhere from 23 bps in Australia to 185 bps in Hungary, with the exception of Japan and some emerging markets (EM) countries.(ii) Furthermore, credit spreads narrowed and the U.S. dollar fell significantly during the month. Securitized credit sectors underperformed many other credit markets as
securitized spreads tightened less because of their generally shorter durations and spread durations. The bond rally was sparked by reduced worries about central bank over-tightening, better news on the inflation front, a market underexposed to duration and credit, and lastly, high yields, making bonds look attractive. December 2022 proved to be a fitting end to a terrible year for bonds and financial assets in general, with yields up significantly once again. Optimism based on declining inflation, weaker growth and less hawkish central banks proved to be illusory. European bonds were hit particularly hard, with French 10-year yields up over 70 bps on the month and Germany not far behind.(iii) U.S. Treasuries did reasonably well, with 10-year yields up only 27 bps.(iii) Credit markets bucked the trend a bit with U.S. investment grade and European credit markets marginally tighter on the month. U.S. high yield corporate debt was the outlier, with spreads over 20 bps wider in the month.(iii) Securitized markets also did well in spread terms, as they continued to play catch-up to the corporate credit markets.
The price action for developed market interest rates in the first quarter of 2023 was staggering and historic. Early in the quarter, strong economic data and hawkish language from the Federal Reserve (Fed) saw yields continue their
(i) "Bloomberg®" and the Bloomberg Index/Indices used are service marks of Bloomberg Finance L.P. and its affiliates, and have been licensed for use for certain purposes by Morgan Stanley Investment Management (MSIM). Bloomberg is not affiliated with MSIM, does not approve, endorse, review, or recommend any product, and does not guarantee the timeliness, accurateness, or completeness of any data or information relating to any product.
(ii) Source: Bloomberg L.P. Data as of November 30, 2022. One basis point = 0.01%
(iii) Source: Bloomberg L.P. Data as of December 31, 2022.
4
movement upwards; however, that was reversed in March 2023 as the collapse of Silicon Valley Bank unfolded. After spiking, rate volatility slowly declined from the highs but remained elevated late in the first quarter of 2023 as the market digested news and tried to interpret the impact of the banking situation. During the first quarter of 2023, 2-, 5-, 10- and 30-year Treasury yields fell by 40, 43, 41 and 31 bps, respectively.(iv) The rally was mostly in real yields, as 10-year breakeven inflation rates rose by 2 bps for the quarter.(iv) The Bloomberg U.S. Corporate Index spread widened 8 bps during the quarter to 138 bps.(v) With the turmoil in the banking sector, the widening was concentrated in the financial sector. Toward the end of March 2023, the market took some confidence from the lack of follow-on headlines, suggesting the events were somewhat idiosyncratic. This led to a drop in equity and interest rate volatility and tighter credit spreads. Given the higher representation of financial issuers on the short end of the yield curve, there was a significant flattening in the corporate spread curve. Investment grade credit fundamentals could be summarized as "things are better in 2023 but far from good," compared to 2022. Despite support for the market from numerous sources, multiple headwinds suggested that above-average risk premiums were appropriate. Higher interest rate volatility and concern about potential FDIC (Federal Deposit Insurance Corporation) sales from failed banks pressured the agency mortgage-backed securities (MBS) market during the first quarter of 2023. Current coupon spreads widened 8 bps to 153 bps above comparable duration U.S. Treasuries.(iv) The average 30-year mortgage rate did not follow other yields lower, as it rose slightly during the quarter to 6.75%.(iv) Securitized credit sectors widened along with financial corporate bonds. Fundamental credit conditions remained stable despite recession risks. Delinquencies
across many asset classes started to increase slowly. But overall delinquencies remained low from a historical perspective. Additionally, securitization structures remained relatively robust in the post-Global Financial Crisis era, and we believed most securities could generally withstand high levels of defaults without being materially impacted.
While banking fears dominated the price action observed in the first quarter of 2023, market behavior coming into the second quarter of 2023 seemed to be range-bound between two narratives. The first was a resilient labor market and sticky core inflation due to pressures from elevated services inflation. The second was the concern around an economic fallout and a potential credit crunch driven by regional banking fears. However, both narratives stood down during May 2023 as all eyes turned to the U.S. debt ceiling. Once a deal in Congress became imminent, that uncertainty subsided and all eyes turned back to the economic data. Economic and labor market data continuously surprised to the upside, conflicting with fears of a weak economy burdened by banking woes, persistent inflation and hawkish policymakers. During the second quarter of 2023, 2-, 5-, 10- and 30-year Treasury yields rose by 87, 58, 37 and 21 bps, respectively.(vi) The upswing in rates was primarily due to the market repricing government yields to reflect a stronger economy and subsequent Fed hikes. The Bloomberg U.S. Corporate Index spread tightened 15 bps during the quarter to
(iv) Source: Bloomberg L.P. Data as of March 31, 2023.
(v) Source: Bloomberg L.P. Data as of March 31, 2023. The Bloomberg U.S. Corporate Index is a broad-based benchmark that measures the investment grade, fixed-rate, taxable, corporate bond market.
(vi) Source: Bloomberg L.P. Data as of June 30, 2023.
5
123 bps.(vi) The bulk of the tightening was due to the market repricing weakness in the financial sector lower, with financial spreads tightening 25 bps as the market abandoned fears of a potential systemic financial crisis.(vi) U.S. investment grade spreads broadly performed well due to several economic data surprises (particularly in the U.S.), such as the labor markets remaining strong and inflation starting to fall, and bondholder-friendly corporate news. Finally, general risk sentiment improved as debt ceiling contention faded, risks of a recession accompanied by a spike in defaults receded, and equity market volatility fell to pre-COVID levels. Broadly, securitized credit sectors were relatively unchanged in the second quarter of 2023, though AAA collateralized loan obligations (CLOs), asset-backed securities (ABS) and non-agency commercial mortgage-backed securities (CMBS) tightened 12 bps, 18 bps and 9 bps, respectively.(vi) Within securitized assets, fundamental credit conditions remained stable despite recession risks. Agency mortgage-backed securities yields broadly tracked the rates market, with yields rising roughly 60 bps in the second quarter of 2023.(vi)
Rising real yields and steeper curves created headwinds for risk assets in the third quarter of 2023. On a global basis, major equity and bond indexes declined as central banks maintained a hawkish stance even as inflation cooled in their respective economies. During the third quarter of 2023, 2-, 5-, 10- and 30-year Treasury yields rose by 15, 45, 73 and 84 bps, respectively.(vii) While rates increased across the Treasury curve, long yields rose significantly more than short yields, and the inversion in the curve (between 2- and 10-year maturities) narrowed by over 60 bps.(vii) The yield on 10-year Japanese government bonds also rose to its highest level
in a decade, pressured by the Bank of Japan's decision to boost its yield cap to 1%, as well as expectations of tighter policy ahead.(vii) Amid signs of economic resilience, central banks in the eurozone, Canada and Australia maintained restrictive policies to further reduce inflation, driving rates higher in those regions. Monetary authorities in emerging markets generally adopted a more hawkish stance as domestic demand remained strong. China was a notable outlier, where the government introduced policy easing measures to address deepening credit problems and weakness in the economy. Credit spreads were largely unchanged, with the Bloomberg U.S. Corporate Index spread tightening 2 bps during the third quarter of 2023.(vii) Nonetheless, defaults started to pick up, especially in the bank loan market, which has floating-rate coupons, as did concerns about companies needing to refinance maturing debt at much higher coupons at a time when growth is expected to weaken. We began to see higher quality credits offering historically attractive starting valuations, and we expect them to outperform lower quality sectors in the coming quarters as growth becomes more challenging and defaults accelerate. Our approach to securitized sectors did not change during the third quarter of 2023.
In October 2023, yields continued to rise (yield curves "bear steepened" with the long end rising faster than the short end), spreads widened, and the dollar strengthened. As war broke out in the Middle East, economic data remained resilient in the U.S. and inflation remained sticky across the globe, it was evident that rates were to remain higher for longer. The 10-year interest rate rose 36 bps in the U.S., 18 bps in Japan,
(vi) Source: Bloomberg L.P. Data as of June 30, 2023.
(vii) Source: Bloomberg L.P. Data as of September 30, 2023.
6
25 bps in New Zealand and 44 bps in Australia in the month.(viii) Yields in the emerging markets also continued their ascent as most countries fixed their sights on what was happening in the U.S. Credit spreads were mostly wider over the month for many of the same reasons (e.g., resilient U.S. economy, continuing inflation, hawkish central banks, higher rates, war in the Middle East, etc.) with high yield corporate bonds underperforming investment grade corporate bonds. Securitized credit was mixed over the month, but the trend was toward slightly wider spreads. Within currencies, the U.S. dollar continued to strengthen against most currencies.
Performance Analysis
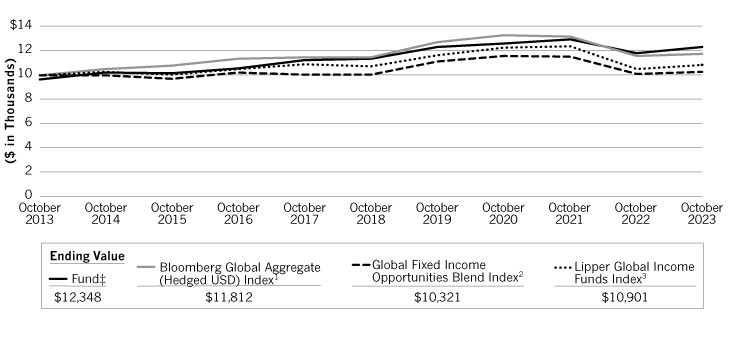
All share classes of the Fund outperformed the Bloomberg Global Aggregate (Hedged USD) Index (the "Index"), the Global Fixed Income Opportunities Blend Index and the Lipper Global Income Funds Index for the 12 months ended October 31, 2023, assuming no deduction of applicable sales charges.
Macro decisions, along with the portfolio's positioning within spread sectors, contributed to the positive absolute performance. Rising global yields detracted the most from performance, but this was more than offset by the higher "risk-free" returns earned in the U.S., euro area, U.K., New Zealand, Australia, South Africa, Mexico and Brazil. The portfolio's currency positioning over the 12-month period marginally detracted from performance, particularly the long positions in EM currencies (Brazilian real, Peruvian sol, Polish zloty, Colombian peso, and others) earlier in 2023. Notably, these losses were mostly offset by the long Mexican peso position, which contributed to performance. Regarding the portfolio's positioning within spread sectors, exposures to
securitized credit (ABS, non-agency residential mortgage-backed securities [RMBS] and CMBS), investment grade corporate bonds, and high yield corporate bonds all contributed to absolute performance as credit spreads mostly tightened over the year.
As of the close of the period, looking forward in terms of strategy, we are wary of chasing yields lower in this environment. While markets are now pricing in rate cuts in many countries (eurozone, U.S., Canada) there is a reasonable chance that these cuts either won't happen or will happen in smaller sizes. It should be noted that the chances of rate cuts in the eurozone are higher than they are in the U.S., but bond yield differentials and yield curve shapes already reflect this. Therefore, we believe a neutral position on interest rate exposure is now warranted while we wait for new data on the extent of the U.S. and global slowdown, particularly on the inflation front. We do think selected EM bond markets look attractive. Recent U.S. economic data released in November 2023 suggest the tightening in financial conditions in the third quarter of 2023 is working to slow the economy. We think a cautious modestly long position in credit markets both in investment grade and in high yield is warranted. Shorter-maturity high yield bonds do look attractive in this environment, in our view. The outlook for inflation will be critical to determine if markets need to be worried about credit spreads. We continue to favor shorter-maturity securitized credit, such as RMBS, ABS and selected CMBS, the most. That said, the outlook has modestly deteriorated as household balance sheets come under more pressure and excess savings are run down. We are trying to take advantage of higher yields on higher quality issuers to seek our target returns, rather than venturing down the risk/rating
(viii) Source: Bloomberg L.P. Data as of October 31, 2023.
7
spectrum. Anything that would reduce the chances of further rate hikes and higher borrowing costs we expect to benefit securitized credit. The outlook for the U.S. dollar also appears to be changing, though we remain largely neutral as we have been for the last few months of the reporting period. It looks opportune to begin thinking about underweighting the dollar versus selected EM currencies once again. Lower and more stable U.S. yields combined with still high carry in many EM currencies make these currencies attractive in our view.
There is no guarantee that any sectors mentioned will continue to perform as discussed herein or that securities in such sectors will be held by the Fund in the future.
PORTFOLIO COMPOSITION* as of 10/31/23 | |||||||
Corporate Bonds | 34.8 | % | |||||
Mortgages — Other | 19.6 | ||||||
Sovereign | 13.1 | ||||||
Short-Term Investments | 12.3 | ||||||
Asset-Backed Securities | 11.8 | ||||||
Commercial Mortgage-Backed Securities | 3.8 | ||||||
Agency Fixed Rate Mortgages | 2.9 | ||||||
Senior Loan Interests | 0.6 | ||||||
Supranational | 0.5 | ||||||
| Collateralized Mortgage Obligations — Agency Collateral Series | 0.4 | ||||||
Investment Company | 0.2 | ||||||
* Percentages indicated are based upon total investments (excluding Securities held as Collateral on Loaned Securities) as of October 31, 2023. Does not include open futures contracts with a value of $122,596,841 and net unrealized depreciation of $572,615. Does not include open foreign currency forward exchange contracts with net unrealized appreciation of $8,876,372.
LONG-TERM CREDIT ANALYSIS as of 10/31/23 | |||||||
AAA | 10.8 | % | |||||
AA | 0.8 | ||||||
A | 11.3 | ||||||
BBB | 27.0 | ||||||
BB | 13.0 | ||||||
B or Below | 7.8 | ||||||
Not Rated | 29.3 | ||||||
Subject to change daily. Provided for informational purposes only and should not be deemed as a recommendation to buy or sell the types of securities mentioned above. All percentages for portfolio composition are stated as a percentage of total investments and all percentages for long-term credit analysis are stated as a percentage of total long-term investments.
Security ratings disclosed with the exception for those labeled "not rated" is an aggregation of the highest security level rating amongst Standard & Poor's Ratings Group ("S&P"), Moody's Investors Services, Inc. ("Moody's") and Fitch Ratings ("Fitch"), each a Nationally Recognized Statistical Ratings Organization ("NRSRO").
Morgan Stanley is a full-service securities firm engaged in securities trading and brokerage activities, investment banking, research and analysis, financing and financial advisory services.
8
Investment Strategy
The Fund will normally invest at least 80% of its assets in a portfolio of fixed-income securities. This policy may be changed without shareholder approval; however, you would be notified upon 60 days' notice in writing of any changes. The Fund's "Adviser," Morgan Stanley Investment Management Inc. and/or "Sub-Adviser," Morgan Stanley Investment Management Limited, will allocate the Fund's investments among the following asset classes or market segments: (1) corporate securities, (2) residential and commercial mortgage-backed securities, (3) asset-backed securities, (4) emerging market securities, (5) convertible securities, (6) U.S. government securities and foreign sovereign debt, and (7) derivatives, including interest rate-related derivatives and currency derivatives. Securities may be rated either investment grade or below investment grade and denominated in any currency, hedged or un-hedged. The amount of the Fund's assets committed to any one asset class or market segment will fluctuate. However, the Fund may invest up to 65% of its net assets in any one asset class or market segment. The Adviser and Sub-Adviser have the flexibility to select any combination of at least two asset classes of the aforementioned groups depending upon market conditions and the current economic environment and, as a result, at any given time the Fund's assets may be invested in certain groups and not others.
9
Performance Summary (unaudited)
Performance of $10,000 Investment—Class A
Over 10 Years
10
Average Annual Total Returns—Period Ended October 31, 2023 (unaudited) | |||||||||||||||||||||||||||
Symbol | Class A Shares* (since 07/28/97) DINAX | Class L Shares** (since 07/28/97) DINCX | Class I Shares*** (since 07/28/97) DINDX | Class C Shares† (since 04/30/15) MSIPX | Class R6 Shares†† (since 09/13/13) MGFOX | Class IR Shares††† (since 06/15/18) MFIRX | |||||||||||||||||||||
| 1 Year | 4.26 0.825 | %4 | 4.09 — | %4 | 4.68 — | %5 | 3.47 2.495 | %4 | 4.78 — | %4 | 4.78 — | %4 | |||||||||||||||
| 5 Years | 1.624 0.945 | 1.324 — | 1.914 — | 0.874 0.875 | 1.994 — | 1.964 — | |||||||||||||||||||||
| 10 Years | 2.474 2.135 | 2.204 — | 2.764 — | — — | 2.834 — | — — | |||||||||||||||||||||
| Since Inception | 3.514 3.385 | 3.024 — | 3.794 — | 1.344 1.345 | 3.164 — | 1.884 — | |||||||||||||||||||||
Performance data quoted represents past performance, which is no guarantee of future results and current performance may be lower or higher than the figures shown. For most recent month-end performance figures, please visit www.morganstanley.com/im/shareholderreports or speak with your Financial Advisor. Investment returns and principal value will fluctuate and fund shares, when redeemed, may be worth more or less than their original cost. The graph and table do not reflect the deduction of taxes that a shareholder would pay on fund distributions or the redemption of fund shares. Performance for Class A, Class L, Class I, Class C, Class R6 and Class IR shares will vary due to differences in sales charges and expenses. See the Fund's current prospectus for complete details on fees and sales charges. Fund returns are calculated based on the net asset value as of the last business day of the period.
* The maximum front-end sales charge for Class A is 3.25%.
** Class L has no sales charge. Class L shares are closed to new investments.
*** Class I has no sales charge.
† The maximum contingent deferred sales charge for Class C is 1.0% for shares redeemed within one year of purchase. Class C shares will generally convert to Class A shares approximately eight years after the end of the calendar month in which the shares were purchased. Performance for periods greater than eight years reflects this conversion (beginning April 2023).
†† Class R6 has no sales charge.
††† Class IR has no sales charge.
(1) The Bloomberg Global Aggregate (Hedged USD) Index provides a broad-based measure of the global investment grade fixed-rate debt markets. Currency exposure is hedged to the U.S. dollar. The Index is unmanaged and its returns do not include any sales charges or fees. Such costs would lower performance. It is not possible to invest directly in an index.
(2) The Global Fixed Income Opportunities Blend Index is a performance linked benchmark of the old benchmark represented by the Bloomberg Global Aggregate Index (unhedged USD) (a benchmark that provides a broad-based measure of the global investment grade fixed-rate debt markets with returns in unhedged USD) from the Fund's inception to December 31, 2016 to the new benchmark represented by the Bloomberg Global Aggregate (Hedged USD) Index for periods thereafter. The Index is unmanaged and its returns do not include any sales charges or fees. Such costs would lower performance. It is not possible to invest directly in an index.
(3) The Lipper Global Income Funds Index is an equally weighted performance index of the largest qualifying funds (based on net assets) in the Lipper Global Income Funds classification. The Index, which is adjusted for capital gains distributions and income dividends, is unmanaged and should not be considered an investment. There are currently 30 funds represented in this Index. The Fund was in the Lipper Global Income Funds classification as of the date of this report. It is not possible to invest directly in an index.
(4) Figure shown assumes reinvestment of all distributions and does not reflect the deduction of any sales charges.
(5) Figure shown assumes reinvestment of all distributions and the deduction of the maximum applicable sales charge. See the Fund's current prospectus for complete details on fees and sales charges.
‡ Ending value assuming a complete redemption on October 31, 2023.
11
Expense Example (unaudited)
As a shareholder of the Fund, you incur two types of costs: (1) transaction costs, including sales charges (loads) on purchase payments; and (2) ongoing costs, which may include advisory fees, administration fees, distribution and shareholder services (12b-1) fees, and other Fund expenses. This example is intended to help you understand your ongoing costs (in dollars) of investing in the Fund and to compare these costs with the ongoing costs of investing in other mutual funds.
This example is based on an investment of $1,000 invested at the beginning of the period and held for the entire period 05/01/23 – 10/31/2023.
Actual Expenses
The first line of the table on the following page provides information about actual account values and actual expenses. You may use the information in this line, together with the amount you invested, to estimate the expenses that you paid over the period. Simply divide your account value by $1,000 (for example, an $8,600 account value divided by $1,000 = 8.6), then multiply the result by the number in the first line under the heading entitled "Expenses Paid During Period" to estimate the expenses you paid on your account during this period.
Hypothetical Example for Comparison Purposes
The second line of the table on the following page provides information about hypothetical expenses based on the Fund's actual expense ratio and an assumed rate of return of 5% per year before expenses, which is not the Fund's actual return. The hypothetical account values and expenses may not be used to estimate the actual ending account balance or expenses you paid for the period. You may use this information to compare the ongoing cost of investing in the Fund and other funds. To do so, compare this 5% hypothetical example with the 5% hypothetical examples that appear in the shareholder reports of the other funds.
Please note that the expenses shown in the table are meant to highlight your ongoing costs only and do not reflect any transactional costs, such as sales charges (loads). Therefore, the second line of the table is useful in comparing ongoing costs, and will not help you determine the relative total cost of owning different funds. In addition, if these transactional costs were included, your costs would have been higher.
12
Expense Example (unaudited) continued
| Beginning Account Value | Ending Account Value | Expenses Paid During Period(1) | |||||||||||||
05/01/23 | 10/31/23 | 05/01/23 – 10/31/23 | |||||||||||||
Class A | |||||||||||||||
Actual (–0.72% return) | $ | 1,000.00 | $ | 992.80 | $ | 4.32 | |||||||||
Hypothetical (5% annual return before expenses) | $ | 1,000.00 | $ | 1,020.87 | $ | 4.38 | |||||||||
Class L | |||||||||||||||
Actual (–0.93% return) | $ | 1,000.00 | $ | 990.70 | $ | 6.37 | |||||||||
Hypothetical (5% annual return before expenses) | $ | 1,000.00 | $ | 1,018.80 | $ | 6.46 | |||||||||
Class I | |||||||||||||||
Actual (–0.79% return) | $ | 1,000.00 | $ | 992.10 | $ | 3.11 | |||||||||
Hypothetical (5% annual return before expenses) | $ | 1,000.00 | $ | 1,022.03 | $ | 3.16 | |||||||||
Class C | |||||||||||||||
Actual (–1.31% return) | $ | 1,000.00 | $ | 986.90 | $ | 8.11 | |||||||||
Hypothetical (5% annual return before expenses) | $ | 1,000.00 | $ | 1,017.04 | $ | 8.24 | |||||||||
Class R6 | |||||||||||||||
Actual (–0.73% return) | $ | 1,000.00 | $ | 992.70 | $ | 2.51 | |||||||||
Hypothetical (5% annual return before expenses) | $ | 1,000.00 | $ | 1,022.68 | $ | 2.55 | |||||||||
Class IR | |||||||||||||||
Actual (–0.73% return) | $ | 1,000.00 | $ | 992.70 | $ | 2.51 | |||||||||
Hypothetical (5% annual return before expenses) | $ | 1,000.00 | $ | 1,022.68 | $ | 2.55 | |||||||||
(1) Expenses are equal to the Fund's annualized expense ratios of 0.86%, 1.27%, 0.62%, 1.62%, 0.50% and 0.50% for Class A, Class L, Class I, Class C, Class R6 and Class IR shares, respectively, multiplied by the average account value over the period and multiplied by 184/365 (to reflect the one-half year period). If the Fund had borne all of its expenses, the annualized expense ratios would have been 0.87%, 1.28%, 0.63%, 1.63%, 0.51% and 22.66% for Class A, Class L, Class I, Class C, Class R6 and Class IR shares, respectively.
13
Morgan Stanley Global Fixed Income Opportunities Fund
Portfolio of Investments ◼ October 31, 2023
| PRINCIPAL AMOUNT (000) | COUPON RATE | MATURITY DATE | VALUE | ||||||||||||||||
Corporate Bonds (35.0%) | |||||||||||||||||||
Australia (2.7%) | |||||||||||||||||||
Basic Materials | |||||||||||||||||||
$ | 2,143 | Newcastle Coal Infrastructure Group Pty. Ltd. (a) | 4.40 | % | 09/29/27 | $ | 1,940,744 | ||||||||||||
1,925 | Newcastle Coal Infrastructure Group Pty. Ltd. (a) | 4.70 | 05/12/31 | 1,551,398 | |||||||||||||||
3,492,142 | |||||||||||||||||||
Energy | |||||||||||||||||||
2,098 | Santos Finance Ltd. | 4.125 | 09/14/27 | 1,911,403 | |||||||||||||||
Finance | |||||||||||||||||||
4,945 | Australia & New Zealand Banking Group Ltd. (a) | 2.57 | 11/25/35 | 3,572,675 | |||||||||||||||
EUR | 2,300 | Commonwealth Bank of Australia | 1.936 | 10/03/29 | 2,345,661 | ||||||||||||||
$ | 5,000 | Westpac Banking Corp. | 2.668 | 11/15/35 | 3,636,096 | ||||||||||||||
9,554,432 | |||||||||||||||||||
Industrials | |||||||||||||||||||
EUR | 1,000 | Aurizon Network Pty. Ltd. | 3.125 | 06/01/26 | 1,028,718 | ||||||||||||||
2,600 | Sydney Airport Finance Co. Pty. Ltd. | 4.375 | 05/03/33 | 2,700,345 | |||||||||||||||
3,729,063 | |||||||||||||||||||
Utilities | |||||||||||||||||||
1,650 | APA Infrastructure Ltd. | 2.00 | 03/22/27 | 1,604,868 | |||||||||||||||
Total Australia | 20,291,908 | ||||||||||||||||||
Brazil (0.4%) | |||||||||||||||||||
Consumer, Non-Cyclical | |||||||||||||||||||
$ | 2,275 | JBS USA LUX SA/JBS USA Food Co./JBS USA Finance, Inc. | 2.50 | 01/15/27 | 1,999,645 | ||||||||||||||
Energy | |||||||||||||||||||
1,400 | Petrobras Global Finance BV | 6.50 | 07/03/33 | 1,305,727 | |||||||||||||||
Total Brazil | 3,305,372 | ||||||||||||||||||
Burkina Faso (0.2%) | |||||||||||||||||||
Basic Materials | |||||||||||||||||||
1,930 | IAMGOLD Corp. (a) | 5.75 | 10/15/28 | 1,522,278 | |||||||||||||||
Canada (1.0%) | |||||||||||||||||||
Basic Materials | |||||||||||||||||||
2,260 | NOVA Chemicals Corp. (a) | 4.875 | 06/01/24 | 2,223,442 | |||||||||||||||
Consumer, Cyclical | |||||||||||||||||||
1,420 | Air Canada (a) | 3.875 | 08/15/26 | 1,293,403 | |||||||||||||||
See Notes to Financial Statements
14
Morgan Stanley Global Fixed Income Opportunities Fund
Portfolio of Investments ◼ October 31, 2023 continued
| PRINCIPAL AMOUNT (000) | COUPON RATE | MATURITY DATE | VALUE | ||||||||||||||||
Consumer, Non-Cyclical | |||||||||||||||||||
$ | 1,370 | Garda World Security Corp. (a) | 6.00 | % | 06/01/29 | $ | 1,045,746 | ||||||||||||
1,700 | Garda World Security Corp. (a) | 9.50 | 11/01/27 | 1,546,409 | |||||||||||||||
1,500 | Kronos Acquisition Holdings, Inc./KIK Custom Products, Inc. (a) | 7.00 | 12/31/27 | 1,276,765 | |||||||||||||||
3,868,920 | |||||||||||||||||||
Total Canada | 7,385,765 | ||||||||||||||||||
Chile (0.1%) | |||||||||||||||||||
Communications | |||||||||||||||||||
1,000 | Liberty Latin America Ltd. | 2.00 | 07/15/24 | 951,252 | |||||||||||||||
Colombia (0.1%) | |||||||||||||||||||
Finance | |||||||||||||||||||
$ | 711 | Grupo Aval Ltd. (a) | 4.375 | 02/04/30 | 525,317 | ||||||||||||||
Denmark (0.7%) | |||||||||||||||||||
Finance | |||||||||||||||||||
EUR | 5,500 | Danske Bank AS | 1.375 | 02/12/30 | 5,509,125 | ||||||||||||||
France (4.6%) | |||||||||||||||||||
Communications | |||||||||||||||||||
4,600 | Orange SA | 5.00 | (b) | 4,850,932 | |||||||||||||||
Consumer, Cyclical | |||||||||||||||||||
2,800 | Renault SA | 1.125 | 10/04/27 | 2,567,492 | |||||||||||||||
Energy | |||||||||||||||||||
2,280 | TotalEnergies SE | 2.00 | (b) | 1,880,968 | |||||||||||||||
Finance | |||||||||||||||||||
2,500 | AXA SA | 3.25 | 05/28/49 | 2,393,113 | |||||||||||||||
1,900 | Banque Federative du Credit Mutuel SA | 5.125 | 01/13/33 | 1,956,164 | |||||||||||||||
3,100 | BNP Paribas SA | 0.50 | 06/04/26 | 3,092,787 | |||||||||||||||
$ | 2,400 | BNP Paribas SA (a) | 2.819 | 11/19/25 | 2,309,570 | ||||||||||||||
EUR | 2,400 | BNP Paribas SA | 2.875 | 10/01/26 | 2,436,789 | ||||||||||||||
1,600 | BNP Paribas SA | 4.375 | 01/13/29 | 1,690,987 | |||||||||||||||
4,500 | BPCE SA | 2.375 | 04/26/32 | 4,099,405 | |||||||||||||||
800 | BPCE SA | 4.00 | 11/29/32 | 821,656 | |||||||||||||||
$ | 1,875 | BPCE SA (a) | 5.15 | 07/21/24 | 1,847,976 | ||||||||||||||
EUR | 3,100 | Credit Agricole Assurances SA | 4.50 | (b) | 3,220,807 | ||||||||||||||
See Notes to Financial Statements
15
Morgan Stanley Global Fixed Income Opportunities Fund
Portfolio of Investments ◼ October 31, 2023 continued
| PRINCIPAL AMOUNT (000) | COUPON RATE | MATURITY DATE | VALUE | ||||||||||||||||
EUR | 2,000 | Credit Agricole SA | 2.625 | % | 03/17/27 | $ | 1,990,479 | ||||||||||||
25,859,733 | |||||||||||||||||||
Total France | 35,159,125 | ||||||||||||||||||
Germany (1.7%) | |||||||||||||||||||
Consumer, Cyclical | |||||||||||||||||||
2,300 | Volkswagen International Finance NV | 4.625 | (b) | 2,306,615 | |||||||||||||||
Consumer, Non-Cyclical | |||||||||||||||||||
2,780 | Bayer AG | 4.625 | 05/26/33 | 2,914,784 | |||||||||||||||
650 | Techem Verwaltungsgesellschaft 675 GmbH (a) | 2.00 | 07/15/25 | 663,229 | |||||||||||||||
600 | Techem Verwaltungsgesellschaft 675 GmbH | 2.00 | 07/15/25 | 612,212 | |||||||||||||||
4,190,225 | |||||||||||||||||||
Energy | |||||||||||||||||||
2,400 | Wintershall Dea Finance BV | 1.332 | 09/25/28 | 2,183,605 | |||||||||||||||
Finance | |||||||||||||||||||
1,900 | Muenchener Rueckversicherungs-Gesellschaft AG in Muenchen | 3.25 | 05/26/49 | 1,836,477 | |||||||||||||||
3,000 | Vonovia SE | 0.625 | 12/14/29 | 2,439,253 | |||||||||||||||
4,275,730 | |||||||||||||||||||
Total Germany | 12,956,175 | ||||||||||||||||||
India (0.3%) | |||||||||||||||||||
Industrials | |||||||||||||||||||
$ | 2,650 | Fly Leasing Ltd. (a) | 7.00 | 10/15/24 | 2,440,610 | ||||||||||||||
Ireland (0.4%) | |||||||||||||||||||
Finance | |||||||||||||||||||
1,375 | AerCap Ireland Capital DAC/AerCap Global Aviation Trust | 2.45 | 10/29/26 | 1,223,589 | |||||||||||||||
750 | AerCap Ireland Capital DAC/AerCap Global Aviation Trust | 3.65 | 07/21/27 | 673,613 | |||||||||||||||
EUR | 1,455 | Luminis Finance PLC | 4.00 | (c) | 12/06/24 | 1,485,325 | |||||||||||||
Total Ireland | 3,382,527 | ||||||||||||||||||
Italy (0.7%) | |||||||||||||||||||
Finance | |||||||||||||||||||
EUR | 3,000 | Assicurazioni Generali SpA | 5.50 | 10/27/47 | 3,164,403 | ||||||||||||||
1,040 | Intesa Sanpaolo SpA | 4.875 | 05/19/30 | 1,093,841 | |||||||||||||||
4,258,244 | |||||||||||||||||||
See Notes to Financial Statements
16
Morgan Stanley Global Fixed Income Opportunities Fund
Portfolio of Investments ◼ October 31, 2023 continued
| PRINCIPAL AMOUNT (000) | COUPON RATE | MATURITY DATE | VALUE | ||||||||||||||||
Industrials | |||||||||||||||||||
$ | 1,300 | F-Brasile SpA/F-Brasile U.S. LLC, Series XR (a) | 7.375 | % | 08/15/26 | $ | 1,209,027 | ||||||||||||
Total Italy | 5,467,271 | ||||||||||||||||||
Luxembourg (0.3%) | |||||||||||||||||||
Finance | |||||||||||||||||||
EUR | 1,000 | Blackstone Property Partners Europe Holdings Sarl | 1.25 | 04/26/27 | 886,235 | ||||||||||||||
1,500 | Blackstone Property Partners Europe Holdings Sarl | 2.20 | 07/24/25 | 1,494,686 | |||||||||||||||
Total Luxembourg | 2,380,921 | ||||||||||||||||||
Mexico (0.4%) | |||||||||||||||||||
Energy | |||||||||||||||||||
$ | 2,000 | Petroleos Mexicanos | 10.00 | 02/07/33 | 1,769,806 | ||||||||||||||
Finance | |||||||||||||||||||
1,579 | Banco Actinver SA/Grupo GICSA SAB de CV (a) | 4.80 | 12/18/34 | 1,105,300 | |||||||||||||||
Total Mexico | 2,875,106 | ||||||||||||||||||
Netherlands (1.5%) | |||||||||||||||||||
Communications | |||||||||||||||||||
EUR | 1,600 | Prosus NV | 2.031 | 08/03/32 | 1,163,333 | ||||||||||||||
2,250 | UPC Holding BV | 3.875 | 06/15/29 | 2,003,381 | |||||||||||||||
3,166,714 | |||||||||||||||||||
Finance | |||||||||||||||||||
3,000 | ASR Nederland NV | 5.00 | (b) | 3,153,255 | |||||||||||||||
2,000 | ING Groep NV | 1.00 | 11/13/30 | 1,927,621 | |||||||||||||||
2,300 | NN Group NV | 4.50 | (b) | 2,370,670 | |||||||||||||||
7,451,546 | |||||||||||||||||||
Industrials | |||||||||||||||||||
$ | 1,000 | Trivium Packaging Finance BV (a) | 8.50 | 08/15/27 | 835,922 | ||||||||||||||
Total Netherlands | 11,454,182 | ||||||||||||||||||
Panama (0.5%) | |||||||||||||||||||
Utilities | |||||||||||||||||||
4,361 | AES Panama Generation Holdings SRL | 4.375 | 05/31/30 | 3,562,901 | |||||||||||||||
See Notes to Financial Statements
17
Morgan Stanley Global Fixed Income Opportunities Fund
Portfolio of Investments ◼ October 31, 2023 continued
| PRINCIPAL AMOUNT (000) | COUPON RATE | MATURITY DATE | VALUE | ||||||||||||||||
Poland (0.2%) | |||||||||||||||||||
Industrials | |||||||||||||||||||
$ | 2,080 | Canpack SA/Canpack U.S. LLC (a) | 3.875 | % | 11/15/29 | $ | 1,635,546 | ||||||||||||
Portugal (0.2%) | |||||||||||||||||||
Utilities | |||||||||||||||||||
EUR | 1,800 | EDP - Energias de Portugal SA | 1.70 | 07/20/80 | 1,770,961 | ||||||||||||||
Spain (3.2%) | |||||||||||||||||||
Communications | |||||||||||||||||||
1,910 | Lorca Telecom Bondco SA | 4.00 | 09/18/27 | 1,881,492 | |||||||||||||||
Consumer, Non-Cyclical | |||||||||||||||||||
1,675 | Grifols SA | 2.25 | 11/15/27 | 1,552,008 | |||||||||||||||
425 | Grifols SA (a) | 2.25 | 11/15/27 | 393,793 | |||||||||||||||
1,945,801 | |||||||||||||||||||
Energy | |||||||||||||||||||
2,050 | Repsol International Finance BV | 2.50 | (b) | 1,929,909 | |||||||||||||||
Finance | |||||||||||||||||||
2,500 | Banco Santander SA | 3.125 | 01/19/27 | 2,543,866 | |||||||||||||||
$ | 5,000 | Banco Santander SA | 5.179 | 11/19/25 | 4,827,958 | ||||||||||||||
EUR | 1,700 | Banco Santander SA | 5.75 | 08/23/33 | 1,788,628 | ||||||||||||||
5,000 | CaixaBank SA | 2.25 | 04/17/30 | 5,006,793 | |||||||||||||||
14,167,245 | |||||||||||||||||||
Utilities | |||||||||||||||||||
2,000 | Iberdrola Finanzas SA | 4.875 | (b) | 2,035,462 | |||||||||||||||
1,700 | Iberdrola International BV, Series NC6 | 1.45 | (b) | 1,567,672 | |||||||||||||||
1,000 | NorteGas Energia Distribucion SA | 0.905 | 01/22/31 | 790,902 | |||||||||||||||
4,394,036 | |||||||||||||||||||
Total Spain | 24,318,483 | ||||||||||||||||||
Sweden (0.5%) | |||||||||||||||||||
Consumer, Non-Cyclical | |||||||||||||||||||
1,570 | Verisure Holding AB, 3.25% - 02/2027 | 3.25 | 02/15/27 | 1,505,478 | |||||||||||||||
Finance | |||||||||||||||||||
3,025 | Akelius Residential Property Financing BV | 1.125 | 01/11/29 | 2,542,648 | |||||||||||||||
Total Sweden | 4,048,126 | ||||||||||||||||||
See Notes to Financial Statements
18
Morgan Stanley Global Fixed Income Opportunities Fund
Portfolio of Investments ◼ October 31, 2023 continued
| PRINCIPAL AMOUNT (000) | COUPON RATE | MATURITY DATE | VALUE | ||||||||||||||||
Switzerland (0.8%) | |||||||||||||||||||
Finance | |||||||||||||||||||
$ | 1,375 | UBS AG | 5.125 | % | 05/15/24 | $ | 1,357,107 | ||||||||||||
2,000 | UBS Group AG (a) | 2.593 | 09/11/25 | 1,929,125 | |||||||||||||||
EUR | 1,450 | UBS Group AG | 2.875 | 04/02/32 | 1,331,770 | ||||||||||||||
$ | 1,725 | UBS Group AG (a) | 6.537 | 08/12/33 | 1,658,454 | ||||||||||||||
Total Switzerland | 6,276,456 | ||||||||||||||||||
Turkey (0.3%) | |||||||||||||||||||
Basic Materials | |||||||||||||||||||
2,670 | Eldorado Gold Corp. (a) | 6.25 | 09/01/29 | 2,292,755 | |||||||||||||||
United Kingdom (2.3%) | |||||||||||||||||||
Communications | |||||||||||||||||||
GBP | 2,350 | Virgin Media Secured Finance PLC | 4.25 | 01/15/30 | 2,316,664 | ||||||||||||||
Energy | |||||||||||||||||||
$ | 2,300 | BP Capital Markets PLC | 4.875 | (b) | 2,009,384 | ||||||||||||||
Finance | |||||||||||||||||||
EUR | 1,700 | Aviva PLC | 3.875 | 07/03/44 | 1,775,543 | ||||||||||||||
$ | 2,075 | Barclays PLC | 3.932 | 05/07/25 | 2,046,933 | ||||||||||||||
2,600 | HSBC Holdings PLC | 2.633 | 11/07/25 | 2,493,447 | |||||||||||||||
GBP | 3,200 | Lloyds Banking Group plc | 1.875 | 01/15/26 | 3,685,413 | ||||||||||||||
EUR | 900 | Lloyds Banking Group PLC | 4.947 | (b) | 890,623 | ||||||||||||||
$ | 1,725 | Standard Chartered PLC (a) | 2.678 | 06/29/32 | 1,283,284 | ||||||||||||||
12,175,243 | |||||||||||||||||||
Utilities | |||||||||||||||||||
GBP | 850 | NGG Finance PLC | 5.625 | 06/18/73 | 991,109 | ||||||||||||||
Total United Kingdom | 17,492,400 | ||||||||||||||||||
United States (11.9%) | |||||||||||||||||||
Basic Materials | |||||||||||||||||||
$ | 3,500 | Celanese U.S. Holdings LLC | 6.165 | 07/15/27 | 3,417,636 | ||||||||||||||
Communications | |||||||||||||||||||
1,306 | Arches Buyer, Inc. (a) | 4.25 | 06/01/28 | 1,083,104 | |||||||||||||||
EUR | 1,220 | AT&T, Inc. | 3.95 | 04/30/31 | 1,259,899 | ||||||||||||||
$ | 2,050 | Charter Communications Operating LLC/Charter Communications Operating Capital | 2.25 | 01/15/29 | 1,660,581 | ||||||||||||||
1,200 | Clear Channel Outdoor Holdings, Inc. (a)(d) | 7.75 | 04/15/28 | 918,624 | |||||||||||||||
See Notes to Financial Statements
19
Morgan Stanley Global Fixed Income Opportunities Fund
Portfolio of Investments ◼ October 31, 2023 continued
| PRINCIPAL AMOUNT (000) | COUPON RATE | MATURITY DATE | VALUE | ||||||||||||||||
$ | 1,238 | Sprint Spectrum Co. LLC/Sprint Spectrum Co. II LLC/ Sprint Spectrum Co. III LLC (a) | 4.738 | % | 09/20/29 | $ | 1,223,682 | ||||||||||||
1,400 | Univision Communications, Inc. (a) | 4.50 | 05/01/29 | 1,114,405 | |||||||||||||||
7,260,295 | |||||||||||||||||||
Consumer, Cyclical | |||||||||||||||||||
2,720 | American Airlines, Inc./AAdvantage Loyalty IP Ltd. (a) | 5.75 | 04/20/29 | 2,456,241 | |||||||||||||||
4,800 | Dick's Sporting Goods, Inc. (d) | 3.15 | 01/15/32 | 3,624,659 | |||||||||||||||
2,260 | Ferrellgas LP/Ferrellgas Finance Corp. (a) | 5.375 | 04/01/26 | 2,117,485 | |||||||||||||||
2,300 | Hyundai Capital America (a) | 1.80 | 01/10/28 | 1,914,203 | |||||||||||||||
1,485 | Macy's Retail Holdings LLC (a)(d) | 5.875 | 03/15/30 | 1,258,074 | |||||||||||||||
1,630 | Newell Brands, Inc. (e) | 5.20 | 04/01/26 | 1,540,461 | |||||||||||||||
3,000 | Nissan Motor Acceptance Co. LLC (a) | 7.05 | 09/15/28 | 2,964,298 | |||||||||||||||
1,990 | Peloton Interactive, Inc. | 0.00 | (f) | 02/15/26 | 1,477,726 | ||||||||||||||
1,000 | Premier Entertainment Sub LLC/Premier Entertainment Finance Corp. (a)(d) | 5.625 | 09/01/29 | 704,120 | |||||||||||||||
1,400 | Resorts World Las Vegas LLC/RWLV Capital, Inc. (a) | 4.625 | 04/16/29 | 1,076,670 | |||||||||||||||
1,570 | Tempur Sealy International, Inc. (a) | 3.875 | 10/15/31 | 1,177,781 | |||||||||||||||
3,000 | Warnermedia Holdings, Inc. | 4.279 | 03/15/32 | 2,488,544 | |||||||||||||||
22,800,262 | |||||||||||||||||||
Consumer, Non-Cyclical | |||||||||||||||||||
980 | Allied Universal Holdco LLC/Allied Universal Finance Corp. (a)(d) | 6.00 | 06/01/29 | 709,152 | |||||||||||||||
2,275 | BAT Capital Corp. | 6.421 | 08/02/33 | 2,144,865 | |||||||||||||||
1,643 | BioMarin Pharmaceutical, Inc. | 0.599 | 08/01/24 | 1,584,924 | |||||||||||||||
1,500 | Sotheby's (a) | 7.375 | 10/15/27 | 1,341,218 | |||||||||||||||
EUR | 3,150 | Upjohn Finance BV | 1.362 | 06/23/27 | 2,979,116 | ||||||||||||||
8,759,275 | |||||||||||||||||||
Energy | |||||||||||||||||||
$ | 1,625 | Energy Transfer LP | 4.95 | 06/15/28 | 1,536,663 | ||||||||||||||
1,493 | Global Partners LP/GLP Finance Corp. | 7.00 | 08/01/27 | 1,408,504 | |||||||||||||||
1,275 | Occidental Petroleum Corp. | 7.875 | 09/15/31 | 1,366,290 | |||||||||||||||
1,475 | ONEOK, Inc. | 6.10 | 11/15/32 | 1,422,138 | |||||||||||||||
1,600 | Sabine Pass Liquefaction LLC | 4.50 | 05/15/30 | 1,435,717 | |||||||||||||||
7,169,312 | |||||||||||||||||||
Finance | |||||||||||||||||||
1,375 | Acrisure LLC/Acrisure Finance, Inc. (a) | 10.125 | 08/01/26 | 1,385,000 | |||||||||||||||
1,125 | Ally Financial, Inc. | 3.875 | 05/21/24 | 1,106,359 | |||||||||||||||
See Notes to Financial Statements
20
Morgan Stanley Global Fixed Income Opportunities Fund
Portfolio of Investments ◼ October 31, 2023 continued
| PRINCIPAL AMOUNT (000) | COUPON RATE | MATURITY DATE | VALUE | ||||||||||||||||
$ | 2,475 | Ally Financial, Inc. | 5.125 | % | 09/30/24 | $ | 2,439,278 | ||||||||||||
2,100 | Ally Financial, Inc. | 6.992 | 06/13/29 | 2,008,005 | |||||||||||||||
EUR | 1,570 | Bank of America Corp. | 2.824 | 04/27/33 | 1,453,494 | ||||||||||||||
$ | 1,900 | Charles Schwab Corp. | 6.136 | 08/24/34 | 1,780,636 | ||||||||||||||
1,180 | Global Atlantic Fin Co. (a) | 4.70 | 10/15/51 | 823,118 | |||||||||||||||
EUR | 1,200 | Goldman Sachs Group, Inc. | 2.00 | 11/01/28 | 1,153,254 | ||||||||||||||
$ | 1,425 | Howard Hughes Corp. (a) | 4.375 | 02/01/31 | 1,086,421 | ||||||||||||||
2,060 | Jane Street Group/JSG Finance, Inc. (a)(d) | 4.50 | 11/15/29 | 1,757,745 | |||||||||||||||
1,610 | Jefferies Finance LLC/JFIN Co.-Issuer Corp. (a) | 5.00 | 08/15/28 | 1,286,730 | |||||||||||||||
EUR | 700 | JPMorgan Chase & Co. | 0.597 | 02/17/33 | 548,369 | ||||||||||||||
$ | 1,375 | Osaic Holdings, Inc. (a)(d) | 10.75 | 08/01/27 | 1,368,329 | ||||||||||||||
EUR | 1,200 | Prologis Euro Finance LLC | 1.875 | 01/05/29 | 1,118,554 | ||||||||||||||
$ | 1,975 | Rocket Mortgage LLC/Rocket Mortgage Co-Issuer, Inc. (a) | 3.875 | 03/01/31 | 1,529,499 | ||||||||||||||
1,350 | Synchrony Bank | 5.625 | 08/23/27 | 1,234,115 | |||||||||||||||
3,825 | Truist Financial Corp. | 5.867 | 06/08/34 | 3,481,187 | |||||||||||||||
25,560,093 | |||||||||||||||||||
Industrials | |||||||||||||||||||
1,300 | LABL, Inc. (a) | 8.25 | 11/01/29 | 967,687 | |||||||||||||||
805 | LABL, Inc. (a) | 10.50 | 07/15/27 | 697,751 | |||||||||||||||
EUR | 2,040 | Standard Industries, Inc. | 2.25 | 11/21/26 | 1,899,493 | ||||||||||||||
$ | 1,900 | Vontier Corp. | 1.80 | 04/01/26 | 1,698,410 | ||||||||||||||
5,263,341 | |||||||||||||||||||
Technology | |||||||||||||||||||
1,140 | AthenaHealth Group, Inc. (a) | 6.50 | 02/15/30 | 932,601 | |||||||||||||||
3,800 | Concentrix Corp. | 6.65 | 08/02/26 | 3,777,937 | |||||||||||||||
EUR | 1,400 | Fidelity National Information Services, Inc. | 1.50 | 05/21/27 | 1,340,403 | ||||||||||||||
$ | 1,300 | McAfee Corp. (a) | 7.375 | 02/15/30 | 1,041,132 | ||||||||||||||
7,092,073 | |||||||||||||||||||
Utilities | |||||||||||||||||||
1,675 | Southern Co. (e) | 4.475 | 08/01/24 | 1,652,970 | |||||||||||||||
2,000 | Vistra Operations Co. LLC (a) | 4.875 | 05/13/24 | 1,979,874 | |||||||||||||||
3,632,844 | |||||||||||||||||||
Total United States | 90,955,131 | ||||||||||||||||||
| Total Corporate Bonds (Cost $296,464,989) | 267,959,693 | ||||||||||||||||||
See Notes to Financial Statements
21
Morgan Stanley Global Fixed Income Opportunities Fund
Portfolio of Investments ◼ October 31, 2023 continued
| PRINCIPAL AMOUNT (000) | COUPON RATE | MATURITY DATE | VALUE | ||||||||||||||||
Sovereign (13.1%) | |||||||||||||||||||
Brazil (4.3%) | |||||||||||||||||||
BRL | 166,000 | Brazil Notas do Tesouro Nacional, Series F | 10.00 | % | 01/01/27 - 01/01/29 | $ | 32,836,632 | ||||||||||||
Colombia (0.7%) | |||||||||||||||||||
COP | 27,996,400 | Colombian TES, Series B | 7.00 | 03/26/31 | 5,369,216 | ||||||||||||||
Dominican Republic (1.1%) | |||||||||||||||||||
$ | 1,700 | Dominican Republic International Bond (a) | 5.50 | 02/22/29 | 1,553,461 | ||||||||||||||
DOP | 135,100 | Dominican Republic International Bond (a) | 11.25 | 09/15/35 | 2,361,040 | ||||||||||||||
211,950 | Dominican Republic International Bond (a) | 13.625 | 02/03/33 | 4,250,882 | |||||||||||||||
Total Dominican Republic | 8,165,383 | ||||||||||||||||||
Greece (0.8%) | |||||||||||||||||||
EUR | 4,040 | Hellenic Republic Government Bond | 4.25 | 06/15/33 | 4,311,676 | ||||||||||||||
1,750 | Hellenic Republic Government Bond | 4.375 | 07/18/38 | 1,824,965 | |||||||||||||||
Total Greece | 6,136,641 | ||||||||||||||||||
Hungary (1.2%) | |||||||||||||||||||
HUF | 2,316,080 | Hungary Government Bond | 4.50 | 05/27/32 | 5,232,494 | ||||||||||||||
1,929,890 | Hungary Government Bond | 4.75 | 11/24/32 | 4,405,481 | |||||||||||||||
Total Hungary | 9,637,975 | ||||||||||||||||||
Indonesia (0.8%) | |||||||||||||||||||
IDR | 92,000,000 | Indonesia Treasury Bond | 7.00 | 02/15/33 | 5,747,263 | ||||||||||||||
2,000,000 | Indonesia Treasury Bond | 8.375 | 03/15/34 | 136,223 | |||||||||||||||
Total Indonesia | 5,883,486 | ||||||||||||||||||
Ivory Coast (0.3%) | |||||||||||||||||||
EUR | 2,600 | Ivory Coast Government International Bond (a) | 4.875 | 01/30/32 | 2,085,648 | ||||||||||||||
Mexico (0.3%) | |||||||||||||||||||
1,300 | Petroleos Mexicanos | 2.75 | 04/21/27 | 1,071,623 | |||||||||||||||
$ | 1,280 | Petroleos Mexicanos | 6.70 | 02/16/32 | 944,603 | ||||||||||||||
Total Mexico | 2,016,226 | ||||||||||||||||||
New Zealand (0.7%) | |||||||||||||||||||
NZD | 3,910 | New Zealand Government Bond | 4.25 | 05/15/34 | 2,036,492 | ||||||||||||||
6,470 | New Zealand Government Bond | 4.50 | 05/15/30 | 3,575,435 | |||||||||||||||
Total New Zealand | 5,611,927 | ||||||||||||||||||
See Notes to Financial Statements
22
Morgan Stanley Global Fixed Income Opportunities Fund
Portfolio of Investments ◼ October 31, 2023 continued
| PRINCIPAL AMOUNT (000) | COUPON RATE | MATURITY DATE | VALUE | ||||||||||||||||
Nigeria (0.4%) | |||||||||||||||||||
$ | 1,300 | Africa Finance Corp. (a) | 4.375 | % | 04/17/26 | $ | 1,202,751 | ||||||||||||
2,500 | Nigeria Government International Bond | 7.375 | 09/28/33 | 1,887,400 | |||||||||||||||
Total Nigeria | 3,090,151 | ||||||||||||||||||
Peru (1.4%) | |||||||||||||||||||
PEN | 22,700 | Peru Government Bond | 5.40 | 08/12/34 | 4,936,643 | ||||||||||||||
25,400 | Peru Government Bond | 6.15 | 08/12/32 | 6,048,483 | |||||||||||||||
Total Peru | 10,985,126 | ||||||||||||||||||
Romania (0.7%) | |||||||||||||||||||
EUR | 1,750 | Romania Government International Bond (a) | 6.375 | 09/18/33 | 1,828,996 | ||||||||||||||
4,300 | Romanian Government International Bond (a) | 3.75 | 02/07/34 | 3,602,823 | |||||||||||||||
Total Romania | 5,431,819 | ||||||||||||||||||
Uruguay (0.4%) | |||||||||||||||||||
UYU | 141,100 | Uruguay Government International Bond | 9.75 | 07/20/33 | 3,518,744 | ||||||||||||||
| Total Sovereign (Cost $105,014,105) | 100,768,974 | ||||||||||||||||||
Agency Fixed Rate Mortgages (2.9%) | |||||||||||||||||||
$ | 1 | Federal Home Loan Mortgage Corporation, Gold Pool: | 6.50 | 10/01/32 | 583 | ||||||||||||||
| Federal National Mortgage Association, Conventional Pools: | |||||||||||||||||||
14 | 6.50 | 05/01/28 - 01/01/32 | 14,055 | ||||||||||||||||
2 | 7.00 | 11/01/32 | 2,315 | ||||||||||||||||
November TBA | |||||||||||||||||||
17,300 | (g) | 5.50 | 11/01/53 | 16,422,160 | |||||||||||||||
2,000 | (g) | 6.00 | 11/01/53 | 1,946,563 | |||||||||||||||
Government National Mortgage Association, | |||||||||||||||||||
3,734 | 6.00 | 08/20/53 | 3,678,000 | ||||||||||||||||
Various Pools: | |||||||||||||||||||
1 | 7.50 | 07/20/25 | 1,115 | ||||||||||||||||
4 | 8.00 | 05/15/24 - 05/15/30 | 4,534 | ||||||||||||||||
| Total Agency Fixed Rate Mortgages (Cost $22,221,904) | 22,069,325 | ||||||||||||||||||
See Notes to Financial Statements
23
Morgan Stanley Global Fixed Income Opportunities Fund
Portfolio of Investments ◼ October 31, 2023 continued
| PRINCIPAL AMOUNT (000) | COUPON RATE | MATURITY DATE | VALUE | ||||||||||||||||
Asset-Backed Securities (11.9%) | |||||||||||||||||||
$ | 712 | ABFC Trust 1 Month Term SOFR + 1.16% | 6.489 | (c)% | 08/25/33 | $ | 693,386 | ||||||||||||
2,649 | AMSR Trust (a) | 3.867 | 01/19/39 | 2,336,506 | |||||||||||||||
500 | Apidos CLO XXXV Ltd. 3 Month Term SOFR + 6.01% (a) | 11.427 | (c) | 04/20/34 | 471,341 | ||||||||||||||
16 | Asset-Backed Securities Corp. Home Equity Loan Trust 1 Month Term SOFR + 0.49% | 3.273 | (c) | 03/25/36 | 15,542 | ||||||||||||||
1,371 | Bayview Financial Revolving Asset Trust 1 Month Term SOFR + 1.11% (a) | 6.441 | (c) | 02/28/40 | 1,188,502 | ||||||||||||||
37 | Bear Stearns Asset-Backed Securities Trust | 4.582 | (c) | 07/25/36 | 36,152 | ||||||||||||||
2,201 | Blackbird Capital Aircraft Lease Securitization Ltd. (a) | 4.213 | 12/16/41 | 2,028,657 | |||||||||||||||
378 | Business Loan Express Business Loan Trust 1 Month USD LIBOR + 0.40% (a) | 5.854 | (c) | 10/20/40 | 340,501 | ||||||||||||||
5,500 | Cascade Funding Mortgage Trust, Class M4 (a) | 4.25 | (c) | 04/25/33 | 4,193,519 | ||||||||||||||
1,024 | Cascade MH Asset Trust (a) | 4.00 | (c) | 11/25/44 | 973,871 | ||||||||||||||
500 | CBAM 2021-14 Ltd. 3 Month Term SOFR + 3.36% (a) | 8.777 | (c) | 04/20/34 | 444,062 | ||||||||||||||
555 | Chase Funding Loan Acquisition Trust | 5.50 | 08/25/34 | 504,443 | |||||||||||||||
345 | Citigroup Mortgage Loan Trust, Inc. 1 Month Term SOFR + 3.11% (a) | 8.439 | (c) | 07/25/44 | 386,597 | ||||||||||||||
Conn's Receivables Funding LLC, | |||||||||||||||||||
3,600 | (a) | 0.00 | (f) | 12/15/26 | 3,110,144 | ||||||||||||||
2,094 | (a) | 4.59 | 05/15/26 | 2,089,897 | |||||||||||||||
1,313 | (a) | 9.52 | 12/15/26 | 1,314,867 | |||||||||||||||
1,500 | Countrywide Asset-Backed Certificates Trust 1 Month Term SOFR + 1.69% | 3.789 | (c) | 03/25/35 | 1,276,871 | ||||||||||||||
1,817 | ECAF I Ltd. (Cayman Islands) (a) | 4.947 | 06/15/40 | 1,144,703 | |||||||||||||||
Finance of America HECM Buyout, | |||||||||||||||||||
4,290 | (a) | 6.00 | (c) | 08/01/32 | 2,886,298 | ||||||||||||||
5,000 | (a) | 7.87 | (c) | 02/25/32 | 4,025,027 | ||||||||||||||
4,000 | FMC GMSR Issuer Trust (a) | 7.17 | 04/25/27 | 3,431,607 | |||||||||||||||
2,504 | GAIA Aviation Ltd. (Cayman Islands) (a) | 7.00 | 12/15/44 | 1,320,816 | |||||||||||||||
GSAA Home Equity Trust, | |||||||||||||||||||
337 | 6.502 | 11/25/36 | 125,145 | ||||||||||||||||
53 | 1 Month Term SOFR + 1.99% | 7.314 | (c) | 12/25/34 | 51,622 | ||||||||||||||
EUR | 1,205 | Hestia Financing 3 Month EURIBOR + 2.50% (Luxembourg) | 6.205 | (c) | 12/31/46 | 1,186,648 | |||||||||||||
$ | 245 | JOL Air Ltd. (Cayman Islands) (a) | 4.948 | 04/15/44 | 189,021 | ||||||||||||||
See Notes to Financial Statements
24
Morgan Stanley Global Fixed Income Opportunities Fund
Portfolio of Investments ◼ October 31, 2023 continued
| PRINCIPAL AMOUNT (000) | COUPON RATE | MATURITY DATE | VALUE | ||||||||||||||||
$ | 500 | KKR CLO 16 Ltd. 3 Month Term SOFR + 7.37% (a) | 12.787 | (c)% | 10/20/34 | $ | 459,476 | ||||||||||||
1,376 | LoanMe Trust Prime (a) | 5.00 | 09/15/34 | 1,270,459 | |||||||||||||||
979 | METAL LLC (a) | 4.581 | 10/15/42 | 603,545 | |||||||||||||||
2,619 | MFA 2021-NPL1 LLC (a) | 2.363 | 03/25/60 | 2,525,620 | |||||||||||||||
2,285 | New Residential Mortgage LLC, Class A (a) | 5.437 | 06/25/25 | 2,190,150 | |||||||||||||||
GBP | 2,000 | Newday Funding Master Issuer PLC 3 Month GBP SONIA + 1.90% (United Kingdom) (a) | 7.098 | (c) | 03/15/29 | 2,419,466 | |||||||||||||
Newtek Small Business Loan Trust, | |||||||||||||||||||
$ | 314 | Daily U.S. Prime Rate - 0.55% (a) | 7.95 | (c) | 02/25/44 | 311,468 | |||||||||||||
876 | Daily U.S. Prime Rate + 0.10% (a) | 8.60 | (c) | 12/25/48 | 852,879 | ||||||||||||||
NRZ Excess Spread-Collateralized Notes, Class A | |||||||||||||||||||
783 | (a) | 2.981 | 03/25/26 | 703,573 | |||||||||||||||
1,860 | (a) | 3.104 | 07/25/26 | 1,675,515 | |||||||||||||||
2,828 | Oakwood Mortgage Investors, Inc. | 7.405 | (c) | 06/15/31 | 335,379 | ||||||||||||||
3,629 | Pagaya AI Technology in Housing Trust, Class E2 (a) | 3.60 | 10/25/40 | 2,713,250 | |||||||||||||||
3,000 | PMT FMSR Issuer Trust 1 Month USD LIBOR + 3.00% (a) | 8.439 | (c) | 03/25/26 | 2,954,139 | ||||||||||||||
PRET LLC, Class A1 | |||||||||||||||||||
2,879 | (a) | 1.843 | 09/25/51 | 2,593,804 | |||||||||||||||
2,998 | (a) | 8.232 | (c) | 09/25/53 | 2,991,871 | ||||||||||||||
Progress Residential 2020-SFR1 Trust, | |||||||||||||||||||
2,975 | (a) | 3.032 | 04/17/37 | 2,798,641 | |||||||||||||||
2,447 | (a) | 3.431 | 04/17/37 | 2,293,204 | |||||||||||||||
3,250 | Raptor Aircraft Finance I LLC (a) | 4.213 | 08/23/44 | 2,598,752 | |||||||||||||||
ReadyCap Lending Small Business Loan Trust, | |||||||||||||||||||
261 | Daily U.S. Prime Rate - 0.50% (a) | 8.00 | (c) | 12/27/44 | 251,031 | ||||||||||||||
2,878 | Daily U.S. Prime Rate + 0.07% (a) | 8.57 | (c) | 04/25/48 | 2,880,388 | ||||||||||||||
3,000 | Retained Vantage Data Centers Issuer LLC, Class A2A (a) | 5.00 | 09/15/48 | 2,713,410 | |||||||||||||||
2,057 | Shenton Aircraft Investment I Ltd. (Cayman Islands) (a) | 4.75 | 10/15/42 | 1,758,808 | |||||||||||||||
939 | Start II Ltd. (Bermuda) (a) | 4.089 | 03/15/44 | 848,709 | |||||||||||||||
1,397 | Start Ltd. (a) | 4.089 | 05/15/43 | 1,248,427 | |||||||||||||||
1,000 | TICP CLO VI Ltd. 3 Month Term SOFR + 6.51% (a) | 11.906 | (c) | 01/15/34 | 921,242 | ||||||||||||||
Tricon American Homes Trust, | |||||||||||||||||||
1,480 | (a) | 3.745 | 03/17/38 | 1,350,878 | |||||||||||||||
4,000 | (a) | 4.882 | 07/17/38 | 3,731,730 | |||||||||||||||
See Notes to Financial Statements
25
Morgan Stanley Global Fixed Income Opportunities Fund
Portfolio of Investments ◼ October 31, 2023 continued
| PRINCIPAL AMOUNT (000) | COUPON RATE | MATURITY DATE | VALUE | ||||||||||||||||
$ | 1,225 | Trimaran Cavu 2021-1 Ltd. 3 Month Term SOFR + 3.71% (Cayman Islands) (a) | 9.124 | (c)% | 04/23/32 | $ | 1,145,255 | ||||||||||||
Trinitas CLO VI Ltd., | |||||||||||||||||||
1,000 | 3 Month Term SOFR + 4.01% (a) | 9.39 | (c) | 01/25/34 | 907,118 | ||||||||||||||
1,000 | 3 Month Term SOFR + 7.08% (a) | 12.456 | (c) | 01/25/34 | 869,536 | ||||||||||||||
1,945 | VCAT LLC (a) | 1.743 | 05/25/51 | 1,801,383 | |||||||||||||||
1,000 | Vibrant CLO XII Ltd. 3 Month Term SOFR + 7.37% (a) | 12.787 | (c) | 01/20/34 | 936,121 | ||||||||||||||
1,500 | Wellfleet CLO 2022-1 Ltd. 3 Month Term SOFR + 4.14% (a) | 9.534 | (c) | 04/15/34 | 1,418,353 | ||||||||||||||
| Total Asset-Backed Securities (Cost $98,952,804) | 90,839,325 | ||||||||||||||||||
Collateralized Mortgage Obligations - Agency Collateral Series (0.4%) | |||||||||||||||||||
9,926 | Federal Home Loan Mortgage Corporation, IO | 4.334 | (c) | 11/25/55 | 2,685,391 | ||||||||||||||
Federal National Mortgage Association, | |||||||||||||||||||
IO REMIC | |||||||||||||||||||
649 | 0.00 | (c) | 10/25/39 - 03/25/44 | 26,054 | |||||||||||||||
59 | 6.44% - SOFR30A | 1.115 | (h) | 08/25/41 | 1,009 | ||||||||||||||
578 | Government National Mortgage Association, IO, 6.14% - 1 Month Term SOFR | 0.796 | (h) | 12/20/42 | 44,844 | ||||||||||||||
| Total Collateralized Mortgage Obligations - Agency Collateral Series (Cost $2,846,495) | 2,757,298 | ||||||||||||||||||
Commercial Mortgage-Backed Securities (3.8%) | |||||||||||||||||||
527 | CG-CCRE Commercial Mortgage Trust 1 Month Term SOFR + 1.97% (a) | 7.303 | (c) | 11/15/31 | 512,607 | ||||||||||||||
900 | Citigroup Commercial Mortgage Trust (a) | 3.503 | (c) | 12/10/41 | 619,422 | ||||||||||||||
Commercial Mortgage Trust | |||||||||||||||||||
1,500 | (a) | 3.40 | (c) | 08/15/57 | 1,361,719 | ||||||||||||||
300 | 4.612 | (c) | 02/10/47 | 215,131 | |||||||||||||||
139 | (a) | 4.735 | (c) | 07/15/47 | 123,206 | ||||||||||||||
IO | |||||||||||||||||||
1,500 | 0.281 | (c) | 02/10/47 | 279 | |||||||||||||||
2,272 | COOF Securitization Trust, IO (a) | 2.591 | (c) | 10/25/40 | 113,592 | ||||||||||||||
3,275 | COOF Securitization Trust II, IO (a) | 2.166 | (c) | 08/25/41 | 145,089 | ||||||||||||||
Credit Suisse Mortgage Trust, | |||||||||||||||||||
Class A | |||||||||||||||||||
2,634 | 1 Month Term SOFR + 3.57% (a) | 8.908 | (c) | 05/15/26 | 2,357,702 | ||||||||||||||
3,000 | 1 Month Term SOFR + 3.61% (a) | 8.95 | (c) | 12/15/35 | 2,998,082 | ||||||||||||||
3,000 | 1 Month Term SOFR + 3.83% (a) | 9.164 | (c) | 08/15/26 | 2,644,267 | ||||||||||||||
See Notes to Financial Statements
26
Morgan Stanley Global Fixed Income Opportunities Fund
Portfolio of Investments ◼ October 31, 2023 continued
| PRINCIPAL AMOUNT (000) | COUPON RATE | MATURITY DATE | VALUE | ||||||||||||||||
$ | 3,598 | 1 Month Term SOFR + 4.08% (a) | 9.419 | (c)% | 04/15/26 | $ | 3,527,690 | ||||||||||||
Federal Home Loan Mortgage Corporation, | |||||||||||||||||||
IO | |||||||||||||||||||
7,000 | 2.629 | (c) | 01/25/49 | 1,010,406 | |||||||||||||||
6,430 | 3.068 | (c) | 11/25/36 | 1,616,252 | |||||||||||||||
189 | FREMF Mortgage Trust SOFR30A + 5.36% (a) | 10.681 | (c) | 07/25/26 | 182,401 | ||||||||||||||
31,578 | GS Mortgage Securities Corp. Trust, IO (a) | 0.457 | (c) | 10/10/32 | 50,702 | ||||||||||||||
2,194 | JP Morgan Chase Commercial Mortgage Securities Trust, IO | 0.703 | (c) | 07/15/47 | 24 | ||||||||||||||
JPMBB Commercial Mortgage Securities Trust | |||||||||||||||||||
136 | (a) | 3.983 | (c) | 09/15/47 | 114,468 | ||||||||||||||
405 | (a) | 4.627 | (c) | 04/15/47 | 373,222 | ||||||||||||||
IO | |||||||||||||||||||
2,584 | 0.934 | (c) | 08/15/47 | 5,828 | |||||||||||||||
KGS-Alpha SBA COOF Trust, | |||||||||||||||||||
IO | |||||||||||||||||||
381 | (a) | 2.555 | (c) | 04/25/40 | 19,198 | ||||||||||||||
388 | (a) | 3.102 | (c) | 07/25/41 | 39,760 | ||||||||||||||
1,500 | MFT Mortgage Trust (a) | 3.283 | (c) | 08/10/40 | 1,013,699 | ||||||||||||||
1,500 | MKT 2020-525M Mortgage Trust (a) | 2.941 | (c) | 02/12/40 | 444,011 | ||||||||||||||
1,500 | Natixis Commercial Mortgage Securities Trust (a) | 4.135 | (c) | 05/15/39 | 1,164,716 | ||||||||||||||
3,000 | SG Commercial Mortgage Securities Trust (a) | 3.477 | (c) | 09/15/39 | 2,162,740 | ||||||||||||||
930 | Sutherland Commercial Mortgage Trust (a) | 2.23 | (c) | 12/25/41 | 881,028 | ||||||||||||||
EUR | 392 | Taurus 2018-1 IT SRL 3 Month EURIBOR + 2.78% (Italy) | 6.578 | (c) | 05/18/32 | 412,252 | |||||||||||||
$ | 1,341 | Velocity Commercial Capital Loan Trust (a) | 6.90 | 05/25/47 | 1,330,836 | ||||||||||||||
2,611 | VMC Finance 2021-HT1 LLC 1 Month Term SOFR + 1.76% (a) | 7.099 | (c) | 01/18/37 | 2,554,114 | ||||||||||||||
900 | Wells Fargo Commercial Mortgage Trust (a) | 4.37 | (c) | 04/15/50 | 768,899 | ||||||||||||||
395 | WFRBS Commercial Mortgage Trust (a) | 4.679 | (c) | 09/15/46 | 357,562 | ||||||||||||||
| Total Commercial Mortgage-Backed Securities (Cost $33,613,768) | 29,120,904 | ||||||||||||||||||
Mortgages - Other (19.7%) | |||||||||||||||||||
1,800 | 510 Asset Backed 2021-NPL1 Trust (a) | 2.24 | 06/25/61 | 1,687,767 | |||||||||||||||
2,565 | 510 Asset Backed 2021-NPL2 Trust (a) | 2.116 | 06/25/61 | 2,384,208 | |||||||||||||||
78 | Banc of America Alternative Loan Trust 1 Month Term SOFR + 0.76% | 6.00 | (c) | 07/25/46 | 60,474 | ||||||||||||||
See Notes to Financial Statements
27
Morgan Stanley Global Fixed Income Opportunities Fund
Portfolio of Investments ◼ October 31, 2023 continued
| PRINCIPAL AMOUNT (000) | COUPON RATE | MATURITY DATE | VALUE | ||||||||||||||||
Banc of America Funding Trust, | |||||||||||||||||||
$ | 8 | 5.25 | % | 07/25/37 | $ | 7,813 | |||||||||||||
345 | 5.50 | 09/25/35 | 311,874 | ||||||||||||||||
46 | 6.00 | 07/25/37 | 36,668 | ||||||||||||||||
GBP | 800 | Banna RMBS DAC 3 Month GBP SONIA + 3.50% (United Kingdom) | 8.72 | (c) | 12/30/63 | 954,344 | |||||||||||||
$ | 3,382 | Bayview Commercial Asset Trust, Class A4A 1 Month Term SOFR + 1.61% (a) | 6.939 | (c) | 12/25/37 | 2,801,725 | |||||||||||||
69 | BCAP LLC Trust (a) | 3.856 | (c) | 03/26/37 | 58,860 | ||||||||||||||
44 | Bear Stearns ARM Trust | 3.732 | (c) | 05/25/47 | 34,602 | ||||||||||||||
4,000 | Boston Lending Trust (a) | 3.25 | (c) | 05/25/62 | 2,886,772 | ||||||||||||||
Brean Asset Backed Securities Trust, | |||||||||||||||||||
3,180 | (a) | 1.40 | (c) | 10/25/63 | 2,605,031 | ||||||||||||||
5,000 | (a) | 4.00 | 09/25/63 | 4,162,889 | |||||||||||||||
Cascade Funding Mortgage Trust, | |||||||||||||||||||
2,340 | (a) | 2.00 | (c) | 09/25/50 | 2,120,686 | ||||||||||||||
1,034 | (a) | 2.00 | (c) | 02/25/52 | 794,698 | ||||||||||||||
326 | (a) | 2.80 | (c) | 06/25/69 | 316,545 | ||||||||||||||
4,000 | (a) | 2.91 | (c) | 02/25/31 | 3,928,860 | ||||||||||||||
4,500 | (a) | 3.25 | (c) | 11/25/35 | 3,986,275 | ||||||||||||||
3,000 | (a) | 3.735 | (c) | 06/25/36 | 2,867,636 | ||||||||||||||
5,500 | (a) | 3.75 | (c) | 04/25/25 | 4,380,805 | ||||||||||||||
5,348 | (a) | 4.00 | (c) | 06/25/69 | 4,469,453 | ||||||||||||||
3,642 | (a) | 4.00 | (c) | 10/25/68 | 3,517,993 | ||||||||||||||
4,500 | (a) | 5.072 | (c) | 10/27/31 | 4,091,569 | ||||||||||||||
3,000 | (a) | 5.683 | (c) | 02/25/31 | 2,970,620 | ||||||||||||||
93 | Chase Mortgage Finance Trust 1 Month Term SOFR + 0.71% | 6.00 | (c) | 02/25/37 | 34,492 | ||||||||||||||
55 | ChaseFlex Trust | 6.50 | 02/25/35 | 45,826 | |||||||||||||||
CHL Mortgage Pass-Through Trust, | |||||||||||||||||||
252 | 5.438 | (c) | 09/25/34 | 221,180 | |||||||||||||||
82 | 5.50 | 05/25/34 | 78,065 | ||||||||||||||||
649 | 6.00 | 12/25/36 | 373,639 | ||||||||||||||||
2,452 | CIM Trust (a) | 2.569 | 07/25/55 | 2,392,702 | |||||||||||||||
Citigroup Mortgage Loan Trust, Inc., | |||||||||||||||||||
1,101 | (a) | 2.50 | (c) | 05/25/51 | 808,022 | ||||||||||||||
59 | 4.889 | (c) | 11/25/36 | 49,942 | |||||||||||||||
Countrywide Alternative Loan Trust, | |||||||||||||||||||
78 | 3.84 | (c) | 05/25/36 | 64,358 | |||||||||||||||
108 | 3.922 | (c) | 10/25/35 | 102,532 | |||||||||||||||
See Notes to Financial Statements
28
Morgan Stanley Global Fixed Income Opportunities Fund
Portfolio of Investments ◼ October 31, 2023 continued
| PRINCIPAL AMOUNT (000) | COUPON RATE | MATURITY DATE | VALUE | ||||||||||||||||
$ | 36 | 3.958 | (c)% | 08/25/35 | $ | 31,082 | |||||||||||||
17 | 5.50 | 02/25/36 | 8,889 | ||||||||||||||||
170 | 1 Month Term SOFR + 0.61% | 5.50 | (c) | 10/25/35 | 108,259 | ||||||||||||||
79 | 1 Month Term SOFR + 0.47% | 5.799 | (c) | 05/25/47 | 69,287 | ||||||||||||||
140 | 6.00 | 07/25/37 | 72,046 | ||||||||||||||||
358 | 6.00 | 04/25/36 | 170,984 | ||||||||||||||||
Countrywide Reperforming Loan REMIC Trust, | |||||||||||||||||||
REMIC | |||||||||||||||||||
114 | (a) | 6.50 | 03/25/35 | 114,523 | |||||||||||||||
105 | (a) | 7.50 | 11/25/34 | 99,954 | |||||||||||||||
6,511 | Credit Suisse First Boston Mortgage Securities Corp., Class B 1 Month Term SOFR + 2.96% (a) | 4.30 | (c) | 03/25/45 | 6,693,516 | ||||||||||||||
CSFB Mortgage-Backed Pass-Through Certificates, | |||||||||||||||||||
213 | 6.50 | 12/25/33 | 206,953 | ||||||||||||||||
254 | 7.50 | 10/25/32 | 249,070 | ||||||||||||||||
1,653 | CSMC Mortgage-Backed Trust | 6.50 | 05/25/36 | 500,542 | |||||||||||||||
EUR | 236 | Dssv Sarl 3 Month EURIBOR + 3.00% (Spain) | 6.663 | (c) | 10/15/24 | 248,216 | |||||||||||||
180 | EMF-NL Prime 3 Month EURIBOR + 0.80% (Netherlands) | 4.785 | (c) | 04/17/41 | 181,291 | ||||||||||||||
722 | Eurohome Mortgages PLC 3 Month EURIBOR + 0.21% (Germany) | 3.925 | (c) | 08/02/50 | 571,876 | ||||||||||||||
FMC GMSR Issuer Trust, Class A | |||||||||||||||||||
$ | 4,000 | (a) | 3.62 | (c) | 07/25/26 | 3,257,215 | |||||||||||||
1,600 | (a) | 4.44 | (c) | 10/25/26 | 1,211,166 | ||||||||||||||
2,000 | (a) | 4.45 | (c) | 01/25/26 | 1,720,107 | ||||||||||||||
GBP | 1,400 | Great Hall Mortgages No. 1 PLC 3 Month GBP SONIA + 3.12% (United Kingdom) | 8.339 | (c) | 06/18/38 | 1,537,566 | |||||||||||||
GSR Mortgage Loan Trust, | |||||||||||||||||||
$ | 78 | 3.62 | (c) | 03/25/37 | 42,014 | ||||||||||||||
10 | 3.971 | (c) | 05/25/35 | 7,486 | |||||||||||||||
290 | 4.019 | (c) | 12/25/34 | 260,487 | |||||||||||||||
872 | 5.50 | 03/25/35 | 713,210 | ||||||||||||||||
205 | HarborView Mortgage Loan Trust | 5.044 | (c) | 05/19/33 | 186,091 | ||||||||||||||
2,500 | Harvest Commercial Capital Loan Trust, Class M5 (a) | 5.964 | (c) | 04/25/52 | 2,113,591 | ||||||||||||||
3,992 | Headlands Residential 2021-RPL1 LLC (a) | 2.487 | (c) | 09/25/26 | 3,514,153 | ||||||||||||||
EUR | 669 | IM Pastor 4 FTA 3 Month EURIBOR + 0.14% (Spain) | 4.074 | (c) | 03/22/44 | 619,592 | |||||||||||||
See Notes to Financial Statements
29
Morgan Stanley Global Fixed Income Opportunities Fund
Portfolio of Investments ◼ October 31, 2023 continued
| PRINCIPAL AMOUNT (000) | COUPON RATE | MATURITY DATE | VALUE | ||||||||||||||||
$ | 17 | Impac CMB Trust 1 Month Term SOFR + 0.89% | 6.219 | (c)% | 10/25/35 | $ | 17,916 | ||||||||||||
3,014 | Imperial Fund Mortgage Trust, Class A1 (a) | 7.369 | 11/25/67 | 3,031,019 | |||||||||||||||
120 | JP Morgan Alternative Loan Trust | 6.00 | 12/25/35 | 90,149 | |||||||||||||||
3,104 | La Hipotecaria Panamanian Mortgage Trust (Panama) (a) | 4.35 | 07/13/52 | 2,852,374 | |||||||||||||||
EUR | 844 | Lansdowne Mortgage Securities No. 2 PLC 3 Month EURIBOR + 0.34% (Ireland) | 4.207 | (c) | 09/16/48 | 797,841 | |||||||||||||
Lehman Mortgage Trust, | |||||||||||||||||||
$ | 76 | 5.50 | 02/25/36 | 38,300 | |||||||||||||||
340 | 6.50 | 09/25/37 | 106,250 | ||||||||||||||||
2,200 | LHOME Mortgage Trust, Class A1, Class A1 (a) | 8.00 | (c) | 08/25/28 | 2,203,368 | ||||||||||||||
Ludgate Funding PLC, | |||||||||||||||||||
EUR | 851 | 3 Month EURIBOR + 0.85% (United Kingdom) | 4.805 | (c) | 01/01/61 | 809,899 | |||||||||||||
486 | 3 Month EURIBOR + 1.10% (United Kingdom) | 5.055 | (c) | 01/01/61 | 444,871 | ||||||||||||||
Mansard Mortgages PLC, | |||||||||||||||||||
GBP | 380 | 3 Month GBP SONIA + 1.22% (United Kingdom) | 6.439 | (c) | 10/15/48 | 402,899 | |||||||||||||
325 | 3 Month GBP SONIA + 2.12% (United Kingdom) | 7.339 | (c) | 12/15/49 | 386,910 | ||||||||||||||
727 | 3 Month GBP SONIA + 3.12% (United Kingdom) | 8.339 | (c) | 12/15/49 | 863,783 | ||||||||||||||
$ | 637 | MASTR Alternative Loan Trust | 6.00 | 05/25/33 | 576,515 | ||||||||||||||
26 | MASTR Asset Securitization Trust 1 Month Term SOFR + 6.00% | 6.00 | (c) | 06/25/36 | 15,237 | ||||||||||||||
916 | Med Trust, Class D 1 Month Term SOFR + 2.11% (a) | 7.449 | (c) | 11/15/38 | 879,719 | ||||||||||||||
1,095 | Merrill Lynch Mortgage Investors Trust, IO (a) | 0.00 | (c) | 02/25/36 | 11 | ||||||||||||||
GBP | 2,000 | Mortgage Funding PLC 3 Month GBP SONIA + 3.32% (United Kingdom) | 8.539 | (c) | 03/13/46 | 2,380,738 | |||||||||||||
$ | 87 | MortgageIT Trust 1 Month Term SOFR + 1.01% | 6.339 | (c) | 10/25/35 | 84,287 | |||||||||||||
GBP | 631 | Newgate Funding PLC 3 Month GBP LIBOR + 3.00% (United Kingdom) | 8.581 | (c) | 12/15/50 | 686,087 | |||||||||||||
| Nomura Asset Acceptance Corp. Alternative Loan Trust, | |||||||||||||||||||
$ | 2,020 | 5.755 | (c) | 06/25/36 | 527,333 | ||||||||||||||
96 | 7.931 | (c) | 06/25/36 | 93,026 | |||||||||||||||
4,488 | NYMT Loan Trust (a) | 5.944 | (c) | 10/25/60 | 4,374,286 | ||||||||||||||
3,000 | Ocwen Loan Investment Trust, Class M1 (a) | 3.00 | (c) | 06/25/36 | 2,606,172 | ||||||||||||||
1,951 | PMC PLS ESR Issuer LLC (a) | 5.114 | 02/25/27 | 1,867,930 | |||||||||||||||
See Notes to Financial Statements
30
Morgan Stanley Global Fixed Income Opportunities Fund
Portfolio of Investments ◼ October 31, 2023 continued
| PRINCIPAL AMOUNT (000) | COUPON RATE | MATURITY DATE | VALUE | ||||||||||||||||
PNMAC GMSR Issuer Trust, | |||||||||||||||||||
$ | 3,337 | 1 Month USD LIBOR + 2.65% (a) | 8.089 | (c)% | 08/25/25 | $ | 3,336,620 | ||||||||||||
4,000 | 1 Month USD LIBOR + 3.85% (a) | 9.289 | (c) | 02/25/25 | 4,000,169 | ||||||||||||||
Residential Accredit Loans, Inc. Trust, | |||||||||||||||||||
53 | 6.00 | 04/25/36 | 37,118 | ||||||||||||||||
31 | 6.00 | 01/25/37 | 23,430 | ||||||||||||||||
230 | RFMSI Trust | 6.00 | 07/25/36 | 187,126 | |||||||||||||||
GBP | 473 | RMAC Securities No. 1 PLC 3 Month GBP SONIA + 0.59% (United Kingdom) | 5.809 | (c) | 06/12/44 | 537,968 | |||||||||||||
RMF Buyout Issuance Trust, | |||||||||||||||||||
$ | 3,500 | (a) | 3.63 | (c) | 10/25/50 | 2,876,059 | |||||||||||||
1,200 | (a) | 3.69 | (c) | 11/25/31 | 1,026,089 | ||||||||||||||
4,000 | (a) | 4.50 | (c) | 04/25/32 | 2,718,515 | ||||||||||||||
8,385 | (a) | 6.00 | 10/25/50 | 5,450,314 | |||||||||||||||
RMF Proprietary Issuance Trust, | |||||||||||||||||||
2,520 | (a) | 3.25 | (c) | 04/26/60 | 1,829,810 | ||||||||||||||
1,000 | (a) | 4.00 | (c) | 08/25/62 | 834,551 | ||||||||||||||
Seasoned Credit Risk Transfer Trust, Class M | |||||||||||||||||||
1,148 | (a) | 3.75 | (c) | 09/25/55 | 997,407 | ||||||||||||||
3,250 | (a) | 4.25 | (c) | 08/25/59 | 2,782,307 | ||||||||||||||
2,500 | (a) | 4.25 | (c) | 05/25/60 | 2,150,252 | ||||||||||||||
1,000 | (a) | 4.50 | (c) | 02/25/59 | 847,877 | ||||||||||||||
3,100 | 4.75 | (c) | 10/25/58 | 2,835,830 | |||||||||||||||
196 | Sequoia Mortgage Trust 1 Month Term SOFR + 0.73% | 6.074 | (c) | 07/20/33 | 183,820 | ||||||||||||||
6,287 | Stanwich Mortgage Loan Co. LLC (a) | 2.735 | 10/16/26 | 5,750,909 | |||||||||||||||
47 | STARM Mortgage Loan Trust | 4.429 | (c) | 10/25/37 | 40,099 | ||||||||||||||
Structured Adjustable Rate Mortgage Loan Trust, | |||||||||||||||||||
308 | 4.167 | (c) | 11/25/34 | 270,596 | |||||||||||||||
290 | 6.153 | (c) | 02/25/35 | 276,660 | |||||||||||||||
371 | Structured Asset Mortgage Investments II Trust | 2.872 | (c) | 04/19/35 | 308,453 | ||||||||||||||
1,097 | Structured Asset Securities Corp., IO (a) | 0.00 | (c) | 07/25/35 | 80 | ||||||||||||||
1,100 | Taubman Centers Commercial Mortgage Trust, Class A 1 Month Term SOFR + 2.19% (a) | 7.521 | (c) | 05/15/37 | 1,086,260 | ||||||||||||||
EUR | 2,088 | TDA 27 FTA 3 Month EURIBOR + 0.19% (Spain) | 4.131 | (c) | 12/28/50 | 1,875,342 | |||||||||||||
AUD | 3,800 | Vermilion Bond Trust, Class C 1 Month BBSW + 3.80% (Australia) | 7.855 | (c) | 12/14/58 | 2,420,112 | |||||||||||||
See Notes to Financial Statements
31
Morgan Stanley Global Fixed Income Opportunities Fund
Portfolio of Investments ◼ October 31, 2023 continued
| PRINCIPAL AMOUNT (000) | COUPON RATE | MATURITY DATE | VALUE | ||||||||||||||||
$ | 210 | Wells Fargo Alternative Loan Trust | 6.232 | (c)% | 07/25/37 | $ | 198,779 | ||||||||||||
| Total Mortgages - Other (Cost $164,103,138) | 151,137,563 | ||||||||||||||||||
Senior Loan Interests (0.6%) | |||||||||||||||||||
4,875 | Cuenca Enterprises, Inc. 3 Month USD LIBOR + 7.33% (Cayman Islands) (i) (acquired 12/07/2021) (Acquisition Cost $4,875,000) | 12.882 | (c) | 12/15/26 | 4,875,000 | ||||||||||||||
Supranational (0.5%) | |||||||||||||||||||
2,100 | African Export-Import Bank (a) | 3.798 | 05/17/31 | 1,599,507 | |||||||||||||||
2,600 | Banque Ouest Africaine de Developpement (a) | 4.70 | 10/22/31 | 2,055,209 | |||||||||||||||
| Total Supranational (Cost $4,476,968) | 3,654,716 | ||||||||||||||||||
| NUMBER OF SHARES (000) | |||||||||||||||||||
Investment Company (0.2%) | |||||||||||||||||||
22 | iShares iBoxx High Yield Corporate Bond ETF (d) (Cost $1,606,680) | 1,596,540 | |||||||||||||||||
| PRINCIPAL AMOUNT (000) | |||||||||||||||||||
Short-Term Investments (13.3%) | |||||||||||||||||||
Commercial Paper (2.0%) | |||||||||||||||||||
$ | 3,910 | Bank of Montreal (j) | 5.819 | 03/18/24 | 3,825,849 | ||||||||||||||
3,910 | Macquarie Bank Ltd. (a)(j) | 5.86 | 03/05/24 | 3,832,532 | |||||||||||||||
3,910 | Skandinaviska Enskilda Banken AB (a)(j) | 5.791 | 03/11/24 | 3,829,821 | |||||||||||||||
3,850 | Svenska Handelsbanken AB (a)(j) | 5.834 | 03/11/24 | 3,772,161 | |||||||||||||||
| Total Commercial Paper (Cost $15,262,368) | 15,260,363 | ||||||||||||||||||
U.S. Treasury Securities (5.7%) | |||||||||||||||||||
U.S. Treasury Bill | |||||||||||||||||||
5,000 | (k) | 5.304 | 11/16/23 | 4,988,976 | |||||||||||||||
5,000 | (k) | 5.388 | 12/14/23 | 4,968,505 | |||||||||||||||
5,000 | (k) | 5.409 | 01/09/24 | 4,949,424 | |||||||||||||||
16,640 | (k) | 5.555 | 03/28/24 | 16,276,179 | |||||||||||||||
1,780 | (k) | 5.56 | 03/28/24 | 1,741,082 | |||||||||||||||
11,000 | (k) | 5.57 | 04/18/24 | 10,725,268 | |||||||||||||||
| Total U.S. Treasury Securities (Cost $43,648,355) | 43,649,434 | ||||||||||||||||||
See Notes to Financial Statements
32
Morgan Stanley Global Fixed Income Opportunities Fund
Portfolio of Investments ◼ October 31, 2023 continued
| NUMBER OF SHARES (000) | VALUE | ||||||||||||||||||
Investment Company (4.7%) | |||||||||||||||||||
35,861 | Morgan Stanley Institutional Liquidity Funds - Government Portfolio - Institutional Class (See Note 7) (Cost $35,860,756) |
| $ | 35,860,756 | |||||||||||||||
Securities held as Collateral on Loaned Securities (0.9%) | |||||||||||||||||||
Investment Company (0.9%) | |||||||||||||||||||
7,098 | Morgan Stanley Institutional Liquidity Funds - Government Portfolio - Institutional Class (See Note 7) (Cost $7,098,369) | 7,098,369 | |||||||||||||||||
| Total Short-Term Investments (Cost $101,869,848) | 101,868,922 | ||||||||||||||||||
| Total Investments (Cost $836,045,699) including $7,825,892 of Securities Loaned (l)(m) | 101.4 | % | 776,648,260 | ||||||||||||||||
Liabilities in Excess of Other Assets | (1.4 | ) | (10,660,868 | ) | |||||||||||||||
Net Assets | 100.0 | % | $ | 765,987,392 | |||||||||||||||
Country assignments and aggregations are based generally on third party vendor classifications and information, and may be different from the assignments and aggregations under the policies set forth in the Fund's prospectus and/or statement of additional information relating to geographic classifications.
BBSW Australia's Bank Bill Swap.
CLO Collateralized Loan Obligation.
DAC Designated Activity Company.
ETF Exchange Traded Fund.
EURIBOR Euro Interbank Offered Rate.
HECM Home Equity Conversion Mortgage.
IO Interest Only Security.
LIBOR London Interbank Offered Rate.
REMIC Real Estate Mortgage Investment Conduit.
SOFR Secured Overnight Financing Rate.
SOFR30A 30-Day Average SOFR.
SONIA Sterling Overnight Index Average.
TBA To Be Announced.
(a) 144A security - Certain conditions for public sale may exist. Unless otherwise noted, these securities are deemed to be liquid.
(b) Perpetual - One or more securities do not have a predetermined maturity date. Rates for these securities are fixed for a period of time after which they revert to a floating rate. Interest rates in effect are as of October 31, 2023.
(c) Floating or variable rate securities: The rates disclosed are as of October 31, 2023. For securities based on a published reference rate and spread, the reference rate and spread are indicated in the description in the Portfolio of Investments. Certain variable rate securities may not be based on a published reference rate and spread but are determined by the issuer or agent and are based on current market conditions. These securities do not indicate a reference rate and spread in their description in the Portfolio of Investments.
(d) All or a portion of this security was on loan at October 31, 2023.
(e) Multi-step - Coupon rate changes in predetermined increments to maturity. Rate disclosed is as of October 31, 2023. Maturity date disclosed is the ultimate maturity date.
(f) Capital appreciation bond.
See Notes to Financial Statements
33
Morgan Stanley Global Fixed Income Opportunities Fund
Portfolio of Investments ◼ October 31, 2023 continued
(g) Security is subject to delayed delivery.
(h) Inverse Floating Rate Security - Interest rate fluctuates with an inverse relationship to an associated interest rate. Indicated rate is the effective rate at October 31, 2023.
(i) Security cannot be offered for public resale without first being registered under the Securities Act of 1933 and related rules ("restricted security"). Acquisition date represents the day on which an enforceable right to acquire such security is obtained and is presented along with related cost in the security description. The Fund has registration rights for certain restricted securities. Any costs related to such registration are borne by the issuer. The aggregate value of restricted securities (excluding 144A holdings) at October 31, 2023 amounts to $4,875,000 and represents 0.6% of net assets.
(j) The rates shown are the effective yields at the date of purchase.
(k) Rate shown is the yield to maturity at October 31, 2023.
(l) Securities are available for collateral in connection with securities purchased on a forward commitment basis, open foreign currency forward exchange contracts, futures contracts.
(m) At October 31, 2023, the aggregate cost for federal income tax purposes is $849,441,088. The aggregate gross unrealized appreciation is $12,428,930 and the aggregate gross unrealized depreciation is $76,982,394, resulting in net unrealized depreciation of $64,553,464.
Foreign Currency Forward Exchange Contracts:
The Fund had the following foreign currency forward exchange contracts open at October 31, 2023:
COUNTERPARTY | CONTRACTS TO DELIVER | IN EXCHANGE FOR | DELIVERY DATE | UNREALIZED APPRECIATION (DEPRECIATION) | |||||||||||||||
Australia & New Zealand Banking Group Ltd. | CNH | 29,467,000 | $ | 4,013,156 | 11/10/23 | $ | (3,105 | ) | |||||||||||
Australia & New Zealand Banking Group Ltd. | EUR | 708 | $ | 767 | 11/10/23 | 18 | |||||||||||||
Australia & New Zealand Banking Group Ltd. | NZD | 917,190 | $ | 543,085 | 11/10/23 | 8,715 | |||||||||||||
Australia & New Zealand Banking Group Ltd. | NZD | 1,796,119 | $ | 1,061,792 | 11/10/23 | 15,344 | |||||||||||||
Australia & New Zealand Banking Group Ltd. | $ | 253,110 | AUD | 392,965 | 11/10/23 | (3,763 | ) | ||||||||||||
Australia & New Zealand Banking Group Ltd. | $ | 250,566 | AUD | 390,215 | 11/10/23 | (2,964 | ) | ||||||||||||
Australia & New Zealand Banking Group Ltd. | $ | 4,607,295 | EUR | 4,359,707 | 11/10/23 | 7,171 | |||||||||||||
Australia & New Zealand Banking Group Ltd. | $ | 3,211,969 | MXN | 57,147,244 | 11/10/23 | (45,768 | ) | ||||||||||||
Australia & New Zealand Banking Group Ltd. | $ | 177,006 | NZD | 298,684 | 11/10/23 | (2,987 | ) | ||||||||||||
Australia & New Zealand Banking Group Ltd. | $ | 2,118,575 | NZD | 3,584,256 | 11/10/23 | (30,329 | ) | ||||||||||||
Bank of America NA | EUR | 1,782,262 | $ | 1,933,101 | 11/10/23 | 46,693 | |||||||||||||
Bank of America NA | ZAR | 1,938,750 | $ | 102,563 | 11/10/23 | (1,391 | ) | ||||||||||||
Barclays Bank PLC | BRL | 17,403,000 | $ | 3,359,004 | 11/10/23 | (88,876 | ) | ||||||||||||
Barclays Bank PLC | EUR | 126,976 | $ | 135,687 | 11/10/23 | 1,291 | |||||||||||||
Barclays Bank PLC | EUR | 3,213 | $ | 3,371 | 11/10/23 | (30 | ) | ||||||||||||
Barclays Bank PLC | $ | 4,342,417 | EUR | 3,987,934 | 11/10/23 | (121,449 | ) | ||||||||||||
Barclays Bank PLC | $ | 13,928 | GBP | 10,937 | 11/10/23 | (634 | ) | ||||||||||||
BNP Paribas SA | BRL | 70,880,993 | $ | 14,446,051 | 11/10/23 | 403,120 | |||||||||||||
BNP Paribas SA | BRL | 70,167,927 | $ | 13,766,515 | 11/10/23 | (135,144 | ) | ||||||||||||
BNP Paribas SA | BRL | 20,150,932 | $ | 3,960,560 | 11/10/23 | (31,740 | ) | ||||||||||||
BNP Paribas SA | CAD | 5,160,000 | $ | 3,776,429 | 11/10/23 | 55,066 | |||||||||||||
BNP Paribas SA | CNH | 82,107,000 | $ | 11,535,278 | 11/10/23 | 344,349 | |||||||||||||
BNP Paribas SA | COP | 5,529,151,598 | $ | 1,387,665 | 11/10/23 | 46,859 | |||||||||||||
BNP Paribas SA | EUR | 130,333,867 | $ | 144,350,362 | 11/10/23 | 6,400,466 | |||||||||||||
BNP Paribas SA | HUF | 383,075,238 | $ | 1,046,808 | 11/10/23 | (11,690 | ) | ||||||||||||
BNP Paribas SA | IDR | 391,104,345,000 | $ | 25,742,404 | 11/10/23 | 1,122,901 | |||||||||||||
BNP Paribas SA | IDR | 34,331,304,258 | $ | 2,163,283 | 11/10/23 | 2,173 | |||||||||||||
See Notes to Financial Statements
34
Morgan Stanley Global Fixed Income Opportunities Fund
Portfolio of Investments ◼ October 31, 2023 continued
| COUNTERPARTY | CONTRACTS TO DELIVER | IN EXCHANGE FOR | DELIVERY DATE | UNREALIZED APPRECIATION (DEPRECIATION) | |||||||||||||||
BNP Paribas SA | PEN | 7,499,000 | $ | 2,014,441 | 11/10/23 | $ | 63,000 | ||||||||||||
BNP Paribas SA | THB | 142,684,000 | $ | 3,866,353 | 11/10/23 | (106,058 | ) | ||||||||||||
BNP Paribas SA | $ | 2,999,543 | BRL | 15,073,004 | 11/10/23 | (13,282 | ) | ||||||||||||
BNP Paribas SA | $ | 3,066,515 | EUR | 2,910,000 | 11/10/23 | 13,530 | |||||||||||||
BNP Paribas SA | $ | 9,955,186 | IDR | 153,280,000,000 | 11/10/23 | (306,412 | ) | ||||||||||||
BNP Paribas SA | $ | 10,675,040 | IDR | 166,103,616,116 | 11/10/23 | (219,036 | ) | ||||||||||||
BNP Paribas SA | $ | 5,892,009 | MXN | 101,992,655 | 11/10/23 | (241,180 | ) | ||||||||||||
BNP Paribas SA | $ | 654,185 | MXN | 11,296,583 | 11/10/23 | (28,306 | ) | ||||||||||||
BNP Paribas SA | $ | 3,984,673 | PLN | 16,796,000 | 11/10/23 | 2,603 | |||||||||||||
BNP Paribas SA | $ | 3,514,623 | ZAR | 67,478,280 | 11/10/23 | 103,488 | |||||||||||||
BNP Paribas SA | $ | 158,120 | ZAR | 2,973,125 | 11/10/23 | 1,295 | |||||||||||||
BNP Paribas SA | $ | 3,372,530 | ZAR | 64,217,992 | 11/10/23 | 70,768 | |||||||||||||
BNP Paribas SA | $ | 100,076 | ZAR | 1,938,750 | 11/10/23 | 3,878 | |||||||||||||
Citibank NA | AUD | 7,407,040 | $ | 4,781,910 | 11/10/23 | 81,944 | |||||||||||||
Citibank NA | EUR | 1,302,304 | $ | 1,395,426 | 11/10/23 | 17,022 | |||||||||||||
Citibank NA | EUR | 6,903,336 | $ | 7,373,343 | 11/10/23 | 66,613 | |||||||||||||
Citibank NA | PEN | 3,888,000 | $ | 1,045,752 | 11/10/23 | 33,989 | |||||||||||||
Citibank NA | $ | 64,807 | AUD | 100,917 | 11/10/23 | (773 | ) | ||||||||||||
Citibank NA | $ | 499,652 | NZD | 840,000 | 11/10/23 | (10,254 | ) | ||||||||||||
Credit Agricole CIB | EUR | 708 | $ | 760 | 11/10/23 | 11 | |||||||||||||
Goldman Sachs International | BRL | 7,895,000 | $ | 1,562,129 | 11/10/23 | (2,027 | ) | ||||||||||||
Goldman Sachs International | CAD | 2,742,000 | $ | 2,006,397 | 11/10/23 | 28,882 | |||||||||||||
Goldman Sachs International | HUF | 395,344,566 | $ | 1,097,554 | 11/10/23 | 5,154 | |||||||||||||
Goldman Sachs International | HUF | 1,463,717,639 | $ | 4,036,262 | 11/10/23 | (8,221 | ) | ||||||||||||
Goldman Sachs International | HUF | 403,354,736 | $ | 1,104,521 | 11/10/23 | (10,012 | ) | ||||||||||||
Goldman Sachs International | $ | 5,531,382 | BRL | 27,408,000 | 11/10/23 | (101,314 | ) | ||||||||||||
Goldman Sachs International | $ | 8,782,255 | MXN | 151,944,107 | 11/10/23 | (363,902 | ) | ||||||||||||
Goldman Sachs International | $ | 719,780 | MXN | 12,430,487 | 11/10/23 | (31,078 | ) | ||||||||||||
Goldman Sachs International | $ | 337,144 | MXN | 5,887,766 | 11/10/23 | (10,936 | ) | ||||||||||||
Goldman Sachs International | $ | 1,174,768 | MXN | 20,308,872 | 11/10/23 | (49,569 | ) | ||||||||||||
Goldman Sachs International | $ | 653,725 | MXN | 11,260,202 | 11/10/23 | (29,862 | ) | ||||||||||||
Goldman Sachs International | $ | 452,593 | MXN | 7,796,590 | 11/10/23 | (20,629 | ) | ||||||||||||
HSBC Bank PLC | EUR | 221,000 | $ | 232,255 | 11/10/23 | (1,659 | ) | ||||||||||||
JPMorgan Chase Bank NA | EUR | 1,720,000 | $ | 1,904,771 | 11/10/23 | 84,263 | |||||||||||||
JPMorgan Chase Bank NA | MXN | 479,662,339 | $ | 27,499,632 | 11/10/23 | 924,290 | |||||||||||||
JPMorgan Chase Bank NA | MXN | 65,030,000 | $ | 3,756,244 | 11/10/23 | 153,304 | |||||||||||||
JPMorgan Chase Bank NA | NZD | 18,707,034 | $ | 11,465,906 | 11/10/23 | 566,881 | |||||||||||||
JPMorgan Chase Bank NA | $ | 3,326,534 | EUR | 3,000,000 | 11/10/23 | (151,230 | ) | ||||||||||||
JPMorgan Chase Bank NA | $ | 11,270,140 | INR | 936,312,000 | 11/10/23 | (25,952 | ) | ||||||||||||
JPMorgan Chase Bank NA | $ | 6,819,101 | MXN | 117,969,853 | 11/10/23 | (283,067 | ) | ||||||||||||
JPMorgan Chase Bank NA | $ | 1,507,864 | PEN | 5,580,000 | 11/10/23 | (55,797 | ) | ||||||||||||
JPMorgan Chase Bank NA | $ | 2,879,438 | ZAR | 54,849,341 | 11/10/23 | 61,523 | |||||||||||||
JPMorgan Chase Bank NA | ZAR | 188,962,687 | $ | 10,141,727 | 11/10/23 | 9,757 | |||||||||||||
Royal Bank of Canada | BRL | 1,008,981 | $ | 201,768 | 11/10/23 | 1,869 | |||||||||||||
Royal Bank of Canada | COP | 14,737,794,000 | $ | 3,339,632 | 11/10/23 | (234,248 | ) | ||||||||||||
See Notes to Financial Statements
35
Morgan Stanley Global Fixed Income Opportunities Fund
Portfolio of Investments ◼ October 31, 2023 continued
COUNTERPARTY | CONTRACTS TO DELIVER | IN EXCHANGE FOR | DELIVERY DATE | UNREALIZED APPRECIATION (DEPRECIATION) | |||||||||||||||
Royal Bank of Canada | IDR | 24,470,430,000 | $ | 1,592,090 | 11/10/23 | $ | 51,709 | ||||||||||||
Royal Bank of Canada | PEN | 15,560,000 | $ | 4,185,046 | 11/10/23 | 135,915 | |||||||||||||
Royal Bank of Canada | PLN | 16,289,000 | $ | 3,739,011 | 11/10/23 | (127,906 | ) | ||||||||||||
Royal Bank of Canada | $ | 3,846,104 | AUD | 6,050,000 | 11/10/23 | (7,216 | ) | ||||||||||||
Standard Chartered Bank | PEN | 6,295,000 | $ | 1,690,477 | 11/10/23 | 52,349 | |||||||||||||
Standard Chartered Bank | $ | 745,545 | EUR | 683,757 | 11/10/23 | (21,833 | ) | ||||||||||||
Standard Chartered Bank | $ | 1,718,015 | MXN | 29,883,432 | 11/10/23 | (62,345 | ) | ||||||||||||
Standard Chartered Bank | $ | 1,406,389 | NZD | 2,410,153 | 11/10/23 | (2,195 | ) | ||||||||||||
State Street Bank and Trust Co. | GBP | 2,399,613 | $ | 3,068,874 | 11/10/23 | 152,139 | |||||||||||||
State Street Bank and Trust Co. | MXN | 8,475,452 | $ | 482,248 | 11/10/23 | 12,671 | |||||||||||||
State Street Bank and Trust Co. | $ | 1,485,021 | MXN | 25,250,000 | 11/10/23 | (86,063 | ) | ||||||||||||
State Street Bank and Trust Co. | $ | 42,304 | PLN | 177,859 | 11/10/23 | (81 | ) | ||||||||||||
State Street Bank and Trust Co. | ZAR | 556,051 | $ | 29,317 | 11/10/23 | (498 | ) | ||||||||||||
UBS AG | AUD | 11,474,874 | $ | 7,571,099 | 11/10/23 | 289,983 | |||||||||||||
UBS AG | CAD | 5,283,000 | $ | 3,811,292 | 11/10/23 | 1,223 | |||||||||||||
UBS AG | COP | 12,041,145,240 | $ | 2,792,473 | 11/10/23 | (127,476 | ) | ||||||||||||
UBS AG | EUR | 2,383,517 | $ | 2,593,796 | 11/10/23 | 70,998 | |||||||||||||
UBS AG | EUR | 3,193,287 | $ | 3,411,226 | 11/10/23 | 31,340 | |||||||||||||
UBS AG | EUR | 840,714 | $ | 889,654 | 11/10/23 | (187 | ) | ||||||||||||
UBS AG | EUR | 1,507,350 | $ | 1,597,419 | 11/10/23 | 1,987 | |||||||||||||
UBS AG | GBP | 10,917,482 | $ | 13,930,107 | 11/10/23 | 659,880 | |||||||||||||
UBS AG | GBP | 641,205 | $ | 817,543 | 11/10/23 | 38,157 | |||||||||||||
UBS AG | GBP | 253 | $ | 309 | 11/10/23 | 2 | |||||||||||||
UBS AG | HUF | 538,592,806 | $ | 1,518,108 | 11/10/23 | 29,892 | |||||||||||||
UBS AG | HUF | 419,530,390 | $ | 1,142,847 | 11/10/23 | (16,382 | ) | ||||||||||||
UBS AG | HUF | 80,097,555 | $ | 220,575 | 11/10/23 | (747 | ) | ||||||||||||
UBS AG | HUF | 295,331,615 | $ | 816,060 | 11/10/23 | 12 | |||||||||||||
UBS AG | NZD | 108,107 | $ | 64,180 | 11/10/23 | 1,195 | |||||||||||||
UBS AG | PLN | 16,732,859 | $ | 3,787,615 | 11/10/23 | (184,671 | ) | ||||||||||||
UBS AG | $ | 4,579,405 | AUD | 7,183,808 | 11/10/23 | (21,085 | ) | ||||||||||||
UBS AG | $ | 3,640,739 | BRL | 17,852,000 | 11/10/23 | (103,904 | ) | ||||||||||||
UBS AG | $ | 618,215 | EUR | 576,280 | 11/10/23 | (8,260 | ) | ||||||||||||
UBS AG | $ | 3,482,945 | EUR | 3,318,203 | 11/10/23 | 29,156 | |||||||||||||
UBS AG | $ | 308,557 | GBP | 253,398 | 11/10/23 | (551 | ) | ||||||||||||
UBS AG | $ | 2,169,459 | HUF | 810,675,459 | 11/10/23 | 70,565 | |||||||||||||
UBS AG | $ | 817,094 | HUF | 295,331,615 | 11/3/23 | (19 | ) | ||||||||||||
UBS AG | $ | 3,705,080 | PLN | 16,048,000 | 11/10/23 | 104,625 | |||||||||||||
Westpac Banking Corp. | $ | 4,696,918 | AUD | 7,377,343 | 11/10/23 | (15,796 | ) | ||||||||||||
Westpac Banking Corp. | $ | 2,742,226 | NZD | 4,648,786 | 11/10/23 | (33,767 | ) | ||||||||||||
$ | 8,876,372 | ||||||||||||||||||
See Notes to Financial Statements
36
Morgan Stanley Global Fixed Income Opportunities Fund
Portfolio of Investments ◼ October 31, 2023 continued
Futures Contracts:
The Fund had the following futures contracts open at October 31, 2023:
| NUMBER OF CONTRACTS | EXPIRATION DATE | NOTIONAL AMOUNT (000) | VALUE | UNREALIZED APPRECIATION (DEPRECIATION) | |||||||||||||||||||
Long: | |||||||||||||||||||||||
German Euro-Bobl Index (Germany) | 314 | Dec-23 | EUR | 31,400 | $ | 38,636,595 | $ | 103,614 | |||||||||||||||
German Euro-Bund Index (Germany) | 41 | Dec-23 | EUR | 4,100 | 5,595,859 | 1,674 | |||||||||||||||||
Long Gilt Index (United Kingdom) | 50 | Dec-23 | GBP | 5,000 | 5,661,563 | 14,516 | |||||||||||||||||
U.S. Treasury 5 yr. Note (United States) | 550 | Dec-23 | $ | 55,000 | 57,462,110 | (652,373 | ) | ||||||||||||||||
U.S. Treasury 10 yr. Note (United States) | 28 | Dec-23 | 2,800 | 2,972,812 | (4,375 | ) | |||||||||||||||||
Short: | |||||||||||||||||||||||
German Euro-BTP Index (Germany) | 43 | Dec-23 | EUR | (4,300 | ) | (5,014,824 | ) | (91,398 | ) | ||||||||||||||
U.S. Treasury 10 yr. Ultra Note (United States) | 17 | Dec-23 | $ | (1,700 | ) | (1,850,078 | ) | (6,375 | ) | ||||||||||||||
U.S. Treasury Ultra Long Bond (United States) | 48 | Dec-23 | (4,800 | ) | (5,403,000 | ) | 62,102 | ||||||||||||||||
$ | (572,615 | ) | |||||||||||||||||||||
AUD — Australian Dollar
BRL — Brazilian Real
CAD — Canadian Dollar
CNH — Chinese Yuan Renminbi Offshore
COP — Colombian Peso
DOP — Dominican Peso
EUR — Euro
GBP — British Pound
HUF — Hungarian Forint
IDR — Indonesian Rupiah
INR — Indian Rupee
MXN — Mexican Peso
NZD — New Zealand Dollar
PEN — Peruvian Nuevo Sol
PLN — Polish Zloty
THB — Thai Baht
USD — United States Dollar
UYU — Uruguay Peso
ZAR — South African Rand
See Notes to Financial Statements
37
Morgan Stanley Global Fixed Income Opportunities Fund
Financial Statements
Statement of Assets and Liabilities October 31, 2023
Assets: | |||||||
Investments in securities, at value (cost $793,086,574) (Including $7,825,892 for securities loaned) | $ | 733,689,135 | |||||
Investment in affiliate, at value (cost $42,959,125) | 42,959,125 | ||||||
Total investments in securities, at value (cost $836,045,699) | 776,648,260 | ||||||
Unrealized appreciation on open foreign currency forward exchange contracts | 12,482,028 | ||||||
| Cash (including foreign currency valued at $1,787,567 with a cost of $1,789,278) | 1,083,804 | ||||||
Receivable for: | |||||||
| Investments sold | 16,913,246 | ||||||
Interest | 6,538,109 | ||||||
Shares of beneficial interest sold | 4,585,986 | ||||||
Variation margin on open futures contracts | 1,302,333 | ||||||
Due from broker | 276,981 | ||||||
Dividends from affiliate | 166,767 | ||||||
Foreign withholding taxes reclaimed | 34,790 | ||||||
Securities lending income | 3,882 | ||||||
Prepaid expenses and other assets | 143,048 | ||||||
Total Assets | 820,179,234 | ||||||
Liabilities: | |||||||
Collateral on securities loaned, at value | 7,098,369 | ||||||
Unrealized depreciation on open foreign currency forward exchange contracts | 3,605,656 | ||||||
Due to broker | 1,250,000 | ||||||
Payable for: | |||||||
Investments purchased | 38,463,032 | ||||||
Shares of beneficial interest redeemed | 2,686,110 | ||||||
Payable for swap agreements termination | 276,445 | ||||||
Advisory fee | 202,305 | ||||||
Dividends to shareholders | 167,592 | ||||||
Transfer and sub transfer agent fees | 101,270 | ||||||
Administration fee | 51,702 | ||||||
Trustees' fees | 37,016 | ||||||
Distribution fee | 23,884 | ||||||
Accrued expenses and other payables | 228,461 | ||||||
Total Liabilities | 54,191,842 | ||||||
Net Assets | $ | 765,987,392 | |||||
Composition of Net Assets: | |||||||
Paid-in-Capital | $ | 887,157,436 | |||||
| Total Accumulated Loss | (121,170,044 | ) | |||||
Net Assets | $ | 765,987,392 | |||||
See Notes to Financial Statements
38
Morgan Stanley Global Fixed Income Opportunities Fund
Financial Statements continued
Statement of Assets and Liabilities October 31, 2023
Class A Shares: | |||||||
Net Assets | $ | 51,476,140 | |||||
| Shares Outstanding (unlimited shares authorized, $0.01 par value) | 10,597,887 | ||||||
Net Asset Value Per Share | $ | 4.86 | |||||
| Maximum Offering Price Per Share, (net asset value plus 3.36% of net asset value) | $ | 5.02 | |||||
Class L Shares: | |||||||
Net Assets | $ | 2,409,988 | |||||
| Shares Outstanding (unlimited shares authorized, $0.01 par value) | 496,364 | ||||||
Net Asset Value Per Share | $ | 4.86 | |||||
Class I Shares: | |||||||
Net Assets | $ | 476,677,388 | |||||
| Shares Outstanding (unlimited shares authorized, $0.01 par value) | 96,749,213 | ||||||
Net Asset Value Per Share | $ | 4.93 | |||||
Class C Shares: | |||||||
Net Assets | $ | 13,914,481 | |||||
| Shares Outstanding (unlimited shares authorized, $0.01 par value) | 2,868,696 | ||||||
Net Asset Value Per Share | $ | 4.85 | |||||
Class R6 Shares: | |||||||
Net Assets | $ | 221,498,812 | |||||
| Shares Outstanding (unlimited shares authorized, $0.01 par value) | 44,938,030 | ||||||
Net Asset Value Per Share | $ | 4.93 | |||||
Class IR Shares: | |||||||
Net Assets | $ | 10,583 | |||||
| Shares Outstanding (unlimited shares authorized, $0.01 par value) | 2,147 | ||||||
Net Asset Value Per Share | $ | 4.93 | |||||
See Notes to Financial Statements
39
Morgan Stanley Global Fixed Income Opportunities Fund
Financial Statements continued
Statement of Operations For the year ended October 31, 2023
| Net Investment Income: Income | |||||||
Interest (net of $83,522 foreign withholding tax) | $ | 39,109,390 | |||||
Dividends from affiliate (Note 7) | 1,850,274 | ||||||
Income from securities loaned - net | 98,237 | ||||||
Dividends (net of $34 foreign withholding tax) | 37,436 | ||||||
Total Income | 41,095,337 | ||||||
Expenses | |||||||
Advisory fee (Note 4) | 2,430,815 | ||||||
Administration fee (Note 4) | 607,704 | ||||||
Sub transfer agent fees and expenses (Class A) | 46,049 | ||||||
Sub transfer agent fees and expenses (Class L) | 1,695 | ||||||
Sub transfer agent fees and expenses (Class I) | 469,503 | ||||||
Sub transfer agent fees and expenses (Class C) | 8,851 | ||||||
Distribution fee (Class A) (Note 5) | 140,622 | ||||||
Distribution fee (Class L) (Note 5) | 13,240 | ||||||
Distribution fee (Class C) (Note 5) | 158,823 | ||||||
Registration fees | 262,736 | ||||||
Professional fees | 246,787 | ||||||
Custodian fees (Note 8) | 96,269 | ||||||
Transfer agent fees and expenses (Class A) (Note 6) | 16,283 | ||||||
Transfer agent fees and expenses (Class L) (Note 6) | 4,385 | ||||||
Transfer agent fees and expenses (Class I) (Note 6) | 21,389 | ||||||
Transfer agent fees and expenses (Class C) (Note 6) | 9,856 | ||||||
Transfer agent fees and expenses (Class R6) (Note 6) | 3,479 | ||||||
Transfer agent fees and expenses (Class IR) (Note 6) | 2,124 | ||||||
Shareholder reports and notices | 41,730 | ||||||
Trustees' fees and expenses | 19,526 | ||||||
Other | 95,135 | ||||||
Total Expenses | 4,697,001 | ||||||
Less: rebate from Morgan Stanley affiliated cash sweep (Note 7) | (60,903 | ) | |||||
Less: reimbursement of class specific expenses (Class IR) (Note 4) | (2,125 | ) | |||||
Net Expenses | 4,633,973 | ||||||
Net Investment Income | 36,461,364 | ||||||
See Notes to Financial Statements
40
Morgan Stanley Global Fixed Income Opportunities Fund
Financial Statements continued
Statement of Operations For the year ended October 31, 2023
| Realized and Unrealized Gain (Loss): Realized Gain (Loss) on: | |||||||
Investments (Net of $26,236 of Capital Gain Country Tax) | $ | (27,307,355 | ) | ||||
Foreign currency forward exchange contracts | (9,401,379 | ) | |||||
Foreign currency translation | 486,225 | ||||||
Futures contracts | (2,491,198 | ) | |||||
Swap agreements | (7,881,196 | ) | |||||
Net Realized Loss | (46,594,903 | ) | |||||
Change in Unrealized Appreciation (Depreciation) on: | |||||||
Investments | 39,831,108 | ||||||
Foreign currency forward exchange contracts | 1,778,043 | ||||||
Foreign currency translation | (3,811 | ) | |||||
Futures contracts | (2,419,976 | ) | |||||
Swap agreements | 3,730,167 | ||||||
Net Change in Unrealized Appreciation (Depreciation) | 42,915,531 | ||||||
Net Loss | (3,679,372 | ) | |||||
Net Increase in Net Assets Resulting from Operations | $ | 32,781,992 | |||||
See Notes to Financial Statements
41
Morgan Stanley Global Fixed Income Opportunities Fund
Financial Statements continued
Statements of Changes in Net Assets
| FOR THE YEAR ENDED OCTOBER 31, 2023 | FOR THE YEAR ENDED OCTOBER 31, 2022 | ||||||||||
| Increase (Decrease) in Net Assets: Operations: | |||||||||||
Net investment income | $ | 36,461,364 | $ | 29,614,307 | |||||||
Net realized loss | (46,594,903 | ) | (3,387,046 | ) | |||||||
Net change in unrealized appreciation (depreciation) | 42,915,531 | (104,787,194 | ) | ||||||||
Net Increase (Decrease) in Net Assets Resulting from Operations | 32,781,992 | (78,559,933 | ) | ||||||||
Dividends and Distributions to Shareholders: | |||||||||||
| Class A | (3,080,911 | ) | (3,106,529 | ) | |||||||
| Class L | (136,463 | ) | (137,204 | ) | |||||||
| Class I | (28,017,165 | ) | (23,005,316 | ) | |||||||
| Class C | (753,930 | ) | (759,229 | ) | |||||||
| Class R6* | (10,979,191 | ) | (9,484,097 | ) | |||||||
| Class IR | (603 | ) | (458 | ) | |||||||
Paid-in-Capital: | |||||||||||
Class A | (557,659 | ) | — | ||||||||
Class L | (27,839 | ) | — | ||||||||
Class I | (4,514,977 | ) | — | ||||||||
Class C | (164,298 | ) | — | ||||||||
Class R6* | (1,705,062 | ) | — | ||||||||
Class IR | (95 | ) | — | ||||||||
Total Dividends and Distributions to Shareholders | (49,938,193 | ) | (36,492,833 | ) | |||||||
Net increase (decrease) from transactions in shares of beneficial interest | 93,434,050 | (242,186,179 | ) | ||||||||
Net Increase (Decrease) | 76,277,849 | (357,238,945 | ) | ||||||||
Net Assets: | |||||||||||
Beginning of period | 689,709,543 | 1,046,948,488 | |||||||||
End of Period | $ | 765,987,392 | $ | 689,709,543 | |||||||
* Effective April 29, 2022, Class IS shares were renamed Class R6 shares.
See Notes to Financial Statements
42
Morgan Stanley Global Fixed Income Opportunities Fund
Notes to Financial Statements ◼ October 31, 2023
1. Organization and Accounting Policies
Morgan Stanley Global Fixed Income Opportunities Fund (the "Fund") is registered under the Investment Company Act of 1940, as amended (the "Act"), as a diversified, open-end management investment company. The Fund's primary investment objective is to seek a high level of current income and, as a secondary objective, to maximize total return, but only to the extent consistent with its primary objective. The Fund was organized as a Massachusetts business trust on December 20, 1991 and commenced operations on April 9, 1992. On July 28, 1997, the Fund converted to a multiple class share structure.
The Fund applies Investment company accounting and reporting guidance Accounting Standards Codification ("ASC") Topic 946. In the preparation of these financial statements, management has evaluated subsequent events occuring after the date of the Fund's Statement of Assets and Liabilities through the date that the financial statements were issued.
The Fund offers Class A shares, Class L shares, Class I shares, Class C shares, Class R6 shares and Class IR shares. The six classes are substantially the same except that most Class A shares are subject to a sales charge imposed at the time of purchase and some Class A shares and most Class C shares are subject to a contingent deferred sales charge imposed on shares redeemed within one year. Class L shares, Class I shares, Class R6 shares and Class IR shares are not subject to a sales charge Additionally, Class A shares, Class L shares and Class C shares incur distribution expenses. Effective April 29, 2022, Class IS shares were renamed Class R6 shares.
The Fund suspended offering Class L shares to all investors (April 30, 2015). Class L shareholders of the Fund do not have the option of purchasing additional Class L shares. However, the existing Class L shareholders may invest through reinvestment of dividends and distributions. In addition, Class L shares of the Fund may be exchanged for Class L shares of any Morgan Stanley Multi-Class Fund, even though Class L shares are closed to investors.
The following is a summary of significant accounting policies:
A. Valuation of Investments — (1) Fixed income securities may be valued by an outside pricing service/vendor approved by the Fund's Board of Trustees (the "Trustees"). The pricing service/vendor may employ a pricing model that takes into account, among other things, bids, yield spreads and/or other market data and specific security characteristics. If Morgan Stanley Investment Management Inc. (the "Adviser") or Morgan Stanley Investment Management Limited (the "Sub-Adviser"), each a wholly-owned subsidiary of Morgan Stanley, determines that the price provided by the outside pricing service/vendor does not reflect the security's fair value or is unable to provide a price, prices from brokers/dealers may also be utilized. In these circumstances, the value of the security will be the mean of bid and asked prices obtained from the reputable brokers/dealers; (2) an equity portfolio security
43
Morgan Stanley Global Fixed Income Opportunities Fund
Notes to Financial Statements ◼ October 31, 2023 continued
listed or traded on an exchange is valued at its latest reported sales price (or at the exchange official closing price if such exchange reports an official closing price), and if there were no sales on a given day and if there is no official exchange closing price for that day, the security is valued at the mean between the last reported bid and asked prices if such bid and asked prices are available on the relevant exchanges. If only bid prices are available then the latest bid price may be used. Listed equity securities not traded on the valuation date with no reported bid and asked prices available on the exchange are valued at the mean between the current bid and asked prices obtained from one or more reputable brokers/dealers. In cases where a security is traded on more than one exchange, the security is valued on the exchange designated as the primary market; (3) all other equity portfolio securities for which over-the-counter ("OTC") market quotations are readily available are valued at the latest reported sales price (or at the market official closing price if such market reports an official closing price), and if there was no trading in the security on a given day and if there is no official closing price from relevant markets for that day, the security is valued at the mean between the last reported bid and asked prices if such bid and asked prices are available on the relevant markets. An unlisted equity security that does not trade on the valuation date and for which bid and asked prices from the relevant markets are unavailable is valued at the mean between the current bid and asked prices obtained from one or more reputable brokers/dealers; (4) when market quotations are not readily available, as defined by Rule 2a-5 under the Act, including circumstances under which the Adviser or the Sub-Adviser, determines that the closing price, last sale price or the mean between the last reported bid and asked prices are not reflective of a security's market value, portfolio securities are valued at their fair value as determined in good faith under procedures approved by and under the general supervision of the Trustees. Occasionally, developments affecting the closing prices of securities and other assets may occur between the times at which valuations of such securities are determined (that is, close of the foreign market on which the securities trade) and the close of business on the New York Stock Exchange ("NYSE"). If developments occur during such periods that are expected to materially affect the value of such securities, such valuations may be adjusted to reflect the estimated fair value of such securities as of the close of the NYSE, as determined in good faith by the Trustees or by the Adviser using a pricing service and/or procedures approved by the Trustees; (5) certain senior collateralized loans ("Senior Loans") are valued based on quotations received from an independent pricing service; (6) futures are valued at the settlement price on the exchange on which they trade or, if a settlement price is unavailable, at the last sale price on the exchange; (7) OTC swaps may be valued by an outside pricing service approved by the Trustees or quotes from a broker/dealer. Swaps cleared on a clearinghouse or exchange may be valued using the closing price provided by the clearinghouse or exchange; (8) foreign exchange transactions ("spot contracts") and foreign exchange forward contracts ("forward contracts") are valued daily using an independent pricing vendor at the spot and forward rates, respectively, as of the close of the NYSE; and (9) investments in mutual funds,
44
Morgan Stanley Global Fixed Income Opportunities Fund
Notes to Financial Statements ◼ October 31, 2023 continued
including the Morgan Stanley Institutional Liquidity Funds, are valued at the net asset value ("NAV") as of the close of each business day.
In connection with Rule 2a-5 of the Act, the Trustees have designated the Fund's Adviser as its valuation designee. The valuation designee has responsibility for determining fair value and to make the actual calculations pursuant to the fair valuation methodologies previously approved by the Trustees. Under procedures approved by the Trustees, the Fund's Adviser, as valuation designee, has formed a Valuation Committee whose members are approved by the Trustees. The Valuation Committee provides administration and oversight of the Fund's valuation policies and procedures, which are reviewed at least annually by the Trustees. These procedures allow the Fund to utilize independent pricing services, quotations from securities and financial instrument dealers and other market sources to determine fair value.
B. Accounting for Investments — Security transactions are accounted for on the trade date (date the order to buy or sell is executed). Realized gains and losses on security transactions are determined by the identified cost method. Dividend income and other distributions are recorded on the ex-dividend date (except for certain foreign dividends which may be recorded as soon as the Fund is informed of such dividends) net of applicable withholding taxes. Discounts are accreted and premiums are amortized over the life of the respective securities and are included in interest income. Interest income is accrued daily as earned, net of applicable withholding taxes.
C. When-Issued/Delayed Delivery Securities — The Fund may purchase or sell when-issued and delayed delivery securities. Securities purchased on a when-issued or delayed delivery basis are purchased for delivery beyond the normal settlement date at a stated price, and no income accrues to the Fund on such securities prior to delivery date. Payment and delivery for when-issued and delayed delivery securities can take place a month or more after the date of the transaction. When the Fund enters into a purchase transaction on a when-issued or delayed delivery basis, securities are available for collateral in an amount at least equal in value to the Fund's commitments to purchase such securities. Purchasing securities on a when-issued or delayed delivery basis may involve a risk that the market price at the time of delivery may be lower than the agreed upon purchase price, in which case there could be an unrealized loss at the time of delivery. Purchasing investments on a when-issued or delayed delivery basis may be considered a form of leverage which may increase the impact that gains (losses) may have on the Fund.
D. Multiple Class Allocations — Investment income, realized and unrealized gain (loss) and non-class specific expenses are allocated daily based upon the proportion of net assets of each class. Class specific expenses are borne by the respective share classes and include Distribution, Transfer Agent and Sub Transfer Agent fees.
45
Morgan Stanley Global Fixed Income Opportunities Fund
Notes to Financial Statements ◼ October 31, 2023 continued
E. Senior Loans — Senior Loans are typically structured by a syndicate of lenders ("Lenders"), one or more of which administers the Senior Loan on behalf of the Lenders ("Agent"). Lenders may sell interests in Senior Loans to third parties ("Participations") or may assign all or a portion of their interest in a Senior Loan to third parties ("Assignments"). Presently, Senior Loans are not readily marketable and are often subject to restrictions on resale.
F. Foreign Currency Translation and Foreign Investments — The books and records of the Fund are maintained in U.S. dollars. Foreign currency amounts are translated into U.S. dollars as follows:
— investments, other assets and liabilities at the prevailing rate of exchange on the valuation date;
— investment transactions and investment income at the prevailing rates of exchange on the dates of such transactions.
Although the net assets of the Fund are presented at the foreign exchange rates and market values at the close of the period, the Fund does not isolate that portion of the results of operations arising as a result of changes in the foreign exchange rates from the fluctuations arising from changes in the market prices of securities held at period end. Similarly, the Fund does not isolate the effect of changes in foreign exchange rates from the fluctuations arising from changes in the market prices of securities sold during the period. Accordingly, realized and unrealized foreign currency gains (losses) on investments in securities are included in the reported net realized and unrealized gains (losses) on investment transactions and balances. However, pursuant to U.S. federal income tax regulations, gains and losses from certain foreign currency transactions and the foreign currency portion of gains and losses realized on sales and maturities of foreign denominated debt securities are treated as ordinary income for U.S. federal income tax purposes.
Net realized gains (losses) on foreign currency transactions represent net foreign exchange gains (losses) from foreign currency forward exchange contracts, disposition of foreign currencies, currency gains (losses) realized between the trade and settlement dates on securities transactions, and the difference between the amount of investment income and foreign withholding taxes recorded on the Fund's books and the U.S. dollar equivalent amounts actually received or paid. The change in unrealized currency gains (losses) on foreign currency transactions for the period is reflected in the Statement of Operations.
G. Securities Lending — The Fund may lend securities to qualified financial institutions, such as broker/dealers, to earn additional income. Any increase or decrease in the fair value of the securities loaned that might occur and any interest earned or dividends declared on those securities during the term of the loan would remain in the Fund. The Fund receives cash or securities as collateral in an
46
Morgan Stanley Global Fixed Income Opportunities Fund
Notes to Financial Statements ◼ October 31, 2023 continued
amount equal to or exceeding 100% of the current fair value of the loaned securities. The collateral is marked-to-market daily by State Street Bank and Trust Company ("State Street"), the securities lending agent, to ensure that a minimum of 100% collateral coverage is maintained.
Based on pre-established guidelines, the securities lending agent invests any cash collateral that is received in an affiliated money market portfolio and repurchase agreements. Securities lending income is generated from the earnings on the invested collateral and borrowing fees, less any rebates owed to the borrowers and compensation to the lending agent, and is recorded as "Income from securities loaned — net" in the Fund's Statement of Operations.
The Fund has the right under the securities lending agreement to recover the securities from the borrower on demand.
The following table presents financial instruments that are subject to enforceable netting arrangements as of October 31, 2023:
GROSS AMOUNTS NOT OFFSET IN THE STATEMENT OF ASSETS AND LIABILITIES
| GROSS ASSET AMOUNT PRESENTED IN THE STATEMENT OF ASSETS AND LIABILITIES | FINANCIAL INSTRUMENT | COLLATERAL RECEIVED | NET AMOUNT (NOT LESS THAN $0) | ||||||||||||
| $ | 7,825,892 | (a) | $ | — | $ | (7,825,892 | )(b)(c) | $ | 0 | ||||||
(a) Represents market value of loaned securities at year end.
(b) The Fund received cash collateral of $7,098,369, which was subsequently invested in Morgan Stanley Institutional Liquidity Funds as reported in the Portfolio of Investments. In addition, the Fund received non-cash collateral of $879,675 in the form of U.S. Government obligations, which the Fund cannot sell or repledge, and accordingly are not reflected in the Portfolio of Investments.
(c) The actual collateral received is greater than the amount shown here due to overcollateralization.
Financial Accounting Standards Board ("FASB") ASC 860, "Transfers & Servicing: Repurchase-to-Maturity Transactions, Repurchase Financings, and Disclosures", is intended to provide increased transparency about the types of collateral pledged in securities lending transactions and other similar transactions that are accounted for as secured borrowings.
47
Morgan Stanley Global Fixed Income Opportunities Fund
Notes to Financial Statements ◼ October 31, 2023 continued
The following table displays a breakdown of transactions accounted for as secured borrowings, the gross obligations by class of collateral pledged and the remaining contractual maturity of those transactions as of October 31, 2023:
REMAINING CONTRACTUAL MATURITY OF THE AGREEMENTS | |||||||||||||||||||||||
| OVERNIGHT AND CONTINUOUS | <30 DAYS | BETWEEN 30 & 90 DAYS | >90 DAYS | TOTAL | |||||||||||||||||||
Securities Lending Transactions | |||||||||||||||||||||||
Corporate bonds | $ | 5,915,405 | $ | — | $ | — | $ | — | $ | 5,915,405 | |||||||||||||
Investment Company | 1,182,964 | — | — | — | 1,182,964 | ||||||||||||||||||
Total Borrowings | $ | 7,098,369 | $ | — | $ | — | $ | — | $ | 7,098,369 | |||||||||||||
Gross amount of recognized liabilities for securities lending transactions | $ | 7,098,369 | |||||||||||||||||||||
H. Dividends and Distributions to Shareholders — Dividends and distributions to shareholders are recorded on the ex-dividend date. Dividends from net investment income, if any, are declared and paid monthly. Net realized capital gains, if any, are distributed at least annually.
I. Use of Estimates — The preparation of financial statements in accordance with generally accepted accounting principles in the United States ("GAAP") requires management to make estimates and assumptions that affect the reported amounts and disclosures. Actual results could differ from those estimates.
J. Indemnifications — The Fund enters into contracts that contain a variety of indemnification clauses. The Fund's maximum exposure under these arrangements is unknown as this would involve future claims that may be made against the Fund that have not yet occurred.
2. Fair Valuation Measurements
FASB ASC 820, "Fair Value Measurement" ("ASC 820"), defines fair value as the price that would be received to sell an asset or pay to transfer a liability in an orderly transaction between market participants at the measurement date. ASC 820 establishes a three-tier hierarchy to distinguish between (1) inputs that reflect the assumptions market participants would use in valuing an asset or liability developed based on market data obtained from sources independent of the reporting entity (observable inputs); and (2) inputs that reflect the reporting entity's own assumptions about the assumptions market participants would use in valuing an asset or liability developed based on the best information available in the circumstances (unobservable inputs) and to establish classification of fair
48
Morgan Stanley Global Fixed Income Opportunities Fund
Notes to Financial Statements ◼ October 31, 2023 continued
value measurements for disclosure purposes. Various inputs are used in determining the value of the Fund's investments. The inputs are summarized in the three broad levels listed below:
• Level 1 — unadjusted quoted prices in active markets for identical investments
• Level 2 — other significant observable inputs (including quoted prices for similar investments, interest rates, prepayment speeds, credit risk, etc.)
• Level 3 — significant unobservable inputs including the Fund's own assumptions in determining the fair value of investments. Factors considered in making this determination may include, but are not limited to, information obtained by contacting the issuer, analysts, or the appropriate stock exchange (for exchange-traded securities), analysis of the issuer's financial statements or other available documents and, if necessary, available information concerning other securities in similar circumstances.
The inputs or methodology used for valuing securities are not necessarily an indication of the risk associated with investing in those securities and the determination of the significance of a particular input to the fair value measurement in its entirety requires judgment and considers factors specific to each security.
The following is a summary of the inputs used to value the Fund's investments as of October 31, 2023:
INVESTMENT TYPE | LEVEL 1 UNADJUSTED QUOTED PRICES | LEVEL 2 OTHER SIGNIFICANT OBSERVABLE INPUTS | LEVEL 3 SIGNIFICANT UNOBSERVABLE INPUTS | TOTAL | |||||||||||||||
Assets: | |||||||||||||||||||
Fixed Income Securities | |||||||||||||||||||
Corporate Bonds | $ | — | $ | 267,959,693 | $ | — | $ | 267,959,693 | |||||||||||
Sovereign | — | 100,768,974 | — | 100,768,974 | |||||||||||||||
Agency Fixed Rate Mortgages | — | 22,069,325 | — | 22,069,325 | |||||||||||||||
Asset-Backed Securities | — | 90,839,325 | — | 90,839,325 | |||||||||||||||
| Collateralized Mortgage Obligations — Agency Collateral Series | — | 2,757,298 | — | 2,757,298 | |||||||||||||||
Commercial Mortgage-Backed Securities | — | 29,120,904 | — | 29,120,904 | |||||||||||||||
Mortgages — Other | — | 151,137,563 | — | 151,137,563 | |||||||||||||||
Senior Loan Interests | — | 4,875,000 | — | 4,875,000 | |||||||||||||||
Supranational | — | 3,654,716 | — | 3,654,716 | |||||||||||||||
Total Fixed Income Securities | — | 673,182,798 | — | 673,182,798 | |||||||||||||||
49
Morgan Stanley Global Fixed Income Opportunities Fund
Notes to Financial Statements ◼ October 31, 2023 continued
INVESTMENT TYPE | LEVEL 1 UNADJUSTED QUOTED PRICES | LEVEL 2 OTHER SIGNIFICANT OBSERVABLE INPUTS | LEVEL 3 SIGNIFICANT UNOBSERVABLE INPUTS | TOTAL | |||||||||||||||
Assets (cont'd): | |||||||||||||||||||
Investment Company | $ | 1,596,540 | $ | — | $ | — | $ | 1,596,540 | |||||||||||
Short-Term Investments | |||||||||||||||||||
U.S. Treasury Securities | — | 43,649,434 | — | 43,649,434 | |||||||||||||||
Investment Company | 42,959,125 | — | — | 42,959,125 | |||||||||||||||
Commercial Paper | — | 15,260,363 | — | 15,260,363 | |||||||||||||||
Total Short-Term Investments | 42,959,125 | 58,909,797 | — | 101,868,922 | |||||||||||||||
Foreign Currency Forward Exchange Contracts | — | 12,482,028 | — | 12,482,028 | |||||||||||||||
Futures Contracts | 181,906 | — | — | 181,906 | |||||||||||||||
Total Assets | 44,737,571 | 744,574,623 | — | 789,312,194 | |||||||||||||||
Liabilities: | |||||||||||||||||||
Foreign Currency Forward Exchange Contracts | — | (3,605,656 | ) | — | (3,605,656 | ) | |||||||||||||
Futures Contracts | (754,521 | ) | — | — | (754,521 | ) | |||||||||||||
Total Liabilities | (754,521 | ) | (3,605,656 | ) | — | (4,360,177 | ) | ||||||||||||
Total | $ | 43,983,050 | $ | 740,968,967 | $ | — | $ | 784,952,017 | |||||||||||
Transfers between investment levels may occur as the markets fluctuate and/or the availability of data used in an investment's valuation changes.
3. Derivatives
The Fund may, but it is not required to, use derivative instruments for a variety of purposes, including hedging, risk management, portfolio management or to earn income. Derivatives are financial instruments whose value is based, in part, on the value of an underlying asset, interest rate, index or financial instrument. Prevailing interest rates and volatility levels, among other things, also affect the value of derivative instruments. A derivative instrument often has risks similar to its underlying asset and may have additional risks, including imperfect correlation between the value of the derivative and the underlying asset, risks of default by the counterparty to certain transactions, magnification of losses incurred due to changes in the market value of the securities, instruments, indices or interest rates to which the derivative instrument relates, risks that the transactions may not be liquid, risks arising from margin and payment requirements, risks arising from mispricing or valuation complexity and operational and legal risks. The use of derivatives involves risks that are different from, and possibly greater than, the risks associated with other portfolio investments. Derivatives may involve the use of highly specialized instruments that require investment techniques and risk analyses different
50
Morgan Stanley Global Fixed Income Opportunities Fund
Notes to Financial Statements ◼ October 31, 2023 continued
from those associated with other portfolio investments. All of the Fund's holdings, including derivative instruments, are marked-to-market each day with the change in value reflected in unrealized appreciation (depreciation). Upon disposition, a realized gain or loss is recognized.
Certain derivative transactions may give rise to a form of leverage. Leverage magnifies the potential for gain and risk of loss. Leverage associated with derivative transactions may cause the Fund to liquidate portfolio positions when it may not be advantageous to do so to satisfy its obligations or may cause the Fund to be more volatile than if the Fund had not been leveraged. Although the Adviser and/or Sub-Adviser seek to use derivatives to further the Fund's investment objectives, there is no assurance that the use of derivatives will achieve this result.
Following is a description of the derivative instruments and techniques that the Fund used during the period and their associated risks:
Foreign Currency Forward Exchange Contracts — The Fund entered into contracts with banks, brokers/dealers to purchase or sell foreign currencies at a future date. A foreign currency forward exchange contract ("currency contract") is a negotiated agreement between the contracting parties to exchange a specified amount of currency at a specified future time at a specified rate. The rate can be higher or lower than the spot rate between the currencies that are the subject of the contract. Currency contracts may be used to protect against uncertainty in the level of future foreign currency exchange rates or to gain or modify exposure to a particular currency. In addition, the Fund may use cross currency hedging or proxy hedging with respect to currencies in which the Fund has or expects to have portfolio or currency exposure. Cross currency hedges involve the sale of one currency against the positive exposure to a different currency and may be used for hedging purposes or to establish an active exposure to the exchange rate between any two currencies. To the extent hedged by the use of currency contracts, the precise matching of the currency contract amounts and the value of the securities involved will not generally be possible because the future value of such securities in foreign currencies will change as a consequence of market movements in the value of those securities between the date on which the contract is entered into and the date it matures. Furthermore, such transactions may reduce or preclude the opportunity for gain if the value of the currency should move in the direction opposite to the position taken. There is additional risk to the extent that currency contracts create exposure to currencies in which the Fund's securities are not denominated. Unanticipated changes in currency prices may result in poorer overall performance for the Fund than if it had not entered into such contracts. The use of currency contracts involves the risk of loss from the insolvency or bankruptcy of the counterparty to the contract or the failure of the counterparty to make payments or otherwise comply with the terms of the contract. A currency contract is marked-to-market daily and the change in market value is recorded by the Fund as unrealized gain or loss. The Fund
51
Morgan Stanley Global Fixed Income Opportunities Fund
Notes to Financial Statements ◼ October 31, 2023 continued
records realized gains (losses) when the currency contract is closed equal to the difference between the value of the currency contract at the time it was opened and the value at the time it was closed.
Futures — A futures contract is a standardized, exchange-traded agreement to buy or sell a specific quantity of an underlying asset, reference rate or index at a specific price at a specific future time. The value of a futures contract tends to increase and decrease in tandem with the value of the underlying instrument. Depending on the terms of the particular contract, futures contracts are settled through either physical delivery of the underlying instrument on the settlement date or by payment of a cash settlement amount on the settlement date. During the period the futures contract is open, payments are received from or made to the broker based upon changes in the value of the contract (the variation margin). A decision as to whether, when and how to use futures contracts involves the exercise of skill and judgment and even a well-conceived futures transaction may be unsuccessful because of market behavior or unexpected events. In addition to the derivatives risks discussed above, the prices of futures contracts can be highly volatile, using futures contracts can lower total return and the potential loss from futures contracts can exceed the Fund's initial investment in such contracts. No assurance can be given that a liquid market will exist for any particular futures contract at any particular time.
Swaps — The Fund may enter into OTC swap contracts or cleared swap transactions. An OTC swap contract is an agreement between two parties pursuant to which the parties exchange payments at specified dates on the basis of a specified notional amount, with the payments calculated by reference to specified securities, indices, reference rates, currencies or other instruments. Typically swap agreements provide that when the period payment dates for both parties are the same, the payments are made on a net basis (i.e., the two payment streams are netted out, with only the net amount paid by one party to the other). The Fund's obligations or rights under a swap contract entered into on a net basis will generally be equal only to the net amount to be paid or received under the agreement, based on the relative values of the positions held by each party. Cleared swap transactions may help reduce counterparty credit risk. In a cleared swap, the Fund's ultimate counterparty is a clearinghouse rather than a swap dealer, bank or other financial institution. OTC swap agreements are not entered into or traded on exchanges and often there is no central clearing or guaranty function for OTC swaps. These OTC swaps are often subject to credit risk or the risk of default or non-performance by the counterparty. Both OTC and cleared swaps could result in losses if interest rates, foreign currency exchange rates or other factors are not correctly anticipated by the Fund or if the reference index, security or investments do not perform as expected. During the period swap agreements are open, payments are received from or made to the counterparty or clearing-house based on changes in the value of the contract or variation margin, respectively. The Dodd-Frank Wall Street Reform and Consumer Protection Act and related regulatory developments require the clearing and exchange-trading of certain standardized swap transactions. Mandatory exchange-trading and clearing is
52
Morgan Stanley Global Fixed Income Opportunities Fund
Notes to Financial Statements ◼ October 31, 2023 continued
occurring on a phased-in basis based on the type of market participant and U.S. Commodities Futures Trading Commission ("CFTC") approval of contracts for central clearing and exchange trading.
The Fund's use of swaps during the period included those based on the credit of an underlying security commonly referred to as "credit default swaps." The Fund may be either the buyer or seller in a credit default swap. Where the Fund is the buyer of a credit default swap contract, it would typically be entitled to receive the par (or other agreed-upon) value of a referenced debt obligation from the counterparty to the contract only in the event of a default or similar event by the issuer of the debt obligation. If no default occurs, the Fund would have paid to the counterparty a periodic stream of payments over the term of the contract and received no benefit from the contract. When the Fund is the seller of a credit default swap contract, it typically receives the stream of payments but is obligated to pay an amount equal to the par (or other agreed-upon) value of a referenced debt obligation upon the default or similar event by the issuer of the referenced debt obligation. The use of credit default swaps could result in losses to the Fund if the Adviser fails to correctly evaluate the creditworthiness of the issuer of the referenced debt obligation.
If the Fund is a seller of protection and a credit event occurs, as defined under the terms of that particular swap agreement, the Fund will either (i) pay to the buyer of protection an amount equal to the notional amount of the swap agreement and take delivery of the referenced obligation, other deliverable obligations or underlying securities comprising the referenced index or (ii) pay a net settlement amount in the form of cash or securities equal to the notional amount of the swap agreement less the recovery value of the referenced obligation or underlying securities comprising the referenced index. If the Fund is a buyer of protection and a credit event occurs, as defined under the terms of that particular swap agreement, the Fund will either (i) receive from the seller of protection an amount equal to the notional amount of the swap agreement and deliver the referenced obligation, other deliverable obligations or underlying securities comprising the referenced index or (ii) receive a net settlement amount in the form of cash or securities equal to the notional amount of the swap agreement less the recovery value of the referenced obligation or underlying securities comprising the referenced index. Recovery values are estimated by market makers considering either industry standard recovery rates or entity specific factors and considerations until a credit event occurs. If a credit event has occurred, the recovery value is determined by a facilitated auction whereby a minimum number of allowable broker bids, together with a specified valuation method, are used to calculate the settlement value. The Fund's maximum risk of loss from counterparty risk, either as the protection seller or as the protection buyer, is the fair value of the swap agreement.
If applicable, the current credit rating of each individual issuer is included in the table following the Portfolio of Investments and serves as an indicator of the current status of the payment/performance risk of the credit derivative. Alternatively, for credit default swaps on an index of credits, the quoted
53
Morgan Stanley Global Fixed Income Opportunities Fund
Notes to Financial Statements ◼ October 31, 2023 continued
market prices and current values serve as an indicator of the current status of the payment/performance risk of the credit derivative. Generally, lower credit ratings and increasing market values, in absolute terms, represent a deterioration of the credit and a greater likelihood of an adverse credit event of the issuer.
When the Fund has an unrealized loss on a swap agreement, the Fund has instructed the custodian to pledge cash or liquid securities as collateral with a value approximately equal to the amount of the unrealized loss. Collateral pledges are monitored and subsequently adjusted if and when the swap valuations fluctuate. If applicable, cash collateral is included with "Due from (to) broker" in the Statement of Assets and Liabilities.
Upfront payments paid or received by the Fund will be reflected as an asset or liability, respectively, in the Statement of Assets and Liabilities.
As of October 31, 2023, the Fund did not have any open swap agreements.
FASB ASC 815, "Derivatives and Hedging" ("ASC 815"), is intended to improve financial reporting about derivative instruments by requiring enhanced disclosures to enable investors to better understand how and why the Fund uses derivative instruments, how these derivative instruments are accounted for and their effects on the Fund's financial position and results of operations.
The following table sets forth the fair value of the Fund's derivative contracts by primary risk exposure as of October 31, 2023:
PRIMARY RISK EXPOSURE | ASSET DERIVATIVES STATEMENT OF ASSETS AND LIABILITIES LOCATION | FAIR VALUE | LIABILITY DERIVATIVES STATEMENT OF ASSETS AND LIABILITIES LOCATION | FAIR VALUE | |||||||||||||||
| Currency Risk | Unrealized appreciation on open foreign currency forward exchange contracts | $ | 12,482,028 | Unrealized depreciation on open foreign currency forward exchange contracts | $ | (3,605,656 | ) | ||||||||||||
| Interest Rate Risk | Variation margin on open futures contracts | 181,906 | (a) | Variation margin on open futures contracts | (754,521 | )(a) | |||||||||||||
$ | 12,663,934 | $ | (4,360,177 | ) | |||||||||||||||
(a) Includes cumulative appreciation (depreciation) as reported in the Portfolio of Investments. Only current day's net variation margin is reported within the Statement of Assets and Liabilities.
54
Morgan Stanley Global Fixed Income Opportunities Fund
Notes to Financial Statements ◼ October 31, 2023 continued
The following tables set forth by primary risk exposure the Fund's realized gains (losses) and change in unrealized appreciation (depreciation) by type of derivative contract for the year ended October 31, 2023 in accordance with ASC 815:
AMOUNT OF REALIZED GAIN (LOSS) ON DERIVATIVES
PRIMARY RISK EXPOSURE | FUTURES CONTRACTS | FOREIGN CURRENCY FORWARD EXCHANGE CONTRACTS | SWAP AGREEMENTS | ||||||||||||
Interest Rate Risk | $ | (2,491,198 | ) | $ | — | $ | (501,727 | ) | |||||||
Currency Risk | — | (9,401,379 | ) | — | |||||||||||
Credit Risk | — | — | (7,379,469 | ) | |||||||||||
Total | $ | (2,491,198 | ) | $ | (9,401,379 | ) | $ | (7,881,196 | ) | ||||||
CHANGE IN UNREALIZED APPRECIATION (DEPRECIATION) ON DERIVATIVES
PRIMARY RISK EXPOSURE | FUTURES CONTRACTS | FOREIGN CURRENCY FORWARD EXCHANGE CONTRACTS | SWAP AGREEMENTS | ||||||||||||
Interest Rate Risk | $ | (2,419,976 | ) | $ | — | $ | 123,056 | ||||||||
Currency Risk | — | 1,778,043 | — | ||||||||||||
Credit Risk | — | — | 3,607,111 | ||||||||||||
Total | $ | (2,419,976 | ) | $ | 1,778,043 | $ | 3,730,167 | ||||||||
At October 31, 2023, the Fund's derivative assets and liabilities are as follows:
GROSS AMOUNTS OF ASSETS AND LIABILITIES PRESENTED IN THE STATEMENT OF ASSETS AND LIABILITIES
DERIVATIVES(a) | ASSETS(b) | LIABILITIES(b) | |||||||||
Foreign Currency Forward Exchange Contracts | $ | 12,482,028 | $ | (3,605,656 | ) | ||||||
(a) Excludes exchange-traded derivatives.
(b) Absent an event of default or early termination, over-the-counter ("OTC") derivative assets and liabilities are presented gross and not offset in the Statement of Assets and Liabilities.
The Fund typically enters into International Swaps and Derivatives Association, Inc. Master Agreements ("ISDA Master Agreements") or similar master agreements (collectively, "Master Agreements") with its contract counterparties for certain OTC derivatives in order to, among other things, reduce its credit risk to counterparties. ISDA Master Agreements include provisions for general obligations, representations, collateral and events of default or termination. Under an ISDA Master Agreement, the Fund typically may offset with the counterparty certain OTC derivative financial instruments' payables and/or receivables with collateral held and/or posted and create one single net payment (close-out netting) in the event of default, termination and/or potential deterioration in the credit quality of the counterparty. Various Master Agreements govern the terms of certain transactions with counterparties,
55
Morgan Stanley Global Fixed Income Opportunities Fund
Notes to Financial Statements ◼ October 31, 2023 continued
including transactions such as swap, forward, repurchase and reverse repurchase agreements. These Master Agreements typically attempt to reduce the counterparty risk associated with such transactions by specifying credit protection mechanisms and providing standardization that improves legal certainty. Cross-termination provisions under Master Agreements typically provide that a default in connection with one transaction between the Fund and a counterparty gives the non-defaulting party the right to terminate any other transactions in place with the defaulting party to create one single net payment due to/due from the defaulting party and may be a feature in certain Master Agreements. In the event the Fund exercises its right to terminate a Master Agreement after a counterparty experiences a termination event as defined in the Master Agreement, the return of collateral with market value in excess of the Fund's net liability may be delayed or denied.
The following tables present derivative financial instruments that are subject to enforceable netting arrangements as of October 31, 2023:
GROSS AMOUNTS NOT OFFSET IN THE STATEMENT OF ASSETS AND LIABILITIES
COUNTERPARTY | GROSS ASSET DERIVATIVES PRESENTED IN THE STATEMENT OF ASSETS AND LIABILITIES | FINANCIAL INSTRUMENT | COLLATERAL RECEIVED(a) | NET AMOUNT (NOT LESS THAN $0) | |||||||||||||||
Australia & New Zealand Banking Group Ltd. | $ | 31,248 | $ | (31,248 | ) | $ | — | $ | 0 | ||||||||||
Bank of America NA | 46,693 | (1,391 | ) | — | 45,302 | ||||||||||||||
Barclays Bank PLC | 1,291 | (1,291 | ) | — | 0 | ||||||||||||||
BNP Paribas SA | 8,633,496 | (1,092,848 | ) | (980,000 | ) | 6,560,648 | |||||||||||||
Citibank NA | 199,568 | (11,027 | ) | (188,541 | ) | 0 | |||||||||||||
Credit Agricole CIB | 11 | — | — | 11 | |||||||||||||||
Goldman Sachs International | 34,036 | (34,036 | ) | — | 0 | ||||||||||||||
JPMorgan Chase Bank NA | 1,800,018 | (516,046 | ) | — | 1,283,972 | ||||||||||||||
Royal Bank of Canada | 189,493 | (189,493 | ) | — | 0 | ||||||||||||||
Standard Chartered Bank | 52,349 | (52,349 | ) | — | 0 | ||||||||||||||
State Street Bank and Trust Co. | 164,810 | (86,642 | ) | — | 78,168 | ||||||||||||||
UBS AG | 1,329,015 | (463,282 | ) | (865,733 | ) | 0 | |||||||||||||
Total | $ | 12,482,028 | $ | (2,479,653 | ) | $ | (2,034,274 | ) | $ | 7,968,101 | |||||||||
56
Morgan Stanley Global Fixed Income Opportunities Fund
Notes to Financial Statements ◼ October 31, 2023 continued
GROSS AMOUNTS NOT OFFSET IN THE STATEMENT OF ASSETS AND LIABILITIES
COUNTERPARTY | GROSS LIABILITY DERIVATIVES PRESENTED IN THE STATEMENT OF ASSETS AND LIABILITIES | FINANCIAL INSTRUMENT | COLLATERAL PLEDGED(a) | NET AMOUNT (NOT LESS THAN $0) | |||||||||||||||
Australia & New Zealand Banking Group Ltd. | $ | 88,916 | $ | (31,248 | ) | $ | — | $ | 57,668 | ||||||||||
Bank of America NA | 1,391 | (1,391 | ) | — | 0 | ||||||||||||||
Barclays Bank PLC | 210,989 | (1,291 | ) | — | 209,698 | ||||||||||||||
BNP Paribas SA | 1,092,848 | (1,092,848 | ) | — | 0 | ||||||||||||||
Citibank NA | 11,027 | (11,027 | ) | — | 0 | ||||||||||||||
Goldman Sachs International | 627,550 | (34,036 | ) | (593,514 | ) | 0 | |||||||||||||
HSBC Bank PLC | 1,659 | — | — | 1,659 | |||||||||||||||
JPMorgan Chase Bank NA | 516,046 | (516,046 | ) | — | 0 | ||||||||||||||
Royal Bank of Canada | 369,370 | (189,493 | ) | — | 179,877 | ||||||||||||||
Standard Chartered Bank | 86,373 | (52,349 | ) | — | 34,024 | ||||||||||||||
State Street Bank and Trust Co. | 86,642 | (86,642 | ) | — | 0 | ||||||||||||||
UBS AG | 463,282 | (463,282 | ) | — | 0 | ||||||||||||||
Westpac Banking Corp. | 49,563 | — | — | 49,563 | |||||||||||||||
Total | $ | 3,605,656 | $ | (2,479,653 | ) | $ | (593,514 | ) | $ | 532,489 | |||||||||
(a) In some instances, the actual collateral received or pledged may be more than the amount shown here due to overcollateralization.
For the year ended October 31, 2023, the average monthly amount outstanding for each derivative type is as follows:
Foreign Currency Forward Exchange Contracts: | |||||||
Average monthly principal amount | $ | 352,644,082 | |||||
Futures Contracts: | |||||||
Average monthly notional value | $ | 220,147,333 | |||||
Swap Agreements: | |||||||
Average monthly notional amount | $ | 45,511,951 | |||||
4. Advisory/Administration and Sub-Advisory Agreements
Pursuant to an Investment Advisory Agreement with the Adviser, the Fund pays an advisory fee, accrued daily and paid monthly, by applying the annual rate of 0.32% to the average net assets of the Fund determined as of the close of each business day.
The Adviser also serves as the Administrator to the Fund and provides administrative services pursuant to an Administration Agreement for an annual fee, accrued daily and paid monthly, of 0.08% of the Fund's average daily net assets.
57
Morgan Stanley Global Fixed Income Opportunities Fund
Notes to Financial Statements ◼ October 31, 2023 continued
Under a Sub-Administration Agreement between the Administrator and State Street, State Street provides certain administrative services to the Fund. For such services, the Administrator pays State Street a portion of the fee the Administrator receives from the Fund.
Under a Sub-Advisory Agreement between the Adviser and the Sub-Adviser, the Sub-Adviser provides the Fund with advisory services, subject to the overall supervision of the Adviser and the Fund's Officers and Trustees. The Adviser pays the Sub-Adviser on a monthly basis a portion of the net advisory fees the Adviser receives from the Fund.
The Adviser/Administrator has agreed to reduce its advisory fee, its administration fee and/or reimburse the Fund so that total annual operating expenses, excluding certain investment related expenses, taxes, interest and other extraordinary expenses (including litigation), will not exceed 0.95% for Class A, 1.24% for Class L, 0.60% for Class I, 1.70% for Class C, 0.57% for Class R6 and 0.57% for Class IR. The fee waivers and/or expense reimbursements will continue for at least one year from the date of the Fund's prospectus or until such time that the Trustees act to discontinue all or a portion of such waivers and/or expense reimbursements when they deem such action is appropriate. For the year ended October 31, 2023, $2,125 of other expenses were reimbursed by the Adviser pursuant to this arrangement.
5. Plan of Distribution
Shares of the Fund are distributed by Morgan Stanley Distribution, Inc. (the "Distributor"), an affiliate of the Adviser/Administrator and Sub-Adviser. The Fund has adopted a Plan of Distribution (the "Plan") pursuant to Rule 12b-1 under the Act. The Plan provides that the Fund will pay the Distributor a fee which is accrued daily and paid monthly at the following annual rates: (i) Class A — up to 0.25% of the average daily net assets of Class A shares; (ii) Class L — up to 0.50% of the average daily net assets of Class L shares; and (iii) Class C — up to 1.00% of the average daily net assets of Class C shares.
In the case of Class A shares, Class L shares and Class C shares, expenses incurred pursuant to the Plan in any calendar year in excess of 0.25%, 0.50% and 1.00% of the average daily net assets of Class A shares, Class L shares and Class C shares, respectively, will not be reimbursed by the Fund through payments in any subsequent year, except that expenses representing a gross sales commission credited to Financial Intermediaries at the time of sale may be reimbursed in the subsequent calendar year. For the year ended October 31, 2023, the distribution fee was accrued for Class A shares, Class L shares and Class C shares at the annual rate of 0.25%, 0.50% and 1.00%, respectively.
58
Morgan Stanley Global Fixed Income Opportunities Fund
Notes to Financial Statements ◼ October 31, 2023 continued
The Distributor has informed the Fund that for the year ended October 31, 2023, it received contingent deferred sales charges from certain redemptions of the Fund's Class A shares and Class C shares of $3,238 and $2,384, respectively, and received $10,859 in front-end sales charges from sales of the Fund's Class A shares. The respective shareholders pay such charges, which are not an expense of the Fund.
6. Dividend Disbursing and Transfer/Co-Transfer Agent
The Fund's dividend disbursing and transfer agent is SS&C Global Investor & Distribution Solutions, Inc. ("SS&C GIDS"). Pursuant to a Transfer Agency Agreement, the Fund pays SS&C GIDS a fee based on the number of classes, accounts and transactions relating to the Fund.
Eaton Vance Management ("EVM"), an affiliate of Morgan Stanley, provides co-transfer agency and related services to the Fund pursuant to a Co-Transfer Agency Services Agreement. For the year ended October 31, 2023, co-transfer agency fees and expenses incurred to EVM, included in "Transfer agent fees and expenses" in the Statement of Operations, amounted to $3,451.
7. Security Transactions and Transactions with Affiliates
The cost of purchases and proceeds from sales of investment securities, excluding short-term investments, for the year ended October 31, 2023, aggregated $839,259,135 and $820,756,714, respectively. Included in the aforementioned are purchases and sales of U.S. Government securities of $323,299,761 and $307,656,811, respectively.
The Fund invests in the Institutional Class of the Morgan Stanley Institutional Liquidity Funds — Government Portfolio (the "Liquidity Fund"), an open-end management investment company managed by the Adviser, both directly and as a portion of the securities held as collateral on loaned securities. Advisory fees paid by the Fund are reduced by an amount equal to its pro-rata share of the advisory and administration fees paid by the Fund due to its investment in the Liquidity Fund. For the year ended October 31, 2023, advisory fees paid were reduced by $60,903 relating to the Fund's investment in the Liquidity Fund.
A summary of the Fund's transactions in shares of affiliated investments during the year ended October 31, 2023 is as follows:
| AFFILIATED INVESTMENT COMPANY | VALUE OCTOBER 31, 2022 | PURCHASES AT COST | PROCEEDS FROM SALES | DIVIDEND INCOME | REALIZED GAIN (LOSS) | CHANGE IN UNREALIZED APPRECIATION (DEPRECIATION) | VALUE OCTOBER 31, 2023 | ||||||||||||||||||||||||
Liquidity Fund | $ | 18,606,089 | $ | 584,205,167 | $ | 559,852,131 | $ | 1,850,274 | $ | — | $ | — | $ | 42,959,125 | |||||||||||||||||
59
Morgan Stanley Global Fixed Income Opportunities Fund
Notes to Financial Statements ◼ October 31, 2023 continued
The Fund has an unfunded noncontributory defined benefit pension plan covering certain independent Trustees of the Fund who will have served as independent Trustees for at least five years at the time of retirement. Benefits under this plan are based on factors which include years of service and compensation. The Trustees voted to close the plan to new participants and eliminate the future benefits growth due to increases to compensation after July 31, 2003. Aggregate pension costs for the year ended October 31, 2023, included in "Trustees' fees and expenses" in the Statement of Operations amounted to $2,150. At October 31, 2023, the Fund had an accrued pension liability of $37,016, which is reflected as "Trustees' fees" in the Statement of Assets and Liabilities.
The Fund has an unfunded Deferred Compensation Plan (the "Compensation Plan"), which allows each independent Trustee to defer payment of all, or a portion, of the fees he or she receives for serving on the Board of Trustees. Each eligible Trustee generally may elect to have the deferred amounts credited with a return equal to the total return on one or more of the Morgan Stanley funds that are offered as investment options under the Compensation Plan. Appreciation/depreciation and distributions received from these investments are recorded with an offsetting increase/decrease in the deferred compensation obligation and do not affect the NAV of the Fund.
8. Custodian Fees
State Street (the "Custodian") also serves as Custodian for the Fund in accordance with a Custodian Agreement. The Custodian holds cash, securities and other assets of the Fund as required by the Act. Custody fees are payable monthly based on assets held in custody, investment purchases and sales activity and account maintenance fees, plus reimbursement for certain out-of-pocket expenses.
60
Morgan Stanley Global Fixed Income Opportunities Fund
Notes to Financial Statements ◼ October 31, 2023 continued
9. Shares of Beneficial Interest
Transactions in shares of beneficial interest were as follows:
| FOR THE YEAR ENDED OCTOBER 31, 2023 | FOR THE YEAR ENDED OCTOBER 31, 2022 | ||||||||||||||||||
SHARES | AMOUNT | SHARES | AMOUNT | ||||||||||||||||
CLASS A SHARES | |||||||||||||||||||
Sold | 1,908,907 | $ | 9,504,861 | 1,930,152 | $ | 10,431,210 | |||||||||||||
Reinvestment of dividends | 678,885 | 3,366,760 | 531,631 | 2,841,942 | |||||||||||||||
Redeemed | (4,311,416 | ) | (21,499,518 | ) | (6,497,884 | ) | (34,629,682 | ) | |||||||||||
Net decrease — Class A | (1,723,624 | ) | (8,627,897 | ) | (4,036,101 | ) | (21,356,530 | ) | |||||||||||
CLASS L SHARES | |||||||||||||||||||
Reinvestment of dividends | 31,205 | 154,669 | 24,538 | 130,867 | |||||||||||||||
Redeemed | (169,841 | ) | (846,027 | ) | (116,281 | ) | (611,820 | ) | |||||||||||
Net decrease — Class L | (138,636 | ) | (691,358 | ) | (91,743 | ) | (480,953 | ) | |||||||||||
CLASS I SHARES | |||||||||||||||||||
Sold | 51,083,342 | 259,258,139 | 27,217,929 | 147,901,081 | |||||||||||||||
Reinvestment of dividends | 5,895,897 | 29,652,612 | 3,716,679 | 20,175,800 | |||||||||||||||
Redeemed | (43,570,486 | ) | (220,080,952 | ) | (66,430,968 | ) | (360,619,007 | ) | |||||||||||
Net increase (decrease) — Class I | 13,408,753 | 68,829,799 | (35,496,360 | ) | (192,542,126 | ) | |||||||||||||
CLASS C SHARES | |||||||||||||||||||
Sold | 260,505 | 1,290,303 | 623,691 | 3,327,088 | |||||||||||||||
Reinvestment of dividends | 170,713 | 845,781 | 130,204 | 696,236 | |||||||||||||||
Redeemed | (1,183,662 | ) | (5,888,470 | ) | (2,134,587 | ) | (11,367,714 | ) | |||||||||||
Net decrease — Class C | (752,444 | ) | (3,752,386 | ) | (1,380,692 | ) | (7,344,390 | ) | |||||||||||
CLASS R6 SHARES* | |||||||||||||||||||
Sold | 6,680,552 | 33,118,530 | 30,897 | 158,045 | |||||||||||||||
Reinvestment of dividends | 2,522,755 | 12,684,253 | 1,755,083 | 9,484,097 | |||||||||||||||
Redeemed | (1,598,579 | ) | (8,127,589 | ) | (5,791,890 | ) | (30,104,780 | ) | |||||||||||
Net increase (decrease) — Class R6* | 7,604,728 | 37,675,194 | (4,005,910 | ) | (20,462,638 | ) | |||||||||||||
CLASS IR SHARES | |||||||||||||||||||
Reinvestment of dividends | 139 | 698 | 85 | 458 | |||||||||||||||
Net increase (decrease) in Fund | 18,398,916 | $ | 93,434,050 | (45,010,721 | ) | $ | (242,186,179 | ) | |||||||||||
* Effective April 29, 2022, Class IS shares were renamed Class R6 shares.
61
Morgan Stanley Global Fixed Income Opportunities Fund
Notes to Financial Statements ◼ October 31, 2023 continued
10. Federal Income Tax Status
It is the Fund's intention to continue to qualify as a regulated investment company and distribute all of its taxable and tax-exempt income. Accordingly, no provision for federal income taxes is required in the financial statements.
The Fund may be subject to taxes imposed by countries in which it invests. Such taxes are generally based on income and/or capital gains earned or repatriated. Taxes are accrued based on net investment income, net realized gains and net unrealized appreciation as such income and/or gains are earned. Taxes may also be based on transactions in foreign currency and are accrued based on the value of investments denominated in such currency.
FASB ASC 740-10, "Income Taxes — Overall", sets forth a minimum threshold for financial statement recognition of the benefit of a tax position taken or expected to be taken in a tax return. Management has concluded there are no significant uncertain tax positions that would require recognition in the financial statements. If applicable, the Fund recognizes interest accrued related to unrecognized tax benefits in "Interest Expense" and penalties in "Other Expenses" in the Statement of Operations. The Fund files tax returns with the U.S. Internal Revenue Service, New York and various states. Generally, each of the tax years in the four-year period ended October 31, 2023 remains subject to examination by taxing authorities.
The tax character of distributions paid may differ from the character of distributions shown for GAAP purposes due to short-term capital gains being treated as ordinary income for tax purposes. The tax character of distributions paid during fiscal years 2023 and 2022 was as follows:
2023 DISTRIBUTIONS PAID FROM: | 2022 DISTRIBUTIONS PAID FROM: | ||||||||||
| ORDINARY INCOME | PAID-IN CAPITAL | ORDINARY INCOME | |||||||||
| $ | 42,968,263 | $ | 6,969,930 | $ | 36,492,833 | ||||||
The amount and character of income and gains to be distributed are determined in accordance with income tax regulations which may differ from GAAP. These book/tax differences are either considered temporary or permanent in nature.
Temporary differences are attributable to differing book and tax treatments for the timing of the recognition of gains (losses) on certain investment transactions and the timing of the deductibility of certain expenses.
The Fund had no permanent differences causing reclassifications among the components of net assets for the year ended October 31, 2023.
62
Morgan Stanley Global Fixed Income Opportunities Fund
Notes to Financial Statements ◼ October 31, 2023 continued
At October 31, 2023, the Fund had no distributable earnings on a tax basis.
At October 31, 2023, the Fund had available for federal income tax purposes unused short-term and long-term capital losses of $22,429,143 and $33,955,909, respectively, that do not have an expiration date.
To the extent that capital loss carryforwards are used to offset any future capital gains realized, no capital gains tax liability will be incurred by the Fund for gains realized and not distributed. To the extent that capital gains are offset, such gains will not be distributed to the shareholders.
11. Credit Facility
The Fund and other Morgan Stanley funds participated in a $300,000,000 committed, unsecured revolving line of credit facility (the "Facility") with State Street. Effective April 17, 2023, the committed line amount increased to $500,000,000. This Facility is to be used for temporary emergency purposes or funding of shareholder redemption requests. The interest rate for any funds drawn will be based on the federal funds rate or overnight bank funding rate plus a spread. The Facility also has a commitment fee of 0.25% per annum based on the unused portion of the Facility, which is allocated among participating funds based on relative net assets. During the year ended October 31, 2023, the Fund did not have any borrowings under the Facility.
12. Other
At October 31, 2023, the Fund had record owners of 10% or greater. Investment activities of these shareholders could have a material impact on the Fund. The aggregate percentage of such owners was 64.6%.
13. Market Risk and Risks Relating to Certain Financial Instruments
The Fund may invest in mortgage securities, including securities issued by the Federal National Mortgage Association ("FNMA") and Federal Home Loan Mortgage Corporation ("FHLMC"). These are fixed income securities that derive their value from or represent interests in a pool of mortgages or mortgage securities. An unexpectedly high rate of defaults on the mortgages held by a mortgage pool may adversely affect the value of a mortgage-backed security and could result in losses to the Fund. The risk of such defaults is generally higher in the case of mortgage pools that include sub-prime mortgages. Sub-prime mortgages refer to loans made to borrowers with weakened credit histories or with a lower capacity to make timely payments on their mortgages. The securities held by the Fund are not backed by sub-prime mortgages.
63
Morgan Stanley Global Fixed Income Opportunities Fund
Notes to Financial Statements ◼ October 31, 2023 continued
Additionally, securities issued by FNMA and FHLMC are not backed by or entitled to the full faith and credit of the United States; rather, they are supported by the right of the issuer to borrow from the U.S. Department of the Treasury.
The Federal Housing Finance Agency ("FHFA") serves as conservator of FNMA and FHLMC and the U.S. Department of the Treasury has agreed to provide capital as needed to ensure FNMA and FHLMC continue to provide liquidity to the housing and mortgage markets.
The Fund may lend securities to qualified financial institutions, such as broker/dealers, to earn additional income. Risks in securities lending transactions are that a borrower may not provide additional collateral when required or return the securities when due, and that the value of the short-term investments will be less than the amount of cash collateral plus any rebate that is required to be returned to the borrower.
Foreign security and currency transactions may involve certain considerations and risks not typically associated with those of U.S. dollar denominated transactions as a result of, among other factors, fluctuations of exchange rates in relation to the U.S. dollar, the possibility of lower levels of governmental supervision and regulation of foreign securities markets and the possibility of political or economic instability.
An investment in the Fund is based on the values of the Fund's investments, which may change due to economic and other events that affect markets generally, as well as those that affect particular regions, countries, industries, companies or governments. The risks associated with these developments may be magnified if social, political, economic and other conditions and events (such as war, natural disasters, health emergencies (e.g., epidemics and pandemics), terrorism, conflicts, social unrest, recessions, inflation, rapid interest rate changes and supply chain disruptions) adversely interrupt the global economy and financial markets. It is difficult to predict when events affecting the U.S. or global financial markets may occur, the effects that such events may have and the duration of those effects (which may last for extended periods). These events may negatively impact broad segments of businesses and populations and have a significant and rapid negative impact on the performance of the Fund's investments, adversely affect and increase the volatility of the Fund's share price and exacerbate pre-existing risks to the Fund. The occurrence, duration and extent of these or other types of adverse economic and market conditions and uncertainty over the long term cannot be reasonably projected or estimated at this time. The ultimate impact of public health emergencies or other adverse economic or market developments and the extent to which the associated conditions impact the Fund and its investments will also depend on other future developments, which are highly uncertain,difficult to accurately predict and subject to change at any time. The financial performance of the Fund's investments (and, in turn, the Fund's investment results) as well as their liquidity may be adversely affected because of these and similar types of factors and developments.
64
Morgan Stanley Global Fixed Income Opportunities Fund
Notes to Financial Statements ◼ October 31, 2023 continued
14. LIBOR Discontinuance or Unavailability Risk
The London Interbank Offering Rate ("LIBOR") was a leading floating rate benchmark used in loans, notes, derivatives and other instruments or investments. As a result of benchmark reforms, publication of most LIBOR settings has ceased. Some LIBOR settings continue to be published but only on a temporary, synthetic and non-representative basis. Regulated entities have generally ceased entering into new LIBOR contracts in connection with regulatory guidance or prohibitions. Public and private sector actors have worked to establish new or alternative reference rates to be used in place of LIBOR. Certain loans, notes, derivatives, and other instruments or investments held by the Fund may be impacted by the foregoing. There is no assurance that the composition or characteristics of any such new or alternative reference rate will be similar to or produce the same value or economic equivalence as LIBOR or that it will have the same volume or liquidity as did LIBOR , which may affect the value or liquidity or return on certain of the Fund's investments and result in costs incurred in connection with closing out positions and entering into new trades.
Neither the effect of the LIBOR transition process nor its ultimate success can yet be known. The transition process might lead to increased volatility and illiquidity in markets for, and reduce the effectiveness of hedges placed against, instruments whose terms currently include (or previously included) LIBOR. While some LIBOR-based instruments contemplated a scenario where LIBOR is no longer available by providing for an alternative rate-setting methodology, there may be significant uncertainty regarding the effectiveness of any such alternative methodologies to replicate or replace LIBOR. Some of the Fund's investments may be so-called "tough legacy" LIBOR instruments which may not have effective alternative rate-setting provisions or may involve counterparties who are unwilling to add or exercise rights under alternative rate-setting provisions in such instruments. On March 15, 2022, the Adjustable Interest Rate (LIBOR) Act was signed into law. This law provides a statutory fallback mechanism on a nationwide basis to replace U.S. Dollar LIBOR with a benchmark rate that is selected by the Board of Governors of the Federal Reserve System based on the Secured Overnight Financing Rate ("SOFR") for tough legacy contracts. On February 27, 2023, the final rule in connection with this law became effective, establishing benchmark replacements based on SOFR and Term SOFR (a forward-looking measurement of market expectations of SOFR implied from certain derivatives markets) for applicable tough legacy contracts governed by U.S. law. In addition, the FCA has announced that it will require the publication of the one-month, three-month and six-month U.S. Dollar LIBOR settings on the basis of a changed methodology (known as "synthetic LIBOR"), after June 30, 2023 through at least September 30, 2024, addressing non-U.S. law governed U.S. Dollar LIBOR instruments, but this synthetic LIBOR will be designated by the FCA as unrepresentative of the underlying market that it seeks to measure and will be solely available for use in legacy transactions. The transition of investments from LIBOR to a new or replacement rate as a result of amendment, application of existing fallbacks, statutory requirements, the application of synthetic LIBOR or otherwise may also result in a
65
Morgan Stanley Global Fixed Income Opportunities Fund
Notes to Financial Statements ◼ October 31, 2023 continued
reduction in the value of certain instruments held by the Fund or a reduction in the effectiveness of related Fund transactions such as hedges. In addition, a liquid market for newly-issued instruments that use a reference rate other than LIBOR is still developing. There may also be challenges for the Fund to enter into hedging transactions against such newly-issued instruments until a market for such hedging transactions more fully develops. All of the aforementioned may adversely affect the Fund's investments (including their volatility, value and liquidity) and, as a result, the performance or NAV.
66
Morgan Stanley Global Fixed Income Opportunities Fund
Financial Highlights
Selected ratios and per share data for a share of beneficial interest outstanding throughout each period:
FOR THE YEAR ENDED OCTOBER 31, | |||||||||||||||||||||||
2023 | 2022 | 2021 | 2020 | 2019 | |||||||||||||||||||
Class A Shares | |||||||||||||||||||||||
Selected Per Share Data: | |||||||||||||||||||||||
Net asset value, beginning of period | $ | 4.97 | $ | 5.68 | $ | 5.70 | $ | 5.73 | $ | 5.54 | |||||||||||||
Income (loss) from investment operations: | |||||||||||||||||||||||
| Net investment income(1) | 0.23 | 0.17 | 0.14 | 0.15 | 0.20 | ||||||||||||||||||
Net realized and unrealized gain (loss) | (0.02 | ) | (0.67 | ) | (0.01 | ) | (0.00 | )(2) | 0.26 | ||||||||||||||
Total income (loss) from investment operations | 0.21 | (0.50 | ) | 0.13 | 0.15 | 0.46 | |||||||||||||||||
Less distributions from: | |||||||||||||||||||||||
| Net investment income | (0.27 | ) | (0.21 | ) | (0.14 | ) | (0.18 | ) | (0.27 | ) | |||||||||||||
Net realized gain | — | — | (0.01 | ) | — | — | |||||||||||||||||
Paid-in-Capital | (0.05 | ) | — | — | — | — | |||||||||||||||||
Total distributions | (0.32 | ) | (0.21 | ) | (0.15 | ) | (0.18 | ) | (0.27 | ) | |||||||||||||
Net asset value, end of period | $ | 4.86 | $ | 4.97 | $ | 5.68 | $ | 5.70 | $ | 5.73 | |||||||||||||
Total Return | 4.26 | %(3) | (8.91 | )%(3) | 2.26 | %(4) | 2.79 | %(4) | 8.55 | %(3) | |||||||||||||
Ratios to Average Net Assets: | |||||||||||||||||||||||
Net expenses | 0.85 | %(5) | 0.83 | %(5) | 0.83 | %(5) | 0.82 | %(5) | 0.86 | %(5) | |||||||||||||
Net expenses excluding interest expenses | N/A | 0.83 | %(5) | N/A | 0.82 | %(5) | N/A | ||||||||||||||||
Net investment income | 4.56 | %(5) | 3.18 | %(5) | 2.52 | %(5) | 2.71 | %(5) | 3.62 | %(5) | |||||||||||||
Rebate from Morgan Stanley affiliate | 0.01 | % | 0.00 | %(6) | 0.00 | %(6) | 0.01 | % | 0.01 | % | |||||||||||||
Supplemental Data: | |||||||||||||||||||||||
Net assets, end of period, in thousands | $ | 51,476 | $ | 61,181 | $ | 92,889 | $ | 112,310 | $ | 110,978 | |||||||||||||
| Portfolio turnover rate | 118 | % | 62 | % | 115 | % | 106 | % | 94 | % | |||||||||||||
(1) The per share amounts were computed using an average number of shares outstanding during the period.
(2) Amount is less than $0.005 per share.
(3) Does not reflect the deduction of sales charge. Calculated based on the net asset value as of the last business day of the period.
(4) Calculated using the NAV for US GAAP financial reporting purposes and as such differs from the total return presented in the Fund Report and Performance Summary. Does not reflect the deduction of sales charge.
(5) The ratios reflect the rebate of certain Fund expenses in connection with investments in a Morgan Stanley affiliate during the period. The effect of the rebate on the ratios is disclosed in the above table as "Rebate from Morgan Stanley affiliate."
(6) Amount is less than 0.005%.
See Notes to Financial Statements
67
Morgan Stanley Global Fixed Income Opportunities Fund
Financial Highlights continued
FOR THE YEAR ENDED OCTOBER 31, | |||||||||||||||||||||||
2023 | 2022 | 2021 | 2020 | 2019 | |||||||||||||||||||
Class L Shares | |||||||||||||||||||||||
Selected Per Share Data: | |||||||||||||||||||||||
Net asset value, beginning of period | $ | 4.96 | $ | 5.68 | $ | 5.70 | $ | 5.73 | $ | 5.54 | |||||||||||||
Income (loss) from investment operations: | |||||||||||||||||||||||
| Net investment income(1) | 0.21 | 0.15 | 0.13 | 0.14 | 0.19 | ||||||||||||||||||
Net realized and unrealized gain (loss) | (0.01 | ) | (0.67 | ) | (0.01 | ) | (0.00 | )(2) | 0.25 | ||||||||||||||
Total income (loss) from investment operations | 0.20 | (0.52 | ) | 0.12 | 0.14 | 0.44 | |||||||||||||||||
Less distributions from: | |||||||||||||||||||||||
| Net investment income | (0.25 | ) | (0.20 | ) | (0.13 | ) | (0.17 | ) | (0.25 | ) | |||||||||||||
Net realized gain | — | — | (0.01 | ) | — | — | |||||||||||||||||
Paid-in-Capital | (0.05 | ) | — | — | — | — | |||||||||||||||||
Total distributions | (0.30 | ) | (0.20 | ) | (0.14 | ) | (0.17 | ) | (0.25 | ) | |||||||||||||
Net asset value, end of period | $ | 4.86 | $ | 4.96 | $ | 5.68 | $ | 5.70 | $ | 5.73 | |||||||||||||
Total Return | 4.09 | %(3) | (9.37 | )%(3) | 1.96 | %(4) | 2.53 | %(4) | 8.25 | %(3) | |||||||||||||
Ratios to Average Net Assets: | |||||||||||||||||||||||
Net expenses | 1.22 | %(5) | 1.14 | %(5) | 1.12 | %(5) | 1.07 | %(5) | 1.14 | %(5) | |||||||||||||
Net expenses excluding interest expenses | N/A | 1.14 | %(5) | N/A | 1.07 | %(5) | N/A | ||||||||||||||||
Net investment income | 4.19 | %(5) | 2.90 | %(5) | 2.23 | %(5) | 2.47 | %(5) | 3.38 | %(5) | |||||||||||||
Rebate from Morgan Stanley affiliate | 0.01 | % | 0.00 | %(6) | 0.00 | %(6) | 0.01 | % | 0.01 | % | |||||||||||||
Supplemental Data: | |||||||||||||||||||||||
Net assets, end of period, in thousands | $ | 2,410 | $ | 3,152 | $ | 4,125 | $ | 4,667 | $ | 5,557 | |||||||||||||
| Portfolio turnover rate | 118 | % | 62 | % | 115 | % | 106 | % | 94 | % | |||||||||||||
(1) The per share amounts were computed using an average number of shares outstanding during the period.
(2) Amount is less than $0.005 per share.
(3) Calculated based on the net asset value as of the last business day of the period.
(4) Calculated using the NAV for US GAAP financial reporting purposes and as such differs from the total return presented in the Fund Report and Performance Summary.
(5) The ratios reflect the rebate of certain Fund expenses in connection with investments in a Morgan Stanley affiliate during the period. The effect of the rebate on the ratios is disclosed in the above table as "Rebate from Morgan Stanley affiliate."
(6) Amount is less than 0.005%.
See Notes to Financial Statements
68
Morgan Stanley Global Fixed Income Opportunities Fund
Financial Highlights continued
FOR THE YEAR ENDED OCTOBER 31, | |||||||||||||||||||||||
2023 | 2022 | 2021 | 2020 | 2019 | |||||||||||||||||||
Class I Shares | |||||||||||||||||||||||
Selected Per Share Data: | |||||||||||||||||||||||
Net asset value, beginning of period | $ | 5.03 | $ | 5.75 | $ | 5.77 | $ | 5.80 | $ | 5.60 | |||||||||||||
Income (loss) from investment operations: | |||||||||||||||||||||||
| Net investment income(1) | 0.24 | 0.19 | 0.16 | 0.17 | 0.22 | ||||||||||||||||||
Net realized and unrealized gain (loss) | (0.01 | ) | (0.68 | ) | (0.01 | ) | (0.00 | )(2) | 0.26 | ||||||||||||||
Total income (loss) from investment operations | 0.23 | (0.49 | ) | 0.15 | 0.17 | 0.48 | |||||||||||||||||
Less distributions from: | |||||||||||||||||||||||
| Net investment income | (0.28 | ) | (0.23 | ) | (0.16 | ) | (0.20 | ) | (0.28 | ) | |||||||||||||
Net realized gain | — | — | (0.01 | ) | — | — | |||||||||||||||||
Paid-in-Capital | (0.05 | ) | — | — | — | — | |||||||||||||||||
Total distributions | (0.33 | ) | (0.23 | ) | (0.17 | ) | (0.20 | ) | (0.28 | ) | |||||||||||||
Net asset value, end of period | $ | 4.93 | $ | 5.03 | $ | 5.75 | $ | 5.77 | $ | 5.80 | |||||||||||||
Total Return | 4.68 | %(3) | (8.74 | )%(3) | 2.51 | %(4) | 3.03 | %(4) | 8.93 | %(3) | |||||||||||||
Ratios to Average Net Assets: | |||||||||||||||||||||||
Net expenses | 0.59 | %(5) | 0.56 | %(5) | 0.55 | %(5) | 0.55 | %(5) | 0.59 | %(5) | |||||||||||||
Net expenses excluding interest expenses | N/A | 0.56 | %(5) | N/A | 0.55 | %(5) | N/A | ||||||||||||||||
Net investment income | 4.82 | %(5) | 3.42 | %(5) | 2.79 | %(5) | 2.97 | %(5) | 3.88 | %(5) | |||||||||||||
Rebate from Morgan Stanley affiliate | 0.01 | % | 0.00 | %(6) | 0.00 | %(6) | 0.01 | % | 0.01 | % | |||||||||||||
Supplemental Data: | |||||||||||||||||||||||
Net assets, end of period, in thousands | $ | 476,677 | $ | 419,470 | $ | 683,692 | $ | 635,329 | $ | 425,720 | |||||||||||||
| Portfolio turnover rate | 118 | % | 62 | % | 115 | % | 106 | % | 94 | % | |||||||||||||
(1) The per share amounts were computed using an average number of shares outstanding during the period.
(2) Amount is less than $0.005.
(3) Calculated based on the net asset value as of the last business day of the period.
(4) Calculated using the NAV for US GAAP financial reporting purposes and as such differs from the total return presented in the Fund Report and Performance Summary.
(5) The ratios reflect the rebate of certain Fund expenses in connection with investments in a Morgan Stanley affiliate during the period. The effect of the rebate on the ratios is disclosed in the above table as "Rebate from Morgan Stanley affiliate."
(6) Amount is less than 0.005%.
See Notes to Financial Statements
69
Morgan Stanley Global Fixed Income Opportunities Fund
Financial Highlights continued
FOR THE YEAR ENDED OCTOBER 31, | |||||||||||||||||||||||
2023 | 2022 | 2021 | 2020 | 2019 | |||||||||||||||||||
Class C Shares | |||||||||||||||||||||||
Selected Per Share Data: | |||||||||||||||||||||||
Net asset value, beginning of period | $ | 4.96 | $ | 5.67 | $ | 5.69 | $ | 5.72 | $ | 5.53 | |||||||||||||
Income (loss) from investment operations: | |||||||||||||||||||||||
| Net investment income(1) | 0.19 | 0.13 | 0.10 | 0.11 | 0.16 | ||||||||||||||||||
Net realized and unrealized gain (loss) | (0.02 | ) | (0.67 | ) | (0.01 | ) | (0.00 | )(2) | 0.26 | ||||||||||||||
Total income (loss) from investment operations | 0.17 | (0.54 | ) | 0.09 | 0.11 | 0.42 | |||||||||||||||||
Less distributions from: | |||||||||||||||||||||||
| Net investment income | (0.23 | ) | (0.17 | ) | (0.10 | ) | (0.14 | ) | (0.23 | ) | |||||||||||||
Net realized gain | — | — | (0.01 | ) | — | — | |||||||||||||||||
Paid-in-Capital | (0.05 | ) | — | — | — | — | |||||||||||||||||
Total distributions | (0.28 | ) | (0.17 | ) | (0.11 | ) | (0.14 | ) | (0.23 | ) | |||||||||||||
Net asset value, end of period | $ | 4.85 | $ | 4.96 | $ | 5.67 | $ | 5.69 | $ | 5.72 | |||||||||||||
Total Return | 3.47 | %(3) | (9.61 | )%(3) | 1.52 | %(4) | 2.05 | %(4) | 7.77 | %(3) | |||||||||||||
Ratios to Average Net Assets: | |||||||||||||||||||||||
Net expenses | 1.61 | %(5) | 1.57 | %(5) | 1.56 | %(5) | 1.55 | %(5) | 1.59 | %(5) | |||||||||||||
Net expenses excluding interest expenses | N/A | 1.57 | %(5) | N/A | 1.55 | %(5) | N/A | ||||||||||||||||
Net investment income | 3.80 | %(5) | 2.43 | %(5) | 1.79 | %(5) | 1.98 | %(5) | 2.91 | %(5) | |||||||||||||
Rebate from Morgan Stanley affiliate | 0.01 | % | 0.00 | %(6) | 0.00 | %(6) | 0.01 | % | 0.01 | % | |||||||||||||
Supplemental Data: | |||||||||||||||||||||||
Net assets, end of period, in thousands | $ | 13,914 | $ | 17,957 | $ | 28,359 | $ | 32,395 | $ | 29,890 | |||||||||||||
| Portfolio turnover rate | 118 | % | 62 | % | 115 | % | 106 | % | 94 | % | |||||||||||||
(1) The per share amounts were computed using an average number of shares outstanding during the period.
(2) Amount is less than $0.005 per share.
(3) Does not reflect the deduction of sales charge. Calculated based on the net asset value as of the last business day of the period.
(4) Calculated using the NAV for US GAAP financial reporting purposes and as such differs from the total return presented in the Fund Report and Performance Summary. Does not reflect the deduction of sales charge.
(5) The ratios reflect the rebate of certain Fund expenses in connection with investments in a Morgan Stanley affiliate during the period. The effect of the rebate on the ratios is disclosed in the above table as "Rebate from Morgan Stanley affiliate."
(6) Amount is less than 0.005%.
See Notes to Financial Statements
70
Morgan Stanley Global Fixed Income Opportunities Fund
Financial Highlights continued
FOR THE YEAR ENDED OCTOBER 31, | |||||||||||||||||||||||
2023 | 2022 | 2021 | 2020 | 2019 | |||||||||||||||||||
| Class R6 Shares* | |||||||||||||||||||||||
Selected Per Share Data: | |||||||||||||||||||||||
Net asset value, beginning of period | $ | 5.03 | $ | 5.75 | $ | 5.77 | $ | 5.80 | $ | 5.61 | |||||||||||||
Income (loss) from investment operations: | |||||||||||||||||||||||
| Net investment income(1) | 0.25 | 0.19 | 0.17 | 0.17 | 0.23 | ||||||||||||||||||
Net realized and unrealized gain (loss) | (0.01 | ) | (0.68 | ) | (0.02 | ) | (0.00 | )(2) | 0.25 | ||||||||||||||
Total income (loss) from investment operations | 0.24 | (0.49 | ) | 0.15 | 0.17 | 0.48 | |||||||||||||||||
Less distributions from: | |||||||||||||||||||||||
| Net investment income | (0.29 | ) | (0.23 | ) | (0.16 | ) | (0.20 | ) | (0.29 | ) | |||||||||||||
Net realized gain | — | — | (0.01 | ) | — | — | |||||||||||||||||
Paid-in-Capital | (0.05 | ) | — | — | — | — | |||||||||||||||||
Total distributions | (0.34 | ) | (0.23 | ) | (0.17 | ) | (0.20 | ) | (0.29 | ) | |||||||||||||
Net asset value, end of period | $ | 4.93 | $ | 5.03 | $ | 5.75 | $ | 5.77 | $ | 5.80 | |||||||||||||
Total Return | 4.78 | %(3) | (8.66 | )%(3) | 2.59 | %(4) | 3.11 | %(4) | 9.01 | %(3) | |||||||||||||
Ratios to Average Net Assets: | |||||||||||||||||||||||
Net expenses | 0.49 | %(5) | 0.48 | %(5) | 0.47 | %(5) | 0.47 | %(5) | 0.51 | %(5) | |||||||||||||
Net expenses excluding interest expenses | N/A | 0.48 | %(5) | N/A | 0.47 | %(5) | N/A | ||||||||||||||||
Net investment income | 4.92 | %(5) | 3.55 | %(5) | 2.87 | %(5) | 3.07 | %(5) | 3.97 | %(5) | |||||||||||||
Rebate from Morgan Stanley affiliate | 0.01 | % | 0.00 | %(6) | 0.00 | %(6) | 0.01 | % | 0.01 | % | |||||||||||||
Supplemental Data: | |||||||||||||||||||||||
Net assets, end of period, in thousands | $ | 221,499 | $ | 187,940 | $ | 237,872 | $ | 189,052 | $ | 208,058 | |||||||||||||
| Portfolio turnover rate | 118 | % | 62 | % | 115 | % | 106 | % | 94 | % | |||||||||||||
* Effective April 29, 2022, Class IS shares were renamed Class R6 shares.
(1) The per share amounts were computed using an average number of shares outstanding during the period.
(2) Amount is less than $0.005 per share.
(3) Calculated based on the net asset value as of the last business day of the period.
(4) Calculated using the NAV for US GAAP financial reporting purposes and as such differs from the total return presented in the Fund Report and Performance Summary.
(5) The ratios reflect the rebate of certain Fund expenses in connection with investments in a Morgan Stanley affiliate during the period. The effect of the rebate on the ratios is disclosed in the above table as "Rebate from Morgan Stanley affiliate."
(6) Amount is less than 0.005%.
See Notes to Financial Statements
71
Morgan Stanley Global Fixed Income Opportunities Fund
Financial Highlights continued
FOR THE YEAR ENDED OCTOBER 31, | |||||||||||||||||||||||
2023 | 2022 | 2021 | 2020 | 2019 | |||||||||||||||||||
Class IR Shares | |||||||||||||||||||||||
Selected Per Share Data: | |||||||||||||||||||||||
Net asset value, beginning of period | $ | 5.03 | $ | 5.75 | $ | 5.77 | $ | 5.81 | $ | 5.61 | |||||||||||||
Income (loss) from investment operations: | |||||||||||||||||||||||
| Net investment income(1) | 0.25 | 0.18 | 0.16 | 0.17 | 0.22 | ||||||||||||||||||
Net realized and unrealized gain (loss) | (0.01 | ) | (0.67 | ) | (0.01 | ) | (0.01 | ) | 0.27 | ||||||||||||||
Total income (loss) from investment operations | 0.24 | (0.49 | ) | 0.15 | 0.16 | 0.49 | |||||||||||||||||
Less distributions from: | |||||||||||||||||||||||
| Net investment income | (0.29 | ) | (0.23 | ) | (0.16 | ) | (0.20 | ) | (0.29 | ) | |||||||||||||
Net realized gain | — | — | (0.01 | ) | — | — | |||||||||||||||||
Paid-in-Capital | (0.05 | ) | — | — | — | — | |||||||||||||||||
Total distributions | (0.34 | ) | (0.23 | ) | (0.17 | ) | (0.20 | ) | (0.29 | ) | |||||||||||||
Net asset value, end of period | $ | 4.93 | $ | 5.03 | $ | 5.75 | $ | 5.77 | $ | 5.81 | |||||||||||||
Total Return | 4.78 | %(2) | (8.66 | )%(2) | 2.59 | %(3) | 2.93 | %(3) | 9.00 | %(2) | |||||||||||||
Ratios to Average Net Assets: | |||||||||||||||||||||||
| Net expenses | 0.49 | %(4)(5) | 0.48 | %(4)(5) | 0.47 | %(4)(5) | 0.47 | %(4)(5) | 0.51 | %(4)(5) | |||||||||||||
Net expenses excluding interest expenses | N/A | 0.48 | %(4)(5) | N/A | 0.47 | %(4)(5) | N/A | ||||||||||||||||
| Net investment income | 4.92 | %(4)(5) | 3.32 | %(4)(5) | 2.74 | %(4)(5) | 2.97 | %(4)(5) | 3.89 | %(4)(5) | |||||||||||||
Rebate from Morgan Stanley affiliate | 0.01 | % | 0.00 | %(6) | 0.00 | %(6) | 0.01 | % | 0.01 | % | |||||||||||||
Supplemental Data: | |||||||||||||||||||||||
Net assets, end of period, in thousands | $ | 11 | $ | 10 | $ | 11 | $ | 11 | $ | 10 | |||||||||||||
| Portfolio turnover rate | 118 | % | 62 | % | 115 | % | 106 | % | 94 | % | |||||||||||||
(1) The per share amounts were computed using an average number of shares outstanding during the period.
(2) Calculated based on the net asset value as of the last business day of the period.
(3) Calculated using the NAV for US GAAP financial reporting purposes and as such differs from the total return presented in the Fund Report and Performance Summary.
(4) The ratios reflect the rebate of certain Fund expenses in connection with investments in a Morgan Stanley affiliate during the period. The effect of the rebate on the ratios is disclosed in the above table as "Rebate from Morgan Stanley affiliate."
(5) If the Fund had borne all of its expenses that were waived by the Adviser/Administrator, the annualized expense and net investment loss ratios would have been as follows:
PERIOD ENDED | EXPENSE | NET INVESTMENT | |||||||||
October 31, 2023 | 20.67 | % | (15.26 | )% | |||||||
October 31, 2022 | 18.79 | (14.99 | ) | ||||||||
October 31, 2021 | 19.14 | (15.93 | ) | ||||||||
October 31, 2020 | 19.09 | (15.65 | ) | ||||||||
October 31, 2019 | 21.28 | (16.88 | ) | ||||||||
(6) Amount is less than 0.005%.
See Notes to Financial Statements
72
Morgan Stanley Global Fixed Income Opportunities Fund
Report of Independent Registered Public Accounting Firm
To the Shareholders and Board of Trustees of
Morgan Stanley Global Fixed Income Opportunities Fund
Opinion on the Financial Statements
We have audited the accompanying statement of assets and liabilities of Morgan Stanley Global Fixed Income Opportunities Fund (the "Fund"), including the portfolio of investments, as of October 31, 2023, and the related statement of operations for the year then ended, the statements of changes in net assets for each of the two years in the period then ended, the financial highlights for each of the five years in the period then ended and the related notes (collectively referred to as the "financial statements"). In our opinion, the financial statements present fairly, in all material respects, the financial position of the Fund at October 31, 2023, the results of its operations for the year then ended, the changes in its net assets for each of the two years in the period then ended and its financial highlights for each of the five years in the period then ended, in conformity with U.S. generally accepted accounting principles.
Basis for Opinion
These financial statements are the responsibility of the Fund's management. Our responsibility is to express an opinion on the Fund's financial statements based on our audits. We are a public accounting firm registered with the Public Company Accounting Oversight Board (United States) ("PCAOB") and are required to be independent with respect to the Fund in accordance with the U.S. federal securities laws and the applicable rules and regulations of the Securities and Exchange Commission and the PCAOB.
We conducted our audits in accordance with the standards of the PCAOB. Those standards require that we plan and perform the audit to obtain reasonable assurance about whether the financial statements are free of material misstatement, whether due to error or fraud. The Fund is not required to have, nor were we engaged to perform, an audit of the Fund's internal control over financial reporting. As part of our audits, we are required to obtain an understanding of internal control over financial reporting but not for the purpose of expressing an opinion on the effectiveness of the Fund's internal control over financial reporting. Accordingly, we express no such opinion.
Our audits included performing procedures to assess the risks of material misstatement of the financial statements, whether due to error or fraud, and performing procedures that respond to those risks. Such procedures included examining, on a test basis, evidence regarding the amounts and disclosures in the financial statements. Our procedures included confirmation of securities owned as of October 31, 2023, by correspondence with the custodian, brokers and others; when replies were not received from brokers and others, we performed other auditing procedures. Our audits also included evaluating the accounting principles used and significant estimates made by management, as well as evaluating the overall presentation of the financial statements. We believe that our audits provide a reasonable basis for our opinion.

We have served as the auditor of one or more Morgan Stanley investment companies since 2000.
Boston, Massachusetts
December 22, 2023
73
Morgan Stanley Global Fixed Income Opportunities Fund
Investment Advisory Agreement Approval (unaudited)
Nature, Extent and Quality of Services
The Board reviewed and considered the nature and extent of the investment advisory services provided by the Adviser under the advisory agreement, including portfolio management, investment research and equity and fixed income securities trading. The Board reviewed similar information and factors regarding the Sub-Adviser, to the extent applicable. The Board also reviewed and considered the nature and extent of the non-advisory, administrative services provided by the Administrator under the administration agreement, including accounting, operations, clerical, bookkeeping, compliance, business management and planning, legal services and the provision of supplies, office space and utilities at the Adviser's expense. The Board also considered the Adviser's investment in personnel and infrastructure that benefits the Fund. (The Adviser, Sub-Adviser and Administrator together are referred to as the "Adviser" and the advisory, sub-advisory and administration agreements together are referred to as the "Management Agreement.") The Board also considered that the Adviser serves a variety of other investment advisory clients and has experience overseeing service providers. The Board also compared the nature of the services provided by the Adviser with similar services provided by non-affiliated advisers as prepared by Broadridge Financial Solutions, Inc. ("Broadridge").
The Board reviewed and considered the qualifications of the portfolio managers, the senior administrative managers and other key personnel of the Adviser who provide the advisory and administrative services to the Fund. The Board determined that the Adviser's portfolio managers and key personnel are well qualified by education and/or training and experience to perform the services in an efficient and professional manner. The Board concluded that the nature and extent of the advisory and administrative services provided were necessary and appropriate for the conduct of the business and investment activities of the Fund and supported its decision to approve the Management Agreement.
Performance, Fees and Expenses of the Fund
The Board reviewed the performance, fees and expenses of the Fund compared to its peers, as prepared by Broadridge, and to appropriate benchmarks where applicable. The Board discussed with the Adviser the performance goals and the actual results achieved in managing the Fund. When considering a fund's performance, the Board and the Adviser place emphasis on trends and longer-term returns (focusing on one-year, three-year and five-year performance, as of December 31, 2022, or since inception, as applicable). When a fund underperforms its benchmark and/or its peer group average, the Board and the Adviser discuss the causes of such underperformance and, where necessary, they discuss specific changes to investment strategy or investment personnel. The Board noted that the Fund's performance was better than its peer group average for the one-, three- and five-year periods. The Board discussed with the Adviser the level of the advisory and administration fees (together, the "management fee") for this Fund relative to comparable funds and/or other accounts advised by the Adviser and/or compared to its peers as prepared by Broadridge. In addition to the management fee, the Board also reviewed the Fund's total expense ratio. The Board noted that the Fund's management fee
74
Morgan Stanley Global Fixed Income Opportunities Fund
Investment Advisory Agreement Approval (unaudited) continued
and total expense ratio were lower than its peer group averages. After discussion, the Board concluded that the Fund's performance, management fee and total expense ratio were competitive with its peer group averages.
Economies of Scale
The Board considered the size and growth prospects of the Fund and how that relates to the Fund's total expense ratio and particularly the Fund's management fee rate, which does not include breakpoints. In conjunction with its review of the Adviser's profitability, the Board discussed with the Adviser how a change in assets can affect the efficiency or effectiveness of managing the Fund and whether the management fee level is appropriate relative to current and projected asset levels and/or whether the management fee structure reflects economies of scale as asset levels change. The Board has determined that its review of the actual and/or potential economies of scale of the Fund supports its decision to approve the Management Agreement.
Profitability of the Adviser and Affiliates
The Board considered information concerning the costs incurred and profits realized by the Adviser and its affiliates during the last year from their relationship with the Fund and during the last two years from their relationship with the Morgan Stanley Fund Complex and reviewed with the Adviser the cost allocation methodology used to determine the profitability of the Adviser and affiliates. The Board has determined that its review of the analysis of the Adviser's expenses and profitability supports its decision to approve the Management Agreement.
Other Benefits of the Relationship
The Board considered other direct and indirect benefits to the Adviser and/or its affiliates derived from their relationship with the Fund and other funds advised by the Adviser. These benefits may include, among other things, fees for trading, distribution and/or shareholder servicing and for transaction processing and reporting platforms used by securities lending agents, and research received by the Adviser generated from commission dollars spent on funds' portfolio trading. The Board reviewed with the Adviser these arrangements and the reasonableness of the Adviser's costs relative to the services performed. The Board has determined that its review of the other benefits received by the Adviser or its affiliates supports its decision to approve the Management Agreement.
Resources of the Adviser and Historical Relationship Between the Fund and the Adviser
The Board considered whether the Adviser is financially sound and has the resources necessary to perform its obligations under the Management Agreement. The Board also reviewed and considered the historical relationship between the Fund and the Adviser, including the organizational structure of the Adviser, the policies and procedures formulated and adopted by the Adviser for managing the Fund's
75
Morgan Stanley Global Fixed Income Opportunities Fund
Investment Advisory Agreement Approval (unaudited) continued
operations and the Board's confidence in the competence and integrity of the senior managers and key personnel of the Adviser. The Board concluded that the Adviser has the financial resources necessary to fulfill its obligations under the Management Agreement and that it is beneficial for the Fund to continue its relationship with the Adviser.
Other Factors and Current Trends
The Board considered the controls and procedures adopted and implemented by the Adviser and monitored by the Fund's Chief Compliance Officer and concluded that the conduct of business by the Adviser indicates a good faith effort on its part to adhere to high ethical standards in the conduct of the Fund's business.
General Conclusion
After considering and weighing all of the above factors, with various written materials and verbal information presented by the Adviser, the Board concluded that it would be in the best interest of the Fund and its shareholders to approve renewal of the Management Agreement for another year. In reaching this conclusion the Board did not give particular weight to any single piece of information or factor referenced above. The Board considered these factors and information over the course of the year and in numerous meetings, some of which were in executive session with only the independent Board members and their counsel present. It is possible that individual Board members may have weighed these factors, and the information presented, differently in reaching their individual decisions to approve the Management Agreement.
76
Morgan Stanley Global Fixed Income Opportunities Fund
Liquidity Risk Management Program (unaudited)
In compliance with Rule 22e-4 under the Investment Company Act of 1940, as amended (the "Liquidity Rule"), the Fund has adopted and implemented a liquidity risk management program (the "Program"), which is reasonably designed to assess and manage the risk that the Fund could not meet requests to redeem shares issued by the Fund without significant dilution of remaining investors' interests in the Fund (i.e., liquidity risk). The Fund's Board of Trustees (the "Board") previously approved the designation of the Liquidity Risk Subcommittee (the "LRS") as Program administrator. The LRS is comprised of representatives from various divisions within Morgan Stanley Investment Management.
At a meeting held on March 1-2, 2023, the Board reviewed a written report prepared by the LRS that addressed the Program's operation and assessed its adequacy, and effectiveness of implementation for the period from January 1, 2022, through December 31, 2022, as required under the Liquidity Rule. The report concluded that the Program operated effectively and was adequately and effectively implemented in all material aspects, and that the relevant controls and safeguards were appropriately designed to enable the LRS to administer the Program in compliance with the Liquidity Rule.
In accordance with the Program, the LRS assessed each Fund's liquidity risk no less frequently than annually taking into consideration certain factors, as applicable, such as (i) investment strategy and liquidity of portfolio investments, (ii) short-term and long-term cash flow projections and (iii) holdings of cash and cash equivalents and borrowing arrangements and other funding sources. Certain factors are considered under both normal and reasonably foreseeable stressed conditions.
Each Fund portfolio investment is classified into one of four liquidity categories, which classification is assessed at least monthly by the LRS. The classification is based on a determination of the number of days it is reasonably expected to take to convert the investment into cash, or sell or dispose of the investment, in current market conditions without significantly changing the market value of the investment. Liquidity classification determinations take into account various market, trading and investment-specific considerations, as well as market depth, and in some cases utilize third-party vendor data.
The Liquidity Rule limits a fund's investments in illiquid investments to 15% of its net assets and requires funds that do not primarily hold assets that are highly liquid investments to determine and maintain a minimum percentage of the fund's net assets to be invested in highly liquid investments (highly liquid investment minimum or "HLIM"). The LRS believes that the Program includes provisions reasonably designed to review, monitor and comply with the 15% limit on illiquid investments and for determining, periodically reviewing and complying with the HLIM requirement, as applicable.
There can be no assurance that the Program will achieve its objectives under all circumstances in the future. Please refer to the Fund's prospectus for more information regarding the Fund's exposure to liquidity risk and other risks to which it may be subject.
77
Morgan Stanley Global Fixed Income Opportunities Fund
Important Notices (unaudited)
Reporting to Shareholders
Each Morgan Stanley fund provides a complete schedule of portfolio holdings in its Semi-Annual and Annual Reports within 60 days of the end of the fund's second and fourth fiscal quarters. The Semi-Annual and Annual Reports are filed electronically with the Securities and Exchange Commission ("SEC") on Form N-CSRS and Form N-CSR, respectively. Morgan Stanley makes these reports available on its public website, www.morganstanley.com/im. Each Morgan Stanley non-money market fund also files a complete schedule of portfolio holdings with the SEC for the fund's first and third fiscal quarters as an attachment to Form N-PORT and monthly holding for each money market fund on Form N-MFP. Morgan Stanley does not deliver the reports for the first and third fiscal quarters to shareholders, but makes the complete schedule of portfolio holdings for the fund's first and third fiscal quarters available on its public website. The holdings for each money market fund are also posted to the Morgan Stanley public website. You may, however, obtain Form N-PORT filings (as well as the Form N-CSR, N-CSRS and N-MFP filings) by accessing the SEC's website, www.sec.gov. You can also request copies of these materials, upon payment of a duplicating fee, by electronic request at the SEC's email address (publicinfo@sec.gov).
Proxy Voting Policies and Procedures and Proxy Voting Record
You may obtain a copy of the Fund's Proxy Voting Policy and Procedures, without charge, upon request, by calling toll free 1 (800) 869-6397 or by visiting our website at www.morganstanley.com/im. This information is also available on the SEC's website at www.sec.gov.
You may obtain information regarding how the Fund voted proxies relating to portfolio securities during the most recent twelve-month period ended June 30 without charge by visiting our website at www.morganstanley.com/im. This information is also available on the SEC's website at www.sec.gov.
Householding Notice
To reduce printing and mailing costs, the Fund attempts to eliminate duplicate mailings to the same address. The Fund delivers a single copy of certain shareholder documents, including shareholder reports, prospectuses and proxy materials, to investors with the same last name who reside at the same address. Your participation in this program will continue for an unlimited period of time unless you instruct us otherwise. You can request multiple copies of these documents by calling 1 (800) 869-6397, 8:00 a.m. to 6:00 p.m., ET. Once our Customer Service Center has received your instructions, we will begin sending individual copies for each account within 30 days.
78
Morgan Stanley Global Fixed Income Opportunities Fund
Important Notices (unaudited) continued
Tailored Shareholder Reports
Effective January 24, 2023, the SEC adopted rule and form amendments to require open-end mutual funds and ETFs to transmit concise and visually engaging streamlined annual and semiannual reports to shareholders that highlight key information. Other information, including financial statements, will no longer appear in a streamlined shareholder report but must be available online, delivered free of charge upon request, and filed on a semiannual basis on Form N-CSR. The rule and form amendments have a compliance date of July 24, 2024. At this time, management is evaluating the impact of these amendments on the shareholder reports for the Morgan Stanley Funds.
79
Morgan Stanley Global Fixed Income Opportunities Fund
U.S. Customer Privacy Notice (unaudited) April 2021
FACTS | WHAT DOES MSIM DO WITH YOUR PERSONAL INFORMATION? | ||||||
Why? | Financial companies choose how they share your personal information. Federal law gives consumers the right to limit some but not all sharing. Federal law also requires us to tell you how we collect, share, and protect your personal information. Please read this notice carefully to understand what we do. | ||||||
What? | The types of personal information we collect and share depend on the product or service you have with us. This information can include: ◼ Social Security number and income ◼ investment experience and risk tolerance ◼ checking account number and wire transfer instructions | ||||||
How? | All financial companies need to share customers' personal information to run their everyday business. In the section below, we list the reasons financial companies can share their customers' personal information; the reasons MSIM chooses to share; and whether you can limit this sharing. | ||||||
Reasons we can share your personal information | Does MSIM share? | Can you limit this sharing? | |||||||||
| For our everyday business purposes — such as to process your transactions, maintain your account(s), respond to court orders and legal investigations, or report to credit bureaus | Yes | No | |||||||||
| For our marketing purposes — to offer our products and services to you | Yes | No | |||||||||
For joint marketing with other financial companies | No | We don't share | |||||||||
| For our investment management affiliates' everyday business purposes — information about your transactions, experiences, and creditworthiness | Yes | Yes | |||||||||
| For our affiliates' everyday business purposes — information about your transactions and experiences | Yes | No | |||||||||
| For our affiliates' everyday business purposes — information about your creditworthiness | No | We don't share | |||||||||
80
Morgan Stanley Global Fixed Income Opportunities Fund
U.S. Customer Privacy Notice (unaudited) continued April 2021
Reasons we can share your personal information | Does MSIM share? | Can you limit this sharing? | |||||||||
For our investment management affiliates to market to you | Yes | Yes | |||||||||
For our affiliates to market to you | No | We don't share | |||||||||
For non-affiliates to market to you | No | We don't share | |||||||||
To limit our sharing | Call toll-free (844) 312-6327 or email: imprivacyinquiries@morganstanley.com Please note: If you are a new customer, we can begin sharing your information 30 days from the date we sent this notice. When you are no longer our customer, we continue to share your information as described in this notice. However, you can contact us at any time to limit our sharing. | ||||||
Questions? | Call toll-free (844) 312-6327 or email: imprivacyinquiries@morganstanley.com | ||||||
Who we are
Who is providing this notice? | Morgan Stanley Investment Management Inc. and its investment management affiliates ("MSIM") (see Investment Management Affiliates definition below) | ||||||
What we do
How does MSIM protect my personal information? | To protect your personal information from unauthorized access and use, we use security measures that comply with federal law. These measures include computer safeguards and secured files and buildings. We have policies governing the proper handling of customer information by personnel and requiring third parties that provide support to adhere to appropriate security standards with respect to such information. | ||||||
How does MSIM collect my personal information? | We collect your personal information, for example, when you ◼ open an account or make deposits or withdrawals from your account ◼ buy securities from us or make a wire transfer ◼ give us your contact information We also collect your personal information from others, such as credit bureaus, affiliates, or other companies. | ||||||
81
Morgan Stanley Global Fixed Income Opportunities Fund
U.S. Customer Privacy Notice (unaudited) continued April 2021
What we do
Why can't I limit all sharing? | Federal law gives you the right to limit only ◼ sharing for affiliates' everyday business purposes — information about your creditworthiness ◼ affiliates from using your information to market to you ◼ sharing for non-affiliates to market to you State laws and individual companies may give you additional rights to limit sharing. See below for more on your rights under state law. | ||||||
Definitions
Investment Management Affiliates | MSIM Investment Management Affiliates include registered investment advisers, registered broker-dealers, and registered and unregistered funds in the Investment Management Division. Investment Management Affiliates does not include entities associated with Morgan Stanley Wealth Management, such as Morgan Stanley Smith Barney LLC and Morgan Stanley & Co. | ||||||
Affiliates | Companies related by common ownership or control. They can be financial and non-financial companies. ◼ Our affiliates include companies with a Morgan Stanley name and financial companies such as Morgan Stanley Smith Barney LLC and Morgan Stanley & Co. | ||||||
Non-affiliates | Companies not related by common ownership or control. They can be financial and non-financial companies. ◼ MSIM does not share with non-affiliates so they can market to you. | ||||||
Joint marketing | A formal agreement between non-affiliated financial companies that together market financial products or services to you. ◼ MSIM doesn't jointly market | ||||||
Other important information
Vermont: Except as permitted by law, we will not share personal information we collect about Vermont residents with Non-affiliates unless you provide us with your written consent to share such information.
California: Except as permitted by law, we will not share personal information we collect about California residents with Non-affiliates and we will limit sharing such personal information with our Affiliates to comply with California privacy laws that apply to us.
82
Morgan Stanley Global Fixed Income Opportunities Fund
Trustees and Officers Information (unaudited)
Independent Trustees:
| Name, Address and Birth Year of Independent Trustee | Position(s) Held with Registrant | Length of Time Served* | Principal Occupation(s) During Past 5 Years and Other Relevant Professional Experience | Number of Funds in Fund Complex Overseen by Independent Trustee** | Other Directorships Held by Independent Trustee During Past 5 Years*** | ||||||||||||||||||
| Frank L. Bowman c/o Perkins Coie LLP Counsel to the Independent Trustees 1155 Avenue of the Americas 22nd Floor New York, NY 10036 Birth Year: 1944 | Trustee | Since August 2006 | President, Strategic Decisions, LLC (consulting) (since February 2009); Director or Trustee of various Morgan Stanley Funds (since August 2006); Chairperson of the Compliance and Insurance Committee (since October 2015); formerly, Chairperson of the Insurance Sub-Committee of the Compliance and Insurance Committee (2007-2015); served as President and Chief Executive Officer of the Nuclear Energy Institute (policy organization) (February 2005-November 2008); retired as Admiral, U.S. Navy after serving over 38 years on active duty including 8 years as Director of the Naval Nuclear Propulsion Program in the Department of the Navy and the U.S. Department of Energy (1996-2004); served as Chief of Naval Personnel (July 1994-September 1996) and on the Joint Staff as Director of Political Military Affairs (June 1992-July 1994); knighted as Honorary Knight Commander of the Most Excellent Order of the British Empire; awarded the Officier de l'Orde National du Mèrite by the French Government; elected to the National Academy of Engineering (2009). | 86 | Director of Naval and Nuclear Technologies LLP; Director Emeritus of the Armed Services YMCA; Member of the National Security Advisory Council of the Center for U.S. Global Engagement and a former member of the CNA Military Advisory Board; Chairman of the Board of Trustees of Fairhaven United Methodist Church; Member of the Board of Advisors of the Dolphin Scholarship Foundation; Director of other various nonprofit organizations; formerly, Director of BP, plc (November 2010-May 2019). | ||||||||||||||||||
| Frances L. Cashman c/o Perkins Coie LLP Counsel to the Independent Trustees 1155 Avenue of the Americas 22nd Floor New York, NY 10036 Birth Year: 1961 | Trustee | Since February 2022 | Chief Executive Officer, Asset Management Division, Delinian Ltd. (financial information) (May 2021-Present); Executive Vice President and various other roles, Legg Mason & Co. (asset management) (2010-2020); Managing Director, Stifel Nicolaus (2005-2010). | 87 | Trustee and Investment Committee Member, GeorgiaTech Foundation (since June 2019); Trustee and Chair of Marketing Committee, and Member of Investment Committee, Loyola Blakefield (Since September 2017); Trustee, MMI Gateway Foundation (since September 2017); Director and Investment Committee Member, Catholic Community Foundation Board (2012-2018); Director and Investment Committee Member, St. Ignatius Loyola Academy (2011-2017). | ||||||||||||||||||
83
Morgan Stanley Global Fixed Income Opportunities Fund
Trustees and Officers Information (unaudited) continued
| Name, Address and Birth Year of Independent Trustee | Position(s) Held with Registrant | Length of Time Served* | Principal Occupation(s) During Past 5 Years and Other Relevant Professional Experience | Number of Funds in Fund Complex Overseen by Independent Trustee** | Other Directorships Held by Independent Trustee During Past 5 Years*** | ||||||||||||||||||
| Kathleen A. Dennis c/o Perkins Coie LLP Counsel to the Independent Trustees 1155 Avenue of the Americas 22nd Floor New York, NY 10036 Birth Year: 1953 | Trustee | Since August 2006 | Chairperson of the Governance Committee (since January 2021), Chairperson of the Liquidity and Alternatives Sub-Committee of the Investment Committee (2006-2020) and Director or Trustee of various Morgan Stanley Funds (since August 2006); President, Cedarwood Associates (mutual fund and investment management consulting) (since July 2006); formerly, Senior Managing Director of Victory Capital Management (1993-2006). | 86 | Board Member, University of Albany Foundation (2012-present); Board Member, Mutual Funds Directors Forum (2014-present); Director of various non-profit organizations. | ||||||||||||||||||
| Nancy C. Everett c/o Perkins Coie LLP Counsel to the Independent Trustees 1155 Avenue of the Americas 22nd Floor New York, NY 10036 Birth Year: 1955 | Trustee | Since January 2015 | Chairperson of the Equity Investment Committee (since January 2021); Director or Trustee of various Morgan Stanley Funds (since January 2015); Chief Executive Officer, Virginia Commonwealth University Investment Company (since November 2015); Owner, OBIR, LLC (institutional investment management consulting) (since June 2014); formerly, Managing Director, BlackRock, Inc. (February 2011-December 2013) and Chief Executive Officer, General Motors Asset Management (a/k/a Promark Global Advisors, Inc.) (June 2005-May 2010). | 87 | Formerly, Member of Virginia Commonwealth University School of Business Foundation (2005-2016); Member of Virginia Commonwealth University Board of Visitors (2013-2015); Member of Committee on Directors for Emerging Markets Growth Fund, Inc. (2007-2010); Chairperson of Performance Equity Management, LLC (2006-2010); and Chairperson, GMAM Absolute Return Strategies Fund, LLC (2006-2010). | ||||||||||||||||||
84
Morgan Stanley Global Fixed Income Opportunities Fund
Trustees and Officers Information (unaudited) continued
| Name, Address and Birth Year of Independent Trustee | Position(s) Held with Registrant | Length of Time Served* | Principal Occupation(s) During Past 5 Years and Other Relevant Professional Experience | Number of Funds in Fund Complex Overseen by Independent Trustee** | Other Directorships Held by Independent Trustee During Past 5 Years*** | ||||||||||||||||||
| Eddie A. Grier c/o Perkins Coie LLP Counsel to the Independent Trustees 1155 Avenue of the Americas 22nd Floor New York, NY 10036 Birth Year: 1955 | Trustee | Since February 2022 | Dean, Santa Clara University Leavey School of Business (since July 2021); Dean, Virginia Commonwealth University School of Business (2010-2021); President and various other roles, Walt Disney Company (entertainment and media) (1981-2010). | 87 | Director, Witt/Keiffer, Inc. (executive search) (since 2016); Director, NuStar GP, LLC (energy) (since August 2021); Director, Sonida Senior Living, Inc. (residential community operator) (2016-2021); Director, NVR, Inc. (homebuilding) (2013-2020); Director, Middleburg Trust Company (wealth management) (2014-2019); Director, Colonial Williamsburg Company (2012-2021); Regent, University of Massachusetts Global (since 2021); Director and Chair, ChildFund International (2012-2021); Trustee, Brandman University (2010-2021); Director, Richmond Forum (2012-2019). | ||||||||||||||||||
| Jakki L. Haussler c/o Perkins Coie LLP Counsel to the Independent Trustees 1155 Avenue of the Americas 22nd Floor New York, NY 10036 Birth Year: 1957 | Trustee | Since January 2015 | Chairperson of the Audit Committee (since January 2023) and Director or Trustee of various Morgan Stanley Funds (since January 2015); Chairman, Opus Capital Group (since 1996); formerly, Chief Executive Officer, Opus Capital Group (1996-2019); Director, Capvest Venture Fund, LP (May 2000-December 2011); Partner, Adena Ventures, LP (July 1999-December 2010); Director, The Victory Funds (February 2005-July 2008). | 87 | Director, Vertiv Holdings Co. (VRT) (since August 2022); Director of Cincinnati Bell Inc. and Member, Audit Committee and Chairman, Governance and Nominating Committee (2008-2021); Director of Service Corporation International and Member, Audit Committee and Investment Committee; Director, Barnes Group Inc. (since July 2021); Director of Northern Kentucky University Foundation and Member, Investment Committee; Member of Chase College of Law Center for Law and Entrepreneurship Board of Advisors; Director of Best Transport (2005-2019); Director of Chase College of Law Board of Visitors; formerly, Member, University of Cincinnati Foundation Investment Committee. | ||||||||||||||||||
85
Morgan Stanley Global Fixed Income Opportunities Fund
Trustees and Officers Information (unaudited) continued
| Name, Address and Birth Year of Independent Trustee | Position(s) Held with Registrant | Length of Time Served* | Principal Occupation(s) During Past 5 Years and Other Relevant Professional Experience | Number of Funds in Fund Complex Overseen by Independent Trustee** | Other Directorships Held by Independent Trustee During Past 5 Years*** | ||||||||||||||||||
| Dr. Manuel H. Johnson c/o Johnson Smick International, Inc. 220 I Street, NE Suite 200 Washington, D.C. 20002 Birth Year: 1949 | Trustee | Since July 1991 | Senior Partner, Johnson Smick International, Inc. (consulting firm); Chairperson of the Fixed Income, Liquidity and Alternatives Investment Committee (since January 2021), Chairperson of the Investment Committee (2006-2020) and Director or Trustee of various Morgan Stanley Funds (since July 1991); Co-Chairman and a founder of the Group of Seven Council (G7C) (international economic commission); formerly, Chairperson of the Audit Committee (July 1991-September 2006); Vice Chairman of the Board of Governors of the Federal Reserve System and Assistant Secretary of the U.S. Treasury. | 86 | Director of NVR, Inc. (home construction). | ||||||||||||||||||
| Joseph K. Kearns c/o Perkins Coie LLP Counsel to the Independent Trustees 1155 Avenue of the Americas 22nd Floor New York, NY 10036 Birth Year: 1942 | Trustee | Since August 1994 | Senior Adviser, Kearns & Associates LLC (investment consulting); Chairperson of the Audit Committee (2006-2022) and Director or Trustee of various Morgan Stanley Funds (since August 1994); formerly, Deputy Chairperson of the Audit Committee (July 2003-September 2006); CFO of the J. Paul Getty Trust (1982-1999). | 87 | Director, Rubicon Investments (since February 2019); Prior to August 2016, Director of Electro Rent Corporation (equipment leasing); Prior to December 31, 2013, Director of The Ford Family Foundation. | ||||||||||||||||||
86
Morgan Stanley Global Fixed Income Opportunities Fund
Trustees and Officers Information (unaudited) continued
| Name, Address and Birth Year of Independent Trustee | Position(s) Held with Registrant | Length of Time Served* | Principal Occupation(s) During Past 5 Years and Other Relevant Professional Experience | Number of Funds in Fund Complex Overseen by Independent Trustee** | Other Directorships Held by Independent Trustee During Past 5 Years*** | ||||||||||||||||||
| Michael F. Klein c/o Perkins Coie LLP Counsel to the Independent Trustees 1155 Avenue of the Americas 22nd Floor New York, NY 10036 Birth Year: 1958 | Trustee | Since August 2006 | Chairperson of the Risk Committee (since January 2021); Managing Director, Aetos Alternatives Management, LP (since March 2000); Co-President, Aetos Alternatives Management, LP (since January 2004) and Co-Chief Executive Officer of Aetos Alternatives Management, LP (since August 2013); Chairperson of the Fixed Income Sub-Committee of the Investment Committee (2006-2020) and Director or Trustee of various Morgan Stanley Funds (since August 2006); formerly, Managing Director, Morgan Stanley & Co. Inc. and Morgan Stanley Dean Witter Investment Management and President, various Morgan Stanley Funds (June 1998-March 2000); Principal, Morgan Stanley & Co. Inc. and Morgan Stanley Dean Witter Investment Management (August 1997-December 1999). | 86 | Director of certain investment funds managed or sponsored by Aetos Alternatives Management, LP; Director of Sanitized AG and Sanitized Marketing AG (specialty chemicals). | ||||||||||||||||||
| Patricia A. Maleski c/o Perkins Coie LLP Counsel to the Independent Trustees 1155 Avenue of the Americas 22nd Floor New York, NY 10036 Birth Year: 1960 | Trustee | Since January 2017 | Director or Trustee of various Morgan Stanley Funds (since January 2017); Managing Director, JPMorgan Asset Management (2004-2016); Oversight and Control Head of Fiduciary and Conflicts of Interest Program (2015-2016); Chief Control Officer-Global Asset Management (2013-2015); President, JPMorgan Funds (2010-2013); Chief Administrative Officer (2004-2013); various other positions including Treasurer and Board Liaison (since 2001). | 87 | Trustee (since January 2022) and Treasurer (since January 2023), Nutley Family Service Bureau, Inc. | ||||||||||||||||||
87
Morgan Stanley Global Fixed Income Opportunities Fund
Trustees and Officers Information (unaudited) continued
| Name, Address and Birth Year of Independent Trustee | Position(s) Held with Registrant | Length of Time Served* | Principal Occupation(s) During Past 5 Years and Other Relevant Professional Experience | Number of Funds in Fund Complex Overseen by Independent Trustee** | Other Directorships Held by Independent Trustee During Past 5 Years*** | ||||||||||||||||||
| W. Allen Reed c/o Perkins Coie LLP Counsel to the Independent Trustees 1155 Avenue of the Americas 22nd Floor New York, NY 10036 Birth Year: 1947 | Chair of the Board and Trustee | Chair of the Board since August 2020 and Trustee since August 2006 | Chair of the Boards of various Morgan Stanley Funds (since August 2020); Director or Trustee of various Morgan Stanley Funds (since August 2006); formerly, Vice Chair of the Boards of various Morgan Stanley Funds (January 2020-August 2020); President and Chief Executive Officer of General Motors Asset Management; Chairman and Chief Executive Officer of the GM Trust Bank and Corporate Vice President of General Motors Corporation (August 1994-December 2005). | 86 | Formerly, Director of Legg Mason, Inc. (2006-2019); and Director of the Auburn University Foundation (2010-2015). | ||||||||||||||||||
* This is the earliest date the Trustee began serving the Morgan Stanley Funds. Each Trustee serves an indefinite term, until his or her successor is elected.
** The Fund Complex includes (as of December 31, 2023) all open-end and closed-end funds (including all of their portfolios) advised by Morgan Stanley Investment Management Inc. (the "Adviser") and any funds that have an adviser that is an affiliated person of the Adviser (including, but not limited to, Morgan Stanley AIP GP LP).
*** This includes any directorships at public companies and registered investment companies held by the Trustees at any time during the past five years.
88
Morgan Stanley Global Fixed Income Opportunities Fund
Trustees and Officers Information (unaudited) continued
Executive Officers:
| Name, Address and Birth Year of Executive Officer | Position(s) Held with Registrant | Length of Time Served* | Principal Occupation(s) During Past 5 Years | ||||||||||||
| John H. Gernon 1585 Broadway New York, NY 10036 Birth Year: 1963 | President and Principal Executive Officer | Since September 2013 | President and Principal Executive Officer of the Equity and Fixed Income Funds and the Morgan Stanley AIP Funds (since September 2013) and the Liquidity Funds and various money market funds (since May 2014) in the Fund Complex; Managing Director of the Adviser. | ||||||||||||
| Deidre A. Downes 1633 Broadway New York, NY 10019 Birth Year: 1977 | Chief Compliance Officer | Since November 2021 | Executive Director of the Adviser (since January 2021) and Chief Compliance Officer of various Morgan Stanley Funds (since November 2021). Formerly, Vice President and Corporate Counsel at PGIM and Prudential Financial (October 2016-December 2020). | ||||||||||||
| Francis J. Smith 750 Seventh Avenue New York, NY 10019 Birth Year: 1965 | Treasurer and Principal Financial Officer | Treasurer since July 2003 and Principal Financial Officer since September 2002 | Managing Director of the Adviser and various entities affiliated with the Adviser; Treasurer (since July 2003) and Principal Financial Officer of various Morgan Stanley Funds (since September 2002). | ||||||||||||
| Mary E. Mullin 1633 Broadway New York, NY 10019 Birth Year: 1967 | Secretary | Since June 1999 | Managing Director of the Adviser; Secretary of various Morgan Stanley Funds (since June 1999). | ||||||||||||
| Michael J. Key 1585 Broadway New York, NY 10036 Birth Year: 1979 | Vice President | Since June 2017 | Vice President of the Equity and Fixed Income Funds, Liquidity Funds, various money market funds and the Morgan Stanley AIP Funds in the Fund Complex (since June 2017); Managing Director of the Adviser; Head of Product Development for Equity and Fixed Income Funds (since August 2013). | ||||||||||||
The Fund's statement of additional information includes further information about the Fund's Trustees and Officers, and is available without charge by visiting www.morganstanley.com/im or upon request by calling 1 (800) 869-6397.
* This is the earliest date the officer began serving the Morgan Stanley Funds. Each officer serves an indefinite term, until his or her successor is elected.
89
Transfer Agent
SS&C Global Investor & Distribution Solutions, Inc.
P.O. Box 219804
Kansas City, Missouri 64121-9804
Co-Transfer Agent
Eaton Vance Management
Two International Place
Boston, Massachusetts 02110
Custodian
State Street Bank and Trust Company
One Congress Street
Boston, Massachusetts 02114
Independent Registered Public Accounting Firm
Ernst & Young LLP
200 Clarendon Street
Boston, Massachusetts 02116
Legal Counsel
Dechert LLP
1095 Avenue of the Americas
New York, New York 10036
Counsel to the Independent Trustees
Perkins Coie LLP
1155 Avenue of the Americas,
22nd Floor
New York, New York 10036
Adviser and Administrator
Morgan Stanley Investment Management Inc.
1585 Broadway
New York, New York 10036
Sub-Adviser
Morgan Stanley Investment Management Limited
25 Cabot Square, Canary Wharf
London, E14 4QA, England
Distributor
Morgan Stanley Distribution, Inc.
1585 Broadway
New York, New York 10036
This report is submitted for the general information of the shareholders of the Fund. For more detailed information about the Fund, its fees and expenses and other pertinent information, please read its Prospectus. The Fund's Statement of Additional Information contains additional information about the Fund, including its Trustees. It is available, without charge, by calling 1 (800) 869-6397.
This report is not authorized for distribution to prospective investors in the Fund unless preceded or accompanied by an effective Prospectus. Please read the Prospectus carefully before investing.
Morgan Stanley Distribution, Inc., member FINRA.
© 2023 Morgan Stanley

DINANN
6120912 EXP 12.31.24
Item 2. Code of Ethics.
(a) The registrant has adopted a code of ethics (the "Code of Ethics") that applies to its principal executive officer, principal financial officer, principal accounting officer or controller, or persons performing similar functions, regardless of whether these individuals are employed by the registrant or a third party.
(b) No information need be disclosed pursuant to this paragraph.
(c) Not applicable.
(d) Not applicable.
(e) Not applicable.
(f)
(1) The registrant’s Code of Ethics is attached hereto as Exhibit 13 A.
(2) Not applicable.
(3) Not applicable.
Item 3. Audit Committee Financial Expert.
The registrant's Board of Trustees has determined that Jakki L. Haussler, an “independent” Trustee, is an “audit committee financial expert" serving on its audit committee. Under applicable securities laws, a person who is determined to be an audit committee financial expert will not be deemed an "expert" for any purpose, including without limitation for the purposes of Section 11 of the Securities Act of 1933, as a result of being designated or identified as an audit committee financial expert. The designation or identification of a person as an audit committee financial expert does not impose on such person any duties, obligations, or liabilities that are greater than the duties, obligations, and liabilities imposed on such person as a member of the audit committee and Board of Trustees in the absence of such designation or identification.
Item 4. Principal Accountant Fees and Services.
(a)(b)(c)(d) and (g). Based on fees billed for the periods shown:
| 2023 | ||||||||
| Registrant | Covered Entities(1) | |||||||
| Audit Fees | $ | 75,070 | N/A | |||||
| Non-Audit Fees | ||||||||
| Audit-Related Fees | $ | — | (2) | $ | — | (2) | ||
| Tax Fees | $ | — | (3) | $ | — | (4) | ||
| All Other Fees | $ | — | $ | 1,586,712 | (5) | |||
| Total Non-Audit Fees | $ | — | $ | 1,586,712 | ||||
| Total | $ | 75,070 | $ | 1,586,712 | ||||
| 2022 | ||||||||
| Registrant | Covered Entities(1) | |||||||
| Audit Fees | $ | 75,070 | N/A | |||||
| Non-Audit Fees | ||||||||
| Audit-Related Fees | $ | — | (2) | $ | — | (2) | ||
| Tax Fees | $ | — | (3) | $ | — | (4) | ||
| All Other Fees | $ | — | $ | 13,150,465 | (5) | |||
| Total Non-Audit Fees | $ | — | $ | 13,150,465 | ||||
| Total | $ | 75,070 | $ | 13,150,465 | ||||
N/A- Not applicable, as not required by Item 4.
| (1) | Covered Entities include the Adviser (excluding sub-advisors) and any entity controlling, controlled by or under common control with the Adviser that provides ongoing services to the Registrant. |
| (2) | Audit-Related Fees represent assurance and related services provided that are reasonably related to the performance of the audit of the financial statements of the Covered Entities' and funds advised by the Adviser or its affiliates, specifically data verification and agreed-upon procedures related to asset securitizations and agreed-upon procedures engagements. |
| (3) | Tax Fees represent tax compliance, tax planning and tax advice services provided in connection with the preparation and review of the Registrant’s tax returns. |
| (4) | Tax Fees represent tax compliance, tax planning and tax advice services provided in connection with the review of Covered Entities' tax returns. |
| (5) | The fees included under “All Other Fees” are for services provided by Ernst & Young LLP related to surprise examinations for certain investment accounts to satisfy SEC Custody Rules and consulting services related to merger integration for sister entity to the Adviser. |
(e)(1) The audit committee’s pre-approval policies and procedures are as follows:
AUDIT COMMITTEE
AUDIT AND NON-AUDIT SERVICES
PRE-APPROVAL POLICY AND PROCEDURES
OF THE
MORGAN STANLEY FUNDS
AS ADOPTED AND AMENDED JULY 23, 2004 AND JUNE 12 AND 13, 20193
1. Statement of Principles
The Audit Committee of the Board is required to review and, in its sole discretion, pre-approve all Covered Services to be provided by the Independent Auditors to the Fund and Covered Entities in order to assure that services performed by the Independent Auditors do not impair the auditor’s independence from the Fund.
The SEC has issued rules specifying the types of services that an independent auditor may not provide to its audit client, as well as the audit committee’s administration of the engagement of the independent auditor. The SEC’s rules establish two different approaches to pre-approving services, which the SEC considers to be equally valid. Proposed services either: may be pre-approved without consideration of specific case-by-case services by the Audit Committee (“general pre-approval”); or require the specific pre-approval of the Audit Committee or its delegate (“specific pre-approval”). The Audit Committee believes that the combination of these two approaches in this Policy will result in an effective and efficient procedure to pre-approve services performed by the Independent Auditors. As set forth in this Policy, unless a type of service has received general pre-approval, it will require specific pre-approval by the Audit Committee (or by any member of the Audit Committee to which pre-approval authority has been delegated) if it is to be provided by the Independent Auditors. Any proposed services exceeding pre-approved cost levels or budgeted amounts will also require specific pre-approval by the Audit Committee.
The appendices to this Policy describe the Audit, Audit-related, Tax and All Other services that have the general pre-approval of the Audit Committee. The term of any general pre-approval is 12 months from the date of pre-approval, unless the Audit Committee considers and provides a different period and states otherwise. The Audit Committee will annually review and pre-approve the services that may be provided by the Independent Auditors without obtaining specific pre-approval from the Audit Committee. The Audit Committee will add to or subtract from the list of general pre-approved services from time to time, based on subsequent determinations.
The purpose of this Policy is to set forth the policy and procedures by which the Audit Committee intends to fulfill its responsibilities. It does not delegate the Audit Committee’s responsibilities to pre-approve services performed by the Independent Auditors to management.
The Fund’s Independent Auditors have reviewed this Policy and believes that implementation of the Policy will not adversely affect the Independent Auditors’ independence.
2. Delegation
As provided in the Act and the SEC’s rules, the Audit Committee may delegate either type of pre-approval authority to one or more of its members. The member to whom such authority is delegated must report, for informational purposes only, any pre-approval decisions to the Audit Committee at its next scheduled meeting.
3. Audit Services
The annual Audit services engagement terms and fees are subject to the specific pre-approval of the Audit Committee. Audit services include the annual financial statement audit and other procedures required to be performed by the Independent Auditors to be able to form an opinion on the Fund’s financial statements. These other procedures include information systems and procedural reviews and testing performed in order to understand and place reliance on the systems of internal control, and consultations relating to the audit. The Audit Committee will approve, if necessary, any changes in terms, conditions and fees resulting from changes in audit scope, Fund structure or other items.
In addition to the annual Audit services engagement approved by the Audit Committee, the Audit Committee may grant general pre-approval to other Audit services, which are those services that only the Independent Auditors reasonably can provide. Other Audit services may include statutory audits and services associated with SEC registration statements (on Forms N-1A, N-2, N-3, N-4, etc.), periodic reports and other documents filed with the SEC or other documents issued in connection with securities offerings.
The Audit Committee has pre-approved the Audit services in Appendix A. All other Audit services not listed in Appendix A must be specifically pre-approved by the Audit Committee (or by any member of the Audit Committee to which pre-approval has been delegated).
4. Audit-related Services
Audit-related services are assurance and related services that are reasonably related to the performance of the audit or review of the Fund’s financial statements and, to the extent they are Covered Services, the Covered Entities or that are traditionally performed by the Independent Auditors. Because the Audit Committee believes that the provision of Audit-related services does not impair the independence of the auditor and is consistent with the SEC’s rules on auditor independence, the Audit Committee may grant general pre-approval to Audit-related services. Audit-related services include, among others, accounting consultations related to accounting, financial reporting or disclosure matters not classified as “Audit services”; assistance with understanding and implementing new accounting and financial reporting guidance from rulemaking authorities; agreed-upon or expanded audit procedures related to accounting and/or billing records required to respond to or comply with financial, accounting or regulatory reporting matters; and assistance with internal control reporting requirements under Forms N-CEN and/or N-CSR.
3 This Audit Committee Audit and Non-Audit Services Pre-Approval Policy and Procedures (the “Policy”), adopted as of the date above, supersedes and replaces all prior versions that may have been adopted from time to time.
The Audit Committee has pre-approved the Audit-related services in Appendix A. All other Audit-related services not listed in Appendix A must be specifically pre-approved by the Audit Committee (or by any member of the Audit Committee to which pre-approval has been delegated).
5. Tax Services
The Audit Committee believes that the Independent Auditors can provide Tax services to the Fund and, to the extent they are Covered Services, the Covered Entities, such as tax compliance, tax planning and tax advice without impairing the auditor’s independence, and the SEC has stated that the Independent Auditors may provide such services.
Pursuant to the preceding paragraph, the Audit Committee has pre-approved the Tax Services in Appendix A. All Tax services in Appendix A must be specifically pre-approved by the Audit Committee (or by any member of the Audit Committee to which pre-approval has been delegated).
6. All Other Services
The Audit Committee believes, based on the SEC’s rules prohibiting the Independent Auditors from providing specific non-audit services, that other types of non-audit services are permitted. Accordingly, the Audit Committee believes it may grant general pre-approval to those permissible non-audit services classified as All Other services that it believes are routine and recurring services, would not impair the independence of the auditor and are consistent with the SEC’s rules on auditor independence.
The Audit Committee has pre-approved the All Other services in Appendix A. Permissible All Other services not listed in Appendix A must be specifically pre-approved by the Audit Committee (or by any member of the Audit Committee to which pre-approval has been delegated).
7. Pre-Approval Fee Levels or Budgeted Amounts
Pre-approval fee levels or budgeted amounts for all services to be provided by the Independent Auditors will be established annually by the Audit Committee. Any proposed services exceeding these levels or amounts will require specific pre-approval by the Audit Committee. The Audit Committee is mindful of the overall relationship of fees for audit and non-audit services in determining whether to pre-approve any such services.
8. Procedures
All requests or applications for services to be provided by the Independent Auditors that do not require specific approval by the Audit Committee will be submitted to the Fund’s Principal Financial and Accounting Officer and must include a detailed description of the services to be rendered. The Fund’s Principal Financial and Accounting Officer will determine whether such services are included within the list of services that have received the general pre-approval of the Audit Committee. The Audit Committee will be informed on a timely basis of any such services rendered by the Independent Auditors. Requests or applications to provide services that require specific approval by the Audit Committee or Chairperson of the Audit Committee will be submitted to the Audit Committee by the Fund’s Principal Financial and Accounting Officer, who, after consultation with the Independent Auditors, will discuss whether the request or application is consistent with the SEC’s rules on auditor independence.
The Audit Committee has designated the Fund’s Principal Financial and Accounting Officer to monitor the performance of all services provided by the Independent Auditors and to determine whether such services are in compliance with this Policy. The Fund’s Principal Financial and Accounting Officer will report to the Audit Committee on a periodic basis on the results of its monitoring. Both the Fund’s Principal Financial and Accounting Officer and management will immediately report to the Chairperson of the Audit Committee any breach of this Policy that comes to the attention of the Fund’s Principal Financial and Accounting Officer or any member of management.
9. Additional Requirements
The Audit Committee has determined to take additional measures on an annual basis to meet its responsibility to oversee the work of the Independent Auditors and to assure the auditor’s independence from the Fund, such as reviewing a formal written statement from the Independent Auditors delineating all relationships between the Independent Auditors and the Fund, consistent with the PCAOB’s Ethics and Independence Rule 3526, and discussing with the Independent Auditors its methods and procedures for ensuring independence.
10. Covered Entities
Covered Entities include the Fund’s investment adviser(s) and any entity controlling, controlled by or under common control with the Fund’s investment adviser(s) that provides ongoing services to the Fund(s). Beginning with non-audit service contracts entered into on or after May 6, 2003, the Fund’s audit committee must pre-approve non-audit services provided not only to the Fund but also to the Covered Entities if the engagements relate directly to the operations and financial reporting of the Fund. This list of Covered Entities would include:
Morgan Stanley Funds
Morgan Stanley & Co. LLC
Morgan Stanley Investment Management Inc.
Morgan Stanley Investment Management Limited
Morgan Stanley Investment Management Private Limited
Morgan Stanley Asset & Investment Trust Management Co., Limited
Morgan Stanley Investment Management Company
Morgan Stanley Services Company, Inc.
Morgan Stanley Distribution, Inc.
Morgan Stanley AIP GP LP
Morgan Stanley Alternative Investment Partners LP
Morgan Stanley Smith Barney LLC
Morgan Stanley Capital Management LLC
Morgan Stanley Asia Limited
Morgan Stanley Services Group
(e)(2) Beginning with non-audit service contracts entered into on or after May 6, 2003, the audit committee also is required to pre-approve services to Covered Entities to the extent that the services are determined to have a direct impact on the operations or financial reporting of the Registrant. 100% of such services were pre-approved by the audit committee pursuant to the Audit Committee’s pre-approval policies and procedures (attached hereto).
(f) Not applicable.
(g) See table above.
(h) The audit committee of the Board of Trustees has considered whether the provision of services other than audit services performed by the auditors to the Registrant and Covered Entities is compatible with maintaining the auditors' independence in performing audit services.
APPENDIX A
Pre-Approved Audit Services
| Service | Range of Fees | |
| The Fund(s) | Covered Entities | |
| Statutory audits or financial audits for the Funds | For a complete list of fees, please contact the legal department ** | N/A |
| Services associated with SEC registration statements (including new fund filings/seed audits), periodic reports and other documents filed with the SEC or other documents issued in connection with securities offerings (e.g., comfort letters for closed-end fund offerings, consents), and assistance in responding to SEC comment letters | * | * |
| Consultations by the Fund’s management as to the accounting or disclosure treatment of transactions or events and/or the actual or potential impact of final or proposed rules, standards or interpretations by the SEC, FASB, or other regulatory or standard setting bodies (Note: Under SEC rules, some consultations may be “audit related” services rather than “audit” services) | * | * |
Pre-Approved Audit-Related Services
| Service | Range of Fees | |
| The Fund(s) | Covered Entities | |
| Attest procedures not required by statute or regulation | * | * |
| Due diligence services pertaining to potential fund mergers | * | * |
| Consultations by the Fund’s management as to the accounting or disclosure treatment of transactions or events and/or the actual or potential impact of final or proposed rules, standards or interpretations by the SEC, FASB, or other regulatory or standard-setting bodies (Note: Under SEC rules, some consultations may be “audit” services rather than “audit-related” services) | * | * |
| General assistance with implementation of the requirements of SEC rules or listing standards promulgated pursuant to the Sarbanes-Oxley Act | * | * |
Pre-Approved Tax Services
| Service | Range of Fees | |
| The Fund(s) | Covered Entities | |
| U.S. federal, state and local tax planning and advice | * | * |
| U.S. federal, state and local tax compliance | * | * |
| International tax planning and advice | * | * |
| International tax compliance | * | * |
| Review/preparation of federal, state, local and international income, franchise, and other tax returns | $450,000 PwC | N/A |
| Identification of Passive Foreign Investment Companies | $175,000 PwC | * |
| PwC ITV Tool – assist in determining which Fund holdings have foreign capital gains tax exposure | $125,000 PwC | * |
| Foreign Tax Services - Preparation of local foreign tax returns and assistance with local tax compliance issues (including maintenance of transaction schedules, assistance in periodic tax remittances, tax registration, representing funds before foreign revenue authorities and assistance with assessment orders) | $500,000 PwC | * |
| Assistance with tax audits and appeals before the IRS and similar state, local and foreign agencies | * | * |
| Tax advice and assistance regarding statutory, regulatory or administrative developments (e.g., excise tax reviews, evaluation of Fund’s tax compliance function) | * | * |
Pre-Approved All Other Services
| Service | Range of Fees | |
| The Fund(s) | Covered Entities | |
| Risk management advisory services, e.g., assessment and testing of security infrastructure controls | * | * |
* Aggregate fees related to the pre-approved services will be limited to 10% of the 2023/2024 annual fees for audit and tax services (see fee schedule distributed by the Auditors).
** Audit and tax services for new funds/portfolios will be subject to the maximum audit and tax fee for a fund/portfolio on fee schedule distributed by the Auditors.
Prohibited Non-Audit Services
• Bookkeeping or other services related to the accounting records or financial statements of the audit client
• Financial information systems design and implementation
• Appraisal or valuation services, fairness opinions or contribution-in-kind reports
• Actuarial services
• Internal audit outsourcing services
• Management functions
• Human resources
• Broker-dealer, investment adviser or investment banking services
• Legal services
• Expert services unrelated to the audit
(i) Not Applicable.
(j) Not Applicable.
Item 5. Audit Committee of Listed Registrants.
(a) The registrant has a separately-designated standing audit committee established in accordance with Section 3(a)(58)(A) of the Exchange Act whose members are:
Joseph J. Kearns, Nancy C. Everett, Eddie A. Grier and Jakki L. Haussler.
(b) Not applicable.
Item 6. Schedule of Investments
(a) Refer to Item 1.
(b) Not applicable.
Item 7. Disclosure of Proxy Voting Policies and Procedures for Closed-End Management Investment Companies.
Applicable only to reports filed by closed-end funds.
Item 8. Portfolio Managers of Closed-End Management Investment Companies
Applicable only to reports filed by closed-end funds.
Item 9. Closed-End Fund Repurchases
Applicable only to reports filed by closed-end funds.
Item 10. Submission of Matters to a Vote of Security Holders
There have been no material changes to the procedures by which shareholders may recommend nominee to the Fund’s Board of Trustees since the Fund last provided disclosure in response to this item.
Item 11. Controls and Procedures
(a) The registrant’s principal executive officer and principal financial officer have concluded that the registrant’s disclosure controls and procedures are sufficient to ensure that information required to be disclosed by the registrant in this Form N-CSR was recorded, processed, summarized and reported within the time periods specified in the Securities and Exchange Commission's rules and forms, based upon such officers' evaluation of these controls and procedures as of a date within 90 days of the filing date of the report.
(b) There were no changes in the registrant's internal control over financial reporting that occurred during the period covered by this report that has materially affected, or is reasonably likely to materially affect, the registrant's internal control over financial reporting.
Item 12. Disclosure of Securities Lending Activities for Closed-End Management Investment Companies.
Not Applicable
Item 13. Exhibits
(a) The Code of Ethics for Principal Executive and Senior Financial Officers.
SIGNATURES
Pursuant to the requirements of the Securities Exchange Act of 1934 and the Investment Company Act of 1940, the registrant has duly caused this report to be signed on its behalf by the undersigned, thereunto duly authorized.
Morgan Stanley Global Fixed Income Opportunities Fund
| /s/ John H. Gernon | |
| John H. Gernon | |
| Principal Executive Officer | |
| December 20, 2023 |
Pursuant to the requirements of the Securities Exchange Act of 1934 and the Investment Company Act of 1940, this report has been signed by the following persons on behalf of the registrant and in the capacities and on the dates indicated.
| /s/ John H. Gernon | |
| John H. Gernon | |
| Principal Executive Officer | |
| December 20, 2023 | |
| /s/ Francis J. Smith | |
| Francis J. Smith | |
| Principal Financial Officer | |
| December 20, 2023 |