UNITED STATES SECURITIES AND EXCHANGE COMMISSION
Washington, D.C. 20549
Form N-CSR
CERTIFIED SHAREHOLDER REPORT OF REGISTERED
MANAGEMENT INVESTMENT COMPANIES
Investment Company Act File Number: 811-06515
Morgan Stanley Global Fixed Income Opportunities Fund
(Exact Name of Registrant as Specified in Charter)
1585 Broadway, New York, New York 10036
(Address of Principal Executive Offices)
John H. Gernon
1585 Broadway, New York, New York 10036
(Name and Address of Agent for Services)
(212) 762-1886
(Registrant’s Telephone Number)
October 31
Date of Fiscal Year End
October 31, 2024
Date of Reporting Period
Item 1. Reports to Stockholders
(a)
TABLE OF CONTENTS
0000882381morganstanley:BloombergGlobalAggregateHedgedUSDIndex21308BroadBasedIndexMember2024-03-31
Morgan Stanley Global Fixed Income Opportunities Fund
Annual Shareholder Report October 31, 2024
This annual shareholder report contains important information about Morgan Stanley Global Fixed Income Opportunities Fund for the period of November 1, 2023 to October 31, 2024. You can find additional information about the Fund at www.morganstanley.com/im/shareholderreports. You can also request this information by contacting us at 1-800-869-6397.
What were the Fund costs for the last year?
(based on a hypothetical $10,000 investment)
| Class Name | Costs of a $10,000 investment | Costs paid as a percentage of a $10,000 investment |
|---|
| Class A | $87 | 0.82% |
How did the Fund perform last year and what affected its performance?
Key contributors to (↑) and detractors from (↓) performance, relative to the Bloomberg Global Aggregate Hedged USD Index:
↑ Securitized debt exposure, particularly within non-agency residential mortgage-backed securities (RMBS), commercial mortgage-backed securities (CMBS) and asset-backed securities (ABS).
↑ Long exposure to investment grade and high yield corporate bonds as spreads tightened across the board.
↑ Long exposure to developed markets rates on the back of global government bonds rallying over the period, particularly within the U.S. and Canada. Higher “risk-free” rates continued to benefit performance.
↓ Emerging markets currency exposure, particularly long exposures to Dominican peso and Mexican peso.
↓ Short duration exposure to the U.K. for the majority of the period as yields marginally fell.
↓ Credit default swap exposure.
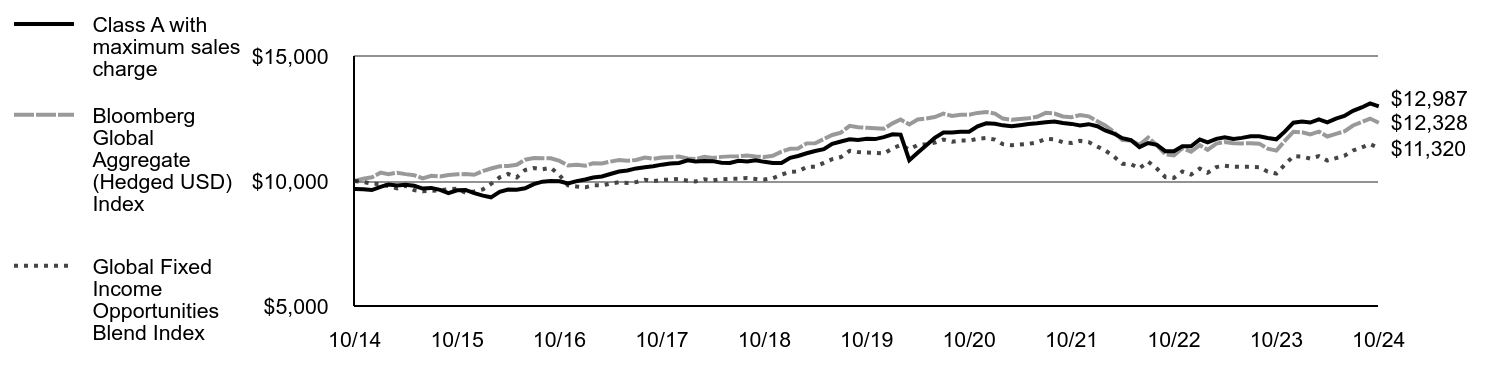
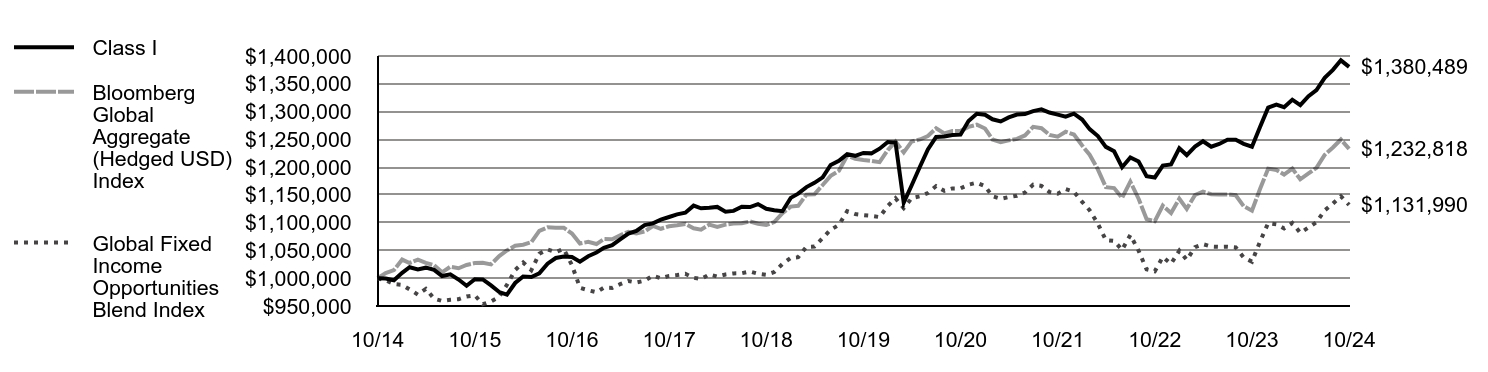
Comparison of the change in value of a $10,000 investment for the period indicated.
| | Bloomberg Global Aggregate (Hedged USD) Index | Global Fixed Income Opportunities Blend Index |
|---|
| 10/14 | $9,681 | $10,000 | $10,000 |
| 11/14 | $9,674 | $10,094 | $9,963 |
| 12/14 | $9,639 | $10,146 | $9,895 |
| 1/15 | $9,768 | $10,335 | $9,879 |
| 2/15 | $9,863 | $10,274 | $9,799 |
| 3/15 | $9,823 | $10,333 | $9,705 |
| 4/15 | $9,849 | $10,275 | $9,808 |
| 5/15 | $9,808 | $10,233 | $9,633 |
| 6/15 | $9,697 | $10,106 | $9,590 |
| 7/15 | $9,724 | $10,206 | $9,612 |
| 8/15 | $9,648 | $10,179 | $9,623 |
| 9/15 | $9,518 | $10,239 | $9,672 |
| 10/15 | $9,630 | $10,272 | $9,693 |
| 11/15 | $9,641 | $10,277 | $9,532 |
| 12/15 | $9,515 | $10,249 | $9,583 |
| 1/16 | $9,413 | $10,399 | $9,666 |
| 2/16 | $9,347 | $10,499 | $9,881 |
| 3/16 | $9,567 | $10,586 | $10,148 |
| 4/16 | $9,661 | $10,604 | $10,283 |
| 5/16 | $9,650 | $10,648 | $10,145 |
| 6/16 | $9,710 | $10,851 | $10,441 |
| 7/16 | $9,877 | $10,916 | $10,520 |
| 8/16 | $9,974 | $10,910 | $10,469 |
| 9/16 | $9,998 | $10,909 | $10,527 |
| 10/16 | $9,988 | $10,803 | $10,234 |
| 11/16 | $9,904 | $10,625 | $9,828 |
| 12/16 | $9,996 | $10,654 | $9,783 |
| 1/17 | $10,058 | $10,615 | $9,747 |
| 2/17 | $10,137 | $10,706 | $9,830 |
| 3/17 | $10,181 | $10,701 | $9,826 |
| 4/17 | $10,280 | $10,774 | $9,893 |
| 5/17 | $10,379 | $10,837 | $9,950 |
| 6/17 | $10,422 | $10,806 | $9,922 |
| 7/17 | $10,503 | $10,842 | $9,955 |
| 8/17 | $10,548 | $10,941 | $10,046 |
| 9/17 | $10,591 | $10,890 | $9,999 |
| 10/17 | $10,654 | $10,936 | $10,042 |
| 11/17 | $10,698 | $10,953 | $10,057 |
| 12/17 | $10,723 | $10,977 | $10,080 |
| 1/18 | $10,825 | $10,899 | $10,008 |
| 2/18 | $10,776 | $10,875 | $9,985 |
| 3/18 | $10,801 | $10,965 | $10,068 |
| 4/18 | $10,794 | $10,924 | $10,030 |
| 5/18 | $10,729 | $10,965 | $10,068 |
| 6/18 | $10,721 | $10,985 | $10,087 |
| 7/18 | $10,809 | $10,988 | $10,089 |
| 8/18 | $10,782 | $11,022 | $10,120 |
| 9/18 | $10,831 | $10,980 | $10,082 |
| 10/18 | $10,766 | $10,958 | $10,062 |
| 11/18 | $10,719 | $11,012 | $10,111 |
| 12/18 | $10,718 | $11,171 | $10,257 |
| 1/19 | $10,927 | $11,289 | $10,366 |
| 2/19 | $10,999 | $11,303 | $10,378 |
| 3/19 | $11,110 | $11,505 | $10,564 |
| 4/19 | $11,201 | $11,512 | $10,571 |
| 5/19 | $11,273 | $11,678 | $10,723 |
| 6/19 | $11,486 | $11,842 | $10,873 |
| 7/19 | $11,579 | $11,935 | $10,959 |
| 8/19 | $11,671 | $12,205 | $11,207 |
| 9/19 | $11,638 | $12,149 | $11,155 |
| 10/19 | $11,687 | $12,128 | $11,136 |
| 11/19 | $11,676 | $12,114 | $11,123 |
| 12/19 | $11,754 | $12,089 | $11,100 |
| 1/20 | $11,866 | $12,307 | $11,300 |
| 2/20 | $11,856 | $12,458 | $11,439 |
| 3/20 | $10,831 | $12,264 | $11,261 |
| 4/20 | $11,129 | $12,462 | $11,443 |
| 5/20 | $11,426 | $12,498 | $11,475 |
| 6/20 | $11,724 | $12,560 | $11,533 |
| 7/20 | $11,939 | $12,697 | $11,659 |
| 8/20 | $11,944 | $12,605 | $11,574 |
| 9/20 | $11,968 | $12,651 | $11,617 |
| 10/20 | $11,971 | $12,652 | $11,617 |
| 11/20 | $12,184 | $12,724 | $11,684 |
| 12/20 | $12,306 | $12,763 | $11,720 |
| 1/21 | $12,287 | $12,695 | $11,657 |
| 2/21 | $12,226 | $12,497 | $11,475 |
| 3/21 | $12,186 | $12,448 | $11,430 |
| 4/21 | $12,231 | $12,481 | $11,460 |
| 5/21 | $12,279 | $12,509 | $11,486 |
| 6/21 | $12,306 | $12,570 | $11,542 |
| 7/21 | $12,354 | $12,726 | $11,685 |
| 8/21 | $12,382 | $12,700 | $11,662 |
| 9/21 | $12,323 | $12,580 | $11,552 |
| 10/21 | $12,284 | $12,548 | $11,521 |
| 11/21 | $12,224 | $12,637 | $11,604 |
| 12/21 | $12,273 | $12,586 | $11,556 |
| 1/22 | $12,190 | $12,388 | $11,375 |
| 2/22 | $12,022 | $12,223 | $11,224 |
| 3/22 | $11,900 | $11,960 | $10,982 |
| 4/22 | $11,711 | $11,638 | $10,687 |
| 5/22 | $11,632 | $11,622 | $10,672 |
| 6/22 | $11,355 | $11,446 | $10,510 |
| 7/22 | $11,521 | $11,738 | $10,778 |
| 8/22 | $11,446 | $11,431 | $10,496 |
| 9/22 | $11,192 | $11,064 | $10,159 |
| 10/22 | $11,190 | $11,026 | $10,124 |
| 11/22 | $11,393 | $11,307 | $10,382 |
| 12/22 | $11,386 | $11,174 | $10,260 |
| 1/23 | $11,663 | $11,431 | $10,496 |
| 2/23 | $11,542 | $11,249 | $10,329 |
| 3/23 | $11,685 | $11,498 | $10,558 |
| 4/23 | $11,752 | $11,557 | $10,612 |
| 5/23 | $11,680 | $11,512 | $10,570 |
| 6/23 | $11,725 | $11,505 | $10,564 |
| 7/23 | $11,793 | $11,509 | $10,568 |
| 8/23 | $11,791 | $11,494 | $10,554 |
| 9/23 | $11,720 | $11,296 | $10,372 |
| 10/23 | $11,667 | $11,216 | $10,299 |
| 11/23 | $11,976 | $11,602 | $10,653 |
| 12/23 | $12,334 | $11,972 | $10,993 |
| 1/24 | $12,384 | $11,949 | $10,972 |
| 2/24 | $12,339 | $11,867 | $10,896 |
| 3/24 | $12,464 | $11,974 | $10,995 |
| 4/24 | $12,346 | $11,781 | $10,818 |
| 5/24 | $12,497 | $11,885 | $10,913 |
| 6/24 | $12,600 | $11,988 | $11,008 |
| 7/24 | $12,806 | $12,220 | $11,221 |
| 8/24 | $12,942 | $12,354 | $11,344 |
| 9/24 | $13,103 | $12,497 | $11,475 |
| 10/24 | $12,987 | $12,328 | $11,320 |
Average Annual Total Returns (%)
| AATR | 1 Year | 5 Years | 10 Years |
|---|
| Class A | 11.31% | 2.13% | 2.98% |
| Class A with maximum 3.25% front end sales charge | 7.77% | 1.47% | 2.65% |
| Bloomberg Global Aggregate (Hedged USD) Index | 9.92% | 0.33% | 2.12% |
Global Fixed Income Opportunities Blend IndexFootnote Reference1 | 9.92% | 0.33% | 1.25% |
| Footnote | Description |
Footnote1 | The Global Fixed Income Opportunities Blend Index is a performance linked benchmark of the old benchmark represented by Bloomberg Global Aggregate Index (unhedged USD) (a benchmark that provides a broad-based measure of the global investment grade fixed rate debt markets with returns in unhedged USD) from the Fund’s inception to December 31, 2016 to the new benchmark represented by Bloomberg Global Aggregate (Hedged USD) Index for periods thereafter. It is not possible to invest directly in an index. |
Performance does not reflect the deduction of taxes that a shareholder would pay on Fund distributions or redemption of Fund shares. Performance assumes that all dividends and distributions, if any, were reinvested. For more recent performance information, visit www.morganstanley.com/im/shareholderreports.
THE FUND'S PAST PERFORMANCE IS NO GUARANTEE OF FUTURE RESULTS.
| Total Net Assets | $788,752,575 |
| # of Portfolio Holdings | 408 |
| Portfolio Turnover Rate | 155% |
| Total Advisory Fees Paid | $2,482,642 |
What did the Fund invest in?
The following tables reflect what the Fund invested in as of the report date.
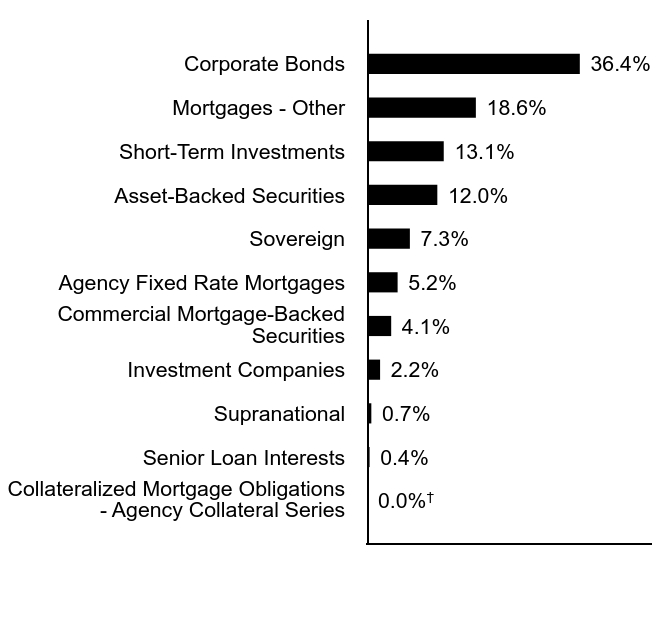
Asset Allocation (% of total investments)
| Value | Value |
|---|
| Collateralized Mortgage Obligations - Agency Collateral Series | 0.0%Footnote Reference† |
| Senior Loan Interests | 0.4% |
| Supranational | 0.7% |
| Investment Companies | 2.2% |
| Commercial Mortgage-Backed Securities | 4.1% |
| Agency Fixed Rate Mortgages | 5.2% |
| Sovereign | 7.3% |
| Asset-Backed Securities | 12.0% |
| Short-Term Investments | 13.1% |
| Mortgages - Other | 18.6% |
| Corporate Bonds | 36.4% |
| Footnote | Description |
Footnote† | Amount is less than 0.05% |
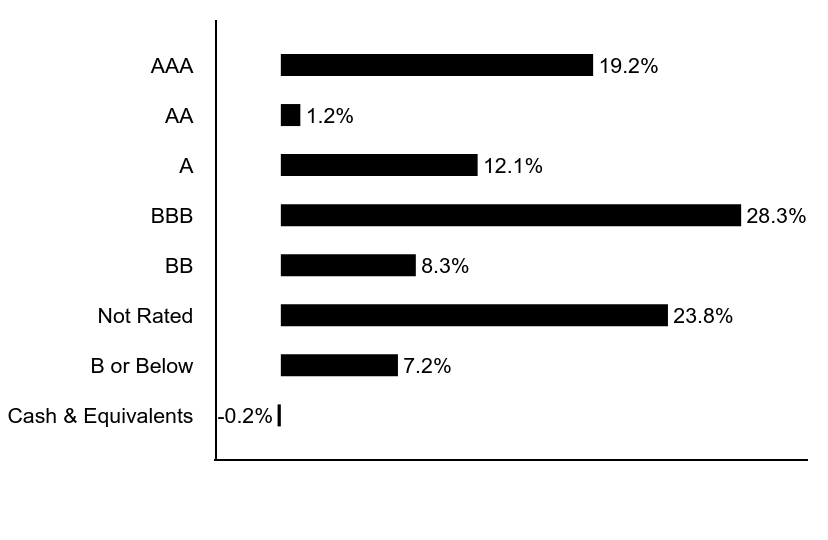
Credit Quality (% of net assets)Footnote Referencea
| Value | Value |
|---|
| Cash & Equivalents | -0.2% |
| B or Below | 7.2% |
| Not Rated | 23.8% |
| BB | 8.3% |
| BBB | 28.3% |
| A | 12.1% |
| AA | 1.2% |
| AAA | 19.2% |
| Footnote | Description |
Footnotea | Security ratings disclosed with the exception for those labeled "Not Rated" is an aggregation of the highest security level rating amongst S&P Global Ratings, Moody's Investors Services, Inc., and Fitch Ratings, each a Nationally Recognized Statistical Ratings Organization. |
If you wish to view additional information about the Fund, including the prospectus, statement of additional information, financial statements and holdings, please scan the QR code or visit www.morganstanley.com/im/shareholderreports. For proxy information, please visit www.morganstanley.com/im/en-us/institutional-investor/about-us/proxy-voting/vote-summary-report.desktop.html.
The Funds may deliver a single copy of certain required shareholder documents (including prospectuses, shareholder reports, and proxy materials) to investors with the same last name and the same address. Your participation will continue indefinitely unless you instruct otherwise by calling1-800-869-6397 or by contacting your financial intermediary. Your instruction will typically be effective within 30 days of receipt.
Not FDIC Insured | May Lose Value | No Bank Guarantee
Annual Shareholder Report October 31, 2024
Morgan Stanley Global Fixed Income Opportunities Fund
Annual Shareholder Report October 31, 2024
This annual shareholder report contains important information about Morgan Stanley Global Fixed Income Opportunities Fund for the period of November 1, 2023 to October 31, 2024. You can find additional information about the Fund at www.morganstanley.com/im/shareholderreports. You can also request this information by contacting us at 1-800-869-6397.
What were the Fund costs for the last year?
(based on a hypothetical $10,000 investment)
| Class Name | Costs of a $10,000 investment | Costs paid as a percentage of a $10,000 investment |
|---|
| Class C | $165 | 1.57% |
How did the Fund perform last year and what affected its performance?
Key contributors to (↑) and detractors from (↓) performance, relative to the Bloomberg Global Aggregate Hedged USD Index:
↑ Securitized debt exposure, particularly within non-agency residential mortgage-backed securities (RMBS), commercial mortgage-backed securities (CMBS) and asset-backed securities (ABS).
↑ Long exposure to investment grade and high yield corporate bonds as spreads tightened across the board.
↑ Long exposure to developed markets rates on the back of global government bonds rallying over the period, particularly within the U.S. and Canada. Higher “risk-free” rates continued to benefit performance.
↓ Emerging markets currency exposure, particularly long exposures to Dominican peso and Mexican peso.
↓ Short duration exposure to the U.K. for the majority of the period as yields marginally fell.
↓ Credit default swap exposure.
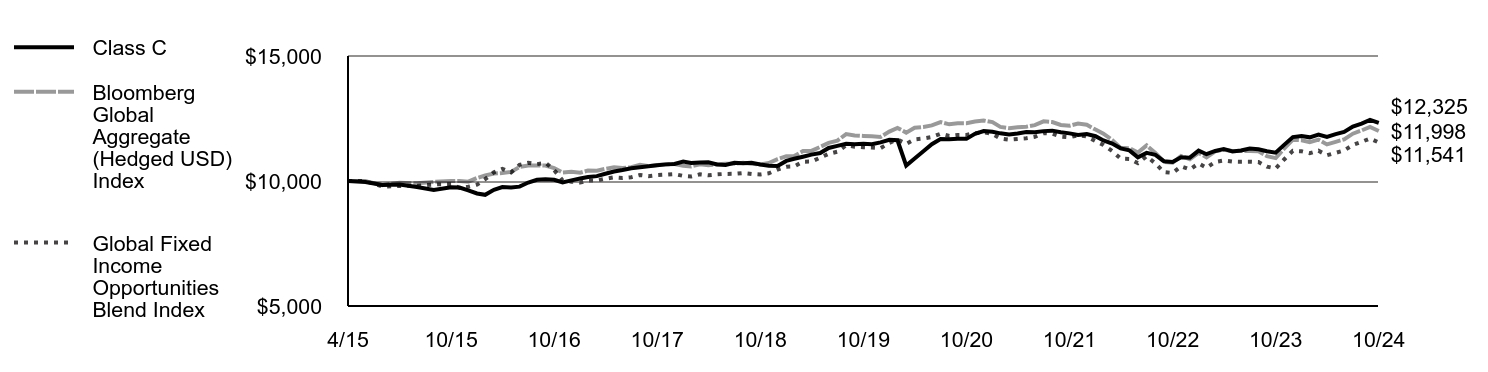
Comparison of the change in value of a $10,000 investment for the period indicated.
| | Bloomberg Global Aggregate (Hedged USD) Index | Global Fixed Income Opportunities Blend Index |
|---|
| 4/15 | $10,000 | $10,000 | $10,000 |
| 5/15 | $9,956 | $10,000 | $10,000 |
| 6/15 | $9,839 | $9,835 | $9,778 |
| 7/15 | $9,862 | $9,933 | $9,800 |
| 8/15 | $9,762 | $9,906 | $9,812 |
| 9/15 | $9,643 | $9,965 | $9,862 |
| 10/15 | $9,752 | $9,997 | $9,882 |
| 11/15 | $9,740 | $10,002 | $9,719 |
| 12/15 | $9,626 | $9,975 | $9,770 |
| 1/16 | $9,501 | $10,121 | $9,855 |
| 2/16 | $9,447 | $10,218 | $10,074 |
| 3/16 | $9,646 | $10,302 | $10,347 |
| 4/16 | $9,755 | $10,319 | $10,484 |
| 5/16 | $9,737 | $10,363 | $10,344 |
| 6/16 | $9,774 | $10,560 | $10,646 |
| 7/16 | $9,938 | $10,623 | $10,726 |
| 8/16 | $10,047 | $10,618 | $10,674 |
| 9/16 | $10,065 | $10,617 | $10,733 |
| 10/16 | $10,048 | $10,514 | $10,435 |
| 11/16 | $9,939 | $10,340 | $10,020 |
| 12/16 | $10,026 | $10,368 | $9,974 |
| 1/17 | $10,101 | $10,331 | $9,938 |
| 2/17 | $10,157 | $10,419 | $10,023 |
| 3/17 | $10,195 | $10,414 | $10,018 |
| 4/17 | $10,289 | $10,485 | $10,086 |
| 5/17 | $10,382 | $10,546 | $10,145 |
| 6/17 | $10,438 | $10,517 | $10,117 |
| 7/17 | $10,513 | $10,551 | $10,150 |
| 8/17 | $10,552 | $10,647 | $10,242 |
| 9/17 | $10,590 | $10,598 | $10,195 |
| 10/17 | $10,627 | $10,643 | $10,238 |
| 11/17 | $10,665 | $10,659 | $10,254 |
| 12/17 | $10,684 | $10,683 | $10,277 |
| 1/18 | $10,779 | $10,607 | $10,204 |
| 2/18 | $10,724 | $10,583 | $10,181 |
| 3/18 | $10,744 | $10,671 | $10,265 |
| 4/18 | $10,749 | $10,631 | $10,227 |
| 5/18 | $10,658 | $10,671 | $10,265 |
| 6/18 | $10,644 | $10,691 | $10,284 |
| 7/18 | $10,725 | $10,694 | $10,287 |
| 8/18 | $10,710 | $10,726 | $10,319 |
| 9/18 | $10,733 | $10,685 | $10,279 |
| 10/18 | $10,662 | $10,665 | $10,259 |
| 11/18 | $10,610 | $10,717 | $10,309 |
| 12/18 | $10,602 | $10,872 | $10,458 |
| 1/19 | $10,803 | $10,987 | $10,569 |
| 2/19 | $10,888 | $11,000 | $10,582 |
| 3/19 | $10,971 | $11,197 | $10,771 |
| 4/19 | $11,055 | $11,204 | $10,778 |
| 5/19 | $11,119 | $11,365 | $10,933 |
| 6/19 | $11,322 | $11,524 | $11,086 |
| 7/19 | $11,406 | $11,615 | $11,173 |
| 8/19 | $11,490 | $11,878 | $11,427 |
| 9/19 | $11,470 | $11,823 | $11,374 |
| 10/19 | $11,491 | $11,803 | $11,354 |
| 11/19 | $11,474 | $11,789 | $11,341 |
| 12/19 | $11,544 | $11,765 | $11,317 |
| 1/20 | $11,648 | $11,977 | $11,522 |
| 2/20 | $11,631 | $12,124 | $11,663 |
| 3/20 | $10,617 | $11,935 | $11,481 |
| 4/20 | $10,903 | $12,128 | $11,667 |
| 5/20 | $11,188 | $12,163 | $11,700 |
| 6/20 | $11,473 | $12,223 | $11,758 |
| 7/20 | $11,677 | $12,357 | $11,887 |
| 8/20 | $11,675 | $12,267 | $11,801 |
| 9/20 | $11,691 | $12,312 | $11,844 |
| 10/20 | $11,686 | $12,313 | $11,845 |
| 11/20 | $11,887 | $12,383 | $11,912 |
| 12/20 | $11,998 | $12,421 | $11,949 |
| 1/21 | $11,972 | $12,355 | $11,885 |
| 2/21 | $11,906 | $12,163 | $11,700 |
| 3/21 | $11,860 | $12,115 | $11,654 |
| 4/21 | $11,897 | $12,146 | $11,684 |
| 5/21 | $11,956 | $12,173 | $11,710 |
| 6/21 | $11,955 | $12,233 | $11,768 |
| 7/21 | $11,995 | $12,385 | $11,914 |
| 8/21 | $12,014 | $12,360 | $11,890 |
| 9/21 | $11,950 | $12,243 | $11,778 |
| 10/21 | $11,905 | $12,211 | $11,747 |
| 11/21 | $11,839 | $12,298 | $11,831 |
| 12/21 | $11,879 | $12,248 | $11,783 |
| 1/22 | $11,792 | $12,056 | $11,598 |
| 2/22 | $11,622 | $11,896 | $11,443 |
| 3/22 | $11,496 | $11,639 | $11,197 |
| 4/22 | $11,306 | $11,326 | $10,896 |
| 5/22 | $11,223 | $11,311 | $10,881 |
| 6/22 | $10,948 | $11,139 | $10,716 |
| 7/22 | $11,123 | $11,423 | $10,989 |
| 8/22 | $11,043 | $11,125 | $10,702 |
| 9/22 | $10,791 | $10,768 | $10,358 |
| 10/22 | $10,760 | $10,731 | $10,323 |
| 11/22 | $10,949 | $11,004 | $10,586 |
| 12/22 | $10,935 | $10,874 | $10,461 |
| 1/23 | $11,217 | $11,125 | $10,702 |
| 2/23 | $11,072 | $10,947 | $10,531 |
| 3/23 | $11,201 | $11,190 | $10,765 |
| 4/23 | $11,282 | $11,248 | $10,820 |
| 5/23 | $11,182 | $11,203 | $10,777 |
| 6/23 | $11,218 | $11,197 | $10,771 |
| 7/23 | $11,299 | $11,200 | $10,774 |
| 8/23 | $11,266 | $11,186 | $10,761 |
| 9/23 | $11,192 | $10,993 | $10,575 |
| 10/23 | $11,134 | $10,915 | $10,500 |
| 11/23 | $11,445 | $11,291 | $10,861 |
| 12/23 | $11,757 | $11,651 | $11,208 |
| 1/24 | $11,796 | $11,629 | $11,186 |
| 2/24 | $11,746 | $11,549 | $11,110 |
| 3/24 | $11,858 | $11,653 | $11,210 |
| 4/24 | $11,761 | $11,465 | $11,029 |
| 5/24 | $11,874 | $11,567 | $11,127 |
| 6/24 | $11,965 | $11,667 | $11,223 |
| 7/24 | $12,177 | $11,893 | $11,440 |
| 8/24 | $12,298 | $12,023 | $11,566 |
| 9/24 | $12,443 | $12,162 | $11,700 |
| 10/24 | $12,325 | $11,998 | $11,541 |
Average Annual Total Returns (%)
| AATR | 1 Year | 5 Years | Since 4/30/15 (Inception) |
|---|
| Class C | 10.70% | 1.41% | 2.22% |
| Class C with maximum 1% deferred sales charge | 9.70% | 1.41% | 2.22% |
| Bloomberg Global Aggregate (Hedged USD) Index | 9.92% | 0.33% | 1.93% |
Global Fixed Income Opportunities Blend IndexFootnote Reference1 | 9.92% | 0.33% | 1.52% |
| Footnote | Description |
Footnote1 | The Global Fixed Income Opportunities Blend Index is a performance linked benchmark of the old benchmark represented by Bloomberg Global Aggregate Index (unhedged USD) (a benchmark that provides a broad-based measure of the global investment grade fixed rate debt markets with returns in unhedged USD) from the Fund’s inception to December 31, 2016 to the new benchmark represented by Bloomberg Global Aggregate (Hedged USD) Index for periods thereafter. It is not possible to invest directly in an index. |
Performance does not reflect the deduction of taxes that a shareholder would pay on Fund distributions or redemption of Fund shares. Performance assumes that all dividends and distributions, if any, were reinvested. For more recent performance information, visit www.morganstanley.com/im/shareholderreports.
THE FUND'S PAST PERFORMANCE IS NO GUARANTEE OF FUTURE RESULTS.
| Total Net Assets | $788,752,575 |
| # of Portfolio Holdings | 408 |
| Portfolio Turnover Rate | 155% |
| Total Advisory Fees Paid | $2,482,642 |
What did the Fund invest in?
The following tables reflect what the Fund invested in as of the report date.
Asset Allocation (% of total investments)
| Value | Value |
|---|
| Collateralized Mortgage Obligations - Agency Collateral Series | 0.0%Footnote Reference† |
| Senior Loan Interests | 0.4% |
| Supranational | 0.7% |
| Investment Companies | 2.2% |
| Commercial Mortgage-Backed Securities | 4.1% |
| Agency Fixed Rate Mortgages | 5.2% |
| Sovereign | 7.3% |
| Asset-Backed Securities | 12.0% |
| Short-Term Investments | 13.1% |
| Mortgages - Other | 18.6% |
| Corporate Bonds | 36.4% |
| Footnote | Description |
Footnote† | Amount is less than 0.05% |
Credit Quality (% of net assets)Footnote Referencea
| Value | Value |
|---|
| Cash & Equivalents | -0.2% |
| B or Below | 7.2% |
| Not Rated | 23.8% |
| BB | 8.3% |
| BBB | 28.3% |
| A | 12.1% |
| AA | 1.2% |
| AAA | 19.2% |
| Footnote | Description |
Footnotea | Security ratings disclosed with the exception for those labeled "Not Rated" is an aggregation of the highest security level rating amongst S&P Global Ratings, Moody's Investors Services, Inc., and Fitch Ratings, each a Nationally Recognized Statistical Ratings Organization. |
If you wish to view additional information about the Fund, including the prospectus, statement of additional information, financial statements and holdings, please scan the QR code or visit www.morganstanley.com/im/shareholderreports. For proxy information, please visit www.morganstanley.com/im/en-us/institutional-investor/about-us/proxy-voting/vote-summary-report.desktop.html.
The Funds may deliver a single copy of certain required shareholder documents (including prospectuses, shareholder reports, and proxy materials) to investors with the same last name and the same address. Your participation will continue indefinitely unless you instruct otherwise by calling1-800-869-6397 or by contacting your financial intermediary. Your instruction will typically be effective within 30 days of receipt.
Not FDIC Insured | May Lose Value | No Bank Guarantee
Annual Shareholder Report October 31, 2024
Morgan Stanley Global Fixed Income Opportunities Fund
Annual Shareholder Report October 31, 2024
This annual shareholder report contains important information about Morgan Stanley Global Fixed Income Opportunities Fund for the period of November 1, 2023 to October 31, 2024. You can find additional information about the Fund at www.morganstanley.com/im/shareholderreports. You can also request this information by contacting us at 1-800-869-6397.
What were the Fund costs for the last year?
(based on a hypothetical $10,000 investment)
| Class Name | Costs of a $10,000 investment | Costs paid as a percentage of a $10,000 investment |
|---|
| Class I | $60 | 0.57% |
How did the Fund perform last year and what affected its performance?
Key contributors to (↑) and detractors from (↓) performance, relative to the Bloomberg Global Aggregate Hedged USD Index:
↑ Securitized debt exposure, particularly within non-agency residential mortgage-backed securities (RMBS), commercial mortgage-backed securities (CMBS) and asset-backed securities (ABS).
↑ Long exposure to investment grade and high yield corporate bonds as spreads tightened across the board.
↑ Long exposure to developed markets rates on the back of global government bonds rallying over the period, particularly within the U.S. and Canada. Higher “risk-free” rates continued to benefit performance.
↓ Emerging markets currency exposure, particularly long exposures to Dominican peso and Mexican peso.
↓ Short duration exposure to the U.K. for the majority of the period as yields marginally fell.
↓ Credit default swap exposure.
Comparison of the change in value of a $1,000,000 investment for the period indicated.
| | Bloomberg Global Aggregate (Hedged USD) Index | Global Fixed Income Opportunities Blend Index |
|---|
| 10/14 | $1,000,000 | $1,000,000 | $1,000,000 |
| 11/14 | $999,512 | $1,009,390 | $996,349 |
| 12/14 | $996,306 | $1,014,616 | $989,489 |
| 1/15 | $1,009,790 | $1,033,538 | $987,924 |
| 2/15 | $1,019,804 | $1,027,432 | $979,924 |
| 3/15 | $1,015,944 | $1,033,319 | $970,479 |
| 4/15 | $1,018,996 | $1,027,542 | $980,800 |
| 5/15 | $1,014,978 | $1,023,282 | $963,264 |
| 6/15 | $1,003,949 | $1,010,633 | $959,045 |
| 7/15 | $1,007,030 | $1,020,643 | $961,194 |
| 8/15 | $997,665 | $1,017,884 | $962,312 |
| 9/15 | $986,401 | $1,023,921 | $967,216 |
| 10/15 | $998,307 | $1,027,242 | $969,259 |
| 11/15 | $997,879 | $1,027,715 | $953,212 |
| 12/15 | $987,021 | $1,024,934 | $958,279 |
| 1/16 | $975,095 | $1,039,927 | $966,583 |
| 2/16 | $970,428 | $1,049,923 | $988,107 |
| 3/16 | $991,417 | $1,058,566 | $1,014,808 |
| 4/16 | $1,003,215 | $1,060,364 | $1,028,306 |
| 5/16 | $1,002,278 | $1,064,846 | $1,014,512 |
| 6/16 | $1,008,672 | $1,085,116 | $1,044,137 |
| 7/16 | $1,026,168 | $1,091,599 | $1,052,008 |
| 8/16 | $1,036,378 | $1,091,043 | $1,046,898 |
| 9/16 | $1,039,067 | $1,090,913 | $1,052,662 |
| 10/16 | $1,038,227 | $1,080,335 | $1,023,446 |
| 11/16 | $1,029,844 | $1,062,492 | $982,783 |
| 12/16 | $1,039,562 | $1,065,404 | $978,268 |
| 1/17 | $1,046,271 | $1,061,523 | $974,704 |
| 2/17 | $1,054,720 | $1,070,610 | $983,048 |
| 3/17 | $1,059,464 | $1,070,116 | $982,595 |
| 4/17 | $1,069,977 | $1,077,373 | $989,258 |
| 5/17 | $1,080,447 | $1,083,662 | $995,032 |
| 6/17 | $1,085,176 | $1,080,629 | $992,247 |
| 7/17 | $1,095,737 | $1,084,181 | $995,509 |
| 8/17 | $1,098,673 | $1,094,062 | $1,004,582 |
| 9/17 | $1,105,370 | $1,089,011 | $999,944 |
| 10/17 | $1,110,196 | $1,093,604 | $1,004,162 |
| 11/17 | $1,115,013 | $1,095,298 | $1,005,717 |
| 12/17 | $1,117,936 | $1,097,747 | $1,007,965 |
| 1/18 | $1,130,685 | $1,089,910 | $1,000,770 |
| 2/18 | $1,125,880 | $1,087,453 | $998,513 |
| 3/18 | $1,126,867 | $1,096,469 | $1,006,792 |
| 4/18 | $1,128,334 | $1,092,389 | $1,003,046 |
| 5/18 | $1,119,888 | $1,096,470 | $1,006,793 |
| 6/18 | $1,121,229 | $1,098,514 | $1,008,670 |
| 7/18 | $1,128,614 | $1,098,815 | $1,008,946 |
| 8/18 | $1,128,010 | $1,102,192 | $1,012,047 |
| 9/18 | $1,133,407 | $1,097,976 | $1,008,175 |
| 10/18 | $1,125,104 | $1,095,830 | $1,006,206 |
| 11/18 | $1,122,526 | $1,101,192 | $1,011,129 |
| 12/18 | $1,120,641 | $1,117,098 | $1,025,734 |
| 1/19 | $1,144,638 | $1,128,930 | $1,036,598 |
| 2/19 | $1,152,283 | $1,130,287 | $1,037,844 |
| 3/19 | $1,164,054 | $1,150,531 | $1,056,432 |
| 4/19 | $1,171,718 | $1,151,216 | $1,057,062 |
| 5/19 | $1,181,482 | $1,167,781 | $1,072,272 |
| 6/19 | $1,203,790 | $1,184,156 | $1,087,307 |
| 7/19 | $1,211,523 | $1,193,474 | $1,095,863 |
| 8/19 | $1,223,471 | $1,220,540 | $1,120,715 |
| 9/19 | $1,220,317 | $1,214,884 | $1,115,522 |
| 10/19 | $1,225,586 | $1,212,787 | $1,113,597 |
| 11/19 | $1,224,741 | $1,211,364 | $1,112,290 |
| 12/19 | $1,233,158 | $1,208,880 | $1,110,010 |
| 1/20 | $1,245,105 | $1,230,696 | $1,130,041 |
| 2/20 | $1,244,250 | $1,245,759 | $1,143,872 |
| 3/20 | $1,136,129 | $1,226,371 | $1,126,070 |
| 4/20 | $1,167,329 | $1,246,224 | $1,144,299 |
| 5/20 | $1,200,558 | $1,249,756 | $1,147,543 |
| 6/20 | $1,231,713 | $1,255,994 | $1,153,270 |
| 7/20 | $1,254,266 | $1,269,719 | $1,165,872 |
| 8/20 | $1,255,135 | $1,260,518 | $1,157,424 |
| 9/20 | $1,257,859 | $1,265,123 | $1,161,652 |
| 10/20 | $1,258,405 | $1,265,215 | $1,161,737 |
| 11/20 | $1,283,026 | $1,272,434 | $1,168,365 |
| 12/20 | $1,296,015 | $1,276,343 | $1,171,955 |
| 1/21 | $1,294,365 | $1,269,497 | $1,165,669 |
| 2/21 | $1,286,096 | $1,249,750 | $1,147,536 |
| 3/21 | $1,282,229 | $1,244,826 | $1,143,015 |
| 4/21 | $1,289,426 | $1,248,080 | $1,146,003 |
| 5/21 | $1,294,641 | $1,250,866 | $1,148,561 |
| 6/21 | $1,295,531 | $1,256,966 | $1,154,163 |
| 7/21 | $1,300,883 | $1,272,589 | $1,168,508 |
| 8/21 | $1,304,012 | $1,270,039 | $1,166,166 |
| 9/21 | $1,298,187 | $1,258,048 | $1,155,156 |
| 10/21 | $1,294,481 | $1,254,759 | $1,152,136 |
| 11/21 | $1,290,766 | $1,263,709 | $1,160,354 |
| 12/21 | $1,296,193 | $1,258,584 | $1,155,648 |
| 1/22 | $1,285,600 | $1,238,810 | $1,137,492 |
| 2/22 | $1,268,360 | $1,222,332 | $1,122,361 |
| 3/22 | $1,255,882 | $1,195,983 | $1,098,167 |
| 4/22 | $1,236,481 | $1,163,839 | $1,068,652 |
| 5/22 | $1,228,538 | $1,162,238 | $1,067,182 |
| 6/22 | $1,199,888 | $1,144,599 | $1,050,986 |
| 7/22 | $1,217,493 | $1,173,753 | $1,077,756 |
| 8/22 | $1,209,942 | $1,143,112 | $1,049,620 |
| 9/22 | $1,183,714 | $1,106,415 | $1,015,925 |
| 10/22 | $1,181,375 | $1,102,628 | $1,012,448 |
| 11/22 | $1,202,807 | $1,130,726 | $1,038,248 |
| 12/22 | $1,204,758 | $1,117,382 | $1,025,994 |
| 1/23 | $1,233,974 | $1,143,118 | $1,049,626 |
| 2/23 | $1,221,634 | $1,124,885 | $1,032,884 |
| 3/23 | $1,236,813 | $1,149,829 | $1,055,788 |
| 4/23 | $1,246,571 | $1,155,748 | $1,061,223 |
| 5/23 | $1,236,775 | $1,151,199 | $1,057,045 |
| 6/23 | $1,241,693 | $1,150,511 | $1,056,415 |
| 7/23 | $1,249,098 | $1,150,884 | $1,056,757 |
| 8/23 | $1,249,098 | $1,149,438 | $1,055,429 |
| 9/23 | $1,241,945 | $1,129,616 | $1,037,228 |
| 10/23 | $1,236,697 | $1,121,595 | $1,029,863 |
| 11/23 | $1,271,691 | $1,160,159 | $1,065,273 |
| 12/23 | $1,306,955 | $1,197,236 | $1,099,317 |
| 1/24 | $1,312,390 | $1,194,889 | $1,097,163 |
| 2/24 | $1,307,948 | $1,186,690 | $1,089,634 |
| 3/24 | $1,321,333 | $1,197,391 | $1,099,460 |
| 4/24 | $1,311,731 | $1,178,112 | $1,081,758 |
| 5/24 | $1,327,806 | $1,188,537 | $1,091,330 |
| 6/24 | $1,338,785 | $1,198,850 | $1,100,800 |
| 7/24 | $1,360,579 | $1,222,010 | $1,122,066 |
| 8/24 | $1,375,045 | $1,235,394 | $1,134,355 |
| 9/24 | $1,392,200 | $1,249,730 | $1,147,518 |
| 10/24 | $1,380,489 | $1,232,818 | $1,131,990 |
Average Annual Total Returns (%)
| AATR | 1 Year | 5 Years | 10 Years |
|---|
| Class I | 11.63% | 2.41% | 3.28% |
| Bloomberg Global Aggregate (Hedged USD) Index | 9.92% | 0.33% | 2.12% |
Global Fixed Income Opportunities Blend IndexFootnote Reference1 | 9.92% | 0.33% | 1.25% |
| Footnote | Description |
Footnote1 | The Global Fixed Income Opportunities Blend Index is a performance linked benchmark of the old benchmark represented by Bloomberg Global Aggregate Index (unhedged USD) (a benchmark that provides a broad-based measure of the global investment grade fixed rate debt markets with returns in unhedged USD) from the Fund’s inception to December 31, 2016 to the new benchmark represented by Bloomberg Global Aggregate (Hedged USD) Index for periods thereafter. It is not possible to invest directly in an index. |
Performance does not reflect the deduction of taxes that a shareholder would pay on Fund distributions or redemption of Fund shares. Performance assumes that all dividends and distributions, if any, were reinvested. For more recent performance information, visit www.morganstanley.com/im/shareholderreports.
THE FUND'S PAST PERFORMANCE IS NO GUARANTEE OF FUTURE RESULTS.
| Total Net Assets | $788,752,575 |
| # of Portfolio Holdings | 408 |
| Portfolio Turnover Rate | 155% |
| Total Advisory Fees Paid | $2,482,642 |
What did the Fund invest in?
The following tables reflect what the Fund invested in as of the report date.
Asset Allocation (% of total investments)
| Value | Value |
|---|
| Collateralized Mortgage Obligations - Agency Collateral Series | 0.0%Footnote Reference† |
| Senior Loan Interests | 0.4% |
| Supranational | 0.7% |
| Investment Companies | 2.2% |
| Commercial Mortgage-Backed Securities | 4.1% |
| Agency Fixed Rate Mortgages | 5.2% |
| Sovereign | 7.3% |
| Asset-Backed Securities | 12.0% |
| Short-Term Investments | 13.1% |
| Mortgages - Other | 18.6% |
| Corporate Bonds | 36.4% |
| Footnote | Description |
Footnote† | Amount is less than 0.05% |
Credit Quality (% of net assets)Footnote Referencea
| Value | Value |
|---|
| Cash & Equivalents | -0.2% |
| B or Below | 7.2% |
| Not Rated | 23.8% |
| BB | 8.3% |
| BBB | 28.3% |
| A | 12.1% |
| AA | 1.2% |
| AAA | 19.2% |
| Footnote | Description |
Footnotea | Security ratings disclosed with the exception for those labeled "Not Rated" is an aggregation of the highest security level rating amongst S&P Global Ratings, Moody's Investors Services, Inc., and Fitch Ratings, each a Nationally Recognized Statistical Ratings Organization. |
If you wish to view additional information about the Fund, including the prospectus, statement of additional information, financial statements and holdings, please scan the QR code or visit www.morganstanley.com/im/shareholderreports. For proxy information, please visit www.morganstanley.com/im/en-us/institutional-investor/about-us/proxy-voting/vote-summary-report.desktop.html.
The Funds may deliver a single copy of certain required shareholder documents (including prospectuses, shareholder reports, and proxy materials) to investors with the same last name and the same address. Your participation will continue indefinitely unless you instruct otherwise by calling1-800-869-6397 or by contacting your financial intermediary. Your instruction will typically be effective within 30 days of receipt.
Not FDIC Insured | May Lose Value | No Bank Guarantee
Annual Shareholder Report October 31, 2024
Morgan Stanley Global Fixed Income Opportunities Fund
Annual Shareholder Report October 31, 2024
This annual shareholder report contains important information about Morgan Stanley Global Fixed Income Opportunities Fund for the period of November 1, 2023 to October 31, 2024. You can find additional information about the Fund at www.morganstanley.com/im/shareholderreports. You can also request this information by contacting us at 1-800-869-6397.
What were the Fund costs for the last year?
(based on a hypothetical $10,000 investment)
| Class Name | Costs of a $10,000 investment | Costs paid as a percentage of a $10,000 investment |
|---|
| Class IR | $49 | 0.46% |
How did the Fund perform last year and what affected its performance?
Key contributors to (↑) and detractors from (↓) performance, relative to the Bloomberg Global Aggregate Hedged USD Index:
↑ Securitized debt exposure, particularly within non-agency residential mortgage-backed securities (RMBS), commercial mortgage-backed securities (CMBS) and asset-backed securities (ABS).
↑ Long exposure to investment grade and high yield corporate bonds as spreads tightened across the board.
↑ Long exposure to developed markets rates on the back of global government bonds rallying over the period, particularly within the U.S. and Canada. Higher “risk-free” rates continued to benefit performance.
↓ Emerging markets currency exposure, particularly long exposures to Dominican peso and Mexican peso.
↓ Short duration exposure to the U.K. for the majority of the period as yields marginally fell.
↓ Credit default swap exposure.
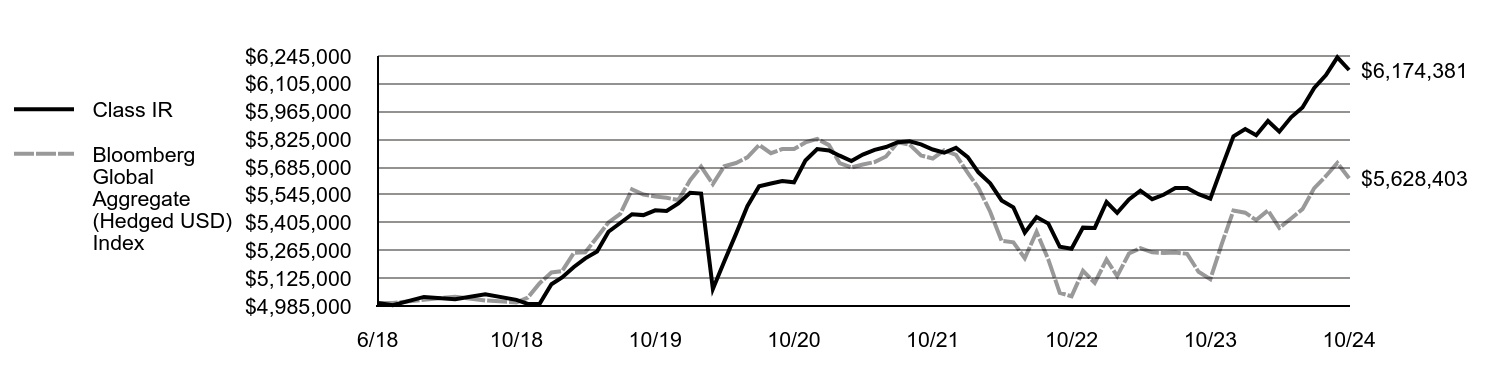
Comparison of the change in value of a $5,000,000 investment for the period indicated.
| | Bloomberg Global Aggregate (Hedged USD) Index |
|---|
| 6/18 | $5,000,000 | $5,000,000 |
| 6/18 | $4,988,667 | $5,000,000 |
| 7/18 | $5,030,710 | $5,016,613 |
| 8/18 | $5,019,560 | $5,032,031 |
| 9/18 | $5,043,636 | $5,012,781 |
| 10/18 | $5,015,725 | $5,002,986 |
| 11/18 | $4,995,576 | $5,027,464 |
| 12/18 | $4,996,598 | $5,100,084 |
| 1/19 | $5,094,585 | $5,154,103 |
| 2/19 | $5,128,872 | $5,160,297 |
| 3/19 | $5,181,522 | $5,252,720 |
| 4/19 | $5,225,117 | $5,255,849 |
| 5/19 | $5,259,666 | $5,331,478 |
| 6/19 | $5,359,258 | $5,406,235 |
| 7/19 | $5,403,278 | $5,448,776 |
| 8/19 | $5,447,436 | $5,572,345 |
| 9/19 | $5,443,084 | $5,546,524 |
| 10/19 | $5,467,362 | $5,536,949 |
| 11/19 | $5,463,903 | $5,530,454 |
| 12/19 | $5,501,685 | $5,519,115 |
| 1/20 | $5,555,183 | $5,618,714 |
| 2/20 | $5,551,659 | $5,687,483 |
| 3/20 | $5,070,449 | $5,598,967 |
| 4/20 | $5,209,804 | $5,689,607 |
| 5/20 | $5,348,630 | $5,705,733 |
| 6/20 | $5,487,819 | $5,734,208 |
| 7/20 | $5,588,673 | $5,796,870 |
| 8/20 | $5,602,593 | $5,754,864 |
| 9/20 | $5,615,033 | $5,775,887 |
| 10/20 | $5,608,146 | $5,776,308 |
| 11/20 | $5,718,154 | $5,809,266 |
| 12/20 | $5,776,334 | $5,827,114 |
| 1/21 | $5,769,256 | $5,795,858 |
| 2/21 | $5,742,528 | $5,705,702 |
| 3/21 | $5,715,855 | $5,683,223 |
| 4/21 | $5,748,348 | $5,698,079 |
| 5/21 | $5,772,038 | $5,710,798 |
| 6/21 | $5,786,371 | $5,738,650 |
| 7/21 | $5,810,666 | $5,809,973 |
| 8/21 | $5,815,109 | $5,798,333 |
| 9/21 | $5,799,590 | $5,743,590 |
| 10/21 | $5,773,564 | $5,728,571 |
| 11/21 | $5,757,381 | $5,769,434 |
| 12/21 | $5,781,992 | $5,746,035 |
| 1/22 | $5,735,183 | $5,655,757 |
| 2/22 | $5,658,663 | $5,580,527 |
| 3/22 | $5,603,423 | $5,460,231 |
| 4/22 | $5,517,243 | $5,313,479 |
| 5/22 | $5,482,177 | $5,306,169 |
| 6/22 | $5,354,704 | $5,225,641 |
| 7/22 | $5,433,675 | $5,358,742 |
| 8/22 | $5,400,231 | $5,218,849 |
| 9/22 | $5,283,345 | $5,051,311 |
| 10/22 | $5,273,406 | $5,034,022 |
| 11/22 | $5,379,907 | $5,162,304 |
| 12/22 | $5,378,484 | $5,101,379 |
| 1/23 | $5,509,271 | $5,218,878 |
| 2/23 | $5,454,434 | $5,135,636 |
| 3/23 | $5,522,498 | $5,249,515 |
| 4/23 | $5,566,389 | $5,276,542 |
| 5/23 | $5,523,176 | $5,255,769 |
| 6/23 | $5,545,652 | $5,252,632 |
| 7/23 | $5,579,268 | $5,254,333 |
| 8/23 | $5,579,854 | $5,247,731 |
| 9/23 | $5,548,501 | $5,157,233 |
| 10/23 | $5,525,656 | $5,120,616 |
| 11/23 | $5,682,456 | $5,296,678 |
| 12/23 | $5,840,542 | $5,465,951 |
| 1/24 | $5,876,602 | $5,455,237 |
| 2/24 | $5,845,842 | $5,417,805 |
| 3/24 | $5,917,549 | $5,466,660 |
| 4/24 | $5,863,708 | $5,378,643 |
| 5/24 | $5,936,165 | $5,426,236 |
| 6/24 | $5,985,830 | $5,473,320 |
| 7/24 | $6,083,894 | $5,579,059 |
| 8/24 | $6,149,206 | $5,640,164 |
| 9/24 | $6,238,209 | $5,705,612 |
| 10/24 | $6,174,381 | $5,628,403 |
Average Annual Total Returns (%)
| AATR | 1 Year | 5 Years | Since 6/15/18 (Inception) |
|---|
| Class IR | 11.74% | 2.46% | 3.36% |
| Bloomberg Global Aggregate (Hedged USD) Index | 9.92% | 0.33% | 1.87% |
Performance does not reflect the deduction of taxes that a shareholder would pay on Fund distributions or redemption of Fund shares. Performance assumes that all dividends and distributions, if any, were reinvested. For more recent performance information, visit www.morganstanley.com/im/shareholderreports.
THE FUND'S PAST PERFORMANCE IS NO GUARANTEE OF FUTURE RESULTS.
| Total Net Assets | $788,752,575 |
| # of Portfolio Holdings | 408 |
| Portfolio Turnover Rate | 155% |
| Total Advisory Fees Paid | $2,482,642 |
What did the Fund invest in?
The following tables reflect what the Fund invested in as of the report date.
Asset Allocation (% of total investments)
| Value | Value |
|---|
| Collateralized Mortgage Obligations - Agency Collateral Series | 0.0%Footnote Reference† |
| Senior Loan Interests | 0.4% |
| Supranational | 0.7% |
| Investment Companies | 2.2% |
| Commercial Mortgage-Backed Securities | 4.1% |
| Agency Fixed Rate Mortgages | 5.2% |
| Sovereign | 7.3% |
| Asset-Backed Securities | 12.0% |
| Short-Term Investments | 13.1% |
| Mortgages - Other | 18.6% |
| Corporate Bonds | 36.4% |
| Footnote | Description |
Footnote† | Amount is less than 0.05% |
Credit Quality (% of net assets)Footnote Referencea
| Value | Value |
|---|
| Cash & Equivalents | -0.2% |
| B or Below | 7.2% |
| Not Rated | 23.8% |
| BB | 8.3% |
| BBB | 28.3% |
| A | 12.1% |
| AA | 1.2% |
| AAA | 19.2% |
| Footnote | Description |
Footnotea | Security ratings disclosed with the exception for those labeled "Not Rated" is an aggregation of the highest security level rating amongst S&P Global Ratings, Moody's Investors Services, Inc., and Fitch Ratings, each a Nationally Recognized Statistical Ratings Organization. |
If you wish to view additional information about the Fund, including the prospectus, statement of additional information, financial statements and holdings, please scan the QR code or visit www.morganstanley.com/im/shareholderreports. For proxy information, please visit www.morganstanley.com/im/en-us/institutional-investor/about-us/proxy-voting/vote-summary-report.desktop.html.
The Funds may deliver a single copy of certain required shareholder documents (including prospectuses, shareholder reports, and proxy materials) to investors with the same last name and the same address. Your participation will continue indefinitely unless you instruct otherwise by calling1-800-869-6397 or by contacting your financial intermediary. Your instruction will typically be effective within 30 days of receipt.
Not FDIC Insured | May Lose Value | No Bank Guarantee
Annual Shareholder Report October 31, 2024
Morgan Stanley Global Fixed Income Opportunities Fund
Annual Shareholder Report October 31, 2024
This annual shareholder report contains important information about Morgan Stanley Global Fixed Income Opportunities Fund for the period of November 1, 2023 to October 31, 2024. You can find additional information about the Fund at www.morganstanley.com/im/shareholderreports. You can also request this information by contacting us at 1-800-869-6397.
What were the Fund costs for the last year?
(based on a hypothetical $10,000 investment)
| Class Name | Costs of a $10,000 investment | Costs paid as a percentage of a $10,000 investment |
|---|
| Class L | $124 | 1.18% |
How did the Fund perform last year and what affected its performance?
Key contributors to (↑) and detractors from (↓) performance, relative to the Bloomberg Global Aggregate Hedged USD Index:
↑ Securitized debt exposure, particularly within non-agency residential mortgage-backed securities (RMBS), commercial mortgage-backed securities (CMBS) and asset-backed securities (ABS).
↑ Long exposure to investment grade and high yield corporate bonds as spreads tightened across the board.
↑ Long exposure to developed markets rates on the back of global government bonds rallying over the period, particularly within the U.S. and Canada. Higher “risk-free” rates continued to benefit performance.
↓ Emerging markets currency exposure, particularly long exposures to Dominican peso and Mexican peso.
↓ Short duration exposure to the U.K. for the majority of the period as yields marginally fell.
↓ Credit default swap exposure.
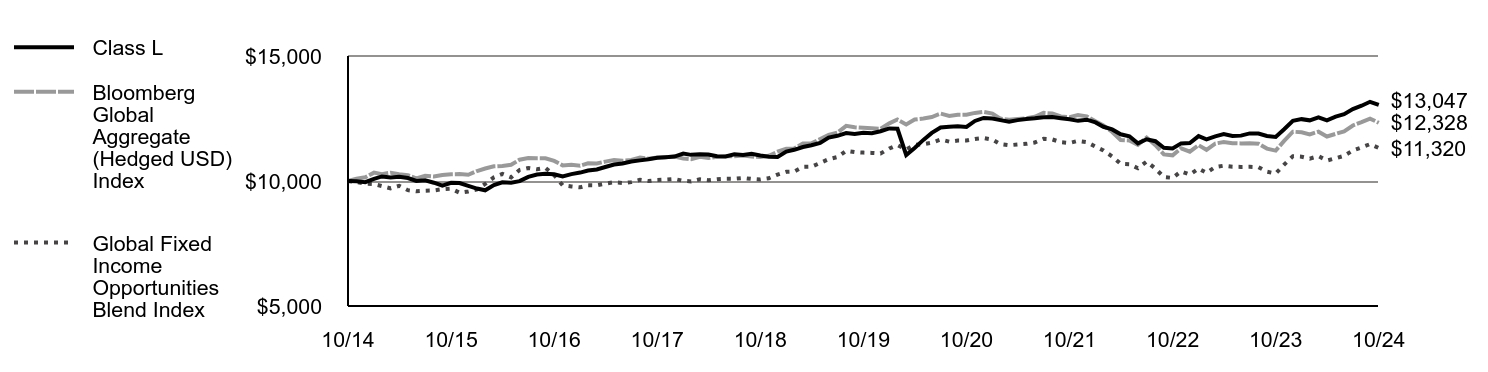
Comparison of the change in value of a $10,000 investment for the period indicated.
| | Bloomberg Global Aggregate (Hedged USD) Index | Global Fixed Income Opportunities Blend Index |
|---|
| 10/14 | $10,000 | $10,000 | $10,000 |
| 11/14 | $9,991 | $10,094 | $9,963 |
| 12/14 | $9,954 | $10,146 | $9,895 |
| 1/15 | $10,085 | $10,335 | $9,879 |
| 2/15 | $10,182 | $10,274 | $9,799 |
| 3/15 | $10,139 | $10,333 | $9,705 |
| 4/15 | $10,165 | $10,275 | $9,808 |
| 5/15 | $10,120 | $10,233 | $9,633 |
| 6/15 | $10,004 | $10,106 | $9,590 |
| 7/15 | $10,030 | $10,206 | $9,612 |
| 8/15 | $9,931 | $10,179 | $9,623 |
| 9/15 | $9,813 | $10,239 | $9,672 |
| 10/15 | $9,927 | $10,272 | $9,693 |
| 11/15 | $9,918 | $10,277 | $9,532 |
| 12/15 | $9,804 | $10,249 | $9,583 |
| 1/16 | $9,698 | $10,399 | $9,666 |
| 2/16 | $9,628 | $10,499 | $9,881 |
| 3/16 | $9,834 | $10,586 | $10,148 |
| 4/16 | $9,948 | $10,604 | $10,283 |
| 5/16 | $9,934 | $10,648 | $10,145 |
| 6/16 | $9,994 | $10,851 | $10,441 |
| 7/16 | $10,165 | $10,916 | $10,520 |
| 8/16 | $10,262 | $10,910 | $10,469 |
| 9/16 | $10,285 | $10,909 | $10,527 |
| 10/16 | $10,272 | $10,803 | $10,234 |
| 11/16 | $10,183 | $10,625 | $9,828 |
| 12/16 | $10,275 | $10,654 | $9,783 |
| 1/17 | $10,337 | $10,615 | $9,747 |
| 2/17 | $10,417 | $10,706 | $9,830 |
| 3/17 | $10,459 | $10,701 | $9,826 |
| 4/17 | $10,559 | $10,774 | $9,893 |
| 5/17 | $10,659 | $10,837 | $9,950 |
| 6/17 | $10,701 | $10,806 | $9,922 |
| 7/17 | $10,782 | $10,842 | $9,955 |
| 8/17 | $10,825 | $10,941 | $10,046 |
| 9/17 | $10,868 | $10,890 | $9,999 |
| 10/17 | $10,930 | $10,936 | $10,042 |
| 11/17 | $10,954 | $10,953 | $10,057 |
| 12/17 | $10,977 | $10,977 | $10,080 |
| 1/18 | $11,099 | $10,899 | $10,008 |
| 2/18 | $11,046 | $10,875 | $9,985 |
| 3/18 | $11,070 | $10,965 | $10,068 |
| 4/18 | $11,060 | $10,924 | $10,030 |
| 5/18 | $10,991 | $10,965 | $10,068 |
| 6/18 | $10,980 | $10,985 | $10,087 |
| 7/18 | $11,069 | $10,988 | $10,089 |
| 8/18 | $11,038 | $11,022 | $10,120 |
| 9/18 | $11,086 | $10,980 | $10,082 |
| 10/18 | $11,019 | $10,958 | $10,062 |
| 11/18 | $10,968 | $11,012 | $10,111 |
| 12/18 | $10,965 | $11,171 | $10,257 |
| 1/19 | $11,177 | $11,289 | $10,366 |
| 2/19 | $11,247 | $11,303 | $10,378 |
| 3/19 | $11,359 | $11,505 | $10,564 |
| 4/19 | $11,429 | $11,512 | $10,571 |
| 5/19 | $11,520 | $11,678 | $10,723 |
| 6/19 | $11,736 | $11,842 | $10,873 |
| 7/19 | $11,807 | $11,935 | $10,959 |
| 8/19 | $11,919 | $12,205 | $11,207 |
| 9/19 | $11,883 | $12,149 | $11,155 |
| 10/19 | $11,928 | $12,128 | $11,136 |
| 11/19 | $11,914 | $12,114 | $11,123 |
| 12/19 | $11,990 | $12,089 | $11,100 |
| 1/20 | $12,102 | $12,307 | $11,300 |
| 2/20 | $12,088 | $12,458 | $11,439 |
| 3/20 | $11,041 | $12,264 | $11,261 |
| 4/20 | $11,322 | $12,462 | $11,443 |
| 5/20 | $11,644 | $12,498 | $11,475 |
| 6/20 | $11,924 | $12,560 | $11,533 |
| 7/20 | $12,141 | $12,697 | $11,659 |
| 8/20 | $12,166 | $12,605 | $11,574 |
| 9/20 | $12,187 | $12,651 | $11,617 |
| 10/20 | $12,165 | $12,652 | $11,617 |
| 11/20 | $12,401 | $12,724 | $11,684 |
| 12/20 | $12,522 | $12,763 | $11,720 |
| 1/21 | $12,500 | $12,695 | $11,657 |
| 2/21 | $12,436 | $12,497 | $11,475 |
| 3/21 | $12,370 | $12,448 | $11,430 |
| 4/21 | $12,435 | $12,481 | $11,460 |
| 5/21 | $12,481 | $12,509 | $11,486 |
| 6/21 | $12,506 | $12,570 | $11,542 |
| 7/21 | $12,552 | $12,726 | $11,685 |
| 8/21 | $12,555 | $12,700 | $11,662 |
| 9/21 | $12,514 | $12,580 | $11,552 |
| 10/21 | $12,470 | $12,548 | $11,521 |
| 11/21 | $12,406 | $12,637 | $11,604 |
| 12/21 | $12,452 | $12,586 | $11,556 |
| 1/22 | $12,342 | $12,388 | $11,375 |
| 2/22 | $12,169 | $12,223 | $11,224 |
| 3/22 | $12,064 | $11,960 | $10,982 |
| 4/22 | $11,870 | $11,638 | $10,687 |
| 5/22 | $11,787 | $11,622 | $10,672 |
| 6/22 | $11,504 | $11,446 | $10,510 |
| 7/22 | $11,670 | $11,738 | $10,778 |
| 8/22 | $11,591 | $11,431 | $10,496 |
| 9/22 | $11,331 | $11,064 | $10,159 |
| 10/22 | $11,302 | $11,026 | $10,124 |
| 11/22 | $11,504 | $11,307 | $10,382 |
| 12/22 | $11,517 | $11,174 | $10,260 |
| 1/23 | $11,794 | $11,431 | $10,496 |
| 2/23 | $11,669 | $11,249 | $10,329 |
| 3/23 | $11,786 | $11,498 | $10,558 |
| 4/23 | $11,874 | $11,557 | $10,612 |
| 5/23 | $11,797 | $11,512 | $10,570 |
| 6/23 | $11,815 | $11,505 | $10,564 |
| 7/23 | $11,904 | $11,509 | $10,568 |
| 8/23 | $11,898 | $11,494 | $10,554 |
| 9/23 | $11,799 | $11,296 | $10,372 |
| 10/23 | $11,764 | $11,216 | $10,299 |
| 11/23 | $12,071 | $11,602 | $10,653 |
| 12/23 | $12,404 | $11,972 | $10,993 |
| 1/24 | $12,474 | $11,949 | $10,972 |
| 2/24 | $12,426 | $11,867 | $10,896 |
| 3/24 | $12,549 | $11,974 | $10,995 |
| 4/24 | $12,426 | $11,781 | $10,818 |
| 5/24 | $12,575 | $11,885 | $10,913 |
| 6/24 | $12,675 | $11,988 | $11,008 |
| 7/24 | $12,879 | $12,220 | $11,221 |
| 8/24 | $13,012 | $12,354 | $11,344 |
| 9/24 | $13,168 | $12,497 | $11,475 |
| 10/24 | $13,047 | $12,328 | $11,320 |
Average Annual Total Returns (%)
| AATR | 1 Year | 5 Years | 10 Years |
|---|
| Class L | 10.91% | 1.81% | 2.70% |
| Bloomberg Global Aggregate (Hedged USD) Index | 9.92% | 0.33% | 2.12% |
Global Fixed Income Opportunities Blend IndexFootnote Reference1 | 9.92% | 0.33% | 1.25% |
| Footnote | Description |
Footnote1 | The Global Fixed Income Opportunities Blend Index is a performance linked benchmark of the old benchmark represented by Bloomberg Global Aggregate Index (unhedged USD) (a benchmark that provides a broad-based measure of the global investment grade fixed rate debt markets with returns in unhedged USD) from the Fund’s inception to December 31, 2016 to the new benchmark represented by Bloomberg Global Aggregate (Hedged USD) Index for periods thereafter. It is not possible to invest directly in an index. |
Performance does not reflect the deduction of taxes that a shareholder would pay on Fund distributions or redemption of Fund shares. Performance assumes that all dividends and distributions, if any, were reinvested. For more recent performance information, visit www.morganstanley.com/im/shareholderreports.
THE FUND'S PAST PERFORMANCE IS NO GUARANTEE OF FUTURE RESULTS.
| Total Net Assets | $788,752,575 |
| # of Portfolio Holdings | 408 |
| Portfolio Turnover Rate | 155% |
| Total Advisory Fees Paid | $2,482,642 |
What did the Fund invest in?
The following tables reflect what the Fund invested in as of the report date.
Asset Allocation (% of total investments)
| Value | Value |
|---|
| Collateralized Mortgage Obligations - Agency Collateral Series | 0.0%Footnote Reference† |
| Senior Loan Interests | 0.4% |
| Supranational | 0.7% |
| Investment Companies | 2.2% |
| Commercial Mortgage-Backed Securities | 4.1% |
| Agency Fixed Rate Mortgages | 5.2% |
| Sovereign | 7.3% |
| Asset-Backed Securities | 12.0% |
| Short-Term Investments | 13.1% |
| Mortgages - Other | 18.6% |
| Corporate Bonds | 36.4% |
| Footnote | Description |
Footnote† | Amount is less than 0.05% |
Credit Quality (% of net assets)Footnote Referencea
| Value | Value |
|---|
| Cash & Equivalents | -0.2% |
| B or Below | 7.2% |
| Not Rated | 23.8% |
| BB | 8.3% |
| BBB | 28.3% |
| A | 12.1% |
| AA | 1.2% |
| AAA | 19.2% |
| Footnote | Description |
Footnotea | Security ratings disclosed with the exception for those labeled "Not Rated" is an aggregation of the highest security level rating amongst S&P Global Ratings, Moody's Investors Services, Inc., and Fitch Ratings, each a Nationally Recognized Statistical Ratings Organization. |
If you wish to view additional information about the Fund, including the prospectus, statement of additional information, financial statements and holdings, please scan the QR code or visit www.morganstanley.com/im/shareholderreports. For proxy information, please visit www.morganstanley.com/im/en-us/institutional-investor/about-us/proxy-voting/vote-summary-report.desktop.html.
The Funds may deliver a single copy of certain required shareholder documents (including prospectuses, shareholder reports, and proxy materials) to investors with the same last name and the same address. Your participation will continue indefinitely unless you instruct otherwise by calling1-800-869-6397 or by contacting your financial intermediary. Your instruction will typically be effective within 30 days of receipt.
Not FDIC Insured | May Lose Value | No Bank Guarantee
Annual Shareholder Report October 31, 2024
Morgan Stanley Global Fixed Income Opportunities Fund
Annual Shareholder Report October 31, 2024
This annual shareholder report contains important information about Morgan Stanley Global Fixed Income Opportunities Fund for the period of November 1, 2023 to October 31, 2024. You can find additional information about the Fund at www.morganstanley.com/im/shareholderreports. You can also request this information by contacting us at 1-800-869-6397.
What were the Fund costs for the last year?
(based on a hypothetical $10,000 investment)
| Class Name | Costs of a $10,000 investment | Costs paid as a percentage of a $10,000 investment |
|---|
| Class R6 | $49 | 0.46% |
How did the Fund perform last year and what affected its performance?
Key contributors to (↑) and detractors from (↓) performance, relative to the Bloomberg Global Aggregate Hedged USD Index:
↑ Securitized debt exposure, particularly within non-agency residential mortgage-backed securities (RMBS), commercial mortgage-backed securities (CMBS) and asset-backed securities (ABS).
↑ Long exposure to investment grade and high yield corporate bonds as spreads tightened across the board.
↑ Long exposure to developed markets rates on the back of global government bonds rallying over the period, particularly within the U.S. and Canada. Higher “risk-free” rates continued to benefit performance.
↓ Emerging markets currency exposure, particularly long exposures to Dominican peso and Mexican peso.
↓ Short duration exposure to the U.K. for the majority of the period as yields marginally fell.
↓ Credit default swap exposure.
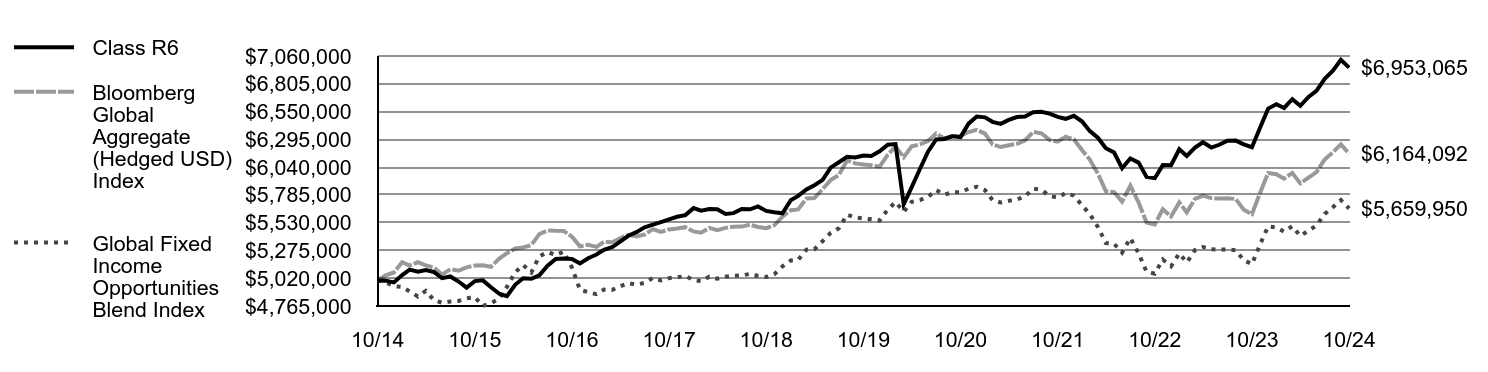
Comparison of the change in value of a $5,000,000 investment for the period indicated.
| | Bloomberg Global Aggregate (Hedged USD) Index | Global Fixed Income Opportunities Blend Index |
|---|
| 10/14 | $5,000,000 | $5,000,000 | $5,000,000 |
| 11/14 | $4,997,670 | $5,046,951 | $4,981,747 |
| 12/14 | $4,981,764 | $5,073,079 | $4,947,445 |
| 1/15 | $5,049,263 | $5,167,691 | $4,939,619 |
| 2/15 | $5,099,406 | $5,137,158 | $4,899,621 |
| 3/15 | $5,080,253 | $5,166,595 | $4,852,395 |
| 4/15 | $5,095,664 | $5,137,708 | $4,903,999 |
| 5/15 | $5,075,737 | $5,116,410 | $4,816,320 |
| 6/15 | $5,020,741 | $5,053,166 | $4,795,225 |
| 7/15 | $5,036,285 | $5,103,215 | $4,805,968 |
| 8/15 | $4,989,631 | $5,089,419 | $4,811,561 |
| 9/15 | $4,933,595 | $5,119,605 | $4,836,082 |
| 10/15 | $4,993,482 | $5,136,209 | $4,846,297 |
| 11/15 | $5,000,444 | $5,138,574 | $4,766,060 |
| 12/15 | $4,937,262 | $5,124,669 | $4,791,394 |
| 1/16 | $4,877,722 | $5,199,636 | $4,832,916 |
| 2/16 | $4,854,497 | $5,249,613 | $4,940,533 |
| 3/16 | $4,959,844 | $5,292,830 | $5,074,041 |
| 4/16 | $5,019,206 | $5,301,818 | $5,141,532 |
| 5/16 | $5,014,877 | $5,324,230 | $5,072,558 |
| 6/16 | $5,047,213 | $5,425,581 | $5,220,687 |
| 7/16 | $5,135,101 | $5,457,997 | $5,260,040 |
| 8/16 | $5,195,878 | $5,455,215 | $5,234,491 |
| 9/16 | $5,200,419 | $5,454,563 | $5,263,312 |
| 10/16 | $5,196,600 | $5,401,675 | $5,117,229 |
| 11/16 | $5,154,893 | $5,312,461 | $4,913,913 |
| 12/16 | $5,203,787 | $5,327,018 | $4,891,338 |
| 1/17 | $5,237,623 | $5,307,615 | $4,873,521 |
| 2/17 | $5,280,137 | $5,353,051 | $4,915,241 |
| 3/17 | $5,304,128 | $5,350,581 | $4,912,974 |
| 4/17 | $5,357,010 | $5,386,866 | $4,946,291 |
| 5/17 | $5,409,729 | $5,418,308 | $4,975,161 |
| 6/17 | $5,443,312 | $5,403,144 | $4,961,237 |
| 7/17 | $5,486,870 | $5,420,905 | $4,977,546 |
| 8/17 | $5,511,514 | $5,470,308 | $5,022,908 |
| 9/17 | $5,535,774 | $5,445,056 | $4,999,721 |
| 10/17 | $5,560,075 | $5,468,021 | $5,020,808 |
| 11/17 | $5,584,423 | $5,476,491 | $5,028,586 |
| 12/17 | $5,599,296 | $5,488,733 | $5,039,826 |
| 1/18 | $5,663,373 | $5,449,550 | $5,003,848 |
| 2/18 | $5,639,496 | $5,437,263 | $4,992,566 |
| 3/18 | $5,654,469 | $5,482,343 | $5,033,959 |
| 4/18 | $5,652,281 | $5,461,945 | $5,015,229 |
| 5/18 | $5,610,372 | $5,482,351 | $5,033,966 |
| 6/18 | $5,617,435 | $5,492,569 | $5,043,349 |
| 7/18 | $5,654,835 | $5,494,074 | $5,044,731 |
| 8/18 | $5,652,252 | $5,510,960 | $5,060,235 |
| 9/18 | $5,679,363 | $5,489,878 | $5,040,877 |
| 10/18 | $5,637,900 | $5,479,151 | $5,031,028 |
| 11/18 | $5,625,279 | $5,505,958 | $5,055,643 |
| 12/18 | $5,616,144 | $5,585,490 | $5,128,670 |
| 1/19 | $5,736,769 | $5,644,651 | $5,182,992 |
| 2/19 | $5,775,377 | $5,651,434 | $5,189,220 |
| 3/19 | $5,834,664 | $5,752,654 | $5,282,162 |
| 4/19 | $5,873,372 | $5,756,080 | $5,285,308 |
| 5/19 | $5,922,690 | $5,838,907 | $5,361,360 |
| 6/19 | $6,034,868 | $5,920,780 | $5,436,537 |
| 7/19 | $6,084,438 | $5,967,369 | $5,479,316 |
| 8/19 | $6,134,162 | $6,102,699 | $5,603,577 |
| 9/19 | $6,129,261 | $6,074,420 | $5,577,612 |
| 10/19 | $6,146,032 | $6,063,934 | $5,567,984 |
| 11/19 | $6,142,138 | $6,056,821 | $5,561,452 |
| 12/19 | $6,184,682 | $6,044,402 | $5,550,049 |
| 1/20 | $6,244,926 | $6,153,481 | $5,650,207 |
| 2/20 | $6,251,689 | $6,228,795 | $5,719,361 |
| 3/20 | $5,699,040 | $6,131,855 | $5,630,349 |
| 4/20 | $5,855,968 | $6,231,121 | $5,721,497 |
| 5/20 | $6,023,125 | $6,248,782 | $5,737,713 |
| 6/20 | $6,179,867 | $6,279,968 | $5,766,348 |
| 7/20 | $6,293,439 | $6,348,593 | $5,829,361 |
| 8/20 | $6,298,207 | $6,302,589 | $5,787,120 |
| 9/20 | $6,323,150 | $6,325,613 | $5,808,260 |
| 10/20 | $6,315,395 | $6,326,074 | $5,808,684 |
| 11/20 | $6,439,276 | $6,362,170 | $5,841,827 |
| 12/20 | $6,504,793 | $6,381,716 | $5,859,775 |
| 1/21 | $6,496,823 | $6,347,485 | $5,828,344 |
| 2/21 | $6,455,656 | $6,248,748 | $5,737,682 |
| 3/21 | $6,436,712 | $6,224,130 | $5,715,077 |
| 4/21 | $6,473,302 | $6,240,400 | $5,730,017 |
| 5/21 | $6,499,980 | $6,254,329 | $5,742,807 |
| 6/21 | $6,504,924 | $6,284,832 | $5,770,815 |
| 7/21 | $6,543,480 | $6,362,944 | $5,842,538 |
| 8/21 | $6,548,482 | $6,350,196 | $5,830,832 |
| 9/21 | $6,531,006 | $6,290,242 | $5,775,782 |
| 10/21 | $6,501,698 | $6,273,794 | $5,760,679 |
| 11/21 | $6,483,474 | $6,318,546 | $5,801,772 |
| 12/21 | $6,511,190 | $6,292,920 | $5,778,241 |
| 1/22 | $6,458,477 | $6,194,050 | $5,687,458 |
| 2/22 | $6,372,307 | $6,111,660 | $5,611,806 |
| 3/22 | $6,310,100 | $5,979,915 | $5,490,836 |
| 4/22 | $6,213,051 | $5,819,195 | $5,343,261 |
| 5/22 | $6,173,563 | $5,811,190 | $5,335,910 |
| 6/22 | $6,030,014 | $5,722,997 | $5,254,930 |
| 7/22 | $6,118,944 | $5,868,766 | $5,388,778 |
| 8/22 | $6,081,282 | $5,715,559 | $5,248,100 |
| 9/22 | $5,949,656 | $5,532,075 | $5,079,623 |
| 10/22 | $5,938,463 | $5,513,141 | $5,062,238 |
| 11/22 | $6,058,395 | $5,653,632 | $5,191,239 |
| 12/22 | $6,056,793 | $5,586,908 | $5,129,972 |
| 1/23 | $6,204,074 | $5,715,590 | $5,248,129 |
| 2/23 | $6,142,321 | $5,624,426 | $5,164,421 |
| 3/23 | $6,218,970 | $5,749,143 | $5,278,938 |
| 4/23 | $6,268,395 | $5,778,742 | $5,306,116 |
| 5/23 | $6,219,733 | $5,755,993 | $5,285,227 |
| 6/23 | $6,245,044 | $5,752,557 | $5,282,073 |
| 7/23 | $6,282,899 | $5,754,420 | $5,283,783 |
| 8/23 | $6,283,558 | $5,747,190 | $5,277,144 |
| 9/23 | $6,248,251 | $5,648,078 | $5,186,139 |
| 10/23 | $6,222,525 | $5,607,976 | $5,149,317 |
| 11/23 | $6,399,100 | $5,800,795 | $5,326,366 |
| 12/23 | $6,577,124 | $5,986,179 | $5,496,587 |
| 1/24 | $6,617,731 | $5,974,445 | $5,485,813 |
| 2/24 | $6,583,092 | $5,933,451 | $5,448,172 |
| 3/24 | $6,663,842 | $5,986,955 | $5,497,300 |
| 4/24 | $6,603,211 | $5,890,561 | $5,408,790 |
| 5/24 | $6,684,806 | $5,942,684 | $5,456,650 |
| 6/24 | $6,740,735 | $5,994,249 | $5,503,998 |
| 7/24 | $6,851,165 | $6,110,052 | $5,610,329 |
| 8/24 | $6,924,714 | $6,176,972 | $5,671,777 |
| 9/24 | $7,024,942 | $6,248,650 | $5,737,592 |
| 10/24 | $6,953,065 | $6,164,092 | $5,659,950 |
Average Annual Total Returns (%)
| AATR | 1 Year | 5 Years | 10 Years |
|---|
| Class R6 | 11.74% | 2.50% | 3.35% |
| Bloomberg Global Aggregate (Hedged USD) Index | 9.92% | 0.33% | 2.12% |
Global Fixed Income Opportunities Blend IndexFootnote Reference1 | 9.92% | 0.33% | 1.25% |
| Footnote | Description |
Footnote1 | The Global Fixed Income Opportunities Blend Index is a performance linked benchmark of the old benchmark represented by Bloomberg Global Aggregate Index (unhedged USD) (a benchmark that provides a broad-based measure of the global investment grade fixed rate debt markets with returns in unhedged USD) from the Fund’s inception to December 31, 2016 to the new benchmark represented by Bloomberg Global Aggregate (Hedged USD) Index for periods thereafter. It is not possible to invest directly in an index. |
Performance does not reflect the deduction of taxes that a shareholder would pay on Fund distributions or redemption of Fund shares. Performance assumes that all dividends and distributions, if any, were reinvested. For more recent performance information, visit www.morganstanley.com/im/shareholderreports.
THE FUND'S PAST PERFORMANCE IS NO GUARANTEE OF FUTURE RESULTS.
| Total Net Assets | $788,752,575 |
| # of Portfolio Holdings | 408 |
| Portfolio Turnover Rate | 155% |
| Total Advisory Fees Paid | $2,482,642 |
What did the Fund invest in?
The following tables reflect what the Fund invested in as of the report date.
Asset Allocation (% of total investments)
| Value | Value |
|---|
| Collateralized Mortgage Obligations - Agency Collateral Series | 0.0%Footnote Reference† |
| Senior Loan Interests | 0.4% |
| Supranational | 0.7% |
| Investment Companies | 2.2% |
| Commercial Mortgage-Backed Securities | 4.1% |
| Agency Fixed Rate Mortgages | 5.2% |
| Sovereign | 7.3% |
| Asset-Backed Securities | 12.0% |
| Short-Term Investments | 13.1% |
| Mortgages - Other | 18.6% |
| Corporate Bonds | 36.4% |
| Footnote | Description |
Footnote† | Amount is less than 0.05% |
Credit Quality (% of net assets)Footnote Referencea
| Value | Value |
|---|
| Cash & Equivalents | -0.2% |
| B or Below | 7.2% |
| Not Rated | 23.8% |
| BB | 8.3% |
| BBB | 28.3% |
| A | 12.1% |
| AA | 1.2% |
| AAA | 19.2% |
| Footnote | Description |
Footnotea | Security ratings disclosed with the exception for those labeled "Not Rated" is an aggregation of the highest security level rating amongst S&P Global Ratings, Moody's Investors Services, Inc., and Fitch Ratings, each a Nationally Recognized Statistical Ratings Organization. |
If you wish to view additional information about the Fund, including the prospectus, statement of additional information, financial statements and holdings, please scan the QR code or visit www.morganstanley.com/im/shareholderreports. For proxy information, please visit www.morganstanley.com/im/en-us/institutional-investor/about-us/proxy-voting/vote-summary-report.desktop.html.
The Funds may deliver a single copy of certain required shareholder documents (including prospectuses, shareholder reports, and proxy materials) to investors with the same last name and the same address. Your participation will continue indefinitely unless you instruct otherwise by calling1-800-869-6397 or by contacting your financial intermediary. Your instruction will typically be effective within 30 days of receipt.
Not FDIC Insured | May Lose Value | No Bank Guarantee
Annual Shareholder Report October 31, 2024
(b) Not applicable.
Item 2. Code of Ethics
The registrant has adopted a code of ethics (the "Code of Ethics") that applies to its Principal Executive Officer and Principal Financial Officer. The Registrant undertakes to provide a copy of such code of ethics to any person upon request, without charge, by calling 1 (212) 259-1155. The Registrant has not amended the code of ethics as described in Form N-CSR during the period covered by this report. The registrant has not granted any waiver, including an implicit waiver, from a provision of the code of ethics as described in Form N-CSR during the period covered by this report.
Item 3. Audit Committee Financial Expert
The registrant's Board of Trustees has determined that Jakki L. Haussler, an “independent” Trustee, is an “audit committee financial expert" serving on its audit committee. Under applicable securities laws, a person who is determined to be an audit committee financial expert will not be deemed an "expert" for any purpose, including without limitation for the purposes of Section 11 of the Securities Act of 1933, as a result of being designated or identified as an audit committee financial expert. The designation or identification of a person as an audit committee financial expert does not impose on such person any duties, obligations, or the liabilities that are greater than the duties, obligations, and liabilities imposed on such person as a member of the audit committee and Board of Trustees in the absence of such designation or identification.
Item 4. Principal Accountant Fees and Services
(a) – (d)
The following table presents the aggregate fees billed to the registrant for the registrant’s fiscal years ended October 31, 2023 and October 31, 2024 by the registrant’s principal accountant, Ernst & Young LLP, for professional services rendered for the audit of the registrant’s annual financial statements and fees billed for other services rendered by Ernst & Young LLP during those periods.
2024
| | | Registrant | | | Covered Entities(1) | |
| Audit Fees | | $ | 80,324 | | | $ | N/A | |
| Non-Audit Fees | | | | | | | | |
| Audit Related Fees | | $ | — | (2) | | $ | — | (2) |
| Tax Fees | | $ | — | (3) | | $ | — | (4) |
| All Other Fees | | $ | — | | | $ | 372,395 | (5) |
| Total Non-Audit Fees | | $ | — | | | $ | 372,395 | |
| | | | | | | | | |
| Total | | $ | 80,324 | | | $ | 372,395 | |
2023
| | | Registrant | | | Covered Entities(1) | |
| Audit Fees | | $ | 75,070 | | | $ | N/A | |
| Non-Audit Fees | | | | | | | | |
| Audit Related Fees | | $ | — | (2) | | $ | — | (2) |
| Tax Fees | | $ | — | (3) | | $ | — | (4) |
| All Other Fees | | $ | — | | | $ | 1,586,712 | (5) |
| Total Non-Audit Fees | | $ | — | | | $ | 1,586,712 | |
| | | | | | | | | |
| Total | | $ | 75,070 | | | $ | 1,586,712 | |
N/A – Not applicable, as not required by Item 4.
(1) Covered Entities include the Adviser (excluding sub-advisors) and any entity controlling, controlled by or under common control with the Adviser that provides ongoing services to the Registrant.
(2) Audit-Related Fees represent assurance and related services provided that are reasonably related to the performance of the audit of the financial statements of the Covered Entities' and funds advised by the Adviser or its affiliates, specifically data verification and agreed-upon procedures related to asset securitizations and agreed-upon procedures engagements.
(3) Tax Fees represent tax compliance, tax planning and tax advice services provided in connection with the preparation and review of the Registrant’s tax returns.
(4) Tax Fees represent tax compliance, tax planning and tax advice services provided in connection with the review of Covered Entities' tax returns.
(5) The Fees included under “All Other Fees” are for services provided by Ernst & Young LLP related to surprise examinations for certain investment accounts to satisfy SEC Custody Rules and consulting services related to merger integration for sister entity to the Adviser.
(e)(1) The registrant’s audit committee has adopted policies and procedures relating to the pre-approval of services provided by the registrant’s principal accountant (the “Pre-Approval Policies”). The Pre-Approval Policies establish a framework intended to assist the audit committee in the proper discharge of its pre-approval responsibilities. As a general matter, the Pre-Approval Policies (i) specify certain types of audit, audit-related, tax, and other services determined to be pre-approved by the audit committee; and (ii) delineate specific procedures governing the mechanics of the pre-approval process, including the approval and monitoring of audit and non-audit service fees. Unless a service is specifically pre-approved under the Pre-Approval Policies, it must be separately pre-approved by the Audit Committee.
The Pre-Approval Policies and the types of audit and non-audit services pre-approved therein must be reviewed and ratified by the registrant’s audit committee at least annually. The registrant’s audit committee maintains full responsibility for the appointment, compensation, and oversight of the work of the registrant’s principal accountant.
(e)(2) No services described in paragraphs (b)-(d) above were approved by the registrant’s audit committee pursuant to the “de minimis exception” set forth in Rule 2-01 (c)(7)(i)(C) of Regulation S-X.
(f) Not applicable.
(g) See table above.
(h) The registrant’s audit committee has considered whether the provision by the registrant’s principal accountant of non-audit services to the registrant’s investment adviser and any entity controlling, controlled by, or under common control with the adviser that provides ongoing services to the registrant that were not pre-approved pursuant to Rule 2-01(c)(7)(ii) of Regulation S-X is compatible with maintaining the principal accountant’s independence.
(i) Not applicable.
(j) Not applicable.
Item 5. Audit Committee of Listed Registrants
The registrant has a separately-designated standing audit committee established in accordance with Section 3(a)(58)(A) of the Exchange Act whose members are:
Nancy C. Everett, Eddie A. Grier and Jakki L. Haussler.
Item 6. Schedule of Investments
| (a) | Please see schedule of investments contained in the Financial Statements and Financial Highlights included under Item 7 of this Form N-CSR. |
Item 7. Financial Statements and Financial Highlights for Open-End Management Investment Companies

Morgan Stanley
Global Fixed Income
Opportunities Fund
Annual Financial Statements and Additional Information
October 31, 2024

Morgan Stanley Global Fixed Income Opportunities Fund
Table of Contents (unaudited)
This material must be preceded or accompanied by a prospectus for the fund being offered.
There is no assurance that the Fund will achieve its investment objective. The Fund is subject to market risk, which is the possibility that market values of securities owned by the Fund will decline and, therefore, the value of the Fund's shares may be less than what you paid for them. Accordingly, you can lose money investing in this Fund. Please see the prospectus for more complete information on investment risks.
2
Morgan Stanley Global Fixed Income Opportunities Fund
Portfolio of Investments ◼ October 31, 2024
PRINCIPAL
AMOUNT
(000) | |
| | COUPON
RATE | | MATURITY
DATE | | VALUE | |
| | | Corporate Bonds (37.9%) | |
| | | Australia (1.6%) | |
| | | Basic Materials | |
$ | 1,856 | | | Newcastle Coal Infrastructure Group Pty. Ltd. (a) | | | 4.40 | % | | 09/29/27 | | $ | 1,802,676 | | |
| | 1,912 | | | Newcastle Coal Infrastructure Group Pty. Ltd. (a) | | | 4.70 | | | 05/12/31 | | | 1,786,591 | | |
| | | | 3,589,267 | | |
| | | Consumer, Non-Cyclical | |
EUR | 1,405 | | | Transurban Finance Co. Pty. Ltd. | | | 4.225 | | | 04/26/33 | | | 1,591,833 | | |
| | | Finance | |
| | 2,630 | | | Australia & New Zealand Banking Group Ltd. | | | 5.101 | | | 02/03/33 | | | 2,975,306 | | |
$ | 4,000 | | | Westpac Banking Corp. | | | 2.668 | | | 11/15/35 | | | 3,419,643 | | |
| | | | 6,394,949 | | |
| | | Industrials | |
EUR | 1,200 | | | Sydney Airport Finance Co. Pty. Ltd. | | | 4.375 | | | 05/03/33 | | | 1,374,584 | | |
| | | | | Total Australia | | | | | | | 12,950,633 | | |
| | | Brazil (0.3%) | |
| | | Industrials | |
$ | 2,050 | | | MV24 Capital BV | | | 6.748 | | | 06/01/34 | | | 1,990,490 | | |
| | | Burkina Faso (0.3%) | |
| | | Basic Materials | |
| | 2,130 | | | IAMGOLD Corp. (a)(b) | | | 5.75 | | | 10/15/28 | | | 2,078,769 | | |
| | | Canada (0.4%) | |
| | | Consumer, Non-Cyclical | |
| | 1,370 | | | Garda World Security Corp. (a) | | | 6.00 | | | 06/01/29 | | | 1,285,115 | | |
| | | Utilities | |
| | 1,700 | | | Algonquin Power & Utilities Corp. (c) | | | 5.365 | | | 06/15/26 | | | 1,710,295 | | |
| | | | | Total Canada | | | | | | | 2,995,410 | | |
| | | China (0.2%) | |
| | | Communications | |
EUR | 1,600 | | | Prosus NV | | | 2.031 | | | 08/03/32 | | | 1,499,903 | | |
| | | Colombia (0.3%) | |
| | | Energy | |
$ | 2,220 | | | Ecopetrol SA | | | 8.875 | | | 01/13/33 | | | 2,282,191 | | |
See Notes to Financial Statements
3
Morgan Stanley Global Fixed Income Opportunities Fund
Portfolio of Investments ◼ October 31, 2024 continued
PRINCIPAL
AMOUNT
(000) | |
| | COUPON
RATE | | MATURITY
DATE | | VALUE | |
| | | Denmark (1.2%) | |
| | | Finance | |
EUR | 5,000 | | | Danske Bank AS | | | 1.375 | % | | 02/12/30 | | $ | 5,404,893 | | |
DKK | 26,317 | | | Realkredit Danmark AS | | | 4.00 | | | 10/01/56 | | | 3,817,092 | | |
| | | | | Total Denmark | | | | | | | 9,221,985 | | |
| | | France (4.7%) | |
| | | Communications | |
EUR | 3,500 | | | Orange SA | | | 5.00 | | | (d) | | | 3,914,676 | | |
| | | Consumer, Cyclical | |
| | 1,500 | | | RCI Banque SA | | | 5.50 | | | 10/09/34 | | | 1,664,747 | | |
| | | Consumer, Non-Cyclical | |
| | 1,700 | | | Cerba Healthcare SACA | | | 3.50 | | | 05/31/28 | | | 1,546,800 | | |
| | | Energy | |
| | 6,480 | | | TotalEnergies SE | | | 2.00 | | | (d) | | | 6,295,386 | | |
| | 1,330 | | | TotalEnergies SE | | | 3.25 | | | (d) | | | 1,288,500 | | |
| | | | 7,583,886 | | |
| | | Finance | |
| | 2,200 | | | AXA SA | | | 3.25 | | | 05/28/49 | | | 2,353,044 | | |
| | 2,000 | | | Banque Federative du Credit Mutuel SA | | | 5.125 | | | 01/13/33 | | | 2,317,767 | | |
$ | 2,200 | | | BNP Paribas SA (a) | | | 2.819 | | | 11/19/25 | | | 2,197,423 | | |
EUR | 3,600 | | | BPCE SA | | | 5.75 | | | 06/01/33 | | | 4,158,427 | | |
| | 2,000 | | | Credit Agricole SA | | | 2.625 | | | 03/17/27 | | | 2,152,371 | | |
| | 4,000 | | | Societe Generale SA | | | 1.00 | | | 11/24/30 | | | 4,225,010 | | |
| | | | 17,404,042 | | |
| | | Utilities | |
| | 2,000 | | | Electricite de France SA | | | 2.625 | | | (d) | | | 2,044,671 | | |
| | 2,400 | | | Engie SA | | | 4.75 | | | (d) | | | 2,686,594 | | |
| | 300 | | | Engie SA | | | 5.125 | | | (d) | | | 336,234 | | |
| | | | 5,067,499 | | |
| | | Total France | | | | | | | | | | | 37,181,650 | | |
| | | Germany (2.9%) | |
| | | Consumer, Cyclical | |
| | 600 | | | Volkswagen International Finance NV | | | 3.875 | | | (d) | | | 632,894 | | |
| | 2,000 | | | Volkswagen International Finance NV | | | 4.625 | | | (d) | | | 2,166,802 | | |
| | 1,700 | | | Volkswagen International Finance NV | | | 7.50 | | | (d) | | | 1,994,971 | | |
| | | | 4,794,667 | | |
See Notes to Financial Statements
4
Morgan Stanley Global Fixed Income Opportunities Fund
Portfolio of Investments ◼ October 31, 2024 continued
PRINCIPAL
AMOUNT
(000) | |
| | COUPON
RATE | | MATURITY
DATE | | VALUE | |
| | | Consumer, Non-Cyclical | |
EUR | 2,580 | | | Bayer AG | | | 4.625 | % | | 05/26/33 | | $ | 2,940,632 | | |
| | | Energy | |
| | 2,400 | | | Wintershall Dea Finance BV | | | 1.332 | | | 09/25/28 | | | 2,399,998 | | |
| | | Finance | |
| | 300 | | | Allianz SE | | | 2.121 | | | 07/08/50 | | | 298,786 | | |
| | 1,900 | | | Allianz SE | | | 5.824 | | | 07/25/53 | | | 2,306,446 | | |
$ | 2,375 | | | Deutsche Bank AG | | | 3.961 | | | 11/26/25 | | | 2,371,920 | | |
EUR | 1,000 | | | Deutsche Bank AG | | | 4.50 | | | 07/12/35 | | | 1,114,419 | | |
| | 1,900 | | | Muenchener Rueckversicherungs-Gesellschaft AG in
Muenchen | | | 3.25 | | | 05/26/49 | | | 2,028,025 | | |
| | 2,000 | | | Vonovia SE | | | 0.625 | | | 12/14/29 | | | 1,895,952 | | |
| | | | 10,015,548 | | |
| | | Utilities | |
| | 2,180 | | | RWE AG | | | 3.625 | | | 01/10/32 | | | 2,399,430 | | |
| | | | | Total Germany | | | | | | | 22,550,275 | | |
| | | Greece (1.0%) | |
| | | Finance | |
| | 3,120 | | | National Bank of Greece SA | | | 8.00 | | | 01/03/34 | | | 3,822,448 | | |
| | 3,310 | | | Piraeus Financial Holdings SA | | | 7.25 | | | 04/17/34 | | | 3,897,489 | | |
| | | | | Total Greece | | | | | | | 7,719,937 | | |
| | | Hong Kong (0.1%) | |
| | | Industrials | |
$ | 870 | | | Seaspan Corp. (a) | | | 5.50 | | | 08/01/29 | | | 828,361 | | |
| | | Italy (1.8%) | |
| | | Finance | |
EUR | 3,000 | | | Generali | | | 5.50 | | | 10/27/47 | | | 3,444,768 | | |
| | 1,990 | | | Intesa Sanpaolo SpA | | | 4.875 | | | 05/19/30 | | | 2,319,851 | | |
$ | 2,825 | | | Intesa Sanpaolo SpA (a) | | | 7.20 | | | 11/28/33 | | | 3,118,717 | | |
| | | | 8,883,336 | | |
| | | Utilities | |
EUR | 4,850 | | | Enel SpA | | | 6.375 | | | (d) | | | 5,654,274 | | |
| | | | | Total Italy | | | | | | | 14,537,610 | | |
See Notes to Financial Statements
5
Morgan Stanley Global Fixed Income Opportunities Fund
Portfolio of Investments ◼ October 31, 2024 continued
PRINCIPAL
AMOUNT
(000) | |
| | COUPON
RATE | | MATURITY
DATE | | VALUE | |
| | | Japan (0.2%) | |
| | | Consumer, Non-Cyclical | |
EUR | 1,450 | | | JT International Financial Services BV | | | 3.625 | % | | 04/11/34 | | $ | 1,558,872 | | |
| | | Luxembourg (0.3%) | |
| | | Finance | |
| | 1,000 | | | Blackstone Property Partners Europe
Holdings SARL | | | 1.25 | | | 04/26/27 | | | 1,032,822 | | |
| | 1,550 | | | Logicor Financing SARL | | | 3.25 | | | 11/13/28 | | | 1,663,833 | | |
| | | | | Total Luxembourg | | | | | | | 2,696,655 | | |
| | | Macau (0.4%) | |
| | | Consumer, Cyclical | |
$ | 3,138 | | | Las Vegas Sands Corp. | | | 6.00 | | | 08/15/29 | | | 3,202,713 | | |
| | | Mexico (0.4%) | |
| | | Finance | |
| | 1,533 | | | Banco Actinver SA/Grupo GICSA SAB de CV (a) | | | 4.80 | | | 12/18/34 | | | 1,195,740 | | |
| | 1,500 | | | BBVA Bancomer SA (a) | | | 8.45 | | | 06/29/38 | | | 1,578,549 | | |
| | | | | Total Mexico | | | | | | | 2,774,289 | | |
| | | Netherlands (1.4%) | |
| | | Finance | |
EUR | 4,000 | | | ING Groep NV | | | 1.00 | | | 11/13/30 | | | 4,240,997 | | |
| | 2,300 | | | NN Group NV | | | 4.50 | | | (d) | | | 2,522,402 | | |
| | | | 6,763,399 | | |
| | | Industrials | |
$ | 1,000 | | | Trivium Packaging Finance BV (a)(b) | | | 8.50 | | | 08/15/27 | | | 998,112 | | |
| | | Utilities | |
EUR | 1,420 | | | Alliander NV | | | 4.50 | | | (d) | | | 1,596,181 | | |
| | 1,500 | | | TenneT Holding BV | | | 4.625 | | | (d) | | | 1,666,215 | | |
| | | | 3,262,396 | | |
| | | Total Netherlands | | | | | | | | | | | 11,023,907 | | |
| | | Panama (0.1%) | |
| | | Utilities | |
$ | 1,132 | | | AES Panama Generation Holdings SRL | | | 4.375 | | | 05/31/30 | | | 1,000,617 | | |
See Notes to Financial Statements
6
Morgan Stanley Global Fixed Income Opportunities Fund
Portfolio of Investments ◼ October 31, 2024 continued
PRINCIPAL
AMOUNT
(000) | |
| | COUPON
RATE | | MATURITY
DATE | | VALUE | |
| | | Portugal (0.4%) | |
| | | Utilities | |
EUR | 1,800 | | | EDP - Energias de Portugal SA | | | 1.70 | % | | 07/20/80 | | $ | 1,928,311 | | |
| | 1,300 | | | EDP Servicios Financieros Espana SA | | | 3.50 | | | 07/16/30 | | | 1,430,349 | | |
| | | | | Total Portugal | | | | | | | 3,358,660 | | |
| | | Spain (4.4%) | |
| | | Communications | |
| | 1,910 | | | Lorca Telecom Bondco SA | | | 4.00 | | | 09/18/27 | | | 2,077,763 | | |
| | 1,100 | | | Telefonica Emisiones SA | | | 3.698 | | | 01/24/32 | | | 1,218,927 | | |
| | 1,800 | | | Telefonica Emisiones SA | | | 4.055 | | | 01/24/36 | | | 2,018,176 | | |
| | 1,800 | | | Telefonica Europe BV | | | 2.502 | | | (d) | | | 1,905,330 | | |
| | | | 7,220,196 | | |
| | | Energy | |
| | 2,050 | | | Repsol International Finance BV | | | 2.50 | | | (d) | | | 2,172,345 | | |
| | | Finance | |
| | 1,000 | | | Banco Santander SA | | | 3.125 | | | 01/19/27 | | | 1,087,708 | | |
$ | 4,400 | | | Banco Santander SA | | | 5.179 | | | 11/19/25 | | | 4,399,048 | | |
EUR | 4,500 | | | Banco Santander SA | | | 5.75 | | | 08/23/33 | | | 5,191,896 | | |
| | 5,000 | | | CaixaBank SA | | | 2.25 | | | 04/17/30 | | | 5,400,558 | | |
| | | | 16,079,210 | | |
| | | Utilities | |
| | 5,600 | | | Iberdrola Finanzas SA | | | 4.875 | | | (d) | | | 6,274,255 | | |
| | 1,700 | | | Iberdrola International BV | | | 1.45 | | | (d) | | | 1,768,573 | | |
| | 1,000 | | | NorteGas Energia Distribucion SA | | | 0.905 | | | 01/22/31 | | | 897,275 | | |
| | | | 8,940,103 | | |
| | | Total Spain | | | | | | | | | | | 34,411,854 | | |
| | | Sweden (0.6%) | |
| | | Consumer, Non-Cyclical | |
| | 1,770 | | | Verisure Holding AB | | | 3.25 | | | 02/15/27 | | | 1,894,926 | | |
| | | Finance | |
| | 3,025 | | | Akelius Residential Property Financing BV | | | 1.125 | | | 01/11/29 | | | 2,946,737 | | |
| | | | | Total Sweden | | | | | | | 4,841,663 | | |
See Notes to Financial Statements
7
Morgan Stanley Global Fixed Income Opportunities Fund
Portfolio of Investments ◼ October 31, 2024 continued
PRINCIPAL
AMOUNT
(000) | |
| | COUPON
RATE | | MATURITY
DATE | | VALUE | |
| | | Switzerland (0.9%) | |
| | | Consumer, Cyclical | |
$ | 1,900 | | | VistaJet Malta Finance PLC/Vista Management
Holding, Inc. (a)(b) | | | 6.375 | % | | 02/01/30 | | $ | 1,628,452 | | |
| | | Finance | |
EUR | 3,500 | | | UBS Group AG | | | 2.875 | | | 04/02/32 | | | 3,644,362 | | |
$ | 1,550 | | | UBS Group AG (a) | | | 9.016 | | | 11/15/33 | | | 1,911,817 | | |
| | | | 5,556,179 | | |
| | | Total Switzerland | | | | | | | | | 7,184,631 | | |
| | | Turkey (0.6%) | |
| | | Basic Materials | |
| | 2,670 | | | Eldorado Gold Corp. (a) | | | 6.25 | | | 09/01/29 | | | 2,629,466 | | |
| | 1,920 | | | WE Soda Investments Holding PLC | | | 9.50 | | | 10/06/28 | | | 1,984,704 | | |
| | | | | Total Turkey | | | | | | | 4,614,170 | | |
| | | United Kingdom (2.3%) | |
| | | Communications | |
GBP | 2,350 | | | Virgin Media Secured Finance PLC | | | 4.25 | | | 01/15/30 | | | 2,674,160 | | |
$ | 1,140 | | | Zegona Finance PLC (a) | | | 8.625 | | | 07/15/29 | | | 1,206,975 | | |
| | | | 3,881,135 | | |
| | | Energy | |
EUR | 3,700 | | | BP Capital Markets PLC | | | 3.625 | | | (d) | | | 3,957,694 | | |
$ | 2,175 | | | BP Capital Markets PLC | | | 4.875 | | | (d) | | | 2,122,459 | | |
| | | | 6,080,153 | | |
| | | Finance | |
| | 1,400 | | | HSBC Holdings PLC | | | 2.633 | | | 11/07/25 | | | 1,399,395 | | |
EUR | 2,100 | | | HSBC Holdings PLC | | | 4.856 | | | 05/23/33 | | | 2,462,050 | | |
$ | 3,575 | | | NatWest Group PLC | | | 4.964 | | | 08/15/30 | | | 3,552,076 | | |
| | | | 7,413,521 | | |
| | | Utilities | |
GBP | 850 | | | NGG Finance PLC | | | 5.625 | | | 06/18/73 | | | 1,095,681 | | |
| | | | | Total United Kingdom | | | | | | | 18,470,490 | | |
| | | United States (11.1%) | |
| | | Basic Materials | |
$ | 2,500 | | | Celanese U.S. Holdings LLC | | | 6.165 | | | 07/15/27 | | | 2,557,744 | | |
See Notes to Financial Statements
8
Morgan Stanley Global Fixed Income Opportunities Fund
Portfolio of Investments ◼ October 31, 2024 continued
PRINCIPAL
AMOUNT
(000) | |
| | COUPON
RATE | | MATURITY
DATE | | VALUE | |
| | | Communications | |
$ | 720 | | | Arches Buyer, Inc. (a) | | | 4.25 | % | | 06/01/28 | | $ | 660,996 | | |
| | 2,000 | | | CCO Holdings LLC/CCO Holdings Capital Corp. (a) | | | 4.50 | | | 08/15/30 | | | 1,787,928 | | |
| | 2,900 | | | Charter Communications Operating LLC/Charter
Communications Operating Capital | | | 4.80 | | | 03/01/50 | | | 2,177,626 | | |
| | 1,660 | | | Clear Channel Outdoor Holdings, Inc. (a)(b) | | | 7.75 | | | 04/15/28 | | | 1,479,253 | | |
EUR | 1,800 | | | Comcast Corp. | | | 3.25 | | | 09/26/32 | | | 1,939,004 | | |
$ | 715 | | | iHeartCommunications, Inc. (b) | | | 6.375 | | | 05/01/26 | | | 605,752 | | |
| | 500 | | | McGraw-Hill Education, Inc. (a) | | | 5.75 | | | 08/01/28 | | | 490,567 | | |
| | 388 | | | Sprint Spectrum Co. LLC/Sprint Spectrum Co. II LLC/
Sprint Spectrum Co. III LLC (a) | | | 4.738 | | | 09/20/29 | | | 386,778 | | |
| | | | 9,527,904 | | |
| | | Consumer, Cyclical | |
| | 2,720 | | | American Airlines, Inc./AAdvantage Loyalty
IP Ltd. (a) | | | 5.75 | | | 04/20/29 | | | 2,695,676 | | |
| | 2,260 | | | Ferrellgas LP/Ferrellgas Finance Corp. (a) | | | 5.375 | | | 04/01/26 | | | 2,245,989 | | |
| | 4,075 | | | Ford Motor Credit Co. LLC | | | 6.798 | | | 11/07/28 | | | 4,236,042 | | |
| | 2,800 | | | Ford Motor Credit Co. LLC | | | 7.35 | | | 03/06/30 | | | 2,971,322 | | |
| | 1,025 | | | Las Vegas Sands Corp. | | | 5.90 | | | 06/01/27 | | | 1,041,518 | | |
| | 600 | | | PetSmart, Inc./PetSmart Finance Corp. (a) | | | 4.75 | | | 02/15/28 | | | 571,043 | | |
| | 1,044 | | | PetSmart, Inc./PetSmart Finance Corp. (a) | | | 7.75 | | | 02/15/29 | | | 1,014,425 | | |
| | 450 | | | Tapestry, Inc. | | | 7.00 | | | 11/27/26 | | | 459,788 | | |
| | 2,250 | | | Warnermedia Holdings, Inc. (b) | | | 4.279 | | | 03/15/32 | | | 1,972,523 | | |
| | | | 17,208,326 | | |
| | | Consumer, Non-Cyclical | |
| | 980 | | | Allied Universal Holdco LLC/Allied Universal
Finance Corp. (a)(b) | | | 6.00 | | | 06/01/29 | | | 897,671 | | |
| | 880 | | | Allied Universal Holdco LLC/Allied Universal
Finance Corp./Atlas Luxco 4 SARL (a) | | | 4.625 | | | 06/01/28 | | | 824,846 | | |
| | 4,300 | | | Centene Corp. | | | 2.50 | | | 03/01/31 | | | 3,598,864 | | |
| | 1,900 | | | Chobani LLC/Chobani Finance Corp., Inc. (a) | | | 7.625 | | | 07/01/29 | | | 1,983,162 | | |
| | 1,720 | | | LifePoint Health, Inc. (a) | | | 9.875 | | | 08/15/30 | | | 1,883,625 | | |
EUR | 2,000 | | | Upjohn Finance BV | | | 1.362 | | | 06/23/27 | | | 2,077,856 | | |
$ | 1,650 | | | WASH Multifamily Acquisition, Inc. (a) | | | 5.75 | | | 04/15/26 | | | 1,647,643 | | |
| | | | 12,913,667 | | |
See Notes to Financial Statements
9
Morgan Stanley Global Fixed Income Opportunities Fund
Portfolio of Investments ◼ October 31, 2024 continued
PRINCIPAL
AMOUNT
(000) | |
| | COUPON
RATE | | MATURITY
DATE | | VALUE | |
| | | Energy | |
$ | 2,000 | | | Occidental Petroleum Corp. | | | 7.50 | % | | 05/01/31 | | $ | 2,214,694 | | |
| | 3,225 | | | ONEOK, Inc. | | | 5.05 | | | 11/01/34 | | | 3,130,368 | | |
| | | | 5,345,062 | | |
| | | Finance | |
| | 3,080 | | | Ally Financial, Inc. | | | 6.848 | | | 01/03/30 | | | 3,202,614 | | |
EUR | 2,270 | | | Bank of America Corp. | | | 2.824 | | | 04/27/33 | | | 2,351,107 | | |
$ | 1,180 | | | Global Atlantic Fin Co. (a) | | | 4.70 | | | 10/15/51 | | | 1,132,273 | | |
| | 925 | | | Global Atlantic Fin Co. (a) | | | 7.95 | | | 10/15/54 | | | 962,086 | | |
| | 2,550 | | | KeyBank NA (b) | | | 5.85 | | | 11/15/27 | | | 2,612,906 | | |
| | 1,375 | | | PNC Financial Services Group, Inc. | | | 6.875 | | | 10/20/34 | | | 1,528,610 | | |
| | 2,625 | | | U.S. Bancorp | | | 5.678 | | | 01/23/35 | | | 2,691,701 | | |
| | 3,325 | | | VICI Properties LP/VICI Note Co., Inc. (a) | | | 5.75 | | | 02/01/27 | | | 3,350,739 | | |
| | | | 17,832,036 | | |
| | | Industrials | |
| | 1,000 | | | Artera Services LLC (a) | | | 8.50 | | | 02/15/31 | | | 992,030 | | |
| | 200 | | | Boeing Co. (a) | | | 6.259 | | | 05/01/27 | | | 204,662 | | |
| | 3,825 | | | Boeing Co. (a) | | | 6.298 | | | 05/01/29 | | | 3,963,415 | | |
| | 1,000 | | | Calderys Financing LLC (a) | | | 11.25 | | | 06/01/28 | | | 1,069,224 | | |
| | 765 | | | LABL, Inc. (a) | | | 8.25 | | | 11/01/29 | | | 675,346 | | |
EUR | 2,240 | | | Standard Industries, Inc. | | | 2.25 | | | 11/21/26 | | | 2,359,242 | | |
$ | 1,600 | | | Vontier Corp. | | | 1.80 | | | 04/01/26 | | | 1,528,606 | | |
| | | | 10,792,525 | | |
| | | Technology | |
| | 1,440 | | | AthenaHealth Group, Inc. (a) | | | 6.50 | | | 02/15/30 | | | 1,362,906 | | |
| | 1,600 | | | Cloud Software Group, Inc. (a) | | | 6.50 | | | 03/31/29 | | | 1,563,886 | | |
| | 3,600 | | | Concentrix Corp. | | | 6.65 | | | 08/02/26 | | | 3,665,904 | | |
| | 1,300 | | | McAfee Corp. (a) | | | 7.375 | | | 02/15/30 | | | 1,254,387 | | |
| | 810 | | | West Technology Group LLC (a) | | | 8.50 | | | 04/10/27 | | | 682,793 | | |
| | | | 8,529,876 | | |
| | | Utilities | |
EUR | 1,000 | | | Duke Energy Corp. | | | 3.10 | | | 06/15/28 | | | 1,082,883 | | |
| | 1,800 | | | Duke Energy Corp. | | | 3.85 | | | 06/15/34 | | | 1,944,481 | | |
| | | | 3,027,364 | | |
| | | Total United States | | | | | | | | | 87,734,504 | | |
| | | Total Corporate Bonds (Cost $299,086,637) | | | | | | | | | 298,710,239 | | |
See Notes to Financial Statements
10
Morgan Stanley Global Fixed Income Opportunities Fund
Portfolio of Investments ◼ October 31, 2024 continued
PRINCIPAL
AMOUNT
(000) | |
| | COUPON
RATE | | MATURITY
DATE | | VALUE | |
| | | Sovereign (7.6%) | |
| | | Angola (0.3%) | |
$ | 2,590 | | | Angolan Government International Bond | | | 8.75 | % | | 04/14/32 | | $ | 2,353,663 | | |
| | | Australia (0.5%) | |
AUD | 8,240 | | | Treasury Corp. of Victoria | | | 2.00 | | | 09/17/35 | | | 3,903,616 | | |
| | | Colombia (0.9%) | |
COP | 21,236,700 | | | Colombian TES, Series B | | | 6.00 | | | 04/28/28 | | | 4,269,810 | | |
| | 3,234,900 | | | Colombian TES | | | 7.00 | | | 03/26/31 | | | 620,068 | | |
| | 7,549,300 | | | Colombian TES | | | 13.25 | | | 02/09/33 | | | 1,925,711 | | |
| | | | | Total Colombia | | | | | | | 6,815,589 | | |
| | | Dominican Republic (0.3%) | |
DOP | 17,150 | | | Dominican Republic International Bond | | | 10.75 | | | 06/01/36 | | | 301,957 | | |
| | 113,250 | | | Dominican Republic International Bond (a) | | | 13.625 | | | 02/03/33 | | | 2,269,871 | | |
| | | | | Total Dominican Republic | | | | | | | 2,571,828 | | |
| | | Egypt (0.2%) | |
$ | 1,770 | | | Egypt Government International Bond | | | 7.625 | | | 05/29/32 | | | 1,556,759 | | |
| | | Ghana (0.1%) | |
| | 135 | | | Ghana Government International Bond (a) | | | 0.00 | (e) | | 07/03/26 - 01/03/30 | | | 111,586 | | |
| | 942 | | | Ghana Government International Bond (a)(c) | | | 5.00 | | | 07/03/29 - 07/03/35 | | | 720,772 | | |
| | | | | Total Ghana | | | | | | | 832,358 | | |
| | | Greece (0.5%) | |
EUR | 3,350 | | | Hellenic Republic Government Bond | | | 3.375 | | | 06/15/34 | | | 3,665,042 | | |
| | | Ivory Coast (0.5%) | |
| | 4,170 | | | Ivory Coast Government International Bond (a) | | | 4.875 | | | 01/30/32 | | | 3,979,024 | | |
| | | Mexico (0.4%) | |
| | 1,300 | | | Petroleos Mexicanos | | | 2.75 | | | 04/21/27 | | | 1,306,786 | | |
$ | 1,400 | | | Petroleos Mexicanos | | | 6.50 | | | 03/13/27 | | | 1,374,830 | | |
| | 800 | | | Petroleos Mexicanos | | | 6.84 | | | 01/23/30 | | | 739,234 | | |
| | | | | Total Mexico | | | | | | | 3,420,850 | | |
| | | New Zealand (3.2%) | |
NZD | 29,860 | | | New Zealand Government Bond | | | 4.25 | | | 05/15/34 - 05/15/36 | | | 17,404,197 | | |
| | 12,640 | | | New Zealand Government Bond | | | 4.50 | | | 05/15/30 | | | 7,707,131 | | |
| | | | | Total New Zealand | | | | | | | 25,111,328 | | |
See Notes to Financial Statements
11
Morgan Stanley Global Fixed Income Opportunities Fund
Portfolio of Investments ◼ October 31, 2024 continued
PRINCIPAL
AMOUNT
(000) | |
| | COUPON
RATE | | MATURITY
DATE | | VALUE | |
| | | Nigeria (0.1%) | | | | | |
$ | 1,000 | | | Nigeria Government International Bond | | | 7.375 | % | | 09/28/33 | | $ | 847,469 | | |
| | | Peru (0.6%) | | | | | |
PEN | 19,610 | | | Peru Government Bond | | | 6.15 | | | 08/12/32 | | | 5,083,452 | | |
| | | | | Total Sovereign (Cost $61,246,377) | | | | | | | | | 60,140,978 | | |
| | | Agency Fixed Rate Mortgages (5.4%) | | | | | |
| | | Federal Home Loan Mortgage Corporation, | | | | | |
$ | 11,401 | | | Conventional Pools: | | | 6.00 | | | 03/01/54 - 07/01/54 | | | 11,500,621 | | |
| | 1 | | | Gold Pool: | | | 6.50 | | | 10/01/32 | | | 544 | | |
| | | | | Federal National Mortgage Association,
Conventional Pools: | | | | | | | |
| | 12 | | | | | | 6.50 | | | 05/01/28 - 01/01/32 | | | 11,838 | | |
| | 2 | | | | | | 7.00 | | | 11/01/32 | | | 2,011 | | |
| | | | | November TBA: | | | | | | | |
| | 7,700 | | | (f) | | | 5.00 | | | 11/01/54 | | | 7,484,039 | | |
| | 11,780 | | | (f) | | | 5.50 | | | 11/01/54 | | | 11,669,102 | | |
| | 8,420 | | | (f) | | | 6.00 | | | 11/01/54 | | | 8,475,256 | | |
| | | | | Government National Mortgage Association,
Various Pools: | | | | | | | |
| | 3,691 | | | | | | 6.00 | | | 08/20/53 | | | 3,768,573 | | |
| | — | @ | | | | | 7.50 | | | 07/20/25 | | | 256 | | |
| | 1 | | | | | | 8.00 | | | 01/15/30 - 05/15/30 | | | 1,349 | | |
| | | | | Total Agency Fixed Rate Mortgages (Cost $43,090,281) | | | | | | | | | 42,913,589 | | |
| | | Asset-Backed Securities (12.4%) | | | | | |
| | 613 | | | ABFC Trust
1 Month Term SOFR + 1.16% | | | 5.902 | (g) | | 08/25/33 | | | 611,465 | | |
| | 2,649 | | | AMSR Trust (a) | | | 3.867 | | | 01/19/39 | | | 2,551,386 | | |
| | 500 | | | Apidos CLO XXXV Ltd.
3 Month Term SOFR + 6.01% (a) | | | 10.629 | (g) | | 04/20/34 | | | 502,091 | | |
| | 1,500 | | | Barings CLO Ltd., Class D2R
3 Month Term SOFR + 4.60% (a) | | | 9.256 | (g) | | 07/15/37 | | | 1,502,883 | | |
| | 1,500 | | | Battalion CLO XXV Ltd., Class D
3 Month Term SOFR + 4.35% (a) | | | 8.967 | (g) | | 03/13/37 | | | 1,535,608 | | |
| | 1,210 | | | Bayview Financial Revolving Asset Trust
1 Month Term SOFR + 1.11% (a) | | | 5.832 | (g) | | 02/28/40 | | | 1,124,217 | | |
| | 1,000 | | | Benefit Street Partners CLO XV Ltd., Class D2R
3 Month Term SOFR + 4.50% (a) | | | 9.156 | (g) | | 07/15/37 | | | 1,010,471 | | |
See Notes to Financial Statements
12
Morgan Stanley Global Fixed Income Opportunities Fund
Portfolio of Investments ◼ October 31, 2024 continued
PRINCIPAL
AMOUNT
(000) | |
| | COUPON
RATE | | MATURITY
DATE | | VALUE | |
$ | 1,266 | | | Blackbird Capital Aircraft Lease
Securitization Ltd. (a) | | | 4.213 | % | | 12/16/41 | | $ | 1,263,375 | | |
| | 750 | | | Brookhaven Park CLO Ltd., Class D
3 Month Term SOFR + 3.60% (a) | | | 8.217 | (g) | | 04/19/37 | | | 764,155 | | |
| | 1,500 | | | Bryant Park Funding Ltd., Class D
3 Month Term SOFR + 4.30% (a) | | | 8.956 | (g) | | 04/15/37 | | | 1,504,501 | | |
| | 319 | | | Business Loan Express Business Loan Trust
1 Month Term SOFR + 0.51% (a) | | | 5.274 | (g) | | 10/20/40 | | | 285,306 | | |
| | 914 | | | Cascade MH Asset Trust (a) | | | 4.00 | (g) | | 11/25/44 | | | 854,631 | | |
| | 469 | | | Chase Funding Loan Acquisition Trust | | | 5.50 | | | 08/25/34 | | | 445,164 | | |
| | 188 | | | Citigroup Mortgage Loan Trust, Inc.
1 Month Term SOFR + 3.11% (a) | | | 7.852 | (g) | | 07/25/44 | | | 249,013 | | |
| | | Conn's Receivables Funding LLC | | | |
| | 1,507 | | | (a) | | | 0.00 | | | 12/15/26 | | | 1,433,616 | | |
| | 2,805 | | | (a) | | | 10.00 | | | 01/17/28 | | | 2,752,520 | | |
| | 1,500 | | | Countrywide Asset-Backed Certificates Trust
1 Month Term SOFR + 1.69% | | | 3.798 | (g) | | 03/25/35 | | | 1,304,196 | | |
| | 1,461 | | | ECAF I Ltd. (Cayman Islands) (a) | | | 4.947 | | | 06/15/40 | | | 986,432 | | |
| | 1,500 | | | Elmwood CLO 32 Ltd., Class D1
3 Month Term SOFR + 2.85% (a) | | | 7.647 | (g) | | 10/18/37 | | | 1,507,147 | | |
| | 1,000 | | | Elmwood CLO VIII Ltd., Class DR
3 Month Term SOFR + 3.80% (a) | | | 8.417 | (g) | | 04/20/37 | | | 1,022,325 | | |
| | 1,500 | | | Empower CLO Ltd., Class D1
3 Month Term SOFR + 3.75% (a) | | | 8.376 | (g) | | 04/25/37 | | | 1,504,635 | | |
| | 6,000 | | | Finance of America HECM Buyout (a) | | | 6.00 | (g) | | 10/01/34 | | | 5,353,726 | | |
| | 2,893 | | | FirstKey Homes Trust, Class F3 (a) | | | 3.686 | | | 08/17/38 | | | 2,718,177 | | |
| | | FMC GMSR Issuer Trust, Class A | | | |
| | 4,000 | | | (a) | | | 3.62 | (g) | | 07/25/26 | | | 3,681,559 | | |
| | 1,600 | | | (a) | | | 4.44 | (g) | | 10/25/26 | | | 1,444,212 | | |
| | 2,000 | | | (a) | | | 4.45 | (g) | | 01/25/26 | | | 1,912,868 | | |
| | 4,000 | | | (a) | | | 7.17 | | | 04/25/27 | | | 3,855,363 | | |
| | 2,669 | | | GAIA Aviation Ltd. (Cayman Islands) (a) | | | 7.00 | | | 12/15/44 | | | 1,904,298 | | |
| | 1,000 | | | Galaxy 33 CLO Ltd., Class D1
3 Month Term SOFR + 3.55% (a) | | | 8.167 | (g) | | 04/20/37 | | | 1,010,865 | | |
| | 1,500 | | | Golub Capital Partners CLO 72 B Ltd., Class D
3 Month Term SOFR + 4.00% (a) | | | 8.626 | (g) | | 04/25/37 | | | 1,532,664 | | |
| | | GSAA Home Equity Trust | | | |
| | 324 | | | | | | 6.502 | | | 11/25/36 | | | 124,772 | | |
| | 42 | | | 1 Month Term SOFR + 1.99% | | | 6.727 | (g) | | 12/25/34 | | | 43,013 | | |
See Notes to Financial Statements
13
Morgan Stanley Global Fixed Income Opportunities Fund
Portfolio of Investments ◼ October 31, 2024 continued
PRINCIPAL
AMOUNT
(000) | |
| | COUPON
RATE | | MATURITY
DATE | | VALUE | |
$ | 1,610 | | | Harvest SBA Loan Trust, Class A
SOFR30A + 3.25% (a) | | | 8.219 | (g)% | | 10/25/50 | | $ | 1,611,180 | | |
| | 1,500 | | | Harvest U.S. CLO Ltd., Class D1
3 Month Term SOFR + 3.25% (a) | | | 8.059 | (g) | | 10/15/37 | | | 1,513,881 | | |
EUR | 742 | | | Hestia Financing
3 Month EURIBOR + 2.50% (Cyprus) | | | 5.719 | (g) | | 12/31/46 | | | 767,109 | | |
$ | 2,490 | | | Horizon Aircraft Finance IV Ltd., Class A (a) | | | 5.375 | | | 09/15/49 | | | 2,429,393 | | |
| | 205 | | | JOL Air Ltd. (Cayman Islands) (a) | | | 4.948 | | | 04/15/44 | | | 192,849 | | |
| | 500 | | | KKR CLO 16 Ltd.
3 Month Term SOFR + 7.37% (a) | | | 11.989 | (g) | | 10/20/34 | | | 496,905 | | |
| | 1,034 | | | LoanMe Trust Prime (a) | | | 5.00 | | | 09/15/34 | | | 1,000,740 | | |
| | 1,500 | | | Madison Park Funding LV Ltd., Class D1R
3 Month Term SOFR + 3.15% (a) | | | 7.782 | (g) | | 07/18/37 | | | 1,515,273 | | |
| | | Magnetite XXII Ltd., Class DRR | |
| | 1,000 | | | 3 Month Term SOFR + 2.90% (a) | | | 7.556 | (g) | | 07/15/36 | | | 1,001,530 | | |
| | 1,000 | | | 3 Month Term SOFR + 4.15% (a) | | | 8.806 | (g) | | 07/15/36 | | | 1,001,025 | | |
| | 878 | | | METAL LLC (a) | | | 4.581 | | | 10/15/42 | | | 561,633 | | |
| | 1,810 | | | Mortgage Subordinate Trust, Class A (a) | | | 0.00 | (g) | | 12/29/31 | | | 1,458,786 | | |
| | 1,835 | | | New Residential Mortgage LLC, Class A (a) | | | 5.437 | | | 06/25/25 | | | 1,827,136 | | |
| | 612 | | | Newtek Small Business Loan Trust
Daily U.S. Prime Rate + 0.10% (a) | | | 8.10 | (g) | | 12/25/48 | | | 596,733 | | |
| | | NRZ Excess Spread-Collateralized Notes, Class A | |
| | 624 | | | (a) | | | 2.981 | | | 03/25/26 | | | 603,044 | | |
| | 1,096 | | | (a) | | | 3.104 | | | 07/25/26 | | | 1,054,788 | | |
| | 1,250 | | | Oaktree CLO Ltd., Class D2RR
3 Month Term SOFR + 4.70% (a) | | | 9.317 | (g) | | 07/20/37 | | | 1,254,013 | | |
| | 2,828 | | | Oakwood Mortgage Investors, Inc., Class A4 | | | 7.405 | (g) | | 06/15/31 | | | 263,514 | | |
| | | OCP CLO Ltd., Class DR | |
| | 1,000 | | | 3 Month Term SOFR + 3.35% (a) | | | 7.997 | (g) | | 07/16/35 | | | 1,007,735 | | |
| | 1,500 | | | 3 Month Term SOFR + 3.75% (a) | | | 8.376 | (g) | | 04/23/37 | | | 1,523,026 | | |
| | 1,000 | | | 3 Month Term SOFR + 4.40% (a) | | | 9.017 | (g) | | 10/20/37 | | | 1,001,140 | | |
| | 1,500 | | | Palmer Square CLO Ltd., Class CR
3 Month Term SOFR + 3.90% (a) | | | 8.532 | (g) | | 04/18/37 | | | 1,534,726 | | |
| | 3,000 | | | PMT FMSR Issuer Trust
1 Month Term SOFR + 3.11% (a) | | | 7.852 | (g) | | 03/25/26 | | | 3,012,360 | | |
| | 4,000 | | | PNMAC GMSR Issuer Trust, Class A
1 Month Term SOFR + 3.20% (a) | | | 7.938 | (g) | | 03/25/29 | | | 4,057,089 | | |
| | 2,500 | | | Progress Residential Trust, Class F (a) | | | 4.053 | | | 11/17/40 | | | 2,255,144 | | |
| | 3,111 | | | Raptor Aircraft Finance I LLC (a) | | | 4.213 | | | 08/23/44 | | | 2,649,550 | | |
See Notes to Financial Statements
14
Morgan Stanley Global Fixed Income Opportunities Fund
Portfolio of Investments ◼ October 31, 2024 continued
PRINCIPAL
AMOUNT
(000) | |
| | COUPON
RATE | | MATURITY
DATE | | VALUE | |
| | | ReadyCap Lending Small Business Loan Trust | | | |
$ | 164 | | | Daily U.S. Prime Rate - 0.50% (a) | | | 7.50 | (g)% | | 12/27/44 | | $ | 163,658 | | |
| | 2,404 | | | Daily U.S. Prime Rate + 0.07% (a) | | | 8.07 | (g) | | 04/25/48 | | | 2,469,995 | | |
| | 1,798 | | | Shenton Aircraft Investment Ltd. (a) | | | 4.75 | | | 10/15/42 | | | 1,710,156 | | |
| | 2,000 | | | STAR Trust, Class D
1 Month Term SOFR + 2.55% (a) | | | 7.354 | (g) | | 05/17/39 | | | 1,991,329 | | |
| | 839 | | | Start II Ltd. (Bermuda) (a) | | | 4.089 | | | 03/15/44 | | | 810,300 | | |
| | 1,163 | | | Start Ltd. (a) | | | 4.089 | | | 05/15/43 | | | 1,111,650 | | |
| | 1,000 | | | TICP CLO VI Ltd.
3 Month Term SOFR + 6.51% (a) | | | 11.168 | (g) | | 01/15/34 | | | 1,006,635 | | |
| | | Trinitas CLO VI Ltd. | | | |
| | 1,000 | | | 3 Month Term SOFR + 4.01% (a) | | | 8.638 | (g) | | 01/25/34 | | | 1,001,573 | | |
| | 1,000 | | | 3 Month Term SOFR + 7.08% (a) | | | 11.704 | (g) | | 01/25/34 | | | 955,916 | | |
| | 50 | | | VCAT LLC (a) | | | 4.743 | | | 05/25/51 | | | 49,717 | | |
| | 2,500 | | | VINE Trust (a) | | | 4.75 | | | 12/17/40 | | | 2,280,958 | | |
| | | Total Asset-Backed Securities (Cost $100,082,167) | | | | | | | | | 98,038,843 | | |
| | | Collateralized Mortgage Obligations - Agency Collateral Series (0.0%)‡ | | | |
| | | Federal National Mortgage Association, | | | |
| | | IO REMIC | | | |
| | 178 | | | | | | 0.377 | (g) | | 03/25/44 | | | 9,926 | | |
| | 384 | | | | | | 1.276 | (g) | | 10/25/39 | | | 22,964 | | |
| | 39 | | | 6.44% - SOFR30A | | | 1.579 | (h) | | 08/25/41 | | | 775 | | |
| | 516 | | | Government National Mortgage Association, IO
6.14% - 1 Month Term SOFR | | | 1.376 | (h) | | 12/20/42 | | | 52,834 | | |
| | | Total Collateralized Mortgage Obligations - Agency Collateral Series
(Cost $0) | | | | | | | | | 86,499 | | |
| | | Commercial Mortgage-Backed Securities (4.3%) | | | |
| | 2,867 | | | Bayview Commercial Asset Trust, Class A4A
1 Month Term SOFR + 1.61% (a) | | | 6.352 | (g) | | 12/25/37 | | | 2,538,528 | | |
| | 1,790 | | | BPR Trust, Class A
1 Month Term SOFR + 1.86% (a) | | | 6.669 | (g) | | 06/15/38 | | | 1,784,619 | | |
| | 900 | | | Citigroup Commercial Mortgage Trust (a) | | | 3.503 | (g) | | 12/10/41 | | | 734,772 | | |
| | | Commercial Mortgage Trust | | | |
| | 1,500 | | | (a) | | | 3.40 | (g) | | 08/15/57 | | | 1,514,680 | | |
| | 22 | | | (a) | | | 4.679 | (g) | | 07/15/47 | | | 20,567 | | |
| | 1,699 | | | COOF Securitization Trust, IO (a) | | | 2.414 | (g) | | 10/25/40 | | | 92,291 | | |
| | 2,418 | | | COOF Securitization Trust II, IO (a) | | | 2.60 | (g) | | 08/25/41 | | | 128,637 | | |
See Notes to Financial Statements
15
Morgan Stanley Global Fixed Income Opportunities Fund
Portfolio of Investments ◼ October 31, 2024 continued
PRINCIPAL
AMOUNT
(000) | |
| | COUPON
RATE | | MATURITY
DATE | | VALUE | |
| | | Credit Suisse Mortgage Trust, Class A | | | |
$ | 2,447 | | | 1 Month Term SOFR + 3.57% (a) | | | 8.378 | (g)% | | 05/09/25 | | $ | 2,397,560 | | |
| | 3,849 | | | 1 Month Term SOFR + 3.83% (a) | | | 8.633 | (g) | | 08/15/26 | | | 3,538,428 | | |
| | | Federal Home Loan Mortgage Corporation, | | | |
| | | IO | | | |
| | 7,000 | | | | | | 2.628 | (g) | | 01/25/49 | | | 938,759 | | |
| | 6,430 | | | | | | 3.068 | (g) | | 11/25/36 | | | 1,574,024 | | |
| | 9,926 | | | | | | 4.334 | (g) | | 11/25/55 | | | 2,634,000 | | |
| | 189 | | | FREMF Mortgage Trust
SOFR30A + 5.36% (a) | | | 10.528 | (g) | | 07/25/26 | | | 122,951 | | |
| | | Harvest Commercial Capital Loan Trust, Class A | | | |
| | 2,991 | | | | | | 6.164 | | | 10/25/56 | | | 2,982,176 | | |
| | 2,500 | | | (a) | | | 5.964 | (g) | | 04/25/52 | | | 2,227,083 | | |
| | 136 | | | JPMBB Commercial Mortgage Securities Trust (a) | | | 4.054 | (g) | | 09/15/47 | | | 118,149 | | |
| | | KGS-Alpha SBA COOF Trust, | | | |
| | | IO | | | |
| | 202 | | | (a) | | | 2.863 | (g) | | 04/25/40 | | | 8,361 | | |
| | 380 | | | (a) | | | 3.11 | (g) | | 07/25/41 | | | 23,013 | | |
| | 1,500 | | | MFT Mortgage Trust (a) | | | 3.283 | (g) | | 08/10/40 | | | 1,078,406 | | |
| | 1,500 | | | MKT 2020-525M Mortgage Trust (a) | | | 2.941 | (g) | | 02/12/40 | | | 800,882 | | |
| | 2,000 | | | Natixis Commercial Mortgage Securities Trust (a) | | | 4.135 | (g) | | 05/15/39 | | | 1,741,326 | | |
| | 3,000 | | | SG Commercial Mortgage Securities Trust (a) | | | 3.477 | (g) | | 09/15/39 | | | 2,480,852 | | |
| | 691 | | | Sutherland Commercial Mortgage Trust (a) | | | 2.23 | (g) | | 12/25/41 | | | 591,899 | | |
EUR | 320 | | | Taurus 2018-1 IT SRL
3 Month EURIBOR + 2.78% (Italy) | | | 6.322 | (g) | | 05/18/32 | | | 348,572 | | |
| | | Velocity Commercial Capital Loan Trust | | | |
$ | 647 | | | (a) | | | 6.90 | | | 05/25/47 | | | 645,502 | | |
| | 2,115 | | | (a) | | | 6.58 | (g) | | 04/25/54 | | | 2,128,916 | | |
| | 900 | | | Wells Fargo Commercial Mortgage Trust (a) | | | 4.494 | (g) | | 04/15/50 | | | 802,800 | | |
| | | Total Commercial Mortgage-Backed Securities (Cost $35,679,307) | | | | | | | | | 33,997,753 | | |
| | | Mortgages - Other (19.4%) | | | |
| | 2,500 | | | ATLX Trust, Class M1 (a) | | | 4.275 | (g) | | 04/25/64 | | | 2,317,465 | | |
| | 70 | | | Banc of America Alternative Loan Trust
1 Month Term SOFR + 0.76% | | | 5.502 | (g) | | 07/25/46 | | | 54,768 | | |
| | | Banc of America Funding Trust | | | |
| | 5 | | | | | | 5.25 | | | 07/25/37 | | | 5,048 | | |
| | 330 | | | | | | 5.50 | | | 09/25/35 | | | 310,657 | | |
| | 41 | | | | | | 6.00 | | | 07/25/37 | | | 35,574 | | |
See Notes to Financial Statements
16
Morgan Stanley Global Fixed Income Opportunities Fund
Portfolio of Investments ◼ October 31, 2024 continued
PRINCIPAL
AMOUNT
(000) | |
| | COUPON
RATE | | MATURITY
DATE | | VALUE | |
GBP | 800 | | | Banna RMBS DAC
3 Month GBP SONIA + 3.50% (United Kingdom) | | | 8.48 | (g)% | | 12/30/63 | | $ | 1,035,440 | | |
$ | 61 | | | BCAP LLC Trust (a) | | | 4.559 | (g) | | 03/26/37 | | | 56,841 | | |
| | 43 | | | Bear Stearns ARM Trust | | | 4.206 | (g) | | 05/25/47 | | | 36,445 | | |
| | 22 | | | Bear Stearns Asset Backed Securities Trust | | | 5.295 | (g) | | 07/25/36 | | | 22,157 | | |
| | 4,000 | | | Boston Lending Trust (a) | | | 3.25 | (g) | | 05/25/62 | | | 3,276,184 | | |
| | | Brean Asset Backed Securities Trust | | | |
| | 3,117 | | | (a) | | | 1.40 | (g) | | 10/25/63 | | | 2,781,021 | | |
| | 5,219 | | | (a) | | | 4.00 | | | 09/25/63 | | | 4,660,945 | | |
| | 2,678 | | | (a) | | | 4.50 | (g) | | 03/25/78 | | | 2,541,400 | | |
| | | Cascade Funding Mortgage Trust, Class M1 | | | |
| | 2,387 | | | (a) | | | 2.00 | (g) | | 09/25/50 | | | 2,280,322 | | |
| | 1,055 | | | (a) | | | 2.00 | (g) | | 02/25/52 | | | 893,676 | | |
| | 2,000 | | | (a) | | | 3.00 | (g) | | 05/25/34 | | | 1,563,895 | | |
| | 4,000 | | | (a) | | | 3.00 | (g) | | 06/25/34 | | | 3,073,643 | | |
| | 4,500 | | | (a) | | | 3.25 | (g) | | 11/25/35 | | | 4,323,267 | | |
| | 5,500 | | | (a) | | | 3.75 | (g) | | 04/25/25 | | | 5,205,026 | | |
| | 5,500 | | | (a) | | | 4.25 | (g) | | 04/25/33 | | | 4,821,519 | | |
| | | Champs Trust, Class A | | | |
| | 3,496 | | | (a) | | | 8.39 | (g) | | 07/25/59 | | | 3,611,609 | | |
| | 2,954 | | | (a) | | | 14.782 | (g) | | 11/25/59 | | | 3,062,275 | | |
| | 53 | | | ChaseFlex Trust | | | 6.50 | | | 02/25/35 | | | 36,766 | | |
| | | CHL Mortgage Pass-Through Trust | | | |
| | 234 | | | | | | 5.329 | (g) | | 09/25/34 | | | 216,254 | | |
| | 68 | | | | | | 5.50 | | | 05/25/34 | | | 67,676 | | |
| | 649 | | | | | | 6.00 | | | 12/25/36 | | | 375,533 | | |
| | 1,401 | | | CIM Trust (a) | | | 5.569 | | | 07/25/55 | | | 1,397,345 | | |
| | 54 | | | Citigroup Mortgage Loan Trust, Inc. | | | 5.167 | (g) | | 11/25/36 | | | 47,358 | | |
| | | Countrywide Alternative Loan Trust | | | |
| | 32 | | | | | | 4.454 | (g) | | 08/25/35 | | | 29,484 | | |
| | 42 | | | | | | 4.487 | (g) | | 05/25/36 | | | 37,332 | | |
| | 102 | | | | | | 4.506 | (g) | | 10/25/35 | | | 102,142 | | |
| | 75 | | | 1 Month Term SOFR + 0.47% | | | 5.212 | (g) | | 05/25/47 | | | 68,513 | | |
| | 154 | | | 1 Month Term SOFR + 0.61% | | | 5.352 | (g) | | 10/25/35 | | | 94,987 | | |
| | 17 | | | | | | 5.50 | | | 02/25/36 | | | 8,490 | | |
| | 343 | | | | | | 6.00 | | | 04/25/36 | | | 173,301 | | |
| | | Countrywide Reperforming Loan REMIC Trust, | | | |
| | | REMIC | | | |
| | 95 | | | (a) | | | 6.50 | | | 03/25/35 | | | 100,365 | | |
| | 79 | | | (a) | | | 7.50 | | | 11/25/34 | | | 67,315 | | |
See Notes to Financial Statements
17
Morgan Stanley Global Fixed Income Opportunities Fund
Portfolio of Investments ◼ October 31, 2024 continued
PRINCIPAL
AMOUNT
(000) | |
| | COUPON
RATE | | MATURITY
DATE | | VALUE | |
$ | 6,511 | | | Credit Suisse First Boston Mortgage Securities
Corp., Class B
1 Month Term SOFR + 2.96% (a) | | | 4.368 | (g)% | | 03/25/45 | | $ | 7,116,881 | | |
| | | CSFB Mortgage-Backed Pass-Through Certificates | | | |
| | 171 | | | | | | 6.50 | | | 12/25/33 | | | 172,291 | | |
| | 209 | | | | | | 7.50 | | | 10/25/32 | | | 208,857 | | |
| | 1,653 | | | CSMC Mortgage-Backed Trust | | | 6.50 | | | 05/25/36 | | | 472,203 | | |
| | 2,836 | | | Ellington Financial Mortgage Trust, Class A1A (a) | | | 4.50 | (g) | | 03/25/54 | | | 2,550,497 | | |
EUR | 101 | | | EMF-NL Prime BV
3 Month EURIBOR + 0.80% (Netherlands) | | | 4.015 | (g) | | 04/17/41 | | | 107,371 | | |
| | 621 | | | Eurohome Mortgages PLC
3 Month EURIBOR + 0.21% (Germany) | | | 3.857 | (g) | | 08/02/50 | | | 646,495 | | |
$ | 2,882 | | | Finance of America Structured Securities
Trust, Class A1 (a) | | | 3.50 | | | 04/25/74 | | | 2,735,361 | | |
| | 2,305 | | | GITSIT Mortgage Loan Trust, Class A1 (a) | | | 7.466 | | | 06/25/54 | | | 2,333,283 | | |
GBP | 1,400 | | | Great Hall Mortgages No. 1 PLC
3 Month GBP SONIA + 3.12% (United Kingdom) | | | 8.099 | (g) | | 06/18/38 | | | 1,742,042 | | |
| | | GSR Mortgage Loan Trust | | | |
$ | 76 | | | | | | 4.29 | (g) | | 03/25/37 | | | 41,555 | | |
| | 10 | | | | | | 4.49 | (g) | | 05/25/35 | | | 7,531 | | |
| | 252 | | | | | | 5.169 | (g) | | 12/25/34 | | | 237,021 | | |
| | 838 | | | PAC | | | 5.50 | | | 03/25/35 | | | 731,663 | | |
| | 187 | | | HarborView Mortgage Loan Trust | | | 6.042 | (g) | | 05/19/33 | | | 177,687 | | |
| | 2,469 | | | Headlands Residential 2021-RPL1 LLC (a) | | | 2.487 | (g) | | 09/25/26 | | | 2,417,874 | | |
EUR | 545 | | | IM Pastor 4 FTA
3 Month EURIBOR + 0.14% (Spain) | | | 3.595 | (g) | | 03/22/44 | | | 529,906 | | |
$ | 8 | | | Impac CMB Trust
1 Month Term SOFR + 0.89% | | | 5.632 | (g) | | 10/25/35 | | | 9,524 | | |
| | 2,564 | | | Imperial Fund Mortgage Trust, Class A1 (a) | | | 7.369 | | | 11/25/67 | | | 2,600,194 | | |
| | 112 | | | JP Morgan Alternative Loan Trust | | | 6.00 | | | 12/25/35 | | | 76,901 | | |
| | 3,316 | | | La Hipotecaria Panamanian Mortgage Trust
(Panama) (a) | | | 4.35 | | | 07/13/52 | | | 2,965,502 | | |
EUR | 720 | | | Lansdowne Mortgage Securities No. 2 PLC
3 Month EURIBOR + 0.34% (Ireland) | | | 3.821 | (g) | | 09/16/48 | | | 702,161 | | |
$ | 338 | | | Lehman Mortgage Trust | | | 6.50 | | | 09/25/37 | | | 113,077 | | |
| | 2,200 | | | LHOME Mortgage Trust, Class A1 (a) | | | 8.00 | | | 08/25/28 | | | 2,244,976 | | |
| | | Ludgate Funding PLC | | | |
EUR | 794 | | | 3 Month EURIBOR + 0.85% (United Kingdom) | | | 4.176 | (g) | | 01/01/61 | | | 816,603 | | |
| | 454 | | | 3 Month EURIBOR + 1.10% (United Kingdom) | | | 4.426 | (g) | | 01/01/61 | | | 457,818 | | |
See Notes to Financial Statements
18
Morgan Stanley Global Fixed Income Opportunities Fund
Portfolio of Investments ◼ October 31, 2024 continued
PRINCIPAL
AMOUNT
(000) | |
| | COUPON
RATE | | MATURITY
DATE | | VALUE | |
| | | Mansard Mortgages PLC | | | |
GBP | 348 | | | 3 Month GBP SONIA + 1.22% (United Kingdom) | | | 6.20 | (g)% | | 10/15/48 | | $ | 424,770 | | |
| | 266 | | | 3 Month GBP SONIA + 2.12% (United Kingdom) | | | 7.099 | (g) | | 12/15/49 | | | 342,108 | | |
| | 569 | | | 3 Month GBP SONIA + 3.12% (United Kingdom) | | | 8.099 | (g) | | 12/15/49 | | | 736,893 | | |
$ | 443 | | | MASTR Alternative Loan Trust | | | 6.00 | | | 05/25/33 | | | 424,445 | | |
| | 25 | | | MASTR Asset Securitization Trust
1 Month Term SOFR + 6.00% | | | 6.00 | (g) | | 06/25/36 | | | 16,317 | | |
| | 1,016 | | | Merrill Lynch Mortgage Investors Trust, IO (a) | | | 0.00 | (g) | | 02/25/36 | | | 10 | | |
GBP | 2,000 | | | Mortgage Funding PLC
3 Month GBP SONIA + 3.32% (United Kingdom) | | | 8.299 | (g) | | 03/13/46 | | | 2,581,981 | | |
$ | 61 | | | MortgageIT Trust
1 Month Term SOFR + 1.01% | | | 5.752 | (g) | | 10/25/35 | | | 60,303 | | |
GBP | 567 | | | Newgate Funding PLC
3 Month GBP LIBOR + 3.12% (United Kingdom) | | | 8.099 | (g) | | 12/15/50 | | | 716,819 | | |
| | | Nomura Asset Acceptance Corp. Alternative Loan
Trust | | | |
$ | 1,960 | | | | | | 5.755 | (g) | | 06/25/36 | | | 547,167 | | |
| | 96 | | | | | | 7.908 | (g) | | 06/25/36 | | | 79,808 | | |
| | 1,630 | | | NYMT Loan Trust, Class A1 (a) | | | 7.154 | | | 02/25/29 | | | 1,650,452 | | |
| | | Ocwen Loan Investment Trust, Class M1 | | | |
| | 3,000 | | | (a) | | | 3.00 | (g) | | 06/25/36 | | | 2,840,243 | | |
| | 1,400 | | | (a) | | | 3.00 | | | 02/25/37 | | | 1,228,198 | | |
| | 1,500 | | | Onity Loan Investment Trust (a) | | | 5.00 | (g) | | 08/25/37 | | | 1,230,980 | | |
| | 1,292 | | | PMC PLS ESR Issuer LLC (a) | | | 5.114 | | | 02/25/27 | | | 1,281,825 | | |
| | | PRET LLC, Class A1 | | | |
| | 2,473 | | | (a) | | | 4.843 | | | 09/25/51 | | | 2,449,639 | | |
| | 2,581 | | | (a) | | | 7.021 | | | 02/25/54 | | | 2,588,097 | | |
| | 1,784 | | | (a) | | | 8.112 | | | 11/25/53 | | | 1,796,660 | | |
| | | PRKCM Trust, Class A1 | | | |
| | 1,340 | | | (a) | | | 6.598 | | | 02/25/58 | | | 1,354,490 | | |
| | 1,702 | | | (a) | | | 7.225 | | | 11/25/58 | | | 1,733,260 | | |
| | 1,555 | | | PRPM LLC (a) | | | 4.00 | | | 05/25/54 | | | 1,331,519 | | |
| | | Residential Accredit Loans, Inc. Trust | | | |
| | 49 | | | | | | 6.00 | | | 04/25/36 | | | 35,894 | | |
| | 28 | | | | | | 6.00 | | | 01/25/37 | | | 22,272 | | |
| | 213 | | | RFMSI Trust | | | 6.00 | | | 07/25/36 | | | 186,838 | | |
| | 1,106 | | | RiverView HECM Trust
1 Month Term SOFR + 0.38% | | | 5.122 | (g) | | 05/25/47 | | | 974,352 | | |
GBP | 414 | | | RMAC Securities No. 1 PLC
3 Month GBP SONIA + 0.59% (United Kingdom) | | | 5.569 | (g) | | 06/12/44 | | | 518,414 | | |
See Notes to Financial Statements
19
Morgan Stanley Global Fixed Income Opportunities Fund
Portfolio of Investments ◼ October 31, 2024 continued
PRINCIPAL
AMOUNT
(000) | |
| | COUPON
RATE | | MATURITY
DATE | | VALUE | |
| | | RMF Buyout Issuance Trust | | | |
$ | 3,500 | | | (a) | | | 3.63 | (g)% | | 10/25/50 | | $ | 3,093,601 | | |
| | 1,200 | | | (a) | | | 3.69 | (g) | | 11/25/31 | | | 1,120,172 | | |
| | 4,000 | | | (a) | | | 4.50 | (g) | | 04/25/32 | | | 3,255,444 | | |
| | 8,858 | | | (a) | | | 6.00 | | | 10/25/50 | | | 6,232,027 | | |
| | 4,382 | | | (a) | | | 6.00 | (g) | | 11/25/31 | | | 3,849,980 | | |
| | | RMF Proprietary Issuance Trust, Class A1 | | | |
| | 2,690 | | | (a) | | | 3.00 | (g) | | 01/25/62 | | | 2,364,696 | | |
| | 2,603 | | | (a) | | | 3.25 | (g) | | 04/26/60 | | | 2,131,501 | | |
| | 1,000 | | | (a) | | | 4.00 | (g) | | 08/25/62 | | | 924,999 | | |
| | | Saluda Grade Alternative Mortgage Trust, Class A1 | | | |
| | 2,000 | | | (a) | | | 7.50 | | | 02/25/30 | | | 2,017,831 | | |
| | 4,000 | | | (a) | | | 7.762 | | | 04/25/30 | | | 4,068,160 | | |
| | | Seasoned Credit Risk Transfer Trust, Class M | | | |
| | 1,031 | | | (a) | | | 3.75 | (g) | | 09/25/55 | | | 936,020 | | |
| | 3,250 | | | (a) | | | 4.25 | (g) | | 08/25/59 | | | 3,050,560 | | |
| | 2,500 | | | (a) | | | 4.25 | (g) | | 05/25/60 | | | 2,348,269 | | |
| | 3,307 | | | (a) | | | 4.50 | (g) | | 02/25/59 | | | 3,080,708 | | |
| | 2,883 | | | | | | 4.75 | (g) | | 10/25/58 | | | 2,772,273 | | |
| | 139 | | | Sequoia Mortgage Trust
1 Month Term SOFR + 0.73% | | | 5.494 | (g) | | 07/20/33 | | | 130,341 | | |
| | 521 | | | Stanwich Mortgage Loan Co. LLC (a) | | | 6.235 | | | 10/16/26 | | | 522,485 | | |
| | 43 | | | STARM Mortgage Loan Trust | | | 5.033 | (g) | | 10/25/37 | | | 37,617 | | |
| | | Structured Adjustable Rate Mortgage Loan Trust | | | |
| | 262 | | | | | | 4.76 | (g) | | 11/25/34 | | | 232,120 | | |
| | 258 | | | | | | 6.193 | (g) | | 02/25/35 | | | 253,756 | | |
| | 344 | | | Structured Asset Mortgage Investments II Trust | | | 3.941 | (g) | | 04/19/35 | | | 305,177 | | |
| | 1,000 | | | Structured Asset Securities Corp., IO (a) | | | 0.00 | (g) | | 07/25/35 | | | 14,081 | | |
EUR | 1,770 | | | TDA 27 FTA
3 Month EURIBOR + 0.19% (Spain) | | | 3.535 | (g) | | 12/28/50 | | | 1,689,017 | | |
$ | 200 | | | Wells Fargo Alternative Loan Trust | | | 7.792 | (g) | | 07/25/37 | | | 200,183 | | |
| | | Total Mortgages - Other (Cost $152,435,369) | | | | | | | | | 152,792,084 | | |
| | | Senior Loan Interests (0.4%) | | | |
| | 3,375 | | | Cuenca Enterprises, Inc.
3 Month USD LIBOR + 7.33% (Cayman Islands) (i)
(acquired 12/07/2021)
(Cost 3,375,000) | | | 12.882 | (g) | | 12/15/26 | | | 3,375,000 | | |
See Notes to Financial Statements
20
Morgan Stanley Global Fixed Income Opportunities Fund
Portfolio of Investments ◼ October 31, 2024 continued
PRINCIPAL
AMOUNT
(000) | |
| | COUPON
RATE | | MATURITY
DATE | | VALUE | |
| | | Supranational (0.7%) | | | |
$ | 1,800 | | | African Export-Import Bank (a) | | | 3.798 | % | | 05/17/31 | | $ | 1,592,856 | | |
| | | Banque Ouest Africaine de Developpement | | | |
EUR | 1,970 | | | | | | 2.75 | | | 01/22/33 | | | 1,789,310 | | |
$ | 2,140 | | | (a) | | | 4.70 | | | 10/22/31 | | | 1,953,085 | | |
| | | Total Supranational (Cost $5,429,089) | | | | | | | | | 5,335,251 | | |
NUMBER OF
SHARES
(000) | | | | | | | | | |
| | | Investment Company (2.3%) | | | |
| | 356 | | | Eaton Vance Floating-Rate ETF (See Note 7) (b) (Cost $18,060,810) | | | | | | | | | | | 17,889,000 | | |
PRINCIPAL
AMOUNT
(000) | |
| | | | | | | |
| | | Short-Term Investments (15.1%) | | | |
| | | U.S. Treasury Securities (8.3%) | | | |
| | | U.S. Treasury Bill | | | |
$ | 6,232 | | | (j) | | | 4.42 | | | 11/12/24 | | | 6,223,525 | | |
| | 7,000 | | | (j)(k) | | | 4.535 | | | 01/16/25 | | | 6,934,209 | | |
| | 6,000 | | | (j)(k) | | | 4.547 | | | 01/16/25 | | | 5,943,608 | | |
| | 12,145 | | | (j) | | | 4.592 | | | 01/02/25 | | | 12,050,755 | | |
| | 5,500 | | | (j) | | | 4.611 | | | 01/30/25 | | | 5,439,031 | | |
| | 2,250 | | | (j)(k) | | | 4.879 | | | 01/16/25 | | | 2,228,853 | | |
| | 18,000 | | | (j) | | | 5.185 | | | 01/09/25 | | | 17,846,130 | | |
| | 8,750 | | | (j)(k) | | | 5.19 | | | 01/16/25 | | | 8,667,761 | | |
| | | Total U.S. Treasury Securities (Cost $65,265,599) | | | | | | | | | 65,333,872 | | |
NUMBER OF
SHARES
(000) | | | | | | | | | |
| | | Investment Company (5.4%) | | | |
| | 42,216 | | | Morgan Stanley Institutional Liquidity Funds - Government Portfolio -
Institutional Class, 4.78% (See Note 7) (Cost $42,215,977) | | | | | | | | | | | 42,215,977 | | |
See Notes to Financial Statements
21
Morgan Stanley Global Fixed Income Opportunities Fund
Portfolio of Investments ◼ October 31, 2024 continued
NUMBER OF
SHARES
(000) | |
| |
| |
| | VALUE | |
| | | Securities Held as Collateral on Loaned Securities (1.4%) | |
| | | Investment Company (1.4%) | |
| | 11,314 | | | Morgan Stanley Institutional Liquidity Funds - Government Portfolio -
Institutional Class, 4.78% (See Note 7) (Cost $11,313,800) | | | | | | | | | | $ | 11,313,800 | | |
| | | Total Short-Term Investments (Cost $118,795,376) | | | | | | | | | 118,863,649 | | |
| | | Total Investments (Cost $837,280,413)
including $11,243,189 of Securities Loaned (l)(m) | | | | | 105.5 | % | | | 832,142,885 | | |
| | | Liabilities in Excess of Other Assets | | | | | (5.5 | ) | | | (43,390,310 | ) | |
| | | Net Assets | | | | | 100.0 | % | | $ | 788,752,575 | | |
Country assignments and aggregations are based generally on third party vendor classifications and information, and may be different from the assignments and aggregations under the policies set forth in the Fund's prospectus and/or statement of additional information relating to geographic classifications.
ARM Adjustable Rate Mortgages.
CLO Collateralized Loan Obligation.
CR Custodial Receipts.
DAC Designated Activity Company.
ETF Exchange Traded Fund.
EURIBOR Euro Interbank Offered Rate.
HECM Home Equity Conversion Mortgage.
IO Interest Only Security.
LIBOR London Interbank Offered Rate.
PAC Planned Amortization Class.
REMIC Real Estate Mortgage Investment Conduit.
SOFR Secured Overnight Financing Rate.
SOFR30A 30-Day Average Secured Overnight Financing Rate.
SONIA Sterling Overnight Index Average.
TBA To Be Announced.
@ Value is less than $500.
‡ Amount is less than 0.05%.
(a) 144A security - Certain conditions for public sale may exist. Unless otherwise noted, these securities are deemed to be liquid.
(b) All or a portion of this security was on loan at October 31, 2024.
(c) Multi-step - Coupon rate changes in predetermined increments to maturity. Rate disclosed is as of October 31, 2024. Maturity date disclosed is the ultimate maturity date.
(d) Perpetual - One or more securities do not have a predetermined maturity date. Rates for these securities are fixed for a period of time after which they revert to a floating rate. Interest rates in effect are as of October 31, 2024.
(e) Capital appreciation bond.
(f) Security is subject to delayed delivery.
(g) Floating or variable rate securities: The rates disclosed are as of October 31, 2024. For securities based on a published reference rate and spread, the reference rate and spread are indicated in the description in the Portfolio of Investments. Certain variable rate securities
See Notes to Financial Statements
22
Morgan Stanley Global Fixed Income Opportunities Fund
Portfolio of Investments ◼ October 31, 2024 continued
may not be based on a published reference rate and spread but are determined by the issuer or agent and are based on current market conditions. These securities do not indicate a reference rate and spread in their description in the Portfolio of Investments.
(h) Inverse Floating Rate Security - Interest rate fluctuates with an inverse relationship to an associated interest rate. Indicated rate is the effective rate at October 31, 2024.
(i) Security cannot be offered for public resale without first being registered under the Securities Act of 1933 and related rules ("restricted security"). Acquisition date represents the day on which an enforceable right to acquire such security is obtained and is presented along with related cost in the security description. The Fund has registration rights for certain restricted securities. Any costs related to such registration are borne by the issuer. The aggregate value of restricted securities (excluding 144A holdings) at October 31, 2024 amounts to approximately $3,375,000 and represents 0.4% of net assets.
(j) Rate shown is the yield to maturity at October 31, 2024.
(k) All or a portion of the security was pledged to cover margin requirements for swap agreements.
(l) Securities are available for collateral in connection with securities purchased on a forward commitment basis, open foreign currency forward exchange contracts, futures contracts and swap agreements.
(m) At October 31, 2024, the aggregate cost for federal income tax purposes is $794,213,777. The aggregate gross unrealized appreciation is $20,508,724 and the aggregate gross unrealized depreciation is $28,749,830, resulting in net unrealized depreciation of $8,241,106.
Foreign Currency Forward Exchange Contracts:
The Fund had the following foreign currency forward exchange contracts open at October 31, 2024:
COUNTERPARTY | | CONTRACTS
TO DELIVER | | IN EXCHANGE
FOR | | DELIVERY
DATE | | UNREALIZED
APPRECIATION
(DEPRECIATION) | |
Australia & New Zealand Banking Group Ltd. | | NZD | 30,679,750 | | | $ | 18,608,342 | | | 1/17/25 | | $ | 256,468 | | |
Bank of America NA | | HUF | 2,147,134,054 | | | $ | 5,805,929 | | | 1/17/25 | | | 106,651 | | |
Bank of America NA | | HUF | 50,198,701 | | | $ | 134,020 | | | 1/17/25 | | | 774 | | |
Barclays Bank PLC | | EUR | 1,460,000 | | | $ | 1,596,661 | | | 1/17/25 | | | 3,421 | | |
Barclays Bank PLC | | GBP | 26,228 | | | $ | 34,137 | | | 1/17/25 | | | 324 | | |
Barclays Bank PLC | | PLN | 31,827,434 | | | EUR | 7,286,000 | | | 1/17/25 | | | 20,396 | | |
BNP Paribas SA | | AUD | 5,991,408 | | | $ | 3,984,315 | | | 1/17/25 | | | 38,943 | | |
BNP Paribas SA | | EUR | 7,286,000 | | | PLN | 31,558,325 | | | 1/17/25 | | | (87,450 | ) | |
BNP Paribas SA | | PLN | 79,418 | | | $ | 19,961 | | | 1/17/25 | | | 172 | | |
BNP Paribas SA | | $ | 1,989,910 | | | AUD | 3,021,000 | | | 1/17/25 | | | (567 | ) | |
BNP Paribas SA | | $ | 1,803,841 | | | COP | 7,862,940,794 | | | 1/17/25 | | | (43,773 | ) | |
BNP Paribas SA | | $ | 42,269 | | | CZK | 979,967 | | | 1/17/25 | | | (79 | ) | |
BNP Paribas SA | | $ | 2,591,086 | | | HUF | 958,143,616 | | | 1/17/25 | | | (47,823 | ) | |
BNP Paribas SA | | $ | 520,769 | | | HUF | 192,451,158 | | | 1/17/25 | | | (9,933 | ) | |
BNP Paribas SA | | $ | 976,293 | | | HUF | 363,803,161 | | | 1/17/25 | | | (10,626 | ) | |
Citibank NA | | EUR | 159,374,706 | | | $ | 173,978,577 | | | 1/17/25 | | | 59,277 | | |
Citibank NA | | GBP | 9,263,412 | | | $ | 12,044,227 | | | 1/17/25 | | | 101,869 | | |
Citibank NA | | NZD | 13,100,000 | | | $ | 7,880,960 | | | 1/17/25 | | | 44,861 | | |
Citibank NA | | $ | 1,508,314 | | | PEN | 5,669,000 | | | 1/17/25 | | | (6,929 | ) | |
Credit Agricole CIB | | $ | 864,501 | | | EUR | 799,636 | | | 1/17/25 | | | 8,110 | | |
Goldman Sachs International | | PEN | 30,047,147 | | | $ | 7,969,220 | | | 1/17/25 | | | 11,496 | | |
HSBC Bank PLC | | EUR | 310,000 | | | $ | 337,804 | | | 1/17/25 | | | (487 | ) | |
HSBC Bank PLC | | EUR | 1,690,000 | | | $ | 1,844,468 | | | 1/17/25 | | | 237 | | |
HSBC Bank PLC | | $ | 12,099 | | | DKK | 82,749 | | | 1/17/25 | | | 16 | | |
JPMorgan Chase Bank NA | | CZK | 184,571,866 | | | EUR | 7,286,000 | | | 1/17/25 | | | 4,706 | | |
See Notes to Financial Statements
23
Morgan Stanley Global Fixed Income Opportunities Fund
Portfolio of Investments ◼ October 31, 2024 continued
COUNTERPARTY | | CONTRACTS
TO DELIVER | | IN EXCHANGE
FOR | | DELIVERY
DATE | | UNREALIZED
APPRECIATION
(DEPRECIATION) | |
JPMorgan Chase Bank NA | | EUR | 7,286,000 | | | CZK | 183,746,363 | | | 1/17/25 | | $ | (40,245 | ) | |
Royal Bank of Canada | | CAD | 21,938,000 | | | $ | 15,977,847 | | | 1/17/25 | | | 179,410 | | |
Royal Bank of Canada | | CAD | 3,858,000 | | | $ | 2,783,272 | | | 1/17/25 | | | 4,971 | | |
Royal Bank of Canada | | COP | 38,423,370,649 | | | $ | 8,944,716 | | | 1/17/25 | | | 343,897 | | |
Royal Bank of Canada | | DKK | 26,267,072 | | | $ | 3,852,779 | | | 1/17/25 | | | 7,088 | | |
Royal Bank of Canada | | EUR | 1,260,000 | | | $ | 1,366,144 | | | 1/17/25 | | | (8,844 | ) | |
Standard Chartered Bank | | $ | 6,099,346 | | | EUR | 5,600,000 | | | 1/17/25 | | | 11,712 | | |
State Street Bank and Trust Co. | | EUR | 1,800,000 | | | $ | 1,961,199 | | | 1/17/25 | | | (3,069 | ) | |
State Street Bank and Trust Co. | | EUR | 750,000 | | | $ | 816,790 | | | 1/17/25 | | | (1,656 | ) | |
State Street Bank and Trust Co. | | EUR | 1,710,000 | | | $ | 1,856,893 | | | 1/17/25 | | | (9,163 | ) | |
UBS AG | | EUR | 2,800,000 | | | $ | 3,037,524 | | | 1/17/25 | | | (18,005 | ) | |
UBS AG | | EUR | 2,970,000 | | | $ | 3,230,089 | | | 1/17/25 | | | (10,954 | ) | |
UBS AG | | $ | 1,838,314 | | | HUF | 682,934,820 | | | 1/17/25 | | | (25,555 | ) | |
Westpac Banking Corp. | | $ | 15,636,316 | | | AUD | 23,402,614 | | | 1/17/25 | | | (225,579 | ) | |
| | | $ | 654,062 | | |
Futures Contracts:
The Fund had the following futures contracts open at October 31, 2024:
| | | NUMBER
OF
CONTRACTS | | EXPIRATION
DATE | | NOTIONAL
AMOUNT
(000) | | VALUE | | UNREALIZED
APPRECIATION
(DEPRECIATION) | |
Long: | |
Canada 10 yr. Bond Index (Canada) | | | 127 | | | Dec-24 | | CAD | 12,700 | | | $ | 11,127,037 | | | $ | (289,508 | ) | |
German Euro-Bobl Index (Germany) | | | 161 | | | Dec-24 | | EUR | 16,100 | | | | 20,691,341 | | | | (226,492 | ) | |
German Euro-Bund Index (Germany) | | | 78 | | | Dec-24 | | EUR | 7,800 | | | | 11,182,504 | | | | (173,789 | ) | |
Long Gilt Index (United Kingdom) | | | 25 | | | Dec-24 | | GBP | 2,500 | | | | 3,031,499 | | | | (108,265 | ) | |
U.S. Treasury 5 yr. Note (United States) | | | 1,083 | | | Dec-24 | | $ | 108,300 | | | | 116,134,828 | | | | (3,056,162 | ) | |
U.S. Treasury 10 yr. Note (United States) | | | 167 | | | Dec-24 | | | 16,700 | | | | 18,448,281 | | | | (664,297 | ) | |
U.S. Treasury 10 yr. Ultra Note (United States) | | | 222 | | | Dec-24 | | | 22,200 | | | | 25,252,500 | | | | (419,009 | ) | |
Short: | |
U.S. Treasury Ultra Long Bond (United States) | | | 172 | | | Dec-24 | | | (17,200 | ) | | | (21,607,500 | ) | | | 1,377,393 | | |
SFE 3 yr. Australian Bond Index (Australia) | | | 195 | | | Dec-24 | | AUD | (19,500 | ) | | | (13,548,063 | ) | | | 37,205 | | |
SFE 10 yr. Australian Bond Index (Australia) | | | 66 | | | Dec-24 | | AUD | (6,600 | ) | | | (4,857,924 | ) | | | 32,251 | | |
| | | | | | | | | | | $ | (3,490,673 | ) | |
See Notes to Financial Statements
24
Morgan Stanley Global Fixed Income Opportunities Fund
Portfolio of Investments ◼ October 31, 2024 continued
Centrally Cleared Interest Rate Swap Agreements:
The Fund had the following centrally cleared interest rate swap agreements open at October 31, 2024:
SWAP
COUNTERPARTY | | FLOATING
RATE
INDEX | | PAY/
RECEIVE
FLOATING
RATE | | FIXED
RATE | | PAYMENT
FREQUENCY
PAID/RECEIVED | | MATURITY
DATE | | NOTIONAL
AMOUNT
(000) | | VALUE | | UPFRONT
PAYMENT
PAID | | UNREALIZED
DEPRECIATION | |
Morgan
Stanley &
Co. LLC | | 6 Month
EURIBOR | | Receive | | | 2.820 | % | | Annual/
Semi-Annual | | 7/5/34 | | EUR | 21,160 | | | $ | (710,450 | ) | | $ | — | | | $ | (710,450 | ) | |
Morgan
Stanley
& Co. LLC | | TONAR | | Receive | | | 0.680 | | | Annual/
Annual | | 10/22/29 | | JPY | 2,762,000 | | | | (27,031 | ) | | | — | | | | (27,031 | ) | |
Morgan
Stanley &
Co. LLC | | TONAR | | Receive | | | 0.660 | | | Annual/
Annual | | 10/21/29 | | | 2,252,500 | | | | (7,348 | ) | | | — | | | | (7,348 | ) | |
Morgan
Stanley &
Co. LLC | | TONAR | | Receive | | | 0.660 | | | Annual/
Annual | | 10/21/29 | | | 2,252,500 | | | | (8,625 | ) | | | — | | | | (8,625 | ) | |
| | | | | | | | | | | | | | | $ | (753,454 | ) | | $ | — | | | $ | (753,454 | ) | |
EURIBOR Euro Interbank Offered Rate.
SFE Sydney Futures Exchange.
TONAR Tokyo Overnight Average Rate.
AUD — Australian Dollar
CAD — Canadian Dollar
COP — Colombian Peso
CZK — Czech Koruna
DKK — Danish Krone
DOP — Dominican Peso
EUR — Euro
GBP — British Pound
HUF — Hungarian Forint
JPY — Japanese Yen
NZD — New Zealand Dollar
PEN — Peruvian Nuevo Sol
PLN — Polish Zloty
USD — United States Dollar
See Notes to Financial Statements
25
Morgan Stanley Global Fixed Income Opportunities Fund
Portfolio of Investments ◼ October 31, 2024 continued
Portfolio Composition*(unaudited)
CLASSIFICATION | | PERCENTAGE OF
TOTAL
INVESTMENTS | |
Corporate Bonds | | | 36.4 | % | |
Mortgages - Other | | | 18.6 | | |
Short-Term Investments | | | 13.1 | | |
Asset-Backed Securities | | | 12.0 | | |
Sovereign | | | 7.3 | | |
Agency Fixed Rate Mortgages | | | 5.2 | | |
Commercial Mortgage-Backed Securities | | | 4.1 | | |
Investment Company | | | 2.2 | | |
Supranational | | | 0.7 | | |
Senior Loan Interests | | | 0.4 | | |
Collateralized Mortgage Obligations - Agency Collateral Series | | | 0.0 | ** | |
Total | | | 100 | %*** | |
* Percentages indicated are based upon total investments (excluding Securities held as Collateral on Loaned Securities) as of October 31, 2024.
** Amount is less than 0.05%.
*** Does not include open futures contracts with a value of $245,881,477 and net unrealized depreciation of $3,490,673. Does not include open foreign currency forward exchange contracts with net unrealized appreciation of $654,062. Also does not include open swap agreements with net unrealized depreciation of $753,454.
See Notes to Financial Statements
26
Morgan Stanley Global Fixed Income Opportunities Fund
Financial Statements
Statement of Assets and Liabilities October 31, 2024
Assets: | |
Investments in securities, at value (cost $765,689,826) (Including $11,243,189 for securities loaned) | | $ | 760,724,108 | | |
Investments in affiliates, at value (cost $71,590,587) | | | 71,418,777 | | |
Total investments in securities, at value (cost $837,280,413) | | | 832,142,885 | | |
Unrealized appreciation on open foreign currency forward exchange contracts | | | 1,204,799 | | |
| Cash (including foreign currency valued at $479,121 with a cost of $495,701) | | | 2,363,121 | | |
Receivable for: | |
Interest | | | 7,242,875 | | |
Investments sold | | | 4,598,586 | | |
Variation margin on open futures contracts | | | 2,843,757 | | |
Shares of beneficial interest sold | | | 348,818 | | |
Dividends from affiliate | | | 206,371 | | |
Dividends receivable | | | 124,232 | | |
Foreign withholding taxes reclaimed | | | 35,765 | | |
Securities lending income | | | 12,559 | | |
Prepaid expenses and other assets | | | 111,204 | | |
| Total Assets | | | 851,234,972 | | |
Liabilities: | |
Payable to Bank | | | 11,650,538 | | |
Collateral on securities loaned, at value | | | 11,313,800 | | |
Unrealized depreciation on open foreign currency forward exchange contracts | | | 550,737 | | |
Due to broker | | | 534,381 | | |
Payable for: | |
| Investments purchased | | | 35,820,293 | | |
Shares of beneficial interest redeemed | | | 1,780,811 | | |
Dividends to shareholders | | | 168,808 | | |
Advisory fee | | | 147,907 | | |
Transfer and sub transfer agency fees | | | 134,770 | | |
Administration fee | | | 53,825 | | |
Variation Margin on Swap Agreements | | | 52,769 | | |
Trustees' fees | | | 35,459 | | |
Distribution fee | | | 23,316 | | |
Deferred capital gain country tax | | | 15,478 | | |
Accrued expenses and other payables | | | 199,505 | | |
| Total Liabilities | | | 62,482,397 | | |
Net Assets | | $ | 788,752,575 | | |
Composition of Net Assets: | |
| Paid-in-Capital | | $ | 857,363,010 | | |
| Total Accumulated Loss | | | (68,610,435 | ) | |
Net Assets | | $ | 788,752,575 | | |
See Notes to Financial Statements
27
Morgan Stanley Global Fixed Income Opportunities Fund
Financial Statements continued
Statement of Assets and Liabilities October 31, 2024
Class A Shares: | |
Net Assets | | $ | 57,291,717 | | |
| Shares Outstanding (unlimited shares authorized, $0.01 par value) | | | 11,139,076 | | |
Net Asset Value Per Share | | $ | 5.14 | | |
Maximum Offering Price Per Share,
(net asset value plus 3.36% of net asset value) | | $ | 5.31 | | |
Class L Shares: | |
Net Assets | | $ | 2,339,488 | | |
| Shares Outstanding (unlimited shares authorized, $0.01 par value) | | | 455,056 | | |
Net Asset Value Per Share | | $ | 5.14 | | |
Class I Shares: | |
Net Assets | | $ | 455,296,374 | | |
| Shares Outstanding (unlimited shares authorized, $0.01 par value) | | | 87,201,477 | | |
Net Asset Value Per Share | | $ | 5.22 | | |
Class C Shares: | |
Net Assets | | $ | 11,534,846 | | |
| Shares Outstanding (unlimited shares authorized, $0.01 par value) | | | 2,245,843 | | |
Net Asset Value Per Share | | $ | 5.14 | | |
Class R6 Shares: | |
Net Assets | | $ | 262,278,314 | | |
| Shares Outstanding (unlimited shares authorized, $0.01 par value) | | | 50,209,620 | | |
Net Asset Value Per Share | | $ | 5.22 | | |
Class IR Shares: | |
Net Assets | | $ | 11,836 | | |
| Shares Outstanding (unlimited shares authorized, $0.01 par value) | | | 2,266 | | |
Net Asset Value Per Share | | $ | 5.22 | | |
See Notes to Financial Statements
28
Morgan Stanley Global Fixed Income Opportunities Fund
Financial Statements continued
Statement of Operations For the year ended October 31, 2024
Net Investment Income:
Income | |
Interest (net of $35,557 foreign withholding tax) | | $ | 42,291,372 | | |
Dividends from affiliates (Note 7) | | | 2,271,032 | | |
Dividends | | | 1,164,367 | | |
Income from securities loaned - net | | | 147,121 | | |
Total Income | | | 45,873,892 | | |
Expenses | |
Advisory fee (Note 4) | | | 2,561,059 | | |
Administration fee (Note 4) | | | 640,265 | | |
Sub transfer agency fees and expenses (Class A) | | | 47,053 | | |
Sub transfer agency fees and expenses (Class L) | | | 1,617 | | |
Sub transfer agency fees and expenses (Class I) | | | 558,154 | | |
Sub transfer agency fees and expenses (Class C) | | | 7,306 | | |
Distribution fee (Class A) (Note 5) | | | 137,346 | | |
Distribution fee (Class L) (Note 5) | | | 12,089 | | |
Distribution fee (Class C) (Note 5) | | | 130,985 | | |
Professional fees | | | 253,039 | | |
Custodian fees (Note 8) | | | 184,501 | | |
Registration fees | | | 174,620 | | |
Shareholder reports and notices | | | 60,046 | | |
Transfer agency fees and expenses (Class A) (Note 6) | | | 11,383 | | |
Transfer agency fees and expenses (Class L) (Note 6) | | | 3,641 | | |
Transfer agency fees and expenses (Class I) (Note 6) | | | 16,795 | | |
Transfer agency fees and expenses (Class C) (Note 6) | | | 7,130 | | |
Transfer agency fees and expenses (Class R6) (Note 6) | | | 3,089 | | |
Transfer agency fees and expenses (Class IR) (Note 6) | | | 2,120 | | |
Trustees' fees and expenses | | | 15,324 | | |
Other | | | 76,636 | | |
Total Expenses | | | 4,904,198 | | |
Less: reimbursement of transfer agency and sub transfer agency fees (Note 4) | | | (153,815 | ) | |
Less: rebate from Morgan Stanley affiliates (Note 7) | | | (99,049 | ) | |
Less: reimbursement of class specific expenses (Class I) (Note 4) | | | (76,297 | ) | |
Less: reimbursement of class specific expenses (Class IR) (Note 4) | | | (2,120 | ) | |
Net Expenses | | | 4,572,917 | | |
Net Investment Income | | | 41,300,975 | | |
See Notes to Financial Statements
29
Morgan Stanley Global Fixed Income Opportunities Fund
Financial Statements continued
Statement of Operations For the year ended October 31, 2024
Realized and Unrealized Gain (Loss):
Realized Gain (Loss) on: | |
Investments (Net of $13,163 of Capital Gain Country Tax) | | $ | (1,432,520 | ) | |
Investments in affiliates (Note 7) | | | (39,105 | ) | |
Foreign currency forward exchange contracts | | | 5,356,238 | | |
Foreign currency transaction | | | (428,068 | ) | |
Futures contracts | | | 2,103,875 | | |
Swap agreements | | | (907,524 | ) | |
Net Realized Gain | | | 4,652,896 | | |
Change in Unrealized Appreciation (Depreciation) on: | |
Investments (Net of increase in deferred capital gain country tax of $15,478) | | | 54,416,243 | | |
Investments in affiliates (Note 7) | | | (171,810 | ) | |
Foreign currency forward exchange contracts | | | (8,222,310 | ) | |
Foreign currency translation | | | (11,120 | ) | |
Futures contracts | | | (2,918,058 | ) | |
Swap agreements | | | (753,454 | ) | |
Net Change in Unrealized Appreciation (Depreciation) | | | 42,339,491 | | |
Net Gain | | | 46,992,387 | | |
Net Increase in Net Assets Resulting from Operations | | $ | 88,293,362 | | |
See Notes to Financial Statements
30
Morgan Stanley Global Fixed Income Opportunities Fund
Financial Statements continued
Statements of Changes in Net Assets
| | | FOR THE YEAR
ENDED
OCTOBER 31, 2024 | | FOR THE YEAR
ENDED
OCTOBER 31, 2023 | |
Increase (Decrease) in Net Assets:
Operations: | |
Net investment income | | $ | 41,300,975 | | | $ | 36,461,364 | | |
Net realized gain (loss) | | | 4,652,896 | | | | (46,594,903 | ) | |
Net change in unrealized appreciation (depreciation) | | | 42,339,491 | | | | 42,915,531 | | |
Net Increase in Net Assets Resulting from Operations | | | 88,293,362 | | | | 32,781,992 | | |
Dividends and Distributions to Shareholders: | |
| Class A | | | (2,432,366 | ) | | | (3,080,911 | ) | |
| Class L | | | (96,973 | ) | | | (136,463 | ) | |
| Class I | | | (21,098,941 | ) | | | (28,017,165 | ) | |
| Class C | | | (474,674 | ) | | | (753,930 | ) | |
| Class R6 | | | (11,630,275 | ) | | | (10,979,191 | ) | |
| Class IR | | | (524 | ) | | | (603 | ) | |
Paid-In-Capital: | |
| Class A | | | (407,229 | ) | | | (557,659 | ) | |
| Class L | | | (17,644 | ) | | | (27,839 | ) | |
| Class I | | | (3,950,928 | ) | | | (4,514,977 | ) | |
| Class C | | | (89,401 | ) | | | (164,298 | ) | |
| Class R6 | | | (2,031,880 | ) | | | (1,705,062 | ) | |
| Class IR | | | (91 | ) | | | (95 | ) | |
Total Dividends and Distributions to Shareholders | | | (42,230,926 | ) | | | (49,938,193 | ) | |
Net increase (decrease) from transactions in shares of beneficial interest | | | (23,297,253 | ) | | | 93,434,050 | | |
Net Increase | | | 22,765,183 | | | | 76,277,849 | | |
Net Assets: | |
Beginning of period | | | 765,987,392 | | | | 689,709,543 | | |
End of Period | | $ | 788,752,575 | | | $ | 765,987,392 | | |
See Notes to Financial Statements
31
Morgan Stanley Global Fixed Income Opportunities Fund
Notes to Financial Statements ◼ October 31, 2024
1. Organization and Accounting Policies
Morgan Stanley Global Fixed Income Opportunities Fund (the "Fund") is registered under the Investment Company Act of 1940, as amended (the "Act"), as a diversified, open-end management investment company. The Fund's primary investment objective is to seek a high level of current income and, as a secondary objective, to maximize total return, but only to the extent consistent with its primary objective. The Fund was organized as a Massachusetts business trust on December 20, 1991 and commenced operations on April 9, 1992. On July 28, 1997, the Fund converted to a multiple class share structure.
The Fund applies Investment company accounting and reporting guidance Accounting Standards Codification ("ASC") Topic 946. In the preparation of these financial statements, management has evaluated subsequent events occurring after the date of the Fund's Statement of Assets and Liabilities through the date that the financial statements were issued.
The Fund offers Class A shares, Class L shares, Class I shares, Class C shares, Class R6 shares and Class IR shares. Class C shares will automatically convert to Class A shares eight years after the end of the calendar month in which the shares were purchased. The six classes are substantially the same except that most Class A shares are subject to a sales charge imposed at the time of purchase and some Class A shares and most Class C shares are subject to a contingent deferred sales charge imposed on shares redeemed within one year. Class L shares, Class I shares, Class R6 shares and Class IR shares are not subject to a sales charge. Additionally, Class A shares, Class L shares and Class C shares incur distribution expenses.
The Fund suspended offering Class L shares to all investors (April 30, 2015). Class L shareholders of the Fund do not have the option of purchasing additional Class L shares. However, the existing Class L shareholders may invest through reinvestment of dividends and distributions. In addition, Class L shares of the Fund may be exchanged for Class L shares of any Morgan Stanley Multi-Class Fund, even though Class L shares are closed to investors.
The following is a summary of significant accounting policies:
A. Valuation of Investments — (1) Fixed income securities may be valued by an outside pricing service/vendor approved by the Fund's Board of Trustees (the "Trustees"). The pricing service/vendor may employ a pricing model that takes into account, among other things, bids, yield spreads and/or other market data and specific security characteristics. If Morgan Stanley Investment Management Inc. (the "Adviser") or Morgan Stanley Investment Management Limited (the "Sub-Adviser"), each a wholly-owned subsidiary of Morgan Stanley, determines that the price provided by the outside pricing service/vendor does not reflect the security's fair value or the pricing service/vendor or exchange is unable to provide a price, prices from reputable brokers/dealers may also be utilized. In these
32
Morgan Stanley Global Fixed Income Opportunities Fund
Notes to Financial Statements ◼ October 31, 2024 continued
circumstances, the value of the security will be the mean of bid and asked prices obtained from the reputable brokers/dealers; (2) an equity portfolio security listed or traded on an exchange is valued at its latest reported sales price (or at the exchange official closing price if such exchange reports an official closing price), and if there were no sales on a given day and if there is no official exchange closing price for that day, the security is valued at the mean between the last reported bid and asked prices if such bid and asked prices are available on the relevant exchanges. If only bid prices are available then the latest bid price may be used. Listed equity securities not traded on the valuation date with no reported bid and asked prices available on the exchange are valued at the mean between the current bid and asked prices obtained from one or more reputable brokers/dealers. In cases where a security is traded on more than one exchange, the security is valued on the exchange designated as the primary market; (3) all other equity portfolio securities for which over-the-counter ("OTC") market quotations are readily available are valued at the latest reported sales price (or at the market official closing price if such market reports an official closing price), and if there was no trading in the security on a given day and if there is no official closing price from relevant markets for that day, the security is valued at the mean between the last reported bid and asked prices if such bid and asked prices are available on the relevant markets. An unlisted equity security that does not trade on the valuation date and for which bid and asked prices from the relevant markets are unavailable is valued at the mean between the current bid and asked prices obtained from one or more reputable brokers/dealers; (4) when market quotations are not readily available as defined by Rule 2a-5 under the Act, including circumstances under which the Adviser or the Sub-Adviser, determines that the closing price, last sale price or the mean between the last reported bid and asked prices are not reflective of a security's market value, portfolio securities are valued at their fair value as determined in good faith under procedures approved by and under the general supervision of the Trustees. Each business day, the Fund uses a third-party pricing service approved by the Trustees to assist with the valuation of foreign equity securities. Events occurring after the close of trading on foreign exchanges may result in adjustments to the valuation of foreign securities to reflect market trading that occurs after the close of the applicable foreign markets of comparable securities or other instruments that have a strong correlation to the fair-valued securities to more accurately reflect their fair value as of the close of regular trading on the NYSE; (5) certain senior collateralized loans ("Senior Loans") are valued based on quotations received from an independent pricing service; (6) futures are valued at the settlement price on the exchange on which they trade or, if a settlement price is unavailable, at the last sale price on the exchange; (7) OTC swaps may be valued by an outside pricing service approved by the Trustees or quotes from a reputable broker/dealer. Swaps cleared on a clearinghouse or exchange may be valued using the closing price provided by the clearinghouse or exchange; (8) foreign exchange transactions ("spot contracts") and foreign exchange forward contracts ("forward contracts") are valued daily using an independent pricing vendor at the spot and forward rates, respectively, as of the close of the
33
Morgan Stanley Global Fixed Income Opportunities Fund
Notes to Financial Statements ◼ October 31, 2024 continued
NYSE; and (9) investments in mutual funds, including the Morgan Stanley Institutional Liquidity Funds, are valued at the net asset value ("NAV") as of the close of each business day.
In connection with Rule 2a-5 of the Act, the Trustees have designated the Fund's Adviser as its valuation designee. The valuation designee has responsibility for determining fair value and to make the actual calculations pursuant to the fair valuation methodologies previously approved by the Trustees. Under procedures approved by the Trustees, the Fund's Adviser, as valuation designee, has formed a Valuation Committee whose members are approved by the Trustees. The Valuation Committee provides administration and oversight of the Fund's valuation policies and procedures, which are reviewed at least annually by the Trustees. These procedures allow the Fund to utilize independent pricing services, quotations from securities and financial instrument dealers and other market sources to determine fair value.
B. Accounting for Investments — Security transactions are accounted for on the trade date (date the order to buy or sell is executed). Realized gains and losses on security transactions are determined by the identified cost method. Dividend income and other distributions are recorded on the ex-dividend date (except for certain foreign dividends which may be recorded as soon as the Fund is informed of such dividends) net of applicable withholding taxes. Discounts are accreted and premiums are amortized over the life of the respective securities and are included in interest income. Interest income is accrued daily as earned, net of applicable withholding taxes.
C. When-Issued/Delayed Delivery Securities — The Fund may purchase or sell when-issued and delayed delivery securities. Securities purchased on a when-issued or delayed delivery basis are purchased for delivery beyond the normal settlement date at a stated price, and no income accrues to the Fund on such securities prior to delivery date. Payment and delivery for when-issued and delayed delivery securities can take place a month or more after the date of the transaction. When the Fund enters into a purchase transaction on a when-issued or delayed delivery basis, securities are available for collateral in an amount at least equal in value to the Fund's commitments to purchase such securities. Purchasing securities on a when-issued or delayed delivery basis may involve a risk that the market price at the time of delivery may be lower than the agreed upon purchase price, in which case there could be an unrealized loss at the time of delivery. Purchasing investments on a when-issued or delayed delivery basis may be considered a form of leverage which may increase the impact that gains (losses) may have on the Fund.
D. Multiple Class Allocations — Investment income, realized and unrealized gain (loss) and non-class specific expenses are allocated daily based upon the proportion of net assets of each class. Class specific expenses are borne by the respective share classes and include Distribution, Transfer Agency, Sub Transfer Agency and Co-Transfer Agency fees.
34
Morgan Stanley Global Fixed Income Opportunities Fund
Notes to Financial Statements ◼ October 31, 2024 continued
E. Senior Loans — Senior Loans are typically structured by a syndicate of lenders ("Lenders"), one or more of which administers the Senior Loan on behalf of the Lenders ("Agent"). Lenders may sell interests in Senior Loans to third parties ("Participations") or may assign all or a portion of their interest in a Senior Loan to third parties ("Assignments"). Senior Loans are exempt from registration under the Securities Act of 1933. Presently, Senior Loans are not readily marketable and are often subject to restrictions on resale.
F. Foreign Currency Translation and Foreign Investments — The books and records of the Fund are maintained in U.S. dollars. Foreign currency amounts are translated into U.S. dollars as follows:
— investments, other assets and liabilities at the prevailing rate of exchange on the valuation date;
— investment transactions and investment income at the prevailing rates of exchange on the dates of such transactions.
Although the net assets of the Fund are presented at the foreign exchange rates and market values at the close of the period, the Fund does not isolate that portion of the results of operations arising as a result of changes in the foreign exchange rates from the fluctuations arising from changes in the market prices of securities held at period end. Similarly, the Fund does not isolate the effect of changes in foreign exchange rates from the fluctuations arising from changes in the market prices of securities sold during the period. Accordingly, realized and unrealized foreign currency gains (losses) on investments in securities are included in the reported net realized and unrealized gains (losses) on investment transactions and balances. However, pursuant to U.S. federal income tax regulations, gains and losses from certain foreign currency transactions and the foreign currency portion of gains and losses realized on sales and maturities of foreign denominated debt securities are treated as ordinary income for U.S. federal income tax purposes.
Net realized gains (losses) on foreign currency transactions represent net foreign exchange gains (losses) from foreign currency forward exchange contracts, disposition of foreign currencies, currency gains (losses) realized between the trade and settlement dates on securities transactions, and the difference between the amount of investment income and foreign withholding taxes recorded on the Fund's books and the U.S. dollar equivalent amounts actually received or paid. The change in unrealized currency gains (losses) on foreign currency translations for the period is reflected in the Statement of Operations.
G. Securities Lending — The Fund may lend securities to qualified financial institutions, such as broker/dealers, to earn additional income. Any increase or decrease in the fair value of the securities loaned that might occur and any interest earned or dividends declared on those securities during the term of the loan would remain in the Fund. The Fund receives cash or securities as collateral in an amount equal to or exceeding 100% of the current fair value of the loaned securities. The collateral is
35
Morgan Stanley Global Fixed Income Opportunities Fund
Notes to Financial Statements ◼ October 31, 2024 continued
marked-to-market daily by State Street Bank and Trust Company ("State Street"), the securities lending agent, to ensure that a minimum of 100% collateral coverage is maintained.
Based on pre-established guidelines, the securities lending agent invests any cash collateral that is received in an affiliated money market portfolio and repurchase agreements. Securities lending income is generated from the earnings on the invested collateral and borrowing fees, less any rebates owed to the borrowers and compensation to the lending agent, and is recorded as "Income from securities loaned — net" in the Fund's Statement of Operations.
The Fund has the right under the securities lending agreement to recover the securities from the borrower on demand.
The following table presents financial instruments that are subject to enforceable netting arrangements as of October 31, 2024:
GROSS AMOUNT NOT OFFSET IN THE STATEMENT OF ASSETS AND LIABILITIES
GROSS ASSET AMOUNT
PRESENTED IN THE STATEMENT
OF ASSETS AND LIABILITIES | | FINANCIAL
INSTRUMENT | | COLLATERAL
RECEIVED | | NET AMOUNT
(NOT LESS THAN $0) | |
| $ | 11,243,189 | (a) | | $ | — | | | $ | (11,243,189 | )(b)(c) | | $ | 0 | | |
(a) Represents market value of loaned securities at year end.
(b) The Fund received cash collateral of $11,313,800, which was subsequently invested in Morgan Stanley Institutional Liquidity Funds as reported in the Portfolio of Investments. In addition, the Fund received non-cash collateral of $181,820 in the form of U.S. Government obligations, which the Fund cannot sell or repledge, and accordingly are not reflected in the Portfolio of Investments.
(c) The actual collateral received is greater than the amount shown here due to overcollateralization.
Financial Accounting Standards Board ("FASB") ASC 860, "Transfers & Servicing: Repurchase-to-Maturity Transactions, Repurchase Financings, and Disclosures", is intended to provide increased transparency about the types of collateral pledged in securities lending transactions and other similar transactions that are accounted for as secured borrowings.
36
Morgan Stanley Global Fixed Income Opportunities Fund
Notes to Financial Statements ◼ October 31, 2024 continued
The following table displays a breakdown of transactions accounted for as secured borrowings, the gross obligations by class of collateral pledged and the remaining contractual maturity of those transactions as of October 31, 2024:
| | | REMAINING CONTRACTUAL MATURITY OF THE AGREEMENTS | |
| | | OVERNIGHT AND
CONTINUOUS | | <30 DAYS | | BETWEEN
30 & 90 DAYS | | >90 DAYS | | TOTAL | |
Securities Lending Transactions | |
Corporate Bonds | | $ | 10,791,125 | | | $ | — | | | $ | — | | | $ | — | | | $ | 10,791,125 | | |
Investment Company | | | 522,675 | | | | — | | | | — | | | | — | | | | 522,675 | | |
Total Borrowings | | $ | 11,313,800 | | | $ | — | | | $ | — | | | $ | — | | | $ | 11,313,800 | | |
Gross amount of recognized liabilities for securities lending transactions | | $ | 11,313,800 | | |
H. Dividends and Distributions to Shareholders — Dividends and distributions to shareholders are recorded on the ex-dividend date. Dividends from net investment income, if any, are declared and paid monthly. Net realized capital gains, if any, are distributed at least annually.
I. Use of Estimates — The preparation of financial statements in accordance with generally accepted accounting principles in the United States ("GAAP") requires management to make estimates and assumptions that affect the reported amounts and disclosures. Actual results could differ from those estimates.
J. Indemnifications — The Fund enters into contracts that contain a variety of indemnification clauses. The Fund's maximum exposure under these arrangements is unknown as this would involve future claims that may be made against the Fund that have not yet occurred.
2. Fair Valuation Measurements
FASB ASC 820, "Fair Value Measurement" ("ASC 820"), defines fair value as the price that would be received to sell an asset or paid to transfer a liability in an orderly transaction between market participants at the measurement date. ASC 820 establishes a three-tier hierarchy to distinguish between (1) inputs that reflect the assumptions market participants would use in valuing an asset or liability developed based on market data obtained from sources independent of the reporting entity (observable inputs); and (2) inputs that reflect the reporting entity's own assumptions about the assumptions market participants would use in valuing an asset or liability developed based on the best information available in the circumstances (unobservable inputs) and to establish classification of fair
37
Morgan Stanley Global Fixed Income Opportunities Fund
Notes to Financial Statements ◼ October 31, 2024 continued
value measurements for disclosure purposes. Various inputs are used in determining the value of the Fund's investments. The inputs are summarized in the three broad levels listed below:
• Level 1 — unadjusted quoted prices in active markets for identical investments
• Level 2 — other significant observable inputs (including quoted prices for similar investments, interest rates, prepayment speeds, credit risk, etc.)
• Level 3 — significant unobservable inputs including the Fund's own assumptions in determining the fair value of investments. Factors considered in making this determination may include, but are not limited to, information obtained by contacting the issuer, analysts, or the appropriate stock exchange (for exchange-traded securities), analysis of the issuer's financial statements or other available documents and, if necessary, available information concerning other securities in similar circumstances.
The inputs or methodology used for valuing securities are not necessarily an indication of the risk associated with investing in those securities and the determination of the significance of a particular input to the fair value measurement in its entirety requires judgment and considers factors specific to each security.
The following is a summary of the inputs used to value the Fund's investments as of October 31, 2024:
INVESTMENT TYPE | | LEVEL 1
UNADJUSTED
QUOTED
PRICES | | LEVEL 2
OTHER
SIGNIFICANT
OBSERVABLE
INPUTS | | LEVEL 3
SIGNIFICANT
UNOBSERVABLE
INPUTS | | TOTAL | |
Assets: | |
Fixed Income Securities | |
Corporate Bonds | | $ | — | | | $ | 298,710,239 | | | $ | — | | | $ | 298,710,239 | | |
Sovereign | | | — | | | | 60,140,978 | | | | — | | | | 60,140,978 | | |
Agency Fixed Rate Mortgages | | | — | | | | 42,913,589 | | | | — | | | | 42,913,589 | | |
Asset-Backed Securities | | | — | | | | 98,038,843 | | | | — | | | | 98,038,843 | | |
Collateralized Mortgage Obligations — Agency
Collateral Series | | | — | | | | 86,499 | | | | — | | | | 86,499 | | |
Commercial Mortgage-Backed Securities | | | — | | | | 33,997,753 | | | | — | | | | 33,997,753 | | |
Mortgages — Other | | | — | | | | 152,792,084 | | | | — | | | | 152,792,084 | | |
Senior Loan Interests | | | — | | | | 3,375,000 | | | | — | | | | 3,375,000 | | |
Supranational | | | — | | | | 5,335,251 | | | | — | | | | 5,335,251 | | |
Total Fixed Income Securities | | | — | | | | 695,390,236 | | | | — | | | | 695,390,236 | | |
38
Morgan Stanley Global Fixed Income Opportunities Fund
Notes to Financial Statements ◼ October 31, 2024 continued
INVESTMENT TYPE | | LEVEL 1
UNADJUSTED
QUOTED
PRICES | | LEVEL 2
OTHER
SIGNIFICANT
OBSERVABLE
INPUTS | | LEVEL 3
SIGNIFICANT
UNOBSERVABLE
INPUTS | | TOTAL | |
Assets (cont'd): | |
Investment Company | | $ | 17,889,000 | | | $ | — | | | $ | — | | | $ | 17,889,000 | | |
Short-Term Investments | |
U.S. Treasury Securities | | | — | | | | 65,333,872 | | | | — | | | | 65,333,872 | | |
Investment Company | | | 53,529,777 | | | | — | | | | — | | | | 53,529,777 | | |
Total Short-Term Investments | | | 53,529,777 | | | | 65,333,872 | | | | — | | | | 118,863,649 | | |
Foreign Currency Forward Exchange Contracts | | | — | | | | 1,204,799 | | | | — | | | | 1,204,799 | | |
Futures Contracts | | | 1,446,849 | | | | — | | | | — | | | | 1,446,849 | | |
Total Assets | | | 72,865,626 | | | | 761,928,907 | | | | — | | | | 834,794,533 | | |
Liabilities: | |
Foreign Currency Forward Exchange Contracts | | | — | | | | (550,737 | ) | | | — | | | | (550,737 | ) | |
Futures Contracts | | | (4,937,522 | ) | | | — | | | | — | | | | (4,937,522 | ) | |
Centrally Cleared Interest Rate Swap Agreements | | | — | | | | (753,454 | ) | | | — | | | | (753,454 | ) | |
Total Liabilities | | | (4,937,522 | ) | | | (1,304,191 | ) | | | — | | | | (6,241,713 | ) | |
Total | | $ | 67,928,104 | | | $ | 760,624,716 | | | $ | — | | | $ | 828,552,820 | | |
Transfers between investment levels may occur as the markets fluctuate and/or the availability of data used in an investment's valuation changes.
3. Derivatives
The Fund may, but it is not required to, use derivative instruments for a variety of purposes, including hedging, risk management, portfolio management or to earn income. Derivatives are financial instruments whose value is based, in part, on the value of an underlying asset, interest rate, index or financial instrument. Prevailing interest rates and volatility levels, among other things, also affect the value of derivative instruments. A derivative instrument often has risks similar to its underlying asset and may have additional risks, including imperfect correlation between the value of the derivative and the underlying asset, risks of default by the counterparty to certain transactions, magnification of losses incurred due to changes in the market value of the securities, instruments, indices or interest rates to which the derivative instrument relates, risks that the transactions may not be liquid, risks arising from margin and payment requirements, risks arising from mispricing or valuation complexity and operational and legal risks. The use of derivatives involves risks that are different from, and possibly greater than, the risks associated with other portfolio investments. Derivatives may involve the use of highly specialized instruments that require investment techniques and risk analyses different
39
Morgan Stanley Global Fixed Income Opportunities Fund
Notes to Financial Statements ◼ October 31, 2024 continued
from those associated with other portfolio investments. All of the Fund's holdings, including derivative instruments, are marked-to-market each day with the change in value reflected in unrealized appreciation (depreciation). Upon disposition, a realized gain or loss is recognized.
Certain derivative transactions may give rise to a form of leverage. Leverage magnifies the potential for gain and risk of loss. Leverage associated with derivative transactions may cause the Fund to liquidate portfolio positions when it may not be advantageous to do so to satisfy its obligations or may cause the Fund to be more volatile than if the Fund had not been leveraged. Although the Adviser and/or Sub-Adviser seek to use derivatives to further the Fund's investment objectives, there is no assurance that the use of derivatives will achieve this result.
Following is a description of the derivative instruments and techniques that the Fund used during the period and their associated risks:
Foreign Currency Forward Exchange Contracts — The Fund entered into contracts with banks and brokers/dealers to purchase or sell foreign currencies at a future date. A foreign currency forward exchange contract ("currency contract") is a negotiated agreement between the contracting parties to exchange a specified amount of currency at a specified future time at a specified rate. The rate can be higher or lower than the spot rate between the currencies that are the subject of the contract. Currency contracts may be used to protect against uncertainty in the level of future foreign currency exchange rates or to gain or modify exposure to a particular currency. In addition, the Fund may use cross currency hedging or proxy hedging with respect to currencies in which the Fund has or expects to have portfolio or currency exposure. Cross currency hedges involve the sale of one currency against the positive exposure to a different currency and may be used for hedging purposes or to establish an active exposure to the exchange rate between any two currencies. To the extent hedged by the use of currency contracts, the precise matching of the currency contract amounts and the value of the securities involved will not generally be possible because the future value of such securities in foreign currencies will change as a consequence of market movements in the value of those securities between the date on which the contract is entered into and the date it matures. Furthermore, such transactions may reduce or preclude the opportunity for gain if the value of the currency should move in the direction opposite to the position taken. There is additional risk to the extent that currency contracts create exposure to currencies in which the Fund's securities are not denominated. Unanticipated changes in currency prices may result in poorer overall performance for the Fund than if it had not entered into such contracts. The use of currency contracts involves the risk of loss from the insolvency or bankruptcy of the counterparty to the contract or the failure of the counterparty to make payments or otherwise comply with the terms of the contract. A currency contract is marked-to-market daily and the change in market value is recorded by the Fund as unrealized gain or loss. The Fund
40
Morgan Stanley Global Fixed Income Opportunities Fund
Notes to Financial Statements ◼ October 31, 2024 continued
records realized gains (losses) when the currency contract is closed equal to the difference between the value of the currency contract at the time it was opened and the value at the time it was closed.
Futures — A futures contract is a standardized, exchange-traded agreement to buy or sell a specific quantity of an underlying asset, reference rate or index at a specific price at a specific future time. The value of a futures contract tends to increase and decrease in tandem with the value of the underlying instrument. Depending on the terms of the particular contract, futures contracts are settled through either physical delivery of the underlying instrument on the settlement date or by payment of a cash settlement amount on the settlement date. During the period the futures contract is open, payments are received from or made to the broker based upon changes in the value of the contract (the variation margin) and are recorded as unrealized gains or losses by the Fund. Gains (losses) are realized upon the expiration or closing of the futures contract. A decision as to whether, when and how to use futures contracts involves the exercise of skill and judgment and even a well-conceived futures transaction may be unsuccessful because of market behavior or unexpected events. In addition to the derivatives risks discussed above, the prices of futures contracts can be highly volatile, using futures contracts can lower total return and the potential loss from futures contracts can exceed the Fund's initial investment in such contracts. No assurance can be given that a liquid market will exist for any particular futures contract at any particular time.
Swaps — The Fund may enter into OTC swap contracts or cleared swap transactions. An OTC swap contract is an agreement between two parties pursuant to which the parties exchange payments at specified dates on the basis of a specified notional amount, with the payments calculated by reference to specified securities, indices, reference rates, currencies or other instruments. Typically swap agreements provide that when the period payment dates for both parties are the same, the payments are made on a net basis (i.e., the two payment streams are netted out, with only the net amount paid by one party to the other). The Fund's obligations or rights under a swap contract entered into on a net basis will generally be equal only to the net amount to be paid or received under the agreement, based on the relative values of the positions held by each party. Cleared swap transactions may help reduce counterparty credit risk. In a cleared swap, the Fund's ultimate counterparty is a clearinghouse rather than a swap dealer, bank or other financial institution. OTC swap agreements are not entered into or traded on exchanges and often there is no central clearing or guaranty function for OTC swaps. These OTC swaps are often subject to credit risk or the risk of default or non-performance by the counterparty. Both OTC and cleared swaps could result in losses if interest rates, foreign currency exchange rates or other factors are not correctly anticipated by the Fund or if the reference index, security or investments do not perform as expected. During the period swap agreements are open, payments are received from or made to the counterparty or clearing-house based on changes in the value of the contract or variation margin, respectively. The Dodd-Frank Wall Street Reform and Consumer Protection Act and related regulatory developments require the clearing and
41
Morgan Stanley Global Fixed Income Opportunities Fund
Notes to Financial Statements ◼ October 31, 2024 continued
exchange-trading of certain standardized swap transactions. Mandatory exchange-trading and clearing is occurring on a phased-in basis based on the type of market participant and U.S. Commodities Futures Trading Commission ("CFTC") approval of contracts for central clearing and exchange trading.
The Fund's use of swaps during the period included those based on the credit of an underlying security commonly referred to as "credit default swaps." The Fund may be either the buyer or seller in a credit default swap. Where the Fund is the buyer of a credit default swap contract, it would typically be entitled to receive the par (or other agreed-upon) value of a referenced debt obligation from the counterparty to the contract only in the event of a default or similar event by the issuer of the debt obligation. If no default occurs, the Fund would have paid to the counterparty a periodic stream of payments over the term of the contract and received no benefit from the contract. When the Fund is the seller of a credit default swap contract, it typically receives the stream of payments but is obligated to pay an amount equal to the par (or other agreed-upon) value of a referenced debt obligation upon the default or similar event by the issuer of the referenced debt obligation. The use of credit default swaps could result in losses to the Fund if the Adviser fails to correctly evaluate the creditworthiness of the issuer of the referenced debt obligation.
If the Fund is a seller of protection and a credit event occurs, as defined under the terms of that particular swap agreement, the Fund will either (i) pay to the buyer of protection an amount equal to the notional amount of the swap agreement and take delivery of the referenced obligation, other deliverable obligations or underlying securities comprising the referenced index or (ii) pay a net settlement amount in the form of cash or securities equal to the notional amount of the swap agreement less the recovery value of the referenced obligation or underlying securities comprising the referenced index. If the Fund is a buyer of protection and a credit event occurs, as defined under the terms of that particular swap agreement, the Fund will either (i) receive from the seller of protection an amount equal to the notional amount of the swap agreement and deliver the referenced obligation, other deliverable obligations or underlying securities comprising the referenced index or (ii) receive a net settlement amount in the form of cash or securities equal to the notional amount of the swap agreement less the recovery value of the referenced obligation or underlying securities comprising the referenced index. Recovery values are estimated by market makers considering either industry standard recovery rates or entity specific factors and considerations until a credit event occurs. If a credit event has occurred, the recovery value is determined by a facilitated auction whereby a minimum number of allowable broker bids, together with a specified valuation method, are used to calculate the settlement value. The Fund's maximum risk of loss from counterparty risk as of the date of the statement of assets and liabilities, either as the protection seller or as the protection buyer, is the fair value of the swap agreement.
If applicable, the current credit rating of each individual issuer is included in the table following the Portfolio of Investments and serves as an indicator of the current status of the payment/performance
42
Morgan Stanley Global Fixed Income Opportunities Fund
Notes to Financial Statements ◼ October 31, 2024 continued
risk of the credit derivative. Alternatively, for credit default swaps on an index of credits, the quoted market prices and current values serve as an indicator of the current status of the payment/performance risk of the credit derivative. Generally, lower credit ratings and increasing market values, in absolute terms, represent a deterioration of the credit and a greater likelihood of an adverse credit event of the issuer.
When the Fund has an unrealized loss on a swap agreement, the Fund has instructed the custodian to pledge cash or liquid securities as collateral with a value approximately equal to the amount of the unrealized loss. Collateral pledges are monitored and subsequently adjusted if and when the swap valuations fluctuate. If applicable, cash collateral is included with "Due from (to) broker" in the Statement of Assets and Liabilities.
Upfront payments paid or received by the Fund will be reflected as an asset or liability, respectively, in the Statement of Assets and Liabilities. Changes in market value, if any, are reflected as a component of net change in unrealized appreciation (depreciation) on the Statement of Operations. Once the interim payments are settled in cash, the net amount is recorded as realized gain (loss) on swap agreement in the the Statement Operations, in addition to any realized gains (loss) recorded upon the termination of swap agreements.
FASB ASC 815, "Derivatives and Hedging" ("ASC 815"), is intended to improve financial reporting about derivative instruments by requiring enhanced disclosures to enable investors to better understand how and why the Fund uses derivative instruments, how these derivative instruments are accounted for and their effects on the Fund's financial position and results of operations.
The following table sets forth the fair value of the Fund's derivative contracts by primary risk exposure as of October 31, 2024:
PRIMARY RISK EXPOSURE | | ASSET DERIVATIVES
STATEMENT OF ASSETS
AND LIABILITIES LOCATION | | FAIR VALUE | | LIABILITY DERIVATIVES
STATEMENT OF ASSETS
AND LIABILITIES LOCATION | | FAIR VALUE | |
Interest Rate Risk
| | Variation margin on open
futures contracts | | $ | 1,446,849 | (a) | | Variation margin on open
futures contracts | | $ | (4,937,522 | )(a) | |
Currency Risk
| | Unrealized appreciation on
open foreign currency
forward exchange
contracts | | | 1,204,799 | | | Unrealized depreciation on
open foreign currency
forward exchange
contracts | | | (550,737 | ) | |
Interest Rate Risk
| | Variation margin on open
swap agreements | | | — | | | Variation margin on open
swap agreements | | | (753,454 | )(a) | |
| | | | | $ | 2,651,648 | | | | | $ | (6,241,713 | ) | |
(a) Includes cumulative appreciation (depreciation) as reported in the Portfolio of Investments. Only current day's net variation margin is reported within the Statement of Assets and Liabilities.
43
Morgan Stanley Global Fixed Income Opportunities Fund
Notes to Financial Statements ◼ October 31, 2024 continued
The following tables set forth by primary risk exposure the Fund's realized gains (losses) and change in unrealized appreciation (depreciation) by type of derivative contract for the year ended October 31, 2024 in accordance with ASC 815:
AMOUNT OF REALIZED GAIN (LOSS) ON DERIVATIVES
PRIMARY RISK EXPOSURE | | FUTURES
CONTRACTS | | FOREIGN CURRENCY
FORWARD EXCHANGE
CONTRACTS | | SWAP
AGREEMENTS | |
Interest Rate Risk | | $ | 2,103,875 | | | $ | — | | | $ | (698,006 | ) | |
Currency Risk | | | — | | | | 5,356,238 | | | | — | | |
Credit Risk | | | — | | | | — | | | | (209,518 | ) | |
Total | | $ | 2,103,875 | | | $ | 5,356,238 | | | $ | (907,524 | ) | |
CHANGE IN UNREALIZED APPRECIATION (DEPRECIATION) ON DERIVATIVES
PRIMARY RISK EXPOSURE | | FUTURES
CONTRACTS | | FOREIGN CURRENCY
FORWARD EXCHANGE
CONTRACTS | | SWAP
AGREEMENTS | |
Interest Rate Risk | | $ | (2,918,058 | ) | | $ | — | | | $ | (753,454 | ) | |
Currency Risk | | | — | | | | (8,222,310 | ) | | | — | | |
Total | | $ | (2,918,058 | ) | | $ | (8,222,310 | ) | | $ | (753,454 | ) | |
At October 31, 2024, the Fund's derivative assets and liabilities are as follows:
GROSS AMOUNTS OF ASSETS AND LIABILITIES PRESENTED IN THE STATEMENT OF ASSETS AND LIABILITIES
DERIVATIVES(a) | | ASSETS(b) | | LIABILITIES(b) | |
Foreign Currency Forward Exchange Contracts | | $ | 1,204,799 | | | $ | (550,737 | ) | |
(a) Excludes exchange-traded derivatives.
(b) Absent an event of default or early termination, over-the-counter ("OTC") derivative assets and liabilities are presented gross and not offset in the Statement of Assets and Liabilities.
The Fund typically enters into International Swaps and Derivatives Association, Inc. Master Agreements ("ISDA Master Agreements") or similar master agreements (collectively, "Master Agreements") with its contract counterparties for certain OTC derivatives in order to, among other things, reduce its credit risk to counterparties. ISDA Master Agreements include provisions for general obligations, representations, collateral and events of default or termination. Under an ISDA Master Agreement, the Fund typically may offset with the counterparty certain OTC derivative financial instruments' payables and/or receivables with collateral held and/or posted and create one single net payment (close-out netting) in the event of default, termination and/or potential deterioration in the credit quality of the counterparty. Various Master Agreements govern the terms of certain transactions with counterparties, including transactions such as swap, forward, repurchase and reverse repurchase agreements. These
44
Morgan Stanley Global Fixed Income Opportunities Fund
Notes to Financial Statements ◼ October 31, 2024 continued
Master Agreements typically attempt to reduce the counterparty risk associated with such transactions by specifying credit protection mechanisms and providing standardization that improves legal certainty. Cross-termination provisions under Master Agreements typically provide that a default in connection with one transaction between the Fund and a counterparty gives the non-defaulting party the right to terminate any other transactions in place with the defaulting party to create one single net payment due to/due from the defaulting party and may be a feature in certain Master Agreements. In the event the Fund exercises its right to terminate a Master Agreement after a counterparty experiences a termination event as defined in the Master Agreement, the return of collateral with market value in excess of the Fund's net liability may be delayed or denied.
The following tables present derivative financial instruments that are subject to enforceable netting arrangements as of October 31, 2024:
GROSS AMOUNTS NOT OFFSET IN THE STATEMENT OF ASSETS AND LIABILITIES
COUNTERPARTY | | GROSS ASSET DERIVATIVES
PRESENTED IN THE STATEMENT
OF ASSETS AND LIABILITIES | | FINANCIAL
INSTRUMENT | | COLLATERAL
RECEIVED(a) | | NET AMOUNT
(NOT LESS THAN $0) | |
Australia & New Zealand Banking Group Ltd. | | $ | 256,468 | | | $ | — | | | $ | — | | | $ | 256,468 | | |
Bank of America NA | | | 107,425 | | | | — | | | | — | | | | 107,425 | | |
Barclays Bank PLC | | | 24,141 | | | | — | | | | — | | | | 24,141 | | |
BNP Paribas SA | | | 39,115 | | | | (39,115 | ) | | | — | | | | 0 | | |
Citibank NA | | | 206,007 | | | | (6,929 | ) | | | (199,078 | ) | | | 0 | | |
Credit Agricole CIB | | | 8,110 | | | | — | | | | — | | | | 8,110 | | |
Goldman Sachs International | | | 11,496 | | | | — | | | | — | | | | 11,496 | | |
HSBC Bank PLC | | | 253 | | | | (253 | ) | | | — | | | | 0 | | |
JPMorgan Chase Bank NA | | | 4,706 | | | | (4,706 | ) | | | — | | | | 0 | | |
Royal Bank of Canada | | | 535,366 | | | | (8,844 | ) | | | (260,000 | ) | | | 266,522 | | |
Standard Chartered Bank | | | 11,712 | | | | — | | | | — | | | | 11,712 | | |
Total | | $ | 1,204,799 | | | $ | (59,847 | ) | | $ | (459,078 | ) | | $ | 685,874 | | |
45
Morgan Stanley Global Fixed Income Opportunities Fund
Notes to Financial Statements ◼ October 31, 2024 continued
GROSS AMOUNTS NOT OFFSET IN THE STATEMENT OF ASSETS AND LIABILITIES
COUNTERPARTY | | GROSS LIABILITY DERIVATIVES
PRESENTED IN THE STATEMENT
OF ASSETS AND LIABILITIES | | FINANCIAL
INSTRUMENT | | COLLATERAL
PLEDGED | | NET AMOUNT
(NOT LESS THAN $0) | |
BNP Paribas SA | | $ | 200,251 | | | $ | (39,115 | ) | | $ | — | | | $ | 161,136 | | |
Citibank NA | | | 6,929 | | | | (6,929 | ) | | | — | | | | 0 | | |
HSBC Bank PLC | | | 487 | | | | (253 | ) | | | — | | | | 234 | | |
JPMorgan Chase Bank NA | | | 40,245 | | | | (4,706 | ) | | | — | | | | 35,539 | | |
Royal Bank of Canada | | | 8,844 | | | | (8,844 | ) | | | — | | | | 0 | | |
State Street Bank and Trust Co. | | | 13,888 | | | | — | | | | — | | | | 13,888 | | |
UBS AG | | | 54,514 | | | | — | | | | — | | | | 54,514 | | |
Westpac Banking Corp. | | | 225,579 | | | | — | | | | — | | | | 225,579 | | |
Total | | $ | 550,737 | | | $ | (59,847 | ) | | $ | — | | | $ | 490,890 | | |
(a) In some instances, the actual collateral received may be more than the amount shown here due to overcollateralization.
For the year ended October 31, 2024, the average monthly amount outstanding for each derivative type is as follows:
Foreign Currency Forward Exchange Contracts: | |
Average monthly principal amount | | $ | 388,962,240 | | |
Futures Contracts: | |
Average monthly notional value | | $ | 262,508,880 | | |
Swap Agreements: | |
Average monthly notional amount | | $ | 49,645,997 | | |
4. Advisory/Administration and Sub-Advisory Agreements
Pursuant to an Investment Advisory Agreement with the Adviser, the Fund pays an advisory fee, accrued daily and paid monthly, by applying the annual rate of 0.32% to the average net assets of the Fund determined as of the close of each business day.
The Adviser also serves as the Administrator to the Fund and provides administrative services pursuant to an Administration Agreement for an annual fee, accrued daily and paid monthly, of 0.08% of the Fund's average daily net assets.
Under a Sub-Administration Agreement between the Administrator and State Street, State Street provides certain administrative services to the Fund. For such services, the Administrator pays State Street a portion of the fee the Administrator receives from the Fund.
46
Morgan Stanley Global Fixed Income Opportunities Fund
Notes to Financial Statements ◼ October 31, 2024 continued
Under a Sub-Advisory Agreement between the Adviser and the Sub-Adviser, the Sub-Adviser provides the Fund with advisory services, subject to the overall supervision of the Adviser and the Fund's Officers and Trustees. The Adviser pays the Sub-Adviser on a monthly basis a portion of the net advisory fees the Adviser receives from the Fund.
The Adviser/Administrator has agreed to reduce its advisory fee, its administration fee and/or reimburse the Fund so that total annual operating expenses, excluding certain investment related expenses, taxes, interest and other extraordinary expenses (including litigation), will not exceed 0.95% for Class A, 1.24% for Class L, 0.60% for Class I, 1.70% for Class C, 0.57% for Class R6 and 0.57% for Class IR. The fee waivers and/or expense reimbursements will continue for at least one year from the date of the Fund's prospectus or until such time that the Trustees act to discontinue all or a portion of such waivers and/or expense reimbursements when they deem such action is appropriate. For the year ended October 31, 2024, $78,417 of other expenses were reimbursed by the Adviser pursuant to this arrangement.
The Adviser agreed to reimburse the Fund for prior years overpayment of transfer agency and sub transfer agency fees. This was reflected as "reimbursement of transfer agency and sub transfer agency fees" in the Statement of Operations.
5. Plan of Distribution
Shares of the Fund are distributed by Morgan Stanley Distribution, Inc. (the "Distributor"), an affiliate of the Adviser/Administrator and Sub-Adviser. The Fund has adopted a Plan of Distribution (the "Plan") pursuant to Rule 12b-1 under the Act. The Plan provides that the Fund will pay the Distributor a fee which is accrued daily and paid monthly at the following annual rates: (i) Class A — up to 0.25% of the average daily net assets of Class A shares; (ii) Class L — up to 0.50% of the average daily net assets of Class L shares; and (iii) Class C — up to 1.00% of the average daily net assets of Class C shares.
In the case of Class A shares, Class L shares and Class C shares, expenses incurred pursuant to the Plan in any calendar year in excess of 0.25%, 0.50% and 1.00% of the average daily net assets of Class A shares, Class L shares and Class C shares, respectively, will not be reimbursed by the Fund through payments in any subsequent year. For the year ended October 31, 2024, the distribution fee was accrued for Class A shares, Class L shares and Class C shares at the annual rate of 0.25%, 0.50% and 1.00%, respectively.
The Distributor has informed the Fund that for the year ended October 31, 2024, it received contingent deferred sales charges from certain redemptions of the Fund's Class A shares of $3,806, and received $11,067 in front-end sales charges from sales of the Fund's Class A shares. The respective shareholders pay such charges, which are not an expense of the Fund.
47
Morgan Stanley Global Fixed Income Opportunities Fund
Notes to Financial Statements ◼ October 31, 2024 continued
6. Dividend Disbursing and Transfer/Co-Transfer Agent
The Fund's dividend disbursing and transfer agent is SS&C Global Investor & Distribution Solutions, Inc. ("SS&C GIDS"). Pursuant to a Transfer Agency Agreement, the Fund pays SS&C GIDS a fee based on the number of classes, accounts and transactions relating to the Fund.
Eaton Vance Management ("EVM"), an affiliate of Morgan Stanley, provides co-transfer agency and related services to the Fund pursuant to a Co-Transfer Agency Services Agreement. For the year ended October 31, 2024, co-transfer agency fees and expenses incurred to EVM, included in "Transfer agent fees and expenses" in the Statement of Operations, amounted to $4,399.
7. Security Transactions and Transactions with Affiliates
The cost of purchases and proceeds from sales of investment securities, excluding short-term investments, for the year ended October 31, 2024, aggregated $1,126,761,050 and $1,137,721,032, respectively. Included in the aforementioned are purchases and sales of U.S. Government securities of $525,855,762 and $503,998,473, respectively.
The Fund invests in the Institutional Class of the Morgan Stanley Institutional Liquidity Funds — Government Portfolio (the "Liquidity Fund"), an open-end management investment company managed by the Adviser, both directly and as a portion of the securities held as collateral on loaned securities. Advisory fees paid by the Fund are reduced by an amount equal to its pro-rata share of the advisory and administration fees paid by the Fund due to its investment in the Liquidity Fund. For the year ended October 31, 2024, advisory fees paid were reduced by $37,492 relating to the Fund's investment in the Liquidity Fund.
The Fund invests in Eaton Vance Floating-Rate ETF, a management investment company advised by an affiliate of the Adviser. Advisory fees paid by the Fund are reduced by an amount equal to its pro-rata share of the advisory and administration fees paid by the Eaton Vance Floating-Rate ETF. For the year ended October 31, 2024, advisory fees paid were reduced by $61,557 relating to the Fund's investment in the Eaton Vance Floating-Rate ETF.
48
Morgan Stanley Global Fixed Income Opportunities Fund
Notes to Financial Statements ◼ October 31, 2024 continued
A summary of the Fund's transactions in shares of affiliated investments during the year ended October 31, 2024 is as follows:
AFFILIATED
INVESTMENT
COMPANY/
ISSUER | | VALUE
OCTOBER 31,
2023 | | PURCHASES
AT COST | | PROCEEDS
FROM SALES | | DIVIDEND
INCOME | | REALIZED
GAIN
(LOSS) | | CHANGE IN
UNREALIZED
APPRECIATION
(DEPRECIATION) | | VALUE
OCTOBER 31,
2024 | |
Liquidity Fund | | $ | 42,959,125 | | | $ | 603,106,917 | | | $ | 592,536,265 | | | $ | 1,317,694 | | | $ | — | | | $ | — | | | $ | 53,529,777 | | |
Eaton Vance
Floating-Rate
ETF | | | — | | | | 22,228,050 | | | | 4,128,135 | | | | 953,338 | | | | (39,105 | ) | | | (171,810 | ) | | | 17,889,000 | | |
Total | | $ | 42,959,125 | | | $ | 625,334,967 | | | $ | 596,664,400 | | | $ | 2,271,032 | | | $ | (39,105 | ) | | $ | (171,810 | ) | | $ | 71,418,777 | | |
The Fund has an unfunded noncontributory defined benefit pension plan covering certain independent Trustees of the Fund who will have served as independent Trustees for at least five years at the time of retirement. Benefits under this plan are based on factors which include years of service and compensation. The Trustees voted to close the plan to new participants and eliminate the future benefits growth due to increases to compensation after July 31, 2003. Aggregate pension costs for the year ended October 31, 2024, included in "Trustees' fees and expenses" in the Statement of Operations amounted to $1,713. At October 31, 2024, the Fund had an accrued pension liability of $35,459, which is reflected as "Trustees' fees" in the Statement of Assets and Liabilities.
Each Trustee receives an annual retainer fee for serving as a Trustee of the Morgan Stanley Funds. The aggregate compensation paid to each Trustee is paid by the Morgan Stanley Funds, and is allocated on a pro rata basis among each of the operational funds of the Morgan Stanley Funds based on the relative net assets of each of the funds. The Fund also reimburses such Trustees for travel and other out-of-pocket expenses incurred by them in connection with attending such meetings.
The Fund has an unfunded Deferred Compensation Plan (the "Compensation Plan"), which allows each independent Trustee to defer payment of all, or a portion, of the fees he or she receives for serving on the Board of Trustees. Each eligible Trustee generally may elect to have the deferred amounts credited with a return equal to the total return on one or more of the Morgan Stanley funds that are offered as investment options under the Compensation Plan. Appreciation/depreciation and distributions received from these investments are recorded with an offsetting increase/decrease in the deferred compensation obligation and do not affect the NAV of the Fund.
8. Custodian Fees
State Street (the "Custodian") also serves as Custodian for the Fund in accordance with a Custodian Agreement. The Custodian holds cash, securities and other assets of the Fund as required by the Act.
49
Morgan Stanley Global Fixed Income Opportunities Fund
Notes to Financial Statements ◼ October 31, 2024 continued
Custody fees are payable monthly based on assets held in custody, investment purchases and sales activity and account maintenance fees, plus reimbursement for certain out-of-pocket expenses.
9. Shares of Beneficial Interest
Transactions in shares of beneficial interest, including direct exchanges pursuant to share class conversions for all periods presented, were as follows:
| | | FOR THE YEAR
ENDED
OCTOBER 31, 2024 | | FOR THE YEAR
ENDED
OCTOBER 31, 2023 | |
| | | SHARES | | AMOUNT | | SHARES | | AMOUNT | |
CLASS A SHARES | |
Sold | | | 2,526,327 | | | $ | 12,856,305 | | | | 1,908,907 | | | $ | 9,504,861 | | |
Reinvestment of dividends | | | 525,898 | | | | 2,681,367 | | | | 678,885 | | | | 3,366,760 | | |
Redeemed | | | (2,511,036 | ) | | | (12,791,519 | ) | | | (4,311,416 | ) | | | (21,499,518 | ) | |
Net increase (decrease) — Class A | | | 541,189 | | | | 2,746,153 | | | | (1,723,624 | ) | | | (8,627,897 | ) | |
CLASS L SHARES | |
Exchanged | | | 2 | | | | 10 | | | | — | | | | — | | |
Reinvestment of dividends | | | 20,992 | | | | 106,982 | | | | 31,205 | | | | 154,669 | | |
Redeemed | | | (62,302 | ) | | | (317,158 | ) | | | (169,841 | ) | | | (846,027 | ) | |
Net decrease — Class L | | | (41,308 | ) | | | (210,166 | ) | | | (138,636 | ) | | | (691,358 | ) | |
CLASS I SHARES | |
Sold | | | 23,229,035 | | | | 119,731,833 | | | | 51,083,342 | | | | 259,258,139 | | |
Reinvestment of dividends | | | 4,483,699 | | | | 23,193,703 | | | | 5,895,897 | | | | 29,652,612 | | |
Redeemed | | | (37,260,470 | ) | | | (192,449,962 | ) | | | (43,570,486 | ) | | | (220,080,952 | ) | |
Net increase (decrease) — Class I | | | (9,547,736 | ) | | | (49,524,426 | ) | | | 13,408,753 | | | | 68,829,799 | | |
CLASS C SHARES | |
Sold | | | 123,456 | | | | 621,836 | | | | 260,505 | | | | 1,290,303 | | |
Reinvestment of dividends | | | 102,304 | | | | 520,940 | | | | 170,713 | | | | 845,781 | | |
Redeemed | | | (848,613 | ) | | | (4,324,924 | ) | | | (1,183,662 | ) | | | (5,888,470 | ) | |
Net decrease — Class C | | | (622,853 | ) | | | (3,182,148 | ) | | | (752,444 | ) | | | (3,752,386 | ) | |
CLASS R6 SHARES | |
Sold | | | 2,912,870 | | | | 14,680,959 | | | | 6,680,552 | | | | 33,118,530 | | |
Reinvestment of dividends | | | 2,638,655 | | | | 13,662,155 | | | | 2,522,755 | | | | 12,684,253 | | |
Redeemed | | | (279,935 | ) | | | (1,470,395 | ) | | | (1,598,579 | ) | | | (8,127,589 | ) | |
Net increase — Class R6 | | | 5,271,590 | | | | 26,872,719 | | | | 7,604,728 | | | | 37,675,194 | | |
CLASS IR SHARES | |
Reinvestment of dividends | | | 119 | | | | 615 | | | | 139 | | | | 698 | | |
Net increase (decrease) in Fund | | | (4,398,999 | ) | | $ | (23,297,253 | ) | | | 18,398,916 | | | $ | 93,434,050 | | |
50
Morgan Stanley Global Fixed Income Opportunities Fund
Notes to Financial Statements ◼ October 31, 2024 continued
10. Federal Income Tax Status
It is the Fund's intention to continue to qualify as a regulated investment company and distribute all of its taxable and tax-exempt income. Accordingly, no provision for federal income taxes is required in the financial statements.
The Fund may be subject to taxes imposed by countries in which it invests. Such taxes are generally based on income and/or capital gains earned or repatriated. Taxes are accrued based on net investment income, net realized gains and net unrealized appreciation as such income and/or gains are earned. Taxes may also be based on transactions in foreign currency and are accrued based on the value of investments denominated in such currency.
FASB ASC 740-10, "Income Taxes — Overall", sets forth a minimum threshold for financial statement recognition of the benefit of a tax position taken or expected to be taken in a tax return. Management has concluded there are no significant uncertain tax positions that would require recognition in the financial statements. If applicable, the Fund recognizes interest accrued related to unrecognized tax benefits in "Interest Expense" and penalties in "Other Expenses" in the Statement of Operations. The Fund files tax returns with the U.S. Internal Revenue Service, New York and various states. Generally, each of the tax years in the four-year period ended October 31, 2024 remains subject to examination by taxing authorities.
The tax character of distributions paid may differ from the character of distributions shown for GAAP purposes due to short-term capital gains being treated as ordinary income for tax purposes. The tax character of distributions paid during fiscal years 2024 and 2023 was as follows:
2024 DISTRIBUTIONS PAID FROM: | | 2023 DISTRIBUTIONS PAID FROM: | |
ORDINARY
INCOME | | PAID-IN-
CAPITAL | | ORDINARY
INCOME | | PAID-IN-
CAPITAL | |
| $ | 35,733,753 | | | $ | 6,497,173 | | | $ | 42,968,263 | | | $ | 6,969,930 | | |
The amount and character of income and gains to be distributed are determined in accordance with income tax regulations which may differ from GAAP. These book/tax differences are either considered temporary or permanent in nature.
Temporary differences are attributable to differing book and tax treatments for the timing of the recognition of gains (losses) on certain investment transactions and the timing of the deductibility of certain expenses.
The Fund had no permanent differences causing reclassifications among the components of net assets for the year ended October 31, 2024.
51
Morgan Stanley Global Fixed Income Opportunities Fund
Notes to Financial Statements ◼ October 31, 2024 continued
At October 31, 2024, the Fund had no distributable earnings on a tax basis.
At October 31, 2024, the Fund had available for federal income tax purposes unused short-term and long-term capital losses of $19,688,540 and $40,446,171, respectively, that do not have an expiration date.
To the extent that capital loss carryforwards are used to offset any future capital gains realized, no capital gains tax liability will be incurred by the Fund for gains realized and not distributed. To the extent that capital gains are offset, such gains will not be distributed to the shareholders.
11. Credit Facility
The Fund and other Morgan Stanley funds participated in a $500,000,000 committed, unsecured revolving line of credit facility (the "Facility") with State Street. This Facility is to be used for temporary emergency purposes or funding of shareholder redemption requests. The interest rate for any funds drawn will be based on the federal funds rate or overnight bank funding rate plus a spread. The Facility also has a commitment fee of 0.25% per annum based on the unused portion of the Facility, which is allocated among participating funds based on relative net assets. During the year ended October 31, 2024, the Fund did not have any borrowings under the Facility.
12. Other
At October 31, 2024, the Fund had record owners of 10% or greater. Investment activities of these shareholders could have a material impact on the Fund. The aggregate percentage of such owners was 66.2%.
13. Market Risk and Risks Relating to Certain Financial Instruments
The Fund may invest in mortgage securities, including securities issued by the Federal National Mortgage Association ("FNMA") and Federal Home Loan Mortgage Corporation ("FHLMC"). These are fixed income securities that derive their value from or represent interests in a pool of mortgages or mortgage securities. An unexpectedly high rate of defaults on the mortgages held by a mortgage pool may adversely affect the value of a mortgage-backed security and could result in losses to the Fund. The risk of such defaults is generally higher in the case of mortgage pools that include sub-prime mortgages. Sub-prime mortgages refer to loans made to borrowers with weakened credit histories or with a lower capacity to make timely payments on their mortgages. The securities held by the Fund are not backed by sub-prime mortgages.
52
Morgan Stanley Global Fixed Income Opportunities Fund
Notes to Financial Statements ◼ October 31, 2024 continued
Additionally, securities issued by FNMA and FHLMC are not backed by or entitled to the full faith and credit of the United States; rather, they are supported by the right of the issuer to borrow from the U.S. Department of the Treasury.
The Federal Housing Finance Agency ("FHFA") serves as conservator of FNMA and FHLMC and the U.S. Department of the Treasury has agreed to provide capital as needed to ensure FNMA and FHLMC continue to provide liquidity to the housing and mortgage markets.
The Fund may lend securities to qualified financial institutions, such as broker/dealers, to earn additional income. Risks in securities lending transactions are that a borrower may not provide additional collateral when required or return the securities when due, and that the value of the short-term investments will be less than the amount of cash collateral plus any rebate that is required to be returned to the borrower.
Foreign security and currency transactions may involve certain considerations and risks not typically associated with those of U.S. dollar denominated transactions as a result of, among other factors, fluctuations of exchange rates in relation to the U.S. dollar, the possibility of lower levels of governmental supervision and regulation of foreign securities markets and the possibility of political or economic instability.
The value of an investment in the Fund is based on the values of the Fund's investments, which change due to economic and other events that affect markets generally, as well as those that affect particular regions, countries, industries, companies or governments. The risks associated with these developments may be magnified if certain social, political, economic and other conditions and events adversely interrupt the global economy and financial markets. Securities in the Fund's portfolio may underperform due to inflation (or expectations for inflation), interest rates, global demand for particular products or resources, natural disasters and extreme weather events, health emergencies (such as epidemics and pandemics), terrorism, regulatory events and governmental or quasi-governmental actions. The occurrence of global events similar to those in recent years, such as terrorist attacks around the world, natural disasters, health emergencies, social and political (including geopolitical) discord and tensions or debt crises and downgrades, among others, may result in market volatility and may have long term effects on both the U.S. and global financial markets. The occurrence of such events may be sudden and unexpected, and it is difficult to predict when similar events affecting the U.S. or global financial markets may occur, the effects that such events may have and the duration of those effects (which may last for extended periods). Any such event(s) could have a significant adverse impact on the value, liquidity and risk profile of the Fund's portfolio, as well as its ability to sell securities and/or meet redemptions. Any such event(s) or similar types of factors and developments may also adversely affect the financial performance of the Fund's investments (and, in turn, the Fund's investment results) and/or negatively impact broad segments of businesses and populations and have a
53
Morgan Stanley Global Fixed Income Opportunities Fund
Notes to Financial Statements ◼ October 31, 2024 continued
significant and rapid negative impact on the performance of the Fund's investments, and exacerbate preexisting risks to the Fund.
14. LIBOR Discontinuance or Unavailability Risk
The Fund's investments, payment obligations and financing terms may be based on floating rates, such as the London Interbank Offered Rates (collectively, "LIBOR"), Euro Interbank Offered Rate, Secured Overnight Financing Rate ("SOFR") and other similar types of reference rates (each, a "Reference Rate"). These Reference Rates are generally intended to represent the rate at which contributing banks may obtain short-term borrowings from each other within certain financial markets. LIBOR was the basic rate of interest used in lending transactions between banks on the London interbank market and was widely used as a reference for setting the interest rate on loans globally. As a result of benchmark reforms, publication of most LIBOR settings has ceased. However, the publication of certain other LIBORs will continue to be published on a temporary, synthetic and non-representative basis (e.g., the 1-month, 3-month, and 6-month USD LIBOR settings which are expected to be continued to be published until the end of September 2024). As these synthetic LIBOR settings are expected to be published for a limited period of time and are considered non-representative of the underlying market, regulators have advised that these settings should be used only in limited circumstances. Various financial industry groups have been planning for the transition from LIBOR and certain regulators and industry groups have taken actions to establish alternative reference rates (e.g., the SOFR, which measures the cost of overnight borrowings through repurchase agreement transactions collateralized with U.S. Treasury securities and is intended to replace U.S. dollar LIBORs with certain adjustments).There is no assurance that the composition or characteristics of any such alternative reference rate will be similar to or produce the same value or economic equivalence as LIBOR or that it will have the same volume or liquidity as did LIBOR. These developments could negatively impact financial markets in general and present heightened risks, including with respect to the Fund's investments. As a result of the uncertainty and developments relating to the transition process, performance, price volatility, liquidity and value of the Fund and its assets may be adversely affected.
54
Morgan Stanley Global Fixed Income Opportunities Fund
Financial Highlights
Selected ratios and per share data for a share of beneficial interest outstanding throughout each period:
| | | FOR THE YEAR ENDED OCTOBER 31, | |
| | | 2024 | | 2023 | | 2022 | | 2021 | | 2020 | |
Class A Shares | |
Selected Per Share Data: | |
Net asset value, beginning of period | | $ | 4.86 | | | $ | 4.97 | | | $ | 5.68 | | | $ | 5.70 | | | $ | 5.73 | | |
Income (loss) from investment operations: | |
| Net investment income(1) | | | 0.25 | | | | 0.23 | | | | 0.17 | | | | 0.14 | | | | 0.15 | | |
Net realized and unrealized gain (loss) | | | 0.29 | | | | (0.02 | ) | | | (0.67 | ) | | | (0.01 | ) | | | (0.00 | )(2) | |
Total income (loss) from investment operations | | | 0.54 | | | | 0.21 | | | | (0.50 | ) | | | 0.13 | | | | 0.15 | | |
Less distributions from: | |
| Net investment income | | | (0.22 | ) | | | (0.27 | ) | | | (0.21 | ) | | | (0.14 | ) | | | (0.18 | ) | |
Net realized gain | | | — | | | | — | | | | — | | | | (0.01 | ) | | | — | | |
| Paid-in-capital | | | (0.04 | ) | | | (0.05 | ) | | | — | | | | — | | | | — | | |
Total distributions | | | (0.26 | ) | | | (0.32 | ) | | | (0.21 | ) | | | (0.15 | ) | | | (0.18 | ) | |
Net asset value, end of period | | $ | 5.14 | | | $ | 4.86 | | | $ | 4.97 | | | $ | 5.68 | | | $ | 5.70 | | |
Total Return | | | 11.31 | %(3)(4) | | | 4.26 | %(4) | | | (8.91 | )%(4) | | | 2.26 | %(5) | | | 2.79 | %(5) | |
Ratios to Average Net Assets: | |
Net expenses | | | 0.82 | %(6)(7) | | | 0.85 | %(6) | | | 0.83 | %(6) | | | 0.83 | %(6) | | | 0.82 | %(6) | |
Net expenses excluding interest expenses | | | N/A | | | | N/A | (6) | | | 0.83 | %(6) | | | N/A | | | | 0.82 | %(6) | |
Net investment income | | | 4.91 | %(6)(7) | | | 4.56 | %(6) | | | 3.18 | %(6) | | | 2.52 | %(6) | | | 2.71 | %(6) | |
Rebate from Morgan Stanley affiliate | | | 0.01 | % | | | 0.01 | % | | | 0.00 | %(8) | | | 0.00 | %(8) | | | 0.01 | % | |
Supplemental Data: | |
Net assets, end of period, in thousands | | $ | 57,292 | | | $ | 51,476 | | | $ | 61,181 | | | $ | 92,889 | | | $ | 112,310 | | |
Portfolio turnover rate | | | 155 | % | | | 118 | % | | | 62 | % | | | 115 | % | | | 106 | % | |
(1) The per share amounts were computed using an average number of shares outstanding during the period.
(2) Amount is less than $0.005 per share.
(3) Refer to Note 4 in the Notes to Financial Statements for discussion of prior period transfer agency and sub transfer agency fees that were reimbursed in the current period. The amount of the reimbursement was immaterial to the total return of Class A shares.
(4) Does not reflect the deduction of sales charge. Calculated based on the net asset value as of the last business day of the period.
(5) Calculated using the NAV for US GAAP financial reporting purposes and as such differs from the total return presented in the Fund Report and Performance Summary. Does not reflect the deduction of sales charge.
(6) The ratios reflect the rebate of certain Fund expenses in connection with investments in a Morgan Stanley affiliate during the period. The effect of the rebate on the ratios is disclosed in the above table as "Rebate from Morgan Stanley affiliate."
(7) If the Fund had not received the reimbursement of transfer agency and sub transfer agency fees from the Adviser, the net expenses and net investment income ratios, would have been as follows for Class A shares:
PERIOD ENDED | | EXPENSE
RATIO | | NET INVESTMENT
INCOME RATIO | |
October 31, 2024 | | | 0.84 | % | | | 4.89 | % | |
(8) Amount is less than 0.005%.
See Notes to Financial Statements
55
Morgan Stanley Global Fixed Income Opportunities Fund
Financial Highlights continued
| | | FOR THE YEAR ENDED OCTOBER 31, | |
| | | 2024 | | 2023 | | 2022 | | 2021 | | 2020 | |
Class L Shares | |
Selected Per Share Data: | |
Net asset value, beginning of period | | $ | 4.86 | | | $ | 4.96 | | | $ | 5.68 | | | $ | 5.70 | | | $ | 5.73 | | |
Income (loss) from investment operations: | |
| Net investment income(1) | | | 0.23 | | | | 0.21 | | | | 0.15 | | | | 0.13 | | | | 0.14 | | |
Net realized and unrealized gain (loss) | | | 0.29 | | | | (0.01 | ) | | | (0.67 | ) | | | (0.01 | ) | | | (0.00 | )(2) | |
Total income (loss) from investment operations | | | 0.52 | | | | 0.20 | | | | (0.52 | ) | | | 0.12 | | | | 0.14 | | |
Less distributions from: | |
| Net investment income | | | (0.20 | ) | | | (0.25 | ) | | | (0.20 | ) | | | (0.13 | ) | | | (0.17 | ) | |
Net realized gain | | | — | | | | — | | | | — | | | | (0.01 | ) | | | — | | |
| Paid-in-capital | | | (0.04 | ) | | | (0.05 | ) | | | — | | | | — | | | | — | | |
Total distributions | | | (0.24 | ) | | | (0.30 | ) | | | (0.20 | ) | | | (0.14 | ) | | | (0.17 | ) | |
Net asset value, end of period | | $ | 5.14 | | | $ | 4.86 | | | $ | 4.96 | | | $ | 5.68 | | | $ | 5.70 | | |
Total Return | | | 10.91 | %(3)(4) | | | 4.09 | %(3) | | | (9.37 | )%(3) | | | 1.96 | %(5) | | | 2.53 | %(5) | |
Ratios to Average Net Assets: | |
Net expenses | | | 1.18 | %(6)(7) | | | 1.22 | %(6) | | | 1.14 | %(6) | | | 1.12 | %(6) | | | 1.07 | %(6) | |
Net expenses excluding interest expenses | | | N/A | | | | N/A | | | | 1.14 | %(6) | | | N/A | | | | 1.07 | %(6) | |
Net investment income | | | 4.55 | %(6)(7) | | | 4.19 | %(6) | | | 2.90 | %(6) | | | 2.23 | %(6) | | | 2.47 | %(6) | |
Rebate from Morgan Stanley affiliate | | | 0.01 | % | | | 0.01 | % | | | 0.00 | %(8) | | | 0.00 | %(8) | | | 0.01 | % | |
Supplemental Data: | |
Net assets, end of period, in thousands | | $ | 2,339 | | | $ | 2,410 | | | $ | 3,152 | | | $ | 4,125 | | | $ | 4,667 | | |
Portfolio turnover rate | | | 155 | % | | | 118 | % | | | 62 | % | | | 115 | % | | | 106 | % | |
(1) The per share amounts were computed using an average number of shares outstanding during the period.
(2) Amount is less than $0.005 per share.
(3) Calculated based on the net asset value as of the last business day of the period.
(4) Refer to Note 4 in the Notes to Financial Statements for discussion of prior period transfer agency and sub transfer agency fees that were reimbursed in the current period. The amount of the reimbursement was immaterial to the total return of Class L shares.
(5) Calculated using the NAV for US GAAP financial reporting purposes and as such differs from the total return presented in the Fund Report and Performance Summary.
(6) The ratios reflect the rebate of certain Fund expenses in connection with investments in a Morgan Stanley affiliate during the period. The effect of the rebate on the ratios is disclosed in the above table as "Rebate from Morgan Stanley affiliate."
(7) If the Fund had not received the reimbursement of transfer agency and sub transfer agency fees from the Adviser, the net expenses and net investment income ratios, would have been as follows for Class L shares:
PERIOD ENDED | | EXPENSE
RATIO | | NET INVESTMENT
INCOME RATIO | |
October 31, 2024 | | | 1.20 | % | | | 4.53 | % | |
(8) Amount is less than 0.005%.
See Notes to Financial Statements
56
Morgan Stanley Global Fixed Income Opportunities Fund
Financial Highlights continued
| | | FOR THE YEAR ENDED OCTOBER 31, | |
| | | 2024 | | 2023 | | 2022 | | 2021 | | 2020 | |
Class I Shares | |
Selected Per Share Data: | |
Net asset value, beginning of period | | $ | 4.93 | | | $ | 5.03 | | | $ | 5.75 | | | $ | 5.77 | | | $ | 5.80 | | |
Income (loss) from investment operations: | |
| Net investment income(1) | | | 0.27 | | | | 0.24 | | | | 0.19 | | | | 0.16 | | | | 0.17 | | |
Net realized and unrealized gain (loss) | | | 0.29 | | | | (0.01 | ) | | | (0.68 | ) | | | (0.01 | ) | | | (0.00 | )(2) | |
Total income (loss) from investment operations | | | 0.56 | | | | 0.23 | | | | (0.49 | ) | | | 0.15 | | | | 0.17 | | |
Less distributions from: | |
| Net investment income | | | (0.23 | ) | | | (0.28 | ) | | | (0.23 | ) | | | (0.16 | ) | | | (0.20 | ) | |
Net realized gain | | | — | | | | — | | | | — | | | | (0.01 | ) | | | — | | |
| Paid-in-capital | | | (0.04 | ) | | | (0.05 | ) | | | — | | | | — | | | | — | | |
Total distributions | | | (0.27 | ) | | | (0.33 | ) | | | (0.23 | ) | | | (0.17 | ) | | | (0.20 | ) | |
Net asset value, end of period | | $ | 5.22 | | | $ | 4.93 | | | $ | 5.03 | | | $ | 5.75 | | | $ | 5.77 | | |
Total Return | | | 11.63 | %(3)(4) | | | 4.68 | %(3) | | | (8.74 | )%(3) | | | 2.51 | %(5) | | | 3.03 | %(5) | |
Ratios to Average Net Assets: | |
Net expenses | | | 0.57 | %(6)(7)(8) | | | 0.59 | %(6) | | | 0.56 | %(6) | | | 0.55 | %(6) | | | 0.55 | %(6) | |
Net expenses excluding interest expenses | | | N/A | | | | N/A | (6) | | | 0.56 | %(6) | | | N/A | | | | 0.55 | %(6) | |
Net investment income | | | 5.16 | %(6)(7)(8) | | | 4.82 | %(6) | | | 3.42 | %(6) | | | 2.79 | %(6) | | | 2.97 | %(6) | |
Rebate from Morgan Stanley affiliate | | | 0.01 | % | | | 0.01 | % | | | 0.00 | %(9) | | | 0.00 | %(9) | | | 0.01 | % | |
Supplemental Data: | |
Net assets, end of period, in thousands | | $ | 455,296 | | | $ | 476,677 | | | $ | 419,470 | | | $ | 683,692 | | | $ | 635,329 | | |
Portfolio turnover rate | | | 155 | % | | | 118 | % | | | 62 | % | | | 115 | % | | | 106 | % | |
(1) The per share amounts were computed using an average number of shares outstanding during the period.
(2) Amount is less than $0.005.
(3) Calculated based on the net asset value as of the last business day of the period.
(4) Refer to Note 4 in the Notes to Financial Statements for discussion of prior period transfer agency and sub transfer agency fees that were reimbursed in the current period. The amount of the reimbursement was immaterial to the total return of Class I shares.
(5) Calculated using the NAV for US GAAP financial reporting purposes and as such differs from the total return presented in the Fund Report and Performance Summary.
(6) The ratios reflect the rebate of certain Fund expenses in connection with investments in a Morgan Stanley affiliate during the period. The effect of the rebate on the ratios is disclosed in the above table as "Rebate from Morgan Stanley affiliate."
(7) If the Fund had not received the reimbursement of transfer agency and sub transfer agency fees from the Adviser, the net expenses and net investment income ratios, would have been as follows for Class I shares:
PERIOD ENDED | | EXPENSE
RATIO | | NET INVESTMENT
INCOME RATIO | |
October 31, 2024 | | | 0.59 | % | | | 5.14 | % | |
(8) If the Fund had borne all of its expenses that were waived by the Adviser/Administrator, the annualized expense and net investment income ratios would have been as follows:
PERIOD ENDED | | EXPENSE
RATIO | | NET INVESTMENT
INCOME RATIO | |
October 31, 2024 | | | 0.62 | % | | | 5.11 | % | |
(9) Amount is less than 0.005%.
See Notes to Financial Statements
57
Morgan Stanley Global Fixed Income Opportunities Fund
Financial Highlights continued
| | | FOR THE YEAR ENDED OCTOBER 31, | |
| | | 2024 | | 2023 | | 2022 | | 2021 | | 2020 | |
Class C Shares | |
Selected Per Share Data: | |
Net asset value, beginning of period | | $ | 4.85 | | | $ | 4.96 | | | $ | 5.67 | | | $ | 5.69 | | | $ | 5.72 | | |
Income (loss) from investment operations: | |
| Net investment income(1) | | | 0.21 | | | | 0.19 | | | | 0.13 | | | | 0.10 | | | | 0.11 | | |
Net realized and unrealized gain (loss) | | | 0.30 | | | | (0.02 | ) | | | (0.67 | ) | | | (0.01 | ) | | | (0.00 | )(2) | |
Total income (loss) from investment operations | | | 0.51 | | | | 0.17 | | | | (0.54 | ) | | | 0.09 | | | | 0.11 | | |
Less distributions from: | |
| Net investment income | | | (0.18 | ) | | | (0.23 | ) | | | (0.17 | ) | | | (0.10 | ) | | | (0.14 | ) | |
Net realized gain | | | — | | | | — | | | | — | | | | (0.01 | ) | | | — | | |
| Paid-in-capital | | | (0.04 | ) | | | (0.05 | ) | | | — | | | | — | | | | — | | |
Total distributions | | | (0.22 | ) | | | (0.28 | ) | | | (0.17 | ) | | | (0.11 | ) | | | (0.14 | ) | |
Net asset value, end of period | | $ | 5.14 | | | $ | 4.85 | | | $ | 4.96 | | | $ | 5.67 | | | $ | 5.69 | | |
Total Return | | | 10.70 | %(3)(4) | | | 3.47 | %(4) | | | (9.61 | )%(4) | | | 1.52 | %(5) | | | 2.05 | %(5) | |
Ratios to Average Net Assets: | |
Net expenses | | | 1.57 | %(6)(7) | | | 1.61 | %(6) | | | 1.57 | %(6) | | | 1.56 | %(6) | | | 1.55 | %(6) | |
Net expenses excluding interest expenses | | | N/A | | | | N/A | (6) | | | 1.57 | %(6) | | | N/A | | | | 1.55 | %(6) | |
Net investment income | | | 4.16 | %(6)(7) | | | 3.80 | %(6) | | | 2.43 | %(6) | | | 1.79 | %(6) | | | 1.98 | %(6) | |
Rebate from Morgan Stanley affiliate | | | 0.01 | % | | | 0.01 | % | | | 0.00 | %(8) | | | 0.00 | %(8) | | | 0.01 | % | |
Supplemental Data: | |
Net assets, end of period, in thousands | | $ | 11,535 | | | $ | 13,914 | | | $ | 17,957 | | | $ | 28,359 | | | $ | 32,395 | | |
Portfolio turnover rate | | | 155 | % | | | 118 | % | | | 62 | % | | | 115 | % | | | 106 | % | |
(1) The per share amounts were computed using an average number of shares outstanding during the period.
(2) Amount is less than $0.005 per share.
(3) Refer to Note 4 in the Notes to Financial Statements for discussion of prior period transfer agency and sub transfer agency fees that were reimbursed in the current period. The amount of the reimbursement was immaterial to the total return of Class C shares.
(4) Does not reflect the deduction of sales charge. Calculated based on the net asset value as of the last business day of the period.
(5) Calculated using the NAV for US GAAP financial reporting purposes and as such differs from the total return presented in the Fund Report and Performance Summary. Does not reflect the deduction of sales charge.
(6) The ratios reflect the rebate of certain Fund expenses in connection with investments in a Morgan Stanley affiliate during the period. The effect of the rebate on the ratios is disclosed in the above table as "Rebate from Morgan Stanley affiliate."
(7) If the Fund had not received the reimbursement of transfer agency and sub transfer agency fees from the Adviser, the net expenses and net investment income ratios, would have been as follows for Class C shares:
PERIOD ENDED | | EXPENSE
RATIO | | NET INVESTMENT
INCOME RATIO | |
October 31, 2024 | | | 1.59 | % | | | 4.14 | % | |
(8) Amount is less than 0.005%.
See Notes to Financial Statements
58
Morgan Stanley Global Fixed Income Opportunities Fund
Financial Highlights continued
| | | FOR THE YEAR ENDED OCTOBER 31, | |
| | | 2024 | | 2023 | | 2022 | | 2021 | | 2020 | |
Class R6 Shares* | |
Selected Per Share Data: | |
Net asset value, beginning of period | | $ | 4.93 | | | $ | 5.03 | | | $ | 5.75 | | | $ | 5.77 | | | $ | 5.80 | | |
Income (loss) from investment operations: | |
| Net investment income(1) | | | 0.27 | | | | 0.25 | | | | 0.19 | | | | 0.17 | | | | 0.17 | | |
Net realized and unrealized gain (loss) | | | 0.30 | | | | (0.01 | ) | | | (0.68 | ) | | | (0.02 | ) | | | (0.00 | )(2) | |
Total income (loss) from investment operations | | | 0.57 | | | | 0.24 | | | | (0.49 | ) | | | 0.15 | | | | 0.17 | | |
Less distributions from: | |
| Net investment income | | | (0.24 | ) | | | (0.29 | ) | | | (0.23 | ) | | | (0.16 | ) | | | (0.20 | ) | |
Net realized gain | | | — | | | | — | | | | — | | | | (0.01 | ) | | | — | | |
| Paid-in-capital | | | (0.04 | ) | | | (0.05 | ) | | | — | | | | — | | | | — | | |
Total distributions | | | (0.28 | ) | | | (0.34 | ) | | | (0.23 | ) | | | (0.17 | ) | | | (0.20 | ) | |
Net asset value, end of period | | $ | 5.22 | | | $ | 4.93 | | | $ | 5.03 | | | $ | 5.75 | | | $ | 5.77 | | |
Total Return | | | 11.74 | %(3)(4) | | | 4.78 | %(3) | | | (8.66 | )%(3) | | | 2.59 | %(5) | | | 3.11 | %(5) | |
Ratios to Average Net Assets: | |
Net expenses | | | 0.46 | %(6)(7) | | | 0.49 | %(6) | | | 0.48 | %(6) | | | 0.47 | %(6) | | | 0.47 | %(6) | |
Net expenses excluding interest expenses | | | N/A | | | | N/A | (6) | | | 0.48 | %(6) | | | N/A | | | | 0.47 | %(6) | |
Net investment income | | | 5.27 | %(6)(7) | | | 4.92 | %(6) | | | 3.55 | %(6) | | | 2.87 | %(6) | | | 3.07 | %(6) | |
Rebate from Morgan Stanley affiliate | | | 0.01 | % | | | 0.01 | % | | | 0.00 | %(8) | | | 0.00 | %(8) | | | 0.01 | % | |
Supplemental Data: | |
Net assets, end of period, in thousands | | $ | 262,278 | | | $ | 221,499 | | | $ | 187,940 | | | $ | 237,872 | | | $ | 189,052 | | |
Portfolio turnover rate | | | 155 | % | | | 118 | % | | | 62 | % | | | 115 | % | | | 106 | % | |
* Effective April 29, 2022, Class IS shares were renamed Class R6 shares.
(1) The per share amounts were computed using an average number of shares outstanding during the period.
(2) Amount is less than $0.005 per share.
(3) Calculated based on the net asset value as of the last business day of the period.
(4) Refer to Note 4 in the Notes to Financial Statements for discussion of prior period transfer agency and sub transfer agency fees that were reimbursed in the current period. The amount of the reimbursement was immaterial to the total return of Class R6 shares.
(5) Calculated using the NAV for US GAAP financial reporting purposes and as such differs from the total return presented in the Fund Report and Performance Summary.
(6) The ratios reflect the rebate of certain Fund expenses in connection with investments in a Morgan Stanley affiliate during the period. The effect of the rebate on the ratios is disclosed in the above table as "Rebate from Morgan Stanley affiliate."
(7) If the Fund had not received the reimbursement of transfer agency and sub transfer agency fees from the Adviser, the net expenses and net investment income ratios, would have been as follows for Class R6 shares:
PERIOD ENDED | | EXPENSE
RATIO | | NET INVESTMENT
INCOME RATIO | |
October 31, 2024 | | | 0.48 | % | | | 5.25 | % | |
(8) Amount is less than 0.005%.
See Notes to Financial Statements
59
Morgan Stanley Global Fixed Income Opportunities Fund
Financial Highlights continued
| | | FOR THE YEAR ENDED OCTOBER 31, | |
| | | 2024 | | 2023 | | 2022 | | 2021 | | 2020 | |
Class IR Shares | |
Selected Per Share Data: | |
Net asset value, beginning of period | | $ | 4.93 | | | $ | 5.03 | | | $ | 5.75 | | | $ | 5.77 | | | $ | 5.81 | | |
Income (loss) from investment operations: | |
| Net investment income(1) | | | 0.27 | | | | 0.25 | | | | 0.18 | | | | 0.16 | | | | 0.17 | | |
Net realized and unrealized gain (loss) | | | 0.30 | | | | (0.01 | ) | | | (0.67 | ) | | | (0.01 | ) | | | (0.01 | ) | |
Total income (loss) from investment operations | | | 0.57 | | | | 0.24 | | | | (0.49 | ) | | | 0.15 | | | | 0.16 | | |
Less distributions from: | |
| Net investment income | | | (0.24 | ) | | | (0.29 | ) | | | (0.23 | ) | | | (0.16 | ) | | | (0.20 | ) | |
Net realized gain | | | — | | | | — | | | | — | | | | (0.01 | ) | | | — | | |
| Paid-in-capital | | | (0.04 | ) | | | (0.05 | ) | | | — | | | | — | | | | — | | |
Total distributions | | | (0.28 | ) | | | (0.34 | ) | | | (0.23 | ) | | | (0.17 | ) | | | (0.20 | ) | |
Net asset value, end of period | | $ | 5.22 | | | $ | 4.93 | | | $ | 5.03 | | | $ | 5.75 | | | $ | 5.77 | | |
Total Return | | | 11.74 | %(2)(3) | | | 4.78 | %(2) | | | (8.66 | )%(2) | | | 2.59 | %(4) | | | 2.93 | %(4) | |
Ratios to Average Net Assets: | |
Net expenses | | | 0.46 | %(5)(6)(7) | | | 0.49 | %(5)(6) | | | 0.48 | %(5)(6) | | | 0.47 | %(5)(6) | | | 0.47 | %(5)(6) | |
Net expenses excluding interest expenses | | | N/A | | | | N/A | (5)(6) | | | 0.48 | %(5)(6) | | | N/A | | | | 0.47 | %(5)(6) | |
Net investment income | | | 5.27 | %(5)(6)(7) | | | 4.92 | %(5)(6) | | | 3.32 | %(5)(6) | | | 2.74 | %(5)(6) | | | 2.97 | %(5)(6) | |
Rebate from Morgan Stanley affiliate | | | 0.01 | % | | | 0.01 | % | | | 0.00 | %(8) | | | 0.00 | %(8) | | | 0.01 | % | |
Supplemental Data: | |
Net assets, end of period, in thousands | | $ | 12 | | | $ | 11 | | | $ | 10 | | | $ | 11 | | | $ | 11 | | |
Portfolio turnover rate | | | 155 | % | | | 118 | % | | | 62 | % | | | 115 | % | | | 106 | % | |
(1) The per share amounts were computed using an average number of shares outstanding during the period.
(2) Calculated based on the net asset value as of the last business day of the period.
(3) Refer to Note 4 in the Notes to Financial Statements for discussion of prior period transfer agency and sub transfer agency fees that were reimbursed in the current period. The amount of the reimbursement was immaterial to the total return of Class IR shares.
(4) Calculated using the NAV for US GAAP financial reporting purposes and as such differs from the total return presented in the Fund Report and Performance Summary.
(5) The ratios reflect the rebate of certain Fund expenses in connection with investments in a Morgan Stanley affiliate during the period. The effect of the rebate on the ratios is disclosed in the above table as "Rebate from Morgan Stanley affiliate."
(6) If the Fund had borne all of its expenses that were waived by the Adviser/Administrator, the annualized expense and net investment loss ratios would have been as follows:
PERIOD ENDED | | EXPENSE
RATIO | | NET INVESTMENT
LOSS RATIO | |
October 31, 2024 | | | 19.12 | % | | | (13.39 | )% | |
October 31, 2023 | | | 20.67 | | | | (15.26 | ) | |
October 31, 2022 | | | 18.79 | | | | (14.99 | ) | |
October 31, 2021 | | | 19.14 | | | | (15.93 | ) | |
October 31, 2020 | | | 19.09 | | | | (15.65 | ) | |
(7) If the Fund had not received the reimbursement of transfer agency and sub transfer agency fees from the Adviser, the net expenses and net investment income ratios, would have been as follows for Class IR shares:
PERIOD ENDED | | EXPENSE
RATIO | | NET INVESTMENT
INCOME RATIO | |
October 31, 2024 | | | 0.48 | % | | | 5.25 | % | |
(8) Amount is less than 0.005%.
See Notes to Financial Statements
60
Morgan Stanley Global Fixed Income Opportunities Fund
Report of Independent Registered Public Accounting Firm
To the Shareholders and Board of Trustees of
Morgan Stanley Global Fixed Income Opportunities Fund
Opinion on the Financial Statements
We have audited the accompanying statement of assets and liabilities of Morgan Stanley Global Fixed Income Opportunities Fund (the "Fund"), including the portfolio of investments, as of October 31, 2024, and the related statement of operations for the year then ended, the statements of changes in net assets for each of the two years in the period then ended, the financial highlights for each of the five years in the period then ended and the related notes (collectively referred to as the "financial statements"). In our opinion, the financial statements present fairly, in all material respects, the financial position of the Fund at October 31, 2024, the results of its operations for the year then ended, the changes in its net assets for each of the two years in the period then ended and its financial highlights for each of the five years in the period then ended, in conformity with U.S. generally accepted accounting principles.
Basis for Opinion
These financial statements are the responsibility of the Fund's management. Our responsibility is to express an opinion on the Fund's financial statements based on our audits. We are a public accounting firm registered with the Public Company Accounting Oversight Board (United States) ("PCAOB") and are required to be independent with respect to the Fund in accordance with the U.S. federal securities laws and the applicable rules and regulations of the Securities and Exchange Commission and the PCAOB.
We conducted our audits in accordance with the standards of the PCAOB. Those standards require that we plan and perform the audit to obtain reasonable assurance about whether the financial statements are free of material misstatement, whether due to error or fraud. The Fund is not required to have, nor were we engaged to perform, an audit of the Fund's internal control over financial reporting. As part of our audits, we are required to obtain an understanding of internal control over financial reporting but not for the purpose of expressing an opinion on the effectiveness of the Fund's internal control over financial reporting. Accordingly, we express no such opinion.
Our audits included performing procedures to assess the risks of material misstatement of the financial statements, whether due to error or fraud, and performing procedures that respond to those risks. Such procedures included examining, on a test basis, evidence regarding the amounts and disclosures in the financial statements. Our procedures included confirmation of securities owned as of October 31, 2024, by correspondence with the custodian, brokers and others; when replies were not received from brokers and others, we performed other auditing procedures. Our audits also included evaluating the accounting principles used and significant estimates made by management, as well as evaluating the overall presentation of the financial statements. We believe that our audits provide a reasonable basis for our opinion.

We have served as the auditor of one or more Morgan Stanley investment companies since 2000.
Boston, Massachusetts
December 23, 2024
61
Morgan Stanley Global Fixed Income Opportunities Fund
Investment Advisory Agreement Approval (unaudited)
Nature, Extent and Quality of Services
The Board reviewed and considered the nature and extent of the investment advisory services provided by the Adviser under the advisory agreement, including portfolio management, investment research and equity and fixed income securities trading. The Board reviewed similar information and factors regarding the Sub-Adviser, to the extent applicable. The Board also reviewed and considered the nature and extent of the non-advisory, administrative services provided by the Administrator under the administration agreement, including accounting, operations, clerical, bookkeeping, compliance, business management and planning, legal services and the provision of supplies, office space and utilities at the Adviser's expense. The Board also considered the Adviser's investment in personnel and infrastructure that benefits the Fund. (The Adviser, Sub-Adviser and Administrator together are referred to as the "Adviser" and the advisory, sub-advisory and administration agreements together are referred to as the "Management Agreement.") The Board also considered that the Adviser serves a variety of other investment advisory clients and has experience overseeing service providers. The Board also compared the nature of the services provided by the Adviser with similar services provided by non-affiliated advisers as prepared by Broadridge Financial Solutions, Inc. ("Broadridge").
The Board reviewed and considered the qualifications of the portfolio managers, the senior administrative managers and other key personnel of the Adviser who provide the advisory and administrative services to the Fund. The Board determined that the Adviser's portfolio managers and key personnel are well qualified by education and/or training and experience to perform the services in an efficient and professional manner. The Board concluded that the nature and extent of the advisory and administrative services provided were necessary and appropriate for the conduct of the business and investment activities of the Fund and supported its decision to approve the Management Agreement.
Performance, Fees and Expenses of the Fund
The Board reviewed the performance, fees and expenses of the Fund compared to its peers, as prepared by Broadridge, and to appropriate benchmarks where applicable. The Board discussed with the Adviser the performance goals and the actual results achieved in managing the Fund. When considering a fund's performance, the Board and the Adviser place emphasis on trends and longer-term returns (focusing on one-year, three-year and five-year performance, as of December 31, 2023, or since inception, as applicable). When a fund underperforms its benchmark and/or its peer group average, the Board and the Adviser discuss the causes of such underperformance and, where necessary, they discuss specific changes to investment strategy or investment personnel. The Board noted that the Fund's performance was better than its peer group average for the one-, three- and five-year periods. The Board discussed with the Adviser the level of the advisory and administration fees (together, the "management fee") for this Fund relative to comparable funds and/or other accounts advised by the Adviser and/or compared to its peers as prepared by Broadridge. In addition to the management fee, the Board also reviewed the Fund's total expense ratio. The Board noted that the Fund's management fee
62
Morgan Stanley Global Fixed Income Opportunities Fund
Investment Advisory Agreement Approval (unaudited) continued
and total expense ratio were lower than its peer group averages. After discussion, the Board concluded that the Fund's performance, management fee and total expense ratio were competitive with its peer group averages.
Economies of Scale
The Board considered the size and growth prospects of the Fund and how that relates to the Fund's total expense ratio and particularly the Fund's management fee rate, which does not include breakpoints. In conjunction with its review of the Adviser's profitability, the Board discussed with the Adviser how a change in assets can affect the efficiency or effectiveness of managing the Fund and whether the management fee level is appropriate relative to current and projected asset levels and/or whether the management fee structure reflects economies of scale as asset levels change. The Board has determined that its review of the actual and/or potential economies of scale of the Fund supports its decision to approve the Management Agreement.
Profitability of the Adviser and Affiliates
The Board considered information concerning the costs incurred and profits realized by the Adviser and its affiliates during the last year from their relationship with the Fund and during the last two years from their relationship with the Morgan Stanley Fund Complex and reviewed with the Adviser the cost allocation methodology used to determine the profitability of the Adviser and affiliates. The Board has determined that its review of the analysis of the Adviser's expenses and profitability supports its decision to approve the Management Agreement.
Other Benefits of the Relationship
The Board considered other direct and indirect benefits to the Adviser and/or its affiliates derived from their relationship with the Fund and other funds advised by the Adviser. These benefits may include, among other things, fees for trading, distribution and/or shareholder servicing and for transaction processing and reporting platforms used by securities lending agents, and research received by the Adviser generated from commission dollars spent on funds' portfolio trading. The Board reviewed with the Adviser these arrangements and the reasonableness of the Adviser's costs relative to the services performed. The Board has determined that its review of the other benefits received by the Adviser or its affiliates supports its decision to approve the Management Agreement.
Resources of the Adviser and Historical Relationship Between the Fund and the Adviser
The Board considered whether the Adviser is financially sound and has the resources necessary to perform its obligations under the Management Agreement. The Board also reviewed and considered the historical relationship between the Fund and the Adviser, including the organizational structure of the Adviser, the policies and procedures formulated and adopted by the Adviser for managing the Fund's
63
Morgan Stanley Global Fixed Income Opportunities Fund
Investment Advisory Agreement Approval (unaudited) continued
operations and the Board's confidence in the competence and integrity of the senior managers and key personnel of the Adviser. The Board concluded that the Adviser has the financial resources necessary to fulfill its obligations under the Management Agreement and that it is beneficial for the Fund to continue its relationship with the Adviser.
Other Factors and Current Trends
The Board considered the controls and procedures adopted and implemented by the Adviser and monitored by the Fund's Chief Compliance Officer and concluded that the conduct of business by the Adviser indicates a good faith effort on its part to adhere to high ethical standards in the conduct of the Fund's business.
General Conclusion
After considering and weighing all of the above factors, with various written materials and verbal information presented by the Adviser, the Board concluded that it would be in the best interest of the Fund and its shareholders to approve renewal of the Management Agreement for another year. In reaching this conclusion the Board did not give particular weight to any single piece of information or factor referenced above. The Board considered these factors and information over the course of the year and in numerous meetings, some of which were in executive session with only the independent Board members and their counsel present. It is possible that individual Board members may have weighed these factors, and the information presented, differently in reaching their individual decisions to approve the Management Agreement.
64
Morgan Stanley Global Fixed Income Opportunities Fund
Federal Tax Notice (unaudited)
For federal income tax purposes, the following information is furnished with respect to the distributions paid by the Fund during its taxable year ended October 31, 2024.
The Fund designated $23,343,493 of its distributions paid as qualified interest income.
The Fund designated $35,733,753 of its distributions paid as business interest income.
In January, the Fund provides tax information to shareholders for the preceding calendar year.
65
(This page has been left blank intentionally.)
(This page has been left blank intentionally.)
This report is submitted for the general information of the shareholders of the Fund. For more detailed information about the Fund, its fees and expenses and other pertinent information, please read its Prospectus. The Fund's Statement of Additional Information contains additional information about the Fund, including its Trustees. It is available, without charge, by calling 1 (800) 869-6397.
This report is not authorized for distribution to prospective investors in the Fund unless preceded or accompanied by an effective Prospectus. Please read the Prospectus carefully before investing.
Morgan Stanley Distribution, Inc., member FINRA.
© 2024 Morgan Stanley

Item 8. Changes in and Disagreements with Accountants for Open-End Management Investment Companies
Not applicable.
Item 9. Proxy Disclosures for Open-End Management Investment Companies
Not applicable.
Item 10. Remuneration Paid to Directors, Officers, and Others of Open-End Management Investment Companies
This information is disclosed as part of the Financial Statements included in Item 7 of this Form N-CSR.
Item 11. Statement Regarding Basis for Approval of Investment Advisory Contract
This information is disclosed as part of the Financial Statements and Additional Information under Item 7 of this Form N-CSR.
Item 12. Disclosure of Proxy Voting Policies and Procedures for Closed-End Management Investment Companies
Not applicable.
Item 13. Portfolio Managers of Closed-End Management Investment Companies
Not applicable.
Item 14. Purchases of Equity Securities by Closed-End Management Investment Company and Affiliated Purchasers
Not applicable.
Item 15. Submission of Matters to a Vote of Security Holders
There have been no material changes to the procedures by which shareholders may recommend nominee to the Fund’s Board of Trustees since the Fund last provided disclosure in response to this item.
Item 16. Controls and Procedures
| (a) | It is the conclusion of the registrant’s principal executive officer and principal financial officer that the effectiveness of the registrant’s current disclosure controls and procedures (such disclosure controls and procedures having been evaluated within 90 days of the date of this filing) provide reasonable assurance that the information required to be disclosed by the registrant has been recorded, processed, summarized and reported within the time period specified in the Commission’s rules and forms and that the information required to be disclosed by the registrant has been accumulated and communicated to the registrant’s principal executive officer and principal financial officer in order to allow timely decisions regarding required disclosure. |
| (b) | There have been no changes in the registrant’s internal controls over financial reporting during the period covered by this report that has materially affected, or is reasonably likely to materially affect, the registrant’s internal control over financial reporting. |
Item 17. Disclosure of Securities Lending Activities for Closed-End Management Investment Companies
Not applicable.
Item 18. Recovery of Erroneously Awarded Compensation
Not applicable.
Item 19. Exhibits
Signatures
Pursuant to the requirements of the Securities Exchange Act of 1934 and the Investment Company Act of 1940, the registrant has duly caused this report to be signed on its behalf by the undersigned, thereunto duly authorized.
Morgan Stanley Global Fixed Income Opportunities Fund
| By: | /s/ John H. Gernon | |
| | John H. Gernon | |
| | Principal Executive Officer | |
| | | |
| Date: | December 17, 2024 | |
Pursuant to the requirements of the Securities Exchange Act of 1934 and the Investment Company Act of 1940, this report has been signed below by the following persons on behalf of the registrant and in the capacities and on the dates indicated.
| By: | /s/ Francis J. Smith | |
| | Francis J. Smith | |
| | Principal Financial Officer | |
| | | |
| Date: | December 17, 2024 | |
| | | |
| By: | /s/ John H. Gernon | |
| | John H. Gernon | |
| | Principal Executive Officer | |
| | | |
| Date: | December 17, 2024 | |