UNITED STATES
SECURITIES AND EXCHANGE COMMISSION
Washington, D.C. 20549
FORM N-CSRS
CERTIFIED SHAREHOLDER REPORT OF REGISTERED
MANAGEMENT INVESTMENT COMPANIES
Investment Company Act file number: 811-06520
AMG Funds I
(Exact name of registrant as specified in charter)
800 Connecticut Avenue, Norwalk, Connecticut 06854
(Address of principal executive offices) (Zip code)
Managers Investment Group LLC
800 Connecticut Avenue, Norwalk, Connecticut 06854
(Name and address of agent for service)
Registrant’s telephone number, including area code: (203) 299-3500
| | |
| Date of fiscal year end: | | September 30, 2015 |
| |
| Date of reporting period: | | OCTOBER 1, 2014 – MARCH 31, 2015 |
| | (Semi-Annual Shareholder Report) |
| Item 1. | Reports to Shareholders |
| | |
 | | SEMI-ANNUAL REPORT |
AMG Funds
March 31, 2015

AMG Managers Brandywine Fund:BRWIX
AMG Managers Brandywine Blue Fund:BLUEX
| | |
| www.amgfunds.com | | SAR073-0315 |
AMG Funds
Semi-Annual Report—March 31, 2015 (unaudited)
Nothing contained herein is to be considered an offer, sale or solicitation of an offer to buy shares of any series of the AMG Fund family of mutual funds. Such offering is made only by Prospectus, which includes details as to offering price and other material information.
| | |
| | AMG Managers Brandywine Fund AMG Managers Brandywine Blue Fund |
DEAR FELLOW SHAREHOLDER:
Although the weather in March did little to add credence to the proverb that closes out the month “like a lamb,” the lion’s share of an uptick in volatility in the March quarter took place early on before giving way to relative calm toward the period’s end.
AMG Managers Brandywine Fund grew 6.79 percent in the March quarter, outpacing gains in the Russell 3000® and Russell 3000® Growth Indexes of 1.80 and 4.05 percent, respectively. The Fund extended its longest streak of consecutive quarterly gains to nine quarters.
AMG Managers Brandywine Blue Fund grew 4.17 percent in the quarter. The S&P 500, Russell 1000® and Russell 1000® Growth Indexes gained 0.95, 1.59 and 3.84 percent, respectively.
Concerns were high amid a rapid rise in the U.S. dollar versus major foreign currencies. The Swiss National Bank caused a stir on January 15 when it said it would allow the franc to trade freely against the euro, removing a fixed rate adopted during the Eurozone crisis in 2011. That same day, the World Bank cut its forecast for global economic growth, and J.P. Morgan reported disappointing fourth-quarter results.
January, during which the euro lost 8 percent of its value against the dollar, was the toughest month for stocks of the three months through March. While currency remained a consistent theme and the Federal Reserve caused handwringing by dropping “patient” from the bank’s stated views on higher interest rates, the market’s mood improved as the fourth-quarter reporting season unfolded.
Three-fourths of the companies in the S&P 500 Index exceeded consensus earnings estimates for the fourth quarter, which is slightly higher than the index’s one-year (74 percent) and five-year (73 percent) averages, according to a study by FactSet Research Systems. On average, companies that reported earnings upside enjoyed a 1.8 percent increase in share price in a window spanning the two days before the earnings release through the two days after. The five-year average is 1.0 percent.
Brandywine and Brandywine Blue isolated the most earnings strength in the technology and consumer discretionary sectors. The FactSet study showed that those sectors recorded the most pronounced upward revisions in fourth-quarter earnings growth due to positive earnings surprises.
The technology sector’s success was symbolically broadcast by the Nasdaq Composite Index, which on March 2 closed above 5,000 for the first time since March 2000. Milestone aside, the March quarter was far from the dot-com days of 15 years ago.
Apple was the most significant contributor to total gains in both Brandywine and Brandywine Blue. Unlike the expensive, often earnings-challenged companies that led the Nasdaq’s last trip to 5,000, Apple shares began the March quarter trading at less than 13 times estimated earnings for its fiscal year ending in September 2015. The company generated a record quarterly net profit of $18 billion in the three months through December and finished the period with $177 billion in cash on hand. Earnings per share topped estimates by 18 percent.
Expectation-beating earnings performance was a common theme among other top contributors, including Avago Technologies (both Funds), Cognizant Technology Solutions Corp. (both Funds), Infinera Corp. (Brandywine) and Qorvo (Brandywine). Technology holdings, which comprised Brandywine’s largest position and Brandywine Blue’s second largest, outperformed the sector as a whole. Technology holdings contributed the most to performance versus Brandywine’s and Brandywine Blue’s respective benchmarks, the Russell 3000® Growth and Russell 1000® Growth Indexes.
Brandywine’s next biggest contribution came from its second largest position, the consumer discretionary sector. Columbia Sportswear Co. was a standout contributor even amid challenges presented by foreign exchange and West Coast port disruptions. Record December-quarter sales contributed to 52 percent earnings growth, exceeding expectations by 18 percent. Skechers USA, Big Lots and American Eagle Outfitters also aided results.
Industrial holdings were notable supporting contributors for Brandywine Blue. While uncertainty surrounded a range of industrial companies amid dramatically lower oil prices during the quarter, investors didn’t associate Trinity Industries (both Funds) with that situation. The maker of railcars and barges posted expectation-beating earnings growth of 21 percent for the December quarter. The company also reported backlogged orders totaling $7.2 billion, providing visibility into its 2015 production plans.
Brandywine was more exposed to the industrial sector, which worked against the Fund in terms of performance versus the Russell 3000® Growth Index. Industrial holdings generated a positive return and modestly outperformed the sector, but holding an overweight position at a time when the industrial sector was among the benchmark’s poorest performers helped make the sector the biggest drag on relative results. Equipment rental companies H&E Equipment Services and United Rentals (both Brandywine) weighed on performance amid concerns that lower oil prices would reduce demand for equipment.
Brandywine Blue’s largest commitment, the consumer discretionary sector, detracted most from performance relative to the Russell 1000® Growth Index. While holdings sensitive to consumer discretion added to absolute performance, they underperformed the sector within the benchmark. Alibaba Group Holding (both Funds) declined after delivering on December-quarter earnings, but disappointing on sales. GoPro (both Funds) exceeded sales and earnings forecasts, but fell as concerns grew that its wearable camera concept could prove limited and vulnerable to competition over the long haul.
For more on companies that influenced performance, please see Roses & Thorns on page 5 for Brandywine and page 10 for Brandywine Blue.
We’re encouraged by recent results, and we’re working hard to build on them.

Scott Gates
Chief Investment Officer
Friess Associates, LLC
About Your Fund’s Expenses (unaudited)
As a shareholder of a Fund, you may incur two types of costs: (1) transaction costs, which may include sales charges (loads) on purchase payments; redemption fees; and exchange fees; and (2) ongoing costs, including management fees; distribution (12b-1) fees; and other Fund expenses. This example is intended to help you understand your ongoing costs (in dollars) of investing in the Fund and to compare these costs with the ongoing costs of investing in other mutual funds. The example is based on $1,000 invested at the beginning of the period and held for the entire period as indicated below.
ACTUAL EXPENSES
The first line of the following table provides information about the actual account values and actual expenses. You may use the information in this line, together with the amount you invested, to estimate the expenses that you paid over the period. Simply divide your account value by $1,000 (for example, an $8,600 account value divided by $1,000 = 8.6), then multiply the result by the number in the first line under the heading entitled “Expenses Paid During Period” to estimate the expenses you paid on your account during this period.
HYPOTHETICAL EXAMPLE FOR COMPARISON PURPOSES
The second line of the following table provides information about hypothetical account values and hypothetical expenses based on the Fund’s actual expense ratio and an assumed annual rate of return of 5% before expenses, which is not the Fund’s actual return. The hypothetical account values and expenses may not be used to estimate the actual ending account balance or expenses you paid for the period. You may use this information to compare the ongoing costs of investing in the Fund and other funds by comparing this 5% hypothetical example with the 5% hypothetical examples that appear in the shareholder reports of other funds.
Please note that the expenses shown in the table are meant to highlight your on going costs only and do not reflect any transactional costs, such as sales charges (loads), redemption fees, or exchange fees. Therefore, the second line of the table is useful in comparing ongoing costs only, and will not help you determine the relative total costs of owning different funds.
| | | | | | | | | | | | | | | | |
| | | Expense | | | Beginning | | | Ending | | | Expenses | |
| Six Months Ended | | Ratio for | | | Account Value | | | Account Value | | | Paid During | |
| March 31, 2015 | | the Period | | | 10/01/14 | | | 3/31/15 | | | the Period* | |
AMG Managers Brandywine Fund | | | | | | | | | | | | | | | | |
Based on Actual Fund Return | | | 1.09 | % | | | $1,000 | | | | $1,126 | | | | $5.78 | |
Hypothetical (5% return before expenses) | | | 1.09 | % | | | $1,000 | | | | $1,019 | | | | $5.49 | |
AMG Managers Brandywine Blue Fund | | | | | | | | | | | | | | | | |
Based on Actual Fund Return | | | 1.19 | % | | | $1,000 | | | | $1,102 | | | | $6.25 | |
Hypothetical (5% return before expenses) | | | 1.19 | % | | | $1,000 | | | | $1,019 | | | | $6.00 | |
| * | Expenses are equal to the Fund’s annualized expense ratio multiplied by the average account value over the period,multiplied by the number of days in the most recent fiscal half-year (182), then divided by 365. |
3
Fund Performance (unaudited)
Periods ended March 31, 2015
The table below shows the average annual total returns for the periods indicated for each Fund, as well as each Fund’s relative index for the same time periods ended March 31, 2015.
| | | | | | | | | | | | | | | | |
| Average Annual Total Retuns1 | | Six Months* | | | One Year | | | Five Years | | | Ten Years | |
AMG Managers Brandywine Fund2,3 | | | 12.60 | % | | | 15.31 | % | | | 10.14 | % | | | 4.65 | % |
Russell 3000® Growth Index4 | | | 9.43 | % | | | 15.76 | % | | | 15.71 | % | | | 9.41 | % |
Russell 3000® Index5 | | | 7.13 | % | | | 12.37 | % | | | 14.71 | % | | | 8.38 | % |
S&P 500 Index6 | | | 5.93 | % | | | 12.73 | % | | | 14.47 | % | | | 8.01 | % |
AMG Managers Brandywine Blue Fund 2,7 | | | 10.24 | % | | | 14.90 | % | | | 10.02 | % | | | 4.80 | % |
Russell 1000® Growth Index8 | | | 8.81 | % | | | 16.09 | % | | | 15.63 | % | | | 9.36 | % |
Russell 1000® Index9 | | | 6.55 | % | | | 12.73 | % | | | 14.73 | % | | | 8.34 | % |
S&P 500 Index6 | | | 5.93 | % | | | 12.73 | % | | | 14.47 | % | | | 8.01 | % |
The performance data shown represents past performance. Past performance is not a guarantee of future results. Current performance may be lower or higher than the performance data quoted. The investment return and principal value of an investment in the Fund will fluctuate so that an investor’s shares, when redeemed, may be worth more or less than their original cost.
Investors should carefully consider the Fund’s investment objectives, risks, charges, and expenses before investing. For performance information through the most recent month end, current net asset values per share for the Fund and other information, please call (800) 835-3879 or visit our website at www.amgfunds.com for a free prospectus. Read it carefully before investing or sending money.
Distributed by AMG Distributors, Inc., member FINRA/SIPC.
| 1 | Total return equals income yield plus share price change and assumes reinvestment of all dividends and capital gain distributions. Returns are net of fees and may reflect offsets of Fund expenses as described in the prospectus. No adjustment has been made for taxes payable by shareholders on their reinvested dividends and capital gain distributions. Returns for periods greater than one year are annualized. The listed returns on the Funds are net of expenses and based on the published NAV as of March 31, 2015. All returns are in U.S. dollars ($). |
| 2 | The Fund inception dates and returns for all periods prior to October 1, 2013, reflect performance of the predecessor Funds, Brandywine Fund, Inc. and Brandywine Blue Fund, which were managed by Friess Associates, LLC with the same investment objective and substantially similar investment policies. |
| 3 | The Fund invests in growth stocks, which may be more sensitive to market movements because their prices tend to reflect future investor expectations rather than just current profits. Growth stocks may underperform value stocks during given periods. |
| 4 | The Russell 3000® Growth Index measures the performance of those Russell 3000® Index companies with higher price-to-book ratios and higher forecasted growth values. Unlike the Fund, the Russell 3000® Growth Index is unmanaged, is not available for investment, and does not incur expenses. |
| 5 | The Russell 3000® Index is composed of the 3,000 largest U.S. companies as measured by market capitalization. Unlike the Fund, the Russell 3000® Index is unmanaged, is not available for investment, and does not incur expenses. |
| 6 | The S&P 500 Index is capitalization-weighted index of 500 stocks. The S&P 500 Index is designed to measure performance of the broad domestic economy through changes in the aggregate market value of 500 stocks representing all major industries. Unlike the Fund, the S&P 500 Index is unmanaged, is not available for investment, and does not incur expenses. |
| 7 | The Fund is subject to risks associated with investing in a concentrated fund, and the value of the Fund will be greatly affected by the fluctuations in the value of a single stock. |
| 8 | The Russell 1000® Growth Index is a market capitalization weighted index that measures the performance of those Russell 1000® companies with higher price-to-book ratio and higher forecasted growth values. Unlike the Fund, the Russell 1000® Growth Index is unmanaged, is not available for investment, and does not incur expenses. |
| 9 | The Russell 1000® Index measures the performance of approximately 1,000 of the largest securities based on a combination of their market cap and current index membership. Unlike the Fund, the Russell 1000® Index is unmanaged, is not available for investment, and does not incur expenses. |
The Russell 3000® Growth Index, Russell 3000® Index, Russell 1000® Growth Index and Russell 1000® Index are registered trademarks of Russell Investments. Russell® is a trademark of Russell Investments.
The S&P 500 Index is proprietary data of Standard & Poor’s, a division of McGraw-Hill Companies, Inc. All rights reserved.
Not FDIC insured, nor bank guaranteed. May lose value.
4
AMG Managers Brandywine Fund
Fund Snapshots (unaudited)
March 31, 2015
PORTFOLIO BREAKDOWN
| | | | | | | | | | | | | | | | |
| | | AMG | | | Russell | | | | | | | |
| | | Managers | | | 3000® | | | Russell | | | | |
| | | Brandywine | | | Growth | | | 3000® | | | S&P 500 | |
Industry (Top Ten) | | Fund** | | | Index | | | Index | | | Index | |
Semiconductors | | | 8.5 | % | | | 2.6 | % | | | 2.5 | % | | | 2.4 | % |
Technology Hardware, Storage & Peripherals | | | 6.7 | % | | | 6.6 | % | | | 4.1 | % | | | 4.9 | % |
Internet Software & Services | | | 6.5 | % | | | 5.8 | % | | | 3.3 | % | | | 3.4 | % |
Apparel, Accessories & Luxury Goods | | | 4.5 | % | | | 1.6 | % | | | 0.9 | % | | | 0.9 | % |
General Merchandise Stores | | | 4.1 | % | | | 0.7 | % | | | 0.7 | % | | | 0.8 | % |
Construction Machinery & Heavy Trucks | | | 3.6 | % | | | 0.1 | % | | | 0.2 | % | | | 0.1 | % |
Trucking | | | 3.5 | % | | | 1.3 | % | | | 1.0 | % | | | 1.0 | % |
Cable & Satellite | | | 3.5 | % | | | 5.0 | % | | | 3.5 | % | | | 3.5 | % |
IT Consulting & Other Services | | | 3.4 | % | | | 5.6 | % | | | 3.3 | % | | | 3.4 | % |
Communications Equipment | | | 3.3 | % | | | 1.4 | % | | | 1.5 | % | | | 1.6 | % |
Other Common Stock | | | 49.9 | % | | | 69.3 | % | | | 79.0 | % | | | 78.0 | % |
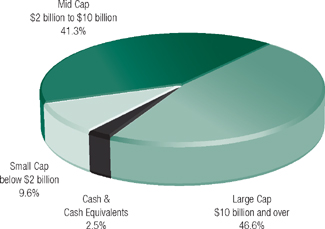
Cash & Cash Equivalents† | | | 2.5 | % | | | 0.0 | % | | | 0.0 | % | | | 0.0 | % |
| ** | As a percentage of net assets. |
| † | Includes Other Assets and Liabilities. |
PORTFOLIO MARKET CAPITALIZATION
TOP TEN HOLDINGS
| | | | | | | | |
| | | % of | | | % Change from | |
Security Name | | Net Assets | | | Book Cost | |
Apple, Inc.* | | | 5.7 | % | | | 28.9 | % |
Synchronoss Technologies, Inc.* | | | 2.2 | | | | 36.2 | |
Cognizant Technology Solutions Corp., Class A | | | 2.2 | | | | 20.1 | |
Jarden Corp.* | | | 2.2 | | | | 85.4 | |
Facebook, Inc., Class A* | | | 2.0 | | | | 22.2 | |
Qorvo, Inc. | | | 2.0 | | | | 109.6 | |
Skechers U.S.A., Inc., Class A | | | 1.9 | | | | 40.3 | |
Spirit AeroSystems Holdings, Inc., Class A | | | 1.9 | | | | 35.2 | |
Comcast Corp., Class A | | | 1.8 | | | | 9.0 | |
Infinera Corp. | | | 1.8 | | | | 78.5 | |
| | | | | | | | |
Top Ten as a Group | | | 23.7 | % | | | | |
| | | | | | | | |
| * | Also Top Ten Holding as of December 31, 2014. |
ESTIMATED EARNINGS GROWTH RATE
OF THE FUND’S INVESTMENTS
Forecasted Increase in Earnings Per Share 2015 vs 2014
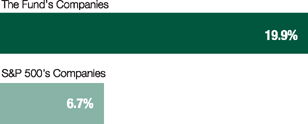
Source: Consensus estimates from FactSet Research Systems Inc
This is not a forecast of the Fund’s future performance. Earnings growth for a Fund holding does not guarantee a corresponding increase in the market value of the holding or the Fund.
Because a fund’s strategy may result in multiple investments in particular sectors of the economy, its performance may depend on the performance of those sectors and may fluctuate more widely than investments diversified across more sectors. For additional information on these and other risk considerations, please see the Fund’s prospectus.
Any sectors, industries, or securities discussed should not be perceived as investment recommendations. Mention of a specific security should not be considered a recommendation to buy or solicitation to sell that security. Specific securities mentioned in this report may have been sold from the Fund’s portfolio of investments by the time you receive this report.
AMG Managers Brandywine Fund
Roses and Thorns (unaudited)
Quarter Ending March 31, 2015
| | | | | | |
| $ Gain | | | | | | |
(in millions) | | % Gain | | Biggest $ Winners | | Reason for Move |
| | | | Apple Inc. | | |
| $5.7 | | 12.9 | | The maker of personal computers, software and mobile communications devices grew December-quarter earnings 48 percent, beating the consensus estimate by 18 percent. Revenue grew 29 percent, driven by strong iPhone sales and growth in international markets. |
| | | |
| | | | Skechers USA Inc. | | |
| $4.4 | | 28.2 | | The footwear company grew December-quarter earnings 54 percent. Market share gains and international expansion drove 26 percent revenue growth. In its release, Sketchers cited a 60 percent increase in backlogged orders, a 17 percent rise in January same-store sales growth and continued expansion as reasons for the investment community to expect record sales in the first quarter of 2015. |
| | | |
| | | | Infinera Corp. | | |
| $3.9 | | 33.2 | | The provider of optical networking equipment, software and services reported December-quarter earnings of $0.13 per share, topping the consensus estimate. Revenue increased 34 percent to $186 million. Results reflected strong demand for data center systems. |
| | | |
| | | | Universal Display Corp. | | |
| $3.5 | | 46.1 | | The leading developer of organic light emitting diode (OLED) technologies and materials for flat-panel displays, lighting, and electronic communications reported December-quarter earnings of $0.28 per share. Revenue grew 14 percent.The company enjoyed strong order growth from Samsung for materials used in handsets sold in China. |
| | | |
| | | | Qorvo Inc. | | |
| $3.2 | | 18.5 | | The maker of semiconductors and components used in wireless communications grew December-quarter earnings 148 percent, beating estimates. Strong sales to handset manufacturers drove revenue growth of 38 percent. Management issued revenue guidance representing more than 40 percent year-over-year growth for the March quarter. |
| | | |
| $ Loss | | | | | | |
(in millions) | | % Loss | | Biggest $ Losers | | Reason for Move |
| | | | Alibaba Group Holding Ltd. | | |
| $3.6 | | 16.9 | | The operator of an online commerce company reported 37 percent earnings growth, topping expectations. While gross merchandise volume was strong, mobile monetization rates were weaker than expected, impacting revenue growth. We sold Alibaba to fund a new holding with better near-term earnings visibility. |
| | | |
| | | | Pilgrim’s Pride Corp. | | |
| $3.0 | | 22.2 | | The producer of chicken products in the U.S. and Mexico exceeded expectations with 51 percent December-quarter earnings growth. While results showed strong pricing amid tight supplies, shares came under pressure due to concerns that chicken production would accelerate and feed costs would rise. We sold Pilgrim’s Pride to fund a new holding with greater near-term earnings visibility. |
| | | |
| | | | H&E Equipment Services Inc. | | |
| $2.0 | | 33.8 | | The heavy construction and industrial equipment rental and sales company grew December-quarter earnings 8 percent. Improved utilization and pricing drove a 21 percent increase in rental revenue. Shares declined on concerns that lower energy prices would decrease demand from energy and industrial customers. We sold H&E Equipment Services to fund an opportunity with greater earnings visibility. |
| | | |
| | | | The Hain Celestial Group Inc. | | |
| $1.6 | | 8.6 | | The natural food and personal care product maker reported 24 percent December-quarter earnings growth, beating the consensus estimate. Shares lost ground when the company tempered forward guidance due to reduced soup sales in the United Kingdom amid warm weather. We sold Hain Celestial to fund a new opportunity with better near-term earnings visibility. |
| | | |
| | | | United Rentals Inc. | | |
| $1.5 | | 10.6 | | The largest equipment rental company in the United States reported 38 percent December-quarter earnings growth, beating the consensus estimate. Although results demonstrated strong utilization, shares declined on concerns that lower energy prices would decrease demand for its equipment in energy related projects. |
All gains/losses are calculated on an average cost basis from December 31, 2014 through March 31, 2015.
This commentary reflects the viewpoints of Friess Associates, LLC as of March 31, 2015 and is not intended as a forecast or guarantee of future results.
6
AMG Managers Brandywine Fund
Schedule of Portfolio Investments (unaudited)
March 31, 2015
| | | | | | | | | | |
Shares | | | | Cost | | | Value | |
Common Stocks - 97.5% | | | | | |
Consumer Discretionary | | | | | | | | |
| | Apparel Retail - 2.9% | |
| 594,125 | | American Eagle Outfitters, Inc. | | $ | 8,379,712 | | | $ | 10,147,655 | |
| 213,410 | | The TJX Cos., Inc. | | | 12,807,346 | | | | 14,949,371 | |
| | Apparel, Accessories & Luxury Goods - 4.5% | |
| 156,465 | | Columbia Sportswear Co. | | | 6,604,816 | | | | 9,528,718 | |
| 30,388 | | Iconix Brand Group, Inc.* | | | 1,073,050 | | | | 1,023,164 | |
| 156,285 | | Under Armour, Inc., Class A* | | | 10,502,734 | | | | 12,620,014 | |
| 200,560 | | VF Corp. | | | 7,710,789 | | | | 15,104,174 | |
| | Cable & Satellite - 3.5% | |
| 181,795 | | AMC Networks, Inc., Class A* | | | 11,799,483 | | | | 13,932,769 | |
| 277,935 | | Comcast Corp., Class A | | | 14,404,856 | | | | 15,694,989 | |
| | Footwear - 2.3% | |
| 26,720 | | NIKE, Inc., Class B | | | 1,982,274 | | | | 2,680,818 | |
| 229,825 | | Skechers U.S.A., Inc., Class A* | | | 11,780,002 | | | | 16,526,716 | |
| | General Merchandise Stores - 4.1% | |
| 308,590 | | Big Lots, Inc. | | | 14,512,445 | | | | 14,821,578 | |
| 180,555 | | Dollar General Corp.* | | | 12,236,723 | | | | 13,610,236 | |
| 79,670 | | Target Corp. | | | 6,502,749 | | | | 6,538,517 | |
| | Hotels, Resorts & Cruise Lines - 0.8% | |
| 211,485 | | Diamond Resorts International, Inc.* | | | 7,137,619 | | | | 7,069,944 | |
| | Household Appliances - 1.1% | |
| 111,810 | | Helen of Troy, Ltd.* | | | 8,529,249 | | | | 9,111,397 | |
| | Housewares & Specialties - 2.2% | |
| 348,885 | | Jarden Corp.* | | | 9,957,085 | | | | 18,456,016 | |
| | Internet Retail - 0.4% | |
| 2,945 | | The Priceline Group, Inc.* | | | 3,444,517 | | | | 3,428,422 | |
| | Movies & Entertainment - 1.9% | |
| 106,810 | | Regal Entertainment Group, Class A1 | | | 2,257,947 | | | | 2,439,540 | |
| 133,605 | | The Walt Disney Co. | | | 12,399,876 | | | | 14,013,828 | |
| | Restaurants - 1.1% | |
| 89,380 | | Papa John’s International, Inc. | | | 3,850,283 | | | | 5,524,578 | |
| 110,465 | | Sonic Corp. | | | 2,335,193 | | | | 3,501,741 | |
| | Specialty Stores - 1.0% | |
| 64,245 | | Signet Jewelers, Ltd. | | | 7,785,765 | | | | 8,916,564 | |
| | | | | | | | | | |
Total Consumer Discretionary | | | 177,994,513 | | | | 219,640,749 | |
| | This sector is 23.4% above your Fund’s cost. | | | | | |
Consumer Staples | | | | | | | | |
| | Drug Retail - 0.6% | |
| 138,725 | | Diplomat Pharmacy, Inc.* | | | 2,109,657 | | | | 4,797,110 | |
| | This sector is 127.4% above your Fund’s cost. | | | | | |
Financials | | | | | | | | |
| | Hotel & Resort REITs - 1.3% | |
| 230,725 | | Pebblebrook Hotel Trust | | | 8,681,742 | | | | 10,744,863 | |
| | | | | | | | | | |
Shares | | | | Cost | | | Value | |
| | Multi-Line Insurance - 1.4% | |
| 215,135 | | HCC Insurance Holdings, Inc. | | $ | 11,466,205 | | | $ | 12,191,700 | |
| | Property & Casualty Insurance - 0.6% | |
| 138,165 | | FNF Group | | | 5,019,224 | | | | 5,078,945 | |
| | | | | | | | | | |
Total Financials | | | 25,167,171 | | | | 28,015,508 | |
| | This sector is 11.3% above your Fund’s cost. | | | | | |
Health Care | | | | | | | | |
| | Biotechnology - 2.8% | |
| 68,690 | | Alexion Pharmaceuticals, Inc.* | | | 12,507,968 | | | | 11,903,977 | |
| 102,590 | | Celgene Corp.* | | | 2,661,610 | | | | 11,826,575 | |
| | Health Care Distributors - 1.1% | |
| 102,650 | | Cardinal Health, Inc. | | | 7,767,294 | | | | 9,266,215 | |
| | Health Care Equipment - 2.5% | |
| 18,720 | | Entellus Medical, Inc.* | | | 351,393 | | | | 409,968 | |
| 167,960 | | NuVasive, Inc.* | | | 5,917,427 | | | | 7,724,480 | |
| 184,125 | | STERIS Corp. | | | 11,854,812 | | | | 12,938,464 | |
| | Health Care Services - 2.0% | |
| 159,825 | | Omnicare, Inc. | | | 12,035,776 | | | | 12,316,115 | |
| 113,070 | | Premier, Inc., Class A | | | 4,116,008 | | | | 4,249,171 | |
| | Health Care Technology - 2.1% | |
| 74,640 | | athenahealth, Inc.* | | | 9,310,443 | | | | 8,911,270 | |
| 124,395 | | Cerner Corp.* | | | 7,243,362 | | | | 9,113,178 | |
| 9,700 | | Connecture, Inc.*,1 | | | 77,600 | | | | 100,395 | |
| | Managed Health Care - 2.6% | |
| 87,435 | | Cigna Corp. | | | 11,244,315 | | | | 11,317,586 | |
| 91,780 | | UnitedHealth Group, Inc. | | | 7,086,243 | | | | 10,856,656 | |
| | Pharmaceuticals - 1.5% | |
| 373,160 | | Pfizer, Inc. | | | 12,844,023 | | | | 12,982,236 | |
| | | | | | | | | | |
Total Health Care | | | 105,018,274 | | | | 123,916,286 | |
| | This sector is 18.0% above your Fund’s cost. | | | | | |
Industrials | | | | | | | | |
| | Aerospace & Defense - 1.9% | |
| 314,125 | | Spirit AeroSystems Holdings, Inc., Class A* | | | 12,129,505 | | | | 16,400,466 | |
| | Air Freight & Logistics - 1.6% | |
| 301,934 | | XPO Logistics, Inc.* | | | 8,130,549 | | | | 13,728,939 | |
| | Airlines - 1.7% | |
| 323,180 | | Delta Air Lines, Inc. | | | 14,954,784 | | | | 14,530,173 | |
| | Building Products - 0.6% | |
| 95,355 | | Universal Forest Products, Inc. | | | 5,077,687 | | | | 5,290,295 | |
| | Construction Machinery & Heavy Trucks - 3.6% | |
| 230,620 | | The Greenbrier Cos., Inc.1 | | | 11,585,842 | | | | 13,375,960 | |
| 115,890 | | Trinity Industries, Inc. | | | 3,216,134 | | | | 4,115,254 | |
| 135,920 | | Wabtec Corp. | | | 3,675,651 | | | | 12,913,759 | |
The accompanying notes are an integral part of these financial statements.
7
AMG Managers Brandywine Fund
Schedule of Portfolio Investments (continued)
| | | | | | | | | | |
Shares | | | | Cost | | | Value | |
Industrials (continued) | | | | | | | | |
| | Diversified Support Services - 1.5% | |
| 342,445 | | KAR Auction Services, Inc. | | $ | 10,577,836 | | | $ | 12,988,939 | |
| | Heavy Electrical Equipment - 0.2% | |
| 105,106 | | PowerSecure International, Inc.* | | | 1,170,886 | | | | 1,383,195 | |
| | Human Resources & Employment Services - 1.2% | |
| 278,370 | | TriNet Group, Inc.* | | | 5,578,011 | | | | 9,806,975 | |
| | Trading Companies & Distributors - 1.4% | |
| 130,800 | | United Rentals, Inc.* | | | 6,727,167 | | | | 11,923,728 | |
| | Trucking - 3.5% | |
| 108,745 | | Knight Transportation, Inc. | | | 3,356,028 | | | | 3,507,026 | |
| 71,070 | | Old Dominion Freight Line, Inc.* | | | 5,070,180 | | | | 5,493,711 | |
| 185,790 | | Saia, Inc.* | | | 8,499,563 | | | | 8,230,497 | |
| 493,740 | | Swift Transportation Co.* | | | 13,919,887 | | | | 12,847,115 | |
| | | | | | | | | | |
Total Industrials | | | 113,669,710 | | | | 146,536,032 | |
| | This sector is 28.9% above your Fund’s cost. | | | | | |
Information Technology | | | | | | | | |
| | Application Software - 2.4% | |
| 145,500 | | Callidus Software, Inc.* | | | 1,891,500 | | | | 1,844,940 | |
| 396,770 | | Synchronoss Technologies, Inc.* | | | 13,826,164 | | | | 18,830,704 | |
| | Communications Equipment - 3.3% | |
| 468,630 | | Cisco Systems, Inc. | | | 12,983,766 | | | | 12,899,041 | |
| 769,480 | | Infinera Corp.* | | | 8,479,869 | | | | 15,135,672 | |
| | Electronic Components - 1.7% | |
| 529,715 | | Corning, Inc. | | | 10,958,372 | | | | 12,013,936 | |
| 61,395 | | Universal Display Corp.* | | | 1,846,705 | | | | 2,870,216 | |
| | Electronic Equipment & Instruments - 0.3% | |
| 160,765 | | Newport Corp.* | | | 3,235,890 | | | | 3,064,181 | |
| | Internet Software & Services - 6.5% | |
| 211,145 | | Facebook, Inc., Class A* | | | 14,208,141 | | | | 17,359,286 | |
| 53,960 | | GrubHub, Inc.* | | | 2,056,806 | | | | 2,449,244 | |
| 304,890 | | LendingClub Corp.* | | | 7,007,170 | | | | 5,991,089 | |
| 47,257 | | LinkedIn Corp., Class A* | | | 12,391,181 | | | | 11,807,634 | |
| 175,960 | | LogMeln, Inc.* | | | 8,071,281 | | | | 9,852,000 | |
| 110,035 | | Shutterstock, Inc.* | | | 7,421,061 | | | | 7,556,103 | |
| | IT Consulting & Other Services - 3.4% | |
| 299,150 | | Cognizant Technology Solutions Corp., Class A* | | | 15,543,766 | | | | 18,663,968 | |
| 194,955 | | Luxoft Holding, Inc.* | | | 7,376,282 | | | | 10,086,972 | |
| | Semiconductors - 8.5% | |
| 117,415 | | Avago Technologies, Ltd. | | | 9,856,677 | | | | 14,909,357 | |
| 394,455 | | Integrated Device Technology, Inc.* | | | 6,881,964 | | | | 7,896,989 | |
| 276,960 | | Maxim Integrated Products, Inc. | | | 9,000,693 | | | | 9,640,978 | |
| 401,255 | | Microsemi Corp.* | | | 10,828,052 | | | | 14,204,427 | |
| 214,408 | | Qorvo, Inc.* | | | 8,152,736 | | | | 17,088,318 | |
| 309,795 | | Silicon Motion Technology Corp. ADR | | | 8,291,252 | | | | 8,327,290 | |
| | Systems Software - 1.6% | |
| 163,805 | | Check Point Software Technologies, Ltd.* | | | 13,026,845 | | | | 13,427,096 | |
| | | | | | | | | | |
Shares | | | | Cost | | | Value | |
| | Technology Hardware, Storage & Peripherals - 6.7% | |
| 315,055 | | 3D Systems Corp.*,1 | | $ | 9,643,296 | | | $ | 8,638,808 | |
| 391,088 | | Apple, Inc. | | | 37,755,227 | | | | 48,663,080 | |
| | | | | | | | | | |
Total Information Technology | | | 240,734,696 | | | | 293,221,329 | |
| | This sector is 21.8% above your Fund’s cost. | | | | | |
Materials | | | | | | | | |
| | Construction Materials - 0.1% | |
| 45,695 | | Headwaters, Inc. | | | 828,700 | | | | 838,046 | |
| | This sector is 1.1% above your Fund’s cost. | | | | | |
Telecommunication Services | | | | | | | | |
| | Alternative Carriers - 0.6% | |
| 67,870 | | Cogent Communications Holdings, Inc.* | | | 2,484,890 | | | | 2,397,847 | |
| 481,165 | | ORBCOMM, Inc.* | | | 2,709,271 | | | | 2,872,555 | |
| | Wireless Telecommunication Services - 0.9% | |
| 66,620 | | SBA Communications Corp., Class A* | | | 5,944,286 | | | | 7,801,202 | |
| | | | | | | | | | |
Total Telecommunication Services | | | 11,138,447 | | | | 13,071,604 | |
| | This sector is 17.4% above your Fund’s cost. | | | | | |
Total Common Stocks | | | 676,661,168 | | | | 830,036,664 | |
| | | |
| | | | | Principal
Amount | | | | |
Short-Term Investments - 3.9% | | | | | | | | |
Repurchase Agreements - 2.2%2 | | | | | | | | |
| | BNP Paribas Securities Corp., dated 03/31/15, due 04/01/15, 0.130%, total to be received $936,903 (collateralized by various U.S. Government Agency Obligations, 1.625% - 6.000%, 06/01/16 - 03/01/45, totaling $955,638) | | $ | 936,900 | | | | 936,900 | |
| | Daiwa Capital Markets America, dated 03/31/15, due 04/01/15, 0.180%, total to be received $4,450,595 (collateralized by various U.S. Government Agency Obligations, 0.000% - 8.000%, 02/15/16 - 03/01/48, totaling $4,539,585) | | | 4,450,573 | | | | 4,450,573 | |
| | Merrill Lynch, Pierce, Fenner & Smith, Inc., dated 03/31/15, due 04/01/15, 0.150%, total to be received $4,450,592 (collateralized by various U.S. Government Agency Obligations, 0.000% - 7.000%, 06/01/15 - 04/01/45, totaling $4,539,584) | | | 4,450,573 | | | | 4,450,573 | |
The accompanying notes are an integral part of these financial statements.
8
AMG Managers Brandywine Fund
Schedule of Portfolio Investments (continued)
| | | | | | | | | | |
| | | | | Principal Amount | | | Value | |
| | Mizuho Securities USA, Inc., dated 03/31/15, due 04/01/15, 0.150%, total to be received $4,450,592 (collateralized by various U.S. Government Agency Obligations, 2.000% - 5.000%, 05/01/44 - 04/01/45, totaling $4,539,585) | | $ | 4,450,573 | | | $ | 4,450,573 | |
| | Nomura Securities International, Inc.,dated 03/31/15, due 04/01/15, 0.130%, total to be received $4,450,589 (collateralized by various U.S. Government Agency Obligations, 1.280% - 7.500%, 08/18/15 - 02/20/65 totaling $4,539,584) | | | 4,450,573 | | | | 4,450,573 | |
| | | | | | | | | | |
Total Repurchase Agreements | | | 18,739,192 | | | | 18,739,192 | |
| | | | | | | | | | |
Shares | | | | Cost | | | Value | |
Other Investment Companies - 1.7%3 | | | | | |
14,606,972 | | Dreyfus Institutional Cash Advantage Fund, Institutional Class Shares, 0.06% | | $ | 14,606,972 | | | $ | 14,606,972 | |
| | | | | | | | | | |
Total Short-Term Investments | | | 33,346,164 | | | | 33,346,164 | |
Total Investments - 101.4% | | $ | 710,007,332 | | | | 863,382,828 | |
| | | | | | | | | | |
Other Assets, less Liabilities - (1.4)% | | | | | | | (12,239,901 | ) |
Total Net Assets - 100.0% | | | | | | $ | 851,142,927 | |
| | | | | | | | | | |
The accompanying notes are an integral part of these financial statements.
9
AMG Managers Brandywine Blue Fund
Fund Snapshots (unaudited)
March 31, 2015
PORTFOLIO BREAKDOWN
| | | | | | | | | | | | | | | | |
| | | AMG | | | | | | | | | | |
| | | Managers | | | Russell | | | | | | | |
| | | Brandywine | | | 1000® | | | Russell | | | | |
| | | Blue | | | Growth | | | 1000® | | | S&P 500 | |
Industry (Top Ten) | | Fund** | | | Index | | | Index | | | Index | |
Biotechnology | | | 7.7 | % | | | 5.9 | % | | | 3.1 | % | | | 3.0 | % |
Technology Hardware, Storage & Peripherals | | | 7.6 | % | | | 7.1 | % | | | 4.4 | % | | | 4.9 | % |
Semiconductors | | | 6.6 | % | | | 2.3 | % | | | 2.3 | % | | | 2.4 | % |
Internet Software & Services | | | 6.1 | % | | | 6.0 | % | | | 3.3 | % | | | 3.4 | % |
Construction Machinery & Heavy Trucks | | | 5.6 | % | | | 0.1 | % | | | 0.2 | % | | | 0.1 | % |
Apparel, Accessories & Luxury Goods | | | 5.2 | % | | | 1.6 | % | | | 0.9 | % | | | 0.9 | % |
Airlines | | | 4.4 | % | | | 1.0 | % | | | 0.7 | % | | | 0.6 | % |
General Merchandise Stores | | | 3.1 | % | | | 0.7 | % | | | 0.8 | % | | | 0.8 | % |
Wireless Telecommunication Services | | | 3.0 | % | | | 0.1 | % | | | 0.1 | % | | | 0.0 | % |
Apparel Retail | | | 3.0 | % | | | 4.3 | % | | | 2.6 | % | | | 2.5 | % |
Other Common Stock | | | 45.6 | % | | | 70.9 | % | | | 81.6 | % | | | 81.4 | % |
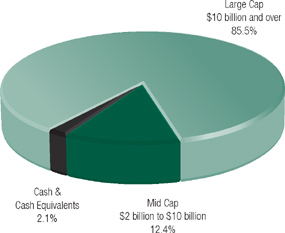
Cash & Cash Equivalent† | | | 2.1 | % | | | 0.0 | % | | | 0.0 | % | | | 0.0 | % |
| ** | As a percentage of net assets. |
| † | Includes Other Assets and Liabilities. |
PORTFOLIO MARKET CAPITALIZATION
TOP TEN HOLDINGS
| | | | | | | | |
| | | % of | | | % Change from | |
Security Name | | Net Assets | | | Book Cost | |
Apple, Inc.* | | | 7.6 | % | | | 52.0 | % |
Facebook, Inc., Class A | | | 3.1 | | | | 22.1 | |
Wabtec Corp. | | | 3.1 | | | | 39.0 | |
SBA Communications Corp., Class A | | | 3.0 | | | | 32.4 | |
The TJX Cos., Inc.* | | | 3.0 | | | | 16.5 | |
Avago Technologies, Ltd. | | | 3.0 | | | | 50.3 | |
VF Corp. | | | 2.9 | | | | 76.4 | |
Signet Jewelers, Ltd. | | | 2.9 | | | | 14.4 | |
Comcast Corp., Class A* | | | 2.8 | | | | 9.4 | |
Marsh & McLennan Cos., Inc. | | | 2.8 | | | | 73.2 | |
| | | | | | | | |
Top Ten as a Group | | | 34.2 | % | | | | |
| | | | | | | | |
| * | Also Top Ten Holding as of December 31, 2014. |
ESTIMATED EARNINGS GROWTH RATE
OF THE FUND’S INVESTMENTS
Forecasted Increase in Earnings Per Share 2015 vs 2014
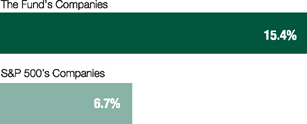
Source: Consensus estimates from FactSet Research Systems Inc.
This is not a forecast of the Fund’s future performance. Earnings growth for a Fund holding does not guarantee a corresponding increase in the market value of the holding or the Fund.
Because a fund’s strategy may result in multiple investments in particular sectors of the economy, its performance may depend on the performance of those sectors and may fluctuate more widely than investments diversified across more sectors. For additional information on these and other risk considerations, please see the Fund’s prospectus.
Any sectors, industries, or securities discussed should not be perceived as investment recommendations. Mention of a specific security should not be considered a recommendation to buy or solicitation to sell that security. Specific securities mentioned in this report may have been sold from the Fund’s portfolio of investments by the time you receive this report.
10
AMG Managers Brandywine Blue Fund
Roses and Thorns (unaudited)
Quarter Ending March 31, 2015
| | | | | | |
| $ Gain | | | | | | |
(in millions) | | % Gain | | Biggest $ Winners | | Reason for Move |
| | | | Apple Inc. | | |
| $1.8 | | 12.7 | | The maker of personal computers, software and mobile communications devices grew December-quarter earnings 48 percent, beating the consensus estimate by 18 percent. Revenue grew 29 percent, driven by strong iPhone sales and growth in international markets. |
| | | |
| | | | Avago Technologies Ltd. | | |
| $1.3 | | 26.2 | | The maker of semiconductors and optoelectronic components reported 149 percent January-quarter earnings growth. Revenue increased 130 percent, driven by strength in its wireless business. The company reported a gross profit margin of 51 percent, up from 48 percent in the year-ago period. |
| | | |
| | | | Trinity Industries Inc. | | |
| $1.1 | | 26.8 | | The manufacturer of railcars, barges, and products used in heavy construction projects grew December-quarter earnings 21 percent, topping expectations. Revenue increased 32 percent. A record number of orders in 2014 brought the company’s backlog to $7.2 billion by the end of the period, providing the company significant production visibility to start 2015. |
| | | |
| | | | Cognizant Technology Solutions Corp. | | |
| $0.9 | | 18.0 | | The developer of software solutions to improve productivity grew December-quarter earnings 18 percent, exceeding expectations. Revenue increased 10 percent, driven by strong demand across all markets and geographies. During the quarter, Cognizant completed its acquisition of TriZetto, a strategic move meant to help Cognizant increase market share in the health-care technology arena. |
| | | |
| | | | Under Armour Inc. | | |
| $0.9 | | 14.2 | | The maker of athletic and outdoor apparel and accessories exceeded expectations with 38 percent December-quarter earnings growth. Sales grew 31 percent, with international sales making a stronger contribution than expected. The company also announced that it completed its acquisition of Endomondo, helping Under Armour establish the world’s largest digital health and fitness community. |
| | | |
| $ Loss | | | | | | |
(in millions) | | % Loss | | Biggest $ Losers | | Reason for Move |
| | | | Alibaba Group Holding Ltd. | | |
| $1.4 | | 19.9 | | The operator of an online commerce company reported 37 percent earnings growth, topping expectations. While gross merchandise volume was strong, mobile monetization rates were weaker than expected, impacting revenue growth. We sold Alibaba to fund a new holding with better near-term earnings visibility. |
| | | |
| | | | Pilgrim’s Pride Corp. | | |
| $1.3 | | 23.0 | | The producer of chicken products in the U.S. and Mexico exceeded expectations with 51 percent December-quarter earnings growth. While results showed strong pricing amid tight supplies, shares came under pressure due to concerns that chicken production would accelerate and feed costs would rise. We sold Pilgrim’s Pride to fund a new holding with greater near-term earnings visibility. |
| | | |
| | | | Seagate Technology PLC | | |
| $0.8 | | 12.7 | | The maker of computer hard disk drives and data storage products earned $1.35 per share in the December quarter, meeting expectations. Shares declined due to pricing pressure on hard disk drives in the notebook PC market and guidance for higher operating expenses for the March quarter. We sold Seagate to fund a new holding with greater earnings visibility. |
| | | |
| | | | LendingClub Corp. | | |
| $0.5 | | 19.2 | | The online marketplace that facilitates loans to individuals and businesses reported 78 percent December-quarter revenue growth. Loan origination growth was 103 percent in the quarter. Shares traded lower as investors grew concerned that potential bank regulatory issues could slow growth. |
| | | |
| | | | Delta Air Lines Inc. | | |
| $0.5 | | 6.9 | | The global commercial airline reported 20 percent December-quarter earnings growth. Revenue rose 6 percent, driven by pricing and cargo-related gains. Shares declined on concerns about foreign exchange headwinds and expenses related to fuel hedging. |
All gains/losses are calculated on an average cost basis from December 31, 2014 through March 31, 2015.
This commentary reflects the viewpoints of Friess Associates, LLC as of March 31, 2015 and is not intended as a forecast or guarantee of future results.
11
AMG Managers Brandywine Blue Fund
Schedule of Portfolio Investments (unaudited)
March 31, 2015
| | | | | | | | | | |
Shares | | | | Cost | | | Value | |
Common Stocks - 97.9% | | | | | |
Consumer Discretionary | | | | | | | | |
| | Apparel Retail - 3.0% | |
| 88,135 | | The TJX Cos., Inc. | | $ | 5,299,103 | | | $ | 6,173,857 | |
| | Apparel, Accessories & Luxury Goods - 5.2% | |
| 58,470 | | Under Armour, Inc., Class A* | | | 3,895,566 | | | | 4,721,452 | |
| 79,855 | | VF Corp. | | | 3,409,607 | | | | 6,013,880 | |
| | Cable & Satellite - 2.8% | |
| 102,850 | | Comcast Corp., Class A | | | 5,310,412 | | | | 5,807,940 | |
| | Footwear - 2.7% | |
| 55,065 | | NIKE, Inc., Class B | | | 4,484,033 | | | | 5,524,671 | |
| | General Merchandise Stores - 3.1% | |
| 61,590 | | Dollar General Corp.* | | | 4,186,513 | | | | 4,642,654 | |
| 19,330 | | Target Corp. | | | 1,577,724 | | | | 1,586,413 | |
| | Home Improvement Retail - 1.8% | |
| 32,150 | | The Home Depot, Inc. | | | 3,703,973 | | | | 3,652,561 | |
| | Homebuilding - 1.9% | |
| 133,495 | | D.R. Horton, Inc. | | | 3,678,054 | | | | 3,801,938 | |
| | Internet Retail - 0.4% | |
| 715 | | The Priceline Group, Inc.* | | | 836,275 | | | | 832,367 | |
| | Movies & Entertainment - 2.3% | |
| 45,600 | | The Walt Disney Co. | | | 4,236,518 | | | | 4,782,984 | |
| | Restaurants - 2.6% | |
| 56,360 | | Starbucks Corp. | | | 4,136,509 | | | | 5,337,292 | |
| | Specialty Stores - 2.9% | |
| 43,205 | | Signet Jewelers, Ltd. | | | 5,242,206 | | | | 5,996,422 | |
| | | | | | | | | | |
Total Consumer Discretionary | | | 49,996,493 | | | | 58,874,431 | |
| | This sector is 17.8% above your Fund’s cost. | | | | | |
Consumer Staples | | | | | | | | |
| | Household Products - 2.6% | |
| 63,860 | | Church & Dwight Co., Inc. | | | 4,878,349 | | | | 5,454,921 | |
| | This sector is 11.8% above your Fund’s cost. | | | | | |
Financials | | | | | | | | |
| | Insurance Brokers - 2.8% | |
| 103,165 | | Marsh & McLennan Cos., Inc. | | | 3,341,679 | | | | 5,786,525 | |
| | Property & Casualty Insurance - 0.7% | |
| 36,517 | | FNF Group | | | 1,324,638 | | | | 1,342,365 | |
| | | | | | | | | | |
Total Financials | | | 4,666,317 | | | | 7,128,890 | |
| | This sector is 52.8% above your Fund’s cost. | | | | | |
Health Care | | | | | | | | |
| | Biotechnology - 7.7% | |
| 28,990 | | Alexion Pharmaceuticals, Inc.* | | | 5,591,604 | | | | 5,023,967 | |
| 48,725 | | Celgene Corp.* | | | 1,264,129 | | | | 5,617,018 | |
| | | | | | | | | | |
Shares | | | | Cost | | | Value | |
| 52,360 | | Gilead Sciences, Inc. | | $ | 5,024,288 | | | $ | 5,138,087 | |
| | Health Care Distributors - 2.7% | |
| 60,775 | | Cardinal Health, Inc. | | | 4,597,544 | | | | 5,486,159 | |
| | Health Care Services - 2.1% | |
| 55,420 | | Omnicare, Inc. | | | 4,168,936 | | | | 4,270,665 | |
| | Health Care Technology - 2.8% | |
| 78,660 | | Cerner Corp.* | | | 4,569,983 | | | | 5,762,632 | |
| | Managed Health Care - 1.3% | |
| 21,450 | | Cigna Corp. | | | 2,758,404 | | | | 2,776,488 | |
| | Pharmaceuticals - 2.1% | |
| 123,015 | | Pfizer, Inc. | | | 4,231,310 | | | | 4,279,692 | |
| | | | | | | | | | |
Total Health Care | | | 32,206,198 | | | | 38,354,708 | |
| | This sector is 19.1% above your Fund’s cost. | | | | | |
Industrials | | | | | | | | |
| | Airlines - 4.4% | |
| 81,400 | | American Airlines Group, Inc. | | | 4,255,433 | | | | 4,296,292 | |
| 104,015 | | Delta Air Lines, Inc. | | | 4,823,920 | | | | 4,676,514 | |
| | Construction Machinery & Heavy Trucks - 5.6% | |
| 145,740 | | Trinity Industries, Inc. | | | 5,984,538 | | | | 5,175,227 | |
| 66,970 | | Wabtec Corp. | | | 4,576,358 | | | | 6,362,820 | |
| | Trucking - 2.2% | |
| 57,990 | | Old Dominion Freight Line, Inc.* | | | 4,195,002 | | | | 4,482,627 | |
| | | | | | | | | | |
Total Industrials | | | 23,835,251 | | | | 24,993,480 | |
| | This sector is 4.9% above your Fund’s cost. | | | | | |
Information Technology | | | | | | | | |
| | Communications Equipment - 2.0% | |
| 149,310 | | Cisco Systems, Inc. | | | 4,140,362 | | | | 4,109,758 | |
| | Electronic Components - 2.0% | |
| 182,895 | | Corning, Inc. | | | 3,604,001 | | | | 4,148,059 | |
| | Internet Software & Services - 6.1% | |
| 77,580 | | Facebook, Inc., Class A* | | | 5,223,485 | | | | 6,378,240 | |
| 102,855 | | LendingClub Corp.* | | | 2,360,325 | | | | 2,021,101 | |
| 16,185 | | LinkedIn Corp., Class A* | | | 4,271,813 | | | | 4,043,984 | |
| | IT Consulting & Other Services - 2.8% | |
| 91,755 | | Cognizant Technology Solutions Corp., Class A* | | | 4,765,747 | �� | | | 5,724,594 | |
| | Semiconductors - 6.6% | |
| 48,610 | | Avago Technologies, Ltd. | | | 4,106,987 | | | | 6,172,498 | |
| 92,205 | | Maxim Integrated Products, Inc. | | | 2,990,359 | | | | 3,209,656 | |
| 53,345 | | Qorvo, Inc.* | | | 4,037,064 | | | | 4,251,597 | |
| | Systems Software - 2.1% | |
| 53,000 | | Check Point Software Technologies, Ltd.* | | | 4,237,314 | | | | 4,344,410 | |
The accompanying notes are an integral part of these financial statements.
12
AMG Managers Brandywine Blue Fund
Schedule of Portfolio Investments (continued)
| | | | | | | | | | |
Shares | | | | Cost | | | Value | |
Information Technology (continued) | | | | | |
| | Technology Hardware, Storage & Peripherals - 7.6% | |
| 125,000 | | Apple, Inc. | | $ | 10,230,632 | | | $ | 15,553,750 | |
| | | | | | | | | | |
Total Information Technology | | | 49,968,089 | | | | 59,957,647 | |
| | This sector is 20.0% above your Fund’s cost. | | | | | |
Telecommunication Services | | | | | |
| | Wireless Telecommunication Services - 3.0% | |
| 52,990 | | SBA Communications Corp., Class A* | | | 4,685,576 | | | | 6,205,129 | |
| | This sector is 32.4% above your Fund’s cost. | | | | | |
Total Common Stocks | | | 170,236,273 | | | | 200,969,206 | |
| | | | | | | | | | |
Shares | | | | Cost | | | Value | |
Other Investment Companies - 1.4%3 | | | | | |
| 2,897,274 | | Dreyfus Institutional Cash Advantage Fund, Institutional Class Shares, 0.06% | | $ | 2,897,274 | | | $ | 2,897,274 | |
| | | | | | | | | | |
Total Investments - 99.3% | | $ | 173,133,547 | | | | 203,866,480 | |
| | | | | | | | | | |
Other Assets, less Liabilities - 0.7% | | | | | | | 1,335,576 | |
Total Net Assets - 100.0% | | | | | | $ | 205,202,056 | |
| | | | | | | | | | |
The accompanying notes are an integral part of these financial statements.
13
Notes to Schedule of Portfolio Investments (unaudited)
The following footnotes and abbreviations should be read in conjunction with each of the Schedules of Portfolio Investments previously presented in this report. At March 31, 2015, the approximate cost of investments for federal income tax purposes and the aggregate gross unrealized appreciation and/or depreciation based on tax cost were as follows:
| | | | | | | | | | | | | | | | |
| Fund | | Cost | | | Appreciation | | | Depreciation | | | Net | |
AMG Managers Brandywine Fund | | $ | 710,223,257 | | | $ | 159,056,994 | | | $ | (5,897,423 | ) | | $ | 153,159,571 | |
AMG Managers Brandywine Blue Fund | | | 173,142,335 | | | | 32,901,475 | | | | (2,177,330 | ) | | | 30,724,145 | |
| * | Non-income producing security. |
| # | Rounds to less than 0.1%. |
| 1 | Some or all of these shares were out on loan to various brokers as of March 31, 2015, amounting to the following: |
| | | | | | | | |
| | | Market Value | | | % of Net Assets | |
AMG Managers Brandywine Fund | | $ | 18,409,023 | | | | 2.2 | % |
| 2 | Collateral received from brokers for securities lending was invested in these short-term investments. |
| 3 | Yield shown represents the March 31, 2015, seven-day average yield, which refers to the sum of the previous seven days’ dividends paid, expressed as an annual percentage. |
As of March 31, 2015, the investments in AMG Managers Brandywine Blue Fund were all Level 1 inputs. For a detailed breakout of the common stocks by major industry classification, please refer to the Schedule of Portfolio Investments.
The following table summarizes the inputs used to value the Fund’s net assets by the fair value hierarchy levels as of March 31, 2015. (See Note 1(a) in the Notes to Financial Statements.)
| | | | | | | | | | | | | | | | |
| | | Quoted Prices in Active Markets for Identical Investments Level 1 | | | Significant Other Observable Inputs Level 2 | | | Significant Unobservable Inputs Level 3 | | | Total | |
AMG Managers Brandywine Fund | | | | | | | | | | | | | | | | |
Investments in Securities | | | | | | | | | | | | | | | | |
Common Stocks† | | $ | 830,036,664 | | | | — | | | | — | | | $ | 830,036,664 | |
Short-Term Investments | | | | | | | | | | | | | | | | |
Repurchase Agreements | | | — | | | $ | 18,739,192 | | | | — | | | | 18,739,192 | |
Other Investment Companies | | | 14,606,972 | | | | — | | | | — | | | | 14,606,972 | |
| | | | | | | | | | | | | | | | |
Total Investments in Securities | | $ | 844,643,636 | | | $ | 18,739,192 | | | | — | | | $ | 863,382,828 | |
| | | | | | | | | | | | | | | | |
| † | All common stocks held in the Fund are Level 1 securities. For a detailed breakout of the common stocks by major industry classification, please refer to the Schedule of Portfolio Investments. |
As of March 31, 2015, the Funds had no transfers between levels from the beginning of the reporting period.
INVESTMENT DEFINITIONS AND ABBREVIATIONS:
ADR: ADR after the name of a holding stands for American Depositary Receipt, representing ownership of foreign securities on deposit with a domestic custodian bank. The value of the ADR securities is determined or significantly influenced by trading on exchanges not located in the United States or Canada. Sponsored ADRs are initiated by the underlying foreign company.
The accompanying notes are an integral part of these financial statements.
14
Statement of Assets and Liabilities (unaudited)
March 31, 2015
| | | | | | | | |
| | | | | | AMG Managers | |
| | | AMG Managers | | | Brandywine Blue | |
| | | Brandywine Fund | | | Fund | |
Assets: | | | | | | | | |
Investments at value* (including securities on loan valued at $18,409,023 and $0, respectively) | | $ | 863,382,828 | | | $ | 203,866,480 | |
Cash | | | 96,135 | | | | — | |
Receivable for investments sold | | | 19,615,892 | | | | 4,366,486 | |
Dividends, interest and other receivables | | | 721,873 | | | | 118,636 | |
Receivable for Fund shares sold | | | 253 | | | | 6,540 | |
Prepaid expenses | | | 14,482 | | | | 4,120 | |
Total assets | | | 883,831,463 | | | | 208,362,262 | |
Liabilities: | | | | | | | | |
Payable upon return of securities loaned | | | 18,739,192 | | | | — | |
Payable for investments purchased | | | 12,105,054 | | | | 2,661,697 | |
Payable for Fund shares repurchased | | | 999,041 | | | | 243,498 | |
Accrued expenses: | | | | | | | | |
Investment advisory and management fees | | | 725,594 | | | | 178,492 | |
Shareholder servicing fees | | | 14,512 | | | | 13,922 | |
Administrative fees | | | 21,247 | | | | 8,693 | |
Trustees fees and expenses | | | 2,066 | | | | 1,151 | |
Other | | | 81,830 | | | | 52,753 | |
Total liabilities | | | 32,688,536 | | | | 3,160,206 | |
Net Assets | | $ | 851,142,927 | | | $ | 205,202,056 | |
Net Assets Represent: | | | | | | | | |
Paid-in capital | | $ | 1,292,728,812 | | | $ | 1,181,446,519 | |
Undistributed net investment income (loss) | | | (577,450 | ) | | | 476,147 | |
Accumulated net realized loss from investments | | | (594,383,931 | ) | | | (1,007,453,543 | ) |
Net unrealized appreciation of investments | | | 153,375,496 | | | | 30,732,933 | |
Net Assets | | $ | 851,142,927 | | | $ | 205,202,056 | |
Shares outstanding | | | 22,729,863 | | | | 5,555,834 | |
Net asset value, offering and redemption price per share | | $ | 37.45 | | | $ | 36.93 | |
* Investments at cost | | $ | 710,007,332 | | | $ | 173,133,547 | |
The accompanying notes are an integral part of these financial statements.
15
Statement of Operations (unaudited)
For the six months ended March 31, 2015
| | | | | | | | |
| | | | | | AMG Managers | |
| | | AMG Managers | | | Brandywine Blue | |
| | | Brandywine Fund | | | Fund | |
Investment Income: | | | | | | | | |
Dividend income | | $ | 5,543,582 | 1 | | $ | 1,975,785 | 2 |
Securities lending income | | | 721,937 | | | | 68,933 | |
Interest income | | | 52,062 | | | | 19,057 | |
Total investment income | | | 6,317,581 | | | | 2,063,775 | |
Expenses: | | | | | | | | |
Investment advisory and management fees | | | 4,156,657 | | | | 1,063,104 | |
Administrative fees | | | 103,078 | | | | 31,893 | |
Shareholder servicing fees | | | 68,927 | | | | 82,922 | |
Transfer agent | | | 64,615 | | | | 10,290 | |
Professional fees | | | 35,692 | | | | 25,033 | |
Custodian | | | 31,163 | | | | 12,919 | |
Reports to shareholders | | | 28,641 | | | | 17,877 | |
Trustees fees and expenses | | | 18,510 | | | | 4,385 | |
Registration fees | | | 15,003 | | | | 17,200 | |
Miscellaneous | | | 8,285 | | | | 2,436 | |
Total expenses | | | 4,530,571 | | | | 1,268,059 | |
Net investment income | | | 1,787,010 | | | | 795,716 | |
Net Realized and Unrealized Gain (Loss): | | | | | | | | |
Net realized gain on investments | | | 55,575,963 | | | | 15,787,107 | |
Net change in unrealized appreciation (depreciation) of investments | | | 41,704,753 | | | | 4,097,339 | |
Net realized and unrealized gain | | | 97,280,716 | | | | 19,884,446 | |
Net increase in net assets resulting from operations | | $ | 99,067,726 | | | $ | 20,680,162 | |
| 1 | Includes non-recurring dividends of $2,531,862. |
| 2 | Includes non-recurring dividends of $1,019,501. |
The accompanying notes are an integral part of these financial statements.
16
Statements of Changes in Net Assets
For the six months ended March 31, 2015 (unaudited) and the fiscal year ended September 30, 2014
| | | | | | | | | | | | | | | | |
| | | AMG Managers | | | AMG Managers | |
| | | Brandywine Fund | | | Brandywine Blue Fund | |
| | | March 31, | | | September 30, | | | March 31, | | | September 30, | |
| | | 2015 | | | 2014 | | | 2015 | | | 2014 | |
Increase (Decrease) in Net Assets From Operations: | | | | | | | | | | | | | | | | |
Net investment income (loss) | | $ | 1,787,010 | | | $ | (3,054,059 | ) | | $ | 795,716 | | | $ | (268,697 | ) |
Net realized gain on investments | | | 55,575,963 | | | | 136,874,008 | | | | 15,787,107 | | | | 49,369,990 | |
Net change in unrealized appreciation (depreciation) of investments | | | 41,704,753 | | | | (13,784,277 | ) | | | 4,097,339 | | | | (21,262,048 | ) |
Net increase in net assets resulting from operations | | | 99,067,726 | | | | 120,035,672 | | | | 20,680,162 | | | | 27,839,245 | |
Capital Share Transactions: | | | | | | | | | | | | | | | | |
Proceeds from sale of shares | | | 34,440,842 | | | | 4,928,378 | | | | 7,020,738 | | | | 10,719,994 | |
Cost of shares repurchased | | | (81,410,180 | ) | | | (142,141,834 | ) | | | (38,439,401 | ) | | | (101,238,732 | ) |
Net decrease from capital share transactions | | | (46,969,338 | ) | | | (137,213,456 | ) | | | (31,418,663 | ) | | | (90,518,738 | ) |
Total increase (decrease) in net assets | | | 52,098,388 | | | | (17,177,784 | ) | | | (10,738,501 | ) | | | (62,679,493 | ) |
Net Assets: | | | | | | | | | | | | | | | | |
Beginning of period | | | 799,044,539 | | | | 816,222,323 | | | | 215,940,557 | | | | 278,620,050 | |
End of period | | $ | 851,142,927 | | | $ | 799,044,539 | | | $ | 205,202,056 | | | $ | 215,940,557 | |
End of period undistributed net investment income (loss) | | $ | (577,450 | ) | | $ | (2,364,460 | ) | | $ | 476,147 | | | $ | (319,569 | ) |
| | | | | | | | | | | | | | | | |
Share Transactions: | | | | | | | | | | | | | | | | |
Sale of shares | | | 987,657 | | | | 156,337 | | | | 197,917 | | | | 333,891 | |
Shares repurchased | | | (2,287,546 | ) | | | (4,517,062 | ) | | | (1,086,602 | ) | | | (3,172,984 | ) |
Net decrease in shares | | | (1,299,889 | ) | | | (4,360,725 | ) | | | (888,685 | ) | | | (2,839,093 | ) |
The accompanying notes are an integral part of these financial statements.
17
AMG Managers Brandywine Fund
Financial Highlights
For a share outstanding throughout each fiscal period
| | | | | | | | | | | | | | | | | | | | | | | | |
| | | For the six
months ended March 31, 2015
(unaudited) | | | | | | | | | | | | | | | | |
| | | | For the fiscal year ended September 30, | |
| | | | 20143 | | | 2013 | | | 2012 | | | 2011 | | | 2010 | |
Net Asset Value, Beginning of Period | | $ | 33.25 | | | $ | 28.75 | | | $ | 24.62 | | | $ | 21.38 | | | $ | 22.02 | | | $ | 21.11 | |
Income (loss) from Investment Operations: | | | | | | | | | | | | | | | | | | | | | | | | |
Net investment income (loss)1 | | | 0.08 | 6 | | | (0.12 | ) | | | (0.03 | ) | | | (0.05 | ) | | | (0.09 | ) | | | (0.07 | ) |
Net realized and unrealized gain (loss) on investments1 | | | 4.12 | | | | 4.62 | | | | 4.16 | | | | 3.29 | | | | (0.55 | ) | | | 0.98 | |
Total income (loss) from investment operations | | | 4.20 | | | | 4.50 | | | | 4.13 | | | | 3.24 | | | | (0.64 | ) | | | 0.91 | |
Net Asset Value, End of Period | | $ | 37.45 | | | $ | 33.25 | | | $ | 28.75 | | | $ | 24.62 | | | $ | 21.38 | | | $ | 22.02 | |
Total Return | | | 12.63 | %4,7 | | | 15.65 | % | | | 16.77 | % | | | 15.15 | % | | | (2.91 | )% | | | 4.31 | % |
Ratio of total expenses to average net assets | | | 1.09 | %5 | | | 1.10 | % | | | 1.11 | %2 | | | 1.08 | % | | | 1.09 | % | | | 1.11 | % |
Ratio of net investment income (loss) to average net assets | | | 0.43 | %5 | | | (0.37 | )% | | | (0.12 | )% | | | (0.23 | )% | | | (0.36 | )% | | | (0.33 | )% |
Portfolio turnover | | | 88 | % | | | 219 | % | | | 214 | % | | | 256 | % | | | 234 | % | | | 225 | % |
Net assets at end of period (000’s omitted) | | $ | 851,143 | | | $ | 799,045 | | | $ | 816,222 | | | $ | 1,062,544 | | | $ | 1,336,871 | | | $ | 1,755,754 | |
| | | | | | | | | | | | | | | | | | | | | | | | |
18
AMG Managers Brandywine Blue Fund
Financial Highlights
For a share outstanding throughout each fiscal period
| | | | | | | | | | | | | | | | | | | | | | | | |
| | | For the six
months ended March 31, 2015
(unaudited) | | | | | | | | | | | | | | | | |
| | | | For the fiscal year ended September 30, | |
| | | | 20143 | | | 2013 | | | 2012 | | | 2011 | | | 2010 | |
Net Asset Value, Beginning of Period | | $ | 33.51 | | | $ | 30.01 | | | $ | 25.00 | | | $ | 21.50 | | | $ | 21.78 | | | $ | 20.67 | |
Income (loss) from Investment Operations: | | | | | | | | | | | | | | | | | | | | | | | | |
Net investment income (loss)1 | | | 0.13 | 6 | | | (0.03 | ) | | | 0.12 | | | | (0.11 | ) | | | (0.10 | ) | | | (0.06 | ) |
Net realized and unrealized gain (loss) on investments1 | | | 3.29 | | | | 3.53 | | | | 4.89 | | | | 3.61 | | | | (0.18 | ) | | | 1.24 | |
Total income (loss) from investment operations | | | 3.42 | | | | 3.50 | | | | 5.01 | | | | 3.50 | | | | (0.28 | ) | | | 1.18 | |
Distributions to Shareholders from: | | | | | | | | | | | | | | | | | | | | | | | | |
Net investment income | | | — | | | | — | | | | — | | | | — | | | | — | | | | (0.07 | ) |
Net Asset Value, End of Period | | $ | 36.93 | | | $ | 33.51 | | | $ | 30.01 | | | $ | 25.00 | | | $ | 21.50 | | | $ | 21.78 | |
Total Return | | | 10.21 | %4,7 | | | 11.66 | % | | | 20.04 | % | | | 16.28 | % | | | (1.29 | )% | | | 5.71 | % |
Ratio of total expenses to average net assets | | | 1.19 | %5 | | | 1.19 | % | | | 1.22 | %2 | | | 1.23 | % | | | 1.18 | % | | | 1.17 | % |
Ratio of net investment income (loss) to average net assets | | | 0.75 | %5 | | | (0.11 | )% | | | 0.45 | % | | | (0.46 | )% | | | (0.38 | )% | | | (0.27 | )% |
Portfolio turnover | | | 77 | % | | | 182 | % | | | 202 | % | | | 243 | % | | | 250 | % | | | 212 | % |
Net assets at end of period (000’s omitted) | | $ | 205,202 | | | $ | 215,941 | | | $ | 278,620 | | | $ | 627,622 | | | $ | 1,487,517 | | | $ | 2,057,591 | |
| | | | | | | | | | | | | | | | | | | | | | | | |
Notes to Financial Highlights (unaudited)
| 1 | Per share numbers have been calculated using average shares. |
| 2 | Interest expense is less then 0.005% of average net assets. |
| 3 | At the start of business October 1, 2013, AMG Managers Brandywine Fund and AMG Managers Brandywine Blue Fund were each reorganized into a respective series of the AMG Funds I. |
| 6 | Includes non-recurring dividends. Without these dividends, net investment loss per share would have been ($0.03) and ($0.04) for the AMG Managers Brandywine and AMG Managers Brandywine Blue Funds, respectively. |
| 7 | The total return is based on the Financial Statement Net Asset Values as shown in the Financial Highlights. |
19
Notes to Financial Statements (unaudited)
March 31, 2015
1. SUMMARY OF SIGNIFICANT ACCOUNTING POLICIES
AMG Funds I (the “Trust”) is an open-end management investment company, organized as a Massachusetts business trust, and registered under the Investment Company Act of 1940, as amended (the “1940 Act”). Currently, the Trust consists of a number of different funds, each having distinct investment management objectives, strategies, risks, and policies. Included in this report are AMG Managers Brandywine Fund (“Brandywine”) and AMG Managers Brandywine Blue Fund (“Brandywine Blue”), each a “Fund” and collectively the “Funds.”
At the start of business on October 1, 2013, Brandywine, a series of Brandywine Fund, Inc. and Brandywine Blue, a series of Brandywine Blue Fund, Inc. (the “Predecessor Funds”), were each reorganized into a respective series of the Trust. As a result of the reorganization, the Funds are the successors to the accounting and performance information of the Predecessor Funds.
The Funds’ financial statements are prepared in accordance with accounting principles generally accepted in the United States of America (“U.S. GAAP”), which require management to make estimates and assumptions that affect the reported amounts of assets and liabilities and disclosure of contingent assets and liabilities at the date of the financial statements and the reported amounts of income and expenses during the reporting periods. Actual results could differ from those estimates and such differences could be material. The following is a summary of significant accounting policies followed by the Funds in the preparation of their financial statements:
a. VALUATION OF INVESTMENTS
Equity securities traded on a domestic or international securities exchange are valued at the last quoted sale price, or, lacking any sales, at the last quoted bid price. Equity securities primarily traded on an international securities exchange and equity securities traded on NASDAQ or in a U.S. or non-U.S. over-the counter market are valued at the market’s official closing price, or, if there are no trades on the applicable date, at the last quoted bid price. In addition, if the applicable market does not offer an official closing price or if the official closing price is not representative of the overall market, equity securities primarily traded on an international securities exchange and equity securities traded in a non-U.S. over-the counter market are valued at the last quoted sales price. The Funds’ investments are generally valued based on independent market quotations or prices or, if none, “evaluative” or other market based valuations provided by third-party pricing services approved by the Board of Trustees of the Funds (the “Board”).
Short-term debt obligations (debt obligations with maturities of one year or less at the time of issuance) that have 60 days or less remaining until maturity will be valued at amortized cost. Investments in other open-end regulated investment companies are valued at their end of day net asset value per share.
Under certain circumstances, the value of certain Fund investments (including derivatives) may be based on an evaluation of fair value, pursuant to procedures established by and under the general supervision of the Board. The Pricing Committee is the committee formed by the Board to make fair value determinations for such investments. Each Fund may use the fair value of a portfolio investment to calculate its net asset value (“NAV”) in the event that the market quotation, price or market based valuation for the portfolio investment is
not deemed to be readily available or otherwise not determinable pursuant to the Board’s valuation procedures, if AMG Funds LLC (the “Investment Manager”) believes the quotation, price or market based valuation to be unreliable, or in certain other circumstances. When determining the fair value of an investment, the Pricing Committee seeks to determine the price that the Fund might reasonably expect to receive from a current sale of that investment in an arms-length transaction. Fair value determinations shall be based upon consideration of all available facts and information, including, but not limited to (i) attributes specific to the investment; (ii) fundamental analytical data and press releases relating to the investment and its issuer; and (iii) the value of other comparable securities or relevant financial instruments, including derivative securities, traded on other markets or among dealers.
The values assigned to fair value investments are based on available information and do not necessarily represent amounts that might ultimately be realized in the future, since such amounts depend on future developments inherent in long-term investments. Because of the inherent uncertainty of valuation, those estimated values may differ significantly from the values that would have been used had a ready market for the investments existed, and the differences could be material. The Board will be presented with a quarterly report showing as of the most recent quarter end, all outstanding securities fair valued by the Pricing Committee, including a comparison with the prior quarter end and the percentage of the Fund that the security represents at each quarter end.
Portfolio investments that trade primarily on foreign markets are priced based upon the market quotation of such securities as of the close of their respective principal markets. Under certain circumstances, on behalf of a fund that invests in international securities, the Investment Manager or applicable subadvisor may recommend an adjustment of such prices based on its determination of the impact of events occurring subsequent to the close of such markets but prior to the time as of which each Fund calculates its NAV. The Board has also adopted a policy that securities held in a fund that invests in international securities and certain foreign debt obligations held by a fund, in each case, that can be fair valued by the applicable fair value pricing service are fair valued on each business day without regard to a “trigger” (e.g., without regard to invoking fair value based upon a change in a U.S. equity securities index exceeding a predetermined level). The Funds may invest in securities that may be thinly traded. The Board has adopted procedures to adjust prices of securities that are judged to be stale so that they reflect fair value. An investment valued on the basis of its fair value may be valued at a price higher or lower than available market quotations.
U.S. GAAP defines fair value as the price that a fund would receive to sell an asset or pay to transfer a liability in an orderly transaction between market participants at the measurement date. U.S. GAAP also establishes a framework for measuring fair value, and a three-level hierarchy for fair value measurements based upon the transparency of inputs to the valuation of an asset or liability. Inputs may be observable or unobservable and refer broadly to the assumptions that market participants would use in pricing the asset or liability. Observable inputs reflect the assumptions market participants would use in pricing the asset or liability based on market data obtained from sources independent of the Funds. Unobservable inputs reflect the Funds’ own assumptions about the assumptions that market participants would use in
Notes to Financial Statements (continued)
pricing the asset or liability developed based on the best information available in the circumstances. Each investment is assigned a level based upon the observability of the inputs which are significant to the overall valuation.
The three-tier hierarchy of inputs is summarized below:
Level 1 – inputs are quoted prices in active markets for identical investments (e.g., equity securities, open-end investment companies)
Level 2 – other observable inputs (including, but not limited to: quoted prices for similar assets or liabilities in markets that are active, quoted prices for identical or similar assets or liabilities in markets that are not active, inputs other than quoted prices that are observable for the assets or liabilities (such as interest rates, yield curves, volatilities, prepayment speeds, loss severities, credit risks and default rates) or other market corroborated inputs) (e.g., debt securities, government securities, foreign currency exchange contracts, foreign securities utilizing international fair value pricing, broker-quoted securities, fair valued securities with observable inputs)
Level 3 – inputs are significant unobservable inputs (including the Fund’s own assumptions used to determine the fair value of investments) (e.g., fair valued securities with unobservable inputs)
Changes in inputs or methodologies used for valuing investments may result in a transfer in or out of levels within the fair value hierarchy. The inputs or methodologies used for valuing investments may not necessarily be an indication of the risk associated with investing in those investments.
b. SECURITY TRANSACTIONS
Security transactions are accounted for as of trade date. Realized gains and losses on securities sold are determined on the basis of identified cost.
c. INVESTMENT INCOME AND EXPENSES
Dividend income is recorded on the ex-dividend date. Dividend and interest income on foreign securities is recorded gross of any withholding tax. Interest income, which includes amortization of premium and accretion of discount on debt securities, is accrued as earned. Non-cash dividends included in dividend income, if any, are reported at the fair market value of the securities received. Distributions received in excess of income from return of capital including real estate investment trusts (REITs) are recorded as a reduction of the cost of the related investment and/or as a realized gain. If the Funds no longer own the applicable securities, any distributions received in excess of income are recorded as an adjustment to realized gain. Other income and expenses are recorded on an accrual basis. Expenses that cannot be directly attributed to a Fund are apportioned among the Funds in the Trust and in some cases other affiliated funds based upon their relative average net assets or number of shareholders.
The Funds have a “balance credit” arrangement with The Bank of New York Mellon (“BNYM”), the Funds’ custodian, whereby each Fund is credited with an interest factor equal to 0.75% below the effective 90-day T-Bill rate for account balances left uninvested overnight. If the T-Bill rate falls below 0.75%, no credits will be earned. These credits serve to reduce custodian expenses that would otherwise be charged to each Fund. For the six months ended March 31, 2015, the Funds’ custodian expense was not reduced.
Overdraft fees are computed at 1% above the effective Federal Funds rate on the day of the overdraft. For the six months ended March 31, 2015, overdraft fees for Brandywine and Brandywine Blue equaled $193 and $30, respectively.
d. DIVIDENDS AND DISTRIBUTIONS
Fund distributions resulting from either net investment income or realized net capital gains, if any, will normally be declared and paid at least annually in December, as described in the Funds’ prospectus. Distributions to shareholders are recorded on the ex-dividend date. Distributions are determined in accordance with federal income tax regulations, which may differ from net investment income and net realized capital gains for financial statement purposes (U.S. GAAP). Differences may be permanent or temporary. Permanent differences are reclassified among capital accounts in the financial statements to reflect their tax character. Permanent book and tax basis differences, if any, relating to shareholder distributions will result in reclassifications to paid-in capital. Temporary differences arise when certain items of income, expense and gain or loss are recognized in different periods for financial statement and tax purposes; these differences will reverse at some time in the future. The differences are due to differing treatments for wash sales.
e. FEDERAL TAXES
Each Fund intends to comply with the requirements under Subchapter M of the Internal Revenue Code of 1986, as amended, and, to distribute substantially all of its taxable income and gains to its shareholders and to meet certain diversification and income requirements with respect to investment companies. Therefore, no provision for federal income or excise tax is included in the accompanying financial statements.
Additionally, based on each Fund’s understanding of the tax rules and rates related to income, gains and transactions for the foreign jurisdictions in which it invests, each Fund will provide for foreign taxes, and where appropriate, deferred foreign taxes.
Management has analyzed the Funds’ tax positions taken on federal income tax returns as of September 30, 2014, and for all open tax years (generally, the three prior taxable years), and has concluded that no provision for federal income tax is required in the Funds’ financial statements. Additionally, the Funds are not aware of any tax position for which it is reasonably possible that the total amounts of unrecognized tax benefits will change materially in the next twelve months.
Net capital losses incurred in taxable years beginning after the enactment of the Regulated Investment Company Modernization Act of 2010, may be carried forward for an unlimited time period. Such losses will be required to be utilized prior to any loss carryovers incurred in pre-enactment taxable years, which generally expire eight years following the close of the taxable year in which they were incurred. As a result of this ordering rule, pre-enactment capital loss carryovers may be more likely to expire unused. Additionally, post-enactment capital losses that are carried forward retain their tax character as either short-term or long-term capital losses, unlike pre-enactment losses which are considered all short-term.
Notes to Financial Statements (continued)
f. CAPITAL LOSS CARRYOVERS AND DEFERRALS
As of March 31, 2015, the following Funds had accumulated net realized capital loss carryovers from securities transactions for federal income tax purposes as shown in the following chart. These amounts may be used to offset future realized capital gains, if any, through the expiration dates listed or in the case of post-enactment losses, for an unlimited time period.
| | | | | | | | | | | | |
| | | Capital Loss | | | | |
| | | Carryover Amount | | | | |
| | | | | | | | | Expires | |
| Fund | | Short-Term | | | Long-Term | | | September 30, | |
Brandywine | | | | | | | | | | | | |
(Pre-Enactment) | | $ | 146,599,760 | | | | — | | | | 2017 | |
(Pre-Enactment) | | $ | 503,144,209 | | | | — | | | | 2018 | |
Brandywine Blue | | | | | | | | | | | | |
(Pre-Enactment) | | $ | 827,345,630 | | | | — | | | | 2017 | |
(Pre-Enactment) | | $ | 195,886,232 | | | | — | | | | 2018 | |
g. CAPITAL STOCK
The Trust’s Declaration of Trust authorizes for each fund the issuance of an unlimited number of shares of beneficial interest, without par value. Each Fund records sales and repurchases of its capital stock on the trade date. The cost of securities contributed to the Funds in connection with the issuance of shares is based on the valuation of those securities in accordance with the Funds’ policy on investment valuation.
At March 31, 2015, certain unaffiliated shareholders of record, specifically omnibus accounts, individually or collectively held greater than 10% of the net assets of the Funds as follows: Brandywine Blue—two collectively own 24%. Transactions by these shareholders may have a material impact on the Fund.
h. REPURCHASE AGREEMENTS
The Funds may enter into repurchase agreements provided that the value of the underlying collateral, including accrued interest, will equal or exceed the value of the repurchase agreement during the term of the agreement. The underlying collateral for all repurchase agreements is held in safekeeping by the Fund’s custodian or at the Federal Reserve Bank. If the seller defaults and the value of the collateral declines, or if bankruptcy proceedings commence with respect to the seller of the security, realization of the collateral by the Fund may be delayed or limited. At March 31, 2015, the market value of repurchase agreements outstanding for Brandywine and Brandywine Blue was $18,739,192, and $0, respectively.
2. AGREEMENTS AND TRANSACTIONS WITH AFFILIATES
For each of the Funds, the Trust has entered into an investment advisory agreement under which the Investment Manager, a subsidiary and the U.S. retail distributor arm of Affiliated Managers Group, Inc. (“AMG”), serves as investment manager to the Funds and is responsible for the Funds’ overall administration and operations. The Investment Manager selects one or more subadvisors for the Funds (subject to Board approval) and monitors each subadvisor’s investment performance, security holdings and investment strategies. Each Fund’s investment portfolio is managed by Friess Associates, LLC (“Friess”) through a subadvisory agreement between the Investment
Manager and Friess relating to each Fund, and Friess Associates of Delaware, LLC (“Friess of Delaware”) through a sub-subadvisor agreement among the Investment Manager, Friess and Friess of Delaware relating to each Fund.
Investment management fees are paid directly by the Funds to the Investment Manager based on average daily net assets. For the six months ended March 31, 2015, the Funds’ investment management fees were paid at the following annual rates of each Fund’s respective average daily net assets:
| | | | |
Brandywine | | | 1.00 | % |
Brandywine Blue | | | 1.00 | % |
The Investment Manager has contractually agreed, through at least February 1, 2016, to waive management fees (but not below zero) and/or reimburse each Fund’s expenses in order to limit total annual Fund operating expenses (exclusive of taxes, interest (including interest incurred in connection with bank and custody overdrafts), brokerage commissions and other transaction costs, acquired fund fees and expenses, and extraordinary expenses) to 2.00% of each Fund’s average daily net assets subject to later reimbursement by the Fund in certain circumstances. Each contractual expense limitation may only be terminated in the event the Investment Manager or a successor ceases to be the investment manager of the Fund or a successor fund, by mutual agreement between the Investment Manager and the Board, or in the event of the Fund’s liquidation unless the Fund is reorganized or is a party to a merger in which the surviving entity is successor to the accounting and performance information of the Fund.
Each Fund is obligated to repay the Investment Manager such amounts waived, paid, or reimbursed in future years provided that the repayment occurs within thirty-six (36) months after the waiver or reimbursement and that such repayment would not cause the Fund’s total annual operating expenses after fee waiver and expense reimbursements in any such future year to exceed that Fund’s contractual expense limitation amount. For the six months ended March 31, 2015, the Funds’ expenses were not reimbursed.
Each Fund has entered into an Administration and Shareholder Servicing Agreement under which the Investment Manager serves as the Funds’ administrator (the “Administrator”) and is responsible for all aspects of managing the Funds’ operations, including administration and shareholder services to each Fund, its shareholders, and certain institutions, such as bank trust departments, broker-dealers and registered investment advisers, that advise or act as intermediary with the Funds’ shareholders. The Funds pay a fee to the Administrator at the rate of 0.03% of each Fund’s average daily net assets for the first $300 million of assets under management, 0.025% for the next $200 million, and 0.02% on amounts in excess of $500 million per annum, subject to a $40,000 annual minimum.
Effective January 1, 2015, the Board provides supervision of the affairs of the Trust, other trusts within the AMG Funds family of mutual funds (collectively the “AMG Funds family”) and other affiliated funds. Previously, the Board provided supervision to only the Trust and other trusts within the AMG Funds family.
Beginning January 1, 2015, the aggregate annual retainer paid to each Independent Trustee of the Board is $200,000, plus $16,000, $4,000 or
Notes to Financial Statements (continued)
$2,000 for each regular, in-person special or telephonic special meeting attended, respectively. The Independent Chairman of the Trusts receives an additional payment of $55,000 per year. The Chairman of the Audit Committee receives an additional payment of $25,000 per year.
Prior to January 1, 2015, the aggregate annual retainer paid to each Independent Trustee of the Board was $130,000, plus $7,000 or $2,500 for each regular or special meeting attended, respectively. The Independent Chairman of the Trust formerly received an additional payment of $35,000 per year. The Chairman of the Audit Committee formerly received an additional payment of $15,000 per year.
Prior to January 1, 2014, the aggregate annual retainer paid to each Independent Trustee of the Board was $105,000, plus $6,000 or $2,500 for each regular or special meeting attended, respectively. The Independent Chairman of the Board formerly received an additional payment of $25,000 per year. The Chairman of the Audit Committee formerly received an additional payment of $10,000 per year.
Effective January 1, 2015, the Trustees’ fees and expenses are generally allocated among all of the funds in the Trust, other trusts within the AMG Funds family and other affiliated funds based on the relative net assets of such funds. Before January 1, 2015, the Trustees’ fees and expenses were generally allocated among all of the funds in the Trust and other trusts within the AMG Funds family. The “Trustees fees and expenses” shown in the financial statements represents each Fund’s allocated portion of the total fees and expenses paid to the Independent Trustees of the Board.
The Funds are distributed by AMG Distributors, Inc. (the “Distributor”), a wholly-owned subsidiary of the Investment Manager. The Distributor serves as the distributor and underwriter for each Fund and is a registered broker-dealer and member of the Financial Industry Regulatory Authority, Inc. (“FINRA”). Shares of each Fund will be continuously offered and will be sold directly to prospective purchasers and through brokers, dealers or other financial intermediaries who have executed selling agreements with the Distributor. Subject to the compensation arrangement discussed below, generally the Distributor bears all or a portion of the expenses of providing services pursuant to the distribution agreement, including the payment of the expenses relating to the distribution of prospectuses for sales purposes and any advertising or sales literature. Certain Trustees and Officers of the Funds are Officers and/or Directors of the Investment Manager, AMG and/or the Distributor.
The Board has approved reimbursement payments to the Investment Manager for shareholder servicing expenses (“shareholder servicing fees”) incurred. Shareholder servicing fees include payments to third parties such as a bank, broker-dealer, trust company or other financial intermediaries who provide shareholder recordkeeping, account servicing and other services. To the extent the Investment Manager makes shareholder servicing payments to a third party, the Fund may reimburse the Investment Manager up to the amounts incurred. For the fiscal year ended March 31, 2015, Brandywine and Brandywine Blue paid $68,927 or 0.01% and $82,922 or 0.04%, respectively.
The Securities and Exchange Commission has granted an exemptive order that permits the Funds to lend and borrow money for certain temporary purposes
directly to and from other eligible Funds in the AMG Funds family. Participation in this interfund lending program is voluntary for both the borrowing and lending Funds, and an interfund loan is only made if it benefits each participating Fund. The Investment Manager administers the program according to procedures approved by the Board, and the Board monitors the operation of the program. An interfund loan must comply with certain conditions set out in the exemptive order, which are designed to assure fairness and protect all participating Funds. For the six months ended March 31, 2015, the Funds neither borrowed from nor lent to other Funds in the AMG Funds family.
3. PURCHASES AND SALES OF SECURITIES
Purchases and sales of securities (excluding short-term securities and U.S. Government obligations) for the six months ended March 31, 2015, were as follows:
| | | | | | | | |
| | | Long-Term Securities | |
| Fund | | Purchases | | | Sales | |
Brandywine | | $ | 717,725,011 | | | $ | 757,752,267 | |
Brandywine Blue | | | 159,183,727 | | | | 189,531,354 | |
The Funds had no purchases or sales of U.S. Government obligations during the six months ended March 31, 2015.
4. PORTFOLIO SECURITIES LOANED
The Funds participate in a securities lending program offered by BNYM (the “Program”), providing for the lending of securities to qualified brokers. Securities lending income includes earnings of such temporary cash investments, plus or minus any rebate to a borrower. These earnings (after any rebate) are then divided between BNYM, as a fee for its services under the Program, and the Funds, according to agreed-upon rates. Collateral received on all securities loaned is accepted in cash and is maintained at a minimum level of 102% (105% in the case of certain foreign securities) of the market value, plus interest, if applicable, of investments on loan. It is the Funds’ policy to obtain additional collateral from or return excess collateral to the borrower by the end of the next business day, following the valuation date of the securities loaned. Therefore, the value of the collateral held may be temporarily less than the value of the securities on loan. Lending securities entails a risk of loss to the Funds if and to the extent that the market value of the securities loaned were to increase and the borrower did not increase the collateral accordingly, and the borrower fails to return the securities. Under the terms of the Program, the Funds are indemnified for such losses by BNYM. Cash collateral is held in a separate account managed by BNYM, who is authorized to exclusively enter into overnight government repurchase agreements. BNYM bears the risk of any deficiency in the amount of the cash collateral available for return to the borrower due to any loss on the collateral invested. At March 31, 2015, the value of the securities loaned and cash collateral received were as follows:
| | | | | | | | |
| | | Securities | | | Cash Collateral | |
| Fund | | Loaned | | | Received | |
Brandywine | | $ | 18,409,023 | | | $ | 18,739,192 | |
5. COMMITMENTS AND CONTINGENCIES
Under the Trust’s organizational documents, its trustees and officers are indemnified against certain liabilities arising out of the performance of their
23
Notes to Financial Statements (continued)
duties to the Trust. In addition, in the normal course of business, the Funds may enter into contracts and agreements that contain a variety of representations and warranties, which provide general indemnifications. The maximum exposure to the Funds under these arrangements is unknown, as this would involve future claims that may be made against a Fund that have not yet occurred. However, based on experience, the Funds had no prior claims or losses and expect the risks of loss to be remote.
6. MASTER NETTING AGREEMENTS
The Funds may enter into master netting agreements with their counterparties for the securities lending program and repurchase agreements, which provide the right, in the event of default (including bankruptcy or insolvency) for the non-defaulting party to liquidate the collateral and calculate net exposure to the defaulting party or request additional collateral. For financial reporting purposes, the Funds do not offset financial assets and financial liabilities that are subject to master netting agreements in the Statement of Assets and Liabilities. For security lending transactions, see Note 4.
The following table is a summary of the Funds’ open repurchase agreements which are subject to a master netting agreement as of March 31, 2015:
| | | | | | | | | | | | | | | | |
| | | | | | Gross Amount Not Offset in the | | | | |
| | | | | | Statement of Assets and Liabilities | | | | |
| | | Net Amounts of Assets
Presented in the Statement
of Assets and Liabilities | | | Financial
Instruments
Collateral | | | Cash Collateral
Received | | | Net Amount | |
Brandywine | | | | | | | | | | | | | | | | |
BNP Paribas Securities Corp. | | $ | 936,900 | | | $ | 936,900 | | | | — | | | | — | |
Daiwa Capital Markets America | | | 4,450,573 | | | | 4,450,573 | | | | — | | | | — | |
Merrill Lynch Pierce, Fenner & Smith, Inc. | | | 4,450,573 | | | | 4,450,573 | | | | — | | | | — | |
Mizuho Securities International, Inc. | | | 4,450,573 | | | | 4,450,573 | | | | — | | | | — | |
Nomura Securities International Inc | | | 4,450,573 | | | | 4,450,573 | | | | — | | | | — | |
| | | | | | | | | | | | | | | | |
Totals | | $ | 18,739,192 | | | $ | 18,739,192 | | | | — | | | | — | |
| | | | | | | | | | | | | | | | |
7. SUBSEQUENT EVENTS
Each Fund has determined that no material events or transactions occurred through the issuance date of the Funds’ financial statements which require additional disclosure in or adjustment of the Funds’ financial statements.
24
Investment Manager and Administrator
AMG Funds LLC
800 Connecticut Avenue
Norwalk, CT 06854
(800) 835-3879
Distributor
AMG Distributors, Inc.
800 Connecticut Avenue
Norwalk, CT 06854
(800) 835-3879
Subadvisor
Friess Associates, LLC
P.O. Box 576
Jackson, Wyoming 83001
Friess Associates of Delaware, LLC
P.O. Box 4166
Greenville, DE 19807
Custodian
The Bank of New York Mellon
2 Hanson Place
Brooklyn, NY 11217
Legal Counsel
Ropes & Gray LLP
Prudential Tower, 800 Boylston Street
Boston, MA 02199-3600
Transfer Agent
BNY Mellon Investment Servicing (US) Inc.
Attn: AMG Funds
P.O. Box 9769
Providence, RI 02940
(800) 548-4539
Trustees
Bruce B. Bingham
Christine C. Carsman
William E. Chapman II
Edward J. Kaier
Kurt Keilhacker
Steven J. Paggioli
Richard F. Powers III
Eric Rakowski
Victoria Sassine
Thomas R. Schneeweis
This report is prepared for the Funds’ shareholders. It is authorized for distribution to prospective investors only when preceded or accompanied by an effective prospectus. To receive a free copy of the prospectus or Statement of Additional Information, which includes additional information about Fund Trustees, please contact us by calling 800.835.3879. Distributed by AMG Distributors, Inc., member FINRA/SIPC.
Current net asset values per share for each Fund are available on the Funds’ website at www.amgfunds.com.
A description of the policies and procedures each Fund uses to vote its proxies is available: (i) without charge, upon request, by calling 800.835.3879, or (ii) on the Securities and Exchange Commission’s (SEC) Web site at www.sec.gov For information regarding each Fund’s proxy voting record for the 12-month period ended June 30, call 800.835.3879 or visit the SEC Web site at www.sec.gov.
Each Fund files its complete schedule of portfolio holdings with the SEC for the first and third quarters of each fiscal year on Form N-Q. The Fund’s Forms N-Q are available on the SEC’s website at www.sec.gov. A Funds’ Forms N-Q may be reviewed and copied at the SEC’s Public Reference Room in Washington, DC. Information on the operation of the Public Reference Room may be obtained by calling 1-800-SEC-0330. To review a complete list of the Fund’s portfolio holdings, or to view the most recent quarterly holdings report, semiannual report, or annual report, please visit www.amgfunds.com.
AFFILIATE SUBADVISED FUNDS
| | | | |
ALTERNATIVE FUNDS AMG FQ Global Alternatives First Quadrant, L.P. BALANCED FUNDS AMG Chicago Equity Partners Balanced Chicago Equity Partners, LLC AMG FQ Global Risk-Balanced (formerly Managers AMG FQ Global Essentials) First Quadrant, L.P. EQUITY FUNDS AMG Chicago Equity Partners Small Cap Value Chicago Equity Partners, LLC AMG FQ Tax-Managed U.S. Equity AMG FQ U.S. Equity First Quadrant, L.P. AMG Frontier Small Cap Growth Frontier Capital Management Company, LLC | | AMG GW&K Small Cap Core (formerly GW&K Small Cap Equity) GW&K Investment Management, LLC AMG Renaissance International Equity AMG Renaissance Large Cap Growth The Renaissance Group LLC AMG SouthernSun Small Cap AMG SouthernSun U.S. Equity SouthernSun Asset Management, LLC AMG Systematic Large Cap Value (formerly Systematic Value) AMG Systematic Mid Cap Value Systematic Financial Management, L.P. AMG TimesSquare All Cap Growth (formerly Managers AMG TSCM Growth Equity) AMG TimesSquare International Small Cap AMG TimesSquare Mid Cap Growth AMG TimesSquare Small Cap Growth TimesSquare Capital Management, LLC | | AMG Trilogy Emerging Markets Equity AMG Trilogy Emerging Wealth Equity AMG Trilogy Global Equity AMG Trilogy International Small Cap Trilogy Global Advisors, L.P. AMG Yacktman Focused AMG Yacktman Yacktman Asset Management LP FIXED INCOME FUNDS AMG GW&K Enhanced Core Bond (formerly GW&K Fixed Income) AMG GW&K Core Bond (formerly AMG Managers Total Return Bond) AMG GW&K Municipal Bond AMG GW&K Municipal Enhanced Yield GW&K Investment Management, LLC |
| |
| |
| |
| |
| |
| |
| |
| |
| |
| |
| |
| |
| |
| |
| |
| |
| |
| |
| |
| |
| |
| |
| |
| |
| |
OPEN-ARCHITECTURE FUNDS
| | | | |
EQUITY FUNDS AMG Managers Brandywine Advisors
Mid Cap Growth AMG Managers Brandywine Blue AMG Managers Brandywine Friess Associates, LLC AMG Managers Cadence Capital
Appreciation AMG Managers Cadence Emerging
Companies AMG Managers Cadence Mid Cap Cadence Capital Management, LLC AMG Managers Emerging Opportunities (formerly Managers Micro-Cap) Lord, Abbett & Co. LLC WEDGE Capital Management L.L.P. Next Century Growth Investors LLC RBC Global Asset Management (U.S.) Inc. | | AMG Managers Essex Small/Micro Cap Growth Essex Investment Management Co., LLC AMG Managers Real Estate Securities CenterSquare Investment Management, Inc. AMG Managers Skyline Special Equities (formerly Skyline Special Equities Portfolio) Skyline Asset Management, L.P. AMG Managers Special Equity Ranger Investment Management, L.P. Lord, Abbett & Co. LLC Smith Asset Management Group, L.P. Federated MDTA LLC | | FIXED INCOME FUNDS AMG Managers Bond AMG Managers Global Income Opportunity Loomis, Sayles & Co., L.P. AMG Managers High Yield J.P. Morgan Investment Management Inc. AMG Managers Intermediate Duration Government AMG Managers Short Duration Government Amundi Smith Breeden LLC |
| |
| |
| |
| |
| |
| |
| |
| |
| |
| |
| |
| |
| |
| |
| |
| |
| |
| |
| |
| |
| |
| |
| | |
 | | www.amgfunds.com |
| | |
| | SEMI-ANNUAL REPORT |
AMG Funds
March 31, 2015
AMG Managers Brandywine Advisors Mid Cap Growth Fund:BWAFX
| | |
| www.amgfunds.com | | SAR075-0315 |
AMG Funds
Semi-Annual Report—March 31, 2015 (unaudited)
Nothing contained herein is to be considered an offer, sale or solicitation of an offer to buy shares of any series of the AMG Fund Family of mutual funds. Such offering is made only by Prospectus, which includes details as to offering price and other material information.
| | |
| | AMG Managers Brandywine Advisors Mid Cap Growth Fund |
DEAR FELLOW SHAREHOLDER:
Although the weather in March did little to add credence to the proverb that closes out the month “like a lamb,” the lion’s share of an uptick in volatility in the March quarter took place early on before giving way to relative calm toward the period’s end.
AMG Managers Brandywine Advisors Mid Cap Growth Fund grew 6.97 percent in the March quarter, outpacing gains in the S&P 500, Russell Midcap® and Russell Midcap® Growth Indexes of 0.95, 3.95 and 5.38 percent, respectively.
Concerns were high amid a rapid rise in the U.S. dollar versus major foreign currencies. The Swiss National Bank caused a stir on January 15 when it said it would allow the franc to trade freely against the euro, removing a fixed rate adopted during the Eurozone crisis in 2011. That same day, the World Bank cut its forecast for global economic growth, and J.P. Morgan reported disappointing fourth-quarter results.
January, during which the euro lost 8 percent of its value against the dollar, was the toughest month for stocks of the three months through March. While currency remained a consistent theme and the Federal Reserve caused handwringing by dropping “patient” from the bank’s stated views on higher interest rates, the market’s mood improved as the fourth-quarter reporting season unfolded.
Three-fourths of the companies in the S&P 500 Index exceeded consensus earnings estimates for the fourth quarter, which is slightly higher than the index’s one-year (74 percent) and five-year (73 percent) averages, according to a study by FactSet Research Systems. On average, companies that reported earnings upside enjoyed a 1.8 percent increase in share price in a window spanning the two days before the earnings release through the two days after. The five-year average is 1.0 percent.
Brandywine Advisors isolated considerable earnings strength in the consumer discretionary and technology sectors. The FactSet study showed that those sectors recorded the most pronounced upward revisions in fourth-quarter earnings growth due to positive earnings surprises.
The Fund’s biggest performance contribution versus the Russell Midcap® Growth Index came from its second largest position, the consumer discretionary sector. Columbia Sportswear Co. was a standout contributor even amid challenges presented by foreign exchange headwinds and disruptions at West Coast ports. Strong demand for Columbia and Sorel brand products drove record December-quarter sales. Columbia Sportswear delivered 52 percent earnings growth, exceeding expectations by 18 percent.
Four out of the top five contributors from the consumer discretionary sector make apparel, footwear or both. Skechers USA, American Eagle Outfitters and Under Armour exceeded expectations in their most recently reported quarter with earnings growth of 54, 33 and 38 percent, respectively. Consumer discretionary holdings represented a modestly overweight position versus the index while outperforming the sector as a whole.
The technology sector’s success was symbolically broadcast by the Nasdaq Composite Index, which on March 2 closed above 5,000 for the first time since March 2000. Milestone aside, the March quarter was far from the dot-com
days of 15 years ago. Unlike the expensive, often money-losing companies that helped make the Nasdaq’s last trip to 5,000 possible, earnings strength and reasonable valuations were common themes among more recent top performers.
Qorvo, Avago Technologies and Integrated Device Technology were standout performers for Brandywine Advisors. Qorvo, Avago Technologies and Integrated Device Technology grew earnings 148, 149 and 47 percent, respectively, in their most recently reported quarter. All three companies exceeded consensus earnings expectations. The technology sector, which was the portfolio’s third largest commitment, was modestly overweight relative to the benchmark. Technology holdings outperformed the sector within the benchmark.
Industrial holdings, which comprised the Fund’s largest position, were supporting contributors thanks in large part to Trinity Industries. While uncertainty surrounded a range of industrial companies amid sharply lower oil prices during the quarter, investors didn’t associate Trinity Industries with that situation. The maker of railcars and barges posted expectation-beating earnings growth of 21 percent for the December quarter. The company also reported backlogged orders totaling $7.2 billion, providing visibility into its 2015 production plans.
Although health care holdings generated a positive return, the health care sector was the biggest negative influence on results versus the Russell Midcap® Growth Index. Health care holdings represented an underweight position size relative to the index in a period when the health care sector generated the index’s strongest return. Single-digit declines in ExamWorks Group and athenahealth didn’t help the cause, either.
Limited exposure to the consumer staples sector also detracted from relative results. Due to limited earnings strength in the sector, Brandywine Advisors held only three consumer staples companies during the quarter. The consumer staples sector was second to health care in terms of March-quarter returns within the index.
For more information on companies that influenced March-quarter performance, please see Roses & Thorns on page 6.
At the start of the June quarter, holdings from the consumer discretionary, industrial and information technology sectors represent the portfolio’s largest positions. For more information on portfolio characteristics, please see page 5.
We’re encouraged by recent results, and we’re working hard to build on them. Best wishes from your entire Friess team!
Scott Gates
Chief Investment Officer
Friess Associates, LLC
About Your Fund’s Expenses (unaudited)
As a shareholder of a Fund, you may incur two types of costs: (1) transaction costs, which may include sales charges (loads) on purchase payments; redemption fees; and exchange fees; and (2) ongoing costs, including management fees; distribution (12b-1) fees; and other Fund expenses. This example is intended to help you understand your ongoing costs (in dollars) of investing in the Fund and to compare these costs with the ongoing costs of investing in other mutual funds. The example is based on $1,000 invested at the beginning of the period and held for the entire period as indicated below.
ACTUAL EXPENSES
The first line of the following table provides information about the actual account values and actual expenses. You may use the information in this line, together with the amount you invested, to estimate the expenses that you paid over the period. Simply divide your account value by $1,000 (for example, an $8,600 account value divided by $1,000 = 8.6), then multiply the result by the number in the first line under the heading entitled “Expenses Paid During Period” to estimate the expenses you paid on your account during this period.
HYPOTHETICAL EXAMPLE FOR COMPARISON PURPOSES
The second line of the following table provides information about hypothetical account values and hypothetical expenses based on the Fund’s actual expense ratio and an assumed annual rate of return of 5% before expenses, which is not the Fund’s actual return. The hypothetical account values and expenses may not be used to estimate the actual ending account balance or expenses you paid for the period. You may use this information to compare the ongoing costs of investing in the Fund and other funds by comparing this 5% hypothetical example with the 5% hypothetical examples that appear in the shareholder reports of other funds.
Please note that the expenses shown in the table are meant to highlight your on going costs only and do not reflect any transactional costs, such as sales charges (loads), redemption fees, or exchange fees. Therefore, the second line of the table is useful in comparing ongoing costs only, and will not help you determine the relative total costs of owning different funds.
| | | | | | | | | | | | | | | | |
| Six Months Ended March 31, 2015 | | Expense | | | Beginning | | | Ending | | | Expenses | |
| | Ratio for | | | Account Value | | | Account Value | | | Paid During | |
| | the Period | | | 10/01/14 | | | 3/31/15 | | | the Period* | |
AMG Managers Brandywine Advisors Mid Cap Growth Fund | | | | | | | | | | | | | | | | |
Based on Actual Fund Return | | | 1.13 | % | | | $1,000 | | | | $1,088 | | | | $5.88 | |
Hypothetical (5% return before expenses) | | | 1.13 | % | | | $1,000 | | | | $1,019 | | | | $5.68 | |
| * | Expenses are equal to the Fund’s annualized expense ratio multiplied by the average account value over the period, multiplied by the number of days in the most recent fiscal half-year (182), then divided by 365. |
3
Fund Performance (unaudited)
Periods ended March 31, 2015
The table below shows the average annual total returns for the AMG Managers Brandywine Advisors Mid Cap Growth Fund, the Russell Midcap® Growth Index, the Russell Midcap® Index and the S&P 500 Index for the same time periods ended March 31, 2015.
| | | | | | | | | | | | | | | | |
| Average Annual Total Retuns1 | | Six Months* | | | One Year | | | Five Years | | | Ten Years | |
AMG Managers Brandywine Advisors Mid Cap Growth Fund2,3 | | | 8.76 | % | | | 4.93 | % | | | 6.92 | % | | | 3.40 | % |
Russell Midcap® Growth Index4 | | | 11.53 | % | | | 15.56 | % | | | 16.43 | % | | | 10.19 | % |
Russell Midcap® Index5 | | | 10.13 | % | | | 13.68 | % | | | 16.16 | % | | | 10.02 | % |
S&P 500 Index6 | | | 5.93 | % | | | 12.73 | % | | | 14.47 | % | | | 8.01 | % |
The performance data shown represents past performance. Past performance is not a guarantee of future results. Current performance may be lower or higher than the performance data quoted. The investment return and principal value of an investment in the Fund will fluctuate so that an investor’s shares, when redeemed, may be worth more or less than their original cost.
Investors should carefully consider the Fund’s investment objectives, risks, charges, and expenses before investing. For performance information through the most recent month end, current net asset values per share for the Fund and other information, please call (800) 835-3879 or visit our website at www.amgfunds.com for a free prospectus. Read it carefully before investing or sending money.
Distributed by AMG Distributors, Inc., member FINRA/SIPC.
| 1 | Total return equals income yield plus share price change and assumes reinvestment of all dividends and capital gain distributions. Returns are net of fees and may reflect offsets of Fund expenses as described in the prospectus. No adjustment has been made for taxes payable by shareholders on their reinvested dividends and capital gain distributions. Returns for periods greater than one year are annualized. The listed returns on the Fund are net of expenses and based on the published NAV as of March 31, 2015. All returns are in U.S. dollars ($). |
| 2 | The Fund inception dates and returns for all periods beginning prior to October 1, 2013 reflects performance of the predecessor Fund, Brandywine Advisors Midcap Growth Fund, which was managed by Friess Associates, LLC with the same investment objectives and substantially similar investment policies. |
| 3 | The Fund is subject to risks associated with investments in mid-capitalization companies such as erratic earnings patterns, competitive conditions, limited earnings history, and a reliance on one or a limited number of products. |
| 4 | The Russell Midcap® Growth Index measures the performance of the Russell Midcap companies with higher price-to-book ratios and higher forecasted growth values. The stocks are also members of the Russell 1000® Growth Index. Unlike the Fund, the Indices are unmanaged, are not available for investment, and do not incur expenses. |
| 5 | The Russell Midcap® Index measures the performance of the 800 smallest companies in the Russell 1000® Index, which represent approximately 25 percent of the total market capitalization of the Russell 1000® Index. Unlike the Fund, the Indices are unmanaged, are not available for investment, and do not incur expenses. |
| 6 | The S&P 500 Index is capitalization-weighted index of 500 stocks. The S&P 500 Index is designed to measure performance of the broad domestic economy through changes in the aggregate market value of 500 stocks representing all major industries. Unlike the Fund, the Indices are unmanaged, are not available for investment, and do not incur expenses. |
The Russell Midcap® Growth Index and the Russell Midcap® Index are registered trademarks of Russell Investments. Russell® is a trademark of Russell Investments.
The S&P 500 Index is proprietary data of Standard & Poor’s, a division of McGraw-Hill Companies, Inc. All rights reserved.
Not FDIC insured, nor bank guaranteed. May lose value.
4
AMG Managers Brandywine Advisors Mid Cap Growth Fund
Fund Snapshots (unaudited)
March 31, 2015
PORTFOLIO BREAKDOWN
| | | | | | | | | | | | | | | | |
| | | Brandywine | | | | | | | | | | |
| | | Advisors | | | Russell | | | | | | | |
| | | Mid Cap | | | Midcap® | | | Russell | | | | |
| | | Growth | | | Growth | | | Midcap® | | | S&P 500 | |
Industry (Top Ten) | | Fund** | | | Index | | | Index | | | Index | |
Semiconductors | | | 12.2 | % | | | 4.4 | % | | | 3.8 | % | | | 2.4 | % |
Trucking | | | 5.8 | % | | | 1.3 | % | | | 0.9 | % | | | 1.0 | % |
Construction Machinery & Heavy Trucks | | | 5.4 | % | | | 0.3 | % | | | 0.5 | % | | | 0.1 | % |
Apparel, Accessories & Luxury Goods | | | 4.6 | % | | | 3.1 | % | | | 1.7 | % | | | 0.9 | % |
Internet Software & Services | | | 4.5 | % | | | 3.2 | % | | | 1.8 | % | | | 3.4 | % |
Health Care Technology | | | 3.4 | % | | | 0.9 | % | | | 0.5 | % | | | 0.1 | % |
Footwear | | | 3.0 | % | | | 5.5 | % | | | 4.1 | % | | | 2.5 | % |
Hotel & Resort REITs | | | 2.9 | % | | | 3.1 | % | | | 8.6 | % | | | 2.5 | % |
Housewares & Specialties | | | 2.9 | % | | | 0.7 | % | | | 0.5 | % | | | 1.8 | % |
Movies & Entertainment | | | 2.8 | % | | | 3.1 | % | | | 2.4 | % | | | 3.5 | % |
Other Common Stock | | | 48.2 | % | | | 74.4 | % | | | 75.2 | % | | | 81.8 | % |
Cash & Cash Equivalents† | | | 4.3 | % | | | 0.0 | % | | | 0.0 | % | | | 0.0 | % |
| ** | As a percentage of net assets. |
| † | Includes Other Assets and Liabilities. |
TOP TEN HOLDINGS
| | | | | | | | |
| | | %of | | | % Change from | |
Security Name | | Net Assets | | | Book Cost | |
Qorvo, Inc. | | | 3.1 | % | | | 109.1 | % |
Skechers U.S.A., Inc., Class A | | | 3.0 | | | | 35.3 | |
Trinity Industries, Inc. | | | 2.9 | | | | 24.4 | |
Pebblebrook Hotel Trust* | | | 2.9 | | | | 23.4 | |
Jarden Corp.* | | | 2.9 | | | | 88.9 | |
Regal Entertainment Group, Class A* | | | 2.8 | | | | 7.8 | |
Signet Jewelers, Ltd. | | | 2.8 | | | | 13.9 | |
TriNet Group, Inc. | | | 2.7 | | | | 34.7 | |
Spirit AeroSystems Holdings, Inc., Class A | | | 2.7 | | | | 36.0 | |
Avago Technologies, Ltd. | | | 2.7 | | | | 44.4 | |
| | | | | | | | |
Top Ten as a Group | | | 28.5 | % | | | | |
| | | | | | | | |
| * | Also Top Ten Holding as of December 31, 2014. |
PORTFOLIO MARKET CAPITALIZATION
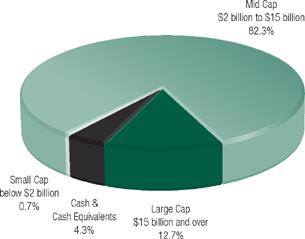
ESTIMATED EARNINGS GROWTH RATE
OF THE FUND’S INVESTMENTS
Forecasted Increase in Earnings Per Share 2015 vs 2014
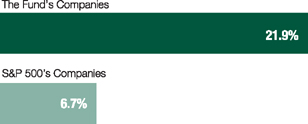
Source: Consensus estimates from FactSet Research Systems Inc.
This is not a forecast of the Fund’s future performance. Earnings growth for a Fund holding does not guarantee a corresponding increase in the market value of the holding or the Fund.
Because a fund’s strategy may result in multiple investments in particular sectors of the economy, its performance may depend on the performance of those sectors and may fluctuate more widely than investments diversified across more sectors. For additional information on these and other risk considerations, please see the Fund’s prospectus.
Any sectors, industries, or securities discussed should not be perceived as investment recommendations. Mention of a specific security should not be considered a recommendation to buy or solicitation to sell that security. Specific securities mentioned in this report may have been sold from the Fund’s portfolio of investments by the time you receive this report.
5
AMG Managers Brandywine Advisors Mid Cap Growth Fund
Roses and Thorns (unaudited)
Quarter Ending March 31, 2015
| | | | | | |
| $ Gain | | | | | | |
(in millions) | | % Gain | | Biggest $ Winners | | Reason for Move |
| | | | Columbia Sportswear Co. | | |
| $1.3 | | 36.4 | | The maker of outdoor and active-lifestyle apparel and footwear grew December-quarter earnings 52 percent, exceeding expectations. Sales increases in Columbia and Sorel brand products of 23 and 29 percent drove results. Columbia also raised forward earnings guidance. |
| | | |
| | | | Skechers USA Inc. | | |
| $1.1 | | 30.2 | | The footwear company grew December-quarter earnings 54 percent. Market share gains and international expansion drove 26 percent revenue growth. In its release, Sketchers cited a 60 percent increase in backlogged orders, a 17 percent rise in January same-store sales growth and continued expansion as reasons for the investment community to expect record sales in the first quarter of 2015. |
| | | |
| | | | Trinity Industries Inc. | | |
| $1.0 | | 26.8 | | The manufacturer of railcars, barges, and products used in heavy construction projects grew December-quarter earnings 21 percent, topping expectations. Revenue increased 32 percent. A record number of orders in 2014 brought the company’s backlog to $7.2 billion by the end of the period, providing the company significant production visibility to start 2015. |
| | | |
| | | | Microsemi Corp. | | |
| $1.0 | | 24.1 | | The manufacturer of high-performance analog and mixed-signal integrated circuits that regulate power reported 41 percent December-quarter earnings growth. Revenue increased 18 percent. The company increased gross profit margins in its forward guidance, sending shares higher. |
| | | |
| | | | Avago Technologies Ltd. | | |
| $0.9 | | 26.2 | | The maker of semiconductors and optoelectronic components reported 149 percent January-quarter earnings growth. Revenue increased 130 percent, driven by strength in its wireless business. The company reported a gross profit margin of 51 percent, up from 48 percent in the year-ago period. |
| | | |
| $ Loss | | | | | | |
(in millions) | | % Loss | | Biggest $ Losers | | Reason for Move |
| | | | Virgin America Inc. | | |
| $1.1 | | 24.8 | | The California-based airline that provides scheduled air travel in the U.S. and Mexico reported 20 percent sequential earnings growth in the December-quarter, topping the consensus estimate by 45 percent. Shares declined on concerns about passenger trends and increased fuel hedging costs. |
| | | |
| | | | Pilgrim’s Pride Corp. | | |
| $0.9 | | 23.2 | | The producer of chicken products in the U.S. and Mexico exceeded expectations with 51 percent December-quarter earnings growth. While results showed strong pricing amid tight supplies, shares came under pressure due to concerns that chicken production would accelerate and feed costs would rise. We sold Pilgrim’s Pride to fund a new holding with greater near-term earnings visibility. |
| | | |
| | | | Five Below Inc. | | |
| $0.5 | | 12.3 | | The discount merchandise retailer targeting teens pre-reported earnings and sales below expectations for the three months through January. Weaker-than-expected store traffic in early December was to blame for the projected shortfall. We sold Five Below to fund a new opportunity with greater earnings visibility. |
| | | |
| | | | United Rentals Inc. | | |
| $0.4 | | 10.6 | | The largest equipment rental company in the United States reported 38 percent December-quarter earnings growth, beating the consensus estimate. Although results demonstrated strong utilization, shares declined on concerns that lower energy prices would decrease demand for its equipment in energy related projects. |
| | | |
| | | | Ryder System Inc. | | |
| $0.4 | | 9.9 | | The logistics and transportation-services company reported 19 percent December-quarter earnings growth. The company’s Fleet Management Solutions division was a notable contributor amid increased demand and improved pricing. Shares traded lower on concerns about potential for the economic backdrop to negatively impact demand. |
All gains/losses are calculated on an average cost basis from December 31, 2014 through March 31, 2015.
This commentary reflects the viewpoints of Friess Associates, LLC as of March 31, 2015 and is not intended as a forecast or guarantee of future results.
6
AMG Managers Brandywine Advisors Mid Cap Growth Fund
Schedule of Portfolio Investments (unaudited)
March 31, 2015
| | | | | | | | | | |
Shares | | | | Cost | | | Value | |
Common Stocks - 95.7% | | | | | |
Consumer Discretionary | | | | | |
| | Apparel Retail - 2.3% | | | | | |
| 215,200 | | American Eagle Outfitters, Inc. | | $ | 2,979,043 | | | $ | 3,675,616 | |
| | Apparel, Accessories & Luxury Goods - 4.6% | |
| 67,400 | | Columbia Sportswear Co. | | | 2,839,547 | | | | 4,104,660 | |
| 41,050 | | Under Armour, Inc., Class A* | | | 2,648,208 | | | | 3,314,788 | |
| | Cable & Satellite - 2.2% | | | | | |
| 45,800 | | AMC Networks, Inc., Class A* | | | 2,908,655 | | | | 3,510,112 | |
| | Footwear - 3.0% | | | | | |
| 68,000 | | Skechers U.S.A., Inc., Class A* | | | 3,613,330 | | | | 4,889,880 | |
| | General Merchandise Stores - 2.4% | |
| 81,200 | | Big Lots, Inc. | | | 3,673,494 | | | | 3,900,036 | |
| | Homebuilding - 1.8% | | | | | |
| 102,125 | | D.R. Horton, Inc. | | | 2,813,748 | | | | 2,908,520 | |
| | Hotels, Resorts & Cruise Lines - 1.5% | | | | | |
| 75,000 | | Diamond Resorts International, Inc.* | | | 2,531,250 | | | | 2,507,250 | |
| | Household Appliances - 2.1% | | | | | |
| 41,600 | | Helen of Troy, Ltd.* | | | 3,174,343 | | | | 3,389,984 | |
| | Housewares & Specialties - 2.9% | | | | | |
| 87,810 | | Jarden Corp.* | | | 2,459,273 | | | | 4,645,149 | |
| | Movies & Entertainment - 2.8% | | | | | |
| 199,000 | | Regal Entertainment Group, Class A1 | | | 4,216,177 | | | | 4,545,160 | |
| | Specialty Stores - 2.7% | | | | | |
| 32,050 | | Signet Jewelers, Ltd. | | | 3,905,940 | | | | 4,448,220 | |
| | | | | | | | | | |
Total Consumer Discretionary | | | 37,763,008 | | | | 45,839,375 | |
| | This sector is 21.4% above your Fund’s cost. | | | | | |
Consumer Staples | | | | | |
| | Household Products - 2.4% | | | | | |
| 45,810 | | Church & Dwight Co., Inc. | | | 3,499,883 | | | | 3,913,090 | |
| | This sector is 11.8% above your Fund’s cost. | | | | | |
Financials | | | | | |
| | Hotel & Resort REITs - 2.9% | | | | | |
| 101,000 | | Pebblebrook Hotel Trust | | | 3,812,846 | | | | 4,703,570 | |
| | Multi-Line Insurance - 2.0% | | | | | |
| 55,800 | | HCC Insurance Holdings, Inc. | | | 3,014,312 | | | | 3,162,186 | |
| | Property & Casualty Insurance - 2.0% | |
| 88,210 | | FNF Group | | | 3,206,564 | | | | 3,242,600 | |
| | | | | | | | | | |
Total Financials | | | 10,033,722 | | | | 11,108,356 | |
| | This sector is 10.7% above your Fund’s cost. | | | | | |
Health Care | | | | | |
| | Health Care Equipment - 2.0% | | | | | |
| 46,000 | | STERIS Corp. | | | 3,018,998 | | | | 3,232,420 | |
| | | | | | | | | | |
Shares | | | | Cost | | | Value | |
| | Health Care Services - 2.0% | | | | | |
| 42,200 | | Omnicare, Inc. | | $ | 3,170,885 | | | $ | 3,251,932 | |
| | Health Care Technology - 3.4% | | | | | |
| 21,000 | | athenahealth, Inc.* | | | 2,632,880 | | | | 2,507,190 | |
| 41,100 | | Cerner Corp.* | | | 2,411,278 | | | | 3,010,986 | |
| | | | | | | | | | |
Total Health Care | | | 11,234,041 | | | | 12,002,528 | |
| | This sector is 6.8% above your Fund’s cost. | | | | | |
Industrials | | | | | |
| | Aerospace & Defense - 2.7% | | | | | |
| 82,740 | | Spirit AeroSystems Holdings, Inc., Class A* | | | 3,175,590 | | | | 4,319,855 | |
| | Air Freight & Logistics - 2.1% | |
| 75,800 | | XPO Logistics, Inc.* | | | 2,743,040 | | | | 3,446,626 | |
| | Airlines - 0.7% | | | | | |
| 37,900 | | Virgin America, Inc.* | | | 1,214,334 | | | | 1,152,160 | |
| | Construction Machinery & Heavy Trucks - 5.4% | |
| 134,000 | | Trinity Industries, Inc. | | | 3,824,252 | | | | 4,758,340 | |
| 42,230 | | Wabtec Corp. | | | 1,234,559 | | | | 4,012,272 | |
| | Diversified Support Services - 2.0% | |
| 85,700 | | KAR Auction Services, Inc. | | | 2,621,421 | | | | 3,250,601 | |
| | Environmental & Facilities Services - 2.4% | |
| 79,000 | | Waste Connections, Inc. | | | 3,796,835 | | | | 3,803,060 | |
| | Human Resources & Employment Services - 2.7% | |
| 125,000 | | TriNet Group, Inc.* | | | 3,269,715 | | | | 4,403,750 | |
| | Trading Companies & Distributors - 2.3% | |
| 40,500 | | United Rentals, Inc.* | | | 2,090,022 | | | | 3,691,980 | |
| | Trucking - 5.8% | | | | | |
| 99,560 | | Knight Transportation, Inc. | | | 2,997,634 | | | | 3,210,810 | |
| 41,700 | | Old Dominion Freight Line, Inc.* | | | 2,991,603 | | | | 3,223,410 | |
| 110,775 | | Swift Transportation Co.* | | | 3,174,134 | | | | 2,882,365 | |
| | | | | | | | | | |
Total Industrials | | | 33,133,139 | | | | 42,155,229 | |
| | This sector is 27.2% above your Fund’s cost. | | | | | |
Information Technology | | | | | |
| | Electronic Components - 1.8% | | | | | |
| 127,000 | | Corning, Inc. | | | 2,732,646 | | | | 2,880,360 | |
| | Internet Software & Services - 4.5% | | | | | |
| 56,000 | | GrubHub, Inc.* | | | 2,132,723 | | | | 2,541,840 | |
| 90,965 | | LendingClub Corp.* | | | 2,077,037 | | | | 1,787,462 | |
| 43,200 | | Shutterstock, Inc.* | | | 2,829,194 | | | | 2,966,544 | |
| | Semiconductors - 12.2% | | | | | |
| 33,815 | | Avago Technologies, Ltd. | | | 2,973,996 | | | | 4,293,829 | |
| 165,000 | | Integrated Device Technology, Inc.* | | | 2,901,521 | | | | 3,303,300 | |
| 87,600 | | Maxim Integrated Products, Inc. | | | 2,836,263 | | | | 3,049,356 | |
| 116,520 | | Microsemi Corp.* | | | 3,000,428 | | | | 4,124,808 | |
| 62,537 | | Qorvo, Inc.* | | | 2,383,198 | | | | 4,984,199 | |
The accompanying notes are an integral part of these financial statements.
7
AMG Managers Brandywine Advisors Mid Cap Growth Fund
Schedule of Portfolio Investments (continued)
| | | | | | | | | | |
| | | |
Shares | | | | Cost | | | Value | |
Information Technology (continued) | | | | | |
| | Systems Software - 1.9% | | | | | |
| 37,600 | | Check Point Software Technologies, Ltd.* | | $ | 3,019,210 | | | $ | 3,082,072 | |
| | Technology Hardware, Storage & Peripherals - 1.8% | |
| 103,500 | | 3D Systems Corp.*,1 | | | 3,207,161 | | | | 2,837,970 | |
| | | | | | | | | | |
Total Information Technology | | | 30,093,377 | | | | 35,851,740 | |
| | This sector is 19.1% above your Fund’s cost. | | | | | |
Telecommunication Services | | | | | |
| | Wireless Telecommunication Services - 2.4% | |
| 33,425 | | SBA Communications Corp., Class A* | | | 2,955,589 | | | | 3,914,067 | |
| | This sector is 32.4% above your Fund’s cost. | | | | | | | | |
Total Common Stocks | | | 128,712,759 | | | | 154,784,385 | |
| | | |
| | | | | Principal
Amount | | | | |
Short-Term Investments - 6.5% | | | | | |
Repurchase Agreements - 3.5%2 | | | | | |
| | BNP Paribas Securities Corp., dated 03/31/15, due 04/01/15, 0.130%, total to be received $283,343 (secured by various U.S. Government Agency Obligations, 1.625% - 6.000%, 06/01/16 - 03/01/45, totaling $289,009) | | $ | 283,342 | | | | 283,342 | |
| | Daiwa Capital Markets America, dated 03/31/15, due 04/01/15, 0.180%, total to be received $1,345,976 (collateralized by various U.S. Government Agency Obligations, 0.000% - 8.000%, 02/15/16 - 03/01/48, totaling $1,372,888) | | | 1,345,969 | | | | 1,345,969 | |
| | Merrill Lynch, Pierce, Fenner & Smith, Inc., dated 03/31/15, due 04/01/15, 0.150%, total to be received $1,345,975 (collateralized by various U.S. Government Agency Obligations, 0.000% - 7.000%, 06/01/15 - 04/01/45, totaling $1,372,888) | | | 1,345,969 | | | | 1,345,969 | |
| | | | | | | | | | |
Shares | | | | Principal
Amount | | | Value | |
| | Mizuho Securities USA, Inc., dated 03/31/15, due 04/01/15, 0.150%, total to be received $1,345,975 (secured by various U.S. Government Agency Obligations, 2.000% - 5.000%, 05/01/44 - 04/01/45, totaling $1,372,888) | | $ | 1,345,969 | | | $ | 1,345,969 | |
| | Nomura Securities International, Inc., dated 03/31/15, due 04/01/15, 0.130%, total to be received $1,345,974 (collateralized by various U.S. Government Agency Obligations, 1.280% - 7.500%, 08/18/15 - 02/20/65 totaling $1,372,888) | | | 1,345,969 | | | | 1,345,969 | |
| | | | | | | | | | |
Total Repurchase Agreements | | | 5,667,218 | | | | 5,667,218 | |
| | | |
| | | | | Cost | | | | |
Other Investment Companies - 3.0%3 | | | | | |
| 4,759,210 | | Dreyfus Institutional Cash Advantage Fund, Institutional Class Shares, 0.06% | | | 4,759,210 | | | | 4,759,210 | |
| | | | | | | | | | |
Total Short-Term Investments | | | 10,426,428 | | | | 10,426,428 | |
Total Investments - 102.2% | | $ | 139,139,187 | | | | 165,210,813 | |
| | | | | | | | | | |
Other Assets, less Liabilities - (2.2)% | | | | (3,546,625 | ) |
Total Net Assets - 100.0% | | | $ | 161,664,188 | |
| | | | | | | | | | |
The accompanying notes are an integral part of these financial statements.
8
Notes to Schedule of Portfolio Investments (unaudited)
The following footnotes and abbreviations should be read in conjunction with the Schedule of Portfolio Investments previously presented in this report.
Based on the approximate cost of investments of $139,139,187 for federal income tax purposes at March 31, 2015, the aggregate gross unrealized appreciation and depreciation were $27,234,024 and $1,162,398, respectively, resulting in net unrealized appreciation of investments of $26,071,626.
| * | Non-income producing security. |
| 1 | Some or all of these securities, amounting to a market value of $5,503,202, or 3.4% of net assets, were out on loan to various brokers. |
| 2 | Collateral received from brokers for securities lending was invested in these short-term investments. |
| 3 | Yield shown represents the March 31, 2015, seven-day average yield, which refers to the sum of the previous seven days’ dividends paid, expressed as an annual percentage. |
The following table summarizes the inputs used to value the Fund’s net assets by the fair value hierarchy levels as of March 31, 2015. (See Note 1(a) in the Notes to the Financial Statements.)
| | | | | | | | | | | | | | | | |
| | | Quoted Prices in Active | | | | | | Significant | | | | |
| | | Markets for Identical | | | Significant Other | | | Unobservable | | | | |
| | | Investments | | | Observable Inputs | | | Inputs | | | | |
| | | Level 1 | | | Level 2 | | | Level 3 | | | Total | |
AMG Managers Brandywine Advisors Mid Cap Growth Fund | | | | | | | | | | | | | | | | |
Investments in Securities | | | | | | | | | | | | | | | | |
Common Stocks† | | $ | 154,784,385 | | | | — | | | | — | | | $ | 154,784,385 | |
Short-Term Investments | | | | | | | | | | | | | | | | |
Repurchase Agreements | | | — | | | $ | 5,667,218 | | | | — | | | | 5,667,218 | |
Other Investment Companies | | | 4,759,210 | | | | — | | | | — | | | | 4,759,210 | |
| | | | | | | | | | | | | | | | |
Total Investments in Securities | | $ | 159,543,595 | | | $ | 5,667,218 | | | | — | | | $ | 165,210,813 | |
| | | | | | | | | | | | | | | | |
| † | All common stocks held in the Fund are Level 1 securities. For a detailed breakout of the common stocks by major industry classification, please refer to the Schedule of Portfolio Investments. |
As of March 31, 2015, the Fund had no transfers between levels from the beginning of the reporting period.
The accompanying notes are an integral part of these financial statements.
9
Statement of Assets and Liabilities (unaudited)
March 31, 2015
| | | | |
Assets: | | | | |
Investments at value* (including securities on loan valued at $5,503,202) | | $ | 165,210,813 | |
Receivable for investments sold | | | 4,278,384 | |
Dividends, interest and other receivables | | | 116,849 | |
Receivable for Fund shares sold | | | 131 | |
Prepaid expenses | | | 8,030 | |
Total assets | | | 169,614,207 | |
Liabilities: | | | | |
Payable upon return of securities loaned | | | 5,667,218 | |
Payable for investments purchased | | | 2,105,815 | |
Payable for Fund shares repurchased | | | 3,548 | |
Accrued expenses: | | | | |
Investment advisory and management fees | | | 136,099 | |
Distribution fees | | | 1,089 | |
Administrative fees | | | 7,421 | |
Shareholder servicing fees | | | 1,225 | |
Trustees fees and expenses | | | 535 | |
Other | | | 27,069 | |
Total liabilities | | | 7,950,019 | |
Net Assets | | $ | 161,664,188 | |
Net Assets Represent: | | | | |
Paid-in capital | | $ | 159,471,280 | |
Undistributed net investment income | | | 134,017 | |
Accumulated net realized loss from investments | | | (24,012,735 | ) |
Net unrealized appreciation of investments | | | 26,071,626 | |
Net Assets | | $ | 161,664,188 | |
Shares outstanding | | | 15,495,939 | |
Net asset value, offering and redemption price per share | | $ | 10.43 | |
* Investments at cost | | $ | 139,139,187 | |
The accompanying notes are an integral part of these financial statements.
10
Statement of Operations (unaudited)
For the six months ended March 31, 2015
| | | | |
Investment Income: | | | | |
Dividend income | | $ | 1,439,873 | 1 |
Securities lending income | | | 123,272 | |
Interest income | | | 20,044 | |
Total investment income | | | 1,583,189 | |
Expenses: | | | | |
Investment advisory and management fees | | | 752,889 | |
Administrative fees | | | 22,587 | |
Shareholder servicing fees | | | 6,776 | |
Distribution fees | | | 1,938 | |
Professional fees | | | 24,644 | |
Registration fees | | | 14,894 | |
Custodian | | | 9,949 | |
Reports to shareholders | | | 8,719 | |
Trustees fees and expenses | | | 3,512 | |
Transfer agent | | | 2,285 | |
Miscellaneous | | | 1,731 | |
Total expenses | | | 849,924 | |
Net investment income | | | 733,265 | |
Net Realized and Unrealized Gain (Loss): | | | | |
Net realized gain on investments | | | 1,914,187 | |
Net change in unrealized appreciation (depreciation) of investments | | | 10,349,055 | |
Net realized and unrealized gain | | | 12,263,242 | |
Net increase in net assets resulting from operations | | $ | 12,996,507 | |
| 1 | Includes non-recurring dividends of $889,236. |
The accompanying notes are an integral part of these financial statements.
11
Statements of Changes in Net Assets
For the six months ended March 31, 2015 (unaudited) and the fiscal year ended September 30, 2014
| | | | | | | | |
| | | March 31, | | | September 30, | |
| | | 2015 | | | 2014 | |
Increase (Decrease) in Net Assets From Operations: | | | | | | | | |
Net investment income (loss) | | $ | 733,265 | | | $ | (808,269 | ) |
Net realized gain on investments | | | 1,914,187 | | | | 15,378,496 | |
Net change in unrealized appreciation (depreciation) of investments | | | 10,349,055 | | | | (2,276,747 | ) |
Net increase in net assets resulting from operations | | | 12,996,507 | | | | 12,293,480 | |
Capital Share Transactions: | | | | | | | | |
Proceeds from sale of shares | | | 105,428 | | | | 562,812 | |
Cost of shares repurchased | | | (284,650 | ) | | | (1,255,676 | ) |
Net decrease from capital share transactions | | | (179,222 | ) | | | (692,864 | ) |
Total increase in net assets | | | 12,817,285 | | | | 11,600,616 | |
Net Assets: | | | | | | | | |
Beginning of period | | | 148,846,903 | | | | 137,246,287 | |
End of period | | $ | 161,664,188 | | | $ | 148,846,903 | |
End of period undistributed net investment income (loss) | | $ | 134,017 | | | $ | (599,248 | ) |
| | | | | | | | |
Share Transactions: | | | | | | | | |
Sale of shares | | | 10,527 | | | | 58,832 | |
Shares repurchased | | | (29,572 | ) | | | (131,593 | ) |
Net decrease in shares | | | (19,045 | ) | | | (72,761 | ) |
The accompanying notes are an integral part of these financial statements.
12
AMG Managers Brandywine Advisors Mid Cap Growth Fund
Financial Highlights
For a share outstanding throughout each fiscal period
| | | | | | | | | | | | | | | | | | | | | | | | |
| | | For the six
months ended March 31, 2015
(unaudited) | | | | | | | | | | | | | | | | |
| | | | For the fiscal years ended September 30, | |
| | | | 20143 | | | 2013 | | | 2012 | | | 2011 | | | 2010 | |
Net Asset Value, Beginning of Period | | $ | 9.59 | | | $ | 8.80 | | | $ | 7.63 | | | $ | 6.82 | | | $ | 7.13 | | | $ | 6.86 | |
Income (loss) from Investment Operations: | | | | | | | | | | | | | | | | | | | | | | | | |
Net investment income (loss)1 | | | 0.05 | 4 | | | (0.05 | ) | | | (0.02 | ) | | | (0.03 | ) | | | (0.05 | ) | | | (0.02 | ) |
Net realized and unrealized gain (loss) on investments1 | | | 0.79 | | | | 0.84 | | | | 1.20 | | | | 0.84 | | | | (0.26 | ) | | | 0.29 | |
Total income (loss) from investment operations | | | 0.84 | | | | 0.79 | | | | 1.18 | | | | 0.81 | | | | (0.31 | ) | | | 0.27 | |
Distributions to Shareholders from: | | | | | | | | | | | | | | | | | | | | | | | | |
Net investment income | | | — | | | | — | | | | (0.01 | ) | | | — | | | | — | | | | — | |
Net Asset Value, End of Period | | $ | 10.43 | | | $ | 9.59 | | | $ | 8.80 | | | $ | 7.63 | | | $ | 6.82 | | | $ | 7.13 | |
Total Return | | | 8.76 | % | | | 8.98 | % | | | 15.43 | % | | | 11.88 | % | | | (4.35 | )% | | | 3.94 | % |
Ratio of total expenses to average net assets | | | 1.13 | % | | | 1.12 | % | | | 1.22 | % | | | 1.22 | %2 | | | 1.25 | %2 | | | 1.28 | % |
Ratio of net investment income (loss) to average net assets | | | 0.97 | % | | | (0.54 | )% | | | (0.20 | )% | | | (0.37 | )% | | | (0.63 | )% | | | (0.30 | )% |
Portfolio turnover | | | 92 | % | | | 249 | % | | | 235 | % | | | 266 | % | | | 241 | % | | | 226 | % |
Net assets at end of period (000’s omitted) | | $ | 161,664 | | | $ | 148,847 | | | $ | 137,246 | | | $ | 119,769 | | | $ | 122,926 | | | $ | 178,780 | |
| | | | | | | | | | | | | | | | | | | | | | | | |
Notes to Financial Highlights (unaudited)
| 1 | Per share numbers have been calculated using average shares. |
| 2 | Interest expense is less than 0.005% of average net assets. |
| 3 | At the start of business October 1, 2013, AMG Managers Brandywine Advisors Midcap Growth Fund was re-organized into a series of AMG Funds I. |
| 4 | Includes non-recurring dividends. Without these dividends, net investment loss per share would have been $(0.01). |
13
Notes to Financial Statements (unaudited)
March 31, 2015
1. SUMMARY OF SIGNIFICANT ACCOUNTING POLICIES
AMG Funds I (the “Trust”) is an open-end management investment company, organized as a Massachusetts business trust and registered under the Investment Company Act of 1940, as amended (the “1940 Act”). Currently, the Trust consists of a number of different funds, each having distinct investment management objectives, strategies, risks, and policies. Included in this report is the AMG Managers Brandywine Advisors Mid Cap Growth Fund (the “Fund”).
At the start of business on October 1, 2013, Brandywine Advisors Midcap Growth Fund, a series of Brandywine Blue Fund, Inc. (the “Predecessor Fund”), was reorganized into a series of the Trust. As a result of the reorganization, the Fund is the successor to the accounting and performance information of the Predecessor Fund.
The Fund’s financial statements are prepared in accordance with accounting principles generally accepted in the United States of America (“U.S. GAAP”), which require management to make estimates and assumptions that affect the reported amount of assets and liabilities and disclosure of contingent assets and liabilities at the date of the financial statements and the reported amounts of income and expenses during the reporting periods. Actual results could differ from those estimates and such differences may be material. The following is a summary of significant accounting policies followed by the Fund in the preparation of its financial statements:
a. VALUATION OF INVESTMENTS
Equity securities traded on a domestic or international securities exchange are valued at the last quoted sale price, or, lacking any sales, at the last quoted bid price. Equity securities primarily traded on an international securities exchange and equity securities traded on NASDAQ or in a U.S. or non-U.S. over-the-counter market are valued at the market’s official closing price, or, if there are no trades on the applicable date, at the last quoted bid price. In addition, if the applicable market does not offer an official closing price or if the official closing price is not representative of the overall market, equity securities primarily traded on an international securities exchange and equity securities traded in a non-U.S. over-the-counter market are valued at the last quoted sales price. The Fund’s investments are generally valued based on independent market quotations or prices or, if none, “evaluative” or other market based valuations provided by third-party pricing services approved by the Board of Trustees of the Fund (the “Board”).
Short-term debt obligations (debt obligations with maturities of one year or less at the time of issuance) that have 60 days or less remaining until maturity will be valued at amortized cost. Investments in other open-end regulated investment companies are valued at their end of day net asset value per share.
Under certain circumstances, the value of certain Fund investments (including derivatives) may be based on an evaluation of fair value, pursuant to procedures established by and under the general supervision of the Board. The Pricing Committee is the committee formed by the Board to make fair value determinations for such investments. The Fund may use the fair value of a portfolio investment to calculate its net asset value (“NAV”) in the event that the market quotation, price or market based valuation for the portfolio investment is not deemed to be readily available or otherwise not determinable pursuant to the Board’s valuation procedures, if AMG Funds LLC (the “Investment
Manager”) believes the quotation, price or market based valuation to be unreliable, or in certain other circumstances. When determining the fair value of an investment, the Pricing Committee seeks to determine the price that the Fund might reasonably expect to receive from a current sale of that investment in an arms-length transaction. Fair value determinations shall be based upon consideration of all available facts and information, including, but not limited to (i) attributes specific to the investment; (ii) fundamental analytical data and press releases relating to the investment and its issuer; and (iii) the value of other comparable securities or relevant financial instruments, including derivative securities, traded on other markets or among dealers.
The values assigned to fair value investments are based on available information and do not necessarily represent amounts that might ultimately be realized in the future, since such amounts depend on future developments inherent in long-term investments. Because of the inherent uncertainty of valuation, those estimated values may differ significantly from the values that would have been used had a ready market for the investments existed, and the differences could be material. The Board will be presented with a quarterly report showing as of the most recent quarter end, all securities fair valued by the Pricing Committee, including a comparison with the prior quarter end and the percentage of the Fund that the security represents at each quarter end.
Portfolio investments that trade primarily on foreign markets are priced based upon the market quotation of such securities as of the close of their respective principal markets. Under certain circumstances, on behalf of a fund that invests in international securities, the Investment Manager or applicable subadvisor may recommend an adjustment of such prices based on its determination of the impact of events occurring subsequent to the close of such markets but prior to the time as of which the Fund calculates its NAV. The Board has also adopted a policy that securities held in a fund that invests in international securities and certain foreign debt obligations held by a fund, in each case, that can be fair valued by the applicable fair value pricing service are fair valued on each business day without regard to a “trigger” (e.g., without regard to invoking fair value based upon a change in a U.S. equity securities index exceeding a pre-determined level). The Fund may invest in securities that may be thinly traded. The Board has adopted procedures to adjust prices of securities that are judged to be stale so that they reflect fair value. An investment valued on the basis of its fair value may be valued at a price higher or lower than available market quotations.
U.S. GAAP defines fair value as the price that a fund would receive to sell an asset or pay to transfer a liability in an orderly transaction between market participants at the measurement date. U.S. GAAP also establishes a framework for measuring fair value, and a three-level hierarchy for fair value measurements based upon the transparency of inputs to the valuation of an asset or liability. Inputs may be observable or unobservable and refer broadly to the assumptions that market participants would use in pricing the asset or liability. Observable inputs reflect the assumptions market participants would use in pricing the asset or liability based on market data obtained from sources independent of the Fund. Unobservable inputs reflect the Fund’s own assumptions about the assumptions that market participants would use in pricing the asset or liability developed based on the best information available in the circumstances. Each investment is assigned a level based upon the observability of the inputs which are significant to the overall valuation.
Notes to Financial Statements (continued)
The three-tier hierarchy of inputs is summarized below:
Level 1 – inputs are quoted prices in active markets for identical investments (e.g., equity securities, open-end investment companies)
Level 2 – other observable inputs (including, but not limited to: quoted prices for similar assets or liabilities in markets that are active, quoted prices for identical or similar assets or liabilities in markets that are not active, inputs other than quoted prices that are observable for the assets or liabilities (such as interest rates, yield curves, volatilities, prepayment speeds, loss severities, credit risks and default rates) or other market corroborated inputs) (e.g., debt securities, government securities, foreign currency exchange contracts, foreign securities utilizing international fair value pricing, broker-quoted securities, fair valued securities with observable inputs)
Level 3 – inputs are significant unobservable inputs (including the Fund’s own assumptions used to determine the fair value of investments) (e.g., fair valued securities with unobservable inputs)
Changes in inputs or methodologies used for valuing investments may result in a transfer in or out of levels within the fair value hierarchy. The inputs or methodologies used for valuing investments may not necessarily be an indication of the risk associated with investing in those investments.
b. SECURITY TRANSACTIONS
Security transactions are accounted for as of trade date. Realized gains and losses on securities sold are determined on the basis of identified cost.
c. INVESTMENT INCOME AND EXPENSES
Dividend income is recorded on the ex-dividend date. Dividend and interest income on foreign securities is recorded gross of any withholding tax. Interest income, which includes amortization of premium and accretion of discount on debt securities, is accrued as earned. Non-cash dividends included in dividend income, if any, are reported at the fair market value of the securities received. Distributions received in excess of income from return of capital including real estate investment trusts (REITs) are recorded as a reduction of the cost of the related investment and/or as a realized gain. If the Fund no longer owns the applicable securities, any distributions received in excess of income are recorded as an adjustment to realized gain. Other income and expenses are recorded on an accrual basis. Expenses that cannot be directly attributed to a Fund are apportioned among the Funds in the Trust and in some cases other affiliated funds based upon their relative average net assets or number of shareholders.
The Fund has a “balance credit” arrangement with The Bank of New York Mellon (“BNYM”), the Fund’s custodian, whereby the Fund is credited with an interest factor equal to 0.75% below the effective 90-day T-Bill rate for account balances left uninvested overnight. If the T-Bill rate falls below 0.75%, no credits will be earned. These credits serve to reduce custodian expenses that would otherwise be charged to the Fund. For the six months ended March 31, 2015, the Fund’s custodian expense was not reduced.
Overdraft fees are computed at 1% above the Federal Funds rate on the day of the overdraft. For the six months ended March 31, 2015, overdraft fees for the Fund equaled $15.
d. DIVIDENDS AND DISTRIBUTIONS
Fund distributions resulting from either net investment income or realized net capital gains, if any, will normally be declared and paid at least annually in December, as described in the Fund’s prospectus. Distributions to shareholders are recorded on the ex-dividend date. Distributions are determined in accordance with federal income tax regulations, which may differ from net investment income and net realized capital gains for financial statement purposes (U.S. GAAP). Differences may be permanent or temporary. Permanent differences are reclassified among capital accounts in the financial statements to reflect their tax character. Permanent book and tax basis differences, if any, relating to shareholder distributions will result in reclassifications to paid-in capital. Temporary differences arise when certain items of income, expense and gain or loss are recognized in different periods for financial statement and tax purposes; these differences will reverse at some time in the future. The differences are due to differing treatments for wash sales.
e. FEDERAL TAXES
The Fund intends to comply with the requirements under Subchapter M of the Internal Revenue Code of 1986, as amended, to distribute substantially all of its taxable income and gains to its shareholders and to meet certain diversification and income requirements with respect to investment companies. Therefore, no provision for federal income or excise tax is included in the accompanying financial statements.
Additionally, based on the Fund’s understanding of the tax rules and rates related to income, gains and transactions for the foreign jurisdictions in which it invests, the Fund will provide for foreign taxes, and where appropriate, deferred foreign taxes.
Management has analyzed the Fund’s tax positions taken on federal income tax returns as of September 30, 2014, and for all open tax years (generally, the three prior taxable years), and has concluded that no provision for federal income tax is required in the Fund’s financial statements. Additionally, the Fund is not aware of any tax position for which it is reasonably possible that the total amounts of unrecognized tax benefits will change materially in the next twelve months.
Net capital losses incurred in taxable years beginning after the enactment of the Regulated Investment Company Modernization Act of 2010, may be carried forward for an unlimited time period. Such losses will be required to be utilized prior to any loss carryovers incurred in pre-enactment taxable years, which generally expire eight years following the close of the taxable year in which they were incurred. As a result of this ordering rule, pre-enactment capital loss carryovers may be more likely to expire unused. Additionally, post-enactment capital losses that are carried forward retain their tax character as either short-term or long-term capital losses, unlike pre-enactment losses which are considered all short-term.
f. CAPITAL LOSS CARRYOVERS AND DEFERRALS
As of March 31, 2015, the Fund had accumulated net realized capital loss carryovers from securities transactions for federal income tax purposes as shown in the following chart. These amounts may be used to offset future realized capital gains, if any, through the expiration dates listed or in the case of post-enactment losses, for an unlimited time period.
Notes to Financial Statements (continued)
| | | | | | | | | | | | |
| | | Capital Loss Carryover Amounts | | | Expires
September 30, | |
| | | Short-Term | | | Long-Term | | |
(Pre-Enactment) | | $ | 25,926,922 | | | | — | | | | 2018 | |
| | | | | | | | | | | | |
g. CAPITAL STOCK
The Trust’s Declaration of Trust authorizes for each fund the issuance of an unlimited number of shares of beneficial interest, without par value. The Fund records sales and repurchases of its capital stock on the trade date. The cost of securities contributed to the Fund in connection with the issuance of shares is based on the valuation of those securities in accordance with the Fund’s policy on investment valuation.
At March 31, 2015, certain affiliated shareholders of record, individually or collectively, held greater than 10% of the net assets of the Fund as follows: one owns 97%. Transactions by this shareholder may have a material impact on the Fund.
h. REPURCHASE AGREEMENTS
The Fund may enter into repurchase agreements provided that the value of the underlying collateral, including accrued interest, will equal or exceed the value of the repurchase agreement during the term of the agreement. The underlying collateral for all repurchase agreements is held in safekeeping by the Fund’s custodian or at the Federal Reserve Bank. If the seller defaults and the value of the collateral declines, or if bankruptcy proceedings commence with respect to the seller of the security, realization of the collateral by the Fund may be delayed or limited. At March 31, 2015, the market value of repurchase agreements outstanding was $5,667,218.
2. AGREEMENTS AND TRANSACTIONS WITH AFFILIATES
The Trust has entered into an investment advisory agreement under which the Investment Manager, a subsidiary and the U.S. retail distribution arm of Affiliated Managers Group, Inc. (“AMG”), serves as investment manager to the Fund and is responsible for the Fund’s overall administration and operations. The Investment Manager selects subadvisors for the Fund (subject to Board approval) and monitors the subadvisor’s investment performance, security holdings and investment strategies. The Fund’s investment portfolio is managed by Friess Associates, LLC (“Friess”) through a subadvisory agreement between the Investment Manager and Friess relating to the Fund, and Friess Associates of Delaware, LLC (“Friess of Delaware”) through a sub-subadvisory agreement among the Investment Manager, Friess and Friess of Delaware relating to the Fund.
Investment management fees are paid directly by the Fund to the Investment Manager based on average daily net assets. For the six months ended March 31, 2015, the Fund paid an investment management fee at the annual rate of 1.00% of the average daily net assets of the Fund.
The Investment Manager has contractually agreed, through at least February 1, 2016, to waive management fees (but not below zero) and/or reimburse Fund expenses in order to limit total annual Fund operating expenses (exclusive of taxes, interest (including interest incurred in connection with bank and custody
overdrafts), brokerage commissions and other transaction costs, acquired fund fees and expenses, and extraordinary expenses) to 1.95% of the Fund’s average daily net assets subject to later reimbursement by the Fund in certain circumstances. The contractual expense limitation may only be terminated in the event the Investment Manager or a successor ceases to be the investment manager of the Fund or a successor fund, by mutual agreement between the Investment Manager and the Board, or in the event of the Fund’s liquidation unless the Fund is reorganized or is a party to a merger in which the surviving entity is successor to the accounting and performance information of the Fund.
The Fund is obligated to repay the Investment Manager such amounts waived, paid or reimbursed in future years provided that the repayment occurs within thirty-six (36) months after the waiver or reimbursement and that such repayment would not cause the Fund’s total annual operating expenses after fee waiver and expense reimbursement in any such future year to exceed the Fund’s expense contractual expense limitation amount. For the six months ended March 31, 2015, the Fund’s expenses were not reimbursed.
The Fund has entered into an Administration and Shareholder Servicing Agreement under which the Investment Manager serves as the Fund’s administrator (the “Administrator”) and is responsible for all aspects of managing the Fund’s operations, including administration and shareholder services to the Fund, its shareholders, and certain institutions, such as bank trust departments, broker-dealers and registered investment advisers, that advise or act as intermediary with the Fund’s shareholders. The Fund pays a fee to the Administrator at the rate of 0.03% of the Fund’s average daily net assets for the first $300 million of assets under management, 0.025% for the next $200 million, and 0.02% on amounts in excess of $500 million per annum, subject to a $40,000 annual minimum.
Effective January 1, 2015, the Board provides supervision of the affairs of the Trust, other trusts within the AMG Funds family of mutual funds (collectively the “AMG Funds family”) and other affiliated funds. Previously, the Board provided supervision to only the Trust and other trusts within the AMG Funds family.
Beginning January 1, 2015, the aggregate annual retainer paid to each Independent Trustee of the Board is $200,000, plus $16,000, $4,000 or $2,000 for each regular, in-person special or telephonic special meeting attended, respectively. The Independent Chairman of the Trusts receives an additional payment of $55,000 per year. The Chairman of the Audit Committee receives an additional payment of $25,000 per year.
Prior to January 1, 2015, the aggregate annual retainer paid to each Independent Trustee of the Board was $130,000, plus $7,000 or $2,500 for each regular or special meeting attended, respectively. The Independent Chairman of the Trusts formerly received an additional payment of $35,000 per year. The Chairman of the Audit Committee formerly received an additional payment of $15,000 per year.
Prior to January 1, 2014, the aggregate annual retainer paid to each Independent Trustee of the Board was $105,000, plus $6,000 or $2,500 for each regular or special meeting attended, respectively. The Independent Chairman of the Board formerly received an additional payment of $25,000 per
Notes to Financial Statements (continued)
year. The Chairman of the Audit Committee formerly received an additional payment of $10,000 per year.
Effective January 1, 2015, the Trustees’ fees and expenses are generally allocated among all of the funds in the Trust, other trusts within the AMG Funds family and other affiliated funds based on the relative net assets of such funds. Before January 1, 2015, the Trustees’ fees and expenses were generally allocated among all of the funds in the Trust and other trusts within the AMG Funds family. The “Trustees fees and expenses” shown in the financial statements represents each Fund’s allocated portion of the total fees and expenses paid to the Independent Trustees of the Board.
The Fund is distributed by AMG Distributors, Inc. (the “Distributor”), a wholly-owned subsidiary of the Investment Manager. The Distributor serves as the distributor and underwriter for the Fund and is a registered broker-dealer and member of the Financial Industry Regulatory Authority, Inc. (“FINRA”). Shares of the Fund will be continuously offered and will be sold directly to prospective purchasers and through brokers, dealers or other financial intermediaries who have executed selling agreements with the Distributor. Subject to the compensation arrangement discussed below, generally the Distributor bears all or a portion of the expenses of providing services pursuant to the distribution agreement, including the payment of the expenses relating to the distribution of prospectuses for sales purposes and any advertising or sales literature. Certain Trustees and Officers of the Fund are Officers and/or Directors of the Investment Manager, AMG and/or the Distributor.
The Board has approved reimbursement payments to the Investment Manager for shareholder servicing expenses (“shareholder servicing fees”) incurred. Shareholder servicing fees include payments to third parties such as a bank, broker-dealer, trust company or other financial intermediaries who provide shareholder recordkeeping, account servicing and other services. To the extent the Investment Manager makes shareholder servicing payments to a third party, the Fund may reimburse the Investment Manager up to the amounts incurred. For the six months ended September 30, 2014, the Fund paid $6,776 or 0.004%.
The Securities and Exchange Commission granted an exemptive order that permits the Fund to lend and borrow money for certain temporary purposes directly to and from other eligible Funds in the AMG Funds family. Participation in this interfund lending program is voluntary for both borrowing and lending Funds, and an interfund loan is only made if it benefits each participating Fund. The Investment Manager administers the program according to procedures approved by the Board, and the Board monitors the operation of the program. An interfund loan must comply with certain conditions set out in the exemptive order, which are designed to assure fairness and protect all participating Funds. For the six months ended March 31, 2015, the Fund neither borrowed from nor lent to other Funds in the AMG Funds family.
3. PURCHASES AND SALES OF SECURITIES
Purchases and sales of securities (excluding short-term securities and U.S. Government obligations) for the six months ended March 31, 2015, were $134,417,045 and $137,023,049, respectively. There were no purchases or sales of U.S. Government obligations for the Fund.
4. PORTFOLIO SECURITIES LOANED
The Fund participates in a securities lending program offered by BNYM (the “Program”), providing for the lending of securities to qualified brokers. Securities lending income includes earnings of such temporary cash investments, plus or minus any rebate to a borrower. These earnings (after any rebate) are then divided between BNYM, as a fee for its services under the Program, and the Fund, according to agreed-upon rates. Collateral received on all securities loaned is accepted in cash and is maintained at a minimum level of 102% (105% in the case of certain foreign securities) of the market value, plus interest, if applicable, of investments on loan. It is the Fund’s policy to obtain additional collateral from or return excess collateral to the borrower by the end of the next business day, following the valuation date of the securities loaned. Therefore, the value of the collateral held may be temporarily less than the value of the securities on loan. Lending securities entails a risk of loss to the Fund if and to the extent that the market value of the securities loaned were to increase and the borrower did not increase the collateral accordingly, and the borrower fails to return the securities. Under the terms of the Program, the Fund is indemnified for such losses by BNYM. Cash collateral is held in a separate account managed by BNYM, who is authorized to exclusively enter into overnight government repurchase agreements. BNYM bears the risk of any deficiency in the amount of the cash collateral available for return to the borrower due to any loss on the collateral invested. At March 31, 2015, the value of the securities loaned and cash collateral received was $5,503,202 and $5,667,218, respectively.
5. COMMITMENTS AND CONTINGENCIES
Under the Trust’s organizational documents, its trustees and officers are indemnified against certain liabilities arising out of the performance of their duties to the Trust. In addition, in the normal course of business, the Fund may enter into contracts and agreements that contain a variety of representations and warranties, which provide general indemnifications. The maximum exposure to the Fund under these arrangements is unknown, as this would involve future claims that may be made against a Fund that have not yet occurred. However, based on experience, the Fund had no prior claims or losses and expects the risk of loss to be remote.
6. MASTER NETTING AGREEMENTS
The Fund may enter into master netting agreements with its counterparties for the securities lending program and repurchase agreements, which provide the right, in the event of default (including bankruptcy or insolvency) for the non-defaulting party to liquidate the collateral and calculate net exposure to the defaulting party or request additional collateral. For financial reporting purposes, the Fund does not offset financial assets and financial liabilities that are subject to master netting agreements in the Statement of Assets and Liabilities. For Securities lending transactions, see Note 4.
Notes to Financial Statements (continued)
The following table is a summary of the Fund’s open repurchase agreements which are subject to a master netting agreement as of March 31, 2015:
| | | | | | | | | | | | | | | | |
| | | Net Amounts of
Assets Presented
in the Statement
of Assets and
Liabilities | | | Gross Amount Not Offset in the
Statement of Assets and Liabilities | | | | |
| | | | Financial
Instruments
Collateral | | | Cash Collateral
Received | | | Net Amount | |
BNP Paribas Securities Corp. | | $ | 283,342 | | | $ | 283,342 | | | | — | | | | — | |
Daiwa Capital Markets America | | | 1,345,969 | | | | 1,345,969 | | | | — | | | | — | |
Merrill Lynch, Pierce. Fenner & Smith, Inc. | | | 1,345,969 | | | | 1,345,969 | | | | — | | | | — | |
Mizuho Securities USA, Inc. | | | 1,345,969 | | | | 1,345,969 | | | | — | | | | — | |
Nomura Securities International, Inc. | | | 1,345,969 | | | | 1,345,969 | | | | — | | | | — | |
| | | | | | | | | | | | | | | | |
Total | | $ | 5,667,218 | | | $ | 5,667,218 | | | | — | | | | — | |
| | | | | | | | | | | | | | | | |
7. SUBSEQUENT EVENTS
The Fund has determined that no material events or transactions occurred through the issuance date of the Fund’s financial statements which require additional disclosure in or adjustment of the Fund’s financial statements.
18
THIS PAGE INTENTIONALLY LEFT BLANK
THIS PAGE INTENTIONALLY LEFT BLANK
| | | | |
INVESTMENT MANAGER AND ADMINISTRATOR AMG Funds LLC 800 Connecticut Avenue Norwalk, CT 06854 (800) 835-3879 DISTRIBUTOR AMG Distributors, Inc. 800 Connecticut Avenue Norwalk, CT 06854 (800) 835-3879 SUBADVISOR Friess Associates, LLC P.O. Box 576 Jackson, Wyoming 83001 Friess Associates of Delaware, LLC P.O. Box 4166 Greenville, DE 19807 CUSTODIAN The Bank of New York Mellon 2 Hanson Place Brooklyn, NY 11217 | | LEGAL COUNCEL Ropes & Gray LLP Prudential Tower, 800 Boylston Street Boston, MA 02199-3600 TRANSFER AGENT BNY Mellon Investment Servicing (US) Inc. Attn: AMG Funds P.O. Box 9769 Providence, RI 02940 (800) 548-4539 TRUSTEES Bruce B. Bingham Christine C. Carsman William E. Chapman II Edward J. Kaier Kurt Keilhacker Steven J. Paggioli Richard F. Powers III Eric Rakowski Victoria Sassine Thomas R. Schneeweis | | This report is prepared for the Fund’s shareholders. It is authorized for distribution to prospective investors only when preceded or accompanied by an effective prospectus. To receive a free copy of the prospectus or Statement of Additional Information, which includes additional information about Fund Trustees, please contact us by calling 800.835.3879. Distributed by AMG Distributors, Inc., member FINRA/SIPC. Current net asset values per share for the Fund are available on the Fund’s website at www.amgfunds.com. A description of the policies and procedures the Fund uses to vote its proxies is available: (i) without charge, upon request, by calling 800.835.3879, or (ii) on the Securities and Exchange Commission’s (SEC) website at www.sec.gov. For information regarding the Fund’s proxy voting record for the 12-month period ended June 30, call 800.835.3879 or visit the SEC website at www.sec.gov. The Fund files its complete schedule of portfolio holdings with the SEC for the first and third quarters of each fiscal year on Form N-Q. The Fund’s Forms N-Q are available on the SEC’s website at www.sec.gov. A Fund’s Forms N-Q may be reviewed and copied at the SEC’s Public Reference Room in Washington, DC. Information on the operation of the Public Reference Room may be obtained by calling 1-800-SEC-0330. To review a complete list of the Fund’s portfolio holdings, or to view the most recent quarterly holdings report, semiannual report, or annual report, please visit www.amgfunds.com. |
AFFILIATE SUBADVISED FUNDS
| | | | |
ALTERNATIVE FUNDS AMG FQ Global Alternatives First Quadrant, L.P. BALANCED FUNDS AMG Chicago Equity Partners Balanced Chicago Equity Partners, LLC AMG FQ Global Risk-Balanced (formerly Managers AMG FQ Global Essentials) First Quadrant, L.P. EQUITY FUNDS AMG Chicago Equity Partners Small Cap Value Chicago Equity Partners, LLC AMG FQ Tax-Managed U.S. Equity AMG FQ U.S. Equity First Quadrant, L.P. AMG Frontier Small Cap Growth Frontier Capital Management Company, LLC | | AMG GW&K Small Cap Core (formerly GW&K Small Cap Equity) GW&K Investment Management, LLC AMG Renaissance International Equity AMG Renaissance Large Cap Growth The Renaissance Group LLC AMG SouthernSun Small Cap AMG SouthernSun U.S. Equity SouthernSun Asset Management, LLC AMG Systematic Large Cap Value (formerly Systematic Value) AMG Systematic Mid Cap Value Systematic Financial Management, L.P. AMG TimesSquare All Cap Growth (formerly Managers AMG TSCM Growth Equity) AMG TimesSquare International Small Cap AMG TimesSquare Mid Cap Growth AMG TimesSquare Small Cap Growth TimesSquare Capital Management, LLC | | AMG Trilogy Emerging Markets Equity AMG Trilogy Emerging Wealth Equity AMG Trilogy Global Equity AMG Trilogy International Small Cap Trilogy Global Advisors, L.P. AMG Yacktman Focused AMG Yacktman Yacktman Asset Management LP FIXED INCOME FUNDS AMG GW&K Enhanced Core Bond (formerly GW&K Fixed Income) AMG GW&K Core Bond (formerly AMG Managers Total Return Bond) AMG GW&K Municipal Bond AMG GW&K Municipal Enhanced Yield GW&K Investment Management, LLC |
OPEN-ARCHITECTURE FUNDS |
EQUITY FUNDS AMG Managers Brandywine Advisors Mid Cap Growth AMG Managers Brandywine Blue AMG Managers Brandywine Friess Associates, LLC AMG Managers Cadence Capital Appreciation AMG Managers Cadence Emerging Companies AMG Managers Cadence Mid Cap Cadence Capital Management, LLC AMG Managers Emerging Opportunities (formerly Managers Micro-Cap) Lord, Abbett & Co. LLC WEDGE Capital Management L.L.P. Next Century Growth Investors LLC RBC Global Asset Management (U.S.) Inc. | | AMG Managers Essex Small/Micro Cap Growth Essex Investment Management Co., LLC AMG Managers Real Estate Securities CenterSquare Investment Management, Inc. AMG Managers Skyline Special Equities (formerly Skyline Special Equities Portfolio) Skyline Asset Management, L.P. AMG Managers Special Equity Ranger Investment Management, L.P. Lord, Abbett & Co. LLC Smith Asset Management Group, L.P. Federated MDTA LLC | | FIXED INCOME FUNDS AMG Managers Bond AMG Managers Global Income Opportunity Loomis, Sayles & Co., L.P. AMG Managers High Yield J.P. Morgan Investment Management Inc. AMG Managers Intermediate Duration Government AMG Managers Short Duration Government Amundi Smith Breeden LLC |
| | |
 | | www.amgfunds.com |
Not applicable for the semi-annual shareholder report.
| Item 3. | AUDIT COMMITTEE FINANCIAL EXPERT |
Not applicable for the semi-annual shareholder report.
| Item 4. | PRINCIPAL ACCOUNTANT FEES AND SERVICES |
Not applicable for the semi-annual shareholder report.
| Item 5. | AUDIT COMMITTEE OF LISTED REGISTRANTS |
Not applicable.
| Item 6. | SCHEDULE OF INVESTMENTS |
The schedule of investments in unaffiliated issuers as of the close of the reporting period is included as part of the shareholder report contained in Item 1 hereof.
| Item 7. | DISCLOSURE OF PROXY VOTING POLICIES AND PROCEDURES FOR CLOSED-END MANAGEMENT INVESTMENT COMPANIES |
Not applicable.
| Item 8. | PORTFOLIO MANAGERS OF CLOSED-END MANAGEMENT INVESTMENT COMPANIES |
Not applicable.
| Item 9. | PURCHASES OF EQUITY SECURITIES BY CLOSED-END MANAGEMENT INVESTMENT COMPANIES AND AFFILIATED PURCHASERS |
Not applicable.
| Item 10. | SUBMISSION OF MATTERS TO A VOTE OF SECURITY HOLDERS |
Not applicable.
| Item 11. | CONTROLS AND PROCEDURES |
| | (a) | The registrant’s principal executive and principal financial officers have concluded, based on their evaluation of the registrant’s disclosure controls and procedures as of a date within 90 days of the filing date of this report, that the registrant’s disclosure controls and procedures are reasonably designed to ensure that information required to be disclosed by the registrant on Form N-CSR is recorded, processed, summarized and reported within the required time periods and that information required to be disclosed by the registrant in the reports that it files or submits on Form N-CSR is accumulated and communicated to the registrant’s management, including its principal executive and principal financial officers, as appropriate to allow timely decisions regarding required disclosure. |
| | (b) | There were no changes in the registrant’s internal control over financial reporting during the registrant’s second fiscal quarter of the period covered by this report that have materially affected, or are reasonably likely to materially affect, the internal control over financial reporting. |
| | | | |
| | |
| | (a) (1) | | Not applicable. |
| | |
| | (a) (2) | | Certifications pursuant to Rule 30a-2(a) under the Investment Company Act of 1940 - Filed herewith. |
| | |
| | (a) (3) | | Not applicable. |
| | |
| | (b) | | Certifications pursuant to Rule 30a-2(b) under the Investment Company Act of 1940 - Filed herewith. |
SIGNATURES
Pursuant to the requirements of the Securities Exchange Act of 1934 and the Investment Company Act of 1940, the registrant has duly caused this report to be signed on its behalf by the undersigned, thereunto duly authorized.
AMG FUNDS I
| | |
| By: | | /s/ Jeffrey T. Cerutti |
| | Jeffrey T. Cerutti, Principal Executive Officer |
| |
| Date: | | April 27, 2015 |
Pursuant to the requirements of the Securities Exchange Act of 1934 and the Investment Company Act of 1940, this report has been signed below by the following persons on behalf of the registrant and in the capacities and on the dates indicated.
| | |
| By: | | /s/ Jeffrey T. Cerutti |
| | Jeffrey T. Cerutti, Principal Executive Officer |
| |
| Date: | | April 27, 2015 |
| |
| By: | | /s/ Donald S. Rumery |
| | Donald S. Rumery, Principal Financial Officer |
| |
| Date: | | April 27, 2015 |